thermally sprayed high temperature sandwich structures
TRANSCRIPT

i
Thermally Sprayed High Temperature Sandwich Structures: Physical Properties and Mechanical
Performance
by
Saeid Salavati
A thesis submitted in conformity with the requirements for the degree of Doctor of Philosophy
Department of Mechanical and Industrial Engineering University of Toronto
© Copyright by Saeid Salavati, 2016
ii
Abstract
Thermally Sprayed High Temperature Sandwich Structures:
Physical Properties and Mechanical Performance
Saeid Salavati
Doctor of Philosophy
Graduate Department of Mechanical and Industrial Engineering
University of Toronto
2016
Metallic foam core sandwich structures have been of particular interest for engineering
applications in recent decades due to their unique physical and mechanical properties. One of the
potential applications of open pore metallic foam core sandwich structures is in heat exchangers.
An investigation of sandwich structures fabricated from materials suitable for application at high
temperatures and in corrosive environments was undertaken in this project.
A novel method for fabrication of metallic foam core sandwich structures is thermal spray
deposition of the faces on the prepared surfaces of the metallic foam substrate. The objective of
the current study was to optimize the twin wire arc spray process parameters for the deposition of
alloy 625 faces with controllable porosity content on the nickel foam substrate, and to characterize
the physical and mechanical properties of the sandwich structure.
The experimental investigations consisted of microstructural evaluation of the skin material and
the foam substrate, investigation of the effect of alloying on the mechanical and thermal properties
of the nickel foam, optimization of the grit-blasting and arc spray processes, observation of
mechanical properties of the alloy 625 deposit by tensile testing and evaluation of the overall
mechanical properties of the sandwich structure under flexural loading condition.
iii
The optimization of arc spraying process parameters allowed deposition of alloy 625 faces with a
porosity of less than 4% for heat exchanger applications. Modification of the arc spraying process
by co-deposition of polyester powder enabled 20% porosity to be obtained in the deposited faces
for heat shield applications with film cooling.
The effects of nickel foam alloying and heat treatment on the flexural rigidity of the sandwich
structures were investigated and compared with as-received foam and as-fabricated sandwich
structures. Available analytical models were employed to describe the effect of constituents’
mechanical properties on the overall mechanical performance of the sandwich structures. Finite
element modeling using ANSYS Structural was used to simulate the behaviour of the sandwich
structures in four-point bending. The analytical and simulation results were compared with the
experimental results obtained from the flexural tests.
iv
Acknowledgments
First and foremost, I would like to thank my supervisors Professor Javad Mostaghimi and Professor
Thomas W. Coyle for their remarkable support and academic guidance during my Ph.D. program
at the University of Toronto, and providing me with the opportunity to complete my Ph.D. thesis
at the Centre for Advanced Coating Technologies (CACT). I also thank Dr. Larry Pershin who
kindly helped me in preparing my samples at the thermal spray shop and provided me with
technical supports throughout my time at the CACT. I must thank supervisory committee
members: Professor Sanjeev Chandra and Professor Glen D. Hibbard for their guidance and
inspiration leading to the preparation of this thesis.
I would like to acknowledge Professor Mansoor Barati and his lab members for assisting me in
using box furnaces at sustainable materials processing research group laboratories. I thank
Professor Olivera Kesler and her post-doctoral fellow, Joel Kuhn, for their great guidance to use
their TGA facilities at Fuel Cell Materials and Manufacturing Laboratory.
I thank Mr. Sal Boccia and Dr. Karim Danaei and Dr. Dan Grozea at the Materials Science and
Engineering Department of the University of Toronto who assisted me in materials
characterization labs. I also thank the staffs of MIE machine shop for their help with fabricating
several parts and assemblies needed for my research.
I would like to express my gratitude to all the current and former member of CACT who have been
very helpful through my study; Dr. Mehrdad Taheri, Dr. Babak Samareh, Mr. Reza Rezaey, Dr.
Arash Kashani, Dr. Fardad Azarmi, Mr. Amirsaman Farrokhpanah, Dr. Nazli Saranjam, Mr. Javad
Esmaeilpanah, and Special thanks to my friend Dr. Hamidreza Salimi Jazi.
I also want to express my deepest gratitude to my father; Mohammad and my mother; Mehri and
my brothers; Hamid and Navid who always greatly supported me throughout my life.
Finally, I wish to thank my wife, Hanya, for her love and support in my life.
v
Table of Contents
Abstract ........................................................................................................................................... ii
Acknowledgments.......................................................................................................................... iv
Table of Contents .............................................................................................................................v
List of Tables ............................................................................................................................... viii
List of Figures ..................................................................................................................................x
List of Appendices .........................................................................................................................xv
Chapter 1 Introduction .....................................................................................................................1
1.1 Background and Motivation ................................................................................................1
1.2 Objectives ............................................................................................................................4
1.3 Guide to the thesis ................................................................................................................6
References ........................................................................................................................................7
Chapter 2 Literature Review.....................................................................................................9
2.1 Sandwich structures .............................................................................................................9
2.1.1 Historical background ..............................................................................................9
2.1.2 Concept of sandwich structures ...............................................................................9
2.1.3 Metallic foam core sandwich structures ................................................................11
2.1.4 Mechanical properties of sandwich structures .......................................................12
2.1.5 Failure modes of sandwich structures ....................................................................13
2.1.6 Failure map ............................................................................................................15
2.2 Material selection ...............................................................................................................16
2.2.1 Core material ..........................................................................................................17
2.2.2 Facing Material ......................................................................................................26
vi
2.3 Sandwich structure fabrication processes ..........................................................................31
2.3.1 Available methods .................................................................................................31
2.3.2 Thermal spray processes ........................................................................................32
References ......................................................................................................................................46
Chapter 3 Experimental Procedure .........................................................................................61
3.1 Metallic foam core .............................................................................................................62
3.1.1 Nickel foam ............................................................................................................62
3.1.2 Ni-Cr alloyed foam ................................................................................................63
3.2 Sandwich structure facings deposition...............................................................................66
3.2.1 Foam surface preparation .......................................................................................66
3.2.2 Arc spraying of alloy 625 ......................................................................................69
3.3 Characterization methods...................................................................................................76
3.3.1 In-flight droplet characteristics measurements ......................................................76
3.3.2 Microstructural characterization ............................................................................77
3.3.3 Thermogravimetric analysis (TGA) .......................................................................78
3.3.4 Mechanical tests .....................................................................................................79
References ......................................................................................................................................84
Chapter 4 Microstructural Characterizations ..........................................................................87
4.1 Introduction ........................................................................................................................87
4.2 Foam substrate ...................................................................................................................87
4.2.1 Microstructural characterization ............................................................................87
4.2.2 High-temperature oxidation ...................................................................................94
4.3 Alloy 625 facings ...............................................................................................................95
4.3.1 Optimization of twin wire arc spray for alloy 625 coatings ..................................96
4.3.2 The effect of heat treatment .................................................................................112
4.3.3 Gas permeability of the alloy 625 deposits ..........................................................116
vii
References ....................................................................................................................................118
Chapter 5 Mechanical Behaviour .........................................................................................122
5.1 Introduction ......................................................................................................................122
5.2 Mechanical behaviour of foam ........................................................................................122
5.2.1 Analytical model ..................................................................................................122
5.2.2 Compression test results ......................................................................................124
5.3 Mechanical behaviour of facings .....................................................................................126
5.3.1 Analytical models ................................................................................................126
5.3.2 Tensile strength tests ............................................................................................129
5.4 Mechanical performance of thermally sprayed sandwich structures ...............................132
5.4.1 Prediction of the behaviour of sandwich panels under four-point bend loading .133
5.4.2 Four-point bending tests ......................................................................................145
5.5 Summary of the results ....................................................................................................158
References ....................................................................................................................................161
Chapter 6 Closure .................................................................................................................164
6.1 Results and Conclusions ..................................................................................................165
6.2 Major contributions ..........................................................................................................167
6.3 Recommendations for future work ..................................................................................168
viii
List of Tables
Table 2-1 Some of the nickel base superalloys and their nominal chemical composition[17] ..... 27
Table 2-2 Alloy 625 physical properties [17] ............................................................................... 29
Table 2-3 Alloy 625 important mechanical properties [72], [85] ................................................. 30
Table 2-4 Common heat treatment procedures for alloy 625 [85]................................................ 31
Table 3-1 Pack chromizing powder mixture ................................................................................. 64
Table 3-2 BASF Acrodur 950 L epoxy properties [2] .................................................................. 67
Table 3-3 Grit blasting process parameters .................................................................................. 68
Table 3-4 External polyester powder feeder parameters- coded values ....................................... 72
Table 3-5 The process factors with their levels. ........................................................................... 72
Table 3-6 compositions of alloy 625 wire used as wire arc feedstock ......................................... 73
Table 3-7 heat treatment procedures for arc sprayed alloy 625 facings on nickel and nickel alloy
foam structures .............................................................................................................................. 76
Table 4-1 the concentration of Chromium on different areas of Ni-Cr foam struts ..................... 91
Table 4-2 micro-harness results for Ni and Ni-Cr foam struts ..................................................... 93
Table 4-3 in-flight alloy 625 droplet temperature and velocity .................................................... 97
Table 4-4 EDS results; chemical composition of different point in SEM micrographs ............... 99
Table 4-5 EDS results for the spots specified in Figure 4-11 ..................................................... 100
Table 4-6 experimental design matrix and the resulted coating porosity content ...................... 103
Table 4-7 ANOVA for Response Surface (porosity content) Quadratic model ......................... 104
Table 4-8 oxide content and hardness of alloy 625 facings deposited in different runs ............. 107
ix
Table 4-9 arc spray process parameters suggested by the model for production of dense and
porous coatings with the measure microstructural properties ..................................................... 111
Table 4-10 Porosity and oxide content of the skin ..................................................................... 113
Table 5-1 The properties of nickel foam structures used in this project ..................................... 123
Table 5-2 compression test results .............................................................................................. 126
Table 5-3 Elastic modulus of the coatings produced by run number 5 and run number 7
calculated by available analytical models ................................................................................... 128
Table 5-4 mechanical properties of arc sprayed alloy 625 facings resulting from tensile test ... 130
Table 5-5 flexural rigidity of thermally sprayed metallic foam core sandwich beams prepared
with various conditions ............................................................................................................... 148
x
List of Figures
Figure 2-1 Schematic of the sandwich structures ......................................................................... 10
Figure 2-2 different types of sandwich structures based on their core material ........................... 11
Figure 2-3 Sandwich structure construction in comparison with I-beam ..................................... 12
Figure 2-4 Failure modes of sandwich structures ......................................................................... 14
Figure 2-5 SEM image of an open pore foam structure ................................................................ 19
Figure 2-6 application of electro-deposition technique to produce open pore Ni foam ............... 21
Figure 2-7 Open-pore nickel foams structure ............................................................................... 22
Figure 2-8 typical stress-stain curve for open pore metallic foam................................................ 24
Figure 2-9 schematic of arc spray process (picture was produced by CACT staffs) .................... 39
Figure 3-1 summary of arc spray metallic foam core sandwich structure production procedure . 62
Figure 3-2 As received 40 PPI open pore nickel foam ................................................................. 62
Figure 3-3 structural features of 10 PPI open pore nickel foam ................................................... 63
Figure 3-4 Schematic of the retort used for chromizing of the nickel foam ................................. 65
Figure 3-5 Chromizing process thermal cycle .............................................................................. 65
Figure 3-6 heat treatment procedure of chromized nickel foam ................................................... 66
Figure 3-7 morphology of alloy 625 powder used for preparing temporary surface.................... 67
Figure 3-8 cross section of paste filled nickel foam a) non-grit blasted surface b) surface roughness
of Ra=18 µm c) Ra=30 µm d) Ra=42 µm ...................................................................................... 69
Figure 3-9 the geometry of Box-Behnken design. Design points are at the midpoints of edges of
the design space and at the center. ................................................................................................ 71
xi
Figure 3-10 morphology of polyester powder particles as the pore generator agent .................... 74
Figure 3-11 Schematic of twin wire arc spraying process and external pore generator agent injector
added to the process for production of porous deposits ................................................................ 75
Figure 3-12 Schematic of tensile test samples .............................................................................. 81
Figure 3-13 Schematic of tensile test equipment, front view and side view. ............................... 81
Figure 3-14 Schematic of compression test equipment ................................................................ 82
Figure 3-15 schematic of four-point bending test set up .............................................................. 83
Figure 4-1 microstructure of a) nickel foam b) Ni-Cr foam ......................................................... 88
Figure 4-2 EDS map of cross section of a) as-received nickel foam b) as-chromized nickel foam
c) 2 hours homogenized Ni-Cr foam d) 5 hours homogenized Ni-Cr Foam ................................ 89
Figure 4-3 linear EDS analysis for Ni-Cr foam samples a) as-chromized b) 2 hours homogenized
c) 5 hours homogenized ................................................................................................................ 90
Figure 4-4 sample SEM image of 5 hours homogenized Ni-Cr foam to measure the concentration
of chromium concentration in different spot of Ni-Cr foam samples ........................................... 91
Figure 4-5 XRD pattern for a) as-chromized foam c) 5 hours homogenized Ni-Cr foam............ 93
Figure 4-6 plot of static air oxidation at 1000 ºC for a) as-received nickel foam ......................... 94
Figure 4-7 SEM image and EDS of the surface of a Ni-Cr foam strut after hot oxidation test for 3
hours at 1000 ºC showing the oxide layer on the surface of strut ................................................. 95
Figure 4-8 SEM micrograph for first layer of arc sprayed alloy 625 a) without external injection
of polyester powder b) with external injection of polyester powder ............................................ 98
Figure 4-9 A typical micrograph use in EDS analysis .................................................................. 98
Figure 4-10 SEM image of typical a) alloy 625/nickel foam sandwich structure ........................ 99
xii
Figure 4-11 EDS analysis on the intermediate and light gray color areas in the SEM images of the
coating cross section ................................................................................................................... 100
Figure 4-12 XRD pattern for alloy 625 wire and as-sprayed alloy 625 coating ......................... 102
Figure 4-13 a) normal probability plot for porosity content of the coating, b) predicted value of
porosity versus the actual value .................................................................................................. 105
Figure 4-14 SEM images of the coating cross section deposited produced in run number ........ 106
Figure 4-15 the perturbation plot of the response for input parameters by considering the middle
level of the variables as the reference point ................................................................................ 108
Figure 4-16 surface plot of porosity percentage versus arc voltage and spraying distance ........ 109
Figure 4-17 surface plot of porosity percentage versus polyester powder feeding rate and arc
voltage ......................................................................................................................................... 109
Figure 4-18 surface plot of porosity percentage versus polyester powder feeding rate and spraying
distance ....................................................................................................................................... 110
Figure 4-19 Microstructure of the alloy 625 arc sprayed coating after a) 1-hour annealing, b) 3
hours annealing, c) 5 hour annealing at 900 ˚C .......................................................................... 114
Figure 4-20 Microstructure of the alloy 625 arc sprayed coating after a) 1 hour annealing, b) 3
hours annealing, c) 5 hour annealing at 1100 ˚C ........................................................................ 114
Figure 4-21 The XRD pattern for alloy 625 as feedstock, as-sprayed and annealed coatings ... 115
Figure 4-22 Schematic illustration of permeability test equipment ............................................ 116
Figure 4-23 permeability test sample a) before mounting in the test apparatus b) after mounting in
test apparatus c) during the permeability test d) during the permeability test with water on top to
illustrate escape of gas ................................................................................................................ 117
Figure 5-1 Metallic foams compression test results ................................................................... 125
Figure 5-2 stress-strain curve for alloy 625 facings – dense coating (3% porosity)................... 129
xiii
Figure 5-3 stress-strain curve for alloy 625 facings – porous coating (24% porosity) ............... 130
Figure 5-4 tensile test samples after the test a) as sprayed b) heat treated for 3 hours c) heat treated
for 5 hours ................................................................................................................................... 132
Figure 5-5 Geometry of a sandwich structure in 4-point bending test ....................................... 134
Figure 5-6 Failure mode map for sandwich structures made of pure nickel foam and 24% porosity
coating with the ratio of L/S=2 ................................................................................................... 142
Figure 5-7 Failure mode map for sandwich structures made of pure nickel foam and 24% porosity
coating with the ratio of L/S=3 ................................................................................................... 142
Figure 5-8 Failure mode map for sandwich structures made of pure nickel foam and 3% porosity
coating with the ratio of L/S=2 ................................................................................................... 142
Figure 5-9 Failure mode map for sandwich structures made of pure nickel foam and 3% porosity
coating with the ratio of L/S=3 ................................................................................................... 142
Figure 5-10 Failure mode map for sandwich structures made of Ni-Cr foam and 24% porosity
coating with the ratio of L/S=2 ................................................................................................... 143
Figure 5-11 Failure mode map for sandwich structures made of Ni-Cr foam and 24% porosity
coating with the ratio of L/S=3 ................................................................................................... 143
Figure 5-12 Failure mode map for sandwich structures made of Ni-Cr foam and 3% porosity
coating with the ratio of L/S=2 ................................................................................................... 143
Figure 5-13 Failure mode map for sandwich structures made of Ni-Cr foam and 3% porosity
coating with the ratio of L/S=3 ................................................................................................... 143
Figure 5-14 Typical sandwich beam modeled in ANSYS workbench V. 15 . This image captures
distribution of elastic strain in the core in the linear region ....................................................... 145
Figure 5-15 Centre point deflection for a typical thermally sprayed sandwich beam after 4-point
bending load ................................................................................................................................ 146
xiv
Figure 5-16 four-point bending load-stroke curves for a 3 hours-annealed dense arc sprayed alloy
625 coating of 1 mm thick .......................................................................................................... 146
Figure 5-17 typical load-displacement curve for non-continuous bending test with the purpose of
determining deviations from linear behavior and visual inspection ........................................... 149
Figure 5-18 Typical load-stroke curve resulting from sample failed by core yielding mechanism a)
mode A b) mode B ...................................................................................................................... 151
Figure 5-19 peak loads associated with the core yield mechanism as a function of overhang length
..................................................................................................................................................... 152
Figure 5-20 Typical load-stroke curve resulted from sample failed by facing indentation
mechanism .................................................................................................................................. 153
Figure 5-21 peak loads associated with the indentation mechanism as a function of facings’
thickness ...................................................................................................................................... 154
Figure 5-22 Typical load-stroke curve resulted from sample failed by face yielding mechanism
..................................................................................................................................................... 155
Figure 5-23 Peak loads associated with the face yield mechanism as a function of (L-S) ......... 155
Figure 5-24 Typical load-stroke curve resulted from sample failed by face cracking mechanism
..................................................................................................................................................... 156
Figure 5-25 Four-point bending load-stroke curve for 500 µm-thick alloy 625 facings sandwich
structure with 10 mm-thick-core of pure nickel and Ni-Cr heat treated alloyed foam ............... 157
Figure 5-26 the effect of annealing on the load-stroke curve for 500 µm thick facings with 24%
porosity/20 mm thick core sandwich panels ............................................................................... 157
Figure 5-27 the effect of annealing on the load-stroke curve for 500 µm thick facings with 3%
porosity/20 mm thick core sandwich panels ............................................................................... 158
xv
List of Appendices
Appendix A: Drawing for pack chromizing retort used for alloying the pure Ni foam ..............169
Appendix B: Curing process and transformation of filling paste epoxy to high strength
thermoset resin ........................................................................................................................170
Appendix C: Arc spray process ...................................................................................................171
Appendix D: Temporary surface burnout temperature indication ...............................................172
Appendix E: DVP-2000 system and the resulted graphs .............................................................174
Appendix F: TGA tests on foam samples ....................................................................................176
Appendix G: Adhesion test for arc sprayed deposits ...................................................................177
1
Chapter 1 Introduction
1.1 Background and Motivation
Sandwich structures are of great interest in advanced engineering applications due to their
attractive properties such as high strength to weight ratio, good flexural rigidity and relatively ease
of manufacture [1]–[3]. Engineering components made of sandwich structures can present the
same mechanical performance as conventional ones with saving about 75% in weight, while the
other specifications such as thermal insulation can be enhanced. While the technology and
application of sandwich structures seem relatively new, but the concept of sandwich structure
construction belongs to the mid-nineteenth century [4]. The application of sandwich structures has
been the particular focus of many manufacturers in a wide variety of industries such as thermal,
aviation and automobile industries due to their excellent performance.
Sandwich constructions are usually made of two faces and a thicker lightweight core. The faces
and the core can be chosen from a wide variety of metallic and non-metallic materials. The faces
are commonly made of stronger materials, while the core may be metallic or nonmetallic
honeycombs, polymeric foams or cellular materials [5]–[8].
Traditionally, sandwich structures have been fabricated for the room temperature structural
applications. While the application of sandwich structure for room temperature structures has been
quite successful, optimization of these structures would extend their applications to hot
temperature devices. One potential application for high-temperature sandwich structures is in heat
transfer and heat insulation devices. This idea is supported by their attractive properties such as;
high permeability, interconnected porosity, high surface area to volume ratio suitable for
fabrication of heat-exchanger channels, and excellent thermal insulation properties across the
structure thickness that is required in heat shield devices [9]. These properties along with their
lower weight compared to conventional structures make sandwich structures good candidates for
high-temperature applications. One of the main driving forces for optimization and
commercializing high temperatures sandwich structures is the potential benefits through saving in
2
fuel consumption by increasing the efficiency of thermal devices and consequently a reduction in
CO2 emissions for fossil fuel thermal facilities [10].
The properties desired for high-temperature applications are; high resistance against hot oxidation,
mechanical stability, good thermal properties, and of course reasonable fabrication cost [11].
Sandwich structures with specific thermal and physical properties in the faces and core can be
designed and fabricated to serve all these criteria, while it is difficult to find conventional structures
that serve all the purposes.
The sandwich structures fabricated by high temperature resistant metallic foams skinned with
superalloy faces can be considered as potential replacements for the conventional heat exchanger
channels and heat shield devices. The porous core would let the fluid flows through the channels
and absorb or deliver the heat in such devices. Higher surface area of the foam core compared to
honeycomb channels would increase the efficiency of the heat transfer device [12], [13].
Nickel base alloys and nickel superalloys are known as very good candidates for high-temperature
applications where mechanical loading is combined with a hot corrosion risk [14]. A combination
of strength, high corrosion resistance, high toughness and ductility, and microstructural stability
at elevated temperatures is offered by nickel base superalloys [15]. While thermal conductivity of
nickel is lower than some other metals such as copper and aluminum and their alloys, but the high-
temperature stability of nickel and its alloys is significantly higher.
The sandwich structure faces have to be oxidation resistant and maintain their mechanical
properties at an acceptable level with the ability to make a good connection with the metallic foam.
Ni-base superalloys such as alloy 738, 718, 713, and 625 are widely used in high-temperature
engineering applications due to their excellent high-temperature properties. Alloy 625 has shown
very good hot oxidation resistance at the temperatures up to 1200 °C [16]. Therefore, it is expected
that sandwich panels made of Ni-Cr alloy foam with Alloy 625 facings exhibit good corrosion
resistance and mechanical properties during high-temperature operations.
Different techniques such as brazing, cladding, and diffusion bonding have been employed to place
the faces on the metallic foams to fabricate metallic foam core sandwich structures. These methods
are normally expensive and have problems in shaping and bonding the faces on the complex-shape
foams. A new approach to fabricating metallic foam core sandwich structures is deposition of face
3
material on the metallic foam substrate by thermal spray processes. Thermal spray methods offer
a wide range of deposits with variable thicknesses. The most common types of thermal spray
methods can be listed as High Velocity Oxy Fuel (HVOF), Plasma Spray, Flame Spray and Twin
Wire Arc Spray (TWAS). Amongst these, arc spray method is a cost-effective high-efficiency
method suitable for mass production of engineering parts. The fundamental of this process is
melting the coating material fed into the gun in the form of two individual wires by forming an
electric arc at the point the wires reach together. Then, it is followed by spraying the molten
droplets to the substrate using a compressed air stream passing through the gun. The droplets
impact the substrate surface and make flat disks called splats. Solidification and build-up of these
splats form the deposit on the substrate. The twin wire arc process parameters such as spraying
voltage and gun stand-off distance can be optimized for each coating material to get maximum
adhesion strength, and also control the coating porosity content [17], [18].
In the present research, twin wire arc spray process, as a rapid and cost-effective method, was used
to deposit alloy 625 on nickel and Ni-Cr foam sheets. The temperature, velocity and size of the in-
flight molten droplets leaving the gun towards the foam substrate were monitored in different
experiments for optimization purposes. It has been shown that these characteristics are in relation
with the coating mechanical and physical properties through influencing oxidation, flattening, and
solidification processes of the coating splats [19]. In addition to droplet characteristics, proper
bonding between deposited alloy 625 and the foam substrate as a result of surface roughening and
mechanical interlocking at the interface was engineered [20]. A robot was employed for the coating
depositions to keep the coating properties consistent throughout the substrate surface.
Non-permeable coating is desired for heat exchanger channel faces while the high amount of open
porosity in the faces activates film cooling mechanism in heat shield devices. Porosity content of
the deposited skins was controlled and optimized through systematic variation of parameters for
two different applications; heat exchanger channel, and heat shield device.
Heat exchanger channels and heat shield panels are normally under bending loads. The mechanical
properties of sandwich panels used in these devices are critical. However, due to the inelastic and
nonlinear behavior of the constituent materials, it is difficult to analyze their mechanical behavior.
In this study, mechanical behavior analysis is divided into four steps: 1- application of the
analytical models to describe the elastic modulus of the alloy 625 arc sprayed coating and the
4
nickel foam. 2- analysis of the foam and skin mechanical properties separately through
compression and tensile tests. 3- analytical investigation, and Finite Element Modeling (FEM) of
the sandwich structure flexural properties by simulating four-point bending test in ANSYS. 4-
Four-point bending test for the sandwich structure made in different conditions. The results of
analytical and simulation studies were compared with the experimental results for validation
purposes. The sandwich panels were tested in as-sprayed mode and also after heat treatment in a
vacuum furnace.
Response Surface Methodology (RSM) as a powerful Design of Experiment (DOE) method was
employed in conducting the surface preparation and facings deposition experiments where various
parameters with different levels could possibly affect the outcome. The effect of coating
microstructure, as a function of spray parameters and heat treatment, on the coating mechanical
properties was studied. Failure modes of the sandwich panels were studied experimentally and
compared with failure mode maps generated from analytical formulas for sandwich structures with
different fabrication criteria and different architectures.
1.2 Objectives
The objective of this Ph.D. project was to fabricate metallic foam core sandwich structures by arc
spray process with controllable porosity in the faces for high-temperature applications. Also, the
aim of this research study was to investigate microstructural and mechanical properties of the
nickel foam, alloy 625 coating, and the sandwich structures experimentally and analytically.
The following steps were taken to pursue the mentioned main objective;
Selection of the faces and the core material based on the available knowledge and literature.
Optimization of the surface preparation procedure to create optimum surface roughness
required for mechanical bonding between the coating and filled foam substrate.
Optimization of the twin wire arc spray process parameters for deposition of low porosity
alloy 625 coatings for heat exchanger application using RSM and characterization of the
low porosity coating.
5
Modification of twin wire arc spray process to deposit high porosity coatings by adding
polyester powder particles to the coating using an external injection nozzle, and
characterization of the porous coating.
Optimization of the pack cementation process for the production of chromium alloyed
nickel foam with high oxidation resistance and characterization of the foam.
Fabrication of the sandwich structure by deposition of alloy 625 on the nickel foam and
nickel alloy foam using conventional and modified twin wire arc process.
The use of analytical models for the foam and coating mechanical properties prediction.
Investigation of the faces and the foam mechanical properties separately, using tensile and
compression tests respectively.
Analytical calculations of the metallic foam core sandwich structures’ stiffness.
Finite Element Modeling (FEM) of the four-point bending test for metallic foam core
sandwich beams using ANSYS software.
Investigation of the flexural properties of the metallic foam core sandwich structures by
conducting four-point bending test and identification of failure mode for the sandwich
structures fabricated in various criteria.

6
1.3 Guide to the thesis
Chapter 2 of this thesis introduces the concept of metallic foam core sandwich structures through
reviewing the relevant literature. Different fabrication methods will be described. Thermal spray
methods with a focus on twin wire arc spray process will be introduced and compared. The benefits
of this process compared to other available fabrication methods are highlighted in this chapter. The
affecting arc spray parameters will be reviewed and compared according to the available
references. The fundamentals of mechanical properties of the foam core, facings and sandwich
panels are briefed in this chapter. The main failure modes of the sandwich beams will be discussed.
Chapter 3 describes the experimental procedure for fabrication of arc sprayed metallic foam core
sandwich structures as well the characterization methods and procedures.
Chapter 4 reviews the microstructural characterization results towards selecting the proper foam
core for high-temperature applications. Results of arc spray optimization and modification for
dense and porous facings will be discussed too.
Chapter 5 focuses on the mechanical properties of the produced sandwich structure and its
constituents. Analytical, FEM, and experimental studies are employed to investigate mechanical
properties of the core, facings, and sandwich beams. The results are compared, and the predictions
are validated for selected sandwich beam architectures. This chapter is to provide a better
understanding of mechanical behavior of thermally sprayed metallic foam core sandwich
structures and to summarize the failure modes of sandwich panels in failure mode maps.
Chapter 6 closes the thesis with summarizing the work done in the Ph.D. project, results of the
investigations, and also suggestions for the future works in this area.
7
References
[1] L. J. Gibson and M. F. Ashby, Cellular Solids: Structure and Properties. Cambridge,
U.K: Cambridge University Press, 1997, pp. 175-231.
[2] J. Banhart, “Manufacture, characterisation and application of cellular metals and metal
foams,” Prog. Mater. Sci., vol. 46, no. 6, pp. 559–632, 2001.
[3] B. H. Smith, S. Szyniszewski, J. F. Hajjar, B. W. Schafer, and S. R. Arwade, “Steel foam
for structures: A review of applications, manufacturing and material properties,” J. Constr.
Steel Res., vol. 71, pp. 1–10, 2012.
[4] G. Caprino and R. Teti, Sandwich Structures : Handbook. Padua, Italy : Il Prato, 1989.
[5] M. F. Ashby, A. G. Evans, N. A. Fleck, L. J. Gibson, J. W. Hutchinson, and H. N. G.
Wadley, Metal Foams. Oxford, UK: Butterworth-Heinemann, 2000.
[6] A.P. Moutitz, Introduction to Aerospace Materials.: Philadelphia, PA: Woodhead
publishing, 2012, pp. 39-56.
[7] O. T. Thomsen, “Sandwich materials for wind turbine blades - present and future,” J.
Sandw. Struct. Mater., vol. 11, no. 1, pp. 7–26, 2009.
[8] L. J. Gibson, “Properties and Applications of Metallic Foams” in Comprehensive
Composite Materials. Vol. 3.31. A. Kelly and C. Zweben, Ed. Oxford, UK: Pergamon,
2000, pp. 821-842.
[9] K. Boomsma, D. Poulikakos, and F. Zwick, “Metal foams as compact high performance
heat exchangers,” Mech. Mater., vol. 35, no. 12, pp. 1161–1176, 2003.
[10] L. P. Lefebvre, J. Banhart, and D. C. Dunand, “Porous metals and metallic foams: Current
status and recent developments,” Adv. Eng. Mater., vol. 10, no. 9, pp. 775–787, 2008.
[11] J. R. Vinson, The Behavior of Sandwich Structures of Isotropic and Composite Materials.
Lancaster, PA: Technomic publishing Company, 1999.
[12] H. R. S. Jazi, J. Mostaghimi, S. Chandra, L. Pershin, and T. Coyle, “Spray-formed, metal-
8
foam heat exchangers for high temperature applications,” J. Therm. Sci. Eng. Appl., vol. 1,
no. 3, pp. 0310081-7, 2009.
[13] N. Dukhan, Metal Foams: Fundamentals and Applications. Lancaster, PA: DEStech
Publications, Inc, 2013.
[14] J. R. Davis, Nickel, Cobalt, and Their Alloys, Materials Park, OH: ASM International, 2000.
[15] M. J. Wahll, D. J. Maykuth, H. J. Hucek, and Metals and Ceramics Information Center
(U.S.), Handbook of superalloys. Columbus, OH: Battelle Press, 1979.
[16] S. Floreen, G. E. Fuchs, and W. J. Yang, “The metallurgy of Alloy 625,” In TMS Proc.,
1994, pp. 13–37.
[17] J. R. Davis, Handbook of Thermal Spray Technology. Materials Park, OH: ASM
International, 2004.
[18] S. Salavati, R. Rezaey, L. Pershin, T. W. Coyle, and J. Mostaghimi, “Development of high
density twin wire arc sprayed coatings on metallic foam substrates,” In Proc. International
Thermal Spray Conference, 2013, pp. 345–350.
[19] A. P. Newbery and P. S. Grant, “Oxidation during electric arc spray forming of steel,” J.
Mater. Process. Technol., vol. 178, no. 1–3, pp. 259–269, 2006.
[20] S. Salavati, T. W. Coyle, and J. Mostaghimi, “Optimization of grit-blasting process
parameters for production of dense coatings on open pores metallic foam substrates using
statistical methods,” J. Therm. Spray Technol., vol. 24, no. 7, pp. 1246–1255, 2015.
9
Chapter 2 Literature Review
2.1 Sandwich structures
2.1.1 Historical background
The combination of different materials in a sandwich form was practiced by independent engineers
and researchers at different times since mid-nineteenth century [1]. It has been stated by Noor et
al. [2] that the concept of sandwich structures was first described by Fairbairn in 1849, who
presented the experimental results for a sandwich structure made of steel sheets attached to wooden
core to be employed in Robert Stephenson’s deflection-limited Britannia tubular railway bridge in
North Wales [3]. The first research article about sandwich structures was published by Marguerre
in 1944 [4]. Since then many researchers and engineers studied the development of sandwich
structures and evaluation of their properties for different applications. These may also include
advanced applications such as 3D sandwich structures for lithium-sulfur batteries [5].
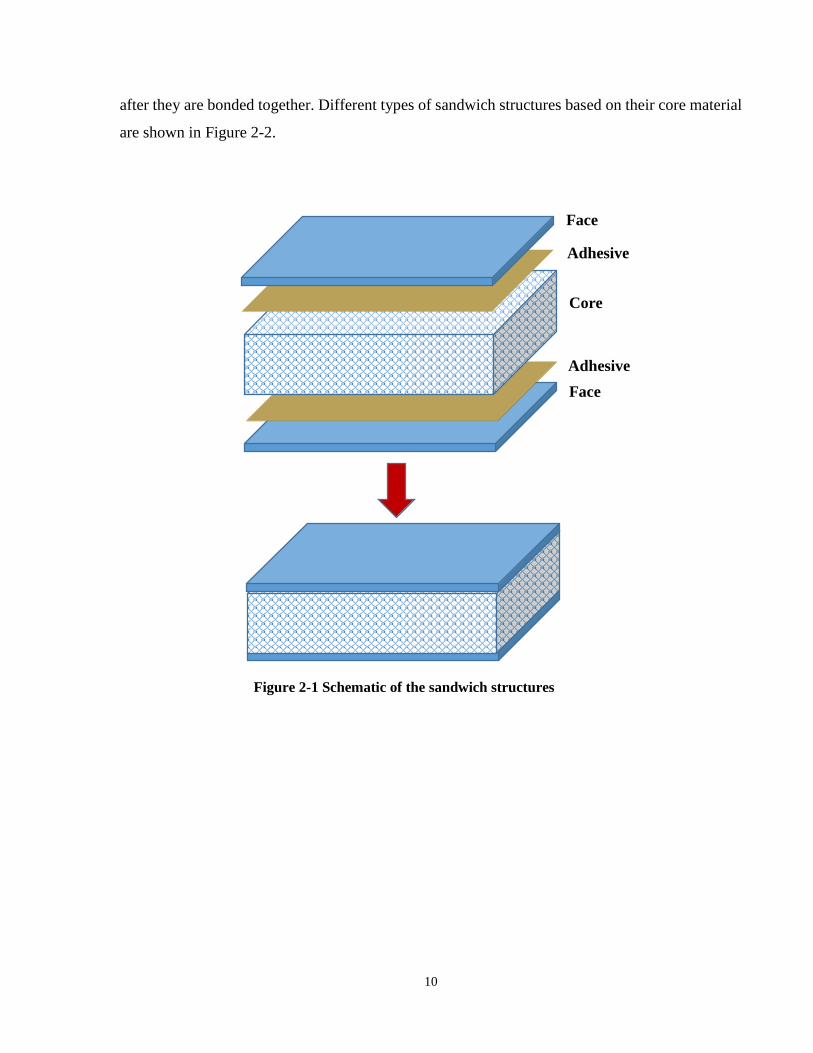
2.1.2 Concept of sandwich structures
Sandwich structures, in general, are made of two faces, most often identical in thickness and
material, and a low-density thicker core.
The material, architecture and manufacturing process of the core and faces are selected based on
the target application that introduces a wide range of sandwich structures different in shape,
material, and properties. The faces are normally made of strong materials with high stiffness such
as metals, PMCs, and glass while the core is selected from low density and low stiffness materials
such as metallic and non-metallic foams, honeycombs and balsa wood. These constituents are
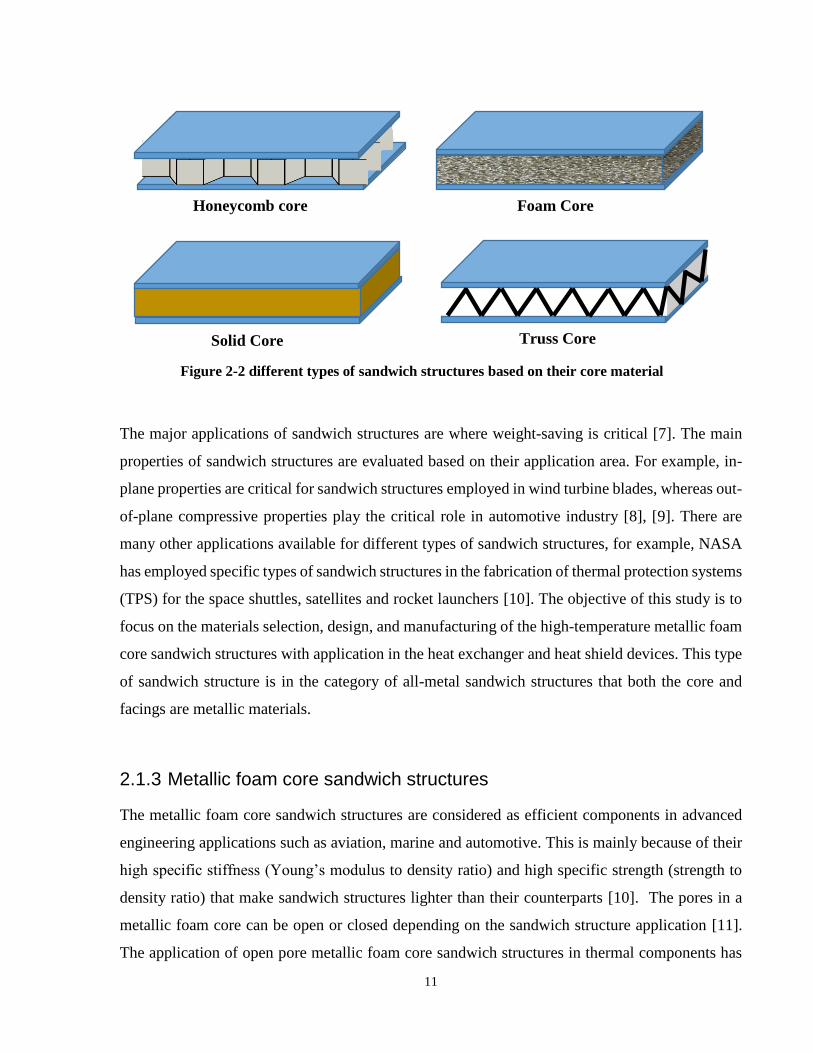
bonded together during the manufacturing process. Depending on the form of the core component,
sandwich structures can be divided into four groups: foam core, honeycomb core, truss core and
solid core [6]. Figure 2-1 presents the schematic of sandwich structures constituents before and
10
after they are bonded together. Different types of sandwich structures based on their core material
are shown in Figure 2-2.
Face
Adhesive
Core
Adhesive
Face
Figure 2-1 Schematic of the sandwich structures
11
The major applications of sandwich structures are where weight-saving is critical [7]. The main
properties of sandwich structures are evaluated based on their application area. For example, in-
plane properties are critical for sandwich structures employed in wind turbine blades, whereas out-
of-plane compressive properties play the critical role in automotive industry [8], [9]. There are
many other applications available for different types of sandwich structures, for example, NASA
has employed specific types of sandwich structures in the fabrication of thermal protection systems
(TPS) for the space shuttles, satellites and rocket launchers [10]. The objective of this study is to
focus on the materials selection, design, and manufacturing of the high-temperature metallic foam
core sandwich structures with application in the heat exchanger and heat shield devices. This type
of sandwich structure is in the category of all-metal sandwich structures that both the core and
facings are metallic materials.
2.1.3 Metallic foam core sandwich structures
The metallic foam core sandwich structures are considered as efficient components in advanced
engineering applications such as aviation, marine and automotive. This is mainly because of their
high specific stiffness (Young’s modulus to density ratio) and high specific strength (strength to
density ratio) that make sandwich structures lighter than their counterparts [10]. The pores in a
metallic foam core can be open or closed depending on the sandwich structure application [11].
The application of open pore metallic foam core sandwich structures in thermal components has
Figure 2-2 different types of sandwich structures based on their core material
Honeycomb core Foam Core
Solid Core Truss Core
12
significantly grown in recent years due to their attractive properties such as interconnected
porosity, high permeability and high surface to volume ratio. Recently, the application of these
structure in the heat exchanger and heat shield devices has become of particular interest. This is
mainly due to the unique properties of metallic foams that offer very high specific surface area
(compare to honeycomb and truss structures) that can increase the efficiency of the heat exchangers
[12]–[15]. Also, excellent insulation properties of the metallic foam core sandwich panels make
them great candidates for the heat shield panels employed to protect industrial parts exposed to
high-temperature gases.
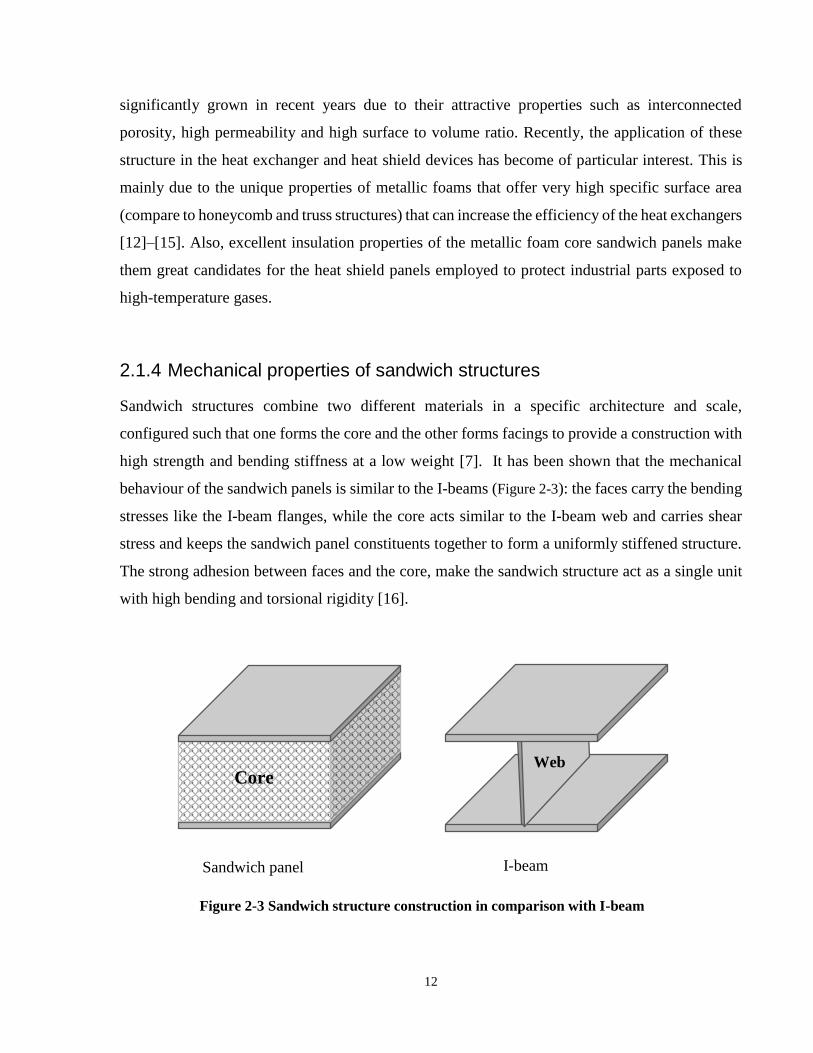
2.1.4 Mechanical properties of sandwich structures
Sandwich structures combine two different materials in a specific architecture and scale,
configured such that one forms the core and the other forms facings to provide a construction with
high strength and bending stiffness at a low weight [7]. It has been shown that the mechanical
behaviour of the sandwich panels is similar to the I-beams (Figure 2-3): the faces carry the bending
stresses like the I-beam flanges, while the core acts similar to the I-beam web and carries shear
stress and keeps the sandwich panel constituents together to form a uniformly stiffened structure.
The strong adhesion between faces and the core, make the sandwich structure act as a single unit
with high bending and torsional rigidity [16].
Sandwich panel I-beam
Core Web
Figure 2-3 Sandwich structure construction in comparison with I-beam
13
Separation of the faces with a light-weight core leads to increasing second moment of area and
therefore higher bending stiffness of the material cross section (sandwich effect). The stiffness of
the construction can be significantly improved by increasing the core thickness in comparison with
a construction made of two faces bonded together [16]. The effect of core thickness will be studied
using experimental and numerical analysis of the thermally sprayed sandwich panels in Chapter 5.
Sandwich panels are commonly subjected to bending loads in different applications where the
primary loads are applied perpendicular to the faces. Some researchers have studied the sandwich
structures under bending conditions and investigated the flexural properties of the sandwich
panels, such as skin bending stress, flexural rigidity, and core shear stress through experimental
and analytical methods [17]–[21]. The mechanical behaviour of the sandwich structures can be
affected by many parameters, but the most important ones are facings and core materials’
properties, loading conditions, and architecture of the sandwich structures. The experimental
procedures used for evaluation of flexural properties of the sandwich panels are 4-point or 3-point
bending test, where both facings and core are considered as isotropic. In this study, the deformation
and failure mechanism of the metallic foam core sandwich beams under four-point flexural loading
were investigated. In four-point bending test, a long sandwich panel is subjected to a bending load
normal to the plane of the sandwich panel. The centre point deflection of the beam versus the
applied force is recorded in this test [22].
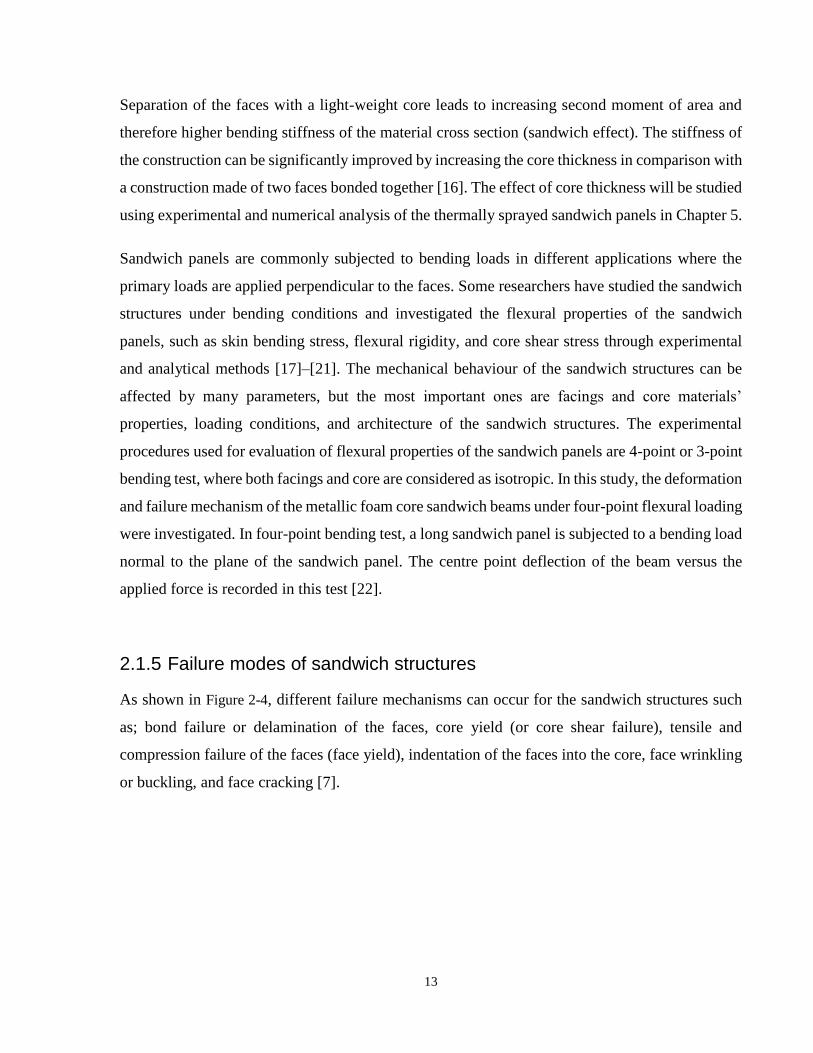
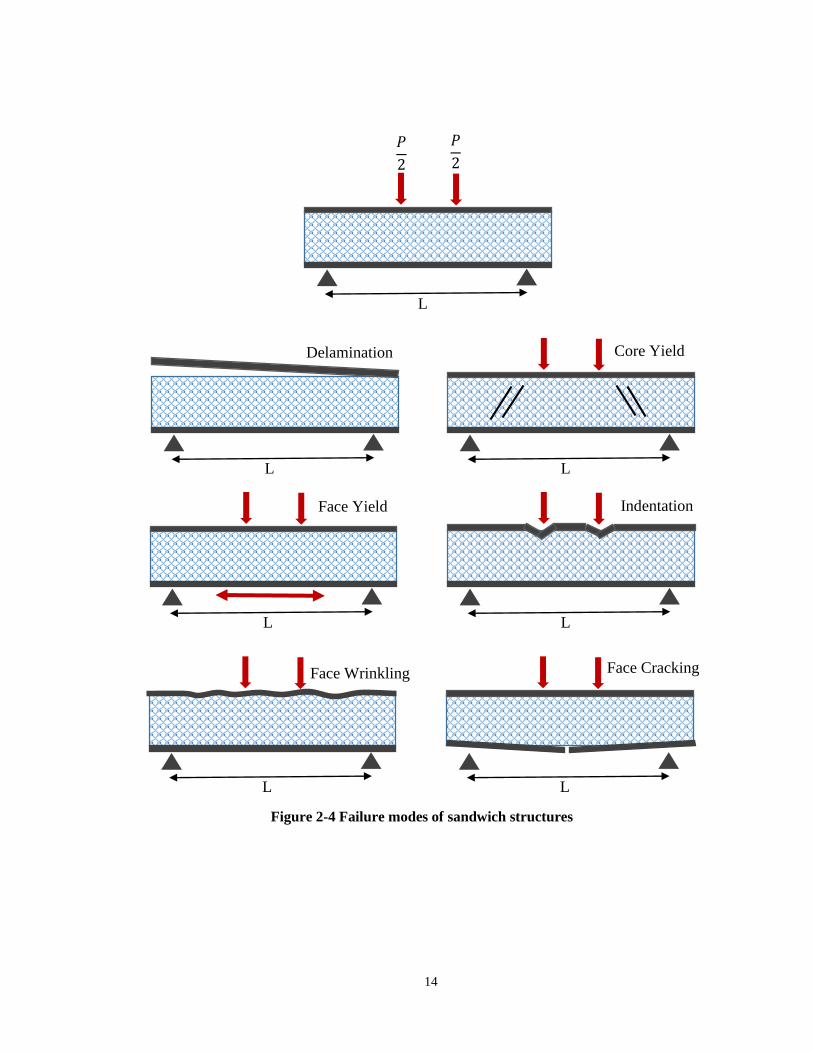
2.1.5 Failure modes of sandwich structures
As shown in Figure 2-4, different failure mechanisms can occur for the sandwich structures such
as; bond failure or delamination of the faces, core yield (or core shear failure), tensile and
compression failure of the faces (face yield), indentation of the faces into the core, face wrinkling
or buckling, and face cracking [7].
14
Figure 2-4 Failure modes of sandwich structures
𝑃
2
𝑃
2
L
L
Delamination
L
Core Yield
L
Face Yield
L
Indentation
L
Face Wrinkling
L
Face Cracking
15
It is critical to study the failure mode of sandwich structures as a function of various architectures
and materials. A better understanding of the effect of design and materials on the failure mode will
help the engineers strengthening the sandwich structures. However, it is not an easy task to do
stress analysis on the sandwich structures due to complex non-linear and inelastic behaviour of the
components and also the boundary condition of the core and faces. Also, most of the times more
than one mechanism is involved in the failure of the sandwich structures [23].
Some researchers have studied the failure modes for various types of sandwich structures.
Delamination or bond failure at the interface of face and core due to low adhesion strength is very
common in hybrid sandwich structures where the constituents are bonded using an adhesive. Such
failure leads to loss of integrity and complete failure of sandwich structure [24]–[26].
Delamination of the face can be prevented by making stronger bonds between core and faces. Face
wrinkling is not usually observed in metallic foam core sandwich structures, because the load
required for this failure mode is much higher than the other failure modes [18]. Core shear failure
and core indentation have been reported as common failure modes for aluminum foam core
sandwich structures under bending loads [27], [28]. McCormack et al. [18] and Ashby et al. [11]
presented failure models for the sandwich beams (Gibson model) and estimated the primary failure
load and also the peak load for each failure mechanism, i.e. core failure, face failure (yielding),
indentation of the face into the core and face wrinkling. Gibson model will be used for prediction
of the dominant failure mechanism in thermally sprayed metallic foam core sandwich structures
in Chapter 5 of this thesis.
2.1.6 Failure map
Sandwich structure failure mode maps can be used to design minimum-weight sandwich panels
with desired mechanical strength. Failure mode maps mainly help with specifying the failure
mechanism that occurs first for a given sandwich panel. The initial failure mechanism, which
happens at the lowest load, depends on both constituent materials properties and architecture of
the beam.
Some studies have tried to map the failure mode of sandwich panels for different types of materials
and architectures. Triantafillou and Gibson [29] developed equations to describe the load at which
each failure mechanism occurs for sandwich structures with rigid polyurethane foam core beams
16
with aluminum faces and developed the failure map using those equations. Bart-smith et al. [30],
Chen et al. [31] and Yu et al. [32], [33] reported on failure mechanism maps presenting the domain
for each failure mode, and also optimized the Gibson model for cylindrical supporting and loading
heads. McCormack et al. [18] tested a number of sandwich structures with aluminum foam as the
core and aluminum 6061-T6 as the facings by 3-point bending setup to investigate the initial failure
mode and produce the failure maps. They presented the typical displacement versus force graphs
for three failure modes of these structures; core yield, indentation and face wrinkling. Chen et al
[31] also tested sandwich beams made of aluminum foam and cold-worked aluminum facings
using a four-point bending test setup and reported face yielding, indentation and core shear as the
observed failure modes for sandwich panels.
2.2 Material selection
The room temperature application of the sandwich structures in different industries is considerable,
and new applications are introduced to the market every day. While there is a big demand for the
room-temperature and mid-temperature sandwich structures, optimizing them for the high-
temperature applications is of particular interest of heat conversion industries. This is due to unique
thermal and physical properties offered by sandwich structures for such applications. Among
those, heat exchanger walls and heat shield devices are considered as the most important high-
temperature applications for the metallic foam core sandwich structures. In heat exchangers, foam
core can act as a permeable media capable of heat extraction from the flowing fluid and deliver it
to the facings to be eventually transferred to a third media. The heat extraction efficiency of
metallic foam structure is very high due to its large specific surface area. In heat shield devices,
the sandwich structure can be bent or wrapped over the surfaces that are going to be protected
against high-temperature gases and internally cooled by cold fluid passing through the metallic
foam core. The driving force to employ a new generation of heat exchangers and heat shield
devices made of metallic foam core sandwich structures is to save energy by increasing the
efficiency of these devices in thermal conduction. That could eventually lead to less fossil fuel
consumption and less emissions of hazardous gases. The higher efficiency of the metallic foam
structures in heat exchanger applications has been reported by several researchers [12]–[15], [34].
However, there are very few studies done on the application of foam made heat exchangers and
heat shield devices at temperatures of higher than 600 ºC. In this study, our focus will be on the
17
sandwich structures applicable in high-temperature heat exchanger and heat shield devices with
the working temperatures of about 800-1000 ºC.
It is critical that all the constituents of the sandwich panels stay mechanically strong and physically
functional and resist chemically against the high-temperature environments. Also, bonds between
the components have to be stable at high temperatures with minimum sensitivity to thermal cycles.
The criteria mentioned above suggest careful materials selection for both skin and core
components as well as designing a fabrication process that satisfies the high-temperature
application requirements for the bonds and interfaces.
Superalloys are known as excellent candidates for high-temperature applications. There are many
different types of superalloys available that are categorized based on their base element (can be
Nickel, Chromium, Iron), their alloying elements and production procedure. Nickel-base
superalloys such as Inconel 625 and Inconel 718 offer very good oxidation resistant at the
temperatures up to 1000 ºC. These superalloys show good ductility and mechanical strength at
very high temperatures [35]. One of the commercial applications for alloy 625 is in the fabrication
of corrosion resistant plate heat-exchangers [36], [37]. Therefore, these alloys are considered as
very good candidates for the high-temperature sandwich structure facings materials. Superalloys
can also be employed as the core of such structures. However, production of superalloy foam using
conventional methods is a challenge. In the next chapter of this thesis, the alloying procedure for
fabrication of superalloy open pore foam structures will be presented.
2.2.1 Core material
In contrast with the conventional core materials, the use of a metallic foam core in sandwich panels
can significantly reduce the weight of components required for heat shield devices and heat
exchanger channels, while improving the performance in such applications simultaneously.
Nickel foams are widely used in room temperature applications because of their excellent density-
compensated mechanical properties [38], [39]. Also, nickel-base alloys are used in high-
temperature applications, mainly because they remain corrosion resistant, ductile, and hard enough
at elevated temperatures [40]. Therefore, commercially available nickel foam is a good candidate
18
to be used in the core section of high-temperature sandwich structures. The high-temperature
properties of the nickel foam, such as corrosion resistance and the yield strength, can be improved
when it is alloyed with elements such as aluminum and chromium [41]. Nickel-aluminide alloy
foams have been employed as the sandwich structure core for the applications that require high
creep resistant such as turbine blades [42]. These alloys show unique mechanical behaviour by
becoming fully ductile at temperatures above 1000°K [43]. For the applications such as heat-
exchangers and heat shields where stresses are modest, creep resistance is less important while hot
corrosion resistance is considered a crucial property. A Cr2O3 layer is formed on the Ni-Cr
structures that protects them against further corrosion at elevated temperatures [41]. It is expected
that Ni-Cr foams exhibit excellent mechanical properties along with good corrosion resistance for
high-temperature applications in heat exchangers and heat shield applications.
In this section, a brief introduction to metallic foam structures and their manufacturing methods is
given first, and then alloying techniques for the commercially available nickel foam structures will
be reviewed.
2.2.1.1 Metallic Foam
Foam structures are used in many different applications from engineering to medicine. These
structures also exist in nature for structural or functional purposes, such as wood and bones. Their
application areas are based on their properties and include; chemical filtration, thermal insulation,
acoustic insulation, heat extraction, vibration damping, and lightweight structural components
[44]–[46]. The term “foam” is defined as a uniform dispersion of the gaseous phase in a liquid or
solid phase [47]. The solid foam structure is sometimes called a “cellular solid”. Energy
minimization limits dictate the shape of bubbles in a liquid foam. Therefore only certain
morphologies can be seen in liquid foam. The same is valid for solid foams made by solidification
of liquid foam. However, cellular solids are not usually made through solidification of a liquid
foam. As an example, cellular metallic structures with pores of various shapes can be produced by
sintering of metallic powder [48].
Foam structures can be divided into two main categories; open cell and closed cell. Pores are not
interconnected in closed cell foam structures, while all pores are connected to their neighbor pores
19
in an open-pore foam structure. The foam structures are usually defined by material, the number
of pores per linear inch (ppi) and density.
These characteristics along with the geometry and topography of the foam structure affect its
overall mechanical and physical properties. For example, in open pore foam structures, increasing
the number of pores per linear inch will reduce the permeability due to greater resistance of struts
against fluid flow. This, in turn, affects the performance of the structure in heat transfer
applications [49]–[52]. Foam structures can be produced in a wide range of porosity content from
20% to 98%. The range of porosity achievable depends on the material, production procedure, and
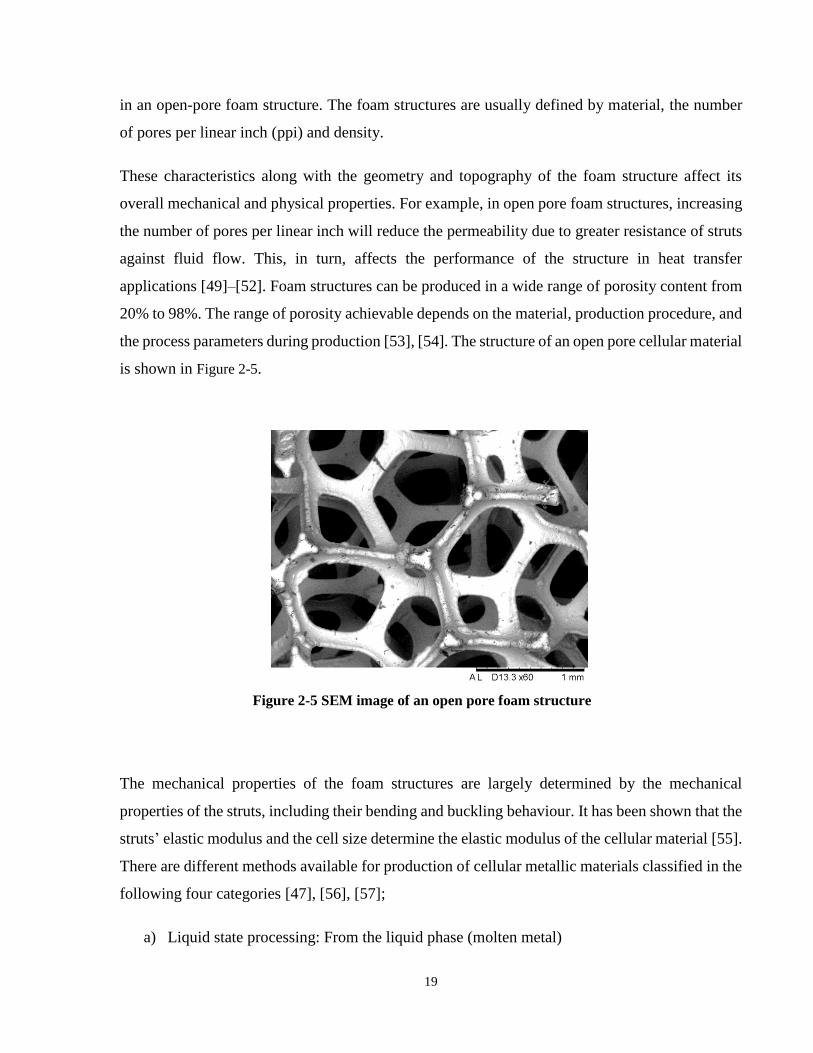
the process parameters during production [53], [54]. The structure of an open pore cellular material
is shown in Figure 2-5.
The mechanical properties of the foam structures are largely determined by the mechanical
properties of the struts, including their bending and buckling behaviour. It has been shown that the
struts’ elastic modulus and the cell size determine the elastic modulus of the cellular material [55].
There are different methods available for production of cellular metallic materials classified in the
following four categories [47], [56], [57];
a) Liquid state processing: From the liquid phase (molten metal)
Figure 2-5 SEM image of an open pore foam structure
20
b) Solid state processing: From the metallic powders
c) Vapor deposition techniques: From the vapor phase or gaseous metallic compounds
d) Electro-deposition techniques: From ionic solutions
The liquid state and solid state processing are more common for production of foams of light
metals such as aluminum. Banhart [57] has summarized these production processes, which differ
in the gas source, mechanism of foam stabilization, and also whether metallic powder or molten
metal has been used as the initial feed.
Industrial scale production of open-pore nickel and nickel-base alloyed foams is done through
either electrodeposition or vapor deposition of nickel on an open-pore polymer foam structure, as
described in the following section.
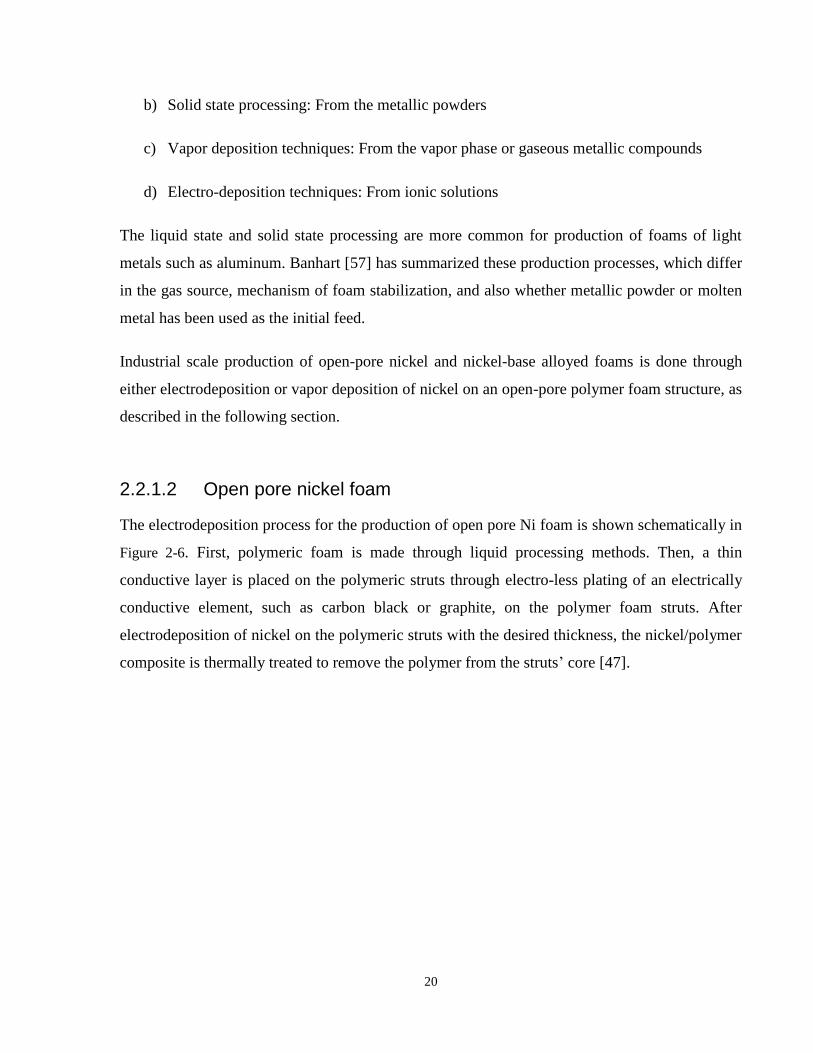
2.2.1.2 Open pore nickel foam
The electrodeposition process for the production of open pore Ni foam is shown schematically in
Figure 2-6. First, polymeric foam is made through liquid processing methods. Then, a thin
conductive layer is placed on the polymeric struts through electro-less plating of an electrically
conductive element, such as carbon black or graphite, on the polymer foam struts. After
electrodeposition of nickel on the polymeric struts with the desired thickness, the nickel/polymer
composite is thermally treated to remove the polymer from the struts’ core [47].
21
Figure 2-6 application of electro-deposition technique to produce open pore Ni foam
Polymer Foam
Applying conductive coating
on the struts’ surface
Electroplating deposition of
the metal on the conductive
surface of foam struts
Removing the polymer
Polymer
Conductive
coating
Metallic
coating
Hollow
metallic struts
22
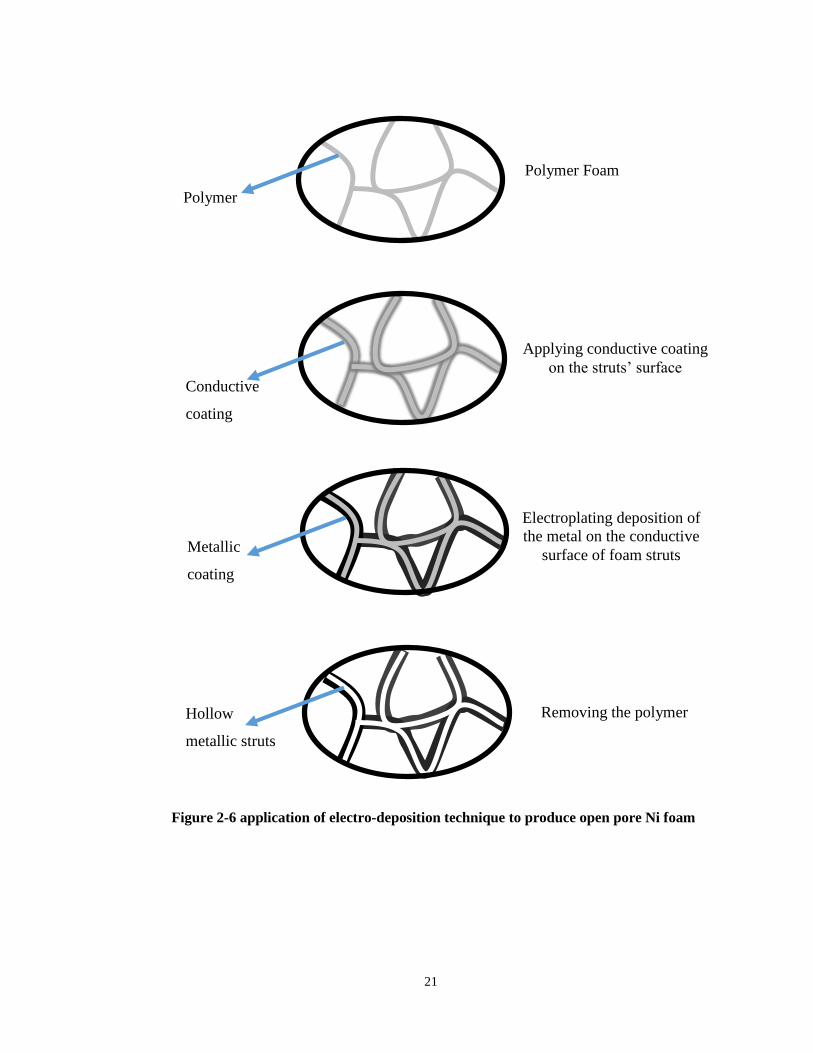
Open-pore nickel foam can also be produced through a vapor deposition process. In this method,
nickel vapor is produced either by heating a nickel target or by decomposition of nickel carbonyl
(Ni(CO)4) in a vacuum chamber. Nickel vapor is deposited on a polymeric open-pore foam
structure till the required thickness is formed on the surface of struts. The polymer is removed in
the next stage through thermal or chemical treatment, and a 3D open-pore nickel foam is achieved.
Hollow nickel struts form a 3D structure like what is shown in Figure 2-7.
2.2.1.3 Mechanical properties of the foam
The mechanical properties of open cell nickel foam structures are very different from nickel in
bulk forms due to the very complex architecture of foam structure, and the boundary effects of free
surfaces and constrained surfaces. Consequently, some of the properties such as elastic moduli
depend on the overall sample size [58]. However, these effects are not significant at a specimen
size to cell size ratio of seven or larger. Open pore foam structures have open polyhedral cells
made of continuous struts in a 3D interconnected network. The relative density of the metallic
open pore foam structures is normally less than 0.1 (where no more than 10% of the total foam
structure volume is occupied by the struts) [58]. Core strength and core elastic modulus are
dependent on the foam core density relative to the bulk material. The foam mechanical properties
are increased by increasing the relative density [59].
Figure 2-7 Open-pore nickel foams structure
23
The open pore nickel foam structures used in this project are formed by a network of connected
struts. The foam structures with a relative density of higher than 0.1 are known as stretch-dominant
structure, while the foam structured with a relative density of less than 0.1 (less than 10% of total
volume is occupied by the struts) are known as bending-dominant structures. Bending of the cell
edges (struts) is the main deformation mechanism in bending-dominant foams [7]. It has been
reported that for a given porosity content of open-pore foams, the effect of structural parameters
such as cell shape on elastic moduli is negligible [60].
The mechanical properties of open-pore metallic foam structures are not completely isotropic.
They offer a better mechanical strength and stiffness when loaded parallel to their major principal
directions [61]. Collapse in open-pore foam is mainly a result of plastic hinges in the cell edges
(struts) when it is subjected to the load perpendicular to its major direction. This happens when
the force exceeds the elastic limit of the foam material. Collapse can occur as plastic deformation
of the struts; for the foam made of plastic (ductile) materials loaded beyond their elastic limit,
elastic buckling of the struts; for elastomeric foams, and brittle fracture of the struts for the brittle
materials [7].
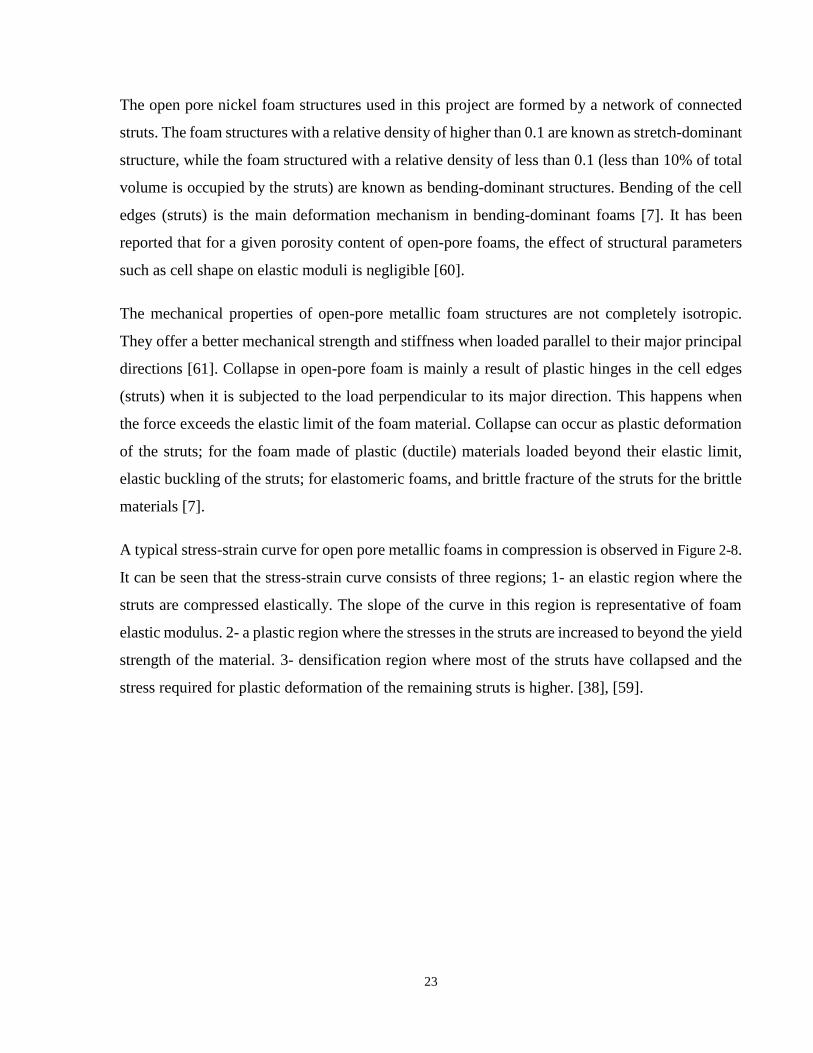
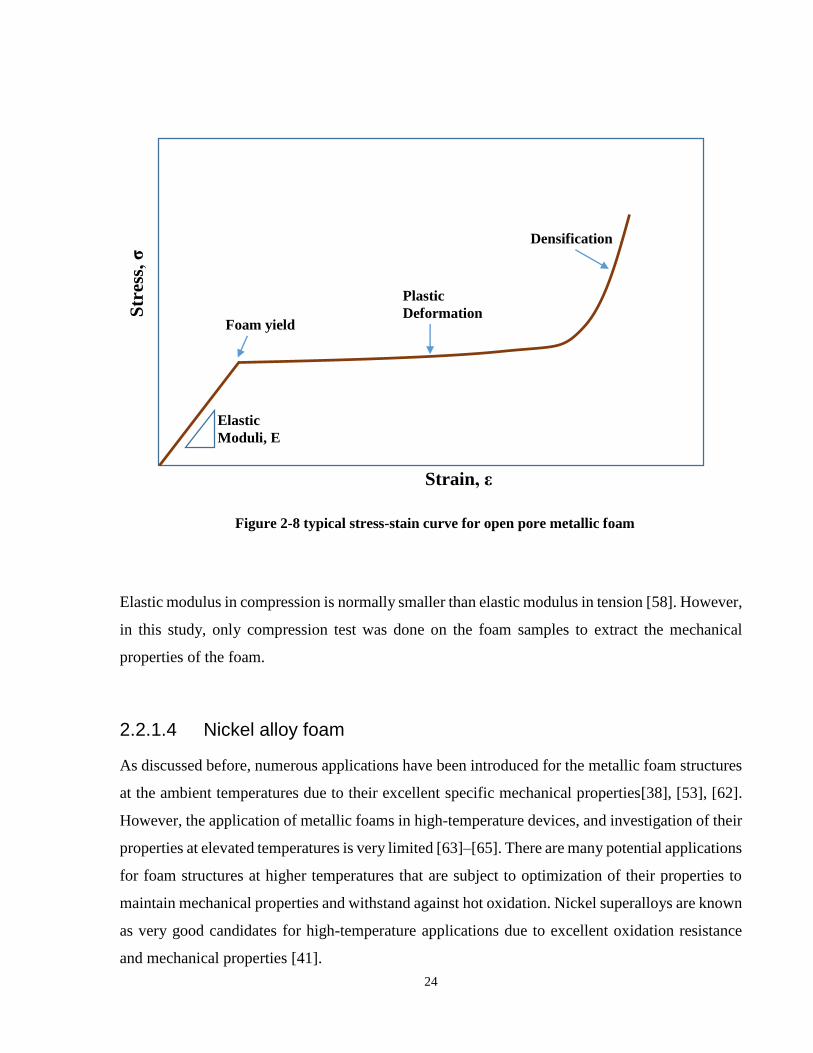
A typical stress-strain curve for open pore metallic foams in compression is observed in Figure 2-8.
It can be seen that the stress-strain curve consists of three regions; 1- an elastic region where the
struts are compressed elastically. The slope of the curve in this region is representative of foam
elastic modulus. 2- a plastic region where the stresses in the struts are increased to beyond the yield
strength of the material. 3- densification region where most of the struts have collapsed and the
stress required for plastic deformation of the remaining struts is higher. [38], [59].
24
Elastic modulus in compression is normally smaller than elastic modulus in tension [58]. However,
in this study, only compression test was done on the foam samples to extract the mechanical
properties of the foam.
2.2.1.4 Nickel alloy foam
As discussed before, numerous applications have been introduced for the metallic foam structures
at the ambient temperatures due to their excellent specific mechanical properties[38], [53], [62].
However, the application of metallic foams in high-temperature devices, and investigation of their
properties at elevated temperatures is very limited [63]–[65]. There are many potential applications
for foam structures at higher temperatures that are subject to optimization of their properties to
maintain mechanical properties and withstand against hot oxidation. Nickel superalloys are known
as very good candidates for high-temperature applications due to excellent oxidation resistance
and mechanical properties [41].
Str
ess,
σ
Strain, ε
Elastic
Moduli, E
Densification
Plastic
Deformation Foam yield
Figure 2-8 typical stress-stain curve for open pore metallic foam
25
Different fabrication methods have been employed to produce superalloy foams such as sintering
of superalloy powder and vapor deposition [66], [67]. However, these processes are expensive,
and shaping of the superalloy foam is a difficult task. Hodge and Dunand [68] have employed pack
cementation process as a cheap and easy to do process to produce single uniform phase Ni-Al alloy
foams with 28 to 33 wt% aluminum content. Alloying the nickel foam with Al and Cr through
pack cementation process has been employed by Choe and Dunand [69] for the production of
nickel base alloy foams with 8-9% Al or 14-18 wt% Cr and 5-9 wt% Al. As reported by them, the
following heat treatment process led to the formation of γ/γ` that belongs to superalloys’
microstructure.
For applications like heat exchangers where stresses are modest, creep resistance is less important
than oxidation resistance. Therefore, placing a protective layer of chromium oxide (Cr2O3) on the
foam structure is more suit to the subject of scope of this project which focuses on the heat
exchanger and heat shield devices. Also, fabrication of binary Ni-Cr foam through pack
cementation is easier than a ternary superalloy like Ni-Al-Cr [41].
Choe and Dunand [41] fabricated Ni-Cr foams with 9-32wt% Cr by the pack-chromizing method.
It was shown in their simulations and mechanical tests that the ambient temperature compressive
yield stress was increased by increasing the Cr content.
It also can be observed in Choe and Dunand’s studies [41] that the creep test results at 825 ºC
illustrated a better resistance for the samples with higher Cr content. Oxidation resistant of the Ni-
20 wt% Cr foam produced by Choe and Dunand [41] was reported as comparable to the bulk Ni-
Cr considering the higher surface area of the foam structure. It was also resulted from their
experiments that higher percentage of Cr placed on the surface of nickel alloy makes it more
resistant to high-temperature oxidation.
2.2.1.5 Pack cementation process
Pack cementation is placed in the category of chemical vapor deposition (CVD) processes and has
been used and improved since nearly sixty years ago. This process applies oxidation resistant and
high-temperature protective coatings on the surface of parts used in the hot sections of industrial
equipment like gas turbines. The most employed pack cementation processes are chromizing,
26
siliconizing and aluminizing. Pack cementation process consists of first preparing the powder
mixture that will supply the coating material in vapor form once in the reaction temperature range
and then immersing the part to be coated in a retort filled with the powder mixture. The retort will
be sealed or semi-sealed and placed in a furnace with a controllable and protective atmosphere to
be heated at process temperature for the required length of time to form the coating. The powder
mixture consists of the coating element source powder and inert filler powder like alumina and an
activator powder like the halide salts. The driving force for diffusion of the coating element(s)
from the source into the substrate surface is the differences between their activities [70].
Some of the advantages of pack cementation process can be listed as followings [71];
- The process is easy to do and easy to reproduce
- The powder mixture enables the applicator to coat complex shape components as well as
holes, grooves and also open pore cellular structures
- The process is cost-effective and efficient, as many parts can be coated at the same time in
a retort. The initial investment is much lower than the other vapor deposition processes
such as physical vapor deposition (PVD).
2.2.2 Facing Material
2.2.2.1 Nickel alloys
As it was mentioned in section 2.2.1, all-metal sandwich structures made of nickel-base alloys can
be considered as proper candidates for high-temperature application such as heat exchangers and
heat shield devices. Table 2-1 shows the commercially available high-temperature nickel base
alloys contain 30-70% nickel and up to 30% chromium. These alloys have face-centered cubic
(FCC) structures [17], [72].
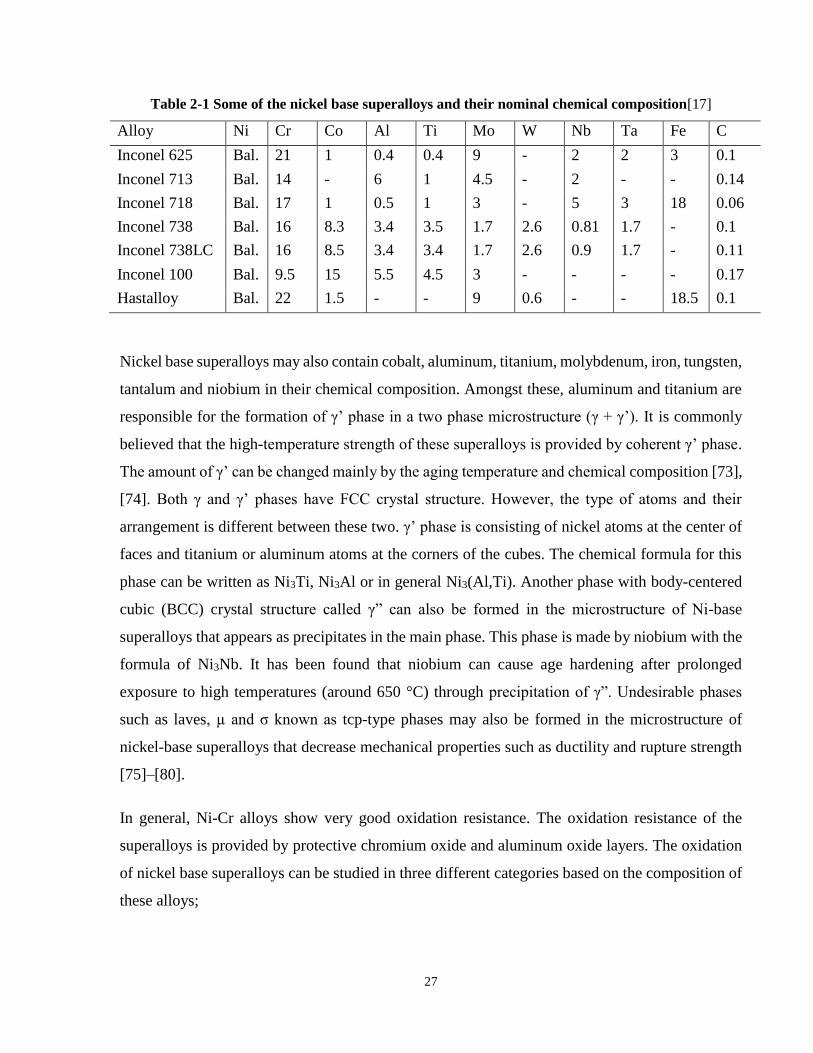
27
Table 2-1 Some of the nickel base superalloys and their nominal chemical composition[17]
Alloy Ni Cr Co Al Ti Mo W Nb Ta Fe C
Inconel 625 Bal. 21 1 0.4 0.4 9 - 2 2 3 0.1
Inconel 713 Bal. 14 - 6 1 4.5 - 2 - - 0.14
Inconel 718 Bal. 17 1 0.5 1 3 - 5 3 18 0.06
Inconel 738 Bal. 16 8.3 3.4 3.5 1.7 2.6 0.81 1.7 - 0.1
Inconel 738LC Bal. 16 8.5 3.4 3.4 1.7 2.6 0.9 1.7 - 0.11
Inconel 100 Bal. 9.5 15 5.5 4.5 3 - - - - 0.17
Hastalloy Bal. 22 1.5 - - 9 0.6 - - 18.5 0.1
Nickel base superalloys may also contain cobalt, aluminum, titanium, molybdenum, iron, tungsten,
tantalum and niobium in their chemical composition. Amongst these, aluminum and titanium are
responsible for the formation of γ’ phase in a two phase microstructure (γ + γ’). It is commonly
believed that the high-temperature strength of these superalloys is provided by coherent γ’ phase.
The amount of γ’ can be changed mainly by the aging temperature and chemical composition [73],
[74]. Both γ and γ’ phases have FCC crystal structure. However, the type of atoms and their
arrangement is different between these two. γ’ phase is consisting of nickel atoms at the center of
faces and titanium or aluminum atoms at the corners of the cubes. The chemical formula for this
phase can be written as Ni3Ti, Ni3Al or in general Ni3(Al,Ti). Another phase with body-centered
cubic (BCC) crystal structure called γ” can also be formed in the microstructure of Ni-base
superalloys that appears as precipitates in the main phase. This phase is made by niobium with the
formula of Ni3Nb. It has been found that niobium can cause age hardening after prolonged
exposure to high temperatures (around 650 °C) through precipitation of γ”. Undesirable phases
such as laves, µ and σ known as tcp-type phases may also be formed in the microstructure of
nickel-base superalloys that decrease mechanical properties such as ductility and rupture strength
[75]–[80].
In general, Ni-Cr alloys show very good oxidation resistance. The oxidation resistance of the
superalloys is provided by protective chromium oxide and aluminum oxide layers. The oxidation
of nickel base superalloys can be studied in three different categories based on the composition of
these alloys;
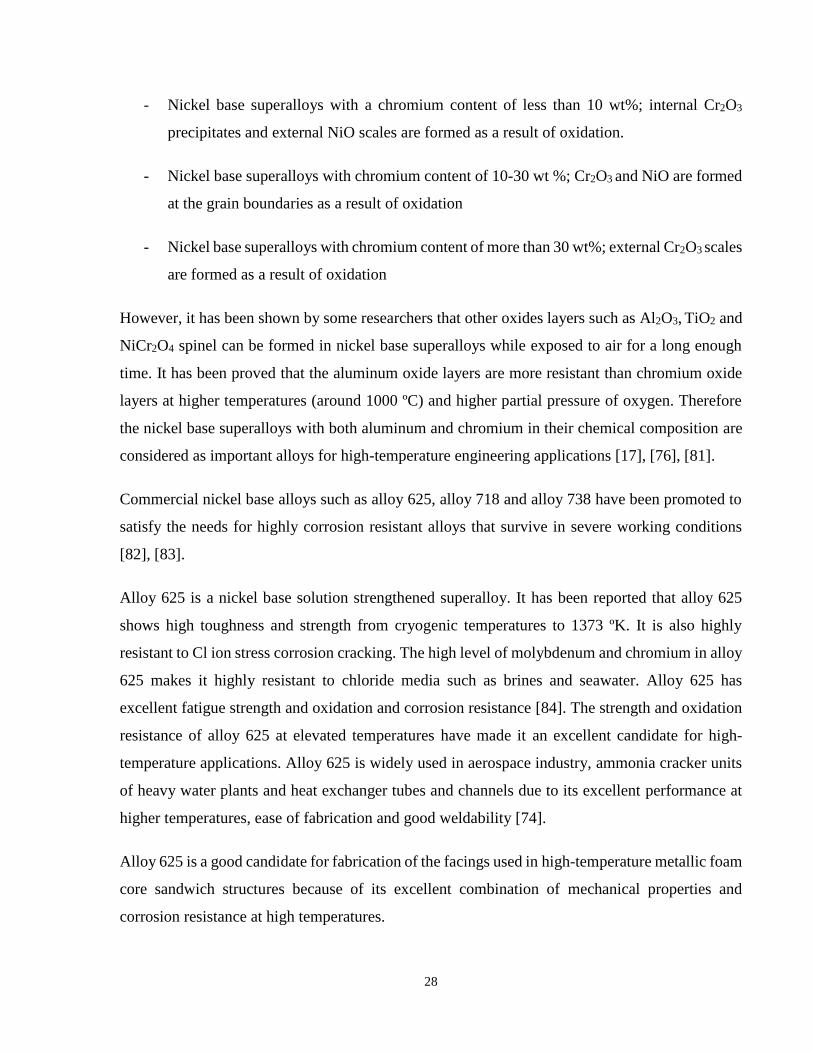
28
- Nickel base superalloys with a chromium content of less than 10 wt%; internal Cr2O3
precipitates and external NiO scales are formed as a result of oxidation.
- Nickel base superalloys with chromium content of 10-30 wt %; Cr2O3 and NiO are formed
at the grain boundaries as a result of oxidation
- Nickel base superalloys with chromium content of more than 30 wt%; external Cr2O3 scales
are formed as a result of oxidation
However, it has been shown by some researchers that other oxides layers such as Al2O3, TiO2 and
NiCr2O4 spinel can be formed in nickel base superalloys while exposed to air for a long enough
time. It has been proved that the aluminum oxide layers are more resistant than chromium oxide
layers at higher temperatures (around 1000 ºC) and higher partial pressure of oxygen. Therefore
the nickel base superalloys with both aluminum and chromium in their chemical composition are
considered as important alloys for high-temperature engineering applications [17], [76], [81].
Commercial nickel base alloys such as alloy 625, alloy 718 and alloy 738 have been promoted to
satisfy the needs for highly corrosion resistant alloys that survive in severe working conditions
[82], [83].
Alloy 625 is a nickel base solution strengthened superalloy. It has been reported that alloy 625
shows high toughness and strength from cryogenic temperatures to 1373 ºK. It is also highly
resistant to Cl ion stress corrosion cracking. The high level of molybdenum and chromium in alloy
625 makes it highly resistant to chloride media such as brines and seawater. Alloy 625 has
excellent fatigue strength and oxidation and corrosion resistance [84]. The strength and oxidation
resistance of alloy 625 at elevated temperatures have made it an excellent candidate for high-
temperature applications. Alloy 625 is widely used in aerospace industry, ammonia cracker units
of heavy water plants and heat exchanger tubes and channels due to its excellent performance at
higher temperatures, ease of fabrication and good weldability [74].
Alloy 625 is a good candidate for fabrication of the facings used in high-temperature metallic foam
core sandwich structures because of its excellent combination of mechanical properties and
corrosion resistance at high temperatures.
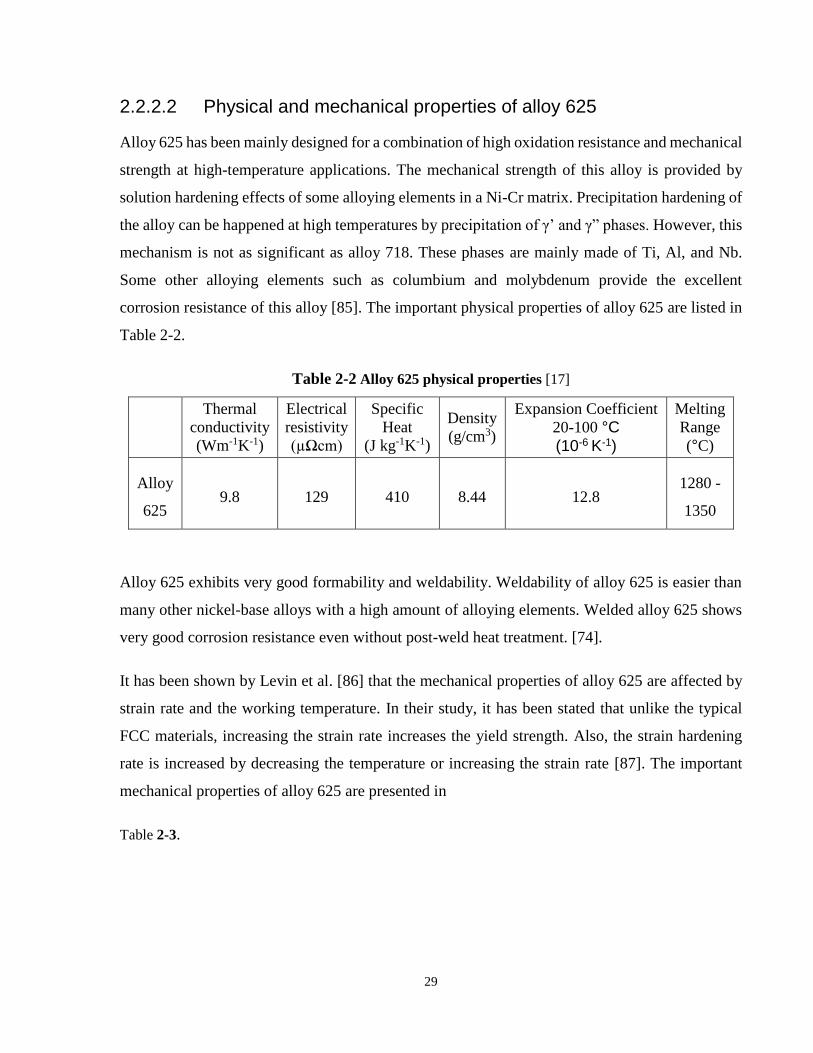
29
2.2.2.2 Physical and mechanical properties of alloy 625
Alloy 625 has been mainly designed for a combination of high oxidation resistance and mechanical
strength at high-temperature applications. The mechanical strength of this alloy is provided by
solution hardening effects of some alloying elements in a Ni-Cr matrix. Precipitation hardening of
the alloy can be happened at high temperatures by precipitation of γ’ and γ” phases. However, this
mechanism is not as significant as alloy 718. These phases are mainly made of Ti, Al, and Nb.
Some other alloying elements such as columbium and molybdenum provide the excellent
corrosion resistance of this alloy [85]. The important physical properties of alloy 625 are listed in
Table 2-2.
Table 2-2 Alloy 625 physical properties [17]
Thermal
conductivity
(Wm-1K-1)
Electrical
resistivity
(µΩcm)
Specific
Heat
(J kg-1K-1)
Density
(g/cm3)
Expansion Coefficient
20-100 °C
)1-K6 -(10
Melting
Range
(°C)
Alloy
625 9.8 129 410 8.44 12.8
1280 -
1350
Alloy 625 exhibits very good formability and weldability. Weldability of alloy 625 is easier than
many other nickel-base alloys with a high amount of alloying elements. Welded alloy 625 shows
very good corrosion resistance even without post-weld heat treatment. [74].
It has been shown by Levin et al. [86] that the mechanical properties of alloy 625 are affected by
strain rate and the working temperature. In their study, it has been stated that unlike the typical
FCC materials, increasing the strain rate increases the yield strength. Also, the strain hardening
rate is increased by decreasing the temperature or increasing the strain rate [87]. The important
mechanical properties of alloy 625 are presented in
Table 2-3.
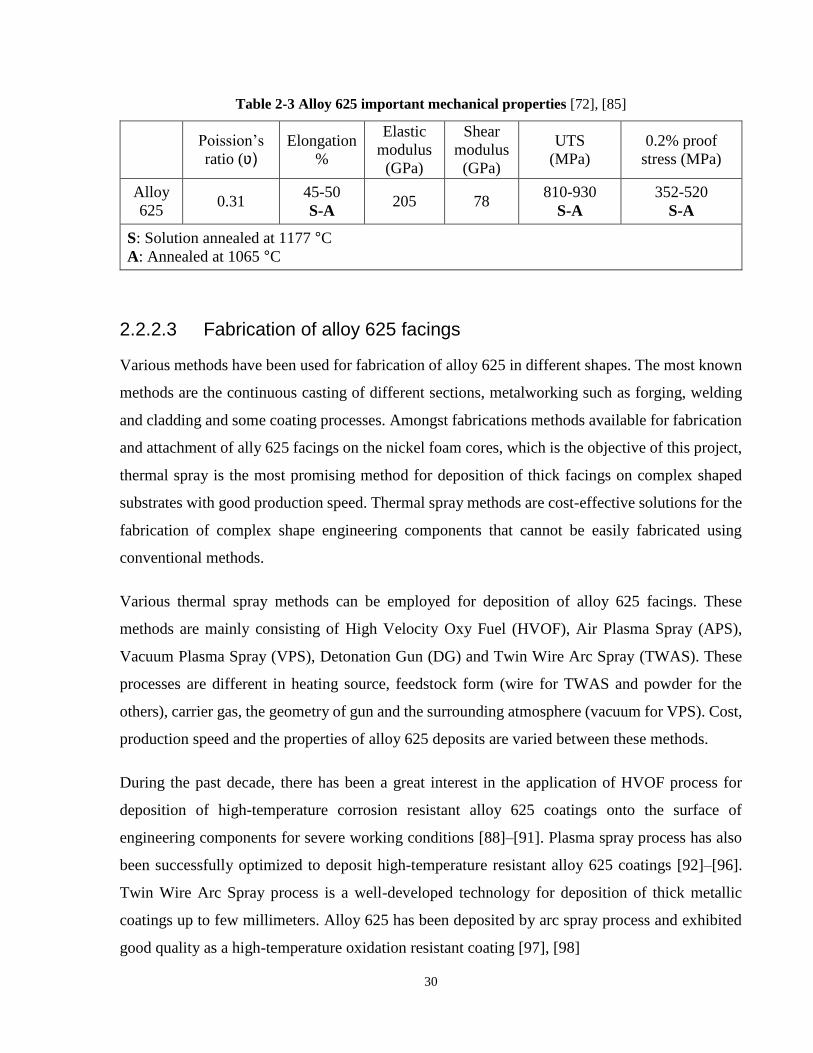
30
Table 2-3 Alloy 625 important mechanical properties [72], [85]
Poission’s
ratio (ʋ) Elongation
%
Elastic
modulus
(GPa)
Shear
modulus
(GPa)
UTS
(MPa)
0.2% proof
stress (MPa)
Alloy
625 0.31
45-50
S-A 205 78
810-930
S-A
352-520
S-A
S: Solution annealed at 1177 °C
A: Annealed at 1065 °C
2.2.2.3 Fabrication of alloy 625 facings
Various methods have been used for fabrication of alloy 625 in different shapes. The most known
methods are the continuous casting of different sections, metalworking such as forging, welding
and cladding and some coating processes. Amongst fabrications methods available for fabrication
and attachment of ally 625 facings on the nickel foam cores, which is the objective of this project,
thermal spray is the most promising method for deposition of thick facings on complex shaped
substrates with good production speed. Thermal spray methods are cost-effective solutions for the
fabrication of complex shape engineering components that cannot be easily fabricated using
conventional methods.
Various thermal spray methods can be employed for deposition of alloy 625 facings. These
methods are mainly consisting of High Velocity Oxy Fuel (HVOF), Air Plasma Spray (APS),
Vacuum Plasma Spray (VPS), Detonation Gun (DG) and Twin Wire Arc Spray (TWAS). These
processes are different in heating source, feedstock form (wire for TWAS and powder for the
others), carrier gas, the geometry of gun and the surrounding atmosphere (vacuum for VPS). Cost,
production speed and the properties of alloy 625 deposits are varied between these methods.
During the past decade, there has been a great interest in the application of HVOF process for
deposition of high-temperature corrosion resistant alloy 625 coatings onto the surface of
engineering components for severe working conditions [88]–[91]. Plasma spray process has also
been successfully optimized to deposit high-temperature resistant alloy 625 coatings [92]–[96].
Twin Wire Arc Spray process is a well-developed technology for deposition of thick metallic
coatings up to few millimeters. Alloy 625 has been deposited by arc spray process and exhibited
good quality as a high-temperature oxidation resistant coating [97], [98]
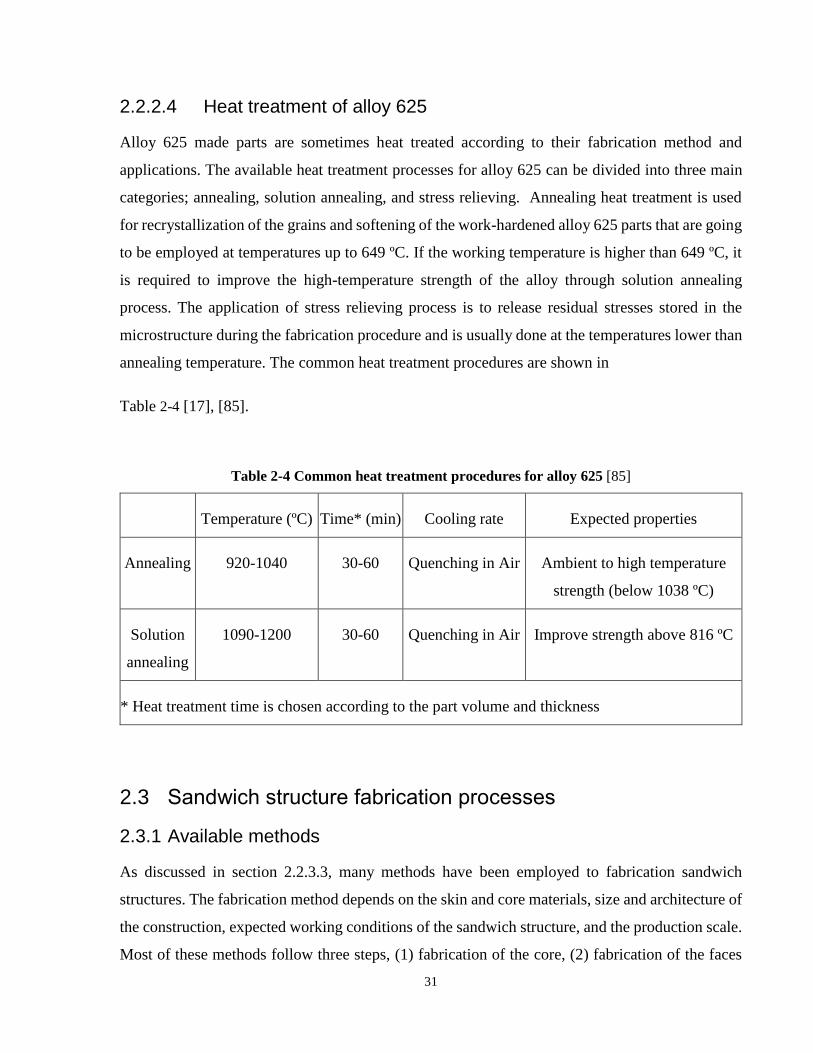
31
2.2.2.4 Heat treatment of alloy 625
Alloy 625 made parts are sometimes heat treated according to their fabrication method and
applications. The available heat treatment processes for alloy 625 can be divided into three main
categories; annealing, solution annealing, and stress relieving. Annealing heat treatment is used
for recrystallization of the grains and softening of the work-hardened alloy 625 parts that are going
to be employed at temperatures up to 649 ºC. If the working temperature is higher than 649 ºC, it
is required to improve the high-temperature strength of the alloy through solution annealing
process. The application of stress relieving process is to release residual stresses stored in the
microstructure during the fabrication procedure and is usually done at the temperatures lower than
annealing temperature. The common heat treatment procedures are shown in
Table 2-4 [17], [85].
Table 2-4 Common heat treatment procedures for alloy 625 [85]
Temperature (ºC) Time* (min) Cooling rate Expected properties
Annealing 920-1040 30-60 Quenching in Air Ambient to high temperature
strength (below 1038 ºC)
Solution
annealing
1090-1200 30-60 Quenching in Air Improve strength above 816 ºC
* Heat treatment time is chosen according to the part volume and thickness
2.3 Sandwich structure fabrication processes
2.3.1 Available methods
As discussed in section 2.2.3.3, many methods have been employed to fabrication sandwich
structures. The fabrication method depends on the skin and core materials, size and architecture of
the construction, expected working conditions of the sandwich structure, and the production scale.
Most of these methods follow three steps, (1) fabrication of the core, (2) fabrication of the faces
32
and (3) bonding the faces and core to make sandwich panels [7]. Most often the methods employed
for bonding all-metal sandwich structures are high-temperature bonding processes such as brazing,
welding (such as resistance welding and laser welding), and diffusion bonding [94]. Brazing and
diffusion bonding are the most commonly used. Brazing consists of applying a brazing material in
the form of powder, paste or a thin sheet at the interface of joining components, then heating to
the reaction point of the brazing material where a liquid phase is formed and attaches the
components through chemical bonding. Brazing is great for superalloys and stainless steel [99]–
[101]. Diffusion bonding is a process consisting of local plastic deformation at high temperatures
to attach the mating surfaces and activating inter-diffusion of the atoms across the interface. This
process is useful for titanium alloys [100], [102]. However, these conventional methods have
limitations in shaping and forming of the facings, especially for complex shapes [103].
A new method developed by Center for Advanced Coating Technologies (CACT) at University of
Toronto for fabrication of all-metal foam core sandwich structures is thermal spraying of the faces
on the metallic foam sheet. Thermal spray techniques are vital engineering processes that offer
cost-effective solutions for deposition of a wide range of metallic, ceramic and polymeric materials
on the complex shape substrates that cannot be easily done through conventional processes. Most
common thermal spray techniques were discussed earlier in section 2.2.3.4. Arc spray process will
be discussed in details, as the method employed in this research, in the next section.
2.3.2 Thermal spray processes
Fauchais et al. [104] introduce M.U. Schoop as the inventor of thermal spray who registered
several patents in collaboration with others and could commercialize the process. Berndt [105] has
well described the impact by Schoop on thermal spray technology. Liquid metals atomization by
inert gas or high-pressure air, using metals wire and rod as the feedstock and metallic or ceramic
powders have been described in Schoop’s early patents [106]–[108]. Since then many types of
research and developments have been done on thermal spray processes, materials, and their
applications to extend their use in various industries.
Thermal spray technology is defined as; “Thermal spraying comprises a group of coating processes
in which finely divided metallic or nonmetallic materials are deposited in a molten or semi-molten
condition to form a coating. The coating material may be in the form of powder, ceramic rod, wire,
33
or molten materials.” [104]. The cold spray cannot be included in this definition, because neither
molten nor semi-molten droplets are formed in this process. However, the cold spray is considered
as a thermal spray process.
All thermal spray processes consist a gun that converts the supplied energy (chemical or electrical)
to the required heat for melting feedstock material. A high-velocity gas stream accelerates the
molten/semi-molten droplets towards the substrate surface. The feedstock material can be in the
form of powder, wire or rods [109].
Thermally sprayed coatings with a thickness of tens of micrometers to tens of millimeters are built
up of layers of chemically bonded and mechanically interlocked lamellae or splats that are formed
by impact, flattening, and solidification of the in-flight droplets on the substrate surface. Thermal
spray coatings are commonly consisting of lamellar splats, pores, bond interfaces, oxide phases,
un-melted particles, and sometimes cracks [109].
Thermal spray is considered a versatile technology in the industry that has been widely used for
the production of composites of base-material/coating to provide surface resistance to corrosive,
high temperature, abrasive and erosive environments while the base material does not need to be
an expensive high-performance composition [110],[111].
Thermal spray processes are divided into different categories in various ways. They are first
divided based on the source of energy provided to the feedstock to form molten/semi-molten
droplets. A second level for dividing thermal spray processes is based on the form of feed stock
material, that can be powder, wire or rod. A further division is based on the velocity of the gas
stream, and finally the atmosphere of spraying. The properties of the thermal spray coatings
determined by the properties of the feedstock material, thermal spray process parameters, and also
the substrate specifications. Apart from feedstock material properties, maximum impact on the
coating properties is by the parameters that control the droplets velocity and temperature at the
impact. It has to be mentioned that different materials require different spraying conditions.
Sometimes it is required to change the spraying process from one material to the other. Every
thermal spray process presents some unique features that make it specifically proper for a type of
coating. Five subsystems can be considered in all of the thermal spray processes that influence the
coating properties [104];
34
1. Plume formation, controlled by spray system/gun design, gas flow rates, gas compositions,
and power.
2. Feedstock, including all the properties of wire, rod or powder that is used as the coating
material such as composition, size, feeder design, and positioning.
3. Spraying and deposition atmosphere, including air, vacuum, or inert gas.
4. Substrate material and specification, including oxidation state, surface roughness, and the
temperature during spraying.
5. Relative motion of the spraying gun and substrate, which affects heat transfer to the
substrate and coating and deposit thickness per pass.
These systems are controllable by altering the spraying process and its parameters.
Despite mentioned features, there are some other differences between thermal spray processes;
namely:
• Feedstock type: the feedstock material can be in the form of wire, powder, or suspension
and solution in different thermal spray processes.
• Heating source: electric arc or combustion.
• The cost of the process: The equipment, operation, and feedstock material costs are
sometimes significantly different between thermal spray processes.
The microstructure of the deposit: the porosity content, oxide content, splats shape and
other microstructural features vary from one thermal spraying process to another, making
them suitable for different applications, such as in membranes, wear-resistant or corrosion
protection coatings.
• Heat introduced to the substrate: impact and solidification of molten droplets on the
substrate surface can warm up the substrate. It can even lead to melting and re-solidification
of a thin layer of the substrate. In some applications, that spray heat input can alter the
35
mechanical properties of the substrate in a bad way, choosing low-temperature spray
methods such as arc spray and using external air cooling can be considered.
Different thermal spray processes will be discussed in the following sections.
2.3.2.1 Flame spray
Flame spray process is the simplest and among the oldest thermal spray processes. The heat source
is combustion of fuel gas (CxHy) with the oxidizer (oxygen or air). Flame temperature can be
controlled by controlling the composition of fuel and flow of fuel and oxidizer. The coating
material is fed into the gun in wire or powder form (depending on the gun design) and carried by
the hot and carrier gas to the substrate. Flame spray process works at atmosphere pressure, and the
temperature and velocity of the droplet in this process are lower than other hot thermal spray
processes. The flame spray system is not as complicated as the other processes, and can be moved
to the working site as a portable device for on-site applications. There are many applications
introduced for flame spray process such as atmospheric corrosion resistant and wear resistant
coatings for low-load conditions [104], [109].
2.3.2.2 High velocity Oxy Fuel (HVOF)
This process isin fact a high velocity flame spray process [112], [113]. In HVOF process the
coating material particles with a size range of 5-60 µm are injected into a high speed and high-
temperature gas jet in the high-pressure combustion chamber of a specialty designed spraying gun.
Combustion is done in a pressurized chamber (pressure of higher than atmospheric pressure) that
is cooled by circulation of water and followed by a Laval-type nozzle. The molten or semi-molten
droplets formed in this hot stream are then sprayed with a velocity of 300 to 800 ms-1 to form very
dense deposits on the substrate surface [90]. The key advantage of HVOF process is achieving a
high velocity of gas due to the special design of its nozzle. The velocity of gas stream exiting the
nozzle is supersonics with visible diamonds shocks downstream the plume. HVOF gun is normally
installed on a robot to scan the substrate and build-up a uniform coating. A low porosity coating
is formed by impact, mechanical interlocking and spreading of the in-flight droplets on the
substrate surface and subsequent solidification [114]. The feedstock material is commonly in the
36
form of powder, but special HVOF guns have been developed to use wire form feedstock [104],
[109], [115]. HVOF process is capable of producing metallic, intermetallic and cermet coatings
with a porosity of less than 1% and high adhesion strength. The main success of HVOF process
was in the deposition of high-hardness wear-resistant tungsten carbide coatings. This process is
more expensive than flame spray in investment and operation costs [116]–[118]. The
microstructure of sprayed alloy 625 coating deposited by an HVOF gun was reported as a lamellar
structure formed by thin layers of nickel alloy and metallic oxides [119].
2.3.2.3 Plasma spray
Plasma spray is defined as “a thermal spray process in which a non-transferred arc as a source of
heat, ionizes a gas which melts the coating material, in-flight, and propels it to the workpiece”
[120]. Plasma is a mixture of atoms, molecules, ions (in excited and fundamental states), electrons
and photons that are electrically neutral (same number of electrons and ions). For the gases that
are used in plasma spray process, thermal plasma is formed at atmospheric pressure as soon as the
gas temperature reaches 7000-8000 ºK. The plasma forming gases usually contain a primary gas
that is responsible for flow and particle entertainment (such as N2 or Ar) and a secondary gas that
improves the gas mixture heat transfer (such as H2 and He). The high temperature required for
formation of thermal plasma is provided by a direct current arc between the anode nozzle and the
cathode of the plasma spray gun. The temperature of plasma jet is usually between 8000 ºK and
14000 ºK at the nozzle exit. Therefore, many engineering materials including ceramics, ceramic
composites, metals, intermetallics, and cermets can be sprayed and deposited as a coating on
different types of substrates. This process is amongst the most expensive thermals pray processes
due to high gas and electricity consumption and also initial investment [109], [111], [112]. The
main application of plasma spray process is to produce thermal barrier coatings (TBCs) that are
mainly made of ceramic material such as yttria-stabilized zirconia (YSZ) on hot sections of
industrial equipment such as gas turbines[121], [122].
Azarmi et al. [92], [103] used APS for deposition of alloy 625 on graphite filled metallic foam
substrate. The aim of their research was to produce a dense coating with a minimum amount of
porosity and oxide in the microstructure. They used SG-100 plasma spray gun to spray Metco
AMDRY 625 powder onto the prepared surface of nickel foam. Three different phases were
37
reported to be present in the lamellar microstructure of APS and HVOF sprayed alloy 625 coatings
as followings:
a) The light color phase that forms the majority of the coating and has FCC structure rich in
nickel. The composition of this phase was reported very close to the feedstock composition
b) Gray phase that was identified as a mixture of Ni and Cr oxides. This phase was distributed
throughout the microstructure.
c) Darkest phase (black) with rounded shapes throughout the microstructure or as thin layers
between the splats was recognized as the remnant porosity.
2.3.2.4 Twin wire arc spray
Twin wire arc process can be defined as: “a thermal spray process in which an arc is struck between
two consumable electrodes of a coating material, compressed gas is used to atomize and propel
the material to the substrate” [120].
Twin wire arc spray process is an economical method of thermal spraying that has become very
popular in industrial applications due to combining low equipment and operation costs with high
material deposition and energy efficiencies. Porosity content of the arc sprayed coatings is
normally higher than HVOF and APS coatings. Nevertheless, in some industrial applications,
higher porosity content is acceptable or even desired (such as membranes and heat shield devices
[123]). Arc spray coatings are widely used for deposition of corrosion-resistant, wear-resistant,
and antibacterial coatings. The applications of arc spray coatings are categorized according to
different coating materials, thickness and microstructural features (i.e. porosity content, etc.)
[124]–[127].
Twin wire arc spraying process
As shown in Figure 2-9, the two consumable wires which carry electrical current are continuously
fed into the arc spray gun. Electric arc struck at the wire tips to provide the heat source required
for melting the wire shape coating material. Molten droplets are removed by the high-pressure
38
cross flow of a carrier gas and sprayed towards the substrate surface. In this process, the gas is not
practically heated by the electric arc, which provides lower substrate temperature during spraying
compared to other processes. The temperature of electric arc can go as high as 20,000 ºK, but
limited to a small volume. Therefore, the wire tips are heated to temperatures above their melting
point [104], [109], [128]. Unlike other thermal spray methods that the heat source is provided
externally, such as combustion, the consumable wires provide a controlled arc as the source of
energy for melting. The velocity of the carrier gas controls the velocity of the formed in-flight
droplets which is generally few of hundreds m/s. Recently, high velocity twin wire arc spray
systems have been developed for the production of dense high-strength coatings. Arc spray process
has the maximum deposition efficiency and production rate amongst all the thermal spray
processes. Wire arc spray system can be stationary or portable based on its application. The
operation and maintenance of this process are not as complex as HVOF and APS. Twin wire arc
spray coatings tend to present microstructures of similar to APS deposits with a comparable level
of oxide and porosity content [129].
The commercially available wires for twin wire arc spray process in the industry are made of
electrically-conductive materials, such as copper and copper alloys, stainless steel, aluminum,
nickel and nickel based alloys, zinc, and Ni-Al. Recently, metal-ceramic composite coatings were
prepared by using cored wires [130], [131] and pre-alloyed wires [132], [133] in which the non-
conductive components are embedded inside the conductive wires as the core.
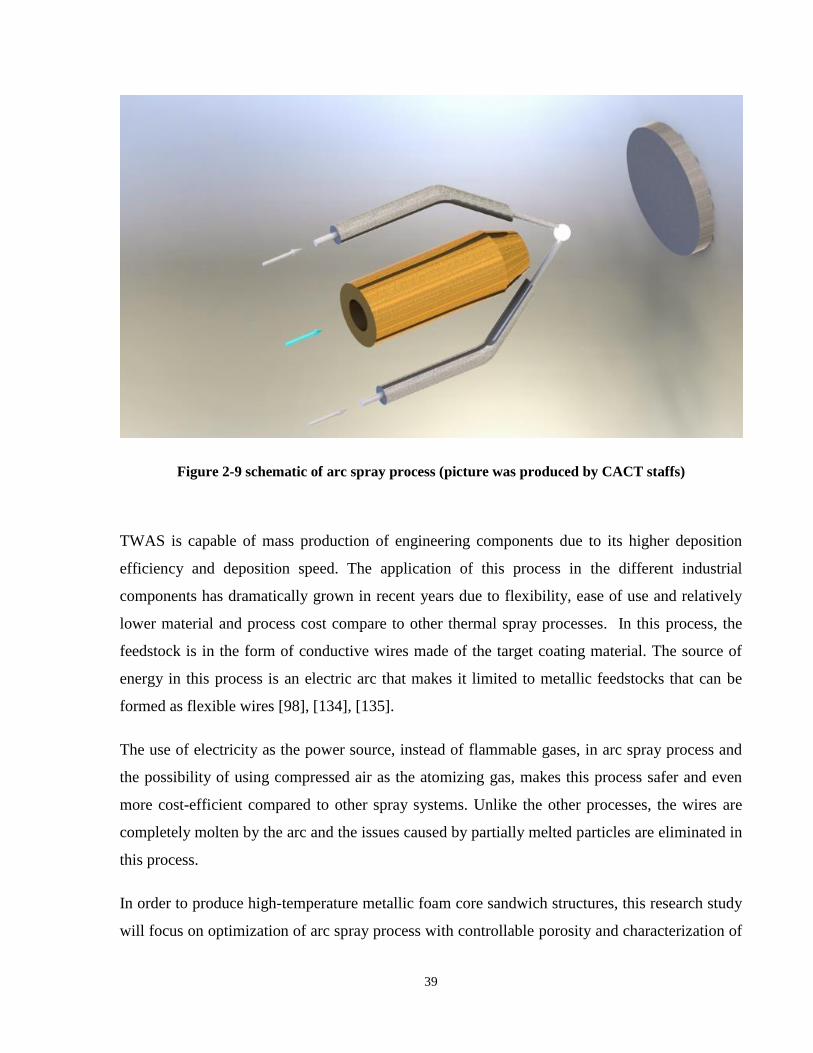
39
Figure 2-9 schematic of arc spray process (picture was produced by CACT staffs)
TWAS is capable of mass production of engineering components due to its higher deposition
efficiency and deposition speed. The application of this process in the different industrial
components has dramatically grown in recent years due to flexibility, ease of use and relatively
lower material and process cost compare to other thermal spray processes. In this process, the
feedstock is in the form of conductive wires made of the target coating material. The source of
energy in this process is an electric arc that makes it limited to metallic feedstocks that can be
formed as flexible wires [98], [134], [135].
The use of electricity as the power source, instead of flammable gases, in arc spray process and
the possibility of using compressed air as the atomizing gas, makes this process safer and even
more cost-efficient compared to other spray systems. Unlike the other processes, the wires are
completely molten by the arc and the issues caused by partially melted particles are eliminated in
this process.
In order to produce high-temperature metallic foam core sandwich structures, this research study
will focus on optimization of arc spray process with controllable porosity and characterization of
40
the sprayed alloy 625 on metallic foam substrates. This processes will be discussed in details in
the next chapter.
In-flight droplets characteristics
In thermal spray processes, droplets temperature and velocity are the most important and
controlling factors in the behaviour of in-flight droplets and the resulting coating microstructure
[136], [137]. Fauchains [111] has reviewed the studies describing the significant effect of in-flight
particle velocities and temperature on splats shape and formation, specifically on flattening,
solidification and oxidation that eventually affect the deposited coating microstructure and
properties. In the studies carried by Friis et al. [138] it was found that microstructural variations in
deposited coating may be better correlated with in-flight particle characteristics than with the
operational spraying parameters.
In-flight droplet temperature depends on the feedstock characteristics such as wire size, heat
capacity, and thermal conductivity. Arc spray parameters such as arc power and cross flow gas
characteristics also affect the droplet temperature prior to impact. In-flight droplet velocity is
related to feedstock density, and detached droplets shape, size, and mass. The droplets velocities
are also affected by spraying parameters such as gas jet velocity and pressure at the exit and
spraying distance. Although smaller droplets may have higher velocity compared to larger ones,
their momentum is not as big as large particles. The online droplet monitoring systems have made
it possible to measure the in-flight size, temperature, and velocity of the sprayed droplets before
impact at any distance from the spraying gun [139]. The droplets velocity, temperature, and size
distribution can be monitored and recorded as a function of position in the arc spray plume during
the spray.
Operating parameters
The spraying parameters that can be changed and controlled in arc spray systems to alter the
microstructural properties of the deposited coatings can be listed as below [131], [140]–[143]:
41
1) Feedstock (fed wires) materials: a wide range of metallic materials are used in industry including
Ni superalloys, stainless steel, titanium, aluminum, copper, tin, zinc and some of their alloys. Each
of these conductive materials or a combination of them as the fed wires can be used for various
applications.
2) Carrier/atomizing gas: different type of gases can be used in arc spray process including dry-
compressed-air, argon, and nitrogen. The carrier gas strips the molten material off the wires
(atomization) and therefore needs not be flammable. Inert gases may be used to reduce the amount
of oxide in the coating.
3) Carrier gas pressure: The upstream pressure of the carrier gas determines the velocity and flow
rate of the gas. As discussed earlier, the gas velocity significantly affects the velocity of in-flight
droplets.
4) Spray voltage: The spraying voltage defines the input power for arc struck. It indirectly affects
the arc temperature and the rate at which the wires tips are melted. Spray voltage specifies the arc
current in most of the arc spray systems.
5) Wire-feed-rate: Determines the rate at which consumable wires are introduced into the spraying
gun, which is equivalent to the rate at which wire tips are melted.
6) Spray distance: The distance between spraying torch tip and the substrate surface. Changing the
spray distance may affect the temperature of droplets at impact and amount of oxide and gain size
in the ultimate microstructure.
7) Scanning speed: Defines the thickness of sprayed deposit in each pass.
Splat formation and coating build up
The in-flight molten droplets leaving the wires tips become spherical due to surface tension forces
while traveling to the substrate surface. Droplets with given velocities and temperature of above
or close to material melting temperature impact the substrate surface. Droplets compress in the
axial direction and speared out perpendicular to their trajectory upon impact, and are flattened on
the surface. The following rapid solidification forms the splat. In-flight droplet characteristics and
42
substrate specifications play a significant role in flattening and consequently final splats shapes
[17], [104].
Droplet impact on the substrate and its relation with the deposited coating properties has been
extensively reviewed experimentally and numerically by other researchers[144]–[147]. It has been
shown that the droplet impact on the surface of the substrate may involve severe deformation with
significant strain rate, recoil, splashing and rapid solidification that are significantly related to in-
flight characteristics and substrate properties.
Most droplet impact studies, for modeling simplification or experimental reasons, have used
smooth substrate surfaces. Key parameters for the substrate consist of surface roughness and
preheating temperature. In the case of poor surface preparation, the oxide layer composition and
thickness also play a considerable role [148].
Thermally sprayed coatings include billions of individual splats connected by chemical and
mechanical bonding. The formation of every single splat plays a role in coating microstructure and
consequently its properties. The splat solidification process is normally completed before the next
molten droplet impacts the same spot. It has been claimed that flattening takes less than 5 µs after
droplet impact while the solidification process is completed in 0.8-10 µs [111], [149]. Splat shape
and properties depend on many parameters such as velocity, size, and thermos-physical
characteristics of the in-flight droplet, as well as the substrate surface topology and properties.
Disk-shaped splats may form stronger bonds together due to the elimination of pores along the
splats boundaries. Flower-shaped splats that result from extensive splashing upon flattening and
solidification, may form coatings with higher porosity content[17], [150].
The arc spray gun can be mounted on a robot to move horizontally and vertically across the
substrate surface in a pattern chosen to uniformly cover the entire surface.
Effect of spraying parameters on coating microstructure
As discussed before there are many process parameters which affect the in-flight characteristics of
the molten droplets, impact on the substrate, and eventually the coating microstructure and
properties. Deposition of the desired microstructure requires a thorough understanding of the
43
correlation between spraying parameters and in-flight droplet characteristics as only then the
relation between coating properties and spraying parameters can be understood. Given the
temperatures and velocities ranges achievable by changing the process parameters, even small
changes in arc spraying parameters can lead to considerable effects on the in-flight droplet
characteristics, and consequently the coating properties.
The correlation between the coating properties and the in-flight droplet characteristic has been
widely studied for HVOF [114], [151]–[155] and APS [17], [94], [156]–[158]. The analysis of in-
flight droplet characteristics in wire arc sprayed coatings has not been the main focus of thermal
spray technologies researchers.
Porosity of the coating
Porosity is one of the most important microstructural features in twin wire arc sprayed coatings.
The desired percentage of porosity in the thermal sprayed coatings is designed based on their
applications. For example, higher porosity content is desirable for plasma sprayed thermal barrier
coatings, because the lower thermal conductivity of the air embedded inside the pores reduces the
overall thermal conductivity of the coating. Very low porosity content is necessary for the
corrosion resistant coatings to avoid penetration of the corrosive media into the coating/substrate
interface. However, it has been proved that the density of thermal spray coatings is usually less
than the bulk material. The main sources of porosity in thermal spray coatings can be listed as
below [17], [119], [152], [159]:
- Splashing of the in-flight molten droplets upon impact
- Entrapment of gases between the splats
- Microporosity formed by dissolved gases
- Splat curl-up
- Embedded solid particles
The oxide phases may also cause porosity formation due to poor wetting at the time of droplet
flattening that lifts the splat edges up and makes small voids. The porosity content in thermal spray
44
coatings can be controlled by optimization of spraying parameters including feedstock, process
parameters, distance, atmosphere, substrate properties and temperature and post-spray treatments
such as annealing and laser treatment. However, changing the porosity content for twin wire arc
process that consumes wire shape feedstock is only possible in a limited range [109]. The scope
of current study requires both high-porosity content coatings for heat shield devices application
where gas penetration through the coating cross section helps cooling the structure and dense
coating for application in heat exchanger channels where sealing of the hot and cold gases are
critical. New techniques will be introduced in this project to control the arc sprayed deposits
porosity content via optimization of the process by response surface method and also externally
added pore generator agent.
Oxidation of the coating
Oxide inclusions in thermally sprayed deposits are commonly observed as elongated phases that
are darker in contrast with the metallic phases in the coating cross section. The interaction between
the molten in-flight droplet and surrounding atmosphere (normally air) and/or heating the already
deposited splats during spraying process are the main causes for oxide inclusions in the thermal
spray coatings. The Higher temperature of molten droplets may increase the oxide layer thickness
on the in-flight droplets, producing higher content of oxides within the coating. Oxides reduce the
wettability of the impacting droplets and consequently a reduction in adhesion strength between
the substrate and coating. A larger concentration of oxide phase may cause poor cohesion strength
between the coating splats and decrease the overall mechanical properties of the coating. In arc
spray process, reducing the droplets superheat through optimization of input power and reducing
substrate temperature by introducing cooling air to its surface may help reducing oxide content
[131], [160].
Substrate effect
Formation of thermally sprayed coatings is highly affected by the substrate properties such as
material, temperature, surface topography and its shape. These can affect the flattening behaviour
of the splats, solidified splats morphology, porosity content, coating thickness and its uniformity,

45
hardness, mechanical properties and residual stresses. The higher surface roughness of substrate
can increase the mechanical interlocking between the coating and substrate surface that eventually
improves the coating adhesion strength. However, high surface roughness may also lead to
incomplete coverage of the surface by splats and formation of a larger number of pores in the
coating microstructure. Therefore coating properties can be controlled by controlling the substrate
surface specifications in addition to changing the spraying parameters [161]–[163]
46
References
[1] H. G. Allen, Analysis and Design of Structural Sandwich Panels. Oxford, UK: Pergamon
Press, 1969.
[2] A. K. Noor, W. S. Burton, and C. W. Bert, “Computational models for sandwich panels and
shells,” Appl. Mech. Rev., vol. 49, no. 3, pp. 155, 1996.
[3] W.Fairbairn., An account of the construction of the Britannia and Conway tubular
bridges. Whitefish, Mont.: Kessinger Publishing reprints, 2010.
[4] K. Marguerre, The optimum buckling load of a flexibly supported plate composed of two
sheets joined by a light weight filler, when under longitudinal compression, Dtsch.
Vierteljahrsschrist für Literalurwiss. und Giests Geschichte, D V L., ZWB UM 136, 1944.
[5] J. Feng, X. Qin, Z. Ma, J. Yang, W. Yang, and G. Shao, “A novel acetylene black/sulfur
graphene composite cathode with unique three-dimensional sandwich structure for lithium-
sulfur batteries,” Electrochim. Acta, vol. 190, pp. 426–433, 2016.
[6] G. Caprino and R. Teti, Sandwich Structures : Handbook. Padua, Italy : Il Prato, 1989.
[7] M. F. Ashby, Materials Selection in Mechanical Design, 3rd ed. Oxford, UK: Butterworth-
Heinemann, 2005, pp. 359-367.
[8] G. Davies, D. Hitchings, T. Besant, a. Clarke, and C. Morgan, “Compression after impact
strength of composite sandwich panels,” Compos. Struct., vol. 63, no. 1, pp. 1–9, 2004.
[9] J. R. Vinson, The Behavior of Sandwich Structures of Isotropic and Composite Materials.
Lancaster, PA: Technomic publishing Company, 1999.
[10] A. S. Herrmann, P. C. Zahlen, and I. Zuardy, “Sandwich structures technology in
commerical aviation: present applications and future trends,” Sandw. Struct. Adv. with
Sandw. Struct. Mater., vol. 7, pp. 13–26, 2005.
[11] M. F. Ashby, A. G. Evans, N. A. Fleck, L. J. Gibson, J. W. Hutchinson, and H. N. G.
Wadley, Metal Foams. Oxford, UK: Butterworth-Heinemann, 2000, pp. 6-23.
[12] A. Chumpia and K. Hooman, “Performance evaluation of tubular aluminum foam heat
exchangers in single row arrays,” Appl. Therm. Eng., vol. 83, pp. 121–130, 2015.
[13] K. Boomsma, D. Poulikakos, and F. Zwick, “Metal foams as compact high performance
47
heat exchangers,” Mech. Mater., vol. 35, no. 12, pp. 1161–1176, 2003.
[14] T. J. Lu, H. A. Stone, and M. F. Ashby, “Heat transfer in open-cell metal foams,” Acta
Mater., vol. 46, no. 10, pp. 3619–3635, 1998.
[15] D. Y. Kim, T. H. Sung, and K. C. Kim, “Application of metal foam heat exchangers for a
high-performance liquefied natural gas regasification system,” Energy, vol. 105, pp. 57–69,
2016.
[16] “HexWebTM Honeycomb sandwich design technology,” Hexcel Composites, Stamfort, CT
Publ. No. AGU 075B, pp. 1–28, December 2000.
[17] F. Azarmi, “Sandwich Structures for High Temperature Applications: Microstructural
Development and Mechanical Performance” Ph.D. dissertation, University of Toronto,
2008.
[18] T. M. McCormack, R. Miller, O. Kesler, and L. J. Gibson, “Failure of sandwich beams with
metallic foam cores,” Int. J. Solids Struct., vol. 38, no. 28–29, pp. 4901–4920, 2001.
[19] G. Belingardi, M. P. Cavatorta, and R. Duella, “Material characterization of a composite–
foam sandwich for the front structure of a high speed train,” Compos. Struct., vol. 61, no.
1–2, pp. 13–25, 2003.
[20] K. Mohan, Y. T. Hon, S. Idapalapati, and H. P. Seow, “Failure of sandwich beams
consisting of alumina face sheet and aluminum foam core in bending,” Mater. Sci. Eng. A,
vol. 409, no. 1–2, pp. 292–301, 2005.
[21] J. B. Min, L. J. Ghosn and B. A. Lerch, “A study for stainless steel fan blade design with
metal foam core,” J. Sandw. Struct. Mater., vol. 17, no. 1, pp. 56-73, 2015.
[22] Standard Test Method for Core Shear Properties of Sandwich Constructions by Beam,
ASTM C393/C 393 M – 06, 2009.
[23] I. M. Daniel, E. E. Gdoutos, J. L. Abot, and K. Wang, “Deformation and failure of
composite sandwich structures,” J. Thermoplast. Compos. Mater., vol. 16, no. 2, pp. 345–
55, 2003.
[24] W.J. Cantwell, R. Scudamore, J. Ratcliffe, and P. Davies, “Interfacial fracture in sandwich
laminates,” Compos. Sci. Technol., vol. 59, no. 14, pp. 2079–2085, 1999.
48
[25] W. J. Cantwell and P. Davies, “A study of skin-core adhesion in glass fibre reinforced
sandwich materials,” Appl. Compos. Mater., vol. 3, no. 6, pp. 407–420, 1996.
[26] K. M. Liechti and B. Marton, “Delamination of a high-temperature sandwich plate,” Exp.
Mech., vol. 42, no. 2, pp. 206–213, 2002.
[27] J. B. Sha and T. H. Yip, “In situ surface displacement analysis on sandwich and multilayer
beams composed of aluminum foam core and metallic face sheets under bending loading,”
Mater. Sci. Eng. A, vol. 386, no. 1–2, pp. 91–103, 2004.
[28] J. B. Sha, T. H. Yip, and M. H. Teo, “FEM modelling of single-core sandwich and 2-core
multilayer beams containing foam aluminum core and metallic face sheets under monolithic
bending,” Prog. Nat. Sci. Mater. Int., vol. 21, no. 2, pp. 127–138, 2011.
[29] T. C. Triantafillou and L. J. Gibson, “Failure mode maps for foam core sandwich beams,”
Mater. Sci. Eng., vol. 95, pp. 37–53, 1987.
[30] H. Bart-Smith, J. W. Hutchinson, and A. G. Evans, “Measurement and analysis of the
structural performance of cellular metal sandwich construction,” Int. J. Mech. Sci., vol. 43,
no. 8, pp. 1945–1963, 2001.
[31] C. Chen, A-M. Harte, and N. A. Fleck, “The plastic collapse of sandwich beams with a
metallic foam core,” Int. J. Mech. Sci., vol. 43, no. 6, pp. 1483–1506, 2001.
[32] J. Yu, E. Wang, J. Li, and Z. Zheng, “Static and low-velocity impact behavior of sandwich
beams with closed-cell aluminum-foam core in three-point bending,” Int. J. Impact Eng.,
vol. 35, no. 8, pp. 885–894, 2008.
[33] J. Yu, X. Wang, Z. G. Wei, and E. H. Wang, “Deformation and failure mechanism of
dynamically loaded sandwich beams with aluminum-foam core,” Int. J. Impact Eng., vol.
28, no. 3, pp. 331–347, 2003.
[34] S. D. Schampheleire, P. D. Jaeger, H. Huisseune, B. Ameel, C. T’Joen, K. D. Kerpel, and
M. D. Paepe, “Thermal hydraulic performance of 10 PPI aluminium foam as alternative for
louvered fins in an HVAC heat exchanger,” Appl. Therm. Eng., vol. 51, no. 1–2, pp. 371–
382, 2013.
[35] M. A. Arafin, M. Medraj, D. P. Turner, and P. Bocher, “Transient liquid phase bonding of
Inconel 718 and Inconel 625 with BNi-2: Modeling and experimental investigations,”
49
Mater. Sci. Eng. A, vol. 447, no. 1–2, pp. 125–133, 2007.
[36] M. Reppich, “Use of high performance plate heat exchangers in chemical and process
industries,” Int. J. Therm. Sci., vol. 38, pp. 999–1008, 1999.
[37] M. M. Abu-Khader, “Plate heat exchangers: Recent advances,” Renew. Sustain. Energy
Rev., vol. 16, no. 4, pp. 1883–1891, 2012.
[38] H. P. Degischer, and B. Kriszt, Handbook of Cellular Metals; Production, Processing,
Applications, Weinheim, Germany: Wiley-VCH, 2002.
[39] L. P. Lefebvre, J. Banhart, and D. C. Dunand, “Porous metals and metallic foams: Current
status and recent developments,” Adv. Eng. Mater., vol. 10, no. 9, pp. 775–787, 2008.
[40] J. R. Davis, Nickel, Cobalt, and Their Alloys, Materials Park, OH: ASM International,
2000.
[41] H. Choe and D. C. Dunand, “Mechanical properties of oxidation-resistant Ni–Cr foams,”
Mater. Sci. Eng. A, vol. 384, no. 1–2, pp. 184–193, 2004.
[42] R. Darolia, “Ductility and fracture toughness issues related to implementation of NiAl for
gas turbine applications,” Intermetallics, vol. 8, no. 9–11, pp. 1321 – 1327, 2000.
[43] P. Nash, Phase diagrams of binary nickel alloys, Materials Park, OH: ASM International,
1991.
[44] N. Dukhan, Metal Foams: Fundamentals and Applications. Lancaster, PA: DEStech
Publications, Inc, 2013.
[45] F. Bidault, D. J. L. Brett, P. H. Middleton, N. Abson, and N. P. Brandon, “A new application
for nickel foam in alkaline fuel cells,” Int. J. Hydrogen Energy, vol. 34, no. 16, pp. 6799–
6808, 2009.
[46] G. Ryan, A. Pandit, and D. P. Apatsidis, “Fabrication methods of porous metals for use in
orthopaedic applications.,” Biomaterials, vol. 27, no. 13, pp. 2651–70, 2006.
[47] J. Banhart, “Manufacture, characterisation and application of cellular metals and metal
foams,” Prog. Mater. Sci., vol. 46, no. 6, pp. 559–632, 2001.
[48] J. Banhart, “Metallic Foams,”, Europhysics News, vol. 30, pp. 17–20, 1999.
50
[49] A. Chumpia and K. Hooman, “Performance evaluation of single tubular aluminium foam
heat exchangers,” Appl. Therm. Eng., vol. 66, no. 1–2, pp. 266–273, 2014.
[50] C. Tekog˜lu, L. J. Gibson, T. Pardoen, and P. R. Onck, “Size effects in foams: Experiments
and modeling,” Prog. Mater. Sci., vol. 56, no. 2, pp. 109–138, 2011.
[51] X. Cao, Z. Wang, H. Ma, L. Zhoa, and G. Yang, “Effects of cell size on compressive
properties of aluminum foam,” Trans. Nanferrous Met. Soc. China, vol. 16, pp. 351-356,
2006.
[52] M. S. Konsta-Gdoutos and E. E. Gdoutos, “The effect of load and geometry on the failure
modes of sandwich beams,” Appl. Compos. Mater., vol. 12, no. 3–4, pp. 165–176, 2005.
[53] L. J. Gibson and M. F. Ashby, Cellular Solids: Structure and Properties. Cambridge, U.K:
Cambridge University Press, 1997, pp. 175-231.
[54] K. Boomsma, D. Poulikakos, and Y. Ventikos, “Simulations of flow through open cell metal
foams using an idealized periodic cell structure,” Int. J. Heat Fluid Flow, vol. 24, no. 6, pp.
825–834, 2003.
[55] A. Ajdari, “Mechanical Behavior of Cellular Structures: A Finite Element Study,” M.S.
Thesis, Northeastern University, 2008.
[56] H. N. G. Wadley, “Cellular metals manufacturing,” Adv. Eng. Mater., vol. 4, no. 10, pp.
726–733, 2002.
[57] J. Banhart, “Manufacturing routes for metallic foams,” JOM, vol. 52, no. 12, pp. 22–27,
2000.
[58] M. F. Ashby, A. G. Evans, N. A. Fleck, L. J. Gibson, J. W. Hutchinson, and H. N. G.
Wadley, Metal Foams. Oxford, UK: Butterworth-Heinemann, 2000, pp. 40-54.
[59] H. Wadley, N. A. Fleckb, and A. G. Evans “Fabrication and structural performance of
periodic cellular metal sandwich structures,” Compos. Sci. Technol., vol. 63, no. 16, pp.
2331–2343, 2003.
[60] T. G. Nieh, K. Higashi, and J. Wadsworth, “Effect of cell morphology on the compressive
properties of open-cell aluminum foams,” Mater. Sci. Eng. A, vol. 283, no. 1–2, pp. 105–
110, 2000.
51
[61] L. J. Gibson, “Mechanical Behavior Of Metallic Foams,” Annu. Rev. Mater. Sci, vol. 30,
no. 1, pp. 191–227, 2000.
[62] M. F. Ashby, A. G. Evans, N. A. Fleck, L. J. Gibson, J. W. Hutchinson, and H. N. G.
Wadley, Metal Foams. Oxford, UK: Butterworth-Heinemann, 2000, pp. 113-149.
[63] E. W. Andrews, J. S. Huang, and L. J. Gibson, “Creep behavior of a closed-cell aluminum
foam,” Acta Mater., vol. 47, no. 10, pp. 2927–2935, 1999.
[64] E. W. Andrews, L. J. Gibson, and M. F. Ashby, “The creep of cellular solids,” Acta Mater.,
vol. 47, no. 10, pp. 2853–2863, 1999.
[65] P. Zhang, M. Haag, O. Kraft, A. Wanner, and E. Arzt, “Microstructural changes in the cell
walls of a closed-cell aluminium foam during creep,” Philos. Mag. A Phys. Condens.
Matter, Struct. Defects Mech. Prop., vol. 82, no. 16, pp. 2895–2907, 2002.
[66] D. T. Queheillalt, Y. Katsumura, and H. N. G. Wadley, “Synthesis of stochastic open cell
Ni-based foams,” Scr. Mater., vol. 50, no. 3, pp. 313–317, 2004.
[67] M. Bram, C. Stiller, H. P. Buchkremer, D. Stöver, and H. Baur, “High-Porosity Titanium,
Stainless Steel, and Superalloy Parts,” Adv. Eng. Mater., vol. 2, no. 4, pp. 196–199, 2000.
[68] A. Hodge and D. Dunand, “Synthesis of nickel–aluminide foams by pack-aluminization of
nickel foams,” Intermetallics, vol. 9, no. 7, pp. 581–589, 2001.
[69] H. Choe and D. C. Dunand, “Synthesis, structure, and mechanical properties of Ni-Al and
Ni-Cr-Al superalloy foams,” Acta Mater., vol. 52, no. 5, pp. 1283–1295, 2004.
[70] R. Mevrel, C. Duret and R. Pichoir, “Pack cementation processes,” Mater. Sci. Tech., vol.
2, pp. 201–206, 1986.
[71] K. H. Stern, Metallurgical and Ceramic Protective Coatings. Dordrecht, Netherlands:
Springer Netherlands, 1996.
[72] M. Donachie, Superalloys: Source Book , Materials Park, OH: ASM International, 1984.
[73] C. Thomas and P. Tait, “The performance of Alloy 625 in long-term intermediate
temperature applications,” Int. J. Press. Vessel. Pip., vol. 59, no. 1–3, pp. 41–49, 1994.
[74] L. Kumar, R. Venkataramani, M. Sundararaman, P. Mukhopadhyay, and S. P. Garg,
“Studies on the oxidation behavior of Inconel 625 between 873 and 1523 K,” Oxid. Met.,
52
vol. 45, no. 1–2, pp. 221–244, 1996.
[75] M. Durand-Charre, The microstructure of superalloys. Amsterdam The Netherlands:
Gordon and Breach Science Publishers, 1997.
[76] S.Chester, T. Stoloff, and W.C. Hagel, Superalloys II: High-Temperature Materials for
Aerospace and Industrial Power, New York, NY: John Wiley & Sons, 1987.
[77] H. Eiselstein and D. Tillack, “The invention and definition of alloy 625,” In TMS Proc.,
1991, pp. 1–14.
[78] I. Kirman and D. H. Warrington, “The precipitation of Ni3Nb phases in a Ni-Fe-Cr-Nb
alloy,” Metall. Trans., vol. 1, no. 10, pp. 2667–2675, 1970.
[79] M. Kohler, “Effect of the elevated-temperature-precpitation in Alloy 625 on properties and
microstructure,” In TMS Proc., 1991, pp. 363–374.
[80] R. Cozar, M. Rouby, B. Mayonobe, and C. Morizot, “Mechanical Properties, Corrosion
Resistance and Microstructure of Both Regular and Titanium Hardened 625 Alloys,” In
TMS Proc., 1991, pp. 423–436.
[81] S. Seal, S. C. Kuiry, and L. A. Bracho, “Surface chemistry of oxide scale on IN-738LC
superalloy : Effect of long-term exposure in air at 1173 K,” Oxid. Met., vol. 57, no. 3/4, pp.
297–322, 2002.
[82] R. C. Reed, The Superalloys: Fundamentals and Applications, New York, NY: Cambridge
University Press. 2008.
[83] M. J. Wahll, D. J. Maykuth, H. J. Hucek, and Metals and Ceramics Information Center (U.S.),
Handbook of superalloys. Columbus, OH: Battelle Press, 1979.
[84] C. E. Stevens and R. W. Ross, “Production, fabrication, and performance of alloy 625 clad
steel for aggressive corrosive environments,” J. Mater. Energy Syst., vol. 8, no. 1, pp. 7–16,
1986.
[85] E. A. Brandes and G. B. Brook, Smithells Metals Reference Book, 7th ed., Oxford, UK:
Butterworth-Heinemann, 1992.
[86] B. F. Levin, K. S. Vecchio, J. N. Dupont, and a R. Marder, “Solid Particle Erosion
Resistance and High Strain Rate Deformation Behavior of Inconel-625 Alloy,” In TMS
53
Proc.,1997, pp. 479–488.
[87] G. F. Vender Voort, J. W. Bowman, and R. B. Frank, “Microstructural characterization of
custom age 625 plus alloy,” In TMS Proc., 1994, pp. 489–498.
[88] A. Neville, J. M. Perry, T. Hodgkiess, and H. P. Chua, “Wrought and high-velocity oxy fuel
sprayed Inconel 625--examination of corrosion aspects,” In Inst. Mech. Eng. Part L J.
Mater. Des. Appl. Proc., vol. 214, no. 1, pp. 41–48, 2000.
[89] M. Design and A. Hall, “Microstructural characterization of high velocity oxy-fuel sprayed
coatings of Inconel 625,” J. of Mater. Sci., vol. 32, no.4, pp. 863–872, 1997.
[90] D. Zhang, S. J. Harris, and D. G. Mccartney, “Microstructure formation and corrosion
behaviour in HVOF-sprayed Inconel 625 coatings,” Mater. Sci. Eng.: A, vol. 344, no. 1-2,
pp. 45-56, 2003.
[91] A. Boudi, M. S. J. Hashmi, and B. S. Yilbas, “HVOF coating of Inconel 625 onto stainless
and carbon steel surfaces: corrosion and bond testing,” J. Mater. Process. Technol., vol.
155–156, pp. 2051–2055, 2004.
[92] F. Azarmi, J. Saaedi, T. W. Coyle, and J. Mostaghimi, “Microstructure Characterization of
Alloy 625 Deposited on Nickel Foam using Air Plasma Spraying,” Adv. Eng. Mater., vol.
10, no. 5, pp. 459–465, 2008.
[93] F. Azarmi, T. Coyle, and J. Mostaghimi, “Young’s modulus measurement and study of the
relationship between mechanical properties and microstructure of air plasma sprayed alloy
625,” Surf. Coatings Technol., vol. 203, no. 8, pp. 1045–1054, 2009.
[94] T. Hussain, T. Dudziak, N. J. Simms, J. R. Nicholls, “Fireside Corrosion Behavior of HVOF
and Plasma-Sprayed Coatings in Advanced Coal/Biomass Co-Fired Power Plants,” J.
Therm. Spray Technol., vol. 22, no. 5, pp. 797–807, 2013.
[95] F. Xu, Y. Lv, Y. Liu, B. Xu, and P. He, “Effect of heat treatment on microstructure and
mechanical properties of inconel 625 alloy fabricated by pulsed plasma arc deposition,”
Phys. Procedia, vol. 50, pp. 48–54, 2013.
[96] F. Azarmi and H. R. Salimijazi, “Grain growth and pore elimination in Inconel 625
deposited by APS,” Surf. Coatings Technol., vol. 268, pp. 3–6, 2015.
[97] C. Leither, J. Risan, M. Bashirzadeh, and F. Azarmi, “Determination of the elastic modulus
54
of wire arc sprayed alloy 625 using experimental, analytical, and numerical simulations,”
Surf. Coatings Technol., vol. 235, pp. 611–619, 2013.
[98] F. Azarmi and C. P. Leither, “Microstructural Formation During Wire Arc Spraying of
Alloy 625 on Wrought Alloy 625 Substrate,” Metall. Mater. Trans. A, vol. 43, no. 12, pp.
4703–4710, 2012.
[99] D. J. Sypeck and H. N. G. Wadley, “Cellular metal truss core sandwich structures,” Adv.
Eng. Mater., vol. 4, no. 10, pp. 759–764, 2002.
[100] H. N. G. Wadley, “Multifunctional periodic cellular metals,” Philos. Trans. R. Soc. A Math.
Phys. Eng. Sci., vol. 364, no. 1838, pp. 31–68, 2006.
[101] F. Cote, N. Fleck, and V. Deshpande, “Fatigue performance of sandwich beams with a
pyramidal core,” Int. J. Fatigue, vol. 29, no. 8, pp. 1402–1412, 2007.
[102] D. T. Queheillalt and H. N. G. Wadley, “Titanium alloy lattice truss structures,” Mater.
Des., vol. 30, no. 6, pp. 1966–1975, 2009.
[103] F. Azarmi, T. Coyle, J. Mostaghimi, and L. Pershin, “A new approach to develop high
temperature foam core sandwich structures using air plasma spraying,” Int. J. Adv. Manuf.
Technol., vol. 44, no. 9–10, pp. 900–905, 2009.
[104] P. L. Fauchais, J. V. R. Heberlein, and M. I. Boulos, Thermal Spray Fundamentals., New
York, NY: Springer, 2014.
[105] C. C. Berndt, “The Origins of Thermal Spray Literature” In international thermal spray
conference Singapore, Proc. C.C. Berndt, K. A. Khor, E. F. Lugscheider, Ed., Materials
Park, OH: ASM International, 2001, pp 1351–1360.
[106] M. U. Schoop, “Early thermal spray application - JTST- historical patent #22,” J. Therm.
Spray Technol., vol. 10, no. 1, pp. 37–39, 2001.
[107] M. U. Schoop, “Device for coating articles with glass, enamel, quartz, and metals -JTST-
historical patent #19,” J. Therm. Spray Technol., vol. 10, no. 2, pp. 244–245, 2001.
[108] M. U. Schoop, “Early thermal spray application - JTST- historical patent #21,” J. Therm.
Spray Technol., vol. 10, no. 1, pp. 35–36, 2001.
[109] J. R. Davis, Handbook of Thermal Spray Technology. Materials Park, OH: ASM
55
International, 2004.
[110] “An Introduction to Thermal Spray,” Sulzer Metco, Winterthur, Switzerland, Intro. Rep.,
2012.
[111] P. Fauchais, “Understanding plasma spraying,” J. Phys. D. Appl. Phys., vol. 37, no. 9, pp.
R86–R108, 2004.
[112] H. Katanoda and K. Matsuo, “Analysis of particle behavior in High-Velocity Oxy-Fuel
thermal sparying process,” J. of Therm. Sci., vol. 12, no. 3, pp. 279-282, 2003.
[113] M. L. Thorpe and H. J. Richter, “A pragmatic analysis and comparison of HVOF
processes,” J. Therm. Spray Technol., vol. 1, no. 2, pp. 161–170, 1992.
[114] S. Gu, D. G. McCartney, C. N. Eastwick, and K. Simmons, “Numerical Modeling of In-
Flight Characteristics of Inconel 625 Particles During High-Velocity Oxy-Fuel Thermal
Spraying,” J. Therm. Spray Technol., vol. 13, no. 2, pp. 200–213, 2004.
[115] R. Neiser, M. Smith, and R. Dykhuizen, “Oxidation in Wire HVOF Sprayed Steel,” J.
Therm. Spray Technol., vol. 7, no. 4, pp. 537–545, 1998.
[116] M. Jafari, M. H. Enayati, M. Salehi, S. M. Nahvi, and C. G. Park, “Comparison between
oxidation kinetics of HVOF sprayed WC-12Co and WC-10Co-4Cr coatings”, Int. J.
Refact. Met. H. vol. 41, pp. 78-84, 2013.
[117] L.-M. Berger, “Coating by Thermal Spray,” in Comprehensive Hard Materials. vol. 1,
V.K. Sarin, Elsevier Science Ltd., 2014, pp. 471-506.
[118] D. J. Nolan and M. Samandi, “Revealing true porosity in WC-Co thermal spray coatings,”
J. Therm. Spray Technol., vol. 6, no. 4, pp. 422–424, 1997.
[119] Z. Liu, J. Cabrero, S. Niang, and Z. Y. Al-Taha, “Improving corrosion and wear
performance of HVOF-sprayed Inconel 625 and WC-Inconel 625 coatings by high power
diode laser treatments,” Surf. Coatings Technol., vol. 201, no. 16–17, pp. 7149–7158, 2007.
[120] F. J. Hermanek, Thermal Spray Terminology and Company Origins, Materials Park, OH:
ASM International, 2001.
[121] H. Liu, H. R. S. Jazi, M. Bussmann, and J. Mostaghimi, “Experiments and modeling of
56
rapid solidification of plasma-sprayed yttria-stabilized zirconia,” Acta Mater., vol. 57, no.
20, pp. 6013–6021, 2009.
[122] A. Keyvani, M. Saremi, and M. H. Sohi, “An investigation on oxidation, hot corrosion and
mechanical properties of plasma-sprayed conventional and nanostructured YSZ coatings,”
Surf. Coatings Technol., vol. 206, no. 2–3, pp. 208–216, 2011.
[123] S. S. Madaeni, M. E. Aalami-Aleagha, and P. Daraei, “Preparation and characterization of
metallic membrane using wire arc spraying,” J. Memb. Sci., vol. 320, no. 1–2, pp. 541–548,
2008.
[124] O. Sharifahmadian, H. R. Salimijazi, M. H. Fathi, J. Mostaghimi, and L. Pershin, “Study of
the Antibacterial Behavior of Wire Arc Sprayed Copper Coatings,” J. Therm. Spray
Technol., vol. 22, no. 2–3, pp. 371–379, 2013.
[125] D. He, N. Dong, and J. Jiang, “Corrosion Behavior of Arc Sprayed Nickel-Base Coatings,”
J. Therm. Spray Technol., vol. 16, no. 5–6, pp. 850–856, 2007.
[126] S. J. Harris and M. P. Overs, “Oxidation behaviour of arc-sprayed iron and nickel alloy
coatings,” Thin Solid Films, vol. 118, no. 4, pp. 495–505, 1984.
[127] K. Cooke, G. Oliver, V. Buchanan, and N. Palmer, “Optimisation of the electric wire arc-
spraying process for improved wear resistance of sugar mill roller shells,” Surf. Coatings
Technol., vol. 202, no. 1, pp. 185–188, 2007.
[128] I. Gedzevicius and A. V. Valiulis, “Analysis of wire arc spraying process variables on
coatings properties,” J. Mater. Process. Technol., vol. 175, no. 1–3, pp. 206–211, 2006.
[129] S. Bose, “Oxidation and Corrosion Resistante Coatings,” In High Temperature Coatings,
Ch. 6, Oxford, UK: Butterworth-Heineman, 2007, pp. 71-154.
[130] H. Steffens and K. Nassenstein, “Influence of the spray velocity on arc-sprayed coating
structures,” J. Therm. Spray Technol., vol. 8, no. 3, pp. 454–460, 1999.
[131] G. Jandin, H. Liao, Z. Q. Feng, and C. Coddet, “Correlations between operating conditions,
microstructure and mechanical properties of twin wire arc sprayed steel coatings,” Mater.
Sci. Eng. A, vol. 349, no. 1–2, pp. 298–305, 2003.
[132] M. K. Hedges, A. P. Newbery, and P. S. Grant, “Characterisation of electric arc spray
formed Ni superalloy IN718,” Mater. Sci. Eng. A, vol. 326, no. 1, pp. 79–91, 2002.
57
[133] T. Watanabe, T. Sato, and A. Nezu, “Electrode phenomena investigation of wire arc
spraying for preparation of Ti-Al intermetallic compounds,” Thin Solid Films, vol. 407, no.
1–2, pp. 98–103, 2002.
[134] Y. Tan, A. Shyam, W. B. Choi, E. Lara-Curzio, and S. Sampath, “Anisotropic elastic
properties of thermal spray coatings determined via resonant ultrasound spectroscopy,”
Acta Mater., vol. 58, no. 16, pp. 5305–5315, 2010.
[135] C. Leither, J. Risan, M. Bashirzadeh, and F. Azarmi, “Determination of the elastic modulus
of wire arc sprayed alloy 625 using experimental, analytical, and numerical simulations,”
Surf. Coatings Technol., vol. 235, pp. 611–619, 2013.
[136] S. Sampath, X. Y. Jiang, J. Matejicek, L. Prchlik, A. Kulkarni, and A. Vaidya, “Role of
thermal spray processing method on the microstructure, residual stress and properties of
coatings: An integrated study of Ni-5 wt. % Al bond coats,” Mater. Sci. Eng. A, vol. 364,
no. 1–2, pp. 216–231, 2004.
[137] F. Gao, X. Huang, R. Liu, Q. Yang, “Optimization of Plasma Spray Process Using
Statistical Methods,” J. Therm. Spray Technol., vol. 21, no. 1, pp. 176–186, 2012.
[138] M. Friis, C. Persson, and J. Wigren, “Influence of particle in-flight characteristics on the
microstructure of atmospheric plasma sprayed yttria stabilized ZrO2,” Surf. coatings
Technol., vol. 141, no. 2, pp. 115–127, 2001.
[139] A. P. Newbery, P. S. Grant, and R. A. Neiser, “The velocity and temperature of steel
droplets during electric arc spraying,” Surf. Coatings Technol., vol. 195, no. 1, pp. 91–101,
2005.
[140] D. J. Varacalle, G. C. Wilson, R. W. Johnson, T. J. Steeper, G. Irons, W. R. Kratochvil, and
W. L. Riggs, “A Taguchi experimental design study of twin-wire electric arc sprayed
aluminum coatings,” J. Therm. Spray Technol., vol. 3, no. 1, pp. 69–74, 1994.
[141] N. A. Hussary and J. V. R. Heberlein, “Effect of system parameters on metal breakup and
particle formation in the wire arc spray process,” J. Therm. Spray Technol., vol. 16, no. 1,
pp. 140–152, 2007.
[142] A. Pourmousa, J. Mostaghimi, A. Abedini, and S. Chandra, “Particle Size Distribution in
a Wire-Arc Spraying System,” J. Therm. Spray Technol., vol. 14, no. 4, pp. 502–510, 2005.
58
[143] W. Zhao, C. Liu, L. Dong, and Y. Wang, “Effects of Arc Spray Process Parameters on
Corrosion Resistance of Ti Coatings,” J. Therm. Spray Technol., vol. 18, no. 4, pp. 702–
707, 2009.
[144] H. B. Parizi, L. Rosenzweig, J. Mostaghimi, S. Chandra, T. Coyle, H. Salimi, L. Pershin,
A. McDonald, and C. Moreau, “Numerical simulation of droplet impact on patterned
surfaces,” J. Therm. Spray Technol., vol. 16, no. 5–6, pp. 713–721, 2007.
[145] Z. G. Feng, M. Domaszewski, G. Montavon, and C. Coddet, “Finite element analysis of
effect of substrate surface roughness on liquid droplet impact,” J. Therm. Spray Technol.,
vol. 11, no. 1, pp. 62–68, 2002.
[146] R. Dhiman, A. G. McDonald, and S. Chandra, “Predicting splat morphology in a thermal
spray process,” Surf. Coatings Technol., vol. 201, no. 18, pp. 7789–7801, 2007.
[147] M. Pasandideh-Fard, V. Pershin, S. Chandra, and J. Mostaghimi, “Splat shapes in a thermal
spray coating process: simulations and experiments,” J. Therm. Spray Technol., vol. 11, no.
2, pp. 206–217, 2002.
[148] P. Fauchais, M. Fukumoto, A. Vardelle, and M. Vardelle, “Knowledge concerning splat
formation: an invited review,” J. Therm. Spray Technol., vol. 13, no. 3, pp. 337–360, 2004.
[149] R. F. Bunshah, Handbook of Deposition Technologies for films and coatings. Park Ridge,
N.J.: Noyes publications, 1994.
[150] M. F. Morks, Y. Tsunekawa, and M. Okumiya, “Characterization and properties of splats
sprayed with different cast iron powders,” Mater. Lett., vol. 58, no. 20, pp. 2481–2485,
2004.
[151] M. Magnani, P. H. Suegama, N. Espallargas, S. Dosta, C. S. Fugivara, J. M. Guilemany,
and A. V. Benedetti, “Influence of HVOF parameters on the corrosion and wear resistance
of WC-Co coatings sprayed on AA7050 T7,” Surf. Coatings Technol., vol. 202, no. 19, pp.
4746–4757, 2008.
[152] J. A. Hearley, J. A. Little, and A. J. Sturgeon, “The effect of spray parameters on the
properties of high velocity oxy-fuel NiAl intermetallic coatings,” Surf. Coatings Technol.,
vol. 123, no. 2–3, pp. 210–218, 2000.
[153] J. G. La Barbera-Sosa, Y. Y. Santana, E. Moreno, N. Cuadrado, J. Caro, P. O. Renault, E.
59
Le Bourhis, M. H. Staia, and E. S. Puchi-Cabrera, “Effect of spraying distance on the
microstructure and mechanical properties of a Colmonoy 88 alloy deposited by HVOF
thermal spraying,” Surf. Coatings Technol., vol. 205, no. 7, pp. 1799–1806, 2010.
[154] S. Hasan and J. Stokes, “Design of experiment analysis of the Sulzer Metco DJ high velocity
oxy-fuel coating of hydroxyapatite for orthopedic applications,” J. Therm. Spray Technol.,
vol. 20, no. 1–2, pp. 186–194, 2011.
[155] J. He, M. Ice, and E. Lavernia, “Particle melting behavior during high-velocity oxygen fuel
thermal spraying,” J. Therm. Spray Technol., vol. 10, no. 1, pp. 83–93, 2001.
[156] H. R. Salimijazi, L. Pershin, T. W. Coyle, J. Mostaghimi, S. Chandra, Y. C. Lau, L.
Rosenzweig, and E. Moran, “Effect of droplet characteristics and substrate surface
topography on the final morphology of plasma-sprayed zirconia single splats,” J. Therm.
Spray Technol., vol. 16, no. 2, pp. 291–299, 2007.
[157] D. Thirumalaikumarasamy, K. Shanmugam, and V. Balasubramanian, “Influences of
atmospheric plasma spraying parameters on the porosity level of alumina coating on AZ31B
magnesium alloy using response surface methodology,” Prog. Nat. Sci. Mater. Int., vol. 22,
no. 5, pp. 468–479, 2012.
[158] F. Azarmi, A. Moradian, J. Mostaghimi, T. W. Coyle, and L. Pershin, “Microstructure
characterization and modeling of splat formation during air plasma spraying for inconel 625
superalloy,” 5th Int. Conf. Process. Manuf. Adv. Mater. - THERMEC’2006, vol. 539–543,
pp. 1218–1223, 2007.
[159] M. Marr and O. Kesler, “Permeability and microstructure of suspension plasma-sprayed
YSZ electrolytes for SOFCs on various substrates,” J. Therm. Spray Technol., vol. 21, no.
6, pp. 1334–1346, 2012.
[160] S. Sampath, X. Jiang, A. Kulkarni, J. Matejicek, D. L. Gilmore, and R. A. Neiser,
“Development of process maps for plasma spray: Case study for molybdenum,” Mater. Sci.
Eng. A, vol. 348, no. 1–2, pp. 54–66, 2003.
[161] R. S. C. Paredes, S. C. Amico, and A. S. C. M. d’Oliveira, “The effect of roughness and
pre-heating of the substrate on the morphology of aluminium coatings deposited by thermal
spraying,” Surf. Coatings Technol., vol. 200, no. 9, pp. 3049–3055, 2006.
60
[162] I. Hofinger, J. Moller, M. Bobeth, and K. Raab, “Effect of Substrate Surface Roughness on
the Adherence of NiCrAlY Thermal Spray Coatings,” J. Therm. Spray Technol., vol. 11,
no. 3, pp. 387–392, 2002.
[163] S. Salavati, L. Pershin, T. W. Coyle, and J. Mostaghimi, “Effect of Porosity Content of Arc-
Sprayed Alloy 625 Skins on the Flexural Behavior of Nickel Foam Core Sandwich
Structures,” J. Therm. Spray Technol., vol. 24, no. 1, pp. 10–13, 2014.
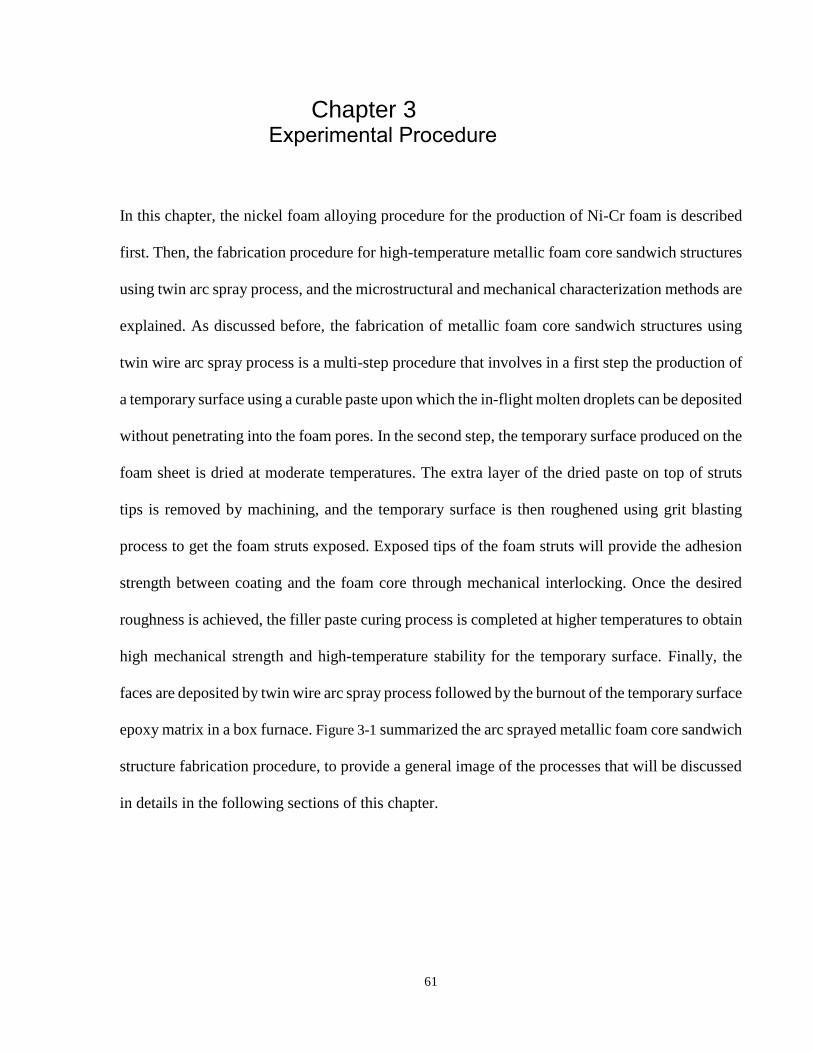
61
Chapter 3 Experimental Procedure
In this chapter, the nickel foam alloying procedure for the production of Ni-Cr foam is described
first. Then, the fabrication procedure for high-temperature metallic foam core sandwich structures
using twin arc spray process, and the microstructural and mechanical characterization methods are
explained. As discussed before, the fabrication of metallic foam core sandwich structures using
twin wire arc spray process is a multi-step procedure that involves in a first step the production of
a temporary surface using a curable paste upon which the in-flight molten droplets can be deposited
without penetrating into the foam pores. In the second step, the temporary surface produced on the
foam sheet is dried at moderate temperatures. The extra layer of the dried paste on top of struts
tips is removed by machining, and the temporary surface is then roughened using grit blasting
process to get the foam struts exposed. Exposed tips of the foam struts will provide the adhesion
strength between coating and the foam core through mechanical interlocking. Once the desired
roughness is achieved, the filler paste curing process is completed at higher temperatures to obtain
high mechanical strength and high-temperature stability for the temporary surface. Finally, the
faces are deposited by twin wire arc spray process followed by the burnout of the temporary surface
epoxy matrix in a box furnace. Figure 3-1 summarized the arc sprayed metallic foam core sandwich
structure fabrication procedure, to provide a general image of the processes that will be discussed
in details in the following sections of this chapter.
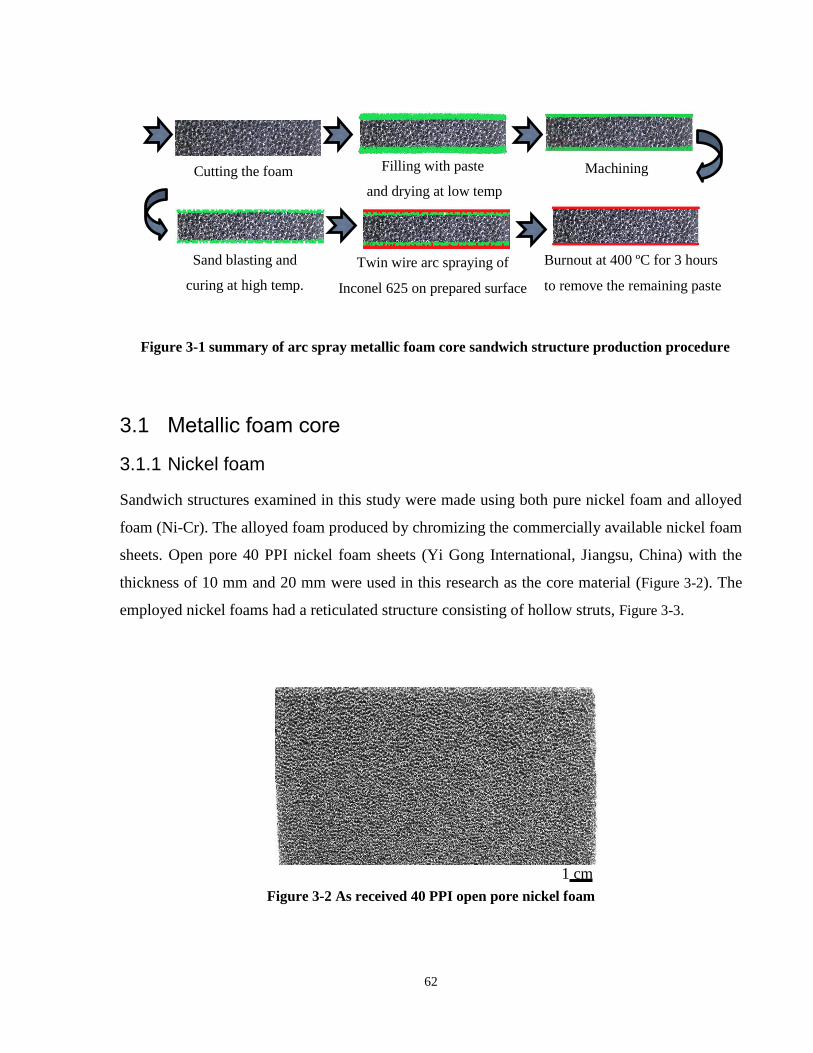
62
3.1 Metallic foam core
3.1.1 Nickel foam
Sandwich structures examined in this study were made using both pure nickel foam and alloyed
foam (Ni-Cr). The alloyed foam produced by chromizing the commercially available nickel foam
sheets. Open pore 40 PPI nickel foam sheets (Yi Gong International, Jiangsu, China) with the
thickness of 10 mm and 20 mm were used in this research as the core material (Figure 3-2). The
employed nickel foams had a reticulated structure consisting of hollow struts, Figure 3-3.
Figure 3-1 summary of arc spray metallic foam core sandwich structure production procedure
Cutting the foam
Burnout at 400 ºC for 3 hours
to remove the remaining paste
Twin wire arc spraying of
Inconel 625 on prepared surface
Sand blasting and
curing at high temp.
Machining Filling with paste
and drying at low temp
Figure 3-2 As received 40 PPI open pore nickel foam
1 cm
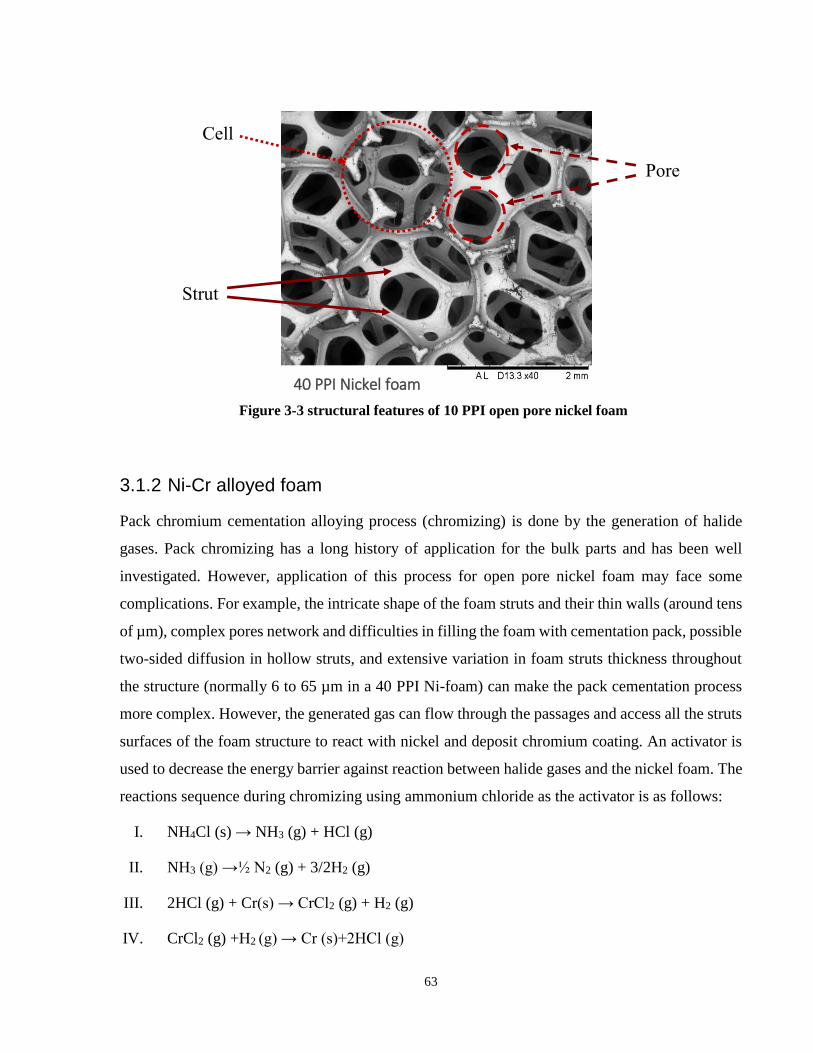
63
3.1.2 Ni-Cr alloyed foam
Pack chromium cementation alloying process (chromizing) is done by the generation of halide
gases. Pack chromizing has a long history of application for the bulk parts and has been well
investigated. However, application of this process for open pore nickel foam may face some
complications. For example, the intricate shape of the foam struts and their thin walls (around tens
of µm), complex pores network and difficulties in filling the foam with cementation pack, possible
two-sided diffusion in hollow struts, and extensive variation in foam struts thickness throughout
the structure (normally 6 to 65 µm in a 40 PPI Ni-foam) can make the pack cementation process
more complex. However, the generated gas can flow through the passages and access all the struts
surfaces of the foam structure to react with nickel and deposit chromium coating. An activator is
used to decrease the energy barrier against reaction between halide gases and the nickel foam. The
reactions sequence during chromizing using ammonium chloride as the activator is as follows:
I. NH4Cl (s) → NH3 (g) + HCl (g)
II. NH3 (g) →½ N2 (g) + 3/2H2 (g)
III. 2HCl (g) + Cr(s) → CrCl2 (g) + H2 (g)
IV. CrCl2 (g) +H2 (g) → Cr (s)+2HCl (g)
Figure 3-3 structural features of 10 PPI open pore nickel foam
40 PPI Nickel foam
Pore
Cell
Strut
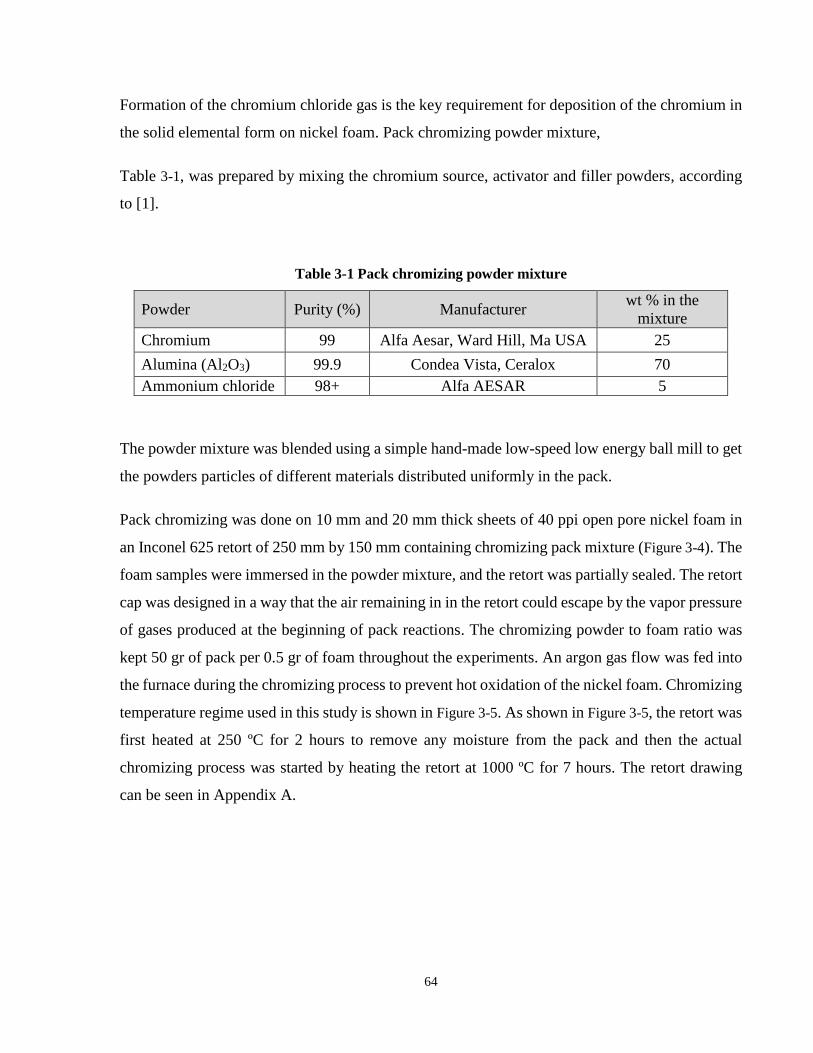
64
Formation of the chromium chloride gas is the key requirement for deposition of the chromium in
the solid elemental form on nickel foam. Pack chromizing powder mixture,
Table 3-1, was prepared by mixing the chromium source, activator and filler powders, according
to [1].
Table 3-1 Pack chromizing powder mixture
Powder Purity (%) Manufacturer wt % in the
mixture
Chromium 99 Alfa Aesar, Ward Hill, Ma USA 25
Alumina (Al2O3) 99.9 Condea Vista, Ceralox 70
Ammonium chloride 98+ Alfa AESAR 5
The powder mixture was blended using a simple hand-made low-speed low energy ball mill to get
the powders particles of different materials distributed uniformly in the pack.
Pack chromizing was done on 10 mm and 20 mm thick sheets of 40 ppi open pore nickel foam in
an Inconel 625 retort of 250 mm by 150 mm containing chromizing pack mixture (Figure 3-4). The
foam samples were immersed in the powder mixture, and the retort was partially sealed. The retort
cap was designed in a way that the air remaining in in the retort could escape by the vapor pressure
of gases produced at the beginning of pack reactions. The chromizing powder to foam ratio was
kept 50 gr of pack per 0.5 gr of foam throughout the experiments. An argon gas flow was fed into
the furnace during the chromizing process to prevent hot oxidation of the nickel foam. Chromizing
temperature regime used in this study is shown in Figure 3-5. As shown in Figure 3-5, the retort was
first heated at 250 ºC for 2 hours to remove any moisture from the pack and then the actual
chromizing process was started by heating the retort at 1000 ºC for 7 hours. The retort drawing
can be seen in Appendix A.
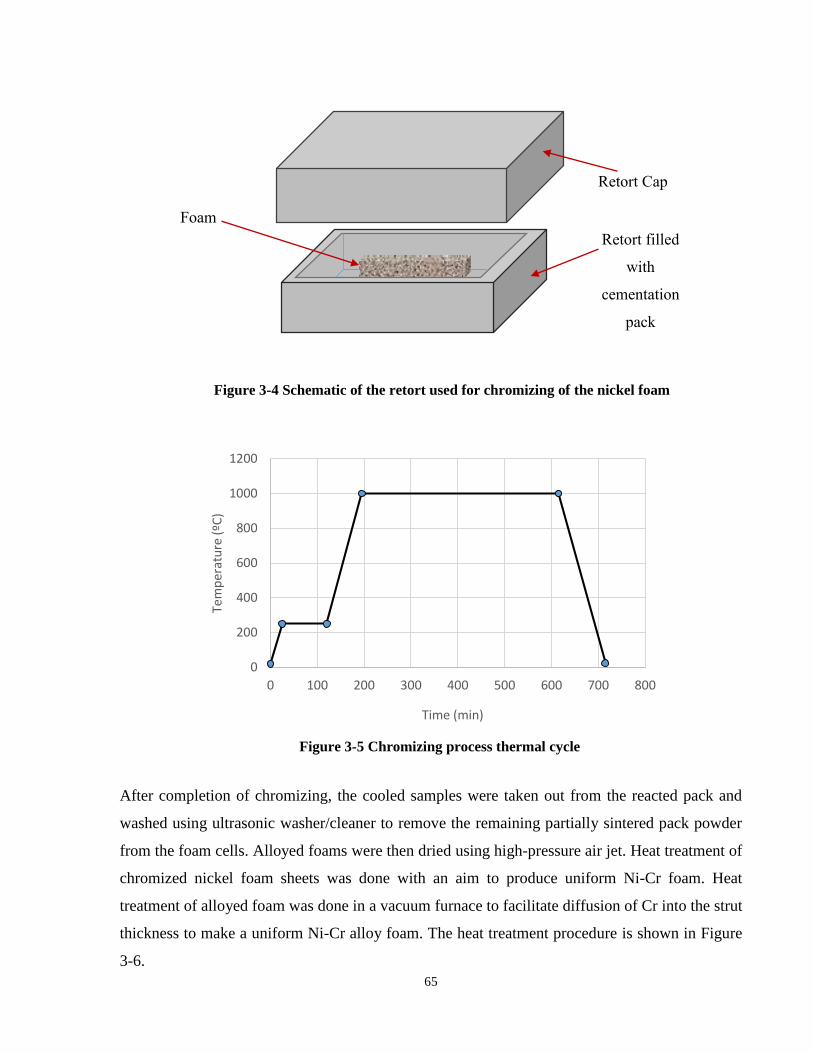
65
After completion of chromizing, the cooled samples were taken out from the reacted pack and
washed using ultrasonic washer/cleaner to remove the remaining partially sintered pack powder
from the foam cells. Alloyed foams were then dried using high-pressure air jet. Heat treatment of
chromized nickel foam sheets was done with an aim to produce uniform Ni-Cr foam. Heat
treatment of alloyed foam was done in a vacuum furnace to facilitate diffusion of Cr into the strut
thickness to make a uniform Ni-Cr alloy foam. The heat treatment procedure is shown in Figure
3-6.
Foam
Retort Cap
Retort filled
with
cementation
pack
Figure 3-4 Schematic of the retort used for chromizing of the nickel foam
Figure 3-5 Chromizing process thermal cycle
0
200
400
600
800
1000
1200
0 100 200 300 400 500 600 700 800
Tem
per
atu
re (º
C)
Time (min)
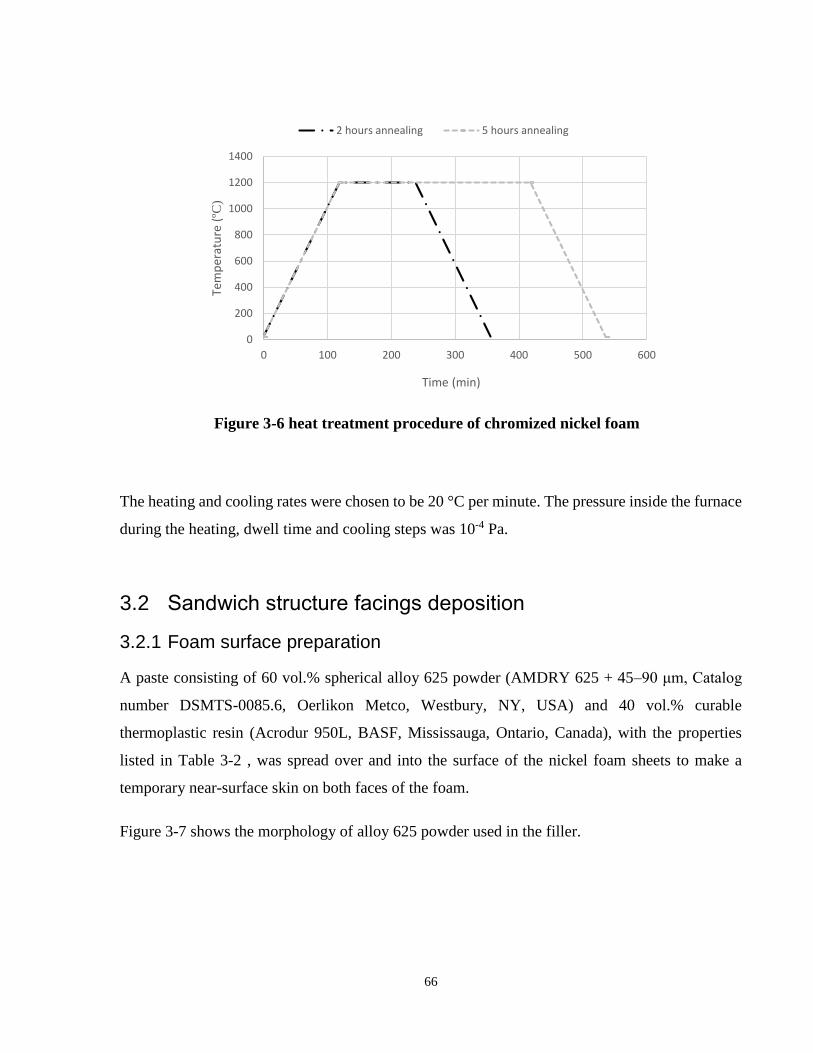
66
The heating and cooling rates were chosen to be 20 °C per minute. The pressure inside the furnace
during the heating, dwell time and cooling steps was 10-4 Pa.
3.2 Sandwich structure facings deposition
3.2.1 Foam surface preparation
A paste consisting of 60 vol.% spherical alloy 625 powder (AMDRY 625 + 45–90 μm, Catalog
number DSMTS-0085.6, Oerlikon Metco, Westbury, NY, USA) and 40 vol.% curable
thermoplastic resin (Acrodur 950L, BASF, Mississauga, Ontario, Canada), with the properties
listed in Table 3-2 , was spread over and into the surface of the nickel foam sheets to make a
temporary near-surface skin on both faces of the foam.
Figure 3-7 shows the morphology of alloy 625 powder used in the filler.
Figure 3-6 heat treatment procedure of chromized nickel foam
0
200
400
600
800
1000
1200
1400
0 100 200 300 400 500 600
Tem
per
atu
re (
ºC)
Time (min)
2 hours annealing 5 hours annealing
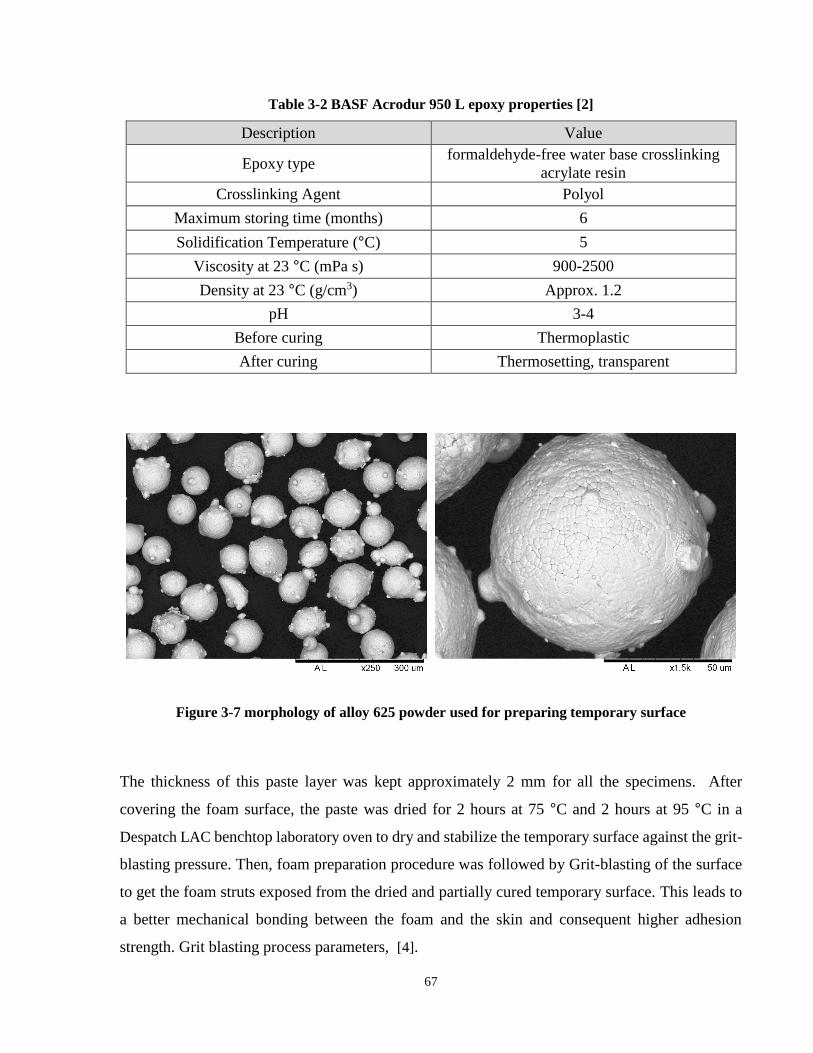
67
Table 3-2 BASF Acrodur 950 L epoxy properties [2]
Description Value
Epoxy type formaldehyde-free water base crosslinking
acrylate resin
Crosslinking Agent Polyol
Maximum storing time (months) 6
Solidification Temperature (°C) 5
Viscosity at 23 °C (mPa s) 900-2500
Density at 23 °C (g/cm3) Approx. 1.2
pH 3-4
Before curing Thermoplastic
After curing Thermosetting, transparent
Figure 3-7 morphology of alloy 625 powder used for preparing temporary surface
The thickness of this paste layer was kept approximately 2 mm for all the specimens. After
covering the foam surface, the paste was dried for 2 hours at 75 °C and 2 hours at 95 °C in a
Despatch LAC benchtop laboratory oven to dry and stabilize the temporary surface against the grit-
blasting pressure. Then, foam preparation procedure was followed by Grit-blasting of the surface
to get the foam struts exposed from the dried and partially cured temporary surface. This leads to
a better mechanical bonding between the foam and the skin and consequent higher adhesion
strength. Grit blasting process parameters, [4].
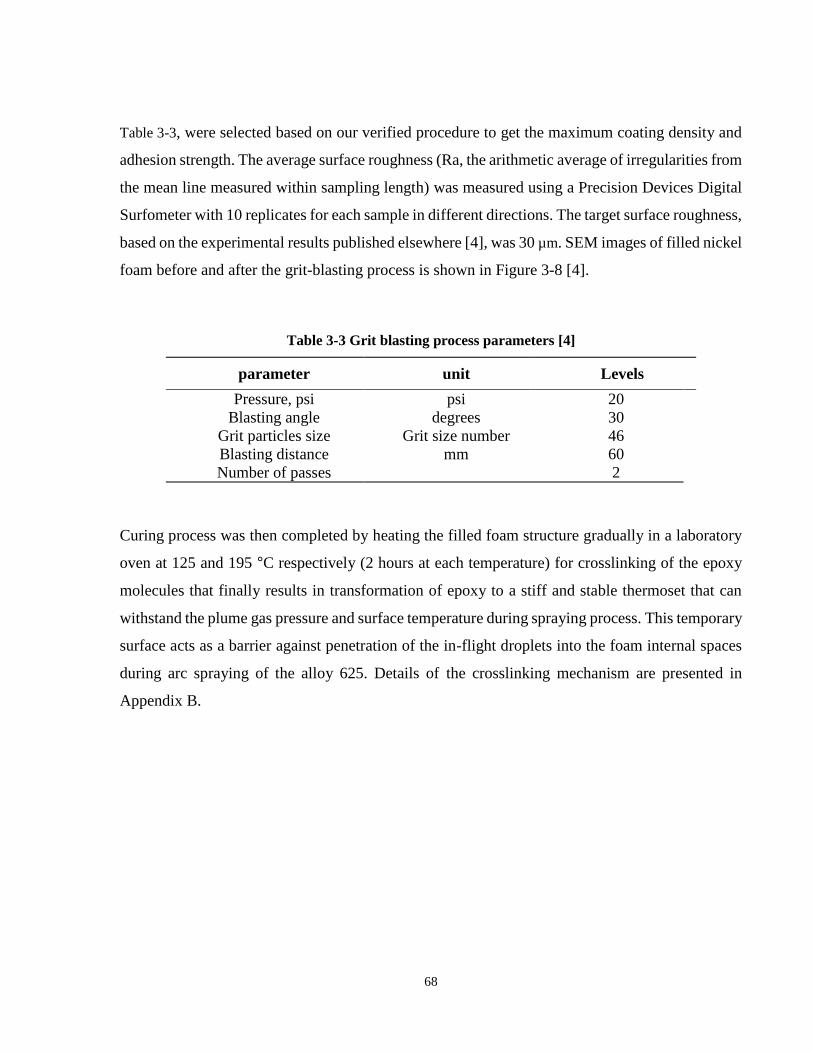
68
Table 3-3, were selected based on our verified procedure to get the maximum coating density and
adhesion strength. The average surface roughness (Ra, the arithmetic average of irregularities from
the mean line measured within sampling length) was measured using a Precision Devices Digital
Surfometer with 10 replicates for each sample in different directions. The target surface roughness,
based on the experimental results published elsewhere [4], was 30 µm. SEM images of filled nickel
foam before and after the grit-blasting process is shown in Figure 3-8 [4].
Table 3-3 Grit blasting process parameters [4]
parameter unit Levels
Pressure, psi psi 20
30
46
60
2
Blasting angle degrees
Grit particles size Grit size number
Blasting distance mm
Number of passes
Curing process was then completed by heating the filled foam structure gradually in a laboratory
oven at 125 and 195 °C respectively (2 hours at each temperature) for crosslinking of the epoxy
molecules that finally results in transformation of epoxy to a stiff and stable thermoset that can
withstand the plume gas pressure and surface temperature during spraying process. This temporary
surface acts as a barrier against penetration of the in-flight droplets into the foam internal spaces
during arc spraying of the alloy 625. Details of the crosslinking mechanism are presented in
Appendix B.
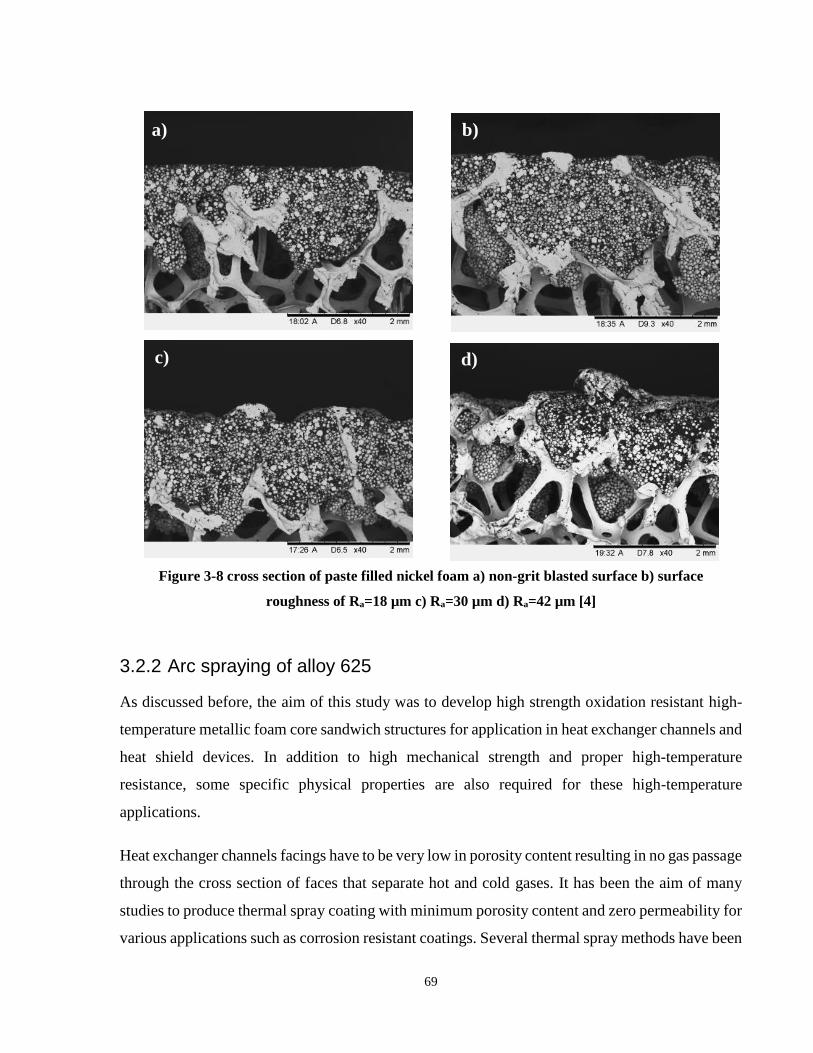
69
3.2.2 Arc spraying of alloy 625
As discussed before, the aim of this study was to develop high strength oxidation resistant high-
temperature metallic foam core sandwich structures for application in heat exchanger channels and
heat shield devices. In addition to high mechanical strength and proper high-temperature
resistance, some specific physical properties are also required for these high-temperature
applications.
Heat exchanger channels facings have to be very low in porosity content resulting in no gas passage
through the cross section of faces that separate hot and cold gases. It has been the aim of many
studies to produce thermal spray coating with minimum porosity content and zero permeability for
various applications such as corrosion resistant coatings. Several thermal spray methods have been
Figure 3-8 cross section of paste filled nickel foam a) non-grit blasted surface b) surface
roughness of Ra=18 µm c) Ra=30 µm d) Ra=42 µm [4]
a) b)
c) d)
c d b a
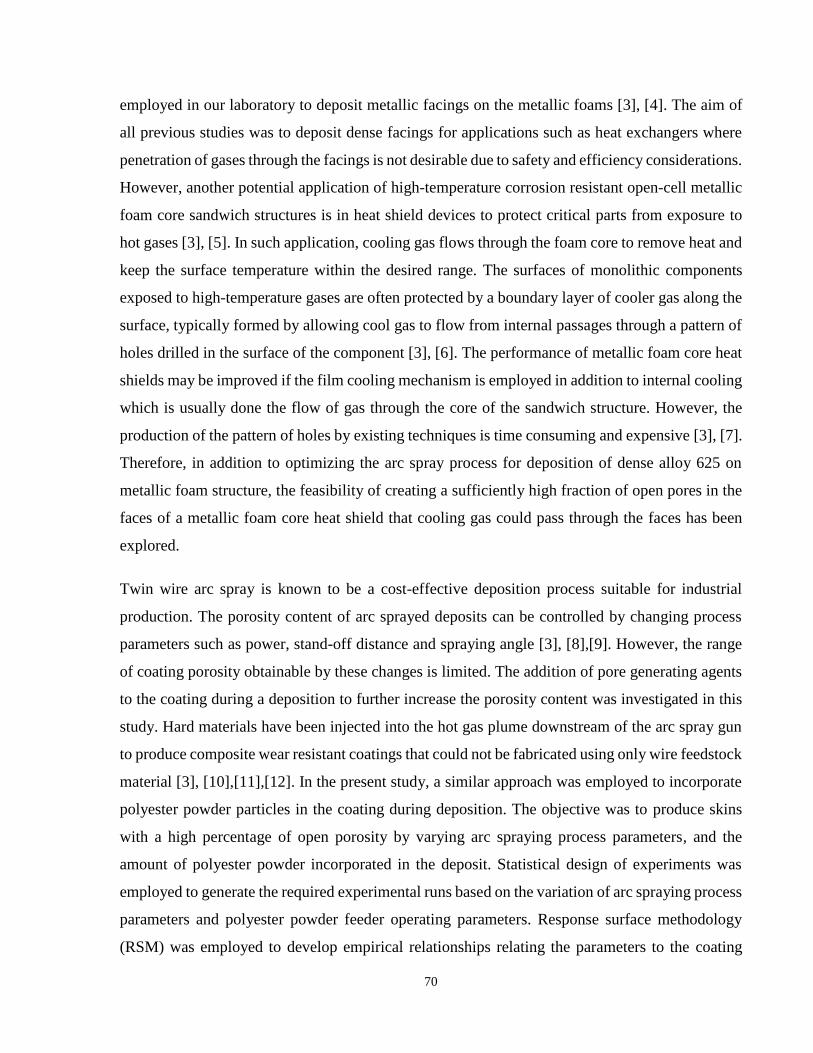
70
employed in our laboratory to deposit metallic facings on the metallic foams [3], [4]. The aim of
all previous studies was to deposit dense facings for applications such as heat exchangers where
penetration of gases through the facings is not desirable due to safety and efficiency considerations.
However, another potential application of high-temperature corrosion resistant open-cell metallic
foam core sandwich structures is in heat shield devices to protect critical parts from exposure to
hot gases [3], [5]. In such application, cooling gas flows through the foam core to remove heat and
keep the surface temperature within the desired range. The surfaces of monolithic components
exposed to high-temperature gases are often protected by a boundary layer of cooler gas along the
surface, typically formed by allowing cool gas to flow from internal passages through a pattern of
holes drilled in the surface of the component [3], [6]. The performance of metallic foam core heat
shields may be improved if the film cooling mechanism is employed in addition to internal cooling
which is usually done the flow of gas through the core of the sandwich structure. However, the
production of the pattern of holes by existing techniques is time consuming and expensive [3], [7].
Therefore, in addition to optimizing the arc spray process for deposition of dense alloy 625 on
metallic foam structure, the feasibility of creating a sufficiently high fraction of open pores in the
faces of a metallic foam core heat shield that cooling gas could pass through the faces has been
explored.
Twin wire arc spray is known to be a cost-effective deposition process suitable for industrial
production. The porosity content of arc sprayed deposits can be controlled by changing process
parameters such as power, stand-off distance and spraying angle [3], [8],[9]. However, the range
of coating porosity obtainable by these changes is limited. The addition of pore generating agents
to the coating during a deposition to further increase the porosity content was investigated in this
study. Hard materials have been injected into the hot gas plume downstream of the arc spray gun
to produce composite wear resistant coatings that could not be fabricated using only wire feedstock
material [3], [10],[11],[12]. In the present study, a similar approach was employed to incorporate
polyester powder particles in the coating during deposition. The objective was to produce skins
with a high percentage of open porosity by varying arc spraying process parameters, and the
amount of polyester powder incorporated in the deposit. Statistical design of experiments was
employed to generate the required experimental runs based on the variation of arc spraying process
parameters and polyester powder feeder operating parameters. Response surface methodology
(RSM) was employed to develop empirical relationships relating the parameters to the coating
71
porosity content. The details of the optimization procedure and experimental data can be found
elsewhere [3].
3.2.2.1 Design of Experiments
A response surface methodology (RSM) based on a Box-Behnken experimental design, was
employed to study the effects of arc spraying parameters and external polyester powder feeding
variables on the coating porosity [13], [14]. The Box-Behnken experimental design contains the
middle points of the edges of a k factor cube and includes replicated center points for orthogonality
and estimation of the standard deviation [3], [15] (Figure 3-9).
The effects of three input factors, namely arc voltage (A), stand-off distance (B), Polyester powder
feeding rate (C) at three levels were studied using Design Expert version 9 software (Stat-Ease
Inc., Minneapolis, USA, http://www.statease.com). The wire feeding rate to the arc spraying gun
and gun carrier gas flow rate were kept constant. The arc spraying angle for all the coatings was
90 degrees. The value of the external powder feeding rate included the feeder disk rotation rate
(RPM) and feeder carrier gas flow rate (LPM) and was included as coded values in the
experimental design (Table 3-4) [3]. All process parameters with their value are presented in
Table 3-5.
Figure 3-9 the geometry of Box-Behnken design. Design points are at the midpoints of edges of
the design space and at the center [4].

72
Table 3-4 External polyester powder feeder parameters- coded values [3]
Coded value feeder disk rotation rate
(RPM)
feeder carrier gas flow
rate (LPM)
-1 0 0
0 12 13
+1 24 26
Table 3-5 The process factors with their levels. [3]
Factors notification unit Levels
Low (-1) Middle (0) High(+1)
Arc Voltage A V 28 32 36
Spraying Distance B cm 10 15 20
Polyester Powder
Feeding rate (coded) C N/A -1 0 +1
Wire Feed Rate E m/min 7 7 7
Gun Air Flow Rate F SCFM 60 60 60
Gun Spraying Angle G Deg. 90 90 90
Gun Translation Speed H m/min 30 30 30
Gun Raster Pattern I pattern
steps(cm)
Linear
4
Linear
4
Linear
4
Based on the combination of various levels of the input factors, 17 experimental runs, including 5
replicates of the center point, were generated by Design Expert software using the RSM/Box-
Behnken method [3].
A second-order polynomial model was used to fit the response surface model to the measured
porosity content. The proposed response function is presented by below expression:
𝒀 = 𝜷𝟎 + ∑ 𝜷𝒊𝒌𝒊=𝟏 𝑿𝒊 + ∑ 𝜷𝒊𝒊
𝒌𝒊=𝟏 𝑿𝒊
𝟐 + ∑ ∑ 𝜷𝒊𝒋𝑿𝒊𝑿𝒋𝒊<𝒋 + 𝜺 Equation 3-1
where Y is the response (coating porosity content), β0 is the mean of the response, βi represents the
effect of variable Xi, βii and βij are the coefficients of regression which present the effect of
interactions of variables Xi and Xj, and ε is the random error [16].
73
For the three process factors, the previously mentioned polynomial model (Equation 3-1) can be
written as follow:
𝒀 = 𝜷𝟎 + 𝜷𝟏(𝑨) + 𝜷𝟐(𝑩) + 𝜷𝟑(𝑪) + 𝜷𝟏𝟏(𝑨𝟐) + 𝜷𝟐𝟐(𝑩𝟐) + 𝜷𝟑𝟑(𝑪𝟐) + 𝜷𝟏𝟐(𝑨𝑩) +
𝜷𝟏𝟑(𝑨𝑪) + 𝜷𝟐𝟑(𝑩𝑪) Equation 3-2
3.2.2.2 Alloy 625 feedstock
Alloy 625 wire (Metco 8625, catalog number 1001594, Oerlikon Metco, Westbury, NY, USA)
with a diameter of 1.6 mm used as the arc spray feedstock for deposition of sandwich structure
facings. The composition of alloy 625 wire is shown in Table 3-6.
Table 3-6 compositions of alloy 625 wire used as wire arc feedstock
Element Nickel Chromium Molybdenum Niobium + Tantalum Other (max)
wt% Bal. 21 9 4 NR
3.2.2.3 Pore generator agent
Spherical Shape polyester powder (Metco 600NS, +45 -125 µm, Catalog number: DSMTS-
0015.3; Oerlikon Metco, Westbury, NY, USA) used as the pore generator agent to be sprayed
simultaneously with the coating material to the substrate for production of porous alloy 625
coatings. The polyester powder was injected using a powder feeder and a nozzle on the surface of
the substrate at the same time and same place of in-flight alloy 625 droplets impact. Morphology
of the polyester powder particle is shown in Figure 3-10 [3].
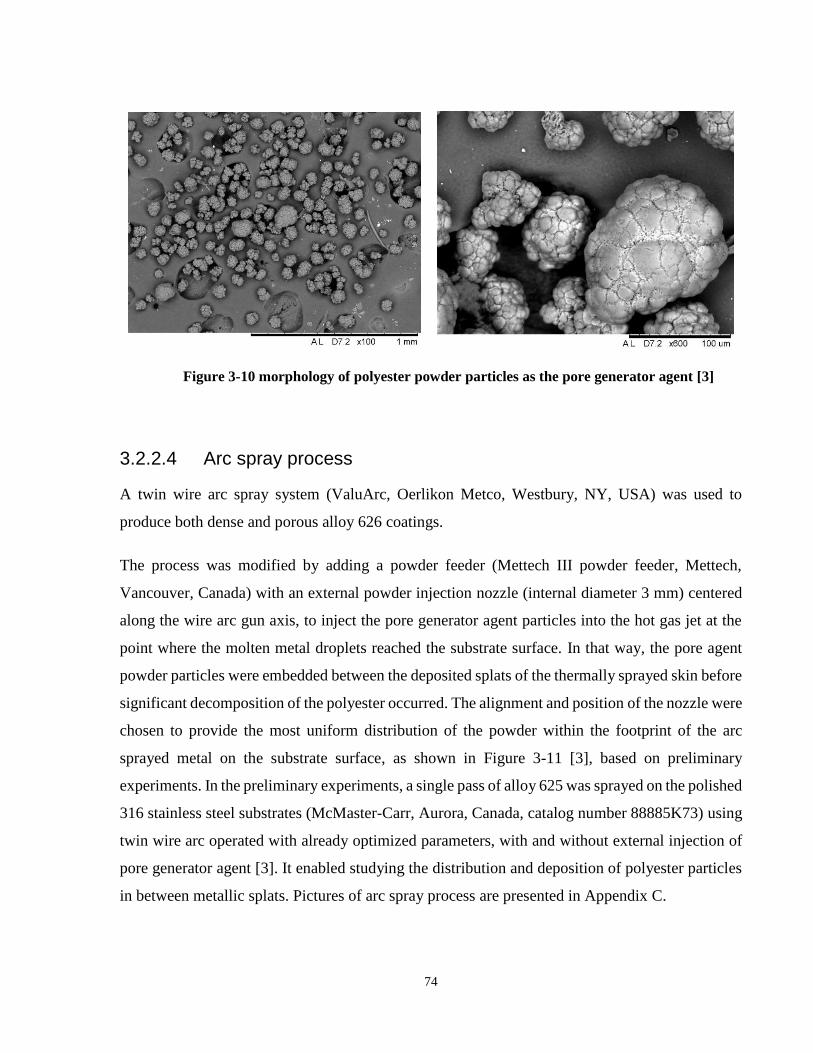
74
3.2.2.4 Arc spray process
A twin wire arc spray system (ValuArc, Oerlikon Metco, Westbury, NY, USA) was used to
produce both dense and porous alloy 626 coatings.
The process was modified by adding a powder feeder (Mettech III powder feeder, Mettech,
Vancouver, Canada) with an external powder injection nozzle (internal diameter 3 mm) centered
along the wire arc gun axis, to inject the pore generator agent particles into the hot gas jet at the
point where the molten metal droplets reached the substrate surface. In that way, the pore agent
powder particles were embedded between the deposited splats of the thermally sprayed skin before
significant decomposition of the polyester occurred. The alignment and position of the nozzle were
chosen to provide the most uniform distribution of the powder within the footprint of the arc
sprayed metal on the substrate surface, as shown in Figure 3-11 [3], based on preliminary
experiments. In the preliminary experiments, a single pass of alloy 625 was sprayed on the polished
316 stainless steel substrates (McMaster-Carr, Aurora, Canada, catalog number 88885K73) using
twin wire arc operated with already optimized parameters, with and without external injection of
pore generator agent [3]. It enabled studying the distribution and deposition of polyester particles
in between metallic splats. Pictures of arc spray process are presented in Appendix C.
Figure 3-10 morphology of polyester powder particles as the pore generator agent [3]
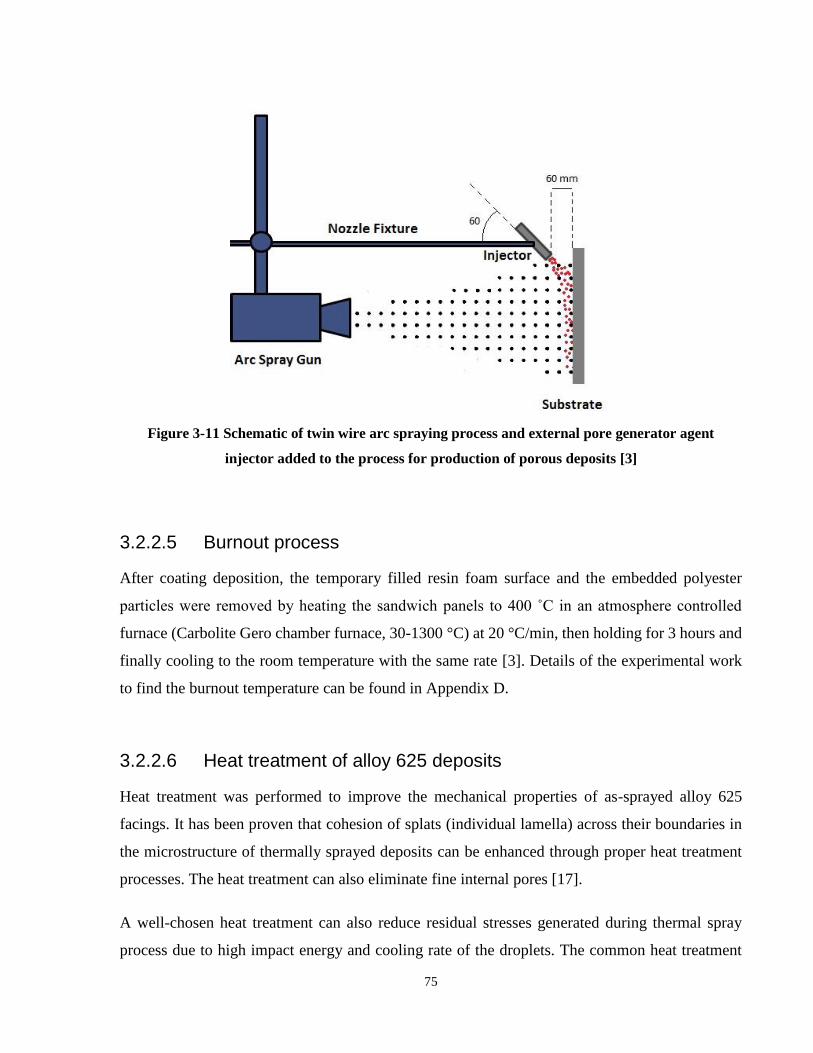
75
3.2.2.5 Burnout process
After coating deposition, the temporary filled resin foam surface and the embedded polyester
particles were removed by heating the sandwich panels to 400 ˚C in an atmosphere controlled
furnace (Carbolite Gero chamber furnace, 30-1300 °C) at 20 °C/min, then holding for 3 hours and
finally cooling to the room temperature with the same rate [3]. Details of the experimental work
to find the burnout temperature can be found in Appendix D.
3.2.2.6 Heat treatment of alloy 625 deposits
Heat treatment was performed to improve the mechanical properties of as-sprayed alloy 625
facings. It has been proven that cohesion of splats (individual lamella) across their boundaries in
the microstructure of thermally sprayed deposits can be enhanced through proper heat treatment
processes. The heat treatment can also eliminate fine internal pores [17].
A well-chosen heat treatment can also reduce residual stresses generated during thermal spray
process due to high impact energy and cooling rate of the droplets. The common heat treatment
Figure 3-11 Schematic of twin wire arc spraying process and external pore generator agent
injector added to the process for production of porous deposits [3]
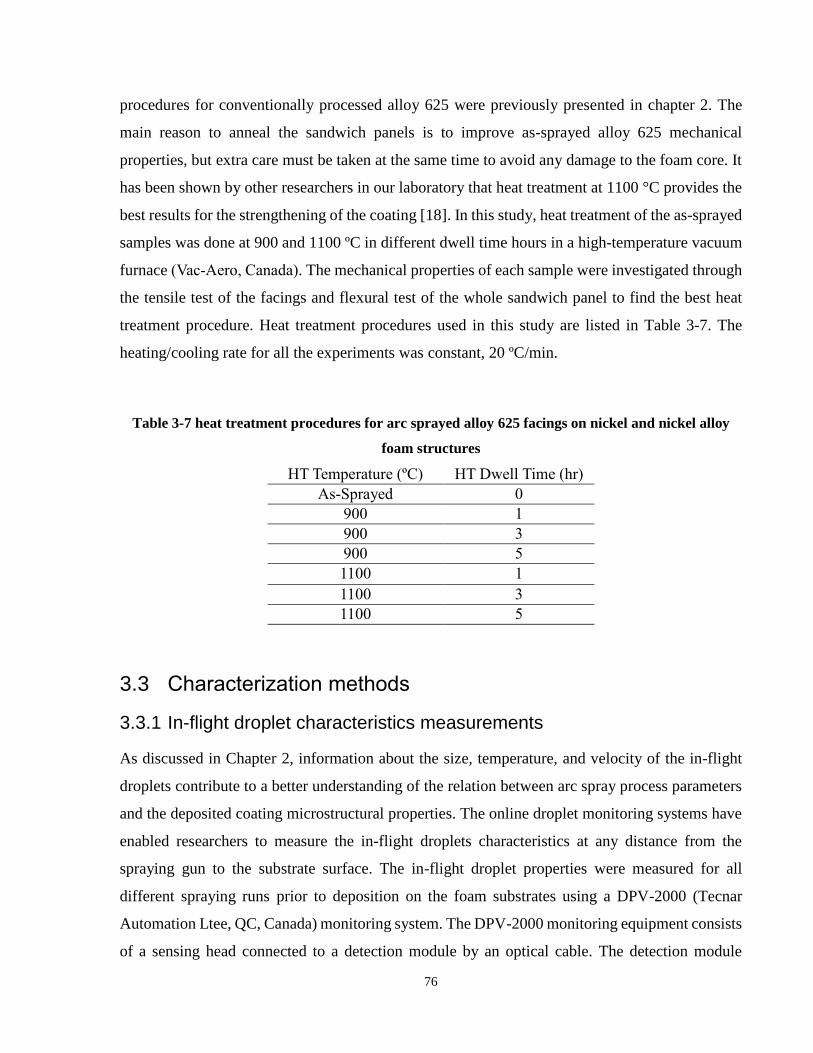
76
procedures for conventionally processed alloy 625 were previously presented in chapter 2. The
main reason to anneal the sandwich panels is to improve as-sprayed alloy 625 mechanical
properties, but extra care must be taken at the same time to avoid any damage to the foam core. It
has been shown by other researchers in our laboratory that heat treatment at 1100 °C provides the
best results for the strengthening of the coating [18]. In this study, heat treatment of the as-sprayed
samples was done at 900 and 1100 ºC in different dwell time hours in a high-temperature vacuum
furnace (Vac-Aero, Canada). The mechanical properties of each sample were investigated through
the tensile test of the facings and flexural test of the whole sandwich panel to find the best heat
treatment procedure. Heat treatment procedures used in this study are listed in Table 3-7. The
heating/cooling rate for all the experiments was constant, 20 ºC/min.
Table 3-7 heat treatment procedures for arc sprayed alloy 625 facings on nickel and nickel alloy
foam structures
HT Temperature (ºC) HT Dwell Time (hr)
As-Sprayed 0
900 1
900 3
900 5
1100 1
1100 3
1100 5
3.3 Characterization methods
3.3.1 In-flight droplet characteristics measurements
As discussed in Chapter 2, information about the size, temperature, and velocity of the in-flight
droplets contribute to a better understanding of the relation between arc spray process parameters
and the deposited coating microstructural properties. The online droplet monitoring systems have
enabled researchers to measure the in-flight droplets characteristics at any distance from the
spraying gun to the substrate surface. The in-flight droplet properties were measured for all
different spraying runs prior to deposition on the foam substrates using a DPV-2000 (Tecnar
Automation Ltee, QC, Canada) monitoring system. The DPV-2000 monitoring equipment consists
of a sensing head connected to a detection module by an optical cable. The detection module
77
transfers the data to a computerized controlling system where the measured droplets characteristics
are shown online during the spray.
The mechanism of measuring droplets velocity is based on the determination of the time of flight
between the two slits optical photomask on the sensing head. The droplet temperature is measured
using two-color pyrometry theory. Before each run, at each spraying distance, the DVP-2000
sensing head was aligned and auto-centered according to the spraying gun axis in both the vertical
and horizontal directions. Spraying runs were performed for droplets characteristics
measurements, without placing a substrate in front of the plume.
The DPV-2000 equipment employed in this project and some of its resulted graphs for arc sprayed
alloy 625 have been shown in Appendix E.
3.3.2 Microstructural characterization
Microstructural characterizations of foam substrates, alloy 625 wire and arc sprayed coating were
performed using scanning electron microscopy (SEM) and energy dispersive X-ray spectroscopy
(EDS), (first SEM instrument: Hitachi Scanning Electron Microscope SU3500 with Oxford X-
Max 80 mm2, second SEM instrument: table-top TM3000, Hitachi High-Technologies Canada
Incorporated, Toronto, ON). The etching solution used for Ni-Cr foams was consisting of 100 ml
HNO3 and 10 ml HF, and the etching solution used for pure nickel foam was consisting of 3 ml
HF and 80 ml HNO3 according to the literature [19]. Grain size for the foam samples was
calculated by drawing 10 random lines on each micrograph and following ASTM E112-96
standard [20].
A Java-based image analysis software, ImageJ (http://imagej.nih.gov/ij/), was employed to
quantify the porosity content of different coatings [21]. Image analysis (IA) has been established
as a reliable technique for characterization of porosity in thermal spray coatings, with an
uncertainty of approximately 2% [22], [23]. The alloy 625 facing samples were cross-sectioned
using a diamond blade before the microscopy and microhardness tests. Samples were mounted in
a vacuum chamber to allow complete filling of the foam pores, and polished by 320-1200 grit SiC
papers followed by 9, 3, and 1 um diamond-impregnated disks in an automatic polishing machine
(EcoMet 250 Pro Grinder-Polisher with AutoMet 250 Power Head, Buehler, Whitby, ON,
78
Canada). At least 10 equally spaced SEM images of 1024 by 768 pixels were taken from the
prepared cross sections of each sample in the secondary electron (SE) and backscattered electron
(BE) imaging modes for accurate differentiation between the existing phases. The magnification
(500×), illumination conditions and field of view were kept constant [3].
X-ray diffractometry (XRD) was performed using Rigaku MiniFlex 600 with Cu Ka radiation (X=
1.542 A) at 40 kV and a scanning rate of 1.45 degree/min. For phase analysis of the samples.
In addition to the microstructural characterization of the foam structures, the theoretical (ideal)
density of each type of foam was estimated using the below equation [18];
𝝆𝒊𝒅𝒆𝒂𝒍 = ∑ 𝑽𝒊𝝆𝒊 Equation 3-3
Where 𝑉𝑖 is volume fraction of the major different phases that form the foam structure, and 𝜌𝑖 is
the density of those phases. The main phases can be identified from XRD test results. Fraction of
each phase was determined by image analysis of 5 SEM micrographs using ImageJ software.
The density of the block shape samples was calculated using the below equation;
𝝆𝒂𝒑𝒑𝒂𝒓𝒆𝒏𝒕 = ∑ 𝑺𝒂𝒎𝒑𝒍𝒆 𝒘𝒆𝒊𝒈𝒉𝒕
(𝒂×𝒃×𝒄) Equation 3-4
Where a, b and c are the length, width and height of the block shape samples.
Having the 𝝆𝒂𝒑𝒑𝒂𝒓𝒆𝒏𝒕 and 𝝆𝒊𝒅𝒆𝒂𝒍 in hand, we are able to calculate the fraction porosity of the
nickel foam structures using the below equation [24];
𝑭𝑷 =𝝆𝒊𝒅𝒆𝒂𝒍− 𝝆𝒂𝒑𝒑𝒂𝒓𝒆𝒏𝒕
𝝆𝒊𝒅𝒆𝒂𝒍 Equation 3-5
3.3.3 Thermogravimetric analysis (TGA)
The high-temperature oxidation behavior of Ni and Ni-Cr foams and the arc sprayed alloy 625
coatings (as-sprayed and annealed) was tested using a SETSYS Evolution TGA instrument in an
air atmosphere. TGA analysis was conducted based on an isothermal mass gain method during the
high-temperature air exposure period in the chamber of the TGA test machine. Small samples of
79
about 50 mg in weight were cut from each type of foam based on the operations manual of the
instrument. After ultrasonic washing in water and raising in ethanol, each sample was completely
dried and placed in a small cylindrical alumina crucibles attached to the TGA machine and tested
individually. An air flow rate of 0.1 l/min was running through the chamber for all the experiments
while the temperature was kept 1000 ˚C throughout the test, for 3 hours. The heating rate to reach
the static temperature was 20 ˚C /min for all the experiments. The TGA test temperature was
chosen according to the maximum temperature that had been monitored on the surface of the
previously developed foam heat exchangers and heat shields, reported between 900 to 1000 ˚C.
The cooling fluids circulated in the heat shield and heat exchanger devices do not let the
temperature goes higher than the mentioned range.
The weights of the samples and crucibles were measured precisely before and after the TGA test
at room temperature and repeated for three times. Changes in mass of the foam samples were also
monitored online during the TGA test. The difference between initial and final weight indicates
the amount of oxygen gained by the sample to form the oxide. Pictures of the instrument and some
resulted graphs can be seen in Appendix F. The weight gain was normalized by original sample
weight for plotting the TG graphs.
3.3.4 Mechanical tests
In this study, the mechanical behavior of the facings and foam were investigated individually in
aim to have a better understanding of mechanical properties of metallic foam core sandwich
structures. The elastic modulus of alloy 625 facings was investigated using uniaxial tensile test,
and the effect of arc spray and heat treatment process parameters were studied. Mechanical
properties of the Ni and Ni-Cr foams were examined through uniaxial compression test. The
overall mechanical performance of sandwich structures was measured by the four-point bending
test.
3.3.4.1 Microhardness
A Vickers micro-hardness testing machine (Zwick micro-hardness machine) was employed to
measure the hardness of foam struts and alloy 625 coatings on their cross section. The foam
80
samples were tested under applied load of 100 grams for 15 seconds, and alloy 625 samples were
tested under 1000 grams for 25 seconds. Five replicates were done for each sample by considering
enough space between the indentations to avoid the work-hardening effects on micro-hardness test
results. For the coating samples, the long axis of the indent was parallel to the coating surface in
all the experiments.
3.3.4.2 Facings tensile test
The mechanical properties of facings produced with different sets of twin wire arc spray process
parameters were examined using tensile test. Sub-size samples were used for this purpose because
of the size limitations. Tensile test specimens were cut by electrical discharge machining (EDM)
from arc sprayed alloy 625 facings of 500 micrometers in thickness deposited on foam substrates.
Samples were made perpendicular to spraying direction according to ASTM E8/E8M-10 [25]. The
cut samples were slightly ground on the back sides to remove the remaining foam struts and other
asperities such as sintered metallic powder in filling paste. Schematic of the sub-size tensile test
specimen along with facings splat orientation is shown in Figure 3-12. Tensile tests were done
using a precise tensile test machine (Table-Top Universal / Tensile Tester SHIMADZU EZ-L,
Japan) at a displacement rate of 1 mm/min. Tensile load and cross head displacement were
measured to produce stress-stain curves. The tests were stopped once the samples failed. The
schematic of tensile test machine is shown in Figure 3-13. Tests were repeated 5 times for each type
of samples. The average of elastic modulus and yield point found for each type of sample plus the
deviation from average will be reported in Chapter 5.

81
Figure 3-12 Schematic of tensile test samples
Figure 3-13 Schematic of tensile test equipment, front view and side view.
Control module
Loading
fixture
Base
fixture
Side view Front view
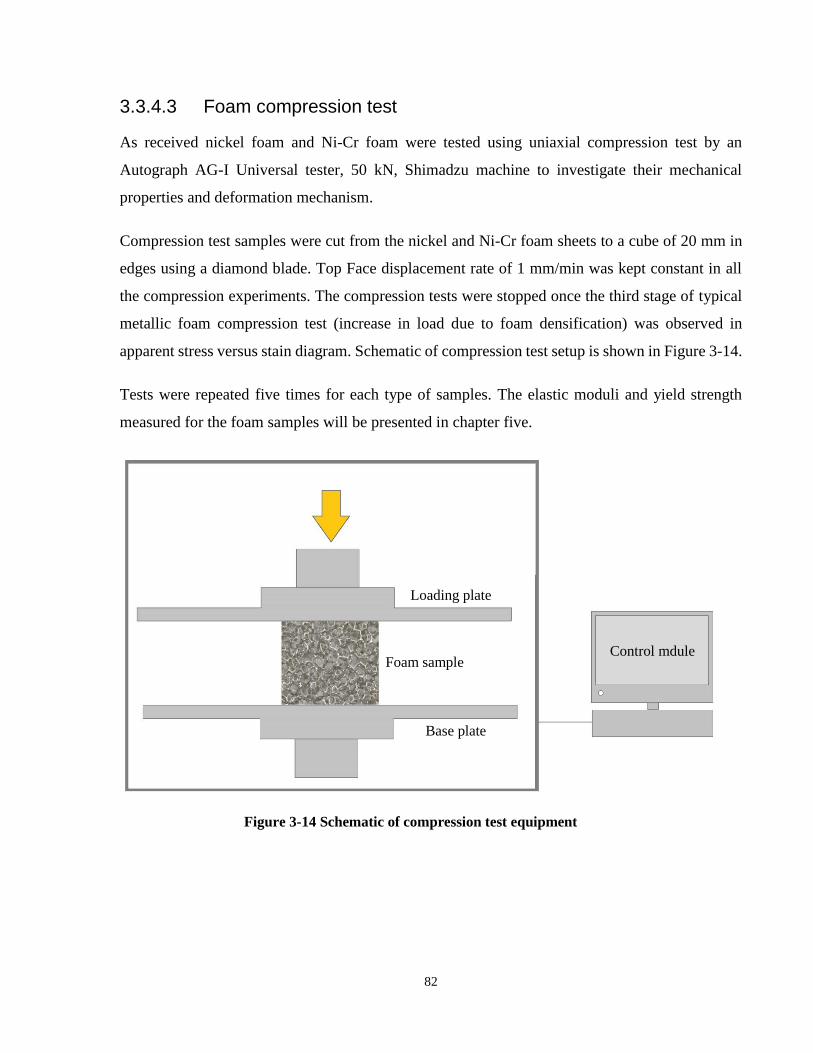
82
3.3.4.3 Foam compression test
As received nickel foam and Ni-Cr foam were tested using uniaxial compression test by an
Autograph AG-I Universal tester, 50 kN, Shimadzu machine to investigate their mechanical
properties and deformation mechanism.
Compression test samples were cut from the nickel and Ni-Cr foam sheets to a cube of 20 mm in
edges using a diamond blade. Top Face displacement rate of 1 mm/min was kept constant in all
the compression experiments. The compression tests were stopped once the third stage of typical
metallic foam compression test (increase in load due to foam densification) was observed in
apparent stress versus stain diagram. Schematic of compression test setup is shown in Figure 3-14.
Tests were repeated five times for each type of samples. The elastic moduli and yield strength
measured for the foam samples will be presented in chapter five.
Figure 3-14 Schematic of compression test equipment
Control mdule Foam sample
Loading plate
Base plate
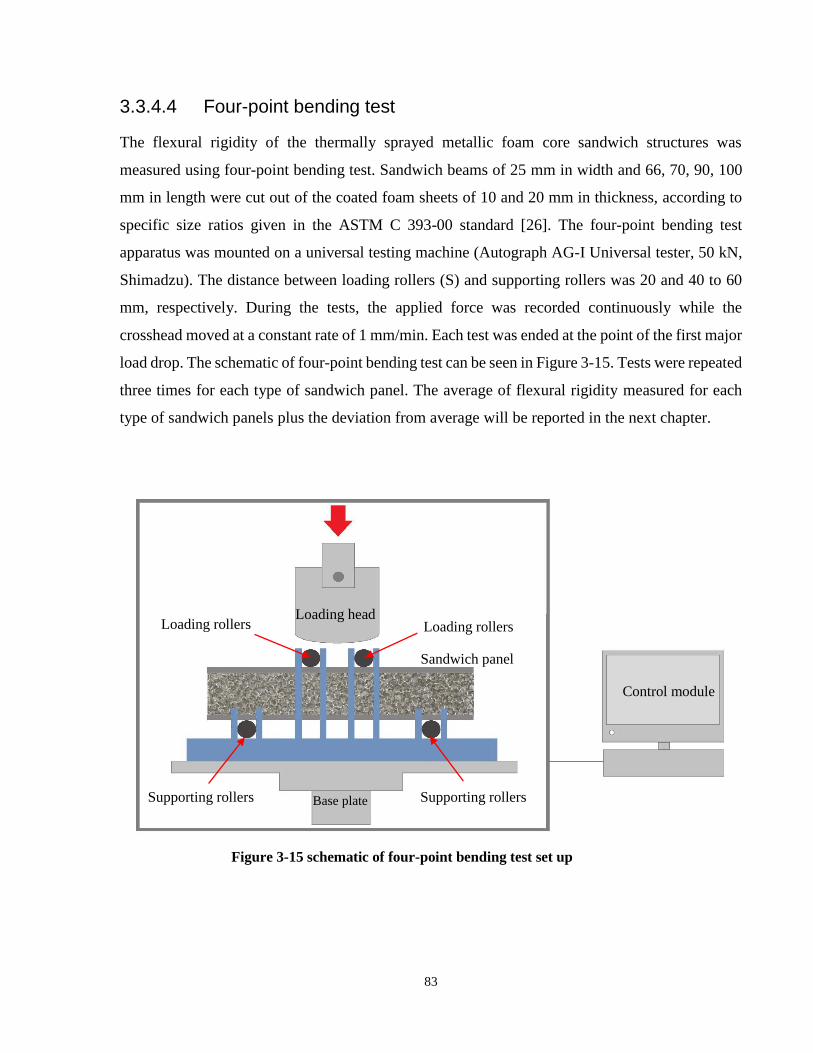
83
3.3.4.4 Four-point bending test
The flexural rigidity of the thermally sprayed metallic foam core sandwich structures was
measured using four-point bending test. Sandwich beams of 25 mm in width and 66, 70, 90, 100
mm in length were cut out of the coated foam sheets of 10 and 20 mm in thickness, according to
specific size ratios given in the ASTM C 393-00 standard [26]. The four-point bending test
apparatus was mounted on a universal testing machine (Autograph AG-I Universal tester, 50 kN,
Shimadzu). The distance between loading rollers (S) and supporting rollers was 20 and 40 to 60
mm, respectively. During the tests, the applied force was recorded continuously while the
crosshead moved at a constant rate of 1 mm/min. Each test was ended at the point of the first major
load drop. The schematic of four-point bending test can be seen in Figure 3-15. Tests were repeated
three times for each type of sandwich panel. The average of flexural rigidity measured for each
type of sandwich panels plus the deviation from average will be reported in the next chapter.
Figure 3-15 schematic of four-point bending test set up
Loading head
Base plate
Sandwich panel
Loading rollers
Supporting rollers Supporting rollers
Loading rollers
Control module
84
References
[1] H. Choe and D. C. Dunand, “Mechanical properties of oxidation-resistant Ni–Cr foams,”
Mater. Sci. Eng. A, vol. 384, no. 1–2, pp. 184–193, 2004.
[2] A. Sealant, “Fiber Bonding Technical Data Sheet - Acradour 950 L,” BASF, Wyandote,
MI, Technical Data Sheet, 2010.
[3] S. Salavati, , T.W. Coyle, J. Mostaghimi, “Twin wire arc spray process modification for
production of porous metallic coatings,” Surf. Coat. Technol., vol. 286, pp. 16-24, 2016.
[4] S. Salavati, T. W. Coyle, J. Mostaghimi, “Optimization of Grit-Blasting Process Parameters
for Production of Dense Coatings on Open Pores Metallic Foam Substrates Using Statistical
Methods,” J. Therm. Spray Technol., vol. 24, no. 7, pp. 1246–1255, 2015.
[5] A. S. Herrmann, P. C. Zahlen, and I. Zuardy, “Sandwich structures technology in
commerical aviation: Present applications and future trends,” Sandw. Struct. Adv. with
Sandw. Struct. Mater., vol. 7, pp. 13–26, 2005.
[6] J.-C. Han, S. Dutta, and S. Ekkad, Gas Turbine Heat Transfer and Cooling Technology, 2nd
ed., Boca Raton, FL: CRC Press, 2012.
[7] J. P. Davim, Laser in Manufacturing Weinheim, Germany: Wiley-VCH, 2013.
[8] G. Jandin, H. Liao, Z. Q. Feng, and C. Coddet, “Correlations between operating conditions,
microstructure and mechanical properties of twin wire arc sprayed steel coatings,” Mater.
Sci. Eng. A, vol. 349, no. 1–2, pp. 298–305, 2003.
[9] I. Gedzevicius and A. V. Valiulis, “Analysis of wire arc spraying process variables on
coatings properties,” J. Mater. Process. Technol., vol. 175, no. 1–3, pp. 206–211, 2006.
[10] W. Tillmann, M. Abdulgader, and L. Hagen, “External powder injection in twin wire arc
spraying to control the coating composition,” in International Thermal Spray Conference
Proc., 2013, pp. 532–537.
[11] J.S. Wilden, J.P. Bergmann, S. Jahn, S. Reich, S. Knapp, F. van Rodjinen, and G. Fischer,
85
“A new method for the production of particle reinforced coatings,” In Thermal Spray Proc.
Materials Park, OH: ASM International, 2007, pp. 359–364.
[12] W. Tillmann, M. Abdulgader, L. Hagen, and J. Nellesen, “Metal Matrix Composites
Deposition in Twin Wire Arc Spraying Utilizing an External Powder Injection
Composition,” J. Therm. Spray Technol., vol. 23, no. 1–2, pp. 40–50, 2013.
[13] R. H. Myers, D. C. Montgomery, and C. M. Anderson-Cook, Response Surface
Methodology: Process and Product Optimization Using Designed Experiments, 3rd ed.,
New York, NY: John Wiley & Sons, 2009.
[14] B. T. Lin, M. D. Jean, and J. H. Chou, “Using response surface methodology for optimizing
deposited partially stabilized zirconia in plasma spraying,” Appl. Surf. Sci., vol. 253, no. 6,
pp. 3254–3262, 2007.
[15] C. Pierlot, L. Pawlowski, M. Bigan, and P. Chagnon, “Design of experiments in thermal
spraying: A review,” Surf. Coatings Technol., vol. 202, no. 18, pp. 4483–4490, 2008.
[16] O. Rozum, F. Zahálka, M. Kašparová, and Š. Houdková, “Design of experiments in the
branch of thermal spraying,” Key Eng. Mater., vol. 465, pp. 137–140, 2011.
[17] H. R. S. Jazi, T. W. Coyle, and J. Mostaghimi, “Understanding grain growth and pore
elimination in vacuum-plasma-sprayed titanium alloy,” Metall. Mater. Trans. A, vol. 38,
no. 3, pp. 476–484, 2007.
[18] F. Azarmi, “Sandwich Structures for High Temperature Applications: Microstructural
Development and Mechanical Performance” Ph.D. dissertation, University of Toronto,
2008.
[19] G.F. Vander Voort, Macrostructure: Principles and practice, Material Parks, OH: ASM
Internationals, 1984.
[20] Standard Test Method for Determining Average Grain Size, ASTM E112-96, 1996.
[21] S. Deshpande, A. Kulkarni, S. Sampath, and H. Herman, “Application of image analysis
for characterization of porosity in thermal spray coatings and correlation with small angle
86
neutron scattering,” Surf. Coatings Technol., vol. 187, no. 1, pp. 6–16, 2004.
[22] S. S. Madaeni, M. E. Aalami-Aleagha, and P. Daraei, “Preparation and characterization of
metallic membrane using wire arc spraying,” J. Memb. Sci., vol. 320, no. 1–2, pp. 541–548,
2008.
[23] A. Belenky and D. Rittel, “Static and dynamic flexural strength of 99.5% alumina: Relation
to porosity,” Mech. Mater., vol. 48, pp. 43–55, 2012.
[24] W. D. Kingery, H. K. Bowen, and D. R. Uhlmann, Introduction to Ceramics, 2nd ed., Wiley,
1976.
[25] Standard Test Methods for Tension Testing of Metallic Materials, ASTM E8-03, 2010.
[26] Standard Test Method for Flexural Properties of Sandwich Constructions, ASTM C 393-
00, 2000.

87
Chapter 4 Microstructural Characterizations
4.1 Introduction
This chapter presents the results of the microstructural characterizations techniques described in
chapter 3. At first, as received nickel foam is compared with chromized nickel foam samples in
the microstructure, hardness, and oxidation resistant. Then, the effect of various processing
parameters on the porosity content, oxide content and hardness of arc sprayed alloy 625 skin is
investigated, and the optimum spraying conditions for different application are identified using
design of experiment (DOE) methods.
4.2 Foam substrate
As received and chromized foam substrates were investigated using different characterization
methods introduced in Chapter 3 to study their chemical composition, available phases,
microstructural uniformity, high-temperature oxidation resistance and mechanical performance.
4.2.1 Microstructural characterization
SEM micrographs of the surface of foam samples were used to observe the grains morphology and
to measure the grain size within the microstructure of foam struts. The microstructure of as-
received nickel foam and as-chromized Ni-Cr foam on the surface of their struts are shown in
Figure 4-1 a and Figure 4-1 b, respectively. Grains in both types of foam substrates are relatively
equiaxed. The grain size for as-received nickel foam and as-chromized Ni-Cr foam were 24±10
µm and 18±15 µm, respectively.
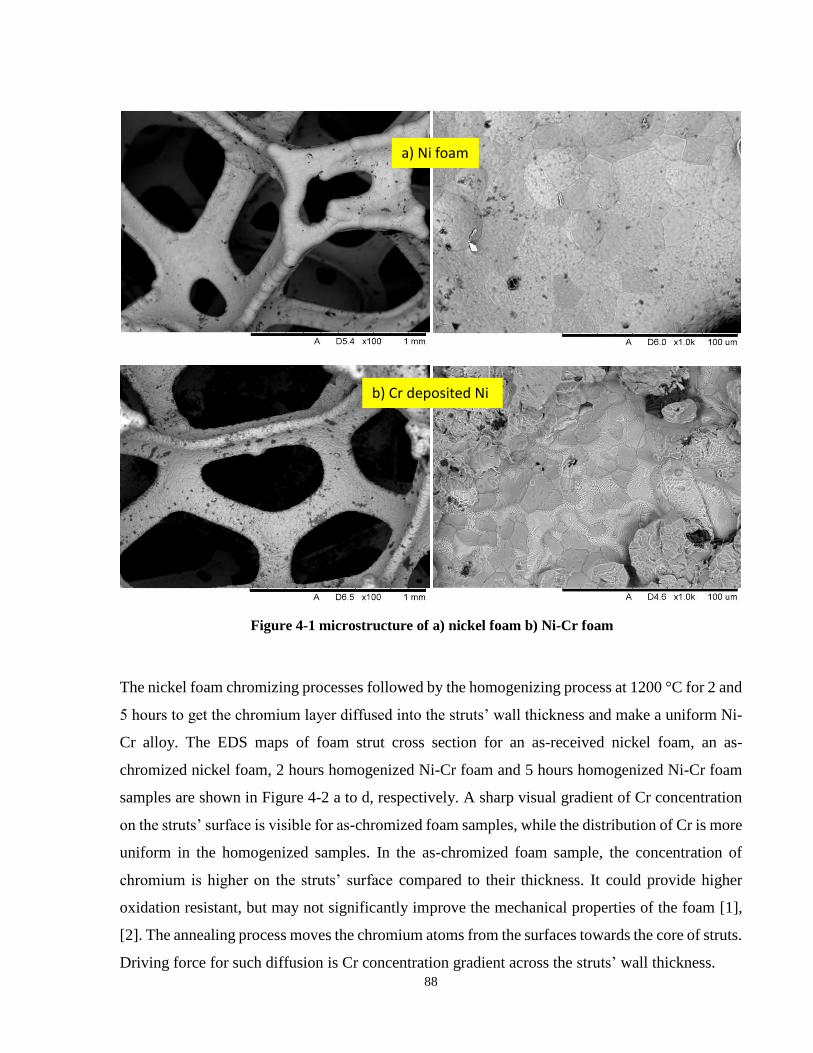
88
The nickel foam chromizing processes followed by the homogenizing process at 1200 °C for 2 and
5 hours to get the chromium layer diffused into the struts’ wall thickness and make a uniform Ni-
Cr alloy. The EDS maps of foam strut cross section for an as-received nickel foam, an as-
chromized nickel foam, 2 hours homogenized Ni-Cr foam and 5 hours homogenized Ni-Cr foam
samples are shown in Figure 4-2 a to d, respectively. A sharp visual gradient of Cr concentration
on the struts’ surface is visible for as-chromized foam samples, while the distribution of Cr is more
uniform in the homogenized samples. In the as-chromized foam sample, the concentration of
chromium is higher on the struts’ surface compared to their thickness. It could provide higher
oxidation resistant, but may not significantly improve the mechanical properties of the foam [1],
[2]. The annealing process moves the chromium atoms from the surfaces towards the core of struts.
Driving force for such diffusion is Cr concentration gradient across the struts’ wall thickness.
Figure 4-1 microstructure of a) nickel foam b) Ni-Cr foam
b) Cr deposited Ni
a) Ni foam
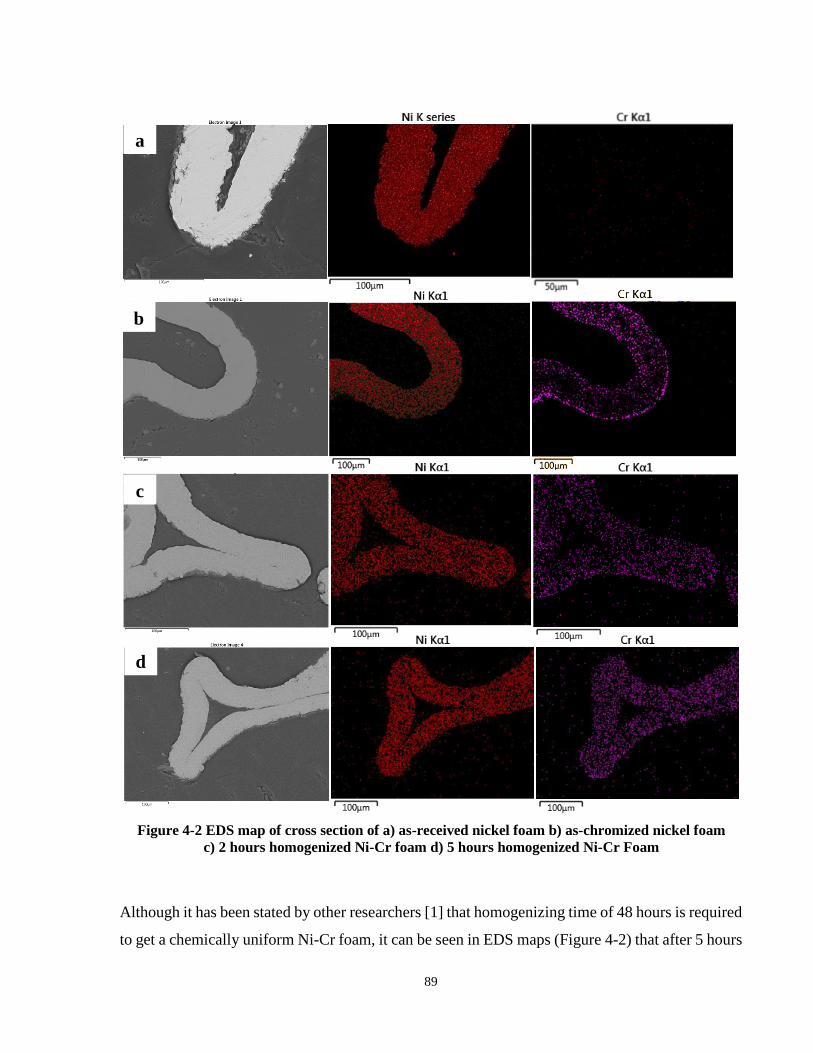
89
Although it has been stated by other researchers [1] that homogenizing time of 48 hours is required
to get a chemically uniform Ni-Cr foam, it can be seen in EDS maps (Figure 4-2) that after 5 hours
Figure 4-2 EDS map of cross section of a) as-received nickel foam b) as-chromized nickel foam
c) 2 hours homogenized Ni-Cr foam d) 5 hours homogenized Ni-Cr Foam
a
d
c
b
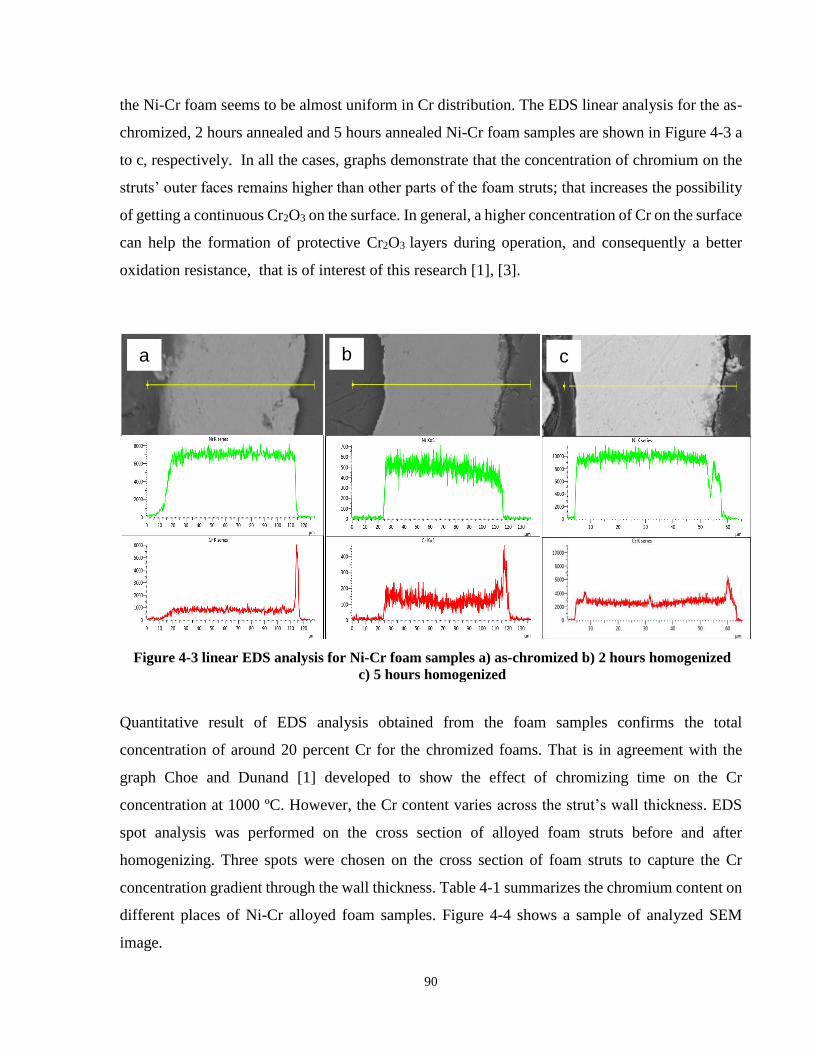
90
the Ni-Cr foam seems to be almost uniform in Cr distribution. The EDS linear analysis for the as-
chromized, 2 hours annealed and 5 hours annealed Ni-Cr foam samples are shown in Figure 4-3 a
to c, respectively. In all the cases, graphs demonstrate that the concentration of chromium on the
struts’ outer faces remains higher than other parts of the foam struts; that increases the possibility
of getting a continuous Cr2O3 on the surface. In general, a higher concentration of Cr on the surface
can help the formation of protective Cr2O3 layers during operation, and consequently a better
oxidation resistance, that is of interest of this research [1], [3].
Quantitative result of EDS analysis obtained from the foam samples confirms the total
concentration of around 20 percent Cr for the chromized foams. That is in agreement with the
graph Choe and Dunand [1] developed to show the effect of chromizing time on the Cr
concentration at 1000 ºC. However, the Cr content varies across the strut’s wall thickness. EDS
spot analysis was performed on the cross section of alloyed foam struts before and after
homogenizing. Three spots were chosen on the cross section of foam struts to capture the Cr
concentration gradient through the wall thickness. Table 4-1 summarizes the chromium content on
different places of Ni-Cr alloyed foam samples. Figure 4-4 shows a sample of analyzed SEM
image.
Figure 4-3 linear EDS analysis for Ni-Cr foam samples a) as-chromized b) 2 hours homogenized
c) 5 hours homogenized
a b c
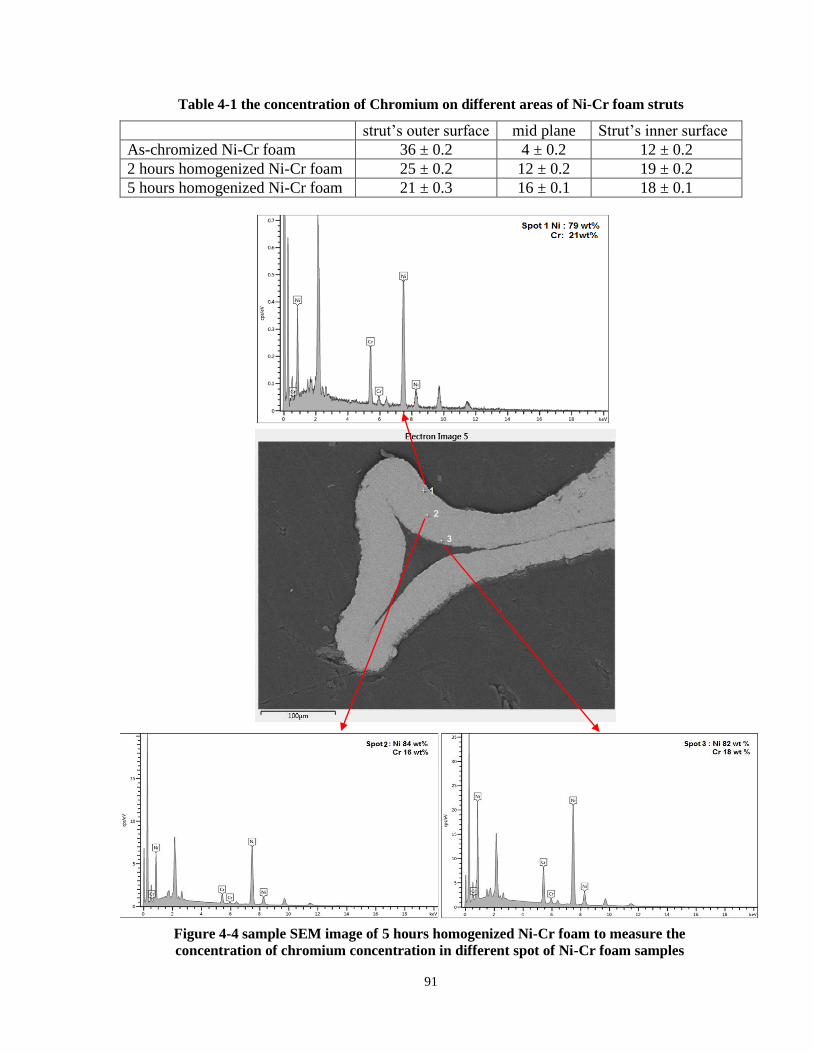
91
Table 4-1 the concentration of Chromium on different areas of Ni-Cr foam struts
strut’s outer surface mid plane Strut’s inner surface
As-chromized Ni-Cr foam 36 ± 0.2 4 ± 0.2 12 ± 0.2
2 hours homogenized Ni-Cr foam 25 ± 0.2 12 ± 0.2 19 ± 0.2
5 hours homogenized Ni-Cr foam 21 ± 0.3 16 ± 0.1 18 ± 0.1
Figure 4-4 sample SEM image of 5 hours homogenized Ni-Cr foam to measure the
concentration of chromium concentration in different spot of Ni-Cr foam samples
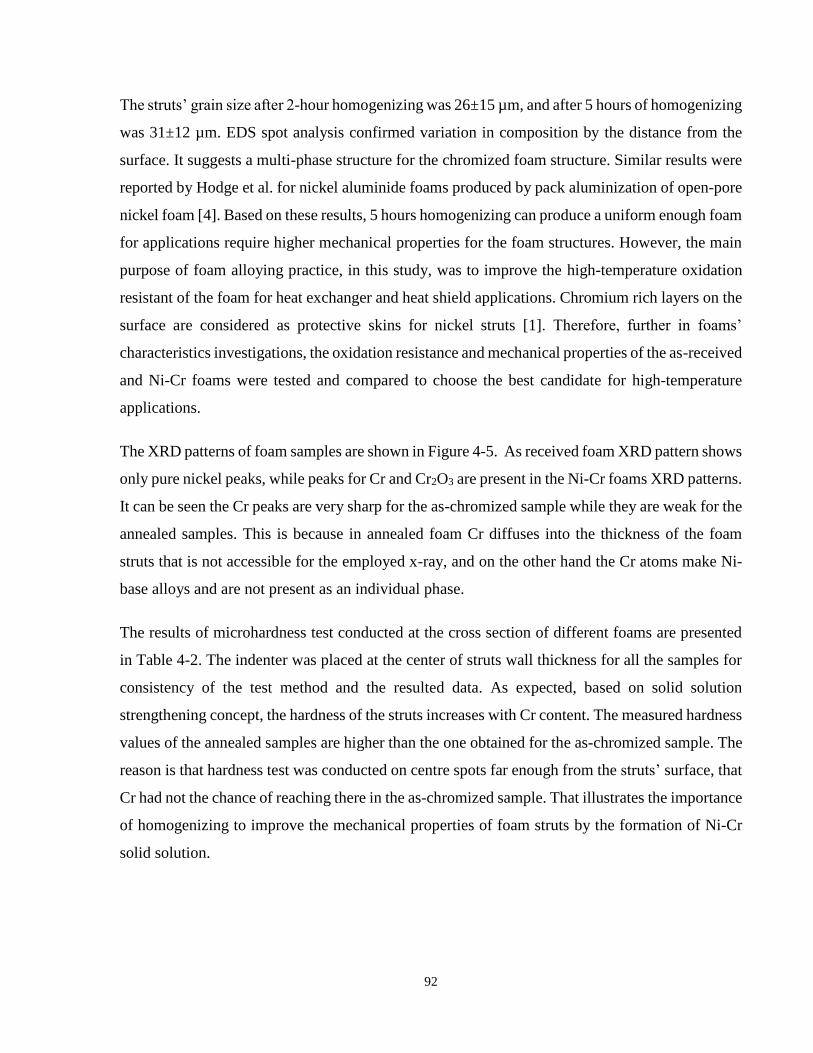
92
The struts’ grain size after 2-hour homogenizing was 26±15 µm, and after 5 hours of homogenizing
was 31±12 µm. EDS spot analysis confirmed variation in composition by the distance from the
surface. It suggests a multi-phase structure for the chromized foam structure. Similar results were
reported by Hodge et al. for nickel aluminide foams produced by pack aluminization of open-pore
nickel foam [4]. Based on these results, 5 hours homogenizing can produce a uniform enough foam
for applications require higher mechanical properties for the foam structures. However, the main
purpose of foam alloying practice, in this study, was to improve the high-temperature oxidation
resistant of the foam for heat exchanger and heat shield applications. Chromium rich layers on the
surface are considered as protective skins for nickel struts [1]. Therefore, further in foams’
characteristics investigations, the oxidation resistance and mechanical properties of the as-received
and Ni-Cr foams were tested and compared to choose the best candidate for high-temperature
applications.
The XRD patterns of foam samples are shown in Figure 4-5. As received foam XRD pattern shows
only pure nickel peaks, while peaks for Cr and Cr2O3 are present in the Ni-Cr foams XRD patterns.
It can be seen the Cr peaks are very sharp for the as-chromized sample while they are weak for the
annealed samples. This is because in annealed foam Cr diffuses into the thickness of the foam
struts that is not accessible for the employed x-ray, and on the other hand the Cr atoms make Ni-
base alloys and are not present as an individual phase.
The results of microhardness test conducted at the cross section of different foams are presented
in Table 4-2. The indenter was placed at the center of struts wall thickness for all the samples for
consistency of the test method and the resulted data. As expected, based on solid solution
strengthening concept, the hardness of the struts increases with Cr content. The measured hardness
values of the annealed samples are higher than the one obtained for the as-chromized sample. The
reason is that hardness test was conducted on centre spots far enough from the struts’ surface, that
Cr had not the chance of reaching there in the as-chromized sample. That illustrates the importance
of homogenizing to improve the mechanical properties of foam struts by the formation of Ni-Cr
solid solution.
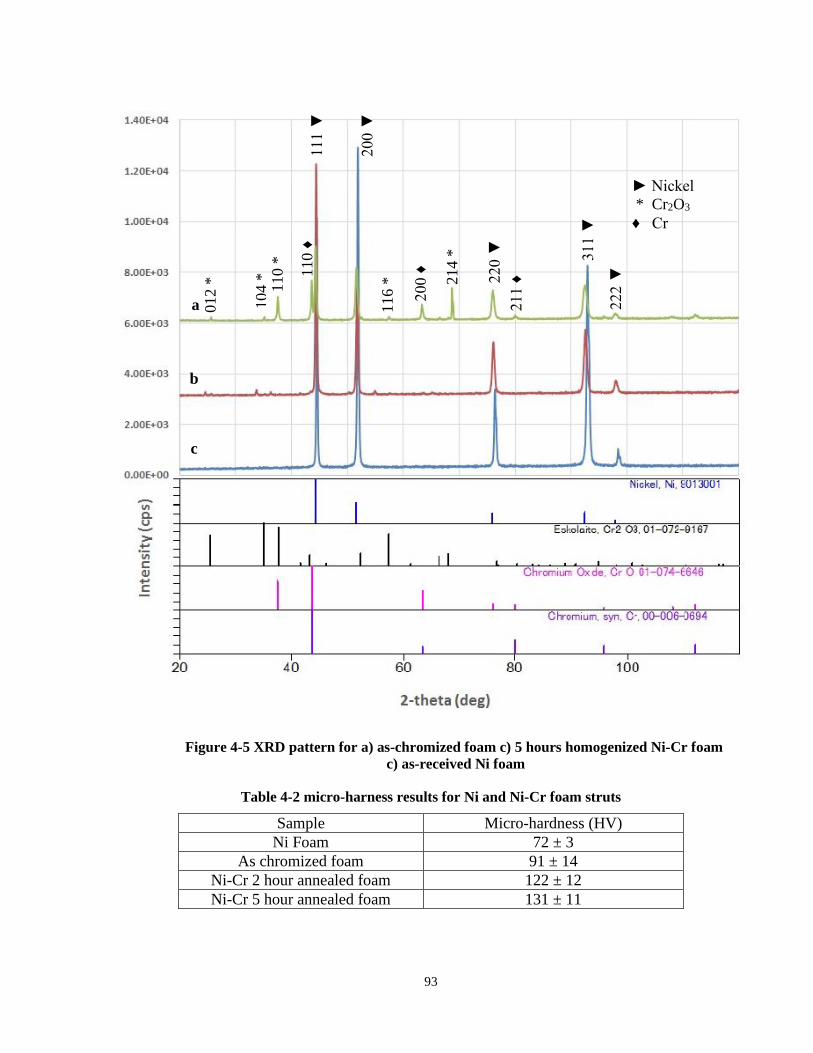
93
Table 4-2 micro-harness results for Ni and Ni-Cr foam struts
Sample Micro-hardness (HV)
Ni Foam 72 ± 3
As chromized foam 91 ± 14
Ni-Cr 2 hour annealed foam 122 ± 12
Ni-Cr 5 hour annealed foam 131 ± 11
Figure 4-5 XRD pattern for a) as-chromized foam c) 5 hours homogenized Ni-Cr foam
c) as-received Ni foam
c
b
a
012 *
104 *
110 *
116 *
214 *
Nickel
* Cr2O3
♦ Cr
111
200
220
311
211 ♦
200 ♦
110 ♦
222
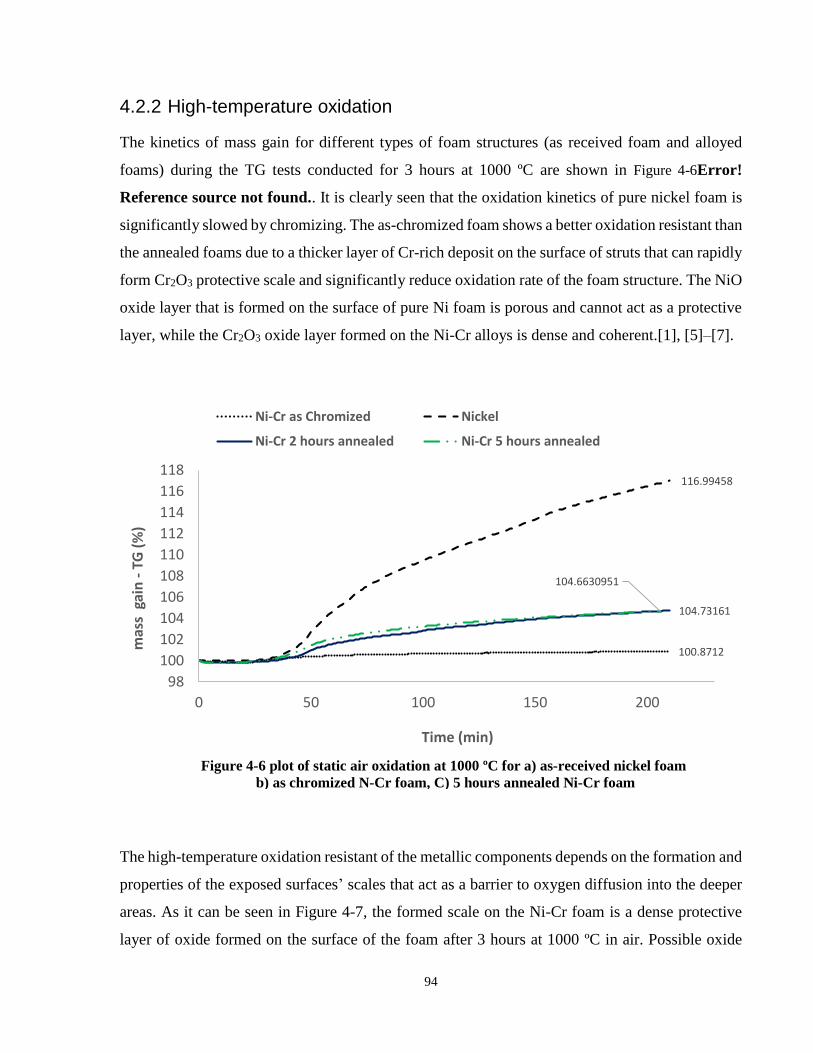
94
4.2.2 High-temperature oxidation
The kinetics of mass gain for different types of foam structures (as received foam and alloyed
foams) during the TG tests conducted for 3 hours at 1000 ºC are shown in Figure 4-6Error!
Reference source not found.. It is clearly seen that the oxidation kinetics of pure nickel foam is
significantly slowed by chromizing. The as-chromized foam shows a better oxidation resistant than
the annealed foams due to a thicker layer of Cr-rich deposit on the surface of struts that can rapidly
form Cr2O3 protective scale and significantly reduce oxidation rate of the foam structure. The NiO
oxide layer that is formed on the surface of pure Ni foam is porous and cannot act as a protective
layer, while the Cr2O3 oxide layer formed on the Ni-Cr alloys is dense and coherent.[1], [5]–[7].
The high-temperature oxidation resistant of the metallic components depends on the formation and
properties of the exposed surfaces’ scales that act as a barrier to oxygen diffusion into the deeper
areas. As it can be seen in Figure 4-7, the formed scale on the Ni-Cr foam is a dense protective
layer of oxide formed on the surface of the foam after 3 hours at 1000 ºC in air. Possible oxide
Figure 4-6 plot of static air oxidation at 1000 ºC for a) as-received nickel foam
b) as chromized N-Cr foam, C) 5 hours annealed Ni-Cr foam
100.8712
116.99458
104.73161
104.6630951
98
100
102
104
106
108
110
112
114
116
118
0 50 100 150 200
mas
s g
ain
-TG
(%
)
Time (min)
Ni-Cr as Chromized Nickel
Ni-Cr 2 hours annealed Ni-Cr 5 hours annealed
95
phases that can be formed in such alloy are NiO, Cr2O3, and NiCr2O4 depending on oxidation
regime and temperature [5]. However, the formation of Cr2O3 at the oxidation temperatures of
above 800 ºC becomes dominant [8]. Based on the TGA test results, the oxidation kinetics of
homogenized foam samples (2 hours and 5 hours annealed Ni-Cr foams) are very similar. The
initial rate of oxidation for the 5 hours annealed Ni-Cr foam is higher than the 2 hours annealed
Ni-Cr foam, but the difference is negligible. Results suggest that the hot oxidation behavior of the
as-chromized and homogenized alloyed foam samples are acceptable, compare to pure Ni foam,
and the decision to choose the proper one should be made based on the mechanical properties of
them.
4.3 Alloy 625 facings
Twin wire arc spray process was employed for the production of alloy 625 facings using alloy 625
wires. The optimization of arc spray process was conducted using DOE methods for production of
dense and porous coatings applicable in heat exchanger channels and heat shield devices,
respectively.
The grit-blasting process parameters for preparation of a surface capable of making good
mechanical interlocks with the arc spray deposit were studied and optimized using DOE methods
before optimization of Arc spray process. That was actually due to the importance of adhesion
strength between the facings and the core of sandwich structures to avoid any delamination and
Element AN Series C norm. [wt.%]
Nickel 28 K-series 9339 60.84
Oxygen 8 K-series 5644 18.02
Chromium 24 K-series 3400 21.14
Figure 4-7 SEM image and EDS of the surface of a Ni-Cr foam strut after hot oxidation test
for 3 hours at 1000 ºC showing the oxide layer on the surface of strut
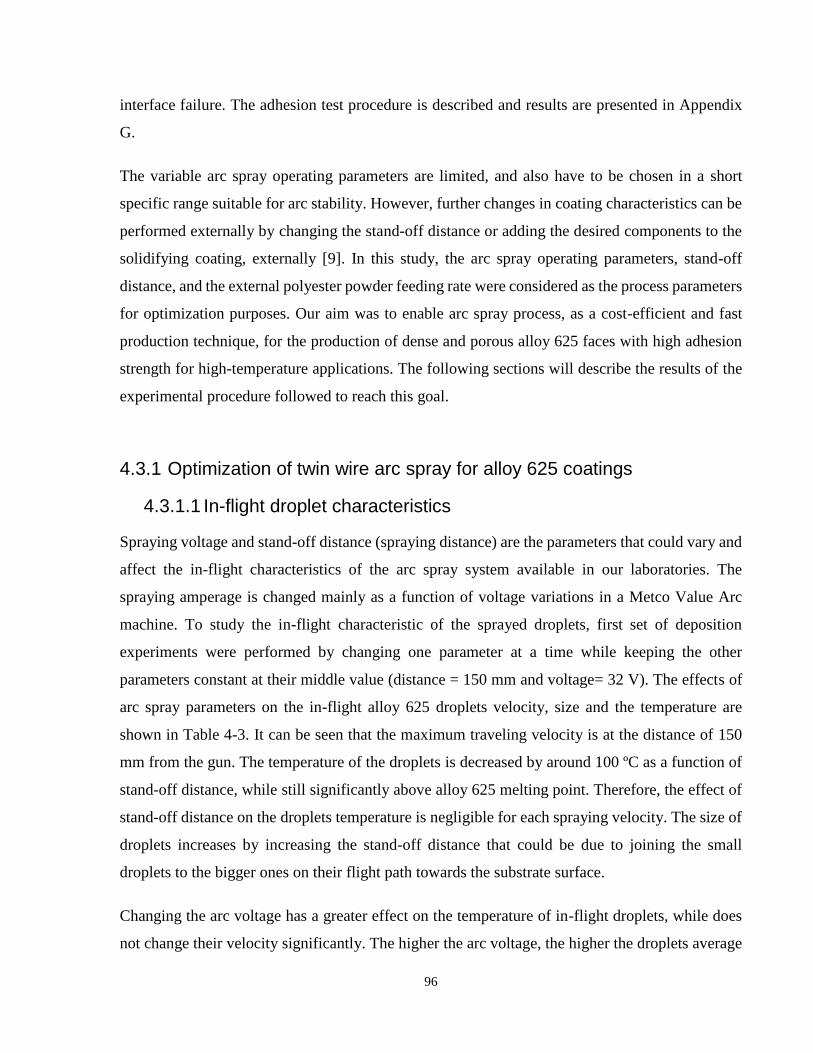
96
interface failure. The adhesion test procedure is described and results are presented in Appendix
G.
The variable arc spray operating parameters are limited, and also have to be chosen in a short
specific range suitable for arc stability. However, further changes in coating characteristics can be
performed externally by changing the stand-off distance or adding the desired components to the
solidifying coating, externally [9]. In this study, the arc spray operating parameters, stand-off
distance, and the external polyester powder feeding rate were considered as the process parameters
for optimization purposes. Our aim was to enable arc spray process, as a cost-efficient and fast
production technique, for the production of dense and porous alloy 625 faces with high adhesion
strength for high-temperature applications. The following sections will describe the results of the
experimental procedure followed to reach this goal.
4.3.1 Optimization of twin wire arc spray for alloy 625 coatings
4.3.1.1 In-flight droplet characteristics
Spraying voltage and stand-off distance (spraying distance) are the parameters that could vary and
affect the in-flight characteristics of the arc spray system available in our laboratories. The
spraying amperage is changed mainly as a function of voltage variations in a Metco Value Arc
machine. To study the in-flight characteristic of the sprayed droplets, first set of deposition
experiments were performed by changing one parameter at a time while keeping the other
parameters constant at their middle value (distance = 150 mm and voltage= 32 V). The effects of
arc spray parameters on the in-flight alloy 625 droplets velocity, size and the temperature are
shown in Table 4-3. It can be seen that the maximum traveling velocity is at the distance of 150
mm from the gun. The temperature of the droplets is decreased by around 100 ºC as a function of
stand-off distance, while still significantly above alloy 625 melting point. Therefore, the effect of
stand-off distance on the droplets temperature is negligible for each spraying velocity. The size of
droplets increases by increasing the stand-off distance that could be due to joining the small
droplets to the bigger ones on their flight path towards the substrate surface.
Changing the arc voltage has a greater effect on the temperature of in-flight droplets, while does
not change their velocity significantly. The higher the arc voltage, the higher the droplets average
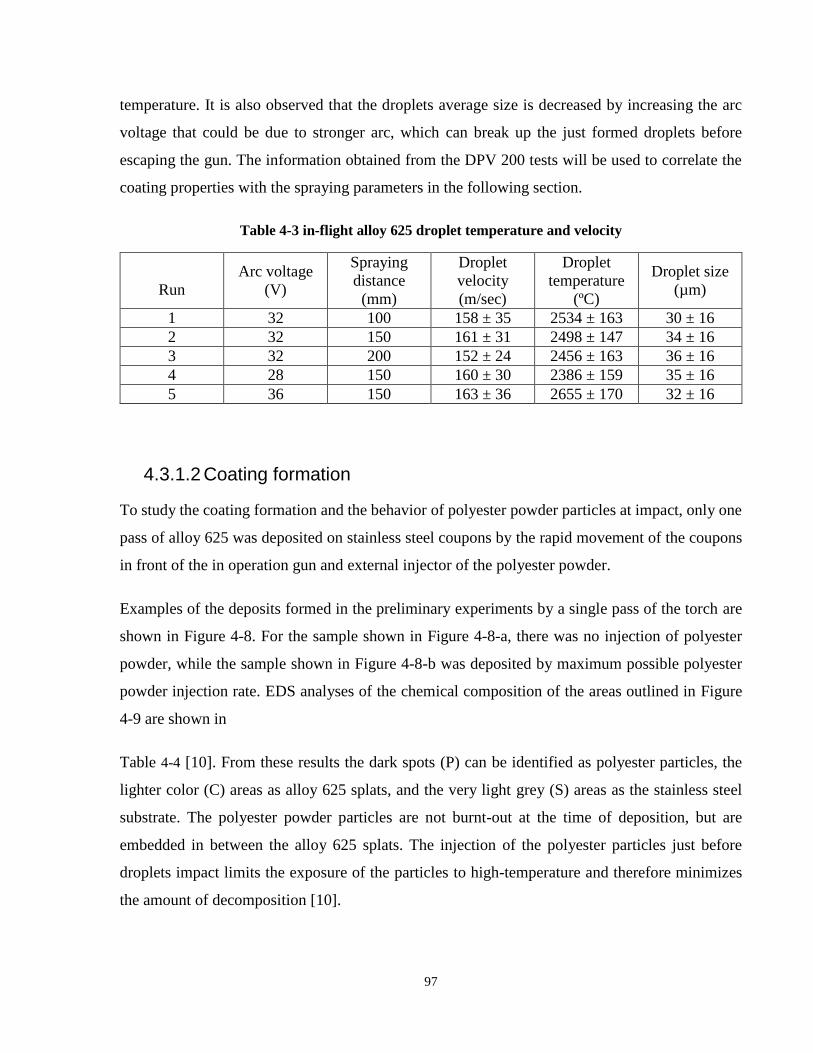
97
temperature. It is also observed that the droplets average size is decreased by increasing the arc
voltage that could be due to stronger arc, which can break up the just formed droplets before
escaping the gun. The information obtained from the DPV 200 tests will be used to correlate the
coating properties with the spraying parameters in the following section.
Table 4-3 in-flight alloy 625 droplet temperature and velocity
4.3.1.2 Coating formation
To study the coating formation and the behavior of polyester powder particles at impact, only one
pass of alloy 625 was deposited on stainless steel coupons by the rapid movement of the coupons
in front of the in operation gun and external injector of the polyester powder.
Examples of the deposits formed in the preliminary experiments by a single pass of the torch are
shown in Figure 4-8. For the sample shown in Figure 4-8-a, there was no injection of polyester
powder, while the sample shown in Figure 4-8-b was deposited by maximum possible polyester
powder injection rate. EDS analyses of the chemical composition of the areas outlined in Figure
4-9 are shown in
Table 4-4 [10]. From these results the dark spots (P) can be identified as polyester particles, the
lighter color (C) areas as alloy 625 splats, and the very light grey (S) areas as the stainless steel
substrate. The polyester powder particles are not burnt-out at the time of deposition, but are
embedded in between the alloy 625 splats. The injection of the polyester particles just before
droplets impact limits the exposure of the particles to high-temperature and therefore minimizes
the amount of decomposition [10].
Run
Arc voltage
(V)
Spraying
distance
(mm)
Droplet
velocity
(m/sec)
Droplet
temperature
(ºC)
Droplet size
(µm)
1 32 100 158 ± 35 2534 ± 163 30 ± 16
2 32 150 161 ± 31 2498 ± 147 34 ± 16
3 32 200 152 ± 24 2456 ± 163 36 ± 16
4 28 150 160 ± 30 2386 ± 159 35 ± 16
5 36 150 163 ± 36 2655 ± 170 32 ± 16
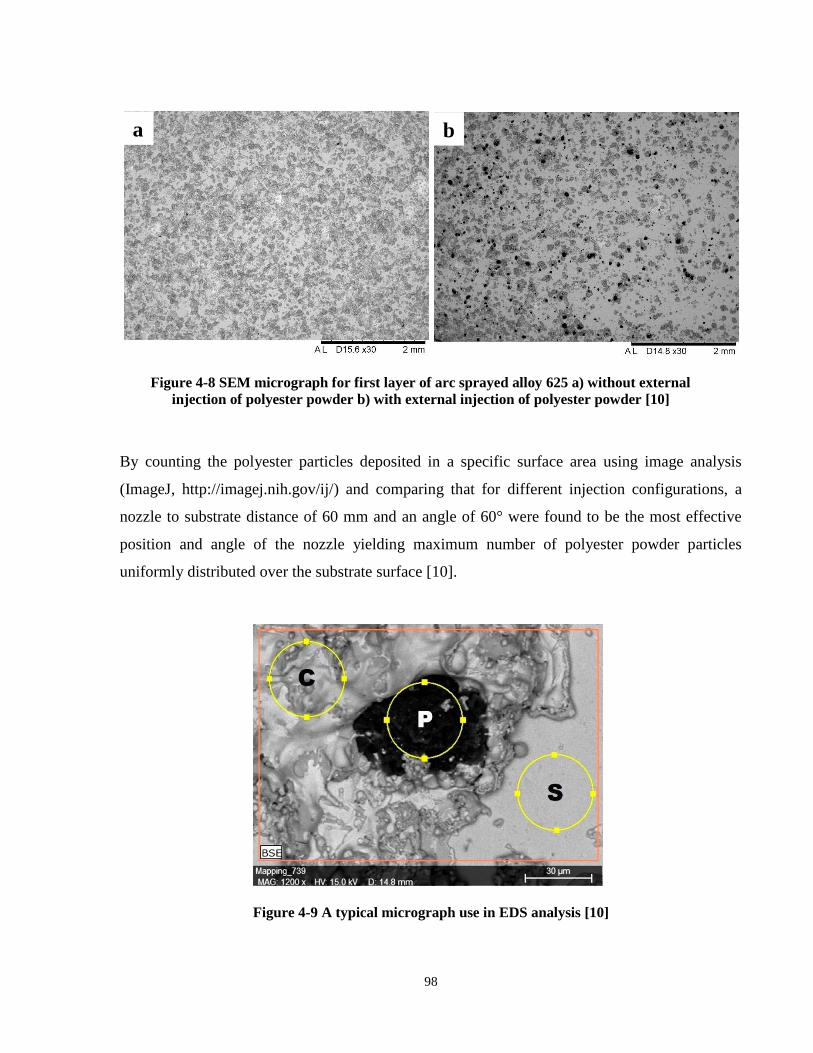
98
By counting the polyester particles deposited in a specific surface area using image analysis
(ImageJ, http://imagej.nih.gov/ij/) and comparing that for different injection configurations, a
nozzle to substrate distance of 60 mm and an angle of 60° were found to be the most effective
position and angle of the nozzle yielding maximum number of polyester powder particles
uniformly distributed over the substrate surface [10].
Figure 4-8 SEM micrograph for first layer of arc sprayed alloy 625 a) without external
injection of polyester powder b) with external injection of polyester powder [10]
a
b
Figure 4-9 A typical micrograph use in EDS analysis [10]
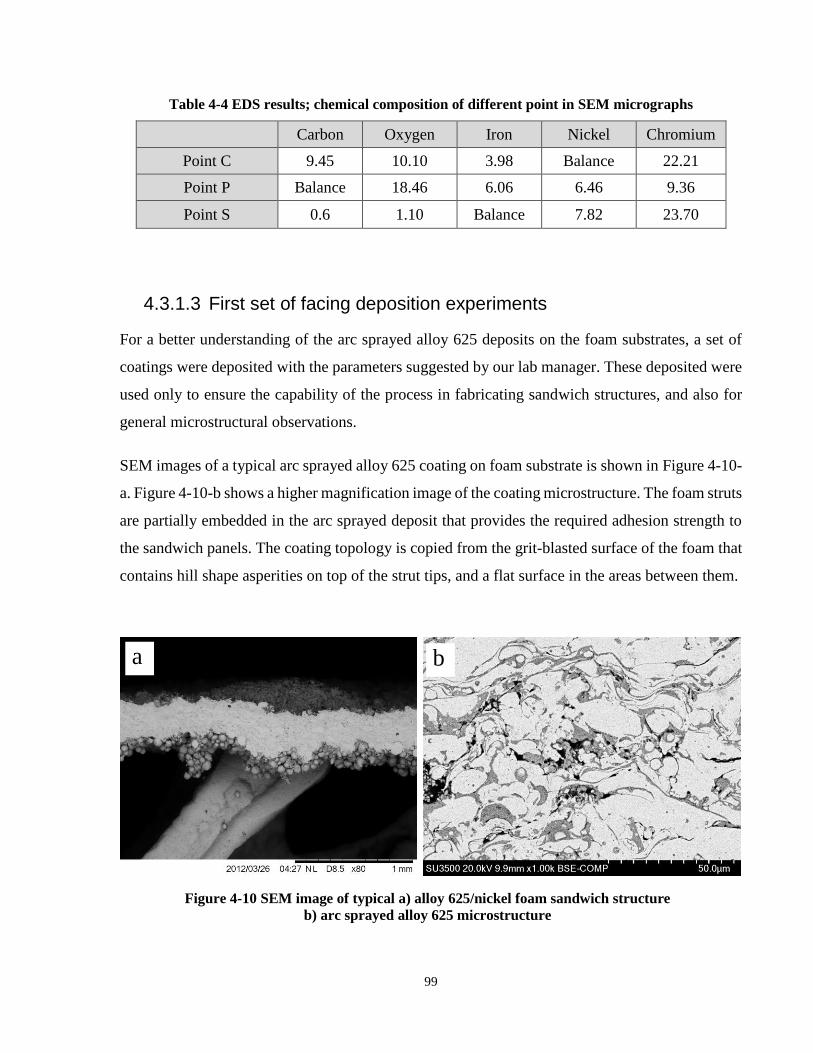
99
Table 4-4 EDS results; chemical composition of different point in SEM micrographs
Carbon Oxygen Iron Nickel Chromium
Point C 9.45 10.10 3.98 Balance 22.21
Point P Balance 18.46 6.06 6.46 9.36
Point S 0.6 1.10 Balance 7.82 23.70
4.3.1.3 First set of facing deposition experiments
For a better understanding of the arc sprayed alloy 625 deposits on the foam substrates, a set of
coatings were deposited with the parameters suggested by our lab manager. These deposited were
used only to ensure the capability of the process in fabricating sandwich structures, and also for
general microstructural observations.
SEM images of a typical arc sprayed alloy 625 coating on foam substrate is shown in Figure 4-10-
a. Figure 4-10-b shows a higher magnification image of the coating microstructure. The foam struts
are partially embedded in the arc sprayed deposit that provides the required adhesion strength to
the sandwich panels. The coating topology is copied from the grit-blasted surface of the foam that
contains hill shape asperities on top of the strut tips, and a flat surface in the areas between them.
Figure 4-10 SEM image of typical a) alloy 625/nickel foam sandwich structure
b) arc sprayed alloy 625 microstructure
b a
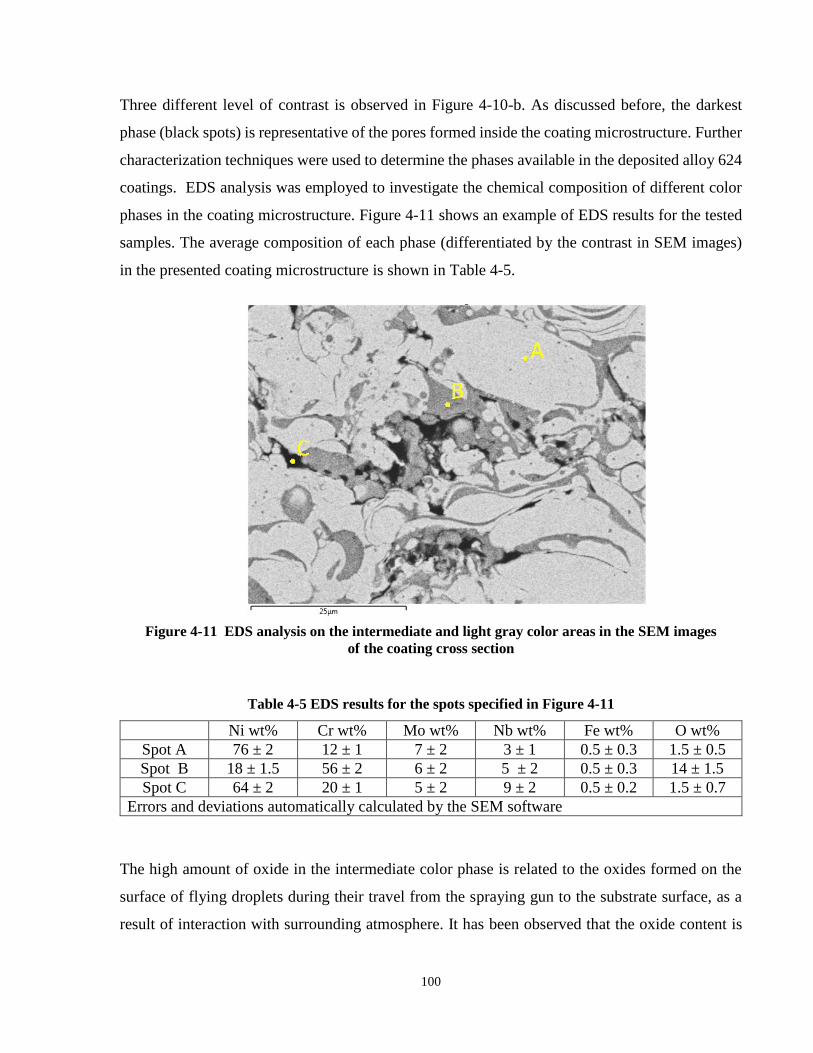
100
Three different level of contrast is observed in Figure 4-10-b. As discussed before, the darkest
phase (black spots) is representative of the pores formed inside the coating microstructure. Further
characterization techniques were used to determine the phases available in the deposited alloy 624
coatings. EDS analysis was employed to investigate the chemical composition of different color
phases in the coating microstructure. Figure 4-11 shows an example of EDS results for the tested
samples. The average composition of each phase (differentiated by the contrast in SEM images)
in the presented coating microstructure is shown in Table 4-5.
Table 4-5 EDS results for the spots specified in Figure 4-11
Ni wt% Cr wt% Mo wt% Nb wt% Fe wt% O wt%
Spot A 76 ± 2 12 ± 1 7 ± 2 3 ± 1 0.5 ± 0.3 1.5 ± 0.5
Spot B 18 ± 1.5 56 ± 2 6 ± 2 5 ± 2 0.5 ± 0.3 14 ± 1.5
Spot C 64 ± 2 20 ± 1 5 ± 2 9 ± 2 0.5 ± 0.2 1.5 ± 0.7
Errors and deviations automatically calculated by the SEM software
The high amount of oxide in the intermediate color phase is related to the oxides formed on the
surface of flying droplets during their travel from the spraying gun to the substrate surface, as a
result of interaction with surrounding atmosphere. It has been observed that the oxide content is
Figure 4-11 EDS analysis on the intermediate and light gray color areas in the SEM images
of the coating cross section

101
increased by increasing the spraying distance. This oxide phase has also been observed in alloy
625 coatings sprayed by APS and HVOF processes [10], [11]
The XRD pattern for the alloy 625 wire feedstock and as-sprayed alloy 625 coating are shown in
Figure 4-12. It can be seen that the microstructure of the alloy 625 has been changed significantly
during the arc spray deposition process, and sharp chromium oxide peaks have appeared in the
pattern. These results, along with the EDS results presented in
Table 4-4 suggest that the moderate gray phase is rich in chromium oxide. The oxide phase is
formed on the surface of in-flight droplets and thus in most of the cases is solidified in between
the splats to make a network of a continuous and thin layer of oxide inside the microstructure.
Such distribution of oxides can significantly reduce the mechanical properties of thermal spray
coatings [10], [12].
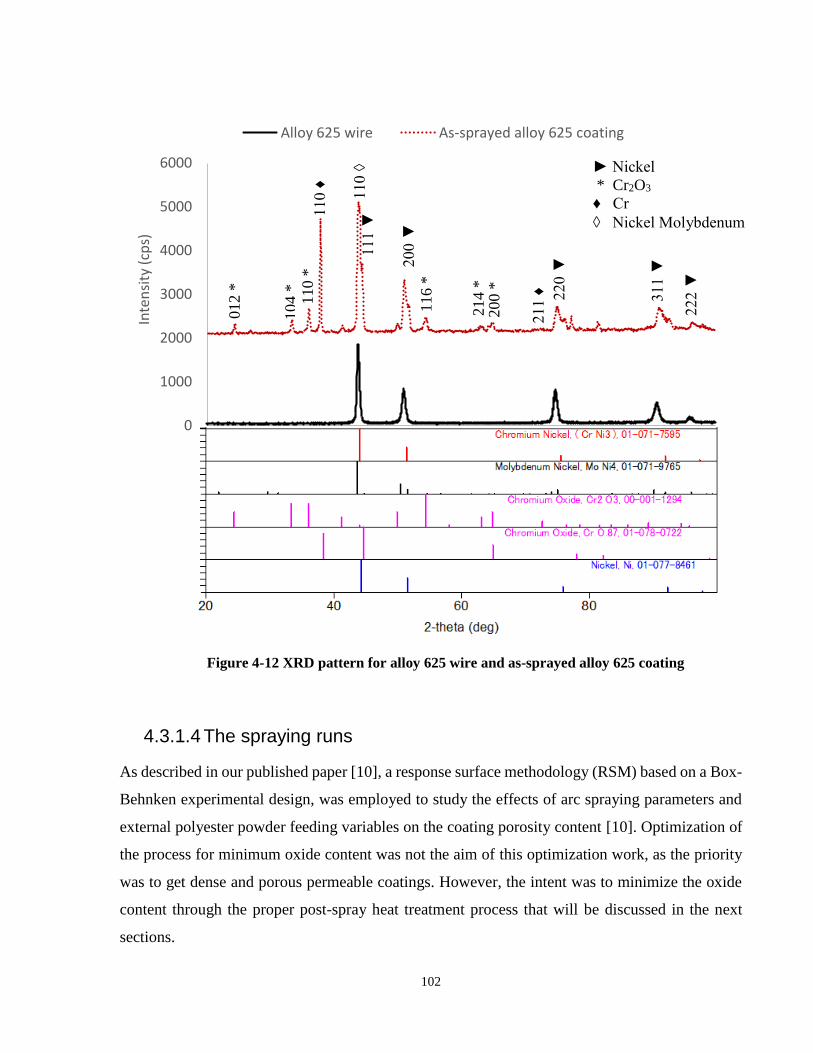
102
4.3.1.4 The spraying runs
As described in our published paper [10], a response surface methodology (RSM) based on a Box-
Behnken experimental design, was employed to study the effects of arc spraying parameters and
external polyester powder feeding variables on the coating porosity content [10]. Optimization of
the process for minimum oxide content was not the aim of this optimization work, as the priority
was to get dense and porous permeable coatings. However, the intent was to minimize the oxide
content through the proper post-spray heat treatment process that will be discussed in the next
sections.
0
1000
2000
3000
4000
5000
6000
20 30 40 50 60 70 80 90 100
Inte
nsi
ty (
cps)
2-theta (deg)
Alloy 625 wire As-sprayed alloy 625 coating
Figure 4-12 XRD pattern for alloy 625 wire and as-sprayed alloy 625 coating
012 *
104 *
110 *
116 *
214 *
Nickel
* Cr2O3
♦ Cr
◊ Nickel Molybdenum
111
200
220
311
211 ♦
200 *
110 ♦
222
110 ◊
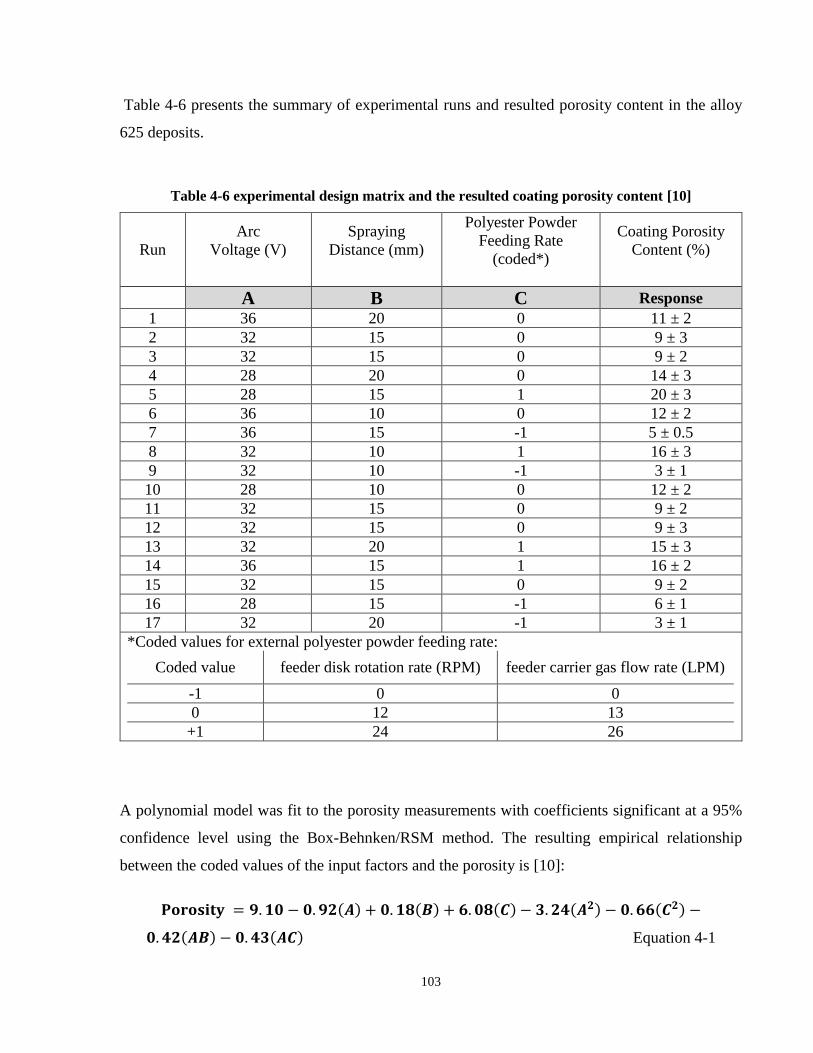
103
Table 4-6 presents the summary of experimental runs and resulted porosity content in the alloy
625 deposits.
Table 4-6 experimental design matrix and the resulted coating porosity content [10]
Run
Arc
Voltage (V)
Spraying
Distance (mm)
Polyester Powder
Feeding Rate
(coded*)
Coating Porosity
Content (%)
A B C Response
1 36 20 0 11 ± 2
2 32 15 0 9 ± 3
3 32 15 0 9 ± 2
4 28 20 0 14 ± 3
5 28 15 1 20 ± 3
6 36 10 0 12 ± 2
7 36 15 -1 5 ± 0.5
8 32 10 1 16 ± 3
9 32 10 -1 3 ± 1
10 28 10 0 12 ± 2
11 32 15 0 9 ± 2
12 32 15 0 9 ± 3
13 32 20 1 15 ± 3
14 36 15 1 16 ± 2
15 32 15 0 9 ± 2
16 28 15 -1 6 ± 1
17 32 20 -1 3 ± 1
*Coded values for external polyester powder feeding rate:
Coded value feeder disk rotation rate (RPM) feeder carrier gas flow rate (LPM)
-1 0 0
0 12 13
+1 24 26
A polynomial model was fit to the porosity measurements with coefficients significant at a 95%
confidence level using the Box-Behnken/RSM method. The resulting empirical relationship
between the coded values of the input factors and the porosity is [10]:
𝐏𝐨𝐫𝐨𝐬𝐢𝐭𝐲 = 𝟗. 𝟏𝟎 − 𝟎. 𝟗𝟐(𝑨) + 𝟎. 𝟏𝟖(𝑩) + 𝟔. 𝟎𝟖(𝑪) − 𝟑. 𝟐𝟒(𝑨𝟐) − 𝟎. 𝟔𝟔(𝑪𝟐) −
𝟎. 𝟒𝟐(𝑨𝑩) − 𝟎. 𝟒𝟑(𝑨𝑪) Equation 4-1
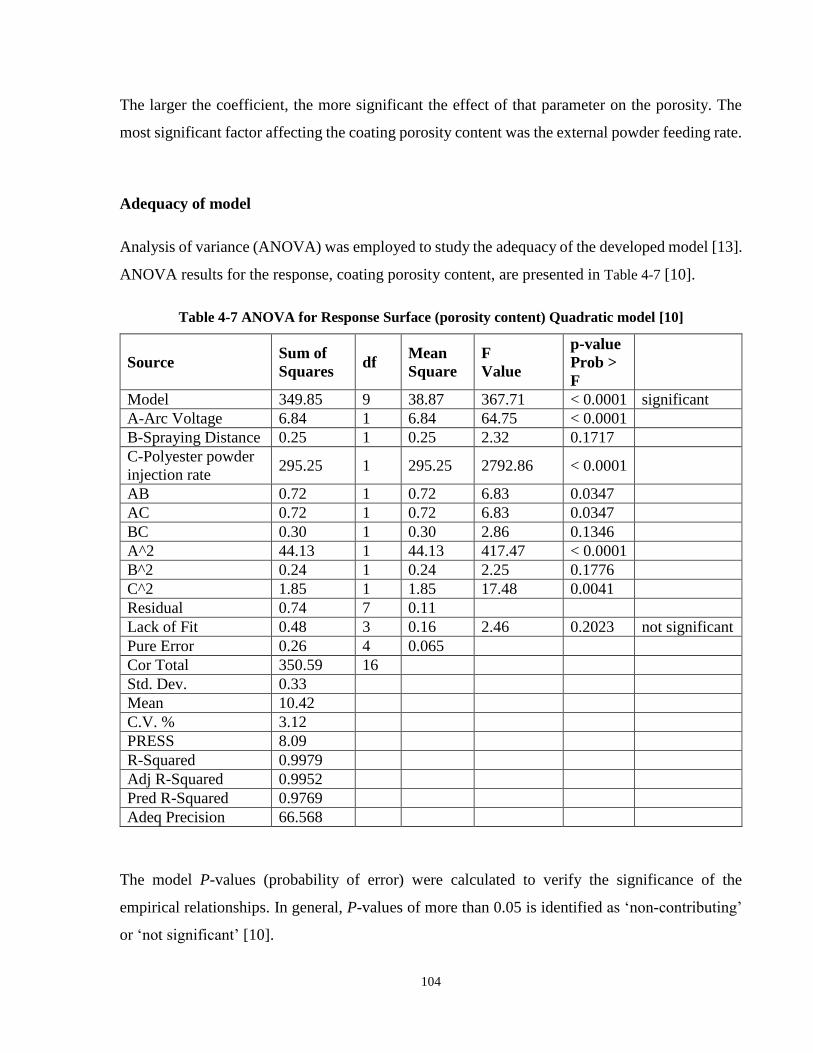
104
The larger the coefficient, the more significant the effect of that parameter on the porosity. The
most significant factor affecting the coating porosity content was the external powder feeding rate.
Adequacy of model
Analysis of variance (ANOVA) was employed to study the adequacy of the developed model [13].
ANOVA results for the response, coating porosity content, are presented in Table 4-7 [10].
Table 4-7 ANOVA for Response Surface (porosity content) Quadratic model [10]
Source Sum of
Squares df
Mean
Square
F
Value
p-value
Prob >
F
Model 349.85 9 38.87 367.71 < 0.0001 significant
A-Arc Voltage 6.84 1 6.84 64.75 < 0.0001
B-Spraying Distance 0.25 1 0.25 2.32 0.1717
C-Polyester powder
injection rate 295.25 1 295.25 2792.86 < 0.0001
AB 0.72 1 0.72 6.83 0.0347
AC 0.72 1 0.72 6.83 0.0347
BC 0.30 1 0.30 2.86 0.1346
A^2 44.13 1 44.13 417.47 < 0.0001
B^2 0.24 1 0.24 2.25 0.1776
C^2 1.85 1 1.85 17.48 0.0041
Residual 0.74 7 0.11
Lack of Fit 0.48 3 0.16 2.46 0.2023 not significant
Pure Error 0.26 4 0.065
Cor Total 350.59 16
Std. Dev. 0.33
Mean 10.42
C.V. % 3.12
PRESS 8.09
R-Squared 0.9979
Adj R-Squared 0.9952
Pred R-Squared 0.9769
Adeq Precision 66.568
The model P-values (probability of error) were calculated to verify the significance of the
empirical relationships. In general, P-values of more than 0.05 is identified as ‘non-contributing’
or ‘not significant’ [10].
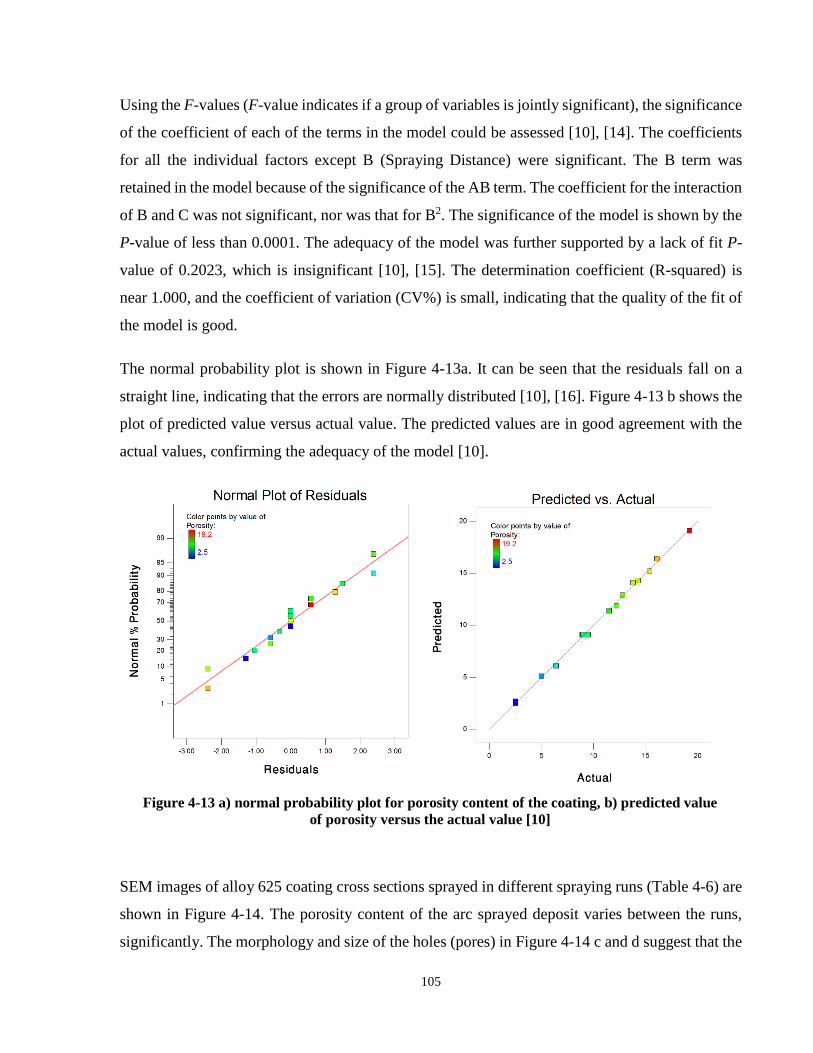
105
Using the F-values (F-value indicates if a group of variables is jointly significant), the significance
of the coefficient of each of the terms in the model could be assessed [10], [14]. The coefficients
for all the individual factors except B (Spraying Distance) were significant. The B term was
retained in the model because of the significance of the AB term. The coefficient for the interaction
of B and C was not significant, nor was that for B2. The significance of the model is shown by the
P-value of less than 0.0001. The adequacy of the model was further supported by a lack of fit P-
value of 0.2023, which is insignificant [10], [15]. The determination coefficient (R-squared) is
near 1.000, and the coefficient of variation (CV%) is small, indicating that the quality of the fit of
the model is good.
The normal probability plot is shown in Figure 4-13a. It can be seen that the residuals fall on a
straight line, indicating that the errors are normally distributed [10], [16]. Figure 4-13 b shows the
plot of predicted value versus actual value. The predicted values are in good agreement with the
actual values, confirming the adequacy of the model [10].
SEM images of alloy 625 coating cross sections sprayed in different spraying runs (Table 4-6) are
shown in Figure 4-14. The porosity content of the arc sprayed deposit varies between the runs,
significantly. The morphology and size of the holes (pores) in Figure 4-14 c and d suggest that the
Figure 4-13 a) normal probability plot for porosity content of the coating, b) predicted value
of porosity versus the actual value [10]
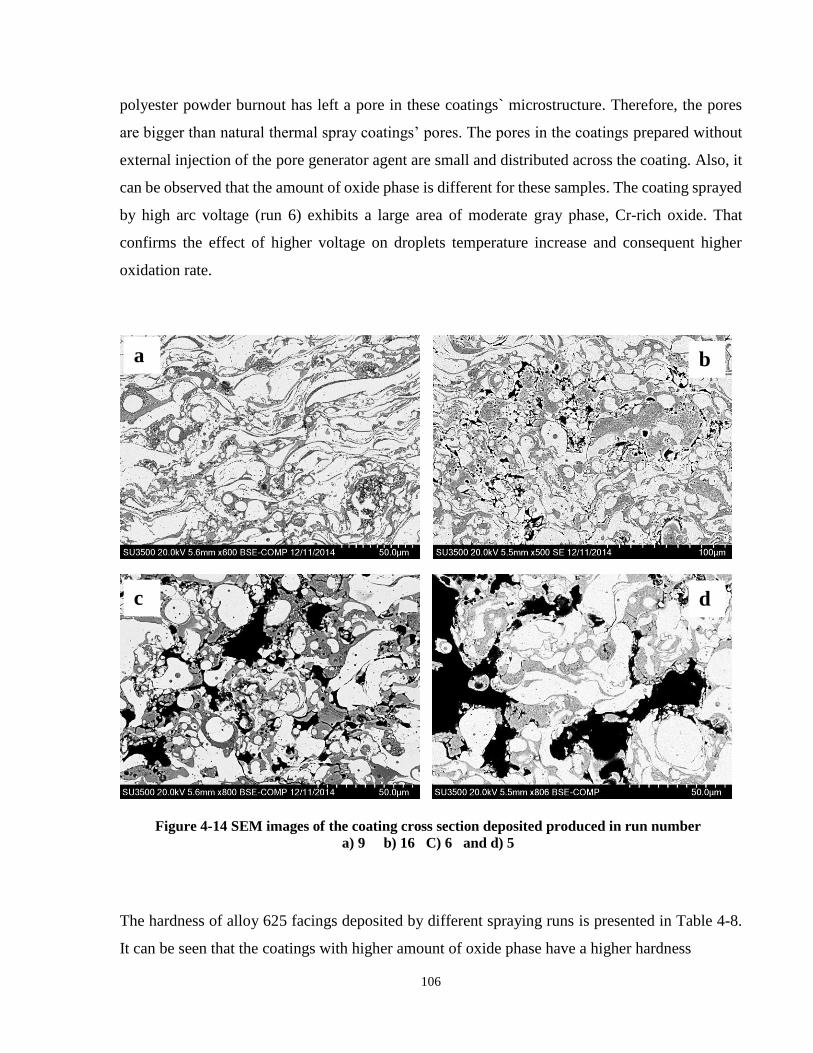
106
polyester powder burnout has left a pore in these coatings` microstructure. Therefore, the pores
are bigger than natural thermal spray coatings’ pores. The pores in the coatings prepared without
external injection of the pore generator agent are small and distributed across the coating. Also, it
can be observed that the amount of oxide phase is different for these samples. The coating sprayed
by high arc voltage (run 6) exhibits a large area of moderate gray phase, Cr-rich oxide. That
confirms the effect of higher voltage on droplets temperature increase and consequent higher
oxidation rate.
The hardness of alloy 625 facings deposited by different spraying runs is presented in Table 4-8.
It can be seen that the coatings with higher amount of oxide phase have a higher hardness
Figure 4-14 SEM images of the coating cross section deposited produced in run number
a) 9 b) 16 C) 6 and d) 5
a
c
b
d
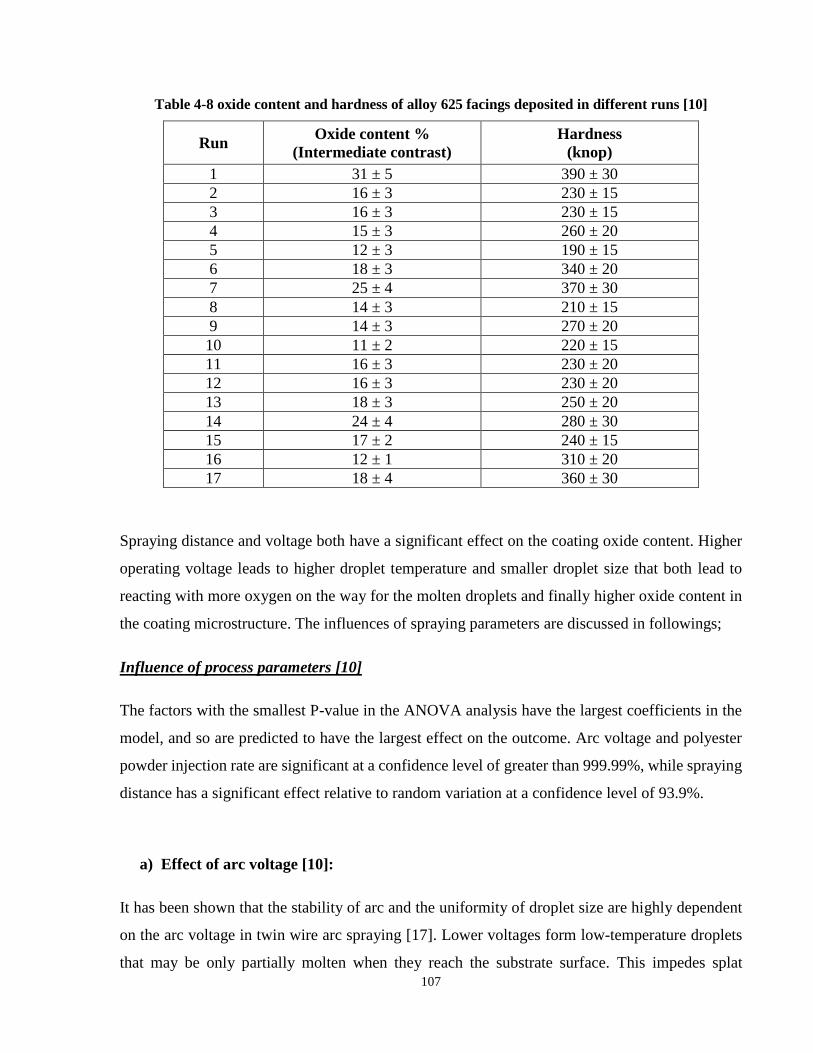
107
Table 4-8 oxide content and hardness of alloy 625 facings deposited in different runs [10]
Run Oxide content %
(Intermediate contrast)
Hardness
(knop)
1 31 ± 5 390 ± 30
2 16 ± 3 230 ± 15
3 16 ± 3 230 ± 15
4 15 ± 3 260 ± 20
5 12 ± 3 190 ± 15
6 18 ± 3 340 ± 20
7 25 ± 4 370 ± 30
8 14 ± 3 210 ± 15
9 14 ± 3 270 ± 20
10 11 ± 2 220 ± 15
11 16 ± 3 230 ± 20
12 16 ± 3 230 ± 20
13 18 ± 3 250 ± 20
14 24 ± 4 280 ± 30
15 17 ± 2 240 ± 15
16 12 ± 1 310 ± 20
17 18 ± 4 360 ± 30
Spraying distance and voltage both have a significant effect on the coating oxide content. Higher
operating voltage leads to higher droplet temperature and smaller droplet size that both lead to
reacting with more oxygen on the way for the molten droplets and finally higher oxide content in
the coating microstructure. The influences of spraying parameters are discussed in followings;
Influence of process parameters [10]
The factors with the smallest P-value in the ANOVA analysis have the largest coefficients in the
model, and so are predicted to have the largest effect on the outcome. Arc voltage and polyester
powder injection rate are significant at a confidence level of greater than 999.99%, while spraying
distance has a significant effect relative to random variation at a confidence level of 93.9%.
a) Effect of arc voltage [10]:
It has been shown that the stability of arc and the uniformity of droplet size are highly dependent
on the arc voltage in twin wire arc spraying [17]. Lower voltages form low-temperature droplets
that may be only partially molten when they reach the substrate surface. This impedes splat
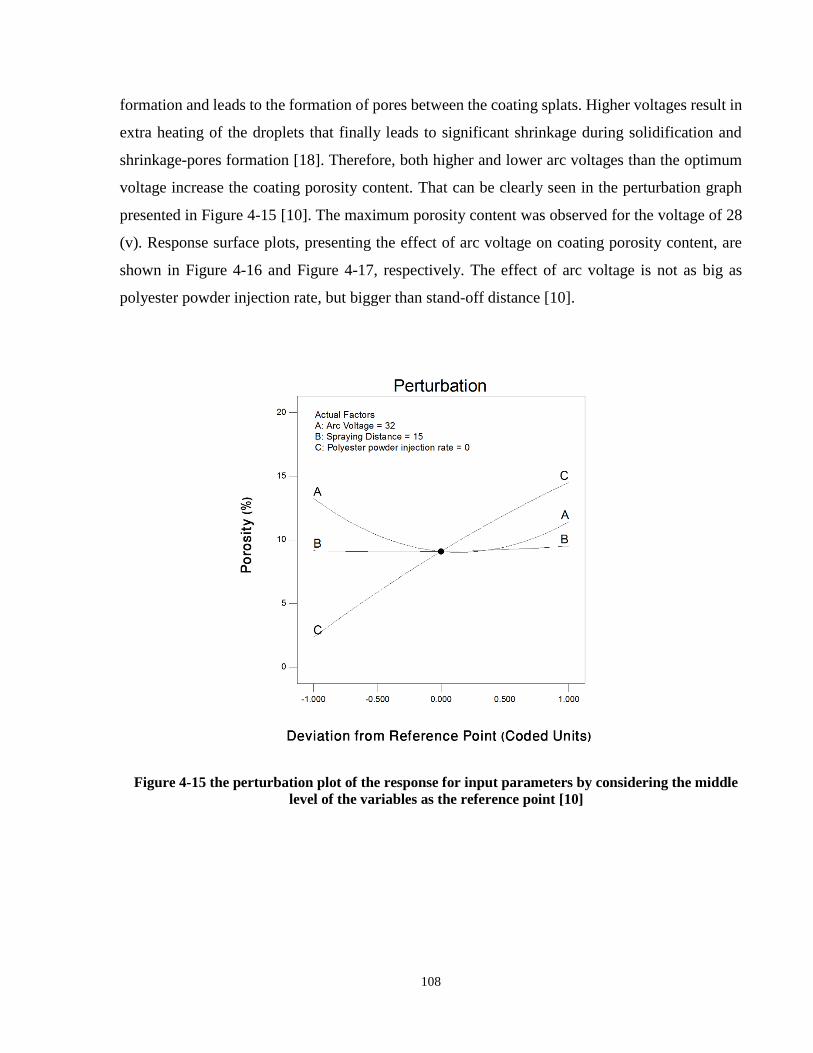
108
formation and leads to the formation of pores between the coating splats. Higher voltages result in
extra heating of the droplets that finally leads to significant shrinkage during solidification and
shrinkage-pores formation [18]. Therefore, both higher and lower arc voltages than the optimum
voltage increase the coating porosity content. That can be clearly seen in the perturbation graph
presented in Figure 4-15 [10]. The maximum porosity content was observed for the voltage of 28
(v). Response surface plots, presenting the effect of arc voltage on coating porosity content, are
shown in Figure 4-16 and Figure 4-17, respectively. The effect of arc voltage is not as big as
polyester powder injection rate, but bigger than stand-off distance [10].
Figure 4-15 the perturbation plot of the response for input parameters by considering the middle
level of the variables as the reference point [10]
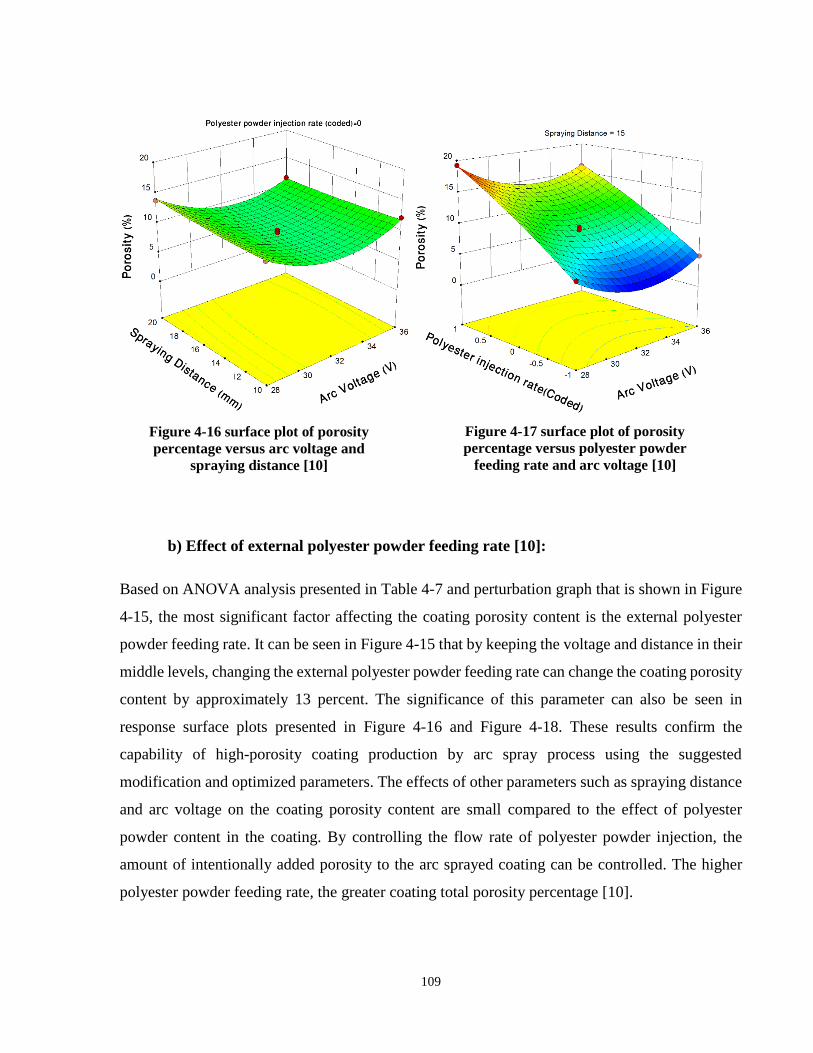
109
b) Effect of external polyester powder feeding rate [10]:
Based on ANOVA analysis presented in Table 4-7 and perturbation graph that is shown in Figure
4-15, the most significant factor affecting the coating porosity content is the external polyester
powder feeding rate. It can be seen in Figure 4-15 that by keeping the voltage and distance in their
middle levels, changing the external polyester powder feeding rate can change the coating porosity
content by approximately 13 percent. The significance of this parameter can also be seen in
response surface plots presented in Figure 4-16 and Figure 4-18. These results confirm the
capability of high-porosity coating production by arc spray process using the suggested
modification and optimized parameters. The effects of other parameters such as spraying distance
and arc voltage on the coating porosity content are small compared to the effect of polyester
powder content in the coating. By controlling the flow rate of polyester powder injection, the
amount of intentionally added porosity to the arc sprayed coating can be controlled. The higher
polyester powder feeding rate, the greater coating total porosity percentage [10].
Figure 4-16 surface plot of porosity
percentage versus arc voltage and
spraying distance [10]
Figure 4-17 surface plot of porosity
percentage versus polyester powder
feeding rate and arc voltage [10]
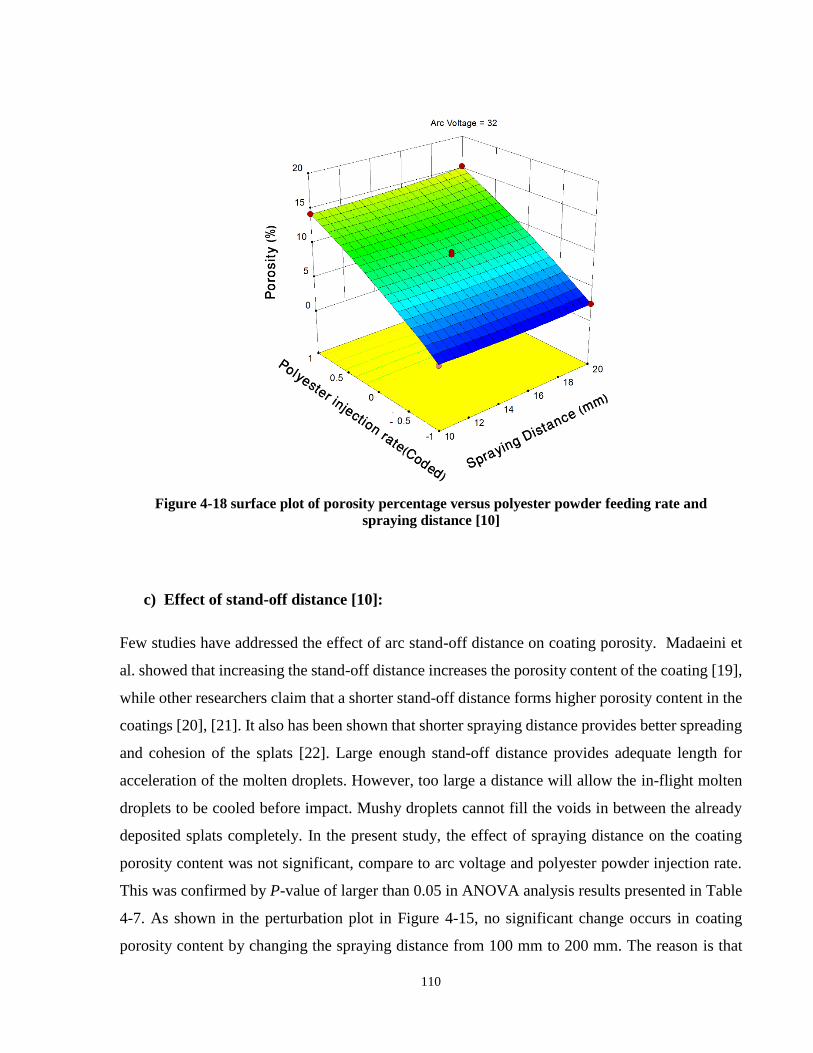
110
c) Effect of stand-off distance [10]:
Few studies have addressed the effect of arc stand-off distance on coating porosity. Madaeini et
al. showed that increasing the stand-off distance increases the porosity content of the coating [19],
while other researchers claim that a shorter stand-off distance forms higher porosity content in the
coatings [20], [21]. It also has been shown that shorter spraying distance provides better spreading
and cohesion of the splats [22]. Large enough stand-off distance provides adequate length for
acceleration of the molten droplets. However, too large a distance will allow the in-flight molten
droplets to be cooled before impact. Mushy droplets cannot fill the voids in between the already
deposited splats completely. In the present study, the effect of spraying distance on the coating
porosity content was not significant, compare to arc voltage and polyester powder injection rate.
This was confirmed by P-value of larger than 0.05 in ANOVA analysis results presented in Table
4-7. As shown in the perturbation plot in Figure 4-15, no significant change occurs in coating
porosity content by changing the spraying distance from 100 mm to 200 mm. The reason is that
Figure 4-18 surface plot of porosity percentage versus polyester powder feeding rate and
spraying distance [10]
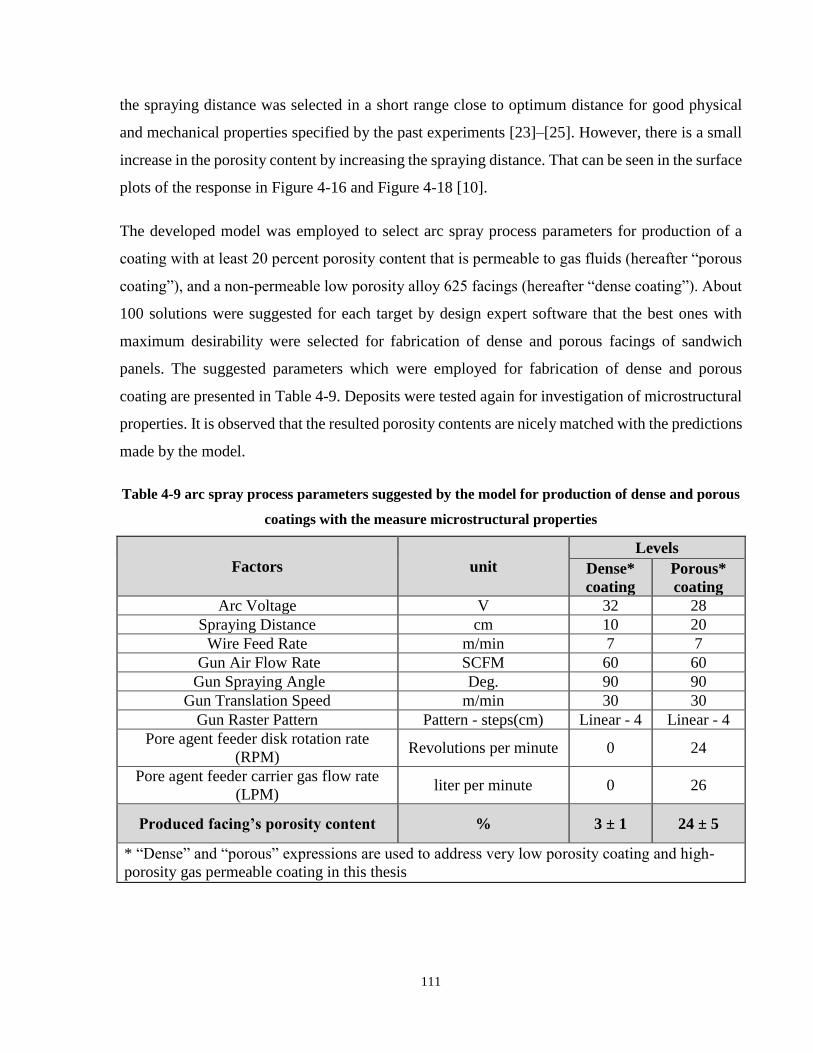
111
the spraying distance was selected in a short range close to optimum distance for good physical
and mechanical properties specified by the past experiments [23]–[25]. However, there is a small
increase in the porosity content by increasing the spraying distance. That can be seen in the surface
plots of the response in Figure 4-16 and Figure 4-18 [10].
The developed model was employed to select arc spray process parameters for production of a
coating with at least 20 percent porosity content that is permeable to gas fluids (hereafter “porous
coating”), and a non-permeable low porosity alloy 625 facings (hereafter “dense coating”). About
100 solutions were suggested for each target by design expert software that the best ones with
maximum desirability were selected for fabrication of dense and porous facings of sandwich
panels. The suggested parameters which were employed for fabrication of dense and porous
coating are presented in Table 4-9. Deposits were tested again for investigation of microstructural
properties. It is observed that the resulted porosity contents are nicely matched with the predictions
made by the model.
Table 4-9 arc spray process parameters suggested by the model for production of dense and porous
coatings with the measure microstructural properties
Factors unit
Levels
Dense*
coating
Porous*
coating
Arc Voltage V 32 28
Spraying Distance cm 10 20
Wire Feed Rate m/min 7 7
Gun Air Flow Rate SCFM 60 60
Gun Spraying Angle Deg. 90 90
Gun Translation Speed m/min 30 30
Gun Raster Pattern Pattern - steps(cm) Linear - 4 Linear - 4
Pore agent feeder disk rotation rate
(RPM) Revolutions per minute 0 24
Pore agent feeder carrier gas flow rate
(LPM) liter per minute 0 26
Produced facing’s porosity content % 3 ± 1 24 ± 5
* “Dense” and “porous” expressions are used to address very low porosity coating and high-
porosity gas permeable coating in this thesis
112
4.3.2 The effect of heat treatment [24]
It is commonly believed that annealing of thermally sprayed coatings leads to a better connection
between the individual splats in the coating and ultimately to better mechanical properties for the
skin [24], [26]. Diffusion bonding across the splats may occur during the annealing process at high
enough temperatures. This phenomenon leads to the formation of metallurgical bonds between the
splats and improves the overall cohesive strength of the skin. Godoy et al. showed that the residual
stresses stored in thermal spray coatings can be released by annealing, which eventually improves
the mechanical properties of these coatings [24], [27]. The presence of pores in the microstructure
of the coating is also a significant factor in determining coating mechanical strength. Pores can act
as stress concentrators that make crack formation and propagation easier inside the coating. It has
been observed by Azarmi et al. that annealing can eliminate fine pores inside the coating
microstructure and improves the mechanical properties [24], [28]. In addition to these findings, it
was observed from the SEM images that the oxide content of the coating could be reduced by
annealing the thermally sprayed coating in a vacuum furnace at high temperatures.
The mechanical performance of the thermally sprayed metallic foam core sandwich structures is
an important factor for engineering applications. Thermal spray coating deposited on the foam
substrate is considered as a structural element. The application of post-spraying heat treatment can
improve the mechanical behavior of the sandwich structures by increasing the coating ductility
and adhesion strength. This could result in reducing the danger of premature brittle failure in the
skin [24], [28], [29].
The microstructures of the dense alloy 625 coatings deposited on 40 ppi nickel foam and then
annealed at 900 ˚C for 1, 3 and 5 hours are shown in Figure 4-19 a to c respectively. Also Figure
4-20 a to c show the microstructure of the same alloy 625 coating annealed at 1100 ˚C for 1, 3 and
5 hours respectively [24]. From the SEM micrographs, higher annealing time and temperature lead
to a more uniform microstructure and less oxide content. The most important role of heat treatment
process can be expressed as breaking the network of oxide phase by diffusion of the neighbor
splats through thin oxide layers. Thiat can significantly improve the mechanical properties of the
arc sprayed facings. Also, increasing the annealing time and temperature can result in a small
decrease in the porosity content of the coating by eliminating tiny pores [28]. This effect was
negligible for the samples annealed at 900 ˚C, and small for the samples annealed at 1100 ˚C. The
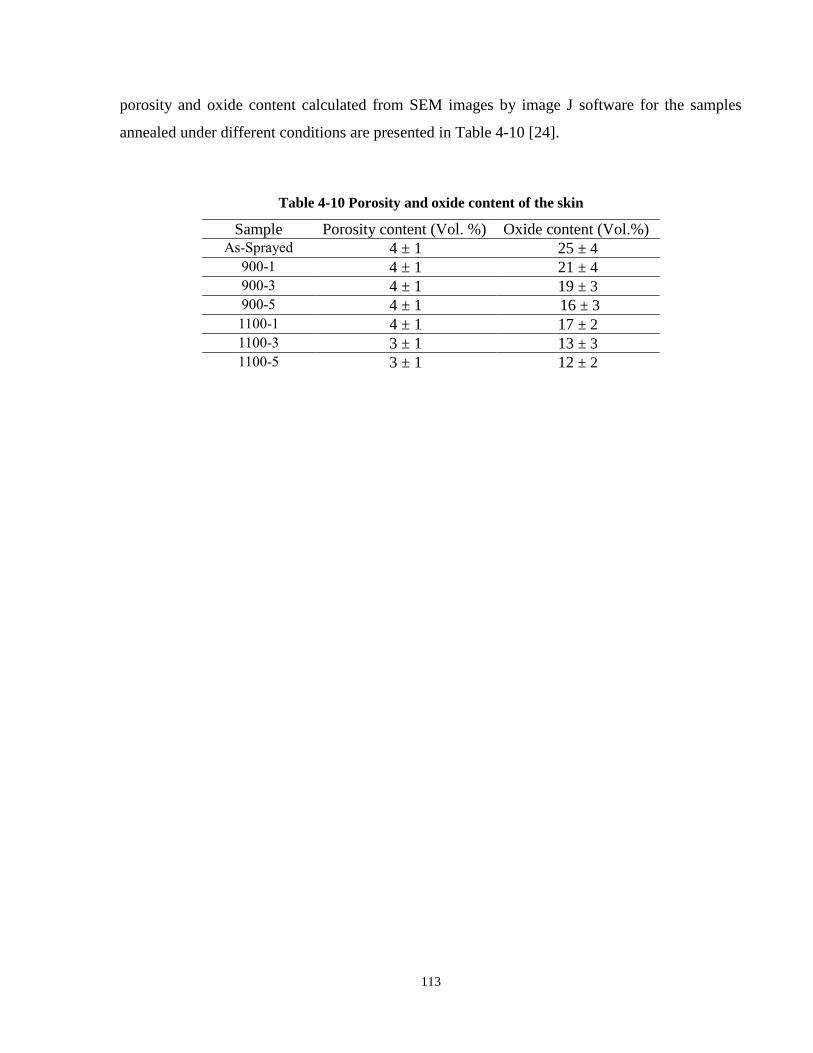
113
porosity and oxide content calculated from SEM images by image J software for the samples
annealed under different conditions are presented in Table 4-10 [24].
Table 4-10 Porosity and oxide content of the skin
Sample Porosity content (Vol. %) Oxide content (Vol.%) As-Sprayed 4 ± 1 25 ± 4
900-1 4 ± 1 21 ± 4 900-3 4 ± 1 19 ± 3 900-5 4 ± 1 16 ± 3 1100-1 4 ± 1 17 ± 2 1100-3 3 ± 1 13 ± 3 1100-5 3 ± 1 12 ± 2
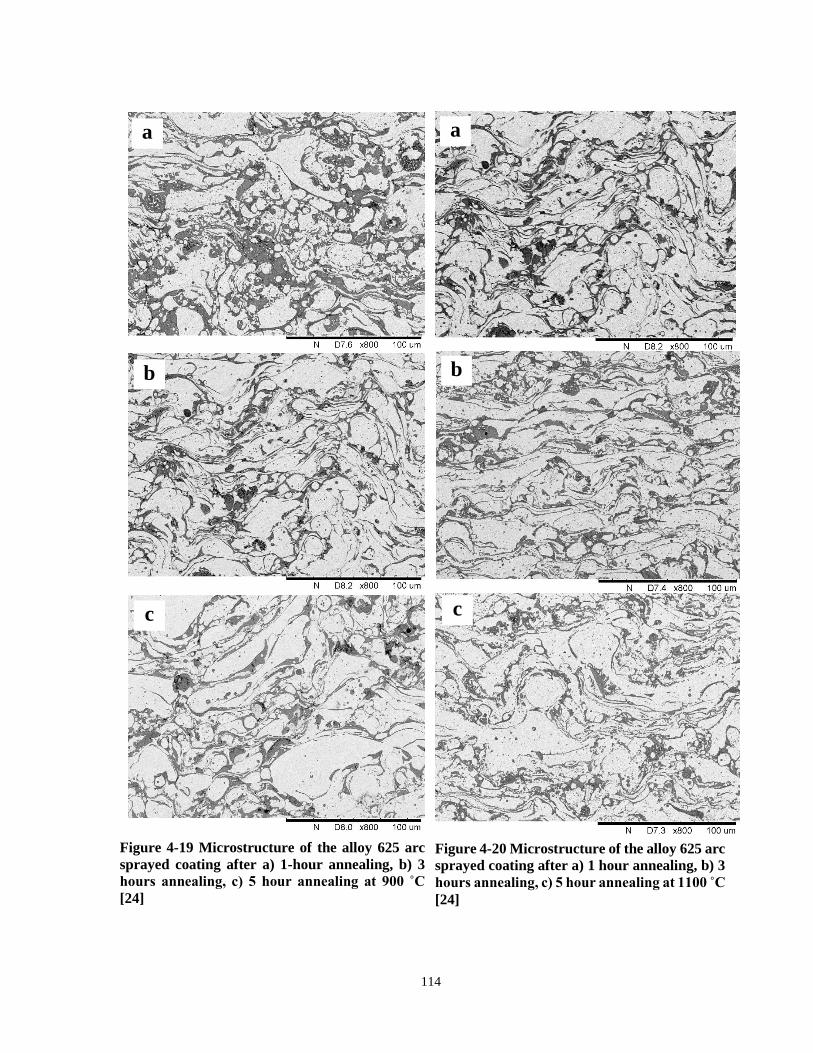
114
a
b
Figure 4-19 Microstructure of the alloy 625 arc
sprayed coating after a) 1-hour annealing, b) 3
hours annealing, c) 5 hour annealing at 900 ˚C
[24]
c
Figure 4-20 Microstructure of the alloy 625 arc
sprayed coating after a) 1 hour annealing, b) 3
hours annealing, c) 5 hour annealing at 1100 C
[24]
a
b
c
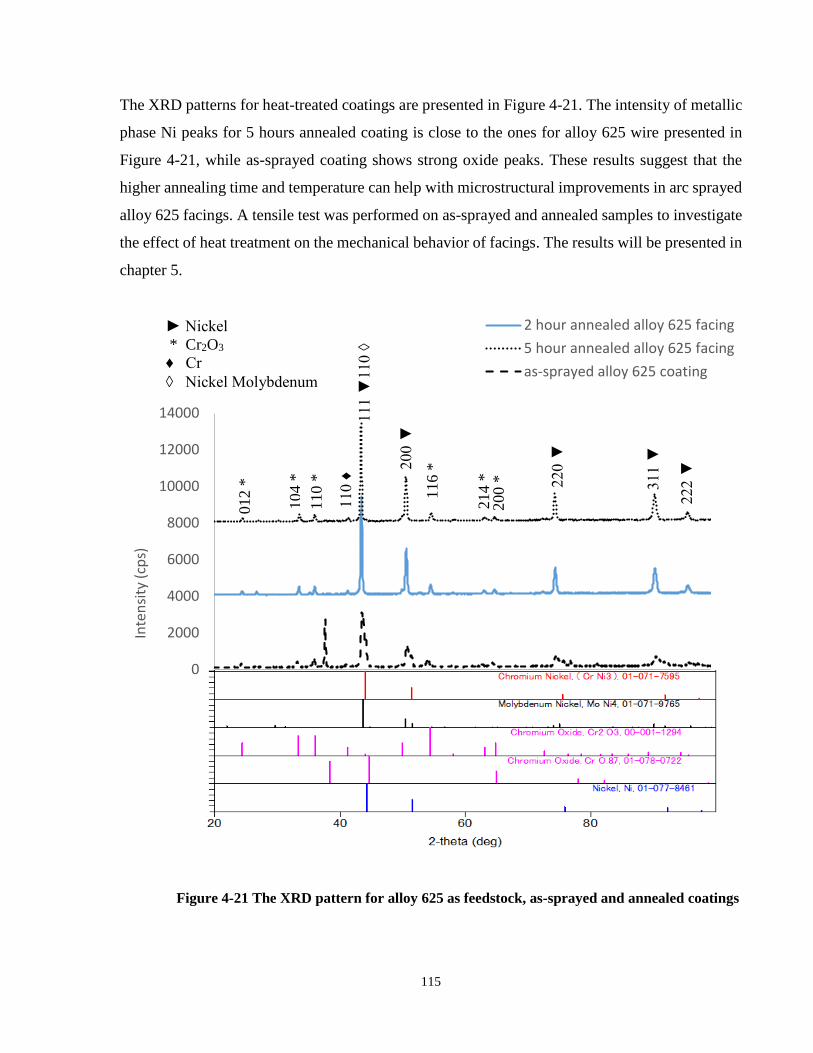
115
The XRD patterns for heat-treated coatings are presented in Figure 4-21. The intensity of metallic
phase Ni peaks for 5 hours annealed coating is close to the ones for alloy 625 wire presented in
Figure 4-21, while as-sprayed coating shows strong oxide peaks. These results suggest that the
higher annealing time and temperature can help with microstructural improvements in arc sprayed
alloy 625 facings. A tensile test was performed on as-sprayed and annealed samples to investigate
the effect of heat treatment on the mechanical behavior of facings. The results will be presented in
chapter 5.
0
2000
4000
6000
8000
10000
12000
14000
20 30 40 50 60 70 80 90 100
Inte
nsi
ty (
cps)
2-theta (deg)
2 hour annealed alloy 625 facing
5 hour annealed alloy 625 facing
as-sprayed alloy 625 coating
Figure 4-21 The XRD pattern for alloy 625 as feedstock, as-sprayed and annealed coatings
01
2 *
104 *
110 *
116 *
214 *
Nickel
* Cr2O3
♦ Cr
◊ Nickel Molybdenum 111
20
0
220
311
200 *
110 ♦
222
110 ◊
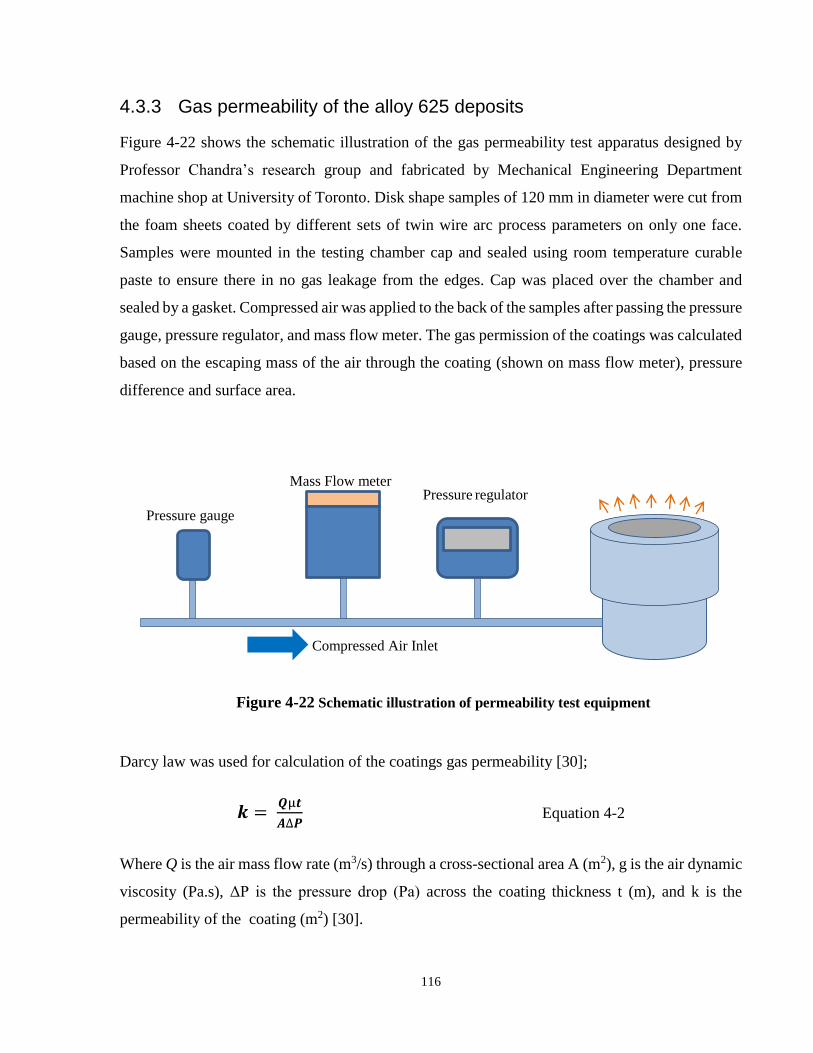
116
4.3.3 Gas permeability of the alloy 625 deposits
Figure 4-22 shows the schematic illustration of the gas permeability test apparatus designed by
Professor Chandra’s research group and fabricated by Mechanical Engineering Department
machine shop at University of Toronto. Disk shape samples of 120 mm in diameter were cut from
the foam sheets coated by different sets of twin wire arc process parameters on only one face.
Samples were mounted in the testing chamber cap and sealed using room temperature curable
paste to ensure there in no gas leakage from the edges. Cap was placed over the chamber and
sealed by a gasket. Compressed air was applied to the back of the samples after passing the pressure
gauge, pressure regulator, and mass flow meter. The gas permission of the coatings was calculated
based on the escaping mass of the air through the coating (shown on mass flow meter), pressure
difference and surface area.
Darcy law was used for calculation of the coatings gas permeability [30];
𝒌 = 𝑸µ𝒕
𝑨∆𝑷 Equation 4-2
Where Q is the air mass flow rate (m3/s) through a cross-sectional area A (m2), g is the air dynamic
viscosity (Pa.s), ΔP is the pressure drop (Pa) across the coating thickness t (m), and k is the
permeability of the coating (m2) [30].
Figure 4-22 Schematic illustration of permeability test equipment
Mass Flow meter Pressure regulator
Compressed Air Inlet
Pressure gauge
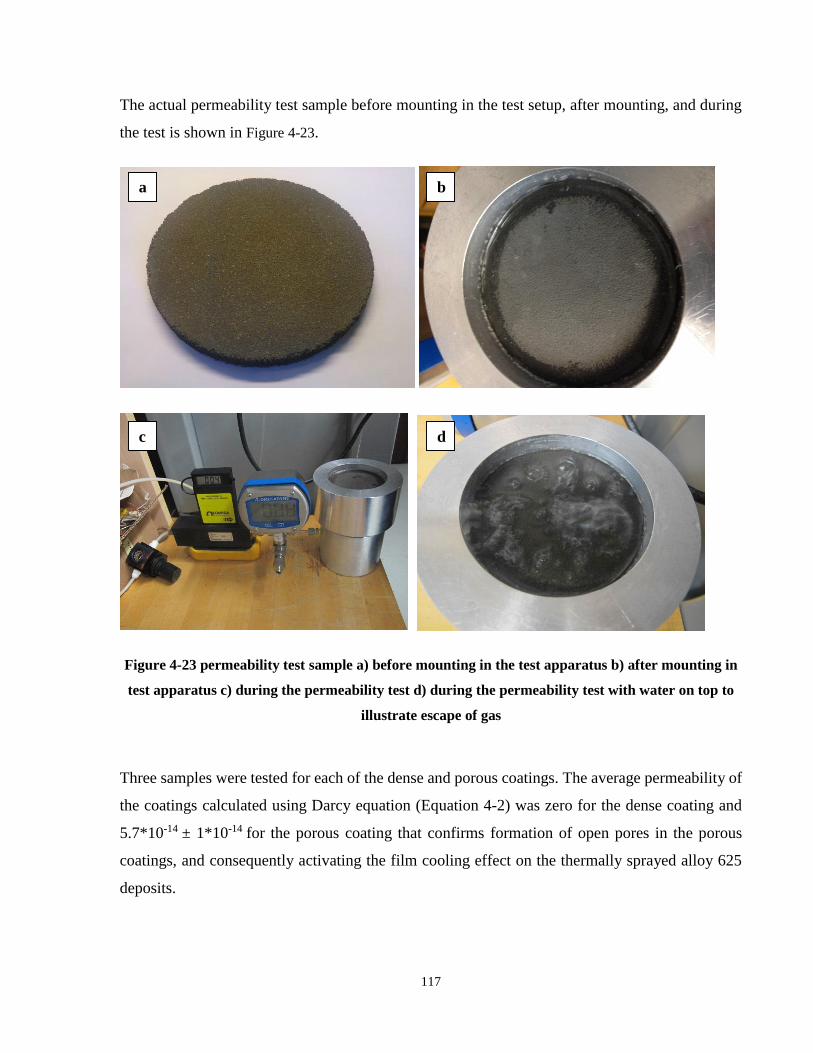
117
The actual permeability test sample before mounting in the test setup, after mounting, and during
the test is shown in Figure 4-23.
Figure 4-23 permeability test sample a) before mounting in the test apparatus b) after mounting in
test apparatus c) during the permeability test d) during the permeability test with water on top to
illustrate escape of gas
Three samples were tested for each of the dense and porous coatings. The average permeability of
the coatings calculated using Darcy equation (Equation 4-2) was zero for the dense coating and
5.7*10-14 ± 1*10-14 for the porous coating that confirms formation of open pores in the porous
coatings, and consequently activating the film cooling effect on the thermally sprayed alloy 625
deposits.
a b
c d
118
References
[1] H. Choe and D. C. Dunand, “Mechanical properties of oxidation-resistant Ni–Cr foams,”
Mater. Sci. Eng. A, vol. 384, no. 1–2, pp. 184–193, 2004.
[2] H. Choe and D. C. Dunand, “Synthesis, structure, and mechanical properties of Ni-Al and
Ni-Cr-Al superalloy foams,” Acta Mater., vol. 52, no. 5, pp. 1283–1295, 2004.
[3] L. Xiao, W. Song, H. Tang, Z. Zhu, J. Wang, and H. Wang, “High temperature compression
properties of open-cell Ni-20Cr foams produced by impregnation,” Mater. Des., vol. 85, pp.
47–53, 2015.
[4] A. Hodge and D. Dunand, “Synthesis of nickel–aluminide foams by pack-aluminization of
nickel foams,” Intermetallics, vol. 9, no. 7, pp. 581–589, 2001.
[5] F. Pedraza, M. Reffass, J. Balmain, G. Bonnet, and J. F. Dinhut, “High-temperature
oxidation behavior of low-energy high-flux nitrided Ni and Ni-20% Cr substrates,” Mater.
Sci. Eng. A, vol. 357, no. 1–2, pp. 355–364, 2003.
[6] O. Smorygo, V. Mikutski, A. Leonov, A. Marukovich, and Y. Vialiuha, “Nickel foams
with oxidation-resistant coatings formed by combustion synthesis,” Scr. Mater., vol. 58, no.
10, pp. 910–913, 2008.
[7] Q. Pang, G. H. Wu, D. L. Sun, Z. Y. Xiu, and L. T. Jiang, “A dual-layer Ce–Cr/Al oxidation
resistant coating for 3D open-cell nickel based foams by a two-step pack cementation,”
Mater. Sci. Eng. A, vol. 568, pp. 228–238, 2013.
[8] G. Calvarin, R. Molins, and a. M. Huntz, “Oxidation mechanism of Ni—20Cr foils and its
relation to the oxide-scale microstructure,” Oxid. Met., vol. 53, no. 1, pp. 25–48, 2000.
[9] W. Tillmann, M. Abdulgader, L. Hagen, and J. Nellesen, “Metal matrix composites
deposition in twin wire arc spraying utilizing an external powder injection composition,” J.
Therm. Spray Technol., vol. 23, no. 1–2, pp. 40–50, 2013.
[10] S. Salavati, , T.W. Coyle, J. Mostaghimi, “Twin wire arc spray process modification for
production of porous metallic coatings,” Surf. Coat. Technol., vol. 286, pp. 16-24, 2016.
119
[11] M. Design and A. Hall, “Microstructural characterization of high velocity oxy-fuel sprayed
coatings of Inconel 625,” J. of Mater. Sci., vol. 32, no.4, pp. 863–872, 1997.
[12] F. Azarmi and C. P. Leither, “Microstructural formation during wire arc spraying of alloy
625 on wrought alloy 625 substrate,” Metall. Mater. Trans. A, vol. 43, no. 12, pp. 4703–
4710, 2012.
[13] H. Öktem, T. Erzurumlu, and H. Kurtaran, “Application of response surface methodology
in the optimization of cutting conditions for surface roughness,” J. Mater. Process.
Technol., vol. 170, no. 1–2, pp. 11–16, 2005.
[14] C. S. Ramachandran, V. Balasubramanian, and P. V. Ananthapadmanabhan,
“Multiobjective optimization of atmospheric plasma spray process parameters to deposit
yttria-stabilized zirconia coatings using response surface methodology,” J. Therm. Spray
Technol., vol. 20, no. 3, pp. 590–607, 2011.
[15] A. S. Shahi and S. Pandey, “Modelling of the effects of welding conditions on dilution of
stainless steel claddings produced by gas metal arc welding procedures,” J. Mater. Process.
Technol., vol. 196, no. 1–3, pp. 339–344, 2008.
[16] S. Kumar, P. Kumar, and H. S. Shan, “Effect of evaporative pattern casting process
parameters on the surface roughness of Al–7% Si alloy castings,” J. Mater. Process.
Technol., vol. 182, no. 1–3, pp. 615–623, 2007.
[17] K. Cooke, G. Oliver, V. Buchanan, and N. Palmer, “Optimisation of the electric wire arc-
spraying process for improved wear resistance of sugar mill roller shells,” Surf. Coatings
Technol., vol. 202, no. 1, pp. 185–188, 2007.
[18] R. Rezaey, S. Salavati, L. Pershin, T. Coyle, S. Chandra, and J. Mostaghimi, “Fabrication
of wire mesh heat exchangers for waste heat recovery using wire-arc spraying,” In
International Thermal Spray Conference Proc., 2013, pp. 103–108.
[19] S. S. Madaeni, M. E. Aalami-Aleagha, and P. Daraei, “Preparation and characterization of
metallic membrane using wire arc spraying,” J. Memb. Sci., vol. 320, no. 1–2, pp. 541–548,
2008.
120
[20] A. Kucuk, C. C. Berndt, U. Senturk, R. S. Lima, and C. R. C. Lima, “Influence of plasma
spray parameters on mechanical properties of yttria stabilized zirconia coatings. I: Four
point bend test,” Mater. Sci. Eng. A, vol. 284, no. 1–2, pp. 29–40, 2000.
[21] D. Thirumalaikumarasamy, K. Shanmugam, and V. Balasubramanian, “Influences of
atmospheric plasma spraying parameters on the porosity level of alumina coating on AZ31B
magnesium alloy using response surface methodology,” Prog. Nat. Sci. Mater. Int., vol. 22,
no. 5, pp. 468–479, 2012.
[22] J. G. La Barbera-Sosa, Y. Y. Santana, E. Moreno, N. Cuadrado, J. Caro, P. O. Renault, E.
Le Bourhis, M. H. Staia, and E. S. Puchi-Cabrera, “Effect of spraying distance on the
microstructure and mechanical properties of a Colmonoy 88 alloy deposited by HVOF
thermal spraying,” Surf. Coatings Technol., vol. 205, no. 7, pp. 1799–1806, 2010.
[23] S. Salavati, L. Pershin, T. W. Coyle, and J. Mostaghimi, “Effect of porosity content of arc-
sprayed alloy 625 skins on the flexural behavior of nickel foam core sandwich structures,”
J. Therm. Spray Technol., vol. 24, no. 1, pp. 10–13, 2014.
[24] S. Salavati, T. W. Coyle, and J. Mostaghimi, “The effect of heat treatment on mechanical
properties of thermally sprayed sandwich structure beams,” J. Therm. Spray Technol., vol.
25, no.1, pp. 105-112, 2016.
[25] S. Salavati, T. W. Coyle, and J. Mostaghimi, “Optimization of grit-blasting process
parameters for production of dense coatings on open pores metallic foam substrates using
statistical methods,” J. Therm. Spray Technol., vol. 24, no. 7, pp. 1246–1255, 2015.
[26] H. R. S. Jazi, T. W. Coyle, and J. Mostaghimi, “Understanding grain growth and pore
elimination in vacuum-plasma-sprayed titanium alloy,” Metall. Mater. Trans. A, vol. 38,
no. 3, pp. 476–484, 2007.
[27] C. Godoy, E. A. Souza, M. M. Lima, and J. C. A. Batista, “Correlation between residual
stresses and adhesion of plasma sprayed coatings: Effects of a post-annealing treatment,”
Thin Solid Films, vol. 420–421, pp. 438–445, 2002.
[28] F. Azarmi, T. Coyle, and J. Mostaghimi, “Young’s modulus measurement and study of the
121
relationship between mechanical properties and microstructure of air plasma sprayed alloy
625,” Surf. Coatings Technol., vol. 203, no. 8, pp. 1045–1054, 2009.
[29] P. J. Callus and C. C. Berndt, “Relationships between the mode II fracture toughness and
microstructure of thermal spray coatings,” Surf. Coatings Technol., vol. 114, no. 2–3, pp.
114–128, 1999.
[30] K. Wittmann-Ténèze, N. Caron, S. Alexandre, “Gas Permeability of Porous Plasma-
Sprayed Coatings,” J. Therm. Spray Technol., vol. 17, no. 5, pp. 902-907, 2008
122
Chapter 5 Mechanical Behaviour
5.1 Introduction
Most of the sandwich structure applications are subject to bending loads. Although not all the high-
temperature metallic foam core sandwich structures are subject to significant mechanical loads,
the flexural stiffness of the sandwich panels is often important and indicates the level of integrity
of these structures.
In this study, the mechanical behaviour of metallic foam core sandwich structures is investigated
using several methods. First, each constituent’s mechanical properties are studied analytically and
experimentally. The elastic modulus of the foam core is investigated using available theoretical
models, followed by the presentation of the foam core compression test results. The yield strength
and elastic modulus of alloy 625 facings produced by different sets of arc spray process parameters,
and various heat treatment procedures, are investigated by tensile testing of freestanding facings,
and compared with the available models. Finally, the overall mechanical performance of the arc
sprayed sandwich panels are studied under four-point bending, and their measured flexural rigidity
compared to analytical and FEM models.
Failure mode maps were generated from the available failure load equations using the
experimentally measured parameters for the core and faces to predict the dominant initial failure
mechanism for the sandwich panels. The results of visual inspection of sandwich panels during
the four-point bending test were included in the generated maps to verify the predictions.
5.2 Mechanical behaviour of foam
5.2.1 Analytical model
As discussed in chapter 2, the elastic modulus of the foam is calculated from the slope of the
compressive apparent stress-stain curve in its linear region. The elastic modulus of the foam can
be modeled through a dimensional analysis of strut bending deflection. A micromechanical model
has been developed by Gibson and Ashby [1], assuming that the mechanical properties of the foam
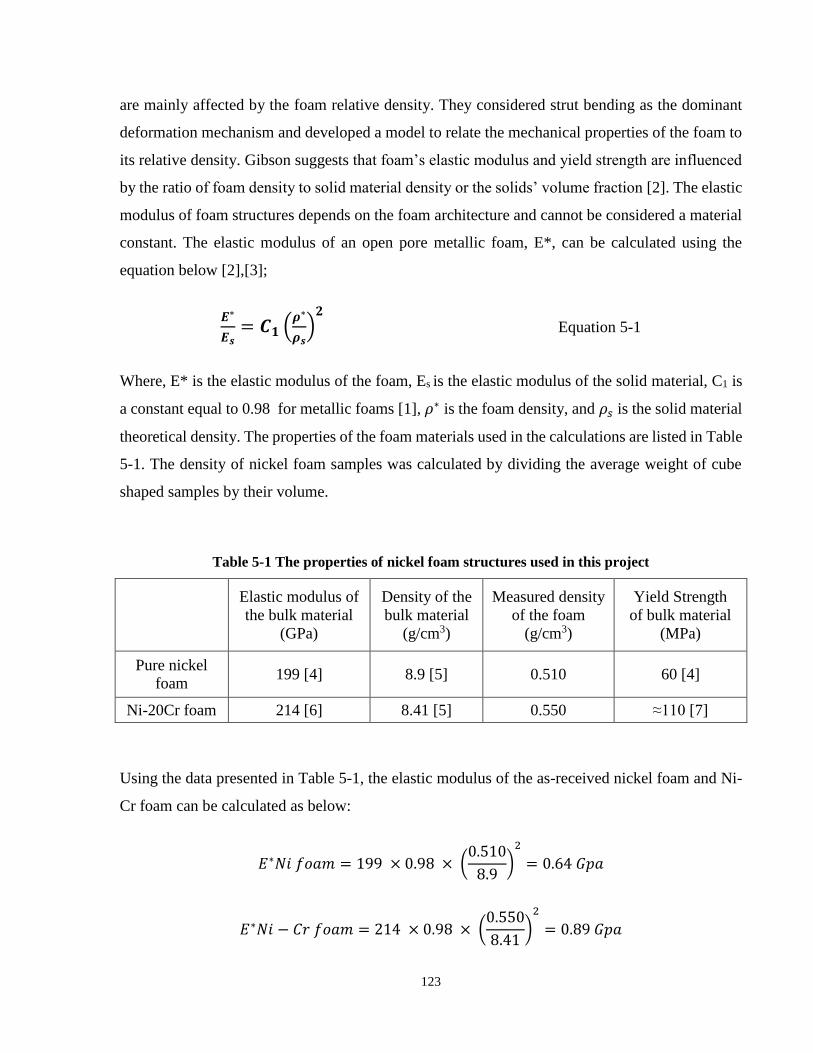
123
are mainly affected by the foam relative density. They considered strut bending as the dominant
deformation mechanism and developed a model to relate the mechanical properties of the foam to
its relative density. Gibson suggests that foam’s elastic modulus and yield strength are influenced
by the ratio of foam density to solid material density or the solids’ volume fraction [2]. The elastic
modulus of foam structures depends on the foam architecture and cannot be considered a material
constant. The elastic modulus of an open pore metallic foam, E*, can be calculated using the
equation below [2],[3];
𝑬∗
𝑬𝒔= 𝑪𝟏 (
𝝆∗
𝝆𝒔)
𝟐
Equation 5-1
Where, E* is the elastic modulus of the foam, Es is the elastic modulus of the solid material, C1 is
a constant equal to 0.98 for metallic foams [1], 𝜌∗ is the foam density, and 𝜌𝑠 is the solid material
theoretical density. The properties of the foam materials used in the calculations are listed in Table
5-1. The density of nickel foam samples was calculated by dividing the average weight of cube
shaped samples by their volume.
Table 5-1 The properties of nickel foam structures used in this project
Elastic modulus of
the bulk material
(GPa)
Density of the
bulk material
)3(g/cm
Measured density
of the foam
(g/cm3)
Yield Strength
of bulk material
(MPa)
Pure nickel
foam 199 [4] 8.9 [5] 0.510 60 [4]
Ni-20Cr foam 214 [6] 8.41 [5] 0.550 ≈110 [7]
Using the data presented in Table 5-1, the elastic modulus of the as-received nickel foam and Ni-
Cr foam can be calculated as below:
𝐸∗𝑁𝑖 𝑓𝑜𝑎𝑚 = 199 × 0.98 × (0.510
8.9)
2
= 0.64 𝐺𝑝𝑎
𝐸∗𝑁𝑖 − 𝐶𝑟 𝑓𝑜𝑎𝑚 = 214 × 0.98 × (0.550
8.41)
2
= 0.89 𝐺𝑝𝑎
124
Gibson and Ashby calculated the 0.2% offset yield strength of the foam using a similar model;
𝝈 𝟎.𝟐%∗ = 𝜶𝟏
𝟏
𝟐(
𝝆∗
𝝆𝒔)
𝟑
𝟐 𝝈𝟎.𝟐% Equation 5-2
Where σ* 0.2% is the foam yield strength, 𝛼1 is a dimensionless geometrical parameter (≈ 1.5 for
nickel foam [8]), and σ0.2% is the yield strength of bulk material (Table 5 1). The yield strength of
the nickel and Ni-Cr foams can be calculated using Equation 5-2 as below:
𝜎 0.2%∗ 𝑁𝑖𝑐𝑘𝑒𝑙 𝑓𝑜𝑎𝑚 = 1.5 ×
1
2× (
0.510
8.9)
32
× 60 = 0.617 𝑀𝑃𝑎
𝜎 0.2%∗ 𝑁𝑖 − 𝐶𝑟 𝑓𝑜𝑎𝑚 = 1.5 ×
1
2× (
0.550
8.41)
32
× 110 = 1.3 𝑀𝑃𝑎
It was assumed that the alloyed foam has a uniform distribution of Cr throughout the foam
structure, and thus the effect of homogenizing time, after the alloying process, has not been
considered in analytical studies of the foam mechanical properties.
5.2.2 Compression test results
Compression test results for as-received nickel foam and Ni-Cr foam samples (as chromized, after
2 hours annealing, and after 5 hours annealing) are presented in Figure 5-1. The apparent stress
was calculated by dividing the applied load by the initial specimen cross-sectional area. It can be
seen that all the foam samples showed a behaviour typical of ductile metallic foam structures [9];
a linear elastic region at low stresses, yield at a relatively higher stress, followed by a long plastic
region with decreasing stress, and finally the densification region with increasing stress due to
interaction of collapsed strut walls. It is clearly seen that the Ni-Cr foam has a higher yield strength
than pure nickel foam. Also, annealing of the chromized foam improves its mechanical properties
(higher collapse stress and higher elastic modulus).
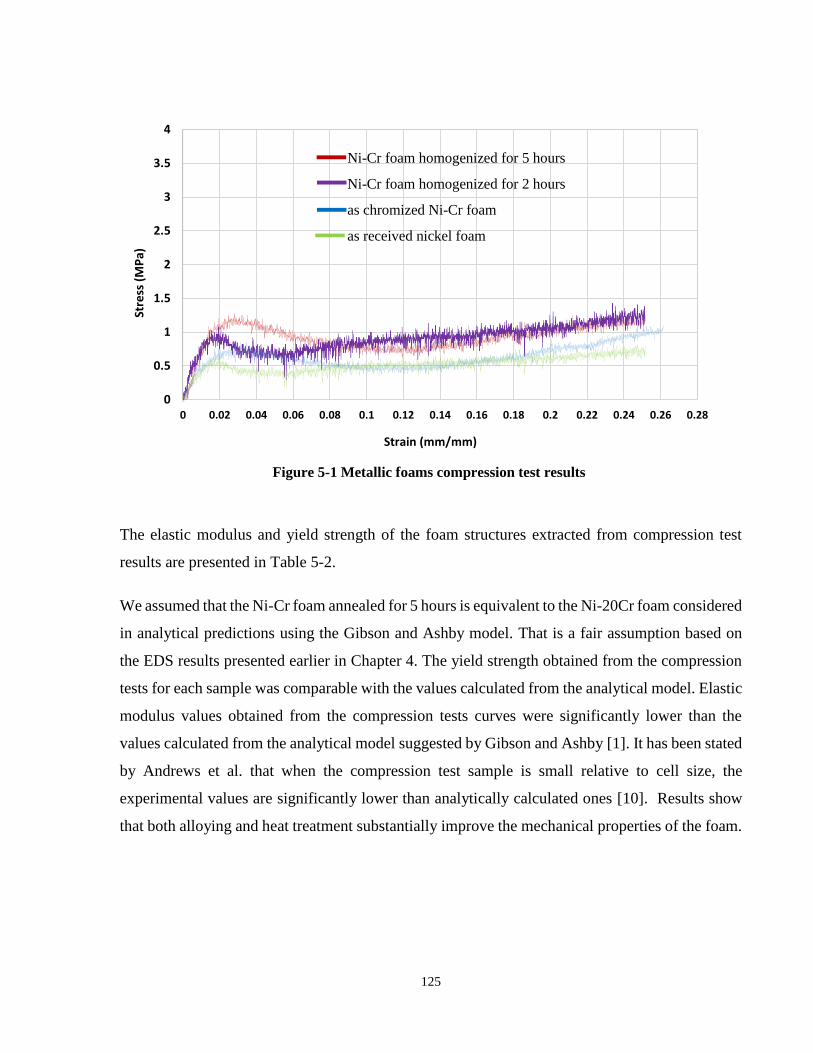
125
The elastic modulus and yield strength of the foam structures extracted from compression test
results are presented in Table 5-2.
We assumed that the Ni-Cr foam annealed for 5 hours is equivalent to the Ni-20Cr foam considered
in analytical predictions using the Gibson and Ashby model. That is a fair assumption based on
the EDS results presented earlier in Chapter 4. The yield strength obtained from the compression
tests for each sample was comparable with the values calculated from the analytical model. Elastic
modulus values obtained from the compression tests curves were significantly lower than the
values calculated from the analytical model suggested by Gibson and Ashby [1]. It has been stated
by Andrews et al. that when the compression test sample is small relative to cell size, the
experimental values are significantly lower than analytically calculated ones [10]. Results show
that both alloying and heat treatment substantially improve the mechanical properties of the foam.
0
0.5
1
1.5
2
2.5
3
3.5
4
0 0.02 0.04 0.06 0.08 0.1 0.12 0.14 0.16 0.18 0.2 0.22 0.24 0.26 0.28
Stre
ss (
MP
a)
Strain (mm/mm)
Ni-Cr foam homogenized for 5 hours
Ni-Cr foam homogenized for 2 hours
as chromized Ni-Cr foam
as received nickel foam
Figure 5-1 Metallic foams compression test results
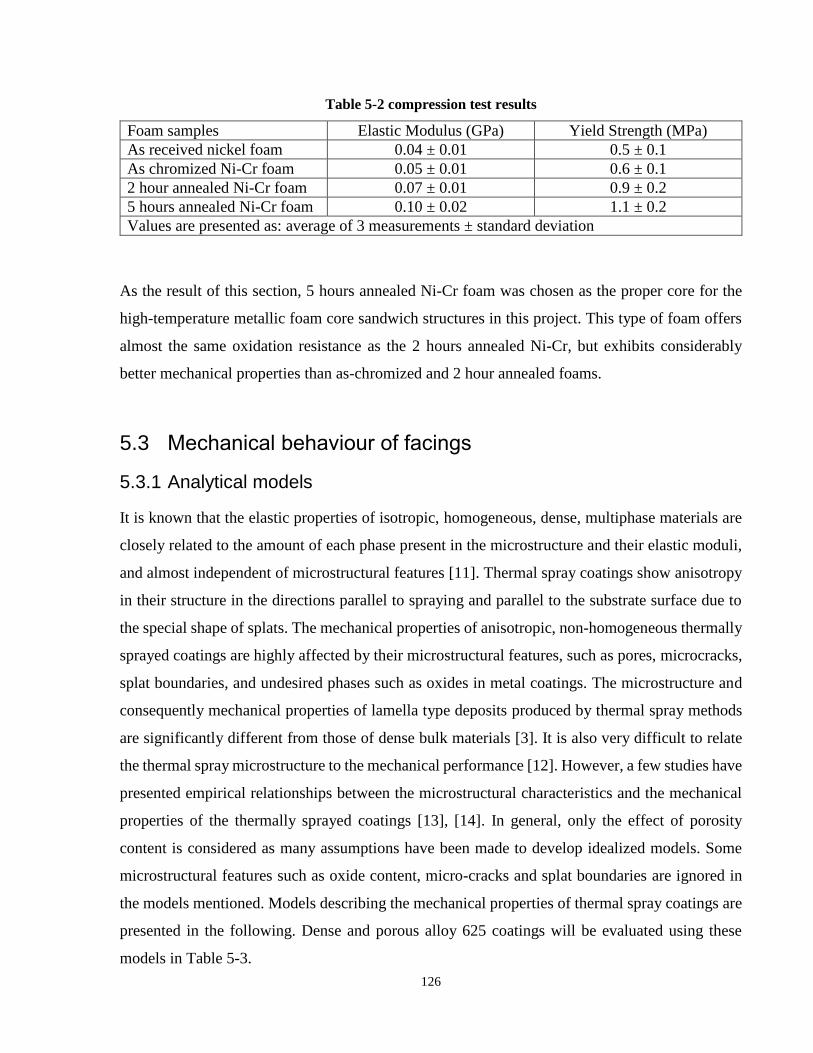
126
Table 5-2 compression test results
Foam samples Elastic Modulus (GPa) Yield Strength (MPa)
As received nickel foam 0.04 ± 0.01 0.5 ± 0.1
As chromized Ni-Cr foam 0.05 ± 0.01 0.6 ± 0.1
2 hour annealed Ni-Cr foam 0.07 ± 0.01 0.9 ± 0.2
5 hours annealed Ni-Cr foam 0.10 ± 0.02 1.1 ± 0.2
Values are presented as: average of 3 measurements ± standard deviation
As the result of this section, 5 hours annealed Ni-Cr foam was chosen as the proper core for the
high-temperature metallic foam core sandwich structures in this project. This type of foam offers
almost the same oxidation resistance as the 2 hours annealed Ni-Cr, but exhibits considerably
better mechanical properties than as-chromized and 2 hour annealed foams.
5.3 Mechanical behaviour of facings
5.3.1 Analytical models
It is known that the elastic properties of isotropic, homogeneous, dense, multiphase materials are
closely related to the amount of each phase present in the microstructure and their elastic moduli,
and almost independent of microstructural features [11]. Thermal spray coatings show anisotropy
in their structure in the directions parallel to spraying and parallel to the substrate surface due to
the special shape of splats. The mechanical properties of anisotropic, non-homogeneous thermally
sprayed coatings are highly affected by their microstructural features, such as pores, microcracks,
splat boundaries, and undesired phases such as oxides in metal coatings. The microstructure and
consequently mechanical properties of lamella type deposits produced by thermal spray methods
are significantly different from those of dense bulk materials [3]. It is also very difficult to relate
the thermal spray microstructure to the mechanical performance [12]. However, a few studies have
presented empirical relationships between the microstructural characteristics and the mechanical
properties of the thermally sprayed coatings [13], [14]. In general, only the effect of porosity
content is considered as many assumptions have been made to develop idealized models. Some
microstructural features such as oxide content, micro-cracks and splat boundaries are ignored in
the models mentioned. Models describing the mechanical properties of thermal spray coatings are
presented in the following. Dense and porous alloy 625 coatings will be evaluated using these
models in Table 5-3.
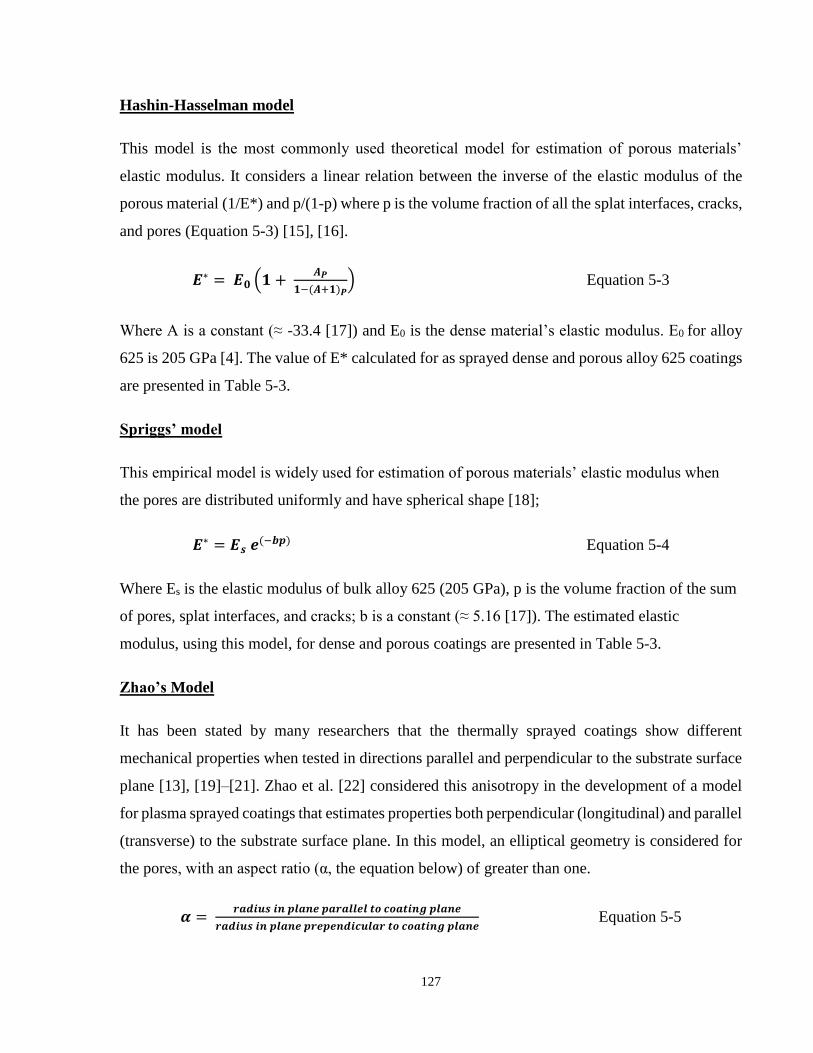
127
Hashin-Hasselman model
This model is the most commonly used theoretical model for estimation of porous materials’
elastic modulus. It considers a linear relation between the inverse of the elastic modulus of the
porous material (1/E*) and p/(1-p) where p is the volume fraction of all the splat interfaces, cracks,
and pores (Equation 5-3) [15], [16].
𝑬∗ = 𝑬𝟎 (𝟏 + 𝑨𝑷
𝟏−(𝑨+𝟏)𝑷) Equation 5-3
Where A is a constant (≈ -33.4 [17]) and E0 is the dense material’s elastic modulus. E0 for alloy
625 is 205 GPa [4]. The value of E* calculated for as sprayed dense and porous alloy 625 coatings
are presented in Table 5-3.
Spriggs’ model
This empirical model is widely used for estimation of porous materials’ elastic modulus when
the pores are distributed uniformly and have spherical shape [18];
𝑬∗ = 𝑬𝒔 𝒆(−𝒃𝒑) Equation 5-4
Where Es is the elastic modulus of bulk alloy 625 (205 GPa), p is the volume fraction of the sum
of pores, splat interfaces, and cracks; b is a constant (≈ 5.16 [17]). The estimated elastic
modulus, using this model, for dense and porous coatings are presented in Table 5-3.
Zhao’s Model
It has been stated by many researchers that the thermally sprayed coatings show different
mechanical properties when tested in directions parallel and perpendicular to the substrate surface
plane [13], [19]–[21]. Zhao et al. [22] considered this anisotropy in the development of a model
for plasma sprayed coatings that estimates properties both perpendicular (longitudinal) and parallel
(transverse) to the substrate surface plane. In this model, an elliptical geometry is considered for
the pores, with an aspect ratio (α, the equation below) of greater than one.
𝜶 = 𝒓𝒂𝒅𝒊𝒖𝒔 𝒊𝒏 𝒑𝒍𝒂𝒏𝒆 𝒑𝒂𝒓𝒂𝒍𝒍𝒆𝒍 𝒕𝒐 𝒄𝒐𝒂𝒕𝒊𝒏𝒈 𝒑𝒍𝒂𝒏𝒆
𝒓𝒂𝒅𝒊𝒖𝒔 𝒊𝒏 𝒑𝒍𝒂𝒏𝒆 𝒑𝒓𝒆𝒑𝒆𝒏𝒅𝒊𝒄𝒖𝒍𝒂𝒓 𝒕𝒐 𝒄𝒐𝒂𝒕𝒊𝒏𝒈 𝒑𝒍𝒂𝒏𝒆 Equation 5-5
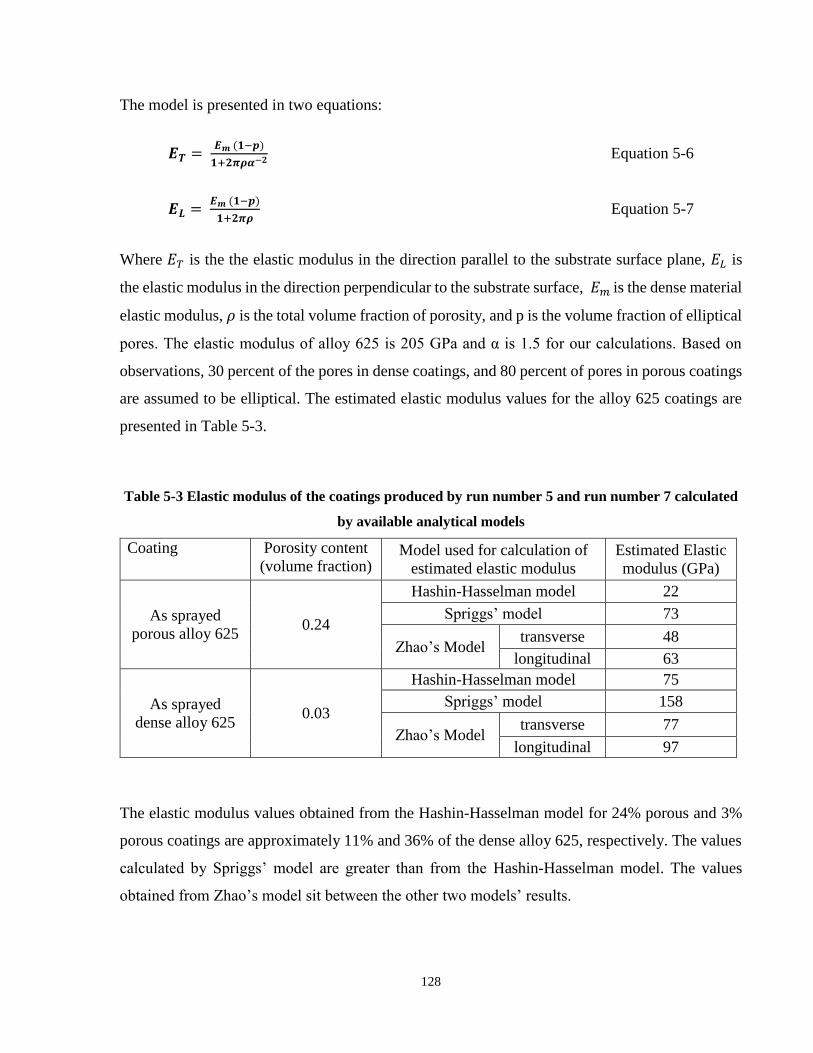
128
The model is presented in two equations:
𝑬𝑻 = 𝑬𝒎 (𝟏−𝒑)
𝟏+𝟐𝝅𝝆𝜶−𝟐 Equation 5-6
𝑬𝑳 = 𝑬𝒎 (𝟏−𝒑)
𝟏+𝟐𝝅𝝆 Equation 5-7
Where 𝐸𝑇 is the the elastic modulus in the direction parallel to the substrate surface plane, 𝐸𝐿 is
the elastic modulus in the direction perpendicular to the substrate surface, 𝐸𝑚 is the dense material
elastic modulus, 𝜌 is the total volume fraction of porosity, and p is the volume fraction of elliptical
pores. The elastic modulus of alloy 625 is 205 GPa and α is 1.5 for our calculations. Based on
observations, 30 percent of the pores in dense coatings, and 80 percent of pores in porous coatings
are assumed to be elliptical. The estimated elastic modulus values for the alloy 625 coatings are
presented in Table 5-3.
Table 5-3 Elastic modulus of the coatings produced by run number 5 and run number 7 calculated
by available analytical models
Coating Porosity content
(volume fraction) Model used for calculation of
estimated elastic modulus
Estimated Elastic
modulus (GPa)
As sprayed
porous alloy 625 0.24
Hashin-Hasselman model 22
Spriggs’ model 73
Zhao’s Model transverse 48
longitudinal 63
As sprayed
dense alloy 625 0.03
Hashin-Hasselman model 75
Spriggs’ model 158
Zhao’s Model transverse 77
longitudinal 97
The elastic modulus values obtained from the Hashin-Hasselman model for 24% porous and 3%
porous coatings are approximately 11% and 36% of the dense alloy 625, respectively. The values
calculated by Spriggs’ model are greater than from the Hashin-Hasselman model. The values
obtained from Zhao’s model sit between the other two models’ results.
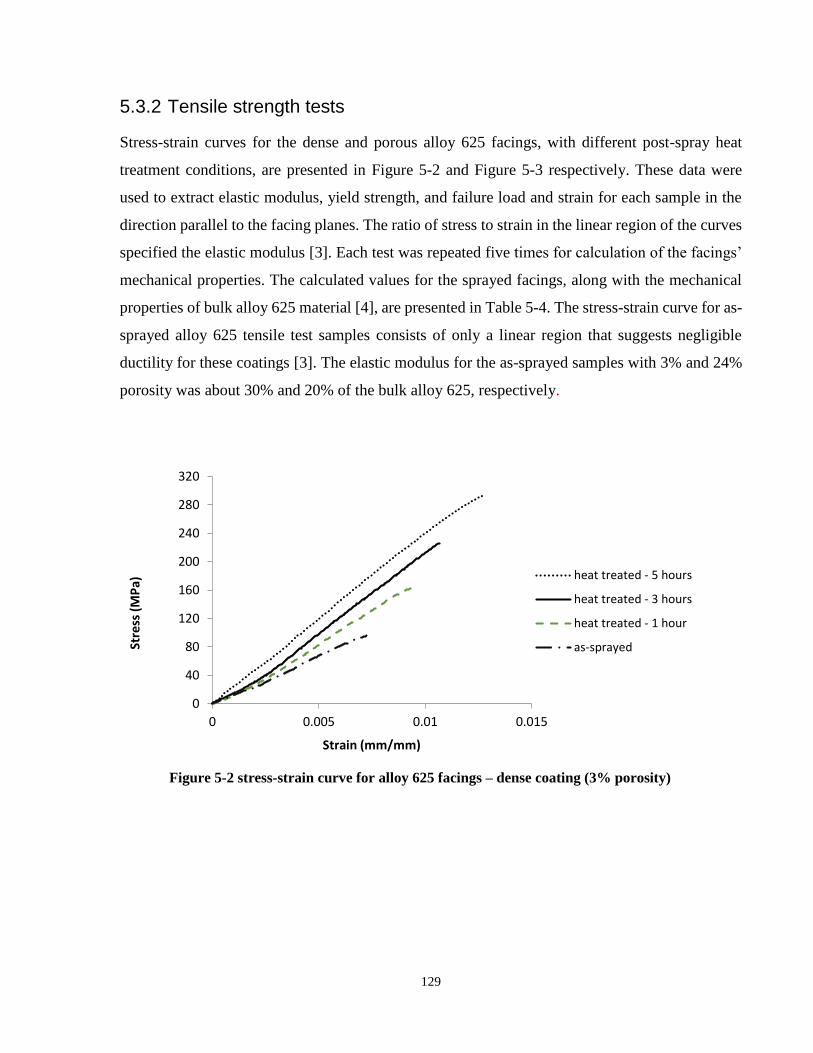
129
5.3.2 Tensile strength tests
Stress-strain curves for the dense and porous alloy 625 facings, with different post-spray heat
treatment conditions, are presented in Figure 5-2 and Figure 5-3 respectively. These data were
used to extract elastic modulus, yield strength, and failure load and strain for each sample in the
direction parallel to the facing planes. The ratio of stress to strain in the linear region of the curves
specified the elastic modulus [3]. Each test was repeated five times for calculation of the facings’
mechanical properties. The calculated values for the sprayed facings, along with the mechanical
properties of bulk alloy 625 material [4], are presented in Table 5-4. The stress-strain curve for as-
sprayed alloy 625 tensile test samples consists of only a linear region that suggests negligible
ductility for these coatings [3]. The elastic modulus for the as-sprayed samples with 3% and 24%
porosity was about 30% and 20% of the bulk alloy 625, respectively.
Figure 5-2 stress-strain curve for alloy 625 facings – dense coating (3% porosity)
0
40
80
120
160
200
240
280
320
0 0.005 0.01 0.015
Stre
ss (
MP
a)
Strain (mm/mm)
heat treated - 5 hours
heat treated - 3 hours
heat treated - 1 hour
as-sprayed
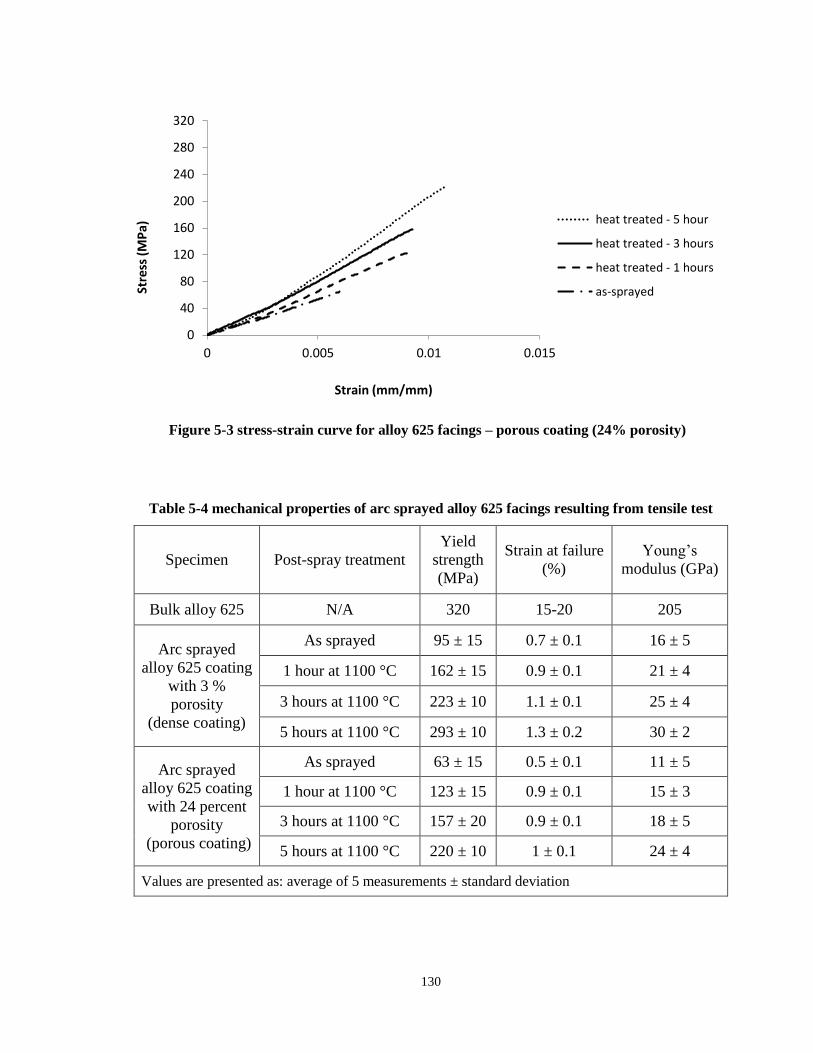
130
Table 5-4 mechanical properties of arc sprayed alloy 625 facings resulting from tensile test
Specimen Post-spray treatment
Yield
strength
(MPa)
Strain at failure
(%)
Young’s
modulus (GPa)
Bulk alloy 625 N/A 320 15-20 205
Arc sprayed
alloy 625 coating
with 3 %
porosity
(dense coating)
As sprayed 95 ± 15 0.7 ± 0.1 16 ± 5
1 hour at 1100 °C 162 ± 15 0.9 ± 0.1 21 ± 4
3 hours at 1100 °C 223 ± 10 1.1 ± 0.1 25 ± 4
5 hours at 1100 °C 293 ± 10 1.3 ± 0.2 30 ± 2
Arc sprayed
alloy 625 coating
with 24 percent
porosity
(porous coating)
As sprayed 63 ± 15 0.5 ± 0.1 11 ± 5
1 hour at 1100 °C 123 ± 15 0.9 ± 0.1 15 ± 3
3 hours at 1100 °C 157 ± 20 0.9 ± 0.1 18 ± 5
5 hours at 1100 °C 220 ± 10 1 ± 0.1 24 ± 4
Values are presented as: average of 5 measurements ± standard deviation
Figure 5-3 stress-strain curve for alloy 625 facings – porous coating (24% porosity)
0
40
80
120
160
200
240
280
320
0 0.005 0.01 0.015
Stre
ss (
MP
a)
Strain (mm/mm)
heat treated - 5 hour
heat treated - 3 hours
heat treated - 1 hours
as-sprayed
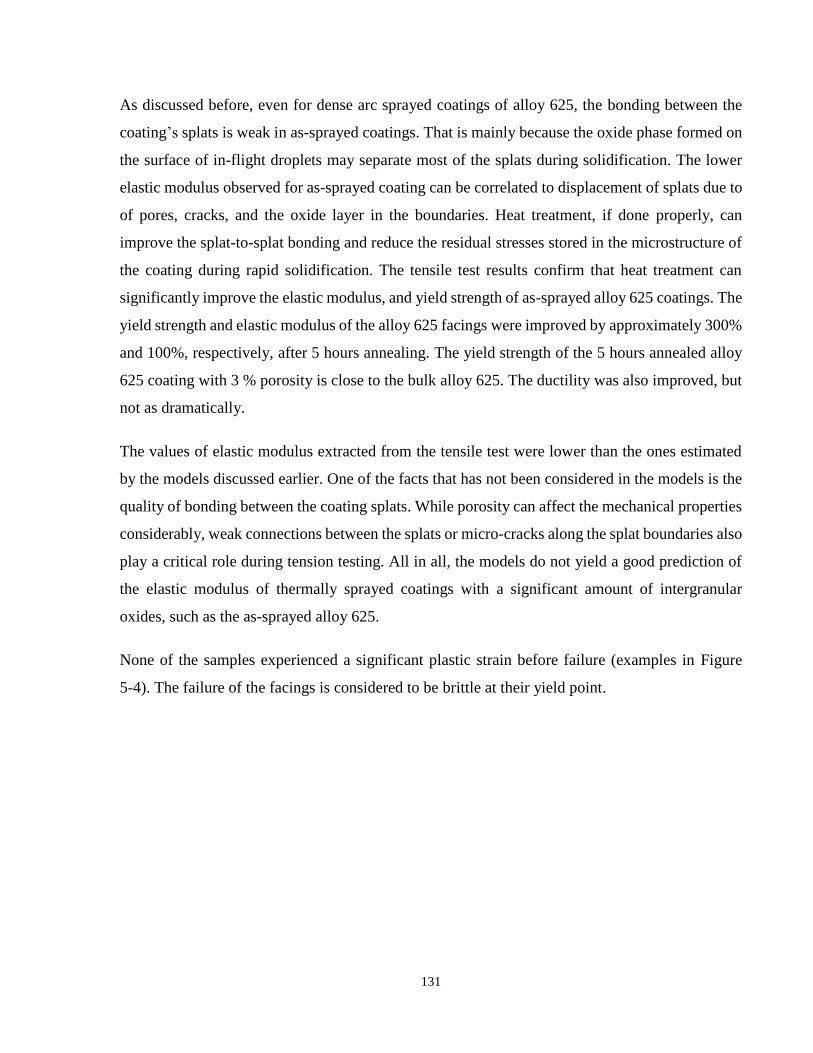
131
As discussed before, even for dense arc sprayed coatings of alloy 625, the bonding between the
coating’s splats is weak in as-sprayed coatings. That is mainly because the oxide phase formed on
the surface of in-flight droplets may separate most of the splats during solidification. The lower
elastic modulus observed for as-sprayed coating can be correlated to displacement of splats due to
of pores, cracks, and the oxide layer in the boundaries. Heat treatment, if done properly, can
improve the splat-to-splat bonding and reduce the residual stresses stored in the microstructure of
the coating during rapid solidification. The tensile test results confirm that heat treatment can
significantly improve the elastic modulus, and yield strength of as-sprayed alloy 625 coatings. The
yield strength and elastic modulus of the alloy 625 facings were improved by approximately 300%
and 100%, respectively, after 5 hours annealing. The yield strength of the 5 hours annealed alloy
625 coating with 3 % porosity is close to the bulk alloy 625. The ductility was also improved, but
not as dramatically.
The values of elastic modulus extracted from the tensile test were lower than the ones estimated
by the models discussed earlier. One of the facts that has not been considered in the models is the
quality of bonding between the coating splats. While porosity can affect the mechanical properties
considerably, weak connections between the splats or micro-cracks along the splat boundaries also
play a critical role during tension testing. All in all, the models do not yield a good prediction of
the elastic modulus of thermally sprayed coatings with a significant amount of intergranular
oxides, such as the as-sprayed alloy 625.
None of the samples experienced a significant plastic strain before failure (examples in Figure
5-4). The failure of the facings is considered to be brittle at their yield point.
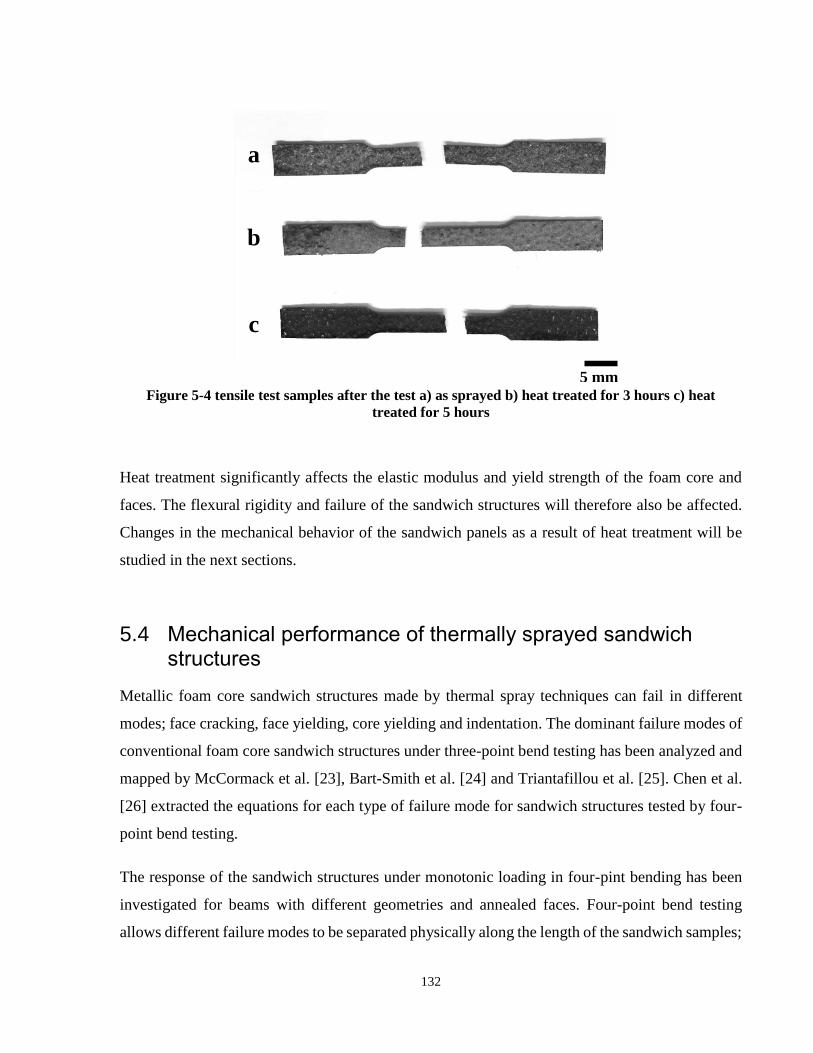
132
Heat treatment significantly affects the elastic modulus and yield strength of the foam core and
faces. The flexural rigidity and failure of the sandwich structures will therefore also be affected.
Changes in the mechanical behavior of the sandwich panels as a result of heat treatment will be
studied in the next sections.
5.4 Mechanical performance of thermally sprayed sandwich structures
Metallic foam core sandwich structures made by thermal spray techniques can fail in different
modes; face cracking, face yielding, core yielding and indentation. The dominant failure modes of
conventional foam core sandwich structures under three-point bend testing has been analyzed and
mapped by McCormack et al. [23], Bart-Smith et al. [24] and Triantafillou et al. [25]. Chen et al.
[26] extracted the equations for each type of failure mode for sandwich structures tested by four-
point bend testing.
The response of the sandwich structures under monotonic loading in four-pint bending has been
investigated for beams with different geometries and annealed faces. Four-point bend testing
allows different failure modes to be separated physically along the length of the sandwich samples;
Figure 5-4 tensile test samples after the test a) as sprayed b) heat treated for 3 hours c) heat
treated for 5 hours
5 mm
b
c
a
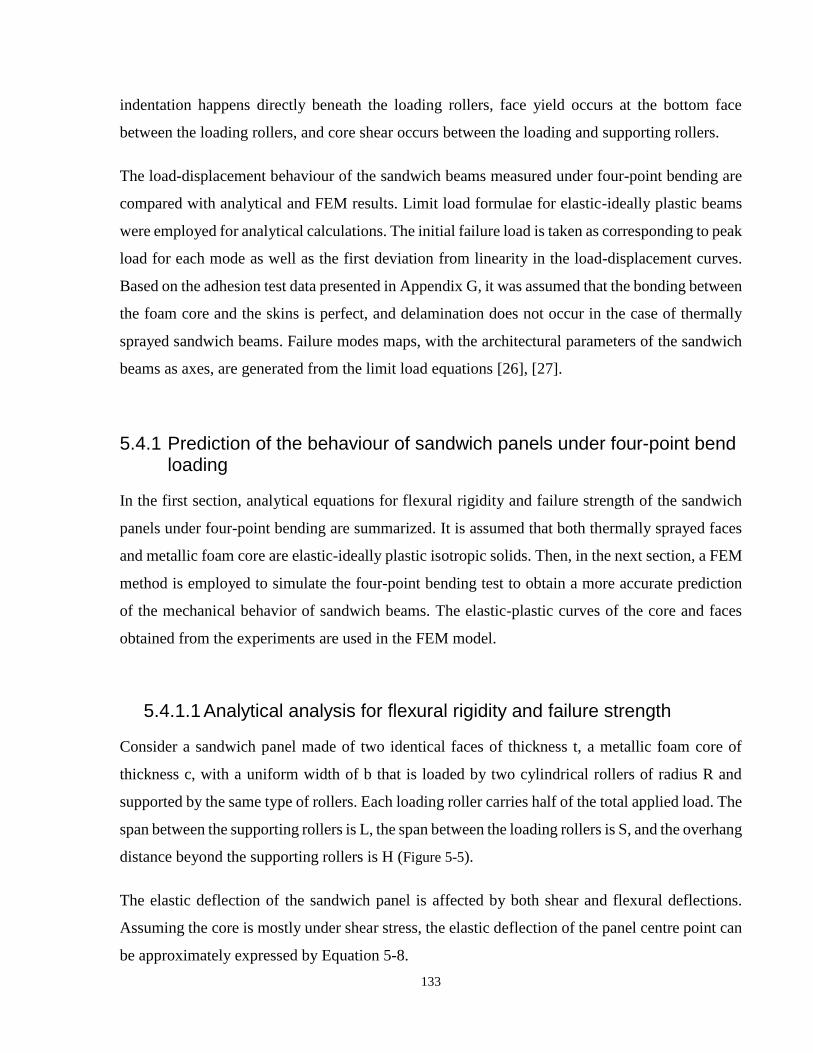
133
indentation happens directly beneath the loading rollers, face yield occurs at the bottom face
between the loading rollers, and core shear occurs between the loading and supporting rollers.
The load-displacement behaviour of the sandwich beams measured under four-point bending are
compared with analytical and FEM results. Limit load formulae for elastic-ideally plastic beams
were employed for analytical calculations. The initial failure load is taken as corresponding to peak
load for each mode as well as the first deviation from linearity in the load-displacement curves.
Based on the adhesion test data presented in Appendix G, it was assumed that the bonding between
the foam core and the skins is perfect, and delamination does not occur in the case of thermally
sprayed sandwich beams. Failure modes maps, with the architectural parameters of the sandwich
beams as axes, are generated from the limit load equations [26], [27].
5.4.1 Prediction of the behaviour of sandwich panels under four-point bend loading
In the first section, analytical equations for flexural rigidity and failure strength of the sandwich
panels under four-point bending are summarized. It is assumed that both thermally sprayed faces
and metallic foam core are elastic-ideally plastic isotropic solids. Then, in the next section, a FEM
method is employed to simulate the four-point bending test to obtain a more accurate prediction
of the mechanical behavior of sandwich beams. The elastic-plastic curves of the core and faces
obtained from the experiments are used in the FEM model.
5.4.1.1 Analytical analysis for flexural rigidity and failure strength
Consider a sandwich panel made of two identical faces of thickness t, a metallic foam core of
thickness c, with a uniform width of b that is loaded by two cylindrical rollers of radius R and
supported by the same type of rollers. Each loading roller carries half of the total applied load. The
span between the supporting rollers is L, the span between the loading rollers is S, and the overhang
distance beyond the supporting rollers is H (Figure 5-5).
The elastic deflection of the sandwich panel is affected by both shear and flexural deflections.
Assuming the core is mostly under shear stress, the elastic deflection of the panel centre point can
be approximately expressed by Equation 5-8.
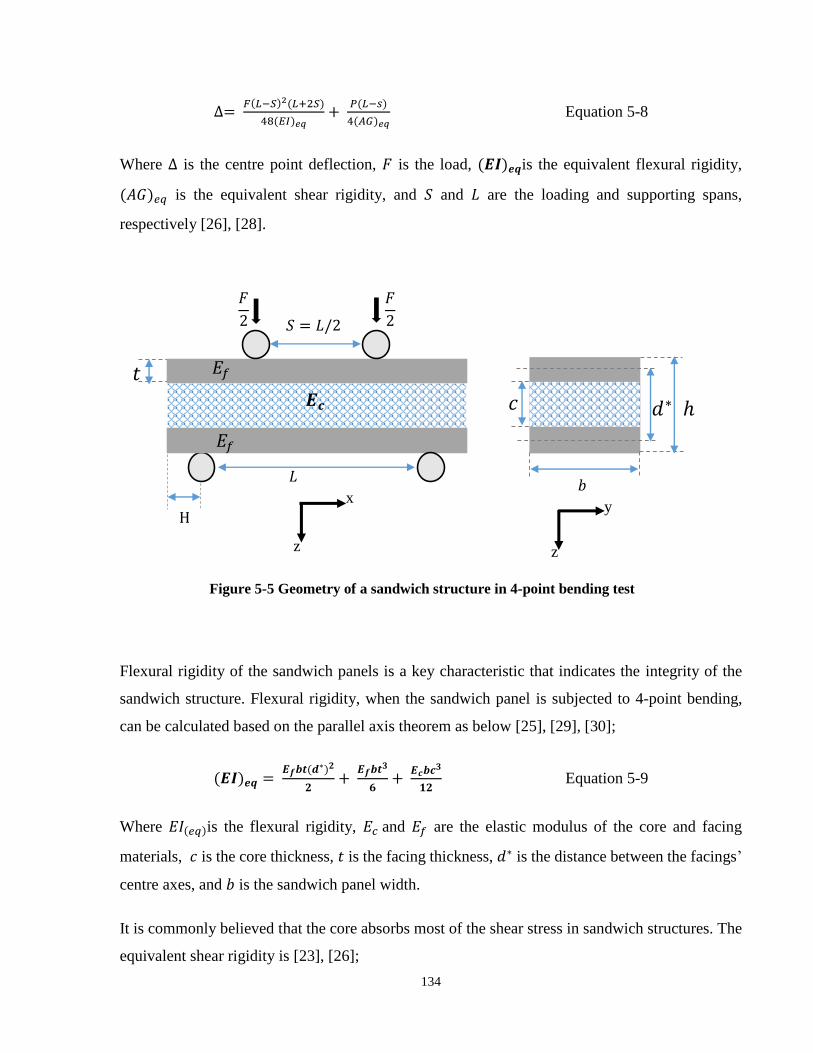
134
∆= 𝐹(𝐿−𝑆)2(𝐿+2𝑆)
48(𝐸𝐼)𝑒𝑞+
𝑃(𝐿−𝑠)
4(𝐴𝐺)𝑒𝑞 Equation 5-8
Where ∆ is the centre point deflection, 𝐹 is the load, (𝑬𝑰)𝒆𝒒is the equivalent flexural rigidity,
(𝐴𝐺)𝑒𝑞 is the equivalent shear rigidity, and 𝑆 and 𝐿 are the loading and supporting spans,
respectively [26], [28].
Flexural rigidity of the sandwich panels is a key characteristic that indicates the integrity of the
sandwich structure. Flexural rigidity, when the sandwich panel is subjected to 4-point bending,
can be calculated based on the parallel axis theorem as below [25], [29], [30];
(𝑬𝑰)𝒆𝒒 = 𝑬𝒇𝒃𝒕(𝒅∗)𝟐
𝟐+
𝑬𝒇𝒃𝒕𝟑
𝟔+
𝑬𝒄𝒃𝒄𝟑
𝟏𝟐 Equation 5-9
Where 𝐸𝐼(𝑒𝑞)is the flexural rigidity, 𝐸𝑐 and 𝐸𝑓 are the elastic modulus of the core and facing
materials, 𝑐 is the core thickness, 𝑡 is the facing thickness, 𝑑∗ is the distance between the facings’
centre axes, and 𝑏 is the sandwich panel width.
It is commonly believed that the core absorbs most of the shear stress in sandwich structures. The
equivalent shear rigidity is [23], [26];
H
𝐹
2
𝐹
2
Figure 5-5 Geometry of a sandwich structure in 4-point bending test
𝑆 = 𝐿/2
𝐿
x
z z
y
ℎ 𝑑∗
𝑏
𝑐
𝑡 𝑬𝒄
𝐸𝑓
𝐸𝑓
135
(𝐴𝐺)𝑒𝑞 = 𝐺𝑐𝑏(𝑐+𝑡)2
𝑐 ≈ 𝐺𝑐𝑏𝑐 Equation 5-10
Where, 𝑮𝒄 is the shear modulus of the core.
It is of particular importance to evaluate the failure strength of the sandwich structures in addition
to their flexural rigidity. Upper bound calculations of different failure modes can be employed to
obtain simple analytical equations. The facings and foam core are considered as ideally plastic,
rigid solids of uniaxial strength of 𝝈𝒄𝒚 and 𝝈𝒇𝒚, respectively [26], [27]. The following summarized
equations can be found in complete detail in the study by Ashby et al. [31].
Face yield
As discussed above, we exclude the brittle behavior of the facings from analytical analysis of the
sandwich beams. That can be translated as we only study the annealed facings in this section.
However, facing cracking that may happen for as-sprayed samples is investigated separately
following this section.
For the thin face sandwich structures, face yielding occurs if the maximum in-plane tensile stresses
in the facing exceed its yield strength (𝝈𝒇𝒚), under a limit load 𝑭𝒇𝒚.
𝑭𝒇𝒚 = 𝝈𝒇𝒚𝟒𝒃𝒕 (𝒄+𝒕)
𝑳−𝑺+
𝒃𝒄𝟐
𝒍−𝒔𝝈𝒄𝒚 Equation 5-11
Core yielding
Core yielding occurs if the maximum normal or shear stresses in the foam reach their yield
strength. Shear forces are mainly carried by the foam core; this may result in plastic failure of the
core. The point experiencing the maximum stress is at the interface of foam and skin. The critical
value of the load for initiation of core yield at this point, has been derived by McCormack et al.
[23]. They also presented expressions describing the stresses at the critical point for three-point
bending;
𝝈𝒄𝒐𝒓𝒆 = 𝑷𝑳
𝟒𝒃𝒕𝒄
𝑬𝒄
𝑬𝒇 Equation 5-12
𝝉𝒄𝒐𝒓𝒆 = 𝑷
𝟐𝒃𝒄 Equation 5-13
136
Therefore, the ratio of the shear to normal stress can be written as below;
𝝉𝒄𝒐𝒓𝒆
𝝈𝒄𝒐𝒓𝒆= 𝟐
𝒕
𝑳
𝑬𝒇
𝑬𝒄 Equation 5-14
For most of the cases the ratio of shear stress to normal stress in the foam core is large, and so the
foam core can be assumed to be under pure shear stress as below [32]:
𝝉 = 𝑷
𝟐𝒃𝒄 Equation 5-15
Under flexural loading of the sandwich panels, two failure modes are possible for the foam core.
In mode A, plastic hinges are formed at the loading points, directly beneath the loading rollers,
and the shear stress is distributed throughout the foam core outside of the plastic hinges. In this
mode failure of the core is by shear yielding, and overhangs extending to the right and left of the
two support points are constrained to shear too [23], [33]. The failure load associated with this
mode has been derived by Chen et al. [26] as;
𝐹𝐶𝑌−𝐴 = 2𝑏𝑡2
𝐿−𝑆𝜎𝑓𝑦 + 2𝑏𝑐 𝜏𝑐𝑦 (1 +
2𝐻
𝐿−𝑆) Equation 5-16
Where; 𝜏𝑐𝑦 is the shear yield strength of the metallic foam. Shear yield strength of the metallic
foam is around two-thirds of the measured uniaxial strength in the compression test (𝜏𝑐𝑦 ≈2𝜎𝑐𝑦
3 )
[26], [31], [34]. From Equation 5-16 it can be understood that the core yield limit load increases
with rising the overhang length, H.
In mode B, plastic hinges occur on both the loading points and the supporting points. In this mode,
overhangs are unloaded and core failure occurs by core shear over length L between the support
points. The failure load for mode B of the core yield has been derived by Chen et al. [26] as:
𝐹𝐶𝑌−𝐵 = 4𝑏𝑡2
𝐿−𝑆𝜎𝑓𝑦 + 2𝑏𝑐 𝜏𝑐𝑦 Equation 5-17
Both equations presented for core yield failure are obtained from upper bound calculations of the
actual failure load. Therefore, the lowest of these two failure loads is considered as the actual
failure load. It has been confirmed that mode A of core yield happens for the sandwich beams with
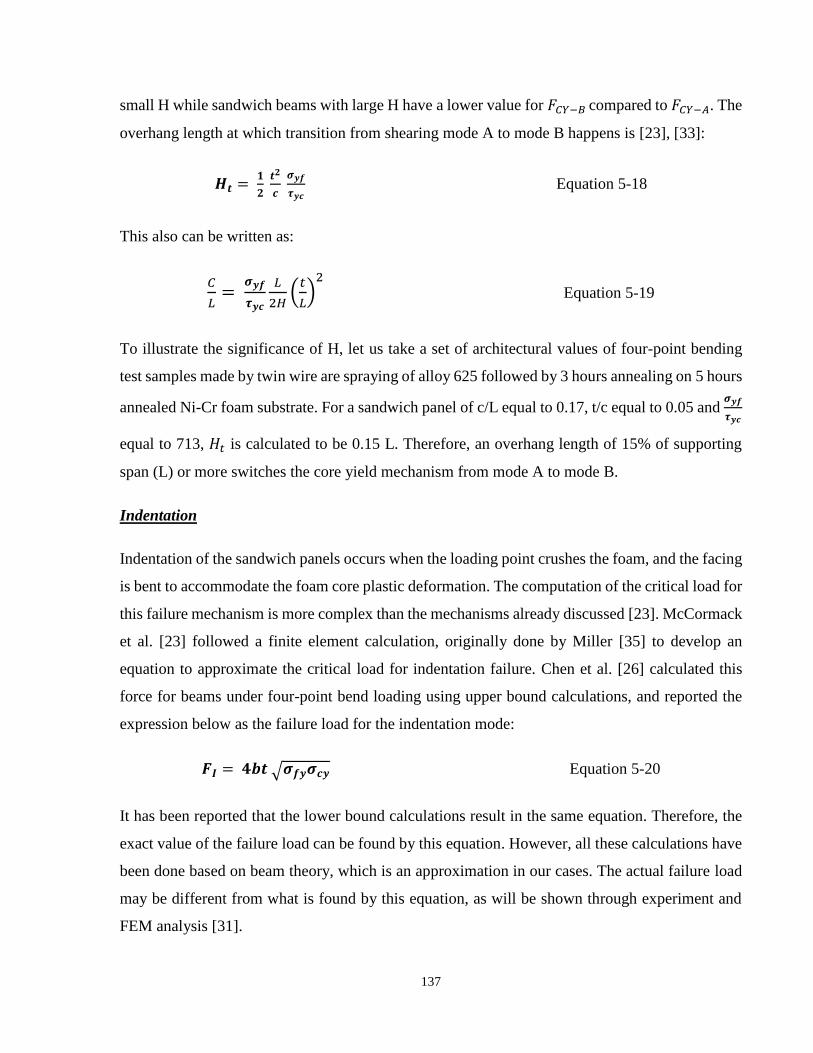
137
small H while sandwich beams with large H have a lower value for 𝐹𝐶𝑌−𝐵 compared to 𝐹𝐶𝑌−𝐴. The
overhang length at which transition from shearing mode A to mode B happens is [23], [33]:
𝑯𝒕 = 𝟏
𝟐 𝒕𝟐
𝒄 𝝈𝒚𝒇
𝝉𝒚𝒄 Equation 5-18
This also can be written as:
𝐶
𝐿=
𝝈𝒚𝒇
𝝉𝒚𝒄
𝐿
2𝐻(
𝑡
𝐿)
2 Equation 5-19
To illustrate the significance of H, let us take a set of architectural values of four-point bending
test samples made by twin wire are spraying of alloy 625 followed by 3 hours annealing on 5 hours
annealed Ni-Cr foam substrate. For a sandwich panel of c/L equal to 0.17, t/c equal to 0.05 and 𝝈𝒚𝒇
𝝉𝒚𝒄
equal to 713, 𝐻𝑡 is calculated to be 0.15 L. Therefore, an overhang length of 15% of supporting
span (L) or more switches the core yield mechanism from mode A to mode B.
Indentation
Indentation of the sandwich panels occurs when the loading point crushes the foam, and the facing
is bent to accommodate the foam core plastic deformation. The computation of the critical load for
this failure mechanism is more complex than the mechanisms already discussed [23]. McCormack
et al. [23] followed a finite element calculation, originally done by Miller [35] to develop an
equation to approximate the critical load for indentation failure. Chen et al. [26] calculated this
force for beams under four-point bend loading using upper bound calculations, and reported the
expression below as the failure load for the indentation mode:
𝑭𝑰 = 𝟒𝒃𝒕 √𝝈𝒇𝒚𝝈𝒄𝒚 Equation 5-20
It has been reported that the lower bound calculations result in the same equation. Therefore, the
exact value of the failure load can be found by this equation. However, all these calculations have
been done based on beam theory, which is an approximation in our cases. The actual failure load
may be different from what is found by this equation, as will be shown through experiment and
FEM analysis [31].
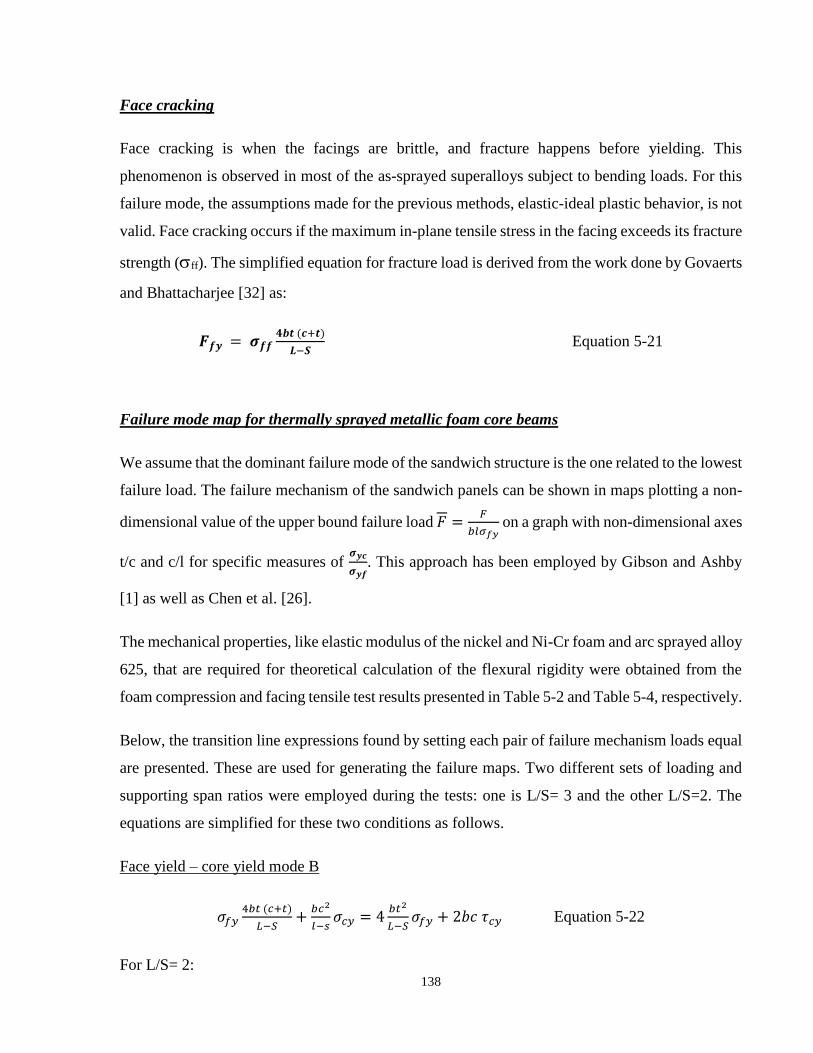
138
Face cracking
Face cracking is when the facings are brittle, and fracture happens before yielding. This
phenomenon is observed in most of the as-sprayed superalloys subject to bending loads. For this
failure mode, the assumptions made for the previous methods, elastic-ideal plastic behavior, is not
valid. Face cracking occurs if the maximum in-plane tensile stress in the facing exceeds its fracture
strength (ff). The simplified equation for fracture load is derived from the work done by Govaerts
and Bhattacharjee [32] as:
𝑭𝒇𝒚 = 𝝈𝒇𝒇𝟒𝒃𝒕 (𝒄+𝒕)
𝑳−𝑺 Equation 5-21
Failure mode map for thermally sprayed metallic foam core beams
We assume that the dominant failure mode of the sandwich structure is the one related to the lowest
failure load. The failure mechanism of the sandwich panels can be shown in maps plotting a non-
dimensional value of the upper bound failure load 𝐹 =𝐹
𝑏𝑙𝜎𝑓𝑦 on a graph with non-dimensional axes
t/c and c/l for specific measures of 𝝈𝒚𝒄
𝝈𝒚𝒇. This approach has been employed by Gibson and Ashby
[1] as well as Chen et al. [26].
The mechanical properties, like elastic modulus of the nickel and Ni-Cr foam and arc sprayed alloy
625, that are required for theoretical calculation of the flexural rigidity were obtained from the
foam compression and facing tensile test results presented in Table 5-2 and Table 5-4, respectively.
Below, the transition line expressions found by setting each pair of failure mechanism loads equal
are presented. These are used for generating the failure maps. Two different sets of loading and
supporting span ratios were employed during the tests: one is L/S= 3 and the other L/S=2. The
equations are simplified for these two conditions as follows.
Face yield – core yield mode B
𝜎𝑓𝑦4𝑏𝑡 (𝑐+𝑡)
𝐿−𝑆+
𝑏𝑐2
𝑙−𝑠𝜎𝑐𝑦 = 4
𝑏𝑡2
𝐿−𝑆𝜎𝑓𝑦 + 2𝑏𝑐 𝜏𝑐𝑦 Equation 5-22
For L/S= 2:

139
(𝑐
𝐿) =
0.9 𝜎𝑐𝑦
𝜎𝑓𝑦
4 (𝑡
𝑐)+
𝜎𝑐𝑦
𝜎𝑓𝑦
Equation 5-23
For L/S=3:
(𝑐
𝐿) =
0.67 𝜎𝑐𝑦
𝜎𝑓𝑦
4 (𝑡
𝑐)+
𝜎𝑐𝑦
𝜎𝑓𝑦
Equation 5-24
Face yield – indentation
𝝈𝒇𝒚𝟒𝒃𝒕 (𝒄+𝒕)
𝑳−𝑺+
𝒃𝒄𝟐
𝑳−𝒔𝝈𝒄𝒚 = 𝟒𝒃𝒕 √𝝈𝒇𝒚𝝈𝒄𝒚 Equation 5-25
For L/S= 2:
(𝒄
𝑳) =
𝟐
𝝈𝒇𝒚 √𝝈𝒇𝒚𝝈𝒄𝒚
(𝟒+𝟒(𝒕
𝒄)+
𝟏
(𝒕𝒄
) (
𝝈𝒄𝒚
𝝈𝒇𝒚))
Equation 5-26
For L/S=3:
(𝒄
𝑳) =
𝟐.𝟔𝟖
𝝈𝒇𝒚 √𝝈𝒇𝒚𝝈𝒄𝒚
(𝟒+𝟒(𝒕
𝒄)+
𝟏
(𝒕𝒄
) (
𝝈𝒄𝒚
𝝈𝒇𝒚))
Equation 5-27
Indentation – core yield mode B
𝟒𝒃𝒕 √𝝈𝒇𝒚𝝈𝒄𝒚 = 𝟒𝒃𝒕𝟐
𝑳−𝑺𝝈𝒇𝒚 + 𝟐𝒃𝒄 𝝉𝒄𝒚 Equation 5-28
For L/S= 2:
(𝒄
𝑳) =
√𝝈𝒇𝒚𝝈𝒄𝒚
𝝈𝒇𝒚−
𝟏𝟑
(𝝈𝒄𝒚𝝈𝒇𝒚
)
(𝒕𝒄
)
𝟐(𝒕
𝒄)
Equation 5-29
For L/S=3:
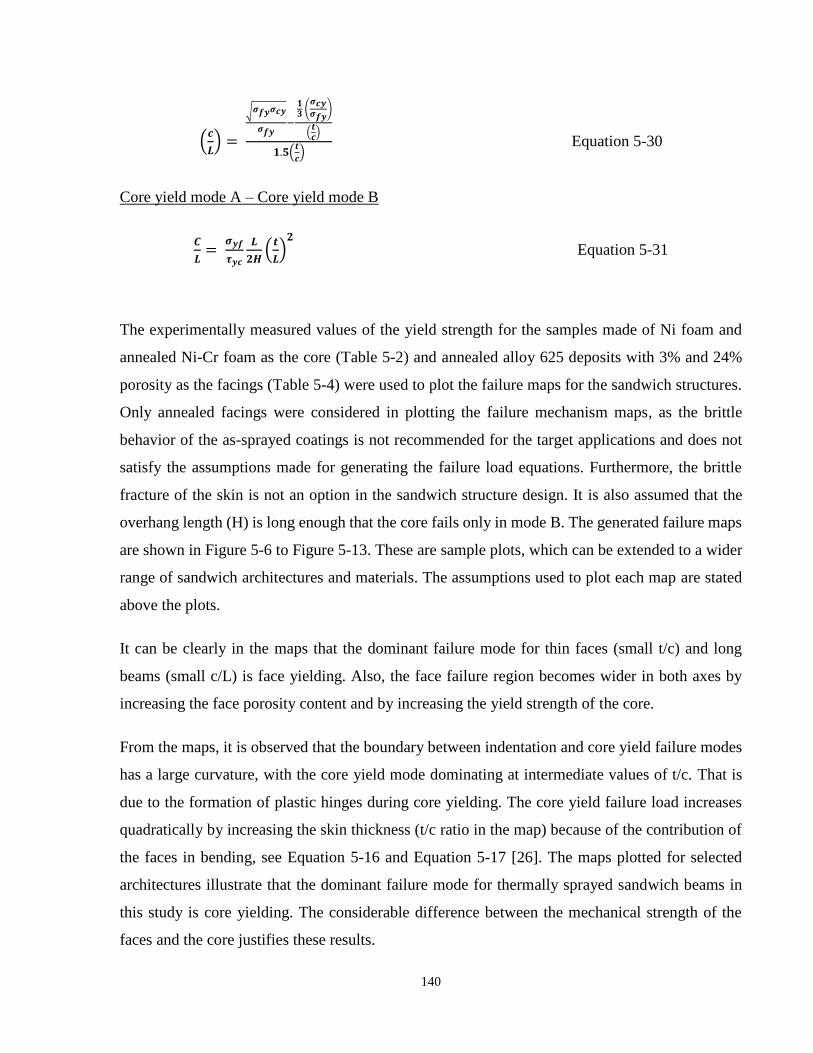
140
(𝒄
𝑳) =
√𝝈𝒇𝒚𝝈𝒄𝒚
𝝈𝒇𝒚−
𝟏𝟑
(𝝈𝒄𝒚𝝈𝒇𝒚
)
(𝒕𝒄
)
𝟏.𝟓(𝒕
𝒄)
Equation 5-30
Core yield mode A – Core yield mode B
𝑪
𝑳=
𝝈𝒚𝒇
𝝉𝒚𝒄
𝑳
𝟐𝑯(
𝒕
𝑳)
𝟐
Equation 5-31
The experimentally measured values of the yield strength for the samples made of Ni foam and
annealed Ni-Cr foam as the core (Table 5-2) and annealed alloy 625 deposits with 3% and 24%
porosity as the facings (Table 5-4) were used to plot the failure maps for the sandwich structures.
Only annealed facings were considered in plotting the failure mechanism maps, as the brittle
behavior of the as-sprayed coatings is not recommended for the target applications and does not
satisfy the assumptions made for generating the failure load equations. Furthermore, the brittle
fracture of the skin is not an option in the sandwich structure design. It is also assumed that the
overhang length (H) is long enough that the core fails only in mode B. The generated failure maps
are shown in Figure 5-6 to Figure 5-13. These are sample plots, which can be extended to a wider
range of sandwich architectures and materials. The assumptions used to plot each map are stated
above the plots.
It can be clearly in the maps that the dominant failure mode for thin faces (small t/c) and long
beams (small c/L) is face yielding. Also, the face failure region becomes wider in both axes by
increasing the face porosity content and by increasing the yield strength of the core.
From the maps, it is observed that the boundary between indentation and core yield failure modes
has a large curvature, with the core yield mode dominating at intermediate values of t/c. That is
due to the formation of plastic hinges during core yielding. The core yield failure load increases
quadratically by increasing the skin thickness (t/c ratio in the map) because of the contribution of
the faces in bending, see Equation 5-16 and Equation 5-17 [26]. The maps plotted for selected
architectures illustrate that the dominant failure mode for thermally sprayed sandwich beams in
this study is core yielding. The considerable difference between the mechanical strength of the
faces and the core justifies these results.

141
Once again, in the current study, only plastic failures have been investigated based on the
assumptions we made about using annealed faces for the sandwich structures. Sudden brittle
fracture of the skin was observed in the four-point bending test performed on as sprayed sandwich
panels (with no annealing post-treatment). This brittle elastic behaviour of the faces and their
consequent catastrophic failure is not acceptable in most of the sandwich structure applications, so
we only considered annealed sandwich panels for further investigations of the failure mode.
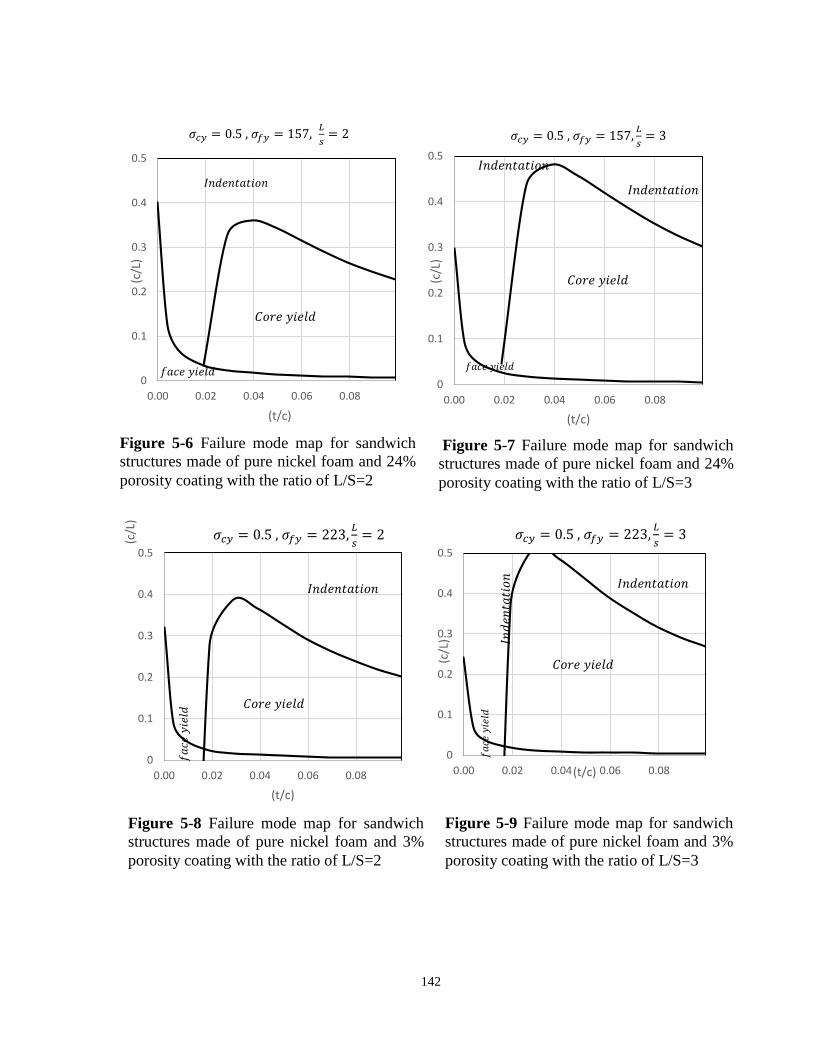
142
Figure 5-6 Failure mode map for sandwich
structures made of pure nickel foam and 24%
porosity coating with the ratio of L/S=2
0
0.1
0.2
0.3
0.4
0.5
0.00 0.02 0.04 0.06 0.08
(c/L
)
(t/c)
𝜎𝑐𝑦 = 0.5 , 𝜎𝑓𝑦 = 157,𝐿
𝑠= 2
𝐼𝑛𝑑𝑒𝑛𝑡𝑎𝑡𝑖𝑜𝑛
𝐶𝑜𝑟𝑒 𝑦𝑖𝑒𝑙𝑑
𝑓𝑎𝑐𝑒 𝑦𝑖𝑒𝑙𝑑
Figure 5-7 Failure mode map for sandwich
structures made of pure nickel foam and 24%
porosity coating with the ratio of L/S=3
0
0.1
0.2
0.3
0.4
0.5
0.00 0.02 0.04 0.06 0.08
(c/L
)(t/c)
𝜎𝑐𝑦 = 0.5 , 𝜎𝑓𝑦 = 157,𝐿
𝑠= 3
𝐼𝑛𝑑𝑒𝑛𝑡𝑎𝑡𝑖𝑜𝑛
𝐼𝑛𝑑𝑒𝑛𝑡𝑎𝑡𝑖𝑜𝑛
𝐶𝑜𝑟𝑒 𝑦𝑖𝑒𝑙𝑑
𝑓𝑎𝑐𝑒 𝑦𝑖𝑒𝑙𝑑
Figure 5-8 Failure mode map for sandwich
structures made of pure nickel foam and 3%
porosity coating with the ratio of L/S=2
0
0.1
0.2
0.3
0.4
0.5
0.00 0.02 0.04 0.06 0.08
(c/L
)
(t/c)
𝜎𝑐𝑦 = 0.5 , 𝜎𝑓𝑦 = 223,𝐿
𝑠= 2
𝐼𝑛𝑑𝑒𝑛𝑡𝑎𝑡𝑖𝑜𝑛
𝐶𝑜𝑟𝑒 𝑦𝑖𝑒𝑙𝑑
𝑓𝑎
𝑐𝑒𝑦
𝑖𝑒𝑙𝑑
Figure 5-9 Failure mode map for sandwich
structures made of pure nickel foam and 3%
porosity coating with the ratio of L/S=3
0
0.1
0.2
0.3
0.4
0.5
0.00 0.02 0.04 0.06 0.08
(c/L
)
(t/c)
𝜎𝑐𝑦 = 0.5 , 𝜎𝑓𝑦 = 223,𝐿
𝑠= 3
𝐶𝑜𝑟𝑒 𝑦𝑖𝑒𝑙𝑑
𝐼𝑛𝑑𝑒𝑛𝑡𝑎𝑡𝑖𝑜𝑛
𝑓𝑎
𝑐𝑒𝑦
𝑖𝑒𝑙𝑑
𝐼𝑛𝑑
𝑒𝑛𝑡𝑎
𝑡𝑖𝑜
𝑛
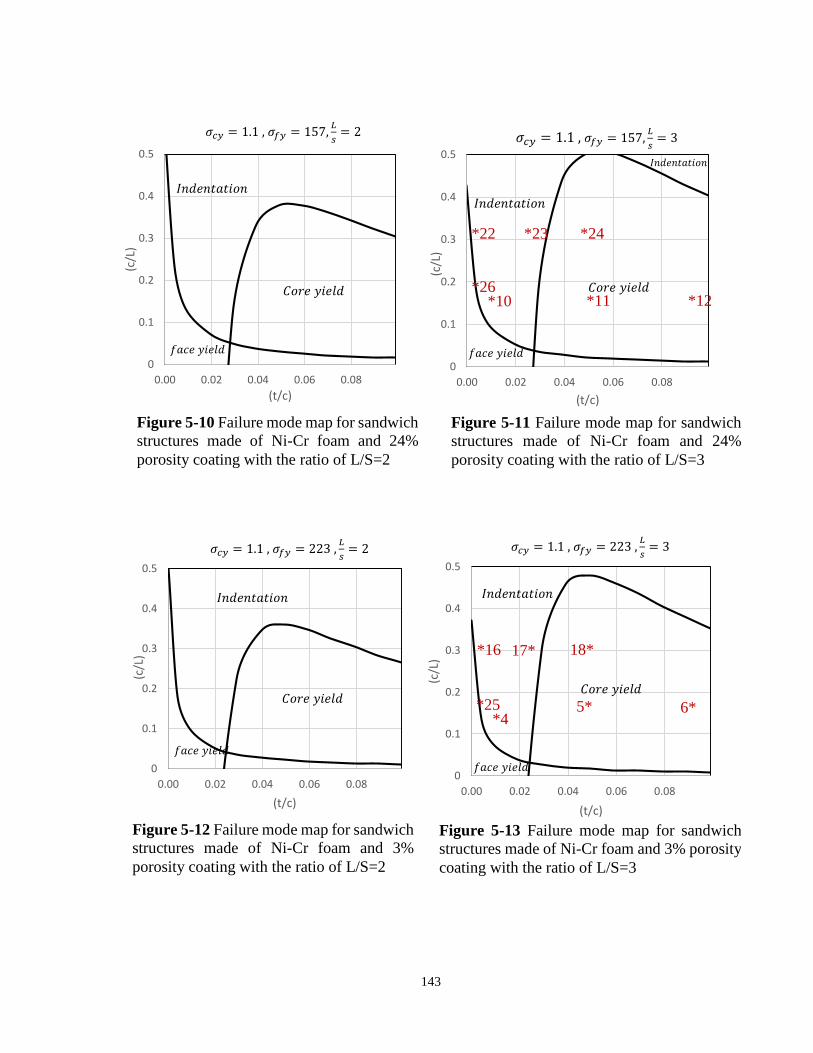
143
Figure 5-10 Failure mode map for sandwich
structures made of Ni-Cr foam and 24%
porosity coating with the ratio of L/S=2
0
0.1
0.2
0.3
0.4
0.5
0.00 0.02 0.04 0.06 0.08
(c/L
)
(t/c)
𝜎𝑐𝑦 = 1.1 , 𝜎𝑓𝑦 = 157,𝐿
𝑠= 2
𝐶𝑜𝑟𝑒 𝑦𝑖𝑒𝑙𝑑
𝐼𝑛𝑑𝑒𝑛𝑡𝑎𝑡𝑖𝑜𝑛
𝑓𝑎𝑐𝑒 𝑦𝑖𝑒𝑙𝑑
Figure 5-11 Failure mode map for sandwich
structures made of Ni-Cr foam and 24%
porosity coating with the ratio of L/S=3
0
0.1
0.2
0.3
0.4
0.5
0.00 0.02 0.04 0.06 0.08
(c/L
)
(t/c)
𝜎𝑐𝑦 = 1.1 , 𝜎𝑓𝑦 = 157,𝐿
𝑠= 3
𝐼𝑛𝑑𝑒𝑛𝑡𝑎𝑡𝑖𝑜𝑛
𝐼𝑛𝑑𝑒𝑛𝑡𝑎𝑡𝑖𝑜𝑛
𝑓𝑎𝑐𝑒 𝑦𝑖𝑒𝑙𝑑
𝐶𝑜𝑟𝑒 𝑦𝑖𝑒𝑙𝑑
*22 *23 *24
*10 *11 *12 *26
Figure 5-12 Failure mode map for sandwich
structures made of Ni-Cr foam and 3%
porosity coating with the ratio of L/S=2
0
0.1
0.2
0.3
0.4
0.5
0.00 0.02 0.04 0.06 0.08
(c/L
)
(t/c)
𝜎𝑐𝑦 = 1.1 , 𝜎𝑓𝑦 = 223 ,𝐿
𝑠= 2
𝐼𝑛𝑑𝑒𝑛𝑡𝑎𝑡𝑖𝑜𝑛
𝐶𝑜𝑟𝑒 𝑦𝑖𝑒𝑙𝑑
𝑓𝑎𝑐𝑒 𝑦𝑖𝑒𝑙𝑑
Figure 5-13 Failure mode map for sandwich
structures made of Ni-Cr foam and 3% porosity
coating with the ratio of L/S=3
0
0.1
0.2
0.3
0.4
0.5
0.00 0.02 0.04 0.06 0.08
(c/L
)
(t/c)
𝜎𝑐𝑦 = 1.1 , 𝜎𝑓𝑦 = 223 ,𝐿
𝑠= 3
𝐶𝑜𝑟𝑒 𝑦𝑖𝑒𝑙𝑑
𝐼𝑛𝑑𝑒𝑛𝑡𝑎𝑡𝑖𝑜𝑛
𝑓𝑎𝑐𝑒 𝑦𝑖𝑒𝑙𝑑
*16 17* 18*
6* 5* *25 *4
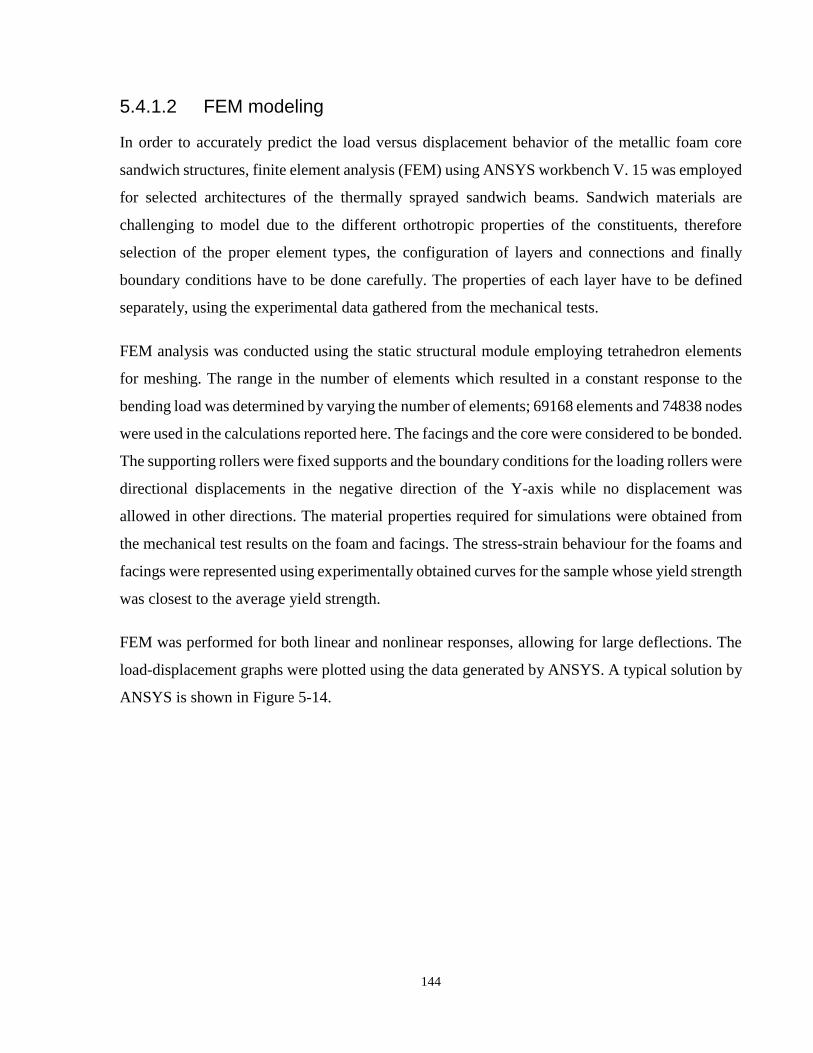
144
5.4.1.2 FEM modeling
In order to accurately predict the load versus displacement behavior of the metallic foam core
sandwich structures, finite element analysis (FEM) using ANSYS workbench V. 15 was employed
for selected architectures of the thermally sprayed sandwich beams. Sandwich materials are
challenging to model due to the different orthotropic properties of the constituents, therefore
selection of the proper element types, the configuration of layers and connections and finally
boundary conditions have to be done carefully. The properties of each layer have to be defined
separately, using the experimental data gathered from the mechanical tests.
FEM analysis was conducted using the static structural module employing tetrahedron elements
for meshing. The range in the number of elements which resulted in a constant response to the
bending load was determined by varying the number of elements; 69168 elements and 74838 nodes
were used in the calculations reported here. The facings and the core were considered to be bonded.
The supporting rollers were fixed supports and the boundary conditions for the loading rollers were
directional displacements in the negative direction of the Y-axis while no displacement was
allowed in other directions. The material properties required for simulations were obtained from
the mechanical test results on the foam and facings. The stress-strain behaviour for the foams and
facings were represented using experimentally obtained curves for the sample whose yield strength
was closest to the average yield strength.
FEM was performed for both linear and nonlinear responses, allowing for large deflections. The
load-displacement graphs were plotted using the data generated by ANSYS. A typical solution by
ANSYS is shown in Figure 5-14.
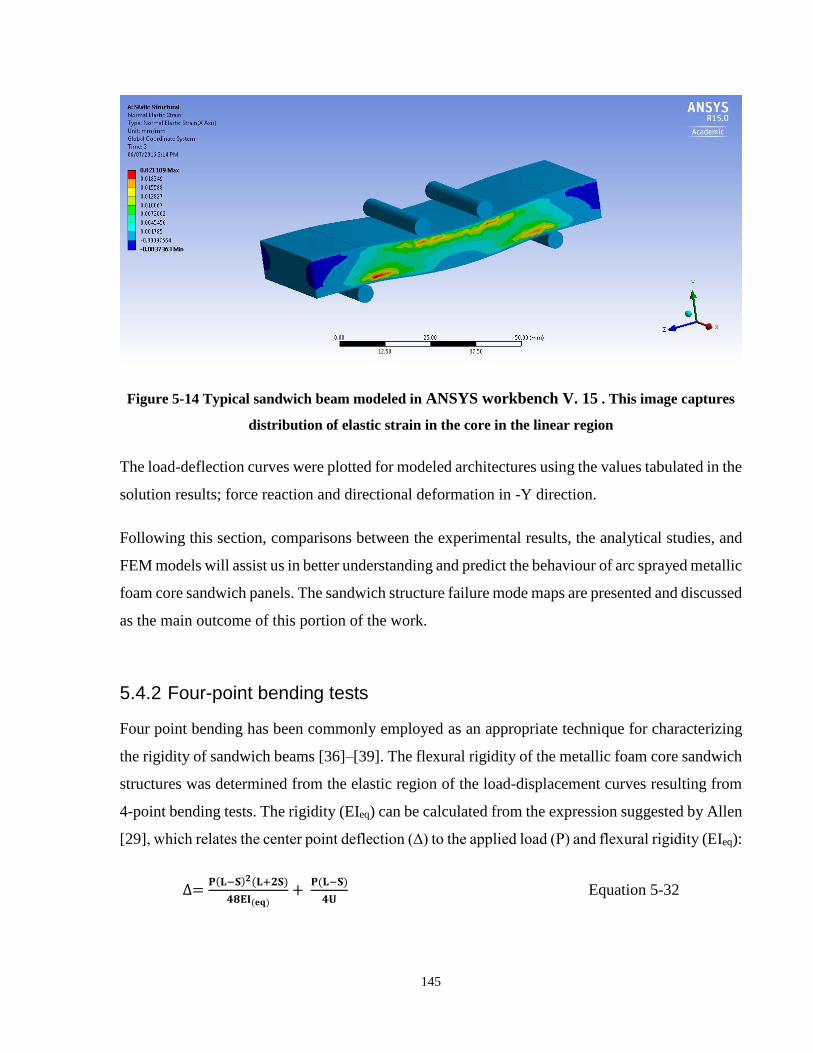
145
Figure 5-14 Typical sandwich beam modeled in ANSYS workbench V. 15 . This image captures
distribution of elastic strain in the core in the linear region
The load-deflection curves were plotted for modeled architectures using the values tabulated in the
solution results; force reaction and directional deformation in -Y direction.
Following this section, comparisons between the experimental results, the analytical studies, and
FEM models will assist us in better understanding and predict the behaviour of arc sprayed metallic
foam core sandwich panels. The sandwich structure failure mode maps are presented and discussed
as the main outcome of this portion of the work.
5.4.2 Four-point bending tests
Four point bending has been commonly employed as an appropriate technique for characterizing
the rigidity of sandwich beams [36]–[39]. The flexural rigidity of the metallic foam core sandwich
structures was determined from the elastic region of the load-displacement curves resulting from
4-point bending tests. The rigidity (EIeq) can be calculated from the expression suggested by Allen
[29], which relates the center point deflection (∆) to the applied load (P) and flexural rigidity (EIeq):
∆=𝐏(𝐋−𝐒)𝟐(𝐋+𝟐𝐒)
𝟒𝟖𝐄𝐈(𝐞𝐪)+
𝐏(𝐋−𝐒)
𝟒𝐔 Equation 5-32
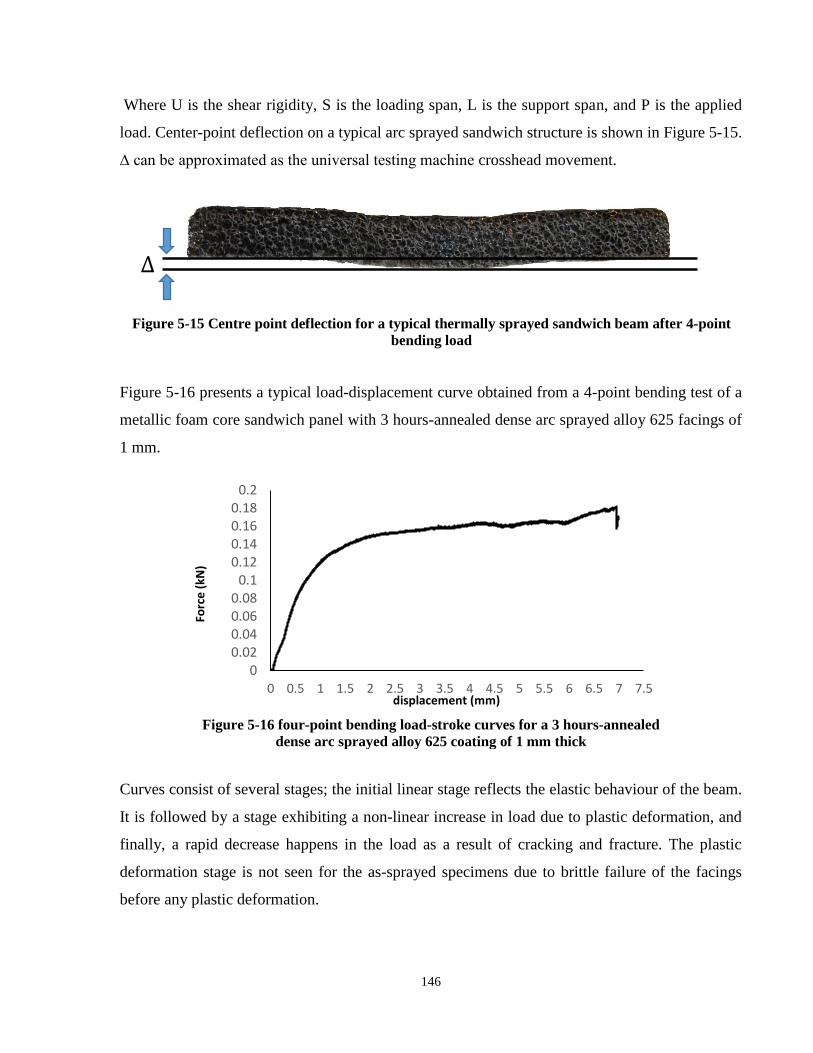
146
Where U is the shear rigidity, S is the loading span, L is the support span, and P is the applied
load. Center-point deflection on a typical arc sprayed sandwich structure is shown in Figure 5-15.
∆ can be approximated as the universal testing machine crosshead movement.
Figure 5-16 presents a typical load-displacement curve obtained from a 4-point bending test of a
metallic foam core sandwich panel with 3 hours-annealed dense arc sprayed alloy 625 facings of
1 mm.
Curves consist of several stages; the initial linear stage reflects the elastic behaviour of the beam.
It is followed by a stage exhibiting a non-linear increase in load due to plastic deformation, and
finally, a rapid decrease happens in the load as a result of cracking and fracture. The plastic
deformation stage is not seen for the as-sprayed specimens due to brittle failure of the facings
before any plastic deformation.
∆
Figure 5-15 Centre point deflection for a typical thermally sprayed sandwich beam after 4-point
bending load
00.020.040.060.08
0.10.120.140.160.18
0.2
0 0.5 1 1.5 2 2.5 3 3.5 4 4.5 5 5.5 6 6.5 7 7.5
Forc
e (
kN)
displacement (mm)
Figure 5-16 four-point bending load-stroke curves for a 3 hours-annealed
dense arc sprayed alloy 625 coating of 1 mm thick
147
The flexural stiffness of the sandwich panels, EI(eq), were determined both theoretically using
Equation 5-9, and experimentally from the 4-point bending force-displacement graphs in their
elastic region, using Equation 5-32 (Table 5-5). Sandwich structure specimens employed for 4-
point bending experiments were fabricated with different geometries, facing thicknesses, and
porosity content. The heat treatments for fabricated sandwich panels were conducted at 1100ºC
following the promising behaviour of the heat treated facings presented in section 5.3.2.
From the results presented in Table 5-5, it can be seen that heat treatment of sandwich panels for
3 hours at 1100 °C improved their mechanical behaviour (flexural rigidity). Also, in comparison
with the theoretical results, the experimentally obtained flexural rigidity values were lower. In
addition to determining the flexural rigidity of the fabricated sandwich panels, four-point bending
tests were used to determine what failure mechanism acts first for different types of sandwich
panels. These tests were run by increasing the load in a stepwise manner, unloading after each step
to inspect the surface and core of the sandwich beam for any signs of failure, then reloading. A
typical load-displacement graph resulting from this type of bending test is presented in Figure
5-17.
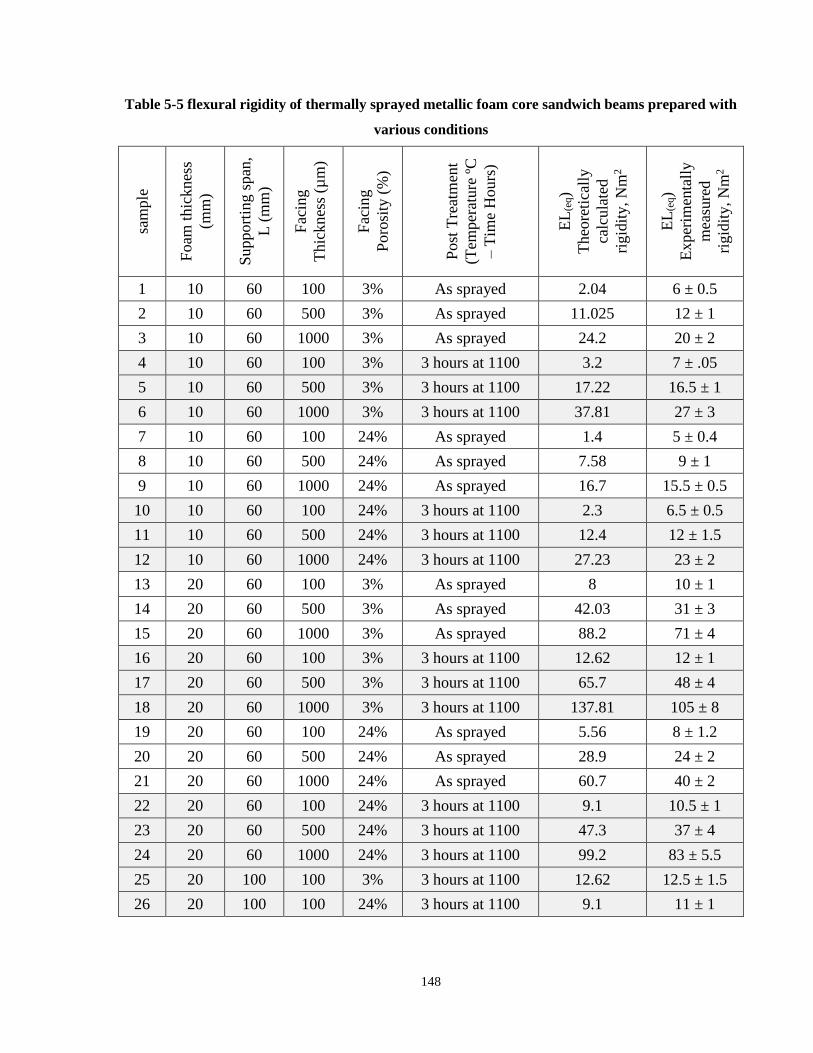
148
Table 5-5 flexural rigidity of thermally sprayed metallic foam core sandwich beams prepared with
various conditions sa
mple
Foam
thic
knes
s
(mm
)
Support
ing s
pan
,
L (
mm
)
Fac
ing
Thic
knes
s (µ
m)
Fac
ing
Poro
sity
(%
)
Post
Tre
atm
ent
(Tem
per
ature
ºC
– T
ime
Hours
)
EL
(eq)
Theo
reti
call
y
calc
ula
ted
rigid
ity, N
m2
EL
(eq)
Exper
imen
tall
y
mea
sure
d
rigid
ity, N
m2
1 10 60 100 3% As sprayed 2.04 6 ± 0.5
2 10 60 500 3% As sprayed 11.025 12 ± 1
3 10 60 1000 3% As sprayed 24.2 20 ± 2
4 10 60 100 3% 3 hours at 1100 3.2 7 ± .05
5 10 60 500 3% 3 hours at 1100 17.22 16.5 ± 1
6 10 60 1000 3% 3 hours at 1100 37.81 27 ± 3
7 10 60 100 24% As sprayed 1.4 5 ± 0.4
8 10 60 500 24% As sprayed 7.58 9 ± 1
9 10 60 1000 24% As sprayed 16.7 15.5 ± 0.5
10 10 60 100 24% 3 hours at 1100 2.3 6.5 ± 0.5
11 10 60 500 24% 3 hours at 1100 12.4 12 ± 1.5
12 10 60 1000 24% 3 hours at 1100 27.23 23 ± 2
13 20 60 100 3% As sprayed 8 10 ± 1
14 20 60 500 3% As sprayed 42.03 31 ± 3
15 20 60 1000 3% As sprayed 88.2 71 ± 4
16 20 60 100 3% 3 hours at 1100 12.62 12 ± 1
17 20 60 500 3% 3 hours at 1100 65.7 48 ± 4
18 20 60 1000 3% 3 hours at 1100 137.81 105 ± 8
19 20 60 100 24% As sprayed 5.56 8 ± 1.2
20 20 60 500 24% As sprayed 28.9 24 ± 2
21 20 60 1000 24% As sprayed 60.7 40 ± 2
22 20 60 100 24% 3 hours at 1100 9.1 10.5 ± 1
23 20 60 500 24% 3 hours at 1100 47.3 37 ± 4
24 20 60 1000 24% 3 hours at 1100 99.2 83 ± 5.5
25 20 100 100 3% 3 hours at 1100 12.62 12.5 ± 1.5
26 20 100 100 24% 3 hours at 1100 9.1 11 ± 1
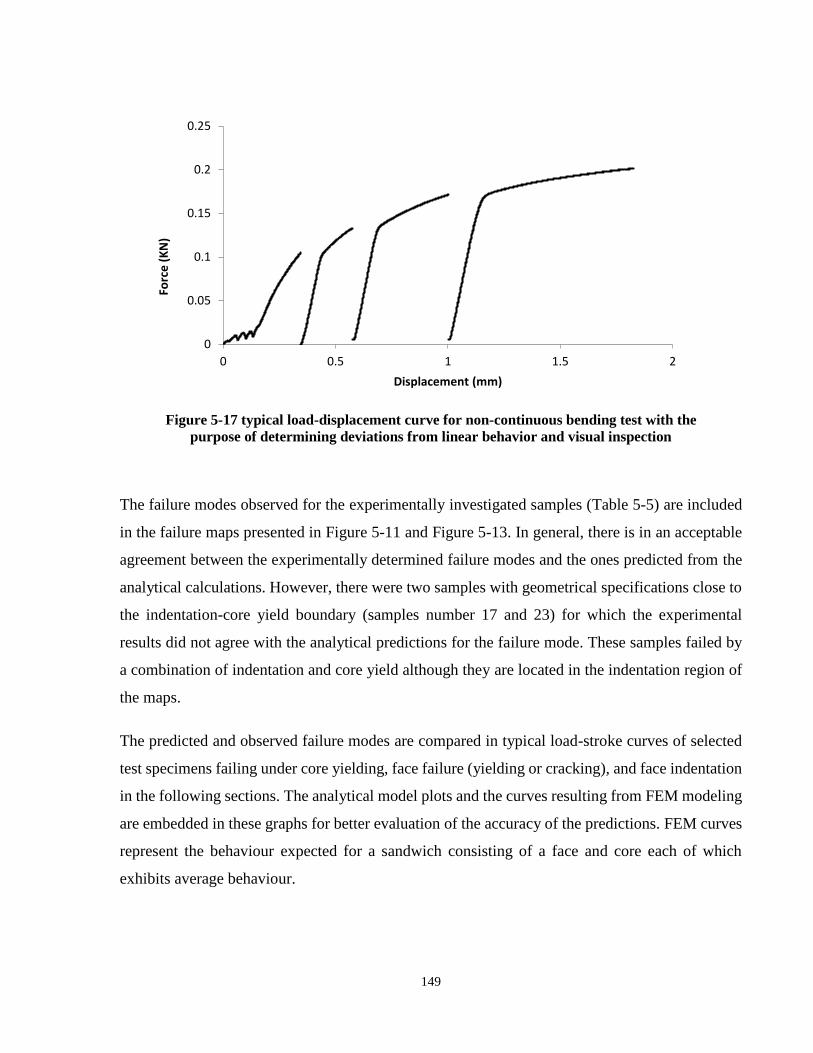
149
The failure modes observed for the experimentally investigated samples (Table 5-5) are included
in the failure maps presented in Figure 5-11 and Figure 5-13. In general, there is in an acceptable
agreement between the experimentally determined failure modes and the ones predicted from the
analytical calculations. However, there were two samples with geometrical specifications close to
the indentation-core yield boundary (samples number 17 and 23) for which the experimental
results did not agree with the analytical predictions for the failure mode. These samples failed by
a combination of indentation and core yield although they are located in the indentation region of
the maps.
The predicted and observed failure modes are compared in typical load-stroke curves of selected
test specimens failing under core yielding, face failure (yielding or cracking), and face indentation
in the following sections. The analytical model plots and the curves resulting from FEM modeling
are embedded in these graphs for better evaluation of the accuracy of the predictions. FEM curves
represent the behaviour expected for a sandwich consisting of a face and core each of which
exhibits average behaviour.
Figure 5-17 typical load-displacement curve for non-continuous bending test with the
purpose of determining deviations from linear behavior and visual inspection
0
0.05
0.1
0.15
0.2
0.25
0 0.5 1 1.5 2
Forc
e (
KN
)
Displacement (mm)
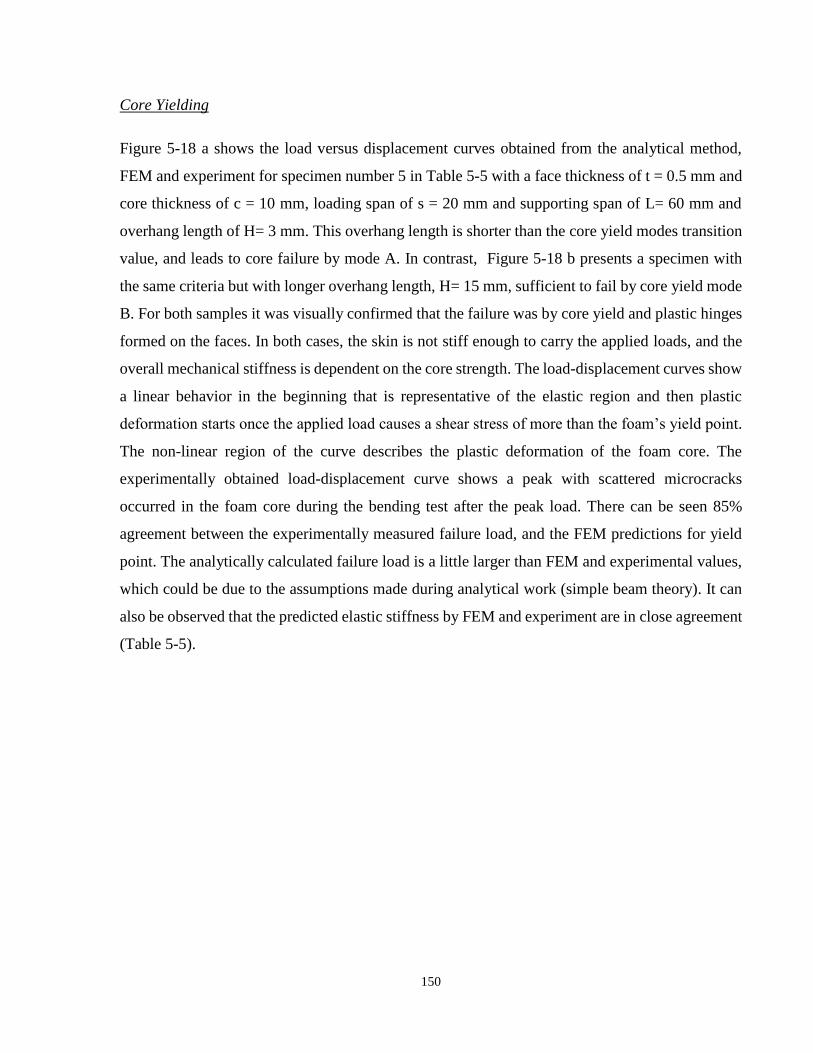
150
Core Yielding
Figure 5-18 a shows the load versus displacement curves obtained from the analytical method,
FEM and experiment for specimen number 5 in Table 5-5 with a face thickness of t = 0.5 mm and
core thickness of c = 10 mm, loading span of s = 20 mm and supporting span of L= 60 mm and
overhang length of H= 3 mm. This overhang length is shorter than the core yield modes transition
value, and leads to core failure by mode A. In contrast, Figure 5-18 b presents a specimen with
the same criteria but with longer overhang length, H= 15 mm, sufficient to fail by core yield mode
B. For both samples it was visually confirmed that the failure was by core yield and plastic hinges
formed on the faces. In both cases, the skin is not stiff enough to carry the applied loads, and the
overall mechanical stiffness is dependent on the core strength. The load-displacement curves show
a linear behavior in the beginning that is representative of the elastic region and then plastic
deformation starts once the applied load causes a shear stress of more than the foam’s yield point.
The non-linear region of the curve describes the plastic deformation of the foam core. The
experimentally obtained load-displacement curve shows a peak with scattered microcracks
occurred in the foam core during the bending test after the peak load. There can be seen 85%
agreement between the experimentally measured failure load, and the FEM predictions for yield
point. The analytically calculated failure load is a little larger than FEM and experimental values,
which could be due to the assumptions made during analytical work (simple beam theory). It can
also be observed that the predicted elastic stiffness by FEM and experiment are in close agreement
(Table 5-5).
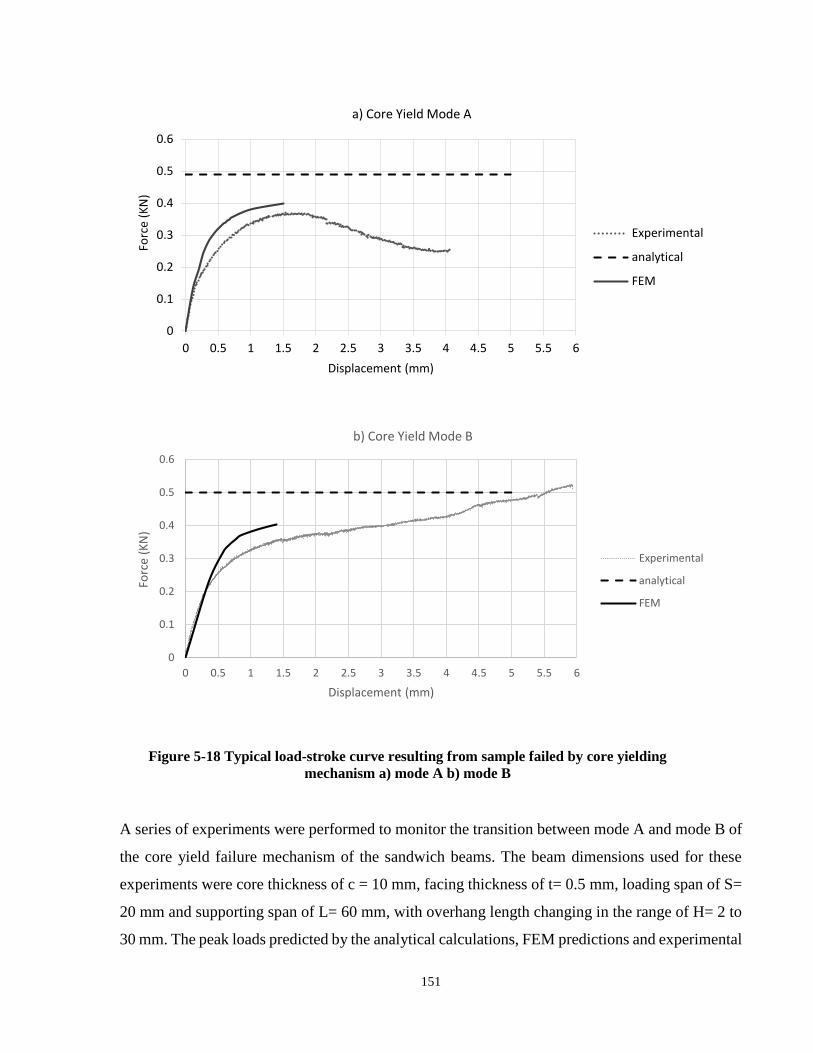
151
A series of experiments were performed to monitor the transition between mode A and mode B of
the core yield failure mechanism of the sandwich beams. The beam dimensions used for these
experiments were core thickness of c = 10 mm, facing thickness of t= 0.5 mm, loading span of S=
20 mm and supporting span of L= 60 mm, with overhang length changing in the range of H= 2 to
30 mm. The peak loads predicted by the analytical calculations, FEM predictions and experimental
0
0.1
0.2
0.3
0.4
0.5
0.6
0 0.5 1 1.5 2 2.5 3 3.5 4 4.5 5 5.5 6
Forc
e (K
N)
Displacement (mm)
a) Core Yield Mode A
Experimental
analytical
FEM
0
0.1
0.2
0.3
0.4
0.5
0.6
0 0.5 1 1.5 2 2.5 3 3.5 4 4.5 5 5.5 6
Forc
e (K
N)
Displacement (mm)
b) Core Yield Mode B
Experimental
analytical
FEM
Figure 5-18 Typical load-stroke curve resulting from sample failed by core yielding
mechanism a) mode A b) mode B
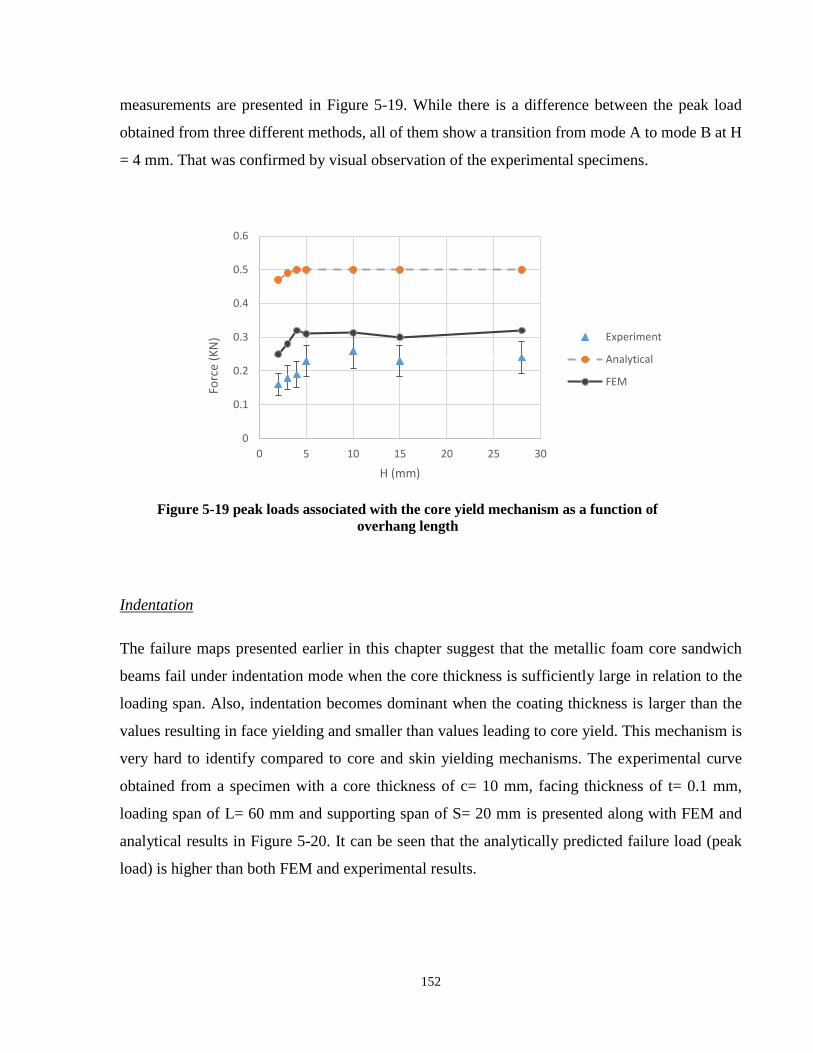
152
measurements are presented in Figure 5-19. While there is a difference between the peak load
obtained from three different methods, all of them show a transition from mode A to mode B at H
= 4 mm. That was confirmed by visual observation of the experimental specimens.
Indentation
The failure maps presented earlier in this chapter suggest that the metallic foam core sandwich
beams fail under indentation mode when the core thickness is sufficiently large in relation to the
loading span. Also, indentation becomes dominant when the coating thickness is larger than the
values resulting in face yielding and smaller than values leading to core yield. This mechanism is
very hard to identify compared to core and skin yielding mechanisms. The experimental curve
obtained from a specimen with a core thickness of c= 10 mm, facing thickness of t= 0.1 mm,
loading span of L= 60 mm and supporting span of S= 20 mm is presented along with FEM and
analytical results in Figure 5-20. It can be seen that the analytically predicted failure load (peak
load) is higher than both FEM and experimental results.
Figure 5-19 peak loads associated with the core yield mechanism as a function of
overhang length
0
0.1
0.2
0.3
0.4
0.5
0.6
0 5 10 15 20 25 30
Forc
e (K
N)
H (mm)
Experiment
Analytical
FEM
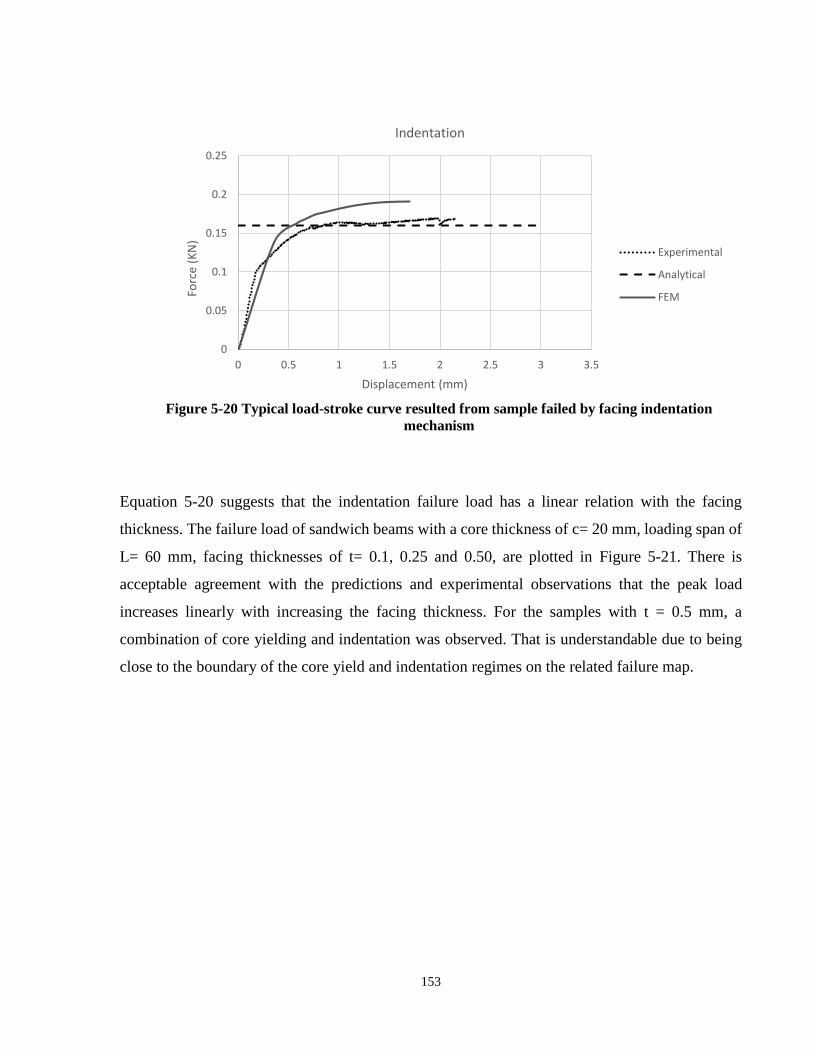
153
Equation 5-20 suggests that the indentation failure load has a linear relation with the facing
thickness. The failure load of sandwich beams with a core thickness of c= 20 mm, loading span of
L= 60 mm, facing thicknesses of t= 0.1, 0.25 and 0.50, are plotted in Figure 5-21. There is
acceptable agreement with the predictions and experimental observations that the peak load
increases linearly with increasing the facing thickness. For the samples with t = 0.5 mm, a
combination of core yielding and indentation was observed. That is understandable due to being
close to the boundary of the core yield and indentation regimes on the related failure map.
0
0.05
0.1
0.15
0.2
0.25
0 0.5 1 1.5 2 2.5 3 3.5
Forc
e (K
N)
Displacement (mm)
Indentation
Experimental
Analytical
FEM
Figure 5-20 Typical load-stroke curve resulted from sample failed by facing indentation
mechanism
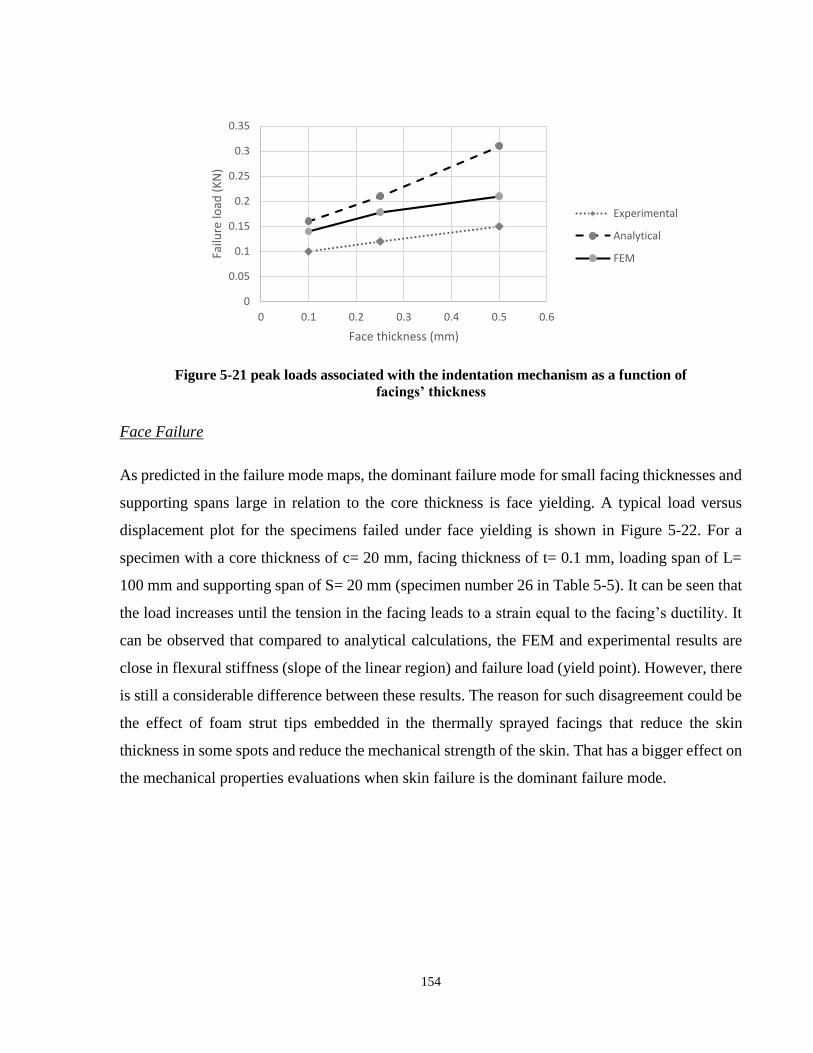
154
Face Failure
As predicted in the failure mode maps, the dominant failure mode for small facing thicknesses and
supporting spans large in relation to the core thickness is face yielding. A typical load versus
displacement plot for the specimens failed under face yielding is shown in Figure 5-22. For a
specimen with a core thickness of c= 20 mm, facing thickness of t= 0.1 mm, loading span of L=
100 mm and supporting span of S= 20 mm (specimen number 26 in Table 5-5). It can be seen that
the load increases until the tension in the facing leads to a strain equal to the facing’s ductility. It
can be observed that compared to analytical calculations, the FEM and experimental results are
close in flexural stiffness (slope of the linear region) and failure load (yield point). However, there
is still a considerable difference between these results. The reason for such disagreement could be
the effect of foam strut tips embedded in the thermally sprayed facings that reduce the skin
thickness in some spots and reduce the mechanical strength of the skin. That has a bigger effect on
the mechanical properties evaluations when skin failure is the dominant failure mode.
Figure 5-21 peak loads associated with the indentation mechanism as a function of
facings’ thickness
0
0.05
0.1
0.15
0.2
0.25
0.3
0.35
0 0.1 0.2 0.3 0.4 0.5 0.6
Failu
re lo
ad (
KN
)
Face thickness (mm)
Experimental
Analytical
FEM
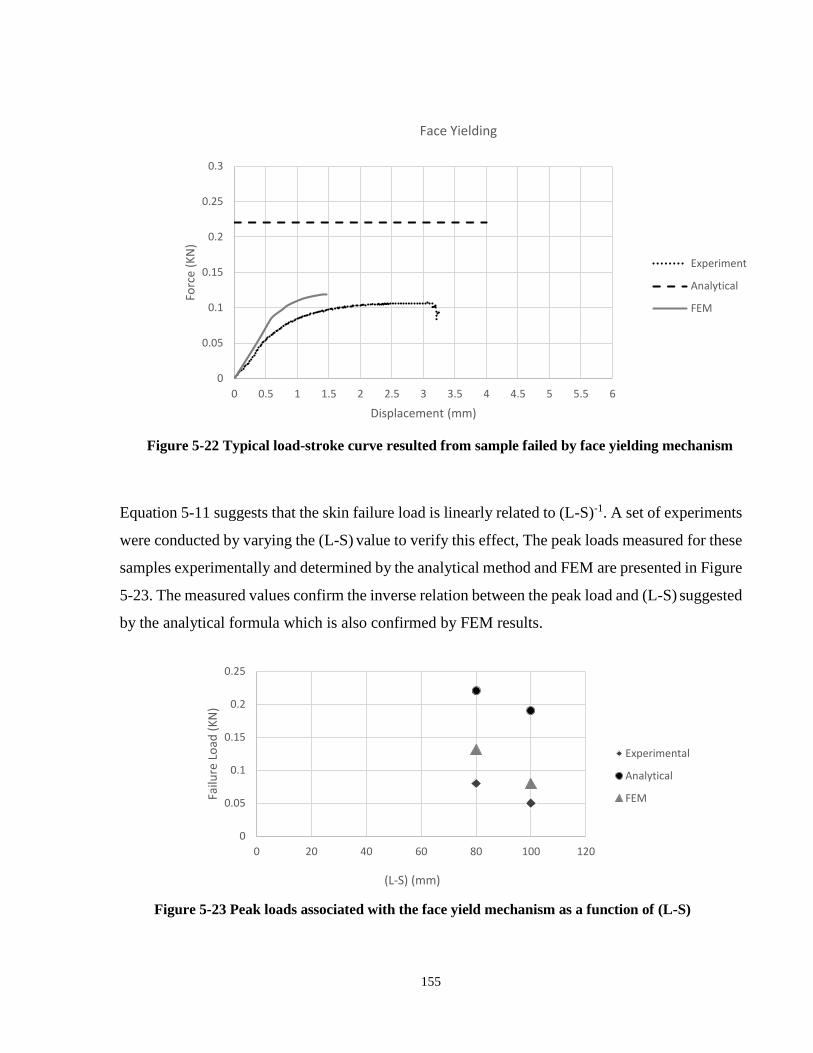
155
Equation 5-11 suggests that the skin failure load is linearly related to (L-S)-1. A set of experiments
were conducted by varying the (L-S) value to verify this effect, The peak loads measured for these
samples experimentally and determined by the analytical method and FEM are presented in Figure
5-23. The measured values confirm the inverse relation between the peak load and (L-S) suggested
by the analytical formula which is also confirmed by FEM results.
Figure 5-22 Typical load-stroke curve resulted from sample failed by face yielding mechanism
0
0.05
0.1
0.15
0.2
0.25
0.3
0 0.5 1 1.5 2 2.5 3 3.5 4 4.5 5 5.5 6
Forc
e (K
N)
Displacement (mm)
Face Yielding
Experiment
Analytical
FEM
Figure 5-23 Peak loads associated with the face yield mechanism as a function of (L-S)
0
0.05
0.1
0.15
0.2
0.25
0 20 40 60 80 100 120
Failu
re L
oad
(K
N)
(L-S) (mm)
Experimental
Analytical
FEM
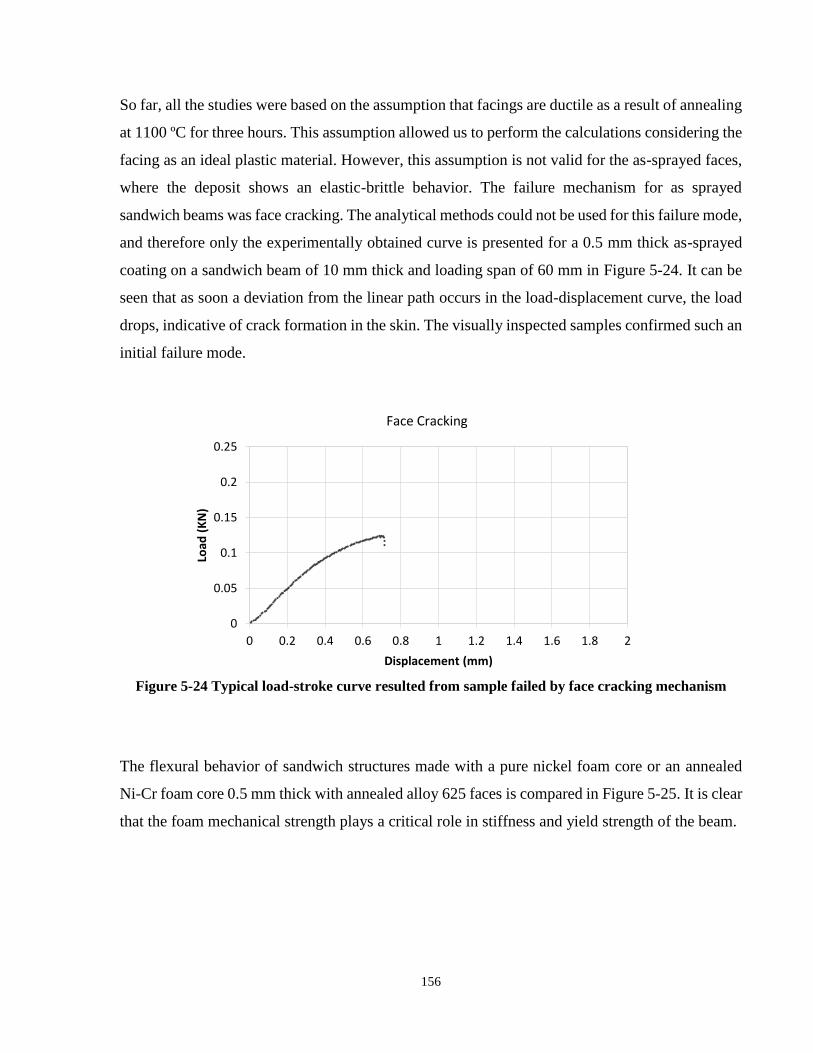
156
So far, all the studies were based on the assumption that facings are ductile as a result of annealing
at 1100 ºC for three hours. This assumption allowed us to perform the calculations considering the
facing as an ideal plastic material. However, this assumption is not valid for the as-sprayed faces,
where the deposit shows an elastic-brittle behavior. The failure mechanism for as sprayed
sandwich beams was face cracking. The analytical methods could not be used for this failure mode,
and therefore only the experimentally obtained curve is presented for a 0.5 mm thick as-sprayed
coating on a sandwich beam of 10 mm thick and loading span of 60 mm in Figure 5-24. It can be
seen that as soon a deviation from the linear path occurs in the load-displacement curve, the load
drops, indicative of crack formation in the skin. The visually inspected samples confirmed such an
initial failure mode.
The flexural behavior of sandwich structures made with a pure nickel foam core or an annealed
Ni-Cr foam core 0.5 mm thick with annealed alloy 625 faces is compared in Figure 5-25. It is clear
that the foam mechanical strength plays a critical role in stiffness and yield strength of the beam.
Figure 5-24 Typical load-stroke curve resulted from sample failed by face cracking mechanism
0
0.05
0.1
0.15
0.2
0.25
0 0.2 0.4 0.6 0.8 1 1.2 1.4 1.6 1.8 2
Load
(K
N)
Displacement (mm)
Face Cracking
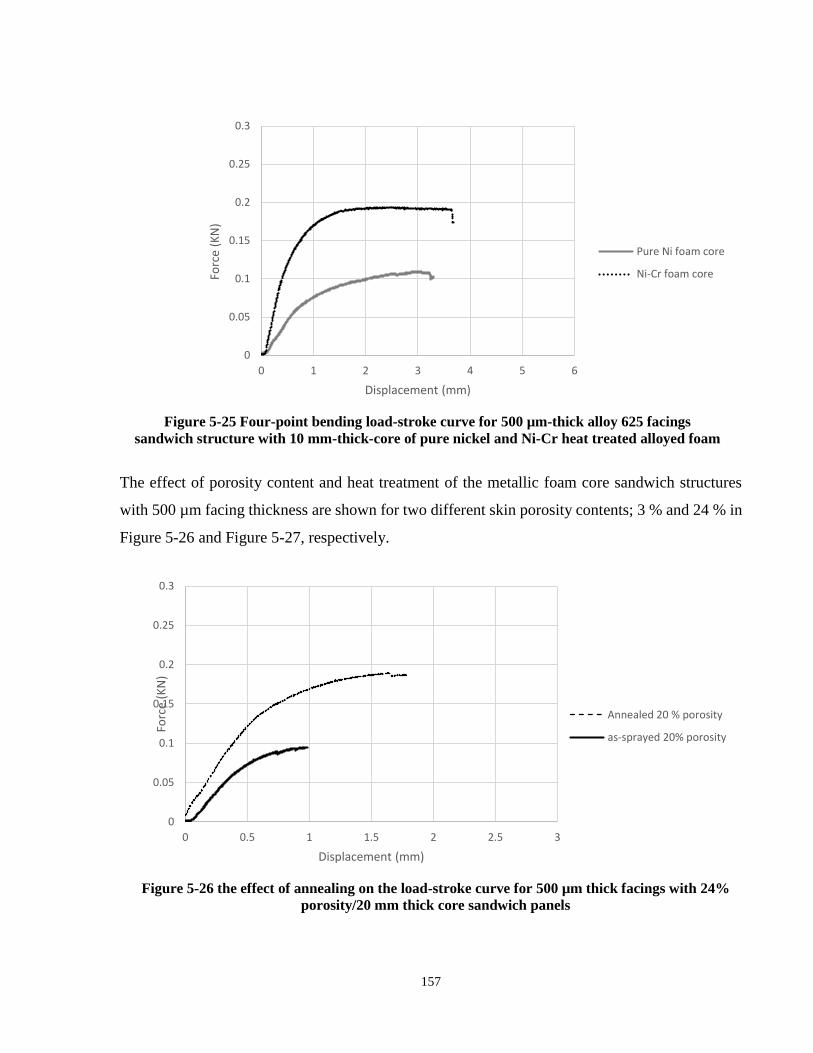
157
The effect of porosity content and heat treatment of the metallic foam core sandwich structures
with 500 µm facing thickness are shown for two different skin porosity contents; 3 % and 24 % in
Figure 5-26 and Figure 5-27, respectively.
Figure 5-25 Four-point bending load-stroke curve for 500 µm-thick alloy 625 facings
sandwich structure with 10 mm-thick-core of pure nickel and Ni-Cr heat treated alloyed foam
0
0.05
0.1
0.15
0.2
0.25
0.3
0 1 2 3 4 5 6
Forc
e (K
N)
Displacement (mm)
Pure Ni foam core
Ni-Cr foam core
Figure 5-26 the effect of annealing on the load-stroke curve for 500 µm thick facings with 24%
porosity/20 mm thick core sandwich panels
0
0.05
0.1
0.15
0.2
0.25
0.3
0 0.5 1 1.5 2 2.5 3
Forc
e (K
N)
Displacement (mm)
Annealed 20 % porosity
as-sprayed 20% porosity
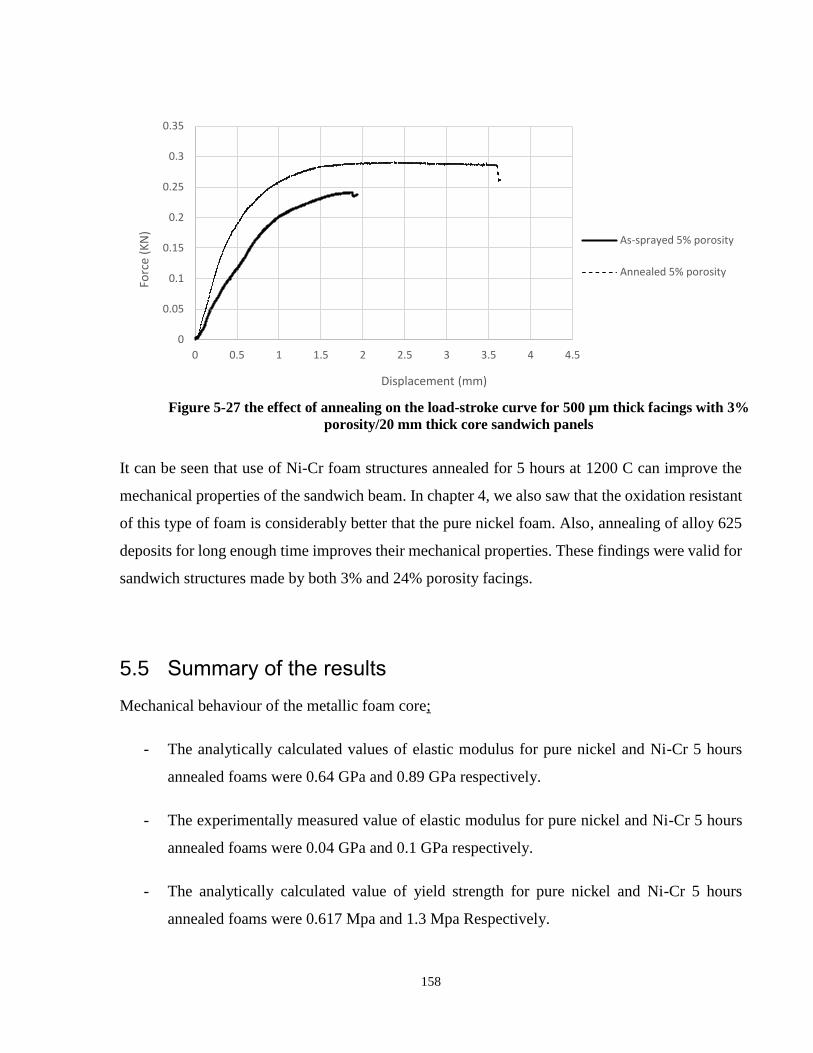
158
It can be seen that use of Ni-Cr foam structures annealed for 5 hours at 1200 C can improve the
mechanical properties of the sandwich beam. In chapter 4, we also saw that the oxidation resistant
of this type of foam is considerably better that the pure nickel foam. Also, annealing of alloy 625
deposits for long enough time improves their mechanical properties. These findings were valid for
sandwich structures made by both 3% and 24% porosity facings.
5.5 Summary of the results
Mechanical behaviour of the metallic foam core;
- The analytically calculated values of elastic modulus for pure nickel and Ni-Cr 5 hours
annealed foams were 0.64 GPa and 0.89 GPa respectively.
- The experimentally measured value of elastic modulus for pure nickel and Ni-Cr 5 hours
annealed foams were 0.04 GPa and 0.1 GPa respectively.
- The analytically calculated value of yield strength for pure nickel and Ni-Cr 5 hours
annealed foams were 0.617 Mpa and 1.3 Mpa Respectively.
Figure 5-27 the effect of annealing on the load-stroke curve for 500 µm thick facings with 3%
porosity/20 mm thick core sandwich panels
0
0.05
0.1
0.15
0.2
0.25
0.3
0.35
0 0.5 1 1.5 2 2.5 3 3.5 4 4.5
Forc
e (K
N)
Displacement (mm)
As-sprayed 5% porosity
Annealed 5% porosity
159
- The experimentally calculated value of yield strength for pure nickel and Ni-Cr 5 hours
annealed foams were 0.5 MPa and 1.1 MPa respectively.
- Elastic modulus and yield strength of the as alloyed Ni-Cr foam was not significantly
different with pure nickel foam. However, this difference increased by increasing the Ni-
Cr foam annealing time to make uniformly alloyed struts.
- The use of 5 hours annealed Ni-20%Cr foam is suggested to increase the stiffness of all
metal foam core sandwich structures for high-temperature applications.
Mechanical behavior of the facings
- Experimentally measured mechanical properties of the arc sprayed alloy 625 facings were
significantly lower than the analytically predicted values. This is because thermal spray
deposits are anisotropic by nature and contain significant amounts of micropores, oxide
layers, and weak splat boundaries. Mechanical properties of the facings were improved by
heat treatment but still far from the ones calculated by the available models.
- Increasing the porosity content of the skin lowers its mechanical properties. The
experimentally obtained elastic modulus of the 3% porosity alloy 625 annealed for 3 hours
was 25 GPa compared to 18 GPa for 24% porosity coating. The measured value of yield
strength for the annealed facings was 223 MPa and 157 MPa for 3% and 24 % porosity
coatings respectively.
- The elastic modulus of the low porosity alloy 625 coating was found to be 7% of the
conventional (bulk) alloy 625 for as sprayed deposits and 12% for 3-hours annealed
deposits.
- The elastic modulus of the high porosity alloy 625 coating was found to be 5% of the
conventional (bulk) alloy 625 for as sprayed deposits and 8% for 3-hours annealed
deposits.
Mechanical behaviour of the sandwich structure
- The flexural rigidity and failure load of sandwich beams were predicted by analytical
models, FEM, and measured by four-point bending tests.
160
- The value of the flexural rigidity obtained for different architectures by FEM and
experiments were close, while there was a difference in the yield points. The analytically
calculated failure load was significantly higher than the experimental measurements.
- The dominant failure mode for sandwich structures with intermediate face thickness and
foam thickness was core yielding.
- The dominant failure mode for thin facing panels was face yielding.
- The failure modes that were predicted analytically and by FEM were very close to the
actual observations, with a few exceptions for architectures close to the boundary between
different failure regimes.
161
References
[1] L. J. Gibson and M. F. Ashby, Cellular Solids: Structure and Properties. Cambridge, U.K:
Cambridge University Press, 1997, pp. 175-231.
[2] L. J. Gibson, “Mechanical Behavior Of Metallic Foams,” Annu. Rev. Mater. Sci, vol. 30,
no. 1, pp. 191–227, 2000.
[3] F. Azarmi, “Sandwich Structures for High Temperature Applications: Microstructural
Development and Mechanical Performance” Ph.D. dissertation, University of Toronto,
2008.
[4] E. A. Brandes and G. B. Brook, Smithells Metals Reference Book, 7th ed., Oxford, UK:
Butterworth-Heinemann, 1992.
[5] J. R. Davis, Nickel, Cobalt, and Their Alloys, Materials Park, OH: ASM International, 2000.
[6] “Nickel & Nickel Alloys.” Internet: https://www.matbase.com/material-
categories/metals/non-ferrous-metals/nickel/material-properties-of-nicr-80-20-nickel-
alloy.html#properties, 2003 [Nov. 29, 2015].
[7] R. W. Cahn and P. Haasen, Physical Metallurgy, Volume 1, 4th ed., Amesterdam,
Netherlands: Elsevier, 1996.
[8] V. Goussery, Y. Bienvenu, S. Forest, A. F. Gourgues, C. Colin, and J. D. Bartout, “Grain
size effects on the mechanical behavior of open-cell nickel foams,” Adv. Eng. Mater., vol.
6, no. 6, pp. 432–439, 2004.
[9] J. Beals and M. Thompson, “Density gradient effects on aluminium foam compression
behaviour,” J. Mater. Sci., vol. 32, no. 13, pp. 3595–3600, 1997.
[10] E. W. Andrews, G. Gioux, P. Onck, and L. J. Gibson, “Size effects in ductile cellular solids.
Part II : experimental results,” Int. J. Mech. Sci., vol. 43, no. 6, pp. 701–713, 2001.
[11] W. D. Callister Jr., and D. G. Rethwisch, Materials Science and Engineering: An
162
Introduction, 7th ed., New York, NY: John Wiley & Sons, 2006.
[12] F. Azarmi, J. Saaedi, T. W. Coyle, and J. Mostaghimi, “Microstructure characterization of
alloy 625 deposited on nickel foam using air plasma spraying,” Adv. Eng. Mater., vol. 10,
no. 5, pp. 459–465, 2008.
[13] T. N. McKechnie, Y.K. Liaw, F. R. Zimmerman, and R. M. Poorman, “Metallurgy and
properties of plasma spray formed materials,” In International Thermal Spray Conference
Proc., 1992, pp. 839–845.
[14] C. J. Li, A. Ohmori, “Relationships between the microstructure and properties of thermally
sprayed deposits,” ,” J. Therm. Spray Technol., vol. 11, no. 3, pp. 365-374, 2002.
[15] Z. Hashin, “The elastic moduli of heterogeneous materials,” J. Appl. Mech., vol. 29, no. 1,
p. 143, 1962.
[16] D. P. H. Hasselman, “On the porosity dependence of the elastic moduli of polycrystalline
refractory materials,” J. Am. Ceram. Soc., vol. 45, no. 9, pp. 452–453, 1962.
[17] J. C. Wang, “Young‘ s modulus of porous materials. Part 2 Young’s modulus of porous
alumina with changing pore structure,” J. Mater. Sci., vol. 19, pp. 809–814, 1984.
[18] R. M. Spriggs, “Expression for effect of porosity on elastic modulus of polycrystalline
refractory materials, particularly aluminum oxide,” J. Am. Ceram. Soc., vol. 44, no. 12, pp.
628–629, 1961.
[19] C. LI, A. Ohmori, and R. Mcpherson, “The relationship between microstructure and
Young’s modulus of thermally sprayed ceramic coatings,” J. Mater. Sci., vol. 32, no. 4, pp.
997–1004, 1997.
[20] Y. He, and A. Ohmori, “Characterization of structure of thermally sprayed Coating,” In
Meeting the Challenges of the 21st Century (ASM International) Proc. , 1998, pp. 717–722.
[21] T. Nakamura, G. Qian, and C. C. Berndt, “Effects of pores on mechanical properties of
plasma-sprayed ceramic coatings,” J. Am. Ceram. Soc., vol. 83, no. 3, pp. 578–584, 2000.
163
[22] Y. H. Zhao, G. P. Tandon, and G. J. Weng, “Elastic moduli for a class of porous materials,”
Acta Mech., vol. 76, no. 1–2, pp. 105–131, 1989.
[23] T. M. McCormack, R. Miller, O. Kesler, and L. J. Gibson, “Failure of sandwich beams with
metallic foam cores,” Int. J. Solids Struct., vol. 38, no. 28–29, pp. 4901–4920, 2001.
[24] H. Bart-Smith, J. W. Hutchinson, and A. G. Evans, “Measurement and analysis of the
structural performance of cellular metal sandwich construction,” Int. J. Mech. Sci., vol. 43,
no. 8, pp. 1945–1963, 2001.
[25] T. C. Triantafillou and L. J. Gibson, “Failure mode maps for foam core sandwich beams,”
Mater. Sci. Eng., vol. 95, pp. 37–53, 1987.
[26] C. Chen, A-M. Harte, and N. A. Fleck, “The plastic collapse of sandwich beams with a
metallic foam core,” Int. J. Mech. Sci., vol. 43, no. 6, pp. 1483–1506, 2001.
[27] A. Petras, M.P.F. Sutcliffe, “Failure mode maps for honeycomb sandwich panels,” Compos.
Struct., vol. 44, no. 4, pp. 237–252, 1999.
[28] Standard Test Method for Core Shear Properties of Sandwich Constructions by Beam,
ASTM C393/C 393 M – 06, 2009.
[29] H. G. Allen, Analysis and Design of Structural Sandwich Panels. Oxford, UK: Pergamon
Press, 1969.
[30] E. E. Gdoutos, I. M. Daniel, K.-A. Wang, J. L. Abot, “Nonlinear behavior of composite
sandwich beams in three-point bending,” Exp. Mech., vol. 41, no. 2, pp. 182–189, 2001.
[31] M. F. Ashby, A. G. Evans, N. A. Fleck, L. J. Gibson, J. W. Hutchinson, and H. N. G.
Wadley, Metal Foams. Oxford, UK: Butterworth-Heinemann, 2000, pp. 113-132
[32] A. Govaerts and B. Bhattacharjee, “Microstructural Effects on Mechanical Behaviour of
Air Plasma Sprayed Sandwich Structures,” University of Toronto, Final Rep. Design &
Research Projct (MSE 498Y1 Y), 2012.
[33] S. B. Baştürk, M. Tanoğlu, “Development and Mechanical Behavior of FML/Aluminium
164
Foam Sandwiches,” Appl. Compos. Mater., vol. 20, no. 5, pp. 789–802, 2013.
[34] Karsten Stöbenera, Dirk Lehmhusa, Massimiliano Avalleb, Lorenzo Peronib, Matthias
Bussea, “Aluminum foam-polymer hybrid structures (APM aluminum foam) in
compression testing,” Int. J. Solids Struct., vol. 45, no. 21, pp. 5627–5641, 2008.
[35] R. E. Miller, “A continuum plasticity model for the constitutive and indentation behaviour
of foamed metals,” Int. J. Mech. Sci., vol. 42, no. 4, pp. 729–754, 2000.
[36] K. Kanny and H. Mahfuz, “Flexural fatigue characteristics of sandwich structures at
different loading frequencies,” Compos. Struct., vol. 67, no. 4, pp. 403–410, Mar. 2005.
[37] F. Azarmi, T. W. Coyle, and J. Mostaghimi, “Flexural properties of sandwich beams
consisting of air plasma sprayed alloy 625 and nickel alloy foam,” J. Mater. Sci., vol. 44,
no. 11, pp. 2836–2843, 2009.
[38] F. Azarmi, T. W. Coyle, and J. Mostaghimi, “Evaluation of the flexural rigidity of sandwich
structures using experimentally obtained mechanical properties of the constituents,” J.
Therm. Spray Technol., vol. 19, no. 1–2, pp. 429–438, 2010.
[39] M. Styles, P. Compston, and S. Kalyanasundaram, “The effect of core thickness on the
flexural behaviour of aluminium foam sandwich structures,” Compos. Struct., vol. 80, no.
4, pp. 532–538, Oct. 2007.
165
Chapter 6 Closure
6.1 Results and Conclusions
This thesis reports the development and characterization of open-cell metallic foam core sandwich
structures suitable for high-temperature applications, fabricated by the arc spray process.
The microstructural and mechanical properties of pure nickel foam and Ni-20%Cr nickel foam
were studied. The results of high-temperature oxidation tests and characterization of mechanical
properties showed that Ni-20%Cr annealed for 5 hours at 1200 ºC, and alloy 625 annealed for 3
hours at 1100 ºC are the best candidates among those investigated for the production of high-
temperature metallic foam core sandwich structures by the arc spray method.
The mechanical performance of the sandwich panels was studied through analytical methods, finite
element modeling (FEM) and experimentally by four-point bending tests. The effects of the
strength and thickness of the core; the thickness, heat treatment and porosity of the facings; and
the span length were investigated.
The following conclusions are drawn from the results of this project:
The pack cementation process can be used for alloying commercially available pure nickel
foam to produce Ni-20% Cr foams with higher mechanical strength and improved high-
temperature oxidation resistance.
The porosity of arc sprayed coatings can be controlled by appropriate selection of the
deposition process parameters. The relations between deposition parameters and porosity
can be identified efficiently through the use of statistically designed experimental trials
(DOE).
The arc spray process is capable of producing low porosity (3%), low oxide content
(13%) skins on the metallic foam substrate for fabrication of metallic foam core
sandwich structures
166
The arc spray process can be modified by adding a pore agent injector to produce
highly porous coating with porosity content of above the normal ranges achievable
by conventional arc spray systems. It was shown by permeability tests that 20%
porosity is high enough to allow gaseous fluid to permeate through the cross section
of arc sprayed deposits and produce a film cooling effect.
The elastic modulus of the arc sprayed alloy 625 was determined by tensile testing and
found to be affected by the porosity content. The elastic modulus of the as-sprayed alloy
635 with 3 % and 24 %porosity content was 7% and 5% of conventionally processed bulk
alloy 625, respectively. This is due to weak bonding between the splats as well as the effect
of pores inside the deposits.
An annealing heat treatment at 1100°C improved the mechanical properties of the alloy
625 deposits for both 3% and 24 % porosity content types. The elastic modulus of the 3%
and 24% coatings improved by around 60 % after 3 hours annealing at 1100°C.
The elastic modulus of the foams measured experimentally was significantly below the
predictions of the analytical model. That may be due to the small specimen size relative to
the foam cell size.
The flexural rigidity and failure load of sandwich panels fabricated from foam cores and
faces with a range of mechanical properties and with a range of architectures were
measured experimentally and compared with the predictions made by the analytical
methods and finite element modeling. The FEM results were close to experimentally
measured flexural rigidity; there was less agreement between the predicted and measured
failure loads. The failure load calculated by analytical methods was significantly higher
than the experimental results for the face yielding failure mode; that might be because the
face becomes very thin on top of foam strut tips. Analytical results were closer to
experimental findings for the core yield mode, although still considerably higher. There
was better agreement among the three methods for the indentation failure mode.
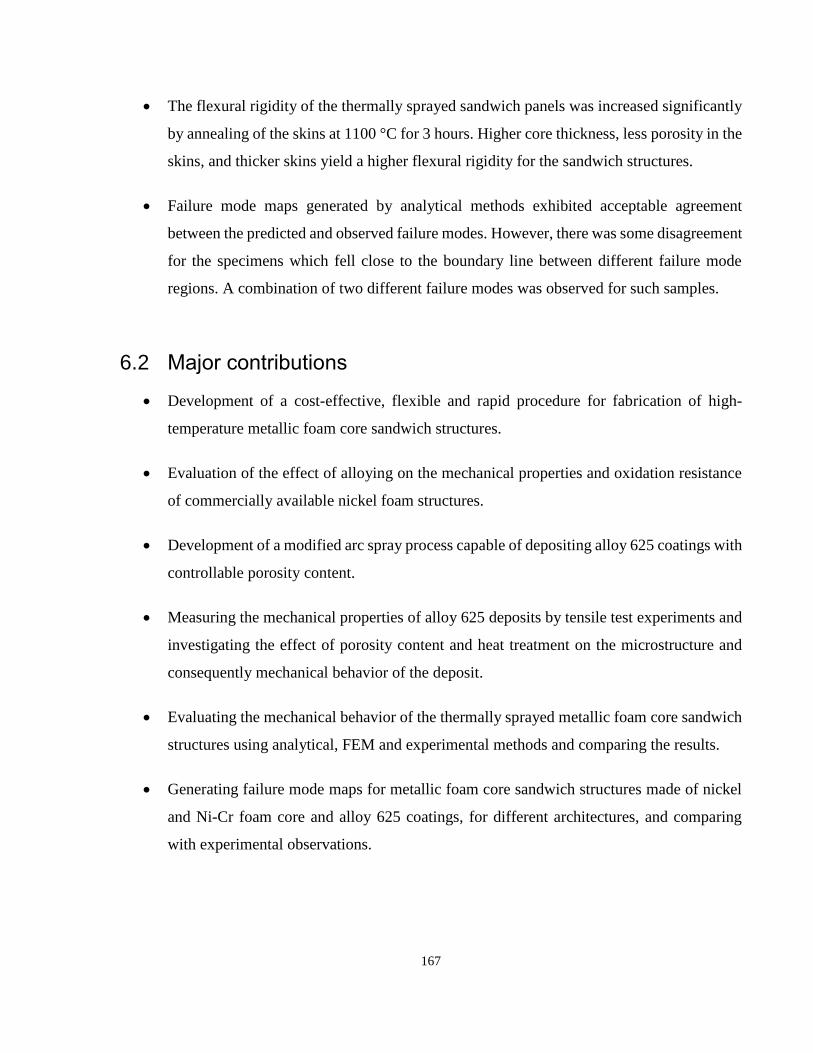
167
The flexural rigidity of the thermally sprayed sandwich panels was increased significantly
by annealing of the skins at 1100 °C for 3 hours. Higher core thickness, less porosity in the
skins, and thicker skins yield a higher flexural rigidity for the sandwich structures.
Failure mode maps generated by analytical methods exhibited acceptable agreement
between the predicted and observed failure modes. However, there was some disagreement
for the specimens which fell close to the boundary line between different failure mode
regions. A combination of two different failure modes was observed for such samples.
6.2 Major contributions
Development of a cost-effective, flexible and rapid procedure for fabrication of high-
temperature metallic foam core sandwich structures.
Evaluation of the effect of alloying on the mechanical properties and oxidation resistance
of commercially available nickel foam structures.
Development of a modified arc spray process capable of depositing alloy 625 coatings with
controllable porosity content.
Measuring the mechanical properties of alloy 625 deposits by tensile test experiments and
investigating the effect of porosity content and heat treatment on the microstructure and
consequently mechanical behavior of the deposit.
Evaluating the mechanical behavior of the thermally sprayed metallic foam core sandwich
structures using analytical, FEM and experimental methods and comparing the results.
Generating failure mode maps for metallic foam core sandwich structures made of nickel
and Ni-Cr foam core and alloy 625 coatings, for different architectures, and comparing
with experimental observations.

168
6.3 Recommendations for future work
Extend the failure mode maps to a wider range of variables, such as foam density, coating
materials and processing conditions and beam architecture.
Model the foam structure by FEM as a porous media, instead of considering it a bulk
material with reduced mechanical properties.
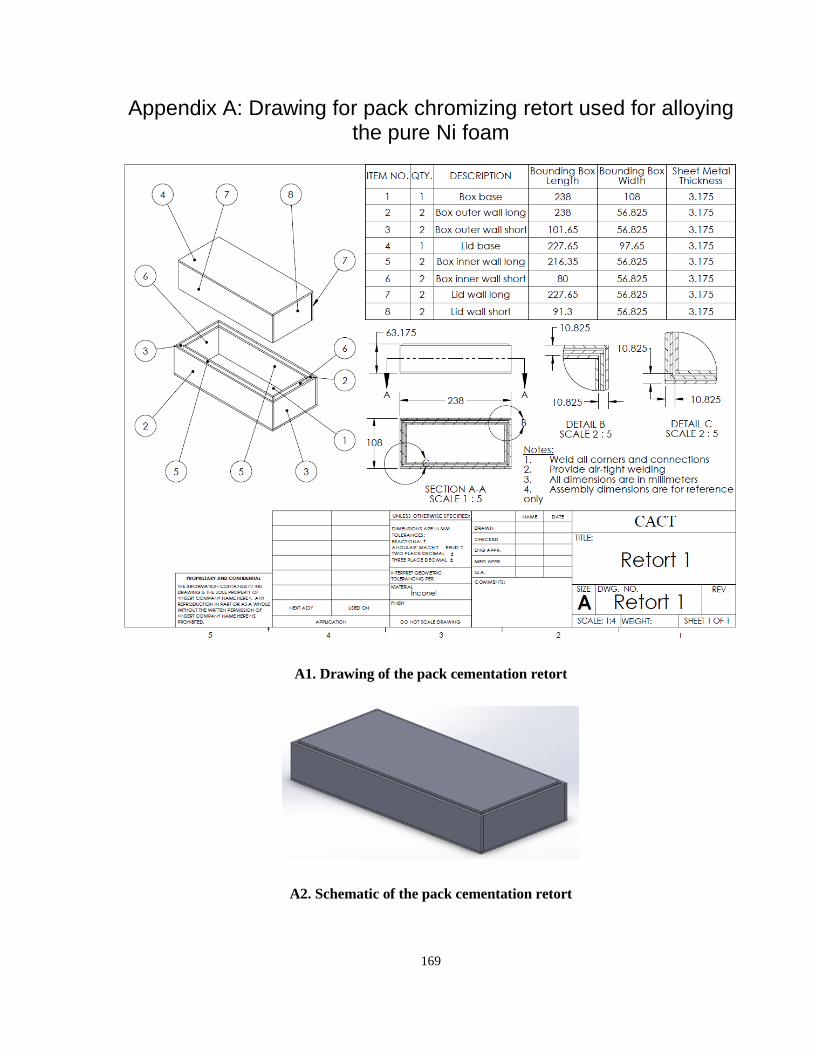
169
Appendix A: Drawing for pack chromizing retort used for alloying the pure Ni foam
A1. Drawing of the pack cementation retort
A2. Schematic of the pack cementation retort
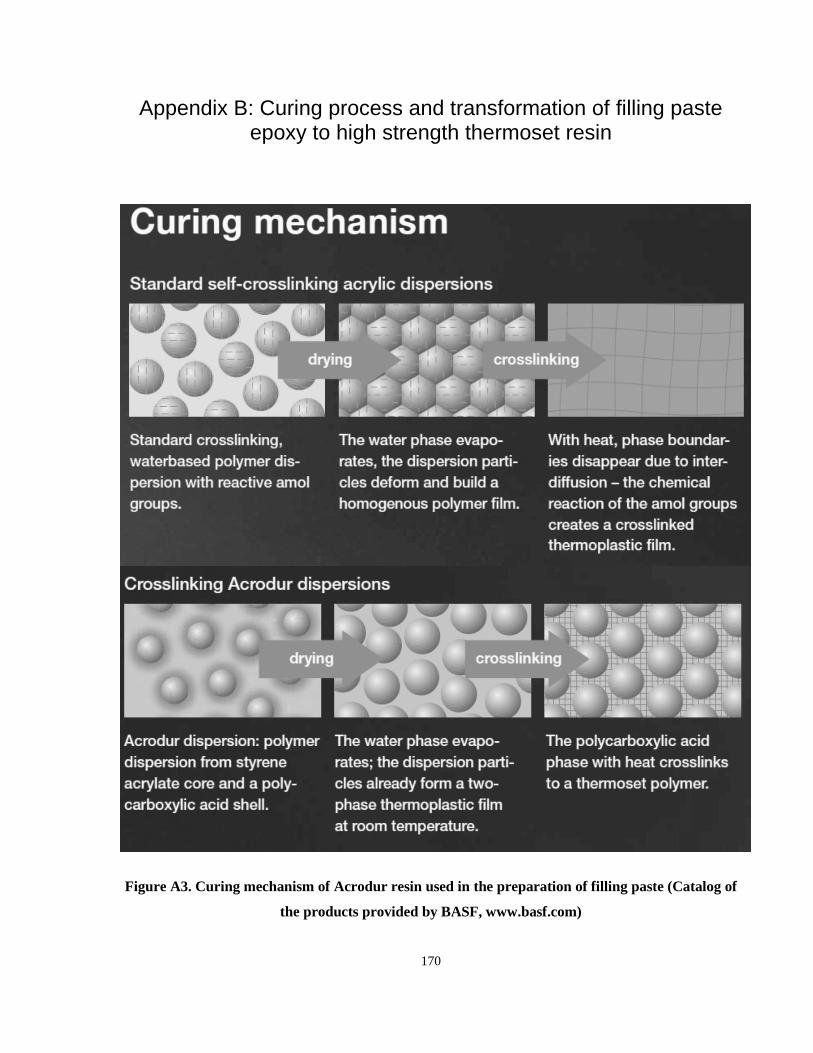
170
Appendix B: Curing process and transformation of filling paste epoxy to high strength thermoset resin
Figure A3. Curing mechanism of Acrodur resin used in the preparation of filling paste (Catalog of
the products provided by BASF, www.basf.com)
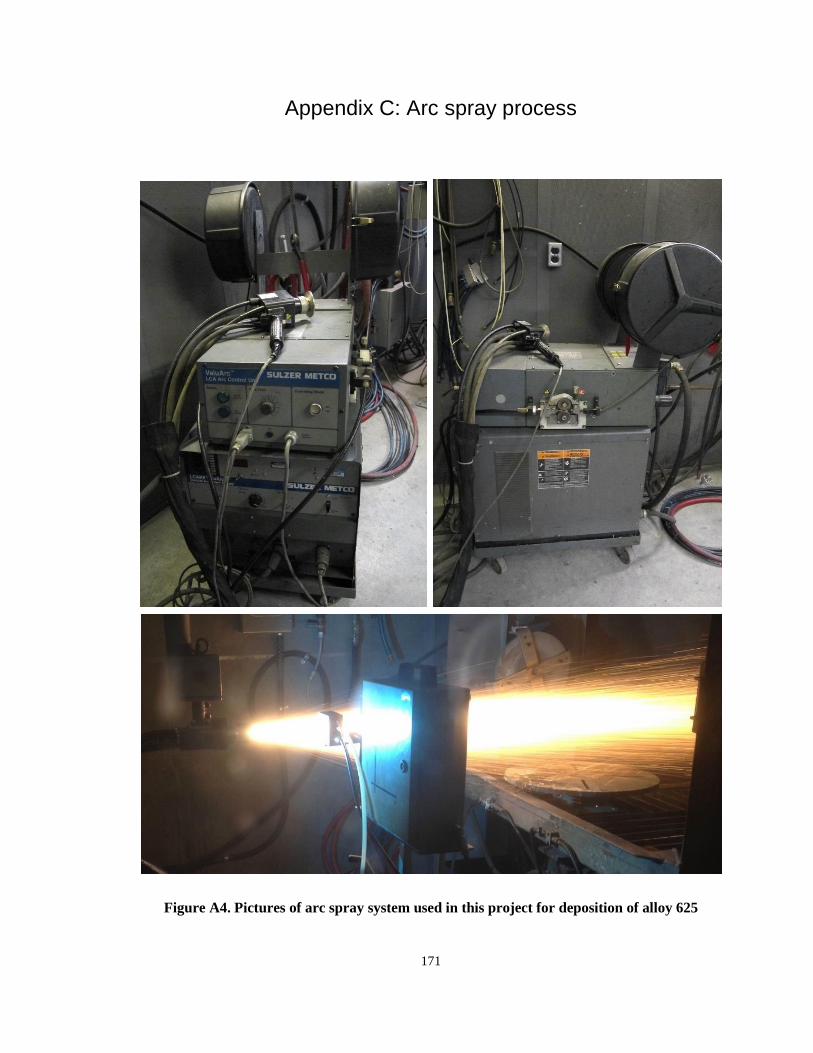
171
Appendix C: Arc spray process
Figure A4. Pictures of arc spray system used in this project for deposition of alloy 625
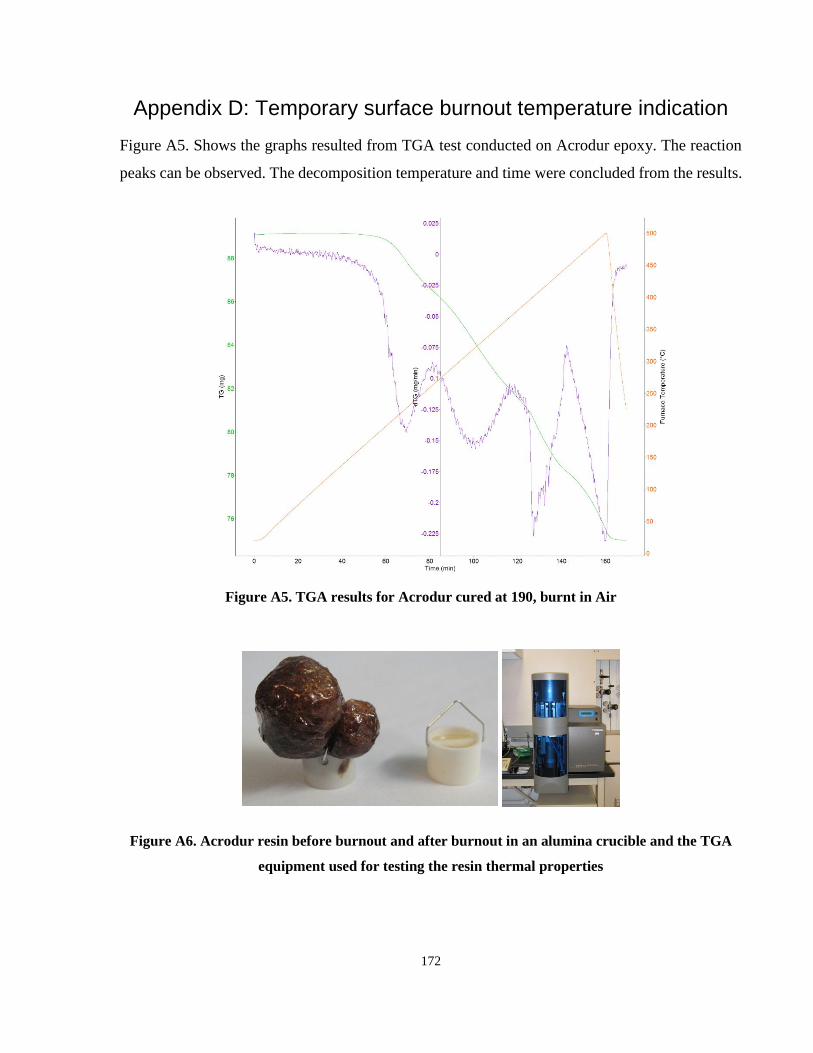
172
Appendix D: Temporary surface burnout temperature indication
Figure A5. Shows the graphs resulted from TGA test conducted on Acrodur epoxy. The reaction
peaks can be observed. The decomposition temperature and time were concluded from the results.
Figure A6. Acrodur resin before burnout and after burnout in an alumina crucible and the TGA
equipment used for testing the resin thermal properties
Figure A5. TGA results for Acrodur cured at 190, burnt in Air
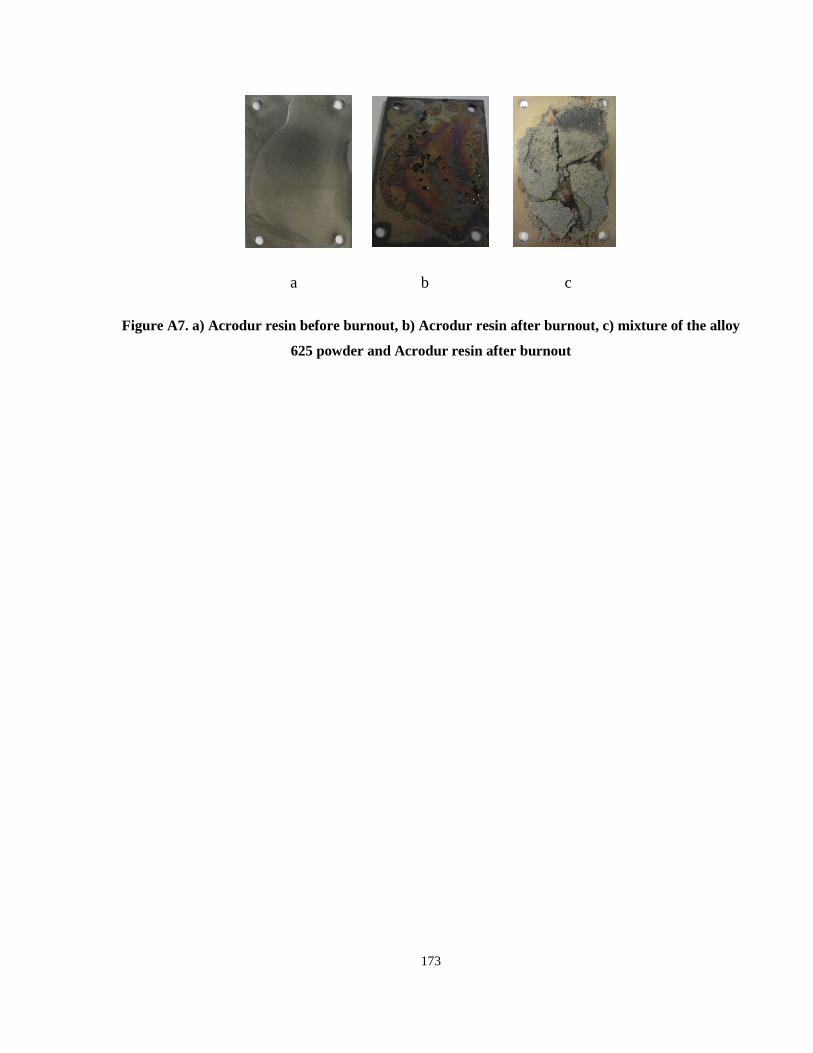
173
a b c
Figure A7. a) Acrodur resin before burnout, b) Acrodur resin after burnout, c) mixture of the alloy
625 powder and Acrodur resin after burnout

174
Appendix E: DVP-2000 system and the resulted graphs
Figure A8. DVP-2000 equipment console and sensing head
Figure A9. DVP-2000 sensing head monitoring the droplets characteristics during arc spray of alloy
625
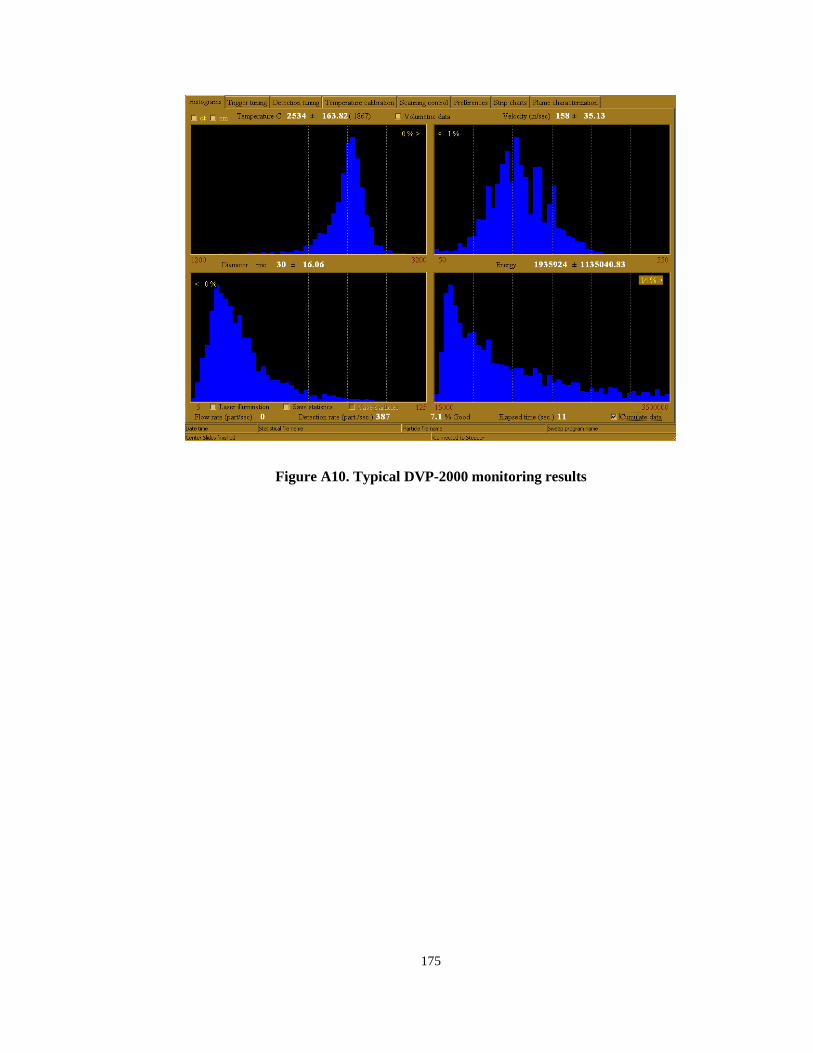
175
Figure A10. Typical DVP-2000 monitoring results
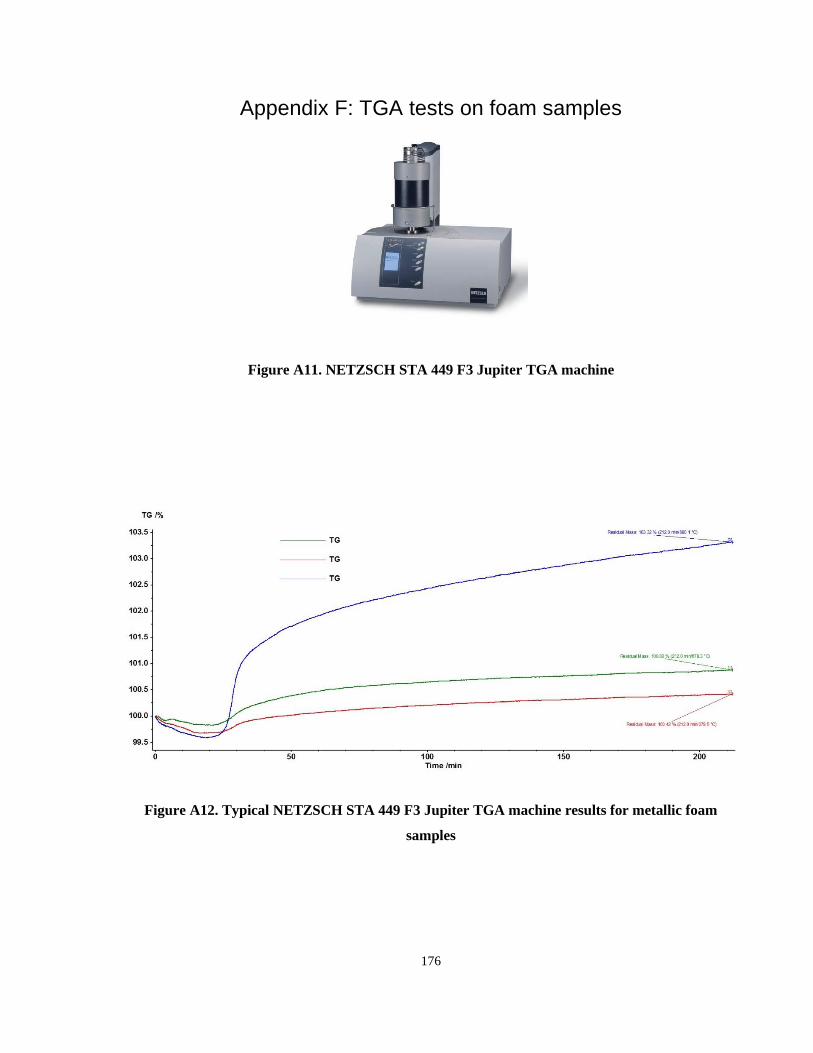
176
Appendix F: TGA tests on foam samples
Figure A11. NETZSCH STA 449 F3 Jupiter TGA machine
Figure A12. Typical NETZSCH STA 449 F3 Jupiter TGA machine results for metallic foam
samples
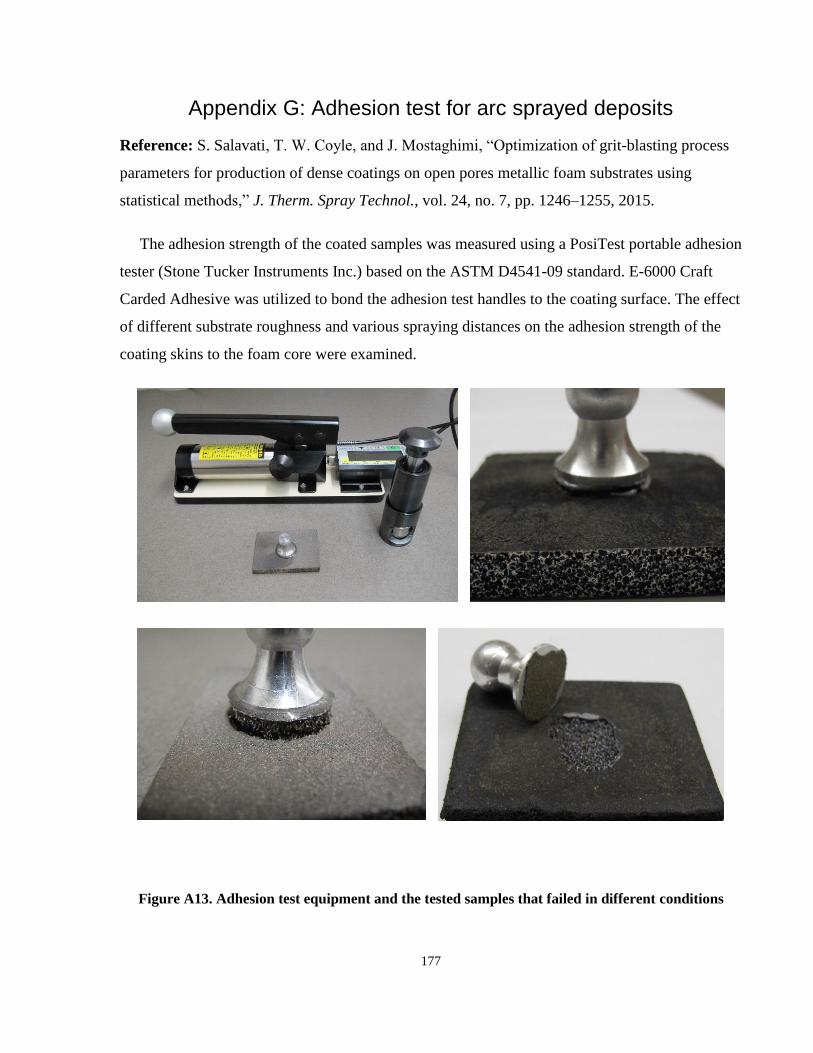
177
Appendix G: Adhesion test for arc sprayed deposits Reference: S. Salavati, T. W. Coyle, and J. Mostaghimi, “Optimization of grit-blasting process
parameters for production of dense coatings on open pores metallic foam substrates using
statistical methods,” J. Therm. Spray Technol., vol. 24, no. 7, pp. 1246–1255, 2015.
The adhesion strength of the coated samples was measured using a PosiTest portable adhesion
tester (Stone Tucker Instruments Inc.) based on the ASTM D4541-09 standard. E-6000 Craft
Carded Adhesive was utilized to bond the adhesion test handles to the coating surface. The effect
of different substrate roughness and various spraying distances on the adhesion strength of the
coating skins to the foam core were examined.
Figure A13. Adhesion test equipment and the tested samples that failed in different conditions