thermal‐fluid flow within innovative heat storage concrete systems for solar power plants
TRANSCRIPT

Thermal-fluid flow withininnovative heat storage concretesystems for solar power plants
Valentina A. Salomoni and Carmelo E. MajoranaDepartment of Construction and Transportation Engineering,Faculty of Engineering, University of Padua, Padua, Italy, and
Giuseppe M. Giannuzzi and Adio MiliozziENEA – Agency for New Technologies, Energy and Environment,
Thermodynamic Solar Project, CRE Casaccia, Rome, Italy
AbstractPurpose – The purpose of this paper is to describe an experience of R&D in the field of newtechnologies for solar energy exploitation within the Italian context. Concentrated solar power systemsoperating in the field of medium temperatures are the main research objectives, directed towards thedevelopment of a new and low-cost technology to concentrate the direct radiation and efficientlyconvert solar energy into high-temperature heat.
Design/methodology/approach – A multi-tank sensible-heat storage system is proposed forstoring thermal energy, with a two-tanks molten salt system. In the present paper, the typology of abelow-grade cone shape storage is taken up, in combination with nitrate molten salts at 5658Cmaximum temperature, using an innovative high-performance concrete for structures absolvingfunctions of containment and foundation.
Findings – Concrete durability in terms of prolonged thermal loads is assessed. The interactionbetween the hot tank and the surrounding environment (ground) is considered. The developed FEmodel simulates the whole domain, and a fixed heat source of 1008C is assigned to the internal concretesurface. The development of the thermal and hygral fronts within the tank thickness are analysed andresults discussed for long-term scenarios.
Originality/value – Within the medium temperature field, an innovative approach is here presentedfor the conceptual design of liquid salts concrete storage systems. The adopted numerical modelaccounts for the strong coupling among moisture and heat transfer and the mechanical field. The basicmathematical model is a single fluid phase non-linear diffusion one based on the theory by Bazant;appropriate thermodynamic and constitutive relationships are supplemented to enhance the approachand catch the effects of different fluid phases (liquid plus gas).
Keywords Solar power, Concretes, Flow, Thermal insulating properties
Paper type Research paper
IntroductionEnergy availability has always been an essential component of human civilization andthe energetic consumption is directly linked to the produced wealth. In many depressedcountries the level of solar radiation is considerably high and it could be the primaryenergy source, under conditions that low cost, simple-to-be-used technologies areemployed. Then, it is responsibility of the most advanced countries to develop newequipments to allows this progress for taking place. A large part of the energeticforecast, based on economic projection for the next decades, ensure us that fossil fuel
The current issue and full text archive of this journal is available at
www.emeraldinsight.com/0961-5539.htm
Solar powerplants
969
Received 28 March 2007Revised 31 July 2007
Accepted 8 November 2007
International Journal of NumericalMethods for Heat & Fluid Flow
Vol. 18 No. 7/8, 2008pp. 969-999
q Emerald Group Publishing Limited0961-5539
DOI 10.1108/09615530810899051
supplies will be largely enough to cover the demand. The predicted and consistentincrease in the energetic demand will be more and more covered by a larger use offossil fuels, without great technology innovations. A series of worrying consequencesare involved in the above scenario: important climatic changes are linked to strong CO2
emissions; sustainable development is hindered by some problems linked to certaintyof oil and natural gas supply; problems of global poverty are not solved but amplifiedby the unavoidable increase in fossil fuel prices caused by an increase in demand.
These negative aspects can be avoided only if a really innovative and moreacceptable technology will be available in the next decades at a suitable level toimpress a substantial effect on the society. Solar energy is the ideal candidate to breakthis vicious circle between economic progress and consequent greenhouse effect. Thelow penetration on the market shown today by the existent renewable technologies,solar energy included, is explained by well-known reasons: the still high costs ofthe produced energy and the “discontinuity” of both solar and wind energies. Theselimitations must be removed in reasonable short times, with the support of innovativetechnologies, in view of such an urgent scenario.
On this purpose ENEA, on the basis of the Italian law no. 388/2000, has started anR&D program addressed to the development of concentrated solar power (CSP)systems able to take advantage of solar energy as heat source at high temperature. Oneof the most relevant objectives of this research program (Rubbia, C., and ENEAWorking Group, 2001) is the study of CSP systems operating in the field of mediumtemperatures (about 5508C), directed towards the development of a new and low-costtechnology to concentrate the direct radiation and efficiently convert solar energy intohigh-temperature heat; another aspect is focused on the production of hydrogen bymeans of thermo-chemical processes at temperatures above 8008C.
The problems concerning the use of CSP technologies has been analyzed andreported by several authors, e.g. Sargent & Lundy Consulting Group (2002) concludethat the CSP technology is a well-established and reliable solution for energyproduction, even if its major disadvantage is that the energy produced is at muchhigher costs than those required by fossil-fuels. The authors propose to enlarge themarket of such technologies and increase their use, thus reducing costs. Price et al.(2002) discuss how a torque box design for parabolic trough collectors, an importantaspect in concentrating solar thermal power plants in California, reduces weight anddeformations of collector structures. Reducing weight and deformations willsubsequently decrease the number of drives and interconnecting pipes henceallowing for more collector elements onto one drive. By using this design of parabolictrough collector, the potential for very large costs reductions comes out. Lupfert et al.(2001) consider how the existing parabolic trough power plants are a capable andever-growing technology and, thanks to improvements reached through R&D, it islikely that costs will consistently decrease while advantages and technology rapidlyincrease.
As well as cost reductions, the current innovative ENEA conception aims tointroduce a set of innovations, concerning:
. The parabolic-trough solar collector. An innovative design to reduce productioncosts, installation and maintenance and to improve thermal efficiency is definedin collaboration with some Italian industries.
HFF18,7/8
970

. The heat transfer fluid. The synthetic hydrocarbon oil, which is flammable,expensive and unusable beyond 4008C, is substituted by a mixture of moltensalts (sodium and potassium nitrate), widely used in the industrial field andchemically stable up to 6008C.
. The thermal energy storage (TES). It allows for the storage of solar energy,which is then used when energy is not directly available from the sun (night andcovered sky) (Pilkington Solar International GmbH, 2000).
After some years of R&D activities, ENEA has built an experimental facility (definedwithin the Italian context as Prova Collettori Solari – PCS) at the Research Centre ofCasaccia in Rome (ENEA, 2007), which incorporates the main proposed innovativeelements (Figure 1).
The next step is to test these innovations at full scale by means of a demonstrationplant, as envisioned by the “Archimede” ENEA/ENEL project in Sicily. Such a projectis designed to upgrade the ENEL thermo-electrical combined-cycle power plant byabout 20MW, using solar thermal energy from concentrating parabolic-troughcollectors.
Point (1) above is being analysed today by the authors (Giannuzzi et al., 2007) andfirst design criteria are being suggested, whereas the attention now is focused on point(3) already introduced in (Giannuzzi et al., 2005), as explained in the following.
Two-tanks CSP systemsThe main advantage of thermal solar power plants is the possibility to use relativelyeconomical storage systems, if compared to other renewable energies (i.e. photo-voltaicand wind). Storing electricity is much more expensive than storing thermal energyitself. TES option can collect energy in order to shift its use to later times, or to smoothout the plant output during irregularly cloudy weather conditions. Hence, thefunctional operativeness of a solar thermal power plant can be extended beyondperiods of no solar radiation without the need of burning fossil fuel. Periods ofmismatch among energy supplied by the sun and energy demand can be reduced.
Figure 1.PCS tool solar collectors atENEA Centre (Casaccia,
Rome)
Solar powerplants
971
Economic thermal storage is a technological key issue for the future success of solarthermal technologies.
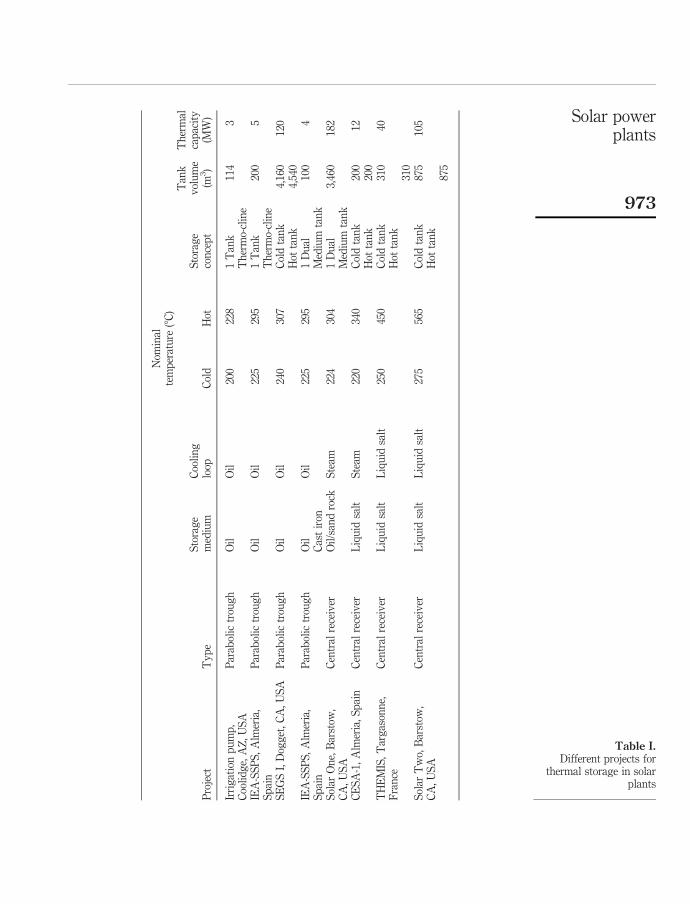
In our days, among eight thermal storage systems in thermo-electric solar plants,seven have been of experimental or prototypal nature and only one has been acommercial unit (Table I). All the listed systems are “at sensible heat storage”: twosingle-tanks oil thermo-cline systems, four two-tanks single medium systems (one oil-and three molten salt) and two single-tanks double medium systems. Actually the mostadvanced technology for heat storage in solar towers and through collector plantsconsiders the use of a two-tanks molten salt system (Ives et al., 1985).
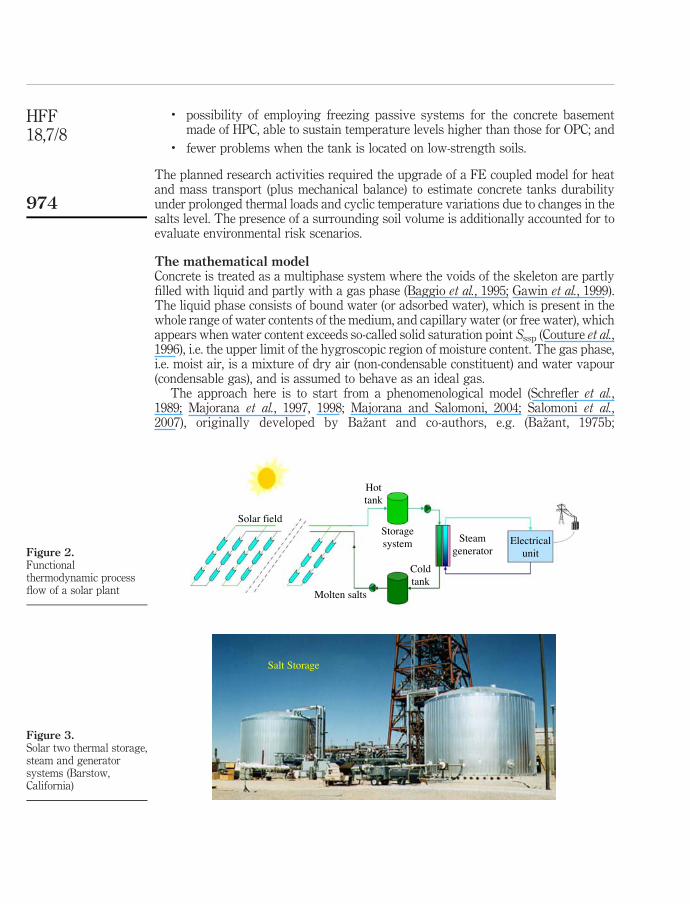
The functional thermodynamic process of a parabolic-trough two-tanks solar plantis shown in Figure 2 (Herrmann et al., 2004). The main elements of the plant are: thesolar field, the storage system, the steam generator and the auxiliary systems forstarting and controlling the plant.
The solar field is the heart of the plant; the solar radiation replaces the fuel ofconventional plants and the solar concentrators absorb and concentrate it. The fieldis made up of several collector elements composed in series to create the singlecollector line. The collected thermal energy is determined by the total number ofcollector elements which are characterized by a reflecting parabolic section(the concentrator), collecting and continuously concentrating the direct solarradiation by means of a sun-tracking control system to a linear receiver located onthe focus of the parabolas. A circulating fluid flows inside a linear receiver totransport the absorbed heat.
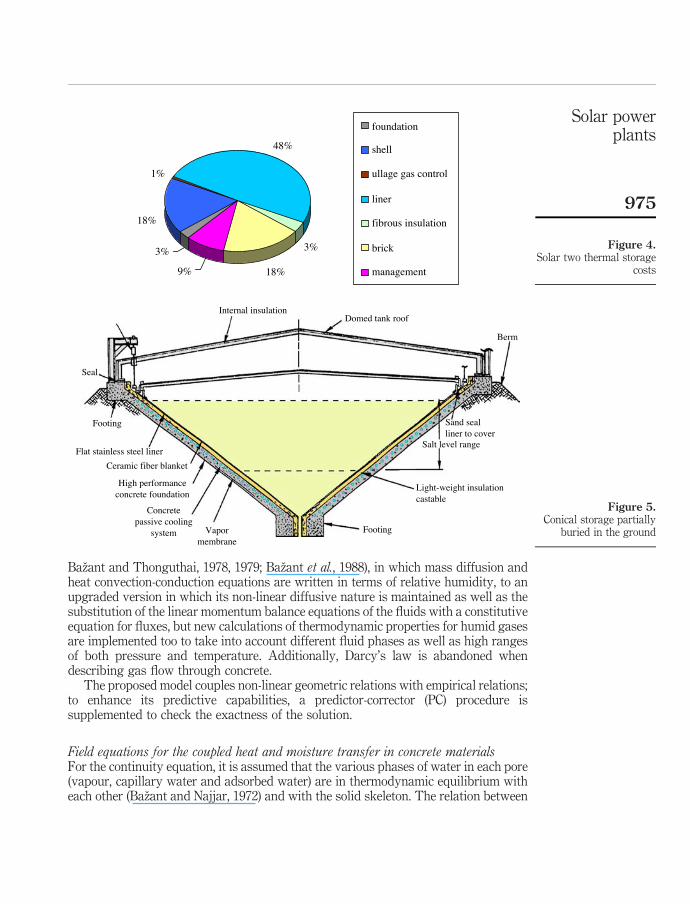
The hot and cold tanks (Figure 3) are located on the ground and they arecharacterized by an internal circumferential and longitudinally-wrinkled liner,appropriately thermally insulated. The cost of the liner is the primary cost of such atank (Figure 4). In recent studies it has been shown that an increase in the hourlycapacity accumulation reduces sensibly the cost of the produced electrical energy; thisleads to increase the reservoir dimensions from the 11.6m diameter and 8.5m height ofthe Solar Two power plant to the larger 18.9m diameter and 2.5 height calculated in theSolar Tres power plant design phase.
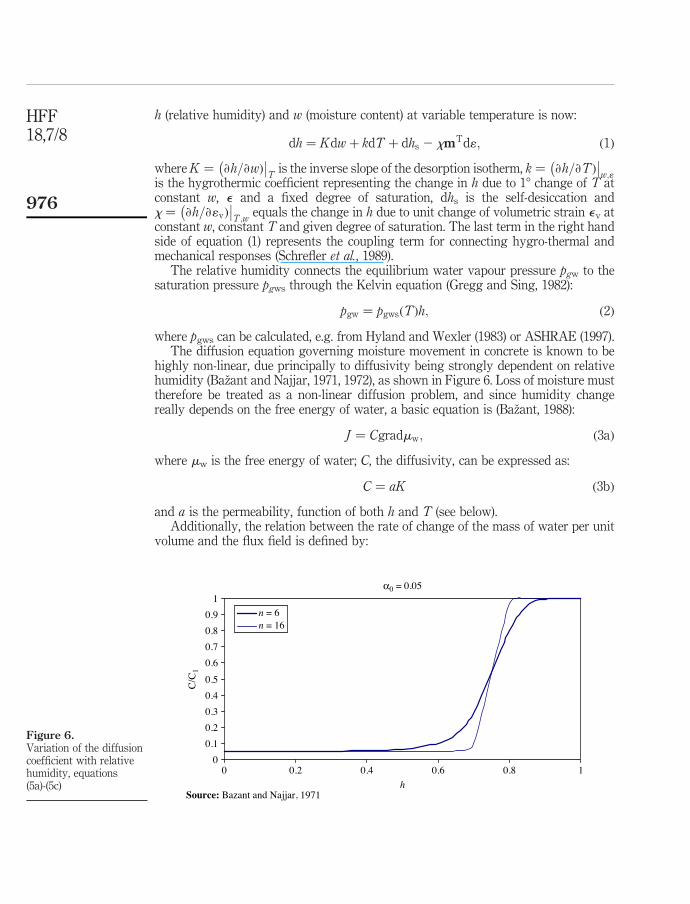
Already in 1985, the Solar Energy Research Institute (SERI) commissioned theconceptual design of a below-grade cone shape storage (Figure 5) with 9008C moltencarbonate salts (Copeland et al., 1984). This solution, even though interesting becauseof the use of low-cost structural materials, showed some limits connected to the highlevel of corrosion induced by carbonate and high temperature.
In this paper, such a type of storage is reconsidered in combination with nitratemolten salts at a maximum temperature of 5658C, using an innovativehigh-performance concrete (HPC) for the tanks. From the technological point ofview, the innovations relies in:
. higher structural safety related to the reduced settlements;
. employment of HPC containment structures and foundations characterised bylower costs with respect to stainless steel structures;
. substitution of highly expensive corrugated steel liners with plane liners takingadvantage of the geometric compensation of thermal dilations due to the conicalshape of the tank;
HFF18,7/8
972
Nom
inal
temperature
(8C)
Project
Typ
eStorage
medium
Coolin
gloop
Cold
Hot
Storage
concept
Tank
volume
(m3 )
Therm
alcapacity
(MW)
Irrigation
pump,
Coolid
ge,A
Z,U
SAParabolictrough
Oil
Oil
200
228
1Tank
114
3Therm
o-cline
IEA-SSP
S,Alm
eria,
Spain
Parabolictrough
Oil
Oil
225
295
1Tank
200
5Therm
o-cline
SEGSI,Dogget,CA,U
SAParabolictrough
Oil
Oil
240
307
Coldtank
4,160
120
Hot
tank
4,540
IEA-SSP
S,Alm
eria,
Spain
Parabolictrough
Oil
Castiron
Oil
225
295
1Dual
Medium
tank
100
4
SolarOne,B
arstow
,CA,U
SACentral
receiver
Oil/sand
rock
Steam
224
304
1Dual
Medium
tank
3,460
182
CESA
-1,A
lmeria,S
pain
Central
receiver
Liquidsalt
Steam
220
340
Coldtank
200
12Hot
tank
200
THEMIS,T
argasonn
e,France
Central
receiver
Liquidsalt
Liquidsalt
250
450
Coldtank
Hot
tank
310
40
310
SolarTwo,Barstow
,CA,U
SACentral
receiver
Liquidsalt
Liquidsalt
275
565
Coldtank
Hot
tank
875
105
875
Table I.Different projects for
thermal storage in solarplants
Solar powerplants
973
. possibility of employing freezing passive systems for the concrete basementmade of HPC, able to sustain temperature levels higher than those for OPC; and
. fewer problems when the tank is located on low-strength soils.
The planned research activities required the upgrade of a FE coupled model for heatand mass transport (plus mechanical balance) to estimate concrete tanks durabilityunder prolonged thermal loads and cyclic temperature variations due to changes in thesalts level. The presence of a surrounding soil volume is additionally accounted for toevaluate environmental risk scenarios.
The mathematical modelConcrete is treated as a multiphase system where the voids of the skeleton are partlyfilled with liquid and partly with a gas phase (Baggio et al., 1995; Gawin et al., 1999).The liquid phase consists of bound water (or adsorbed water), which is present in thewhole range of water contents of the medium, and capillary water (or free water), whichappears when water content exceeds so-called solid saturation point Sssp (Couture et al.,1996), i.e. the upper limit of the hygroscopic region of moisture content. The gas phase,i.e. moist air, is a mixture of dry air (non-condensable constituent) and water vapour(condensable gas), and is assumed to behave as an ideal gas.
The approach here is to start from a phenomenological model (Schrefler et al.,1989; Majorana et al., 1997, 1998; Majorana and Salomoni, 2004; Salomoni et al.,2007), originally developed by Bazant and co-authors, e.g. (Bazant, 1975b;
Figure 3.Solar two thermal storage,steam and generatorsystems (Barstow,California)
Salt Storage
Figure 2.Functionalthermodynamic processflow of a solar plant
Solar field
Hottank
Molten salts
Storagesystem
Coldtank
Steamgenerator
Electricalunit
HFF18,7/8
974
Bazant and Thonguthai, 1978, 1979; Bazant et al., 1988), in which mass diffusion andheat convection-conduction equations are written in terms of relative humidity, to anupgraded version in which its non-linear diffusive nature is maintained as well as thesubstitution of the linear momentum balance equations of the fluids with a constitutiveequation for fluxes, but new calculations of thermodynamic properties for humid gasesare implemented too to take into account different fluid phases as well as high rangesof both pressure and temperature. Additionally, Darcy’s law is abandoned whendescribing gas flow through concrete.
The proposed model couples non-linear geometric relations with empirical relations;to enhance its predictive capabilities, a predictor-corrector (PC) procedure issupplemented to check the exactness of the solution.
Field equations for the coupled heat and moisture transfer in concrete materialsFor the continuity equation, it is assumed that the various phases of water in each pore(vapour, capillary water and adsorbed water) are in thermodynamic equilibrium witheach other (Bazant and Najjar, 1972) and with the solid skeleton. The relation between
Figure 4.Solar two thermal storage
costs
3%
18%
1%
48%
3%
18%9%
foundation
shell
ullage gas control
liner
fibrous insulation
brick
management
Figure 5.Conical storage partially
buried in the ground
Seal
Footing
Flat stainless steel linerCeramic fiber blanket
High performanceconcrete foundation
Concretepassive cooling
system Vapormembrane
Footing
Light-weight insulationcastable
Salt level range
Sand sealliner to cover
Berm
Domed tank roofInternal insulation
Solar powerplants
975
h (relative humidity) and w (moisture content) at variable temperature is now:
dh ¼ Kdwþ kdT þ dhs 2 xmTd1; ð1Þ
whereK ¼ ›h=›wÞ! ""
Tis the inverse slope of the desorption isotherm, k ¼ ›h=›TÞ
! ""w;1
is the hygrothermic coefficient representing the change in h due to 18 change of T atconstant w, e and a fixed degree of saturation, dhs is the self-desiccation andx ¼ ›h=›1vÞ
! ""T;w
equals the change in h due to unit change of volumetric strain ev atconstant w, constant T and given degree of saturation. The last term in the right handside of equation (1) represents the coupling term for connecting hygro-thermal andmechanical responses (Schrefler et al., 1989).
The relative humidity connects the equilibrium water vapour pressure pgw to thesaturation pressure pgws through the Kelvin equation (Gregg and Sing, 1982):
pgw ¼ pgwsðTÞh; ð2Þ
where pgws can be calculated, e.g. from Hyland and Wexler (1983) or ASHRAE (1997).The diffusion equation governing moisture movement in concrete is known to be
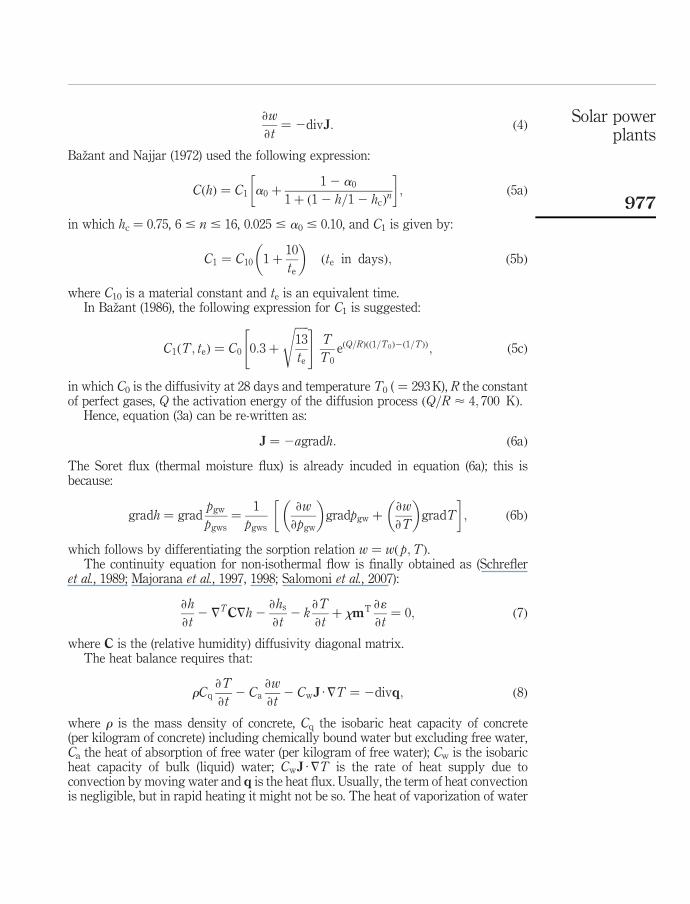
highly non-linear, due principally to diffusivity being strongly dependent on relativehumidity (Bazant and Najjar, 1971, 1972), as shown in Figure 6. Loss of moisture musttherefore be treated as a non-linear diffusion problem, and since humidity changereally depends on the free energy of water, a basic equation is (Bazant, 1988):
J ¼ Cgradmw; ð3aÞ
where mw is the free energy of water; C, the diffusivity, can be expressed as:
C ¼ aK ð3bÞ
and a is the permeability, function of both h and T (see below).Additionally, the relation between the rate of change of the mass of water per unit
volume and the flux field is defined by:
Figure 6.Variation of the diffusioncoefficient with relativehumidity, equations(5a)-(5c)
α0 = 0.05
00.10.20.30.40.50.60.70.80.9
1
0
Source: Bazant and Najjar, 1971
0.2 0.4 0.6 0.8 1h
C/C
1
n = 6n = 16
HFF18,7/8
976
›w
›t¼ 2divJ: ð4Þ
Bazant and Najjar (1972) used the following expression:
CðhÞ ¼ C1 a0 þ12 a0
1þ ð12 h=12 hcÞn# $
; ð5aÞ
in which hc ¼ 0.75, 6 # n # 16, 0.025 # a0 # 0.10, and C1 is given by:
C1 ¼ C10 1þ 10
te
% &ðte in daysÞ; ð5bÞ
where C10 is a material constant and te is an equivalent time.In Bazant (1986), the following expression for C1 is suggested:
C1ðT; teÞ ¼ C0 0:3þffiffiffiffiffi13
te
s" #T
T0eðQ=RÞðð1=T0Þ2ð1=TÞÞ; ð5cÞ
in which C0 is the diffusivity at 28 days and temperature T0 ( ¼ 293 K), R the constantof perfect gases, Q the activation energy of the diffusion process ðQ=R < 4; 700 KÞ.
Hence, equation (3a) can be re-written as:
J ¼ 2agradh: ð6aÞThe Soret flux (thermal moisture flux) is already incuded in equation (6a); this isbecause:
gradh ¼ gradpgwpgws
¼ 1
pgws
›w
›pgw
% &gradpgw þ ›w
›T
% &gradT
# $; ð6bÞ
which follows by differentiating the sorption relation w ¼ wð p;TÞ.The continuity equation for non-isothermal flow is finally obtained as (Schrefler
et al., 1989; Majorana et al., 1997, 1998; Salomoni et al., 2007):
›h
›t2 7TC7h2
›hs›t
2 k›T
›tþ xmT ›1
›t¼ 0; ð7Þ
where C is the (relative humidity) diffusivity diagonal matrix.The heat balance requires that:
rCq›T
›t2 Ca
›w
›t2 CwJ ·7T ¼ 2divq; ð8Þ
where r is the mass density of concrete, Cq the isobaric heat capacity of concrete(per kilogram of concrete) including chemically bound water but excluding free water,Ca the heat of absorption of free water (per kilogram of free water); Cw is the isobaricheat capacity of bulk (liquid) water; CwJ ·7T is the rate of heat supply due toconvection by moving water and q is the heat flux. Usually, the term of heat convectionis negligible, but in rapid heating it might not be so. The heat of vaporization of water
Solar powerplants
977
does not figure explicitly, but it may be included within the second term of the left handside expression (Bazant and Thonguthai, 1979).
The heat flux q is due to temperature gradient (governed by Fourier’s law) and tomoisture concentration gradient (Dufour’s flux):
q ¼ 2aTw7w2 aTT7T; ð9aÞwhere the coefficients aTw, aTT depend on w and T.
Owing to the negligible contribution of the moisture flux, equation (9a) is re-writtenas:
q ¼ 2aTT7T; ð9bÞand aTT is the heat conductivity.
Equation of state for pore waterFor temperatures T , 647.3 K (critical point of water) we must distinguish betweensaturated and partially saturated concrete. A saturated state for concrete can bereferred to the value of h or to another variable, the degree of saturation, linked to hthrough a pressure called capillary pressure (Gawin et al., 1999; Grasley and Lange,2007):
pc ¼ 2rwRT
MwInh; ð10Þ
in which rw ¼ rwð p;TÞ is the liquid water density (see below) andMw is the molecularweight of water.
The degree of saturation is calculated, starting from Baroghel-Bouny et al. (1999),as:
S ¼
(Tcr2T0Tcr2T
)N
a* pc
2
64
3
75
b=ðb21Þ
T # Tcr
NzNþ1 ðTcr 2 T0ÞNT þ Tcr2T0
z
! *N12 N
z ðTcr 2 zÞ+ ,
T . Tcr
8>>>>>><
>>>>>>:
; ð11Þ
in which Tcr is the critical temperature of water, N an empirical parameter ( ¼ 1.2), z aparameter governing the transition through the critical temperature of water ( ¼ 0.5 K),b a constant ( ¼ 2.2748). Parameter a* is a function of temperature:
a*¼
Q3¼18:6237 MPa T#373:15 K
Q0þQ2
with Q2¼7 MPa;Q0¼ðQ32Q2Þ 2 T2373:15Tcr2373:15
( )323 T2373:15
Tcr2373:15
( )2þ1
# $T. 373:15 K
8>>><
>>>:
ð12ÞThe expression in equation (11) is a proposal for upgrading the Baroghel-Bouny’sdesorption isotherms to account for high-temperature effects (Khoury andMajorana, 2007).
HFF18,7/8
978
Using such an approach it is possible to skip a problem arising when using Bazant’smodel, i.e. under the critical point of water the water content is considered as liquidwater (free water plus a small percentage for bound water), while when Tovercomes the critical point, the residual water has to be considered as gas water or amonolayer of physically bound water. Differently, through this upgraded approach, itis possible to have a consistent amount of water also above critical temperature,representing the gas phase and the chemically bound water in this zone which areseparately computed.
Partially saturated concrete. From experimental data (England and Ross, 1970;Zhukov and Shevchenko, 1974) it was seen that the following semi-empiricalexpression is acceptable:
w
c¼ w1
ch
( )1=mðtÞfor h # 0:96; ð13Þ
in which:
mðtÞ ¼ 1:042t0
22:34þ t0; t0 ¼ t þ 10
t0 þ 10
% &2
; ð14Þ
with t expressed in 8C; t0 ¼ 258C; c is the (dried) cement mass per m3 of concrete; w1 isthe saturation water content at 258C.
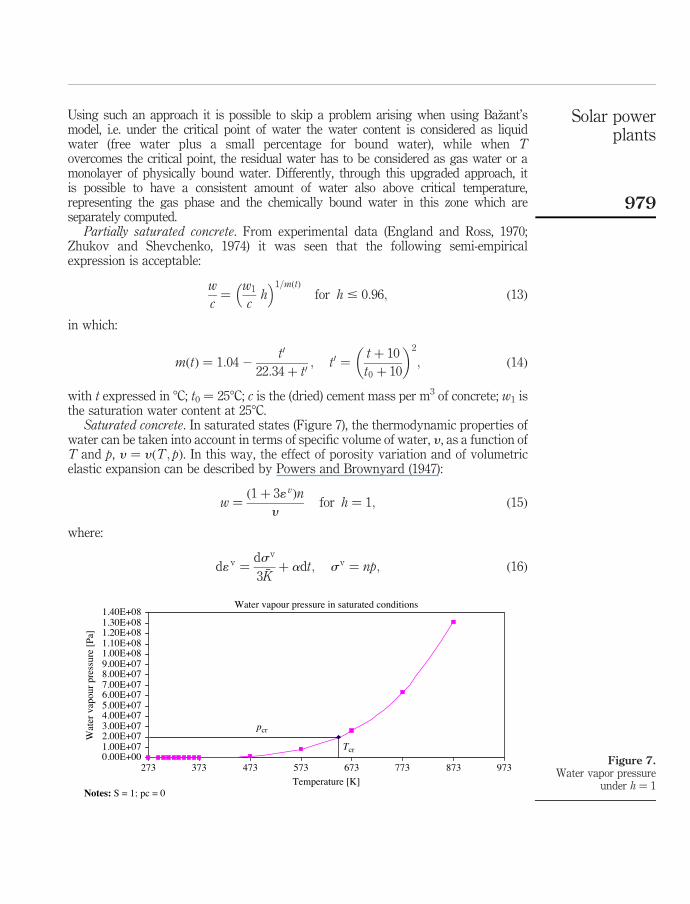
Saturated concrete. In saturated states (Figure 7), the thermodynamic properties ofwater can be taken into account in terms of specific volume of water, y , as a function ofT and p, y ¼ y ðT; pÞ. In this way, the effect of porosity variation and of volumetricelastic expansion can be described by Powers and Brownyard (1947):
w ¼ ð1þ 31 vÞny
for h ¼ 1; ð15Þ
where:
d1v ¼ dsv
3 !Kþ adt; sv ¼ np; ð16Þ
Figure 7.Water vapor pressure
under h ¼ 1
0.00E+001.00E+072.00E+073.00E+074.00E+075.00E+076.00E+077.00E+078.00E+079.00E+071.00E+081.10E+081.20E+081.30E+081.40E+08
273 373 473 573 673 773 873 973Temperature [K]
Notes: S = 1; pc = 0
Wat
er v
apou
r pre
ssur
e [P
a]
Tcr
pcr
Water vapour pressure in saturated conditions
Solar powerplants
979
with n porosity, e v volumetric strain of concrete due to the stress s v, !K volumetricmodulus, a coefficient of linear thermal expansion of concrete (typically,12 £ 10268C21), and p pore water pressure (Bazant et al., 1988), i.e. an averagepressure of the mixture of fluids filling the voids, which takes the form:
p ¼ pg 2 pc 2 patm; ð17Þ
where pg is the moist air pressure (defined below) and patm the atmosperic pressure.A more interesting approach is presented in Grasley and Lange (2007), following the
approach of Bentz et al. (1998), according to which the linear strain associated with thepressure change within the pore fluid can be expressed as:
1 ¼ DpS1
3ks2
1
kss
# $; ð18Þ
in which Dp is calculated by subtracting pc calculated from equation (10) prior to thetemperature change from the pc calculated from equation (10) after the temperaturechange, ks is the bulk modulus of the porous solid, kss the bulk modulus of the solidskeleton of the material and S (there defined as saturation factor) is referable to thedegree of saturation of equation (11).
Concrete permeability. It is assumed that the flux of moisture inside the concrete iscontrolled by the minimum transverse section of the pores, or “necks”, in the flux tubesthrough the cement paste.
An acceptable form for permeability (Bazant and Najjar, 1972) is:
a ¼ a0f 1ðhÞ · f 2ðtÞ for t # 958C; ð19aÞ
a ¼ a00f 3ðtÞ for t . 958C; ð19bÞ
with a00 ¼ a0f 2ð958CÞ; a0 is the reference permeability at 258C.The temperature of 958C is chosen as the beginning of this transition. The function
f1(h) reflects the moisture transfer in the layers of water adsorbed inside the necks andin agreement with (Bazant and Najjar, 1972; Bazant, 1975a):
f 1ðhÞ ¼ !aþ 12 !a1þðð12hÞ=ð12hcÞÞ for h , 1
f 1ðhÞ ¼ 1 for h ¼ 1; ð20Þ
where hc ø 0:75 ¼ humidity of transition; !a ø 1=20 at 258C.At t ¼ 958C, it is assumed that the necks are sufficiently large to allow the flow of
both liquid water and water vapour phases. Hence, !a is equal to 1 at 958C. Between 25and 958C a linear interpolation of !a is assumed. If the curve is extended below 258C, therelation 1= !a ¼ 1þ 19ð952 tÞ=70 seems more appropriate.
f2 in equation (19a) is given by an Arrhenius’ type equation:
f 2ðTÞ ¼ e½ðQ0=RÞðð1=T0Þ2ð1=TÞÞ& T , 368:15 Kð958CÞ; ð21Þ
with Q0 activation energy for the migration along the multimolecolar layers of wateradsorbed inside the necks.
HFF18,7/8
980
In accordance with Bazant and Najjar (1972) Q0=R ø 2; 700 K, and a good choicefor f3(T) is given by:
f 3ðTÞ ¼ e½ðt295Þ=ð0:881þ0:214ðt295ÞÞ& t . 958C: ð22ÞThe permeability is also largely influenced by the hydration degree (or aging).Referring to the available data, this dependence seems to be well described by:
a0 ¼ a1 · 10ffiffiffiffiffiffiffiffia2=te
p: ð23Þ
The values of a1 ¼ 10213 m=s; a2 ¼ 40 days agree with the data by Powers andBrownyard (1947).
The effect of thermo-mechanical damage on permeability (not reported here) isbeing implemented.
Hydration and drying of concrete. The hydration degree can be convenientlyreferred to the period of equivalent hydration, te, which represents the period ofhydration at 258C in water, necessary to confer the same hydration degree which isassumed at the real time t and with the actual history of variable h and t. It is defined,for 0 , t , 1008C, as:
te ¼Z t
0bTbhdt: ð24Þ
The coefficient bT is a function of temperature and, since the chemical reaction ofhydration is a processwhich is thermally activated, it can be expressed as (Bazant, 1975a):
bT ¼ e½ðQh=RÞðð1=T0Þ2ð1=TÞÞ; bh ¼ ½1þ a*ð1þ hÞ4&21; ð25Þwhere Qh is the activation energy of hydration (Bazant and Najjar, 1972) and a* variesbetween 5 and 7.5 (Bazant and Najjar, 1972; Bazant and Panula, 1979; Bazant andWittmann, 1982; Bazant, 1986).
From the interpolation of experimental results by Powers and Brownyard (1947) at258C, the hydrated water takes the form:
whðteÞ < 0:21cte
te þ te
% &1=3
te ¼ 23 days: ð26Þ
The total amount of free water (evaporable) wd (per m3 of concrete), can be expressed
as:
wd ¼ w105h f dðTÞ; ð27Þ
where w105h represents the hydrated water content at 1058C and typical values for fd(T)
are reported in Harmathy and Allen (1973).
Additional constitutive and thermodynamic relationships for the description ofhygro-thermal states of concreteThe liquid water density of equation (10) can be calculated through a linearrelationship of both temperature and water pressure pw ( pw ¼ pg–pc) (Reid et al., 1987;Bear, 1988; Forsyth and Simpson, 1991):
Solar powerplants
981
rw ¼ rw0½12 bwðT 2 T0Þ þ awð pw 2 patmÞ&ðif T $ Tcx; then T ¼ TcxÞ; ð28Þ
in which rw0 is the liquid water density at reference temperature T0 and pressure patm( ¼ 999.84 kg/m3), bw the volumetric thermal expansion coefficient of water (see below)and aw the isothermal compression modulus of water.
The state equation of liquid water is valid for bulk free liquid water, but it is alsooften used for the description of capillary and bound water. However, due to thecomplex nature of the interaction between the water and the solid skeleton, itsapplicability is questionable, especially as far as pressure dependence is concerned(although capillary water is in traction, but its density is not expected to be lower thanthat for bulk water). Sometimes (and ours is the case) this relationship is usedassuming water incompressibility, i.e. aw ¼ 0, taking into account that, close to thecritical point of water, a sharp increase in bw takes place.
Typical values of bw are 0.68 £ 1024 K21 if T ¼ 273.15 K, and 10.1 £ 1024 K21 ifT ¼ 420K; its relationship with temperature is non-linear, hence the present authorspropose the following expression:
bwðTÞ ¼ 4 £ 1027e0:0184T : ð29Þ
For water vapour and moist air, the Clapeyron equation of state (EOS) of perfect gases:
pgw ¼ rgwRT
Mw; pg ¼
rgRT
Mg; ð30Þ
and Dalton’s law:
pg ¼ pga þ pgw; ð31Þ
are assumed as state equations. The dry air pressure pga in our approach has beenevaluated using iteratively the virial EOS (Hyland andWexler, 1983; Wylie and Fisher,1996; Jayaraman, 1999; Ji et al., 2003; Ji and Yan, 2006), to adjust the non-idealbehaviour of the vapour phase (the same approach could be followed for both vapourand moist air), with indications by ASHRAE (1989) for calculating dry air density. Thevirial EOS takes the form:
pgay 0
RT¼ 1þ Baa
y 0 þ Caaa
y 02 ; ð32Þ
where y 0 is the molar volume of dry air and Baa, Caaa are the second and third virialcoefficient, respectively, given by:
Baa½cm3=mol& ¼X3
i¼0
BiT2i Caa½cm6=mol2& ¼
X3
i¼0
CiT2i; ð33Þ
with Bi and Ci listed in Table II.As regards moisture transport, being the moisture flow still governed by a
differential equation expressed in terms of pores’ relative humidity (equation (7)), theauthors propose to express the equation deriving the velocity of water flow, inaccordance with Shazali et al. (2006), as:
HFF18,7/8
982
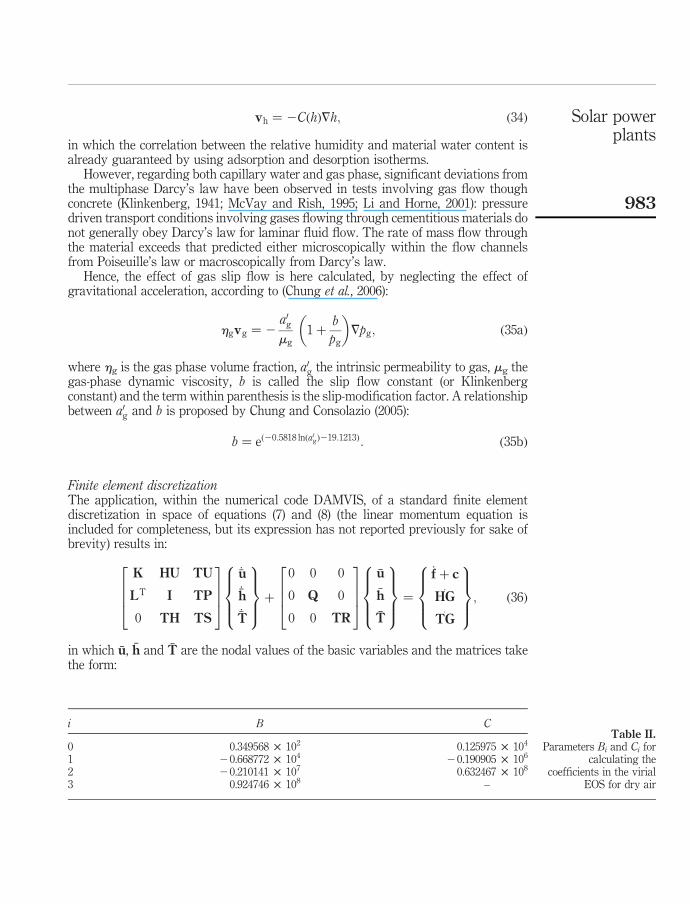
vh ¼ 2CðhÞ7h; ð34Þ
in which the correlation between the relative humidity and material water content isalready guaranteed by using adsorption and desorption isotherms.
However, regarding both capillary water and gas phase, significant deviations fromthe multiphase Darcy’s law have been observed in tests involving gas flow thoughconcrete (Klinkenberg, 1941; McVay and Rish, 1995; Li and Horne, 2001): pressuredriven transport conditions involving gases flowing through cementitious materials donot generally obey Darcy’s law for laminar fluid flow. The rate of mass flow throughthe material exceeds that predicted either microscopically within the flow channelsfrom Poiseuille’s law or macroscopically from Darcy’s law.
Hence, the effect of gas slip flow is here calculated, by neglecting the effect ofgravitational acceleration, according to (Chung et al., 2006):
hgvg ¼ 2a0gmg
1þ b
pg
% &7pg; ð35aÞ
where hg is the gas phase volume fraction, a0g the intrinsic permeability to gas, mg thegas-phase dynamic viscosity, b is called the slip flow constant (or Klinkenbergconstant) and the term within parenthesis is the slip-modification factor. A relationshipbetween a0g and b is proposed by Chung and Consolazio (2005):
b ¼ eð20:5818 lnða0gÞ219:1213Þ: ð35bÞ
Finite element discretizationThe application, within the numerical code DAMVIS, of a standard finite elementdiscretization in space of equations (7) and (8) (the linear momentum equation isincluded for completeness, but its expression has not reported previously for sake ofbrevity) results in:
K HU TU
LT I TP
0 TH TS
2
664
3
775
_!u_!h_!T
8>><
>>:
9>>=
>>;þ
0 0 0
0 Q 0
0 0 TR
2
664
3
775
!u
!h
!T
8>><
>>:
9>>=
>>;¼
_fþ c:
HG:
TG
8>><
>>:
9>>=
>>;; ð36Þ
in which !u, !h and !T are the nodal values of the basic variables and the matrices takethe form:
i B C
0 0.349568 £ 102 0.125975 £ 104
1 20.668772 £ 104 20.190905 £ 106
2 20.210141 £ 107 0.632467 £ 108
3 0.924746 £ 108 –
Table II.Parameters Bi and Ci for
calculating thecoefficients in the virial
EOS for dry air
Solar powerplants
983
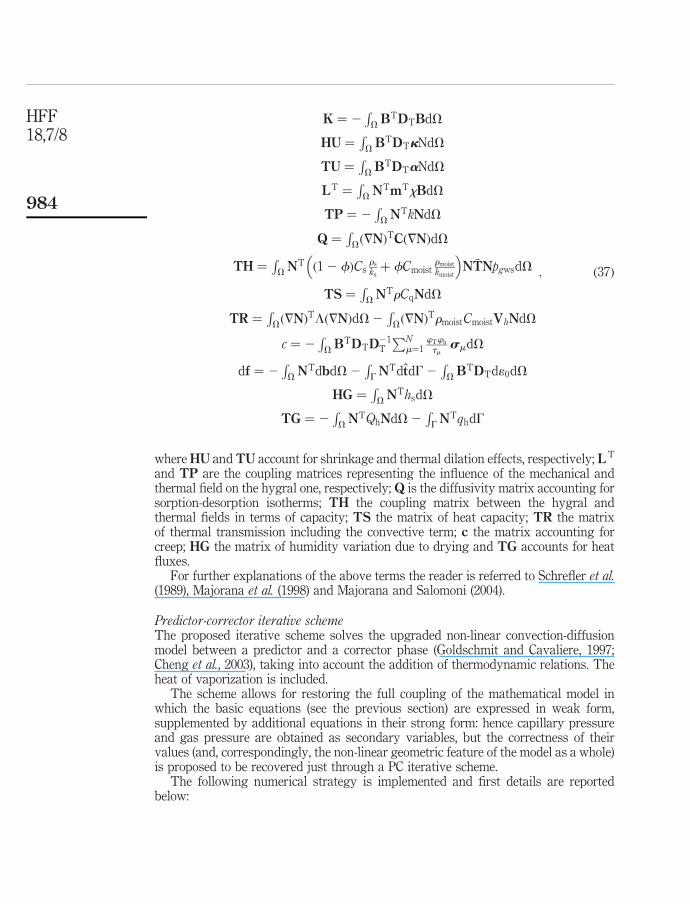
K ¼ 2RV BTDTBdV
HU ¼RV BTDTkNdV
TU ¼RV BTDTaNdV
LT ¼RV NTmTxBdV
TP ¼ 2RV NTkNdV
Q ¼RVð7NÞTCð7NÞdV
TH ¼RV NT ð12 fÞCs
rsksþ fCmoist
rmoist
kmoist
( )N !TNpgwsdV
TS ¼RV NTrCqNdV
TR ¼RVð7NÞTLð7NÞdV2
RVð7NÞTrmoistCmoistVhNdV
c ¼ 2RV BTDTD
21T
PNm¼1
wTwh
tmsmdV
df ¼ 2RV NTdbdV2
RG N
TdtdG2RV BTDTd10dV
HG ¼RV NThsdV
TG ¼ 2RV NTQhNdV2
RG N
TqhdG
; ð37Þ
whereHU andTU account for shrinkage and thermal dilation effects, respectively; LT
and TP are the coupling matrices representing the influence of the mechanical andthermal field on the hygral one, respectively; Q is the diffusivity matrix accounting forsorption-desorption isotherms; TH the coupling matrix between the hygral andthermal fields in terms of capacity; TS the matrix of heat capacity; TR the matrixof thermal transmission including the convective term; c the matrix accounting forcreep; HG the matrix of humidity variation due to drying and TG accounts for heatfluxes.
For further explanations of the above terms the reader is referred to Schrefler et al.(1989), Majorana et al. (1998) and Majorana and Salomoni (2004).
Predictor-corrector iterative schemeThe proposed iterative scheme solves the upgraded non-linear convection-diffusionmodel between a predictor and a corrector phase (Goldschmit and Cavaliere, 1997;Cheng et al., 2003), taking into account the addition of thermodynamic relations. Theheat of vaporization is included.
The scheme allows for restoring the full coupling of the mathematical model inwhich the basic equations (see the previous section) are expressed in weak form,supplemented by additional equations in their strong form: hence capillary pressureand gas pressure are obtained as secondary variables, but the correctness of theirvalues (and, correspondingly, the non-linear geometric feature of the model as a whole)is proposed to be recovered just through a PC iterative scheme.
The following numerical strategy is implemented and first details are reportedbelow:
HFF18,7/8
984

Starting procedure:. i ¼ 0 (i iteration counter); and. initial guess for u0 (displacement vector, see next section), h 0, T 0 (e.g. obtained
from a zero equation model solution).
Predictor phase:. (P1) i ¼ i þ 1.. (P2) Solve moisture and heat balance equations (7) and (8) neglecting the
coupling term with the mechanical field.. (P3) Solve equation (32) using the Newton-Raphson iteration method and
determine pga.. (P4) Calculate ( pgw, pc, S), pg (equations (2), (10), (11), (31)).. (P5) Solve the linear momentum equation (Majorana et al., 1998) for u.. (P6) Repeat from (P2) until convergence is achieved, both in a h-norm and in a
T-norm (h (i ) and T (i ) are the converged values).
Corrector phase:. (C1) Determine h from equation (10).. (C2) Solve iteratively moisture and heat balance equations for u and T (coupling
term included) until convergence is achieved in a u-norm (u (i ) is the convergedvalue).
. (C3) Update pga from equation (32).
Convergence check. Repeat the predictor and corrector phase until convergence isachieved, in a h-, T-, u-norm.
The convergence criteria adopted are:. predictor phase: NormðhÞ # hTOL and NormðTÞ # TTOL;. corrector phase: NormðuÞ # uTOL;. complete corrector/predictor algorithm: NormðhÞ # hTOL; NormðTÞ # TTOL;
NormðuÞ # uTOL, with:
NormðxÞ ¼ kxs 2 xs21kL2
kxskL2
;
and TOL convergence tolerance.To give some additional details about the proposed PC scheme, let us consider thesystem of equations (36) neglecting the coupling with the mechanical field (Step (P2)),re-written in a compact form as:
B _Xþ CX ¼ F; X ¼ {h;T}T: ð38Þ
Discretizing in time equation (38), e.g. following Turska and Schrefler (1993), weobtain:
½Bþ uDtC&Xnþ1 ¼ ½B2 ð12 uÞDtC&Xn þ DtFnþu; ð39Þ
Solar powerplants
985
where Dt is the time step length,Xnþ1 andXn are the state vectors at time instant tnþ1
and tn, and u is a parameter (usually 0 # u # 1) of the “generalized midpoint rule”used.
Equation (39) can be solved, e.g. by a staggered procedure performed afterpartitioning the matrixD ¼ Bþ uDtC; the predictor Xnþ1 ¼ XðPÞ
nþ1 is obtained afterrearranging equation (39). Usually, XðPÞ
nþ1 depends linearly on the already calculatedvalues Xn2i .
Hence, the displacement vector in system (36) can be directly calculated after steps(P4-P5), e.g. in accordance with what proposed in Salomoni and Schrefler (2005), and
finally !XðPÞnþ1 ¼ {u; h;T}T is obtained.
Once the predictor is set and convergence achieved (P6), it is then corrected afterdirect evaluation of hn, hnþ1 (C1); (C2) leads to obtain a system similar to equation (38),where now X ¼ {u;T}T and the corrector is finally reached, i.e. !X
ðCÞnþ1 ¼ {u; h;T}T.
The final convergence check allows for checking:
XðCÞnþ1 2XðPÞ
nþ1
""""""L2
XðCÞnþ1
""""""L2
# TOL;
with TOL a suitable convergence tolerance.
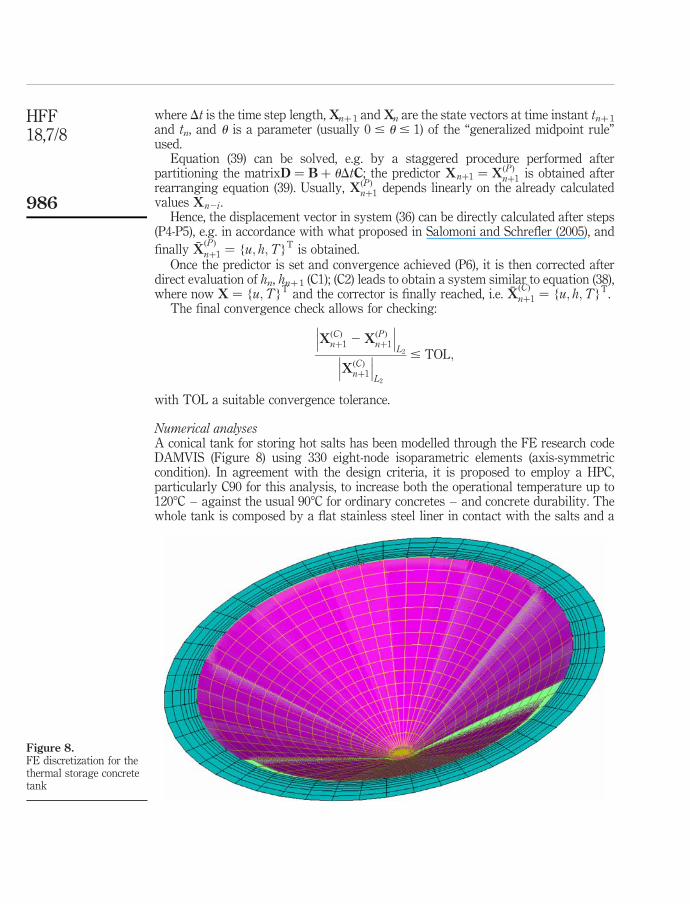
Numerical analysesA conical tank for storing hot salts has been modelled through the FE research codeDAMVIS (Figure 8) using 330 eight-node isoparametric elements (axis-symmetriccondition). In agreement with the design criteria, it is proposed to employ a HPC,particularly C90 for this analysis, to increase both the operational temperature up to1208C – against the usual 908C for ordinary concretes – and concrete durability. Thewhole tank is composed by a flat stainless steel liner in contact with the salts and a
Figure 8.FE discretization for thethermal storage concretetank
HFF18,7/8
986
ceramic fibre blanket (not modelled here) close to the concrete main structure (Figure 5).An additional passive cooling system is supposed to be added within the concretethickness to reach such operational temperature on concrete surfaces. Geometricdetails have not been included for privacy reasons.
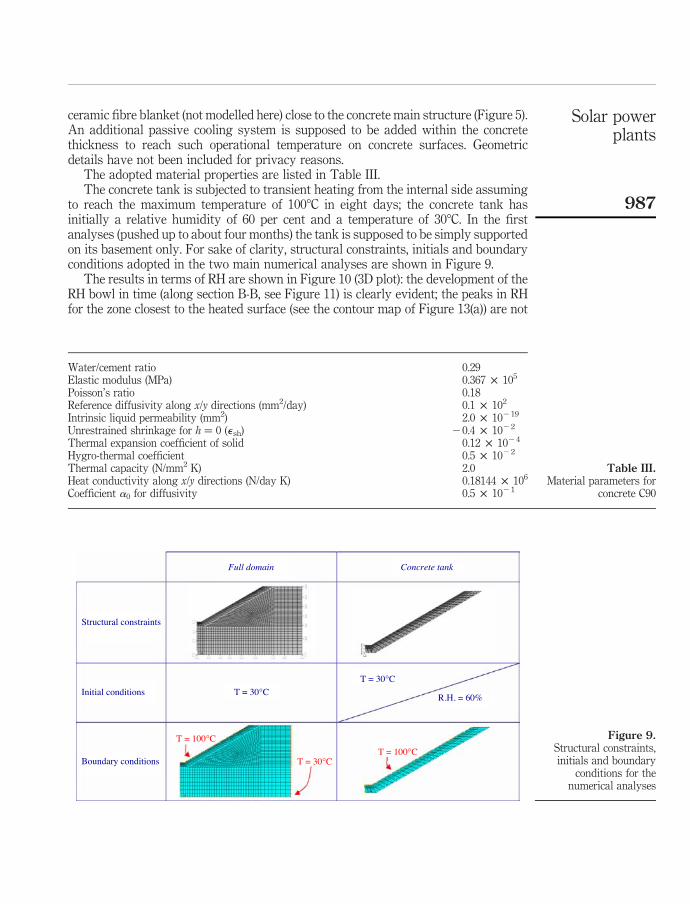
The adopted material properties are listed in Table III.The concrete tank is subjected to transient heating from the internal side assuming
to reach the maximum temperature of 1008C in eight days; the concrete tank hasinitially a relative humidity of 60 per cent and a temperature of 308C. In the firstanalyses (pushed up to about four months) the tank is supposed to be simply supportedon its basement only. For sake of clarity, structural constraints, initials and boundaryconditions adopted in the two main numerical analyses are shown in Figure 9.
The results in terms of RH are shown in Figure 10 (3D plot): the development of theRH bowl in time (along section B-B, see Figure 11) is clearly evident; the peaks in RHfor the zone closest to the heated surface (see the contour map of Figure 13(a)) are not
Water/cement ratio 0.29Elastic modulus (MPa) 0.367 £ 105
Poisson’s ratio 0.18Reference diffusivity along x/y directions (mm2/day) 0.1 £ 102
Intrinsic liquid permeability (mm2) 2.0 £ 10219
Unrestrained shrinkage for h ¼ 0 (esh) 20.4 £ 1022
Thermal expansion coefficient of solid 0.12 £ 1024
Hygro-thermal coefficient 0.5 £ 1022
Thermal capacity (N/mm2 K) 2.0Heat conductivity along x/y directions (N/day K) 0.18144 £ 106
Coefficient a0 for diffusivity 0.5 £ 1021
Table III.Material parameters for
concrete C90
Figure 9.Structural constraints,initials and boundary
conditions for thenumerical analyses
Full domain
Structural constraints
Initial conditions T = 30°C
T = 30°CT = 100°C
T = 100°C
T = 30°C
R.H. = 60%
Boundary conditions
Concrete tank
Solar powerplants
987
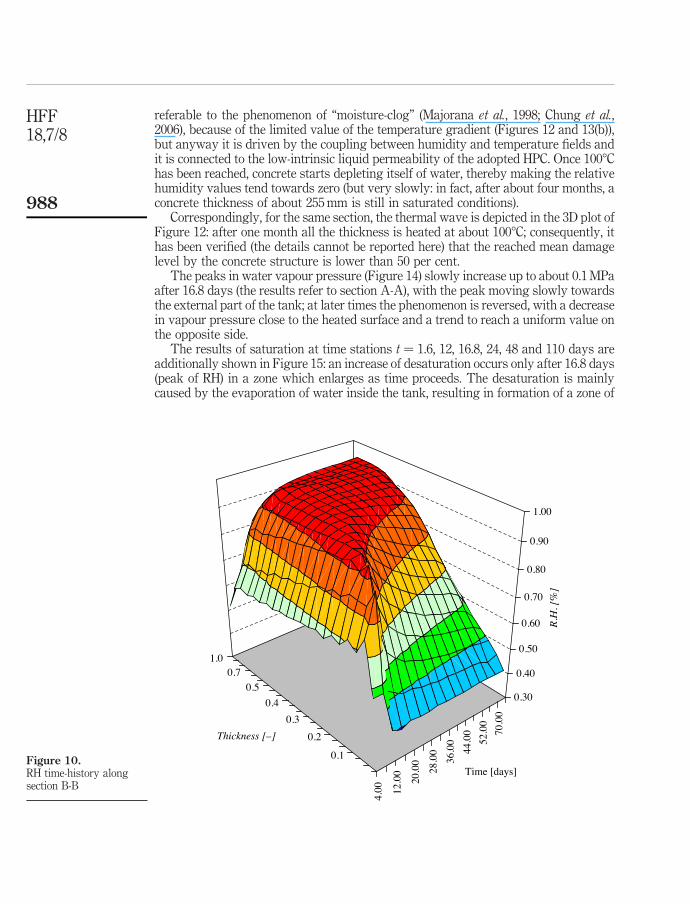
referable to the phenomenon of “moisture-clog” (Majorana et al., 1998; Chung et al.,2006), because of the limited value of the temperature gradient (Figures 12 and 13(b)),but anyway it is driven by the coupling between humidity and temperature fields andit is connected to the low-intrinsic liquid permeability of the adopted HPC. Once 1008Chas been reached, concrete starts depleting itself of water, thereby making the relativehumidity values tend towards zero (but very slowly: in fact, after about four months, aconcrete thickness of about 255mm is still in saturated conditions).
Correspondingly, for the same section, the thermal wave is depicted in the 3D plot ofFigure 12: after one month all the thickness is heated at about 1008C; consequently, ithas been verified (the details cannot be reported here) that the reached mean damagelevel by the concrete structure is lower than 50 per cent.
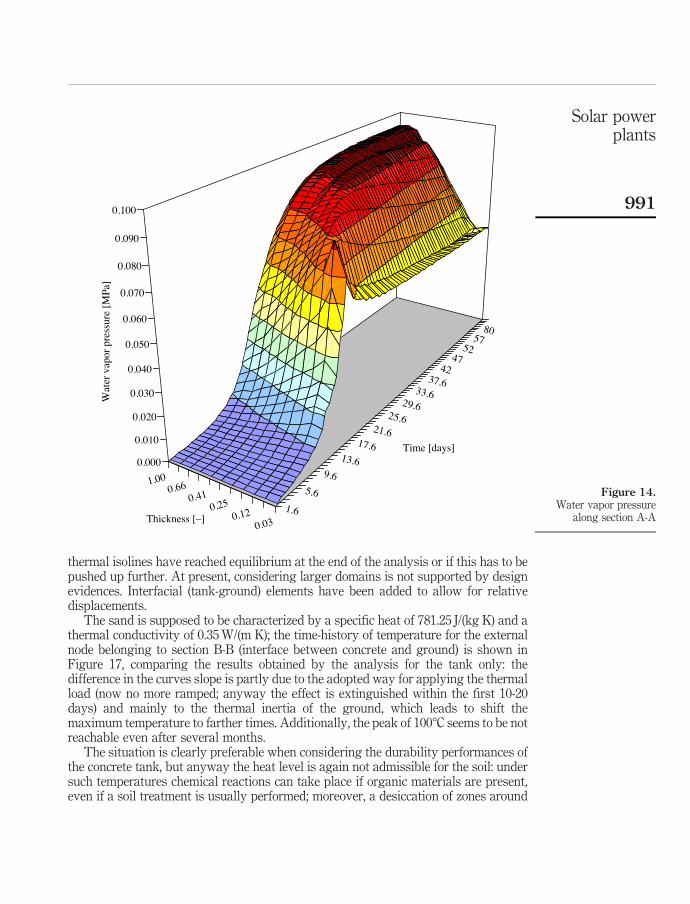
The peaks in water vapour pressure (Figure 14) slowly increase up to about 0.1MPaafter 16.8 days (the results refer to section A-A), with the peak moving slowly towardsthe external part of the tank; at later times the phenomenon is reversed, with a decreasein vapour pressure close to the heated surface and a trend to reach a uniform value onthe opposite side.
The results of saturation at time stations t ¼ 1.6, 12, 16.8, 24, 48 and 110 days areadditionally shown in Figure 15: an increase of desaturation occurs only after 16.8 days(peak of RH) in a zone which enlarges as time proceeds. The desaturation is mainlycaused by the evaporation of water inside the tank, resulting in formation of a zone of
Figure 10.RH time-history alongsection B-B
1.00.7
0.50.4
0.30.2
0.1
4.00 12
.00
20.0
0
28.0
036
.00
44.0
052
.00
70.0
0
0.30
0.40
0.50
0.60
0.70
0.80
0.90
1.00
R.H
. [%
]
Thickness [–]
Time [days]
HFF18,7/8
988
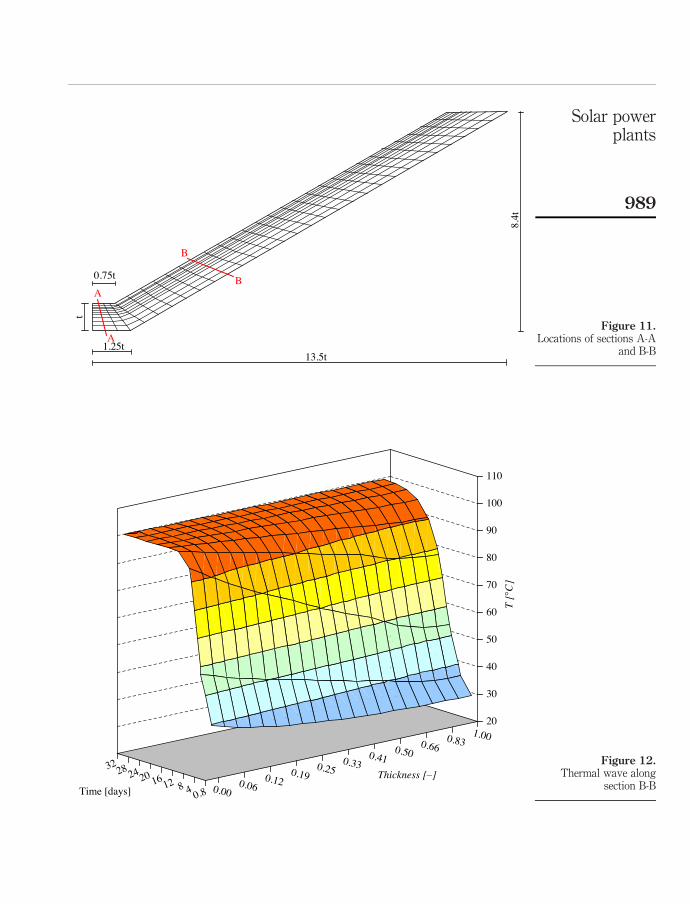
Figure 12.Thermal wave along
section B-B
1.000.830.660.500.410.330.250.190.120.060.000.848121620242832
20
30
40
50
60
70
80
90
100
110
T [°
C]
Thickness [–]Time [days]
Figure 11.Locations of sections A-A
and B-B
t
0.75t
1.25t 13.5t
8.4t
A
A
B
B
Solar powerplants
989
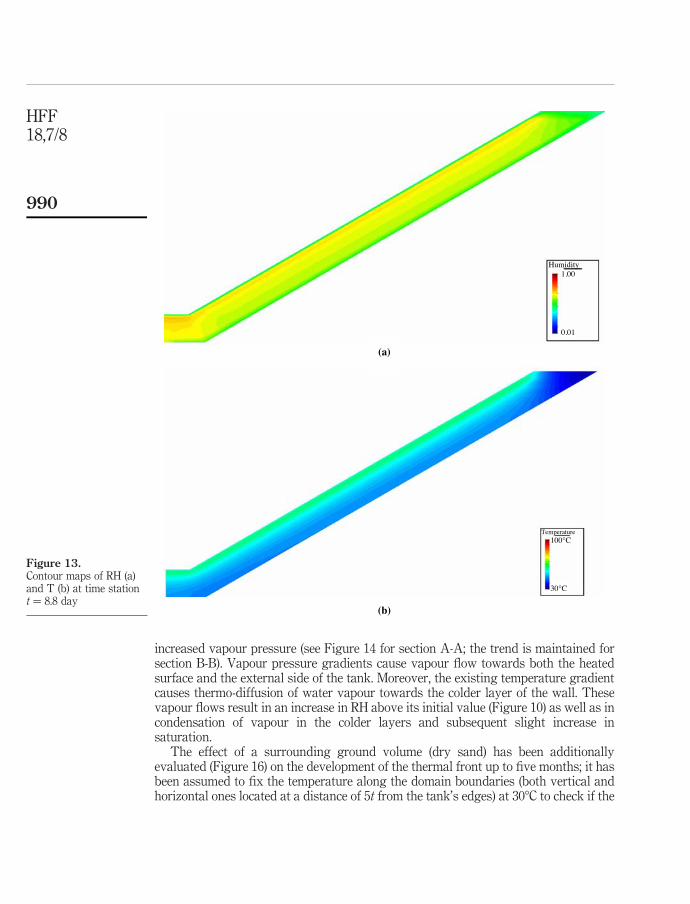
increased vapour pressure (see Figure 14 for section A-A; the trend is maintained forsection B-B). Vapour pressure gradients cause vapour flow towards both the heatedsurface and the external side of the tank. Moreover, the existing temperature gradientcauses thermo-diffusion of water vapour towards the colder layer of the wall. Thesevapour flows result in an increase in RH above its initial value (Figure 10) as well as incondensation of vapour in the colder layers and subsequent slight increase insaturation.
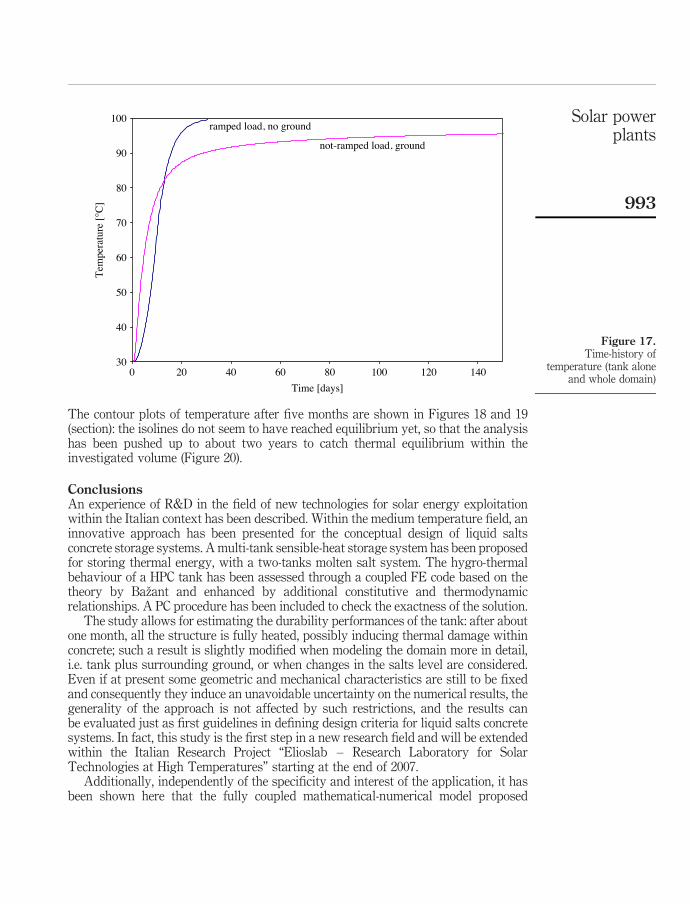
The effect of a surrounding ground volume (dry sand) has been additionallyevaluated (Figure 16) on the development of the thermal front up to five months; it hasbeen assumed to fix the temperature along the domain boundaries (both vertical andhorizontal ones located at a distance of 5t from the tank’s edges) at 308C to check if the
Figure 13.Contour maps of RH (a)and T (b) at time stationt ¼ 8.8 day
Humidity1.00
0.01
Temperature100°C
30°C
(a)
(b)
HFF18,7/8
990
thermal isolines have reached equilibrium at the end of the analysis or if this has to bepushed up further. At present, considering larger domains is not supported by designevidences. Interfacial (tank-ground) elements have been added to allow for relativedisplacements.
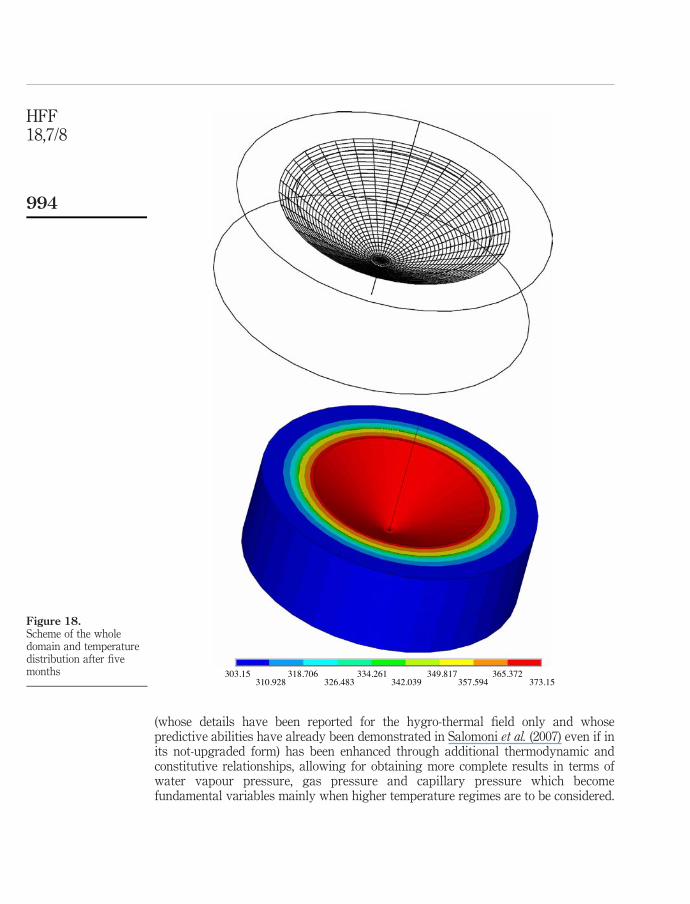
The sand is supposed to be characterized by a specific heat of 781.25 J/(kg K) and athermal conductivity of 0.35W/(m K); the time-history of temperature for the externalnode belonging to section B-B (interface between concrete and ground) is shown inFigure 17, comparing the results obtained by the analysis for the tank only: thedifference in the curves slope is partly due to the adopted way for applying the thermalload (now no more ramped; anyway the effect is extinguished within the first 10-20days) and mainly to the thermal inertia of the ground, which leads to shift themaximum temperature to farther times. Additionally, the peak of 1008C seems to be notreachable even after several months.
The situation is clearly preferable when considering the durability performances ofthe concrete tank, but anyway the heat level is again not admissible for the soil: undersuch temperatures chemical reactions can take place if organic materials are present,even if a soil treatment is usually performed; moreover, a desiccation of zones around
Figure 14.Water vapor pressure
along section A-A1.6
5.6
9.6
13.6
17.621.6
25.629.6
33.637.6
4247
5257
80
0.030.120.250.410.661.000.000
0.010
0.020
0.030
0.040
0.050
0.060
0.070
0.080
0.090
0.100
Wat
er v
apor
pre
ssur
e [M
Pa]
Time [days]
Thickness [–]
Solar powerplants
991
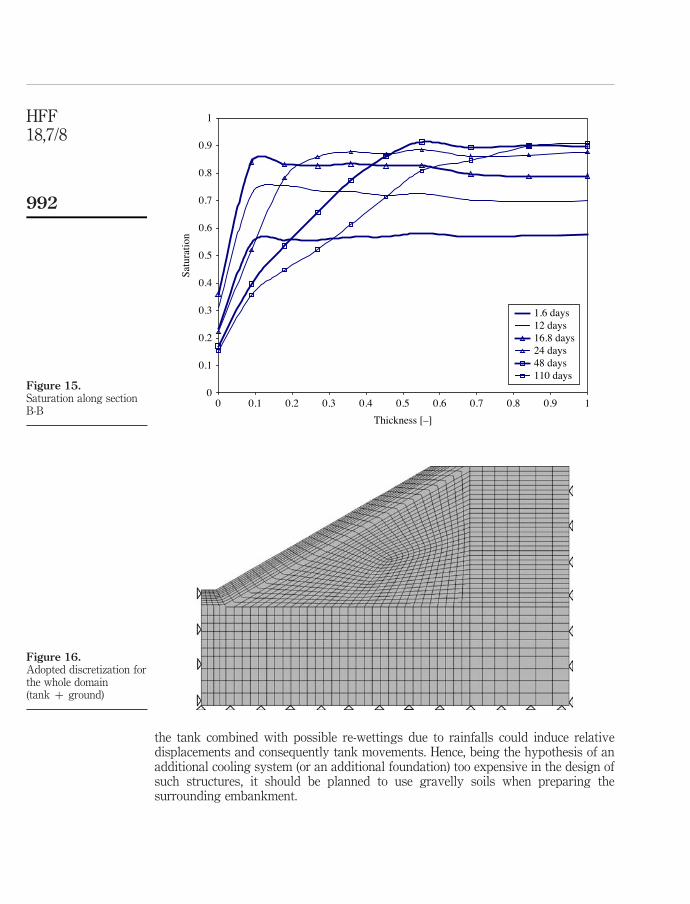
the tank combined with possible re-wettings due to rainfalls could induce relativedisplacements and consequently tank movements. Hence, being the hypothesis of anadditional cooling system (or an additional foundation) too expensive in the design ofsuch structures, it should be planned to use gravelly soils when preparing thesurrounding embankment.
Figure 15.Saturation along sectionB-B
0
0.1
0.2
0.3
0.4
0.5
0.6
0.7
0.8
0.9
1
0 0.1 0.2 0.3 0.4 0.5 0.6 0.7 0.8 0.9 1Thickness [–]
Satu
ratio
n
1.6 days12 days16.8 days24 days48 days110 days
Figure 16.Adopted discretization forthe whole domain(tank þ ground)
HFF18,7/8
992
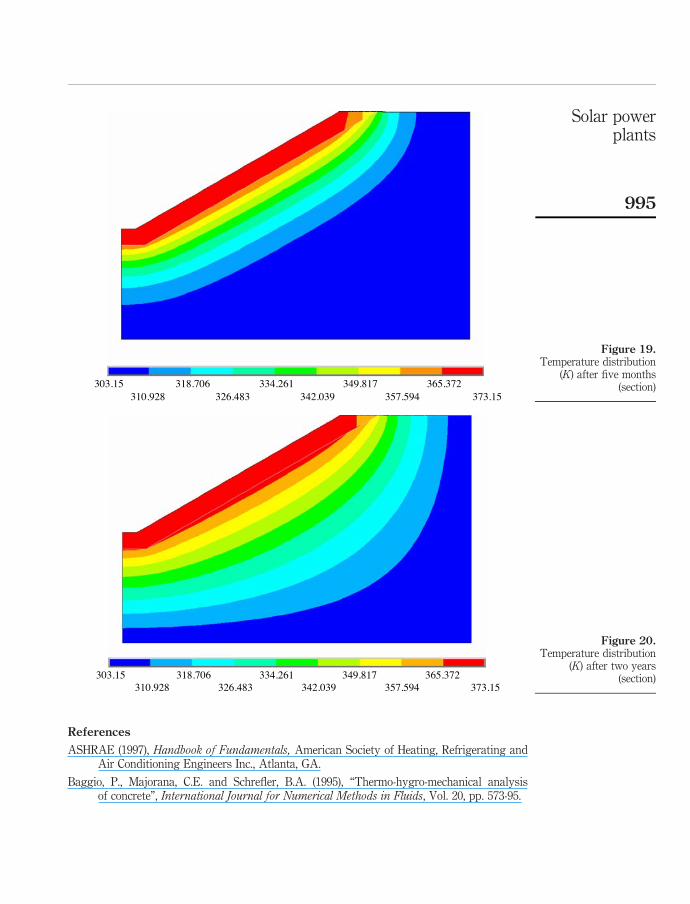
The contour plots of temperature after five months are shown in Figures 18 and 19(section): the isolines do not seem to have reached equilibrium yet, so that the analysishas been pushed up to about two years to catch thermal equilibrium within theinvestigated volume (Figure 20).
ConclusionsAn experience of R&D in the field of new technologies for solar energy exploitationwithin the Italian context has been described. Within the medium temperature field, aninnovative approach has been presented for the conceptual design of liquid saltsconcrete storage systems. Amulti-tank sensible-heat storage system has been proposedfor storing thermal energy, with a two-tanks molten salt system. The hygro-thermalbehaviour of a HPC tank has been assessed through a coupled FE code based on thetheory by Bazant and enhanced by additional constitutive and thermodynamicrelationships. A PC procedure has been included to check the exactness of the solution.
The study allows for estimating the durability performances of the tank: after aboutone month, all the structure is fully heated, possibly inducing thermal damage withinconcrete; such a result is slightly modified when modeling the domain more in detail,i.e. tank plus surrounding ground, or when changes in the salts level are considered.Even if at present some geometric and mechanical characteristics are still to be fixedand consequently they induce an unavoidable uncertainty on the numerical results, thegenerality of the approach is not affected by such restrictions, and the results canbe evaluated just as first guidelines in defining design criteria for liquid salts concretesystems. In fact, this study is the first step in a new research field and will be extendedwithin the Italian Research Project “Elioslab – Research Laboratory for SolarTechnologies at High Temperatures” starting at the end of 2007.
Additionally, independently of the specificity and interest of the application, it hasbeen shown here that the fully coupled mathematical-numerical model proposed
Figure 17.Time-history of
temperature (tank aloneand whole domain)
30
40
50
60
70
80
90
100
0 20 40 60 80 100 120 140Time [days]
Tem
pera
ture
[°C
]
ramped load, no ground
not-ramped load, ground
Solar powerplants
993
(whose details have been reported for the hygro-thermal field only and whosepredictive abilities have already been demonstrated in Salomoni et al. (2007) even if inits not-upgraded form) has been enhanced through additional thermodynamic andconstitutive relationships, allowing for obtaining more complete results in terms ofwater vapour pressure, gas pressure and capillary pressure which becomefundamental variables mainly when higher temperature regimes are to be considered.
Figure 18.Scheme of the wholedomain and temperaturedistribution after fivemonths 303.15 318.706 334.261 349.817 365.372
310.928 326.483 342.039 357.594 373.15
HFF18,7/8
994
References
ASHRAE (1997), Handbook of Fundamentals, American Society of Heating, Refrigerating andAir Conditioning Engineers Inc., Atlanta, GA.
Baggio, P., Majorana, C.E. and Schrefler, B.A. (1995), “Thermo-hygro-mechanical analysisof concrete”, International Journal for Numerical Methods in Fluids, Vol. 20, pp. 573-95.
Figure 19.Temperature distribution
(K) after five months(section)303.15 318.706 334.261 349.817 365.372
310.928 326.483 342.039 357.594 373.15
Figure 20.Temperature distribution
(K) after two years(section)303.15 318.706 334.261 349.817 365.372
310.928 326.483 342.039 357.594 373.15
Solar powerplants
995
Baroghel-Bouny, V., Mainguy, M., Lassabatere, T. and Coussy, O. (1999), “Characterization andidentification of equilibrium and transfer moisture properties for ordinary andhigh-performance cementitious materials”, Cement and Concrete Research, Vol. 29,pp. 1225-38.
Bazant, Z.P. (1975a), “Theory of creep and shrinkage in concrete structures: a precis of recentdevelopments”, in Nemat-Nasser, S. (Ed.), Mechanics Today, Vol. 2, Pergamon, New York,NY, pp. 1-93.
Bazant, Z.P. (1975b), “Pore pressure, uplift, and failure analysis of concrete dams”,Int. Commission on Large Dams Symp. on Criteria and. Assumptions for Analysis ofDams Swansee.
Bazant, Z.P. (1986), “Material models for structural creep analysis”, in Bazant, Z.P. (Ed.), Creepand Shrinkage of Concrete: Mathematical Modeling, Ch. 2, Proc. of the 4th RILEMInternational Symposium, Northwestern University, Evanston, IL.
Bazant, Z.P. (Ed.) (1988), Mathematical Modelling of Creep and Shrinkage of Concrete, Wiley,New York, NY.
Bazant, Z.P. and Najjar, L.N. (1971), “Drying of concrete as a non-linear diffusion problem”,Cement and Concrete Research, Vol. 1, pp. 461-73.
Bazant, Z.P. and Najjar, L.N. (1972), “Nonlinear water diffusion in non-saturated concrete”,Materials and Structures, Vol. 5 No. 25, pp. 3-21.
Bazant, Z.P. and Panula, L. (1979), “Practical prediction of time-dependent deformations ofconcrete”, Materials and Structures, Vol. 12 No. 3, pp. 169-74.
Bazant, Z.P. and Thonguthai, W. (1978), “Pore pressure and drying of concrete athigh temperature”, Journal of the Engineering Materials Division, ASME, Vol. 104,pp. 1058-80.
Bazant, Z.P. and Thonguthai, W. (1979), “Pore pressure in heated concrete walls: theoreticalpredictions”, Magazine of Concrete Research, Vol. 31 No. 107, pp. 67-76.
Bazant, Z.P. and Wittmann, F.H. (1982), Creep and Shrinkage in Concrete Structures, Wiley,New York, NY.
Bazant, Z.P., Chern, J.C., Rosenberg, A.M. and Gaidis, J.M. (1988), “Mathematical model forfreeze-thaw durability of concrete”, Journal of the American Ceramic Society, Vol. 71 No. 9,pp. 776-83.
Bear, J. (1988), Dynamics of Fluids in Porous Media, Dover, New York, NY.
Bentz, D.P., Garboczi, E.J. and Quenard, D.A. (1998), “Modelling drying shrinkage inreconstructed porous materials: application to porous Vycor glass”, Modelling andSimulation in Materials Science and Engineering, Vol. 6 No. 3, pp. 211-36.
Cheng, H.P., Li, M.H. and Cheng, J.R. (2003), “An assessment of using the predictor-correctortechnique to solve reactive transport equations”, International Journal for NumericalMethods in Engineering, Vol. 56, pp. 739-66.
Chung, J.H. and Consolazio, G.R. (2005), “Numerical modeling of transport phenomena inreinforced concrete exposed to elevated temperatures”, Cement and Concrete Research,Vol. 35 No. 3, pp. 597-608.
Chung, J.H., Consolazio, G.R. and McVay, M.C. (2006), “Finite element stress analysis of areinforced high-strength concrete column in severe fires”, Computers & Structures, Vol. 84,pp. 1338-52.
Copeland, R.J., West, R.E. and Kreith, F. (1984), “Thermal energy storage at 9008C”, Proc. of the19th Ann. Intersoc. Energy Conversion Eng. Conf., San Francisco, 19-24 August,pp. 1171-5.
HFF18,7/8
996
Couture, F., Jomaa, W. and Ruiggali, J.R. (1996), “Relative permeability relations: a key factor fora drying model”, Transport in Porous Media, Vol. 23, pp. 303-35.
ENEA (2007), available at: www.enea.it/com/ingl/solarframe.htm
England, G.L. and Ross, A.D. (1970), “Shrinkage, moisture and pore pressures in heatedconcrete”, Proc. of the American Concrete Institute – International Seminar of Concrete forNuclear Reactors, Berlin, pp. 883-907.
Forsyth, P.A. and Simpson, R.B. (1991), “A two-phase, two-component model for naturalconvection in a porous medium”, International Journal for Numerical Methods in Fluids,Vol. 12, pp. 655-82.
Gawin, D., Majorana, C.E. and Schrefler, B.A. (1999), “Numerical analysis of hygro-thermalbehaviour and damage of concrete at high temperature”, Mechanics of Cohesive-FrictionalMaterials, Vol. 4, pp. 37-74.
Giannuzzi, G.M., Miliozzi, A., Majorana, C.E. and Salomoni, V. (2005), “Conceptual design ofinnovative heat storage systems for medium and high temperatures solar technology”,Proc. of TCN CAE 2005 – Int. Conf. on CAE and Computational Technologies for Industry,Lecce, 5-8 October.
Giannuzzi, G.M., Majorana, C.E., Miliozzi, A., Salomoni, V.A. and Nicolini, D. (2007), “Structuraldesign criteria for steel components of parabolic-trough solar concentrators”, ASMEJournal of Solar Energy Engineering, Vol. 129, pp. 382-90.
Goldschmit, M.B. and Cavaliere, M.A. (1997), “An iterative (k-L)-predictor/(-corrector algorithmfor solving (k-() turbulent models”, Engineering Computations, Vol. 14 No. 4, pp. 441-55.
Grasley, Z.C. and Lange, D.A. (2007), “Thermal dilation and internal relative humidity ofhardened cement paste”, Materials and Structures, Vol. 40, pp. 311-7.
Gregg, S.J. and Sing, K.S.W. (1982), Adsorption, Surface Area and Porosity, Academic Press,London.
Harmathy, T.Z. and Allen, L.W. (1973), “Thermal properties of selected masonry unit concretes”,ACI Journal, Vol. 70 No. 15, pp. 135-42.
Herrmann, U., Kelly, B. and Price, H. (2004), “Two-tank molten salt storage for parabolic troughsolar power plants”, Energy, Vol. 29 Nos 5/6, pp. 883-93.
Hyland, R.W. and Wexler, A. (1983), “Formulation for the thermodynamic properties of dry airfrom 173.15K to 473.15K, and of saturated moist air from 173.15K to 372.15K, at pressuresto 5MPa”, ASHRAE Transactions A, Vol. 89 No. 2, pp. 520-35.
Ives, J., Newcomb, J.C. and Pard, A.G. (1985), “High temperature molten salt storage”,SERI/STR-231-2836 (Technical paper).
Jayaraman, B. (1999), “Thermodynamic properties of air water mixtures (2100 to 1008C and 50to 5000 kPa)”, Air Conditioning and Refrigeration Journal, April-June.
Ji, X. and Yan, J. (2006), “Thermodynamic properties for humid gases from 298 to 573K and up to200 bar”, Applied Thermal Engineering, Vol. 26, pp. 251-8.
Ji, X., Lu, X. and Yan, J. (2003), “Survey of experimental data and assessment of calculationmethods of properties for the air-water mixture”, Applied Thermal Engineering, Vol. 23,pp. 2213-28.
Khoury, G.A. and Majorana, C.E. (Eds) (2007), Heat Effects on Concrete, Thomas Telford,London.
Klinkenberg, L.J. (1941), “The permeability of porous media to liquids and gases”, Drilling andProduction Practice, American Petroleum Institute, Washington, DC, pp. 200-13.
Solar powerplants
997
Li, K. and Horne, R.N. (2001), “Gas slippage in two-phase flow and the effect oftemperature”, SPE 68778, Proc. of the 2001 SPE Western Region Meeting,Bakersfield, CA, 26-30 March.
Lupfert, E., Geyer, M., Schiel, W., Esteban, A., Osuna, R., Zarza, E. and Nava, P. (2001),“EUROTROUGH design issues and prototype testing at PSA”, Proc. of ASME Int. SolarEnergy Conference – Forum 2001, Solar Energy: The Power to Choose, Washington, DC,21-25 April, pp. 389-94.
McVay, M.C. and Rish, J.W. (1995), “Flow of nitrogen and superheated steam through cementmortar”, Journal of ThermoPhysics and Heat Transfer, Vol. 9 No. 4, pp. 41-3.
Majorana, C.E. and Salomoni, V.A. (2004), “Parametric analyses of diffusion of activated sourcesin disposal forms”, Journal of Hazardous Materials, Vol. A113, pp. 45-56.
Majorana, C.E., Salomoni, V. and Schrefler, B.A. (1998), “Hygrothermal and mechanical model ofconcrete at high temperature”, Materials and Structures, Vol. 31, pp. 378-86.
Majorana, C.E., Salomoni, V. and Secchi, S. (1997), “Effects of mass growing on mechanical andhygrothermic response of three-dimensional bodies”, Journal of Materials ProcessingTechnology, Vol. 64 Nos 1/3, pp. 277-86.
Pilkington Solar International GmbH (2000), “Survey of thermal storage for parabolic-troughpower plants”, NREL/SR-550-27925 (Technical report).
Powers, T.C. and Brownyard, T.L. (1947), “Studies of the physical properties of hardenedportland cement pastes”, Proc. Am. Concr. Inst., ACI Journal, Vol. 41, pp. 845-80.
Price, H., Lupfert, E., Kearney, D., Zarza, E., Cohen, G., Gee, R. and Mahoney, R. (2002),“Advances in parabolic trough solar power technology”, ASME Journal of Solar EnergyEngineering, Vol. 124 No. 2, pp. 109-25.
Reid, R.C., Praunsnitz, J.M. and Bruce, E.P. (1987), The Properties of Gases and Liquids,McGraw-Hill, New York, NY.
Rubbia, C., and ENEA Working Group (2001), “Solar thermal energy production:guidelines and future programmes of ENEA”, ENEA/TM/PRES/2001_7, Rome,(Technical report).
Salomoni, V.A. and Schrefler, B.A. (2005), “A CBS-type stabilizing algorithm for theconsolidation of saturated porous media”, International Journal for Numerical Methods inEngineering, Vol. 63, pp. 502-27.
Salomoni, V.A., Mazzucco, G. and Majorana, C.E. (2007), “Mechanical and durabilitybehaviour of growing concrete structures”, Engineering Computations, Vol. 24 No. 5,pp. 536-61.
Sargent & Lundy Consulting Group (2002), “Assessment of parabolic trough and power towersolar technology cost and performance forecasts”, NREL SL-5641, Chicago, IL (Technicalreport).
Schrefler, B.A., Simoni, L. and Majorana, C.E. (1989), “A general model for themechanics of saturated-unsaturated porous materials”, Materials and Structures, Vol. 22,pp. 323-34.
Shazali, M.A., Baluch, M.H. and Al-Gadhib, A.H. (2006), “Predicting residual strength inunsaturated concrete exposed to sulphate attack”, Journal of Materials in CivilEngineering, Vol. 18 No. 3, pp. 343-54.
Turska, E. and Schrefler, B.A. (1993), “On convergence conditions of partitioned solutionprocedures for consolidation problems”, Computer Methods in Applied Mechanics andEngineering, Vol. 106, pp. 51-63.
HFF18,7/8
998

Wylie, R.G. and Fisher, R.S. (1996), “Molecular interaction of water vapor and air”, Journal ofChemical & Engineering Data, Vol. 41, pp. 133-42.
Zhukov, V.V. and Shevchenko, V.I. (1974), “Investigation of causes of possible spalling andfailure of heat-resistant concretes at drying, first heating and cooling”, in Nebrasov, K.D.(Ed.), Zharostoikie Betony, Stroiizdat, Moscow.
Corresponding authorValentina A. Salomoni can be contacted at: [email protected]
Solar powerplants
999
To purchase reprints of this article please e-mail: [email protected] visit our web site for further details: www.emeraldinsight.com/reprints