thermal analysis of some fly ashes
TRANSCRIPT
Journal of Thermal Analysis, Vol. 46 (1996) 139-150
THERMAL ANALYSIS OF SOME FLY ASHES II. Self-hardening activity of fly ashes
ZI Adonyi* and K. M~sz6ros ozecsenyt** Department of Chemical Technology, Technical University of Budapest, H-1521 Budapest, Hungary **Institute of Chemistry, Faculty of Sciences, University of Novi Sad, 21000 Novi Sad, Yugoslavia
(Received April 13, 1995)
Abstract The self-hardening activity of fly ashes was investigated looking for the possibility of their
chemical reactions with water without additives. A method had to be developed for separation of the structural water from the adsorbed or free one. The decomposition of the chemically bound water was measured by thermogravimetry. The ' r dimensionless number proved to be applicable for the quantitative eharacterisation of the measured data with more DTG peaks. The examined reaction depends on the chemical composition and the physical structure of the fly ashes and the time of interaction with water. The SO3 content seems important, but the charac- teristics of the formed compounds differ deeply from the CaSO4.2H20. The observed and exam- ined reaction is an important factor of the self-hardening process of fly ash deposits.
Keywords: deposit, dimensionless evaluation, fly ash, reaction with water, self-hardening
Introduction
Coal is one of the most important raw material of power stations, but they produce large volume of slag and ashes as waste. Several hundred kilograms per head is the average production of fly ash in different countries yearly [1]. The cost of deposition of this solid waste is great and increasing very quickly by the expanding requirements of environmental protection, e.g. the cost of deposition was about 200 USD/t in Germany and has multiplied during 15 years 24-26 times in the USA [2]. A program began to develop about fifty years ago for decreasing the costs and problems of deposition looking for the application possibilities of fly ashes as secondary raw materials. The domains of industrial fly ash applications are very wide today [e.g. 2, 3].
* To whom all correspondence should be addressed
0368--4466/96/$ 5. O0
�9 1996 Akad~miai Kiad6, Budapest John Wiley & Sons, Limited
Chichester
140 ADONYI, MF.SZ~d~OS SZI~CSI~NYI: FLY ASHES
The chemical composition and other properties of fly ashes depend not only on the type of coal but on the burning conditions as well [4]. Very important is the composition and structure of the fly ashes in case of their deposition, be- cause the leaching of the toxic components (heavy metals, dioxins, radioactive materials, etc.) can contaminate the water sources. The leaching capacity influ- ences first of all the need and costs of the isolation of the deposits.
The most valuable industrial application of fly ashes is based upon their la- tent hydraulic, so-called pozzolanic property that can be activated by basic ad- ditives like lime or portland cement. This phenomenon was known from the Roman times, and there are well developed and standardised systems for mea- suring the pozzolanic activity [e.g. 5-7].
It is a known fact, however, that the fly ash deposits can harden within lim- ited time and without additives with basic properties, too. The reason of this self-hardening of fly ashes was not examined till now, though this process probably influences the leaching properties. Consequently, this phenomenon has increasing importance from the aspect of environmental protection, if deposition is the single possibility for the elimination of fly ash as waste mate- rial. Thermogravimetry (TG) and differential thermogravimetry (DTG) to- gether with the T dimensionless evaluation [8] of the measured data proved a good or perhaps the sole method for this examination nowadays.
Experimental The samples for the investigation of the self-hardening effect were collected
from the electrical precipitators of boilers fired with powdered coals. Sam- pies 1 and 2 were fly ashes of bituminous coals, while samples 3 and 4 of lig- nite.
The mass ratio of the mixed fly ash samples and distilled water were 2:1 and the mixtures were kept under saturated water vapour at 25~ A method was applied to remove the not reacted free water before the TG measurements. These measurements have been carried out in air atmosphere with a thermo- balance type Derivatograph-C (MOM, Budapest). The heating rate was 10 deg.min -~ and the sample mass was 150-650 mg depending on the probable weight change (chemically bound water content). The measurements were re- peated with the mixtures of water and ashes after 1, 7 and 28 days respectively.
The results of oxide analysis of the ashes are given in Table 1. The composition of the original samples was determined by X-ray diffrac-
tometry [9] and the thermal properties by simultaneous TG, DTG and DTA measurements [9].
The X-ray analysis of the original samples showed, that all of them contain CaSO4, (z-SiO2 and oc-Fe203. Besides these components sample 3 contains FeS and sample 4 contains AI2SiO5.
CaCO3 and hydrated CaO were found, too, in the original fly ash samples 1 and 2 with TG measurements [9]. In all the samples a certain amount of un-
J. Thermal Anal., 46, 1996
ADONYI, MF_,SZ,~d~.OS SZI~CSI~NYI: FLY ASHES 141
Table 1 Chemical composition of the fly ashes/weight%
Sample SiO2 A 1 2 0 3 Fe203 CaO MgO Na20 K20 SO3
1 15.7 10.6 4.5 48.0 3.7 0.1 0.3 15.5
2 48.0 16.8 5.0 17.3 1.8 0.7 1.3 7.4
3 46.2 20.5 11.6 10.3 1.6 0.2 0.9 8.0
4 61.0 17.7 7.5 5.9 1.7 0.3 0.9 4.3
burned carbon was found beside these components. The carbon content of the samples 1 and 2 was very small (~0.1%), but in the samples 3 and 4 the carbon content amounted up to 4 %.
Because the free water quantity is much more in the original mixtures of water and fly ashes, it is obvious by TG measurements that the evaporation of the free water content of the mixture can overlap the decomposition of the chemically bound one. Consequently, it was necessary to develop a method for the separation of the adsorptive or free water from the chemically bound one. The samples were treated for this purpose with ethyl alcohol or acetone for 30 min and dried using vacuum filter for another 30 min after the definite re- action times (1, 7, 28 days). The premeasurements showed that both the ethyl alcohol and the acetone remove the adsorptive and free water and they have no effect on the chemically bound water. The samples were dried for the TG measurements in most of the cases with acetone because of its greater vapour pressure.
Results of TG measurements
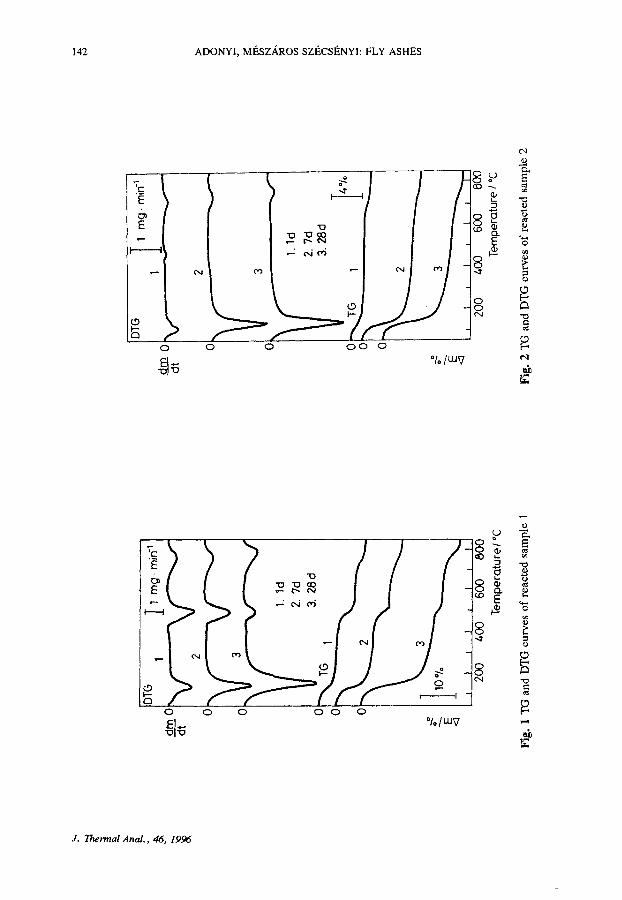
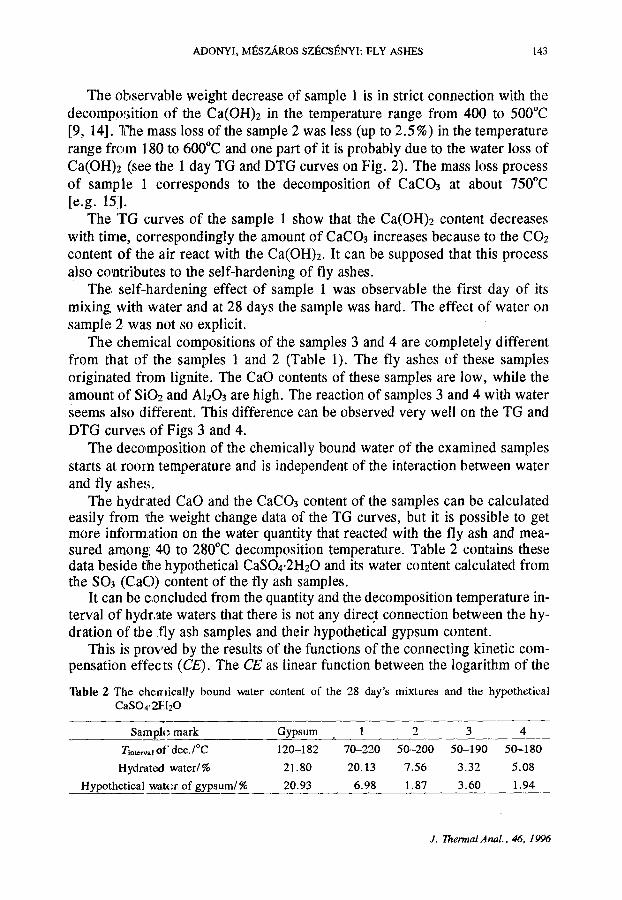
The Figs 1-4 show the measured TG and DTG data of the 1, 7 and 28 days old mixtures of water and fly ashes dried with acetone. It can be seen that the chemical reactions of the water with fly ashes depend on the time and the tem- peratures of the maximum of the DTG peaks shift to higher temperature.
The TG and DTG curves of the samples 1 and 2 seem completely different from the corresponding curves of samples 3 and 4.
There is a relatively high CaO content in samples 1 and 2 (Table 1). CaO in contact with water reacts intensively forming Ca(OH)2. On the other hand, it follows from the SO3 contents of the samples that the alkali and alkaline-earth metals can be present as sulphates and some of them form hydrates easily. For example the FeSO4.7H20 and the CaSO4.2H20 loses their crystal water up to about 200~ [e.g. 10-12] and this mass loss can correspond with the measured TG and DTG data.
In sample 1 there is a slight mass loss among 180 and 400~ that changes a little during the hydration time from 1 to 28 days. In this temperature range the hydration process could correspond to the dehydration of calcium aluminates [ 13].
J. Thermal AnaL, 46, 1996
&
a.
IDTG
1
I 1
mg.
min
-1
dm 0
1%,,
r
~
dt
OI V
l
2 V
-
~1
1.1(J
II z
7~
0 V
3.
28(
:1
o",,
2 G
~..~
|
0 2
4 3
200
400
600
800
Tem
pera
ture
/ *C
dm.
0 dt
-g
<3
DTG
1
mg.
min
-~
V
_ ,-
0 ...
.. --
~r
1.1d
2.
7d
3.28
d e/@
TG
o -
,,,~
~ L
0
i ~
1 I
I I
I- 20
0 400
600
800
Tem
pera
ture
/ *C
b-~ >.
o z E N
�9
N z ,.<
>
m
Fig
. 1
TG
and
DT
G e
urve
s of
rea
cted
sam
ple
1 F
ig.
2 T
G a
nd D
TG
cur
ves
of r
eact
ed s
ampl
e 2
ADONYI, MF_,SZAROS SZI~CSI~NYI: FLY ASHES 143
The observable weight decrease of sample 1 is in strict connection with the decomp0t~ition of the Ca(OH)z in the temperature range from 400 to 500~ [9, 14]. The mass loss of the sample 2 was less (up to 2.5%) in the temperature range from 180 to 600~ and one part of it is probably due to the water loss of Ca(OH)2 (see the 1 day TG and DTG curves on Fig. 2). The mass loss process of sample 1 corresponds to the decomposition of CaCO3 at about 750~ [e.g. 15].
The TG curves of the sample 1 show that the Ca(OH)z content decreases with time, correspondingly the amount of CaCO3 increases because to the CO2 content of the air react with the Ca(OH)z. It can be supposed that this process also co:ntributes to the self-hardening of fly ashes.
The, self-hardening effect of sample 1 was observable the first day of its mixing with water and at 28 days the sample was hard. The effect of water on sample 2 was not so explicit.
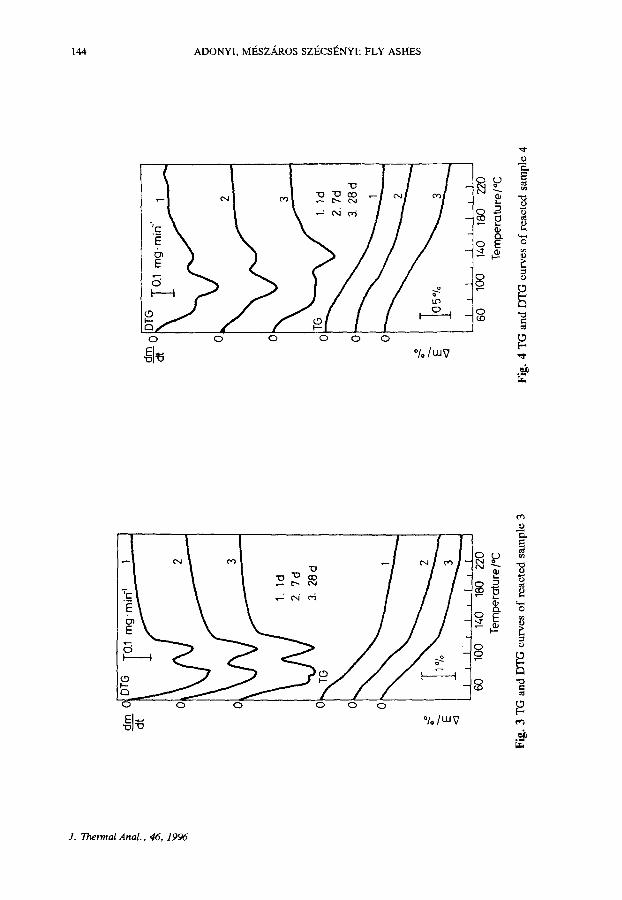
The chemical compositions of the samples 3 and 4 are completely different from that of the samples 1 and 2 (Table 1). The fly ashes of these samples originated from lignite. The CaO contents of these samples are low, while the amount of SiO2 and AlzO3 are high. The reaction of samples 3 and 4 with water seems also different. This difference can be observed very well on the TG and DTG curves of Figs 3 and 4.
The decc, mposition of the chemically bound water of the examined samples starts at roorn temperature and is independent of the interaction between water and fly ashe,~.
The hydr:ated CaO and the CaCO3 content of the samples can be calculated easily from ;the weight change data of the TG curves, but it is possible to get more information on the water quantity that reacted with the fly ash and mea- sured among 40 to 280~ decomposition temperature. Table 2 contains these data beside tihe hypothetical CaSO4.2H20 and its water content calculated from the SO3 (CaO) content of the fly ash samples.
It can be c,oncluded from the quantity and the decomposition temperature in- terval of hydr.ate waters that there is not any direct connection between the hy- dration of the fly ash samples and their hypothetical gypsum content.
This is pro~,ed by the results of the functions of the connecting kinetic com- pensation effects (CE). The CE as linear function between the logarithm of the
Table 2 The eherrlically bound water content of the 28 day's mixtures and the hypothetical CaSO4.2~.I20
Sampl~ ~. mark Gypsum 1 2 3 4
Tmt~,~,lot'dee,/~ 120-182 70-220 50-200 50-190 50-180
Hydrated water/% 21.80 20.13 7.56 3.32 5.08
Hypothetical watc~r of gypsum/% 20.93 6.98 1.87 3.60 1.94
J. Thermal Anal., 46, 1996
l/
1~
v 3.
2
8d
o
%TO
O\
<I
] I
I I
~ I
I I
60
100
140
180
220
Tem
pera
ture
/~
Fig.
3 T
G a
nd D
TG
cur
ves
of r
eact
ed s
ampl
e 3
6O
100
140
180
~0
Tem
pero
tu r
e/*C
Fig.
4 T
G a
nd D
TG
cur
ves
of r
eact
ed
sam
ple
4
> �9
Z ,.<
�9
N
rrl.
Z .<
oo
= m
~o
ADONYI, MF, SZ,/~ROS SZI~CSI~NYI: FLY ASHES 145
pre-exponential factor (In A) and the activation energy (E) calculated from the formal kinetic evaluation of the measured TG and DTG data. The tgcx of the C E characterises the decomposition process [e.g. 16-18]. According to this and giving the 'r' value, too, the tgcz of the CE of
the hydrated sample 1 is 7~ ' ' (with plenty of CaO content), (r= 1.0000) the hydrated samples without sample 1 is 8~ (r=0.9999) all the hydrated samples is 8~ ' ' (r=0.9996).
From the TG, DTG measurement of gypsum the tg ~ of the C E of the first DTG peak is 16~ (R= 1.0000) the second DTG peak is 15047'22 ' ' , (r= 1.0000) all data pairs is 16~ ' ' (r=0.9995).
Dimensionless evaluation of TG measurements
It is known that the shape of TG and DTG curves depend on the measuring conditions, consequently the comparability of the measurements is very limited and it is confined to the qualitative comparison in most of the cases. Limited is the applicability of the formal kinetic analysis of the measured TG data, too, because the calculated kinetic constants depend also on the measuring condi- tions and on the method of calculation strongly. The basic reasons of these phe- nomena are the complexity of the decomposition processes. The elimination of the complexity is impossible at present. So, instead of looking for some kinetic constants, investigations of the dependence of the decomposition processes from the factors (measuring conditions, different materials) can lead to the ex- pression of the analogy of TG measurements. The dimensionless analysis of the TG data [8] proved to be applicable for this purpose, too, in the case of the ex- amination of the self-hardening process.
The base of the applied 'I' dimensionless number is the very extensively used and known differential Eq. (1).
where: -dcz /d t
A E R T n
- d ~ / d t = A e x p ( - E / R T ) ( 1 - ~ ) ~ (1)
velocity of decomposition (from the measured (DTG)i) fraction not reacted (from the measured (TG)i) pre-exponential factor activation energy universal gas constant temperature (from the measured ~ order of reaction.
The 'I' dimensionless number can be calculated with the following Eq. (2), saving the usual structure and marks of Eq. (1) but only formally:
Ii = Ei/RZi = lnA + n ln(1-a)i - ln(-d~z/dt)i (2)
J. Thermal Anal., 46, 1996
146 ADONYI, M~SZ,~,ROS SZI~CSt~NYI: FLY ASHES
The Eq. (2) is suitable for the requirement, namely to determine how I~ de- pends on the measuring conditions and on the system of the superposed partial processes of the decomposition. The I~ is a direct function of the measured TG~, DTGI and T~ data if for the basic calculations A= 1 and n= 1 are introduced.
The result is Ei by multiplication of I~ with RT~ and it is possible to express the degree of analogy of different measurements by the following functions:
Ii vs . (1-a)i (3)
Ii VS. 1/Ti (4)
Ei v s . (1-~)i (5)
El vs. 1/Ti (6)
The application of Eq. (4) is enough to show the quantitative connections among the different measurements looking for the self-hardening effect. From this aspect the first task is to look for the type of the formed compounds and the second task is to look for the effect of the reaction time and the properties of the fly ashes.
There are CaSO4.2H20, FeS, ot-SiO2, ~x-Fe203, Al2SiOs beside CaO and SO3 in the samples 1-4 according to the X-ray analysis of the original fly ashes [9]. Consequently, it was advisable to measure beside the water and fly ash mixture some other thermal processes as follows:
i. the thermal dehydration of CaSO4.2H20 ii. the hydration product of tricalcium aluminate (C3A) as one clinker min-
eral iii. the hydration product of tricalcium aluminate after mixing with gypsum
(CS) and the drying process of different powders, namely iv. the SiO2 (25-50 ~tm), v. the A1203 (25-70 p.m), vi. the Air Cleaner Fine Test Dust measured with ANL 8 N US (ACFTD).
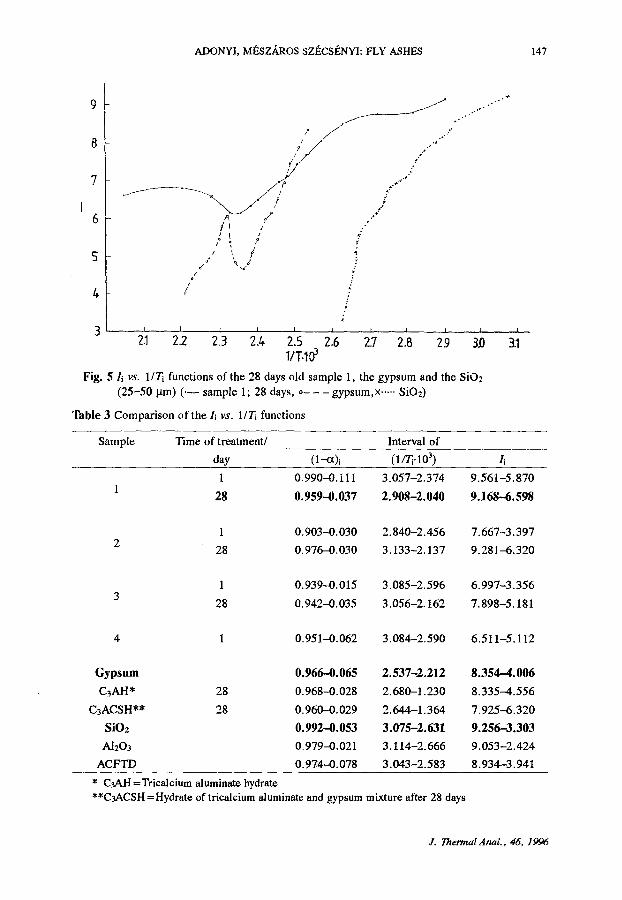
Plotting of all the measured I~ vs. 1/Ti functions would decrease the lucidity of the curves, so Fig. 5 shows only the Ii vs. l /Ti functions of the 28 days old sample 1, the gypsum and the drying process of SiO2 (25-50 lain) - water mix- ture. These results were chosen for showing the character of the examined functions and for helping to conclude from the data of Table 3, where all the important and connecting results for comparison and discussion the TG mea- surements are shown.
Table 3 shows the 1/Ti and the I~ values connecting to the similar (1-cx)~ in- tervals, namely the beginning and ends of the measurement. Among others the great 1/T~ interval clifferences are obvious.
J. Thermal Anal., 46, 1996
ADONYI, MF_,SZ.td~OS SZI~CSI~NYI: FLY ASHES 147
8
7
I 6
/~
///
,~ f,* / l /
,~t /
/ +
/ / o
~ _ j S "" " '"
.++" ,+
.§ .§247
a t / i /
2 2.2 2.3 2 2.5 2 6 2.7 2.8 29 3D 3.1 VT. 0 3
Fig. 5 Ii vs. 1/Tq functions of the 28 days old sample 1, the gypsum and the SiO: (25-50 Ixm) ( . - - sample 1; 28 days, 0 - - - gypsum,x ..... SiO2)
Table 3 Comparison of the li vs. 1/7] functions
Sample Time of treatment/ Interval of
day (1-<z)i (1/Tr 103) Ii
1 0.990--0.111 3.057-2.374 9.561-5.870
28 0. 959-0. 037 2. 908-2. 040 9.168-6. 598
1 0,903-0.030 2.840-2.456 7.667-3.397
28 0,976-0.030 3.133-2.137 9.281-6.320
1 0.939-0.015 3,085-2.596 6.997-3,356
28 0.942-0,035 3.056-2.162 7.898-5.181
4 1 0.951-0.062 3.084-2.590 6.511-5.112
Gypsum 0.966-0.065 2.537-2.212 8.354-4.006
C3AH* 28 0.968-0.028 2.680-1.230 8.335-4.556
C3ACSH** 28 0.960-0.029 2.644-1.364 7.925-6.320
SiOz 0.992-0.053 3.075-2.631 9.256-3.303
A1203 0.979-0.021 3.114-2.666 9.053-2.424
ACFTD 0.974-0.078 3.043-2.583 8.934-3.941
* C~AH =Tricalcium aluminate hydrate **C3ACSH =Hydrate of tricaicium aluminate and gypsum mixture after 28 days
J. Thermal Anal., 46, 1996
t48 ADONYI, M~s SZECSENYI: FLY ASHES
The conclusion is that the thermal decomposition of the formed compounds by the reaction of water and fly ashes differs characteristically from the exam- ined other thermal dehydrations, namely from that of the gypsum, from that of one supposable clinker minerals (C3AH) and it's practically very important re- action with gypsum (C3ACSH) and from that of mixtures of water with different fine powders controlling with these the method of drying with acetone as well.
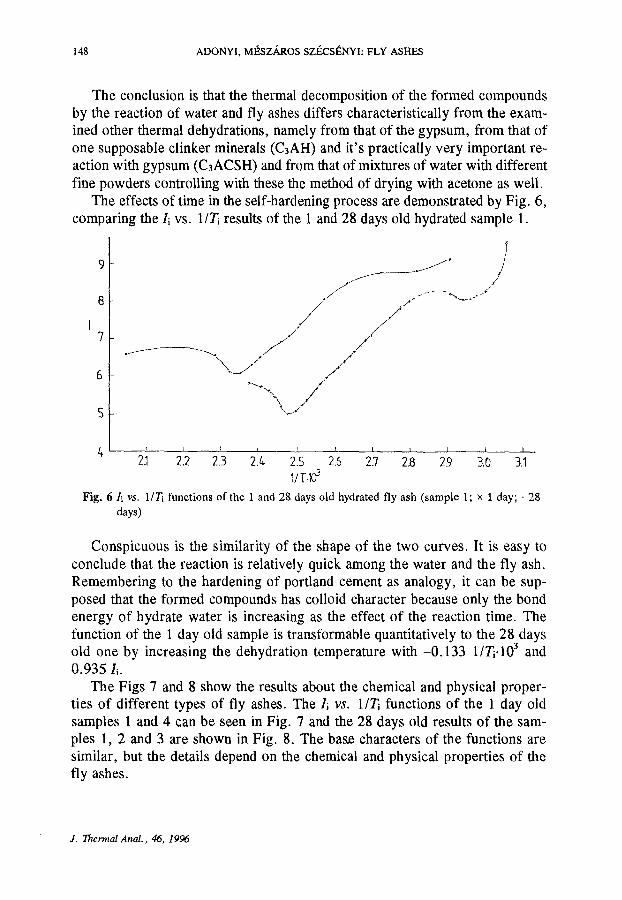
The effects of time in the self-hardening process are demonstrated by Fig. 6, comparing the li vs. 1/T~ results of the 1 and 28 days old hydrated sample 1.
9
8
7
6
5
4 2.1
~ . _ . . - . - / / ~ �9 /
/ ,~J" / / /
j / / +/
1 1 I ! 1 t I ] t I
2.3 2s 26 2.7 2.8 29 3.o 3.1 VT O 3
Fig, 6 li vs. 1/Ti functions of the 1 and 28 days old hydrated fly ash (sample 1; • 1 day; �9 28 days)
Conspicuous is the similarity of the shape of the two curves. It is easy to conclude that the reaction is relatively quick among the water and the fly ash. Remembering to the hardening of portland cement as analogy, it can be sup- posed that the formed compounds has colloid character because only the bond energy of hydrate water is increasing as the effect of the reaction time. The function of the 1 day old sample is transformable quantitatively to the 28 days old one by increasing the dehydration temperature with -0.133 1/Trl03 and 0.935 Ii.
The Figs 7 and 8 show the results about the chemical and physical proper- ties of different types of fly ashes. The I~ vs. 1/Ti functions of the 1 day old samples 1 and 4 can be seen in Fig. 7 and the 28 days old results of the sam- ples 1, 2 and 3 are shown in Fig. 8. The base characters of the functions are similar, but the details depend on the chemical and physical properties of the fly ashes.
J. 2"hemal Anal., 46, 1996

ADONYI, MF_.SZ.,~OS SZI~CSI~NYI: FLY ASHES 149
5
2.3 2.4
/ /
"-.. / - "
, / " /
/ / , -
/
" ~ / / x \ . j /
I ~ I 1 ~ I J
2.5 2.6 2.7 2.6 2.9 3.0 3.1 1/T.~
Fig. 7 li vs. 1/7] functions o f the 1 day old hydrated fly ashes (- sample 1, and • sample 4)
8
I 7
a
[ I I I I I
22 23 z~ 21s 26 27 218 29 t~ 3.1 I/T.I0 3
Fig. 8 ]i vs. 1 /Ti functions the 28 days old hydrated fly ashes (. - - sample 1, • - - - sam- ple 2, o ..... sample 3)
C o n c l u s i o n s
The self-hardening process of the fly ashes is a hydration process. The TG measurements connected to the dimensionless evaluation of the data are suit- able for the research of the process and the formed compounds.
T h e Ii vs. 1/T~ function is very well suitable for the characterisation of the formed compounds of the self-hardening process but the details of the shape of
J. Therrnal Anal. , 46, 1996
150 ADONYI, MF.SZ2~ROS SZI~CSI~NYI: FLY ASHES
the functions depend on the chemical and physical properties of the examined fly ash.
The colloid character of the formed compounds can be supposed. The carbonisation of the CaO content and the hydration of the CaSO4 con-
tent of the fly ashes can take some part in the self-hardening process, too. The dimensionless evaluation is suitable for the quantitative comparison of
the TG data with more DTG peaks as well.
References
1 R. Kov~cs, TIZ-Fachberichte, 106 (1982) 659. 2 P. Tarricone, Civil Engineering, 61 (1991) 46. 3 G. Ferraiolo, M. Yilli and A. Converti, J. Chemical Technology and Biotechnology, 47
(1990) 281. 4 E. Raask, Prog. Energy Combust. Sci., 8 (1982) 261. 5 ASTM C 618-80. 6 ASTM C 311-77. 7 DIN 1045. 8 Z. Adonyi, J. Thermal Anal., 42 (1994) 491. 9 K. M6sz~iros Sz6es6nyi, M. Arnold, K. Tomor and F. F. GaAI, J. Thermal Anal., 44 (1995)
419. 10 Atlas of thermoanalytical curves, Vol. 3, G. Liptay Ed., Akad6miai Kiad6, Budapest 1947,
p. 150. 11 F. Paulik, J. Paulik and M. Arnold, Thermochim. Acta, 200 (1992) 195. 12 Atlas of thermoanalytical curves, Vol. 1, G. Liptay Ed., Akad6miai Kiad6, Budapest 1971,
p. 19. 13 Z. Adonyi, G. Gyarmathy, J. Kiligm and i. Sz6kely, Periodica Polytechnica Chem. Eng., 13
(1969) 131. 14 Atlas of thermoanalytieal curves, Vol. 2, G. Liptay Ed., Akad6miai Kiad6, Budapest 1973,
p. 60. 15 Atlas of thermoanaltyical curves, Vol. 1, G. Liptay Ed., Akad6miai Kiad6, Budapest 1973,
p, 20. 16 Z. Adonyi and G. K6r6si, Thermochim. Aeta, 60 (1983) 23. 17 Z. Jian-Huan, L. Hong-Gou, J. Ben-Gau and Y. Zhao-He, J. Thermal Anal., 39 (1993)
1431. 18 Z. Adonyi, l~pit6anyag, 47 (1995) 52 (in Hungarian).
J. Thermal Anal,, 46, 1996