the use of contingent valuation for evaluating protected areas in the developing world: economic...
TRANSCRIPT
This article appeared in a journal published by Elsevier. The attachedcopy is furnished to the author for internal non-commercial researchand education use, including for instruction at the authors institution
and sharing with colleagues.
Other uses, including reproduction and distribution, or selling orlicensing copies, or posting to personal, institutional or third party
websites are prohibited.
In most cases authors are permitted to post their version of thearticle (e.g. in Word or Tex form) to their personal website orinstitutional repository. Authors requiring further information
regarding Elsevier’s archiving and manuscript policies areencouraged to visit:
http://www.elsevier.com/copyright
Author's personal copy
ANALYSIS
The use of contingent valuation for evaluating protected areasin the developing world: Economic valuation of Morro do DiaboState Park, Atlantic Rainforest, São Paulo State (Brazil)
Cristina Adamsa,⁎, Ronaldo Seroa da Mottab, Ramón Arigoni Ortizc, John Reidd,Cristina Ebersbach Aznar, Paulo Antonio de Almeida Sinisgallie
aLaboratory of Human Ecology, School of Arts, Sciences and Humanity (EACH-USP), University of São Paulo, BrazilbEstudos de Regulação do IPEA — Instituto de Pesquisa Econômica Aplicada, Rio de Janeiro, BrazilcDepartment of Economics and International Development, University of Bath, UKdConservation Strategy Fund (EUA), USAeSchool of Arts, Sciences and Humanity (EACH-USP), University of São Paulo, Brazil
A R T I C L E I N F O A B S T R A C T
Article history:Received 17 September 2005Received in revised form10 August 2007Accepted 13 September 2007Available online 31 October 2007
The Brazilian Atlantic Rainforest is internationally recognised as one of the most biodiverseand threatened tropical forests in the world [Myers, N., Mittermeier, R.A., Mittermeier, C.G.,da Fonseca, G.A.B., Kent, J., 2000. Biodiversity hotspots for conservation priorities. Nature403, 853–858]. The Seasonal Semi-Deciduous Forest is among the most fragmented andthreatened biomes of the Atlantic Rainforest Domain. The largest remnant of this biome(35,000 ha) is protected by the Morro do Diabo State Park (MDSP), situated in the area knownas the Pontal do Paranapanema, in São Paulo State, Brazil. Despite its environmentalimportance, the park is under political, economic and demographic pressure. The main aimof our research was to estimate the population's willingness to pay (WTP) for theconservation of MDSP and for the Atlantic Rainforest's remnants in São Paulo State as awhole, by means of the contingent valuation method (CVM). The results featured a highincidence of null WTP and of protest votes. Nevertheless, the population is willing to payUS$ 2,113,548.00/year (R$ 7,080,385.00/year) for the conservation of the MDSP (use andexistence values), or US$ 60.39 ha/year (R$ 202.30/ha/year). The results indicate that thepreservation value is strongly associated to the population's ability to pay, increasing withincome levels. Qualitative research questions showed that the population considers protectedareas to be very important. Still, the valuation of MDSP revealed a gap between thegovernment budget allotted to the park and the value assigned to the area by the public.
© 2007 Elsevier B.V. All rights reserved.
Keywords:Contingent valuation methodWillingness to paySeasonal Semi-Deciduous ForestBrazilUse valueExistence value
E C O L O G I C A L E C O N O M I C S 6 6 ( 2 0 0 8 ) 3 5 9 – 3 7 0
⁎ Corresponding author. Laboratory of Human Ecology, School of Arts, Sciences and Humanity (EACH-USP), University of São Paulo, Av.Arlindo Betio, 1.000, Ermelino Matarazzo, 03828-080, São Paulo, Brazil.
E-mail addresses: [email protected] (C. Adams), [email protected] (R. Seroa da Motta), [email protected] (R.A. Ortiz),[email protected] (J. Reid), [email protected] (P.A. de Almeida Sinisgalli).
0921-8009/$ – see front matter © 2007 Elsevier B.V. All rights reserved.doi:10.1016/j.ecolecon.2007.09.008
ava i l ab l e a t www.sc i enced i r ec t . com
www.e l sev i e r. com/ loca te / eco l econ
Author's personal copy
1. Introduction
Despite being internationally recognised as one of the mostimportant and threatened tropical forests in the world (Myerset al., 2000), there are very few studies on the economicvaluation of the Atlantic Rainforest (Camphora and May, 2006;May et al., 2000). Before the European conquest, the AtlanticRainforest covered the Brazilian coastline for 4000 kmandhad atotal estimated extent of 1,200,000 km2. It is now reduced toapproximately7.5%of its originaldistribution (Mittermeieretal.,2000; Myers et al., 2000). The Seasonal Semi-Deciduous Forestoriginally covered the inland plateau of São Paulo State (Brazil),but was nearly completely devastated in the last 130 years.Today, the Seasonal Semi-Deciduous Forest covers around 7.7%(349,574 ha) of its former area, mostly in small and isolatedfragments within private properties (São Paulo, 2005). Never-theless, these fragments still provide important ecosystemservices, such as biodiversity preservation, watershed protec-tion (Viana and Tabanez, 1996), landscape connectivity and soilseed bank conservation (Ditt, 2002), all fundamental to conser-vation strategies and the recuperation of natural vegetation.
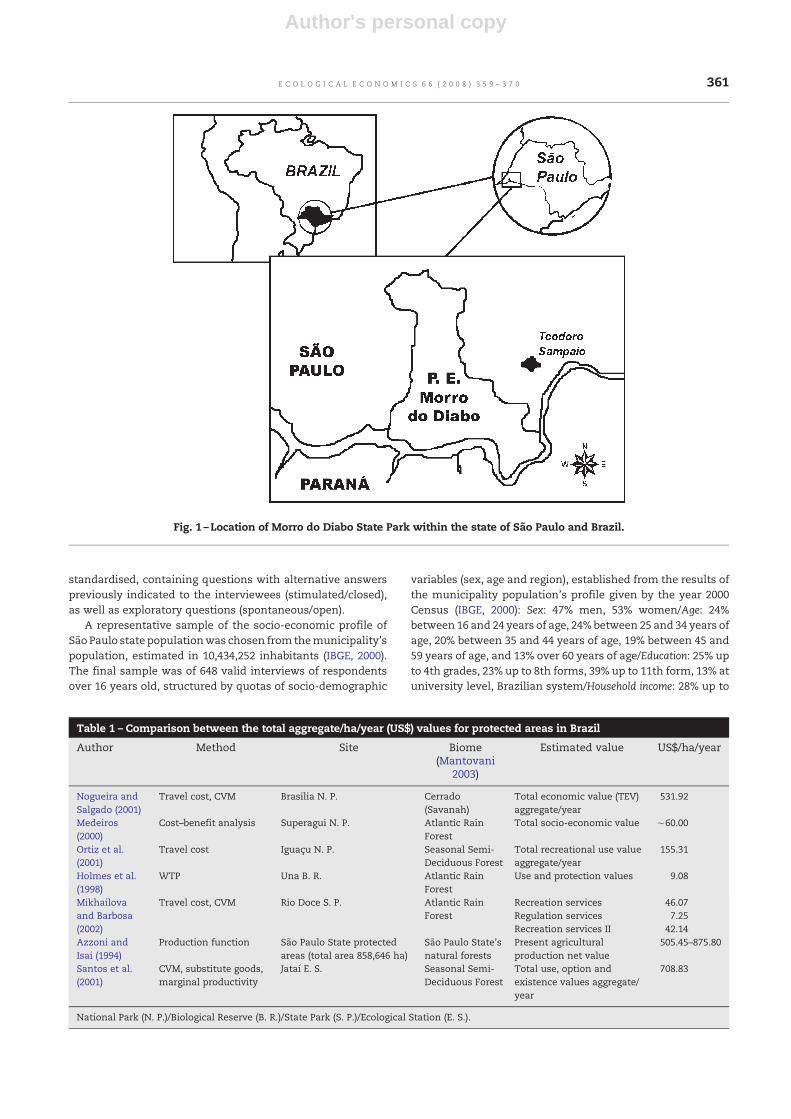
The largest remnant of Seasonal Semi-Deciduous Forest(approximately 35,000 ha) is situated in Pontal do Paranapa-nema (22°27′–22°40′ S and 52°10′–52°22′ W), south-west of SãoPaulo State (Brazil) (see Fig. 1), protected by theMorro do DiaboState Park (MDSP). Located in the municipality of TeodoroSampaio,MDSPwas created in 1986 and is administered by thestate Forest Institute (Instituto Florestal).
The park is the State's largest natural reserve of the peroba-rosa tree (Aspidosperma polyneuron), and the last haven forendemic and critically endangered species such as the blacklion tamarin (Leontopithecus chrysopygus) (IUCN, 2006;MMA, 2006),and others listed as vulnerable or near threatened species by theBrazilian (MMA, 2006) or IUCN's red lists (IUCN, 2006) (theBrazilian tapir Tapirus terrestris, the jaguar Panthera onca, and thesolitary tinamou, Tinamus solitarius) (IPE, 2000; IUCN, 2006; MMA,2006). The park is bisected by the SP-613 highway,where roadkillis common (São Paulo, 1999). It is surrounded by small-scalefarmers settled by federal government, larger agriculturalistsand cattle ranchers, landless peasant camps and the urbanpopulation of the city of Teodoro Sampaio. In fact, MDSP is aforested island in a landscape matrix of pasture and agricultureland, and suffers from deleterious edge effects such as alteredmicroclimate (drier, hotter and less shady) and invasive species(suchasgrasses).Thepark'sboundariesareoccasionallyaffectedby the fire used by local farmers to clear pastures of weeds.
In the State of São Paulo, where there are approximately900,000 ha of protected areas (Instituto Florestal, 2002), therehas been an increasing reduction in the budget allotted toenvironmental agencies in the last few years (Dale, personalcommunication, 2002). The MDSP has also suffered cuts.Despite its importance, the park's annual budget has beendecreasing since 1992, making it very difficult to manage thearea satisfactorily (Faria, 2002; São Paulo, 1999).
The estimation of economic value associated to environ-mental services of protected natural areas is increasinglycommon in developed countries (Ortiz et al., 2001). However,despite the fact that developing countries encompass thelargest share of natural resources in the planet, few economic
valuation studies of any kind have been conducted in theseregions, and willingness to paymethods have been very rarelyapplied (Dixon and Hufshmidt 1986; Dixon and Sherman 1990;Hadker et al., 1997).
Environmental valuation, based on microeconomic utilitytheory, seeks to reflect people's well being as a function ofenvironmental goods and services. However, the measure-ment of monetary values associated with environmentalbenefits can be very difficult, especially in the case of littleknown resources, such as biodiversity. Besides the limitationsin existing knowledge about the association between ecolog-ical functions and economic benefits, there are fundamentalmethodological limitations. For example, most of the eco-nomic studies associated with ecosystem service values onlylook for their contribution to human welfare (Brito, 2005).Nevertheless, the attribution of economic values to environ-mental resources is advantageous as it brings up social andeconomic issues that the ecological criterion by itself is notable to. By identifying the distribution of gains and losseswithin society, the public manager can find ways of reconcil-ing alternative resource uses (Seroa da Motta, 1998).
The few examples of protected areas valuation in Brazil(Camphora and May, 2006), including those in the AtlanticRainforest area, are listed in Table 1. The Jataí EcologicalStation (JES), covering an area of about 4532 ha, and IguaçúNational Park (INP) are the only ones that, besides MDSP, alsoprotect Seasonal Semi-Deciduous Forest remnants. Santoset al. (2001) analysed the environmental benefits resultingfrom structural and functional aspects of the ecosystemsprotected by JES by means of substitute goods, marginalproductivity and contingent valuation methods. The contin-gent valuation method was applied to investigate sixteenenvironmental function values, divided into regulation, car-rying capacity, production and information functions. Oneaspect of the information function was aesthetic value,estimated by travel cost. The authors tried to associate travelcost values to society's aesthetic or cultural values as anunder-estimated proxy for the cultural, religious, ideologicaland aesthetic values of JES. The total socio-economic value ofJES was estimated at US$ 708.83/ha/year (US$ 3,212,545.15/year), considered an underestimate by the authors, sincemany benefits could not be included due to lack of informationor methodological limitations (Santos et al., 2001). Ortiz et al.(2001) used the travel costs method to estimate INP's totalrecreational value at US$ 155.31 ha/year.
2. Economic valuation of Morro do Diabo StatePark: methodology
The central aim of this study was to value the existence of theMDSP by means of the contingent valuationmethod (CVM), asa way of evaluating its economic importance for the conser-vation of the Atlantic Seasonal Semi-Deciduous Forest. CVMwas applied to capture the population's willingness to pay(WTP) for the conservation (existence value) of MDSP and forthe rest of the Atlantic Rainforest's remnants in São PauloState.
A survey was conducted by means of personal interviewsat home from a questionnaire previously structured and
360 E C O L O G I C A L E C O N O M I C S 6 6 ( 2 0 0 8 ) 3 5 9 – 3 7 0
Author's personal copy
standardised, containing questions with alternative answerspreviously indicated to the interviewees (stimulated/closed),as well as exploratory questions (spontaneous/open).
A representative sample of the socio-economic profile ofSão Paulo state populationwas chosen from themunicipality'spopulation, estimated in 10,434,252 inhabitants (IBGE, 2000).The final sample was of 648 valid interviews of respondentsover 16 years old, structured by quotas of socio-demographic
variables (sex, age and region), established from the results ofthe municipality population's profile given by the year 2000Census (IBGE, 2000): Sex: 47% men, 53% women/Age: 24%between 16 and 24 years of age, 24% between 25 and 34 years ofage, 20% between 35 and 44 years of age, 19% between 45 and59 years of age, and 13% over 60 years of age/Education: 25% upto 4th grades, 23% up to 8th forms, 39% up to 11th form, 13% atuniversity level, Brazilian system/Household income: 28% up to
Fig. 1 –Location of Morro do Diabo State Park within the state of São Paulo and Brazil.
Table 1 – Comparison between the total aggregate/ha/year (US$) values for protected areas in Brazil
Author Method Site Biome(Mantovani
2003)
Estimated value US$/ha/year
Nogueira andSalgado (2001)
Travel cost, CVM Brasilia N. P. Cerrado(Savanah)
Total economic value (TEV)aggregate/year
531.92
Medeiros(2000)
Cost–benefit analysis Superagui N. P. Atlantic RainForest
Total socio-economic value ∼60.00
Ortiz et al.(2001)
Travel cost Iguaçu N. P. Seasonal Semi-Deciduous Forest
Total recreational use valueaggregate/year
155.31
Holmes et al.(1998)
WTP Una B. R. Atlantic RainForest
Use and protection values 9.08
Mikhailovaand Barbosa(2002)
Travel cost, CVM Rio Doce S. P. Atlantic RainForest
Recreation services 46.07Regulation services 7.25Recreation services II 42.14
Azzoni andIsai (1994)
Production function São Paulo State protectedareas (total area 858,646 ha)
São Paulo State'snatural forests
Present agriculturalproduction net value
505.45–875.80
Santos et al.(2001)
CVM, substitute goods,marginal productivity
Jataí E. S. Seasonal Semi-Deciduous Forest
Total use, option andexistence values aggregate/year
708.83
National Park (N. P.)/Biological Reserve (B. R.)/State Park (S. P.)/Ecological Station (E. S.).
361E C O L O G I C A L E C O N O M I C S 6 6 ( 2 0 0 8 ) 3 5 9 – 3 7 0
Author's personal copy
twice the minimum wage (MW)1, 33% between 2 and 5 timesthe MW, 22% between 5 and 10 times the MW, and 14% over 10times theMW/Economically Active Population: 63% (26% in formalemployment, 21% in the informal labour market, 15% unem-ployed)/Non-Economically Active Population: 37% (19% house-wives, 10% retired, 8% exclusively students). The error marginwas of ±4% for the final results, with a 95% confidence interval.
The interviews were carried out in the residence of theinterviewee and captured the willingness to pay for theconservation of the MDSP (WTPp) and also for the whole SãoPaulo State Atlantic Rainforest remnants (WTPm). The valueassociated to the Atlantic Rainforest as a whole (WTPm) wasasked as an addition to the WTP for the MDSP (WTPp) value.The payment instrument chosen was a monthly tax chargedon the interviewee's water bill. This instrument was chosenbecause water is universally charged for in the municipality.
Before the questions regarding WTP, cards containing abrief description of MDSP and the Atlantic Rainforest werehanded out to the interviewee and read by the interviewer.This procedure was established to give better information forthe interviewer about the park and the Atlantic Rainforest.The questionnaire's was used with a focus group andsubjected to two pilot tests before its final application. Theresults obtained reflect the opinion of the resident populationof the municipality of São Paulo.
The inclusion of open questions sought to evaluate theinterest of the population in environmental issues and theconservation of MDSP, independent of willingness to pay. Theinvestigation of qualitative information has the advantage ofaggregating social and cultural perspectives to the contingentvaluation method (Clark et al., 2000). The analysis of such dataconsidered the total valid sample of 648 interviews, since thelarge number of protest votes and/or nullWTPsdid not interferein the results. An econometric analysis was conducted toexplain the WTP as a result from the interviews. The modelused was Censored Regression Model (Tobit model) (Greene,1997; Halstead et al., 1991; Pindyck and Rubinfeld, 1991) due tothe high number of zeros in the dependent variables.
3. Econometric analysis
The socio-economic variables analysed were Age (age of theinterviewee in years), Sex, School (code representing the inter-viewee's level of education) and Income (household income). TheSchool variable used a proportional education scale, that is, thehigher the code the more complete the education.
New variables were created to facilitate theWTP econometricestimation and the analysis of variables important for theexplanation of the willingness to pay stated by the interviewees.The WTPp variable represented the willingness to pay for thepreservation of the Morro do Diabo State Park. The sameprocedure was used in the creation of the WTPm variable(willingness topay for thepreservationof theAtlanticRainforest).
The dummy variable Head was created, which featuredpositive value (1) if the intervieweewas head of the household,and null (0) if the interviewee was not the head of thehousehold. The aim was to test if this attribute of theinterviewee was a factor of importance in the value estab-lished for theWTPs (the sample was formed by 44.5% of headsof household and 55.5% of people with some kind of relationwith the head of the house). Of the latter, only 23 intervieweeshad no familial relation with the head of the house.
Other dummy variables were created with the aim ofisolating the effect of each of the total economic valuecomponents informed by the interviewee, that is, to test ifthe existence values for the MDSP and the Atlantic Rainforestwere captured or if they expressed use or option use valueonly. The variables dummyEV (existence value), dummyOV(option value), dummyUV (use value), dummyEVm (MDSPexistence value), dummyOVm (MDSP option value) anddummyUVm (MDSP use value) were created from the answersto the variables questioning the respondent about the mainmotivation for the each WTP response.
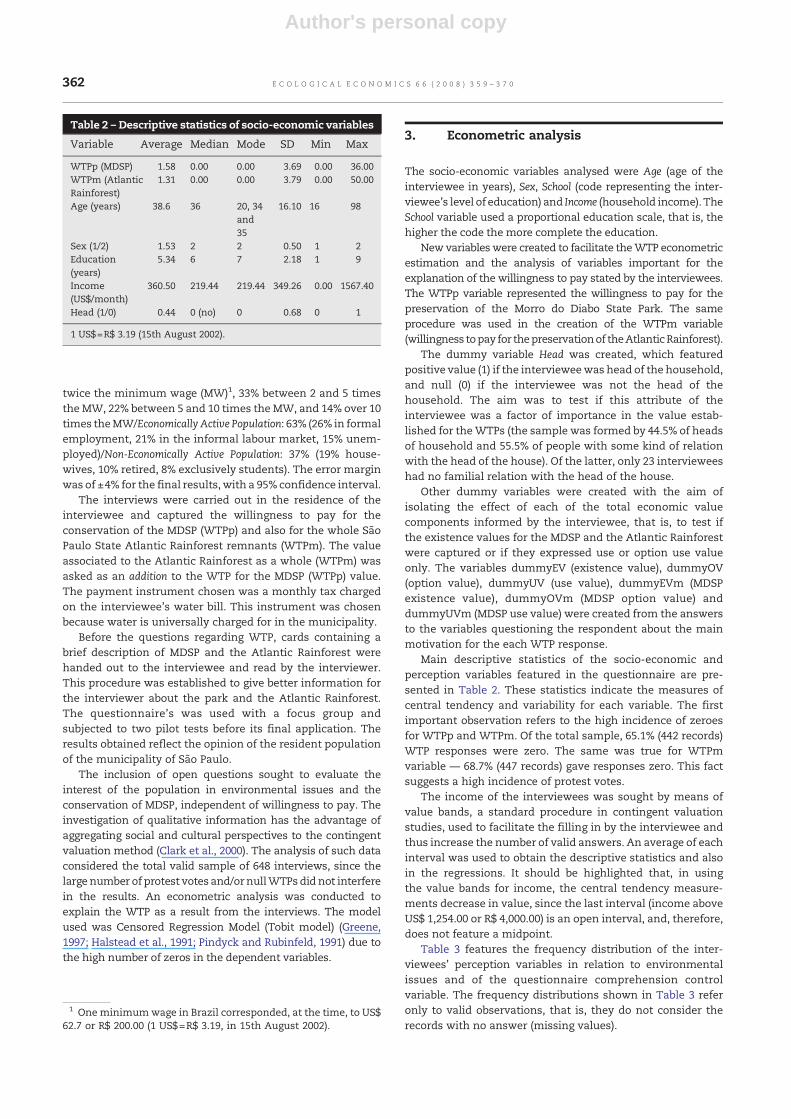
Main descriptive statistics of the socio-economic andperception variables featured in the questionnaire are pre-sented in Table 2. These statistics indicate the measures ofcentral tendency and variability for each variable. The firstimportant observation refers to the high incidence of zeroesfor WTPp and WTPm. Of the total sample, 65.1% (442 records)WTP responses were zero. The same was true for WTPmvariable — 68.7% (447 records) gave responses zero. This factsuggests a high incidence of protest votes.
The income of the interviewees was sought by means ofvalue bands, a standard procedure in contingent valuationstudies, used to facilitate the filling in by the interviewee andthus increase the number of valid answers. An average of eachinterval was used to obtain the descriptive statistics and alsoin the regressions. It should be highlighted that, in usingthe value bands for income, the central tendency measure-ments decrease in value, since the last interval (income aboveUS$ 1,254.00 or R$ 4,000.00) is an open interval, and, therefore,does not feature a midpoint.
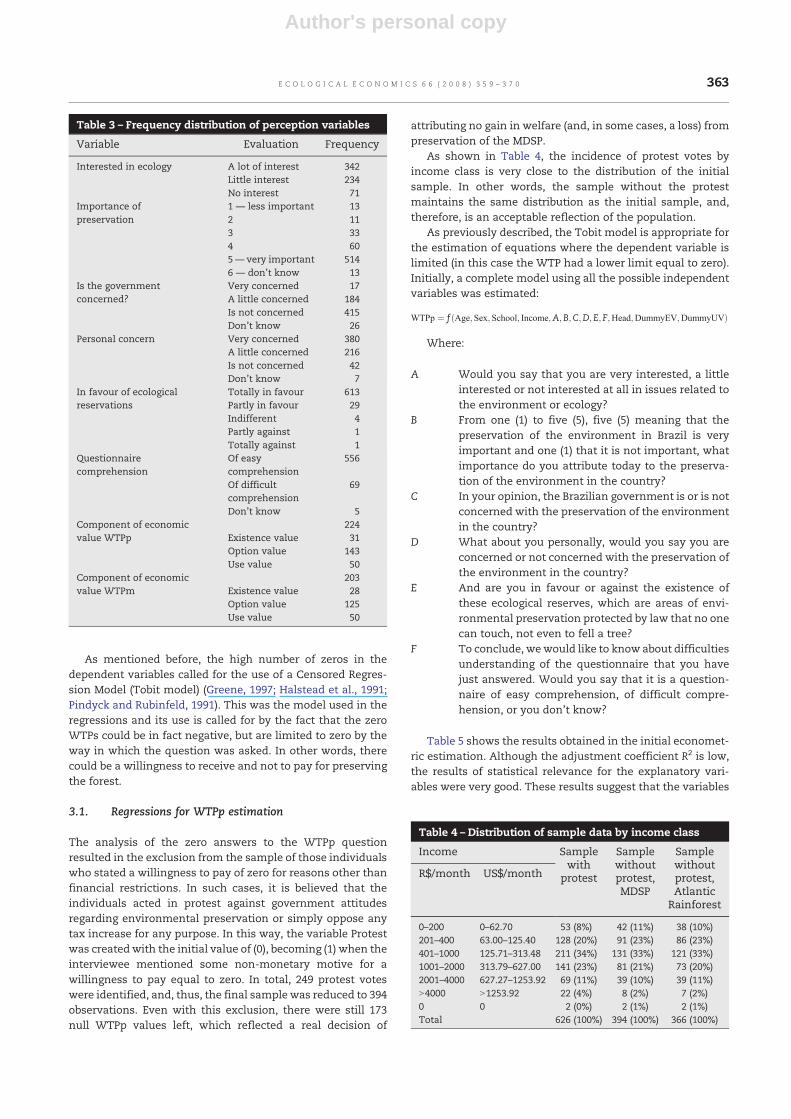
Table 3 features the frequency distribution of the inter-viewees' perception variables in relation to environmentalissues and of the questionnaire comprehension controlvariable. The frequency distributions shown in Table 3 referonly to valid observations, that is, they do not consider therecords with no answer (missing values).
1 One minimumwage in Brazil corresponded, at the time, to US$62.7 or R$ 200.00 (1 US$=R$ 3.19, in 15th August 2002).
Table 2 – Descriptive statistics of socio-economic variables
Variable Average Median Mode SD Min Max
WTPp (MDSP) 1.58 0.00 0.00 3.69 0.00 36.00WTPm (AtlanticRainforest)
1.31 0.00 0.00 3.79 0.00 50.00
Age (years) 38.6 36 20, 34and35
16.10 16 98
Sex (1/2) 1.53 2 2 0.50 1 2Education(years)
5.34 6 7 2.18 1 9
Income(US$/month)
360.50 219.44 219.44 349.26 0.00 1567.40
Head (1/0) 0.44 0 (no) 0 0.68 0 1
1 US$=R$ 3.19 (15th August 2002).
362 E C O L O G I C A L E C O N O M I C S 6 6 ( 2 0 0 8 ) 3 5 9 – 3 7 0
Author's personal copy
As mentioned before, the high number of zeros in thedependent variables called for the use of a Censored Regres-sion Model (Tobit model) (Greene, 1997; Halstead et al., 1991;Pindyck and Rubinfeld, 1991). This was the model used in theregressions and its use is called for by the fact that the zeroWTPs could be in fact negative, but are limited to zero by theway in which the question was asked. In other words, therecould be a willingness to receive and not to pay for preservingthe forest.
3.1. Regressions for WTPp estimation
The analysis of the zero answers to the WTPp questionresulted in the exclusion from the sample of those individualswho stated a willingness to pay of zero for reasons other thanfinancial restrictions. In such cases, it is believed that theindividuals acted in protest against government attitudesregarding environmental preservation or simply oppose anytax increase for any purpose. In this way, the variable Protestwas created with the initial value of (0), becoming (1) when theinterviewee mentioned some non-monetary motive for awillingness to pay equal to zero. In total, 249 protest voteswere identified, and, thus, the final sample was reduced to 394observations. Even with this exclusion, there were still 173null WTPp values left, which reflected a real decision of
attributing no gain in welfare (and, in some cases, a loss) frompreservation of the MDSP.
As shown in Table 4, the incidence of protest votes byincome class is very close to the distribution of the initialsample. In other words, the sample without the protestmaintains the same distribution as the initial sample, and,therefore, is an acceptable reflection of the population.
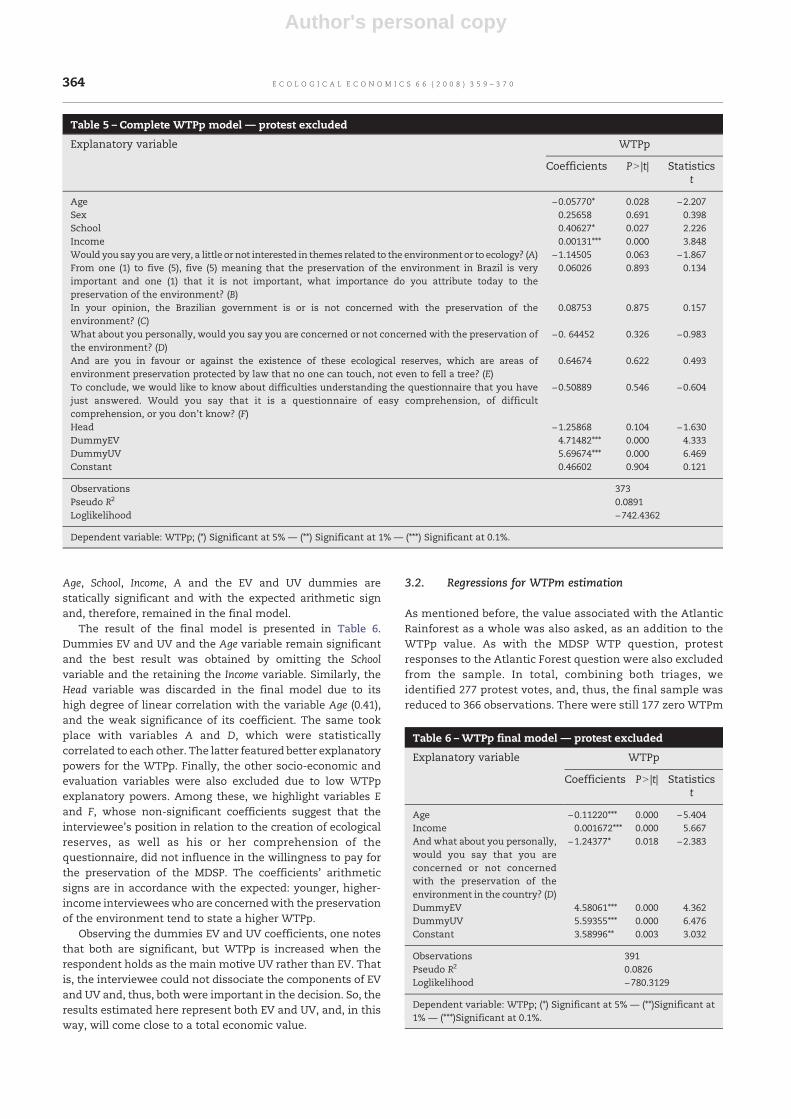
As previously described, the Tobit model is appropriate forthe estimation of equations where the dependent variable islimited (in this case the WTP had a lower limit equal to zero).Initially, a complete model using all the possible independentvariables was estimated:
WTPp ¼ f Age;Sex;School; Income;A;B;C;D;E; F;Head;DummyEV;DummyUVð Þ
Where:
A Would you say that you are very interested, a littleinterested or not interested at all in issues related tothe environment or ecology?
B From one (1) to five (5), five (5) meaning that thepreservation of the environment in Brazil is veryimportant and one (1) that it is not important, whatimportance do you attribute today to the preserva-tion of the environment in the country?
C In your opinion, the Brazilian government is or is notconcerned with the preservation of the environmentin the country?
D What about you personally, would you say you areconcerned or not concerned with the preservation ofthe environment in the country?
E And are you in favour or against the existence ofthese ecological reserves, which are areas of envi-ronmental preservation protected by law that no onecan touch, not even to fell a tree?
F To conclude, wewould like to know about difficultiesunderstanding of the questionnaire that you havejust answered. Would you say that it is a question-naire of easy comprehension, of difficult compre-hension, or you don't know?
Table 5 shows the results obtained in the initial economet-ric estimation. Although the adjustment coefficient R2 is low,the results of statistical relevance for the explanatory vari-ables were very good. These results suggest that the variables
Table 3 – Frequency distribution of perception variables
Variable Evaluation Frequency
Interested in ecology A lot of interest 342Little interest 234No interest 71
Importance ofpreservation
1 — less important 132 113 334 605— very important 5146 — don't know 13
Is the governmentconcerned?
Very concerned 17A little concerned 184Is not concerned 415Don't know 26
Personal concern Very concerned 380A little concerned 216Is not concerned 42Don't know 7
In favour of ecologicalreservations
Totally in favour 613Partly in favour 29Indifferent 4Partly against 1Totally against 1
Questionnairecomprehension
Of easycomprehension
556
Of difficultcomprehension
69
Don't know 5Component of economicvalue WTPp
224Existence value 31Option value 143Use value 50
Component of economicvalue WTPm
203Existence value 28Option value 125Use value 50
Table 4 – Distribution of sample data by income class
Income Samplewith
protest
Samplewithoutprotest,MDSP
Samplewithoutprotest,Atlantic
Rainforest
R$/month US$/month
0–200 0–62.70 53 (8%) 42 (11%) 38 (10%)201–400 63.00–125.40 128 (20%) 91 (23%) 86 (23%)401–1000 125.71–313.48 211 (34%) 131 (33%) 121 (33%)1001–2000 313.79–627.00 141 (23%) 81 (21%) 73 (20%)2001–4000 627.27–1253.92 69 (11%) 39 (10%) 39 (11%)N4000 N1253.92 22 (4%) 8 (2%) 7 (2%)0 0 2 (0%) 2 (1%) 2 (1%)Total 626 (100%) 394 (100%) 366 (100%)
363E C O L O G I C A L E C O N O M I C S 6 6 ( 2 0 0 8 ) 3 5 9 – 3 7 0
Author's personal copy
Age, School, Income, A and the EV and UV dummies arestatically significant and with the expected arithmetic signand, therefore, remained in the final model.
The result of the final model is presented in Table 6.Dummies EV and UV and the Age variable remain significantand the best result was obtained by omitting the Schoolvariable and the retaining the Income variable. Similarly, theHead variable was discarded in the final model due to itshigh degree of linear correlation with the variable Age (0.41),and the weak significance of its coefficient. The same tookplace with variables A and D, which were statisticallycorrelated to each other. The latter featured better explanatorypowers for the WTPp. Finally, the other socio-economic andevaluation variables were also excluded due to low WTPpexplanatory powers. Among these, we highlight variables Eand F, whose non-significant coefficients suggest that theinterviewee's position in relation to the creation of ecologicalreserves, as well as his or her comprehension of thequestionnaire, did not influence in the willingness to pay forthe preservation of the MDSP. The coefficients' arithmeticsigns are in accordance with the expected: younger, higher-income intervieweeswho are concernedwith the preservationof the environment tend to state a higher WTPp.
Observing the dummies EV and UV coefficients, one notesthat both are significant, but WTPp is increased when therespondent holds as the main motive UV rather than EV. Thatis, the interviewee could not dissociate the components of EVand UV and, thus, both were important in the decision. So, theresults estimated here represent both EV and UV, and, in thisway, will come close to a total economic value.
3.2. Regressions for WTPm estimation
As mentioned before, the value associated with the AtlanticRainforest as a whole was also asked, as an addition to theWTPp value. As with the MDSP WTP question, protestresponses to the Atlantic Forest question were also excludedfrom the sample. In total, combining both triages, weidentified 277 protest votes, and, thus, the final sample wasreduced to 366 observations. There were still 177 zero WTPm
Table 5 – Complete WTPp model — protest excluded
Explanatory variable WTPp
Coefficients PN |t| Statisticst
Age −0.05770⁎ 0.028 −2.207Sex 0.25658 0.691 0.398School 0.40627⁎ 0.027 2.226Income 0.00131⁎⁎⁎ 0.000 3.848Would you say you are very, a little or not interested in themes related to the environment or to ecology? (A) −1.14505 0.063 −1.867From one (1) to five (5), five (5) meaning that the preservation of the environment in Brazil is veryimportant and one (1) that it is not important, what importance do you attribute today to thepreservation of the environment? (B)
0.06026 0.893 0.134
In your opinion, the Brazilian government is or is not concerned with the preservation of theenvironment? (C)
0.08753 0.875 0.157
What about you personally, would you say you are concerned or not concerned with the preservation ofthe environment? (D)
−0. 64452 0.326 −0.983
And are you in favour or against the existence of these ecological reserves, which are areas ofenvironment preservation protected by law that no one can touch, not even to fell a tree? (E)
0.64674 0.622 0.493
To conclude, we would like to know about difficulties understanding the questionnaire that you havejust answered. Would you say that it is a questionnaire of easy comprehension, of difficultcomprehension, or you don't know? (F)
−0.50889 0.546 −0.604
Head −1.25868 0.104 −1.630DummyEV 4.71482⁎⁎⁎ 0.000 4.333DummyUV 5.69674⁎⁎⁎ 0.000 6.469Constant 0.46602 0.904 0.121
Observations 373Pseudo R2 0.0891Loglikelihood −742.4362
Dependent variable: WTPp; (⁎) Significant at 5% — (⁎⁎) Significant at 1% — (⁎⁎⁎) Significant at 0.1%.
Table 6 –WTPp final model — protest excluded
Explanatory variable WTPp
Coefficients PN |t| Statisticst
Age −0.11220⁎⁎⁎ 0.000 −5.404Income 0.001672⁎⁎⁎ 0.000 5.667And what about you personally,would you say that you areconcerned or not concernedwith the preservation of theenvironment in the country? (D)
−1.24377⁎ 0.018 −2.383
DummyEV 4.58061⁎⁎⁎ 0.000 4.362DummyUV 5.59355⁎⁎⁎ 0.000 6.476Constant 3.58996⁎⁎ 0.003 3.032
Observations 391Pseudo R2 0.0826Loglikelihood −780.3129
Dependent variable: WTPp; (⁎) Significant at 5% — (⁎⁎)Significant at1% — (⁎⁎⁎)Significant at 0.1%.
364 E C O L O G I C A L E C O N O M I C S 6 6 ( 2 0 0 8 ) 3 5 9 – 3 7 0
Author's personal copy
values left after this screening process, reflecting an eco-nomic decision of not attributing a well being gain to thepreservation of all of the Atlantic Rainforest remnants in theState of São Paulo.
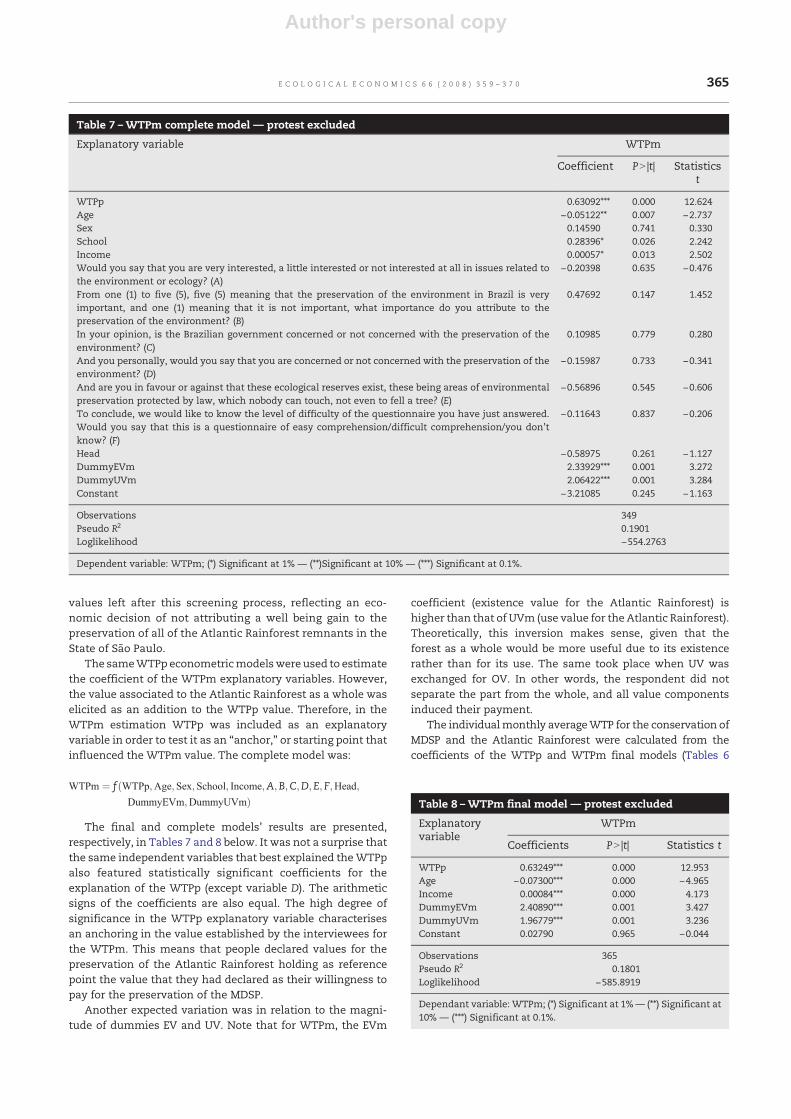
The sameWTPp econometricmodelswereused to estimatethe coefficient of the WTPm explanatory variables. However,the value associated to the Atlantic Rainforest as a whole waselicited as an addition to the WTPp value. Therefore, in theWTPm estimation WTPp was included as an explanatoryvariable in order to test it as an “anchor,” or starting point thatinfluenced the WTPm value. The complete model was:
WTPm ¼ f ðWTPp;Age;Sex;School; Income;A;B;C;D;E; F;Head;DummyEVm;DummyUVmÞ
The final and complete models' results are presented,respectively, in Tables 7 and 8 below. It was not a surprise thatthe same independent variables that best explained theWTPpalso featured statistically significant coefficients for theexplanation of the WTPp (except variable D). The arithmeticsigns of the coefficients are also equal. The high degree ofsignificance in the WTPp explanatory variable characterisesan anchoring in the value established by the interviewees forthe WTPm. This means that people declared values for thepreservation of the Atlantic Rainforest holding as referencepoint the value that they had declared as their willingness topay for the preservation of the MDSP.
Another expected variation was in relation to the magni-tude of dummies EV and UV. Note that for WTPm, the EVm
coefficient (existence value for the Atlantic Rainforest) ishigher than that of UVm (use value for the Atlantic Rainforest).Theoretically, this inversion makes sense, given that theforest as a whole would be more useful due to its existencerather than for its use. The same took place when UV wasexchanged for OV. In other words, the respondent did notseparate the part from the whole, and all value componentsinduced their payment.
The individualmonthly averageWTP for the conservation ofMDSP and the Atlantic Rainforest were calculated from thecoefficients of the WTPp and WTPm final models (Tables 6
Table 7 –WTPm complete model — protest excluded
Explanatory variable WTPm
Coefficient PN |t| Statisticst
WTPp 0.63092⁎⁎⁎ 0.000 12.624Age −0.05122⁎⁎ 0.007 −2.737Sex 0.14590 0.741 0.330School 0.28396⁎ 0.026 2.242Income 0.00057⁎ 0.013 2.502Would you say that you are very interested, a little interested or not interested at all in issues related tothe environment or ecology? (A)
−0.20398 0.635 −0.476
From one (1) to five (5), five (5) meaning that the preservation of the environment in Brazil is veryimportant, and one (1) meaning that it is not important, what importance do you attribute to thepreservation of the environment? (B)
0.47692 0.147 1.452
In your opinion, is the Brazilian government concerned or not concerned with the preservation of theenvironment? (C)
0.10985 0.779 0.280
And you personally, would you say that you are concerned or not concerned with the preservation of theenvironment? (D)
−0.15987 0.733 −0.341
And are you in favour or against that these ecological reserves exist, these being areas of environmentalpreservation protected by law, which nobody can touch, not even to fell a tree? (E)
−0.56896 0.545 −0.606
To conclude, we would like to know the level of difficulty of the questionnaire you have just answered.Would you say that this is a questionnaire of easy comprehension/difficult comprehension/you don'tknow? (F)
−0.11643 0.837 −0.206
Head −0.58975 0.261 −1.127DummyEVm 2.33929⁎⁎⁎ 0.001 3.272DummyUVm 2.06422⁎⁎⁎ 0.001 3.284Constant −3.21085 0.245 −1.163
Observations 349Pseudo R2 0.1901Loglikelihood −554.2763
Dependent variable: WTPm; (⁎) Significant at 1% — (⁎⁎)Significant at 10% — (⁎⁎⁎) Significant at 0.1%.
Table 8 –WTPm final model — protest excluded
Explanatoryvariable
WTPm
Coefficients PN |t| Statistics t
WTPp 0.63249⁎⁎⁎ 0.000 12.953Age −0.07300⁎⁎⁎ 0.000 −4.965Income 0.00084⁎⁎⁎ 0.000 4.173DummyEVm 2.40890⁎⁎⁎ 0.001 3.427DummyUVm 1.96779⁎⁎⁎ 0.001 3.236Constant 0.02790 0.965 −0.044
Observations 365Pseudo R2 0.1801Loglikelihood −585.8919
Dependant variable: WTPm; (⁎) Significant at 1%— (⁎⁎) Significant at10% — (⁎⁎⁎) Significant at 0.1%.
365E C O L O G I C A L E C O N O M I C S 6 6 ( 2 0 0 8 ) 3 5 9 – 3 7 0
Author's personal copy
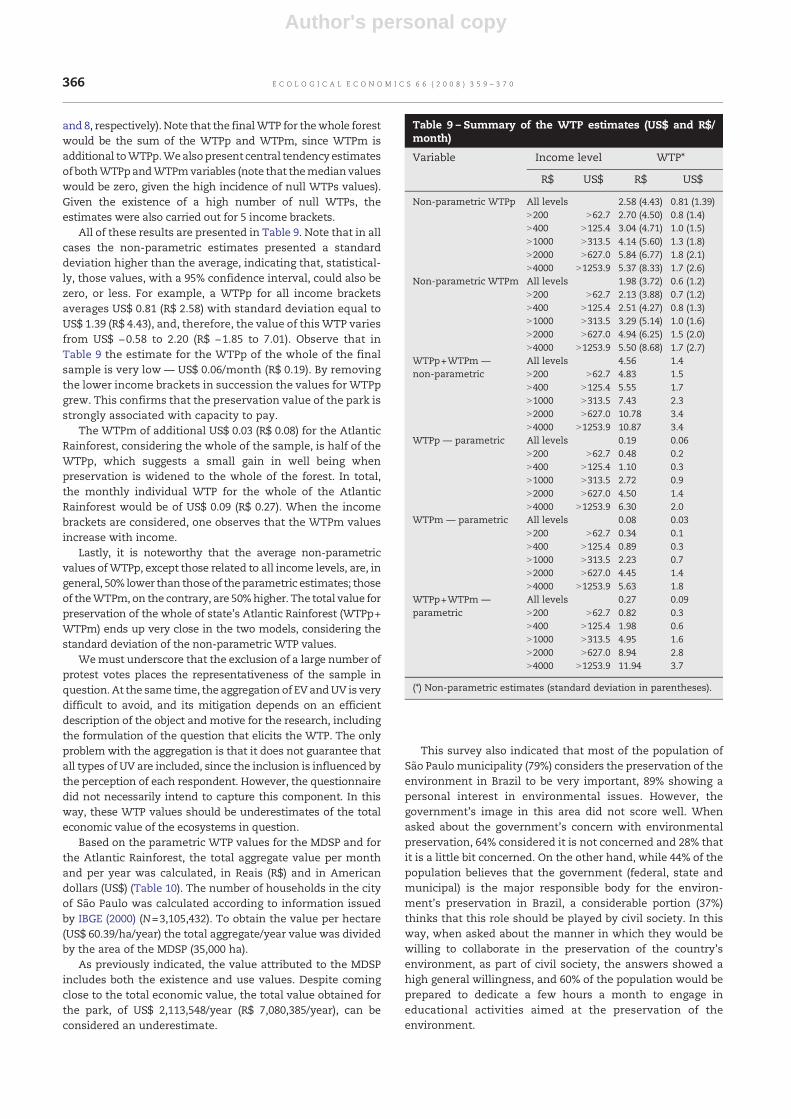
and 8, respectively). Note that the finalWTP for thewhole forestwould be the sum of the WTPp and WTPm, since WTPm isadditional toWTPp.Wealsopresent central tendency estimatesof bothWTPpandWTPmvariables (note that themedianvalueswould be zero, given the high incidence of null WTPs values).Given the existence of a high number of null WTPs, theestimates were also carried out for 5 income brackets.
All of these results are presented in Table 9. Note that in allcases the non-parametric estimates presented a standarddeviation higher than the average, indicating that, statistical-ly, those values, with a 95% confidence interval, could also bezero, or less. For example, a WTPp for all income bracketsaverages US$ 0.81 (R$ 2.58) with standard deviation equal toUS$ 1.39 (R$ 4.43), and, therefore, the value of this WTP variesfrom US$ −0.58 to 2.20 (R$ −1.85 to 7.01). Observe that inTable 9 the estimate for the WTPp of the whole of the finalsample is very low — US$ 0.06/month (R$ 0.19). By removingthe lower income brackets in succession the values for WTPpgrew. This confirms that the preservation value of the park isstrongly associated with capacity to pay.
The WTPm of additional US$ 0.03 (R$ 0.08) for the AtlanticRainforest, considering the whole of the sample, is half of theWTPp, which suggests a small gain in well being whenpreservation is widened to the whole of the forest. In total,the monthly individual WTP for the whole of the AtlanticRainforest would be of US$ 0.09 (R$ 0.27). When the incomebrackets are considered, one observes that the WTPm valuesincrease with income.
Lastly, it is noteworthy that the average non-parametricvalues ofWTPp, except those related to all income levels, are, ingeneral, 50% lower than those of theparametric estimates; thoseof theWTPm, on the contrary, are 50%higher. The total value forpreservation of the whole of state's Atlantic Rainforest (WTPp+WTPm) ends up very close in the two models, considering thestandard deviation of the non-parametric WTP values.
Wemust underscore that the exclusion of a large number ofprotest votes places the representativeness of the sample inquestion. At the same time, the aggregation of EVandUV is verydifficult to avoid, and its mitigation depends on an efficientdescription of the object and motive for the research, includingthe formulation of the question that elicits the WTP. The onlyproblemwith the aggregation is that it does not guarantee thatall types of UV are included, since the inclusion is influenced bythe perception of each respondent. However, the questionnairedid not necessarily intend to capture this component. In thisway, these WTP values should be underestimates of the totaleconomic value of the ecosystems in question.
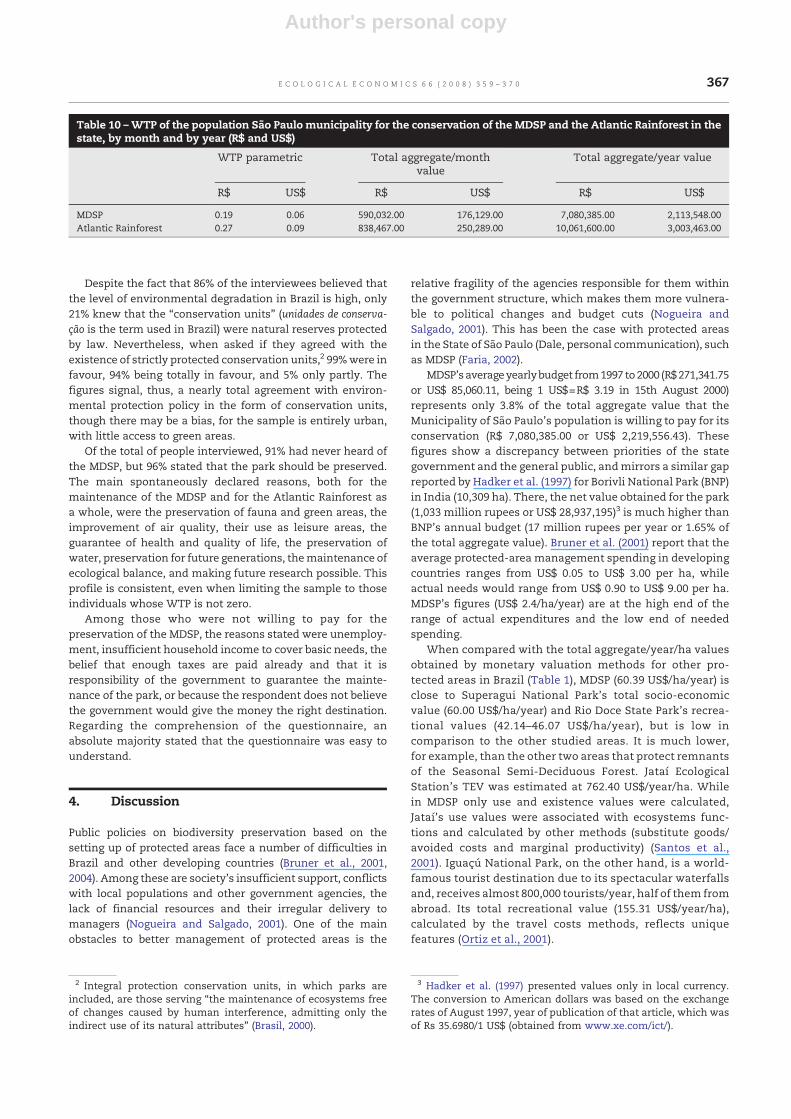
Based on the parametric WTP values for the MDSP and forthe Atlantic Rainforest, the total aggregate value per monthand per year was calculated, in Reais (R$) and in Americandollars (US$) (Table 10). The number of households in the cityof São Paulo was calculated according to information issuedby IBGE (2000) (N=3,105,432). To obtain the value per hectare(US$ 60.39/ha/year) the total aggregate/year value was dividedby the area of the MDSP (35,000 ha).
As previously indicated, the value attributed to the MDSPincludes both the existence and use values. Despite comingclose to the total economic value, the total value obtained forthe park, of US$ 2,113,548/year (R$ 7,080,385/year), can beconsidered an underestimate.
This survey also indicated that most of the population ofSão Paulo municipality (79%) considers the preservation of theenvironment in Brazil to be very important, 89% showing apersonal interest in environmental issues. However, thegovernment's image in this area did not score well. Whenasked about the government's concern with environmentalpreservation, 64% considered it is not concerned and 28% thatit is a little bit concerned. On the other hand, while 44% of thepopulation believes that the government (federal, state andmunicipal) is the major responsible body for the environ-ment's preservation in Brazil, a considerable portion (37%)thinks that this role should be played by civil society. In thisway, when asked about the manner in which they would bewilling to collaborate in the preservation of the country'senvironment, as part of civil society, the answers showed ahigh general willingness, and 60% of the population would beprepared to dedicate a few hours a month to engage ineducational activities aimed at the preservation of theenvironment.
Table 9 – Summary of the WTP estimates (US$ and R$/month)
Variable Income level WTP⁎
R$ US$ R$ US$
Non-parametric WTPp All levels 2.58 (4.43) 0.81 (1.39)N200 N62.7 2.70 (4.50) 0.8 (1.4)N400 N125.4 3.04 (4.71) 1.0 (1.5)N1000 N313.5 4.14 (5.60) 1.3 (1.8)N2000 N627.0 5.84 (6.77) 1.8 (2.1)N4000 N1253.9 5.37 (8.33) 1.7 (2.6)
Non-parametric WTPm All levels 1.98 (3.72) 0.6 (1.2)N200 N62.7 2.13 (3.88) 0.7 (1.2)N400 N125.4 2.51 (4.27) 0.8 (1.3)N1000 N313.5 3.29 (5.14) 1.0 (1.6)N2000 N627.0 4.94 (6.25) 1.5 (2.0)N4000 N1253.9 5.50 (8.68) 1.7 (2.7)
WTPp+WTPm —non-parametric
All levels 4.56 1.4N200 N62.7 4.83 1.5N400 N125.4 5.55 1.7N1000 N313.5 7.43 2.3N2000 N627.0 10.78 3.4N4000 N1253.9 10.87 3.4
WTPp — parametric All levels 0.19 0.06N200 N62.7 0.48 0.2N400 N125.4 1.10 0.3N1000 N313.5 2.72 0.9N2000 N627.0 4.50 1.4N4000 N1253.9 6.30 2.0
WTPm — parametric All levels 0.08 0.03N200 N62.7 0.34 0.1N400 N125.4 0.89 0.3N1000 N313.5 2.23 0.7N2000 N627.0 4.45 1.4N4000 N1253.9 5.63 1.8
WTPp+WTPm —parametric
All levels 0.27 0.09N200 N62.7 0.82 0.3N400 N125.4 1.98 0.6N1000 N313.5 4.95 1.6N2000 N627.0 8.94 2.8N4000 N1253.9 11.94 3.7
(⁎) Non-parametric estimates (standard deviation in parentheses).
366 E C O L O G I C A L E C O N O M I C S 6 6 ( 2 0 0 8 ) 3 5 9 – 3 7 0
Author's personal copy
Despite the fact that 86% of the interviewees believed thatthe level of environmental degradation in Brazil is high, only21% knew that the “conservation units” (unidades de conserva-ção is the term used in Brazil) were natural reserves protectedby law. Nevertheless, when asked if they agreed with theexistence of strictly protected conservation units,2 99%were infavour, 94% being totally in favour, and 5% only partly. Thefigures signal, thus, a nearly total agreement with environ-mental protection policy in the form of conservation units,though there may be a bias, for the sample is entirely urban,with little access to green areas.
Of the total of people interviewed, 91% had never heard ofthe MDSP, but 96% stated that the park should be preserved.The main spontaneously declared reasons, both for themaintenance of the MDSP and for the Atlantic Rainforest asa whole, were the preservation of fauna and green areas, theimprovement of air quality, their use as leisure areas, theguarantee of health and quality of life, the preservation ofwater, preservation for future generations, themaintenance ofecological balance, and making future research possible. Thisprofile is consistent, even when limiting the sample to thoseindividuals whose WTP is not zero.
Among those who were not willing to pay for thepreservation of the MDSP, the reasons stated were unemploy-ment, insufficient household income to cover basic needs, thebelief that enough taxes are paid already and that it isresponsibility of the government to guarantee the mainte-nance of the park, or because the respondent does not believethe government would give the money the right destination.Regarding the comprehension of the questionnaire, anabsolute majority stated that the questionnaire was easy tounderstand.
4. Discussion
Public policies on biodiversity preservation based on thesetting up of protected areas face a number of difficulties inBrazil and other developing countries (Bruner et al., 2001,2004). Among these are society's insufficient support, conflictswith local populations and other government agencies, thelack of financial resources and their irregular delivery tomanagers (Nogueira and Salgado, 2001). One of the mainobstacles to better management of protected areas is the
relative fragility of the agencies responsible for them withinthe government structure, which makes them more vulnera-ble to political changes and budget cuts (Nogueira andSalgado, 2001). This has been the case with protected areasin the State of São Paulo (Dale, personal communication), suchas MDSP (Faria, 2002).
MDSP'saverageyearlybudget from1997 to2000 (R$271,341.75or US$ 85,060.11, being 1 US$=R$ 3.19 in 15th August 2000)represents only 3.8% of the total aggregate value that theMunicipality of São Paulo's population is willing to pay for itsconservation (R$ 7,080,385.00 or US$ 2,219,556.43). Thesefigures show a discrepancy between priorities of the stategovernment and the general public, andmirrors a similar gapreported by Hadker et al. (1997) for Borivli National Park (BNP)in India (10,309 ha). There, the net value obtained for the park(1,033 million rupees or US$ 28,937,195)3 is much higher thanBNP's annual budget (17 million rupees per year or 1.65% ofthe total aggregate value). Bruner et al. (2001) report that theaverage protected-area management spending in developingcountries ranges from US$ 0.05 to US$ 3.00 per ha, whileactual needs would range from US$ 0.90 to US$ 9.00 per ha.MDSP's figures (US$ 2.4/ha/year) are at the high end of therange of actual expenditures and the low end of neededspending.
When compared with the total aggregate/year/ha valuesobtained by monetary valuation methods for other pro-tected areas in Brazil (Table 1), MDSP (60.39 US$/ha/year) isclose to Superagui National Park's total socio-economicvalue (60.00 US$/ha/year) and Rio Doce State Park's recrea-tional values (42.14–46.07 US$/ha/year), but is low incomparison to the other studied areas. It is much lower,for example, than the other two areas that protect remnantsof the Seasonal Semi-Deciduous Forest. Jataí EcologicalStation's TEV was estimated at 762.40 US$/year/ha. Whilein MDSP only use and existence values were calculated,Jataí's use values were associated with ecosystems func-tions and calculated by other methods (substitute goods/avoided costs and marginal productivity) (Santos et al.,2001). Iguaçú National Park, on the other hand, is a world-famous tourist destination due to its spectacular waterfallsand, receives almost 800,000 tourists/year, half of them fromabroad. Its total recreational value (155.31 US$/year/ha),calculated by the travel costs methods, reflects uniquefeatures (Ortiz et al., 2001).
Table 10 –WTP of the population São Paulo municipality for the conservation of the MDSP and the Atlantic Rainforest in thestate, by month and by year (R$ and US$)
WTP parametric Total aggregate/monthvalue
Total aggregate/year value
R$ US$ R$ US$ R$ US$
MDSP 0.19 0.06 590,032.00 176,129.00 7,080,385.00 2,113,548.00Atlantic Rainforest 0.27 0.09 838,467.00 250,289.00 10,061,600.00 3,003,463.00
2 Integral protection conservation units, in which parks areincluded, are those serving “the maintenance of ecosystems freeof changes caused by human interference, admitting only theindirect use of its natural attributes” (Brasil, 2000).
3 Hadker et al. (1997) presented values only in local currency.The conversion to American dollars was based on the exchangerates of August 1997, year of publication of that article, which wasof Rs 35.6980/1 US$ (obtained from www.xe.com/ict/).
367E C O L O G I C A L E C O N O M I C S 6 6 ( 2 0 0 8 ) 3 5 9 – 3 7 0
Author's personal copy
Another aspect of this study that should be highlighted isthe lack of proportionality between the total aggregated valuefor Atlantic Rainforest in the State of São Paulo (US$ 0.09/household or US$ 3,003,463.00/year) and MDSP (US$ 0.06/household or US$ 2,113,548.00). These figures can beexplained, first of all, by the fact that when WTPm wasasked (as an addition to WTPp) the respondent had alreadymentally “spent” most of his altruistic budget with the park.This attitude could also be explained by the expectation ofdiminishing marginal utility of consumption: one may bewilling to pay a certain amount for preserving an extra hectareof rainforest, but it's unlikely that he or shewould bewilling topay the same amount per hectare for the whole forest.Alternatively, one could consider that if existence value iscorrelated to stock, the respondent may want to guarantee aminimum stock to ensure the existence of the Semi-Decidu-ous Forest. The marginal willingness to pay for a larger stockwould be proportionally lower than the stock variation until itreached almost zero at the sustainable stock level. Thismeansthat at that sustainable level the population's total WTPwould be equal to the value of the total stock. Although thearea of the whole forest is much bigger than the park,marginal WTP is not. For example, when Horton et al. (2002)changed the size of a conservation area in the Amazon in300%, resulting WTP estimate changed of only 38% (for atheoretical discussion on this argument, see also Hanemann,1995).
According to Attfield (1998, pp. 165) existence value (EV) isthe value “of the continued existence of various things” thatcan be related to the intrinsic value of the minimum criticalstock (“good continued existence” — Aldred, 1994 apudAttfield, 1998, pp. 163). This value is not related to the flowof environmental goods and services that determine usevalues. It follows that EV would decrease with the size of thepreserved area or would grow less than proportionally to thatarea. Note that the WTPm values are always inferior to thoseofWTPp, even knowing that the area of the Atlantic Rainforestis fifty times bigger than that of the park. This would beexpected since we have demonstrated that EV more forcefullycommands the WTPm valuation than WTPp's, and, therefore,the increase in the WTPm is proportionally lower than that ofthe preserved area.
As described before, our results also showed a largenumber of questionnaires with null WTP both for MDSP(65.1% of the total) and for the Atlantic Rainforest (68.7%),pointing to two factors: (1) lack of credibility of the govern-ment in the use of public resources and, therefore, lack of trustin charging for public services (water, electricity) as paymentvehicles for WTP estimation; (2) the bias induced by thepopulation's budget restrictions, which can seriously influ-ence the size of the final sample.
These results are similar to those obtained by Hadker et al.(1997) for Mumbai residents' WTP for the preservation of BNP.Willingness to pay was estimated by means of dichotomousbids, followed by an open question about the maximum WTP.The authors also investigated the willingness to participate involuntary park maintenance, as a way to include those whocould not contribute financially but would be interested inpreserving the park. Of the total population interviewed by theauthors, 35.9% respondedwith protest votes (in the case of the
MDSP 38.5%), and 24.9% thought that the government shouldbe responsible for the maintenance of the park. Besides, 26.9%said that household budget restrictions limited paymentcapacity (26.8% in the case of MDSP). When asked about theavailability for voluntary work, 28% of the populationresponded positively (Hadker et al., 1997), while in São Paulo60% of the population would be willing to dedicate a few hoursa month for environmental education activities, and 37%believes that the major responsible player for environmentalpreservation in Brazil was civil society and not thegovernment.
The issues discussed above highlight some of the problemsfaced by the monetary valuation of natural resources,especially through stated WTP methods. These difficultiescan be added to those discussed by Brito (2005) concerningbiodiversity valuation, such as the kind of inputs (knowledgeabout all components of biodiversity, in terms of genes,species or ecosystems) required to form current individualpreferences and the fact that national and international goalsof biodiversity conservation and economic growth are usuallyconflicting (Ehrenfeld, 1988; Czech et al., 2000). Other ecolo-gists and conservation biologists think that it is eitherimpossible or unwise to place a value on such intangiblethings as biodiversity, environmental aesthetics or long-termecological benefits (Pimm, 1997). Besides, Balmford et al. (2002)have demonstrated that the loss of nonmarketed servicesoutweighs the marketed marginal benefits of ecosystemconversion often by a considerable amount.
On the other side, most economists think that some of theproblems faced by protected areas arise because ecosystemservices normally do not have market values, and for thisreason are undervalued in policy decisions (Costanza et al.,1997). The establishment of economic value as a criterioncomplementary to environmental criteria could help to in-crease the efficiency of environmental management (SeroadaMotta, 1998; Tomam, 1998), highlighting the importance ofprotected areas to society. Nevertheless, some economistsadmit that there are moral issues involved in ecosystemvaluation, but, instead of abandoning it altogether, weshould choose to make them more explicit (Costanza et al.,1997).
Despite all the problems faced by protected areas in thetropics, Bruner et al. (2001, 2004) have shown that they havebeen effective in protecting the ecosystems and biodiversitywithin their borders, suggesting they should remain a centralpart of conservation strategies. We believe that beside thepossible contributions of this study to public policy decisions(including the importance of establishing new conservationstrategies), the economic valuation of MDSP can bring benefitsfor the resolution of social problems and land conflicts inPontal do Paranapanema. Most farmers in Pontal do Para-napanema occupy public areas without legal title, making badenvironmental use of the land, and the park is the onlysignificant example of the benefits that native ecosystemconservation can bring to the region. The economic valuationof MDSP could orient the State government in the negotiationsconcerning land conflict resolution and in the development ofmore sustainable land use alternatives. Besides, our resultscould serve as a reference value for compensation of lossescaused by environmental damage.
368 E C O L O G I C A L E C O N O M I C S 6 6 ( 2 0 0 8 ) 3 5 9 – 3 7 0
Author's personal copy
5. Conclusion
The aim of this study was to carry out the economic valuationof the existence value of Morro do Diabo State Park (MDSP) andthe Atlantic Rainforest's remnants in São Paulo State bymeans of the contingent valuation method (CVM). Ourquestionnaire captured both the use and existence values inboth cases. The WTP values can be considered as under-estimates of the total economic value. The high incidence ofzero values was due to: (i) protest votes and (ii) thepopulation's low payment capacity. The effect of the abilityto pay was dominant, for, even when the protest votes wereleft out of the sample, the WTP average estimates featuredvalues close to zero (or even negative). However, these WTPestimates increased with income level. The coefficients'arithmetic signs were as expected: younger, higher-incomeintervieweeswhowere concernedwith the preservation of theenvironment tended to state a higher WTP for MDSP.
The results showed consistency with all the correlationsbetween the WTP values and the socio-economic and percep-tion variables investigated. Monetary and non-monetaryinterests point to the potential for more effective action bythe State and environmental NGOs in the conservation of thelast remnants of the Seasonal Semi-Deciduous Forest in theState of São Paulo, including the organisation of voluntarywork.
Although the CVM has limitations in the valuation ofprotected areas in developing countries, we believe that it canserve as a useful tool for the formulation of public policies, asit highlights the environmental values quantitatively in a wayfew methods can. This study has shown that the inclusion ofqualitative research, in which a non-monetary contributionoption is offered to the interviewee, can sketch a moretrustworthy picture of people's real interest in the preserva-tion of a protected area, avoiding one of the main criticisms toCVM: that the economic valuation of natural resourcesdepends on the interviewees' income (Jacobs, 1991, pp. 212).
Acknowledgements
The authors would like to thank Conservation Strategy Fund(CSF) for the training and funding needed to conduct thisresearch, the Instituto Internacional de Educação do Brasil (IEB) foralso supporting training, and the Federação das Associações deRecuperação Florestal do Estado de São Paulo (FARESP) institu-tional support. We also thank the Parque Estadual do Morro doDiabo's administration; Dr. Helder Henrique de Faria, head ofthe Reservas de Teodoro Sampaio Section of Instituto Florestal deSão Paulo; the team at the Instituto de Pesquisas Ecológicas (IPÊ) inTeodoro Sampaio; and Mr. Paul Dale, of the Fundação Florestal,for valuable information he provided.
R E F E R E N C E S
Aldred, J., 1994.Existencevalue,welfareandaltruism.EnvironmentalValues 3, 381–402.
Attfield, R., 1998. Existence value and intrinsic value. EcologicalEconomics 24, 163–168.
Azzoni, C.R., Isai, J.Y., 1994. Estimating the costs of environmentalprotection in Brazil. Ecological Economics 11, 127–133.
Balmford, A., Bruner, A., Cooper, P., Costanza, R., Farber, S., Green,R.E., Jenkins, M., Jefferiss, P., Jessamy, V., Madden, J., Munro, K.,Myers, N., Naeem, S., Paavola, J., Rayment, M., Rosendo, S.,Roughgarden, J., Trumper, K., Turner, R.K., 2002. Economicreasons for conserving wild nature. Science 297, 950–953.
Brasil, 2000. Lei no 9.985, de 18 de julho de 2000. Institui o SistemaNacional de Unidades de Conservação. Diário Oficial da União,Brasília.
Brito, D., 2005. The importance of sound biological informationand theory for ecological economics studies valuing Brazilianbiodiversity: a response to Mendonça et al. (2003). EcologicalEconomics 55, 5–10.
Bruner, A.G., Gullison, R.E., Balmford, A., 2004. Financial costs andshortfalls of managing and expanding protected-area systemsin developing countries. BioScience 54, 1119–1126.
Bruner, A.G., Gullison, R.E., Rice, R.E., Fonseca, G.A.B., 2001.Effectiveness of parks in protecting tropical biodiversity.Science 251, 125–128.
Camphora, A.L.L., May, P.H., 2006. A valoração ambiental comoferramenta de gestão de unidades de conservação: háconvergência de valores para o bioma Mata Atlântica?Megadiversidade 2, 23–38.
Clark, J., Burgess, J., Harrison, C.M., 2000. “I struggled with thismoney business”: respondents' perspective on contingentvaluation. Ecological Economics 33, 45–62.
Costanza, R., D'Arge, R., de Groot, R., Farber, S., Grasso, M.,Hannon, B., Limburg, K., Naeem, S., O'Neill, R.V., Paruelo, J.,Raskin, R.G., Sutton, P., van den Belt, M., 1997. The value of theworld's ecosystem services and natural capital. Nature 387,253–260.
Czech, B., Krausman, P.R., Devers, P.K., 2000. Economic associationsamong causes of species endangerment in the United States.BioScience 50, 593–601.
Dale, P., 2002. Instituto Florestal, Secretaria do Meio Ambiente, SãoPaulo, Brazil. Personal communication.
Ditt, E.H., 2002. Fragmentos Florestais no Pontal do Paranapanema.Annablume/IPÊ/IIEB, São Paulo.
Dixon, J.A., Hufshmidt, M.M., 1986. Evaluation of Lumpinee PublicPark in Bangkok, Thailand. In: Dixon, J.A., Hufshmidt, M.M.(Eds.), Economic Valuation Techniques for the Environment. ACase Study Workbook. The John Hopkins University Press,London, pp. 121–140.
Dixon, J.A., Sherman, P.B., 1990. Economics of Protected Areas.East-West Center, Washington.
Ehrenfeld, D.W., 1988.Why put a value on biodiversity? In: Wilson,E.O., Peter, F.M. (Eds.), Biodiversity. National Academy Press,Washington, pp. 212–216.
Faria, H.H., 2002. Estado da gestão de três unidades de conservaçãode São Paulo inseridas nos domínios da mata atlântica:Parques Estaduais da Ilha do Cardoso, de Carlos Botelho e doMorro do Diabo. Paper presented at the III Congresso Brasileirode Unidades de Conservação. Fortaleza, CE. September.
Greene, W.H., 1997. Econometric Analysis. Prantice Hall, NewJersey.
Hadker, N., Sharma, S., David, A., Muraleedharan, T.R., 1997.Willingness-to-pay for Borivli National Park: evidence from acontingent valuation. Ecological Economics 21, 105–122.
Halstead, J.M., Lindsay, B.E., Brown, C.M., 1991. Use of the Tobitmodel in contingent valuation: experimental evidence fromthe Pemigewasset Wilderness Area. Journal of EnvironmentalManagement 33, 79–89.
Hanemann, W.M., 1995. Contingent valuation and economics. In:Willis, K.G., Corkindale, J.T. (Eds.), Environmental Valuation:New Perspectives. CAB International, Wallingford, pp. 79–117.
Holmes, T., Alger, K., Zinkhan, C., Mercer, D.E., 1998. The effect ofresponse time on conjoint analysis estimates of rainforestprotection values. Journal of Forestry Economics 4, 7–28.
369E C O L O G I C A L E C O N O M I C S 6 6 ( 2 0 0 8 ) 3 5 9 – 3 7 0
Author's personal copy
Horton, B., Coralullo, G., Bateman, I., Peres, C., 2002. Evaluatingnon-users willingness to pay for the implementation of aproposed national parks program in Amazonia: a UK/ItalianContingentValuation Study byCSERGEWPEMC02-01. Availableat http://www.uea.ac.uk/env/cserge/pub/wp/ecm/ecm_2002_01.htm.
IBGE, 2000. Censo Demográfico 2000. Instituto Brasileiro deGeografia e Estatística, Brasília. Available at http://www.ibge.gov.br/censo/default.php (accessed in 2nd December,2002).
Instituto Florestal, 2002. Instituto Florestal. Secretaria do MeioAmbiente. Secretaria do Meio Ambiente/Instituto Florestal,São Paulo. Available at www.iflorestsp.br (accessed in 28thNovember, 2002).
IPE, 2000. Instituto de Pesquisas Ecológicas. Instituto de PesquisasEcológicas, Nazaré Paulista. Available at www.ipe.org.br(accessed in 28th November, 2002).
IUCN, 2006. 2006 IUCN Red List of Threatened Species. The WorldConservation Union. Available at www.iucnredlist.org(accessed in 2nd March, 2007).
Jacobs, M., 1991. The Green Economy: Environment. SustainableDevelopment and the Politics of the Future. Pluto Press,London.
Mantovani, W., 2003. A Degradação dos Biomas Brasileiros. In:Patrimônio Ambiental Brasileiro. EDUSP/ Imprensa Oficial doEstado de São Paulo, São Paulo, pp. 367–439.
May, P.H., VeigaNeto, F.C., Pozo, O.V.C., 2000. Valoração Econômicada Biodiversidade. Estudos de Caso no Brasil. Ministério doMeio Ambiente (MMA), Brasília.
Medeiros, C.P.S., 2000. A importância econômica da biodiversidade –uma análise social de custo benefício para o Parque nacional deSuperagüi, no litoral norte do estado do Paraná, Brasil. Paperpresented at the V Encontro Brasileiro de Ecossistemas.
Mikhailova, I., Barbosa, F.A.R., 2002. Estimativa Preliminar do Valordos Recursos Ambientais do Parque Estadual do Rio Doce (MG):uma aplicação dos métodos “disposição a pagar”. SimpósioNacional sobreRecuperaçãodeÁreasDegradadas, BeloHorizonte,CEMAC/UFLA/SOBRADE. Available at http://www.cemac-ufla.com.br/trabalhospdf/trabalhos%20voluntarios/protoc%2051.pdf(accessed in 25th July, 2004).
Mittermeier, R.A., Myers, N., Mittermeier, C.G., 2000. Hot Spots:Earth's Biologically Richest and Most Endangered TerrestrialEcoregions. Cemex and Conservation International, Mexico.
MMA, 2006. Lista das espécies Ameaçadas de Extinção da FaunaBrasileira. Ministério do Meio Ambiente, Brasília. Available athttp://www.mma.gov.br/port/sbf/fauna/index.html (accessedin 5th March, 2007).
Myers, N., Mittermeier, R.A., Mittermeier, C.G., da Fonseca, G.A.B.,Kent, J., 2000. Biodiversity hotspots for conservation priorities.Nature 403, 853–858.
Nogueira, J.M., Salgado, G.S.M., 2001. Economia e Gestão de ÁreasProtegidas: o caso do Parque Nacional de Brasília. Paperpresented at the IV Encontro da Sociedade Brasileira deEconomia Ecológica, Belém, PA. November.
Ortiz, R.A., Seroa da Motta, R., Ferraz, C., 2001. Estimando o valorambiental do Parque Nacional do Iguaçu: uma aplicação dométodo de custo viagem. IPEA, Rio de Janeiro. January (Textopara Discussão no 777).
Pimm, S.L., 1997. The value of everything. Nature 387, 231–232.Pindyck, R.S., Rubinfeld, Daniel L., 1991. Econometric Models and
Economic Forecasts. McGraw-Hill, New York.Santos, J.E., Nogueira, F.M.B., Pires, J.S.R., Obara, A.T., Pires,
A.M.Z.C.R., 2001. The value of the Ecological Station of Jatai'secosystem services and natural capital. Revista Brasileira deBiologia 61, 171–190.
São Paulo, 1999. Pontal do Paranapanema. Zoneamento Ecológico-Econômico. Secretaria de Estado do Meio Ambiente, São Paulo.
São Paulo, 2005. Inventário Florestal da Vegetação Natural doEstado de São Paulo. Secretaria do Meio Ambiente/InstitutoFlorestal/Imprensa Oficial, São Paulo.
Seroa da Motta, R., 1998. Manual para Valoração Econômica deRecursos Naturais. MMARHAL, Brasília.
Tomam, M., 1998. Why not to calculate the value of the world'secosystem services and natural capital. Ecological Economics25, 57–60.
Viana, V.M., Tabanez, A.J., 1996. Biology and Conservation ofForest Fragments in the Brazilian Atlantic Moist Forest. In:Schelhas, J., Greenberg, R. (Eds.), Forest Patches in TropicalLandscapes. Island Press, Washington, pp. 151–167.
370 E C O L O G I C A L E C O N O M I C S 6 6 ( 2 0 0 8 ) 3 5 9 – 3 7 0