the use of acoustic telemetry in south african squid research (2003-2010)
TRANSCRIPT
20
The Use of Acoustic Telemetry in South African Squid Research (2003-2010)
Nicola Downey, Dale Webber, Michael Roberts, Malcolm Smale, Warwick Sauer and Larvika Singh
Bayworld Centre for Research and Education South Africa
1. Introduction
The South African chokka squid, Loligo reynaudii is found along the coast of South Africa, from Southern Namibia in the west to Port Alfred in the east (Augustyn, 1991). Inshore spawning, however, is limited to the South Coast between Plettenberg Bay and Port Alfred (Figure 1) (Augustyn, 1990). As it is these inshore spawning aggregations that are targeted by the squid jigging fishery (Sauer et al., 1992), an in depth knowledge of the spawning process is essential to the development of effective management strategies for this fishery. In addition squid catches are determined to a large extent by the successful formation and size of these aggregations. As a result, the majority of research on the chokka squid has focused on inshore spawning, i.e. environmental effects on spawning (Augustyn, 1990, Roberts, 1998, 2005; Roberts & Sauer, 1994; Roberts & van den Berg, 2002, 2005; Sauer et al. 1991, 1992), the impact of fishing on spawning concentrations (Hanlon et al., 2002; Oosthuizen et al., 2002a; Sauer, 1995; Schön et al. 2002), biological studies (Augustyn 1990; Lipinski & Underhill, 1995; Melo & Sauer, 1999; Olyott et al., 2006; Roel et al., 2000; Sauer & Lipinski, 1990; Sauer, 1995; Sauer et al., 1992, 1999), life cycle (Augustyn, 1990, 1991; Olyott et al. 2007; Roberts & Sauer, 1994), feeding on the spawning grounds (Augustyn, 1990; Sauer & Lipinski, 1991; Sauer & Smale, 1991, 1993; Sauer et al., 1992), spawning behaviour (Hanlon et al, 1994, 2002; Sauer, 1995; Sauer & Smale, 1993; Sauer et al. 1992, 1993, 1997; Shaw & Sauer, 2004), the inshore spawning environment (Augustyn, 1990; Roberts, 1998, 2002; Roberts & Sauer, 1994; Roberts and van den Berg, 2002; Sauer et al. 1991, 1992), the location of spawning grounds (Augustyn, 1990; Roberts, 1995; Roberts & Sauer, 1994; Sauer, 1995; Sauer et al., 1992, 1993), predation on spawning grounds (Hanlon et al. 2002; Roberts, 1998; Sauer & Smale, 1991, 1993; Smale et al., 1995, 2001), migration / movement on spawning grounds (Augustyn, 1990, 1991; Lipinski et al. 1998; Roberts & Sauer, 1994; Sauer & Smale, 1993) and paralarval development (Oosthuizen & Roberts, 2009; Oosthuizen et al. 2002b; Roberts & van den Berg, 2002; Vidal et al. 2005). A number of these studies have, however, been limited by certain factors. The inshore spawning grounds extend from ~20 to 70 m. Diving observations are only possible up to a depth of 30 m, are limited in terms of the amount of time that can be spent underwater and are highly dependent on water visibility. Many of these limitations can be overcome by the use of underwater cameras, however, the issue of water visibility remains. Not only has the
Modern Telemetry
424
development of acoustic telemetry systems allowed researchers to overcome many limitations, it has also opened up new avenues of research. Initial telemetry experiments, conducted in 1993 and 1994 (Sauer et al., 1997), made use of a four buoy radio-linked acoustic positioning system and simple acoustic transmitters. The use of this then “unorthodox technique” (Sauer et al., 1997) led to the discovery that the formation of spawning aggregations and mating behaviours is well organized in time and space. The advancement of telemetry systems has enabled researchers to apply this technique to many different areas of research. This chapter describes and compares the various telemetry systems used in South African squid research from 2003 to date. These studies aimed to: 1. further our knowledge of inshore (20-70 m) spawning behaviour 2. determine the effect of upwelling and turbidity events on spawning 3. investigate movement on the inshore spawning grounds 4. investigate nocturnal behaviour 5. monitor the presence and movement of predators on the inshore spawning grounds 6. investigate movement on the deep spawning grounds (71-130 m) Also described are the types of transmitters used and the various transmitter attachment techniques developed, which are dependent on the species being tagged.
2. The chosen study site for acoustic telemetry squid research
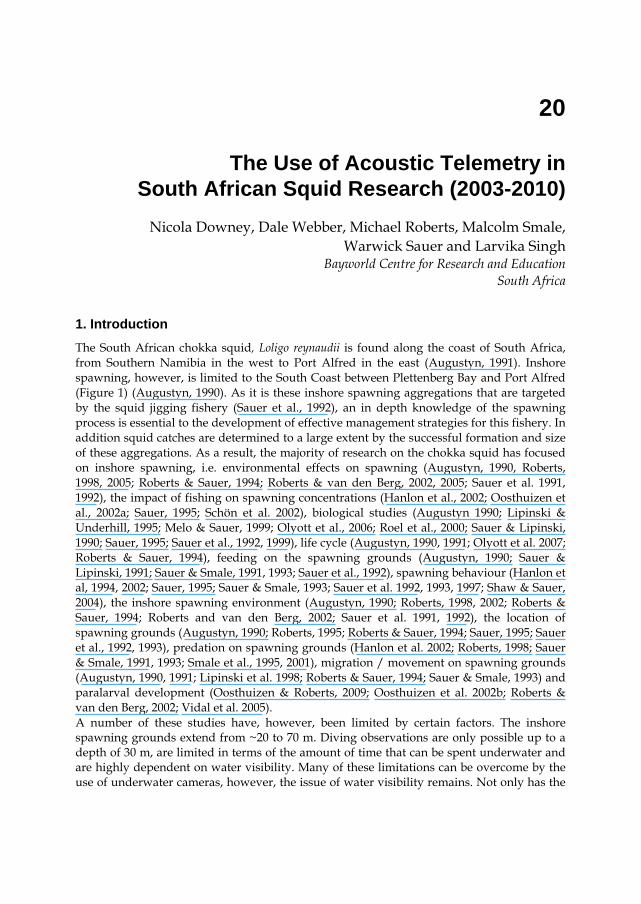
Kromme Bay (St Francis Bay, South Africa, Figure 1) forms part of the main squid spawning grounds on the south coast of South Africa, and is a commonly used spawning area. Relatively sheltered from south-westerly swells and winds, with a gentle-sloping seabed (Birch, 1981) consisting mainly of rippled coarse sand (Roberts, 1998), this area is an ideal study site for squid acoustic telemetry experiments. The annual November squid fishery closed season provides an ideal opportunity to conduct such studies, as the potential impact of boat anchors on instrumentation, as well as intense commercial fishing on spawning aggregations, are avoided.
Fig. 1. Maps of (a) the study site, Kromme Bay, (b) the main spawning grounds (shaded area) between Plettenberg Bay and Port Alfred
The Use of Acoustic Telemetry in South African Squid Research (2003-2010)
425
3. Passive tracking telemetry systems
Passive tracking involves the use of stationary or fixed receivers to monitor the movement of acoustically tagged animals in a particular area. South African researchers made use of two such systems, namely VR2 receiver arrays and the VRAP system. All acoustic telemetry equipment mentioned throughout this section and following sections was purchased from Vemco, Ltd, Canada.
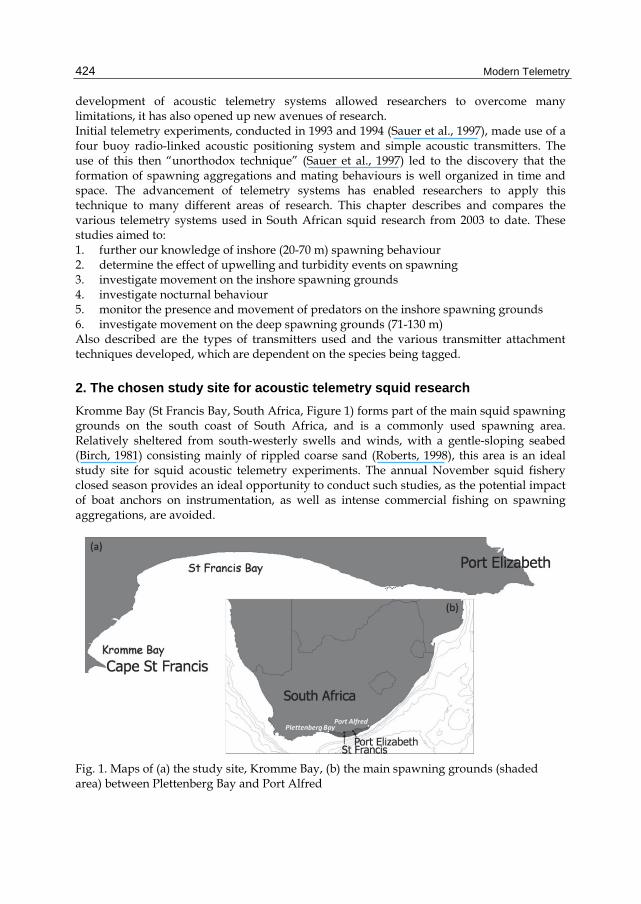
3.1 VR2 receivers VR2 receivers (Figure 2) are single frequency autonomous omnidirectional underwater units. Transmitters send out a series of pings, known as a ‘pulse train’, which are detected by the receivers. When all the pings are recognised in sequence, the ‘pulse train’ is then recorded as a signal detection by the VR2. The transmitter ID code, date and time of detection as well as any other received information (depth/temperature) are stored in the internal memory. Once the receiver has been recovered the data is downloaded using a VR PC interface and a computer running VR2PC software. Receiver ranges vary depending on the power output of the transmitters as well as local factors and environmental conditions (Singh et al., 2009).
Fig. 2. VR2 receiver deployed in Kromme Bay
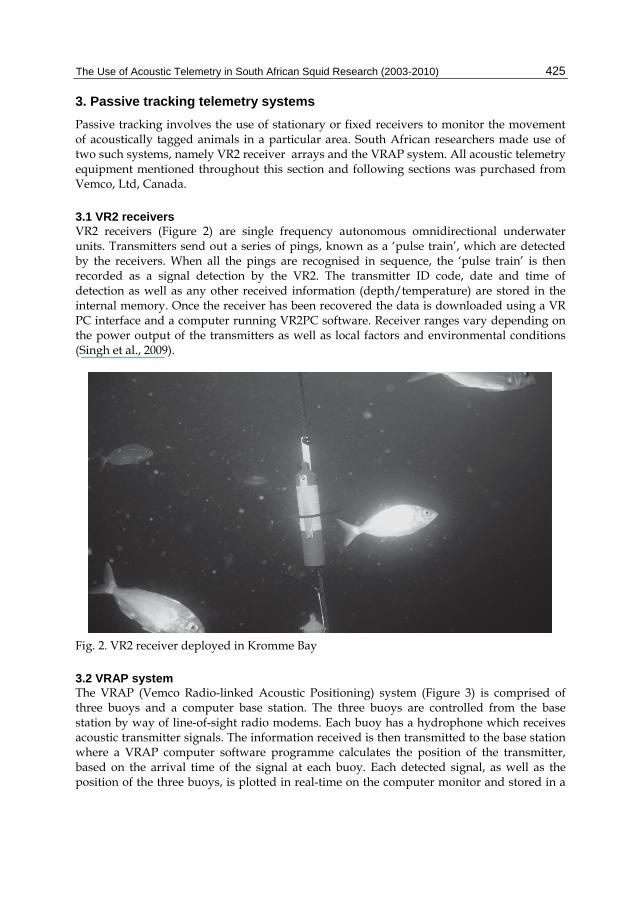
3.2 VRAP system The VRAP (Vemco Radio-linked Acoustic Positioning) system (Figure 3) is comprised of three buoys and a computer base station. The three buoys are controlled from the base station by way of line-of-sight radio modems. Each buoy has a hydrophone which receives acoustic transmitter signals. The information received is then transmitted to the base station where a VRAP computer software programme calculates the position of the transmitter, based on the arrival time of the signal at each buoy. Each detected signal, as well as the position of the three buoys, is plotted in real-time on the computer monitor and stored in a
Modern Telemetry
426
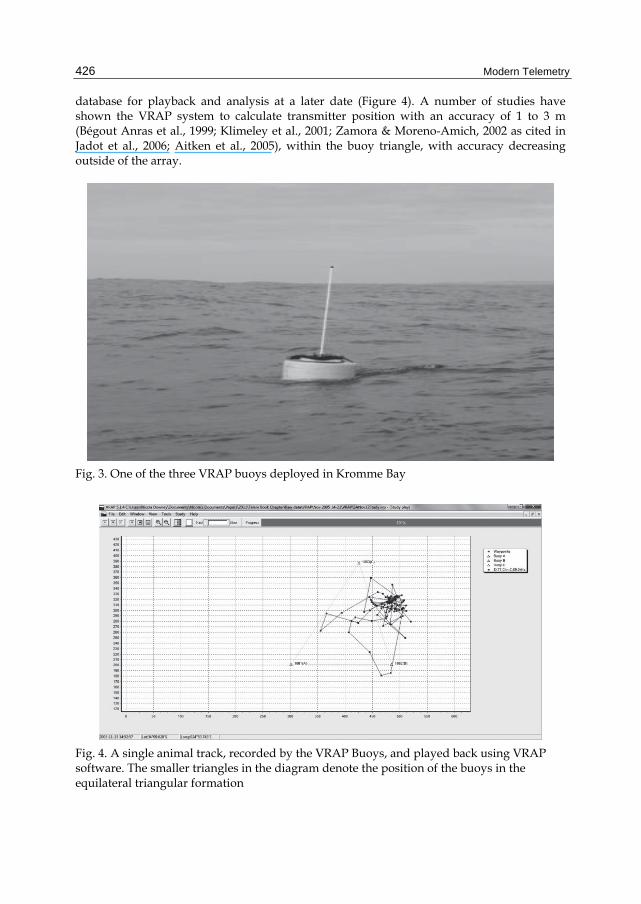
database for playback and analysis at a later date (Figure 4). A number of studies have shown the VRAP system to calculate transmitter position with an accuracy of 1 to 3 m (Bégout Anras et al., 1999; Klimeley et al., 2001; Zamora & Moreno-Amich, 2002 as cited in Jadot et al., 2006; Aitken et al., 2005), within the buoy triangle, with accuracy decreasing outside of the array.
Fig. 3. One of the three VRAP buoys deployed in Kromme Bay
Fig. 4. A single animal track, recorded by the VRAP Buoys, and played back using VRAP software. The smaller triangles in the diagram denote the position of the buoys in the equilateral triangular formation
The Use of Acoustic Telemetry in South African Squid Research (2003-2010)
427
3.3 Passive tracking studies Four experiments using VR2 receiver were performed in Kromme Bay during the November 2003–2006 squid fishery closed seasons. In addition to the VR2 receiver arrays, the VRAP system was deployed in November 2005 and 2006.
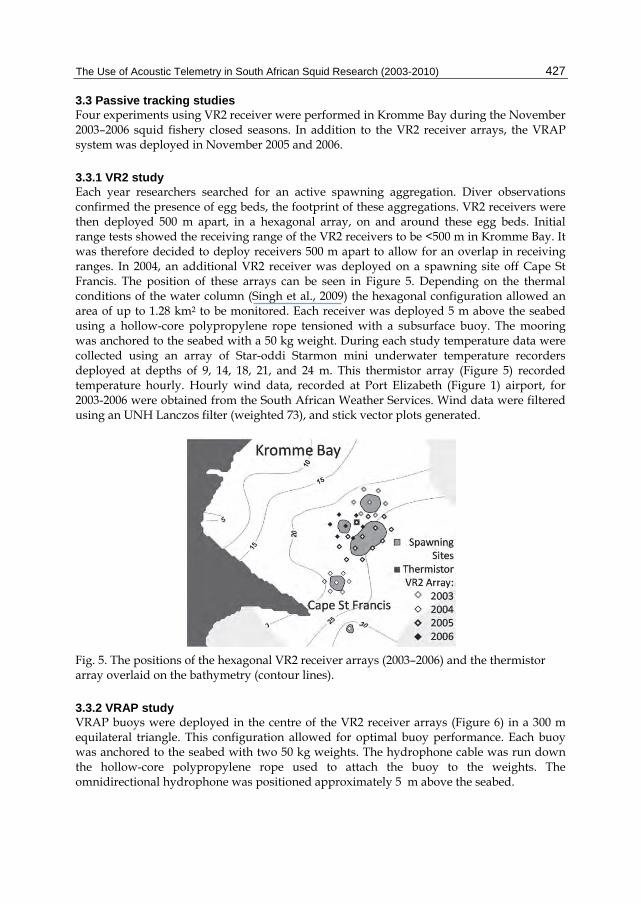
3.3.1 VR2 study Each year researchers searched for an active spawning aggregation. Diver observations confirmed the presence of egg beds, the footprint of these aggregations. VR2 receivers were then deployed 500 m apart, in a hexagonal array, on and around these egg beds. Initial range tests showed the receiving range of the VR2 receivers to be <500 m in Kromme Bay. It was therefore decided to deploy receivers 500 m apart to allow for an overlap in receiving ranges. In 2004, an additional VR2 receiver was deployed on a spawning site off Cape St Francis. The position of these arrays can be seen in Figure 5. Depending on the thermal conditions of the water column (Singh et al., 2009) the hexagonal configuration allowed an area of up to 1.28 km2 to be monitored. Each receiver was deployed 5 m above the seabed using a hollow-core polypropylene rope tensioned with a subsurface buoy. The mooring was anchored to the seabed with a 50 kg weight. During each study temperature data were collected using an array of Star-oddi Starmon mini underwater temperature recorders deployed at depths of 9, 14, 18, 21, and 24 m. This thermistor array (Figure 5) recorded temperature hourly. Hourly wind data, recorded at Port Elizabeth (Figure 1) airport, for 2003-2006 were obtained from the South African Weather Services. Wind data were filtered using an UNH Lanczos filter (weighted 73), and stick vector plots generated.
Fig. 5. The positions of the hexagonal VR2 receiver arrays (2003–2006) and the thermistor array overlaid on the bathymetry (contour lines).
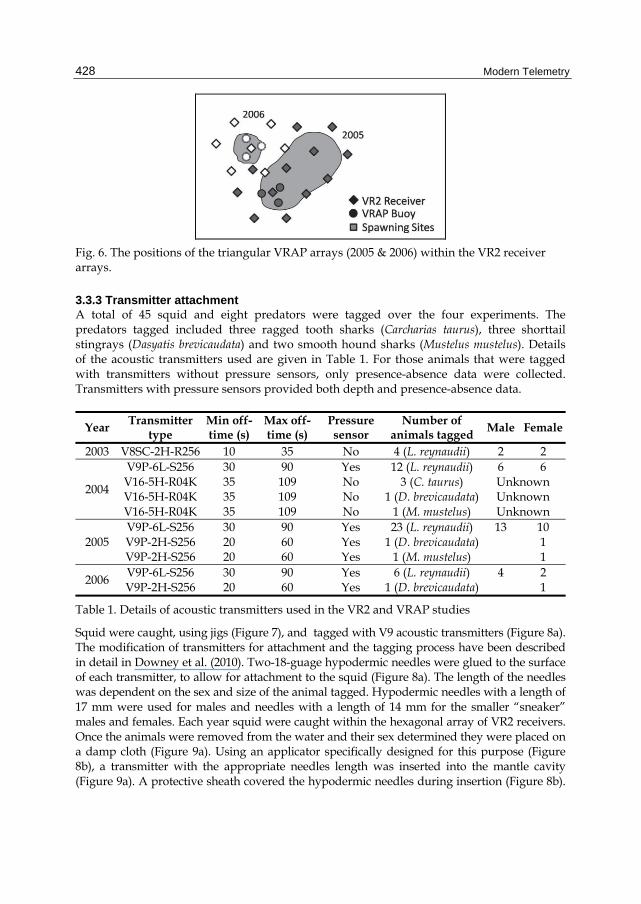
3.3.2 VRAP study VRAP buoys were deployed in the centre of the VR2 receiver arrays (Figure 6) in a 300 m equilateral triangle. This configuration allowed for optimal buoy performance. Each buoy was anchored to the seabed with two 50 kg weights. The hydrophone cable was run down the hollow-core polypropylene rope used to attach the buoy to the weights. The omnidirectional hydrophone was positioned approximately 5 m above the seabed.
Modern Telemetry
428
Fig. 6. The positions of the triangular VRAP arrays (2005 & 2006) within the VR2 receiver arrays.
3.3.3 Transmitter attachment A total of 45 squid and eight predators were tagged over the four experiments. The predators tagged included three ragged tooth sharks (Carcharias taurus), three shorttail stingrays (Dasyatis brevicaudata) and two smooth hound sharks (Mustelus mustelus). Details of the acoustic transmitters used are given in Table 1. For those animals that were tagged with transmitters without pressure sensors, only presence-absence data were collected. Transmitters with pressure sensors provided both depth and presence-absence data.
Year Transmitter type
Min off-time (s)
Max off-time (s)
Pressure sensor
Number of animals tagged
Male Female
2003 V8SC-2H-R256 10 35 No 4 (L. reynaudii) 2 2
2004
V9P-6L-S256 30 90 Yes 12 (L. reynaudii) 6 6 V16-5H-R04K 35 109 No 3 (C. taurus) Unknown V16-5H-R04K 35 109 No 1 (D. brevicaudata) Unknown V16-5H-R04K 35 109 No 1 (M. mustelus) Unknown
2005 V9P-6L-S256 30 90 Yes 23 (L. reynaudii) 13 10 V9P-2H-S256 20 60 Yes 1 (D. brevicaudata) 1 V9P-2H-S256 20 60 Yes 1 (M. mustelus) 1
2006 V9P-6L-S256 30 90 Yes 6 (L. reynaudii) 4 2 V9P-2H-S256 20 60 Yes 1 (D. brevicaudata) 1
Table 1. Details of acoustic transmitters used in the VR2 and VRAP studies
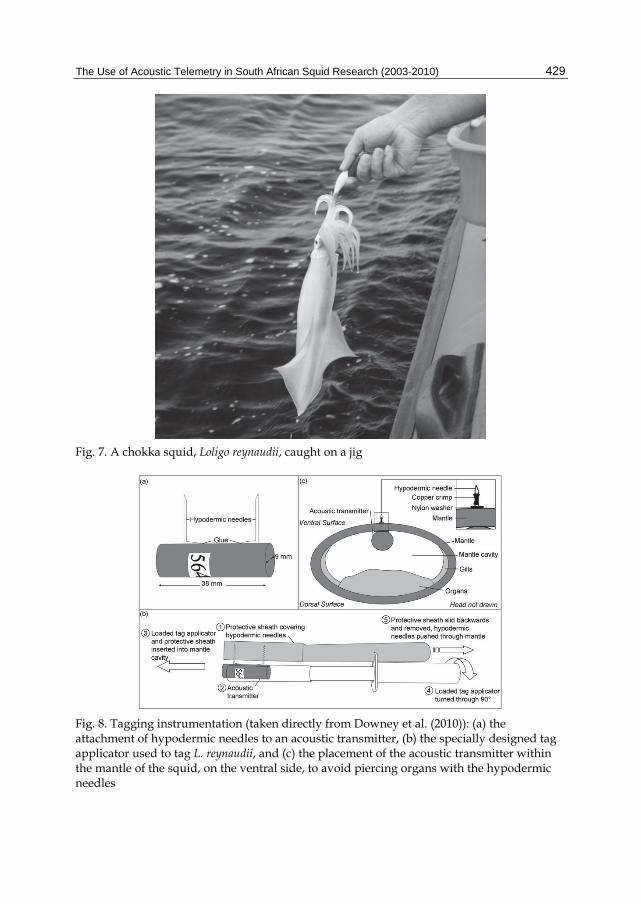
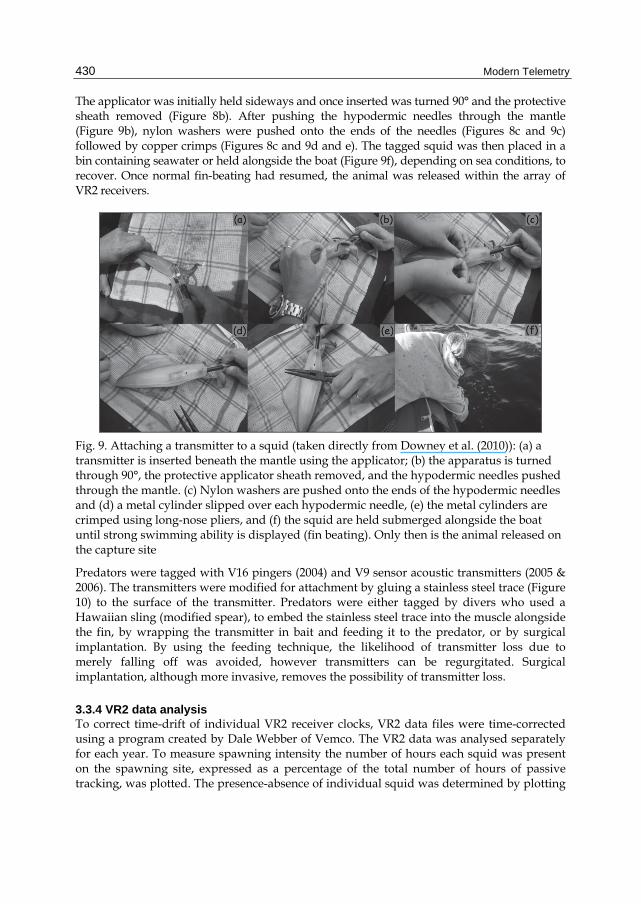
Squid were caught, using jigs (Figure 7), and tagged with V9 acoustic transmitters (Figure 8a). The modification of transmitters for attachment and the tagging process have been described in detail in Downey et al. (2010). Two-18-guage hypodermic needles were glued to the surface of each transmitter, to allow for attachment to the squid (Figure 8a). The length of the needles was dependent on the sex and size of the animal tagged. Hypodermic needles with a length of 17 mm were used for males and needles with a length of 14 mm for the smaller “sneaker” males and females. Each year squid were caught within the hexagonal array of VR2 receivers. Once the animals were removed from the water and their sex determined they were placed on a damp cloth (Figure 9a). Using an applicator specifically designed for this purpose (Figure 8b), a transmitter with the appropriate needles length was inserted into the mantle cavity (Figure 9a). A protective sheath covered the hypodermic needles during insertion (Figure 8b).
The Use of Acoustic Telemetry in South African Squid Research (2003-2010)
429
Fig. 7. A chokka squid, Loligo reynaudii, caught on a jig
Fig. 8. Tagging instrumentation (taken directly from Downey et al. (2010)): (a) the attachment of hypodermic needles to an acoustic transmitter, (b) the specially designed tag applicator used to tag L. reynaudii, and (c) the placement of the acoustic transmitter within the mantle of the squid, on the ventral side, to avoid piercing organs with the hypodermic needles
Modern Telemetry
430
The applicator was initially held sideways and once inserted was turned 90° and the protective sheath removed (Figure 8b). After pushing the hypodermic needles through the mantle (Figure 9b), nylon washers were pushed onto the ends of the needles (Figures 8c and 9c) followed by copper crimps (Figures 8c and 9d and e). The tagged squid was then placed in a bin containing seawater or held alongside the boat (Figure 9f), depending on sea conditions, to recover. Once normal fin-beating had resumed, the animal was released within the array of VR2 receivers.
Fig. 9. Attaching a transmitter to a squid (taken directly from Downey et al. (2010)): (a) a transmitter is inserted beneath the mantle using the applicator; (b) the apparatus is turned through 90°, the protective applicator sheath removed, and the hypodermic needles pushed through the mantle. (c) Nylon washers are pushed onto the ends of the hypodermic needles and (d) a metal cylinder slipped over each hypodermic needle, (e) the metal cylinders are crimped using long-nose pliers, and (f) the squid are held submerged alongside the boat until strong swimming ability is displayed (fin beating). Only then is the animal released on the capture site
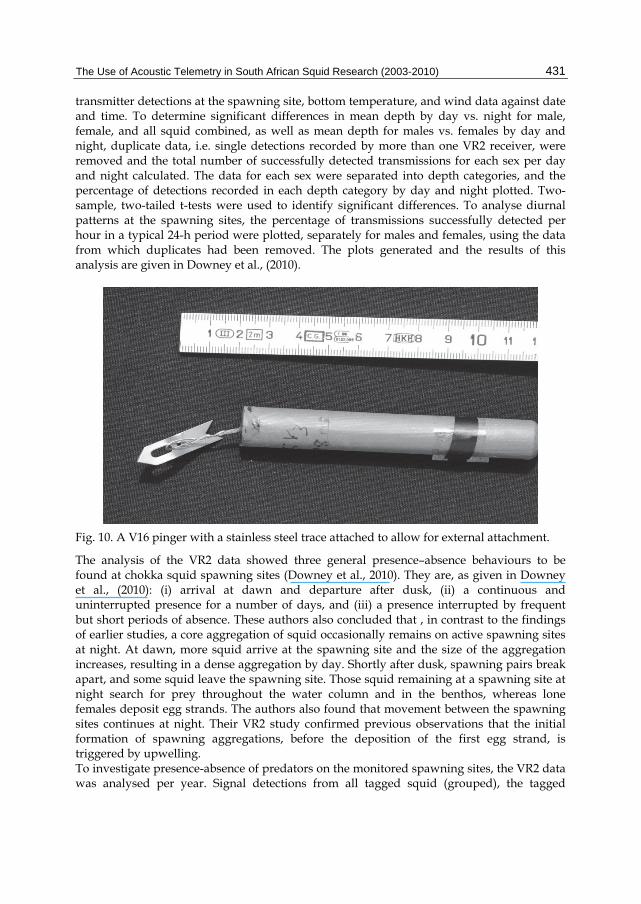
Predators were tagged with V16 pingers (2004) and V9 sensor acoustic transmitters (2005 & 2006). The transmitters were modified for attachment by gluing a stainless steel trace (Figure 10) to the surface of the transmitter. Predators were either tagged by divers who used a Hawaiian sling (modified spear), to embed the stainless steel trace into the muscle alongside the fin, by wrapping the transmitter in bait and feeding it to the predator, or by surgical implantation. By using the feeding technique, the likelihood of transmitter loss due to merely falling off was avoided, however transmitters can be regurgitated. Surgical implantation, although more invasive, removes the possibility of transmitter loss.
3.3.4 VR2 data analysis To correct time-drift of individual VR2 receiver clocks, VR2 data files were time-corrected using a program created by Dale Webber of Vemco. The VR2 data was analysed separately for each year. To measure spawning intensity the number of hours each squid was present on the spawning site, expressed as a percentage of the total number of hours of passive tracking, was plotted. The presence-absence of individual squid was determined by plotting
The Use of Acoustic Telemetry in South African Squid Research (2003-2010)
431
transmitter detections at the spawning site, bottom temperature, and wind data against date and time. To determine significant differences in mean depth by day vs. night for male, female, and all squid combined, as well as mean depth for males vs. females by day and night, duplicate data, i.e. single detections recorded by more than one VR2 receiver, were removed and the total number of successfully detected transmissions for each sex per day and night calculated. The data for each sex were separated into depth categories, and the percentage of detections recorded in each depth category by day and night plotted. Two-sample, two-tailed t-tests were used to identify significant differences. To analyse diurnal patterns at the spawning sites, the percentage of transmissions successfully detected per hour in a typical 24-h period were plotted, separately for males and females, using the data from which duplicates had been removed. The plots generated and the results of this analysis are given in Downey et al., (2010).
Fig. 10. A V16 pinger with a stainless steel trace attached to allow for external attachment.
The analysis of the VR2 data showed three general presence–absence behaviours to be found at chokka squid spawning sites (Downey et al., 2010). They are, as given in Downey et al., (2010): (i) arrival at dawn and departure after dusk, (ii) a continuous and uninterrupted presence for a number of days, and (iii) a presence interrupted by frequent but short periods of absence. These authors also concluded that , in contrast to the findings of earlier studies, a core aggregation of squid occasionally remains on active spawning sites at night. At dawn, more squid arrive at the spawning site and the size of the aggregation increases, resulting in a dense aggregation by day. Shortly after dusk, spawning pairs break apart, and some squid leave the spawning site. Those squid remaining at a spawning site at night search for prey throughout the water column and in the benthos, whereas lone females deposit egg strands. The authors also found that movement between the spawning sites continues at night. Their VR2 study confirmed previous observations that the initial formation of spawning aggregations, before the deposition of the first egg strand, is triggered by upwelling. To investigate presence-absence of predators on the monitored spawning sites, the VR2 data was analysed per year. Signal detections from all tagged squid (grouped), the tagged
Modern Telemetry
432
predators (individually) and surface and bottom temperatures were plotted. The position of predators in the water column, in relation to squid, was analyzed by plotting all squid depth data (grouped), predator depth data (individually) and surface and bottom temperatures. Plots were generated only for those days predators were present. The results of the predator study are as yet unpublished. This study, however, showed predators moved to and from the spawning sites a number of times, despite the continual presence of squid. The presence of predators on the spawning sites appeared to be strongly linked to surface temperature. When temperatures were stable at ~18 °C, predators remained on the spawning sites for long periods. When surface temperatures increased, predators either moved to the surface and left the spawning site shortly thereafter or immediately moved off.
3.3.5 VRAP data analysis Invalid positional fixes were identified by their large distance from previous and successive fixes, whereas these were close in proximity. For each squid monitored by the VRAP system daily plots, separating day vs. night movement, were generated using Arcview GIS software. This allowed analysis of horizontal movement at the individual level as well as the identification of patterns in movement. Similarly depth over time was plotted for each individual. Depth data recorded by the VRAP system was not analyzed in great detail as the analysis of the VR2 receiver depth data was fairly comprehensive. The distance between two consecutive points, when the time between consecutive detections was less than 10 minutes, was used to calculate swimming speed. The distance (d) between two consecutive locations was calculated in Microsoft Excel using Equasion 1:
d=acos(cos(radians(90-Latitude1)).cos(radians(90-Latitude2))+ sin(radians(90-Latitude1)).sin(radians(90-Latitude2)). (1)
cos(radians(Longitude1-Longitude2))).R
The value 6371 km was used for the radius of the earth (R). This formulae made use of latitudes and longitudes in decimal degrees. Swimming speed was calculated by dividing the distance between two consecutive detections by the number of seconds taken to move between the two points (m.s-1). Average swimming speeds were then calculated. As these results are as yet unpublished and data is still being analysed, only the initial analysis and findings are reported here. At night males appeared to move around the spawning site, covering a larger surface area, compared to females. This was possibly due to the males’ main nocturnal activity being feeding, whereas females often continue to deposit eggs, using stored spermatophores for fertilization. On occasion however, males would also spend a number of hours in one specific area of the site, possibly resting. Both sexes spent time concentrated in one area for a number of hours during the day. Average swimming speed for males at night was calculated as 0.25 m.s-1, compared to 0.22 m.s-1 for females. These slight differences are possibly a result of the different nocturnal activities. Average swimming speed for males during the day (0.21 m.s-1) was slower than that calculated for females (0.24 m.s-1). The 1993/1994 telemetry studies (Sauer et al., 1997) also reported males to swim more slowly than females when part of a spawning aggregation. The swimming speeds reported by these authors were however, slower than those observed in this study (0.18 m.s-1 for females and 0.14 m.s-1 for males). No predators were detected by the VRAP system.
The Use of Acoustic Telemetry in South African Squid Research (2003-2010)
433
4. Active tracking telemetry system
Active or manual tracking involves monitoring the movement of acoustically tagged animals from a vessel. South African researchers made use of the VR100 system for active tracking.
4.1 VR100 receiver The manual tracking study discussed here made use of a VH110 directional hydrophone and a VR100 receiver. This general purpose, splash-resistant receiver is designed for tracking animals from vessels. The hydrophone is held in the water, either manually or by attachment to the side of the boat. The hydrophone detects transmitter signals and the VR100 records the ID Code, date, time, other received information (depth/temperature) and GPS location of the detections. This information can then be downloaded to a computer for viewing or analysis.
4.2 Active tracking studies As part of a project investigating deep spawning (71-130 m) in Loligo reynaudii, a phenomenon researchers as yet know very little about, the movement of squid on the deep spawning grounds was monitored using the above-mentioned manual tracking system. As it is difficult to find and identify active spawning aggregations deeper than 60 m, using the two fixed telemetry systems previously described would not be feasible. This study was conducted during the November 2010 squid fishery closed season.
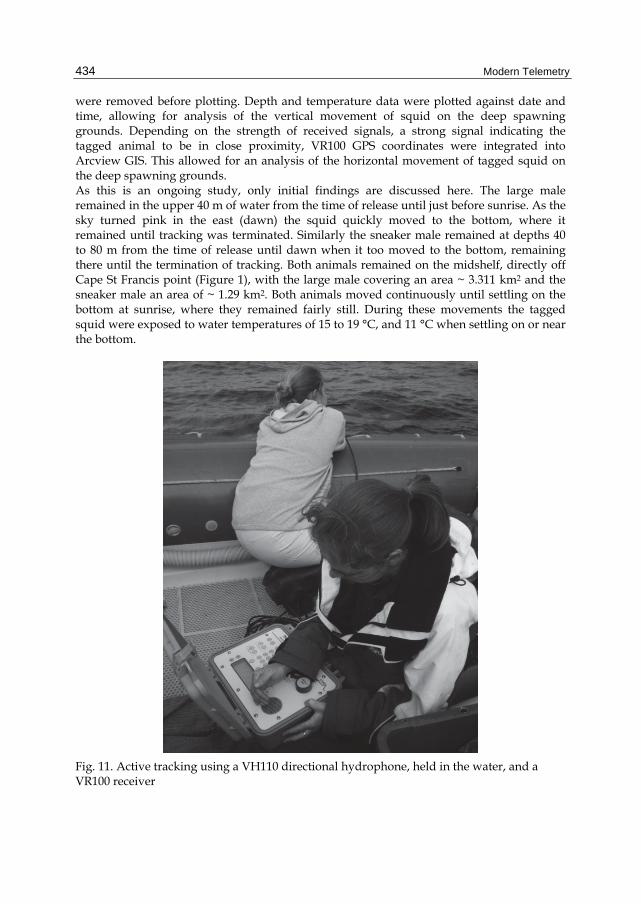
4.2.1 Tagging of animals Using the jigging fishing method (Figure 7), squid at depths >60 m can only be caught at night, using powerful lights to attract them to the surface. For the manual tracking study, squid were caught from an 8 m inflatable boat anchored next to a chokka boat. The two boats were close enough for the chokka boat lights to attract squid to the area around the smaller boat. Two squid were caught in this manner, on separate nights, and tagged with V9TP-6L continuous sensor transmitters. Details of the transmitters used are given in Table 2. Animals were tracked (Figure 11) from the time of tagging to shortly after sunrise. The tagging method and instrumentation used was the same as that described for the VR2 and VRAP studies.
Year Transmitter
type
Min period (ms)
Max period (ms)
Pressure sensor
Temperature sensor
Frequency (kHz) Sex
2010 V9TP-6L 450 1050 Yes Yes 63 Male
V9TP-6L 450 1050 Yes Yes 75 Sneaker
male
Table 2. Details of acoustic transmitters used in the VR100 tracking study
4.2.2 VR100 data analysis The VR100 data was manually examined, using Microsoft Excel, for erroneous depth and/or temperature data. Erroneous data were identified by their large difference from previous and successive values, whereas these were similar. Those data entries containing errors
Modern Telemetry
434
were removed before plotting. Depth and temperature data were plotted against date and time, allowing for analysis of the vertical movement of squid on the deep spawning grounds. Depending on the strength of received signals, a strong signal indicating the tagged animal to be in close proximity, VR100 GPS coordinates were integrated into Arcview GIS. This allowed for an analysis of the horizontal movement of tagged squid on the deep spawning grounds. As this is an ongoing study, only initial findings are discussed here. The large male remained in the upper 40 m of water from the time of release until just before sunrise. As the sky turned pink in the east (dawn) the squid quickly moved to the bottom, where it remained until tracking was terminated. Similarly the sneaker male remained at depths 40 to 80 m from the time of release until dawn when it too moved to the bottom, remaining there until the termination of tracking. Both animals remained on the midshelf, directly off Cape St Francis point (Figure 1), with the large male covering an area ~ 3.311 km2 and the sneaker male an area of ~ 1.29 km2. Both animals moved continuously until settling on the bottom at sunrise, where they remained fairly still. During these movements the tagged squid were exposed to water temperatures of 15 to 19 °C, and 11 °C when settling on or near the bottom.
Fig. 11. Active tracking using a VH110 directional hydrophone, held in the water, and a VR100 receiver
The Use of Acoustic Telemetry in South African Squid Research (2003-2010)
435
5. Comparison of the various telemetry systems
Each of the systems described here (VR2 receiver arrays, VRAP system and VR100 manual tracking system) have various advantages and disadvantages. VR2 receiver arrays are ideal for studying movement and behaviour on a spawning site (Downey et al. 2010), homing behaviour (Mitamura et al., 2005), movement in a river (Carr et al., 1997) or straight (Welch et al., 2004) and movement within a marine reserve (Egli & Babcock, 2004), to name a few examples. These receivers allow researchers to monitor a large area (depending on the number of receivers used) continuously and for long periods of time. Depending on the study area, the geometry of the array can be selected to maximize coverage in critical sites, providing information on the entering and exiting of a specific area (Egli & Babcock, 2004). Range tests can be used to determine the maximum and minimum receiver ranges at a specific location and using specific transmitters (Singh et al., 2009). Placing the VR2 receivers in such a way that the receiver ranges of individual VR2s overlap, maximises the likelihood of a tagged animal being detected when in the area. VR2 receivers can be used to determine direction of animal movement to a certain degree, depending on the design of the array and the study site itself. These receivers are however, more often used to collect presence-absence data and it is not known where in the array the animal is situated. As the VR2 receiver is programmed to work on a single frequency, there is a limit to the number of transmitters that can be introduced into the system at one time. As previously mentioned and as described by Singh et al., (2009), transmitters send out a series of pulses known as a ‘pulse train’. Only when all the pings are recognised in sequence by the receiver, is the pulse recorded as a signal detection. The overlapping of ‘pulse trains’ from two or more transmitters results in no signals being detected. As the number of transmitters in a system increases, so it is possible for the number of successful detections to decrease. However, as the data can only be downloaded once the receiver is retrieved, it is not possible to discern how many transmitters are present in the area using the VR2 receivers. It is therefore necessary to use a VR100 to monitor ‘system saturation’ (Singh et al., 2009) before introducing more tagged animals into the system. Another method to reduce the number of signal collisions is to programme transmitters with longer off times. However, the speed with which the study species moves needs to be taken into consideration, to prevent an animal moving through an array too quickly to be detected. The VRAP system differs from the VR2 receiver array in that data recorded is transmitted to a land-based station and the movement of tagged animals in the study area can be observed in real-time. In addition, the direction of movement and location of a tagged animal within the array can be monitored and recorded. One major disadvantage of the VRAP system when compared to the VR2 receiver array is the size of the area that can be monitored. In the study discussed here, the 300 m equilateral triangular configuration resulted in the buoy triangle covering an area of ~ 400 m2. As previously mentioned, accuracy decreases outside of the buoy triangle. In addition, when a transmitter is directly behind a buoy, no position can be calculated (Aitken et al., 2005). Shadow zones (areas along parabolas behind each buoy) also exist. Two positions are calculated for transmitters in this area. The VRAP software assumes the calculated position closest to the last valid position fix is correct and this value is plotted. As for the VR2 receiver arrays, it is also possible for ‘system saturation’ to result in a decreased number of successfully detected signals. As the VRAP system is used to monitor tagged individuals in real-time however, the number of tagged animals present within the area can be observed before introducing more tagged individuals. The
Modern Telemetry
436
VRAP system has been used to study the search behaviour of fish towards bait (Vabø et al., 2004) and food (Løkkeborg et al., 2000), activity patterns, home-range size and habitat utilization (Jadot et al., 2006) and behaviour and energetics (Aitken et al., 2005). Manual tracking is more labour-intensive and manpower-demanding (Jadot et al., 2006) than the passive or fixed telemetry systems, which require more logistical support (boats, divers etc.). Tagged animals can be tracked for a number of hours, possibly days, unlike the VR2 and VRAP systems which can track animals for weeks or even months. It is only possible to track one animal at a time however, the animal can be followed and tracked wherever in the area it moves. Manual tracking has been used to study daily movements, habitat use and submergence intervals in turtles (Brill et al., 1995), estuarine movement patterns (Almeida, 1996), movement patterns and trajectories of crabs (Carr et al., 2004) and the behaviour and mortality of caught-and–released bonefish (Cooke & Phillip, 2004), to name a few examples. A number of studies have made use of multiple telemetry systems, for example Jadot et al. (2006) and Acolas et al. (2004) both made use of the VRAP and manual tracking systems. Comparing the different telemetry systems available to researchers can aid in determining which system will be most favourable for a particular study. However, as each system has its limitations, using two or even three simultaneously would be the most beneficial. For example the use of the VR2 receiver arrays and VRAP system simultaneously in this study has enabled the study of not only presence-absence related topics but also movement and swimming speed on the spawning sites. To conclude, a number of telemetry systems are available to researchers. The type of system, transmitters and hydrophones used are dependent not only the species studied but also the key questions or focus areas of the study. Our research has shown that not only can a number of telemetry systems be used simultaneously to great benefit, but telemetry systems can also be used to monitor species interactions as well as environmental effects on behaviour.
6. References
Acolas, M.L., Bégout Anras, M.L., Véron, V., Jourdan, H., Sabatié, M.R. & Baglinière, J.L. (2004). An assessment of the upstream migration and reproductive behaviour of allis shad (Alosa alosa L.) using acoustic tracking. ICES Journal of Marine Science, Vol.61, (December 2004), pp. 1291-1304, ISSN 1054-3139
Aitken, J.P., O’Dor, R.K. & Jackson, G.D. (2005). The secret life of the giant Australian cuttlefish Sepia apama (Cephalopoda): Behaviour and energetics in nature revealed through radio acoustic positioning and telemetry (RAPT). Journal of Experimental Marine Biology and Ecology, Vol.320, (June 2005), pp. 77-91, ISSN 0022-0981
Almeida, P.R. (1996). Estuarine movement patterns of adult thin-lipped grey mullet, Liza ramada (Risso) (Pisces, Mugilidae), observed by ultrasonic tracking. Journal of Experimental Marine Biology and Ecology, Vol.202, (September 1996), pp. 137-150, ISSN 0022-0981
Augustyn, C.J. (1990). Biological studies on the chokker squid Loligo vulgaris reynaudii (Cephalopoda; Myopsida) on spawning grounds off the south-east coast of South Africa. South African Journal of Marine Science, Vol.9, (June 1990), pp. 11-26, ISSN 0257-7615
The Use of Acoustic Telemetry in South African Squid Research (2003-2010)
437
Augustyn, C.J. (1991). The biomass and ecology of chokka squid Loligo vulgaris reynaudii off the west coast of South Africa. South African Journal of Zoology, Vol.26, No.4, (October 1991), pp. 164-181, ISSN 0254-1858
Birch GF. (1981). Bathymetry and geomorphology of the Cape Seal to Cape Recife inner shelf. Transactions of the Geological Society of South Africa, Vol.84, pp. 233–237, ISSN 0371-7208
Brill, R.W., Balazs, G.H., Holland, K.N., Chang, R.K.C., Sullivan, S. & George, J.C. (1995). Daily movements, habitat use, and submergence intervals of normal and tumor-bearing juvenile green turtles (Chelonia mydas L.) within a foraging area in the Hawaiian islands. Journal of Experimental Marine Biology and Ecology, Vol.185, (February 1995), pp. 203-218, ISSN 0022-0981
Carr, J.W., Lacroix, G.L., Andersons, J.M. & Dilworth, T. (1997). Short communication: Movements of non-maturing cultured Atlantic salmon (Salmo salar) in a Canadian River. ICES Journal of Marine Science, Vol.54, (December 1997), pp. 1082-1085, ISSN 1054-3139
Carr, S.D., Tankersley, R.A., Hench, J.L., Forward, R.B. Jr., Leittich, R.A. (2004). Movement patterns and trajectories of ovigerous blue crabs Callinectes sapidus during spawning migration. Estuarine, Coastal and Shelf Science Vol.60, (August 2004), pp. 567-579, ISSN 0272-7714
Cooke, S.J. & Philipp, D.P. (2004). Behaviour and mortality of caught-and-released bonefish (Albula spp.) in Bahamian waters with implications for a sustainable recreational fishery. Biological Conservation, Vol.118, (August 2004), pp. 599-607, ISSN 0006-3207
Downey N.J., Roberts, M.J. & Baird, D. (2010). An investigation of the spawning behaviour of the chokka squid Loligo reynaudii and the potential effects of temperature using acoustic telemetry. ICES Journal of Marine Science, Vol.67, (March 2010), pp. 231-243, ISSN 1054-3139
Egli, D.P. & Babcock, R.C. (2004). Ultrasonic tracking reveals multiple behavioural modes of snapper (Pagrus auratus) in a temperate no-take marine reserve. ICES Journal of Marine Science, Vol.61, (August 2004), pp. 1137-1143, ISSN 1054-3139
Hanlon, R.T., Smale, M.J. & Sauer, W.H.H. (1994). An ethogram of body patterning behaviour in the squid Loligo vulgaris reynaudii on spawning grounds in South Africa. Biology Bulletin, Vol.187, (December 1994), pp. 363-372, ISSN 1062-3590
Hanlon, R.T., Smale, M.J. & Sauer, W.H.H. (2002). The mating system of the squid Loligo vulgaris reynaudii (Cephalopoda, Mollusca) off South Africa: Fighting, guarding, sneaking, mating and egg laying behaviour. Bulletin of Marine Science, Vol.71, No.1, (January 2002), pp. 331-345, ISSN 0007-4977
Jadot, C., Donnay, A., Acolas, M.L., Cornet, Y. & Bégout Anras, M.L. (2006). Activity patterns, home-range size, and habitat utilization of Sarpa salpa (Teleostei: Sparidae) in the Mediterranean Sea. ICES Journal of Marine Science, Vol.63, (January 2006), pp. 128-139, ISSN 1054-3139
Lipinski, M.R., Hampton, I., Sauer, W.H.H. & Augustyn, C.J. (1998). Daily net emigration from a spawning concentration of chokka squid (Loligo vulgaris reynaudii d'Orbigny, 1845) in Kromme Bay South Africa. ICES Journal of Marine Science, Vol.55, (April 1998), pp. 258-270, ISSN 1054-3139
Modern Telemetry
438
Lipinski, M.R. & Underhill, L.G. (1995). Sexual maturation in squid: Quantum or continuum. South African Journal of Marine Science, Vol.15, (June 1995), pp. 207-223, ISSN 0257-7615
Løkkeborg, S., Skajaa, K. & Fernö, A. (2000). Food-search strategy in ling (Molva molva L.): Crepuscular activity and use of space. ICES Journal of Marine Science, Vol.247, (April 2000), pp. 195-208, ISSN 1054-3139
Melo, Y.C. & Sauer, W.H.H. (1999). Confirmation of serial spawning in the chokka squid Loligo vulgaris reynaudii off the coast of South Africa. Marine Biology, Vol.135, (November 1999), pp. 307-313, ISSN 0025-3162
Mitamura, H., Arai, N., Sakamoto, W., Mitsunaga, Y., Tanaka, H., Mukai, Y., Nakamura, K., Sasaki, M. & Yoneda, Y. (2005). Role of olfaction and vision in homing behaviour of black rockfish Sebastes inermes. Journal of Experimental Marine Biology and Ecology, Vol.322, (September 2005), pp. 123-134, ISSN 0022-0981
Olyott, L.J.H., Sauer, W.H.H. & Booth, A.J. (2006). Spatio-temporal patterns in maturation of the chokka squid (Loligo vulgaris reynaudii) off the coast of South Africa. ICES Journal of Marine Science, Vol.63, (July 2006), pp. 1649-1664, ISSN 1054-3139
Olyott, L.J.H., Sauer, W.H.H. & Booth, A.J. (2007). Spatial patterns in the biology of the chokka squid, Loligo vulgaris reynaudii on the Agulhas Bank, South Africa. Reviews in Fish Biology and Fisheries, Vol.17, No.2-3, (August 2007), pp. 159-172, ISSN 0960-3166
Oosthuizen, A. & Roberts, M.J. (2009). Bottom temperature and in situ development of chokka squid eggs (Loligo vulgaris reynaudii) on the deep spawning grounds, South Africa. ICES Journal of Marine Science, Vol.66, (October 2009), pp. 1967-1971, ISSN 1054-3139
Oosthuizen, A., Roberts, M.J. & Sauer, W.H.H. (2002a). Temperature effects on the embryonic development and hatching success of the squid Loligo vulgaris reynaudii. Bulletin of Marine Science, Vol.71, No.2, (September 2006), pp. 619-632, ISSN 0007-4977
Oosthuizen, A., Roberts, M.J. & Sauer, W.H.H. (2002b). Early post-cleavage stages and abnormalities identified in the embryonic development of chokka squid eggs Loligo vulgaris reynaudii. South African Journal of Marine Science, Vol.24, (June 2002), pp. 379-382, ISSN 0257-7615
Roberts, M.J. (1998). The influence of the environment on chokka squid Loligo vulgaris reynaudii spawning aggregations: Steps towards a quantified model. South African Journal of Marine Science, Vol.20, (December 1998), pp. 267-284, ISSN 0257-7615
Roberts, M.J. (2005). Chokka squid (Loligo vulgaris reynaudii) abundance linked to changes in South Africa's Agulhas Bank ecosystem during spawning and the early life cycle. ICES Journal of Marine Science, Vol.62, No.1, (February 2005), pp. 33-55, ISSN 1054-3139
Roberts, M.J. & Sauer, W.H.H. (1994). Environment: the key to understanding the South African chokka squid (Loligo vulgaris reynaudii) life cycle and fishery? Antarctic Science, Vol.6, No.2, (June 1994), pp. 249-258, ISSN 0954-1020
Roberts, M.J. & van den Berg, M. (2002). Recruitment variability of chokka squid (Loligo vulgaris reynaudii) - Role of currents on the Agulhas Bank (South Africa) in paralarvae distribution and food abundance. Bulletin of Marine Science, Vol.71, No.2, (September 2002), pp. 691-710, ISSN 0007-4977
The Use of Acoustic Telemetry in South African Squid Research (2003-2010)
439
Roberts, M.J. & van den Berg, M. (2005). Currents along the Tsitsikamma coast, South Africa, and potential transport of squid paralarvae and ichthyoplankton. African Journal of Marine Science, Vol.27, No.2, (October 2005), pp. 375-388, ISSN 1814-232X
Roel, B.A., Cochrane, K.L. & Field, J.G. (2000). Investigation into the declining trend in chokka squid Loligo vulgaris reynaudii catches made by South African trawlers. South African Journal of Marine Science, Vol.22, (June 2000), pp. 121-135, ISSN 0257-7615
Sauer, W.H.H. (1995). The impact of fishing on chokka squid Loligo vulgaris reynaudii concentrations on inshore spawning grounds in the South-Eastern Cape, South Africa. South African Journal of Marine Science, Vol.16, (December 1995), pp. 185-193, ISSN 0257-7615
Sauer, W.H.H., Goschen, W.S., & Koorts, A.S. (1991). A preliminary investigation of the effect of sea temperature fluctuations and wind direction on catches of chokka squid Loligo vulgaris reynaudii off the Eastern Cape, South Africa. South African Journal of Marine Science, Vol.11, (December 1991), pp. 467-473, ISSN 0257-7615
Sauer, W.H.H. & Lipinski, M.R. (1990). Histological validation of morphological stages of sexual maturity in chokker squid Loligo vulgaris reynaudii D'Orb (Cephalopoda; Loliginidae). South African Journal of Marine Science, Vol.9, (June 1990), pp. 189-200, ISSN 0257-7615
Sauer, W.H.H. & Lipinski, M.R. (1991). Food of squid Loligo vulgaris reynaudii (Cephalopoda: Loliginidae) on their spawning grounds off the Eastern Cape, South Africa. South African Journal of Marine Science, Vol.10, (June 1991), pp. 193-201, ISSN 0257-7615
Sauer, W.H.H., McCarthy, C, Smale, M.J. & Koorts, A.S. (1993). An investigation of the egg distribution of the chokka squid, Loligo vulgaris reynaudii, in Krom Bay, South Africa. Bulletin of Marine Science, Vol.53, No.3, (November 1993), pp. 1066-1077, ISSN 0007-4977
Sauer, W.H.H., Melo, Y.C. & de Wet, W. (1999). Fecundity of the chokka squid Loligo vulgaris reynaudii on the southeastern coast of South Africa. Marine Biology, Vol.135, (November 1999), pp. 315-319, ISSN 0025-3162
Sauer, W.H.H., Roberts, M.J., Lipinski, M.R., Smale, M.J., Hanlon, R.T., Webber, D.M. & O’Dor, R.K. (1997). Choreography of the squid's "nuptial dance". Biology Bulletin, Vol.192, (April 1997), pp. 203-207, ISSN 1062-3590
Sauer, W.H.H. & Smale, M.J. (1991). Predation patterns on the inshore spawning grounds of the squid Loligo vulgaris reynaudii (Cephalopoda: Loliginidae) off the south-eastern cape, South Africa. South African Journal of Marine Science, Vol.11, (December 1991), pp. 513-523, ISSN 0257-7615
Sauer, W.H.H. & Smale, M.J. (1993). Spawning behaviour of Loligo vulgaris reynaudii in shallow coastal waters of the south-Eastern Cape, South Africa, In: Recent Advances in Fisheries Biology, Okutani, T., O’Dor, R.K. & Kobodera, T., pp. 489-498, Tokai University Press, Tokyo
Sauer, W.H.H., Smale, M.J. & Lipinski, M.R. (1992). The location of spawning grounds, spawning and schooling behaviour of the squid Loligo vulgaris reynaudii (Cephalopoda: Myopsida) off the Eastern Cape coast, South Africa. Marine Biology, Vol.114, (September 1992), pp. 97-107, ISSN 0025-3162
Schön, P., Sauer, W.H.H. & Roberts, M.J. (2002). Environmental influences on spawning aggregations and jig catches of chokka squid Loligo vulgaris reynaudii: a 'black box'
Modern Telemetry
440
approach. Bulletin of Marine Science, Vol.71, No.2, (September 2002), pp. 783-800, ISSN 0007-4977
Shaw, P.W. & Sauer, W.H.H. (2004). Multiple paternity and complex fertilisation dynamics in the squid Loligo vulgaris reynaudii. Marine Ecology Progress Series, Vol.270, (April 2004), pp. 173-179, ISSN 0171-8630
Singh, L., Downey, N.J., Roberts, M.J., Webber, D.M., Smale, M.J., van den Berg, M.A., Harding, R.T., Engelbrecht, D.C. & Blows, B.M. (2009). Design and calibration of an acoustic telemetry system subject to upwelling events. African Journal of Marine Science, Vol.31, No.1, (May 2010), pp. 355-364, ISSN 0257-7615
Smale, M.J., Sauer, W.H.H. & Hanlon, R.T. (1995). Short Communications: Attempted ambush predation on spawning squids Loligo vulgaris reynaudii by benthic pyjama sharks, Poroderma africanum, off South Africa. Journal of the Marine Biological Association of the United Kingdom, Vol.75, (August 1995), pp. 739-742, ISSN 0025-3154
Smale, M.J., Sauer, W.H.H. & Roberts, M.J. (2001). Behavioural interactions of predators and spawning chokka squid off South Africa: towards quantification. Marine Biology, Vol.139, (December 2001), pp. 1095-1105, ISSN 0025-3162
Welch, D.W., Ward, B.R. & Batten, S.D. (2004). Early ocean survival and marine movements of hatchery and wild steelhead trout (Oncorhynchus mykiss) determined by an acoustic array: Queen Charlotte Strait, British Columbia. Deep-Sea Research II, Vol.51, (March-May 2004), pp. 897-909, ISSN 0967-0645
Vabø, R., Huse, G., Fernö, A., Jørgensen, T., Løkkeborg, S. & Skaret, G. (2004). Simulating search behaviour of fish towards bait. ICES Journal of Marine Science, Vol.61, (December 2004), pp. 1224-1232, ISSN 1054-3139
Vidal, E.A.G., Roberts, M.J. & Martins, R.S, (2005). Yolk utilization, metabolism and growth in reared Loligo vulgaris reynaudii paralarvae. Aquatic Living Resources, Vol.18, (October 2005), pp. 385-393, ISSN 0990-7440