the story of drinking water
TRANSCRIPT

The Story of Drinking Water
NOTE: Consider ALL Information in this booklet a DIRECT QUOTE from indicated source. Page 1 of 92 NOTE :
The Story
of
Drinking Water
The Story of Drinking Water
NOTE: Consider ALL Information in this booklet a DIRECT QUOTE from indicated source. Page 2 of 92 NOTE :
Table of Contents
The Story of Drinking Water
1. Water During Ancient Times………………….………….………….3
2. Water Throughout the Earth……………………….……..……...4
All Things Need Water
3. Human Body and Water………………………………..………………..7
4. Water in Food……………………………………………………………..8, 9
5. Water Uses in the Community (WKST) ………………………..10
Characteristics of Water
6. Water Molecule ……………………………………………………………..11
Other Properties of Water
7. Water’s Three Forms…………………………….…..12
8. Surface Tension of Water ………………….13, 14
9. Water pH………………………………………………….5, 16
Water on Earth
10. Salt of the Earth……………………………………….…………..…….17
11. Fresh Water Uses………………………………….…………….……...18
12. Groundwater and Contaminants………….…..……...…………19
Karst……………………………………………………………………....20, 21
Water and Ecosystems
13. Water’s Journey……………………………………………….…………22
14. Canadian Moose Populations…………………………..…………23
Moose Population Decline MN, Ontario…..…………..24
A Deepening Mystery……………………….………………25, 26
The Hydrologic Cycle
15. Water Cycle Words……………………………………………………28
Water and Weather
17. Extreme Weather………………………………………..……...29, 30
18. Reading a Weather Map………………………….…………31 - 37
19. Low-Pressure Clouds………………………………….………………40
Drinking Water Supply
20. Water Sources…………………………………………………..41 - 44
What is Water Pollution?................................45 - 48
21. Water Transmission………………………………………….49 - 51
22. Groundwater and Land Subsidence……………....52, 53
23. Soil and Water Do Mix!.....................................54 - 56
Drinking Water Treatment
24. Water Purification…………………………………..………….57, 58
25. Parts Per Million………………………………………………...……….59
Types of Drinking Water Contaminants……...….60, 61
Flint MI Water Crisis Fast Facts………………….62 - 66
26. Waterborne Diseases…………………………………...…..67 - 69
27. Water Still……………………………………………………………………70
Water Distribution
28. Water’s Way…………………………………………………………………71
29. Water Pressure……………………………………………………………72
Cost and Conservation
30. Water Works……………………………………………………………….73
31. Water Economics……………………………………………….………..74
32. Save the Water…………………………………………………………..75
33. The Value of Water…………………………………….……………..76
Appendix A. Organisms Found in Raw Water……………………………………..78 - 83
B. Water Treatment Around the World……………………………………..84
C. EPA National Primary Drinking Water Regulations…....85 - 87
D. CDC Water Borne Pathogens……………………………………………88 - 90
The Story of Drinking Water
NOTE: Consider ALL Information in this booklet a DIRECT QUOTE from indicated source. Page 3 of 92 NOTE :
1. Water During Ancient Times
The story of water begins thousands of years ago in prehistoric times. Even then people built their homes on
lakeshores or along rivers so they had water to drink and wash in, and so they could travel easily from place
to place. These waterways contained some contamination, but the water was probably cleaner because
pollutants produced by industrialization and population growth had not yet affected water sources.
The ancient Asians were the first to record methods for purifying water. In about 2000 B.C., the Asians
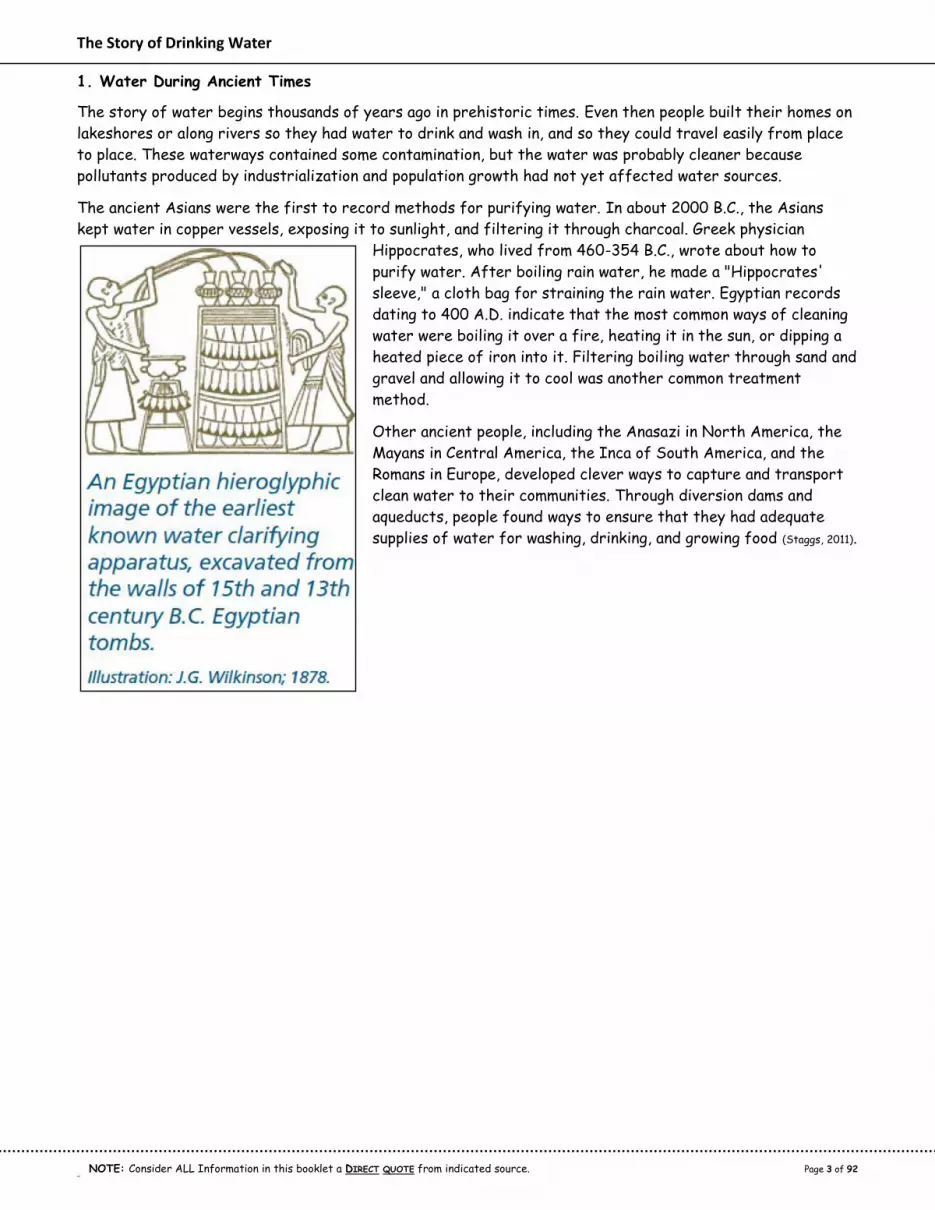
kept water in copper vessels, exposing it to sunlight, and filtering it through charcoal. Greek physician
Hippocrates, who lived from 460-354 B.C., wrote about how to
purify water. After boiling rain water, he made a "Hippocrates'
sleeve," a cloth bag for straining the rain water. Egyptian records
dating to 400 A.D. indicate that the most common ways of cleaning
water were boiling it over a fire, heating it in the sun, or dipping a
heated piece of iron into it. Filtering boiling water through sand and
gravel and allowing it to cool was another common treatment
method.
Other ancient people, including the Anasazi in North America, the
Mayans in Central America, the Inca of South America, and the
Romans in Europe, developed clever ways to capture and transport
clean water to their communities. Through diversion dams and
aqueducts, people found ways to ensure that they had adequate
supplies of water for washing, drinking, and growing food (Staggs, 2011).

The Story of Drinking Water
NOTE: Consider ALL Information in this booklet a DIRECT QUOTE from indicated source. Page 4 of 92 NOTE :
2. Water Throughout the Earth
Most major North American cities, such as New Your, Chicago, Baltimore, Detroit, Ottawa, New Orleans, and
Quebec City, were established on the banks of rivers or bays. This is because the major method of
transportation in the 1700’s and 1800’s was by ship and boat.
As larger cities outgrew their local water sources, they began to create elaborate systems (such as canals,
reservoirs, and aqueducts to store and move water from areas where there was more water to their cities
and towns. The city of Los Angeles, for instance, built a 450-mile (724 km) canal to capture water from the
mountains near Sacramento and bring it south to the city(Staggs, 2011).
Solve the Problem On the map of North American, identify the major rivers and lakes with a blue pencil.
Add the names of the rivers. Locate the major cities of North America with a red X and name of city.
How many cities are located near a major body of fresh water or a river?
For those cities not located near fresh water, what are the city’s water sources? (Staggs, 2011)

The Story of Drinking Water
NOTE: Consider ALL Information in this booklet a DIRECT QUOTE from indicated source. Page 5 of 92 NOTE :
Solve the Problem On the map of North American, identify the major rivers and lakes with a blue pencil.
Add the names of the rivers. Locate the major cities of North America with a red X and name of city.
How many cities are located near a major body of fresh water or a river?
For those cities not located near fresh water, what are the city’s water sources? (Staggs, 2011)
Name: ____________________________________________________ Pd: _____

The Story of Drinking Water
NOTE: Consider ALL Information in this booklet a DIRECT QUOTE from indicated source. Page 6 of 92 NOTE :

The Story of Drinking Water
NOTE: Consider ALL Information in this booklet a DIRECT QUOTE from indicated source. Page 7 of 92 NOTE :
https://water.usgs.gov/edu/images/property-you.png
3. Our Bodies Need Water
Without water, the Earth would look like the moon, there wouldn’t be any trees ... or animals ... or humans.
All life depends on water. Next to the air we breathe, water is our most essential element of life. (Staggs, 2011)
The human body is more than 60% water dependent upon our age and sex. (Children 65%)
(Women 55%, Men 60%)
Every system in our body uses water.
Water makes up 73% of our brain and our heart.
Water makes up 83% of our blood and our lungs. (U.S. Department of
Interior, 2016) Water transports body wastes.
Water lubricates body joints.
Water keeps body temperature stable (think sweat!).
Water aids in digestion (think spit!).
Human beings can live several weeks without food but only four to
seven days without water, depending on conditions. We must drink
six to eight glasses of water each day to replace the water we lose
from normal activity. Some water loss is visible through sweat and
excretion. (Staggs, 2011)
A person needs to drink enough water each day to replace the
water lost through everyday activities and climate conditions.
Generally, an adult male needs about 3 liters of water per day while
and adult female needs about 2.2 liters per day. Babies’ and kids’
bodies have a larger percentage of water than adults so they need
to drink more water proportionately to be hydrated. Some of water is found in food (U.S. Department of Interior,
2016) .
Solve the Problem Calculate how much water you need to replace each day by filling answering the following questions on your paper:
What is your weight in pounds? _______________
Divide by 2 to determine how many ounces you should be drinking: _______________ Add 8 ounces if you are active: _______________
Add another 8 ounces if you live in a dry climate: _______________
Take this number a divide by 8 to determine how many cups you need to drink a day? _______________ (Staggs, 2011)

The Story of Drinking Water
NOTE: Consider ALL Information in this booklet a DIRECT QUOTE from indicated source. Page 8 of 92 NOTE :
4. Water in Foods
Drinking water or other liquids provides only part of the water we need. The other part comes from the
foods we eat. Fresh fruit and vegetables contain much more water than cooked or processed food.
For Example:
A cucumber is about 97% water.
A tomato is about 95% water.
An apple is about 80% water.
A banana is about 75% water.
A slice of cheese pizza is about 47% water.
A slice of bread is about 37% water.
Chicken nuggets contain about 47% water.
Buttered popcorn is about 5% water.
Potato Chips contain less than 1% water.
Pretzels contain about 3% water. (Staggs, 2011)

The Story of Drinking Water
NOTE: Consider ALL Information in this booklet a DIRECT QUOTE from indicated source. Page 9 of 92 NOTE :
Water Content of Select Foods

The Story of Drinking Water
NOTE: Consider ALL Information in this booklet a DIRECT QUOTE from indicated source. Page 10 of 92 NOTE :
5. Water Uses in the Community
Ways You Use Water How Much Water Does this Require Each Day?
1. 1.
2. 2.
3. 3.
4. 4.
5. 5.
6. 6.
7. 7.
8. 8.
9. 9.
10. 10.
Ways Other People Use Water Ways You Can Save Water
1. 1.
2. 2.
3. 3.
4. 4.
5. 5.
6. 6.
7. 7.
8. 8.
9. 9.
10. 10.
List your Sources:
Name: ____________________________________________________ Pd:
_____

The Story of Drinking Water
NOTE: Consider ALL Information in this booklet a DIRECT QUOTE from indicated source. Page 11 of 92 NOTE :
6. The Water Molecule
Everything is made of atoms. An atom is the smallest particle of an
element, such as oxygen or hydrogen. Atoms join together to form
molecules. A water molecule has three atoms: two hydrogen (H) atoms and
one oxygen (O) atom. That’s why water is sometimes referred to as H2O. A
single drop of water contains
billions of water molecules.
What is a solvent?
A solvent is a liquid that can dissolve other substances (Staggs, 2011). Water is
the called the “universal solvent” because it dissolves more substances than any other liquid. This is
important to every living thing on earth. It means that wherever water goes, whether through the ground or
through our bodies, it takes along valuable chemicals, minerals, and nutrients. Even when we cook, we use
water as a solvent. How else do we take advantage of this ability of water to dissolve almost anything?
It is water's chemical composition and physical attributes that make it such an excellent solvent. Water
molecules have a polar arrangement of the oxygen and hydrogen atoms—one side (hydrogen) has a positive
electrical charge and the other side (oxygen) has a negative charge. This allows the water molecule to
become attracted to many other different types of molecules. Water can become so heavily attracted to a
different molecule, like salt (NaCl), that it can disrupt the attractive forces that hold the sodium and
chloride in the salt molecule together and, thus, dissolve it (U.S. Department of Interior, 2016).
Other Properties of Water
Water can absorb heat. (Staggs, 2011) Water has a high specific heat capacity. This means that water can absorb a lot of
heat before it begins to get hot. The high specific heat capacity of water is valuable to industries and in your car’s
radiator as a coolant. The high specific heat capacity of water also helps regulate the rate at which air changes
temperature, which is why the temperature change between seasons is gradual rather than sudden, especially near
the oceans (Commonwealth of Kentucky, 2010) . Water has very high surface tension. Water molecules naturally attract to each other bunching together tightly at
the surface, so you can fill a water glass above the rim. Surface tension also helps things float.
Pure water has a neutral pH of 7. Pure water is not an acid or base, which allows plants and animals to live and thrive in
it.
Water weighs 8.34 pounds per gallon and 1 liter of water weighs 1 kg (Staggs, 2011) .
Specific Conductance of water is the measure of the ability of water to conduct an electric current and is dependent
on the amount of dissolved solids in the water. Pure water, such as distilled water, will have a very low specific
conductance and sea water will have a high specific conductance. Specific conductance is an important water-quality
measurement because it gives a good idea of the amount of dissolved material in the water.
Turbidity is the measure of cloudiness of water. It is measured by passing a beam of light through the water and
seeing how much is reflected off particles.
Dissolved oxygen is the amount of oxygen that is actually dissolved in the water. This dissolved oxygen is breathed by
fish and zooplankton and is needed by them to survive. Excess organic materials can cause an oxygen deficient
saturation to occur. Dissolved-oxygen levels are at a seasonal low in the summer (hot weather).
Hardness is the amount of dissolved calcium and magnesium in water. Where the water is relatively hard, it is
difficult to get a lather up when washing your hands or clothes and industries spend money to soften water as hard
water can damage equipment (Commonwealth of Kentucky, 2010) .
http://science.halleyhosting.com/sci/ibbio/chem/notes/chpt2/water.htm
http://www.grandinetti.org/solution-chemistry

The Story of Drinking Water
NOTE: Consider ALL Information in this booklet a DIRECT QUOTE from indicated source. Page 12 of 92 NOTE :
Water Facts Chemical Formula H2O Molecular Weight 18.015 g/mole Freezing Point 32
oF, 0
oC, 273.2K
Boiling Point 212oF, 100
oC, 373.2K
Density of Ice 0.99987 g/cm3
Density of Liquid 1.00 g/cm3
Specific Heat Water 4.187 kJ/kgK Specific Heat Ice 2.108 kJ/kgK Specific Heat Vapor 1.966 kJ/kgK
7. Water’s Three Forms
Water is unique in that it is the only substance that is found in all three states – liquid, solid and gas – at
temperatures normally found on earth. Earth’s water is constantly interacting, changing and in movement
(Commonwealth of Kentucky, 2010) .
Pure water is tasteless, odorless, and colorless. Water can occur in three states: solid (ice), liquid, or gas
(vapor).
Solid water – ice is frozen water. When water freezes, its molecules move farther apart, making ice less
dense than water. This means that ice will be lighter than the same volume of water and so ice will float in
water. Water freezes at 0oC (32oF).
Liquid water – is wet and fluid. This is the form of water with which we are most familiar. We use liquid
water in many ways, including washing and drinking.
Water as a gas – vapor is always present in the air around us. You cannot see it. When you boil water, the
water changes from a liquid to a gas or water vapor. As some of the water vapor cools, we see it as a small
cloud called steam. This cloud of steam is a mini version of clouds we see in the sky. As sea level, steam is
formed at 100oC (212oF).
The water vapor attaches to small bits of dust in the air. It forms raindrops in warm temperatures. In
cold temperatures, it freezes and forms snow or hail (American Water Works Association).
Solve the Problem What do you think would happen if ice did not float? What would happen to the fish and plants in the water? How does the ice on top of a lake help the fish and plants that live underneath? (Staggs, 2011)

The Story of Drinking Water
NOTE: Consider ALL Information in this booklet a DIRECT QUOTE from indicated source. Page 13 of 92 NOTE :
8. Surface Tension of Water
One of the most easily observed properties of water is a drop’s ability to attract other drops, to hold on to
each other in larger sets, and to connect to each other in streams. This is called surface tension. Water
molecules at a surface try to hold on to the molecules next to them. This is called cohesion. This phenomenon
is even more interesting when you attribute this property to our ability to suck a beverage through a straw
or pump water up from a well, or water’s ability to flow downward in a stream.
http://www.studydroid.com/index.php?page=viewPack&packId=355026
Floating paper clip made of steel with copper plating. The high surface tension
helps the paper clip - with much higher density - float on the water.
The cohesive forces between liquid molecules are responsible for the phenomenon known as surface tension.
The molecules at the surface of a glass of water do not have other water molecules on all sides of them and
consequently they cohere more strongly to those directly associated with them (in this case, next to and
below them, but not above). It is not really true that a "skin" forms on the water surface; the stronger
cohesion between the water molecules as opposed to the attraction of the water molecules to the air makes
it more difficult to move an object through the surface than to move it when it is completely submersed.
Cohesion and Surface Tension
The cohesive forces between molecules in a liquid are shared with all neighboring molecules. Those on the
surface have no neighboring molecules above and, thus, exhibit stronger attractive forces upon their nearest
neighbors on and below the surface. Surface tension could be defined as the property of the surface of a
liquid that allows it to resist an external force, due to the cohesive nature of the water molecules.
Surface tension at a molecular level
Water molecules want to cling to each other. At the surface, however, there
are fewer water molecules to cling to since there is air above (thus, no water
molecules). This results in a stronger bond between those molecules that
actually do come in contact with one another, and a layer of strongly bonded
water (see diagram). This surface layer (held together by surface tension)
creates a considerable barrier between the atmosphere and the water. In fact,
other than mercury, water has the greatest surface tension of any liquid.
Within a body of a liquid, a molecule will not experience a net force because
the forces by the neighboring molecules all cancel out (diagram). However for a molecule on the surface of
the liquid, there will be a net inward force since there will be no attractive force acting from above. This
inward net force causes the molecules on the surface to contract and to resist being stretched or broken.
Thus the surface is under tension, which is probably where the name "surface tension" came from.
Surface tension -- The property of the surface of a liquid that allows it to
resist an external force, due to the cohesive nature of its molecules.

The Story of Drinking Water
NOTE: Consider ALL Information in this booklet a DIRECT QUOTE from indicated source. Page 14 of 92 NOTE :
Due to the surface tension, small objects will "float" on the surface of a fluid, as long as the object cannot
break through and separate the top layer of water molecules. When an object is on the surface of the fluid,
the surface under tension will behave like an elastic membrane.
Examples of surface tension
Walking on water: Small insects such as the water strider can walk on water
because their weight is not enough to penetrate the surface.
Floating a needle: A carefully placed small needle can be made to float on the
surface of water even though it is several times as dense as water. If the
surface is agitated to break up the surface tension, then needle will quickly
sink.
Don't touch the tent!: Common tent materials are somewhat rainproof in that
the surface tension of water will bridge the pores in the finely woven material. But if you touch the tent
material with your finger, you break the surface tension and the rain will drip through.
Clinical test for jaundice: Normal urine has a surface tension of about 66 dynes/centimeter but if bile is
present (a test for jaundice), it drops to about 55. In the Hay test, powdered sulfur is sprinkled on the
urine surface. It will float on normal urine, but will sink if the surface tension is lowered by the bile.
Surface tension disinfectants: Disinfectants are usually solutions of low surface tension. This allow them
to spread out on the cell walls of bacteria and disrupt them.
Soaps and detergents: These help the cleaning of clothes by lowering the surface tension of the water so
that it more readily soaks into pores and soiled areas.
Washing with cold water: The major reason for using hot water for washing is that its surface tension is
lower and it is a better wetting agent. But if the detergent lowers the surface tension, the heating may
be unneccessary.
Why bubbles are round: The surface tension of water provides the necessary wall tension for the
formation of bubbles with water. The tendency to minimize that wall tension pulls the bubbles into
spherical shapes.
Surface Tension and Droplets: Surface tension is responsible for the shape of liquid droplets. Although
easily deformed, droplets of water tend to be pulled into a spherical shape by the cohesive forces of the
surface layer. (U.S. Department of Interior, 2016)
http://slideplayer.com/slide/7345329/

The Story of Drinking Water
NOTE: Consider ALL Information in this booklet a DIRECT QUOTE from indicated source. Page 15 of 92 NOTE :
9. Water pH
The potential of hydrogen in a substance is called pH. pH is a measure of acid or alkaline. This is measured on
a scale divided into 14 standard units, 0-14. Acids such as lemon juice and vinegar have pH values less than 7.
Alkalis such as ammonia have pH values greater than 7. A pH of 7 is considered neutral. Soft drinks are pH
2.4 and milk has a pH of 6.3 – 6.6. Most natural water systems have a pH from 6 to 9.
As rain water runs through pollution in the air, small amounts of acid can be absorbed into the water.
Detergents washed into streams add phosphates and nitrates, encouraging plant like and changing the
chemistry of the water. The rock and soil composition of a watershed also affect the pH of water, adding
alkalinity to the waterways.
Most aquatic life needs water within a pH within 6.5 – 9.0, although some water life, particularly algae and
bacteria, thrives in high alkaline waters. pH that varies greatly or that is extremely low or high can destroy
other plant and wildlife that depend on the waterways for survival.
Aquatic Life Minimum
pH value
Maximum
pH value
Bacteria 10 13
Algae, rooted plants 6.5 12
Carp, suckers 6 9
Catfish 6 9
Insects 6 9
Bass, Crappie 6.5 8.5
Trout 5.5 7.5
Stonefly, Mayfly, Caddisfly 5.5 7.5
Perch 4.6 9.5
Mosquito larvae 3.3 4.7
Fish eggs 6 7.2 (Staggs, 2011)
http://www.edinformatics.com/math_science/what_is_ph.htm

The Story of Drinking Water
NOTE: Consider ALL Information in this booklet a DIRECT QUOTE from indicated source. Page 16 of 92 NOTE :
pH and water quality
Excessively high and low pHs can be detrimental for the use of water. High pH causes a bitter taste, water
pipes and water-using appliances become encrusted with deposits, and it depresses the effectiveness of the
disinfection of chlorine, thereby causing the need for additional chlorine when pH is high. Low-pH water will
corrode or dissolve metals and other substances.
Pollution can change a water's pH, which in turn can harm animals and plants living in the water. For instance,
water coming out of an abandoned coal mine can have a pH of 2, which is very acidic and would definitely
affect any fish crazy enough to try to live in it! By using the logarithm scale, this mine-drainage water would
be 100,000 times more acidic than neutral water -- so stay out of abandoned mines.
Variation of pH across the United States
The pH of precipitation, and water bodies, vary widely across the United States. Natural and human
processes determine the pH of water. The National Atmospheric Deposition Program has developed maps
showing pH patterns, such as the one below showing the spatial pattern of the pH of precipitation at field
sites for 2002. You should be aware that this contour map was developed using the pH measurements at the
specific sampling locations; thus, the contours and isolines were created using interpolation between data
points. You should not necessarily use the map to document the pH at other particular map locations, but
rather, use the map as a general indicator of pH throughout the country.
(U.S. Department of Interior, 2016)

The Story of Drinking Water
NOTE: Consider ALL Information in this booklet a DIRECT QUOTE from indicated source. Page 17 of 92 NOTE :
http://flash.esva.net/bigthings.htm https://pubs.usgs.gov/gip/gw/compar.html
10. Salt of the Earth
About 70% of Earth’s surface is covered with water. Ninety-seven percent of water on Earth is salt water,
mostly in the oceans. Salt water contains salt and other minerals, which humans cannot drink. New
technology, however, can remove salt from ocean water to make it safe to drink, or potable. This technology,
called desalination, is used increasingly around the world. Particularly in the Middle East and in coastal cities,
where the nearest water supply is an ocean.
Two percent of the water on Earth is glacier ice at the North and South Poles. This ice is fresh water and
could be melted; however, it is too far away from where people live to be usable. Because of the Earth’s
changing temperatures, some glaciers are melting into the oceans. Perhaps someday there will be a way to
capture this fresh water before it mixes with the salty ocean water.
Less than 1% of all the water on Earth is fresh water. We use this small amount of water for drinking and
cleaning but also for agriculture, industry, and commercial operations. Most of this water must be treated to
remove any pollutants before humans use it. Because fresh water is limited, many communities are finding
ways to conserve this resource by using less water, reusing it, and installing water-saving devices.
This ruler has 100 spaces representing 100% of the water on Earth.
One space of Red is 1% of the spaces on the ruler. This shows the fresh water we can use.
Two spaces of Green are 2% of the spaces on the ruler. This shows the water frozen in glaciers.
Ninety-seven spaces of Yellow are 97% of the spaces on the ruler. These show the amount of salt water on Earth. (Staggs, 2011)
The total water supply of the world is 326 trillion cubic miles (a cubic mile is an imaginary cube measuring one
mile on each side. A cubic mile of water equals more than one trillion gallons. About 3,100 cubic miles of
water, mostly in the form of water vapor, is in the atmosphere at one time. If it all fell as precipitation at
once, the earth would be covered with only about 1 inch of water. IF all of the world’s water was poured on
the United States, it would cover the land to a depth of 90 miles. Of the freshwater on Earth, much more is
stored in the ground than is available in lakes and rivers. More than 2,000,000 cubic miles of fresh water is
stored in the Earth, most within one-half mile of the surface. Contrast that with the 60,000 cubic miles of
water stored as fresh water in lakes, inland seas, and rivers. But if you really want to find fresh water, the
most is stored in the 7,000,000 cubic miles of water found in glaciers and icecaps, mainly in the polar regions
and in Greenland (Commonwealth of Kentucky, 2010).

The Story of Drinking Water
NOTE: Consider ALL Information in this booklet a DIRECT QUOTE from indicated source. Page 18 of 92 NOTE :
http://www.water.ca.gov/education/wffcatalog.cfm
11. Fresh Water Uses
In addition to home use, fresh water is used for transportation, agriculture, heating and cooling, industry,
livestock, and many other purposes. That one percent of water is primarily used in eight different ways or
categories as listed below. (mgd = million gallon /day)
Public supply. Public and commercial buildings, such as
schools and restaurants. 42,000 mgd
Domestic. Residential indoor and outdoor used, such as
drinking, cleaning and watering lawns. 3,600 mgd
Irrigation. Systems for farms that grow food. 115,000 mgd
Livestock. Systems for animals on ranches and farms.
2,000 mgd
Aquaculture. Systems for fish farms and hatcheries.
9,420 mgd
Industrial. Manufacturing products, including food, paper,
and petroleum products. 15,9000 mgd
Mining. Extraction natural resources, such as metals,
minerals, natural gas and oil. 5,320 mgd
Thermoelectric. Generating electricity using steam-driven generators. 161,000 mgd (Staggs, 2011) (PennState
College of Earth and Mineral Sciences, 2017).
About 80 percent of all the water we use in everyday life comes from surface-water sources such as rivers,
streams, lakes, and reservoirs. The other 20 percent comes from ground-water. Surface-water is a lot easier
and cheaper to get than to drill a well and pump water out of the ground. Ground water is the part of
precipitation that seeps down through the soil until it reaches rock material that is saturated with water.
The rock below the Earth’s surface is the bedrock. If all bedrock consisted of a dense material like solid
granite, then even gravity would have a hard time pumping water downward. But Earth’s bedrock consists of
many types of rock, such as sandstone, granite, and limestone. Bedrocks have varying amounts of void spaces
in them where ground water accumulates. Bedrock can also become broken and fractured, creating spaces
that can fill with water And some bedrock, such as limestone, id dissolved by water – which results in large
cavities that fill with water. Try as it might, gravity doesn’t pull water all the way to the center of the
Earth. Deep in the bedrock there are layers made of dense material, such as granite or clay. These layers
may be underneath the porous rock layers and act as a confining layer to retard the vertical movement of
water. Since it is more difficult for the water to go any deeper, it tends to pool in the porous layers and flow
in a more horizontal direction across the aquifer. Ground water slowly moves underground, generally at a
downward angle (due to gravity) toward an exposed surface-water body (Commonwealth of Kentucky, 2010).
NOTE: thermoelectric cooling was responsible for almost half of the water withdrawals in the U.S. in 2010, with irrigation very close behind. However, about 30% of thermoelectric water use was salt water, so irrigation is actually the biggest user of freshwater in the U.S. (PennState College of Earth and Mineral Sciences, 2017)
Solve the Problem: According to the above information, what category uses the most fresh water? How
can we reduce this amount of water use? Which category is 2nd in freshwater use?
Make a bar graph of the above information.

The Story of Drinking Water
NOTE: Consider ALL Information in this booklet a DIRECT QUOTE from indicated source. Page 19 of 92 NOTE :
12. Groundwater and Contaminants
Groundwater is the part of precipitation that seeps down through the soil until it reaches rock material that
is saturated with water. Groundwater slowly moves underground, generally at a downward angle (gravity), and
may eventually seep into streams, lakes, and oceans.
A couple of important factors are responsible for the existence of ground water: Gravity and Bedrock.
Gravity pulls water toward the center of the Earth – water on the surface will try to seep into the ground
below it. The Earth’s bedrock consists of many types of rock, such as sandstone, granite, and limestone.
Bedrocks have varying amounts of void spaces in them where ground water accumulates. Bedrock can also
become broken and fractured; creating spaces that can fill with water. And some bedrock, such as limestone,
is dissolved by water – which results in large cavities that fill with water. Try as it might, gravity doesn’t pull
water all the way to the center of the Earth. Deep in the bedrock there are rock layers made of dense
material, such as granite, or material that water has a hard time penetrating, such as clay. These layers may
be underneath the porous rock layers and thus, act as a confining layer to retard the vertical movement of
water. Since it is more difficult for the water to go any deeper, it tends to pool in the porous layers and flow
in a more horizontal direction across the aquifer toward an exposed surface-water body, like a river. Bye the
way, it’s a myth that all our ground-water supplies are really fivers flowing underground – except in the case
of caves that exist in limestone rock. These caves can have flowing streams in them. Kentucky has many such
caves.
Because water is such an excellent solvent it can contain lots of dissolved chemicals. And since ground water
moves through rocks and subsurface soil, it has a lot of opportunity to dissolve substances as it moves. For
that reason ground water will often have more dissolved substance than surface water. Even though the
ground is an excellent mechanism for filtering out particulate matter, dissolved chemicals and gases can still
occur in large enough concentrations in ground water to cause problems. Underground water can become
contaminated from industrial, domestic, and agricultural chemicals from the surface. This includes chemicals
such as pesticides and herbicides along with road salt used on roads to melt ice. The most common water-
quality problem in rural water supplies is bacterial contamination from septic tanks(Commonwealth of Kentucky, 2010).
http://www.sswm.info/content/pathogens-contaminants

The Story of Drinking Water
NOTE: Consider ALL Information in this booklet a DIRECT QUOTE from indicated source. Page 20 of 92 NOTE :
http://www.uky.edu/KGS/karst/index.php
According to Kentucky’s Division of Water, “...more than half of Kentucky is underlain by karst”. The rapid
water movement makes any karst terrain sensitive to pollution, whether well-developed karst features are
present or not. (Commonwealth of Kentucky, 2016)
Karst
Karst is a special type of landscape that is formed by the dissolution of soluble rocks, including limestone and
dolomite (Karst Waters Institute). The term “karst” is derived from a Slavic word that means barren, stony ground.
It is also the name of a region in Slovenia near the border with Italy that is well known for its sinkholes and
springs. Geologists have adopted “karst” as the term for all such terrain. The term “karst” describes the
whole landscape, not a single sinkhole or spring. A karst landscape most commonly develops on limestone, but
can develop on several other types of rocks, such as dolostone (magnesium carbonate or the mineral
dolomite), gypsum, and salt. Precipitation infiltrates into the soil and flows into the subsurface from higher
elevations and generally toward a
stream at a lower elevation. Weak acids
found naturally in rain and soil water
slowly dissolve the tiny fractures in the
soluble bedrock, enlarging the joints
and bedding planes. To the right is a
generalized block diagram showing a
typical karst landscape in Kentucky.
Other types of karst features occur
that are not illustrated (Kentucky Geological
Survey, 2017) .
Karst regions contain aquifers that are
capable of providing large supplies of
water. More that 25 percent of the world’s
population either lives on or obtains its
water from karst aquifers. In the United
States, 20 percent of the land surface is
karst and 40 percent of the groundwater
used for drinking comes from karst
aquifers. Natural features of the landscape
such as caves and springs are typical of
karst regions. Common geological
characteristics of karst regions that
influence human use of its land and water
resources include ground subsidence,
sinkhole collapse, groundwater
contamination, and unpredictable water
supply (Karst Waters Institute).
When groundwater is contained in karst areas, successful cleanup is very difficult. Because large openings in
the subsurface – like caves and conduits – are often part of a karst aquifer, groundwater can travel long
distances very rapidly with being filtered through soil or rock. Contaminants can remain in the water supply
at distant locations. Volatile compounds can collect in underground streams and migrate upward into homes
and schools. Special techniques must be applied to contain and remove contaminants in the water, soil, and
rock of karst regions (Karst Waters Institute) .
http://karstwaters.org/educational-resources/what-is-karst-and-why-is-it-
important/

The Story of Drinking Water
NOTE: Consider ALL Information in this booklet a DIRECT QUOTE from indicated source. Page 21 of 92 NOTE :
Interactive map of Kentucky wells and springs:
http://kgs.uky.edu/kgsmap/KGSWater/viewer.asp
Everything we do with water adds
something to it, and sometimes that
causes pollution. The most worrisome
pollutants are animal and chemical
wastes. Livestock operations, industry,
and mining operations must be extra
sure that the water they use is clean
before it is returned to the ecosystem.
A law in the United States called the
Clean Water Act puts limits on how
much of any given substance can be
discharged to open waterways.
After water is used, it goes down the drain, into sewer pipes that carry the used water to a wastewater
treatment plant where it is treated (cleaned) before it is sent back to a natural water source such as a river.
This protects everyone and everything that use the water downstream. Some water is sent back to a water
treatment plant to be recycles and reused again for nonpotable (non-drinking) purposes such as irrigating
parks and car washes.
In the United States, the Safe Drinking Water Act protects our drinking water. In Canada, safe drinking
water is required by the Guidelines for Canadian Drinking Water Quality. These laws help make our drinking
water safe by setting standards of how clean our water must be before we can drink it from our taps. The
rules establish how much of a substance, be it a contaminant like bacteria or gasoline or an additive like
fluoride, can be in our water and still be safe to drink. Your local water utility follows these standards when
cleaning our water.
Everyone must do his or her part to keep our water sources clean. Fresh water in lakes and rivers are part of
the drinking water supply, so it is important not to pollute these sources. Even deep underground aquifers can
be polluted from the surface. For example, oil thrown on the ground can seep into the groundwater (Staggs,
2011).
According to many Susan Reiger in Kentucky Bourbon Country, “The water is a very important ingredient and
is a key reason why the bourbon industry has flourished in Kentucky. The state’s limestone geology means
that iron is filtered out of the water as it flows over the rock and becomes a sweet-tasting mineral water.”
In fact, the same thing that makes Kentucky’s limestone filtered water superior for bourbon production is
also one of the things that make Thoroughbreds flourish here. The calcium and other minerals in the water
and bluegrass give horses strong bones (Kimberi, 2015).
(Natural Resources and Environmental Protection Cabinet, 1991)
The USGS Karst Website with interactive map of aquifers in US: https://water.usgs.gov/ogw/karst/
Information concerning Water Sources in Hardin County:
http://www.uky.edu/KGS/water/library/gwatlas/Hardin/Foreword.htm

The Story of Drinking Water
NOTE: Consider ALL Information in this booklet a DIRECT QUOTE from indicated source. Page 22 of 92 NOTE :
https://s-media-cache-
ak0.pinimg.com/originals/01/3e/6b/013e6bc4bf995fb9cd04e3642a41172e.jp
g
13. Water’s Journey
Nature distributes its fresh water through a variety of land features, creating ecosystems that depend upon
this water. For example, some ecosystems start in the Rocky Mountains, where winter snow melts into
streams and rivers that nourish forests of spruce, willow, and aspen trees that are home to cougar, elk,
moose, mountain goats, big horn sheep, beaver, marmots, and many other animals.
As the rivers flow down from the mountains and rush toward the oceans,
they break down rock, soil, and minerals. This is called weathering.
Smaller bits of rock and minerals are carried downstream. This is called
erosion. Some sediment is deposited along the river banks, helping
create riparian ecosystems that are the habitat of fish, frogs,
waterfowl, and other migrating birds and wildlife. The runoff from snow-
packed peaks provides shelter, food, and travel corridors for wildlife.
Many cities and towns along the way also rely on these freshwater rivers
for their community drinking water.
As the rivers flow into the bays and straits that line the coast, they deposit eroded sand, mud, and silt,
which create new land and habitat called deltas. Deltas create ecosystems such as mudflats, marshes, and
peat bogs. Millions of migrating birds, including sandpipers, yellowlegs, and black-bellied plovers, rely on this
water ecosystem being clean and healthy. People also depend on clean water in the deltas for sail boarding,
boating, fishing, and other activities.
Finally the rivers empty into the ocean, forming nutrient-rich ocean ecosystem. Kelp forests are nurseries
for smaller marine life which become food for schools of larger fish, sea birds, and marine animals such as
harbor seals, killer whales, octopodes, and sea stars (Staggs, 2011).
https://www.fcwa.org/story_of_water/html/story.htm
Page 12

The Story of Drinking Water
NOTE: Consider ALL Information in this booklet a DIRECT QUOTE from indicated source. Page 23 of 92 NOTE :
14. Canadian Moose Populations
As water flows from the Canadian Rockies, along rivers and deltas, and finally to lakes or even the ocean, it
creates areas of prime ecosystem habitat for a variety of animals. Wherever bogs, wetlands, marshes,
streams, and ponds occur, the moose of Canada and the northern United States may be found. They like
areas that mix meadows, mixed coniferous forest (taigas), and ample amounts of willow and aspen to eat.
Many Canadian provinces have healthy and large moose populations. In Nova Scotia, however, populations are
on the decline with less than 1,000 on the mainland. Nova Scotia officially listed moose as an endangered in
2003. The province’s moose management program asks citizens to officially report any moose sighting so an
accurate count of the current moose population can be determined (Staggs, 2011).
Solve the Problem Citing evidence found in the chart above and the articles “Moose Populations Decline in
Minnesota, Ontario” & A Deepening Mystery: Of the nine Canadian provinces in the above graph, which three provinces have the most successful water-
related ecosystems for moose populations?
Which problems with moose populations are caused by humans? What problems with moose populations are caused by nature?
How do water resources affect the success of moose populations? (Staggs, 2011)
With a partner, brainstorm some ideas to improve moose populations?
Create a graph of the above data. Make sure to have all parts of a science graph.

The Story of Drinking Water
NOTE: Consider ALL Information in this booklet a DIRECT QUOTE from indicated source. Page 24 of 92 NOTE :
Moose Populations Decline in Minnesota, Ontario
By Rachael Leason From Great Lakes Echo March 15, 2010
Warmer temperatures may be the cause of declining moose populations in northeast Minnesota.
A model by the Minnesota Department of Natural Resources shows moose numbers dropping by 15 percent each
year over the long-term, according to an aerial survey.
The agency estimates that there were 7,600 moose in January 2009. That number dropped to 5,500 this year.
There are also fewer baby moose — numbers fell to a record low of 28 calves per 100 cows. Ontario is
experiencing a similar decline in reproduction rates, according to the province’s Ministry of Natural Resources.
Minnesota moose are dying for a number of reasons, said Mark Lenarz, group leader for the department in Grand
Rapids, Minn.
The ultimate cause is climate change, but parasites and collisions with vehicles are also killing off individual
animals. Nearly 70 percent of 150 adult moose with radio collars have died since 2002 because of diseases and parasites, according the department.
The most common parasite is brain worm, Lenarz said. Virtually all white-tailed deer carry the long, threadlike worm.
“It does not affect deer, but it’s invariably fatal to moose,” he said.
Winter ticks, which attach to moose and feed from their blood, are found throughout Minnesota, Ontario, Alberta and Manitoba. Lenarz found one animal infested with more than 70,000 to 80,000 ticks.
“Needless to say, it’s very irritating,” he said. “Moose tend to rub up against tree and rocks in attempt to dislodge
ticks. Consequently, they rub off extensive areas of hair.”
Some moose lose up to 80 percent of their body hair. Death can result from loss of blood or insulation, Lenarz said.
Moose mortality is also caused in part by collisions with vehicles and wolf predation. In Minnesota, approximately 15 percent of 150 collared moose died from fender benders since 2002, according to the department.
Six deaths were the result of wolf attacks in northeast Minnesota.
The opposite is true in Michigan’s Upper Peninsula, where moose have increased slowly due to wolf predation. That’s because the wolves keep deer populations low; thus reducing the chance for moose to contract deadly
parasites.
“ Wolf predation is a very effective control on deer density in such deep snow areas, so essentially there is a deer-
free area in winter where moose density is highest,” said Rolf Peterson, wildlife ecology research professor at Michigan Technological University, in an e-mail. “It is possible that this reduces the rate at which moose acquire
brain worm, which most moose biologists think is an important reason for the moose decline in Minnesota.”
Moose were re-introduced to Michigan in 1985 and now number in the hundreds, Peterson said.
Peterson studies the wolves and moose on Isle Royale and published a book on the relationship. He’s also chair of
the Minnesota Moose Advisory Committee.
The ultimate cause of moose decline in northeast Minnesota is climate change, Lenarz said.
Moose aren’t adapted to warm weather and prefer the cold.
When temperatures exceed 57 degrees in the summer and 23 degrees in the winter, moose have to increase their metabolic rate, Lenarz said. This impairs the animal’s immune system and increases its respiration rate.
“Warmer temperatures from climate change are making ideal conditions for diseases and parasites to become fatal to moose,” he said.
Lenarz isn’t sure what will happen to Minnesota moose. Peterson expects deer populations to increase if moose
levels get too low.
The species will likely persist in the foreseeable future, according to a report by the Moose Advisory committee. But
monitoring is critical.
The Minnesota Department of Natural Resources conducts aerial surveys every January to observe moose numbers
and uses models to estimate the entire population.
The committee also makes yearly recommendations, like keeping white-tailed deer populations low to reduce parasite-related deaths.
“At this point, all we can do it watch,” Lenarz said. “We can manage habitat to make sure we’re not losing it. That
may simply delay declining populations.
“There’s no way we can control climate, so there’s not an awful lot we can do,” he said. (Gleason, 2010)

The Story of Drinking Water
NOTE: Consider ALL Information in this booklet a DIRECT QUOTE from indicated source. Page 25 of 92 NOTE :
ON A WINTER DAY IN EARLY MARCH, biologist
Michelle Carstensen got a text message from a moose.
“He was a five-year-old bull moose in his prime,”
Carstensen says. “He should have been fat and happy,
loving life.” He wasn’t. The text message said he was
dead.
Carstensen and her team at the Minnesota Department of
Natural Resources had captured the animal a year earlier
and outfitted him, and scores of other moose, with high-
tech GPS collars and mortality sensors in an effort to solve
a pressing wildlife mystery: During roughly the past
decade, the moose population in northwestern
Minnesota has plunged from 4,000 animals to just 100.
Moose numbers are declining fast in northeastern
Minnesota, too, and as far away as central and southern
New Hampshire.
The text message meant that another piece of the puzzle
was lying in the snow in the North Woods—if the wildlife
biologists could get there before the dead moose rotted or
was eaten. So Carstensen gathered up the equipment
needed to drag a 1,000-pound carcass out of the forest—
snowmobiles and winches—and raced up the highway
from her office in Forest Lake toward the moose’s GPS
location some 240 miles away near Grand Marais.
In the woods, the snow was too deep for snowmobiles, so Carstensen and her colleague snowshoed in from the
nearest road. They had suspected that wolves might already be dining, since the motion-sensitive mortality detector
kept going on and off, as if something were tugging at the corpse. Sure enough, when Carstensen got close and
gave a wolf howl, “the wolves all howled back,” she says.
By the time the team reached the moose, the wolf pack had moved away. The kill proved to be an enigma. “A bull
like that should be able to fight wolves off,” Carstensen says. A rank smell was one clue as to why it couldn’t.
The bull had a rotted liver, caused by a secondary infection and a parasite called a liver fluke. The biologists’ notes
also showed that the animal had been behaving abnormally—walking in circles—when the team radio-collared it,
strong evidence of an infection from a parasitic brain worm that can weaken and kill moose.
The Tiny Taking Down the Mighty
Of course, parasites and wolves have always been around. So “something must have changed in the last decade
and a half that makes the moose more susceptible,” Carstensen says. Climate change is a prime suspect, since
Minnesota has experienced a series of warmer winters—but many scientists don’t think temperatures have warmed
fast enough to cause such a steep decline. Adding to the perplexity is the fact that moose are doing just fine in
Quebec, Ontario, Alaska and Maine. The thriving population in Maine is especially important, because the state is
home to an estimated 60,000 to 70,000 moose, more than the other lower 48 states combined. “It’s a really mixed
bag across Canada and the U.S.,” says Lee Kantar, the moose biologist for Maine. “You can’t have Quebec right
next to us with increasing moose populations and have this talk about doom and gloom.”
Studies spawned by alarm over the U.S. declines are seeking answers to the problem. In early 2013, Minnesota
biologists outfitted 110 adult moose with GPS collars and mortality sensors—and a year later added 36 more to
replace those that already had died. They also put collars on 34 calves in May 2013. In a similar effort, New
Hampshire and Maine biologist radio-collared 103 moose, half of them calves, in January 2014. The devices not
only track locations, they also send messages to researchers when an animal may be dead, making it possible for the
biologists to race in to collect carcasses or samples for analysis. Other studies are examining moose habitat to figure
out if the animals are finding sufficient food and cover. “The great thing is that moose are finally getting the
attention that they needed,” says Peter Pekins, professor of wildlife ecology at the University of New Hampshire.
The Story of Drinking Water
NOTE: Consider ALL Information in this booklet a DIRECT QUOTE from indicated source. Page 26 of 92 NOTE :
By March 2014, only 9 of the 34 Minnesota radio-collared calves were still alive. “That was a surprise,” says Glenn
DelGiudice, moose researcher for the Minnesota Department of Natural Resources. “The mortality rate was much
higher than we expected.” Wolves got most of them, while bears killed a few.
The adults in the study haven’t fared well either, with more than a fifth dying in just the first year. Half succumbed
to infections and other ills. The others were brought down by wolves, but like the five-year old bull, many probably
had underlying health problems. “To me, it seems to be a shotgun of causes,” Carstensen says.
To some researchers, however, one cause looms largest—Parelaphostrongylus tenuis, or brain worm. This tiny
parasite coexists happily with white-tailed deer, living in the connective tissue around the brain and spinal cord (or
the meninges). In a complex life cycle, the worms spew out eggs that hatch in the deer’s lungs. The deer coughs up,
swallows and excretes the worm larvae, which find homes in snails and slugs. Other deer get infected eating the
snails accidently while nibbling on forest-floor greenery. “Nearly 90 percent of deer get infected in their first two
years of life,” explains Murray Lankester, retired biologist from Lakehead University in Thunder Bay, Ontario, who
has studied the effects of P. tenuis extensively. In areas with lots of deer, moose pick up the worm, too.
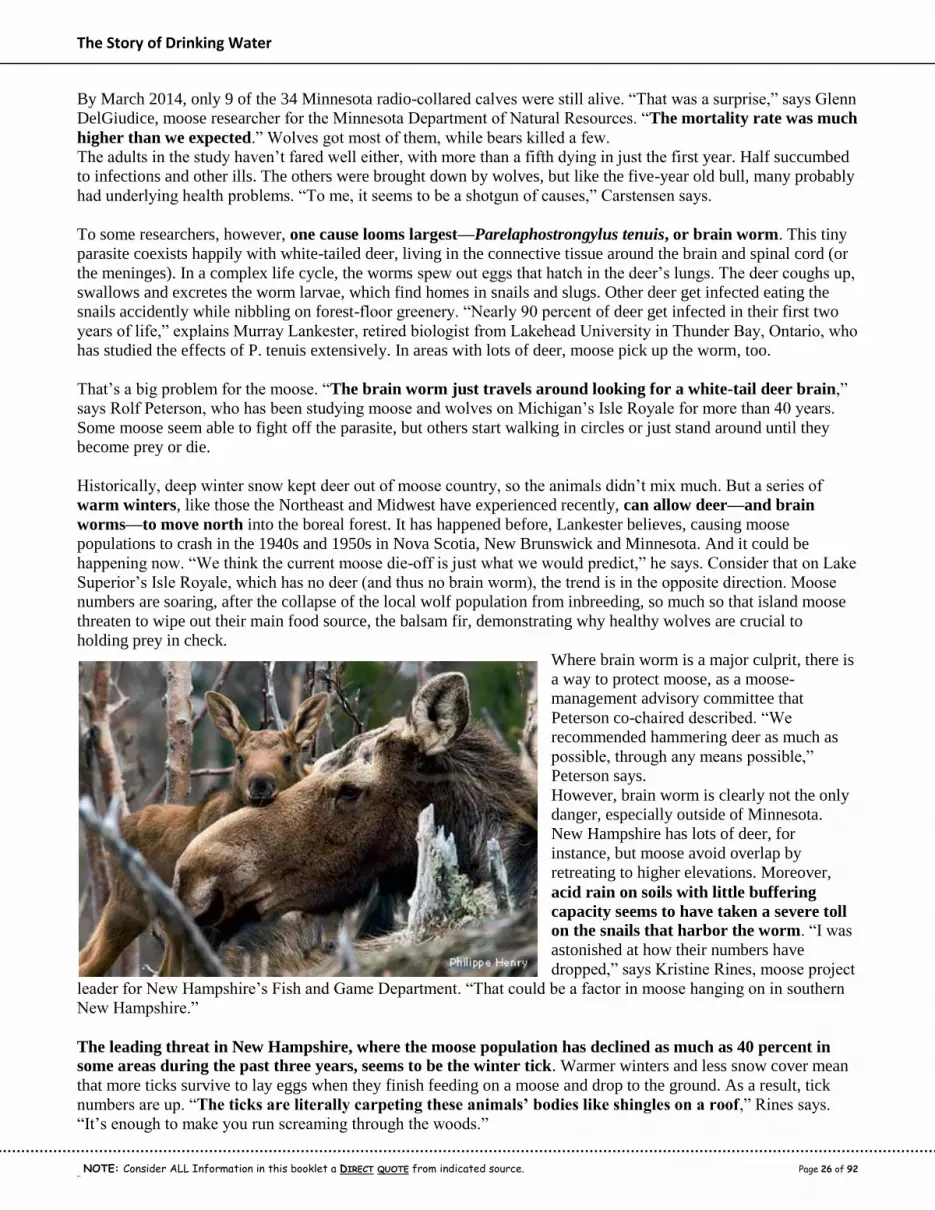
That’s a big problem for the moose. “The brain worm just travels around looking for a white-tail deer brain,”
says Rolf Peterson, who has been studying moose and wolves on Michigan’s Isle Royale for more than 40 years.
Some moose seem able to fight off the parasite, but others start walking in circles or just stand around until they
become prey or die.
Historically, deep winter snow kept deer out of moose country, so the animals didn’t mix much. But a series of
warm winters, like those the Northeast and Midwest have experienced recently, can allow deer—and brain
worms—to move north into the boreal forest. It has happened before, Lankester believes, causing moose
populations to crash in the 1940s and 1950s in Nova Scotia, New Brunswick and Minnesota. And it could be
happening now. “We think the current moose die-off is just what we would predict,” he says. Consider that on Lake
Superior’s Isle Royale, which has no deer (and thus no brain worm), the trend is in the opposite direction. Moose
numbers are soaring, after the collapse of the local wolf population from inbreeding, so much so that island moose
threaten to wipe out their main food source, the balsam fir, demonstrating why healthy wolves are crucial to
holding prey in check.
Where brain worm is a major culprit, there is
a way to protect moose, as a moose-
management advisory committee that
Peterson co-chaired described. “We
recommended hammering deer as much as
possible, through any means possible,”
Peterson says.
However, brain worm is clearly not the only
danger, especially outside of Minnesota.
New Hampshire has lots of deer, for
instance, but moose avoid overlap by
retreating to higher elevations. Moreover,
acid rain on soils with little buffering
capacity seems to have taken a severe toll
on the snails that harbor the worm. “I was
astonished at how their numbers have
dropped,” says Kristine Rines, moose project
leader for New Hampshire’s Fish and Game Department. “That could be a factor in moose hanging on in southern
New Hampshire.”
The leading threat in New Hampshire, where the moose population has declined as much as 40 percent in
some areas during the past three years, seems to be the winter tick. Warmer winters and less snow cover mean
that more ticks survive to lay eggs when they finish feeding on a moose and drop to the ground. As a result, tick
numbers are up. “The ticks are literally carpeting these animals’ bodies like shingles on a roof,” Rines says.
“It’s enough to make you run screaming through the woods.”

The Story of Drinking Water
NOTE: Consider ALL Information in this booklet a DIRECT QUOTE from indicated source. Page 27 of 92 NOTE :
Larval ticks climb onto moose as the animals brush by bushes and trees in the fall and then feed through the winter
while growing into adults. Rines, Pekins and others have counted more than 100,000 ticks on a single moose.
With that many insects, the moose can’t eat enough to keep replacing the blood the ticks suck out and end up
cannibalizing their own muscles for protein before dying. When the researchers find the carcasses, “these animals
all have full stomachs of what we would describe as good browse,” Pekins says. “We believe they simply run out
of gas, or in this case, the protein required to counteract blood loss. The tick loads seem like they couldn’t be much
higher. It’s a very, very sad story.”
It could get even sadder. Both the brain worm and the tick problems are expected to get worse as global climate
continues to warm. Milder winters with less snow cover enable more deer to move into moose habitat. And little or
no snow in spring, when engorged adult ticks fall off moose to lay eggs, boosts tick survival. Ticks, though, are
unlikely to wipe out moose entirely, because the insects prey on few other hosts. As moose numbers drop, so will
tick numbers, giving moose a chance to bounce back.
Giving Moose a Boost
Wildlife managers also have other levers to pull to give moose a boost. They can reduce the white-tailed deer
population in some areas or create more browse and prime moose habitat by cutting openings in the forest. In the late 1970s, for instance, the spruce budworm, a native
species that experiences periodic outbreaks as part of a natural
cycle, cut a devastating swath through Maine’s forest, and timber
companies stepped up logging to salvage the timber. “That created
moose nirvana,” Pekins says. “A population explosion of moose
swept out of Maine into New Hampshire, Vermont and even a
little bit of Massachusetts.” It could happen again. Another spruce
budworm infestation is knocking on Maine’s northern door.
“Maybe this is how we will grow more moose again,” Pekins
says.
And so the mystery of the disappearing moose will not come to a
simple conclusion. The moose’s prospects depend on complex
and interacting ecological factors and relationships, and the
animal’s numbers will rise and fall as those factors evolve. With
climate change bringing increasingly mild winters, the species
could disappear in some regions, wiped out by a triple whammy
of parasites, pests and predators. But this massive symbol of the
North Woods likely will continue to survive, even thrive, in other
regions—and the new research will lay the groundwork for
making that happen.
(Carey, 2014)

The Story of Drinking Water
NOTE: Consider ALL Information in this booklet a DIRECT QUOTE from indicated source. Page 28 of 92 NOTE :
15. Water Cycle Words
Would you believe that a dinosaur could have once used your last drink of water? Water on
Earth today has been here for millions of years. Because of the hydrologic cycle (water cycle),
water moves from Earth to the air to Earth again. It changes from solid to liquid to gas, over
and over again.
Hydrologic cycle (water cycle) vocabulary Aquifer – An underground water source
Condensation – Water vapor cooling and becoming a liquid
Evaporation – Liquid water hearting and becoming a gas
Groundwater—Water under the ground that supplies springs
and sells
Hydrologic – Relating to water Percolation – Water moving downward through opening in the
soil Precipitation – Rain, snow, sleet, or hail Transpiration – Process of water vapor transferring from
living plants to the atmosphere Surface runoff – Storm water that runs along Earth’s surface
into lakes and rivers Water vapor – Water as a gas in the air
Water evaporates. It travels into the air and becomes part
of a cloud. It falls to Earth as precipitation. Then it
evaporates again. This repeats in a never-ending cycle.
Precipitation creates runoff that
travels over Earth’s surface and
helps to fill lakes and rivers. It
also percolates or moves
downward through openings in the
soil to replenish aquifers under
the ground. Some places receive
more precipitation that others.
These areas may be close to large
bodies of water that allow more
water to evaporate and form
clouds. Other areas receive less
precipitation. Often these areas
are far from water or near
mountains. As clouds move up and
over mountains, the water vapor
condenses to form precipitation
and freezes. Snow falls on the
peaks. When the snow melts, it flows into the rivers and lakes or seeps into the ground (Staggs, 2011).
https://www.fcwa.org/story_of_water/html/story.htm
Solve the Problem: Create a model of the hydrologic cycle, identifying each part of the cycle.
What role does the sun play in the water cycle? How do you think the hydrologic cycle will be affected by global
warming? (Staggs, 2011)
https://www.fcwa.org/story_of_water/html/story.htm
https://water.usgs.gov/edu/watercycle.html

The Story of Drinking Water
NOTE: Consider ALL Information in this booklet a DIRECT QUOTE from indicated source. Page 29 of 92 NOTE :
17. Extreme Weather
The hydrologic cycle plays a major role in weather patterns around the world. Extreme weather conditions
almost always involve water. Consider thunderstorms, hurricanes, and floods (Staggs, 2011).
Thunderstorms result from unstable air
masses. An unstable air mass results
when the air in the lowest layers of an
air mass are unusually warm and humid or
the upper layers of an air mass are
unusually cool or both conditions occur
simultaneously. Pockets of rising near-
surface air in an unstable air mass
expand and cool, and as some of the
water vapor present condenses into a
cloud it releases heat, which then makes
the air parcel even warmer, forcing it to
rise still higher in the atmosphere. This
convection process continues until a tall
convective cloud, a thunderstorm, is
formed (WeatherStreet.com, 2013) . Thunderstorms produce a large amount of rainfall over a particular area,
replenishing water sources and nourishing ecosystems (Staggs, 2011) . Thunderstorms are most common in the
afternoon over land, when daytime heating of the land by the sun causes the lower part of the troposphere
to become unstable from higher temperatures and more water vapor in the air. The approach of an upper air
disturbance can result in thunderstorms any time of the day. The fuel for a thunderstorm is water vapor. A
thunderstorm stabilizes the atmosphere by using up the excess water vapor (WeatherStreet.com, 2013) .
Hurricanes develop in warm, tropical regions where the water is at
least 27oC. The storms also require moist air and converging
equatorial winds. The fuel for a hurricane is water vapor. Most
Atlantic hurricanes begin off the west coast of Africa, starting as
thunderstorms that move out over the warm equatorial ocean waters
(Hurricane Management Group, LLC, 2014). When massive amounts of warm, moist
ocean air evaporates into the troposphere, the part of the upper
atmosphere where weather is created, a low-pressure system is
created nearer the ocean’s surface (Staggs, 2011). A hurricane’s low-
pressure center of relative calm is called the eye (Hurricane Management
Group, LLC, 2014). This low-pressure is fed by more high-pressure air that
tries to displace and equalize it, creating a rotating wind that spirals air inward. The air in the upper
atmosphere continues to twist and gather energy, producing higher and higher winds. When the winds reach
74 miles per hour (119 Kilometers per hour), the storm is classified as a hurricane (Staggs, 2011) . The area
surrounding the eye is called the eye wall, where the storm’s most violent winds occur. The bands of
thunderstorms that circulate outward from the eye are called rain bands. The rotation of a hurricane is a
product of the Coriolis effect. Due to this effect, hurricanes in the Northern Hemisphere rotate
counterclockwise and clockwise in the Southern Hemisphere. The effect bends hurricanes to the right in the
Northern Hemisphere (toward the North Pole) and to the left in the Southern Hemisphere (toward the
South Pole) (Hurricane Management Group, LLC, 2014). In Asia and Australia these storms are referred to as typhoons,
while those occurring in the Indian Ocean are called cyclones. (Mrs. Booker)
https://water.usgs.gov/edu/watercycle.html
http://www.weatherquestions.com/What_causes_thunderstorms.htm
http://hurricanemanagementgroup.com/how-hurricanes-form-what-
causes-hurricane-models/

The Story of Drinking Water
NOTE: Consider ALL Information in this booklet a DIRECT QUOTE from indicated source. Page 30 of 92 NOTE :
Floods occur when excess water overflows banks of a river, stream, reservoir, or drainage area and spreads
across nearby land. Extreme rainfall or snowmelt, storm surges from hurricanes, or breaks in human-made
retaining walls such as dams or levies can cause flooding. The Mississippi River has flooded many times. In
1993, intense rainfall and snowmelt during the spring and summer drained into the Mississippi from
tributaries flowing from 13 states and Canada. This surge of water lasted for 144 days and left the Missouri
and Mississippi Rivers at record high levels. Many drinking water sources were contaminated and some water
treatment plants were flooded. Many drinking water sources were contaminated and some water treatment
plants were flooded. Many people had to boil their water before drinking it to kill the germs until the flood
waters receded.
Dry weather over a long period of time causes drought, when the lack of water depletes water supplies and
prevents ecosystems from thriving. When surface water sources are depleted, the sun’s heat can no longer
create enough evaporation for clouds to form and the land dries out instead. Water utilities may ask
everyone to conserve water and require homeowners to minimize lawn watering. Agricultural crops are
damaged because farmers can’t irrigate their fields. Lightning can spark wildfires in arid areas. The National
Oceanic and Atmospheric Administration (NOAA) monitors areas that may experience extreme droughts by
measuring precipitation, soil moisture, stream flows, and reservoir levels (Staggs, 2011).
Solve the Problem: If your area were experiencing a drought, what measures could you take to conserve
water? (Staggs, 2011)

The Story of Drinking Water
NOTE: Consider ALL Information in this booklet a DIRECT QUOTE from indicated source. Page 31 of 92 NOTE :
18. Reading A Weather Map – Wind
Wind is simply air in motion. Usually in meteorology, when we are talking
about the wind it is the horizontal speed and direction we are concerned
about. For example, if you hear a report of a west wind at 15 mph (24 km/h)
that means the horizontal winds will be coming FROM the west at that
speed.
High and low pressure indicated by lines of equal pressure called isobars.
Although we cannot actually see the air moving we can measure its motion by
the force that it applies on objects. We use a wind vane to indicate the
wind's direction and an anemometer to measure the wind's speed. But even without those instruments we can
determine the direction.
The vertical direction of wind motion is typically very small (except in thunderstorm updrafts) compared to
the horizontal component, but is very important for determining the day to day weather. Rising air will cool,
often to saturation, and can lead to clouds and precipitation. Sinking air warms causing evaporation of clouds
and thus fair weather.
You have probably seen weather maps marked with H's and L's which
indicate high and low pressure centers. Usually surrounding these
"highs" and "lows" are lines called isobars. "Iso" means "equal" and a
"bar" is a unit of pressure so an isobar means "equal pressure". So
everywhere along each line is the pressure has the same value.
Pressure gradient force extends from high pressure to low pressure
With high pressure systems, the value of air pressure along each
isobar increases toward the center with each concentric line. The
opposite is true for low pressure systems in that with each concentric line toward the center represents
lower pressure. Isobars maybe be close together or far apart.
The closer the isobars are drawn together the quicker the air pressure changes. This change in air pressure
is called the "pressure gradient". Pressure gradient is just the difference in pressure between high and low
pressure areas.
The speed of the wind is directly proportional to the pressure gradient meaning that as the change in
pressure increases (i.e. pressure gradient increases) the speed of the wind also increases at that location.
Also, notice that the wind direction (yellow arrows) is clockwise around the high pressure system and
counter-clockwise around the low pressure system. In addition, the direction of the wind is across the
isobars slightly, away from the center of the high pressure system and toward the center of the low
pressure system.
Why does this happen? To understand we need to examine the forces that govern the wind. There are three
forces that cause the wind to move as it does. All three forces work together at the same time.
The pressure gradient force (Pgf) is a force that tries to equalize pressure differences. This is the force
that causes high pressure to push air toward low pressure. Thus air would flow from high to low pressure if
the pressure gradient force was the only force acting on it.
An air mass is a large body of air with generally uniform temperature and humidity. The area over which an
air mass originates is what provides it's characteristics. The longer the air mass stays over its source region,
the more likely it will acquire the properties of the surface below. As such, air masses are associated with
high pressure systems.
There are two broad overarching divisions of air masses based upon the moisture content. Continental air
masses, designated by the lowercase letter 'c', originate over continents are therefore dry air masses.
Maritime air masses, designated by the letter 'm', originate over the oceans and are therefore moist air
masses (National Oceanic and Atmospheric Administration).

The Story of Drinking Water
NOTE: Consider ALL Information in this booklet a DIRECT QUOTE from indicated source. Page 32 of 92 NOTE :
Each of the two divisions are then divided based upon the temperature content of the surface over which
they originate.
Arctic air masses, designated by the letter 'A', are
very cold as they originate over the Arctic or
Antarctic regions.
Polar air masses, designated by the letter 'P', are
not as cold as Arctic air masses as they originate
over the higher latitudes of both land and sea.
Tropical air masses, designated by the letter 'T',
are warm/hot as they originate over the lower
latitudes of both land and sea. Putting both designations together, we have, for example, a
"continental arctic" air mass designated by 'cA', which source is
over the poles and therefore very cold and dry. Continental polar
(cP) is not as cold as the Arctic air mass but is also very dry. Martime polar (mP) is also cold but moist due to its
origination over the oceans. The desert region air masses (hot and dry) are designated by 'cT' for 'continental tropical'.
As these air masses move around the earth they can begin to acquire additional attributes. For example, in winter an
arctic air mass (very cold and dry air) can move over the ocean, picking up some warmth and moisture from the warmer
ocean and becoming a maritime polar air mass (mP) - one that is still fairly cold but contains moisture.
If that same polar air mass moves south from Canada into the southern U.S. it will pick up some of the warmth of the
ground, but due to lack of moisture it remains very dry. This is called a continental polar air mass (cP).
Air mass boundaries
The motion of air mass motion is usually based upon the air flow in the upper atmosphere. As the jet stream
changes intensity and position, it affects the motion and strength of air masses. Where air masses converge,
they form boundaries called "fronts".
Fronts are identified by change of temperature based upon their motion. With a cold front, a colder air mass
is replacing a warmer air mass. A warm front is the opposite affect in that warm
air replaces cold air. There is also a stationary front, which, as the name implies,
means the boundary between two air masses does not move.
The motion of air masses also affects where a good portion of precipitation
occurs. The air of cold air masses is more dense than warmer air masses.
Therefore, as these cold air masses move, the dense air undercuts the warmer
air masses forcing the warm air up and over the colder air causing it to rise into
the atmosphere.
So fronts just don't appear at the surface of the earth, they have a vertical structure or slope to them as
well. Warm fronts typically have a gentle slope so the air rising along the
frontal surface is gradual. With warm fronts, the gentle slope favors a broad
area of rising air so there is typically widespread layered or stratiform
cloudiness and precipitation along and to the north of the front. The slope of
cold fronts, being much more steep forces air upward more abruptly. This can
lead to a fairly narrow band of showers and thunderstorms along or just ahead
of the front.
There is another boundary that exists except this boundary divides moist air from dry air. Called a dry line
this boundary will separate moist air from the Gulf of Mexico (to the east) and dry desert air from the
southwestern states (to the west). It typically lies north-south across the central and southern high Plains
states during the spring and early summer. The dry line typically advances eastward during the afternoon and
retreats westward at night. (National Oceanic and Atmospheric Administration)
http://www.srh.noaa.gov/jetstream/synoptic/airmass.html
http://www.srh.
noaa.gov/jetstre
am/synoptic/air
mass.html
http://www.srh.noaa.gov/jetstream/synoptic/airmass.html

The Story of Drinking Water
NOTE: Consider ALL Information in this booklet a DIRECT QUOTE from indicated source. Page 33 of 92 NOTE :
18. Reading A Weather Map – Fronts
Fronts are usually detectable at the surface in a number of ways. Winds often "converge" or come together
at the fronts. Also, temperature differences can be quite noticeable from one side of a front to the other
side. Finally, the pressure on either side of a front can vary significantly.
Cold Front
Cold fronts are depicted by blue line with triangles pointing in the direction of motion. Cold fronts demarcate
the leading edge of a cold air mass displacing a warmer air mass.
Phrases like "ahead of the front" and "behind of the front" refer to its motion. So being "ahead
of the cold front" is being in the "warm" air mass and "behind of the cold front" is in the cold
air mass.
Also remember however, the terms "cold" and "warm" are relative. So, it is still called a cold
front even in summer if the temperature only lowers from, for example, 95°F (35°C) ahead of the front to
near 90°F (32°C) behind the front.
Cold fronts nearly always extend anywhere from a south direction to a west direction from the center of low
pressure areas and never from the center of high pressure systems.
Warm Front
A warm front is the leading edge of a relatively warmer air mass replacing a colder air mass. A warm front
are depicted by a red line with half-moons located on the side of the direction of its motion.
Like cold front, warm fronts also extend from the center of low pressure areas but on nearly
always on the east side of the low.
Here is an example of a location that experiences typical warm frontal passage followed by a cold
frontal passage: Clouds lower and thicken as the warm front approaches with several hours of light to
moderate rain. Temperatures are in the 50s with winds from the east. As the warm front passes, the rain
ends, skies become partly cloudy and temperatures warm into the mid 70s. Winds become gusty from the
south. A few hours later, a line of thunderstorms sweeps across the area just ahead of the cold front. After
the rain ends and the front passes, winds shift to the northwest and temperatures fall into the 40s and
skies clear.
Stationary Front
If the front is essentially not moving (i.e. the two air masses on either side are not moving perpendicular to
the front) it is called a stationary front. Stationary front are depicted by an alternating red and
blue line with a triangle on the blue portion and half moon on the opposite side of the red portion
of the line.
A cold front (or warm front) that stops moving becomes a stationary front. The difference in
temperature and wind direction from one side of a stationary front to the other is generally not large but
there can be times where the difference is stark.
Occluded Front
The cold air mass is moving faster than the cool air mass. As the two fronts converge the cold air undercuts
the cooler air mass.
Cold fronts typically move faster than warm fronts, so in time they can "catch up" to warm
fronts. As they do the warm air mass is forced up forming an occlusion.
The surface location of the occluded front is directly below the convergence point of the warm,
cool and cold air masses. Occluded fronts points to a decrease in intensity of the parent weather
system and are indicated by a purple line with alternating triangles and half-moons on the side of
its motion.
(National Oceanic and Atmospheric Administration)

The Story of Drinking Water
NOTE: Consider ALL Information in this booklet a DIRECT QUOTE from indicated source. Page 34 of 92 NOTE :
While there is no difference in how they are depicted on a weather map, there are two types of occlusions;
cold and warm.
The cool air mass is out running the cold air mass. But the because the
cold air mass is more dense, the cool (less dense) air is forced up.
Cold occlusions are the most common where the cold front over takes the
warm front and also undercuts the cooler air mass ahead of the warm
front.
Warm occlusions occur when the air associated with the "cold" front is
actually not a cold as the air mass associated with the warm front. The
warm air is forced up as before but the colder, more dense, air mass
ahead of the warm front remains at the surface forcing the air mass
associated with the cold front up as well.
Other Boundaries
Dry Line
Dry air, being more dense undercuts the light moist air forcing it up.
A dryline marks the boundary between a moist air mass and dry air mass. It typically lies north-
south across the central and southern high Plains states during the spring and early summer,
where it separates moist air from the Gulf of Mexico (to the east) and dry desert air from the
southwestern states (to the west).
The dry line typically advances eastward during the afternoon
and retreats westward at night. However, a strong storm
system can sweep the dry line eastward into the Mississippi
Valley, or even further east, regardless of the time of day.
A typical dry line passage results in a sharp drop in humidity, a
rise in temperatures, clearing skies, and a wind shift from
south or southeasterly to west or southwesterly. (Blowing dust and rising temperatures also may follow,
especially if the dry line passes during the daytime.) These changes occur in reverse order when the dry line
retreats westward.
Since drier air is more dense than moist air, as the dryline moves east it forces moist air up into the
atmosphere. Therefore, severe and sometimes tornadic thunderstorms can develop along a dry line or in the
moist air just to the east of it.
Squall Line
This is a line of thunderstorms that generally form along a front but the storms move ahead of the front. As
the rain cooled air under the thunderstorms begins to surge forward new thunderstorms form on
the leading edge of the outflow.
The outflow acts like a cold front with an increase of forward speed and therefore an increase in
forward speed of the line of thunderstorms. Squall lines are most notably seen in derechos.
Other Symbols
Trough
A trough is not a boundary but an elongated area of lower air pressure. There are changes in wind
direction across a trough but there is no change in air mass.
While not specificity a surface boundary, troughs reflect the change in atmospheric conditions in
the upper atmosphere. As such, troughs can be areas where showers and thunderstorms can form.
(National Oceanic and Atmospheric Administration)
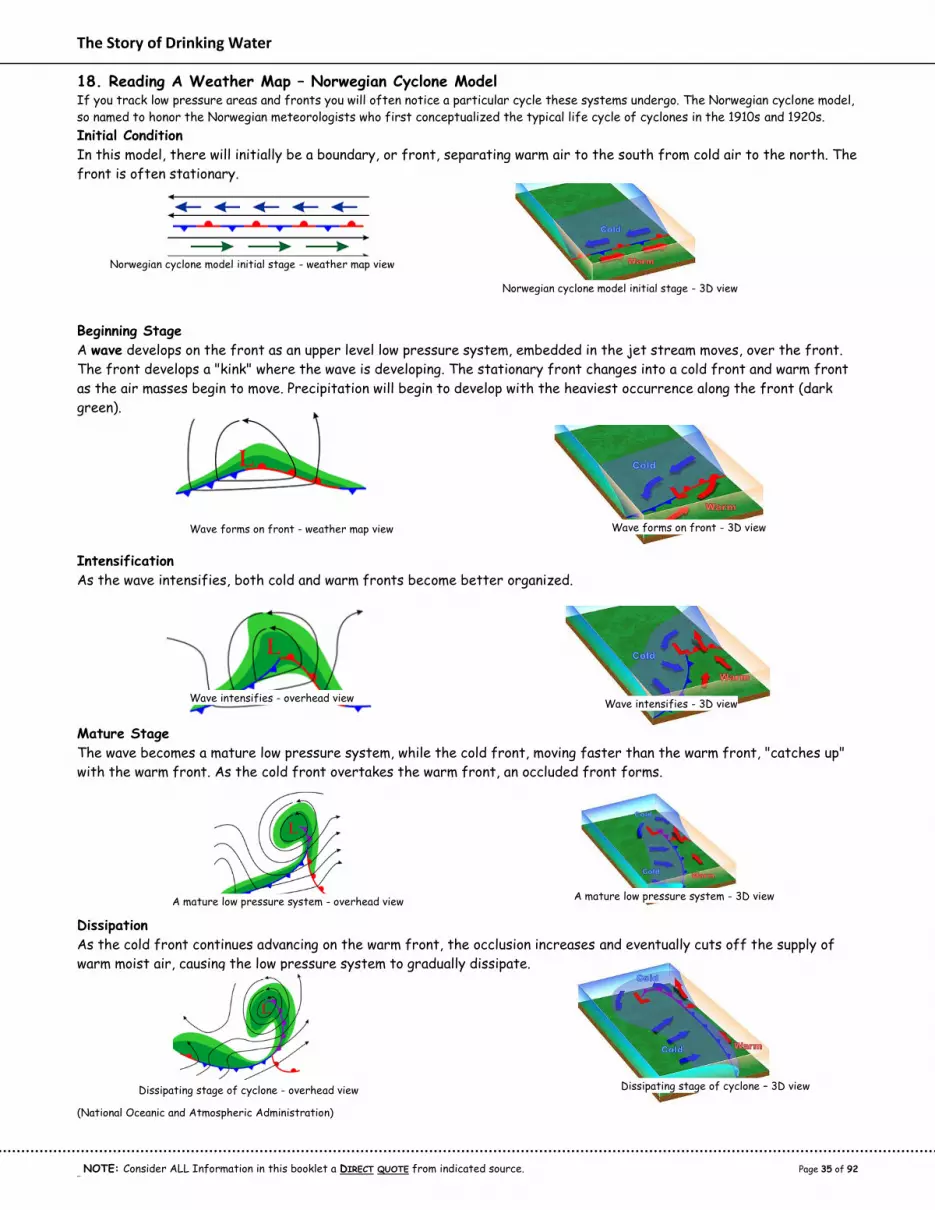
The Story of Drinking Water
NOTE: Consider ALL Information in this booklet a DIRECT QUOTE from indicated source. Page 35 of 92 NOTE :
18. Reading A Weather Map – Norwegian Cyclone Model If you track low pressure areas and fronts you will often notice a particular cycle these systems undergo. The Norwegian cyclone model,
so named to honor the Norwegian meteorologists who first conceptualized the typical life cycle of cyclones in the 1910s and 1920s.
Initial Condition
In this model, there will initially be a boundary, or front, separating warm air to the south from cold air to the north. The
front is often stationary.
Beginning Stage
A wave develops on the front as an upper level low pressure system, embedded in the jet stream moves, over the front.
The front develops a "kink" where the wave is developing. The stationary front changes into a cold front and warm front
as the air masses begin to move. Precipitation will begin to develop with the heaviest occurrence along the front (dark
green).
Intensification
As the wave intensifies, both cold and warm fronts become better organized.
Mature Stage
The wave becomes a mature low pressure system, while the cold front, moving faster than the warm front, "catches up"
with the warm front. As the cold front overtakes the warm front, an occluded front forms.
Dissipation
As the cold front continues advancing on the warm front, the occlusion increases and eventually cuts off the supply of
warm moist air, causing the low pressure system to gradually dissipate.
(National Oceanic and Atmospheric Administration)
Norwegian cyclone model initial stage - weather map view
Norwegian cyclone model initial stage - 3D view
Wave forms on front - weather map view Wave forms on front - 3D view
Wave intensifies - overhead view Wave intensifies - 3D view
A mature low pressure system - overhead view A mature low pressure system - 3D view
Dissipating stage of cyclone - overhead view Dissipating stage of cyclone – 3D view

The Story of Drinking Water
NOTE: Consider ALL Information in this booklet a DIRECT QUOTE from indicated source. Page 36 of 92 NOTE :
18. Reading A Weather Map – Fronts Continued
https://socratic.org/questions/what-are-the-main-types-of-fronts

The Story of Drinking Water
NOTE: Consider ALL Information in this booklet a DIRECT QUOTE from indicated source. Page 37 of 92 NOTE :
http://www.srh.noaa.gov/jetstream/synoptic/synoptic_review.html
Weather fronts are -- The point where two air masses meet. There are four types of fronts: warm, cold, stationary and occluded.
cold fronts: Cold fronts form when dense masses of cold air advance into a mass of warm air and push the lighter warm air
up out of its way. As the warm air rises, it often forms cumuli or cumulonimbi clouds. These clouds are responsible for
thunderstorms, which is why thunderstorms are often seen along the leading edge of a cold front. rain, snow and cold
weather are typically associated with cold fronts.
warm fronts: Warm fronts form When a warm air mass runs into a cold air mass, the warm air is forced to rise above the
cold air. The transition zone where a warm air mass collides with and is replacing a dense cold air mass is called a warm
front. This collision causes slowly rising clouds. Generally, along the trailing edge of the warm front, nimbostratus clouds
are formed, which bring a drizzle or slow, steady rain to the area. sunny, warm weather is associated with warm fronts.
stationary fronts: A stationary front forms when a cold or warm front stops moving, which happens when two masses of
air are pushing against each other but neither is powerful enough to move the other and Winds blowing parallel to the
front. A stationary front can last for days. If the wind direction changes the front will start moving again, becoming
either a cold or warm front, Or the front may break apart. Because a stationary front marks the differences between two
air masses, there are often changes in air temperature and wind on opposite sides of it. cloudy weather and rain or snow
are often associated with this type of front.
occluded fronts: a occluded front forms when a cold front overtakes a warm front. A wide variety of weather can be
found along an occluded front, with thunderstorms possible, but usually their passage is associated with a drying of the air
mass. Precipitations and clouds are associated with this front http://figurskiweather.weebly.com/weather-fronts.html

The Story of Drinking Water
NOTE: Consider ALL Information in this booklet a DIRECT QUOTE from indicated source. Page 38 of 92 NOTE :
18. Reading A Weather Map Check your Understanding
1) The force that results from the rotation of the earth is called the ______.
a. ) Divergence b. ) Coriolis c. ) Pressure gradient d. ) Frictional
2) A mid-level cloud deck that has a heap-like appearance would be called?
a. ) Stratocumulus b. ) Cumulus c. ) Altostratus d. ) Altocumulus
3) An east wind means that the air is moving from west to east. True / False
4) The force that results from roughness of the earth’s surface is called the ___ force.
a. ) Divergence b. ) Coriolis c. ) Pressure gradient d. ) Frictional
5) Sleet will typically occur to the north of a warm front? True / False
6) A high level cloud that forms in a layer would be called?
a. ) Cirrostratus b. ) Altostratus c. ) Cirrocumulus d. ) Cirrus
7) The temperature at the station in the weather plot below is
8) The air pressure at the station in the above weather plot is
9) The dewpoint temperature at the above weather plot is
10) The wind direction and speed at the station in the weather plot above is
a. ) Northwest at 10 knots
b. ) Northwest at 15 knots
c. ) Southeast at 15 knots
d. ) Southeast at 20 knots
11) The force that results from equalizing pressure differences is called the ___ force.
a. ) Divergence b. ) Coriolis c. ) Pressure gradient d. ) Frictional
12) Sleet and freezing rain are caused by a cold layer aloft with temperatures at or below freezing. True / False
13) Which of the following is not required for precipitation?
a. ) A source of lift
b. ) Southerly winds
c. ) Condensation nuclei
d. ) Moisture
14) Which one of these clouds can produce moderate to heavy precipitation?
a. ) Stratocumulus b. ) Cumulonimbus c. ) Altostratus d. ) Nimbostratus

The Story of Drinking Water
NOTE: Consider ALL Information in this booklet a DIRECT QUOTE from indicated source. Page 39 of 92 NOTE :
(National Oceanic and Atmospheric Administration)

The Story of Drinking Water
NOTE: Consider ALL Information in this booklet a DIRECT QUOTE from indicated source. Page 40 of 92 NOTE :
19. Clouds
https://www.thinglink.com/scene/716006590028709889
Cirrus Cloud – These are high up in the troposphere and are made of ice crystals creating a wispy shape.
Stratus Cloud – Thick layer of high cloud that covers most of the sky.
Cumulus – Puffy clouds with small low bases. These clouds indicate good weather. https://www.thinglink.com/scene/716006590028709889
http://figurskiweather.weebly.com/weather-fronts.html

The Story of Drinking Water
NOTE: Consider ALL Information in this booklet a DIRECT QUOTE from indicated source. Page 41 of 92 NOTE :
20. Water Sources
Almost every body of fresh water is a potential source of drinking water supplies. Surface water in
particular is subject to a wide variety of pollutants, from direct dumping of industrial waste spills, surface
runoff, activities in the water such as boating, and more recently, contaminants that come from what people
ingest, such as prescription drugs, and products they use, such as cleaning fluids, that survive the
wastewater treatment process and are released back into the ecosystem. Water supplies in North America,
particularly in towns and cities, are usually managed by utilities. Utilities are companies or government
agencies that supply electricity, gas, or water to the public. The water utility often manages three aspects
of the water supply: source, treatment, and distribution.
The source can either be surface water, such as lakes and rivers, or groundwater, which is water below the
Earth’s surface. The majority of people served by public water systems in the United States and in Canada’s
major cities are served by surface water. Some surface water sources are created by dams that are built to
hold rivers back or capture the flow of natural springs. The water collected behind the dam is called a
reservoir. This water is then piped to a water treatment plant through transmissions pipes. Dams are also
used to protect areas from flooding and, if they are built with turbines, dams can create electricity. These
are called hydroelectric dams.
Ground water can be found in the porous areas of underground rock, clay, sand, and gravel. Precipitation
evaporates, runs into streams and rivers, and soaks into the soil. Roots of trees and plants may absorb this
water, or it can continue to percolate through various layers of sediment and rock formations. Water fills in
all of the pores (or spaces) between the grains of rock. Some rock layers are more porous than others and
able to trap large amounts of water in what’s called an aquifer. The top of an aquifer is called the water
table. Ground water is pumped out of the rock layers through drilled wells. Aquifers can be recharged, or
refilled, by more precipitation soaking through the soil and rock layers. If an aquifer is completely full, a
swamp, lake, or spring may form on the surface. If too much water is pumped out for irrigation or a drought
occurs, an aquifer can be depleted. As water is pumped out, the surface area of the land drops, and the land
becomes more susceptible to flooding. This is called subsidence. Because most pollutants are filtered out as
the water percolates through soil, ground water is generally cleaner than surface water. Recent regulations,
however, require most groundwater to undergo a certain level of treatment to ensure that it is clean before
it reaches our faucets (Staggs, 2011).
Subsurface water
As precipitation infiltrates into the subsurface soil,
it generally forms an unsaturated zone and a
saturated zone. In the unsaturated zone, the voids—
that is, the spaces between grains of gravel, sand,
silt, clay, and cracks within rocks—contain both air
and water. Although a lot of water can be present in
the unsaturated zone, this water cannot be pumped
by wells because it is held too tightly by capillary
forces. The upper part of the unsaturated zone is
the soil-water zone. The soil zone is crisscrossed by
roots, openings left by decayed roots, and animal
and worm burrows, which allow the precipitation to
infiltrate into the soil zone. Water in the soil is used
by plants in life functions and leaf transpiration, but
it also can evaporate directly to the atmosphere. Below the unsaturated zone is a saturated zone where
water completely fills the voids between rock and soil particles.

The Story of Drinking Water
NOTE: Consider ALL Information in this booklet a DIRECT QUOTE from indicated source. Page 42 of 92 NOTE :
Infiltration replenishes aquifers
Natural refilling of deep aquifers is a slow
process because groundwater moves slowly
through the unsaturated zone and the
aquifer. The rate of recharge is also an
important consideration. It has been
estimated, for example, that if the aquifer
that underlies the High Plains of Texas and
New Mexico—an area of slight
precipitation—was emptied, it would take
centuries to refill the aquifer at the present small rate of replenishment. In contrast, a shallow aquifer in an
area of substantial precipitation such as those in the coastal plain in south Georgia, USA, may be replenished
almost immediately (U.S. Department of Interior, 2016).
Groundwater is one of our most valuable resource—even though you probably never see it or even realize it is
there. As you may have read, most of the void spaces in the rocks below the water table are filled with
water. But rocks have different porosity and permeability characteristics, which means that water does not
move around the same way in all rocks below ground.
When a water-bearing rock readily transmits water to wells and springs, it is called an aquifer. Wells can be
drilled into the aquifers and water can be pumped out. Precipitation eventually adds water (recharge) into
the porous rock of the aquifer. The rate of recharge is not the same for all aquifers, though, and that must
be considered when pumping water from a well. Pumping too much water too fast draws down the water in the
aquifer and eventually causes a well to yield less and less water and even run dry. In fact, pumping your well
too much can even cause your neighbor's well to run dry if you both are pumping from the same aquifer.
In the diagram, you can see
how the ground below the
water table (the blue area) is
saturated with water. The
"unsaturated zone" above the
water table (the greenish area)
still contains water (after all,
plants' roots live in this area),
but it is not totally saturated
with water. You can see this in
the two drawings at the bottom
of the diagram, which show a
close-up of how water is stored
in between underground rock
particles.
Sometimes the porous rock
layers become tilted in the earth. There might be a confining layer of less porous rock both above and below
the porous layer. This is an example of a confined aquifer. In this case, the rocks surrounding the aquifer
confines the pressure in the porous rock and its water. If a well is drilled into this "pressurized" aquifer, the
internal pressure might (depending on the ability of the rock to transport water) be enough to push the
water up the well and up to the surface without the aid of a pump, sometimes completely out of the well. This
type of well is called artesian. The pressure of water from an artesian well can be quite dramatic.
A relationship does not necessarily exist between the water-bearing capacity of rocks and the depth at
which they are found. A very dense granite that will yield little or no water to a well may be exposed at the
land surface. Conversely, a porous sandstone, such as the Dakota Sandstone mentioned previously, may lie
hundreds or thousands of feet below the land surface and may yield hundreds of gallons per minute of water.

The Story of Drinking Water
NOTE: Consider ALL Information in this booklet a DIRECT QUOTE from indicated source. Page 43 of 92 NOTE :
Rocks that yield freshwater have been found at depths of more than 6,000 feet, and salty water has come
from oil wells at depths of more than 30,000 feet. On the average, however, the porosity and permeability
of rocks decrease as their depth below land surface increases; the pores and cracks in rocks at great depths
are closed or greatly reduced in size because of the weight of overlying rocks.
Pumping can affect the level of the water table
Groundwater occurs in the saturated soil and rock below the water table. If the aquifer is shallow enough
and permeable enough to allow water to move through it at a rapid-enough rate, then people can drill wells
into it and withdraw water. The level of the water table can naturally change over time due to changes in
weather cycles and precipitation patterns, stream flow and geologic changes, and even human-induced
changes, such as the increase in impervious surfaces on the landscape.
The pumping of wells can have a great deal of influence on water levels below ground, especially in the vicinity
of the well, as this diagram shows. If water is
withdrawn from the ground at a faster rate
that it is replenished, either by infiltration
from the surface or from streams, then the
water table can become lower, resulting in a
"cone of depression" around the well.
Depending on geologic and hydrologic
conditions of the aquifer, the impact on the
level of the water table can be short-lived or
last for decades, and it can fall a small
amount or many hundreds of feet. Excessive
pumping can lower the water table so much
that the wells no longer supply water—they
can "go dry."
Water movement in aquifers
Water movement in aquifers is highly dependent of the permeability of the aquifer material. Permeable
material contains interconnected cracks or spaces that are both numerous enough and large enough to allow
water to move freely. In some permeable materials groundwater may move several meters in a day; in other
places, it moves only a few centimeters in a century. Groundwater moves very slowly through relatively
impermeable materials such as clay and shale.
After entering an aquifer,
water moves slowly toward
lower lying places and
eventually is discharged from
the aquifer from springs,
seeps into streams, or is
withdrawn from the ground
by wells. Groundwater in
aquifers between layers of
poorly permeable rock, such
as clay or shale, may be
confined under pressure. If
such a confined aquifer is
tapped by a well, water will
rise above the top of the
aquifer and may even flow from the well onto the land surface. Water confined in this way is said to be under
artesian pressure, and the aquifer is called an artesian aquifer (U.S. Department of the Interior, 2016) .

The Story of Drinking Water
NOTE: Consider ALL Information in this booklet a DIRECT QUOTE from indicated source. Page 44 of 92 NOTE :
Solve the Problem In this diagram of a groundwater aquifer, where do you think wells should be placed. You want to be close to the house for access and want to have water even during dry seasons.
Staggs, 2011
Name: ____________________________________________________ Pd:
_____

The Story of Drinking Water
NOTE: Consider ALL Information in this booklet a DIRECT QUOTE from indicated source. Page 45 of 92 NOTE :
What is Water Pollution
Water pollution is the pollution or contamination of natural water bodies like lakes, rivers, streams, oceans,
and groundwater due to inflow or deposition of pollutants directly or indirectly into water systems. Water
pollution very often caused by human activities. Any modifications or change in the chemical, physical and
biological properties of water that can cause any harmful consequences on living things and the environment
is known as water pollution.
Types of Water Pollution
There are many types of water pollution depending on the sources the pollutants originate from. Types of
water pollution are as follows:
Nutrient Pollution Sewage water, waste water that contain high level of nutrients enter into water
bodies. Nutrients in water encourage the growth of algae and weed in the water. This is known as
eutrophication. This makes the water unfit for consumption and clog filters. Algal blooms in the water
consume all the oxygen in the water, leading to suffocation for other water organisms.
Surface Water Pollution Surface water includes rivers, lakes, oceans, streams, lagoons. Surface run-off
substances that are hazardous dissolve and mix with water polluting the surface water. These run-off
substances can be from any source like factories, domestic, sewage, agriculture etc.
Oxygen Depletion Increase in the content of biodegradable matter in the water encourages the growth
of microorganisms which end up using most of the oxygen. This results in oxygen depletion, killing aerobic
organisms producing more of toxins like ammonia and sulphides.
Ground Water Pollution Chemicals from fertilizers and pesticides applied to the soil are washed off and
seep in the ground contaminating the composition of the ground water causing pollution.
Natural Pollution Sometimes pollution is caused by microorganisms like bacteria and protozoa, this
natural pollution can be lethal for fishes and other water life. Consumption of this water can lead to
serious illness to humans.
Suspended Matter Particulate matter of chemicals and other substances do not dissolve in water easily.
These suspended particulate matters settle at the bottom of the water body harming the aquatic life at
the floor of the water bodies.
Chemical Water Pollution Most of the industrial let-off and chemical fertilizers used in farming end up
in the water bodies. These materials are poisonous to most of the aquatic life, can make them infertile
and eventually cause death. Water from these sources is obviously unfit for consumption.
Oil Spillage Oil tankers and offshore petroleum refineries cause oil leakage polluting water. Oil spills can
cause death of many aquatic organisms and also stick to the bodies and feather so seabirds which makes
them unable to fly.
Domestic Sewage Domestic sewage is the waste water from households. It is also includes sanitary
sewage, and it contains a variety of dissolved and suspended. Domestic sewage contains disease causing
microbes and chemicals contained in washing powders affect the health of all life forms in water.
Agricultural Run-off The practices followed in agriculture affect the groundwater quality. Intensive
cultivation causes fertilizers and pesticides to seep into the groundwater; this process is known as
leaching. Irrigation run-off from agricultural fields causes high nitrate content in ground water.
Industrial Effluents Untreated waste water from manufacturing industries contributes to water
pollution.
Thermal Water Pollution Thermal water pollution is the rise or fall in water temperatures. This changes
in the temperature of water can be caused due to industries. Some industries use water as cooling agent,
the heated water is let-off directly into the natural environment at a higher temperature. Cold water
pollution happens when cold water is released into the water bodies. Aquatic organisms like fish are
vulnerable to slight changes in the temperature. Heated water decreases oxygen in the water killing fish
and other aquatic organisms. Cold water affects eggs and larvae, some invertebrates of the aquatic
ecosystem.

The Story of Drinking Water
NOTE: Consider ALL Information in this booklet a DIRECT QUOTE from indicated source. Page 46 of 92 NOTE :
Sources of Water Pollution
Sources of water pollution, particularly ground water pollution are group under two categories based on the
origin of the pollutant.
Point Source Pollution Water pollution caused by point sources refers to the contaminants that enter
the water body from a single, identifiable source like pipe or ditch. Point source pollutants can be
discharges from sewage treatment plant, factories or a city storm drain.
Nonpoint Source Pollution Pollution caused by nonpoint sources refers to the contamination that does not
originate from a single source. Nonpoint source pollution is the cumulative effect of small contaminants
gathered in large area. Leaching of nitrogen compounds from agricultural land, storm water runoff over
an agricultural land or a forest are examples of nonpoint source pollution.
Water Pollutants
Major water pollutants are as follows:
Sewage - Sewage pollutants include domestic and hospital wastes, animal and human excreta etc. The
sewage let off causes oxygen depletion, spread of diseases/epidemics.
Metals - Metals like mercury are let off into water bodies from industries. Heavy metals like mercury
cause poisoning and affect health causing numbness of tongue, lips, limbs,deafness, blurred vision and
mental disorders.
Lead - Industrial wastes also lead to Lead pollution. If lead enters the human body system in higher
quantities it affects RBCs, bone, brain, liver, kidney and the nervous system. Severe lead poisoning can
also lead to coma and death.
Cadmium - Source for cadmium pollution is industries, fertilizers. Cadmium gets deposited in visceral
organs like liver, pancreas, kidney, intestinal mucosa etc. Cadmium poisoning causes vomiting, headache,
bronchial pneumonia, kidney necrosis, etc.
Arsenic - Fertilizers are source for arsenic pollution. Arsenic poisoning causes renal failure and death. It
also causes liver and kidney disorders, nervous disorders and muscular atrophy, etc.
Agrochemicals like DDT - It is a pesticide. Accumulation of these pesticides in bodies of fishes, birds,
mammals and man affects nervous system, fertility and causes thinning of egg shells in birds.
Bacteria, Viruses and Parasites - These are sourced from human and animal excreta, they are infectious
agents.
Plastics, Detergents, Oil and Gasoline - They are a waste from industries, household and farms. They
trigger organic pollution and is harmful to health.
Inorganic Chemicals - Inorganic chemicals like acids, salts, metals are a result of industrial effluents,
household cleansers, and surface run-off and are injurious to health.
Radioactive Materials - Mining and ores processing, power plants, weapons production and natural give rise
to radioactive pollution like that of uranium, thorium, cesium, iodine and radon. Radioactive pollution
causes serious health diseases to all organisms.
Sediments - Sedimentation of soil, silt due to land erosion and deposition causes disruption in ecosystem.
Plant Nutrients - Nutrients like nitrates, phosphates, and ammonium are let off from agricultural and
urban fertilizers, sewage and manure. Excess of nutrients cause eutrophication and affect the
ecosystem.
Animal Manure and Plant Residues - These substances in water causes increased algal blooms and
microorganism population. This increases oxygen demand of water, affecting aquatic ecosystem. This is
introduced into water due to sewage, agricultural run-off, paper mills, food processing etc.
Thermal Pollution - Temperature changes of water caused due to using water as cooling agent in power
plants and industries causes increase in water temperature affecting the aquatic life.

The Story of Drinking Water
NOTE: Consider ALL Information in this booklet a DIRECT QUOTE from indicated source. Page 47 of 92 NOTE :
Causes of Water Pollution
The contaminants that lead to water pollution include a wide variety of substance like chemicals, pathogens,
temperature changes and discoloration.
Industrial activity causes huge water pollution. Wastes from factories are let off into freshwater to
carry waste from plants into rivers. This contaminates water with pollutants like lead, mercury, asbestos
and petrochemicals.
Sewage let off from domestic households, factories, commercial buildings are untreated in water
treatment plants yet are disposed into the sea. Sewage containing flush chemicals and pharmaceuticals
causes greater problems.
Solid waste dumping and littering of cardboard, plastics, glass, styrofoam, aluminium tins, etc., in water
bodies.
Oil spills from tankers and ship travel causes oil pollution. Oil does not dissolve in water and forms a thick
layer on the water surface.
Burning of fossil fuels and emissions from industries and motor vehicles causes formation of acidic
particles in the atmosphere. These particles fuse with water vapor resulting in acid rain. Acid rain harms
aquatic life.
Increase in water temperature is a result of global warming and thermal plants use water as cooling
agents for mechanical equipments.
Other causes of water pollution:
Detergents, by-productions of disinfection, food processing waste, insecticides, petrochemicals, debris from
logging operations, volatile organic compounds, personal hygiene and cosmetic products, drug pollution,
chemical wastes, fertilizers, heavy metals, and sedimentation are other causes of water pollution.
Effects of Water Pollution
Water pollution extensively affects health in humans and aquatic ecosystems.
Groundwater contamination causes reproductive and fertility disorders in wildlife ecosystems.
Sewage, fertilizer and agricultural run-off has nutrients, organic substances which lead to increase of
algal bloom causing oxygen depletion. The lower oxygen levels affect the natural ecological balance of
rivers and lake ecosystem.
Consumption and swimming in contaminated water causes skin diseases, cancer, reproductive problems,
stomach ailments in humans.
Industrial effluents and agricultural pesticides accumulate in aquatic environments causing harm to
aquatic animals and lead to biomagnifications. Heavy metals like mercury, lead are poisonous to small
children and women. These chemicals interfere in the development of nervous system in fetuses and young
children.
Rising water temperatures destroy aquatic ecosystem. Coral reefs are bleached due to warmer
temperatures. Warmer waters forces indigenous water species to seek cooler water causing ecological
shift of the affected area.
Littering by humans like plastic bags, clog and suffocate aquatic animals.
Water pollution causes soil erosion in streams, rivers and flooding due to accumulation. (TutorVista.com, 2017)
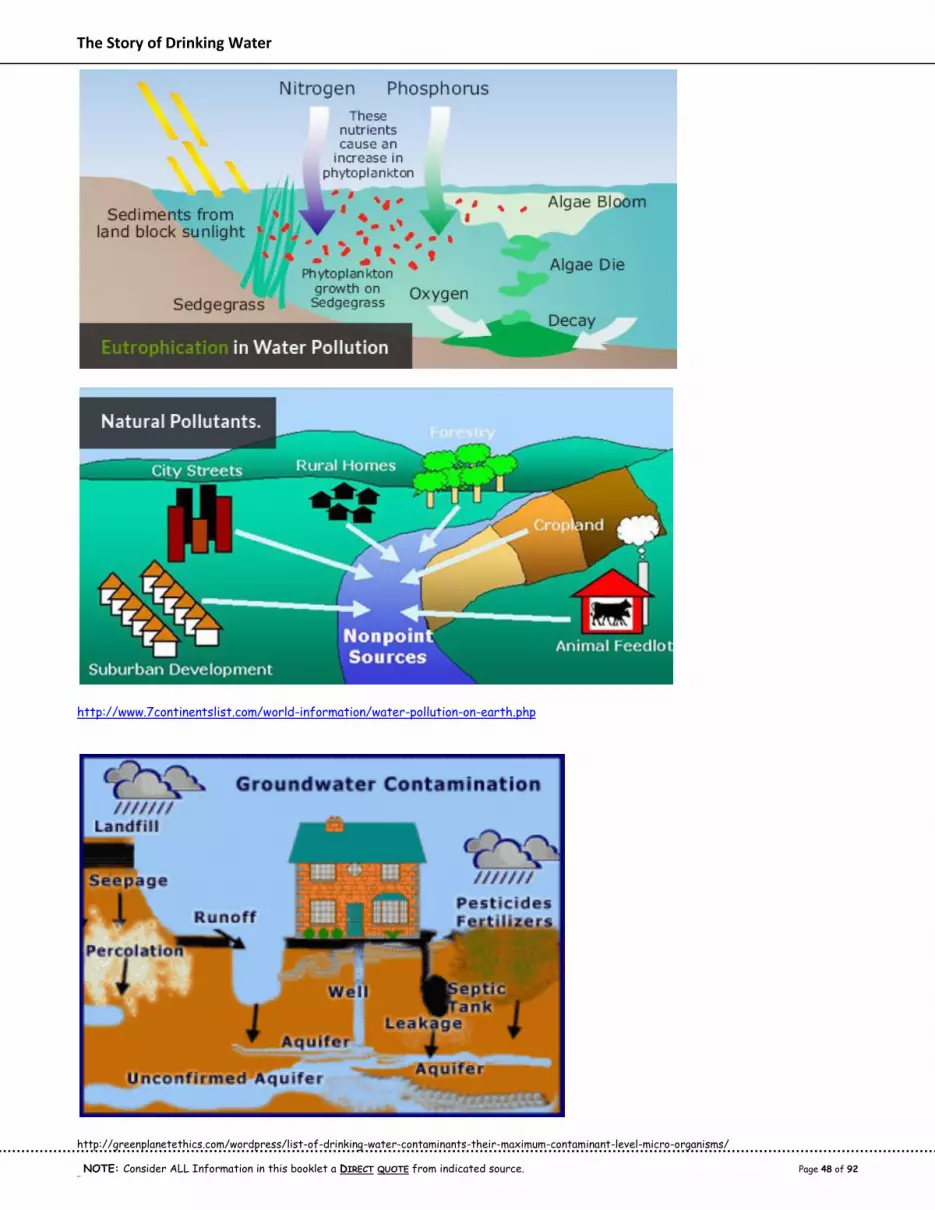
The Story of Drinking Water
NOTE: Consider ALL Information in this booklet a DIRECT QUOTE from indicated source. Page 48 of 92 NOTE :
http://www.7continentslist.com/world-information/water-pollution-on-earth.php
http://greenplanetethics.com/wordpress/list-of-drinking-water-contaminants-their-maximum-contaminant-level-micro-organisms/

The Story of Drinking Water
NOTE: Consider ALL Information in this booklet a DIRECT QUOTE from indicated source. Page 49 of 92 NOTE :
21. Water Transmission
For most of our history, people have had to live near safe water sources such as lakes, rivers, and springs.
That is why many of our communities are near a large water source; for example: Chicago is near Lake
Michigan, Toronto is near Lake Ontario, and Montreal is near the St. Lawrence River. Some other cities, such
as Phoenix, Los Angeles, and Mexico City were started near water source, but have grown too large to depend
on the surrounding surface sources for their water. These cities depend on groundwater sources or must
import their water through pipes, canals, aqueducts and ditches from sources many miles away. The process
of bringing water supplies to water treatment plants is called water transmission.
In some developing countries, many people must still carry their domestic water by hand over long distances.
This is usually a job for the women and children, who may spend many hours each day carrying water for
their families. According to the World Health Organization, which monitors water and sanitation issues in
developing countries, the situation is improving, and now 3.8 billion people, or 57% of the world’s population,
get their drinking water from a piped connection that provides running water in their homes or compound.
This means that some 1.6 billion people, 43%, still must go outside their immediate domiciles to obtain clean
water (Staggs, 2011).
Water was an important factor in the location of the earliest communities and the evolution of public water
supply systems is tied directly to the growth of cities. In the development of water resources beyond their
natural condition in rivers, lakes, and springs, the digging of shallow wells was probably the earliest
innovation. As the need for water increased and tools were developed, wells were made deeper. Brick-lined
wells were built by city dwellers in the Indus River basin as early as 2500 BCE, and wells almost 500 meters
deep are known to have been used in ancient China.
Construction of qanāts, slightly sloping tunnels driven into hillsides that contained groundwater, probably
originated in ancient Persia about 700BCE. From the hillsides the water was conveyed by gravity in open
channels to nearby towns or cities. The use of qanāts became widespread throughout the region, and some
are still in existence. Until 1933, the Iranian capital city of Tehrān, drew its entire water supply from a
system of qanāts.
The need to channel water supplies from distant sources was an outcome of the growth of urban
communities. Among the most notable of ancient water-conveyance systems are the aqueducts built between
312 BCE and 455 CE throughout the Roman Empire. Some of these impressive works are still in existence.
The writing of Sextus Julius Frontinus (who was appointed superintendent of Roman aqueducts in 97 CE)
provides information about the design and construction of the 11 major aqueducts that supplied Rome itself.
Extending from a distant spring-fed area, a lake or a river, a typical Roman aqueduct included a series of
underground and aboveground channels. The longest was the Aqua Marcia, built in 44 BCE. Its source was
about 37 km from Rome. The aqueduct itself was 92 km long, however, because it had to meander along land
contours in order to maintain a steady flow of water. For about 80 km the aqueduct was underground in a
covered trench and only the last 11 km was it carried aboveground on an arcade. In fact, most of the
combined length of the aqueducts supplying Rome (about 420 km) was built as covered trenches or tunnels.
When crossing a valley, aqueducts were supported by arcades comprising one or more levels of massive piers
and impressive arches.
The aqueducts ended in Rome at distribution reservoirs, from which the water was conveyed to public baths
or fountains. A few very wealthy or privileged citizens had water piped directly into their homes, but most
people carried water in containers from a public fountain. Water was running constantly, the excess being
used to clean the streets and flush the sewers.
Ancient aqueducts and pipelines were not capable of withstanding much pressure. Channels were constructed
of cut stone, brick, rubble, or rough concrete. Pipes were typically made of drilled stone or of hollowed
wooden logs, although clay and lead pipes were also used. During the Middle Ages there was no notable
progress in the methods or materials used to convey and distribute water.

The Story of Drinking Water
NOTE: Consider ALL Information in this booklet a DIRECT QUOTE from indicated source. Page 50 of 92 NOTE :
Cast-iron pipes with joints capable of withstanding high pressures were not used very much until the early
19th century. The steam engine was first applied to water-pumping operations at about that time, making
possible for all but the smallest communities to have drinking water supplied directly to individual homes.
Asbestos cement, ductile iron, reinforced concrete, and steel came into use as materials for water supply
pipelines in the 20th century.
Distribution pipes are made of asbestos cement, cast iron, ductile iron, plastic, reinforced concrete, or steel.
Although not as strong as iron, asbestos cement, because of its corrosion resistance and ease of installation,
is a desirable material for feeders up to 41 cm in diameter. Cast iron has an excellent record of service, with
many installations still functioning after 100 years. Ductile iron, a stronger and more elastic type of cast
iron, is used in newer installations. Iron pipes are provided in diameters up to 122 cm and are usually coated
to prevent corrosion. Plastic pipes are available in diameters up to 61 cm. They are lightweight, easily
installed, and corrosion-resistant, and their smoothness provides good hydraulic characteristics. Precast
reinforced concrete pipe sections up to 366 cm in diameter are used for arterial mains. Reinforced concrete
pipes are strong and durable. Steel pipe is sometimes used for arterial mains in aboveground installations. It
is very strong and lighter than concrete pipe, but it must be protected against corrosion with lining of the
interior and with painting and wrapping of the exterior.
Water mains must be placed roughly 1 to 2 meters below the ground surface in order to protect against
traffic loads and to prevent freezing. Since the water in a distribution system is under pressure, pipelines
can follow the shape of the land, uphill as well as downhill. A water main should never be installed in the same
trench with a sewer line. Where the two must cross, the water main should be placed above the sewer line
(Nathanson, 2014).
Solve the Problem Are there areas in North America that are more densely populated than others? Are these
densely populated areas more or less likely to be near a water source? How does water get from the mountains
to the cities? (Staggs, 2011)
The Colorado River provides water to many major metropolitan areas that are far from its banks through a series of
dams and aqueducts. Find out more by exploring the Los Angeles Aqueduct project at
www.ladwp.com/ladwp/cms/ladwp004409.jsp , the Central Arizona Project, www.cap-az.com , and the largest dam and
reservoir system, Hoover Dam and Lake Mead, operated by the Southern Nevada Water Authority,
https://www.snwa.com/ . (Staggs, 2011)

The Story of Drinking Water
NOTE: Consider ALL Information in this booklet a DIRECT QUOTE from indicated source. Page 51 of 92 NOTE :
Built in 1913, the Los Angeles Aqueduct (L.A. Aqueduct) remains an engineering marvel that provides critical water to millions of people. For 100 years, the L.A. Aqueduct has been the source of legend and controversy, helped create the second largest city in the United States, and preserved the Owens Valley in a natural state. In these pages, you will find accurate, current, and historical information about the system that has fueled so much interest over the years.
www.ladwp.com/ladwp/cms/ladwp004409.jsp
Lake Mead water levels are falling due to an extended drought and over appropriation, which increases the risk to millions of people who depend on the Colorado River of water supply shortages. The health and future of the entire Colorado River system could be under threat without additional actions by all river users. All users have a stake in protecting and preserving the environments and economies tied to the reliable water supply the river provides. Visit the Protect Lake Mead Site http://protectlakemead.com/colorado-river-lower-basin-structural-deficit
Colorado River
Southern Nevada's water supply begins as snow melt in the Rocky Mountains.
Southern Nevada gets nearly 90 percent of its water supply from the Colorado
River, which begins as snow melt in the Rocky Mountains. The snow melt travels
through a series of tributaries into the river, which winds its way south for 1,450
miles and empties into the Gulf of California in Mexico.
Sharing the River
Seven western states and Mexico share the river, which serves more than 25
million people. The river is divided into two major districts: the Upper Basin and
the Lower Basin, and it is governed by a series of compacts, laws and court
decisions collectively known as the Law of the River.
Apportionment/Allocation
Nevada receives 300,000 acre-feet per year (AFY) of Colorado River water under the Law of the River
compacts. An acre-foot is equivalent to 325,851 gallons of water.
When the allocation was assigned, Nevada’s negotiators viewed 300,000 acre-feet as more than reasonable
for the sparsely populated Southern Nevada. The state instead focused on hydro-electricity and secured
one-third of the electricity generated by Hoover Dam. https://www.snwa.com/ws/river.html

The Story of Drinking Water
NOTE: Consider ALL Information in this booklet a DIRECT QUOTE from indicated source. Page 52 of 92 NOTE :
22. Groundwater and Land Subsidence
Approximately 53% of the population in the United States gets its water from underground aquifers. An
aquifer is a geological (created by rocks) formation containing water. Like the holes in a sponge, an aquifer
has opening or pores that can store water. Most aquifers are separated from each other by layers of rock or
bodies of dense rock that do not have many holes (nonporous). The water is drawn up from the aquifer to the
surface by a well or spring. The world’s largest aquifer is the Ogallala Aquifer, which extends from Nebraska
to Texas.
Rain and snow can percolate through the soil into the ground. As groundwater, it can seep into an aquifer at
various rates, depending on the rock above it. Water may move through sandstone a few inches or feet per
day, but it moves much more slowly through hard rock and much faster through gravel.
Because ground water seeps down through soil, the soil filters the water. Because of that natural filtering,
groundwater tends to need less treatment than surface water before it is used as drinking water. But
pollutants can migrate through earth layers along with water, so even these sources need to be checked for
purity. As the water percolates through the ground, it dissolves some of the materials it encounters,
increasing its mineral concentration. Aquifers near the surface are more easily polluted than deep aquifers
(Staggs, 2011).
Land Subsidence
Land subsidence occurs when large amounts of groundwater have been withdrawn from certain types of
rocks, such as fine-grained sediments. The rock compacts because the water is partly responsible for holding
the ground up. When the water is withdrawn, the rocks falls in on itself. You may not notice land subsidence
too much because it can occur over large areas rather than in a small spot, like a sinkhole. That doesn't mean
that subsidence is not a big event -- states like California, Texas, and Florida have suffered damage to the
tune of hundreds of millions of dollars over the years.
This is a picture of the San Joaquin Valley southwest
of Mendota in the agricultural area of California.
Years and years of pumping groundwater for
irrigation has caused the land to drop. The top sign
shows where the land surface was back in 1925!
Compare that to where Dr. Poland is standing (1977).
Here in the United States, one place that has
experienced substantial land subsidence is California.
You can read all about it on our California Water
Science Center Web site.
Subsidence is a problem everywhere
Subsidence is a global problem and, in the United
States, more than 17,000 square miles in 45 States,
an area roughly the size of New Hampshire and
Vermont combined, have been directly affected by
subsidence. More than 80 percent of the identified
subsidence in the Nation has occurred because of
exploitation of underground water, and the increasing
development of land and water resources threatens
to exacerbate existing land-subsidence problems and
initiate new ones. In many areas of the arid
Southwest, and in more humid areas underlain by
soluble rocks such as limestone, gypsum, or salt, land
subsidence is an often-overlooked environmental consequence of our land- and water-use practices.

The Story of Drinking Water
NOTE: Consider ALL Information in this booklet a DIRECT QUOTE from indicated source. Page 53 of 92 NOTE :
When you look at this picture of buildings in
Mexico City, do you find yourself asking if
these buildings in Mexico City seem to be
following a wave pattern instead of a straight
line from left to right? In fact, that is just
what is happening not only to these buildings,
but throughout Mexico City, where long-term
extraction of groundwater has caused
significant land subsidence and associated
aquifer-system compaction, which has damaged
colonial-era buildings, buckled highways, and
disrupted water supply and waste-water
drainage. Some buildings have been deemed unsafe and have been closed and many others have needed repair
to keep them intact.
Land subsidence is most often caused by
human activities, mainly from the removal of
subsurface water. This picture shows a
fissure near Lucerne Lake in San Bernardino
County, Mojave Desert, California
(photograph by Loren Metzger). The probable
cause was declining groundwater levels. Here
are some other things that can cause land
subsidence: The principal causes are aquifer-
system compaction, drainage of organic soils,
underground mining, hydrocompaction, natural
compaction, sinkholes, and thawing
permafrost. (U.S. Department of the Interior, 2016)
Solve the Problem What do you think happens to wells when all of the water is removed from them? What would happen to the lakes and rivers that are fed by water from springs if all the water were pumped out of the
aquifers? (Staggs, 2011)

The Story of Drinking Water
NOTE: Consider ALL Information in this booklet a DIRECT QUOTE from indicated source. Page 54 of 92 NOTE :
23. Soil and Water Do Mix!
Although soils consist primarily of sand, silt, and clay, there are more than 70,000 different types of soils
around the globe. Each of these soils holds water differently. Soils can be classified into three groups by
texture: clayey, sandy, and loamy. Clay soils are very smooth and sticky. Since clay particles are very small,
they do not easily release water to plants or forms pools for wells or aquifers. Sandy soils are very loose and
crumbly. The sand particles are so large that they do not hold water and allow water to pass through the soil.
Loamy soils are a combination of both sand and clay. (Staggs, 2011)
The mineral particles of the soil differ widely in size and can be classified as follows:
Name of the particles Size limits in mm Distinguishable with naked eye
gravel larger than 1 obviously
sand 1 to 0.5 easily
silt 0.5 to 0.002 barely
clay less than 0.002 impossible
The amount of sand, silt and clay present in the soil determines the soil texture.
In coarse textured soils: sand is predominant (sandy soils).
In medium textured soils: silt is predominant (loamy soils).
In fine textured soils: clay is predominant (clay soils).
The texture of a soil is permanent, the farmer is unable to modify or change it.
Coarse textured soil is gritty. Individual particules are loose and fall apart in the hand, even when
moist.
Medium textured soil feels very soft (like flour) when dry. It can be easily be pressed when wet and
then feels silky.
Fine textured soil sticks to the fingers when wet and can form a ball when pressed.
Soil structure refers to the grouping of soil particles (sand, silt, clay, organic matter and fertilizers) into
porous compounds. These are called aggregates. Soil structure also refers to the arrangement of these
aggregates separated by pores and cracks.
Generally speaking, water infiltrates quickly (high infiltration rate) into granular soils but very slowly (low
infiltration rate) into massive and compact soils.
Because the farmer can influence the soil structure (by means of cultural practices), he can also change the
infiltration rate of his soil.
Soil moisture content
The soil moisture content indicates the amount of water present in the soil.

The Story of Drinking Water
NOTE: Consider ALL Information in this booklet a DIRECT QUOTE from indicated source. Page 55 of 92 NOTE :
It is commonly expressed as the amount of water (in mm of water depth) present in a depth of one metre of
soil. For example: when an amount of water (in mm of water depth) of 150 mm is present in a depth of one
metre of soil, the soil moisture content is 150 mm/m (see Fig. 36).
Fig. 36. A soil moisture content of 150 mm/m
The soil moisture content can also be expressed in percent of volume. In the example above, 1 m3 of soil (e.g.
with a depth of 1 m, and a surface area of 1 m2) contains 0.150 m3 of water (e.g. with a depth of 150 mm =
0.150 m and a surface area of 1 m2). This results in a soil moisture content in volume percent of:
Thus, a moisture content of 100 mm/m corresponds to a moisture content of 10 volume percent.
Note: The amount of water stored in the soil is not constant with time, but may vary.
Saturation
During a rain shower or irrigation application, the soil pores will fill with water. If all soil pores are filled with
water the soil is said to be saturated. There is no air left in the soil (see Fig. 37a). It is easy to determine in
the field if a soil is saturated. If a handful of saturated soil is squeezed, some (muddy) water will run
between the fingers.
Plants need air and water in the soil. At saturation, no air is present and the plant will suffer. Many crops
cannot withstand saturated soil conditions for a period of more than 2-5 days. Rice is one of the exceptions
to this rule. The period of saturation of the topsoil usually does not last long. After the rain or the irrigation
has stopped, part of the water present in the larger pores will move downward. This process is called
drainage or percolation.
The water drained from the pores is replaced by air. In coarse textured (sandy) soils, drainage is completed
within a period of a few hours. In fine textured (clay) soils,
drainage may take some (2-3) days.
Groundwater
Part of the water applied to the soil surface drains below the
rootzone and feeds deeper soil layers which are permanently
saturated; the top of the saturated layer is called
groundwater table or sometimes just water table.
Depth of the groundwater table
The depth of the groundwater table varies greatly from place
to place, mainly due to changes in topography of the area (see
Fig. 41).
The groundwater table

The Story of Drinking Water
NOTE: Consider ALL Information in this booklet a DIRECT QUOTE from indicated source. Page 56 of 92 NOTE :
In one particular place or field, the depth of the
groundwater table may vary in time.
Following heavy rainfall or irrigation, the
groundwater table rises. It may even reach and
saturate the rootzone. If prolonged, this situation
can be disastrous for crops which cannot resist
"wet feet" for a long period. Where the
groundwater table appears at the surface, it is
called an open groundwater table. This is the case
in swampy areas.
The groundwater table can also be very deep and distant from the rootzone, for example following a
prolonged dry period. To keep the rootzone moist, irrigation is then necessary.
Perched groundwater table
A perched groundwater layer can be found on top of an
impermeable layer rather close to the surface (20 to 100
cm). It covers usually a limited area. The top of the perched
water layer is called the perched groundwater table.
The impermeable layer separates the perched groundwater
layer from the more deeply located groundwater table (see
Fig. 42).
Soil with an impermeable layer not far below the rootzone
should be irrigated with precaution, because in the case of
over irrigation (too much irrigation), the perched water table
may rise rapidly.
Capillary rise
So far, it has been explained that water can move downward,
as well as horizontally (or laterally). In addition, water can
move upward.
If a piece of tissue is dipped in water, the water is sucked upward by the tissue.
Upward movement of water or capillary rise
The same process happens with a groundwater table and the soil above it. The groundwater can be sucked
upward by the soil through very small pores that are called capillars. This process is called capillary rise.
In fine textured soil (clay), the upward movement of water is slow but covers a long distance. On the other
hand, in coarse textured soil (sand), the upward movement of the water is quick but covers only a short
distance.
Soil texture Capillary rise (in cm)
coarse (sand) 20 to 50 cm
medium 50 to 80 cm
fine (clay) more than 80 cm up to several metres
(Natural Resources Management and Environment Department)
Fig. 41. Variations in depth of the groundwater table
Fig. 42. A perched groundwater table

The Story of Drinking Water
NOTE: Consider ALL Information in this booklet a DIRECT QUOTE from indicated source. Page 57 of 92 NOTE :
24. Water Purification
In the United States and Canada, almost all urban areas treat or clean their water using some type of
process. Which process is used depends primarily on the quality of the raw (untreated) water. For example,
many communities that use groundwater as their water source simply chlorinate the water before ehy
distribute it to their customers.
Cities that depend on surface water (lakes or rivers) for their supply generally use conventional treatment to
purify the water. Water treatment is the process of cleaning water. Treatment makes the water safe for
people to drink. Because water is a good solvent, it picks up all sorts of natural substances. In addition,
industry, transportation, agriculture, and other human activities can add pollution to waterways that must be
removed before the water can be consumed.
When the microscope was invented in the 1850s, germs could be seen in water for the first time. In 1902,
Belgium was the first country to use chlorine to clean or treat water in a public water supply. Today, almost
every city in the industrialized world treats its drinking water. Treatment includes disinfection with chlorine
or other chemicals to kill germs. Conventional water treatment plants – the most common- follow the same
basic process.
1. Intake. Water is taken from surface water.
Logs, fish, and plants are screened out at the
intake, and the water is drawn into the
treatment plant. If the source is groundwater,
the “screening” is done by the soil as the water
travels under the earth’s surface. Sometimes
very little treatment is required for
groundwater.
2. Chemical Addition. Aluminum sulfate (alum),
polymers, lime-soda ash and/or chlorine are
added to the water to kill germs, improve taste
and odor, and help settle solids still in the water.
The water and chemicals are rapidly mixed
together to create a reaction that helps the
chemicals work.
3. Coagulation and Flocculation. During this step,
the added chemicals continue to react with
natural particles in the water, allowing them to
cling together during the process of coagulation.
The particles are gently stirred during
flocculation to form particles called floc that
are large enough to be removed.
4. Sedimentation. The water and the floc
particles flow into a sedimentation basin where
the floc settles to the bottom and is removed.
5. Filtration. After sedimentation, the water
flows through filters made of layers of sand,
gravel, and sometimes charcoal. Filtration removes any remaining particles.
6. Disinfection. A small amount of chlorine, or other disinfection chemical, is added to the water, which is
then held in a closed tank or reservoir called a clearwell. Here, the disinfection chemicals mix throughout the
water to keep the water safe as it travels to the public through the distribution system. In some water
systems, especially those with groundwater sources, disinfection is the only treatment necessary (American
Water Works Association) (Staggs, 2011).
(American Water Works Association)
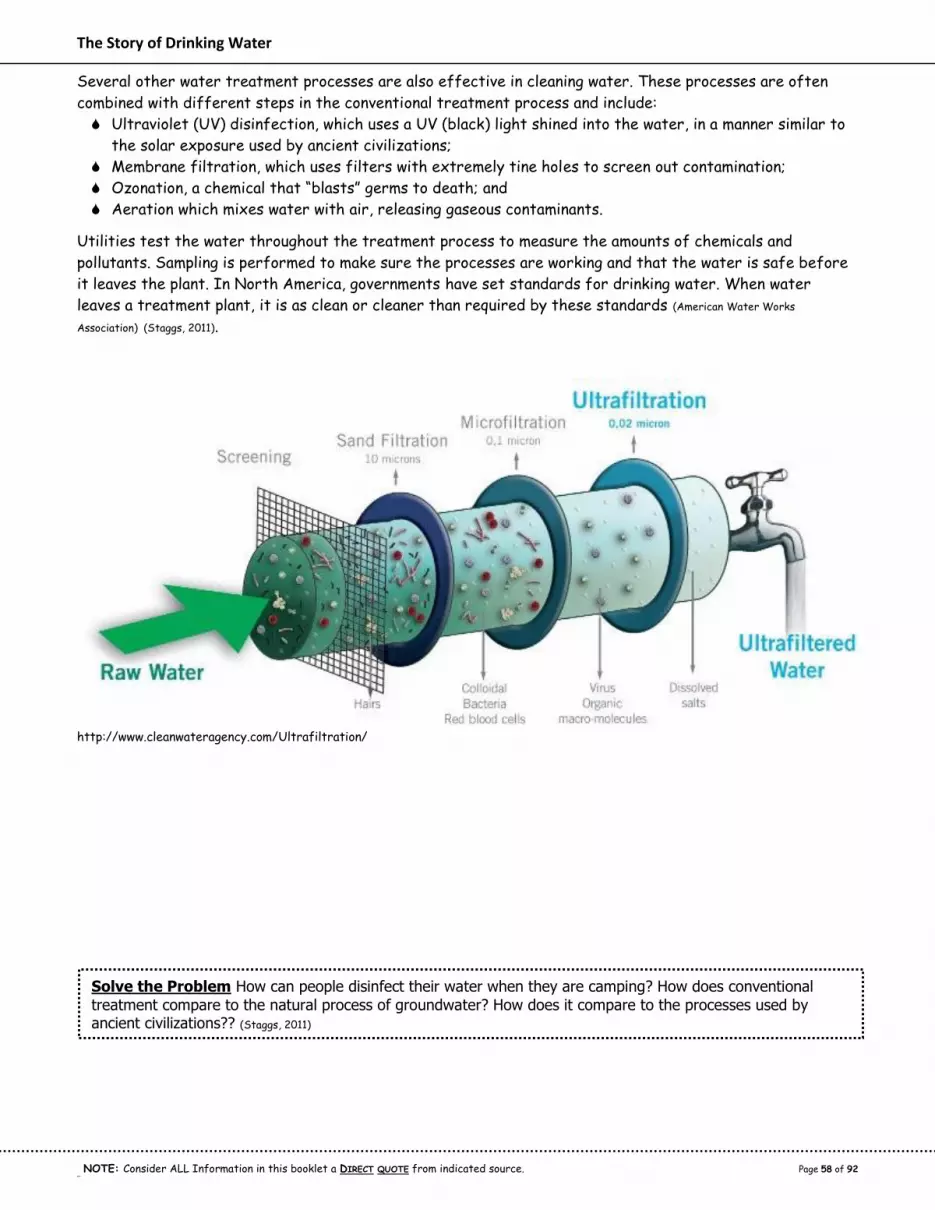
The Story of Drinking Water
NOTE: Consider ALL Information in this booklet a DIRECT QUOTE from indicated source. Page 58 of 92 NOTE :
Several other water treatment processes are also effective in cleaning water. These processes are often
combined with different steps in the conventional treatment process and include:
Ultraviolet (UV) disinfection, which uses a UV (black) light shined into the water, in a manner similar to
the solar exposure used by ancient civilizations;
Membrane filtration, which uses filters with extremely tine holes to screen out contamination;
Ozonation, a chemical that “blasts” germs to death; and
Aeration which mixes water with air, releasing gaseous contaminants.
Utilities test the water throughout the treatment process to measure the amounts of chemicals and
pollutants. Sampling is performed to make sure the processes are working and that the water is safe before
it leaves the plant. In North America, governments have set standards for drinking water. When water
leaves a treatment plant, it is as clean or cleaner than required by these standards (American Water Works
Association) (Staggs, 2011).
http://www.cleanwateragency.com/Ultrafiltration/
Solve the Problem How can people disinfect their water when they are camping? How does conventional
treatment compare to the natural process of groundwater? How does it compare to the processes used by ancient civilizations?? (Staggs, 2011)

The Story of Drinking Water
NOTE: Consider ALL Information in this booklet a DIRECT QUOTE from indicated source. Page 59 of 92 NOTE :
25. Parts Per Million
Because water is such a good solvent, it picks up many minerals, chemicals and microbes in the environment
(both natural and man-made). The U.S. Environmental Protection Agency has set standards for how much of
what contaminant can be in our water. Local water departments treat the water to meet these standards so
our water is clean and safe to drink.
It is impossible for all contaminants to be removed, however, and the standards to limit these are expressed
in milligrams per liter, which is parts per million (ppm), or even micrograms per liter, which is parts per billion
(ppb). Nearly everyone has difficulty understanding what “one in a million” actually means. Highly
sophisticated testing equipment means that minuscule amounts of pollutants can be identified and measured –
parts per million, parts per billion, and even parts per trillion. These tiny amounts can be imagined this way:
One part per million is equal to one drop in a 28-gallon (50 liter) trash can.
One part per billion is equal to one drop in about the amount found in an average home swimming pool, or
250 trash cans.
One part per trillion is equal to one drop in 20 Olympic-size swimming pools.
(Staggs, 2011)
http://jennarocca.com/parts-per-million-equation/

The Story of Drinking Water
NOTE: Consider ALL Information in this booklet a DIRECT QUOTE from indicated source. Page 60 of 92 NOTE :
Types of Drinking Water Contaminants
The Safe Drinking Water Act defines the term "contaminant" as meaning any
physical, chemical, biological, or radiological substance or matter in water.
Therefore, the law defines "contaminant" very broadly as being anything other
than water molecules. Drinking water may reasonably be expected to contain at
least small amounts of some contaminants. Some drinking water contaminants
may be harmful if consumed at certain levels in drinking water while others may
be harmless. The presence of contaminants does not necessarily indicate that
the water poses a health risk.
Only a small number of the universe of contaminants as defined above are listed
on the Contaminant Candidate List (CCL). The CCL serves as the first level of
evaluation for unregulated drinking water contaminants that may need further
investigation of potential health effects and the levels at which they are found
in drinking water.
The following are general categories of drinking water contaminants and
examples of each:
Physical contaminants primarily impact the physical appearance or other physical properties of water.
Examples of physical contaminants are sediment or organic material suspended in the water of lakes,
rivers and streams from soil erosion.
Chemical contaminants are elements or compounds. These contaminants may be naturally occurring or
man-made. Examples of chemical contaminants include nitrogen, bleach, salts, pesticides, metals, toxins
produced by bacteria, and human or animal drugs.
Biological contaminants are organisms in water. They are also referred to as microbes or
microbiological contaminants. Examples of biological or microbial contaminants include bacteria, viruses,
protozoan, and parasites.
Radiological contaminants are chemical elements with an unbalanced number of protons and neutrons
resulting in unstable atoms that can emit ionizing radiation. Examples of radiological contaminants
include cesium, plutonium and uranium. (U.S. Environmental Protection Agency, 2016)
(United States Environmental Protection Agency, 2009)
Scientist collecting water sample.

The Story of Drinking Water
NOTE: Consider ALL Information in this booklet a DIRECT QUOTE from indicated source. Page 61 of 92 NOTE :
Contaminants in water sources affecting public health can be divided into three categories:
Inorganic
Chemicals
Inorganic chemicals comprise some of the most common and mobile contaminants in
groundwater. Such contaminants include nitrate, ammonia, sodium, chloride, fluoride, and
arsenic. Nitrate contamination from sewage and agricultural practices occurs over large
areas. Salt in groundwater can be the result of the upwelling of highly mineralised
geothermal or sea water in coastal areas, and road de-icing. Fluoride and arsenic can occur
naturally in areas containing sediments derived from igneous rocks. Nitrate and chloride do
not adsorb readily on to soil materials and can be transported great distances.
E.g. nitrate, ammonia, sodium, chloride, fluoride, cyanide, arsenic, etc.
Organic
Chemicals
Organic compounds are carbon and hydrogen-based chemicals, some of which occur
naturally. However, it is mainly the human-produced chemicals that are of concern. These
chemicals include solvents, pesticides, and other industrial chemicals. Organic chemicals are
removed from groundwater by chemical reactions and microbial activity. Many organic
compounds, however, particularly those containing chlorine, can remain in the subsurface for
many years. Many organic chemicals are highly toxic and cause severe health problems such
as birth defects and cancer.
E.g. petro-chemicals (oil, diesel), plastic, solvents, pesticides, chlorine, paint, etc.
Metals
Metals, including heavy metals, are also of environmental concern. The transport of metals is
controlled by their solubility. The solubility of metals is dependent on pH. The pH of water
can be affected by acid drainage from mining activities. Dissolved metals can also be
adsorbed onto large organic molecules in water and be transported by them.
E.g. cadmium, copper, lead, mercury, etc.
http://www.sswm.info/content/pathogens-contaminants

The Story of Drinking Water
NOTE: Consider ALL Information in this booklet a DIRECT QUOTE from indicated source. Page 62 of 92 NOTE :
Flint Water Crisis Fast Facts
(CNN)Here is a look at the water crisis in Flint, Michigan, where cost-cutting measures led to tainted drinking water that contained lead and other toxins.
Facts:
Flint, located 70 miles north of Detroit, is a city of 98,310, where 41.2% of residents live below the poverty line and the median household income is $24,862, according to the US Census Bureau. The median household income for the rest of Michigan is $49,576. The city is 56.6% African-American.
Flint once thrived as the home of the nation's largest General Motors plant. The city's economic decline began during the 1980s, when GM downsized its sprawling industrial complex.
In 2011, the state of Michigan took over Flint's finances after an audit projected a $25 million deficit. Even though Flint's water supply fund was $9 million in the red, officials were using some of this money to cover shortfalls in its general fund. A receivership ended in April 2015, when the water fund was declared solvent and the remaining deficit was eliminated by an emergency loan.
In order to reduce the water fund shortfall, the city switched water sources in 2014. While a new pipeline connecting Flint with Lake Huron was under construction, the city turned to the Flint River as a water source during the two-year transition.
The Flint River had been the city's primary water source decades earlier, but Flint switched to Lake Huron in 1967, purchasing its supply through the Detroit Water and Sewerage Department.
Contaminated Water Supply:
Historically, the water in the Flint River downstream of Flint has been of poor quality, and was severely degraded during the 1970s, due to "the presence of fecal coliform bacteria, low dissolved oxygen, plant nutrients, oils, and toxic substances." In 2001, the state ordered the monitoring and cleanup of 134 polluted sites within the Flint River watershed, including industrial complexes, landfills and farms laden with pesticides and fertilizer.
According to a class-action lawsuit, the state Department of Environmental Quality was not treating the Flint River water with an anti-corrosive agent, in violation of federal law. The river water was found to be 19 times more corrosive than water from Detroit, which was from Lake Huron, according to a study by Virginia Tech.
Since the water wasn't properly treated, lead from aging service lines to homes began leaching into the Flint water supply after the city tapped into the Flint River as its main water source.
Health effects of lead exposure in children include impaired cognition, behavioral disorders, hearing problems and delayed puberty. In pregnant women, lead is associated with reduced fetal growth. In everyone, lead consumption can affect the heart, kidneys and nerves. Although there are medications that may reduce the amount of lead in the blood, treatments for the adverse health effects of lead have yet to be developed.
Timeline: 2007 - Flint prepares to tap into the Flint River as a backup water source, despite residents' concerns about sewage spills and
industrial waste. Flint is the only city in Genesee County poised to use the Flint River as an emergency water source, according to the county's drain commissioner.
March 22, 2012 - Genesee County announces a new pipeline is being designed to deliver water from Lake Huron to Flint. The
plan is to reduce costs by switching the city's water supplier from the Detroit Water and Sewerage Department (DWSD) to the Karegnondi Water Authority (KWA).
April 16, 2013 - On the city council's recommendation Andy Dillon, state treasurer, authorizes Flint to make the switch. One day
later, the DWSD terminates its water service contract with Flint, effective April of 2014. There are further discussions, however, between Flint's leaders and the DWSD about options that would allow the city to purchase Detroit water after the contract ended. Flint resumes buying Detroit water in October of 2015.
April 21, 2014 - The changeover to the Flint River is delayed by days as workers complete construction of a disinfectant system
at the treatment plant.
August 14, 2014 - The city announces fecal coliform bacterium has been detected in the water supply, prompting a boil water
advisory for a neighborhood on the west side of Flint. The city boosts the amount of chlorine in the water and flushes the system. The advisory is lifted on August 20.
September 5, 2014 - Flint issues another boil water advisory after a positive test for total coliform bacteria. The presence of this
type of bacteria is a warning sign that E. coli or other disease-causing organisms may be contaminating the water. City officials tell residents they will flush the pipes and add more chlorine to the water. After four days, residents are told they can safely resume drinking water from the tap.
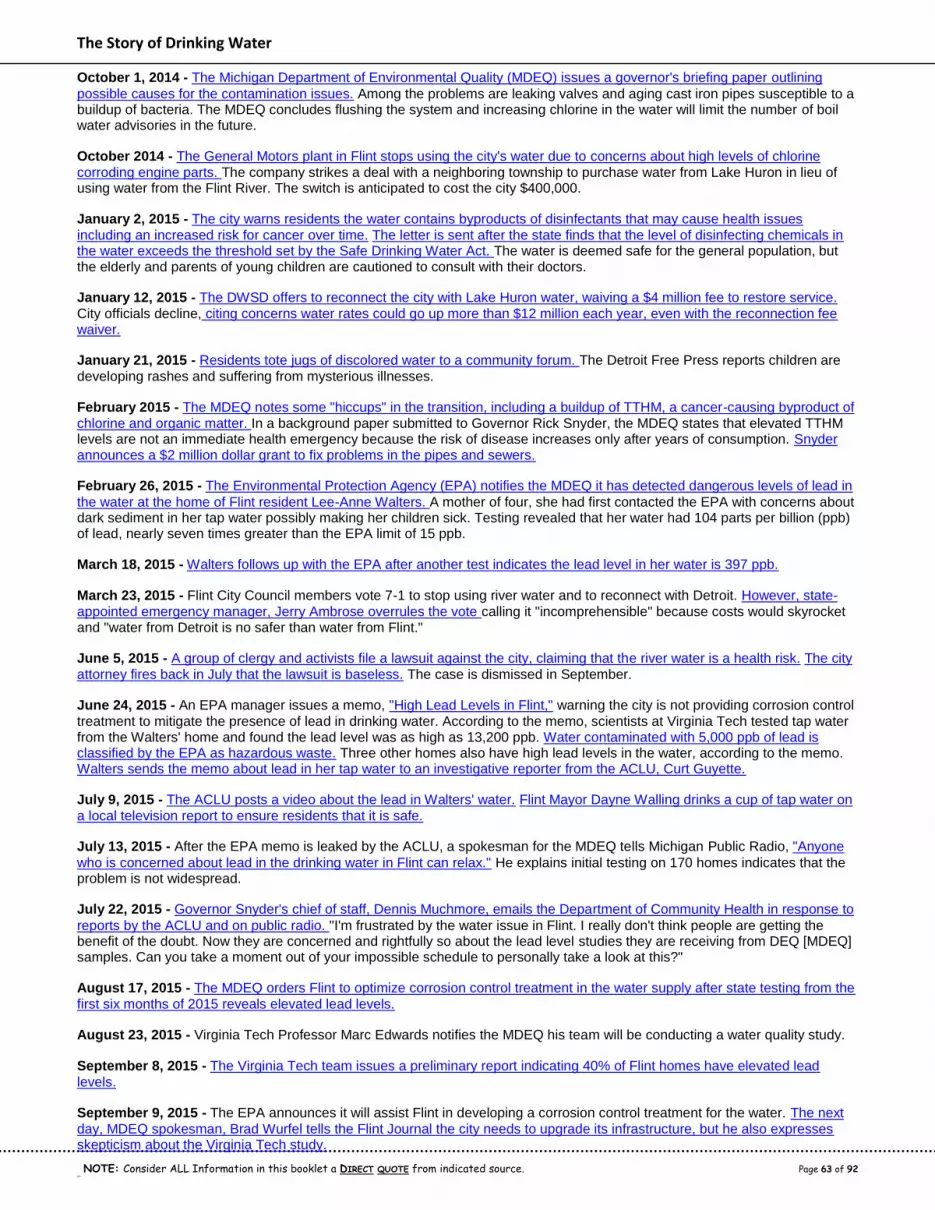
The Story of Drinking Water
NOTE: Consider ALL Information in this booklet a DIRECT QUOTE from indicated source. Page 63 of 92 NOTE :
October 1, 2014 - The Michigan Department of Environmental Quality (MDEQ) issues a governor's briefing paper outlining
possible causes for the contamination issues. Among the problems are leaking valves and aging cast iron pipes susceptible to a buildup of bacteria. The MDEQ concludes flushing the system and increasing chlorine in the water will limit the number of boil water advisories in the future.
October 2014 - The General Motors plant in Flint stops using the city's water due to concerns about high levels of chlorine
corroding engine parts. The company strikes a deal with a neighboring township to purchase water from Lake Huron in lieu of using water from the Flint River. The switch is anticipated to cost the city $400,000.
January 2, 2015 - The city warns residents the water contains byproducts of disinfectants that may cause health issues
including an increased risk for cancer over time. The letter is sent after the state finds that the level of disinfecting chemicals in the water exceeds the threshold set by the Safe Drinking Water Act. The water is deemed safe for the general population, but the elderly and parents of young children are cautioned to consult with their doctors.
January 12, 2015 - The DWSD offers to reconnect the city with Lake Huron water, waiving a $4 million fee to restore service.
City officials decline, citing concerns water rates could go up more than $12 million each year, even with the reconnection fee waiver.
January 21, 2015 - Residents tote jugs of discolored water to a community forum. The Detroit Free Press reports children are
developing rashes and suffering from mysterious illnesses.
February 2015 - The MDEQ notes some "hiccups" in the transition, including a buildup of TTHM, a cancer-causing byproduct of
chlorine and organic matter. In a background paper submitted to Governor Rick Snyder, the MDEQ states that elevated TTHM levels are not an immediate health emergency because the risk of disease increases only after years of consumption. Snyder announces a $2 million dollar grant to fix problems in the pipes and sewers.
February 26, 2015 - The Environmental Protection Agency (EPA) notifies the MDEQ it has detected dangerous levels of lead in
the water at the home of Flint resident Lee-Anne Walters. A mother of four, she had first contacted the EPA with concerns about dark sediment in her tap water possibly making her children sick. Testing revealed that her water had 104 parts per billion (ppb) of lead, nearly seven times greater than the EPA limit of 15 ppb.
March 18, 2015 - Walters follows up with the EPA after another test indicates the lead level in her water is 397 ppb.
March 23, 2015 - Flint City Council members vote 7-1 to stop using river water and to reconnect with Detroit. However, state-
appointed emergency manager, Jerry Ambrose overrules the vote calling it "incomprehensible" because costs would skyrocket and "water from Detroit is no safer than water from Flint."
June 5, 2015 - A group of clergy and activists file a lawsuit against the city, claiming that the river water is a health risk. The city
attorney fires back in July that the lawsuit is baseless. The case is dismissed in September.
June 24, 2015 - An EPA manager issues a memo, "High Lead Levels in Flint," warning the city is not providing corrosion control
treatment to mitigate the presence of lead in drinking water. According to the memo, scientists at Virginia Tech tested tap water from the Walters' home and found the lead level was as high as 13,200 ppb. Water contaminated with 5,000 ppb of lead is classified by the EPA as hazardous waste. Three other homes also have high lead levels in the water, according to the memo. Walters sends the memo about lead in her tap water to an investigative reporter from the ACLU, Curt Guyette.
July 9, 2015 - The ACLU posts a video about the lead in Walters' water. Flint Mayor Dayne Walling drinks a cup of tap water on
a local television report to ensure residents that it is safe.
July 13, 2015 - After the EPA memo is leaked by the ACLU, a spokesman for the MDEQ tells Michigan Public Radio, "Anyone
who is concerned about lead in the drinking water in Flint can relax." He explains initial testing on 170 homes indicates that the problem is not widespread.
July 22, 2015 - Governor Snyder's chief of staff, Dennis Muchmore, emails the Department of Community Health in response to
reports by the ACLU and on public radio. "I'm frustrated by the water issue in Flint. I really don't think people are getting the benefit of the doubt. Now they are concerned and rightfully so about the lead level studies they are receiving from DEQ [MDEQ] samples. Can you take a moment out of your impossible schedule to personally take a look at this?"
August 17, 2015 - The MDEQ orders Flint to optimize corrosion control treatment in the water supply after state testing from the
first six months of 2015 reveals elevated lead levels.
August 23, 2015 - Virginia Tech Professor Marc Edwards notifies the MDEQ his team will be conducting a water quality study.
September 8, 2015 - The Virginia Tech team issues a preliminary report indicating 40% of Flint homes have elevated lead
levels.
September 9, 2015 - The EPA announces it will assist Flint in developing a corrosion control treatment for the water. The next
day, MDEQ spokesman, Brad Wurfel tells the Flint Journal the city needs to upgrade its infrastructure, but he also expresses skepticism about the Virginia Tech study.

The Story of Drinking Water
NOTE: Consider ALL Information in this booklet a DIRECT QUOTE from indicated source. Page 64 of 92 NOTE :
September 11, 2015 - After concluding that Flint water is 19 times more corrosive than Detroit water, Virginia Tech
recommends the state declare that the water is not safe for drinking or cooking. The river water is corroding old pipes and lead is leaching into the water, according to the study.
September 24, 2015 - A research team led by Dr. Mona Hanna-Attisha, a pediatrician from the Hurley Medical Center, releases
a study revealing the number of children with elevated lead levels in their blood nearly doubled after the city switched its water source. In neighborhoods with the most severe contamination problems, testing showed lead levels tripled.
October 2, 2015 - The Michigan Department of Health and Human Services (MDHHS) reviews the data from the Hurley Medical
Center and verifies the findings. The state begins testing drinking water in schools and distributing free water filters.
October 8, 2015 - The MDEQ announces three Flint schools tested positive for dangerous lead levels in the water. Governor
Snyder says the city will discontinue using Flint River water.
October 15, 2015 - Governor Snyder signs a spending bill appropriating $9.35 million to help Flint reconnect with Detroit for
water and provide health services for residents.
October 16, 2015 - The city switches back to Detroit water. Residents are cautioned that it will take weeks for the system to be
properly flushed out and there may be lingering issues. The EPA establishes a Flint Safe Drinking Water Task Force.
November 4, 2015 - The EPA publishes a final, redacted version of its report on high lead levels in three Flint homes, including
Walters' residence.
November 13, 2015 - Residents file a federal class action lawsuit claiming 14 state and city officials, including Governor Snyder,
knowingly exposed Flint residents to toxic water.
December 14, 2015 - Flint declares a state of emergency.
December 29, 2015 - MDEQ Director Dan Wyant resigns after the Flint Water Advisory Task Force concludes the crisis resulted
from a failure of state regulators.
January 5, 2016 - Governor Snyder declares a state of emergency in Genesee County. A spokeswoman for the US Attorney's
Office in Detroit tells CNN that a federal investigation is underway.
January 12, 2016 - The Michigan National Guard is mobilized to help distribute clean water.
January 13, 2016 - Governor Snyder announces an outbreak of Legionnaires' disease occurred in the Flint area between June
2014 and November 2015, with 87 cases and 10 deaths. It is unclear, however, whether the spike is linked to the water switch.
January 14, 2016 - Governor Snyder writes President Barack Obama to request the declaration of an expedited major disaster
in Flint, estimating it will cost $55 million to install lead-free pipes throughout the city.
January 16, 2016 - The president declines to declare a disaster in Flint. Instead, he authorizes $5 million in aid, declaring a
state of emergency in the city. The state of emergency allows the Federal Emergency Management Agency (FEMA) to step in.
January 21, 2016 - The EPA criticizes the state's slow response to the crisis and expresses concerns about the construction of
the new pipeline to Lake Huron. The agency issues an emergency administrative order to ensure state regulators are complying with the Safe Drinking Water Act and are being transparent in their response to the crisis. The EPA says it will begin testing the water and publishing the results on a government website. An EPA administrator who was notified in June about Flint's high lead levels resigns effective February 1.
January 22, 2016 - The MDEQ claims the EPA has failed to note the state's multimillion-dollar initiatives to address the crisis,
including water testing, distribution of filters and medical care.
January 27, 2016 - A new federal lawsuit is filed in Detroit against the state, alleging the violation of the Safe Water Drinking
Act.
February 1, 2016 - A spokeswoman for the US Attorney's Office in Detroit tells the Detroit Free Press that the FBI, the US
Postal Inspection Service, the inspector general of the EPA and the EPA's criminal investigation division are assisting in the probe of the Flint water crisis.
February 3, 2016 - The House Committee on Oversight and Government Reform holds a hearing on the Flint water crisis.
Governor Snyder is not called to appear.
February 8, 2016 - Governor Snyder turns down an invitation to testify at another congressional hearing on the crisis, citing a
previous commitment to deliver a budget presentation to the state legislature in Michigan. The committee does not have the power of subpoena.
March 17, 2016 - Governor Snyder testifies before the House Committee on Oversight and Government Reform.

The Story of Drinking Water
NOTE: Consider ALL Information in this booklet a DIRECT QUOTE from indicated source. Page 65 of 92 NOTE :
March 31, 2016 - Lawyers, including some with the NAACP, file a class action lawsuit against Lockwood, Andrews & Newnam,
PC, the state of Michigan, Governor Snyder and others. Plaintiffs seek damages for those affected by the water crisis.
April 20, 2016 - Criminal charges are filed against government employees Mike Glasgow, Stephen Busch and Mike Prysby.
Busch, a district water supervisor for the Michigan Department of Environmental Quality, and Prysby, a district water engineer, each face six charges. Glasgow, a former laboratory and water quality supervisor who now serves as the city's utilities administrator, is charged with tampering with evidence, a felony, and willful neglect of duty, a misdemeanor. All are on administrative leave.
April 25, 2016 - Five hundred and fourteen residents and former residents of Flint file a class action lawsuit against the EPA.
The plaintiffs allege negligence and demand more than $220 million in damages for the EPA's role in the water crisis.
April 25, 2016 - Flint activists announce the formation of a new initiative, the Community Development Organization. Created in
response to the water crisis, the non-profit will assist and share information with those effected by the Flint River water switch.
May 4, 2016 - President Barack Obama visits Flint to hear first-hand how residents have endured the city's water crisis and to
highlight federal assistance to state and local agencies.
May 4, 2016 - Mike Glasgow reaches a deal with prosecutors contingent on his cooperating as a witness in the investigation.
Glasgow gives a plea of no contest to willful neglect of duty, a misdemeanor, and the felony charge of tampering with evidence is dismissed. He is released on personal bond following the plea agreement.
May 9, 2016 - Fired city administrator Natasha Henderson files a federal lawsuit against the city of Flint and Mayor Karen
Weaver. Henderson claims that in February 2016, Weaver told former employee Maxine Murray to direct donors to a political campaign fund "Karenabout Flint" instead of to the Safe Water/Safe Homes fund. The Safe Water/Safe Homes fund is specifically for the residents who are suffering due to the water crisis. Mayor Weaver calls the allegations "outrageously false."
June 22, 2016 - The Michigan Attorney General Bill Schuette files civil lawsuits against two companies for their alleged role in
the Flint water crisis. Veolia North America is charged with negligence, fraud, and public nuisance. Lockwood, Andrews & Newman (LAN) is charged with negligence and public nuisance.
-- LAN responds to the lawsuit by stating it was "surprised and disappointed that the state would change direction and wrongfully
accuse LAN of acting improperly, and will vigorously defend itself against these unfounded claims." LAN also says the accusations ignored the assessments of investigators that the City of Flint and the Michigan Department of Environmental Quality made the key decisions about water treatment. "LAN was not hired to operate the plant and had no responsibility for water quality," the statement says, adding that the company "regularly advised that corrosion control should be added and that the system needed to be fully tested before going online."
-- Veolia also responds with "disappointment in Attorney General Schuette's inaccurate and unwarranted allegations." The
company says, "the Attorney General has not talked to Veolia about its involvement in Flint, interviewed the company's technical experts or asked any questions about our one-time, one-month contract with Flint." The company says its "engagement with the city was wholly unrelated to the current lead issues."
July 29, 2016 - Six current and former state workers are charged as the criminal investigation continues. One of the employees,
Liane Shekter-Smith, is the former chief of the Michigan Office of Drinking Water and Municipal Assistance. She faces charges of misconduct in office and willful neglect of duty for allegedly misleading the public and concealing evidence of rising lead levels in water.
October 18, 2016 - The ACLU of Michigan files a class action lawsuit against school districts in Flint for exposing students to
tainted water and inadequately testing children for learning disabilities that may have been caused by ingesting lead.
November 2016 - Dennis Walters, the husband of Flint advocate Lee-Anne Walters, files a complaint claiming that he is being
mistreated at work by superiors and colleagues who resent his wife's activism. Walters, a Navy veteran who works at a police precinct at the Naval Station Norfolk, says that he has been scheduled to work long hours with no breaks and denied opportunities to expand his skill set via training. The family relocated to Virginia because of the water problems in Flint.
November 10, 2016 - The state of Michigan and city of Flint are ordered to deliver bottled water to homes where the
government hasn't checked to ensure that filters are working properly. In court documents, the leader of a nonprofit group helping residents said that as many as 52% of the water filters installed in a sample of more than 400 homes had problems.
December 20, 2016 - Four officials -- two of Flint's former emergency managers, who reported directly to the governor, and two
water plant officials -- are charged with felonies of false pretenses and conspiracy. They are accused of misleading the Michigan Department of Treasury into getting millions in bonds, and then misused the money to finance the construction of a new pipeline and force Flint's drinking water source to be switched to the Flint River.
January 24, 2017 - The Michigan Department of Environmental Quality says that lead levels in the city's water tested below the
federal limit in a recent six-month study.

The Story of Drinking Water
NOTE: Consider ALL Information in this booklet a DIRECT QUOTE from indicated source. Page 66 of 92 NOTE :
January 30, 2017 - A $722 million class action lawsuit is filed against the EPA on behalf of more than 1,700 residents impacted
by the water crisis.
February 17, 2017 - The Michigan Civil Rights Commission issues a report: "The Flint Water Crisis: Systemic Racism Through
the Lens of Flint." According to the 129-page report, "deeply embedded institutional, systemic and historical racism" indirectly contributed to the ill-fated decision to tap the Flint River for drinking water as a cost-saving measure. While the study says the commission did not find specific violations of Michigan's civil rights laws, the commission says it believes "the current state civil rights laws appear inadequate to address" the "root of this crisis."
March 17, 2017 - The EPA announces that it has awarded $100 million to Flint for drinking water infrastructure upgrades.
March 28, 2017 - A federal judge approves a $97 million settlement, in which the state of Michigan agrees to replace lead or
galvanized steel water lines in the City of Flint. The state will cover the cost of replacing water lines -- the pipes that connect household plumbing to the main distribution pipe running beneath the street -- for at least 18,000 Flint households by 2020.
June 14, 2017 - The Michigan attorney general's office announces that several state officials have been charged with
involuntary manslaughter in connection with a Legionnaires' outbreak that killed 12 people during the Flint water crisis.
(CNN, 2017)

The Story of Drinking Water
NOTE: Consider ALL Information in this booklet a DIRECT QUOTE from indicated source. Page 67 of 92 NOTE :
26. Waterborne Diseases
Cholera and typhoid are two common diseases that are caused by untreated drinking water. Cholera is a
serious infectious intestinal disease characterized by acute fever, severe diarrhea, vomiting and muscle
cramps. Death can occur several hours after the onset of the disease. Typhoid, a less severe disease, is
characterized by malaise, fever, and a severe headache. Every day nearly 6,000 people who share our planet
die from water-related illnesses and the vast majority are children. During the past 10 years, thousands of
people have died in many developing countries from waterborne diseases. In fact, more than 50% of those
hospitalized in developing countries are victims of waterborne diseases.
With the introduction of chlorine, typhoid and cholera have been virtually eliminated in North America. The
only recent cases of U.S. residents dying from these waterborne diseases were people who had traveled in
developing countries.
In recent years, scientists have carefully investigated to see if the same chlorine that disinfects our
drinking water could also form harmful substances (called trihalomethanes, or THMs) when combined with
organic compounds – typically decaying leaves, grass, and dead trees. The U.S. Environmental Protection
Agency has stated: “The benefits of chlorination far outweigh any potential harmful effects of compounds
that may be created in the process.” (Staggs, 2011).
Tapped Out?: Are Chlorine's Beneficial Effects in Drinking Water Offset by Its Links to Cancer?
Thousands of American municipalities add chlorine to their drinking water to get rid of microbes. But this
inexpensive and highly effective disinfectant has a dark side. “Chlorine, added as an inexpensive and
effective drinking water disinfectant, is also a known poison to the body,” says Vanessa Lausch of filter
manufacturer Aquasana. “It is certainly no coincidence that chlorine gas was used with deadly effectiveness
as a weapon in the First World War.” The gas would severely burn the lungs and other body tissues when
inhaled, and is no less powerful when ingested by mouth.
Lausch adds that researchers have now linked chlorine in drinking water to higher incidences of bladder,
rectal and breast cancers. Reportedly chlorine, once in water, interacts with organic compounds to create
trihalomethanes (THMs)—which when ingested encourage the growth of free radicals that can destroy or
damage vital cells in the body. “Because so much of the water we drink ends up in the bladder and/or rectum,
ingestions of THMs in drinking water are particularly damaging to these organs,” says Lausch.
https://www.cdc.gov/mmwr/preview/mmwrhtml/ss5709a4.htm

The Story of Drinking Water
NOTE: Consider ALL Information in this booklet a DIRECT QUOTE from indicated source. Page 68 of 92 NOTE :
The link between chlorine and bladder and rectal cancers has long been known, but only recently have
researchers found a link between common chlorine disinfectant and breast cancer, which affects one out of
every eight American women. A recent study conducted in Hartford, Connecticut found that women with
breast cancer have 50-60 percent higher levels of organochlorines (chlorine by-products) in their breast
tissue than cancer-free women.
But don't think that buying bottled water is any solution. Much of the bottled water for sale in the U.S.
comes from public municipal water sources that are often treated with, you guessed it, chlorine. A few cities
have switched over to other means of disinfecting their water supplies. Las Vegas, for example, has followed
the lead of many European and Canadian cities in switching over to harmless ozone instead of chlorine to
disinfect its municipal water supply.
As for getting rid of the chlorine that your city or town adds to its drinking water on your own, theories
abound. Some swear by the method of letting their water sit for 24 hours so that the chlorine in the glass or
pitcher will off-gas. Letting the tap run for awhile is not likely to remove any sizable portion of chlorine,
unless one were to then let the water sit overnight before consuming it. Another option is a product called
WaterYouWant, which looks like sugar but actually is composed of tasteless antioxidants and plant extracts.
The manufacturer claims that a quick shake of the stuff removes 100 percent of the chlorine (and its odor)
from a glass a tap water. A year’s supply of WaterYouWant retails for under $30.
Of course, an easier way to get rid of chlorine from your tap water is by installing a carbon-based filter,
which absorbs chlorine and other contaminants before they get into your glass or body. Tap-based filters
from the likes of Paragon, Aquasana, Kenmore, Seagull and others remove most if not all of the chlorine in
tap water, and are relatively inexpensive to boot (Tapped Out?: Are Chlorine's Beneficial Effects in Drinking Water Offset by Its
Links to Cancer?, 2017).

The Story of Drinking Water
NOTE: Consider ALL Information in this booklet a DIRECT QUOTE from indicated source. Page 69 of 92 NOTE :
Waterborne Pathogens
http://www.sswm.info/content/pathogens-contaminants
Pathogen Disease (Symptoms)
Bacteria
Aeromonas spp Enteritis
Campylobacter jejuni/coli Campylobacteriosis (diarrhoea, cramping, abdominal pain, fever, nausea;
arthritis; Guillain-Barré syndrome)
Escherichia coli (EIEC, EPEC,
ETEC, EHEC) Enteritis
Plesiomonas shigelloides Enteritis
Salmonella typhi/paratyphi Typhoid/paratyphoid fever (headache, fever, malaise, anorexia, bradycardia,
splenomegaly, cough)
Salmonella spp. Salmonellosis (diarrhoea, fever, abdominal cramps)
Shigella spp. Shigellosis (dysentery - bloody diarrhoea, vomiting, cramps, fever; Reiter’s
syndrome)
Vibrio cholera Cholera (watery diarrhoea, lethal if severe and untreated)
Yersinia spp. Yersinioses (fever, abdominal pain, diarrhoea, joint pains, rash)
Virus
Enteric adenovirus 40 and 41 Enteritis
Astrovirus Enteritis
Calicivirus (incl. Noroviruses) Enteritis
Coxsackievirus Various: respiratory illness, enteritis, viral meningitis
Echovirus Aseptic meningitis, encephalitis (often asymptomatic)
Enterovirus types 68-71 Meningitis, encephalitis, paralysis
Hepatitis A Hepatitis (fever, malaise, anorexia, nausea, abdominal discomfort, jaundice)
Hepatitis E Hepatitis
Poliovirus Poliomyelitis (often asymptomatic, fever, nausea, vomiting, headache,
paralysis)
Rotavirus Enteritis
Parasitic protozoa
Cryptosporidium parvum/hominis Cryptosporidiosis (watery diarrhoea, abdominal cramps and pain)
Cyclospora cayetanensis (often asymptomatic; diarrhoea; abdominal pain)
Entamoeba histolytica Amoebiasis (often asymptomatic, dysentery, abdominal discomfort, fever,
chills)
Giardia intestinalis Giardiasis (diarrhoea, abdominal cramps, malaise, weight loss)
Helminthes (parasitic worms)
Ascaris lumbricoides
Ascariasis (generally no or few symptoms; wheezing; coughing; fever;
enteritis; pulmonary eosinophilia)
Taenia solium/saginata Taeniasis
Trichuris trichiura Trichuriasis(unapparent through vague digestive tract distress to emaciation
with dry skin and diarrhoea)
Ancylostoma duodenale(Hookworm) (Itch; rash; cough; anaemia; protein deficiency)
Schistosomiasis spp Schistosomiasis, bilharzia

The Story of Drinking Water
NOTE: Consider ALL Information in this booklet a DIRECT QUOTE from indicated source. Page 70 of 92 NOTE :
27. Solar Still
Water is called the universal solvent. That means minerals and additives can be small enough to completely
mix with the liquid. Ocean water has large amounts of salt minerals dissolved in it. Humans cannot drink this
because the dissolved salt damages the brain, nerves, heart, and kidney.
Distillation refers to the process of removing impurities from a liquid by first vaporizing it and then allowing
it to condense. Distillation can be used to convert salt water into drinking water. The key to distillation is the
amount of heat and energy that is used in the process. Some areas use a solar still. A solar still uses the
energy of the sun to convert salt water into drinking water. Because a great deal of energy is needed to
convert the large amounts of water that communities require, solar stills are not widely used for converting
salt water into drinking water.
Some areas such as Kuwait, Saudi Arabia, and the U.S. Naval Base in Guantanamo Bay, Cuba, use distillation to
produce drinking water. Most of these stills are powered by oil-burning generators. Since ocean water is
abundant in these areas (but fresh water isn’t), the benefit of producing portable drinking water outweighs
the cost of the fuel to produce it (Staggs, 2011).
https://sustainability.stackexchange.com/questions/5455/why-
cant-solar-stills-convert-sea-water-into-fresh-water
http://file.scirp.org/Html/10-6401101_8277.htm

The Story of Drinking Water
NOTE: Consider ALL Information in this booklet a DIRECT QUOTE from indicated source. Page 71 of 92 NOTE :
28. Water’s Way
The third part of a water supply system is distribution. Each day, about 40 billion gallons (227 billion liters)
of clean drinking water are produced to be distributed to consumers by water systems in the United States.
The water treatment plant is connected to homes and businesses through miles and miles of underground
pipes.
Large pipes, called mains, run beneath streets to carry the water to different neighborhoods and business
districts. These pipes are made of iron concrete, steel or hard plastic. Buildings are connected to the mains
by service lines, often made of copper. These service lines are linked to a building’s indoor plumbing.
In addition to service lines, storage tanks and fire hydrants are also connected to the mains. The storage
tanks are usually built on high ground so gravity can move the water through the pipes to the customers. This
saves energy.
Storage tanks hold water in reserve so there is enough water for everyone to use water at the same time,
like in the morning when people are getting ready for school and work. More importantly, tanks store water
so there is enough to fight fires. Firefighters connect hoses to hydrants that pull water out of the
distribution system when they need to fight a fire. Back in the 1800s, before water treatment plants
existed, water distribution systems were built in cities just to provide access to water to put out fires.
In many cities today, computers control the amount of water that goes through the mains. Large valves are
also used to control the water. The vales act just like giant faucet handles that can shut off the water at
important points in the distribution system. If a water main breaks or other problems occur, the water suply
can be shut off to the broken section of pipe until repairs are made.
Utilities sample and test water throughout the distribution system to make sure the water reaching the
customers is safe. They also flush the water pipes regularly to keep them clean. This done is by turning off
valves at certain points and forcing water at high pressure through a section of pipe and out fire hydrants
(Staggs, 2011).
https://www.epa.gov/dwsixyearreview/drinking-water-distribution-systems

The Story of Drinking Water
NOTE: Consider ALL Information in this booklet a DIRECT QUOTE from indicated source. Page 72 of 92 NOTE :
29. Water Pressure
Water pressure is the force of water pushing against an object (such as the sides of water pipes). Most
cities build their water treatment plant or a water tower on the highest point of the city. This allows the
natural force of gravity to distribute the water throughout the town. Without pressure water would not be
able to move long distances (Staggs, 2011).
http://www.nwwater.com/index.php/water-pressure-questions

The Story of Drinking Water
NOTE: Consider ALL Information in this booklet a DIRECT QUOTE from indicated source. Page 73 of 92 NOTE :
30. Water Works
Most treated water isn’t consumed. In addition to residential homes, treated water is distributed to
industrial, commercial, and public facilities. Some industrial plants, such as computer chip manufacturers,
pump and process their own water to completely remove any trace minerals, producing ultrapure water.
Several cities also have treatment plants that clean the water to slightly lower standards, producing
reclaimed, or reuse, water. This recycled water is then distributed through separate pipes to nonpotable
uses.
Water is a necessity in all aspects of life. Water distribution systems connect to buildings and irrigation
systems throughout a community, providing clean water for many uses. These are some of the different ways
that water is used.
RESIDENTIAL
Watering
Bathing
Cooking
Washing
Recreation
COMMERCIAL
Hospitals
Restaurants
Sports arenas
Schools and universities
PUBLIC USE
Parks
Public pools
Highway medians
INDUSTRIAL
Processing microchips for computers
Ore smelting
Meat butchering and packing
Food processing
Producing electricity
(Staggs, 2011)
Solve the Problem Which of the listed activities would be appropriate for reused water – clean water that
doesn’t need to meet drinking water standards? (Staggs, 2011)

The Story of Drinking Water
NOTE: Consider ALL Information in this booklet a DIRECT QUOTE from indicated source. Page 74 of 92 NOTE :
31. Water Economics
Every day people work around the clock to produce and deliver the clean, safe water we use. The average
amount of water produced per person per day in the United States is about 160 gallons (606liters) for all
uses, including industrial, commercial and public use. U.S. residents each use an average of 80 to 100 gallons
(303 to 279 liters) per day. Canadians use considererably less, with an average home use per person of 230
liters (60 gallons) per day. For areas with heavy industry or that are highly agricultural, this average is
higher. For residential areas, the average is lower.
Most people pay for water delivered to their home according to the amount they use. In the United States,
the water rate is usually based on each 1,000 gallons used; in most other industrialized countries, the charge
is for each cubic meter (m3) used. This is the “volume” charge for actual water used. One thousand gallons
(3.8 m3) of water typically serves one consumer for about 20 days. Prices vary greatly, but a typical cost is in
the United States is about $3 (US) for 1,000 gallons (3.8 m3). In Canada, where households tend to use less
water, typical rates are about $1/m3 264 gallons) in Canadian dollars, so if you do the math, rates are about
the same in both countries (Staggs, 2011).
https://www.scgov.net/utilities/Pages/ReadWaterMeter.aspx

The Story of Drinking Water
NOTE: Consider ALL Information in this booklet a DIRECT QUOTE from indicated source. Page 75 of 92 NOTE :
32. Save the Water
A person needs only five gallons of clean water a day to meet basic needs, but most North Americans use
much more than that. A typical U.S. household of four people uses 400 gallons (1,514 liters) of water per day.
Much of that water goes to watering the lawn. Indoors, nearly 30 percent is flushed down the toilet. Clothes
washing accounts for 26 percent of that use, followed by showers at 20 percent and faucets (dishes, washing
hands, brushing teeth, etc.) at 19 percent.
Water-saving toilets and other fixtures can save more than 11,000 gallons (41,600 liters) per year in an
average home. For example, low-water use toilets require less than 1.3 gallons (4.9 liters) per flush, compared
to 3.5 gallons (13.2 liters) per flush for older, less-efficient models. Conserving water also conserves energy,
because it takes energy to treat and deliver the water that you use every day.
A lot of water is wasted because of leaky fixtures. A dripping faucet that fills an 8-ounce (237 milliliters)
container in less than 30 minutes can waste as much as 1,225 gallons (4,630litres) of water each year. To
detect hidden leaks, look at your family’s water fill. It will tell you how much water is used per month, or per
billing period. If four people live in your house and the bill show more than 12,ooo gallons (45,500 liters) used
per month during a winter month, such as January or February, your house probably has some serious leaks.
What are some ways you can save water?
1.) Take a shower instead of a bath. A full bathtub uses about 70 gallons (265 liters) of water, while a five-
minute shower uses just 10 to 25 gallons (38 to 95 liters).
2.) Be a drip detective. Check all faucets, toilets and appliances for leaks. A leak faucet that fills an 8-
ounce (237 milliliter) container in less than 30 minutes can waste as much as 1,225 gallons (4,620 liters)
of water a year.
3.) Clean vegetables in a pan of water rather than under running tap water, then give your plants a drink
with the used water.
4.) Run the dishwasher and clothes washer only when full.
5.) Cool your drinking water in the refrigerator instead of running the tap.
6.) Run water at less than full flow, and turn the faucet off when you floss and brush.
7.) Adjust the height of your lawn mower to cut your grass higher. A lawn height of 2 ½ to 3 inches (6.3 to
7.6 cm) helps protect the roots from heat stress and reduces the loss of moisture to evaporation.
8.) Use a broom or a rake, not the hose, to remove debris from driveways and walkways.
9.) Keep swimming pools covered when not in use to slow evaporation.
10.) Water lawns and plants early in the morning or in the evening, when the sun’s rays aren’t working to
evaporate your water.
(Staggs, 2011)

The Story of Drinking Water
NOTE: Consider ALL Information in this booklet a DIRECT QUOTE from indicated source. Page 76 of 92 NOTE :
33. The Value of Water
In a world of sky-rocketing prices on everything from food to homes to fuel, your tap water remains one of
the best bargains around. At a fraction of a penny per gallon, tap water provides safety, convenience and
freedom. Less than 1% of the average person’s total personal income is spent on water and wastewater
services. Studies show that bottled water is not purer than tap water, yet bottled water costs about 1900%
more. Community water supplies are test every day – far more frequent testing than bottled water.
Based on 2010 data:
The average price of water in the United States is about $1.50 for 1,000 gallons. At that price, a gallon of
water costs less than one penny.
Gallon of Cost $
Tap water Less than 0.5
Bottled water 1.43 – 8.00
Soda pop 2.80 – 4.60
Milk 3.79 – 4.24
Gasoline 2.49 – 3.75
Table wine 5.45 – 37.95
Coffee-shop latte individually served 35.00 – 52.00
Imported olive oil 135.00 – 525.00
French perfume 60,160
An 8-ounce (237 milliliters) glass can be refilled with tap water approximately 15,000 times for the same
price as a six-pack of soda. Bottled water costs about 1900% more than water straight from the tap. What
do you think is the better bargain? (Staggs, 2011)
2016 Data: A typical household, using 60,000 gallons a year, paid $316 for water service from a local
government and $501 for service from a private company. (Food & Water Watch, 2016)This is $5.27 per 1,000
gallons, which is 0.00527 cents per gallon compared to the 2010 Data of 0.0015 cents per gallon. So
water is still less than one penny per gallon. (Mrs. Booker)

The Story of Drinking Water
NOTE: Consider ALL Information in this booklet a DIRECT QUOTE from indicated source. Page 77 of 92 NOTE :
Appendix A. Organisms Found in Raw Water
B. Water Treatment Around the World
C. EPA National Primary Drinking Water Regulations
D. CDC Water Borne Pathogens
http://www.microscopy-uk.org.uk/index.html?http://www.microscopy-uk.org.uk/ponddip/index.html

The Story of Drinking Water
NOTE: Consider ALL Information in this booklet a DIRECT QUOTE from indicated source. Page 78 of 92 NOTE :
APPENDIX A Organisms Found in Raw Water
NOT TO SCALE
http://www.emporia.edu/ksn/v03n3-february1957/
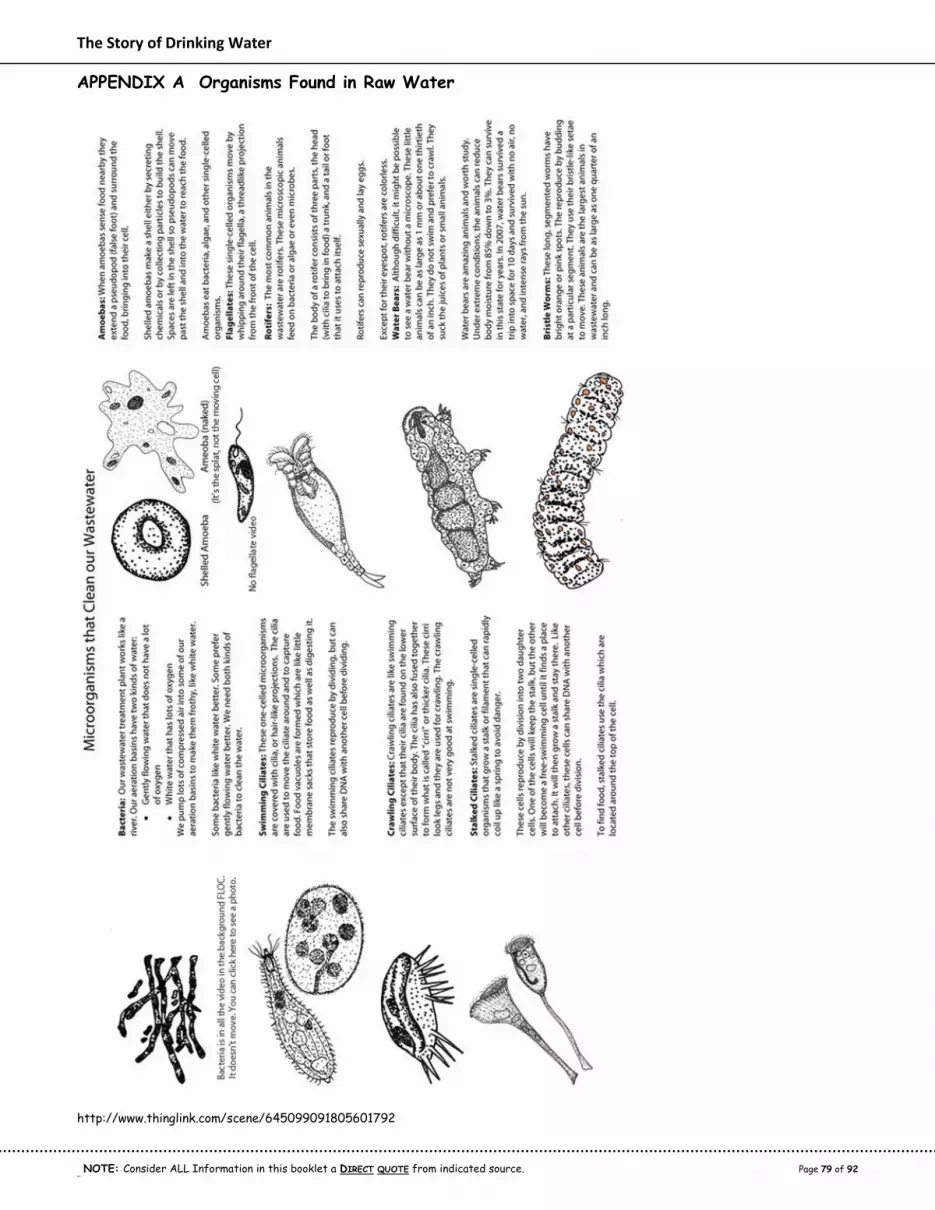
The Story of Drinking Water
NOTE: Consider ALL Information in this booklet a DIRECT QUOTE from indicated source. Page 79 of 92 NOTE :
APPENDIX A Organisms Found in Raw Water
http://www.thinglink.com/scene/645099091805601792

The Story of Drinking Water
NOTE: Consider ALL Information in this booklet a DIRECT QUOTE from indicated source. Page 80 of 92 NOTE :
APPENDIX A Organisms Found in Raw Water
Amoebae Rarely predominant except for start-up conditions and conditions that mimic start-up such as
over-wasting, recovery from toxicity, washout, and organic overloading.
Flagellates, plant-
like
Dominant under high organic loading, dispersion of floc particles, such as through chlorination,
and start-up conditions or conditions that mimic start-up.
Also may dominate in the presence of excess soluble phosphorus.
Flagellates,animal-
like
Except for the presence of excess soluble phosphorus, these are dominant for operational
conditions listed for plant-like flagellates and usually follow plant-like flagellates as the
dominant group.
Free-swimming
ciliates
Transition group that dominates between healthy and unhealthy conditions and proliferates when
large numbers of free-swimming bacteria are present.
Crawling ciliates
Dominant in the presence of mature floc particles and low biochemical oxygen demand (BOD) in
the bulk solution.
Alternate with stalked ciliates as the dominant group.
Stalked ciliates Dominant in the presence of mature floc particles and low BOD in the bulk solution.
Alternate with crawling ciliates as the dominant group.
https://eponline.com/Articles/2007/03/01/The-Protozoa-Puzzle.aspx?Page=1
https://www.studyblue.com/notes/note/n/ch-12-vocab/deck/12306093
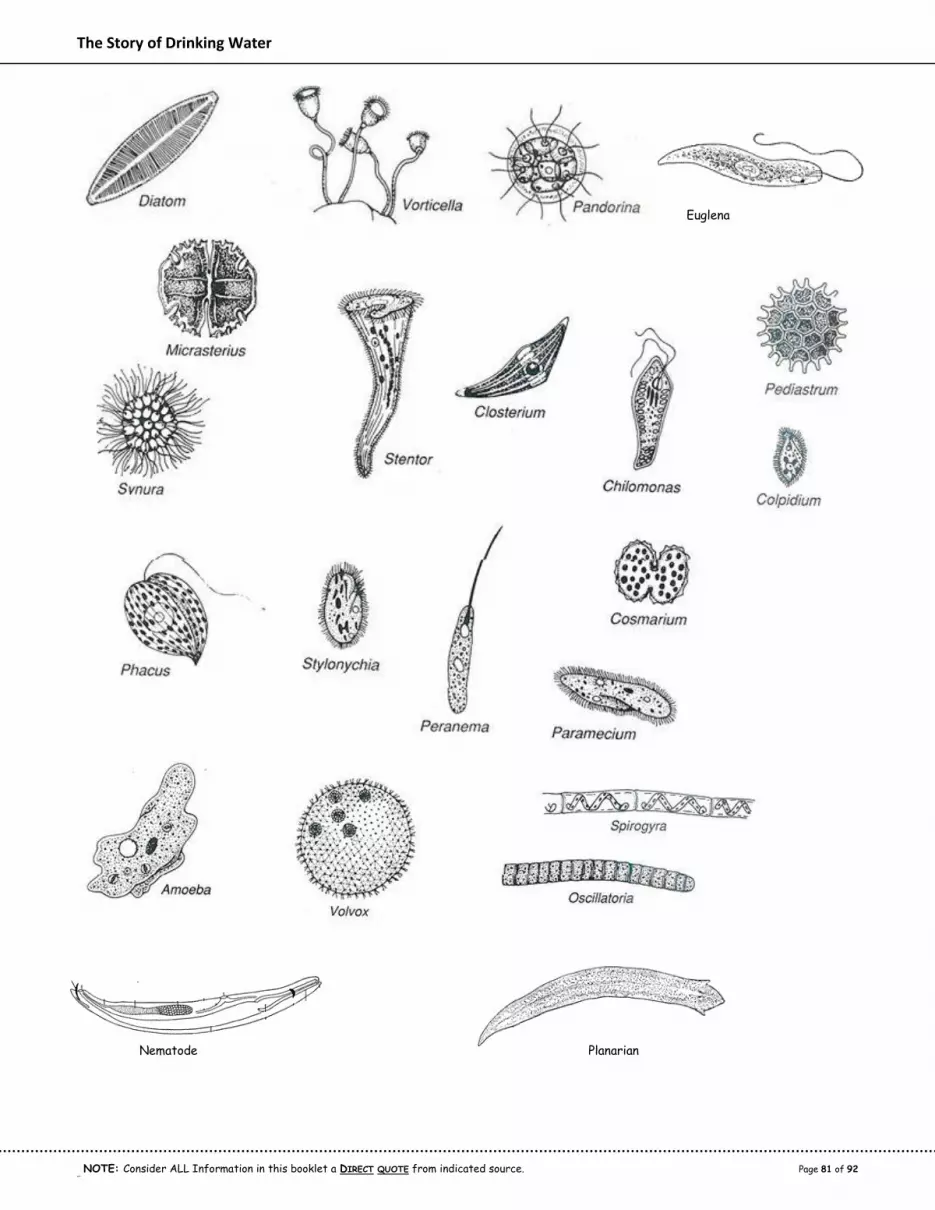
The Story of Drinking Water
NOTE: Consider ALL Information in this booklet a DIRECT QUOTE from indicated source. Page 81 of 92 NOTE :
Euglena
Nematode Planarian

The Story of Drinking Water
NOTE: Consider ALL Information in this booklet a DIRECT QUOTE from indicated source. Page 82 of 92 NOTE :
Rotifers Waterbear Cyclops Water Shrimp
Volvox (green) Spirogyra (green) Desmids (green)
Haematococcus (red) dinoflagellates (red, green, multicolored
Daphnia (Water Flea)
https://www.biologycorner.com/worksheets/identifypond.html

The Story of Drinking Water
NOTE: Consider ALL Information in this booklet a DIRECT QUOTE from indicated source. Page 83 of 92 NOTE :
https://sites.google.com/a/jeffcoschools.us/mr-
cuthbertson/_/rsrc/1478644134367/annoucements/11316labpondwaterorganisms50pts/LAB%20-%20Pond%20Water.jpg

The Story of Drinking Water
NOTE: Consider ALL Information in this booklet a DIRECT QUOTE from indicated source. Page 84 of 92 NOTE :
APPENDIX B Water Treatment Around the World
This table shows statistics about countries throughout the world.
Country Total
Population
Child
Population
(Ages 0-14)
Infant
Death
Rate (per 1,000
births)
Gross
Domestic
National
Product* (per capita)
% of
Population
Having Access
to Clean
Water Supply
Waterborne
Diseases
Senegal 12.5 million 5.2 million 60 $ 1 700 72% 78
Pakistan 117 million 64 million 65 $ 2 600 90%
Haiti 92 million 34 million 58 $ 1 800 46% 71
Malaysia 26 million 8 million 15 $ 14 000 95% 91
Mexico 112.5 million 32 million 18 $ 13 500 91%
Canada 33.7 million 5.3 million 5 $ 24 515 100%
United States 310 million 62 million 6 $ 46 400 100% * U.S. Dollars
NOTE: Water percentages were rounded to nearest whole number. Sources: All data from CIA World Fact Book 2010, Pharos Books. New Your, N.YU>, except for percent of population having access to clean water supply, which was taken from
UNEP.Net, 2006 WorldWater.org, safe drinking water unicef.org
(Staggs, 2011)
Solve the Problem: Do countries with high infant death rates have greater or less access to clean water
supplies than countries with low infant death rates?
Do countries with low per-capita incomes have higher or lower rates of infant deaths than countries with
high per-capita incomes?
Why?

The Story of Drinking Water
NOTE: Consider ALL Information in this booklet a DIRECT QUOTE from indicated source. Page 85 of 92 NOTE :
APP
ENDIX C
: EPA
Nation
al Pr
imary
Drink
ing
Wate
r Regu
lation
s
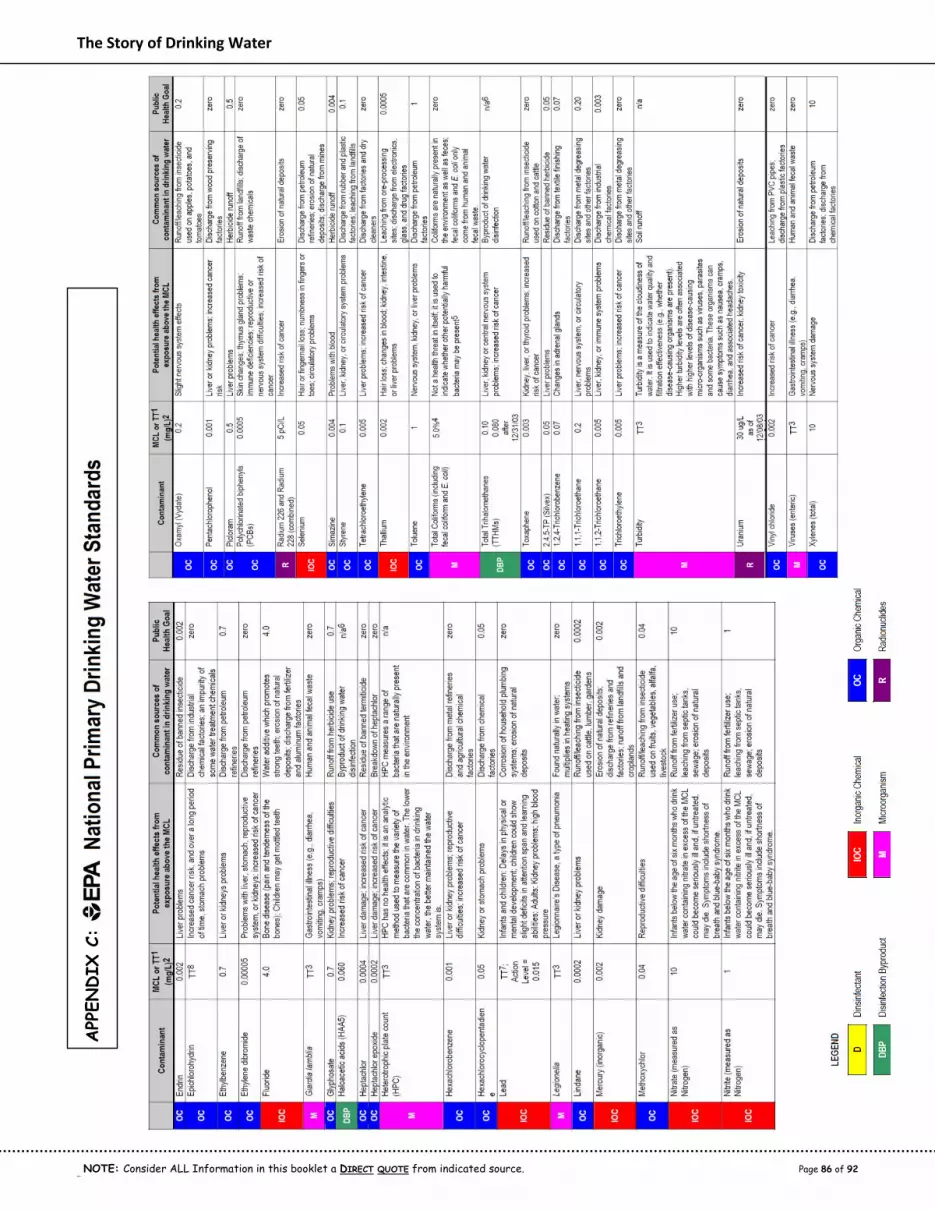
The Story of Drinking Water
NOTE: Consider ALL Information in this booklet a DIRECT QUOTE from indicated source. Page 86 of 92 NOTE :
APP
ENDIX C
: EPA
Nation
al Pr
imary
Drink
ing
Wate
r Regu
lation
s

The Story of Drinking Water
NOTE: Consider ALL Information in this booklet a DIRECT QUOTE from indicated source. Page 87 of 92 NOTE :
APP
ENDIX C
: EPA
Nation
al Pr
imary
Drink
ing
Wate
r Regu
lation
s

The Story of Drinking Water
NOTE: Consider ALL Information in this booklet a DIRECT QUOTE from indicated source. Page 88 of 92 NOTE :
APPENDIX D: CDC Water Borne Pathogens
Centers for Disease Control and Prevention National Center
for Environmental Health Vessel Sanitation Program
Health Practices on Cruise Ships: Training for Employees Transcript
Waterborne Illnesses The Centers for Disease Control and Prevention's Vessel Sanitation Program is proud to bring to you the following session: Waterborne Illness.
While this session primarily for cruise vessels under the jurisdiction of the Vessel Sanitation Program, it may be used by anyone who is interested in
this topic. This session should not be used to replace existing interactive training, but should be used as an adjunct to a comprehensive training
program.
Waterborne illness. Learning objectives. At the end of the session, you will be able to list the pathogens associated with waterborne illness
outbreaks, list the routes of transmission for waterborne pathogens, and list the prevention methods for specific pathogens.
Waterborne illnesses. There are potable water illnesses and recreational water illnesses, and we'll be discussing both of these.
Waterborne outbreak agents. There are bacterial agents, viral agents, parasitic agents, and chemical agents which cause waterborne illness.
Routes of transmission. Waterborne illnesses can be caused by ingestion or consuming water, by dermal contact,
which is contact of the water with skin or mucous membranes, or by inhalation, which is by breathing in a mist or
aerosolized water particles.
Bacterial pathogens. We will be discussing each one of these pathogens in detail: E. coli O157:H7, Salmonella,
Salmonella typhi, Shigella, Campylobacter, Vibrio cholerae, Pseudomonas, and others.
Escherichia coli. There are several pathogenic strains of Escherichia coli, which are classified under enterovirulent E.
coli. They are enterohemorrhagic, enteroinvasive, enterotoxigenic, enteropathogenic, and enteroaggregative. Escherichia
coli O157:H7, the basics. It's a bacteria. It causes diarrheal illness, and it's classified as an enterohemorrhagic E. coli. In
its most severe form, it can cause hemorrhagic colitis. The reservoir for this bacteria are cattle, deer, goats, and sheep.
Humans can also be a reservoir. It is typically associated with contaminated food and water. E. coli O157:H7 prevention.
Prevention strategies for this pathogen include source protection, halogenation of water, or boiling water for one minute.
Salmonella species, the basics. It's a bacteria. It causes diarrheal illness known as salmonellosis. Humans and animals are
the reservoir, and it's typically associated with contaminated food and water. Salmonella species, prevention. Prevention
strategies for this pathogen include source protection, halogenation of water, and also boiling water for one minute.
Salmonella typhi, the basics. It's a bacteria. It causes diarrheal illness, also known as typhoid fever. And humans
are the reservoir for this pathogen. Salmonella typhi, prevention. Prevention strategies for this pathogen include
source protection, halogenation of water, and boiling water for one minute.
Shigella species, the basics. It's a bacteria. It causes diarrheal illness known as shigellosis. Humans and primates are the
reservoir for this pathogen. Shigella species, in the United Statestwothirds of the shigellosis in the U.S. is caused by
Shigella sonnei, and the remaining onethird is caused by Shigella flexnieri. In developing countries, Shigella dysenteriae
is the primary cause of illness associated with this pathogen. Shigella species, prevention. Prevention strategies for this
pathogen include source protection, halogenation of water, and boiling water for one minute.
Campylobacter, the basics. It's a bacteria. It causes diarrheal illness. And Campylobacter is primarily associated with
poultry, animals, and humans. Campylobacter, prevention. Prevention strategies for this pathogen include source
protection, halogenation of water, and boiling water for one minute.
Vibrio cholerae, the basics. It's a bacteria. It causes diarrheal illness, also known as cholera. It is typically associated
with aquatic environments, shellstocks, and human. Vibrio cholerae has also been associated with ship ballast water,
and there will be a discussion later on in this presentation of an outbreak associated with ship ballast water. Vibrio
cholerae, prevention. Prevention strategies for this pathogen include source protection, halogenation of water, and
boiling water for one minute.
Legionella, the basics. It's a bacteria. It causes a respiratory illness known as legionellosis. There are two illnesses
associated with legionellosis: the first, Legionnaire's disease, which causes a severe pneumonia, and the second, Pontiac
fever, which is a nonpneumonia illness; it's typically an influenzalike illness, and it's less severe. Legionella is naturally
found in water, both natural and artificial water sources. Legionella, prevention. Maintaining hot water systems at or
above 50 degrees Centigrade and cold water below 20 degrees Centigrade can prevent or control the proliferation of
Legionella in water systems. Hot water in tanks should be maintained between 71 and 77 degrees Centigrade. Proper
recreational water system maintenance and disinfection can prevent the proliferation of Legionella in recreational water
systems. It is important to prevent water stagnation. This can be accomplished by eliminating dead ends in distribution

The Story of Drinking Water
NOTE: Consider ALL Information in this booklet a DIRECT QUOTE from indicated source. Page 89 of 92 NOTE :
systems and in recreational water systems. Additionally, preventing biofilm development is important to control
this particular pathogen in water systems.
Pseudomonas, the basics. It's a bacteria. It is caused by dermal contact with water. It can cause dermatitis, which is an
inflammation of the skin, or it can cause otitis, which is an infection of the ear. Pseudomonas is typically associated
with soil and water. Pseudomonas, prevention. Proper maintenance and disinfection of recreational water systems is
important in preventing Pseudomonas.
Viral pathogens. We will be discussing Hepatitis A and Norovirus in this presentation.
Hepatitis A, the basics. It's a virus. It causes inflammation of the liver. And the reservoir for Hepatitis A virus is
humans. Hepatitis A, prevention. Prevention strategies for this pathogen include source protection and adequate
disinfection. Fecal matter can protect Hepatitis A virus from chlorine. Additionally, Hepatitis A virus is resistant to
combined chlorines, so it is important to have an adequate free chlorine residual.
Norovirus, the basics. It's a virus. It causes diarrheal illness. And humans are the reservoir for this virus. Norovirus,
prevention. Prevention strategies for this pathogen include source protection. Parasitic pathogens. During this
presentation, we will be discussing Cryptosporidium, Giardia, and Schistosomatidae.
Cryptosporidium, the basics. It's a parasite. It causes diarrheal illness known as crytpsporidiosis. It is typically associated
with animals and humans, and it can be acquired through consuming fecally contaminated food, contact with fecally
contaminated soil and water. Cryptosporidium, prevention. Prevention strategies for this pathogen include source
protection. A CT value of 9,600 is required when dealing with fecally accidents. CT equals a concentration, in parts per
million, while time equals a contact time in minutes. Cryptosporidium can also be prevented or eliminated by boiling
water for one minute. Filtration with an "absolute" pore size of one micron or smaller can eliminate Cryptosporidium.
And reverse osmosis is known to be effective as well.
Giardia, the basics. It is a parasite. It causes diarrheal illness known as giardiasis. It is typically associated with water. It
is the most common pathogen in waterborne outbreaks. It can also be found in soil and food. And humans and animals
are the reservoir for this pathogen. Giardia, prevention. Prevention strategies for this pathogen include source protection;
filtration, coagulation, and halogenation of drinking water.
Schistosomatidae, the basics. It is a parasite. It is acquired through dermal contact, cercarial dermatitis. It is commonly
known as swimmer's itch. The reservoir for this pathogen are aquatic snails and birds. Schistosomatidae, prevention.
Prevention strategies for this pathogen include eliminating snails with a molluscicide or interrupting the life cycle of the
parasite by treating birds with an antihelmetic drug.
Chemical illnesses. Chemical illnesses associated with potable water and recreational water are too numerous to
itemize. They are typically associated with crossconnections and runoff. Some chemical contamination can occur
naturally.
Waterborne illness associated with drinking water by etiologic agent, United States 1999 to 2000. As we can see from
this slide, 51% of the outbreaks were associated with the pathogens we just discussed.
Waterborne outbreaks that have occurred both in the United States and also in Europe. Waterborne outbreaks. In the following slides, we'll be discussing potable water and recreational water outbreaks.
Potable water outbreaks.
What: cholera. Who: this resulted in greater than 10,000 fatalities. When: 1854. Where: in Soho, England. Why: poor
sanitary conditions of city water system. This was the result of contamination of the city's water supply from cesspits. In
the middle of the 19th century, 1854, Soho had become an unsanitary place. Underneath the floorboards of the
overcrowded cellars lurked a sea of cesspits as old as the houses, and many of these had never been drained. It was only a
matter of time for a big outbreak to occur. It finally did so in the summer of 1854. When a wave of Asiatic cholera first
hit England in late 1831, it was thought to be spread by miasma in the atmosphere. By the time of the Soho outbreak 23
years later, medical knowledge about the disease has barely changed, though one man, Dr. John Snow, a pioneer of
science of epidemiology, had recently published a report speculating that it was spread by contaminated water.
What: typhoid. Who: 1,000 individuals were infected. When: 1885. Where: this occurred in Plymouth, Pennsylvania. Why: as a result of contaminated water pumped into the city's water supply.
Death rate for typhoid fever, United States, 1900 to 1960. This slide depicts the reduction in typhoid fever cases in the
United States. The first system to be chlorinated in the United States was Boonton, New Jersey, in 1908. Chlorine
standards were then introduced in 1914. In Wheeling, West Virginia, in 1918 to 1919, there were approximately 155 to
200 cases of typhoid fever per 100,000 population. After the introduction of chlorination in the first part of 1919, there

The Story of Drinking Water
NOTE: Consider ALL Information in this booklet a DIRECT QUOTE from indicated source. Page 90 of 92 NOTE :
were only seven cases per 100,000. In developing countries, 80% of all diseases are caused by consuming water
contaminated with pathogens and pollutants. This slide depicts that correlation. On the left hand of the slide shows
access to safe potable drinking water, while the right hand side shows death rates for children under five. You can
see a direct correlation to access to the safe potable drinking water and the reduction in those death rates.
What: E. coli O157:H7. Who did it affect? There were 243 cases, 32 hospitalizations, and four deaths. When: 1989.
Where: Cabool, Missouri. Why: there was no disinfection of the city's water supply during heavy rains, when runoff ran
through cattle manure and washed into the well system.
What: Cryptosporidium. Who did it affect? 370,000 cases per 800,000 population with over 4,400 hospitalizations and
more than 100 deaths. When: 1993. Where: Milwaukee, Wisconsin. Why: during heavy rains, the city's filtration
system was overwhelmed, and the Cryptosporidium oocysts passed through that system and infected the water supply
throughout the city.
What: Vibrio cholera. Who: there were no individuals affected. This affected the shellfish supplies in Mobile Bay. When:
1992. Where: Alabama. Why: there was contaminated ballast water in cargo ships. The corrective action was the FDA
recommended the U.S. Coast Guard to have ships dumped and change ballast water at high seas before entering port.
What: a photo chemical contamination. Who: 544 ill individuals and one death. When did this occur? In 1978. Where:
aboard a U.S. aircraft carrier. Why: this was the result of an unprotected cross connection between the vessel's potable
water supply and a photo chemical development system.
What: Legionella. Who: there were two fatalities. When: January 1999. Where: a cargo vessel under repair. Why:
mechanics were exposed to Legionella pneumophilia in a ship's fresh water pump.
What: Norovirus. Who: 48 outbreaks, 200 to 5,500 cases. Samples from 28 outbreaks are available. Norovirus caused 18
of these outbreaks. When: 1998 to 2003. Where: in Finland. Why: most likely caused by sewage contamination of
surface water systems. Waterborne disease associated with ships, 1970 to 2003. As you can see on this slide, 15 of the
outbreaks were associated with pathogenic organisms that we discussed earlier. 21 of these outbreaks were the result of
chemical contamination of the water supplies.
Recreational water illness outbreaks.
What: Cryptosporidium. Who did it affect? There were 369 cases. When: July of 1997. Where: Minnesota. Why did this
occur? This was an inadequately treated decorative fountain that had been converted to a recreational fountain.
Corrective action: the recreation fountain was switched back to a decorative fountain. What: Cryptosporidium. Who: 47
initial cases. This quickly spread to 3,000 ill with 711 positive for Cryptosporidium. When: August 2005. Where: in
Seneca, New York. Why: Cryptosporidium oocysts were found in an inadequately treated system for a splash zone.
Corrective action: implementation of new guidelines for nonpool facilities such as spray pads.
What: Cryptosporidium. Who: 1,000 cases. When: in the summer of 2000. Where: this occurred in Ohio and
Nebraska. Why: the exact cause was undetermined. However, the swallowing of water, fecal accidentsfive in
Ohioswimming while symptomatic18% in Nebraskawere indicated as contributing factors.
What: Pseudomonas dermatitis. As you can see from this slide, we have two outbreaks of Pseudomonas dermatitis. In the
first cases on your left, it affected 19 individuals. When: in February of 1999. Where: in Colorado. Why: Pseudomonas in
a hot tub due to inadequate chlorine levels. On the righthand side, you can see we have nine cases. When: February of
2000. Where: in Maine. And why: again, Pseudomonas was growing in a hot tub due to inadequate chlorine levels.
What: Legionella. Whom did it affect? There were 15 cases. When: October of 1996. Where: in Virginia. Why: a
whirlpool spa display at a retail store tested positive for Legionella. The corrective action: the whirlpool spas and
displays were to be inspected and maintained.
Resources and references. For further information about the Centers for Disease Control and Prevention, please visit www.cdc.gov.
For further information about the Food and Drug Administration, please visit www.fda.gov. Some of the material in these slides was
taken from "Waterborne Pathogens," American Water Works Association manual 48, and the "Journal of Water and Health."

The Story of Drinking Water
NOTE: Consider ALL Information in this booklet a DIRECT QUOTE from indicated source. Page 91 of 92 NOTE :
Bibliography American Water Works Association. (n.d.). Fairfax Water. Retrieved from The Story of Drinking Water:
https://www.fcwa.org/story_of_water/html/3forms.htm
Carey, J. (2014, September 29). The Deepening Mystery of Moose Decline. Retrieved from National Wildlife
Federation: https://www.nwf.org/News-and-Magazines/National-
Wildlife/Animals/Archives/2014/Moose.aspx
CNN. (2017, June 14). Flint Water Crisis Fast Facts. Retrieved from CNN Library:
http://www.cnn.com/2016/03/04/us/flint-water-crisis-fast-facts/index.html
Commonwealth of Kentucky. (2010). Kentucky's Wonderful Commonwealth of Water. Kentucky Environmental
Education Council.
Commonwealth of Kentucky. (2016). Karst Hydrological Issues. Retrieved from Energy and Environment Cabinet:
http://water.ky.gov/groundwater/Pages/KarstHydrologicalIssues.aspx
Food & Water Watch. (2016). The State of Public Water in the United States. Washington, D.C.: Food & Water
Watch.
Gleason, R. (2010, March 15). Moose Populations decline in Minnesota, Ontario. Retrieved from Great Lakes Echo:
http://greatlakesecho.org/2010/03/15/moose-populations-decline-in-northern-great-lakes-state/
Hurricane Management Group, LLC. (2014, Jan 13). How Hurricanes Form, What Causes, Hurrican Models.
Retrieved from Hurricane Season Facts: http://hurricanemanagementgroup.com/how-hurricanes-form-
what-causes-hurricane-models/
Karst Waters Institute. (n.d.). Educational Resources. Retrieved from Karst Waters Institute:
http://karstwaters.org/educational-resources/
Kentucky Geological Survey. (2017, Feb 03). Karst Is a Landscape. Retrieved from Karst:
http://www.uky.edu/KGS/karst/index.php
Kimberi, M. (2015, Sep 14). Limestone Filtered Water A Key Bourbon Ingredient. Retrieved from The Whiskey
Wash: https://thewhiskeywash.com/whiskey-styles/bourbon/whats-deal-limestone-water/
Nathanson, J. A. (2014, March 5). Water Supply System. Retrieved from Encyclopaedia Britannica:
https://www.britannica.com/technology/water-supply-system
National Oceanic and Atmospheric Administration. (n.d.). How to read 'Surface' weather maps. Retrieved from
National Weather Service: http://www.srh.noaa.gov/jetstream/synoptic/airmass.html
Natural Resources and Environmental Protection Cabinet. (1991). Groundwater and Karst. Frankfort: Department
for Environmental Protection.
Natural Resources Management and Environment Department. (n.d.). Soil and Water. Retrieved from Irrigation
Water Management: http://www.fao.org/docrep/r4082e/r4082e03.htm
PennState College of Earth and Mineral Sciences. (2017). Water. Retrieved from Energy and Sustainability in
Contemporary Culture: https://www.e-education.psu.edu/emsc240/node/478

The Story of Drinking Water
NOTE: Consider ALL Information in this booklet a DIRECT QUOTE from indicated source. Page 92 of 92 NOTE :
Staggs, K. (2011). Story of Drinking Water. Denver: American Water Works Association.
Tapped Out?: Are Chlorine's Beneficial Effects in Drinking Water Offset by Its Links to Cancer? (2017). Scientific
American, pp. https://www.scientificamerican.com/article/earth-talks-tapped-out/.
TutorVista.com. (2017). Water Pollution. Retrieved from Biology Environmental Pollution:
http://biology.tutorvista.com/environmental-pollution/water-pollution.html
U.S. Department of Interior. (2016, Dec 2016). Infiltration -- The Water Cycle. Retrieved from The Water Cycle -
USGS Water Science School: http://water.usgs.gov/edu/watercycleinfiltration.html
U.S. Department of Interior. (2016, December 02). The Water in You. Retrieved from USGS Water Science School:
http://water.usgs.gov/edu/propertyyou.html
U.S. Department of Interior. (2016, December 02). Water Questions and Answers. Retrieved from USGS Water
Science School: http://water.usgs.gov/edu/qa-solvent.html
U.S. Department of the Interior. (2016, Feb 09). Aquifers and Groundwater. Retrieved from The USGS Water
Science School: https://water.usgs.gov/edu/earthgwaquifer.html
U.S. Department of the Interior. (2016, Dec 9). Land Subsidence. Retrieved from The USGS Water Science School:
https://water.usgs.gov/edu/earthgwlandsubside.html
U.S. Environmental Protection Agency. (2016, September 29). Types of Drinking Water Contaminants. Retrieved
from Contaminant andidate List (CCL) and Regulatory Determination: https://www.epa.gov/ccl/types-
drinking-water-contaminants
United States Environmental Protection Agency. (2009). National Primary Drinking Water Regulations. EPA.
WeatherStreet.com. (2013). What Causes Thunderstorms? Retrieved from Weatherquestions.com:
http://www.weatherquestions.com/What_causes_thunderstorms.htm