the role of emotion and context in musical preference. - core
TRANSCRIPT
The Role of Emotion and Context in Musical Preference.Song, Yading
The copyright of this thesis rests with the author and no quotation from it or information
derived from it may be published without the prior written consent of the author
For additional information about this publication click this link.
http://qmro.qmul.ac.uk/xmlui/handle/123456789/12915
Information about this research object was correct at the time of download; we occasionally
make corrections to records, please therefore check the published record when citing. For
more information contact [email protected]
brought to you by COREView metadata, citation and similar papers at core.ac.uk
provided by Queen Mary Research Online
The Role of Emotion and Context
in Musical Preference
Yading Song
PhD thesis
Thesis submitted in partial fulfilment of the requirements
for the degree of Doctor of Philosophy
of the University of London
School of Electronic Engineering and Computer Science
Queen Mary, University of London
United Kingdom
January 2016
Abstract
The powerful emotional effects of music increasingly attract the attention of music informa-
tion retrieval researchers and music psychologists. In the past decades, a gap exists between these
two disciplines, and researchers have focused on different aspects of emotion in music. Music
information retrieval researchers are concerned with computational tasks such as the classifica-
tion of music by its emotional content, whereas music psychologists are more interested in the
understanding of emotion in music. Many of the existing studies have investigated the above
issues in the context of classical music, but the results may not be applicable to other genres.
This thesis focusses on musical emotion in Western popular music combining knowledge from
both disciplines.
I compile a Western popular music emotion dataset based on online social tags, and present a
music emotion classification system using audio features corresponding to four different musical
dimensions. Listeners’ perceived and induced emotional responses to the emotion dataset are
compared, and I evaluate the reliability of emotion tags with listeners’ ratings of emotion using
two dominant models of emotion, namely the categorical and the dimensional emotion models.
In the next experiment, I build a dataset of musical excerpts identified in a questionnaire,
and I train my music emotion classification system with these audio recordings. I compare the
differences and similarities between the emotional responses of listeners and the results from
automatic classification.
Music emotions arise in complex interactions between the listener, the music, and the situa-
tion. In the final experiments, I explore the functional uses of music and musical preference in
everyday situations. Specifically, I investigate emotional uses of music in different music-listening
situational contexts. Finally, I discuss the use of emotion and context in the future design of
subjective music recommendation systems and propose the study of musical preference using
musical features.
1
I, Yading Song, confirm that the research included within this thesis is my own work or that
where it has been carried out in collaboration with, or supported by others, that this is duly
acknowledged below and my contribution indicated. Previously published material is also ac-
knowledged below.
I attest that I have exercised reasonable care to ensure that the work is original, and does not
to the best of my knowledge break any UK law, infringe any third party’s copyright or other
Intellectual Property Right, or contain any confidential material.
I accept that the College has the right to use plagiarism detection software to check the electronic
version of the thesis.
I confirm that this thesis has not been previously submitted for the award of a degree by this or
any other university.
The copyright of this thesis rests with the author and no quotation from it or information derived
from it may be published without the prior written consent of the author.
Signature:
Date:
Details of collaboration and publications:
All collaborations and earlier publications that have influenced the work and writing of this thesis
are fully detailed in Section 1.4.
Acknowledgements
It has been 4 years since a PhD position at Queen Mary University of London was offered to me
(a massive thank to Dawn Black for motivating me). My work on this thesis is now coming to
an end, and I would like to take this opportunity to thank all the people who have helped me.
While working on this thesis, I was very fortunate to be part of the Centre for Digital Music
(C4DM). It has been a wonderful experience, and it is definitely the highlight of my life.
First and foremost, I would like to thank my two supervisors, Simon Dixon and Marcus
Pearce most sincerely, for their patience and guidance, for their firm support and faith in me,
for all the delightful and inspiring conversations, for keeping me focused throughout my PhD
study, as well as for allowing me to grow as a research scientist. Each one is unsurpassed as a
supervisor, except by their combination. I would also like to thank my independent assessor,
Professor Geraint Wiggins, for his invaluably constructive criticism and friendly advice in the
past four years.
I want to express my gratitude to both of my external examiners, Professor David J. Harg-
reaves and Dr. Alinka Greasley. I was very privileged to receive feedback from two experts in
music psychology. Their advice has been priceless to shape the final version of my thesis.
I also would like to express my warm thanks to George Fazekas and Katerina Kosta for their
zealous support on the Greek music project. I want to thank Professor Andrea Halpern and
Professor Tuomas Eerola for their collaborations on the projects related to musical emotion and
context respectively. It was a great honour to receive their brilliant comments and suggestions.
My sincere thanks goes to Birgitta Burger, Martın Hartmann, Markku Poyhonen, Pasi Saari,
Petri Toiviainen, and Anemone Van Zijl at the Finnish Centre of Excellence in Interdisciplinary
Music Research at the University of Jyvaskyla, for making my stay in Finland so pleasant.
Additionally, thank you my former colleagues at Youtube, Eric, Meijie, Zack, Dominick,
Justin, Sam, Sean, and Umang for offering me a fabulous and fruitful summer in California. I
would like to express my heartfelt gratitude especially to Vivek and Bob for their encouragement
and support, for leading my work on exciting projects. You have also been tremendous managers
2
3
for me. I am very also grateful to my mentor Luke, for his guidance and advice on my career.
Good friends are hard to find, harder to leave, and impossible to forget. A special thanks
to my sweetest “104 gang”: Siying, Chunyang, Tian, Shan, and Mi. I will always remember
the days and evenings we spent together working, playing, and have amazing dinners. Thank
you for the laughs and tears you shared with me and everything in between. Thank you for the
absolute privilege of being able to attend special moments with you on wedding days, birthdays,
and travelling. Also, I am very grateful to Kelly and Sally from learning development for their
helpful support during my writing-up period, and to Peta for her writing tips. I appreciate my
writing buddies, Pollie and Kavin, for keeping good progress of our work: they have made my
writing-up so colourful and fun.
I would like to express appreciation to Emmanouil Benetos for introducing me to IEEE,
sharing his truthful views on my research, and for his occasional proofreading. Thank you,
Mark Plumbley, for providing all the resources to me. Many thanks to my amazing music
informatics group colleagues: Magdelena Chudy, Pablo Alejandro Alvarado Duran, Sebastian
Ewert, Peter Foster, Holger Kirchhoff, Robert Macrae, Matthias Mauch, Lesley Mearns, Julien
Osmalskyj, Maria Panteli, and Rob Tubb, as well as my enthusiastic music cognition colleagues:
Yvonne Blokland, Ioana Dalca, Lena Delval, Miriam Kirsch, Sarah Sauve, JP Tauscher, Jordan
Smith, and Sonia Wilkie for their assistance, dedicated involvement, and lively discussions. I
also enjoyed lunch and coffee breaks, nights out, and trips together with Dimitrious Giannoulis,
Steve Hargreaves, Chris Harte, Antonella Mazzoni, Dave Moffat, Giulio Moro, Madeleine Le
Bouteiller, Jose J. Valero-Mas, Elio Quinton, and Bogdan Vera. Further thanks to other members
and visitors of C4DM who have made my time enjoyable at QMUL: Mathieu Barthet, Chris
Cannam, Alice Clifford, Brecht De Man, Luıs Figueira, Shengchen Li, Zheng Ma, Laurel Pardue,
Dan Stowell, and Janis Sokolovskis. I must also thank all the people who participated in my
listening tests and anonymous reviewers. Without them, this thesis would have never been
accomplished.
Unquestionably, my deep gratitude goes to my family, especially to my dad, mom, and my
partner Mati. You are the best and most beautiful things that happened to me in this world.
I will always be grateful for standing behind me and giving me your biggest support. You are
always my inspiration. Thank you for believing in me and giving me your unconditional and
selfless love.
This work was supported financially by China Scholarship Council.
Contents
Acknowledgements . . . . . . . . . . . . . . . . . . . . . . . . . . . . . . . . . . . . . . 2
List of Figures . . . . . . . . . . . . . . . . . . . . . . . . . . . . . . . . . . . . . . . . . 8
List of Tables . . . . . . . . . . . . . . . . . . . . . . . . . . . . . . . . . . . . . . . . . . 10
Glossary of Technical Terms . . . . . . . . . . . . . . . . . . . . . . . . . . . . . . . . 14
List of Abbreviations . . . . . . . . . . . . . . . . . . . . . . . . . . . . . . . . . . . . . 16
1 Introduction . . . . . . . . . . . . . . . . . . . . . . . . . . . . . . . . . . . . . . . . 18
1.1 Motivation and Aim . . . . . . . . . . . . . . . . . . . . . . . . . . . . . . . . . . 18
1.2 Thesis Structure . . . . . . . . . . . . . . . . . . . . . . . . . . . . . . . . . . . . 20
1.3 Contributions . . . . . . . . . . . . . . . . . . . . . . . . . . . . . . . . . . . . . . 21
1.4 Associated Publications . . . . . . . . . . . . . . . . . . . . . . . . . . . . . . . . 22
2 Background in Music and Emotion . . . . . . . . . . . . . . . . . . . . . . . . . . 24
2.1 Definition . . . . . . . . . . . . . . . . . . . . . . . . . . . . . . . . . . . . . . . . 24
2.2 Perception and Induction of Musical Emotions . . . . . . . . . . . . . . . . . . . 25
2.2.1 Perceived Musical Emotion . . . . . . . . . . . . . . . . . . . . . . . . . . 26
2.2.2 Induced Musical Emotion . . . . . . . . . . . . . . . . . . . . . . . . . . . 27
2.2.3 Relationship between Emotion Perception and Induction . . . . . . . . . . 28
2.3 Musical Emotion Representation . . . . . . . . . . . . . . . . . . . . . . . . . . . 29
2.3.1 Categorical Model . . . . . . . . . . . . . . . . . . . . . . . . . . . . . . . 29
2.3.2 Dimensional Model . . . . . . . . . . . . . . . . . . . . . . . . . . . . . . . 31
2.3.3 Domain-specific Model . . . . . . . . . . . . . . . . . . . . . . . . . . . . . 33
2.4 Related Work in Music and Emotion . . . . . . . . . . . . . . . . . . . . . . . . . 34
2.4.1 Research on Music and Emotion in Computer Science . . . . . . . . . . . 35
4
CONTENTS 5
2.4.2 Research on Music and Emotion in Psychology . . . . . . . . . . . . . . . 37
2.5 Musical Stimuli . . . . . . . . . . . . . . . . . . . . . . . . . . . . . . . . . . . . . 40
2.6 Discussion . . . . . . . . . . . . . . . . . . . . . . . . . . . . . . . . . . . . . . . . 41
3 Music Listening: Function, Context, and Preference . . . . . . . . . . . . . . . 43
3.1 Terminology . . . . . . . . . . . . . . . . . . . . . . . . . . . . . . . . . . . . . . . 43
3.2 Music-listening Contexts . . . . . . . . . . . . . . . . . . . . . . . . . . . . . . . . 45
3.3 Emotional Uses of Music . . . . . . . . . . . . . . . . . . . . . . . . . . . . . . . . 47
3.4 Functions of Music Listening . . . . . . . . . . . . . . . . . . . . . . . . . . . . . 50
3.5 Musical Preference . . . . . . . . . . . . . . . . . . . . . . . . . . . . . . . . . . . 52
3.6 Discussion . . . . . . . . . . . . . . . . . . . . . . . . . . . . . . . . . . . . . . . . 54
4 Music and Emotion . . . . . . . . . . . . . . . . . . . . . . . . . . . . . . . . . . . . 55
4.1 Emotion Data Collection for Western Popular Music . . . . . . . . . . . . . . . . 56
4.1.1 Emotion Tags Provided by Last.FM . . . . . . . . . . . . . . . . . . . . . 56
4.1.2 Musical Excerpts Collection . . . . . . . . . . . . . . . . . . . . . . . . . . 57
4.2 Evaluation of Musical Features for Emotion Classification . . . . . . . . . . . . . 58
4.2.1 Data Preprocessing . . . . . . . . . . . . . . . . . . . . . . . . . . . . . . . 59
4.2.2 Musical Feature Extraction . . . . . . . . . . . . . . . . . . . . . . . . . . 60
4.2.3 Emotion Classification . . . . . . . . . . . . . . . . . . . . . . . . . . . . . 60
4.2.4 Classification Results . . . . . . . . . . . . . . . . . . . . . . . . . . . . . . 62
4.2.5 Discussion . . . . . . . . . . . . . . . . . . . . . . . . . . . . . . . . . . . . 65
4.3 Listening Experiment 1 - The Categorical Model . . . . . . . . . . . . . . . . . . 67
4.3.1 Participants . . . . . . . . . . . . . . . . . . . . . . . . . . . . . . . . . . . 67
4.3.2 Stimuli . . . . . . . . . . . . . . . . . . . . . . . . . . . . . . . . . . . . . 67
4.3.3 Procedure . . . . . . . . . . . . . . . . . . . . . . . . . . . . . . . . . . . . 68
4.3.4 Results . . . . . . . . . . . . . . . . . . . . . . . . . . . . . . . . . . . . . 70
4.3.5 Discussion . . . . . . . . . . . . . . . . . . . . . . . . . . . . . . . . . . . . 77
4.4 Listening Experiment 2 - The Dimensional Model . . . . . . . . . . . . . . . . . . 79
4.4.1 Participants . . . . . . . . . . . . . . . . . . . . . . . . . . . . . . . . . . . 79
4.4.2 Stimuli . . . . . . . . . . . . . . . . . . . . . . . . . . . . . . . . . . . . . 79
4.4.3 Procedure . . . . . . . . . . . . . . . . . . . . . . . . . . . . . . . . . . . . 80
4.4.4 Results . . . . . . . . . . . . . . . . . . . . . . . . . . . . . . . . . . . . . 81
4.4.5 Discussion . . . . . . . . . . . . . . . . . . . . . . . . . . . . . . . . . . . . 87
CONTENTS 6
4.5 Summary of Experiments 1 and 2 . . . . . . . . . . . . . . . . . . . . . . . . . . . 89
4.5.1 Comparison of Two Models of Emotion . . . . . . . . . . . . . . . . . . . 89
4.5.2 General Discussion . . . . . . . . . . . . . . . . . . . . . . . . . . . . . . . 90
4.6 Human versus Machine Emotion Recognition . . . . . . . . . . . . . . . . . . . . 94
4.6.1 Musical Example Collection Using Participants’ Suggestions . . . . . . . . 94
4.6.2 Collection of Participants’ Emotional Responses . . . . . . . . . . . . . . 95
4.6.3 Musical Feature Extraction . . . . . . . . . . . . . . . . . . . . . . . . . . 95
4.6.4 Results . . . . . . . . . . . . . . . . . . . . . . . . . . . . . . . . . . . . . 96
4.6.5 Discussion . . . . . . . . . . . . . . . . . . . . . . . . . . . . . . . . . . . . 100
4.7 General Discussion . . . . . . . . . . . . . . . . . . . . . . . . . . . . . . . . . . . 101
5 Functions of Music Listening and Musical Preference in Everyday Situations103
5.1 Motivation . . . . . . . . . . . . . . . . . . . . . . . . . . . . . . . . . . . . . . . 103
5.2 Method . . . . . . . . . . . . . . . . . . . . . . . . . . . . . . . . . . . . . . . . . 105
5.2.1 Participants . . . . . . . . . . . . . . . . . . . . . . . . . . . . . . . . . . . 105
5.2.2 Procedure . . . . . . . . . . . . . . . . . . . . . . . . . . . . . . . . . . . . 106
5.3 Results . . . . . . . . . . . . . . . . . . . . . . . . . . . . . . . . . . . . . . . . . . 107
5.3.1 How Much Does Engagement with Music Vary Across Situations? . . . . 108
5.3.2 What Are the Functions of Listening to Music? . . . . . . . . . . . . . . . 109
5.3.3 What Are the Expected Emotions from Music in Different Situations? . . 111
5.3.4 How Do Different Styles of Music Serve Different Situations? . . . . . . . 114
5.3.5 How Do Individual Differences Relate to Musical Preference? . . . . . . . 115
5.4 Discussion . . . . . . . . . . . . . . . . . . . . . . . . . . . . . . . . . . . . . . . . 119
6 Emotional and Functional Uses of Music in Various Contexts . . . . . . . . . 123
6.1 Aims . . . . . . . . . . . . . . . . . . . . . . . . . . . . . . . . . . . . . . . . . . . 123
6.2 Method . . . . . . . . . . . . . . . . . . . . . . . . . . . . . . . . . . . . . . . . . 125
6.2.1 Participants . . . . . . . . . . . . . . . . . . . . . . . . . . . . . . . . . . . 125
6.2.2 Questionnaires . . . . . . . . . . . . . . . . . . . . . . . . . . . . . . . . . 126
6.2.3 Procedure . . . . . . . . . . . . . . . . . . . . . . . . . . . . . . . . . . . . 128
6.3 Results . . . . . . . . . . . . . . . . . . . . . . . . . . . . . . . . . . . . . . . . . . 129
6.3.1 Usage of Music Varies Across Situations . . . . . . . . . . . . . . . . . . . 129
6.3.2 Functions of Music Vary Across Situations . . . . . . . . . . . . . . . . . . 129
6.3.3 Emotional Associations with Situations . . . . . . . . . . . . . . . . . . . 134
CONTENTS 7
6.3.4 Emotional Associations with Situations and Music . . . . . . . . . . . . . 135
6.3.5 Emotional Associations With and Without the Presence of Music . . . . . 136
6.3.6 Emotional Responses and Functions of Music Listening . . . . . . . . . . 139
6.3.7 Musical Preference Varies Across Situations . . . . . . . . . . . . . . . . . 139
6.3.8 Individual Factors . . . . . . . . . . . . . . . . . . . . . . . . . . . . . . . 140
6.4 Discussion . . . . . . . . . . . . . . . . . . . . . . . . . . . . . . . . . . . . . . . . 141
7 Conclusion and Future Work . . . . . . . . . . . . . . . . . . . . . . . . . . . . . . 146
7.1 Summary . . . . . . . . . . . . . . . . . . . . . . . . . . . . . . . . . . . . . . . . 146
7.2 Future Directions . . . . . . . . . . . . . . . . . . . . . . . . . . . . . . . . . . . . 148
7.2.1 Continuous Emotion Prediction in Music . . . . . . . . . . . . . . . . . . 148
7.2.2 Cultural Dependence of Perception and Induction of Emotion in Music . 148
7.2.3 Genre-informed Music Emotion Recognition System . . . . . . . . . . . . 149
7.2.4 Emotional Uses of Music and Musical Preference . . . . . . . . . . . . . . 149
7.2.5 Musical Emotions Using Psychophysiological Measurements . . . . . . . . 150
7.2.6 Musical Feature Analysis of Musical Preferences . . . . . . . . . . . . . . 150
7.2.7 The Design of Subjective Music Recommendation Systems . . . . . . . . 150
References . . . . . . . . . . . . . . . . . . . . . . . . . . . . . . . . . . . . . . . . . . . . 152
A Emotion Tags Retrieved from Last.FM . . . . . . . . . . . . . . . . . . . . . . . 178
B Statistics of Participants in Two Listening Experiments . . . . . . . . . . . . . 179
C List of Stimuli Used in Two Listening Experiments . . . . . . . . . . . . . . . 181
D Activities Involving with Music Listening and Its Purposes . . . . . . . . . . 184
E Participant-Suggested Musical Emotion Excerpts . . . . . . . . . . . . . . . . . 185
List of Figures
2.1 Russell’s model using direct circular scaling coordinates for 28 affect words. . . . 33
3.1 Interactions among musical emotions, functions of music listening, and musical
preferences with different situations. . . . . . . . . . . . . . . . . . . . . . . . . . 49
4.1 Stages of experimental procedure. . . . . . . . . . . . . . . . . . . . . . . . . . . . 60
4.2 Comparison of classification results for the four classes of features. . . . . . . . . 63
4.3 Induced emotional response distribution for each tag. The horizontal axis shows
the five responses for each of the four emotion tags happy, sad, relaxed, and angry.
The vertical axis shows the number of responses. . . . . . . . . . . . . . . . . . . 74
4.4 Perceived emotion response distribution for each tag. The horizontal axis shows
the five responses for each of the four emotion tags happy, sad, relaxed, and angry.
The vertical axis shows the number of responses. . . . . . . . . . . . . . . . . . . 75
4.5 Valence-Arousal model showing the quadrants of the four emotion tags used in
this experiment. . . . . . . . . . . . . . . . . . . . . . . . . . . . . . . . . . . . . 80
4.6 Perceived emotion response distribution for each tag. The horizontal axis shows
the five responses for each of the four emotion tags happy, sad, relaxed, and angry.
The vertical axis shows the number of responses. . . . . . . . . . . . . . . . . . . 86
4.7 Induced emotion response distribution for each tag. The horizontal axis shows the
five responses for each of the four emotion tags happy, sad, relaxed, and angry.
The vertical axis shows the number of responses. . . . . . . . . . . . . . . . . . . 87
5.1 Expected felt emotion from music for each situation on a valence-arousal space.
For each situation, the centroid is presented with standard error bars for both
horizontal (valence) and vertical (arousal) axes. Note the difference in scale of
axes. The predominant function shown in Table 5.6 is represented by circle =
energising, square = distraction, and triangle = meaning enhancement. . . . . . . 112
8

LIST OF FIGURES 9
5.2 Summary of situations on a valence-arousal plane of emotion by dividing up the
plane. . . . . . . . . . . . . . . . . . . . . . . . . . . . . . . . . . . . . . . . . . . 113
6.1 Changes of participants’ ratings of valence for situations with and without the
presence of music. . . . . . . . . . . . . . . . . . . . . . . . . . . . . . . . . . . . 139
6.2 Changes of participants’ ratings of arousal for situations with and without the
presence of music. . . . . . . . . . . . . . . . . . . . . . . . . . . . . . . . . . . . 140
6.3 Changes in valence and arousal ratings for situations due to the presence of music. 142
List of Tables
2.1 The terms used to describe the two forms of emotional processes in relation to
music by grammatical subject (perspective). . . . . . . . . . . . . . . . . . . . . . 26
2.2 Nine mood clusters proposed by Schubert (2003). . . . . . . . . . . . . . . . . . . 30
2.3 Four mood categories proposed by Thayer (1989). . . . . . . . . . . . . . . . . . 31
2.4 Five mood clusters used in the MIREX audio mood classification task proposed
by Hu and Downie (2007). . . . . . . . . . . . . . . . . . . . . . . . . . . . . . . . 31
2.5 Geneva Emotional Music Scale (nine dimensions) proposed by Zentner et al. (2008). 34
3.1 Situations designed by North and Hargreaves (1996). . . . . . . . . . . . . . . . . 46
3.2 Categorisation of activities by Sloboda et al. (2001). . . . . . . . . . . . . . . . . 47
3.3 Examples of activities chosen in other studies. . . . . . . . . . . . . . . . . . . . . 48
3.4 Functions of music proposed by Merriam (1964). . . . . . . . . . . . . . . . . . . 52
4.1 Top 5 emotion tags returned by Last.FM for four basic emotions. . . . . . . . . . 57
4.2 Top 5 titles and artists’ names returned with emotion tags from the “happy”
category. . . . . . . . . . . . . . . . . . . . . . . . . . . . . . . . . . . . . . . . . . 57
4.3 Top 5 titles and artist’s names returned with emotion tags from the “sad” category. 58
4.4 Top 5 titles and artists’ names returned with emotion tags from the “relaxed”
category. . . . . . . . . . . . . . . . . . . . . . . . . . . . . . . . . . . . . . . . . . 58
4.5 Top 5 titles and artists’ names returned with emotion tags from the “angry” category. 59
4.6 Summary of ground truth data collection. . . . . . . . . . . . . . . . . . . . . . . 59
4.7 The feature set used in this music emotion classification experiment. . . . . . . . 61
4.8 Classification results of Experiment 1. . . . . . . . . . . . . . . . . . . . . . . . . 62
4.9 Comparison of classification accuracy with mean (M) and standard deviation (SD)
feature values. . . . . . . . . . . . . . . . . . . . . . . . . . . . . . . . . . . . . . . 64
4.10 Classification results for combinations of feature sets. . . . . . . . . . . . . . . . . 65
4.11 Group allocation among participants. . . . . . . . . . . . . . . . . . . . . . . . . . 68
10
LIST OF TABLES 11
4.12 Correlations between induced and perceived emotional responses. . . . . . . . . . 72
4.13 Possible relationships between perceived and induced emotions in the categorical
model. . . . . . . . . . . . . . . . . . . . . . . . . . . . . . . . . . . . . . . . . . . 73
4.14 Proportion of responses agreeing with Last.FM tag data for the corresponding song. 75
4.15 Summary of responses to 32 questions adapted from the Gold-MSI. . . . . . . . . 76
4.16 Consistency of participants’ responses for valence and arousal. . . . . . . . . . . . 82
4.17 Possible relationships between perceived and induced emotions in the dimensional
model. . . . . . . . . . . . . . . . . . . . . . . . . . . . . . . . . . . . . . . . . . . 83
4.18 Agreement of valence-arousal ratings with tag quadrants, and spread of per-song
ratings (averaged over participants). . . . . . . . . . . . . . . . . . . . . . . . . . 85
4.19 Agreement of participant ratings with the quadrant of the emotion tag for each
category. . . . . . . . . . . . . . . . . . . . . . . . . . . . . . . . . . . . . . . . . . 86
4.20 Summary of design differences between the two experiments. . . . . . . . . . . . 89
4.21 The differences between “match” and “no match” cases in participants’ consistency. 90
4.22 The distribution of musical examples provided by participants. . . . . . . . . . . 95
4.23 Musical excerpts examples for each emotion category provided by participants. . 95
4.24 Audio features extracted from the musical excerpts. . . . . . . . . . . . . . . . . 96
4.25 Comparison of classification performance using support vector machines and ran-
dom forest approaches. . . . . . . . . . . . . . . . . . . . . . . . . . . . . . . . . . 97
4.26 Correlation between the song-wise consistency of the recognition system using the
RF approach and participants’ responses. . . . . . . . . . . . . . . . . . . . . . . 98
4.27 Correlation between the responses from the MER system and participants using
the categorical model. . . . . . . . . . . . . . . . . . . . . . . . . . . . . . . . . . 98
4.28 Correlation between the responses from the MER system and participants using
the dimensional model. . . . . . . . . . . . . . . . . . . . . . . . . . . . . . . . . . 99
4.29 Examples of emotion vote distribution for the recognition system and participants’
ratings (categorical and dimensional models of emotion). . . . . . . . . . . . . . . 99
5.1 Categorisation of situations used in the Experiment. . . . . . . . . . . . . . . . . 104
5.2 Musical training score of participants. . . . . . . . . . . . . . . . . . . . . . . . . 106
5.3 Genre preferences of participants. . . . . . . . . . . . . . . . . . . . . . . . . . . 106
5.4 The mean (standard deviation) ratings for frequency (left) and importance (right),
sorted in descending order. . . . . . . . . . . . . . . . . . . . . . . . . . . . . . . 108
LIST OF TABLES 12
5.5 Post-hoc analysis for functions of listening to music. . . . . . . . . . . . . . . . . 110
5.6 Participants’ ratings for the importance of functions of listening to music in
various situations. . . . . . . . . . . . . . . . . . . . . . . . . . . . . . . . . . . . 111
5.7 Correlations between and within emotion responses to music and functions. . . . 114
5.8 Counts of genres selected for various situational contexts. . . . . . . . . . . . . . 115
5.9 Correlations between three individual factors and three aspects of music listening
preference. . . . . . . . . . . . . . . . . . . . . . . . . . . . . . . . . . . . . . . . . 117
5.10 Relationships between the frequency of listening to music in various situations
between male and female, age, and musical training (MT). . . . . . . . . . . . . . 118
6.1 Activities (situations, contexts) used in Chapter 5 and the present study. . . . . 124
6.2 Participants’ musical training scores. . . . . . . . . . . . . . . . . . . . . . . . . . 126
6.3 Musical genre preference of participants. . . . . . . . . . . . . . . . . . . . . . . . 127
6.4 The mean (standard deviation) ratings of frequency and importance for music in
different situations. . . . . . . . . . . . . . . . . . . . . . . . . . . . . . . . . . . . 130
6.5 Mean (standard deviation) ratings of importance of functions of music for each
situation. . . . . . . . . . . . . . . . . . . . . . . . . . . . . . . . . . . . . . . . . 131
6.6 Results of pair-wise comparison of participants’ ratings of importance for function
“distraction” across situations. . . . . . . . . . . . . . . . . . . . . . . . . . . . . 132
6.7 Results of pair-wise comparison of participants’ ratings of importance for function
“energising” across situations. . . . . . . . . . . . . . . . . . . . . . . . . . . . . . 132
6.8 Results of pair-wise comparison of participants’ ratings of importance for function
“entrainment” across situations. . . . . . . . . . . . . . . . . . . . . . . . . . . . . 133
6.9 Results of pair-wise comparison of participants’ ratings of importance for function
“meaning enhancement” across situations. . . . . . . . . . . . . . . . . . . . . . . 133
6.10 Summary of pair-wise comparisons for four functions across situations. . . . . . . 134
6.11 Mean (standard deviation) emotional ratings for different situations without music.135
6.12 Mean (standard deviation) emotional ratings for different situations with music. 136
6.13 Results of Spearman’s rank correlation analysis and Wilcoxon signed rank test
between ratings of valence (and arousal) with and without the presence of music. 137
6.14 Summary of emotional uses of music for valence and arousal. . . . . . . . . . . . 141
6.15 Results of Spearman’s correlation analysis between the ratings for four functions
and for two emotional dimensions. . . . . . . . . . . . . . . . . . . . . . . . . . . 141

LIST OF TABLES 13
6.16 Genre preference for each situation. . . . . . . . . . . . . . . . . . . . . . . . . . . 143
6.17 The effects of individual differences on music-listening behaviour. . . . . . . . . . 144
E.1 Examples for Induced Emotions. . . . . . . . . . . . . . . . . . . . . . . . . . . . 185
E.2 Examples for Perceived Emotions. . . . . . . . . . . . . . . . . . . . . . . . . . . 188
Glossary of Technical Terms
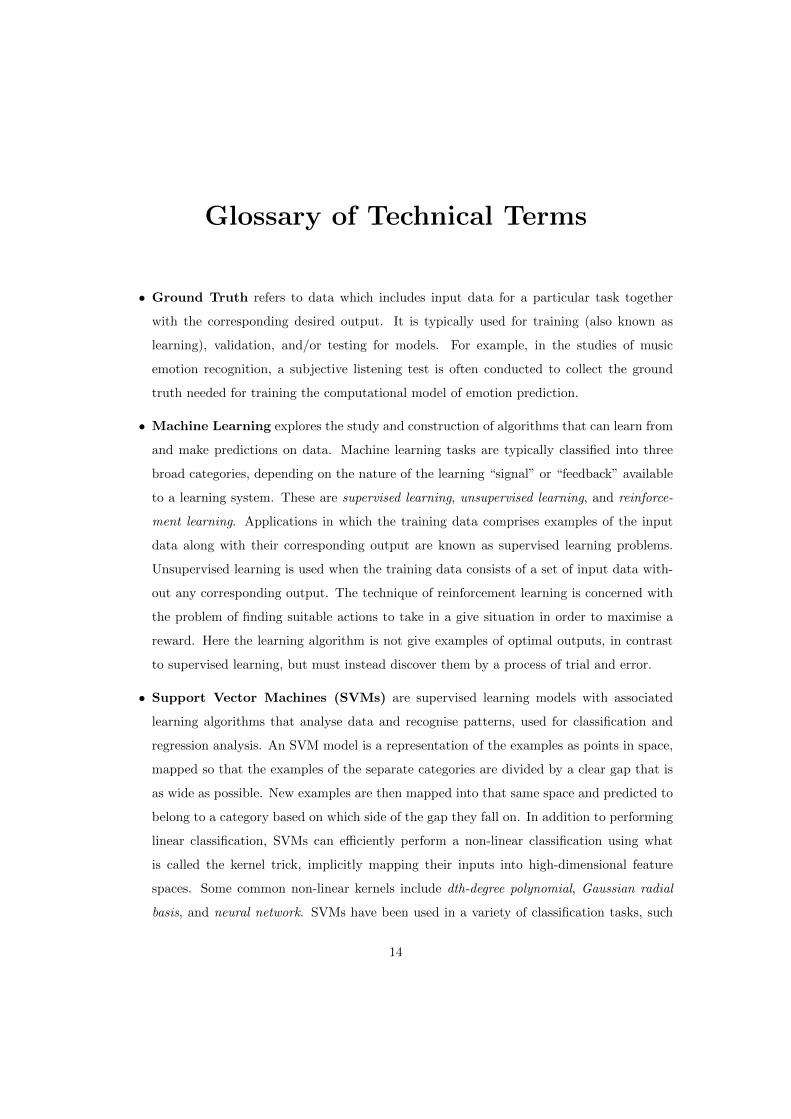
• Ground Truth refers to data which includes input data for a particular task together
with the corresponding desired output. It is typically used for training (also known as
learning), validation, and/or testing for models. For example, in the studies of music
emotion recognition, a subjective listening test is often conducted to collect the ground
truth needed for training the computational model of emotion prediction.
• Machine Learning explores the study and construction of algorithms that can learn from
and make predictions on data. Machine learning tasks are typically classified into three
broad categories, depending on the nature of the learning “signal” or “feedback” available
to a learning system. These are supervised learning, unsupervised learning, and reinforce-
ment learning. Applications in which the training data comprises examples of the input
data along with their corresponding output are known as supervised learning problems.
Unsupervised learning is used when the training data consists of a set of input data with-
out any corresponding output. The technique of reinforcement learning is concerned with
the problem of finding suitable actions to take in a give situation in order to maximise a
reward. Here the learning algorithm is not give examples of optimal outputs, in contrast
to supervised learning, but must instead discover them by a process of trial and error.
• Support Vector Machines (SVMs) are supervised learning models with associated
learning algorithms that analyse data and recognise patterns, used for classification and
regression analysis. An SVM model is a representation of the examples as points in space,
mapped so that the examples of the separate categories are divided by a clear gap that is
as wide as possible. New examples are then mapped into that same space and predicted to
belong to a category based on which side of the gap they fall on. In addition to performing
linear classification, SVMs can efficiently perform a non-linear classification using what
is called the kernel trick, implicitly mapping their inputs into high-dimensional feature
spaces. Some common non-linear kernels include dth-degree polynomial, Gaussian radial
basis, and neural network. SVMs have been used in a variety of classification tasks, such
14
LIST OF TABLES 15
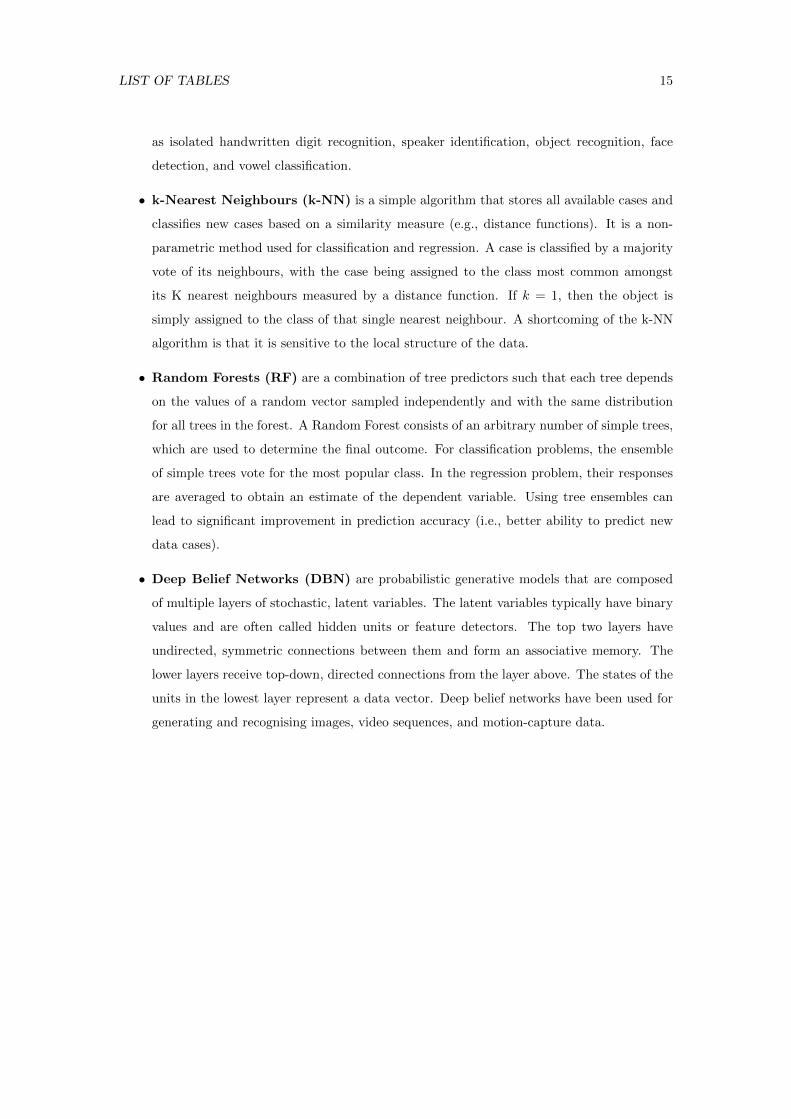
as isolated handwritten digit recognition, speaker identification, object recognition, face
detection, and vowel classification.
• k-Nearest Neighbours (k-NN) is a simple algorithm that stores all available cases and
classifies new cases based on a similarity measure (e.g., distance functions). It is a non-
parametric method used for classification and regression. A case is classified by a majority
vote of its neighbours, with the case being assigned to the class most common amongst
its K nearest neighbours measured by a distance function. If k = 1, then the object is
simply assigned to the class of that single nearest neighbour. A shortcoming of the k-NN
algorithm is that it is sensitive to the local structure of the data.
• Random Forests (RF) are a combination of tree predictors such that each tree depends
on the values of a random vector sampled independently and with the same distribution
for all trees in the forest. A Random Forest consists of an arbitrary number of simple trees,
which are used to determine the final outcome. For classification problems, the ensemble
of simple trees vote for the most popular class. In the regression problem, their responses
are averaged to obtain an estimate of the dependent variable. Using tree ensembles can
lead to significant improvement in prediction accuracy (i.e., better ability to predict new
data cases).
• Deep Belief Networks (DBN) are probabilistic generative models that are composed
of multiple layers of stochastic, latent variables. The latent variables typically have binary
values and are often called hidden units or feature detectors. The top two layers have
undirected, symmetric connections between them and form an associative memory. The
lower layers receive top-down, directed connections from the layer above. The states of the
units in the lowest layer represent a data vector. Deep belief networks have been used for
generating and recognising images, video sequences, and motion-capture data.
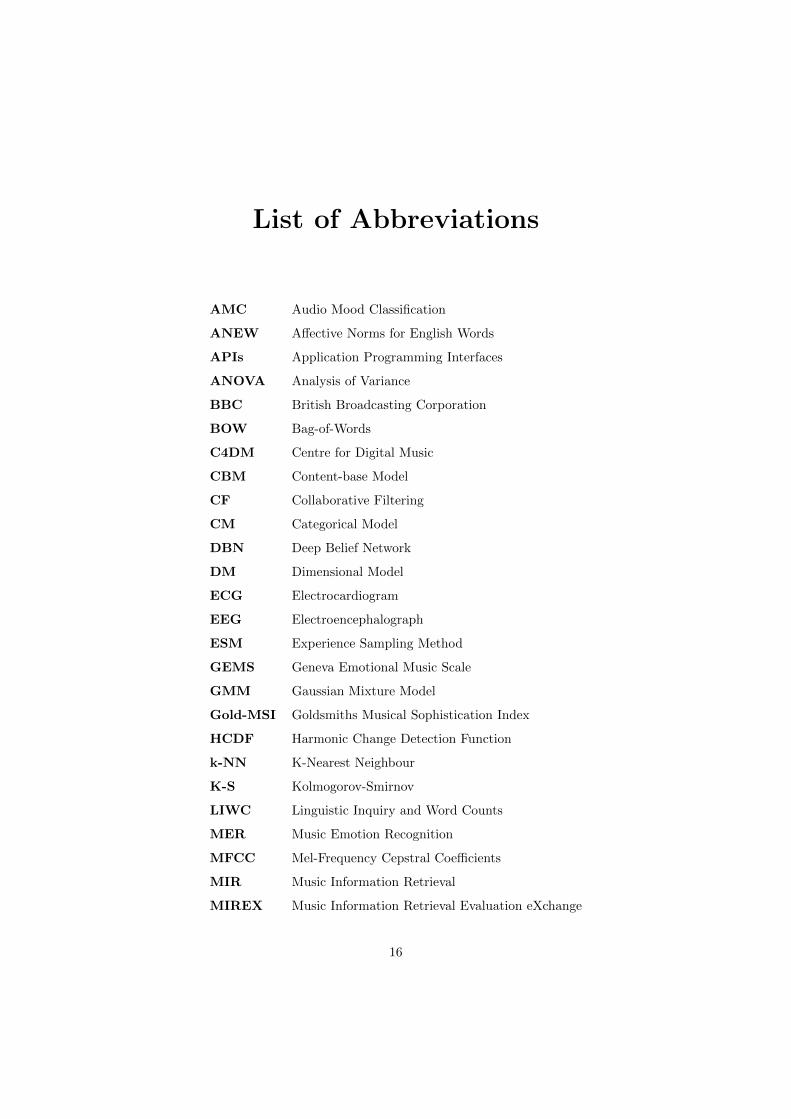
List of Abbreviations
AMC Audio Mood Classification
ANEW Affective Norms for English Words
APIs Application Programming Interfaces
ANOVA Analysis of Variance
BBC British Broadcasting Corporation
BOW Bag-of-Words
C4DM Centre for Digital Music
CBM Content-base Model
CF Collaborative Filtering
CM Categorical Model
DBN Deep Belief Network
DM Dimensional Model
ECG Electrocardiogram
EEG Electroencephalograph
ESM Experience Sampling Method
GEMS Geneva Emotional Music Scale
GMM Gaussian Mixture Model
Gold-MSI Goldsmiths Musical Sophistication Index
HCDF Harmonic Change Detection Function
k-NN K-Nearest Neighbour
K-S Kolmogorov-Smirnov
LIWC Linguistic Inquiry and Word Counts
MER Music Emotion Recognition
MFCC Mel-Frequency Cepstral Coefficients
MIR Music Information Retrieval
MIREX Music Information Retrieval Evaluation eXchange
16
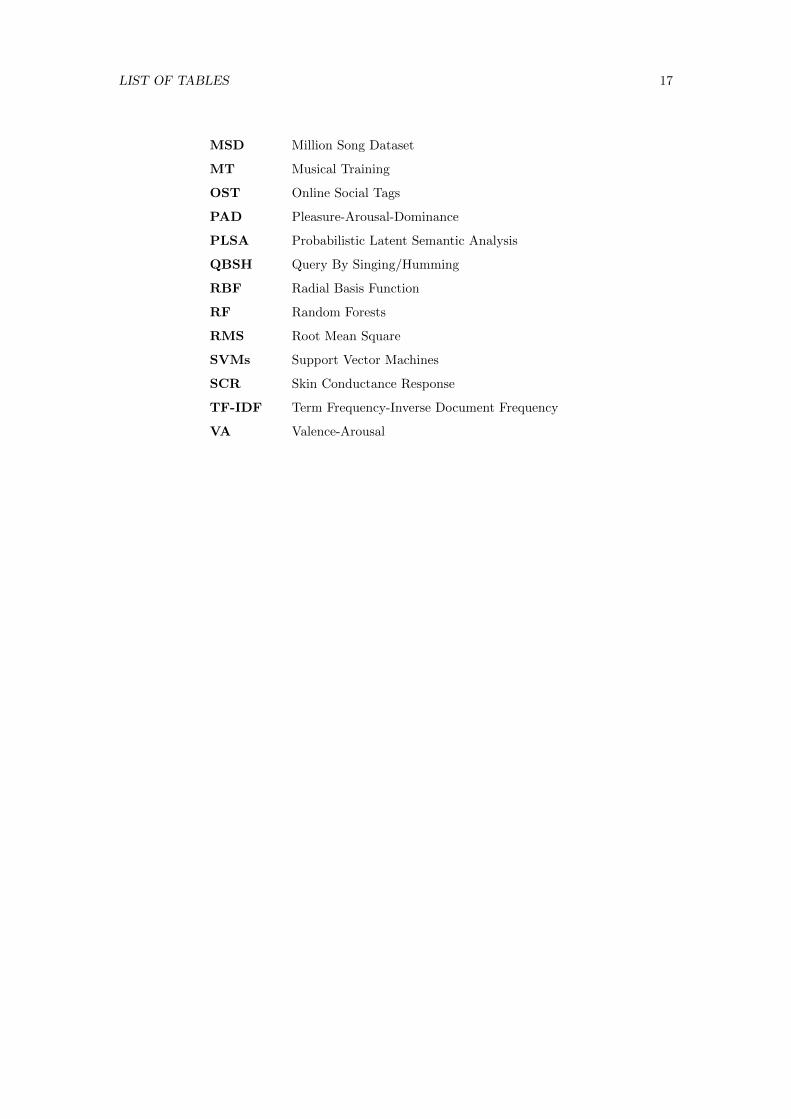
LIST OF TABLES 17
MSD Million Song Dataset
MT Musical Training
OST Online Social Tags
PAD Pleasure-Arousal-Dominance
PLSA Probabilistic Latent Semantic Analysis
QBSH Query By Singing/Humming
RBF Radial Basis Function
RF Random Forests
RMS Root Mean Square
SVMs Support Vector Machines
SCR Skin Conductance Response
TF-IDF Term Frequency-Inverse Document Frequency
VA Valence-Arousal
Chapter 1
Introduction
This thesis is concerned with the role of emotion and context in musical preference. In this
chapter, the motivations and aims of my work are described in Section 1.1. The thesis is outlined
in Section 1.2, and a summarisation of contributions are presented in Section 1.3. Finally,
publications associated with this thesis are listed in Section 1.4.
1.1 Motivation and Aim
With the emergence of digital music in the past two decades, the Internet has become a major
source of retrieving multimedia information such as video, book, and music. The nature of music
experience has changed at a fundamental level, and traditional ways of exploring and listening
to music from radio stations and record stores have been partially replaced by music discovery
web sites such as AllMusic1, iTunes2, Last.FM3, Pandora4, Spotify5, and Youtube6 (Casey et al.,
2008). Additionally, the rapid growth of portable digital devices has made music available almost
everywhere. A study of recreational activities (watching television, listening to music, reading
books, and watching movies) showed that people listen to music more often than any of the
other activities (Rentfrow and Gosling, 2003). Due to the tremendous expansion of digital music
libraries, personal collections of music can also easily exceed practical limits on the time we
have to listen to them (Casey et al., 2008). For music researchers, the large collection of music
recordings has also raised a major challenge for searching, retrieving, and organising musical
1http://www.allmusic.com/2https://www.apple.com/music/3http://www.last.fm/4http://www.pandora.com/5https://www.spotify.com/6https://www.youtube.com/
18
CHAPTER 1. INTRODUCTION 19
content.
In the last fifteen years, music information retrieval (MIR) techniques have been developed to
deal with common issues such as identification, recognition, and recommendation of music. Music
recommendation systems, an effective application of discovering and filtering musical information,
have been widely discussed (Celma, 2009). A good music recommendation system is capable of
automatically modelling users’ musical preferences and generating playlists accordingly. The
development of music recommendation systems also provides a great opportunity for industry
to aggregate users who are interested in music and have similar musical preference. At present,
the majority of commercial music recommendation systems are metadata-based, which provides
search functionality based on the artist’s name, track title, album, and genre. In recent years,
although MIR researchers have achieved relative success in content-based music recommendation
systems by measuring inter-song similarity, there is still a lack of personalised design, involvement
of human subjects, and user interactions with music recommendation systems.
The experience of music is highly subjective. It not only can convey and express emotion, but
it can also regulate a listener’s emotion (Schubert, 2013; Eerola and Vuoskoski, 2013). People
reported that their primary motivation for listening to music lies in its emotional effects (Juslin
and Laukka, 2004; Juslin et al., 2008). In addition, Sloboda et al. (2009) reported that a substan-
tial amount of music listening in contemporary Western society is deliberately chosen. People
choose to listen to music for different reasons and to achieve various goals. Lamont and Greasley
(2009) advocated that musical preferences and motivations for music listening are also context-
dependent.
Companies such as Musicovery7, Songza8, and Stereomood9 have attempted to integrate more
subjective elements into the implementation of music recommendation systems, and have used
emotional and contextual tags to help people discover music. However, these tags have been
mostly manually annotated by experts. The process is very expensive and laborious. Further-
more, many questions on the practicality of emotion- and context-based music recommendation
systems remain unclear. The development of subjective music recommendation system is handi-
capped due to the lack of empirical studies on musical emotion and music-listening context (Uit-
denbogerd and Van Schyndel, 2002).
In music psychology, an extensive body of research is dedicated to the understanding of
7http://musicovery.com/8http://daily.songza.com/9http://www.stereomood.com/
CHAPTER 1. INTRODUCTION 20
music and emotion (Schubert, 2007b; Juslin and Sloboda, 2010; Eerola and Vuoskoski, 2013).
Such research in music psychology literature has highlighted the importance of context in music
listening (North and Hargreaves, 1996; Sloboda et al., 2001; North et al., 2004; Juslin et al.,
2008; Greasley and Lamont, 2011). It is important to combine the knowledge from these two
fields, music information retrieval and music psychology, in order to further advance in our
understanding.
This thesis focusses on Western popular music, and the aim of my work is to investigate music
and emotion using approaches from both MIR and psychology, and explore its relationship with
music-listening context, functions, and musical preference. By carrying out this research, I am
hoping to bring together research in MIR and music psychology.
1.2 Thesis Structure
Chapter 2 covers background knowledge for the research on music and emotion. It starts with
the definitions used in this thesis and discusses different emotional processes in relation to
music. The models of musical emotion, along with the advantages and disadvantages
are described. Research in two different fields, music information retrieval and music
psychology, is reviewed. A brief summary of stimuli used in previous research is presented,
and the problems identified are discussed at the end.
Chapter 3 describes the terminology related to research of musical preference and music-
listening context. A review of previous research on context is provided. Furthermore,
three different aspects: emotional uses of music, functions of music listening, and musical
preference are presented in detail.
Chapter 4 investigates the first element, emotion. This chapter provides the “ground truth”
music emotion data collection of Western popular music. Features in four musical dimen-
sions are extracted. Machine learning techniques are applied to classification of emotional
content in music. I further investigate musical emotions and the reliability of social tags
using two popular models of emotion, the categorical model and the dimensional model.
The results of two listening tests using these two models are shown, and discussed in detail.
In addition, the differences in music emotion classification accuracy between machine and
human are compared.
Chapter 5 explores the second element, music-listening context. A questionnaire on daily
CHAPTER 1. INTRODUCTION 21
usage of music is presented to participants. I compare the functional uses of music, musical
preference, and emotional responses to music in everyday situations. Answers for the
questions such as “What are the functions of listening to music?” and “How do different
styles of music serve different situations?” can be found in this Chapter. For the study of
emotional responses for different situations, this chapter focusses on the expected emotional
responses from the impact of music. The emotion changes due to the presence of music is
investigated in Chapter 6.
Chapter 6 addresses the emotional uses of music, and further discusses the relationships be-
tween emotional responses and functional uses of music. Based on the activity selected
in Chapter 5, thirteen activities are chosen and presented to participants. This chapter
compares the emotional responses with and without the presence of music, and examines
the effects of individual factors such as age, gender, and musical training on the experience
of music listening. Five emotional uses of music, namely to maintain, intensify, diminish,
create, and to change emotion, are also identified.
Chapter 7 concludes the thesis, summarises the doctoral project, and provides ideas for future
studies on music and emotion using psychophysiological measurements, musical feature
analysis of musical preference, and the use of emotion and context in the design of subjective
music recommendation systems.
1.3 Contributions
The following list contains the main contributions of this thesis and the chapters they appear in:
• Chapter 4: Creation of a Western popular music dataset (N = 2904) for music emotion
classification using social tags “happy”, “sad”, “angry”, and “relaxed” from Last.FM.
• Chapter 4: Evaluation of audio features for music emotion classification with the collected
emotion dataset.
• Chapter 4: Comparison of induced and perceived emotional responses using the categorical
and the dimensional models of emotion.
• Chapter 4: Implementation of a music emotion classifier trained with a participant-suggested
emotion dataset (N = 207) and comparison of human versus machine emotion recognition.
CHAPTER 1. INTRODUCTION 22
• Chapter 5: Exploration of musical preference in twenty everyday situations.
• Chapter 5: Categorisation of expected emotional responses to music for each activity on a
valence-arousal space.
• Chapter 6: Investigation of functional uses of music in various contexts, and a proposal of
five emotional uses of music.
1.4 Associated Publications
The research was carried out by the author between September 2011 and August 2015 in the
Centre for Digital Music at Queen Mary University of London. Most of the work in the thesis
has been presented at international conferences or in journals.
Peer-Reviewed Journal Articles
i (Song et al., 2015c) - Song, Y., Dixon, S., Pearce, M. T., and Halpern, A. R. (2016).
Perceived and induced emotion responses to popular music: Categorical and dimensional
models. Music Perception: An Interdisciplinary Journal, in press.
ii (Song et al., 2015b) - Song, Y., Dixon, S., Pearce, M. T., and Eerola, T. (2016). Functional
uses of music vary across everyday situations, emotions and music preferences. In preparation.
iii (Song et al., 2015a) - Song, Y., Dixon, S., Pearce, M. T., and Eerola, T. (2016). Emotional
and functional uses of music in various contexts. In preparation.
Peer-Reviewed Conference Papers
iv (Song and Dixon, 2015) - Song, Y., Dixon, S. (2015). How well can a music emotion
recognition system predict the emotional responses of participants?. In Proceedings of the
12th Sound and Music Computing Conference (SMC), Maynooth, Ireland.
v (Song et al., 2013b) - Song, Y., Dixon, S., Pearce, M. T., and Halpern, A. R. (2013). Do
online social tags predict perceived or induced emotional responses to music?. In Proceedings
of the 14th International Society for Music Information Retrieval Conference (ISMIR), pp.
89-94, Curitiba, Brazil.

CHAPTER 1. INTRODUCTION 23
vi (Kosta et al., 2013) - Kosta, K., Song, Y., Fazekas, G., and Sandler, M. (2013). A study of
cultural dependence of perceived mood in Greek music. In Proceedings of the 14th Interna-
tional Society for Music Information Retrieval Conference (ISMIR), pp. 317-322, Curitiba,
Brazil.
vii (Song et al., 2013a) - Song, Y., Dixon, S., Pearce, M. T., and Fazekas, G. (2013). Using tags
to select stimuli in the study of music and emotion. In Proceedings of the 3rd International
Conference on Music and Emotion (ICME), Jyvaskyla, Finland.
viii (Song et al., 2012b) - Song, Y., Dixon, S., and Pearce, M. T. (2012). Evaluation of musical
features for emotion classification. In Proceedings of the 13th International Society for Music
Information Retrieval Conference (ISMIR), pp. 523-528, Porto, Portugal.
ix (Song et al., 2012a) - Song, Y., Dixon, S., and Pearce, M. T. (2012). A survey of music
recommendation systems and future perspectives. In Proceedings of the 9th International
Symposium on Computer Music Modelling and Retrieval (CMMR), pp. 395-410, London,
UK.
Chapters 1 and 7 are based on some of the work published in ix. Publications i, iv, v, vii,
and viii are the basis for Chapter 4. Articles ii and iii are the basis for Chapters 5 and 6.
In addition to the research supervised by Simon Dixon and Marcus Pearce, for publication vi,
the author also worked with Andrea Halpern on publications i and v. During the 2-month
research visit at Finnish Centre of Excellence in Interdisciplinary Music Research at University
of Jyvaskyla from June to July, 2013, Tuomas Eerola supervised the project “emotional and
functional uses of music in everyday life” (see publications ii and iii).
In publications i, ii, iii, and v, I conducted all the experiments and wrote the articles.
Co-authors (Simon Dixon, Marcus Pearce, Andrea Halpern, and Tuomas Eerola) provided ideas
for experimental design and data analysis. The manuscripts were also checked by co-authors
throughout the submission and review process. In publication iv, Simon Dixon offered some
insights into method and data analysis. In publication vi, I proposed different hypotheses, con-
ducted data analysis, and wrote results and conclusion sections. Katerina Kosta collected Greek
music dataset, wrote introduction section, and helped data analysis. Gyorgy Fazekas worked on
experimental design and wrote background and introduction sections. In publications vii, viii,
and ix, I wrote the articles and conducted the experiments. Simon Dixon and Marcus Pearce
provided their advices on writing and analysis, and Gyorgy Fazekas kindly assisted me with the
online experiments setup.
Chapter 2
Background in Music and Emotion
This chapter describes background knowledge for the research on music and emotion. Section 2.1
defines the concepts that are used throughout this work. Next, two forms of emotional processes
in relation to music, perception and induction of musical emotions, are described in Section 2.2.
Section 2.3 covers an overview of the models of emotion in music. Previous studies are then
explained in Section 2.4, particularly in the fields of computer science (see Section 2.4.1) and
music psychology (see Section 2.4.2). In Section 2.5, I briefly discuss the stimuli used in previous
research. Finally, a review of the gap between research from different fields is presented in
Section 2.6.
2.1 Definition
Given the importance of emotion in music, researchers have paid increasing attention to the
study of music and emotion in the past two decades (Juslin and Sloboda, 2001, 2010; Eerola and
Vuoskoski, 2013). Previous studies have used the terms emotion and mood, and sometimes they
are referring to the same concept. Also when people describe their “emotional experience” in
music, they may choose other words such as feeling and affect (Juslin and Sloboda, 2010). Scherer
(2005) has stated that the definition of emotions, distinguishing them from other affective states
or traits, is a notorious problem and constant challenge for emotion researchers. For exam-
ple, the differences among these terms are not always stated by music information retrieval
researchers (Huq et al., 2010; Yang and Chen, 2012; Watson and Mandryk, 2012), whereas the
distinction is often made by psychologists (Scherer, 2004; Juslin et al., 2008; Saari and Eerola,
2014). This phenomenon causes terminological confusion. In order to avoid this problem in
this work, I follow the concepts (i.e., affect, emotion, mood, and feeling) defined in the book
24
CHAPTER 2. BACKGROUND IN MUSIC AND EMOTION 25
Handbook of music and emotion: Theory, research, applications by Juslin and Sloboda (2010).
i Affect: This is used as an umbrella term that covers all evaluative - states (e.g., emotion,
mood, and preference) or “valences” (positive/negative). The term denotes such phenomena
in general. If that is not intended, a more precise term (e.g., mood, emotion, and preference)
is used instead (p. 10);
ii Emotion: This term is used to refer to a quite brief but intense affective reaction that usually
involves a number of sub-components: subjective feeling, physiological arousal, expression,
action tendency, and regulation, that are more or less “synchronised”. Emotions focus on
specific “objects” and last minutes to a few hours (e.g., happiness, sadness) (p. 10);
iii Mood: This term is used to denote such affective states that are lower in intensity than
emotions, that do not have a clear “object”, and that are much longer lasting than emotions
(i.e., several hours to days). Moods do not involve a synchronised response in components
like expression and physiology (e.g., gloomy) (p. 10);
iv Feeling: This term is used to refer to the subjective experience of emotions or moods. Feeling
is one component of an emotion that is typically measured via verbal self-report (p. 10).
This work focusses mainly on the emotion in music. Juslin and Sloboda (2010) define musical
emotions as a short term for “emotions that were somehow induced by music”, without any
further implications about the precise nature of these emotions. In this work, I use the terms
emotion and musical emotion to represent perceived and induced emotion interchangeably.
2.2 Perception and Induction of Musical Emotions
Music can both express and evoke emotions (Krumhansl, 2002). In the study of music and
emotion, one of the challenges faced by psychologists is to compare the two forms of emotional
processes in relation to music, namely perception and induction of musical emotions. Gabriels-
son (2002) has stated that induced emotion (also known as felt emotion, or internal locus) is
the emotion experienced by the listener, whereas the perceived emotion (also known as expressed
emotion, or external locus) is the emotion recognised in the music. Schubert (2013) has sum-
marised the terms used to describe these two forms of emotional processes in relation to music
(see Table 2.1).
CHAPTER 2. BACKGROUND IN MUSIC AND EMOTION 26
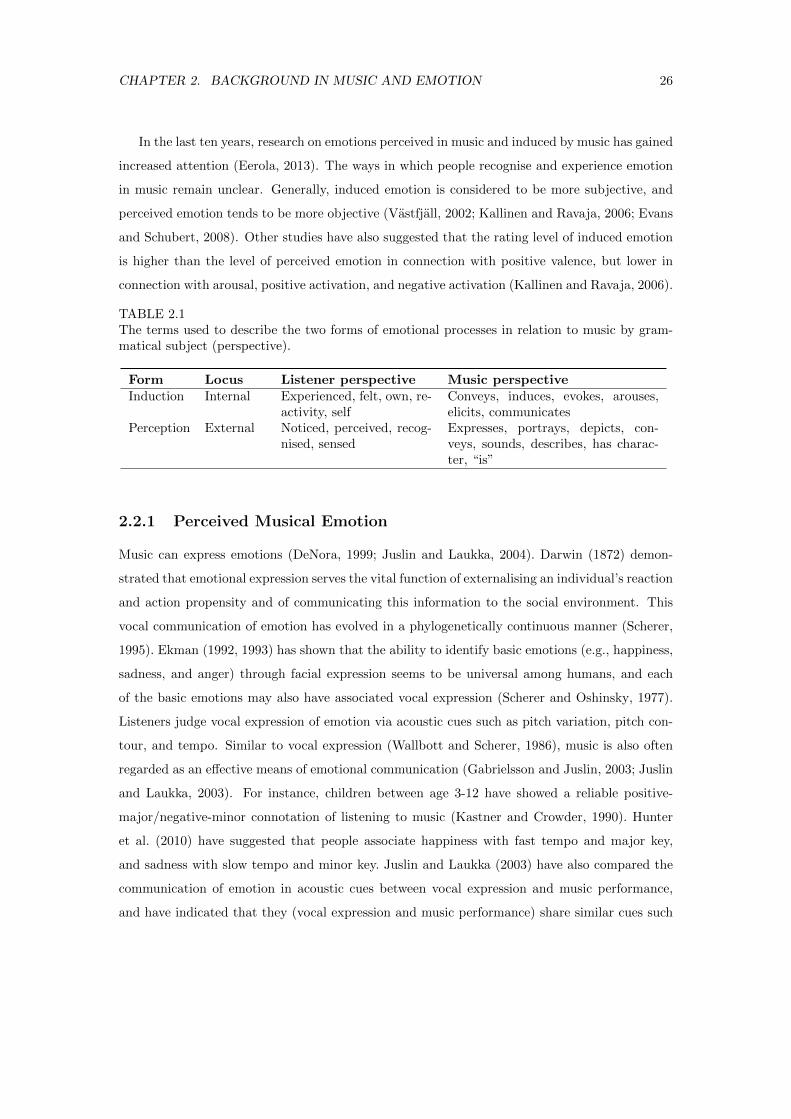
In the last ten years, research on emotions perceived in music and induced by music has gained
increased attention (Eerola, 2013). The ways in which people recognise and experience emotion
in music remain unclear. Generally, induced emotion is considered to be more subjective, and
perceived emotion tends to be more objective (Vastfjall, 2002; Kallinen and Ravaja, 2006; Evans
and Schubert, 2008). Other studies have also suggested that the rating level of induced emotion
is higher than the level of perceived emotion in connection with positive valence, but lower in
connection with arousal, positive activation, and negative activation (Kallinen and Ravaja, 2006).
TABLE 2.1The terms used to describe the two forms of emotional processes in relation to music by gram-matical subject (perspective).
Form Locus Listener perspective Music perspectiveInduction Internal Experienced, felt, own, re-
activity, selfConveys, induces, evokes, arouses,elicits, communicates
Perception External Noticed, perceived, recog-nised, sensed
Expresses, portrays, depicts, con-veys, sounds, describes, has charac-ter, “is”
2.2.1 Perceived Musical Emotion
Music can express emotions (DeNora, 1999; Juslin and Laukka, 2004). Darwin (1872) demon-
strated that emotional expression serves the vital function of externalising an individual’s reaction
and action propensity and of communicating this information to the social environment. This
vocal communication of emotion has evolved in a phylogenetically continuous manner (Scherer,
1995). Ekman (1992, 1993) has shown that the ability to identify basic emotions (e.g., happiness,
sadness, and anger) through facial expression seems to be universal among humans, and each
of the basic emotions may also have associated vocal expression (Scherer and Oshinsky, 1977).
Listeners judge vocal expression of emotion via acoustic cues such as pitch variation, pitch con-
tour, and tempo. Similar to vocal expression (Wallbott and Scherer, 1986), music is also often
regarded as an effective means of emotional communication (Gabrielsson and Juslin, 2003; Juslin
and Laukka, 2003). For instance, children between age 3-12 have showed a reliable positive-
major/negative-minor connotation of listening to music (Kastner and Crowder, 1990). Hunter
et al. (2010) have suggested that people associate happiness with fast tempo and major key,
and sadness with slow tempo and minor key. Juslin and Laukka (2003) have also compared the
communication of emotion in acoustic cues between vocal expression and music performance,
and have indicated that they (vocal expression and music performance) share similar cues such
CHAPTER 2. BACKGROUND IN MUSIC AND EMOTION 27
as intensity (i.e., loudness of speech, loudness) and attack (i.e., rapidity of voice/tone onset),
and that music performance has specific cues such as articulation (i.e., the relative proportion of
sound to silence in note values) and vibrato (i.e., periodic changes in the pitch of a tone).
Previously, research showed that happiness and sadness can be expressed well and identified
easily in music (Vieillard et al., 2008; Mohn et al., 2010). However, fear and anger are harder
to identify than happiness and sadness (Terwogt and Van Grinsven, 1991; Kallinen, 2005). As
pointed out in some studies, certain genres such as classical and popular music may express
specific emotions (Eerola, 2011), and other individual differences such as culture (Fritz et al.,
2009; Zacharopoulou and Kyriakidou, 2009; Thompson and Laura-Lee, 2010; Hu and Lee, 2012;
Kosta et al., 2013), age (Morrison et al., 2008), musical expertise (Castro and Lima, 2014), and
personality (Vuoskoski and Eerola, 2011b) may also affect the perception of emotion in music.
2.2.2 Induced Musical Emotion
People in Western culture have reported that one of the main motivations to engage in musical
activities is emotional responses (Juslin and Laukka, 2004; Schafer et al., 2013). It is known that
music can evoke strong emotions (Gabrielsson, 2010). Emotions induced by music are often ac-
companied with psychophysiological changes (e.g., heart rate, blood pressure, skin conductance,
and temperature) (Nyklıcek et al., 1997; Khalfa et al., 2002; Gomez and Danuser, 2004; Miu
and Balte, 2012). For example, compared with emotional musical excerpts of sadness, fear, and
tension, happy excerpts produce the largest changes in the measures of respiration and generate
more zygomatic facial muscle activity and greater skin conductance (Krumhansl, 1997; Lundqvist
et al., 2008).
Comparing with studies of perceived emotion in music, there is much less research con-
cerning induced musical emotions. Questions such as “What emotions can be induced by mu-
sic?” (Scherer, 2004) and “How does music induce emotions?” (Juslin and Vastfjall, 2008) remain
unclear. Scherer and Zentner (2001) have suggested several production rules for emotion induction
by music, including appraisal, memory, and empathy. In addition to cognitive appraisal (Scherer,
1999), Juslin and Vastfjall (2008) have proposed six additional underlying psychological mecha-
nisms by which music might be expected to evoke emotions, (i) brain stem reflexes, (ii) evaluative
conditioning, (iii) emotional contagion, (iv) visual imagery, (v) episodic memory, and (vi) mu-
sical expectancy. Later, a unified theoretical framework (BRECVEMA) is presented featuring
two more mechanisms, namely aesthetic judgment and rhythmic entrainment (Juslin et al., 2010,
2014). Zentner et al. (2008) have reported some emotions (e.g., amazement, peacefulness) are
CHAPTER 2. BACKGROUND IN MUSIC AND EMOTION 28
more frequently felt in response to music than in everyday life. Also, generally, emotions induced
by music tend to be more positive (Juslin and Laukka, 2004; Schellenberg et al., 2008). Mean-
while, individual factors such as personality (Kallinen and Ravaja, 2006; Vuoskoski et al., 2011),
culture (Egermann et al., 2015), and current states (Vuoskoski and Eerola, 2011a) can also affect
the musical emotion experience in response to music.
2.2.3 Relationship between Emotion Perception and Induction
People enjoy experiencing songs they perceive as sad (Vuoskoski et al., 2011), but they may also
love songs which make them sad (Hunter et al., 2011; Schubert, 2012). Perceiving an expression
of sadness in music without necessarily being affected oneself is mainly a perceptual-cognitive
process, and it should be distinguished from listeners’ emotional response to the music (Gabriels-
son, 2002). In general, music seems to evoke emotions similar to the emotional quality perceived
in music (Kallinen and Ravaja, 2006). Research has shown that ratings of perceived emotion are
more consistent than ratings of induced emotion (Schubert, 2007a; Hunter et al., 2010).
Separating induced emotion from perceived emotion is not straightforward, and the distinc-
tion is not always observed (Eerola, 2011; Schubert, 2013; Egermann et al., 2013). Juslin and
Laukka (2004) have distinguished the perception and induction of emotion in music from emo-
tions induced in everyday life, yet the quantitative relationship between the two has not been
examined (Evans and Schubert, 2008). Gabrielsson (2002) has proposed and given examples of
four possible relationships between perceived and induced emotion (shown below), namely pos-
itive relationship, negative relationship, no systematic relationship, and no relationship. Those
relationships have also been discussed by Kallinen and Ravaja (2006), and Evans and Schubert
(2008).
• Positive relationship occurs when “the listener’s emotional response is in agreement with
the emotional expression in the music” (p. 131);
• Negative relationship occurs when the “listener reacts with an emotion opposite to
that expressed in the music: positive emotion in the music elicits negative emotion in the
response, or negative emotion in the music elicits positive emotion in the response” (p.
134);
• No systematic relationship occurs when the listener stays “emotionally neutral” regard-
less of the expression of the music, or experiences different emotions on different occasions
(p. 136);
CHAPTER 2. BACKGROUND IN MUSIC AND EMOTION 29
• No relationship occurs when there is not even a potential relationship, such as when a
person feels an emotion that cannot be expressed in music (p. 136).
2.3 Musical Emotion Representation
During the past two decades, categorical (or discrete), dimensional, miscellaneous (McAdams
et al., 2004; Ilie and Thompson, 2006), and domain-specific emotion models (e.g., Geneva Emo-
tional Music Scale, which is only used for induced emotion) (Zentner et al., 2008) have been
proposed and used in the study of music and emotion. The categorical model and dimensional
model have received empirical support (Kreutz et al., 2007; Vieillard et al., 2008; Mion and Poli,
2008) and have been commonly used (Vieillard et al., 2008; Juslin et al., 2008; Truong et al.,
2009; Vuoskoski and Eerola, 2011b). Recently, Eerola and Vuoskoski (2010, 2013) have compared
the use of these two models and have suggested that the categorical emotion model is less reliable
than the dimensional model at predicting the rating of excerpts that are ambiguous examples
of an emotion category, but they both produce highly compatible ratings of perceived emotions.
In addition, to model the mapping between the categorical and the dimensional models of emo-
tion, a probabilistic framework utilising a Gaussian Mixture Model (GMM) has been discussed
by Wang et al. (2012).
2.3.1 Categorical Model
The categorical model (CM) assumes that an independent neural system subserves every discrete
basic emotion (Eerola and Vuoskoski, 2010) and it represents all emotions as being derived from
a limited number of universal and innate basic emotions such as happiness, sadness, fear, and
anger (Ekman, 1992; Panksepp, 1998). Empirical support for the categorical model can be
found in the research on neuropsychological and functional brain imaging studies. For instance,
researchers have found that recognition of facial expressions of fear may be associated with specific
neural substrates (Morris et al., 1996; Phillips et al., 1998). Apart from the basic emotions such
as happiness and sadness, the categorical model may also include emotions such as tragedy,
aggressiveness, and sensation (Thayer, 1989; Schubert, 2003; Hu and Downie, 2007). Previous
studies have suggested that musically inappropriate categories such as disgust should be replaced
with more fitting categories such as tenderness or peacefulness (Gabrielsson and Juslin, 1996;
Vieillard et al., 2008).
CHAPTER 2. BACKGROUND IN MUSIC AND EMOTION 30
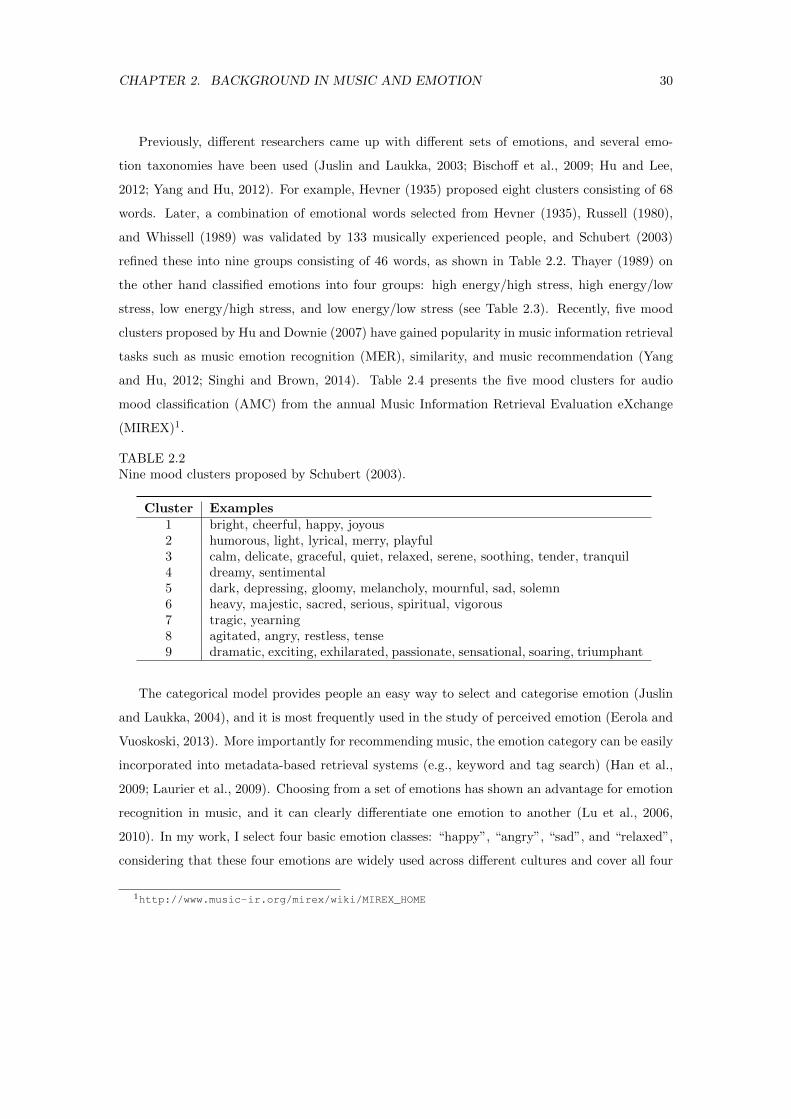
Previously, different researchers came up with different sets of emotions, and several emo-
tion taxonomies have been used (Juslin and Laukka, 2003; Bischoff et al., 2009; Hu and Lee,
2012; Yang and Hu, 2012). For example, Hevner (1935) proposed eight clusters consisting of 68
words. Later, a combination of emotional words selected from Hevner (1935), Russell (1980),
and Whissell (1989) was validated by 133 musically experienced people, and Schubert (2003)
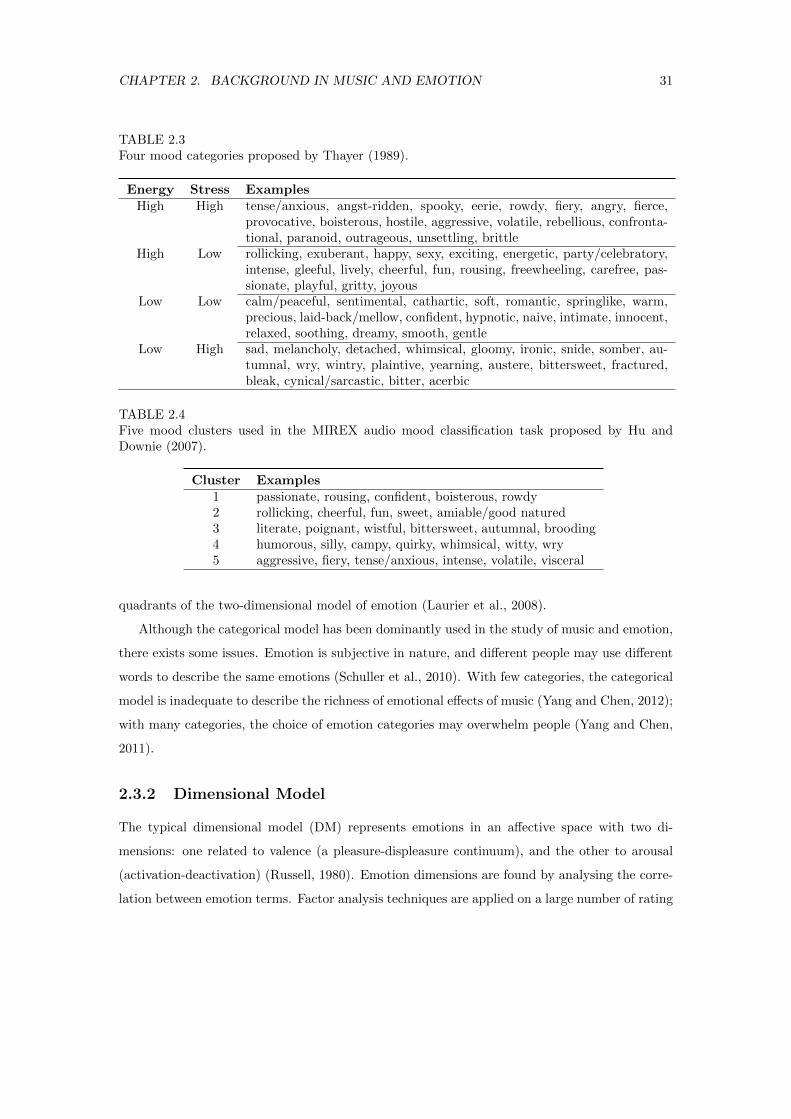
refined these into nine groups consisting of 46 words, as shown in Table 2.2. Thayer (1989) on
the other hand classified emotions into four groups: high energy/high stress, high energy/low
stress, low energy/high stress, and low energy/low stress (see Table 2.3). Recently, five mood
clusters proposed by Hu and Downie (2007) have gained popularity in music information retrieval
tasks such as music emotion recognition (MER), similarity, and music recommendation (Yang
and Hu, 2012; Singhi and Brown, 2014). Table 2.4 presents the five mood clusters for audio
mood classification (AMC) from the annual Music Information Retrieval Evaluation eXchange
(MIREX)1.
TABLE 2.2Nine mood clusters proposed by Schubert (2003).
Cluster Examples1 bright, cheerful, happy, joyous2 humorous, light, lyrical, merry, playful3 calm, delicate, graceful, quiet, relaxed, serene, soothing, tender, tranquil4 dreamy, sentimental5 dark, depressing, gloomy, melancholy, mournful, sad, solemn6 heavy, majestic, sacred, serious, spiritual, vigorous7 tragic, yearning8 agitated, angry, restless, tense9 dramatic, exciting, exhilarated, passionate, sensational, soaring, triumphant
The categorical model provides people an easy way to select and categorise emotion (Juslin
and Laukka, 2004), and it is most frequently used in the study of perceived emotion (Eerola and
Vuoskoski, 2013). More importantly for recommending music, the emotion category can be easily
incorporated into metadata-based retrieval systems (e.g., keyword and tag search) (Han et al.,
2009; Laurier et al., 2009). Choosing from a set of emotions has shown an advantage for emotion
recognition in music, and it can clearly differentiate one emotion to another (Lu et al., 2006,
2010). In my work, I select four basic emotion classes: “happy”, “angry”, “sad”, and “relaxed”,
considering that these four emotions are widely used across different cultures and cover all four
1http://www.music-ir.org/mirex/wiki/MIREX_HOME
CHAPTER 2. BACKGROUND IN MUSIC AND EMOTION 31
TABLE 2.3Four mood categories proposed by Thayer (1989).
Energy Stress ExamplesHigh High tense/anxious, angst-ridden, spooky, eerie, rowdy, fiery, angry, fierce,
provocative, boisterous, hostile, aggressive, volatile, rebellious, confronta-tional, paranoid, outrageous, unsettling, brittle
High Low rollicking, exuberant, happy, sexy, exciting, energetic, party/celebratory,intense, gleeful, lively, cheerful, fun, rousing, freewheeling, carefree, pas-sionate, playful, gritty, joyous
Low Low calm/peaceful, sentimental, cathartic, soft, romantic, springlike, warm,precious, laid-back/mellow, confident, hypnotic, naive, intimate, innocent,relaxed, soothing, dreamy, smooth, gentle
Low High sad, melancholy, detached, whimsical, gloomy, ironic, snide, somber, au-tumnal, wry, wintry, plaintive, yearning, austere, bittersweet, fractured,bleak, cynical/sarcastic, bitter, acerbic
TABLE 2.4Five mood clusters used in the MIREX audio mood classification task proposed by Hu andDownie (2007).
Cluster Examples1 passionate, rousing, confident, boisterous, rowdy2 rollicking, cheerful, fun, sweet, amiable/good natured3 literate, poignant, wistful, bittersweet, autumnal, brooding4 humorous, silly, campy, quirky, whimsical, witty, wry5 aggressive, fiery, tense/anxious, intense, volatile, visceral
quadrants of the two-dimensional model of emotion (Laurier et al., 2008).
Although the categorical model has been dominantly used in the study of music and emotion,
there exists some issues. Emotion is subjective in nature, and different people may use different
words to describe the same emotions (Schuller et al., 2010). With few categories, the categorical
model is inadequate to describe the richness of emotional effects of music (Yang and Chen, 2012);
with many categories, the choice of emotion categories may overwhelm people (Yang and Chen,
2011).
2.3.2 Dimensional Model
The typical dimensional model (DM) represents emotions in an affective space with two di-
mensions: one related to valence (a pleasure-displeasure continuum), and the other to arousal
(activation-deactivation) (Russell, 1980). Emotion dimensions are found by analysing the corre-
lation between emotion terms. Factor analysis techniques are applied on a large number of rating
CHAPTER 2. BACKGROUND IN MUSIC AND EMOTION 32
scales of affective terms to obtain a small number of fundamental factors from the correlations
between the scales (Yang and Chen, 2012). Studies have shown that valence and arousal may be
the most fundamental, and most clearly communicated emotion dimensions among others (Yang
and Chen, 2011). Research has shown that the two-dimensional model of emotion can adequately
describe self-reported symptoms of depression (Killgore, 1999). The most well-known example is
the circumplex model proposed by Russell (1980), who has applied four approaches to 28 emotion
terms:
1. Ross’s technique for a circular ordering of variables (see Figure 2.1);
2. A multidimensional scaling procedure based on perceived similarity among the terms;
3. A unidimensional scaling on hypothesised pleasure-displeasure and degree-of-arousal di-
mensions;
4. A principal component analysis of 343 subjects’ self-reports of their current affective states.
Other studies have used a third dimension such as dominance (Pleasure-Arousal-Dominance,
or PAD, Mehrabian and Russell, 1974), to explain the difference between dominant and submis-
sive emotions (Ilie and Thompson, 2006; Schubert, 2007b; Collier, 2007), and interest (Leman
et al., 2005), to contrast moving, exciting, pleasing, and passionate with indifferent, boring, an-
noying, and restrained. Participants, however, have found it difficult to rate on the dominance
scale (Evans and Schubert, 2008). Likewise, the interest scale is sensitive to subject-related
factors (Leman et al., 2005).
The typical dimensional model (Valence-Arousal, or VA) provides a reliable way for people
to measure two distinct dimensions (Schuller et al., 2010; Yang and Chen, 2011; Schubert, 2014;
Egermann et al., 2015). It allows representation of a more detailed range of emotion than what
the categorical model can provide. These two core dimensions are often compared. For example,
a study of emotion detection has suggested that arousal and valence (for high arousal states)
can be differentiated using electrocardiogram (ECG). Previous research has also shown that the
responses of arousal are more consistent than valence (Gomez and Danuser, 2004; Leman et al.,
2005). Similarly, in the study of MER, arousal has been predicted from musical features better
than valence (Schubert, 2007b; Yang et al., 2008; Huq et al., 2010).
Although the dimensional model has been widely used in the study of music and emotion (Le-
man et al., 2005; Ilie and Thompson, 2006), it is not free of criticism. For example, the dimen-
sional model has been criticised for its lack of differentiation when it comes to emotions that
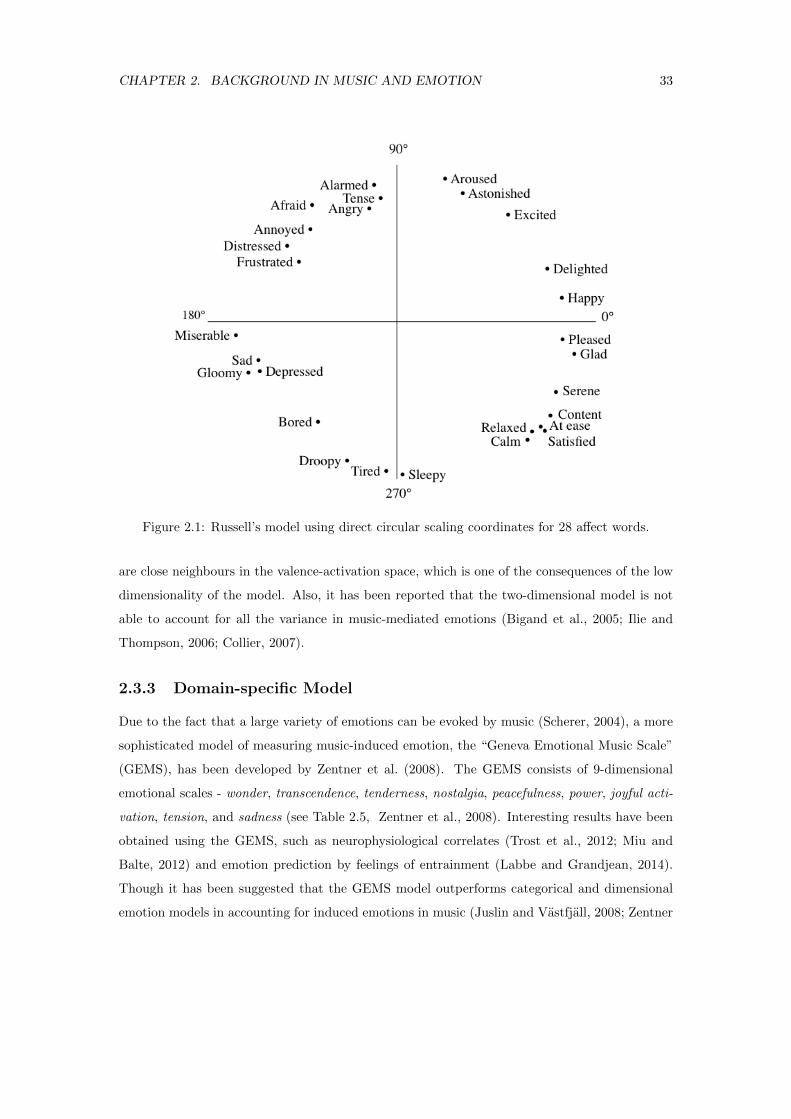
CHAPTER 2. BACKGROUND IN MUSIC AND EMOTION 33
Figure 2.1: Russell’s model using direct circular scaling coordinates for 28 affect words.
are close neighbours in the valence-activation space, which is one of the consequences of the low
dimensionality of the model. Also, it has been reported that the two-dimensional model is not
able to account for all the variance in music-mediated emotions (Bigand et al., 2005; Ilie and
Thompson, 2006; Collier, 2007).
2.3.3 Domain-specific Model
Due to the fact that a large variety of emotions can be evoked by music (Scherer, 2004), a more
sophisticated model of measuring music-induced emotion, the “Geneva Emotional Music Scale”
(GEMS), has been developed by Zentner et al. (2008). The GEMS consists of 9-dimensional
emotional scales - wonder, transcendence, tenderness, nostalgia, peacefulness, power, joyful acti-
vation, tension, and sadness (see Table 2.5, Zentner et al., 2008). Interesting results have been
obtained using the GEMS, such as neurophysiological correlates (Trost et al., 2012; Miu and
Balte, 2012) and emotion prediction by feelings of entrainment (Labbe and Grandjean, 2014).
Though it has been suggested that the GEMS model outperforms categorical and dimensional
emotion models in accounting for induced emotions in music (Juslin and Vastfjall, 2008; Zentner
CHAPTER 2. BACKGROUND IN MUSIC AND EMOTION 34
and Eerola, 2009), Eerola and Vuoskoski (2010) have pointed out that these studies are limited
to only familiar classical music examples.
A comparison of these three models of emotion (i.e., the categorical, dimensional, and the
GEMS) has shown that low-dimensional models often suffice to account for the main emotional
experiences induced by music (Vuoskoski and Eerola, 2011a). Since the nine factors proposed in
the GEMS consider only the emotion induced by music, and there exists no validated version in
other languages, the use of the GEMS still needs further investigation.
TABLE 2.5Geneva Emotional Music Scale (nine dimensions) proposed by Zentner et al. (2008).
Dimension TermsWonder filled with wonder, dazzled, movedTranscendence fascinated, overwhelmed, feelings of transcendence, spiritualityPower strong, triumphant, energeticTenderness tender, affectionate, in loveNostalgia nostalgic, dreamy, melancholicPeacefulness serene, calm, soothedJoyful activation joyful, amused, bouncySadness sad, sorrowfulTension tense, agitated, nervous
2.4 Related Work in Music and Emotion
Music provides a powerful means of communication and self-expression (DeNora, 2000). A study
of recreational activities (i.e., watching television, listening to music, reading books, and watching
movies) among undergraduates at University of Texas at Austin indicated that they listen to
music more often than do any of the other activities (Rentfrow and Gosling, 2003). The powerful
emotional effects in music have attracted significant research interest not only in fields such as
neuroscience of music, music psychology, musicology, and music cognition, but also in signal
processing, machine learning, and computer science (for reviews, see Juslin and Sloboda, 2010;
Yang and Chen, 2011; Fu et al., 2011; Eerola and Vuoskoski, 2013). On the one hand, as for
MIR researchers in computer science, researchers are interested in understanding emotion in
music computationally and building content-based models to solve issues such as identification,
detection, recognition, and recommendation (Casey et al., 2008). On the other hand, as for
music psychologists, researchers are interested in the understanding of emotion in music such
as emotional responses to music, and the role of music in everyday life (Hallam et al., 2008).
CHAPTER 2. BACKGROUND IN MUSIC AND EMOTION 35
Therefore, this section covers studies in signal processing and machine learning (Section 2.4.1),
and in music psychology (Section 2.4.2).
2.4.1 Research on Music and Emotion in Computer Science
The rapid growth in Internet technology and portable digital devices has made vast amounts of
music available. In the past decade, MIR researchers have been developing methods to search,
organise, and manage millions of songs (Casey et al., 2008). One of the applications is a music
recommendation system, into which emotion can be easily incorporated. Musicovery, for example,
has successfully used a two-dimensional model of emotion within its recommendation system.
MIR techniques have also been developed to solve problems in the research of content-based
models such as genre classification (Tzanetakis and Cook, 2002; Li et al., 2003; Fu et al., 2011;
Laurier, 2011), cover song identification (Ellis and Poliner, 2007; Foster et al., 2015), and query
by singing/humming (QBSH) (Jang and Lee, 2008; Wang et al., 2010a). Since 2007, the annual
MIREX evaluation campaign for MIR algorithms facilitates finding solutions to the problems of
music classification (Hu et al., 2008).
Research on music and emotion has attracted increasing attention in the MIR community,
and has been widely discussed in the past ten years (for reviews, see Kim et al., 2010; Yang
and Chen, 2011). In these studies of music and emotion, significant amount of research has
been carried out on MER systems (Kim et al., 2010; Yang and Chen, 2011). A typical method
for emotion recognition is to classify music into different emotion categories (e.g., happy, sad,
angry, and relaxed) (Trohidis et al., 2008). For classifying musical audio signals, various feature
extraction toolboxes have been developed to extract features such as dynamics, rhythm, timbre,
and harmony (Beveridge and Knox, 2012). However, features provided in these toolboxes are
different. For example, MIRtoolbox2 provides a set of features from the statistics of frame-
level features (Lartillot and Toiviainen, 2007), and Marsyas3 computes features from audio,
including melody and frequency spectrum (Tzanetakis and Cook, 2000). In addition, PsySound34
creates features based on psychoacoustic models, and the Sound Description Toolbox5 gives
a set of MPEG-7 standard descriptors. Classifiers are then trained using machine learning
techniques (Yang and Chen, 2012). For instance, previous studies have successfully applied a
regression approach to predict emotion categories and values of valence and arousal in music (Lu
2https://www.jyu.fi/music/coe/materials/mirtoolbox3http://marsyas.info/4http://psysound.wikidot.com/5http://www.ifs.tuwien.ac.at/mir/muscle/del/audio_tools.html#SoundDescrToolbox
CHAPTER 2. BACKGROUND IN MUSIC AND EMOTION 36
et al., 2006; Yang et al., 2008; Eerola et al., 2009). Other common classification algorithms
used in MER systems include k-Nearest Neighbour (k-NN) (Saari et al., 2011), random forests
(RF) (Eerola, 2011), support vector machines (SVMs) (Laurier et al., 2007; Schmidt et al.,
2010; Schuller et al., 2010), and deep belief networks (Schmidt and Kim, 2011; Schmidt et al.,
2012). Pachet and Roy (2009) have proposed feature generation to improve classification results,
and it can outperform approaches based on standard features in some contexts. Recently, Serra
(2011) criticised MIR for being Western-specific. To meet the needs of music users in different
cultures and languages, MIR researchers have also investigated cross-cultural and multilingual
music information seeking behaviours (Downie and Cunningham, 2005), cross-cultural emotion
classification (Yang and Hu, 2012), and development of culture specific approaches in MIR (Serra,
2012).
Apart from the audio signal analysis mentioned above, studies in computer science have also
considered the linguistic aspect of songs. In fact, lyrics contain semantically rich information,
which is not taken into account in audio signal analysis. Also, lyrics can provide a more explicit
and objective expression of emotion (Logan and Kositsky, 2004). Juslin and Laukka (2004)
have reported in a questionnaire study of everyday listening that 29% of the sample choose
lyrics as the basis of their judgements of emotional expression in music. Previous studies have
extracted words and characteristics of sentences from lyrics, and each song has been represented
by a vector of features. The most popular approaches to analysing lyric features are using
Probabilistic Latent Semantic Analysis (PLSA) (Logan and Kositsky, 2004; Laurier et al., 2008;
Saari and Eerola, 2014), Bag-of-Words (BOW) (Hu et al., 2009; Lu et al., 2010), and Term
Frequency Inverse Document Frequency (TF-IDF) (Van Zaanen and Kanters, 2010; Wang et al.,
2011; McVicar and De Bie, 2012). Moreover, several language packages are developed to provide
semantic meanings in different aspects of emotion. For example, Affective Norms for English
Words (ANEW) (Bradley and Lang, 1999), WordNet (Fellbaum, 1998), and Linguistic Inquiry
and Word Count (LIWC) (Pennebaker et al., 2007) have been successfully applied in computing
the emotion values of valence, arousal, and dominance (Alm et al., 2005; Pettijohn and Sacco,
2009; Hu and Downie, 2010).
Both audio-based and lyric-based approaches have achieved satisfying results. Although
previous research has reported conflicting results for audio and lyrics (i.e., lyrics-based approach
outperforms audio-based approach, or vice versa), multi-modal emotion classification integrating
these two approaches has provided a better classification accuracy (Laurier et al., 2008; Hu and
Downie, 2010; Lu et al., 2010; Serra, 2011; McVicar and De Bie, 2012).
CHAPTER 2. BACKGROUND IN MUSIC AND EMOTION 37
With the emergence of music discovery and recommendation platforms such as Last.FM in
the past decade, which supports tagging for music videos, online social tags (OST) have received
increasing interest for the study of music and emotion (Eck et al., 2007; Levy and Sandler, 2009;
Wang et al., 2010b). Social tags are words or groups of words supplied by a community of
Internet users. They are more and more commonly used to aid navigation through large media
collections (Wu et al., 2006), allowing users to get a sense of what qualities characterise a song
at a glance (Hoffman et al., 2009). Compared with traditional expensive human annotation, or
web mining that gives noisy results, semantic tags provide a large-scale, cost-efficient, rich, and
easily accessible source of metadata (Hu and Downie, 2007; Turnbull et al., 2008a; Saari and
Eerola, 2014). In addition, the information they provide is highly relevant to MIR, including
genre, mood, and instrument, which together account for 70% of the tags (Lamere, 2008). Levy
and Sandler (2007) have also shown that social tags give a high quality source of “ground truth”
data and can be effective in capturing music similarity. Studies of social tags from Last.FM
has confirmed the usability of emotion tags, which could help create “ground truth” for music
research (Bischoff et al., 2009; Saari, 2015). Additionally, Laurier et al. (2009) have combined
the use of emotion tags and audio signals to improve the emotion recognition systems. Although
previous studies have suggested that tag features are more useful than audio content features for
certain analyses such as artistic style clustering, and social tags have been widely used in areas
of research such as classification, recognition, and identification, the reliability of emotion tags
has rarely been evaluated (Lamere, 2008; Wang et al., 2010b).
2.4.2 Research on Music and Emotion in Psychology
In the past few decades, music psychologists have paid much attention to research on music and
emotion (for reviews, see Eerola and Vuoskoski, 2013; Swaminathan and Schellenberg, 2015).
Previous research has also reported that the primary motivation for people listening to music
lies in its emotional functions, namely to express and induce emotion (Tarrant et al., 2000;
North et al., 2000; Juslin and Laukka, 2004; Lonsdale and North, 2011). The ability to identify
emotional content is established at a very early age (Dalla Bella et al., 2001), and people engage
with music in different contexts (e.g., travelling, cooking, and driving) and for different purposes
(e.g., distraction and emotion regulation) (DeNora, 2000; Sloboda et al., 2001; Juslin et al.,
2008). A large body of research has focussed on fundamental questions such as “How does music
evoke emotions and how do people perceive emotion in music?”, “What factors (e.g., culture,
music training, age, and personality) influence people’s emotion experience in music?”, and “In
CHAPTER 2. BACKGROUND IN MUSIC AND EMOTION 38
different situational contexts, which musical emotion typically occurs?”.
Kreutz et al. (2007) noted that perceived emotion (see Section 2.2.1) refers to intellec-
tual processing, such as the perception of an intended or expressed emotion, whereas induced
emotions (see Section 2.2.2) reflect the introspective perception of psychophysiological changes,
which are often associated with emotional self-regulation (Khalfa et al., 2002; Thayer and Faith,
2001). Schubert (2007a) has studied the distinction between induced and perceived emotion and
suggested that induced emotional responses fluctuate more than perceived emotional responses.
Understanding the similarities and differences between the two will provide a clearer view of
the underlying psychological mechanisms involved in musical emotion (Scherer, 2004; Juslin and
Vastfjall, 2008; Juslin et al., 2014).
The categorical model (see Section 2.3.1) and dimensional model (see Section 2.3.2), have
received empirical support in studies of music and emotion (Kreutz et al., 2007; Vieillard et al.,
2008). Owing to the nature of emotion, the categorical model tends to be applied for perceived
emotion, whereas the dimensional model is frequently used for measuring induced emotion. A
comparison of these two models has been presented by Eerola and Vuoskoski (2010), based only
on film music excerpts. Therefore, a lack of studies in other musical genres still exists, which I
address in Chapter 4.
Due to the subjective nature of emotion in music, the most common way to measure subjec-
tive emotional responses is still via a format of self-report (Gabrielsson, 2002). Although other
approaches such as behavioural measurement and physiological reaction are becoming increas-
ingly popular, there exist several issues. For instance, measuring behavioural responses to music
including facial expression and body language (Frijda et al., 1986), and various physiological re-
actions such as heart rate, respiration, skin conductance response (SCR), and electroencephalo-
graph (EEG) (Khalfa et al., 2002; Levenson, 2003; Baumgartner et al., 2006; Mas-Herrero et al.,
2014) can provide us valuable evidence of emotion, but these behaviours do not always associate
with specific emotions, and the relationships between emotions and physiological responses are
still unclear (Juslin and Laukka, 2004; Eerola and Vuoskoski, 2013). Previously, the Experi-
ence Sampling Method (ESM) has been shown to be effective in study of music experience (e.g.,
emotion, and musical preference) in different situations of daily life (e.g., North and Hargreaves,
1996; Sloboda et al., 2001; North et al., 2004; Juslin et al., 2008; Greasley and Lamont, 2011).
It provides a valuable tool to collect subjective responses in natural contexts. However, it is
less appropriate when measuring the emotion in specific events such as cooking, studying, and
clubbing (Randall and Rickard, 2013).
CHAPTER 2. BACKGROUND IN MUSIC AND EMOTION 39
The emotional meaning of music always emerges from the interaction between a listener
and a (real or imagined) sound object in some context. The listener plays an important role
in the perception and recognition of emotion in music. Different individual factors such as
one’s personality, musical skills, age, and music culture, may affect how emotional meaning is
elicited (Bigand et al., 2005; Kallinen and Ravaja, 2006; Schubert, 2007a; Sandstrom and Russo,
2011). Previous studies have suggested that age has negative correlation with music consump-
tion (Chamorro-Premuzic et al., 2010). Also, older people reported fewer negative emotional
experiences and greater emotion control (Gross et al., 1997; Mroczek and Kolarz, 1998; Novak
and Mather, 2007). Additionally, Malatesta and Kalnok (1984) have shown that women consider
emotion more important than men, and that women report more inhibition of emotion. Several
studies have investigated the relationship between personality traits (“Big Five”) (Gosling et al.,
2003), musical judgements (Shiota et al., 2006; Vuoskoski and Eerola, 2011b; Vuoskoski et al.,
2011), artistic interests (McAdams, 2006), and musical preferences (Rentfrow and Gosling, 2003;
Chamorro-Premuzic and Furnham, 2007; North, 2010). Studies on classical music have claimed
that emotional responses and intellectual responses tend not to occur together, and that musically
experienced listeners are more likely to focus on intellectual properties, whereas less musically
experienced listeners tend to focus on emotional properties (Gabrielsson, 2002).
A wealth of research focusses on the above themes in the context of Western musical cul-
ture (Kallinen, 2005; Eerola and Vuoskoski, 2010, 2013), assuming that generic models can be
built independently from musical style, culture, genre, or listeners’ acculturation. Although mu-
sic is a cross-cultural universal (Fritz et al., 2009), Balkwill and Thompson (1999) found that
emotion in music is communicated through a combination of universal and cultural clues. Cross-
cultural studies in music have gained popularity considerably (Gregory and Varney, 1996; Tsai
et al., 2006; Eerola et al., 2006; Morrison et al., 2008; Thompson and Laura-Lee, 2010; Kosta
et al., 2013). For instance, several studies have attempted to explore the music emotion classi-
fication between Chinese and English songs (Yang and Hu, 2012), and perceived complexity of
Western and African folk melodies by Western and African listeners (Eerola et al., 2006). Hu and
Lee (2012) have explored the emotion perception of pop songs between American and Chinese
listeners, and showed that people with the same cultural background tend to agree on what per-
ceived emotions they recognise. Similar results were found by Egermann et al. (2015) between
Canadian and Congolese Pygmies in music-related psychophysiological responses. Also, Singhi
and Brown (2014) have revealed the consistency of music emotion judgement is reduced between
Canadian and Chinese listeners with the presence of both lyrics and audio. A few studies have
CHAPTER 2. BACKGROUND IN MUSIC AND EMOTION 40
been performed that took into account only a specific culture such as Greek (Zacharopoulou
and Kyriakidou, 2009; Kosta et al., 2013), Indian (Gregory and Varney, 1996; Gupta, 2005) and
native African (Fritz et al., 2009).
2.5 Musical Stimuli
In recent years, psychologists have predominantly used excerpts of Western classical (Gomez and
Danuser, 2004; Bigand et al., 2005), jazz music, film soundtracks (Vuoskoski and Eerola, 2011a;
Eerola, 2011), and non-Western cross-cultural music in the study of music and emotion (Evans
and Schubert, 2008; Mohn et al., 2010; Vuoskoski et al., 2011). Classical music (prevalence 48%)
has been the most dominant genre in past studies, but listeners may not be familiar with the
genre, and the results may not be applicable to other musical genres such as Western popular
music (3%), which is generally well-understood by participants (Juslin and Laukka, 2003; Eerola
and Vuoskoski, 2013). Musical preference influences perceived and induced emotion, and the
emotional reactions may differ across genres due to their inherent musical differences (Kreutz
et al., 2007; Zentner et al., 2008; Eerola, 2011). Among different experiments, the numbers of
the stimuli used are normally less than 20 (60%); only a few studies have used more than 60
stimuli (Eerola and Vuoskoski, 2013).
Previous research of classifying different genres of music (i.e., classical, film, pop, and mixed)
has shown that emotion can be better identified in classical music and film soundtracks (Saari
et al., 2011; Eerola, 2011), whereas the recognition of pop music fails to reach a satisfactory
level (see Yang and Chen, 2012, for a recent review).
One crucial problem of music research is a lack of “ground truth6”. Most researchers compile
their own databases (Yang and Lee, 2004). Due to copyright issues, only musical features (e.g.,
million song dataset, or MSD, McFee et al., 2012), ratings of emotion (Kim, 2008; Schmidt and
Kim, 2010), and user posts (Liu et al., 2014) are made available, whereas the raw audio files
cannot be distributed to reproduce the results for research and evaluation.
To investigate emotion in music, it is important to collect the “ground truth”. Manual
annotation is one of the most common ways to create a “ground truth” data set (Leman et al.,
2005; Schuller et al., 2010; Yang and Chen, 2011; Saari, 2015). However, it is expensive in terms of
financial cost and human labour. Additionally, terms used may differ between individuals leading
to inconsistency and unreliability of the data. Turnbull et al. (2008a) mentioned that different
6“Ground truth” refers to a collection of objective data used in classification for supervised learning techniques.
CHAPTER 2. BACKGROUND IN MUSIC AND EMOTION 41
emotions described using the same term by different people would result in poor prediction. With
the help of social tags from music discovery web services such as Last.FM, it is possible to access
rich human-annotated information (e.g., semantic tags) about music and fetch popular musical
examples tagged with different emotional labels (Turnbull et al., 2008a; Levy and Sandler, 2009).
2.6 Discussion
In this chapter, I have provided definitions of relevant concepts in the research on music and
emotion. Two forms of emotional processes in relation to music, perception and induction,
are explained in Section 2.2. In addition, I have presented three models of emotion (i.e., the
categorical, dimensional, and the GEMS) used in music research. However, due to the high-
dimensionality and induced-emotion-only bias of the GEMS model, as well as the confusion
caused by the dominance scale in the dimensional model of emotion, only the categorical model
and the typical dimensional model with two core dimensions, valence, and arousal, are used in
this work.
In Sections 2.4.1 and 2.4.2, I reviewed the related work in two different domains: computer
science and psychology. I found that diverse attentions have been paid to research on music
and emotion. For example, computer scientists have applied machine learning techniques to
recognise different emotions, or to predict emotional ratings from audio recordings. In addi-
tion, much effort has been applied to combining other sources (e.g., lyrics and tags) to improve
emotion classification and recommendation problems. Although machine learning techniques
have been applied for genres such as classical music and film soundtracks, the study of emotion
recognition for popular music is still limited. Moreover, the differences between two forms of
emotional processes are often neglected, as well as the selection of models of emotion. Psycholo-
gists, however, have focussed on emotional responses to music and their underlying mechanisms,
comparison of induced and perceived emotion, effects of individual factors (e.g., personality, age,
gender, and musical training), cross-cultural studies of emotion perception in music, comparison
of emotion models in music, and different approaches to measuring induced emotion such as
behavioural measurement (facial expression and body language) and physiological reaction (e.g.,
heart rate, respiration, skin conductance, and electroencephalograph). However, the majority of
those studies are limited only to classical music and film soundtracks, and their results may not
be applicable to other musical genres such as Western popular music.
As we expected, there exists a “gap” between computer science and psychology (Aucouturier
CHAPTER 2. BACKGROUND IN MUSIC AND EMOTION 42
and Bigand, 2012). Aucouturier and Bigand (2013) identified a series of “misunderstandings”
between these two disciplines, and called for greater collaboration between psychologists and MIR
researchers. On the one hand, psychologists can provide a deeper understanding of theoretical
background in emotion. On the other hand, music information retrieval researchers can provide
valuable tools to help analyse data relating to musical emotions. In this thesis, I focus on the
study of Western popular music. Due to the lack of a public dataset of Western popular music
with “ground truth” annotations for emotion, I create a new dataset in Chapter 4, based on
social tags. Although studies have successfully applied social tags in emotion related tasks, their
reliability has not been examined.
In this work, I present studies of music and emotion spanning both computer science and
psychology. Music emotions occur in complex interactions between the listener, the music, and
the situation. Therefore, Chapter 3 covers the background in music-listening contexts, musical
preference, emotional uses of music, and the functions of music listening.
Chapter 3
Music Listening: Function, Context, and
Preference
This chapter covers background knowledge on the functions of music listening, musical preference,
emotional uses of music, and music-listening context. First of all, Section 3.1 defines two concepts,
music-listening context and musical preference, used for my work. Listening to music is a common
activity in daily life. Various ways of categorising activities and situations have been proposed.
These are presented in Section 3.2, where research on music-listening contexts in everyday life
is reviewed. The study of emotion in music has received a lot attention in the past few decades
(for reviews, see Chapter 2). Section 3.3 provides different examples of emotional uses of music
listening (e.g., in the sporting context). In addition to the emotional use of music, other functional
uses of music listening are explained in Section 3.4. The definitions of four recurring functions of
listening to music extracted from previous studies, namely distraction, energising, entrainment,
and meaning enhancement, are presented. Finally, Section 3.5 summarises background knowledge
in musical preference, and a brief discussion in Section 3.6 concludes the chapter.
3.1 Terminology
According to Nielsen (2014), in the year of 2014, around 164 billion songs were streamed on-
demand through audio and video platforms in the United States, which constitutes a 54.5%
increase comparing to 2013. Also, a report from the International Federation of the Phonographic
Industry (2014) showed that subscriptions of streaming services such as Rdio1, Spotify, and Google
1http://www.rdio.com/home/
43
CHAPTER 3. MUSIC LISTENING: FUNCTION, CONTEXT, AND PREFERENCE 44
Play2 have increased, whereas physical album sales have dropped by 11.2% (Nielsen, 2014). The
rapid development of digital technology and social networks such as Twitter3 and Facebook4 has
provided a convenient platform that enables people to listen to music, share music, and discover
music everywhere (Lee and Waterman, 2012; Yang and Liu, 2013; Krause et al., 2014).
With the greater access to music, listening to it has become one of the main activities in
everyday life (Juslin and Laukka, 2004; Juslin et al., 2008). Rentfrow and Gosling (2003) found
that listening to music is more common than other activities such as watching television, reading
books, and watching movies. According to recent surveys by UK Music (2014)5 and Krause et al.
(2015), mobile devices (such as mp3 players, radio, tablets (39%), and smartphones (44%)) are
predominantly used for music listening in the United Kingdom.
The fact that people listen to music in diverse situations means that they choose music to ac-
company different non-musical activities (e.g., running, travelling, and commuting; see Sloboda
et al., 2001). In previous studies of music in everyday life, different terms have been used to
describe the contexts in which music is listened to. For example, North et al. (2004) examined var-
ious aspects of music listening, including when people listen to music (time of day or day of week),
where they listen (e.g., restaurant, shopping mall, at home doing housework, pub/nightclub, and
gym/exercising), and who they listen with (e.g., alone, with friends, with spouse/partner only,
and with strangers). Research has also investigated other aspects of music-listening contexts such
as listening conditions (group vs. solitary; Egermann et al., 2011), situational contexts (North
and Hargreaves, 1996; Juslin et al., 2011; Krause et al., 2015), and activities (Sloboda et al.,
2001; Greasley and Lamont, 2011). In this work, I focus on the activities during which music is
listened to. I use the terms activity, context, and situation interchangeably.
Previously, Greasley and Lamont (2011) discussed the selection of certain styles of music
used to accompany specific activities. The terms musical taste and musical preference have
been commonly used in describing the liking for different types of music (Lamont and Greasley,
2009). Hargreaves et al. (2006) defined musical preference as “a person’s liking for one piece of
music as compared with another at a given point in time”, and musical taste as “the overall
patterning of an individual’s preferences over longer time periods”. Following these definitions,
I investigate the liking of musical styles in particular activities, thus the term musical preference
is selected and used throughout my work. I focus on general preference for a style rather than
2https://play.google.com/music/3https://twitter.com/4https://www.facebook.com/5http://www.ukmusic.org/
CHAPTER 3. MUSIC LISTENING: FUNCTION, CONTEXT, AND PREFERENCE 45
specific preference for a piece or particular performance/recording.
3.2 Music-listening Contexts
The rapid growth in Internet technology and portable digital devices, has made music available
almost everywhere. The nature of music experience has changed at a fundamental level, and tra-
ditional ways of exploring and listening to music from radio stations and record stores have been
partially replaced by music discovery web sites such as Pandora, Spotify, and Youtube (Casey
et al., 2008). Hence, music can be heard in far varied and diverse situations (Greasley and
Lamont, 2011; Krause et al., 2015). Moreover, the idea of subjective music recommendation
systems using emotion and context has raised considerable interest among researchers in recent
years (Song et al., 2012a; Krause and North, 2014).
The majority of music and emotion studies (see Chapter 2) have focussed on emotional re-
sponses to music and their underlying mechanisms (Juslin and Vastfjall, 2008; Juslin et al., 2014),
comparison of induced and perceived emotion (Gabrielsson, 2002), and emotion models (cate-
gorical and dimensional) in music (Eerola and Vuoskoski, 2010, 2013). It has been shown that
emotional meaning in music is related to the context within which music is heard (Gabrielsson,
2010; Greasley and Lamont, 2011). Studies of music listening in daily life have focussed on the
functions of music (Hargreaves and North, 1999; North et al., 2004) and the reasons for listening
to music (Tarrant et al., 2000), where the situational factors are often neglected (Juslin et al.,
2011).
The ESM and the mobile-ESM (or m-ESM) have been widely used in the study of music
experience in different situations of daily life (North and Hargreaves, 1996; Sloboda et al., 2001;
North et al., 2004; Juslin et al., 2008; Greasley and Lamont, 2011; Randall and Rickard, 2013).
It presents the participant with brief questionnaires relating to their current subjective expe-
rience throughout everyday functioning (Csikszentmihalyi and LeFevre, 1989). The ESM can
capture data in a spontaneous and natural context, as well as providing robustly interpretable
results (Randall and Rickard, 2013). Sloboda et al. (2001) identified housework and travel as
the most frequent activities involving music and showed that music listening was not randomly
distributed over contexts, and that listeners’ mood was changed based on different choices of
music. Juslin et al. (2008) also used the ESM to investigate music listening in real situations
(e.g., shopping, physical activity, and relaxation) and found that certain patterns such as anger-
irritation occurred often during work, and happiness-elation usually occurred in social interaction.

CHAPTER 3. MUSIC LISTENING: FUNCTION, CONTEXT, AND PREFERENCE 46
TABLE 3.1Situations designed by North and Hargreaves (1996).
Examples FactorsAt an end-of-term party with friends AAt a nightclub AJogging with your Walkman on ADoing the washing-up AIroning some clothes AIn the countryside CIn a French restaurant BAt a posh cocktail reception B, DHaving just broken up with a boyfriend/girlfriend DOn Christmas Day with your family A, CYour parents have come to visit BFirst thing on a Sunday morning BLast thing at night before going to bed BMaking love BTrying to woo someone over a romantic candlelit dinner for two at home BIn church CDriving on the motorway A, CNote. Factor A - activity, Factor B - localised subdued behaviour, Factor C - spirituality, and Factor D -social constraint.
Although the ESM and the m-ESM can provide vast amount of empirical data, and they allow
an exploration of ways in which participants perceive their physical and social environments,
they are not tied to specific events.
Music can be heard in diverse situations (Greasley and Lamont, 2011). Juslin et al. (2008)
advocated that the study of music needs to take the context of music listening into consideration.
Different categorisations of activities have been proposed. For example, to study the influence
of the situation on musical preferences, North and Hargreaves (1996) identified seventeen music
listening situations, and then factorised these situations into four categories: activity, localised
subdued behaviour, spirituality, and social constraint (see Table 3.1). Sloboda et al. (2001) also
classified music-listening activities into three main categories: personal, leisure, and work (see Ta-
ble 3.2). Each category was further divided into subcategories based on purpose and engagement.
For instance, the category personal consists of three levels, personal-being (e.g., sleeping and wak-
ing up), personal-maintenance (e.g., washing and getting dressed), and personal-travelling (e.g.,
walking and going home). Later, Greasley and Lamont (2011) used these categories and showed
that people are likely to use music while travelling or engaging in active leisure. In addition,
other research has also provided more refined categories of music-listening contexts including
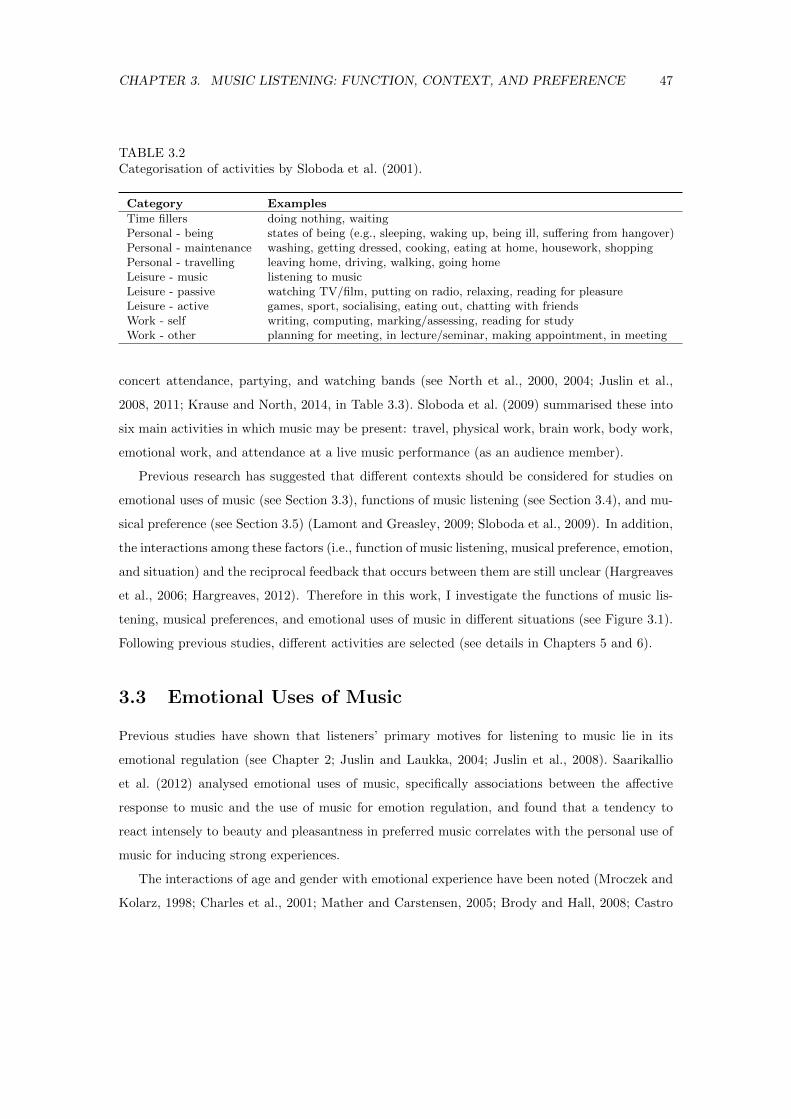
CHAPTER 3. MUSIC LISTENING: FUNCTION, CONTEXT, AND PREFERENCE 47
TABLE 3.2Categorisation of activities by Sloboda et al. (2001).
Category Examples
Time fillers doing nothing, waitingPersonal - being states of being (e.g., sleeping, waking up, being ill, suffering from hangover)Personal - maintenance washing, getting dressed, cooking, eating at home, housework, shoppingPersonal - travelling leaving home, driving, walking, going homeLeisure - music listening to musicLeisure - passive watching TV/film, putting on radio, relaxing, reading for pleasureLeisure - active games, sport, socialising, eating out, chatting with friendsWork - self writing, computing, marking/assessing, reading for studyWork - other planning for meeting, in lecture/seminar, making appointment, in meeting
concert attendance, partying, and watching bands (see North et al., 2000, 2004; Juslin et al.,
2008, 2011; Krause and North, 2014, in Table 3.3). Sloboda et al. (2009) summarised these into
six main activities in which music may be present: travel, physical work, brain work, body work,
emotional work, and attendance at a live music performance (as an audience member).
Previous research has suggested that different contexts should be considered for studies on
emotional uses of music (see Section 3.3), functions of music listening (see Section 3.4), and mu-
sical preference (see Section 3.5) (Lamont and Greasley, 2009; Sloboda et al., 2009). In addition,
the interactions among these factors (i.e., function of music listening, musical preference, emotion,
and situation) and the reciprocal feedback that occurs between them are still unclear (Hargreaves
et al., 2006; Hargreaves, 2012). Therefore in this work, I investigate the functions of music lis-
tening, musical preferences, and emotional uses of music in different situations (see Figure 3.1).
Following previous studies, different activities are selected (see details in Chapters 5 and 6).
3.3 Emotional Uses of Music
Previous studies have shown that listeners’ primary motives for listening to music lie in its
emotional regulation (see Chapter 2; Juslin and Laukka, 2004; Juslin et al., 2008). Saarikallio
et al. (2012) analysed emotional uses of music, specifically associations between the affective
response to music and the use of music for emotion regulation, and found that a tendency to
react intensely to beauty and pleasantness in preferred music correlates with the personal use of
music for inducing strong experiences.
The interactions of age and gender with emotional experience have been noted (Mroczek and
Kolarz, 1998; Charles et al., 2001; Mather and Carstensen, 2005; Brody and Hall, 2008; Castro
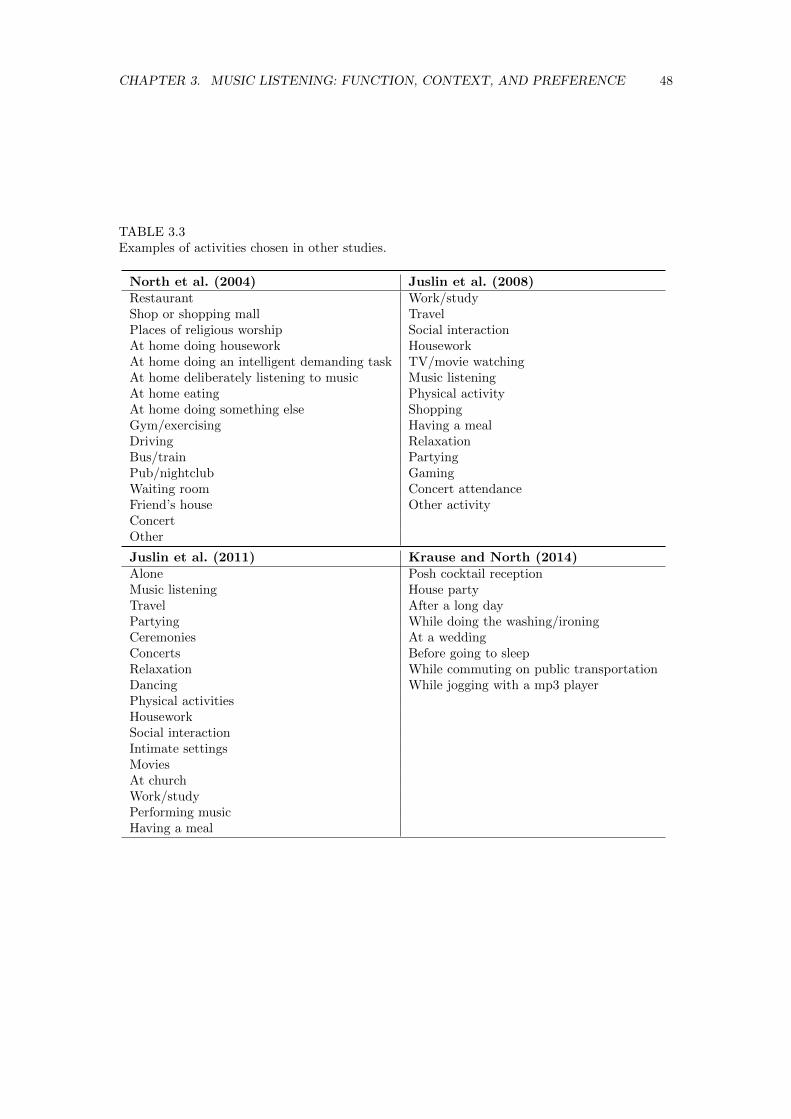
CHAPTER 3. MUSIC LISTENING: FUNCTION, CONTEXT, AND PREFERENCE 48
TABLE 3.3Examples of activities chosen in other studies.
North et al. (2004) Juslin et al. (2008)Restaurant Work/studyShop or shopping mall TravelPlaces of religious worship Social interactionAt home doing housework HouseworkAt home doing an intelligent demanding task TV/movie watchingAt home deliberately listening to music Music listeningAt home eating Physical activityAt home doing something else ShoppingGym/exercising Having a mealDriving RelaxationBus/train PartyingPub/nightclub GamingWaiting room Concert attendanceFriend’s house Other activityConcertOther
Juslin et al. (2011) Krause and North (2014)Alone Posh cocktail receptionMusic listening House partyTravel After a long dayPartying While doing the washing/ironingCeremonies At a weddingConcerts Before going to sleepRelaxation While commuting on public transportationDancing While jogging with a mp3 playerPhysical activitiesHouseworkSocial interactionIntimate settingsMoviesAt churchWork/studyPerforming musicHaving a meal
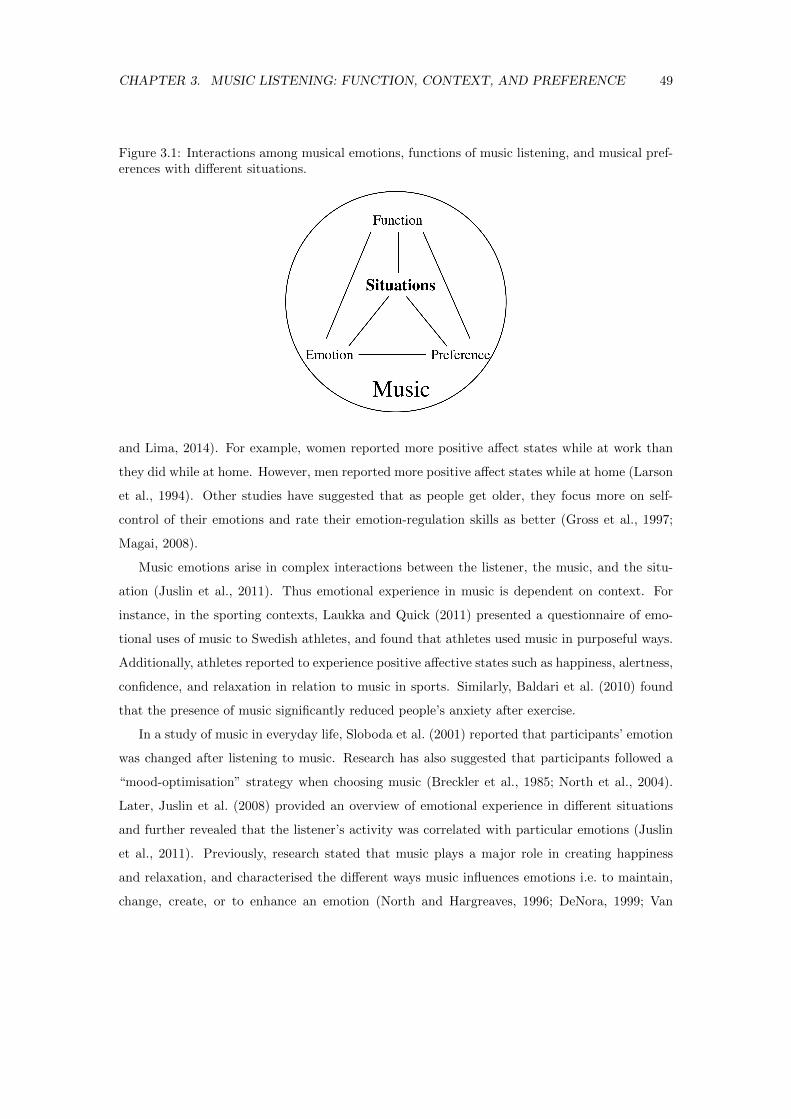
CHAPTER 3. MUSIC LISTENING: FUNCTION, CONTEXT, AND PREFERENCE 49
Figure 3.1: Interactions among musical emotions, functions of music listening, and musical pref-erences with different situations.
and Lima, 2014). For example, women reported more positive affect states while at work than
they did while at home. However, men reported more positive affect states while at home (Larson
et al., 1994). Other studies have suggested that as people get older, they focus more on self-
control of their emotions and rate their emotion-regulation skills as better (Gross et al., 1997;
Magai, 2008).
Music emotions arise in complex interactions between the listener, the music, and the situ-
ation (Juslin et al., 2011). Thus emotional experience in music is dependent on context. For
instance, in the sporting contexts, Laukka and Quick (2011) presented a questionnaire of emo-
tional uses of music to Swedish athletes, and found that athletes used music in purposeful ways.
Additionally, athletes reported to experience positive affective states such as happiness, alertness,
confidence, and relaxation in relation to music in sports. Similarly, Baldari et al. (2010) found
that the presence of music significantly reduced people’s anxiety after exercise.
In a study of music in everyday life, Sloboda et al. (2001) reported that participants’ emotion
was changed after listening to music. Research has also suggested that participants followed a
“mood-optimisation” strategy when choosing music (Breckler et al., 1985; North et al., 2004).
Later, Juslin et al. (2008) provided an overview of emotional experience in different situations
and further revealed that the listener’s activity was correlated with particular emotions (Juslin
et al., 2011). Previously, research stated that music plays a major role in creating happiness
and relaxation, and characterised the different ways music influences emotions i.e. to maintain,
change, create, or to enhance an emotion (North and Hargreaves, 1996; DeNora, 1999; Van
CHAPTER 3. MUSIC LISTENING: FUNCTION, CONTEXT, AND PREFERENCE 50
Goethem and Sloboda, 2011). Moreover, Lonsdale and North (2011) argued emotional uses of
music for “negative mood management”. This means that music is used to alleviate negative
feelings (e.g., anxiety and stress) and for mood enhancement. They also proposed the emotional
use of music for “positive mood management”, i.e., to achieve and optimise positive moods (e.g.,
to relax).
Although a few studies have examined emotional responses in different situations such as a
posh cocktail reception, a house party, or a wedding (Juslin et al., 2011; Liljestrom et al., 2012;
Krause and North, 2014), yet the emotional changes (with and without the presence of music)
within these contexts have rarely been studied.
Two forms of emotional processes in relation to music, namely perception and induction of
musical emotions, and models of emotion (i.e., the categorical and the dimensional model) in
music were discussed in Chapter 2. In my work, I am interested in the subjective emotional
experience (induced emotion) across a wider range of situations. Additionally, previous research
has shown the advantage of the dimensional model in measuring induced emotion (Eerola and
Vuoskoski, 2013), thus I use the two-dimensional model of emotion (valence and arousal) in my
study and focus only the emotions felt (or expected to be felt) in response to music.
3.4 Functions of Music Listening
Music provides a powerful means of conveying and evoking feelings (Eerola and Vuoskoski, 2013;
Schubert, 2013), and it has been shown that “emotional regulation” is the primary reason for
listening to music (Juslin and Laukka, 2004). In addition to this emotional use of music, re-
searchers have also noted rational/cognitive and background uses of music (Chamorro-Premuzic
and Furnham, 2007) and proposed that music can serve for different functions such as enter-
tainment and communication (Merriam, 1964; Lamont and Greasley, 2009; Krause et al., 2014).
For example, music is the most common topic in conversation among strangers given the task of
getting acquainted (Rentfrow and Gosling, 2006).
People purposely choose to listen to music, and research has suggested that people listen
to music for various reasons (North and Hargreaves, 1996; DeNora, 2000; Sloboda et al., 2001;
Lamont and Greasley, 2009). Studies have shown that the presence of certain music can fa-
cilitate the first stages of language learning (Kang and Williamson, 2013), and even influence
flavour perception in wine tasting (North, 2012). Additionally, Sloboda et al. (2009) revealed
that music can serve various needs and functions, and the functions of listening to music are
CHAPTER 3. MUSIC LISTENING: FUNCTION, CONTEXT, AND PREFERENCE 51
context-dependent (North and Hargreaves, 1996; Lamont and Webb, 2009). For example, Heye
and Lamont (2010) reported that while travelling people used music to fulfil the functions of
enjoyment, passing time, and enhancing emotional states. Moreover, Schafer and Sedlmeier
(2009) claimed that people tend to choose different musical styles for particular reasons based
on a study of musical preference. Therefore, the study of music behaviour and the development
and evaluation of music information retrieval systems should consider the listener and listening
context (Sloboda et al., 2001; Schedl and Flexer, 2012).
Different functions of music listening have been identified by different researchers in the
field (DeNora, 2000; Sloboda et al., 2001; Juslin et al., 2008; Schafer and Sedlmeier, 2009). Mer-
riam (1964) proposed ten functions as shown in Table 3.4, and the top three of them are “emo-
tional expression”, “aesthetic enjoyment”, and “entertainment”. Hargreaves and North (1999)
concluded that the social functions of music can be manifested in three principal ways for the
individual, namely self-identity, interpersonal relationships, and mood. Later, Juslin and Laukka
(2004) stated in a study of everyday listening that people predominantly engage with music
“to express, release, and influence emotions”, “to relax and settle down”, and “for enjoyment,
fun, and pleasure”. Likewise, Schafer and Sedlmeier (2009) reported that in the case of people
listening to their favourite music, the music is able to put them in a good mood, as well as
help them “chill” and “tune out”. Other studies have also mentioned functions: “it helped to
pass the time”, “it helped to create the right atmosphere”, “creating external impression”, and
“social bonding through music” (Hargreaves and North, 1999; Tarrant et al., 2000; North et al.,
2000, 2004; Juslin and Laukka, 2004; Rentfrow and Gosling, 2006). Chamorro-Premuzic and
Furnham (2007) pointed out three underlying factors from the uses of music inventory (UMI):
emotional (i.e., music for emotion regulation such as mood manipulation), cognitive/rational
(i.e., rational musical appreciation or intellectual processing of music) and background (i.e., mu-
sic as background for social events, work, or interpersonal interaction). However, functions such
as social identity formation (North et al., 2000), and interpersonal exchange and communica-
tion (Rentfrow and Gosling, 2006) are missing in the study (Chamorro-Premuzic et al., 2010).
Recently, Boer and Fischer (2011) have also proposed a model of functions of music listening
based on a cross-cultural study containing seven functions (e.g., music as diversion and social
bonding). In my work, I use four recurring functions summarised by Sloboda et al. (2009, p. 431,
see below) in the use of self-chosen music.
i Distraction: A way of engaging unallocated attention and reducing boredom;
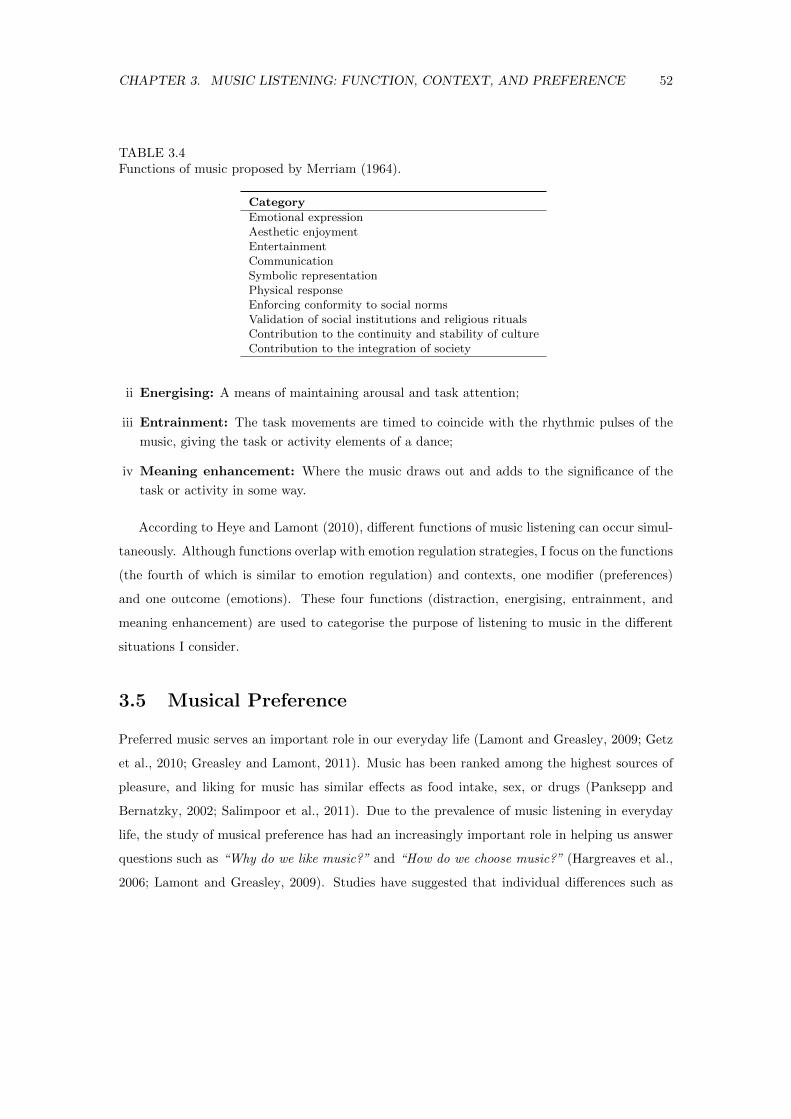
CHAPTER 3. MUSIC LISTENING: FUNCTION, CONTEXT, AND PREFERENCE 52
TABLE 3.4Functions of music proposed by Merriam (1964).
Category
Emotional expressionAesthetic enjoymentEntertainmentCommunicationSymbolic representationPhysical responseEnforcing conformity to social normsValidation of social institutions and religious ritualsContribution to the continuity and stability of cultureContribution to the integration of society
ii Energising: A means of maintaining arousal and task attention;
iii Entrainment: The task movements are timed to coincide with the rhythmic pulses of the
music, giving the task or activity elements of a dance;
iv Meaning enhancement: Where the music draws out and adds to the significance of the
task or activity in some way.
According to Heye and Lamont (2010), different functions of music listening can occur simul-
taneously. Although functions overlap with emotion regulation strategies, I focus on the functions
(the fourth of which is similar to emotion regulation) and contexts, one modifier (preferences)
and one outcome (emotions). These four functions (distraction, energising, entrainment, and
meaning enhancement) are used to categorise the purpose of listening to music in the different
situations I consider.
3.5 Musical Preference
Preferred music serves an important role in our everyday life (Lamont and Greasley, 2009; Getz
et al., 2010; Greasley and Lamont, 2011). Music has been ranked among the highest sources of
pleasure, and liking for music has similar effects as food intake, sex, or drugs (Panksepp and
Bernatzky, 2002; Salimpoor et al., 2011). Due to the prevalence of music listening in everyday
life, the study of musical preference has had an increasingly important role in helping us answer
questions such as “Why do we like music?” and “How do we choose music?” (Hargreaves et al.,
2006; Lamont and Greasley, 2009). Studies have suggested that individual differences such as
CHAPTER 3. MUSIC LISTENING: FUNCTION, CONTEXT, AND PREFERENCE 53
personality, intelligence, and musical skills could influence both musical preferences (Chamorro-
Premuzic and Furnham, 2007) and emotional responses (Vuoskoski et al., 2011; Liljestrom et al.,
2012). For instance, individuals who listen to music in a rational/cognitive way tend to have
higher IQ scores and be more open and intellectual (Chamorro-Premuzic and Furnham, 2007).
Extraversion is correlated with musical preference for popular/rock music, whereas thinking-
feeling is correlated with liking for country and Western music (Pearson and Dollinger, 2004).
Moreover, individuals who enjoy energetic and rhythmic music tend to be talkative and full of
energy (Gosling et al., 2003). However, the actual correlations are low (extraversion r = .22 and
agreeableness r = .08, Rentfrow and Gosling, 2003).
Musical preference has also been shown to relate to properties of music such as tempo, rhythm,
and pitch (Makris and Mullet, 2003). North and Hargreaves (1995) found a positive relationship
between liking and familiarity, and an inverted-U relationship between liking and subjective
complexity. They reported that repeated exposure to a given piece of music also increases its
familiarity and reduces its subjective complexity (North and Hargreaves, 1995, 1997).
One important element of musical preference is musical genre. Rentfrow and Gosling (2003)
factorised 14 musical genres into four music-preference dimensions: Reflective and Complex, In-
tense and Rebellious, Upbeat and Conventional, and Energetic and Rhythmic. Recently, Rentfrow
et al. (2011a) proposed a five-factor model of musical preference related to emotional responses
to music (i.e., mellow, unpretentious, sophisticated, intense, and contemporary). Various musical
styles have been used in previous studies of musical preference. In my work, I use a genre-based
method to explore participants’ musical preferences and select the following 19 musical genres:
alternative, blues, classical, country, electronic, folk, hip-hop, jazz, light instrumental, metal, pop,
RnB, rap, reggae, religious, rock, soul, soundtrack, and world, combined from several past studies
of musical preference (Rentfrow and Gosling, 2003; North et al., 2004; Ferrer et al., 2012).
Rentfrow et al. (2011b) reported that people may prefer a specific style of music in a
given situation. Similar to the functions of music listening and emotions, musical preference
is highly context-dependent (Lamont and Webb, 2009). For example, people reported to prefer
arousal-polarising music over arousal-moderating music during relaxation and exercise. How-
ever, their preferences changed to arousal-moderating music over arousal-polarising music after
exercise (North and Hargreaves, 2000). North and Hargreaves (2007a,b,c) also discussed the re-
lationship between musical preference and life choices (e.g., travel, money, media, leisure time,
relationships, and living arrangement), and suggested that different reasons can be found for
liking different musical styles (North, 2010). On the one hand, certain music styles are related to
CHAPTER 3. MUSIC LISTENING: FUNCTION, CONTEXT, AND PREFERENCE 54
functions (e.g., express identity, help meet people, and feel ecstatic; see Schafer and Sedlmeier,
2009; Gardikiotis and Baltzis, 2011). On the other hand, musical genres are also associated with
specific emotions (Eerola, 2011). The use of specific styles of music (musical preference) is used
to accompany specific activities (Greasley and Lamont, 2011). At present, musical preference has
not been extensively examined with other factors (e.g., musical emotion). Therefore, I investigate
musical preferences within different situations in Chapters 5 and 6.
3.6 Discussion
In this chapter, I have explained the relevant concepts in the research on emotional and functional
uses of music, musical preference, and music-listening context. Different music-listening contexts
proposed and used in past studies were provided in Section 3.2. Change in emotional state, as
an outcome of music listening, overlaps with functional uses of listening to music (Schafer and
Sedlmeier, 2009; Lonsdale and North, 2011; Chin and Rickard, 2013). Different examples for
emotional uses of music were discussed in Section 3.3. In the past, few studies have explored the
functions of and motives for listening to music in daily life (DeNora, 2000; Sloboda et al., 2001;
Juslin et al., 2008; Schafer and Sedlmeier, 2009), thus in Section 3.4, I have presented previous
work on functions of music listening. Also, musical preference has become a topic of interest,
the relevant background knowledge were given in Section 3.5.
In Chapter 4, the first element, musical emotion, is examined. I explain my collection of
a Western popular music emotion dataset using social tags from Last.FM (see Section 4.1).
Relevant musical features are extracted, and machine learning techniques are then applied to
classify musical emotions. To have a better understanding of human responses to Western popular
music and to evaluate the reliability of social tags, two models of emotions are used. Moreover,
my MER system is trained with a user-suggested emotion dataset. The differences between the
predictions of the MER system and responses from human beings are also provided.
Chapter 4
Music and Emotion
In the past decade, increasing attention has been paid to research on music and emotion. How-
ever, different approaches have been used by music information retrieval researchers and music
psychologists to carry out their research. There exists a series of “misunderstandings” between
these two fields, and it is important to bring their knowledge together. This chapter covers my
work in automatic music emotion classification using machine learning techniques (MIR) and
human’s emotional responses to music (music psychology). First of all, Section 4.1 describes the
collection of “ground truth” data using online social tags from the Last.FM web site. A total
of 2094 Western popular musical excerpts in four emotion categories (i.e., happy, sad, relaxed,
and angry) are collected. Next, audio features are extracted for the collected emotion dataset.
In Section 4.2, machine learning techniques are applied to audio features, and I investigate the
performance of my music emotion recognition system via four experiments. Eighty stimuli are
randomly selected from those 2904 musical excerpts, and they are used in two listening exper-
iments. The first listening experiment using the categorical model with four basic emotions is
explained in Section 4.3, and the second experiment using the two-dimensional Valence-Arousal
model of emotion is described in Section 4.4. Section 4.5 compares and summarises the results
from the two listening experiments. To provide some insights into the performance of music emo-
tion recognition systems, Section 4.6 presents the similarities and differences between listeners’
emotional responses and predictions from a music emotion recognition system. At the end of
this chapter, Section 4.7 concludes my work on music and emotion.
55
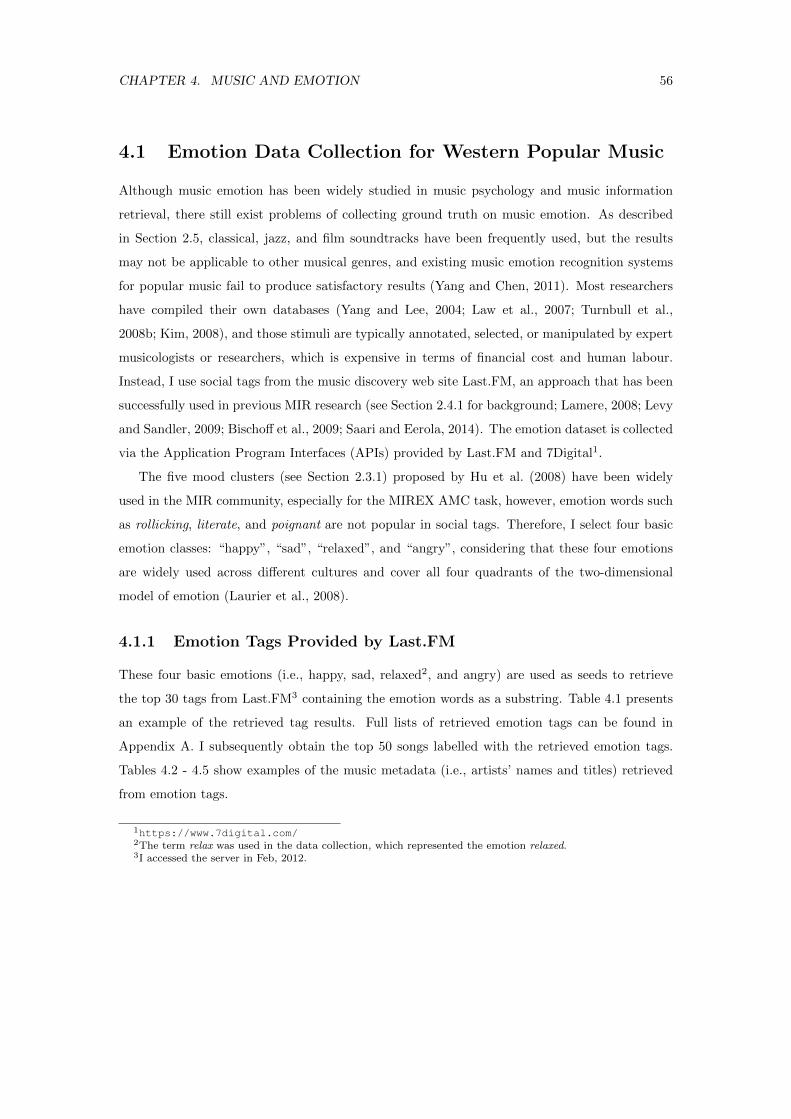
CHAPTER 4. MUSIC AND EMOTION 56
4.1 Emotion Data Collection for Western Popular Music
Although music emotion has been widely studied in music psychology and music information
retrieval, there still exist problems of collecting ground truth on music emotion. As described
in Section 2.5, classical, jazz, and film soundtracks have been frequently used, but the results
may not be applicable to other musical genres, and existing music emotion recognition systems
for popular music fail to produce satisfactory results (Yang and Chen, 2011). Most researchers
have compiled their own databases (Yang and Lee, 2004; Law et al., 2007; Turnbull et al.,
2008b; Kim, 2008), and those stimuli are typically annotated, selected, or manipulated by expert
musicologists or researchers, which is expensive in terms of financial cost and human labour.
Instead, I use social tags from the music discovery web site Last.FM, an approach that has been
successfully used in previous MIR research (see Section 2.4.1 for background; Lamere, 2008; Levy
and Sandler, 2009; Bischoff et al., 2009; Saari and Eerola, 2014). The emotion dataset is collected
via the Application Program Interfaces (APIs) provided by Last.FM and 7Digital1.
The five mood clusters (see Section 2.3.1) proposed by Hu et al. (2008) have been widely
used in the MIR community, especially for the MIREX AMC task, however, emotion words such
as rollicking, literate, and poignant are not popular in social tags. Therefore, I select four basic
emotion classes: “happy”, “sad”, “relaxed”, and “angry”, considering that these four emotions
are widely used across different cultures and cover all four quadrants of the two-dimensional
model of emotion (Laurier et al., 2008).
4.1.1 Emotion Tags Provided by Last.FM
These four basic emotions (i.e., happy, sad, relaxed2, and angry) are used as seeds to retrieve
the top 30 tags from Last.FM3 containing the emotion words as a substring. Table 4.1 presents
an example of the retrieved tag results. Full lists of retrieved emotion tags can be found in
Appendix A. I subsequently obtain the top 50 songs labelled with the retrieved emotion tags.
Tables 4.2 - 4.5 show examples of the music metadata (i.e., artists’ names and titles) retrieved
from emotion tags.
1https://www.7digital.com/2The term relax was used in the data collection, which represented the emotion relaxed.3I accessed the server in Feb, 2012.
CHAPTER 4. MUSIC AND EMOTION 57
TABLE 4.1Top 5 emotion tags returned by Last.FM for four basic emotions.
Happy Angry Sad Relaxedhappy angry sad relaxhappy hardcore angry music sad songs relax trancemakes me happy angry metal happysad relax musichappy music angry pop music sad song jazz relaxhappysad angry rock sad & beautiful only relax
TABLE 4.2Top 5 titles and artists’ names returned with emotion tags from the “happy” category.
Artist TitleNoah And The Whale 5 Years TimeJason Mraz I’m YoursRusted Root Send Me On My WayRoyksopp Happy Up HereKaren O And The Kids All Is Love
4.1.2 Musical Excerpts Collection
Given the retrieved titles and the names of the artists, I use a public API from 7Digital to get
preview audio files. Each song excerpt is either 30 seconds or 60 seconds long (as provided by
7Digital), and in a standard mp3 format (bit rate: 128 kbps or 64 kbps; sample rate: 22050 Hz or
44100 Hz). The results cover different types of pop music, meaning that I avoid particular artist
and genre effects (Kim et al., 2006). The purpose of this step is to find ground truth data, and
I was using only the top 50 songs for each tag, which protects against issues such as cold start,
noise, hacking, and bias (Celma, 2006; Lamere, 2008).
However, as shown in Table 4.1, there is some noise in the data such as confusing tags
and repeated songs. I manually removed data with the tag “happysad” and “happy sad” which
existed in both the happy and sad classes, and delete repeated songs, to make sure every song will
only exist once in a single class. Most existing datasets on music emotion recognition are quite
small (less than 1000 items), which indicates that 2904 songs (see Table 4.6) for four emotions
retrieved by social tags is a good size for the current experiments. The dataset has been made
available4, to encourage other researchers to reproduce the results for research and evaluation.
4The dataset can be found at https://code.soundsoftware.ac.uk/projects/emotion-recognition
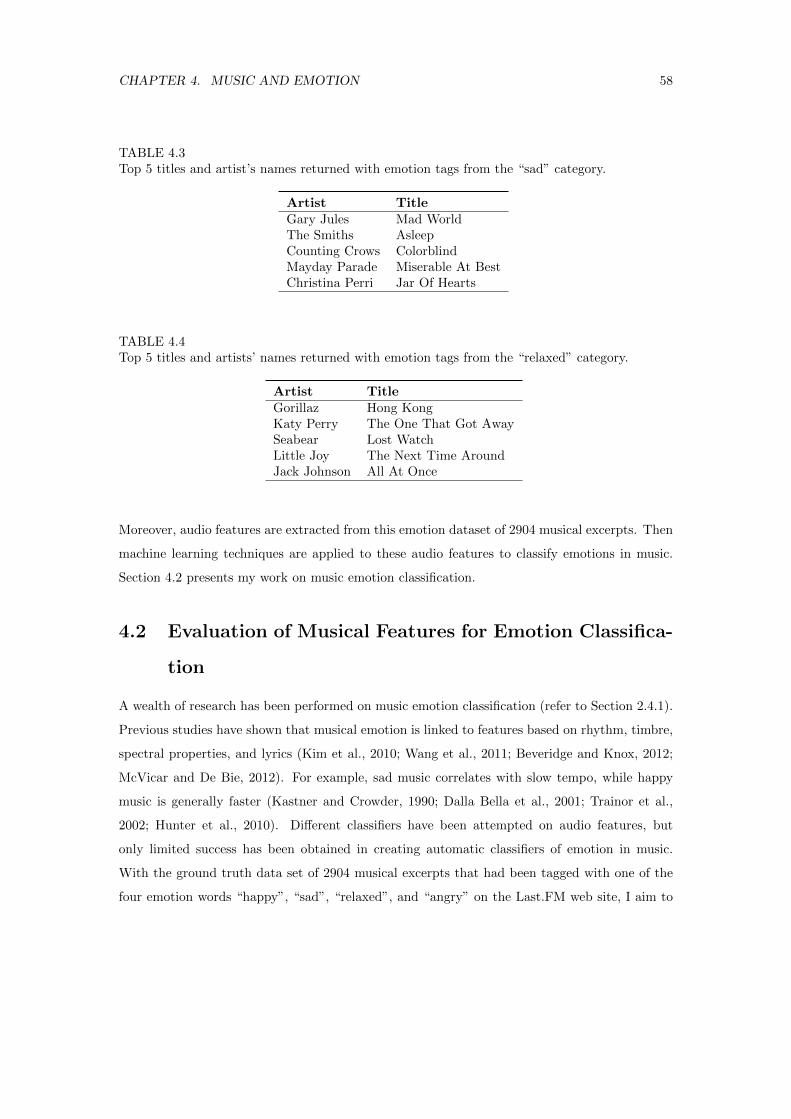
CHAPTER 4. MUSIC AND EMOTION 58
TABLE 4.3Top 5 titles and artist’s names returned with emotion tags from the “sad” category.
Artist TitleGary Jules Mad WorldThe Smiths AsleepCounting Crows ColorblindMayday Parade Miserable At BestChristina Perri Jar Of Hearts
TABLE 4.4Top 5 titles and artists’ names returned with emotion tags from the “relaxed” category.
Artist TitleGorillaz Hong KongKaty Perry The One That Got AwaySeabear Lost WatchLittle Joy The Next Time AroundJack Johnson All At Once
Moreover, audio features are extracted from this emotion dataset of 2904 musical excerpts. Then
machine learning techniques are applied to these audio features to classify emotions in music.
Section 4.2 presents my work on music emotion classification.
4.2 Evaluation of Musical Features for Emotion Classifica-
tion
A wealth of research has been performed on music emotion classification (refer to Section 2.4.1).
Previous studies have shown that musical emotion is linked to features based on rhythm, timbre,
spectral properties, and lyrics (Kim et al., 2010; Wang et al., 2011; Beveridge and Knox, 2012;
McVicar and De Bie, 2012). For example, sad music correlates with slow tempo, while happy
music is generally faster (Kastner and Crowder, 1990; Dalla Bella et al., 2001; Trainor et al.,
2002; Hunter et al., 2010). Different classifiers have been attempted on audio features, but
only limited success has been obtained in creating automatic classifiers of emotion in music.
With the ground truth data set of 2904 musical excerpts that had been tagged with one of the
four emotion words “happy”, “sad”, “relaxed”, and “angry” on the Last.FM web site, I aim to
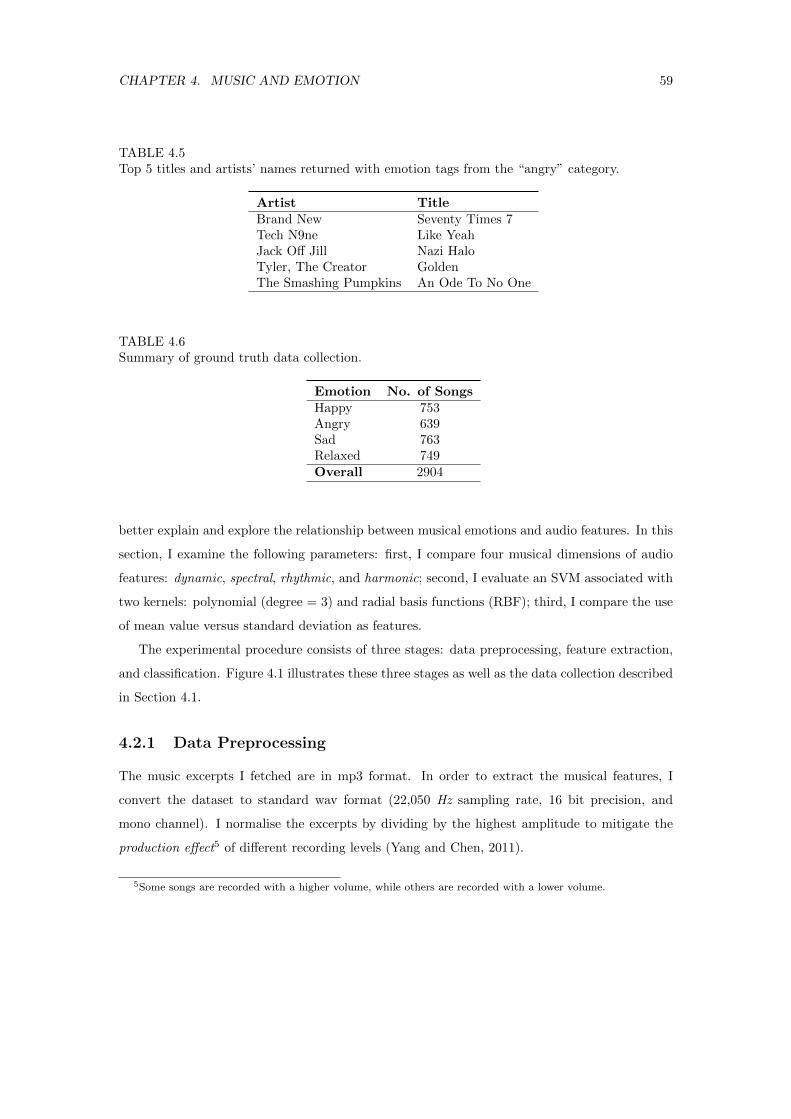
CHAPTER 4. MUSIC AND EMOTION 59
TABLE 4.5Top 5 titles and artists’ names returned with emotion tags from the “angry” category.
Artist TitleBrand New Seventy Times 7Tech N9ne Like YeahJack Off Jill Nazi HaloTyler, The Creator GoldenThe Smashing Pumpkins An Ode To No One
TABLE 4.6Summary of ground truth data collection.
Emotion No. of SongsHappy 753Angry 639Sad 763Relaxed 749Overall 2904
better explain and explore the relationship between musical emotions and audio features. In this
section, I examine the following parameters: first, I compare four musical dimensions of audio
features: dynamic, spectral, rhythmic, and harmonic; second, I evaluate an SVM associated with
two kernels: polynomial (degree = 3) and radial basis functions (RBF); third, I compare the use
of mean value versus standard deviation as features.
The experimental procedure consists of three stages: data preprocessing, feature extraction,
and classification. Figure 4.1 illustrates these three stages as well as the data collection described
in Section 4.1.
4.2.1 Data Preprocessing
The music excerpts I fetched are in mp3 format. In order to extract the musical features, I
convert the dataset to standard wav format (22,050 Hz sampling rate, 16 bit precision, and
mono channel). I normalise the excerpts by dividing by the highest amplitude to mitigate the
production effect5 of different recording levels (Yang and Chen, 2011).
5Some songs are recorded with a higher volume, while others are recorded with a lower volume.
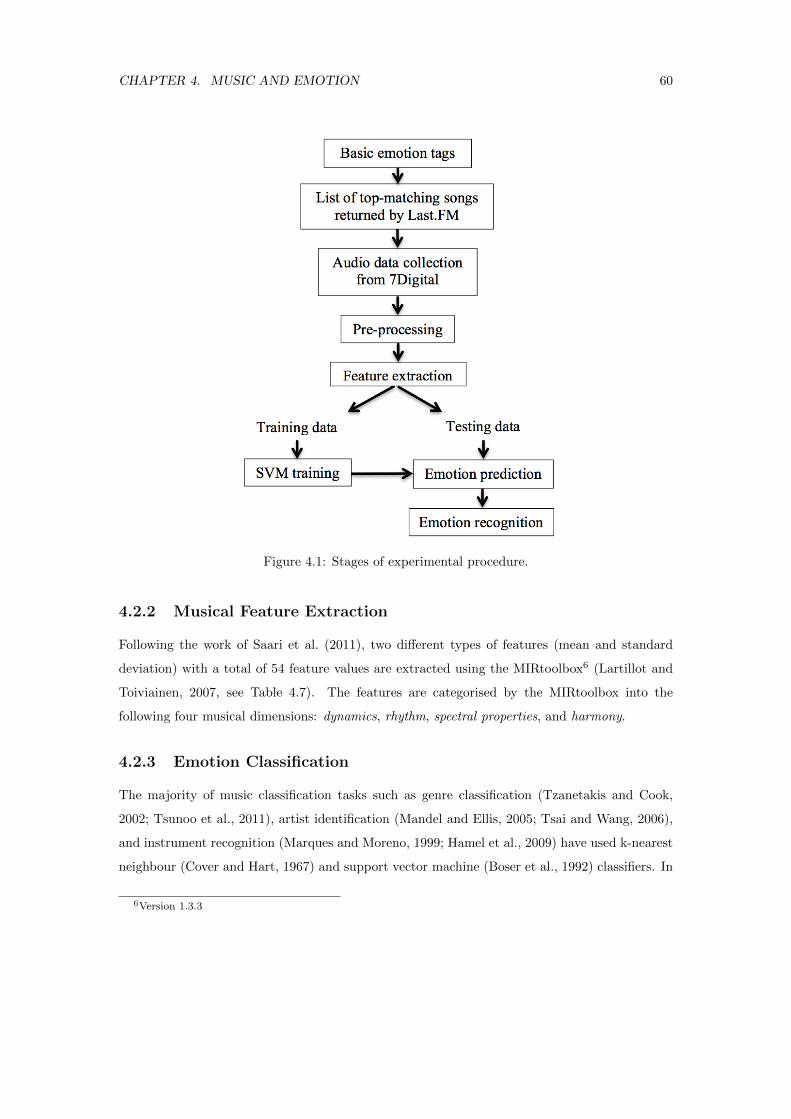
CHAPTER 4. MUSIC AND EMOTION 60
Figure 4.1: Stages of experimental procedure.
4.2.2 Musical Feature Extraction
Following the work of Saari et al. (2011), two different types of features (mean and standard
deviation) with a total of 54 feature values are extracted using the MIRtoolbox6 (Lartillot and
Toiviainen, 2007, see Table 4.7). The features are categorised by the MIRtoolbox into the
following four musical dimensions: dynamics, rhythm, spectral properties, and harmony.
4.2.3 Emotion Classification
The majority of music classification tasks such as genre classification (Tzanetakis and Cook,
2002; Tsunoo et al., 2011), artist identification (Mandel and Ellis, 2005; Tsai and Wang, 2006),
and instrument recognition (Marques and Moreno, 1999; Hamel et al., 2009) have used k-nearest
neighbour (Cover and Hart, 1967) and support vector machine (Boser et al., 1992) classifiers. In
6Version 1.3.3
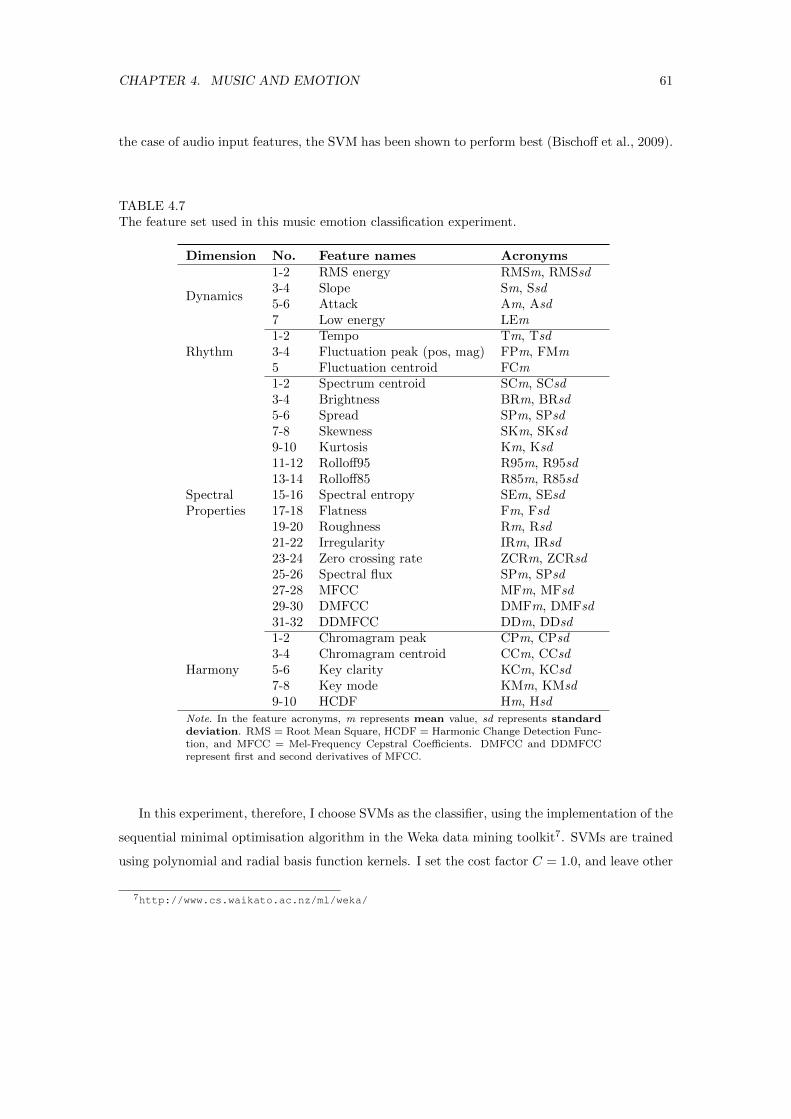
CHAPTER 4. MUSIC AND EMOTION 61
the case of audio input features, the SVM has been shown to perform best (Bischoff et al., 2009).
TABLE 4.7The feature set used in this music emotion classification experiment.
Dimension No. Feature names Acronyms
Dynamics
1-2 RMS energy RMSm, RMSsd3-4 Slope Sm, Ssd5-6 Attack Am, Asd7 Low energy LEm
Rhythm1-2 Tempo Tm, Tsd3-4 Fluctuation peak (pos, mag) FPm, FMm5 Fluctuation centroid FCm1-2 Spectrum centroid SCm, SCsd3-4 Brightness BRm, BRsd5-6 Spread SPm, SPsd7-8 Skewness SKm, SKsd9-10 Kurtosis Km, Ksd11-12 Rolloff95 R95m, R95sd13-14 Rolloff85 R85m, R85sd
Spectral 15-16 Spectral entropy SEm, SEsdProperties 17-18 Flatness Fm, Fsd
19-20 Roughness Rm, Rsd21-22 Irregularity IRm, IRsd23-24 Zero crossing rate ZCRm, ZCRsd25-26 Spectral flux SPm, SPsd27-28 MFCC MFm, MFsd29-30 DMFCC DMFm, DMFsd31-32 DDMFCC DDm, DDsd
Harmony
1-2 Chromagram peak CPm, CPsd3-4 Chromagram centroid CCm, CCsd5-6 Key clarity KCm, KCsd7-8 Key mode KMm, KMsd9-10 HCDF Hm, Hsd
Note. In the feature acronyms, m represents mean value, sd represents standarddeviation. RMS = Root Mean Square, HCDF = Harmonic Change Detection Func-tion, and MFCC = Mel-Frequency Cepstral Coefficients. DMFCC and DDMFCCrepresent first and second derivatives of MFCC.
In this experiment, therefore, I choose SVMs as the classifier, using the implementation of the
sequential minimal optimisation algorithm in the Weka data mining toolkit7. SVMs are trained
using polynomial and radial basis function kernels. I set the cost factor C = 1.0, and leave other
7http://www.cs.waikato.ac.nz/ml/weka/
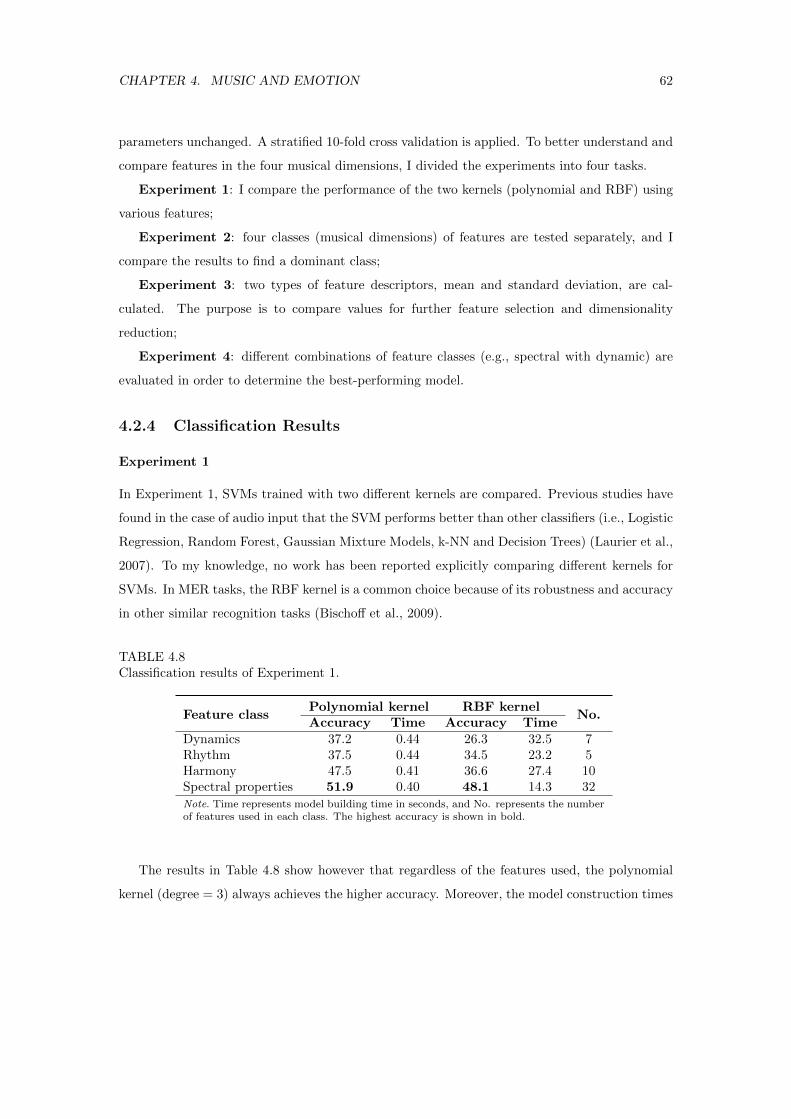
CHAPTER 4. MUSIC AND EMOTION 62
parameters unchanged. A stratified 10-fold cross validation is applied. To better understand and
compare features in the four musical dimensions, I divided the experiments into four tasks.
Experiment 1: I compare the performance of the two kernels (polynomial and RBF) using
various features;
Experiment 2: four classes (musical dimensions) of features are tested separately, and I
compare the results to find a dominant class;
Experiment 3: two types of feature descriptors, mean and standard deviation, are cal-
culated. The purpose is to compare values for further feature selection and dimensionality
reduction;
Experiment 4: different combinations of feature classes (e.g., spectral with dynamic) are
evaluated in order to determine the best-performing model.
4.2.4 Classification Results
Experiment 1
In Experiment 1, SVMs trained with two different kernels are compared. Previous studies have
found in the case of audio input that the SVM performs better than other classifiers (i.e., Logistic
Regression, Random Forest, Gaussian Mixture Models, k-NN and Decision Trees) (Laurier et al.,
2007). To my knowledge, no work has been reported explicitly comparing different kernels for
SVMs. In MER tasks, the RBF kernel is a common choice because of its robustness and accuracy
in other similar recognition tasks (Bischoff et al., 2009).
TABLE 4.8Classification results of Experiment 1.
Feature classPolynomial kernel RBF kernel
No.Accuracy Time Accuracy Time
Dynamics 37.2 0.44 26.3 32.5 7Rhythm 37.5 0.44 34.5 23.2 5Harmony 47.5 0.41 36.6 27.4 10Spectral properties 51.9 0.40 48.1 14.3 32Note. Time represents model building time in seconds, and No. represents the numberof features used in each class. The highest accuracy is shown in bold.
The results in Table 4.8 show however that regardless of the features used, the polynomial
kernel (degree = 3) always achieves the higher accuracy. Moreover, the model construction times
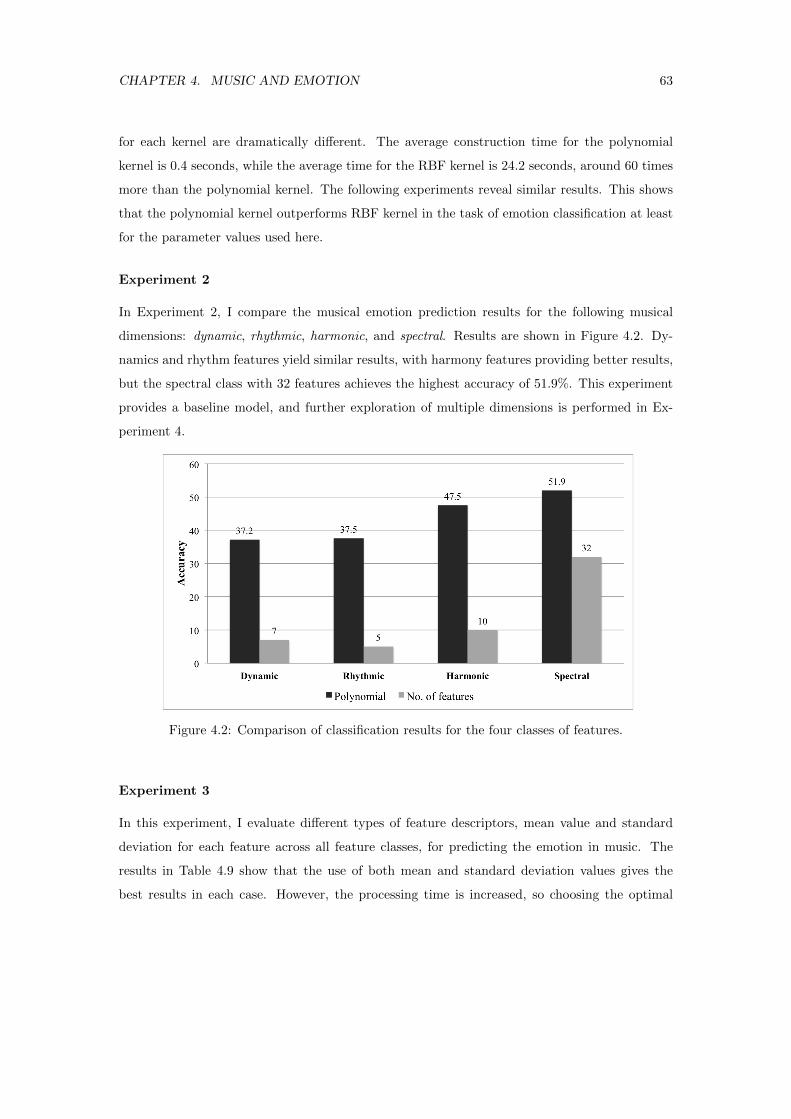
CHAPTER 4. MUSIC AND EMOTION 63
for each kernel are dramatically different. The average construction time for the polynomial
kernel is 0.4 seconds, while the average time for the RBF kernel is 24.2 seconds, around 60 times
more than the polynomial kernel. The following experiments reveal similar results. This shows
that the polynomial kernel outperforms RBF kernel in the task of emotion classification at least
for the parameter values used here.
Experiment 2
In Experiment 2, I compare the musical emotion prediction results for the following musical
dimensions: dynamic, rhythmic, harmonic, and spectral. Results are shown in Figure 4.2. Dy-
namics and rhythm features yield similar results, with harmony features providing better results,
but the spectral class with 32 features achieves the highest accuracy of 51.9%. This experiment
provides a baseline model, and further exploration of multiple dimensions is performed in Ex-
periment 4.
Figure 4.2: Comparison of classification results for the four classes of features.
Experiment 3
In this experiment, I evaluate different types of feature descriptors, mean value and standard
deviation for each feature across all feature classes, for predicting the emotion in music. The
results in Table 4.9 show that the use of both mean and standard deviation values gives the
best results in each case. However, the processing time is increased, so choosing the optimal
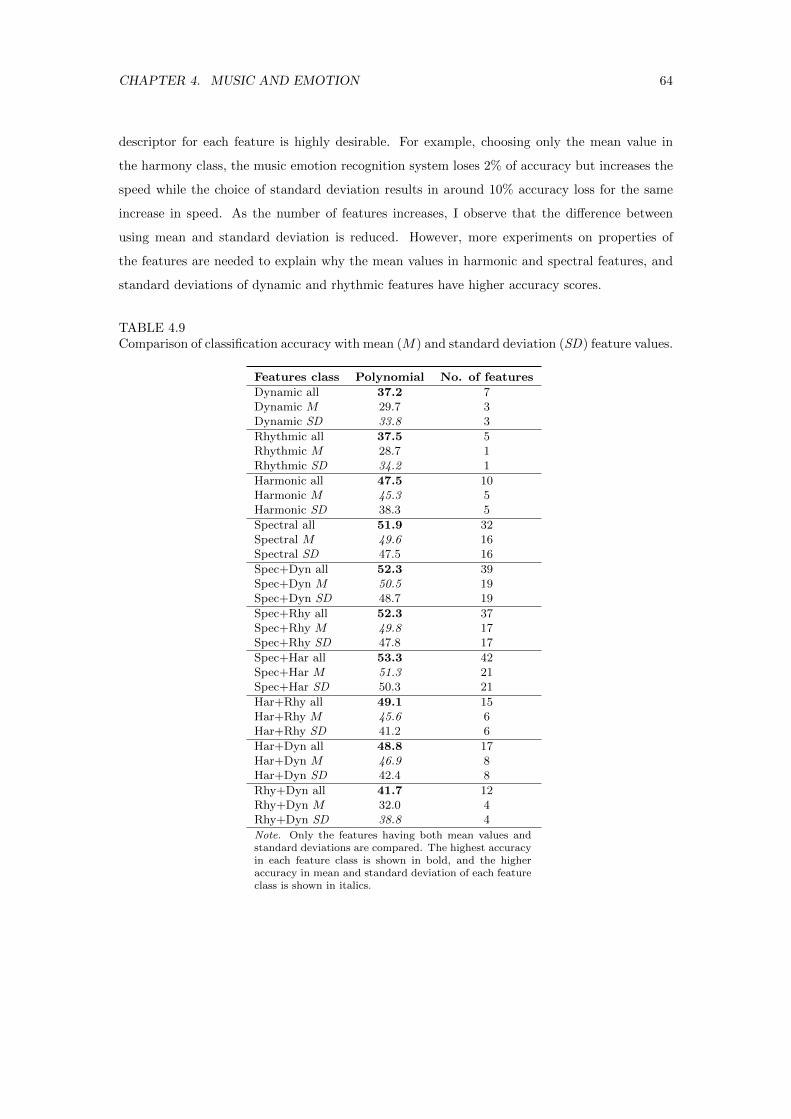
CHAPTER 4. MUSIC AND EMOTION 64
descriptor for each feature is highly desirable. For example, choosing only the mean value in
the harmony class, the music emotion recognition system loses 2% of accuracy but increases the
speed while the choice of standard deviation results in around 10% accuracy loss for the same
increase in speed. As the number of features increases, I observe that the difference between
using mean and standard deviation is reduced. However, more experiments on properties of
the features are needed to explain why the mean values in harmonic and spectral features, and
standard deviations of dynamic and rhythmic features have higher accuracy scores.
TABLE 4.9Comparison of classification accuracy with mean (M) and standard deviation (SD) feature values.
Features class Polynomial No. of features
Dynamic all 37.2 7Dynamic M 29.7 3Dynamic SD 33.8 3
Rhythmic all 37.5 5Rhythmic M 28.7 1Rhythmic SD 34.2 1
Harmonic all 47.5 10Harmonic M 45.3 5Harmonic SD 38.3 5
Spectral all 51.9 32Spectral M 49.6 16Spectral SD 47.5 16
Spec+Dyn all 52.3 39Spec+Dyn M 50.5 19Spec+Dyn SD 48.7 19
Spec+Rhy all 52.3 37Spec+Rhy M 49.8 17Spec+Rhy SD 47.8 17
Spec+Har all 53.3 42Spec+Har M 51.3 21Spec+Har SD 50.3 21
Har+Rhy all 49.1 15Har+Rhy M 45.6 6Har+Rhy SD 41.2 6
Har+Dyn all 48.8 17Har+Dyn M 46.9 8Har+Dyn SD 42.4 8
Rhy+Dyn all 41.7 12Rhy+Dyn M 32.0 4Rhy+Dyn SD 38.8 4
Note. Only the features having both mean values andstandard deviations are compared. The highest accuracyin each feature class is shown in bold, and the higheraccuracy in mean and standard deviation of each featureclass is shown in italics.
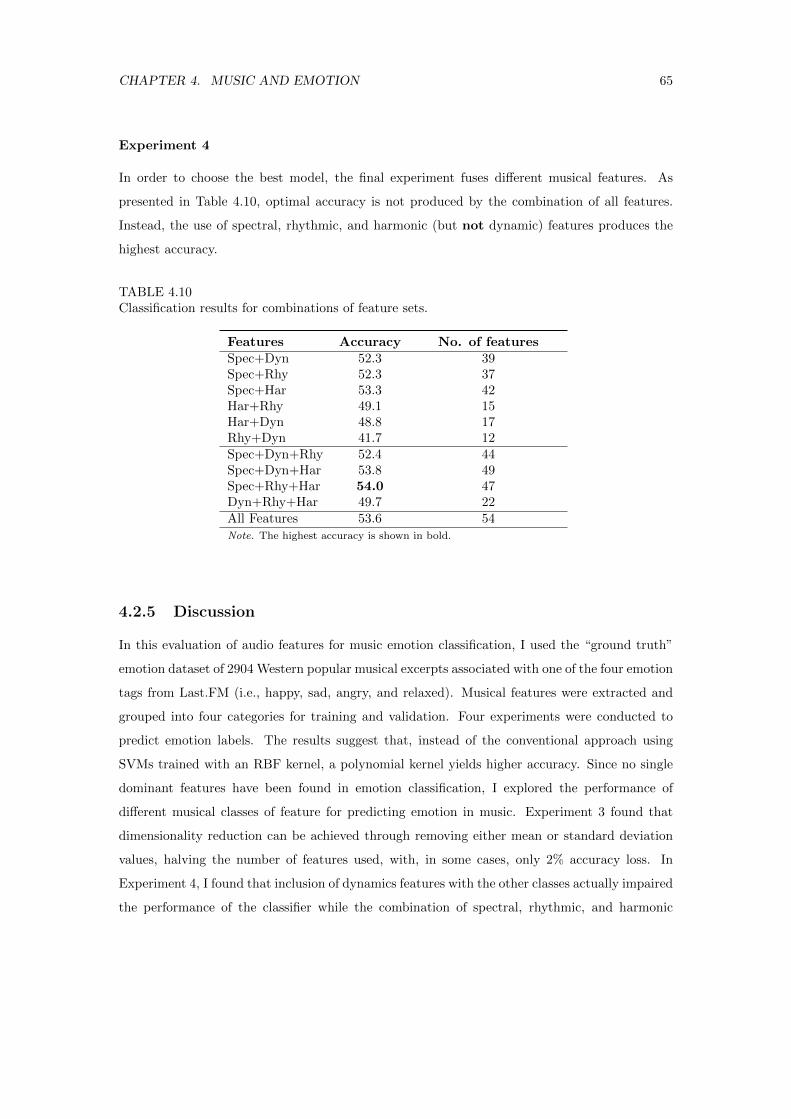
CHAPTER 4. MUSIC AND EMOTION 65
Experiment 4
In order to choose the best model, the final experiment fuses different musical features. As
presented in Table 4.10, optimal accuracy is not produced by the combination of all features.
Instead, the use of spectral, rhythmic, and harmonic (but not dynamic) features produces the
highest accuracy.
TABLE 4.10Classification results for combinations of feature sets.
Features Accuracy No. of featuresSpec+Dyn 52.3 39Spec+Rhy 52.3 37Spec+Har 53.3 42Har+Rhy 49.1 15Har+Dyn 48.8 17Rhy+Dyn 41.7 12Spec+Dyn+Rhy 52.4 44Spec+Dyn+Har 53.8 49Spec+Rhy+Har 54.0 47Dyn+Rhy+Har 49.7 22All Features 53.6 54Note. The highest accuracy is shown in bold.
4.2.5 Discussion
In this evaluation of audio features for music emotion classification, I used the “ground truth”
emotion dataset of 2904 Western popular musical excerpts associated with one of the four emotion
tags from Last.FM (i.e., happy, sad, angry, and relaxed). Musical features were extracted and
grouped into four categories for training and validation. Four experiments were conducted to
predict emotion labels. The results suggest that, instead of the conventional approach using
SVMs trained with an RBF kernel, a polynomial kernel yields higher accuracy. Since no single
dominant features have been found in emotion classification, I explored the performance of
different musical classes of feature for predicting emotion in music. Experiment 3 found that
dimensionality reduction can be achieved through removing either mean or standard deviation
values, halving the number of features used, with, in some cases, only 2% accuracy loss. In
Experiment 4, I found that inclusion of dynamics features with the other classes actually impaired
the performance of the classifier while the combination of spectral, rhythmic, and harmonic
CHAPTER 4. MUSIC AND EMOTION 66
features yielded optimal performance. The highest accuracy achieved by the MER system was
54% (baseline around 25%). Similar to other MER studies using popular music, the emotion
classification accuracy failed to reach a satisfactory result. The confusion matrix showed that
the proposed MER system collectively confused the emotions “sad” and “relaxed”. Since only
low-level features provided by the MIRtoolbox were used in this experiment, high-level features
such as mode and genre could be considered in future studies.
One of the possible reasons for the low accuracy is the ground truth data collection using
social tags. Though the use of social tags is a powerful tool which can assist searching and the
exploration of music (Levy and Sandler, 2007), several issues with tags have been identified,
such as the “cold start” problem (i.e., new or unknown music has no tags), noise, malicious
tagging, and bias towards popular artists or genres (Lamere, 2008). Social tags have been
successfully used in a variety of MIR studies, testing whether they are reliable is often neglected.
There are a number of incentives and motivations for tagging, such as to aid memory, provide
context for task organisation, social signalling, social contribution, play and competition, and
opinion expression (Ames and Naaman, 2007). People annotate the emotional experience of
music listening on the Last.FM web site, however, we know very little about the criteria on
which tagging is based.
Music can both induce (more subjective) and express emotion (more objective) (Vastfjall,
2002; Kallinen and Ravaja, 2006; Schubert, 2007a; Evans and Schubert, 2008). Previous studies
have suggested that music induces emotions similar to the emotional quality perceived in the mu-
sic (Gabrielsson, 2002). To my knowledge, the two facets of emotion communication (perceived
emotion and induced emotion) in music have rarely been studied in combination with emotion
tags.
To describe musical emotions, two well-known and dominant models have arisen (see Sec-
tion 2.3): the categorical model and the dimensional model. Sections 4.3 and 4.4 explore the as-
sociation between human-annotated tags and emotional judgements in perceived emotion and in-
duced emotion using both models of emotion. The data was collected through human-annotated
social tags, which are categorical in nature (Ekman, 1992; Panksepp, 1998). Considering the
difficulty in judging other proposed dimensions such as dominance, intensity, tension, or inter-
ests reported in previous studies (e.g., Leman et al., 2005; Ilie and Thompson, 2006; Schubert,
2007b; Collier, 2007), to find the mapping of emotion onto the dimensional model, only the two
core dimensions valence and arousal are used. Similar to tempo (Repp, 1993; Dixon et al., 2006),
emotion might be instantaneous, which can be recognised and experienced as soon as the music
CHAPTER 4. MUSIC AND EMOTION 67
starts, or emotion may evolve and change continuously over time. Due to this dynamic nature
of music, I measure the “dominant emotion” from a musical excerpt that participants perceive
and feel, which might be considered as a central tendency (not an average, nor the median) of
emotion in a certain range of exposure (e.g., 30 or 60 seconds). The following questions are
examined,
i How do induced emotion and perceived emotion responses differ from each other, in the
categorical and the dimensional models of emotion?
ii How well do semantic emotion tags reflect listeners’ perceived emotion and induced emotion?
iii To what degree can the emotion tags be used to select stimuli for the study of music and
emotion?
iv What are the influences of individual difference (i.e., musical training, music engagement,
culture, age, and gender) on the attribution of emotion to music?
4.3 Listening Experiment 1 - The Categorical Model
4.3.1 Participants
Forty English-speaking students (20 male) participated in Experiment 1 using the categorical
model. All the participants were recruited through university email lists, and had ages ranging
from 18 to 44 years, with various educational backgrounds (from undergraduate to postgraduate)
and levels of musical training. Among the participants, 50% attentively listened to music more
than one hour per day, and 88% of the participants can play at least one instrument. Moreover,
68% of the participants preferred pop/rock music, 10% of them preferred jazz, and the rest pre-
ferred classical music. Full details of participants’ information (i.e., age, gender and nationality)
can be found in Appendix B.
4.3.2 Stimuli
The stimuli were selected from my collection of 2904 musical excerpts retrieved from Last.FM
and 7Digital. Each excerpt had been tagged on Last.FM with one of the four words “happy”,
“sad”, “angry”, or “relaxed”. I randomly chose a total of 80 excerpts from these four categories
(20 tracks from each category). The excerpts ranged from recent releases back to 1960s, and
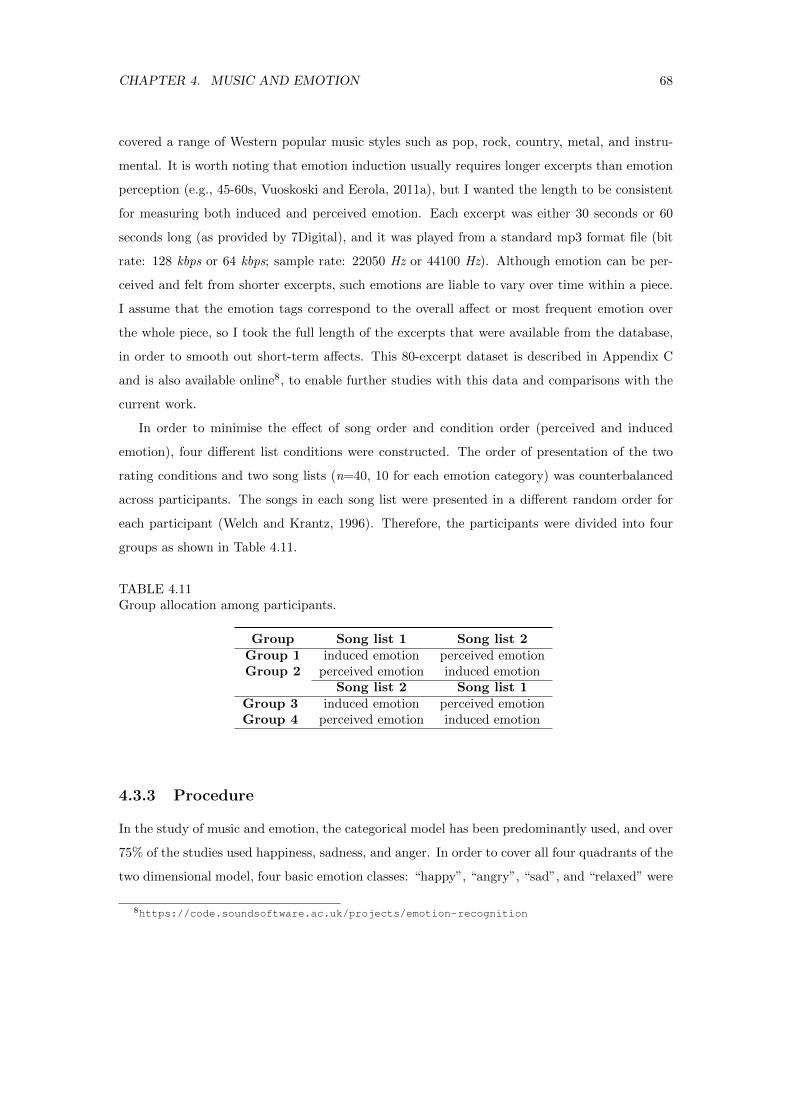
CHAPTER 4. MUSIC AND EMOTION 68
covered a range of Western popular music styles such as pop, rock, country, metal, and instru-
mental. It is worth noting that emotion induction usually requires longer excerpts than emotion
perception (e.g., 45-60s, Vuoskoski and Eerola, 2011a), but I wanted the length to be consistent
for measuring both induced and perceived emotion. Each excerpt was either 30 seconds or 60
seconds long (as provided by 7Digital), and it was played from a standard mp3 format file (bit
rate: 128 kbps or 64 kbps; sample rate: 22050 Hz or 44100 Hz). Although emotion can be per-
ceived and felt from shorter excerpts, such emotions are liable to vary over time within a piece.
I assume that the emotion tags correspond to the overall affect or most frequent emotion over
the whole piece, so I took the full length of the excerpts that were available from the database,
in order to smooth out short-term affects. This 80-excerpt dataset is described in Appendix C
and is also available online8, to enable further studies with this data and comparisons with the
current work.
In order to minimise the effect of song order and condition order (perceived and induced
emotion), four different list conditions were constructed. The order of presentation of the two
rating conditions and two song lists (n=40, 10 for each emotion category) was counterbalanced
across participants. The songs in each song list were presented in a different random order for
each participant (Welch and Krantz, 1996). Therefore, the participants were divided into four
groups as shown in Table 4.11.
TABLE 4.11Group allocation among participants.
Group Song list 1 Song list 2Group 1 induced emotion perceived emotionGroup 2 perceived emotion induced emotion
Song list 2 Song list 1Group 3 induced emotion perceived emotionGroup 4 perceived emotion induced emotion
4.3.3 Procedure
In the study of music and emotion, the categorical model has been predominantly used, and over
75% of the studies used happiness, sadness, and anger. In order to cover all four quadrants of the
two dimensional model, four basic emotion classes: “happy”, “angry”, “sad”, and “relaxed” were
8https://code.soundsoftware.ac.uk/projects/emotion-recognition
CHAPTER 4. MUSIC AND EMOTION 69
used. Experiment 1 was conducted using the categorical model in a laboratory environment9
in November 2012. The study was approved by the Queen Mary Research Ethics Committee
(REF: QMREC1019). The only way to assess subjective emotional experience, is via a format
of listening and self-report (Gabrielsson, 2002). First, the participants were asked to read the
instruction page:
1. Listen to the songs (they will last either 30 or 60 seconds);
2. After listening, for each piece please choose one of the following: happy, sad, relaxed, angry,
or cannot tell/none of above;
Note: participants were asked to answer one of the two questions (condition induced and
condition perceived).
3. For each track, you may click the “stop” button of the audio player if required;
4. Be careful, do not press too quickly, since you can only listen to each song once;
5. Please answer all the questions; the test will take about 40 mins to complete.
Participants were then asked to fill in a demographic form including name, age, gender, “type
of music they are most familiar with”, nationality, and “music culture they grew up with” as
well as a selected subscale from the Goldsmiths Musical Sophistication Index (Gold-MSI v0.910)
questionnaire to measure participants’ level of musical expertise and engagement (Mullensiefen
et al., 2012). For Experiment 1, 32 questions regarding the importance of music in everyday
life (importance), importance of music for psychological functions (emotion), and life history of
formal musical training (music skills) were measured by the Gold-MSI. The listeners responded
to each excerpt (10 excerpts per page) and rated them with a categorical model. Participants
were reminded of the two different rating conditions (induced and perceived emotion). During
the listening test, they were asked “How would you describe the emotional content of the music
itself?” for the emotion perceived, and “What emotion do you feel in response to the music?” for
the emotion induced. In order not to constrain people in the experiment to four basic emotion
classes, I added the fifth option cannot tell/none of above. The whole test lasted about 40
minutes without any planned breaks. However, the participants were able to stop whenever they
wanted and adjust volume to a comfortable level. At the end of the experiment, their opinions
9http://isophonics.net/emotion/test/10http://www.gold.ac.uk/music-mind-brain/gold-msi/
CHAPTER 4. MUSIC AND EMOTION 70
and feedback were collected. Participants were also asked to provide examples of musical pieces
for each perceived and induced emotion (see Appendix E), as well as the activities involved with
music listening and its purposes (see Appendix D).
The statistical analyses were all conducted using the Matlab 2012 Statistics Toolbox. Re-
sponses were aggregated across participants for song-level analysis, or aggregated across items
for individual-level analysis.
4.3.4 Results
4.3.4.1 Comparison of Responses for Perceived and Induced Emotion
The normality of participants’ responses was checked via a Kolmogorov-Smirnov test (K-S test),
and the results rejected the assumption of normality with KS = 0.5 (p < .001). To compare
listeners’ reports of induced and perceived emotion of music, a nonparametric Wilcoxon signed-
rank test was used to analyse the results of the two conditions. Participants’ responses were
aggregated by their corresponding labels, and the agreement between responses and emotion
tags for perceived emotion (Mdn = 0.54) was significantly higher than for induced emotion
(Mdn = 0.47, Z = −2.09, and p < .05).
Participants’ consistency of perceived and induced responses
Regardless of the emotion tags, to examine the differences in the consistency of participants’
perceived and induced responses, one-way analysis of variance (ANOVA) was conducted on the
category with the highest number of responses for each music excerpt. The analysis revealed
that the consistency of participants’ perceived emotional responses (M = 0.61) was significantly
higher than of their induced emotional responses (M = 0.52, F (1) = 10.27, and p < .01). For
each stimulus, I computed an uncertainty score, corresponding to the proportion of participants
who indicated cannot tell/none of the above. Using this as a dependent variable, a Wilcoxon
signed-rank test revealed a significant difference between the uncertainty for induced (Mdn = 3)
and perceived emotion (Mdn = 2, Z = 5.27, and p < .001). The result is consistent with the
literature in suggesting that a higher consistency can be found in the responses of perceived
emotion (Gabrielsson and Juslin, 1996; Schubert, 2007a). One of the possible reasons for the
lower uncertainty level in perceived responses could be explained by the previous findings that the
basic emotions such as happiness, sadness, and anger are often expressed in music because of their
distinct expressive characteristics (Juslin and Laukka, 2004). A different explanation may come
CHAPTER 4. MUSIC AND EMOTION 71
from the fact that emotions induced by music are more sophisticated and context-dependent,
and the categorical model is inadequate to describe the richness of subjective emotions (Zentner
et al., 2008; Eerola and Vuoskoski, 2013).
The relationship between listening duration and emotional responses
Given that participants were free to stop whenever they wanted, the listening duration for each
emotional response was studied. The duration of each musical stimulus is either 30 or 60 seconds,
and the percentage of the length of each excerpt that a participant listened to was computed
as the “listening duration”. Therefore, the listening durations across four emotion categories
were compared using the Kruskal-Wallis test. The results showed that the listening duration
for emotional responses of sad and relaxed was significantly longer than responses of happy and
angry, for both induced (χ2(3) = 47.96, p < .001) and perceived emotion (χ2(3) = 57.64,
p < .001). However, no significant differences in listening duration were found between induced
and perceived emotional responses. This agrees with previous studies that happiness can be
easily identified in music, whereas sadness and relaxedness are often confounded (Vieillard et al.,
2008).
The relationship between the responses for perceived and induced emotion
Since participants’ perceived and induced responses were different, the relationships between
these two emotional responses were investigated. Correlation analyses between perceived and in-
duced emotional responses were performed on the number of responses for each emotion category
with the results shown in Table 4.12. Positive correlations (p < .001) were found on correspond-
ing emotions in perceived and induced emotion, and several negative correlations were shown
such as induced happiness with both perceived and induced sadness and relaxedness, as well
as perceived anger with perceived happiness, sadness, and relaxedness. Interestingly, a positive
correlation was found between perceived sadness and induced relaxedness (Pearson’s r(78) = .29,
p < .01).
In order to categorise the relationships between responses for perceived and induced emotion,
I used and adapted Gabrielsson’s (2002) model (see Table 4.13). To distinguish between various
types of “negative” relationships, the negative category was further divided into three cases:
valence and arousal (negative valence and arousal in perceived emotion, but positive valence and
arousal in induced emotion, etc.), valence (negative valence and arousal in perceived emotion,
but positive valence and negative arousal in induced emotion, etc.) and arousal (negative valence
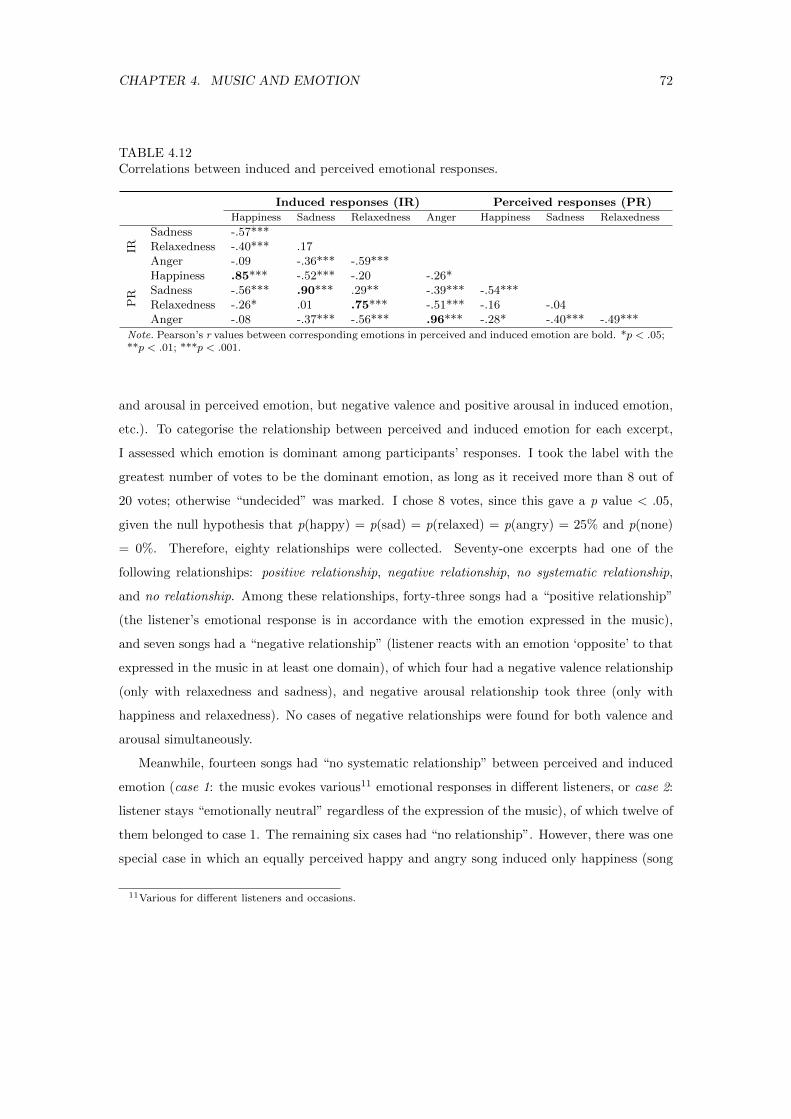
CHAPTER 4. MUSIC AND EMOTION 72
TABLE 4.12Correlations between induced and perceived emotional responses.
Induced responses (IR) Perceived responses (PR)Happiness Sadness Relaxedness Anger Happiness Sadness Relaxedness
IR
Sadness -.57***Relaxedness -.40*** .17Anger -.09 -.36*** -.59***
PR
Happiness .85*** -.52*** -.20 -.26*Sadness -.56*** .90*** .29** -.39*** -.54***Relaxedness -.26* .01 .75*** -.51*** -.16 -.04Anger -.08 -.37*** -.56*** .96*** -.28* -.40*** -.49***
Note. Pearson’s r values between corresponding emotions in perceived and induced emotion are bold. *p < .05;**p < .01; ***p < .001.
and arousal in perceived emotion, but negative valence and positive arousal in induced emotion,
etc.). To categorise the relationship between perceived and induced emotion for each excerpt,
I assessed which emotion is dominant among participants’ responses. I took the label with the
greatest number of votes to be the dominant emotion, as long as it received more than 8 out of
20 votes; otherwise “undecided” was marked. I chose 8 votes, since this gave a p value < .05,
given the null hypothesis that p(happy) = p(sad) = p(relaxed) = p(angry) = 25% and p(none)
= 0%. Therefore, eighty relationships were collected. Seventy-one excerpts had one of the
following relationships: positive relationship, negative relationship, no systematic relationship,
and no relationship. Among these relationships, forty-three songs had a “positive relationship”
(the listener’s emotional response is in accordance with the emotion expressed in the music),
and seven songs had a “negative relationship” (listener reacts with an emotion ‘opposite’ to that
expressed in the music in at least one domain), of which four had a negative valence relationship
(only with relaxedness and sadness), and negative arousal relationship took three (only with
happiness and relaxedness). No cases of negative relationships were found for both valence and
arousal simultaneously.
Meanwhile, fourteen songs had “no systematic relationship” between perceived and induced
emotion (case 1: the music evokes various11 emotional responses in different listeners, or case 2:
listener stays “emotionally neutral” regardless of the expression of the music), of which twelve of
them belonged to case 1. The remaining six cases had “no relationship”. However, there was one
special case in which an equally perceived happy and angry song induced only happiness (song
11Various for different listeners and occasions.
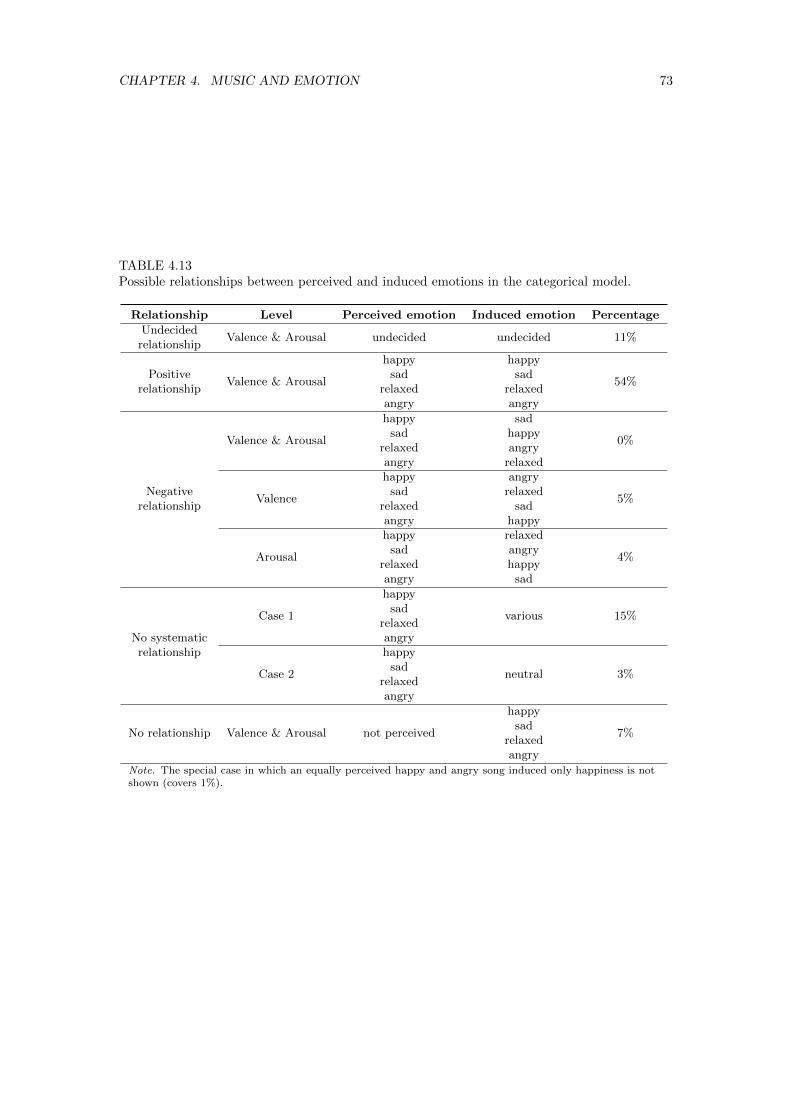
CHAPTER 4. MUSIC AND EMOTION 73
TABLE 4.13Possible relationships between perceived and induced emotions in the categorical model.
Relationship Level Perceived emotion Induced emotion Percentage
UndecidedValence & Arousal undecided undecided 11%
relationship
Valence & Arousal
happy happy
54%Positive sad sad
relationship relaxed relaxedangry angry
Valence & Arousal
happy sad
0%sad happy
relaxed angryangry relaxed
Valence
happy angry
5%Negative sad relaxed
relationship relaxed sadangry happy
Arousal
happy relaxed
4%sad angry
relaxed happyangry sad
Case 1
happy
various 15%sad
relaxedNo systematic angryrelationship
Case 2
happy
neutral 3%sad
relaxedangry
No relationship Valence & Arousal not perceived
happy
7%sad
relaxedangry
Note. The special case in which an equally perceived happy and angry song induced only happiness is notshown (covers 1%).
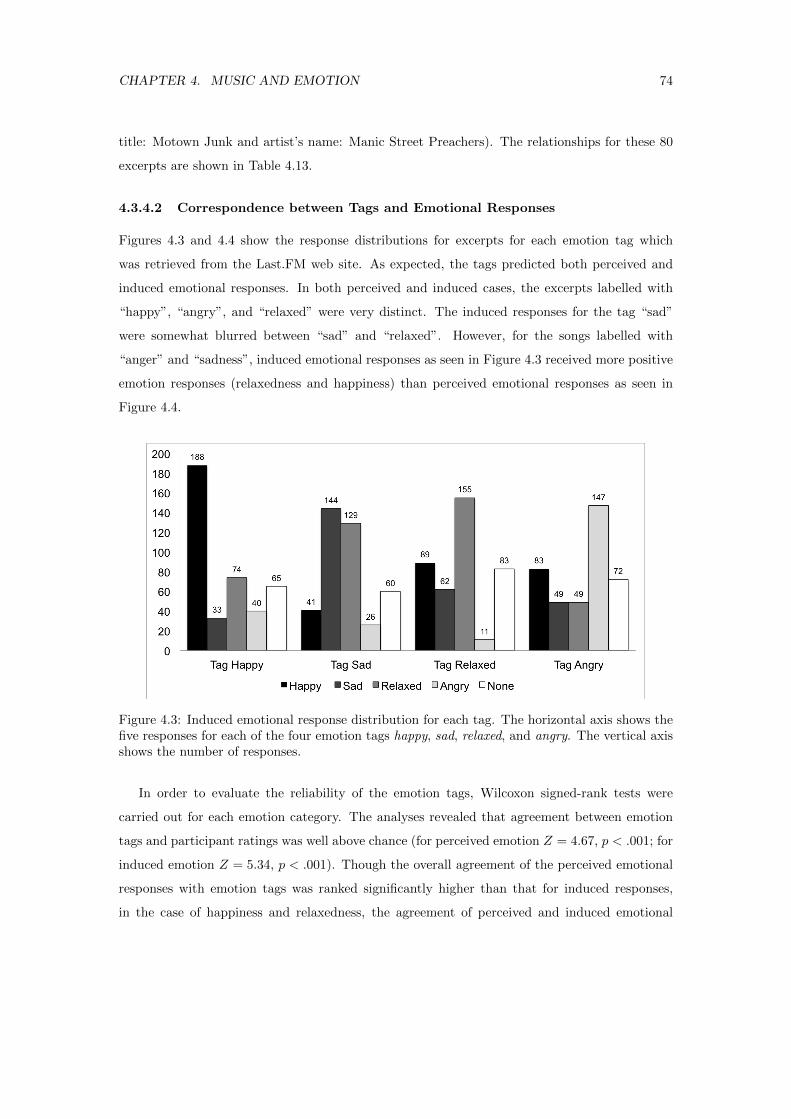
CHAPTER 4. MUSIC AND EMOTION 74
title: Motown Junk and artist’s name: Manic Street Preachers). The relationships for these 80
excerpts are shown in Table 4.13.
4.3.4.2 Correspondence between Tags and Emotional Responses
Figures 4.3 and 4.4 show the response distributions for excerpts for each emotion tag which
was retrieved from the Last.FM web site. As expected, the tags predicted both perceived and
induced emotional responses. In both perceived and induced cases, the excerpts labelled with
“happy”, “angry”, and “relaxed” were very distinct. The induced responses for the tag “sad”
were somewhat blurred between “sad” and “relaxed”. However, for the songs labelled with
“anger” and “sadness”, induced emotional responses as seen in Figure 4.3 received more positive
emotion responses (relaxedness and happiness) than perceived emotional responses as seen in
Figure 4.4.
Figure 4.3: Induced emotional response distribution for each tag. The horizontal axis shows thefive responses for each of the four emotion tags happy, sad, relaxed, and angry. The vertical axisshows the number of responses.
In order to evaluate the reliability of the emotion tags, Wilcoxon signed-rank tests were
carried out for each emotion category. The analyses revealed that agreement between emotion
tags and participant ratings was well above chance (for perceived emotion Z = 4.67, p < .001; for
induced emotion Z = 5.34, p < .001). Though the overall agreement of the perceived emotional
responses with emotion tags was ranked significantly higher than that for induced responses,
in the case of happiness and relaxedness, the agreement of perceived and induced emotional
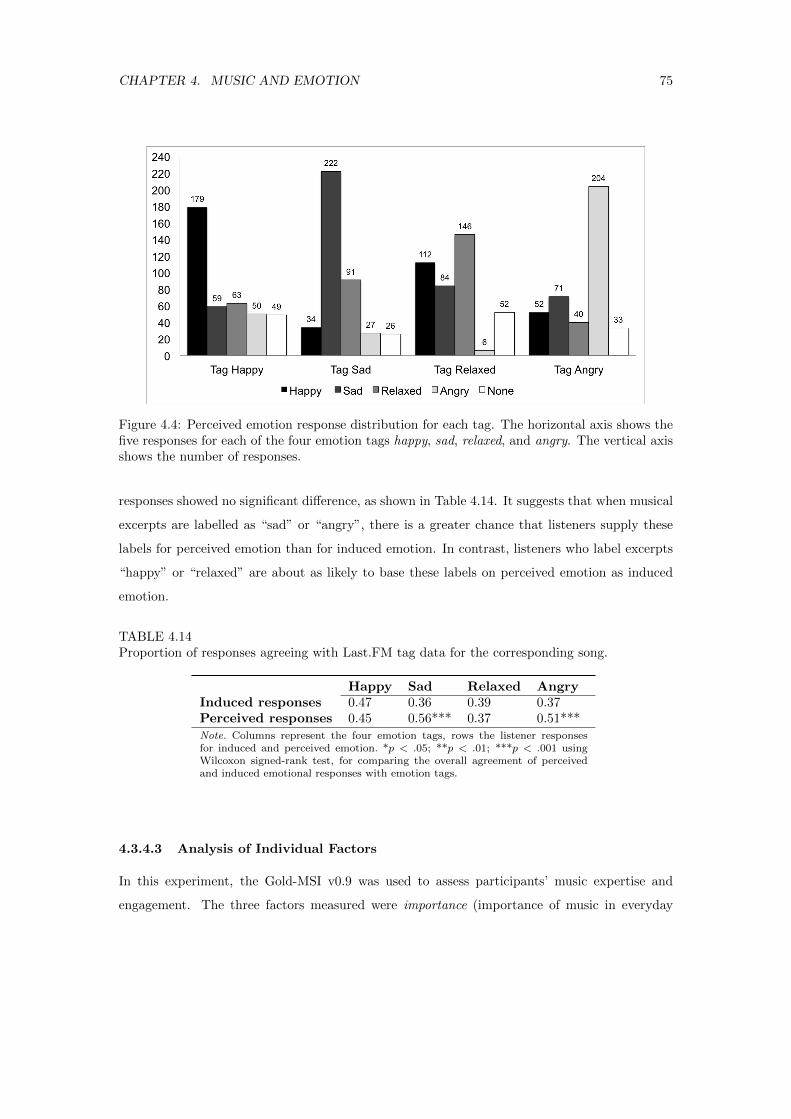
CHAPTER 4. MUSIC AND EMOTION 75
Figure 4.4: Perceived emotion response distribution for each tag. The horizontal axis shows thefive responses for each of the four emotion tags happy, sad, relaxed, and angry. The vertical axisshows the number of responses.
responses showed no significant difference, as shown in Table 4.14. It suggests that when musical
excerpts are labelled as “sad” or “angry”, there is a greater chance that listeners supply these
labels for perceived emotion than for induced emotion. In contrast, listeners who label excerpts
“happy” or “relaxed” are about as likely to base these labels on perceived emotion as induced
emotion.
TABLE 4.14Proportion of responses agreeing with Last.FM tag data for the corresponding song.
Happy Sad Relaxed AngryInduced responses 0.47 0.36 0.39 0.37Perceived responses 0.45 0.56*** 0.37 0.51***Note. Columns represent the four emotion tags, rows the listener responsesfor induced and perceived emotion. *p < .05; **p < .01; ***p < .001 usingWilcoxon signed-rank test, for comparing the overall agreement of perceivedand induced emotional responses with emotion tags.
4.3.4.3 Analysis of Individual Factors
In this experiment, the Gold-MSI v0.9 was used to assess participants’ music expertise and
engagement. The three factors measured were importance (importance of music in everyday
CHAPTER 4. MUSIC AND EMOTION 76
life), musical training (life history of formal musical training), and emotion (importance of music
for psychological, especially emotional functions). A summary of the responses can be found
in Table 4.15, as well as statistics for a large BBC (British Broadcasting Corporation) Internet
study (n = 137, 633) using the Gold-MSI v1.0 (Mullensiefen et al., 2014). Comparing these
three musical attributes in this study, a positive correlation was found for importance with both
musical training (Pearson’s r(38) = .32, p < .05) and emotion (r(38) = .57, p < .001).
TABLE 4.15Summary of responses to 32 questions adapted from the Gold-MSI.
Scale Min Scale Max Mean SD
Experiment 1Importance 15 105 72.5 18.1
Musical training 9 63 37.4 15.0Emotions 8 56 45.5 6.7
BBC studyActive engagement 9 63 41.5 10.4
Musical training 7 49 26.5 11.4Emotions 6 42 34.7 5.04
Note. For example, a musical training score of 26 using Gold-MSI v0.9 could mean that the participantcan play one musical instrument, had one year of formal training, and practices the instrument forone hour daily.
To discover whether individual differences such as age, gender, musical training, and engage-
ment influence emotion judgements, correlation analysis and Kruskal-Wallis one-way analysis of
variance were carried out. However, no significant difference was found between responses of
male and female participants, nor for age12, on their agreement with emotion tags for perceived
and induced emotion. I found that older participants were more likely to listen to music for its
emotional functions (r(38) = .57, p < .001), and there was a tendency of participants to feel
less “happy” from music with increasing age. Interestingly, the distribution of individual partic-
ipant responses showed that some people perceived anger in the music but never became angry
listening to the excerpts. Likewise, some people could be easily moved by music. Therefore,
I examined the response distribution over the 80 musical excerpts for each participant, but no
significant result was found. The reason for the random distribution among people might depend
on other factors such as the participant’s personality, taste, or current mood.
12Only age categories of 18-24 and 25-34 were compared, as there was not enough data for participants’ ageover 35.
CHAPTER 4. MUSIC AND EMOTION 77
4.3.5 Discussion
The aim of Experiment 1 was to examine the difference between perceived and induced responses
using a categorical model, and to explore associations between participants’ emotional judge-
ments and emotion tags (happy, sad, relaxed, and angry), as well as the influence of individual
differences. First, participants’ responses for perceived emotion in popular music showed a higher
level of consistency than induced emotion ratings, thus agreeing with a previous study (Gabriels-
son and Juslin, 1996). In addition, I found a higher uncertainty level in induced compared to
perceived responses, indicating that the basic emotions are often expressed in music and the cat-
egorical model may be inadequate to describe the richness of emotion induced by music. Though
I found the listening duration for emotional responses of “sad” and “relaxed” were significantly
longer than for the responses of “happy” and “angry” for both induced and perceived emotion, no
significant differences in listening duration were found between perceived and induced emotional
responses.
Secondly, the potential relationships between perceived and induced emotion were studied.
The analyses showed the ratings of perceived and induced emotion were positively correlated.
Nonetheless, a small but significant difference was found. It suggests most of the times a person
feels the emotion that the music expresses. Some interesting correlations were also found such
as a perceived sad song could induce relaxedness in listeners, but not the other way round. If
a song is perceived as sad or relaxed, the song would be unlikely to induce happiness. The
majority of the music excerpts used in the experiment were sung, and lyrics may add some
semantic meaning for emotional responses, therefore it is also possible that emotional judgements
could be related not to the elements of music structure itself but with the meaning expressed
by the lyrics. The analyses showed the same results after removing the instrumental tracks13.
However, the relationship between emotion perceived and induced is complex, as it may take
various forms (Gabrielsson, 2002). Therefore, quantitative analyses were conducted between
the two conditions. As reported in the literature, a positive relationship is the most frequent
one (Gabrielsson, 2002; Evans and Schubert, 2008). A similar result was found in the experiment
that a positive relationship occurred 54% of the time. Moreover, the only negative relationship
on the valence level was between the emotions relaxedness and sadness, and the only negative
relationship on the arousal level occurred between relaxedness and happiness. Other relationships
13There were not enough data points (4 in song list 1, and 6 in song list 2) to analyse instrumental tracksseparately.
CHAPTER 4. MUSIC AND EMOTION 78
such as “no relationship” and “no systematic relationship” were found in 7% and 18% of the
cases respectively.
Even though social tags have been widely used in recent literature, emotion tags are rarely
explored. Therefore, it is important to evaluate the reliability of the emotion tags for predicting
listeners’ induced or perceived responses. The results showed that the participant agreement
with emotion tags was well above chance for both perceived and induced emotion. For the cases
of sadness and anger, perceived emotion showed a significantly higher agreement with tags than
induced emotion showed. One of the explanations is that the user tagging behaviour is based on
their perceived feelings, but other explanations could be the subjectivity of induced emotion and
between-subject differences in music experience, culture, personality, situation, current mood,
and preference. However, further studies need to be conducted with controlled environment and
stimuli. Interestingly, the induced emotion distribution showed responses that were more positive
than the emotion tags would have indicated. This agrees with findings that emotional functions
of music are generally positive (Juslin and Laukka, 2004; Zentner et al., 2008).
Finally, the influence of individual differences in age, gender, importance (importance of
music in everyday life), musical training (life history of formal musical training), and emotion
(importance of music for psychological, especially emotional functions), on participants’ emotion
judgements was assessed. No significant differences were found between male and female par-
ticipants’ responses for either perceived or induced emotion, nor their agreement with emotion
tags. Studies have suggested that as people get older, they focus more on self-control of their
emotions and rate their emotion-regulation skills as better (Gross et al., 1997). Similar results
could be found in this experiment that participants’ ratings of importance of music for emotional
functions increased with age. Previously, different findings on age and emotional experience have
been reported (Mroczek and Kolarz, 1998; Charles et al., 2001; Mather and Carstensen, 2005).
No significant relationships were found between age, participants’ emotional responses and the
agreement with emotion tags, but a tendency of older participants to choose “cannot tell/none
of above” rather than “happy” of induced emotional responses was shown. In addition, the three
musical attributes importance, musical skills, and emotion had no correlation with participants’
emotion judgements. Positive correlations were found between importance and both musical
training and emotion. Individual differences such as preference, personality traits, and listener’s
current mood are also known to be relevant to emotional judgement (Vuoskoski and Eerola,
2011a,b; Shiota et al., 2006), but they are beyond the scope of this study.
CHAPTER 4. MUSIC AND EMOTION 79
General comments from participants raised other issues which are worthy of further investi-
gation, for example: participants’ musical preferences may influence their emotion judgements
(“I really like heavy metal, so I think many of the metal songs, normally people would’ve felt
angry, but I just felt happy and energised.”); the responses for perceived and induced emotion in
music may depend on lyrics and cultural factors (“If I feel sad I will usually listen to songs in
my mother tongue”, “Sometimes, emotional content of the music itself is closely related to the
lyrics. Considering that English is not my mother language, it is more difficult for me to get the
insight”). Feedback from participants reinforces the issue of the inadequacy of the categorical
model, with comments such as: “four emotional classes are not enough”, “more options should
be added”, “many times I was feeling limited because of the small amount of feelings options I
had to choose from”, and “I could feel more than one emotion, or another emotion which was not
included in options (like energetic, romantic, etc.)”. To address the limitations in the categorical
model, Experiment 2 was conducted using a two-dimensional continuous model of emotion.
4.4 Listening Experiment 2 - The Dimensional Model
4.4.1 Participants
Fifty-four English-speaking participants (25 male) took part. They were recruited through pro-
fessional and academic email lists and social media, and had ages ranging from 15 to 54 years,
as well as various educational, cultural, and musical training backgrounds. Full details of par-
ticipants’ information (age, gender, and nationality) can be found in Appendix B.
4.4.2 Stimuli
The same 80 musical excerpts used in Experiment 1 were used in Experiment 2. Similar to the
design in Experiment 1, four different list conditions were constructed to minimise the effect of
song order and conditions (perceived and induced emotion). The order of presentation of the two
rating conditions and two song lists (n=40, 10 for each emotion category) was counterbalanced
across participants. The songs in each song list were also presented in a different random order
for each participant.
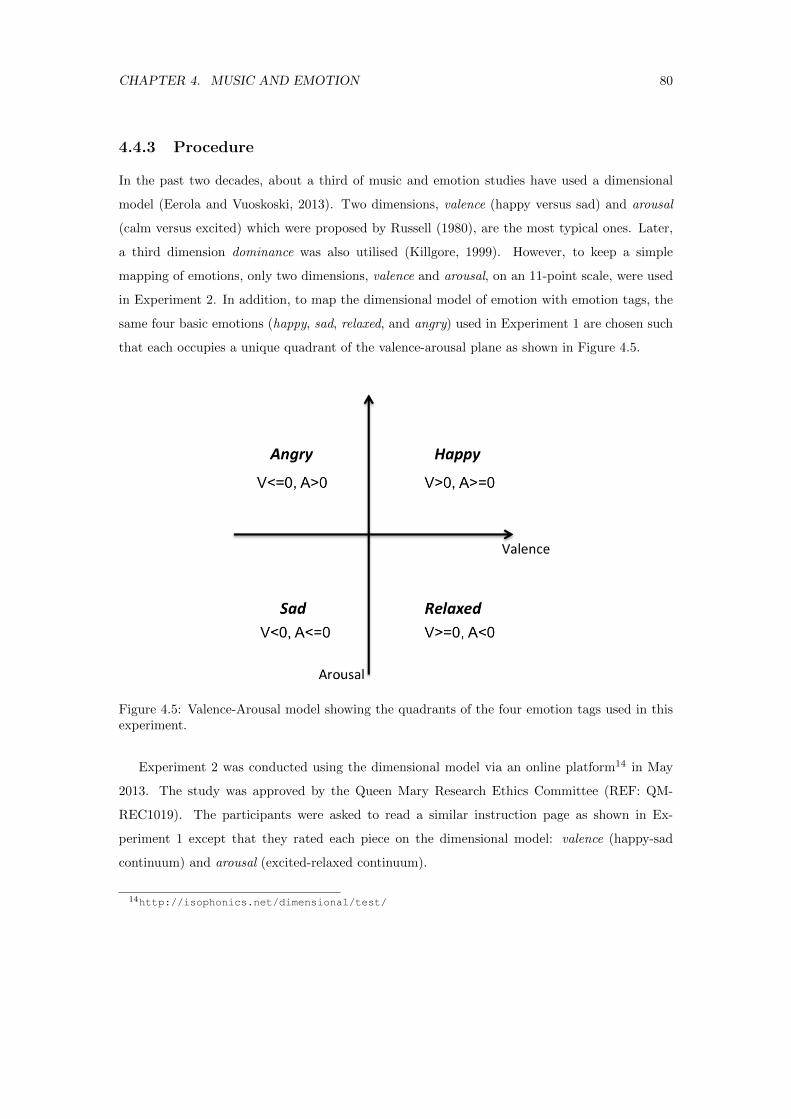
CHAPTER 4. MUSIC AND EMOTION 80
4.4.3 Procedure
In the past two decades, about a third of music and emotion studies have used a dimensional
model (Eerola and Vuoskoski, 2013). Two dimensions, valence (happy versus sad) and arousal
(calm versus excited) which were proposed by Russell (1980), are the most typical ones. Later,
a third dimension dominance was also utilised (Killgore, 1999). However, to keep a simple
mapping of emotions, only two dimensions, valence and arousal, on an 11-point scale, were used
in Experiment 2. In addition, to map the dimensional model of emotion with emotion tags, the
same four basic emotions (happy, sad, relaxed, and angry) used in Experiment 1 are chosen such
that each occupies a unique quadrant of the valence-arousal plane as shown in Figure 4.5.
Figure 4.5: Valence-Arousal model showing the quadrants of the four emotion tags used in thisexperiment.
Experiment 2 was conducted using the dimensional model via an online platform14 in May
2013. The study was approved by the Queen Mary Research Ethics Committee (REF: QM-
REC1019). The participants were asked to read a similar instruction page as shown in Ex-
periment 1 except that they rated each piece on the dimensional model: valence (happy-sad
continuum) and arousal (excited-relaxed continuum).
14http://isophonics.net/dimensional/test/
CHAPTER 4. MUSIC AND EMOTION 81
Participants were asked to fill in a demographic form including name, age, gender, “type of
music they are most familiar with”, nationality, and “music culture they grew up with” as well
as the musical training background from the Gold-MSI v0.9. The participants then responded
to each excerpt (10 excerpts per page) and rated valence and arousal on an 11-point scale.
Valence was rated from very positive to very negative; arousal from very calm to very excited.
Participants were also reminded of two different rating conditions (perceived and induced) by
an alert box when turning each page. During the listening test, they were asked “How would
you describe the emotional content of the music itself?” for the perceived emotion, and “What
emotion do you feel in response to the music?” for the induced emotion. The whole test lasted
about 40 minutes without any planned breaks. At the end of the experiment, participants’
feedback was collected via email.
The statistical analyses were all conducted using the Matlab 2012 Statistics Toolbox. Re-
sponses were aggregated across participants for song-level analysis, or aggregated across items
for individual-level analysis.
4.4.4 Results
4.4.4.1 Comparison of Responses for Perceived and Induced Emotion
To check the normality of participants’ ratings of valence and arousal, the Jarque-Bera test was
carried out. The results showed that the ratings of valence were normally distributed, whereas
the analysis rejected the assumption of normality for ratings of arousal. In the dimensional
model of emotion, to assess the effects of rating conditions (perceived and induced emotion) and
emotion tags (happy, sad, relaxed and angry), two-way ANOVA was conducted on the ratings
of valence, and Friedman’s test and a Wilcoxon signed-rank test were conducted on the ratings
of arousal. I found that the four emotion labels differentially predicted the ratings of valence
(F (3) = 34.02 and p < .001) and arousal (χ2(3) = 51.52 and p < .001). However, no significant
difference was found between the two conditions for the ratings of valence and arousal.
Participants’ consistency of perceived and induced responses
The tags associated with a song are not an absolute ground truth, but are also generated by
users, under unknown conditions; I also looked at the consistency of rating quadrants among
the participants. The level of participant agreement is defined as the proportion of participants
whose ratings are in the quadrant with the highest number of participant ratings. This value
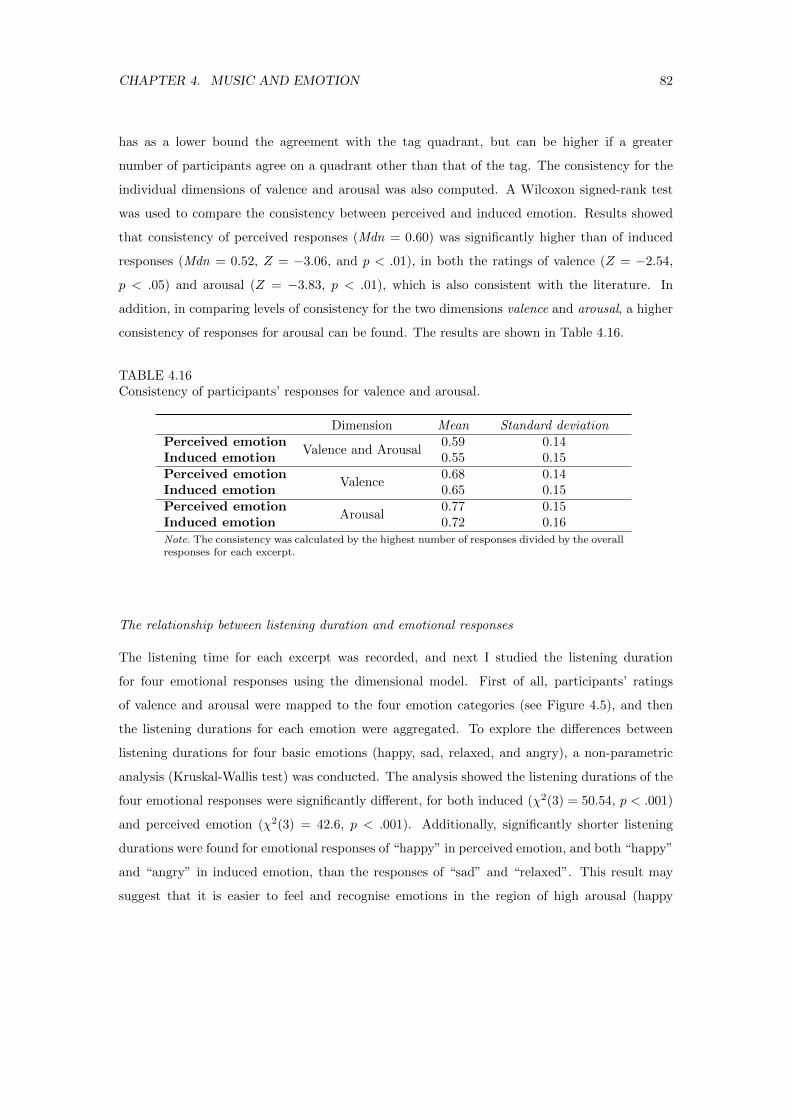
CHAPTER 4. MUSIC AND EMOTION 82
has as a lower bound the agreement with the tag quadrant, but can be higher if a greater
number of participants agree on a quadrant other than that of the tag. The consistency for the
individual dimensions of valence and arousal was also computed. A Wilcoxon signed-rank test
was used to compare the consistency between perceived and induced emotion. Results showed
that consistency of perceived responses (Mdn = 0.60) was significantly higher than of induced
responses (Mdn = 0.52, Z = −3.06, and p < .01), in both the ratings of valence (Z = −2.54,
p < .05) and arousal (Z = −3.83, p < .01), which is also consistent with the literature. In
addition, in comparing levels of consistency for the two dimensions valence and arousal, a higher
consistency of responses for arousal can be found. The results are shown in Table 4.16.
TABLE 4.16Consistency of participants’ responses for valence and arousal.
Dimension Mean Standard deviationPerceived emotion
Valence and Arousal0.59 0.14
Induced emotion 0.55 0.15Perceived emotion
Valence0.68 0.14
Induced emotion 0.65 0.15Perceived emotion
Arousal0.77 0.15
Induced emotion 0.72 0.16Note. The consistency was calculated by the highest number of responses divided by the overallresponses for each excerpt.
The relationship between listening duration and emotional responses
The listening time for each excerpt was recorded, and next I studied the listening duration
for four emotional responses using the dimensional model. First of all, participants’ ratings
of valence and arousal were mapped to the four emotion categories (see Figure 4.5), and then
the listening durations for each emotion were aggregated. To explore the differences between
listening durations for four basic emotions (happy, sad, relaxed, and angry), a non-parametric
analysis (Kruskal-Wallis test) was conducted. The analysis showed the listening durations of the
four emotional responses were significantly different, for both induced (χ2(3) = 50.54, p < .001)
and perceived emotion (χ2(3) = 42.6, p < .001). Additionally, significantly shorter listening
durations were found for emotional responses of “happy” in perceived emotion, and both “happy”
and “angry” in induced emotion, than the responses of “sad” and “relaxed”. This result may
suggest that it is easier to feel and recognise emotions in the region of high arousal (happy
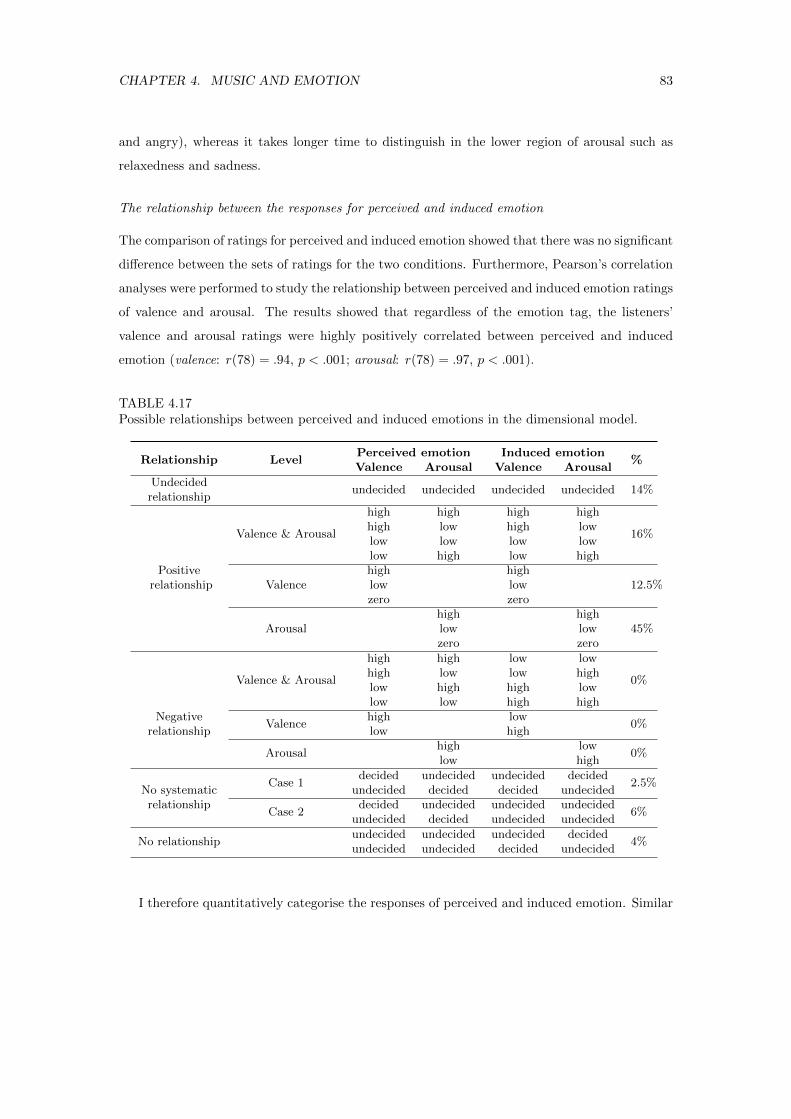
CHAPTER 4. MUSIC AND EMOTION 83
and angry), whereas it takes longer time to distinguish in the lower region of arousal such as
relaxedness and sadness.
The relationship between the responses for perceived and induced emotion
The comparison of ratings for perceived and induced emotion showed that there was no significant
difference between the sets of ratings for the two conditions. Furthermore, Pearson’s correlation
analyses were performed to study the relationship between perceived and induced emotion ratings
of valence and arousal. The results showed that regardless of the emotion tag, the listeners’
valence and arousal ratings were highly positively correlated between perceived and induced
emotion (valence: r(78) = .94, p < .001; arousal: r(78) = .97, p < .001).
TABLE 4.17Possible relationships between perceived and induced emotions in the dimensional model.
Relationship LevelPerceived emotion Induced emotion
%Valence Arousal Valence Arousal
Undecidedundecided undecided undecided undecided 14%
relationship
Valence & Arousal
high high high high
16%high low high lowlow low low lowlow high low high
PositiveValence
high high12.5%relationship low low
zero zero
Arousalhigh high
45%low lowzero zero
Valence & Arousal
high high low low
0%high low low highlow high high lowlow low high high
NegativeValence
high low0%
relationship low high
Arousalhigh low
0%low high
Case 1decided undecided undecided decided
2.5%No systematic undecided decided decided undecidedrelationship
Case 2decided undecided undecided undecided
6%undecided decided undecided undecided
No relationshipundecided undecided undecided decided
4%undecided undecided decided undecided
I therefore quantitatively categorise the responses of perceived and induced emotion. Similar
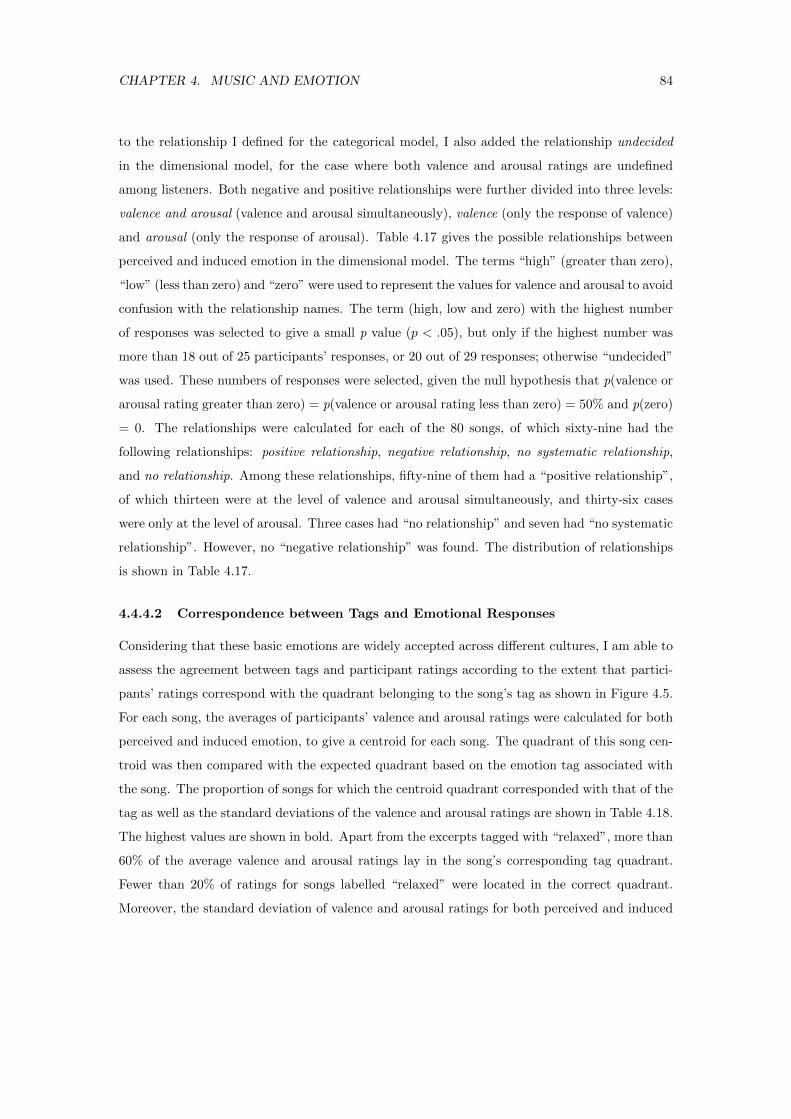
CHAPTER 4. MUSIC AND EMOTION 84
to the relationship I defined for the categorical model, I also added the relationship undecided
in the dimensional model, for the case where both valence and arousal ratings are undefined
among listeners. Both negative and positive relationships were further divided into three levels:
valence and arousal (valence and arousal simultaneously), valence (only the response of valence)
and arousal (only the response of arousal). Table 4.17 gives the possible relationships between
perceived and induced emotion in the dimensional model. The terms “high” (greater than zero),
“low” (less than zero) and “zero” were used to represent the values for valence and arousal to avoid
confusion with the relationship names. The term (high, low and zero) with the highest number
of responses was selected to give a small p value (p < .05), but only if the highest number was
more than 18 out of 25 participants’ responses, or 20 out of 29 responses; otherwise “undecided”
was used. These numbers of responses were selected, given the null hypothesis that p(valence or
arousal rating greater than zero) = p(valence or arousal rating less than zero) = 50% and p(zero)
= 0. The relationships were calculated for each of the 80 songs, of which sixty-nine had the
following relationships: positive relationship, negative relationship, no systematic relationship,
and no relationship. Among these relationships, fifty-nine of them had a “positive relationship”,
of which thirteen were at the level of valence and arousal simultaneously, and thirty-six cases
were only at the level of arousal. Three cases had “no relationship” and seven had “no systematic
relationship”. However, no “negative relationship” was found. The distribution of relationships
is shown in Table 4.17.
4.4.4.2 Correspondence between Tags and Emotional Responses
Considering that these basic emotions are widely accepted across different cultures, I am able to
assess the agreement between tags and participant ratings according to the extent that partici-
pants’ ratings correspond with the quadrant belonging to the song’s tag as shown in Figure 4.5.
For each song, the averages of participants’ valence and arousal ratings were calculated for both
perceived and induced emotion, to give a centroid for each song. The quadrant of this song cen-
troid was then compared with the expected quadrant based on the emotion tag associated with
the song. The proportion of songs for which the centroid quadrant corresponded with that of the
tag as well as the standard deviations of the valence and arousal ratings are shown in Table 4.18.
The highest values are shown in bold. Apart from the excerpts tagged with “relaxed”, more than
60% of the average valence and arousal ratings lay in the song’s corresponding tag quadrant.
Fewer than 20% of ratings for songs labelled “relaxed” were located in the correct quadrant.
Moreover, the standard deviation of valence and arousal ratings for both perceived and induced
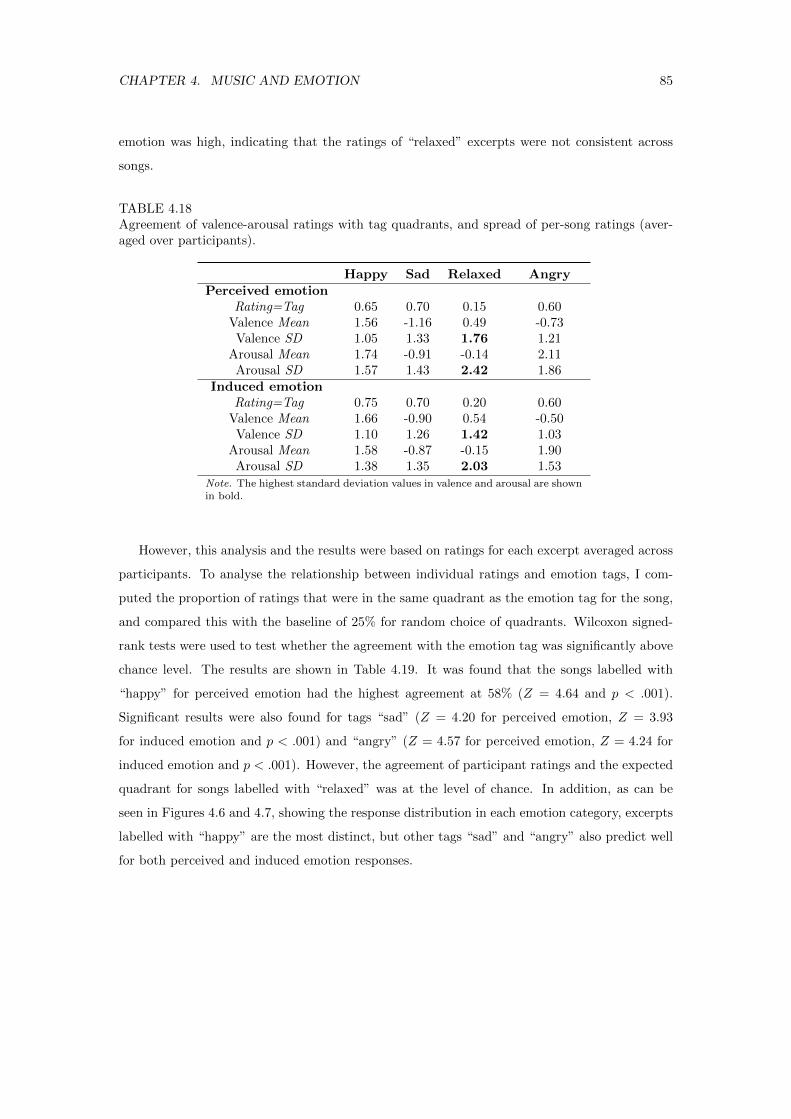
CHAPTER 4. MUSIC AND EMOTION 85
emotion was high, indicating that the ratings of “relaxed” excerpts were not consistent across
songs.
TABLE 4.18Agreement of valence-arousal ratings with tag quadrants, and spread of per-song ratings (aver-aged over participants).
Happy Sad Relaxed AngryPerceived emotion
Rating=Tag 0.65 0.70 0.15 0.60Valence Mean 1.56 -1.16 0.49 -0.73Valence SD 1.05 1.33 1.76 1.21
Arousal Mean 1.74 -0.91 -0.14 2.11Arousal SD 1.57 1.43 2.42 1.86
Induced emotionRating=Tag 0.75 0.70 0.20 0.60
Valence Mean 1.66 -0.90 0.54 -0.50Valence SD 1.10 1.26 1.42 1.03
Arousal Mean 1.58 -0.87 -0.15 1.90Arousal SD 1.38 1.35 2.03 1.53
Note. The highest standard deviation values in valence and arousal are shownin bold.
However, this analysis and the results were based on ratings for each excerpt averaged across
participants. To analyse the relationship between individual ratings and emotion tags, I com-
puted the proportion of ratings that were in the same quadrant as the emotion tag for the song,
and compared this with the baseline of 25% for random choice of quadrants. Wilcoxon signed-
rank tests were used to test whether the agreement with the emotion tag was significantly above
chance level. The results are shown in Table 4.19. It was found that the songs labelled with
“happy” for perceived emotion had the highest agreement at 58% (Z = 4.64 and p < .001).
Significant results were also found for tags “sad” (Z = 4.20 for perceived emotion, Z = 3.93
for induced emotion and p < .001) and “angry” (Z = 4.57 for perceived emotion, Z = 4.24 for
induced emotion and p < .001). However, the agreement of participant ratings and the expected
quadrant for songs labelled with “relaxed” was at the level of chance. In addition, as can be
seen in Figures 4.6 and 4.7, showing the response distribution in each emotion category, excerpts
labelled with “happy” are the most distinct, but other tags “sad” and “angry” also predict well
for both perceived and induced emotion responses.
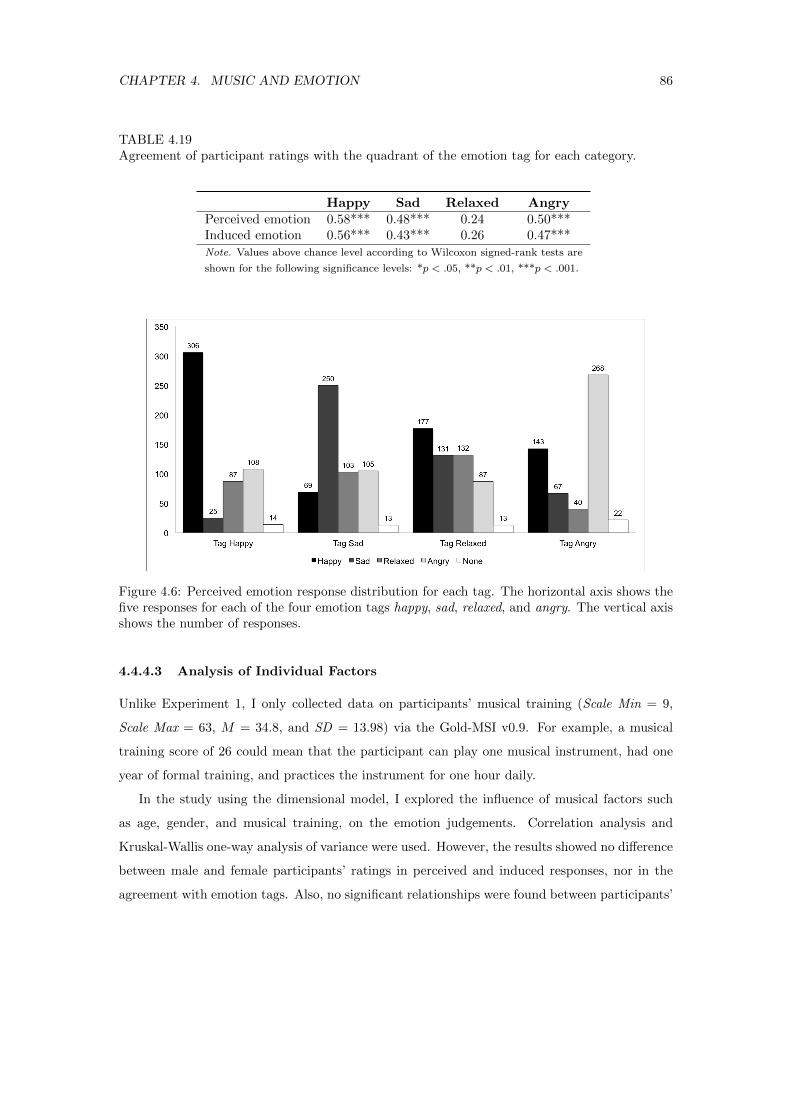
CHAPTER 4. MUSIC AND EMOTION 86
TABLE 4.19Agreement of participant ratings with the quadrant of the emotion tag for each category.
Happy Sad Relaxed AngryPerceived emotion 0.58*** 0.48*** 0.24 0.50***Induced emotion 0.56*** 0.43*** 0.26 0.47***Note. Values above chance level according to Wilcoxon signed-rank tests are
shown for the following significance levels: *p < .05, **p < .01, ***p < .001.
Figure 4.6: Perceived emotion response distribution for each tag. The horizontal axis shows thefive responses for each of the four emotion tags happy, sad, relaxed, and angry. The vertical axisshows the number of responses.
4.4.4.3 Analysis of Individual Factors
Unlike Experiment 1, I only collected data on participants’ musical training (Scale Min = 9,
Scale Max = 63, M = 34.8, and SD = 13.98) via the Gold-MSI v0.9. For example, a musical
training score of 26 could mean that the participant can play one musical instrument, had one
year of formal training, and practices the instrument for one hour daily.
In the study using the dimensional model, I explored the influence of musical factors such
as age, gender, and musical training, on the emotion judgements. Correlation analysis and
Kruskal-Wallis one-way analysis of variance were used. However, the results showed no difference
between male and female participants’ ratings in perceived and induced responses, nor in the
agreement with emotion tags. Also, no significant relationships were found between participants’
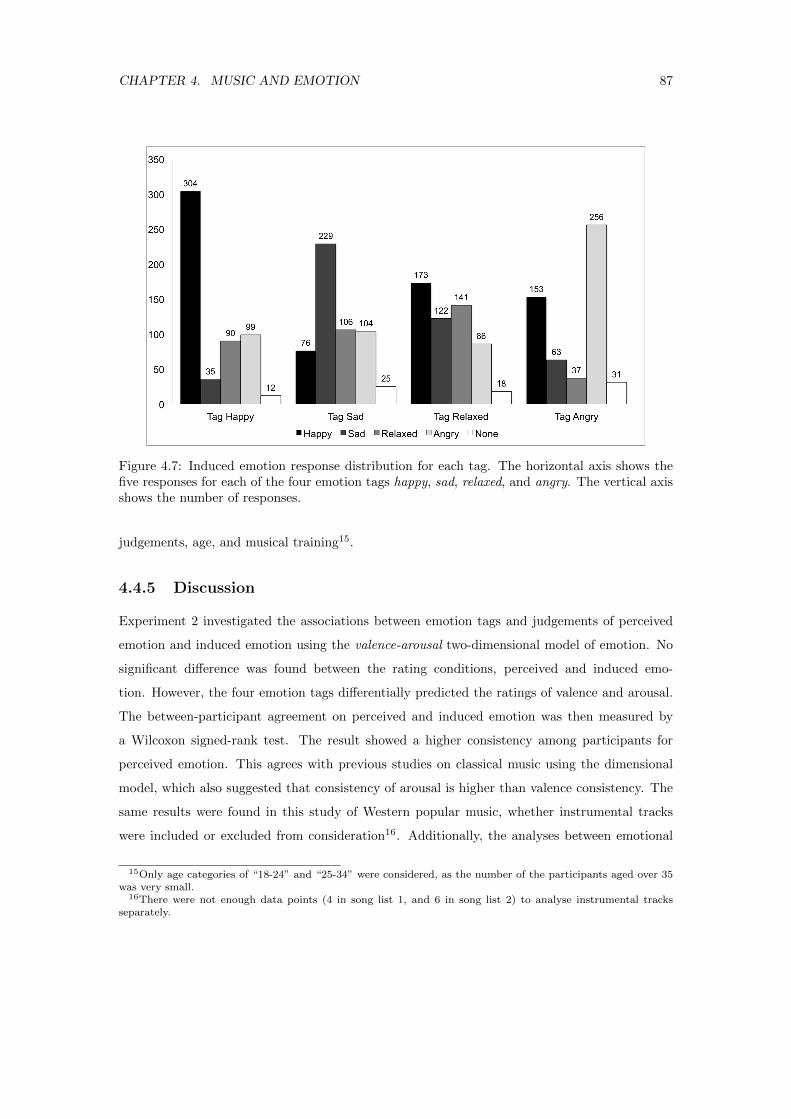
CHAPTER 4. MUSIC AND EMOTION 87
Figure 4.7: Induced emotion response distribution for each tag. The horizontal axis shows thefive responses for each of the four emotion tags happy, sad, relaxed, and angry. The vertical axisshows the number of responses.
judgements, age, and musical training15.
4.4.5 Discussion
Experiment 2 investigated the associations between emotion tags and judgements of perceived
emotion and induced emotion using the valence-arousal two-dimensional model of emotion. No
significant difference was found between the rating conditions, perceived and induced emo-
tion. However, the four emotion tags differentially predicted the ratings of valence and arousal.
The between-participant agreement on perceived and induced emotion was then measured by
a Wilcoxon signed-rank test. The result showed a higher consistency among participants for
perceived emotion. This agrees with previous studies on classical music using the dimensional
model, which also suggested that consistency of arousal is higher than valence consistency. The
same results were found in this study of Western popular music, whether instrumental tracks
were included or excluded from consideration16. Additionally, the analyses between emotional
15Only age categories of “18-24” and “25-34” were considered, as the number of the participants aged over 35was very small.
16There were not enough data points (4 in song list 1, and 6 in song list 2) to analyse instrumental tracksseparately.
CHAPTER 4. MUSIC AND EMOTION 88
responses and listening duration showed that feeling and recognising emotion “happy” in music
took significantly less time than experiencing emotions such as “relaxed” and “sad”. It also
indicates that in the two dimensional model of emotion, emotions with high arousal are easier
to identify and distinguish.
Furthermore, I studied the relationship between perceived and induced ratings. As expected,
strong positive correlations between the two conditions for both ratings of valence and arousal
were found. These results again suggest that listeners will typically feel the emotions expressed
by the music. Due to the fact that perceived and induced emotion are often difficult to clearly
delineate, a quantitative analysis was used to measure the possible relationships. The results
showed that “positive relationship” dominates, covering 64% of the cases, and no cases of “nega-
tive relationship” were found. Due to the strict threshold, only the strongly consistent responses
across participants were retained. Comparing Tables 4.16 and 4.19, the levels of participant
agreement among themselves are higher than the agreement with the emotion tags, suggesting
that at least some of the tags do not correspond either with participants’ perceived or induced
emotion. It might also suggest that the controlled collection of responses creates more systematic
results than data created for other purposes without specific instructions.
Thirdly, the reliability of emotion tags in the dimensional model was evaluated. A mapping
between valence, arousal, and four emotion tags was created, so that each emotion occupies a
unique quadrant of the two-dimensional plane. The analyses indicated that songs labelled with
“happy”, “sad”, and “angry” had ratings in the corresponding quadrants of the valence-arousal
plane at a level that was significantly above chance. For songs tagged “relaxed”, however, the
agreement of ratings with the positive-valence, negative-arousal quadrant was at chance for both
perceived and induced emotion. Comparing these four tags, regardless of song or person, the
excerpts tagged with “happy” are most likely to produce responses in the corresponding quadrant
of the valence-arousal plane.
Finally, I explored the influence of individual factors on the responses of perceived and in-
duced emotion. Gender, age, and participants’ music training did not significantly mediate any
relationships.
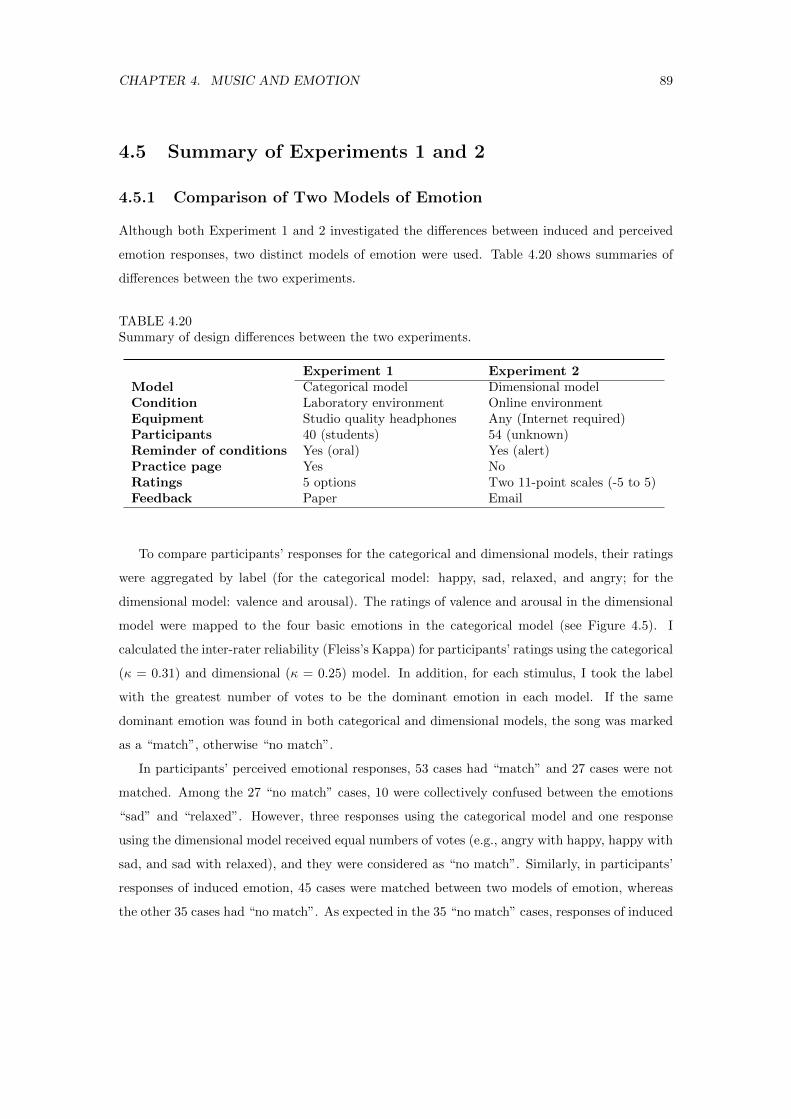
CHAPTER 4. MUSIC AND EMOTION 89
4.5 Summary of Experiments 1 and 2
4.5.1 Comparison of Two Models of Emotion
Although both Experiment 1 and 2 investigated the differences between induced and perceived
emotion responses, two distinct models of emotion were used. Table 4.20 shows summaries of
differences between the two experiments.
TABLE 4.20Summary of design differences between the two experiments.
Experiment 1 Experiment 2Model Categorical model Dimensional modelCondition Laboratory environment Online environmentEquipment Studio quality headphones Any (Internet required)Participants 40 (students) 54 (unknown)Reminder of conditions Yes (oral) Yes (alert)Practice page Yes NoRatings 5 options Two 11-point scales (-5 to 5)Feedback Paper Email
To compare participants’ responses for the categorical and dimensional models, their ratings
were aggregated by label (for the categorical model: happy, sad, relaxed, and angry; for the
dimensional model: valence and arousal). The ratings of valence and arousal in the dimensional
model were mapped to the four basic emotions in the categorical model (see Figure 4.5). I
calculated the inter-rater reliability (Fleiss’s Kappa) for participants’ ratings using the categorical
(κ = 0.31) and dimensional (κ = 0.25) model. In addition, for each stimulus, I took the label
with the greatest number of votes to be the dominant emotion in each model. If the same
dominant emotion was found in both categorical and dimensional models, the song was marked
as a “match”, otherwise “no match”.
In participants’ perceived emotional responses, 53 cases had “match” and 27 cases were not
matched. Among the 27 “no match” cases, 10 were collectively confused between the emotions
“sad” and “relaxed”. However, three responses using the categorical model and one response
using the dimensional model received equal numbers of votes (e.g., angry with happy, happy with
sad, and sad with relaxed), and they were considered as “no match”. Similarly, in participants’
responses of induced emotion, 45 cases were matched between two models of emotion, whereas
the other 35 cases had “no match”. As expected in the 35 “no match” cases, responses of induced
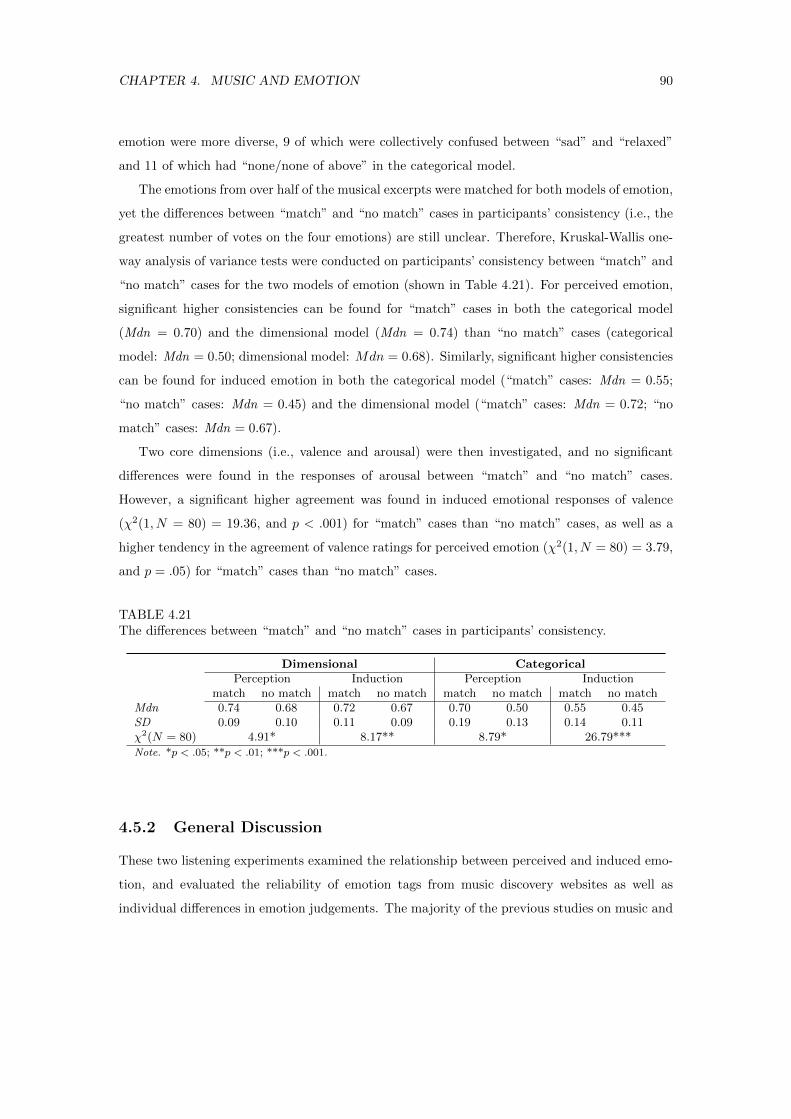
CHAPTER 4. MUSIC AND EMOTION 90
emotion were more diverse, 9 of which were collectively confused between “sad” and “relaxed”
and 11 of which had “none/none of above” in the categorical model.
The emotions from over half of the musical excerpts were matched for both models of emotion,
yet the differences between “match” and “no match” cases in participants’ consistency (i.e., the
greatest number of votes on the four emotions) are still unclear. Therefore, Kruskal-Wallis one-
way analysis of variance tests were conducted on participants’ consistency between “match” and
“no match” cases for the two models of emotion (shown in Table 4.21). For perceived emotion,
significant higher consistencies can be found for “match” cases in both the categorical model
(Mdn = 0.70) and the dimensional model (Mdn = 0.74) than “no match” cases (categorical
model: Mdn = 0.50; dimensional model: Mdn = 0.68). Similarly, significant higher consistencies
can be found for induced emotion in both the categorical model (“match” cases: Mdn = 0.55;
“no match” cases: Mdn = 0.45) and the dimensional model (“match” cases: Mdn = 0.72; “no
match” cases: Mdn = 0.67).
Two core dimensions (i.e., valence and arousal) were then investigated, and no significant
differences were found in the responses of arousal between “match” and “no match” cases.
However, a significant higher agreement was found in induced emotional responses of valence
(χ2(1, N = 80) = 19.36, and p < .001) for “match” cases than “no match” cases, as well as a
higher tendency in the agreement of valence ratings for perceived emotion (χ2(1, N = 80) = 3.79,
and p = .05) for “match” cases than “no match” cases.
TABLE 4.21The differences between “match” and “no match” cases in participants’ consistency.
Dimensional CategoricalPerception Induction Perception Induction
match no match match no match match no match match no matchMdn 0.74 0.68 0.72 0.67 0.70 0.50 0.55 0.45SD 0.09 0.10 0.11 0.09 0.19 0.13 0.14 0.11χ2(N = 80) 4.91* 8.17** 8.79* 26.79***
Note. *p < .05; **p < .01; ***p < .001.
4.5.2 General Discussion
These two listening experiments examined the relationship between perceived and induced emo-
tion, and evaluated the reliability of emotion tags from music discovery websites as well as
individual differences in emotion judgements. The majority of the previous studies on music and
CHAPTER 4. MUSIC AND EMOTION 91
emotion deal with classical and film soundtracks, but as previous results may not be applicable
to other genres, this work extends the study to Western popular music. In addition, two models
of emotions, the categorical and dimensional models, were used in my experiments to structure
the investigations and interpret my findings. Though the participants of the two experiments
were recruited in different ways, the distribution of key variables (age and musical training score)
did not differ significantly between experiments17.
Results for both the categorical and the dimensional model showed that the four emotion
labels “happy”, “sad”, “relaxed”, and “angry” did correlate with the perceived and induced
emotional responses. The inter-participant consistency in perceived emotion was, however, sig-
nificantly higher than the consistency in induced emotion. This supports the argument that
perceived emotion refers to intellectual processing (objective), such as the perception of an in-
tended or expressed emotional character, whereas felt emotions reflect the introspective per-
ception of psychophysiological changes (subjective), which are often associated with emotional
self-regulation. But also, it may be unreasonable to expect induced emotions to change so rapidly
from moment to moment, and the results could be different in extended listening of a single piece.
The excerpts used in these experiments were 30-60 seconds in duration. Since participants were
able to stop whenever they wished, the listening time for each song was recorded. The analy-
sis of listening duration and emotional responses showed that for both induced and perceived
conditions, emotions such as “happy” and “angry” were easier to recognise and feel in music,
whereas participants needed a significantly longer time to experience emotions such as “sad” and
“relaxed”, which are located in the lower region of the dimensional model (low arousal). How-
ever, no significant differences in listening duration were found between induced and perceived
emotion responses.
Similarly, a higher uncertainty level was found for induced emotional responses. To an extent,
it suggests that these four basic emotions better capture the musical emotions which are expressed
in music than those induced by music. The feedback from participants also implies that the
categorical model is inadequate to describe the richness of emotions induced by music. In the
analysis of the dimensional model, higher consistency was also found in the ratings of arousal than
of valence, which is in accordance with previous results in music emotion prediction (Schubert,
2007b; Huq et al., 2010). The majority of music excerpts used in the experiment had lyrics,
and the overall results remained the same after removing the instrumental tracks. However, it is
17The same participant could take part in both experiments.
CHAPTER 4. MUSIC AND EMOTION 92
possible that emotional judgements could be related not to the elements of music structure but
to the meaning expressed by the lyrics.
In addition, positive correlations were found for corresponding emotions between perceived
and induced emotion. This result is consistent with the finding that music evokes emotions similar
to the emotions perceived in music. However, other correlations showed that a perceived sad song
might induce relaxedness. Meanwhile, a perceived angry song is less likely to induce sadness and
relaxedness. In addition, I tested for four possible relationships proposed by Gabrielsson (2002):
positive relationship, negative relationship, no systematic relationship, and no relationship. I
found that in both the categorical and dimensional models, a positive relationship is the most
frequent one. Negative relationships were found in my analysis of the categorical model, but
not in the dimensional model. This may be caused by the fundamental differences between the
models, that one allows people to respond in a graded way whereas the other forces them into
a small number of discrete categories; or this may be caused by the thresholding, that only the
strongest response is retained in the dimensional model. “No systematic relationship” and “no
relationship” also existed for a small minority of stimuli. My empirical results follow Gabrielsson’s
(2002) framework; however, the case in which both the perceived and induced emotions are
disagreed by listeners was not included in this framework. I therefore expand Gabrielsson’s
framework with the relationship undecided. There are various underlying mechanisms involved
in explaining the relationships between induced and perceived emotion. For example, Juslin and
Vastfjall (2008) mentioned that the same perceived and induced emotional responses is due to
the emotional contagion mechanism, whereas the negative relationship may involve the episodic
memory mechanism. Details of underlying mechanisms are beyond the scope of this study, but
for future studies it will be useful to consider all relevant mechanisms to provide an accurate
understanding of the relationships between induced and perceived emotion.
The reliability of emotion tags was evaluated via the level of agreement between partici-
pants’ responses and the tags. The results revealed that the agreement between social tags and
participants’ ratings was well above chance for both the categorical model and the dimensional
model. However, the excerpts labelled with “relaxed” had the lowest agreement with tags in the
categorical model and agreed with the tags only at the level of chance in the dimensional model.
Moreover, the distribution of listeners’ responses for the excerpts corresponding to each tag indi-
cated that the emotion tags predicted both the perceived and induced emotional responses well.
It is worth mentioning that with respect to valence, listeners often collectively confused sadness
with relaxedness, and happiness with anger. Responses may vary because of individual factors
CHAPTER 4. MUSIC AND EMOTION 93
such as current mood, music culture, and preference.
Finally, the analysis of individual differences showed that age, gender, and musical training
were found not to mediate listeners’ emotion judgements, nor their agreement with tags. One
interpretation is that the excerpt selections are Western popular music which is generally well-
understood by participants who are English speakers. However, a tendency was found that older
participants were more likely to feel and experience less “happy”, and use music more for its
emotional functions. Also, positive correlations between three factors from the Gold-MSI v0.9,
importance and musical training, emotion were found in Experiment 1.
I also need to acknowledge two potential limitations of collecting both perceived and felt
emotion responses in a laboratory setting. First, it is likely that people do not feel as much in
this setting as they would in a natural condition during which listeners are actively choosing
music pieces for obtaining a given internal feeling (Altenmuller et al., 2002). However, I believe
that whereas the setting might affect quantitative responses (how much is felt), it should not
alter the qualitative responses (which emotion is felt). Second, it is possible that participants
might confuse the two rating conditions. However, they were given very precise instructions and
were reminded of the two different rating conditions (perceived and induced emotion) just prior
to the ratings. Also, the obtained significant differences between the conditions show that, on
the whole, the participants understood the tasks.
In summary, my study of the relationship between perceived and induced emotion showed
similar results using both the categorical and dimensional models. This study supports the
previous work on classical and film soundtracks, suggesting that the robustness of the models
does not depend on the genre of music considered. Emotion, like music, is dynamic and it may
change and evolve continuously. In my experiments, emotional response was measured by a static
value. Future research should consider the dynamic emotional judgements in a more controlled
environment (Egermann et al., 2013). In addition, a two-dimension model was used to map the
categorical model. However, the third dimension “dominance” is worth investigating further.
Musical emotional meaning can not only be influenced by subjective factors (taste, musical
abilities, and personality), but also social factors (e.g., music culture and context). In further
studies, I explore emotional association with and without the presence of music in various music-
listening contexts (see Chapters 5 and 6). Also, more objective measurements such as behavioural
and physiological reactions could be conducted in combination with a self-report approach to
provide richer evidence of emotional responses. A greater understanding of these factors would
be beneficial in the design of subjective music recommendation systems (Song et al., 2012a).
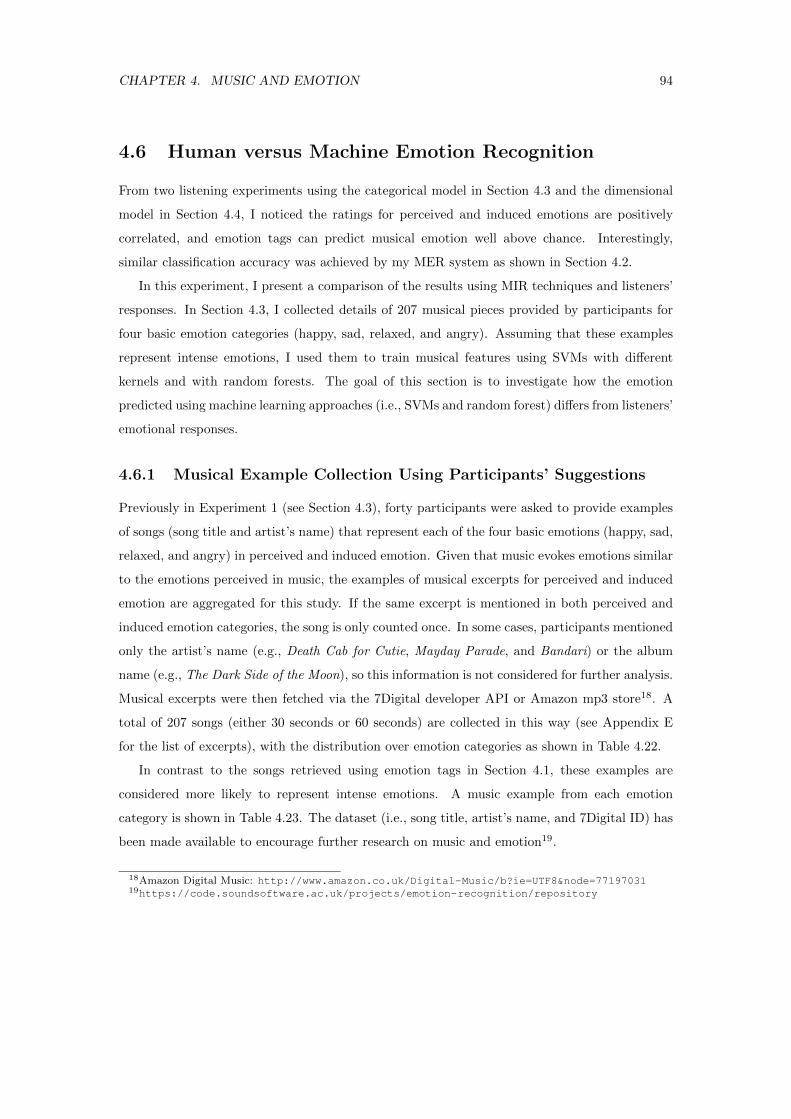
CHAPTER 4. MUSIC AND EMOTION 94
4.6 Human versus Machine Emotion Recognition
From two listening experiments using the categorical model in Section 4.3 and the dimensional
model in Section 4.4, I noticed the ratings for perceived and induced emotions are positively
correlated, and emotion tags can predict musical emotion well above chance. Interestingly,
similar classification accuracy was achieved by my MER system as shown in Section 4.2.
In this experiment, I present a comparison of the results using MIR techniques and listeners’
responses. In Section 4.3, I collected details of 207 musical pieces provided by participants for
four basic emotion categories (happy, sad, relaxed, and angry). Assuming that these examples
represent intense emotions, I used them to train musical features using SVMs with different
kernels and with random forests. The goal of this section is to investigate how the emotion
predicted using machine learning approaches (i.e., SVMs and random forest) differs from listeners’
emotional responses.
4.6.1 Musical Example Collection Using Participants’ Suggestions
Previously in Experiment 1 (see Section 4.3), forty participants were asked to provide examples
of songs (song title and artist’s name) that represent each of the four basic emotions (happy, sad,
relaxed, and angry) in perceived and induced emotion. Given that music evokes emotions similar
to the emotions perceived in music, the examples of musical excerpts for perceived and induced
emotion are aggregated for this study. If the same excerpt is mentioned in both perceived and
induced emotion categories, the song is only counted once. In some cases, participants mentioned
only the artist’s name (e.g., Death Cab for Cutie, Mayday Parade, and Bandari) or the album
name (e.g., The Dark Side of the Moon), so this information is not considered for further analysis.
Musical excerpts were then fetched via the 7Digital developer API or Amazon mp3 store18. A
total of 207 songs (either 30 seconds or 60 seconds) are collected in this way (see Appendix E
for the list of excerpts), with the distribution over emotion categories as shown in Table 4.22.
In contrast to the songs retrieved using emotion tags in Section 4.1, these examples are
considered more likely to represent intense emotions. A music example from each emotion
category is shown in Table 4.23. The dataset (i.e., song title, artist’s name, and 7Digital ID) has
been made available to encourage further research on music and emotion19.
18Amazon Digital Music: http://www.amazon.co.uk/Digital-Music/b?ie=UTF8&node=7719703119https://code.soundsoftware.ac.uk/projects/emotion-recognition/repository
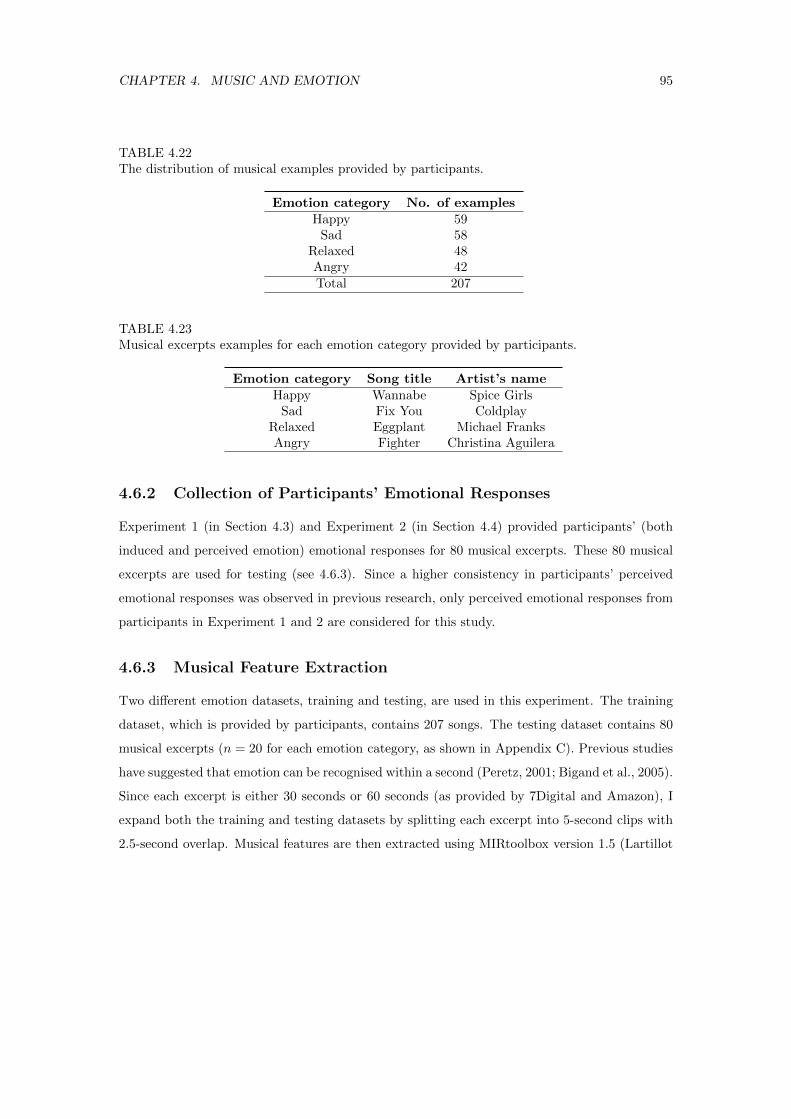
CHAPTER 4. MUSIC AND EMOTION 95
TABLE 4.22The distribution of musical examples provided by participants.
Emotion category No. of examplesHappy 59
Sad 58Relaxed 48Angry 42Total 207
TABLE 4.23Musical excerpts examples for each emotion category provided by participants.
Emotion category Song title Artist’s nameHappy Wannabe Spice Girls
Sad Fix You ColdplayRelaxed Eggplant Michael FranksAngry Fighter Christina Aguilera
4.6.2 Collection of Participants’ Emotional Responses
Experiment 1 (in Section 4.3) and Experiment 2 (in Section 4.4) provided participants’ (both
induced and perceived emotion) emotional responses for 80 musical excerpts. These 80 musical
excerpts are used for testing (see 4.6.3). Since a higher consistency in participants’ perceived
emotional responses was observed in previous research, only perceived emotional responses from
participants in Experiment 1 and 2 are considered for this study.
4.6.3 Musical Feature Extraction
Two different emotion datasets, training and testing, are used in this experiment. The training
dataset, which is provided by participants, contains 207 songs. The testing dataset contains 80
musical excerpts (n = 20 for each emotion category, as shown in Appendix C). Previous studies
have suggested that emotion can be recognised within a second (Peretz, 2001; Bigand et al., 2005).
Since each excerpt is either 30 seconds or 60 seconds (as provided by 7Digital and Amazon), I
expand both the training and testing datasets by splitting each excerpt into 5-second clips with
2.5-second overlap. Musical features are then extracted using MIRtoolbox version 1.5 (Lartillot
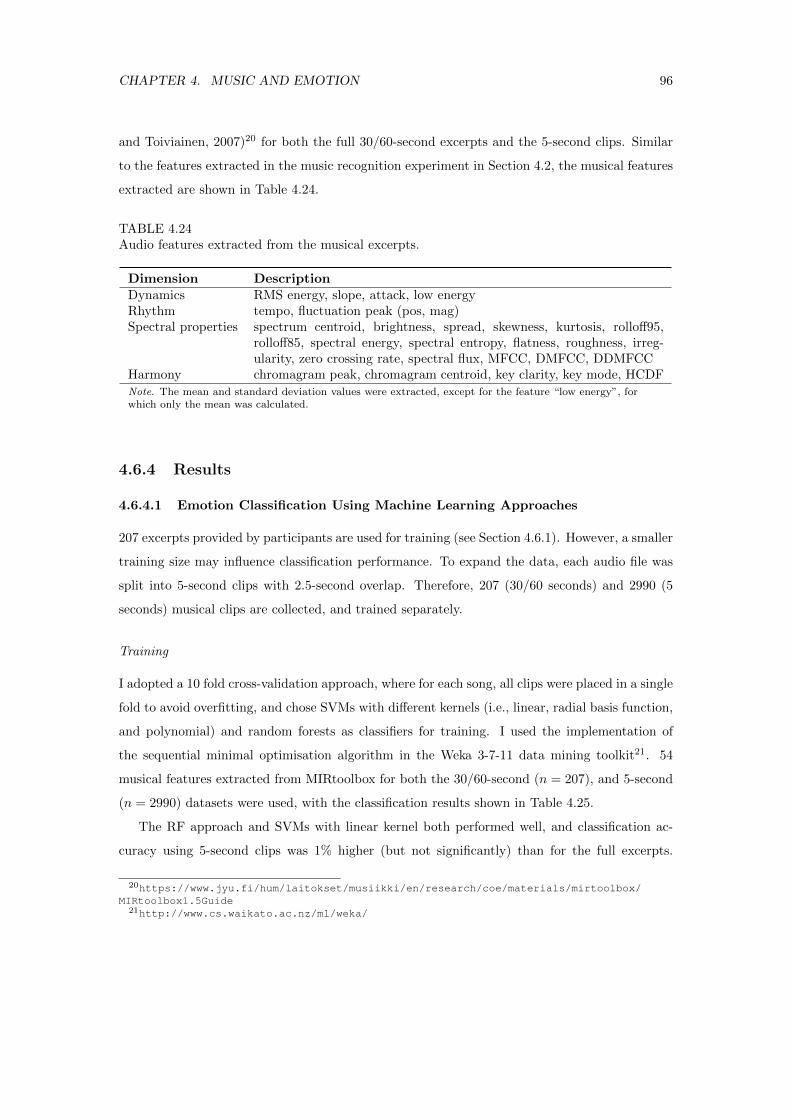
CHAPTER 4. MUSIC AND EMOTION 96
and Toiviainen, 2007)20 for both the full 30/60-second excerpts and the 5-second clips. Similar
to the features extracted in the music recognition experiment in Section 4.2, the musical features
extracted are shown in Table 4.24.
TABLE 4.24Audio features extracted from the musical excerpts.
Dimension DescriptionDynamics RMS energy, slope, attack, low energyRhythm tempo, fluctuation peak (pos, mag)Spectral properties spectrum centroid, brightness, spread, skewness, kurtosis, rolloff95,
rolloff85, spectral energy, spectral entropy, flatness, roughness, irreg-ularity, zero crossing rate, spectral flux, MFCC, DMFCC, DDMFCC
Harmony chromagram peak, chromagram centroid, key clarity, key mode, HCDFNote. The mean and standard deviation values were extracted, except for the feature “low energy”, forwhich only the mean was calculated.
4.6.4 Results
4.6.4.1 Emotion Classification Using Machine Learning Approaches
207 excerpts provided by participants are used for training (see Section 4.6.1). However, a smaller
training size may influence classification performance. To expand the data, each audio file was
split into 5-second clips with 2.5-second overlap. Therefore, 207 (30/60 seconds) and 2990 (5
seconds) musical clips are collected, and trained separately.
Training
I adopted a 10 fold cross-validation approach, where for each song, all clips were placed in a single
fold to avoid overfitting, and chose SVMs with different kernels (i.e., linear, radial basis function,
and polynomial) and random forests as classifiers for training. I used the implementation of
the sequential minimal optimisation algorithm in the Weka 3-7-11 data mining toolkit21. 54
musical features extracted from MIRtoolbox for both the 30/60-second (n = 207), and 5-second
(n = 2990) datasets were used, with the classification results shown in Table 4.25.
The RF approach and SVMs with linear kernel both performed well, and classification ac-
curacy using 5-second clips was 1% higher (but not significantly) than for the full excerpts.
20https://www.jyu.fi/hum/laitokset/musiikki/en/research/coe/materials/mirtoolbox/MIRtoolbox1.5Guide
21http://www.cs.waikato.ac.nz/ml/weka/
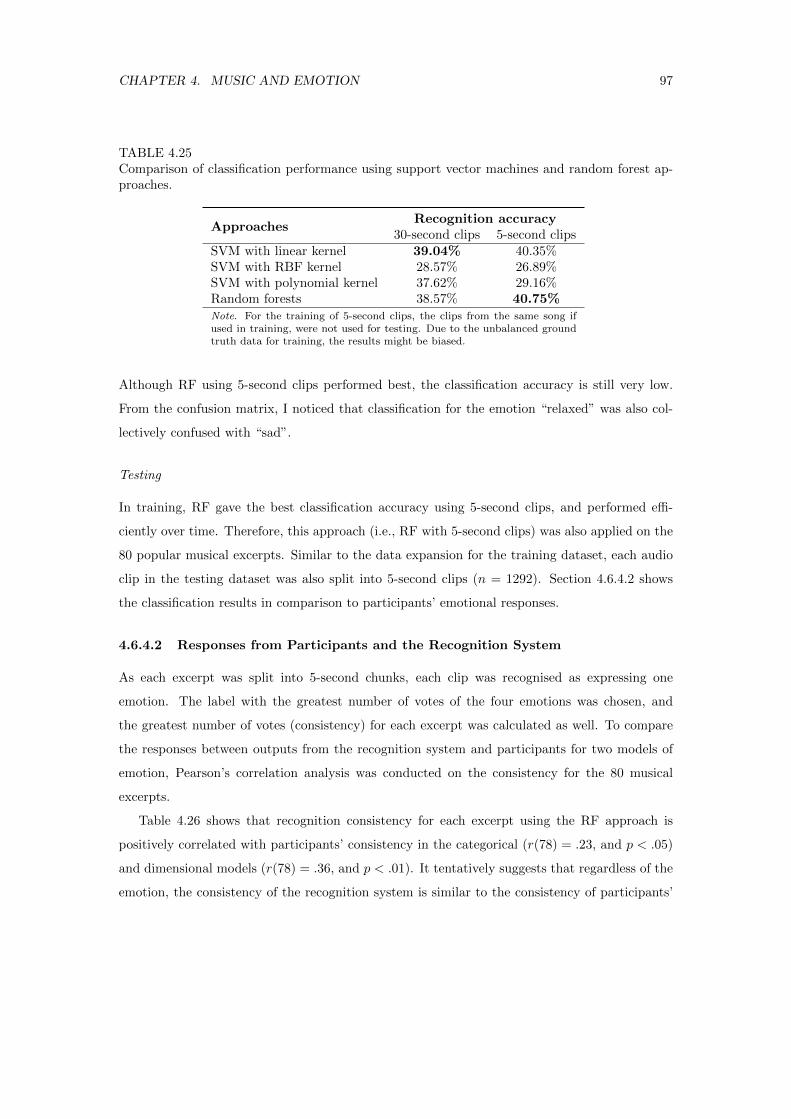
CHAPTER 4. MUSIC AND EMOTION 97
TABLE 4.25Comparison of classification performance using support vector machines and random forest ap-proaches.
ApproachesRecognition accuracy
30-second clips 5-second clipsSVM with linear kernel 39.04% 40.35%SVM with RBF kernel 28.57% 26.89%SVM with polynomial kernel 37.62% 29.16%Random forests 38.57% 40.75%Note. For the training of 5-second clips, the clips from the same song ifused in training, were not used for testing. Due to the unbalanced groundtruth data for training, the results might be biased.
Although RF using 5-second clips performed best, the classification accuracy is still very low.
From the confusion matrix, I noticed that classification for the emotion “relaxed” was also col-
lectively confused with “sad”.
Testing
In training, RF gave the best classification accuracy using 5-second clips, and performed effi-
ciently over time. Therefore, this approach (i.e., RF with 5-second clips) was also applied on the
80 popular musical excerpts. Similar to the data expansion for the training dataset, each audio
clip in the testing dataset was also split into 5-second clips (n = 1292). Section 4.6.4.2 shows
the classification results in comparison to participants’ emotional responses.
4.6.4.2 Responses from Participants and the Recognition System
As each excerpt was split into 5-second chunks, each clip was recognised as expressing one
emotion. The label with the greatest number of votes of the four emotions was chosen, and
the greatest number of votes (consistency) for each excerpt was calculated as well. To compare
the responses between outputs from the recognition system and participants for two models of
emotion, Pearson’s correlation analysis was conducted on the consistency for the 80 musical
excerpts.
Table 4.26 shows that recognition consistency for each excerpt using the RF approach is
positively correlated with participants’ consistency in the categorical (r(78) = .23, and p < .05)
and dimensional models (r(78) = .36, and p < .01). It tentatively suggests that regardless of the
emotion, the consistency of the recognition system is similar to the consistency of participants’
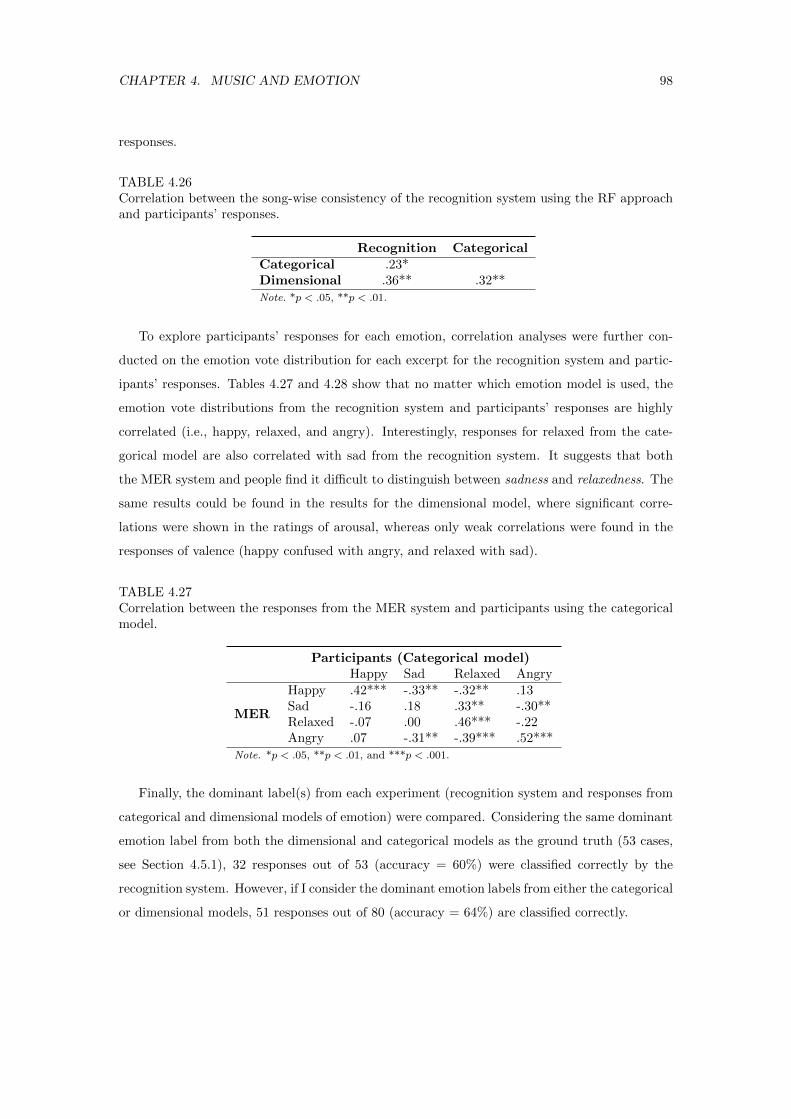
CHAPTER 4. MUSIC AND EMOTION 98
responses.
TABLE 4.26Correlation between the song-wise consistency of the recognition system using the RF approachand participants’ responses.
Recognition CategoricalCategorical .23*Dimensional .36** .32**Note. *p < .05, **p < .01.
To explore participants’ responses for each emotion, correlation analyses were further con-
ducted on the emotion vote distribution for each excerpt for the recognition system and partic-
ipants’ responses. Tables 4.27 and 4.28 show that no matter which emotion model is used, the
emotion vote distributions from the recognition system and participants’ responses are highly
correlated (i.e., happy, relaxed, and angry). Interestingly, responses for relaxed from the cate-
gorical model are also correlated with sad from the recognition system. It suggests that both
the MER system and people find it difficult to distinguish between sadness and relaxedness. The
same results could be found in the results for the dimensional model, where significant corre-
lations were shown in the ratings of arousal, whereas only weak correlations were found in the
responses of valence (happy confused with angry, and relaxed with sad).
TABLE 4.27Correlation between the responses from the MER system and participants using the categoricalmodel.
Participants (Categorical model)Happy Sad Relaxed Angry
MER
Happy .42*** -.33** -.32** .13Sad -.16 .18 .33** -.30**Relaxed -.07 .00 .46*** -.22Angry .07 -.31** -.39*** .52***
Note. *p < .05, **p < .01, and ***p < .001.
Finally, the dominant label(s) from each experiment (recognition system and responses from
categorical and dimensional models of emotion) were compared. Considering the same dominant
emotion label from both the dimensional and categorical models as the ground truth (53 cases,
see Section 4.5.1), 32 responses out of 53 (accuracy = 60%) were classified correctly by the
recognition system. However, if I consider the dominant emotion labels from either the categorical
or dimensional models, 51 responses out of 80 (accuracy = 64%) are classified correctly.
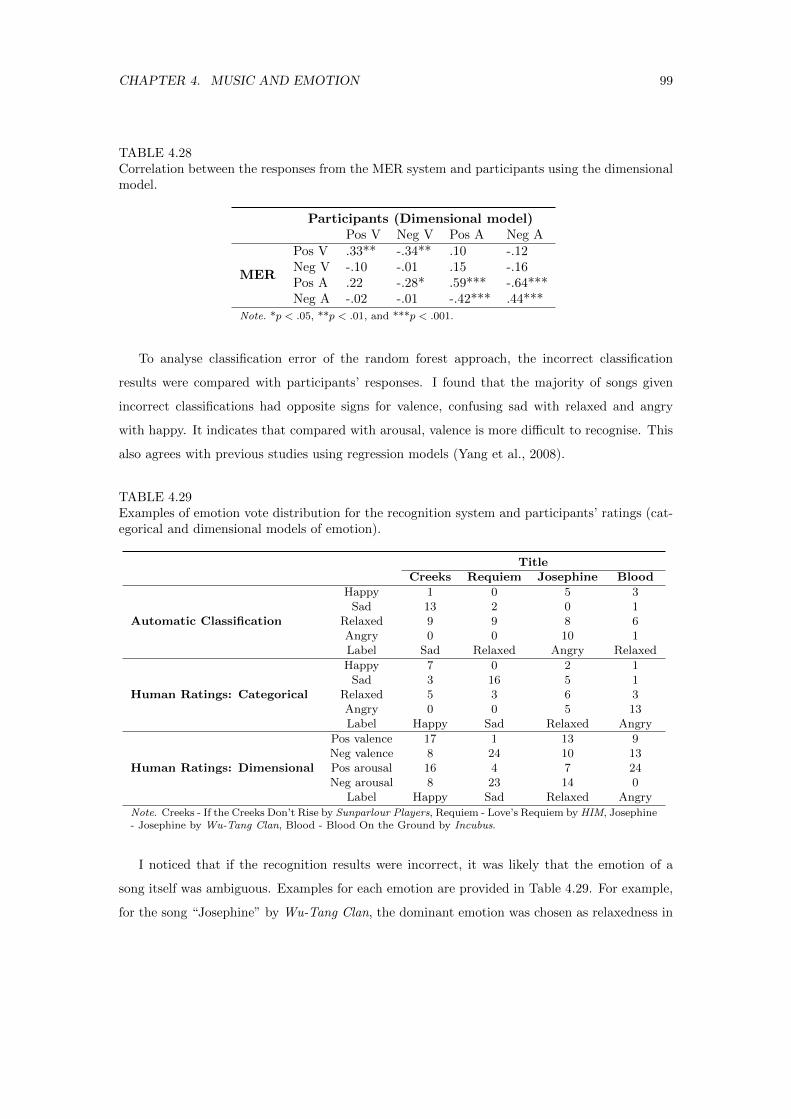
CHAPTER 4. MUSIC AND EMOTION 99
TABLE 4.28Correlation between the responses from the MER system and participants using the dimensionalmodel.
Participants (Dimensional model)Pos V Neg V Pos A Neg A
MER
Pos V .33** -.34** .10 -.12Neg V -.10 -.01 .15 -.16Pos A .22 -.28* .59*** -.64***Neg A -.02 -.01 -.42*** .44***
Note. *p < .05, **p < .01, and ***p < .001.
To analyse classification error of the random forest approach, the incorrect classification
results were compared with participants’ responses. I found that the majority of songs given
incorrect classifications had opposite signs for valence, confusing sad with relaxed and angry
with happy. It indicates that compared with arousal, valence is more difficult to recognise. This
also agrees with previous studies using regression models (Yang et al., 2008).
TABLE 4.29Examples of emotion vote distribution for the recognition system and participants’ ratings (cat-egorical and dimensional models of emotion).
TitleCreeks Requiem Josephine Blood
Automatic Classification
Happy 1 0 5 3Sad 13 2 0 1
Relaxed 9 9 8 6Angry 0 0 10 1Label Sad Relaxed Angry Relaxed
Human Ratings: Categorical
Happy 7 0 2 1Sad 3 16 5 1
Relaxed 5 3 6 3Angry 0 0 5 13Label Happy Sad Relaxed Angry
Human Ratings: Dimensional
Pos valence 17 1 13 9Neg valence 8 24 10 13Pos arousal 16 4 7 24Neg arousal 8 23 14 0
Label Happy Sad Relaxed Angry
Note. Creeks - If the Creeks Don’t Rise by Sunparlour Players, Requiem - Love’s Requiem by HIM, Josephine- Josephine by Wu-Tang Clan, Blood - Blood On the Ground by Incubus.
I noticed that if the recognition results were incorrect, it was likely that the emotion of a
song itself was ambiguous. Examples for each emotion are provided in Table 4.29. For example,
for the song “Josephine” by Wu-Tang Clan, the dominant emotion was chosen as relaxedness in
CHAPTER 4. MUSIC AND EMOTION 100
both the categorical and dimensional models, whereas it was recognised as angry by the machine.
The distribution, shows that 8 clips from the excerpt were classified as relaxed, whereas 10 clips
were classified as angry. In addition, participants’ responses for both models of emotion were also
distributed across four emotions. Similarly, for the song “Blood On the Ground” by Incubus,
participants mostly agreed on arousal level, but the responses for valence were ambivalent.
Interestingly, I found the song “Anger” by Skinny Puppy was recognised as angry by all
participants, whereas the recognition system classified it as happy. Possible reasons could be
the selection of clips, that different parts of the song may express different emotions. It is also
reasonable to guess that the emotion perceived by human is genre-specific (e.g., metal as anger
and pop music as happy) and cultural-dependent. Participants may also be influenced by lyrics.
4.6.5 Discussion
In this experiment, I presented an empirical study of music and emotion, comparing the results
between a music emotion recognition system and participants’ responses for two models of emo-
tion. A total of 207 musical excerpts were collected from participants for four basic emotion
categories (i.e., happy, sad, relaxed, and angry). My emotion recognition model was trained us-
ing support vector machines and random forest classifiers. Two different training datasets were
compared, one using the entire 30/60-second audio files and the one using multiple 5-second
segments with 2.5-second overlap from the same excerpt. Audio features were extracted using
MIRtoolbox. The results showed that the support vector machine with linear kernel and ran-
dom forest approaches performed best, and the use of 5-second clips increased the classification
accuracy by only 1%. In addition, the recognition system did not classify emotions well for
the emotions sadness and relaxedness. One of the possible reasons for the low accuracy of the
music emotion recognition systems could be the participant-suggested dataset, that my MER
system was trained using both perceived and induced emotion. Another explanation could be
the subjective nature of emotion in music.
Finally, the time-efficient random forest with 5-second clips approach was applied to the 80
musical excerpts for testing. The analysis showed that responses from the recognition system
were highly correlated with participants’ responses for the categorical and dimensional models.
Moreover, the distribution of responses for each emotion was also highly correlated. However,
significant correlations between relaxedness and sadness in the categorical model suggest that
listeners and emotion recognition systems have difficulty distinguishing valence (positive and
negative emotions). Similarly, strong correlations were found for responses of arousal, whereas
CHAPTER 4. MUSIC AND EMOTION 101
only weak correlations were shown in responses for valence. The comparison of emotion distri-
bution also indicates that the performance of music emotion recognition systems is similar to
participants’ emotional responses for the two models of emotion. Additionally, the prediction ac-
curacy is higher for songs where participants agreed more. This suggests that strongly consistent
emotional responses are likely to be predicted by music emotion recognition systems.
In this study, only low-level audio features (e.g., MFCC and chromagram) were used for
classifying emotions in music; future studies should consider incorporating high-level descriptors
such as genres and instruments. Due to the dynamic nature of music, emotions may vary over
time and the emotion classification accuracy may be affected by the selection of clips. Also more
importantly, music emotion involves complex interactions between the listener, the music, and
the situation. The perception of music is most likely influenced by individual differences such
as age, music skills, culture, and musical preference (Malatesta and Kalnok, 1984; Rentfrow and
Gosling, 2003; Shiota et al., 2006; Novak and Mather, 2007).
4.7 General Discussion
In this chapter, I described the collection of an emotion dataset via online social tags from the
music discovery web site Last.FM. Each musical excerpt is associated with one of the four emotion
categories, “happy”, “sad”, “relaxed”, and “angry”. With 2904 Western popular musical excerpts
collected, an MER system was built using audio features for four musical dimensions. However,
the fact that social tags are annotated by a wide range of internet users with different background
(e.g., education and musical training), means that these tags may not be reliable. In addition,
users’ tagging behaviours are unclear. Therefore, I evaluated the reliability of emotion tags,
and explored the agreement of emotion tags with participants’ perceived and induced emotional
responses.
Two popular models of emotion, the categorical and the two-dimensional model of emotion,
were used with 80 stimuli randomly selected from the 2904 musical excerpts. The relationships
between induced and perceived emotional responses were also systematically compared for those
80 stimuli. I found that the emotion tags can predict human emotional responses well above
chance, and people tend to annotate emotion based on the emotion perceived rather than emotion
felt. In addition, a participant-provided emotion dataset of 207 songs was collected. The MER
system was trained again using these 207 musical excerpts, and tested on the previous 80 musical
stimuli. Results from the MER system were highly correlated with participants’ responses. The
CHAPTER 4. MUSIC AND EMOTION 102
analysis showed that the MER system performs well in distinguishing the level of arousal (happy
and angry versus sad and relaxed), which is similar to human responses. The results also suggest
that consistent emotional responses are more likely to be correctly predicted by the music emotion
recognition systems.
As mentioned in Chapter 3, listening context (the second element) should be considered in
the study of music and emotion. Research has shown that the listener’s emotion was changed
based on different choices of music. In the next chapter, therefore, I explore the effects of context
(twenty situations) on participants’ expected emotional responses from the impact of music. A
questionnaire containing various aspects of music listening is presented to participants. The
interactions among emotion, musical preference, function of music listening, and context are
investigated.
Chapter 5
Functions of Music Listening and
Musical Preference in Everyday
Situations
This chapter aims at exploring the functional uses of music, emotional responses to music, and
musical preference in everyday situations. Music-listening contexts selected from previous stud-
ies, and the motivation of my work are presented in Section 5.1. The design of my experiment
is then described in Section 5.2. Section 5.2.1 provides the details of forty-five participants re-
cruited for this study, and Section 5.2.2 gives the instructions of my designed online experiment.
Answers for the questions “What are the function of listening to music?”, “What are the ex-
pected emotions from music in different situations?” and “How do individual differences relate
to musical preference?” are shown in Section 5.3. At the end of this chapter, a discussion is
provided (see Section 5.4).
5.1 Motivation
Chapter 3 gives the background knowledge for different aspects of music listening, namely con-
texts, emotions, functions, and musical preferences. People listen to music for various reasons,
and listening context has a powerful influence on musical preference (Hargreaves and North,
1999; Hunter et al., 2011). The better the needs of a listener are served by a given music, the
higher the degree of preference for that music should be (Behne, 1997). Similarly, Schafer and
Sedlmeier (2009) showed the functions of participants’ favourite were highly related to the degree
to which they preferred it. Sloboda et al. (2001) reported that music listening is not randomly
103
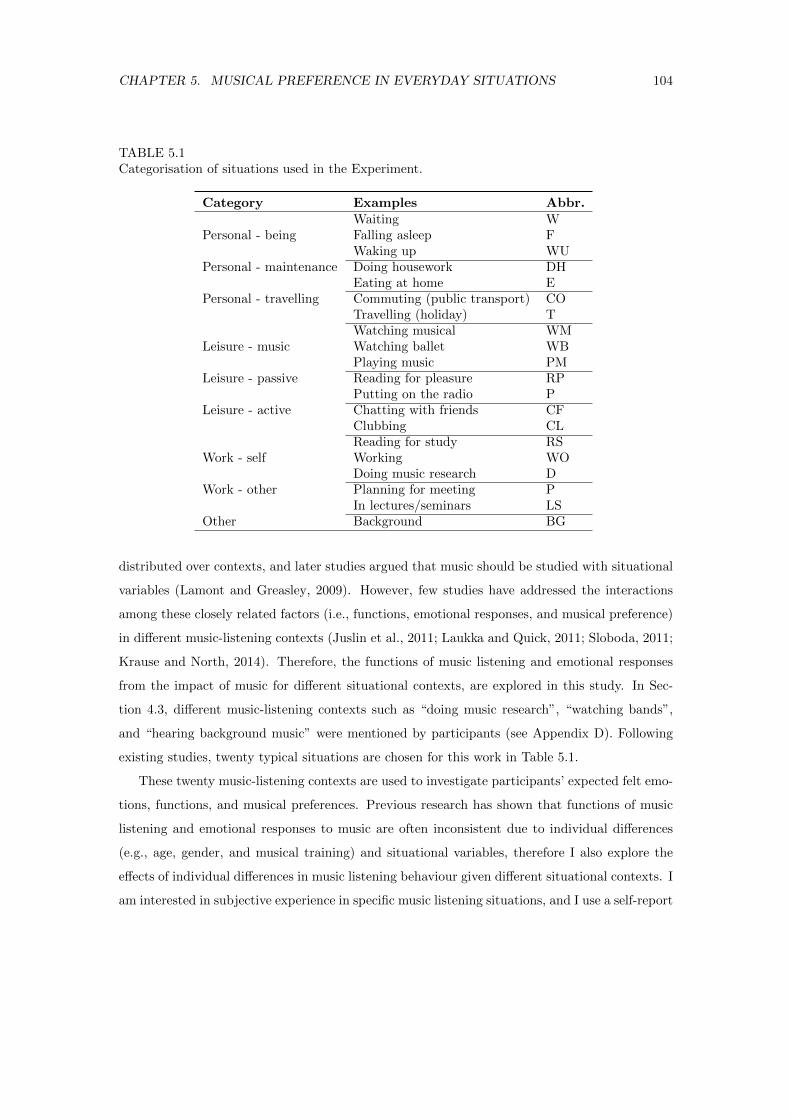
CHAPTER 5. MUSICAL PREFERENCE IN EVERYDAY SITUATIONS 104
TABLE 5.1Categorisation of situations used in the Experiment.
Category Examples Abbr.Waiting W
Personal - being Falling asleep FWaking up WU
Personal - maintenance Doing housework DHEating at home E
Personal - travelling Commuting (public transport) COTravelling (holiday) TWatching musical WM
Leisure - music Watching ballet WBPlaying music PM
Leisure - passive Reading for pleasure RPPutting on the radio P
Leisure - active Chatting with friends CFClubbing CLReading for study RS
Work - self Working WODoing music research D
Work - other Planning for meeting PIn lectures/seminars LS
Other Background BG
distributed over contexts, and later studies argued that music should be studied with situational
variables (Lamont and Greasley, 2009). However, few studies have addressed the interactions
among these closely related factors (i.e., functions, emotional responses, and musical preference)
in different music-listening contexts (Juslin et al., 2011; Laukka and Quick, 2011; Sloboda, 2011;
Krause and North, 2014). Therefore, the functions of music listening and emotional responses
from the impact of music for different situational contexts, are explored in this study. In Sec-
tion 4.3, different music-listening contexts such as “doing music research”, “watching bands”,
and “hearing background music” were mentioned by participants (see Appendix D). Following
existing studies, twenty typical situations are chosen for this work in Table 5.1.
These twenty music-listening contexts are used to investigate participants’ expected felt emo-
tions, functions, and musical preferences. Previous research has shown that functions of music
listening and emotional responses to music are often inconsistent due to individual differences
(e.g., age, gender, and musical training) and situational variables, therefore I also explore the
effects of individual differences in music listening behaviour given different situational contexts. I
am interested in subjective experience in specific music listening situations, and I use a self-report
CHAPTER 5. MUSICAL PREFERENCE IN EVERYDAY SITUATIONS 105
approach to collect data for this study. Compared to conventional laboratory-based experimen-
tal settings, web-based experiments (or online experiments) have the advantage of efficiently
allowing us to reach a wider participant demographic (for a recent overview, see Reips, 2012). I
designed a web-based questionnaire measuring each of these factors (daily usage of music, mu-
sical preference, functions of music listening, expected felt emotional responses, and individual
factors). This study is designed to be mainly exploratory, although based on previous studies I
formed a few hypotheses. For example, previous research has demonstrated that the function of
music listening is context-dependent, thus given a situation I hypothesise that significant differ-
ences in ratings of function (i.e., distraction, energising, entrainment, and meaning enhancement)
can be found. Moreover in the sporting context, researchers found that athletes consciously se-
lected music to fulfil certain functions and elicited various emotional states (Bishop et al., 2007;
Laukka and Quick, 2011). I hypothesise that in the contexts of active pursuits (e.g., sport and
housework), arousal will be higher than inactive/passive pursuits. I also hypothesise that positive
relationships can be found between functions of music listening (i.e., energising and entrainment)
and expected emotional responses to music (i.e., valence and arousal).
5.2 Method
This survey was conducted online1 via self-report from October to November 2013, and approved
by Queen Mary Research Ethics Committee (QMREC1255). No financial reward was offered for
participation. The entire survey lasted about 25 minutes without any planned breaks.
5.2.1 Participants
A total of 45 participants took part in the survey. The participants were recruited through
professional and academic mailing lists such as “ISMIR Community”, “Auditory”, and depart-
mental mailing lists, as well as social media (i.e., Facebook and LinkedIn2). The participants
all understood English. There were 18 male and 27 female participants, with ages ranging from
18 to 77 years (M = 37.6 and SD = 16.2). A selected subscale (9 items) from the Gold-MSI
v0.9 questionnaire was used to measure participants’ musical training. In version 1.0 of the
Gold-MSI, 2 items of the factor musical training (i.e., “I can’t read a musical score” and “I have
played or sung in a group, band, choir, or orchestra for years”) were removed. I include my
1http://www.isophonics.net/content/music-activity-survey2https://uk.linkedin.com/
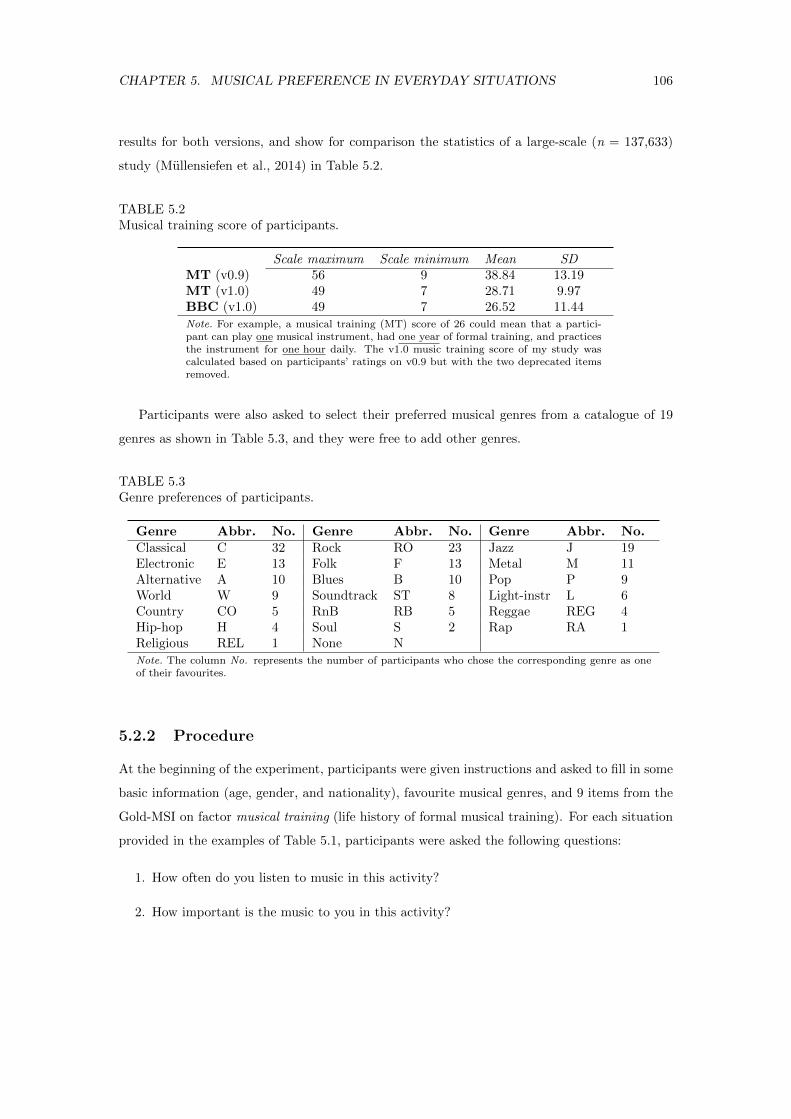
CHAPTER 5. MUSICAL PREFERENCE IN EVERYDAY SITUATIONS 106
results for both versions, and show for comparison the statistics of a large-scale (n = 137,633)
study (Mullensiefen et al., 2014) in Table 5.2.
TABLE 5.2Musical training score of participants.
Scale maximum Scale minimum Mean SDMT (v0.9) 56 9 38.84 13.19MT (v1.0) 49 7 28.71 9.97BBC (v1.0) 49 7 26.52 11.44Note. For example, a musical training (MT) score of 26 could mean that a partici-pant can play one musical instrument, had one year of formal training, and practicesthe instrument for one hour daily. The v1.0 music training score of my study wascalculated based on participants’ ratings on v0.9 but with the two deprecated itemsremoved.
Participants were also asked to select their preferred musical genres from a catalogue of 19
genres as shown in Table 5.3, and they were free to add other genres.
TABLE 5.3Genre preferences of participants.
Genre Abbr. No. Genre Abbr. No. Genre Abbr. No.Classical C 32 Rock RO 23 Jazz J 19Electronic E 13 Folk F 13 Metal M 11Alternative A 10 Blues B 10 Pop P 9World W 9 Soundtrack ST 8 Light-instr L 6Country CO 5 RnB RB 5 Reggae REG 4Hip-hop H 4 Soul S 2 Rap RA 1Religious REL 1 None NNote. The column No. represents the number of participants who chose the corresponding genre as oneof their favourites.
5.2.2 Procedure
At the beginning of the experiment, participants were given instructions and asked to fill in some
basic information (age, gender, and nationality), favourite musical genres, and 9 items from the
Gold-MSI on factor musical training (life history of formal musical training). For each situation
provided in the examples of Table 5.1, participants were asked the following questions:
1. How often do you listen to music in this activity?
2. How important is the music to you in this activity?
CHAPTER 5. MUSICAL PREFERENCE IN EVERYDAY SITUATIONS 107
3. Which music genres would you like to listen to in this activity? [see Table 5.3];
4. Could you please provide us some examples of musical excerpts (artist and song title) that
you would listen to while you are doing this activity? [open question];
5. Please rate each purpose for selecting music in this activity,
• Distraction: A way of engaging unallocated attention and reducing boredom;
• Energising: A means of maintaining arousal and task attention;
• Entrainment: The task movements are timed to coincide with the rhythmic pulses of the
music, giving the task or activity elements of a dance;
• Meaning enhancement: Where the music draws out and adds to the significance of the
task or activity in some way.
6. What emotional effect do you expect to feel in response to the music (note: not from
the action), please click on the 2-D model (valence: sad to happy, arousal: relaxed to
excited).
Question 1 was rated on a 5-point Likert scale (1 = Never, 3 = Sometimes, and 5 = Always)
and Question 2 and 5 were rated on a 7-point Likert scale (1 = Not at all, 4 = Neutral, and 7
= Extremely). For Question 5, an explanation of each function was shown to participants. For
Question 6, valence and arousal were rated from -0.5 to 0.5. There was also an additional free
response field at the end of each page.
5.3 Results
Responses from forty-five participants were collected, as well as participants’ comments for each
response. I examined participants’ free comments, and checked whether they understood the
question correctly. However, the feedback for four situations showed disagreement in under-
standing among participants: “playing music”, “doing music research”, “watching ballet”, and
“watching musical”. Therefore, to remove ambiguities, these four categories were discarded from
further analysis so that responses for sixteen situations remained.
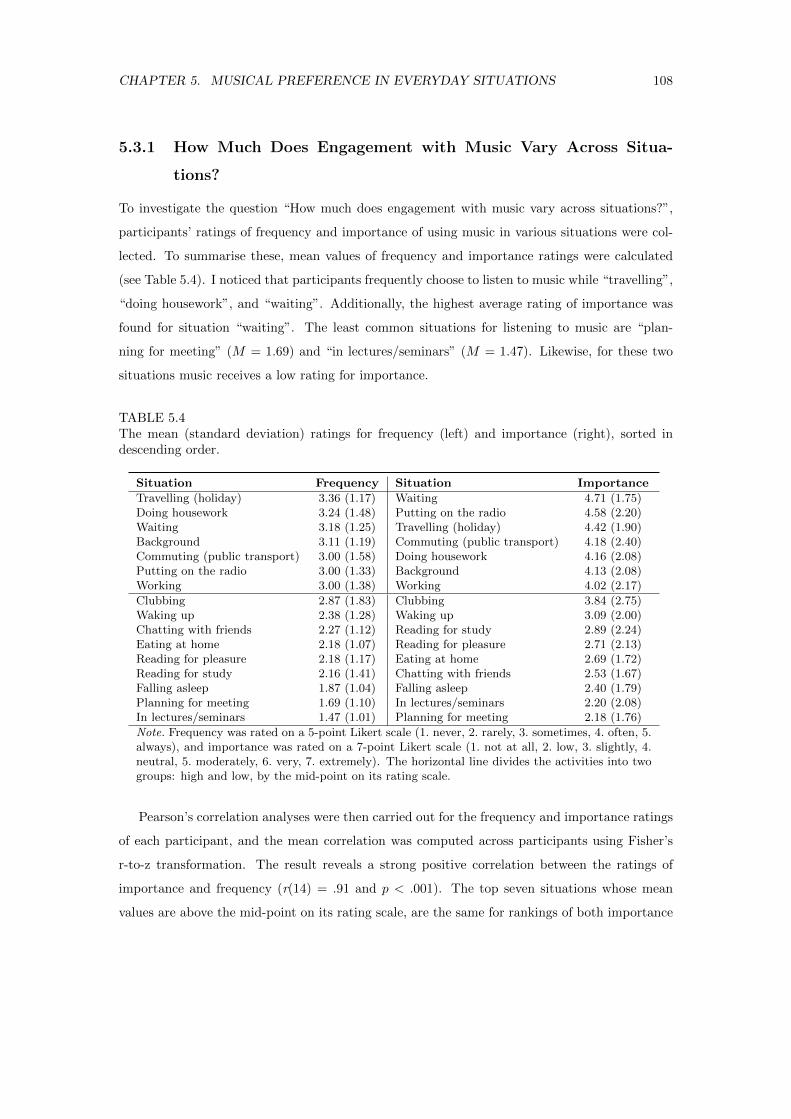
CHAPTER 5. MUSICAL PREFERENCE IN EVERYDAY SITUATIONS 108
5.3.1 How Much Does Engagement with Music Vary Across Situa-
tions?
To investigate the question “How much does engagement with music vary across situations?”,
participants’ ratings of frequency and importance of using music in various situations were col-
lected. To summarise these, mean values of frequency and importance ratings were calculated
(see Table 5.4). I noticed that participants frequently choose to listen to music while “travelling”,
“doing housework”, and “waiting”. Additionally, the highest average rating of importance was
found for situation “waiting”. The least common situations for listening to music are “plan-
ning for meeting” (M = 1.69) and “in lectures/seminars” (M = 1.47). Likewise, for these two
situations music receives a low rating for importance.
TABLE 5.4The mean (standard deviation) ratings for frequency (left) and importance (right), sorted indescending order.
Situation Frequency Situation Importance
Travelling (holiday) 3.36 (1.17) Waiting 4.71 (1.75)Doing housework 3.24 (1.48) Putting on the radio 4.58 (2.20)Waiting 3.18 (1.25) Travelling (holiday) 4.42 (1.90)Background 3.11 (1.19) Commuting (public transport) 4.18 (2.40)Commuting (public transport) 3.00 (1.58) Doing housework 4.16 (2.08)Putting on the radio 3.00 (1.33) Background 4.13 (2.08)Working 3.00 (1.38) Working 4.02 (2.17)
Clubbing 2.87 (1.83) Clubbing 3.84 (2.75)Waking up 2.38 (1.28) Waking up 3.09 (2.00)Chatting with friends 2.27 (1.12) Reading for study 2.89 (2.24)Eating at home 2.18 (1.07) Reading for pleasure 2.71 (2.13)Reading for pleasure 2.18 (1.17) Eating at home 2.69 (1.72)Reading for study 2.16 (1.41) Chatting with friends 2.53 (1.67)Falling asleep 1.87 (1.04) Falling asleep 2.40 (1.79)Planning for meeting 1.69 (1.10) In lectures/seminars 2.20 (2.08)In lectures/seminars 1.47 (1.01) Planning for meeting 2.18 (1.76)
Note. Frequency was rated on a 5-point Likert scale (1. never, 2. rarely, 3. sometimes, 4. often, 5.always), and importance was rated on a 7-point Likert scale (1. not at all, 2. low, 3. slightly, 4.neutral, 5. moderately, 6. very, 7. extremely). The horizontal line divides the activities into twogroups: high and low, by the mid-point on its rating scale.
Pearson’s correlation analyses were then carried out for the frequency and importance ratings
of each participant, and the mean correlation was computed across participants using Fisher’s
r-to-z transformation. The result reveals a strong positive correlation between the ratings of
importance and frequency (r(14) = .91 and p < .001). The top seven situations whose mean
values are above the mid-point on its rating scale, are the same for rankings of both importance
CHAPTER 5. MUSICAL PREFERENCE IN EVERYDAY SITUATIONS 109
and frequency, but with different order. Kendall’s Tau was computed for each participant’s
frequency and importance rankings, and I obtained a correlation of .81. Yet, from participants’
comments, it seems that responses for some situations are age and culture-dependent. For
instance, with regard to the situation “clubbing”, some people reported that they have never
been clubbing, or it is not their scene.
5.3.2 What Are the Functions of Listening to Music?
Previously, Sloboda et al. (2009) showed how music accompanies non-musical activity and is
often chosen to enhance the activity in some way. Thus, the functions of listening to music for
each situation were studied. 720 ratings of sixteen situations were collected for four functions:
distraction (a way of engaging unallocated attention and reducing boredom), energising (a means
of maintaining arousal and task attention), entrainment (the task movements are timed to coin-
cide with the rhythmic pulses of the music, giving the task or activity elements of a dance), and
meaning enhancement (where the music draws out and adds to the significance of the task or ac-
tivity in some way). The function ratings were considered if participants’ frequency ratings were
not marked as “never”, and there was no explicit indication of ambiguity or misunderstanding in
the comment such as I have never been clubbing so all these answers are random and confusing.
471 valid ratings were collected for analysis.
To assess the roles of the situation (16 levels) and the function dimension (4 levels) for par-
ticipants’ ratings of function, variance analyses were conducted using a non-parametric Kruskal-
Wallis test, as the ratings were not normally distributed (Shapiro-Wilk normality test, p < .001).
There were significant differences in ratings according to different situations (χ2(3) = 19.37,
p < .001) and functions (χ2(15) = 186.81, p < .001).
A post-hoc multiple comparison analysis using Tukey’s HSD test shows that some func-
tions are significantly more important than the other functions for some situations as shown
in Table 5.5. For example, for the situation “falling asleep”, the ratings for function meaning
enhancement are significantly higher than ratings for energising and entrainment. However, the
analysis does not reveal the absolute level of importance of the functions. Therefore, the partici-
pants’ responses for each function were categorised into two groups: important (5 = moderately,
6 = very, and 7 = extremely) and not important (1 = not at all, 2 = low, 3 = slightly, and 4
= neutral). Chi-square tests were applied for each situation on the four functions. In addition,
participants’ ratings for the four functions were ordered, and rankings were averaged across par-
ticipant for each situation. The highest ranking was chosen as the predominant function (see
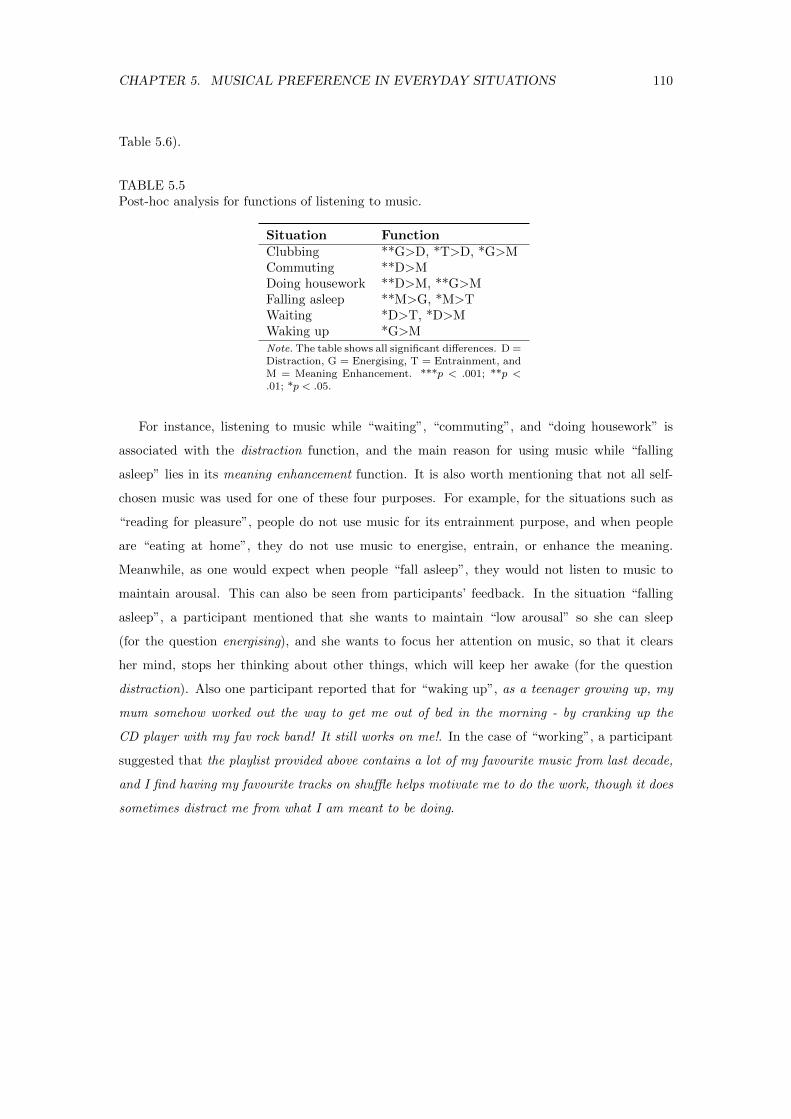
CHAPTER 5. MUSICAL PREFERENCE IN EVERYDAY SITUATIONS 110
Table 5.6).
TABLE 5.5Post-hoc analysis for functions of listening to music.
Situation FunctionClubbing **G>D, *T>D, *G>MCommuting **D>MDoing housework **D>M, **G>MFalling asleep **M>G, *M>TWaiting *D>T, *D>MWaking up *G>MNote. The table shows all significant differences. D =Distraction, G = Energising, T = Entrainment, andM = Meaning Enhancement. ***p < .001; **p <.01; *p < .05.
For instance, listening to music while “waiting”, “commuting”, and “doing housework” is
associated with the distraction function, and the main reason for using music while “falling
asleep” lies in its meaning enhancement function. It is also worth mentioning that not all self-
chosen music was used for one of these four purposes. For example, for the situations such as
“reading for pleasure”, people do not use music for its entrainment purpose, and when people
are “eating at home”, they do not use music to energise, entrain, or enhance the meaning.
Meanwhile, as one would expect when people “fall asleep”, they would not listen to music to
maintain arousal. This can also be seen from participants’ feedback. In the situation “falling
asleep”, a participant mentioned that she wants to maintain “low arousal” so she can sleep
(for the question energising), and she wants to focus her attention on music, so that it clears
her mind, stops her thinking about other things, which will keep her awake (for the question
distraction). Also one participant reported that for “waking up”, as a teenager growing up, my
mum somehow worked out the way to get me out of bed in the morning - by cranking up the
CD player with my fav rock band! It still works on me!. In the case of “working”, a participant
suggested that the playlist provided above contains a lot of my favourite music from last decade,
and I find having my favourite tracks on shuffle helps motivate me to do the work, though it does
sometimes distract me from what I am meant to be doing.
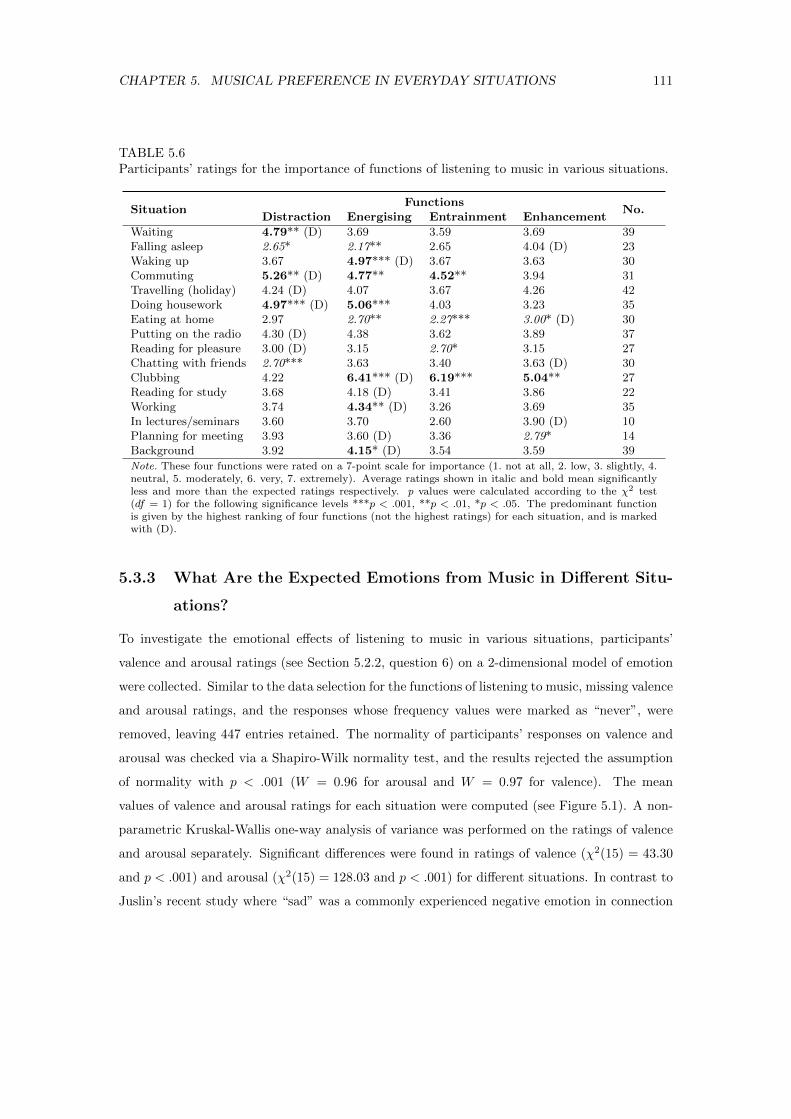
CHAPTER 5. MUSICAL PREFERENCE IN EVERYDAY SITUATIONS 111
TABLE 5.6Participants’ ratings for the importance of functions of listening to music in various situations.
SituationFunctions
No.Distraction Energising Entrainment Enhancement
Waiting 4.79** (D) 3.69 3.59 3.69 39Falling asleep 2.65* 2.17** 2.65 4.04 (D) 23Waking up 3.67 4.97*** (D) 3.67 3.63 30Commuting 5.26** (D) 4.77** 4.52** 3.94 31Travelling (holiday) 4.24 (D) 4.07 3.67 4.26 42Doing housework 4.97*** (D) 5.06*** 4.03 3.23 35Eating at home 2.97 2.70** 2.27*** 3.00* (D) 30Putting on the radio 4.30 (D) 4.38 3.62 3.89 37Reading for pleasure 3.00 (D) 3.15 2.70* 3.15 27Chatting with friends 2.70*** 3.63 3.40 3.63 (D) 30Clubbing 4.22 6.41*** (D) 6.19*** 5.04** 27Reading for study 3.68 4.18 (D) 3.41 3.86 22Working 3.74 4.34** (D) 3.26 3.69 35In lectures/seminars 3.60 3.70 2.60 3.90 (D) 10Planning for meeting 3.93 3.60 (D) 3.36 2.79* 14Background 3.92 4.15* (D) 3.54 3.59 39
Note. These four functions were rated on a 7-point scale for importance (1. not at all, 2. low, 3. slightly, 4.neutral, 5. moderately, 6. very, 7. extremely). Average ratings shown in italic and bold mean significantlyless and more than the expected ratings respectively. p values were calculated according to the χ2 test(df = 1) for the following significance levels ***p < .001, **p < .01, *p < .05. The predominant functionis given by the highest ranking of four functions (not the highest ratings) for each situation, and is markedwith (D).
5.3.3 What Are the Expected Emotions from Music in Different Situ-
ations?
To investigate the emotional effects of listening to music in various situations, participants’
valence and arousal ratings (see Section 5.2.2, question 6) on a 2-dimensional model of emotion
were collected. Similar to the data selection for the functions of listening to music, missing valence
and arousal ratings, and the responses whose frequency values were marked as “never”, were
removed, leaving 447 entries retained. The normality of participants’ responses on valence and
arousal was checked via a Shapiro-Wilk normality test, and the results rejected the assumption
of normality with p < .001 (W = 0.96 for arousal and W = 0.97 for valence). The mean
values of valence and arousal ratings for each situation were computed (see Figure 5.1). A non-
parametric Kruskal-Wallis one-way analysis of variance was performed on the ratings of valence
and arousal separately. Significant differences were found in ratings of valence (χ2(15) = 43.30
and p < .001) and arousal (χ2(15) = 128.03 and p < .001) for different situations. In contrast to
Juslin’s recent study where “sad” was a commonly experienced negative emotion in connection
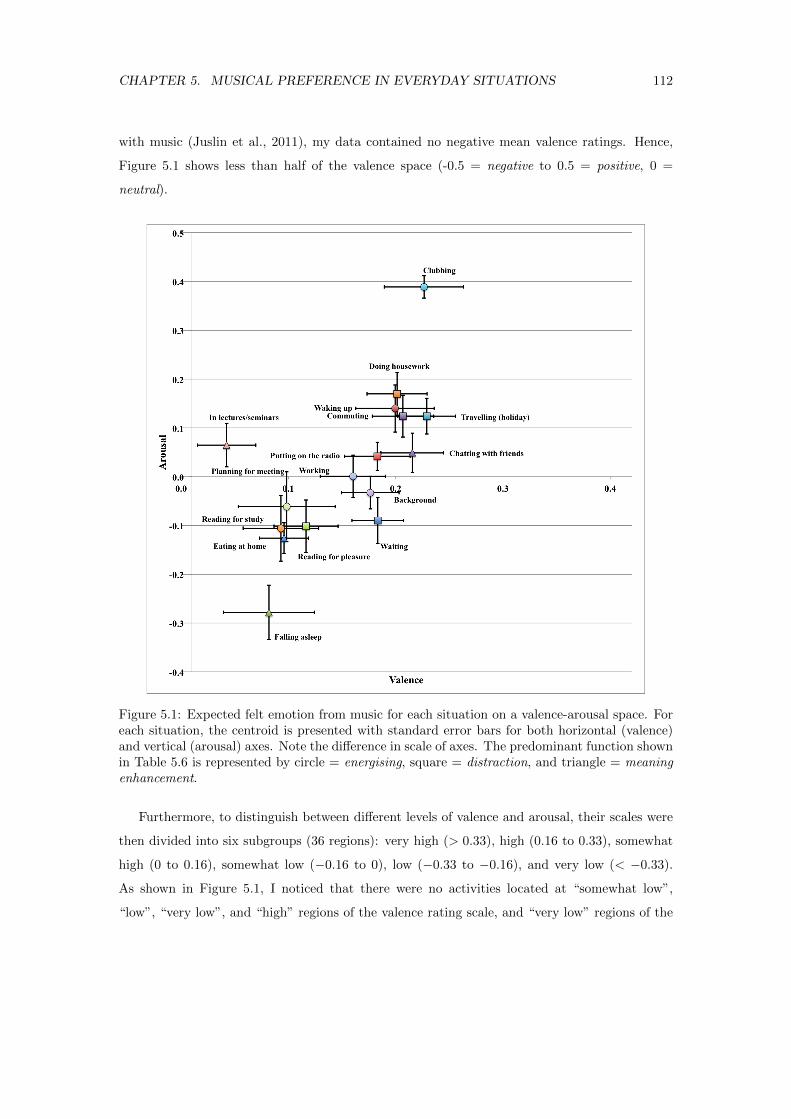
CHAPTER 5. MUSICAL PREFERENCE IN EVERYDAY SITUATIONS 112
with music (Juslin et al., 2011), my data contained no negative mean valence ratings. Hence,
Figure 5.1 shows less than half of the valence space (-0.5 = negative to 0.5 = positive, 0 =
neutral).
Figure 5.1: Expected felt emotion from music for each situation on a valence-arousal space. Foreach situation, the centroid is presented with standard error bars for both horizontal (valence)and vertical (arousal) axes. Note the difference in scale of axes. The predominant function shownin Table 5.6 is represented by circle = energising, square = distraction, and triangle = meaningenhancement.
Furthermore, to distinguish between different levels of valence and arousal, their scales were
then divided into six subgroups (36 regions): very high (> 0.33), high (0.16 to 0.33), somewhat
high (0 to 0.16), somewhat low (−0.16 to 0), low (−0.33 to −0.16), and very low (< −0.33).
As shown in Figure 5.1, I noticed that there were no activities located at “somewhat low”,
“low”, “very low”, and “high” regions of the valence rating scale, and “very low” regions of the
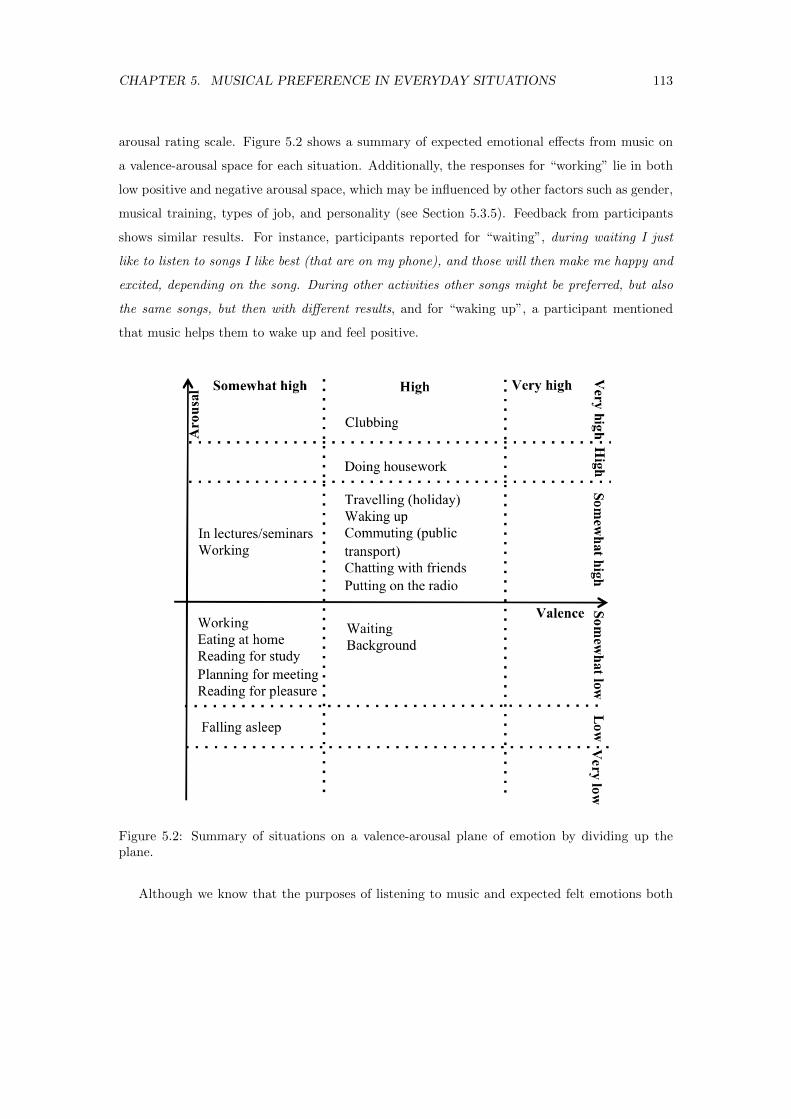
CHAPTER 5. MUSICAL PREFERENCE IN EVERYDAY SITUATIONS 113
arousal rating scale. Figure 5.2 shows a summary of expected emotional effects from music on
a valence-arousal space for each situation. Additionally, the responses for “working” lie in both
low positive and negative arousal space, which may be influenced by other factors such as gender,
musical training, types of job, and personality (see Section 5.3.5). Feedback from participants
shows similar results. For instance, participants reported for “waiting”, during waiting I just
like to listen to songs I like best (that are on my phone), and those will then make me happy and
excited, depending on the song. During other activities other songs might be preferred, but also
the same songs, but then with different results, and for “waking up”, a participant mentioned
that music helps them to wake up and feel positive.
Figure 5.2: Summary of situations on a valence-arousal plane of emotion by dividing up theplane.
Although we know that the purposes of listening to music and expected felt emotions both
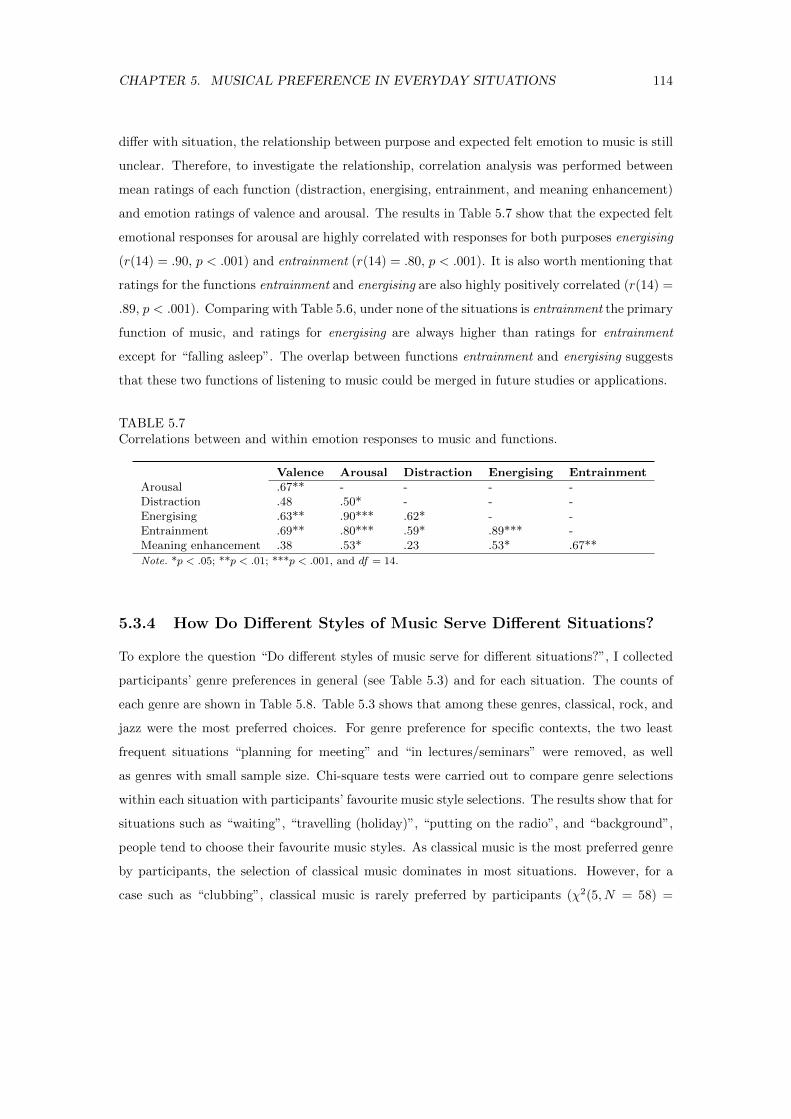
CHAPTER 5. MUSICAL PREFERENCE IN EVERYDAY SITUATIONS 114
differ with situation, the relationship between purpose and expected felt emotion to music is still
unclear. Therefore, to investigate the relationship, correlation analysis was performed between
mean ratings of each function (distraction, energising, entrainment, and meaning enhancement)
and emotion ratings of valence and arousal. The results in Table 5.7 show that the expected felt
emotional responses for arousal are highly correlated with responses for both purposes energising
(r(14) = .90, p < .001) and entrainment (r(14) = .80, p < .001). It is also worth mentioning that
ratings for the functions entrainment and energising are also highly positively correlated (r(14) =
.89, p < .001). Comparing with Table 5.6, under none of the situations is entrainment the primary
function of music, and ratings for energising are always higher than ratings for entrainment
except for “falling asleep”. The overlap between functions entrainment and energising suggests
that these two functions of listening to music could be merged in future studies or applications.
TABLE 5.7Correlations between and within emotion responses to music and functions.
Valence Arousal Distraction Energising EntrainmentArousal .67** - - - -Distraction .48 .50* - - -Energising .63** .90*** .62* - -Entrainment .69** .80*** .59* .89*** -Meaning enhancement .38 .53* .23 .53* .67**
Note. *p < .05; **p < .01; ***p < .001, and df = 14.
5.3.4 How Do Different Styles of Music Serve Different Situations?
To explore the question “Do different styles of music serve for different situations?”, I collected
participants’ genre preferences in general (see Table 5.3) and for each situation. The counts of
each genre are shown in Table 5.8. Table 5.3 shows that among these genres, classical, rock, and
jazz were the most preferred choices. For genre preference for specific contexts, the two least
frequent situations “planning for meeting” and “in lectures/seminars” were removed, as well
as genres with small sample size. Chi-square tests were carried out to compare genre selections
within each situation with participants’ favourite music style selections. The results show that for
situations such as “waiting”, “travelling (holiday)”, “putting on the radio”, and “background”,
people tend to choose their favourite music styles. As classical music is the most preferred genre
by participants, the selection of classical music dominates in most situations. However, for a
case such as “clubbing”, classical music is rarely preferred by participants (χ2(5, N = 58) =
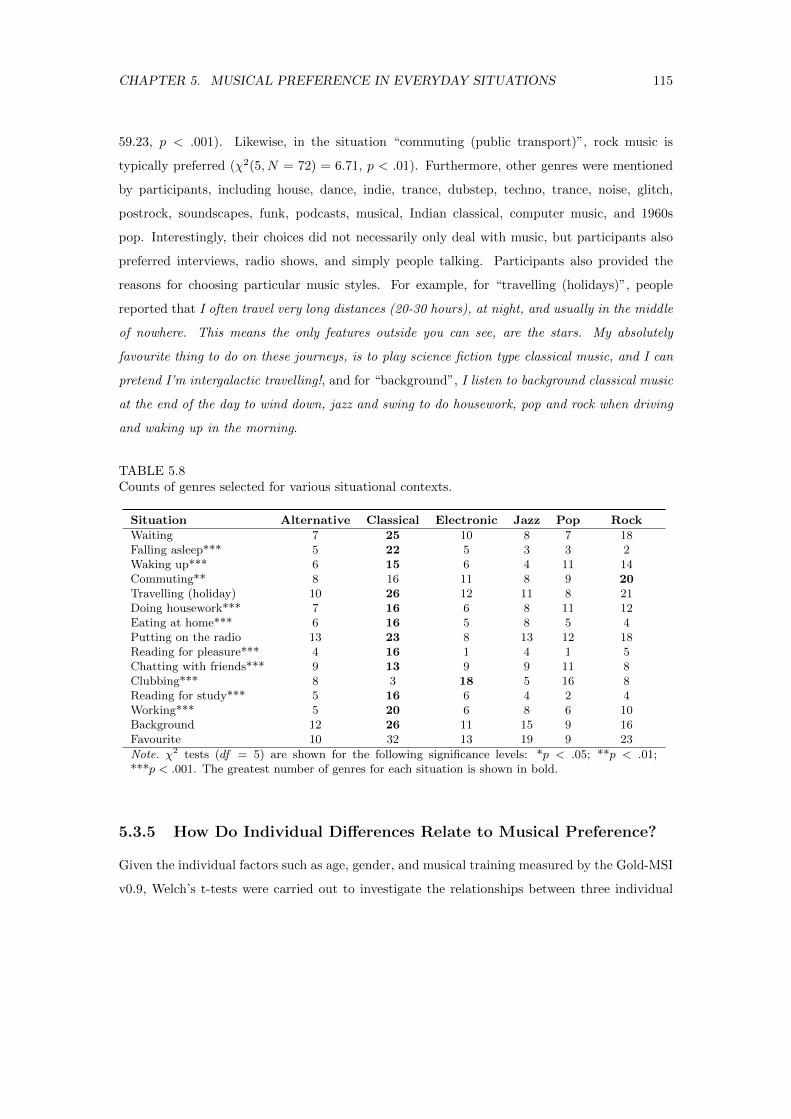
CHAPTER 5. MUSICAL PREFERENCE IN EVERYDAY SITUATIONS 115
59.23, p < .001). Likewise, in the situation “commuting (public transport)”, rock music is
typically preferred (χ2(5, N = 72) = 6.71, p < .01). Furthermore, other genres were mentioned
by participants, including house, dance, indie, trance, dubstep, techno, trance, noise, glitch,
postrock, soundscapes, funk, podcasts, musical, Indian classical, computer music, and 1960s
pop. Interestingly, their choices did not necessarily only deal with music, but participants also
preferred interviews, radio shows, and simply people talking. Participants also provided the
reasons for choosing particular music styles. For example, for “travelling (holidays)”, people
reported that I often travel very long distances (20-30 hours), at night, and usually in the middle
of nowhere. This means the only features outside you can see, are the stars. My absolutely
favourite thing to do on these journeys, is to play science fiction type classical music, and I can
pretend I’m intergalactic travelling!, and for “background”, I listen to background classical music
at the end of the day to wind down, jazz and swing to do housework, pop and rock when driving
and waking up in the morning.
TABLE 5.8Counts of genres selected for various situational contexts.
Situation Alternative Classical Electronic Jazz Pop Rock
Waiting 7 25 10 8 7 18Falling asleep*** 5 22 5 3 3 2Waking up*** 6 15 6 4 11 14Commuting** 8 16 11 8 9 20Travelling (holiday) 10 26 12 11 8 21Doing housework*** 7 16 6 8 11 12Eating at home*** 6 16 5 8 5 4Putting on the radio 13 23 8 13 12 18Reading for pleasure*** 4 16 1 4 1 5Chatting with friends*** 9 13 9 9 11 8Clubbing*** 8 3 18 5 16 8Reading for study*** 5 16 6 4 2 4Working*** 5 20 6 8 6 10Background 12 26 11 15 9 16Favourite 10 32 13 19 9 23
Note. χ2 tests (df = 5) are shown for the following significance levels: *p < .05; **p < .01;***p < .001. The greatest number of genres for each situation is shown in bold.
5.3.5 How Do Individual Differences Relate to Musical Preference?
Given the individual factors such as age, gender, and musical training measured by the Gold-MSI
v0.9, Welch’s t-tests were carried out to investigate the relationships between three individual
CHAPTER 5. MUSICAL PREFERENCE IN EVERYDAY SITUATIONS 116
factors (i.e, age3, gender, and musical training4) and three aspects of music listening preference
(i.e., daily usage of music, four functions of music listening, and expected emotional responses
to music, see Table 5.9). Regardless of the situation, I found that younger participants rated
the four functions significantly higher than older participants, and likewise for their ratings of
daily usage of music. However, no significant differences were found between gender and three
aspects of music listening preference. Although no significant differences were shown between
musical training and daily usage of music, ratings of function energising and expected emotional
response arousal are significantly higher for participants with higher musical training scores.
Furthermore, for each of the 16 situations, Welch’s t-tests and Pearson’s correlation analyses
were used to investigate the interactions among situational contexts, individual differences, and
music listening preferences.
First, individual factors (i.e., age, gender, and musical training) were compared with daily
usage of music5 in different situations (shown in Table 5.10). Only one significant difference
was found for situation “planning for meeting”, where female participants use music more often
than male participants. The frequency of listening to music for certain situations such as “doing
housework” may be related to how often they are in these situations. People reported that they
enjoy doing housework to music as a type of physical activity to music where the music is a good
distraction from jobs that they hate to do. Moreover, results show that age is highly correlated
with participants’ reported frequency of listening, but only limited to certain situations such as
“commuting”, “chatting with friends”, and “clubbing”.
3Participants’ ages were classified into two groups, younger group (23 participants, ≤ 30 years old) and oldergroup (22 participants, > 30 years old).
4Participants’ musical training scores were categorised into two levels, high (25 participants, > 40) and low(20 participants, ≤ 40).
5As ratings for importance and frequency were positively correlated, only ratings of frequency were used inthis analysis.
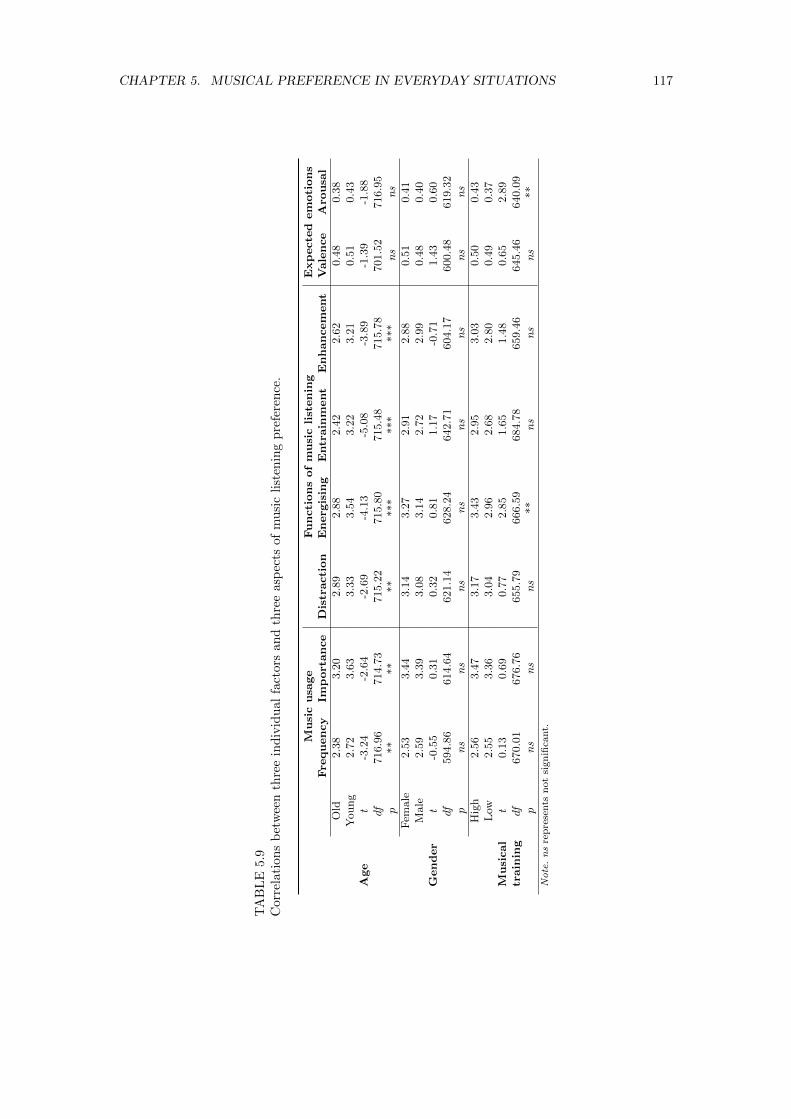
CHAPTER 5. MUSICAL PREFERENCE IN EVERYDAY SITUATIONS 117
TA
BL
E5.
9C
orre
lati
ons
bet
wee
nth
ree
ind
ivid
ual
fact
ors
an
dth
ree
asp
ects
of
mu
sic
list
enin
gp
refe
ren
ce.
Musi
cusa
ge
Functi
ons
of
musi
clist
enin
gE
xp
ecte
dem
oti
ons
Fre
quency
Imp
ort
ance
Dis
tracti
on
Energ
isin
gE
ntr
ain
ment
Enhancem
ent
Vale
nce
Aro
usa
l
Age
Old
2.3
83.2
02.8
92.8
82.4
22.6
20.4
80.3
8Y
oung
2.7
23.6
33.3
33.5
43.2
23.2
10.5
10.4
3t
-3.2
4-2
.64
-2.6
9-4
.13
-5.0
8-3
.89
-1.3
9-1
.88
df716.9
6714.7
3715.2
2715.8
0715.4
8715.7
8701.5
2716.9
5p
**
**
**
***
***
***
ns
ns
Gender
Fem
ale
2.5
33.4
43.1
43.2
72.9
12.8
80.5
10.4
1M
ale
2.5
93.3
93.0
83.1
42.7
22.9
90.4
80.4
0t
-0.5
50.3
10.3
20.8
11.1
7-0
.71
1.4
30.6
0df
594.8
6614.6
4621.1
4628.2
4642.7
1604.1
7600.4
8619.3
2p
ns
ns
ns
ns
ns
ns
ns
ns
Hig
h2.5
63.4
73.1
73.4
32.9
53.0
30.5
00.4
3L
ow2.5
53.3
63.0
42.9
62.6
82.8
00.4
90.3
7M
usi
cal
t0.1
30.6
90.7
72.8
51.6
51.4
80.6
52.8
9tr
ain
ing
df670.0
1676.7
6655.7
9666.5
9684.7
8659.4
6645.4
6640.0
9p
ns
ns
ns
**
ns
ns
ns
**
Note.ns
rep
rese
nts
not
sign
ifica
nt.
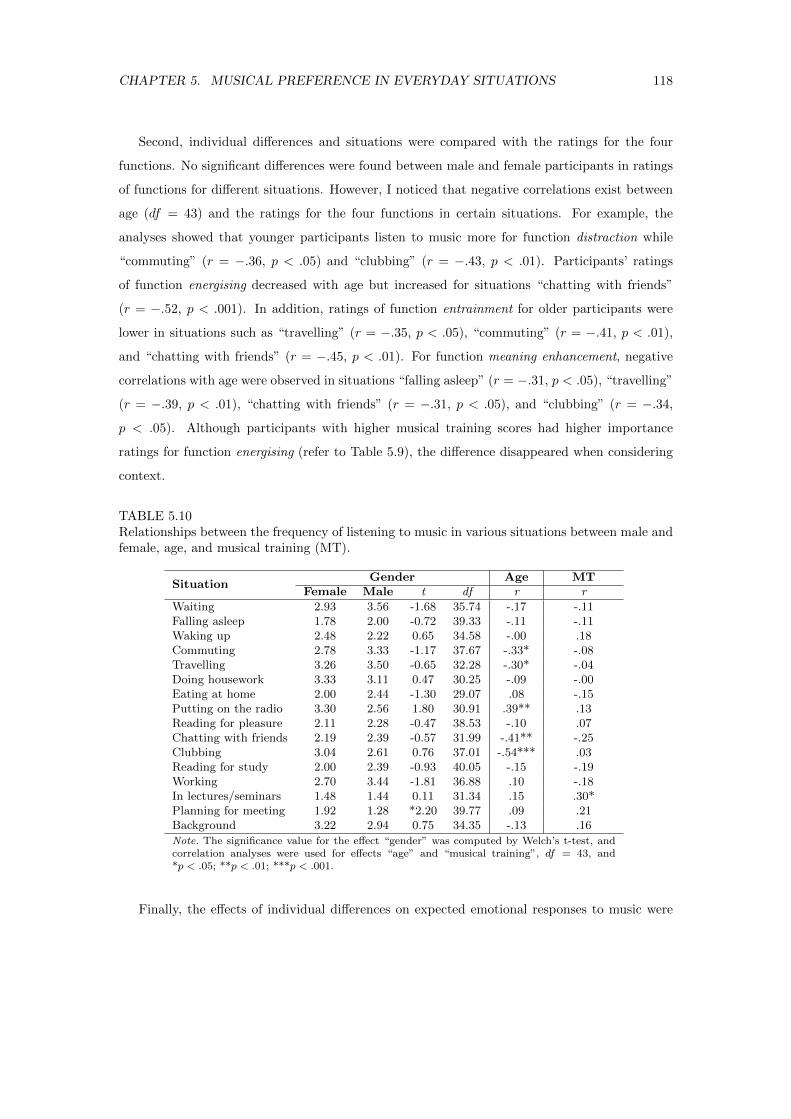
CHAPTER 5. MUSICAL PREFERENCE IN EVERYDAY SITUATIONS 118
Second, individual differences and situations were compared with the ratings for the four
functions. No significant differences were found between male and female participants in ratings
of functions for different situations. However, I noticed that negative correlations exist between
age (df = 43) and the ratings for the four functions in certain situations. For example, the
analyses showed that younger participants listen to music more for function distraction while
“commuting” (r = −.36, p < .05) and “clubbing” (r = −.43, p < .01). Participants’ ratings
of function energising decreased with age but increased for situations “chatting with friends”
(r = −.52, p < .001). In addition, ratings of function entrainment for older participants were
lower in situations such as “travelling” (r = −.35, p < .05), “commuting” (r = −.41, p < .01),
and “chatting with friends” (r = −.45, p < .01). For function meaning enhancement, negative
correlations with age were observed in situations “falling asleep” (r = −.31, p < .05), “travelling”
(r = −.39, p < .01), “chatting with friends” (r = −.31, p < .05), and “clubbing” (r = −.34,
p < .05). Although participants with higher musical training scores had higher importance
ratings for function energising (refer to Table 5.9), the difference disappeared when considering
context.
TABLE 5.10Relationships between the frequency of listening to music in various situations between male andfemale, age, and musical training (MT).
SituationGender Age MT
Female Male t df r r
Waiting 2.93 3.56 -1.68 35.74 -.17 -.11Falling asleep 1.78 2.00 -0.72 39.33 -.11 -.11Waking up 2.48 2.22 0.65 34.58 -.00 .18Commuting 2.78 3.33 -1.17 37.67 -.33* -.08Travelling 3.26 3.50 -0.65 32.28 -.30* -.04Doing housework 3.33 3.11 0.47 30.25 -.09 -.00Eating at home 2.00 2.44 -1.30 29.07 .08 -.15Putting on the radio 3.30 2.56 1.80 30.91 .39** .13Reading for pleasure 2.11 2.28 -0.47 38.53 -.10 .07Chatting with friends 2.19 2.39 -0.57 31.99 -.41** -.25Clubbing 3.04 2.61 0.76 37.01 -.54*** .03Reading for study 2.00 2.39 -0.93 40.05 -.15 -.19Working 2.70 3.44 -1.81 36.88 .10 -.18In lectures/seminars 1.48 1.44 0.11 31.34 .15 .30*Planning for meeting 1.92 1.28 *2.20 39.77 .09 .21Background 3.22 2.94 0.75 34.35 -.13 .16
Note. The significance value for the effect “gender” was computed by Welch’s t-test, andcorrelation analyses were used for effects “age” and “musical training”, df = 43, and*p < .05; **p < .01; ***p < .001.
Finally, the effects of individual differences on expected emotional responses to music were
CHAPTER 5. MUSICAL PREFERENCE IN EVERYDAY SITUATIONS 119
explored in different situations. Significant negative correlations between age and valence were
found for situations “waiting” (r = −.30, p < .05) and “chatting with friends” (r = −.38, < .05).
Additionally, ratings of arousal were negatively correlated with age for situations “commuting”
(r = −.52, p < .001) and “clubbing” (r = −.33, p < .05).
5.4 Discussion
In this chapter, I explored functional uses of music in everyday situations, and their associa-
tions with emotions, particularly the expected felt emotion in response to music. Twenty situa-
tions were selected from past studies, and the ratings from forty-five participants were reported.
Firstly, results for the study on the importance and frequency of music listening in everyday
life revealed that regardless of situations, the frequency of using music is highly correlated with
the perceived importance of listening to music. The least common and important situations
for listening to music are “planning for meeting” and “in lectures/seminars”. Reasons for these
responses could be found from participants’ comments such as you don’t listen to music during
a lecture/seminar! Even if it’s dead boring, that’s not respectful!, or I usually leave planning a
meeting until the last minute, which means I have a truck load of work to do, in very little time,
therefore listening to music, is too distracting, and too fun, so I focus and punish myself for a
short amount of time while I cram in the work. The top seven mean ratings for situations “travel-
ling (holiday)”, “doing housework”, “waiting”, “background”, “commuting (public transport)”,
“putting on the radio”, and “working” were all above the mid-point for both frequency (some-
times) and importance (neutral). This is consistent with the literature that a greater frequency
of listening to music can be found in music use for personal maintenance (e.g., doing housework)
and personal travelling (e.g., travelling for holidays) than for other uses such as personal-being
(e.g., waking up and falling asleep), work and leisure (Sloboda et al., 2001; North et al., 2004).
It also supports studies showing that participants are likely to choose to listen to music “at home
doing housework”, “driving”, and “travelling” (North et al., 2004). However, previous studies
reported less frequent listening to music while “waiting”, whereas participants tend to choose to
listen to music in my study. This difference could be due to the popularity of portable devices
such as iPod and smartphone, meaning that people can easily hear music everywhere.
Moreover, four recurring functions of using music, distraction (a way of engaging unallocated
attention and reducing boredom), energising (a means of maintaining arousal and task attention),
entrainment (the task movements are timed to coincide with the rhythmic pulses of the music,
CHAPTER 5. MUSICAL PREFERENCE IN EVERYDAY SITUATIONS 120
giving the task or activity elements of a dance), and meaning enhancement (where the music
draws out and adds to the significance of the task or activity in some way) were compared in
various situations. As expected, the ratings for these four functions showed that the choice of
music is dependent on the situation. Among these functions, energising is the most common one,
which can be found for situations such as “waking up”, “commuting (public transport)”, “doing
housework”, “clubbing”, “working”, and “background”. I also noticed that music for “falling
asleep” and “chatting with friends” was not chosen for distraction. These results support previous
findings that motivations for music listening are context-dependent. My results agree with the
statement that people listen to music for different reasons (Lamont and Greasley, 2009) but
provide a more detailed account of functions of listening to music within different situations.
Though previous research suggested that listeners’ primary motives for listening to music lie
in its emotional functions, the emotional effects in everyday contexts are rarely studied. There-
fore, the expected felt emotional responses to music were investigated given various situational
contexts. My findings are consistent with others that regardless of various situational contexts,
people tend to feel positive emotions in response to music (e.g., happy and relaxed), whereas the
expected felt arousal level would differ with the situation (Schubert, 2007a; Eerola and Vuoskoski,
2013). This is also supported by Juslin et al. (2008) where the most frequent emotions connected
with music were positive or neutral in valence. This supports the view that positive emotions
such as happy, relaxed, and moved tend to be dominant in felt emotions as compared to perceived
emotion (Juslin and Laukka, 2004; Zentner et al., 2008). This effect could also be because partic-
ipants select music which they like. Situations such as “clubbing” and “falling asleep” received
the strongest positive and negative arousal ratings respectively. However, ratings for the other
situations were distributed over the middle region of the arousal space. Interestingly, “working”
lies in both weak positive and negative arousal regions, and this may be caused by individual
differences such as personality and types of job resulting in a relatively neutral average. Further-
more, correlation analyses revealed that the ratings for functions energising and entrainment are
strongly positively correlated, and they also have a strong positive correlation with the ratings
of valence and arousal. For future studies or applications, these two factors (i.e., energising and
entrainment) could be merged. It is worth pointing out that the felt emotion data examined
here pertain to self-report of what people expect to feel, but these expected emotional responses
to music may differ slightly from how participants would actually feel in those situations. Addi-
tionally, participants suggested that the purpose of selecting music in various contexts seems to
miss the point that the music might be enjoyable and absorbing in itself, and they raised some
CHAPTER 5. MUSICAL PREFERENCE IN EVERYDAY SITUATIONS 121
questions such as multiple emotional effects, the categories of situation and individual factors
(e.g., occupation and culture).
With regard to the question “How do different styles of music serve different situations?”,
genre selection for each situation was compared with participants’ favourite genres. My study
supports previous results concerning musical preference in everyday life, and extends existing
work to the association of preference with felt emotions and with various situational contexts.
The analysis suggests that people tend to choose their favourite genres in most cases. However, for
the cases such as “clubbing” and “commuting (public transport)” with high arousal expectations,
“electronic” and “rock” were the most preferred genres respectively. This again supports the
conclusion that people choose different types of music for different situations.
Finally, I studied the influence of individual differences in music use. Agreeing with Bonneville-
Roussy et al. (2013), the analyses suggest that regardless of the situation, younger participants
listen to music more often and consider the four functions of music listening more important.
Individual differences (i.e., age, gender, and musical training) and situational variables were then
studied with three aspects of music listening preference (i.e., music engagement, functions, and
emotional responses to music). No strong correlation was found between the ratings of frequency
with gender, but a weak correlation was found for the situation in lectures/seminars between fre-
quency and musical training (life history of formal musical training) measured by the Gold-MSI
v0.9. However, depending on the situation, age may influence daily use of music. One possi-
ble explanation is that music consumption behaviour has changed with recent technological and
social development. The musical training effect may be explained by their profession, as some
participants reported that as a teacher they use musical examples in lectures. The comments
from participants also support my conclusions. Additionally, functions and expected emotional
responses to music were also influenced by individual differences and situational factors. It ap-
pears that lifestyle variables (whether one commutes regularly, has hobbies relating to music,
clubbing, etc.) that were only indirectly captured in the present study have an impact on music
choices and functions. This calls for more study of the relationship between lifestyle variables
and different aspects of music listening preference. However, the sample size is fairly small, and
the results remain tentative. A larger amount of data and a more heterogeneous sample should
be collected in future for more detailed individual analysis.
I also need to acknowledge three potential limitations of collecting participants’ ratings in
a web-based experimental setting. First, during a web-based experiment there is a lack of
interaction with participants, and instructions might be misunderstood. However, I provided
CHAPTER 5. MUSICAL PREFERENCE IN EVERYDAY SITUATIONS 122
an additional free response field at the end of each page (Reips, 2002), and data was removed if
misunderstandings were found in participants’ responses. Second, it is possible that participants
might have been unable to separate the expected felt emotion of the activity from the impact
of the music. However, they were given very precise instructions “what emotional effect do you
expect to feel in response to the music (note: not from the action)”. As an example, “waiting” is
generally considered to be a negative experience but the high positive emotional ratings obtained
show that, on the whole, the participants understood the question. Finally, these analyses were
provided by a sample of participants who like classical music. This bias in classical music
could be affected by the recruitment of participants through professional mailing lists such as
“ISMIR Community” and “Auditory” (e.g., people who are interested in classical music and
music research). However, future research should examine whether the results generalise to
participants with different stylistic preferences.
Although in this Chapter the function of music listening and musical preference in different
situations were compared, situations “playing music”, “doing music research”, “watching ballet”,
and “watching musical” caused confusion in participants. Also, some music-listening situations
(“planning for meeting” and “in lectures/seminar”) were reported not to be very common. In
this study, the question “what emotional effect do you expect to feel in response to the music
(note: not from the action)” was asked to investigate only the expected felt emotional responses
with the presence of music. However, the emotional changes due to the presence of music within
these activities are neglected in this study. For instance, the question how emotion changes for
situations such as “waiting” and “travelling (holidays)” remains unclear. Therefore, in the next
chapter, based on the activities presented in this experiment, a refined category is selected. I
focus on the emotional uses of music (e.g., to create, enhance, or to change), specially emotional
changes after the presence of music in various contexts.
Chapter 6
Emotional and Functional Uses of Music
in Various Contexts
The emotional responses to music, functions of music listening, and musical preference within dif-
ferent situations were examined in Chapter 5. However, participants reported only the expected
felt emotion from the impact of music. The emotional association with the activity was missing,
and emotion changes due to the presence of music was neglected in Chapter 5. Therefore in this
chapter, I investigate the emotional associations with and without the presence of music, and
further explore the relationships between emotional and functional uses of music. Based on the
activities used in Section 5.1, Section 6.1 presents thirteen refined activities to avoid confusion,
and explains the aims of the present study. The method of the experiment including partici-
pants, design of the questionnaires (an additional question concerning the emotional association
without the presence of music is included), and procedure is explained in Section 6.2. Results
are provided in Section 6.3. The emotional associations with (see Section 6.3.4) and without (see
Section 6.3.3) the presence of music are compared in Section 6.3.5. Emotional and functional
uses of music are further examined in Section 6.3.6. Finally, a summary of the study is provided
in Section 6.4.
6.1 Aims
Previously in Chapter 5, twenty situations were considered and used. However, participants’ re-
sponses for situations “playing music”, “doing music research”, “watching ballet”, and “watching
musical” were not consistent. Participants reported that they do not often listen to music in situ-
ations “planning for meeting” and “in lectures/seminar”. Therefore, these activities are removed
123
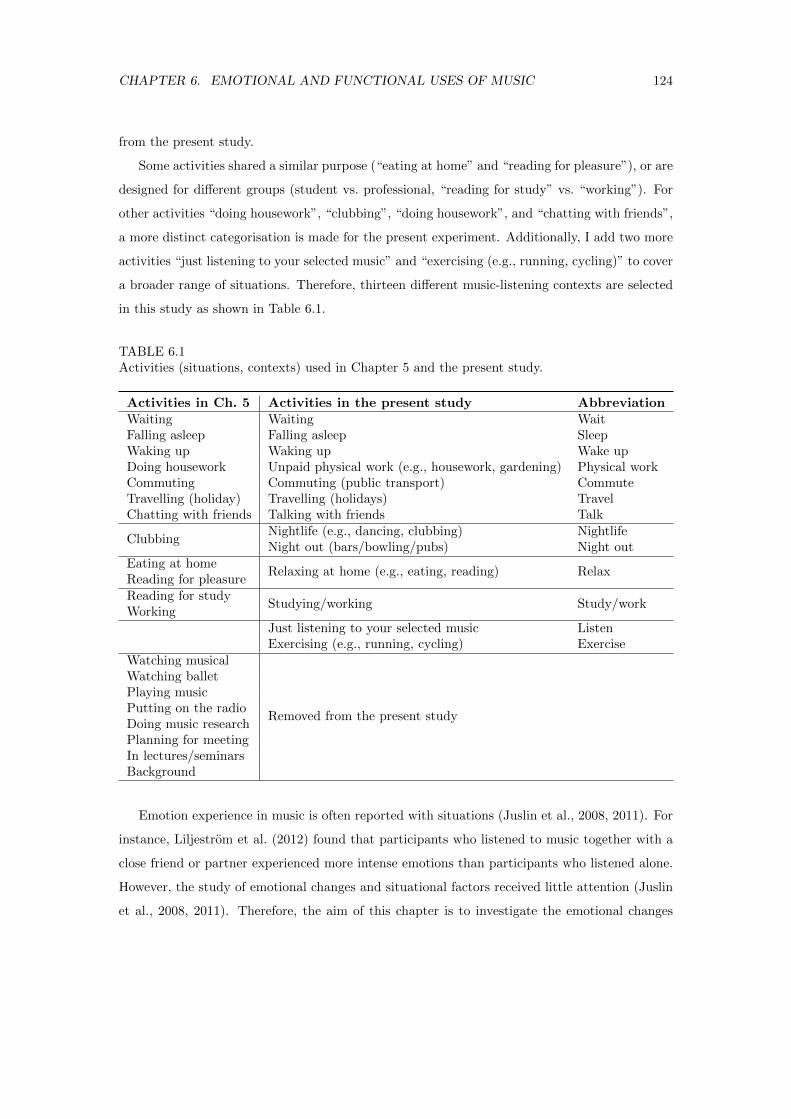
CHAPTER 6. EMOTIONAL AND FUNCTIONAL USES OF MUSIC 124
from the present study.
Some activities shared a similar purpose (“eating at home” and “reading for pleasure”), or are
designed for different groups (student vs. professional, “reading for study” vs. “working”). For
other activities “doing housework”, “clubbing”, “doing housework”, and “chatting with friends”,
a more distinct categorisation is made for the present experiment. Additionally, I add two more
activities “just listening to your selected music” and “exercising (e.g., running, cycling)” to cover
a broader range of situations. Therefore, thirteen different music-listening contexts are selected
in this study as shown in Table 6.1.
TABLE 6.1Activities (situations, contexts) used in Chapter 5 and the present study.
Activities in Ch. 5 Activities in the present study AbbreviationWaiting Waiting WaitFalling asleep Falling asleep SleepWaking up Waking up Wake upDoing housework Unpaid physical work (e.g., housework, gardening) Physical workCommuting Commuting (public transport) CommuteTravelling (holiday) Travelling (holidays) TravelChatting with friends Talking with friends Talk
ClubbingNightlife (e.g., dancing, clubbing) NightlifeNight out (bars/bowling/pubs) Night out
Eating at homeRelaxing at home (e.g., eating, reading) Relax
Reading for pleasureReading for study
Studying/working Study/workWorking
Just listening to your selected music ListenExercising (e.g., running, cycling) Exercise
Watching musical
Removed from the present study
Watching balletPlaying musicPutting on the radioDoing music researchPlanning for meetingIn lectures/seminarsBackground
Emotion experience in music is often reported with situations (Juslin et al., 2008, 2011). For
instance, Liljestrom et al. (2012) found that participants who listened to music together with a
close friend or partner experienced more intense emotions than participants who listened alone.
However, the study of emotional changes and situational factors received little attention (Juslin
et al., 2008, 2011). Therefore, the aim of this chapter is to investigate the emotional changes
CHAPTER 6. EMOTIONAL AND FUNCTIONAL USES OF MUSIC 125
due to the presence of music in different situations, and the relationships between emotional
association (with and without the presence of music) and functions of music listening. Several
hypotheses are formulated in this study. Firstly, I hypothesise that the emotional response to
an activity is similar to the nature of the activity. Previous research has mentioned that people
select music to follow a “mood-optimisation” strategy, and their emotions change after listening
to music. As an extension to the previous study in Chapter 5, I examine the emotional changes
for each given situation due to the presence of music. It is hypothesised that people’s “mood-
optimisation” strategies vary across situations, but I expect a positive correlation between the
emotional responses with and without the presence of music. Change in emotional state, as an
outcome of music listening, overlaps with functional uses of music (Schafer and Sedlmeier, 2009;
Lonsdale and North, 2011; Chin and Rickard, 2013). Lastly, I hypothesise a positive correlation
between participants’s ratings of valence and arousal with the ratings of functions of music
listening.
Previous studies have shown that individual differences such as age and music-training also
affect emotional experience (Malatesta and Kalnok, 1984; Novak and Mather, 2007; Castro and
Lima, 2014). Kreutz et al. (2007) explained connections between emotional experience and mu-
sical preference. I also explore individual factors (age, gender, musical training, and musical
preference) within different situations. Similar to the experiment in Chapter 5, I design a self-
report format questionnaire to measure participants’ responses in this study.
6.2 Method
This study was conducted online1 using a self-report approach. The data was collected from
February to October 2014.
6.2.1 Participants
In the present study, ninety-four English-speaking participants (52 male and 42 female) took part
in the experiment. All the participants were recruited through a variety of mailing lists such
as “ISMIR Community”, “Auditory”, and the departmental mailing list, and social-media sites
(i.e., LinkedIn and Facebook). Their ages ranged from 17 to 73 (M = 38.17, SD = 14.70 years,
and 2 not reported) with various educational backgrounds. All participation was voluntary,
1http://www.isophonics.net/content/music-activity-survey-2
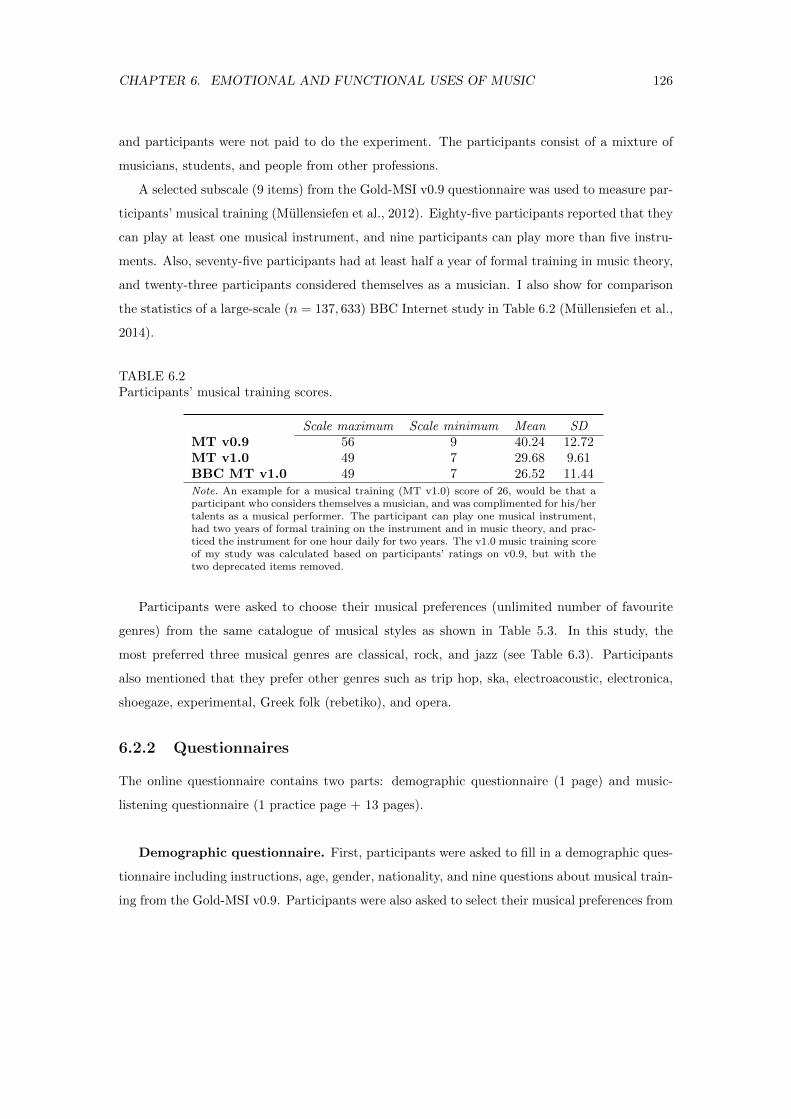
CHAPTER 6. EMOTIONAL AND FUNCTIONAL USES OF MUSIC 126
and participants were not paid to do the experiment. The participants consist of a mixture of
musicians, students, and people from other professions.
A selected subscale (9 items) from the Gold-MSI v0.9 questionnaire was used to measure par-
ticipants’ musical training (Mullensiefen et al., 2012). Eighty-five participants reported that they
can play at least one musical instrument, and nine participants can play more than five instru-
ments. Also, seventy-five participants had at least half a year of formal training in music theory,
and twenty-three participants considered themselves as a musician. I also show for comparison
the statistics of a large-scale (n = 137, 633) BBC Internet study in Table 6.2 (Mullensiefen et al.,
2014).
TABLE 6.2Participants’ musical training scores.
Scale maximum Scale minimum Mean SDMT v0.9 56 9 40.24 12.72MT v1.0 49 7 29.68 9.61BBC MT v1.0 49 7 26.52 11.44Note. An example for a musical training (MT v1.0) score of 26, would be that aparticipant who considers themselves a musician, and was complimented for his/hertalents as a musical performer. The participant can play one musical instrument,had two years of formal training on the instrument and in music theory, and prac-ticed the instrument for one hour daily for two years. The v1.0 music training scoreof my study was calculated based on participants’ ratings on v0.9, but with thetwo deprecated items removed.
Participants were asked to choose their musical preferences (unlimited number of favourite
genres) from the same catalogue of musical styles as shown in Table 5.3. In this study, the
most preferred three musical genres are classical, rock, and jazz (see Table 6.3). Participants
also mentioned that they prefer other genres such as trip hop, ska, electroacoustic, electronica,
shoegaze, experimental, Greek folk (rebetiko), and opera.
6.2.2 Questionnaires
The online questionnaire contains two parts: demographic questionnaire (1 page) and music-
listening questionnaire (1 practice page + 13 pages).
Demographic questionnaire. First, participants were asked to fill in a demographic ques-
tionnaire including instructions, age, gender, nationality, and nine questions about musical train-
ing from the Gold-MSI v0.9. Participants were also asked to select their musical preferences from
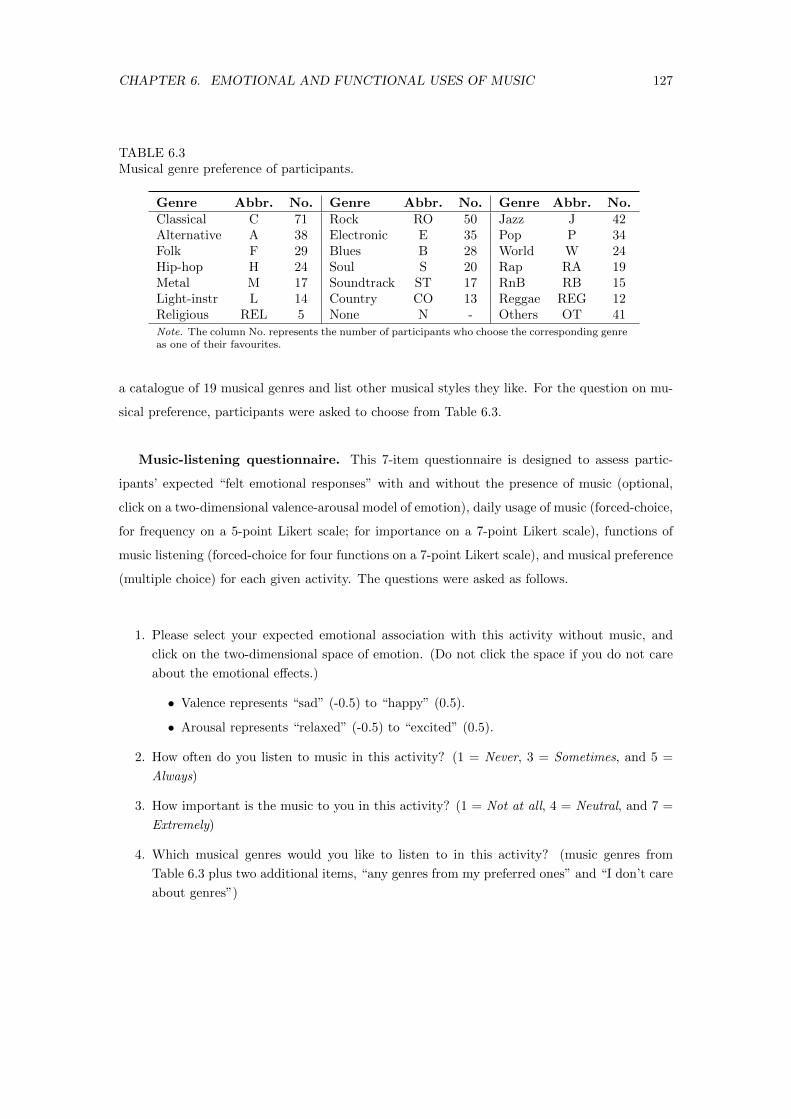
CHAPTER 6. EMOTIONAL AND FUNCTIONAL USES OF MUSIC 127
TABLE 6.3Musical genre preference of participants.
Genre Abbr. No. Genre Abbr. No. Genre Abbr. No.Classical C 71 Rock RO 50 Jazz J 42Alternative A 38 Electronic E 35 Pop P 34Folk F 29 Blues B 28 World W 24Hip-hop H 24 Soul S 20 Rap RA 19Metal M 17 Soundtrack ST 17 RnB RB 15Light-instr L 14 Country CO 13 Reggae REG 12Religious REL 5 None N - Others OT 41Note. The column No. represents the number of participants who choose the corresponding genreas one of their favourites.
a catalogue of 19 musical genres and list other musical styles they like. For the question on mu-
sical preference, participants were asked to choose from Table 6.3.
Music-listening questionnaire. This 7-item questionnaire is designed to assess partic-
ipants’ expected “felt emotional responses” with and without the presence of music (optional,
click on a two-dimensional valence-arousal model of emotion), daily usage of music (forced-choice,
for frequency on a 5-point Likert scale; for importance on a 7-point Likert scale), functions of
music listening (forced-choice for four functions on a 7-point Likert scale), and musical preference
(multiple choice) for each given activity. The questions were asked as follows.
1. Please select your expected emotional association with this activity without music, and
click on the two-dimensional space of emotion. (Do not click the space if you do not care
about the emotional effects.)
• Valence represents “sad” (-0.5) to “happy” (0.5).
• Arousal represents “relaxed” (-0.5) to “excited” (0.5).
2. How often do you listen to music in this activity? (1 = Never, 3 = Sometimes, and 5 =
Always)
3. How important is the music to you in this activity? (1 = Not at all, 4 = Neutral, and 7 =
Extremely)
4. Which musical genres would you like to listen to in this activity? (music genres from
Table 6.3 plus two additional items, “any genres from my preferred ones” and “I don’t care
about genres”)
CHAPTER 6. EMOTIONAL AND FUNCTIONAL USES OF MUSIC 128
5. Please indicate your purpose of selecting music in this activity? (1 = Not at all, 4 =
Neutral, and 7 = Extremely)
• Distraction (a way of engaging unallocated attention and reducing boredom);
• Energising (a means of maintaining arousal and task attention);
• Entrainment (the task movements are timed to coincide with the rhythmic pulses of
the music, giving the task or activity elements of a dance);
• Meaning enhancement (where the music draws out and adds to the significance of the
task or activity in some way).
6. If listening to music in this activity, select the emotional effect you expect to feel in response
to the music (NOT from the activity), and click on the two-dimensional space of emotion.
(Do not click the space if you do not care about the emotional effects.)
To increase the interaction with participants, an additional free response field was provided
at the end of each page (Reips, 2012).
6.2.3 Procedure
The first page provided the instructions, and participants filled in the demographic question-
naire. Then a practice page of the music-listening questionnaire with activity “cooking at
home” was shown to participants. For each question in the practice page, a detailed expla-
nation was presented to participants. After the practice session, they completed a 13-page
music-listening questionnaire with each activity provided in Table 6.1. Following the strate-
gies proposed by Reips (2002), the activities were given in random order. The two-dimensional
model of emotion (valence-arousal) is used to measure emotional responses. Ninety-four English-
speaking participants completed the questionnaire. For the questionnaire, a 5-point Likert scale
(1=Never, 5=Always) is used to measure the frequency of listening to music for each situation
and a 7-point Likert scale (1=Not at all, 7=Extremely) used to measure the importance and
the functions (distraction, energising, entrainment, and meaning enhancement) of listening to
music. The whole experiment took 15 minutes to complete without any planned breaks, and
participants were able to stop at any time.
CHAPTER 6. EMOTIONAL AND FUNCTIONAL USES OF MUSIC 129
6.3 Results
A total of 1222 participants’ ratings (13 situations×94 participants) was collected for data anal-
ysis. Firstly, I examined participants’ feedback, and checked whether they understood the ques-
tions correctly. One participant mentioned that It’s not possible for me to make meaningful
choices - because my response to, and association with music to, housework and gardening are
*completely* different. So rather than choose one, I’m choosing “Not at all” for all answers.
Please delete them as they are meaningless. This entry was discarded, and only 1221 participants’
ratings were retained for further analysis.
6.3.1 Usage of Music Varies Across Situations
To compare participants’ usage of music across different activities, the mean ratings of frequency
(1 = Never to 5 = Always) and importance (1 = Not at all to 7 = Extremely), as well as
their standard deviations are shown in Table 6.4. The results revealed that the most frequent
and important activity of using music is “just to listen to your selected music” (Mfrequency =
4.20 and Mimportance = 6.46). Other frequent and important situations which music is used
to accompany include “travelling”, “exercising”, and “unpaid physical work”. The top ten
situations whose mean ratings were above the middle point of their rating scales are the same
for both importance and frequency. A Spearman’s rank correlation analysis between the ratings
of frequency and importance was carried out for each participant. The Spearman’s correlation
coefficients were then aggregated over 94 participants using the Fisher z-transformation. The
analysis shows a significant positive correlation between participants’ ratings of frequency and
importance (rs(11) = 0.86, p < .001).
Although participants reported that they frequently listen to music during “nightlife”, the
standard deviations of participants’ ratings on importance and frequency are also very high.
These variations may be influenced by the individual differences in age, gender, and culture.
Some participants pointed out that they used to do those activities a lot, but they no longer do
so or they do not go to those kinds of places.
6.3.2 Functions of Music Vary Across Situations
To examine the question “How do the functions of listening to music vary across situations?”,
participants’ ratings (1 = Not at all, 4 = Neutral, and 7 = Extremely) on four music-listening
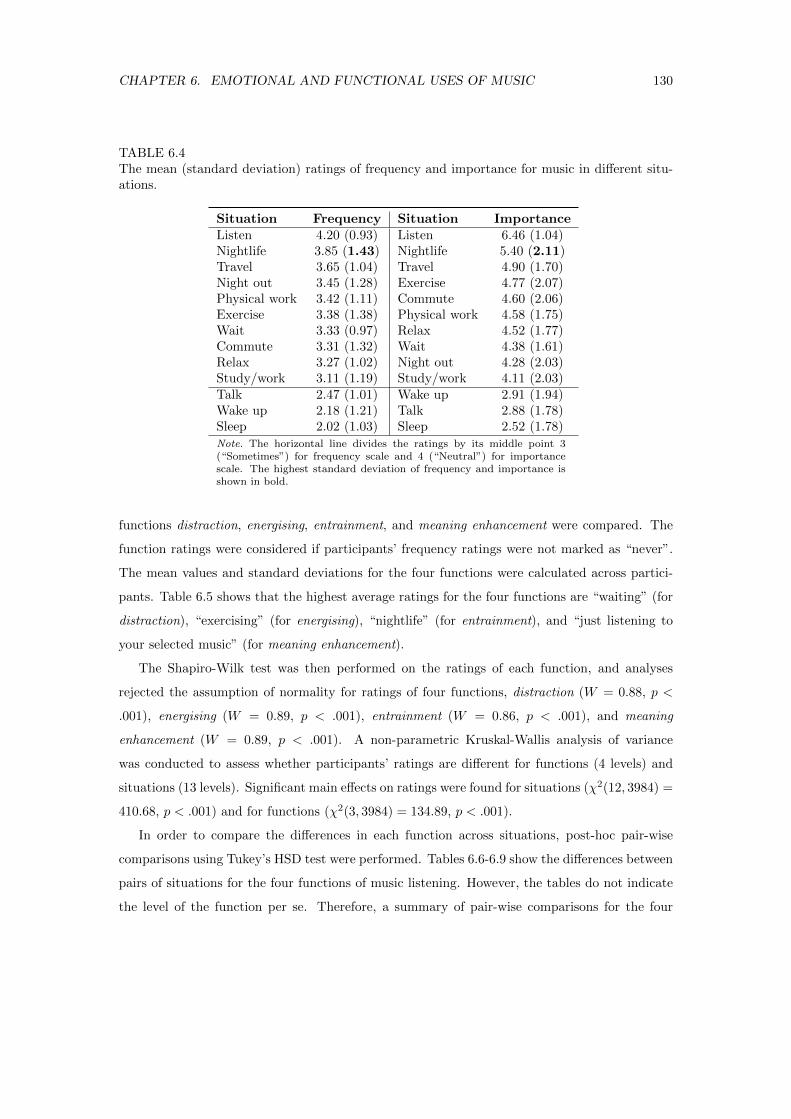
CHAPTER 6. EMOTIONAL AND FUNCTIONAL USES OF MUSIC 130
TABLE 6.4The mean (standard deviation) ratings of frequency and importance for music in different situ-ations.
Situation Frequency Situation ImportanceListen 4.20 (0.93) Listen 6.46 (1.04)Nightlife 3.85 (1.43) Nightlife 5.40 (2.11)Travel 3.65 (1.04) Travel 4.90 (1.70)Night out 3.45 (1.28) Exercise 4.77 (2.07)Physical work 3.42 (1.11) Commute 4.60 (2.06)Exercise 3.38 (1.38) Physical work 4.58 (1.75)Wait 3.33 (0.97) Relax 4.52 (1.77)Commute 3.31 (1.32) Wait 4.38 (1.61)Relax 3.27 (1.02) Night out 4.28 (2.03)Study/work 3.11 (1.19) Study/work 4.11 (2.03)Talk 2.47 (1.01) Wake up 2.91 (1.94)Wake up 2.18 (1.21) Talk 2.88 (1.78)Sleep 2.02 (1.03) Sleep 2.52 (1.78)Note. The horizontal line divides the ratings by its middle point 3(“Sometimes”) for frequency scale and 4 (“Neutral”) for importancescale. The highest standard deviation of frequency and importance isshown in bold.
functions distraction, energising, entrainment, and meaning enhancement were compared. The
function ratings were considered if participants’ frequency ratings were not marked as “never”.
The mean values and standard deviations for the four functions were calculated across partici-
pants. Table 6.5 shows that the highest average ratings for the four functions are “waiting” (for
distraction), “exercising” (for energising), “nightlife” (for entrainment), and “just listening to
your selected music” (for meaning enhancement).
The Shapiro-Wilk test was then performed on the ratings of each function, and analyses
rejected the assumption of normality for ratings of four functions, distraction (W = 0.88, p <
.001), energising (W = 0.89, p < .001), entrainment (W = 0.86, p < .001), and meaning
enhancement (W = 0.89, p < .001). A non-parametric Kruskal-Wallis analysis of variance
was conducted to assess whether participants’ ratings are different for functions (4 levels) and
situations (13 levels). Significant main effects on ratings were found for situations (χ2(12, 3984) =
410.68, p < .001) and for functions (χ2(3, 3984) = 134.89, p < .001).
In order to compare the differences in each function across situations, post-hoc pair-wise
comparisons using Tukey’s HSD test were performed. Tables 6.6-6.9 show the differences between
pairs of situations for the four functions of music listening. However, the tables do not indicate
the level of the function per se. Therefore, a summary of pair-wise comparisons for the four
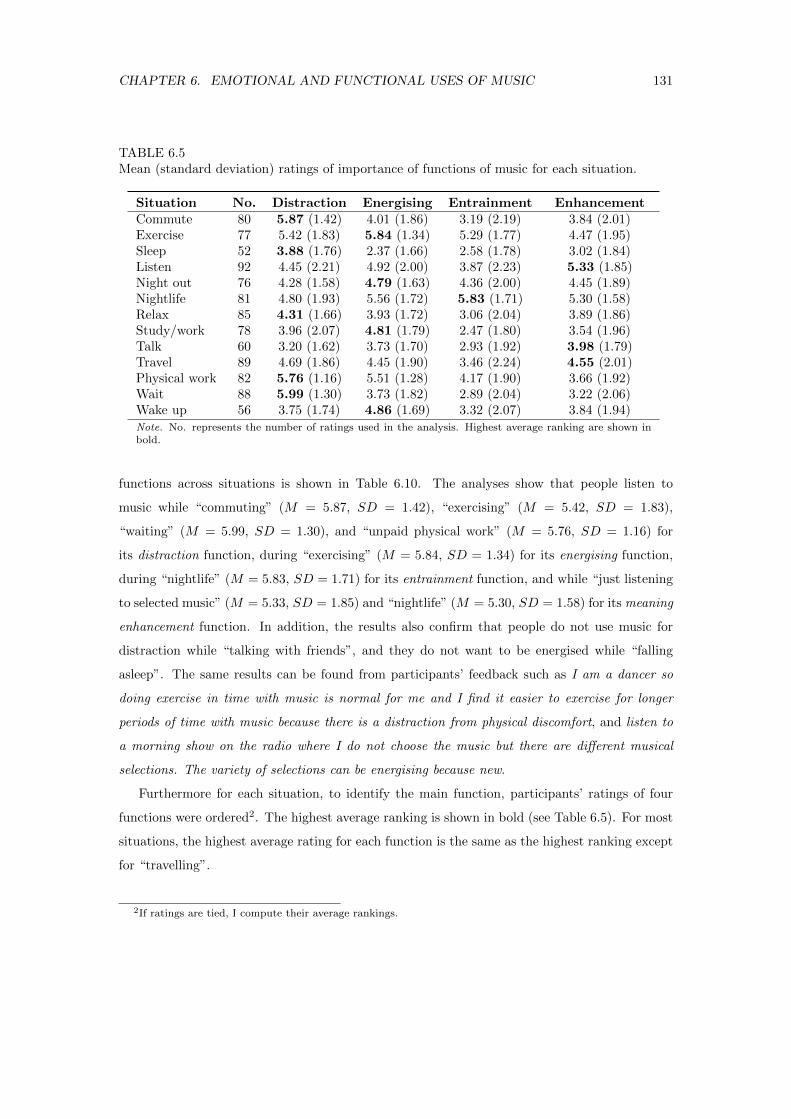
CHAPTER 6. EMOTIONAL AND FUNCTIONAL USES OF MUSIC 131
TABLE 6.5Mean (standard deviation) ratings of importance of functions of music for each situation.
Situation No. Distraction Energising Entrainment EnhancementCommute 80 5.87 (1.42) 4.01 (1.86) 3.19 (2.19) 3.84 (2.01)Exercise 77 5.42 (1.83) 5.84 (1.34) 5.29 (1.77) 4.47 (1.95)Sleep 52 3.88 (1.76) 2.37 (1.66) 2.58 (1.78) 3.02 (1.84)Listen 92 4.45 (2.21) 4.92 (2.00) 3.87 (2.23) 5.33 (1.85)Night out 76 4.28 (1.58) 4.79 (1.63) 4.36 (2.00) 4.45 (1.89)Nightlife 81 4.80 (1.93) 5.56 (1.72) 5.83 (1.71) 5.30 (1.58)Relax 85 4.31 (1.66) 3.93 (1.72) 3.06 (2.04) 3.89 (1.86)Study/work 78 3.96 (2.07) 4.81 (1.79) 2.47 (1.80) 3.54 (1.96)Talk 60 3.20 (1.62) 3.73 (1.70) 2.93 (1.92) 3.98 (1.79)Travel 89 4.69 (1.86) 4.45 (1.90) 3.46 (2.24) 4.55 (2.01)Physical work 82 5.76 (1.16) 5.51 (1.28) 4.17 (1.90) 3.66 (1.92)Wait 88 5.99 (1.30) 3.73 (1.82) 2.89 (2.04) 3.22 (2.06)Wake up 56 3.75 (1.74) 4.86 (1.69) 3.32 (2.07) 3.84 (1.94)Note. No. represents the number of ratings used in the analysis. Highest average ranking are shown inbold.
functions across situations is shown in Table 6.10. The analyses show that people listen to
music while “commuting” (M = 5.87, SD = 1.42), “exercising” (M = 5.42, SD = 1.83),
“waiting” (M = 5.99, SD = 1.30), and “unpaid physical work” (M = 5.76, SD = 1.16) for
its distraction function, during “exercising” (M = 5.84, SD = 1.34) for its energising function,
during “nightlife” (M = 5.83, SD = 1.71) for its entrainment function, and while “just listening
to selected music” (M = 5.33, SD = 1.85) and “nightlife” (M = 5.30, SD = 1.58) for its meaning
enhancement function. In addition, the results also confirm that people do not use music for
distraction while “talking with friends”, and they do not want to be energised while “falling
asleep”. The same results can be found from participants’ feedback such as I am a dancer so
doing exercise in time with music is normal for me and I find it easier to exercise for longer
periods of time with music because there is a distraction from physical discomfort, and listen to
a morning show on the radio where I do not choose the music but there are different musical
selections. The variety of selections can be energising because new.
Furthermore for each situation, to identify the main function, participants’ ratings of four
functions were ordered2. The highest average ranking is shown in bold (see Table 6.5). For most
situations, the highest average rating for each function is the same as the highest ranking except
for “travelling”.
2If ratings are tied, I compute their average rankings.
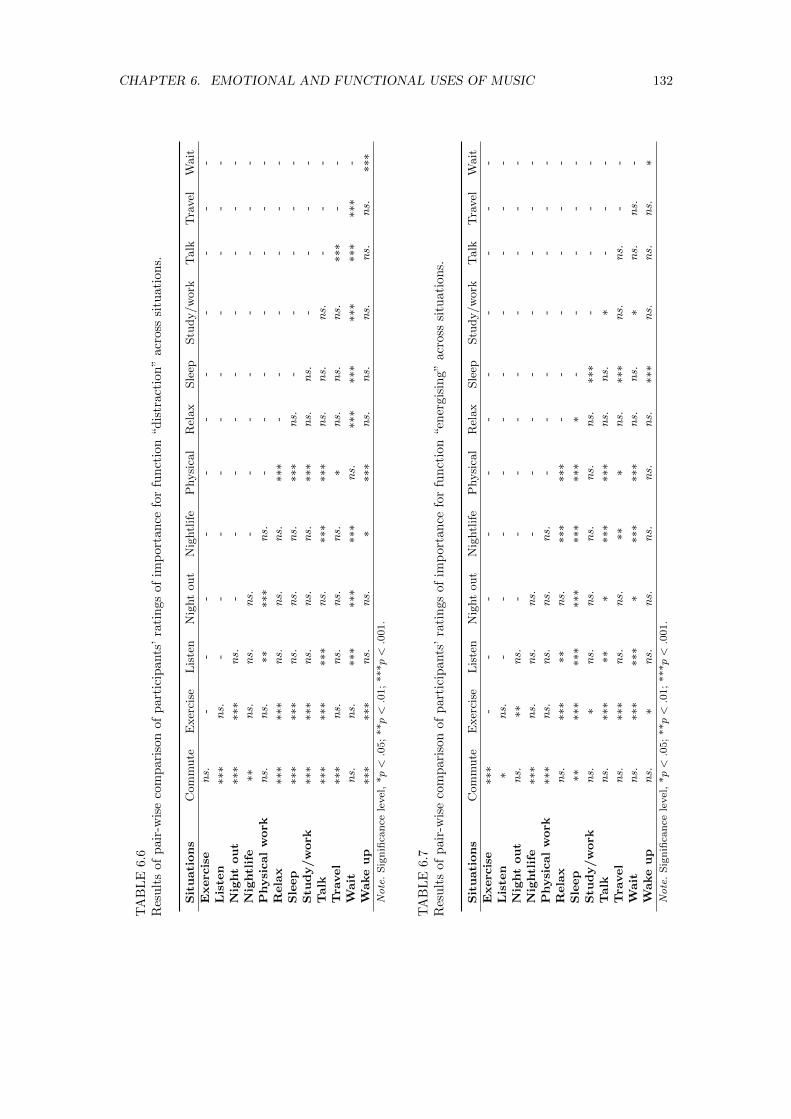
CHAPTER 6. EMOTIONAL AND FUNCTIONAL USES OF MUSIC 132
TA
BL
E6.
6R
esu
lts
ofp
air-
wis
eco
mp
aris
onof
par
tici
pants
’ra
tin
gs
of
imp
ort
an
cefo
rfu
nct
ion
“d
istr
act
ion
”acr
oss
situ
ati
on
s.
Sit
uati
ons
Com
mute
Exer
cise
Lis
ten
Nig
ht
out
Nig
htl
ife
Physi
cal
Rel
ax
Sle
epStu
dy/w
ork
Talk
Tra
vel
Wait
Exerc
ise
ns.
--
--
--
--
--
-L
iste
n***
ns.
--
--
--
--
--
Nig
ht
out
***
***
ns.
--
--
--
--
-N
ightl
ife
**
ns.
ns.
ns.
--
--
--
--
Physi
cal
work
ns.
ns.
**
***
ns.
--
--
--
-R
ela
x***
***
ns.
ns.
ns.
***
--
--
--
Sle
ep
***
***
ns.
ns.
ns.
***
ns.
--
--
-Stu
dy/w
ork
***
***
ns.
ns.
ns.
***
ns.
ns.
--
--
Talk
***
***
***
ns.
***
***
ns.
ns.
ns.
--
-T
ravel
***
ns.
ns.
ns.
ns.
*ns.
ns.
ns.
***
--
Wait
ns.
ns.
***
***
***
ns.
***
***
***
***
***
-W
ake
up
***
***
ns.
ns.
****
ns.
ns.
ns.
ns.
ns.
***
Note.
Sig
nifi
can
cele
vel
,*p<.0
5;
**p<.0
1;
***p<.0
01.
TA
BL
E6.
7R
esu
lts
ofp
air-
wis
eco
mp
aris
onof
par
tici
pants
’ra
tin
gs
of
imp
ort
an
cefo
rfu
nct
ion
“en
ergis
ing”
acr
oss
situ
ati
on
s.
Sit
uati
ons
Com
mute
Exer
cise
Lis
ten
Nig
ht
out
Nig
htl
ife
Physi
cal
Rel
ax
Sle
epStu
dy/w
ork
Talk
Tra
vel
Wait
Exerc
ise
***
--
--
--
--
--
-L
iste
n*
ns.
--
--
--
--
--
Nig
ht
out
ns.
**
ns.
--
--
--
--
-N
ightl
ife
***
ns.
ns.
ns.
--
--
--
--
Physi
cal
work
***
ns.
ns.
ns.
ns.
--
--
--
-R
ela
xns.
***
**
ns.
***
***
--
--
--
Sle
ep
**
***
***
***
***
***
*-
--
--
Stu
dy/w
ork
ns.
*ns.
ns.
ns.
ns.
ns.
***
--
--
Talk
ns.
***
**
****
***
ns.
ns.
*-
--
Tra
vel
ns.
***
ns.
ns.
**
*ns.
***
ns.
ns.
--
Wait
ns.
***
***
****
***
ns.
ns.
*ns.
ns.
-W
ake
up
ns.
*ns.
ns.
ns.
ns.
ns.
***
ns.
ns.
ns.
*Note.
Sig
nifi
can
cele
vel
,*p<.0
5;
**p<.0
1;
***p<.0
01.
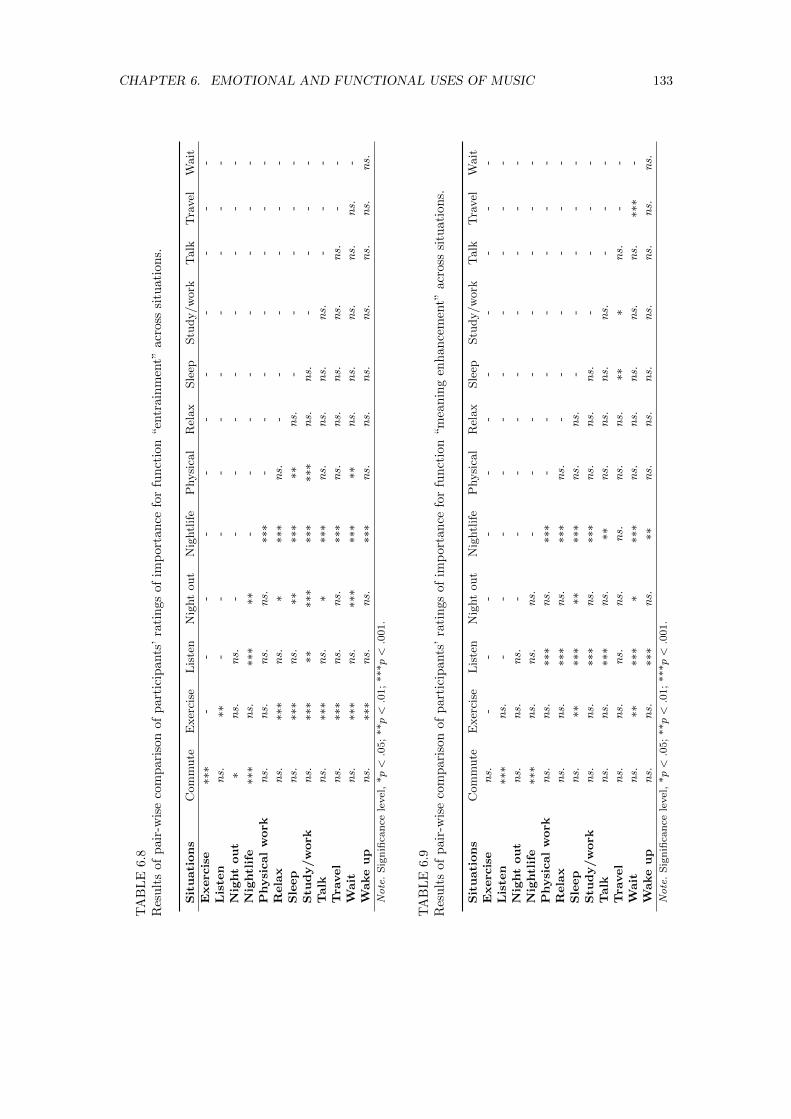
CHAPTER 6. EMOTIONAL AND FUNCTIONAL USES OF MUSIC 133
TA
BL
E6.
8R
esu
lts
ofp
air-
wis
eco
mp
aris
onof
par
tici
pants
’ra
tin
gs
of
imp
ort
an
cefo
rfu
nct
ion
“en
train
men
t”acr
oss
situ
ati
on
s.
Sit
uati
ons
Com
mute
Exer
cise
Lis
ten
Nig
ht
out
Nig
htl
ife
Physi
cal
Rel
ax
Sle
epStu
dy/w
ork
Talk
Tra
vel
Wait
Exerc
ise
***
--
--
--
--
--
-L
iste
nns.
**
--
--
--
--
--
Nig
ht
out
*ns.
ns.
--
--
--
--
-N
ightl
ife
***
ns.
***
**
--
--
--
--
Physi
cal
work
ns.
ns.
ns.
ns.
***
--
--
--
-R
ela
xns.
***
ns.
****
ns.
--
--
--
Sle
ep
ns.
***
ns.
**
***
**
ns.
--
--
-Stu
dy/w
ork
ns.
***
**
***
***
***
ns.
ns.
--
--
Talk
ns.
***
ns.
****
ns.
ns.
ns.
ns.
--
-T
ravel
ns.
***
ns.
ns.
***
ns.
ns.
ns.
ns.
ns.
--
Wait
ns.
***
ns.
***
***
**
ns.
ns.
ns.
ns.
ns.
-W
ake
up
ns.
***
ns.
ns.
***
ns.
ns.
ns.
ns.
ns.
ns.
ns.
Note.
Sig
nifi
can
cele
vel
,*p<.0
5;
**p<.0
1;
***p<.0
01.
TA
BL
E6.
9R
esu
lts
ofp
air-
wis
eco
mp
aris
onof
par
tici
pants
’ra
tin
gs
of
imp
ort
an
cefo
rfu
nct
ion
“m
ean
ing
enh
an
cem
ent”
acr
oss
situ
ati
on
s.
Sit
uati
ons
Com
mute
Exer
cise
Lis
ten
Nig
ht
out
Nig
htl
ife
Physi
cal
Rel
ax
Sle
epStu
dy/w
ork
Talk
Tra
vel
Wait
Exerc
ise
ns.
--
--
--
--
--
-L
iste
n***
ns.
--
--
--
--
--
Nig
ht
out
ns.
ns.
ns.
--
--
--
--
-N
ightl
ife
***
ns.
ns.
ns.
--
--
--
--
Physi
cal
work
ns.
ns.
***
ns.
***
--
--
--
-R
ela
xns.
ns.
***
ns.
***
ns.
--
--
--
Sle
ep
ns.
**
***
**
***
ns.
ns.
--
--
-Stu
dy/w
ork
ns.
ns.
***
ns.
***
ns.
ns.
ns.
--
--
Talk
ns.
ns.
***
ns.
**
ns.
ns.
ns.
ns.
--
-T
ravel
ns.
ns.
ns.
ns.
ns.
ns.
ns.
**
*ns.
--
Wait
ns.
**
***
****
ns.
ns.
ns.
ns.
ns.
***
-W
ake
up
ns.
ns.
***
ns.
**
ns.
ns.
ns.
ns.
ns.
ns.
ns.
Note.
Sig
nifi
can
cele
vel
,*p<.0
5;
**p<.0
1;
***p<.0
01.
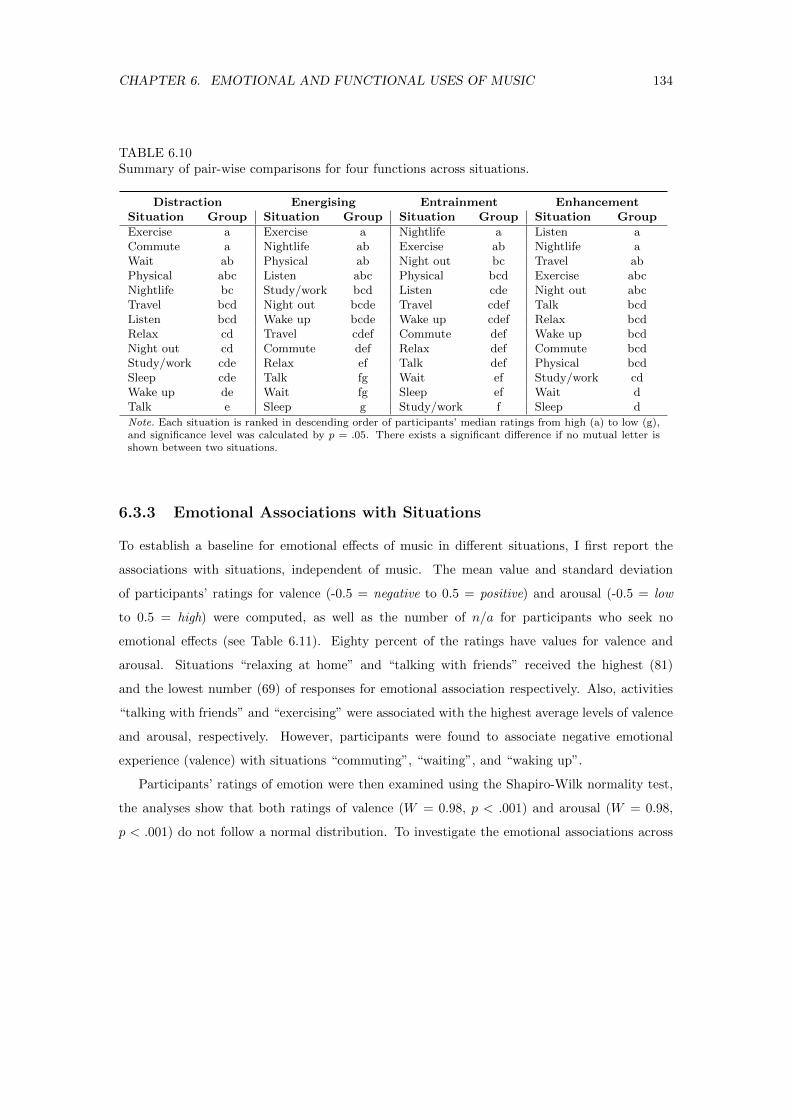
CHAPTER 6. EMOTIONAL AND FUNCTIONAL USES OF MUSIC 134
TABLE 6.10Summary of pair-wise comparisons for four functions across situations.
Distraction Energising Entrainment EnhancementSituation Group Situation Group Situation Group Situation Group
Exercise a Exercise a Nightlife a Listen aCommute a Nightlife ab Exercise ab Nightlife aWait ab Physical ab Night out bc Travel abPhysical abc Listen abc Physical bcd Exercise abcNightlife bc Study/work bcd Listen cde Night out abcTravel bcd Night out bcde Travel cdef Talk bcdListen bcd Wake up bcde Wake up cdef Relax bcdRelax cd Travel cdef Commute def Wake up bcdNight out cd Commute def Relax def Commute bcdStudy/work cde Relax ef Talk def Physical bcdSleep cde Talk fg Wait ef Study/work cdWake up de Wait fg Sleep ef Wait dTalk e Sleep g Study/work f Sleep d
Note. Each situation is ranked in descending order of participants’ median ratings from high (a) to low (g),and significance level was calculated by p = .05. There exists a significant difference if no mutual letter isshown between two situations.
6.3.3 Emotional Associations with Situations
To establish a baseline for emotional effects of music in different situations, I first report the
associations with situations, independent of music. The mean value and standard deviation
of participants’ ratings for valence (-0.5 = negative to 0.5 = positive) and arousal (-0.5 = low
to 0.5 = high) were computed, as well as the number of n/a for participants who seek no
emotional effects (see Table 6.11). Eighty percent of the ratings have values for valence and
arousal. Situations “relaxing at home” and “talking with friends” received the highest (81)
and the lowest number (69) of responses for emotional association respectively. Also, activities
“talking with friends” and “exercising” were associated with the highest average levels of valence
and arousal, respectively. However, participants were found to associate negative emotional
experience (valence) with situations “commuting”, “waiting”, and “waking up”.
Participants’ ratings of emotion were then examined using the Shapiro-Wilk normality test,
the analyses show that both ratings of valence (W = 0.98, p < .001) and arousal (W = 0.98,
p < .001) do not follow a normal distribution. To investigate the emotional associations across
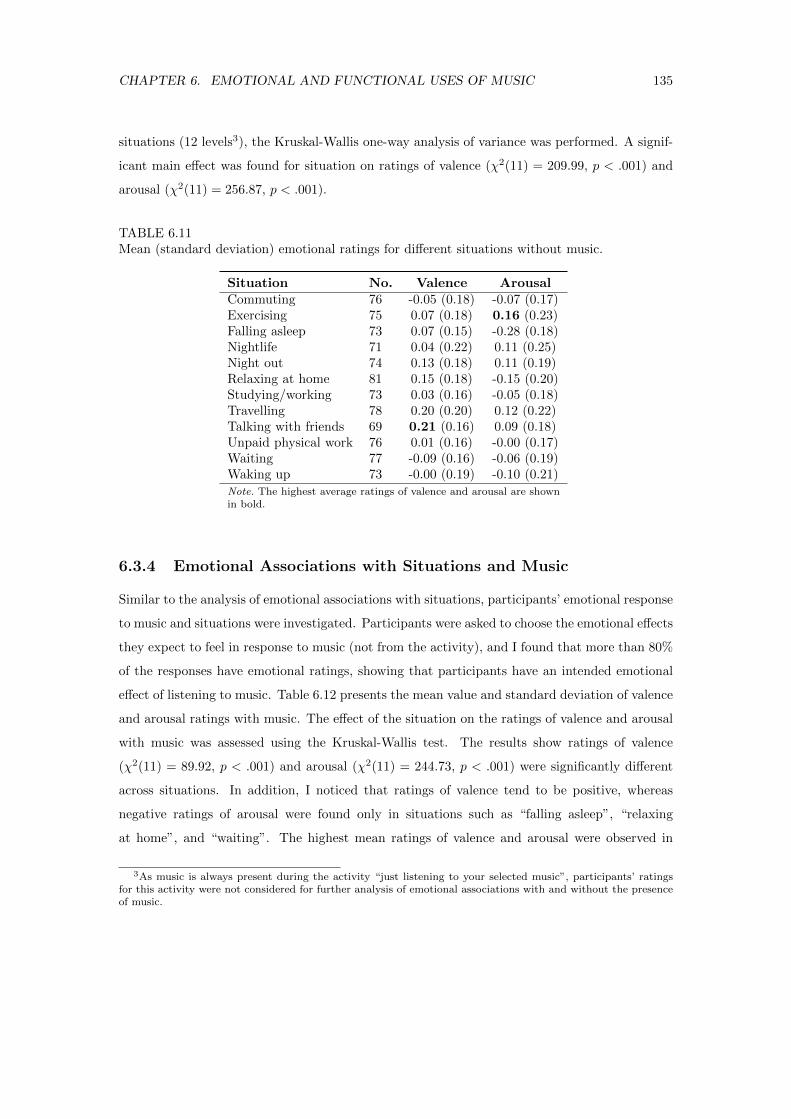
CHAPTER 6. EMOTIONAL AND FUNCTIONAL USES OF MUSIC 135
situations (12 levels3), the Kruskal-Wallis one-way analysis of variance was performed. A signif-
icant main effect was found for situation on ratings of valence (χ2(11) = 209.99, p < .001) and
arousal (χ2(11) = 256.87, p < .001).
TABLE 6.11Mean (standard deviation) emotional ratings for different situations without music.
Situation No. Valence ArousalCommuting 76 -0.05 (0.18) -0.07 (0.17)Exercising 75 0.07 (0.18) 0.16 (0.23)Falling asleep 73 0.07 (0.15) -0.28 (0.18)Nightlife 71 0.04 (0.22) 0.11 (0.25)Night out 74 0.13 (0.18) 0.11 (0.19)Relaxing at home 81 0.15 (0.18) -0.15 (0.20)Studying/working 73 0.03 (0.16) -0.05 (0.18)Travelling 78 0.20 (0.20) 0.12 (0.22)Talking with friends 69 0.21 (0.16) 0.09 (0.18)Unpaid physical work 76 0.01 (0.16) -0.00 (0.17)Waiting 77 -0.09 (0.16) -0.06 (0.19)Waking up 73 -0.00 (0.19) -0.10 (0.21)Note. The highest average ratings of valence and arousal are shownin bold.
6.3.4 Emotional Associations with Situations and Music
Similar to the analysis of emotional associations with situations, participants’ emotional response
to music and situations were investigated. Participants were asked to choose the emotional effects
they expect to feel in response to music (not from the activity), and I found that more than 80%
of the responses have emotional ratings, showing that participants have an intended emotional
effect of listening to music. Table 6.12 presents the mean value and standard deviation of valence
and arousal ratings with music. The effect of the situation on the ratings of valence and arousal
with music was assessed using the Kruskal-Wallis test. The results show ratings of valence
(χ2(11) = 89.92, p < .001) and arousal (χ2(11) = 244.73, p < .001) were significantly different
across situations. In addition, I noticed that ratings of valence tend to be positive, whereas
negative ratings of arousal were found only in situations such as “falling asleep”, “relaxing
at home”, and “waiting”. The highest mean ratings of valence and arousal were observed in
3As music is always present during the activity “just listening to your selected music”, participants’ ratingsfor this activity were not considered for further analysis of emotional associations with and without the presenceof music.
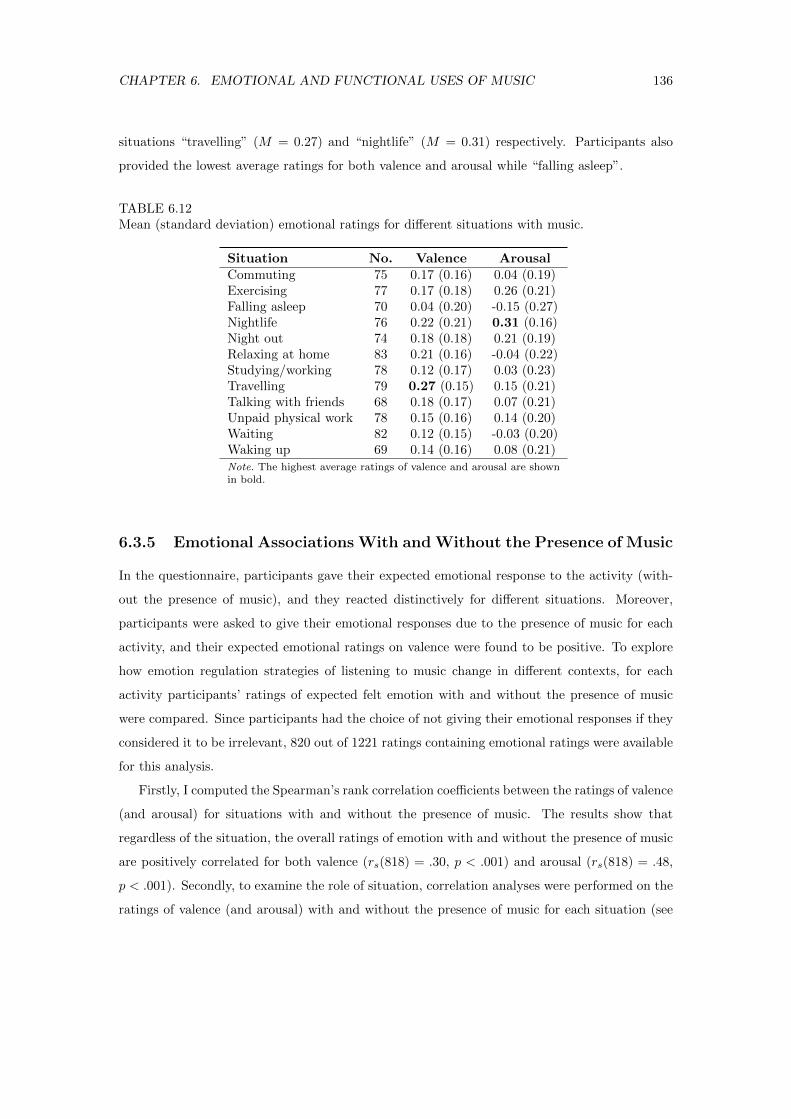
CHAPTER 6. EMOTIONAL AND FUNCTIONAL USES OF MUSIC 136
situations “travelling” (M = 0.27) and “nightlife” (M = 0.31) respectively. Participants also
provided the lowest average ratings for both valence and arousal while “falling asleep”.
TABLE 6.12Mean (standard deviation) emotional ratings for different situations with music.
Situation No. Valence ArousalCommuting 75 0.17 (0.16) 0.04 (0.19)Exercising 77 0.17 (0.18) 0.26 (0.21)Falling asleep 70 0.04 (0.20) -0.15 (0.27)Nightlife 76 0.22 (0.21) 0.31 (0.16)Night out 74 0.18 (0.18) 0.21 (0.19)Relaxing at home 83 0.21 (0.16) -0.04 (0.22)Studying/working 78 0.12 (0.17) 0.03 (0.23)Travelling 79 0.27 (0.15) 0.15 (0.21)Talking with friends 68 0.18 (0.17) 0.07 (0.21)Unpaid physical work 78 0.15 (0.16) 0.14 (0.20)Waiting 82 0.12 (0.15) -0.03 (0.20)Waking up 69 0.14 (0.16) 0.08 (0.21)Note. The highest average ratings of valence and arousal are shownin bold.
6.3.5 Emotional Associations With and Without the Presence of Music
In the questionnaire, participants gave their expected emotional response to the activity (with-
out the presence of music), and they reacted distinctively for different situations. Moreover,
participants were asked to give their emotional responses due to the presence of music for each
activity, and their expected emotional ratings on valence were found to be positive. To explore
how emotion regulation strategies of listening to music change in different contexts, for each
activity participants’ ratings of expected felt emotion with and without the presence of music
were compared. Since participants had the choice of not giving their emotional responses if they
considered it to be irrelevant, 820 out of 1221 ratings containing emotional ratings were available
for this analysis.
Firstly, I computed the Spearman’s rank correlation coefficients between the ratings of valence
(and arousal) for situations with and without the presence of music. The results show that
regardless of the situation, the overall ratings of emotion with and without the presence of music
are positively correlated for both valence (rs(818) = .30, p < .001) and arousal (rs(818) = .48,
p < .001). Secondly, to examine the role of situation, correlation analyses were performed on the
ratings of valence (and arousal) with and without the presence of music for each situation (see
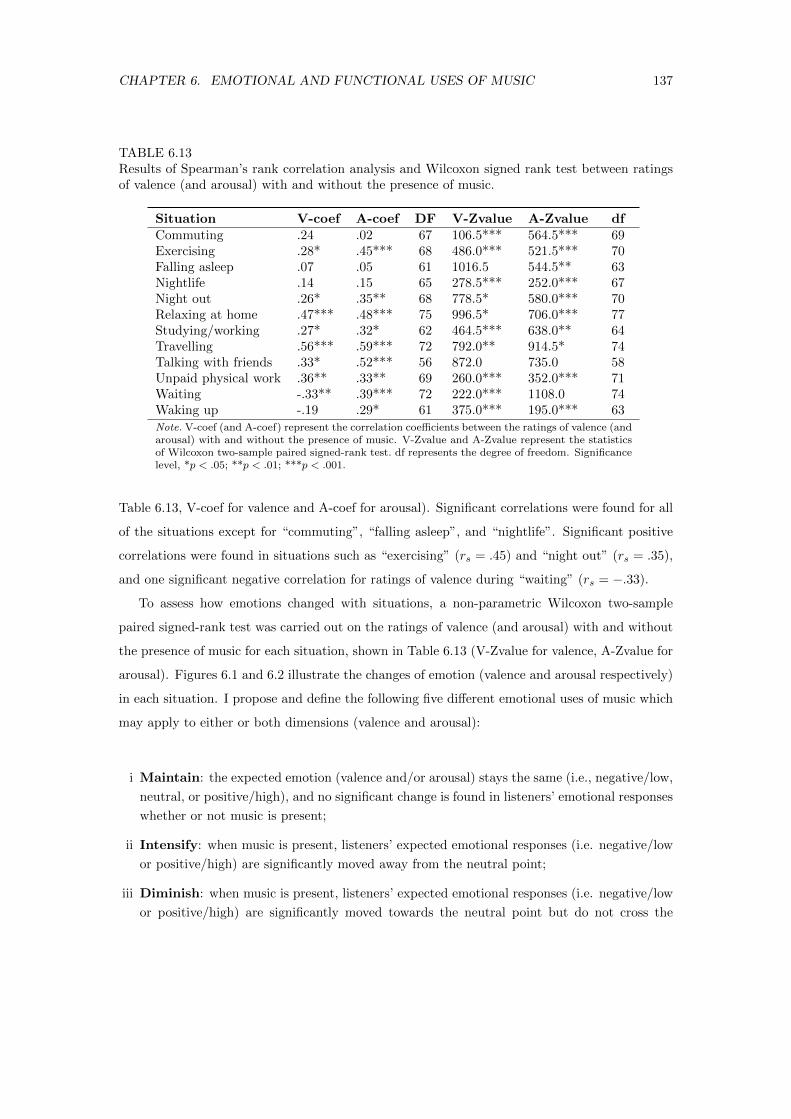
CHAPTER 6. EMOTIONAL AND FUNCTIONAL USES OF MUSIC 137
TABLE 6.13Results of Spearman’s rank correlation analysis and Wilcoxon signed rank test between ratingsof valence (and arousal) with and without the presence of music.
Situation V-coef A-coef DF V-Zvalue A-Zvalue dfCommuting .24 .02 67 106.5*** 564.5*** 69Exercising .28* .45*** 68 486.0*** 521.5*** 70Falling asleep .07 .05 61 1016.5 544.5** 63Nightlife .14 .15 65 278.5*** 252.0*** 67Night out .26* .35** 68 778.5* 580.0*** 70Relaxing at home .47*** .48*** 75 996.5* 706.0*** 77Studying/working .27* .32* 62 464.5*** 638.0** 64Travelling .56*** .59*** 72 792.0** 914.5* 74Talking with friends .33* .52*** 56 872.0 735.0 58Unpaid physical work .36** .33** 69 260.0*** 352.0*** 71Waiting -.33** .39*** 72 222.0*** 1108.0 74Waking up -.19 .29* 61 375.0*** 195.0*** 63Note. V-coef (and A-coef) represent the correlation coefficients between the ratings of valence (andarousal) with and without the presence of music. V-Zvalue and A-Zvalue represent the statisticsof Wilcoxon two-sample paired signed-rank test. df represents the degree of freedom. Significancelevel, *p < .05; **p < .01; ***p < .001.
Table 6.13, V-coef for valence and A-coef for arousal). Significant correlations were found for all
of the situations except for “commuting”, “falling asleep”, and “nightlife”. Significant positive
correlations were found in situations such as “exercising” (rs = .45) and “night out” (rs = .35),
and one significant negative correlation for ratings of valence during “waiting” (rs = −.33).
To assess how emotions changed with situations, a non-parametric Wilcoxon two-sample
paired signed-rank test was carried out on the ratings of valence (and arousal) with and without
the presence of music for each situation, shown in Table 6.13 (V-Zvalue for valence, A-Zvalue for
arousal). Figures 6.1 and 6.2 illustrate the changes of emotion (valence and arousal respectively)
in each situation. I propose and define the following five different emotional uses of music which
may apply to either or both dimensions (valence and arousal):
i Maintain: the expected emotion (valence and/or arousal) stays the same (i.e., negative/low,
neutral, or positive/high), and no significant change is found in listeners’ emotional responses
whether or not music is present;
ii Intensify: when music is present, listeners’ expected emotional responses (i.e. negative/low
or positive/high) are significantly moved away from the neutral point;
iii Diminish: when music is present, listeners’ expected emotional responses (i.e. negative/low
or positive/high) are significantly moved towards the neutral point but do not cross the
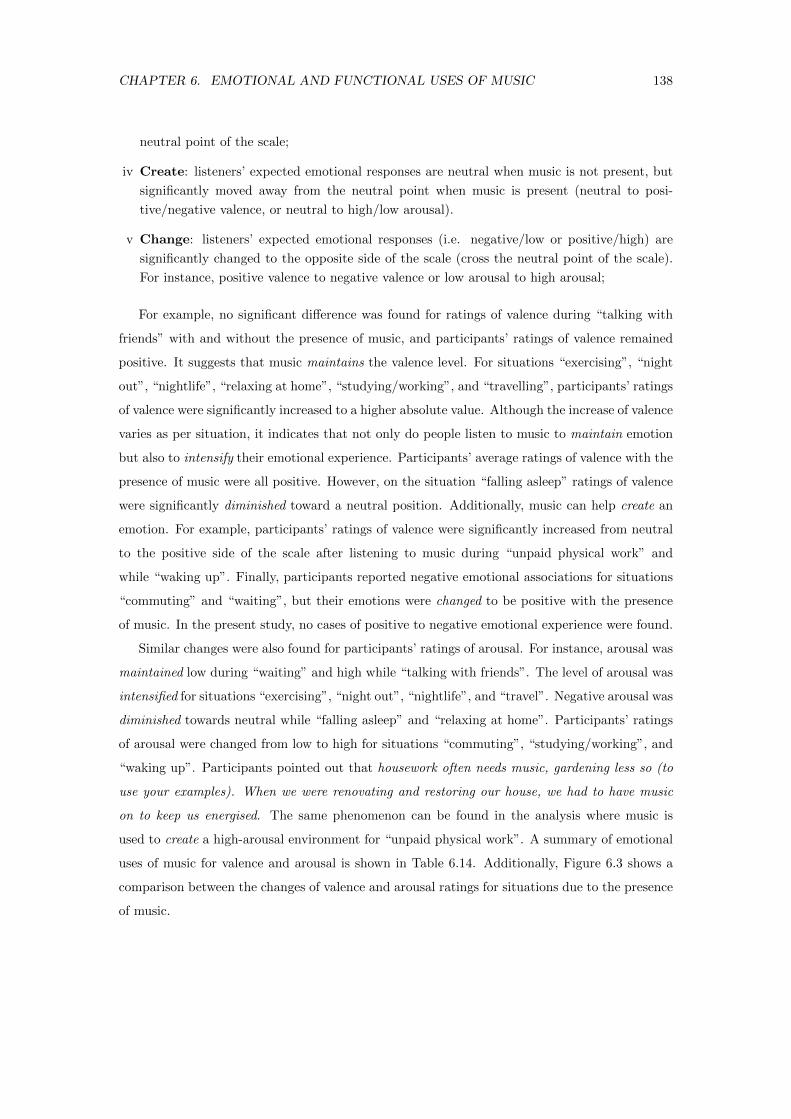
CHAPTER 6. EMOTIONAL AND FUNCTIONAL USES OF MUSIC 138
neutral point of the scale;
iv Create: listeners’ expected emotional responses are neutral when music is not present, but
significantly moved away from the neutral point when music is present (neutral to posi-
tive/negative valence, or neutral to high/low arousal).
v Change: listeners’ expected emotional responses (i.e. negative/low or positive/high) are
significantly changed to the opposite side of the scale (cross the neutral point of the scale).
For instance, positive valence to negative valence or low arousal to high arousal;
For example, no significant difference was found for ratings of valence during “talking with
friends” with and without the presence of music, and participants’ ratings of valence remained
positive. It suggests that music maintains the valence level. For situations “exercising”, “night
out”, “nightlife”, “relaxing at home”, “studying/working”, and “travelling”, participants’ ratings
of valence were significantly increased to a higher absolute value. Although the increase of valence
varies as per situation, it indicates that not only do people listen to music to maintain emotion
but also to intensify their emotional experience. Participants’ average ratings of valence with the
presence of music were all positive. However, on the situation “falling asleep” ratings of valence
were significantly diminished toward a neutral position. Additionally, music can help create an
emotion. For example, participants’ ratings of valence were significantly increased from neutral
to the positive side of the scale after listening to music during “unpaid physical work” and
while “waking up”. Finally, participants reported negative emotional associations for situations
“commuting” and “waiting”, but their emotions were changed to be positive with the presence
of music. In the present study, no cases of positive to negative emotional experience were found.
Similar changes were also found for participants’ ratings of arousal. For instance, arousal was
maintained low during “waiting” and high while “talking with friends”. The level of arousal was
intensified for situations “exercising”, “night out”, “nightlife”, and “travel”. Negative arousal was
diminished towards neutral while “falling asleep” and “relaxing at home”. Participants’ ratings
of arousal were changed from low to high for situations “commuting”, “studying/working”, and
“waking up”. Participants pointed out that housework often needs music, gardening less so (to
use your examples). When we were renovating and restoring our house, we had to have music
on to keep us energised. The same phenomenon can be found in the analysis where music is
used to create a high-arousal environment for “unpaid physical work”. A summary of emotional
uses of music for valence and arousal is shown in Table 6.14. Additionally, Figure 6.3 shows a
comparison between the changes of valence and arousal ratings for situations due to the presence
of music.
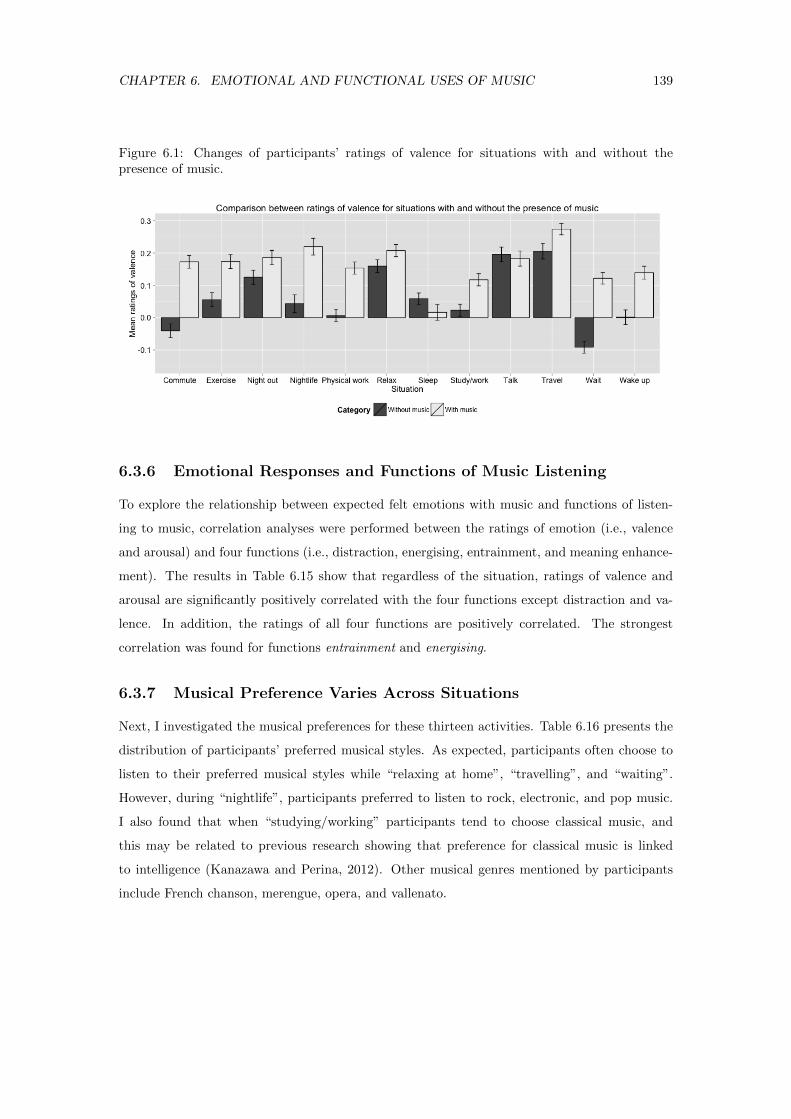
CHAPTER 6. EMOTIONAL AND FUNCTIONAL USES OF MUSIC 139
Figure 6.1: Changes of participants’ ratings of valence for situations with and without thepresence of music.
6.3.6 Emotional Responses and Functions of Music Listening
To explore the relationship between expected felt emotions with music and functions of listen-
ing to music, correlation analyses were performed between the ratings of emotion (i.e., valence
and arousal) and four functions (i.e., distraction, energising, entrainment, and meaning enhance-
ment). The results in Table 6.15 show that regardless of the situation, ratings of valence and
arousal are significantly positively correlated with the four functions except distraction and va-
lence. In addition, the ratings of all four functions are positively correlated. The strongest
correlation was found for functions entrainment and energising.
6.3.7 Musical Preference Varies Across Situations
Next, I investigated the musical preferences for these thirteen activities. Table 6.16 presents the
distribution of participants’ preferred musical styles. As expected, participants often choose to
listen to their preferred musical styles while “relaxing at home”, “travelling”, and “waiting”.
However, during “nightlife”, participants preferred to listen to rock, electronic, and pop music.
I also found that when “studying/working” participants tend to choose classical music, and
this may be related to previous research showing that preference for classical music is linked
to intelligence (Kanazawa and Perina, 2012). Other musical genres mentioned by participants
include French chanson, merengue, opera, and vallenato.
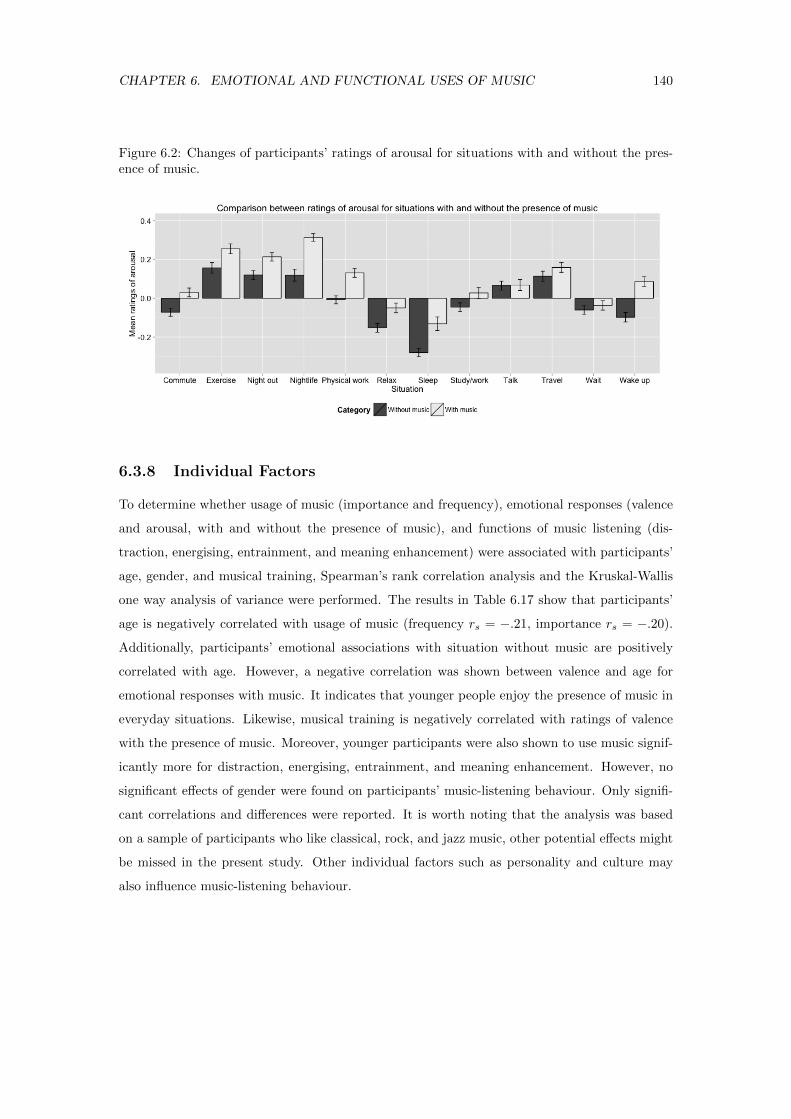
CHAPTER 6. EMOTIONAL AND FUNCTIONAL USES OF MUSIC 140
Figure 6.2: Changes of participants’ ratings of arousal for situations with and without the pres-ence of music.
6.3.8 Individual Factors
To determine whether usage of music (importance and frequency), emotional responses (valence
and arousal, with and without the presence of music), and functions of music listening (dis-
traction, energising, entrainment, and meaning enhancement) were associated with participants’
age, gender, and musical training, Spearman’s rank correlation analysis and the Kruskal-Wallis
one way analysis of variance were performed. The results in Table 6.17 show that participants’
age is negatively correlated with usage of music (frequency rs = −.21, importance rs = −.20).
Additionally, participants’ emotional associations with situation without music are positively
correlated with age. However, a negative correlation was shown between valence and age for
emotional responses with music. It indicates that younger people enjoy the presence of music in
everyday situations. Likewise, musical training is negatively correlated with ratings of valence
with the presence of music. Moreover, younger participants were also shown to use music signif-
icantly more for distraction, energising, entrainment, and meaning enhancement. However, no
significant effects of gender were found on participants’ music-listening behaviour. Only signifi-
cant correlations and differences were reported. It is worth noting that the analysis was based
on a sample of participants who like classical, rock, and jazz music, other potential effects might
be missed in the present study. Other individual factors such as personality and culture may
also influence music-listening behaviour.
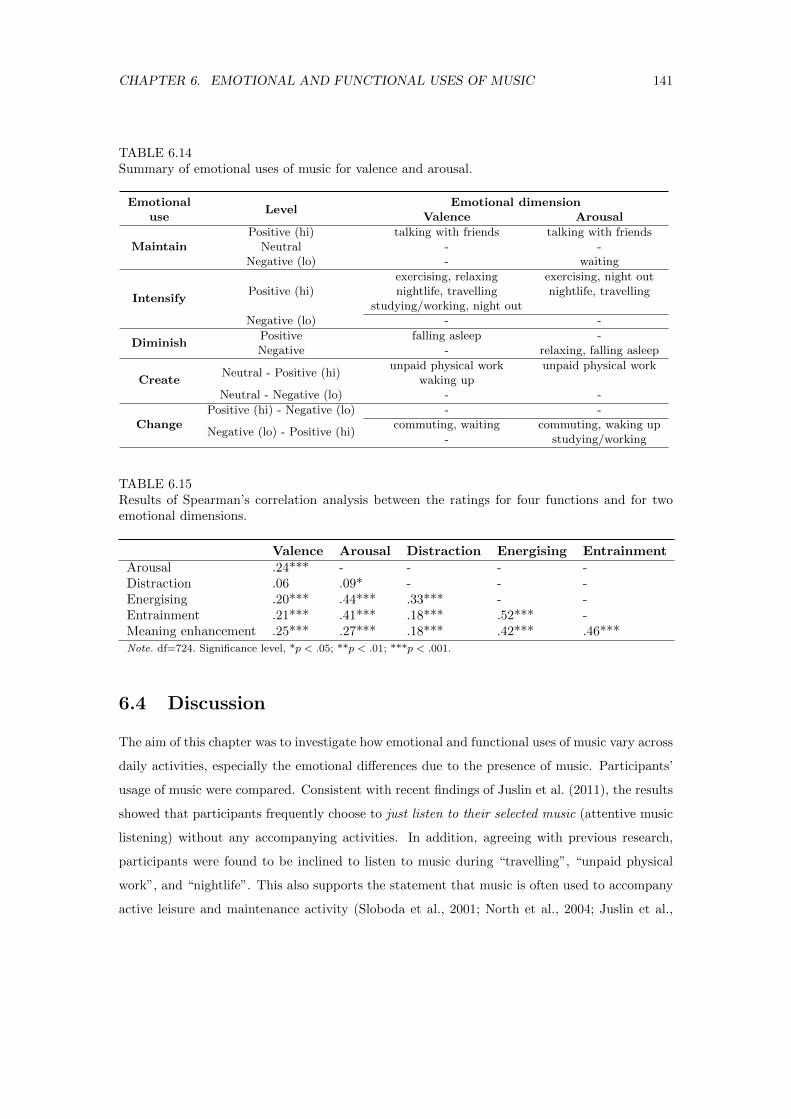
CHAPTER 6. EMOTIONAL AND FUNCTIONAL USES OF MUSIC 141
TABLE 6.14Summary of emotional uses of music for valence and arousal.
EmotionalLevel
Emotional dimensionuse Valence Arousal
MaintainPositive (hi) talking with friends talking with friends
Neutral - -Negative (lo) - waiting
IntensifyPositive (hi)
exercising, relaxing exercising, night outnightlife, travelling nightlife, travelling
studying/working, night outNegative (lo) - -
DiminishPositive falling asleep -Negative - relaxing, falling asleep
CreateNeutral - Positive (hi)
unpaid physical work unpaid physical workwaking up
Neutral - Negative (lo) - -
ChangePositive (hi) - Negative (lo) - -
Negative (lo) - Positive (hi)commuting, waiting commuting, waking up
- studying/working
TABLE 6.15Results of Spearman’s correlation analysis between the ratings for four functions and for twoemotional dimensions.
Valence Arousal Distraction Energising EntrainmentArousal .24*** - - - -Distraction .06 .09* - - -Energising .20*** .44*** .33*** - -Entrainment .21*** .41*** .18*** .52*** -Meaning enhancement .25*** .27*** .18*** .42*** .46***Note. df=724. Significance level, *p < .05; **p < .01; ***p < .001.
6.4 Discussion
The aim of this chapter was to investigate how emotional and functional uses of music vary across
daily activities, especially the emotional differences due to the presence of music. Participants’
usage of music were compared. Consistent with recent findings of Juslin et al. (2011), the results
showed that participants frequently choose to just listen to their selected music (attentive music
listening) without any accompanying activities. In addition, agreeing with previous research,
participants were found to be inclined to listen to music during “travelling”, “unpaid physical
work”, and “nightlife”. This also supports the statement that music is often used to accompany
active leisure and maintenance activity (Sloboda et al., 2001; North et al., 2004; Juslin et al.,
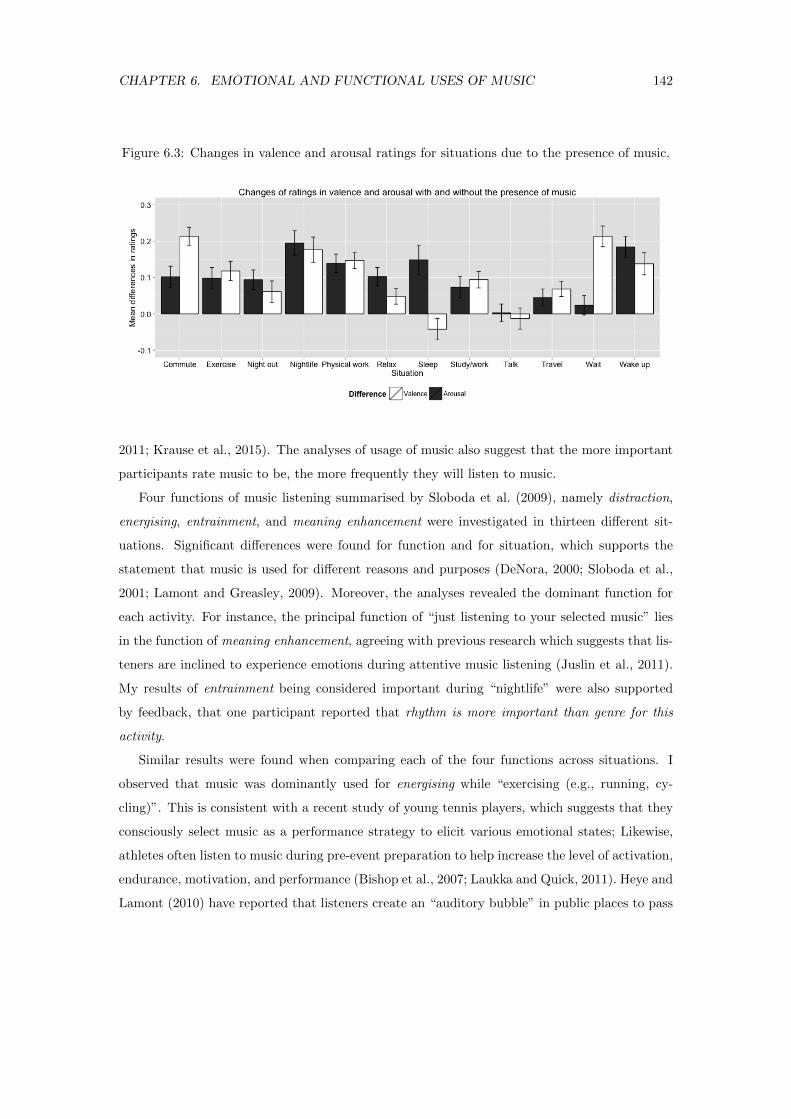
CHAPTER 6. EMOTIONAL AND FUNCTIONAL USES OF MUSIC 142
Figure 6.3: Changes in valence and arousal ratings for situations due to the presence of music.
2011; Krause et al., 2015). The analyses of usage of music also suggest that the more important
participants rate music to be, the more frequently they will listen to music.
Four functions of music listening summarised by Sloboda et al. (2009), namely distraction,
energising, entrainment, and meaning enhancement were investigated in thirteen different sit-
uations. Significant differences were found for function and for situation, which supports the
statement that music is used for different reasons and purposes (DeNora, 2000; Sloboda et al.,
2001; Lamont and Greasley, 2009). Moreover, the analyses revealed the dominant function for
each activity. For instance, the principal function of “just listening to your selected music” lies
in the function of meaning enhancement, agreeing with previous research which suggests that lis-
teners are inclined to experience emotions during attentive music listening (Juslin et al., 2011).
My results of entrainment being considered important during “nightlife” were also supported
by feedback, that one participant reported that rhythm is more important than genre for this
activity.
Similar results were found when comparing each of the four functions across situations. I
observed that music was dominantly used for energising while “exercising (e.g., running, cy-
cling)”. This is consistent with a recent study of young tennis players, which suggests that they
consciously select music as a performance strategy to elicit various emotional states; Likewise,
athletes often listen to music during pre-event preparation to help increase the level of activation,
endurance, motivation, and performance (Bishop et al., 2007; Laukka and Quick, 2011). Heye and
Lamont (2010) have reported that listeners create an “auditory bubble” in public places to pass
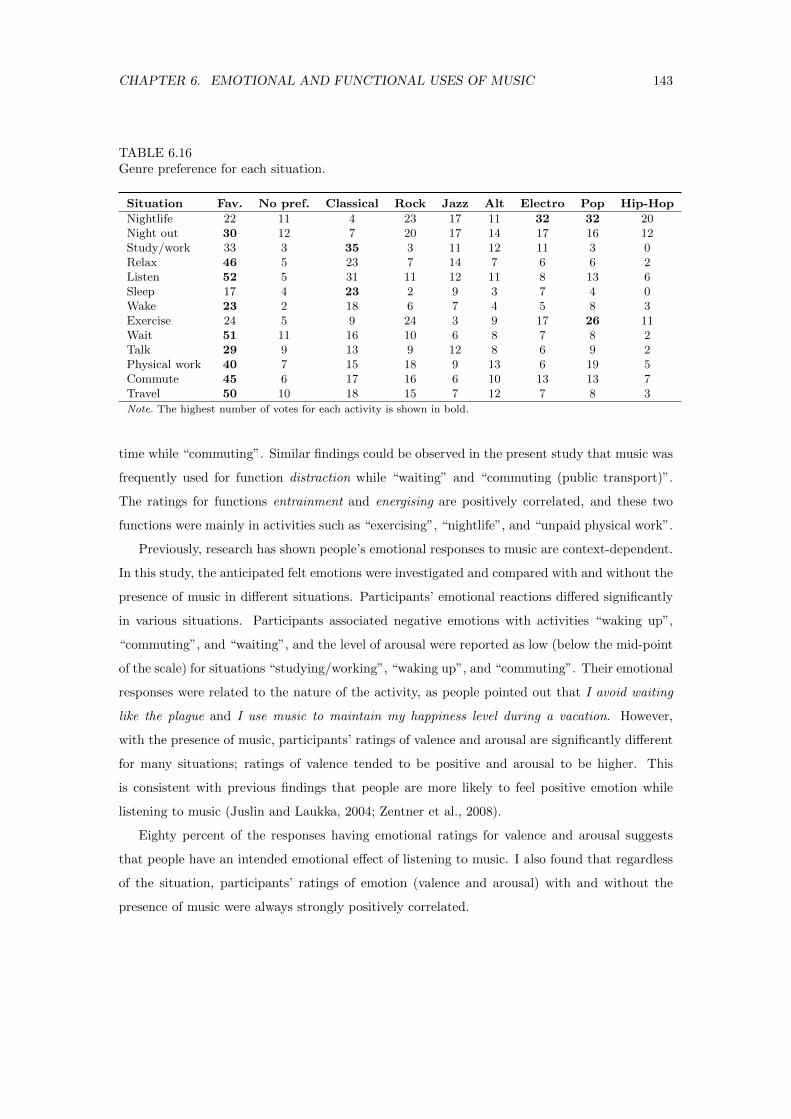
CHAPTER 6. EMOTIONAL AND FUNCTIONAL USES OF MUSIC 143
TABLE 6.16Genre preference for each situation.
Situation Fav. No pref. Classical Rock Jazz Alt Electro Pop Hip-Hop
Nightlife 22 11 4 23 17 11 32 32 20Night out 30 12 7 20 17 14 17 16 12Study/work 33 3 35 3 11 12 11 3 0Relax 46 5 23 7 14 7 6 6 2Listen 52 5 31 11 12 11 8 13 6Sleep 17 4 23 2 9 3 7 4 0Wake 23 2 18 6 7 4 5 8 3Exercise 24 5 9 24 3 9 17 26 11Wait 51 11 16 10 6 8 7 8 2Talk 29 9 13 9 12 8 6 9 2Physical work 40 7 15 18 9 13 6 19 5Commute 45 6 17 16 6 10 13 13 7Travel 50 10 18 15 7 12 7 8 3
Note. The highest number of votes for each activity is shown in bold.
time while “commuting”. Similar findings could be observed in the present study that music was
frequently used for function distraction while “waiting” and “commuting (public transport)”.
The ratings for functions entrainment and energising are positively correlated, and these two
functions were mainly in activities such as “exercising”, “nightlife”, and “unpaid physical work”.
Previously, research has shown people’s emotional responses to music are context-dependent.
In this study, the anticipated felt emotions were investigated and compared with and without the
presence of music in different situations. Participants’ emotional reactions differed significantly
in various situations. Participants associated negative emotions with activities “waking up”,
“commuting”, and “waiting”, and the level of arousal were reported as low (below the mid-point
of the scale) for situations “studying/working”, “waking up”, and “commuting”. Their emotional
responses were related to the nature of the activity, as people pointed out that I avoid waiting
like the plague and I use music to maintain my happiness level during a vacation. However,
with the presence of music, participants’ ratings of valence and arousal are significantly different
for many situations; ratings of valence tended to be positive and arousal to be higher. This
is consistent with previous findings that people are more likely to feel positive emotion while
listening to music (Juslin and Laukka, 2004; Zentner et al., 2008).
Eighty percent of the responses having emotional ratings for valence and arousal suggests
that people have an intended emotional effect of listening to music. I also found that regardless
of the situation, participants’ ratings of emotion (valence and arousal) with and without the
presence of music were always strongly positively correlated.
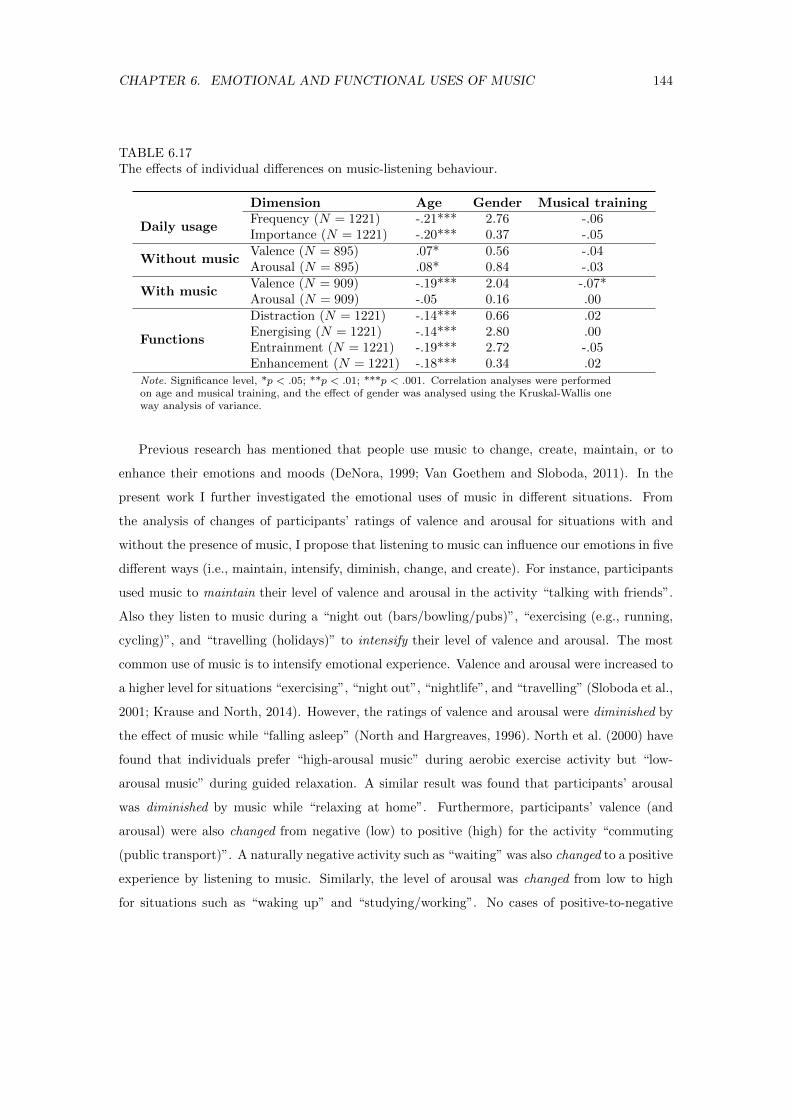
CHAPTER 6. EMOTIONAL AND FUNCTIONAL USES OF MUSIC 144
TABLE 6.17The effects of individual differences on music-listening behaviour.
Dimension Age Gender Musical training
Daily usageFrequency (N = 1221) -.21*** 2.76 -.06Importance (N = 1221) -.20*** 0.37 -.05
Without musicValence (N = 895) .07* 0.56 -.04Arousal (N = 895) .08* 0.84 -.03
With musicValence (N = 909) -.19*** 2.04 -.07*Arousal (N = 909) -.05 0.16 .00
Functions
Distraction (N = 1221) -.14*** 0.66 .02Energising (N = 1221) -.14*** 2.80 .00Entrainment (N = 1221) -.19*** 2.72 -.05Enhancement (N = 1221) -.18*** 0.34 .02
Note. Significance level, *p < .05; **p < .01; ***p < .001. Correlation analyses were performedon age and musical training, and the effect of gender was analysed using the Kruskal-Wallis oneway analysis of variance.
Previous research has mentioned that people use music to change, create, maintain, or to
enhance their emotions and moods (DeNora, 1999; Van Goethem and Sloboda, 2011). In the
present work I further investigated the emotional uses of music in different situations. From
the analysis of changes of participants’ ratings of valence and arousal for situations with and
without the presence of music, I propose that listening to music can influence our emotions in five
different ways (i.e., maintain, intensify, diminish, change, and create). For instance, participants
used music to maintain their level of valence and arousal in the activity “talking with friends”.
Also they listen to music during a “night out (bars/bowling/pubs)”, “exercising (e.g., running,
cycling)”, and “travelling (holidays)” to intensify their level of valence and arousal. The most
common use of music is to intensify emotional experience. Valence and arousal were increased to
a higher level for situations “exercising”, “night out”, “nightlife”, and “travelling” (Sloboda et al.,
2001; Krause and North, 2014). However, the ratings of valence and arousal were diminished by
the effect of music while “falling asleep” (North and Hargreaves, 1996). North et al. (2000) have
found that individuals prefer “high-arousal music” during aerobic exercise activity but “low-
arousal music” during guided relaxation. A similar result was found that participants’ arousal
was diminished by music while “relaxing at home”. Furthermore, participants’ valence (and
arousal) were also changed from negative (low) to positive (high) for the activity “commuting
(public transport)”. A naturally negative activity such as “waiting” was also changed to a positive
experience by listening to music. Similarly, the level of arousal was changed from low to high
for situations such as “waking up” and “studying/working”. No cases of positive-to-negative
CHAPTER 6. EMOTIONAL AND FUNCTIONAL USES OF MUSIC 145
change were found. I have discussed in Chapter 5 that people associate high valence and arousal
with doing housework with music. Although participants reported neutral with activity “unpaid
physical work (e.g. housework, gardening)”, a positive valence and high arousal was created by
listening to music. A general increasing tendency for valence and arousal were observed with the
presence of music, but the changes varied across situations.
The study of emotional and functional uses of music showed that ratings of valence and
arousal were significantly correlated with four functions of music listening. Ratings of valence
were most strongly correlated with function meaning enhancement, whereas ratings of arousal
were most positively correlated with functions energising and entrainment. Musical preference
was then investigated with situations. The results suggest that people generally choose to listen
to their preferred music styles in most daily activities. However, people tended to listen to rock,
electronic, pop, and hip-hop during “nightlife”. People are also more likely to listen to classical
music while “studying/working”. Possible explanations could be that preference for classical
music might be related to one’s intelligence, and listening to classical music could help focus and
increase performance (Schafer and Sedlmeier, 2009; Kanazawa and Perina, 2012). Although the
preference of music styles might be correlated with functions of music (North and Hargreaves,
2007a; Getz et al., 2010; Schafer et al., 2013; Krause and North, 2014) and emotion (Rentfrow
et al., 2011a; Eerola, 2011), it is beyond the scope of this study.
Lastly, individual analysis showed that participants’ music-listening behaviour is not affected
by gender or musical training. Similar to the findings in Chapter 5, younger participants are
likely to use music more frequently, and they would react to music more positively. People’s
music-listening behaviour and emotional responses are also influenced by other factors such as
personality, current mood, culture, and familiarity (Krohne, 2003; Schubert, 2007b; Delsing et al.,
2008), therefore, future studies are encouraged to investigate these factors.
In summary, this Chapter investigated the emotional and functional uses of music, and ex-
tended the existing research to different contexts. This work agrees with and supports previous
work on music in everyday life. Musical emotions arise in the interaction between the listener, the
music, and the situation (Tarrant et al., 2000; Gabrielsson, 2002; Juslin and Laukka, 2004; Juslin
et al., 2011). Therefore, future study of musical emotions, functions, and musical preference
should consider music-listening contexts. It will also help the design of subjective context-based
music recommendation systems in the future (Song et al., 2012a; Schedl, 2013; Kaminskas et al.,
2013).
Chapter 7
Conclusion and Future Work
Musical emotion has been attentively examined by music psychologists in the past few decades.
Music information retrieval researchers are concerned with computational tasks such as classifi-
cation of music by its emotional content, and emotion- and context-based music recommendation
systems that have emerged only in the last ten years. In this thesis, I have investigated two im-
portant roles in musical preference, namely musical emotion and music-listening context. Back-
ground knowledge on musical emotion and context was provided in Chapters 2 and 3 respectively.
Chapter 4 presented my work on automatic emotion classification of music, the comparison be-
tween perception and induction of music, and the reliability of emotion tags. My work on musical
preference, and emotional and functional uses of music in different music-listening contexts was
then discussed in Chapters 5 and 6. Most of the work presented in this thesis has been published
in or submitted to international peer-reviewed journals and conferences (see Section 1.4).
In this chapter, I summarise the experiments and my research contributions in Section 7.1.
Finally, Section 7.2 proposes a few potential research questions for future studies.
7.1 Summary
This thesis investigated the role of emotion and context in musical preference. My work started
with background knowledge of music and emotion for both psychology and music information
retrieval, described in Chapter 2. Research efforts were discussed in detail to explore different
aspects of musical emotion, and I identified the advantages of collaboration between these two
fields. Psychologists provide a deeper understanding of theoretical background in emotion (e.g.,
forms of emotional processes in relation to music and models of emotion in music), whereas music
information retrieval researchers provide valuable tools to help analyse data relating to musical
146
CHAPTER 7. CONCLUSION AND FUTURE WORK 147
emotions (e.g., machine learning techniques and musical feature extraction).
Previous research has suggested that emotional responses, functions of music listening, and
musical preferences should be studied with their contexts (Juslin and Laukka, 2004; Juslin et al.,
2008; Liljestrom et al., 2012). Few studies have addressed the interactions among these closely
related factors (i.e., functions, emotional responses, musical preferences, and individual differ-
ences) in different situations (Hargreaves et al., 2006; Hargreaves, 2012). In Chapter 3, research
on emotional and functional uses of music was presented. In addition, musical preference and
the music-listening context were discussed.
Chapter 4 presented my work on music and emotion. Emotion tags were collected using
social tags, and musical excerpts were fetched. I provided an emotion data set containing 2904
musical excerpts. This data set has been used throughout my work, and each excerpt was tagged
with one of the four emotions: “happy”, “sad”, “relaxed”, and “angry”. Musical features were
then extracted for those 2904 musical excerpts, and SVMs were applied to classify emotion of
music. The results, however, reached only the accuracy of about 53%. Compared with other
classification tasks such as genre classification and instrument classification of music, emotion
classification of music appears to be still very limited. Therefore, I investigated musical emotions
and the reliability of social tags further using eighty excerpts (see Appendix C) that were ran-
domly selected from emotion data set of the 2904 musical excerpts. The results of two listening
experiments using the categorical model and dimensional model showed that four basic emotions
(i.e., happy, sad, relaxed, and angry) better capture the emotions that are expressed in music
than those induced by music. Emotions such as “happy” and “angry” were easier to recognise
than “sad” and “relaxed”. Additionally, a positive relationship between induced and perceived
emotion was found to be the most frequent one. Although the agreement between social tags
and participants’ ratings was well above chance, the excerpts labelled with “relaxed” had the
lowest agreement with tags. Moreover, I collected a participant-suggested emotion data set of
207 tracks covering four emotions of both perceived and induced emotion (see Appendix E).
Assuming these 207 participant-suggested tracks represent people’s emotional experience better,
these tracks were used to train my MER system with SVMs and random forests. Then the 80
excerpts were tested by my MER system, and the classification results were compared with par-
ticipants’ responses. I found that consistent emotional responses were more likely to be correctly
predicted by the music emotion recognition systems.
Musical emotion is known to be context-dependent. However, as I discovered in Chapter 3,
existing research has paid little attention to the context, in which music is listened to. The
CHAPTER 7. CONCLUSION AND FUTURE WORK 148
emotional responses to music and functions of music listening were addressed in Chapter 5. A
questionnaire was designed to measure three factors (i.e., emotional responses to music, func-
tions, and musical preferences) in 20 different situations. Four recurring functions, distraction,
energising, entrainment, and meaning enhancement were compared. The analyses suggest that
reasons for listening to music vary with music-listening contexts. In addition, emotional re-
sponses were distributed widely across the full range of arousal on a two-dimensional model of
emotion, whereas valence ratings tended to be positive.
Chapter 5 supported previous studies and extended the existing research to different contexts.
Finally in Chapter 6, I further investigated the emotional responses with and without the presence
of music in thirteen music-listening situations. Participants’ emotional responses were found to
relate to the nature of the activity. With the presence of music, I reported 5 different emotional
uses of music, namely to maintain, intensify, diminish, change, and to create.
7.2 Future Directions
During the process of undertaking the research for this thesis, several research ideas for extensions
and applications of this work arose. I propose seven potential directions for future research.
7.2.1 Continuous Emotion Prediction in Music
Emotion, like music, is dynamic and it may change and evolve continuously. The majority of
emotion research in MIR is aimed at recognising emotion using 30/60-second audio previews, yet
the changes of emotion in the whole piece are often neglected (Ogihara, 2004; Trohidis et al., 2008;
Terrell et al., 2012; Flexer et al., 2012). For future study of emotion in music, it is recommended
to use longer audio clips or the whole piece, to explore how emotion is formed and changed during
music listening. Additionally, more research on building continuous music emotion prediction
systems using the two models of emotion is also encouraged.
7.2.2 Cultural Dependence of Perception and Induction of Emotion in
Music
The perception of music emotion is known to be culture-dependent. A wealth of research has
focussed on cross-cultural studies in music and emotion (Fritz et al., 2009; Hu and Kando, 2012).
In previous studies, research has suggested that individual differences such as culture may affect
CHAPTER 7. CONCLUSION AND FUTURE WORK 149
the perception of emotion in music. In this thesis, results from two listening experiments showed
different relationships (i.e., positive, negative, no systematic, undecided, and no relationship)
between the perception and induction of music. Over half of the musical excerpts had a positive
relationship, but the reasons for these relationships were still unclear. One possible reason could
be that the study was conducted using Western popular music; although all the participants
understood English, they had a different cultural background. I suggest that future studies
could investigate the effects of cultural differences on the perception and induction of music.
7.2.3 Genre-informed Music Emotion Recognition System
As pointed out in Chapter 2, certain genres such as classical and popular music may express spe-
cific emotions (Eerola, 2011). For example, blues is mostly sad and relaxed, whereas pop music
tends to be happy (Laurier, 2011; Kosta et al., 2013). Progress in the development of emotion
recognition systems is difficult. Additionally, how musical emotion is expressed is rarely empir-
ically investigated. With the existing studies on genre classification, the differences in emotion
and genre, and the selection of musical features could be further explored. In addition, music
emotion recognition systems could incorporate genre information to test for an improvement in
recognition accuracy.
7.2.4 Emotional Uses of Music and Musical Preference
In Chapters 5 and 6, the emotional uses of music were investigated. Given different music-
listening activities, I proposed five different emotional uses of music (i.e., maintain, intensify,
diminish, change, and create). However, the results were provided by a sample of participants
who liked classical music. Participants with different stylistic preferences and cultural background
could be selected to validate my results. For each emotional use of music, I also encourage other
researchers to explore its underlying mechanisms.
In this thesis, I investigated musical preference for specific activities. Musical preference
changes over time (Hargreaves et al., 2006; Lamont and Greasley, 2009), and it follows an inverted
U-shaped function of exposure (North and Hargreaves, 1995; Schellenberg et al., 2008). For
future studies, it would be interesting to explore how emotional uses of music can change with
the exposure to music, and how short- and long-term musical preference affect the emotional
uses of music.
CHAPTER 7. CONCLUSION AND FUTURE WORK 150
7.2.5 Musical Emotions Using Psychophysiological Measurements
Because of the subjective experience of music, a self-report format is commonly used in the
study of musical emotion. In recent years, with the development and availability of tools, we
could reliably measure behavioural and physiological reactions such as facial expression, body
language, heart rate, respiration, skin conductance response, and electroencephalograph. These
objective measurements could be conducted in combination with the self-report approach to
provide a deeper understanding and richer evidence of emotional responses.
7.2.6 Musical Feature Analysis of Musical Preferences
In this thesis, I have found that participants’ emotional responses were distributed across the
Valence-Arousal space for different situations. Musical emotions, genres, and instruments can
all be classified into subcategories. Similarly, musical preferences for different situations can also
be classified and categorised. Therefore, as a continuation of my work, it is worth investigating
low-level audio features for modelling musical preferences. For example, studies could focus on
whether people have certain preferences for musical features in different contexts, and how they
are associated with emotional responses. More importantly, the study of contextual information
may further improve accuracy of emotion classification of music.
7.2.7 The Design of Subjective Music Recommendation Systems
The development of music recommendation systems has gained increasing attention in the MIR
community. Existing approaches such as metadata-based models (e.g., keywords, song title,
and artist’s name), collaborative filtering (CF), and content-based models (CBM) have achieved
some success in music recommendation system technology. However, their drawbacks such as
popularity bias and human effort seem to be obvious. For example, popular music can get
more ratings. The music in “long tail”1, however, can rarely get any (Celma, 2009; Schnitzer
et al., 2011). As a result, collaborative filtering2 mainly recommends popular music to listeners.
Though giving popular items could meet some users’ needs, it is still risky, since the user rarely
gets pleasantly surprised. In addition, a perfect recommendation system should not involve too
much human effort, since the users are not always willing to rate songs. The ratings may also
1The “long tail” includes unknown artists and songs where barely any information can be found.2It assumes that if user X and Y rate items similarly or have similar behaviour, they will rate or act on other
items similarly.
CHAPTER 7. CONCLUSION AND FUTURE WORK 151
grow towards those who do rate, but it may not be representative of the overall population.
Because of this absence of evenly distributed ratings, recommendation systems can either give
users false negative or false positive results.
The experience of music is highly subjective. In recent years, there has been a tendency
for music recommendation systems to have a more personalised design. Only considering the
music itself, human ratings are no longer sufficient. Emotion and context, as two important
factors in musical preference, have been proposed as ingredients of a human-centred approach
to music recommendation. Due to the lack of empirical data, the research is still at an early
stage. One future application would be focussing on the development of subjective design of
music recommendation systems using affective (emotion-based music recommendation systems)
and contextual information (context-based music recommendation systems). These two features
can also be integrated directly into existing content-based models using musical features (Song
et al., 2012a).
References
Alm, C. O., Roth, D., and Sproat, R. (2005). Emotions from text: Machine learning for text-
based emotion prediction. In Proceedings of Human Language Technology Conference and
Conference on Empirical Methods in Natural Language Processing (HLT/EMNLP), pages 579–
586. Association for Computational Linguistics.
Altenmuller, E., Schurmann, K., Lim, V. K., and Parlitz, D. (2002). Hits to the left, flops to
the right: Different emotions during listening to music are reflected in cortical lateralisation
patterns. Neuropsychologia, 40(13):2242–2256.
Ames, M. and Naaman, M. (2007). Why we tag: Motivations for annotation in mobile and online
media. In Proceedings of the SIGCHI Conference on Human Factors in Computing Systems,
pages 971–980, San Jose, California, USA.
Aucouturier, J. J. and Bigand, E. (2012). Mel Cepstrum & Ann Ova: The difficult dialog
between MIR and music cognition. In Proceedings of the 13th International Society for Music
Information Retrieval Conference (ISMIR), pages 397–402, Porto, Portugal.
Aucouturier, J. J. and Bigand, E. (2013). Seven problems that keep MIR from attracting the
interest of cognition and neuroscience. Journal of Intelligent Information Systems, 41(3):483–
497.
Baldari, C., Macone, D., Bonavolonata, V., and Guidetti, L. (2010). Effects of music during
exercise. Journal of Sports Medicine and Physical Fitness, 50(3):281–287.
Balkwill, L. and Thompson, W. (1999). A cross-cultural investigation of the perception of
emotion in music: Psychophysical and cultural cues. Music Perception: An Interdisciplinary
Journal, 17(1):43–64.
Baumgartner, T., Esslen, M., and Jancke, L. (2006). From emotion perception to emotion
experience: Emotions evoked by pictures and classical music. International Journal of Psy-
chophysiology, 60(1):34–43.
152
REFERENCES 153
Behne, K. E. (1997). The development of ‘musikerleben’ in adolescence: How and why young
people listen to music. In Deliege, I. and Sloboda, J., editors, Perception and Cognition of
Music, pages 143–159. Psychology Press.
Beveridge, S. and Knox, D. (2012). A feature survey for emotion classification of Western popular
music. In Proceedings of the 9th International Symposium on Computer Music Modeling and
Retrieval (CMMR), pages 508–517, London, United Kingdom.
Bigand, E., Vieillard, S., Madurell, F., Marozeau, J., and Dacquet, A. (2005). Multidimensional
scaling of emotional responses to music: The effect of musical expertise and of the duration of
the excerpts. Cognition & Emotion, 19(8):1113–1139.
Bischoff, K., S. Firan, C., Paiu, R., Nejdl, W., Laurier, C., and Sordo, M. (2009). Music mood
and theme classification - A hybrid approach. In Proceedings of the 10th International Society
for Music Information Retrieval Conference (ISMIR), pages 657–662, Kobe, Japan.
Bishop, D. T., Karageorghis, C. I., and Loizou, G. (2007). A grounded theory of young tennis
players use of music to manipulate emotional state. Journal of Sport & Exercise Psychology,
29(5):584–607.
Boer, D. and Fischer, R. (2011). Towards a holistic model of functions of music listening across
cultures: A culturally decentred qualitative approach. Psychology of Music, 40(2):179–200.
Bonneville-Roussy, A., Rentfrow, P. J., Xu, M. K., and Potter, J. (2013). Music through the ages:
Trends in musical engagement and preferences from adolescence through middle adulthood.
Journal of Personality and Social Psychology, 105(4):703–17.
Boser, B. E., Guyon, M. I., and Vapnik, V. N. (1992). A training algorithm for optimal margin
classifiers. In Proceedings of the 5th Annual Workshop on Computational Learning Theory,
pages 144–152.
Bradley, M. M. and Lang, P. J. (1999). Affective norms for English words (ANEW): Instruction
manual and affective ratings. Technical report, The Center for Research in Psychophysiology,
University of Florida, USA.
Breckler, S. J., Allen, R. B., and Konezni, V. J. (1985). Mood-optimizing strategies in aesthetic-
choice behavior. Music Perception: An Interdisciplinary Journal, 2(4):459–470.
REFERENCES 154
Brody, L. R. and Hall, J. A. (2008). Gender and emotion in context. In Lewis, M., Haviland-
Jones, J. M., and Feldman Barrett, L., editors, Handbook of Emotions, chapter 24, pages
395–408. The Guiford Press, New York, USA, 3rd edition.
Casey, M. A., Veltkamp, R., Goto, M., Leman, M., Rhodes, C., and Slaney, M. (2008). Content-
based music information retrieval: Current directions and future challenges. Proceedings of
the IEEE, 96(4):668–696.
Castro, S. L. and Lima, C. F. (2014). Age and musical expertise influence emotion recognition
in music. Music Perception: An Interdisciplinary Journal, 32(2):125–142.
Celma, O. (2006). FOAFing the music: Bridging the semantic gap in music recommendation.
In Proceedings of the 5th International Semantic Web Conference (ISWC), pages 927–934,
Athens, GA, USA.
Celma, O. (2009). Music recommendation and discovery in the long tail. PhD thesis, Universitat
Pompeu Fabra.
Chamorro-Premuzic, T. and Furnham, A. (2007). Personality and music: Can traits explain how
people use music in everyday life? British Journal of Psychology, 98(2):175–185.
Chamorro-Premuzic, T., Swami, V., and Cermakova, B. (2010). Individual differences in mu-
sic consumption are predicted by uses of music and age rather than emotional intelligence,
neuroticism, extraversion or openness. Psychology of Music, 40(3):285–300.
Charles, S. T., Reynolds, C. A., and Gatz, M. (2001). Age-related differences and change in
positive and negative affect over 23 years. Journal of Personality and Social Psychology,
80(1):136–151.
Chin, T. and Rickard, N. S. (2013). Emotion regulation strategy mediates both positive and
negative relationships between music uses and well-being. Psychology of Music, 42:692–713.
Collier, G. L. (2007). Beyond valence and activity in the emotional connotations of music.
Psychology of Music, 35(1):110–131.
Cover, T. M. and Hart, P. E. (1967). Nearest neighbor pattern classification. IEEE Transactions
on Information Theory, 13(1):21–27.
Csikszentmihalyi, M. and LeFevre, J. (1989). Optimal experience in work and leisure. Journal
of Personality and Social Psychology, 56(5):815–822.
REFERENCES 155
Dalla Bella, S., Peretz, I., Rousseau, L., and Gosselin, N. (2001). A developmental study of the
affective value of tempo and mode in music. Cognition, 80(3):B1–10.
Darwin, C. (1872). The expression of the emotions in man and animals. John Murray, London,
United Kingdom.
Delsing, M. J. M. H., Ter Bogt, T. F. M. T., Engels, R. C. M. E., and Meeus, W. H. J.
(2008). Adolescents’ music preferences and personality characteristics. European Journal of
Personality, 22:109–130.
DeNora, T. (1999). Music as a technology of the self. Poetics, 27:31–56.
DeNora, T. (2000). Music in Everyday Life. Cambridge University Press, Cambridge, United
Kingdom.
Dixon, S., Goebl, W., and Cambouropoulos, E. (2006). Perceptual smoothness of tempo in
expressively performed music. Music Perception, 23(3):195–214.
Downie, J. S. and Cunningham, S. J. (2005). Challenges in cross-cultural/multilingual music
information seeking. In Proceedings of the 6th International Conference on Music Information
Retrieval (ISMIR), pages 1–7, London, United Kingdom.
Eck, D., Lamere, P., Bertin-Mahieux, T., and Green, S. (2007). Automatic generation of so-
cial tags for music recommendation. In Advances in Neural Information Processing Systems
(NIPS), pages 385–392.
Eerola, T. (2011). Are the emotions expressed in music genre-specific? An audio-based evaluation
of datasets spanning classical, film, pop and mixed genres. Journal of New Music Research,
40(4):349–366.
Eerola, T. (2013). Modelling emotional effects of music: Key areas of improvement. In Proceedings
of the Sound and Music Computing Conference (SMC), pages 269–276, Stockholm, Sweden.
Eerola, T., Himberg, T., Toiviainen, P., and Louhivuori, J. (2006). Perceived complexity of
western and African folk melodies by western and African listeners. Psychology of Music,
34(3):337–371.
Eerola, T., Lartillot, O., and Toiviainen, P. (2009). Prediction of multidimensional emotional
ratings in music from audio using multivariate regression models. In Proceedings of the 10th
REFERENCES 156
International Society for Music Information Retrieval Conference (ISMIR), pages 621–626,
Kobe, Japan.
Eerola, T. and Vuoskoski, J. K. (2010). A comparison of the discrete and dimensional models of
emotion in music. Psychology of Music, 39(1):18–49.
Eerola, T. and Vuoskoski, J. K. (2013). A review of music and emotion studies: Approaches,
emotion models, and stimuli. Music Perception: An Interdisciplinary Journal, 30(3):307–340.
Egermann, H., Fernando, N., Chuen, L., and McAdams, S. (2015). Music induces universal
emotion-related psychophysiological responses: Comparing Canadian listeners to Congolese
Pygmies. Frontiers in Psychology, 5(January):1–9.
Egermann, H., Pearce, M. T., Wiggins, G. A., and McAdams, S. (2013). Probabilistic models
of expectation violation predict psychophysiological emotional responses to live concert music.
Cognitive, Affective & Behavioral Neuroscience, 13(3):533–553.
Egermann, H., Sutherland, M. E., Grewe, O., Nagel, F., Kopiez, R., and Altenmuller, E. (2011).
Does music listening in a social context alter experience? A physiological and psychological
perspective on emotion. Musicae Scientiae, 15(3):307–323.
Ekman, P. (1992). An argument for basic emotions. Cognition & Emotion, 6(3/4):169–200.
Ekman, P. (1993). Facial expression and emotion. American Psychologist, 48(4):384–392.
Ellis, D. P. W. and Poliner, G. E. (2007). Identifying ‘cover songs’ with chroma features and
dynamic programming beat tracking. In Proceedings of the IEEE International Conference
on Acoustics, Speech and Signal Processing (ICASSP), pages 1429 – 1432, Honolulu, Hawaii,
USA.
Evans, P. and Schubert, E. (2008). Relationships between expressed and felt emotions in music.
Musicae Scientiae, 12(1):75–99.
Fellbaum, C. (1998). WordNet: An Electronic Lexical Database. MIT Press, USA.
Ferrer, R., Eerola, T., and Vuoskoski, J. K. (2012). Enhancing genre-based measures of music
preference by user-defined liking and social tags. Psychology of Music, 41(4):499–518.
Flexer, A., Schnitzer, D., and Schl, J. (2012). A MIREX meta-analysis of hubness in audio music
similarity. In Proceedings of the 13th International Society for Music Information Retrieval
Conference (ISMIR), pages 175–180, Porto, Portugal.
REFERENCES 157
Foster, P., Dixon, S., and Klapuri, A. (2015). Identification of cover songs using information
theoretic measures of similarity. IEEE/ACM Transactions on Audio, Speech and Language
Processing, 23(6):993–1005.
Frijda, N. H., Ekman, P., and Scherer, K. R. (1986). Theory of emotion. In The Emotions.
Cambridge University Press, New York, USA.
Fritz, T., Jentschke, S., Gosselin, N., Sammler, D., Peretz, I., Turner, R., Friederici, A. D., and
Koelsch, S. (2009). Universal recognition of three basic emotions in music. Current Biology,
19(7):573–576.
Fu, Z., Lu, G., Ting, K., and Zhang, D. (2011). A survey of audio-based music classification and
annotation. IEEE Transactions on Multimedia, 13(2):303–319.
Gabrielsson, A. (2002). Emotion perceived and emotion felt: Same or different? Musicae
Scientiae, 5(1):123–147.
Gabrielsson, A. (2010). Strong experiences with music. In Juslin, P. N. and Sloboda, J. A.,
editors, Handbook of Music and Emotion: Theory, Research, Applications, chapter 20, pages
547–574. Oxford University Press, New York, USA.
Gabrielsson, A. and Juslin, P. N. (1996). Emotional expression in music performance: Between
the performer’s intention and the listener’s experience. Psychology of Music, 24(1):68–91.
Gabrielsson, A. and Juslin, P. N. (2003). Emotional expression in music. In Davidson, R. J.,
Scherer, K. R., and Goldsmith, H. H., editors, Handbook of Affective Sciences, pages 503–534.
Oxford University Press, New York, USA.
Gardikiotis, A. and Baltzis, A. (2011). ‘Rock music for myself and justice to the world!’: Musical
identity, values, and music preferences. Psychology of Music, 40(2):143–163.
Getz, L. M., Chamorro-Premuzic, T., Roy, M. M., and Devroop, K. (2010). The relationship
between affect, uses of music, and music preferences in a sample of South African adolescents.
Psychology of Music, 40(2):164–178.
Gomez, P. and Danuser, B. (2004). Affective and physiological responses to environmental noises
and music. International Journal of Psychophysiology, 53(2):91–103.
Gosling, S. D., Rentfrow, P. J., and Swann Jr, W. B. (2003). A very brief measure of the Big-Five
personality domains. Journal of Research in Personality, 37(6):504–528.
REFERENCES 158
Greasley, A. E. and Lamont, A. (2011). Exploring engagement with music in everyday life using
experience sampling methodology. Musicae Scientiae, 15(1):45–71.
Gregory, A. H. and Varney, N. (1996). Cross-cultural comparisons in the affective response to
music. Psychology of Music, 24(1):47–52.
Gross, J. J., Carstensen, L. L., Tsai, J., Skorpen, C. G., and Hsu, A. Y. C. (1997). Emotion and
aging: Experience, expression, and control. Psychology and Aging, 12(4):590–599.
Gupta, U. (2005). Psychophysiological responsivity to Indian instrumental music. Psychology of
Music, 33(4):363–372.
Hallam, S., Cross, I., and Thaut, M., editors (2008). The Oxford Handbook of Music Psychology.
Oxford University Press, New York, USA.
Hamel, P., Wood, S., and Eck, D. (2009). Automatic identification of instrument classes in
polyphonic and poly-instrument audio. In Proceedings of the 10th International Society for
Music Information Retrieval Conference (ISMIR), pages 399–404, Kobe, Japan.
Han, B.-J., Rho, S., Jun, S., and Hwang, E. (2009). Music emotion classification and context-
based music recommendation. Multimedia Tools and Applications, 47(3):433–460.
Hargreaves, D. J. (2012). Musical imagination: Perception and production, beauty and creativity.
Psychology of Music, 40(5):539–557.
Hargreaves, D. J. and North, A. C. (1999). The functions of music in everyday life: Redefining
the social in music psychology. Psychology of Music, 27(1):71–83.
Hargreaves, D. J., North, A. C., and Tarrant, M. (2006). Musical preference and taste in
childhood and adolescence. In McPherson, G., editor, The Child as Musician: A Handbook of
Musical Development, chapter 7, pages 135–154. Oxford University Press, New York, USA.
Hevner, K. (1935). Expression in music: A discussion of experimental studies and theories.
Psychological Review, 42(2):186–204.
Heye, A. and Lamont, A. (2010). Mobile listening situations in everyday life: The use of MP3
players while travelling. Musicae Scientiae, 14(1):95–120.
Hoffman, M. D., Blei, D. M., and Cook, P. R. (2009). Easy as CBA: A simple probabilistic model
for tagging music. In Proceedings of the 10th International Society for Music Information
Retrieval Conference (ISMIR), pages 369–374, Kobe, Japan.
REFERENCES 159
Hu, X., Downie, J., Laurier, C., and Bay, M. (2008). The 2007 MIREX audio mood classification
task: Lesson learned. In Proceedings of the 9th International Conference on Music Information
Retrieval (ISMIR), pages 462–467, Philadelphia, USA.
Hu, X. and Downie, J. S. (2007). Exploring mood metadata: Relationships with genre, artist
and usage metadata. In Proceedings of the 8th International Conference on Music Information
Retrieval (ISMIR), pages 67–72, Vienna, Austria.
Hu, X. and Downie, J. S. (2010). When lyrics outperform audio for music mood classification:
A feature analysis. In Proceedings of the 11th International Society for Music Information
Retrieval Conference (ISMIR), pages 619–624, Utrecht, Netherlands.
Hu, X., Downie, J. S., and Ehmann, A. F. (2009). Lyric text mining in music mood classification.
In Proceedings of the 10th International Society for Music Information Retrieval Conference
(ISMIR), pages 411–416, Kobe, Japan.
Hu, X. and Kando, N. (2012). User-centered measures VS. system effectiveness in finding sim-
ilar songs. In Proceedings of the 13th International Society for Music Information Retrieval
Conference (ISMIR), pages 331–336, Porto, Portugal.
Hu, X. and Lee, J. H. (2012). A cross-cultural study of music mood perception between American
and Chinese listeners. In Proceedings of the 13th International Society for Music Information
Retrieval Conference (ISMIR), pages 535–540, Porto, Portugal.
Hunter, P., Schellenberg, E. G., and Schimmack, U. (2010). Feelings and perceptions of happiness
and sadness induced by music: Similarities, differences, and mixed emotions. Psychology of
Aesthetics, Creativity, and the Arts, 4(1):47–56.
Hunter, P. G., Schellenberg, E. G., and Griffith, A. T. (2011). Misery loves company: Mood-
congruent emotional responding to music. Emotion, 11:1068–1072.
Huq, A., Bello, J. P., and Rowe, R. (2010). Automated music emotion recognition: A systematic
evaluation. Journal of New Music Research, 39(3):227–244.
Ilie, G. and Thompson, W. (2006). A comparison of acoustic cues in music and speech for three
dimensions of affect. Music Perception: An Interdisciplinary Journal, 23(4):319–330.
International Federation of the Phonographic Industry (2014). Digital Music Report 2014. Tech-
nical report, The International Federation of the Phonographic Industry (IFPI).
REFERENCES 160
Jang, J. R. and Lee, H. (2008). A general framework of progressive filtering and its application to
query by singing/humming. IEEE Transactions on Audio, Speech, and Language Processing,
16(2):350–358.
Juslin, P. N., Harmat, L., and Eerola, T. (2014). What makes music emotionally significant?
Exploring the underlying mechanisms. Psychology of Music, 42(4):599–623.
Juslin, P. N. and Laukka, P. (2003). Communication of emotions in vocal expression and music
performance: Different channels, same code? Psychological Bulletin, 129(5):770–814.
Juslin, P. N. and Laukka, P. (2004). Expression, perception, and induction of musical emotions:
A review and a questionnaire study of everyday listening. Journal of New Music Research,
33(3):217–238.
Juslin, P. N., Liljestrom, S., Laukka, P., Vastfjall, D., and Lundqvist, L.-O. (2011). Emotional
reactions to music in a nationally representative sample of Swedish adults: Prevalence and
causal influences. Musicae Scientiae, 15(2):174–207.
Juslin, P. N., Liljestrom, S., Vastfjall, D., Barradas, G., and Silva, A. (2008). An experience
sampling study of emotional reactions to music: Listener, music, and situation. Emotion,
8(5):668–683.
Juslin, P. N., Liljestrom, S., Vastfjall, D., and Lundqvist, L. (2010). How does music evoke
emotions? Exploring the underlying mechanisms. In Juslin, P. N. and Sloboda, J. A., editors,
Handbook of Music and Emotion: Theory, Research, Applications, chapter 22, pages 605–642.
Oxford University Press, New York, USA.
Juslin, P. N. and Sloboda, J. A., editors (2001). Music and Emotion: Theory and Research.
Oxford University Press, New York, USA.
Juslin, P. N. and Sloboda, J. A., editors (2010). Handbook of Music and Emotion: Theory,
Research, Applications. Oxford University Press, New York, USA.
Juslin, P. N. and Vastfjall, D. (2008). Emotional responses to music: The need to consider
underlying mechanisms. The Behavioral and Brain Sciences, 31(5):559–621.
Kallinen, K. (2005). Emotional ratings of music excerpts in the western art music repertoire and
their self-organization in the Kohonen neural network. Psychology of Music, 33(4):373–393.
REFERENCES 161
Kallinen, K. and Ravaja, N. (2006). Emotion perceived and emotion felt: Same and different.
Musicae Scientiae, 10(2):191–213.
Kaminskas, M., Ricci, F., and Schedl, M. (2013). Location-aware music recommendation using
auto-tagging and hybrid matching. Proceedings of the 7th ACM Conference on Recommender
Systems - RecSys ’13, pages 17–24.
Kanazawa, S. and Perina, K. (2012). Why more intelligent individuals like classical music.
Journal of Behavioral Decision Making, 25:264–275.
Kang, H. J. and Williamson, V. J. (2013). Background music can aid second language learning.
Psychology of Music, 42:728–747.
Kastner, M. P. and Crowder, R. G. (1990). Perception of the major/minor distinction: IV.
Emotional connotations in young children. Music Perception: An Interdisciplinary Journal,
8(2):189–201.
Khalfa, S., Isabelle, P., Jean-Pierre, B., and Manon, R. (2002). Event-related skin conductance
responses to musical emotions in humans. Neuroscience Letters, 328(2):145–149.
Killgore, W. (1999). Affective valence and arousal in self-rated depression and anxiety. Perceptual
and Motor Skills, 89(1):301–304.
Kim, Y. E. (2008). MoodSwings: A collaborative game for music mood label collection. In
Proceedings of the 9th International Conference on Music Information Retrieval (ISMIR),
pages 231–236, Philadelphia, USA.
Kim, Y. E., Schmidt, E. M., Migneco, R., Morton, B. G., Richardson, P., Scott, J., Speck, J. A.,
and Turnbull, D. (2010). Music emotion recognition: A state of the art review. In Proceedings
of the 11th International Society for Music Information Retrieval Conference (ISMIR), pages
255–266, Utrecht, Netherlands.
Kim, Y. E., Williamson, D. S., and Pilli, S. (2006). Towards quantifying the album effect in
artist identification. In Proceedings of the 7th International Conference on Music Information
Retrieval (ISMIR), pages 393–394, Victoria, Canada.
Kosta, K., Song, Y., Fazekas, G., and Sandler, M. B. (2013). A study of cultural dependence
of perceived mood in Greek music. In Proceedings of the 14th International Society for Music
Information Retrieval Conference (ISMIR), pages 317–322, Curitiba, Brazil.
REFERENCES 162
Krause, A. E. and North, A. C. (2014). Contextualized music listening: Playlists and the
Mehrabian and Russell model. Psychology of Well-Being: Theory, Research and Practice,
4(22):1–16.
Krause, A. E., North, A. C., and Heritage, B. (2014). The uses and gratifications of using
Facebook music listening applications. Computers in Human Behavior, 39:71–77.
Krause, A. E., North, A. C., and Hewitt, L. Y. (2015). Music-listening in everyday life: Devices
and choice. Psychology of Music, 42(2):155–170.
Kreutz, G., Ott, U., Teichmann, D., Osawa, P., and Vaitl, D. (2007). Using music to induce
emotions: Influences of musical preference and absorption. Psychology of Music, 36(1):101–
126.
Krohne, H. W. (2003). Individual differences in emotional reactions and coping. In Davidson,
R. J., Scherer, K. R., and Goldsmith, H. H., editors, Handbook of Affective Sciences. Series in
Affective Science, pages 698–725. Oxford University Press, New York, USA.
Krumhansl, C. L. (1997). An exploratory study of musical emotions and psychophysiology.
Canadian Journal of Experimental Psychology, 51(4):336–353.
Krumhansl, C. L. (2002). Music: A link between cognition and emotion. American Psychological
Society, 11(2):45–50.
Labbe, C. and Grandjean, D. (2014). Musical emotions predicted by feelings of entrainment.
Music Perception: An Interdisciplinary Journal, 32(2):170–185.
Lamere, P. (2008). Social tagging and music information retrieval. Journal of New Music
Research, 37(2):101–114.
Lamont, A. and Greasley, A. E. (2009). Musical preferences. In Hallam, S., Cross, I., and Thaut,
M., editors, The Oxford Handbook of Music Psychology, chapter 15, pages 160–168. Oxford
University Press, New York, USA.
Lamont, A. and Webb, R. (2009). Short- and long-term musical preferences: What makes a
favourite piece of music? Psychology of Music, 38(2):222–241.
Larson, R. W., Richards, M. H., and Perry-Jenkins, M. (1994). Divergent worlds: The daily
emotional experience of mothers and fathers in the domestic and public spheres. Journal of
Personality and Social Psychology, 67(6):1034–1046.
REFERENCES 163
Lartillot, O. and Toiviainen, P. (2007). MIR in Matlab (II): A toolbox for musical feature ex-
traction from audio. In Proceedings of the 8th International Conference on Music Information
Retrieval (ISMIR), pages 237–244, Vienna, Austria.
Laukka, P. and Quick, L. (2011). Emotional and motivational uses of music in sports and exercise:
A questionnaire study among athletes. Psychology of Music, 41(2):198–215.
Laurier, C. (2011). Automatic classification of musical mood by content-based analysis. PhD
thesis, Universitat Pompeu Fabra.
Laurier, C., Grivolla, J., and Herrera, P. (2008). Multimodal music mood classification using
audio and lyrics. In Proceedings of the 7th International Conference on Machine Learning and
Applications (ICMPLA), pages 1–6, San Diego, California, USA.
Laurier, C., Herrera, P., Mandel, M., and Ellis, D. (2007). Audio music mood classification using
support vector machine. In MIREX Task on Audio Mood Classification, pages 1–3.
Laurier, C., Sordo, M., Serra, J., and Herrera, P. (2009). Music mood representations from
social tags. In Proceedings of the 10th International Society for Music Information Retrieval
Conference (ISMIR), pages 381–386, Kobe, Japan.
Law, E. L. M., Von Ahn, L., Dannenberg, R. B., and Crawford, M. (2007). Tagatune: A game
for music and sound annotation. In Proceedings of the 8th International Conference on Music
Information Retrieval (ISMIR), pages 361–364, Vienna, Austria.
Lee, J. H. and Waterman, N. M. (2012). Understanding user requirements for music information
services. In Proceedings of the 13th International Society for Music Information Retrieval
Conference (ISMIR), pages 253–258, Porto, Portugal.
Leman, M., Vermeulen, V., De Voogdt, L., Moelants, D., and Lesaffre, M. (2005). Prediction of
musical affect using a combination of acoustic structural cues. Journal of New Music Research,
34(1):39–67.
Levenson, R. W. (2003). Autonomic specificity and emotion. In Handbook of Affective Sciences,
pages 212–224. Oxford University Press, New York, USA.
Levy, M. and Sandler, M. (2007). A semantic space for music derived from social tags. In
Proceedings of the 8th International Conference on Music Information Retrieval (ISMIR),
pages 411–416, Vienna, Austria.
REFERENCES 164
Levy, M. and Sandler, M. B. (2009). Music information retrieval using social tags and audio.
IEEE Transactions on Multimedia, 11(3):383–395.
Li, T., Ogihara, M., and Li, Q. (2003). A comparative study on content-based music genre
classification. In Proceedings of the 26th Annual International ACM SIGIR Conference on
Research and Development in Information Retrieval, pages 282–289, Toronto, Canada.
Liljestrom, S., Juslin, P. N., and Vastfjall, D. (2012). Experimental evidence of the roles of music
choice, social context, and listener personality in emotional reactions to music. Psychology of
Music, 41(5):579–599.
Liu, J., Liu, S., and Yang, Y. (2014). LJ2M Dataset: Towards better understanding of music
listening behavior and user mood. In Proceedings of the IEEE International Conference on
Multimedia and Expo (ICME), pages 1 – 6, Chengdu, China.
Logan, B. and Kositsky, A. (2004). Semantic analysis of song lyrics. In Proceedings of the IEEE
International Conference on Multimedia and Expo (ICME), pages 1–7, Taipei, Taiwan.
Lonsdale, A. J. and North, A. C. (2011). Why do we listen to music? A uses and gratifications
analysis. British Journal of Psychology, 102(1):108–34.
Lu, L., Liu, D., and Zhang, H. J. (2006). Automatic mood detection and tracking of music audio
signals. IEEE Transactions on Audio, Speech and Language Processing, 14(1):5–18.
Lu, Q., Chen, X., Yang, D., and Wang, J. (2010). Boosting for multi-modal music emotion
classification. In Proceedings of the 11th International Society for Music Information Retrieval
Conference (ISMIR), pages 105–110, Utrecht, Netherlands.
Lundqvist, L.-O., Carlsson, F., Hilmersson, P., and Juslin, P. N. (2008). Emotional responses to
music: Experience, expression, and physiology. Psychology of Music, 37(1):61–90.
Magai, C. (2008). Long-lived emotions: A life course perspective. In Lewis, M., Haviland-Jones,
J. M., and Feldman Barrett, L., editors, Handbook of Emotions, chapter 23, pages 376–392.
The Guiford Press, New York, USA, 3rd edition.
Makris, I. and Mullet, E. (2003). Judging the pleasantness of contour-rhythm-pitch-timbre
musical combinations. American Journal of Psychology, 116:581–611.
Malatesta, C. Z. and Kalnok, M. (1984). Emotional experience in younger and older adults.
Journal of Gerontology, 39(3):301–308.
REFERENCES 165
Mandel, M. and Ellis, D. P. W. (2005). Song-level features and support vector machines for
music classification. In Proceedings of the 6th International Conference on Music Information
Retrieval (ISMIR), pages 594–599, London, United Kingdom.
Marques, J. and Moreno, P. (1999). A study of musical instrument classification using Gaussian
mixture models and support vector machines. Technical report, Cambridge Research Labs.
Mas-Herrero, E., Zatorre, R. J., Rodriguez-Fornells, A., and Marco-Pallares, J. (2014). Dissoci-
ation between musical and monetary reward responses in specific musical anhedonia. Current
Biology, 24(6):699–704.
Mather, M. and Carstensen, L. L. (2005). Aging and motivated cognition: The positivity effect
in attention and memory. Trends in Cognitive Sciences, 9(10):496–502.
McAdams, D. P. (2006). The Person. John Wiley, New Jersey, USA.
McAdams, S., Vines, B. W., Vieillard, S., Smith, B. K., and Reynolds, R. (2004). Influences of
large-scale form on continuous ratings in response to a contemporary piece in a live concert
setting. Music Perception: An Interdisciplinary Journal, 22(2):297–350.
McFee, B., Bertin-Mahieux, T., Ellis, D. P., and Lanckriet, G. R. (2012). The million song
dataset challenge. In Proceedings of the 21st International Conference Companion on World
Wide Web (WWW), pages 909–916, Lyon, France.
McVicar, M. and De Bie, T. (2012). CCA and a multi-way extension for investigating common
components between audio, lyrics and tags. In Proceedings of the 9th International Symposium
on Computer Music Modeling and Retrieval (CMMR), pages 19–22, London, United Kingdom.
Mehrabian, A. and Russell, J. A. (1974). An approach to environmental psychology. MIT Press,
Cambridge, MA, USA.
Merriam, A. P. (1964). Uses and functions. In The Anthropology of Music, chapter 11, pages
209–227. Northwestern University Press, USA.
Mion, L. and Poli, G. D. (2008). Score-independent audio features for description of music
expression. IEEE Transactions on Audio, Speech, and Language Processing, 16(2):458–466.
Miu, A. C. and Balte, F. R. (2012). Empathy manipulation impacts music-induced emotions: A
psychophysiological study on opera. PloS ONE, 7(1):e30618.
REFERENCES 166
Mohn, C., Argstatter, H., and Wilker, F. W. (2010). Perception of six basic emotions in music.
Psychology of Music, 39(4):503–517.
Morris, J. S., Frith, C. D., Perrett, D. I., Rowland, D., Young, A. W., Calder, A. J., and Dolan,
R. J. (1996). A differential neural response in the human amygdala to fearful and happy facial
expressions. Nature, 383(6603):812–815.
Morrison, S. J., Demorest, S. M., and Stambaugh, L. A. (2008). Enculturation effects in music
cognition: The role of age and music complexity. Journal of Research in Music Education,
56(2):118–129.
Mroczek, D. K. and Kolarz, C. M. (1998). The effect of age on positive and negative affect:
A developmental perspective on happiness. Journal of Personality and Social Psychology,
75(5):1333–1349.
Mullensiefen, D., Gingras, B., Musil, J., and Stewart, L. (2014). The musicality of non-musicians:
An index for assessing musical sophistication in the general population. PloS ONE, 9(2):e89642.
Mullensiefen, D., Gingras, B., Stewart, L., and Musil, J. (2012). Goldsmiths Musical Sophistica-
tion Index (Gold-MSI) : Technical report and documentation. Technical report, Goldsmiths,
University of London., London, United Kingdom.
Nielsen (2014). 2014 Nielsen music U.S. report. Technical report, The Nielsen.
North, A. C. (2010). Individual differences in music tastes. American Journal of Psychology,
123(2):199–208.
North, A. C. (2012). The effect of background music on the taste of wine. British Journal of
Psychology, 103:293–301.
North, A. C. and Hargreaves, D. J. (1995). Subjective complexity, familiarity, and liking for
popular music. Psychomusicology: A Journal of Research in Music Cognition, 14(1-2):77–93.
North, A. C. and Hargreaves, D. J. (1996). Situational influences on reported musical preference.
Psychomusicology, 15(Spring/Fall):30–45.
North, A. C. and Hargreaves, D. J. (1997). Experimental aesthetics and everyday music listening.
In Hargreaves, D. J. and North, A. C., editors, The Social Psychology of Music, pages 84–103.
Oxford University Press, New York, USA.
REFERENCES 167
North, A. C. and Hargreaves, D. J. (2000). Musical preferences during and after relaxation and
exercise. American Journal of Psychology, 113(1):43–67.
North, A. C. and Hargreaves, D. J. (2007a). Lifestyle correlates of musical preference: 1. Rela-
tionships, living arrangements, beliefs, and crime. Psychology of Music, 35(1):58–87.
North, A. C. and Hargreaves, D. J. (2007b). Lifestyle correlates of musical preference: 2. Media,
leisure time and music. Psychology of Music, 35(2):179–200.
North, A. C. and Hargreaves, D. J. (2007c). Lifestyle correlates of musical preference: 3. Travel,
money, education, employment and health. Psychology of Music, 35(3):473–497.
North, A. C., Hargreaves, D. J., and Hargreaves, J. J. (2004). Uses of music in everyday life.
Music Perception: An Interdisciplinary Journal, 22(1):41–77.
North, A. C., Hargreaves, D. J., and O’Neill, S. A. (2000). The importance of music to adoles-
cents. The British Journal of Educational Psychology, 70:255–272.
Novak, D. L. and Mather, M. (2007). Aging and variety seeking. Psychology and Aging, 22(4):728–
737.
Nyklıcek, I., Thayer, J. F., and Van Doornen, L. J. P. (1997). Cardiorespiratory differentiation
of musically-induced emotions. Journal of Psychophysiology, 11(4):304–321.
Ogihara, M. (2004). Content-based music similarity search and emotion detection. In Proceedings
of the IEEE International Conference on Acoustics Speech and Signal Processing (ICASSP),
pages 705–708, Montreal, Quebec, Canada.
Pachet, F. and Roy, P. (2009). Analytical features: A knowledge-based approach to audio feature
generation. EURASIP Journal on Audio, Speech, and Music Processing, 2009(2):1–23.
Panksepp, J. (1998). Affective Neuroscience: The Foundation of Human and Animal Emotions.
Oxford University Press, New York, USA.
Panksepp, J. and Bernatzky, G. (2002). Emotional sounds and the brain: The neuro-affective
foundations of musical appreciation. Behavioural Processes, 60:133–155.
Pearson, J. L. and Dollinger, S. J. (2004). Music preference correlates of Jungian types. Person-
ality and Individual Differences, 36(5):1005–1008.
REFERENCES 168
Pennebaker, J. W., Booth, R. J., and Francis, M. E. (2007). Operator’s manual: Linguistic
Inquiry and Word Count - LIWC2007. Technical report, The University of Texas at Austin
and The University of Auckland, New Zealand, Texas, USA.
Peretz, I. (2001). Listen to the brain: A biological perspective on musical emotions. In Juslin,
P. N. and Sloboda, J. A., editors, Music and Emotion: Theory and Research, pages 105–134.
Oxford University Press, New York, USA.
Pettijohn, T. F. and Sacco, D. F. (2009). The language of lyrics: An analysis of popular bill-
board songs across conditions of social and economic threat. Journal of Language and Social
Psychology, 28(3):297–311.
Phillips, M. L., Young, A. W., Scott, S. K., Calder, A. J., Andrew, C., Giampietro, V., Williams,
S. C., Bullmore, E. T., Brammer, M., and Gray, J. A. (1998). Neural responses to facial and
vocal expressions of fear and disgust. Proceedings of the Royal Society of London B: Biological
Sciences, 265(July):1809–1817.
Randall, W. M. and Rickard, N. S. (2013). Development and trial of a mobile experience sampling
method (m-EMS) for personal music listening. Music Perception: An Interdisciplinary Journal,
31(2):157–170.
Reips, U.-D. (2002). Standards for Internet-based experimenting. Experimental Psychology
(formerly Zeitschrift fur Experimentelle Psychologie), 49(4):243–256.
Reips, U.-D. (2012). Using the Internet to collect data. In Cooper, H., Camic, P. M., Long,
D. L., Panter, A. T., Rindskopf, D., and Sher, K. J., editors, APA Handbook of Research
Methods in Psychology, Vol 2: Research Designs: Quantitative, Qualitative, Neuropsychologi-
cal, and Biological, volume 2, chapter 17, pages 291–310. American Psychological Association,
Washington, DC, USA.
Rentfrow, P. J., Goldberg, L. R., and Levitin, D. J. (2011a). The structure of musical preferences:
A five-factor model. Journal of Personality and Social Psychology, 100(6):1139–57.
Rentfrow, P. J., Goldberg, L. R., and Zilca, R. (2011b). Listening, watching, and reading: The
structure and correlates of entertainment preferences. Journal of Personality, 79(2):223–258.
Rentfrow, P. J. and Gosling, S. D. (2003). The Do Re Mi’s of everyday life: The structure
and personality correlates of music preferences. Journal of Personality and Social Psychology,
84(6):1236–1256.
REFERENCES 169
Rentfrow, P. J. and Gosling, S. D. (2006). Message in a ballad: The role of music preferences in
interpersonal perception. Psychological Science, 17(3):236–242.
Repp, B. H. (1993). On determining the basic tempo of an expressive music performance.
Technical report, Haskins Laboratories Status Report on Speech Research.
Russell, J. A. (1980). A circumplex model of affect. Journal of Personality and Social Psychology,
39(6):1161–1178.
Saari, P. (2015). Music mood annotation using semantic computing and machine learning. PhD
thesis, University of Jyvaskyla.
Saari, P. and Eerola, T. (2014). Semantic computing of moods based on tags in social media of
music. IEEE Transactions on Knowledge and Data Engineering, 26(10):2548 – 2560.
Saari, P., Eerola, T., and Lartillot, O. (2011). Generalizability and simplicity as criteria in feature
selection: Application to mood classification in music. IEEE Transactions on Audio, Speech,
and Language Processing, 19(6):1802–1812.
Saarikallio, S., Nieminen, S., and Brattico, E. (2012). Affective reactions to musical stimuli
reflect emotional use of music in everyday life. Musicae Scientiae, 17(1):27–39.
Salimpoor, V. N., Benovoy, M., Larcher, K., Dagher, A., and Zatorre, R. J. (2011). Anatomically
distinct dopamine release during anticipation and experience of peak emotion to music. Nature
Neuroscience, 14(2):257–262.
Sandstrom, G. M. and Russo, F. A. (2011). Absorption in music: Development of a scale to
identify individuals with strong emotional responses to music. Psychology of Music, 41(2):216–
228.
Schafer, T. and Sedlmeier, P. (2009). From the functions of music to music preference. Psychology
of Music, 37(3):279–300.
Schafer, T., Sedlmeier, P., Stadtler, C., and Huron, D. (2013). The psychological functions of
music listening. Frontiers in Psychology, 4:1–33.
Schedl, M. (2013). Ameliorating music recommendation: Integrating music content, music con-
text, and user context for improved music retrieval and recommendation. In Proceedings of
11th International Conference on Advances in Mobile Computing & Multimedia (MoMM2013),
pages 33–39, Vienna, Austria.
REFERENCES 170
Schedl, M. and Flexer, A. (2012). Putting the user in the center of music information retrieval.
In Proceedings of the 13th International Society for Music Information Retrieval Conference
(ISMIR), pages 385–390, Porto, Portugal.
Schellenberg, E. G., Peretz, I., and Vieillard, S. (2008). Liking for happy- and sad-sounding
music: Effects of exposure. Cognition & Emotion, 22(2):218–237.
Scherer, K. R. (1995). Expression of emotion in voice and music. Journal of Voice, 9(3):235–48.
Scherer, K. R. (1999). Appraisal theory. In Dalgleish, T. and Power, M., editors, Handbook of
Cognition and Emotion, pages 637–663. Wiley, Chichester, UK.
Scherer, K. R. (2004). Which emotions can be induced by music? What are the underlying
mechanisms? And how can we measure them? Journal of New Music Research, 33(3):239–
251.
Scherer, K. R. (2005). What are emotions? And how can they be measured? Social Science
Information, 44(4):695–729.
Scherer, K. R. and Oshinsky, J. S. (1977). Cue utilization in emotion attribution from auditory
stimuli. Motivation and Emotion, 1(4):331–346.
Scherer, K. R. and Zentner, M. R. (2001). Emotional effects of music: Production rules. In Juslin,
P. N. and Sloboda, J. A., editors, Music and Emotion: Theory and Research, chapter 16, pages
361–392. Oxford University Press, New York, USA.
Schmidt, E. M. and Kim, Y. E. (2010). Prediction of time-varying musical mood distributions
from audio. In Proceedings of the 11th International Society for Music Information Retrieval
Conference (ISMIR), pages 465–470, Utrecht, Netherlands.
Schmidt, E. M. and Kim, Y. E. (2011). Learning emotion-based acoustic features with deep belief
networks. In IEEE Workshop on Applications of Signal Processing to Audio and Acoustics
(WASPAA), pages 65–68, New Paltz, New York, USA.
Schmidt, E. M., Prockup, M., Scott, J., Dolhansky, B., Morton, B. G., and Kim, Y. E. (2012).
Relating perceptual and feature space invariances in music emotion recognition. In Proceedings
of the 9th International Symposium on Computer Music Modeling and Retrieval (CMMR),
pages 19–22, London, United Kingdom.
REFERENCES 171
Schmidt, E. M., Turnbull, D., and Kim, Y. E. (2010). Feature selection for content-based,
time-varying musical emotion regression categories and subject descriptors. In Multimedia
Information Retrieval, pages 267–273.
Schnitzer, D., Flexer, A., Schedl, M., and Widmer, G. (2011). Using mutual proximity to
improve content-based audio similarity. In Proceedings of the 12th International Society for
Music Information Retrieval Conference (ISMIR), pages 79–84, Miami, USA.
Schubert, E. (2003). Update of the Hevner adjective checklist. Perceptual and Motor Skills, 96(3
Pt 2):1117–1122.
Schubert, E. (2007a). Locus of emotion: The effect of task order and age on emotion perceived
and emotion felt in response to music. Journal of Music Therapy, 44(4):344–368.
Schubert, E. (2007b). The influence of emotion, locus of emotion and familiarity upon preference
in music. Psychology of Music, 35(3):499–515.
Schubert, E. (2012). Loved music can make a listener feel negative emotions. Musicae Scientiae,
17(1):11–26.
Schubert, E. (2013). Emotion felt by the listener and expressed by the music: Literature review
and theoretical perspectives. Frontiers in Psychology, 4(December):1–18.
Schubert, E. (2014). Perceived emotion with continuous musical features. Music Perception: An
Interdisciplinary Journal, 21(4):561–585.
Schuller, B., Dorfner, J., and Rigoll, G. (2010). Determination of nonprototypical valence and
arousal in popular music: Features and performances. EURASIP Journal on Audio, Speech,
and Music Processing, pages 1–19.
Serra, X. (2011). A multicultural approach in music information research. In Proceedings of
the 12th International Society for Music Information Retrieval Conference (ISMIR), pages
151–156, Miami, USA.
Serra, X. (2012). Data gathering for a culture specific approach in MIR. In Proceedings of
the 21st International Conference Companion on World Wide Web (WWW), pages 867–868,
Lyon, France.
REFERENCES 172
Shiota, M., Keltner, D., and John, O. (2006). Positive emotion dispositions differentially asso-
ciated with Big Five personality and attachment style. The Journal of Positive Psychology,
1(2):61–71.
Singhi, A. and Brown, D. G. (2014). On cultural, textual and experiential aspects of music mood.
In Proceedings of the 15th International Society for Music Information Retrieval Conference
(ISMIR), pages 3–8, Taipei, Taiwan.
Sloboda, J. A. (2011). Music in everyday life - The role of emotion. In Juslin, P. N. and Sloboda,
J. A., editors, Handbook of Music and Emotion, chapter 18, pages 493–514. Oxford University
Press, New York, USA.
Sloboda, J. A., Lamont, A., and Greasley, A. E. (2009). Choosing to hear music: Motivation,
process, and effect. In Hallam, S., Cross, I., and Thaut, M., editors, Oxford Handbook of Music
Psychology, chapter 40, pages 431–439. Oxford University Press, New York, USA.
Sloboda, J. A., O’Neill, S. A., and Ivaldi, A. (2001). Function of music in everyday life: An
exploratory study using the experience sampling method. Musicae Scientiae, 5(1):9–32.
Song, Y. and Dixon, S. (2015). How well can a music emotion recognition system predict the
emotional responses of participants? In Proceedings of the 12th Sound and Music Computing
Conference (SMC), Maynooth, Ireland.
Song, Y., Dixon, S., and Pearce, M. T. (2012a). A survey of music recommendation systems and
future perspectives. In Proceedings of the 9th International Symposium on Computer Music
Modeling and Retrieval (CMMR), pages 395–410, London, United Kingdom.
Song, Y., Dixon, S., and Pearce, M. T. (2012b). Evaluation of musical features for emotion
classification. In Proceedings of the 13th International Society for Music Information Retrieval
Conference (ISMIR), pages 523–528, Porto, Portugal.
Song, Y., Dixon, S., Pearce, M. T., and Eerola, T. (2015a). Emotional and functional uses of
music in various contexts. Submitted, pages 1–32.
Song, Y., Dixon, S., Pearce, M. T., and Eerola, T. (2015b). Functional uses of music vary across
everyday situations, emotions and music preferences. Submitted, pages 1–15.
REFERENCES 173
Song, Y., Dixon, S., Pearce, M. T., and Fazekas, G. (2013a). Using tags to select stimuli in the
study of music and emotion. In Proceedings of the 3rd International Conference on Music &
Emotion (ICME), Jyvaskyla, Finland.
Song, Y., Dixon, S., Pearce, M. T., and Halpern, A. R. (2013b). Do online social tags predict
perceived or induced emotional responses to music? In Proceedings of the 14th International
Society for Music Information Retrieval Conference (ISMIR), pages 89–94, Curitiba, Brazil.
Song, Y., Dixon, S., Pearce, M. T., and Halpern, A. R. (2015c). Perceived and induced emotion
responses to popular music: Categorical and dimensional models. Music Perception (In press),
pages 1–46.
Swaminathan, S. and Schellenberg, E. G. (2015). Current emotion research in music psychology.
Emotion Review, 7(2):189–197.
Tarrant, M., North, A. C., and Hargreaves, D. J. (2000). English and American adolescents’
reasons for listening to music. Psychology of Music, 28(2):166–173.
Terrell, M. J., Fazekas, G., Simpson, A. J. R., Smith, J., and Dixon, S. (2012). Listening
level changes music similarity. In Proceedings of the 13th International Society for Music
Information Retrieval Conference (ISMIR), pages 487–492, Porto, Portugal.
Terwogt, M. M. and Van Grinsven, F. (1991). Musical expression of mood states. Psychology of
Music, 19(2):99–109.
Thayer, J. and Faith, M. (2001). A dynamic systems model of musically induced emotions.
Annals of the New York Academy of Sciences, 930:452–456.
Thayer, R. E. (1989). The Biopsychology of Mood and Arousal. Oxford University Press, New
York, USA.
Thompson, W. F. and Laura-Lee, B. (2010). Cross-cultural similarities and differences. In
Handbook of Music and Emotion: Theory, Research, Applications, pages 755–788. Oxford
University Press, New York, USA.
Trainor, L. J., Tsang, C. D., and Cheung, V. H. W. (2002). Preference for sensory consonance in
2- and 4-month-old infants. Music Perception: An Interdisciplinary Journal, 20(2):187–194.
REFERENCES 174
Trohidis, K., Tsoumakas, G., Kalliris, G., and Vlahavas, I. (2008). Multi-label classification of
music into emotions. In Proceedings of the 9th International Conference on Music Information
Retrieval (ISMIR), pages 325–330, Philadelphia, USA.
Trost, W., Ethofer, T., Zentner, M., and Vuilleumier, P. (2012). Mapping aesthetic musical
emotions in the brain. Cerebral Cortex, 22(12):2769–2783.
Truong, K. P., Leeuwen, D. A. V., Neerincx, M. A., and Jong, F. M. G. D. (2009). Arousal
and valence prediction in spontaneous emotional speech: Felt versus perceived emotion. In
Proceedings of the Interspeech Conference, pages 2027–2030, Brighton, United Kingdom.
Tsai, J. L., Knutson, B., and Fung, H. H. (2006). Cultural variation in affect valuation. Journal
of Personality and Social Psychology, 90(2):288–307.
Tsai, W.-H. and Wang, H.-M. (2006). Automatic singer recognition of popular music recordings
via estimation and modeling of solo vocal signals. IEEE Transactions on Audio, Speech and
Language Processing, 14(1):330–341.
Tsunoo, E., Tzanetakis, G., Ono, N., and Sagayama, S. (2011). Beyond timbral statistics:
Improving music classification using percussive patterns and bass lines. IEEE Transactions on
Audio, Speech and Language Processing, 19(4):1003–1014.
Turnbull, D., Barrington, L., and Lanckriet, G. (2008a). Five approaches to collecting tags for
music. In Proceedings of the 9th International Conference on Music Information Retrieval
(ISMIR), pages 225–230, Philadelphia, USA.
Turnbull, D., Barrington, L., Torres, D., and Lanckriet, G. (2008b). Semantic annotation and
retrieval of music and sound effects. IEEE Transactions on Audio, Speech, and Language
Processing, 16(2):467–476.
Tzanetakis, G. and Cook, P. (2000). MARSYAS: A framework for audio analysis. Organised
Sound, 4(3):169–175.
Tzanetakis, G. and Cook, P. (2002). Musical genre classification of audio signals. IEEE Trans-
actions on Speech and Audio Processing, 10(5):293–302.
Uitdenbogerd, A. and Van Schyndel, R. (2002). A review of factors affecting music recommender
success. In Proceedings of the 3rd International Conference on Music Information Retrieval
(ISMIR), Paris, France.
REFERENCES 175
UK Music (2014). The economic contribution of the core UK music industry. Technical report,
UK Music.
Van Goethem, A. and Sloboda, J. (2011). The functions of music for affect regulation. Musicae
Scientiae, 15(2):208–228.
Van Zaanen, M. and Kanters, P. (2010). Automatic mood classification using TF*IDF based
on lyrics. In Proceedings of the 11th International Society for Music Information Retrieval
Conference (ISMIR), pages 75–80, Utrecht, Netherlands.
Vastfjall, D. (2002). Emotion induction through music: A review of the musical mood induction
procedure. Musicae Scientiae, 5(Special Issue: Current trends in the study of music and
emotion):173–212.
Vieillard, S., Peretz, I., Gosselin, N., Khalfa, S., Gagnon, L. B., and Bernard, B. (2008). Happy,
sad, scary and peaceful musical excerpts for research on emotions. Cognition & Emotion,
22(4):720–752.
Vuoskoski, J. K. and Eerola, T. (2011a). Measuring music-induced emotion: A comparison of
emotion models, personality biases, and intensity of experiences. Musicae Scientiae, 15(2):159–
173.
Vuoskoski, J. K. and Eerola, T. (2011b). The role of mood and personality in the perception
of emotions represented by music. Cortex (Special Section on Music in the Brain): Research
Report, 47(9):1099–1106.
Vuoskoski, J. K., Thompson, W. F., and Eerola, T. (2011). Who enjoys listening to sad music
and why? Music Perception: An Interdisciplinary Journal, 29(3):311–318.
Wallbott, H. G. and Scherer, K. R. (1986). Cues and channels in emotion recognition. Journal
of Personality and Social Psychology, 51(4):690–699.
Wang, C.-C., Jang, J.-S. R., and Wang, W. (2010a). An improved query by singing/humming
system using melody and lyrics information. In Proceedings of the 11th International Society
for Music Information Retrieval Conference (ISMIR), pages 45–50, Utrecht, Netherlands.
Wang, D., Li, T., and Ogihara, M. (2010b). Are tags better than audio features? The effect of
joint use of tags and audio content features for artistic style clustering. In Proceedings of the
REFERENCES 176
11th International Society for Music Information Retrieval Conference (ISMIR), pages 57–62,
Utrecht, Netherlands.
Wang, J., Yang, Y.-H., Chang, K., Wang, H., and Jeng, S. (2012). Exploring the relationship
between categorical and dimensional emotion semantics of music. In Proceedings of the Sec-
ond International ACM Workshop on Music Information Retrieval with User-centered and
Multimodal Strategies - (MIRUM), pages 63–68, New York, USA.
Wang, X., Chen, X., Yang, D., and Wu, Y. (2011). Music emotion classification of Chinese songs
based on lyrics using TF*IDF and rhyme. In Proceedings of the 12th International Society for
Music Information Retrieval Conference (ISMIR), pages 765–770, Miami, USA.
Watson, D. and Mandryk, R. L. (2012). Modeling musical mood from audio features and listening
context on an in-situ data set. In Proceedings of the 13th International Society for Music
Information Retrieval Conference (ISMIR), pages 31–36, Porto, Portugal.
Welch, N. and Krantz, J. H. (1996). The World-Wide Web as a medium for psychoacousti-
cal demonstrations and experiments: Experience and results. Behavior Research Methods,
Instruments, and Computers, 28(2):192–196.
Whissell, C. (1989). Whissell’s Dictionary of Affect in Language. In Plutchik., R. and Kellerman,
H., editors, Theory, Research, and Experience, pages 113–131. New York: Academic Press.
Wu, X., Zhang, L., and Yu, Y. (2006). Exploring social annotations for the semantic web.
In Proceedings of the 15th international conference on World Wide Web - WWW ’06, pages
417–426, New York, USA.
Yang, D. and Lee, W. S. (2004). Disambiguating music emotion using software agents. In
Proceedings of the 5th International Conference on Music Information Retrieval (ISMIR),
pages 52–58, Barcelona, Spain.
Yang, Y.-H. and Chen, H. H. (2011). Music Emotion Recognition. CRC Press, Taylor & Francis
Group.
Yang, Y.-H. and Chen, H. H. (2012). Machine recognition of music emotion. ACM Transactions
on Intelligent Systems and Technology, 3(3):1–30.
REFERENCES 177
Yang, Y.-H. and Hu, X. (2012). Cross-cultural music mood classification: A comparison on En-
glish and Chinese songs. In Proceedings of the 13th International Society for Music Information
Retrieval Conference (ISMIR), pages 19–24, Porto, Portugal.
Yang, Y.-H., Lin, Y., Su, Y., and Chen, H. H. (2008). A regression approach to music emotion
recognition. IEEE Transactions on Audio, Speech and Language Processing, 16(2):448–457.
Yang, Y.-H. and Liu, J. Y. (2013). Quantitative study of music listening behavior in a social and
affective context. IEEE Transactions on Multimedia, 15(6):1304–1315.
Zacharopoulou, K. and Kyriakidou, A. (2009). A cross-cultural comparative study of the role of
musical structural features in the perception of emotion in Greek traditional music. Journal
of Interdisciplinary Music Studies, 3(1&2):1–15.
Zentner, M. and Eerola, T. (2009). Self-report measures and models. In Juslin, P. N. and Sloboda,
J. A., editors, Handbook of Music and Emotion Theory Research Applications, chapter 8, pages
185–222. Oxford University Press, New York, USA.
Zentner, M., Grandjean, D., and Scherer, K. R. (2008). Emotions evoked by the sound of music:
Characterization, classification, and measurement. Emotion, 8(4):494–521.

Appendix A
Emotion Tags Retrieved from Last.FM
Happy tags Sad tags Relaxed tags Angry tags
happy sad relax angry
happy hardcore sad songs relax trance angry music
makes me happy happysad relax music angry metal
happy music sad song jazz relax angry pop music
happysad sad and beautiful only relax angry rock
happy metal so sad relax and cool angry girl music
songs that make me happy sad music just relax angry songs
happy songs makes me sad for relax angry women
happy rock sad but true relax dance angry love
happy punk beautifully sad relax jazz angry girl
happy birthday very sad relax rock angry angry angry
happy house slow and sad relax feelings angry lyrics
happy grindcore beautiful sad to relax angry chick music
happy pop sad but beautiful relax me angry girl songs
die happy sad mood cool relax angry samoans
happy song sad and slow relax song angry punk
happy emo songs for sad moods rock relax fucking angry
happy days sad day relax metal angry hate music
happy happy joy joy makes me smile in a sad way chill relax angry as fuck
happy happy sad love relax1 angry girls
happy feet feeling sad work relax angry bitch
happy mondays sad memories aerobic relax angry rap
happy sad sad boys with guitars relax baby relax angry chick
get happy happy sad positive relax mood: angry
music that makes me happy sad love songs no relax angry mob
happy tunes sad guitar pop relax angry pop
make me happy sad lyrics deep relax angry song
happy dance sad maniac relax time angry angry music
be happy sad love song music to relax by angry woman
happy thoughts sad bastard music guitar relax angry chair
178
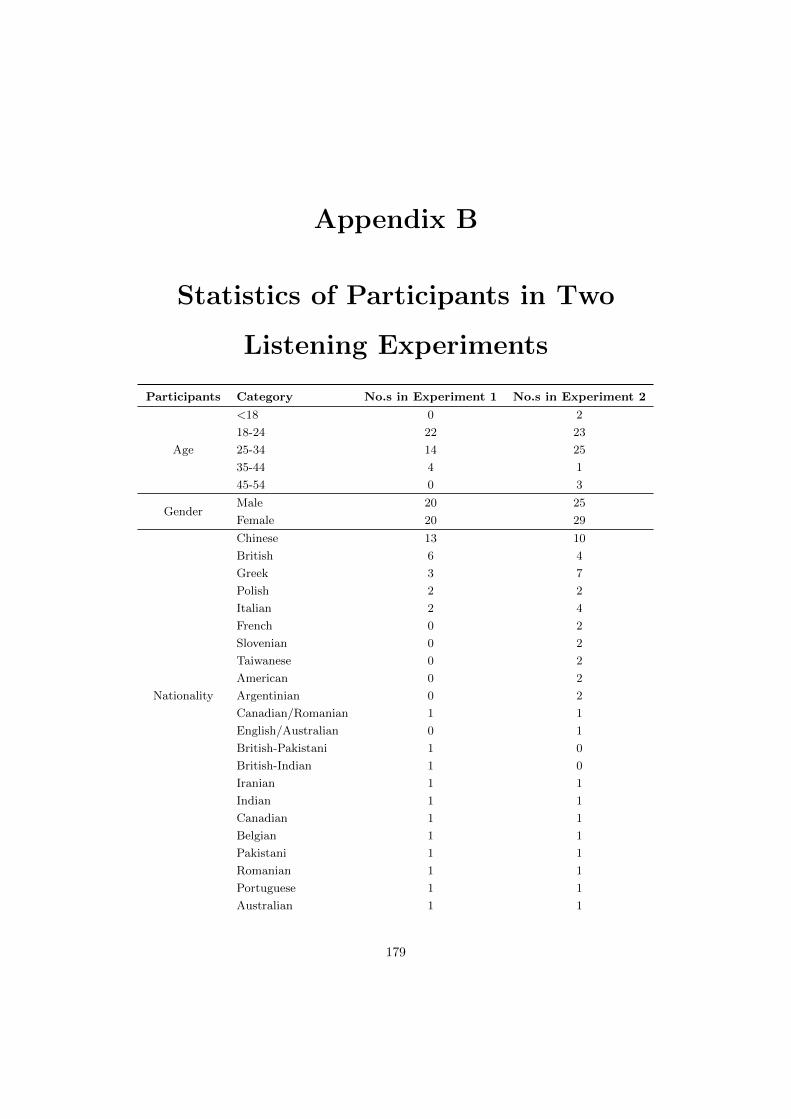
Appendix B
Statistics of Participants in Two
Listening Experiments
Participants Category No.s in Experiment 1 No.s in Experiment 2
Age
<18 0 2
18-24 22 23
25-34 14 25
35-44 4 1
45-54 0 3
GenderMale 20 25
Female 20 29
Nationality
Chinese 13 10
British 6 4
Greek 3 7
Polish 2 2
Italian 2 4
French 0 2
Slovenian 0 2
Taiwanese 0 2
American 0 2
Argentinian 0 2
Canadian/Romanian 1 1
English/Australian 0 1
British-Pakistani 1 0
British-Indian 1 0
Iranian 1 1
Indian 1 1
Canadian 1 1
Belgian 1 1
Pakistani 1 1
Romanian 1 1
Portuguese 1 1
Australian 1 1
179
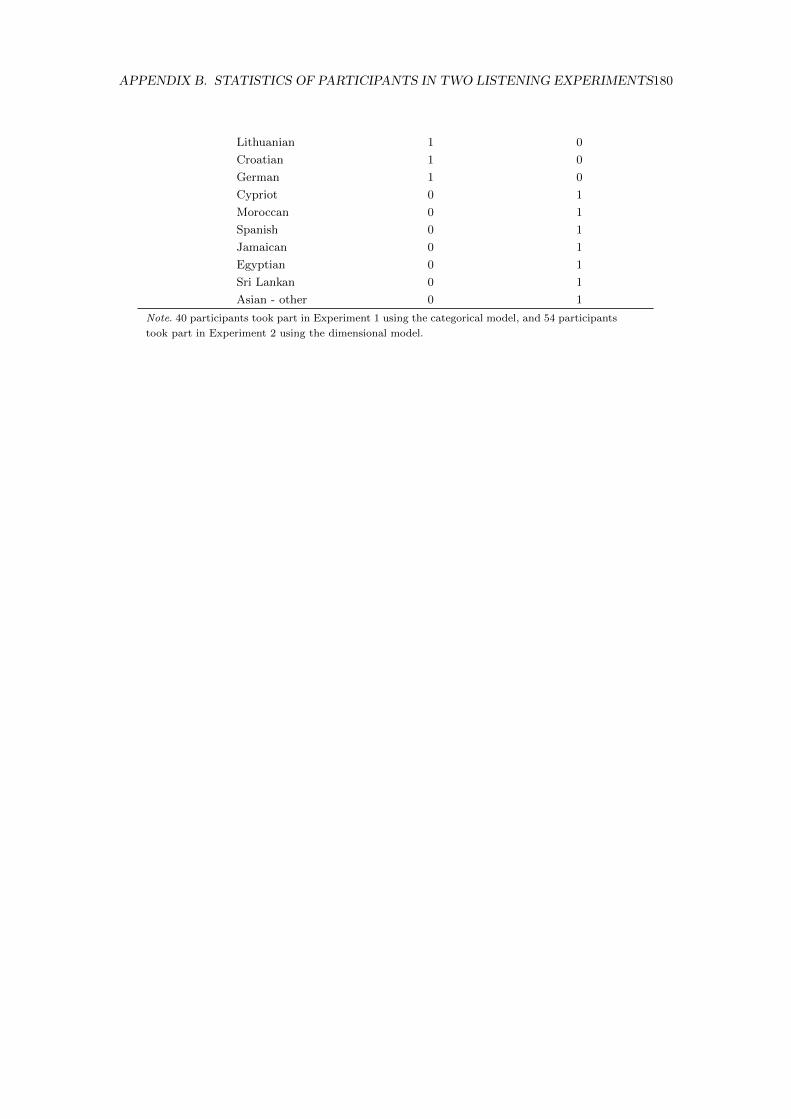
APPENDIX B. STATISTICS OF PARTICIPANTS IN TWO LISTENING EXPERIMENTS180
Lithuanian 1 0
Croatian 1 0
German 1 0
Cypriot 0 1
Moroccan 0 1
Spanish 0 1
Jamaican 0 1
Egyptian 0 1
Sri Lankan 0 1
Asian - other 0 1
Note. 40 participants took part in Experiment 1 using the categorical model, and 54 participants
took part in Experiment 2 using the dimensional model.
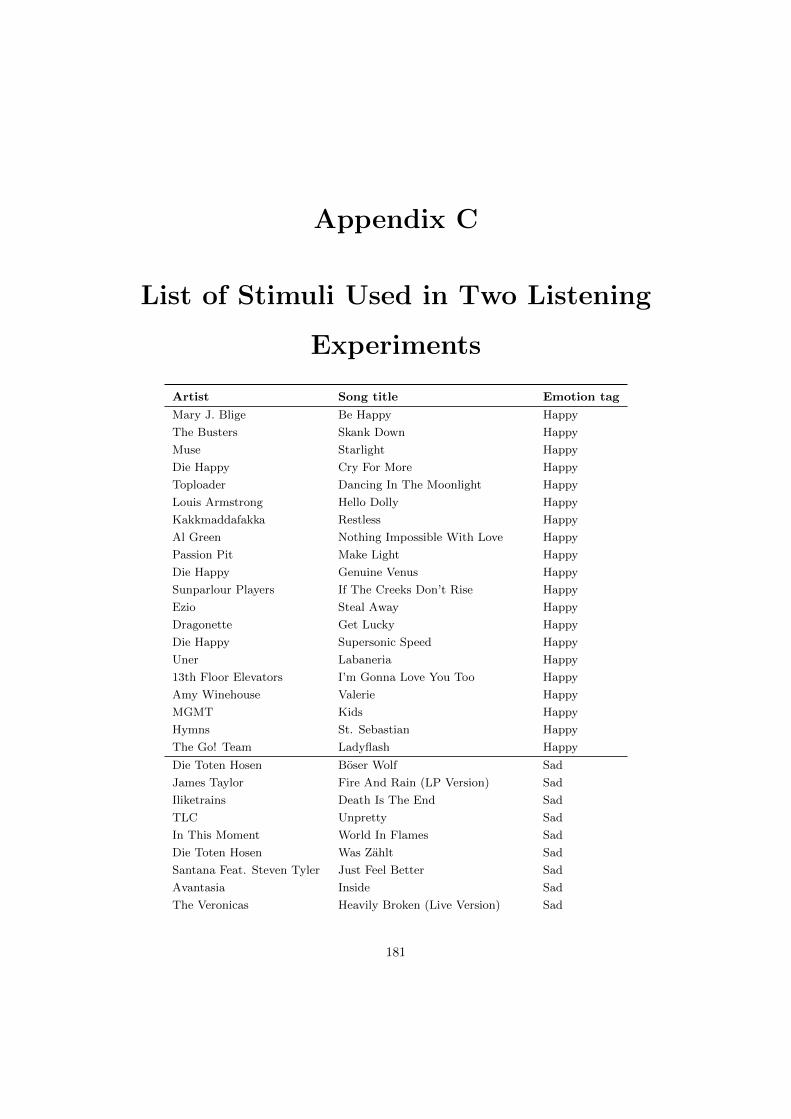
Appendix C
List of Stimuli Used in Two Listening
Experiments
Artist Song title Emotion tag
Mary J. Blige Be Happy Happy
The Busters Skank Down Happy
Muse Starlight Happy
Die Happy Cry For More Happy
Toploader Dancing In The Moonlight Happy
Louis Armstrong Hello Dolly Happy
Kakkmaddafakka Restless Happy
Al Green Nothing Impossible With Love Happy
Passion Pit Make Light Happy
Die Happy Genuine Venus Happy
Sunparlour Players If The Creeks Don’t Rise Happy
Ezio Steal Away Happy
Dragonette Get Lucky Happy
Die Happy Supersonic Speed Happy
Uner Labaneria Happy
13th Floor Elevators I’m Gonna Love You Too Happy
Amy Winehouse Valerie Happy
MGMT Kids Happy
Hymns St. Sebastian Happy
The Go! Team Ladyflash Happy
Die Toten Hosen Boser Wolf Sad
James Taylor Fire And Rain (LP Version) Sad
Iliketrains Death Is The End Sad
TLC Unpretty Sad
In This Moment World In Flames Sad
Die Toten Hosen Was Zahlt Sad
Santana Feat. Steven Tyler Just Feel Better Sad
Avantasia Inside Sad
The Veronicas Heavily Broken (Live Version) Sad
181
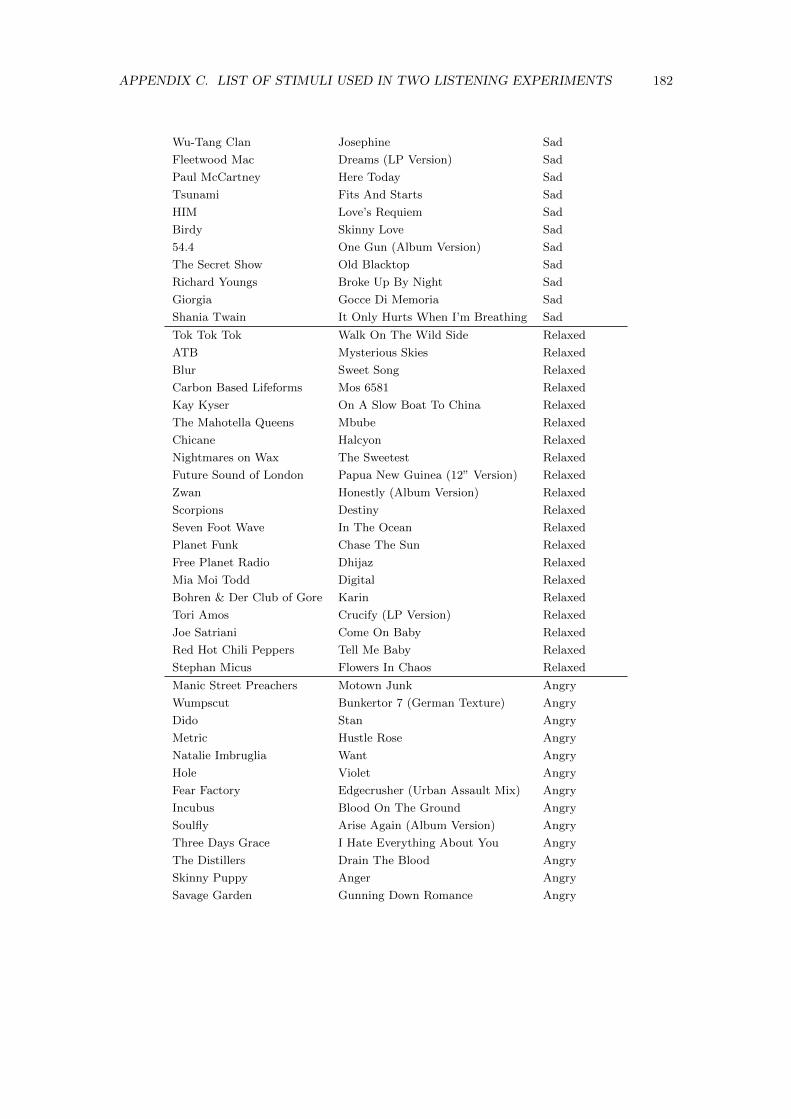
APPENDIX C. LIST OF STIMULI USED IN TWO LISTENING EXPERIMENTS 182
Wu-Tang Clan Josephine Sad
Fleetwood Mac Dreams (LP Version) Sad
Paul McCartney Here Today Sad
Tsunami Fits And Starts Sad
HIM Love’s Requiem Sad
Birdy Skinny Love Sad
54.4 One Gun (Album Version) Sad
The Secret Show Old Blacktop Sad
Richard Youngs Broke Up By Night Sad
Giorgia Gocce Di Memoria Sad
Shania Twain It Only Hurts When I’m Breathing Sad
Tok Tok Tok Walk On The Wild Side Relaxed
ATB Mysterious Skies Relaxed
Blur Sweet Song Relaxed
Carbon Based Lifeforms Mos 6581 Relaxed
Kay Kyser On A Slow Boat To China Relaxed
The Mahotella Queens Mbube Relaxed
Chicane Halcyon Relaxed
Nightmares on Wax The Sweetest Relaxed
Future Sound of London Papua New Guinea (12” Version) Relaxed
Zwan Honestly (Album Version) Relaxed
Scorpions Destiny Relaxed
Seven Foot Wave In The Ocean Relaxed
Planet Funk Chase The Sun Relaxed
Free Planet Radio Dhijaz Relaxed
Mia Moi Todd Digital Relaxed
Bohren & Der Club of Gore Karin Relaxed
Tori Amos Crucify (LP Version) Relaxed
Joe Satriani Come On Baby Relaxed
Red Hot Chili Peppers Tell Me Baby Relaxed
Stephan Micus Flowers In Chaos Relaxed
Manic Street Preachers Motown Junk Angry
Wumpscut Bunkertor 7 (German Texture) Angry
Dido Stan Angry
Metric Hustle Rose Angry
Natalie Imbruglia Want Angry
Hole Violet Angry
Fear Factory Edgecrusher (Urban Assault Mix) Angry
Incubus Blood On The Ground Angry
Soulfly Arise Again (Album Version) Angry
Three Days Grace I Hate Everything About You Angry
The Distillers Drain The Blood Angry
Skinny Puppy Anger Angry
Savage Garden Gunning Down Romance Angry

APPENDIX C. LIST OF STIMULI USED IN TWO LISTENING EXPERIMENTS 183
Skinny Puppy Scrapyard Angry
Vanessa Carlton Paint It Black Angry
Kittie Pain (Live Version) Angry
Rilo Kiley A Better Son/Daughter Angry
Texas Summer Son Angry
4LYN Incomplete Angry
Stone Sour Cold Reader Angry
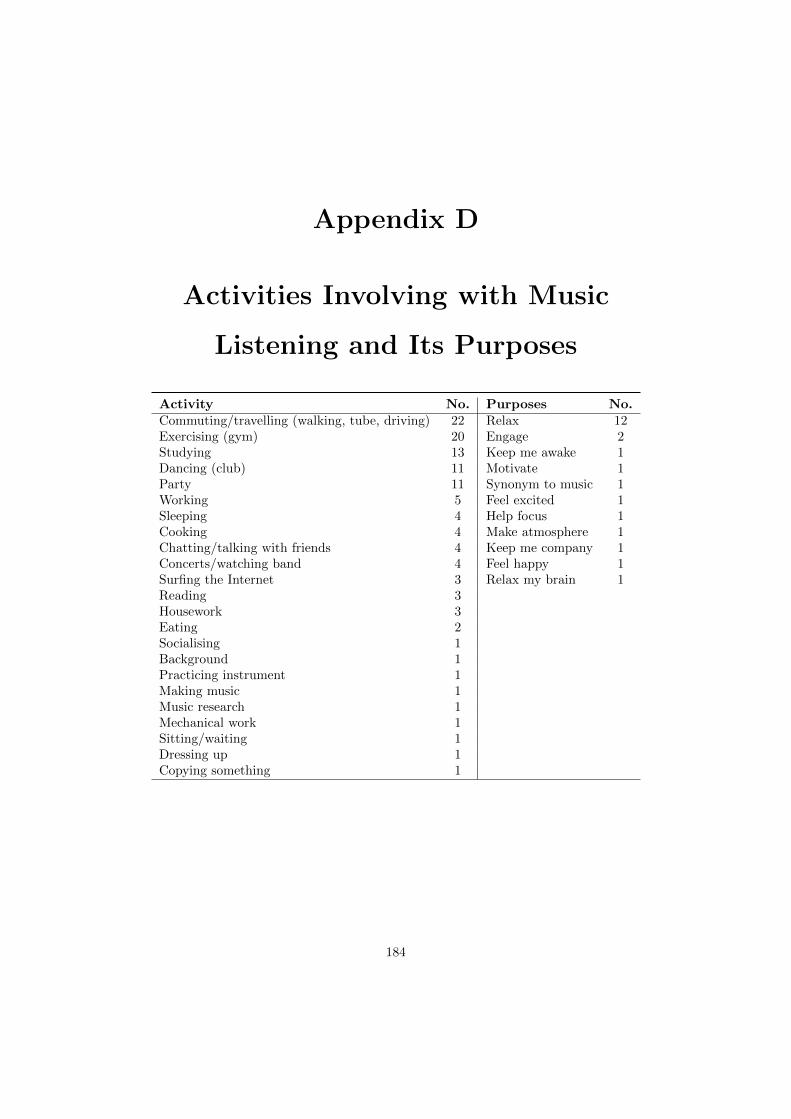
Appendix D
Activities Involving with Music
Listening and Its Purposes
Activity No. Purposes No.Commuting/travelling (walking, tube, driving) 22 Relax 12Exercising (gym) 20 Engage 2Studying 13 Keep me awake 1Dancing (club) 11 Motivate 1Party 11 Synonym to music 1Working 5 Feel excited 1Sleeping 4 Help focus 1Cooking 4 Make atmosphere 1Chatting/talking with friends 4 Keep me company 1Concerts/watching band 4 Feel happy 1Surfing the Internet 3 Relax my brain 1Reading 3Housework 3Eating 2Socialising 1Background 1Practicing instrument 1Making music 1Music research 1Mechanical work 1Sitting/waiting 1Dressing up 1Copying something 1
184
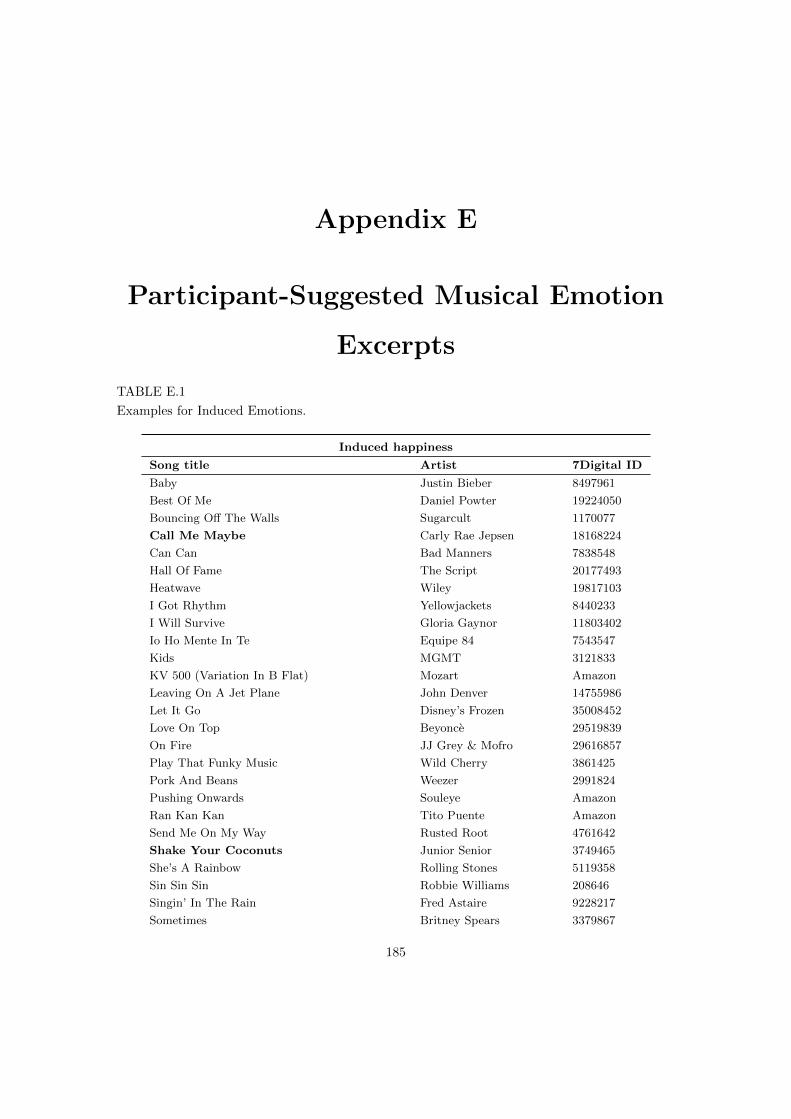
Appendix E
Participant-Suggested Musical Emotion
Excerpts
TABLE E.1
Examples for Induced Emotions.
Induced happiness
Song title Artist 7Digital ID
Baby Justin Bieber 8497961
Best Of Me Daniel Powter 19224050
Bouncing Off The Walls Sugarcult 1170077
Call Me Maybe Carly Rae Jepsen 18168224
Can Can Bad Manners 7838548
Hall Of Fame The Script 20177493
Heatwave Wiley 19817103
I Got Rhythm Yellowjackets 8440233
I Will Survive Gloria Gaynor 11803402
Io Ho Mente In Te Equipe 84 7543547
Kids MGMT 3121833
KV 500 (Variation In B Flat) Mozart Amazon
Leaving On A Jet Plane John Denver 14755986
Let It Go Disney’s Frozen 35008452
Love On Top Beyonce 29519839
On Fire JJ Grey & Mofro 29616857
Play That Funky Music Wild Cherry 3861425
Pork And Beans Weezer 2991824
Pushing Onwards Souleye Amazon
Ran Kan Kan Tito Puente Amazon
Send Me On My Way Rusted Root 4761642
Shake Your Coconuts Junior Senior 3749465
She’s A Rainbow Rolling Stones 5119358
Sin Sin Sin Robbie Williams 208646
Singin’ In The Rain Fred Astaire 9228217
Sometimes Britney Spears 3379867
185
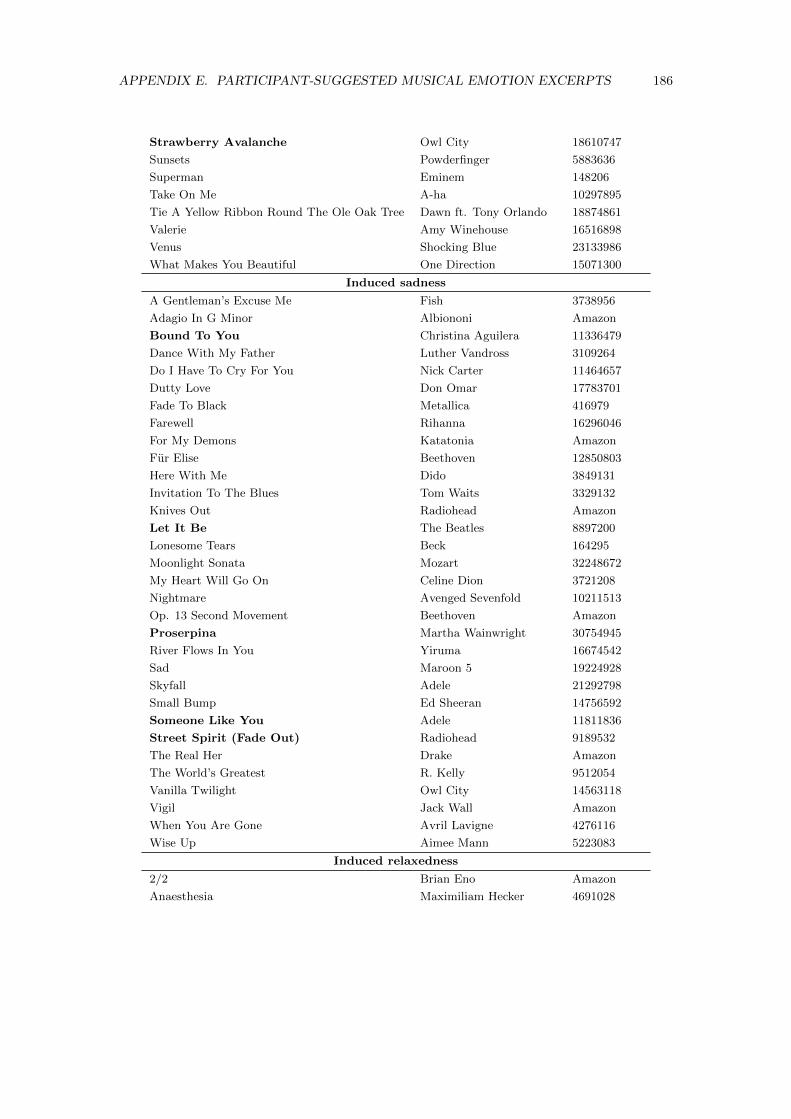
APPENDIX E. PARTICIPANT-SUGGESTED MUSICAL EMOTION EXCERPTS 186
Strawberry Avalanche Owl City 18610747
Sunsets Powderfinger 5883636
Superman Eminem 148206
Take On Me A-ha 10297895
Tie A Yellow Ribbon Round The Ole Oak Tree Dawn ft. Tony Orlando 18874861
Valerie Amy Winehouse 16516898
Venus Shocking Blue 23133986
What Makes You Beautiful One Direction 15071300
Induced sadness
A Gentleman’s Excuse Me Fish 3738956
Adagio In G Minor Albiononi Amazon
Bound To You Christina Aguilera 11336479
Dance With My Father Luther Vandross 3109264
Do I Have To Cry For You Nick Carter 11464657
Dutty Love Don Omar 17783701
Fade To Black Metallica 416979
Farewell Rihanna 16296046
For My Demons Katatonia Amazon
Fur Elise Beethoven 12850803
Here With Me Dido 3849131
Invitation To The Blues Tom Waits 3329132
Knives Out Radiohead Amazon
Let It Be The Beatles 8897200
Lonesome Tears Beck 164295
Moonlight Sonata Mozart 32248672
My Heart Will Go On Celine Dion 3721208
Nightmare Avenged Sevenfold 10211513
Op. 13 Second Movement Beethoven Amazon
Proserpina Martha Wainwright 30754945
River Flows In You Yiruma 16674542
Sad Maroon 5 19224928
Skyfall Adele 21292798
Small Bump Ed Sheeran 14756592
Someone Like You Adele 11811836
Street Spirit (Fade Out) Radiohead 9189532
The Real Her Drake Amazon
The World’s Greatest R. Kelly 9512054
Vanilla Twilight Owl City 14563118
Vigil Jack Wall Amazon
When You Are Gone Avril Lavigne 4276116
Wise Up Aimee Mann 5223083
Induced relaxedness
2/2 Brian Eno Amazon
Anaesthesia Maximiliam Hecker 4691028
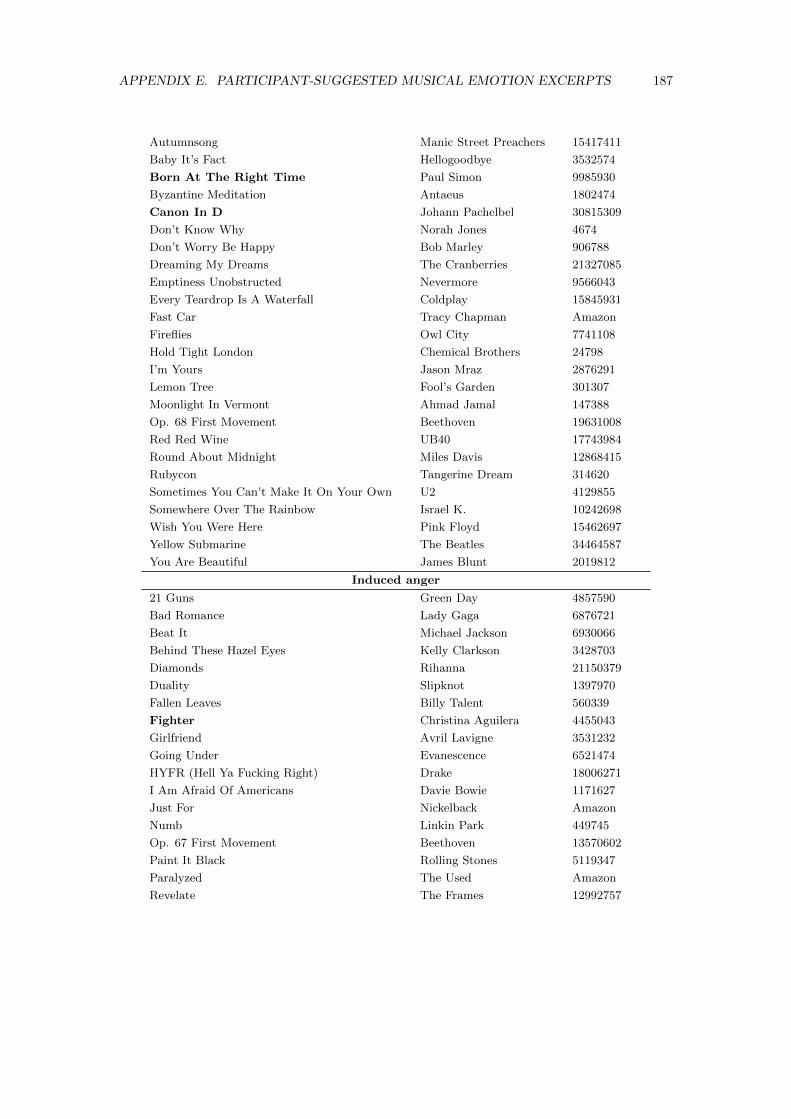
APPENDIX E. PARTICIPANT-SUGGESTED MUSICAL EMOTION EXCERPTS 187
Autumnsong Manic Street Preachers 15417411
Baby It’s Fact Hellogoodbye 3532574
Born At The Right Time Paul Simon 9985930
Byzantine Meditation Antaeus 1802474
Canon In D Johann Pachelbel 30815309
Don’t Know Why Norah Jones 4674
Don’t Worry Be Happy Bob Marley 906788
Dreaming My Dreams The Cranberries 21327085
Emptiness Unobstructed Nevermore 9566043
Every Teardrop Is A Waterfall Coldplay 15845931
Fast Car Tracy Chapman Amazon
Fireflies Owl City 7741108
Hold Tight London Chemical Brothers 24798
I’m Yours Jason Mraz 2876291
Lemon Tree Fool’s Garden 301307
Moonlight In Vermont Ahmad Jamal 147388
Op. 68 First Movement Beethoven 19631008
Red Red Wine UB40 17743984
Round About Midnight Miles Davis 12868415
Rubycon Tangerine Dream 314620
Sometimes You Can’t Make It On Your Own U2 4129855
Somewhere Over The Rainbow Israel K. 10242698
Wish You Were Here Pink Floyd 15462697
Yellow Submarine The Beatles 34464587
You Are Beautiful James Blunt 2019812
Induced anger
21 Guns Green Day 4857590
Bad Romance Lady Gaga 6876721
Beat It Michael Jackson 6930066
Behind These Hazel Eyes Kelly Clarkson 3428703
Diamonds Rihanna 21150379
Duality Slipknot 1397970
Fallen Leaves Billy Talent 560339
Fighter Christina Aguilera 4455043
Girlfriend Avril Lavigne 3531232
Going Under Evanescence 6521474
HYFR (Hell Ya Fucking Right) Drake 18006271
I Am Afraid Of Americans Davie Bowie 1171627
Just For Nickelback Amazon
Numb Linkin Park 449745
Op. 67 First Movement Beethoven 13570602
Paint It Black Rolling Stones 5119347
Paralyzed The Used Amazon
Revelate The Frames 12992757
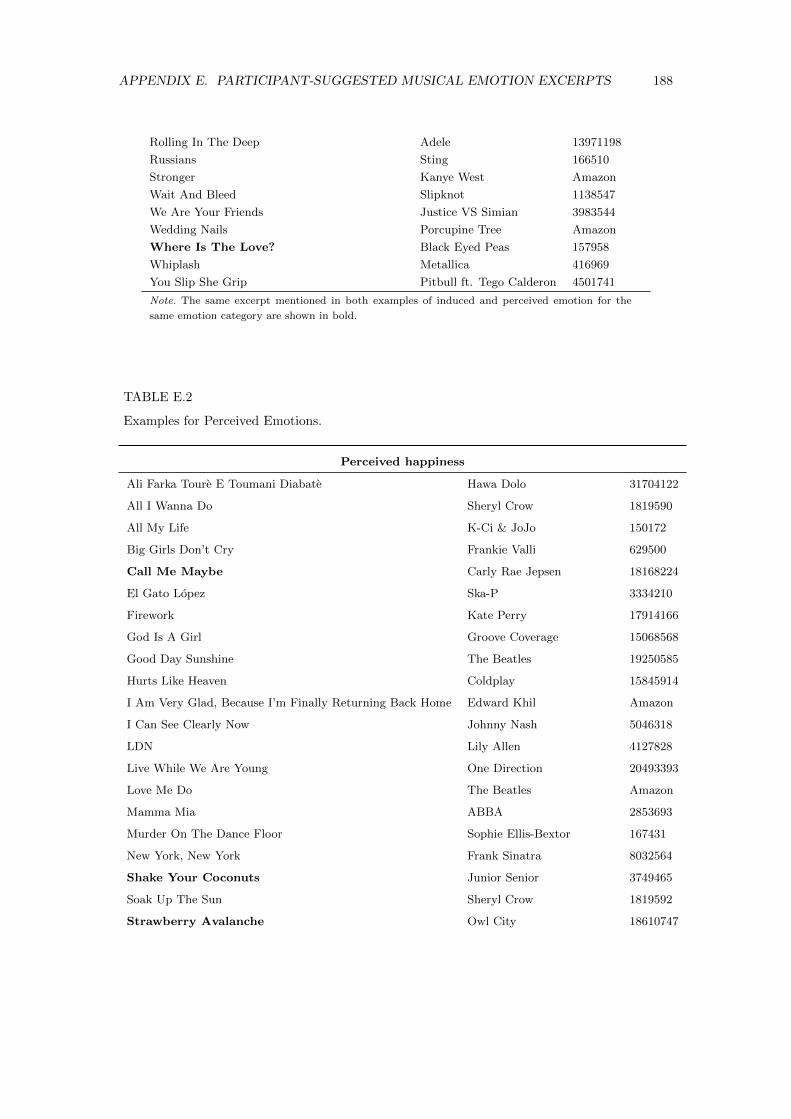
APPENDIX E. PARTICIPANT-SUGGESTED MUSICAL EMOTION EXCERPTS 188
Rolling In The Deep Adele 13971198
Russians Sting 166510
Stronger Kanye West Amazon
Wait And Bleed Slipknot 1138547
We Are Your Friends Justice VS Simian 3983544
Wedding Nails Porcupine Tree Amazon
Where Is The Love? Black Eyed Peas 157958
Whiplash Metallica 416969
You Slip She Grip Pitbull ft. Tego Calderon 4501741
Note. The same excerpt mentioned in both examples of induced and perceived emotion for the
same emotion category are shown in bold.
TABLE E.2
Examples for Perceived Emotions.
Perceived happiness
Ali Farka Toure E Toumani Diabate Hawa Dolo 31704122
All I Wanna Do Sheryl Crow 1819590
All My Life K-Ci & JoJo 150172
Big Girls Don’t Cry Frankie Valli 629500
Call Me Maybe Carly Rae Jepsen 18168224
El Gato Lopez Ska-P 3334210
Firework Kate Perry 17914166
God Is A Girl Groove Coverage 15068568
Good Day Sunshine The Beatles 19250585
Hurts Like Heaven Coldplay 15845914
I Am Very Glad, Because I’m Finally Returning Back Home Edward Khil Amazon
I Can See Clearly Now Johnny Nash 5046318
LDN Lily Allen 4127828
Live While We Are Young One Direction 20493393
Love Me Do The Beatles Amazon
Mamma Mia ABBA 2853693
Murder On The Dance Floor Sophie Ellis-Bextor 167431
New York, New York Frank Sinatra 8032564
Shake Your Coconuts Junior Senior 3749465
Soak Up The Sun Sheryl Crow 1819592
Strawberry Avalanche Owl City 18610747
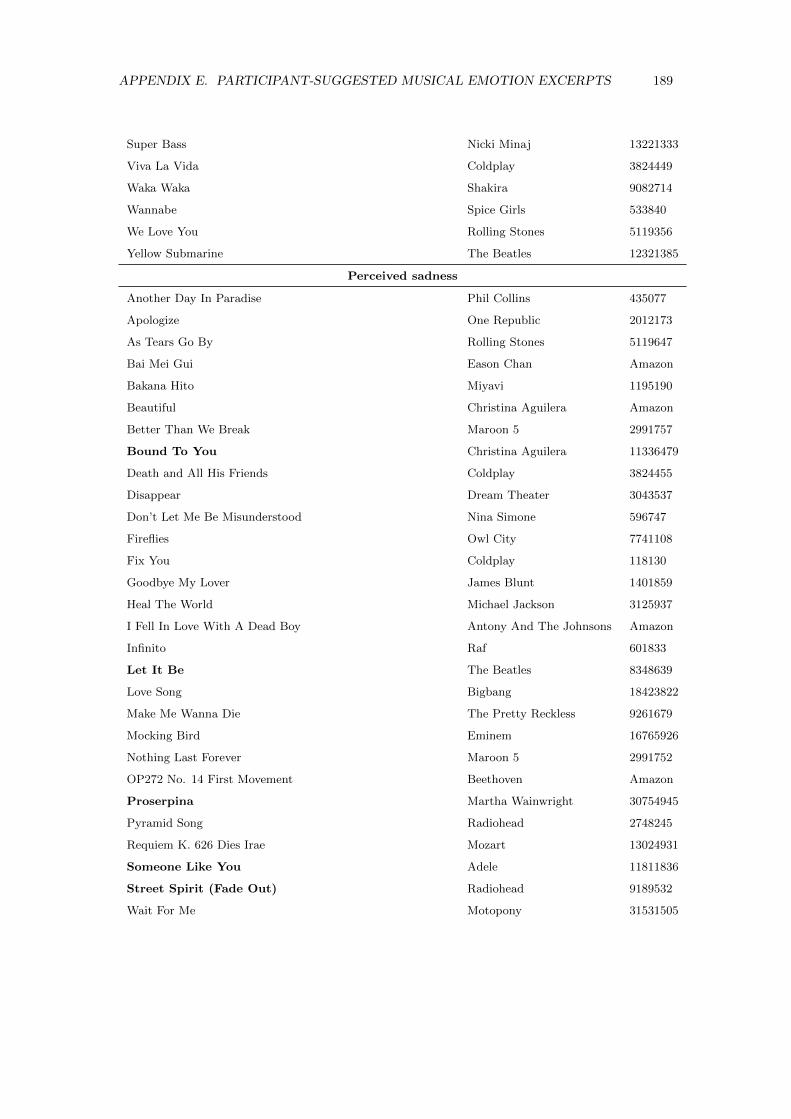
APPENDIX E. PARTICIPANT-SUGGESTED MUSICAL EMOTION EXCERPTS 189
Super Bass Nicki Minaj 13221333
Viva La Vida Coldplay 3824449
Waka Waka Shakira 9082714
Wannabe Spice Girls 533840
We Love You Rolling Stones 5119356
Yellow Submarine The Beatles 12321385
Perceived sadness
Another Day In Paradise Phil Collins 435077
Apologize One Republic 2012173
As Tears Go By Rolling Stones 5119647
Bai Mei Gui Eason Chan Amazon
Bakana Hito Miyavi 1195190
Beautiful Christina Aguilera Amazon
Better Than We Break Maroon 5 2991757
Bound To You Christina Aguilera 11336479
Death and All His Friends Coldplay 3824455
Disappear Dream Theater 3043537
Don’t Let Me Be Misunderstood Nina Simone 596747
Fireflies Owl City 7741108
Fix You Coldplay 118130
Goodbye My Lover James Blunt 1401859
Heal The World Michael Jackson 3125937
I Fell In Love With A Dead Boy Antony And The Johnsons Amazon
Infinito Raf 601833
Let It Be The Beatles 8348639
Love Song Bigbang 18423822
Make Me Wanna Die The Pretty Reckless 9261679
Mocking Bird Eminem 16765926
Nothing Last Forever Maroon 5 2991752
OP272 No. 14 First Movement Beethoven Amazon
Proserpina Martha Wainwright 30754945
Pyramid Song Radiohead 2748245
Requiem K. 626 Dies Irae Mozart 13024931
Someone Like You Adele 11811836
Street Spirit (Fade Out) Radiohead 9189532
Wait For Me Motopony 31531505
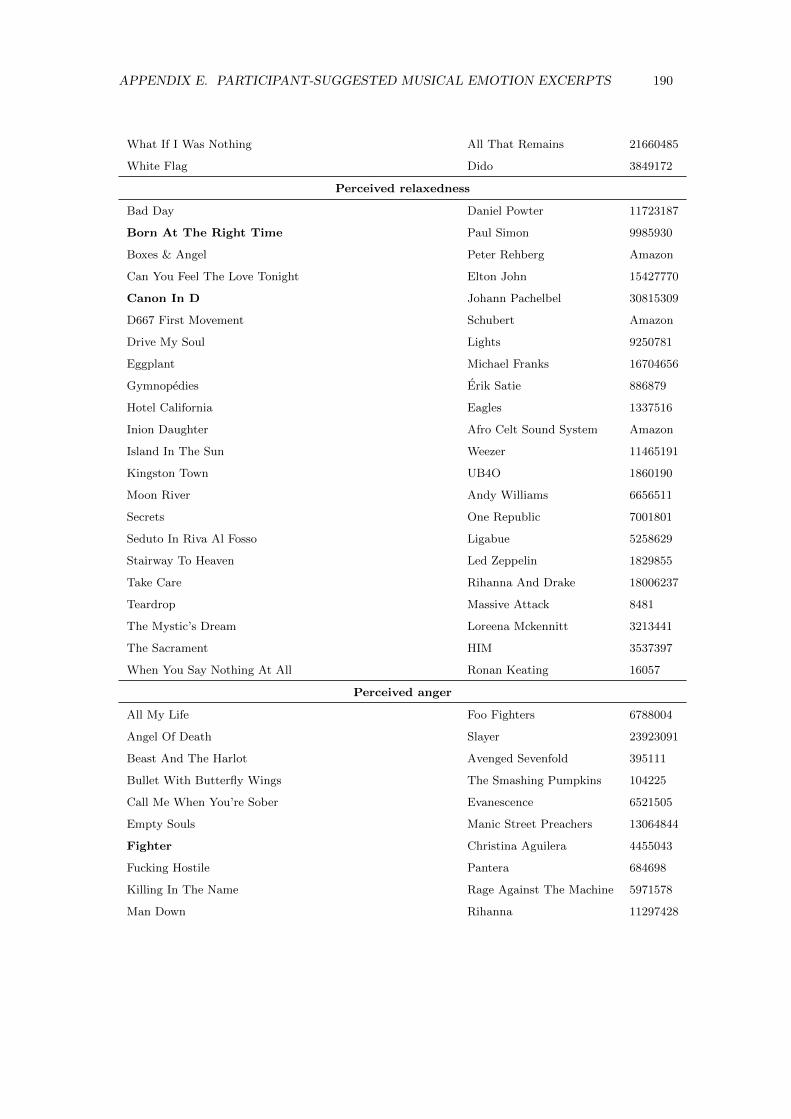
APPENDIX E. PARTICIPANT-SUGGESTED MUSICAL EMOTION EXCERPTS 190
What If I Was Nothing All That Remains 21660485
White Flag Dido 3849172
Perceived relaxedness
Bad Day Daniel Powter 11723187
Born At The Right Time Paul Simon 9985930
Boxes & Angel Peter Rehberg Amazon
Can You Feel The Love Tonight Elton John 15427770
Canon In D Johann Pachelbel 30815309
D667 First Movement Schubert Amazon
Drive My Soul Lights 9250781
Eggplant Michael Franks 16704656
Gymnopedies Erik Satie 886879
Hotel California Eagles 1337516
Inion Daughter Afro Celt Sound System Amazon
Island In The Sun Weezer 11465191
Kingston Town UB4O 1860190
Moon River Andy Williams 6656511
Secrets One Republic 7001801
Seduto In Riva Al Fosso Ligabue 5258629
Stairway To Heaven Led Zeppelin 1829855
Take Care Rihanna And Drake 18006237
Teardrop Massive Attack 8481
The Mystic’s Dream Loreena Mckennitt 3213441
The Sacrament HIM 3537397
When You Say Nothing At All Ronan Keating 16057
Perceived anger
All My Life Foo Fighters 6788004
Angel Of Death Slayer 23923091
Beast And The Harlot Avenged Sevenfold 395111
Bullet With Butterfly Wings The Smashing Pumpkins 104225
Call Me When You’re Sober Evanescence 6521505
Empty Souls Manic Street Preachers 13064844
Fighter Christina Aguilera 4455043
Fucking Hostile Pantera 684698
Killing In The Name Rage Against The Machine 5971578
Man Down Rihanna 11297428
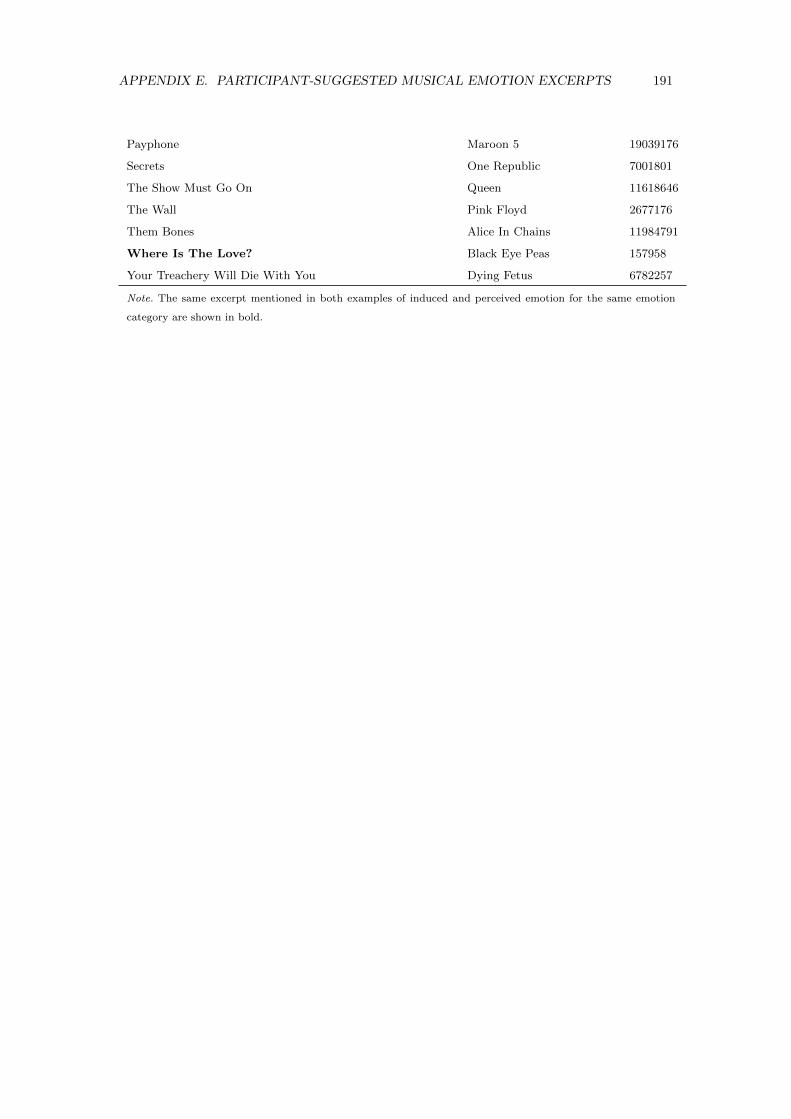
APPENDIX E. PARTICIPANT-SUGGESTED MUSICAL EMOTION EXCERPTS 191
Payphone Maroon 5 19039176
Secrets One Republic 7001801
The Show Must Go On Queen 11618646
The Wall Pink Floyd 2677176
Them Bones Alice In Chains 11984791
Where Is The Love? Black Eye Peas 157958
Your Treachery Will Die With You Dying Fetus 6782257
Note. The same excerpt mentioned in both examples of induced and perceived emotion for the same emotion
category are shown in bold.