the restoration of ecological interactions: plant-pollinator networks on ancient and restored...
TRANSCRIPT
Journal of Applied Ecology
2008,
45
, 742–752 doi: 10.1111/j.1365-2664.2007.01390.x
© 2007 The Authors. Journal compilation © 2007 British Ecological Society
Blackwell Publishing Ltd
The restoration of ecological interactions: plant–pollinator networks on ancient and restored heathlands
Mikael
Lytzau
Forup†,
Kate S. E. Henson,
Paul G. Craze
and
Jane Memmott*
School of Biological Sciences, University of Bristol, Woodland Road, Bristol, BS8 1UG, UK
Summary
1.
Attempts to restore damaged ecosystems usually emphasize structural aspects of biodiversity,such as species richness and abundance. An alternative is to emphasize functional aspects, such aspatterns of interaction between species. Pollination is a ubiquitous interaction between plants andanimals. Patterns in plant–pollinator interactions can be analysed with a food web or complex-systems approach and comparing pollination webs between restored and reference sites can be usedto test whether ecological restoration has taken place.
2.
Using an ecological network approach, we compared plant–pollinator interactions on four pairsof restored and ancient heathlands 11 and 14 years following initiation of restoration management.We used the network data to test whether visitation by pollinators had been restored and wecalculated pollinator importance indices for each insect species on the eight sites. Finally, wecompared the robustness of the restored and ancient networks to species loss.
3.
Plant and pollinator communities were established successfully on the restored sites. There waslittle evidence of movement of pollinators from ancient sites onto adjacent restored sites, althoughpaired sites correlated in pollinator species richness in both years. There was little insect speciesoverlap within each heathland between 2001 and 2004.
4.
A few widespread insect species dominated the communities and were the main pollinators.The most important pollinators were typically honeybees (
Apis mellifera
), species of bumblebee(
Bombus
spp.) and one hoverfly species (
Episyrphus balteatus
). The interaction networks were signi-ficantly less complex on restored heathlands, in terms of connectance values, although in 2004the low values might reflect the negative relationship between connectance and species richness.Finally, there was a trend of restored networks being more susceptible to perturbation than ancientnetworks, although this needs to be interpreted with caution.
5.
Synthesis and applications.
Ecological networks provide a powerful tool for assessing the out-come of restoration programmes. Our results indicate that heathland restoration does not have tooccur immediately adjacent to ancient heathland for functional pollinator communities to be estab-lished. Moreover, in terms of restoring pollinator interactions, heathland managers need only beconcerned with the most common insect species. Our focus on pollination demonstrates how a keyecological service can serve as a yardstick for judging restoration success.
Key-words:
complex system, ecological restoration, food web, heathland, network, pollinationweb, pollination
Introduction
Terrestrial restoration projects focus normally on some basiccore of the target community, usually the dominant plantspecies, in the hope that natural processes will subsequentlysteer the community on a trajectory towards complete restora-tion (Palmer, Ambrose & Poff 1997). However, ecologists
*Correspondence author. E-mail: [email protected]†Present address: Department of Ecology, Evolution and NaturalResources, 1 College Farm Road, Rutgers University, New Brunswick,NJ 08901–1582, USA.

Plant–pollinator networks on heathlands
743
© 2007 The Authors. Journal compilation © 2007 British Ecological Society,
Journal of Applied Ecology
,
45
, 742–752
rarely possess complete records of the structure of a historicalcommunity, let alone regional species pools. This makes it dif-ficult to define an exact target community for the restorationprocess and to evaluate later if the community has beenreturned to its original state. Moreover, an approach that aimsto restore some historical community structure is funda-mentally flawed where landscape properties have changedand can no longer sustain the target community (Cairns &Heckman 1996; Palmer, Ambrose & Poff 1997; Ehrenfeld2000). Similarly, the use of reference communities as targetsto aim for in the restoration process can be inappropriate,because species composition is expected to vary betweenlocalities in response to variations in soil type, hydrology,aspect, disturbance frequency, size and composition of thelocal species pool, landscape connectivity, priority effects andchance events (Jordano 1994; Williams
et al
. 1996; White &Walker 1997; Potts
et al
. 2003; Young, Petersen & Clary 2005).In planning and evaluating restoration projects, therefore, apurely structural focus is inadequate. An alternative is toconsider function, i.e. what constituent species do rather thansimply recording whether or not they are present (Ehrenfeld& Toth 1997). Indeed, a direct functional comparison ofsuccessfully restored and target habitat is possible when con-sidering ecological processes that should not vary betweenlocalities, such as processes needed for target plants to surviveand reproduce.
Pollination is one of several ecosystem services that must bereinstated for ecological restoration to be successful. Pollina-tion by animals is ubiquitous in terrestrial habitats, involving67% of flowering plant species (Kearns & Inouye 1997) andan equivalently high diversity of insect species (Nabhan &Buchmann 1997). However, plant–pollinator interactionsmay not re-establish automatically themselves in communitiesundergoing restoration management, because pollinatorsestablish populations only once their habitat requirementshave been met. For example, in addition to food resources,bees require nesting sites and nesting materials (e.g. Kearns,Inouye & Waser 1998; Gathmann & Tscharntke 2002). Thesefeatures make pollination a useful functional bio-indicator forcomparing restored communities to reference communities.
Connections between plants and pollinators can be analysedfor entire ecological communities using a food web approach(Jordano 1987; Waser
et al
. 1996; Memmott 1999; Dicks, Corbet& Pywell 2002; Memmott & Waser 2002; Vázquez & Aizen 2003)or, more generally, a complex systems approach (Bascompte
et al
. 2003; Jordano, Bascompte & Olesen 2003; Memmott,Waser & Price 2004). The recent surge in work investigatingthe properties and consequences of network structure hasyielded many new insights (Jordano, Bascompte & Olesen2006), some of which have implications for restoration ecology.For example, the way interaction webs assemble is relevant forrestoration projects, and both Dunne, Williams & Martinez(2002) and Jordano
et al.
(2003) have shown that the build-upof ecological interaction networks is not explained adequatelyby ‘preferential attachment’ to highly connected nodes, asseen in many other real-world networks (Barabási & Albert1999).
In addition to providing a target community structure,information on interaction networks also enables the robust-ness of a whole community to be ascertained, providing apowerful tool to test the impact, on community structure,of ‘that most insidious type of extinction, the extinction ofecological interactions’ (Janzen 1974). For example, model-ling the removal of pollinator species from two plant–pollinatornetworks, Memmott, Waser & Price (2004) found that thegreatest effect on plant survival occurred when generalistpollinators were removed. By comparing the robustness ofnetworks from restored sites to those from ancient sites, theability of restored sites to withstand future natural and man-made perturbations can be assessed.
Here we use a network approach to evaluate the outcome ofheathland restoration in the county of Dorset, southernEngland. We focus on the following three questions: (1) haspollination been reinstated in restored heathlands; (2) doinsect species which visit flowers on restored heaths originatefrom adjacent ancient heathland; and (3) do ancient heathshave a more complex network structure than restored heathsand is any variation in complexity linked to the resilience ofthe networks to future perturbation?
Materials and methods
BRIT ISH
HEATHLANDS
Dry lowland heathland is a relatively species-poor, seminatural plantcommunity dominated by the ericaceous shrubs
Calluna vulgaris
Hull,
Erica tetralix
L. and
E. cinerea
L., and the fabaceous shrubs
Ulex minor
Roth,
U. europaeus
L. and/or
U. gallii
Planch. The habitatis an important focus for conservation and ecological restorationefforts, because heathlands have a limited distribution internation
-
ally, are associated with a number of rare or threatened species ofvertebrates and invertebrates (Usher 1992; Anonymous 2002) andhave considerable aesthetic and cultural significance (Webb 1986;Usher 1992; Anonymous 2002). The Dorset heathlands were onceextensive: a survey in the 1750s listed some 40 000 ha, but by 1978only 6000 ha remained (Webb & Haskins 1980). This reduction wascaused predominantly by afforestation, conversion to agriculture,urban spread and a lack of appropriate management to halt succes-sion (Rose
et al
. 2000). The heathland that remains is highly frag-mented but ecological restoration is currently being carried out toincrease the total heathland area and link up heath fragments.
THE
F IELD
S ITES
We used a paired design to study restored heathlands and comparetheir vegetation and visitation networks to those of ancient heath-lands (
>
250 years old). Thus each of the four restored sites (R1–R4)was paired with an ancient site (A1–A4). Paired sites were adjacent,except pair 2, where the sites were separated by 3 km (although R2 wasadjacent to ancient heathland, the ancient site could not be sampledbecause of an asbestos pollution there. A2 was the nearest alternativesite of ancient heathland). All the heathlands were located within a100-km
2
area with a similar climate and soils (Table 1). The restoredsites were heathlands before being afforested with pine. The pine treesprevent sufficient light reaching the heathland, which then dies off.Restoration began in 1990 when the pine plantations were cleared.

744
M. L. Forup
et al.
© 2007 The Authors. Journal compilation © 2007 British Ecological Society,
Journal of Applied Ecology
,
45
, 742–752
SAMPLING
PROTOCOL
Plants, pollinators and their interactions were collected every3 weeks from late April until late September in 2001 and from earlyMay to late September in 2004. Thus each site was sampled eighttimes throughout each season. Slightly different sampling methodswere used in the 2 years, because the methods in 2004 were changedto conform to methods used in other ongoing pollination projects.In 2001 the centre of a circular plot was marked with a pole at eachsite, and sampling was carried out along two 100-m-long transectslaid out in random directions from the pole. In 2004, circular plotswere changed to square plots (100
×
100 m), with the centre of thenew plots being coincident with the centre of the old plots. Samplingwas again carried out along two 100-m-long transects. One of the four100-m edges of each square plot was established as a baseline. Fromthis, 10 transect lines, spaced equally at 10 m apart, extended atright-angles across the plot for 100 m. These were then split intotwo blocks of five transects each. At any given sampling event, onetransect was selected randomly from each of the two blocks. Themethods in 2001 and 2004 both sampled the same location in eachheathland (eight sampling sessions, two transects each of 100 m
2
inlength) but from plots that differed in size between the two censuses(31 416 m
2
in 2001 vs. 10 000 m
2
in 2004).In both years, sites were sampled alternately in the morning and
in the afternoon to avoid differences emerging between sites thatcould reflect patterns in insect day activity. Sampling was conductedonly in calm, sunny weather, although in 2004 a wet summer prevailed.While sites were never sampled in the rain, in 2004 the weather wasnot as consistent between the samples as in 2001. Each transect wassampled twice, allowing at least 30 min between samples. All flower-visiting insects in a 2-m-wide swathe of vegetation were sampledalong the 100 m long transect, with insects up to 1 m ahead beingrecorded. No
a priori
decision was made concerning if an insect waslikely to be a pollinator; rather, all flower-visiting insects were col-lected. They were caught using a sweep-net, or captured directlyinto a killing tube. Each killing tube was lined with a small paperbag and this, together with a paper disk that lined the vial cap andwas replaced after each catch, prevented insects from touching thesides of the glass vial, reducing the risk of pollen contamination be-tween insects. Insects were identified to species or morphotype bytaxonomists at the National Museum of Wales. Workers of
Bombuslucorum
L. and
B. terrestris
L. are difficult to tell apart and thesespecies were therefore grouped as
B. lucorum/terrestris
, similar toDicks, Corbet & Pywell (2002).
Following insect sampling, all entomophilous plant speciesblooming in each transect were recorded together with their floralabundance. In 2001 flowers were counted along the entire transect,until the copious flowering of the ericaceous shrubs in July, Augustand September when counting individual flowers was unrealistic. Theabundance of these species was therefore estimated from six 1-mquadrats placed along the transect line at the 15 m, 30 m, 45 m,60 m, 75 m and 90 m marks. These data were used to calculate theaverage number of floral units per m
2
. In 2004 floral abundance wasmeasured along the two 100 m long transects using a 0·5
×
0·5 mquadrate placed at 0, 15, 30, 45, 60 and 75 m along each transect. Ateach point the number of floral units were recorded and used to cal-culate the average number of floral units per m
2
.
LABORATORY
METHODS
In 2001 pollen carried by insects was identified and quantified inorder to distinguish the probable pollinators. It was sampled from eachinsect specimen by dabbing the left-hand side of the body systemat-ically with a 5
×
5 mm square of fuchsin pink gel (Kearns & Inouye1993). Both the dorsal and the ventral surfaces were sampled, butpollen storage areas were avoided; for example, pollen baskets onbumblebees, as these contain pollen unlikely to be available for pol-lination. Pollen samples were identified under the light microscopeusing a pollen reference collection of all the insect-pollinated plantspecies found in or near the plots. Sub-sampling was carried out on
Apis mellifera
and
B. lucorum/terrestris
when a high number of beesbelonging to one of these species was caught in the same transectand on the same flower species. When this was the case, only thefirst eight individuals were sampled for pollen and their averageload used to estimate the remainder of that species’ sample. Pollenspecies represented on a specimen with fewer than five grains wereremoved from analysis, as was pollen from plant species growingoutside the transects and the small amount of pollen that could notbe identified.
DATA
ANALYSIS
Has pollination been reinstated in restored heathlands?
In order to compare pollination on restored and ancient heathlands,we used the data to construct two types of network for each site:quantitative flower visitation networks from both the 2001 and 2004
Table 1. The location and size of the four pairs of restored and ancient dry lowland heaths in the Poole Basin, Dorset, South England, alongwith the web statistics for each heathland: plant and insect diversity, insect abundance and network connectance for 2001 and 2004
Pair Code Latitude and longitude Size (ha)
Plants Insects Network connectance
2001 2004 2001 2004 2001 2004
Spp. Spp. N Spp. N Spp. Visitation Pollen transport Visitation
1 R1 50°41·3′ N 2°02·0′ W 8 8 4 212 23 336 34 0·18 0·17 0·32A1 50°41·2′ N 2°02·0′ W 30 5 4 463 34 468 27 0·28 0·32 0·41
2 R2 50°43·5′ N 2°03·7′ W 15 8 6 352 38 457 44 0·17 0·17 0·26A2 50°42·6′ N 2°06·3′ W 25 7 6 367 43 425 38 0·24 0·23 0·30
3 R3 50°42·9′ N 2°10·4′ W 2 10 7 205 41 162 32 0·15 0·18 0·20A3 50°43·1′ N 2°09·7′ W 18 6 4 422 48 194 29 0·26 0·24 0·36
4 R4 50°43·8′ N 2°07·6′ W 8 6 5 351 28 424 52 0·23 0·24 0·26A4 50°43·7′ N 2°07·2′ W 16 6 4 351 32 362 34 0·27 0·30 0·37
Plant–pollinator networks on heathlands
745
© 2007 The Authors. Journal compilation © 2007 British Ecological Society,
Journal of Applied Ecology
,
45
, 742–752
data, and quantitative pollen transport networks from the 2001 data.Visitation networks show how insects respond to the diversity,quantity and regularity in nectar and pollen supplies (Memmott1999). Constructing pollen transport networks is a recently developedapproach (Forup & Memmott 2005; Gibson
et al
. 2006) that showswhich insect species carry which pollen species. These ‘pollen vec-tors’ are considered the potential pollinators. We used the pollentransport data to calculate pollinator importance,
PI
, followingGibson
et al
. (2006), as a measure of the importance of individualinsect species in pollinating the plant species. The measure combinesboth the ‘quality’ and ‘quantity’ components of each pollinator’spotential value to a given plant species, using the following equation:
PI
=
[Relative abundance of pollinator]
×
[Pollen fidelity]
where [Relative abundance of pollinator] is the proportion of all in-sects carrying a given pollen species that belong to the pollinatorspecies and [Pollen fidelity] is the average proportion of individualpollen loads on the pollinator species that originate from the givenplant species.
Do the pollinators on restored heaths originate from adjacent, ancient heathland?
The percentage overlap in species was calculated for each pair ofsites using the raw data on species richness for each site and for both2001 and 2004. Species richness was then weighted for insect abun-dance and the percentage overlap recalculated. To measure theamount of temporal variation, we also compared the pollinatorcommunity within each site between the 2 years. As before, theoverlap in species between 2001 and 2004 was calculated using theraw data on species richness. Species richness was subsequentlyweighted for abundance and the percentage overlap recalculated.
Do ancient heaths have a more complex network structure and is this linked to the robustness of the networks in the face of future perturbation?
Connectance,
C
, was calculated for each network. This measures thegeneralization of each network by looking at the actual number ofconnections as a proportion of the possible pairwise connectionsbetween plant and insect species (Jordano 1987; Lundgren & Olesen2005).
To model the response of the networks to species loss, we used threedifferent algorithms to remove species from the eight data sets. Forrandom removal we removed increasing proportions of all specieschosen at random and without replacement. This process was repeated300 times for each web. Random removal represents a ‘null model’ withwhich to contrast two types of systematic removal of the number oflinks of pollinator species, i.e. the number of plant species that theyvisit. We removed systematically species from the least linked (mostspecialized) species to the most linked (most generalized); and converse-ly from the most to least linked. After each primary removal, the mostor least connected species was recalculated. The analysis was runtwice, first ranking all species, i.e. both plants and pollinators andsecondly ranking only the pollinators. The first approach was that usedby Dunne, Williams & Martinez (2002) and the second approach thatof Memmott, Waser & Price (2004). The approach used by Dunne
et al.
(2002) is used widely in network analysis and is useful for comparisonwith other networks. In contrast, the approach used by Memmott
et al.
(2004) is tailored specifically for the probable order of extinction inplant–pollinator communities. We calculated the ‘robustness’ of each
network to species loss by using the method of Dunne
et al.
(2002). Thiscalculates the fraction of species that needs to be removed to result in aloss of 50% or more of the species (i.e. primary species removals plussecondary extinctions). The maximum possible robustness is 0·50 andminimum is 1/
S
, where
S
is the number of species (Dunne
et al.
(2002).These measures of robustness were compared between ancient and re-stored sites using paired
t
-tests.
Results
In both 2001 and 2004 we recorded abundant heath vegetationon all eight sites, with the low species diversity characteristicof heathlands. All sites were dominated by the ericoids
C.vulgaris
and
E. cinerea
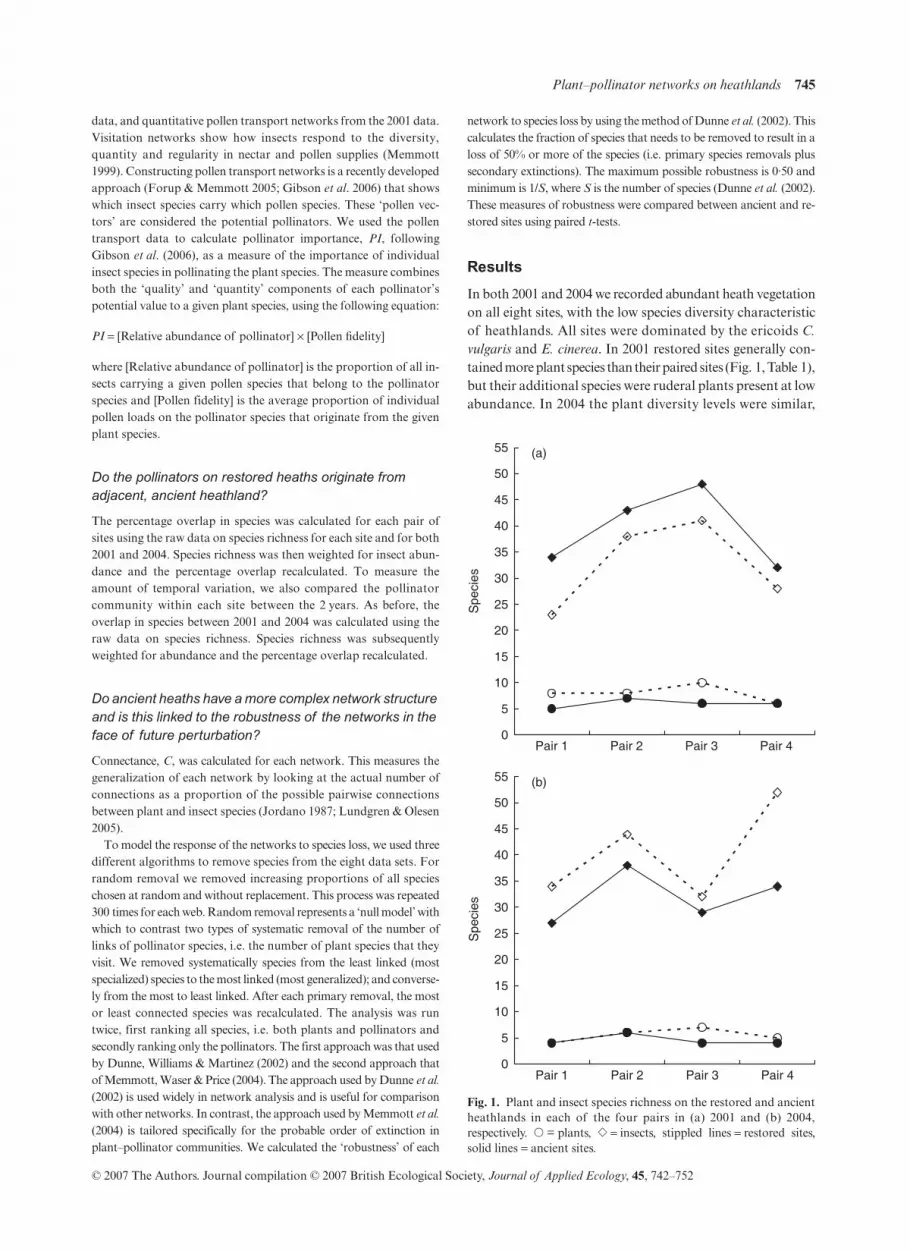
. In 2001 restored sites generally con-tained more plant species than their paired sites (Fig. 1, Table 1),but their additional species were ruderal plants present at lowabundance. In 2004 the plant diversity levels were similar,
Fig. 1. Plant and insect species richness on the restored and ancientheathlands in each of the four pairs in (a) 2001 and (b) 2004,respectively. � = plants, � = insects, stippled lines = restored sites,solid lines = ancient sites.

746
M. L. Forup
et al.
© 2007 The Authors. Journal compilation © 2007 British Ecological Society,
Journal of Applied Ecology
,
45
, 742–752
because the weeds had disappeared. Similarly, plant abun-dance was successfully restored and there was no significantdifference in the overall floral abundance between paired sites(2001: paired t-test, t = 0·90, P = 0·44; 2004: Mann–WhitneyU-test, U = 6, P = 0·67). In contrast, restored sites containedfewer insect species than their paired, ancient sites in 2001 butmore species in 2004 (Fig. 1). In 2001 we collected a total of112 insect species (n = 2723) from flowers of eight plantspecies across the eight heathlands and in 2004 we collected105 species of insect (n = 2828) from seven plant species.
Has pollination been reinstated in restored heathlands?
In 2001 and 2004 plants and pollinators were linked in com-plex visitation networks on restored and ancient sites. Anexample of such a network is shown in Fig. 2a. Hymenopteraand Diptera dominated all communities, and A. mellifera andB. lucorum/terrestris were the dominant flower visitors on mostsites, regardless of whether a site was a restored or ancientheathland. In 2001 we sampled and identified over 1 millionpollen grains from insects captured on flowers and the datawere used to construct pollen transport webs (Fig. 2b).Hymenopterans were responsible for 97% of the pollen trans-port (Fig. 2b). The network statistics for the visitation and
pollen transport webs are shown in Table 1. Using the datafrom the visitation and pollination transport networks, wecalculated pollinator importance values for all insects visitingthe plant species on each of the eight heathlands in 2001.Many insects in the networks had extremely small PI values,reflecting either their low abundance and/or the fact that theycarried little pollen. Only for C. vulgaris and E. cinerea were PIvalues large enough to be meaningful, and these two speciesmade up an average of 93% of the floral abundance at eachsite. Table 2 shows the PI values for the highest-scoring andmost abundant flower visitors. Pollinator importance wascorrelated with pollinator abundance (Spearman’s rho = 0·379,P < 0·001), and given that pollinator abundance is one of thetwo components in our PI index, this result is not unexpected.However, nor can it be taken for granted, because if the valuesfor the other component, pollen fidelity, are allocatedrandomly to each insect, the correlation becomes very weak(Spearman’s rho = 0·135, P < 0·001). Moreover, PI values forspecies shared between paired sites were, with one exception,moderately or strongly correlated (C. vulgaris; pair 1: Spear-man’s rho = 0·72, P < 0·01, pair 2: Spearman’s rho = 0·704,P < 0·001, pair 3: Spearman’s rho = 0·649, P < 0·001 and pair4: Spearman’s rho = 0·599, P < 0·05. E. cinerea; pair 1: Spear-man’s rho = 0·388, P > 0·05, pair 2: Spearman’s rho = 0·891,
Fig. 2. Ecological networks: (a) quantitativeflower visitation network for an ancientheathland (A3). In the network each speciesof plant and insect is represented by arectangle: the lower line represents flowerabundance, the upper line represents insectabundance (note scale bars at bottom offigure). The width of the rectangles and thesize of the interaction between them areproportional to their abundance at the fieldsite. Hymenoptera are shown in black, Dipterain light grey, Lepidoptera and Coleoptera indark grey; (b) quantitative pollen transportnetwork for an ancient heathland (A3). In thenetwork each species of pollen and insect isrepresented by a rectangle: the lower linerepresents the pollen abundance sampled fromthe insects’ bodies, the upper line representsinsect abundance (scale bars at bottom offigure). The width of the rectangles and thesize of the interaction between them areproportional to their abundance at the fieldsite. Insects with no interactions are flowervisitors, but not pollen transporters. Colourcodes as in Fig. 2a.
Plant–pollinator networks on heathlands 747
© 2007 The Authors. Journal compilation © 2007 British Ecological Society, Journal of Applied Ecology, 45, 742–752
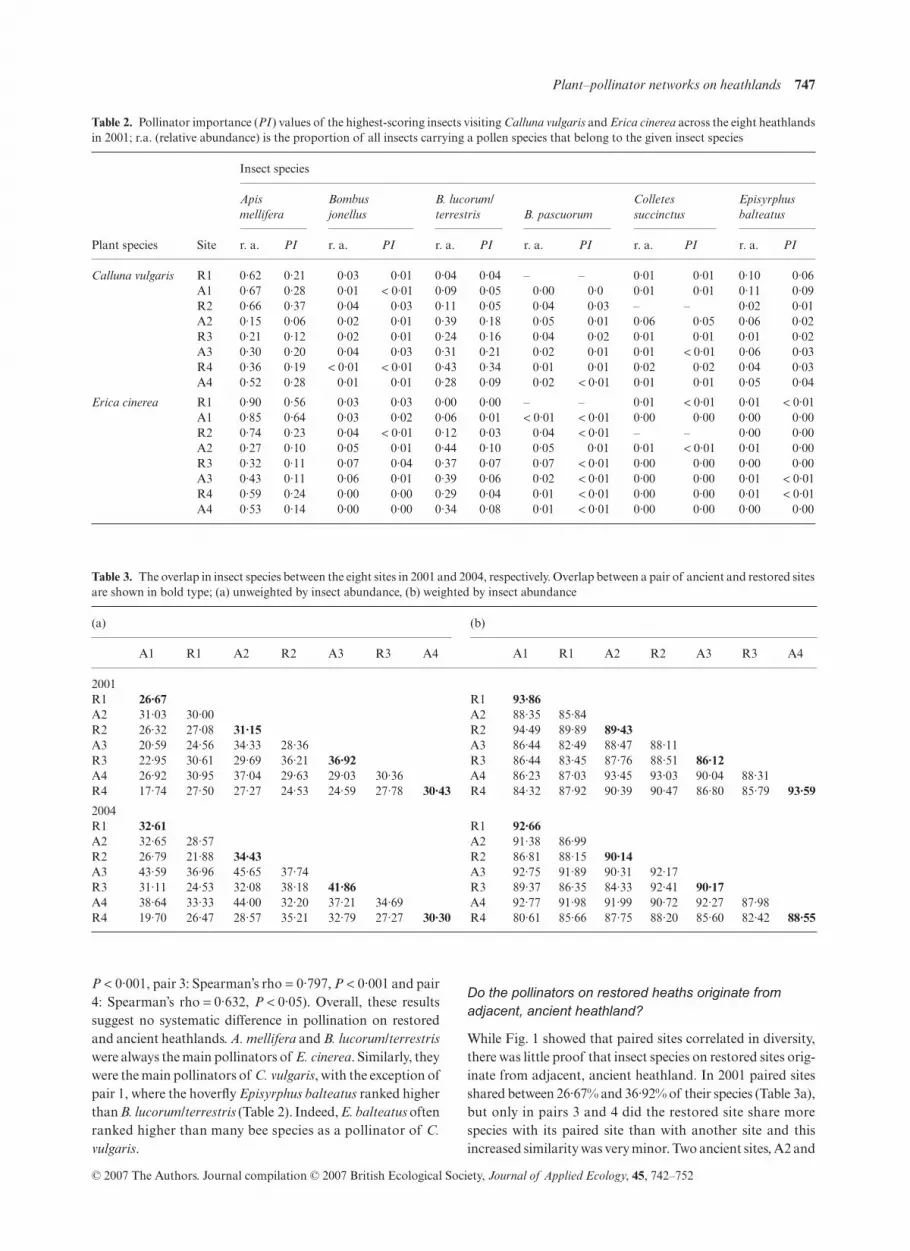
P < 0·001, pair 3: Spearman’s rho = 0·797, P < 0·001 and pair4: Spearman’s rho = 0·632, P < 0·05). Overall, these resultssuggest no systematic difference in pollination on restoredand ancient heathlands. A. mellifera and B. lucorum/terrestriswere always the main pollinators of E. cinerea. Similarly, theywere the main pollinators of C. vulgaris, with the exception ofpair 1, where the hoverfly Episyrphus balteatus ranked higherthan B. lucorum/terrestris (Table 2). Indeed, E. balteatus oftenranked higher than many bee species as a pollinator of C.vulgaris.
Do the pollinators on restored heaths originate from adjacent, ancient heathland?
While Fig. 1 showed that paired sites correlated in diversity,there was little proof that insect species on restored sites orig-inate from adjacent, ancient heathland. In 2001 paired sitesshared between 26·67% and 36·92% of their species (Table 3a),but only in pairs 3 and 4 did the restored site share morespecies with its paired site than with another site and thisincreased similarity was very minor. Two ancient sites, A2 and
Table 2. Pollinator importance (PI ) values of the highest-scoring insects visiting Calluna vulgaris and Erica cinerea across the eight heathlandsin 2001; r.a. (relative abundance) is the proportion of all insects carrying a pollen species that belong to the given insect species
Plant species Site
Insect species
Apis mellifera
Bombus jonellus
B. lucorum/ terrestris B. pascuorum
Colletes succinctus
Episyrphus balteatus
r. a. PI r. a. PI r. a. PI r. a. PI r. a. PI r. a. PI
Calluna vulgaris R1 0·62 0·21 0·03 0·01 0·04 0·04 – – 0·01 0·01 0·10 0·06A1 0·67 0·28 0·01 < 0·01 0·09 0·05 0·00 0·0 0·01 0·01 0·11 0·09R2 0·66 0·37 0·04 0·03 0·11 0·05 0·04 0·03 – – 0·02 0·01A2 0·15 0·06 0·02 0·01 0·39 0·18 0·05 0·01 0·06 0·05 0·06 0·02R3 0·21 0·12 0·02 0·01 0·24 0·16 0·04 0·02 0·01 0·01 0·01 0·02A3 0·30 0·20 0·04 0·03 0·31 0·21 0·02 0·01 0·01 < 0·01 0·06 0·03R4 0·36 0·19 < 0·01 < 0·01 0·43 0·34 0·01 0·01 0·02 0·02 0·04 0·03A4 0·52 0·28 0·01 0·01 0·28 0·09 0·02 < 0·01 0·01 0·01 0·05 0·04
Erica cinerea R1 0·90 0·56 0·03 0·03 0·00 0·00 – – 0·01 < 0·01 0·01 < 0·01A1 0·85 0·64 0·03 0·02 0·06 0·01 < 0·01 < 0·01 0·00 0·00 0·00 0·00R2 0·74 0·23 0·04 < 0·01 0·12 0·03 0·04 < 0·01 – – 0·00 0·00A2 0·27 0·10 0·05 0·01 0·44 0·10 0·05 0·01 0·01 < 0·01 0·01 0·00R3 0·32 0·11 0·07 0·04 0·37 0·07 0·07 < 0·01 0·00 0·00 0·00 0·00A3 0·43 0·11 0·06 0·01 0·39 0·06 0·02 < 0·01 0·00 0·00 0·01 < 0·01R4 0·59 0·24 0·00 0·00 0·29 0·04 0·01 < 0·01 0·00 0·00 0·01 < 0·01A4 0·53 0·14 0·00 0·00 0·34 0·08 0·01 < 0·01 0·00 0·00 0·00 0·00
Table 3. The overlap in insect species between the eight sites in 2001 and 2004, respectively. Overlap between a pair of ancient and restored sitesare shown in bold type; (a) unweighted by insect abundance, (b) weighted by insect abundance
(a) (b)
A1 R1 A2 R2 A3 R3 A4 A1 R1 A2 R2 A3 R3 A4
2001R1 26·67 R1 93·86A2 31·03 30·00 A2 88·35 85·84R2 26·32 27·08 31·15 R2 94·49 89·89 89·43A3 20·59 24·56 34·33 28·36 A3 86·44 82·49 88·47 88·11R3 22·95 30·61 29·69 36·21 36·92 R3 86·44 83·45 87·76 88·51 86·12A4 26·92 30·95 37·04 29·63 29·03 30·36 A4 86·23 87·03 93·45 93·03 90·04 88·31R4 17·74 27·50 27·27 24·53 24·59 27·78 30·43 R4 84·32 87·92 90·39 90·47 86·80 85·79 93·59
2004R1 32·61 R1 92·66A2 32·65 28·57 A2 91·38 86·99R2 26·79 21·88 34·43 R2 86·81 88·15 90·14A3 43·59 36·96 45·65 37·74 A3 92·75 91·89 90·31 92·17R3 31·11 24·53 32·08 38·18 41·86 R3 89·37 86·35 84·33 92·41 90·17A4 38·64 33·33 44·00 32·20 37·21 34·69 A4 92·77 91·98 91·99 90·72 92·27 87·98R4 19·70 26·47 28·57 35·21 32·79 27·27 30·30 R4 80·61 85·66 87·75 88·20 85·60 82·42 88·55

748 M. L. Forup et al.
© 2007 The Authors. Journal compilation © 2007 British Ecological Society, Journal of Applied Ecology, 45, 742–752
A4, had the highest overall overlap in insect species but sharedonly 37·04% of their species. In 2004 paired sites sharedslightly more species than in 2001, ranging from 30·30% to41·86% of their species (Table 3a), but only in pair 3 did therestored site share more species with its paired ancient sitethan with another site.
When the data were weighted in terms of insect abundance,sites were much more similar: in 2001 between 86·12% and93·86% of all specimens on paired sites belonged to sharedspecies (Table 3b). These results are largely explained by theabundance of honeybees, A. mellifera, which dominated theinsect community on six of the eight sites, followed by variousspecies of bumblebee, notably B. lucorum/terrestris. Of thefour restored sites, only R4 was more similar to its paired sitethan to any other site (Table 3b). Weighting the 2004 datarevealed that between 88·55% and 92·66% of all specimenson paired sites belonged to shared species, but of the fourrestored sites only R1 was more similar to its paired site thanto any other site (Table 3b). Again, these results are explainedlargely by the abundance of social bees.
In three of the four pairs, the restored site retained slightlyfewer species between 2001 and 2004 than did the ancient site(Table 4), but the species overlap between years was modestfor all sites and ranged from only 21·21% for R4 to 39·02% forR2. When the data were weighted in terms of specimensbelonging to species found in both years, the same relativepattern emerged, although similarity coefficients were muchhigher, ranging from 75·48% for R3 to 92·15% for R2. However,there was a change in dominance from Apis to Bombus between2001 and 2004. This was caused by a significant decrease inhoneybees, whereas the increase in bumblebees was not sig-nificant (honeybees: paired t-test, t = 5·09, P = 0·0015; all bum-blebees: paired t-test, t = 0·64, P = 0·54, B. lucorum/terrestrisalone: paired t-test, t = 1·01, P = 0·35).
Do ancient heaths have a more complex network structure and is this linked to the robustness of the networks in the face of future perturbation?
For the visitation networks connectance was higher for theancient site within each pair in both 2001 (paired t-test,t = 5·06, P = 0·015) and in 2004 (paired t-test, t = 4·03, P = 0·028)(Table 1). Because connectance in flower-visitation networksusually declines as the number of species increases (Jordano1987), and because the networks had very different levels ofdiversity, connectance values have been plotted against spe-cies richness to determine whether the significant differencebetween the ancient and restored connectance values is due to
species-rich ancient sites being compared to species-poorrestored sites. Interestingly, the relationship between the twovariables is different in 2001 and 2004. Thus, in 2001 there wasno evidence of the expected negative association between con-nectance and species richness (Fig. 3a). In contrast, the sig-nificant difference in connectance values for ancient andrestored networks in 2004 could just reflect the higher numberof species found on restored sites, because ancient and restorednetworks appear to fit the expected relationship of C to S(Fig. 3b). The 2001 pollen transport networks were similar tothe visitation networks, with connectance values significantlyhigher for the ancient site within each pair (paired t-test,t = 2·97, P = 0·025). As before, however, the plot of connectanceagainst species richness does not follow the expected negativeassociation between connectance and species richness, sug-gesting different relationships between these two variables forancient and restored pollen transport networks (Fig. 3c).
Using the method of Dunne et al. (2002) and removing themost connected plants and pollinators first from the network(most to least in Fig. 4a) led to a rapid collapse of both ancientand restored heathlands: once about 20% of species wereremoved in primary extinctions, a cascade of secondaryextinctions was elicited, leading to 100% extinction (Fig. 4a).Removing the least connected species first reduced drasticallythe collapse of the networks (Fig. 4a). Using the method ofMemmott et al. (2004) and removing only the pollinatorsfrom the community caused far fewer secondary extinctions(Fig. 4b) for both most to least connected, and least to mostconnected algorithms. Analysing data from all the sitesthough, there was some evidence of a trend towards a greaterrobustness in the ancient sites vs. the restored sites when usingthe method of Dunne et al. (2002) and that of Memmottet al. (2004) (Wilcoxon’s signed-rank tests, Dunne method:extinction order most to least, W = 3·0, P = 0·584; least tomost, W = 0, P = 0·100; random, W = 2, P < 0·361; Memmottmethod: most to least, W = 0, P = 0·100; least to most, W = 0,P < 0·100, random, W = 3, P < 0·181).
Discussion
The four restoration projects established successfully heath-land plant and pollinator communities. Using the networksto calculate pollinator importance indicated that the keypollinators are in place on the restored heaths and that thesepollinators are also the most abundant ones. Unexpectedly,adjacent heathlands did not share more species than moredistant ones, which suggests that adjacency to ancient habitatneed not be a criterion when choosing heathlands to restore.
Table 4. The overlap in insect species within sites between 2001 and 2004, unweighted (upper line) and weighted by insect abundance (lower line)
A1 R1 A2 R2 A3 R3 A4 R4
Species shared 2001–04 (%) 27·08 39·02 32·79 22·39 30·51 23·73 34·69 21·21Specimens in shared species (%) 90·98 92·15 88·76 84·18 82·95 75·48 90·60 79·10

Plant–pollinator networks on heathlands 749
© 2007 The Authors. Journal compilation © 2007 British Ecological Society, Journal of Applied Ecology, 45, 742–752
While the restored heathlands were functionally less complexthan ancient heathlands in 2001 (i.e. connectance was signi-ficantly lower), this did not correspond to a reduction in theirrobustness towards perturbation, and in 2004 the apparentdifferences in connectance could be explained by differencesin species richness. The results are discussed below with respectto our approach and the implications of our data for the res-toration of British heathlands.
THE NETWORK APPROACH
In this study, we have analysed species interaction data ratherthan simply described species presence and abundance. This hasprovided an understanding of the actual workings of restoredcommunities and how this compares to ancient communities. Asampling protocol with replication is uncommon (especially at
Fig. 3. Connectance (C ) plotted against species richness (S ). (a)Visitation networks for 2001; (b) visitation networks for 2004; (c)pollination networks for 2001. Open symbols = restored sites, filledsymbols = ancient sites.
Fig. 4. Community robustness analysis. The proportion of specieslost to secondary extinctions as a function of proportion of speciesremoved (primary extinction) from A3 and R3. The diagonal dashedlines connect points at which all species in the network are lost. (a)Plants and pollinators are equally at risk of being removed (c.f. Dunneet al. 2002); (b) pollinators alone are removed, and secondaryextinctions are solely of plants (c.f. Memmott et al. 2004). Each curvein the random removals represents 300 replicate simulations; the errorbars are smaller than the symbols and are not shown. These curves dipdownwards as they approach the diagonal as not all of the replicatesimulations persist equally long before the whole pollination webbecomes extinct. Those that persist longest have slower accumulationof secondary extinctions, so the mean of the cumulative secondaryextinctions tends to be lower towards the end.

750 M. L. Forup et al.
© 2007 The Authors. Journal compilation © 2007 British Ecological Society, Journal of Applied Ecology, 45, 742–752
the community level) in restoration ecology; this study has pro-vided one of the few examples of a replicated design in the ana-lysis of ecological restorations. Moreover, in addition to spatialreplication, our study has demonstrated the value of temporalreplication. For example, data from only 2001 would have led tothe erroneous conclusion that ancient sites were more speciesrich with regard to pollinators, when the opposite was true in2004. Finally, by investigating an essential ecosystem service, wehave overcome the main problem of using reference sites; polli-nation must be comparable between restored and ancient habitatdespite any variation in species structure.
Has pollination been reinstated in restored heathlands?
Despite considerable differences in the visitation networks, thekey pollinators were the same on ancient and restored sitesafter 11 years. Moreover, these key pollinators were also themost abundant flower visitors 14 years after restoration,suggesting that the service of pollination was relatively stable.Our findings support the conclusion by Vázquez, Morris &Jordano (2005) that the most common flower visitors are alsothe most important pollinators. Particularly importantwere the honeybees (A. mellifera) and bumblebees (mainlyB. terrestris/lucorum) that dominated most communities inboth years. Given their abundance, it is not surprising thathoneybees score highly, even though they are less efficientpollinators relative to many other bee species (Westerkamp1991). It is perhaps a greater surprise that a hoverfly, E. balteatus,often scored higher than bees as a pollinator of the dominantheath species, C. vulgaris. Overall, the pollination serviceson restored sites were equivalent to those of ancient sites.
Do the pollinators on restored heaths originate from adjacent, ancient heathland?
Contrary to our prediction that more insects would be sharedbetween adjacent heaths than between more distant heaths,paired sites did not have more species in common than theydid with other sites, although they correlated in the level ofdiversity. This suggests an effect of landscape and site condi-tions, combined with chance events. It is well known thatlandscape setting has a marked influence on how great asubset of the regional species pool can be found locally (e.g.Tscharntke et al. 2002; Steffan-Dewenter 2003; Steffan-Dewenter& Kuhn 2003), but some of the factors causing pollinatorassemblies to vary dramatically between years may also accountfor differences between nearby localities within seasons. In a15-year-long study of hoverflies in an urban garden, Gilbert& Owen (1990) concluded that species fluctuated independ-ently in response to resource availability but that competitionplayed no role in structuring the species assemblage. The var-iation they observed between years was so great that Gilbert& Owen (1990) questioned the notion of ‘community’. Itseems likely that some of the species in our study behaved insimilar ways on a spatial scale in response to varying site con-ditions. In addition, the regional insect species pool containsa high number of uncommon species, which are more suscep-
tible to chance events than are common species. Consequently,it may be invalid to expect a great overlap in pollinator specieseven between nearby heathlands. Instead, a more appropriatefocus may be the relative abundance of species. When weweighted species by abundance, the heathlands in our studyemerged as being remarkably similar; the same few speciesdominating the pollinator guild on most sites. Those arespecies which are abundant in the landscape surrounding theseheathlands, or species that are able to travel the distances andcross the barriers between the sites in this study. Overall, ourresults imply that restoration of species structure is less rele-vant than the restoration of functionality.
Do ancient heaths have a more complex network structure and is this linked to the robustness of the networks in the face of future perturbation?
While the robustness of networks is currently a very activearea of research (e.g. Dunne et al. 2002; Tanizawa et al. 2005;Buzna, Peters & Helbing 2006; Fortuna & Bascompte 2006),to our knowledge this is the first time the method has beenused in an applied context. In 2001 we found the insectforaging networks were less generalized (i.e. connectance wassignificantly lower) on restored heathlands than on ancientheaths. The same result was seen in the measure with mostrelevance for plant reproduction, namely the pollen transportnetworks. In their analysis of 16 food webs, Dunne et al. (2002)reported that increasing connectance also leads to a greaterrobustness towards secondary extinctions following pertur-bation. Although we found no significant difference innetwork robustness on ancient and restored heathlands, therewas evidence of a trend. However, our statistical power is verylow when interpreting trends, and in reality we can concludeonly that the comparison of ancient and restored sites isinconclusive with respect to robustness. By 2004 networkgeneralization appeared equivalent between ancient andrestored heathlands, because the values for both heathlandtypes appeared to follow the same relationship with speciesrichness. In other words, the reduced level of functioning onrestored sites in 2001 did not affect robustness to a largedegree and its effect had disappeared by 2004. While theseresults are inconclusive, the question of whether restoredhabitats are as robust as ancient habitats to perturbation iscentral in restoration ecology, and our approach (using alarger sample size) could prove very useful in future studiesassessing the efficacy of ecological restoration.
PRACTICAL IMPLICATIONS
Our findings have practical implications for the managementof heathland restoration schemes. First, heathland restora-tion is evidently a relatively rapid process for both plants andpollinators: 11 years after restoration, highly functional com-munities had established that appeared as robust as ancientcommunities. Secondly, heathland restoration sites may notneed to be immediately adjacent to intact habitat to be suc-cessful. The functionally important pollinators are mobile,
Plant–pollinator networks on heathlands 751
© 2007 The Authors. Journal compilation © 2007 British Ecological Society, Journal of Applied Ecology, 45, 742–752
abundant and able to traverse other habitat than heathland.This makes pollination likely even where heathlands are moreisolated and likely to host fewer pollinator species. However,a note of caution should be sounded for other systems orprojects with a special focus on invertebrate conservation,because some species are unlikely to travel even short dis-tances. For example, even though we recorded few butterflieson either the ancient or the restored heathlands, some species,such as the silver-studded blue (Plebejus argus), are restrictedto mainly this habitat. Working in North Wales, Thomas &Harrison (1992) found that the silver-studded blue was unlikelyto colonize new habitat more than 1 km away.
Concluding remarks
As a practical tool, ecological restoration is widespread andused in a range of contexts. In contrast, its scientific basis hasbeen slow to develop. Here we have shown the value of applyinga network approach to restoration ecology. Although habitatrestoration is an essential component of conservation ecology(Dobson, Bradshaw & Baker 1997), our current understand-ing of the ecological processes underlying successful habitatrestoration is both incomplete and poorly integrated acrossdifferent systems. Developing a ‘general template’ that willhelp to run ongoing projects and provide direction for futurerestoration projects is crucial (Montalvo et al. 1997). Speciesinteraction networks, whether they be pollination networks,as described here, or predation, parasitoid or seed dispersalnetworks, can provide such a general template, allowingassessment of whether ecosystem processes such as pollinationare restored. Interactions between species can provide a superioryardstick for judging restoration success in comparison tospecies richness and abundance. This is because they charac-terize what species actually do, in addition to whether or notthey are present. Moreover, by working with species inter-actions, ecologists are working in the currency of ecosystemservices; the restoration of these services remains one of themost exciting and challenging areas of restoration ecology.
Acknowledgements
M. L. F. is grateful for the funding from the Danish Research Councils that sup-ported this work. Thanks are also due to the following land owners for kindlyallowing access to their heathlands: Dorset Wildlife Trust, English Nature, theForestry Commission, the Herpetological Trust, Holton Lee Charity, TheNational Trust, Poole City Council and the Royal Society for the Protection ofBirds. The authors would like to thank Nickolas Waser, whose comments on anearlier draft of the manuscript greatly improved the paper.
References
Anonymous (2002) Lowland Heathland: a Cultural and Endangered Landscape.English Nature, Northminster House, Peterborough.
Barabási, A.L. & Albert, R. (1999) Emergence of scaling in random networks.Science, 286, 509–512.
Bascompte, J., Jordano, P., Melián, C.J. & Olesen, J.M. (2003) The nestedassembly of plant–animal mutualistic networks. Proceedings of the NationalAcademy of Sciences USA, 100, 9383–9387.
Buzna, L., Peters, K. & Helbing, D. (2006) Modelling the dynamics of disasterspreading in networks. Physica A – Statistical Mechanics and its Application,363, 132–140.
Cairns, J. Jr & Heckman, J.R. (1996) Restoration ecology: the state of an emerg-ing field. Annual Review of Energy and the Environment, 21, 167–189.
Dicks, L.V., Corbet, S.A. & Pywell, R.F. (2002) Compartmentalization inplant–insect flower visitor webs. Journal of Animal Ecology, 71, 32–43.
Dobson, A.P., Bradshaw, A.D. & Baker, A.J.M. (1997) Hopes for the future:restoration ecology and conservation biology. Science, 277, 515–522.
Dunne, J.A., Williams, R.J. & Martinez, N.D. (2002) Network structure andbiodiversity loss in food webs: robustness increases with connectance.Ecology Letters, 5, 558–567.
Ehrenfeld, J.G. (2000) Defining the limits of restoration: the need for realisticgoals. Restoration Ecology, 8, 2–9.
Ehrenfeld, J.G. & Toth, L.A. (1997) Restoration ecology and the ecosystemperspective. Restoration Ecology, 5, 307–317.
Fortuna, M.A. & Bascompte, J. (2006) Habitat loss and the structure of plant–animal mutualistic networks. Ecology Letters, 9, 278–283.
Forup, M.L. & Memmott, J. (2005) The restoration of plant–pollinator inter-actions in hay meadows. Restoration Ecology, 13, 265–274.
Gathmann, A. & Tscharntke, T. (2002) Foraging ranges of solitary bees.Journal of Animal Ecology, 71, 757–764.
Gibson, R.H., Nelson, I.L., Hopkins, G.W., Hamlett, B.J. & Memmott, J.(2006) Pollinator webs, plant communities and the conservation of rareplants: arable weeds as a case study. Journal of Applied Ecology, 43 (2), 246–257.
Gilbert, F. & Owen, J. (1990) Size, shape, competition, and community structurein hoverflies (Diptera: Syrphidae). Journal of Animal Ecology, 59, 21–39.
Janzen, D.H. (1974) The deflowering of Central America. Natural History, 83,48–53.
Jordano, P. (1987) Patterns of mutualistic interactions in pollination andseed dispersal: connectance, dependence asymmetries, and coevolution.American Naturalist, 129, 657–677.
Jordano, P. (1994) Spatial and temporal variation in the avian–frugivoreassemblage of Prunus mahaleb – patterns and consequences. Oikos, 71,479–491.
Jordano, P., Bascompte, J. & Olesen, J.M. (2003) Invariant properties incoevolutionary networks of plant–animal interactions. Ecology Letters, 6,69–81.
Jordano, P., Bascompte, J. & Olesen, J.M. (2006) The ecological consequencesof complex topology and nested structure in pollination webs. Plant–Pollinator Interactions. From Specialization to Generalization (eds N. M. Waser& J. Ollerton), p. 445. University of Chicago Press, Chicago, IL.
Kearns, C.A. & Inouye, D.W. (1993) Techniques for Pollination Biologists.University Press of Colorado, Denver.
Kearns, C.A. & Inouye, D.W. (1997) Pollinators, flowering plants, and conser-vation biology. Bioscience, 47, 297–307.
Kearns, C.A. & Inouye, D.W. & Waser, N.M. (1998) Endangered mutualisms:the conservation of plant–pollinator interactions. Annual Review of Ecologyand Systematics, 29, 83–112.
Lundgren, R. & Olesen, J.M. (2005) The dense and highly connected world ofGreenland’s plants and their pollinators. Arctic, Antarctic and Alpine Research,37, 514–520.
Memmott, J. (1999) The structure of a plant–pollinator food web. EcologyLetters, 2, 276–280.
Memmott, J. & Waser, N.M. (2002) Integration of alien plants into a nativeflower–pollinator visitation web. Proceedings of the Royal Society of London,Series B, 269, 2395–2399.
Memmott, J., Waser, N.M. & Price, M.V. (2004) Tolerance of pollinationnetworks to species extinctions. Proceedings of the Royal Society of London,Series B, Biological Sciences, 271, 2605–2611.
Montalvo, A.M., Williams, S.L., Rice, K.J., Buchmann, S.L., Cory, C.,Handel, S.N., Nabhan, G.P., Primack, R. & Robichaux, R.H. (1997)Restoration biology: a population biology perspective. Restoration Ecology,5, 277–290.
Nabhan, G.P. & Buchmann, S.L. (1997) Services provided by pollinators.Nature’s Services – Societal Dependence on Natural Ecosystems (ed. G. E.Daily), pp. 133–150. Island Press, Washington, DC.
Palmer, M.A., Ambrose, R.F. & Poff, N.L. (1997) Ecological theory andcommunity restoration ecology. Restoration Ecology, 5, 291–300.
Potts, S.G., Vulliamy, B., Dafni, A., Ne’eman, G. & Willmer, P. (2003)Linking bees and flowers: how do floral communities structure pollinatorcommunities? Ecology, 84, 2628–2642.
Rose, R.J., Webb, N.R. & Clarke, R.T. & Traynor, C.H. (2000) Changes onthe heathlands in Dorset, England, between 1987 and 1996. BiologicalConservation, 93, 117–125.
Steffan-Dewenter, I. (2003) Importance of habitat area and landscape contextfor species richness of bees and wasps in fragmented orchard meadows.Conservation Biology, 17, 1036–1044.
752 M. L. Forup et al.
© 2007 The Authors. Journal compilation © 2007 British Ecological Society, Journal of Applied Ecology, 45, 742–752
Steffan-Dewenter, I. & Kuhn, A. (2003) Honeybee foraging in differentiallystructured landscapes. Proceedings of the Royal Society of London, Series B,270, 569–575.
Tanizawa, T., Paul, G., Cohen, R., Havlin, S. & Stanley, H.E. (2005)Optimization of network robustness to waves of targeted and random attacks.Physical Review E, 71, 047101.
Thomas, C.D. & Harrison, S. (1992) Spatial dynamics of a patchily distributedbutterfly species. Journal of Animal Ecology, 61, 437–446.
Tscharntke, T., Steffan-Dewenter, I., Kruess, A. & Thies, C. (2002) Character-istics of insect populations on habitat fragments: a mini review. EcologicalResearch, 17, 229–239.
Usher, M.B. (1992) Management and diversity of arthropods in Callunaheathland. Biodiversity and Conservation, 1, 63–79.
Vázquez, D.P. & Aizen, M.A. (2003) Null model analyses of specialization inplant–pollinator interactions. Ecology, 84, 2493–2501.
Vázquez, D.P., Morris, W. & Jordano, P. (2005) Interaction frequency as asurrogate for the total effect of animal mutualists on plants. Ecology Letters,8, 1088–1094.
Waser, N.M., Chittka, L., Price, M.V., Williams, N.M. & Ollerton, J. (1996)Generalization in pollination systems, and why it matters. Ecology, 77, 1043–1060.
Webb, N.R. (1986) Heathlands. A Natural History of Britain’s Lowland Heaths.Collins, London.
Webb, N.R. & Haskins, L.E. (1980) An ecological survey of heathlands inthe Poole Basin, Dorset, England, in 1978. Biological Conservation, 17, 281–296.
Westerkamp, C. (1991) Honeybees are poor pollinators – why. Plant Systematicsand Evolution, 177, 71–75.
White, P.S. & Walker, J.L. (1997) Approximating nature’s variation: selectingand using reference information in restoration ecology. Restoration Ecology,5, 338–349.
Williams, R.J., Duff, G.A., Bowman, D. & Cook, G.D. (1996) Variation in thecomposition and structure of tropical savannas as a function of rainfall andsoil texture along a large-scale climatic gradient in the Northern Territory,Australia. Journal of Biogeography, 23, 747–756.
Young, T.P., Petersen, D.A. & Clary, J.J. (2005) The ecology of restoration:historical links, emerging issues and unexplored realms. Ecology Letters, 8,662–673.
Received 31 July 2006; accepted 13 July 2007 Handling Editor: Andreas Erhardt