the potential for grass biomethane as a biofuel, compressed biomethane generated from grass,...
TRANSCRIPT

EPA Climate Change Research Programme 2007–2013
The Potential for Grass Biomethane as a Biofuel
Compressed Biomethane Generated from Grass,
Utilised as a Transport Biofuel
CCRP Report
End of Project Report available for download on http://erc.epa.ie/safer/reports
Prepared for the Environmental Protection Agency
by
Environmental Research Institute, University College Cork
Authors:
Jerry D. Murphy, Nicholas E. Korres, Anoop Singh, Beatrice Smyth,
Abdul-Sattar Nizami and Thanasit Thamsiriroj
ENVIRONMENTAL PROTECTION AGENCY
An Ghníomhaireacht um Chaomhnú ComhshaoilPO Box 3000, Johnstown Castle, Co. Wexford, Ireland
Telephone: +353 53 916 0600 Fax: +353 53 916 0699Email: [email protected] Website: www.epa.ie

3. The013. Itnment and
rank’Kiely, and DrAgri- maps
in thisgency
imed tog from
ay be
to informtection. of the
© Environmental Protection Agency 2011
ACKNOWLEDGEMENTS
This report is published as part of the Climate Change Research Programme 2007–201programme is financed by the Irish Government under the National Development Plan 2007–2is administered on behalf of the Department of the Environment, Community and Local Goverby the Environmental Protection Agency which has the statutory function of co-ordinatingpromoting environmental research.
The authors acknowledge the support of the EPA and, in particular, Dr Philip O’Brien, Dr FMcGovern and Ms Laura Burke. They also wish to acknowledge the support of Dr Padraig O(Teagasc, Grange) which has enhanced our understanding of the production of grass silageRogier Shulte, Grange, Johnstown Castle, Wexford. Dr I.N. Vogiatzakis, Centre for Environmental Research, University of Reading, UK, was responsible for constructing theincluded in this report.
DISCLAIMER
Although every effort has been made to ensure the accuracy of the material contained publication, complete accuracy cannot be guaranteed. Neither the Environmental Protection Anor the author(s) accept any responsibility whatsoever for loss or damage occasioned or clahave been occasioned, in part or in full, as a consequence of any person acting, or refraininacting, as a result of a matter contained in this publication. All or part of this publication mreproduced without further permission, provided the source is acknowledged.
The EPA Climate Change Research Programme addresses the need for research in Ireland policymakers and other stakeholders on a range of questions in relation to environmental proThese reports are intended as contributions to the necessary debate on the protectionenvironment.
EPA CLIMATE CHANGE RESEARCH PROGRAMME 2007–2013
Published by the Environmental Protection Agency, Ireland
PRINTED ON RECYCLED PAPER
ISBN: 978-1-84095-427-2
Price: Free 12/11/150
ii

Details of Project Partners
Jerry D. MurphyEnvironmental Research InstituteUniversity College CorkCorkIrelandTel.: +353 21 4902286Email: [email protected]
Nicholas E. KorresEnvironmental Research InstituteUniversity College CorkCorkIreland
Anoop SinghEnvironmental Research InstituteUniversity College CorkCorkIreland
Beatrice SmythEnvironmental Research InstituteUniversity College CorkCorkIreland
Abdul-Sattar NizamiEnvironmental Research InstituteUniversity College CorkCorkIreland
Thanasit ThamsirirojEnvironmental Research InstituteUniversity College CorkCorkIreland
iii


2
2
3
5
6
7
9
Table of Contents
Acknowledgements ii
Disclaimer ii
Details of Project Partners iii
Executive Summary vii
1 Why Grass and Why Biomethane? 1
1.1 Overarching Policy and Strategy 1
1.2 Ireland: The Food Island 1
1.3 Agricultural Legislation 1
1.4 Agri-Environmental Schemes 1
1.5 Renewable Energy in Transport 2
1.6 Biofuels in Ireland – Targets and Options
1.7 The Renewable Energy Directive
1.8 Advantages of Grass Methane
1.9 Waste Management and Residues
1.10 Conclusions 5
2 What is Grass? 6
2.1 Grassland 6
2.2 Grassland Classification 6
2.3 Grassland and Farming Practices
2.4 Grass in Animal and Biomethane Production Systems
2.5 Suitability of Grass Species for Biomethane and Animal Production in Ireland
2.6 Fertilisation 10
2.7 Harvesting Date 11
2.8 Ensiling of Grass 12
2.9 Mixed Pastures 13
2.10 Conclusions 13
3 How Do We Convert Grass to Biomethane? 15
3.1 Anaerobic Digestion 15
3.2 Anaerobic Digesters 15
3.3 Upgrading and Injection 18
3.4 Conclusions 20
4 Life-Cycle Analysis of Grass Biomethane 21
4.1 Aims and Methodology 21
v

4.2 Grass Silage Production 22
4.3 Biogas Production 23
4.4 Compressed Biomethane Production 24
4.5 Energy and GHG Emissions Associated with Grass Silage Production 24
4.6 Direct Energy Consumption and Related Emissions Associated with Biomethane Production 29
4.7 Sensitivity Analysis 30
4.8 Conclusions 32
5 What is the Market for Grass Biomethane? 33
5.1 The Relationship between Grass, Farming and Energy 33
5.2 Biomethane Potential in Ireland from Numerous Sources 33
5.3 Economic Analysis of Grass Biomethane System 35
5.4 Economic Analysis of Grass Biogas and Biomethane under Current Conditions 37
5.5 Improving the Viability of Grass Biomethane for the Farmer and the Consumer 41
5.6 Conclusions 46
6 Conclusions and Recommendations 47
6.1 Conclusions 47
6.2 Recommendations 47
References 49
Peer-Reviewed Journal Publications from Report 58
Acronyms and Annotations 59
vi

Executive Summary
Grass is an excellent energy crop due to long
persistence of high yields accompanied by low energy
inputs. Approximately 91% of Irish agricultural land is
under grass. The national herd has decreased and will
continue to do so. Cross compliance does not
encourage the conversion of permanent pastureland to
arable land; thus we have and will continue to have
increased quantities of excess grassland. Therefore,
grass must be considered a significant source of
biomass. Current grass species and cultivation
practices are favourable for anaerobic digestion (AD),
which is a mature technology. Upgrading biogas to
biomethane, injecting into the gas grid, leads to an
effective bioenergy system complete with distribution
to all major cities and 620,000 houses.
The Renewable Energy Directive allows a double
credit for biofuels derived from residues and
lignocellulosic material (such as grass). It is shown that
100,000 ha of grass (2.3% of agricultural land) will
allow compliance with the 10% renewable energy in
transport target for 2010. Alternatively, this would
substitute for 35% of residential gas consumption.
Reactor design must take account of the specific
feedstock or combinations of feedstock; the reactor
must be suited to the feedstock. This is not technically
difficult. Of significant concern in the sustainability of
the biofuel produced is the parasitic energy demand of
the process and the vehicle efficiency. Emission
reductions are optimised by the use of green electricity
and the use of biomass for thermal energy input. On a
field-to-wheel basis, it is essential that the vehicle
operating on biomethane has an equivalent efficiency
(expressed as MJ/km) as the displaced fossil fuel. The
Renewable Energy Directive requires an emission
savings of 60% compared with the displaced fuel for
new facilities constructed after 2017. This is readily
achieved for grass biomethane through optimisation of
the system. Allowing for carbon (C) sequestration in
grassland of 0.6 t C ha/year will lead to emissions
savings of 89%. This would suggest that grass
biomethane is one of the most sustainable indigenous,
non-residue-based transport biofuels. The economics
of biomethane are shown to be difficult. There is a
requirement for innovative policy and marketing of the
industry. A compressed natural gas transport fuel
market is an essential prerequisite to using
biomethane as a transport fuel. Mandating a certain
percentage of biomethane in natural gas sales is of
benefit to biomethane as both a transport and a
thermal biofuel. Government policy is required to
support a biomethane industry.
Further research is required in the following areas:
• Bioresource mapping: This includes the
creation of a Geographical Information System to
highlight sources of the organic fraction of
municipal solid waste (OFMSW), slurry, slaughter
waste and areas of high-yielding silage
production. The system would include distribution
systems (natural gas grid, electricity grid) and
demand nodes (e.g. transport fleets, district
heating, new towns) to propose areas with
significant potential for biomethane production.
• Assessment of biomethane facilities: This
includes full life-cycle analysis of different
biomethane facilities, including co-digestion of
slurries and grass silage, mono-digestion of
OFMSW, and mono-digestion of slaughter
wastes. The research should allow assessment
of the cost of the produced biomethane.
• Digester design: This basic research should
assess optimal digester systems for different
feedstocks.
• Agricultural impact of AD: This research
includes monitoring carbon sequestration in
grasslands where silage is cut and digestate is
applied. This should be compared with carbon
sequestration on grazed pastures. The fertiliser
value of different digestates needs to be
assessed along with the emissions associated
with application of digestate. The research should
also assess the effect on biodiversity.
vii


1 Why Grass and Why Biomethane?
1.1 Overarching Policy and Strategy
The deployment of biofuels is affected by policy in
energy and agriculture. In the agricultural sector, policy
enforces environmentally friendly production systems
that will affect agricultural status quo and production
chains. In the energy sector, concerns regarding the
sustainability of biofuel systems and their impact on
food prices led to a set of sustainability criteria in the
Renewable Energy Directive (EC, 2009a). In addition,
the site specificity of biofuel feedstock production,
agricultural practices, and indirect land-use change will
significantly affect growth trends in biofuel usage and
the ability of an EU Member State to reach a 10%
renewable energy in transport target by 2020.
1.2 Ireland: The Food Island
The agri-food sector is one of the most important and
dynamic indigenous manufacturing elements in the
Irish economy and accounts for an estimated 8.1%,
8.1% and 9.8% of gross domestic product (GDP),
employment and exports, respectively (DAFF,
undated). Irish agriculture, influenced by the wet and
mild climate, has traditionally been characterised by
extensive grass-based farming systems and relies
heavily on grassland-based livestock farming. Grass
and grass crops cover around 91% (i.e. 3.9 million ha)
of all agricultural land (O’Mara, 2008). Livestock and
livestock products account for most of total agricultural
output (Jensen et al., 2003). About 53% of farms are
classified as beef and they account for 40% of the
agricultural area used (AAU), while they contribute to
over a third (€1.3 billion) of agricultural export earnings
(Anonymous, 2008a). Farm profitability associated
with beef production is not competitive (Anonymous,
2008a). Projections estimate a decline in cattle
numbers (Donnellan and Hanrahan, 2008; CSO,
undated), particularly those of suckler cows (Binfield et
al., 2008) by possible trade and policy reform
scenarios.
1.3 Agricultural Legislation
The 2003 Mid-Term Review of the Common
Agricultural Policy (CAP) made agricultural support
payments conditional upon compliance with
environmental standards and ‘good farming practice’.
Community initiatives, amongst others, aim to limit
agricultural pollution, to promote the production and
use of biofuels, and to protect biodiversity (Osterburg
et al., 2005). Attaching conditions to the receipt of
agricultural subsidies is a policy mandatory tool known
as cross compliance (EC, 2003). It consists of two
strands (i.e. Good Agricultural and Environmental
Condition and the Statutory Management
Requirements) (Mussner et al., 2006) and aims to
improve standards in modern farming practices
(Farmer and Swales, 2004). Cross-compliance
regulations (Article 5) require that the land declared as
under permanent pasture in 2003 is maintained under
permanent pasture. It also requires that the ratio of
land under permanent pasture to the total agricultural
area of each Member State must not decrease by 10%
or more from the 2003 reference ratio. Ireland is
therefore under obligation not to allow any significant
reduction in the total area of permanent pasture; this
restricts the type of energy crops that can be grown. In
the same CAP reforms, a special aid for energy crops
grown on non-set-aside land was introduced. Energy
crops (crops grown for the production of biofuels
including biogas or for use as biomass in the
production of electric and thermal energy) are eligible
for a premium of €45/ha. An additional top-up of
€80/ha, funded by the National Exchequer, is also
paid. Major reform of the CAP is expected in 2013 and
this may have implications for energy crops and
biofuels.
1.4 Agri-Environmental Schemes
The Rural Environment Protection Scheme (REPS)
was introduced under Council Regulation
EEC/2078/1992 in order to encourage farmers to carry
out their activities in a more extensive and
environmentally friendly manner (Hynes et al., 2008).
1

The potential for grass biomethane as a biofuel
This was introduced due to the realisation of the severe
ecological and environmental impacts of agricultural
intensification under previous EU agricultural support
mechanisms (Clergue et al., 2005). The Sixth
Environment Action Programme (EC, 2001), the Water
Framework Directive (EC, 2000) and the Nitrate
Directive (EEC, 1991) introduce a series of measures
that should lead to an overall reduction in greenhouse
gas (GHG) emissions at farm level through lower
stocking rates. This, in turn, could free up grassland for
other purposes, such as grass biomethane. The
adoption of batch storage for slurry has also been
suggested (Chardon and Schoumans, 2008), which
could make it amenable to anaerobic digestion (AD)
and biofuel production. Biofuels are also influenced by
the Biodiversity Action Plan (Caslin, 2009), which aims
to improve or maintain biodiversity and prevent further
biodiversity loss due to agricultural activities. Priorities
include restricting intensive farming and establishing
sustainable resource management. Most grassland in
the EU is devoted to meat production, where
profitability is low and farmers often rely on EU single-
farm payments to survive; thus, grassland farming can
face considerable challenges in implementing new
environmental measures without financial supports
(Boyle, 2008).
1.5 Renewable Energy in Transport
Renewable energy originates from energy resources
that are continuously replenished through the cycles of
nature, and their supply is unlikely, compared with
fossil fuels, to be exhausted. The use of biofuels as a
means of greening the transport sector is strongly
supported by European policy (EEA, 2004). EU
Directive 2009/28/EC on renewable energy sets a
mandatory target for each EU Member State for 10%
of transport energy (road and rail) to be met by
renewable sources by 2020 (EC, 2009a). Liquid
biofuels (i.e. biodiesel from rapeseed, soybean and
palm oil and bioethanol from maize, wheat, sugar beet
and sugar cane) are the main renewable fuels
produced and consumed in the EU (USDA, 2006). The
use of biogas as a transport fuel after its upgrading to
biomethane has started gaining attention in many
European countries, such as Sweden, Austria, France
and Switzerland (Mathiasson, 2008). Additional to the
production of biofuels from wastes, residues and
lignocellulosic material, the use of electricity in
transport is encouraged in the EU by Directives
2009/28/EC and 2009/33/EC (EC, 2009a,b).
1.6 Biofuels in Ireland – Targets andOptions
The share of biofuels in Ireland in 2008 (as a
percentage of energy content in petrol and diesel) was
1.2%, although significant increases from 1 ktoe1 in
2005 to 56 ktoe in 2008 were recorded (Howley et al.,
2009a). Biodiesel was the dominant biofuel in 2007
followed by bioethanol and pure plant oil at 76%, 16%
and 8%, respectively, (Foley et al., 2009) whereas the
contribution of biomethane is still negligible. The target
for biofuels was 4% by volume of biofuel (DCENR,
2009) by 2010. For 2020, two approaches to national
energy forecasts for Ireland were employed for the
quantification of the 10% target for transport energy;
these were termed Baseline and White Paper Plus
(Walker et al., 2009). The White Paper Plus approach
allowed consideration of the energy savings in
transport associated with Ireland’s National Energy
Efficiency Action Plan. Estimated values of 24.7 PJ
and 23.8 PJ for Baseline and White Paper Plus were
calculated, respectively. In this report, a value of 24 PJ
will be used as the renewable energy in transport
target for 2020. The Electric Vehicles Plan sets an
ambition of 10% of private vehicles powered by
electricity in combination with the 40% target of
electricity from renewable energy (Howley et al., 2008)
by 2020. It has been shown that the utilisation of
electricity in transport (vehicles, trams and rail) will
account for 3.6 PJ by 2020 (Foley et al., 2009; Walker
et al., 2009) or 1.5% of energy in transport, leaving a
shortfall of 8.5%, which must be filled by biofuels.
These biofuels may be sourced from various feedstock
sources, which may be imported or indigenous energy
crops, wastes and residues, or lignocellulosic biomass.
In order to achieve Ireland’s renewable energy target,
the biofuel system must meet certain sustainability
criteria.
1.7 The Renewable Energy Directive
Biofuels eligible to contribute to the mandatory target
of 10% as set in the EU Renewable Energy Directive
1. ktoe, kilotonnes of oil equivalent.
2

J.D. Murphy et al. (2007-CCRP-1.7)
2009/28/EC (EC, 2009a) should meet the
requirements summarised in Box 1.1. The Directive
allows for double credit/counting of biofuels produced
from wastes, residues and lignocellulosic materials.
Singh et al. (2010b) consider grass as a lignocellulosic
source and as such it is liable for a double credit.
1.8 Advantages of Grass Methane
Smyth et al. (2010a) reported on sustainability issues
concerning imported biofuels (such as corn ethanol
and soybean diesel), which may not allow these
imported biofuels count in achieving the 10% target.
The issues relate to:
• Poor or negative energy balances;
• Adverse environmental impacts;
• Habitat destruction;
• Low GHG savings;
• High land requirements; and
• Carbon leakage.
Imported biofuels from tropical regions such as Brazil,
Malaysia and Indonesia have significant issues with
land-use change and deforestation. Higher demand for
palm oil leads to significant land-use change, which
results in lower GHG emission savings, accompanied
by adverse social and environmental impacts. In
addition, importing biofuels at the expense of local
industry could make it difficult for indigenous producers
to find a place in the energy market. This is contrary to
the government’s goals of accelerating the growth of
renewables and creating jobs in the energy sector
(DCMNR, 2007). However, the use of grass for biofuel
(biomethane) production has been highlighted by
Murphy and Power (2009a). The energy balance of the
grass biomethane system is significantly better than
alternative Irish biofuel crops and compares favourably
with tropical biofuels (Fig. 1.1) such as sugar-cane
ethanol and palm-oil biodiesel (Smyth et al., 2009;
Korres et al., 2010). In terms of GHG emissions, an
analysis by Korres et al (2010) found grass
biomethane to be one of the most sustainable
indigenous, non-residue-based European transport
biofuels. The advantages of perennial grasses over
first-generation agro-fuels include long persistency of
high dry matter (DM) yield, intercropping potential with
legumes and subsequent reduction in fertiliser
application rates, lower rates of pesticide application,
and the protection of grassland area in the present
CAP cross-compliance system (Peeters, 2009). The
reduction in the cattle herd will lead to reduced
requirements for grazing and for silage production.
Cross compliance will limit the ability to convert excess
grassland to arable land. Even allowing for the
conversion of grassland to forest, significant quantities
of high-value grassland will be available for grass
biomethane by 2020 (Smyth et al., 2010a). Smyth et al.
(2009, 2010a) suggested an excess of 0.39 Mha by
2020 and allowing for grass biomethane from 25% of
this area (ca. 100 kha) could produce 11.9 PJ of
biomethane. This is equivalent to 5% of energy in
transport in 2020 and 10% when the double credit for
lignocellulosic material is allowed (Table 1.1).
Box 1.1 Significant Articles in The Renewable Energy Directive (2009/28/EC) relating to sustainable biofuels
• Article 17 (2): From 1 January 2017, the greenhouse gas emissions of biofuels from new facilities must
be reduced by 60% compared with the alternative fossil fuel use.
• Article 17 (3): No damage may be done to sensitive or important ecosystems in producing biofuels.
• Article 17 (4): In the production of sustainable biofuels, wetland, forestry or grassland may not be
converted to energy crop production.
• Article 21 (2): The contribution from biofuels made from wastes, residues, non-food cellulosic material
and lignocellulosic material shall be considered to be twice that made by other biofuels.
3

The potential for grass biomethane as a biofuel
Figure 1.1. Comparison of gross and net energy output of selected energy crop biofuel systems (Smyth et
al., 2009; Korres et al., 2010). Gross energy is the energy produced in the form of transport fuel. Net energy
is the gross energy less all the energy inputs to the system including for all the steps in the production of
the crop and all parasitic energy demands in the production system. WDGS, wet distiller’s grains with
solubles. ‘Grass biomethane, base case’ excludes the use of digestate as a fertiliser and uses gas to
satisfy thermal parasitic demand. ‘Grass biomethane, digestate fertilizer’ allows for the use of digestate as
a substitute for mineral fertiliser. ‘Grass biomethane, wood chips’ allows for woodchips to satisfy thermal
parasitic demand.
Table 1.1. Strategy for meeting the target of 10% renewable energy in transport by 2020 (adapted from
Singh and Murphy, 2009).
Fuel Feedstock Practical energy in 2020(PJ)
Factor Contribution to target (PJ)
Percentage of energy in transport (2020)
Biodiesel Tallow 0.715 ×2 1.43 0.58%
Used cooking oil 0.455 ×2 0.91 0.38%
Rapeseed 0.6 0.60 0.25%
Bioethanol Cheese whey 0.27 ×2 0.54 0.23%
Biomethane Slurry 1.88 ×2 3.76 1.57%
OFMSW 0.57 ×2 1.14 0.48%
Slaughter waste 0.68 ×2 1.36 0.57%
Grass 11.93 ×2 23.86 9.94%
Electricity National grid 1.44 ×2.5 3.60 1.5%
Total 18.54 37.20 15.5%
OFMSW, organic fraction of municipal solid waste.
46
66
84
120135
122 122 122
25
4
43
74
120
6978
67
0
20
40
60
80
100
120
140
160R
apes
eed
biod
iese
l
Whe
atet
hano
l
Whe
atet
hano
l,W
DG
Sbi
omet
hane
Pal
m o
ilbi
odie
sel
Sug
arca
neet
hano
l
Gra
ssbi
omet
hane
,ba
se c
ase
Gra
ssbi
omet
hane
,di
gest
ate
fert
ilize
r
Gra
ssbi
omet
hane
,w
ood
chip
s
Gross energy Net energy
GJ/
ha/y
ear
4

J.D. Murphy et al. (2007-CCRP-1.7)
1.9 Waste Management and Residues
Treatment of organic wastes is currently of particular
importance in the European Union (Ward et al., 2008)
under the EU Landfill Directive (EC, 1999). Recent
research for Ireland (Singh and Murphy, 2009)
estimated the practical transport energy available from
biodiesel (produced from tallow and used cooking oil
(UCO)) and biomethane (from cattle slurry, the organic
fraction of municipal solid waste (OFMSW) and
slaughter waste) to be 4.3 PJ/year in 2020 (Table 1.1).
Allowing for double credits, this equates to 3.6% of
energy in transport by 2020. This is based on readily
achievable collection regimes; for example, 2% of
cattle slurry, 5% of pig slurry, and 25% of OFMSW.
Significant GHG emissions savings are associated
with biomethane from residues. Singh and Murphy
(2009) calculated 82% GHG savings for cattle slurry
biomethane and 100% for slaughter waste biomethane
when compared with diesel.
1.10 Conclusions
The high potential of grassland utilisation as feedstock
for biomethane production, given the environmental
constraints in agricultural production in conjunction
with sustainability issues associated with first-
generation biofuels, suggests grass biomethane to be
an optimum solution for achieving the 2020 renewable
energy in transport target. Diversification of agricultural
enterprise to biomethane production will assist rural
development through sustainable employment,
security of energy supply, and environmental benefits
associated with reduced stocking rates.
5

The potential for grass biomethane as a biofuel
2 What is Grass?
2.1 Grassland
Grassland is defined as the habitat where the
vegetation is either dominated by grasses or is ‘grassy’
in appearance, with abundant small sedges or rushes
and is mainly used for feeding herbivores and
ruminants. It also provides an important regulating
ecosystem service and supports biodiversity and
cultural services, for example by contributing to a
region’s cultural heritage and to recreational values
(Smit et al., 2008). Among its major benefits (i.e. long
persistency of high dry matter yield, intercropping
potential with legumes and subsequent reduction in
fertiliser application rates (Peeters, 2009), protection of
soil from erosion, and groundwater formation
(Prochnow et al., 2009)), grassland is also an
important carbon store and potential carbon sink
(Tilman et al., 2006) and a source of feedstock for the
production of renewable energy in the form of grass
biomethane (Smyth et al., 2009; Korres et al., 2010).
2.2 Grassland Classification
There are various grassland types (based on
husbandry practices) and grassland classifications
based on botanical composition or phytosociology
(Braun-Blanquet, 1932; Feehan, 2003). O’Sullivan
(1982) and O’Sullivan and Murphy (1982)
distinguished three types of Irish grassland:
1. High-quality swards: High-quality swards with
Molinio-Arrhenatheretea and Lolio-Cynosuretum
as the prevailing class and association,
respectively, are found in high fertile soils, such as
those in the east, south and south-east (i.e.
Meath, Kildare, Wicklow, Waterford, Wexford and
Cork). The dominant species within this class are
Lolium perenne (perennial ryegrass), Poa trivialis
(rough meadow grass) and Trifolium repens
(white clover). High-quality swards include the
majority of reseeded pastures found in Ireland.
2. Moderate-quality swards: Moderate-quality
swards are characterised by the Molinio-
Arrhenatheretea class and are distinguished from
the former type by the Centaureo-Cynosuretum
association. The dominant species in this type are
Lolium perenne, Trifolium repens, Holcus lanatus
(Yorkshire fog) and Agrostis spp (bentgrass).
Three sub-associations are observed within this
type of grassland:
(i) Type A is confined to shallow, well-drained,
limestone soils;
(ii) Type B is found in the better-drained
lowlands or deep, well-drained brown earths
and grey–brown podzolics; and
(iii) Type C is common on drumlins in the North
Midlands, the Castlecomer Plateau and
some soils in the mid-west and is often
subjected to poaching under wet conditions.
3. Low-quality swards: Low-quality swards include
poor-quality wet pastures on soils of low natural
fertility and represent around 11% of Irish
grassland. Species of the order Molinietalia
Caeruleae such as Juncus spp. (rushes), Lythrum
salicaria (purple loosestrife), Lychnis flos-cuculi
(ragged robin), Angelica sylvestris (wild angelica),
Achillea millefolium (yarrow), Senecio aquaticus
(marsh ragwort) and Lotus uliginosus (marsh
trefoil) are dominant in this type of grassland.
2.3 Grassland and Farming Practices
Brockman and Wilkins (2003) classified grassland
according to farming practices as rough mountain hill
grazing, permanent and rotational or temporary
grassland.
• Rough mountain grassland is found in
unenclosed or relatively large enclosures on hills,
uplands, moorland, heaths and downlands. It is
uncultivated grassland and is characterised by
high levels of species richness, low stocking
rates and low production. The soil is usually
acidic or peaty and therefore difficult to cultivate.
• Permanent grassland is grassland in fields or
relatively small enclosures not in arable rotation.
6

J.D. Murphy et al. (2007-CCRP-1.7)
It is dominated by perennial grasses and it is
more productive and usually more highly stocked
than mountain hill grazing grassland.
• Rotational or temporary grassland is grassland
within an arable rotation. It is characterised by
low abundance and low species richness, high
stocking rates and production.
In addition, Lockhart and Wiseman (1988)
distinguished two types of grassland, uncultivated and
cultivated. The former consists of rough mountain and
lowland heaths grassland, whereas the latter includes
permanent grassland (over 5 years old) and leys or
temporary grassland (less than 5 years old). This,
based on perennial ryegrass percentage, can be
further distinguished as first- (>30%), second- (20–
29%), third-grade (<20%) and poor (usually dominated
by bentgrass) grassland. Cultivated grassland
according to Fossitt (2000) can be classified as
improved grassland that is highly modified, intensively
managed and species poor used for heavy grazing
and/or silage production. It includes regularly reseeded
monoculture grasslands dominated by perennial
ryegrass that is planted as part of an arable rotation.
The Irish Central Statistics Office (CSO) displays its
data on grassland use based on four categories –
pasture, rough grazing, silage and hay. Increased
production from grassland has arisen from improved
understanding of soil and plant nutrition, plant
physiology and cultivar improvement, while improved
understanding of feed evaluation, ruminant nutrition,
grazing management and silage technology have
contributed to increased utilisation of grassland under
grazing and cutting. In this report, high-quality,
improved first-grade grassland (i.e. pasture and silage)
is considered for the analysis of energy balance and
related GHG emissions for biomethane production.
2.4 Grass in Animal and BiomethaneProduction Systems
Grass, more than anything else, is what Irish farming is
all about (Feehan, 2003) and it evolves as modern
scientific approaches to farming are developed.
Agronomists and progressive farmers require the
cultivation of high productive grass species for high
productive pastures (Connolly, 2001) which allows
them to receive full benefit from its various uses (e.g.
grazing, silage production) (Walker, 1995). This is true
for the use of grass and grass silage along with animal
feed as a feedstock for the production of biomethane
(Nizami et al., 2009).
The attention on different perennial grasses, i.e.
Panicum vigratum (switchgrass) (McLaughlin and
Kszos, 2005), Miscanthus × Giganteus (miscanthus)
(Clifton-Brown et al., 2004), Phalaris arundinacea
(reed canary grass) and Phleum pratense (timothy)
(Lewandowski et al., 2003), Andropogon gerardii (big
bluestem) (Weimer and Springer, 2007), forage
grasses (i.e. ryegrass) (Smyth et al., 2009; Korres et
al., 2010), as energy crops, mainly in the USA and
Europe, was accelerated when it was realised that they
offer good energy balances along with several
environmental advantages. Species, varieties and
seed mixtures should clearly be chosen to suit the
purposes for which the sward is to be used and the
environment (Feehan, 2003). The physiology of
grasses considering, for example, their photosynthetic
(PS) pathway, i.e. C-3 (cool or temperate) versus C-4
(warm or tropical) grasses, imposes environmental
specificity and, hence, differences in their productivity
(Niu et al., 2006) and biomethane yield (Table 2.1).
The main characteristics of cool compared with warm
grasses that affect their productivity are that the former
fix carbon dioxide (CO2) in a cooler environment, i.e.
they respond to nitrogen fertiliser early in the spring,
whereas in warm seasons their growth rates are
reduced. In contrast, warm species require less
nitrogen to achieve the same light-saturated
assimilation rate, leading to higher photosynthetic
nitrogen use efficiency, are more efficient at gathering
carbon dioxide in warm environments and more
tolerant at water stress conditions (Winslow et al.,
2003; Lunt et al., 2007; Nippert et al., 2007).
However, productivity of animals (i.e. meat, milk, wool)
consuming mostly forage is directly related to the
quality of the forage and the amount consumed
(Buxton, 1996). The quality of forages consumed by
animals is accounted for, in large part, by their
digestibility (dry matter digestible (DMD)) and the
fraction of the DM or energy that remains in the body
on passage through the gut tract (dry matter
indigestible (DMI)) (Brown, 1999). The lower
digestibility of warm grasses due to their higher fibre
7

The potential for grass biomethane as a biofuel
content (Minson, 1981; Reid et al., 1988) (Table 2.2) is
indicative for possible lower biomethane yields since
digestibility of dry matter may be equated to the
potential digestibility of the silage in cattle paunch
(Robson et al., 1989). It is therefore imperative that the
selection of the appropriate type of grass should
consider several characteristics in terms of farming
system, environmental conditions, legislative issues
Table 2.1. Potential perennial grasses as energy crops in Europe (data adapted from
Lewandowski et al. (2003); Prochnow et al. (2009); Braun et al., undated).
Common name Latin name PS pathway Methane(m3/ha)
Yield(t DM/ha)
Ryegrass Lolium perenne C-3 2,500–6,150 9–16.7a
Miscanthus Miscanthus × Giganteus C-4 1,432–5,450 5–44
Switchgrass Panicum vigratum C-4 900–7,820b 5–23
Reed canary grass Phalaris arundinacea C-3 1,700–4,730 7–13
Timothy Phleum pratense C-3 1,362–5,800 9–18
Meadow foxtail Alopecurus pratensis C-3 1463 6–13
Big bluestem Andropogon gerardii C-4 – 8–15
Cocksfoot Dactylis glomerata C-3 1,480–3,800 8–10
Tall fescue Festuca arundinacea C-3 1,462 8–14
Napier grass Pennisetum purpureum C-4 0.19–0.34c 27
Sudan grass Sorghum × drummondii C-4 2,130–6,060 10–20
Cypergrass Cyperus longus C-4 – 4–19
aYields of early, intermediate and late perennial ryegrass were reported equal to 16.7, 15.3 and 15 t DM/ha/year,respectively (Lockhart and Wiseman, 1988).
bBased on 0.18–0.34 m3 CH4/kg dry matter (Pettigrew, 2000; Chynoweth et al., 2001; Samson, 2006). cLitres of methane (CH4) per gram of volatile solids (Wilkie, 2008). PS, photosynthetic; DM, dry matter.
Table 2.2. Dry matter indigestible (DMI), dry matter digestible (DMD) and acid detergent fibre
(ADF) concentration of C-4 and C-3 grasses, adapted from Brown (1999)
Grass type DMIa
(g/day/kg0.75)DMDb
(%) ADFc
(% of DM)
C-4 (sheep) 56 62 –
C-3 (sheep) 71 71 –
C-4 (sheep) 65.7 54.5 42.5
C-3 (sheep) 66.2 65.5 35.8
C-4 (cattle) 89.8 60 42.7
C-3 (cattle) 89.5 67 38.3
aDMI (dry matter indigestible): dietary fibre (sometimes called roughage) is the indigestible portion of plant food. bDMD (dry matter digestible): the percentage of the feed dry matter actually digested by animals; high-quality feedshave a DMD of over 65%, whilst feeds below 55% DMD are of poor quality.
cADF (acid detergent fibre): estimation of cellulose and lignin content in a feed; the lower the ADF the higher the DMD(and metabolisable energy).
8

J.D. Murphy et al. (2007-CCRP-1.7)
(i.e. cross compliance) and biomethane production
potential.
2.5 Suitability of Grass Species forBiomethane and Animal Productionin Ireland
The use of grass either as feed for livestock or as a
feedstock for biomethane production determines the
husbandry management and agricultural operations
due to differences in environmental factors and the
microbiology of AD as opposed to rumen (Nizami et al.,
2009). For example, the level of cellulose degradation
is up to 80% in biogas plants with retention times of
30–80 days, while it is 40–60% in rumen with retention
of about 2 days (Ress et al., 1998). In the temperate
grassland region, particularly in Ireland, grass silage of
perennial ryegrass is preferred for biomethane
production because of its high digestibility values
(Robson et al., 1989), water-soluble carbohydrate
(WSC) levels (Smith et al., 2002) and reduced
quantities of crude fibre (Table 2.3) (Nizami et al.,
2009).
Mahnert et al. (2005) reported that perennial ryegrass
gave the highest biogas yield (0.83–0.86 m3/kg volatile
dry solids (VDS) added), compared with other grass
species, both fresh and ensiled. For example,
cocksfoot gave a biogas yield of 0.65–0.72 m3/kg VDS
added. Considering that grass biogas is typically 55%
methane (CH4), these results indicate that ryegrass
yielded 0.45–0.47 m3 CH4/kg VDS added, while
cocksfoot yielded 0.36–0.40 m3 CH4/kg VDS added.
Perennial ryegrass is one of the most dominant grass
species in Irish grassland (Fig. 2.1). Along with Italian
ryegrass and white clover, it accounts for nearly all of
the grass/clover seed sold for forage production in
Ireland (Anonymous, 2008b). Additionally, O’Kiely et
al. (2005) stated that the main attractions in favour of
perennial ryegrass swards are that they produce high
yields in response to fertiliser application, have high
digestibility when harvested at the appropriate growth
stage, are relatively easy to preserve as silage due to
their superior content of sugar and they persist as
permanent swards where favourable management
practices prevail. Tetraploid ryegrass varieties are
recommended due to high sugar levels (Dieterich,
2008). In recent times diploid varieties have tended to
dominate mixtures in Ireland, but tetraploid varieties
remain an important component of grass seed
mixtures because of their higher WSC content, their
increased palatability, which determines higher intake
by livestock, and their tolerance to drought. However,
they tend to have lower tiller densities resulting in more
Table 2.3. Comparison of fresh and ensiled grass characteristics in batch and continuously stirred tank
reactor (CSTR) digesters (Nizami et al., 2009).
Batch digester CSTR
Fresh grasses Grass silage Fresh grasses
PRG CF MF PRG CF PRG CF MF MIX
Total solids (TS) (%FM) 17.6 18.6 15.8 18.7 27.3 25.6 22.9 24.2 24.2
Volatile dry solids (%TS) 90.1 89.1 91.1 88.5 88.8 90.6 88.8 90.6 90
Volatile fatty acids (g/kg FM) 0.5 0.5 0.3 6.9 14.3 0.7 0.5 0.6 0.6
pH 6.5 6.7 6.6 4.6 6.1 6.5 7.1 7.1 6.9
Carbon to nitrogen ratio 16.4 13.7 15.5 14.3 19.8 12 13.5 15.1
Crude protein (%TS) 14.7 18.5 17 18.4 11.8 21.4 18.8 17.4
Crude fibre (%TS) 24.8 24.8 25.3 31.3 30.1 29.1 28 31.5 29.5
Saccharides (%TS) 10.8 9.8 3.3 3.4 3.1 19.3 9.8 9.1 12.7
Crude fat (%TS) 2.1 2.3 2.2 4.9 4.6 2.4 2.6 2.1 2.4
PRG, perennial ryegrass; CF, cocksfoot; MF, meadow foxtail; MIX, mixture; FM, fresh matter.
9

The potential for grass biomethane as a biofuel
open swards and lower dry matter compared with
diploids. Seeding rates for tetraploid grasses will need
to be higher because of their larger seed size
(Anonymous, 2008b).
Considering the potential of grass and grass silage as
a feedstock for biomethane production as a biofuel
(Murphy and Power, 2009b) and the need to increase
biofuel penetration in line with the European Directive
for the use of biofuels (EC/28/2009), this then
necessitates the rapprochement of grass and grass
silage production and their characteristics that make
them suitable for both feed and biofuel. Grass for AD is
grown in the same way as high-quality grass for animal
feed as, in both cases, the aim is to maximise
metabolisable energy (ME) by harvesting the grass as
long as it is in a leafy, non-lignified stage (Dieterich,
2008). Nevertheless, certain agronomical
management decisions, such as fertilisation,
harvesting date and frequency, and ensiling, can affect
biomethane yield through mainly changes in chemical
and structural composition of cell walls in grasses.
2.6 Fertilisation
Fertilisation of grassland to achieve higher yields is the
most important husbandry factor. Nevertheless,
Nordheim-Viken and Volden (2009), investigating the
effects of husbandry factors such as nitrogen
fertilisation of timothy, found that increases in
fertilisation rate resulted in increases in neutral
detergent fibre (NDF). Such fibre is a measure of
cellulose and hemicellulose and is a reflection of the
total cell wall content. This is supported by findings of
Keady et al. (2000), where increases of nitrogen
application rate were accompanied by increases in the
cellulose and hemicellulose content of ryegrass
(Fig. 2.2). This leads to a decrease in digestibility.
In general, the results of nitrogen fertilisation on fibre
digestibility are moderate. As such, Peyraud et al.
(1997) found that unfertilised perennial ryegrass was
accompanied by decreased fibre digestibility of 0.06
units when provided as a feed to dairy cattle but all
NDF, acid detergent fibre (ADF) and acid detergent
lignin ((ADL) estimation of lignin content) moderately
increased with nitrogen application. Additionally,
several authors have reported lower water-soluble
carbohydrates in grasses with increased nitrogen
fertilisation (Buxton and Fales, 1994; O’Kiely et al.,
2002). These evidences suggest that an excess in
fertilisation rate could negatively affect biomethane
production since increases of the non-easily
fermentable content of grasses occur.
Figure 2.1. Distribution of (a) perennial ryegrass, (b) Italian ryegrass, and (c) white clover in Irish
grassland. Maps constructed based on data provided from the National Biodiversity Network Gateway
(http://data.nbn.org.uk).
(a) (b) (c)
10

J.D. Murphy et al. (2007-CCRP-1.7)
2.7 Harvesting Date
Grass for silage is usually harvested at a less mature
stage of growth (leafy and non-lignified) (Fig. 2.3),
since the aim is to obtain a crop with a relatively high
content of fermentable substrate and a low content of
fibre as the crop at this stage usually has a high leaf–
stem ratio (Woolford, 1984).
Amon et al. (2007), reporting on a multifaceted crop
rotation to increase the yield of methane per hectare,
found that the first cut at vegetation stage was selected
as the optimum option for harvesting. Furthermore, De
Boever et al. (1993) found significant increases in
structural carbohydrates (i.e. NDF and ADF) and lignin
between early and late first cut in a permanent pasture
consisting of a 50:50 ratio between diploid and
tetraploid varieties of perennial ryegrass. The same
was reported by Keady et al. (2000) for perennial
ryegrass comprised of intermediate varieties (Fig. 2.4).
Nevertheless, inconsistencies in biomethane
production per kilogram VDS and harvesting date have
been reported for clover, ryegrass and timothy in
mixed swards. Kaparaju et al. (2002) found that clover
produced 50% more methane per kilogram VDS at the
vegetative stage than at the flowering stage, whereas
Pouech et al. (1998), performing the same experiment,
obtained different results, where 32% lower methane
yield per kilogram VDS was recorded at the vegetative
stage than at the flowering stage. Prochnow et al.
(2005) described more biogas yield in second-cut than
first-cut silage, but, in spite of high dry solids (DS) and
VDS contents present in late-cut grass, a lower
methane yield was established. The total solids (TS)
and VDS contents in grass, hence yield of biomethane
production (Nizami and Murphy, 2010), depend on
several factors, such as location, origin, climate,
cultivation practices, soil type, nutrient content of grass
and pretreatment of biomass for AD (Bauer et al.,
2007). Additionally, methane production potential can
also be increased if grass is cut in the afternoon as it
increases the concentration of WSC (White, 1973).
Another important factor affecting the qualitative
characteristics of grass silage relates to harvesting
management (Buxton, 1996) – the methane yield may
possibly be affected by harvest frequency. It has been
mentioned by various authors that a cutting cycle of
grass between 2 and 4 weeks in terms of the
carbon/nitrogen ratio (Holliday, 2005) or at cutting
intervals of 6 weeks following an early first cut
(Murdoch, 1980) can optimise the methane yield in AD
through increases in digestibility of grass.
Figure 2.2. Effects of nitrogen fertilisation on the concentration of structural carbohydrates (cellulose and
hemicellulose). Based on data from Keady et al. (2000).
278
281
287
278278
262
249
251
252
258
272
274
276
278
280
282
284
286
288
N1 (72) N2 (96) N3 (120) N4 (144) N5 (168)
N fertilizer (kg N/ha)
Cel
ullo
se (
g/kg
)
240
245
250
255
260
265
Hem
icel
lulo
se (
g/kg
)
Cellulose
Hemicellulose
11

The potential for grass biomethane as a biofuel
2.8 Ensiling of Grass
Grass and, in particular, grass silage form the basal
diet for the vast majority of ruminants in many parts of
the world during the winter feeding period (Charmley,
2001). Additionally, ensiling of grass for AD is
preferable compared with fresh grass (Nizami et al.,
2009), whilst ensiled grass in comparison with dried
and stored grass ensures lower organic matter losses
and independency of weather conditions that might
cause damage to the dried feedstock. There may be
potential to batch digest fresh grass in the summer
months and to utilise other energy crops or biomass in
the winter months. Grass silage produced higher
methane per tonne of organic dry matter (ODM) than
fresh grass (Holliday, 2005). During ensiling, the
Figure 2.4. Effects of harvesting date on grass fibre components (based on data from Keady et al., 2000).
279
281
278
283
281258
216
252261
286
275
276
277
278
279
280
281
282
283
284
HD1 (May10) HD2 (May 17) HD3 (May 24) HD 4 (May 31) HD 5 (June 7)
Harvesting date
Cel
lulo
se (
g/kg
)
0
50
100
150
200
250
300
350
Hem
icel
lulo
se (
g/kg
)
Cellulose
Hemicellulose
Figure 2.3. Effects of harvesting date on morphological and chemical composition of grass.
Cell wall
Cytoplasm
HemicelluloseCelluloseLigninsBound N
Neutral Detergent Fibres
Acid Detergent Fibres
Late harvested forageEarly harvested forage
CytoplasmNucleic acidAmino acidProteinsOther N compoundsMonosaccharidesOligosaccharidesRefractory compounds
Thin cell wallLow Neutral Detergent Fibres = High intakeLow Acid Detergent Fibres = High energy
Thick cell wallHigh Neutral Detergent Fibres = Low intakeHigh Acid Detergent Fibres = Low energy
Cell wall A
A
12

J.D. Murphy et al. (2007-CCRP-1.7)
resistive polysaccharides are degraded and
intermediates, such as volatile fatty acids (VFAs), for
methanogens are produced, which increase methane
yield in the digester (Madhukara et al., 1993). Use of
additives during ensiling is a common practice.
Nevertheless, the use of additives in silage preparation
did not increase methane as recorded by Neureiter et
al. (2005) and Rani and Nand (2004). Conversely,
according to Lehtomaki (2006), formic acid addition
resulted in higher methane production, possibly due to
improvements in silage fermentation through
decreases in pH and ammonia-nitrogen (Keady et al.,
2000). Acidic conditions are suggested during the
whole ensiling process to produce efficient silage for
the digester (Mosier et al., 2005). Another agronomical
factor that influences biomethane production from
grass silage is the biological pretreatment of feedstock,
such as the use of cellulase enzymes during ensiling
(Clavero and Razz, 2002). This can result in an
increased degradation of cell walls and the breakdown
of structural carbohydrates, hence improving the
potential of biomethane production (Clavero and Razz,
2002). Considering the use of inoculants, it has been
proposed that heterofermentative bacteria (as
compared with homofermentative bacteria) could be
more beneficial for efficient AD since they facilitate the
production of intermediates for methanogens (Idler et
al., 2007).
2.9 Mixed Pastures
Mixtures of species are more common than pure
stands in grazed pastures, with grasses (i.e. ryegrass)
and clover in rotational pastures (Brown, 1999) being
most common. Such mixtures have advantages over
monospecific pasture because legumes have a higher
nutritive value for ruminants and fix atmospheric
nitrogen, whereas the different resource requirements
or environmental responses between various species
in mixed pastures allow for broader resource
exploitation (Brown, 1999). Additionally, grass species
may vary in terms of their chemical composition –
hence methane yields from grassland could possibly
depend on the mixture of species within the vegetation
(Prochnow et al., 2009).
Mixtures of grasses and grass silage increase
methane yield when compared with a single grass
type, such as Cynodon spp. (Bermuda grass)
(Gunaseelan and Nallathambi, 1997). Additionally,
Plochl and Heiermann (2006) reported methane
production from forage and paddock mixtures of 297–
370 m3/t and 246 m3/t ODM, respectively. The
efficiency of AD can be considerably improved in
mixed feedstock such as that of grass with legumes
because the NDF concentration of grasses is usually
greater than that of legumes, which is caused mostly
by differences in the NDF concentration of grass and
legume leaves (Buxton, 1996). Hence, increasing the
proportion of legumes, particularly clover, and,
consequently, the leaf to stem ratio of forage results in
lower cell wall concentration, in other words reduced
indigestible material and increases in digestibility of
feedstock. This improves the efficiency of
lignocellulosic decomposers and possibly increases
biomethane production (Table 2.4).
2.10 Conclusions
• The most important husbandry factors that could
affect the potential biomethane production from
grass and grass silage are species selection,
fertilisation and harvesting date.
• The selection of suitable grass species (e.g.
perennial ryegrass, timothy, cocksfoot and
meadow foxtail), based on their chemical
composition and dominance in Irish grasslands,
can significantly affect biomethane production.
• Excess fertilisation could negatively affect
biomethane production due to increases in the
structural carbohydrate content of grasses.
• Late harvesting contributes to decreases in the
non-structural carbohydrate content of grasses,
hence the potential for biomethane production.
• Mixed pastures (e.g. ryegrass and clover) have
shown that they might positively affect
biomethane production.
• Conservation of grass has been shown to
produce higher methane per tonne of organic
matter than fresh grass.
13

The potential for grass biomethane as a biofuel
Table 2.4. Effects of pasture type on methane production (Prochnow et al., 2005).
Substrate Biogas yield (l/kg VDS)
Methane yield(l/kg VDS)
Conditions
Intensive grassland (monoculture fresh, silage)
700–720 – Batch, 35°C, 25 days
Extensive grassland (fresh and silage) 540–580 –
Extensive grassland (fresh and hay) 500–600 – Semi-continuous, 35°C, 18–36 days, co-digestion
Extensive grassland (silage) 500–550 – Continuous, 35°C, 20 days, co-digestion
Mixed pasture grassland (fresh and silage) 650–860 310–360 Batch, 35°C, 28 days, mono-digestion
Mixed pasture grassland (silage) 560–610 300–320 Semi-continuous, 35°C, 28 days, mono-digestion
Grasses and clover (silage) 532, 474, 427a 370, 326, 297a Batch, 37–39°C, 58 days, mono-digestion
Intensive grassland (monoculture, silage) – 390 Semi-continuous, 37°C, 25–60 days, co-digestion
Extensive grassland (silage) – 220 Semi-continuous, 37°C, 25–60 days, co-digestion
aHarvesting mid-May (before anthesis), end of May (anthesis), mid-June (after anthesis), respectively.VDS, volatile dry solids.
14

J.D. Murphy et al. (2007-CCRP-1.7)
3 How Do We Convert Grass to Biomethane?
3.1 Anaerobic Digestion
Anaerobic digestion is an old technology used for
stabilising waste and wastewaters and, more recently,
for energy production. The process of AD also occurs
in nature when organic matter degrades and decays,
for example the cow’s digestive system, marshes and
swamps, landfills, etc. Biogas, the major end product
of the AD process, is either produced naturally or
artificially in airtight vessels known as anaerobic
digesters (Salminen and Rintala, 2002). The
biochemical processes in AD, through which the
microbial decomposition of organic matter under
anaerobic conditions occurs, are distinguished by the
following phases:
• Hydrolysis (complex organic matter is
decomposed into smaller units);
• Acidogenesis (products of hydrolysis are
converted into VFAs and methanogenic
substrates);
• Acetogenesis (products from acidogenesis,
which cannot be directly converted to methane by
methanogenic bacteria, are converted into
methanogenic substrates such as acetic acid);
and
• Methanogenesis (the production of methane and
carbon dioxide from intermediate products) (Al
Seadi et al., 2008).
The process of biogas production is not efficient unless
carried out in a controlled environment within an
anaerobic digester. The digester technology should be
designed so as to optimise the conversion of the
specific organic material to gaseous products
(Demirbas and Ozturk, 2005). A range of digester
types and configurations may be utilised. The
configuration chosen (Fig. 3.1) must be based on
various process parameters, such as the solids
content of the feedstock, the number of phases or
stages of digestion activities, the operating
temperature, the method of feeding the substrate, the
retention time in the digester, and the organic loading
rate (Karagiannidis and Perkoulidis, 2009; Nizami and
Murphy, 2010).
The history of AD starts with sanitation – septic tanks
treating low-strength wastewaters under psychrophilic
temperatures (ambient, less than 20°C) (Rebac et al.,
1995). The technology has advanced to the
thermophilic treatment of solid waste (Vandevivere,
1999) and the production of gaseous transport fuel
from high solid content feedstocks such as grass
silage (Murphy and Power, 2009b). A significant trend
in AD technology is higher treatment efficiency. This is
made possible by adequate pre- or post-treatments
and by various types of additives or co-substrates that
improve nutrient composition, metabolic diversity and
resistance towards toxicants (Nizami et al., 2009). The
application of AD technology covers a wide range of
uses and substrates, for example farm waste,
wastewater, industrial organic waste, municipal solid
waste, agricultural residues, crops, crop residues,
grass and grass silage (Vandevivere, 1999).
3.2 Anaerobic Digesters
A steady and predictable supply of usable biogas can
be achieved if anaerobic digesters are designed,
operated and maintained properly. Concrete, steel and
brick or plastic are the materials with which anaerobic
digesters are made. A variety of shapes, such as silos,
troughs, basins or ponds, exist. They may be placed
underground or on the surface. The same basic
components in all designs are a premixing area or
tank, a digester vessel, a system for using the biogas,
and a system for distributing or spreading the effluent
(Demirbas and Ozturk, 2005).
In a one-stage digester, all the AD processes (i.e.
hydrolysis, acidification and methanisation) occur in
one tank. In a two-stage system, all the reactions occur
in each vessel. In a two-phase reactor, microbiological
processes are separated: hydrolysis and acidification
occur in the first reactor and acetogenesis and
methanogenesis in the second reactor. In batch
15

The potential for grass biomethane as a biofuel
digesters, the feedstock is inserted once into the
digester for a certain period of time to complete the
digestion activity, while in continuous digesters the
feedstock is constantly or regularly fed either
mechanically or by force of the new feed. In dry
digesters, high solid feedstock with dry matter ranging
from 20% to 50% is used as substrate. The feedstock
is either sprinkled with recirculating water (dry batch
digestion) or mixed with digestate (dry continuous).
Wet digesters, such as the continuously stirred tank
reactor (CSTR), typically operate at less than 12% DS
content. High solid content feedstock may be treated in
a wet continuous system through homogenisation to
liquid state (Nizami and Murphy, 2010), (Fig. 3.1).
The majority of digesters treating OFMSW and
biowaste (i.e. 90% of the full-scale plants currently in
use in Europe) rely on continuous one-phase systems
(Lissens et al., 2001) (Table 3.1). Nevertheless, a
considerable amount of information in the literature
exists (e.g. Sachs et al., 2003) on anaerobic treatment
of wastes in two-phase digestion (i.e. the acid-forming
phase followed by the methanogenic phase). Two-
phase systems offer more possibilities to control the
intermediate steps of the digestion process, although
the single-phase system is preferred in industry
because of simplicity in design and lower investment
cost (Arvanitoyannis and Varzakas, 2008) (Table 3.2).
Currently, only 5% of European biogas plants are
psychrophilic, 8% are thermophilic, and 87% are
Figure 3.1. (a) Design variation in one- and two-stage digesters, (b) one-stage dry continuous digesters, (c)
one-stage dry batch digester, (d) two-stage dry batch digesters, and (e) sequencing fed leach bed digesters
coupled with an upflow anaerobic sludge blanket (UASB) (Vandevivere et al., 2003; Nizami and Murphy,
2010). CSTR, continuously stirred tank reactor; DRANCO, DRy ANaerobic COnversion.
16
J.D. Murphy et al. (2007-CCRP-1.7)
mesophilic. In Europe, only Italy and Switzerland use
psychrophilic biogas plants, whereas in Denmark there
are more thermophilic than mesophilic biogas plants
(Poulsen, 2003).
Anaerobic digestion technology due to recent
improvements – reduced technology costs and
increased process efficiency (Murphy and Power,
2009a) – has become an attractive option as a source
for renewable energy production as opposed simply to
waste treatment (Durand, 2003). Anaerobic digestion
of grass and grass silage has received increased
attention in recent years in Europe (Murphy and
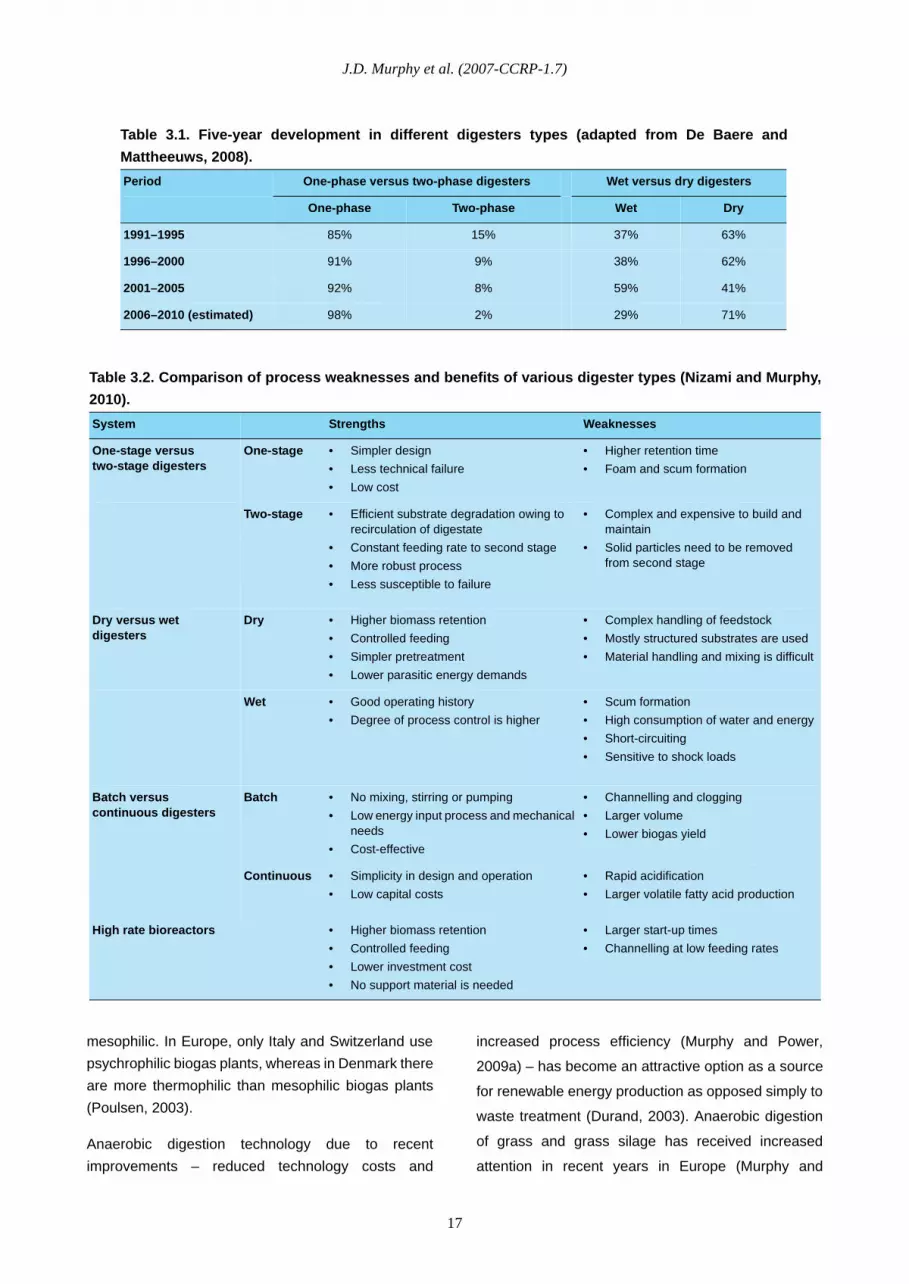
Table 3.1. Five-year development in different digesters types (adapted from De Baere and
Mattheeuws, 2008).
Period One-phase versus two-phase digesters Wet versus dry digesters
One-phase Two-phase Wet Dry
1991–1995 85% 15% 37% 63%
1996–2000 91% 9% 38% 62%
2001–2005 92% 8% 59% 41%
2006–2010 (estimated) 98% 2% 29% 71%
Table 3.2. Comparison of process weaknesses and benefits of various digester types (Nizami and Murphy,
2010).
System Strengths Weaknesses
One-stage versustwo-stage digesters
One-stage • Simpler design
• Less technical failure
• Low cost
• Higher retention time
• Foam and scum formation
Two-stage • Efficient substrate degradation owing to recirculation of digestate
• Constant feeding rate to second stage
• More robust process
• Less susceptible to failure
• Complex and expensive to build and maintain
• Solid particles need to be removed from second stage
Dry versus wet digesters
Dry • Higher biomass retention
• Controlled feeding
• Simpler pretreatment
• Lower parasitic energy demands
• Complex handling of feedstock
• Mostly structured substrates are used
• Material handling and mixing is difficult
Wet • Good operating history
• Degree of process control is higher
• Scum formation
• High consumption of water and energy
• Short-circuiting
• Sensitive to shock loads
Batch versus continuous digesters
Batch • No mixing, stirring or pumping
• Low energy input process and mechanical needs
• Cost-effective
• Channelling and clogging
• Larger volume
• Lower biogas yield
Continuous • Simplicity in design and operation
• Low capital costs
• Rapid acidification
• Larger volatile fatty acid production
High rate bioreactors • Higher biomass retention
• Controlled feeding
• Lower investment cost
• No support material is needed
• Larger start-up times
• Channelling at low feeding rates
17
The potential for grass biomethane as a biofuel
Power, 2009a), but its use is modest in comparison
with others substrates (Abraham et al., 2007). Most of
the work on digestion of grass and grass silage is
carried out at laboratory and pilot scales (Murphy and
Power, 2009b), using manure and maize silage as co-
substrates. Nevertheless, in European biogas plants
during 2002–2004, grass and maize silage were the
most used co-substrates (Weiland, 2006). The
literature regarding the mono-digestion of grass and
grass silage is limited. However, some studies have
shown a high potential of biogas production
(Table 3.3).
3.3 Upgrading and Injection
Utilisation of biogas as a vehicular fuel should have as
high as possible a volumetric energy density content
as can be achieved. This is affected by removal of
carbon dioxide and other gases that exist in the biogas
mixture. Apart from methane and carbon dioxide,
biogas also contains water, hydrogen sulphide,
nitrogen, oxygen, ammonia, siloxanes and particles.
These impurities can be removed by cooling,
compression, precipitation, absorption or adsorption
(Petersson and Wellinger, 2009); collectively this is
termed upgrading (Murphy et al., 2004; Persson et al.,
2006). de Hullu et al. (2008) compared five techniques
for upgrading of biogas (Table 3.4):
1. Chemical absorption
2. High-pressure water scrubbing (HPWS)
3. Pressure swing adsorption
4. Cryogenic separation, and
5. Membrane separation.
They found that membrane separation and HPWS are
the simplest processes to operate because they do not
need special chemicals or equipment to run. In
addition, HPWS provides maximum purity, with up to
98% methane with minimal cost.
Upgraded biogas, biomethane, can either be used
directly on the site where it is generated or distributed
to customers via pipelines. After upgrading, it may be
fed into the distribution grid (Persson et al., 2006). The
on-site option for the use of biomethane as a transport
fuel is to compress it up to 300 bar and discharge it to
the vehicle through cascading pressure reduction to
250 bar. Alternatively, the existing natural gas
infrastructure may be used as a distribution system to
a service station at a remove from the facility. A
European Commission report (EC, 2006) states that
the energy required for local distribution of natural gas
is zero. This is because the high-pressure trunk lines
(typically operating at between 35 and 70 bar) that feed
the low-pressure networks (typically operating at 4 bar)
provide sufficient energy to supply local distribution. In
either case, for use as a transport fuel it is necessary
to scrub and to compress to 300 bar.
Intermediate pipelines (8 bar) present an interesting
option since pressure is similar to some biogas
upgrading processes while injection into the
distribution network (4 bar) is the final and most
practical solution. However, the gas utility must ensure
that the minimal summer load is greater than the
projected biomethane flow. Furthermore, for security
reasons, the utility may require more stringent
monitoring of the gas quality since dilution of
biomethane will be low. Technologies such as
pressure swing adsorption (PSA) and amine scrubbing
are promising candidates for simple injection and
monitoring systems, since they often provide an
additional assurance that gas quality will meet
specification (Electrigaz, 2008).
There are several incentives for using the gas grid for
distribution of biogas:
• One important advantage is that the grid
connects the production site with more densely
populated areas which enables the gas to reach
new customers.
• An off-site customer may have a year-round
demand for electricity and thermal energy (a
brewery for example).
• An off-site customer may achieve far higher
energy conversion efficiency due to economy of
scale (a combined cycle gas turbine).
• An off-site customer may have a large captive
fleet (bus service).
• It is also possible to increase the production at a
remote site and still use 100% of the gas.
18

J.D. M
urphy et al. (2007-CC
RP
-1.7)
19
Table 3.3. Comparison of the optimal anaerobic digesters for grass silage (adapted from Nizami and Murphy, 2010).
ating ratureC)
Cost Destruction of volatile solids
(%)
OLR(kg VDS/m 3/day)
–40 Medium 40–70 < 3.5
5 High 40–70 overall 75–98 from
UASB
10–15
–58 Medium 40–70 12
5 Low 40–70 12–15
Ry ANaerobic COnversion; UASB, upflow anaerobic
Example Pretreatment Process Quality of digestate
HRT(days)
Solid contents(%)
Opertempe
(°
Wet continuous one/two-stage digester
CSTR • Pulping• Chopping• Slurry• Hydrolysed
Two-stage (can be one-stage)
Juice rich in protein and nutrients, soil conditioner
>60 2–14 35
Two-stage sequential batch digester connected with high-rate bioreactor
Leach bed with UASB
• Chopping• Pulping
Two or multistage
Soil conditioner, fertiliser, fibrous materials
<40 20–40 3
One-stage dry continuous digester
DRANCO • Shredding Chopping
One-stage Dewatered, good quality, fibrous materials
< 40 20–50 50
One or multistage dry batch digester
BEKON • Chopping One-stage Dewatered, good quality, fibrous materials
<40 30–40 3
HRT, hydraulic retention time; OLR, organic loading rate; VDS, volatile dry solids; CSTR, continuously stirred tank reactor; DRANCO, Dsludge blanket.

The potential for grass biomethane as a biofuel
• Furthermore, injecting biogas into the gas grid
improves the local security of supply (Persson et
al., 2006).
3.4 Conclusions
Selection of the proper digester design for grass
biomethane production is an important
management/design decision that merits further
investigation. The wet continuous two-stage system,
the leach bed system with an upflow anaerobic sludge
blanket (UASB), the dry continuous system and batch
digesters all have potential for biomethanation of grass
silage. Nevertheless, comparisons for treating similar
quantities of grass silage under similar loading rates
and characteristics to evaluate optimal digestion
configuration are required. These systems can be
further optimised for better and continuous biogas
production, based on changing their filling regimes and
co-digestion patterns. There is a need to compare the
potential of various pretreatment options (including
pressure, thermal, enzymatic and chemical
pretreatments) for increased efficiency. Upgrading of
biogas comprises the removal of carbon dioxide,
hydrogen sulphide and other possible pollutants from
biogas. Membrane separation and HPWS may be the
simplest processes to operate because the use of
special chemicals or equipment is not necessary. Also,
HPWS provides maximum purity (up to 98% CH4) with
minimal cost. The technology is evolving and better
results than those indicated in Table 3.4 have and will
be achieved. The produced biomethane can either be
used directly on-site as a transport fuel or, after grid
injection, may be used off-site where better energy
efficiencies and financial returns may be achieved.
Table 3.4. Comparison of different biogas upgrading techniques (adapted from de Hullu et al., 2008).
Technique Maximum achievable Advantages Disadvantages
Yield (%) Purity (%)
Chemical absorption
90 98 • Almost complete hydrogen sulphide removal
• Only removal of one component in one column
• Expensive catalyst
High-pressure water scrubbing
94 98 • Removes gases and particulate matter
• High purity, good yield
• Simple technique, no special chemicals or equipment required
• Neutralisation of corrosive gases
• Limitation of hydrogen sulphide absorption due to changing pH
• Hydrogen sulphide damages equipment
• Requires a lot of water, even with the regenerative process
Pressure swing adsorption
91 98 • More than 97% methane enrichment
• Low power demand
• Low level of emissions
• Adsorption of nitrogen and oxygen
• Additional complex hydrogen sulphide removal step needed
Cryogenic separation
98 91 • Can produce large quantities with high purity
• Easy scaling up
• No chemicals used in the process
• A lot of equipment is required
Membrane separation
78 89.5 • Compact and light in weight
• Low maintenance
• Low energy requirements
• Easy process
• Relatively low methane yield
• Hydrogen sulphide removal step needed
• Membranes can be expensive
20

J.D. Murphy et al. (2007-CCRP-1.7)
4 Life-Cycle Analysis of Grass Biomethane
4.1 Aims and Methodology
Biomass, which includes both energy crops and
residues, is a renewable energy resource with
significant potential in Ireland. This study proposes to
assess the use of grass silage as a feedstock for
biomethane production. The advantages according to
Murphy and Power (2009b) include:
• Arable land is not needed for growing grass and
direct food substitution is not an issue;
• Over 91% of Ireland’s agricultural land is under
grass;
• Biomethane as a transport fuel is a mature
technology;
• Biogas can also be made from wastes and
residues, thus increasing the availability of
feedstock; and
• Projections for reductions in animal stock will
release grassland for biomethane production.
Grassland sequesters carbon into the soil, which is not
released on harvesting leading to a potential for
sustainable biofuel production from grass (Tillman et
al., 2006). The Renewable Energy Directive
recognises the potential for biogas as a transport fuel
in attributing a GHG saving of 83% to compressed
biomethane generated from residues. The aim of this
study was to investigate in detail the production of
grass biomethane as a transport biofuel in accordance
with the Renewable Energy Directive sustainability
criteria, in particular GHG emissions savings in
comparison with the fossil fuel it replaces (diesel in this
instance). To be deemed sustainable according to the
Renewable Energy Directive, a reduction in emissions
of 35% is required if operated before 2017, 50% after
2017, and 60% for new installations installed after
2017 (EC, 2009a). The methodology employed
involves a life-cycle assessment (LCA) of current
agricultural practices for reseeded perennial ryegrass
pastures for silage production; the process technology
includes a two-stage CSTR, and biogas upgrading for
biomethane production.
Life-cycle assessment is one of the most appropriate
methodologies for the evaluation of the environmental
burdens associated with biofuel production, since it
allows the identification of opportunities for
environmental improvement and is widely used for
evaluation of sustainability of biofuel production (Singh
et al., 2010a). The scope of the study may be
represented by the cradle (grass silage production) to
the grave (the utilisation of produced biomethane in the
vehicles) analogy (Fig. 4.1). The analysis takes into
consideration the energy and emissions (both direct
and indirect) associated with all stages of production of
silage and biomethane. This facilitates comparison of
systems if the boundary conditions are the same. The
functional unit is defined as cubic metres of
biomethane per year and the environmental impacts
are expressed as grams carbon dioxide equivalent
(CO2e) per megajoule energy replaced. This is
important; the analysis is a field-to-wheel system
rather than a field-to-tank system. The vehicle
operating on gaseous transport fuel is assumed to
have an efficiency (MJ/km) 18% less than a diesel
vehicle (Korres at al., 2010). This thus reduces the
efficiency of the whole process. Emissions associated
with the manufacture of machinery are not included as
per the EU Renewable Energy Directive (EC, 2009a).
The global warming potential (GWP) for carbon
dioxide, nitrogen dioxide and methane is 1 kg CO2, 296
kg CO2 and 23 kg CO2, respectively.
The basis of the analysis is a grass-based farm-to-
biomethane facility visited by the authors in Austria in
early 2008. The Austrian facility digests grass from 150
ha, which equates to 1,650 t DM/year based on a
typical yield of 11 t DM/ha/year. Yields in Ireland tend
to be higher; the assumption in this analysis is that the
farms entering the biomethane industry will be from
areas with good yields. A production of 12 t DM/ha is
assumed. Accordingly, the facility modelled under Irish
conditions, assuming that grassland is used
exclusively for silage production, requires a farm of
21

The potential for grass biomethane as a biofuel
137.5 ha. The energy used in the process is split into
direct and indirect energy. Direct energy is the energy
used in the production process, e.g. fossil fuel used in
machinery. Indirect energy is the energy used in
producing materials that are subsequently used in the
production, e.g. fertiliser, diesel, etc.
4.2 Grass Silage Production
• Reseeding:
Reseeding of grassland is recommended in order
to improve grass vigour and growth (Kilroy,
2007). Life-cycle assessments of grass systems
in the literature use various reseeding
frequencies, from 2 to 8 years (Kelm et al., 2004;
Gerin et al., 2008). The Irish Farmers Journal
recommends reseeding every 4–8 years (Kilroy,
2007). A 2004 survey of 180 silage-making farms
(O’Brien et al., 2008) found that 54% of pasture
farms were more than 10 years old. The
reseeding frequency used in this analysis is once
every 8 years and assumes that the traditional
method of direct sowing is carried out in the
autumn. A seeding rate of 25 kg/ha is used in this
study as recommended in the Irish Farmers
Journal (Kilroy, 2007). It is preferable when
reseeding that low or no-till methods are
employed to minimise production of GHG
emissions.
• Harvesting:
Harvesting is assumed to take place twice per
year, i.e. two-cut silage – the first cut is usually at
the end of May, the second at the beginning of
July. Two cuts are the norm in the Irish livestock
sector, as a three-cut system is generally
deemed uneconomic due to the high costs of
harvesting and lower yields from third (or
subsequent) cuts.
• Fertiliser application rates:
Fertiliser application rates for nitrogen (N),
phosphorus (P) and potassium (K) used in this
Figure 4.1. Grass-to-biomethane system (Smyth et al., 2009).
Plantation, cultivation +harvesting
Transport
Storage
Macerating
Anaerobic digestion
Cleaning +upgrading
Compression
Distribution +pumping
Process Product
Grass
Silage
BiogasDigestate
Biomethane
Compressedbiomethane
Energy
Fertilizer /herbicide /seed / lime
Diesel
Electricity
Heat +electricity
Electricity
Stage
Cropproduction
Biogasproduction
Biomethaneproduction
Transport FertilizerDieselDigestate use
22

J.D. Murphy et al. (2007-CCRP-1.7)
study are as recommended by Teagasc
(Table 4.1). Biomethane production results in the
generation of digestate that can replace
conventional fertilisers. In this study, each
hectare produced 12 t of DM, equivalent to 54.5 t
of grass silage at 22% DS content. The resultant
digestate production is 48.6 t/ha/year (Table 4.2).
As digestate contains 2.1 kg/t, 0.087 kg/t and
3.08 kg/t N, P and K, respectively, it can replace
102 kg/ha/year N, 4.2 kg/ha/year P and 149.7
kg/ha/year K.
• Herbicides:
Weeds are not a problem for the majority of Irish
pastures, but better weed control has the
potential to increase output in some cases
(O’Mara, 2008). In the case of continuous silage,
weeds (e.g. docks) may become problematic and
herbicide spraying is therefore recommended
every 3–4 years (Fitzgerald, 2007). The herbicide
glyphosate is assumed to be applied once before
ploughing and asulam twice during the life cycle
of the crop.
• Lime:
Irish soil tends to be slightly acidic. A common
practice to restore pH to acceptable levels is
through the application of lime. Lime application
enhances nutrient availability, increases the
activity of micro-organisms and earthworms, and
improves the response to fertiliser (Coulter,
2004). The optimum pH for grassland in mineral
soils is 6.3 (Culleton et al., 1999; Coulter, 2004)
and Teagasc recommends that grassland should
be limed at least every 5 years (Coulter, 2004).
The application of 10 t/ha over the 8-year crop
cycle is assumed.
• Silage yields:
Silage yields in Ireland are typically between 11
and 15 t DM/ha/year; yields are generally higher
in the south-west of the country and decrease
towards the north-east (Ryan, 1974; Brereton,
1995; Holden and Brereton, 2002). For this study,
each hectare is assumed to produce 12 t
DM/year, which is somewhat conservative. It is
assumed that pit silage has a DS content of 22%,
which yields an overall production of 54.5 t/year.
Grass when cut may be at 18% DS, thus 67 t of
grass may be cut in every hectare. Losses will
occur in silage production; 12 t DM/ha/year are
taken as the solids remaining in the silage pit.
4.3 Biogas Production
Anaerobic digestion is a ubiquitous technique for
converting organic wet biomass into renewable energy
in the form of biogas by bacteria in an oxygen-free
environment, which may then be upgraded to
biomethane (Singh et al., 2010b). It is a well-
established process and is widely used in many
European countries, although research aiming to
optimise the process for biogas yields is still ongoing
(Nizami and Murphy, 2010).
A CSTR operating at 10% DS is assumed. Typically
slurries with a DS content below 12% are used as a
feedstock in a CSTR. The digestion of grass with a
higher DS content is achieved through the addition of
water and/or recirculated leachate to reduce the DS
content below 12%. It is assumed that the digester
Table 4.1. Fertiliser application rates (adapted from Coulter, 2004).
Nitrogen (kg/ha)a,b
Phosphorus(kg/ha)b,c
Potassium (kg/ha)b,d
Establishment year 75 70 110
First cut Second cut First cut Second cut First cut Second cut
First 4 years after establishment 150 125 20 10 200 95
Subsequent years 125 100 20 10 200 95
aIn the establishment year, half of the nitrogen is applied at sowing and half 3–4 weeks later.bValues given assume no slurry application.cPhosphorus advice assumes a soil phosphorus index of 2.dPotassium advice assumes a grass only (no clover in the sward), a soil potassium index of 1, and a target yield of12 t DM/ha.
23

The potential for grass biomethane as a biofuel
operates at a mesophilic temperature of 38°C and that
the temperature of the incoming feedstock is 10°C,
which is typical for the south of Ireland.
The loading rate for wet digestion of grass silage is
taken as 1.44 kg VDS/m3/day. The working volume of
each digester for 7,500 t grass silage per year is
calculated as 1,413 m3, assuming that digesters are
cylindrical in shape, with a diameter to height ratio of
1:1.5 (CropGen, 2007). The volume of the first digester
is 1,766 m3, assuming an 80% working volume,
whereas the volume of the second digester is 3,532
m3, assuming half of the digester volume is used for
storage. Approximately 45.2 m3 feedstock (at 10% DS)
are fed into the first digester every day. The total
retention time is 62.5 days, with the substrate
remaining about half of the time in each digester. The
substrate flows by gravity from the first to the second
digester and the liquid is circulated back to the first
digester. The recirculation of the liquid digestate
reduces the water demand and increases the microbial
population, improving the efficiency of the AD facility
(Nizami et al., 2009). Maceration of the silage is carried
out before insertion of feedstock into the first digester.
It reduces the particle size of the feedstock, hence
preventing physical obstruction of pipes and pumps by
the fibres, and increases the surface area available for
microbial attack, thus speeding up the digestion
process (Nizami et al., 2009). Mixing may allow better
digestion of grass silage by keeping the material
homogenous and hindering the settling of silage
particles. The optimal DS content for grass silage
digestion in a CSTR is reported as 10% (Börjesson and
Berglund, 2006). The produced grass silage (7,500
t/year) is mixed with up to 9,000 t of water/liquid
digestate to obtain the desired DS level. The water
demand is fulfilled by the recirculation of the liquid
digestate. Varying the recirculation rate of this liquid
digestate can allow control of the relative rate of biogas
production in the two vessels and the level of VFA in
both vessels.
A methane yield of 186–380 m3 CH4/kg VDS is
reported in the literature (Steffen et al., 1998; Gerin et
al., 2008; Lehtomaki et al., 2008). The destruction of
1 kg VDS produces about 1 mn3 of biogas at 55%
methane content. Maximum destruction therefore is
550 l CH4/kg VDS added. A methane yield of 550 mn3
biogas per tonne VDS (302 mn3 CH4/t VDS) added to
the AD plant is assumed on the basis of 55%
destruction of VDS. Total biogas production is 816,750
mn3/year (Table 4.2). The daily mass balance for the
digester is presented in Fig. 4.2.
4.4 Compressed Biomethane Production
Biogas from the AD of grass consists of approximately
55% methane, 45% carbon dioxide and a small
amount of other contaminants. It must be upgraded or
scrubbed to natural gas standard (about 97%
methane) before being used in vehicles or in the
natural gas grid. There are two types of filling
operations, slow fill and fast fill. Slow-fill stations have
the simpler design, with the dispensing lines
connected directly to the compressor, but have longer
filling times, typically from 20 min to a number of hours.
A fast-fill operation is more complex, but gives filling
times of only 3–5 min, and is typically used on a
traditional service station forecourt. Fast fill is assumed
in this analysis.
4.5 Energy and GHG EmissionsAssociated with Grass SilageProduction
4.5.1 Direct energy consumption and related
emissions associated with grass silage
productionThe primary fuel input into a ryegrass production
system is diesel for tractors and trucks. The GHG
emissions from diesel consumption are 2.688 kg
CO2e/l (Murphy et al., 2004) and in production are 0.51
kg CO2e/l (Thamsiriroj and Murphy, 2009). The gross
energy of the diesel equals 36 MJ/l (EC, 2009a), thus
the GHG emissions equal 88.8 g CO2e/MJ. The direct
energy consumed during field operations was
estimated based on Eqn 4.1 (Romanelli and Milan,
2004). The individual values for each component for
each field operation were selected among an
extensive range of publications suitable for grass
production and the highest value to obtain a more
conservative interpretation was chosen. Greenhouse
gas emissions were then estimated based on Eqn 4.2.
The results from the energy consumed during the
whole crop cycle and the subsequent GHG emissions
are reported in Table 4.3. The average direct energy
consumption was estimated as 2.98 GJ/ha/year.
24

J.D. Murphy et al. (2007-CCRP-1.7)
Table 4.2. Size of the digester tanks and biomethane yield (Korres et al., 2010).
Component Quantity
Farm size (ha) 137.5
Silage production (t DM/ha/year) 12
Silage biomass (t/ha/year) 54.2
Silage yield (t/year) 7,500
Dry solids (DS) (t/year) at 22% DS 1,650
Volatile dry solids (VDS) (t/year) at 90% of DS 1,485
Loading rate (kg VDS m3/day) 1.44
Working volume of each digester (m3) 1,413
Volume of Digester 1 (m3) at 80% working volume 1,766
Volume of Digester 2 (m3) 3,532
Amount of feedstock added (m3/day) at 10% DS 45.2
Retention time (days) 62.5
VDS degraded (t/year) at 55% degradation 816.8
Biogas production (mn3/year) at 55% VDS destruction 816,750
Biomethane production (mn3/year) at 97% methane 463,105
Losses in upgradation and compression process (mn3/year) at 2% loss 9262
Net biomethane production (mn3/year) 453,843
Energy in net biomethane produced (GJ/year) 16,631
Energy in net biomethane produced (GJ/ha/year) 121
Energy displaced vehicle operating 18% less efficiently on gas than diesel (GJ/ha/year) 99
Digestate yield: (t/year) 6,683
(t/ha/year) 48.6
Figure 4.2. Daily mass balance of anaerobic digester (Smyth et al., 2009). DS, dry solids; VDS, volatile dry
solids; CSTR, continuous stirred tank reactor.
25

The potential for grass biomethane as a biofuel
Harvesting, spreading of digestate, ensiling and
ploughing are the operations (in that order) that require
the highest energy inputs and thus emit the highest
amounts of CO2e. Direct emissions during the crop
cycle equal 2.67 g CO2e/MJ of energy replaced
(Table 4.3).
GHG = FE × 0.0888 (Eqn 4.2)
where FE is the fuel energy consumed (MJ/ha), Fci is
the fuel consumption (l/h) for i field operations, ƒc is the
heating value of the fuel, and Oci is the work capacity
for i operation (ha/h) and GHG is the GHG emissions
(kg CO2e/ha/year).
Volatilisation of herbicides occurs up to 48 h after their
application. Derivation of herbicide emission due to
volatilisation was estimated from Eqn 4.3 (Baas and
Lekkerkerk, 2003). The energy consumed for the
production of 1 kg of active ingredient (a.i.) as
proposed by Saunders et al. (2006) and the
corresponding emission factors (i.e. kg CO2e/MJ) was
adopted. The final result equated to 5.44 kg
CO2e/ha/year or 0.054 g CO2e/MJ energy replaced
and was insignificant in terms of GHG emissions.
∑ ×=i
cicci OfFFE1
/)( (Eqn 4.1)
Table 4.3. Direct energy consumption and related carbon dioxide emissions during the 8-year crop cycle
(emissions from diesel production are included) (Korres et al., 2010).
Operations Energy consumed(MJ/ha/year)
Average energy consumed
(MJ/ha/year)
CO2 emissions(kg CO2/ha/year)
Average emissions
(kg CO2/ha/year)
g CO2e/MJ energy
replaced
Year 1 Years 2–8 Year 1 Years 2–8
Ploughing 1,141.7 0 142.7 101.4 0.0 12.7 0.13
Sowing 148.8 0 18.6 13.2 0.0 1.7 0.02
Harrowing 238.1 0 29.7 21.2 0.0 2.6 0.03
Rolling a 249.9 0 31.2 22.2 0.0 2.8 0.03
Fertiliser b 154.8 77.4 87.1 13.8 6.9 7.7 0.08
Lime c 22.5 0 (22.5) 5.6 2.0 0 (2.0) 0.5 0.01
Herbicide d 54 0 (27) 13.5 4.8 0 (2.4) 1.2 0.01
Spreading e 473.9 947.8 888.6 42.1 84.2 78.9 0.80
Transport e 1.9 37.7 33.2 1.7 3.3 3.1 0.03
Harvesting f 1,309.0 1,309.0 1,309.0 116.3 116.3 116.3 1.17
Ensiling a,g 416.0 416.0 416.0 37.0 37.0 37.0 0.37
Total 4,210.5 2,787.9 (2,814.9, 2810.4)h
2,975.3 375.5 247.7(250.1, 249.7)h
264.5 2.67
aData on energy consumption for rolling and ensiling from Smyth et al. (2009).bFertiliser is applied four times during the first year of the crop cycle and twice every subsequent year after each harvesting. cLime is applied at two intervals during the crop cycle, the first and fifth year after establishmentdHerbicides are applied before ploughing and after sowing to favour crop-against-weed competition. Application is in the first year and twice during the rest of the crop cycle in the third and sixth year (corresponding values for energy consumption and related emissions are shown in parentheses). eTransport and spreading were estimated based on the assumption that each load carries 16 t digestate; hence, 418 loads needed per year of which 250 were assumed, excluding empty return. The energy consumption for transport is assumed as 1 and 1.6 MJ/t/km, excluding and including empty return, respectively (Salter and Banks, 2009). Energy required for loading and spreading of digestate is assumed as 2.5 and 17 MJ/t, respectively (Power and Murphy, 2009).fHarvesting includes operations such as cutting, mowing and turning the grass. gEnsiling comprises operations such as silage collection, unloading and inlaying.hThe first number in the parentheses represents values for the 3rd and 6th year, and the second number for the 5th year.
26

J.D. Murphy et al. (2007-CCRP-1.7)
where EHerbicide is the total emission of pesticide
(kg/year) due to volatilisation, mHerbicide, i is the mass
of the individual herbicide applied (kg/year), and
EFHerbicide, i is the emission factor for the individual
herbicide (kg/kg).
The lime application in the pasture is in the form of
crushed limestone (CaCO3). Carbon dioxide
emissions from liming are calculated from the amount
of crushed limestone applied per year (10 t/ha/year
over 8 years = 1,250 kg/year) (Eqn 4.4). The emission
factor equals 0.12 t CO2-C/t of CaCO3 (Baas and
Lekkerkerk, 2003). A value of 550 kg CO2e/ha/year
was calculated, which equals 5.55 g CO2e/MJ energy
replaced (see Table 4.8).
where Elime is the total emission of carbon or carbon
dioxide from liming (t C/year), mlime,i is the mass of the
individual liming agent applied (t CaCO3/year), and
EFlime,i is the emission factor (carbon conversion
factor) for the individual liming agent (t C/t CaCO3).
The fraction of applied nitrogen actually emitted as
nitrous oxide (N2O) varies on a site-specific basis
(Thornton, 1996). Coefficients of variation for nitrous
oxide emissions typically range from 0.003 to 0.03
(IPCC, 2006). Emissions of nitrous oxide from the use
of fertiliser were estimated from Eqn 4.5
(EMEP/CORINAIR, 2004) which includes both direct
and indirect nitrous oxide emissions (Eqns 4.6 and
4.7):
where cƒi values for the most common fertilisers used
in Ireland (ammonium nitrate, calcium ammonium
nitrate (CAN) and urea) are 0.02, 0.02 and 0.15 t NH3/t
N applied/year, respectively (EMEP/CORINAIR,
2004).
The most common source of nitrogen fertiliser used in
Ireland is CAN; thus, a value of 0.02 is chosen. Indirect
emissions of nitric oxide (NO) are estimated based on
Eqn 4.7. Both ammonia (NH3) and nitric oxide
emissions are summed as indirect emissions
(Table 4.4). The total nitrous oxide emission from
fertiliser applications is estimated as 525 kg
CO2e/ha/year (Table 4.4). This result is in the lower
level of the range observed by Kiely et al. (2009), who
reported nitrous oxide emissions in Irish grassland
ecosystems of between 2 and 8.4 kg N2O/ha/year
(equivalent to 592–2,486 kg CO2e/ha/year).
4.5.2 Indirect inputs and related emissions
associated with grass silage production
Indirect emissions result from the energy (and the
associated CO2) invested for the production of the
primary inputs into the crop (i.e. fertilisers and lime,
herbicides and seeds), along with the energy required
for their transport and application (Table 4.5).
Limestone is transformed into quicklime or calcium
oxide (CaO) after heating, and then into hydrated lime
(Ca(OH)2). The amount of carbon dioxide released into
the atmosphere was estimated as a direct emission.
Nitrogen and potassium have the highest percentages
of indirect energy consumed in the silage crop (i.e.
71.4% and 13.3%, respectively) and carbon dioxide
∑ ×=i
iHerbicideiHerbicideHerbicide EFmE1
,, (Eqn 4.3)
(Eqn 4.4)
N2O (t) = 0.0125 × N applied (t)+ 0.01 (NH3 + NO) emitted (t)
(Eqn 4.5)
N fertiliseri applied (t) (Eqn 4.6)
NO (t) = 0.0007 × Total N applied (t) (Eqn 4.7)
∑ ×=i
icf)NH3 (t
Table 4.4. Direct and indirect nitrous oxide emissions (Korres et al., 2010).
Direct Indirect Total
Year 1 (kg CO2e/ha/year) 923 19.6 942.6
Years 2–8 (kg CO 2e/ha/year) 456 9.7 465.7
Average (kg CO 2e/ha/year) 514 10.9 525
Emissions (g CO 2e/MJ energy replaced) 5.18 0.11 5.29
27

The potential for grass biom
ethane as a biofuel
28
Table 4.5. Indirect energy consumption and related carbon dioxide emissions during the 8-year crop cycle (Korres et al., 2010).
CO2 emissionskg CO2e/ha/year)
Average emissions (kg CO2e/ha/year)
g CO2 e/MJ energy
replaced
r 1 Years 2–8
9.2 399.7 450.94 4.55
.1 23.4 31.49 0.32
8.1 87 100.89 1.02
.5 0 8.32 0.08
.8 0 (81.8)f 30.69 0.31
0 0 0
.5 0 6.19 0.06
3.3 510.1 (2,670, 592)
628.5 6.34
Crop production
Dose applied(kg/ha/year)
Energy required(MJ/kg)
Energy consumed(MJ/ha/year)
Average energy consumed
(MJ/ha/year)
Emission factora
(kg CO2e/MJ) (
Year 1 Years 2–8 Year 1 Years 2–8 Yea
Fertiliser a,b,c
Nitrogen 249 123 65 16,185 7,995 9,018.7 0.05 80
Phosphorus 97.9 26 15 1,468.5 390 524.8 0.06 88
Potassium 330.2 145 10 3,302 1,450 1,681.5 0.06 19
Herbicide a,b
Glyphosate d 2.016 0 550 1,108.8 0 138.6 0.06 66
Asulam d 4.4 0 (4.4) 310 1,364 0 (1,364)e 511.5 0.06 81
Lime a,b,f 5,000 0 (5,000) 0.6 3,000 0 (3,000) 750.0 – 0
Seed 25d 40d 0 5 1.98f,g 49
Total 26,468.3 9,835(11,199, 12,835)
12,630.2 1,29
aSaunders et al. (2006).bKelm et al. (2004).cStyles and Jones (2004). dSmyth et al. (2009).eEnergy and emissions in parentheses for the application of herbicide (asulam) in the third and sixth year of the crop cycle.fWest and Marland (2002).gkg CO2e/kg seed.

J.D. Murphy et al. (2007-CCRP-1.7)
emissions during the crop production period (i.e.
71.7% and 16%, respectively). Indirect energy
consumption and emissions during the crop production
cycle equate to 12,630 MJ/ha/year and 6.34 CO2e/MJ
energy replaced, respectively (Table 4.5).
4.5.3 Emissions from transportation
Berglund and Börjesson (2006) reported that
transportation of grass by truck requires 0.7 MJ energy
per tkm excluding empty return. The transportation of
7,500 t grass/year from field to AD plant (10 km distant)
requires 52.5 GJ/year. Total emissions in
transportation of grass are calculated as 0.34 g
CO2e/MJ energy replaced.
The summed emissions for lime transport from the UK
are 0.5 GJ/t lime (Kongshaug and Jenssen, 2003;
Harrison et al., 2006), with subsequent carbon dioxide
emissions equal to 0.044 kg CO2e/kg of limestone
(88.8 g CO2e/MJ diesel). At 10 t of limestone per
hectare in an 8-year cycle on 137.5 ha displacing 99.2
GJ/ha/year, this equates to 55 kg CO2e/ha/year, which
equals 0.55 g CO2e/MJ energy replaced.
4.6 Direct Energy Consumption andRelated Emissions Associated withBiomethane Production
4.6.1 Heating digesters
The heat requirement of digestion is calculated by
summing the energy lost from the digester tank and
energy required to heat the feedstock. Equations 4.8
and 4.9 are used (Salter and Banks, 2009):
hl = UA∆T Eqn 4.8
where hl is heat loss (J/s), U is the overall coefficient of
heat transfer (W/m2/°C), A is the cross-sectional area
through which heat loss is occurring (m2), and ∆T is the
temperature drop across the surface (°C);
q = CQ∆T Eqn 4.9
where q is the heat required to raise feedstock to
digester temperature (kJ/s), C is the specific heat of the
feedstock (kJ/kg/°C), and Q is the volume to be added
(kg).
The coefficient of heat transfer for the wall, floor and
roof of the digester is taken as 0.8, 1.7 and 1 W/m2/°C,
respectively (CropGen, 2007). The volume of
feedstock added daily is 45.21 m3 at 10% DS. As the
feedstock has a low solids content, its specific heat is
assumed to be similar to that of water (4.2 MJ/t/°C).
The production of thermal energy is assumed to be by
natural gas; an emission factor of 240 g CO2e/kWh
thermal energy (Murphy et al., 2004) is used. This
analysis may be considered conservative as
temperature drop from the floor of the digester must be
less than 28°C and recycled leachate will be warmer
than 10°C, also the amount of heat provided by
metabolic generation is uncertain and therefore
neglected. The annual thermal energy demand is
calculated as 3,703 GJ, which emits 248.8 t
CO2e/year, equivalent to 18.25 g CO2e/MJ energy
replaced (Table 4.6). The conservativeness of the
approach employed here relates to modest loading
rates, effective volumes of only 80% of the tank and the
oversizing of the second digester to provide storage.
Thus the stored material is also heated.
4.6.2 Biogas losses
Even moderate losses of methane can affect
significantly the emissions from the biomethane
production process, since methane is 23 times a more
potent GHG than carbon dioxide. Methane losses
Table 4.6. Greenhouse gas emissions from digesters (Korres et al., 2010).
Energy (GJ/year)
Energy(GJ/ha/year)
GHG emission(kg CO2e/year)
GHG emission(g CO2e/MJ energy replaced)
Heat loss from Digester 1 681 4.95 45,785 3.36
Heat loss from Digester 2 1,082 7.87 72,679 5.33
Heating of the feedstock Digester 1 1,940 14.11 130,395 9.56
Heating of the feedstock Digester 2 0.00 0.00 0.00
Total 3,703 26.93 248,859 18.25
29

The potential for grass biomethane as a biofuel
during the upgrading and compression of biogas are
taken as 2% of biomethane (Börjesson and Burglund,
2006), whereas losses during the rest of the system
are considered negligible. According to Murphy and
McKeogh (2004), each cubic metre of biogas that
escapes and is not combusted produces 9.16 kg of
CO2e. Thus, this escape equates to 147.5 t CO2e/year
or 10.82 g CO2e/MJ energy replaced.
4.6.3 Indirect emissions from biomethane
production
The energy required for maceration, mixing and water
pumping activities is supplied by the electric grid. At the
time of writing, 542.8 kg CO2e/MWh are produced in
the Irish Grid (SEI, 2009a). The electrical energy
requirement for maceration is taken as 2 kWh/t of
silage added (Smyth et al., 2009), for mixing slurry
digesters (operating at about 10% DS) 10 kWh/t of
slurry digested (Murphy et al., 2004), and for pumping
of water from the second digester to the first is taken
as 0.2 kWh/m3 (assuming a 4 kW pump with a capacity
of 20 m3/h). The total energy consumption and
emissions from the maceration, mixing and water
pumping are calculated as 4,760 MJ/year and 98.68 t
CO2e/year, respectively. These emissions are
equivalent to 7.24 g CO2e/MJ energy replaced
(Table 4.7).
The electrical demand for biogas scrubbing and
compression ranges between 0.3 and 0.6 kWh/m3 and
0.35 and 0.63 kWh/m3 upgraded biomethane,
respectively (Persson, 2003; EC, 2006; Murphy and
Power, 2009a). A value of 0.35 kWh/m3 is assumed for
each operation, which equates to 317.7 MWh/year
(8,318 MJ/ha/year) electricity demand. Approximately
172.4 t CO2e are emitted during the production of the
required electricity. The upgradation and compression
of biomethane emits 12.6 g CO2e/MJ energy replaced.
4.7 Sensitivity Analysis
4.7.1 Base case
Table 4.8 outlines the summary of the energy demand
and GHG emissions of biomethane production. The
total parasitic energy demand is 56.7 GJ/ha/year and
emissions are 6.9 t CO2e/ha/year, equivalent to 69.7 g
CO2e/MJ energy replaced. The net energy production
from each hectare is equal to 64.4 GJ (Fig. 4.3) and
emissions savings equal 21.5% in comparison with
fossil diesel (88.8 g CO2e/MJ). Grass silage
production, upgrading and compression of biomethane
and parasitic energy demand of anaerobic digesters
are the main contributors to GHG emissions.
4.7.2 Wind energy for electrical demand
Significant GHG emissions reductions can be
achieved by technology substitution or improvement.
Using electricity from wind greatly reduces the
emissions associated with the grass biomethane
system. Assessment of GHG per kWeh varies greatly
(8–46.4 g CO2e/kWeh) in the literature (Weisser, 2007;
Tremeac and Meunier, 2009). Considering the highest
value, biomethane from grass silage effects a 42%
reduction in emissions (Fig. 4.3), which would lead to a
classification of sustainable biofuel for the years 2010–
2017.
4.7.3 Woodchips for thermal demand
The supply of thermal heat demand by utilisation of
woodchips in biomethane production can provide
significant GHG savings. Eriksson and Gustavsson
(2010) reported 3.5–5.5 kg CO2/MWh energy
production from woodchips under various scenarios.
Table 4.7. Emissions in maceration, mixing and pumping activity during biogas production (Korres et al.,
2010).
Quantity (t/year)
Energy required(kWh/t)
Energy required(MJ/ha/year)
GHG emissions(kg CO2e/year)
GHG emissions(g CO2e/MJ energy replaced)
Maceration 7,500 2 392 8,142 0.60
Mixing 16,500 10 4,320 89,562 6.57
Water pumping 9,000 0.2 47 977 0.07
Total 12.20 4,759 98,681 7.24
GHG, greenhouse gas.
30

J.D. Murphy et al. (2007-CCRP-1.7)
Table 4.8. Energy demand and greenhouse gas (GHG) emissions for biomethane production from grass
silage under base-case scenario (adapted from Korres et al., 2010).
Activity Energy required(MJ/ha/year)
GHG emissions(kg CO2e/ha/year)
GHG emissions(g CO2e/MJ energy replaced)
Grass silage production
Direct
Agronomic operation 2,975 265 2.67
Herbicide volatilisation – 5.4 0.054
Lime dissolution – 550 5.55
Nitrous oxide emissions – 514 5.18
Indirect
Production of inputs 12,630 629 6.34
Nitrous oxide emissions – 10.9 0.11
Transportation
Grass silage 382 33.9 0.34
Lime 750 55 0.55
Biomethane production
Direct
Heating of digesters 26,930 1,809.9 18.25
Biogas loss – 1,072.7 10.82
Indirect
Maceration, mixing and pumping 4,760 717.7 7.24
Upgrading and compression 8,318 1,253.8 12.6
Total 56,745 6,917 69.70
Figure 4.3. Percentage carbon dioxide savings over fossil diesel and net energy production under various
scenarios in biomethane production (the scenarios are cumulative top to bottom) (adapted from Korres et
al., 2010).
66.75
66.75
66.75
66.75
66.75
63.84
64.4
64.4
260.05
164.47
89.37
68.9
62.1
62
42
21.5
0 50 100 150 200 250 300
2.8 t/ha/annum C sequestration
2.2 t/ha/annum C sequestration
0.6 t/ha/annum C sequestration
Vehicle eff iciency
Digester configuration
Wood chips for heat demand
Wind energy for electricity
Base case % CO2 saving
Net energy (GJ/ha/annum)
31

The potential for grass biomethane as a biofuel
Adopting the highest emission value, biomethane from
grass silage results in 62% reduction in emissions
(Fig. 4.3), which would lead to a classification of
sustainable biofuel for the years after 2017. The net
energy of the system is slightly lower (63.84
GJ/ha/year) than other scenarios, as the energy used
in the production and transport of woodchips has to be
taken into account (0.02 MJ of primary energy per 1 MJ
of biomass stored (Gasol et al., 2009)).
4.7.4 Digester configuration
Half of the volume in the second digester is used as a
storage tank. The heat requirement to maintain a
constant temperature within it for maximum microbial
activity can be reduced significantly if the second
digester is used only for digestion and the digestate is
stored in a separate tank. This leads to a drop of 2.91
GJ/ha/year energy demand and cumulative GHG
savings of 62.1% compared with diesel.
4.7.5 Vehicle efficiency
Spark ignition engines converted to use natural gas as
a fuel show a power decrease of 18% (used in this
study) due to decreases in volumetric efficiency. This
power loss can be decreased by utilising a higher
compression ratio and advancement in spark timing
(Henham and Makkar, 1998). Improvements in engine
efficiency to a similar km/MJ as diesel will improve the
emissions. This leads to an overall production of 27.63
g CO2e/MJ instead of 88.8 g CO2e/MJ for diesel,
generating a cumulative saving of 68.9% compared
with diesel.
4.7.6 Carbon sequestration
Three scenarios are examined:
1. The amount of carbon sequestered by grassland
as recorded by Byrne et al. (2007) is 2 t C/ha/year
(0.6 t soil C/ha/year). This is in agreement with
Freibauer et al. (2004) and Jones and Donnelly
(2004), where a minimum amount of 0.6 t
C/ha/year was reported as the potential soil
carbon sequestration rate for perennial ryegrass
and permanent crops under European agricultural
conditions. This yields a cumulative emissions
savings in relation to fossil fuel for substitution of
89.4%.
2. The amount of carbon contained in digestate (2.2
t C/ha/year). This yields a savings in relation to
fossil fuel for substitution of 164.5%.
3. The sum of carbon contained in the above two
cases (2.8 t C/ha/year). This yields a savings in
relation to fossil fuel for substitution of 260%.
All scenarios secure sustainability of biomethane
production from grass silage after 2017.
4.8 Conclusions
The life-cycle analysis is necessarily detailed. It draws
upon data from numerous sources, both agricultural
and process engineering. There is potential for
variance in many of the figures. The agricultural data in
particular are open to discussion – indirect emissions
associated with fertiliser, nitrous oxide emissions, and
emissions associated with land spreading of digestate.
Carbon sequestration is site specific, depends on the
land type, and whether the grass is grazed or used for
silage production. These topics abound in the scientific
literature and are subject to numerous ongoing
research studies. Likewise, the process is open to
debate. How much gas is lost in the biogas plant?
What is the efficiency of the upgrading process? What
is the vehicle efficiency?
However, allowing for the above, the analysis
presented in this section suggests that parasitic energy
demands at the grass biomethane facility are the major
source of emissions. Thus, purchase of green
electricity and minimisation of thermal energy input are
essential. As supported by other researchers, the
vehicle must be optimised for biomethane; bi-fuel
vehicles may not meet this criterion.
Through process optimisation, an emission reduction
of more than 60% may be effected by grass
biomethane. Allowing for grassland sequestering
carbon (a value of 0.6 t C/ha/year is deemed
conservative), a reduction in emissions of 89% is
achievable, which would suggest that grass
biomethane is one of the most sustainable,
indigenous, non-residue, European transport biofuels.
32

J.D. Murphy et al. (2007-CCRP-1.7)
5 What is the Market for Grass Biomethane?
5.1 The Relationship between Grass,Farming and Energy
Farm incomes in Ireland are in decline and many
farmers would operate at a loss in the absence of
subsidies. When inflation is considered, the average
family farm income (FFI) for all farming systems
decreased by 22% in real terms from 1995 to 2008
(Connolly et al., 2009). There is a growing dependence
on grants and subsidies in all farming sectors. Low
FFIs lead farmers to seek opportunities for farm
diversification and alternative sources of income. The
National Development Plan (NDP, 2007) recognises
as a key task the promotion of the diversification of the
rural economy. A move away from conventional
farming can be further supported by the fact that all
grass-based farming systems (beef, dairy, and sheep)
produce large quantities for the export market. This is
especially true in the beef sector, which had self-
sufficiency values of over 600% for each year in the
period 2000–2008 (DAFF, 2009; CSO, 2010). This
means that the cattle industry is effectively subsidised
for export.
Ireland is over 89% dependent on imported energy,
with imported oil and gas accounting for 81% of energy
supply (Howley et al., 2009a). This has significant
implications for security of supply, emissions
agreements and national and EU targets for renewable
energy. Targets have been set in Ireland for renewable
energy penetration by 2020 in each of the three energy
sectors:
1. 40% renewable electricity (Howley et al., 2008);
2. 12% renewable heat (DCMNR, 2007); and
3. 10% renewable transport fuels (DCMNR, 2007).
Ireland is currently over 99% dependent on oil and oil
products for transport energy (Howley et al., 2009b),
while 96% of thermal energy is from non-renewable
sources (Howley et al., 2009a). Thus, Ireland imports
energy and exports agricultural produce; it could be
said that it exports grass as this is the feedstock for
cattle.
Grass is used in many operational AD plants
throughout Europe, and is the second most important
energy crop for AD in Germany (Rösch et al., 2009).
Grass covers around 91% of Ireland’s agricultural land;
thus, as a bioenergy crop, no land-use change is
required. The energy balance of grass biomethane is
better than that of temperate energy crops (Smyth el
al., 2009) and the GHG savings meet the requirements
of the EU Renewable Energy Directive (Korres et al.,
2010). An indigenous grass biomethane industry could
also provide employment and aid in developing the
‘greentech’ sector.
Biogas can be burned directly for heat or electricity
generation or can be upgraded to natural gas
standard, i.e. biomethane. Biomethane and natural
gas are mixable and interchangeable; mixtures of
biomethane and natural gas are termed bioNG and
can be sold from the gas grid in a similar manner to
renewable electricity. A 10:90 blend could be sold as a
transport fuel to aid in meeting the target for 10%
renewable energy in transport. While there is currently
no market for gas as a transport fuel in Ireland, there
are over 10 million compressed natural gas (CNG)
vehicles worldwide (NGV, 2009) and the use of
compressed biomethane, either on its own or mixed
with natural gas (bioCNG), is growing.
5.2 Biomethane Potential in Ireland fromNumerous Sources
If a biomethane industry develops in Ireland, grass will
not be the only source. It is prudent to examine the
potential of the industry and to assess the bioresource
and the relative role of grass in this. Meaney et al.
(2003) categorise agriculture as the single largest
source of waste in Ireland. Organic agricultural wastes
refer to all types of animal excreta (i.e. faeces and
urine from cattle, sheep, pigs, and poultry) in the form
of slurries and farmyard manures. Cattle slurry is
generated for 20 weeks of the year (the period that the
33
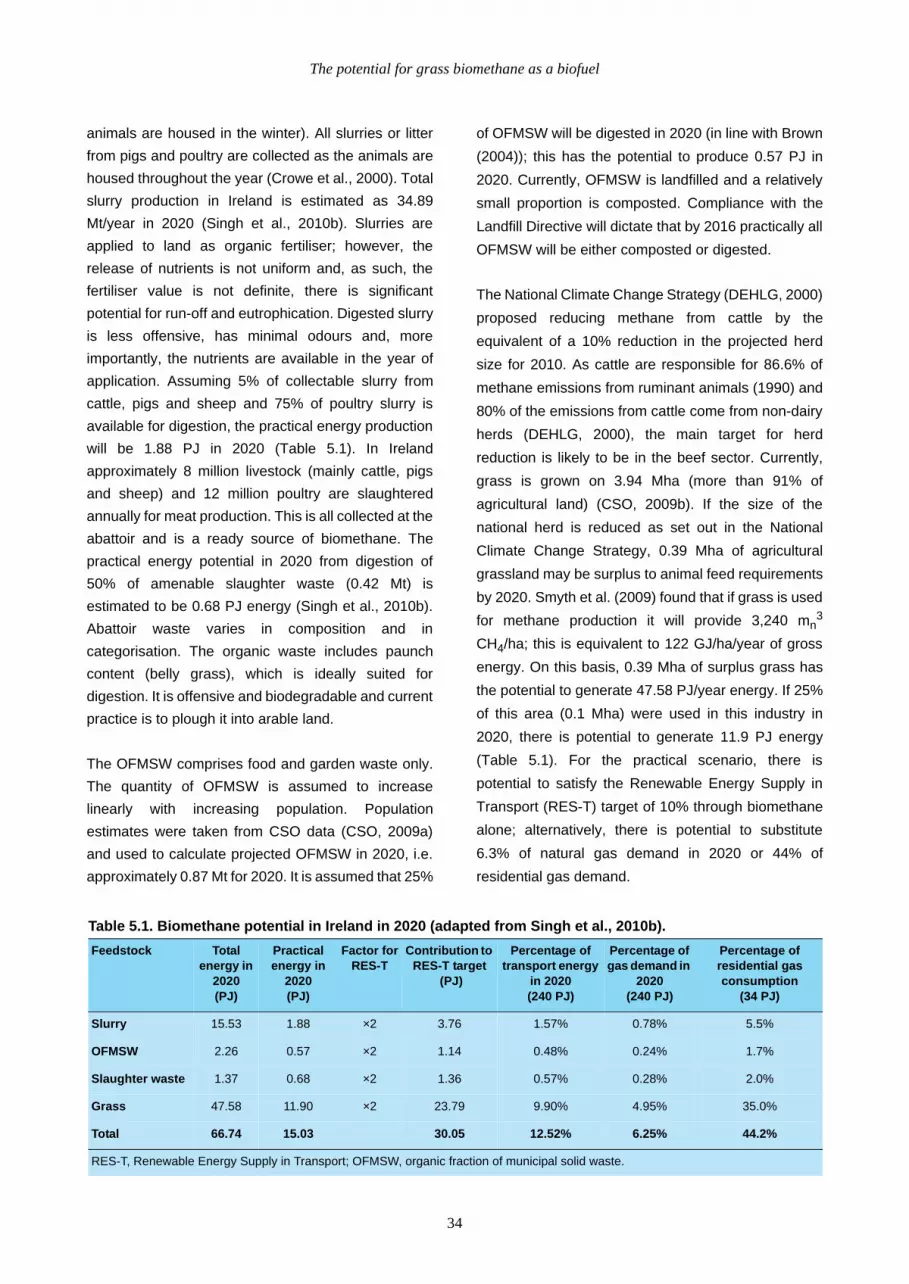
The potential for grass biomethane as a biofuel
animals are housed in the winter). All slurries or litter
from pigs and poultry are collected as the animals are
housed throughout the year (Crowe et al., 2000). Total
slurry production in Ireland is estimated as 34.89
Mt/year in 2020 (Singh et al., 2010b). Slurries are
applied to land as organic fertiliser; however, the
release of nutrients is not uniform and, as such, the
fertiliser value is not definite, there is significant
potential for run-off and eutrophication. Digested slurry
is less offensive, has minimal odours and, more
importantly, the nutrients are available in the year of
application. Assuming 5% of collectable slurry from
cattle, pigs and sheep and 75% of poultry slurry is
available for digestion, the practical energy production
will be 1.88 PJ in 2020 (Table 5.1). In Ireland
approximately 8 million livestock (mainly cattle, pigs
and sheep) and 12 million poultry are slaughtered
annually for meat production. This is all collected at the
abattoir and is a ready source of biomethane. The
practical energy potential in 2020 from digestion of
50% of amenable slaughter waste (0.42 Mt) is
estimated to be 0.68 PJ energy (Singh et al., 2010b).
Abattoir waste varies in composition and in
categorisation. The organic waste includes paunch
content (belly grass), which is ideally suited for
digestion. It is offensive and biodegradable and current
practice is to plough it into arable land.
The OFMSW comprises food and garden waste only.
The quantity of OFMSW is assumed to increase
linearly with increasing population. Population
estimates were taken from CSO data (CSO, 2009a)
and used to calculate projected OFMSW in 2020, i.e.
approximately 0.87 Mt for 2020. It is assumed that 25%
of OFMSW will be digested in 2020 (in line with Brown
(2004)); this has the potential to produce 0.57 PJ in
2020. Currently, OFMSW is landfilled and a relatively
small proportion is composted. Compliance with the
Landfill Directive will dictate that by 2016 practically all
OFMSW will be either composted or digested.
The National Climate Change Strategy (DEHLG, 2000)
proposed reducing methane from cattle by the
equivalent of a 10% reduction in the projected herd
size for 2010. As cattle are responsible for 86.6% of
methane emissions from ruminant animals (1990) and
80% of the emissions from cattle come from non-dairy
herds (DEHLG, 2000), the main target for herd
reduction is likely to be in the beef sector. Currently,
grass is grown on 3.94 Mha (more than 91% of
agricultural land) (CSO, 2009b). If the size of the
national herd is reduced as set out in the National
Climate Change Strategy, 0.39 Mha of agricultural
grassland may be surplus to animal feed requirements
by 2020. Smyth et al. (2009) found that if grass is used
for methane production it will provide 3,240 mn3
CH4/ha; this is equivalent to 122 GJ/ha/year of gross
energy. On this basis, 0.39 Mha of surplus grass has
the potential to generate 47.58 PJ/year energy. If 25%
of this area (0.1 Mha) were used in this industry in
2020, there is potential to generate 11.9 PJ energy
(Table 5.1). For the practical scenario, there is
potential to satisfy the Renewable Energy Supply in
Transport (RES-T) target of 10% through biomethane
alone; alternatively, there is potential to substitute
6.3% of natural gas demand in 2020 or 44% of
residential gas demand.
Table 5.1. Biomethane potential in Ireland in 2020 (adapted from Singh et al., 2010b).
Feedstock Total energy in
2020(PJ)
Practical energy in
2020 (PJ)
Factor forRES-T
Contribution to RES-T target
(PJ)
Percentage of transport energy
in 2020(240 PJ)
Percentage of gas demand in
2020(240 PJ)
Percentage of residential gas consumption
(34 PJ)
Slurry 15.53 1.88 ×2 3.76 1.57% 0.78% 5.5%
OFMSW 2.26 0.57 ×2 1.14 0.48% 0.24% 1.7%
Slaughter waste 1.37 0.68 ×2 1.36 0.57% 0.28% 2.0%
Grass 47.58 11.90 ×2 23.79 9.90% 4.95% 35.0%
Total 66.74 15.03 30.05 12.52% 6.25% 44.2%
RES-T, Renewable Energy Supply in Transport; OFMSW, organic fraction of municipal solid waste.
34

J.D. Murphy et al. (2007-CCRP-1.7)
5.3 Economic Analysis of GrassBiomethane System
5.3.1 Methodology
A simple economic analysis is carried out on a grass
biomethane system as outlined in Table 4.2 (137.5 ha
of grass silage with an annual production of 7,500
t/year of pit silage, 820,000 m3 biogas or 460,000 m3
biomethane). The values used for costs and incomes
are relevant to the Irish context and are taken from the
literature and from discussions with industry in Ireland
and abroad. Annualised capital costs (R) (€/year) are
calculated from Eqn 5.1:
R = [P(1 + r)Nr] / [(1+r)N – 1] (Eqn 5.1)
where P is the principal (€), r is the rate of return (5%),
and N is the lifetime of the project (15 years).
Land is assumed to already be in the ownership of the
farmers’ co-op and the cost of land acquisition and rent
are excluded from the analysis. The calculated break-
even tariffs are compared with existing tariffs where
appropriate, and the effectiveness of the tariff system
is assessed. The results also compare profitability
under the current tariff structure with existing farm
incomes. The use of biogas for energy can follow a
number of different pathways. Two main scenarios are
considered in this study:
• Scenario 1: biogas for on-site combined heat
and power (CHP);
• Scenario 2: upgrading to biomethane standard
and injection into the gas grid.
On-site heat production is not considered, as there are
limited markets for heat in Ireland. Sale as a vehicle
fuel on site is excluded, as there is unlikely to be a
market in the vicinity of a rural farm plant, while
container transport of compressed biomethane is not
considered due to logistical difficulties. It is assumed
that biomethane injected into the gas grid is purchased
by a shipper for sale elsewhere on the grid. The
calculation of shipping charges is beyond the scope of
this study.
5.3.2 Capital costs of silage storage and AD plant
Silage is to be stored in a horizontal silo or silage pit. In
practice, the farms would already have pits; thus, the
estimated construction cost of €456,250 for 21 pits
(Table 5.2) must be viewed as conservative.
The cost of an AD plant depends on a number of
factors, including the plant size and type, with larger
plants generally having lower capital costs per cubic
metre of biogas produced. The capital cost of a CSTR
visited by the authors in Austria, of the same size, was
€745,000. As AD is a relatively new technology to
Ireland, 10% is added to this value to give €819,500
(approximately €110/t feedstock). This is assumed to
include the cost of in-situ hydrogen sulphide removal.
5.3.3 Capital costs of a CHP and connection to the
electricity grid
From discussions with industry and values found in the
literature (Murphy and McKeogh, 2004; Murphy and
McCarthy, 2005), the cost of the CHP plant is
conservatively taken as €1,500/kWe, which is the fully
installed cost, including civil works, electrical and
piping installations. Assuming 85% operational
efficiency, the cost of a 220 kWe CHP plant is
€330,000. The cost of connection to the electricity grid
is very site specific and depends on the location of the
new generator in relation to the existing loads and
Table 5.2. Cost of a silage pit (Smyth et al., 2010b).
Component Quantitya Unit costb (Teagasc, 2008) Total cost
Silo wall 22 walls × 25 m long €400/m €220,000
Silage base 21 pits × 25 m long × 10 m wide €42/m2€220,500
Effluent channel Assume 250 m €63/m €15,750
Total €456,250
aTypical dimensions for a full silage pit are 25 m long, 10 m wide and 2.1 m high, with a capacity of 360 t silage(ACA, 2008). Therefore 21 such pits would be required.
bCosts for silo wall and effluent channel are per linear metre.
35

The potential for grass biomethane as a biofuel
generation on the network, as well as the distance from
the grid. A survey of a number of developers puts the
typical cost for a 200- to 250-kWe facility as €80,000
for connection equipment, €10,000 for a connection
study, and €10,000 for the substation (if required).
Underground lines cost around €50,000/km; 400-m
lines costing €20,000 are assumed in this analysis,
giving a total cost of €120,000.
5.3.4 Capital costs of upgrading plant and
connection to the gas grid
The capital cost of an upgrading facility is highly
dependent on plant size, with smaller plants having
higher costs per cubic metre of upgraded gas. A
membrane plant with a capital cost of €500,000
(€0.10/kWh/year) is assumed, which includes gas
metering and quality monitoring (Murphy and Power,
2009a). The cost of connection to the gas grid can vary
widely and depends on distance to the network,
ground conditions, and the type of pipes, grid
connection and compressor. Contractual costs can
form a significant part of the overall cost. There are
currently no biomethane plants with grid injection in
Ireland and a full pricing scheme has yet to be
developed. It is assumed that the upgrading plant is
located within 0.5 km of the distribution network, which
has a pressure of about 4.2 bar. The cost of installing
distribution pipes has been estimated to be between
€150,000 and €400,000 in the literature (Biogasmax,
2008) and in discussions with Bord Gáis (the Irish Gas
Board). Bearing in mind the variability associated with
this, the total capital cost of connection to the gas grid
is estimated as €200,000. Upgrading plants typically
pressurise gas up to 7 bar, hence no additional
compressor is required.
5.3.5 Operating costs of silage harvesting
Yield per hectare has the biggest influence on the
silage cost, whereas the machinery and labour costs
affect the cost of harvesting. Oil price fluctuations and
their direct effects on fuel and fertiliser costs result in
considerable fluctuations on the cost of silage
production. The cost of getting grass into the pit is
€950/ha (€17/t), which includes fertiliser, reseeding,
lime, plastic and contractor charges (calculated from
data in Teagasc, 2008). As the market price of silage
is around 40% higher, it is important that grass silage
is produced on-farm.
5.3.6 Operating costs of AD plant
The operational cost of an AD plant is made up of the
cost of labour, electricity (for mixing and pumping),
heating fuel, and maintenance. Previous work
suggests annual operational costs of an AD plant
(excluding feedstock) to be of the order of 10–12% of
the unsubsidised capital costs (Murphy, 2004). Work in
the UK (Holliday et al., 2005) and Sweden (Hagen et
al., 2001) used values of 4% and 15%, respectively. A
value of 10% is used in this analysis. An additional
allowance of 6.67% of the unsubsidised capital costs is
made for depreciation of the AD, CHP and upgrading
plants. This allows for a fund equal to the initial
investment to be available after the 15-year lifetime of
the facility. The inclusion of a depreciation fund results
in a relatively conservative analysis as not all
developers allow for such a fund.
5.3.7 Operating costs of CHP and upgrading
plants
Typical running costs for a CHP plant are given as
€0.01/kWhe (Murphy and McKeogh, 2004; Murphy
and McCarthy, 2005). The operating cost of the
upgrading plant is taken as €0.02/kWh (€0.20/m3) of
upgraded gas, which equates to around €92,000/year,
and gives a total (capital + operating) cost of
€0.03/kWh (€0.30/m3) for upgraded gas. This is at the
lower end of the range quoted by the Swedish Gas
Centre (Persson, 2003) for plants of this size. The plant
in this analysis upgrades around 110 m3/h of raw gas
(85% operational efficiency) and is relatively small
compared with operational plants in Germany and
Sweden. Membrane plants have lower maintenance
and energy requirements leading to lower operating
costs than for other technologies (de Hullu et al.,
2008). It is assumed that the renewable energy tariff
received for electricity is the net revenue to the
renewable energy provider; additional costs have not
been included in the analysis for this. The operating
costs of the compression plant for injection into the gas
grid are assumed to be included in the upgrading
costs. The operating costs for metering and quality
monitoring are also included in the cost of the
upgrading plant.
36

J.D. Murphy et al. (2007-CCRP-1.7)
5.3.8 Finance and subsidies
There is a national scheme in place offering capital
grants for biogas CHP plants of up to 30% of the
eligible capital costs (SEI, 2009b). The maximum grant
is assumed in this analysis. There are no specific
grants for biomethane plants injecting into the gas grid,
although there are a number of schemes that could
potentially provide funding. Three sub-scenarios (30%,
50% and no grant towards capital costs) are
investigated. The CAP is a system of subsidies and
support programmes for agriculture in the EU. On top
of standard farm payments, there are a number of
schemes under the CAP that could provide additional
support for a grass biogas/biomethane system, such
as the Energy Crops Scheme and the REPS. The
average direct payment received by cattle-rearing
farms is €461/ha (from 2006, 2007 and 2008 farm
survey data (Connolly et al., 2008, 2009)).
5.3.9 Income for biogas and digestate
Biogas can be used on-site to generate end products,
which can then be sold, i.e. heat, electricity and
biomethane. The price paid for heat depends on what
it is replacing. Examples of average commercial fuel
costs (SEI, 2010) are: oil at €0.058–0.069/kWhth
(depending on grade); wood pellets at €0.036/kWhth
(bulk) or €0.061/kWhth (bagged); woodchips at
€0.034/kWhth; and natural gas at €0.04/kWhth (based
on a medium-sized business and including standing
charges). It is assumed that €0.06/kWhth is paid for
heat in this analysis. Subtracting VAT of 13.5%, the
income to the biogas plant is €0.053/kWhth. The tariff
for electricity from biogas CHP in Ireland is
€0.12/kWhe. Currently, there is no tariff structure for
biomethane injected into the gas grid. There is
considerable volatility in the wholesale price of natural
gas, which varies depending on the season and on
international markets. A figure of €0.02–0.03/kWh is
assumed and this is considered the minimum tariff for
biomethane injected into the grid and is used for
comparison in the initial analysis. However, a
biomethane tariff system should incentivise renewable
gas and offer a higher return than for fossil gas.
Biomethane injected into the grid can be used in the
heat, electricity or transport sector, and the existing
market conditions will influence the price paid.
Potential markets and prices are discussed in
Section 5.5.
For farm-based AD plants, it is common practice for the
digestate to be returned to the land as replacement for
chemical fertiliser, contributing to financial savings.
The amount of fertiliser replaced depends on the
nutrient content of the digestate which is highly
dependent, amongst other factors, on the type of
feedstock. Further difficulties arise as the price of
chemical fertilisers, and hence the savings achieved
through their replacement, varies considerably from
year to year. Discussions with the AD industry in
Ireland resulted in a conservative estimate for the net
value of digestate of €4/t. The digestate quantity is
assumed to be 90% of the silage input (Korres et al.,
2010) and the value of digestate is therefore 4 x 0.9 x
7,500 = €27,000, or €196/ha.
5.4 Economic Analysis of Grass Biogasand Biomethane under CurrentConditions
5.4.1 Scenario 1: Biogas to on-site CHP
The base-case analysis considers three different
cases (Table 5.3):
1. The sale of heat (€0.053/kWhth) and electricity
(€0.12/kWhe) with no capital grant (E+H);
2. The sale of electricity only with capital grant
(G+E); and
3. The sale of electricity and heat with capital grant
(G+E+H).
The proposed facility is not profitable and would
require an electricity tariff of between €0.196 and
€0.256/kWhe to break-even, which is significantly
higher than the current tariff of €0.12/kWhe. Even
when the average farming subsidy of €461/ha is
included, the plant still operates at a loss (Table 5.4).
A relatively high value for operating costs is used in the
base-case analysis (10% of unsubsidised capital
costs) and an additional allowance is made for
depreciation (6.67%) of the AD and CHP plants. Using
a less onerous value of 10%, to cover both operating
costs and depreciation, lowers the break-even prices
(Table 5.4), but they are still higher than the current
37

The potential for grass biomethane as a biofuel
Table 5.3. Scenario 1: Grass to biogas to combined heat and power base-case economic analysis (Smyth et
al., 2010b).
System boundaries Assumptions Scenarios
Biogas yield (m3/year) 810,000 Grant included G
Energy yield (GJ/year) 16,831 Electricity incl. E
Electricity output (GJ/year) 5,891 35% electrical efficiency Heat included H
Electricity output (MWhe) 1,636
Electricity output (kWe) 220 85% operational efficiency
Heat output (GJ/year) 6,732 40% thermal efficiency
Heat output (MWht) 1,870
(€) (€/year) E+H (€/year)
G+E (€/year)
G+E+H (€/year)
Assumptions
Capital costs
Silage pit 456,250 43,956
AD plant 819,500 78,953
Combined heat and power plant 330,000 31,793 CHP plant (€/kWe) 1,500
Connection to electricity grid 120,000 11,561
Total capital costs 1,725,750 166,263 166,263
Capital finance 263,714 Max. grant (€/kWe) 1,200
Total capital cost incl. grant 1,462,036 140,856 140,856 140,856
Operating costs
Depreciation 76,672 % capital costs 6.67
Silage production 130,625 €/ha 950
Anaerobic digestion plant 81,950 % capital costs 10
CHP plant 16,363 €/kWhe 0.01
Total operating cost 305,610 305,610 305,610 305,610
Capital + operating costs 471,873 446,466 446,466
Income €/kWh
Heat 0.053 99,116
Electricity 0.12 196,362 196,362
Fertiliser savings 27,000 27,000 Estimate (€/t) 4
Total income 322,477 322,477 223,362 322,477
Income – costs –149,395 –223,104 –113,989
Profit (€/ha) –1,087 –1,623 –902
Profit (€/m3 biogas) –0.184 –0.275 –0.153
Profit (€/kWhe) –0.091 –0.136 –0.076
Elec. price for break-even (€/kWhe) 0.211 0.256 0.196
Subsidy for break-even (€/ha) 1,087 1,623 902
AD, anaerobic digestion; CHP, combined heat and power.E+H, the sale of heat and electricity with no capital grant; G+E, the sale of electricity only with capital grant; G+E+H, the sale ofelectricity and heat with capital grant.
38

J.D. Murphy et al. (2007-CCRP-1.7)
tariff of €0.12/kWhe. Inclusion of the farming subsidy
(€461/ha) brings the best-case scenario (G+E+H) into
profit and results in an annual return of €117/ha.
However, this is lower than the average FFI for cattle-
rearing farms (€279/ha for 2006–2008, inclusive
(Connolly et al., 2008; 2009)), and therefore
uncompetitive with current farming practice.
As plant size increases, investment costs per kilowatt
decrease (Murphy and McCarthy, 2005; Walla and
Schneeberger, 2008); therefore, increasing the
quantity of grass silage could increase profits.
However, this would also result in increased transport
distances for silage delivery and digestate disposal.
Ideally, transport distances should be kept to a
minimum because of associated costs, emissions and
nuisance on rural roads. The average haul distance for
137.5 ha of silage is 1.25 km (Eqn 5.2; Walla and
Schneeberger (2008)), which is within the range used
in the literature (EPA, 2005; Murphy and McCarthy,
2005; Gerin et al., 2008). For a large plant of 1 MWe
size, around 625 ha of grass silage are required, giving
an average haul distance of 2.66 km.
Average haul distance (km) = = 2/3xτ (Eqn 5.2)
where x is the radius of area of supply (km) =
, τ is the tortuosity factor ( for rural
roads), y is the silage yield (t/km), Q is the required
amount of silage (t), a is the factor of silage
availability2.
Under current conditions, profitability of grass biogas
CHP is possible, but difficult, and relies on:
• Keeping operational costs to a minimum;
Table 5.4. Scenario 2: Biogas to biomethane to grid; tariff required for break-even (Smyth et al., 2010b).
Scenario 1a (€/kWhe)
Scenario 2a
(€/kWh)
E+H G+E G+E+H 50%G 30%G NG
Base case
No subsidy 0.211 0.256 0.196 0.100 0.108 0.121
With subsidy (€461/ha) 0.173 0.218 0.157 0.086 0.095 0.107
Reduced operating costs and depreciation
No subsidy 0.164 0.209 0.149 0.081 0.089 0.102
With subsidy (€461/ha) 0.126 0.171 0.110 0.067 0.075 0.088
Co-digestionb
No subsidy 0.100 0.145 0.084 0.059 0.064 0.071
With subsidy (€461/ha) 0.084 0.129 0.068 0.053 0.058 0.066
Co-digestion (reduced operating costs and depreciation)
No subsidy 0.059 0.104 0.043 0.045 0.050 0.058
With subsidy (€461/ha) 0.043 0.088 0.027 0.040 0.045 0.052
aFigures in bold indicate profitability under current conditions:• €0.12/kWhe is paid for electricity from biogas combined heat and power; and• €0.02–0.03/kWh is the wholesale price of natural gas.
bCo-digestion of 7,500 t/year grass and 7,500 t/year belly grass.E+H, the sale of heat and electricity with no capital grant; G+E, the sale of electricity only with capital grant; G+E+H, the sale ofelectricity and heat with capital grant.50%G, receipt of grant for 50% of capital cost; 30%G, receipt of grant for 30% of capital cost; and NG, no grant.
2. On average in Ireland, silage, hay and pasture make up50% of the total land area (CSO, 2009b; OSI, 2010).Assuming that half of the grass in a given area is used forAD, the factor of silage availability is 0.5 × 0.5 = 0.25.
x
Q yaπ( )⁄ 2
39

The potential for grass biomethane as a biofuel
• Finding a year-round market for heat, although
this may prove challenging due to limited heat
markets; and
• Maintaining current farming subsidies.
5.4.2 Scenario 2: Biogas to biomethane to gridThe plant produces biomethane on-site and the
biomethane is injected into the gas grid. The boundary
of the analysis is at injection into the grid and the
break-even price of biomethane sold to the grid is
calculated. Three different scenarios are considered:
1. Receipt of grant for 50% of capital cost (50%G);
2. Receipt of grant for 30% of capital cost (30%G);
and
3. No grant (NG).
The break-even price of gas is found to be €0.100,
€0.108 and €0.121/kWh, assuming 50%, 30% and 0%
capital grant, respectively (Table 5.4). If the farming
subsidy of €461/ha is included, the break-even price
falls to between €0.086 and €0.107/kWh. There is
considerable volatility in the wholesale price of natural
gas, which varies depending on the season and on
international markets. A figure of €0.02–0.03/kWh is
assumed and this is considered the minimum tariff for
biomethane injected into the grid and is used for
comparison in the initial analysis. Reducing the
operating costs and depreciation (as for the CHP plant)
brings the break-even gas price down to €0.081–
0.102/kWh, excluding the farming subsidy, and
€0.067–0.088 if the subsidy is included (Table 5.4).
Even in the best-case scenario, the break-even price is
still more than double the wholesale price of natural
gas.
5.4.3 Co-digestionCo-digestion is a common practice, as this frequently
improves the performance of the digester and
increases the biogas production. Examples of co-
substrates include manure, food remains, animal
blood, rumen contents, fermentation slops and
OFMSW. A gate fee can often be charged for the co-
substrates, generating additional revenue for the plant,
and larger plants can also take advantage of
economies of scale, thus lowering the capital and
operational costs per tonne of feedstock.
Nevertheless, current legislation restricts the use of
substrates from certain sources and may lead to higher
AD processing and digestate disposal costs.
Animal by-products (ABP) may be a suitable feedstock
for AD plant but they can pose a threat to animal and
human health via the environment if not properly
disposed of. The collection, transport, storage,
handling, processing and use or disposal of all ABP are
therefore tightly controlled by the Animal By-Products
Regulations (ABPR). Compliance with the ABPR can
add significant cost and must be weighed against the
gate fees received. While the ABPR are obviously
needed to protect human and animal health and the
environment, the strict requirements pose challenges
for the development of AD in Ireland and have been a
stumbling block for the industry. The Department of
Agriculture, Fisheries and Food has recognised this
and is currently in consultation with industry with the
aim of facilitating the growth of AD (Farrar, 2009).
This study considers a co-operative AD plant among a
group of livestock farmers; the co-substrate is
therefore cattle slurry. From a microbiological
perspective, cattle slurry is a recommended co-
substrate for grass silage (Nizami et al., 2009).
Previous studies (e.g. Yiridoe et al., 2009) have found
that, if the non-market co-benefits are excluded, the
AD of farm wastes is generally not financially viable.
This is exacerbated by the dilute nature of cattle slurry
and its low methane yield (10% DS, 140 m3 CH4/t
VDSadded (Steffen et al., 1998)), meaning that larger
digestion tanks and operational energy demands
(heating and mixing) are required than for grass silage
(22% DS, 300 m3 CH4/t VDSadded), but with much
lower energy return. In the absence of financial
incentives, co-digestion of cattle slurry with grass does
not improve the economic viability of the plant. Grass
biomethane is cheaper than slurry biomethane.
Greater economic benefit could be achieved by
digesting co-substrates that attract a gate fee. For the
CSTR, a low solids content substrate such as
slaughter waste (belly grass) would be appropriate.
Discussions with the slaughterhouse industry in
Ireland suggest that gate fees of around €20/t could be
attracted. Equal quantities (7,500 t/year of each) of
grass silage and belly grass are used and it is
40

J.D. Murphy et al. (2007-CCRP-1.7)
conservatively assumed that there are no financial
savings from the digestate. Substantial profits are
achievable with the CHP plant (Table 5.4), showing
that the current tariff system works well for feedstock
that attracts a gate fee. However, for grid injection even
the base-case scenario has a higher break-even price
than the wholesale price of natural gas.
5.4.4 Viability of grass biogas and biomethane
under current conditions
Under current conditions, the only financially viable
option for grass biogas/biomethane in Ireland is use in
an on-site CHP plant, and viability is heavily dependent
on heat markets and farming subsidies. Profits are low
and there is little incentive to switch from current
farming practice. There is currently no tariff structure in
place for grid injection, although the development of
such a structure is under way. This analysis shows that
grass biomethane injected into the grid is not
competitive with natural gas. Co-digestion can improve
the economics, but the ABPR pose challenges for the
industry.
5.5 Improving the Viability of GrassBiomethane for the Farmer and theConsumer
5.5.1 Why should we subsidise grass biomethane?
Grassland agriculture in Ireland is effectively
subsidised for export (Howley et al., 2009a). It is
suggested that diverting some grassland to
biomethane production will allow the benefit of double
credits (EC, 2009a) for meeting the 2020 targets for
RES-T. Injecting biomethane into the gas grid is an
effective means of distributing renewable energy to a
large number of consumers without any requirement
for new infrastructure beyond the existing modern,
extensive natural gas grid. In addition, farm
diversification is served well leading to a strong case
for subsidising grass biomethane and AD plants in
general. The use of biogas/biomethane reduces GHG
emissions: 82% for cattle slurry biomethane compared
with diesel have been reported (Singh and Murphy,
2009), while savings of 75–150% can be achieved for
grass biomethane compared with diesel (Korres et al.,
2010). Methane is a clean burning fuel in terms of local
pollutants; it improves air quality and benefits health
(Rabl, 2002; Goyal and Sidhartha, 2003). In addition,
the digestion of wastes is a proven waste treatment
option that reduces GHG emissions from uncontrolled
fermentation and reduces pollution from poor waste
management practices (Yiridoe et al., 2009).
A considerable uncertainty governs the non-market co-
benefits of an AD plant and values are likely to change
in the future as concerns over environmental issues
heighten (Yiridoe et al., 2009). At the end of pipe,
savings from methane through avoiding emissions,
such as carbon dioxide, nitrogen oxides and
particulate matter, have been estimated as €0.43/l of
diesel replaced for a passenger car in an urban area
(Biogasmax, 2008), which equates to €1,387/ha of
grass digested. In city centres, this rises to €0.89/l
diesel replaced (Biogasmax, 2008) or €2,870/ha of
grass. If a waste feedstock is used, the benefit from
avoided methane leakage is €0.26/l of diesel replaced
and the total benefit including improved end-of-pipe
emissions is €1.15/l of diesel replaced (Biogasmax,
2008). This equates to €13.8/t of cattle slurry digested
(based on a biogas yield of 22 m3/t of slurry at 55%
methane).
5.5.2 Competitive advantage of biomethaneWhen non-market benefits are excluded, grass
biomethane is not competitive with natural gas.
However, renewable energy targets in each of the
three energy sectors (heat, transport and electricity)
mean that biomethane (renewable gas) is in
competition with other renewables. The existing
natural gas network, which can serve as a vehicle for
biomethane transport, yields the competitive
advantage of biomethane.
The natural gas grid in Ireland is quite extensive and
reaches all major cities and 23 out of the 32 counties.
A programme has been completed replacing all of the
old cast-iron pipes with polyethylene pipes, resulting in
a more efficient network. There are currently about
619,100 domestic connections and 24,000 industrial
and commercial connections to the gas grid in the
Republic of Ireland and another 118,800 domestic
customers and 8,400 industrial and commercial
customers (NIAUR, 2009) in Northern Ireland.
For new installations, bioNG has the edge over other
renewable technologies in areas on the gas grid,
especially in urban areas where space may be at a
41

The potential for grass biomethane as a biofuel
premium. Significant space is required for many
renewable energy solutions, such as woodchips (fuel
storage areas) or horizontal geothermal installations;
such space may be costly or unavailable in cities and
towns (e.g. in apartment blocks).
There are clearly competitive advantages of grass
biomethane; the issue is now to find the right market in
order to exploit these advantages.
5.5.3 Grass biomethane in the renewable
electricity market
Ireland’s 40% renewable electricity target for 2020
(Howley et al., 2008) is expected to be provided largely
by wind. There are also targets for electricity from
ocean energy (500 MWe of installed capacity by 2020)
and for 30% biomass co-firing in existing peat-fired
power plants (DCMNR, 2007). The presence of viable
alternatives for renewable electricity means that there
is not expected to be a large market for electricity from
grass biomethane; however, there may be some scope
in the CHP market and in existing power plants running
on natural gas. The market size is considerable as
62% of primary natural gas energy is used for
electricity generation (SEI, 2009c).
There is a government target to achieve at least 800
MWe from CHP by 2020, with emphasis on biomass-
fuelled CHP (DCMNR, 2007). The use of grass biogas
in an on-site CHP plant struggles economically, due
largely to the current tariff structure and the lack of heat
markets in Ireland. However, there is potential for
existing natural-gas-fuelled CHP plants to purchase
renewable gas from the grid, with the advantages that
the capital investment has already been made and
there is generally a market for heat at existing plants.
As 93% of the installed CHP capacity in Ireland runs on
gas fuels (O’Leary et al., 2007), there is significant
market potential; however, the renewable bonus of
€0.12/kWhe for biomethane does not make financial
sense as CHP plants typically displace electricity
purchased from the grid and have returns of about
€0.10–0.11/kWhe.
It is suggested that a revised system of tariffs be
introduced. Currently, a flat rate of €0.12/kWhe is paid
for biogas CHP. The same electricity tariff is paid
regardless of whether a gate fee is received or the
feedstock is purchased, and there is no allowance for
the non-monetary benefits of AD, for example to
encourage use of cattle slurry. The German tariff
structure (BMELV, 2009) uses graded tariffs that
depend on feedstock type, plant size and AD
technology type, among other factors. The
International Energy Agency (IEA) has stated (IEA,
2007) that the high investor security provided by the
German feed-in tariff has been a success, resulting in
a rapid deployment of renewables, the entrance of
many new actors to the market, and a subsequent
reduction in costs. Using the German tariffs for the
grass plant in this analysis, the electricity tariff rises to
a minimum of €0.1718/kWh for an on-site CHP plant
and €0.1818/kWh for an off-site CHP plant using
biomethane tapped from the grid (Table 5.5). Sale of
heat off-site leads to an extra bonus of €0.03/kWhe
based on the proportion of heat sold. Thus there is
potential for these rates to rise to €0.21/kWhe.
Such a tariff structure would bring the on-site CHP
plant into profit as long as there is a market for the heat
(Table 5.6). The annual income for E+H and G+E+H is
over twice the average FFI for cattle-rearing farms
Table 5.5. Potential revenues from combined heat and power (CHP) using the
German tariff structure (simplified) (Smyth et al., 2010b).
Tariff On-site CHP (€/kWhe)
Off-site CHP (€/kWhe)
Basic compensation 0.0918 0.0918
Emission minimisation bonus 0.01 –
Grass as a feedstock 0.07 0.07
Upgrading – 0.02
Total 0.1718 0.1818
42

J.D. Murphy et al. (2007-CCRP-1.7)
(€279/ha) when reduced operating costs and
depreciation are considered. In the case of the off-site
CHP plant, a return of €0.085/kWh biomethane can be
achieved, assuming 40% thermal and 35% electrical
efficiency (€0.1818/kWhe + €0.053/kWhth). This is
over 25% higher (€0.085/kWh compared with
€0.11/kWh) than the best-case break-even
biomethane price (from Table 5.4). The viability of off-
site CHP plants can only be assessed on a case-by-
case basis. Determining factors include the plant size,
the proportion of biomethane/natural gas in the mix,
and the individual circumstances of the plant, for
example if capital costs have already been paid. There
is potential for the use of biomethane in combined
cycle gas turbine (CCGT) plants. The initial
advantages of biomethane used in a CCGT facility
include:
• An electrical efficiency of around 55% compared
with 35% in a small-scale CHP;
• Increasing the priority listing of the CCGT plant as
it is now seen as a renewable source of electricity
as opposed to a fossil fuel electricity-generating
plant; and
• Use of electricity from CCGT to power electric
cars and provide renewable fuel in transport.
The lack of a comprehensive tariff structure is a
stumbling block for the industry. There is also a
disparity between AD plant output and the demand of
off-site electricity generators. Three-quarters of CHP
plants in Ireland are in the size range 0.5–1 MWe
(O’Leary et al., 2007). Assuming 30% co-firing (which
is the target for biomass co-firing in peat plants) in
0.75-MWe CHP plants, the grass biomethane facility in
this analysis would serve only 2.7 such plants. Being
reliant on such a small customer base puts the
biomethane supplier at risk of failure from small
changes in demand. An obligation for CHP plants to
meet renewable energy targets would improve the
viability through providing greater market stability for
the developing industry, and by putting biomethane in
competition with other renewables, as opposed to
cheap natural gas.
5.5.4 Grass biomethane in the renewable transport
market
There is a target for 10% renewable energy in
Transport 2020 (DCMNR, 2007). Unlike the electricity
sector where significant progress is being made
towards meeting the target, there are significant
challenges in the transport sector. Penetration of
renewables in transport currently stands at less than
1.2% (Howley et al., 2009a). The problem is further
compounded by policy constraints in biofuels
(sustainability criteria) and agriculture (land use) which
restrict the type of biofuels that can be used and the
type of energy crops that can be grown. Smyth et al.
(2010a) showed that the largest potential for the
Table 5.6. Profitability of on-site combined heat and power (CHP) with German tariff structure and farming
subsidies (Smyth et al., 2010b).
Base case Reduced operating costs and depreciation
E+H G+E G+E+H E+H G+E G+E+H
Total incomea (€/year) 407,240 308,124 407,240 407,240 308,124 407,240
Total costs (€/year) 471,873 446,466 446,466 395,201 369,794 369,794
Income – costs ( €/year) –64,633 –138,342 –39,266 12,039 –61,670 37,446
Income – costs ( €/ha) –470 –1,006 –285 88 –459 272
Average annual subsidy (€/ha) 461 461 461 461 461 461
Return including subsidy (€/ha) –9 –545 176 549 12 733
a€0.1718/kWhe received for electricity, €0.053/kWhth received for heat.
E+H, the sale of heat and electricity with no capital grant; G+E, the sale of electricity only with capital grant; G+E+H, the sale ofelectricity and heat with capital grant.
43

The potential for grass biomethane as a biofuel
achievement of Irish 2020 targets in renewable energy
in transport is grass biomethane.
The break-even price of compressed biomethane from
grass varies between €0.078 and €0.132/kWh
(Table 5.7). Excise duty is not charged on gas used as
a propellant, but VAT at 21% has to be added (EC,
2010), giving a minimum selling price (i.e. break-even
price) of between €0.096 and €0.163/kWh. The sale
price of petrol and diesel lies within this range
(Table 5.8). The price of CNG is significantly lower
than that of petrol and diesel, meaning that
considerable savings can be achieved if bioCNG is
sold. If a 10% biomethane/90% CNG blend is used, the
break-even price is between €0.0199 and €0.0217/MJ
(based on UK CNG prices). At 53% of the price of
petrol and 71% of the price of diesel (for the higher
price of €0.0217/MJ), this is competitive.
The obvious stumbling block for the sale of
biomethane as a transport fuel in Ireland is the
absence of a market; there are currently only two
natural gas vehicles in the country (NGV, 2009). The
development of biomethane for transport in other
Table 5.7. Break-even of compressed biomethane from grass silage as a vehicle fuel (Smyth et al., 2010b).
Base casea Reduced operating costs and depreciationb
50%G 30%G NG 50%G 30%G NG
Break-even price of biomethane injected to grid (€/kWh) 0.100 0.108 0.121 0.067 0.075 0.107
Cost of compression to 250 bar + filling station (€/kWh)c 0.011 0.011 0.011 0.011 0.011 0.011
Break-even price of compressed biomethane (€/kWh) 0.111 0.119 0.132 0.078 0.086 0.118
– including 21% VAT ( €/kWh) 0.134 0.144 0.160 0.094 0.104 0.143
– including 21% VAT ( €/m3) 1.37 1.47 1.63 0.96 1.06 1.45
aExcludes farming subsidy.bIncludes farming subsidy (€461/ha).cEstimated from values in the literature (Murphy and Power, 2009b) and discussions with industry.50%G, receipt of grant for 50% of capital cost; 30%G, receipt of grant for 30% of capital cost; and NG, no grant.
Table 5.8. Comparison of vehicle fuel costs (Smyth et al., 2010b).
Fuel Unit cost Energy value Cost per unit energy(€/MJ)
Petrola €1.224/l 30 MJ/l 0.0408
Diesela €1.150/l 37.4 MJ/l 0.0307
Compressed biomethane (high)b €1.63/m3 37 MJ/m3 0.0441
Compressed biomethane (low)b €0.96/m3 37 MJ/m3 0.0260
CNG – Austria c€0.89/m3 37 MJ/m3 0.0241
CNG – UKc€0.71/m3 37 MJ/m3 0.0192
CNG – Germany c€0.70/m3 37 MJ/m3 0.0189
Bio-CNG (high) d€0.80/m3 37 MJ/m3 0.0217
Bio-CNG (low) d€0.74/m3 37 MJ/m3 0.0199
aPrice of petrol and diesel is the price at the pumps (AA Ireland, 2010).bPrice of compressed biomethane is the minimum selling price of grass biomethane. The highest and lowest pricesfrom Table 5.8 are used.cIn the absence of Irish compressed natural gas (CNG) prices, the prices in Austria, Germany and the UK (NGV,2009) are shown for comparison.dBio-CNG price calculated using UK CNG prices and a blend of 10% biomethane/90% CNG.
44

J.D. Murphy et al. (2007-CCRP-1.7)
countries has generally been based on an existing
CNG market, and the development of CNG is often
based on the introduction of CNG to captive fleets (e.g.
buses, waste collection lorries, taxis) followed by
private cars. The sale of biomethane for transport in
other countries has been found to be profitable,
offering higher returns than heat or electricity. The
CNG market may develop in Ireland as it has done
elsewhere, but would require regulation and incentives
from government to do so.
5.5.5 Grass biomethane in the renewable heat
market
The government has set a target for 12% renewable
heat by 2020 and has also stated that the public sector
will lead the way with the deployment of bioenergy
heating (DCMNR, 2007). The residential sector is
responsible for the largest share of natural gas final
energy consumption, at 40.7% (SEI, 2009c). Twenty-
eight per cent of houses have gas central heating
(O’Leary et al., 2008), with the highest proportion in
Dublin, where there are almost 375,000 natural gas
customers or about 60% of national customers.
Average residential natural gas demand (weather
corrected) in 2008 was 14.4 MWh (51.8 GJ) per
household. The grass biomethane plant in this analysis
could fuel about 320 houses solely on biomethane or
2,665 houses on bioNG containing 12% renewable
gas. The potential for a large number of customers
offers more flexibility than the electricity market.
Obviously, alternatives such as woodchips or wood
pellets could also be employed; however, the
installation of these systems requires significant capital
investment in both the boiler and biomass storage
areas, as well as changes in practice. Figure 5.1
compares heating costs based on an existing building
remaining on the gas grid (fuel and running costs only
for natural gas, grass biomethane and bioNG) and new
woodchip and pellet heating systems (fuel, running
and annualised capital costs). While grass biomethane
is uncompetitive, a 12:88 (biomethane/CNG) bioNG
fuel is competitive with the renewable energy
alternatives. The analysis assumes that biomethane is
produced from grass only; biomethane produced from
feedstock with a gate fee, such as slaughter waste,
would be considerably more competitive.
In Fig. 5.1, the cost of grass biomethane is the break-
even price (highest and lowest values are taken from
Table 5.4 and 13.5% VAT is added). The cost of bioNG
is based on a blend of 12% biomethane and 88%
natural gas. For the gas systems, estimated running
costs are added to the fuel costs to give the heating
cost. The heating cost of woodchips and wood pellets
includes capital and operational costs. Total woodchip,
wood pellet and natural gas heating costs were
calculated using a heat cost comparison spreadsheet
Figure 5.1. Comparison of heating costs for various systems (Smyth et al., 2010b).
€c/
kWh
45

The potential for grass biomethane as a biofuel
(EVA, 2007), current commercial fuel costs (SEI, 2010)
and work undertaken as part of a Master’s thesis
(Smyth, 2007). A 570-kW boiler with 900 h/year
operation is assumed.
Although Directive 2009/73/EC on the natural gas
market (EC, 2009c) states that biogas should be
granted non-discriminatory access to the gas system,
and biomethane is injected into the grid in other
countries, as yet there is no system for this in Ireland.
Gaslink (the Irish gas network operator) and Bord Gáis
are currently investigating a quality standard for
biomethane injection into the grid.
5.6 Conclusions
The key to the competitiveness of biogas/biomethane
is the renewable energy targets. The principal
advantage of biomethane over other renewables is
that it can be distributed through the gas grid to a large
existing customer base. The renewable electricity
market is largely dominated by wind and it is the view
of the authors that electricity is not the most
advantageous avenue for biogas. If a biogas electricity
industry were to develop from grass, a revised tariff
structure would be necessary. The existing tariff
structure works well for feedstock that attracts a gate
fee but, in spite of this, the industry is faltering, largely
due to the strict interpretation of the ABPR and
uncertainty in the waste sector. The transport market
offers the potential for profitability and provides a
cheaper alternative to fossil fuels for the consumer.
However, there is currently no market for CNG in
Ireland and the transport market is therefore not a
practical option at present. Unlike other renewable
technologies in the heat sector, grass biomethane has
a large, easily accessible customer base. Existing
natural gas customers would not require new
installation and their gas supplier would need only a
change in their billing system; thus the higher cost of
renewable gas can be offset against avoided capital
investment. Injecting grass biomethane into the grid for
sale as a heating fuel is the path of least resistance.
However, there is currently no legislation in place in
Ireland to allow grid injection. Under certain conditions
grass biogas/biomethane has the potential to be an
economically viable alternative for farmers and for the
consumer. Its cost competitiveness can be further
improved by co-digestion with gate fee feedstock and
by taking account of the associated non-monetary co-
benefits. However, a recurring theme is the lack of
consistent legislation regarding AD and the use of
biogas/biomethane, and this is acting as a barrier to
the development and economic success of the
industry. For the industry to succeed economically, the
implementation of cohesive legislation is required.
46

J.D. Murphy et al. (2007-CCRP-1.7)
6 Conclusions and Recommendations
6.1 Conclusions
• Grassland is the dominant agricultural landscape
in Ireland, covering 91% of agricultural land. The
size of the national herd has decreased and will
continue to do so. Conversion of grassland to
arable land is not encouraged due to cross
compliance. Diversification of agricultural
enterprise to grass biomethane production will
assist rural development through sustainable
employment, security of energy supply, and
environmental benefits associated with reduced
stocking rates.
• Perennial ryegrass is an excellent grass species
for biogas production. Mixed pastures (ryegrass
and clover) may result in higher biogas
production and reduced fertilisation
requirements. Excess fertilisation and late
harvesting can negatively affect biogas
production due to the increased structural
carbohydrate content of grasses.
• The selection of the correct digester system for
grass biomethane is an important decision. The
wet continuous two-stage system offers readily
available technology. However, grass has a
tendency to float to the top of the liquid level in a
wet system, which may inhibit the process; thus,
great care must be taken in the choice of the
mixing system. Dry-batch leach-bed systems
coupled with a UASB have potential for increased
biogas production in smaller chambers. These
systems can be further optimised, particularly in
leaching mode using pretreatment options.
Membrane separation and HPWS are
recommended for upgrading of biogas (typically
at 55% CH4) to biomethane (at 97%+ CH4). In
addition, HPWS also provides maximum purity
(up to 98% CH4) with minimal cost.
• An essential element of a grass biomethane
facility is the reduction in emissions associated
with parasitic energy demands. Thus, purchase
of green electricity and minimisation of thermal
energy input are essential. In use as a transport
fuel the vehicle must be optimised for
biomethane; bi-fuel vehicles may not meet this
criterion. Through process optimisation, a GHG
emission reduction of more than 60% as
compared with diesel may be effected. Grassland
sequesters carbon; a value of 0.6 t C/ha/year is
deemed conservative. This would lead to a
reduction in emissions of 89% which would
suggest that grass biomethane is one of the most
sustainable indigenous non-residue European
transport biofuels.
• The key to the competitiveness of grass
biomethane is the renewable energy targets. The
principal advantage of biomethane over other
renewables is that it can be distributed through
the gas grid to a large existing customer base. It
is suggested that biomethane has advantages in
the transport and thermal sectors rather than the
electricity sector. The transport market offers the
best potential for profitability; however, there is
currently no market for CNG in Ireland. Grass
biomethane as a source of renewable thermal
energy has a large, easily accessible customer
base; existing natural gas customers would not
require new installations. Cost competitiveness
can be further improved by co-digestion with gate
fee feedstock and by taking account of the
associated non-monetary co-benefits. However,
a recurring theme is the lack of consistent
legislation regarding the use of
biogas/biomethane, and this is acting as a barrier
to the development and economic success of the
industry. For the industry to succeed
economically, the implementation of cohesive
legislation is required.
6.2 Recommendations
• Employ a tariff scheme that differentiates the
source of biomass:
Applying one tariff rate to biomass is a relatively
47

The potential for grass biomethane as a biofuel
blunt instrument. The present tariff for AD CHP is
€150/MWeh for facilities smaller than 500 kWe.
This does not differentiate the source of biomass.
Biogas may be made from OFMSW, which
carries a gate fee, slurry, which typically has no
gate fee, or silage, which must be purchased.
Germany employs a tiered system for tariffs for
biogas. There is a basic compensation for biogas
with additional bonuses. One of these bonuses is
priced to allow competitiveness for feedstocks,
such as grass, which offer rural sustainable
employment.
• Employ a tariff scheme for biomethane:
At present, there is a tariff structure for electricity
from biomass. It is suggested that the utilisation
of biogas is better employed when upgraded to
biomethane and used as either a source of heat
(distributed through the natural gas grid to
620,000 houses) or as a transport fuel. There is
no tariff scheme for these end uses. The German
system allows a bonus for grid injection of
biomethane and use at a different site. Support
for transport fuel is of particular importance as
biomethane is allowed a double credit for
renewable energy in transport targets.
• Develop, promote and regulate the CNG
market:
The sale of biomethane for transport in other
countries has been found to be profitable, offering
higher returns than heat or electricity. The
development of biomethane for transport in other
countries has generally been based on an
existing CNG market, and the development of
CNG is often based on the introduction of CNG to
captive fleets (e.g. buses, waste collection lorries,
taxis) followed by private cars. The CNG market
requires support through regulation and
incentives from government. For example, a
target of CNG vehicles could be introduced to
mirror the target of 10% of all vehicles to be
electric powered by 2020. Other examples
include grant-aiding CNG service stations and
mandating of public transport fleets to incorporate
a certain percentage of CNG vehicles by
specified dates.
• Develop, promote and regulate biomethane
as a source of thermal energy:
The sale of biomethane for renewable thermal
energy has a significant advantage due to the
existence of a modern, extensive natural gas
grid. There are about 619,000 domestic
connections to the gas grid, with an average
demand of 51.9 GJ/house. This equates to 32 PJ
of thermal energy. If we consider a 12%
Renewable Energy Supply in Heat (RES-H)
target, then 3.84 PJ/year can be met by 32,000
ha of grass or about 0.8% of existing grassland.
Again, the renewable gas and heat market
requires Government support. This may be done
(similar to the biofuel obligation scheme) by
mandating suppliers of gas to incorporate a
specific percentage of renewable gas in their
sales by specific dates.
48

J.D. Murphy et al. (2007-CCRP-1.7)
References
AA Ireland, 2010. Irish Petrol Prices: February 2010. AAIreland. Available athttp://www.aaireland.ie/ petrolprices/[accessed February 2010].
Abraham, E.R., Ramachandran, S. and Ramalingam, V.,2007. Biogas: Can it be an important source ofenergy? Environmental Science and PollutionResearch 14: 67–71.
ACA, 2008. The Farmers’ Handbook 2009 compiled forACA by O’Sullivan Farm and Forestry Consultants.The Agricultural Consultants Association, Carrick-on-Suir, Co. Tipperary, Ireland.
Al Seadi, T., Rutz, D., Prassl, H., Kotther, M.,Finsterwalder, T., Volk, S. and Janssen R., 2008.Biogas Handbook. BiGEast Project. Biogas forEastern Europe. University of Southern Denmark,Denmark.
Amon, T., Amon, B., Kryvoruchko, V., Machmuller, A.,Hopfner-Sixt, K., Bodiroza, V., Hrbek, R., Friedel, J.,Potsch, E., Wagentristl, H., Schreiner, M. andZollitsch, W., 2007. Methane production throughanaerobic digestion of various energy crops grown insustainable crop rotations. Bioresource Technology98: 3204–3212.
Anonymous, 2008a, Beef Sector Roadmap. Teagasc.Available at http://www.teagasc.ie/publications/20080507/Beef_Roadmap.pdf [accessed February 2010].
Anonymous, 2008b, Grass and Clover. RecommendedList of Varieties for Ireland 2008. The Department ofAgriculture, Fisheries and Food, Dublin, Ireland.
Arvanitoyannis, I.S. and Varzakas, T.H., 2008. Vegetablewaste treatment: comparison and critical presentationof methodologies. Critical Reviews in Food Scienceand Nutrition 48: 205–247.
Baas, J. and Lekkerkerk, L., 2003. Use of Pesticides andLimestone (Agriculture) Activities 100601 to 100604.Emission Inventory Guidebook (2003). Available athttp://www.eea.europa.eu/publications/EMEPCORINAIR4/B1060vs3.0.pdf [accessed 10 November 2009].
Bauer, A., Hrbek, R., Amon, B., Kryvoruchko, V.,Machmuller, A., Hopfner-Sixt, K., Bodiroza, V.,Wagentristl, H., Potsch, E., Zollitsch, W. and Amon,T., 2007. Potential of Biogas Production inSustainable Biorefinery Concepts. Proceedings of the5th Research and Development Conference ofCentral and Eastern European Institutes ofAgricultural Engineering; Part 2(2), pp. 20–31.
Berglund, M. and Börjesson, P., 2006. Assessment of
energy performance in the life cycle of biogasproduction. Biomass and Bioenergy 30: 254–266.
Binfield, J., Donnellan, T., Hanrahan, K. and Westhoff, P.,2008. FAPRI-Ireland 2008 WTO Reform Analysis:Potential Impact on EU and Irish Agriculture. TeagascRural Economy Research Centre, Athenry, Co.Galway, Ireland.
Biogasmax, 2008. How to Implement a BiomethaneProject – Decision Makers' Guide. Biogasmax.Available at http://www.xebecinc.com/pdf/biogasmax_decision_guide_en.pdf.
BMELV, 2009. The Renewable Energy Sources and theRenewable Energies Heat Act Data and Facts forBiomass. Federal Ministry of Food, Agriculture andConsumer Protection, Berlin, Germany.
Börjesson, P. and Berglund, M., 2006. Environmentalsystems analysis of biogas systems – Part I: Fuel-cycle emissions. Biomass and Bioenergy 30: 469–485.
Boyle, G., 2008. Sustainable Grassland Systems inEurope and the EU Water Framework Directive.Proceedings of Sustainable Grassland Systems inEurope and the EU Water Framework Directive.Teagasc, Johnstown Castle Research Centre,Wexford, Ireland. 12–14 November 2008, p. 11.
Braun, R., Weiland, P. and Wellinger, A., undated. Biogasfrom Energy Crop Digestion. IEA Bioenergy. Task 37– Energy from Biogas and Landfill Gas. InternationalEnergy Agency.
Braun-Blanquet, J. (Ed.), 1932. Plant Sociology: TheStudy of Plant Communities. Fuller, G.D. and Conrad,H.S. (revised). McGraw-Hill, New York, USA.
Brereton, A.J., 1995. Regional and year-to-year variationin production. In: Jeffrey, D.W., Jones, M.B. andMcAdam, J.H. (Eds) Irish Grasslands their Biologyand Management. Royal Irish Academy, Dublin,Ireland, pp. 12–22.
Brockman, J.S. and Wilkins, R.J., 2003. Grassland. In:Soffe, R.J. (Ed.) Primrose McConnell’s TheAgricultural Notebook, 20th Edn, BlackwellPublishing.
Brown, R.H., 1999. Agronomic implications of C4photosynthesis. In: Sage, R.F. and Monson, R.K.(Eds) C4 Plant Biology. Academic Press, San Diego,London, pp. 473–509.
Brown, K., 2004. Bioenergy in Ireland. SustainableEnergy Ireland, Dublin, Ireland.
Buxton, D.R., 1996. Quality-related characteristics offorages as influenced by plant environment and
49

The potential for grass biomethane as a biofuel
agronomic factors. Animal Feed Science andTechnology 59: 37–49.
Buxton, D.R. and Fales, S.L., 1994. Plant environmentand quality. In: Jeffrey, D.W., Jones, M.B. andMcAdam, J.H. (Eds) Forage Quality, Evaluation, andUtilization. American Society of Agronomy, Madison,WI, USA. pp. 155–199.
Byrne, K.A., Kiely, G. and Leahy, P., 2007. Carbonsequestration determined using farm scale carbonbalance and eddy covariance. Agriculture Ecosystemand Environment 121: 357–364.
Caslin, B., 2009. Overview of Biofuels in Ireland.Bioenergy News. Renewable Energy InformationOffice, Sustainable Energy Ireland, Dublin, Ireland.Autumn 2009. pp. 12–14.
Chardon, W.J. and Schoumans, O.F., 2008. Overview ofPotential European Measures for Agriculture underWFD, Collected within COST Action 869: MitigationOptions for Nutrient Reduction in Surface Water andGroundwaters. Proceedings of SustainableGrassland Systems in Europe and the EU WaterFramework Directive. Teagasc, Johnstown CastleResearch Centre, Wexford, Ireland. 12–14November.
Charmley, E., 2001. Towards improved silage quality – areview. Canadian Journal of Animal Science 81: 157–168.
Chynoweth, D.P., Owens, J.M. and Legrand, R.L., 2001.Renewable methane from anaerobic digestion ofbiomass. Renewable Energy 22: 1–8.
Clavero, T. and Razz, R., 2002. Effects of biologicaladditives on silage composition of mott dwarfelephant-grass and animal performance. RevistaCientifica 12: 313–316.
Clergue, B., Amiaud, B., Pervanchon, F., Lasserre-Joulin,F. and Plantureux, S., 2005. Biodiversity: function andassessment in agricultural areas: A review. Agronomyfor Sustainable Development 25: 1–15.
Clifton-Brown, J.C., Stampfl, P.F. and Jones M.B., 2004.Miscanthus biomass production for energy in Europeand its potential contribution to decreasing fossil fuelcarbon emission. Global Change Biology 10: 509–518.
Connolly, L., Kinsella, A., Quinlan, G. and Moran, B.,2008. National Farm Survey 2007. Farm SurveysDepartment, Teagasc, Athenry, Ireland.
Connolly, L., Kinsella, A., Quinlan, G. and Moran, B.,2009. National Farm Survey 2008. Farm SurveysDepartment, Teagasc, Athenry, Ireland.
Connolly, V., 2001. Breeding Improved Varieties ofPerennial Ryegrass. Teagasc, Dublin, Ireland.
Coulter, B.S. (Ed.), 2004. Nutrient and Trace ElementAdvice for Grassland, Tillage, Vegetable and FruitCrops. Teagasc, Dublin, Ireland.
CropGen, 2007. Renewable Energy from Crops andAgrowastes D18. Quantification of Energy Deficitsand Surpluses for a Staged Approach to Crop EnergyProduction. SES6-CT-2004-502824, University ofVienna (BOKU-IFA), Austria.
Crowe, M., Fanning, A., Nolan, K., Carty, G. and Howley,D., 2000. National Waste Report 1998. EnvironmentalProtection Agency, Johnstown Castle Estate, Co.Wexford, Ireland.
CSO, 2009a. Projected Population 2006 Based(Number) by Sex, Age, Criteria for Projection andYear. Central Statistics Office, Cork, Ireland. Availableat http://www.cso.ie/px/pxeirestat/database/eirestat/Population%20Estimates/Population%20Estimates.asp[accessed February 2009].
CSO, 2009b. Area Farmed in June (000 Hectares) byType of Land Use, Region and Year. Central StatisticsOffice Cork, Ireland. Available athttp://www.cso.ie/px/pxeirestat/database/eirestat/Agriculture%20Area%20Used%20and%20Crop%20Production/Agriculture%20Area%20Used%20and%20Crop%20Production.asp [accessed November 2009].
CSO, 2010. Meat Supply Balance by Type of Meat, Yearand Statistic – Self Sufficiency in Meat Products (%).Central Statistics Office, Cork, Ireland. Available athttp://www.cso.ie/px/pxeirestat/database/eirestat/Agriculture%20Supply%20Balances/Agriculture%20Supply%20Balances.asp [accessed January 2010].
CSO, undated. Farm Animals in December (Thousand)by Type of Animal and Year. Central Statistics Office,Cork, Ireland.
Culleton, N., Murphy, W.E. and Coulter, B., 1999. Lime inIrish Agriculture. Fertilizer Association of Ireland.Available at http://www.fertilizer-assoc.ie/publications/lime_in_ireland/publications_lime_report4.htm[accessed October 2008].
DAFF, 2009. Conditions for Approval and Operating ofBiogas Plants Treating Animal By-Products in Ireland.Department of Agriculture, Fisheries and Food,Dublin, Ireland.
DAFF, undated. Ireland Rural Development NationalStrategy Plan 2007–2013. Department of Agriculture,Fisheries and Food, Dublin, Ireland.
DCENR, 2009. Press Release: Minister Ryan'sAnnouncement Re Biofuels Obligation. 9 November2009. Department of Communications, Energy andNatural Resources, Dublin, Ireland.
DCMNR, 2007. Government White Paper, Delivering aSustainable Energy Future for Ireland The EnergyPolicy Framework 2007 – 2020. Department ofCommunications, Marine and Natural Resources,Dublin, Ireland.
De Baere, L.D. and Mattheeuws, B., 2008. State-of-the-art 2008 – Anaerobic digestion of solid waste. Waste
50

J.D. Murphy et al. (2007-CCRP-1.7)
Management World. Volume 9, Issue 4. Available athttp://www.waste-management-world.com [accessed January 2010].
De Boever, J.L., De Smet, A., De Brabander, D.L. andBoucque, C.V., 1993. Evaluation of physical structure.1. Grass silage. Journal of Dairy Science 76: 140–153.
de Hullu, J., Maassen, J., van Meel, P.A., Shazad, S.,Vaessen, J.M.P., Bini, L. and Reijenga, J., 2008.Comparing Different Biogas Upgrading Techniques.Dirkse Milieutechniek, Eindhoven University ofTechnology, Eindhoven, The Netherlands.
DEHLG, 2000. National Climate Change Strategy.Department of the Environment, Heritage and LocalGovernment, Dublin, Ireland.
Demirbas, A. and Ozturk, T., 2005. Anaerobic digestionof Agricultural Solid Residues. International Journal ofGreen Energy 1: 483–494.
Dieterich, B., 2008. Energy Crops for AnaerobicDigestion (AD) in Westray. Report written for Heatand Power Ltd., Westray, Orkney, UK. Available athttp://cngireland.com/bio-methane%20info/Burkart%20Grass%20Report%20-%20Final170308.pdf[accessed February 2010]
Donnellan, T. and Hanrahan, K., 2008. Baseline 2008Outlook for EU and Irish Agriculture. Rural EconomyResearch Centre, Teagasc, Athenry, Ireland.
Durand, A., 2003. Bioreactor designs for solid statefermentation. Biochemical Engineering Journal 13:113–125.
EC, 1999. Council Directive 1999/31/EC of 26 April 1999on the landfill of waste. Official Journal of theEuropean Communities L182: 1–19.
EC, 2000. Directive 2000/60/EC of the EuropeanParliament and of the Council of 23 October 2000establishing a framework for Community action in thefield of water policy. Official Journal of the EuropeanCommunities L327: 1–72.
EC, 2001. Commission of the European Communities,COM (2001) 31 final. Communication from theCommission to the Council, the European Parliament,the Economic and Social Committee and theCommittee of the Regions on the Sixth EnvironmentAction Programme of the European CommunityEnvironment 2010: Our Future, Our Choice. Proposalfor a Decision of the European Parliament and of theCouncil laying down the Community EnvironmentAction Programme 2001–2010.
EC, 2003. Council Regulation (EC) No 1782/2003 of 29September 2003 establishing common rules for directsupport schemes under the common agriculturalpolicy and establishing certain support schemes forfarmers. Official Journal of the European Union,2003. pp. 1–69.
EC, 2005. Council Regulation EC/1698/2005 of 20September 2005 on support for rural development bythe European Agricultural Fund for RuralDevelopment (EAFRD), Official Journal of theEuropean Union L277: 21/10/2005.
EC, 2006. Well-to-wheels analysis of future automotivefuels and powertrains in the European context,European Commission, CONCAWE and EUCAR(European Council for Automotive R&D) (2006).
EC, 2009a, Directive 2009/28/EC of the EuropeanParliament and of the Council of 23 April 2009 on thepromotion of the use of energy from renewablesources and amending and subsequently repealingDirectives 2001/77/EC and 2003/30/EC. OfficialJournal of the European Union.
EC. 2009b, Directive 2009/33/EC of the EuropeanParliament and of the Council of 23 April 2009 on thepromotion of clean and energy efficient road transportvehicles. Official Journal of the European UnionL120: 5–12.
EC, 2009c, Directive 2009/73/EC of the EuropeanParliament and of the Council of 13 July 2009concerning common rules for the internal market innatural gas and repealing Directive 2003/55/EC.Official Journal of the European Union.
EC, 2010. Excise Duty Tables Part II – Energy Productsand Electricity. European Commission, Brussels,Belgium.
EEA, 2004. Transport Biofuels: Exploring Links with theEnergy and Agriculture Sectors. EEA Briefing 04.European Environment Agency, Copenhagen,Denmark. Available at http://www.eea.eu.int[accessed January 2010].
EEC. 1991. Council Directive 1991/676/EEC of 12December 1991 concerning the protection of watersagainst pollution caused by nitrates from agriculturalsources.
Electrigaz, 2008. Feasibility Study – Biogas Upgradingand Grid Injection in the Fraser Valley. ElectrigazTechnologies Inc., British Columbia, Canada.
EMEP/CORINAIR, 2004. Emission Inventory Guidebook.3rd Edn, European Environmental Agency.
EPA, 2005. Anaerobic Digestion: Benefits for WasteManagement, Agriculture, Energy, and theEnvironment. Environmental Protection Agency,Johnstown Castle Estate, Wexford, Ireland.
Eriksson, L. and Gustavsson, L., 2010. Comparativeanalysis of wood chips and bundles – costs, carbondioxide emissions, dry matter losses and allergicreactions. Biomass and Bioenergy 34: 82–90.
EVA, 2007. Heat Cost Calculation. Altener BIOHEAT, TheAustrian Energy Agency, Vienna, Austria. Available athttp://www.bioheat.info/ [accessed July 2007].
Farmer, M. and Swales, V., 2004. The Development and
51

The potential for grass biomethane as a biofuel
Implementation of Cross Compliance in the EU 15:An Analysis. Institute for European EnvironmentalPolicy, London, UK.
Farrar, M., 2009. Regulatory Update, Animal By-Products(ABP) as a Feedstock in Anaerobic Digestion (AD).Department of Agriculture, Fisheries and Food,Dublin, Ireland.
Feehan, J., 2003. Farming in Ireland. History, Heritageand Environment. University College Dublin, Facultyof Agriculture, Dublin, Ireland.
Fitzgerald, L., 2007. Cattle Weekly Farm ManagementNotes. Teagasc: 3 July. Available at http://www.bak.teagasc.ie/newsletters/farmingtips/2007/cattle-20070703.asp [accessed January, 2010].
Foley, A., Ó Gallachóir, B.P., Leahy, P. and McKeogh,E.J., 2009. Electric Vehicles and Energy Storage – aCase Study on Ireland. IEEE International VehiclePower and Propulsion Conference. Institute ofElectrical and Electronics Engineers, Dearborn, MI,USA.
Fossitt, J.A., 2000. A Guide to Habitats in Ireland. TheHeritage Council, Kilkenny, Ireland.
Freibauer, A., Rounsevell, M.D.A., Smith, P. andVerhagen, J., 2004. Carbon sequestration in theagricultural soils of Europe. Geoderma 122: 1–23.
Gasol, C.M., Gabarrell, X., Anton, A., Rigola, M.,Carrasco, J., Ciria, P. and Rieradevall, J., 2009. LCAof poplar bioenergy system compared with Brassicacarinata energy crop and natural gas in regionalscenario. Biomass and Bioenergy 33: 119–129.
Gerin, P.A., Vliegen, F. and Jossart, J.M., 2008. Energyand CO2 balance of maize kai grass as energy cropsfor anaerobic digestion. Bioresource Technology 99:2620–2627.
Goyal, P. and Sidhartha, 2003. Present scenario of airquality in Delhi: a case study of CNG implementation.Atmospheric Environment 37: 5423–5431.
Gunaseelan, V. and Nallathambi, S., 1997. Anaerobicdigestion of biomass for methane production: areview. Biomass and Bioenergy 13: 83–114.
Hagen, M., Polman, E., Jensen, J., Myken, A., Jönsson,O. and Dahl, A., 2001. Adding Gas from Biomass tothe Gas Grid. Report SGC 118: Swedish Gas Centre(SGC), Malmö, Sweden.
Harrison, D., Highley, D., Bloodworth, A. and Bate, R.,2006. Limestone. Mineral Planning Factsheet. BritishGeological Survey, Natural Environment ResearchCouncil, Office of the Deputy Prime Minister, London,UK.
Henham, A. and Makkar, M.K., 1998. Combustion ofsimulated biogas in a dual-fuel diesel engine. EnergyConversion Management 39: 2001–2009.
Holden, N.M. and Brereton, A.J., 2002. An assessment
of the potential impact of climate change on grassyield in Ireland over the next 100 years. Irish Journalof Agricultural and Food Research 41: 213–226.
Holliday, L., 2005. Rye-Grass as an Energy Crop UsingBiogas Technology. Report no. B/CR/00801/00/00.UK Department of Trade and Industry (DTI), London,UK.
Howley, M., Ó Gallachóir, B., Dennehy, E. and O'Leary,F., 2008. Renewable Energy in Ireland Focus onWind Energy and Biofuels. Energy Policy StatisticalSupport Unit, Sustainable Energy Ireland, Cork,Ireland.
Howley, M., Ó Gallachóir, B. and Dennehy, E., 2009a.Energy in Ireland 1990 – 2008. Energy PolicyStatistical Support Unit, Sustainable Energy Ireland,Cork, Ireland.
Howley, M., Ó Gallachóir, B. and Dennehy, E., 2009b.Energy in Transport. Energy Policy Statistical SupportUnit, Sustainable Energy Ireland, Cork, Ireland.
Hynes, S., O’Donoghue, C., Murphy, E. and Kinsella, A.,2008. Are Far Off Hills Really Greener? The Impact ofREPS on Farmer Behaviour. RERC Working PaperSeries 08-WP-RE-12. Available athttp://www.tnet.teagasc.ie/rerc/ [accessed January 2010].
Idler, C., Heckel, M., Herrmann, C. and Heiermann, M.,2007. Influence of biological additives in grass silageson the biogas yield. Research Papers of the Instituteof Agricultural Engineering, Lithuanian University ofAgriculture 39: 69–82.
IEA, OECD, 2007. Energy Policies of IEA CountriesGermany 2007 Review. International Energy Agencyand Organisation for Economic Co-operation andDevelopment, Paris, France.
IPCC, 2006. N2O emissions from managed soils, andCO2 emissions from lime and urea application. In:Eggleston, S., Buendia, L., Miwa, K., Ngara, T. andTanabe, K. (Eds) IPCC Guidelines for NationalGreenhouse Gas Inventories. Vol. 4 Agriculture,Forestry and Other Land Use, Institute for GlobalEnvironmental Strategies (IGES), Hayama, Japan pp.11.1–11.54.
Jensen, J., O’Toole, R. and Matthews, A., 2003.Controlling Greenhouse Gas Emissions fromAgricultural Sector in Ireland. A CGE ModellingApproach. A paper presented at the 6th AnnualConference on global economic analysis, The Hague,Netherlands. June 2003.
Jones, M.B. and Donnelly, A., 2004. Carbonsequestration in temperate grassland ecosystemsand the influence of management, climate andelevated CO2. New Phytologist 164: 423–439.
Kaparaju, P., Luostarinen, S., Kalmari, E., Kalmari, J. andRintala, J., 2002. Co-digestion of energy crops and
52

J.D. Murphy et al. (2007-CCRP-1.7)
industrial confectionery by-products with cow manure:Batch scale and farm-scale evaluation. WaterScience and Technology 45: 275–280.
Karagiannidis, A. and Perkoulidis, G., 2009. A multi-criteria ranking of different technologies for theanaerobic digestion for energy recovery of theorganic fraction of municipal solid wastes.Bioresource Technology 100: 2355–2360.
Keady, T.W.J., Mayne, C.S. and Fitzpatrick, D.A., 2000.Prediction of silage feeding value from the analysis ofthe herbage at ensiling and effects of nitrogenfertilizer, date of harvest and additive treatment ongrass silage composition. Journal of AgriculturalScience 134: 353–368.
Kelm, M., Wachendorf, M., Trott, H., Volkers, K. andTaude, F., 2004. Performance and environmentaleffects of forage production on sandy soils III. Energyefficiency in forage production from grassland andmaize for silage. Grass Forage Science 59: 69–79.
Kiely, G., Leahy, P., Sottocornola, M., Laine, A., Mishurov,M., Albertson, J. and Carton, O., 2009. Celticflux:Measurements and Modelling of Greenhouse GasFluxes from Grasslands and Peatland in Ireland.Environmental Protection Agency, Johnstown CastleEstate, Wexford, Ireland.
Kilroy, M., 2007. Grassland 1 – laying down land topasture, Ag-science study guide. Irish FarmersJournal 24 March 2007.
Kongshaug, G. and Jenssen, T.K., 2003. EnergyConsumption and Greenhouse Emissions in FertilizerProduction. International Fertilizer Society Meeting,London, UK, 3 April.
Korres, N.E., Singh, A., Nizami, A.S. and Murphy, J.D.,2010. Is grass biomethane a sustainable transportbiofuel? Biofuels, Bioproducts and Biorefining 4: 310–325.
Lehtomaki, A., 2006. Biogas Production from EnergyCrops and Crop Residues. PhD dissertation,Jyvaskyla Studies in Biological and EnvironmentalScience, University of Jyvaskyla, Finland.
Lehtomaki, A, Viinikainen, T.A. and Rintala, J.A., 2008.Screening boreal energy crops and crop residues formethane biofuel production. Biomass and Bioenergy32: 541–50.
Lewandowski, I., Scurlock, J.M.O., Lindvall, E. andChristou, M., 2003. The development and currentstatus of perennial rhizomatous grasses as energycrops in the US and Europe. Biomass and Bioenergy25: 335–361.
Lissens, G., Vandevivere, P., De Baere, L., Biey, E.M. andVestrae, W., 2001. Solid waste digesters: processperformance and practice for municipal solid wastedigestion. Abstract. Water Science and Technology44: 91–102.
Lockhart, J.A.R. and Wiseman, A.J.L., 1988. Introductionto Crop Husbandry. Sixth edition. Oxford PergamonPress, UK.
Lunt, D.J., Ross, I., Hopley, P.J. and Valdes, P.J., 2007.Modelling Late Oligocene C4 grasses and climate.Palaeogeography, Palaeoclimatology, Palaeoecology251: 239–253.
Madhukara, K., Nand, K., Raju, N.R. and Srilahta, H.R.,1993. Ensilage of mango peel for methanegeneration. Process Biochemistry 28: 119–123.
Mahnert, P., Heiermann, M. and Linke, B., 2005. Batch-and semi-continuous biogas production from differentgrass species. Agricultural Engineering InternationalThe CIGR EJournal 2005, V11, Manuscript EE 05010.
Mathiasson, A., 2008. Vehicle Gas Utilization in Sweden– Today and Tomorrow. 2nd Nordic BiogasConference. The Swedish Gas Association, Malmö,Sweden.
McLaughlin, S.B. and Kszos, L.A., 2005. Development ofswitchgrass (Panicum vigratum) as a bioenergyfeedstock in the United States. Biomass andBioenergy 28: 515–535.
Meaney, B., Collins, C., Nolan, K., Cahill, E., Delaney, J.,Murray, B., Healy, J. and Carty, G., 2003. NationalWaste Database Report 2001. EnvironmentalProtection Agency, Johnstown Castle Estate,Wexford, Ireland.
Minson, D.J., 1981. The effects of feeding protected andunprotected casein on the milk production of cowsgrazing ryegrass. The Journal of Agricultural Science96: 239–241.
Mosier, N., Hendrickson, R., Ho, N., Sedlak, M. andLadisch, M.R., 2005. Optimization of pH controlledliquid hot water pretreatment of corn stover.Bioresource Technology 96: 1986–1993.
Murdoch, J.C., 1980. The conservation of grass. In:Holmes, W. (Ed.) Grass: Its Production andUtilisation. Published for the British GrasslandSociety by Blackwell Scientific Publications, UK.
Murphy, J.D., 2004. Biogas Systems: Small is Beautiful.World Renewable Energy Congress, August–September. Denver, CO, USA.
Murphy, J.D. and McCarthy, K., 2005. The optimalproduction of biogas for use as a transport fuel inIreland. Renewable Energy 30: 2111–27.
Murphy, J.D. and McKeogh, E., 2004. Technical,economic and environmental analysis of energyproduction from municipal solid waste. RenewableEnergy 29: 1043–1057.
Murphy, J.D. and Power, N.M., 2006. A technical,economic and environmental comparison ofcomposting and anaerobic digestion of biodegradablemunicipal waste. Journal of Environmental Science
53

The potential for grass biomethane as a biofuel
and Health Part A Toxic/Hazardous Substances &Environmental Engineering 41: 865–879.
Murphy, J.D. and Power, N., 2009a. Technical andeconomic analysis of biogas production in Irelandutilising three different crop rotations. Applied Energy86: 25–36.
Murphy, J.D. and Power, N.M., 2009b. An argument forusing biomethane generated from grass as a biofuelin Ireland. Biomass and Bioenergy 33: 504–512.
Murphy, J.D., McKeogh, E. and Kiely, G., 2004. Atechnical, economic and environmental analysis ofbiogas utilisation. Applied Energy 77: 407–427.
Mussner, R., Leipprand, A. and Schlegel, S., 2006.Facilitating the CAP Reform: Compliance andcompetitiveness of European Agriculture. Deliverable5. Mandatory Standards in 7 EU countries and 3 non-EU countries. Germany Country Report. Project No.SSPE-CT-2005-006489.
NDP, 2007. Ireland National Development Plan 2007–2013. Government Stationery Office, Dublin, Ireland.
Neureiter, M., dos Santos, J.T.P., Lopez, C.P., Pichler, H.,Kirchmayr, R. and Braun, R., 2005. Effect of silagepreparation on methane yields from whole crop maizesilages. In: Ahring, B.K. and Hartmann, H. (Eds)Proceedings of the 4th International Symposium onAnaerobic Digestion of Solid Waste. BioCentrum-DTU, Copenhagen, Denmark. 1: 109–115.
NGV, 2009. The GVR Gas Vehicles Report. 8#7(92):NGV Communications Group, Argentina.
NIAUR, 2009. Energy Retail Report 2009. The NorthernIreland Authority for Utility Regulation, Belfast,Northern Ireland.
Nippert, J.B., Fay, P.A. and Knapp, A.K., 2007.Photosynthetic traits in C3 and C4 grassland speciesin mesocosm and field environments. Environmentaland Experimental Botany 60: 412–420.
Niu, S., Zhang, Y., Yuan, Z., Liu, W., Huang, J. and Wan,S., 2006. Effects of interspecific competition andnitrogen seasonality on the photosyntheticcharacteristics of C3 and C4 grasses. Environmentaland Experimental Botany 57: 270–277.
Nizami, A.S. and Murphy, J.D., 2010. What is the optimaldigester configuration for producing grassbiomethane? Renewable and Sustainable EnergyReviews 14: 1558–1568.
Nizami, A.S., Korres, N.E. and Murphy, J.D., 2009.Review of the integrated process for the production ofgrass biomethane. Environmental Science andTechnology 43: 8496–8508.
Nordheim-Viken, H. and Volden, H., 2009. Effect ofmaturity stage, nitrogen fertilization and seasonalvariation on ruminant degradation characteristics ofneutral detergent fibre in timothy (Phleum pratenseL.). Animal Feed Science and Technology 149: 30–
59.
O’Brien, M., O’Kiely, P., Forristal, P.D. and Fuller, H.T.,2008. Fungal contamination of big-bale grass silageon Irish farms: predominant mould and yeast speciesand features of bales and silage. Grass and ForageScience 63: 121–137.
O’Kiely, P., Conaghan, P., Howard, H., Moloney, A. andBlack, A., 2005. Grazing and Ensiling of Energy-RichGrasses with Elevated Sugar Contents forSustainable Production of Ruminant Livestock(Acronym: SweetGrass). Beef Production Series No.80. RMIS No. 5002. Teagasc, Grange LivestockResearch Centre, Meath, Ireland.
O’Kiely, P., Moloney, A. and O’Riordan, E.G., 2002.Reducing the Cost of Beef Production by IncreasingSilage Intake. Project No. 4622. Beef ProductionSeries No. 51. December. ARMIS No. 4622. ISBN 184170 282. Teagasc, Grange Research Centre,Meath, Ireland.
O'Leary, F., Howley, M. and Ó Gallachóir, B., 2007.Combined Heat and Power in Ireland 2007 Update.Sustainable Energy Ireland, Dublin, Ireland.
O'Leary, F., Howley, M. and Ó Gallachóir, B., 2008.Energy in the Residential Sector 2008 Report.Sustainable Energy Ireland, Dublin, Ireland.
O’Mara, F., 2008. Country Pasture/Forage ResourceProfile Ireland. Food and Agriculture Organization ofthe United Nations, Rome, Italy.
O’Sullivan, A.M., 1982. The lowland grasslands ofIreland. Journal of Life Sciences, Royal DublinSociety 3: 131–142.
O’Sullivan, A.M. and Murphy, W.E., 1982. Grassproduction from old permanent pasture. GrasslandProduction Seminar. Johnstown Castle ResearchCentre, An Foras Talúntais, Dublin, Ireland. pp. 125–133.
OSI, 2010. Frequently Asked Questions – What is thearea by county in land and water (fresh)? OrdnanceSurvey Ireland, Dublin, Ireland. Available athttp://www.osi.ie/en/faq/faq3.aspx#faq5 [accessed January 2010].
Osterburg, B., Nitsch, H. and Kristensen, L., 2005.Environmental standards and their linkage to supportinstruments of the EU Common Agricultural Policy.Paper prepared for presentation at the 99th seminarof the EAAE, The future of Rural Europe in the GlobalAgri-Food System, Copenhagen, Denmark, August22–27.
Peeters, A., 2009. Importance, evolution, environmentalimpact and future challenges of grasslands andgrassland-based systems in Europe. GrasslandScience 55: 113–125.
Persson, M., 2003. Evaluation of Upgrading Techniquesfor Biogas. Report SGC 142, Swedish Gas Centre,
54
J.D. Murphy et al. (2007-CCRP-1.7)
Malmö, Sweden.
Persson, M., Jönsson, O. and Wellinger, A., 2006. BiogasUpgrading to Vehicle Fuel Standards and GridInjection. IEA Bioenergy, Task 37 – Energy fromBiogas and Landfill Gas. International EnergyAgency.
Petersson, A. and Wellinger, A., 2009. Biogas UpgradingTechnologies – Developments and Innovations. Task37 – Energy from Biogas and Landfill Gas, IEABioenergy, International Energy Agency.
Pettigrew, M., 2000. http://www.esru.strath.ac.uk/
Peyraud, J.L., Astigarraga, L. and Faverdin, P., 1997.Digestion of fresh perennial ryegrass fertilized at twolevel of nitrogen by lactating cows. Animals FeedScience Technology 64: 155–171.
Plochl, M. and Heiermann, M., 2006. Biogas Farming inCentral and Northern Europe: a strategy forDeveloping Countries? Invited Overview. Agriculturalengineering international, CIGR Ejournal No. 8. Vol.VIII.
Pouech, P., Fruteau, H. and Bewa, H., 1998. Agriculturalcrops for biogas production on anaerobic digestionplants. Proceedings of the 10th EuropeanConference on Biomass for Energy and Industry,Wurzburg, Germany. pp. 163–165.
Poulsen, T.G., 2003. Anaerobic Digestion – CourseMaterial – Solid Waste Management. Chapter 5,M.Sc. Environmental Engineering, Aalborg University,Aalborg, Denmark. pp. 93–109.
Power, N. and Murphy, J.D., 2009. Which is thepreferable transport fuel on a greenhouse gas basis;biomethane or ethanol? Biomass and Bioenergy 33:1403–1412.
Prochnow, A., Heiermann, M., Drenckhan, A. andSchelle, H., 2005. Seasonal pattern ofbiomethanisation of grass from landscapemanagement. Agricultural Engineering International:CIGR Ejournal 2005. Vol. VII, Manuscript EE 05 011.
Prochnow, A., Heiermann, M., Plochl, M., Linke, B., Idler,C., Amon, T. and Hodds, P.J., 2009. Bioenergy frompermanent grassland – A review: 1. Biogas.Bioresource Technology 100: 4931–4944.
Rabl, A., 2002. Environmental benefits of natural gas forbuses. Transportation Research Part D: Transportand Environment 7: 391–405.
Rani, D.S. and Nand, K., 2004. Ensilage of pineappleprocessing waste for methane generation. WasteManagement 24: 523–528.
Rebac, S., Kato, M.T. and Lettinga, G., 1995. High-rateanaerobic treatment of wastewater underpsychrophilic conditions. Journal of Fermentation andBioengineering 80: 499–506.
Reid, R.L., Jung, G.A. and Thayne, W.V., 1988.
Relationships between nutritive quality and fibercomponents of cool season and warm seasonforages: A retrospective study. Journal of AnimalScience 66: 1275–1291.
Ress, B.B., Calvert, P.P., Pettigrew, C.A. and Barlaz,M.A., 1998. Testing anaerobic biodegradability ofpolymers in a laboratory-scale simulated landfill.Environmental Science and Technology 32: 821–827.
Robson, M.J., Parsons, A.J. and Williams, T.E., 1989.Herbage production: grasses and legumes. In:Holmes, W. (Ed.) Grass. Its Production andUtilization. 2nd Edn. Blackwell, Oxford, UK. pp. 7–88.
Romanelli, T.L. and Milan, M., 2004. Energy balancemethodology and modelling of supplementary forageproduction. In: Ortega, E. and Ulgiati, S. (Eds) IVBiennial International Workshop on Advances inEnergy Studies. Unicamp, Campians, SP, Brazil. pp.315–321.
Rösch, C., Skarka, J., Raab, K. and Stelzer, V., 2009.Energy production from grassland – Assessing thesustainability of different process chains underGerman conditions. Biomass and Bioenergy 33: 689–700.
Ryan, M., 1974. Grassland productivity. 1. Nitrogen andsoil effects on yield of herbage. Irish Journal ofAgricultural Research 13: 275–291.
Sachs, J.V., Meyer, U., Rys, P. and Feikenhauer, H.,2003. New approach to control the methanogenicreactor of a two-phase anaerobic digestion system.Water Research 37: 973–982.
Salminen, E. and Rintala, J., 2002. Anaerobic digestionof organic solid poultry slaughterhouse waste: areview. Bioresource Technology 83: 13–26.
Salter, A. and Banks, C.J., 2009. Establishing an energybalance for crop-based digestion. Water ScienceTechnology 59: 1053–1060.
Samson, R., 2006. Journée CRAAQ Québec, 2006.Available at http://www.craaq.qc.ca [accessed May 2009].
Saunders, C., Barber, A. and Taylor, G., 2006. Food Miles– Comparative Energy/Emissions Performance ofNew Zealand’s Agriculture Industry. Research Report285, Lincoln University New Zealand (2006).Available at http://www.lincoln.ac.nz/documents/2328_rr285_s13389.pdf [accessed November 2009].
SEI, 2009a, Emission Factors. Sustainable EnergyIreland, Dublin, Ireland. Available at http://www.sei.ie/Publications/Statistics_Publications/Emission_Factors/[accessed January 2010].
SEI, 2009b, Biomass CHP / Anaerobic Digestion CHPDeployment Programme Call for ProposalsApplication Guidelines. Ver. 1.6, Sustainable EnergyIreland, Dublin, Ireland.
SEI, 2009c, Ireland's Provisional Energy Balance 2008.
55

The potential for grass biomethane as a biofuel
Sustainable Energy Ireland, Dublin, Ireland.
SEI, 2010. Commercial/Industrial Fuels Comparison ofEnergy Costs. Sustainable Energy Ireland, Dublin,Ireland.
Singh, A. and Murphy, J.D., 2009. Biomethane fromAnimal Waste and Grass for Clean Vehicular Biofuelin Ireland. Twelfth International Waste Managementand Landfill Symposium; 5–9 October; Cagliari,Sardinia, Italy. CISA, Environmental SanitaryEngineering Centre, Italy.
Singh, A., Pant, D., Korres, N.E., Nizami, A.S., Prasad,S. and Murphy, J.D., 2010a. Key issues in life cycleassessment of ethanol production from lignocellulosicbiomass: challenges and perspectives. BioresourceTechnology 101: 5003–5012.
Singh, A., Smyth, B.M. and Murphy, J.D., 2010b. Abiofuel strategy for Ireland with an emphasis onproduction of biomethane and minimization of landtake. Renewable and Sustainable Energy Reviews14: 277–288.
Smit, H.J., Metzger, M.J. and Ewert, F., 2008. Spatialdistribution of grassland productivity and land use inEurope. Agricultural Systems 98: 208–219.
Smith, K.F., Culvenor, R.A., Humphreys, M.O. andSimpson, R.J., 2002. Growth and carbon partitioningin perennial ryegrass (Lolium perenne) cultivarsselected for high water-soluble carbohydrateconcentrations. Journal Agricultural Science 138:375–385.
Smyth, B.M., 2007. Optimal biomass technology for theproduction of heat and power. Master’s thesis.Department of Civil and Environmental Engineering,University College Cork, Cork, Ireland.
Smyth, B.M., Murphy, J.D. and O’Brien, C., 2009. What isthe energy balance of grass biomethane in Irelandand other temperate northern European climates?Renewable and Sustainable Energy Reviews 13:2349–2360.
Smyth, B., Ó Gallachóir, B.P., Korres, N.E. and Murphy,J.D., 2010a. Can we meet targets for biofuels andrenewable energy in transport given the constraintsimposed by policy in agriculture and energy? Journalof Cleaner Production 18: 1671–1685.
Smyth, B.M., Smyth, H. and Murphy, J.D., 2010b. Cangrass biomethane be an economically viable biofuelfor the farmer and the consumer? Biofuels,Bioproducts, Biorefinery 4(5): 519–537.
Steffen, R., Szolar, O. and Braun, R., 1998. Feedstocksfor Anaerobic Digestion. Institute forAgrobiotechnology Tulln, University of AgriculturalSciences, Vienna, Austria.
Styles, D. and Jones, M.B., 2004. Energy Crops inIreland. An Assessment of their Potential Contributionto Sustainable Agriculture, Electricity and Heat
Production. Final Report. Environmental ProtectionAgency, Johnstown Castle Estate, Wexford, Ireland.
Teagasc, 2008. Management Data for Farm Planning2008. Teagasc, Carlow, Ireland.
Thamsiriroj, T. and Murphy, J.D., 2009. Is it better toimport palm oil from Thailand to produce biodiesel inIreland than to produce biodiesel from indigenousIrish rape seed? Applied Energy 86: 595–604.
Thornton, F.C., 1996. Soil emissions of nitric oxide andnitrous oxide from no-till corn. Soil Science Society ofAmerican Journal 60: 1127–1133.
Tilman, D., Hill, J. and Lehman, C., 2006. Carbon-negative biofuels from low-input high-diversitygrassland biomass. Science 314: 1598–1600.
Tremeac, B. and Meunier, F., 2009. Life cycle analysis of4.5 MW and 250 W wind turbines. Renewable andSustainable Energy Reviews 13: 2104–2110.
USDA, 2006. GAIN Report EU-25 Bio-fuels. BiofuelsAnnual 2006. USDA Foreign Agricultural Service,Washington, DC, USA.
Vandevivere, P., 1999. New and broad applications ofanaerobic digestion. Critical Reviews inenvironmental Science and Technology 29: 151–173.
Vandevivere, P., De Baere, L. and Verstraete, W., 2003.Types of anaerobic digester for solid wastes. In:Mata-Alvarez, J. (Ed.) Biomethanization of theOrganic Fraction of Municipal Solid Wastes. IWAPress London, UK. pp. 112–140.
Walker, J.W., 1995. Viewpoint: grazing management andresearch now and in the next millennium. Journal ofRange Management 48: 350–357.
Walker, N., Scheer, J., Clancy, M. and Ó Gallachóir, B.,2009. Energy Forecasts in Ireland to 2020. EnergyModelling Group, Sustainable Energy Ireland, Dublin,Ireland.
Walla, C. and Schneeberger, W., 2008. The optimal sizefor biogas plants. Biomass and Bioenergy 32: 551–557.
Ward, A.J., Hobbs, P.J., Holliman, P.J. and Jones, D.L.,2008. Optimisation of the anaerobic digestion ofagricultural residues. Bioresource Technology 99:7928–7940.
Weiland, P., 2006. Biomass design in agriculture: asuccessful pathway for the energy production andwaste treatment in Germany. Engineering in LifeSciences 6: 302–309.
Weimer, P.J. and Springer, T.L., 2007. Fermentability ofEastern gamagrass, big bluesten and sand bluestemgrown across a wide variety of environments.Bioresource Technology 98: 1615–1621.
Weisser, D., 2007. A guide to life-cycle greenhouse gas(GHG) emissions from electric supply technologies.Energy 32: 1543–1559.
56

J.D. Murphy et al. (2007-CCRP-1.7)
West, T.O. and Marland, G., 2002. A synthesis of carbonsequestration, carbon emissions, and net carbon fluxin agriculture: comparing tillage practices in theUnited States. Agriculture Ecosystem andEnvironment 91: 217–232.
White, L.M., 1973. Carbohydrate reserves of grasses: Areview. Journal of Range Management 26: 13–18.
Wilkie, A.C., 2008. Biomethane from biomass, biowasteand biofuels. In: Wall, J.D. Harwood, C.S. andDemain, A. (Eds) Bioenergy. ASM Press,Washington, DC, USA. pp. 195–205.
Winslow, J.C., Hunt, R.E. and Piper, S.C., 2003. Theinfluence of seasonal water availability on global C3versus C4 grassland biomass and its implications forclimate change research. Ecological Modelling 163:153–173.
Woolford, M.K., 1984. The Silage Fermentation. MarcelDekker Inc., New York, Basel.
Yiridoe, E.K., Gordon, R. and Brown, B.B., 2009.Nonmarket cobenefits and economic feasibility of on-farm biogas energy production. Energy Policy 37:1170–1179.
57

The potential for grass biomethane as a biofuel
Peer-Reviewed Journal Publications from Report
These papers were written while undertaking the
research project; the report is drawn from the papers
and the papers from the report.
Korres, N.E., Singh, A., Nizami, A.S. and Murphy, J.D.,2010. Is grass biomethane a sustainable transportbiofuel? Biofuels, Bioproducts, Biorefinery 4: 310–325.
Nizami, A.S. and Murphy, J.D., 2010. What type ofdigester configurations should be employed toproduce biomethane from grass silage? Renewableand Sustainable Energy Reviews 14: 1558–1568.
Nizami, A.S., Korres, N.E. and Murphy, J.D., 2009. Areview of the integrated process for the production ofgrass biomethane. Environmental Science andTechnology 43(22): 8496–8508.
Singh, A., Smyth, B.M. and Murphy, J.D., 2010. A biofuelstrategy for Ireland with an emphasis on production ofbiomethane and minimization of land take.Renewable and Sustainable Energy Reviews 14(1):
277–288.
Singh, A., Nizami, A.S., Korres, N.E. and Murphy, J.D.,2011. The effect of reactor design on thesustainability of grass biomethane. Renewable andSustainable Energy Reviews 15: 1567–1574.
Smyth, B.M., Murphy, J.D. and O'Brien, C., 2009. What isthe energy balance of grass biomethane in Irelandand other temperate northern European climates?Renewable and Sustainable Energy Reviews 13(9):2349–2360.
Smyth, B., Smyth, H. and Murphy, J.D., 2010. Can grassbiomethane be an economically viable biofuel for thefarmer and the consumer? Biofuels, Bioproducts,Biorefinery 4(5): 519–537. doi:10.1002/bbb.238.
Smyth, B., Ó Gallachóir, B., Korres, N. and Murphy, J.D.,2010. Can we meet targets for biofuels andrenewable energy in transport given the constraintsimposed by policy in agriculture and energy? TheJournal of Cleaner Production 18: 1671–1685.
58

J.D. Murphy et al. (2007-CCRP-1.7)
Acronyms and Annotations
a.i. Active ingredient: chemical substance of a pesticide that kills the target pest
AAU Agricultural area used
ABP Animal by-products
ABPR Animal By-Product Regulations
AD Anaerobic digestion
ADF Acid detergent fibre; an estimation of the cellulose and lignin content in a feed
ADL Acid detergent lignin: estimates lignin content in feedstock
BioCNG Compressed biomethane and natural gas
C-3 plant First product of photosynthesis consists of three carbon atoms (cool or temperate grasses)
C-4 plant First product of photosynthesis consists of four carbon atoms (warm or tropical grasses)
CAD Centralised anaerobic digestion
CAN Calcium ammonium nitrate
CAP Common Agricultural Policy
CCGT Combined cycle gas turbine
CF Cocksfoot
CH4 Methane
CHP Combined heat and power
CNG Compressed natural gas
CO2e Carbon dioxide equivalent
CP Crude protein
CSO Central Statistics Office
CSTR Continuous stirred tank reactor
DAFF Department of Agriculture, Fisheries and Food
DM Dry matter
DMD Dry matter digestible: percentage of the feed dry matter actually digested by animals
DMI Dry matter indigestible: dietary fibre (roughage), the indigestible portion of plant food
DS Dry solids
FE Fuel efficiency
FFI Farm family income
FM Fresh matter
GDP Gross Domestic Product
GHG Greenhouse gas
59

The potential for grass biomethane as a biofuel
GWP Global warming potential
HPWS High pressure water scrubbing
HRT Hydraulic retention time
IEA International Energy Agency
ktoe Kilotonnes of oil equivalent
LCA Life-cycle assessment
ME Metabolisable energy: the feed energy actually used by the animal
MF Meadow foxtail
N, P, K Nitrogen, phosphorus, potassium
NDF Neutral detergent fibre; estimation of hemicellulose and cellulose content, cell wall content
NDP National Development Plan
ODM Organic dry matter
OFMSW Organic fraction of municipal solid waste
OLR Organic loading rate
PRG Perennial ryegrass
PS Photosynthetic
REPS Rural Environment Protection Scheme
RES-H Renewable Energy Supply in Heat
RES-T Renewable Energy Supply in Transport
TS Total solids
UASB Upflow anaerobic sludge blanket
UCO Used cooking oil
VDS Volatile dry solids
VFA Volatile fatty acids
WDGS Wet distiller’s grains with solubles
WSC Water-soluble carbohydrate
60