the minho-lima sub-region as a common destination: agentsââ¬â¢ commitment on it
TRANSCRIPT

46th Congress of the European Regional Science Association Enlargement, Southern Europe and the Mediterranean
University of Thessaly, Volos - Greece, August 30th – September 3rd 2006 Cadima Ribeiro, José EEG e NIPE Universidade do Minho Campus de Gualtar 4710 Braga - Portugal Fax: 351 253676375 [email protected]
Cruz Vareiro, Laurentina IPCA- ESG Urb. Quinta da Formiga, Ed. Panorâmico II, Lote 3 4750 Arcozelo – Portugal Fax: 351 253812461 [email protected]
Pardellas de Blas, Xulio Dep. Economia Aplicada Universidad de Vigo Campus Lagoas Marcosende s/n 36200 Vigo- Spain [email protected]
The Minho-Lima sub-region as a common destination: tourist potential and
agents’ commitment on it
Abstract
Empirical evidence shows that tourism can give a real contribution to regional development
and, in the case of certain remote and economic lagged territories, it is one of the best placed
sectors to achieve this goal. This as to do, namely, with the possibility of making use of
endogenous resources of territories. In the case of the Minho-Lima sub-region, an important
tourist potential exists coming from the variety and singularity of its resources - the beauty of its
landscapes, the architectonic wealth of secular buildings, and the exuberance of the gastronomy
and many of its cultural manifestations.
Taking this in view, this paper attempts to catalogue and evaluate the tourist resources of
Minho-Lima, as well as to analyze the complementary elements and the external factors related
with the image of the destination. The methodology followed relies on a two-stage process.
Firstly, taking the primary components, the consistency of the territory as a tourist destination
was analysed, evaluating its tourism potential. In a second stage, considering the secondary
elements, the components of the image of the common tourist destination were evaluated
through the study of local, regional and national promotion strategies, in what brochures and
web sites are concerned. The ultimate goal is to check the perception of the territory as a
common destination and agents’ commitment on it.
Key words: endogenous resources; regional development; tourist potential.
2
Introduction It is usually admitted that tourism plays an important role in economic development,
providing long-term benefits to local economies, mostly when implemented on a
sustained base. The capacity of tourism to establish synergies with other activities, like
lodging, feeding, drinking, transport and entertainment services for tourists, makes
tourism a structuring sector of many economies.
In many developed countries and in developing ones tourism is nowadays a strategic
sector. This is the Portuguese case, where tourism is presented as a strategic cluster by
government’s Economic and Social Development Plan for 2000/2006. In this document,
tourism is officially claimed to be one pivotal activity to achieve the economic and
social development of the nation and of its regions, particularly of the remote and
lagged ones.
Assuming the analysis of the available tourist resources is crucial to define the tourist
vocation of a territory, and, above all, to select the best tourist alternative within the
range of available possibilities (Leno Cerro, 1993), this investigation aims to present a
preliminary evaluation of the tourist resources of the Minho-Lima sub-region. For this
purpose, we have selected the methodology of tourist value index or tourist potential
suggested by Leno Cerro (1992), introducing some innovation by the use of a linear
regression to calculate some weighting factors.
In a second stage, the components of the image of this territory as a common tourist
destination were analysed through the study of local, regional and national promotion
strategies, as documented by the brochures and web sites available.
1. Tourist Potential Evaluation
The tourist potential or the elements that configure a tourist destination depend,
basically, of the amount and quality of the available tourist resources, although other
aspects as the accessibility or equipments/infrastructures available also determine this
potential. In other words, to characterize a destination it is necessary to evaluate
resources as well as to analyze the geographical space that configures this territory, not
just as a resource but also as a location factor for those activities (Pardellas et al., 2001).

3
Empirical data show that tourism activities follow singular space location behaviour.
This way, the general location theory can apply to this kind of studies, but the
specificity of tourism activities and connected services sector must be present. In
particular, one should account for the circumstance of the consumption of its products
to take place where they are produced. This specificity implies, on the one hand, a direct
and physical relation between tourist resources and goods produced from them and, on
the other hand, that the tourists have to displace themselves from their usual residence
to satisfy that demand.
The classification methods and the inventory of the resources constitute a first step in
the analysis of the tourist potential, but the real value of the potential of a territory is not
only measured by the number of attractions it possesses but also by their quality. This is
the role of the evaluation techniques, which allow establishing a measure of the value of
resources available, and thus, to support decisions taken in the aim of planning
processes.
Therefore, the evaluation of the tourist potential of all municipalities of the Minho-Lima
sub-region aims to establish indicators that can be useful for the private and public
planning decisions.
Following Leno Cerro (1992 and 1993), to analyze the real value of the tourist potential
of a territory we cannot only measure the number of resources and attractions that it
possesses but, mostly, its quality, as well as other aspects like accessibility and
equipment. Leno Cerro (1992 and 1993) establishes a formula of the Tourist Value
Index or Tourist Potential, of a certain territory, as follows:
IPTi = αFri + βFai + δFei
where,
IPTi = Tourist Potentiality Index of the municipality “i”.
Fr, Fa, Fe = values of the “resources”, “accessibilities” and “equipments” factors of the
municipality “i”.
α, β, δ = weighting factors.
The weighting factors attributed to each one of the elements in the elaboration of the
model are justified by the fact that not all them have equal importance in the calculation
of the tourist value.

4
1.1 Resources Value
From the touristic point of view, not all the inventoried resources have the same value.
The value depends on the nature of the resource (natural, historical, ethnographic) and
on its characteristics related to singularity, availability, etc.. Therefore, it is not enough
to account for the number of resources available in each municipality. It is also needed
to consider the individual importance of each one. By other words, we have to be able
to evaluate them.
For this purpose, we have selected the methodology of resources evaluation suggested
by Leno Cerro (1992 and 1993), which determines that the tourist value of a particular
resource attending its nature and singularity, in agreement with the following equation:
Vri= Jpi*µi
where,
Vri= tourist value of resource “i”
Jpi = primary hierarchy of the resource “i”
µi = weighting factor, attending to the nature of the resource “i”
This way, the tourist value of a resource will depend on the hierarchy that it occupies, in
terms of importance and/or singularity, as well as on the weighting factor attributed to
the category which it belongs, taking into account its nature. With regard to this last
issue, besides considering the weighting factors presented by Leno Cerro, we have
introduced an alternative approach, calculating these factors through a linear regression.
However, before proceeding to the evaluation of the resources, it matters to classify
them in large groups. Indeed, the simple identification of resources is not enough for its
treatment in a planning process, because its nature can be very diverse. This
circumstance makes necessary to take as a previous task their classification by
homogeneous groups. Taking in consideration the classifications proposals of Defert
(1996), Vera (1997) and Padín (2004), it was decided to classify resources in 3 major
categories: RN - natural resources; RH - historical resources; and RE - ethnographical
resources.

5
1.1.1 Establishment of hierarchies In what concerns the evaluation of resources, by one side, this implies the establishment
of hierarchies. Those hierarchies are function of the importance and singularity of each
resource, which can be classified as being of international, national, regional or local
interest. For the estimation of these hierarchies, one considered the several references
we could find to them in electronic supports and in published paper materials (that is,
brochures, tourist guides, itineraries, etc.). Trough this procedure we could attribute a
scale of 1 to 4 points to the importance and/or singularity of each of the resources
identified, being:
Hierarchy 1: local interest.
Hierarchy 2: regional interest.
Hierarchy 3: national interest.
Hierarchy 4: international interest.
Table 1 – Resources by category and hierarchy, in Minho-Lima
Hierarchy/Category Natural Resources
Historical Resources
Ethnographical Resources
Total Total %
Hierarchy 1 56 103 86 245 24,43 Hierarchy 2 79 314 166 559 55,73 Hierarchy 3 21 74 25 120 11,96 Hierarchy 4 15 49 15 79 7,88 Total 171 540 292 1003 100 Total % 17,05 53,84 29,11 100 Source: authors’ elaboration.
On the other side, the evaluation of resources implies the consideration of a factor that
weights the nature of the resource1, once the hierarchy doesn't indicate the touristic
value of the resource, but its importance inside of the own category. The weighting
factor will allow transforming that hierarchy in an economic graduation. With this
purpose, one appealed to two differentiated methodologies, which we present in the
next sections.
1.1.2 Demand-based coefficients / Leno Cerro’s coefficients Leno Cerro proposal (1992), has its bases in the empirical work done by other authors,
like Var et al. (1977), Ferrario (1980) and Cinelli (1985). Starting from there, in order to
1 The establishment of weighting factors is made not for each resource but for major groups of resources, according to its nature, which, in our case, will correspond to the three categories inventoried.

6
solve the problem of dealing with different space scopes used in the previous
researches, Leno Cerro conducted a questionnaire about the Spanish tourists'
motivations. Although the numerical values they got didn't coincide, these authors had
in common the fact of identifying natural resources as the ones that raised larger interest
in the tourist demand.
Following the before mentioned procedure, the weighting coefficients proposed by
Leno Cerro for each of the resources categories were:
Weighting factors
- Natural resources: 1,65
- Historical resources: 1,11
- Ethnographical resources: 1,12
As, in a study accomplished by RTAM2 (RTAM, 2004), these factors broadly express
the motivations of the tourists that had visited the Minho-Lima sub-region - occupying
the natural and ethnographical resources the first places in its preferences - we thought
to be appropriate to use the same values in our analysis.
1.1.3 Supply-based coefficients / Alternative coefficients Besides the tourists' opinion, in the evaluation of resources we also decide to consider
the one of the agents (publics and privates) charged of the elaboration of this territory
promotion materials. From there, we would get the vision of the tourist destination
trough the eyes of promoters, that is, an offer approach, and, of course, to confront both
views.
Therefore, starting from its mention in the several promotional materials, we made the
estimation of a linear regression (annex1), in order to determine the implicit importance
of each category of resources.
As dependent variable, we chose the number of references in the various promotional
supports (web sites, brochures, tourist guides, itineraries…). As independent variables,
we used i) the number of natural resources, ii) the number of historical resources and iii)
the number of ethnographical resources existing in each one of the parishes of the
municipalities taken in our study.
The results obtained were:
2 Alto Minho’s Tourist Board - official entity charged of Alto Minho tourist promotion.

7
Weighting factors
- Natural resources: 2,682
- Historical resources: 5,342
- Ethnographical resources: 4,493
As previously mentioned, these coefficients expose the importance that the agents
(public and private) charged of the elaboration of the promotional material continue
giving to the constructed heritage, as well as to the festivities, pilgrimages, gastronomy,
etc. Supposedly, that is the mark image of this area.
1.1.4 Results of the factor resources evaluation After the estimation of the parameters that define the tourist value of the each group of
resource, it is possible to evaluate the potential of each municipality of Minho-Lima.
The resources factor3 for each municipality is given by the sum of the scores obtained
by the n resources that it possesses (table 2).
Table 2 - Resources value, by municipality
Municipality Vr
(Leno Cerro) Weighed value
(Leno Cerro) Vr
(Regression) Weighed value
(Regression) Arcos de Valdevez 265,03 63,37 1031,07 62,88 Caminha 244,03 58,35 872,66 53,22 Melgaço 169,37 40,50 681,1 41,54 Monção 197,84 47,31 796,71 48,59 Paredes de Coura 177,59 42,46 697,06 42,51 Ponte da Barca 207,73 49,67 774,03 47,21 Ponte de Lima 379,75 90,80 1565 95,44 Valença 226,61 54,19 890,41 54,30 Viana do Castelo 418,21 100 1639,7 100 V.N. Cerveira 164,64 39,37 578,69 35,29 Minho-Lima 2450,8 9526,43 Source: authors’ elaboration.
To be able to compare the different factors inside the tourist potential index, we have to
standardise the values, since they present themselves in different scales. That is why it
was decided to express the results in a scale from 0 to 100 points, the maximum value
3 The results shown in table 2 are the final ones; the intermediate calculations and the weighting scales were not incorporated in the paper to prevent is extension.

8
corresponding to the municipality that reaches the biggest value after the addition of
resources.
Even if the coefficients (weighting factors) we got using the two methodologies are
quite different, it is interesting to conclude that the final results obtained in terms of
tourist ranking of the municipalities are similar.
We should consider these results from two perspectives: a nowadays one, and future
one. The former considers the conditions and current characteristic of each municipality
in analysis, establishing the potential from the present data. According, we could
observe great disparities between the better localised municipalities and better resources
endowed, and the other ones, less favoured in terms of geographical position and natural
and historical resources endowment.
The second perspective has to do with the change in the initial parameters. That means,
in strict terms, the election of planning alternatives, considering established objectives
of improvement of the economic and social situation of the municipalities worst placed.
This also means that some future desirable scenery should be defined
Table 3 - Resources value, by resource category
Resource category Vr (Leno Cerro)
Weighed value (Leno Cerro)
Vr (Regression)
Weighed value (Regression)
Natural Resources 556,05 22,69 903,83 9,49Historical Resources 1275,40 52,04 6138,00 64,43Ethnographic Resources 619,36 25,27 2484,60 26,08Total 2450,8 100 9526,43 100Source: authors’ elaboration.
1.2 Accessibilities Value
The accessibilities factor refers, basically, to the conditions that facilitate or make
difficult the tourists' displacement from the emitting markets to the destination.
To calculate this factor rigorously it would be necessary to separately consider the
internal accessibility and the external one. The internal accessibility would is related
with the real and ideal distance between the municipalities. In this case, it will be taken
just from a qualitative approach, through the consideration of the main communication
infrastructures and accesses to each of the municipalities.
On the other hand, having in mind that in the concept of external accessibility we
should capture the space-distance and the space-time vectors, we will assume that the

9
whole area in study benefits of the same net of highways regarding the access to the
remaining domestic and European territory. This is a simplifying hypothesis we believe
acceptable in a preliminary approach.
Figure 1 – Road National Plan (PNR): Portugal
Source: PNR 2000, in www.estradasdeportugal.pt
Figure 2 - Road National Plan: Minho-Lima
Source: PNR 2000, in www.estradasdeportugal.pt

10
The above listed maps allow us to conclude that our goal area presents easiness of
access similar to other known and visited tourist destinations. This is a favourable factor
that should be considered in the planning of the set of offers, as well as in the promotion
strategies.
Regarding the internal accessibility, we will use as basic element for its estimation the
type of road infrastructures available to reach each municipality, establishing a
schematic and simplified structure based on the following scores:
- Municipalities acceded exclusively through city roads: 1 point.
- Municipalities acceded exclusively through regional roads: 2 points.
- Municipalities acceded through national roads: 3 points.
- Municipalities acceded through complementary high-speed roads: 4 points.
- Municipalities acceded through main itineraries/ highways: 5 points.
Table 4 – Accessibility Value, by municipality
Municipality Total Value Fai Arcos de Valdevez 4 80 Caminha 4 80 Melgaço 3 60 Monção 3 60 Paredes de Coura 3 60 Ponte da Barca 4 80 Ponte de Lima 5 100 Valença 5 100 Viana do Castelo 5 100 Vila Nova de Cerveira 3 60 Source: authors’ elaboration.
The analysis of Table 4 allows establishing two differentiated situations. On the one
hand, the axis Viana do Castelo, Ponte de Lima and Valença, served by highways, and,
for another hand, the municipalities of Melgaço, Monção, Paredes de Coura and V.N.
Cerveira, which have as main ways of internal communication national roads. In this
second case, this signifies larger difficulties in accessibility terms, more emphasised if
we consider the easy identification of the destinations and resources routes (markers and
informative signs in the access roads).
1.3 Equipment Value The equipment factor is the most complex one and also the one with smaller specific
weight in the final value of the IPT (Pardellas et al., 2005). This factor is defined as a

11
synthetic indicator of three basic elements: the tourist infrastructure; the commercial
infrastructure; and the recreational-sport infrastructure -
FEi = f (Iti, Ici, Irdi)
where,
FEi = equipment factor in the municipality “i”.
Iti = tourist infrastructure in the municipality “i”.
Ici = commercial infrastructure in the municipality “i”.
Irdi = recreational-sport infrastructure in the municipality “i”.
In what concerns the tourist infrastructure, we considered two variables: lodging
services and restaurants4, being defined as:
Iti = (aci + ri)/2
where,
aci = accommodation capacity in the municipality “i”.
ri = restaurants capacity in the municipality “i”.
Each one of these variables was expressed in a scale of five points, although in this case
they can also take the value zero. In table 5 we can evidence that the results obtained
reflect a widespread lack of tourist infrastructure, over all in the areas already referred
as “poor” in terms of accessibilities.
Table 5 – Tourist Infrastructures, by municipality
Iti = (aci+ri)/2 Municipality aci ri (aci+ri) Iti
Arcos de Valdevez 3,09 1,4 4,49 2,245 Caminha 4,45 2,4 6,85 3,425 Melgaço 2,14 1,22 3,36 1,68 Monção 0,74 1,84 2,58 1,29 Paredes de Coura 0,41 0,21 0,62 0,31 Ponte da Barca 1,91 1,75 3,66 1,83 Ponte de Lima 2,15 3,66 5,81 2,905 Valença 0,64 2,05 2,69 1,345 Viana do Castelo 5 5 10 5 V. N. Cerveira 1,22 0,93 2,15 1,075 Source: authors’ elaboration.
4 Leno Cerro (1993) suggests a third variable in this factor, the number of secondary residences, calculated by approaching the quotient between the number of telephones and its inhabitants. With the proliferation of mobiles, we considered that this variable could adulterate the results.

12
The commercial infrastructure was calculated from data of Commercial Cadastre
Database of DG Trade and Competition, in what refers to the number of retailing and
wholesale establishments of the area in study. For this variable it was used, as in the
previous ones, a relative location coefficient, using a scale of 0 to 5 points, applying the
equation:
Ici = (Estci*5)/Estcm
where,
Ici = commercial infrastructure in the municipality “i”.
Estci = number of commercial establishments in the municipality “i”.
Estcm = number of commercial establishments of the municipality with the maximum
number of commercial establishments.
Table 6 – Commercial Infrastructures, by municipality
Municipality Estci Eci Arcos de Valdevez 315 1,23Caminha 283 1,10Melgaço 111 0,43Monção 373 1,46Paredes de Coura 116 0,45Ponte da Barca 152 0,59Ponte de Lima 478 1,87Valença 128 0,50Viana do Castelo 1281 5Vila Nova de Cerveira 108 0,42Source: authors’ elaboration.
It is worthy mentioning the strong disparity among the number of commercial
establishments of Viana do Castelo (the more urban municipality) and the remaining
ones, presenting this city the maximum value (5), against values that round the 0,4 in
V.N. Cerveira, Melgaço and Paredes de Coura.
The estimation of the recreational-sport infrastructure is based on the facilities of this
type that each municipality possesses, transforming into a scale of 0 to 5 points the
existent establishments. The inclusion of this variable in the IPT is justified by the more
or less active nature of the tourists who visit the area included in our research.
Analyzing the results obtained from the work-field and from the information given by
city councils and by RTAM, the scarcity of this type of infrastructures is verified, not
only from the tourism point of view, but also if the support to the local population is
considered.

13
Table 7 – Recreational-Sport Infrastructure, by municipality
Municipality Eqrdi Erdi Arcos de Valdevez 9 2,14Caminha 21 5Melgaço 11 2,62Monção 5 1,19Paredes de Coura 6 1,43Ponte da Barca 11 2,62Ponte de Lima 18 4,29Valença 16 3,81Viana do Castelo 20 4,76Vila Nova de Cerveira 11 2,62Source: authors’ elaboration.
Just as in the previous variable, a relative location coefficient was used, that it is
expressed in a scale of 0 to 5 points, applying the formula:
Irdi=(Eqrdi*5)/Eqrdm
where,
Irdi = recreational-sport infrastructure in the municipality “i”.
Eqrdi = number of recreational-sport establishments in the municipality “i”.
Eqrdm = number of recreational-sport establishments of the municipality with the
maximum number of recreational-sport establishments.
The three analyzed indicators, tourist infrastructure (It), commercial infrastructure (Ic)
and recreational-sport infrastructure (Ird) are synthesized in an only factor (FE). That is
the third component of the Tourist Potentiality Index (IPT).
This way, the equipment factor is the result of the weighed sum of the values obtained
in the individual components. The sum is weighed by the different specific weights of
the values, being the tourist infrastructure the one that better reflects the tourist
importance of the municipality, marked with a coefficient 2. Thus, the equipment factor
is expressed as:
FEi=2Iti + Ici + Irdi
where,
FEi = equipment Factor of municipality “i”.
Iti = touristic infrastructure of municipality “i”.
Ici = commercial infrastructure of municipality “i”.
Irdi = recreational-sport infrastructure of municipality “i”.
14
As these variables are expressed in a scale of 0 to 5 points, the theoretical limit of this
factor would be between 0 points, for that municipality that does not have any
equipment or infrastructure, and 20 points, for one better endowed. To allow the
comparability of this factor with the remaining ones analyzed, these initial results
should be transformed into a scale of 0 to 100 points (FEiPond).
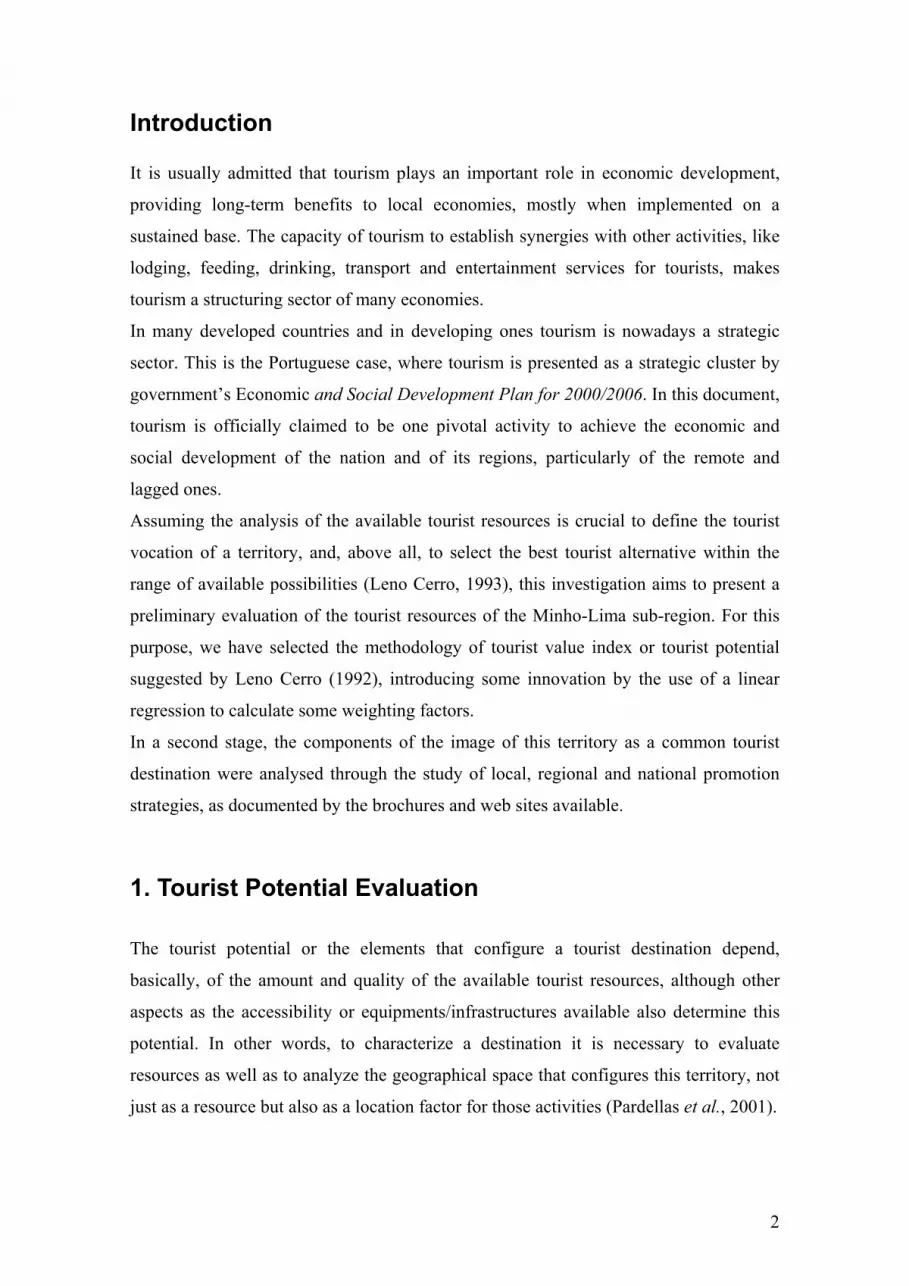
Table 8 –Equipment Factor, by municipality
Municipality 2Iti Ici Irdi FEi FEiPond Arcos de Valdevez 4,5 1,23 2,14 7,87 39,83 Caminha 6,86 1,10 5 12,96 65,59 Melgaço 3,36 0,43 2,62 6,41 32,44 Monção 2,58 1,46 1,19 5,23 26,47 Paredes de Coura 0,62 0,45 1,43 2,5 12,65 Ponte da Barca 3,66 0,59 2,62 6,87 34,77 Ponte de Lima 5,82 1,87 4,29 11,98 60,63 Valença 2,7 0,50 3,81 7,01 35,48 Viana do Castelo 10 5 4,76 19,76 100 Vila Nova de Cerveira 2,16 0,42 2,62 5,2 26,32 Source: authors’ elaboration.
1.4 The Tourist Potentiality Index
The tourist resources, the accessibility and the equipments, as it was mentioned, are the
three factors that determine, highly, the tourist value of a certain territory. Although it is
difficult to measure the value of a perception, in this paper we intend to follow that
goal, applying some theoretical concepts suggested by a few authors (Leno Cerro, 1992
and 1993; Pardellas et al., 2005).
Meanwhile, it is necessary to have in mind that nor all elements of the index have the
same importance in the estimation of this value. For that, in the theoretical formulation,
we must include weighting factors for the different elements. For the quantification of
these weighting coefficients, the basic hypothesis was the human intervention level on
each one of the factors. As a consequence, the resources will have the highest
coefficient, considering that, if they don't exist, it will be very difficult to create them.
The accessibility factor is the second in importance, since we can improve the quality of
the accesses, but it is impossible to reduce the physical distances. Finally, the
equipments constitute the less critical factor, since its lack is relatively easy to solve. In

15
this regard, the Tourist Potentiality Index (IPT) would be expressed by the following
equation:
IPTi= 1,5 FRi + 1,25FAi + 1,00FEi
Thus, the IPT of a concrete municipality will vary between a maximum of 375 and 05.
To keep the homogeneity with the scales used in the estimation of each factor, we
transformed the index into a scale of 0 to 100 points (IPTiPond), taking as base the 375
possible points. The results we’ve got are presented in the table that follows:
Table 9 – Tourist Potentiality Index, by municipality
1,5 Fri IPTi IPTiPond Municipality Leno
Cerro Regression1,25FAi 1,00FEi Leno
Cerro Regression Leno Cerro Regression
Arcos de Valdevez 95,06 94,32 100 39,83 234,89 234,15 62,64 62,44Caminha 87,53 79,83 100 65,59 253,12 245,42 67,50 65,45Melgaço 60,75 62,31 75 32,44 168,19 169,75 44,85 45,27Monção 70,97 72,89 75 26,47 172,44 174,36 45,98 46,50Paredes de Coura 63,69 63,77 75 12,65 151,34 151,42 40,36 40,38Ponte da Barca 74,51 70,82 100 34,77 209,28 205,59 55,81 54,82Ponte de Lima 136,2 143,16 125 60,63 321,83 328,79 85,82 87,68Valença 81,29 81,45 125 35,48 241,77 241,93 64,47 64,51Viana do Castelo 150 150 125 100 375 375 100 100Vila Nova de Cerveira 59,06 52,94 75 26,32 160,38 154,26 42,77 41,14
Source: authors’ elaboration.
The Tourist Potentiality Index allows to analyse the possibilities of this sector
development and, by extension and integration, of the set of the productive sector in a
certain territory (Pardellas et al., 2005). In our research, we got significant information
about the differences between municipalities, and this will allow adjusting the
mechanisms and planning alternatives to each situation, having in mind to modify the
factors that can be considered less favourable.
5 The result 375 is obtained from: 1,5x100 + 1,25x100 + 1,00x100, that are the maximum values of each one of the factors. The minimum value is close to zero, for each one of the factors.

16
2. The analysis of the image of the destination
After analysing the “internal” elements of a destination, which represent the intrinsic
components or elements that motivate tourists displacement, and that were synthesized
in a range of tourist potential indicators of the territory, this paper aims to add some
elements more to the destination analysis. These elements, which are part of the
destination and have a clear influence on it, are called external factors, and have to do
with the image of the destination.
The image of the destination is formed by a set of elements or individual attributes that
clearly influence it. The definition of image refers to a set of attitudes, perceptions,
beliefs and ideas that a person has regarding a geographic area. It is a “mental”
representation that promoters try to pass to people in order to influence their destination
choice (Gartner, 1996). As a result, if one wants to analyze the destination, it has to
analyze the image and the particular elements that form it.
In tourism scientific literature, the importance of the tourists` image of the destination is
generally recognized, since it affects the individual’s subjective perception and, then,
their behaviour and destination choice (Gallarza et al., 2002; Echtner and Ritchie, 1993;
Stabler, 1988; Telisman-Kosuta, 1989; Chon, 1990 and 1992).
The empirical studies carried out to measure the image of the destination are numerous
and varied. Generally, studies make use of combinations of multivariate and bivariate
techniques, as well as of qualitative techniques, at least in a first stage (Gallarza et al.,
2002; Guthrie and Gale, 1991; Echtner and Ritchie, 1993; Ashworth, 1991; Selby and
Morgan, 1996; Mazanec, 1994).
In our case, the analysis of the image of the new destination will be carried out through
the study of the factors that determine the formation of the image of the destination,
measuring and evaluating it.
This work is of special importance in the case of a destination not consolidated or in
process of formation, since it has been demonstrated by the empirical literature (Baloglu
and Brinberg, 1997) that the results obtained are closely correlated with the image
projected. This image is formed by a set of factors that should be analyzed in an isolated
way and, also, together, once it is the group of attributes that determines the last image
of the destination kept.
In the analysis of the factors that determine the image, planners should have present that
multiple variables are relevant, with different degrees of influence. As a matter of fact,

17
we can speak of exogenous variables and endogenous variables. The former refer to
those factors of the image linked with the profile of the tourist consumer, like the age,
the education and travel motivations. This certainly has influence in the choice of
destinations and planners have to keep it in mind. The studies regarding the
segmentation of demand deal with it. Planers can try to adjust the characteristics of the
destination to tourists, but they can not influence their tastes. Endogenous variables, on
the other hand, are those related with the factors where the planner has a more or less
direct influence. In this group we can find the variety (amount) and types of sources of
information relative to the destination. Having this in mind, the planner should have a
direct influence in the design of these materials. This agent’ role is crucial since the
image projected should be very similar to the image designed in the planning process.
Starting from the study of the endogenous variables, we should note that the external
image of the destination passed to the public can be scrutinized, as the more
consolidated the destination is, the more visible it will be in the several sources of
information used. Likewise, the consistency of the planning process can be evaluated
checking the adequacy between the available “endogenous resources” and what is
offered to the market and, therefore, the proximity between the image projected and the
real image of the territory. In this regard, the latter represents the set of products
designed according the available resources, whereas the projected image will be the
information of the destination we want to pass (sell) to potential consumers.
In our study, the analysis of the image had a clear aim: to check the perception of the
destination as a common destination and the agents’ commitment on it. The analysis
followed two stages: in the first one, the promotion strategy of the different
municipalities was studied through the analysis of the brochures and web sites used.
Those are considered the two basic vehicles in this domain. This is the traditional
methodology used in this kind of studies. The results we got will be presented in the
paper. Simultaneously, as a second approach, contact was established with a sample of
tourism operators, applying an inquiry-type to restaurants, as well as conducting
interviews with institutional agents, main actors in the promotion of the territory.
Unfortunately, those results are not yet available. We hope to be able to release those
data in the next future.
The brochures are understood as a tourist pack that, despite the differences, simulates
the pack of any product (Muñoz Oñate, 1997). They are considered a basic element in
the classic promotion of tourism destinations. Much of the information available in a

18
brochure about a destination and their products, themselves, can be considered by
consumers as essential, since they take it as a database.
According to the objectives of the research, the brochures to tourists available in the
destination’s tourism offices were analyzed, in order to establish the current situation of
the promotion of the territory. The brochures analysed are mentioned in Table 6.
Table 6 – Brochures GENERAL SPECIFIC
ARCOS DE VALDEVEZ 2 1 (Gastronomic Route of Arcos de Valdevez)
1 (Religious Baroque in Arcos de Valdevez)
2 (Trails)
CAMINHA 1
MELGAÇO 1 1 (Sports/Leisure Complex of Melgaço)
1 (Solar do Alvarinho /Wine visiting house)
1 (Porta de Lamas do Mouro / Door to Natural Park)
MONÇÃO 1
PAREDES DE COURA 1 1 (Fortified Town of Cossourado – Paredes de Coura)
1 (Archaeological Route of Paredes de Coura)
1 (Corno do Bico Protected Landscape)
1 (Território com Alma – 17 trails)
PONTE DA BARCA 1
PONTE DE LIMA 1 1 (Protected Area of the Lagoons – Ponte de Lima)
1 (Arnado’s Park) VALENÇA 1
VIANA DO CASTELO 2 1 (The Viana do Castelo Municipal Museum)
5 (Nuclei Museums)
2 (Trails)
V.N.CERVEIRA 1 1 (Art Village)
1 (Tourist and Cultural Route)
VALE DO LIMA 1 1 (The sea, the river and the mountain - Routes through the Lima Valley)
1 (History, Heritage and Culture - Routes through the Lima Valley)
1 (Colours, Tastes and Traditions – Routes through the Lima Valley)
VALE MINHO 1
ALTO MINHO 2 1 (Gastronomic Sundays)
1 (Romanesque of Ribeira Minho)
1 (Santiago – Routes of Alto Minho)
1 (Alto Minho Festivities)
1 (Handicraft Route)
1 (Congress Centre)
Source: authors` elaboration.
19
The analysis of the brochures was carried out paying attention, specially, to graphical
characteristics and content. The elements kept in mind were: front pages, texts, general
information data, maps and plans, languages used.
In what concerns the content, not only the texts were analyzed but also the general data
was considered, since this section usually collects data about the available services and
its space localization. The graphical characteristics were measured through the quality
of the front pages, maps and languages used.
Each municipality has a generalist brochure, with equal structure. The front page
consists of an image that identifies the municipality (in general, a monument) and the
logo of the Alto Minho’s Tourist Board (RTAM), presenting in the interior pages the
representative heraldry of the municipality. The exceptions, in what regards to this last
point, are Monção and Vila Nova de Cerveira.
The maps of these brochures, present, in general, a plan of the municipality with its
main tourist resources and another one that inserts the municipality in the Minho-Lima
sub-region. However, there is no reference to points of interest in the other Minho
municipalities or in the other side of the border. The only exception regards the mention
to the motorway that connects Valença and Tui, in the scope of the religious tradition of
the Santiago Route (Caminhos de Santiago).
Even if the photos shown in the brochures do have some quality6, in most of the cases
the place that was photographed is not identified and, in some situations, the images
presented are not related with the text that they were supposed to illustrate.
In what concerns the languages used, brochures are written in Portuguese and in
English. Surprisingly, no brochure in Spanish was found, despite the proximity of the
territories. These verifications reinforce the idea of the modest visibility given to the
destination and he inconsistency of its local and regional promotion.
In what the content of the brochures is concerned, one must underline that they should
present only strictly necessary information and related photos and maps. The brochures
analysed present a small synopsis of the history of the municipality and/or a general
description of the most emblematic monuments, some general information, a few maps
and some coloured photographs.
Regarding the general information made available, we must underline the importance
given to it in all the analyzed brochures. Under this head line one can find a wide list of
6 The new brochures that replaced the ones that were analyzed are of worse quality, using just 2 colours.

20
restaurants, lodgings, leisure firms, etc.. It is likewise important to mention that the
prices and hours of visit are not available in the information packages.
As a first conclusion, we can say that brochures currently used to promote the
municipalities included in our research are characterized by being essentially
informative, offering elementary information. Its content does not integrate data which
allows considering them tourist packs. Indeed, they can be considered as supports to
promotion of the municipalities, but not real promotional materials of this common
destination. The municipalities continue to ignore the possibility to establish a joint
promotion strategy of this territory or to develop any sort of substantive tourist
collaboration. The exceptions we have identified were the brochures of the Lima and
Minho Valleys, even if they present municipalities separately. Another exception was a
touristic-cultural route, created in the aim of a Cross-Border Cooperation Program
joining Vila Nova de Cerveira and Baiona. There, we could find several informations
regarding those two localities. However, there is no reference to the closer Galician
municipalities.
The strengths of the brochures are the quality and amount of useful information they
offer about each municipality, besides the presence of some maps and plans. The
weaknesses regard, above all, the absence of information relative to hours of visit and
prices. The scarce quality of the new brochures is also something to notice, and correct,
of course.
Finally, we have analysed the web sites. These electronic platforms have converted
lately into fundamental communication vehicles to interact with diverse types of public
and other agents. On the demand side, the evolution of the travel culture makes the
access to update information a major value of our time. Besides, information of better
quality is increasingly easy to obtain. These reality has transformed web sites and, by
extension, the Internet in a basic resource. The study of this territory as a tourist
destination cannot forget this fact and, therefore, the use of web sites is analyzed as
mean to promote its tourist offer.
The analyse of the web sites intends to answer to our study central aim, that is: to
analyze the current tourism products offered and the degree of exploitation of the
potentialities of that territory, having in mind the perspective of implementing a
sustainable and integrated development strategy of the Minho-Lima sub-region..
In a first approach to the territory, using diverse web searchers, we could highlight the
amount of pages in which information regarding the territory was available.

21
Interestingly, through a posterior analysis we could see that other territories make use of
several resources of this destination as their own offer. In fact, in the search of Minho-
Lima sub-region in the main Portuguese web searcher, no page of any municipality did
show. Trying Alto Minho (that includes the municipalities of Minho-Lima and 3
others), instead, the first municipal web site listed was one that does not make part of
Alto Minho (even so, it is in a border area). The only official sites from municipalities
of Minho-Lima that have shown were Viana do Castelo and Paredes de Coura.
The same way, using another national searcher, it is only possible to accede to the web
sites of the municipalities through the site of the Alto Minho’s Tourist Board, or
searching directly with the address of the municipality. Once in these web sites, only in
Arcos de Valdevez, Caminha, Ponte de Lima, Valença e Viana do Castelo we can find
real guides of the municipalities, having all the necessary information to program a
touristic journey. In the other municipalities web sites, the tourism information is very
scarce. Also the ones from Alto Minho’s Tourist Board and from the Valley of Minho
Municipalities Association have all kind of useful tourism information, including maps
of the region and quite suggestive images.
Another aspect to underline is the strong exploitation that the establishments of rural
tourism and adventure sports firms or associations make of this sort of information.
Just as in the analysis of the brochures, a conclusion to keep is that the degree of use of
the tourist resources of the territory is scarce, taking the existing potentialities. It is also
reduced the information and systematisation of the resources available.
Conclusion The Tourist Potentiality Index analysis allowed us to reach some conclusions. The first
one has to do with the high value of the resources factor in Viana do Castelo and Ponte
de Lima. In the first case, this is the result of the singular natural resources endowment
(it joins sea, river and mountain) and wealthy ethnographic heritage. In the Ponte de
Lima case, that potential comes from the important constructed heritage, not only
civilian but also religious, as well as from the relevant ethnographic resources. In the
case of some municipalities, it is worthy noting the scarce importance given to natural
resources, even if they are endowed with excellent resources, as it is the case of Paredes
de Coura with the Corno do Bico Protecting Landscape.

22
A second remark refers to the accessibility factor that, due to the simplification adopted
in the analyses, presents values more elevated in Ponte de Lima, Valença and Viana and
lower in the other areas. If we add this result to the previous one, we will verify that the
rectification of the deficiencies identified at the infrastructures level is a crucial factor
for the improvement of the tourist and economic position of the less favoured areas.
The third remark regards the equipments, where the differences are larger between the
municipalities in analysis. Partially, this situation is linked with the differences between
the population densities found. As a consequence, the highest equipment values are
reached by the more urban areas, allowing comparative distances of 2,5 and 19,76
points, if we take the minimum (Paredes de Coura) and maximum (Viana do Castelo)
values.
Clearly, on one side, this factor highlights the need of public policies, because it is the
factor more easily modifiable on short-term and, on the other side, it makes clear the
market tendency to an asymmetric growth path. This is the result of the circular effect
between (less) offer/(more) production costs and (less) demand.
From the analysis of the image of the destination, we have tried to check the perception
of the destination as a common one. We have also tested the agents’ commitment on it.
We have verified if the promotion materials developed by the municipalities of the
analyzed territory did reflect the reality of the tourist demand previously mentioned.
The analysis conducted allowed us to conclude that the degree of use of the available
tourist resources of our goal territory was reduced, mainly when compared with the
existing potential. We also concluded that it is scarce the importance given to the
territory as a common destination, which is reflected in its promotion strategy. In fact,
the municipalities (and private agents) continue to ignore the possibility to establishing
a joint promotion strategy or to develop any sort of substantive tourist territorial
collaboration.
For the consolidation of the territory as a tourist destination it will be needed that all the
agents, publics and private, take action in order to attain a more efficient use of the
available endogenous resources. A prioritary step in that direction will be the definition
and consequent promotion of an image of the region as common tourist destination.

23
References
- ASHWORTH, G. J. (1991), Products, places and promotion: destination images in
the analyses of the tourism industry, in The tourism industry: an international
analyses, SINCLAIR, T. and STABLER, M.J. (eds.), CAB International,
Wallingford.
- ASHWORTH, G. J. and DIETVORST, G. J. (ed.) (1995), Tourism and spatial
transformations - implications for policy and planning, CAB International, Oxon.
- BALOGLU, S. and BRINBERG, D. (1997), “Affective images of tourism
destination”, Journal of Travel Research 35 (4): 11-15.
- CHON, K.S. (1990), “The role of destination image in tourism: a review and
discussion”, Reveu du Tourism 47 (2): 2-9.
- CHON, K.S. (1992), “The role of destination image modification process –
marketing implications”, Tourism Management 12 (1): 68-72.
- CINELLI, A. (1985), “Il poténciale turistico”, in Turismo come e perché. Modelo di
recerca geografica e psicologica. Il territorio Varesino, CORNA PELLEGRINI, G.
and FRIGERIO, A. (eds.), ASK Edizioni, Varese.
- COFFEY, W.J. and POLÈSE, M. (1985), “Local development: conceptual basis and
policy implications” Regional Studies 19: 85-93.
- DEFERT (1966), La localisation turistique: problèmes theoriques et practiques,
Gurten, Berna.
- DREDGE, D. and MOORE, S. (1992), “A methodology for the integration of
tourism in town planning”, Journal of Tourism Studies 11 (3): 8-21.
- DREDGE, D. (1999), “Destination place planning and design”, Annals of Tourism
Research 26 (4): 772-791.
- ECHTNER, C. M. and RITCHIE, B. (1993), “The measurement of destination
image: an empirical assessment”, Journal of Travel Research 31 (4): 3-13.
- FAGANCE, M. (1995), Changing paradigms of orthodoxy: the case of spatial
models in tourism planning, Les Caters du Tourisme, Centre Des Hautes Études
Touristiques, Aix-en-Provence.
- FERRARIO, F. (1980), An evaluation of the tourist resources of South Africa, Col.
Etudes et Memoires (44), Centre de Hautes Etudes Touristiques, , Aix-en Provence.

24
- GALLARZA, M. et al. (2002), “Destination image – towards a conceptual
framework “, Annals of Tourism Research 29 (1): 56-78.
- GARTNER, W. C. (1996), Tourism development: principles and policies, Van
Nostram Reinhold, New York.
- GETZ, D. (1986), “Models in tourism planning - towards integration of theory and
practice”, Tourist Management 7(1): 21-32.
- GUNN, Clare A. (2002), Tourism planning: basics, concepts, cases, 4th ed.,
Routledge, New York.
- GUTHRIE, J. and GALE, P. (1991), “Positioning ski areas”, in New Horizons
Conference Proceeding, University of Calgary, Calgary
- JENKINS, O. (1999), “Understanding and measuring tourist destination images”, in
International Journal of Tourism Research 1: 1-15.
- LAWS, Eric (1995), Tourist destination management: issues, analysis and policies,
Routledge, London.
- LEIPER, N. (1995), Tourism management, RMIT Press, Melbourne.
- LENO CERRO, F. (1992), “La evaluación del potencial turístico en un proceso de
planificación: el Canal de Castilla”, Estudios Turísticos (16): 49-85.
- LENO CERRO, F. (1993), Técnicas de evaluación del potencial turístico, Centro de
Publicaciones, Ministerio de Industria, Comercio i Turismo, Madrid.
- MAZANEC, J. A. (1994), “Images measurements with self-organizing maps: a
tentative application to Austrian tour operators”, Revue du Tourisme 49 (3): 9-18.
- MUÑOZ OÑATE, F. (1997), Marketing turístico, Ed. Ramón Areces, Madrid.
- ORGANIZACIÓN MUNDIAL DEL TURISMO (OMT) (1996), El desarrollo
sustentable del turismo: papel del municipio, Ed. OMT, Habana.
- PADÍN, C. (2004), El desarrollo endógeno local. Estudio de la actividad turística
como forma de aprovechamiento de los recursos: aplicación al caso del Baixo
Miño, Departamento de Economía Aplicada, Universidad de Vigo, Doctoral thesis
not published.
- PARDELLAS, X. et al., C. (2005), “Competitividade e innovación no sector
turístico: unha nova oportunidade de avaliación dos recursos endóxenos”, in II
Estudos Estratéxicos do Eixo Atlântico – Libro IV, SOUTO, X. et al (coord.), Eixo
Atlântico, Ourense.

25
- PARDELLAS, X. and PADÍN, C. (2001), “El patrimonio etnográfico y el desarrollo
local: el Baixo Miño como destino turístico en Galicia”, in IV Congreso De
Turismo, Universidad y Empresa, Castellón.
- PARDELLAS, X. et al. (2003), “El desarrollo local y la cooperación ente España y
Portugal”, in Actas do IX Encontro Nacional da APDR, Colecção APDR, Coimbra.
- PARDELLAS, X. (2002), Aproximación á actividade turística nas cidades do Eixo
Atlântico, Ed. Eixo Atlântico, Vigo.
- PEREIRA, A. (1999), Guia prático de utilização do SPSS – análise de dados para
ciências sociais e psicologia, Edições Sílabo, Lisboa.
- PESTANA, M. and GAGEIRO, J. (2005), Descobrindo a regressão com a
complementaridade do SPSS, Edições Sílabo, Lisboa.
- PESTANA, M. and GAGEIRO, J. (2005), Análise de dados para ciências sociais –
a complementaridade do SPSS, Edições Sílabo, Lisboa.
- RITCHIE, J. (1993), “Crafting a destination vision: putting the concept of resident
responsive tourism into practice”, Tourism Management 14: 379-381.
- RITCHIE, J. and CROUCH, G. (2003), The competitive destination: a
sustainability perspective, Univ. Calgary, Canada.
- RTAM (2004), “Procura turística do Alto Minho”, in Boletim da Região de Turismo
do Alto Minho 10: 2-11.
- SELBY, M. and MORGAN, N. G. (1996), “Reconstructing place image: a case
study of its role in destination market research”, Tourism Management 17: 287-294.
- STABLER (1988), “The image of destination regions: theoretical and empirical
aspects, in Marketing in tourism industry: the promotion of destination regions,
GOODALL, B.; ASHWORTH (eds.), Croom Helm, London.
- SWARBROOKE, J. and HORNER, S. (1999), Consumer behaviour in tourism,
Butterworth Heinemann, Oxford.
- TELISMAN-KOSUTA, N. (1989), “Tourism destination image”, in Tourism
marketing and management handbook, WILL, S.F.; MOUTINHO, L. (eds.),
Prentice Hall, Cambridge.
- TORRES, E. (2003), “Una aproximación a la sostenibilidad económica en los
procesos de desarrollo turístico” in Experiencias públicas y privadas en el

26
desarrollo de un modelo de turismo sostenible, VALDÉS, L. and PÉREZ, J. M.
(dir.), Fundación Universidad de Oviedo.
- VALDÉS, L. and RUIZ, A. (Coord.) (1996), Turismo y promoción de destinos
turísticos: implicaciones empresariales, Servic. Publicaciones, Universidad de
Oviedo.
- VALLS, J. F. (1996), Las claves del mercado turístico, Ed. Deusto, Bilbao.
- VAR, T. et al. (1977), “Determination of tourist attractiveness of the tourist areas in
British Columbia”, Journal of Travel Research (5): 1-8.
- VAZQUEZ BARQUERO, A. (1999), Desarrollo, redes e innovación. Lecciones
sobre desarrollo endógeno, Ed. Pirámide, Madrid.
- VEAL, A. J. (2002), Leisure and tourism policy and planning, 2ª ed., CABI
Publishing. Oxon.
- VERA, F. (Coord.) (1997), Análisis territorial del turismo, Ariel, Barcelona.
- VERA, F. (2002), “Estrategias de diversificación y diferenciación en destinos
turísticos litorales”, in Estrategias turísticas urbanas, PARDELLAS, X. (coord.),
AECR, Vigo.
- WORLD TOURISM ORGANIZATION (WTO) (1999), National and regional
tourism planning, International Thomson Business Press, London.
- ZIMMERMANN, E. (1933), World resources and industries, Harper and Brothers,
New York.
Sites: - www.dgempresa.min-economia.pt; information collected in 05/01/2006. - www.estradasdeportugal.pt; information collected in 09/02/2006. - www.rtam.pt; information collected in 21/06/2005.

Annex 1. Linear regression to estimate the weighting factor, attending to the nature of the
resource
Dep. Var.
Ind. Var. NRef
RN
RH
RE
Constant
2,682 (7,243)***
5,342 (40,400)***
4,493 (17,272)*** - 1,394
(-2,822)**
R2
Adjusted R2
F
N
0,965
0,965
2093,805
228
Notes: *p<0,05; **p<0,01; ***p<0,001. The values in parenthesis are t-statistics. *statistically significant at the 0,05 level; ** at the 0,01 level; *** at the 0,001 level.
Annex 2. Tourist Infrastructures Value, by municipalities
Tourist Infrastructures Municipality EH TER TN MCAT PC
CETi Aci = (CETi*5)/CETm
Arcos de Valdevez 0,94 1,61 5 0 1,28 8,83 3,09Caminha 2,2 1,14 0 5 4,36 12,7 4,45Melgaço 1,14 0,19 3,33 0 1,44 6,1 2,14Monção 0,92 1,18 0 0 0 2,1 0,74Paredes de Coura 0,16 1 0 0 0 1,16 0,41Ponte da Barca 0,16 0,59 3,33 0,09 1,28 5,45 1,91Ponte de Lima 1,15 5 0 0 0 6,15 2,15Valença 1,29 0,54 0 0 0 1,83 0,64Viana do Castelo 5 3,42 0 0,86 5 14,28 5V. N. Cerveira 1,51 0,18 0 0,83 0,96 3,48 1,22Minho-Lima 14,47 14,85 11,66 6,78 14,32 62,08
Source: authors` elaboration.
EH – Hotel accommodation capacity weighted by categories.
TER – Tourism establishments’ capacity available in rural areas weighted by categories.
TN – Tourism establishments’ capacity available in natural areas weighted by categories.
MCAT – Extra-Hotel accommodation capacity weighted by categories.
PC- Camping capacity weighted by categories
CETi – Tourist infrastructures capacity weighted by categories.
CETm – municipality value with higher CETi.
Aci - Accommodation capacity in the municipality “i”.

28
Annex3. Restaurants Value, by municipality
Municipality Capacity CRi Ri = (CRI*5)/CRm Arcos de Valdevez 2416 6383 1,40 Caminha 4145 10931 2,40 Melgaço 2095 5533 1,22 Monção 3126 8367 1,84 Paredes de Coura 337 941 0,21 Ponte da Barca 2795 7960 1,75 Ponte de Lima 5794 16654 3,66 Valença 3361 9356 2,05 Viana do Castelo 7796 22767 5,00 Vila Nova de Cerveira 1444 4226 0,93 Minho-Lima 33309
Source: authors` elaboration.
CRi - Restaurant capacity in the municipality “i” weighted by categories.
CRm - municipality value with higher CRi.
Ri - Restaurants value in the municipality “i”.