the microstructures of ti-6a1-4v and ti-6al-2sn-4zr-6mo and
TRANSCRIPT
2004:19
D O C T O R A L T H E S I S L
The Microstructures of Ti-6A1-4V and
Ti-6Al-2Sn-4Zr-6Mo and their
Relationship to Processing and Properties
Robert Pederson
Luleå University of Technology Department of Applied Physics and Mechanical Engineering, Division of Engineering Materials
2004:19 I ISSN: 1402-1544 I ISRN: L T U - D T — 04/19 — SE
The Microstructures of Ti-6A1-4V and Ti-6Al-2Sn-4Zr-6Mo and their Relationship to Processing and Properties
•
Robert Pederson
Avdelningen för Materialteknik Institutionen för Tillämpad fysik, Maskin och Materialteknik
Luleå tekniska universitet
-
Akademisk avhandling
som med vederbörligt tillstånd av Tekniska fakultetsnämnden vid Luleå tekniska universitet för avläggande av teknologie doktorsexamen, kommer att offentligt försvaras vid Luleå tekniska universitet, lokal E246, måndagen den 14:e juni 2004, kl 10.00.
Fakultetsopponent: Professor Barbara Shollock, Imperial College, London, United Kingdom.
Doctoral Thesis 2004:19 ISSN 1402-1544
ISRN: LTU-DT-04/19-SE
LULEÅ • UNIVERSITY ø f ^ ^
OF TECHNOLOGY
The Microstructures of Ti-6A1-4V and Ti-6Al-2Sn-4Zr-6Mo and their Relationship
to Processing and Properties
by
Robert Pederson
Department of Applied Physics and Mechanical Engineering Division of Engineering Materials Luleå University of Technology
SE-971 87 Luleå, Sweden
May 2004

To my parents
Preface
Preface The work presented in this thesis is based on work carried out at the Division of Engineering Materials, Luleå University of Technology, Sweden, during 1999-2004, in close cooperation with Volvo Aero Corporation. It has been funded by the Swedish National Program for Aeronautical Technology (NFFP).
The thesis contains an introduction and the following papers:
Paper I
R. Pederson, F. Skystedt and R. Warren: 'A Contrastive Study of the Relation between Thermomechanical Processing and Fatigue Life for Ring-rolled and Close Die Forged Components of Ti-6A1-4V, presented at Junior Euromat 2002, IOM Conference, Lausanne, Switzerland, 2-5 September, 2002.
Paper II
R. Pederson, O. Babushkin, F. Skystedt and R. Warren: 'The Use of High Temperature X-Ray Diffractometry to Study Phase Transitions in Ti-6A1-4V, in Titanium Alloys at Elevated Temperature: Structural Development and Service Behaviour, M. Winston and A. Strang, eds., 41-49, 2001, Institute of Materials, London.
Paper III R. Pederson, O. Babushkin, F. Skystedt and R. Warren: 'Use of High Temperature X-Ray Diffractometry to Study Phase Transitions and Thermal Expansion Properties in Ti-6A1-4V, Mat. Sei. Tech., 2003, vol. 19, 1533-1538.
Paper IV
E.-L. Westman, R. Pederson, B. Wikman and M. Oldenburg: 'Numerical and Microstructural Evaluation of Elevated Temperature Compression Tests on Ti-6A1-4 V , Titanium '03: Science and Technology, Proc. 10th World Conf. on Titanium, Hamburg, Germany, July, 2003, Proceeding currently in press.
Paper V
R. Pederson, D. Berglund, F. Skystedt and R. Warren: 'Modelling and Experimental Calibration of Electron Beam Welded Ti-6A1-4V, To be submitted.
Paper VI
R. Pederson, F. Niklasson, F. Skystedt and R. Warren: 'Microstructure and Mechanical Properties of Friction- and Electron Beam Welded Ti-6A1-4V and Ti-6A1-2Sn-4Zr-6Mo', To be submitted.
Luleå, April 2004
Robert Pederson
Abstract
Abstract The research described in the thesis concerns phase transformations and mechanical properties of the titanium alloys Ti-6A1-4V and Ti-6Al-2Sn-4Zr-6Mo. The need to weld the alloys for certain engine components can expose the alloy locally to non-optimum thermal cycles and it is therefore of importance to gain an understanding of the kinetics involved in the phase transformations during heating and cooling. Moreover, for the purpose of modelling and computer simulations of heat treatments and welding processes, quantitative descriptions of the transformation are necessary. One focus in this work has been to examine the feasibility of using high temperature X-ray diffraction (HT-XRD) to study the phase transformation kinetics. Another aim in this work was to develop a weld simulation model leading to a prediction of the joint structure and microstructure of an electron beam welded component of the alloy Ti-6A1-4V. Electron beam welding (EBW) and friction welding (FRW) of Ti-6AI-4V and Ti-6Al-2Sn-4Zr-6Mo have also been investigated, including microstructural weld characterization and the effect of post weld heat treatments on selected mechanical properties. In addition, two components of Ti-6A1-4V produced by ring-rolling and closed die forging, respectively, showed unexpected differences in low cycle fatigue (LCF) under certain loading conditions. Quantitative metallographic studies and texture examinations were conducted in order to find possibly reasons for the observed difference in fatigue properties.
The HT-XRD technique was successfully used to monitor the alpha-to-beta transition during heating and the beta-to-alpha transition during cooling and including the transformation kinetics during isothermal hold. From the recorded spectra the thermal expansion properties for the alpha and beta phases could be extracted up to a temperature of 1050°C, enabling the determination of the overall thermal expansion for the alloy by using rule of mixture (ROM) calculations.
The weld simulation model presented here proved to be capable of predicting the joint structure and microstructure of an electron beam welded Ti64 component with reasonably good accuracy, both in terms of thermal history during welding and also in terms of martensitic fraction formed during cooling and the distribution of martensite through the cross section of the FZ and HAZ.
Al l mechanically tested Ti64/Ti6246 EBWs and FRWs, independent of PWHT temperature, fractured in the Ti64 base material and not in the weld region, thus, both types of welding process seem to be promising candidate methods for successful joining of the Ti64 alloy to the Ti6246 alloy.
Quantitative metallographic studies revealed that the closed die forged material exhibited a finer primary alpha grain size and a finer Widmanstätten platelet colony size which would be expected to provide a superior resistance to fatigue crack initiation. Observed differences in the texture of the two materials as determined by electron back-scattered diffraction might also have contributed to the difference in fatigue properties.
Keywords: Ti-6A1-4V, Ti-6Al-2Sn-4Zr-6Mo, microstructure, phase transformation kinetics, thermal expansion, phase volume fraction, physical properties, mechanical properties, HT-XRD, weld simulation, electron beam welding, friction welding.
Acknowledgements
Acknowledgements Living through the journey of a PhD is not a single person's work, rather the continuous joint efforts of cheerful friends, highly skilled and more knowledgeable colleagues and many others. Therefore I would here like to thank some of those important people that have helped me in various ways throughout the period of my work.
First I would like to express my sincere gratitude to my supervisor Professor Richard Warren. I have really been fortunate to have such a professional and skilful supervisor guiding and encouraging me in the sometimes frustrating but more often exciting field of materials science. Thank you for believing in me!
Docent Bengt Loberg, formerly working at the Division of Engineering Materials and now retired: thank you for your wise advice and constant support regarding research as well as teaching and related issues. I hope that the fishing in Dalsland is evolving!
The optimistic and always cheerful encouragement of Frank Skystedt at Volvo Aero Corporation is greatly acknowledged. You have been a strong support and of great help in connecting applied science with theoretical science, a task sometimes very difficult to manage. Together with your colleagues at Volvo, especially Bengt Petterson and Fredrik Niklasson and the 'Titanium group', you have really made my stays in Trollhättan fruitful and fun both in work and private.
My former and present colleagues at the Division of Engineering Materials, thank you all! Marta-Lena, I have lost count of the number of talks and discussions we have had during these years, but your constant care for others and inspiration and support, both as a colleague and as a friend, is truly appreciated. Jesper and Saied, thank you for all the intriguing and interesting discussions we have had during evenings and numerous lunch breaks. Johnny and Lars, your help with laboratory and computer related work is sincerely appreciated. To my former office-mate Jonas, thank you for exciting discussions and your and Lars' cheerful and fruitful companionship on our yearly fishing expeditions in the mountains. I hope that we will be able to keep this tradition alive! Esa, Ture, Magnus, Marie-Louise and Cathrine, thank you for all your help and support in research-, teaching-, administrative- and private matters. To my present and former friends at the Division of Polymer Materials, thank you for all the fun experiences I have shared in your company and remember - stay solid. To all my present PhD-student friends - you are next!
To my fishing friends in SG Norrsken, especially Krister and Conny, thank you for all the joyful and exciting days and nights spent outdoors in rain and sunshine, when all kinds of important non-work-related life issues have been dealt with!
To Bosse, Peter and Magnus, thank you for being there when needed!
Finally, I would like to express my sincerest gratitude to my family. My parents, Stig and Gertrude, you have always been a source of solid support and encouragement. You have taught me what really matters in life. Sincere appreciations also goes to my two brothers, Thomas for leading and showing me the way and Niklas for all the great fishing adventures we have shared and hopefully will share in the future! And thank you Katarina, for sharing your days and nights with me, for your strong support and immense patience especially during the last period of time and for all your love.
Contents
1. INTRODUCTION 3
2. BACKGROUND 4 2.1 INDUSTRY AND APPLICATIONS 4 2.2 COMMON TITANIUM ALLOYS AND PHYSICAL METALLURGY... 5 2.3 PROCESSING AND MANUFACTURING OF TITANIUM ALLOYS.... 7
3. THERMOMECHANICAL TREATMENT AND MICROSTRUCTURE 11
4. MICROSTRUCTURE AND MECHANICAL PROPERTIES 12 4.1 Ti-6A1-4V 14 4.2 Ti-6Al-2Sn-4Zr-6Mo 17
5. OWN EXPERIMENTAL RESULTS 18 5.1 COMPARISON OF A RING-ROLLED AND A CLOSED DIE FORGED D-6A1-4V 18 5.2 INTRODUCTION TO X-RAY DIFFRACTION 18
5.2.1 Sample preparation 19 5.2.2 Interpretation of diffraction patterns 19
5.3 TRANSFORMATION EXPERIMENTS 20 5.4 TRANSFORMATION AND MICROSTRUCTURAL EVOLUTION LNTi-6Al-4V 22
5.4.1 A combined study of a ^ ß and ß->cc phase transformation through a continuous heating and cooling cycle during HT-XRD measurements 22 5.4.2 a-^ßphase transformation study during heating up/isothermal hold cycles in HT-XRD 23 5.4.3 ß-^aphase transformation during cooling down/isothermal hold in HT-XRD measurements 25 5.4.4 Conventional heating-quenching experiments 29
5.5 WELDING OF TITANIUM ALLOYS 33 5.5.1 Electron beam welding andfiction welding 33
6. DISCUSSION 38
7. SHORT SUMMARY OF APPENDED PAPERS 41
8. REFERENCES 44
1
Introduction
1. INTRODUCTION Titanium alloys are used extensively in aerospace applications such as components in aero-engines and space shuttles, mainly due to their superior strength to weight ratio. For these demanding applications functionality and reliability of components are of great importance. Therefore research aiming towards better knowledge and understanding of all processes in the manufacture of titanium components from mineral ore to finished parts are of great significance, not only for the purpose of developing new stronger materials but also for the optimisation of already existing processes. Two commonly used titanium alloys are the two phase (oc+ß) alloys Ti-6A1-4V and Ti-6Al-2Sn-4Zr-6Mo. The existence of the oc/ß transformation means that a variety of microstructures and property combinations can be achieved in the alloys through appropriate thermomechanical processing thus permitting the adaptation of properties to specific applications. The need to weld the alloys for certain engine components can expose the alloys locally to non-optimum thermal cycles and it is therefore of importance to gain an understanding of the kinetics involved in the phase transformations during heating and cooling. Moreover, for the purpose of modelling and computer simulations of heat treatments and welding processes, quantitative descriptions of the transformations are necessary.
3
Background
2. BACKGROUND This section contains an overview of titanium alloy characteristics, their physical metallurgy, and the production and manufacturing of titanium and its alloys.
2.1 INDUSTRY AND APPLICATIONS
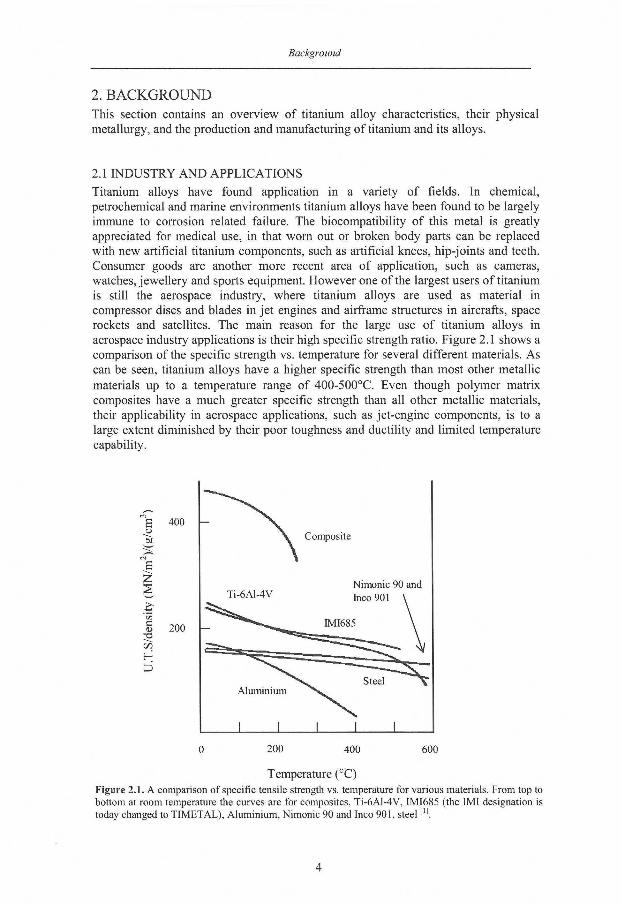
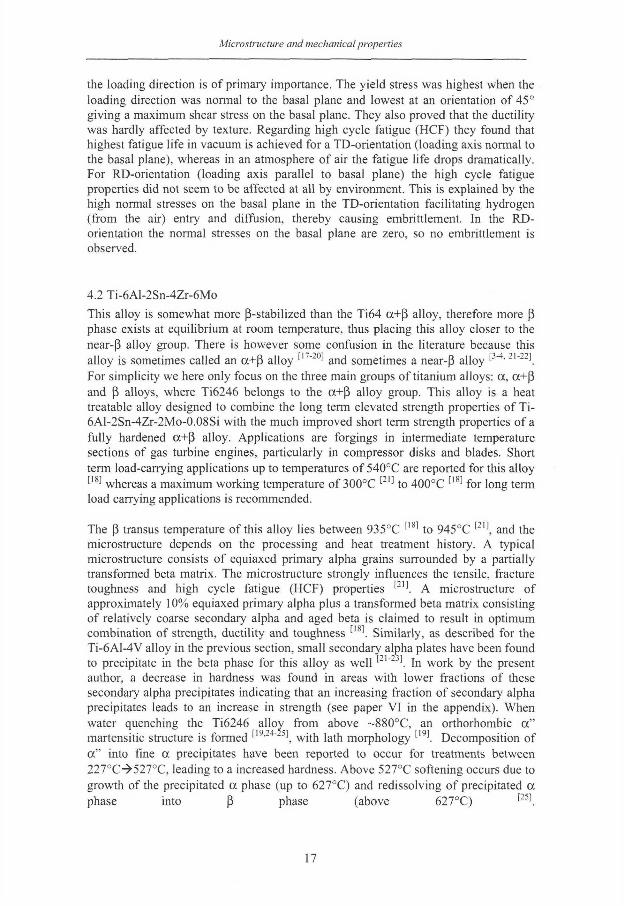
Titanium alloys have found application in a variety of fields. In chemical, petrochemical and marine environments titanium alloys have been found to be largely immune to corrosion related failure. The biocompatibility of this metal is greatly appreciated for medical use, in that worn out or broken body parts can be replaced with new artificial titanium components, such as artificial knees, hip-joints and teeth. Consumer goods are another more recent area of application, such as cameras, watches, jewellery and sports equipment. However one of the largest users of titanium is still the aerospace industry, where titanium alloys are used as material in compressor discs and blades in jet engines and airframe structures in aircrafts, space rockets and satellites. The main reason for the large use of titanium alloys in aerospace industry applications is their high specific strength ratio. Figure 2.1 shows a comparison of the specific strength vs. temperature for several different materials. As can be seen, titanium alloys have a higher specific strength than most other metallic materials up to a temperature range of 400-500°C. Even though polymer matrix composites have a much greater specific strength than all other metallic materials, their applicability in aerospace applications, such as jet-engine components, is to a large extent diminished by their poor toughness and ductility and limited temperature capability.
I I I I I I I
0 200 400 600
Temperature (°C) Figure 2.1. A comparison of specific tensile strength vs. temperature for various materials. From top to bottom at room temperature the curves are for composites, T1-6A1-4V, IMI685 (the 1MI designation is today changed to TIMETAL) , Aluminium, Nimonic 90 and Inco 901, s t e e l .
4
Background
One major effort in the jet engine industry development is to increase the working temperature in the engine to improve the efficiency of the fuel burning process. This demands new materials suited to higher temperature service. Taking a glance into the last half-decade of titanium alloy development, Table 2.1 shows year of introduction and maximum working temperature for several different titanium alloys. As can be seen, the most common titanium alloy used today, Ti-6A1-4V, was introduced as early as in the mid 50's with a maximum working temperature of approximately 300°C. The highest temperature that a titanium alloy can be used at today lies just below 600°C for the alloy IMI-834 (the IMI designations have in recent years been changed to TIMETAL, but the old designations are still commonly used and in order not to confuse the reader they will be kept throughout this work). By implementing adequate cooling design, coating processing or combinations of different materials the maximum working temperature range of titanium alloys can be increased even more. The "maximum working temperature" definition is a somewhat relative expression; for short time loading conditions a higher temperature working regimen can be accepted, whereas for a planned long time loading condition a lower temperature working regimen is necessary. Important factors deciding to what temperature a titanium alloy is applicable are oxidation resistance, creep properties, phase stability and thereby the strength stability.
Table 2.1. Introduction year and maximum working temperature for several titanium alloys 1 . (The I M I designations found for some alloys in this table are recently changed to TIMETAL) .
Name Composition (wt%) Introduction Max. working year temperature (°C)
Ti-64 6AI.4V 1954 300
IMI-550 4Al,2Sn,4Mo, 0.5Si 1956 425
Ti-811 8 A l , l M o , l V 1961 400 IMI-679 2Al,l lSn,5Zr,lMo,0.2Si 1961 450
Ti-6246 6Al,2Sn,4Zr,6Mo 1966 450 Ti-6242 6Al,2Sn,4Zr,2Mo 1967 450
IMI-685 6Al,5Zr,0.5Mo,0.25Si 1969 520 Ti-11 6AI,2Sn,1.5Zr,lMo, 0.1Si,0.3Bi 1972 540
Ti-17 5Al,2Sn,2Zr,4Mo,4Cr 1973 =350
Ti-6242S 6Al,2Sn,4Zr,2Mo,0.1Si 1974 520 IMI-829 5.5Al,3.5Sn,3Zr,0.3Mo,lNb,0.3Si 1976 580 IMI-834 5.5 Al,4Sn,4Zr,0.3Mo, lNb,0.SSi,0.06C 1984 590
2.2 COMMON TITANIUM ALLOYS AND PHYSICAL METALLURGY
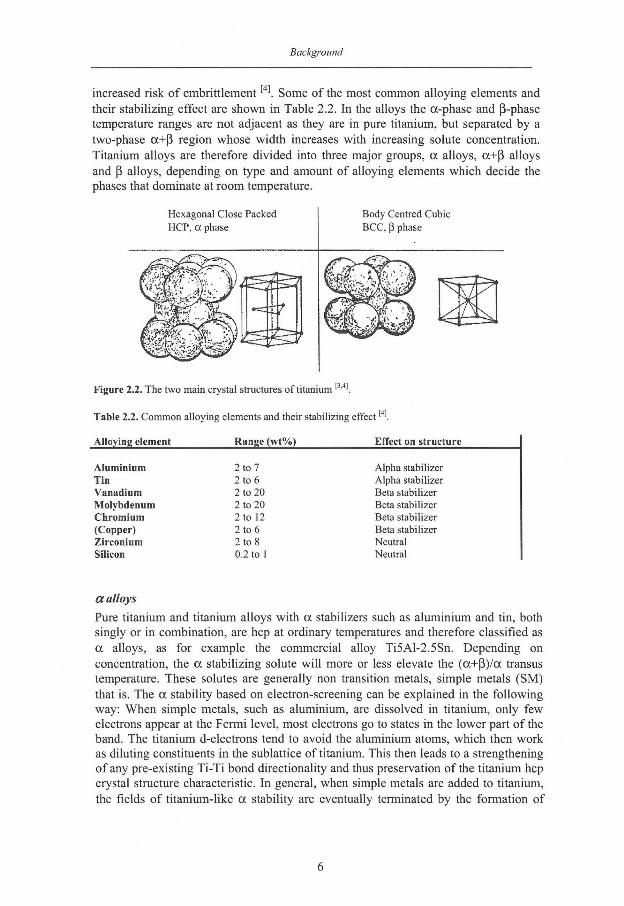
Pure titanium undergoes an allotropic transformation from hep (a) to bec (ß) (see Figure 2.2) when the temperature is raised through 882 °C [ 3 ' 4 l Alloying elements that are dissolved in titanium can either i) stabilize the a phase by raising the a-ß transition temperature (simple metals (SM) and most interstitial elements), ii) stabilize the ß phase by lowering the a-ß transition temperature (transition metals (TM) and noble metals), or iii) act only as solid solution strengtheners and not affect the transition temperature. Of the interstitial elements, nitrogen, carbon and especially oxygen, have a strong a-stabilizing effect and thereby raise the transus temperature, whereas hydrogen, which has a ß stabilizing affect, lowers the transus temperature. Increasing the amount of interstitial elements leads to a drastic increase in strength (see Figure 2.4 in section 2.3) but at the same time a sharp drop in ductility with an
5
Background
increased risk of embrittlement . Some of the most common alloying elements and their stabilizing effect are shown in Table 2.2. In the alloys the cx-phase and ß-phase temperature ranges are not adjacent as they are in pure titanium, but separated by a two-phase oc+ß region whose width increases with increasing solute concentration. Titanium alloys are therefore divided into three major groups, a alloys, a+ß alloys and ß alloys, depending on type and amount of alloying elements which decide the phases that dominate at room temperature.
Hexagonal Close Packed
HCP, a phase
Body Centred Cubic
BCC, ß phase
Figure 2.2. The two main crystal structures of titanium [ 3 ' 4 1 .
Table 2.2. Common alloying elements and their stabilizing effect [ 4 ) .
Alloying element Range (wt%) Effect on structure
Aluminium Tin Vanadium Molybdenum Chromium (Copper) Zirconium Silicon
2 to 7 2 to 6 2 to 20 2 to 20 2 to 12 2 to 6 2 to 8 0.2 to 1
Alpha stabilizer Alpha stabilizer Beta stabilizer Beta stabilizer Beta stabilizer Beta stabilizer Neutral Neutral
a alloys
Pure titanium and titanium alloys with rx stabilizers such as aluminium and tin, both singly or in combination, are hep at ordinary temperatures and therefore classified as a alloys, as for example the commercial alloy Ti5Al-2.5Sn. Depending on concentration, the a stabilizing solute will more or less elevate the (a+ß)/a transus temperature. These solutes are generally non transition metals, simple metals (SM) that is. The a stability based on electron-screening can be explained in the following way: When simple metals, such as aluminium, are dissolved in titanium, only few electrons appear at the Fermi level, most electrons go to states in the lower part of the band. The titanium d-electrons tend to avoid the aluminium atoms, which then work as diluting constituents in the sublattice of titanium. This then leads to a strengthening of any pre-existing Ti-Ti bond directionality and thus preservation of the titanium hep crystal structure characteristic. In general, when simple metals are added to titanium, the fields of titanium-like a stability are eventually terminated by the formation of
6
Background
intermetallic compounds, of composition Ti 3SM, which also have hexagonal structure m
ofrß alloys
The alloys belonging to the a+ß system contain one or more a stabilizing or a soluble element together with one or more ß stabilizing element. At room temperature equilibrium these alloys usually support a mixture of a and ß phases, to an extent depending on the amount and type of ß stabilizing element [ 3 , 4 l
ß alloys
The transition-metal (TM) solutes stabilize the bcc phase, so all ß alloys generally contain large amounts of one or more of the so-called "ß-isomorphous"-forming additions, vanadium, niobium, tantalum (transition metals group V), and molybdenum (group V I transition metal) "'. ß alloys, despite the name, are actually metastable, and cold work at ambient temperature or heating to a slightly elevated temperature can result in partial transformation to cc phase. After solution treatment, metastable ß alloys are usually aged at temperatures of 450°C to 650°C in order to partially transform the ß phase to a. The alpha then forms as finely dispersed particles in the retained ß, and strength levels comparable to, or even superior to, those attainable in aged a+ß alloys can be achieved [ 4 l
2.3 PROCESSING AND MANUFACTURING OF TITANIUM ALLOYS
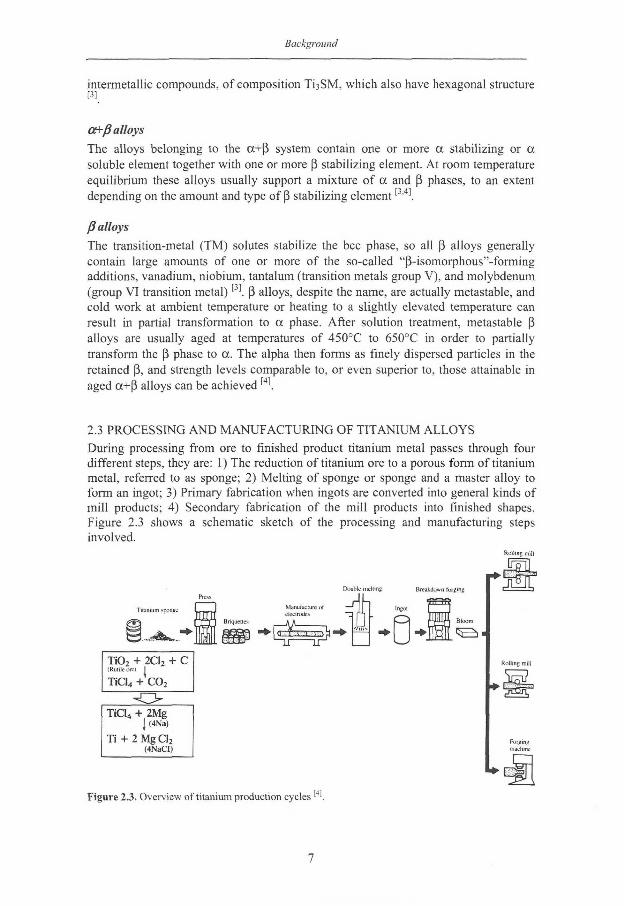
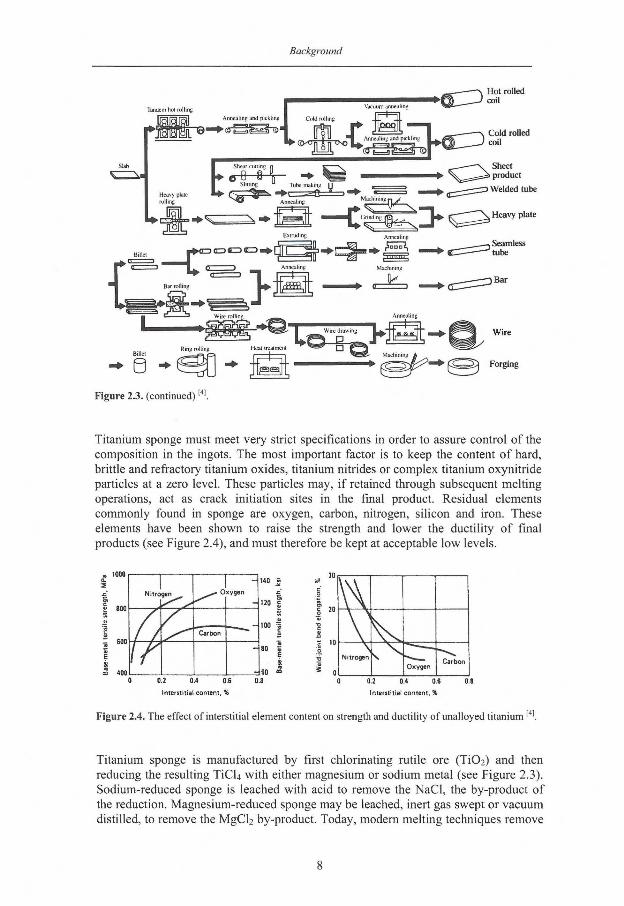
During processing from ore to finished product titanium metal passes through four different steps, they are: 1) The reduction of titanium ore to a porous form of titanium metal, referred to as sponge; 2) Melting of sponge or sponge and a master alloy to form an ingot; 3) Primary fabrication when ingots are converted into general kinds of mill products; 4) Secondary fabrication of the mill products into finished shapes. Figure 2.3 shows a schematic sketch of the processing and manufacturing steps involved.
Rolling mill
Double melting Breakdown forging
Ingo)
T i 0 2 + 2C12 + C [Rulile oro I
T i C L + C O ,
T i C l 4 + 2Mg J (4Na)
Ti + 2 Mg C l 2
(4NaCI)
Rolling mill
Figure 2.3. Overview of titanium production cycles [4!
7
Background
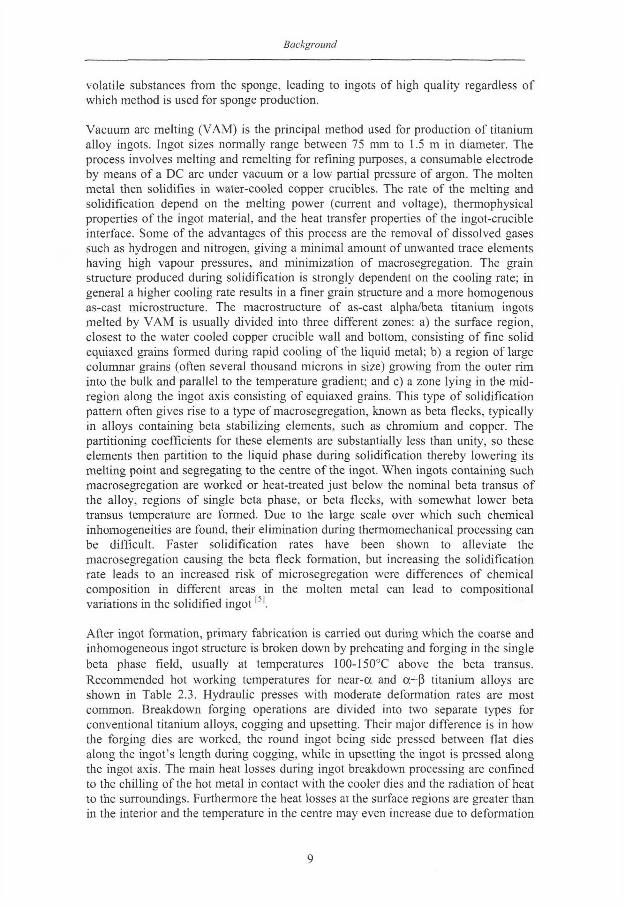
Titanium sponge must meet very strict specifications in order to assure control of the composition in the ingots. The most important factor is to keep the content of hard, brittle and refractory titanium oxides, titanium nitrides or complex titanium oxynitride particles at a zero level. These particles may, i f retained through subsequent melting operations, act as crack initiation sites in the final product. Residual elements commonly found in sponge are oxygen, carbon, nitrogen, silicon and iron. These elements have been shown to raise the strength and lower the ductility of final products (see Figure 2.4), and must therefore be kept at acceptable low levels.
. 1000 Q,
? J 800
Nitro gen 0 xygen
A If
Carbon
\r 0.2 0.4 0.6
Interstitial content, %
140 »
120 I
100 Ü c
80 £
S S 10
Nitrogen Oxygen
Carbon
0.2 0.4 0.6
Interstitial content, %
Figure 2.4. The effect of interstitial element content on strength and ductility of unalloyed titanium [4]
Titanium sponge is manufactured by first chlorinating rutile ore (TiCh) and then reducing the resulting TiCU with either magnesium or sodium metal (see Figure 2.3). Sodium-reduced sponge is leached with acid to remove the NaCl, the by-product of the reduction. Magnesium-reduced sponge may be leached, inert gas swept or vacuum distilled, to remove the MgCF by-product. Today, modem melting techniques remove
8
Background
volatile substances from the sponge, leading to ingots of high quality regardless of which method is used for sponge production.
Vacuum arc melting (VAM) is the principal method used for production of titanium alloy ingots. Ingot sizes normally range between 75 mm to 1.5 m in diameter. The process involves melting and remelting for refining purposes, a consumable electrode by means of a DC arc under vacuum or a low partial pressure of argon. The molten metal then solidifies in water-cooled copper crucibles. The rate of the melting and solidification depend on the melting power (current and voltage), thermophysical properties of the ingot material, and the heat transfer properties of the ingot-crucible interface. Some of the advantages of this process are the removal of dissolved gases such as hydrogen and nitrogen, giving a minimal amount of unwanted trace elements having high vapour pressures, and minimization of macrosegregation. The grain structure produced during solidification is strongly dependent on the cooling rate; in general a higher cooling rate results in a finer grain structure and a more homogenous as-cast microstructure. The macrostructure of as-cast alpha/beta titanium ingots melted by V A M is usually divided into three different zones: a) the surface region, closest to the water cooled copper crucible wall and bottom, consisting of fine solid equiaxed grains formed during rapid cooling of the liquid metal; b) a region of large columnar grains (often several thousand microns in size) growing from the outer rim into the bulk and parallel to the temperature gradient; and c) a zone lying in the mid-region along the ingot axis consisting of equiaxed grains. This type of solidification pattern often gives rise to a type of macrosegregation, known as beta flecks, typically in alloys containing beta stabilizing elements, such as chromium and copper. The partitioning coefficients for these elements are substantially less than unity, so these elements then partition to the liquid phase during solidification thereby lowering its melting point and segregating to the centre of the ingot. When ingots containing such macrosegregation are worked or heat-treated just below the nominal beta transus of the alloy, regions of single beta phase, or beta flecks, with somewhat lower beta transus temperature are formed. Due to the large scale over which such chemical inhomogeneities are found, their elimination during thermomechanical processing can be difficult. Faster solidification rates have been shown to alleviate the macrosegregation causing the beta fleck formation, but increasing the solidification rate leads to an increased risk of microsegregation were differences of chemical composition in different areas in the molten metal can lead to compositional variations in the solidified ingot
After ingot formation, primary fabrication is carried out during which the coarse and inhomogeneous ingot structure is broken down by preheating and forging in the single beta phase field, usually at temperatures 100-150°C above the beta transus. Recommended hot working temperatures for near-a and a+ß titanium alloys are shown in Table 2.3. Hydraulic presses with moderate deformation rates are most common. Breakdown forging operations are divided into two separate types for conventional titanium alloys, cogging and upsetting. Their major difference is in how the forging dies are worked, the round ingot being side pressed between flat dies along the ingot's length during cogging, while in upsetting the ingot is pressed along the ingot axis. The main heat losses during ingot breakdown processing are confined to the chilling of the hot metal in contact with the cooler dies and the radiation of heat to the surroundings. Furthermore the heat losses at the surface regions are greater than in the interior and the temperature in the centre may even increase due to deformation
9
Background
energy release effects. In order to introduce a reasonable amount of hot work in the ingot for following heat treatment, the final reduction during the ingot breakdown forging is usually controlled so that the temperature here lies below the beta transus temperature.
Table 2.3. ß-transus temperatures and recommended hot-working temperatures for near-a and a + ß titanium alloys [ 5 l
ß-transus Ingot Secondary hot working
Alloy temperature breakdown (°C) CO (°C)
Ti-5Al-2.5Sn 1040 1120-1175 900-1010 Ti-8Al- lMo-lV 1040 1120-1175 930-1010 Ti-6A1-4V 995 1095-1150 860-980 Ti-6Al-2Sn-4Zr-2Mo 990 1095-1150 920-975 Ti-6Al-2Sn-2Zr-2Mo-2Cr 980 1070-1130 870-955 Ti-6Al-6V-2Sn 945 1035-1095 845-915 Ti-6Al-2Sn-4Zr-6Mo 940 1030-1090 850-910 Ti-4.5Al-5Mo-l.5Cr 925 1015-1070 850-910 Ti-17 (Ti-5Al-2Sn-2Zr-4Cr-4Mo) 885 990-1050 800-865
Due to the temperature variations across the ingot during breakdown processing, the forged ingot microstructure can also be expected to be somewhat non-uniform with variations in the amounts of globular (primary) a and transformed ß (Widmanstätten) across the section. In order to keep this microstructural variation at a minimum, a heat treatment at a temperature 50-75°C above the ß transus is usually applied after the breakdown forging. The stored work in the ingot helps drive the recrystallization to completion and the heating time is kept at a minimum to prevent excessive grain growth. However, normal as-heat-treated grain sizes are of the order of 500 urn. During cooling, following this heat treatment, a phase forms in the prior ß grain boundaries and platelet/basketweave a forms within the ß grains via a Widmanstätten transformation. The grain boundary a phase is deleterious to subsequent subtransus hot workability, so to minimize the thickness of this grain boundary a a high cooling rate is preferred, which also leads to a finer platelet/basketweave a structure within the prior ß grains .
Any of several factors or a combination of these factors, during each of the above steps may affect the mechanical and physical properties of the finished titanium product. Some of the most important factors are amounts of specific alloying elements and impurities, melting process used to produce the ingot, methods for mechanically working ingots into mill products, fabrication and heat treatment employed in the final step of working. Since titanium and its alloys are so readily influenced by processing, great care must be taken in controlling the conditions and environment during which the processing is carried out. At the same time, this characteristic of titanium makes it possible for the titanium industry to accommodate a wide range of applications with a minimum number of alloys or grades. A broad range of specific properties can be produced in commercially pure titanium and titanium alloys by only varying thermal and/or mechanical processing [ 4 l
10
Thermomechanical treatment and microstructure
3. THERMOMECHANICAL TREATMENT AND MICROSTRUCTURE The mechanical properties and microstructure of titanium alloys are strongly dependent on processing history and heat treatment [ 3 A 6 - 7 ] . For example, when an a+ß alloy is hot worked and heat treated in the a+ß phase field, below the ß transus, it subsequently develops a duplex microstructure consisting of primary a and transformed ß (see for example Figure 5.5). The primary a forms through nucleation and growth during the a+ß working operation and its morphology can vary from elongated plates in lightly worked material to equiaxed globular morphology in heavily worked material. The equiaxed morphology is a result of recrystallization. Nevertheless, it has been found in the present work that the formation and growth of globular a is not necessarily limited to deformation/recrystallization processes; the formation and growth of globular a is also enhanced by very slow cooling rates from high up in the a+ß phase field (see Figure 5.6). Transformed ß refers to regions which were beta phase at the solution treatment temperature, annealing temperature, or finishing temperature of the hot working operation and can also have a varied morphology mainly depending on the cooling rate and composition. During fast cooling the ß phase can transform martensitically into a (see for example Figure 5.25) while at slower cooling rates it transforms to Widmanstätten plates of a by nucleation and growth. Sometimes metastable ß can be retained down to room temperature, depending on composition. When the finishing or solution treatment temperatures are above the ß transus, the microstructure consists entirely of transformed ß (see for example Figure 5.17).
a martensite decomposes during subsequent aging to precipitate fine beta, which gives useful increments in strength I For thick sections, martensite is difficult to form because of the low thermal conductivity of titanium. It is also difficult to form martensite in lean beta-stabilized alloys because the kinetics of the competing widmanstätten nucleation and growth mechanism is more rapid.
The Widmanstätten a can have several different morphologies. Slow cooling rates favour the formation of similarly aligned a platelets in colonies, together with prior ß grain boundary a. Faster cooling rates and higher ß stabilizing contents favour a more basketweave type of structure. Some authors consider the basket weave structure to be merely a finer form of Widmanstätten morphology whereas others [ 8 1 distinguish between the basketweave morphology and the Widmanstätten morphology, stating that in the former the nucleation and growth of a plates starts not only from the ß grain boundaries but also within the ß grains. The present author's interpretation is that the term 'basket weave' refers to a woven structure in which strands with different orientations weave in and out of each other. Thus the criterion for 'basket weave' would be colonies of a-plates formed with specific orientations to each other. So the term 'basket weave' refers more to the structure as a whole not to a single colony. Confusion may have arisen in the literature because different authors may have different interpretations. Metastable ß decomposes upon subsequent aging to precipitate fine a, which also gives useful increments in strength. More recent work ^ has revealed the possibility of precipitating very fine secondary a in lamellar structures to give a so called bi-lamellar microstructure, leading to enhanced strength of the alloy. The more weakly stabilized the ß phase is, the larger the volume fraction of a is that can be precipitated and the higher the strength that can be achieved.
11
Microstructure and mechanical properties
4. MICROSTRUCTURE AND MECHANICAL PROPERTIES Mechanical properties of a alloys
Satisfactory strength, toughness, creep resistance and weldability characterize these alloys. The absence of ductile-to43rittle fracture behaviour, commonly occurring in bcc alloys, makes a alloys suitable for cryogenic applications (typified by Ti-5A1-2.5Sn) [ 3 l
Mechanical properties of a+ß alloys
The properties of a+ß alloys can be controlled by heat treatment, which is used to adjust the microstructural and precipitation states of the ß component as explained in the previous section. This leads to the advantage that components with a wide range of mechanical properties can be produced, a+ß alloys generally exhibit good fabricability, high room temperature strength and moderate elevated temperature strength [ 3 ' 4 ] . The alloys Ti-6A1-4V and Ti-6Al-2Sn-4Zr-6Mo are described in more detail in sections 4.1 and 4.2 respectively.
Mechanical properties of ß alloys
In the solution treated condition (100% retained ß) ß alloys have good ductility and toughness, low basic strength but excellent formability. Due to the precipitation of a at slightly elevated temperatures, the ß alloys in the solution treated condition are not suitable for elevated temperature service without prior stabilization or over-aging treatment. However aging of ß alloys (precipitation of a) will generally lead to fracture toughness values higher than for aged a+ß alloys of comparable yield strength 1 4 1.
Table 4.1 shows a schematic relationship between the effect of alloying elements on structure and selected alloy characteristics.
Table 4.1. Alloying effect on structure and selected properties of Ti alloys [ 3 ' 4 ' .
a alloys
Near-a
a + ß alloys
Near-ß
ß alloys
Unalloyed titanium Ti-5Al-2.5Sn
T i - 8 A l - l M o - l V Ti-6Al-2Sn-4Zr-2Mo
Ti-6A1-4V Ti-6Al-2Sn-6V
Ti-6Al-2Sn-4Zr-6Mo Ti-3Al-10V-2Fe
Ti -13V- l lCr-3Al Ti-8Mo-8V-2Fe-3Al
-Higher density -Increasing heat treatment response
-Higher short time strength -Increasing strain rate sensitivity
-Improved fabricability
-Higher creep strength
-Improved
weldability
12

Microstructure and mechanical properties
A summary of commercial and semi commercial titanium grades and alloys is shown in Table 4.2.
Table 4.2. Summary of commercial and semi commercial Ti grades and alloys
Impurity limits. wt% Nominal composition, wt%
Designation YS (MPa)
TS (MPa)
N (max)
C (max)
H (max)
Fe (max)
0 (max)
Al Sn Zr Mo Others
Unalloyed grades
ASTM Gr.l 170 240 0.03 0.10 0.015 0.20 0.1,8
ASTM Gr.2 280 340 0.03 0.10 0.015 0.30 0.25
ASTM Gr.3 380 450 0.05 0.10 0.015 0.30 0.35
ASTM Gr.4 480 550 0.05 0.10 0.015 0.50 0.40
ASTM Gr.7 28« 340 0.03 0.10 0.015 0.30 0.25 0.2 Pd
a and near-a alloys Ti-0.3Mo-0.8Ni 380 480 0.03 0.10 0.015 0.30 0.25 0,3 0.8 Ni
Ti-5AI-2.5Sn 760 790 0.05 0.08 0.02 0.50 0.20 5 2.5
Ti-5Al-2.5Sn-ELI 620 690 0.07 0.08 0.0125 0.25 0.12 5 2.5
Ti-8Al-lMo-lV 830 900 0.05 0.08 0.015 0.30 0.12 8 1 1 V
Ti-6AI-2Sn-4Zr-2Mo 830 900 0.05 0.05 0.0125 0.25 0.15 6 2 4 2
Ti-6AI-2Nh-1Ta-0.8Mo 690 790 0.02 0.03 0.0125 0.12 0.10 6 1 2Nb. 1 Ta
Ti-2.25Al-llSn-5Zr-lMo 900 1000 0.04 0.04 0.008 0.12 0.17 2.25 11.0 5.0 1.0 0.2 Si
Ti-5Al-5Sn-2Zr-2Mo (a) 830 900 0.03 0.05 0.0125 0.15 0.13 5 5 2 2 0.25 Si
a+ß alloys
Ti-6AI-4V (b) 830 900 0.05 0.10 0.0125 0.30 0.20 6.0 4.0 V
Ti-6A1-4V-ELI (b) 760 830 0.05 0.08 0.0125 0.25 0.13 6.0 4.0 V
Ti-6Al-6V-2Sn (b) 970 1030 0.04 0.05 0.015 1.0 0.20 6.0 2.0 0.75 Cu, 6.0 V
Ti-8Mn (b) 760 860 0.05 0.08 0.015 0.50 0.20 8.0 Mn
Ti-7AI-4Mo (b) 970 1030 0.05 0.10 0.013 0.30 0.20 7.0 4.0
Ti-6Al-2Sn-4Zr-6Mo (c) 1100 1170 0.04 0.04 0.0125 0.15 0.15 6.0 2.0 4.0 6.0
Ti-SAl-2Sn-2Zr-4Mo-4Cr (a, c) 1055 1125 0.04 0.05 0.0125 0.30 0.13 5,0 2.0 2,0 4.0 4.0 Cr
Ti-6AI-2Sn-2Zr-2Mo-2Cr (a, b) 970 1030 0.03 0.05 0.0125 0.25 0.14 5.7 2.(1 2.0 2.0 2.0 Cr. 0.25 Si
Ti-3A1-2,5V (d) 520 620 0.015 0.05 0.015 0.30 0.12 3.0 2.5 V
ß alloys
Ti-10V-2Fe-3Al (a, c) 1100 1170 0.05 0.05 0.015 2.5 0.16 3.0 10.0 V
Ti-13V-llCr-3Al(c) UOO 1170 0.05 0.05 0.025 0.35 0.17 3.0 11.0 Cr,13.0V
Ti-8Mo-8V-2Fe-3Al (a, c) 1100 1170 0.05 0.05 0.015 2,5 0.17 3.0 8.0 8.0 V
Ti-3AI-8V-6Cr-4Mo-4Zr (a, c) 830 900 0.03 0.05 0.020 0.25 0.12 3.0 4.0 4.0 6.0 Cr, 8,0 V
Ti-ll.5Mo-6Zr-4.5Sn (b) 620 690 0.05 0.10 0.020 (1.35 0.18 4.5 6.0 11.5
(a) Semi commercial alloy, mechanical properties and composition limits subject to negotiation with suppliers, (b) Mechanical properties given for annealed condition, may be solution treated and aged to increase strength, (c) Mechanical properties given for solution treated and aged condition, alloy nonnally not applied in annealed condition. Properties may be sensitive to section size and processing, (d) Primarily a tubing alloy, may be cold drawn to increase strength.
13
Microstructure and mechanical properties
4.1 Ti-6A1-4V
This alloy is an a+ß alloy, with 6 wt% aluminium stabilizing the a phase and 4 wt% vanadium stabilizing the ß phase. At room temperature the microstructure at equilibrium consists mainly of the a phase (hep) with some retained ß phase (bcc). Depending on cooling rate and prior heat treatment the microconstituents and microstructures are divided into several types, namely grain boundary allotriomorph a, globular or primary a (called bi-modal microstructure when the globular a is surrounded by Widmanstätten platelets), Widmanstätten, and martensitic. A recently described microstructure is the bi-lamellar, in which the retained ß phase, lying between the a platelets in a Widmanstätten structure, itself contains thinner secondary a platelets [ 6 ] .
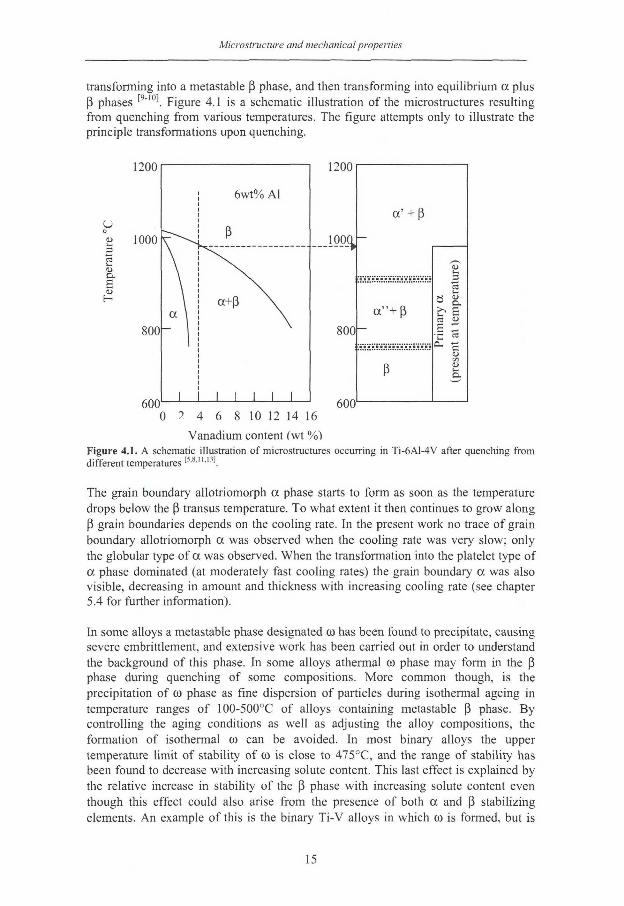
For very slow cooling rates from high up in the a+ß region or above the ß-transus temperature (995°C ± 20°C) the ß phase mainly transforms into a globular type of a. Increasing the cooling rate enhances the a nucleation rate in the ß grain boundaries thereby enhancing the formation and growth of a platelets into the prior ß grains. The length and width of these a platelets are determined by the cooling rate, an increased cooling rate enhancing the nucleation rate and slowing the diffusion process (growth rate). For age hardening purposes this cooling rate determines whether precipitation of coherent T13AI particles, the so-called alloy element partitioning effect, is possible (discussed further below in this section). When several of these a plates are aligned parallel to each other the structure is called basket weave. These baskets of a plates may start forming from prior ß grain boundaries but can also form inside the prior ß grains. Finally, i f quenched, the ß phase wil l fully or partly transform into a martensitic type of a. This martensite exists in two different forms, a' having hexagonal structure and a" having an orthorhombic crystal structure t 5 ' 8 l 0 ] . The type and amount of a' and/or a" formed upon quenching depends on the chemical composition of the ß phase existing at temperature prior to quenching. The ß phase experiences large compositional variation, which is reflected in significant mechanical property changes Vanadium enrichment of the ß phase occurs in proportion to the reduction of the volume fraction of ß phase. At vanadium contents >15 wt%, the ß phase is stabilized and retains its bcc crystal structure upon quenching. When ß phase with 10 ± 2 wt% vanadium is quenched (from a temperature range of approximately 750-900°C), it partly retains the bcc structure and partly transforms into soft orthorhombic a" martensite. In earlier studies the formation and existence of a" martensite was neglected, but its importance is now being recognized. The presence of a" martensite has been found to lower the tensile ductility in alloys although it does have the advantage of being a favourable precursor for producing a very uniform distribution of the a phase formed upon subsequent heat treatments [ , 2 l The higher the solution heat treatment temperature, the smaller is the vanadium enrichment in the ß phase, leading to transformation into hexagonal a' upon quenching (from temperatures above 900°C) [ " l 3 ] . The hexagonal a' martensitic structure shows characteristic relative orientations of the martensite needles. These needles are inclined by 0, 30, 60, or 90° to each other, in accordance with the Burgers relationships between the bcc (ß) and hexagonal (a) phases 1 9 - 1 \ For the Ti64 alloy aging at a temperature below the ß transus temperature and above the M s result in the transformation of the martensite to equilibrium a plus ß phases. Aging at a temperature below the M 5 , on the other hand, results in the martensite first partially
14
Microstructure and mechanical properties
transforming into a metastable ß phase, and then transforming into equilibrium a plus ß phases [ 9 " i o l Figure 4.1 is a schematic illustration of the microstructures resulting from quenching from various temperatures. The figure attempts only to illustrate the principle transformations upon quenching.
o p 3 ra u
I-•->
f—
1200
1000
800
600
6wt% Al
ß
\ a+ß \
ot \
1
1200
100C
800h
7 4 6 8 10 12 14 16
Vanadium content (wt % 1
600
a' + ß
atur
e)
atur
e)
a " + ß
nary
a
tem
pei
Prin
>e
nt a
t Pr
in
>ent
at
ß (pre
; Figure 4.1. A schematic illustration of microstructures occurring in Ti-6A1-4V after quenching from different temperatures ' 5 A " ' 1 3 1 .
The grain boundary allotriomorph a phase starts to form as soon as the temperature drops below the ß transus temperature. To what extent it then continues to grow along ß grain boundaries depends on the cooling rate. In the present work no trace of grain boundary allotriomorph a was observed when the cooling rate was very slow; only the globular type of a was observed. When the transformation into the platelet type of a phase dominated (at moderately fast cooling rates) the grain boundary a was also visible, decreasing in amount and thickness with increasing cooling rate (see chapter 5.4 for further information).
In some alloys a metastable phase designated co has been found to precipitate, causing severe embrittlement, and extensive work has been carried out in order to understand the background of this phase. In some alloys athermal co phase may form in the ß phase during quenching of some compositions. More common though, is the precipitation of to phase as fine dispersion of particles during isothermal ageing in temperature ranges of 100-500°C of alloys containing metastable ß phase. By controlling the aging conditions as well as adjusting the alloy compositions, the formation of isothermal (0 can be avoided. In most binary alloys the upper temperature limit of stability of (O is close to 475°C, and the range of stability has been found to decrease with increasing solute content. This last effect is explained by the relative increase in stability of the ß phase with increasing solute content even though this effect could also arise from the presence of both a and ß stabilizing elements. An example of this is the binary Ti-V alloys in which oo is formed, but is
15
Microstructure and mechanical properties
absent in ternary alloys such as Ti-6A1-4V. This is one reason why most ot/ß and ß titanium alloys contain at least 3 wt% A l [ .
The relationship between microstructure and mechanical properties of Ti-6Al-4V wil l now be addressed in more detail. Beginning with the fatigue properties, the dominating factor for high cycle fatigue (HCF) is the resistance to crack nucleation, whereas for low cycle fatigue (LCF) the resistance to propagation of the small surface cracks (microcracks) is important. Colony boundaries as well as martensitic plates are strong obstacles to microcrack propagation. Consequently LCF strength generally improves with increasing cooling rate (decreasing colony size). According to Lütjering [ 6 ] the most important microstructural parameter determining the mechanical properties, for a+ß titanium alloys, is the a colony size. With decreasing a colony size (decreasing slip length) the yield strength, the ductility, the crack propagation resistance (together with the crack nucleation resistance determining the LCF strength) are improved, whereas only the macrocrack propagation resistance and fracture toughness are improved by a large a colony size. The latter effects are probably due to increased crack deflection and crack closure phenomena. The a colony size depends on the cooling rate from the ß phase field and the ß grain size, which limits the maximum a colony dimensions .
Another important parameter also shown to affect the mechanical properties for this alloy is the alloying element partitioning effect. The ß phase contains lower concentration of those elements (especially oxygen) that promote age hardening by formation of coherent Ti3Al particles. This partitioning has the consequence that the a plates (lamellaes) formed from the ß phase upon cooling will not respond as well to age hardening as globular (primary) a. Since for Ti-6A1-4V, the Ti^PA solvus temperature is about 550°C aging at 500°C will precipitate Y\sA\ particles whereas heat treatment at 600°C or above wil l only lead to stress-relief. The alloy partitioning effect increases with the volume fraction globular a, leading to a lower strength within the platelet region of the bi-modal microstructure as compared to that in fully platelet structure. The partitioning effect has a negligible influence on ductility, on the propagation behaviour of micro- and macrocracks and on fracture toughness, these being determined mainly by the a colony size. The dependence of yield strength on a p volume fraction, is determined both by the a colony size effect and the alloy element partitioning effect and usually shows a maximum between 10 and 20 vol% a p. For small volume fractions of a p the colony size effect dominates and for large volume fractions of a p the alloy element partitioning effect dominates [ 6 l
The mechanical properties of Ti-6A1-4V are also affected by the texture of the alpha phase. Forming processes are usually performed by hot rolling or hot forging in the ß phase field or in the a+ß phase field which generally induces relatively sharp textures in the a phase formed upon cooling. Thus, adaptation of properties for a given application requires good control of the induced texture. Various investigations have been carried out to study the influence the deformation parameters (temperature, degree and rate) on microstructures and texture [ l 4 l Gey et. al. ^ found that in hot rolled Ti-6A1-4V products the degree of deformation in the ß field (high temperature) significantly affects the inherited selection of the resulting a texture. Albrect et. a l . [ i 6 1
have made some well-defined comparisons between texture and mechanical properties for Ti-6A1-4V. Their work shows that the orientation of the basal plane with respect to
16
Microstructure and mechanical properties
the loading direction is of primary importance. The yield stress was highest when the loading direction was normal to the basal plane and lowest at an orientation of 45° giving a maximum shear stress on the basal plane. They also proved that the ductility was hardly affected by texture. Regarding high cycle fatigue (HCF) they found that highest fatigue life in vacuum is achieved for a TD-orientation (loading axis normal to the basal plane), whereas in an atmosphere of air the fatigue life drops dramatically. For RD-orientation (loading axis parallel to basal plane) the high cycle fatigue properties did not seem to be affected at all by environment. This is explained by the high normal stresses on the basal plane in the TD-orientation facilitating hydrogen (from the air) entry and diffusion, thereby causing embrittlement. In the RD-orientation the normal stresses on the basal plane are zero, so no embrittlement is observed.
4.2 Ti-6Al-2Sn-4Zr-6Mo
This alloy is somewhat more ß-stabilized than the Ti64 a+ß alloy, therefore more ß phase exists at equilibrium at room temperature, thus placing this alloy closer to the near-ß alloy group. There is however some confusion in the literature because this alloy is sometimes called an a+ß alloy [ 1 7 " 2 0 ] and sometimes a near-ß alloy [ 3 " 4 ' 2 1 _ 2 2 ] . For simplicity we here only focus on the three main groups of titanium alloys: a, a+ß and ß alloys, where Ti6246 belongs to the a+ß alloy group. This alloy is a heat treatable alloy designed to combine the long term elevated strength properties of Ti-6Al-2Sn-4Zr-2Mo-0.08Si with the much improved short term strength properties of a fully hardened a+ß alloy. Applications are forgings in intermediate temperature sections of gas turbine engines, particularly in compressor disks and blades. Short term load-carrying applications up to temperatures of 540°C are reported for this alloy ^ l 8 ] whereas a maximum working temperature of 300°C [ 2 I ] to 400°C ' l 8 ] for long term load carrying applications is recommended.
The ß transus temperature of this alloy lies between 935°C [ 1 8 ] to 945°C [ 2 1 ] , and the microstructure depends on the processing and heat treatment history. A typical microstructure consists of equiaxed primary alpha grains surrounded by a partially transformed beta matrix. The microstructure strongly influences the tensile, fracture toughness and high cycle fatigue (HCF) properties ' 2 1 \ A microstructure of approximately 10% equiaxed primary alpha plus a transformed beta matrix consisting of relatively coarse secondary alpha and aged beta is claimed to result in optimum combination of strength, ductility and toughness . Similarly, as described for the Ti-6A1-4V alloy in the previous section, small secondary alpha plates have been found to precipitate in the beta phase for this alloy as well [ 2 1 _ 2 31. in work by the present author, a decrease in hardness was found in areas with lower fractions of these secondary alpha precipitates indicating that an increasing fraction of secondary alpha precipitates leads to an increase in strength (see paper V I in the appendix). When water quenching the Ti6246 alloy from above ~880°C, an orthorhombic a" martensitic structure is formed l 1 9 - 2 4 - 2 5 ^ with lath morphology ' 1 9 l Decomposition of a" into fine a precipitates have been reported to occur for treatments between 227°C->527°C, leading to a increased hardness. Above 527°C softening occurs due to growth of the precipitated a phase (up to 627°C) and redissolving of precipitated a phase into ß phase (above 627°C) [ 2 5 ] .
17
Experimental results
5. OWN EXPERIMENTAL RESULTS This section summarizes the appended papers I -VI , and contains complementary work mainly connected to Papers I I - I I I . It also contains several micrographs of heat treated specimens of the Ti-6A1-4V and Ti-6Al-2Sn-4Zr-6Mo alloys, not included in the articles.
5.1 COMPARISON OF A RING-ROLLED AND A CLOSED DIE FORGED Ti-6A1-4V
In aerospace applications, such as engine components, Ti-6A1-4V is a commonly used alloy for components working at moderately high temperatures. In this study two components in a compressor, a disc manufactured by closed die forging and a case manufactured by ring rolling, showing significant fatigue life differences were examined. The relationship between thermomechanical history and the resulting microstructure are complicated ^ but in this case the two processes led to similar bimodal microstructures consisting of around 30 vol% primary globular a surrounded by a transformed ß structure (widmanstätten/lamellar). Previous studies l 6 - 1 3 - 1 6 - 2 6 - 3 5 ! have shown that the fatigue properties depend in a complex way on the morphology of this type of microstructure, for example, fraction and particle size of primary a, lamellae colony size, lamellae width, crystailographic texture etc. There are also indications that the partitioning of alloying elements between the primary a and transformed ß may be significant ' ' '. These aspects have been investigated in this work. The ring rolled specimens were found to have an overall coarser microstructure as well as a more pronounced texture. Thus the inferior fatigue strength of ring rolled specimens could be due to a combination of these unfavourable factors. This work is presented in more detail in paper I .
5.2 INTRODUCTION TO X-RAY DIFFRACTION
An important aspect of the present work has been the use of X-ray diffraction, and in particular high temperature X-ray diffraction (HT-XRD) to study the phase transformations in Ti-6A1-4V (Papers I I and III). In this section some background to the XRD technique will be presented.
X-rays were discovered in 1895 by the German physicist Wilhelm Röntgen and named after him. These rays were invisible, unlike ordinary light, but they travelled in straight lines and affected photographic f i lm in the same way as ordinary light. Moreover they were shown to be able to penetrate much more than light, and could pass through the human body, wood, thick pieces of metal, and other opaque objects. Today we know that X-rays are electromagnetic radiation of exactly the same nature as light, but with a much shorter wavelength. X-rays are commonly measured in angstrom (Å), equal to 10"10 m, and X-rays used in diffraction have wavelengths usually lying in the range of 0.5-2.5Å, as compared to the wavelength of visible light lying in the order of 6000Å m .
X-ray diffraction has provided a wealth of important information to science and industry. For example, much that is known about the arrangement and the spacing of atoms in crystalline materials has been determined directly from diffraction studies. In addition, such studies have led to a much clearer understanding of the physical properties of metals, polymeric materials, and other solids. X-ray diffraction also
18
Experimental results
provides a convenient and practical means for qualitative identification of crystalline compounds The X-ray powder diffraction method is capable of providing quantitative crystailographic information about the compounds present in a solid sample as well as indicating their amount [ 3 6 " 3 7 ] .
5.2.1 Sample preparation
For analytical diffraction studies, the crystalline sample is either ground to a fine homogeneous powder (powder diffraction), or for solid samples (for example a piece of solid metal) the average grain size should be kept at a minimum. In this way large number of small crystallites/grains are oriented in every possible direction; thus, when an X-ray beam traverses the material, a significant number of the particles/grains can be expected to be oriented in such ways that the Bragg condition for reflection is fulfilled from every possible interplanar spacing (see also section 5.2.2) [ 3 7 l For solid samples, such as pieces of metals, that are to be examined by X-ray diffraction, the prior thermomechanical treatment is of importance, since this may have induced texture into the material l 6 1 4 - ' 6 - 2 6 - 3 8 ! Texture means that there is a pronounced orientation of certain crystailographic planes in certain directions relative to the processing direction. This texture means that the measured intensity from certain favourable oriented crystailographic planes, relative to the examined sample surface, will be higher than in a texture free specimen where some less favourably oriented crystailographic planes will diffract the incoming X-ray beam less or even not at all, thus leading to a decrease or lack of measured intensity for these. This can to some extent be compensated for by rotating the sample rapidly during measurement. This is however not practical in HT-XRD.
5.2.2 Interpretation of diffraction patterns
The identification of species/phases from their diffraction patterns is based upon the position of diffracted lines/peaks (in terms of 6, the angle of the crystal plane with respect to the direction of the X-ray beam) and their relative intensities. The diffraction angle 29 is determined by the spacing, d, between a particular set of planes, in accordance with the Bragg equation, nÅ=2d sind, where Å is the known wavelength of the X-ray source, n is the order of reflection; it may take on any integral value, and is the path difference, in terms of number of wavelengths, between waves scattered by adjacent planes of atoms.
The intensity of a diffracted beam depends in a complex way on several different factors, and is described theoretically by eq. (5.2.2.1) [ 3 6 - 3 9 ] :
Equation (5.2.2.1) consists of the following variables:
• F2 is the structure factor and describes the effect of the crystal structure on the intensity of the diffracted beam.
• p is the multiplicity factor, which is the number of families of planes independently contributing to the reflection.
eq. (5.2.2.1).
19
Experimental results
• v is the volume of the unit cell (in nm3). • The term in the parentheses is the Lorentz-polarization factor, which actually
is a combination of two factors - the Lorentz factor and the polarization factor. The Lorentz factor deals with certain geometrical factors related to the orientation of the reflecting planes in the crystal, which also affect the intensity of the diffracted beam. The origin of the polarization factor is that the incident beam from the X-ray source is unpolarized. It may be resolved into two plane-polarized components, and the total scattered intensity is the sum of the intensities of these two components, which depends on the scattering angle (i.e. 26). The Lorentz-polarization factor varies strongly with Bragg angle, 6, and the overall effect is that the intensity of reflections at intermediate Bragg angles is decreased compared to the intensities obtained at low or high angles.
• e2M is the temperature factor, and takes into consideration the effect of temperature on the intensity of the reflections in the X-ray diffraction pattern. At all temperatures atoms in a crystal are undergoing thermal vibration around their mean positions. One of the effects of this vibration is that the intensities of the reflections decrease as the temperature increases. Normally we consider each lattice plane as consisting of atoms in very well defined positions and the planes are perfectly flat and of uniform thickness. The thennal vibration of the atoms causes the spacing of the planes to be rather ill-defined, and the diffraction by sets of parallel planes at the Bragg angle is no longer perfect, resulting in an intensity loss. In the definition of the temperature factor, e2M, M is a function of several variables, including the average displacement of an atom from its mean position (w), and the diffraction angle (26). Data required for calculation of the temperature factor for alloys and nonmetallic materials are not readily available, so in our work we have not taken the temperature factor into account. Thus, we assume that the temperature factor affects the hexagonal a phase and the cubic ß phase in a similar way.
5.3 TRANSFORMATION EXPERIMENTS
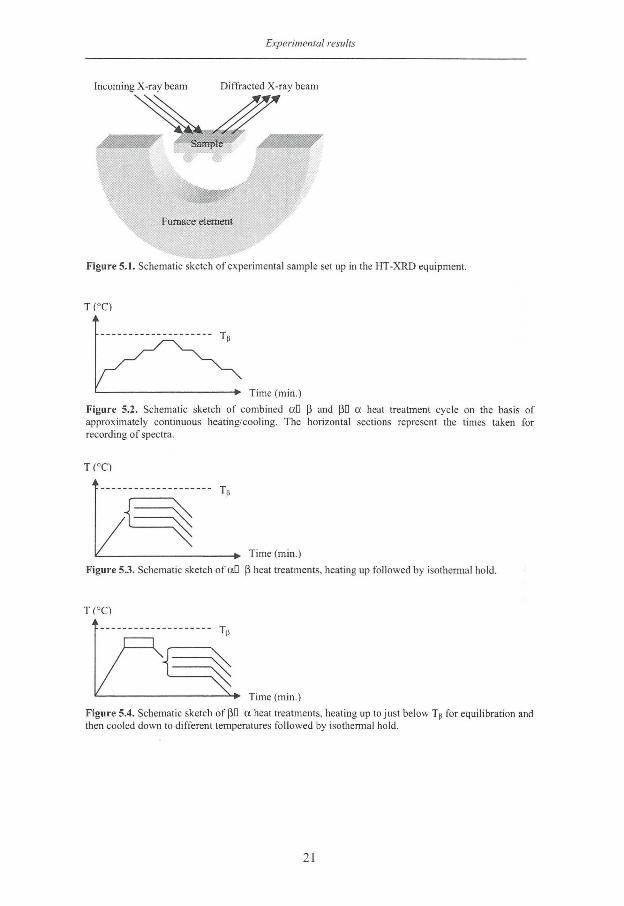
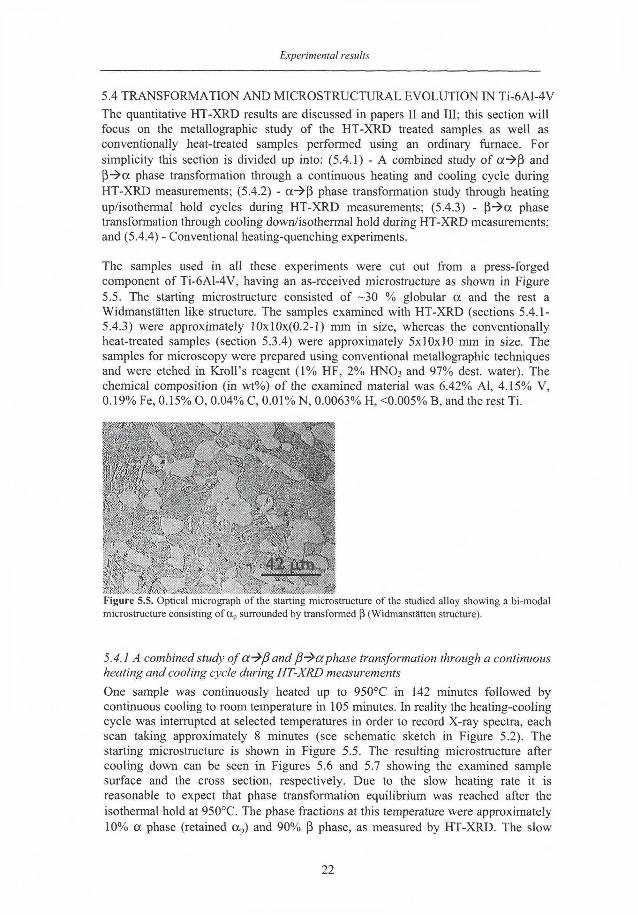
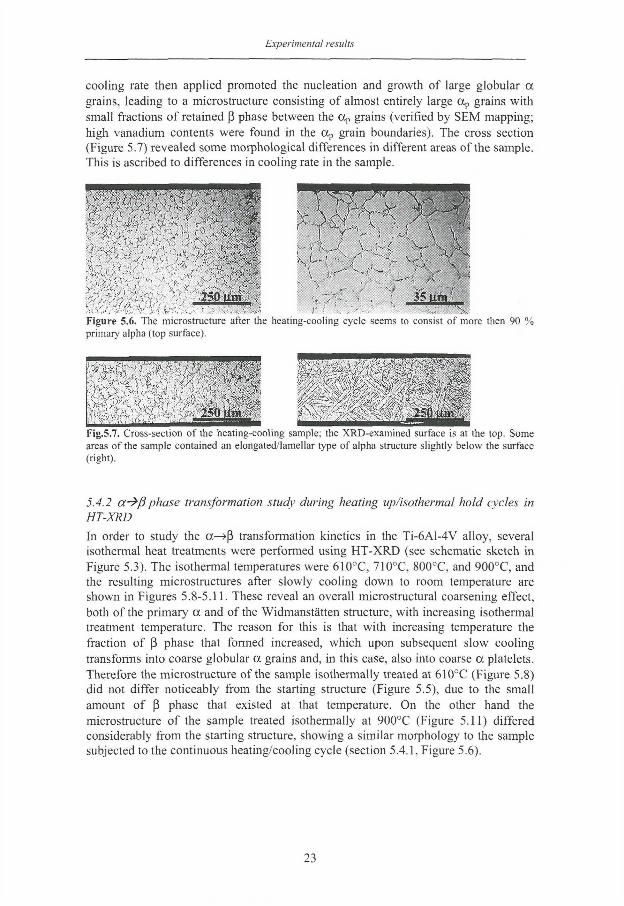
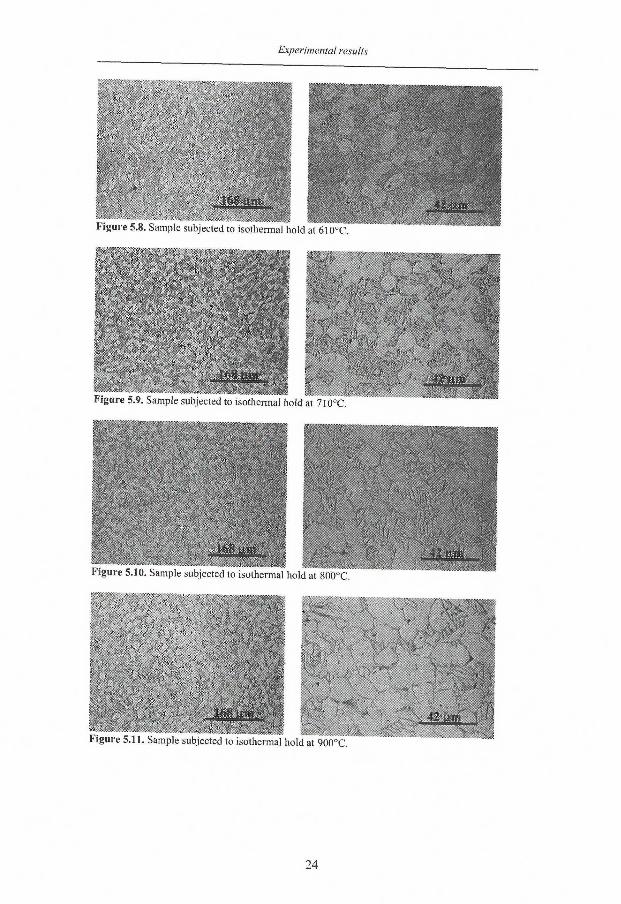
High temperature X-ray diffraction (HT-XRD) was used to study the phase transformation kinetics in the alloy Ti-6A1-4V. Several different heat treatments were performed in order to study the cx^ß and ß->a phase transformations during heating up, isothermal hold and during cooling down. Schematic sketches of the different experiments are shown in Figures 5.2-5.4 below. The results from these HT-XRD experiments are presented in paper I I and I I I , and some associated metallography is discussed in sections 5.4.1 - 5.4.3. The experimental sample set up is sketched schematically in Figure 5.1. The sample is placed on two ceramic holders, partly surrounded by the furnace element as shown in the figure. One thermocouple is placed inside the furnace element and one thermocouple is placed on the specimen surface.
20
Experimental results
Incoming X-ray beam Diffracted X-ray beam
Sample
Furnace element
Figure 5.1. Schematic sketch of experimental sample set up in the HT-XRD equipment.
Time (min.)
Figure 5.2. Schematic sketch of combined aO ß and ßD a heal treatment cycle on the basis of approximately continuous heating/cooling. The horizontal sections represent the times taken for recording of spectra.
Time (min.)
Figure 5.3. Schematic sketch o f aD ß heat treatments, heating up followed by isothermal hold.
TCO
Time (min.)
Figure 5.4. Schematic sketch of ßD a heat treatments, heating up to just below Tp for equilibration and then cooled down to different temperatures followed by isothermal hold.
21
Experimental results
5.4 TRANSFORMATION AND MICROSTRUCTURAL EVOLUTION IN Ti-6A1-4V
The quantitative HT-XRD results are discussed in papers I I and I I I ; this section wil l focus on the metallographic study of the HT-XRD treated samples as well as conventionally heat-treated samples performed using an ordinary furnace. For simplicity this section is divided up into: (5.4.1) - A combined study of oc->ß and ß - ^ a phase transformation through a continuous heating and cooling cycle during HT-XRD measurements; (5.4.2) - a -^ß phase transformation study through heating up/isothermal hold cycles during HT-XRD measurements; (5.4.3) - ß->oc phase transformation through cooling down/isothermal hold during HT-XRD measurements; and (5.4.4) - Conventional heating-quenching experiments.
The samples used in all these experiments were cut out from a press-forged component of Ti-6A1-4V, having an as-received microstructure as shown in Figure 5.5. The starting microstructure consisted of -30 % globular a and the rest a Widmanstätten like structure. The samples examined with HT-XRD (sections 5.4.1-5.4.3) were approximately 10xl0x(0.2-l) mm in size, whereas the conventionally heat-treated samples (section 5.3.4) were approximately 5x10x10 mm in size. The samples for microscopy were prepared using conventional metallographic techniques and were etched in Kroll's reagent ( 1 % HF, 2% H N 0 3 and 97% dest. water). The chemical composition (in wt%) of the examined material was 6.42% Al , 4.15% V, 0.19% Fe, 0.15% O, 0.04% C, 0.01% N , 0.0063% H, <0.005% B, and the rest Ti.
Figure 5.5. Optical micrograph of the starting microstructure of the studied alloy showing a bi-modal
microstructure consisting of a p surrounded by transformed ß (Widmanstätten structure).
5.4.1 A combined study of a-^ßand ß-^aphase transformation through a continuous heating and cooling cycle during HT-XRD measurements
One sample was continuously heated up to 950°C in 142 minutes followed by continuous cooling to room temperature in 105 minutes. In reality the heating-cooling cycle was interrupted at selected temperatures in order to record X-ray spectra, each scan taking approximately 8 minutes (see schematic sketch in Figure 5.2). The starting microstructure is shown in Figure 5.5. The resulting microstructure after cooling down can be seen in Figures 5.6 and 5.7 showing the examined sample surface and the cross section, respectively. Due to the slow heating rate it is reasonable to expect that phase transformation equilibrium was reached after the isothermal hold at 950°C. The phase fractions at this temperature were approximately 10% ex phase (retained cxp) and 90% ß phase, as measured by HT-XRD. The slow
B
'•i
22
Experimental results
cooling rate then applied promoted the nucleation and growth of large globular a grains, leading to a microstructure consisting of almost entirely large ccp grains with small fractions of retained ß phase between the ocp grains (verified by SEM mapping; high vanadium contents were found in the ocp grain boundaries). The cross section (Figure 5.7) revealed some morphological differences in different areas of the sample. This is ascribed to differences in cooling rate in the sample.
Figure 5.6. The microstructure after the heating-cooling cycle seems to consist of more then 90 % primary alpha (top surface).
Fig.5.7. Cross-section of the heating-cooling sample; the XRD-examined surface is at the top. Some areas of the sample contained an elongated/lamellar type of alpha structure slightly below the surface (right).
5.4.2 a-^ß phase transformation study during heating up/isothermal hold cycles in HT-XRD
In order to study the a—»ß transformation kinetics in the Ti-6A1-4V alloy, several isothermal heat treatments were performed using HT-XRD (see schematic sketch in Figure 5.3). The isothermal temperatures were 610°C, 710°C, 800°C, and 900°C, and the resulting microstructures after slowly cooling down to room temperature are shown in Figures 5.8-5.11. These reveal an overall microstructural coarsening effect, both of the primary a and of the Widmanstätten structure, with increasing isothermal treatment temperature. The reason for this is that with increasing temperature the fraction of ß phase that formed increased, which upon subsequent slow cooling transforms into coarse globular a grains and, in this case, also into coarse a platelets. Therefore the microstructure of the sample isothermally treated at 610°C (Figure 5.8) did not differ noticeably from the starting structure (Figure 5.5), due to the small amount of ß phase that existed at that temperature. On the other hand the microstructure of the sample treated isothermally at 900°C (Figure 5.11) differed considerably from the starting structure, showing a similar morphology to the sample subjected to the continuous heating/cooling cycle (section 5.4.1, Figure 5.6).
23
Experimental results
- H i
• .
tigure 5.9. Sample subjected to isothermal hold at 7I0°C.
åc.' wmmm. «a ja f i
24
Experimental results
5.4.3 ß-^a phase transformation during cooling down/isothermal hold in HT-XRD
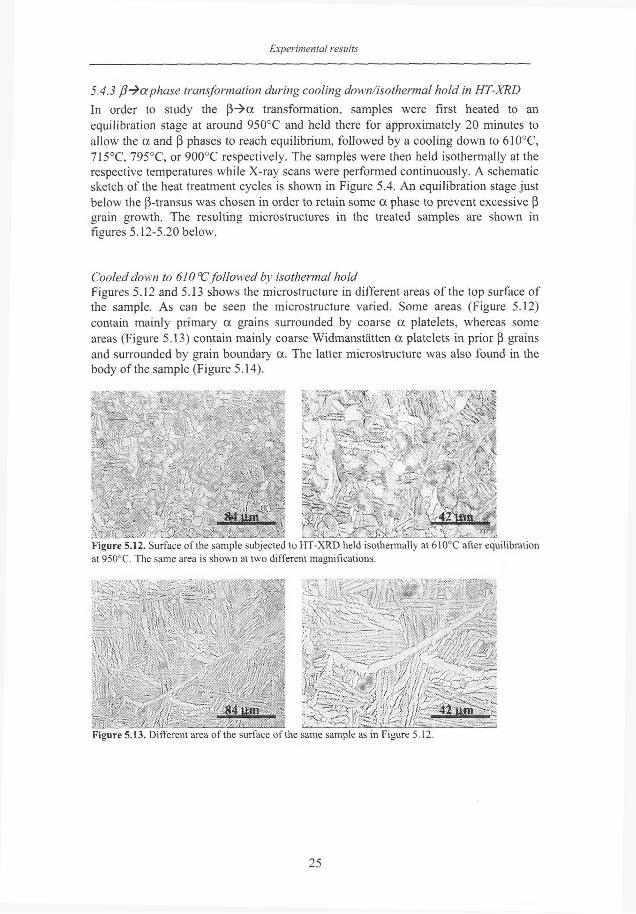
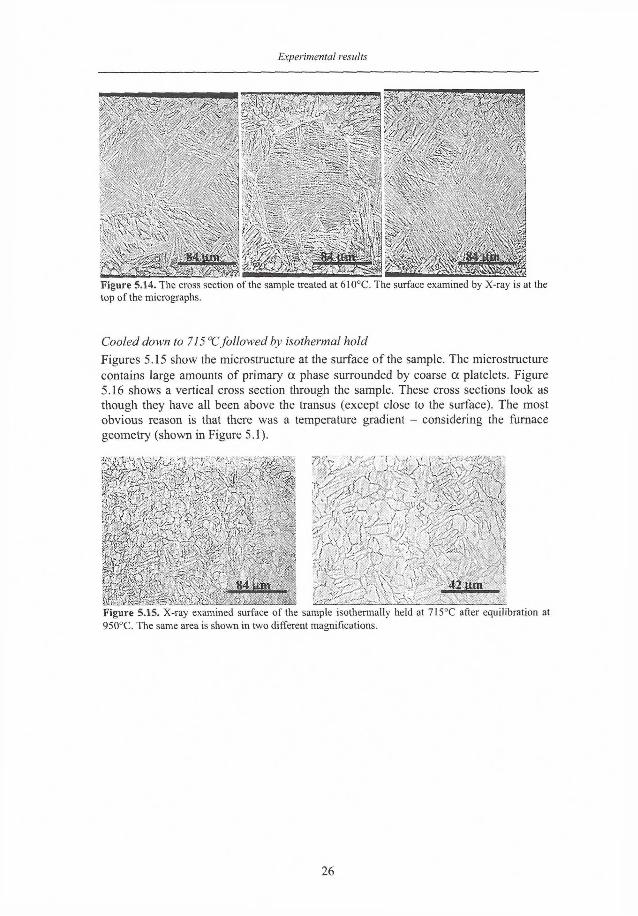
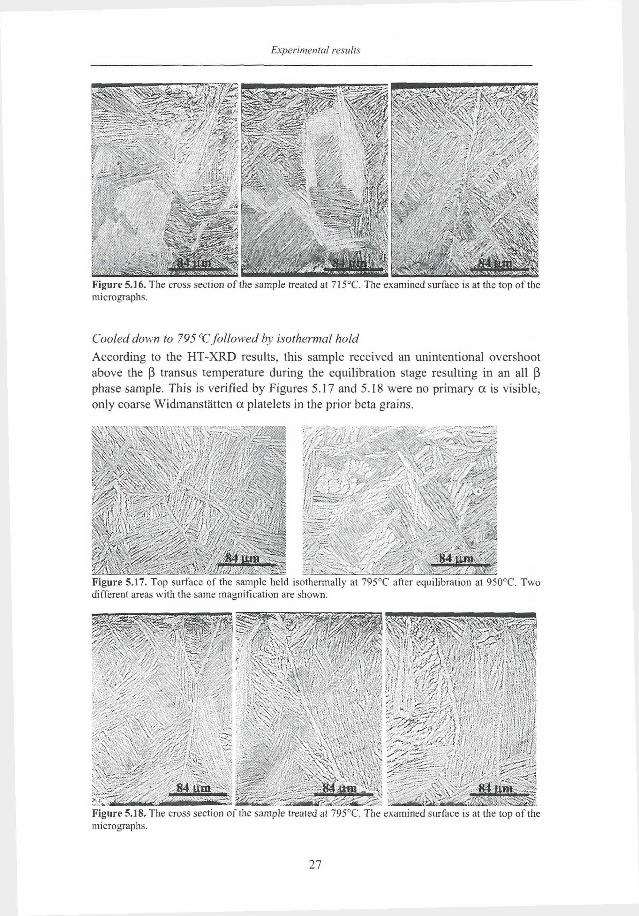
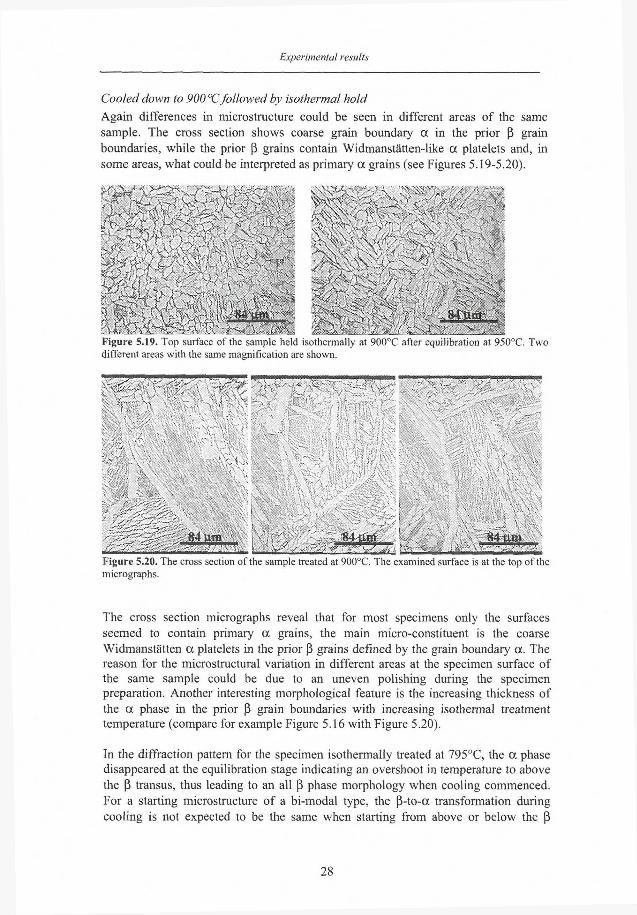
In order to study the ß-^ot transformation, samples were first heated to an equilibration stage at around 950°C and held there for approximately 20 minutes to allow the a and ß phases to reach equilibrium, followed by a cooling down to 610°C, 715°C, 795°C, or 900°C respectively. The samples were then held isothermally at the respective temperatures while X-ray scans were performed continuously. A schematic sketch of the heat treatment cycles is shown in Figure 5.4. An equilibration stage just below the ß-transus was chosen in order to retain some a phase to prevent excessive ß grain growth. The resulting microstructures in the treated samples are shown in figures 5.12-5.20 below.
Cooled down to 610°C followed by isothermal hold Figures 5.12 and 5.13 shows the microstructure in different areas of the top surface of the sample. As can be seen the microstructure varied. Some areas (Figure 5.12) contain mainly primary a grains surrounded by coarse a platelets, whereas some areas (Figure 5.13) contain mainly coarse Widmanstätten a platelets in prior ß grains and surrounded by grain boundary a. The latter microstructure was also found in the body of the sample (Figure 5.14).
-
• I
MS. -
42 mw
Figure 5.12. Surface of the sample subjected to HT-XRD held isothermally at 610°C after equilibration
at 950°C. The same area is shown at two different magnifications.
•• wy. 42 um
Figure 5.13. Different area of the surface of the same sample as in Figure 5.12.
25
Experimental results
V
Figure 5.14. The cross section of the sample treated at 610°C. The surface examined by X-ray is at the top of the micrographs.
Cooled down to 715 °C followed by isothermal hold
Figures 5.15 show the microstructure at the surface of the sample. The microstructure contains large amounts of primary a phase surrounded by coarse a platelets. Figure 5.16 shows a vertical cross section through the sample. These cross sections look as though they have all been above the transus (except close to the surface). The most obvious reason is that there was a temperature gradient - considering the furnace geometry (shown in Figure 5.1).
Figure 5.15. X-ray examined surface of the sample isothermally held at 715°C after equilibration at
950°C. The same area is shown in two different magnifications.
V
_ „ 42 um
26
Experimental results
Figure 5.16. The cross section o f the sample treated at 715°C. The examined surface is at the top of the micrographs.
Cooled down to 795 °C followed by isothermal hold
According to the HT-XRD results, this sample received an unintentional overshoot above the ß transus temperature during the equilibration stage resulting in an all ß phase sample. This is verified by Figures 5.17 and 5.18 were no primary ot is visible, only coarse Widmanstätten a platelets in the prior beta grains.
• *
HH N ;•
Figure 5.17. Top surface of the sample held isothermally at 795°C after equilibration at 950°C. different areas with the same magnification are shown.
Two
Ilt Figure 5.18. The cross section of the sample treated at 795°C. The examined surface is at the top of the micrographs.
„84 ij'm '-••^•£'J.-:.->
27
Experimental results
Cooled down to 900 °C followed by isothermal hold
Again differences in microstructure could be seen in different areas of the same sample. The cross section shows coarse grain boundary a in the prior ß grain boundaries, while the prior ß grains contain Widmanstätten-like a platelets and, in some areas, what could be interpreted as primary a grains (see Figures 5.19-5.20).
^ \ ' S ' ; ' ~ ['—^K
Figure 5.19. Top surface of the sample held isothermally at 900°C after equilibration at 950°C. Two different areas with the same magnification are shown.
f f f C ^ € ^ -. -
'i, zS g 84 um f - C ' " - ' - " ! '• Figure 5.20. The cross section of the sample treated at 900°C. The examined surface is at the top of the micrographs.
The cross section micrographs reveal that for most specimens only the surfaces seemed to contain primary a grains, the main micro-constituent is the coarse Widmanstätten a platelets in the prior ß grains defined by the grain boundary oc. The reason for the microstructural variation in different areas at the specimen surface of the same sample could be due to an uneven polishing during the specimen preparation. Another interesting morphological feature is the increasing thickness of the a phase in the prior ß grain boundaries with increasing isothermal treatment temperature (compare for example Figure 5.16 with Figure 5.20).
In the diffraction pattern for the specimen isothermally treated at 795°C, the a phase disappeared at the equilibration stage indicating an overshoot in temperature to above the ß transus, thus leading to an all ß phase morphology when cooling commenced. For a starting microstructure of a bi-modal type, the ß-to-oc transformation during cooling is not expected to be the same when starting from above or below the ß
28
Experimental results
transus temperature, due to the existence of primary a when starting from below the ß transus (the alloying element partitioning effect is present, see section 4.1) and its absence above the ß transus (no alloying element partitioning effect.
The ß-to-a transformation in Ti-6A1-4V during continuous cooling has been examined by Malinov et. al. t 4 0 " 4 2 ] using differential scanning calorimetry and electrical resistivity. They found that the ß-to-a transformation finished between 820-865 °C for cooling rates between 50°C/min - 10°C/min, respectively. It should be pointed out that their experiments started from above the ß transus (i.e. at 1100°C), thus starting with a fully ß microstructure. Their results [ 4 0 ] differ from the CCT diagrams published by J. Sieniawski et. al. [ 4 3 \ in which the end of the transformation is found to lie between 670-690°C for the same cooling rates. Malinov et. al. ascribe this discrepancy to differences in chemical composition. The material used in this project has a similar chemical composition to that of reference 40. The present experimental results on the ß-to-a transformation using HT-XRD m , seem to fit the results of reference 40 well. The similar morphology of the microstructures in Figures 5.14 and 5.16 for 610°C and 715°C holds respectively, could then be explained by the fact that the ß-to-a transformation had already finished at around 800°C. Even though the morphology of the formed a plates/globular a grains does not change after the ß-to-a transformation finish, re-distribution of the alloying elements still continues at elevated temperature, due to diffusional processes. Katzarov et. al . [ 4 2 ^ try to model the morphology of ß-to-a phase transformation in the Ti-6A1-4V alloy, taking into account the diffusional re-distribution even after the ß-to-a transformation has finished.
5.4.4 Conventional heating-quenching experiments
In order to avoid excessive temperature gradients and disturbance of the furnace in the HT-XRD equipment the rates of heating and cooling in this work were limited. To examine the a -^ß phase transformation several conventional heat treatments, using a preheated furnace, were performed (high heating rate followed by short isothermal hold and finally water quenching). The temperatures were measured with thermocouples welded onto reference samples that were subjected to corresponding heat treatment cycles. The measured temperatures were 570°C, 670°C, 780°C and 888°C, with corresponding heating rates of 128°C/min, 283°C/min, 304°C/min, and 347°C/min, respectively. The samples were then held isothermally for 0.5min, lmin, and 5min at temperature, followed by quenching in water. Another test in which one sample was held at 950°C for 15 minutes followed by water quenching was also conducted. Due to oxidation at the sample surfaces the samples were cut in half and the metallographic examination was restricted to the interior. The resulting microstructures are shown in Figures 5.21-5.27 below.
The samples treated up to 888°C (Figures 5.21-5.24) were very similar to the as received microstructure (Figure 5.5); no obvious difference can be seen. This leads to the conclusion that 5 minutes was too short for any optical microscopic detection of a ^ ß transformation. Therefore in another experiment a sample was heated to 950°C in 2 minutes, isothermally held for 15 minutes and finally water quenched. The
29

Experimental results
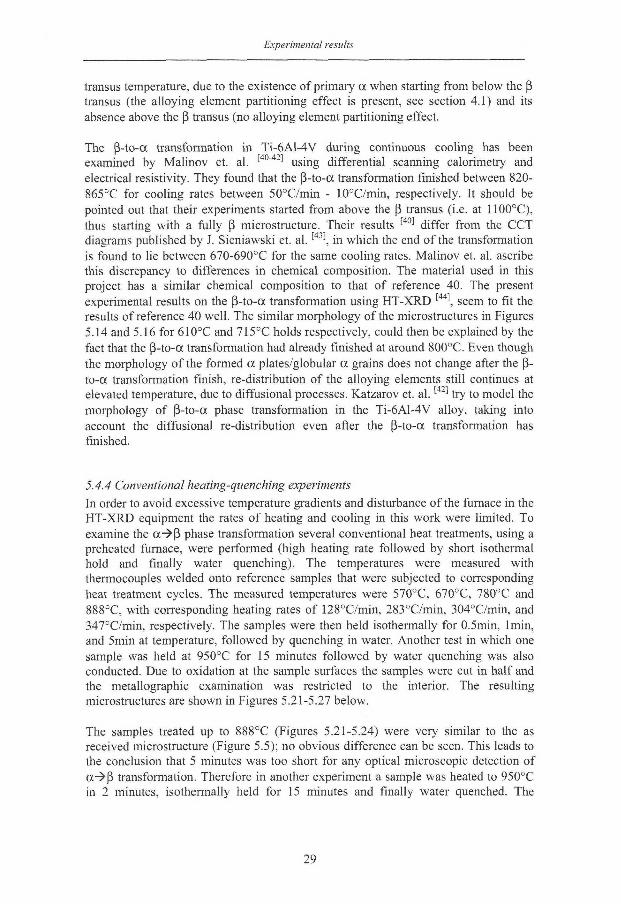
resulting microstructure is shown in Figures 5.25-5.26. These results are consistent with the relatively slow transformation kinetics observed in HT-XRD.
Figure 5.21. Microstructures after isothermal hold for 0.5min (left), lmin (middle), and 5min (right) at
570°C, followed by water quenching.
Figure 5.23. Microstructures after isothermal hold for 0.5min (left), lmin (middle), and 5min (right) at
780°C, followed by water quenching.
Figure 5.24. Microstructures after isothermal hold for 0.5min (left), lmin (middle), and 5min (right) at
888°C, followed by water quenching.
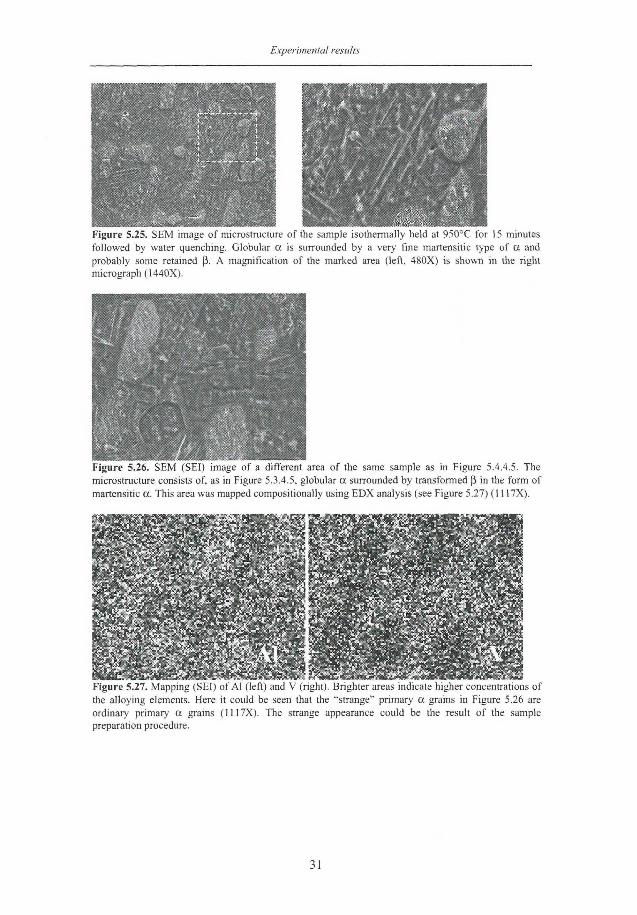
As can be seen in Figure 5.25, primary a grains still exist after the treatment. One reason for this is that the primary a grains contain more a-stabilizing elements than the transformed ß matrix (the Widmanstätten structure in this case), the alloying element partitioning effect is discussed in section 4.2. A mapping sequence, performed by using SEM, on the sample reveals the compositional difference between the primary a and the transformed ß, see Figures 5.26-5.27 below. Also, the sample described in chapter 5.4.1 is examined, with similar results (Figure 5.28).
30
Experimental results
Figure 5.25. SEM image of microstructure of the sample isothermally held at 950°C for 15 minutes
followed by water quenching. Globular a is surrounded by a very fine martensitic type of a and
probably some retained ß. A magnification of the marked area (left. 480X) is shown in the right micrograph (1440X).
Figure 5.26. SEM (SEI) image of a different area of the same sample as in Figure 5.4.4.5. The
microstructure consists of, as in Figure 5.3.4.5, globular a surrounded by transformed ß in the form of
martensitic a. This area was mapped compositionally using EDX analysis (see Figure 5.27) (1117X).
Figure 5.27. Mapping (SEI) of A l (left) and V (right). Brighter areas indicate higher concentrations of
the alloying elements. Here it could be seen that the "strange" primary a grains in Figure 5.26 are
ordinary primary a grains (1117X). The strange appearance could be the result of the sample preparation procedure.
31

Experimental results
Figure 5.28. Mapping (SEI) of A l and V in the continuous heating/cooling treated specimen described
in section 5.4.1. The ß phase between the primary a grains clearly contains a higher content of the ß stabilizing vanadium (1100X).
32
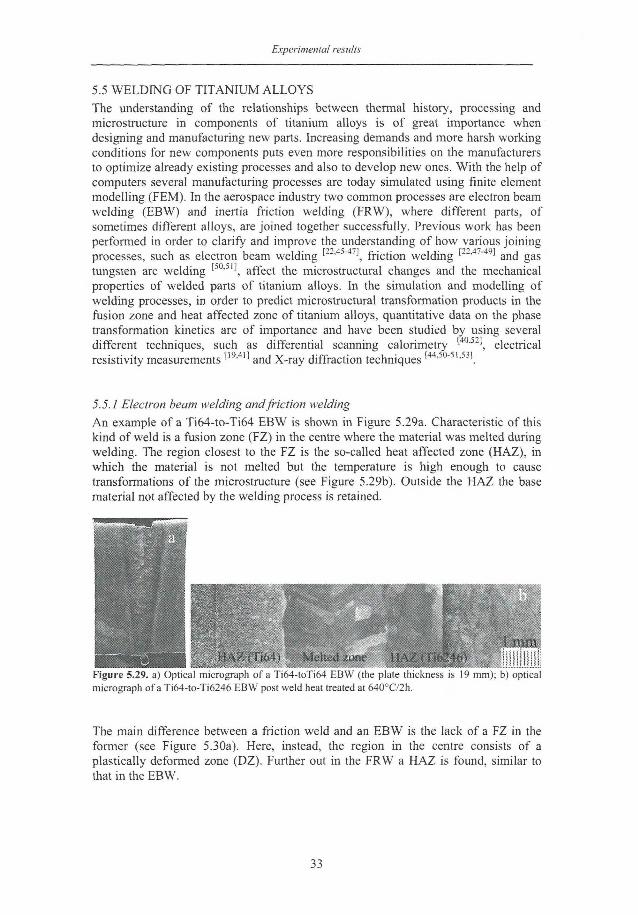
Experimental results
5.5 WELDING OF TITANIUM ALLOYS
The understanding of the relationships between thermal history, processing and microstructure in components of titanium alloys is of great importance when designing and manufacturing new parts. Increasing demands and more harsh working conditions for new components puts even more responsibilities on the manufacturers to optimize already existing processes and also to develop new ones. With the help of computers several manufacturing processes are today simulated using finite element modelling (FEM). In the aerospace industry two common processes are electron beam welding (EBW) and inertia friction welding (FRW), where different parts, of sometimes different alloys, are joined together successfully. Previous work has been performed in order to clarify and improve the understanding of how various joining processes, such as electron beam welding l 2 2 ' 4 5 - 4 7 ^ friction welding l 2 2 - 4 7 - 4 9 ! and gas tungsten arc welding ^ ° ^ [ \ affect the microstructural changes and the mechanical properties of welded parts of titanium alloys. In the simulation and modelling of welding processes, in order to predict microstructural transformation products in the fusion zone and heat affected zone of titanium alloys, quantitative data on the phase transformation kinetics are of importance and have been studied by using several different techniques, such as differential scanning calorimetry [ 4 0 - 5 2 \ electrical resistivity measurements t , 9 ' 4 1 ] and X-ray diffraction techniques l 4 4 - 5 1>5 31.
5.5.1 Electron beam welding and friction welding
An example of a Ti64-to-Ti64 EBW is shown in Figure 5.29a. Characteristic of this kind of weld is a fusion zone (FZ) in the centre where the material was melted during welding. The region closest to the FZ is the so-called heat affected zone (HAZ), in which the material is not melted but the temperature is high enough to cause transformations of the microstructure (see Figure 5.29b). Outside the HAZ the base material not affected by the welding process is retained.
Figure 5.29. a) Optical micrograph of a Ti64-toTi64 EBW (the plate thickness is 19 mm)
micrograph of a Ti64-to-Ti6246 EBW post weld heat treated at 640°C72h.
b) optical
The main difference between a friction weld and an EBW is the lack of a FZ in the former (see Figure 5.30a). Here, instead, the region in the centre consists of a plastically deformed zone (DZ). Further out in the FRW a HAZ is found, similar to that in the EBW.
33
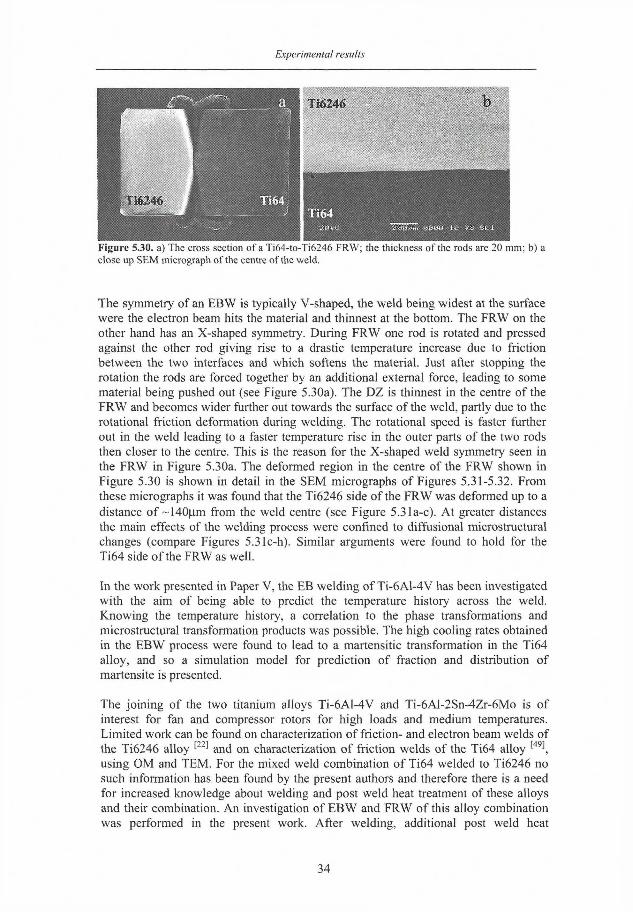
Experimental results
Figure 5.30. a) The cross section of a Ti64-to-Ti6246 FRW; the thickness of the rods are 20 mm; b) a close up SEM micrograph of the centre of the weld.
The symmetry of an EBW is typically V-shaped, the weld being widest at the surface were the electron beam hits the material and thinnest at the bottom. The FRW on the other hand has an X-shaped symmetry. During FRW one rod is rotated and pressed against the other rod giving rise to a drastic temperature increase due to friction between the two interfaces and which softens the material. Just after stopping the rotation the rods are forced together by an additional external force, leading to some material being pushed out (see Figure 5.30a). The DZ is thinnest in the centre of the FRW and becomes wider further out towards the surface of the weld, partly due to the rotational friction deformation during welding. The rotational speed is faster further out in the weld leading to a faster temperature rise in the outer parts of the two rods then closer to the centre. This is the reason for the X-shaped weld symmetry seen in the FRW in Figure 5.30a. The deformed region in the centre of the FRW shown in Figure 5.30 is shown in detail in the SEM micrographs of Figures 5.31-5.32. From these micrographs it was found that the Ti6246 side of the FRW was deformed up to a distance of ~140um from the weld centre (see Figure 5.31a-c). At greater distances the main effects of the welding process were confined to diffusional microstructural changes (compare Figures 5.31c-h). Similar arguments were found to hold for the Ti64 side of the FRW as well.
In the work presented in Paper V, the EB welding of Ti-6A1-4V has been investigated with the aim of being able to predict the temperature history across the weld. Knowing the temperature history, a correlation to the phase transformations and microstructural transformation products was possible. The high cooling rates obtained in the EBW process were found to lead to a martensitic transformation in the Ti64 alloy, and so a simulation model for prediction of fraction and distribution of martensite is presented.
The joining of the two titanium alloys Ti-6A1-4V and Ti-6Al-2Sn-4Zr-6Mo is of interest for fan and compressor rotors for high loads and medium temperatures. Limited work can be found on characterization of friction- and electron beam welds of the Ti6246 alloy ^2 2' and on characterization of friction welds of the Ti64 alloy ^ 4 9\ using OM and TEM. For the mixed weld combination of Ti64 welded to Ti6246 no such information has been found by the present authors and therefore there is a need for increased knowledge about welding and post weld heat treatment of these alloys and their combination. An investigation of EBW and FRW of this alloy combination was performed in the present work. After welding, additional post weld heat
34
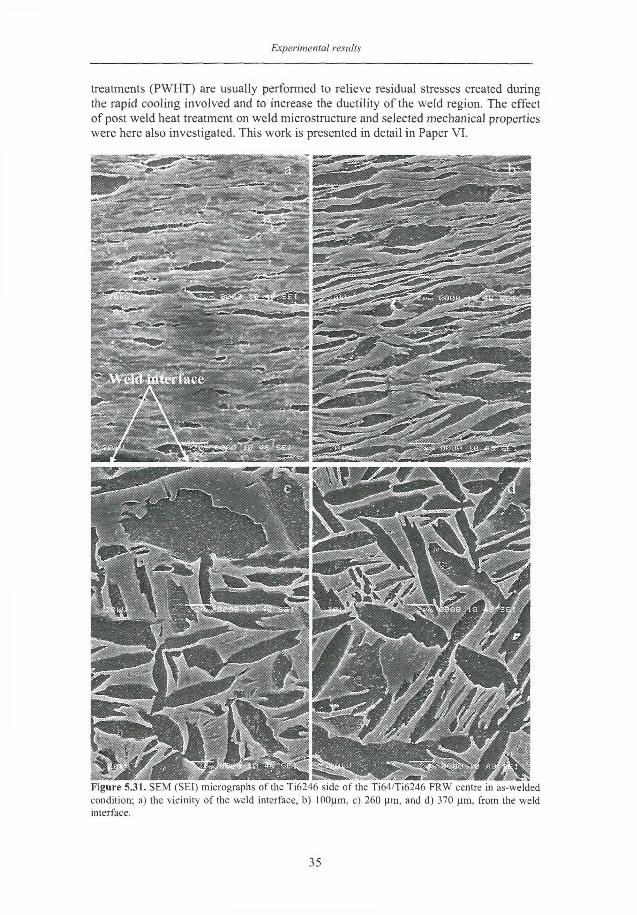
Experimental results
treatments (PWHT) are usually performed to relieve residual stresses created during the rapid cooling involved and to increase the ductility of the weld region. The effect of post weld heat treatment on weld microstructure and selected mechanical properties were here also investigated. This work is presented in detail in Paper V I .
Figure 5.31. SEM (SEI) micrographs of the Ti6246 side of the T i64/Ti6246 FRW centre in as-welded
condition; a) the vicinity of the weld interface, b) 100p.m, c) 260 urn, and d) 370 p.m. from the weld interface.
35
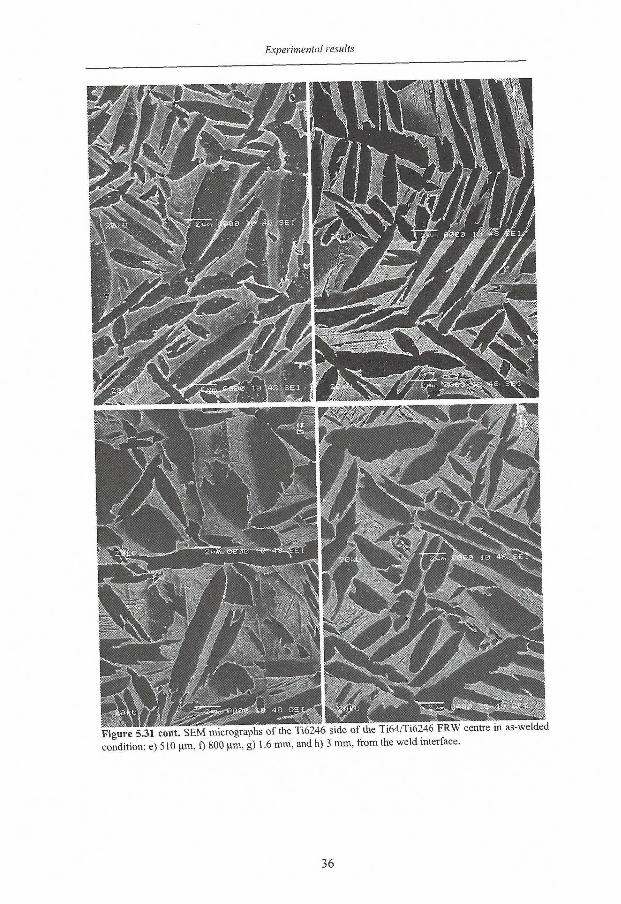
Experimental results
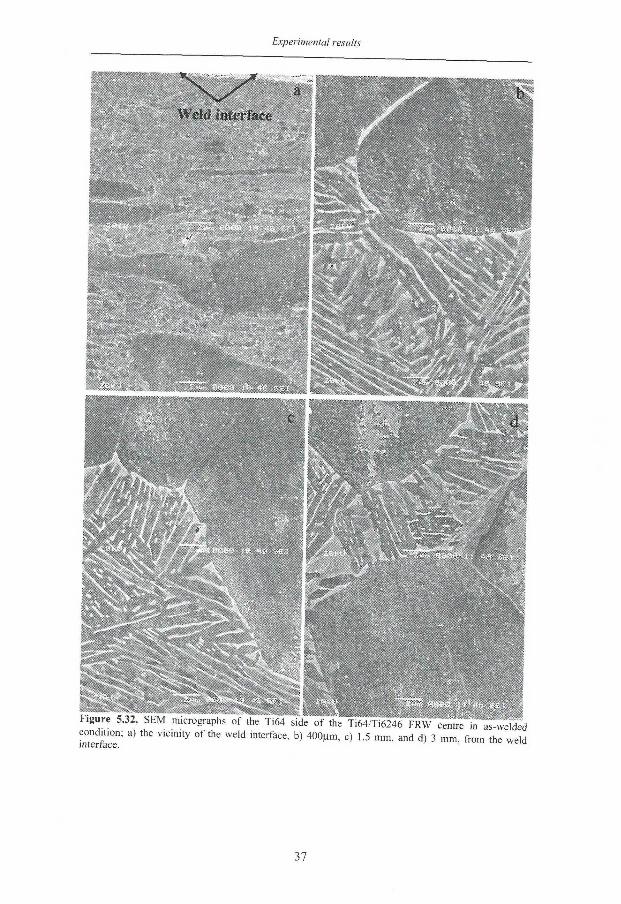
Experimental results
Discussion
6. DISCUSSION The effect of processing on microstructure and thereby mechanical properties of Ti -6A1-4V have been investigated in that closed die forged and ring rolled versions of the alloy have been compared with respect to their microstructure and fatigue properties. Even though both versions had similar duplex microstructures consisting of around 30 vol% primary alpha grains in a Widmanstätten type transformed beta phase, the closed die forged material had a significantly longer fatigue life under certain loading conditions. It was found that this material exhibited a finer primary alpha grains size and a finer Widmanstätten platelet colony size which would be expected to provide a superior resistance to fatigue crack initiation. In addition, observed differences in the texture of the two materials, as determined by electron back-scattered diffraction, are also believed to have contributed to the difference in fatigue properties. This work is presented in Paper I ,
One major part of this thesis work explored the use of high temperature X-ray diffraction (HT-XRD) for studying the phase transformation kinetics in two phase titanium alloys (Papers I I and III). The main weaknesses found with this technique can be summarized as follows:
1. Relatively low heating and cooling rates are necessary in order to avoid distortion of the furnace and excessive temperature gradients.
2. In order to record the necessary diffractogram, as well as to allow equilibration of the sample, a time delay is required (one scan takes between 6-8 minutes).
3. The X-rays penetrate only a relatively small depth of a few tens of micrometers of surface material; the phase transformation kinetics here might deviate from those of the bulk material.
Further development of the equipment, such as furnace element geometry and size, could possibly help increasing the maximum allowable heating and cooling rate. With the use of a position sensitive detector (PSD) it is possible to receive diffracted radiation over a range of 28 simultaneously thus shortening the necessary recording time. The phase fraction results obtained in the present work fit well with those obtained by alternative methods, indicating that the difference in phase transformation kinetics is minor between the surface region and the bulk material.
Notwithstanding the above difficulties, the present work has demonstrated that the phase contents can be measured to a satisfactory level of accuracy as a function of both time and temperature. It has also been demonstrated that the HT-XRD technique provides a valuable means of studying thermal expansion behaviour in two phase transforming alloys.
The three constitutive models that were studied in the present work (Paper IV) were not able to describe the material hardening behavior satisfactorily. A remaining challenge of future work is therefore to find alternative descriptions for the material behavior. However the estimation performed to check the functionality of the inverse modeling programming system described in work by others shows that inverse modelling is a viable way to determine material model parameters. It should be mentioned that different sets of parameters can describe the same material behavior.
38
Discussion
Thus it is important that the error between the reference data and the response generated by the FE-analysis is small. The existence of a minimum for the objective function should be analyzed, since several minima often exist. Another crucial issue to investigate is the stability of the achieved solution. For instance, a flat minimum is considered non-unique, and for this reason the solution may change substantially by even small changes in the data. Therefore it is important to exclude misleading local minima by investigation of different initial guesses. In future work results from the compression and continuous cooling tests (C-C) are to be used as reference data in order to achieve more accurate data with a reduced number of experiments. Regarding the FE-model, the friction coefficient between the specimen and the anvils has not yet been investigated but it is an important factor. It determines the shape of the billet when deformed and influences the estimated parameters, thus it should be investigated in future work. One possibility is to include the friction coefficient as a design parameter or perform parameter estimations with different friction coefficients. The foil and the recessed area at the compression surfaces of the specimen will cause difficulties in friction modelling. In order to take internal heat generation into account and to determine its effects it may also be justified to perform coupled thermo-mechanical analyses.
Accurate simulations and models of welding processes are of great benefit for industry in that they help in the choice of suitable welding parameters for particular materials, processes, geometries etc. This helps to reduce time consuming trial and error experiments and. i f the model itself is properly built, even helps to optimize a particular process to an extent that could not be realistically achieved by traditional methods. In the present work (Paper V) a simulation model for electron beam welding of the Ti64 alloy is presented. The temperature history could here be predicted with reasonable accuracy throughout the weld (in three dimensions). With the proper phase transformation kinetics data this model was then built to predict the amount of a and ß phases during the welding process and, in addition, based on the assumption that all ß phase formed during the welding would transform into martensitic a' upon cooling, the model then proved to be able to predict the fraction and distribution of martensite formed throughout the weld. Another important factor from an industrial standpoint is the possibility of predicting the width of the fusion zone for a particular set of welding parameters. The heat source parameters in this model are valid for different welding velocities and small changes in power input (± 10%), as long as the efficiency and flow in the molten zone is kept the same as in the calibration case. It would however be possible to extend the applicability of this model to a broader range of welding parameters by conducting additional welding experiments. The main focus in the present simulation work has been on the Ti64 alloy, but with appropriate material property data the model could also be applied to other alloys.
Electron beam welding and friction welding both proved to be suitable methods for joining of Ti-6A1-4V to Ti-6Al-2Sn-4Zr-6Mo as well as joining of Ti6246 to itself (Paper VI). The microhardness profiles measured on welds after different post weld heat treatment temperatures revealed significant changes in hardness, especially in the weld region. However, the mechanical property measurements, conducted on PWHT
39

Discussion
specimens, in general showed little effect of the treatments. It was concluded that the welds are in fact stronger than the base materials in terms of tensile strength and creep resistance. Impact test results however revealed that the welds were more brittle then the base materials for all PWHT temperatures. Therefore it is recommended that additional fatigue tests be performed on the same types of specimens in order to investigate how the fatigue resistance is affected by the welds and different PWHTs. This is a central issue, since the components originally intended to be welded with these methods are working under dynamic loading conditions where fatigue strength is a critical factor.
40
Summary of appended papers
7. SHORT SUMMARY OF APPENDED PAPERS
Paper I
A Contrastive Study of the Relation between Thermomechanical Processing and Fatigue Life for Ring-rolled and Close Die Forged Components ofTi-6Al-4V
Closed die forged and ring rolled versions of the alloy Ti-6A1-4V have been compared with respect to their microstructure and fatigue properties. Both versions had duplex microstructures consisting of around 30 vol% spheroidal primary alpha phase in a matrix of Widmanstätten-type transformed beta phase. In spite of the similar microstructures, the closed die forged material had a significantly longer fatigue life under certain loading conditions. Quantitative metallographic studies revealed that this material exhibited a finer primary alpha grain size and a finer Widmanstätten platelet colony size which would be expected to provide a superior resistance to fatigue crack initiation. Observed differences in the texture of the two materials as determined by electron back-scattered diffraction might also have contributed to the difference in fatigue properties.
The author has performed the fractographic investigation on fatigue tested specimens, parts of the metallographic studies and is one of the main writers of the paper.
Paper II
The Use of High Temperature X-Ray Diffractometry to Study Phase Transitions in Ti-6AI-4V
Phase transitions in Ti-6A1-4V were studied by means of high-temperature X-ray diffraction using a resistance heated furnace in high vacuum and Cu Ka radiation. The alpha and beta phases could be observed conveniently using the cx(100), a(002) and a(101) peaks of the alpha structure and the ß(110) peak of the beta. The phase composition of the sample at selected times and temperatures were determined from diffractograms recorded in the range of 32-45° (20), the scan time being around 8 minutes. The technique was successfully used to monitor the kinetics of the alpha-to-beta transition during heating and the beta-to-alpha transition during cooling and including the transformation kinetics during isothermal holds.
The author has performed the analysis of the diffractograms, the metallographic examinations of tested samples and is one of the main writers of the paper
Paper III
Use of High Temperature X-Ray Diffractometry to Study Phase Transitions and Thermal Expansion Properties in TT6AT4V
This work is a continuation of the work included in paper I I , here the calculation methods for the phase transformation kinetics have been further developed. Also, measurements of the interplanar distance change with temperature for the crystailographic planes of alpha and beta phases enabled the derivation of the overall thermal expansion for the alloy using a rule of mixtures.
41
Summary of appended papers
The author has performed the analysis of the diffractograms, the metallographic examination of tested specimens and is one of the main writers of the paper.
Paper IV
Numerical and Microstructural Evaluation of Elevated Temperature Compression Tests on Ti-6AI-4V
An investigation of the use of inverse modelling of a compression test for estimation of material properties of forged Ti-6A1-4V is presented. The compression tests performed on cylindrical specimens indicated that initial material hardening was followed by specimen cracking at lower temperatures while at 700°C and 900°C material hardening was followed by flow softening. The alloy was also found to be strain rate sensitive. The ability of three different constitutive models to describe the inelastic thermomechanical behaviour of TU6A1-4V was examined and none of them were found able to describe it satisfactorily. However, it was shown that inverse modelling is a viable way to determine relevant material parameters, i f suitable functions are chosen. Changes in the microstructure as a consequence of heat treatment and deformation were also investigated. In general, it was found in cross sections parallel to the loading direction, that the deformation was non-uniform and concentrated in bands going diagonally from one corner to the other. The alpha platelets in the Widmanstätten structure were increasingly broken up going from the less deformed anvil contact region into the more deformed centre of the specimen.
The author has performed the metallographic examinations and is responsible in writing the part of the paper regarding the metallography.
Paper V
Calibration of FE-model for EBW of TT6AI-4V using DSC and Metallographic Examination
Differential scanning calorimetry (DSC) was used to study the a-to-ß phase transformation kinetics during continuous heating. The results from this study were used for calibration and optimisation of an alpha-to-beta phase transformation model. This model was then implemented into a finite element model (FE) of electron beam welding (EBW). In the FE model the predicted temperature distribution during the EBW process was calibrated with data collected from a full scale EBW experiment. Moreover, thermophysical property data required for the modelling was determined where necessary. With the assumption that all ß phase, formed during the welding process, transformed to martensitic a' upon cooling, prediction of the amount and distribution of martensite throughout the weld was possible.
The author has performed the analysis of the raw data DSC curves, the metallographic characterization of the weld and is one of the main writers of the paper.
42
Summan- of appended papers
Paper VI
Microstructure and Mechanical Properties of Friction- and Electron Beam Welded TU6AI-4V and Ti-6Al-2Sn-4Zr-6Mo
This work presents mechanical data and a metallographic investigation of welded Ti-6Al-2Sn-4Zr-6Mo and Ti-6A1-4V joints for comparison of two different welding processes, namely electron beam welding (EBW) and friction welding (FR) with subsequent post weld heat treatment (PWHT). Ti-6246 welded to Ti-6246 and Ti-64 welded to Ti-6246 were evaluated with tensile-, creep- and Charpy-V tests. Three different post weld heat treatments were evaluated (593°C/2h, 640°C/2h, 704°C/2h). The microstructure of the different weld types and alloy combinations where characterized using optical microscopy, SEM and microhardness profiles.
Tensile strength and yield strength were within specification for both material combinations. The elongation for Ti-6246 welded to Ti-6246 was below specification. Only small variations in tensile properties were found for the different heat treatments. Higher post weld heat treatment temperature resulted in lower micro hardness across the welds. Tensile and creep fracture always occurred in the Ti-64 base alloy in the Ti-64 - to - Ti-6246 welds and in most cases in the base alloy in the Ti6246/Ti6246 welds.
Charpy-V tests shows that the welds were more brittle compared with the base materials. The largest difference was found in Ti-6246 welded to Ti-6246.
No significant variation in creep properties for the different post weld heat treatments was found. Ti-64 welded to Ti-6246 showed poor creep properties due to the significantly lower creep resistance of the Ti-64. Ti-6246 welded to Ti-6246 shows good creep properties compared to the base material.
The author has performed parts of the micro hardness investigations, the metallographic examinations, the weld characterizations and is one of the main writers of the paper.
43
References
8. REFERENCES 1. 'The Development of Gas Turbine Materials', G. W. Meetham, ed., 1981,
Applied Science Publishers LTD, Essex, England.
2. D. Eylon:./. Met., 1984, 55-61.
3. 'Titanium and its Alloys: Principles of Alloying Titanium', J. L. Walter, M. R. Jackson and C. T. Sims, eds., 1988, Metals Park, Ohio: ASM International, USA.
4. 'Titanium - A Technical Guide', M. J. Donachie, ed., 1988, Metals Park, Ohio: ASM International, USA.
5. S. L. Semiatin, V. Seetharaman and I . Weiss: in Advances in the Science and Technology of Titanium Alloy Processing, TMS annual meeting, Anaheim, California, Feb., 1996,1. Weiss, R. Srinivasan, P. J. Bania, D. Eylon and S. L. Semiatin, eds., Minerals, Metals and Materials Society, 1997, 3-73.
6. G. Liitjering: Mater. Sei. Eng. A, 1998, vol. 243, 32-45.
7. J. B. Borradaile and R. H. Jeal: Titanium '80: Science and Technology, Proc. 4 t h World Conf. on Titanium, Kyoto, Japan, May, 1980, Kimura and Izumi, eds., The Metallurgical Society, AIME, 1980, vol. 1, 141-152.
8. B. K. Damkroger and G. R, Edwards: Simulation and Theory of Evolving Microstructures, Proc. Symp., Indianapolis, USA, Oct. 2-5, 1989, M . P. Andersson and A. D. Rollet, eds., Minerals, Metals and Materials Society, 1990, 129-150.
9. J. I . Qazi, O. N. Senkov, J. Rahim and F. H. (Sam) Froes: Mat. Set. Eng. A, 2003, vol. 359, 137-149.
10. P. Tarin, F. X. Gil, M. P. Ginebra, J. M. Manero, J. M Prado, M. Sole and J. A. Planell: J. Phys. Ill, 1995, vol. 5 (C2), 317-322.
11. Y. T. Lee, M. Peters and G. Welsch: Metall. Mater. Trans. A, 1999, vol. 22, 709-714.
12.1. J. Polmear: 'Light Alloys - Metallurgy of the Light Metals', Halsted Press, John Wiley & Sons, Inc., New York, 3 r d edition published by Arnold, London, 1995.
13. in 'Materials Properties Handbook: Titanium Alloys', R. Boyer et. al., ed., 483-636, 1994, Materials Park, OH, ASM International.
14. H. Moustahfid, N. Gey, M. Humbert, and M. J. Philippe: Metall. Mater. Trans. A, 1997, vol. 28, 51-61.
15. N. Gey, M. Humbert, M. J. Philippe and Y. Combres: Mat. Sei. Eng A, 1996, vol. 219, 80-88.
16. J. Albrecht and G. Liitjering: Titanium '99: Science and Technology, Proc. 9 n
World Conf. on Titanium, Saint-Petersburg, Russia, June, 1999, I . V. Goryn and S. S. Ushkov, eds., Central Research Institute of Structural Materials, 2000, vol. 1,363-374.
17. in 'Metals Handbook: Atlas of Microstructures of Industrial Alloys', T. Lyman, ed., 1972, vol. 7, American Society for Metals, Metals Park, OH, 8 t h
edition.
18. in 'Materials properties handbook: titanium alloys', R. Boyer et. al., ed., 465-481, 1994, Materials Park, OH, ASM International.
19. S. Bein and J. Bechet: / . Phys. IV, 1996, vol. 6 (CI), 99-108.
44

References
20. M . Jackson, R. J. Dashwood, L. Christodoulou and H. M . Flower: in Titanium Alloys at Elevated Temperature: Structural Development and Service Behaviour, M. Winston and A. Strang, eds., 89-101, 2001, Institute of Materials, London.
21. C. Sauer and G. Liitjering: Titanium '99: Science and Technology, Proc. 9 t h
World Conf. on Titanium, Saint-Petersburg, Russia, June, 1999, I . V. Goryn and S. S. Ushkov, eds., Central Research Institute of Structural Materials, 2000, vol. 1,390-397.
22. O. Roder, D. Helm and G. Liitjering: Titanium '03: Science and Technology, Proc. 10th World Conf. on Titanium, Hamburg, Germany, July, 2003. Proceeding currently in press.
23. R. Pederson, F. Niklasson, F. Skystedt and R. Warren: 'Microstructure and mechanical properties of friction- and electron beam welded Ti-6A1-4V and Ti-6Al-2Sn-4Zr-6Mo', to be published.
24. Y. Murakami, O. Izumi and T. Nishimura: Titanium '84: Science and Technology, Proc. 5 t h World Conf. on Titanium, Munich, Germany, September, 1984, G. Lutjering, U. Zwicker and W. Bunk, eds., Deutsche Gesellschaft fur Metallkunde E.V., 1985, vol. 3, 1404-1406.
25. T. Sugimoto, K. Kamei, S. Komatsu and K. Sugimoto: Titanium '84: Science and Technology, Proc. 5* World Conf. on Titanium, Munich, Germany, September, 1984, G. Lutjering, U. Zwicker and W. Bunk, eds., Deutsche Gesellschaft fur Metallkunde E.V., 1985, vol. 3, 1583-1590.
26. J. A. Hines, J. O. Peters and G. Liitjering: Titanium '99: Science and Technology, Proc. 9 t h World Conf. on Titanium, Saint-Petersburg, Russia, June, 1999, I . V. Goryn and S. S. Ushkov, eds., Central Research Institute of Structural Materials, 2000, vol. 1, 433-440.
27. O. M. Ivasishin and G. Liitjering: Titanium '99: Science and Technology, Proc. 9 , h World Conf. on Titanium, Saint-Petersburg, Russia, June, 1999, I . V. Goryn and S. S. Ushkov, eds., Central Research Institute of Structural Materials, 2000, vol. 1, 441-449.
28. V. K. Saxena and V. M. Radhakrishnan: Metall. Mater. Trans. A, 1998, vol. 29, 245-261.
29. K. Keshava Murthy, N. B. Potluri and S. Sundaresan: Mat. Sei. Tech., 1997, vol. 13,503-510.
30. C. C. Chen and J. E. Coyne: Titanium and Titanium Alloys: Scientific and Technological Aspects, Proc. 3 r d Int. Conf. on Titanium, Moscow, May, 1976, J. C. Williams and A. F. Belov, eds., Plenum Press, New York, NY, 1982, 383-396.
31. J. Hall: Int. J. Fatigue, 1997, vol. 19, issue 93, 23-37.
32. B. E. Powell, M . Hawkyard and L. Grabowski: Int. J. Fatigue, 1997, vol. 19, issue 93, 167-176.
33. J. C. Chesnut, A. W. Thompson and J. C. Williams: Titanium '80: Science and Technology, Proc. 4 t h World Conf. on Titanium, Kyoto, Japan, May, 1980, Kimura and Izumi, eds., The Metallurgical Society, AIME, 1980, vol. 4, 1875-1882.
34. A. S. Fedotov: Metalloved, 1984, No. 5, 55-57.
45
References
35.1. W. Hall and C. Hammond: Titanium and Titanium Alloys: Scientific and Technological Aspects, Proc. 3 r d Int. Conf. on Titanium, Moscow, May, 1976, J. C. Williams and A. F. Belov, eds., Plenum Press, New York, NY, 1982, 601-613.
36. B. D. Cullity: 'Elements of X-Ray Diffraction', 1956, New York, Addison-Wesley.
37. D. A. Skoog, F. J. Holler and T. A. Nieman: 'Principles of Instrumental Analysis', 1998, 5 t h ed., Harcourt Brace & Company, USA.
38. D. P. Garriga-Majo, B. A. Shollock and M . G. Arkadani: 'Micro-texture Study of Ti-6A1-4V Using Electron Back Scattering Diffraction', Laboratory report, Imperial College, UK, 1999.
39. C. Suryanarayana and M . Grant Norton: 'X-Ray Diffraction - A Practical Approach', 1998, New York, Plenum Press.
40. S. Malinov, Z. Guo, W. Sha and A. Wilson: Metall. Mater. Trans. A, 2001, vol. 32, 879-887.
41. S. Malinov, P. Markovsky, W. Sha and Z, Guo: J. Alloys and Compounds, 2001, vol. 314, No. 1-2, 181-192.
42.1. Katzarov, S. Malinov and W. Sha: Metall. Mater. Trans. A, 2002, vol. 33, 1027-1040.
43. J. Sieniawski, R. Filip, W. Ziaja and F. Grosman: Titanium '95: Science and Technology, Proc. 8th World Conf. on Titanium, Birmingham, UK, Oct., 1995, P. A. Blenkinsop, W. J. Evans and H. M . Flowers, eds., The Institute of Materials, London, 1996, 1411-1418.
44. R. Pederson, O. Babushkin, F. Skystedt and R. Warren: Mat. Sei. Tech., 2003, vol. 19, 1533-1538.
45. Y. Obata, Y. Mori, K. Aoki, T. Kakimi, A. Morimoto, H. Satoh, M . Nakanose and T. Kishi: Titanium '84: Science and Technology, Proc. 5 t h World Conf. on Titanium, Munich, Germany, September, 1984, G. Lutjering, U. Zwicker and W. Bunk, eds., Deutsche Gesellschaft fur Metallkunde E.V., 1985, vol. 2, 807-813.
46. J.-R. Cho, S. M. Roberts, R. C. Reed and K. T. Conlon: in Titanium Alloys at Elevated Temperature: Structural Development and Service Behaviour, M . Winston and A. Strang, eds., 151-164, 2001, Institute of Materials, London.
47.1. C. Wallis and A. Wisbey: in Titanium Alloys at Elevated Temperature: Structural Development and Service Behaviour, M . Winston and A. Strang, eds., 133-150, 2001, Institute of Materials, London.
48. A. Wisbey, IC. Wallis, H. S. Ubhi, P. Sketchley, CM. Ward-Close and PL. Threadgill: Titanium '99: Science and Technology, Proc. 9 t h World Conf. on Titanium, Saint-Petersburg, Russia, June, 1999, I . V. Goryn and S. S. Ushkov, eds., Central Research Institute of Structural Materials, 2000, vol. 3, 1718-1725.
49. D. Helm and G. Lutjering: Titanium '99: Science and Technology, Proc. 9 t h
World Conf. on Titanium, Saint-Petersburg, Russia, June, 1999, I . V. Goryn and S. S. Ushkov, eds., Central Research Institute of Structural Materials, 2000, vol. 3, 1726-1733.
46
References
50. J. W. Elmer, T. A. Palmer, S. S. Babu, W. Zhang and T. DebRoy: 'Phase Transformation Dynamics During Welding of Ti-6A1-4V, to be published in J. Applied Physics, 2004, June 15.
51. J. W. Elmer, T. A. Palmer and J. Wong: J. Applied Physics, 2003, vol. 93, No. 4, 1941-1947.
52. W. Sha and Z. Guo: J. Alloys and Compounds, 1999, vol. 290, L3-L7.
53. Z. Yang, J. W. Elmer, J. Wong and T. Debroy: Welding Journal, April 2000, 97-111.
47

Notes

Notes

Notes

Notes

Notes
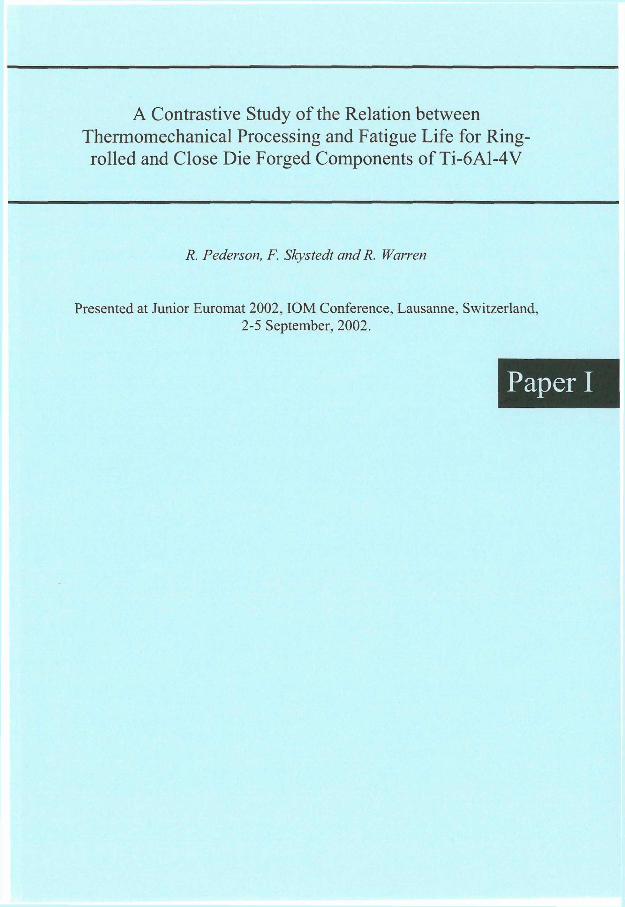
A Contrastive Study of the Relation between Thermomechanical Processing and Fatigue Life for Ring-rolled and Close Die Forged Components of Ti-6A1-4V
R. Pederson, F. Skystedt and R. Warren
Presented at Junior Euromat 2002, IOM Conference, Lausanne, Switzerland, 2-5 September, 2002.
Paper I
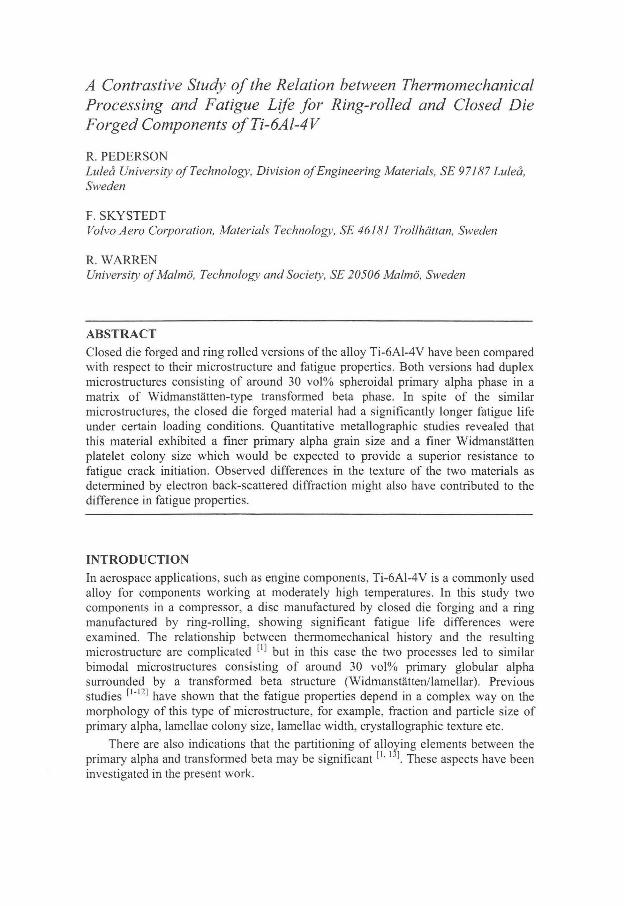
A Contrastive Study of the Relation between Thermomechanical Processing and Fatigue Life for Ring-rolled and Closed Die Forged Components ofTi-6Al-4V
R. PEDERSON Luleå University of Technology, Division of Engineering Materials, SE 97187 Luleå, Sweden
F. SKYSTEDT
Volvo Aero Corporation, Materials Technology, SE 46181 Trollhättan, Sweden
R. WARREN University of Malmö, Technology and Society, SE 20506 Malmö, Sweden
ABSTRACT
Closed die forged and ring rolled versions of the alloy Ti-6A1-4V have been compared with respect to their microstructure and fatigue properties. Both versions had duplex microstructures consisting of around 30 vol% spheroidal primary alpha phase in a matrix of Widmanstätten-type transformed beta phase. In spite of the similar microstructures, the closed die forged material had a significantly longer fatigue life under certain loading conditions. Quantitative metallographic studies revealed that this material exhibited a finer primary alpha grain size and a finer Widmanstätten platelet colony size which would be expected to provide a superior resistance to fatigue crack initiation. Observed differences in the texture of the two materials as determined by electron back-scattered diffraction might also have contributed to the difference in fatigue properties.
INTRODUCTION
In aerospace applications, such as engine components, Ti-6A1-4V is a commonly used alloy for components working at moderately high temperatures. In this study two components in a compressor, a disc manufactured by closed die forging and a ring manufactured by ring-rolling, showing significant fatigue life differences were examined. The relationship between thermomechanical history and the resulting microstructure are complicated [ l ] but in this case the two processes led to similar bimodal microstructures consisting of around 30 vol% primary globular alpha surrounded by a transformed beta structure (Widmanstätten/lamellar). Previous studies [ l _ 1 2 ] have shown that the fatigue properties depend in a complex way on the morphology of this type of microstructure, for example, fraction and particle size of primary alpha, lamellae colony size, lamellae width, crystailographic texture etc.
There are also indications that the partitioning of alloying elements between the primary alpha and transformed beta may be significant [ 1 , I j l These aspects have been investigated in the present work.
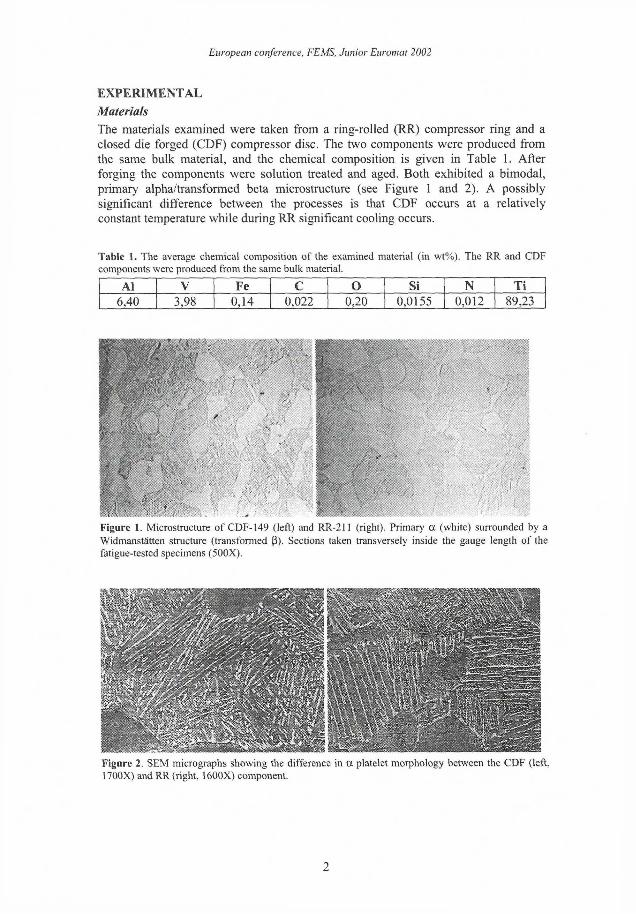
European conference, FEMS, Junior Euromat 2002
EXPERIMENTAL
Materials
The materials examined were taken from a ring-rolled (RR) compressor ring and a closed die forged (CDF) compressor disc. The two components were produced from the same bulk material, and the chemical composition is given in Table 1. After forging the components were solution treated and aged. Both exhibited a bimodal, primary alpha/transformed beta microstructure (see Figure 1 and 2). A possibly significant difference between the processes is that CDF occurs at a relatively constant temperature while during RR significant cooling occurs.
Table 1. The average chemical composition of the examined material (in wt%). The RR and CDF components were produced from the same bulk material.
Al V Fe C O Si N Ti 6,40 3,98 0,14 0,022 0,20 0,0155 0,012 89,23
Figure 1. Microstructure of CDF-149 (left) and RR-211 (right). Primary a (white) surrounded by a
Widmanstätten structure (transformed ß). Sections taken transversely inside the gauge length of the fatigue-tested specimens (500X).
Figure 2. SEM micrographs showing the difference in a platelet morphology between the CDF (left, 1700X) and RR (right, 1600X) component.
2
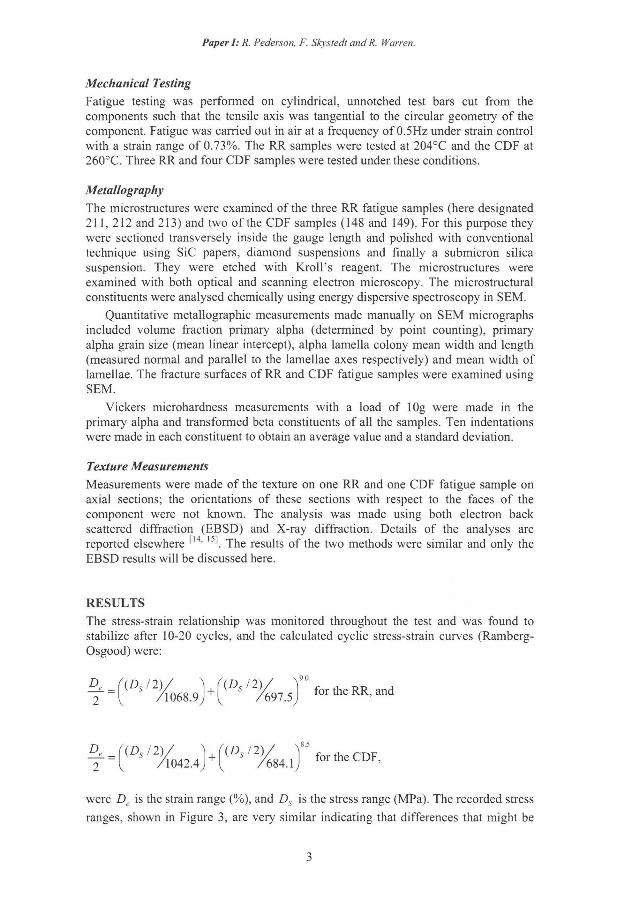
Paper I: R. Pederson, F. Skystedt and R. Warren.
Mechanical Testing
Fatigue testing was performed on cylindrical, unnotched test bars cut from the components such that the tensile axis was tangential to the circular geometry of the component. Fatigue was carried out in air at a frequency of 0.5Hz under strain control with a strain range of 0.73%. The RR samples were tested at 204°C and the CDF at 260°C. Three RR and four CDF samples were tested under these conditions.
Metallography
The microstructures were examined of the three RR fatigue samples (here designated 211,212 and 213) and two of the CDF samples (148 and 149). For this purpose they were sectioned transversely inside the gauge length and polished with conventional technique using SiC papers, diamond suspensions and finally a submicron silica suspension. They were etched with Kroll's reagent. The microstructures were examined with both optical and scanning electron microscopy. The microstructural constituents were analysed chemically using energy dispersive spectroscopy in SEM.
Quantitative metallographic measurements made manually on SEM micrographs included volume fraction primary alpha (determined by point counting), primary alpha grain size (mean linear intercept), alpha lamella colony mean width and length (measured normal and parallel to the lamellae axes respectively) and mean width of lamellae. The fracture surfaces of RR and CDF fatigue samples were examined using SEM.
Vickers microhardness measurements with a load of 10g were made in the primary alpha and transformed beta constituents of all the samples. Ten indentations were made in each constituent to obtain an average value and a standard deviation.
Texture Measurements
Measurements were made of the texture on one RR and one CDF fatigue sample on axial sections; the orientations of these sections with respect to the faces of the component were not known. The analysis was made using both electron back scattered diffraction (EBSD) and X-ray diffraction. Details of the analyses are reported elsewhere [ l 4 ' . The results of the two methods were similar and only the EBSD results will be discussed here.
RESULTS
The stress-strain relationship was monitored throughout the test and was found to stabilize after 10-20 cycles, and the calculated cyclic stress-strain curves (Ramberg-Osgood) were:
were De is the strain range (%), and Ds is the stress range (MPa). The recorded stress
ranges, shown in Figure 3, are very similar indicating that differences that might be
3
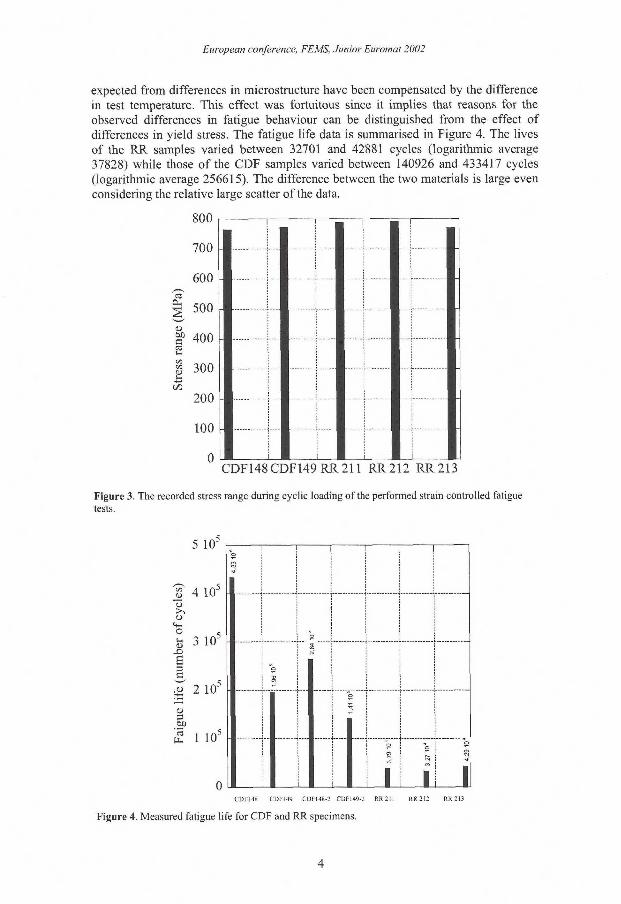
European conference, FEMS, Junior Euromal 2002
expected from differences in microstructure have been compensated by the difference in test temperature. This effect was fortuitous since it implies that reasons for the observed differences in fatigue behaviour can be distinguished from the effect of differences in yield stress. The fatigue life data is summarised in Figure 4. The lives of the RR samples varied between 32701 and 42881 cycles (logarithmic average 37828) while those of the CDF samples varied between 140926 and 433417 cycles (logarithmic average 256615). The difference between the two materials is large even considering the relative large scatter of the data.
a
3
800
700
600
500
400
300
200
100
0 CDF148CDF149RR211 RR 212 RR 213
Figure 3. The recorded stress range during cyclic loading of the performed strain controlled fatigue tests.
5 10'
o -O
4 W
3 103
& 2 10°
o
So '3 1 10"
0 I i i i CDF14S CDF149 C D F 148-2 CDF149-2 R R 2
Figure 4. Measured fatigue life for C D F and RR specimens.
R R 212 RR 213
4
Paper I: R. Pederson, F. Skystedt and R. Warren.
By using light microscope and SEM several microstructural features were measured and calculated, the results are shown in Table 2 ' 1 5 l The globular a grains in the CDF samples seemed more deformed and had a more elongated elliptical type of shape. The average globular a grain sizes were larger for the RR samples than for the CDF specimens. The average volume fraction of globular a was 31,4 % and 28,1 % for the RR and CDF specimens, respectively.
The mean colony size was also larger for the RR specimens as compared to the CDF samples. The a platelets in the RR specimens were both longer and thicker and had a right angular configuration, where as for the CDF samples the a platelets were more broken up and in a triangular configuration.
A quantitative chemical analysis of the microstructural constituents, globular a and transformed ß, was performed for the RR and the CDF specimens in order to find out i f the chemical composition in these constituents varied in the two types of components investigated. The results are shown in Table 2. A higher Al content and a smaller V content could be seen in the globular a of the RR specimens, compared to the corresponding constituents of the CDF specimens. For the chemical composition of the transformed ß no clear difference could be found, but the total sum of the elements, supposed to add up to 100%, is slightly less for both types of specimens indicating a small error in the measurements. Nevertheless, for the globular a the sums add up, and a difference in chemical composition was confirmed.
Table 2. Microstructural features and results from quantitative chemical analysis of microstructural
constituents of RR and CDF specimens. The standard deviations for 0Cp are shown inside the parenthesis. For the chemical analysis the standard deviations are for Al:0,03%, V:0,15%, and Ti:0,16%.
Ring-rolled Closed die forged
ap volume fraction (%) 31,4 (2,0) 28,1 (1,7)
dp grain size (gm) 17,5(1,9) 13,5(1,7)
Mean lamella width (um) 1,74 1,03
Mean colony length (urn) 21,9 15
Mean colony width (u.m) 13,2 7,8
% Al in globular a 7 6,8
% V in globular a 2 2,2
% Ti in globular a 91 91
% Al in transformed ß 5,7 5,7
% V in transformed ß 5,1 5,1
% Ti in transformed ß 89 89,1
Microhardness tests were carried out in the primary alpha and transformed beta constituent of three RR specimens (211, 212 and 213) and two CDF specimens (148 and 149). A wide spread in measured microhardness for the primary alpha as well as for the transformed beta, the results are shown in Table 3, lead to large standard deviations, thereby making concluder nary work regarding microhardness variations difficult.
5
European conference, FEMS, Junior Euromat 2002
Table 3. Measured microhardness of primary alpha and transformed beta microstructure. The standard deviations are shown inside the parenthesis.
Average microhardness [HVioJ
Sample Primary alpha Transformed beta RR 211 334(60) 324 (42) RR212 332 (43) 332 (24) RR 213 381 (59) 365 (68)
CDF 148 394 (40) 356 (36) CDF 149 346 (59) 337 (32)
By using EBSD a pronounced micro texture in the RR specimens was revealed [ l 4 l In the RR specimens the (0002) planes are oriented at 90° and 45° to the specimen axis, whereas in the CDF specimens the (0002) planes are at 90° and 0° to the axis.
The fatigue in this work is considered to be LCF since it was strain controlled and because significant plastic deformation occurred in the cycle, leading to relatively few cycles to failure. It was observed in this case that a significant proportion of the life was taken up with initiation while the SEM fractography confirmed that initiation occurred at the surface in all samples (see Figure 5).
Figure 5. CDF specimen 149. Crack initiation site at the specimen surface (left) and propagation (right).
DISCUSSION
The LCF regime is characterized by a high stress range in a cyclic loading process leading to significant plastic deformation during the fatigue cycle, at least at a localized scale. The LCF failure regime usually lies below 104-106 cycles. The measured fatigue lives for the examined specimens (104-105 cycles to fracture) lies clearly within the LCF regimen, in which the microcrack initiation and growth dominatesc .
Initiation is favoured by large colony width (and/or large primary alpha grains) since this leads to longer slip bands crossing the colonies (grains). For large components the macro crack propagation resistance is enhanced by increasing the colony size, due to crack closure. The CDF specimens triangular and more broken up a platelet configuration lead to smaller slip length and thereby enhanced micro crack nucleation and propagation resistance, as compared to the RR specimens. Initiation is
6
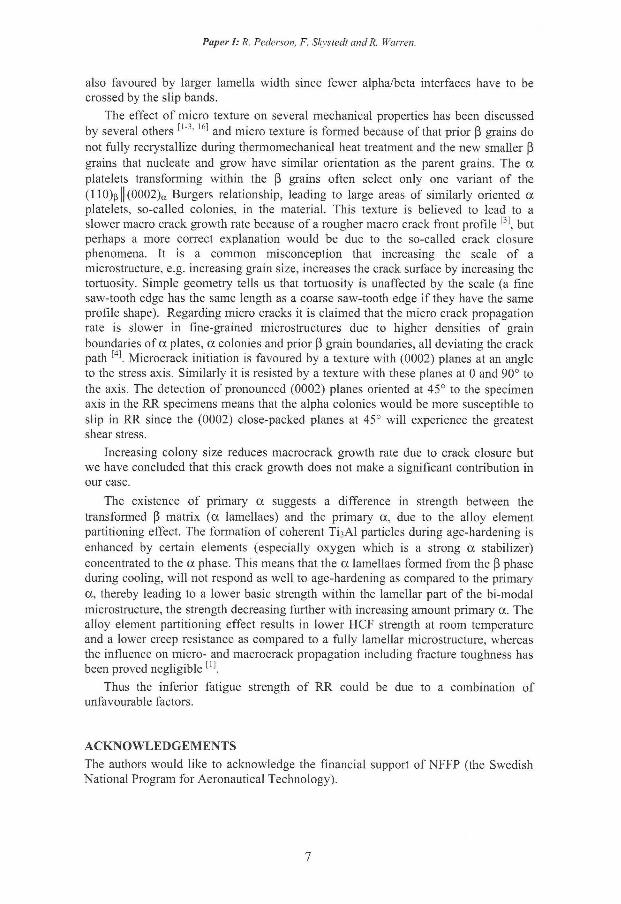
Paper I: R. Pederson, F. Skystedt and R. Warren.
also favoured by larger lamella width since fewer alpha/beta interfaces have to be crossed by the slip bands.
The effect of micro texture on several mechanical properties has been discussed by several others [ I " 3 ' 1 6 1 and micro texture is formed because of that prior ß grains do not fully recrystallize during thermomechanical heat treatment and the new smaller ß grains that nucleate and grow have similar orientation as the parent grains. The a platelets transforming within the ß grains often select only one variant of the (110)ß||(0002)„ Burgers relationship, leading to large areas of similarly oriented a platelets, so-called colonies, in the material. This texture is believed to lead to a slower macro crack growth rate because of a rougher macro crack front profde ^ \ but perhaps a more correct explanation would be due to the so-called crack closure phenomena. It is a common misconception that increasing the scale of a microstructure, e.g. increasing grain size, increases the crack surface by increasing the tortuosity. Simple geometry tells us that tortuosity is unaffected by the scale (a fine saw-tooth edge has the same length as a coarse saw-tooth edge i f they have the same profile shape). Regarding micro cracks it is claimed that the micro crack propagation rate is slower in fine-grained microstructures due to higher densities of grain boundaries of a plates, a colonies and prior ß grain boundaries, all deviating the crack path [ 4 l Microcrack initiation is favoured by a texture with (0002) planes at an angle to the stress axis. Similarly it is resisted by a texture with these planes at 0 and 90° to the axis. The detection of pronounced (0002) planes oriented at 45° to the specimen axis in the RR specimens means that the alpha colonies would be more susceptible to slip in RR since the (0002) close-packed planes at 45° will experience the greatest shear stress.
Increasing colony size reduces macrocrack growth rate due to crack closure but we have concluded that this crack growth does not make a significant contribution in our case.
The existence of primary a suggests a difference in strength between the transformed ß matrix (a lamellaes) and the primary a, due to the alloy element partitioning effect. The formation of coherent T i 3 A l particles during age-hardening is enhanced by certain elements (especially oxygen which is a strong a stabilizer) concentrated to the a phase. This means that the a lamellaes formed from the ß phase during cooling, will not respond as well to age-hardening as compared to the primary a, thereby leading to a lower basic strength within the lamellar part of the bi-modal microstructure, the strength decreasing further with increasing amount primary a. The alloy element partitioning effect results in lower HCF strength at room temperature and a lower creep resistance as compared to a fully lamellar microstructure, whereas the influence on micro- and macrocrack propagation including fracture toughness has been proved negligible [ ' l
Thus the inferior fatigue strength of RR could be due to a combination of unfavourable factors.
ACKNOWLEDGEMENTS
The authors would like to acknowledge the financial support of NFFP (the Swedish National Program for Aeronautical Technology).
7
European conference, FEMS, Junior Euromal 2002
R E F E R E N C E S
1. G. Lütjering: Mater. Sei. Eng. A, 1998, vol. 243, 32-45.
2. J. Albrecht, G. Lütjering: Titanium '99: Science and Technology, Proc. 9 t h
World Conf. on Titanium, Saint-Petersburg, Russia, June, 1999, I . V. Goryn and S. S. Ushkov, eds., Central Research Institute of Structural Materials, 2000, vol. 1,363-374.
3. J. A. Hines, J. O. Peters, G. Lütjering: Titanium '99: Science and Technology, Proc. 9 l h World Conf. on Titanium, Saint-Petersburg, Russia, June, 1999, I . V. Goryn and S. S. Ushkov, eds., Central Research Institute of Structural Materials, 2000, vol. 1, 433-440.
4. O. M. Ivasishin, G. Lütjering: Titanium '99: Science and Technology, Proc. 9 t h
World Conf. on Titanium, Saint-Petersburg, Russia, June, 1999, I . V. Goryn and S. S. Ushkov, eds., Central Research Institute of Structural Materials, 2000, vol. 1,441-449.
5. in 'Materials Properties Handbook: Titanium Alloys', R. Boyer et. a l , ed., 483-636, 1994, Materials Park, OH, ASM International.
6. V. K. Saxena, V. M . Radhakrishnan: Metall. Mater. Trans. A, 1998, vol. 29, 245-261.
7. K. Keshava Murthy, N. B. Potluri, S. Sundaresan: Mat. Sei. Tech., 1997, vol. 13, 503-510.
8. C. C. Chen, J. E. Coyne: Titanium and Titanium Alloys: Scientific and Technological Aspects, Proc. 3 r d Int. Conf. on Titanium, Moscow, May, 1976, J. C. Williams and A. F. Belov, eds., Plenum Press, New York, NY, 1982, 383-396.
9. J. Hall: Int. J. Fatigue, 1997, vol. 19, issue 93, 23-37.
10. B. E. Powell, M. Hawkyard, L. Grabowski: Int. J. Fatigue, 1997, vol. 19, issue 93, 167-176.
11. J. C. Chesnut, A. W. Thompson, J. C. Williams: Titanium '80: Science and Technology, Proc. 4 t h World Conf. on Titanium, Kyoto, Japan, May, 1980, Kimura and Izumi, eds., The Metallurgical Society, AIME, 1980, vol. 4, 1875-1882.
12. A. S. Fedotov: Metalloved, 1984, No. 5, 55-57.
13.1. W. Hall, C. Hammond: Titanium and Titanium Alloys: Scientific and Technological Aspects, Proc. 3 r d Int. Conf. on Titanium, Moscow, May, 1976, J. C. Williams and A. F. Belov, eds., Plenum Press, New York, NY, 1982, 601-613.
14. D.P. Garriga-Majo, B. A. Shollock, M . G. Arkadani: 'Micro-texture Study of Ti-6A1-4V Using Electron Back Scattering Diffraction', Laboratory report. Imperial College, UK, 1999.
15. O. R. Brea, 'The Microstructure and Properties of Ring-rolled and Press-forged Ti-6A1-4V Alloy', Thesis work, Luleå University of Technology, Sweden, 1999.
16. H. Moustahfid, N . Gey, M. Humbert, and M. J. Philippe: Metall. Mater. Trans. A, 1997, vol. 28,51-61.
8
The Use of High Temperature X-Ray Diffractometry to Study Phase Transitions in Ti-6A1-4V
R. Pederson, O. Babushkin, F. Skystedt and R. Warren
in Titanium Alloys at Elevated Temperature: Structural Development and Service Behaviour, M. Winston and A. Strang, eds., 41-49, 2001, Institute of
Materials, London.
The Use of High Temperature X-Ray Diffractometry to Study Phase Transitions in Ti-6Al-4V
R. PEDERSON, O. BABUSHKIN AND R. WARREN Luleå University of Technology, Division of Engineering Materials, SE 97187 Luleå, Sweden
F. SKYSTEDT Volvo Aero Corporation, Materials Technology, SE 46181 Trollhättan, Sweden
ABSTRACT
Phase transitions in Ti-6A1-4V were studied by means of high-temperature X-ray diffraction using a resistance heated furnace in high vacuum and Cu K« radiation. The alpha and beta phases could be observed conveniently using the a(100), a(002) and a(101) peaks of the alpha structure and the ß(l 10) peak of the beta. The phase composition of the sample at selected times and temperatures were determined from spectra recorded in the range of 32-45° (29), the scan time being around 8 minutes. The technique was successfully used to monitor the kinetics of the alpha-to-beta transition during heating and the beta-to-alpha transition during cooling and including the transformation kinetics during isothermal holds.
INTRODUCTION
Due to their high strength/weight ratio titanium alloys are used extensively in aerospace applications such as components in aeroengines and space shuttles. The most commonly used titanium alloy is the two phase (oc+ß) alloy, Ti-6A1-4V. The existence of the alpha/beta transformation means that a wide variety of microstructures and property combinations can be achieved in the alloy through thermomechanical processing '̂"^ thus permitting the adaptation of properties to specific applications. The need to weld the alloy for certain engine components can expose the alloy locally to non-optimum thermal cycles and it is therefore of importance to gain an understanding of the kinetics involved in the phase transformations during heating and cooling. Moreover, for the purposes of modelling and computer simulations of heat treatments and welding processes, quantitative descriptions of the transformation are necessary.
In this work phase transitions in Ti-6A1-4V were studied by means of high-temperature X-ray diffraction. This technique permits the observation of phase changes in a single specimen directly at temperature and so avoids the need for time-consuming heat-treatment/quenching experiments on numerous specimens. The objective of the study was to assess the feasibility of this technique to provide quantitative information on the transformation.
Titanium Alloys at Elevated Temperature: Structural Development and Service Behaviour
EXPERIMENTAL PROCEDURE
The starting material was a 1 mm thick plate of Ti-6-4 produced by ring-rolling. Its microstructure was bimodal consisting of about 30 vol% equiaxed primary alpha (a p) particles with an average particle size of 17um and 70 vol% of a Widmannstatten-type structure (see Figure 5). The structure contained approximately 5% retained beta phase as measured by XRD.
The high temperature XRD unit was a Philips X-Pert MRD system fitted with a Bühler HDK 2.4 high temperature chamber and a PW 3011/10 Xe filled proportional detector. The specimens, approximately 10x10 mm, surface were ground and polished on the surface to be examined. The specimen was placed onto two ceramic holders surrounded by a Tantalum resistance heating element. It was not completely surrounded since the upper side had to be free for access of the X-ray beam. One thermocouple was placed in the heater and another was pressed against (in one case welded onto) the specimen surface. A l l treatments were carried in high vacuum (< 10"3 Pa).
Three types of heat treatment cycle were examined, namely, (i) isothermal treatments of the as-received material at selected temperatures up to 900°C in order to monitor the transformation of alpha to beta, (ii) isothermal treatments of material previously equilibrated at approximately 950°C to produce a microstructure predominantly of beta phase in order to monitor the beta-to-alpha transformation. The equilibration treatment was designed to retain a small fraction of alpha in order to inhibit grain growth of the beta phase, (iii) cycles of continuous heating to a predetermined temperature followed by cooling. In reality the heating and cooling were interrupted at selected temperatures to carry out X-ray scans.
For all the cycles, heating and cooling rates between the various temperatures lay generally between 5 and 20°C per minute while a single scan between 20 = 32 and 45° required between 6 and 8 minutes. The contents of alpha and beta phases in the microstructures were estimated from the integrated peak areas of the alpha (101) and the beta (110) peaks after deconvolution, smoothing and measurement using ProFit-for-Windows software. The results in the present work are limited to alpha contents estimated as a ratio of the area of the (101) peak to that of an estimated standard corresponding to 100% alpha. The latter was estimated from the spectra of samples with high alpha content on the basis of the approximation that the 100% alpha peak area was the same as the combined area of the alpha (101) and beta (110) in that sample. Apart from this estimate, the practice of adjusting the combined estimated alpha and beta contents to 100% was avoided because of the lack of a reliable standard representing 100% beta. Samples containing high beta contents exhibited significant grain growth " , particularly around the transus temperature, which can lead to unpredictable variations in peak intensity.
After the XRD cycles, selected specimens were prepared for examination by optical microscopy using conventional metallographic techniques.
RESULTS
The isothermal kinetics of the alpha to beta transformation in the as-received material are shown in Figure 1 in terms of the alpha content. The contents were estimated on the basis of a 100% standard derived from the room-temperature
2
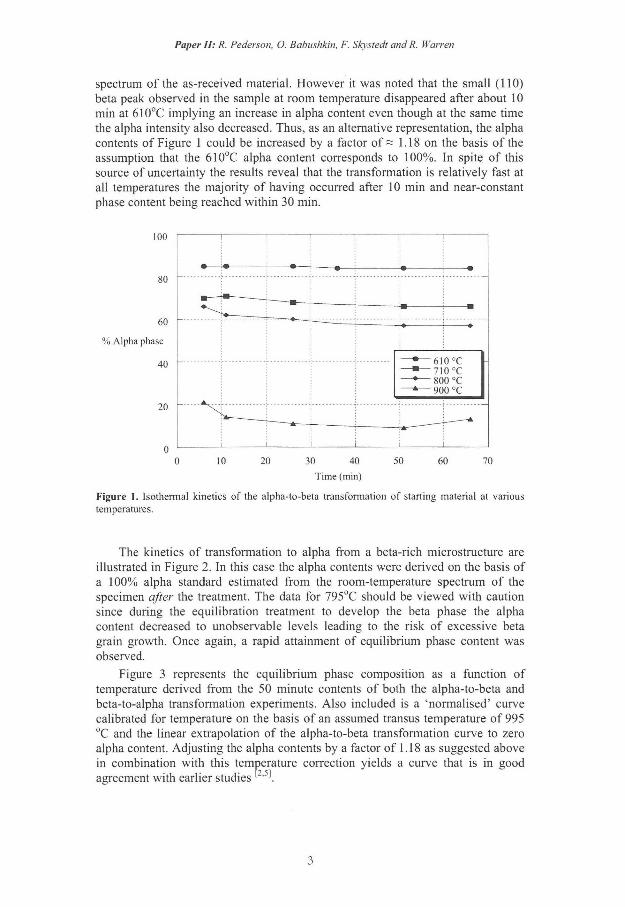
Paper II: R. Pederson, O. Babushkin, F. Skystedt and R. Warren
spectrum of the as-received material. However it was noted that the small (110) beta peak observed in the sample at room temperature disappeared after about 10 min at 610°C implying an increase in alpha content even though at the same time the alpha intensity also decreased. Thus, as an alternative representation, the alpha contents of Figure 1 could be increased by a factor of = 1.18 on the basis of the assumption that the 610°C alpha content corresponds to 100%. In spite of this source of uncertainty the results reveal that the transformation is relatively fast at all temperatures the majority of having occurred after 10 min and near-constant phase content being reached within 30 min.
100
so
60
% Alpha phase
40
20
0
0 10 20 30 40 50 60 70
Time (min)
Figure 1. Isothermal kinetics of the alpha-to-beta transformation of starting material at various temperatures.
The kinetics of transformation to alpha from a beta-rich microstructure are illustrated in Figure 2. In this case the alpha contents were derived on the basis of a 100% alpha standard estimated from the room-temperature spectrum of the specimen after the treatment. The data for 795°C should be viewed with caution since during the equilibration treatment to develop the beta phase the alpha content decreased to unobservable levels leading to the risk of excessive beta grain growth. Once again, a rapid attainment of equilibrium phase content was observed.
Figure 3 represents the equilibrium phase composition as a function of temperature derived from the 50 minute contents of both the alpha-to-beta and beta-to-alpha transformation experiments. Also included is a 'normalised' curve calibrated for temperature on the basis of an assumed transus temperature of 995 °C and the linear extrapolation of the alpha-to-beta transformation curve to zero alpha content. Adjusting the alpha contents by a factor of 1.18 as suggested above in combination with this temperature correction yields a curve that is in good agreement with earlier studies ' ' .
3
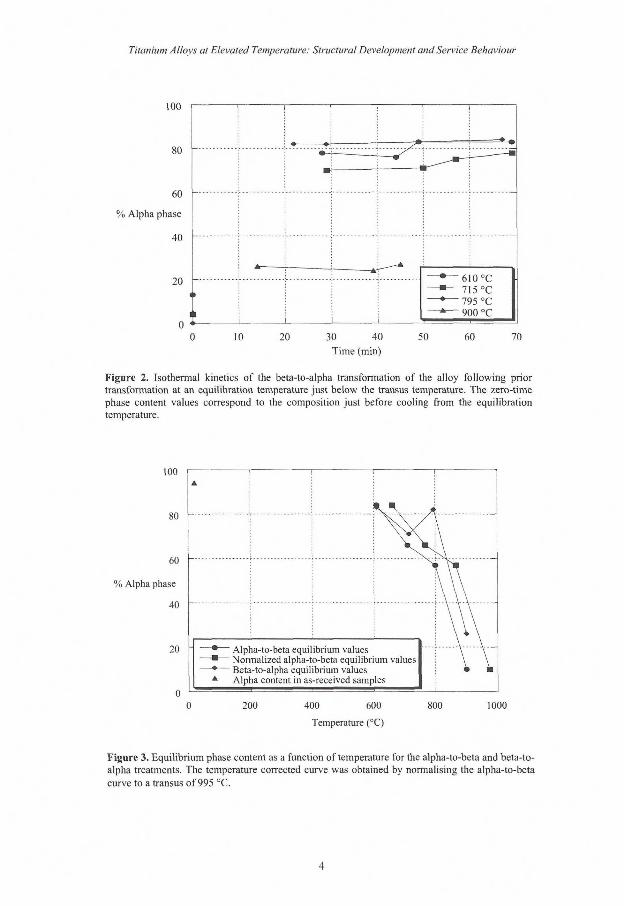
Titanium Alloys at Elevated Temperature: Structural Development and Service Behaviour
100
80
60
% Alpha phase
40
20
! ] i
—!—«
•
— 6 1 0 °C • 715 °C
— • — 795 °C * 900 °C i I i
— 6 1 0 °C • 715 °C
— • — 795 °C * 900 °C
10 20 30 40
Time (min)
50 60 70
Figure 2. Isothermal kinetics of the beta-to-alpha transformation of the alloy following prior transformation at an equilibration temperature just below the transus temperature. The zero-time phase content values correspond to the composition just before cooling from the equilibration temperature.
100
SO
60
% Alpha phase
40
20 " Alpha-to-beta equilibrium values " Normalized alpha-to-beta equilibrium values " Beta-to-alpha equilibrium values
Alpha content in as-received samples
200 400 600
Temperature (°C)
soo 1000
Figure 3. Equilibrium phase content as a function of temperature for the alpha-to-beta and beta-to-alpha treatments. The temperature corrected curve was obtained by normalising the alpha-to-beta curve to a transus of 995 °C.
4
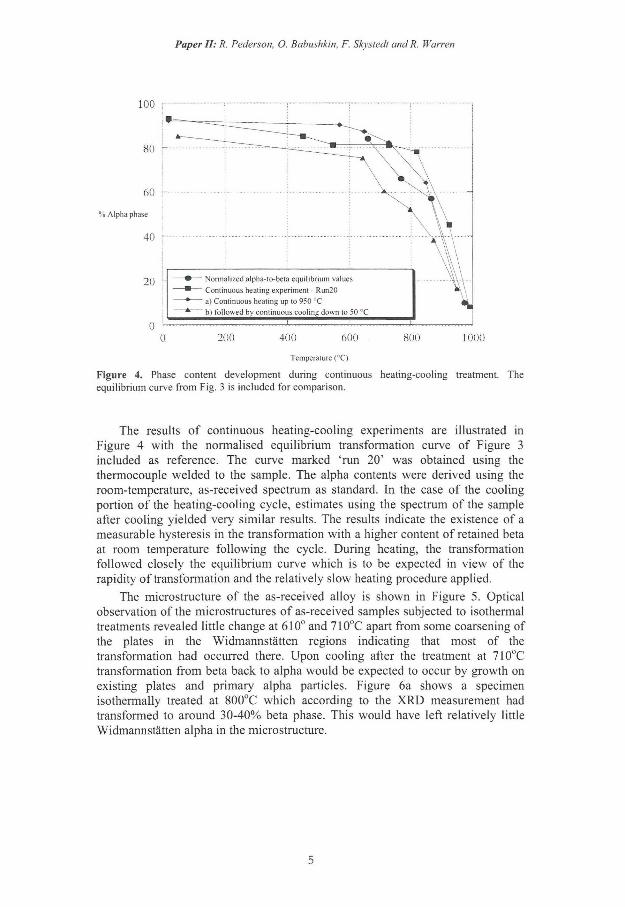
Paper II: R. Pederson, O. Babushkin, F. Skystedt and R. Warren
The results of continuous heating-cooling experiments are illustrated in Figure 4 with the normalised equilibrium transformation curve of Figure 3 included as reference. The curve marked 'run 20' was obtained using the thermocouple welded to the sample. The alpha contents were derived using the room-temperature, as-received spectrum as standard. In the case of the cooling portion of the heating-cooling cycle, estimates using the spectrum of the sample after cooling yielded very similar results. The results indicate the existence of a measurable hysteresis in the transformation with a higher content of retained beta at room temperature following the cycle. During heating, the transformation followed closely the equilibrium curve which is to be expected in view of the rapidity of transformation and the relatively slow heating procedure applied.
The microstructure of the as-received alloy is shown in Figure 5. Optical observation of the microstructures of as-received samples subjected to isothermal treatments revealed little change at 610° and 710°C apart from some coarsening of the plates in the Widmannstätten regions indicating that most of the transformation had occurred there. Upon cooling after the treatment at 710°C transformation from beta back to alpha would be expected to occur by growth on existing plates and primary alpha particles. Figure 6a shows a specimen isothermally treated at 800°C which according to the XRD measurement had transformed to around 30-40% beta phase. This would have left relatively little Widmannstätten alpha in the microstructure.
5
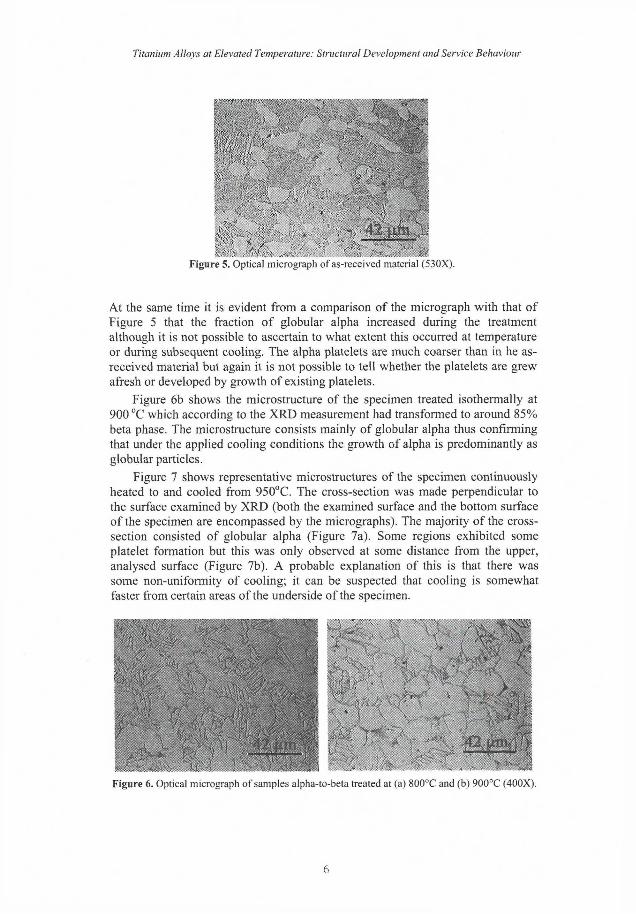
Titanium Alloys at Elevated Temperature: Structural Development and Service Behaviour
Figure 5. Optical micrograph of as-received material (530X).
At the same time it is evident from a comparison of the micrograph with that of Figure 5 that the fraction of globular alpha increased during the treatment although it is not possible to ascertain to what extent this occurred at temperature or during subsequent cooling. The alpha platelets are much coarser than in he as-received material but again it is not possible to tell whether the platelets are grew afresh or developed by growth of existing platelets.
Figure 6b shows the microstructure of the specimen treated isothermally at 900 °C which according to the XRD measurement had transformed to around 85% beta phase. The microstructure consists mainly of globular alpha thus confirming that under the applied cooling conditions the growth of alpha is predominantly as globular particles.
Figure 7 shows representative microstructures of the specimen continuously heated to and cooled from 950°C. The cross-section was made perpendicular to the surface examined by XRD (both the examined surface and the bottom surface of the specimen are encompassed by the micrographs). The majority of the cross-section consisted of globular alpha (Figure 7a). Some regions exhibited some platelet formation but this was only observed at some distance from the upper, analysed surface (Figure 7b). A probable explanation of this is that there was some non-uniformity of cooling; it can be suspected that cooling is somewhat faster from certain areas of the underside of the specimen.
Figure 6. Optical micrograph of samples alpha-to-beta treated at (a) 800°C and (b) 900°C (400X).
6
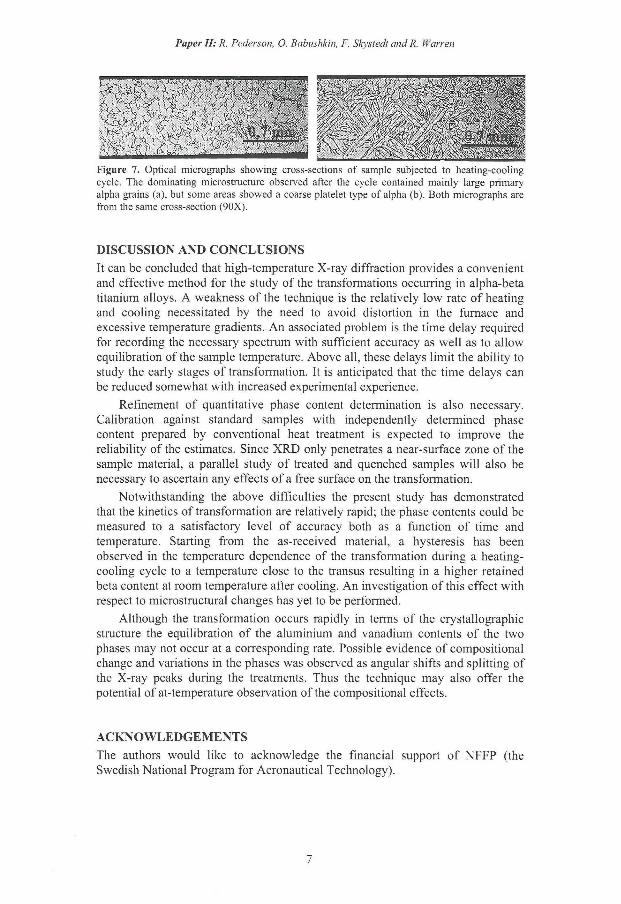
Paper II: R. Pederson, O. Babushkin, F. Skystedt and R. Warren
Figure 7. Optical micrographs showing cross-sections of sample subjected to heating-cooling cycle. The dominating microstructure observed after the cycle contained mainly large primary alpha grains (a), but some areas showed a coarse platelet type of alpha (b). Both micrographs are from the same cross-section (90X).
DISCUSSION AND CONCLUSIONS
It can be concluded that high-temperature X-ray diffraction provides a convenient and effective method for the study of the transformations occurring in alpha-beta titanium alloys. A weakness of the technique is the relatively low rate of heating and cooling necessitated by the need to avoid distortion in the furnace and excessive temperature gradients. An associated problem is the time delay required for recording the necessary spectrum with sufficient accuracy as well as to allow equilibration of the sample temperature. Above all, these delays limit the ability to study the early stages of transformation. It is anticipated that the time delays can be reduced somewhat with increased experimental experience.
Refinement of quantitative phase content determination is also necessary. Calibration against standard samples with independently determined phase content prepared by conventional heat treatment is expected to improve the reliability of the estimates. Since XRD only penetrates a near-surface zone of the sample material, a parallel study of treated and quenched samples will also be necessary to ascertain any effects of a free surface on the transformation.
Notwithstanding the above difficulties the present study has demonstrated that the kinetics of transformation are relatively rapid; the phase contents could be measured to a satisfactory level of accuracy both as a function of time and temperature. Starting from the as-received material, a hysteresis has been observed in the temperature dependence of the transformation during a heating-cooling cycle to a temperature close to the transus resulting in a higher retained beta content at room temperature after cooling. An investigation of this effect with respect to microstructural changes has yet to be performed.
Although the transformation occurs rapidly in terms of the crystailographic structure the equilibration of the aluminium and vanadium contents of the two phases may not occur at a corresponding rate. Possible evidence of compositional change and variations in the phases was observed as angular shifts and splitting of the X-ray peaks during the treatments. Thus the technique may also offer the potential of at-temperature observation of the compositional effects.
ACKNOWLEDGEMENTS
The authors would like to acknowledge the financial support of NFFP (the Swedish National Program for Aeronautical Technology).
7
Titanium Alloys at Elevated Temperature: Structural Development and Service Behaviour
R E F E R E N C E S
1. Weiss, F.H. Froes, D. Eylon and G. E. Welsh, 'Modification of Alpha Morphology in Ti-6A1-4V by Thermomechanical Processing', Met. Trans., 1986,17A, 1935-1947.
2. S. L. Semiatin, V. Seetharaman and I . Weiss, 'The Thermomechanical Processing of Alpha/Beta Titanium Alloys', J. Metals, 1997, 49 (6) 33.
3. G. Lütjering, 'Influence of Processing on Microstructure and Mechanical Properties of (a +ß) Titanium Alloys, Matls. Sei. Eng., 1998, A243, 32-45.
4. N . Gey, M. Humbert, M . J. Philippe and Y. Combres, 'Investigation of the eland ß- Texture Evolution of Hot Rolled Ti-64 Products, Matls. Sei. Eng., 1996, 219A, 80-88.
5. J. J. Rausch, F. A, Crossiey and H. D. Kessler, 'Titanium-Rich Comer of the Ti-Al-V System, Trans AIME, J. Metals, 1956, 8, 211-214.
8
Use of High Temperature X-Ray Diffractometry to Study Phase Transitions and Thermal Expansion Properties
in Ti-6A1-4V
R. Pederson, O. Babushkin, F. Skystedt and R. Warren
Materials Science and Technology, 2003, vol. 19, 1533-1538.
Paper I I I
Use of High Temperature X-Ray Diffractometry to Study Phase Transitions and Thermal Expansion Properties in Ti-6Al-4V
R. PEDERSON and O. BABUSHKIN Luleå University of Technology, Division of Engineering Materials, SE 97187 Luleå, Sweden
F. SKYSTEDT
Volvo Aero Corporation, Materials Technology', SE 46181 Trollhättan, Sweden
R. WARREN University of Malmö, Technology and Society, SE 20506 Malmö, Sweden
ABSTRACT
Phase transitions in Ti-6A1-4V were studied by means of high-temperature X-ray diffraction using a resistance heated furnace in high vacuum and Cu K a radiation. The alpha and beta phases could be observed conveniently using the oc(10.0), a(00.2) and Ot(lO.l) peaks of the alpha structure and the ß(110) peak of the beta. The phase composition of the sample at selected times and temperatures were determined from spectra recorded in the range of 32-45° (20), the scan time being around 8 minutes. The technique was successfully used to monitor the kinetics of the alpha-to-beta transition during heating and the beta-to-alpha transition during cooling and including the transformation kinetics during isothermal holds. Measurements of the interplanar distance change with temperature for the crystailographic planes of alpha and beta phases enabled the derivation of the overall thermal expansion for the alloy using a rule of mixtures.
1. INTRODUCTION
Due to their high strength/weight ratio titanium alloys are used extensively in aerospace applications such as components in aeroengines and space shuttles. The most commonly used titanium alloy is the two-phase (oc+ß) alloy, Ti-6A1-4V. The existence of the alpha/beta transformation means that a wide variety of microstructures and property combinations can be achieved in the alloy through thermomechanical processing thus permitting the adaptation of properties to specific applications.[1"3] The need to weld the alloy for certain engine components can expose the alloy locally to non-optimum thermal cycles and it is therefore of importance to gain an understanding of the kinetics involved in the phase transformations during heating and cooling. Moreover, for the purposes of modelling and computer simulations of heat treatments and welding processes, quantitative descriptions of the transformations are necessary.
In this work, phase transitions in Ti-6A1-4V were studied by means of high-temperature X-ray diffraction. This technique permits the observation of phase changes in a single specimen directly at temperature and so avoids the need for time-consuming heat-treatment/quenching experiments on numerous specimens. The
Materials Science and Technology, Nov. 2003, vol. 19, 1533-1538
objective of the study was to assess the feasibility of this technique to provide quantitative information on the transformation. This work is a continuation of previously published work.'4-1 Based on the changes in interplanar spacing with temperature, the thermal expansion of the alpha and beta phases were measured and the results used to estimate the overall thermal expansion of the alloy up to 1000°C.
2. E X P E R I M E N T A L PROCEDURE The starting material was a 1 mm thick plate of Ti-6-4 cut out from a forged component. Its microstructure was bimodal consisting of about 30 vol% equiaxed primary alpha (ocp) particles with an average particle size of 17um and 70 vol% of a Widmanstätten type structure (see Figure 4). It contained approximately 5% retained beta phase as measured by XRD. The chemical composition of the alloy was (in wt%): 6.42 Al , 4.15 V, 0.19 Fe, 0.04 C, 0.15 O, 0.01 N, 0.006 H, <0.005 B, and Ti balance.
The high temperature XRD equipment consisted of a Philips X-Pert MRD system fitted with a Bühler HDK 2.4 high temperature chamber. The specimen, approximately 10x10 mm, was ground and polished on the surface to be examined. The specimen was placed onto two ceramic holders surrounded by a tantalum resistance heating element. It was not completely surrounded since the upper side had to be free for access of the X-ray beam. One thermocouple (W-Rh/Type C) was placed close to the heating element and another was pressed against (in one case welded onto) the specimen surface. Al l treatments were carried out in high vacuum (< 10"5 Pa). The X-ray source was Cu K«.
Three types of heat treatment cycles were examined, namely (i) isothermal treatments of the as-received material at selected temperatures up to 900°C in order to monitor the transformation of alpha to beta; (ii) isothermal treatments of material previously equilibrated at approximately 950°C to produce a microstructure predominantly of beta phase in order to monitor the beta-to-alpha transformation. The equilibration treatment was designed to retain a small fraction of alpha in order to inhibit grain growth of the beta phase; (iii) cycles of continuous heating to a predetermined temperature followed by cooling. In reality the heating and cooling were interrupted at selected temperatures to carry out X-ray scans.
For all the cycles, heating and cooling rates between the various temperatures lay generally between 5 and 20°C per minute while a single scan between 32 and 45° (20) required between 6 and 8 minutes. The amounts of alpha and beta phases in the microstructure were estimated from the integrated peak areas of the alpha (10.1) and the beta (110) peaks after deconvolution, smoothing and measurement using ProFit-for-Windows software. These peaks were chosen on the basis of their relatively high intensity, their close proximity (to minimise scan time) and relatively little overlap with other peaks. After the XRD measurements, selected specimens were prepared for examination by optical microscopy using conventional metallographic techniques.
The diffractograms were also used to determine crystailographic planar spacings and peak widths (full width at half maximum, FWHM) as a function of temperature.
2
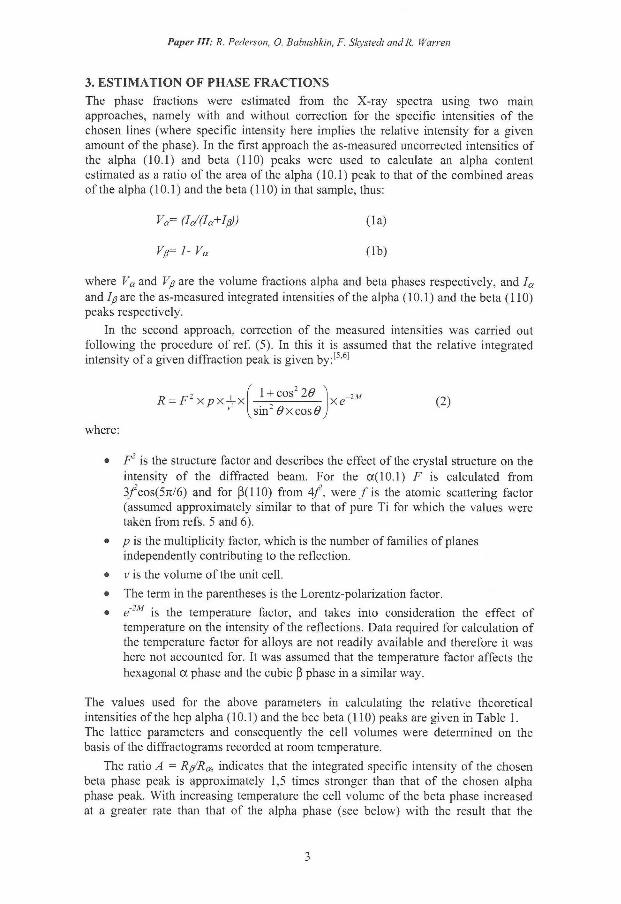
Paper III: R. Pederson, O. Babushkin, F. Skystedt and R. Warren
3. ESTIMATION OF PHASE FRACTIONS The phase fractions were estimated from the X-ray spectra using two main approaches, namely with and without correction for the specific intensities of the chosen lines (where specific intensity here implies the relative intensity for a given amount of the phase). In the first approach the as-measured uncorrected intensities of the alpha (10.1) and beta (110) peaks were used to calculate an alpha content estimated as a ratio of the area of the alpha (10.1) peak to that of the combined areas of the alpha (10.1) and the beta (110) in that sample, thus:
Va= dc/(Ia+Iß)) (la)
Vß= 1- Va (lb)
where Va and Vß are the volume fractions alpha and beta phases respectively, and l a
and J/yare the as-measured integrated intensities of the alpha (10.1) and the beta (110) peaks respectively.
In the second approach, correction of the measured intensities was carried out following the procedure of ref. (5). In this it is assumed that the relative integrated intensity of a given diffraction peak is given by:'5'6-'
x px-jX f l + cos2 26>
sin2 ßxcosß xe~/M (2)
where:
• F is the structure factor and describes the effect of the crystal structure on the intensity of the diffracted beam. For the a(10.1) F is calculated from 3/cos(57t/6) and for ß(110) from 4 f , were f i s the atomic scattering factor (assumed approximately similar to that of pure Ti for which the values were taken from refs. 5 and 6).
• p is the multiplicity factor, which is the number of families of planes independently contributing to the reflection.
• v is the volume of the unit cell.
• The term in the parentheses is the Lorentz-polarization factor.
• e2M is the temperature factor, and takes into consideration the effect of temperature on the intensity of the reflections. Data required for calculation of the temperature factor for alloys are not readily available and therefore it was here not accounted for. It was assumed that the temperature factor affects the hexagonal a phase and the cubic ß phase in a similar way.
The values used for the above parameters in calculating the relative theoretical intensities of the hep alpha (10.1) and the bcc beta (110) peaks are given in Table 1. The lattice parameters and consequently the cell volumes were determined on the basis of the diffractograms recorded at room temperature.
The ratio A = Rß/Ra, indicates that the integrated specific intensity of the chosen beta phase peak is approximately 1,5 times stronger than that of the chosen alpha phase peak. With increasing temperature the cell volume of the beta phase increased at a greater rate than that of the alpha phase (see below) with the result that the
3
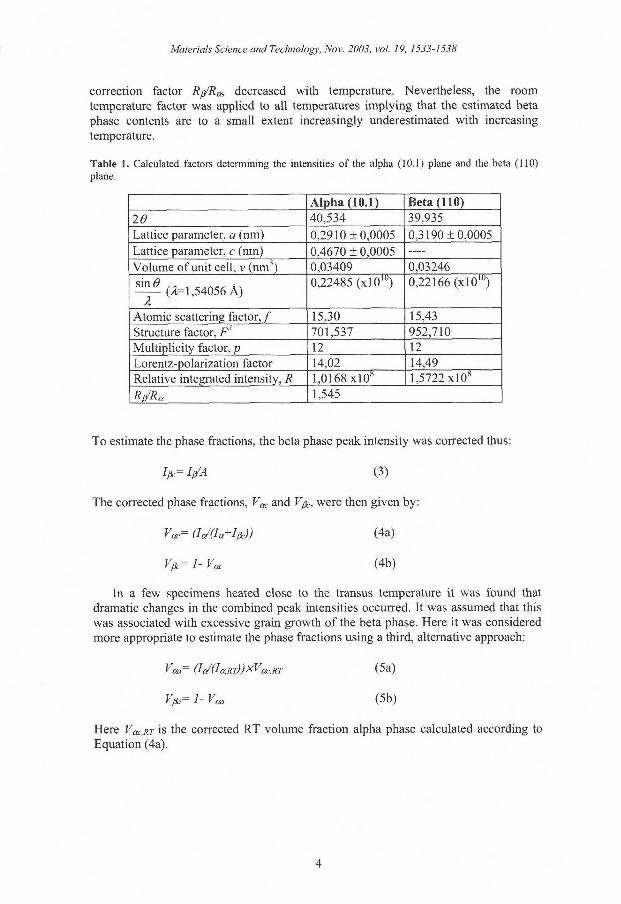
Materials Science and Technology, Nov. 2003, vol. 19, 1533-1538
correction factor R/Ra, decreased with temperature. Nevertheless, the room temperature factor was applied to all temperatures implying that the estimated beta phase contents are to a small extent increasingly underestimated with increasing temperature.
Table 1. Calculated factors determining the intensities of the alpha (10.1) plane and the beta (110)
plane.
Alpha (10.1) Beta (110) 26 40,534 39,935
Lattice parameter, a (nm) 0,2910 ±0,0005 0,319010,0005 Lattice parameter, c (nm) 0,4670 ± 0,0005 . . . .
Volume of unit cell, v (nm J) 0,03409 0,03246
S m 8 (Å-1,54056 Å) A
0,22485 (x l0 l u ) 0,22166 (xlO 1 0)
Atomic scattering factor,/ 15,30 15,43 Structure factor, F2 701,537 952,710 Multiplicity factor, p 12 12 Lorentz-polarization factor 14,02 14,49 Relative integrated intensity, R 1,0168 x10 s 1,5722 xlO 8
R/^Ra 1,545
To estimate the phase fractions, the beta phase peak intensity was corrected thus:
i > = W (3)
The corrected phase fractions, Væ. and Vß,, were then given by:
Vac= (U(la+Ißc)) (4a)
Vßc= 1- V æ (4b)
In a few specimens heated close to the transus temperature it was found that dramatic changes in the combined peak intensities occurred. It was assumed that this was associated with excessive grain growth of the beta phase. Here it was considered more appropriate to estimate the phase fractions using a third, alternative approach:
Vcm= (IJ(Ia.RT))xVac.RT (5a)
Vßa= 1- Vaa (5b)
Here VOCRT is the corrected RT volume fraction alpha phase calculated according to Equation (4a).
4
Paper III: R. Pederson. O. Babushkin, F. Skystedt and R. Warren
4. RESULTS 4.1 Phase Fractions
In most cases the combined a and b intensities remained relatively constant regardless of the phase fractions. This suggests that the applied intensity correction may be superfluous. Nevertheless, both uncorrected and corrected estimates are considered here.
The isothermal kinetics of the alpha to beta transformation in the as-received material are shown in Figure 1 in terms of fractions of alpha and beta phases respectively, calculated both with and without correction for the specific intensities (Equation 1 and 4). The calculated phase fractions at room temperature in the start of each experiment and the corresponding phase fractions after cooling down are also included in the diagrams. The time between the room temperature result and that of the first scan in the diagrams corresponds to the heating time. Half of the scan time for the given measurement is included in the recorded hold time. It is to be concluded that at all temperatures a significant proportion of the transformation has already taken place during the time taken to heat to the hold temperature and run the first scan. At all temperatures the phase fractions approach a constant value assumed to correspond to the equilibrium fraction. At 900°C the phase fraction values became somewhat erratic which might indicate some migration of the beta grain boundaries.
610°C O Alpha volume fraction uncorrected • Corrected Alpha volume traction O Beta volume fraction uncorrected X Corrected Beta volume fraction
3 \ 8öo°c : 0
O -Ol ) • Q : • : . . o j ; ;
a \
^OO Q O O o
J > o « o \ o \
O x X X X X X
i : i >k
i 9.
3
710° c
]
i //XA X: X X
o -
3 900°C i q
* X X s X
0
X >
\
• •
o c i
- OO .. . . . . ( ^
50 100 150 200 250 300 350 400 0
Time (minutes )
50 100 150 200 250 300 350 400
Time (minutes)
Figure 1. Isothermal transformation from a-to-b at four different temperatures. Values are calculated both with and without the correction factor according to Equation (1) and (4), respectively. Both the RT starting values and the end values after cooling down to RT (370 minutes) are also included in the diagrams.
5
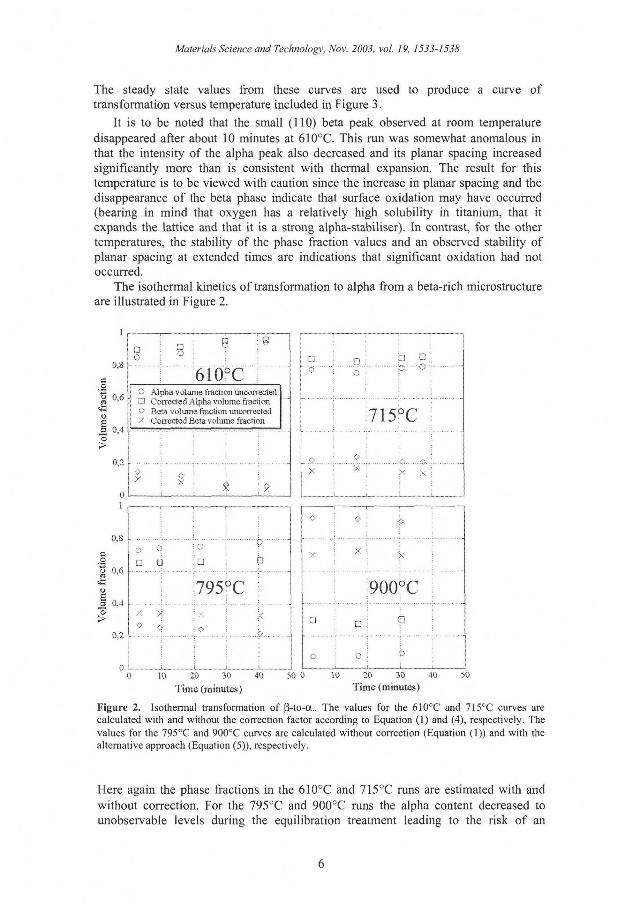
Materials Science and Technology, Nov. 2003, vol. 19, 1533-1S38
The steady state values from these curves are used to produce a curve of transformation versus temperature included in Figure 3.
It is to be noted that the small (110) beta peak observed at room temperature disappeared after about 10 minutes at 610°C. This run was somewhat anomalous in that the intensity of the alpha peak also decreased and its planar spacing increased significantly more than is consistent with thermal expansion. The result for this temperature is to be viewed with caution since the increase in planar spacing and the disappearance of the beta phase indicate that surface oxidation may have occurred (bearing in mind that oxygen has a relatively high solubility in titanium, that it expands the lattice and that it is a strong alpha-stabiliser). In contrast, for the other temperatures, the stability of the phase fraction values and an observed stability of planar spacing at extended times are indications that significant oxidation had not occurred.
The isothermal kinetics of transformation to alpha from a beta-rich microstructure are illustrated in Figure 2.
0.8 i
610°C O Alpha volume fraction uncorrected • Corrected Alpha volume traction O Beta volume fraction uncorrected X Corrected Beta volume fraction
O ;
:715°C
© X
O : L „ j
• • • 3
795 °C
X X
O Å
10 20 30
Time (minutes)
40
x X ><
900°C
• D
50 0 20 30 40 Time (minutes)
50
Figure 2. isothermal transformation of ß-to-a.. The values for the 610°C and 715°C curves are calculated with and without the correction factor according to Equation (1) and (4), respectively. The
values for the 795°C and 900°C curves are calculated without correction (Equation (1)) and with the alternative approach (Equation (5)), respectively.
Here again the phase fractions in the 610°C and 715°C runs are estimated with and without correction. For the 795°C and 900°C runs the alpha content decreased to unobservable levels during the equilibration treatment leading to the risk of an
6
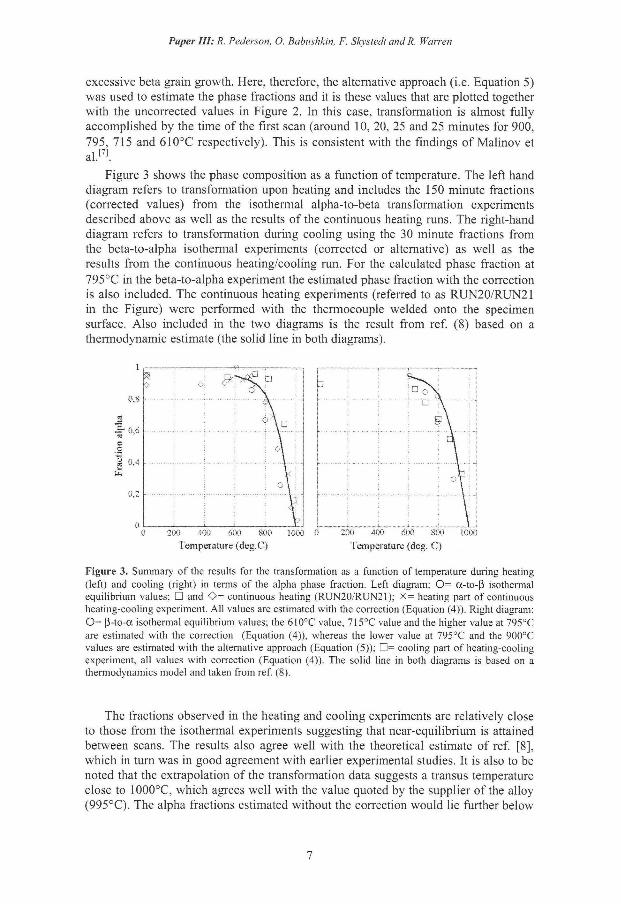
Paper III: R. Pederson, O. Babushkin, F. Skystedt and R. Warren
excessive beta grain growth. Here, therefore, the alternative approach (i.e. Equation 5) was used to estimate the phase fractions and it is these values that are plotted together with the uncorrected values in Figure 2. In this case, transformation is almost fully accomplished by the time of the first scan (around 10, 20, 25 and 25 minutes for 900, 795, 715 and 610°C respectively). This is consistent with the findings of Malinov et al.[7>.
Figure 3 shows the phase composition as a function of temperature. The left hand diagram refers to transformation upon heating and includes the 150 minute fractions (corrected values) from the isothermal alpha-to-beta transformation experiments described above as well as the results of the continuous heating runs. The right-hand diagram refers to transformation during cooling using the 30 minute fractions from the beta-to-alpha isothermal experiments (corrected or alternative) as well as the results from the continuous heating/cooling run. For the calculated phase fraction at 795°C in the beta-to-alpha experiment the estimated phase fraction with the correction is also included. The continuous heating experiments (referred to as RUN20/RUN21 in the Figure) were performed with the thermocouple welded onto the specimen surface. Also included in the two diagrams is the result from ref. (8) based on a thermodynamic estimate (the solid line in both diagrams).
as
g °-4
0 I 1 i ' i £J l i i i : LJ 0 200 400 600 800 1000 0 200 400 600 800 1000
Temperature (deg.C) Temperature (deg. C)
Figure 3. Summary of the results for the transformation as a function of temperature during heating
(left) and cooling (right) in terms of the alpha phase fraction. Left diagram: 0 = a-to-ß isothermal equilibrium values; • and 0 = continuous heating (RUN20/RUN21); X = heating part of continuous heating-cooling experiment. A l l values are estimated with the correction (Equation (4)). Right diagram:
0 = ß-to-a isothermal equilibrium values; the 610°C value, 715°C value and the higher value at 795°C
are estimated with the correction (Equation (4)), whereas the lower value at 795°C and the 900°C values are estimated with the alternative approach (Equation (5)); • = cooling part of heating-cooling experiment, all values with correction (Equation (4)). The solid line in both diagrams is based on a thermodynamics model and taken from ref. (8).
The fractions observed in the heating and cooling experiments are relatively close to those from the isothermal experiments suggesting that near-equilibrium is attained between scans. The results also agree well with the theoretical estimate of ref. [8], which in turn was in good agreement with earlier experimental studies. It is also to be noted that the extrapolation of the transformation data suggests a transus temperature close to 1000°C, which agrees well with the value quoted by the supplier of the alloy (995°C). The alpha fractions estimated without the correction would lie further below
7
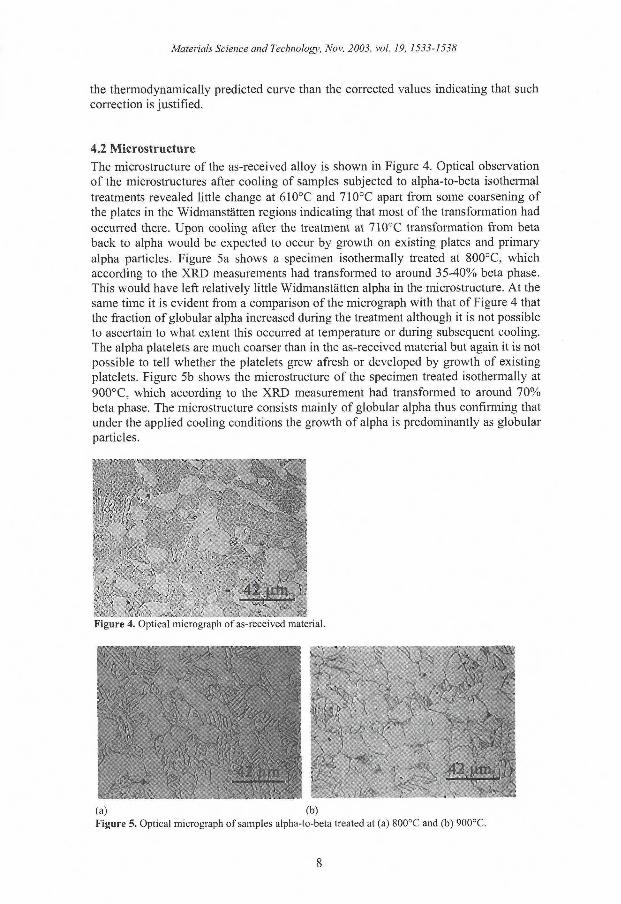
Materials Science and Technology, Nov. 2003, vol. 19, 1533-1538
the thermodynamically predicted curve than the corrected values indicating that such correction is justified,
4.2 Microstructure
The microstructure of the as-received alloy is shown in Figure 4. Optical observation of the microstructures after cooling of samples subjected to alpha-to-beta isothermal treatments revealed little change at 610°C and 710°C apart from some coarsening of the plates in the Widmanstätten regions indicating that most of the transformation had occurred there. Upon cooling after the treatment at 710°C transformation from beta back to alpha would be expected to occur by growth on existing plates and primary alpha particles. Figure 5a shows a specimen isothermally treated at 800°C, which according to the XRD measurements had transformed to around 35-40% beta phase. This would have left relatively little Widmanstätten alpha in the microstructure. At the same time it is evident from a comparison of the micrograph with that of Figure 4 that the fraction of globular alpha increased during the treatment although it is not possible to ascertain to what extent this occurred at temperature or during subsequent cooling. The alpha platelets are much coarser than in the as-received material but again it is not possible to tell whether the platelets grew afresh or developed by growth of existing platelets. Figure 5b shows the microstructure of the specimen treated isothermally at 900°C, which according to the XRD measurement had transformed to around 70% beta phase. The microstructure consists mainly of globular alpha thus confirming that under the applied cooling conditions the growth of alpha is predominantly as globular particles.
Figure 4. Optical micrograph of as-received material.
(a) (b) Figure 5. Optical micrograph of samples alpha-to-beta treated at (a) 800°C and (b) 900°C.
8
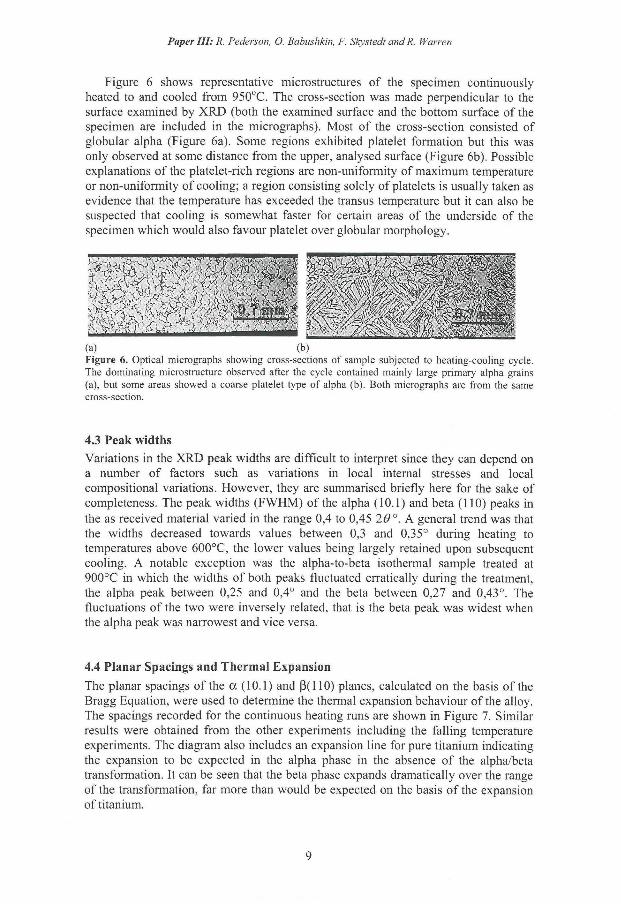
Paper III: R. Pederson, O. Babushkin, F. Skystedi and R. Warren
Figure 6 shows representative microstructures of the specimen continuously heated to and cooled from 950°C. The cross-section was made perpendicular to the surface examined by XRD (both the examined surface and the bottom surface of the specimen are included in the micrographs). Most of the cross-section consisted of globular alpha (Figure 6a). Some regions exhibited platelet formation but this was only observed at some distance from the upper, analysed surface (Figure 6b). Possible explanations of the platelet-rich regions are non-uniformity of maximum temperature or non-uniformity of cooling; a region consisting solely of platelets is usually taken as evidence that the temperature has exceeded the transus temperature but it can also be suspected that cooling is somewhat faster for certain areas of the underside of the specimen which would also favour platelet over globular morphology.
(a) (b) Figure 6. Optical micrographs showing cross-sections of sample subjected to heating-cooling cycle. The dominating microstructure observed after the cycle contained mainly large primary alpha grains (a), but some areas showed a coarse platelet type of alpha (b). Both micrographs are from the same cross-section.
4.3 Peak widths Variations in the XRD peak widths are difficult to interpret since they can depend on a number of factors such as variations in local internal stresses and local compositional variations. However, they are summarised briefly here for the sake of completeness. The peak widths (FWHM) of the alpha (10.1) and beta (110) peaks in the as received material varied in the range 0,4 to 0,45 20°. A general trend was that the widths decreased towards values between 0,3 and 0,35° during heating to temperatures above 600°C, the lower values being largely retained upon subsequent cooling. A notable exception was the alpha-to-beta isothermal sample treated at 900°C in which the widths of both peaks fluctuated erratically during the treatment, the alpha peak between 0,25 and 0,4° and the beta between 0,27 and 0,43°. The fluctuations of the two were inversely related, that is the beta peak was widest when the alpha peak was narrowest and vice versa.
4.4 Planar Spacings and Thermal Expansion
The planar spacings of the a (10.1) and ß(110) planes, calculated on the basis of the Bragg Equation, were used to determine the thermal expansion behaviour of the alloy. The spacings recorded for the continuous heating runs are shown in Figure 7. Similar results were obtained from the other experiments including the falling temperature experiments. The diagram also includes an expansion line for pure titanium indicating the expansion to be expected in the alpha phase in the absence of the alpha/beta transformation. It can be seen that the beta phase expands dramatically over the range of the transformation, far more than would be expected on the basis of the expansion of titanium.
9
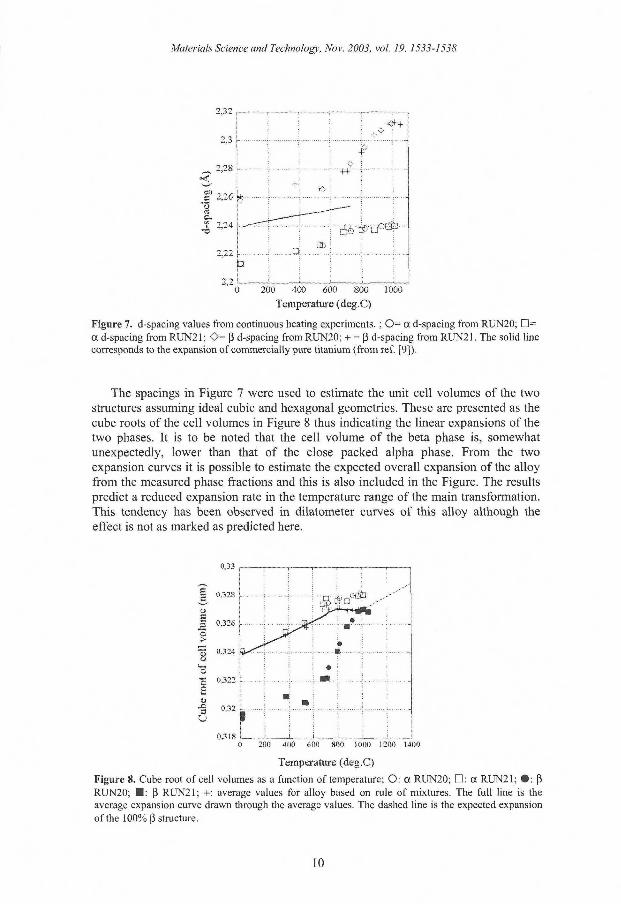
Materials Science and Technology, Nov. 2003, vol. 19, 1533-1538
2,32
2,3 h
ST 2.26
fä» t/i i O ,1
T? 2,22
*>
0
- - ^ — '
Å 26
^•CÄJ -
•
200 400 600 S00
Temperature (deg.C) 1000
Figure 7. d-spacing values from continuous heating experiments. ; 0 = a d-spacing from RUN20; • =
a d-spacing from RUN21; 0 = ß d-spacing from RUN20; + = ß d-spacing from RUN21. The solid line corresponds to the expansion of commercially pure titanium (from ref. [9]).
The spacings in Figure 7 were used to estimate the unit cell volumes of the two structures assuming ideal cubic and hexagonal geometries. These are presented as the cube roots of the cell volumes in Figure 8 thus indicating the linear expansions of the two phases. It is to be noted that the cell volume of the beta phase is, somewhat unexpectedly, lower than that of the close packed alpha phase. From the two expansion curves it is possible to estimate the expected overall expansion of the alloy from the measured phase fractions and this is also included in the Figure. The results predict a reduced expansion rate in the temperature range of the main transformation. This tendency has been observed in dilatometer curves of this alloy although the effect is not as marked as predicted here.
0,33
jl 0,328
J 0.32« p
13 0324
'z % 0.322 O
a • § 0.32 O
0,318 0 200 400 600 800 1000 1200 1400
Temperature (deg.C) Figure 8. Cube root of cell volumes as a function of temperature; O: a RUN20; • : a RUN21; • : ß
RUN20; • : ß RUN21; +: average values for alloy based on rule of mixtures. The fu l l line is the average expansion curve drawn through the average values. The dashed line is the expected expansion of the 100% ß structure.
3 .--'"'* 3 .--'"'*
• m ~
.m.l .
• • 1
10
Paper III: R. Pederson, O. Babushkin, F. Skystedt and R. Warren
The low cell volume of the beta phase and its marked expansion above 600°C could be associated with a varying vanadium content. The vanadium content is expected to be high in the lower temperature range and to decrease with increasing temperature above 600°C as the beta phase fraction increases, falling of necessity to 4 wt% at the transus temperature.
5. DISCUSSION AND CONCLUSIONS
It can be concluded that high-temperature X-ray diffraction provides a convenient and effective method for study of the transformations occurring in alpha-beta titanium alloys. A weakness of the technique is the relatively low rate of heating and cooling necessitated by the need to avoid distortion in the furnace and excessive temperature gradients. An associated problem is the time delay required for recording the necessary diffractogram with sufficient accuracy as well as to allow equilibration of the sample temperature. Above all, these delays limit the ability to study the early stages of transformation. Notwithstanding the above difficulties the present study has demonstrated that the phase contents could be measured to a satisfactory level of accuracy both as a function of time and temperature.
A potential weakness of the method is that the X-rays sample a relatively small depth of a few tens of microns of surface material in which the transformation kinetics might deviate from those of the bulk material. However, the phase fraction results obtained in this work fit well with those obtained by alternative methods as, for example, those reported by Saunders [ s ] (see Figure 3). The technique also yielded a reasonable measure of the transus temperature.
It has also been demonstrated that the HT-XRD technique provides a valuable means of studying thermal expansion behaviour in two-phase transforming alloys.
ACKNOWLEDGEMENT
The authors would like to acknowledge the financial support of NFFP (the Swedish National Program for Aeronautical Technology).
R E F E R E N C E S
1. I . Weiss, F.H. Froes, D. Eylon and G. E. Welsh: Met. Trans. A, 1986, vol. 17, 1935-1947.
2. S. L. Semiatin, V. Seetharaman and I . Weiss: J. Met., 1997, vol. 49, (6), 33-39.
3. G. Lütjering: Mater. Sei. Eng. A, 1998, vol. 243, 32-45.
4. R. Pederson, O. Babushkin, F. Skystedt and R. Warren: in Titanium Alloys at Elevated Temperature: Structural Development and Service Behaviour, M . Winston and A. Strang, eds., 41-49, 2001, Institute of Materials, London.
5. C. Suryanarayana and M. Grant Norton: 'X-Ray Diffraction - A Practical Approach', 1998, New York, Plenum Press.
6. B. D. Cullity: 'Elements of X-Ray Diffraction', 1956, New York, Addison-Wesley.
7. S. Malinov, Z. Guo, W. Sha and A. Wilson: Metall. Mater. Trans. A, 2001, vol. 32, 879-887.
1 1

Materials Science and Technology, Nov. 2003, vol. 19, 1533-1538
8. N. Saunders: Titanium '95: Science and Technology, Proc. 8th World Conf. on Titanium, Birmingham, UK, Oct., 1995, P. A. Blenkinsop, W. J. Evans and H. M . Flowers, eds., The Institute of Materials, London, 1996, 2167.
9. in 'Materials Properties Handbook: Titanium Alloys', R. Boyer et. al., ed., 483-636, 1994, Materials Park, OH, ASM International.
12
Numerical and Microstrucniral Evaluation of Elevated Temperature Compression Tests on Ti-6A1-4V
E.-L. Westman, R. Pederson, B. Wikman and M. Oldenburg
Titanium '03: Science and Technology, Proc. 10th World Conf. on Titanium, Hamburg, Germany, July, 2003, Proceeding currently in press.
Numerical and Microstructural Evaluation of Elevated Temperature Compression Tests on Ti-6Al-4V
E.-L. WESTMAN 1 , R. PEDERSON2, B. WIKMAN 1 and M. OLDENBURG1
Luleå University of Technology, Division of Solid Mechanics' /Engineering Materials2, SE
97187Luleå, Sweden
ABSTRACT An investigation of the use of inverse modeling of a compression test for estimation of material properties of forged Ti-6A1-4V is presented. The compression tests performed on cylindrical specimens indicated that initial material hardening was followed by specimen cracking at lower temperatures while at 700°C and 900°C material hardening was followed by flow softening. The alloy was also found to be strain rate sensitive. The ability of three different constitutive models to describe the inelastic thermomechanical behavior of Ti-6A1-4V has been examined and none of them were found able to describe it satisfactorily. However, it was shown that inverse modeling is a viable way to determine relevant material parameters, i f suitable functions are chosen. Changes in the microstructure as a consequence of heat treatment and deformation were also investigated. In general, it was found in cross sections parallel to the loading direction, that the deformation was non-uniform and concentrated in bands going diagonally from one comer to the other. The alpha platelets in the Widmanstätten structure were increasingly broken up going from the less deformed anvil contact region into the more deformed center of the specimen.
1 INTRODUCTION
Ti-6A1-4V is a commonly used alloy in aerospace applications such as turbine engines and airframes. In industrial applications it is often of great importance to know the thermomechanical properties of the material and to be able to predict and detect changes in these properties. Another need for accurate material property data stems from the industrial requirement to perform numerical analyses at different stages in the product development process. This could be simulation of a manufacturing process such as welding or forming, or it could be the function analysis of a component. In order to perform high quality FE-analyses, accurate model input is crucial. Consequently, the development of appropriate constitutive models for Ti-6A1-4V for various applications is a central issue. It is also essential to emphasize the use of proper routines for efficient application of numerical modeling of industrial processes.
Traditional methods to determine necessary property data in which the material is characterized by several tension and/or compression tests at different temperatures and strain rates is time demanding and expensive and the results are often not in an appropriate form. An alternative route to obtain material parameters in terms of force and displacement is by inverse modeling [ 1 l Inhomogeneous stress conditions can be taken into account, which is of great benefit, in contrast to traditional methods where a homogenous stress distribution is assumed. The idea is to create different deformation mechanisms in one test. Inverse modeling has, in work by others t 2 ' , been shown to generate more accurate material data
World Conference on Titanium, Hamburg, 2003
compared to traditional experiments, for the accurate modeling of processes such as forming and usually requires a reduced number of experiments [ 2 l
2 E X P E R I M E N T A L PROCEDURE
The starting material was in the form of cylindrical test specimens of Ti-6A1-4V cut out from a forged jet engine compressor disc. Specimen dimensions were 0 4.0 x 5.5 mm or 0 6.0 x 8.0 mm (Test 1), the dimensions depending on the desired cooling rate. The microstructure was bimodal consisting of about 34 vol% equiaxed primary alpha (a p) particles and 66 vol% of a Widmanstätten type structure. The chemical composition of the alloy was (in wt%): 6.20 Al , 4.10 V, 0.19 Fe, 0.04 Si, 0.01 Cu, 0.01 C, 0.18 O, 0.005 N , 0.0024 H, <0.001 B, <0.001 Y, and Ti balance.
A Gleeble 1500 thermo mechanical simulator with lengthwise strain control was used to perform axial compression tests. The test specimens were placed between two tungsten carbide anvils, coated with a film of graphite and tantalum to minimize friction and prevent sticking between the anvils and the specimen. Resistance heating of the specimen permited high temperatures and rapid heating/cooling rates. The temperature was measured using a Pt/PtRh-thermocouple welded onto the surface and at mid height of the specimens. The tests were performed in an evacuated chamber (0.1 torr). During the testing sequence, the axial and radial displacements together with axial compression force and temperature were measured continuously.
Two sets of tests were performed as described in sections 2.1 and 2.2. Prior to deformation, all specimens were heated up (10°C/s) to an equilibrium temperature of 950°C and kept there for 20 minutes before cooling down to the desired test temperature. The main purpose of this heat treatment was both to relieve residual stresses , caused by the machining used to produce the specimens, and to reach an equilibrium fraction of alpha and beta phases and thereby avoid time-dependent phase transformation Due to limitations on the Gleeble 1500 machine, a rather rapid cooling rate of 25°C/s was chosen.
2.1 Isothermal compression tests at different temperatures
Six isothermal tests were performed, all heat-treated as described above. A schematic temperature history diagram for the isothermal tests is shown in Figure 1. After the equilibration stage the specimens were cooled to the desired testing temperature, e.g. 900°C (Test 1 in Figure 1), which was held for 10 seconds (in order to make a few adjustments of the control system). The specimens were then compressed to a final lengthwise true strain of 0.693 at a strain rate of 0.05 s"'. Finally, the specimens were cooled down to room temperature (RT, 25°C). The same procedure was applied to Test 2-6, but with cooling down to test temperatures of 700°C, 500°C, 300°C, 100°C and RT, respectively.
In order to detect strain rate sensitivity, further tests were performed at higher strain rates (0.5 s"1 and 5 s"1) and at a testing temperature of 500°C (Test 7 and 8, respectively).
2.2 Compression and continuous cooling tests
To receive more information from one single test, compression and continuous cooling tests (C-C) were performed, with the same strain rate and lengthwise strain as in Test 1-6. Two tests were chosen with certain overlaps, Test 9 and 10. Testing in the lower temperature
2
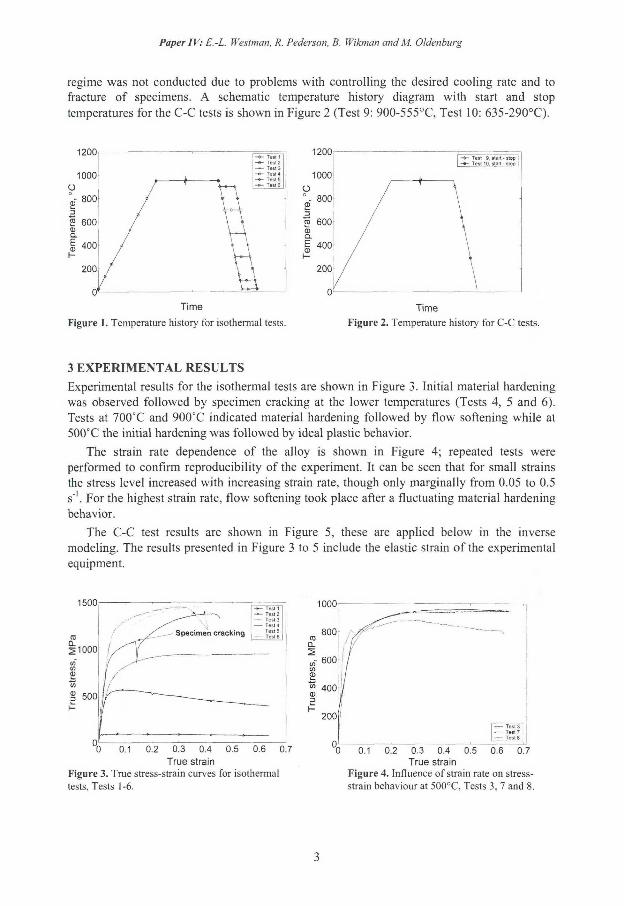
Paper IV: E.-L. Westman, R. Pederson, B. Wikman and M. Oldenburg
regime was not conducted due to problems with controlling the desired cooling rate and to fracture of specimens. A schematic temperature history diagram with start and stop temperatures for the C-C tests is shown in Figure 2 (Test 9: 900-555°C, Test 10: 635-290°C).
3 EXPERIMENTAL RESULTS Experimental results for the isothermal tests are shown in Figure 3. Initial material hardening was observed followed by specimen cracking at the lower temperatures (Tests 4, 5 and 6). Tests at 700°C and 900°C indicated material hardening followed by flow softening while at 500°C the initial hardening was followed by ideal plastic behavior.
The strain rate dependence of the alloy is shown in Figure 4; repeated tests were performed to confirm reproducibility of the experiment. It can be seen that for small strains the stress level increased with increasing strain rate, though only marginally from 0.05 to 0.5 s"1. For the highest strain rate, flow softening took place after a fluctuating material hardening behavior.
The C-C test results are shown in Figure 5, these are applied below in the inverse modeling. The results presented in Figure 3 to 5 include the elastic strain of the experimental equipment.
3
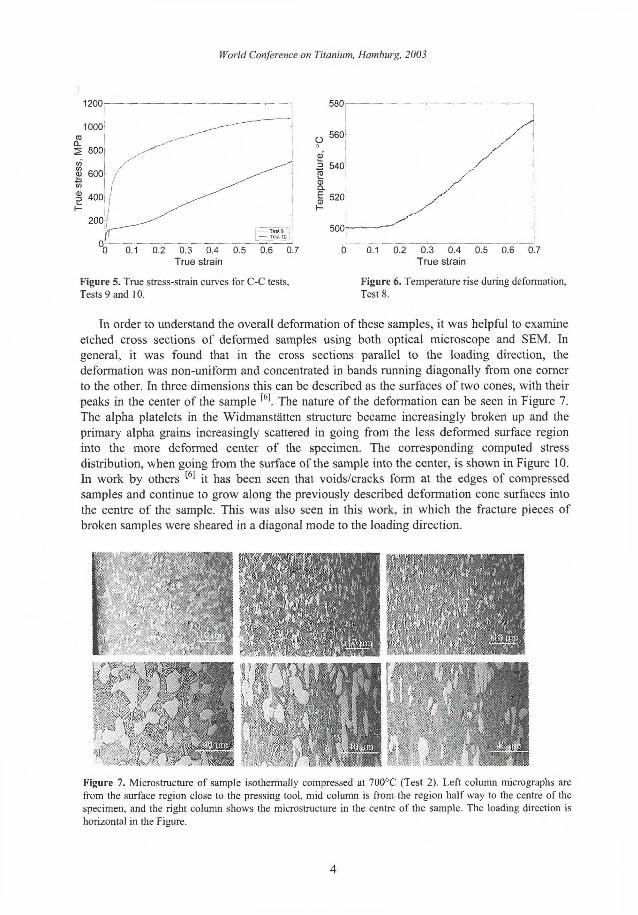
World Conference on Titanium, Hamburg, 2003
True strain True strain
Figure 5. True stress-strain curves for C-C tests, Figure 6. Temperature rise during deformation, Tests 9 and 10. Test 8.
In order to understand the overall deformation of these samples, it was helpful to examine etched cross sections of deformed samples using both optical microscope and SEM. In general, it was found that in the cross sections parallel to the loading direction, the deformation was non-uniform and concentrated in bands running diagonally from one comer to the other. In three dimensions this can be described as the surfaces of two cones, with their peaks in the center of the sample [ 6 l The nature of the deformation can be seen in Figure 7. The alpha platelets in the Widmanstätten structure became increasingly broken up and the primary alpha grains increasingly scattered in going from the less deformed surface region into the more deformed center of the specimen. The corresponding computed stress distribution, when going from the surface of the sample into the center, is shown in Figure 10. In work by others 1 6 1 it has been seen that voids/cracks form at the edges of compressed samples and continue to grow along the previously described deformation cone surfaces into the centre of the sample. This was also seen in this work, in which the fracture pieces of broken samples were sheared in a diagonal mode to the loading direction.
Figure 7. Microstructure of sample isothermally compressed at 700°C (Test 2). Left column micrographs are from the surface region close to the pressing tool, mid column is from the region half way to the centre of the specimen, and the right column shows the microstructure in the centre of the sample. The loading direction is
horizontal in the Figure.
4
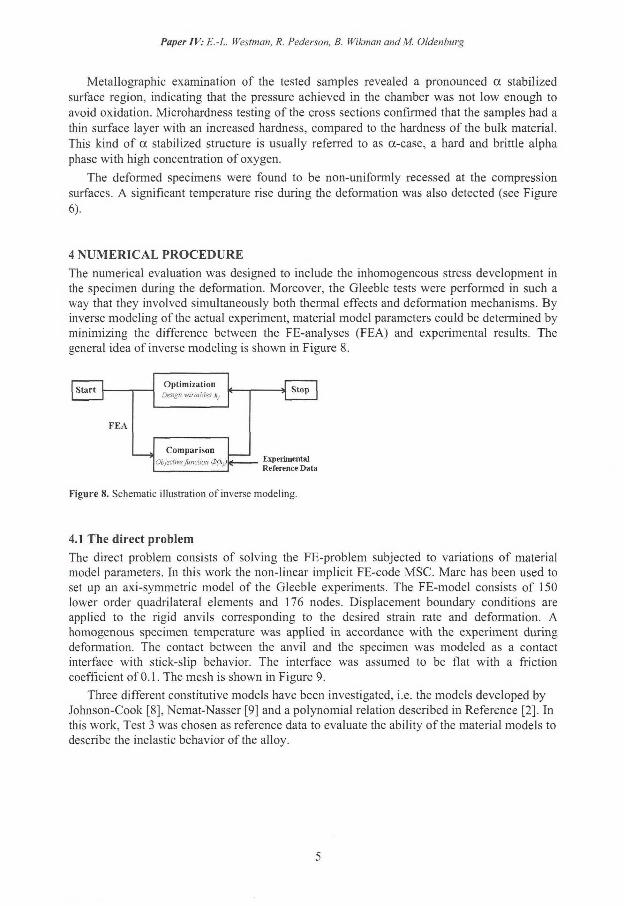
Paper IV: E.-L. Westman, R. Pederson, B. Wikman andM. Oldenburg
Metallographie examination of the tested samples revealed a pronounced a stabilized surface region, indicating that the pressure achieved in the chamber was not low enough to avoid oxidation. Microhardness testing of the cross sections confirmed that the samples had a thin surface layer with an increased hardness, compared to the hardness of the bulk material. This kind of a stabilized structure is usually referred to as a-case, a hard and brittle alpha phase with high concentration of oxygen.
The deformed specimens were found to be non-uniformly recessed at the compression surfaces. A significant temperature rise during the deformation was also detected (see Figure 6).
4 NUMERICAL PROCEDURE
The numerical evaluation was designed to include the inhomogeneous stress development in the specimen during the deformation. Moreover, the Gleeble tests were performed in such a way that they involved simultaneously both thermal effects and deformation mechanisms. By inverse modeling of the actual experiment, material model parameters could be determined by minimizing the difference between the FE-analyses (FEA) and experimental results. The general idea of inverse modeling is shown in Figure 8.
Optimization Design variables X,
Comparison Objective Junction
Stop
Experimental Reference Data
Figure 8. Schematic illustration of inverse modeling.
4.1 The direct problem
The direct problem consists of solving the FE-problem subjected to variations of material model parameters. In this work the non-linear implicit FE-code MSC. Marc has been used to set up an axi-symmetric model of the Gleeble experiments. The FE-model consists of 150 lower order quadrilateral elements and 176 nodes. Displacement boundary conditions are applied to the rigid anvils corresponding to the desired strain rate and deformation. A homogenous specimen temperature was applied in accordance with the experiment during deformation. The contact between the anvil and the specimen was modeled as a contact interface with stick-slip behavior. The interface was assumed to be flat with a friction coefficient of 0.1. The mesh is shown in Figure 9.
Three different constitutive models have been investigated, i.e. the models developed by Johnson-Cook [8], Nemat-Nasser [9] and a polynomial relation described in Reference [2]. In this work, Test 3 was chosen as reference data to evaluate the ability of the material models to describe the inelastic behavior of the alloy.
5
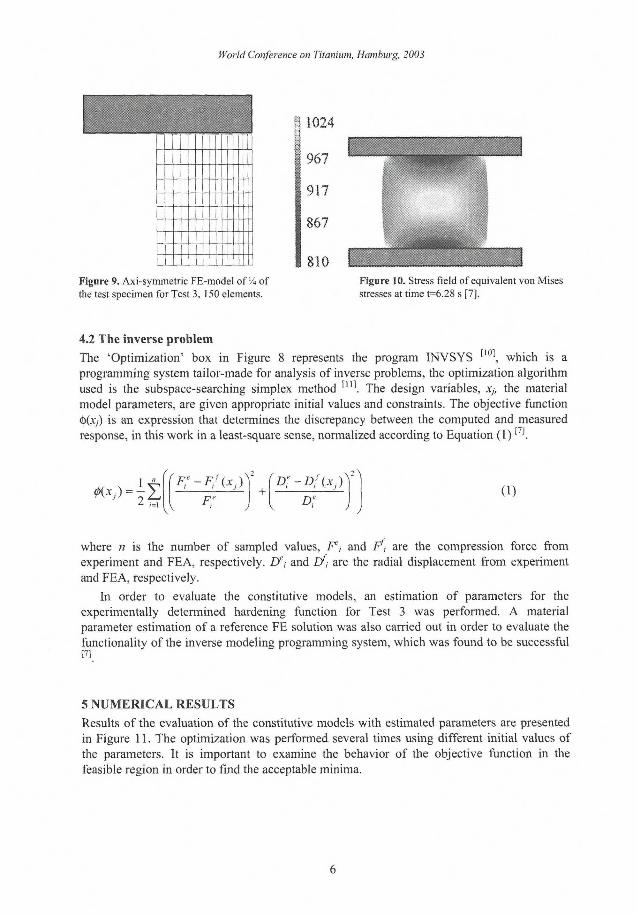
World Conference on Titanium, Hamburg, 2003
Figure 9. Axi-symmetric FE-model of 'A of Figure 10. Stress field of equivalent von Mises
the test specimen for Test 3, 150 elements. stresses at time t=6.28 s [7].
4.2 The inverse problem
The 'Optimization' box in Figure 8 represents the program INVSYS [ 1 , which is a programming system tailor-made for analysis of inverse problems, the optimization algorithm used is the subspace-searching simplex method [ 1 . The design variables, x,, the material model parameters, are given appropriate initial values and constraints. The objective function <j)(x,) is an expression that determines the discrepancy between the computed and measured response, in this work in a least-square sense, normalized according to Equation (1)
2t
r F l
, - F / ( x J ) s
~Fe D' (1)
where n is the number of sampled values, F', and F, are the compression force from experiment and FEA, respectively. Eft and £/,• are the radial displacement from experiment and FEA, respectively.
In order to evaluate the constitutive models, an estimation of parameters for the experimentally determined hardening function for Test 3 was performed. A material parameter estimation of a reference FE solution was also carried out in order to evaluate the functionality of the inverse modeling programming system, which was found to be successful
m
5 NUMERICAL RESULTS
Results of the evaluation of the constitutive models with estimated parameters are presented in Figure 11. The optimization was performed several times using different initial values of the parameters. It is important to examine the behavior of the objective function in the feasible region in order to find the acceptable minima.
6

Paper IV: E.-L. Westman, R. Pederson, B. Wikman and M. Oldenburg
0.2 _ 0.4 . True stram
0.2 „ 0.4 . True stram
0.2 _ 0.4 True stram
Figure 11. Evaluation of Johnson-Cook, Nemat-Nasser and the polynomial relation material models,
respectively.
The evaluation shows that none of the three constitutive models describes the inelastic behavior of this specific alloy satisfactorily. The three constitutive models, with estimated parameters, generate functions fairly similar to each other; there are only small differences in the behavior. A rotated and mirrored plot showing the von Mises stress of the deformed specimen, with the estimated parameters presented in Reference [7], is shown in Figure 10.
6 DISCUSSION AND CONCLUSIONS The samples compressed between RT and 300°C cracked during testing and the cracks leading to fracture were seen to originate at the comers of the samples and to grow in a diagonal mode to the loading direction. This is in well agreement with the simulated stress field occurring in compressed samples during testing (see Figure 10). It is reasonable to expect that the resistance to crack initiation is reduced because of the observed oc-case found in the surface regions of the tested samples.
The strain rate sensitivity was examined by applying three different strain rates during isothermal deformation at 500°C, and the resulting stress-strain curves are shown in Figure 4. No clear difference could be seen between the strain rates of 0.05 s" and 0.5 s", but at a strain rate of 5 s"1 flow softening seem to occur. This could be explained by heat generation during plastic deformation. Indication of this was found during examination of the recorded temperature during the test (Figure 6), where the temperature increased by approximately 70°C during the deformation process. I f this temperature increase is high enough to cause flow softening is not yet certain, but it is possible that on a local scale (some distance from the thermocouple) the temperature increase could well be significantly higher than that recorded by the thermocouple, due to the variation in the degree of plastic deformation through the sample. The isothermal compression test conducted at 700°C with a strain rate of 0.05 s"' (see Figure 3) indicated a typical softening behaviour. Thus it is reasonably to suppose that the test performed at 500°C, due to the higher strain rate of 5 s"1, could have reached the softening regime observed at 700°C because of local heating in the specimen during deformation. However, it should be pointed out that no similar evidence of local heating during the compression of Ti-6A1-4V has been found reported elsewhere. Thus, the possibility of an equipment error in the measured temperature rise cannot be ruled out. The slope of the 5 s"1
curve seems initially somewhat irregular and also steeper than for the curves at lower strain rates. This serrated form of the curve closely resembles serrated yielding, a phenomenon mainly known to occur in a titanium alloys during plastic deformation at low (cryogenic) temperatures. However, similar compression experiments performed with other materials, with the same Gleeble 1500 equipment as was used in this work, produced similar types of
7
World Conference on Titanium, Hamburg, 2003
serrated curves when high strain rates were applied. Thus, the serrated form of the curve observed here most likely stems from the equipment.
The three constitutive models that were studied in this work were not able to describe the material hardening behavior satisfactorily. A remaining challenge of future work is therefore to find alternative descriptions for the material behavior. However the estimation performed to check the functionality of the inverse modeling programming system described in Reference [7] shows that inverse modeling is a viable way to determine material model parameters. It shall be mentioned that different sets of parameters can describe the same material behavior. Thus it is important that the error between the reference data and the response generated by the FE-analysis is small. The existence of a minimum for the objective function should be analyzed, since several minima often exist. Another crucial issue to investigate is the stability of the achieved solution. For instance, a flat minimum is considered non-unique, and for this reason the solution may change substantially by even small changes in the data. Thus, it is important to exclude misleading local minima by investigation of different initial guesses. In future work results from the C-C tests are to be used as reference data in order to achieve more accurate data with a reduced number of experiments.
Regarding the FE-model, the friction coefficient between the specimen and the anvils has not yet been investigated but is an important factor. It determines the shape of the billet when deformed and influences the estimated parameters, thus it should be investigated in future work. One possibility is to include the friction coefficient as a design parameter or perform parameter estimations with different friction coefficients. The foil and the recessed area at the compression surfaces of the specimen will cause difficulties in friction modeling. In order to take internal heat generation into account and to determine its effects it may also be justified to perform coupled thermo-mechanical analyses.
7 ACKNOWLEDGEMENTS
The research founding by VINNOVA, grant P22122-1A, and the collaboration with Prof. Pentti Karjalainen and Ph.D. Mahesh Somani at University of Oulu, Finland, are gratefully acknowledged.
8 REFERENCES
1. A. Tarantola: Inverse Problem Theory - Methods for Data Fitting and Model Parameter Estimation, Elsevier, 1987.
2. M . C. F. Eriksson: Doctoral Thesis 2002:19, Luleå University of Technology, Sweden, May 2002.
3. G. Lindkvist: Master Thesis 2001:307, Luleå University of Technology, Sweden, November 2001.
4. in 'Materials properties handbook: titanium alloys', R. Boyer et. al., ed., 599, 1994, Materials Park, OH, ASM International.
5. R. Pederson: Licentiate Thesis 2002:30, Luleå University of Technology, Sweden, May 2002.
6. A. J. Wagoner Johnson, C. W. Bull, K. S. Kumar and C. L. Briant: Metall. Mater. Trans. A, 2003, vol. 34, 295-306.
8
Paper IV: E.-L. Westman, R. Pederson, B. Wikmctn andM. Oldenburg
7. E.-L., Westman: Master Thesis 2003:108, Luleå University of Technology, Sweden, February 2003.
8. G. R. Johnson and W. H. Cook: in the 7 t h International Symposium on Ballistics, The Hague, The Netherlands, 1983.
9. S. Nemat-Nasser: in the IUTAM Symposium on Micro- and Macrostructural Aspects of Thermoplasticity, 1999, 101-113.
10. B. Wikman and G. Bergman: Technical Report 2000:27, Luleå University of Technology. December 2000.
11. T. H. Rowan: Doctoral Thesis, University of Texas at Austin, Texas, USA, chapter 5, May, 1990.
9

Modelling and Experimental Calibration of Electron Beam Welded Ti-6A1-4V
R. Pederson, D. Berglund, F. Skystedt and R. Warren
To be submitted.
Paper V
Modelling and Experimental Calibration of Electron Beam Welded TU6AI-4V
R. PEDERSON1, D. BERGLUND 2, F. SKYSTEDT3 and R. WARREN 4
' 'Luleå University of Technology, Division of Engineering Materials/Computer Aided Design, SE 97187, Luleå Sweden. s Volvo Aero Corporation, Materials Technolog); SE 46181 Trollhättan, Sweden. 'University of Malmö, Technology? and Society, SE 20506 Malmö, Sweden.
Abstract A simulation model was developed that predicts the geometries, dimensions and microstructure of the fusion zone and heat affected zone formed during the electron beam welding of the titanium alloy, TU6A1-4V. The model is based on a finite element prediction of the thermal history of the weld in combination with a model for the kinetics of the alpha/beta phase transformation during arbitrary thermal cycles. As input for the thermal history model experimental measurements were made of the thermal conductivity and specific heat of the alloy from room temperature up to 1200°C. In support of the phase transformation model, experimental measurements of the alpha-to-beta transformation were investigated. The model was calibrated by performing an experimental weld test in which thermal cycles at selected locations in the weld region were monitored by thermocouples. Certain parameters in the phase transformation model were calibrated through metallographic examination of the weld zone. It is concluded that the model can be used for the prediction of the weld zone in electron beam welds carried out with welding parameters that lie within ±10% of those used in the calibration weld test.
1. Introduction Titanium alloys have found an extensive application in aerospace components, such as in aeroengines. One of the most important advantages of these alloys is their high strength-to-weight ratio, as compared to other metals. The two-phase cc+ß alloy Ti-6A1-4V is the most commonly used titanium alloy today, and the existence of a mixture of a and ß phases means that a wide variety of microstructures and property combinations can be achieved. In other words, this single alloy can be used for different components exposed to a wide range of working conditions i f appropriate thermo mechanical processing and heat treatments are applied.1"3 Ti-6A1-4V is an a+ß alloy with a beta transus temperature of ~995°C (above which only beta phase exists at equilibrium). At room temperature the microstructure consists mainly of alpha phase with a few percent retained beta phase.
An important process in the manufacture of components with complex geometry is welding. When applied to advanced Ti-alloy components careful control of the welding process is essential. The aim of this work was to develop a weld simulation model leading to a prediction of the joint structure and microstructure of an electron beam welded component of the alloy Ti-6A1-4V. The general approach was to electron beam weld experimentally a component-like test piece of a specific geometry and with specific welding parameters and then to model this test. The first stage of the model was prediction of thermal distribution and history during the welding process using a finite element-based model. The resulting thermal
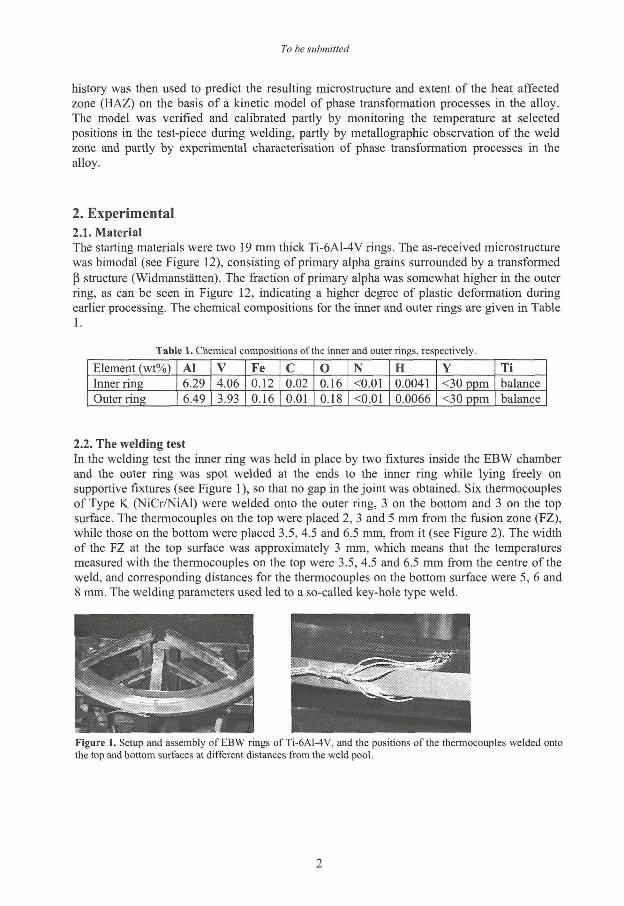
To be submitted
history was then used to predict the resulting microstructure and extent of the heat affected zone (HAZ) on the basis of a kinetic model of phase transformation processes in the alloy. The model was verified and calibrated partly by monitoring the temperature at selected positions in the test-piece during welding, partly by metallographic observation of the weld zone and partly by experimental characterisation of phase transformation processes in the alloy.
2. Experimental 2.1. Material The starting materials were two 19 mm thick Ti-6A1-4V rings. The as-received microstructure was bimodal (see Figure 12), consisting of primary alpha grains surrounded by a transformed ß structure (Widmanstätten). The fraction of primary alpha was somewhat higher in the outer ring, as can be seen in Figure 12, indicating a higher degree of plastic deformation during earlier processing. The chemical compositions for the inner and outer rings are given in Table 1.
Table 1. Chemical compositions of the inner and outer rings, respectively.
Element (wt%) Al V Fe C O N H Y Ti Inner ring 6.29 4.06 0.12 0.02 0.16 <0.01 0.0041 <30 ppm balance Outer ring 6.49 3.93 0.16 0.01 0.18 O.01 0.0066 <30 ppm balance
2.2. The welding test In the welding test the inner ring was held in place by two fixtures inside the EBW chamber and the outer ring was spot welded at the ends to the inner ring while lying freely on supportive fixtures (see Figure 1), so that no gap in the joint was obtained. Six thermocouples of Type K (NiCr/NiAl) were welded onto the outer ring, 3 on the bottom and 3 on the top surface. The thermocouples on the top were placed 2, 3 and 5 mm from the fusion zone (FZ), while those on the bottom were placed 3.5, 4.5 and 6.5 mm, from it (see Figure 2). The width of the FZ at the top surface was approximately 3 mm, which means that the temperatures measured with the thermocouples on the top were 3.5, 4.5 and 6.5 mm from the centre of the weld, and corresponding distances for the thermocouples on the bottom surface were 5, 6 and 8 mm. The welding parameters used led to a so-called key-hole type weld.
Figure 1. Setup and assembly of EBW rings of Ti-6A1-4V, and the positions of the thermocouples welded onto the top and bottom surfaces at different distances from the weld pool.
2
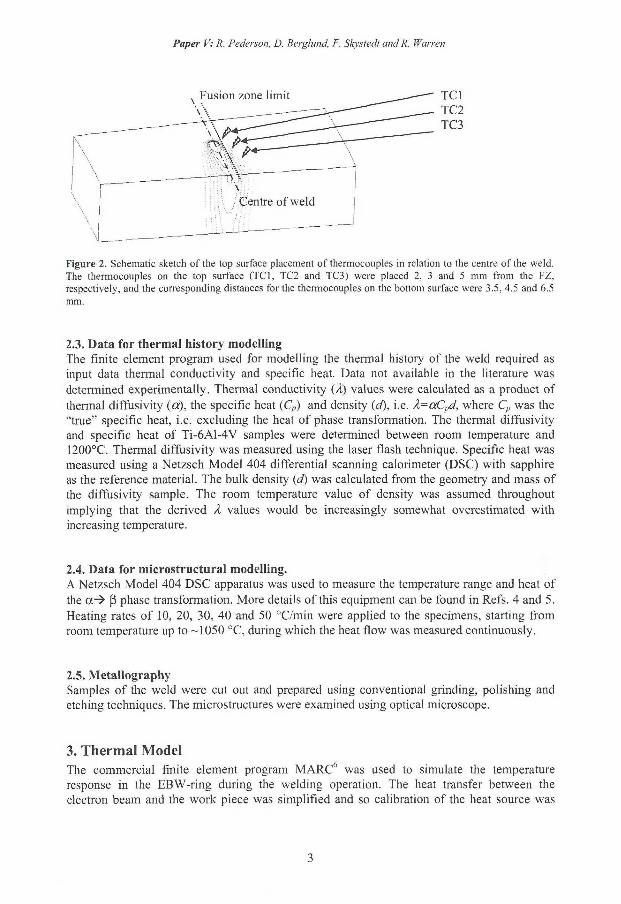
Paper V: R. Pederson, D. Berglund, F. Skystedt and R. Warren
TCI TC2 TC3
\
\ Centre of weld \ \ \ \
Figure 2. Schematic sketch of the top surface placement of thermocouples in relation to the centre of the weld. The thermocouples on the top surface (TCI , TC2 and TC3) were placed 2, 3 and 5 mm from the FZ, respectively, and the corresponding distances for the thermocouples on the bottom surface were 3.5, 4.5 and 6.5 mm.
2.3. Data for thermal history modelling The finite element program used for modelling the thermal history of the weld required as input data thennal conductivity and specific heat. Data not available in the literature was determined experimentally. Thermal conductivity (/t) values were calculated as a product of thermal diffusivity (a), the specific heat (Cp) and density (d), i.e. A=aCpd, where Cp was the "true" specific heat, i.e. excluding the heat of phase transformation. The thermal diffusivity and specific heat of Ti-6A1-4V samples were determined between room temperature and 1200°C. Thermal diffusivity was measured using the laser flash technique. Specific heat was measured using a Netzsch Model 404 differential scanning calorimeter (DSC) with sapphire as the reference material. The bulk density (d) was calculated from the geometry and mass of the diffusivity sample. The room temperature value of density was assumed throughout implying that the derived Å values would be increasingly somewhat overestimated with increasing temperature.
2.4. Data for microstructural modelling. A Netzsch Model 404 DSC apparatus was used to measure the temperature range and heat of the oc-} ß phase transformation. More details of this equipment can be found in Refs. 4 and 5. Heating rates of 10, 20, 30, 40 and 50 °C/min were applied to the specimens, starting from room temperature up to -1050 °C, during which the heat flow was measured continuously.
2.5. Metallography Samples of the weld were cut out and prepared using conventional grinding, polishing and etching techniques. The microstructures were examined using optical microscope.
3. Thermal Model The commercial finite element program MARC 6 was used to simulate the temperature response in the EBW-ring during the welding operation. The heat transfer between the electron beam and the work piece was simplified and so calibration of the heat source was
3
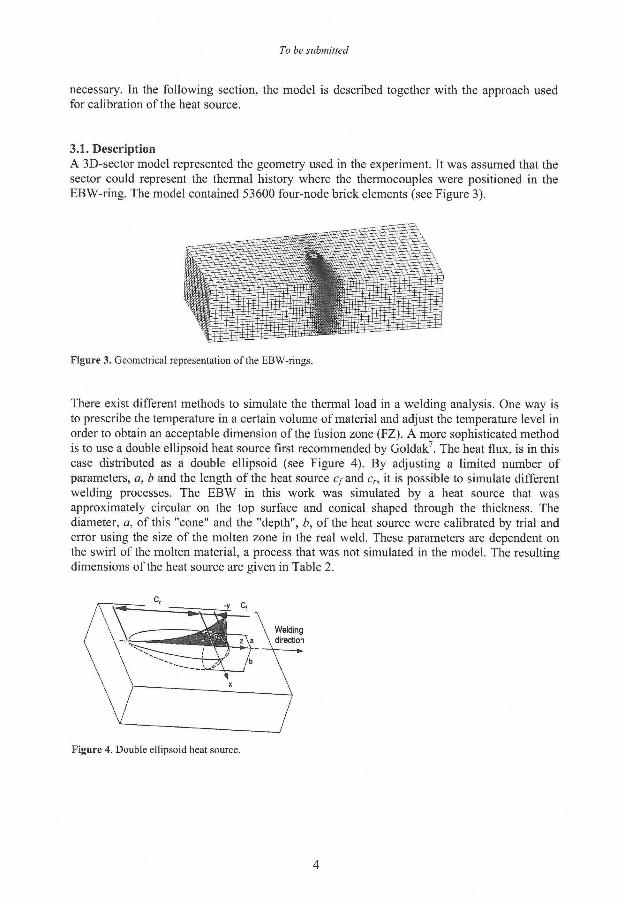
To be submitted
necessary. In the following section, the model is described together with the approach used for calibration of the heat source.
3.1. Description A 3D-sector model represented the geometry used in the experiment. It was assumed that the sector could represent the thermal history where the thermocouples were positioned in the EBW-ring. The model contained 53600 four-node brick elements (see Figure 3).
Figure 3. Geometrical representation of the EBW-rings.
There exist different methods to simulate the thermal load in a welding analysis. One way is to prescribe the temperature in a certain volume of material and adjust the temperature level in order to obtain an acceptable dimension of the fusion zone (FZ). A more sophisticated method is to use a double ellipsoid heat source first recommended by Goldak7. The heat flux, is in this case distributed as a double ellipsoid (see Figure 4). By adjusting a limited number of parameters, a, b and the length of the heat source tyand cr, it is possible to simulate different welding processes. The EBW in this work was simulated by a heat source that was approximately circular on the top surface and conical shaped through the thickness. The diameter, a, of this "cone" and the "depth", b, of the heat source were calibrated by trial and error using the size of the molten zone in the real weld. These parameters are dependent on the swirl of the molten material, a process that was not simulated in the model. The resulting dimensions of the heat source are given in Table 2.
Welding
direction
Figure 4. Double ellipsoid heat source.
4
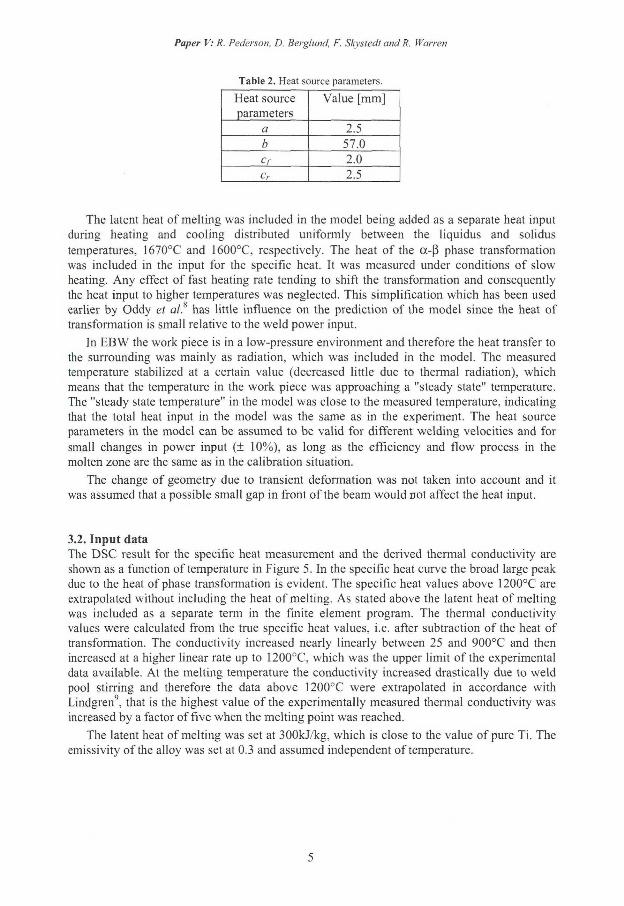
Paper V: R. Pederson, D. Berglund, F. Skystedt and R. Warren
Table 2. Heat source parameters.
Heat source Value [mm] parameters
a 2.5 h 57.0
2.0 Cr 2.5
The latent heat of melting was included in the model being added as a separate heat input during heating and cooling distributed uniformly between the liquidus and solidus temperatures, 1670°C and 1600°C, respectively. The heat of the a-ß phase transformation was included in the input for the specific heat. It was measured under conditions of slow heating. Any effect of fast heating rate tending to shift the transformation and consequently the heat input to higher temperatures was neglected. This simplification which has been used earlier by Oddy et a/.8 has little influence on the prediction of the model since the heat of transformation is small relative to the weld power input.
In EBW the work piece is in a low-pressure environment and therefore the heat transfer to the surrounding was mainly as radiation, which was included in the model. The measured temperature stabilized at a certain value (decreased little due to thermal radiation), which means that the temperature in the work piece was approaching a "steady state" temperature. The "steady state temperature" in the model was close to the measured temperature, indicating that the total heat input in the model was the same as in the experiment. The heat source parameters in the model can be assumed to be valid for different welding velocities and for small changes in power input (± 10%), as long as the efficiency and flow process in the molten zone are the same as in the calibration situation.
The change of geometry due to transient deformation was not taken into account and it was assumed that a possible small gap in front of the beam would not affect the heat input.
3.2. Input data The DSC result for the specific heat measurement and the derived thermal conductivity are shown as a function of temperature in Figure 5. In the specific heat curve the broad large peak due to the heat of phase transformation is evident. The specific heat values above 1200°C are extrapolated without including the heat of melting. As stated above the latent heat of melting was included as a separate term in the finite element program. The thermal conductivity values were calculated from the true specific heat values, i.e. after subtraction of the heat of transformation. The conductivity increased nearly linearly between 25 and 900°C and then increased at a higher linear rate up to 1200°C, which was the upper limit of the experimental data available. At the melting temperature the conductivity increased drastically due to weld pool stirring and therefore the data above 1200°C were extrapolated in accordance with Lindgren9, that is the highest value of the experimentally measured thermal conductivity was increased by a factor of five when the melting point was reached.
The latent heat of melting was set at 300kJ/kg, which is close to the value of pure Ti. The emissivity of the alloy was set at 0.3 and assumed independent of temperature.
5
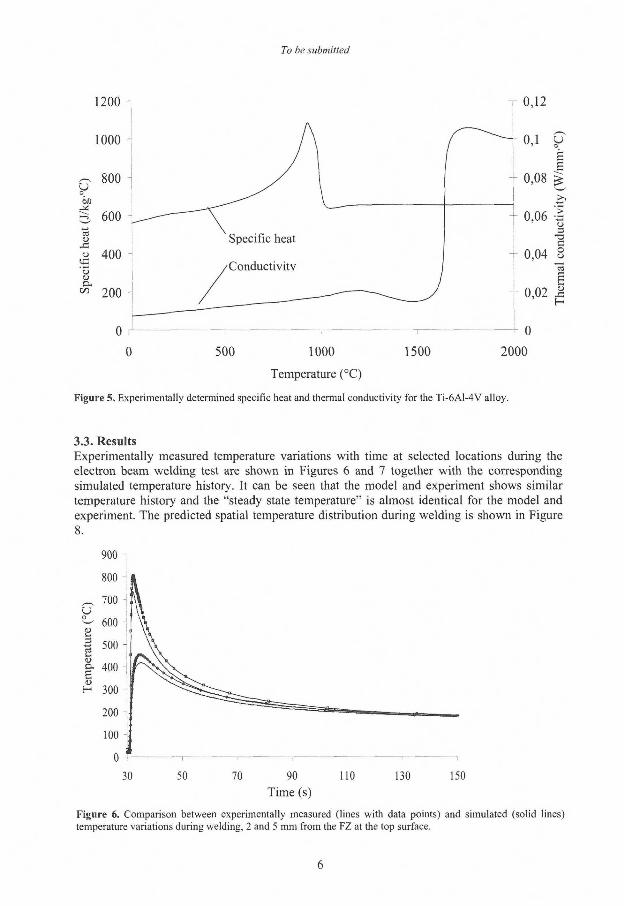
To be submitted
3.3. Results Experimentally measured temperature variations with time at selected locations during the electron beam welding test are shown in Figures 6 and 7 together with the corresponding simulated temperature history. It can be seen that the model and experiment shows similar temperature history and the "steady state temperature" is almost identical for the model and experiment. The predicted spatial temperature distribution during welding is shown in Figure
Time (s)
Figure 6. Comparison between experimentally measured (lines with data points) and simulated (solid lines) temperature variations during welding, 2 and 5 mm from the FZ at the top surface.
6
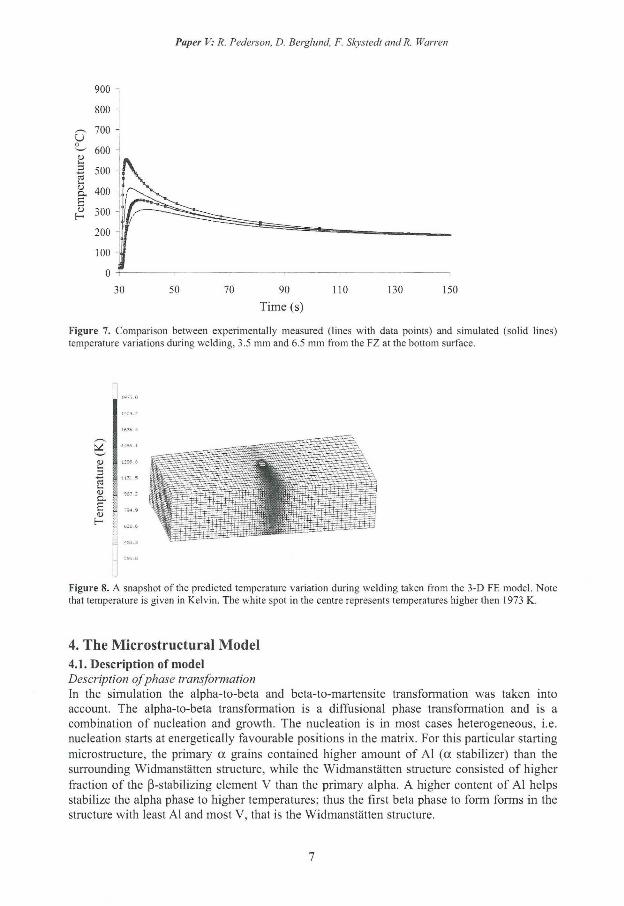
Paper V: R. Pederson, D. Berglund, F. Skystedt and R. Warren
Figure 8. A snapshot of the predicted temperature variation during welding taken from the 3-D FE model. Note that temperature is given in Kelvin. The white spot in the centre represents temperatures higher then 1973 K.
4. The Microstructural Model 4.1. Description of model Description of phase transformation In the simulation the alpha-to-beta and beta-to-martensite transformation was taken into account. The alpha-to-beta transformation is a diffusional phase transformation and is a combination of nucleation and growth. The nucleation is in most cases heterogeneous, i.e. nucleation starts at energetically favourable positions in the matrix. For this particular starting microstructure, the primary a grains contained higher amount of A l (a stabilizer) than the surrounding Widmanstätten structure, while the Widmanstätten structure consisted of higher fraction of the ß-stabilizing element V than the primary alpha. A higher content of A l helps stabilize the alpha phase to higher temperatures; thus the first beta phase to form forms in the structure with least Al and most V, that is the Widmanstätten structure.
7
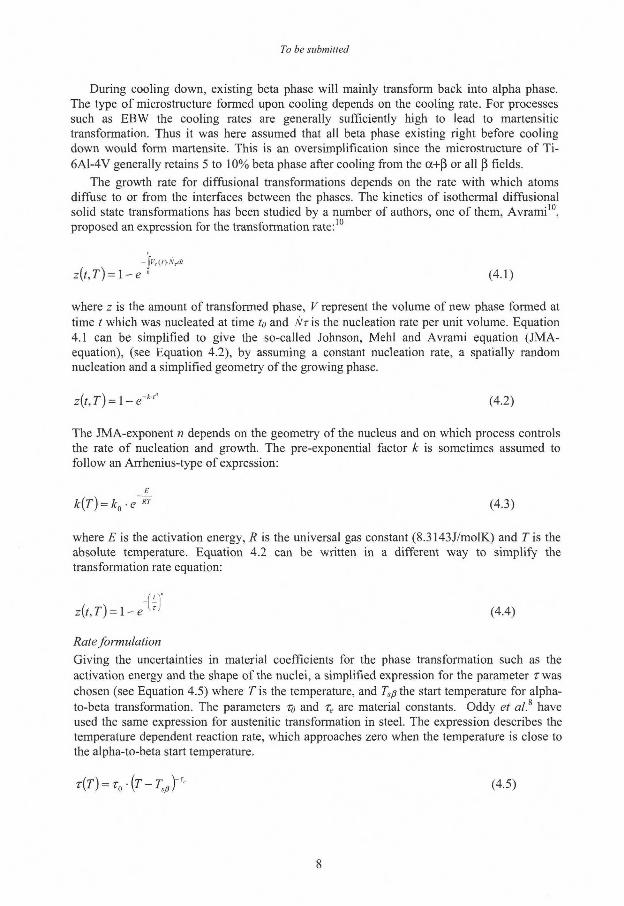
To be submitted
During cooling down, existing beta phase will mainly transform back into alpha phase. The type of microstructure formed upon cooling depends on the cooling rate. For processes such as EBW the cooling rates are generally sufficiently high to lead to martensitic transformation. Thus it was here assumed that all beta phase existing right before cooling down would form martensite. This is an oversimplification since the microstructure of Ti-6A1-4V generally retains 5 to 10% beta phase after cooling from the ot+ß or all ß fields.
The growth rate for diffusional transformations depends on the rate with which atoms diffuse to or from the interfaces between the phases. The kinetics of isothermal diffusional solid state transformations has been studied by a number of authors, one of them, Avrami 1 0, proposed an expression for the transformation rate:10
- j V r ( l ) ; \ , d l
z { t j ) = \-e" (4.1)
where z is the amount of transformed phase, V represent the volume of new phase formed at time / which was nucleated at time to and Nr is the nucleation rate per unit volume. Equation 4.1 can be simplified to give the so-called Johnson, Mehl and Avrami equation (JMA-equation), (see Equation 4.2), by assuming a constant nucleation rate, a spatially random nucleation and a simplified geometry of the growing phase.
z(/,r) = l - e - " " (4.2)
The JMA-exponent n depends on the geometry of the nucleus and on which process controls the rate of nucleation and growth. The pre-exponential factor k is sometimes assumed to follow an Arrhenius-type of expression:
E
k(T) = k0-e~«> (4.3)
where E is the activation energy, 7? is the universal gas constant (8.3143J/molK) and T is the absolute temperature. Equation 4.2 can be written in a different way to simplify the transformation rate equation:
z { t j ) = \-e u J (4.4)
Rate formulation
Giving the uncertainties in material coefficients for the phase transformation such as the activation energy and the shape of the nuclei, a simplified expression for the parameter rwas chosen (see Equation 4.5) where Tis the temperature, and Tspmz start temperature for alpha-to4?eta transformation. The parameters To and Te are material constants. Oddy et a/.8 have used the same expression for austenitic transformation in steel. The expression describes the temperature dependent reaction rate, which approaches zero when the temperature is close to the alpha-to-beta start temperature.
z(T) = T ü \ T - T s ß Y ' (4.5)
8
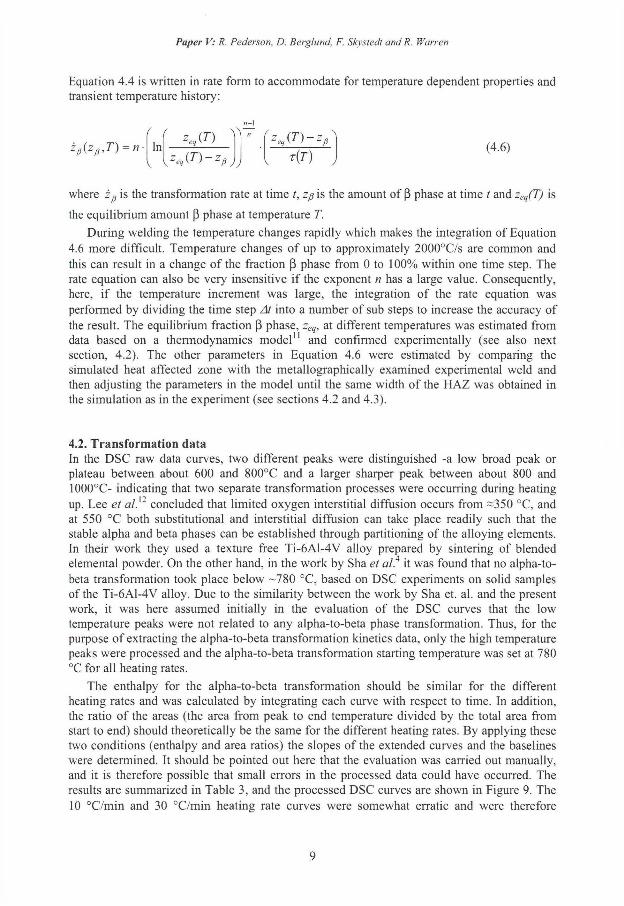
Paper V: R. Pederson, D. Berglund, F. Skystedi and R. Warren
Equation 4.4 is written in rate form to accommodate for temperature dependent properties and transient temperature history:
zß{zß,T) = n ( (
In r(r)
(4.6)
where z ß is the transformation rate at time t, iß is the amount of ß phase at time t and zeq(T) is
the equilibrium amount ß phase at temperature T.
During welding the temperature changes rapidly which makes the integration of Equation 4.6 more difficult. Temperature changes of up to approximately 2000°C7s are common and this can result in a change of the fraction ß phase from 0 to 100% within one time step. The rate equation can also be very insensitive i f the exponent n has a large value. Consequently, here, i f the temperature increment was large, the integration of the rate equation was performed by dividing the time step At into a number of sub steps to increase the accuracy of the result. The equilibrium fraction ß phase, zeq, at different temperatures was estimated from data based on a thermodynamics model" and confirmed experimentally (see also next section, 4.2). The other parameters in Equation 4.6 were estimated by comparing the simulated heat affected zone with the metallographically examined experimental weld and then adjusting the parameters in the model until the same width of the HAZ was obtained in the simulation as in the experiment (see sections 4.2 and 4.3).
4.2. Transformation data In the DSC raw data curves, two different peaks were distinguished -a low broad peak or plateau between about 600 and 800°C and a larger sharper peak between about 800 and 1000°C- indicating that two separate transformation processes were occurring during heating up. Lee et al. concluded that limited oxygen interstitial diffusion occurs from =350 °C, and at 550 °C both substitutional and interstitial diffusion can take place readily such that the stable alpha and beta phases can be established through partitioning of the alloying elements. In their work they used a texture free Ti-6A1-4V alloy prepared by sintering of blended elemental powder. On the other hand, in the work by Sha et al.4 it was found that no alpha-to-beta transformation took place below -780 °C, based on DSC experiments on solid samples of the Ti-6A1-4V alloy. Due to the similarity between the work by Sha et. al. and the present work, it was here assumed initially in the evaluation of the DSC curves that the low temperature peaks were not related to any alpha-to-beta phase transformation. Thus, for the purpose of extracting the alpha-to-beta transformation kinetics data, only the high temperature peaks were processed and the alpha-to-beta transformation starting temperature was set at 780 °C for all heating rates.
The enthalpy for the alpha-to-beta transformation should be similar for the different heating rates and was calculated by integrating each curve with respect to time. In addition, the ratio of the areas (the area from peak to end temperature divided by the total area from start to end) should theoretically be the same for the different heating rates. By applying these two conditions (enthalpy and area ratios) the slopes of the extended curves and the baselines were determined. It should be pointed out here that the evaluation was carried out manually, and it is therefore possible that small errors in the processed data could have occurred. The results are summarized in Table 3, and the processed DSC curves are shown in Figure 9. The 10 °C/min and 30 °C/min heating rate curves were somewhat erratic and were therefore
9
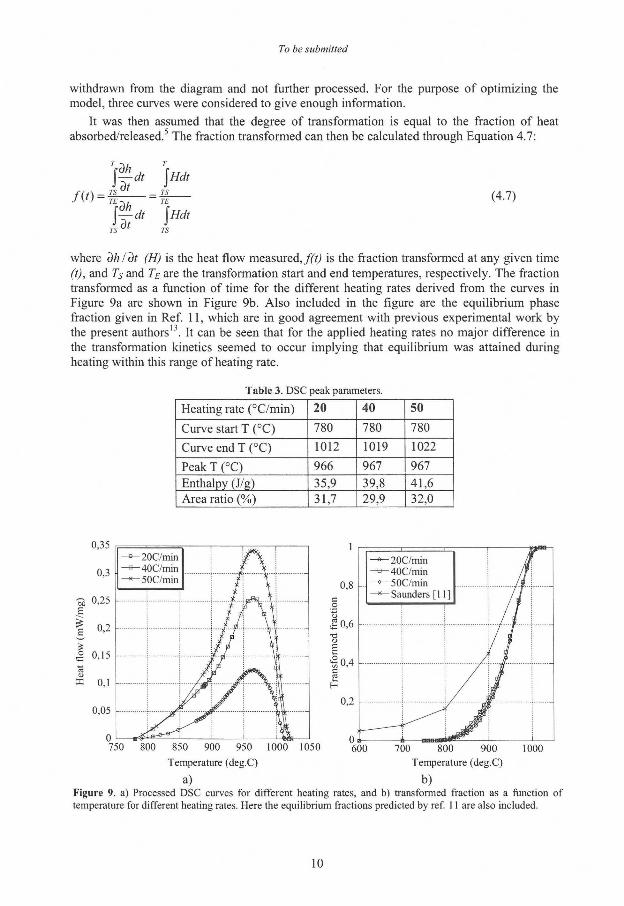
To be submitted
withdrawn from the diagram and not further processed. For the purpose of optimizing the model, three curves were considered to give enough information.
It was then assumed that the degree of transformation is equal to the fraction of heat absorbed/released.5 The fraction transformed can then be calculated through Equation 4.7:
(4.7)
where dh/dt (H) is the heat flow measured, f(t) is the fraction transformed at any given time (t), and Ts and Te are the transformation start and end temperatures, respectively. The fraction transformed as a function of time for the different heating rates derived from the curves in Figure 9a are shown in Figure 9b. Also included in the figure are the equilibrium phase fraction given in Ref. 11, which are in good agreement with previous experimental work by the present authors'3. It can be seen that for the applied heating rates no major difference in the transformation kinetics seemed to occur implying that equilibrium was attained during heating within this range of heating rate.
Table 3. DSC peak parameters.
Heating rate (°C/min) 20 40 50 Curve start T (°C) 780 780 780
Curve end T (°C) 1012 1019 1022
Peak T (°C) 966 967 967
Enthalpy (J/g) 35,9 39,8 41,6 Area ratio (%) 31,7 29,9 32,0
Figure 9. a) Processed DSC curves for different heating rates, and b) transformed fraction as a function of temperature for different heating rates. Here the equilibrium fractions predicted by ref. 11 are also included.
10
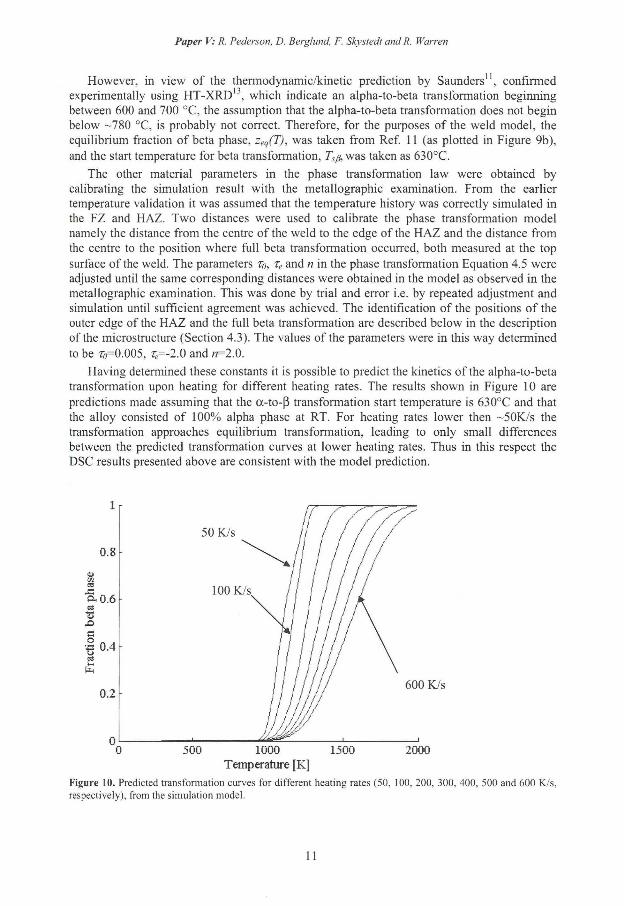
Paper V: R. Pederson, D. Berglund, F. Skystedt and R. Warren
However, in view of the thermodynamic/kinetic prediction by Saunders", confirmed experimentally using HT-XRD 1 3 , which indicate an alpha-to-beta transformation beginning between 600 and 700 °C, the assumption that the alpha-to-beta transformation does not begin below -780 °C, is probably not correct. Therefore, for the purposes of the weld model, the equilibrium fraction of beta phase, zeq(T), was taken from Ref. 11 (as plotted in Figure 9b), and the start temperature for beta transformation, Tsp\ was taken as 630°C.
The other material parameters in the phase transformation law were obtained by calibrating the simulation result with the metallographic examination. From the earlier temperature validation it was assumed that the temperature history was correctly simulated in the FZ and HAZ. Two distances were used to calibrate the phase transformation model namely the distance from the centre of the weld to the edge of the HAZ and the distance from the centre to the position where full beta transformation occurred, both measured at the top surface of the weld. The parameters t0, re and n in the phase transformation Equation 4.5 were adjusted until the same corresponding distances were obtained in the model as observed in the metallographic examination. This was done by trial and error i.e. by repeated adjustment and simulation until sufficient agreement was achieved. The identification of the positions of the outer edge of the HAZ and the full beta transformation are described below in the description of the microstructure (Section 4.3). The values of the parameters were in this way determined to be r»=0.005, rf=-2.0 and «=2.0.
Having determined these constants it is possible to predict the kinetics of the alpha-to-beta transformation upon heating for different heating rates. The results shown in Figure 10 are predictions made assuming that the a-to-ß transformation start temperature is 630°C and that the alloy consisted of 100% alpha phase at RT. For heating rates lower then ~50K7s the transformation approaches equilibrium transformation, leading to only small differences between the predicted transformation curves at lower heating rates. Thus in this respect the DSC results presented above are consistent with the model prediction.
Temperature [K]
Figure 10. Predicted transformation curves for different heating rates (50, 100, 200, 300, 400, 500 and 600 K/s, respectively), from the simulation model.
11
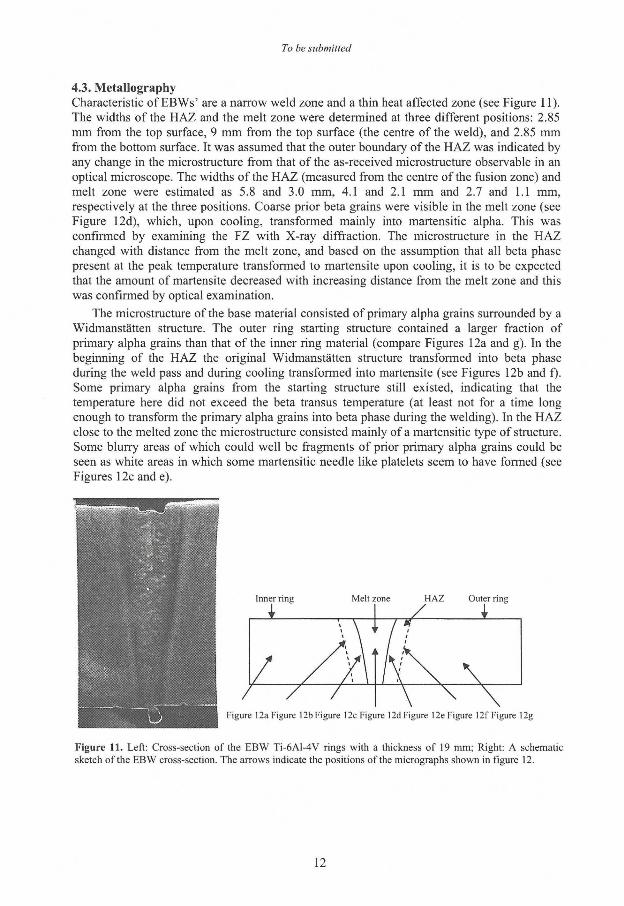
To be submitted
4.3. Metallography Characteristic of EBWs' are a narrow weld zone and a thin heat affected zone (see Figure 11). The widths of the HAZ and the melt zone were determined at three different positions: 2.85 mm from the top surface, 9 mm from the top surface (the centre of the weld), and 2.85 mm from the bottom surface. It was assumed that the outer boundary of the HAZ was indicated by any change in the microstructure from that of the as-received microstructure observable in an optical microscope. The widths of the HAZ (measured from the centre of the fusion zone) and melt zone were estimated as 5.8 and 3.0 mm, 4.1 and 2.1 mm and 2.7 and 1.1 mm, respectively at the three positions. Coarse prior beta grains were visible in the melt zone (see Figure 12d), which, upon cooling, transformed mainly into martensitic alpha. This was confirmed by examining the FZ with X-ray diffraction. The microstructure in the HAZ changed with distance from the melt zone, and based on the assumption that all beta phase present at the peak temperature transformed to martensite upon cooling, it is to be expected that the amount of martensite decreased with increasing distance from the melt zone and this was confirmed by optical examination.
The microstructure of the base material consisted of primary alpha grains surrounded by a Widmanstätten structure. The outer ring starting structure contained a larger fraction of primary alpha grains than that of the inner ring material (compare Figures 12a and g). In the beginning of the HAZ the original Widmanstätten structure transformed into beta phase during the weld pass and during cooling transformed into martensite (see Figures 12b and f) . Some primary alpha grains from the starting structure still existed, indicating that the temperature here did not exceed the beta transus temperature (at least not for a time long enough to transform the primary alpha grains into beta phase during the welding). In the HAZ close to the melted zone the microstructure consisted mainly of a martensitic type of stmcture. Some blurry areas of which could well be fragments of prior primary alpha grains could be seen as white areas in which some martensitic needle like platelets seem to have formed (see Figures 12c and e).
Inner ring Melt zone HAZ Outer ring
771 1 / ' / /
Figure 12a Figure 12b Figure 12c Figure 12d Figure 12e Figure 12f Figure 12g
Figure 11. Left: Cross-section of the EBW Ti-6A1-4V rings with a thickness of 19 mm; Right: A schematic sketch of the EBW cross-section. The arrows indicate the positions of the micrographs shown in figure 12.
12
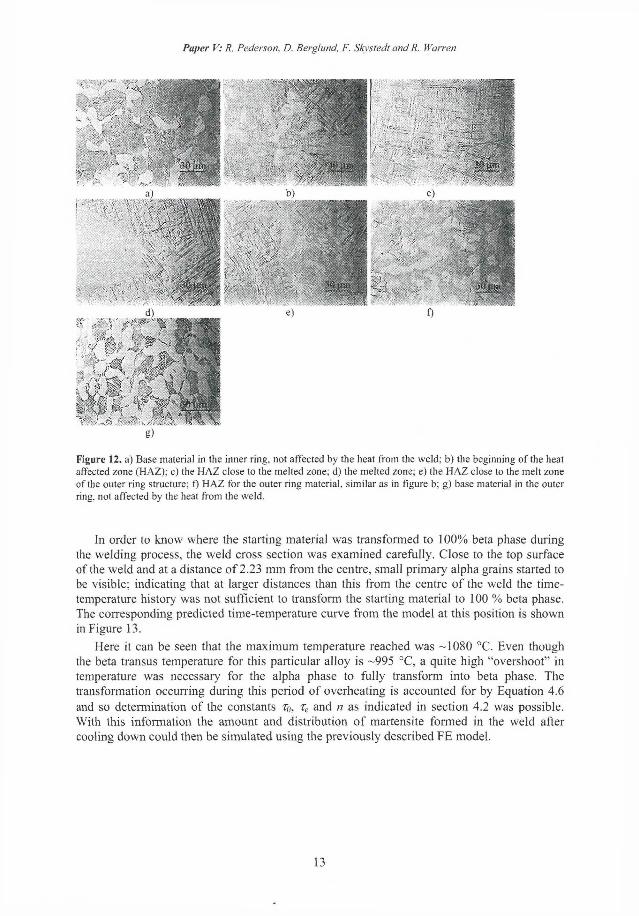
Paper V: R. Pederson, D. Berglund, F. Sky stedi and R. Warren
Figure 12. a) Base material in the inner ring, not affected by the heat from the weld; b) the beginning of the heat affected zone (HAZ); c) the HAZ close to the melted zone; d) the melted zone; e) the HAZ close to the melt zone of the outer ring structure; f) HAZ for the outer ring material, similar as in figure b; g) base material in the outer ring, not affected by the heat from the weld.
In order to know where the starting material was transformed to 100% beta phase during the welding process, the weld cross section was examined carefully. Close to the top surface of the weld and at a distance of 2.23 mm from the centre, small primary alpha grains started to be visible; indicating that at larger distances than this from the centre of the weld the time-temperature history was not sufficient to transform the starting material to 100 % beta phase. The corresponding predicted time-temperature curve from the model at this position is shown in Figure 13.
Here it can be seen that the maximum temperature reached was -1080 °C. Even though the beta transus temperature for this particular alloy is -995 °C, a quite high "overshoot" in temperature was necessary for the alpha phase to fully transform into beta phase. The transformation occurring during this period of overheating is accounted for by Equation 4.6 and so determination of the constants To, Te and n as indicated in section 4.2 was possible. With this information the amount and distribution of martensite formed in the weld after cooling down could then be simulated using the previously described FE model.
13
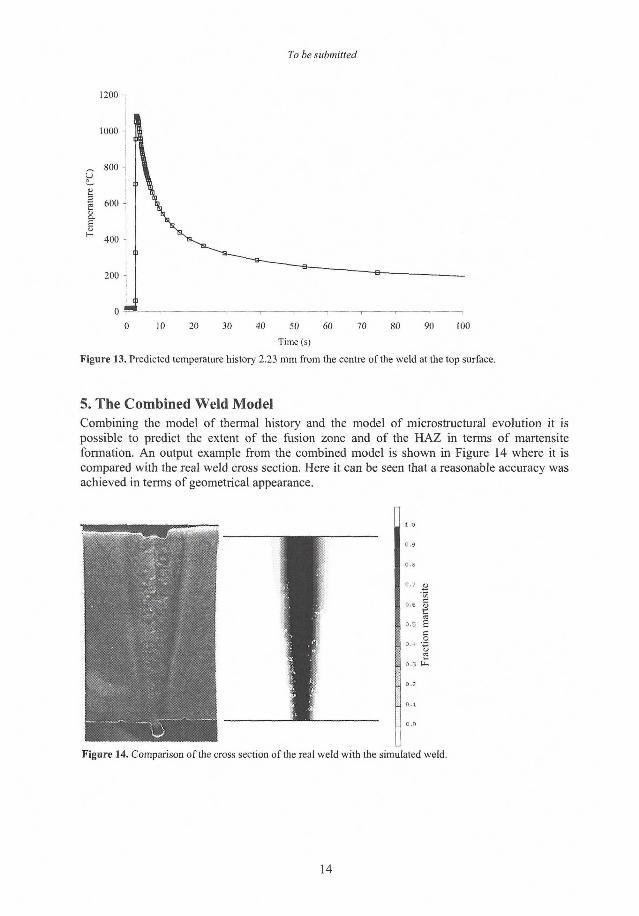
To be submitted
1200
1000
„ 800 -u
£ H 400 -
200 1
0 ™ - T , 1 i i 1 1
0 10 20 30 40 50 60 70 80 90 100
Time (s)
Figure 13. Predicted temperature history 2.23 mm from the centre of the weld at the top surface.
5 . T h e C o m b i n e d W e l d M o d e l Combining the model of thermal history and the model of microstrucmral evolution it is possible to predict the extent of the fusion zone and of the HAZ in terms of martensite formation. An output example from the combined model is shown in Figure 14 where it is compared with the real weld cross section. Here it can be seen that a reasonable accuracy was achieved in terms of geometrical appearance.
Figure 14. Comparison of the cross section of the real weld with the simulated weld.
14
Paper V: R. Pederson, D. Berglund, F. Skystedt and R. Warren
6. Conclusions A simulation model has been developed that predicts the geometries, dimensions and microstructure of the fusion zone and heat affected zone formed during the electron beam welding of the titanium alloy, T1-6A1-4V. The model, based on a finite element prediction of the thermal history of the weld in combination with a model for the kinetics of the alpha/beta phase transformation during arbitrary thermal cycles can be used for the prediction of the weld zone in electron beam welds carried out with welding parameters that lie within ±10% of those used in a weld test that was used to calibrate certain model parameters.
7. Acknowledgements Dr. Savko Malinov, at Queen's University Belfast, is sincerely acknowledged for his valuable advice, cooperation and supply of results. The authors would like to acknowledge the financial support of NFFP (the Swedish National Program for Aeronautical Technology).
8. References 1. I . Weiss, F.H. Froes, D. Eylon, and G. E. Welsh: Met. Tram. A, 1986, vol. 17, 1935-
1947.
2. S. L. Semiatin, V. Seetharaman, and I . Weiss: J. Met, 1997, vol. 49, (6), 33-39.
3. G. Lütjering: Mater. Sei. Eng. A, 1998, vol. 243, 32-45.
4. W. Sha and Z. Guo: J. Alloys and Compounds, 1999, vol. 290, L3-L7.
5. S. Malinov, Z. Guo, W. Sha, and A. Wilson: Metall. Mater. Trans. A, 2001, vol. 32, 879-887.
6. Marc Analysis Research Corporation, Theory and User Information, USA, Palo Alto, 1998.
7. J. Goldak, A. Chakravarti and M. Bibby: Metall. Trans. B, 1984, vol. 15, 299-305.
8. A.S. Oddy, J.M.J. McDill, L. Karlsson: Can Metall. Q., 1996, No 3, 275-283.
9. L.-E. Lindgren: J. Thermal Stresses, 2001, vol. 24, 195-231.
10. M. Avrami: J. Chem. Phys., 1939, vol. 7, 1103-1112.
11. N . Saunders: Titanium '95: Science and Technology, Proc. 8th World Conf. on Titanium, Birmingham, UK, Oct., 1995, P. A. Blenkinsop, W. J. Evans and H. M. Flowers, eds., The Institute of Materials, London, 1996, 2167.
12. Y. T. Lee and G. Welsch: Titanium '84: Science and Technology, Proc. 5 t h World Conf. on Titanium, Munich, Germany, September, 1984, G. Lutjering, U. Zwicker and W. Bunk, eds., Deutsche Gesellschaft fur Metallkunde E.V., 1985, vol. 3, 1689-1696.
13. R. Pederson, O. Babushkin, F. Skystedt and R. Warren: Mat. Sei. Tech., 2003, vol. 19, 1533-1538.
15
Microstructure and Mechanical Properties of Friction- and Electron Beam Welded Ü-6A1-4V and Ti-6Al-2Sn-4Zr-6Mo
R. Pederson, F. Niklasson, F. Skystedt and R. Warren
To be submitted.
Paper V I
Microstructure and mechanical properties of friction- and electron beam welded Ti-6Al-4Vand Ti-6Al-2Sn-4Zr-6Mo
R. PEDERSON1, F. NIKLASSON 2, F. SKYSTEDT2 and R. WARREN 3
]Luleå University of Technology, Division of Engineering Materials, SE 97187 Luleå, Sweden. 'Volvo Aero Corporation, Materials Technology, SE 46181 Trollhättan, Sweden. 3 University of Malmö, Technology and Society, SE 20506 Malmö, Sweden.
Abstract This work presents mechanical data and microstructural characterization of friction welded (FRW) and electron beam welded (EBW) post weld heat treated (PWHT) specimens of Ti-6Al-2Sn-4Zr-6Mo and Ti-6A1-4V. PWHT Ti6246/Ti6246 welds and Ti64/Ti6246 welds were evaluated with tensile-, creep-, Charpy-V, and microhardness tests. The PWHT treatments were 593°C/2h, 640°C/2h and 704°C/2h, respectively. The microstructure of the different weld types and alloy combinations where examined and characterized using optical microscope and SEM.
Tensile strength and yield strength were within specification for both material combinations. The elongation for Ti6246 welded to Ti6246 is below specification. Only small variations in tensile properties were found for the different PWHTs. Fracture occurred in base material of the Ti64 alloy for the combination of Ti64 welded to Ti6246.
Charpy-V tests shows that the welds are more brittle compared with the base material. The largest difference was found in Ti6246 welded to Ti6246.
No significant variation in creep properties for the different PWHTs has been found. Ti64 welded to Ti6246 shows poor creep properties due to the high testing temperature for the Ti64 alloy. Ti6246 welded to Ti6246 shows good creep properties compared to the base material.
The general trend for the weld microhardness was a decreasing hardness with increasing PWHT temperature. One exception though was the FRW Ti64/Ti6246 combination, were the hardness of the Ti6246 side of the HAZ, close to the interface between the two alloys, was highest after a PWHT temperature of 593°C, then decreasing in hardness for 640°C, not PWHT and being least hard for the PWHT temperature of 704°C. The hardness of the Ti64 base material showed no decrease after the PWHTs, but the hardness of the Ti6246 bulk material decreased after PWHT at 704°C.
1. Introduction Due to their high strength-to-weight ratio titanium alloys have found an extensive use in components of aero engines. Different alloys are used for different components and in different sections of an engine. Thus joining by different welding methods components of sometimes different alloys is an important issue in the manufacturing and development process. Extensive work has been performed in order to clarify and improve understanding of how various joining processes, such as electron beam welding '"4, friction welding J" 6 and gas tungsten arc welding 7"8, affect the microstructural changes and the mechanical properties of welded parts of titanium alloys. In the simulation and modelling of welding processes in order to predict microstructural transformation products in the fusion zone and heat affected zone of titanium alloys, quantitative data on the phase transformation kinetics are of importance. The
To be submitted
phase transformations in Ti alloys have been studied by using several different techniques, such as differential scanning calorimetry 9" 1 ( ), electrical resistivity measurements 1 1 and X-ray diffraction techniques 7 _ 8 1 2 " 1 3 .
Joining of the titanium alloys Ti-6A1-4V (Ti64) and Ti-6Al-2Sn-4Zr-6Mo (Ti6246) is of interest for fan and compressor rotors for high loads and medium temperatures. Limited work has been reported on characterization of friction- and electron beam welds of the alloy Ti6246 4 and on characterization of friction welds of the alloys Ti64 6 , using OM and TEM. For the mixed weld combination of Ti64 welded to Ti6246 no such information has been found by the present authors and therefore an investigation of the welding and post weld heat treatment of these alloys is of value. A test program for electron beam welding (EBW) and friction welding (FRW) of Ti6246/Ti6246 and Ti6246/Ti64 welds including different post weld heat treatments (PWHT) was therefore defined.
The FRW trials were conducted on cylindrical test specimens and the EBW trials on plates. Three temperatures were selected for the post weld heat treatments. The first two temperatures used were 704°C which can be used for annealing of Ti64, and 593°C which can be used for ageing of Ti6246. A heat treatment for an intermediate temperature (640°C) was also selected based on the precipitation behavior of Ti64 ' 4 . Welded and PWHT treated samples were subjected to tensile-, creep-, Charpy-V and microhardness tests. Selected samples of the joints were also investigated metallographically using optical (OM), scanning electron microscopy (SEM) and X-ray diffraction.
2. Experimental The specimens were cut from a beta forged disk of Ti6246 and a (alpha+beta) forged disk of Ti64. Both disks were solution heat treated below beta transus. The Ti6246 disk was aged (593°C/8h) and the Ti64 disk was annealed (704°C/lh). The chemical compositions of the two alloys are given in Table 1 (in wt %) :
Table 1. Chemical compositions of the two alloys investigated (in wt % ) .
Alloy AI V Sn Z r Mo Fe Si C Cu O N H Ti64 6.20 4.10 0.19 0.04 0.01 0.01 0.18 0.005 0.0024 Ti6246 5.99 - 1.97 3.92 6.18 0.06 0.04 0.01 <0.05 0.11 0.0025 <0.0010
For the FRWs two rod-like samples with a diameter of 20 mm were joined, and for the EBWs two plates with a thickness of 14 mm (Ti64-to-Ti6246) or 16 mm (Ti6246-to-Ti6246) were joined. Standard welding parameters were used for these processes. After welding, the welded joints were cut up into smaller pieces and PWHT treated at the three different temperatures (593°C/2h, 640°C/2h and 704°C/2h). Finally, samples for the mechanical tests with a diameter of ~6 mm or a cross section of 10x10 mm (Charpy-V test specimens) were cut from the PWHT parts, with the weld placed in the centre of each specimen. It should be pointed out here that due to the typical V-shape of the EBWs and typical X-shape of the FRWs (see Figure 6), the widths of the welds in the mechanically tested specimens differed somewhat through the specimen cross sections depending on where the specimens were cut from the welded rods or plates. The notch in the Charpy-V test specimens were placed in the centre of the welds.
Details of the mechanical testing conditions are given in the appropriate Results sections. For metallographic examinations in OM and SEM specimens where prepared using conventional grinding and polishing techniques and careful final etching using Kroll's reagent
2
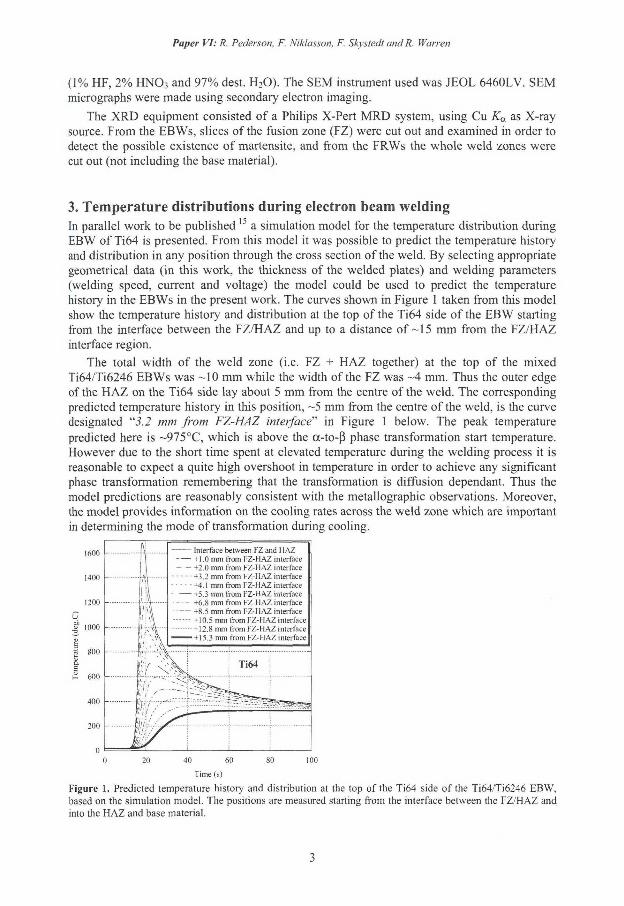
Paper VI: R. Pederson, F. Niklasson, F. Sh-stedl and R. Warren
(1% HF, 2% HNO3 and 97% dest. H 2 0) . The SEM instrument used was JEOL 6460LV. SEM micrographs were made using secondary electron imaging.
The XRD equipment consisted of a Philips X-Pert MRD system, using Cu Ka as X-ray source. From the EBWs, slices of the fusion zone (FZ) were cut out and examined in order to detect the possible existence of martensite, and from the FRWs the whole weld zones were cut out (not including the base material).
3. Temperature distributions during electron beam welding In parallel work to be published 1 a simulation model for the temperature distribution during EBW of Ti64 is presented. From this model it was possible to predict the temperature history and distribution in any position through the cross section of the weld. By selecting appropriate geometrical data (in this work, the thickness of the welded plates) and welding parameters (welding speed, current and voltage) the model could be used to predict the temperature history in the EBWs in the present work. The curves shown in Figure 1 taken from this model show the temperature history and distribution at the top of the Ti64 side of the EBW stalling from the interface between the FZ/HAZ and up to a distance of ~15 mm from the FZ/HAZ interface region.
The total width of the weld zone (i.e. FZ + HAZ together) at the top of the mixed Ti64/Ti6246 EBWs was -10 mm while the width of the FZ was -4 mm. Thus the outer edge of the HAZ on the Ti64 side lay about 5 mm from the centre of the weld. The corresponding predicted temperature history in this position, -5 mm from the centre of the weld, is the curve designated "5.2 mm from FZ-HAZ interface" in Figure 1 below. The peak temperature predicted here is ~975°C, which is above the a-to-ß phase transformation start temperature. However due to the short time spent at elevated temperature during the welding process it is reasonable to expect a quite high overshoot in temperature in order to achieve any significant phase transformation remembering that the transformation is diffusion dependant. Thus the model predictions are reasonably consistent with the metallographic observations. Moreover, the model provides information on the cooling rates across the weld zone which are important in determining the mode of transformation during cooling.
0 20 40 60 80 100
Time (s)
Figure 1. Predicted temperature history and distribution at the top of the Ti64 side of the Ti64/Ti6246 EBW, based on the simulation model. The positions are measured starting from the interface between the FZ/HAZ and into the HAZ and base material.
3
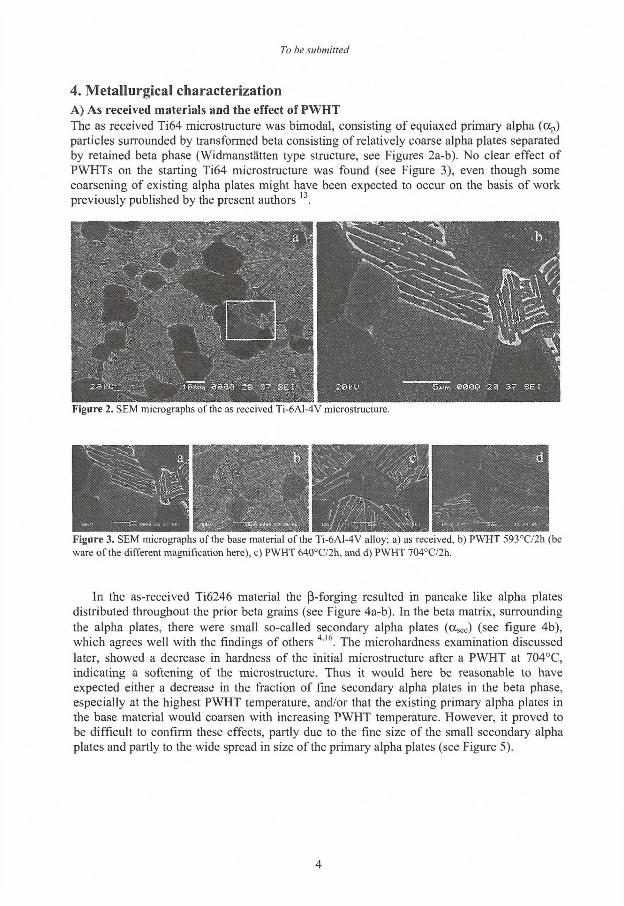
To be submitted
4. Metallurgical characterization A) As received materials and the effect of PWHT The as received Ti64 microstructure was bimodal, consisting of equiaxed primary alpha (ocp) particles surrounded by transformed beta consisting of relatively coarse alpha plates separated by retained beta phase (Widmanstätten type structure, see Figures 2a-b). No clear effect of PWHTs on the starting Ti64 microstructure was found (see Figure 3), even though some coarsening of existing alpha plates might have been expected to occur on the basis of work previously published by the present authors 1 3 .
In the as-received Ti6246 material the ß-forging resulted in pancake like alpha plates distributed throughout the prior beta grains (see Figure 4a-b). In the beta matrix, surrounding the alpha plates, there were small so-called secondary alpha plates (a s e c ) (see figure 4b), which agrees well with the findings of others 4 ' 1 6 . The microhardness examination discussed later, showed a decrease in hardness of the initial microstructure after a PWHT at 704°C, indicating a softening of the microstructure. Thus it would here be reasonable to have expected either a decrease in the fraction of fine secondary alpha plates in the beta phase, especially at the highest PWHT temperature, and/or that the existing primary alpha plates in the base material would coarsen with increasing PWHT temperature. However, it proved to be difficult to confirm these effects, partly due to the fine size of the small secondary alpha plates and partly to the wide spread in size of the primary alpha plates (see Figure 5).
4
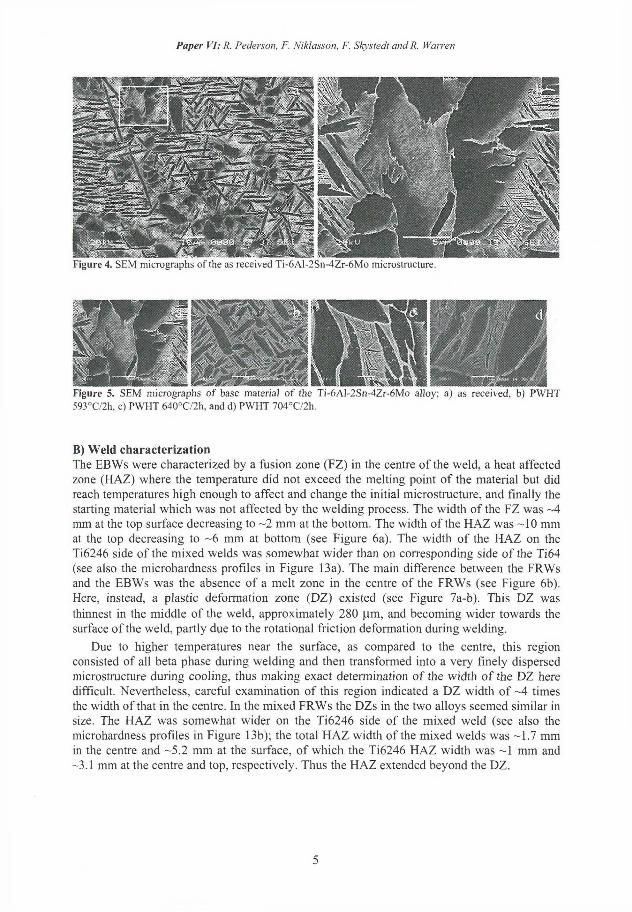
Paper Vh R. Pederson, F. Niklasson, F. Skystedt and R. Warren
Figure 5. SEM micrographs of base materia] of the Ti-6Al-2Sn-4Zr-6Mo alloy; a) as received, b) PWHT 593°C/2h. c) PWHT 640°C/2h, and d) PWHT 704°C/2h.
B) Weld characterization The EBWs were characterized by a fusion zone (FZ) in the centre of the weld, a heat affected zone (HAZ) where the temperature did not exceed the melting point of the material but did reach temperatures high enough to affect and change the initial microstructure, and finally the starting material which was not affected by the welding process. The width of the FZ was -4 mm at the top surface decreasing to -2 mm at the bottom. The width of the HAZ was -10 mm at the top decreasing to ~6 mm at bottom (see Figure 6a). The width of the HAZ on the Ti6246 side of the mixed welds was somewhat wider than on corresponding side of the Ti64 (see also the microhardness profiles in Figure 13a). The main difference between the FRWs and the EBWs was the absence of a melt zone in the centre of the FRWs (see Figure 6b). Here, instead, a plastic deformation zone (DZ) existed (see Figure 7a-b). This DZ was thinnest in the middle of the weld, approximately 280 pm, and becoming wider towards the surface of the weld, partly due to the rotational friction deformation during welding.
Due to higher temperatures near the surface, as compared to the centre, this region consisted of all beta phase during welding and then transformed into a very finely dispersed microstructure during cooling, thus making exact determination of the width of the DZ here difficult. Nevertheless, careful examination of this region indicated a DZ width of ~4 times the width of that in the centre. In the mixed FRWs the DZs in the two alloys seemed similar in size. The HAZ was somewhat wider on the Ti6246 side of the mixed weld (see also the microhardness profiles in Figure 13b); the total HAZ width of the mixed welds was -1.7 mm in the centre and -5.2 mm at the surface, of which the Ti6246 HAZ width was ~1 mm and -3.1 mm at the centre and top, respectively. Thus the HAZ extended beyond the DZ.
5
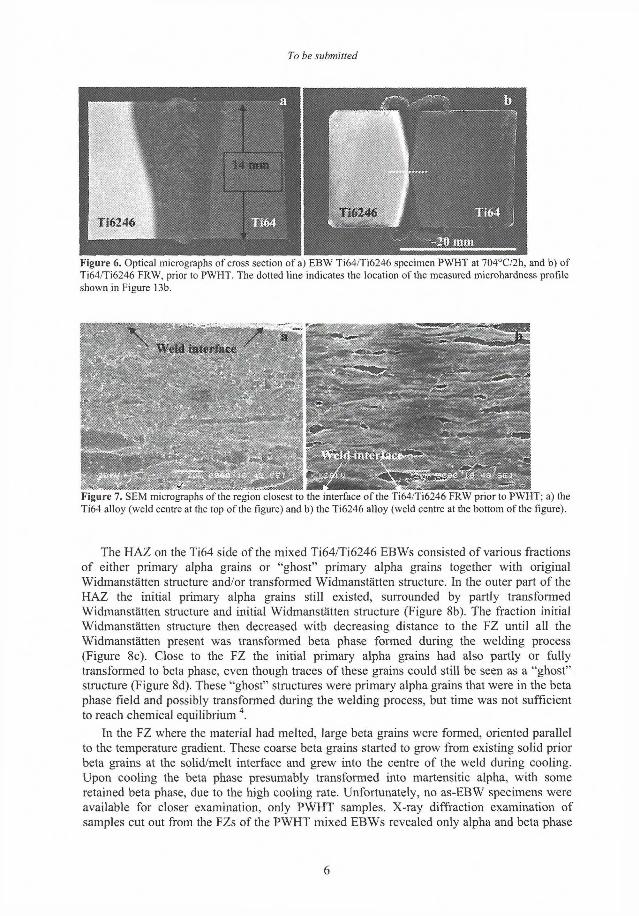
To be submitted
Figure 6. Optical micrographs of cross section of a) EBW Ti64/Ti6246 specimen PWHT at 704°C/2h, and b) of Ti64/Ti6246 FRW, prior to PWHT. The dotted line indicates the location of the measured microhardness profile shown in Figure 13b.
Figure 7. SEM micrographs of the region closest to the interface of the Ti64/Ti6246 FRW prior to PWHT; a) the Ti64 alloy (weld centre at the top of the figure) and b) the Ti6246 alloy (weld centre at the bottom of the figure).
The HAZ on the Ti64 side of the mixed Ti64/Ti6246 EBWs consisted of various fractions of either primary alpha grains or "ghost" primary alpha grains together with original Widmanstätten structure and/or transformed Widmanstätten structure. In the outer part of the HAZ the initial primary alpha grains still existed, surrounded by partly transformed Widmanstätten structure and initial Widmanstätten structure (Figure 8b). The fraction initial Widmanstätten structure then decreased with decreasing distance to the FZ until all the Widmanstätten present was transformed beta phase formed during the welding process (Figure 8c). Close to the FZ the initial primary alpha grains had also partly or fully transformed to beta phase, even though traces of these grains could still be seen as a "ghost" structure (Figure 8d). These "ghost" structures were primary alpha grains that were in the beta phase field and possibly transformed during the welding process, but time was not sufficient to reach chemical equilibrium 4 .
In the FZ where the material had melted, large beta grains were formed, oriented parallel to the temperature gradient. These coarse beta grains started to grow from existing solid prior beta grains at the solid/melt interface and grew into the centre of the weld during cooling. Upon cooling the beta phase presumably transformed into martensitic alpha, with some retained beta phase, due to the high cooling rate. Unfortunately, no as-EBW specimens were available for closer examination, only PWHT samples. X-ray diffraction examination of samples cut out from the FZs of the PWHT mixed EBWs revealed only alpha and beta phase
6
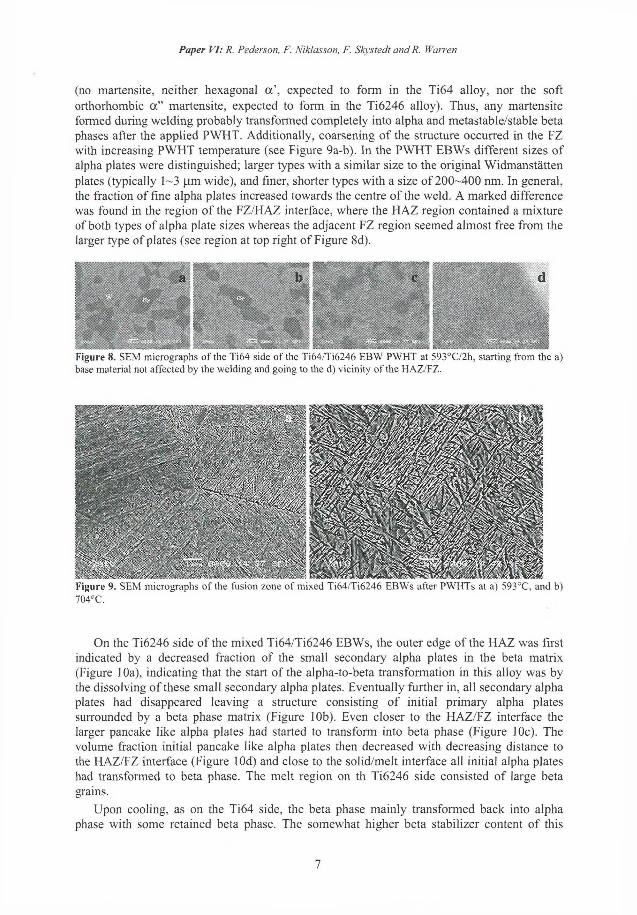
Paper VI: R. Pederson, F. Niklasson, F. Skys tedi and R. Warren
(no martensite, neither hexagonal a', expected to form in the Ti64 alloy, nor the soft orthorhombic a" martensite, expected to form in the Ti6246 alloy). Thus, any martensite formed during welding probably transformed completely into alpha and metastable/stable beta phases after the applied PWHT. Additionally, coarsening of the structure occurred in the FZ with increasing PWHT temperature (see Figure 9a-b). In the PWHT EBWs different sizes of alpha plates were distinguished; larger types with a similar size to the original Widmanstätten plates (typically 1-3 (im wide), and finer, shorter types with a size of 200-400 nm. In general, the fraction of fine alpha plates increased towards the centre of the weld. A marked difference was found in the region of the FZ/HAZ interface, where the HAZ region contained a mixture of both types of alpha plate sizes whereas the adjacent FZ region seemed almost free from the larger type of plates (see region at top right of Figure 8d).
Figure 9. SEM micrographs of the fusion zone of mixed Ti64/Ti6246 EBWs after PWHTs at a) 593°C, and b)
704°C.
On the Ti6246 side of the mixed Ti64/Ti6246 EBWs, the outer edge of the HAZ was first indicated by a decreased fraction of the small secondary alpha plates in the beta matrix (Figure 10a), indicating that the start of the alpha-to-beta transformation in this alloy was by the dissolving of these small secondary alpha plates. Eventually further in, all secondary alpha plates had disappeared leaving a structure consisting of initial primary alpha plates surrounded by a beta phase matrix (Figure 10b). Even closer to the HAZ/FZ interface the larger pancake like alpha plates had started to transform into beta phase (Figure 10c). The volume fraction initial pancake like alpha plates then decreased with decreasing distance to the HAZ/FZ interface (Figure lOd) and close to the solid/melt interface all initial alpha plates had transformed to beta phase. The melt region on th Ti6246 side consisted of large beta grains.
Upon cooling, as on the Ti64 side, the beta phase mainly transformed back into alpha phase with some retained beta phase. The somewhat higher beta stabilizer content of this
7
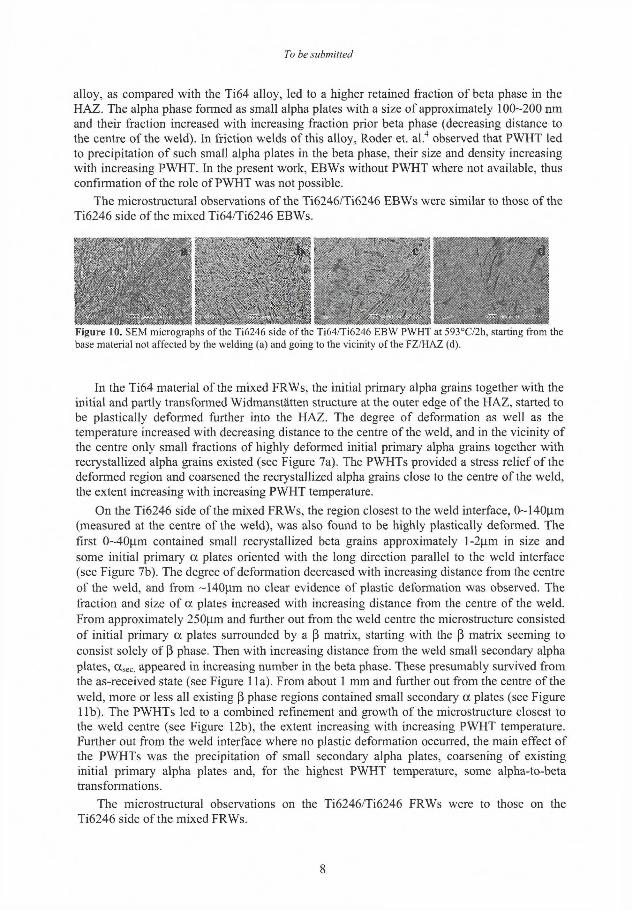
To be submitted
alloy, as compared with the Ti64 alloy, led to a higher retained fraction of beta phase in the HAZ. The alpha phase formed as small alpha plates with a size of approximately 100-200 nm and their fraction increased with increasing fraction prior beta phase (decreasing distance to the centre of the weld). In friction welds of this alloy, Roder et. al. 4 observed that PWHT led to precipitation of such small alpha plates in the beta phase, their size and density increasing with increasing PWHT. In the present work, EBWs without PWHT where not available, thus confirmation of the role of PWHT was not possible.
The microstructural observations of the Ti6246/Ti6246 EBWs were similar to those of the Ti6246 side of the mixed Ti64/Ti6246 EBWs.
... l y ! . •• ••' / ......
, \ - 'i..,. 'Xf.' ::. , i J ' \
" ^
- . . . :•• " • , , • * t . •••• .. .. : .• •
• •
Figure 10. SEM micrographs of the T16246 side of the Ti64/Ti6246 EBW PWHT at 593°C/2h, starting from the base material not affected by the welding (a) and going to the vicinity of the FZ/HAZ (d).
In the Ti64 material of the mixed FRWs, the initial primary alpha grains together with the initial and partly transformed Widmanstätten structure at the outer edge of the HAZ, started to be plastically deformed further into the HAZ. The degree of deformation as well as the temperature increased with decreasing distance to the centre of the weld, and in the vicinity of the centre only small fractions of highly deformed initial primary alpha grains together with recrystallized alpha grains existed (see Figure 7a). The PWHTs provided a stress relief of the deformed region and coarsened the recrystallized alpha grains close to the centre of the weld, the extent increasing with increasing PWHT temperature.
On the Ti6246 side of the mixed FRWs, the region closest to the weld interface, 0~140um (measured at the centre of the weld), was also found to be highly plastically deformed. The first 0~40(xm contained small recrystallized beta grains approximately l-2u.m in size and some initial primary a plates oriented with the long direction parallel to the weld interface (see Figure 7b). The degree of deformation decreased with increasing distance from the centre of the weld, and from - 140pm no clear evidence of plastic deformation was observed. The fraction and size of a plates increased with increasing distance from the centre of the weld. From approximately 250pm and further out from the weld centre the microstructure consisted of initial primary a plates surrounded by a ß matrix, starting with the ß matrix seeming to consist solely of ß phase. Then with increasing distance from the weld small secondary alpha plates, a s e c. appeared in increasing number in the beta phase. These presumably survived from the as-received state (see Figure 1 la). From about 1 mm and further out from the centre of the weld, more or less all existing ß phase regions contained small secondary a plates (see Figure l i b ) . The PWHTs led to a combined refinement and growth of the microstructure closest to the weld centre (see Figure 12b), the extent increasing with increasing PWHT temperature. Further out from the weld interface where no plastic deformation occurred, the main effect of the PWHTs was the precipitation of small secondary alpha plates, coarsening of existing initial primary alpha plates and, for the highest PWHT temperature, some alpha-to-beta transformations.
The microstructural observations on the Ti6246/Ti6246 FRWs were to those on the Ti6246 side of the mixed FRWs.
8
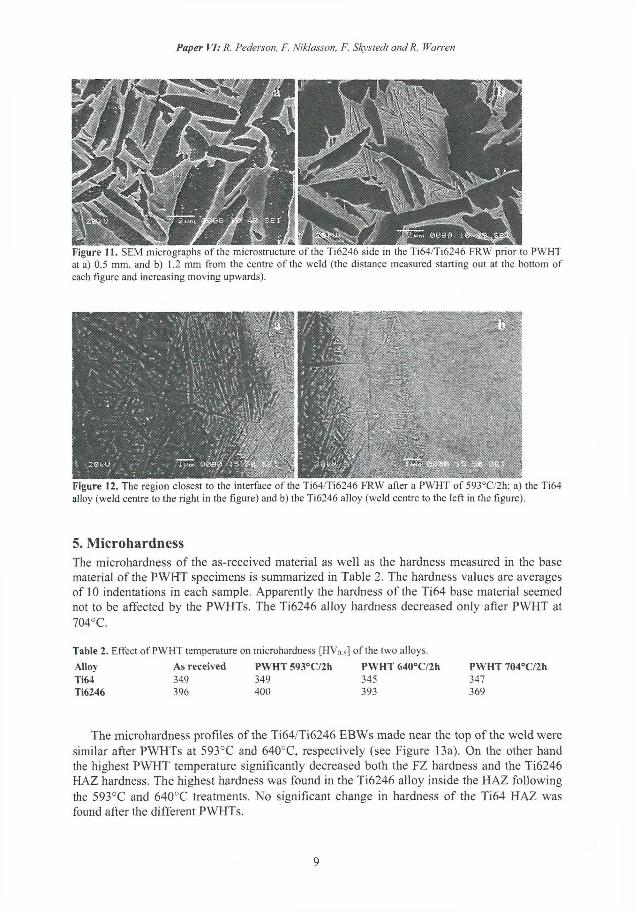
Paper VI: R. Pederson, F. Niklasson, F. Skystedt and R. Warren
Figure 11. SEM micrographs of the microstructure of the Ti6246 side in the Ti64/Ti6246 FRW prior to PWHT at a) 0.5 mm. and b) 1.2 mm from the centre of the weld (the distance measured starting out at the bottom of each figure and increasing moving upwards).
Figure 12. The region closest to the interface of the Ti64/Ti6246 FRW after a PWHT of 593°C/2h; a) the Ti64 alloy (weld centre to the right in the figure) and b) the Ti6246 alloy (weld centre to the left in the figure).
5. Microhardness The microhardness of the as-received material as well as the hardness measured in the base material of the PWHT specimens is summarized in Table 2. The hardness values are averages of 10 indentations in each sample. Apparently the hardness of the Ti64 base material seemed not to be affected by the PWHTs. The Ti6246 alloy hardness decreased only after PWHT at 704°C.
Table 2. Effect o f PWHT temperature on microhardness [ H V 0 5 ] of the two alloys.
Alloy As received PWHT 593°C/2h P W H T 640°C/2h PWHT 704°C/2h Ti64 349 349 345 347 Ti6246 396 400 393 369
The microhardness profiles of the Ti64/Ti6246 EBWs made near the top of the weld were similar after PWHTs at 593°C and 640°C, respectively (see Figure 13a). On the other hand the highest PWHT temperature significantly decreased both the FZ hardness and the Ti6246 HAZ hardness. The highest hardness was found in the Ti6246 alloy inside the HAZ following the 593°C and 640°C treatments. No significant change in hardness of the Ti64 HAZ was found after the different PWHTs.
9
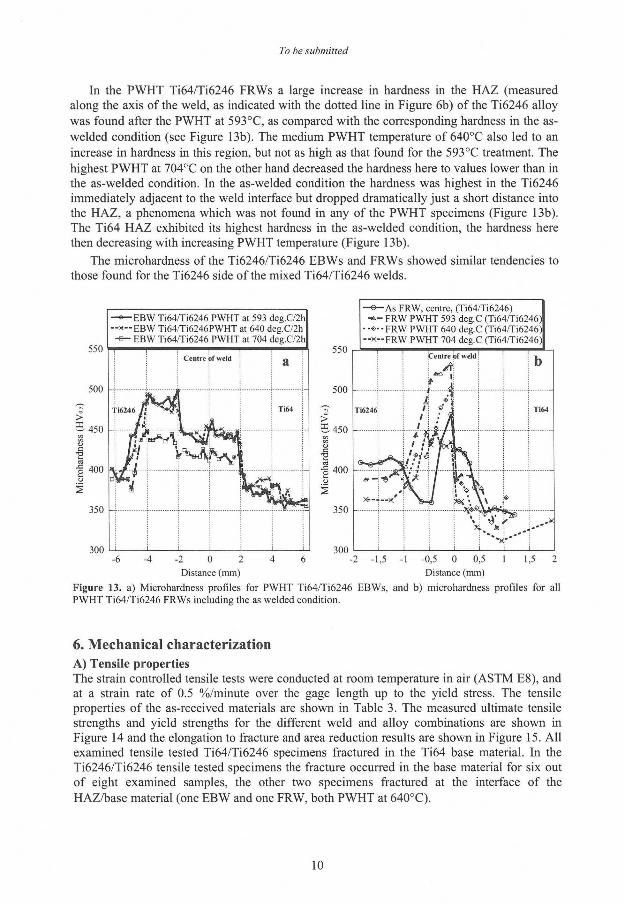
To be submitted
In the PWHT Ti64/Ti6246 FRWs a large increase in hardness in the HAZ (measured along the axis of the weld, as indicated with the dotted line in Figure 6b) of the Ti6246 alloy was found after the PWHT at 593°C, as compared with the corresponding hardness in the as-welded condition (see Figure 13b). The medium PWHT temperature of 640°C also led to an increase in hardness in this region, but not as high as that found for the 593°C treatment. The highest PWHT at 704°C on the other hand decreased the hardness here to values lower than in the as-welded condition. In the as-welded condition the hardness was highest in the Ti6246 immediately adjacent to the weld interface but dropped dramatically just a short distance into the HAZ, a phenomena which was not found in any of the PWHT specimens (Figure 13b). The Ti64 HAZ exhibited its highest hardness in the as-welded condition, the hardness here then decreasing with increasing PWHT temperature (Figure 13b).
The microhardness of the Ti6246/Ti6246 EBWs and FRWs showed similar tendencies to those found for the Ti6246 side of the mixed Ti64/Ti6246 welds.
550
500
400
350
300
—8—EBW Ti64/Ti6246 PWHT at 593 deg.C/2h —*—EBW Ti64/Ti6246PWHT at 640 deg.C72h
- b - EBW Ti64,Ti6246 PWHT at 704 deg.C/2h
: Centre Of weld a i
ti6246 ff
A' i it
4J-I-I- 1
Ti64 j
Hl f.
i i 1 i i i
550 r-1
-450
400
350
300
- e - A s FRW, centre, (Ti64/Ti6246) • * - FRW PWHT 593 deg.C (Ti64Ti6246)
• FRW PWHT 640 deg.C (Ti64/Ti6246) •-X -FRW PWHT 704 deg.C (Ti64/Ti6246)
I I
Ti6246; \ hfl ! ; Ti64
j
Figure PWHT
-6 -4 -2 0 2 4 6
Distance (mm)
13. a) Microhardness profiles for PWHT Ti64/Ti6246 EBWs, and b) microhardness profile Ti64/Ti6246 FRWs including the as welded condition.
6. Mechanical characterization A) Tensile properties The strain controlled tensile tests were conducted at room temperature in air (ASTM E8), and at a strain rate of 0.5 %/minute over the gage length up to the yield stress. The tensile properties of the as-received materials are shown in Table 3. The measured ultimate tensile strengths and yield strengths for the different weld and alloy combinations are shown in Figure 14 and the elongation to fracture and area reduction results are shown in Figure 15. A l l examined tensile tested Ti64/Ti6246 specimens fractured in the Ti64 base material. In the Ti6246/Ti6246 tensile tested specimens the fracture occurred in the base material for six out of eight examined samples, the other two specimens fractured at the interface of the HAZ/base material (one EBW and one FRW, both PWHT at 640°C).
10
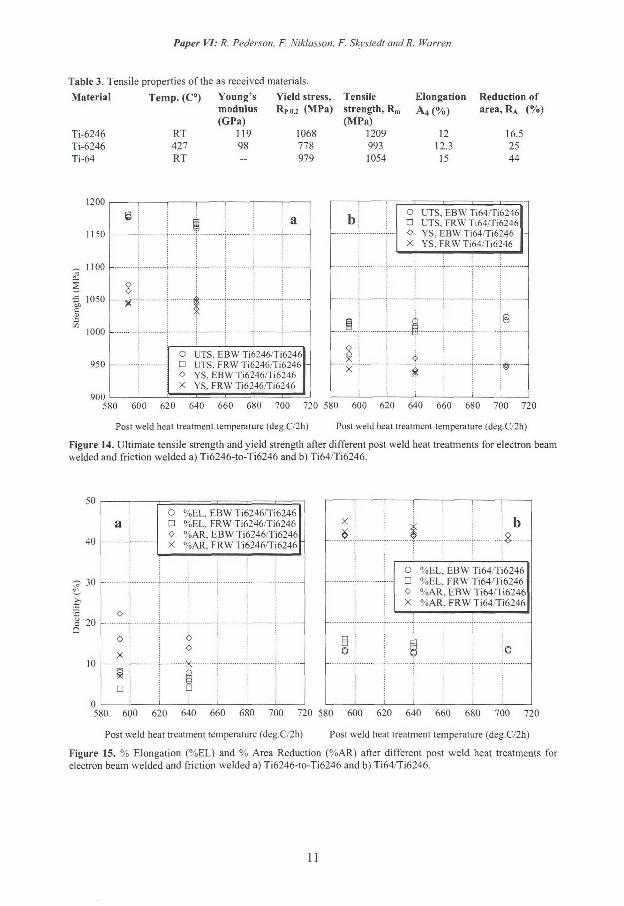
Paper VI: R. Pederson, F. Niklasson, F. Sky stedt and R. Warren
Table 3. Tensile properties of the as received materials.
Material Temp. (C°) Young's Yield stress, Tensile Elongation Reduction of modulus Rpo.2 (MPa) strength, R m A4 (%) area, R A (%) (GPa) (MPa)
Ti-6246 RT 119 1068 1209 12 16.5 Ti-6246 427 98 778 993 12.3 25 Ti-64 RT - 979 1054 15 44
8 1 1 a
0
j 1 ] -
0 - x
O UTS, EBW Ti6246/Ti6246 - j • UTS, FRW Ti6246/Ti6246 -
O YS, EBW Ti6246/Ti6246 X YS, FRW Ti6246/Ti6246
o X
O UTS, EBW Ti64/Ti6246 • UTS, FRW Ti64/Ti6246 O YS, EBW Ti64/Ti6246 X YS, FRW Ti64/Ti6246
580 600 620 640 660 680 700 720 580 600 620 640 660 680 700 720
Post weld heat treatment temperature (deg.C/2h) Post weld heat treatment temperature (deg.C/2h)
Figure 14. Ultimate tensile strength and yield strength after different post weld heat treatments for electron beam welded and friction welded a) Ti6246-to-Ti6246 and b) Ti64/Ti6246.
O %EL, EBW Ti6246/Ti6246 • %EL, FRW Ti6246/Ti6246 O %AR, EBW Ti6246/Ti6246 X %AR. FRW Ti6246/Ti6246
X j i
s !
! ! ! !
i ] b
f . i ; j £ _
O %EL. EBW Ti64/Ti6246 • %EL, FRW Ti64/Ti6246 O %AR. EBW Ti64/Ti6246 X %AR. FRW Ti64/Ti6246
O %EL. EBW Ti64/Ti6246 • %EL, FRW Ti64/Ti6246 O %AR. EBW Ti64/Ti6246 X %AR. FRW Ti64/Ti6246
§ l i é L 0 ; i 9 ; Q
i i i 1 1 i 580 600 620 640 660 680 700 720 580 600 620 640 660 680 700 720
Post weld heat treatment temperature (deg.C/'2h) Post weld heat treatment temperature (deg.C/2h)
Figure 15. % Elongation (%EL) and % Area Reduction (%AR) after different post weld heat treatments for electron beam welded and friction welded a) Ti6246-to-Ti6246 and b) Ti64/Ti6246.
11
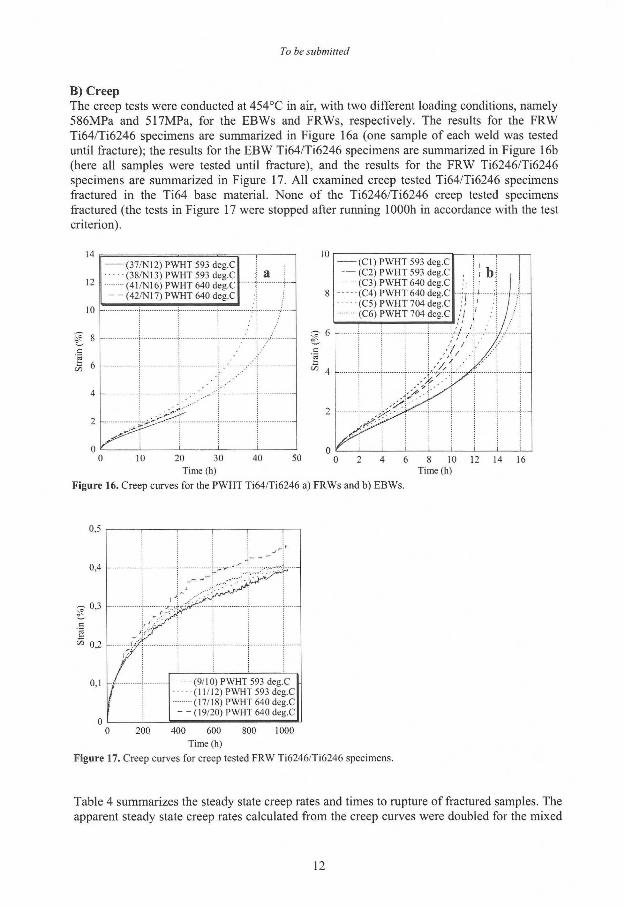
To be submitted
B) Creep The creep tests were conducted at 454°C in air, with two different loading conditions, namely 586MPa and 517MPa, for the EBWs and FRWs, respectively. The results for the FRW Ti64/Ti6246 specimens are summarized in Figure 16a (one sample of each weld was tested until fracture); the results for the EBW Ti64/Ti6246 specimens are summarized in Figure 16b (here all samples were tested until fracture), and the results for the FRW Ti6246/Ti6246 specimens are summarized in Figure 17. Al l examined creep tested Ti64/Ti6246 specimens fractured in the Ti64 base material. None of the Ti6246/Ti6246 creep tested specimens fractured (the tests in Figure 17 were stopped after running 1000h in accordance with the test criterion).
Table 4 summarizes the steady state creep rates and times to rupture of fractured samples. The apparent steady state creep rates calculated from the creep curves were doubled for the mixed
12
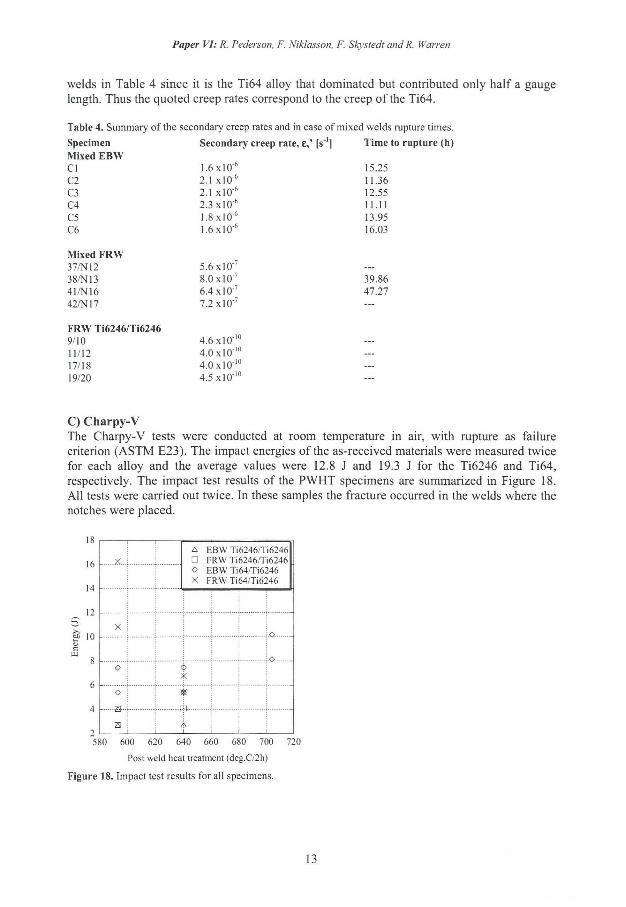
Paper VI: R. Pederson, F. Niklasson, F. Skystedt and R. Warren
welds in Table 4 since it is the Ti64 alloy that dominated but contributed only half a gauge length. Thus the quoted creep rates correspond to the creep of the Ti64.
Table 4. Summary of the secondary creep rates and in case of mixed welds rupture times.
Specimen Secondary creep rate, [s 1] Time to rupture (h) Mixed E B W CI 1.6 xlO" 6 15.25 C2 2.1 xlO' 6 11.36 C3 2.1 xlO" 6 12.55 C4 2.3x10'" 11.11
C5 1.8 xlO' 6 13.95 C6 1.6 xlO" 6 16.03
Mixed F R W 37/N12 5.6 xlO' 7 ___
38/N13 8.0 x lO - 7 39.86 41/N16 6.4 xlO" 7 47.27 42/N17 7.2 xlO" 7 —
F R W Ti6246/Ti6246 9/10 4.6 xlO" 1 0 _. 11/12 4.0 x l O 1 0 „ .
17/18 4.0 x l O ' 1 0 ___
19/20 4.5 xlO" 1" —
C) Charpy-V The Charpy-V tests were conducted at room temperature in air, with rupture as failure criterion (ASTM E23). The impact energies of the as-received materials were measured twice for each alloy and the average values were 12.8 J and 19.3 J for the T16246 and Ti64, respectively. The impact test results of the PWHT specimens are summarized in Figure 18. All tests were carried out twice. In these samples the fracture occurred in the welds where the notches were placed.
16
14
_ 12
j? 10
c _
8
6
4 2
A EBW Ti6246/Ti6246 C FRW Ti6246/Ti6246 O EBW Ti64/Ti6246 X FRW Ti64/Ti6246
580 600 620 640 660 680 700
Post weld heat treatment (deg.C/2h)
Figure 18. Impact test results for all specimens.
X .0.
.o. o i <b i
i * i
o *
-20
13
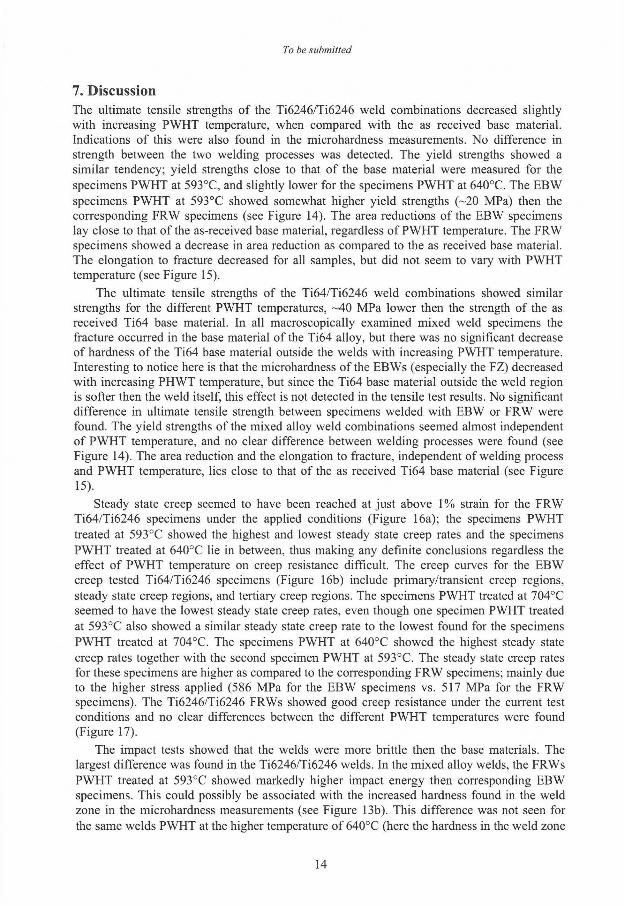
To be submitted
7. Discussion The ultimate tensile strengths of the Ti6246/Ti6246 weld combinations decreased slightly with increasing PWHT temperature, when compared with the as received base material. Indications of this were also found in the microhardness measurements. No difference in strength between the two welding processes was detected. The yield strengths showed a similar tendency; yield strengths close to that of the base material were measured for the specimens PWHT at 593°C, and slightly lower for the specimens PWHT at 640°C. The EBW specimens PWHT at 593°C showed somewhat higher yield strengths (~20 MPa) then the corresponding FRW specimens (see Figure 14). The area reductions of the EBW specimens lay close to that of the as-received base material, regardless of PWHT temperature. The FRW specimens showed a decrease in area reduction as compared to the as received base material. The elongation to fracture decreased for all samples, but did not seem to vary with PWHT temperature (see Figure 15).
The ultimate tensile strengths of the Ti64/Ti6246 weld combinations showed similar strengths for the different PWHT temperatures, ~40 MPa lower then the strength of the as received Ti64 base material. In all macroscopically examined mixed weld specimens the fracture occurred in the base material of the Ti64 alloy, but there was no significant decrease of hardness of the Ti64 base material outside the welds with increasing PWHT temperature. Interesting to notice here is that the microhardness of the EBWs (especially the FZ) decreased with increasing PHWT temperature, but since the Ti64 base material outside the weld region is softer then the weld itself, this effect is not detected in the tensile test results. No significant difference in ultimate tensile strength between specimens welded with EBW or FRW were found. The yield strengths of the mixed alloy weld combinations seemed almost independent of PWHT temperature, and no clear difference between welding processes were found (see Figure 14). The area reduction and the elongation to fracture, independent of welding process and PWHT temperature, lies close to that of the as received Ti64 base material (see Figure 15).
Steady state creep seemed to have been reached at just above 1% strain for the FRW Ti64/Ti6246 specimens under the applied conditions (Figure 16a); the specimens PWHT treated at 593°C showed the highest and lowest steady state creep rates and the specimens PWHT treated at 640°C lie in between, thus making any definite conclusions regardless the effect of PWHT temperature on creep resistance difficult. The creep curves for the EBW creep tested Ti64/Ti6246 specimens (Figure 16b) include primary/transient creep regions, steady state creep regions, and tertiary creep regions. The specimens PWHT treated at 704°C seemed to have the lowest steady state creep rates, even though one specimen PWHT treated at 593°C also showed a similar steady state creep rate to the lowest found for the specimens PWHT treated at 704°C. The specimens PWHT at 640°C showed the highest steady state creep rates together with the second specimen PWHT at 593°C. The steady state creep rates for these specimens are higher as compared to the corresponding FRW specimens; mainly due to the higher stress applied (586 MPa for the EBW specimens vs. 517 MPa for the FRW specimens). The Ti6246/Ti6246 FRWs showed good creep resistance under the current test conditions and no clear differences between the different PWHT temperatures were found (Figure 17).
The impact tests showed that the welds were more brittle then the base materials. The largest difference was found in the Ti6246/Ti6246 welds. In the mixed alloy welds, the FRWs PWHT treated at 593°C showed markedly higher impact energy then corresponding EBW specimens. This could possibly be associated with the increased hardness found in the weld zone in the microhardness measurements (see Figure 13b). This difference was not seen for the same welds PWHT at the higher temperature of 640°C (here the hardness in the weld zone
14
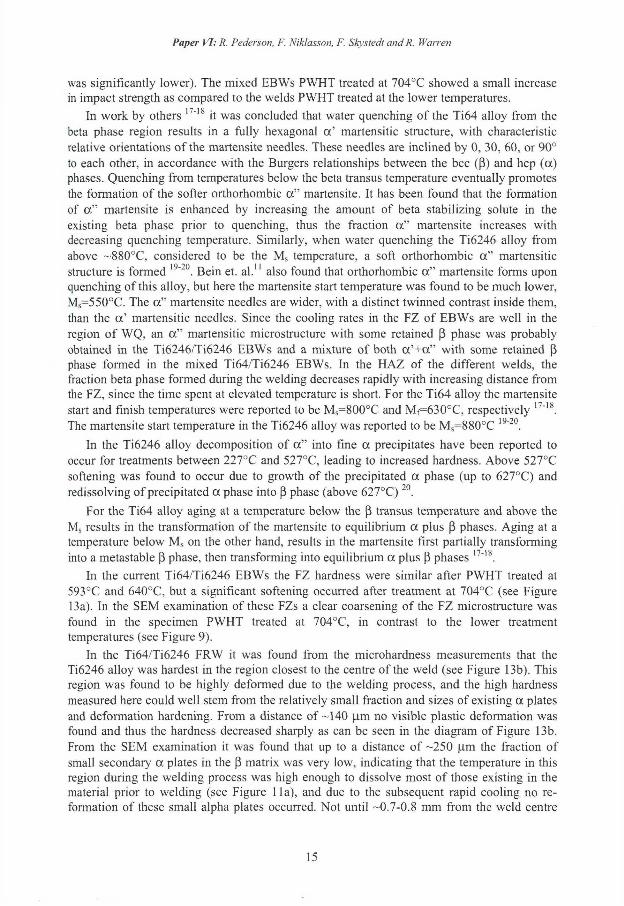
Paper VI: R. Pederson, F. Niklasson, F. Skystedi and R. Warren
was significantly lower). The mixed EBWs PWHT treated at 704°C showed a small increase in impact strength as compared to the welds PWHT treated at the lower temperatures.
In work by others 1 7 - 1 8 it was concluded that water quenching of the Ti64 alloy from the beta phase region results in a fully hexagonal a' martensitic structure, with characteristic relative orientations of the martensite needles. These needles are inclined by 0, 30, 60, or 90° to each other, in accordance with the Burgers relationships between the bcc (ß) and hep (a) phases. Quenching from temperatures below the beta transus temperature eventually promotes the formation of the softer orthorhombic a" martensite. It has been found that the formation of a" martensite is enhanced by increasing the amount of beta stabilizing solute in the existing beta phase prior to quenching, thus the fraction a" martensite increases with decreasing quenching temperature. Similarly, when water quenching the Ti6246 alloy from above ~880°C, considered to be the M s temperature, a soft orthorhombic a" martensitic stmcture is formed 1 9 2 0 . Bein et. al." also found that orthorhombic a" martensite forms upon quenching of this alloy, but here the martensite start temperature was found to be much lower, MS=550°C. The a" martensite needles are wider, with a distinct twinned contrast inside them, than the ot' martensitic needles. Since the cooling rates in the FZ of EBWs are well in the region of WQ, an a" martensitic microstructure with some retained ß phase was probably obtained in the Ti6246/Ti6246 EBWs and a mixture of both a'+a" with some retained ß phase formed in the mixed Ti64/Ti6246 EBWs. In the HAZ of the different welds, the fraction beta phase formed during the welding decreases rapidly with increasing distance from the FZ, since the time spent at elevated temperature is short. For the Ti64 alloy the martensite start and finish temperatures were reported to be MS=800°C and Mf=630°C, respectively 1 7" 1 8 . The martensite start temperature in the Ti6246 alloy was reported to be MS=880°C 1 9" 2 0.
In the Ti6246 alloy decomposition of a" into fine a precipitates have been reported to occur for treatments between 227°C and 527°C, leading to increased hardness. Above 527°C softening was found to occur due to growth of the precipitated a phase (up to 627°C) and redissolving of precipitated a phase into ß phase (above 627°C) 2 0 .
For the Ti64 alloy aging at a temperature below the ß transus temperature and above the M s results in the transformation of the martensite to equilibrium a plus ß phases. Aging at a temperature below M s on the other hand, results in the martensite first partially transforming into a metastable ß phase, then transforming into equilibrium a plus ß phases 1 7~'8.
In the current Ti64/Ti6246 EBWs the FZ hardness were similar after PWHT treated at 593°C and 640°C, but a significant softening occurred after treatment at 704°C (see Figure 13a). In the SEM examination of these FZs a clear coarsening of the FZ microstructure was found in the specimen PWHT treated at 704°C, in contrast to the lower treatment temperatures (see Figure 9).
In the Ti64/Ti6246 FRW it was found from the microhardness measurements that the TI6246 alloy was hardest in the region closest to the centre of the weld (see Figure 13b). This region was found to be highly deformed due to the welding process, and the high hardness measured here could well stem from the relatively small fraction and sizes of existing a plates and deformation hardening. From a distance of-140 pm no visible plastic deformation was found and thus the hardness decreased sharply as can be seen in the diagram of Figure 13b. From the SEM examination it was found that up to a distance of -250 pm the fraction of small secondary a plates in the ß matrix was very low, indicating that the temperature in this region during the welding process was high enough to dissolve most of those existing in the material prior to welding (see Figure 11a), and due to the subsequent rapid cooling no reformation of these small alpha plates occurred. Not until -0.7-0.8 mm from the weld centre
15
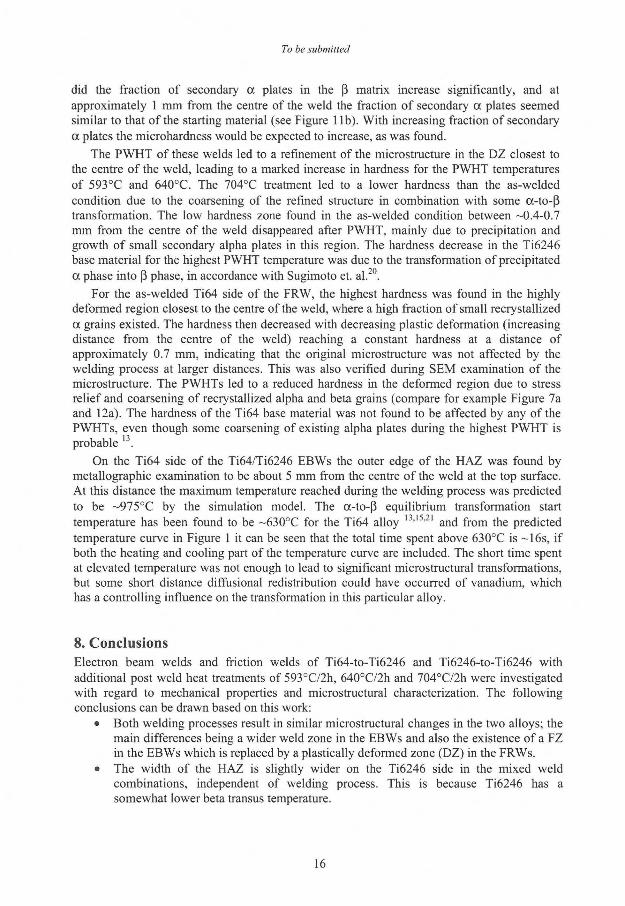
To be submitted
did the fraction of secondary ot plates in the ß matrix increase significantly, and at approximately 1 mm from the centre of the weld the fraction of secondary a plates seemed similar to that of the starting material (see Figure 1 lb). With increasing fraction of secondary a plates the microhardness would be expected to increase, as was found.
The PWHT of these welds led to a refinement of the microstructure in the DZ closest to the centre of the weld, leading to a marked increase in hardness for the PWHT temperatures of 593°C and 640°C. The 704°C treatment led to a lower hardness than the as-welded condition due to the coarsening of the refined structure in combination with some ot-to-ß transformation. The low hardness zone found in the as-welded condition between -0.4-0.7 mm from the centre of the weld disappeared after PWHT, mainly due to precipitation and growth of small secondary alpha plates in this region. The hardness decrease in the Ti6246 base material for the highest PWHT temperature was due to the transformation of precipitated a phase into ß phase, in accordance with Sugimoto et. al. 2 0 .
For the as-welded Ti64 side of the FRW, the highest hardness was found in the highly deformed region closest to the centre of the weld, where a high fraction of small recrystallized ot grains existed. The hardness then decreased with decreasing plastic deformation (increasing distance from the centre of the weld) reaching a constant hardness at a distance of approximately 0.7 mm, indicating that the original microstructure was not affected by the welding process at larger distances. This was also verified during SEM examination of the microstructure. The PWHTs led to a reduced hardness in the deformed region due to stress relief and coarsening of recrystallized alpha and beta grains (compare for example Figure 7a and 12a). The hardness of the Ti64 base material was not found to be affected by any of the PWHTs, even though some coarsening of existing alpha plates during the highest PWHT is probable 1 3 .
On the Ti64 side of the Ti64/Ti6246 EBWs the outer edge of the HAZ was found by metallographic examination to be about 5 mm from the centre of the weld at the top surface. At this distance the maximum temperature reached during the welding process was predicted to be ~975°C by the simulation model. The a-to-ß equilibrium transformation start temperature has been found to be ~630°C for the Ti64 alloy 1 3 , 1 - 2 1
a n ( j from the predicted temperature curve in Figure 1 it can be seen that the total time spent above 630°C is ~16s, i f both the heating and cooling part of the temperature curve are included. The short time spent at elevated temperature was not enough to lead to significant microstructural transformations, but some short distance diffusional redistribution could have occurred of vanadium, which has a controlling influence on the transformation in this particular alloy.
8. Conclusions Electron beam welds and friction welds of Ti64-to-Ti6246 and Ti6246-to-Ti6246 with additional post weld heat treatments of 593°C/2h, 640°C/2h and 704°C/2h were investigated with regard to mechanical properties and microstructural characterization. The following conclusions can be drawn based on this work:
• Both welding processes result in similar microstructural changes in the two alloys; the main differences being a wider weld zone in the EBWs and also the existence of a FZ in the EBWs which is replaced by a plastically deformed zone (DZ) in the FRWs.
• The width of the HAZ is slightly wider on the Ti6246 side in the mixed weld combinations, independent of welding process. This is because Ti6246 has a somewhat lower beta transus temperature.
16
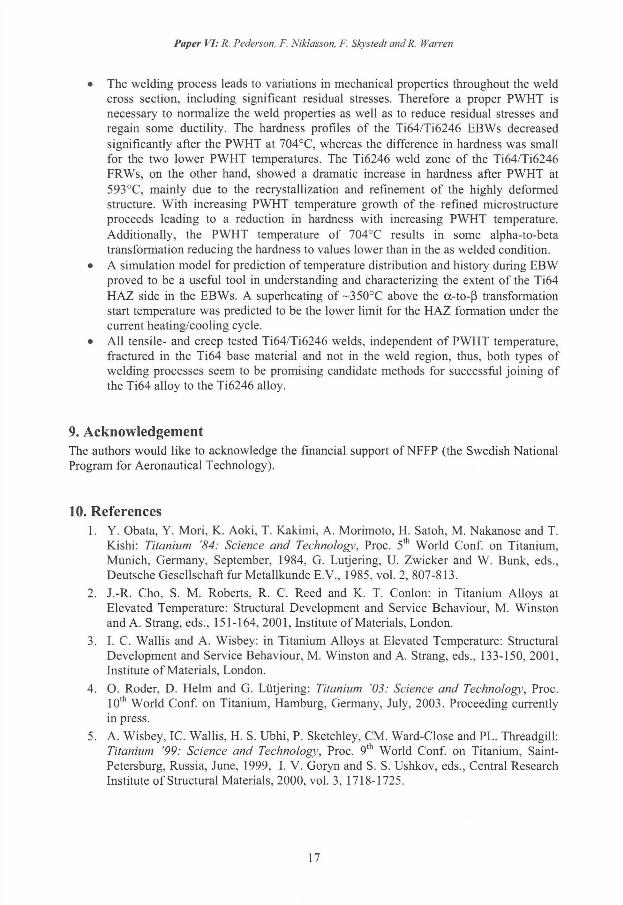
Paper VI: R. Pederson, F. Niklasson, F. Skystedt and R. Warren
• The welding process leads to variations in mechanical properties throughout the weld cross section, including significant residual stresses. Therefore a proper PWHT is necessary to normalize the weld properties as well as to reduce residual stresses and regain some ductility. The hardness profiles of the Ti64/Ti6246 EBWs decreased significantly after the PWHT at 704°C, whereas the difference in hardness was small for the two lower PWHT temperatures. The Ti6246 weld zone of the Ti64/Ti6246 FRWs, on the other hand, showed a dramatic increase in hardness after PWHT at 593°C, mainly due to the recrystallization and refinement of the highly deformed structure. With increasing PWHT temperature growth of the refined microstructure proceeds leading to a reduction in hardness with increasing PWHT temperature. Additionally, the PWHT temperature of 704°C results in some alpha-to-beta transformation reducing the hardness to values lower than in the as welded condition.
• A simulation model for prediction of temperature distribution and history during EBW proved to be a useful tool in understanding and characterizing the extent of the Ti64 HAZ side in the EBWs. A superheating of ~350°C above the cx-to-ß transformation start temperature was predicted to be the lower limit for the HAZ formation under the current heating/cooling cycle.
• Al l tensile- and creep tested Ti64/Ti6246 welds, independent of PWHT temperature, fractured in the Ti64 base material and not in the weld region, thus, both types of welding processes seem to be promising candidate methods for successful joining of the Ti64 alloy to the Ti6246 alloy.
9. Acknowledgement The authors would like to acknowledge the financial support of NFFP (the Swedish National Program for Aeronautical Technology).
10. References 1 . Y. Obata, Y. Mori, K. Aoki, T. Kakimi, A. Morimoto, H. Satoh, M. Nakanose and T.
Kishi: Titanium '84: Science and Technology, Proc. 51 World Conf. on Titanium, Munich, Germany, September, 1984, G. Lutjering, U. Zwicker and W. Bunk, eds., Deutsche Gesellschaft fur Metallkunde E.V., 1985, vol. 2, 807-813.
2. J.-R. Cho, S. M . Roberts, R. C. Reed and K. T. Conlon: in Titanium Alloys at Elevated Temperature: Structural Development and Service Behaviour, M. Winston and A. Strang, eds., 151-164, 2001, Institute of Materials, London.
3. I . C. Wallis and A. Wisbey: in Titanium Alloys at Elevated Temperature: Structural Development and Service Behaviour, M. Winston and A. Strang, eds., 133-150, 2001, Institute of Materials, London.
4. O. Roder, D. Helm and G. Lütjering: Titanium '03: Science and Technology, Proc. 10 th World Conf. on Titanium, Hamburg, Germany, July, 2003. Proceeding currently in press.
5. A. Wisbey, IC. Wallis, H. S. Ubhi, P. Sketchley, CM. Ward-Close and PL. Threadgill: Titanium '99: Science and Technology, Proc. 9 t h World Conf. on Titanium, Saint-Petersburg, Russia, June, 1999, I . V. Goryn and S. S. Ushkov, eds., Central Research Institute of Structural Materials, 2000, vol. 3, 1718-1725.
17
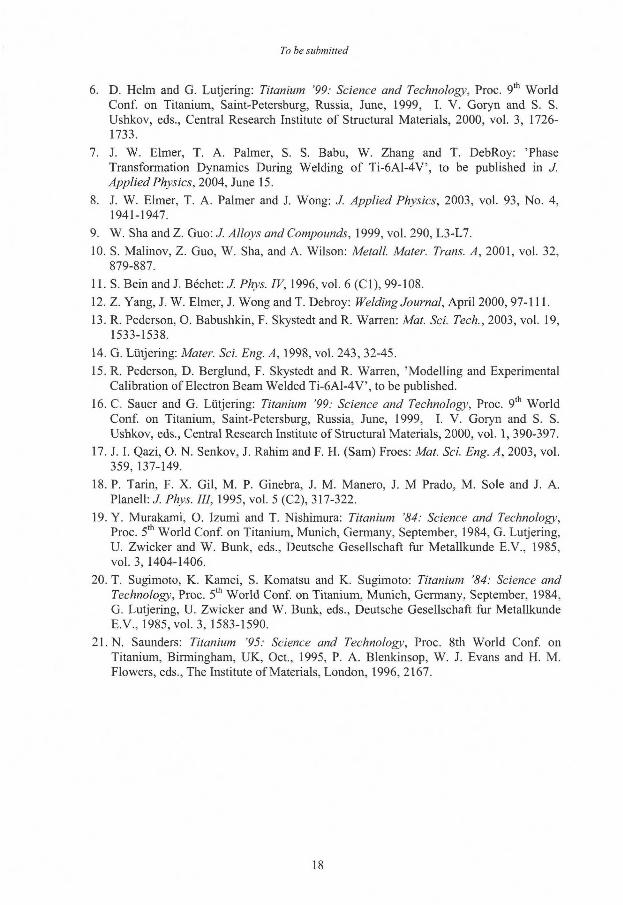
To be submitted
6. D. Helm and G. Lutjering: Titanium '99: Science and Technology, Proc. 9* World Conf. on Titanium, Saint-Petersburg, Russia, June, 1999, I . V. Goryn and S. S. Ushkov, eds., Central Research Institute of Structural Materials, 2000, vol. 3, 1726-1733.
7. J. W. Elmer, T. A. Palmer, S. S. Babu, W. Zhang and T. DebRoy: 'Phase Transformation Dynamics During Welding of Ti-6A1-4V, to be published in J. Applied Physics, 2004, June 15.
8. J. W. Elmer, T. A. Palmer and J. Wong: J. Applied Physics, 2003, vol. 93, No. 4, 1941-1947.
9. W. Sha and Z. Guo: J. Alloys and Compounds, 1999, vol. 290, L3-L7.
10. S. Malinov, Z. Guo, W. Sha, and A. Wilson: Metall. Mater. Trans. A, 2001, vol. 32, 879-887.
U .S . Bein and J. Béchet: J. Phys. IV, 1996, vol. 6 (CI), 99-108.
12. Z. Yang, J. W. Elmer, J. Wong and T. Debroy: Welding Journal, April 2000, 97-111.
13. R. Pederson, O. Babushkin, F. Skystedt and R. Warren: Mat. Sei. Tech., 2003, vol. 19, 1533-1538.
14. G. Lütjering: Mater. Sei. Eng. A, 1998, vol. 243, 32-45.
15. R. Pederson, D. Berglund, F. Skystedt and R. Warren, 'Modelling and Experimental Calibration of Electron Beam Welded Ti-6A1-4V, to be published.
16. C. Sauer and G. Lütjering: Titanium '99: Science and Technology, Proc. 9 t h World Conf. on Titanium, Saint-Petersburg, Russia, June, 1999, I . V. Goryn and S. S. Ushkov, eds., Central Research Institute of Structural Materials, 2000, vol. 1, 390-397.
17. J. I . Qazi, O. N. Senkov, J. Rahim and F. H. (Sam) Froes: Mat. Sei. Eng. A, 2003, vol. 359, 137-149.
18. P. Tarin, F. X. Gil, M . P. Ginebra, J. M. Manero, J. M Prado, M . Sole and J. A. Planell: J. Phys. Ill, 1995, vol. 5 (C2), 317-322.
19. Y. Murakami, O. Izumi and T. Nishimura: Titanium '84: Science and Technology, Proc. 5 t h World Conf. on Titanium, Munich, Germany, September, 1984, G. Lutjering, U. Zwicker and W. Bunk, eds., Deutsche Gesellschaft fur Metallkunde E.V., 1985, vol. 3, 1404-1406.
20. T. Sugimoto, K. Kamei, S. Komatsu and K. Sugimoto: Titanium '84: Science and Technology, Proc. 5 t h World Conf. on Titanium, Munich, Germany, September, 1984, G. Lutjering, U. Zwicker and W. Bunk, eds., Deutsche Gesellschaft fur Metallkunde E.V., 1985, vol. 3, 1583-1590.
21. N . Saunders: Titanium '95: Science and Technology, Proc. 8th World Conf. on Titanium, Birmingham, UK, Oct., 1995, P. A. Blenkinsop, W. J. Evans and H. M . Flowers, eds., The Institute of Materials, London, 1996, 2167.
18

LULEÅ I U N I V E R S I T Y ,
O F T E C H N O L O G Y
Universitetstryckeriet, Luleå