the mexican migration to the united states and substance use in northern mexico
TRANSCRIPT
The Mexican migration to the US and substance use in NorthernMexico
Guilherme Borges, ScD, Maria-Elena Medina-Mora, PhD, Ricardo Orozco, M.Sc., Clara Fleiz,M.Sc., Cheryl Cherpitel, Dr.PH, and Joshua Breslau, PhD ScD
AbstractAims—To examine the impact of migration to the US on substance use and substance use disordersin three urban areas of Northern Mexico.
Design—Cross-sectional survey of immigration related experiences and lifetime and past-yearalcohol and drug use, in a representative sample of respondents ages 12 to 65.
Setting—Interviews were conducted in the cities of Tijuana, Ciudad Juarez, and Monterrey during2005. Respondents were classified into three groups: 1) “return migrants”, 2) “relatives of migrants”and 3) “others in the general population”.
Findings—A total of 1,630 completed interviews were obtained for a response rate of 70.5%.“Return migrants” were more likely to have used alcohol, marijuana or cocaine at least once in theirlifetime and in the last 12-months, more likely to develop a substance use disorder, and more likelyto have a 12-month substance use disorder, compared with “others in the general population”. Among“return migrants”, longer length of time in the US and type of work performed as an immigrant wererelated to higher prevalence of substance use. Among “relatives of migrants”, migration experienceswere not associated with increased prevalence of substance use compared with “others in the generalpopulation”.
Conclusion—This study found a link between migration to the US and the transformation ofsubstance use norms and pathology in Mexico. Future research of pre-migration involvement insubstance use and data on the timing of events among return migrants is needed. Public healthmeasures are likely to require cross-border coordination of research and service development.
Keywordsmigration; alcohol; drug use; Mexico; Hispanic
IntroductionThe prevalence of alcohol and drug use and of disorders of abuse and dependence associatedwith substance use is much lower in Mexico than in the United States (1,2). However, evidencefrom a number of sources suggests that this gap may be closing, driven in part by thetransmission of cultural norms across transnational migration networks (3). The prevalence ofdrug use has a clear geographical distribution within Mexico, with much higher levels foundin the northern regions, closer to the Mexico-US border, compared with other parts of thecountry (4). The little data available suggest higher rates of heavy alcohol and alcohol- relatedproblems on the Mexico-US border than in the interior of both countries (5,6). Among
Address comments to Guilherme Borges: Instituto Nacional de Psiquiatria, Calzada Mexico Xochimilco No 101- Col. San LorenzoHuipulco, Mexico D.F. C.P.14370, Mexico tel: (52 55) 5655-3031; fax (52 55) 5513-3446, [email protected] /[email protected].
NIH Public AccessAuthor ManuscriptAddiction. Author manuscript; available in PMC 2010 April 1.
Published in final edited form as:Addiction. 2009 April ; 104(4): 603–611. doi:10.1111/j.1360-0443.2008.02491.x.
NIH
-PA Author Manuscript
NIH
-PA Author Manuscript
NIH
-PA Author Manuscript
Mexican-Americans in the US, longer duration of residence in the US and US-birth areassociated with higher prevalence of substance use and substance use disorders (7-10).
A better understanding of the pathways through which migration to the US may affectsubstance use disorders in Mexico is needed to inform public health efforts to reduce theirimpact. A recent study by our group examined a Mexican national sample for evidence of thedirect impact of migration on substance use among people who had migrated to work in theUS and then returned to live in Mexico, and the indirect impact of migration on people withouta personal history of migration who had a migrant in their immediate family. In that study,both return migrants and relatives of migrants were more likely to have used alcohol, marijuana,cocaine, and other illicit drugs at least once in their lives, and more likely to have met criteriafor lifetime and last year substance abuse than were other Mexicans (11). That research wasthe first epidemiological study to report such findings, although prior reports from clinicalsamples of Mexican addicts under treatment (12), as well as isolated anthropological reports(13) and local descriptive surveys of rural communities with migrant flows (14) have alsomentioned this phenomena. These findings suggest that transnational networks that connectmigrants with their families in Mexico may be primary vectors for change in substance useand substance use disorders in the Mexican population. Introduction of new patterns of otherbehaviours such as risky sexual practices among return migrants and their relationship withthe HIV-AIDS epidemic has been reported previously in Mexico (15-16), as have reports onchanges in dietary habits among Mexican migrants and their families (17-18), among otherhealth-related behaviours that may be influenced by migratory movements (19).
This study investigates the association between migration to the US, substance use andsubstance use disorders in three urban areas of Northern Mexico. The Northern region is ofparticular interest in Mexico because of its proximity to the US and previous evidence thatalcohol and drug use is about twice as common in this region compared with other regions.Data come from the Local Surveys on Addictions 2005 (Encuestas Locales de Adicciones2005) (20) conducted in three US-Mexico border cities. These surveys include more detailedinformation regarding the experience of migration than was available in previous studies. Inaddition to the original distinction of the three groups described above, this survey includesdata on the length of time in the US, the type of work performed as an immigrant and theexperience of stress among return immigrants. For the relatives of migrants, the number ofrelatives living in the US and the amount of communication with these members are alsoincluded. These analyses are important for providing much needed information on healthpolicies for the Mexicans migrants and their families, both in the US and in Mexico.
MethodsSample
The Local Surveys on Addictions 2005 is part of the Mexican National Survey on Addictions(ENA) series, supported by the Ministry of Health (CONADIC- National Council Against theAddictions), state and local governments, and the National Institute of Psychiatry (INP), andincluded the cities of Tijuana (Baja California), Ciudad Juarez (Chihuahua), and Monterrey(Nuevo Leon). A common methodology was used, in which 50 primary sampling units (PSUs)were selected with probability proportional to a measure of size in each location, based on datafrom the National Institute of Geography and Informatics 2000 census count (similar to UScensus tracts). Two city blocks were selected in each PSU as second stage units and eachhousing unit was listed within each block. A selected segment of these were drawn as the thirdstage sampling unit, and all eligible respondents within the selected housing unit were listedand a systematic sampling scheme applied to produce a self-weighting sample of respondents.All residents 12 to 65 years old were listed in order of age and selected according to the “lastbirthday” technique in which the respondent who had the closest birthday to the interview day
Borges et al. Page 2
Addiction. Author manuscript; available in PMC 2010 April 1.
NIH
-PA Author Manuscript
NIH
-PA Author Manuscript
NIH
-PA Author Manuscript
was selected. Four days of interviewer training were provided by INP staff, who also followedsupplementary field supervision and data control protocols. Data were collected in November2005 on a total of 1,630 respondents, representing a 70.5% response rate. The data reportedhere is based on a sample representative of large urban areas of three states in Northern Mexico,that shared border areas with the States of California, New Mexico and Texas in the US, butcannot be assumed to be representative of all Northern Mexico, specially their rural areas.
MeasuresThe survey questionnaire, lasting an average of 49 minutes, included items related to alcoholuse/dependence and related problems, drug use/dependence, immigration experiences, anddemographic characteristics, including the city in which the respondent was living at the timeof the interview, since large differences have been found in migration and substances userelated to geographic locality in Mexico.
Alcohol and drug use—Lifetime and last 12-month alcohol and illicit drug use (marijuana,crack-cocaine, other drugs) was assessed with a series of questions validated in local andnational surveys in Mexico dating since the 1970's (21). Heavy drinking (last 12-months) wasdefined as at least weekly use of alcohol with 5 or more drinks on an occasion at least weekly.Alcohol and drug dependence were assessed with a scale that included items adapted from theAlcohol Section of the Composite International Diagnostic Interviews (CIDI) core (22) whichoperationalized Diagnostic and Statistical Manual of Mental Disorders (DSM-IV) (23) criteriafor alcohol (last 12 months) and drug dependence (lifetime and last 12 months) (24-25).Following the DSM-IV criterion for establishing alcohol dependence, at least one positive itemis needed in each of at least three of the seven domains that constitute the dependence criteria.
Migration experience—“Return migrants” were categorized as those who had themselvesstayed in the US for at least one month and gave ‘work’ as their reason for visiting the US.“Relatives of migrants” included those who had members of their immediate family currentlyin the US, and had never, themselves, been in the US for work. A third category of ‘others’included those not in either of the two prior migration groups. Those who ever immigrated tothe US and relatives of migrants were both asked parallel questions regarding how long theystayed in the US (or have been in the US for relatives), and the type of work performed in theUS. If a respondent had more than one relative in the US, type of work and length of time forthe relative with the longer stay was used. Return migrants with at least one year in the US,were also asked a series of five questions related to experiences of stress and discriminationthat included difficulties in interacting because of English skills (three questions), difficultiesin finding work because of being Mexican, and feeling rejected because of Mexican origin.These questions were rated on a five point Likert scale (where 0 indicated “not worried/stressed” while 4 indicated “very worried/stressed”). The five items were summed andcategorized as: no stress (0 points), medium (1-8) and high stress (9+).For the relatives ofimmigrants, additional information was elicited on the number of relatives currently in the USand how often these migrants communicated with their family.
AnalysesThe data were weighted to adjust for differential probabilities of selection and non-response,and post-stratified to represent the three cities according to the 2000 census. The 12-month andlifetime prevalence of substance use and substance use disorders was calculated as theproportion of the entire sample reporting each outcome. Proportions were compared withdesign-adjusted chi-square tests using SUDAAN software (26). Crude and adjusted odds ratios(ORs) were estimated in logistic and polytomous logistic regression models (27) also usingSUDAAN software to adjust for design effects. Tests for migration variables and statisticalsignificance were evaluated using two-sided design-based tests at the 0.05 level of significance.
Borges et al. Page 3
Addiction. Author manuscript; available in PMC 2010 April 1.
NIH
-PA Author Manuscript
NIH
-PA Author Manuscript
NIH
-PA Author Manuscript
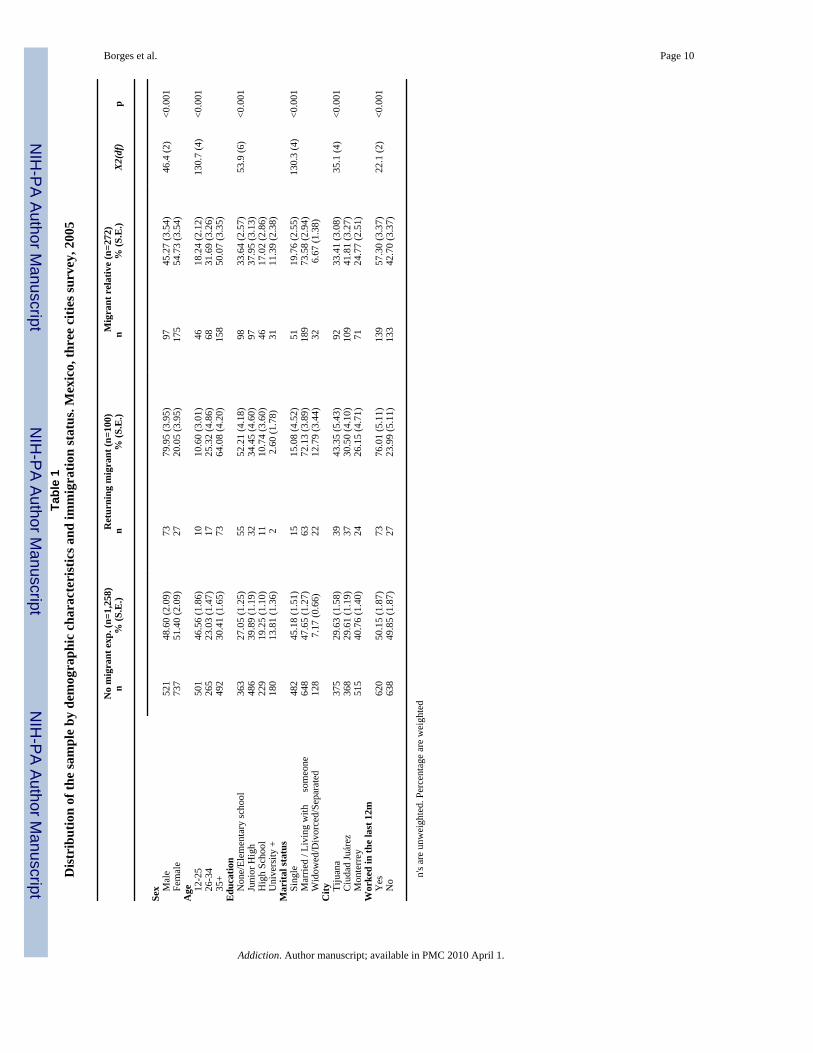
ResultsTable 1 presents the demographic characteristics of the three groups defined by migrant status.All demographics variables differed across the samples. Compared to the group with no migrantexperience, return migrants were more likely to be male, older, less educated married, to livein Tijuana or Ciudad Juarez and to have worked in the prior 30 days. Relatives of migrantswere more similar to people from families without migrants, but they were still more likely tobe female, older and married when compared to the later group.
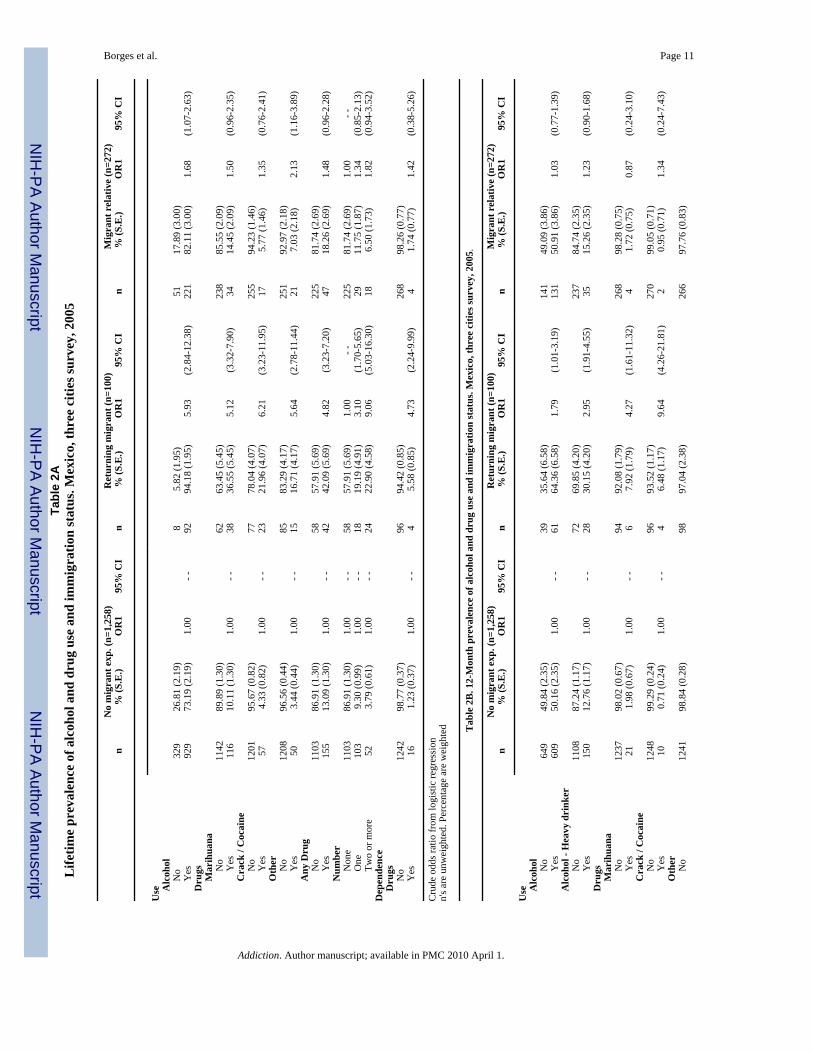
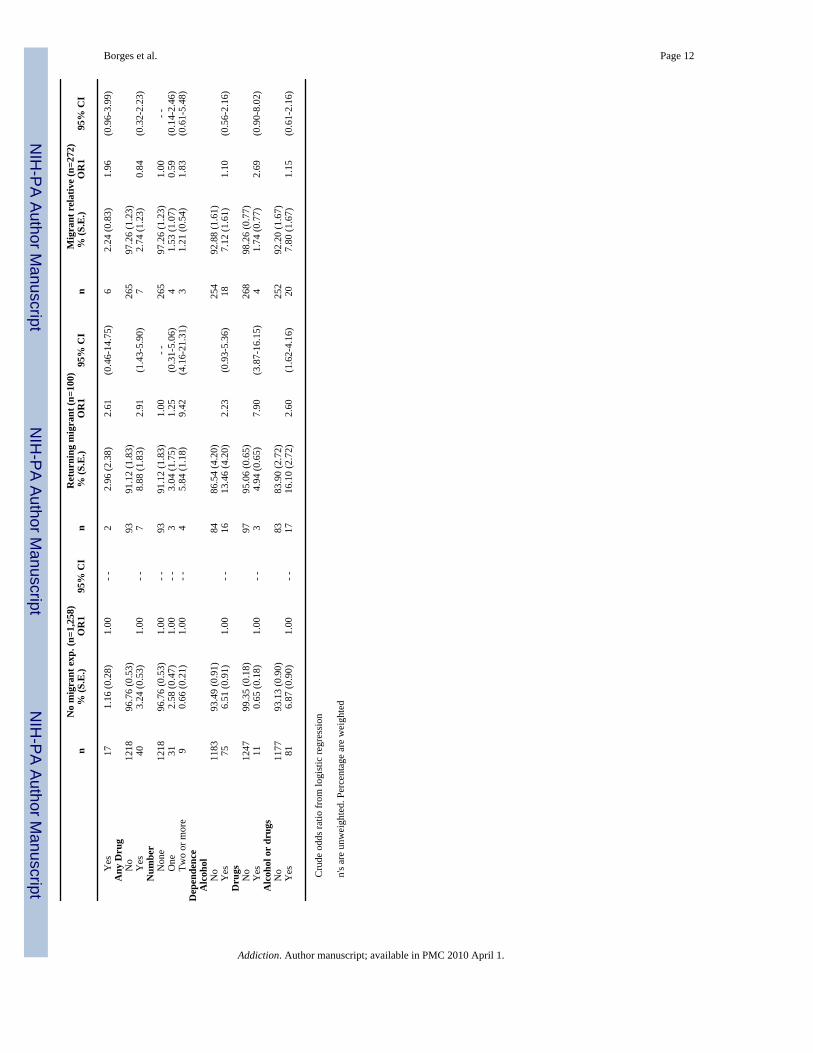
The lifetime prevalence of alcohol, marijuana, cocaine and other drug use was higher amongmigrants and relatives of migrants compared with other Mexicans (Table 2A). The lifetimeprevalence of any drug use and of using multiple drugs was also higher for both the returnmigrants and relatives of migrants, but more so in the former group. The lifetime prevalenceof drug dependence was elevated among return migrants but not among relatives of migrants.The crude OR estimates from Table 2A are positive and most are statistically significant.
Current year alcohol use, heavy drinking and drug use, alcohol dependence, drug dependenceand any substance dependence (alcohol or drug) were all elevated among return migrantscompared to other Mexicans. There was a tendency for positive ORs among relatives ofmigrants for these variables, but none reached statistical significance (Table 2B).
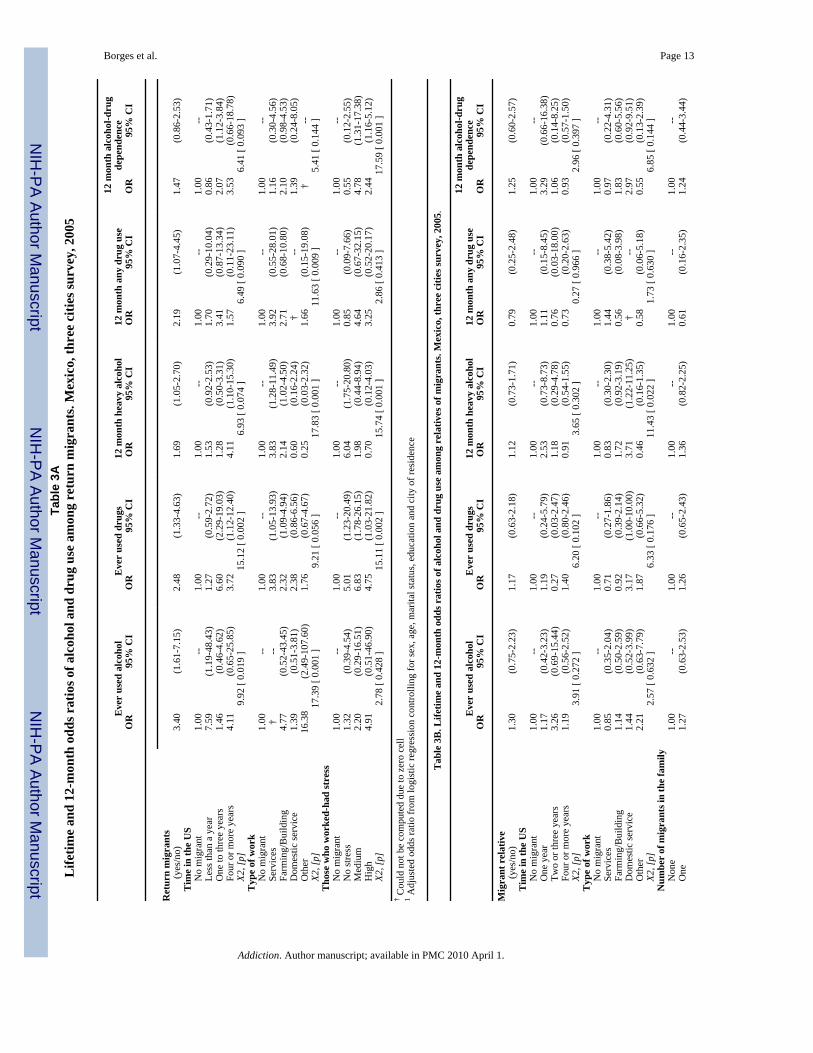
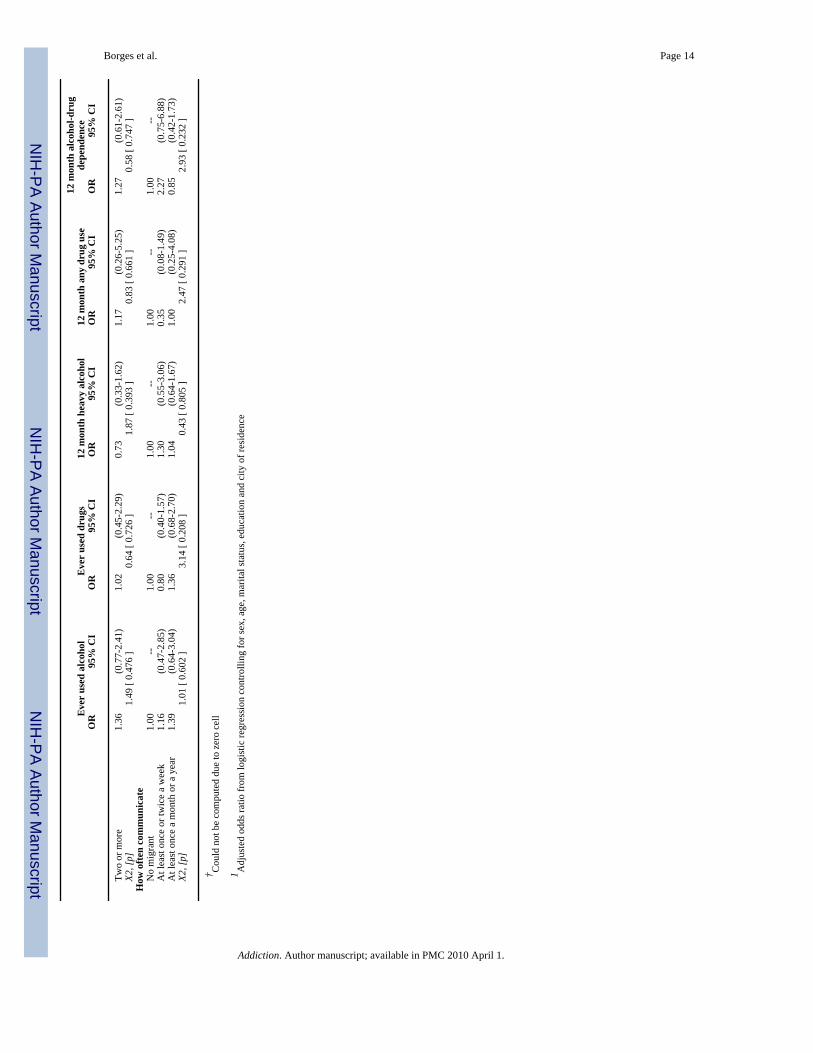
Table 3A shows the association of alcohol and drug use and disorders with migrationexperiences, adjusted for age, sex, marital status, education and city of residence. Sample sizeprecluded analyses for the full set of variables in Table 2A and 2B, and only summary variablesand those with larger prevalence are included. Controlling for sociodemographic variablesreduced the strength but did not eliminated associations between return migrants and alcoholand drug use and disorders, as shown at the top of Table 3A. Dose- response relationshipsbetween time in the US and substance use was apparent for most variables (except for everused alcohol), with migrants spending more than one year in the US showing increased ORs.Return migrants who performed work in the services and in farming/building had a tendencyto shown larger ORs and those with medium and high levels of stress were generally morelikely to report substance use. For the relatives of migrants (Table 3B), controlling forsociodemographic variables eliminated the associations described previously in Table 2A and2B. With very few exceptions, no associations were found between time living in the US andtype of work performed by the migrant and substance use on the part of the migrant's relative,nor were associations apparent between substance use and the number of migrant members inthe US or the amount of communication with migrants.
DiscussionThis study is the first to examine migration to the US as a risk factor for alcohol and drug usein the Northern urban areas of Mexico. These areas close to the US border are known to havethe highest levels of use of alcohol and drugs in Mexico. For instance, in the 1998 MexicanNational Survey on Addictions (Encuesta Nacional de Adicciones: ENA) 11% of thepopulation of areas along the US border reported heavy drinking (5 or more drinks at least oncein the past month), twice as many as in other areas of Mexico (5). In that survey Tijuana andCiudad Juarez had the highest lifetime prevalence of illegal drug use in Mexico, over twice thenational average (28). Other studies have also found that the border areas have the highest ratesand the fastest rates of increase in drug use in Mexico (4,29,30). We found that individuals inthis region who have personal experience as migrant workers in the US were more likely touse substances than others, as we found in our previous study that examined this associationon a nationwide basis (11). The finding that both initiation of substance use (alcohol and drugs)and recent substance use (heavy use of alcohol and drug use) are more common among those
Borges et al. Page 4
Addiction. Author manuscript; available in PMC 2010 April 1.
NIH
-PA Author Manuscript
NIH
-PA Author Manuscript
NIH
-PA Author Manuscript
with experience as migrants suggests that migration may contribute to substance use and thatthese acquired substance use patterns continue to some degree after they return to Mexico.
The association between migration and substance use in this regional study differed from thepattern observed nationally with respect to differences between relatives of migrants and othernon-migrants (those who have neither been migrant workers in the US nor have relativesworking in the US), in the Mexican population. In the previous nationwide study relatives ofmigrants were more likely to use substances and to have substance use disorders than othernon-migrants. This finding should be interpreted in light of the much higher prevalence ofsubstance use among members of both groups in this region compared with the prevalence ofsubstance use nationally. The prevalence of use of marijuana, cocaine and other drugs amongpeople with no migration experience and no family member in the US was about twice as highin these urban border regions as in the nationwide study: 5.8%, 2.6% and 1.7% vs. 10.1%,4.3%, and 3.4% respectively. This pattern of findings is consistent with strong regionalinfluences on substance use that pervade the population of this region as a whole regardless offamilial network connections to the US.
This study is also the first to examine particular aspects of migration experience that have beensuggested as explanations for the association between migration and substance use. Amongreturn migrants, substance use was more common among those who stayed in the US for longerperiods of time, felt discriminated against while in the US, and worked at jobs in the servicesand agricultural sectors. Among relatives of migrants, however, none of these migrationexperience factors were related to substance use. These findings suggest that a useful strategyfor preventing increases in substance use among Mexican migrants in the US may be to focuson living and working conditions among those working in these particular employment sectors.Studies of Mexican-origin migrants in the US could be conducted to examine the context ofsubstance use among these workers in greater detail. The benefits of reducing initiation ofsubstance use among Mexican migrants working in the US are likely to accrue on both sidesof the border.
The finding that longer periods of residence in the US are associated with increased substanceuse is consistent with studies of Mexican immigrants that have been conducted in the US.Among Mexican immigrants interviewed in the US, longer periods of residence are alsoassociated with higher levels of substance use (7-9,31), particularly in the agricultural sector(32-34). It is likely that the increase in substance use among migrants is not attributable to asingle factor, but rather arises from a combination of increased opportunity to use substances,emersion in a cultural setting in which substance use is condoned or encouraged, and isolationfrom the family and community imposed constraints on behaviour while in the US. Thepotential for interventions addressing these factors to reduce substance use among migrantsshould be examined.
The relationship between discrimination stress and increase in substance use among returnmigrants in this survey is also consistent with prior work among Latinos and Mexican-Americas in the US (9,35,36). This relationship may be due to the use of alcohol and drugs inan effort to relieve psychological distress or to the fact that Hispanics, in general, have a lowerSES which has been associated in Mexico with a greater likelihood of heavy drinking, alcoholabuse and dependence (37) and substance use (4). Research on the effects of ethnicdiscrimination and health is limited (38) and the mechanism by which return migrants withfeelings related to discrimination are more likely to use substances and continue to show higherlevels of substance use and substance use disorder is speculative.
Our results may be influenced by selection bias if migrants are more likely to use substancesthan the general population prior to migration to the US or if migrants to the US who use
Borges et al. Page 5
Addiction. Author manuscript; available in PMC 2010 April 1.
NIH
-PA Author Manuscript
NIH
-PA Author Manuscript
NIH
-PA Author Manuscript
substances are more likely to return to Mexico than migrants who do not use substances (39).Testing either of these hypotheses directly requires data on representative samples of migrantson both sides of the border, and information on the timing of substance use relative to migration.A study on alcohol use disorders among Mexicans and Mexican-Americans reported limitedevidence contrary to the first bias (40), and studies of related psychiatric outcomes are mixed.A study of suicidality by our group found no evidence of an association between migrationand suicidality prior to migration (i.e. comparing migrants with the Mexican generalpopulation) or between suicidality and return migration (i.e. comparing return migrants withmigrants remaining in the US) (41). A smaller study that included only English-speakingMexican-born migrants in the US found higher pre-migration prevalence of mood and anxietydisorder among migrants relative to the general Mexican population (42). Sociological studieshave found that compared with the general Mexican population migrants are more likely to bemarried (43), a status strongly associated with low levels of use of substances. Thus, there isno evidence to suggest that selective migration or selective return migration might account forour results, but these alternative explanations cannot be entirely ruled out without furtherstudies.
LimitationsThis study has important limitations that should be considered when interpreting the reportedfindings. First, this study is cross-sectional, cannot imply casual relationships and containslimited information on the relative timing of events. We do not have specific information onthe age of migration, age of return migration or age at initiation of substance use that wouldallow a more definitive statement of causal pathways. Future studies should includeinformation on the timing of these key events. Information on the timing of return migrationwould be particularly helpful in identifying the long term consequences of migration amongthose migrants who return to Mexico.
We also lack information on the number of times the individual migrated to the US and thenreturned to Mexico. Substance use and stress might vary by how many times an individualmigrated to the US and then returned, and should be investigated in future research. Finally,this survey relied on retrospective reports of immigration, substance use and dependence.Although prospectively collected data would be preferable, there is no reason to believe thaterrors in recall of substance use are related to migration experience in a way that would accountfor findings reported here.
ConclusionThis study supports previous findings showing that the risk for alcohol and drug use andsubstance use disorders in Mexico is associated to the migration experience of Mexicansworkers to the US, and may be particularly related to certain types of work, the length of stayin the US, and experiences of discrimination and associated stress. Public health measures tohelp cope with these factors are important and should be implemented on both sides of theMexico-US border. This effort is likely to require cross-border coordination of research andservice development. Future research is needed which is related to sequencing with precisionthe ordering of events (migration and substance use) or, minimally, to obtaining data onsubstance use in varying time frames (before, during and after migration) and to identify thequalitative aspects of migrant experience that could be linked to increased substance use.
References1. Merikangas KR, Mehta RL, Molnar BE, Walters EE, Swendsen JD, Aguilar-Gaziola S, et al.
Comorbidity of substance use disorders with mood and anxiety disorders: results of the InternationalConsortium in Psychiatric Epidemiology. Addict Behav 1998;23:893–907. [PubMed: 9801724]
Borges et al. Page 6
Addiction. Author manuscript; available in PMC 2010 April 1.
NIH
-PA Author Manuscript
NIH
-PA Author Manuscript
NIH
-PA Author Manuscript
2. Vega WA, Aguilar-Gaxiola S, Andrade L, Bijl R, Borges G, Caraveo-Anduaga JJ, et al. Prevalenceand age of onset for drug use in seven international sites: results from the international consortium ofpsychiatric epidemiology. Drug Alcohol Depend 2002;68:285–97. [PubMed: 12393223]
3. Room R. Multicultural contexts and alcohol and drug use as symbolic behaviour. Addiction ResearchTheory 2005;13:321–331.
4. Medina-Mora ME, Borges G, Fleiz C, Benjet C, Rojas E, Zambrano J, et al. Prevalence and correlatesof drug use disorders in Mexico. Rev Panam Salud Publica 2006;19:265–276. [PubMed: 16723068]
5. Medina-Mora, ME.; Natera, G.; Borges, G. Alcoholismo y abuso de bebidas alcohólicas. In: Secretaríade Salud. , editor. Observatorio Mexicano en Tabaco, Alcohol y Otras Drogas. CONADIC, Secretaríade Salud; Mexico City, Mexico: 2002. p. 15-25.
6. Wallisch LS, Spence RT. Alcohol and drug use, abuse, and dependence in urban areas and coloniasof the Texas–Mexico border. Hisp J Behav Sci 2006;28:286–307.
7. Burnam MA, Hough RL, Karno M, Escobar JI, Telles CA. Acculturation and lifetime prevalence ofpsychiatric disorders among Mexican Americans in Los Angeles. J Health Soc Behav 1987;28:89–102. [PubMed: 3571910]
8. Vega WA, Kolody B, Aguilar-Gaxiola S, Alderete E, Catalano R. Lifetime prevalence of DSM-III-Rpsychiatric disorders among urban and rural Mexican Americans in California. Arch Gen Psychiatry1998;55:771–778. [PubMed: 9736002]
9. Vega WA, Alderete E, Kolody B, Aguilar-Gaxiola S. Illicit drug use among Mexicans and MexicanAmericans in California: the effects of gender and acculturation. Addiction 1998;93:1839–1850.[PubMed: 9926572]
10. Grant BF, Stinson FS, Hasin DS, Dawson DA, Chou SP, Anderson K. Immigration and lifetimeprevalence of DSM-IV psychiatric disorders among Mexican Americans and non-Hispanic whitesin the United States: results from the National Epidemiologic Survey on Alcohol and RelatedConditions. Arch Gen Psychiatry 2004;61:1226–33. [PubMed: 15583114]
11. Borges G, Medina-Mora ME, Breslau J, Aguilar-Gaxiola S. The effect of migration to the UnitedStates on substance use disorders among returned Mexican migrants and families of migrants. Am JPublic Health 2007;97:1847–51. [PubMed: 17761563]
12. Sánchez-Huesca R, Arellanez-Hernández JL, Pérez-Islas V, Rodríguez-Kuri SE. Estudio de larelación entre consumo de drogas y migración a la frontera norte de México y Estados Unidos (Studyof the relationship between drug consumption and migration to the north border of Mexico and UnitedStates). Salud Mental 2006;29:35–43.
13. Vidal L, Tunón P, Rojas E, Ayús R. De Paraíso a Carolina del Norte. Redes de apoyo y percepcionesde la migración a Estados Unidos de mujeres tabasquenas despulpadoras de jaiba (From Paraíso toNorth Carolina. Support networks and perceptions from the migration to the United States of crabfarmer women from Tabasco). Migraciones Internacionales 2002;1:1–49.
14. Wagner F, Diaz DB, López AL, Collado ME, Aldaz E. Social cohesion, cultural identity, and druguse in Mexican rural communities. Subst Use Misuse 2002;37:715–47. [PubMed: 12117067]
15. Sanchez MA, Lemp GF, Magis-Rodríguez C, Bravo-García E, Carter S, Ruiz JD. The epidemiologyof HIV among Mexican migrants and recent immigrants in California and Mexico. J Acquir ImmuneDefic Syndr 2004;37:S204–14. [PubMed: 15722863]
16. Fosados R, Caballero-Hoyos R, Torres-López T, Valente TW. Condom use and migration in a sampleof Mexican migrants: potential for HIV/STI transmission. Salud Publica Mex 2006;48:57–61.[PubMed: 16555535]
17. Sundquist J, Winkleby M. Country of birth, acculturation status and abdominal obesity in a nationalsample of Mexican-American women and men. Int J Epidemiol 2000;29:470–7. [PubMed:10869319]
18. Kaplan MS, Huguet N, Newsom JT, McFarland BH. The association between length of residenceand obesity among Hispanic immigrants. Am J Prev Med 2004;27:323–6. [PubMed: 15488363]
19. Lara M, Gamboa C, Kahramanian MI, Morales LS, Bautista DE. Acculturation and Latino health inthe United States: a review of the literature and its sociopolitical context. Annu Rev Public Health2005;26:367–97. [PubMed: 15760294]
Borges et al. Page 7
Addiction. Author manuscript; available in PMC 2010 April 1.
NIH
-PA Author Manuscript
NIH
-PA Author Manuscript
NIH
-PA Author Manuscript
20. Medina-Mora, ME. Encuesta de Consumo de Alcohol, Tabaco y Drogas, 2005. Ciudad Juárez,Monterrey, Tijuana y Querétaro. Mexico City: Secretaria de Salud and Instituto Nacional dePsiquiatria; 2005. p. 1-62.
21. Medina-Mora ME, Borges D, Villatoro J. The measurement of drinking patterns and consequencesin Mexico. J Subst Abuse 2000;12:183–96. [PubMed: 11288470]
22. World Health Organization. Composite International Diagnostic Interview (Version authorize coreversion 1.1). Geneva, Switzerland: 1993.
23. American Psychiatric Association. Diagnostic and statistical manual of mental disorders. Vol. 4th.Washington, DC: 1994.
24. Caetano R, Room R. Alcohol dependence in the 1990 U.S. National Alcohol Survey: Operationalizingand comparing two nosological systems. Drug and Alcohol Review 1994;13:257–267. [PubMed:16818337]
25. Caetano R, Tam TW. Prevalence and correlates of DSM-IV and ICD-10 alcohol dependence: 1990U.S. National Alcohol Survey. Alcohol Alcohol 1995;30:177–186. [PubMed: 7662036]
26. Research Triangle Institute. Research Triangle Park [Sudaan Release 8.0.1]. NC: Research TriangleInstitute; 2002.
27. Hosmer, DW.; Lemeshow, S. Applied Logistic Regression. New York: John Wiley & Sons; 2000.28. Bucardo J, Brouwer KC, Magis-Rodríguez C, Ramos R, Fraga M, Perez SG, et al. Historical trends
in the production and consumption of illicit drugs in Mexico: implications for the prevention of blood-borne infections. Drug Alcohol Depend 2005;79:281–293. [PubMed: 16102372]
29. Medina-Mora ME, Cravioto P, Ortiz A, Kuri P, Villatoro J. Mexico: systems for the epidemiologicaldiagnosis of drug abuse. Bull Narc 2003;55:105–109.
30. Medina-Mora ME, Guiot ER. Demand of drugs: Mexico in the international perspective. Salud Mental2003;26:1–11.
31. Gfroerer JC, Tan LL. Substance use among foreign-born youths in the United States: does the lengthof residence matter? Am J Public Health 2003;93:1892–5. [PubMed: 14600061]
32. Alderete E, Vega WA, Kolody B, Aguilar-Gaxiola S. Lifetime prevalence of and risk factors forpsychiatric disorders among Mexican migrant farmworkers in California. Am J Public Health2000;90:608–14. [PubMed: 10754977]
33. Grzywacz JG, Quandt SA, Isom S, Arcury TA. Alcohol use among immigrant Latino farmworkersin North Carolina. Am J Ind Med 2007;50:617–25. [PubMed: 17579343]
34. Worby PA, Organista KC. Alcohol use and problem drinking among male Mexican and centralAmerican im/migrant laborers - A review of the literature. Hispanic Journal of Behavioral Sciences2007;29:413–455.
35. Romero AJ, Martinez D, Carvajal SC. Bicultural stress and adolescent risk behaviors in a communitysample of Latinos and non-Latino European Americans. Ethn Health 2007;12:443–63. [PubMed:17978943]
36. Turner RJ, Lloyd DA, Taylor J. Stress burden, drug dependence and the nativity paradox among U.S.Hispanics. Drug Alcohol Depend 2006;83:79–89. [PubMed: 16330158]
37. Borges G, Medina-Mora ME, Lara C, Zambrano J, Benjet C, Fleiss C. Alcohol use and alcohol usedisorders in Mexico. Contemporary Drug Problems 2007;24:389–410.
38. Williams DR, Neighbors HW, Jackson JS. Racial/ethnic discrimination and health: findings fromcommunity studies. Am J Public Health 2003;93:200–8. [PubMed: 12554570]
39. Abraído-Lanza AF, Dohrenwend BP, Ng-Mak DS, Turner JB. The Latino mortality paradox: a testof the “salmon bias” and healthy migrant hypotheses. Am J Public Health 1999;89:1543–8. [PubMed:10511837]
40. Borges G, Medina-Mora ME, Lown A, Ye Y, Robertson MJ, Cherpitel C, et al. Alcohol use disordersin national samples of Mexicans and Mexican–Americans—The Mexican National Addiction Surveyand the U.S. National Alcohol Survey. Hispanic Journal of Behavioral Sciences 2006;28:425–449.
41. Borges G, Breslau J, Su M, Miller M, Medina-Mora ME, Aguilar-Gaxiola S. Immigration and suicidalbehavior among Mexicans and Mexican-Americans. Am J Public Health. in press
Borges et al. Page 8
Addiction. Author manuscript; available in PMC 2010 April 1.
NIH
-PA Author Manuscript
NIH
-PA Author Manuscript
NIH
-PA Author Manuscript
42. Breslau J, Aguilar-Gaxiola S, Borges G, Castilla-Puentes RC, Kendler KS, Medina-Mora ME, et al.Mental disorders among English-speaking Mexican immigrants to the US compared to a nationalsample of Mexicans. Psychiatry Res 2007;151:115–22. [PubMed: 17363072]
43. Massey D, Espinosa K. What's Driving Mexico-U.S. Migration? A Theoretical, Empirical and PolicyAnalysis. American J Sociology 1997;102:939–999.
Borges et al. Page 9
Addiction. Author manuscript; available in PMC 2010 April 1.
NIH
-PA Author Manuscript
NIH
-PA Author Manuscript
NIH
-PA Author Manuscript
NIH
-PA Author Manuscript
NIH
-PA Author Manuscript
NIH
-PA Author Manuscript
Borges et al. Page 10Ta
ble
1D
istr
ibut
ion
of th
e sa
mpl
e by
dem
ogra
phic
cha
ract
eris
tics a
nd im
mig
ratio
n st
atus
. Mex
ico,
thre
e ci
ties s
urve
y, 2
005
No
mig
rant
exp
. (n=
1,25
8)R
etur
ning
mig
rant
(n=1
00)
Mig
rant
rel
ativ
e (n
=272
)n
% (S
.E.)
n%
(S.E
.)n
% (S
.E.)
X2(d
f)p
Sex
M
ale
521
48.6
0 (2
.09)
7379
.95
(3.9
5)97
45.2
7 (3
.54)
46.4
(2)
<0.0
01
Fem
ale
737
51.4
0 (2
.09)
2720
.05
(3.9
5)17
554
.73
(3.5
4)A
ge
12-2
550
146
.56
(1.8
6)10
10.6
0 (3
.01)
4618
.24
(2.1
2)13
0.7
(4)
<0.0
01
26-3
426
523
.03
(1.4
7)17
25.3
2 (4
.86)
6831
.69
(3.2
6)
35+
492
30.4
1 (1
.65)
7364
.08
(4.2
0)15
850
.07
(3.3
5)E
duca
tion
N
one/
Elem
enta
ry sc
hool
363
27.0
5 (1
.25)
5552
.21
(4.1
8)98
33.6
4 (2
.57)
53.9
(6)
<0.0
01
Juni
or H
igh
486
39.8
9 (1
.19)
3234
.45
(4.6
0)97
37.9
5 (3
.13)
H
igh
Scho
ol22
919
.25
(1.1
0)11
10.7
4 (3
.60)
4617
.02
(2.8
6)
Uni
vers
ity +
180
13.8
1 (1
.36)
22.
60 (1
.78)
3111
.39
(2.3
8)M
arita
l sta
tus
Si
ngle
482
45.1
8 (1
.51)
1515
.08
(4.5
2)51
19.7
6 (2
.55)
130.
3 (4
)<0
.001
M
arrie
d / L
ivin
g w
ith
som
eone
648
47.6
5 (1
.27)
6372
.13
(3.8
9)18
973
.58
(2.9
4)
Wid
owed
/Div
orce
d/Se
para
ted
128
7.17
(0.6
6)22
12.7
9 (3
.44)
326.
67 (1
.38)
City
Ti
juan
a37
529
.63
(1.5
8)39
43.3
5 (5
.43)
9233
.41
(3.0
8)35
.1 (4
)<0
.001
C
iuda
d Ju
árez
368
29.6
1 (1
.19)
3730
.50
(4.1
0)10
941
.81
(3.2
7)
Mon
terr
ey51
540
.76
(1.4
0)24
26.1
5 (4
.71)
7124
.77
(2.5
1)W
orke
d in
the
last
12m
Y
es62
050
.15
(1.8
7)73
76.0
1 (5
.11)
139
57.3
0 (3
.37)
22.1
(2)
<0.0
01
No
638
49.8
5 (1
.87)
2723
.99
(5.1
1)13
342
.70
(3.3
7)
n's a
re u
nwei
ghte
d. P
erce
ntag
e ar
e w
eigh
ted
Addiction. Author manuscript; available in PMC 2010 April 1.
NIH
-PA Author Manuscript
NIH
-PA Author Manuscript
NIH
-PA Author Manuscript
Borges et al. Page 11Ta
ble
2AL
ifetim
e pr
eval
ence
of a
lcoh
ol a
nd d
rug
use
and
imm
igra
tion
stat
us. M
exic
o, th
ree
citie
s sur
vey,
200
5
No
mig
rant
exp
. (n=
1,25
8)R
etur
ning
mig
rant
(n=1
00)
Mig
rant
rel
ativ
e (n
=272
)n
% (S
.E.)
OR
195
% C
In
% (S
.E.)
OR
195
% C
In
% (S
.E.)
OR
195
% C
I
Use
A
lcoh
ol
No
329
26.8
1 (2
.19)
85.
82 (1
.95)
5117
.89
(3.0
0)
Yes
929
73.1
9 (2
.19)
1.00
- -92
94.1
8 (1
.95)
5.93
(2.8
4-12
.38)
221
82.1
1 (3
.00)
1.68
(1.0
7-2.
63)
D
rugs
Mar
ihua
na
No
1142
89.8
9 (1
.30)
6263
.45
(5.4
5)23
885
.55
(2.0
9)
Yes
116
10.1
1 (1
.30)
1.00
- -38
36.5
5 (5
.45)
5.12
(3.3
2-7.
90)
3414
.45
(2.0
9)1.
50(0
.96-
2.35
)
Cra
ck /
Coc
aine
No
1201
95.6
7 (0
.82)
7778
.04
(4.0
7)25
594
.23
(1.4
6)
Yes
574.
33 (0
.82)
1.00
- -23
21.9
6 (4
.07)
6.21
(3.2
3-11
.95)
175.
77 (1
.46)
1.35
(0.7
6-2.
41)
Oth
er
No
1208
96.5
6 (0
.44)
8583
.29
(4.1
7)25
192
.97
(2.1
8)
Yes
503.
44 (0
.44)
1.00
- -15
16.7
1 (4
.17)
5.64
(2.7
8-11
.44)
217.
03 (2
.18)
2.13
(1.1
6-3.
89)
Any
Dru
g
No
1103
86.9
1 (1
.30)
5857
.91
(5.6
9)22
581
.74
(2.6
9)
Yes
155
13.0
9 (1
.30)
1.00
- -42
42.0
9 (5
.69)
4.82
(3.2
3-7.
20)
4718
.26
(2.6
9)1.
48(0
.96-
2.28
)
Num
ber
Non
e11
0386
.91
(1.3
0)1.
00- -
5857
.91
(5.6
9)1.
00- -
225
81.7
4 (2
.69)
1.00
- -
One
103
9.30
(0.9
9)1.
00- -
1819
.19
(4.9
1)3.
10(1
.70-
5.65
)29
11.7
5 (1
.87)
1.34
(0.8
5-2.
13)
Two
or m
ore
523.
79 (0
.61)
1.00
- -24
22.9
0 (4
.58)
9.06
(5.0
3-16
.30)
186.
50 (1
.73)
1.82
(0.9
4-3.
52)
Dep
ende
nce
D
rugs
No
1242
98.7
7 (0
.37)
9694
.42
(0.8
5)26
898
.26
(0.7
7)
Yes
161.
23 (0
.37)
1.00
- -4
5.58
(0.8
5)4.
73(2
.24-
9.99
)4
1.74
(0.7
7)1.
42(0
.38-
5.26
)
Cru
de o
dds r
atio
from
logi
stic
regr
essi
onn'
s are
unw
eigh
ted.
Per
cent
age
are
wei
ghte
d Tab
le 2
B. 1
2-M
onth
pre
vale
nce
of a
lcoh
ol a
nd d
rug
use
and
imm
igra
tion
stat
us. M
exic
o, th
ree
citie
s sur
vey,
200
5.
No
mig
rant
exp
. (n=
1,25
8)R
etur
ning
mig
rant
(n=1
00)
Mig
rant
rel
ativ
e (n
=272
)n
% (S
.E.)
OR
195
% C
In
% (S
.E.)
OR
195
% C
In
% (S
.E.)
OR
195
% C
I
Use
A
lcoh
ol
No
649
49.8
4 (2
.35)
3935
.64
(6.5
8)14
149
.09
(3.8
6)
Yes
609
50.1
6 (2
.35)
1.00
- -61
64.3
6 (6
.58)
1.79
(1.0
1-3.
19)
131
50.9
1 (3
.86)
1.03
(0.7
7-1.
39)
A
lcoh
ol -
Hea
vy d
rink
er
No
1108
87.2
4 (1
.17)
7269
.85
(4.2
0)23
784
.74
(2.3
5)
Yes
150
12.7
6 (1
.17)
1.00
- -28
30.1
5 (4
.20)
2.95
(1.9
1-4.
55)
3515
.26
(2.3
5)1.
23(0
.90-
1.68
)
Dru
gs
Mar
ihua
na
No
1237
98.0
2 (0
.67)
9492
.08
(1.7
9)26
898
.28
(0.7
5)
Yes
211.
98 (0
.67)
1.00
- -6
7.92
(1.7
9)4.
27(1
.61-
11.3
2)4
1.72
(0.7
5)0.
87(0
.24-
3.10
)
Cra
ck /
Coc
aine
No
1248
99.2
9 (0
.24)
9693
.52
(1.1
7)27
099
.05
(0.7
1)
Yes
100.
71 (0
.24)
1.00
- -4
6.48
(1.1
7)9.
64(4
.26-
21.8
1)2
0.95
(0.7
1)1.
34(0
.24-
7.43
)
Oth
er
No
1241
98.8
4 (0
.28)
9897
.04
(2.3
8)26
697
.76
(0.8
3)
Addiction. Author manuscript; available in PMC 2010 April 1.
NIH
-PA Author Manuscript
NIH
-PA Author Manuscript
NIH
-PA Author Manuscript
Borges et al. Page 12N
o m
igra
nt e
xp. (
n=1,
258)
Ret
urni
ng m
igra
nt (n
=100
)M
igra
nt r
elat
ive
(n=2
72)
n%
(S.E
.)O
R1
95%
CI
n%
(S.E
.)O
R1
95%
CI
n%
(S.E
.)O
R1
95%
CI
Yes
171.
16 (0
.28)
1.00
- -2
2.96
(2.3
8)2.
61(0
.46-
14.7
5)6
2.24
(0.8
3)1.
96(0
.96-
3.99
)
Any
Dru
g
No
1218
96.7
6 (0
.53)
9391
.12
(1.8
3)26
597
.26
(1.2
3)
Yes
403.
24 (0
.53)
1.00
- -7
8.88
(1.8
3)2.
91(1
.43-
5.90
)7
2.74
(1.2
3)0.
84(0
.32-
2.23
)
Num
ber
Non
e12
1896
.76
(0.5
3)1.
00- -
9391
.12
(1.8
3)1.
00- -
265
97.2
6 (1
.23)
1.00
- -
One
312.
58 (0
.47)
1.00
- -3
3.04
(1.7
5)1.
25(0
.31-
5.06
)4
1.53
(1.0
7)0.
59(0
.14-
2.46
)
Two
or m
ore
90.
66 (0
.21)
1.00
- -4
5.84
(1.1
8)9.
42(4
.16-
21.3
1)3
1.21
(0.5
4)1.
83(0
.61-
5.48
)D
epen
denc
e
Alc
ohol
No
1183
93.4
9 (0
.91)
8486
.54
(4.2
0)25
492
.88
(1.6
1)
Yes
756.
51 (0
.91)
1.00
- -16
13.4
6 (4
.20)
2.23
(0.9
3-5.
36)
187.
12 (1
.61)
1.10
(0.5
6-2.
16)
D
rugs
No
1247
99.3
5 (0
.18)
9795
.06
(0.6
5)26
898
.26
(0.7
7)
Yes
110.
65 (0
.18)
1.00
- -3
4.94
(0.6
5)7.
90(3
.87-
16.1
5)4
1.74
(0.7
7)2.
69(0
.90-
8.02
)
Alc
ohol
or
drug
s
No
1177
93.1
3 (0
.90)
8383
.90
(2.7
2)25
292
.20
(1.6
7)
Yes
816.
87 (0
.90)
1.00
- -17
16.1
0 (2
.72)
2.60
(1.6
2-4.
16)
207.
80 (1
.67)
1.15
(0.6
1-2.
16)
Cru
de o
dds r
atio
from
logi
stic
regr
essi
on
n's a
re u
nwei
ghte
d. P
erce
ntag
e ar
e w
eigh
ted
Addiction. Author manuscript; available in PMC 2010 April 1.
NIH
-PA Author Manuscript
NIH
-PA Author Manuscript
NIH
-PA Author Manuscript
Borges et al. Page 13Ta
ble
3AL
ifetim
e an
d 12
-mon
th o
dds r
atio
s of a
lcoh
ol a
nd d
rug
use
amon
g re
turn
mig
rant
s. M
exic
o, th
ree
citie
s sur
vey,
200
5
Eve
r us
ed a
lcoh
olE
ver
used
dru
gs12
mon
th h
eavy
alc
ohol
12 m
onth
any
dru
g us
e12
mon
th a
lcoh
ol-d
rug
depe
nden
ceO
R95
% C
IO
R95
% C
IO
R95
% C
IO
R95
% C
IO
R95
% C
I
Ret
urn
mig
rant
s
(yes
/no)
3.40
(1.6
1-7.
15)
2.48
(1.3
3-4.
63)
1.69
(1.0
5-2.
70)
2.19
(1.0
7-4.
45)
1.47
(0.8
6-2.
53)
T
ime
in th
e U
S
No
mig
rant
1.00
--1.
00--
1.00
--1.
00--
1.00
--
Less
than
a y
ear
7.59
(1.1
9-48
.43)
1.27
(0.5
9-2.
72)
1.53
(0.9
2-2.
53)
1.70
(0.2
9-10
.04)
0.86
(0.4
3-1.
71)
One
to th
ree
year
s1.
46(0
.46-
4.62
)6.
60(2
.29-
19.0
3)1.
28(0
.50-
3.31
)3.
41(0
.87-
13.3
4)2.
07(1
.12-
3.84
)
Four
or m
ore
year
s4.
11(0
.65-
25.8
5)3.
72(1
.12-
12.4
0)4.
11(1
.10-
15.3
0)1.
57(0
.11-
23.1
1)3.
53(0
.66-
18.7
8)
X2, [
p]9.
92 [
0.01
9 ]
15.1
2 [ 0
.002
]6.
93 [
0.07
4 ]
6.49
[ 0.
090
]6.
41 [
0.09
3 ]
T
ype
of w
ork
No
mig
rant
1.00
--1.
00--
1.00
--1.
00--
1.00
--
Serv
ices
†--
3.83
(1.0
5-13
.93)
3.83
(1.2
8-11
.49)
3.92
(0.5
5-28
.01)
1.16
(0.3
0-4.
56)
Farm
ing/
Bui
ldin
g4.
77(0
.52-
43.4
5)2.
32(1
.09-
4.94
)2.
14(1
.02-
4.50
)2.
71(0
.68-
10.8
0)2.
10(0
.98-
4.53
)
Dom
estic
serv
ice
1.39
(0.5
1-3.
81)
2.38
(0.8
6-6.
56)
0.60
(0.1
6-2.
24)
†--
1.39
(0.2
4-8.
05)
Oth
er16
.38
(2.4
9-10
7.60
)1.
76(0
.67-
4.67
)0.
25(0
.03-
2.32
)1.
66(0
.15-
19.0
8)†
--
X2, [
p]17
.39
[ 0.0
01 ]
9.21
[ 0.
056
]17
.83
[ 0.0
01 ]
11.6
3 [ 0
.009
]5.
41 [
0.14
4 ]
T
hose
who
wor
ked-
had
stre
ss
No
mig
rant
1.00
--1.
00--
1.00
--1.
00--
1.00
--
No
stre
ss1.
32(0
.39-
4.54
)5.
01(1
.23-
20.4
9)6.
04(1
.75-
20.8
0)0.
85(0
.09-
7.66
)0.
55(0
.12-
2.55
)
Med
ium
2.20
(0.2
9-16
.51)
6.83
(1.7
8-26
.15)
1.98
(0.4
4-8.
94)
4.64
(0.6
7-32
.15)
4.78
(1.3
1-17
.38)
Hig
h4.
91(0
.51-
46.9
0)4.
75(1
.03-
21.8
2)0.
70(0
.12-
4.03
)3.
25(0
.52-
20.1
7)2.
44(1
.16-
5.12
)
X2, [
p]2.
78 [
0.42
8 ]
15.1
1 [ 0
.002
]15
.74
[ 0.0
01 ]
2.86
[ 0.
413
]17
.59
[ 0.0
01 ]
† Cou
ld n
ot b
e co
mpu
ted
due
to z
ero
cell
1 Adj
uste
d od
ds ra
tio fr
om lo
gist
ic re
gres
sion
con
trolli
ng fo
r sex
, age
, mar
ital s
tatu
s, ed
ucat
ion
and
city
of r
esid
ence
Tab
le 3
B. L
ifetim
e an
d 12
-mon
th o
dds r
atio
s of a
lcoh
ol a
nd d
rug
use
amon
g re
lativ
es o
f mig
rant
s. M
exic
o, th
ree
citie
s sur
vey,
200
5.
Eve
r us
ed a
lcoh
olE
ver
used
dru
gs12
mon
th h
eavy
alc
ohol
12 m
onth
any
dru
g us
e12
mon
th a
lcoh
ol-d
rug
depe
nden
ceO
R95
% C
IO
R95
% C
IO
R95
% C
IO
R95
% C
IO
R95
% C
I
Mig
rant
rel
ativ
e
(yes
/no)
1.30
(0.7
5-2.
23)
1.17
(0.6
3-2.
18)
1.12
(0.7
3-1.
71)
0.79
(0.2
5-2.
48)
1.25
(0.6
0-2.
57)
T
ime
in th
e U
S
No
mig
rant
1.00
--1.
00--
1.00
--1.
00--
1.00
--
One
yea
r1.
17(0
.42-
3.23
)1.
19(0
.24-
5.79
)2.
53(0
.73-
8.73
)1.
11(0
.15-
8.45
)3.
29(0
.66-
16.3
8)
Two
or th
ree
year
s3.
26(0
.69-
15.4
4)0.
27(0
.03-
2.47
)1.
18(0
.29-
4.78
)0.
76(0
.03-
18.0
0)1.
06(0
.14-
8.25
)
Four
or m
ore
year
s1.
19(0
.56-
2.52
)1.
40(0
.80-
2.46
)0.
91(0
.54-
1.55
)0.
73(0
.20-
2.63
)0.
93(0
.57-
1.50
)
X2, [
p]3.
91 [
0.27
2 ]
6.20
[ 0.
102
]3.
65 [
0.30
2 ]
0.27
[ 0.
966
]2.
96 [
0.39
7 ]
T
ype
of w
ork
No
mig
rant
1.00
--1.
00--
1.00
--1.
00--
1.00
--
Serv
ices
0.85
(0.3
5-2.
04)
0.71
(0.2
7-1.
86)
0.83
(0.3
0-2.
30)
1.44
(0.3
8-5.
42)
0.97
(0.2
2-4.
31)
Farm
ing/
Bui
ldin
g1.
14(0
.50-
2.59
)0.
92(0
.39-
2.14
)1.
72(0
.92-
3.19
)0.
56(0
.08-
3.98
)1.
83(0
.60-
5.56
)
Dom
estic
serv
ice
1.44
(0.5
2-3.
99)
3.17
(1.0
0-10
.00)
3.71
(1.2
2-11
.25)
†--
2.97
(0.9
2-9.
51)
Oth
er2.
21(0
.63-
7.79
)1.
87(0
.66-
5.32
)0.
46(0
.16-
1.35
)0.
58(0
.06-
5.18
)0.
55(0
.13-
2.39
)
X2, [
p]2.
57 [
0.63
2 ]
6.33
[ 0.
176
]11
.43
[ 0.0
22 ]
1.73
[ 0.
630
]6.
85 [
0.14
4 ]
N
umbe
r of
mig
rant
s in
the
fam
ily
Non
e1.
00--
1.00
--1.
00--
1.00
--1.
00--
One
1.27
(0.6
3-2.
53)
1.26
(0.6
5-2.
43)
1.36
(0.8
2-2.
25)
0.61
(0.1
6-2.
35)
1.24
(0.4
4-3.
44)
Addiction. Author manuscript; available in PMC 2010 April 1.
NIH
-PA Author Manuscript
NIH
-PA Author Manuscript
NIH
-PA Author Manuscript
Borges et al. Page 14
Eve
r us
ed a
lcoh
olE
ver
used
dru
gs12
mon
th h
eavy
alc
ohol
12 m
onth
any
dru
g us
e12
mon
th a
lcoh
ol-d
rug
depe
nden
ceO
R95
% C
IO
R95
% C
IO
R95
% C
IO
R95
% C
IO
R95
% C
I
Two
or m
ore
1.36
(0.7
7-2.
41)
1.02
(0.4
5-2.
29)
0.73
(0.3
3-1.
62)
1.17
(0.2
6-5.
25)
1.27
(0.6
1-2.
61)
X2, [
p]1.
49 [
0.47
6 ]
0.64
[ 0.
726
]1.
87 [
0.39
3 ]
0.83
[ 0.
661
]0.
58 [
0.74
7 ]
H
ow o
ften
com
mun
icat
e
No
mig
rant
1.00
--1.
00--
1.00
--1.
00--
1.00
--
At l
east
onc
e or
twic
e a
wee
k1.
16(0
.47-
2.85
)0.
80(0
.40-
1.57
)1.
30(0
.55-
3.06
)0.
35(0
.08-
1.49
)2.
27(0
.75-
6.88
)
At l
east
onc
e a
mon
th o
r a y
ear
1.39
(0.6
4-3.
04)
1.36
(0.6
8-2.
70)
1.04
(0.6
4-1.
67)
1.00
(0.2
5-4.
08)
0.85
(0.4
2-1.
73)
X2, [
p]1.
01 [
0.60
2 ]
3.14
[ 0.
208
]0.
43 [
0.80
5 ]
2.47
[ 0.
291
]2.
93 [
0.23
2 ]
† Cou
ld n
ot b
e co
mpu
ted
due
to z
ero
cell
1 Adj
uste
d od
ds ra
tio fr
om lo
gist
ic re
gres
sion
con
trolli
ng fo
r sex
, age
, mar
ital s
tatu
s, ed
ucat
ion
and
city
of r
esid
ence
Addiction. Author manuscript; available in PMC 2010 April 1.