new mexico substance abuse epidemiology profile
TRANSCRIPT

New Mexico Substance Abuse Epidemiology Profile
Substance Abuse Epidemiology Program Injury and Behavioral Epidemiology Bureau
Epidemiology and Response Division
New Mexico Department of Health
This document made possible by the NMHSD Behavioral Health Services Division Office of Substance Abuse Prevention through
a generous allocation of funds from the State Epidemiological Outcomes Workgroup (SEOW) grant it received from the
Substance Abuse and Mental Health Services Administration Center for Substance Abuse Prevention (SAMHSA-CSAP);
and by funding from the Centers for Disease Control and Prevention (CDC) Alcohol Team.
July 2011

New Mexico Substance Abuse Epidemiology Profile

Epidemiology and Response Division
Injury and Behavioral Epidemiology Bureau
Substance Abuse Epidemiology Program
Survey Section
Office of Injury Prevention
New Mexico Substance Abuse Epidemiology Profile
NEW MEXICO DEPARTMENT OF HEALTH
Dr. Catherine D. Torres, MD, Secretary
C. Mack Sewell, DrPH, MS, Director and State EpidemiologistMichael Landen, MD, MPH, Deputy State Epidemiologist
Nina Shah, MS, Drug EpidemiologistJim Roeber, MSPH, Alcohol Epidemiologist
Toby Rosenblatt, MPA, Bureau Chief
Dan Green, MPH, YRRS Coordinator and Survey Epidemiologist
Tierney Murphy, MD, MPH, Injury Epidemiologist

SPF-SIG Statewide Epidemiology Workgroup (SEW)
New Mexico Substance Abuse Epidemiology Profile
Acknowledgments
The State Epidemiological Outcomes Workgroup (SEOW) is a core component funded by the State Epidemiological Outcomes Workgroup grant. Its focus is the development of assessment data and indicators for use in planning and evaluation. The workgroup includes the following individuals: Jim Roeber and Nina Shah, NMDOH-ERD Substance Abuse Epidemiology Program; Daphne Rood-Hopkins and Karen Cheman, NMHSD-BHSD Office of Substance Abuse Prevention; Glenn Wieringa, New Mexico Department of Transportation Traffic Safety Bureau; Brenda Martinez, Optum Health; Nadine Tafoya, community member; Ann DelVecchio, community member; Sindy Sacoman, community member; Paula Feathers, New Mexico ATODA Prevention Training System; Martha Waller and Liz Lilliott, PIRE (under contract to the OSAP); and, is coordinated and staffed by Michael Coop and Natalie Skogerboe, Coop Consulting, Inc.
The New Mexico Substance Abuse Epidemiology Profile was prepared by the New Mexico Department of Health (NMDOH) Epidemiology and Response Division (ERD) Injury and Behavioral Epidemiology Bureau (IBEB) Substance Abuse Epidemiology Program (SAEP), with data provision and analytic support from the NMDOH IBEB Survey Section; and was made possible by the generous support of the NMHSD Behavioral Health Services Division (BHSD) Office of Substance Abuse Prevention (OSAP), based on an allocation from the State Epidemiological Outcomes Workgroup (SEOW) grant received from the Substance Abuse and Mental Health Services Administration Center for Substance Abuse Prevention (SAMHSA-CSAP); and by funding from the Centers for Disease Control and Prevention (CDC) Alcohol Team.

PageIntroduction iii
- Technical Note: Methodological Changes since Previous Reports vi
Executive Summary vii
- Data Sources ix
I. Consequences 1
A. Alcohol-Related Death 3
1. Alcohol-Related Chronic Disease Death 7 (a) Alcohol-Related Chronic Liver Disease Death 11
2. Alcohol-Related Injury Death 15 (a) Alcohol-Related Motor Vehicle Crash Death 19
B. Smoking-Related Death 23
C. Drug-Induced Death 27
D. Suicide 33
E. Adult Mental Health 37
1. Frequent Mental Distress (BRFSS) 37
2. Current Depression (BRFSS) 41
F. Youth Mental Health 45
1. Persistent Sadness or Hopelessness (YRRS) 45
2. Seriously Considered Suicide (YRRS) 49 3. Attempted Suicide (YRRS) 53
4. Risk and Resiliency (YRRS) 57
II. Consumption 61
A. Alcohol 63
1. Binge Drinking (a) Adult Binge Drinking (BRFSS) 63 (b) Youth Binge Drinking (YRRS) 67
2. Heavy Drinking (a) Adult Heavy Drinking (BRFSS) 71
3. Drinking and Driving (a) Adult Drinking and Driving (BRFSS) 75 (b) Youth Drinking and Driving (YRRS) 79
B. Illicit Drugs
1. Youth Marijuana Use (YRRS) 83
2. Youth Cocaine Use (YRRS) 87 3. Youth Painkiller Use to Get High (YRRS) 91
4. Youth Other Drug Use (YRRS) 95
New Mexico Substance Abuse Epidemiology Profile Page i
TABLE OF CONTENTS
Sections

II. Consumption (continued) 99
C. Tobacco
1. Adult Cigarette Smoking (BRFSS) 99
2. Youth Cigarette Smoking (YRRS) 103
Appendices
1. State Population by Age, Sex, Race/Ethnicity, and County, 2007 107
2. Substance Abuse and Mental Health by Region, Age 12+, 2006-2008 115
Page ii
TABLE OF CONTENTS (continued)

New Mexico Substance Abuse Epidemiology Profile
Important Note about Comparability to Previous Reports
New Additions this Report
How to Use this Report
New Mexico Substance Abuse Epidemiology Profile Page iii
INTRODUCTION
The New Mexico Substance Abuse Epidemiology Profile is a tool for substance abuse prevention planners at thecounty and community level. The primary purpose is to support efforts related to the State EpidemiologicalOutcomes Workgroup (SEOW) grant received by the New Mexico Human Services Department (NMHSD)Behavioral Health Services Division (BHSD) Office of Substance Abuse Prevention (OSAP) from the SubstanceAbuse and Mental Health Services Administration Center for Substance Abuse Prevention (SAMHSA-CSAP). TheSEOW funding is intended to develop resources to help communities conduct needs assessments regardingsubstance use and its consequences, build capacity to address those needs, and plan, implement and evaluateevidence-based programs, policies and practices designed to address the intervening variables related to identifiedsubstance-related problems. This document will be useful to those preparing proposals for funding, and to programplanners designing substance abuse prevention interventions for other purposes.
The main section of the profile presents several major indicators of substance abuse in New Mexico. Thesemajor indicators include outcome indicators (e.g., major causes of alcohol-related death) and indicators ofsubstance abuse consumption behavior (i.e., self-reported substance use behavior from statewide surveys). Thepresentation of each major indicator includes a text description of the major data findings; a detailed table withresults by gender, age-group, and race/ethnicity; a table detailing county results by race/ethnicity; a bar chart and amap with rates for each New Mexico county; and additional charts illustrating other pertinent findings. For example,charts of recent trends are included for numerous indicators. There is also an appendix that provides populationdenominators used in the calculation of death rates included in this report.
A combined five-year period is used when presenting death rates. Combining deaths over multiple years isnecessary because in many of New Mexico's small counties there are very few deaths due to a given cause in anygiven year. Combining deaths over multiple years allows the calculation of rates that are more stable and thereforemore meaningful than rates calculated based on very few cases. Death rates were calculated and reported for thefive-year period 2005-2009 for all reported causes of death. These represented the most current years of dataavailable when this report was compiled.
This report is the third in a series that began with the New Mexico State Epidemiology Profile published in 2005(available at http://nmhealth.org/ERD/HealthData/pdf/SPF-SIG_State_Epi_Report_v3.2.pdf); and continued with theNew Mexico Substance Abuse Epidemiology Profile published in 2010 (available athttp://nmhealth.org/ERD/HealthData/SubstanceAbuse/2010%20New%20Mexico%20Substance%20Abuse%20Epidemiology%20Profile.pdf). Each report has reflected important methodological changes from the previous report inthis series. As a result, this 2011 report is not comparable to previous reports in the series in several importantways. The following categories should not be compared between the reports in this series:
- Death counts and/or rates for any alcohol-related death indicators should not be compared between the 2005report and any later reports
- Race/ethnicity reporting for indicators based on deaths or the Behavioral Risk Factor Surveillance Survey(BRFSS) should not be compared between the 2005 report and any later reports
- Race/ethnicity reporting for indicators based on the Youth Risk and Resiliency Survey (YRRS) should not becompared between the 2005 or 2010 reports and the 2011 reports
The methodological changes and their impact on the comparability of reports in this series are described in moredetail in a technical note at the end of this section.
This report contains some new indicators added since the previous (2010) edition, intended to support theSubstance Abuse and Mental Health Services Administration's increased focus on mental health and co-morbiditiesof substance abuse, in addition to its ongoing focus on substance abuse prevention. These new indicators include:new sections on suicide and adult mental health; new sections on youth persistent sadness and hopelessness andyouth seriously considering and/or attempting suicide; a new section on youth risk and resiliency and its associationwith other risk behaviors; and a new appendix which includes estimates of substance use and mental healthdisorders by New Mexico health region, from the National Survey on Drug Use and Health.

Use of this Report: The Problem Statements
Use of this Report: Tables and Charts
Use of this Report: Rates and Numbers
New Mexico Substance Abuse Epidemiology Profile Page iv
INTRODUCTION (continued)
Both death rates and the numbers of deaths are presented in the tables and charts of the Epidemiology Profile.While the rates are very important in indicating the severity of an indicator within any given county or populationgroup, they only provide part of the picture when comparing the burden of a problem from one county or group toanother. For instance, Rio Arriba County has an alcohol-related death rate (100.8 per 100,000 population) morethan twice that of Bernalillo County (47.8 per 100,000). However, the number of alcohol-related deaths inBernalillo County (1,499) is more than seven times the number in Rio Arriba County (211). Another way ofexpressing a similar idea is to say that Bernalillo County accounts for 30.7% of all alcohol-related deaths in thestate, and Rio Arriba County accounts for 4.3%. When prioritizing the distribution of resources and selectinginterventions, it is important to look at both the total number of deaths and the death rate. Because of theextremely high rate of alcohol-related deaths, interventions that address this problem are very important in RioArriba County. At the same time, Bernalillo County is also very important when locating interventions because itbears much of the statewide burden of alcohol-related deaths.
Each of the outcome indicators is presented with at least two tables. Table 1 for each indicator presents deathsand death rates by sex, age group, and race/ethnicity. In sections that report on causes of death, these tablesinclude the numbers of deaths on the left side of the table, and age-adjusted death rates per 100,000 populationon the right side of the table. In sections that report on adult risk behaviors, these tables include an estimate of thenumber of persons engaging in the risk behavior, on the left side of the table, and the prevalence rate of thebehavior in the population, on the right side of the table. In sections that report on youth risk behaviors Table 1includes only prevalence rates. These tables are very useful in determining the most important risk groups at thestatewide level.
Table 2 for each outcome indicator presents results for each New Mexico county by race/ethnicity. Once again,the numbers of deaths (or the estimated number of persons engaging in a risk behavior) are presented on the leftside of the table; and the age-adjusted death rates (or the weighted behavior prevalence rates) are presented onthe right side of the table. These tables are useful in determining which counties have the most severe substanceuse problems, and which groups are at the highest risk within each county.
The discussion of each indicator also includes a county bar chart that graphically presents age-adjusted deathrates (or weighted behavior prevalence rates) for each New Mexico county in descending order. Adjacent to eachcounty name on the left side of the chart, the number of deaths occurring (or the estimated number of personsengaging in the behavior) in the county and the percent of New Mexico deaths occurring (or the weighted percentof New Mexicans engaging in a behavior) in each county are presented. Counties with the highest rates are easilyidentified at the top of the chart, while counties with low rates are at the bottom of the chart. The state rate isdepicted with a darker colored bar, and for most indicators the most recent available United States rate is alsoincluded, depicted with a cross-hatched bar, making it easy to compare the county rate to the state and nationalrate in each instance.
Finally, maps showing rates by county have been included for each indicator. The counties have beencategorized and shaded in these maps according to the severity of the problem in the county. The map shadingcategories have been chosen to identify counties that have rates lower than the state rate, counties that have ratessomewhat higher than the state rate, and counties that have rates substantially higher than the state rate. Thelatter category (corresponding to the darkest-shaded counties on each map) represents rates that are higher thanthe state rate by a selected amount. For most of the maps based on death rates this threshold is rates that are50% or higher than the state rate; for most of the maps based on behavioral data from either the adult BehavioralRisk Factor Surveillance Survey (BRFSS) or the high-school Youth Risk and Resiliency Survey (YRRS), thisthreshold is rates that are 15-25% higher than the state rate.
This report presents considerable detail in the form of numbers, proportions, rates and other statisticalsummaries, many of these to be found in tables and charts. One way to synthesize this information has beenthrough the development of specific "Problem Statements" which give the reader a brief narrative overview of thedata and detailed statistics. These Problem Statements are designed to help explain and frame the epidemiologicaldata presented in each section of the report.

Use of this Report: Why are some rates missing from the tables?
Other Data Resources
New Mexico Substance Abuse Epidemiology Profile Page v
INTRODUCTION (continued)
Even though deaths were combined over a five-year period, for some causes of death there were still very fewdeaths occurring in some small counties or for specific age/sex/race-ethnic groups. While rates can becalculated based on very small numbers, these rates can be unstable and are often misleading. In a smallcounty, even a single death over a five year period can result in a rate that is extremely high. Such rates are ofquestionable value for planning purposes. Including these rates would have resulted in very dense tables thatwere difficult to interpret because they included information that clouded the overall picture rather than clarifyingit. For this reason, county rates based on fewer than two deaths per year have been removed from all county-level tables and charts. For the same reason, for survey-based measures of adult risk behaviors, rates based onfewer than 50 respondents for a given table cell have been removed.
- Other reports produced by the Substance Abuse Epidemiology Program (SAEP), Injury and Behavioral Epidemiology Bureau, Epidemiology and Response Division (ERD),NMDOH.Available online at: http://nmhealth.org/ERD/HealthData/substance_abuse.shtml.
- New Mexico Behavioral Risk Factor Surveillance System (BRFSS) reports,produced by the Survey Section, Injury and Behavioral Epidemiology Bureau, Epidemiology andResponse Division (ERD), NMDOH. Available online at:http://nmhealth.org/ERD/HealthData/health_behaviors.shtml.
- New Mexico Youth Risk and Resiliency Survey (YRRS) reports, produced byNMDOH, NM Public Education Department, and the UNM Prevention Research Center. Available online at:http://nmhealth.org/ERD/HealthData/health_behaviors.shtml.
The data presented here come from various sources. Other valuable publications have been written utilizingthese data sources. The New Mexico Substance Abuse Epidemiology Profile should be seen ascomplementary to these other publications, and serious program planners will want to refer to thesedocuments for further information. These publications include:

Technical Note: Methodological Changes since Previous Reports
New Mexico Substance Abuse Epidemiology Profile Page vi
INTRODUCTION (continued)
This 2011 report and the previous 2010 report in this series reflects several important methodological changesimplemented since the original New Mexico State Epidemiology Profile (the first report in this series) waspublished in 2005. These methodological changes and their impact on this report are described in more detailbelow:
- Changes to the definition of alcohol-related death. The Center for Disease Control’s (CDC’s) revisedAlcohol-Related Disease Impact (ARDI) alcohol attributable fractions (AAFs) were implemented in the 2010and 2011 reports. AAFs are the proportion of a given cause of death which can be attributed to excessivealcohol use. These AAFs are central to the estimation of alcohol-related deaths and alcohol-related deathrates in this report. The revised CDC ARDI AAFs are the standard AAFs recommended for use by the CDC.These AAFs were first reported in the publication Alcohol-Attributable Deaths and Years of Potential Life Lost--- United States, 2001 (Centers for Disease Control and Prevention. MMWR. 2004:53(37);866-870). Therevised ARDI AAFs are further described on the CDC websitehttps://apps.nccd.cdc.gov/ardi/Homepage.aspx.
Key differences between the revised CDC ARDI AAFs used in the 2010 and 2011 reports and the AAFsused in the 2005 report include: (a) elimination of AAFs for a number of alcohol-related causes of death (e.g.,diabetes mellitus); (b) addition of AAFs for a number of alcohol-related causes of death (e.g., liver cancer);(c) changes to the AAFs for many of the causes of alcohol-related death retained from the previous version(e.g., reduction in the AAF for unspecified liver cirrhosis); and (d) implementation of age-and-sex-specificAAFs for motor vehicle traffic crash deaths.
The net impact of these changes in the AAFs has been to: (a) reduce the overall alcohol-related death rateby about 15% in the 2010 and 2011 reports compared to the 2005 report; (b) to reduce the alcohol-relatedchronic disease death rate by about 30% compared to the 2005 report; (c) to increase the alcohol-relatedinjury death rate by about 5% compared to the 2005 report; and (d) to change the relative ranking of thesetwo high-level alcohol-related cause-of-death categories compared to the 2005 report, so that alcohol-relatedinjury rates are now higher than alcohol-related chronic disease rates (the reverse of the rank order in theoriginal report).
These changes in the AAFs make the 2010 and 2011 reports' counts and rates for all the alcohol-relateddeath indicators non-comparable to the 2005 report. For this reason, comparison of alcohol-related deathindicators in these reports to similarly-labeled indicators in the 2005 report is strongly discouraged. In orderto support trend analysis based on the revised CDC ARDI AAFs, multi-year trend charts have been added tothe Alcohol-Related Death sections in the later reports.
- Changes to race/ethnicity categories. The original 2005 report in this series used the National Center forHealth Statistics (NCHS) standard race/ethnicity categories for reporting by race/ethnicity. These NCHSstandard race/ethnicity categories break out Hispanic for each race category (e.g., White non-Hispanic, Blacknon-Hispanic, etc); and combine the Hispanic portion of each race category (e.g., White Hispanic, BlackHispanic, etc) when reporting the Hispanic category.
The 2010 report implemented new race/ethnicity reporting standards used by the New Mexico Departmentof Health (NMDOH), for all indicators except those based on the Youth Risk and Resiliency Survey (YRRS).These NMDOH standard race/ethnicity categories report only the White Hispanic category as Hispanic; andreport the Hispanic subset of other race groups (e.g., Black Hispanic) in the corresponding race category(e.g., Black). The 2011 report implemented the NMDOH race/ethnicity reporting categories for all YRRS-based indicators as well.
These changes in the race/ethnicity categories make the 2010 and 2011 reports' counts and rates byrace/ethnicity comparable to each other, and not comparable to the 2005 report, for all indicators exceptthose based on the Youth Risk and Resiliency Survey (YRRS). For indicators based on YRRS, the 2005 and2010 reports' rates by race/ethnicity are comparable to each other, but are not comparable to the 2011report.

Consequences of Substance Abuse
New Mexico Substance Abuse Epidemiology Profile Page vii
EXECUTIVE SUMMARY
Introduction
Eight of the ten leading causes of death in New Mexico are at least partially caused by the abuse of alcohol,tobacco, or other drugs. In 2009, the ten leading causes of death in New Mexico were diseases of the heart,malignant neoplasms, unintentional injuries, chronic lower respiratory disease, cerebrovascular disease, diabetes,suicide, Alzheimer’s disease, chronic liver disease, and influenza and pneumonia. Of these, chronic liver disease,unintentional injuries, and suicide are associated with alcohol use; chronic lower respiratory disease and influenzaand pneumonia are associated with tobacco use; heart disease, malignant neoplasms, and cerebrovasculardisease are associated with both alcohol and tobacco use; and unintentional injuries and suicide are associatedwith the use of other drugs.
Alcohol-Related Death
Over the past 30 years, New Mexico has consistently had among the highest alcohol-related death rates in theUnited States; and it has had the highest alcohol-related death rate since 1997. The negative consequences ofexcessive alcohol use in New Mexico are not limited to death, but also include domestic violence, crime, poverty,and unemployment, as well as chronic liver disease, motor vehicle crash and other injuries, mental illness, and avariety of other medical problems. In 2006, the economic cost of alcohol abuse in New Mexico was more than $2.5billion, or $1,250 per person.
Death rates from alcohol-related causes increase with age. Male rates are substantially higher than femalerates. American Indians have higher alcohol-related death rates than other race/ethnicities. McKinley and RioArriba counties have extremely high alcohol-related death rates, driven by high rates in the American Indian andHispanic male populations, respectively. The counties with the most deaths for the five-year period 2005-2009 areBernalillo, San Juan, Santa Fe, McKinley, and Doña Ana. New Mexico has extremely high death rates due to bothalcohol-related chronic diseases and alcohol-related injuries.
- Alcohol-Related Chronic Disease Death. New Mexico’s rate of death due to alcohol-related chronicdiseases is 1.9 times the national rate. Death rates increase with age. American Indians, both male andfemale, and Hispanic males have extremely high rates. As with total alcohol-related death, McKinley andRio Arriba counties have the highest rates in the state.
Alcohol-related chronic liver disease (AR-CLD) is the disease that accounts for the most deaths due toalcohol-related chronic disease. AR-CLD death rates are extremely high among American Indians, bothmale and female, and Hispanic males. The high rates among American Indians and Hispanic malesbetween the ages of 35 and 64 represent a tremendous burden in terms of years of potential life lost. WhileBernalillo County has the highest number of deaths due to AR-CLD (458 for the years 2005-2009), threecounties that stand out for their very high rates are Rio Arriba, McKinley, and Cibola counties, which haverates 3.5 to almost 6 times the national rate.
- Alcohol-Related Injury Death. New Mexico’s rate of alcohol-related injury death is 1.8 times the nationalrate. In the current reporting period (2005-2009) falls injuries surpassed alcohol-related motor vehicle trafficcrashes as the leading cause of alcohol-related injury death; and numerous other types of injury death arealso associated with excessive alcohol use (particularly binge drinking, see below). Deaths from drugoverdose, a sizeable portion of which are partially attributable to alcohol, have also increased substantially inrecent years. Males are more at risk for alcohol-related injury death than females, with American Indianmales at particularly elevated risk
New Mexico’s alcohol-related motor vehicle traffic crash (AR-MVTC) death rate has decreaseddramatically over the past 30 years. After substantial declines during the 1980’s and 1990’s, New Mexico’srate stagnated for almost ten years. However, a comprehensive program to prevent driving while intoxicated(DWI), initiated in 2004, resulted in substantial rate declines during the period 2005-2008. Nonetheless, ratedisparities remain: both male and female American Indians have elevated rates, especially among youngermales (age 15-44). McKinley and Rio Arriba counties had rates almost five times the national rate for theperiod covered by this report (2005-2009). The McKinley County rate was driven by the high AmericanIndian rate, while the Rio Arriba County rate was driven by the high Hispanic and American Indian rates.

Consequences of Substance Abuse (continued)
Alcohol, Tobacco, and Other Drug Consumption Behavior
New Mexico Substance Abuse Epidemiology Profile Page viii
EXECUTIVE SUMMARY (continued)
Smoking-Related Death
Historically, New Mexico has had one of the lowest smoking-related death rates in the nation. Nonetheless, NewMexico’s burden of death associated with smoking is considerably greater than the burden associated with alcoholand other drugs. Among all race/ethnic groups, males have higher smoking-related death rates than females.Among both males and females, Whites have the highest rates, followed by Blacks. The counties with the highestrates and relatively heavy burdens of smoking-related death (i.e., 20 or more deaths a year) are Torrance, Sierra,Quay, Valencia, and Socorro counties. The high rates in most of these counties and in the state overall are drivenby high rates among Whites.
Drug-Induced Death
New Mexico has the highest drug-induced death rate in the nation, and the consequences of drug use continueto burden New Mexico communities. Drug-induced death rates remained higher for males than for females. Thehighest drug-induced death rate was among Hispanic males, followed by White males. Rio Arriba County had thehighest drug-induced death rate in the state, followed by Eddy, Torrance, Chaves, and Bernalillo counties.Bernalillo County continued to bear the highest burden of drug-induced death in terms of total numbers of deaths.Unintentional drug overdoses account for more than 80% of drug-induced deaths. The most common drugscausing unintentional overdose death for the period covered in this report were prescription opioids (i.e.,methadone, oxycodone, morphine; 49%), heroin (36%), cocaine (31%), tranquilizers/muscle relaxants (29%) andantidepressants (16%). In New Mexico and nationally, overdose death from prescription opioids has become anissue of enormous concern as these potent drugs are widely available.
Suicide and Mental Health
Suicide is a serious and persistent public health problem in New Mexico. Over the period 1981 through 2007 New Mexico's suicide rate has consistently been among the highest in the nation -- 1.5 to 1.9 times the U.S. rate. Male suicide rates are more than three times female rates across the age range, and among all race/ethnic groups. Six counties (Taos, Sierra, Grant, Rio Arriba, Torrance, and Otero) had suicide rates in 2005-2009 that were more than twice the most recent available U.S. rates.
New indicators in this report also document the prevalence of frequent mental distress and current depression among New Mexico adults; persistent sadness or hopelessness, suicidal ideation, and suicide attempt among New Mexico youth; and the association between risk and resiliency factors and substance abuse and mental health indicators, among New Mexico youth.
Substance use behaviors are important to examine not only because substance abuse can lead to very negativeconsequences in the short term, but because substance abuse can also have long-term negative consequences.For example, while drinking by youth is a behavior that can lead directly to alcohol-related injury or death, it canalso lead to very serious consequences in adulthood, ranging from alcohol abuse or dependence to a variety ofdiseases associated with chronic heavy drinking.
The following is a list of the substance use indicators included in this report, along with a brief description of keyfindings related to each indicator:
- Adult Binge Drinking. Binge drinking (defined as drinking 5+ drinks on a single occasion, for men, or 4+drinks on a single occasion, for women) is associated with numerous types of injury death, including motorvehicle traffic crash fatalities, drug overdose, falls, suicide, and homicide. Among adults (age 18 or over) ofall ethnicities, binge drinking was more commonly reported by males than females, mirroring higher rates ofalcohol-related injury death among males. Among males, American Indians were more likely to report bingedrinking than other ethnicities. Young adults (age 18-24) were more likely than other age groups to reportbinge drinking.
- Youth Binge Drinking. In 2009, New Mexico public high school students were slightly more likely to reportbinge drinking than U.S. high school students. Among New Mexico high school students, binge drinking wasmore commonly reported by upper grade students than lower grade students. There was no significantdifference in the binge drinking rate between male and female high school students. Hispanic students weremore likely to report binge drinking than high school students of other race/ethnicities.

Alcohol, Tobacco, and Other Drug Consumption Behavior (continued)
Data Sources
New Mexico Substance Abuse Epidemiology Profile ix
EXECUTIVE SUMMARY (continued)
- Adult Heavy Drinking. In 2009, adult heavy drinking (defined as drinking more than two drinks per day, onaverage, for men, or more than one drink per day, on average, for women) was less commonly reported inNew Mexico (4.2%) than in the rest of the nation (5.1%). Heavy drinking was more prevalent among younger(aged 18-24) and middle-aged (aged 25-64) adults, with 4.3% and 4.4% of these age groups, respectively,reporting past-month heavy drinking. New Mexico men were 1.2 times more likely to report chronic drinkingthan women (4.5% vs. 3.9%).
- Adult Drinking and Driving. In 2008, adult past-30-day drinking and driving was reported in New Mexico by1.2% of adults aged 18 and over. Past-30-day drinking and driving was more prevalent among young adults(aged 18-24) than among older age groups. New Mexico men were more than three times as likely to reportdrinking and driving than women (1.9% vs 0.6%). Hispanic males (2.5%) were more likely to report drinkingand driving than American Indian (2.0%) and White (1.6%) males.
- Youth Drinking and Driving. In 2009, New Mexico high school students were as likely to report driving afterdrinking alcohol as other U.S. students. Driving after drinking was more slighty common among boys thangirls, and was less common among White youth than among other race/ethnic groups. Eleventh and 12thgrade students were more likely to report drinking and driving than 9th and 10th grade students.
- Youth Drug Use. In 2009, marijuana and cocaine use were more prevalent among New Mexico studentsthan among U.S. students. The use of marijuana, cocaine, other illicit drugs (heroin, methamphetamine,inhalants, or ecstasy), and pain-killers was less commonly reported by White students than by students inother race/ethnic groups.
- Adult Tobacco Use. In 2009, the prevalence of adult smoking was the same in New Mexico as in the nationoverall (17.9%). Smoking was most prevalent among younger age groups, and was more common amongmen than women for the age categories 18-24 and 25-64.
-Youth Tobacco Use. In 2009, smoking was more prevalent among New Mexico high school students(24.0%) than in the rest of the nation (19.5%). New Mexico boys were slightly more likely than girls to reportcurrent smoking (24.6% vs. 23.2%). American Indian high school students (28.1%) were more likely to reportcurrent cigarette smoking than White (23.1%) and Hispanic (23.2%) students.
National/New Mexico population data, 1981-1989: U.S. Census Bureau. Estimates of the Population of States by Age, Sex, Race, and Hispanic Origin: 1981 to 1989. Available from: http://www.census.gov/popest/archives/1980s/80s_st_detail.html as of August 16,2010.
National/New Mexico population data, 1990-1999: U.S. Census Bureau. Estimates of the Population of States by Age, Sex, Race and Hispanic Origin: 1990 to 1999, Internet Release Date August 30, 2000. Available from: http://www.cdc.gov/nchs/nvss/bridged_race/data_documentation.htm#july1999 as of September 23, 2010.

Data Sources (continued)
New Mexico Substance Abuse Epidemiology Profile x
EXECUTIVE SUMMARY (continued)
National population data, 2000-2008: National Center for Health Statistics. Postcensal estimates of the resident population of the United States for July 1, 2000-July 1, 2008, by year, county, age, bridged race, Hispanic origin, and sex (Vintage 2008). Prepared under a collaborative arrangement with the U.S. Census Bureau; released May 14, 2009. Available from: http://www.cdc.gov/nchs/nvss/bridged_race.htm as of September 2, 2009.
New Mexico population data, 2000-2009: University of New Mexico, Bureau of Business and Economic Research. Annual Estimates of the Population of New Mexico by County, Age, Sex, Race and Hispanic Origin, 2000 to 2009.
National death data: National Center for Health Statistics. Multiple Cause-of-Death files, 1981-2007, machine readable data files and documentation. National Center for Health Statistics, Hyattsville, Maryland. Available from: http://www.cdc.gov/nchs/data_access/VitalStatsOnline.htm#Mortality_Multiple. Death rates were calculated by the New Mexico Department of Health, Epidemiology and Response Division, Injury and Behavioral Epidemiology Bureau, Substance Abuse Epidemiology Program.
New Mexico death data: New Mexico Department of Health, Epidemiology and Response Division, Bureau of Vital Records and Health Statistics; and University of New Mexico, Office of the Medical Investigator (for drug overdose death reporting). Death rates were calculated by the New Mexico Department of Health, Epidemiology and Response Division, Injury and Behavioral Epidemiology Bureau, Substance Abuse Epidemiology Program..
National/New Mexico motor vehicle traffic crash fatality data: National Highway Traffic Safety Administration, Fatality Analysis Reporting System.
(1) VMT reporting: Fatalities, Fatalities in Crashes by Driver Alcohol Inolvement, Vehicle Miles Traveled (VMT), and Fatality Rate per 100 Million VMT, by State, 1982-2007. Report provided by NHTSA National Center for Statistics and Analysis, Information Services Team. 2008 death rates per 100M VMT calculated by the New Mexico Department of Health, Epidemiology and Response Division, Injury and Behavioral Epidemiology Bureau, Substance Abuse Epidemiology Program.
(2) Per 100,00 population reporting: Persons Killed, by STATE and Highest Driver Blood Alcohol Concentration (BAC) in Crash - State : USA, Year. Available from: http://www-fars.nhtsa.dot.gov/States/StatesAlcohol.aspx. Death rates were calculated by the New Mexico Department of Health, Epidemiology and Response Division, Injury and Behavioral Epidemiology Bureau, Substance Abuse Epidemiology Program.
National adult behavioral data: Centers for Disease Control and Prevention, National Center for Chronic Disease Prevention and Health Promotion, Division of Adult and Community Health. Behavioral Risk Factor Surveillance System Online Prevalence Data, 1995-2009. Available from: http://apps.nccd.cdc.gov/brfss/ as of April 12, 2011.
New Mexico adult behavioral data: New Mexico Department of Health, Epidemiology and Response Division, Injury and Behavioral Epidemiology Bureau, Survey Unit. New Mexico Behavioral Risk Factor Surveillance System (BRFSS). More reporting available from: http://nmhealth.org/ERD/HealthData/health_behaviors.shtml as of April 12, 2011.
National youth behavioral data: Centers for Disease Control and Prevention. Surveillance Summaries, June 4, 2010. MMWR. 2010:59(SS-5). More reporting available from: http://www.cdc.gov/HealthyYouth/yrbs/index.htm as of April 12, 2011.
New Mexico youth behavioral data: New Mexico Department of Health, Epidemiology and Response Division, Injury and Behavioral Epidemiology Bureau, Survey Unit; and the New Mexico Public Education Department, School and Family Support Bureau. New Mexico Youth Risk and Resiliency Survey (YRRS). More reporting available from: http://nmhealth.org/ERD/HealthData/health_behaviors.shtml as of April 12, 2011.
New Mexico substance use disorder and mental health data: Substance Abuse and Mental Health Services Administration, Office of Applied Studies. Substate Estimates from the 2006-2008 National Surveys on Drug Use and Health. Available from: http://oas.samhsa.gov/substate2k10/StateFiles/NM.htm.More reporting available from: http://oas.samhsa.gov/statesList.cfm as of April 12, 2011.

Consequences
New Mexico Substance Abuse Epidemiology Profile Page 1
Section 1

New Mexico Substance Abuse Epidemiology Profile Page 2

ALCOHOL-RELATED DEATH
* Rate per 100,000, age-adjusted to the 2000 US standard population
Sources: NMDOH BVRHS death files and UNM-BBER population files (NM); NCHS death and population files (US); CDC ARDI; SAEP
Ages Ages Ages All Ages Ages Ages All
Sex Race/Ethnicity 0-24 25-64 65+ Ages 0-24 25-64 65+ Ages*
White 83 863 402 1,348 13.7 71.4 109.5 55.5
Hispanic 181 1,112 256 1,549 20.5 106.8 144.5 83.8
American Indian 75 489 61 625 29.0 193.6 183.1 136.0
Black 10 34 6 50 16.8 48.3 59.1 41.8
Asian/Pacific Islander 3 6 3 12 9.4 13.1 57.1 23.6Total 353 2,505 727 3,585 19.2 95.7 122.9 73.3
White 25 383 312 721 4.5 30.5 69.4 27.2
Hispanic 41 310 156 507 4.8 29.4 70.3 29.6
American Indian 23 207 42 272 8.7 74.2 93.2 56.0
Black 2 12 3 18 4.2 19.7 24.5 15.8
Asian/Pacific Islander 1 5 3 9 4.6 8.6 38.6 12.5Total 93 917 517 1,526 5.2 33.9 70.1 30.6
White 109 1,246 714 2,069 9.3 50.6 87.4 40.9
Hispanic 222 1,422 412 2,056 12.8 67.9 103.2 56.1
American Indian 98 696 103 898 18.7 131.0 131.2 93.5
Black 13 47 8 68 10.6 34.9 39.9 28.5
Asian/Pacific Islander 4 10 6 21 7.1 10.7 45.8 17.2
Total 446 3,421 1,244 5,111 12.3 64.3 93.6 51.4
* Age-specific rates (e.g., Ages 0-24) are per 100,000; all-ages rate is per 100,000, age-adjusted to the 2000 US standard population
Sources: NMDOH BVRHS death files and UNM-BBER population files; CDC ARDI; SAEP
New Mexico Substance Abuse Epidemiology Profile Page 3
Chart 1: Alcohol-Related Death Rates*, New Mexico and United States, 1990-2009
Table 1: Alcohol-Related Deaths and Rates* by Age, Sex, and Race/Ethnicity, New Mexico, 2005-2009
Problem Statement
Total
Deaths Rates*
Male
Female
0
10
20
30
40
50
60
Rate
*
Year
NM - Total Alcohol-Related (A-R)
NM - A-R Injury
NM - A-R Chronic Disease
US - Total Alcohol-Related
The consequences of excessive alcohol use are severe in New Mexico. New Mexico’s total alcohol-related deathrate has ranked 1st, 2nd, or 3rd in the U.S. since 1981; and 1st for the period 1997 through 2007 (the most recent yearfor which state comparison data is available). The negative consequences of excessive alcohol use in New Mexico arenot limited to death, but also include domestic violence, crime, poverty, and unemployment, as well as chronic liverdisease, motor vehicle crash and other injuries, mental illness, and a variety of other medical problems.
Chart 1 shows the two principal components of alcohol-related death: deaths due to chronic diseases (such aschronic liver disease), which are strongly associated with chronic heavy drinking; and deaths due to alcohol-relatedinjuries, which are strongly associated with binge drinking. Each of these categories will be considered in more detail ina later section of this report. Chart 1 shows that while New Mexico's alcohol-related chronic disease death rates wererelatively unchanged over the past 18 years, its alcohol-related injury death rate has been increasing since 2001. NewMexico's total alcohol-related death rate increased 11% from 1990 through 2007, driven by a 19% increase in alcohol-related injury death rates from 2001 through 2007. By contrast, the U.S. alcohol-related death rate decreased 9% from1990 through 2007 (16% for alcohol-related chronic disease; 3% for alcohol-related injury), although US alcohol-relatedinjury death rates have also been increasing since 2000 (data not shown).
NOTE:New Mexico rate changes from 2006 to 2007 must be interpreted with caution, as they may be partly attributable to changes in the UNM-BBER population estimates used in the New Mexico rate calculations, which became effective in 2007.

County White
His-
panic
Ameri-
can
Indian Black
Asian
PI All Races White
His-
panic
Ameri-
can
Indian Black
Asian
PI
All
Races
Bernalillo 728 713 119 39 11 1,609 41.1 59.9 72.0 36.0 17.9 49.5
Catron 8 2 0 0 0 11 -- -- -- -- -- 52.2
Chaves 90 65 2 2 0 159 51.5 54.6 -- -- -- 51.4
Cibola 20 27 52 0 0 100 46.3 68.8 99.2 -- -- 73.0
Colfax 22 22 0 0 0 44 44.1 64.4 -- -- -- 51.5
Curry 38 31 1 4 0 74 27.1 50.1 -- -- -- 33.6
De Baca 4 2 0 0 0 6 -- -- -- -- -- --
Dona Ana 146 168 1 3 1 319 38.8 34.0 -- -- -- 35.5
Eddy 74 48 2 2 0 126 49.8 56.1 -- -- -- 50.1
Grant 40 38 2 0 1 82 42.2 52.1 -- -- -- 48.6
Guadalupe 2 12 0 0 0 14 -- 99.0 -- -- -- 83.1
Harding 1 1 0 0 0 2 -- -- -- -- -- --
Hidalgo 7 11 0 0 0 18 -- 73 -- -- -- 60.5Lea 74 42 1 5 0 122 46.9 49.3 -- -- -- 44.0
Lincoln 30 10 3 0 0 43 31.3 37.5 -- -- -- 35.5
Los Alamos 21 4 0 0 0 25 23.0 -- -- -- -- 22.5
Luna 29 26 0 0 1 56 44.2 45.1 -- -- -- 41.7
McKinley 20 16 302 2 0 340 44.5 51.4 132.5 -- -- 107.6
Mora 2 9 0 0 0 12 -- -- -- -- -- 46.9
Otero 66 27 29 2 1 125 32.6 35.3 142.3 -- -- 39.3
Quay 23 8 0 1 0 32 62.5 -- -- -- -- 54.6Rio Arriba 19 143 51 0 0 213 58.7 97.7 166.6 -- -- 100.6
Roosevelt 14 10 0 0 0 25 23.5 35.4 -- -- -- 28.5
Sandoval 105 65 67 1 1 240 34.6 46.9 82.4 -- -- 44.0
San Juan 115 34 215 1 0 365 39.6 42.7 88.3 -- -- 58.6
San Miguel 17 89 1 0 0 108 43.0 80.7 -- -- -- 68.5
Santa Fe 151 192 20 2 1 365 44.5 63.6 64.9 -- -- 53.0Sierra 40 9 0 0 0 49 64.9 -- -- -- -- 57.7
Socorro 17 29 12 0 0 59 46.5 76.5 115.6 -- -- 68.5
Taos 35 68 7 0 1 111 50.1 80.1 -- -- -- 66.6
Torrance 33 22 1 0 0 57 74.7 91.4 -- -- -- 77.8
Union 5 4 1 0 0 11 -- -- -- -- -- 43.0
Valencia 71 108 6 2 1 188 46.7 65.1 -- -- -- 55.3
Total 2,069 2,056 898 68 21 5,111 40.9 56.1 93.5 28.5 17.2 51.4
* All rates are per 100,000, age-adjusted to the 2000 US standard population
-- Excluded due to small number of deaths (< 2 per county per year) during reported periodSources: NMDOH BVRHS death files and UNM-BBER population files; CDC ARDI; SAEP
New Mexico Substance Abuse Epidemiology Profile Page 4
Rates*
ALCOHOL-RELATED DEATH (continued)
Problem Statement (continued)
Table 2: Alcohol-Related Deaths and Rates* by Race/Ethnicity and County, New Mexico, 2005-2009
Deaths
Table 1 shows that death rates from alcohol-related causes increase with age. However, there are substantial numbers ofalcohol-related deaths in the 0-24 year age category (these are mostly injury-related); and large numbers and high rates ofalcohol-related death in the 25-64 year age category (due to both chronic disease and injury). Table 1 also shows extremelyhigh alcohol-related death rates among American Indians (almost twice the state rate for both males and females); and therelatively high rate among Hispanic males relative to White non-Hispanic males. As will be shown in later sections, the ratedisparities for American Indian males are driven by this group's relatively high rates of both alcohol-related injury andalcohol-related chronic disease death; whereas the rate disparities for Hispanic males and American Indian females aredriven largely by their relatively high alcohol-related chronic disease death rates.
Table 2 shows that Rio Arriba and McKinley counties have the highest rates of alcohol-related death, with rates roughlytwice the state rate and almost 4 times the national rate (see Chart 2). Several other counties (Cibola, San Miguel, Taos,and San Juan) have a substantial burden (20 or more alcohol-related deaths per year) and rates more than twice the U.S.rate (see Chart 2). High rates among American Indian males and females drive the rates in McKinley, Cibola, and San Juancounties; Rio Arriba has high rates among both Hispanic and American Indian males and females; deaths among Hispanicmales drive the high rates in San Miguel and Taos counties (data by gender not shown).

* All rates are per 100,000, age-adjusted to the 2000 US standard population
The following counties were not included due to small number of deaths (< 2 per county per year) during reported period:
De Baca, HardingSources: NMDOH BVRHS death files and UNM-BBER population files (NM); NCHS death and population files (US); CDC ARDI; SAEP
New Mexico Substance Abuse Epidemiology Profile Page 5
ALCOHOL-RELATED DEATH (continued)
Chart 2: Alcohol-Related Death Rates* by County, New Mexico, 2005-2009
27.7
0.0
0.0
22.5
28.5
33.6
35.5
35.5
39.3
41.7
43.0
44.0
44.0
46.9
48.6
49.5
50.1
51.4
51.4
51.5
52.2
53.0
54.6
55.3
57.7
58.6
60.5
66.6
68.5
68.5
73.0
77.8
83.1
100.6
107.6
0 20 40 60 80 100 120
United States, 2003-2007
Los Alamos (25; 0.5%)
Roosevelt (25; 0.5%)
Curry (74; 1.5%)
Dona Ana (319; 6.2%)
Lincoln (43; 0.8%)
Otero (125; 2.4%)
Luna (56; 1.1%)
Union (11; 0.2%)
Sandoval (240; 4.7%)
Lea (122; 2.4%)
Mora (12; 0.2%)
Grant (82; 1.6%)
Bernalillo (1609; 31.5%)
Eddy (126; 2.5%)
New Mexico (5111; 100%)
Chaves (159; 3.1%)
Colfax (44; 0.9%)
Catron (11; 0.2%)
Santa Fe (365; 7.1%)
Quay (32; 0.6%)
Valencia (188; 3.7%)
Sierra (49; 1%)
San Juan (365; 7.1%)
Hidalgo (18; 0.4%)
Taos (111; 2.2%)
San Miguel (108; 2.1%)
Socorro (59; 1.2%)
Cibola (100; 2%)
Torrance (57; 1.1%)
Guadalupe (14; 0.3%)
Rio Arriba (213; 4.2%)
McKinley (340; 6.7%)
Rate*
County (# of deaths; % of statewide deaths)

* All rates are per 100,000, age-adjusted to the 2000 US standard population
Not included: Rate not reported due to small number of deaths (< 2 per county per year) during reported periodSources: NMDOH BVRHS death files and UNM-BBER population files; CDC ARDI; SAEP
New Mexico Substance Abuse Epidemiology Profile Page 6
ALCOHOL-RELATED DEATH (continued)
Chart 3: Alcohol-Related Death Rates* by County, New Mexico, 2005-2009

ALCOHOL-RELATED CHRONIC DISEASE DEATH
Chart 1: Leading Causes of Alcohol-Related Chronic Disease Death, New Mexico, 2005-2009
Sources: NMDOH BVRHS death files and UNM-BBER population files; CDC ARDI; SAEP
Ages Ages Ages All Ages Ages Ages All
Sex Race/Ethnicity 0-24 25-64 65+ Ages 0-24 25-64 65+ Ages*
White 1 412 193 606 0.2 34.1 52.6 22.0
Hispanic 4 564 175 743 0.4 54.2 98.9 42.5
American Indian 4 267 42 312 1.4 105.7 125.0 72.4
Black 0 8 3 11 0.3 10.7 35.4 11.6
Asian/Pacific Islander 0 1 1 2 0.4 3.4 15.5 4.9Total 9 1,253 414 1,675 0.5 47.9 69.9 33.0
White 0 191 110 302 0.1 15.2 24.5 10.3
Hispanic 3 160 84 247 0.4 15.1 37.8 13.8
American Indian 1 149 31 181 0.4 53.6 68.0 37.9
Black 0 7 2 9 0.1 11.5 16.4 8.9
Asian/Pacific Islander 0 2 2 3 0.1 3.0 20.0 4.0Total 5 509 228 742 0.3 18.8 31.0 13.8
White 2 603 303 908 0.1 24.5 37.1 15.9
Hispanic 7 724 259 990 0.4 34.6 64.9 27.5
American Indian 5 416 73 494 0.9 78.4 92.1 53.9
Black 0 15 5 20 0.2 11.1 24.9 10.0
Asian/Pacific Islander 0 3 2 6 0.2 3.2 18.3 4.4
Total 14 1,761 642 2,417 0.4 33.1 48.3 23.0
* Age-specific rates (e.g., Ages 0-24) are per 100,000; all-ages rate is per 100,000, age-adjusted to the 2000 US standard populationSources: NMDOH BVRHS death files and UNM-BBER population files; CDC ARDI; SAEP
New Mexico Substance Abuse Epidemiology Profile Page 7
Problem Statement
Male
Female
Total
Table 1: Alcohol-Related Chronic Disease Deaths/Rates* by Age, Sex, and Race/Ethnicity, New Mexico, 2005-2009
Deaths Rates*
13.4
5.4
0.8
0.6
0.4
0 5 10 15
Chronic liver disease
Alcohol dependence
Hypertension
Alcohol abuse
Stroke, hemorrhagic
Rate **
Alcohol-related* deaths due to:
** Rate per 100,000, age-adjusted to the 2000 US standard population
* Rates reflect only alcohol-related portion of deaths from cause
Chronic heavy drinking (defined as drinking, on average, more than two drinks per day for men, and more than onedrink per day for women) often is associated with alcoholism or alcohol dependence, and can cause or contribute to anumber of diseases, including alcoholic liver cirrhosis. For the past 15 years, New Mexico’s death rate from alcohol-related chronic disease has consistently been first or second in the nation, and 1.5 to 2 times the national rate.Furthermore, while the national death rate from alcohol-related chronic disease decreased 16% from 1990-2007, NewMexico’s rate remained high and unchanged.
Chart 1 shows the five leading causes of alcohol-related chronic disease death in New Mexico during 2005-2009.Alcohol-related chronic liver disease (AR-CLD) was the leading cause of alcohol-related death overall, and of alcohol-related chronic disease death during this period. This cause of death will be discussed in more detail in a later section ofthis report. New Mexico also had the highest rate of alcohol dependence death in the U.S. for the period 1999 through2007 (the most recent year for which state comparison data is available).
Table 1 shows that death rates from alcohol-related chronic diseases increase with age. The large number of deaths inthe age 25-64 category illustrates the very large burden of premature mortality associated with alcohol-related chronicdisease. The high rates in this age category among American Indians (both males and females) and Hispanic malesfurther illustrate the heavy burden of premature death due to heavy drinking in these racial/ethnic groups.

County White
His-
panic
Ameri-
can
Indian Black
Asian
PI All Races White
His-
panic
Ameri-
can
Indian Black
Asian
PI
All
Races
Bernalillo 340 345 68 13 3 768 17.5 29.6 43.7 12.8 -- 22.3
Catron 3 2 0 0 0 5 -- -- -- -- -- --
Chaves 37 22 1 1 0 61 19.6 20.2 -- -- -- 19.2
Cibola 8 14 31 0 0 53 -- 38.9 57.9 -- -- 36.8
Colfax 12 12 0 0 0 25 21.2 34.3 -- -- -- 25.7
Curry 16 17 1 1 0 36 10.8 31.9 -- -- -- 15.8
De Baca 1 0 0 0 0 1 -- -- -- -- -- --
Dona Ana 63 83 0 2 0 147 14.5 17.0 -- -- -- 15.6
Eddy 24 21 0 0 0 46 13.8 25.5 -- -- -- 16.3
Grant 13 17 1 0 1 32 10.5 23.5 -- -- -- 17.2
Guadalupe 1 5 0 0 0 6 -- -- -- -- -- --
Harding 0 1 0 0 0 1 -- -- -- -- -- --
Hidalgo 4 7 0 0 0 11 -- -- -- -- -- 33.7
Lea 31 15 1 0 0 48 16.7 21.3 -- -- -- 17.0Lincoln 15 3 1 0 0 19 11.8 -- -- -- -- 11.5
Los Alamos 9 2 0 0 0 11 -- -- -- -- -- 8.0
Luna 14 12 0 0 0 26 16.0 24.6 -- -- -- 18.1
McKinley 9 8 170 0 0 187 -- -- 79.7 -- -- 61.3
Mora 0 4 0 0 0 4 -- -- -- -- -- --
Otero 30 16 15 0 0 61 13.4 19.2 78.2 -- -- 18.0
Quay 13 4 0 0 0 18 32.6 -- -- -- -- 26.8
Rio Arriba 8 71 37 0 0 116 -- 47.8 117.6 -- -- 52.8Roosevelt 4 4 0 0 0 8 -- -- -- -- -- --
Sandoval 50 34 39 0 1 123 14.9 26.5 48.6 -- -- 21.9
San Juan 39 13 102 0 0 154 11.2 15.9 43.8 -- -- 23.7
San Miguel 7 47 1 0 0 56 -- 40.2 -- -- -- 33.1
Santa Fe 63 101 13 0 0 177 14.3 32.4 43.9 -- -- 22.4
Sierra 21 5 0 0 0 26 28.7 -- -- -- -- 27.5Socorro 8 12 6 0 0 26 -- 30.9 -- -- -- 29.4
Taos 15 34 4 0 0 53 14.8 35.7 -- -- -- 26.9
Torrance 16 12 1 0 0 29 28.1 53.3 -- -- -- 34.8
Union 1 3 1 0 0 5 -- -- -- -- -- --
Valencia 32 44 2 1 0 79 18.4 28.5 -- -- -- 21.9
Total 908 990 494 20 6 2,417 15.9 27.5 53.9 10.0 -- 23.0
* All rates are per 100,000, age-adjusted to the 2000 US standard population
-- Excluded due to small number of deaths (< 2 per county per year) during reported periodSources: NMDOH BVRHS death files and UNM-BBER population files; CDC ARDI; SAEP
New Mexico Substance Abuse Epidemiology Profile Page 8
Problem Statement (continued)
Deaths Rates*
ALCOHOL-RELATED CHRONIC DISEASE DEATH (continued)
Table 2: Alcohol-Related Chronic Disease Deaths and Rates* by Race/Ethnicity and County, New Mexico, 2005-2009
Table 1 also shows that, in general, males are more at risk than females for alcohol-related chronic disease death.Male rates are 2-3 times higher than female rates, across most racial/ethnic groups (except Blacks and Asian/PacificIslanders). American Indians are most at risk among the race/ethnic groups, with both total rates and male and femalerates more than twice the corresponding state rates. As mentioned earlier, Hispanic males are also at elevated risk, withrates 1.3 times the state rate for males (42.5 vs. 33.0), and almost twice the total state rate (42.5 vs. 23.0).
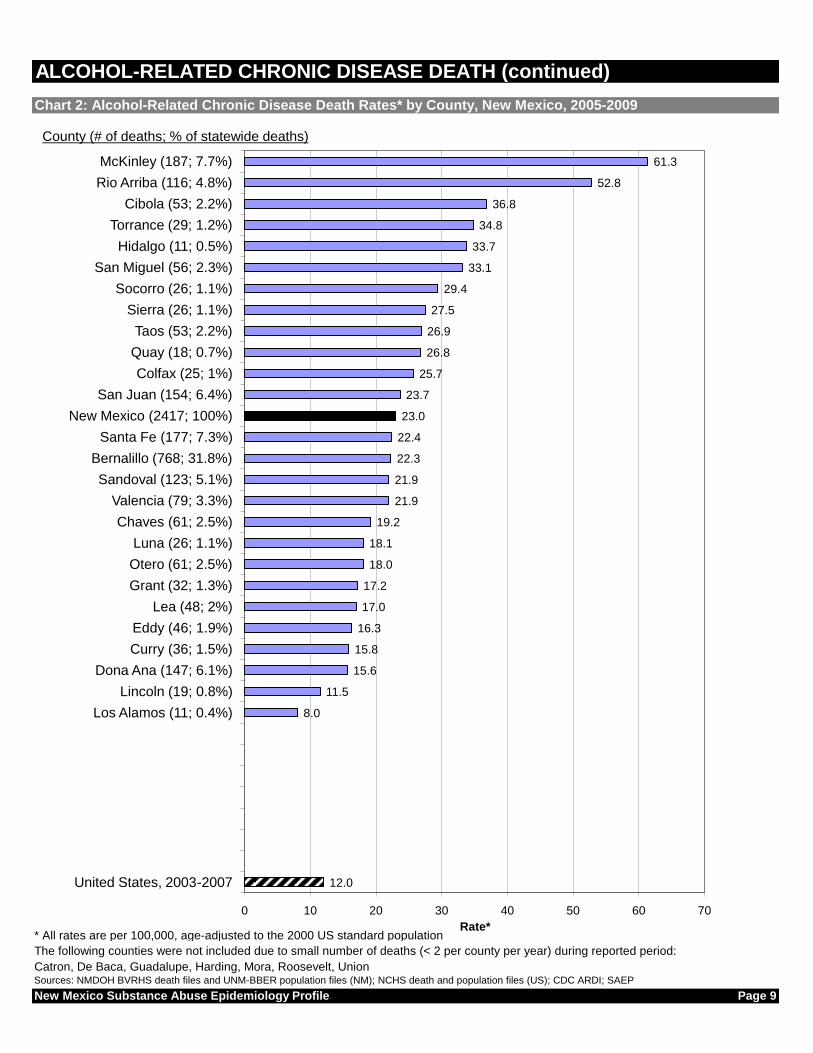
Table 2 shows that McKinley, Rio Arriba, and Cibola counties have the highest death rates for diseases associated withchronic heavy alcohol use. In these counties, the rates are 3 to 5 times the national rate of 12.0 (see Chart 2). The highrates in McKinley and Cibola counties are driven by unusually high rates in the American Indian population. In Rio ArribaCounty the rate is driven by high rates in both the Hispanic and American Indian populations. It is worth noting theconsiderable variation across counties in American Indian alcohol-related chronic disease death rates, with substantiallylower rates seen in San Juan County than in McKinley and Cibola counties. It is also important to remember that thesechronic disease deaths represent only the tip of the iceberg of health and social problems associated with chronic heavyalcohol use in New Mexico. For every alcohol-related death, there are many living persons (and their families) impaired byserious morbidity and reduced quality of life due to chronic alcohol abuse.
* All rates are per 100,000, age-adjusted to the 2000 US standard population
The following counties were not included due to small number of deaths (< 2 per county per year) during reported period:
Catron, De Baca, Guadalupe, Harding, Mora, Roosevelt, UnionSources: NMDOH BVRHS death files and UNM-BBER population files (NM); NCHS death and population files (US); CDC ARDI; SAEP
New Mexico Substance Abuse Epidemiology Profile Page 9
ALCOHOL-RELATED CHRONIC DISEASE DEATH (continued)
Chart 2: Alcohol-Related Chronic Disease Death Rates* by County, New Mexico, 2005-2009
12.0
0.0
0.0
0.0
0.0
0.0
0.0
0.0
8.0
11.5
15.6
15.8
16.3
17.0
17.2
18.0
18.1
19.2
21.9
21.9
22.3
22.4
23.0
23.7
25.7
26.8
26.9
27.5
29.4
33.1
33.7
34.8
36.8
52.8
61.3
0 10 20 30 40 50 60 70
United States, 2003-2007
Los Alamos (11; 0.4%)
Lincoln (19; 0.8%)
Dona Ana (147; 6.1%)
Curry (36; 1.5%)
Eddy (46; 1.9%)
Lea (48; 2%)
Grant (32; 1.3%)
Otero (61; 2.5%)
Luna (26; 1.1%)
Chaves (61; 2.5%)
Valencia (79; 3.3%)
Sandoval (123; 5.1%)
Bernalillo (768; 31.8%)
Santa Fe (177; 7.3%)
New Mexico (2417; 100%)
San Juan (154; 6.4%)
Colfax (25; 1%)
Quay (18; 0.7%)
Taos (53; 2.2%)
Sierra (26; 1.1%)
Socorro (26; 1.1%)
San Miguel (56; 2.3%)
Hidalgo (11; 0.5%)
Torrance (29; 1.2%)
Cibola (53; 2.2%)
Rio Arriba (116; 4.8%)
McKinley (187; 7.7%)
Rate*
County (# of deaths; % of statewide deaths)

* All rates are per 100,000, age-adjusted to the 2000 US standard population
Not included: Rate not reported due to small number of deaths (< 2 per county per year) during reported periodSources: NMDOH BVRHS death files and UNM-BBER population files; CDC ARDI; SAEP
New Mexico Substance Abuse Epidemiology Profile Page 10
ALCOHOL-RELATED CHRONIC DISEASE DEATH (continued)
Chart 3: Alcohol-Related Chronic Disease Death Rates* by County, New Mexico, 2005-2009
Not included

ALCOHOL-RELATED CHRONIC LIVER DISEASE (CLD) DEATH
* Age-specific rates per 100,000Sources: NMDOH BVRHS death files and UNM-BBER population files; CDC ARDI; SAEP
Ages Ages Ages All Ages Ages Ages All
Sex Race/Ethnicity 0-24 25-64 65+ Ages 0-24 25-64 65+ Ages*
White 0 215 70 285 0.0 17.8 19.0 9.9Hispanic 0 383 94 477 0.0 36.8 53.3 26.2American Indian 1 166 25 193 0.4 65.9 76.2 44.9Black 0 3 0 3 0.0 3.9 4.3 2.9
Asian/Pacific Islander 0 0 0 0 0.0 0.9 0.0 0.5Total 1 768 190 959 0.1 29.3 32.1 18.3
White 0 105 44 149 0.0 8.4 9.8 5.1Hispanic 0 126 60 187 0.0 12.0 27.0 10.1American Indian 1 113 24 137 0.4 40.4 52.3 27.8Black 0 5 1 6 0.0 7.7 8.6 5.1Asian/Pacific Islander 0 0 1 1 0.0 0.0 15.6 1.6Total 1 349 130 480 0.1 12.9 17.7 8.7
White 0 320 114 434 0.0 13.0 14.0 7.4Hispanic 0 509 154 664 0.0 24.3 38.6 17.9American Indian 2 279 49 330 0.4 52.5 62.4 35.7Black 0 8 1 9 0.0 5.7 6.6 3.9Asian/Pacific Islander 0 0 1 2 0.0 0.4 9.5 1.2
Total 2 1,116 320 1,439 0.1 21.0 24.1 13.4
* Age-specific rates (e.g., Ages 0-24) are per 100,000; all-ages rate is per 100,000, age-adjusted to the 2000 US standard population
Sources: NMDOH BVRHS death files and UNM-BBER population files; CDC ARDI; SAEP
New Mexico Substance Abuse Epidemiology Profile Page 11
Problem Statement
Chart 1: Alcohol-Related CLD Death Rates* by Age, Sex, and Race/Ethnicity, New Mexico, 2005-2009
Table 1: Alcohol-Related CLD Deaths and Rates* by Age, Sex, and Race/Ethnicity, New Mexico, 2005-2009
Total
Deaths Rates*
Male
Female
0
20
40
60
80
100
120
140
15-2
4
25-3
4
35-4
4
45-5
4
55-6
4
65-7
4
75-8
4
85+
15-2
4
25-3
4
35-4
4
45-5
4
55-6
4
65-7
4
75-8
4
85+
Male Female
Rate
*
American Indian
Hispanic
White
Alcohol-related chronic liver disease (AR-CLD) is a progressive chronic disease caused by chronic alcohol abuse. Itimposes a heavy burden of morbidity and mortality in New Mexico, and is the principal driver of New Mexico'sconsistently high alcohol-related chronic disease death rate. Over the past 27 years, New Mexico's AR-CLD rate hasincreased 25%, whereas the national rate has decreased 25%. New Mexico has had the highest AR-CLD death rate inthe U.S. for most of this period, including every year from 1999 through 2007 (the most recent year for which statecomparison data is available). In 1993, AR-CLD surpassed alcohol-related motor vehicle crash death as the leadingcause of alcohol-related death in New Mexico. Since 1998, New Mexico's death rate from AR-CLD has consistentlybeen 45-50% higher than the death rate from alcohol-related motor vehicle crashes.
County White
His-
panic
Ameri-
can
Indian Black
Asian
PI All Races White
His-
panic
Ameri-
can
Indian Black
Asian
PI All Races
Bernalillo 161 245 44 6 1 458 8.2 20.3 29.3 -- -- 13.0Catron 1 1 0 0 0 2 -- -- -- -- -- --Chaves 20 15 1 1 0 37 9.9 13.4 -- -- -- 11.2Cibola 2 11 21 0 0 35 -- 31.5 39.1 -- -- 23.6Colfax 8 8 0 0 0 16 -- -- -- -- -- 16.3Curry 8 10 1 0 0 19 -- 18.2 -- -- -- 8.3De Baca 0 0 0 0 0 0 -- -- -- -- -- --Dona Ana 29 60 0 0 0 89 6.6 12.0 -- -- -- 9.3
Eddy 11 16 0 0 0 27 6.4 18.4 -- -- -- 9.5Grant 5 11 0 0 0 16 -- 13.5 -- -- -- 7.6Guadalupe 0 3 0 0 0 3 -- -- -- -- -- --
Harding 0 0 0 0 0 0 -- -- -- -- -- --
Hidalgo 4 5 0 0 0 8 -- -- -- -- -- --Lea 16 12 0 0 0 28 9.1 15.2 -- -- -- 10.0
Lincoln 6 1 0 0 0 7 -- -- -- -- -- --
Los Alamos 4 1 0 0 0 6 -- -- -- -- -- --
Luna 4 5 0 0 0 8 -- -- -- -- -- --McKinley 2 4 115 0 0 121 -- -- 52.1 -- -- 38.7Mora 0 3 0 0 0 3 -- -- -- -- -- --Otero 19 10 10 0 0 39 8.2 11.3 55.7 -- -- 11.1
Quay 7 4 0 0 0 11 -- -- -- -- -- 15.8Rio Arriba 6 48 24 0 0 78 -- 32.1 79.0 -- -- 35.2
Roosevelt 1 4 0 0 0 5 -- -- -- -- -- --Sandoval 21 25 25 0 0 72 5.7 18.5 31.4 -- -- 11.9San Juan 19 7 66 0 0 92 5.1 -- 28.5 -- -- 14.0San Miguel 4 29 0 0 0 33 -- 24.8 -- -- -- 19.4Santa Fe 30 60 11 0 0 102 5.8 18.0 38.5 -- -- 12.0Sierra 8 4 0 0 0 12 -- -- -- -- -- 12.8
Socorro 2 8 6 0 0 15 -- -- -- -- -- 17.5Taos 8 21 3 0 0 32 -- 22.3 -- -- -- 16.1Torrance 10 6 0 0 0 15 16.2 -- -- -- -- 18.4Union 1 2 1 0 0 4 -- -- -- -- -- --Valencia 17 27 0 1 0 46 9.5 17.8 -- -- -- 12.4
Total 434 664 330 9 2 1,439 7.4 17.9 35.7 -- -- 13.4
* All rates are per 100,000, age-adjusted to the 2000 US standard population
-- Excluded due to small number of deaths (< 2 per county per year) during reported periodSources: NMDOH BVRHS death files and UNM-BBER population files; CDC ARDI; SAEP
New Mexico Substance Abuse Epidemiology Profile Page 12
ALCOHOL-RELATED CHRONIC LIVER DISEASE (CLD) DEATH (continued)
Problem Statement (continued)
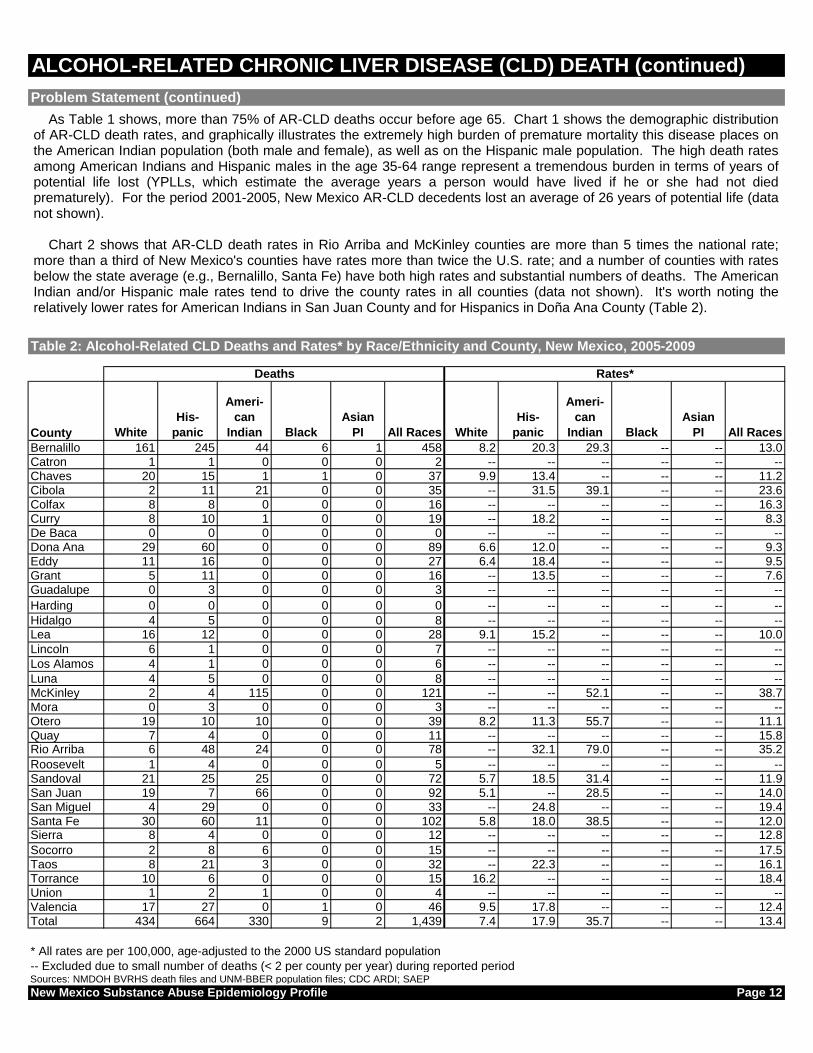
Table 2: Alcohol-Related CLD Deaths and Rates* by Race/Ethnicity and County, New Mexico, 2005-2009
Deaths Rates*
As Table 1 shows, more than 75% of AR-CLD deaths occur before age 65. Chart 1 shows the demographic distributionof AR-CLD death rates, and graphically illustrates the extremely high burden of premature mortality this disease places onthe American Indian population (both male and female), as well as on the Hispanic male population. The high death ratesamong American Indians and Hispanic males in the age 35-64 range represent a tremendous burden in terms of years ofpotential life lost (YPLLs, which estimate the average years a person would have lived if he or she had not diedprematurely). For the period 2001-2005, New Mexico AR-CLD decedents lost an average of 26 years of potential life (datanot shown).
Chart 2 shows that AR-CLD death rates in Rio Arriba and McKinley counties are more than 5 times the national rate;more than a third of New Mexico's counties have rates more than twice the U.S. rate; and a number of counties with ratesbelow the state average (e.g., Bernalillo, Santa Fe) have both high rates and substantial numbers of deaths. The AmericanIndian and/or Hispanic male rates tend to drive the county rates in all counties (data not shown). It's worth noting therelatively lower rates for American Indians in San Juan County and for Hispanics in Doña Ana County (Table 2).

* All rates are per 100,000, age-adjusted to the 2000 US standard population
The following counties were not included due to small number of deaths (< 2 per county per year) during reported period:
Catron, De Baca, Guadalupe, Harding, Hidalgo, Lincoln, Los Alamos, Luna, Mora, Roosevelt, UnionSources: NMDOH BVRHS death files and UNM-BBER population files (NM); NCHS death and population files (US); CDC ARDI; SAEP
New Mexico Substance Abuse Epidemiology Profile Page 13
ALCOHOL-RELATED CHRONIC LIVER DISEASE (CLD) DEATH (continued)
Chart 2: Alcohol-Related CLD Death Rates* by County, New Mexico, 2005-2009
6.6
0.0
0.0
0.0
0.0
0.0
0.0
0.0
0.0
0.0
0.0
7.6
8.3
9.3
9.5
10.0
11.1
11.2
11.9
12.0
12.4
12.8
13.0
13.4
14.0
15.8
16.1
16.3
17.5
18.4
19.4
23.6
35.2
38.7
0 5 10 15 20 25 30 35 40 45
United States, 2003-2007
Grant (16; 1.1%)
Curry (19; 1.3%)
Dona Ana (89; 6.2%)
Eddy (27; 1.9%)
Lea (28; 2%)
Otero (39; 2.7%)
Chaves (37; 2.5%)
Sandoval (72; 5%)
Santa Fe (102; 7.1%)
Valencia (46; 3.2%)
Sierra (12; 0.8%)
Bernalillo (458; 31.8%)
New Mexico (1439; 100%)
San Juan (92; 6.4%)
Quay (11; 0.8%)
Taos (32; 2.2%)
Colfax (16; 1.1%)
Socorro (15; 1.1%)
Torrance (15; 1.1%)
San Miguel (33; 2.3%)
Cibola (35; 2.4%)
Rio Arriba (78; 5.4%)
McKinley (121; 8.4%)
Rate*
County (# of deaths; % of statewide deaths)

* All rates are per 100,000, age-adjusted to the 2000 US standard population
Not included: Rate not reported due to small number of deaths (< 2 per county per year) during reported periodSources: NMDOH BVRHS death files and UNM-BBER population files; CDC ARDI; SAEP
New Mexico Substance Abuse Epidemiology Profile Page 14
ALCOHOL-RELATED CHRONIC LIVER DISEASE (CLD) DEATH (continued)
Chart 3: Alcohol-Related CLD Death Rates* by County, New Mexico, 2005-2009
Not included

Problem Statement
Chart 1: Top 3 Leading Causes of Alcohol-Related Injury Death (from 2005-2009), New Mexico, 1981-2009
Sources: NMDOH BVRHS death files and UNM-BBER population files; CDC ARDI; SAEP
Table 1: Alcohol-Related Injury Deaths and Rates* by Age, Sex, and Race/Ethnicity, New Mexico, 2005-2009
Ages Ages Ages All Ages Ages Ages All
Sex Race/Ethnicity 0-24 25-64 65+ Ages 0-24 25-64 65+ Ages*
White 82 451 209 742 13.5 37.4 57.0 33.6Hispanic 178 547 81 806 20.1 52.6 45.6 41.3American Indian 72 222 19 313 27.7 87.9 58.1 63.7Black 10 27 2 39 16.5 37.6 23.7 30.2Asian/Pacific Islander 3 4 2 9 9.0 9.7 41.6 18.7Total 344 1,252 313 1,910 18.7 47.8 53.0 40.3
White 25 192 202 419 4.4 15.3 44.9 16.9Hispanic 38 150 72 260 4.4 14.3 32.5 15.8American Indian 22 58 11 91 8.2 20.7 25.2 18.1Black 2 5 1 8 4.1 8.2 8.0 6.9Asian/Pacific Islander 1 3 1 6 4.5 5.7 18.6 8.5Total 88 408 288 784 5.0 15.1 39.1 16.8
White 107 643 411 1,161 9.1 26.1 50.3 25.1Hispanic 215 698 153 1,066 12.4 33.3 38.3 28.5American Indian 93 280 31 404 17.8 52.6 39.1 39.7Black 12 32 3 47 10.4 23.9 15.0 18.5Asian/Pacific Islander 4 7 3 15 6.9 7.5 27.6 12.8Total 432 1,660 602 2,694 11.9 31.2 45.3 28.4
* Age-specific rates (e.g., Ages 0-24) are per 100,000; all-ages rate is per 100,000, age-adjusted to the 2000 US standard population
Sources: NMDOH BVRHS death files and UNM-BBER population files; CDC ARDI; SAEP
New Mexico Substance Abuse Epidemiology Profile Page 15
ALCOHOL-RELATED INJURY DEATH
Total
Deaths Rates*
Male
Female
** Rates are rolling 3-year average per 100,000, age-adjusted to the 2000 US standard population
* Rates reflect only alcohol-related portion of deaths from cause
Acute or episodic heavy drinking (defined as having five drinks or more on an occasion for men, and four drinks ormore on an occasion for women) also called binge drinking, is a high-risk behavior associated with numerous injuryoutcomes, including motor vehicle fatalities, homicide, and suicide. Since 1990, New Mexico’s death rate for alcohol-related (AR) injury has consistently been among the highest in the nation, ranging from 1.4 to 1.8 times the nationalrate. While New Mexico’s AR motor vehicle crash death rates have declined more than 30% during this period, deathrates from other AR injuries have increased. Chart 1 shows the substantial increase in AR fall injury and AR drugoverdose death rates since the early 1990s. These increases have more than offset the decline in AR motor vehiclecrash deaths, as well as slight decreases in AR homicide and suicide death rates, to drive an overall 18.2% increase inNew Mexico's AR injury death during the period 1990 through 2007. During the period 2005-2009, AR falls injurydeaths replaced AR motor vehicle crash deaths as the leading cause of alcohol-related injury death in New Mexico.
Table 1 shows that total death rates from AR injuries increase with age. However, there were substantially highnumbers and rates of AR injury death in the lowest age category (Age 0-24), especially among American Indian andHispanic males. Deaths in this age category represent a very large burden of premature mortality (years of potential lifelost). For the period 2001-2005, New Mexico AR injury decedents (and their families and communities) lost an averageof 35 years of potential life (data not shown).
02468
101214
Ra
te**
Years
Fall injuries
Motor-vehicle traffic crashes
Poisoning (not alcohol)

County White
His-
panic
Ameri-
can
Indian Black
Asian
PI All Races White
His-
panic
Ameri-
can
Indian Black
Asian
PI All Races
Bernalillo 388 368 51 26 8 841 23.6 30.3 28.3 23.2 -- 27.2Catron 5 1 0 0 0 6 -- -- -- -- -- --Chaves 53 43 1 0 0 98 31.9 34.4 -- -- -- 32.2Cibola 12 13 21 0 0 47 31.4 29.9 41.3 -- -- 36.2Colfax 9 10 0 0 0 19 -- 30.1 -- -- -- 25.9Curry 22 14 0 2 0 39 16.4 18.2 -- -- -- 17.8De Baca 3 2 0 0 0 5 -- -- -- -- -- --Dona Ana 83 85 1 1 1 172 24.3 17.0 -- -- -- 19.9
Eddy 50 27 2 2 0 80 36.0 30.6 -- -- -- 33.8Grant 27 20 1 0 0 49 31.7 28.6 -- -- -- 31.4Guadalupe 1 7 0 0 0 8 -- -- -- -- -- --
Harding 1 0 0 0 0 1 -- -- -- -- -- --
Hidalgo 3 4 0 0 0 7 -- -- -- -- -- --Lea 43 27 0 4 0 74 30.2 27.9 -- -- -- 27.1
Lincoln 15 7 2 0 0 24 19.5 -- -- -- -- 24.0
Los Alamos 12 2 0 0 0 15 15.1 -- -- -- -- 14.4
Luna 15 14 0 0 1 30 28.2 20.5 -- -- -- 23.7McKinley 11 7 132 2 0 153 26.1 -- 52.8 -- -- 46.3Mora 2 5 0 0 0 8 -- -- -- -- -- --Otero 36 11 14 2 1 64 19.2 16.0 64.1 -- -- 21.2Quay 10 4 0 1 0 14 29.8 -- -- -- -- 27.9Rio Arriba 11 72 14 0 0 97 39.1 49.9 49.0 -- -- 47.8
Roosevelt 10 6 0 0 0 17 16.8 -- -- -- -- 19.0Sandoval 56 31 28 1 1 116 19.7 20.4 33.9 -- -- 22.1San Juan 76 22 113 1 0 211 28.4 26.8 44.5 -- -- 34.9San Miguel 9 42 0 0 0 52 -- 40.5 -- -- -- 35.4Santa Fe 88 91 7 2 1 188 30.3 31.2 -- -- -- 30.7Sierra 19 4 0 0 0 23 36.2 -- -- -- -- 30.2
Socorro 9 17 7 0 0 33 -- 45.6 -- -- -- 39.1Taos 20 34 3 0 1 58 35.3 44.4 -- -- -- 39.7Torrance 17 11 0 0 0 29 46.6 38.1 -- -- -- 43.0Union 4 1 0 0 0 6 -- -- -- -- -- --Valencia 39 64 4 1 1 109 28.3 36.5 -- -- -- 33.3Total 1,161 1,066 404 47 15 2,694 25.1 28.5 39.7 18.5 12.8 28.4
* All rates are per 100,000, age-adjusted to the 2000 US standard population
-- Excluded due to small number of deaths (< 2 per county per year) during reported periodSources: NMDOH BVRHS death files and UNM-BBER population files; CDC ARDI; SAEP
New Mexico Substance Abuse Epidemiology Profile Page 16
Rates*
ALCOHOL-RELATED INJURY DEATH (continued)
Deaths
Problem Statement (continued)
Table 2: Alcohol-Related Injury Deaths and Rates* by Race/Ethnicity and County, New Mexico, 2005-2009
Table 1 shows that males are more at risk of AR injury death than females, with male rates 2-4 times higher than femalerates across the race/ethnic categories. American Indian males are the most at-risk, with a rate more than twice the staterate and 1.9 times the White male rate. Hispanic males are also at risk, with a rate 20% (1.2 times) higher than the rate forWhite males.
Table 2 shows that AR injury is a serious issue in many New Mexico counties. Rio Arriba and McKinley counties havethe most serious problems, with rates roughly 3 times the U.S. rate. More than a third of New Mexico counties have ratesmore than twice the U.S. rate (see Chart 2); and more than half have rates more than 1.5 times the U.S. rate. A number ofcounties have high rates and a relatively heavy burden (roughly 20 or more alcohol-related deaths per year), Rio ArribaCounty's high rate is driven by high rates in both the Hispanic and American Indian population; but most of the burden ofdeaths falls on the Hispanic population. In McKinley and San Juan counties, elevated rates are driven by high rates in theAmerican Indian male population. Valencia County's high rate is driven by elevated rates in the Hispanic male population.

* All rates are per 100,000, age-adjusted to the 2000 US standard population
The following counties were not included due to small number of deaths (< 2 per county per year) during reported period:
Catron, De Baca, Guadalupe, Harding, Hidalgo, Mora, UnionSources: NMDOH BVRHS death files and UNM-BBER population files (NM); NCHS death and population files (US); CDC ARDI; SAEP
New Mexico Substance Abuse Epidemiology Profile Page 17
ALCOHOL-RELATED INJURY DEATH (continued)
Chart 2: Alcohol-Related Injury Death Rates* by County, New Mexico, 2005-2009
15.7
0.0
0.0
0.0
0.0
0.0
0.0
0.0
14.4
17.8
19.0
19.9
21.2
22.1
23.7
24.0
25.9
27.1
27.2
27.9
28.4
30.2
30.7
31.4
32.2
33.3
33.8
34.9
35.4
36.2
39.1
39.7
43.0
46.3
47.8
0 10 20 30 40 50 60
United States, 2003-2007
Los Alamos (15; 0.5%)
Curry (39; 1.4%)
Roosevelt (17; 0.6%)
Dona Ana (172; 6.4%)
Otero (64; 2.4%)
Sandoval (116; 4.3%)
Luna (30; 1.1%)
Lincoln (24; 0.9%)
Colfax (19; 0.7%)
Lea (74; 2.7%)
Bernalillo (841; 31.2%)
Quay (14; 0.5%)
New Mexico (2694; 100%)
Sierra (23; 0.8%)
Santa Fe (188; 7%)
Grant (49; 1.8%)
Chaves (98; 3.6%)
Valencia (109; 4.1%)
Eddy (80; 3%)
San Juan (211; 7.8%)
San Miguel (52; 1.9%)
Cibola (47; 1.7%)
Socorro (33; 1.2%)
Taos (58; 2.2%)
Torrance (29; 1.1%)
McKinley (153; 5.7%)
Rio Arriba (97; 3.6%)
Rate*
County (# of deaths; % of statewide deaths)

* All rates are per 100,000, age-adjusted to the 2000 US standard population
Not included: Rate not reported due to small number of deaths (< 2 per county per year) during reported periodSources: NMDOH BVRHS death files and UNM-BBER population files; CDC ARDI; SAEP
New Mexico Substance Abuse Epidemiology Profile Page 18
ALCOHOL-RELATED INJURY DEATH (continued)
Chart 3: Alcohol-Related Injury Death Rates* by County, New Mexico, 2005-2009
Not included

ALCOHOL-RELATED MOTOR VEHICLE TRAFFIC CRASH (MVTC) DEATH
Source: National Highway Traffic Safety Administration (NHTSA) Fatality Analysis Reporting System (FARS); NCHS (population)
Ages Ages Ages All Ages Ages Ages All
Sex Race/Ethnicity 0-24 25-64 65+ Ages 0-24 25-64 65+ Ages*
White 34 115 12 162 5.7 9.5 3.4 7.5Hispanic 71 134 6 210 8.0 12.8 3.2 9.7American Indian 31 71 1 103 12.0 28.0 3.5 18.8Black 2 6 0 8 2.8 8.4 4.1 5.7Asian/Pacific Islander 1 1 0 3 3.7 2.9 2.6 3.1Total 139 326 20 485 7.5 12.5 3.3 9.6
White 10 30 5 46 1.8 2.4 1.1 2.1Hispanic 19 33 2 54 2.2 3.1 0.9 2.5American Indian 11 20 1 32 4.3 7.1 1.4 5.3Black 1 1 0 2 1.5 1.5 0.6 1.4Asian/Pacific Islander 1 1 0 1 2.2 1.3 0.0 1.4Total 43 85 8 135 2.4 3.1 1.1 2.6
White 45 145 18 207 3.8 5.9 2.1 4.8Hispanic 90 166 8 264 5.2 7.9 1.9 6.1American Indian 42 91 2 135 8.1 17.0 2.3 11.7Black 3 7 0 10 2.2 5.2 2.2 3.6Asian/Pacific Islander 2 2 0 4 3.0 2.1 1.0 2.2Total 182 411 28 620 5.0 7.7 2.1 6.1
* Age-specific rates (e.g., Ages 0-24) per 100,000 population; all-ages rate per 100,000 population, age-adjusted to 2000 US standard population1 Alcohol-related motor vehicle traffic crash (AR-MVTC) deaths estimated based on CDC ARDI alcohol-attributable fractions (BAC>=0.10)
Sources: NMDOH BVRHS death files and UNM-BBER population files; CDC ARDI; SAEP
New Mexico Substance Abuse Epidemiology Profile Page 19
Problem Statement
Chart 1: Alcohol-Impaired MVTC Fatality Rates*, New Mexico and United States, 1982-2009
Table 1: Alcohol-Related MVTC Deaths/Rates1,2
by Age, Sex, and Race/Ethnicity, New Mexico, 2005-2009
Total
Deaths Rates*
Male
Female
0
5
10
15
20
25
0.0
0.5
1.0
1.5
2.0
2.5
Ra
te p
er
10
0,0
00
pe
rso
ns
Ra
te p
er
10
0 m
illi
on
ve
hic
le m
ile
s t
rav
ele
d
(VM
T)
Year
New Mexico (per 100M VMT)
United States (per 100M VMT)
New Mexico (per 100K population)
* Deaths in motor vehicle traffic crashes with highest driver blood alcohol content (BAC) >= 0.08; rates are crude rates per 100 million vehicle miles traveled (VMT)(NM and US); and per 100,000 population (NM); 2009 rates per 100M VMT not yet available at time of report
Alcohol-related motor vehicle crash (AR-MVTC) death has historically been the leading cause of alcohol-related injurydeath. Nonetheless, AR-MVTC deaths provide a hopeful example of a substance-related health outcome that has beensuccessfully reduced using a public health approach, both nationally and in New Mexico. From 1982 through 2009, inresponse to a wide range of policy and preventive interventions, New Mexico's alcohol-impaired motor vehicle trafficcrash (AI-MVTC) fatality rate declined more dramatically than the U.S. rate, decreasing 74% and dropping New Mexicofrom 1st to 12th among states in AI-MVTC fatalities per 100,000 population. In terms of deaths per 100 million vehiclemiles traveled (VMT), New Mexico's AI-MVTC fatality rate in 2007 was one-fifth what it was in 1982. Furthermore, acomprehensive AR-MVTC prevention campaign in place from 2005-2009 was successful in reinitiating rate decreasesthat had been stalled since the late 1990s: from 2005 through 2008 (the most recent year for which VMT estimates areavailable) New Mexico's AI-MVTC fatality rate per 100 million VMT dropped 36%.
2 These death counts/rates are estimates. They do not equal the actual deaths/rates reported in Charts 1-3 based on FARS. ARDI-based deaths/rates are included here to describe the demographic distribution of AR-MVTC deaths, which is not available from FARS.

County White
His-
panic
Ameri-
can
Indian Black
Asian
PI All Races White
His-
panic
Ameri-
can
Indian Black
Asian
PI All Races
Bernalillo 49 63 14 5 2 132 3.1 4.6 7.2 -- -- 4.0Catron 2 0 0 0 0 2 -- -- -- -- -- --Chaves 11 12 0 0 0 24 8.0 9.0 -- -- -- 7.9Cibola 3 5 6 0 0 13 -- -- -- -- -- 9.3Colfax 3 1 0 0 0 4 -- -- -- -- -- --Curry 5 7 0 0 0 13 -- -- -- -- -- 5.2De Baca 1 1 0 0 0 2 -- -- -- -- -- --Dona Ana 10 24 0 0 0 35 3.1 3.6 -- -- -- 3.3Eddy 13 8 0 0 0 22 11.2 -- -- -- -- 9.2
Grant 4 5 0 0 0 9 -- -- -- -- -- --Guadalupe 1 2 0 0 0 2 -- -- -- -- -- --
Harding 0 0 0 0 0 0 -- -- -- -- -- --
Hidalgo 1 1 0 0 0 2 -- -- -- -- -- --Lea 15 12 0 1 0 28 11.1 8.7 -- -- -- 9.6
Lincoln 3 2 0 0 0 5 -- -- -- -- -- --
Los Alamos 1 1 0 0 0 2 -- -- -- -- -- --
Luna 4 7 0 0 1 11 -- -- -- -- -- 8.5McKinley 3 1 47 1 0 52 -- -- 15.9 -- -- 13.7Mora 0 1 0 0 0 1 -- -- -- -- -- --Otero 5 2 4 0 0 10 -- -- -- -- -- 3.1Quay 2 1 0 0 0 3 -- -- -- -- -- --Rio Arriba 1 20 5 0 0 26 -- 12.8 -- -- -- 11.9
Roosevelt 2 3 0 0 0 5 -- -- -- -- -- --Sandoval 8 5 14 0 0 27 -- -- 12.4 -- -- 4.2San Juan 20 6 37 0 0 63 7.6 -- 13.5 -- -- 9.9San Miguel 3 10 0 0 0 13 -- 8.8 -- -- -- 8.3Santa Fe 17 22 2 1 0 42 5.3 6.0 -- -- -- 5.8Sierra 2 1 0 0 0 2 -- -- -- -- -- --
Socorro 3 7 1 0 0 11 -- -- -- -- -- 11.5Taos 4 13 2 0 0 19 -- 17.0 -- -- -- 13.4Torrance 5 4 0 0 0 9 -- -- -- -- -- --Union 1 0 0 0 0 2 -- -- -- -- -- --Valencia 7 19 2 0 0 28 -- 9.9 -- -- -- 7.6Total 207 264 135 10 4 620 4.8 6.1 11.7 3.6 -- 6.1
* All rates are per 100,000 population, age-adjusted to the 2000 US standard population
-- Excluded due to small number of deaths (< 2 per county per year) during reported period1 Alcohol-related motor vehicle traffic crash (AR-MVTC) deaths estimated based on CDC ARDI alcohol-attributable fractions (BAC>=0.10)
2 See footnote 2 for Table 1
Sources: NMDOH BVRHS death files and UNM-BBER population files; CDC ARDI; SAEP
New Mexico Substance Abuse Epidemiology Profile Page 20
ALCOHOL-RELATED MOTOR VEHICLE TRAFFIC CRASH (MVTC) DEATH
Problem Statement (continued)
Deaths Rates*
Table 2: Alcohol-Related MVTC Deaths and Rates*,1,2
by Race/Ethnicity and County, New Mexico, 2005-2009
Table 1 shows the demographic distribution of AR-MVTC deaths in New Mexico. Because demographic data is notreadily available from the system of record for motor vehicle crash death (the Fatality Analysis Reporting System used forCharts 1-3), death certificate data for alcohol-related motor vehicle crash deaths was used here to provide the demographicdescriptions in Tables 1 and 2. Because they are based on different data sources, the total and county-level rates reportedin Tables 1 and 2 do not match the rates reported in Charts 1-3. The most pronounced feature of the demographic profile ofAR-MVTC deaths is the elevated rates among both male and female American Indians. A finer breakdown by age (notshown) shows that rates are especially high -- 2 to 3.5 times the corresponding White rates -- among American Indianmales and females ages 15-54. Hispanic and White male rates are highest in the age range 15-54, with a slight elevation ofHispanic rates relative to White rates. There are no meaningful differences between White and Hispanic female ratesacross the age range. Chart 2 shows that McKinley, Rio Arriba and San Juan counties have both substantial AI-MVTCfatalities and high rates; other counties have high rates but fewer deaths. Table 2 shows that the McKinley and San Juancounty rates are driven by the American Indian rates (both male and female rates are high, data not shown); and that theRio Arriba County rate is driven by the Hispanic rate (the male rate is high, data not shown).
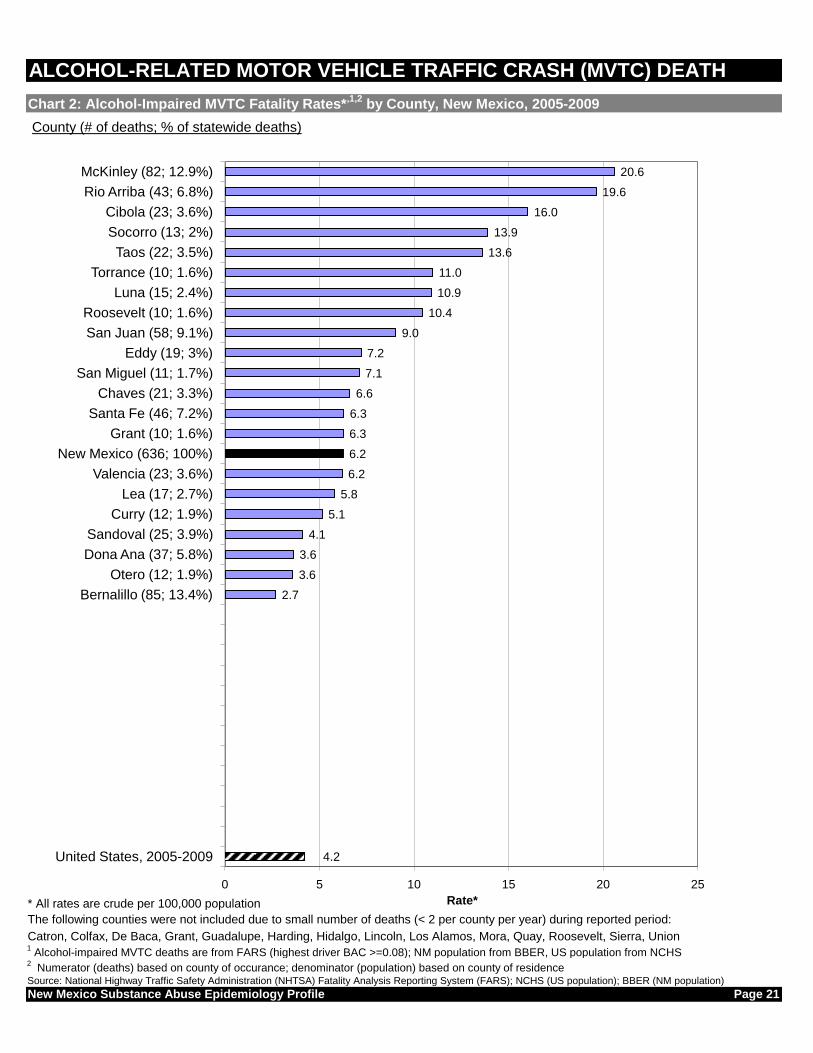
* All rates are crude per 100,000 population
The following counties were not included due to small number of deaths (< 2 per county per year) during reported period:
Catron, Colfax, De Baca, Grant, Guadalupe, Harding, Hidalgo, Lincoln, Los Alamos, Mora, Quay, Roosevelt, Sierra, Union1 Alcohol-impaired MVTC deaths are from FARS (highest driver BAC >=0.08); NM population from BBER, US population from NCHS
2 Numerator (deaths) based on county of occurance; denominator (population) based on county of residence
Source: National Highway Traffic Safety Administration (NHTSA) Fatality Analysis Reporting System (FARS); NCHS (US population); BBER (NM population)
New Mexico Substance Abuse Epidemiology Profile Page 21
ALCOHOL-RELATED MOTOR VEHICLE TRAFFIC CRASH (MVTC) DEATH
Chart 2: Alcohol-Impaired MVTC Fatality Rates*,1,2
by County, New Mexico, 2005-2009
4.2
0.0
0.0
0.0
0.0
0.0
0.0
0.0
0.0
0.0
0.0
0.0
0.0
2.7
3.6
3.6
4.1
5.1
5.8
6.2
6.2
6.3
6.3
6.6
7.1
7.2
9.0
10.4
10.9
11.0
13.6
13.9
16.0
19.6
20.6
0 5 10 15 20 25
United States, 2005-2009
Bernalillo (85; 13.4%)
Otero (12; 1.9%)
Dona Ana (37; 5.8%)
Sandoval (25; 3.9%)
Curry (12; 1.9%)
Lea (17; 2.7%)
Valencia (23; 3.6%)
New Mexico (636; 100%)
Grant (10; 1.6%)
Santa Fe (46; 7.2%)
Chaves (21; 3.3%)
San Miguel (11; 1.7%)
Eddy (19; 3%)
San Juan (58; 9.1%)
Roosevelt (10; 1.6%)
Luna (15; 2.4%)
Torrance (10; 1.6%)
Taos (22; 3.5%)
Socorro (13; 2%)
Cibola (23; 3.6%)
Rio Arriba (43; 6.8%)
McKinley (82; 12.9%)
Rate*
County (# of deaths; % of statewide deaths)

* All rates are crude per 100,000 population
Not included: Rate not reported due to small number of deaths (< 2 per county per year) during reported period1 Alcohol-impaired MVTC deaths are from FARS (highest driver BAC >=0.08); NM population from BBER, US population from NCHS
2 Numerator (deaths) based on county of occurance; denominator (population) based on county of residence
Source: National Highway Traffic Safety Administration (NHTSA) Fatality Analysis Reporting System (FARS); NCHS (US population); BBER (NM population)
New Mexico Substance Abuse Epidemiology Profile Page 22
ALCOHOL-RELATED MOTOR VEHICLE TRAFFIC CRASH (MVTC) DEATH
Chart 3: Alcohol-Impaired MVTC Fatality Rates1,2
by County, New Mexico, 2005-2009
Not included

SMOKING-RELATED DEATH
Sources: NMDOH BVRHS death files and UNM-BBER population files; CDC SAMMEC; SAEP
Ages Ages Ages All Ages Ages Ages All
Sex Race/Ethnicity 0-24 25-64 65+ Ages 0-24 25-64 65+ Ages*
White 0 1,148 3,300 4,449 0.0 95.0 899.7 174.7
Hispanic 0 531 1,204 1,735 0.0 51.0 679.1 142.2
American Indian 0 90 127 216 0.0 35.5 379.3 89.3
Black 0 36 77 112 0.0 50.1 814.5 161.2
Asian/Pacific Islander 0 17 12 29 0.0 38.9 239.4 72.4Total 0 1,822 4,719 6,541 0.0 69.6 797.4 159.1
White 0 577 2,420 2,997 0.0 45.9 537.9 99.0
Hispanic 0 239 740 979 0.0 22.7 333.0 70.6
American Indian 0 51 79 131 0.0 18.4 174.7 43.0
Black 0 17 40 57 0.0 27.1 340.9 77.6
Asian/Pacific Islander 0 4 16 20 0.0 7.9 204.9 40.0Total 0 888 3,295 4,183 0.0 32.8 447.1 86.5
White 0 1,725 5,720 7,445 0.0 70.0 700.4 132.8
Hispanic 0 770 1,944 2,714 0.0 36.8 486.5 102.6
American Indian 0 141 206 347 0.0 26.5 261.3 62.7
Black 0 53 116 169 0.0 39.4 552.1 114.2
Asian/Pacific Islander 0 22 28 49 0.0 22.0 218.4 53.1
Total 0 2,710 8,014 10,724 0.0 50.9 603.1 118.7
* Age-specific rates (e.g., Ages 0-24) are per 100,000; all-ages rate is per 100,000, age-adjusted to the 2000 US standard population
Sources: NMDOH BVRHS death files and UNM-BBER population files; CDC SAMMEC; SAEP
New Mexico Substance Abuse Epidemiology Profile Page 23
Chart 1: Leading Causes of Smoking-Related Death, New Mexico, 2005-2009
Female
Total
Table 1: Smoking-Related Deaths and Rates* by Age, Sex, and Race/Ethnicity, New Mexico, 2005-2009
Deaths Rates*
Male
Problem Statement
36.2
28.4
20.8
7.3
4.4
0 10 20 30 40
Chronic airway obstruction
Lung cancer
Ischemic heart disease
Other heart disease
Bronchitis and emphysema
Rate**
** Rate per 100,000, age-adjusted to the 2000 US standard population
* Rates reflect only smoking-related portion of deaths from cause
Smoking-related* deaths due to:
Smoking is a risk factor for many causes of death, and a serious source of preventable death in New Mexico. Chart 1shows the five leading causes of smoking-related death in New Mexico, and Table 1 shows the cumulative deaths andrates for all smoking-related causes. New Mexico's smoking-related death rate is actually lower than the national rate.Historically, New Mexico's rates for smoking-related causes such as lung cancer have been among the lowest in thenation. Nonetheless, a comparison of New Mexico's smoking-related death rates to its alcohol and drug-related deathrates shows that the burden of death associated with smoking is still considerably greater than the burden associatedwith these other substances. This speaks to the public health importance of smoking prevention efforts, even in a statewith low rates relative to the rest of the nation.
Table 1 shows the demographic distribution of smoking-related death in New Mexico. Smoking-related death ratesincrease sharply in the oldest age group (age 65+), consistent with the fact that smoking-related causes of death aremostly chronic conditions with a long development period. This is in contrast to both alcohol and drug-related deaths,both of which show a greater proportion of "premature" deaths (deaths before age 65+).

County White
His-
panic
Ameri-
can
Indian Black
Asian
PI All Races White
His-
panic
Ameri-
can
Indian Black
Asian
PI All Races
Bernalillo 2,273 818 49 80 26 3,247 116.1 93.5 53.1 124.1 55.3 107.4
Catron 23 3 1 0 0 27 107.8 -- -- -- -- 98.2
Chaves 374 79 1 4 0 459 159.5 115.3 -- -- -- 142.9
Cibola 73 37 25 1 2 137 155.2 111.2 70.2 -- -- 115.2
Colfax 68 36 0 1 0 105 123.9 105.1 -- -- -- 115.3
Curry 210 50 3 16 1 280 141.7 147.3 -- 181.4 -- 141.6
De Baca 18 7 0 0 0 24 173.7 -- -- -- -- 142.3
Dona Ana 591 305 3 8 3 910 139.7 86.5 -- -- -- 112.7
Eddy 334 63 0 8 0 406 172.3 96.8 -- -- -- 150.9
Grant 171 65 1 0 0 237 150.8 95.2 -- -- -- 128.3
Guadalupe 5 21 1 0 0 26 -- 165.9 -- -- -- 160.5
Harding 1 3 0 0 0 5 -- -- -- -- -- --
Hidalgo 26 10 0 0 0 36 152.2 94 -- -- -- 125.0Lea 319 47 1 16 1 384 164.0 113.1 -- 135.1 -- 149.7
Lincoln 110 18 1 0 0 129 96.9 75.9 -- -- -- 91.2
Los Alamos 53 6 1 0 0 60 55.6 -- -- -- -- 56.6
Luna 175 44 1 2 1 222 172.5 122.4 -- -- -- 151.3
McKinley 70 23 100 4 0 196 189.0 110.8 85.4 -- -- 111.2
Mora 6 23 0 0 0 30 -- 122.2 -- -- -- 109.2
Otero 332 63 6 7 1 409 166.1 105.0 -- -- -- 146.1
Quay 87 29 0 2 1 119 166.3 238.1 -- -- -- 173.8Rio Arriba 49 133 13 2 2 198 150.7 117.5 79.7 -- -- 121.6
Roosevelt 108 13 1 0 0 122 165.2 75.3 -- -- -- 143.5
Sandoval 392 94 36 9 4 536 126.1 106.8 77.7 -- -- 117.0
San Juan 453 53 83 2 1 592 136.0 100.6 53.0 -- -- 108.8
San Miguel 50 123 1 0 1 175 132.7 127.3 -- -- -- 127.0
Santa Fe 349 240 5 1 3 597 106.1 111.6 -- -- -- 106.1Sierra 182 20 1 2 0 204 187.4 126.3 -- -- -- 175.7
Socorro 72 34 2 0 0 109 194.5 125.8 -- -- -- 156.3
Taos 64 87 6 0 0 157 106.1 105.7 -- -- -- 103.0
Torrance 91 23 3 0 0 117 242.7 147.6 -- -- -- 212.2
Union 31 8 0 0 0 39 158.9 -- -- -- -- 140.1
Valencia 285 138 4 4 0 431 189.3 134.9 -- -- -- 159.3
Total 7,445 2,714 347 169 49 10,724 132.8 102.6 62.7 114.2 53.1 118.7
* All rates are per 100,000, age-adjusted to the 2000 US standard population
-- Excluded due to small number of deaths (< 2 per county per year) during reported period
Sources: NMDOH BVRHS death files and UNM-BBER population files; CDC SAMMEC; SAEP
New Mexico Substance Abuse Epidemiology Profile Page 24
Table 2: Smoking-Related Deaths and Rates* by Race/Ethnicity and County, New Mexico, 2005-2009
Deaths Rates*
SMOKING-RELATED DEATH (continued)
Problem Statement (continued)
Table 1 also shows that male rates are 1.8 to 2 times female rates across all race/ethnic groups. Among both males andfemales, Whites have the highest rates followed by Blacks.
Table 2 and Chart 2 show that the counties with the highest rates and relatively heavy burdens of smoking-related death(i.e., 20 or more deaths a year) are Torrance, Sierra, Quay, Valencia, and Socorro counties. The high rates in most ofthese counties (and in the state overall) are driven by high rates among Whites. However, there are notably elevated ratesamong Hispanics in Quay and Valencia counties; and a substantial buden of smoking-related death among Hispanics inseveral other counties (e.g., Dona Ana, Bernalillo, Santa Fe). The high rates of smoking-related death among Blacks inCurry and Lea counties are also notable. The smoking-related death rates among the American Indian and Asian/PacificIslander population are relatively low.
NOTE: These tables are based on the Centers for Disease Control and Prevention Smoking Attributable Mortality,Morbidity, and Economic Costs (SAMMEC) methodology. However, CDC's SAMMEC site reports age-adjusted ratesbased on the age 35+ population; whereas this report calculates age-adjusted rates for the entire population. As a result,the smoking-attributable mortality rates reported here are lower than those reported by the CDC's SAMMEC site.

* All rates are per 100,000, age-adjusted to the 2000 US standard population
The following county was not included due to small number of deaths (< 2 per county per year) during reported period:
Harding
Sources: NMDOH BVRHS death files and UNM-BBER population files (NM); NCHS death and population files (US); CDC SAMMEC; SAEP
New Mexico Substance Abuse Epidemiology Profile Page 25
SMOKING-RELATED DEATH (continued)
Chart 2: Smoking-Related Death Rates* by County, New Mexico, 2005-2009
127.8
0.0
56.6
91.2
98.2
103.0
106.1
107.4
108.8
109.2
111.2
112.7
115.2
115.3
117.0
118.7
121.6
125.0
127.0
128.3
140.1
141.6
142.3
142.9
143.5
146.1
149.7
150.9
151.3
156.3
159.3
160.5
173.8
175.7
212.2
0 50 100 150 200 250
United States, 2003-2007
Los Alamos (60; 0.6%)
Lincoln (129; 1.2%)
Catron (27; 0.3%)
Taos (157; 1.5%)
Santa Fe (597; 5.6%)
Bernalillo (3247; 30.3%)
San Juan (592; 5.5%)
Mora (30; 0.3%)
McKinley (196; 1.8%)
Dona Ana (910; 8.5%)
Cibola (137; 1.3%)
Colfax (105; 1%)
Sandoval (536; 5%)
New Mexico (10724; 100%)
Rio Arriba (198; 1.8%)
Hidalgo (36; 0.3%)
San Miguel (175; 1.6%)
Grant (237; 2.2%)
Union (39; 0.4%)
Curry (280; 2.6%)
De Baca (24; 0.2%)
Chaves (459; 4.3%)
Roosevelt (122; 1.1%)
Otero (409; 3.8%)
Lea (384; 3.6%)
Eddy (406; 3.8%)
Luna (222; 2.1%)
Socorro (109; 1%)
Valencia (431; 4%)
Guadalupe (26; 0.2%)
Quay (119; 1.1%)
Sierra (204; 1.9%)
Torrance (117; 1.1%)
Rate*
County (# of deaths; % of statewide deaths)

* All rates are per 100,000, age-adjusted to the 2000 US standard population
Not included: Rate not reported due to small number of deaths (< 2 per county per year) during reported period
Sources: NMDOH BVRHS death files and UNM-BBER population files; CDC SAMMEC; SAEP
New Mexico Substance Abuse Epidemiology Profile Page 26
SMOKING-RELATED DEATH (continued)
Chart 3: Smoking-Related Death Rates* by County, New Mexico, 2005-2009
Not included

DRUG-INDUCED DEATH
Sources: NMDOH BVRHS death files and UNM-BBER population files
Ages Ages Ages All Ages Ages Ages All
Sex Race/Ethnicity 0-24 25-64 65+ Ages 0-24 25-64 65+ Ages*
White 48 460 25 533 7.9 38.1 6.8 23.5
Hispanic 83 679 14 776 9.4 65.2 7.9 37.9
American Indian 16 57 1 74 6.2 22.6 3.0 13.7
Black 3 29 0 32 5.0 40.7 0.0 23.0
Asian/Pacific Islander 2 4 0 6 6.1 9.0 0.0 7.0Total 152 1,229 40 1,421 8.3 47.0 6.8 28.2
White 17 378 34 429 3.0 30.1 7.6 17.2
Hispanic 30 257 5 292 3.5 24.4 2.2 14.1
American Indian 6 36 0 42 2.3 12.9 0.0 7.4
Black 2 9 0 11 3.5 14.4 0.0 8.4
Asian/Pacific Islander 0 4 0 4 0.0 7.5 0.0 4.0Total 55 684 39 778 3.1 25.3 5.3 14.8
White 65 838 59 962 5.5 34.0 7.2 20.4
Hispanic 113 936 19 1,068 6.5 44.7 4.8 25.9
American Indian 22 93 1 116 4.2 17.5 1.3 10.4
Black 5 38 0 43 4.2 28.4 0.0 16.1
Asian/Pacific Islander 2 8 0 10 3.2 8.2 0.0 5.5
Total 207 1,913 79 2,199 5.7 36.0 5.9 21.4
* Age-specific rates (e.g., Ages 0-24) are per 100,000; all-ages rate is per 100,000, age-adjusted to the 2000 US standard population
Sources: NMDOH BVRHS death files and UNM-BBER population files; SAEP
New Mexico Substance Abuse Epidemiology Profile Page 27
Chart 1: Drug-Induced Death Rates* by Cause Category, New Mexico, 2000-2009
Problem Statement
Female
Total
Table 1: Drug-Induced Deaths and Rates* by Age, Sex, and Race/Ethnicity, New Mexico, 2005-2009
Deaths Rates*
Male
In 2007, New Mexico had the highest drug-induced death rate in the nation and the consequences of drug use continueto burden New Mexico communities. Drug use can result in overdose death, and is also associated with other societalproblems including crime, violence, homelessness, loss of productivity and spread of blood-borne disease such as HIV andhepatitis. Unintentional overdose, or poisoning, is the largest subset of drug-induced death, accounting for 80-85% of drug-induced death in New Mexico (Chart 1). The other substantial cause of drug-induced death is suicide, or intentional self-poisoning, which accounts for 10-15% of all drug-induced death in New Mexico. Poisoning was the leading cause ofunintentional injury in New Mexico during 2007, surpassing motor vehicle crash.
During 2005-2009, 60% of unintentional drug overdose deaths were caused primarily by illicit drugs, while 40% werecaused primarily by prescription drugs. Medical examiner data indicate that the most common drug types causing deathwere prescription opioids (i.e., methadone, oxycodone, morphine; 49%), heroin (36%), cocaine (31%), tranquilizers/musclerelaxants (29%) and antidepressants (16%)(not mutually exclusive). The median age of unintentional drug overdosedecedents was 43.7 years. In New Mexico and nationally, overdose death from prescription opioids has become an issueof enormous concern as these potent drugs are widely available. Interventions are currently being formulated, assessedand implemented in-state and in communities across the country.
0
5
10
15
20
25
30
Rate
*
Year
Total
Drug poisoning
Intentional self-poisoning
Mental health/ behavioral diagnosis
* Rate per 100,000, age-adjusted to the 2000 US standard population

County White
His-
panic
Ameri-
can
Indian Black
Asian
PI All Races White
His-
panic
Ameri-
can
Indian Black
Asian
PI All Races
Bernalillo 362 463 30 23 4 882 22.1 34.7 15.2 20.1 -- 26.5
Catron 3 0 0 0 0 3 -- -- -- -- -- --
Chaves 48 32 1 0 1 82 30.8 24.6 -- -- -- 26.6
Cibola 5 11 5 0 0 21 -- 24.3 -- -- -- 15.1
Colfax 4 11 0 0 0 15 -- 34.0 -- -- -- 20.0
Curry 17 7 0 2 0 26 11.9 -- -- -- -- 11.4
De Baca 1 0 0 0 0 1 -- -- -- -- -- --
Dona Ana 78 73 2 1 1 155 23.2 12.8 -- -- -- 16.1
Eddy 41 26 2 1 0 70 29.1 28.2 -- -- -- 28.0
Grant 22 14 0 1 0 37 30.2 19.0 -- -- -- 24.0
Guadalupe 1 7 0 0 0 8 -- -- -- -- -- --
Harding 0 0 0 0 0 0 -- -- -- -- -- --
Hidalgo 1 2 0 0 0 3 -- -- -- -- -- --Lea 30 9 0 6 0 45 21.9 -- -- -- -- 16.3
Lincoln 19 1 0 0 0 20 21.4 -- -- -- -- 16.4
Los Alamos 7 0 0 0 0 7 -- -- -- -- -- --
Luna 9 4 0 0 0 13 -- -- -- -- -- 10.8
McKinley 13 11 22 1 0 47 26.6 40.2 7.8 -- -- 13.5
Mora 3 2 0 0 0 5 -- -- -- -- -- --
Otero 39 17 5 2 0 63 19.8 17.6 -- -- -- 18.8
Quay 5 5 0 0 0 10 -- -- -- -- -- 20.2Rio Arriba 15 92 4 1 0 112 47.2 61.4 -- -- -- 51.1
Roosevelt 4 7 0 0 0 11 -- -- -- -- -- 12.5
Sandoval 44 39 9 0 1 93 14.2 21.3 -- -- -- 15.6
San Juan 56 14 19 1 0 90 20.4 14.8 6.8 -- -- 14.0
San Miguel 6 29 0 0 0 35 -- 28.9 -- -- -- 23.5
Santa Fe 45 85 10 1 0 141 12.8 23.4 31.3 -- -- 18.1Sierra 15 1 0 0 0 16 30.8 -- -- -- -- 23.1
Socorro 4 15 2 0 0 21 -- 36.2 -- -- -- 22.4
Taos 16 21 1 0 2 40 24.8 26.8 -- -- -- 24.8
Torrance 18 7 0 1 0 26 31.9 -- -- -- -- 27.9
Union 1 2 0 0 0 3 -- -- -- -- -- --
Valencia 28 61 4 2 1 96 18.0 32.2 -- -- -- 25.8
Total 962 1,068 116 43 10 2,199 20.4 25.9 10.4 16.1 5.5 21.4
* All rates are per 100,000, age-adjusted to the 2000 US standard population
-- Excluded due to small number of deaths (< 2 per county per year) during reported period
Sources: NMDOH BVRHS death files and UNM-BBER population files; SAEP
New Mexico Substance Abuse Epidemiology Profile Page 28
Table 2: Drug-Induced Deaths and Rates* by Race/Ethnicity and County, New Mexico, 2005-2009
Problem Statement (continued)
DRUG-INDUCED DEATH (continued)
Deaths Rates*
Table 1 shows that Hispanics had the highest drug-induced death rate during 2005-2009. Hispanics also had higher unintentional drug overdose death rates by age group, compared to white decedents (Chart 4). The rates of drug-induced death (Table 1) and unintentional drug overdose death (Table 3) among males were roughly two times that of females. Among females, drug overdose death from prescription drugs was more common than from illicit drugs for women aged 45-74 years (Chart 4). Illicit drugs were the predominant drug type causing death among males across age groups, where the rates were highest among the age group of 25-54 years.
Rio Arriba County had the highest drug-induced death rate (51.1 deaths per 100,000; Chart 2) and unintentional drugoverdose death rate (47.5 deaths per 100,000; Chart 5) among all New Mexico counties during 2005-2009. Rio Arriba hadthe third highest unintentional/undetermined drug overdose death rate in the nation during 2003-2007 (data not shown).As expected, Bernalillo County had the largest number of overdose deaths (Table 3). The death rate from prescriptiondrugs exceeded the death rate from illicit drugs in 10 of the 24 New Mexico counties with rates reported in Table 3.

* All rates are per 100,000, age-adjusted to the 2000 US standard population
The following counties were not included due to small number of deaths (< 2 per county per year) during reported period:
Catron, De Baca, Guadalupe, Harding, Hidalgo, Los Alamos, Mora, Union
Sources: NMDOH BVRHS death files and UNM-BBER population files (NM); NCHS death and population files (US); SAEP
New Mexico Substance Abuse Epidemiology Profile Page 29
Chart 2: Drug-Induced Death Rates* by County, New Mexico, 2005-2009
DRUG-INDUCED DEATH (continued)
11.4
0.0
0.0
0.0
0.0
0.0
0.0
0.0
0.0
10.8
11.4
12.5
13.5
14.0
15.1
15.6
16.1
16.3
16.4
18.1
18.8
20.0
20.2
21.4
22.4
23.1
23.5
24.0
24.8
25.8
26.5
26.6
27.9
28.0
51.1
0 10 20 30 40 50 60
United States, 2003-2007
Luna (13; 0.6%)
Curry (26; 1.2%)
Roosevelt (11; 0.5%)
McKinley (47; 2.1%)
San Juan (90; 4.1%)
Cibola (21; 1%)
Sandoval (93; 4.2%)
Dona Ana (155; 7.1%)
Lea (45; 2%)
Lincoln (20; 0.9%)
Santa Fe (141; 6.4%)
Otero (63; 2.9%)
Colfax (15; 0.7%)
Quay (10; 0.5%)
New Mexico (2199; 100%)
Socorro (21; 1%)
Sierra (16; 0.7%)
San Miguel (35; 1.6%)
Grant (37; 1.7%)
Taos (40; 1.8%)
Valencia (96; 4.4%)
Bernalillo (882; 40.1%)
Chaves (82; 3.7%)
Torrance (26; 1.2%)
Eddy (70; 3.2%)
Rio Arriba (112; 5.1%)
Rate*
County (# of deaths; % of statewide deaths)
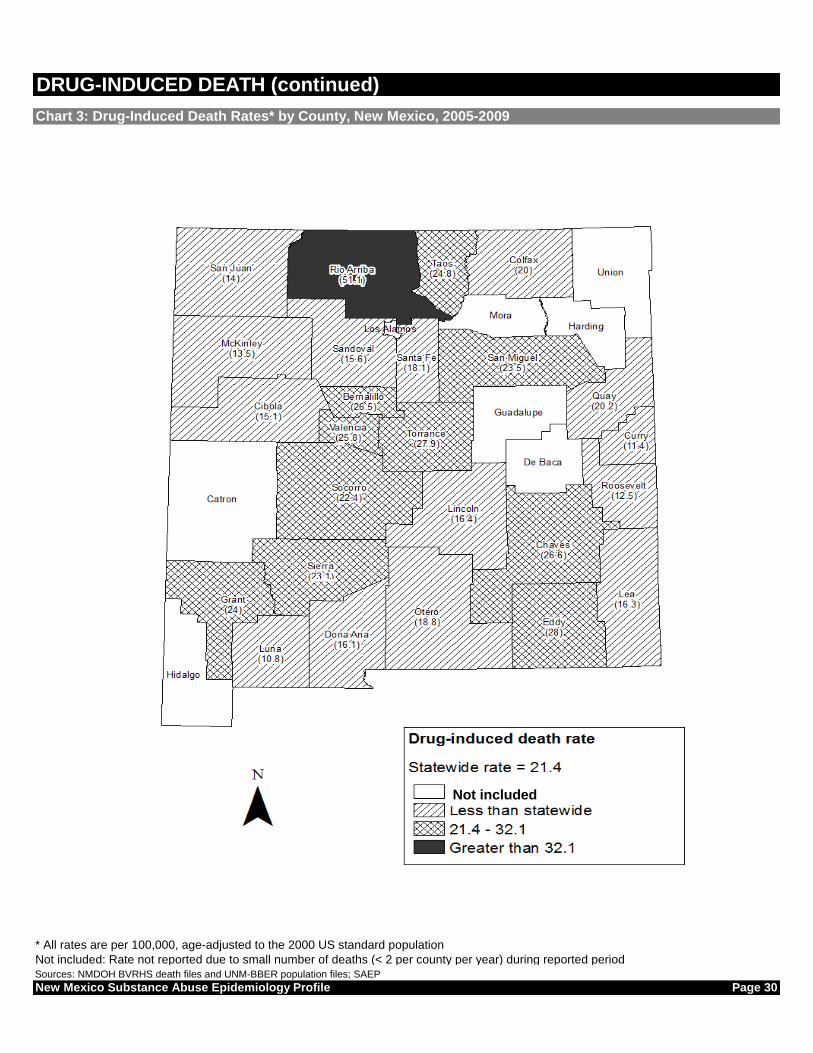
* All rates are per 100,000, age-adjusted to the 2000 US standard population
Not included: Rate not reported due to small number of deaths (< 2 per county per year) during reported period
Sources: NMDOH BVRHS death files and UNM-BBER population files; SAEP
New Mexico Substance Abuse Epidemiology Profile Page 30
Chart 3: Drug-Induced Death Rates* by County, New Mexico, 2005-2009
DRUG-INDUCED DEATH (continued)
Not included

* Age-specific rates per 100,000 population; drug overdose primary type categories are mutually exclusiveSource: OMI death files; UNM-BBER population files; SAEP
County Male Female Illicit Rx Male Female Illicit Rx
Bernalillo 545 234 506 275 781 33.3 13.7 15.3 8.1 23.5
Catron 3 0 2 1 3 -- -- -- -- --
Chaves 31 24 26 29 55 19.7 15.4 8.4 9.1 17.5
Cibola 16 5 13 8 21 25.1 -- 9.6 -- 15.3
Colfax 6 5 2 9 11 -- -- -- -- 13.4
Curry 14 6 7 13 20 12.5 -- -- 5.6 8.7
DeBaca 1 1 0 2 2 -- -- -- -- --
Dona Ana 72 36 58 50 108 15.7 7.1 6.1 5.1 11.2
Eddy 32 19 29 22 51 25.6 15.4 11.8 8.7 20.4
Grant 15 12 13 14 27 19.2 13.5 8.1 8.3 16.3
Guadalupe 7 2 4 5 9 -- -- -- -- --
Harding 0 0 0 0 0 -- -- -- -- --
Hidalgo 1 1 1 1 2 -- -- -- -- --Lea 22 18 25 17 42 15.7 12.9 9.1 5.9 15.0
Lincoln 11 7 7 11 18 22.2 -- -- 9.4 16.2
Los Alamos 3 3 3 3 6 -- -- -- -- --
Luna 5 5 4 6 10 -- -- -- -- 8.8
McKinley 24 9 18 15 33 13.0 -- 4.8 4.8 9.5
Mora 3 1 2 2 4 -- -- -- -- --
Otero 33 20 16 37 53 20.4 11.5 5.0 10.9 15.8
Quay 6 3 5 4 9 -- -- -- -- --Rio Arriba 86 18 77 28 105 77.7 15.8 34.8 12.7 47.5
Roosevelt 10 0 6 4 10 23.0 -- -- -- 11.4
Sandoval 39 24 32 33 65 12.8 7.8 5.1 5.5 10.6
San Juan 30 24 20 34 54 9.7 7.4 3.2 5.3 8.5
San Miguel 18 7 20 5 25 26.1 -- 13.8 -- 17.5
Santa Fe 82 31 71 42 113 21.6 7.9 9.3 5.4 14.7Sierra 8 8 2 14 16 -- -- -- 20.4 23.6
Socorro 16 4 10 10 20 33.8 -- 10.7 11.3 22.1
Taos 23 13 20 16 36 29.9 14.3 11.5 11.4 22.9
Torrance 11 9 7 13 20 22.9 -- -- 13.8 22.1
Union 5 0 3 2 5 -- -- -- -- --
Valencia 58 19 56 21 77 31.2 10.2 15.0 5.7 20.7
Total 1,237 568 1,066 746 1,812 24.5 10.8 10.5 7.1 17.6
* All rates are per 100,000, age-adjusted to the 2000 US standard population; drug overdose primary type categories are mutually exclusive
-- Excluded due to small number of deaths (< 2 per county per year) during reported period
Source: OMI death files; UNM-BBER population files; SAEP
New Mexico Substance Abuse Epidemiology Profile Page 31
DRUG-INDUCED DEATH (continued)
Table 3: Uninintentional Drug Overdose Deaths and Rates*, New Mexico, 2005-2009
Chart 4: Unintentional Drug Overdose Death Rates* by Selected Characteristics, New Mexico, 2005-2009
Deaths Rates*
Total
Sex Primary TypeSex Primary Type
Total
0
20
40
60
80
0-4
5-1
4
15
-24
25
-34
35
-44
45
-54
55
-64
65
-74
75
-84
85
+
0-4
5-1
4
15
-24
25
-34
35
-44
45
-54
55
-64
65
-74
75
-84
85
+
Rate
*
By Age, Sex, and Race/Ethnicity
Hispanic
White
0
10
20
30
40
0-4
5-1
4
15
-24
25
-34
35
-44
45
-54
55
-64
65
-74
75
-84
85
+
0-4
5-1
4
15
-24
25
-34
35
-44
45
-54
55
-64
65
-74
75
-84
85
+
Ra
te*
By Age, Sex, andPrimary Type of Overdose
Illicit
Rx
Male Female Male Female

* All rates are per 100,000, age-adjusted to the 2000 US standard population
The following counties were not included due to small number of illicit and/or rx deaths (< 2 per county per year) during reported period:
Catron, Cibola, Colfax, Curry, DeBaca, Guadalupe, Harding, Hidalgo, Lincoln, Los Alamos, Luna, Mora, Quay, Roosevelt,
San Miguel, Sierra, Torrance, Union
Source: OMI death files; UNM-BBER population files; SAEP
New Mexico Substance Abuse Epidemiology Profile Page 32
Chart 5: Uninintentional Drug Overdose Death Rates* by County and Drug Type, New Mexico, 2005-2009
DRUG-INDUCED DEATH (continued)
0.0
0.0
0.0
0.0
0.0
0.0
0.0
0.0
3.2
4.8
5.1
6.1
9.3
9.1
5.0
8.1
8.4
10.5
11.8
15.0
10.7
11.5
15.3
34.8
0.0
0.0
0.0
0.0
0.0
0.0
0.0
0.0
0.0
5.3
4.8
5.5
5.1
5.4
5.9
10.9
8.3
9.1
7.1
8.7
5.7
11.3
11.4
8.1
12.7
0 10 20 30 40 50
San Juan (54; 3%)
McKinley (33; 1.8%)
Sandoval (65; 3.6%)
Dona Ana (108; 6%)
Santa Fe (113; 6.2%)
Lea (42; 2.3%)
Otero (53; 2.9%)
Grant (27; 1.5%)
Chaves (55; 3%)
New Mexico (1812; 100%)
Eddy (51; 2.8%)
Valencia (77; 4.3%)
Socorro (20; 1.1%)
Taos (36; 2%)
Bernalillo (781; 43.1%)
Rio Arriba (105; 5.8%)
Rate*
County (# of deaths; % of statewide deaths)
illicit rate rx rate

SUICIDE
Source: NMDOH BVRHS death files and UNM-BBER population files (NM); CDC Wonder (US)
Ages Ages Ages All Ages Ages Ages All
Sex Race/Ethnicity 0-24 25-64 65+ Ages 0-24 25-64 65+ Ages*
White 93 505 189 787 15.4 41.8 51.5 33.0Hispanic 133 314 42 489 15.0 30.2 23.7 23.8American Indian 57 101 3 161 22.0 40.0 9.0 28.5Black 12 10 2 24 19.9 14.0 21.3 19.5
Asian/Pacific Islander 1 5 0 6 3.1 11.2 0.0 7.5Total 296 935 236 1,467 16.1 35.7 39.9 29.3
White 16 202 27 245 2.8 16.1 6.0 9.6Hispanic 15 76 3 94 1.7 7.2 1.3 4.5American Indian 22 21 0 43 8.3 7.5 0.0 6.6Black 2 1 1 4 3.5 1.6 8.6 2.8Asian/Pacific Islander 1 4 0 5 3.3 7.5 0.0 5.0Total 56 304 31 391 3.1 11.2 4.2 7.3
White 109 707 216 1,032 9.3 28.7 26.4 20.9Hispanic 148 390 45 583 8.5 18.6 11.3 14.0American Indian 79 122 3 204 15.1 23.0 3.8 17.1Black 14 11 3 28 11.8 8.2 14.2 10.8
Asian/Pacific Islander 2 9 0 11 3.2 9.2 0.0 6.0
Total 352 1,239 267 1,858 9.7 23.3 20.1 17.9
* Age-specific rates (e.g., Ages 0-24) are per 100,000; all-ages rate is per 100,000, age-adjusted to the 2000 US standard population
Sources: NMDOH BVRHS death files and UNM-BBER population files; CDC ARDI; SAEP
New Mexico Substance Abuse Epidemiology Profile Page 33
Chart 1: Suicide Rates*, New Mexico and United States, 1981-2009
Problem Statement
Table 1: Suicide Deaths and Rates* by Age, Sex, and Race/Ethnicity, New Mexico, 2005-2009
Deaths Rates*
Male
Female
Total
Suicide is a serious and persistent public health problem in New Mexico. As shown in Chart 1, over the period 1981through 2007 New Mexico's suicide rate has consistently been 1.5 to 1.9 times the U.S. rate. New Mexico has rankedamong the top 5 states for all but one of those years. While the U.S. rate declined 10% between 1981 and 2000, thenincreased slightly for an overall 5% decline during the period, the New Mexico rate remained high throughout. In NewMexico in 2007, suicide was the second leading cause of death (after unintentional injuries) for persons aged 10-44; andthe seventh leading cause of death overall.
Table 1 and Chart 2 show that male suicide rates are more than three times female rates across the age range, andamong all race/ethnic groups. This reflects the fact that men tend to choose more lethal means (e.g., firearms) whenattempting suicide. American Indian males have somewhat higher suicide rates from ages 15-34; but White males havesubstantially higher rates at older ages. It's important to note that the very high white male rate in the age 85+ category isbased on a small number of deaths. The vast majority (75%) of White male suicides (and an even higher proportion ofHispanic and American Indian male suicides) occur before age 65.
Chart 3 shows that six counties (Taos, Sierra, Grant, Rio Arriba, Torrance, and Otero) had suicide rates in 2005-2009that were more than twice the most recent available U.S. rates. Suicide remains a problem throughout the state.
0.0
5.0
10.0
15.0
20.0
25.0
Ra
te*
Year
New Mexico
United States
* Rate per 100,000, age-adjusted to the 2000 US standard population

* Age-specific rates per 100,000
Sources: NMDOH BVRHS death files and UNM-BBER population files; CDC ARDI; SAEP
County White
His-
panic
Ameri-
can
Indian Black
Asian
PI All Races White
His-
panic
Ameri-
can
Indian Black
Asian
PI All Races
Bernalillo 335 204 25 14 4 582 20.2 15.2 12.8 10.7 -- 17.6Catron 6 0 0 0 0 6 -- -- -- -- -- --Chaves 35 15 2 0 0 52 20.2 10.8 -- -- -- 16.1Cibola 4 6 17 0 0 27 -- -- 30.3 -- -- 19.2Colfax 4 11 0 0 0 15 -- 34.1 -- -- -- 21.3
Curry 13 6 0 1 0 20 9.7 -- -- -- -- 8.5
De Baca 1 2 0 0 0 3 -- -- -- -- -- --
Dona Ana 98 55 0 2 2 157 26.6 9.3 -- -- -- 16.2Eddy 41 8 2 1 1 53 27.1 -- -- -- -- 21.1Grant 28 13 0 1 0 42 27.7 19.6 -- -- -- 25.3Guadalupe 1 3 0 0 0 4 -- -- -- -- -- --
Harding 0 0 0 0 0 0 -- -- -- -- -- --
Hidalgo 2 6 0 0 0 8 -- -- -- -- -- --Lea 25 18 0 1 0 44 16.1 13.8 -- -- -- 15.3
Lincoln 12 5 1 0 0 18 14.4 -- -- -- -- 16.5
Los Alamos 12 3 0 0 0 15 13.1 -- -- -- -- 13.0
Luna 13 7 0 0 0 20 19.7 -- -- -- -- 14.7McKinley 8 3 62 1 0 74 -- -- 19.5 -- -- 19.3Mora 1 5 1 0 0 7 -- -- -- -- -- --Otero 49 6 13 1 2 71 24.5 -- 49.9 -- -- 22.1
Quay 6 1 0 1 0 8 -- -- -- -- -- --Rio Arriba 14 30 10 0 0 54 46.3 19.5 25.4 -- -- 24.4
Roosevelt 11 3 0 0 0 14 17.8 -- -- -- -- 15.1Sandoval 57 18 10 1 0 86 17.6 9.8 9.7 -- -- 14.2San Juan 52 17 55 1 0 125 19.9 17.3 18.1 -- -- 19.0San Miguel 9 21 0 0 0 30 -- 20.2 -- -- -- 19.3Santa Fe 83 47 1 2 0 133 22.4 13.3 -- -- -- 17.2Sierra 17 4 0 0 0 21 36.2 -- -- -- -- 30.3
Socorro 11 9 1 0 0 21 27.3 -- -- -- -- 21.5Taos 32 18 2 1 1 54 49.3 22.8 -- -- -- 33.5Torrance 14 6 0 0 0 20 25.4 -- -- -- -- 22.6Union 4 3 0 0 0 7 -- -- -- -- -- --
Valencia 33 30 2 0 1 66 21.8 15.6 -- -- -- 18.7
Total 1,032 583 204 28 11 1,858 20.9 14.0 17.1 10.8 6.0 17.9
* All rates are per 100,000, age-adjusted to the 2000 US standard population
-- Excluded due to small number of deaths (< 2 per county per year) during reported periodSources: NMDOH BVRHS death files and UNM-BBER population files; CDC ARDI; SAEP
New Mexico Substance Abuse Epidemiology Profile Page 34
Table 2: Suicide Deaths and Rates* by Race/Ethnicity and County, New Mexico, 2005-2009
Chart 2: Suicide Rates* by Age, Sex, and Race/Ethnicity, New Mexico, 2005-2009
SUICIDE (continued)
Deaths Rates*
020406080
100120140160
5-1
4
15
-24
25
-34
35
-44
45
-54
55
-64
65
-74
75
-84
85
+
5-1
4
15
-24
25
-34
35
-44
45
-54
55
-64
65
-74
75
-84
85
+
Male Female
Rate
*
American Indian
Hispanic
White

* All rates are per 100,000, age-adjusted to the 2000 US standard population
The following counties were not included due to small number of deaths (< 2 per county per year) during reported period:
Catron, De Baca, Guadalupe, Harding, Hidalgo, Mora, Quay, UnionSources: NMDOH BVRHS death files and UNM-BBER population files (NM); NCHS death and population files (US); CDC ARDI; SAEP
New Mexico Substance Abuse Epidemiology Profile Page 35
Chart 3: Suicide Rates* by County, New Mexico, 2005-2009
SUICIDE (continued)
11.0
0.0
0.0
0.0
0.0
0.0
0.0
0.0
0.0
8.5
13.0
14.2
14.7
15.1
15.3
16.1
16.2
16.5
17.2
17.6
17.9
18.7
19.0
19.2
19.3
19.3
21.1
21.3
21.5
22.1
22.6
24.4
25.3
30.3
33.5
0 5 10 15 20 25 30 35 40
United States, 2003-2007
Curry (20; 1.1%)
Los Alamos (15; 0.8%)
Sandoval (86; 4.6%)
Luna (20; 1.1%)
Roosevelt (14; 0.8%)
Lea (44; 2.4%)
Chaves (52; 2.8%)
Dona Ana (157; 8.5%)
Lincoln (18; 1%)
Santa Fe (133; 7.2%)
Bernalillo (582; 31.3%)
New Mexico (1858; 100%)
Valencia (66; 3.6%)
San Juan (125; 6.7%)
Cibola (27; 1.5%)
San Miguel (30; 1.6%)
McKinley (74; 4%)
Eddy (53; 2.9%)
Colfax (15; 0.8%)
Socorro (21; 1.1%)
Otero (71; 3.8%)
Torrance (20; 1.1%)
Rio Arriba (54; 2.9%)
Grant (42; 2.3%)
Sierra (21; 1.1%)
Taos (54; 2.9%)
Rate*
County (# of deaths; % of statewide deaths)

* All rates are per 100,000, age-adjusted to the 2000 US standard population
Not included: Rate not reported due to small number of deaths (< 2 per county per year) during reported periodSources: NMDOH BVRHS death files and UNM-BBER population files; CDC ARDI; SAEP
New Mexico Substance Abuse Epidemiology Profile Page 36
Chart 4: Suicide Rates* by County, New Mexico, 2005-2009
SUICIDE (continued)
Not included

Ages Ages Ages All Ages Ages Ages All
Sex Race/Ethnicity 18-24 25-64 65+ Ages 18-24 25-64 65+ Ages*
White -- 19,590 2,996 25,733 -- 7.7 3.8 7.1Hispanic 6,201 27,101 1,272 34,575 13.8 15.1 4.9 13.8American Indian -- 5,471 -- 5,895 -- 14.9 -- 9.7Black -- -- -- -- -- -- -- --
Asian/Pacific Islander -- -- -- -- -- -- -- --Total 10,508 54,885 4,615 70,008 10.0 10.9 4.0 9.7
White -- 27,257 6,911 36,000 -- 11.3 7.4 10.0Hispanic 2,986 27,984 3,450 34,420 5.5 13.6 9.3 11.6American Indian -- 5,836 485 6,669 -- 16.5 14.4 12.7Black -- 2,196 -- 2,459 -- 20.9 -- 18.9Asian/Pacific Islander -- -- -- -- -- -- -- --Total 5,165 68,885 11,579 85,629 5.4 13.4 8.2 11.4
White 4,979 46,847 9,906 61,732 9.3 9.5 5.7 8.6Hispanic 9,187 55,085 4,723 68,995 9.3 14.3 7.5 12.6American Indian 743 11,308 513 12,564 2.1 15.7 8.3 11.1Black -- 3,395 -- 3,658 -- 19.8 -- 15.5Asian/Pacific Islander -- 2,981 -- 2,981 -- 21.7 -- 17.3
Total 15,674 123,770 16,194 155,637 7.8 12.2 6.3 10.6
* Estimate of number of people in population group who reported Frequent Mental Distress in past 30 days
** Estimate of percent of people in population group who reported Frequent Mental Distress in past 30 days
-- Excluded due to small number of respondents (< 50) in cell
Source: BRFSS; SAEP
New Mexico Substance Abuse Epidemiology Profile Page 37
ADULT MENTAL HEALTH
Problem Statement
Male
Female
Total
Table 1: Frequent Mental Distress (past 30 days) by Age, Sex, and Race, Adults Aged 18+, New Mexico, 2009
Number* Percent**
Adult mental health issues range in a spectrum from day-to-day challenges with stress, anxiety, and "the blues"; topersistent mental health challenges arising from chronic physical conditions such as diabetes, asthma, and obesity; tochronic clinically diagnosable psychiatric morbidities such as clinical anxiety and depression; to serious life-threateningsituations such as suicidal ideation and suicide attempt, which sometimes result from a combination of the mentalhealth challenges mentioned above. A host of measures exist for assessing the mental health status of individuals, butcharacterizing the mental health status of the population is a relatively new field. If such an assessment could be doneusing a simple and non-invasive approach with a reasonable level of sensitivity and specificity, the resultingcharacterization of the population's mental health could help public health and mental health professionals betterunderstand the distribution of mental health issues in the population; and design better systems to help identify,address, and mitigate these issues before they become more serious.
Among measures that have been suggested by the CDC as potential tools for assessing population well-being andmental health is a measure of the frequency with which people experience poor mental health. This measure is basedon the single simple question "How many days during the past 30 days was your mental health not good?".Respondents who report that they experienced 14 or more days when their mental health was "not good" are classifiedas experiencing Frequent Mental Distress (FMD). Although FMD is certainly not a clincal diagnosis, there is evidenceto suggest that it is indeed associated with a person's mental health status. In 2006, the New Mexico Behavioral RiskFactor Surveillance Survey (BRFSS) asked the FMD question as well as questions about anxiety and depression,experience of various chronic health conditions, and experience of suicidal ideation and/or suicide attempt. Chart 1shows the proportion of people in various response categories who also experienced FMD. The proportion of the totalNew Mexico population that experienced FMD was only about 10%. As might be expected, people in good health withhigher incomes and more education were significantly less likely than the general population to report FMD. Peoplewith less education, with chronic health conditions such as obesity, diabetes, or asthma, or with lower income, weresignificantly more likely to report FMD. Of particular relevance regarding FMD's potential usefulness as a measure ofpopulation mental health, FMD was many times more prevalent among respondents who reported more seriouspsychiatric morbidity, including ever being diagnosed with an anxiety disorder (31% reported past-month FMD),screening positive for alcohol dependence or abuse (33% reported FMD), current depression based on the PatientHealth Questionaire (54%), and among the very high-risk cohort that reported both past-year suicidal ideation and alifetime suicide attempt (64% reported past-month FMD). Fully half of the FMD respondents were diagnosed withcurrent depression. These results suggest that this simple question, which is asked annually on the BRFSS, couldpotentially be a useful indicator of population mental health.

* Frequent Mental Distress definition: respondent reported 14 or more days in past 30 days when mental health was "not good"
Source: BRFSS; SAEP (NOTE: Brackets around reported rates are 95% confidence intervals)
County White
His-
panic
Ameri-
can
Indian Black Asian PI
All
Races White
His-
panic
Ameri-
can
Indian Black Asian PI
All
Races
Bernalillo 14,311 20,487 1,673 -- -- 40,649 5.9 11.6 6.8 -- -- 8.5Catron -- -- -- -- -- -- -- -- -- -- -- --Chaves 1,717 2,851 -- -- -- 6,222 7.4 14.5 -- -- -- 13.0Cibola 472 -- 550 -- -- 2,056 10.3 -- 9.6 -- -- 11.9Colfax 441 -- -- -- -- 1,803 5.0 -- -- -- -- 11.4Curry 1,506 -- -- -- -- 2,330 9.3 -- -- -- -- 8.1De Baca -- -- -- -- -- -- -- -- -- -- -- --
Doña Ana 4,318 9,705 -- -- -- 15,749 8.7 11.5 -- -- -- 10.7Eddy 2,726 4,260 -- -- -- 7,250 11.3 35.8 -- -- -- 18.2Grant 1,676 3,667 -- -- -- 5,671 12.8 31.3 -- -- -- 20.9Guadalupe -- -- -- -- -- -- -- -- -- -- -- --
Harding -- -- -- -- -- -- -- -- -- -- -- --
Hidalgo -- -- -- -- -- -- -- -- -- -- -- --
Lea 1,269 633 -- -- -- 2,281 6.7 4.2 -- -- -- 6.2
Lincoln 811 -- -- -- -- 1,371 7.2 -- -- -- -- 7.7
Los Alamos 1,909 -- -- -- -- 2,319 16.1 -- -- -- -- 14.7
Luna 1,120 -- -- -- -- 2,004 15.3 -- -- -- -- 13.7McKinley 765 401 1,869 -- -- 3,250 10.2 6.7 9.3 -- -- 9.2Mora -- -- -- -- -- -- -- -- -- -- -- --Otero 3,082 1,023 -- -- -- 4,915 12.8 11.7 -- -- -- 12.4
Quay -- -- -- -- -- 1,200 -- -- -- -- -- 14.1Rio Arriba -- 2,128 -- -- -- 3,605 -- 10.3 -- -- -- 10.8
Roosevelt 1,040 -- -- -- -- 1,435 13.1 -- -- -- -- 10.6Sandoval 6,533 3,141 350 -- -- 10,704 11.0 12.3 3.1 -- -- 10.5San Juan 5,263 2,113 2,299 -- -- 10,238 10.7 14.1 13.4 -- -- 12.0San Miguel -- 1,904 -- -- -- 2,015 -- 19.0 -- -- -- 13.7Santa Fe 4,599 5,444 -- -- -- 11,098 8.6 13.4 -- -- -- 11.0Sierra 770 -- -- -- -- 1,418 8.5 -- -- -- -- 12.0
Socorro 891 -- -- -- -- 1,759 14.1 -- -- -- -- 13.8Taos 594 1,505 -- -- -- 2,174 4.8 10.9 -- -- -- 7.0Torrance 1,137 -- -- -- -- 2,715 11.1 -- -- -- -- 15.8Union -- -- -- -- -- -- -- -- -- -- -- --Valencia 2,650 3,416 -- -- -- 7,559 10.4 11.2 -- -- -- 12.4
Total 61,673 68,995 12,564 3,658 2,981 155,717 8.5 12.6 11.1 15.4 17.3 10.6
* Estimate of number of people in population group who reported Frequent Mental Distress in past 30 days
** Estimate of percent of people in population group who reported Frequent Mental Distress in past 30 days
-- Excluded due to small number of respondents (< 50) in cell
Source: BRFSS; SAEP
New Mexico Substance Abuse Epidemiology Profile Page 38
ADULT MENTAL HEALTH (continued)
Chart 1: Frequent Mental Distress (past 30 days)* by Selected Characteristics, Adults Aged 18+, New Mexico, 2006
Table 2: Frequent Mental Distress (past 30 days) by Race and County, Adults Aged 18+, New Mexico, 2009
Number* Percent**
5.46.46.7
10.113.0
13.714.7
16.417.5
21.423.8
25.331.3
32.637.2
54.363.5
0 10 20 30 40 50 60 70 80
Health excellent/very goodIncome $50,000+
College degreeAll New Mexico adults
< High school educationObese (BMI >= 30)
< 150% Federal Poverty LevelDiabetes (ever diagnosed)
Current asthmaHistory of suicide attempt/no past-year suicidal ideation
Income < $15,000Health fair/poor
Anxiety (ever diagnosed)Alcohol dependence or abuse (2007)
Past-year suicidal ideation/no history of suicide attemptCurrent depression
Past-year suicidal ideation/history of suicide attempt
Prevalence (%)

* Estimate of percent of people in population group who reported Frequent Mental Distress in past 30 days
The following counties were not included due to small number of respondents (< 50) in cell:
Catron, De Baca, Guadalupe, Harding, Hidalgo, Mora, Union
Source: NMBRFSS (NM); CDC BRFSS (US); SAEP
New Mexico Substance Abuse Epidemiology Profile Page 39
ADULT MENTAL HEALTH (continued)
Chart 2: Frequent Mental Distress (past 30 days)* by County, Adults Aged 18+, New Mexico, 2009
10.6
6.2
7.0
7.7
8.1
8.5
9.2
10.5
10.6
10.6
10.7
10.8
11.0
11.4
11.9
12.0
12.0
12.4
12.4
13.0
13.7
13.7
13.8
14.1
14.7
15.8
18.2
20.9
0 10 20 30 40 50
United States
Lea (2281; 1.5%)
Taos (2174; 1.4%)
Lincoln (1371; 0.9%)
Curry (2330; 1.5%)
Bernalillo (40649; 26.1%)
McKinley (3250; 2.1%)
Sandoval (10704; 6.9%)
New Mexico (155717; 100%)
Roosevelt (1435; 0.9%)
Doña Ana (15749; 10.1%)
Rio Arriba (3605; 2.3%)
Santa Fe (11098; 7.1%)
Colfax (1803; 1.2%)
Cibola (2056; 1.3%)
San Juan (10238; 6.6%)
Sierra (1418; 0.9%)
Valencia (7559; 4.9%)
Otero (4915; 3.2%)
Chaves (6222; 4%)
Luna (2004; 1.3%)
San Miguel (2015; 1.3%)
Socorro (1759; 1.1%)
Quay (1200; 0.8%)
Los Alamos (2319; 1.5%)
Torrance (2715; 1.7%)
Eddy (7250; 4.7%)
Grant (5671; 3.6%)
Percent (%)*
County (# of adults with FMD; % of statewide FMD adults)

* Estimate of percent of people in population group who reported Frequent Mental Distress in past 30 days
Not included: Rate not reported due to small number of respodents (< 50) in cell
Source: BRFSS; SAEP
New Mexico Substance Abuse Epidemiology Profile Page 40
ADULT MENTAL HEALTH (continued)
Chart 3: Frequent Mental Distress (past 30 days)* by County, Adults Aged 18+, New Mexico, 2009
Not included

* Current Depression definition: scored 10 or more on Patient Health Questionaire depression inventory (PHQ-8); this instrument can establish a provisional
depressive disorder diagnosis using Diagnostic and Statistical Manual of Mental Disorders, Fourth Edition (DSM-IV) criteria.
Source: BRFSS; SAEP (NOTE: Brackets around reported rates are 95% confidence intervals)
Figure reproduced from: Murphy, T. "Major Depression in New Mexico Adults". New Mexico Epidemiology Report, 2008(5), 2008.
Ages Ages Ages All Ages Ages Ages All
Sex Race/Ethnicity 18-24 25-64 65+ Ages 18-24 25-64 65+ Ages*
White -- 13,748 4,141 22,322 -- 6.2 6.8 7.1Hispanic 3,826 15,792 1,111 20,730 7.4 10.8 5.4 9.5American Indian -- 1,703 -- 2,412 -- 4.3 -- 5.0Black -- -- -- -- -- -- -- --
Asian/Pacific Islander -- -- -- -- -- -- -- --Total 8,856 32,660 6,129 47,646 9.4 7.5 7.0 7.7
White 3,334 22,520 3,617 29,471 9.6 9.9 4.7 8.6Hispanic 7,592 22,856 2,049 32,497 21.2 13.0 7.5 13.6American Indian -- 4,118 -- 7,022 -- 13.0 -- 15.3Black -- -- -- -- -- -- -- --Asian/Pacific Islander -- -- -- -- -- -- -- --Total 13,570 51,153 6,133 70,856 15.8 11.3 5.5 10.9
White 7,767 36,267 7,758 51,793 12.1 8.0 5.6 7.9Hispanic 11,418 38,649 3,160 53,228 13.1 12.0 6.6 11.6American Indian -- 5,821 373 9,434 -- 8.2 7.1 10.1Black -- 472 -- 1,237 -- 2.8 -- 4.9Asian/Pacific Islander -- -- -- 1,549 -- -- -- 12.9
Total 22,426 83,813 12,262 118,502 12.5 9.5 6.2 9.3
* Estimate of number of people in population group who reported current (past 2-week) depression based on DSM-IV criteria
** Estimate of percent of people in population group who reported current (past 2-week) depression based on DSM-IV criteria
-- Excluded due to small number of respondents (< 50) in cell
Source: BRFSS; SAEP
New Mexico Substance Abuse Epidemiology Profile Page 41
ADULT MENTAL HEALTH
Problem Statement (continued)
Total
Chart 4: Unhealthy Behaviors by Depression Status and Sex, New Mexico, 2006
Table 3: Current Depression (past 2 weeks) by Age, Sex, and Race, Adults Aged 18+, New Mexico, 2006
Number* Percent**
Male
Female
Depression is one of the most prevalent and treatable mental disorders. Major depression is usually associated with co-morbid mental disorders, such as anxiety and substance use disorders, and impairment of a person’s ability to function in work, home, relationship, and social roles. Depression is also a risk factor for suicide and attempted suicide. In addition, depressive disorders have been associated with an increased prevalence of chronic medical conditions, such as heart disease, stroke, asthma, arthritis, cancer, diabetes, and obesity. In 2006, the BRFSS assessed current depression using Diagnostic and Statistical Manual of Mental Disorders, 4th Edition (DSM-IV) criteria.
Table 1 shows the prevalence of current depression was highest among young adults 18-24 years (12.5%), higher among females than males for ages less than 65, and higher among Hispanic (11.6%) and American Indian adults (10.1%) than White adults (7.9%). Depression was more common among American Indian females (15.3%) and Hispanic females (13.6%) than among White females (8.6%). Chart 4 shows that current depression was associated among both males and females with higher rates of unhealthy behaviors including physical inactivity, current smoking, binge drinking, and drinking and driving. Chart 5 shows that current depression was associated with higher rates of chronic health conditions such as heart disease and diabetes among males, and asthma and obesity among females.
0
10
20
30
40
50
60
70
Depression None Depression None Depression None
Total Male Female
Pe
rce
nt
(%)
Physical inactivity
Current smoking
Binge drinking
Drinking and driving

Source: BRFSS; SAEP
Figure reproduced from: Murphy, T. "Major Depression in New Mexico Adults". New Mexico Epidemiology Report, 2008(5), 2008.
County White
His-
panic
Ameri-
can
Indian Black Asian PI
All
Races White
His-
panic
Ameri-
can
Indian Black Asian PI
All
Races
Bernalillo 11,883 19,361 1,497 -- -- 35,445 5.8 12.9 7.0 -- -- 8.8Catron -- -- -- -- -- -- -- -- -- -- -- --Chaves 2,723 1,502 -- -- -- 4,769 13.5 9.3 -- -- -- 11.8Cibola -- -- -- -- -- 2,405 -- -- -- -- -- 15.4Colfax -- -- -- -- -- 1,784 -- -- -- -- -- 14.2Curry 1,597 -- -- -- -- 1,762 10.6 -- -- -- -- 6.9De Baca -- -- -- -- -- -- -- -- -- -- -- --
Doña Ana 5,210 6,573 -- -- -- 11,974 10.6 10.7 -- -- -- 10.1Eddy 2,643 2,184 -- -- -- 5,070 10.8 21.3 -- -- -- 13.9Grant 1,566 -- -- -- -- 2,395 11.4 -- -- -- -- 11.5Guadalupe -- -- -- -- -- -- -- -- -- -- -- --
Harding -- -- -- -- -- -- -- -- -- -- -- --
Hidalgo -- -- -- -- -- -- -- -- -- -- -- --
Lea 2,619 1,106 -- -- -- 3,818 12.7 9.9 -- -- -- 11.0
Lincoln 583 -- -- -- -- 583 4.4 -- -- -- -- 3.5
Los Alamos 1,053 -- -- -- -- 1,053 7.1 -- -- -- -- 5.2
Luna -- -- -- -- -- 3,060 -- -- -- -- -- 17.5McKinley 613 214 1,635 -- -- 2,497 7.0 3.2 8.9 -- -- 7.0Mora -- -- -- -- -- -- -- -- -- -- -- --Otero 1,075 -- -- -- -- 3,010 4.1 -- -- -- -- 8.3
Quay -- -- -- -- -- 827 -- -- -- -- -- 14.2Rio Arriba -- 1,689 -- -- -- 2,040 -- 9.0 -- -- -- 7.7
Roosevelt 590 -- -- -- -- 767 8.1 -- -- -- -- 5.6Sandoval 2,339 2,552 -- -- -- 5,232 5.2 13.9 -- -- -- 7.4San Juan 3,902 2,531 1,813 -- -- 8,378 8.2 18.5 9.1 -- -- 10.1San Miguel -- 1,375 -- -- -- 1,724 -- 11.5 -- -- -- 10.3Santa Fe 2,921 3,540 -- -- -- 6,833 5.8 9.1 -- -- -- 7.3Sierra -- -- -- -- -- -- -- -- -- -- -- --
Socorro -- -- -- -- -- -- -- -- -- -- -- --Taos 537 1,843 -- -- -- 2,586 5.1 18.5 -- -- -- 11.6Torrance -- -- -- -- -- -- -- -- -- -- -- --Union -- -- -- -- -- -- -- -- -- -- -- --Valencia 2,686 913 -- -- -- 3,984 11.8 4.0 -- -- -- 8.3
Total 51,012 53,228 9,434 1,237 1,549 117,721 7.8 11.6 10.1 5.1 12.9 9.3
* Estimate of number of people in population group who reported current (past 2-week) depression based on DSM-IV criteria
** Estimate of percent of people in population group who reported current (past 2-week) depression based on DSM-IV criteria
-- Excluded due to small number of respondents (< 50) in cell
Source: BRFSS; SAEP
New Mexico Substance Abuse Epidemiology Profile Page 42
ADULT MENTAL HEALTH (continued)
Chart 5: Chronic Health Conditions by Depression Status and Sex, New Mexico, 2006
Table 4: Current Depression (past 2 weeks) by Race and County, Adults Aged 18+, New Mexico, 2006
Number* Percent**
0
5
10
15
20
25
30
35
40
45
50
Depression None Depression None Depression None
Total Male Female
Pe
rce
nt
(%)
Asthma
Obesity
Diabetes
Myocardial infarction
Angina/CHD
Stroke

* Estimate of percent of people in population group who reported current (past 2-week) depression based on DSM-IV criteria
The following counties were not included due to small number of respondents (< 50) in cell:
Catron, De Baca, Guadalupe, Harding, Hidalgo, Mora, Sierra, Socorro, Torrance, Union
Source: NMBRFSS (NM); CDC BRFSS (US); SAEP
New Mexico Substance Abuse Epidemiology Profile Page 43
ADULT MENTAL HEALTH (continued)
Chart 6: Current Depression (past 2 weeks)* by County, Adults Aged 18+, New Mexico, 2006
N/A
3.5
5.2
5.6
6.9
7.0
7.3
7.4
7.7
8.3
8.3
8.8
9.3
10.1
10.1
10.3
11.0
11.5
11.6
11.8
13.9
14.2
14.2
15.4
17.5
0 10 20 30 40 50
United States
Lincoln (583; 0.5%)
Los Alamos (1053; 0.9%)
Roosevelt (767; 0.7%)
Curry (1762; 1.5%)
McKinley (2497; 2.1%)
Santa Fe (6833; 5.8%)
Sandoval (5232; 4.4%)
Rio Arriba (2040; 1.7%)
Valencia (3984; 3.4%)
Otero (3010; 2.6%)
Bernalillo (35445; 30.1%)
New Mexico (117721; 100%)
Doña Ana (11974; 10.2%)
San Juan (8378; 7.1%)
San Miguel (1724; 1.5%)
Lea (3818; 3.2%)
Grant (2395; 2%)
Taos (2586; 2.2%)
Chaves (4769; 4.1%)
Eddy (5070; 4.3%)
Quay (827; 0.7%)
Colfax (1784; 1.5%)
Cibola (2405; 2%)
Luna (3060; 2.6%)
Percent (%)*
County (# of adults with current depression; % of statewide currently depressed adults)

* Estimate of percent of people in population group who reported current (past 2-week) depression based on DSM-IV criteria
Not included: Rate not reported due to small number of respodents (< 50) in cell
Source: BRFSS; SAEP
New Mexico Substance Abuse Epidemiology Profile Page 44
ADULT MENTAL HEALTH (continued)
Chart 7: Current Depression (past 2 weeks)* by County, Adults Aged 18+, New Mexico, 2006
Not included
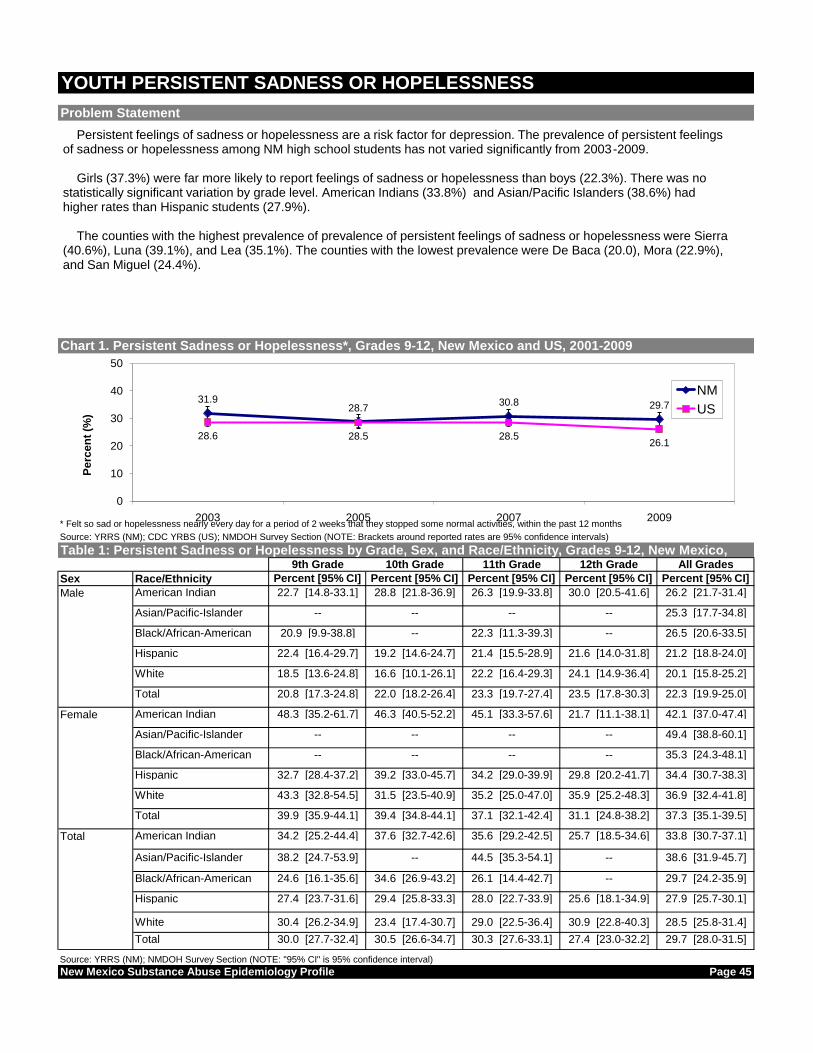
* Felt so sad or hopelessness nearly every day for a period of 2 weeks that they stopped some normal activities, within the past 12 months
Source: YRRS (NM); CDC YRBS (US); NMDOH Survey Section (NOTE: Brackets around reported rates are 95% confidence intervals)
9th Grade 10th Grade 11th Grade 12th Grade All Grades
Sex Race/Ethnicity Percent [95% CI] Percent [95% CI] Percent [95% CI] Percent [95% CI] Percent [95% CI]
Male American Indian 22.7 [14.8-33.1] 28.8 [21.8-36.9] 26.3 [19.9-33.8] 30.0 [20.5-41.6] 26.2 [21.7-31.4]
Asian/Pacific-Islander -- -- -- -- 25.3 [17.7-34.8]
Black/African-American 20.9 [9.9-38.8] -- 22.3 [11.3-39.3] -- 26.5 [20.6-33.5]
Hispanic 22.4 [16.4-29.7] 19.2 [14.6-24.7] 21.4 [15.5-28.9] 21.6 [14.0-31.8] 21.2 [18.8-24.0]
White 18.5 [13.6-24.8] 16.6 [10.1-26.1] 22.2 [16.4-29.3] 24.1 [14.9-36.4] 20.1 [15.8-25.2]
Total 20.8 [17.3-24.8] 22.0 [18.2-26.4] 23.3 [19.7-27.4] 23.5 [17.8-30.3] 22.3 [19.9-25.0]
Female American Indian 48.3 [35.2-61.7] 46.3 [40.5-52.2] 45.1 [33.3-57.6] 21.7 [11.1-38.1] 42.1 [37.0-47.4]
Asian/Pacific-Islander -- -- -- -- 49.4 [38.8-60.1]
Black/African-American -- -- -- -- 35.3 [24.3-48.1]
Hispanic 32.7 [28.4-37.2] 39.2 [33.0-45.7] 34.2 [29.0-39.9] 29.8 [20.2-41.7] 34.4 [30.7-38.3]
White 43.3 [32.8-54.5] 31.5 [23.5-40.9] 35.2 [25.0-47.0] 35.9 [25.2-48.3] 36.9 [32.4-41.8]
Total 39.9 [35.9-44.1] 39.4 [34.8-44.1] 37.1 [32.1-42.4] 31.1 [24.8-38.2] 37.3 [35.1-39.5]
Total American Indian 34.2 [25.2-44.4] 37.6 [32.7-42.6] 35.6 [29.2-42.5] 25.7 [18.5-34.6] 33.8 [30.7-37.1]
Asian/Pacific-Islander 38.2 [24.7-53.9] -- 44.5 [35.3-54.1] -- 38.6 [31.9-45.7]
Black/African-American 24.6 [16.1-35.6] 34.6 [26.9-43.2] 26.1 [14.4-42.7] -- 29.7 [24.2-35.9]
Hispanic 27.4 [23.7-31.6] 29.4 [25.8-33.3] 28.0 [22.7-33.9] 25.6 [18.1-34.9] 27.9 [25.7-30.1]
White 30.4 [26.2-34.9] 23.4 [17.4-30.7] 29.0 [22.5-36.4] 30.9 [22.8-40.3] 28.5 [25.8-31.4]
Total 30.0 [27.7-32.4] 30.5 [26.6-34.7] 30.3 [27.6-33.1] 27.4 [23.0-32.2] 29.7 [28.0-31.5]
Source: YRRS (NM); NMDOH Survey Section (NOTE: "95% CI" is 95% confidence interval)
New Mexico Substance Abuse Epidemiology Profile Page 45
Table 1: Persistent Sadness or Hopelessness by Grade, Sex, and Race/Ethnicity, Grades 9-12, New Mexico,
Problem Statement
Chart 1. Persistent Sadness or Hopelessness*, Grades 9-12, New Mexico and US, 2001-2009
YOUTH PERSISTENT SADNESS OR HOPELESSNESS
31.928.7
30.8 29.7
28.6 28.5 28.526.1
0
10
20
30
40
50
2003 2005 2007 2009
Pe
rce
nt
(%)
NM
US
Persistent feelings of sadness or hopelessness are a risk factor for depression. The prevalence of persistent feelings of sadness or hopelessness among NM high school students has not varied significantly from 2003-2009.
Girls (37.3%) were far more likely to report feelings of sadness or hopelessness than boys (22.3%). There was no statistically significant variation by grade level. American Indians (33.8%) and Asian/Pacific Islanders (38.6%) had higher rates than Hispanic students (27.9%).
The counties with the highest prevalence of prevalence of persistent feelings of sadness or hopelessness were Sierra (40.6%), Luna (39.1%), and Lea (35.1%). The counties with the lowest prevalence were De Baca (20.0), Mora (22.9%), and San Miguel (24.4%).

Source: YRRS (NM); NMDOH Survey Section (NOTE: Brackets around reported rates are 95% confidence intervals)
* Estimate of percent of high school students who reported persistent feelings of sadness or hopelessness within the past 12 months
Harding and Sandoval County estimates not available because of low numbers and/or low response rates
Source: YRRS (NM); NMDOH Survey Section (NOTE: Brackets around reported rates are 95% confidence intervals)
New Mexico Substance Abuse Epidemiology Profile Page 46
Chart 2. Persistent Sadness or Hopelessness by Sex and Grade, Grades 9-12, New Mexico, 2009
Chart 3: Persistent Sadness or Hopelessness* by County, Grades 9-12, New Mexico, 2009
YOUTH PERSISTENT SADNESS OR HOPELESSNESS (continued)
26.1
20.0
22.9
24.4
25.7
25.9
26.4
27.0
27.2
27.2
28.0
28.3
28.4
28.8
28.9
29.1
29.2
29.3
29.6
29.7
29.9
30.1
30.1
30.3
30.7
31.2
31.4
31.5
32.1
32.9
35.1
39.1
40.6
0 20 40 60 80 100
United States
De Baca
Mora
San Miguel
Taos
Guadalupe
Torrance
Roosevelt
Catron
Quay
Union
McKinley
San Juan
Cibola
Valencia
Santa Fe
Lincoln
Colfax
Bernalillo
New Mexico
Los Alamos
Chaves
Doña Ana
Hidalgo
Socorro
Rio Arriba
Grant
Curry
Otero
Eddy
Lea
Luna
Sierra
Percent (%)*
29.737.3
22.3
30.0 30.5 30.3 27.4
0
25
50
75
100
Total Female Male 9th 10th 11th 12th
Pe
rcen
t (%
)

Chart 4. Persistent Sadness or Hopelessness* by County, Grades 9 - 12, New Mexico, 2009
* Estimate of percent of high school students who reported binge drinking at least once in past 30 days
Not included: county estimates not available because of low numbers and/or low response rates
Source: YRRS (NM); NMDOH Survey Section; SAEP
New Mexico Substance Abuse Epidemiology Profile Page 47
YOUTH PERSISTENT SADNESS OR HOPELESSNESS (continued)
Not included

New Mexico Substance Abuse Epidemiology Profile Page 48

Source: YRRS (NM); CDC YRBS (US); NMDOH Survey Section (NOTE: Brackets around reported rates are 95% confidence intervals)
9th Grade 10th Grade 11th Grade 12th Grade All Grades
Sex Race/Ethnicity Percent [95% CI] Percent [95% CI] Percent [95% CI] Percent [95% CI] Percent [95% CI]
Male American Indian 16.9 [10.2-26.9] 14.8 [7.7-26.7] 15.1 [7.1-29.3] 12.5 [5.5-26.0] 15.2 [10.9-20.9]
Asian/Pacific-Islander -- -- -- -- 19.5 [12.8-28.8]
Black/African-American 17.0 [6.6-37.2] -- 23.8 [10.1-46.5] -- 20.5 [12.3-32.1]
Hispanic 12.1 [9.0-16.2] 7.9 [5.0-12.3] 8.9 [5.8-13.5] 8.7 [5.5-13.4] 9.6 [7.8-11.7]
White 7.5 [5.1-10.9] 11.7 [6.6-19.9] 11.8 [6.7-20.1] 10.2 [5.0-19.8] 10.2 [7.1-14.3]
Total 12.0 [8.9-15.9] 11.7 [9.5-14.3] 12.7 [9.0-17.6] 10.4 [7.0-15.2] 11.9 [9.7-14.4]
Female American Indian 28.9 [22.4-36.5] 27.5 [21.1-34.8] 25.5 [16.8-36.8] 15.4 [8.9-25.3] 25.3 [20.5-30.8]
Asian/Pacific-Islander -- -- -- -- 30.2 [21.2-41.0]
Black/African-American -- -- -- -- 18.7 [11.5-28.9]
Hispanic 16.6 [14.2-19.2] 21.1 [14.7-29.5] 17.1 [14.3-20.3] 14.4 [10.1-20.0] 17.6 [15.4-20.2]
White 21.6 [17.4-26.6] 17.9 [11.2-27.6] 18.9 [12.7-27.3] 18.5 [10.6-30.3] 19.3 [15.4-23.9]
Total 21.0 [18.0-24.4] 22.4 [17.7-27.9] 19.5 [16.6-22.9] 16.2 [12.1-21.4] 20.0 [17.7-22.6]
Total American Indian 22.3 [16.4-29.5] 21.2 [17.7-25.2] 20.2 [15.4-25.9] 13.8 [9.0-20.7] 20.0 [16.4-24.1]
Asian/Pacific-Islander 19.5 [10.8-32.7] -- 28.3 [21.0-37.0] -- 25.3 [19.4-32.4]
Black/African-American 19.8 [9.3-37.1] 27.6 [19.1-38.0] 19.5 [9.3-36.3] -- 19.8 [14.4-26.6]
Hispanic 14.3 [12.3-16.5] 14.7 [11.3-18.9] 13.1 [10.7-15.9] 11.5 [8.3-15.6] 13.6 [12.3-15.1]
White 14.2 [12.6-16.1] 14.6 [9.1-22.6] 15.8 [12.7-19.4] 14.9 [9.9-22.0] 14.8 [12.7-17.3]
Total 16.3 [13.7-19.3] 16.9 [13.9-20.3] 16.2 [14.1-18.6] 13.4 [10.0-17.7] 15.9 [14.0-18.0]
Source: YRRS (NM); NMDOH Survey Section (NOTE: "95% CI" is 95% confidence interval)
New Mexico Substance Abuse Epidemiology Profile Page 49
Table 1: Seriously Considered Suicide (past 12 months) by Grade, Sex, and Race/Ethnicity, Grades 9-12, New
Problem Statement
Chart 1. Seriously Considered Suicide (past 12 months), Grades 9-12, New Mexico and US, 2001-2009
YOUTH SERIOUSLY CONSIDERED SUICIDE
20.7 18.5 19.315.9
16.9 16.914.5 13.8
0
10
20
30
40
50
2003 2005 2007 2009
Pe
rce
nt
(%)
NM
US
Suicidal ideation is a risk factor for suicide. Among NM high school students, the prevalence of seriously considering suicide in the past 12 months decreased from 20.7% in 2003 to 15.9% in 2009. This corresponds to a decrease in the US rate over the same time period (2003= 16.9%, 2009 = 13.8%). While the NM rate has been higher than the US rate over most of these years, the difference between the US and NM was not statistically significant in 2009.
NM girls (20.0%) had a higher rate than boys (11.9%) in 2009. There was no statistically significant variation by grade level. American Indians (20.0%) and Asian/Pacific Islanders (25.3%) had higher rates than Hispanics (13.6%).
The counties with the highest prevalence of seriously considering suicide were Luna (23.4%), Sierra (20.2%), and McKinley (19.0%). The counties with the lowest prevalence were De Baca (5.2), Catron (6.7%), and San Miguel (11.4%).

Source: YRRS (NM); NMDOH Survey Section (NOTE: Brackets around reported rates are 95% confidence intervals)
* Estimate of percent of high school students seriously considered suicide at least once in past 12 months
Harding and Sandoval County estimates not available because of low numbers and/or low response rates
Source: YRRS (NM); NMDOH Survey Section (NOTE: Brackets around reported rates are 95% confidence intervals)
New Mexico Substance Abuse Epidemiology Profile Page 50
Chart 2. Seriously Considered Suicide (past 12 months) by Sex and Grade, Grades 9-12, New Mexico, 2009
Chart 3: Seriously Considered Suicide (past 12 months)* by County, Grades 9-12, New Mexico, 2009
YOUTH SERIOUSLY CONSIDERED SUICIDE (continued)
13.8
5.2
6.7
11.4
12.3
12.5
12.8
13.1
13.1
13.3
13.5
13.5
13.8
14.5
14.5
14.7
15.1
15.2
15.9
15.9
16.2
16.2
16.4
16.4
17.0
17.4
18.4
18.4
18.6
18.6
19.0
20.2
23.4
0 20 40 60 80 100
United States
De Baca
Catron
San Miguel
Cibola
Taos
Socorro
Guadalupe
Roosevelt
Mora
Rio Arriba
Valencia
Doña Ana
Chaves
Santa Fe
Otero
Torrance
Lincoln
New Mexico
Lea
Curry
Union
Bernalillo
Grant
Hidalgo
Quay
Colfax
San Juan
Eddy
Los Alamos
McKinley
Sierra
Luna
Percent (%)*
15.9 20.011.9
16.3 16.9 16.2 13.4
0
25
50
75
100
Total Female Male 9th 10th 11th 12th
Pe
rcen
t (%
)

Chart 4. Seriously Considered Suicide (past 12 months)* by County, Grades 9 - 12, New Mexico, 2009
* Estimate of percent of high school students seriously considered suicide at least once in past 12 months
Not included: county estimates not available because of low numbers and/or low response rates
Source: YRRS (NM); NMDOH Survey Section; SAEP
New Mexico Substance Abuse Epidemiology Profile Page 51
YOUTH SERIOUSLY CONSIDERED SUICIDE (continued)
Not included

New Mexico Substance Abuse Epidemiology Profile Page 52

Source: YRRS (NM); CDC YRBS (US); NMDOH Survey Section (NOTE: Brackets around reported rates are 95% confidence intervals)
9th Grade 10th Grade 11th Grade 12th Grade All Grades
Sex Race/Ethnicity Percent [95% CI] Percent [95% CI] Percent [95% CI] Percent [95% CI] Percent [95% CI]
Male American Indian 13.7 [7.5,23.8] 12.4 [4.4,30.6] 6.3 [3.2,12.1] -- 12.5 [7.3,20.4]
Asian/Pacific-Islander -- -- -- -- 17.6 [10.1,28.9]
Black/African-American -- -- -- -- 16.6 [9.5,27.4]
Hispanic 7.6 [4.6,12.3] 2.8 [2.0,4.0] 4.0 [2.0,8.1] 4.8 [2.1,10.8] 4.8 [3.5,6.7]
White 1.9 [0.5,6.6] 4.8 [2.4,9.1] 7.3 [3.5,14.3] 7.6 [4.2,13.5] 5.2 [3.5,7.7]
Total 7.8 [5.0-11.9] 6.7 [4.0-10.9] 6.3 [3.6-11.1] 9.3 [5.5-15.1] 7.6 [5.2-10.9]
Female American Indian 19.3 [10.9,32.0] 18.9 [13.0,26.8] 17.9 [11.5,26.7] -- 17.1 [13.0,22.0]
Asian/Pacific-Islander -- -- -- -- 22.0 [15.0,31.0]
Black/African-American -- -- -- -- 9.0 [3.8,19.8]
Hispanic 12.8 [10.6,15.3] 11.7 [8.8,15.6] 9.0 [6.1,13.2] 5.2 [2.2,12.2] 10.3 [8.4,12.5]
White 15.0 [11.3,19.5] 7.8 [3.3,17.2] 7.2 [2.9,16.7] 6.6 [2.4,17.0] 9.2 [7.0,11.9]
Total 15.8 [13.4-18.6] 12.4 [9.6-15.9] 9.8 [7.3-12.9] 6.7 [3.3-13.1] 11.7 [9.7-13.9]
Total American Indian 16.3 [9.4,26.6] 15.8 [9.6,25.0] 12.2 [8.4,17.4] 12.3 [5.1,26.7] 14.7 [10.5,20.2]
Asian/Pacific-Islander 20.6 [11.0,35.3] -- 13.7 [8.7,20.9] -- 19.9 [14.5,26.7]
Black/African-American 17.2 [6.3,39.0] 14.4 [7.2,26.9] 7.3 [2.1,22.5] -- 13.8 [8.7,21.2]
Hispanic 10.2 [8.2,12.6] 7.5 [5.6,9.8] 6.6 [4.8,9.0] 5.0 [2.9,8.6] 7.6 [6.3,9.2]
White 8.2 [5.8,11.4] 6.2 [3.1,12.0] 7.7 [4.2,13.8] 7.0 [3.8,12.8] 7.3 [6.1,8.7]
Total 11.7 [9.2-14.7] 9.6 [6.9-13.0] 8.3 [6.5-10.4] 7.9 [5.0-12.3] 9.7 [7.7-12.0]
Source: YRRS (NM); NMDOH Survey Section (NOTE: "95% CI" is 95% confidence interval)
New Mexico Substance Abuse Epidemiology Profile Page 53
Table 1: Attempted Suicide (past 12 months) by Grade, Sex, and Race/Ethnicity, Grades 9-12, New Mexico,
Problem Statement
Chart 1. Attempted Suicide (past 12 months), Grades 9-12, New Mexico and US, 2001-2009
YOUTH ATTEMPTED SUICIDE
14.512.5
14.3
9.7
8.5 8.4 6.9 6.30
10
20
30
40
50
2003 2005 2007 2009
Pe
rce
nt
(%)
NM
US
Suicide is the second leading cause of death among NM youth of high school age. Previous suicide attempts are an important risk factor for completed suicide. The prevalence of past year suicide attempts among NM high school students decreased from 14.3% in 2007 to 9.7% in 2009. The rate of suicide attempts among NM students has been consistently higher than among US students.
In 2009, the difference in the suicide attempt rate between girls (11.7%) and boys (7.6%) was not statistically significant. There was no statistically significant variation in suicide attempts by grade level. The rates among American Indians (14.7%) and Asian/Pacific Islanders (19.9%) were higher than among Hispanic (7.6%) and White (7.3%) students.
The counties with the highest prevalence of suicide attempts were McKinley (15.5%), San Juan (13.4%), and Luna (13.2%). The counties with the lowest prevalence of suicide attempts were Roosevelt (4.9%), Mora (6.2), Valencia (6.2%), and Cibola (6.4%).

Source: YRRS (NM); NMDOH Survey Section (NOTE: Brackets around reported rates are 95% confidence intervals)
* Estimate of percent of high school students who attempted suicide at least once in past 12 months
De Baca, Harding, and Sandoval County estimates not available because of low numbers and/or low response rates
Source: YRRS (NM); NMDOH Survey Section (NOTE: Brackets around reported rates are 95% confidence intervals)
New Mexico Substance Abuse Epidemiology Profile Page 54
Chart 2. Attempted Suicide (past 12 months) by Sex and Grade, Grades 9-12, New Mexico, 2009
Chart 3: Attempted Suicide (past 12 months)* by County, Grades 9-12, New Mexico, 2009
YOUTH ATTEMPTED SUICIDE (continued)
6.3
4.9
6.2
6.2
6.3
6.4
6.7
7.5
7.9
8.0
8.2
8.5
8.6
8.6
8.9
9.1
9.2
9.4
9.5
9.6
9.7
9.7
10.5
11.1
11.1
11.2
11.4
11.8
12.3
13.2
13.4
15.5
0 20 40 60 80 100
United States
Roosevelt
Mora
Valencia
Cibola
San Miguel
Taos
Lincoln
Torrance
Catron
Union
Guadalupe
Colfax
Curry
Chaves
Grant
Santa Fe
Los Alamos
Sierra
Rio Arriba
New Mexico
Bernalillo
Doña Ana
Otero
Quay
Socorro
Lea
Hidalgo
Eddy
Luna
San Juan
McKinley
Percent (%)
9.7 11.7 7.611.7
9.6 8.3 7.9
0
25
50
75
100
Total Female Male 9th 10th 11th 12th
Pe
rcen
t (%
)

Chart 4. Attempted Suicide (past 12 months)* by County, Grades 9 - 12, New Mexico, 2009
* Estimate of percent of high school students who attempted suicide at least once in past 12 months
Not included: county estimates not available because of low numbers and/or low response rates
Source: YRRS (NM); NMDOH Survey Section; SAEP
New Mexico Substance Abuse Epidemiology Profile Page 55
YOUTH ATTEMPTED SUICIDE (continued)
Not included

New Mexico Substance Abuse Epidemiology Profile Page 56

New Mexico Substance Abuse Epidemiology Profile Page 57
Chart 1: Binge Drinking by Selected Resiliency Factors, Grades 9-12, New Mexico, 2009
YOUTH RISK AND RESILIENCY
Association Between Risk and Resilincy
Strong relationships with parents, peers, schools, and adults in the community can be protective factors for engaging in risk behaviors that endanger the health and well being of young people. These protective factors, or resiliency factors, are measured by several series of questions in the NM Youth Risk and Resiliency Survey. Results from the 2009 YRRS demnstrate that youth with high levels of these resiliency factors were less likely than other students to engage in binge drinking, drug use, tobacco use, and suicidal ideation and attempts.
Resilency factors presented in the following charts are:
0 20 40 60 80 100
Low
Moderate
High
Low
Moderate
High
Low
Moderate
High
Low
Moderate
High
Low
Moderate
High
Low
Moderate
High
Percent (%) binge drinkers
Resiliency Factor and Level
Caring and supportive relationships in the family
Positive peer influence (pro-social peers)
High expectations by an adult in the community
Caring and supportive relationships in the school
Behavioral boundaries in the school
Involvement in school activities
- Caring and supportive relationships in the family: the interactions between youth and parents or other adults in the home that convey love, acceptance, and affirmation.
- Positive peer influence (pro-social peers): standards for acceptable behavior are influenced by peersand close friends(i.e., students whose friends do not get into a lot of trouble and do well in school arelikely to do the same).
- High expectations by an adult in the community: adults outside of the home who recognize and expectsuccess from youth.
- Caring and supportive relationships in the school: the interactions between youth and teachers or otheradults in the school that convey love, acceptance, and affirmation.
- Behavioral boundaries in the school: student perception that there are clear standards for acceptableand appropriate behavior in the school.
- Involvement in school activities: taking part in in school sports, clubs, or other extra-curricular activities
Students responding to the YRRS are categorized as having low, moderate, or high levels of each resiliency factor. The bar charts below and on the following pages show the prevalence of selected risk behaviors among each of these three groups of students. In general, students having low levels of resiliency factors (light colored bars) have a higher prevalence of risk behaviors than other students, and students having high levels of resiliency factors (dark colored bars) have lower rates of risk behaviors.
Students were less likely to be binge drinkers if they had high levels
- Caring and supportive relationships in the family- Postive peer influence- High expectations in the community- Caring and supportive relationships in the school- Involvement in school activities.
This relationship is not statistically significant for
- Behavioral boundaries in the school.
* Had 5 or more drinks on a single occasion (i.e., in a row or within a couple of hours) at least once in the past 30 days

New Mexico Substance Abuse Epidemiology Profile Page 58
Chart 3: Used Pain Killers to Get High by Selected Resiliency Factors, Grades 9-12, New Mexico, 2009
YOUTH RISK AND RESILIENCY (continued)
Chart 2: Current Marijuana Use* by Selected Resiliency Factors, Grades 9-12, New Mexico, 2009
0 20 40 60 80 100
Low
Moderate
High
Low
Moderate
High
Low
Moderate
High
Low
Moderate
High
Low
Moderate
High
Low
Moderate
High
Percent (%) current marijuana users
Resiliency Factor and Level
Caring and supportive relationships in the family
Positive peer influence (pro-social peers)
High expectations by an adult in the community
Caring and supportive relationships in the school
Behavioral boundaries in the school
Involvement in school activities
0 20 40 60 80 100
Low
Moderate
High
Low
Moderate
High
Low
Moderate
High
Low
Moderate
High
Low
Moderate
High
Low
Moderate
High
Percent (%) used pain killers to get high
Resiliency Factor and Level
Caring and supportive relationships in the family
Positive peer influence (pro-social peers)
High expectations by an adult in the community
Caring and supportive relationships in the school
Behavioral boundaries in the school
Involvement in school activities
Students were less likely to be current marijuana users if they had high levels of
- Caring and supportive relationships in the family- Postive peer influence- High expectations in the community- Caring and supportive relationships in the school- Involvement in school activities.
This relationship is not statistically significant for
- Behavioral boundaries in the school.
* Used marijuana in the past 30 days
Students were less likely to be use pain killers to get high if they had
- Caring and supportive relationships in the family- Postive peer influence- High expectations in the community- Caring and supportive relationships in the school- Behavioral boundaries in the school.- Involvement in school activities.
* Used a pain killer, like Vicodin, OxyContin, or Percocet, to get high in the past 30 days

Chart 4: Current Cocaine Use* by Selected Resiliency Factors, Grades 9-12, New Mexico, 2009
Chart 5: Current Cigarette Smoking by Selected Resiliency Factors, Grades 9-12, New Mexico, 2009
New Mexico Substance Abuse Epidemiology Profile Page 59
YOUTH RISK AND RESILIENCY (continued)
0 20 40 60 80 100
Low
Moderate
High
Low
Moderate
High
Low
Moderate
High
Low
Moderate
High
Low
Moderate
High
Low
Moderate
High
Percent (%) current cocaine users
Resiliency Factor and Level
Caring and supportive relationships in the family
Positive peer influence (pro-social peers)
High expectations by an adult in the community
Caring and supportive relationships in the school
Behavioral boundaries in the school
Involvement in school activities
0 20 40 60 80 100
Low
Moderate
High
Low
Moderate
High
Low
Moderate
High
Low
Moderate
High
Low
Moderate
High
Low
Moderate
High
Percent (%) current cigarette smokers
Resiliency Factor and Level
Caring and supportive relationships in the family
Positive peer influence (pro-social peers)
High expectations by an adult in the community
Caring and supportive relationships in the school
Behavioral boundaries in the school
Involvement in school activities
Students were less likely to be current cocaine users if they had high levels of
- Caring and supportive relationships in the family- Postive peer influence- High expectations in the community- Caring and supportive relationships in the school- Involvement in school activities.
Students were less likely to be current cocaine users if they had high or moderage levels of
- Behavioral boundaries in the school.
* Used any form of cocaine, including powder, crack, or freebase in the past 30 days
Students were less likely to be current cigarette smokers if they had
- Caring and supportive relationships in the family- Postive peer influence- High expectations in the community- Caring and supportive relationships in the school- Involvement in school activities.
- Behavioral boundaries in the school.
* Smoked cigarettes on at least one of the past 30 days
This relationship is not statistically significant for

Chart 6: Persistent Sadness or Hopelessness by Selected Resiliency Factors, Grades 9-12, New Mexico, 2009
Chart 7: Suicide Attempts by Selected Resiliency Factors, Grades 9-12, New Mexico, 2009
New Mexico Substance Abuse Epidemiology Profile Page 60
YOUTH RISK AND RESILIENCY (continued)
0 20 40 60 80 100
Low
Moderate
High
Low
Moderate
High
Low
Moderate
High
Low
Moderate
High
Low
Moderate
High
Low
Moderate
High
Percent (%) with persistent feelings of sadness or hopelessness
Resiliency Factor and Level
Caring and supportive relationships in the family
Positive peer influence (pro-social peers)
High expectations by an adult in the community
Caring and supportive relationships in the school
Behavioral boundaries in the school
Involvement in school activities
0 20 40 60 80 100
Low
Moderate
High
Low
Moderate
High
Low
Moderate
High
Low
Moderate
High
Low
Moderate
High
Low
Moderate
High
Percent (%) attempted suicide
Resiliency Factor and Level
Caring and supportive relationships in the family
Positive peer influence (pro-social peers)
High expectations by an adult in the community
Caring and supportive relationships in the school
Behavioral boundaries in the school
Involvement in school activities
Students were less likely to have persistent feelings of sadness or hopelessness if they had high levels of
- Caring and supportive relationships in the family- Postive peer influence- High expectations in the community- Caring and supportive relationships in the school- Behavioral boundaries in the school.- Involvement in school activities.
* Felt so sad or hopeless almost every day for at least two weeks that they stopped some normal activities, within the past 12 months
Students were less likely to attempt suicide if they had high levels of
- Caring and supportive relationships in the family- Postive peer influence- High expectations in the community- Caring and supportive relationships in the school- Behavioral boundaries in the school.- Involvement in school activities.
* Attempted suicide at least once in the past 12 months

Consumption
New Mexico Substance Abuse Epidemiology Profile Page 61
Section 2

New Mexico Substance Abuse Epidemiology Profile Page 62

* Binge drinking definition: 1998-2005, drinking five or more drinks on an occasion at least once in past 30 days; 2006-2009,
drinking five or more drinks (for men) or four or more drinks (for women) on an occasion at least once in past 30 days
Source: BRFSS; SAEP (NOTE: Brackets around reported rates are 95% confidence intervals)
Ages Ages Ages All Ages Ages Ages All
Sex Race/Ethnicity 18-24 25-64 65+ Ages 18-24 25-64 65+ Ages*
White -- 42,012 2,520 56,309 -- 16.8 3.2 15.8
Hispanic 11,008 35,941 1,294 48,243 25.9 20.7 5.1 20.0
American Indian -- 7,731 -- 14,503 -- 22.5 -- 24.9
Black -- -- -- -- -- -- -- --
Asian/Pacific Islander -- -- -- -- -- -- -- --Total 32,953 89,245 4,127 126,325 32.2 18.2 3.7 17.9
White -- 22,288 2,342 29,510 -- 9.3 2.5 8.2
Hispanic 4,824 19,847 168 24,838 9.7 9.7 0.5 8.5
American Indian -- 2,780 0 3,302 -- 8.0 0.0 6.3
Black -- 1,103 -- 1,103 -- 10.9 -- 8.6
Asian/Pacific Islander -- -- -- -- -- -- -- --Total 10,226 47,230 2,510 59,966 10.9 9.3 1.8 8.0
White 16,658 64,300 4,862 85,819 30.0 13.2 2.8 12.0
Hispanic 15,832 55,788 1,462 73,081 17.1 14.8 2.3 13.7
American Indian 7,099 10,511 195 17,805 20.4 15.2 3.2 16.2
Black -- 1,666 -- 1,666 -- 9.8 -- 7.1
Asian/Pacific Islander -- 408 -- 1,301 -- 3.1 -- 7.7
Total 43,179 136,476 6,637 186,292 22.0 13.7 2.6 12.8
* Estimate of number of people in population group who reported binge drinking at least once in past 30 days
** Estimate of percent of people in population group who reported binge drinking at least once in past 30 days
-- Excluded due to small number of respondents (< 50) in cell
Source: BRFSS; SAEP
New Mexico Substance Abuse Epidemiology Profile Page 63
Female
Total
Male
Table 1: Binge Drinking (past 30 days) by Age, Sex, and Race, Adults Aged 18+, New Mexico, 2009
Number* Percent**
Chart 1: Binge Drinking (past 30 days)* by Age, Adults Aged 18+, New Mexico, 1998-2009
ADULT BINGE DRINKING
Problem Statement
27.2 25.3 26.4 27.3 26.9 28.924.7
22.6 21.9
16.217.4
22.0
14.315.8 16.5 16.7
14.5 15.413.2
10.3
13.8 13.5 12.7 13.7
3.4 3.5 4.3 3.2 3.2 3.4 2.6 2.0 2.7 3.21.6 2.6
0
5
10
15
20
25
30
35
40
1998 1999 2000 2001 2002 2003 2004 2005 2006 2007 2008 2009
Pe
rce
nt
(%)
Year
Age 18-24
Age 25-64
Age 65+
Binge drinking is defined as a pattern of alcohol consumption that brings the blood alcohol concentration (BAC) levelto 0.08% or above. This pattern of drinking usually corresponds to 5 or more drinks on a single occasion for men or 4 ormore drinks on a single occasion for women, generally within about 2 hours. According to the latest estimates from theCenters for Disease Control and Prevention, about 47% of homicides, 32% of falls injury deaths, 29% of drug overdosedeaths, and 23% of suicide deaths are alcohol attributable. Likewise, alcohol consumption is the primary causal factorin roughly 45% of motor vehicle crash deaths among males aged 20-44, and in more than a third of motor vehicle crashdeaths among females aged 20-44. Binge drinking is also associated with a wide range of other social problems,including domestic and sexual violence, crime, and risky sexual behavior.
Table 1 shows that binge drinking rates decrease with age and are higher among males. Chart 1 shows that bingedrinking prevalence among younger adults, after decreasing for several years in a row, appears to have increased in2008 and 2009. Chart 2 shows that adults who do binge drink continue to do so multiple times per month; and to drinkwell above the binge drinking limit when they do. County-level results are shown in Table 2 and Charts 3-4. Survey-related issues (e.g., poor landline telephone coverage) may be affecting reported binge drinking rates in some counties(e.g., McKinley County).

* Binge frequency is number of binge episodes in past 30 days; binge intensity is average number of drinks on last binge occasion
Source: BRFSS; SAEP
County White
His-
panic
Ameri-
can
Indian Black Asian PI
All
Races White
His-
panic
Ameri-
can
Indian Black Asian PI
All
Races
Bernalillo 35,289 22,630 4,569 -- -- 63,718 14.6 13.4 19.4 -- -- 13.6
Catron -- -- -- -- -- -- -- -- -- -- -- --
Chaves 1,725 2,597 -- -- -- 5,445 7.4 14.0 -- -- -- 11.7
Cibola 15 -- 945 -- -- 1,871 0.3 -- 16.5 -- -- 11.0
Colfax 302 -- -- -- -- 519 3.7 -- -- -- -- 3.7
Curry 2,669 -- -- -- -- 4,808 16.4 -- -- -- -- 17.2
De Baca -- -- -- -- -- -- -- -- -- -- -- --
Doña Ana 3,409 13,575 -- -- -- 18,403 6.9 16.4 -- -- -- 12.6
Eddy 3,987 992 -- -- -- 5,745 16.8 8.4 -- -- -- 14.5
Grant 857 660 -- -- -- 1,692 6.6 5.7 -- -- -- 6.3
Guadalupe -- -- -- -- -- -- -- -- -- -- -- --
Harding -- -- -- -- -- -- -- -- -- -- -- --
Hidalgo -- -- -- -- -- -- -- -- -- -- -- --
Lea 1,824 1,753 -- -- -- 4,419 9.6 11.6 -- -- -- 12.0
Lincoln 1,993 -- -- -- -- 2,822 17.4 -- -- -- -- 15.7
Los Alamos 1,905 -- -- -- -- 2,090 16.5 -- -- -- -- 14.0
Luna 1,201 -- -- -- -- 2,569 16.8 -- -- -- -- 17.7
McKinley 428 578 2,130 -- -- 3,136 5.5 9.6 11.0 -- -- 9.0
Mora -- -- -- -- -- -- -- -- -- -- -- --
Otero 3,252 373 -- -- -- 4,708 13.7 4.4 -- -- -- 12.2
Quay -- -- -- -- -- 670 -- -- -- -- -- 8.2Rio Arriba -- 1,759 -- -- -- 3,366 -- 8.6 -- -- -- 10.4
Roosevelt 757 -- -- -- -- 1,293 9.6 -- -- -- -- 9.6
Sandoval 7,103 2,966 -- -- -- 13,576 12.2 11.7 -- -- -- 13.5
San Juan 3,627 2,570 3,455 -- -- 9,896 7.4 17.1 21.2 -- -- 11.8
San Miguel -- 1,826 -- -- -- 2,979 -- 18.8 -- -- -- 21.0
Santa Fe 5,912 7,473 -- -- -- 13,905 11.1 18.8 -- -- -- 14.0Sierra 669 -- -- -- -- 669 7.4 -- -- -- -- 5.7
Socorro 1,129 -- -- -- -- 1,822 17.7 -- -- -- -- 14.1
Taos 2,321 842 -- -- -- 3,852 18.9 6.1 -- -- -- 12.4
Torrance 1,365 -- -- -- -- 3,109 13.3 -- -- -- -- 18.3
Union -- -- -- -- -- -- -- -- -- -- -- --
Valencia 1,829 4,514 -- -- -- 7,328 7.3 15.3 -- -- -- 12.3
Total 85,633 73,260 17,805 1,666 1,301 186,284 12.0 13.8 16.2 7.1 7.7 12.8
* Estimate of number of people in population group who reported binge drinking at least once in past 30 days
** Estimate of percent of people in population group who reported binge drinking at least once in past 30 days
-- Excluded due to small number of respondents (< 50) in cell
Source: BRFSS; SAEP
New Mexico Substance Abuse Epidemiology Profile Page 64
Table 2: Binge Drinking (past 30 days) by Race and County, Adults Aged 18+, New Mexico, 2009
Number* Percent**
ADULT BINGE DRINKING (continued)
Chart 2: Binge Drinking Frequency and Intensity*, Adult Binge Drinkers Aged 18+, New Mexico, 1998-2009
7.9 8.27.4
7.5
0
5.0
4.23.9 4.0
4.44.7
3.94.3
3.8 3.94.5
3.7
0
1
2
3
4
5
6
0
1
2
3
4
5
6
7
8
9
10
1998 1999 2000 2001 2002 2003 2004 2005 2006 2007 2008 2009
Fre
qu
en
cy (
ave
rag
e b
ing
e
ep
iso
de
s p
as
t 3
0 d
ays
)
Inte
ns
ity (
ave
rag
e d
rin
ks
on
la
st
bin
ge
oc
ca
sio
n)
Year
Intensity
Frequency

* Estimate of percent of people in population group who reported binge drinking at least once in past 30 days
The following counties were not included due to small number of respondents (< 50) in cell:
Catron, De Baca, Guadalupe, Harding, Hidalgo, Mora, Union
Source: NMBRFSS (NM); CDC BRFSS (US); SAEP
New Mexico Substance Abuse Epidemiology Profile Page 65
ADULT BINGE DRINKING (continued)
Chart 3: Binge Drinking (past 30 days)* by County, Adults Aged 18+, New Mexico, 2009
15.8
8.2
9.0
9.6
10.4
11.0
11.7
11.8
12.0
12.2
12.3
12.4
12.6
12.8
13.5
13.6
14.0
14.0
14.1
14.5
15.7
17.2
17.7
18.3
21.0
0 10 20 30 40 50
United States
Colfax (519; 0.3%)
Sierra (669; 0.4%)
Grant (1692; 0.9%)
Quay (670; 0.4%)
McKinley (3136; 1.7%)
Roosevelt (1293; 0.7%)
Rio Arriba (3366; 1.8%)
Cibola (1871; 1%)
Chaves (5445; 2.9%)
San Juan (9896; 5.3%)
Lea (4419; 2.4%)
Otero (4708; 2.5%)
Valencia (7328; 3.9%)
Taos (3852; 2.1%)
Doña Ana (18403; 9.9%)
New Mexico (186284; 100%)
Sandoval (13576; 7.3%)
Bernalillo (63718; 34.2%)
Los Alamos (2090; 1.1%)
Santa Fe (13905; 7.5%)
Socorro (1822; 1%)
Eddy (5745; 3.1%)
Lincoln (2822; 1.5%)
Curry (4808; 2.6%)
Luna (2569; 1.4%)
Torrance (3109; 1.7%)
San Miguel (2979; 1.6%)
Percent (%)*
County (# of binge drinkers; % of statewide binge drinkers)

* Estimate of percent of people in population group who reported binge drinking at least once in past 30 days
Not included: Rate not reported due to small number of respodents (< 50) in cell
Source: BRFSS; SAEP
New Mexico Substance Abuse Epidemiology Profile Page 66
ADULT BINGE DRINKING (continued)
Chart 4: Binge Drinking (past 30 days)* by County, Adults Aged 18+, New Mexico, 2009
Not included

* Binge drinking definition: drinking five or more drinks of alcohol in a row within a couple of hours at least once in past 30 daysSource: YRRS (NM); CDC YRBS (US); NMDOH Survey Section (NOTE: Brackets around reported rates are 95% confidence intervals)
9th Grade 10th Grade 11th Grade 12th Grade All Grades
Sex Race/Ethnicity Percent [95% CI] Percent [95% CI] Percent [95% CI] Percent [95% CI] Percent [95% CI]
Male American Indian 19.9 [12.8-29.7] 23.9 [18.4-30.4] 27.1 [17.1-40.0] 30.9 [23.9-39.0] 24.2 [19.3-29.9]
Asian/Pacific-Islander -- -- -- -- 26.0 [13.9-43.5]
Black/African-American 28.6 [16.0-45.6] -- 27.3 [13.6-47.1] -- 31.1 [20.1-44.6]
Hispanic 23.2 [16.8-31.1] 30.9 [24.9-37.5] 30.6 [25.6-36.0] 33.7 [26.7-41.5] 29.4 [27.1-31.8]
White 9.3 [5.8-14.6] 14.9 [10.7-20.3] 25.0 [14.8-38.8] 22.1 [12.4-36.3] 17.2 [12.1-23.9]
Total 19.2 [15.3-23.8] 25.1 [21.2-29.4] 27.4 [23.3-32.0] 28.1 [21.6-35.6] 24.5 [21.6-27.8]
Female American Indian 25.9 [21.3-31.1] 28.0 [21.6-35.3] 28.7 [12.6-52.9] 34.0 [20.2-51.2] 28.4 [22.9-34.6]
Asian/Pacific-Islander -- -- -- -- 28.7 [18.6-41.5]
Black/African-American -- -- -- -- 18.7 [11.1-29.8]
Hispanic 25.4 [19.4-32.7] 30.2 [22.5-39.2] 26.9 [22.4-32.0] 36.4 [32.8-40.2] 29.4 [26.6-32.4]
White 11.6 [7.1-18.2] 16.0 [9.0-26.9] 21.2 [14.2-30.3] 22.8 [15.0-33.1] 18.1 [15.7-20.6]
Total 21.2 [17.7-25.1] 25.5 [21.5-30.0] 25.6 [21.6-30.0] 30.3 [25.3-35.8] 25.4 [23.5-27.4]
Total American Indian 22.6 [18.2-27.7] 25.9 [21.4-31.0] 27.9 [16.0-43.9] 32.2 [23.0-43.0] 26.2 [22.1-30.7]
Asian/Pacific-Islander 26.8 [14.2-44.8] -- 24.3 [13.8-39.2] -- 28.0 [18.5-39.9]
Black/African-American 25.5 [13.8-42.3] 28.9 [14.7-48.8] 26.8 [18.5-37.1] -- 26.4 [17.4-37.9]
Hispanic 24.3 [19.9-29.3] 30.5 [25.6-35.9] 28.7 [25.1-32.5] 35.1 [31.0-39.4] 29.4 [28.1-30.7]
White 10.4 [6.6-15.9] 15.5 [12.0-19.9] 23.5 [16.6-32.1] 22.5 [17.7-28.1] 17.8 [15.3-20.7]
Total 20.1 [17.6-23.0] 25.4 [22.7-28.3] 26.6 [23.0-30.6] 29.2 [24.6-34.2] 25.0 [22.9-27.3]
Source: YRRS (NM); NMDOH Survey Section (NOTE: "95% CI" is "95% confidence interval")
New Mexico Substance Abuse Epidemiology Profile Page 67
Table 1: Binge Drinking (past 30 days) by Grade, Sex, and Race/Ethnicity, Grades 9-12, New Mexico, 2009
Problem Statement
Chart 1. Binge Drinking (past 30 days)*, Grades 9-12, New Mexico and US, 2001-2009
YOUTH BINGE DRINKING
28.6
35.4
28.627.4
25.029.9
28.325.5 26.0
23.4
0
10
20
30
40
50
2001 2003 2005 2007 2009
Pe
rce
nt
(%)
NM
US
Binge drinking (defined as having 5 or more drinks of alcohol in a row within a couple of hours) is a major risk factor forthe three leading causes of death among youth (motor vehicle crashes, suicide, and homicide), as well as beingassociated with poor academic performance and risk behaviors such as impaired driving, riding with a drinking driver,physical fighting, increased number of sexual partners, and other substance use.
Binge drinking is the norm among current high school drinkers in NM. In 2009, of the 40.5% of students who werecurrent drinkers, 64.2% were binge drinkers, while only 35.8% did not binge drink. Chart 1 demonstrates that bingedrinking prevalence has been decreasing in NM since 2003, as it has been in the US since 2001 or earlier. As shown inChart 2, while binge drinking prevalence jumped significantly from 9th to 10th grade, there was no significant difference inprevalence between grades 10 and 12. There was also no difference in the prevalence of binge drinking between boysand girls. As seen in Table 1, the rate of binge drinking was higher among Hispanic students (29.4%) than Whitestudents(17.8%), and this was true among both girls (29.4% vs. 18.1%) and boys (29.4% vs. 17.2%).The prevalence ofbinge drinking was similar for boys (24.5%) and girls (25.4%). The binge drinking rate increased with grade level(9th=20.1%; 10th=25.4%; 11th=26.6%; 12th=29.2%).

Source: YRRS (NM); NMDOH Survey Section (NOTE: Brackets around reported rates are 95% confidence intervals)
* Estimate of percent of high school students who reported binge drinking at least once in past 30 days
Harding and Sandoval County estimates not available because of low numbers and/or low response rates
Source: YRRS (NM); NMDOH Survey Section (NOTE: Brackets around reported rates are 95% confidence intervals)
New Mexico Substance Abuse Epidemiology Profile Page 68
Chart 2. Binge Drinking (past 30 days) by Sex and Grade, Grades 9-12, New Mexico, 2009
Chart 3: Binge Drinking (past 30 days)* by County, Grades 9-12, New Mexico, 2009
YOUTH BINGE DRINKING (continued)
23.4
11.3
16.3
19.5
21.1
21.2
23.1
23.6
24.0
24.4
25.0
25.2
25.4
26.2
26.3
26.4
26.5
28.1
28.1
28.7
29.9
30.0
30.1
30.6
31.3
31.3
31.4
32.9
33.0
33.6
34.9
37.2
38.6
0 20 40 60 80 100
United States
De Baca
Roosevelt
Catron
McKinley
Torrance
San Juan
Doña Ana
San Miguel
Bernalillo
New Mexico
Quay
Los Alamos
Curry
Mora
Chaves
Luna
Colfax
Taos
Hidalgo
Lincoln
Valencia
Eddy
Cibola
Otero
Santa Fe
Grant
Rio Arriba
Socorro
Guadalupe
Lea
Union
Sierra
Percent (%)*
25.0 25.4 24.5 20.125.4 26.6
29.2
0
25
50
75
100
Total Female Male 9th 10th 11th 12th
Pe
rce
nt
(%)

Chart 4. Binge Drinking (past 30 days)* by County, Grades 9 - 12, New Mexico, 2009*
* Estimate of percent of high school students who reported binge drinking at least once in past 30 days
Not included: county estimates not available because of low numbers and/or low response rates
Source: YRRS (NM); NMDOH Survey Section; SAEP
New Mexico Substance Abuse Epidemiology Profile Page 69
YOUTH BINGE DRINKING (continued)
Not included

New Mexico Substance Abuse Epidemiology Profile Page 70

* Heavy drinking definition: drinking more than 2 drinks/day on average (for men) or more than 1 drink/day (for women)
in past 30 days
Source: BRFSS; SAEP (NOTE: Brackets around reported rates are 95% confidence intervals)
Ages Ages Ages All Ages Ages Ages All
Sex Race/Ethnicity 18-24 25-64 65+ Ages 18-24 25-64 65+ Ages*
White -- 11,686 2,193 14,389 -- 4.7 2.8 4.1
Hispanic 4,988 8,469 214 13,671 11.6 4.9 0.8 5.7
American Indian -- 1,453 -- 1,521 -- 4.3 -- 2.7
Black -- -- -- -- -- -- -- --
Asian/Pacific Islander -- -- -- -- -- -- -- --Total 6,264 22,244 2,614 31,122 6.4 4.6 2.3 4.5
White -- 15,533 4,349 21,585 -- 6.5 4.6 6.0
Hispanic 0 4,930 373 5,303 0.0 2.4 1.0 1.8
American Indian -- 389 0 650 -- 1.1 0.0 1.3
Black -- 577 -- 614 -- 5.7 -- 4.8
Asian/Pacific Islander -- -- -- -- -- -- -- --Total 1,964 21,949 4,759 28,672 2.1 4.3 3.4 3.9
White 2,212 27,219 6,543 35,974 4.2 5.6 3.8 5.1
Hispanic 4,988 13,399 586 18,974 5.5 3.6 0.9 3.6
American Indian 261 1,842 68 2,172 0.8 2.7 1.1 2.0
Black -- 577 -- 614 -- 3.5 -- 2.7
Asian/Pacific Islander -- 0 -- 0 -- 0.0 -- 0.0
Total 8,228 44,193 7,373 59,794 4.3 4.4 2.9 4.2
* Estimate of number of people in population group who reported heavy drinking in past 30 days
** Estimate of percent of people in population group who reported heavy drinking in past 30 days
-- Excluded due to small number of respondents (< 50) in cellSource: BRFSS; SAEP
New Mexico Substance Abuse Epidemiology Profile Page 71
Female
Total
Table 1: Heavy Drinking (past 30 days) by Age, Sex, and Race/Ethnicity, Adults Aged 18+, New Mexico, 2009
Number* Percent**
Male
ADULT HEAVY DRINKING
Chart 1: Heavy Drinking (past 30 days)*, Adults Aged 18+, New Mexico, 1998-2009
Problem Statement
4.0 3.84.5
5.0 5.15.6
4.5 4.1 4.43.9 4.4 4.2
0
1
2
3
4
5
6
7
8
1998 1999 2000 2001 2002 2003 2004 2005 2006 2007 2008 2009
Pe
rce
nt
(%)
Year
Heavy drinking (defined as having more than 2 drinks/day, for males; and more than 1 drink/day, for females) is apattern of excessive alcohol consumption that can lead to alcohol-related chronic disease and death. According to thelatest estimates from the CDC, 100% of numerous chronic disease conditions (e.g., alcoholic liver disease, alcoholdependence syndrome), and a significant proportion of many other conditions (e.g., unspecified liver cirrhosis,pancreatitis) are alcohol-related. For each of these causes, it is chronic heavy drinking (as opposed to acute episodic,or binge drinking) that is considered primarily responsible for the incidence and progression of alcohol-related chronicdisease. Heavy drinking is also associated with a wide range of other social problems, including alcoholism (alsoknown as alcohol dependence), domestic violence and family disruption.
Chart 1 shows that adult heavy drinking prevalence increased slightly in 2008 and 2009, from a rate of 3.9% in 2007,Heavy drinking prevalence is still lower among adults in New Mexico (4.2%) than in the U.S. overall (5.1%). As shownin Table 1, heavy drinking was most prevalent among adults in the 25-64 year age group, with 4.4% of adults in thisgroup reporting past-month heavy drinking. New Mexico men were only slightly more likely to report chronic drinkingthan women (4.5% vs 3.9%); and White females had the highest reported rate of heavy drinking (6.0%) followed byHispanic males (5.7%) and White males (4.1%).

County White
His-
panic
Ameri-
can
Indian Black Asian PI
All
Races White
His-
panic
Ameri-
can
Indian Black Asian PI
All
Races
Bernalillo 10,927 7,081 187 -- -- 18,990 4.6 4.2 0.9 -- -- 4.1
Catron -- -- -- -- -- -- -- -- -- -- -- --
Chaves 1,643 384 -- -- -- 2,028 7.1 2.0 -- -- -- 4.4
Cibola 47 -- 0 -- -- 72 1.0 -- 0.0 -- -- 0.4
Colfax 272 -- -- -- -- 1,139 3.4 -- -- -- -- 7.8
Curry 1,018 -- -- -- -- 2,598 6.3 -- -- -- -- 9.3
De Baca -- -- -- -- -- -- -- -- -- -- -- --
Doña Ana 3,026 2,523 -- -- -- 5,961 6.1 3.1 -- -- -- 4.1
Eddy 1,365 0 -- -- -- 2,130 5.8 0.0 -- -- -- 5.4
Grant 543 359 -- -- -- 903 4.2 3.1 -- -- -- 3.4
Guadalupe -- -- -- -- -- -- -- -- -- -- -- --
Harding -- -- -- -- -- -- -- -- -- -- -- --
Hidalgo -- -- -- -- -- -- -- -- -- -- -- --
Lea 444 337 -- -- -- 781 2.3 2.3 -- -- -- 2.2
Lincoln 920 -- -- -- -- 1,073 8.0 -- -- -- -- 6.0
Los Alamos 1,221 -- -- -- -- 1,221 10.6 -- -- -- -- 8.1
Luna 258 -- -- -- -- 258 3.7 -- -- -- -- 1.8
McKinley 139 0 307 -- -- 463 1.8 0.0 1.6 -- -- 1.3
Mora -- -- -- -- -- -- -- -- -- -- -- --
Otero 1,860 373 -- -- -- 2,537 7.8 4.4 -- -- -- 6.6
Quay -- -- -- -- -- 239 -- -- -- -- -- 3.0Rio Arriba -- 963 -- -- -- 1,217 -- 4.7 -- -- -- 3.7
Roosevelt 41 -- -- -- -- 340 0.5 -- -- -- -- 2.5
Sandoval 3,254 816 -- -- -- 4,362 5.7 3.2 -- -- -- 4.4
San Juan 1,517 676 408 -- -- 2,638 3.1 4.6 2.5 -- -- 3.1
San Miguel -- 90 -- -- -- 133 -- 0.9 -- -- -- 0.9
Santa Fe 3,808 2,073 -- -- -- 6,083 7.2 5.4 -- -- -- 6.2Sierra 263 -- -- -- -- 263 2.9 -- -- -- -- 2.2
Socorro 283 -- -- -- -- 585 4.4 -- -- -- -- 4.6
Taos 780 0 -- -- -- 1,114 6.3 0.0 -- -- -- 3.6
Torrance 498 -- -- -- -- 498 4.9 -- -- -- -- 2.9
Union -- -- -- -- -- -- -- -- -- -- -- --
Valencia 1,256 597 -- -- -- 1,929 5.0 2.1 -- -- -- 3.3
Total 36,062 18,974 2,172 614 0 59,882 5.1 3.6 2.0 2.7 0.0 4.2
* Estimate of number of people in population group who reported heavy drinking in past 30 days
** Estimate of percent of people in population group who reported heavy drinking in past 30 days
-- Excluded due to small number of respondents (< 50) in cellSource: BRFSS; SAEP
New Mexico Substance Abuse Epidemiology Profile Page 72
Problem Statement (continued)
Table 2: Heavy Drinking (past 30 days) by Race/Ethnicity and County, Adults Aged 18+, New Mexico, 2009
Number* Percent**
ADULT HEAVY DRINKING (continued)
Meanwhile, it is notable that American Indian males and females, who have the highest rates of alcohol-related chronicdisease death, once again, as in past years, have the lowest reported heavy drinking rates. The lack of congruence betweenheavy drinking rates and chronic disease death rates raises important questions. Is this result accurate? If so, it mightsuggest differences in the patterns of heavy drinking between different population groups. Perhaps, for example, the smallerproportion of the American Indian population that drinks heavily tends to drink more heavily (hence with more lethal effect)than heavy drinkers in other race/ethnic groups. On the other hand, it's also possible that this low heavy drinking rate is anartifact of survey methods. Ongoing efforts are being made to improve American Indian representation in the Behavioral RiskFactor Surveillace Survey (BRFSS). American Indian male binge drinking rates were higher than the binge drinking rates formales in other race/ethnic groups. This finding, which is congruent with the very high alcohol-related injury rates in thispopulation, suggests that the BRFSS may be more accurately measuring American Indian alcohol consumption than in thepast.
In 2007, as shown in Table 2 and Chart 2, heavy drinking rates were highest in Curry, Los Alamos, Colfax, and Oterocounties; and substantially lower in counties that have among the highest rates of alcohol-related chronic disease death rates(e.g., McKinley, Cibola), once again raising the types of questions mentioned above.

* Estimate of percent of people in population group who reported heavy drinking in past 30 days
The following counties were not included due to small number of respondents (< 50) in cell:
Catron, De Baca, Guadalupe, Harding, Hidalgo, Mora, UnionSource: NMBRFSS (NM); CDC BRFSS (US); SAEP
New Mexico Substance Abuse Epidemiology Profile Page 73
Chart 2: Heavy Drinking (past 30 days)* by County, Adults Aged 18+, New Mexico, 2009
ADULT HEAVY DRINKING (continued)
5.1
0.0
0.0
0.0
0.0
0.0
0.0
0.0
0.4
0.9
1.3
1.8
2.2
2.2
2.5
2.9
3.0
3.1
3.3
3.4
3.6
3.7
4.1
4.1
4.2
4.4
4.4
4.6
5.4
6.0
6.2
6.6
7.8
8.1
9.3
0 10 20 30 40 50
United States
Cibola (72; 0.1%)
San Miguel (133; 0.2%)
McKinley (463; 0.8%)
Luna (258; 0.4%)
Lea (781; 1.3%)
Sierra (263; 0.4%)
Roosevelt (340; 0.6%)
Torrance (498; 0.8%)
Quay (239; 0.4%)
San Juan (2638; 4.4%)
Valencia (1929; 3.2%)
Grant (903; 1.5%)
Taos (1114; 1.9%)
Rio Arriba (1217; 2%)
Bernalillo (18990; 31.7%)
Doña Ana (5961; 10%)
New Mexico (59882; 100%)
Chaves (2028; 3.4%)
Sandoval (4362; 7.3%)
Socorro (585; 1%)
Eddy (2130; 3.6%)
Lincoln (1073; 1.8%)
Santa Fe (6083; 10.2%)
Otero (2537; 4.2%)
Colfax (1139; 1.9%)
Los Alamos (1221; 2%)
Curry (2598; 4.3%)
Percent (%)*
County (# of heavy drinkers; % of statewide heavy drinkers)

* Estimate of percent of people in population group who reported heavy drinking in past 30 days
Not included: Rate not reported due to small number of respodents (< 50) in cellSource: NMBRFSS (NM); CDC BRFSS (US); SAEP
New Mexico Substance Abuse Epidemiology Profile Page 74
ADULT HEAVY DRINKING (continued)
Chart 3: Heavy Drinking (past 30 days)* by County, Adults Aged 18+, New Mexico, 2009
Not included

* Drinking and driving definition: drove after having "perhaps too much to drink" at least once in past 30 daysSource: BRFSS; SAEP (NOTE: Brackets around reported rates are 95% confidence intervals)
Ages Ages Ages All Ages Ages Ages All
Sex Race/Ethnicity 18-24 25-64 65+ Ages 18-24 25-64 65+ Ages*
White -- 4,719 795 6,148 -- 1.8 1.0 1.6Hispanic -- 2,077 0 5,793 -- 1.2 0.0 2.5American Indian -- 1,117 -- 1,117 -- 2.9 -- 2.0
Black -- -- -- -- -- -- -- --
Asian/Pacific Islander -- -- -- -- -- -- -- --
Total 4,349 8,307 795 13,451 4.1 1.7 0.7 1.9
White -- 779 35 1,923 -- 0.3 0.0 0.5
Hispanic 117 940 0 1,058 0.2 0.5 0.0 0.4
American Indian -- 76 -- 358 -- 0.2 -- 0.7
Black -- -- -- -- -- -- -- --
Asian/Pacific Islander -- -- -- -- -- -- -- --
Total 1,507 2,564 35 4,106 1.5 0.5 0.0 0.6
White 1,742 5,499 831 8,071 2.6 1.1 0.5 1.1
Hispanic 3,833 3,017 0 6,850 4.3 0.8 0.0 1.3
American Indian 281 1,194 0 1,475 1.0 1.7 0.0 1.4
Black -- -- -- 651 -- -- -- 3.5
Asian/Pacific Islander -- 352 -- 352 -- 1.8 -- 1.3
Total 5,856 10,871 831 17,558 2.9 1.1 0.3 1.2
* Estimate of number of people in population group who drove after "perhaps too much to drink" at least once in past 30 days
** Estimate of percent of people in population group who drove after "perhaps too much to drink" at least once in past 30 days
-- Excluded due to small number of respondents (< 50) in cellSource: BRFSS; SAEP
New Mexico SPF-SIG State Epidemiology Profile Page 75
Female
Total
Male
Table 1: Drinking and Driving (past 30 days) by Age, Sex, and Race, Adults Aged 18+, New Mexico, 2008
Number* Percent**
Chart 1: Drinking and Driving (past 30 days)* by Drinking Status, Adults Aged 18+, New Mexico, 1998-2008*
ADULT DRINKING AND DRIVING
Problem Statement
Adult drinking and driving is a precursor to alcohol-related motor vehicle crash injury and death. Any drinking anddriving is dangerous (i.e., associated with an elevated risk of crash and injury), but driving after binge drinking (which isdefined as a level of drinking likely to lead to a 0.08 BAC) is particularly risky. Unfortunately, as shown in Chart 1, bingedrinkers are much more likely to report driving after drinking than non-binge drinkers. For example, in 2006, only 2.2%of the general population reported driving after drinking; but 14.5% of binge drinkers reported engaging in this riskybehavior in the past 30 days, compared to only 1.0% of non-binge drinkers. On a positive note, Chart 1 shows thatdriving after drinking prevalence decreased significantly between 2006 and 2008 (from 2.1% to 1.2%), including asubstantial decline among binge drinkers (from 14.5% to 8.3%).
As shown in Table 1 and Chart 2, driving after drinking continues to be most prevalent among the younger age groupsthat are also most likely to binge drink, with 2.9% of young adults (aged 18-24) reporting past-month drinking anddriving in 2006, compared to lower rates in older age groups. New Mexico men continued to be more than twice aslikely to report drinking and driving as women (1.9% vs 0.6%). Hispanic males (2.5%) were more likely to reportdrinking and driving than American Indian (2.0%) and White (1.6%) males. On the plus side, rates among all thesegroups were substantially reduced from 2006. Table 2 and Chart 3 show drinking and driving rates by county. Four ofthe ten counties with the highest reported drinking and driving rates (i.e., McKinley, Socorro, Taos, and Eddy) are alsoamong the top ten counties in terms of alcohol-impaired motor vehicle crash fatality rates.
1998 1999 2000 2001 2002 2003 2004 2005 2006 2007 2008
Total 2.2 2.3 2.8 2.0 1.9 2.2 1.2
Binge 13.1 13.4 15.1 11.6 11.2 14.5 8.3
Non-Binge 0.9 0.9 1.1 0.8 1.0 1.0 0.7
0
5
10
15
20
Pe
rce
nt
(%)

* Drinking and driving definition: drove after having "perhaps too much to drink" at least once in past 30 daysSource: BRFSS; SAEP (NOTE: Brackets around reported rates are 95% confidence intervals)
County White
His-
panic
Ameri-
can
Indian Black Asian PI
All
Races White
His-
panic
Ameri-
can
Indian Black Asian PI
All
Races
Bernalillo 2,269 290 -- -- -- 3,327 0.9 0.2 -- -- -- 0.7Catron -- -- -- -- -- -- -- -- -- -- -- --Chaves 0 229 -- -- -- 229 0.0 1.1 -- -- -- 0.5Cibola -- -- -- -- -- 76 -- -- -- -- -- 0.5Colfax -- -- -- -- -- 0 -- -- -- -- -- 0.0Curry 193 -- -- -- -- 1,248 1.1 -- -- -- -- 3.7De Baca -- -- -- -- -- -- -- -- -- -- -- --Doña Ana 916 2,101 -- -- -- 3,018 1.7 2.9 -- -- -- 2.2Eddy 1,230 0 -- -- -- 1,230 6.5 0.0 -- -- -- 4.0Grant 183 -- -- -- -- 371 1.3 -- -- -- -- 1.4Guadalupe -- -- -- -- -- -- -- -- -- -- -- --
Harding -- -- -- -- -- -- -- -- -- -- -- --
Hidalgo -- -- -- -- -- -- -- -- -- -- -- --Lea 0 193 -- -- -- 193 0.0 1.2 -- -- -- 0.5
Lincoln 198 -- -- -- -- 198 1.5 -- -- -- -- 1.2
Los Alamos 0 -- -- -- -- 0 0.0 -- -- -- -- 0.0
Luna -- -- -- -- -- 0 -- -- -- -- -- 0.0McKinley 336 0 287 -- -- 623 3.9 0.0 1.1 -- -- 1.5Mora -- -- -- -- -- -- -- -- -- -- -- --
Otero 0 -- -- -- -- 1,400 0.0 -- -- -- -- 3.2
Quay -- -- -- -- -- 0 -- -- -- -- -- 0.0
Rio Arriba -- 0 -- -- -- 0 -- 0.0 -- -- -- 0.0
Roosevelt 116 -- -- -- -- 116 1.4 -- -- -- -- 1.0
Sandoval 1,108 0 -- -- -- 1,150 2.0 0.0 -- -- -- 1.3
San Juan 144 117 349 -- -- 611 0.3 0.8 2.0 -- -- 0.7
San Miguel -- 0 -- -- -- 0 -- 0.0 -- -- -- 0.0
Santa Fe 982 1,185 -- -- -- 2,167 1.9 3.0 -- -- -- 2.1
Sierra -- -- -- -- -- 0 -- -- -- -- -- 0.0
Socorro -- -- -- -- -- 481 -- -- -- -- -- 3.5
Taos 355 373 -- -- -- 1,080 3.1 4.1 -- -- -- 5.0
Torrance -- -- -- -- -- 0 -- -- -- -- -- 0.0
Union -- -- -- -- -- -- -- -- -- -- -- --
Valencia 39 0 -- -- -- 39 0.1 0.0 -- -- -- 0.1
Total 8,071 6,850 1,475 651 352 17,558 1.1 1.3 1.4 3.5 1.3 1.2
* Estimate of number of people in population group who drove after "perhaps too much to drink" at least once in past 30 days
** Estimate of percent of people in population group who drove after "perhaps too much to drink" at least once in past 30 days
-- Excluded due to small number of respondents (< 50) in cellSource: BRFSS; SAEP
New Mexico SPF-SIG State Epidemiology Profile Page 76
Table 2: Drinking and Driving (past 30 days) by Race/Ethnicity and County, Adults Aged 18+, New Mexico, 2008
Number* Percent**
ADULT DRINKING AND DRIVING (continued)
Chart 2: Drinking and Driving (past 30 days)* by Age, Adults Aged 18+, New Mexico, 1998-2008
4.1 4.6
5.6
3.6
6.4
4.3
2.9
2.3 2.42.8
2.01.4
2.1
1.10.1
0.30.6 0.6
0.20.5
0.3
0
2
4
6
8
10
12
1998 1999 2000 2001 2002 2003 2004 2005 2006 2007 2008
Pe
rce
nt
(%)
Year
Age 18-24
Age 25-64
Age 65+

* Estimate of percent of people in population group who drove after having "perhaps too much to drink" at least once in past 30 days
The following counties were not included due to small number of respondents (< 50) in cell:
Catron, De Baca, Guadalupe, Harding, Hidalgo, Mora, Union
N/A: United States rate not availableSource: BRFSS; SAEP
New Mexico SPF-SIG State Epidemiology Profile Page 77
ADULT DRINKING AND DRIVING (continued)
Chart 3: Drinking and Driving (past 30 days)* by County, Adults Aged 18+, New Mexico, 2008
N/A
0.0
0.0
0.0
0.0
0.0
0.0
0.0
0.0
0.1
0.5
0.5
0.5
0.7
0.7
1.0
1.2
1.2
1.3
1.4
1.5
2.1
2.2
3.2
3.5
3.7
4.0
5.0
0 10 20 30 40 50
United States
Colfax (0; 0%)
Los Alamos (0; 0%)
Luna (0; 0%)
Quay (0; 0%)
Rio Arriba (0; 0%)
San Miguel (0; 0%)
Sierra (0; 0%)
Torrance (0; 0%)
Valencia (39; 0.2%)
Lea (193; 1.1%)
Chaves (229; 1.3%)
Cibola (76; 0.4%)
Bernalillo (3327; 18.9%)
San Juan (611; 3.5%)
Roosevelt (116; 0.7%)
Lincoln (198; 1.1%)
New Mexico (17558; 100%)
Sandoval (1150; 6.5%)
Grant (371; 2.1%)
McKinley (623; 3.5%)
Santa Fe (2167; 12.3%)
Doña Ana (3018; 17.2%)
Otero (1400; 8%)
Socorro (481; 2.7%)
Curry (1248; 7.1%)
Eddy (1230; 7%)
Taos (1080; 6.2%)
Percent (%)*
County (# of drinking drivers; % of statewide drinking drivers)

* Estimate of percent of people in population group who drove after having "perhaps too much to drink" at least once in past 30 days
Not included: Rate not reported due to small number of respodents (< 50) in cellSource: BRFSS; SAEP
New Mexico SPF-SIG State Epidemiology Profile Page 78
ADULT DRINKING AND DRIVING (continued)
Chart 4: Drinking and Driving (past 30 days)* by County, Adults Aged 18+, New Mexico, 2008
Not included

* Drinking and driving definition:drove "when [they] had been drinking alcohol" at least once in past 30 daysSource: YRRS (NM); CDC YRBS (US); NMDOH Survey Section (NOTE: Brackets around reported rates are 95% confidence intervals)
9th Grade 10th Grade 11th Grade 12th Grade All Grades
Sex Race/Ethnicity Percent [95% CI] Percent [95% CI] Percent [95% CI] Percent [95% CI] Percent [95% CI]
Male American Indian 12.6 [5.0-28.2] 9.5 [5.0-17.1] 13.5 [8.4-20.8] 16.9 [10.4-26.3] 12.6 [8.0-19.2]
Asian/Pacific-Islander -- -- -- -- 12.8 [6.4-24.1]
Black/African-American 10.1 [2.2-36.3] -- 11.1 [4.5-24.7] -- 11.6 [6.1-20.7]
Hispanic 8.2 [4.7-13.9] 11.0 [8.5-14.1] 12.4 [9.2-16.5] 9.3 [5.8-14.7] 10.3 [8.7-12.1]
White 2.7 [0.8-8.7] 4.3 [0.9-17.8] 10.4 [3.6-26.6] 12.0 [6.1-22.4] 6.8 [3.7-12.3]
Total 7.8 [4.9-12.2] 8.8 [6.6-11.7] 12.0 [8.6-16.6] 11.4 [8.0-16.0] 9.8 [7.7-12.3]
Female American Indian 12.2 [7.1-20.2] 14.4 [7.5-25.9] 12.0 [4.8-26.8] 11.6 [7.7-17.1] 12.7 [9.7-16.4]
Asian/Pacific-Islander -- -- -- -- 14.4 [8.5-23.4]
Black/African-American -- -- -- -- 7.6 [3.3-16.2]
Hispanic 7.2 [4.9-10.4] 9.4 [7.1-12.4] 7.5 [5.2-10.9] 11.4 [8.5-15.3] 8.9 [7.1-11.1]
White 5.6 [2.7-11.0] 5.2 [2.5-10.5] 6.5 [3.2-13.0] 14.2 [8.0-24.0] 8.0 [5.7-11.0]
Total 8.1 [6.4-10.2] 9.9 [6.9-14.0] 8.3 [6.4-10.8] 12.5 [9.7-15.9] 9.6 [8.1-11.4]
Total American Indian 12.4 [7.3-20.2] 11.9 [7.4-18.8] 12.8 [7.5-20.9] 14.2 [10.4-19.0] 12.6 [9.6-16.3]
Asian/Pacific-Islander 12.3 [5.1-26.7] -- 11.1 [5.2-22.2] -- 14.2 [8.6-22.7]
Black/African-American 10.4 [2.4-35.0] 11.0 [5.2-21.6] 10.9 [5.2-21.6] -- 10.0 [5.6-17.2]
Hispanic 7.7 [5.8-10.0] 10.2 [8.1-12.7] 9.9 [7.3-13.2] 10.4 [7.4-14.3] 9.6 [8.2-11.1]
White 4.1 [2.2-7.5] 4.7 [1.9-10.9] 8.5 [4.1-16.5] 13.3 [8.1-20.9] 7.4 [4.9-10.9]
Total 7.9 [6.0-10.5] 9.4 [7.3-12.0] 10.2 [7.8-13.2] 11.9 [9.4-15.1] 9.7 [8.1-11.6]
Source: YRRS (NM); NMDOH Survey Section (NOTE: "95% CI" is 95% confidence interval)
New Mexico Substance Abuse Epidemiology Profile Page 79
Table 1: Drinking and Driving (past 30 days) by Grade, Sex, and Race/Ethnicity, Grades 9-12, New Mexico,
YOUTH DRINKING AND DRIVING
Problem Statement
Chart 1. Drinking and Driving (past 30 days)*, Grades 9-12, New Mexico and US, 2001-2009
Drinking and driving is a major risk factor for the motor vehicle accidents, the leading cause of death among youth.
The rate of drinking drinking and driving among NM high school students has been decreasing since 2003, and hasbeen decreasing among US high school students since 2001 or earlier. In recent years NM had a higher rate than theUS, but in 2009 the difference between the US and NM disappeared, and both had a rate 0f 9.7%.
Drinking and driving increased in prevalence with increasing grade levels (9th = 7.9%; 10th = 9.4%; 11th = 10.2%;12th = 11.9%). The prevalence did not vary significantly by gender or by race/ethnicity.
The drinking and driving rate was highest in Union (29.6%), Sierra (17.2%), and Eddy County (16.6%). The rate waslowest in Torrance (5.9%), Roosevelt (7.3%), Colfax (8.6%), and De Baca County (8.6%).
13.3
19.1
12.0 12.5
9.7
13.3
12.1 9.9 10.5 9.70
10
20
30
40
50
2001 2003 2005 2007 2009
Pe
rce
nt
(%)
NM
US

Source: YRRS (NM); NMDOH Survey Section (NOTE: Brackets around reported rates are 95% confidence intervals)
* Estimate of percent of high school students who reported drinking and driving at least once in past 30 days
Harding and Sandoval County estimates not available because of low numbers and/or low response rates
Source: YRRS (NM); NMDOH Survey Section (NOTE: Brackets around reported rates are 95% confidence intervals)
New Mexico Substance Abuse Epidemiology Profile Page 80
YOUTH DRINKING AND DRIVING (continued)
Chart 2. Drinking and Driving (past 30 days) by Sex and Grade, Grades 9-12, New Mexico, 2009
Chart 3: Drinking and Driving (past 30 days)* by County, Grades 9-12, New Mexico, 2009
9.7
5.9
7.3
8.6
8.6
8.9
9.7
10.2
10.4
10.5
10.5
11.1
11.3
11.4
11.5
11.5
11.6
11.9
12.9
12.9
13.2
13.5
13.6
13.6
13.8
14.5
14.5
14.5
15.3
15.6
16.6
17.2
29.6
0 20 40 60 80 100
United States
Torrance
Roosevelt
Colfax
De Baca
San Miguel
New Mexico
Chaves
Bernalillo
San Juan
Socorro
Catron
Lincoln
McKinley
Doña Ana
Santa Fe
Luna
Grant
Cibola
Valencia
Taos
Curry
Mora
Rio Arriba
Otero
Lea
Los Alamos
Quay
Hidalgo
Guadalupe
Eddy
Sierra
Union
Percent (%)*
9.7 9.6 9.8 7.9 9.4 10.211.9
0
25
50
75
100
Total Female Male 9th 10th 11th 12th
Perc
en
t (%
)

YOUTH DRINKING AND DRIVING (continued)
Chart 4. Drinking and Driving (past 30 days)* by County, Grades 9 - 12, New Mexico, 2009
* Estimate of percent of high school students who reported drinking and driving at least once in past 30 days
Not included: county estimates not available because of low numbers and/or low response rates
Source: YRRS (NM); NMDOH Survey Section; SAEP
New Mexico Substance Abuse Epidemiology Profile Page 81
Not included

New Mexico Substance Abuse Epidemiology Profile Page 82

YOUTH MARIJUANA USE
* Marijuana use definition: used marijuana at least once in past 30 daysSource: YRRS (NM); CDC YRBS (US); NMDOH Survey Section (NOTE: Brackets around reported rates are 95% confidence intervals)
9th Grade 10th Grade 11th Grade 12th Grade All Grades
Sex Race/Ethnicity Percent [95% CI] Percent [95% CI] Percent [95% CI] Percent [95% CI] Percent [95% CI]
Male American Indian 28.5 [16.0-45.6] 39.6 [29.6-50.6] 37.1 [28.1-47.2] 38.0 [25.8-51.8] 34.8 [26.4-44.2]
Asian/Pacific-Islander -- -- -- -- 34.2 [24.7-45.0]
Black/African-American 21.6 [11.5-36.9] -- -- -- 39.0 [26.7-52.9]
Hispanic 23.6 [17.1-31.7] 33.5 [25.2-42.9] 29.2 [21.3-38.7] 27.9 [19.0-38.9] 28.8 [24.9-33.1]
White 16.1 [9.3-26.4] 14.4 [9.1-22.1] 20.8 [13.9-29.9] 23.2 [14.5-35.0] 18.4 [13.8-24.0]
Total 23.5 [18.1-29.9] 29.3 [23.4-35.9] 29.6 [23.0-37.1] 29.1 [21.7-37.7] 27.8 [23.3-32.8]
Female American Indian 32.1 [24.7-40.5] 37.6 [30.6-45.1] 35.3 [25.4-46.8] 40.6 [26.1-56.9] 35.9 [31.3-40.8]
Asian/Pacific-Islander -- -- -- -- 24.4 [16.3-34.7]
Black/African-American -- -- -- -- 29.8 [16.4-47.8]
Hispanic 24.4 [18.4-31.6] 33.0 [26.9-39.8] 27.9 [21.2-35.7] 32.3 [22.6-44.0] 29.3 [26.4-32.4]
White 18.8 [14.4-24.1] 24.0 [15.3-35.5] 23.2 [14.7-34.7] 24.3 [15.4-36.1] 22.7 [20.1-25.5]
Total 24.1 [21.4-27.1] 31.4 [26.3-37.1] 27.9 [22.9-33.5] 29.9 [23.5-37.3] 28.2 [26.0-30.6]
Total American Indian 30.0 [22.2-39.3] 38.6 [32.8-44.7] 36.2 [30.1-42.8] 39.4 [30.7-48.9] 35.3 [29.6-41.5]
Asian/Pacific-Islander 30.0 [18.9-44.0] -- 34.6 [27.0-43.0] -- 29.3 [21.3-38.7]
Black/African-American 21.0 [10.4-37.9] 40.1 [22.6-60.4] 46.2 [29.7-63.5] -- 35.5 [22.6-50.8]
Hispanic 23.9 [20.8-27.3] 33.2 [26.7-40.4] 28.5 [21.8-36.3] 30.1 [23.7-37.3] 29.0 [26.1-32.1]
White 17.4 [12.5-23.7] 18.8 [13.6-25.5] 21.9 [16.1-29.0] 23.8 [18.0-30.7] 20.5 [18.3-23.1]
Total 23.8 [20.6-27.3] 30.4 [25.6-35.6] 28.7 [23.6-34.3] 29.5 [24.2-35.5] 28.0 [24.8-31.4]
Source: YRRS (NM); NMDOH Survey Section (NOTE: "95% CI" is 95% confidence interval)
New Mexico Substance Abuse Epidemiology Profile Page 83
Table 1: Marijuana Use (past 30 days) by Grade, Sex, and Race/Ethnicity, Grades 9-12, New Mexico, 2009
Problem Statement
Chart 1. Marijuana Use (past 30 days)*, Grades 9-12, New Mexico and US, 2001-2009
29.026.2 25.0
28.0
22.420.2 19.7
20.8
0
10
20
30
40
50
2003 2005 2007 2009
Pe
rce
nt
(%)
NM
US
There is no apparent trend in the rate of past 30-day marijuana use by NM high school students. While it appearsthat the rate in 2009 (28.0%) was higher than the rate in 2007 (25.0%), the difference is not statistically significant. TheNM rate has been consistently higher than the US rate.
In 2007, there was no statistically significant variation in the rate of past 30-day marijuana use by grade level orgender. The rate among American Indian students (35.3%) was higher than among White students (20.5%). This wastrue for both males (34.8% vs. 18.4%) and females (35.9% vs. 22.7%).
The rate of past 30-day marijuana use was highest in Mora (37.1%), Taos (39.4%), and Sierra County (37.3%). Therate was lowest in Catron (4.6%), De Baca (11.2%), and Roosevelt County (13.5%).

YOUTH MARIJUANA USE (continued)
Source: YRRS (NM); NMDOH Survey Section (NOTE: Brackets around reported rates are 95% confidence intervals)
* Estimate of percent of high school students who reported marijuana use at least once in past 30 days
Harding and Sandoval County estimates not available because of low numbers and/or low response rates
Source: YRRS (NM); NMDOH Survey Section (NOTE: Brackets around reported rates are 95% confidence intervals)
New Mexico Substance Abuse Epidemiology Profile Page 84
Chart 2. Marijuana Use (past 30 days) by Sex and Grade, Grades 9-12, New Mexico, 2009
Chart 3: Marijuana Use (past 30 days) by County, Grades 9-12, New Mexico, 2009
20.8
4.6
11.2
13.5
17.0
17.8
19.9
20.5
22.5
23.2
24.1
24.7
25.1
26.6
27.4
27.7
28.0
28.9
29.0
29.6
30.2
30.8
31.0
31.4
31.8
32.0
32.1
33.4
33.8
34.4
37.3
39.4
39.6
0 20 40 60 80 100
United States
Catron
De Baca
Roosevelt
Luna
Hidalgo
Doña Ana
Chaves
Curry
Torrance
Lea
Los Alamos
Quay
Guadalupe
Eddy
Lincoln
New Mexico
Cibola
Otero
Colfax
Valencia
San Miguel
San Juan
Socorro
Grant
Bernalillo
Union
McKinley
Santa Fe
Rio Arriba
Sierra
Taos
Mora
Percent (%)*
28.0 28.2 27.8 23.830.4 28.7
29.5
0
25
50
75
100
Total Female Male 9th 10th 11th 12th
Pe
rce
nt
(%)

Chart 4. Marijuana Use (past 30 days)* by County, Grades 9 - 12, New Mexico, 2009
* Estimate of percent of high school students who reported marijuana use at least once in past 30 days
Not included: county estimates not available because of low numbers and/or low response rates
Source: YRRS (NM); NMDOH Survey Section; SAEP
New Mexico Substance Abuse Epidemiology Profile Page 85
YOUTH MARIJUANA USE (continued)
Not included

New Mexico Substance Abuse Epidemiology Profile Page 86

* Cocaine use definition: used cocaine at least once in past 30 daysSource: YRRS (NM); CDC YRBS (US); NMDOH Survey Section (NOTE: Brackets around reported rates are 95% confidence intervals)
9th Grade 10th Grade 11th Grade 12th Grade All Grades
Sex Race/Ethnicity Percent [95% CI] Percent [95% CI] Percent [95% CI] Percent [95% CI] Percent [95% CI]
Male American Indian 8.4 [2.1-28.2] 8.8 [4.6-16.1] 7.3 [3.7-13.9] 11.1 [5.6-20.7] 8.8 [4.4-16.8]
Asian/Pacific-Islander -- -- -- -- 12.3 [5.5-25.4]
Black/African-American 0.9 [0.1-6.6] -- 7.6 [2.4-21.7] -- 10.5 [3.5-27.5]
Hispanic 5.8 [3.5-9.2] 6.7 [4.1-10.9] 5.9 [3.8-9.0] 6.9 [2.8-16.0] 6.3 [5.1-7.7]
White 2.0 [0.6-6.1] 1.3 [0.2-7.8] 3.4 [1.3-8.7] 6.1 [3.2-11.4] 3.0 [1.7-5.5]
Total 5.3 [2.6-10.4] 5.6 [3.7-8.4] 5.8 [4.4-7.6] 8.6 [4.2-16.7] 6.2 [4.3-8.7]
Female American Indian 4.2 [2.0-8.6] 10.0 [7.1-14.1] 4.5 [0.9-19.1] 7.4 [2.9-17.9] 6.6 [5.1-8.5]
Asian/Pacific-Islander -- -- -- -- 9.8 [4.4-20.2]
Black/African-American -- -- -- -- 3.1 [0.7-12.7]
Hispanic 4.4 [2.5-7.5] 5.8 [3.1-10.7] 3.9 [1.8-8.0] 4.4 [1.5-12.0] 4.6 [3.0-7.2]
White 5.0 [1.3-17.2] 6.0 [2.8-12.2] 2.3 [0.9-5.4] 4.8 [2.4-9.3] 4.5 [2.9-6.9]
Total 4.9 [3.0-7.8] 6.7 [4.2-10.4] 3.7 [1.7-7.8] 5.0 [2.9-8.4] 5.1 [4.0-6.4]
Total American Indian 6.5 [2.2-17.8] 9.4 [6.4-13.7] 5.9 [2.5-13.3] 9.1 [5.8-14.1] 7.7 [5.1-11.6]
Asian/Pacific-Islander 14.2 [6.1-29.6] -- 12.0 [6.7-20.6] -- 11.0 [6.6-17.9]
Black/African-American 0.6 [0.1-4.5] 6.6 [1.2-29.3] 4.9 [1.4-15.4] -- 7.7 [2.5-21.5]
Hispanic 5.0 [3.3-7.6] 6.3 [3.9-9.9] 4.9 [3.2-7.3] 5.6 [2.9-10.6] 5.4 [4.3-6.9]
White 3.4 [1.4-8.1] 3.4 [1.9-6.1] 2.8 [1.3-6.0] 5.4 [3.1-9.2] 3.8 [2.9-4.9]
Total 5.1 [3.2-8.0] 6.1 [4.4-8.4] 4.8 [3.3-6.9] 6.7 [4.0-11.1] 5.6 [4.4-7.2]
Source: YRRS (NM); NMDOH Survey Section (NOTE: "95% CI" is 95% confidence interval)
New Mexico Substance Abuse Epidemiology Profile Page 87
Table 1: Cocaine Use (past 30 days) by Grade, Sex, and Race/Ethnicity, Grades 9-12, New Mexico, 2009
Problem Statement
Chart 1. Cocaine Use (past 30 days)*, Grades 9-12, New Mexico and US, 2001-2009
YOUTH COCAINE USE
8.9
7.95.4 5.6
4.1 3.4 3.3 2.80
10
20
30
40
50
2003 2005 2007 2009
Pe
rce
nt
(%)
NM
US
While the past 30-day cocaine use prevalence among NM high school students did not change significantly from2007 to 2009, it has been generally decreasing since 2003. Despite the decreasing rate of cocaine use among NMyouth, the NM rate has consistently been higher than the US rate. In 2009 the NM rate was two times as high as theUS rate (5.6% vs. 2.8%).
The difference in the rate between males (6.2%) and females (5.1%) was not statistically significant. The rate did notvary significantly by grade level. The rate of cocaine use was higher among Asian/Pacific Islanders (11.0%) andAmerican Indians (7.7%) than among White students (3.8%).
The rate of past 30-day cocaine use was highest in Los Alamos (10.3%), Hidalgo (9.6%), Rio Arriba (8.6%), and LeaCounty (8.6%). The rate was lowest in Roosevelt (0.9%), Catron (1.3%), and Luna (1.3%).

Source: YRRS (NM); NMDOH Survey Section (NOTE: Brackets around reported rates are 95% confidence intervals)
* Estimate of percent of high school students who reported cocaine use at least once in past 30 days
Harding and Sandoval County estimates not available because of low numbers and/or low response rates
Source: YRRS (NM); NMDOH Survey Section (NOTE: Brackets around reported rates are 95% confidence intervals)
New Mexico Substance Abuse Epidemiology Profile Page 88
Chart 2. Cocaine Use (past 30 days) by Sex and Grade, Grades 9-12, New Mexico, 2009
Chart 3: Cocaine Use (past 30 days)* by County, Grades 9-12, New Mexico, 2009
YOUTH COCAINE USE (continued)
2.8
0.9
1.3
1.3
2.3
2.7
2.9
3.2
3.2
3.5
4.0
4.4
4.4
4.5
4.5
4.7
5.0
5.3
5.3
5.4
5.4
5.6
5.8
5.9
6.0
6.6
6.8
7.5
8.5
8.6
8.6
9.6
10.3
0 20 40 60 80 100
United States
Roosevelt
Catron
Luna
Chaves
Curry
Torrance
De Baca
Socorro
Grant
Union
Cibola
Taos
Lincoln
Sierra
Guadalupe
San Juan
Colfax
San Miguel
Otero
Santa Fe
New Mexico
Quay
McKinley
Mora
Doña Ana
Bernalillo
Valencia
Eddy
Lea
Rio Arriba
Hidalgo
Los Alamos
Percent (%)*
5.6 5.16.2 5.1 6.1 4.8
6.7
0
10
20
30
40
50
Total Female Male 9th 10th 11th 12th
Perc
en
t (%
)

Chart 4. Cocaine Use (past 30 days)* by County, Grades 9 - 12, New Mexico, 2009
* Estimate of percent of high school students who reported cocaine use at least once in past 30 days
Not included: county estimates not available because of low numbers and/or low response rates
Source: YRRS (NM); NMDOH Survey Section; SAEP
New Mexico Substance Abuse Epidemiology Profile Page 89
YOUTH COCAINE USE (continued)
Not included

New Mexico Substance Abuse Epidemiology Profile Page 90

* Pain killer to get high definition: Used a pain killer, like Vicodin, OxyContin, or Percocet, to get high in the past 30 daysSource: YRRS (NM); CDC YRBS (US); NMDOH Survey Section (NOTE: Brackets around reported rates are 95% confidence intervals)
9th Grade 10th Grade 11th Grade 12th Grade All Grades
Sex Race/Ethnicity Percent [95% CI] Percent [95% CI] Percent [95% CI] Percent [95% CI] Percent [95% CI]
Male American Indian 14.1 [6.2-28.8] 12.1 [7.3-19.2] 20.1 [12.0-31.9] 17.2 [10.6-26.6] 15.1 [9.5-23.4]
Asian/Pacific-Islander -- -- -- -- 21.5 [12.2-35.0]
Black/African-American 17.6 [4.6-48.3] -- 31.8 [15.6-54.0] -- 28.7 [15.7-46.6]
Hispanic 12.2 [7.7-18.7] 17.5 [13.2-22.9] 17.8 [13.7-22.7] 12.6 [7.6-20.3] 15.1 [12.8-17.7]
White 8.3 [4.1-15.9] 8.2 [4.5-14.4] 10.1 [6.5-15.4] 13.0 [7.3-21.9] 9.6 [7.4-12.5]
Total 12.2 [7.9-18.5] 14.1 [10.8-18.1] 16.7 [13.0-21.2] 15.4 [11.5-20.3] 14.4 [12.0-17.2]
Female American Indian 14.8 [8.8-23.7] 15.0 [10.4-21.1] 16.5 [9.7-26.6] 12.4 [5.5-25.3] 15.0 [11.0-20.1]
Asian/Pacific-Islander -- -- -- -- 20.7 [12.0-33.3]
Black/African-American -- -- -- -- 12.3 [6.1-23.3]
Hispanic 13.4 [8.6-20.1] 18.3 [12.4-26.3] 12.7 [7.0-22.1] 18.4 [12.5-26.4] 15.7 [12.7-19.3]
White 11.3 [5.0-23.5] 14.2 [7.6-24.9] 10.7 [4.8-22.1] 7.3 [4.1-12.7] 10.7 [7.3-15.4]
Total 13.0 [9.0-18.3] 16.6 [13.6-20.1] 13.6 [9.5-19.1] 13.1 [8.7-19.2] 14.2 [11.8-17.0]
Total American Indian 14.4 [8.0-24.4] 13.5 [10.8-16.7] 18.4 [12.0-27.0] 14.9 [8.5-25.0] 15.1 [10.8-20.7]
Asian/Pacific-Islander 18.4 [10.2-30.9] -- 27.3 [19.3-37.1] -- 21.5 [15.8-28.6]
Black/African-American 16.2 [4.8-42.6] 23.6 [11.3-42.9] 24.5 [13.3-40.5] -- 22.7 [13.1-36.5]
Hispanic 12.7 [8.8-18.0] 17.9 [13.2-23.9] 15.2 [11.3-20.1] 15.5 [10.5-22.2] 15.4 [13.3-17.8]
White 9.7 [4.9-18.3] 10.9 [6.1-18.6] 10.4 [6.3-16.7] 9.7 [6.4-14.5] 10.2 [8.0-12.9]
Total 12.6 [8.8-17.7] 15.3 [12.3-18.9] 15.1 [11.8-19.2] 14.2 [10.4-19.1] 14.3 [12.1-16.9]
Source: YRRS (NM); NMDOH Survey Section (NOTE: "95% CI" is 95% confidence interval)
New Mexico Substance Abuse Epidemiology Profile Page 91
Table 1: Pain Killer Use to Get High (past 30 days) by Grade, Sex, and Race/Ethnicity, Grades 9-12, New
Problem Statement
Chart 1. Pain Killer Use to Get High (past 30 days)*, Grades 9-12, New Mexico and US, 2001-2009
YOUTH PAIN KILLER USE TO GET HIGH
11.714.3
0
10
20
30
40
50
2007 2009
Pe
rce
nt
(%)
NM
The rate of past 30 day use of pain killers to get high was 14.3% in 2009, and 11.7% in 2007, but the differencebetween the two rates was not statistically significant. Pain killer use to get high had the second highest prevalence ofall 30 day drug use measures in the 2009 YRRS, just behind marijuana (28.0%). The question about the use of painkillers to get high was new to the NM YRRS in 2007, and there is no national comparison.
The rate of pain killer use to get high did not vary significantly by gender, and the difference by grade level was notstatistically significant. The prevalence was higher among Black/African Americans (22.7%), and Hispanics (15.4%)than among White students (10.2%). The rate among Hispanic males (9.6%) was higher than among White males(9.6%).
The rate of pain killer use to get high was highest in Eddy (26.8%), Socorro (24.4%), and Sierra counties (24.1%).The rate was lowest in Luna (1.6%), Catron (3.6%), and Cibola counties (6.8%).

Source: YRRS (NM); NMDOH Survey Section (NOTE: Brackets around reported rates are 95% confidence intervals)
* Estimate of percent of high school students who reported pain killer use to get high at least once in past 30 days
Harding and Sandoval County estimates not available because of low numbers and/or low response rates
Source: YRRS (NM); NMDOH Survey Section (NOTE: Brackets around reported rates are 95% confidence intervals)
New Mexico Substance Abuse Epidemiology Profile Page 92
Chart 2. Pain Killer Use to Get High (past 30 days) by Sex and Grade, Grades 9-12, New Mexico, 2009
Chart 3: Pain Killer Use to Get High (past 30 days)* by County, Grades 9-12, New Mexico, 2009
YOUTH PAIN KILLER USE TO GET HIGH (Continued)
N/A
1.6
3.6
6.8
7.1
8.5
9.7
10.0
11.2
11.9
12.2
12.9
13.4
14.2
14.3
14.8
15.2
15.7
15.8
16.3
16.4
16.7
16.7
17.0
17.1
18.1
18.1
18.1
19.4
20.2
24.1
24.4
26.8
0 100
United States
Luna
Catron
Cibola
Roosevelt
De Baca
McKinley
Doña Ana
Curry
Guadalupe
Torrance
San Miguel
Colfax
Chaves
New Mexico
Taos
Bernalillo
San Juan
Los Alamos
Santa Fe
Otero
Lea
Union
Lincoln
Grant
Hidalgo
Mora
Quay
Rio Arriba
Valencia
Sierra
Socorro
Eddy
Percent (%)*
14.3 14.2 14.4 12.615.3 15.1 14.2
0
10
20
30
40
50
Total Female Male 9th 10th 11th 12th
Pe
rce
nt
(%)

Chart 4. Pain Killer Use to Get High (past 30 days)* by County, Grades 9 - 12, New Mexico, 2009
* Estimate of percent of high school students who reported pain killer use to get high at least once in past 30 days
Not included: county estimates not available because of low numbers and/or low response rates
Source: YRRS (NM); NMDOH Survey Section; SAEP
New Mexico Substance Abuse Epidemiology Profile Page 93
YOUTH PAIN KILLER USE TO GET HIGH (Continued)
Not included

New Mexico Substance Abuse Epidemiology Profile Page 94

* Other drug use definition: used inhalants, ecstasy, methamphetamine, or heroin at least once in past 30 daysSource: YRRS (NM); CDC YRBS (US); NMDOH Survey Section (NOTE: Brackets around reported rates are 95% confidence intervals)
9th Grade 10th Grade 11th Grade 12th Grade All Grades
Sex Race/Ethnicity Percent [95% CI] Percent [95% CI] Percent [95% CI] Percent [95% CI] Percent [95% CI]
Male American Indian 13.2 [5.2-29.7] 16.4 [10.2-25.3] 12.5 [7.1-21.1] 19.8 [8.6-39.2] 15.1 [10.0-22.2]
Asian/Pacific-Islander -- -- -- -- 21.2 [12.5-33.8]
Black/African-American 20.7 [7.3-46.4] -- 30.5 [18.3-46.3] -- 28.4 [16.9-43.7]
Hispanic 11.7 [7.9-17.1] 13.8 [9.3-20.0] 13.7 [8.9-20.5] 12.3 [6.8-21.2] 12.9 [10.5-15.8]
White 7.0 [3.0-15.3] 4.1 [1.5-10.7] 6.5 [2.3-17.3] 9.8 [5.5-17.0] 6.7 [3.8-11.3]
Total 11.7 [8.8-15.4] 11.9 [8.4-16.6] 12.9 [9.1-18.0] 14.3 [8.9-22.3] 12.6 [10.1-15.5]
Female American Indian 14.9 [9.1-23.4] 21.6 [16.3-28.1] 13.4 [4.5-33.7] 10.5 [5.2-20.1] 16.2 [12.0-21.4]
Asian/Pacific-Islander -- -- -- -- 22.5 [16.5-30.0]
Black/African-American -- -- -- -- 8.7 [4.4-16.6]
Hispanic 17.3 [13.3-22.2] 16.5 [12.2-22.0] 7.2 [5.3-9.6] 9.8 [5.5-16.8] 13.3 [11.0-16.1]
White 14.8 [7.4-27.1] 12.5 [8.5-17.9] 12.6 [5.9-25.0] 12.5 [7.2-20.8] 13.1 [10.2-16.7]
Total 15.9 [12.0-20.8] 16.4 [13.4-20.0] 11.2 [7.8-15.9] 10.8 [7.9-14.6] 14.1 [12.3-16.1]
Total American Indian 14.2 [7.9-24.1] 19.0 [14.9-23.9] 12.9 [7.1-22.5] 14.9 [8.0-26.2] 15.6 [12.2-19.8]
Asian/Pacific-Islander 24.1 [16.3-34.0] -- 30.0 [21.7-39.9] -- 22.0 [18.2-26.3]
Black/African-American 17.7 [7.7-35.9] 21.3 [10.8-37.5] 22.2 [13.4-34.5] -- 21.1 [13.1-32.3]
Hispanic 14.5 [11.5-18.2] 15.2 [12.1-18.9] 10.4 [7.5-14.1] 11.1 [7.2-16.6] 13.1 [11.3-15.2]
White 10.7 [7.2-15.7] 8.0 [4.6-13.6] 10.0 [4.2-22.0] 11.4 [7.8-16.4] 10.0 [7.6-13.0]
Total 13.8 [11.4-16.6] 14.1 [11.0-17.9] 12.2 [8.7-16.9] 12.5 [9.4-16.5] 13.4 [11.6-15.4]
Source: YRRS (NM); NMDOH Survey Section (NOTE: "95% CI" is 95% confidence interval)
New Mexico Substance Abuse Epidemiology Profile Page 95
Table 1: Other Drug Use (past 30 days) by Grade, Sex, and Race/Ethnicity, Grades 9-12, New Mexico, 2009
Problem Statement
Chart 1. Other Drug Use (past 30 days)*, Grades 9-12, New Mexico, 2001-2009
YOUTH OTHER DRUG USE
4.1 2.9 3.9 3.2
7.3
4.6 4.43.9
6.8
7.5 7.8 7.7
5.1
8.0
0
5
10
15
20
25
2003 2005 2007 2009
Pe
rce
nt
(%)
Heroin Methamphetamine Inhalants Ecstasy
Past 30 day use of other drugs (inhalants, ecstasy, methamphetamine, or heroin) shows mixed trends. While the rateof past 30-day methamphetamine use has decreased from 7.3% in 2003 to 3.9% in 2009, the rates for inhalants (8.0%)and heroin (3.2%) use have remained relatively stable. The rate for past 30-day ecstasy use increased from 5.1% in2007 to 8.0% in 2009.
For the combined measure for all four substances, there was no statistically significant difference between boys(12.6%) and girls (12.6%), or between the different grade levels (9th=13.8%; 10th=14.1%; 11th=12.2%; 12th=12.5%) in2009. Heroin use was more common among boys (4.6%) than girls (1.7%). There was not a statistically significantdifference between boys and girls for the other three substances (methamphetamine - boys=4.8%, girls=3.0%; inhalants -boys=6.9%, girls=8.6%; ecstasy - boys=8.7%, girls=7.3%). The decrease in prevalence with increasing grade level forinhalants was not statistically significant (9th=9.8%; 10th=7.3%; 11th=6.6%; 12th=5.9%). Other differences by grade levelwere not statistically significant.
The rate of past 30-day other drug use was highest in Eddy (23.2%), Union (18.6%), and Rio Arriba counties (18.4%).The rate was lowest in Catron (0.4%), Roosevelt (4.2%), and Luna counties (5.5%).

Source: YRRS (NM); NMDOH Survey Section (NOTE: Brackets around reported rates are 95% confidence intervals)
* Methamphetamine, ecstasy, heroin, or inhalants
Harding and Sandoval County estimates not available because of low numbers and/or low response rates
Source: YRRS (NM); NMDOH Survey Section (NOTE: Brackets around reported rates are 95% confidence intervals)
New Mexico Substance Abuse Epidemiology Profile Page 96
Chart 2. Other Drug Use (past 30 days) by Sex and Grade, Grades 9-12, New Mexico, 2009
Chart 3: Other Drug Use (past 30 days)* by County, Grades 9-12, New Mexico, 2009
YOUTH OTHER DRUG USE (Continued)
8.0
0.4
4.2
5.5
6.8
8.2
8.4
8.5
9.3
10.1
10.2
10.6
11.0
11.5
11.9
12.7
12.7
12.8
13.4
13.6
14.5
14.7
15.5
16.0
16.1
16.2
16.2
16.6
17.2
18.3
18.4
18.6
23.2
0 20 40 60 80 100
United States
Catron
Roosevelt
Luna
De Baca
Curry
Socorro
Guadalupe
Cibola
Mora
Taos
San Miguel
Chaves
Torrance
McKinley
Colfax
San Juan
Grant
New Mexico
Otero
Los Alamos
Quay
Sierra
Santa Fe
Hidalgo
Bernalillo
Doña Ana
Lea
Valencia
Lincoln
Rio Arriba
Union
Eddy
Percent (%)*
13.4 14.1 12.613.8 14.1 12.2
12.5
0
10
20
30
40
50
Total Female Male 9th 10th 11th 12th
Pe
rce
nt
(%)

Chart 4. Other Drug Use (past 30 days)* by County, Grades 9 - 12, New Mexico, 2009
* Estimate of percent of high school students who used methamphetamine, ecstasy, heroin, or inhalants in the past 30 days
Not included: county estimates not available because of low numbers and/or low response rates
Source: YRRS (NM); NMDOH Survey Section; SAEP
New Mexico Substance Abuse Epidemiology Profile Page 97
YOUTH OTHER DRUG USE (Continued)
Not included

New Mexico Substance Abuse Epidemiology Profile Page 98

* Cigarette smoking definition: smoked >= 100 cigarettes in lifetime and smoked cigarettes in past 30 days
Source: BRFSS; SAEP (NOTE: Brackets around reported rates are 95% confidence intervals)
Ages Ages Ages All Ages Ages Ages All
Sex Race/Ethnicity 18-24 25-64 65+ Ages 18-24 25-64 65+ Ages*
White -- 47,493 5,565 58,925 -- 18.7 7.1 16.3
Hispanic 12,996 39,151 1,803 53,950 28.9 21.7 6.8 21.4
American Indian -- 9,025 -- 19,807 -- 24.7 -- 32.6
Black -- -- -- -- -- -- -- --
Asian/Pacific Islander -- -- -- -- -- -- -- --Total 33,898 101,207 9,005 144,110 32.2 20.0 7.9 19.9
White -- 43,116 9,782 58,314 -- 17.8 10.1 16.0
Hispanic 9,257 33,355 4,237 46,849 17.2 16.2 11.2 15.7
American Indian -- 6,669 460 8,374 -- 18.8 14.0 15.8
Black -- 3,646 -- 3,928 -- 34.8 -- 29.8
Asian/Pacific Islander -- -- -- -- -- -- -- --Total 16,646 90,137 15,069 121,852 17.0 17.5 10.4 16.1
White 11,283 90,609 15,347 117,239 20.6 18.3 8.8 16.1
Hispanic 22,253 72,506 6,040 100,799 22.5 18.7 9.4 18.3
American Indian 11,524 15,694 964 28,182 32.5 21.8 15.6 24.8
Black -- 5,253 -- 5,915 -- 29.4 -- 24.1
Asian/Pacific Islander -- 1,796 -- 2,815 -- 12.9 -- 16.2
Total 50,544 191,344 24,074 265,963 24.9 18.7 9.3 17.9* Estimate of number of people in population group who have smoked >= 100 cigarettes in lifetime and who smoked cigarettes in past 30 days
** Estimate of percent of people in population group who have smoked >= 100 cigarettes in lifetime and who smoked cigarettes in past 30 days
-- Excluded due to small number of respondents (< 50) in cellSource: BRFSS; SAEP
New Mexico Substance Abuse Epidemiology Profile Page 99
Table 1: Cigarette Smoking (past 30 days) by Age, Sex, and Race/Ethnicity, Adults Aged 18+, New Mexico, 2009
ADULT CIGARETTE SMOKING
Problem Statement
Total
Number* Percent**
Male
Female
Chart 1: Cigarette Smoking (past 30 days)*, Adults Aged 18+, New Mexico, 1998-2009
22.5 22.4 23.6 23.821.2 22
20.3 21.5 20.1 20.8 19.417.9
0
5
10
15
20
25
30
35
1998 1999 2000 2001 2002 2003 2004 2005 2006 2007 2008 2009
Pe
rce
nt
(%)
Year
Adult cigarette smoking (defined as having smoked 100 or more cigarettes in lifetime, and currently smoking) isassociated with significant rates of smoking-related death and morbidity. According to the CDC's SAMMEC (SmokingAttributable Mortality, Morbidity, and Economic Costs) website, smoking is responsible for a significant proportion of thedeaths from numerous types of malignant neoplasms (e.g., lung, esophageal, and laryngeal cancers); from numerouscardiovascular diseases (e.g., ischemic heart disease, cerebrovascular disease); and from several respiratory diseases(e.g., bronchitis, emphysema, chronic airway obstruction). Combined, these smoking-related deaths make smoking theleading behavioral cause of death in the United States.
In 2009, the same proportion of adults in New Mexico reported current smoking as in the U.S. overall (17.9%). Asshown in Chart 1, New Mexico's adult smoking prevalence rate has decreased over the past 10 years, with twosuccessive declines seen in the past two years. In 2009, as shown in Table 1, smoking was more prevalent amongyoung adults aged 18-24 (24.9%), than among adults aged 25-64 (18.7%) or adults aged 65 and over (9.3%). NewMexico men were more likely to smoke than women (19.9% vs 16.1%). Among males, American Indian males had thehighest smoking prevalence (32.6%), a substantial increase from the 2007 rate (25.1) last reported; followed byHispanic males (21.4) and White males (16.3%). Among females, the highest prevalence of smoking was among Blackfemales (29.8%), followed by White females (16.0%).

County White His-panic
Ameri-
can
Indian Black Asian PI
All
Races White His-panic
Ameri-
can
Indian Black Asian PI
All
Races
Bernalillo 33,626 28,402 9,629 -- -- 78,615 13.8 16.0 39.4 -- -- 16.3
Catron -- -- -- -- -- -- -- -- -- -- -- --
Chaves 3,985 3,793 -- -- -- 9,376 16.8 19.3 -- -- -- 19.4
Cibola 1,192 -- 257 -- -- 3,366 26.1 -- 4.5 -- -- 19.6
Colfax 1,528 -- -- -- -- 3,265 17.3 -- -- -- -- 20.8
Curry 2,719 -- -- -- -- 5,133 16.6 -- -- -- -- 17.8
De Baca -- -- -- -- -- -- -- -- -- -- -- --
Doña Ana 5,153 15,423 -- -- -- 23,091 10.3 18.3 -- -- -- 15.6
Eddy 6,080 4,185 -- -- -- 11,565 24.9 35.1 -- -- -- 28.6
Grant 1,784 2,615 -- -- -- 4,669 14.3 21.9 -- -- -- 17.5
Guadalupe -- -- -- -- -- -- -- -- -- -- -- --
Harding -- -- -- -- -- -- -- -- -- -- -- --
Hidalgo -- -- -- -- -- -- -- -- -- -- -- --
Lea 4,179 1,389 -- -- -- 6,795 21.8 8.9 -- -- -- 18.1
Lincoln 2,056 -- -- -- -- 5,691 17.8 -- -- -- -- 30.7
Los Alamos 1,169 -- -- -- -- 1,699 9.8 -- -- -- -- 10.8
Luna 2,110 -- -- -- -- 3,937 28.2 -- -- -- -- 26.5
McKinley 673 1,542 2,697 -- -- 5,119 8.6 25.6 13.3 -- -- 14.3
Mora -- -- -- -- -- -- -- -- -- -- -- --
Otero 5,207 2,813 -- -- -- 10,496 21.2 31.9 -- -- -- 26.3
Quay -- -- -- -- -- 2,672 -- -- -- -- -- 31.2Rio Arriba -- 2,757 -- -- -- 5,115 -- 13.2 -- -- -- 15.3
Roosevelt 1,648 -- -- -- -- 2,517 21.5 -- -- -- -- 19.0
Sandoval 7,127 2,497 1,896 -- -- 12,754 12.0 9.7 16.4 -- -- 12.4
San Juan 11,073 3,705 3,702 -- -- 20,087 22.3 24.6 21.4 -- -- 23.3
San Miguel -- 3,075 -- -- -- 4,563 -- 30.6 -- -- -- 31.0
Santa Fe 4,900 4,645 -- -- -- 10,782 9.0 11.5 -- -- -- 10.6Sierra 2,598 -- -- -- -- 2,668 28.4 -- -- -- -- 22.3
Socorro 1,016 -- -- -- -- 2,178 16.6 -- -- -- -- 17.3
Taos 2,145 2,507 -- -- -- 5,687 17.2 17.9 -- -- -- 18.0
Torrance 3,101 -- -- -- -- 5,201 30.3 -- -- -- -- 30.2
Union -- -- -- -- -- -- -- -- -- -- -- --
Valencia 6,768 6,260 -- -- -- 14,394 26.5 20.5 -- -- -- 23.6
Total 116,501 100,881 28,574 5,915 2,815 266,069 16.0 18.3 25.2 24.0 16.2 17.9* Estimate of number of people in population group who have smoked >= 100 cigarettes in lifetime and who smoked cigarettes in past 30 days
** Estimate of percent of people in population group who have smoked >= 100 cigarettes in lifetime and who smoked cigarettes in past 30 days
-- Excluded due to small number of respondents (< 50) in cellSource: BRFSS; SAEP
New Mexico Substance Abuse Epidemiology Profile Page 100
Number* Percent**
ADULT CIGARETTE SMOKING (continued)
Problem Statement (continued)
Table 2: Cigarette Smoking (past 30 days) by Race/Ethnicity and County, Adults Aged 18+, New Mexico, 2009
Smoking prevalence rates by sex and race/ethnicity are not completely aligned with smoking-related death rates.For example, although American Indian and Hispanic males had the highest smoking rates among males, their smoking-related death rates were substantially lower than the Black male and White male death rates. This suggests thepossibility that Hispanic and American Indian male smoking rates have increased relatively recently, and may befollowed by an increase in smoking-related death rates in these groups in coming years.
As shown in Table 2 and Chart 2, the counties with the highest smoking rates were in the eastern half of the state.

* Estimate of percent of people in population group who have smoked >= 100 cigarettes in lifetime and who smoked cigarettes in past 30 days
The following counties were not included due to small number of respondents (< 50) in cell:
Catron, De Baca, Guadalupe, Harding, Hidalgo, Mora, UnionSource: NMBRFSS (NM); CDC BRFSS (US); SAEP
New Mexico Substance Abuse Epidemiology Profile Page 101
Chart 2: Cigarette Smoking (past 30 days)* by County, Adults Aged 18+, New Mexico, 2009
ADULT CIGARETTE SMOKING (continued)
17.9
0.0
0.0
0.0
0.0
0.0
0.0
0.0
10.6
10.8
12.4
14.3
15.3
15.6
16.3
17.3
17.5
17.8
17.9
18.0
18.1
19.0
19.4
19.6
20.8
22.3
23.3
23.6
26.3
26.5
28.6
30.2
30.7
31.0
31.2
0 10 20 30 40 50
United States
Santa Fe (10782; 4.1%)
Los Alamos (1699; 0.6%)
Sandoval (12754; 4.8%)
McKinley (5119; 1.9%)
Rio Arriba (5115; 1.9%)
Doña Ana (23091; 8.7%)
Bernalillo (78615; 29.5%)
Socorro (2178; 0.8%)
Grant (4669; 1.8%)
Curry (5133; 1.9%)
New Mexico (266069; 100%)
Taos (5687; 2.1%)
Lea (6795; 2.6%)
Roosevelt (2517; 0.9%)
Chaves (9376; 3.5%)
Cibola (3366; 1.3%)
Colfax (3265; 1.2%)
Sierra (2668; 1%)
San Juan (20087; 7.5%)
Valencia (14394; 5.4%)
Otero (10496; 3.9%)
Luna (3937; 1.5%)
Eddy (11565; 4.3%)
Torrance (5201; 2%)
Lincoln (5691; 2.1%)
San Miguel (4563; 1.7%)
Quay (2672; 1%)
Percent (%)*
County (# of smokers; % of statewide smokers)

* Estimate of percent of people in population group who have smoked >= 100 cigarettes in lifetime and who smoked cigarettes in past 30 days
Not included: Rate not reported due to small number of respodents (< 50) in cellSource: BRFSS; SAEP
New Mexico Substance Abuse Epidemiology Profile Page 102
ADULT CIGARETTE SMOKING (continued)
Chart 3: Cigarette Smoking (past 30 days)* by County, Adults Aged 18+, New Mexico, 2009
Not included

Source: YRRS (NM); CDC YRBS (US); NMDOH Survey Section (NOTE: Brackets around reported rates are 95% confidence intervals)
9th Grade 10th Grade 11th Grade 12th Grade All Grades
Sex Race/Ethnicity Percent [95% CI] Percent [95% CI] Percent [95% CI] Percent [95% CI] Percent [95% CI]
Male American Indian 23.0 [15.5-32.7] 37.9 [26.1-51.4] 27.9 [22.4-34.2] -- 30.9 [23.3-39.7]
Asian/Pacific-Islander -- -- -- -- 27.5 [20.3-36.3]
Black/African-American -- -- -- -- 22.8 [11.4-40.2]
Hispanic 19.7 [15.2-25.1] 20.0 [15.0-26.2] 26.1 [18.3-35.9] 26.7 [21.2-33.1] 23.0 [20.5-25.7]
White 18.9 [11.2-30.2] 17.6 [11.8-25.4] 26.2 [19.6-34.0] 32.1 [20.6-46.2] 22.9 [18.6-28.0]
Total 20.3 [16.4-24.9] 23.7 [17.4-31.4] 26.8 [20.8-33.6] 29.2 [23.3-35.8] 24.6 [20.9-28.7]
Female American Indian 19.4 [10.3-33.4] 24.7 [13.0-41.8] 28.6 [19.9-39.1] 32.5 [16.5-53.9] 25.2 [16.4-36.6]
Asian/Pacific-Islander -- -- -- -- 22.9 [14.2-34.8]
Black/African-American -- -- -- -- 13.6 [8.0-22.3]
Hispanic 21.0 [15.9-27.1] 22.5 [17.0-29.2] 23.4 [17.4-30.7] 27.9 [18.1-40.4] 23.4 [19.2-28.3]
White 16.5 [12.3-21.9] 20.2 [13.6-28.8] 16.9 [9.8-27.7] 37.0 [26.7-48.6] 22.8 [18.4-27.9]
Total 19.2 [15.8-23.3] 21.8 [17.3-27.0] 22.1 [18.9-25.7] 31.4 [25.7-37.8] 23.2 [20.6-26.0]
Total American Indian 21.3 [15.6-28.4] 31.6 [20.7-44.8] 28.2 [23.8-33.2] 35.2 [20.8-52.9] 28.1 [20.6-37.0]
Asian/Pacific-Islander 23.6 [13.7-37.6] -- 28.7 [17.1-43.8] -- 25.3 [18.4-33.8]
Black/African-American 19.4 [10.6-32.8] 17.0 [7.0-35.8] 20.4 [10.0-37.3] -- 19.2 [11.3-30.6]
Hispanic 20.3 [16.4-24.7] 21.3 [17.2-26.1] 24.7 [19.1-31.3] 27.3 [21.3-34.3] 23.2 [20.9-25.7]
White 17.8 [12.8-24.1] 18.9 [13.6-25.6] 22.0 [16.5-28.9] 34.9 [27.3-43.4] 23.1 [19.5-27.1]
Total 19.8 [16.7-23.3] 22.9 [18.4-28.1] 24.6 [20.6-29.0] 30.3 [25.6-35.6] 24.0 [21.2-27.0]
Source: YRRS (NM); NMDOH Survey Section (NOTE: "95% CI" is 95% confidence interval)
New Mexico Substance Abuse Epidemiology Profile Page 103
Table 1: Cigarette Smoking (past 30 days) by Grade, Sex, and Race/Ethnicity, Grades 9-12, New Mexico, 2009
Problem Statement
Chart 1. Cigarette Smoking (past 30 days) by Sex and Grade, Grades 9-12, New Mexico and US, 2001-2009
YOUTH CIGARETTE SMOKING
30.2
25.7 24.2 24.0
21.9 23.020.0 19.5
0
10
20
30
40
50
2003 2005 2007 2009
Pe
rce
nt
(%)
NM
US
The prevalence of current cigarette smoking (smoked cigarettes within the past 30 days) among NM high school students has decreased from 30.2% in 2003 to 24.0% in 2009. This coincides with a decrease in the rate of current smoking among US high school students that has occurred over the past several years. At the same time, the NM rate of current smoking has been consistently higher than the US rate.
In 2009, there was no statistically significant variation in this rate by gender. The prevalence of current smoking increased with grade level (9th=19.8%; 10th=22.9%; 11th=24.6%; 12th=30.3%). Differences by race/ethnicity were not statistically significant.
The counties with the highest prevalence of current smoking were Union (42.3%), Socorro (31.9%), and Eddy (31.9%). The counties with the lowest prevalence of current smoking were Catron (17.7), Los Alamos (17.7%), and De Baca (18.1%).

Source: YRRS (NM); NMDOH Survey Section (NOTE: Brackets around reported rates are 95% confidence intervals)
* Estimate of percent of high school students who reported binge drinking at least once in past 30 days
Harding and Sandoval County estimates not available because of low numbers and/or low response rates
Source: YRRS (NM); NMDOH Survey Section (NOTE: Brackets around reported rates are 95% confidence intervals)
New Mexico Substance Abuse Epidemiology Profile Page 104
Chart 2. Cigarette Smoking (past 30 days) by Sex and Grade, Grades 9-12, New Mexico, 2009
Chart 3: Cigarette Smoking (past 30 days)* by County, Grades 9-12, New Mexico, 2009
YOUTH CIGARETTE SMOKING (continued)
19.5
17.7
17.7
18.4
18.8
19.4
19.8
19.8
19.9
20.9
21.5
21.7
22.6
22.7
23.0
24.0
24.0
24.1
24.2
25.1
25.2
25.5
26.9
27.0
27.2
27.3
27.8
28.4
29.6
29.8
31.9
31.9
42.3
0 20 40 60 80 100
United States
Catron
Los Alamos
De Baca
Doña Ana
Chaves
Roosevelt
Torrance
Guadalupe
Bernalillo
Lincoln
Hidalgo
Luna
Otero
Colfax
New Mexico
San Juan
San Miguel
Santa Fe
Taos
Grant
Rio Arriba
Mora
Valencia
Curry
Lea
McKinley
Cibola
Sierra
Quay
Eddy
Socorro
Union
Percent (%)*
24.0 23.224.6
19.8 22.9 24.6
30.3
0
25
50
75
100
Total Female Male 9th 10th 11th 12th
Pe
rcen
t (%
)

Chart 4. Cigarette Smoking (past 30 days)* by County, Grades 9 - 12, New Mexico, 2009
* Estimate of percent of high school students who reported binge drinking at least once in past 30 days
Not included: county estimates not available because of low numbers and/or low response rates
Source: YRRS (NM); NMDOH Survey Section; SAEP
New Mexico Substance Abuse Epidemiology Profile Page 105
YOUTH CIGARETTE SMOKING (continued)
Not included

New Mexico Substance Abuse Epidemiology Profile Page 106

State Population by Age, Sex, Race/Ethnicity, and County
New Mexico Substance Abuse Epidemiology Profile Page 107
Appendix 1

New Mexico Substance Abuse Epidemiology Profile Page 108

Sex County Name 0-24 25-64 65+ All Ages 0-24 25-64 65+ All Ages 0-24 25-64 65+ All Ages 0-24 25-64 65+ All Ages 0-24 25-64 65+ All Ages 0-24 25-64 65+ All Ages
Male Bernalillo 37,104 84,786 25,067 146,957 4,927 5,955 872 11,754 51,663 67,295 11,370 130,328 7,952 8,860 1,016 17,828 3,012 4,624 598 8,234 104,658 171,520 38,923 315,101
Catron 389 825 319 1,533 0 0 3 3 137 174 77 388 14 29 6 49 0 4 2 6 540 1,032 407 1,979
Chaves 4,379 7,702 2,908 14,989 445 408 68 921 6,485 6,731 923 14,139 249 311 46 606 158 162 18 338 11,716 15,314 3,963 30,993
Cibola 917 1,999 763 3,679 37 126 25 188 1,694 2,327 549 4,570 2,470 2,601 495 5,566 19 40 5 64 5,137 7,093 1,837 14,067
Colfax 921 2,025 748 3,694 15 25 2 42 1,360 1,666 436 3,462 62 111 18 191 7 18 1 26 2,365 3,845 1,205 7,415
Curry 4,231 6,614 1,891 12,736 934 845 112 1,891 3,563 3,459 415 7,437 205 281 43 529 329 424 9 762 9,262 11,623 2,470 23,355
De Baca 197 318 185 700 0 1 0 1 149 174 79 402 3 11 0 14 1 0 0 1 350 504 264 1,118
Dona Ana 9,414 16,835 5,636 31,885 1,176 1,448 134 2,758 28,639 29,182 4,884 62,705 1,008 1,149 212 2,369 591 744 71 1,406 40,828 49,358 10,937 101,123
Eddy 4,385 7,283 2,415 14,083 272 278 60 610 4,702 4,813 832 10,347 188 266 55 509 68 96 13 177 9,615 12,736 3,375 25,726
Grant 2,093 3,919 1,601 7,613 70 103 5 178 3,013 3,308 890 7,211 138 191 27 356 32 37 6 75 5,346 7,558 2,529 15,433
Guadalupe 101 373 68 542 12 66 0 78 702 1,122 242 2,066 5 40 1 46 3 14 0 17 823 1,615 311 2,749
Harding 30 116 60 206 0 1 0 1 35 84 64 183 1 3 0 4 0 0 0 0 66 204 124 394
Hidalgo 385 627 252 1,264 11 8 1 20 715 739 193 1,647 0 22 5 27 7 14 0 21 1,118 1,410 451 2,979
Lea 4,336 7,260 2,409 14,005 688 777 142 1,607 6,203 6,042 625 12,870 181 283 51 515 103 103 13 219 11,511 14,465 3,240 29,216
Lincoln 1,901 3,949 1,790 7,640 46 68 9 123 1,363 1,445 299 3,107 126 131 23 280 7 26 3 36 3,443 5,619 2,124 11,186
Los Alamos 2,091 4,651 1,298 8,040 39 36 4 79 466 565 136 1,167 57 93 13 163 221 324 17 562 2,874 5,669 1,468 10,011
Luna 1,123 2,278 1,660 5,061 175 115 25 315 4,062 3,313 670 8,045 99 110 37 246 36 29 4 69 5,495 5,845 2,396 13,736
McKinley 1,367 2,623 508 4,498 124 149 19 292 1,507 1,738 292 3,537 15,797 12,855 1,377 30,029 80 144 17 241 18,875 17,509 2,213 38,597
Mora 161 313 119 593 2 4 0 6 769 1,055 335 2,159 12 17 4 33 1 6 1 8 945 1,395 459 2,799
Otero 5,593 9,597 2,921 18,111 796 783 108 1,687 4,886 4,715 865 10,466 1,200 907 117 2,224 355 170 16 541 12,830 16,172 4,027 33,029
Quay 717 1,463 738 2,918 20 32 12 64 747 910 239 1,896 21 43 10 74 21 27 24 72 1,526 2,475 1,023 5,024
Rio Arriba 571 1,876 506 2,953 97 102 9 208 5,682 7,992 1,540 15,214 1,475 1,689 168 3,332 48 89 11 148 7,873 11,748 2,234 21,855
Roosevelt 2,095 2,722 859 5,676 123 115 8 246 1,593 1,532 225 3,350 65 68 10 143 19 34 2 55 3,895 4,471 1,104 9,470
San Juan 7,783 15,089 4,123 26,995 301 317 34 652 3,914 4,864 677 9,455 11,710 11,995 1,790 25,495 141 221 21 383 23,849 32,486 6,645 62,980
San Miguel 688 2,022 472 3,182 97 104 10 211 4,252 5,838 1,110 11,200 155 209 33 397 46 87 10 143 5,238 8,260 1,635 15,133
Sandoval 10,044 16,089 4,052 30,185 668 802 110 1,580 8,624 8,778 1,198 18,600 5,213 4,303 629 10,145 517 397 47 961 25,066 30,369 6,036 61,471
Santa Fe 7,467 19,464 4,626 31,557 472 572 40 1,084 12,886 18,920 2,854 34,660 1,184 1,670 172 3,026 404 620 50 1,074 22,413 41,246 7,742 71,401
Sierra 1,009 1,993 1,604 4,606 23 16 8 47 910 860 293 2,063 50 90 19 159 1 11 5 17 1,993 2,970 1,929 6,892
Socorro 1,331 1,950 456 3,737 57 59 4 120 1,795 1,995 394 4,184 688 509 58 1,255 41 146 6 193 3,912 4,659 918 9,489
Taos 1,371 3,682 801 5,854 44 87 11 142 2,998 4,360 1,148 8,506 442 628 107 1,177 78 80 4 162 4,933 8,837 2,071 15,841
Torrance 1,754 2,603 447 4,804 94 334 6 434 1,611 1,776 213 3,600 177 163 14 354 39 22 2 63 3,675 4,898 682 9,255
Union 450 714 266 1,430 0 0 0 0 326 382 95 803 11 12 5 28 3 6 0 9 790 1,114 366 2,270
Valencia 4,629 7,894 1,798 14,321 280 503 40 823 9,482 9,986 1,283 20,751 817 889 110 1,816 154 172 15 341 15,362 19,444 3,246 38,052
Male Total 121,027 241,654 73,366 436,047 12,045 14,239 1,881 28,165 176,933 208,140 35,445 420,518 51,775 50,539 6,671 108,985 6,542 8,891 991 16,424 368,322 523,463 118,354 1,010,139
* 2007 population is reported here because 2007 was the mid-point year used as the denominator for the 2005-2009 rates calculated for this report
SOURCE: University of New Mexico Bureau of Business and Economic Research
New Mexico Substance Abuse Epidemiology Profile Page 109
Other All Race.EthnicitiesWhite Black Hispanic American Indian
Appendix 1: Male Population, New Mexico, 2007*
Race/Ethnicity

New Mexico Substance Abuse Epidemiology Profile Page 110

Sex County Name 0-24 25-64 65+ All Ages 0-24 25-64 65+ All Ages 0-24 25-64 65+ All Ages 0-24 25-64 65+ All Ages 0-24 25-64 65+ All Ages 0-24 25-64 65+ All Ages
Female Bernalillo 34,717 86,540 31,854 153,111 4,835 5,498 1,111 11,444 51,138 69,076 15,409 135,623 8,108 9,916 1,427 19,451 2,940 5,433 920 9,293 101,738 176,463 50,721 328,922
Catron 329 861 319 1,509 1 4 1 6 111 165 76 352 19 30 10 59 1 11 5 17 461 1,071 411 1,943
Chaves 4,273 8,060 3,932 16,265 397 385 99 881 6,594 6,632 1,105 14,331 302 273 68 643 165 171 31 367 11,731 15,521 5,235 32,487
Cibola 789 2,039 765 3,593 70 151 14 235 1,539 2,373 592 4,504 2,613 3,033 705 6,351 30 50 5 85 5,041 7,646 2,081 14,768
Colfax 773 1,992 907 3,672 14 16 2 32 1,251 1,521 529 3,301 68 90 13 171 3 22 3 28 2,109 3,641 1,454 7,204
Curry 3,954 6,670 2,626 13,250 955 922 143 2,020 3,347 3,516 504 7,367 219 307 27 553 252 424 40 716 8,727 11,839 3,340 23,906
De Baca 189 327 246 762 0 4 0 4 132 148 94 374 5 10 2 17 0 4 0 4 326 493 342 1,161
Dona Ana 9,214 17,219 6,948 33,381 1,167 1,203 196 2,566 27,733 30,662 6,005 64,400 972 1,197 233 2,402 518 744 113 1,375 39,604 51,025 13,495 104,124
Eddy 4,293 7,748 3,184 15,225 238 253 79 570 4,640 4,800 965 10,405 177 254 58 489 84 157 20 261 9,432 13,212 4,306 26,950
Grant 1,922 4,266 1,803 7,991 97 82 6 185 2,979 3,730 1,122 7,831 149 179 41 369 38 70 8 116 5,185 8,327 2,980 16,492
Guadalupe 78 175 66 319 1 5 0 6 603 834 289 1,726 1 10 2 13 7 12 1 20 690 1,036 358 2,084
Harding 31 118 78 227 1 0 0 1 41 80 69 190 0 5 0 5 0 0 0 0 73 203 147 423
Hidalgo 354 694 274 1,322 10 4 1 15 695 728 205 1,628 7 13 4 24 0 15 2 17 1,066 1,454 486 3,006
Lea 4,268 7,386 3,281 14,935 682 697 192 1,571 5,866 5,565 669 12,100 141 236 61 438 96 113 16 225 11,053 13,997 4,219 29,269
Lincoln 1,794 4,447 1,884 8,125 40 74 8 122 1,156 1,432 324 2,912 152 183 26 361 36 39 2 77 3,178 6,175 2,244 11,597
Los Alamos 1,996 4,452 1,437 7,885 35 28 4 67 424 692 212 1,328 62 80 5 147 177 370 20 567 2,694 5,622 1,678 9,994
Luna 1,230 2,407 1,684 5,321 137 126 30 293 4,155 3,740 650 8,545 72 110 25 207 22 56 9 87 5,616 6,439 2,398 14,453
McKinley 1,112 2,851 620 4,583 93 152 23 268 1,347 1,720 387 3,454 15,963 14,672 2,090 32,725 56 186 36 278 18,571 19,581 3,156 41,308
Mora 110 328 112 550 1 8 0 9 725 1,043 359 2,127 11 17 5 33 0 1 1 2 847 1,397 477 2,721
Otero 5,290 9,317 3,369 17,976 729 699 120 1,548 4,820 5,213 981 11,014 1,205 1,180 140 2,525 252 487 75 814 12,296 16,896 4,685 33,877
Quay 685 1,567 881 3,133 27 21 10 58 666 944 293 1,903 22 51 5 78 20 50 7 77 1,420 2,633 1,196 5,249
Rio Arriba 572 1,886 536 2,994 57 61 5 123 5,485 7,692 1,906 15,083 1,643 1,813 304 3,760 17 84 3 104 7,774 11,536 2,754 22,064
Roosevelt 2,034 2,779 1,097 5,910 104 103 6 213 1,500 1,514 202 3,216 86 82 10 178 40 58 9 107 3,764 4,536 1,324 9,624
San Juan 7,601 15,543 4,895 28,039 268 277 40 585 4,048 4,534 708 9,290 12,127 13,124 2,304 27,555 136 274 25 435 24,180 33,752 7,972 65,904
San Miguel 704 1,989 532 3,225 85 92 3 180 4,041 6,340 1,553 11,934 155 224 36 415 47 88 11 146 5,032 8,733 2,135 15,900
Sandoval 8,836 16,606 4,980 30,422 703 694 137 1,534 8,477 8,910 1,421 18,808 4,892 4,548 897 10,337 460 591 71 1,122 23,368 31,349 7,506 62,223
Santa Fe 6,787 22,828 5,476 35,091 333 512 36 881 12,344 18,324 3,768 34,436 1,349 1,724 249 3,322 375 743 46 1,164 21,188 44,131 9,575 74,894
Sierra 961 2,202 1,587 4,750 15 15 4 34 819 852 256 1,927 45 99 12 156 0 21 6 27 1,840 3,189 1,865 6,894
Socorro 971 1,886 531 3,388 39 39 2 80 1,818 2,075 446 4,339 698 571 73 1,342 66 81 3 150 3,592 4,652 1,055 9,299
Taos 1,178 4,126 989 6,293 40 57 11 108 2,901 4,407 1,415 8,723 500 618 137 1,255 32 68 11 111 4,651 9,276 2,563 16,490
Torrance 1,740 2,826 498 5,064 67 26 4 97 1,418 1,438 219 3,075 150 138 10 298 15 41 5 61 3,390 4,469 736 8,595
Union 381 677 331 1,389 0 0 0 0 313 351 117 781 4 13 5 22 0 10 2 12 698 1,051 455 2,204
Valencia 4,369 8,314 2,251 14,934 343 303 50 696 8,542 9,528 1,615 19,685 959 910 115 1,984 214 207 35 456 14,427 19,262 4,066 37,755
Female Total 113,535 251,126 89,973 454,634 11,584 12,511 2,337 26,432 171,668 210,579 44,465 426,712 52,876 55,710 9,099 117,685 6,099 10,681 1,541 18,321 355,762 540,607 147,415 1,043,784
* 2007 population is reported here because 2007 was the mid-point year used as the denominator for the 2005-2009 rates calculated for this report
SOURCE: University of New Mexico Bureau of Business and Economic Research
New Mexico Substance Abuse Epidemiology Profile Page 111
Black Hispanic American Indian
Race/Ethnicity
Appendix 1: Female Population, New Mexico, 2007*
Other All Race.EthnicitiesWhite

New Mexico Substance Abuse Epidemiology Profile Page 112

Sex County Name 0-24 25-64 65+ All Ages 0-24 25-64 65+ All Ages 0-24 25-64 65+ All Ages 0-24 25-64 65+ All Ages 0-24 25-64 65+ All Ages 0-24 25-64 65+ All Ages
Both Bernalillo 71,821 171,326 56,921 300,068 9,762 11,453 1,983 23,198 102,801 136,371 26,779 265,951 16,060 18,776 2,443 37,279 5,952 10,057 1,518 17,527 206,396 347,983 89,644 644,023
Catron 718 1,686 638 3,042 1 4 4 9 248 339 153 740 33 59 16 108 1 15 7 23 1,001 2,103 818 3,922
Chaves 8,652 15,762 6,840 31,254 842 793 167 1,802 13,079 13,363 2,028 28,470 551 584 114 1,249 323 333 49 705 23,447 30,835 9,198 63,480
Cibola 1,706 4,038 1,528 7,272 107 277 39 423 3,233 4,700 1,141 9,074 5,083 5,634 1,200 11,917 49 90 10 149 10,178 14,739 3,918 28,835
Colfax 1,694 4,017 1,655 7,366 29 41 4 74 2,611 3,187 965 6,763 130 201 31 362 10 40 4 54 4,474 7,486 2,659 14,619
Curry 8,185 13,284 4,517 25,986 1,889 1,767 255 3,911 6,910 6,975 919 14,804 424 588 70 1,082 581 848 49 1,478 17,989 23,462 5,810 47,261
De Baca 386 645 431 1,462 0 5 0 5 281 322 173 776 8 21 2 31 1 4 0 5 676 997 606 2,279
Dona Ana 18,628 34,054 12,584 65,266 2,343 2,651 330 5,324 56,372 59,844 10,889 127,105 1,980 2,346 445 4,771 1,109 1,488 184 2,781 80,432 100,383 24,432 205,247
Eddy 8,678 15,031 5,599 29,308 510 531 139 1,180 9,342 9,613 1,797 20,752 365 520 113 998 152 253 33 438 19,047 25,948 7,681 52,676
Grant 4,015 8,185 3,404 15,604 167 185 11 363 5,992 7,038 2,012 15,042 287 370 68 725 70 107 14 191 10,531 15,885 5,509 31,925
Guadalupe 179 548 134 861 13 71 0 84 1,305 1,956 531 3,792 6 50 3 59 10 26 1 37 1,513 2,651 669 4,833
Harding 61 234 138 433 1 1 0 2 76 164 133 373 1 8 0 9 0 0 0 0 139 407 271 817
Hidalgo 739 1,321 526 2,586 21 12 2 35 1,410 1,467 398 3,275 7 35 9 51 7 29 2 38 2,184 2,864 937 5,985
Lea 8,604 14,646 5,690 28,940 1,370 1,474 334 3,178 12,069 11,607 1,294 24,970 322 519 112 953 199 216 29 444 22,564 28,462 7,459 58,485
Lincoln 3,695 8,396 3,674 15,765 86 142 17 245 2,519 2,877 623 6,019 278 314 49 641 43 65 5 113 6,621 11,794 4,368 22,783
Los Alamos 4,087 9,103 2,735 15,925 74 64 8 146 890 1,257 348 2,495 119 173 18 310 398 694 37 1,129 5,568 11,291 3,146 20,005
Luna 2,353 4,685 3,344 10,382 312 241 55 608 8,217 7,053 1,320 16,590 171 220 62 453 58 85 13 156 11,111 12,284 4,794 28,189
McKinley 2,479 5,474 1,128 9,081 217 301 42 560 2,854 3,458 679 6,991 31,760 27,527 3,467 62,754 136 330 53 519 37,446 37,090 5,369 79,905
Mora 271 641 231 1,143 3 12 0 15 1,494 2,098 694 4,286 23 34 9 66 1 7 2 10 1,792 2,792 936 5,520
Otero 10,883 18,914 6,290 36,087 1,525 1,482 228 3,235 9,706 9,928 1,846 21,480 2,405 2,087 257 4,749 607 657 91 1,355 25,126 33,068 8,712 66,906
Quay 1,402 3,030 1,619 6,051 47 53 22 122 1,413 1,854 532 3,799 43 94 15 152 41 77 31 149 2,946 5,108 2,219 10,273
Rio Arriba 1,143 3,762 1,042 5,947 154 163 14 331 11,167 15,684 3,446 30,297 3,118 3,502 472 7,092 65 173 14 252 15,647 23,284 4,988 43,919
Roosevelt 4,129 5,501 1,956 11,586 227 218 14 459 3,093 3,046 427 6,566 151 150 20 321 59 92 11 162 7,659 9,007 2,428 19,094
San Juan 15,384 30,632 9,018 55,034 569 594 74 1,237 7,962 9,398 1,385 18,745 23,837 25,119 4,094 53,050 277 495 46 818 48,029 66,238 14,617 128,884
San Miguel 1,392 4,011 1,004 6,407 182 196 13 391 8,293 12,178 2,663 23,134 310 433 69 812 93 175 21 289 10,270 16,993 3,770 31,033
Sandoval 18,880 32,695 9,032 60,607 1,371 1,496 247 3,114 17,101 17,688 2,619 37,408 10,105 8,851 1,526 20,482 977 988 118 2,083 48,434 61,718 13,542 123,694
Santa Fe 14,254 42,292 10,102 66,648 805 1,084 76 1,965 25,230 37,244 6,622 69,096 2,533 3,394 421 6,348 779 1,363 96 2,238 43,601 85,377 17,317 146,295
Sierra 1,970 4,195 3,191 9,356 38 31 12 81 1,729 1,712 549 3,990 95 189 31 315 1 32 11 44 3,833 6,159 3,794 13,786
Socorro 2,302 3,836 987 7,125 96 98 6 200 3,613 4,070 840 8,523 1,386 1,080 131 2,597 107 227 9 343 7,504 9,311 1,973 18,788
Taos 2,549 7,808 1,790 12,147 84 144 22 250 5,899 8,767 2,563 17,229 942 1,246 244 2,432 110 148 15 273 9,584 18,113 4,634 32,331
Torrance 3,494 5,429 945 9,868 161 360 10 531 3,029 3,214 432 6,675 327 301 24 652 54 63 7 124 7,065 9,367 1,418 17,850
Union 831 1,391 597 2,819 0 0 0 0 639 733 212 1,584 15 25 10 50 3 16 2 21 1,488 2,165 821 4,474
Valencia 8,998 16,208 4,049 29,255 623 806 90 1,519 18,024 19,514 2,898 40,436 1,776 1,799 225 3,800 368 379 50 797 29,789 38,706 7,312 75,807
Both Sexes 234,562 492,780 163,339 890,681 23,629 26,750 4,218 54,597 348,601 418,719 79,910 847,230 104,651 106,249 15,770 226,670 12,641 19,572 2,532 34,745 724,084 1,064,070 265,769 2,053,923
* 2007 population is reported here because 2007 was the mid-point year used as the denominator for the 2005-2009 rates calculated for this report
SOURCE: University of New Mexico Bureau of Business and Economic Research
New Mexico Substance Abuse Epidemiology Profile Page 113
Appendix 1: Total Population, New Mexico, 2007*
Race/Ethnicity
White Black Hispanic American Indian Other All Race.Ethnicities

New Mexico Substance Abuse Epidemiology Profile Page 114

Substance Abuse and Mental Health by Region, Age 12+, 2006-2008
National Survey on Drug Use and Health (NSDUH)
New Mexico Substance Abuse Epidemiology Profile Page 115
Appendix 2

New Mexico Substance Abuse Epidemiology Profile Page 116
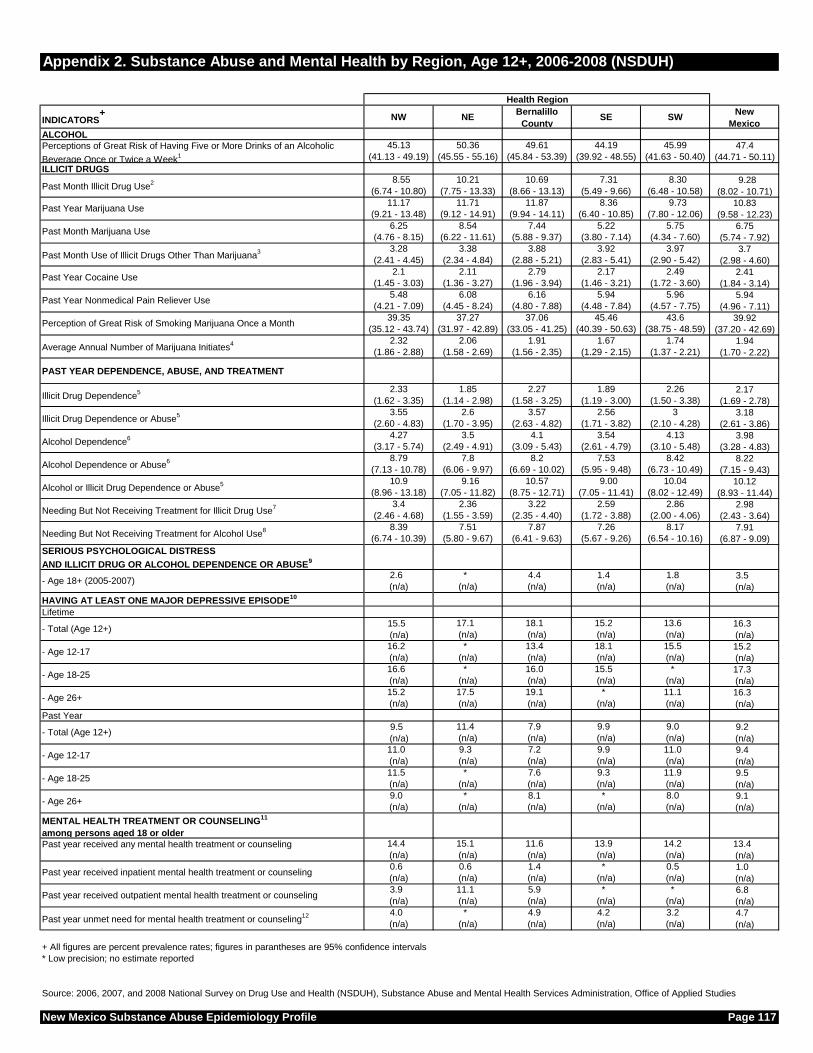
INDICATORS+ NW NE
Bernalillo
CountySE SW
New
Mexico
ALCOHOL45.13 50.36 49.61 44.19 45.99 47.4
(41.13 - 49.19) (45.55 - 55.16) (45.84 - 53.39) (39.92 - 48.55) (41.63 - 50.40) (44.71 - 50.11)
ILLICIT DRUGS 8.55 10.21 10.69 7.31 8.30 9.28
(6.74 - 10.80) (7.75 - 13.33) (8.66 - 13.13) (5.49 - 9.66) (6.48 - 10.58) (8.02 - 10.71)
11.17 11.71 11.87 8.36 9.73 10.83
(9.21 - 13.48) (9.12 - 14.91) (9.94 - 14.11) (6.40 - 10.85) (7.80 - 12.06) (9.58 - 12.23)
6.25 8.54 7.44 5.22 5.75 6.75
(4.76 - 8.15) (6.22 - 11.61) (5.88 - 9.37) (3.80 - 7.14) (4.34 - 7.60) (5.74 - 7.92)
3.28 3.38 3.88 3.92 3.97 3.7
(2.41 - 4.45) (2.34 - 4.84) (2.88 - 5.21) (2.83 - 5.41) (2.90 - 5.42) (2.98 - 4.60)
2.1 2.11 2.79 2.17 2.49 2.41
(1.45 - 3.03) (1.36 - 3.27) (1.96 - 3.94) (1.46 - 3.21) (1.72 - 3.60) (1.84 - 3.14)
5.48 6.08 6.16 5.94 5.96 5.94
(4.21 - 7.09) (4.45 - 8.24) (4.80 - 7.88) (4.48 - 7.84) (4.57 - 7.75) (4.96 - 7.11)
39.35 37.27 37.06 45.46 43.6 39.92
(35.12 - 43.74) (31.97 - 42.89) (33.05 - 41.25) (40.39 - 50.63) (38.75 - 48.59) (37.20 - 42.69)
2.32 2.06 1.91 1.67 1.74 1.94
(1.86 - 2.88) (1.58 - 2.69) (1.56 - 2.35) (1.29 - 2.15) (1.37 - 2.21) (1.70 - 2.22)
PAST YEAR DEPENDENCE, ABUSE, AND TREATMENT
2.33 1.85 2.27 1.89 2.26 2.17
(1.62 - 3.35) (1.14 - 2.98) (1.58 - 3.25) (1.19 - 3.00) (1.50 - 3.38) (1.69 - 2.78)
3.55 2.6 3.57 2.56 3 3.18
(2.60 - 4.83) (1.70 - 3.95) (2.63 - 4.82) (1.71 - 3.82) (2.10 - 4.28) (2.61 - 3.86)
4.27 3.5 4.1 3.54 4.13 3.98
(3.17 - 5.74) (2.49 - 4.91) (3.09 - 5.43) (2.61 - 4.79) (3.10 - 5.48) (3.28 - 4.83)
8.79 7.8 8.2 7.53 8.42 8.22
(7.13 - 10.78) (6.06 - 9.97) (6.69 - 10.02) (5.95 - 9.48) (6.73 - 10.49) (7.15 - 9.43)
10.9 9.16 10.57 9.00 10.04 10.12
(8.96 - 13.18) (7.05 - 11.82) (8.75 - 12.71) (7.05 - 11.41) (8.02 - 12.49) (8.93 - 11.44)
3.4 2.36 3.22 2.59 2.86 2.98
(2.46 - 4.68) (1.55 - 3.59) (2.35 - 4.40) (1.72 - 3.88) (2.00 - 4.06) (2.43 - 3.64)
8.39 7.51 7.87 7.26 8.17 7.91
(6.74 - 10.39) (5.80 - 9.67) (6.41 - 9.63) (5.67 - 9.26) (6.54 - 10.16) (6.87 - 9.09)
SERIOUS PSYCHOLOGICAL DISTRESS
AND ILLICIT DRUG OR ALCOHOL DEPENDENCE OR ABUSE9
2.6 * 4.4 1.4 1.8 3.5
(n/a) (n/a) (n/a) (n/a) (n/a) (n/a)
HAVING AT LEAST ONE MAJOR DEPRESSIVE EPISODE10
Lifetime
15.5 17.1 18.1 15.2 13.6 16.3
(n/a) (n/a) (n/a) (n/a) (n/a) (n/a)
16.2 * 13.4 18.1 15.5 15.2
(n/a) (n/a) (n/a) (n/a) (n/a) (n/a)
16.6 * 16.0 15.5 * 17.3
(n/a) (n/a) (n/a) (n/a) (n/a) (n/a)
15.2 17.5 19.1 * 11.1 16.3
(n/a) (n/a) (n/a) (n/a) (n/a) (n/a)
Past Year
9.5 11.4 7.9 9.9 9.0 9.2
(n/a) (n/a) (n/a) (n/a) (n/a) (n/a)
11.0 9.3 7.2 9.9 11.0 9.4
(n/a) (n/a) (n/a) (n/a) (n/a) (n/a)
11.5 * 7.6 9.3 11.9 9.5
(n/a) (n/a) (n/a) (n/a) (n/a) (n/a)
9.0 * 8.1 * 8.0 9.1
(n/a) (n/a) (n/a) (n/a) (n/a) (n/a)
MENTAL HEALTH TREATMENT OR COUNSELING11
among persons aged 18 or older14.4 15.1 11.6 13.9 14.2 13.4
(n/a) (n/a) (n/a) (n/a) (n/a) (n/a)
0.6 0.6 1.4 * 0.5 1.0
(n/a) (n/a) (n/a) (n/a) (n/a) (n/a)
3.9 11.1 5.9 * * 6.8
(n/a) (n/a) (n/a) (n/a) (n/a) (n/a)
4.0 * 4.9 4.2 3.2 4.7
(n/a) (n/a) (n/a) (n/a) (n/a) (n/a)
+ All figures are percent prevalence rates; figures in parantheses are 95% confidence intervals
* Low precision; no estimate reported
Source: 2006, 2007, and 2008 National Survey on Drug Use and Health (NSDUH), Substance Abuse and Mental Health Services Administration, Office of Applied Studies
New Mexico Substance Abuse Epidemiology Profile Page 117
Past year received any mental health treatment or counseling
Past year received inpatient mental health treatment or counseling
Past year received outpatient mental health treatment or counseling
Past year unmet need for mental health treatment or counseling12
Perceptions of Great Risk of Having Five or More Drinks of an Alcoholic
Beverage Once or Twice a Week1
Past Month Illicit Drug Use2
Past Year Marijuana Use
Past Month Marijuana Use
Past Month Use of Illicit Drugs Other Than Marijuana3
Past Year Cocaine Use
Past Year Nonmedical Pain Reliever Use
Perception of Great Risk of Smoking Marijuana Once a Month
Average Annual Number of Marijuana Initiates4
- Age 12-17
Alcohol or Illicit Drug Dependence or Abuse5
Needing But Not Receiving Treatment for Illicit Drug Use7
Needing But Not Receiving Treatment for Alcohol Use8
- Age 26+
- Age 18+ (2005-2007)
- Age 12-17
- Age 18-25
Health Region
Illicit Drug Dependence5
Illicit Drug Dependence or Abuse5
Alcohol Dependence6
Alcohol Dependence or Abuse6
Appendix 2. Substance Abuse and Mental Health by Region, Age 12+, 2006-2008 (NSDUH)
- Age 18-25
- Age 26+
- Total (Age 12+)
- Total (Age 12+)

New Mexico Substance Abuse Epidemiology Profile Page 118
New Mexico Substance Abuse Epidemiology Profile Page 119
Appendix 2. Substance Abuse and Mental Health by Region, Age 12+, 2006-2008 (NSDUH) (continued)
FOOTNOTES:
1. Binge Alcohol Use is defined as drinking five or more drinks on the same occasion (i.e., at the same time or within a couple of hours of each other) on at least 1 day in the past 30 days.
2. Illicit Drugs include marijuana/hashish, cocaine (including crack), heroin, hallucinogens, inhalants, or prescription-type psychotherapeutics used nonmedically.
3. Illicit Drugs Other Than Marijuana include cocaine (including crack), heroin, hallucinogens, inhalants, or prescription-type psychotherapeutics used nonmedically.
4. Average annual marijuana initiation rate = 100 * {[X1 ÷ (0.5 * X1 + X2)] ÷ 2}, where X1 is the number of marijuana initiates in the past 24 months and X2 is the number of persons who never used marijuana.
5. Dependence or abuse is based on definitions found in the 4th edition of the Diagnostic and Statistical Manual of Mental Disorders (DSM-IV). Illicit Drugs include marijuana/hashish, cocaine (including crack), heroin, hallucinogens, inhalants, or prescription-type psychotherapeutics used nonmedically.
6. Dependence or abuse is based on definitions found in the 4th edition of the Diagnostic and Statistical Manual of Mental Disorders (DSM-IV).
7. Needing But Not Receiving Treatment refers to respondents classified as needing treatment for illicit drugs, but not receiving treatment for an illicit drug problem at a specialty facility (i.e., drug and alcohol rehabilitation facilities [inpatient or outpatient], hospitals [inpatient only], or mental health centers). Illicit Drugs include marijuana/hashish, cocaine (including crack), heroin, hallucinogens, inhalants, or prescription-type psychotherapeutics used nonmedically.
8. Needing But Not Receiving Treatment refers to respondents classified as needing treatment for alcohol, but not receiving treatment for an alcohol problem at a specialty facility (i.e., drug and alcohol rehabilitation facilities [inpatient or outpatient], hospitals [inpatient only], or mental health centers).
9. Serious Psychological Distress (SPD) is defined as having a score of 13 or higher on the K6 scale. Illicit Drugs includemarijuana/hashish, cocaine (including crack), heroin, hallucinogens, inhalants, or prescription-type psychotherapeutics used nonmedically. Dependence or abuse is based on definitions found in the 4th edition of the Diagnostic and Statistical Manual of Mental Disorders (DSM-IV).
10. Major Depressive Episode (MDE) is defined as in the 4th edition of the Diagnostic and Statistical Manual of Mental Disorders (DSM-IV), which specifies a period of at least 2 weeks when a person experienced a depressed mood or loss of interest or pleasure in daily activities and had a majority of specified depression symptoms. Respondents with unknown data for the respective lifetime or past year MDE measure were excluded.
11. Mental Health Treatment/Counseling is defined as having received inpatient care or outpatient care or having used prescription medication for problems with emotions, nerves, or mental health. Respondents were not to include treatment for drug or alcohol use. Respondents with unknown treatment/counseling information were excluded. Estimates were based only on responses to items in the Adult Mental Health Service Utilization module.
12. Unmet Need for Mental Health Treatment/Counseling is defined as a perceived need for treatment that was not received. Respondents with unknown unmet need information were excluded.