the magnetic field at milliarcsecond resolution around iras 20126+4104
TRANSCRIPT
Astronomy & Astrophysicsmanuscript no. Surcis˙2013 c© ESO 2013March 18, 2013
EVN observations of 6.7 GHz methanol maser polarization inmassive star-forming regions II. First statistical results.
G. Surcis1, W.H.T. Vlemmings2, H.J. van Langevelde1,3, B. Hutawarakorn Kramer4,5, and L.H. Quiroga-Nunez6
1 Joint Institute for VLBI in Europe, Postbus 2, 7990 AA Dwingeloo, The Netherlands e-mail:[email protected] Chalmers University of Technology, Onsala Space Observatory, SE-439 92 Onsala, Sweden3 Sterrewacht Leiden, Leiden University, Postbus 9513, 2300RA Leiden, The Netherlands4 Max-Planck Institut fur Radioastronomie, Auf dem Hugel 69, 53121 Bonn, Germany5 National Astronomical Research Institute of Thailand, Ministry of Science and Technology, Rama VI Rd., Bangkok 10400,Thailand6 Planetario de Bogota, IDARTES, Calle 26 B No.5 - 93, Bogota, Colombia
Received ; accepted
ABSTRACT
Context. Magnetic fields have been included in theoretical simulations of high-mass star formation only recently. The simulationsshow that magnetic fields play an important role in the formation and dynamics of molecular outflows. Masers, in particular 6.7-GHzCH3OH masers, are the best probes of the magnetic field morphologies around massive protostars at the smallest scales of 10-100 AU.Aims. Providing new observational measurements of the morphology of magnetic fields around massive protostars by using 6.7-GHzCH3OH maser emission is of high importance in order to test and/or improve the numerical simulations of massive star formation.Methods. This second paper focuses on 4 massive protostars: IRAS 06058+2138-NIRS 1, IRAS 22272+6358A, S255-IR, and S231.From all these sources molecular outflows were detected in the past. Seven of the European VLBI Network antennas were usedtomeasure the linear polarization and Zeeman-splitting of the 6.7-GHz CH3OH masers in the star-forming regions in this Second EVNGroup.Results. We detected a total of 128 CH3OH masers. Fractional linear polarization (0.8 % – 11.3 %) was detected towards 24CH3OH masers. The linear polarization vectors are well-ordered in all the massive protostars. We measured significant Zeeman-splitting in IRAS 06058+2138-NIRS 1 (∆VZ= 3.8± 0.6 m s−1) and S255-IR (∆VZ= 3.2± 0.7 m s−1).Conclusions. By considering the 20 massive protostars towards which the morphology of magnetic fields was determined by observ-ing 6.7-GHz CH3OH masers in both hemispheres, we found no evident relation between the linear distributions of CH3OH masersand the outflows or the linear polarization vectors, but we instead determined that the magnetic fields (on scale 10-100 AU) are pref-erentially oriented along the outflows. Moreover, we empirically found that the flux density of unsaturated CH3OH masers growsexponentially with the maser-amplification path and that their linear polarization fraction isPl < 4.5%.
Key words. Stars: formation - masers: methanol - polarization - magnetic fields - ISM: individual: IRAS 06058+2138,IRAS 22272+6358A, S255, S231
1. Introduction
Despite the likely importance of magnetic fields in the formationof low-mass stars, observations around massive protostarsarestill only few (e.g., Crutcher 2005, Vlemmings et al. 2006, Girartet al. 2009) and theoretical simulations of massive star formationhave included them only recently (e.g., Banerjee & Pudritz 2007,Peters et al. 2011, Seifried et al. 2012a). Since massive stars arefully radiative, they are, with few exceptions (e.g., Donati et al.2006, Alecian et al. 2012), not expected to have significant mag-netic fields. Consequently, it has been thought that the magneticfields do not have any role in their formation. However, the de-tection of molecular outflows in massive star-forming regionsand their necessary inclusion in the main models (e.g., McKee& Tan 2003, Bonnell et al. 2004) makes the presence of mag-netic fields during the formation of high-mass stars unavoidable.
The formation of outflows has been observed in all simu-lations that include magnetic fields. Banerjee & Pudritz (2007)indicated magnetic fields coupled to the prestellar discs asthepossible driving power for early outflows that can be understoodin terms of a growing magnetic tower. These early outflows re-duce the limitations on the final mass of massive stars formedby simply considering the gravitational collapse. The outflows
seem to be relatively fast and well-collimated for low and in-termediate magnetic intensities (µ1= 30− 120), and slower andpoorly collimated for stronger fields (µ ∼ 5; Hennebelle et al.2011, Seifried et al. 2012a). Furthermore, Seifried et al. (2012a)showed that magneto-centrifugally driven outflows consists oftwo regimes. In the first regime close to the disc and the rota-tion axis, acceleration is dominated by the centrifugal force, i.e.gas gets flung outwards along the poloidal magnetic field lines,whereas in the second regime further away from the disc thetoroidal magnetic field starts to dominate the acceleration. Theyalso suggested that, for strong magnetic fields, the poorly col-limated outflows are typical for the very early stage of massivestar formation and subsequently the collimation will increase be-cause of the launching of a well-collimated, fast jet overtakingthe slowly expanding outflow. Peters et al. (2011) suggestedtwoeffects that tend to weaken and broaden the outflows. The firstone is due to the disruption of the velocity coherence due to
1 To evaluate the importance of the magnetic fields it is fundamentalto compare the mass to magnetic flux ratio (M/Φ) to the critical valueof this ratio, (M/Φ)crit ≈ 0.12/
√G, that isµ = (M/Φ)/(M/Φ)crit. The
stronger the magnetic field is, the lowerµ is. If µ < 1, the magnetic fieldcan prevent the collapse (Mouschovias & Spitzer 1976).
1
Surcis et al.: Magnetic field and outflows: first statistical results.
the gravitational fragmentation of the accretion flow. Second,the thermal pressure of ionized gas is larger than the magneticpressure and so it is dynamically dominant within the Hii re-gion. Hence, because the magnetically driven jets can surviveuntil gravitational fragmentation disrupts uniform rotation, theyproposed the ionization feedback as better driving source of theobserved uncollimated outflows rather than the magnetic field.
Besides contributing to the formation of outflows, the simu-lations show that magnetic fields prevent fragmentation, reduceangular momentum via magnetic braking, and, marginally, influ-ences the accretion rate (Banerjee & Pudritz 2007, Peters etal.2011, Hennebelle et al. 2011, Seifried et al. 2011). The magneticfields also play a significant role in the evolution of the circum-stellar disc. While for weak magnetic fields,µ > 10, Kepleriandiscs with sizes of a few 100 AU are easily formed, for strongmagnetic fields (µ < 10) the Keplerian discs are formed only if aturbulent velocity field is introduced in the simulations (Seifriedet al. 2011, 2012b). At last, magnetic fields determine also thesize of Hii regions that in the presence of strong magnetic fieldare generally smaller than without magnetic field (Peters etal.2011).
Therefore, providing new measurements of magnetic fieldsorientation and strength at milliarcsecond (mas) resolution closeto the massive protostars is fundamental to test and/or improvethe numerical simulations of massive star formation. Over thelast years, the great importance of using masers as probes ofmagnetic fields on the smallest scales (10-100 AU) has beenlargely proven (e.g., Vlemmings et al. 2006, 2010, Surcis etal.2011a, 2011b, 2012). In particular, the 6.7-GHz CH3OH masers,which are the most abundant maser species in massive star-forming regions, are playing a crucial role in determining themagnetic field morphology (e.g., Surcis et al. 2009, 2011b,2012). Magnetic fields have mainly been detected along out-flows and in few cases on surfaces of disc/tori (Vlemmingset al. 2010; Surcis et al. 2009, 2011b, 2012). Moreover, 6.7-GHz CH3OH masers are also ideal for measuring the Zeeman-splitting even though the exact proportionality between the mea-sured splitting and the magnetic field strength is still uncertain(Vlemmings et al. 2011). Therefore, enlarging the number ofmassive protostars towards which observations in full polariza-tion of 6.7-GHz CH3OH maser are made is of great importance.Here we show the results of our Second EVN Group composedof 4 massive star-forming regions, which are described in detailsin Sect. 2. The results, which are presented in Sect. 5, are dis-cussed in Sect. 6, here we statistically analyze the sample com-posed of all the massive protostars towards which the morphol-ogy of magnetic fields was determined by observing the 6.7-GHzCH3OH masers.
2. The Second EVN Group
We selected a second group of massive star-forming regionsamong the northern hemisphere sources observed with theEffelsberg 100-m telescope (Vlemmings 2008, Vlemmings etal. 2011). Here, we present four of them while the results ofIRAS20126+4104 will be discussed in a subsequent paper alongwith the results from 22-GHz H2O maser polarization observa-tions. The sources were selected based on their peak flux densityto allow potential detection of Zeeman-splitting as well asthepresence of outflows.
2.1. IRAS 06058+2138-NIRS 1
IRAS 06058+2138 (better known as S252 or AFGL5180) is anear-infrared cluster at a parallax distance of 1.76± 0.11 kpc(Oh et al. 2010). Three massive clumps were identified in theregion by Saito et al. (2007). The most massive one namedMCS B coincides with the MM1 clump (M≈ 50 M⊙) de-tected at 1.2-mm by Minier et al. (2005). The massive protostarNIRS 1 (Tamura et al. 1991) is associated with MCS B and isalso the 6.7-GHz CH3OH maser site (Minier et al. 2000, Xu et al.2009). The CH3OH masers show a linear distribution of 120 maswith a roughly linear velocity gradient along it, although afewmasers following a different velocity distribution (Minier et al.2000). A CO-outflow (PAout = 130, Snell et al. 1988; Wu etal. 2010) is centered and perpendicular to the linear distribu-tion of the CH3OH masers (Wu et al. 2010). Wu et al. (2010)measured a velocity range for the blue-shifted and red-shiftedlobes of−10 km s−1< Vblue
IRAS06058 < −2 km s−1 and+8 km s−1<
V redIRAS06058 < +20 km s−1, respectively. A Zeeman-splitting of
the 6.7-GHz CH3OH masers of∆VZ = −0.49± 0.15 m s−1 wasmeasured by Vlemmings et al. (2011).
2.2. IRAS 22272+6358A
IRAS 22272+6358A is a Young Stellar Object (YSO) deeplyembedded in the bright-rimmed cloud L1206 (Sugitani et al.1991). L1206 is located in the Local Spur Arm at a parallaxdistance of 0.776+0.104
−0.083 kpc (Rygl et al. 2010). No radio con-tinuum emission at 2 cm and 6 cm has been detected towardsIRAS 22272+6358A (Wilking et al. 1989; McCutcheon et al.1991) indicating that an Hii region has not been formed yet.Considering also the low color temperatureT (60µm/100µm) ≈38 K measured by Casoli et al. (1986), IRAS 22272+6358Ais a massive protostar at a very young phase (14.2 M⊙ andVlsr ⋍ −11 km s−1; Beltran et al. 2006). Beltran et al. (2006)also observed a CO-outlow (PAout = 140) centered at the posi-tion of IRAS 22272+6358A with velocity ranges−19.5 km s−1<Vblue
IRAS22272 < −13.5 km s−1 and −8.5 km s−1< V redIRAS22272 <
−2.5 km s−1 of the blue-shifted and red-shifted lobes, respec-tively.
At mas resolution two 6.7-GHz CH3OH maser groups weredetected, which are separated by∼100 mas and associated withIRAS 22272+6358A. A third weak group of CH3OH maserswas also found northeast of the other two (Rygl et al. 2010).Vlemmings et al. (2011) measured a small Zeeman-splitting ofthe 6.7-GHz CH3OH masers of∆VZ = 0.53± 0.15 m s−1.
2.3. S255-IR
S255-IR is a famous star-forming region located between thetwo H ii regions S255 and S257 at a parallax distance of1.59+0.07
−0.06 kpc (Rygl et al. 2010). Minier et al. (2005) identi-fied, with SCUBA, three mm sources in a dusty filament elon-gated north-south: MM1, MM2, and MM3. MM2, which con-tains three ultra-compact Hii regions (UCHii), is associated witha near-infrared cluster (NIR) and appears to be the most evolvedof the three regions (Minier et al. 2005). Wang et al. (2011)detected three 1.3 mm continuum peaks towards MM2 and thestronger one named as SMA 1 coincides with the near-infraredsource NIRS 3 (Tamura et al. 1991), which drives an UCHii re-gion (Wang et al. 2011).
6.7-GHz CH3OH masers and 22-GHz H2O masers are de-tected towards SMA 1 (Goddi et al. 2007, Wang et al. 2011).
2
Surcis et al.: Magnetic field and outflows: first statistical results.
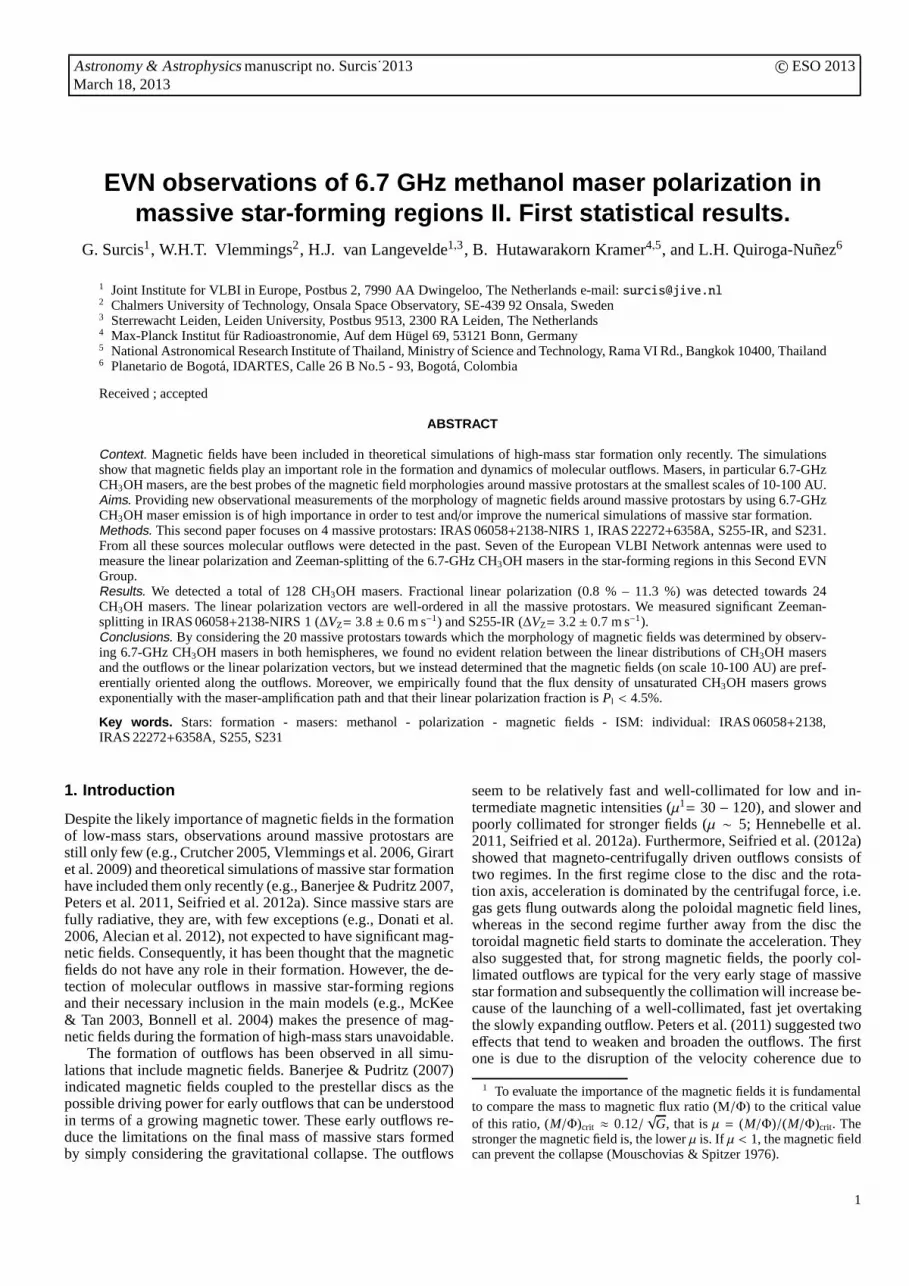
Fig. 1. Total intensity (I) and circular polarized (V) spectra for the two maser features IRAS06.22 and S255.30. The thick red lines are the best-fitmodels ofI and V emission obtained using the adapted full radiative transfer method (see Sect. 4). The maser features were centered to zerovelocity.
Because the H2O masers are associated with the inner partof the jet/outflow system (PAjet = 67, Howard et al. 1997;PAout = 75, Wang et al 2011), NIR 3 is thought to be the driv-ing source of this jet/outflow system and should not be olderthan 105 yr (Wang et al. 2011). The velocities of the blue-shiftedand red-shifted lobes of the outflow are−40 km s−1< Vblue
S255−IR <
0 km s−1 and+16 km s−1< V redS255−IR < +56 km s−1, respectively
(Wang et al. 2011). Wang et al. (2011) also detected a rotat-ing toroid perpendicular to the outflow that fragmented intotwosources SMA 1 and SMA 2.
A Zeeman-splitting of∆VZ = 0.47± 0.08 m s−1 for the 6.7-GHz CH3OH masers was measured by Vlemmings et al. (2011).
2.4. S231
IRAS05358+3543 is a cluster of embedded infrared sourcesassociated with a number of Hii regions (V IRAS05358
lsr =
−17.5 km s−1), among which S231, S233, and S235 (Israel &Felli 1978). Even if the 6.7-GHz CH3OH maser site is sur-rounded by the three Hii regions and it is not directly associatedwith any of them, the maser site is known in literature with thename S231 (e.g. Minier et al. 2000). The Hii regions are locatedat a kinematic distance of 1.8 kpc (Heyer et al. 1996).
The CH3OH masers show a linear distribution that traces apotential disk (PACH3OH ≈ 25, Minier et al. 2000), which is as-sociated with one of the millimeter continuum sources identifiedby Beuther et al. (2007), i.e. mm1a. Beuther et al. (2007) sug-gested that mm1a, which is also associated with an hypercom-pact Hii region and a mid-infrared source, forms a binary systemwith mm1b (with a projected separation of 1700 AU). Ginsburget al. (2009) observed mm1a with the VLA and they determineda projected separation between mm1a and the CH3OH masersite of∼ 400 AU suggesting that probably the binary system isformed by mm1a and the massive protostar associated with theCH3OH maser site. Furthermore, Ginsburg et al. (2009) asso-ciated one of the seven outflows detected towards this region,the collimated outflow 2 of which only the blue-shifted lobe isvisible (PAout = 133 ± 5), with the linear distribution of the
Table 1. Observational details.
(1) (2) (3)Source beam size rms
(mas×mas) (mJy beam−1)IRAS06058+2138-NIRS1 7.3× 3.4 3IRAS22272+6358A 6.7× 4.3 4S255-IR 8.4× 3.4 3S231 6.5× 3.4 3
CH3OH masers. Vlemmings et al. (2011) measured a Zeeman-splitting of 0.95± 0.11 m s−1 of the CH3OH masers.
3. Observations and data reduction
The sources were observed at 6.7-GHz in full polarization spec-tral mode with seven of the European VLBI Network2 anten-nas (Effelsberg, Jodrell, Onsala, Medicina, Torun, Westerbork,and Yebes-40m), for a total observation time of 26 h,on May 30 (IRAS 06058+2138), October 27 (S231 andIRAS 22272+6358A) and 30 (S255), 2011 (program codeES066). The bandwidth was 2 MHz, providing a velocity rangeof ∼ 100 km s−1. The data were correlated with the Joint Institutefor VLBI in Europe (JIVE) software correlator (SFXC) us-ing 2048 channels and generating all 4 polarization combina-tions (RR, LL, RL, LR) with a spectral resolution of∼1 kHz(∼0.05 km s−1).
The data were edited and calibrated using AIPS. The band-pass, the delay, the phase, and the polarization calibration wereperformed on the calibrators J0927+3902 (IRAS 06058+2138),J2202+4216 (IRAS 22272+6358A), and J0359+5057 (S255 andS231). Fringe-fitting and self-calibration were performedon thebrightest maser feature of each star-forming region. Then theI, Q, U, and V cubes were imaged (2 arcsec× 2 arcsec) us-ing the AIPS task IMAGR. TheQ and U cubes were com-
2 The European VLBI Network is a joint facility of European,Chinese, South African and other radio astronomy institutes funded bytheir national research councils.
3
Surcis et al.: Magnetic field and outflows: first statistical results.
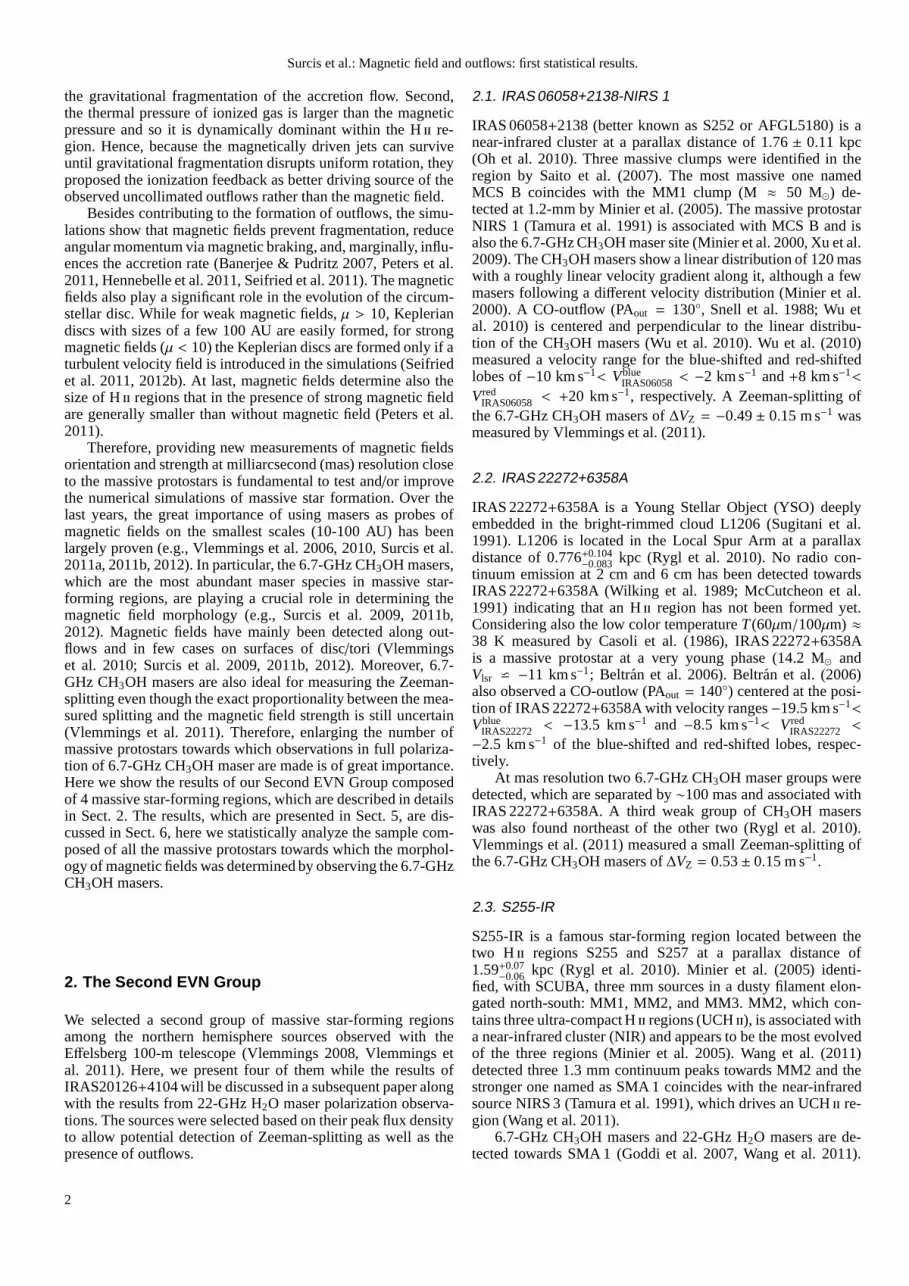
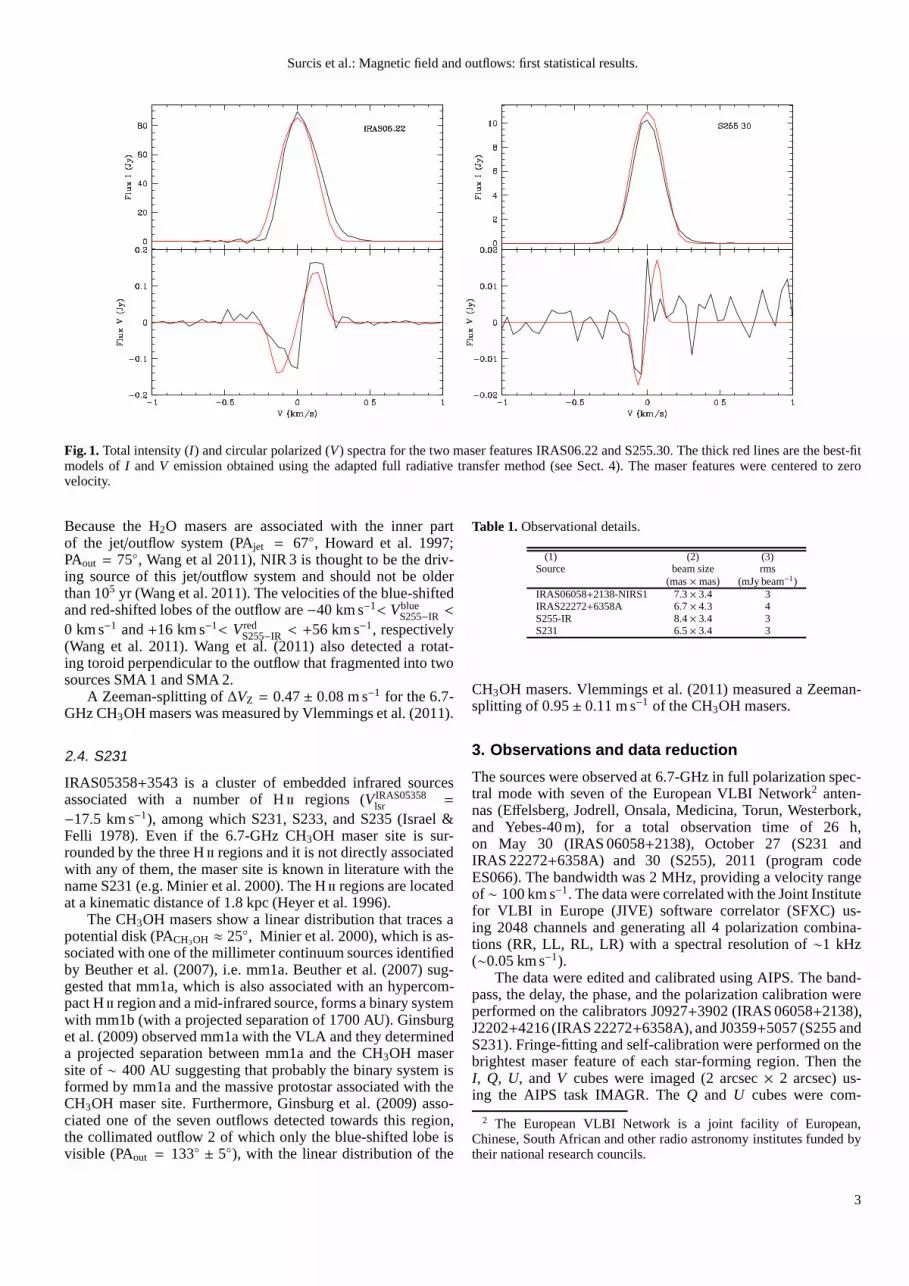
Fig. 2. Left panel: a view of the CH3OH maser features detected around IRAS06058+2138-NIRS 1. Right panel: a zoom-in view of group A. Thetriangles symbols are the identified CH3OH maser features scaled logarithmically according to their peak flux density (Table 2). The maser LSRradial velocity is indicated by color (the velocity of the protostar isVC18O
lsr = +3.9 km s−1, Saito et al. 2007). A 4 Jy beam−1 symbol is plottedfor illustration in both panels. The linear polarization vectors, scaled logarithmically according to polarization fraction Pl, are overplotted. Onthe right-bottom corner of both panels the error weighted orientation of the magnetic field (ΦB, see Sect.6.2.1) is also reported, the two dashedsegments indicates the uncertainty. The two arrows indicate the direction of the red- and blue-shifted lobe of the bipolar outflow (PAout = 130;Wu et al. 2010). The dashed line is the best linear fit of the CH3OH maser features of group A (PACH3OH = 78 ± 7).
bined to produce cubes of polarized intensity (Pl =√
Q2 + U2)and polarization angle (χ = 1/2 × atan(U/Q)). We calibratedthe linear polarization angles by comparing the linear polariza-tion angles of the polarization calibrators measured by us withthe angles obtained by calibrating the POLCAL observationsmade by NRAO3. IRAS 06058+2138 was observed a day af-ter a POLCAL observations run and the polarization angle ofJ0927+3902 was−85.2. The other three sources were observedbetween two POLCAL observations runs during which the lin-ear polarization angles were constant, the average values are−74 ± 4 and −31 ± 1 for J0359+5057 and J2202+4216,respectively. Hence, we were able to estimate the polarizationangles with a systemic error of no more than∼ 5. The for-mal errors onχ are due to thermal noise. This error is givenbyσχ = 0.5σP/P × 180/π (Wardle & Kronberg 1974), whereP andσP are the polarization intensity and corresponding rmserror respectively.
4. Analysis
The CH3OH maser features were identified by using the processdescribed in Surcis et al. (2011a). Considering the same rangeof ∆Vi used in Surcis et al. (2011b, 2012), we modeled the to-tal intensity and the linearly polarized spectra of every maserfeature for which we were able to detect linearly polarized emis-sion by using the adapted full radiative transfer method code for6.7-GHz CH3OH masers (Vlemmings et al. 2010, Surcis et al.2011b, 2012).
The outputs of the code are the emerging brightness tem-perature (Tb∆Ω) and the intrinsic thermal linewidth (∆Vi).ConsideringTb∆Ω and Pl we determined the angle betweenthe maser propagation direction and the magnetic field (θ). Ifθ > θcrit = 55, whereθcrit is the Van Vleck angle, the magnetic
3 http://www.aoc.nrao.edu/∼ smyers/calibration/
field appears to be perpendicular to the linear polarizationvec-tors, otherwise it is parallel (Goldreich et al. 1973). To better de-termine the orientation of the magnetic field w.r.t. the linear po-larization vectors we take into account the errors associated withθ, which we indicate here asε− andε+, i.e.θε
+
ε− in Tables 2–5. Wedefine the two limit values of the measuredθ asθ− = θ − ε− andθ+ = θ+ε+. Considering the critical value we have∆− = |θ−−55|and∆+ = |θ+ − 55|. If ∆+ > ∆− the magnetic field is most likelyperpendicular to the linear polarization vectors, if∆+ < ∆− themagnetic field assumed to be parallel. Of course ifθ− andθ+ areboth larger or smaller than 55 the magnetic field is perpendicu-lar or parallel to the linear polarization vectors, respectively.
Until now, because the spectral resolution of the past obser-vations was of about 0.1 km s−1, we were only able to mea-sure the Zeeman-splitting (∆VZ) from the cross-correlation be-tween RR and LL spectra of the CH3OH maser features (Surciset al. 2009, 2011b, 2012). Nowadays, although using the sameobserving setup, the JIVE SFXC enables us to correlate theEVN spectral data with a larger number of channels than previ-ously possible on the JIVE hardware correlator (Schilizzi et al.2001), providing a better spectral resolution (i.e.,∼ 0.05 km s−1).Because of this higher spectral resolution we can now deter-mine the∆VZ by using the adapted full radiative transfer methodcode for 6.7-GHz CH3OH maser like it was successfully donefor H2O masers by Surcis et al. (2011a). The best values forTb∆Ω and∆Vi are included in the code to produce theI andVmodels that were used for fitting the total intensity and circularpolarized spectra of the CH3OH masers (Fig. 1).
5. Results
In Tables 2–5 (see online material) we list all the 128CH3OH maser features detected towards the 4 massive star-forming regions observed with the EVN. The description of the
4
Surcis et al.: Magnetic field and outflows: first statistical results.
maser distribution and the polarization results are reported foreach source separately in Sects. 5.1–5.4.
5.1. IRAS 06058+2138-NIRS 1
We list all the identified 6.7-GHz CH3OH maser features, whichcan be divided into two groups (A and B), in Table 2, named asIRAS06.01–IRAS06.39. In the left panel of Fig. 2 we show allthe 6.7-GHz CH3OH maser features while in the right panel weshow only the maser features of group A. The three maser fea-tures of group B were not detected in previous observations byMinier et al. (2000). Group A show a linear distribution of about143 mas (∼250 AU) with a PACH3OH = 78 ± 7, that is almostperpendicular to the direction of the CO-outflow (PAout = 130,Wu et al. 2010). Although the velocity range of group A is simi-lar to that reported by Minier et al. (2000), we do not see a clearlinear velocity gradient, indicating that the masers are not likelytracing a Keplerian disc. The velocities of group A, which arered-shifted w.r.t. the velocity of NIRS 1 (VC18O
lsr = +3.9 km s−1,Saito et al. 2007), are consistent with the red-shifted lobeof theCO-outflow suggesting an association with it. Instead the ve-locities of group B are slightly blue-shifted w.r.t. the velocityof NIRS 1 but do not fall within the velocity range of the blue-shifted lobe. Therefore group B might be directly associated withNIRS 1.
We detected linear polarization in 11 CH3OH maser fea-tures (Pl = 1.3%− 9.2%), all of which exclusively belong togroup A. The full radiative transfer method code was able toproperly fit almost half of them. The results of the code are re-ported in column 10, 11, and 14 of Table 2. If the emergingbrightness temperature isTb∆Ω> 2.6 × 10⁹ K sr, the 6.7-GHzCH3OH masers can be considered partially saturated (Surcis etal. 2011b). Therefore three of the maser features are partiallysaturated, i.e. IRAS06.09, IRAS06.22, and IRAS06.30. FromSurcis et al. (2011b) we know that for these maser features∆Vi isoverestimated andTb∆Ω is underestimated. But we can be con-fident that the orientation of their linear polarization vectors isnot affected by their saturation state (Surcis et al. 2012), andconsequently they can be taken into account for determiningtheorientation of the magnetic field in the region. Although alltheθ angles (Col. 14) are greater thanθcrit = 55, ∆+ is smaller than∆− for IRAS06.30 indicating that in this case the magnetic fieldis more likely parallel to the linear polarization vector. We mea-sured a Zeeman-splitting of∆VZ = 3.8±0.6m s−1 for the bright-est maser feature IRAS06.22, its circular polarization fraction isPV = 0.3%.
5.2. IRAS 22272+6358A
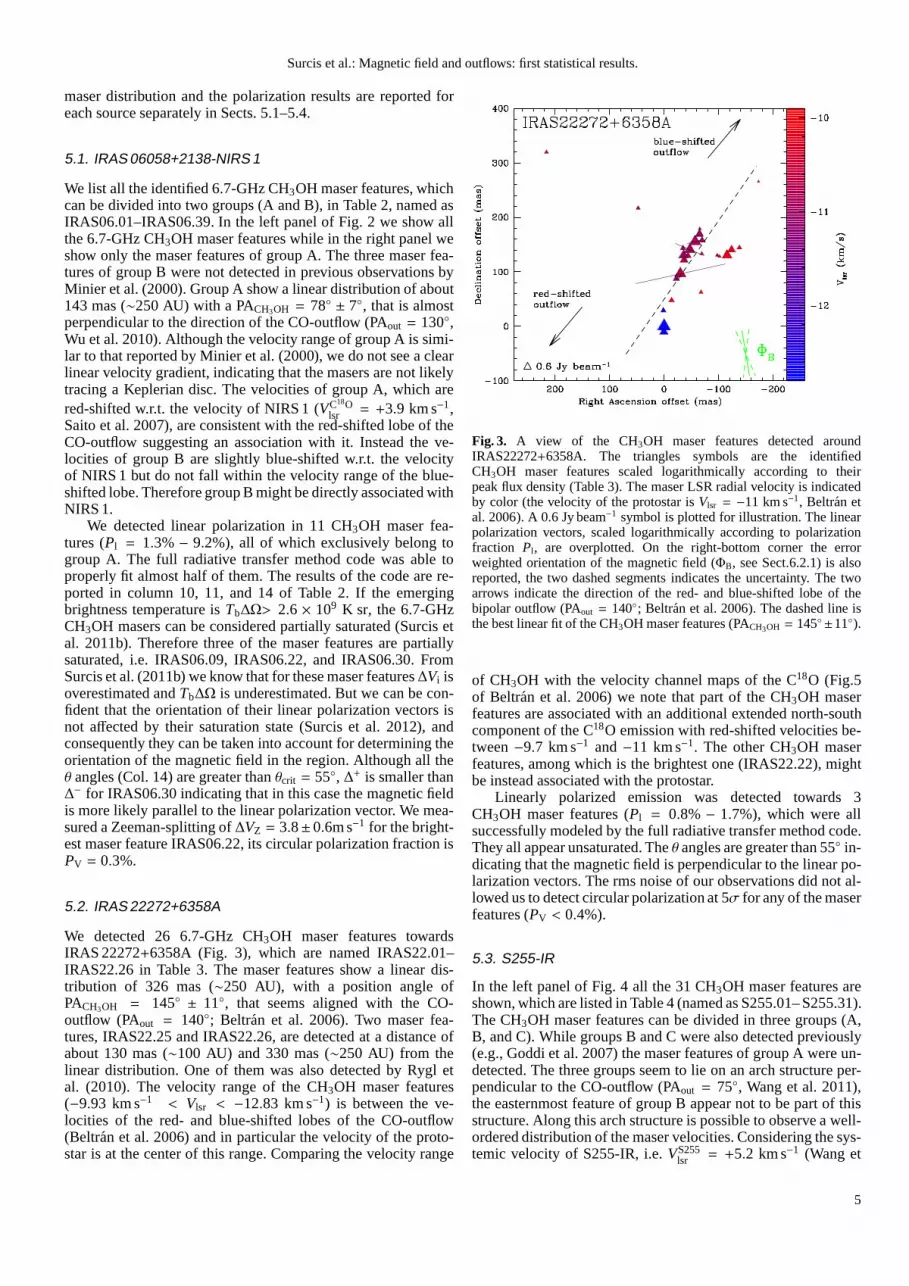
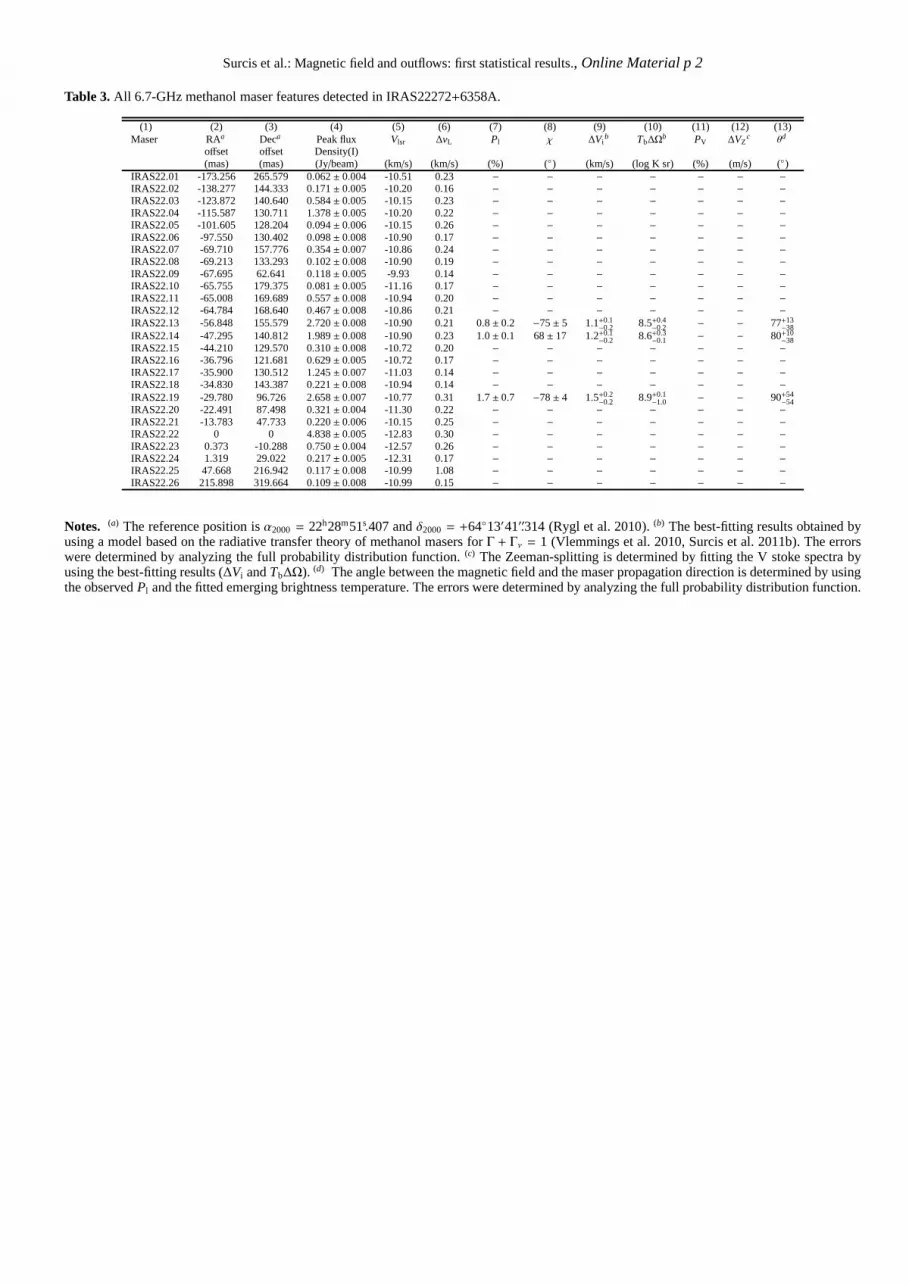
We detected 26 6.7-GHz CH3OH maser features towardsIRAS 22272+6358A (Fig. 3), which are named IRAS22.01–IRAS22.26 in Table 3. The maser features show a linear dis-tribution of 326 mas (∼250 AU), with a position angle ofPACH3OH = 145 ± 11, that seems aligned with the CO-outflow (PAout = 140; Beltran et al. 2006). Two maser fea-tures, IRAS22.25 and IRAS22.26, are detected at a distance ofabout 130 mas (∼100 AU) and 330 mas (∼250 AU) from thelinear distribution. One of them was also detected by Rygl etal. (2010). The velocity range of the CH3OH maser features(−9.93 km s−1 < Vlsr < −12.83 km s−1) is between the ve-locities of the red- and blue-shifted lobes of the CO-outflow(Beltran et al. 2006) and in particular the velocity of the proto-star is at the center of this range. Comparing the velocity range
Fig. 3. A view of the CH3OH maser features detected aroundIRAS22272+6358A. The triangles symbols are the identifiedCH3OH maser features scaled logarithmically according to theirpeak flux density (Table 3). The maser LSR radial velocity is indicatedby color (the velocity of the protostar isVlsr = −11 km s−1, Beltran etal. 2006). A 0.6 Jy beam−1 symbol is plotted for illustration. The linearpolarization vectors, scaled logarithmically according to polarizationfraction Pl, are overplotted. On the right-bottom corner the errorweighted orientation of the magnetic field (ΦB, see Sect.6.2.1) is alsoreported, the two dashed segments indicates the uncertainty. The twoarrows indicate the direction of the red- and blue-shifted lobe of thebipolar outflow (PAout = 140; Beltran et al. 2006). The dashed line isthe best linear fit of the CH3OH maser features (PACH3OH = 145±11).
of CH3OH with the velocity channel maps of the C18O (Fig.5of Beltran et al. 2006) we note that part of the CH3OH maserfeatures are associated with an additional extended north-southcomponent of the C18O emission with red-shifted velocities be-tween−9.7 km s−1 and−11 km s−1. The other CH3OH maserfeatures, among which is the brightest one (IRAS22.22), mightbe instead associated with the protostar.
Linearly polarized emission was detected towards 3CH3OH maser features (Pl = 0.8% − 1.7%), which were allsuccessfully modeled by the full radiative transfer methodcode.They all appear unsaturated. Theθ angles are greater than 55 in-dicating that the magnetic field is perpendicular to the linear po-larization vectors. The rms noise of our observations did not al-lowed us to detect circular polarization at 5σ for any of the maserfeatures (PV < 0.4%).
5.3. S255-IR
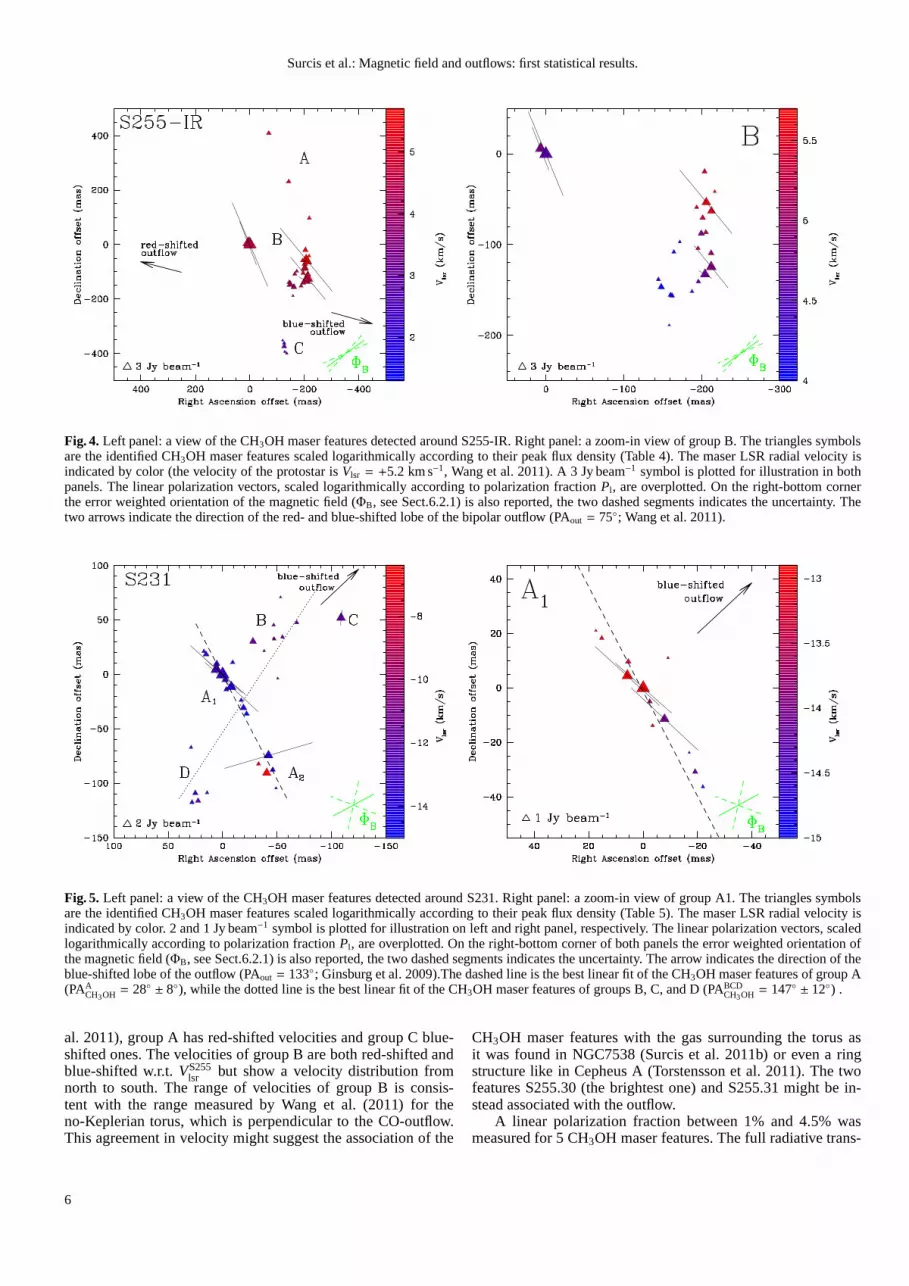
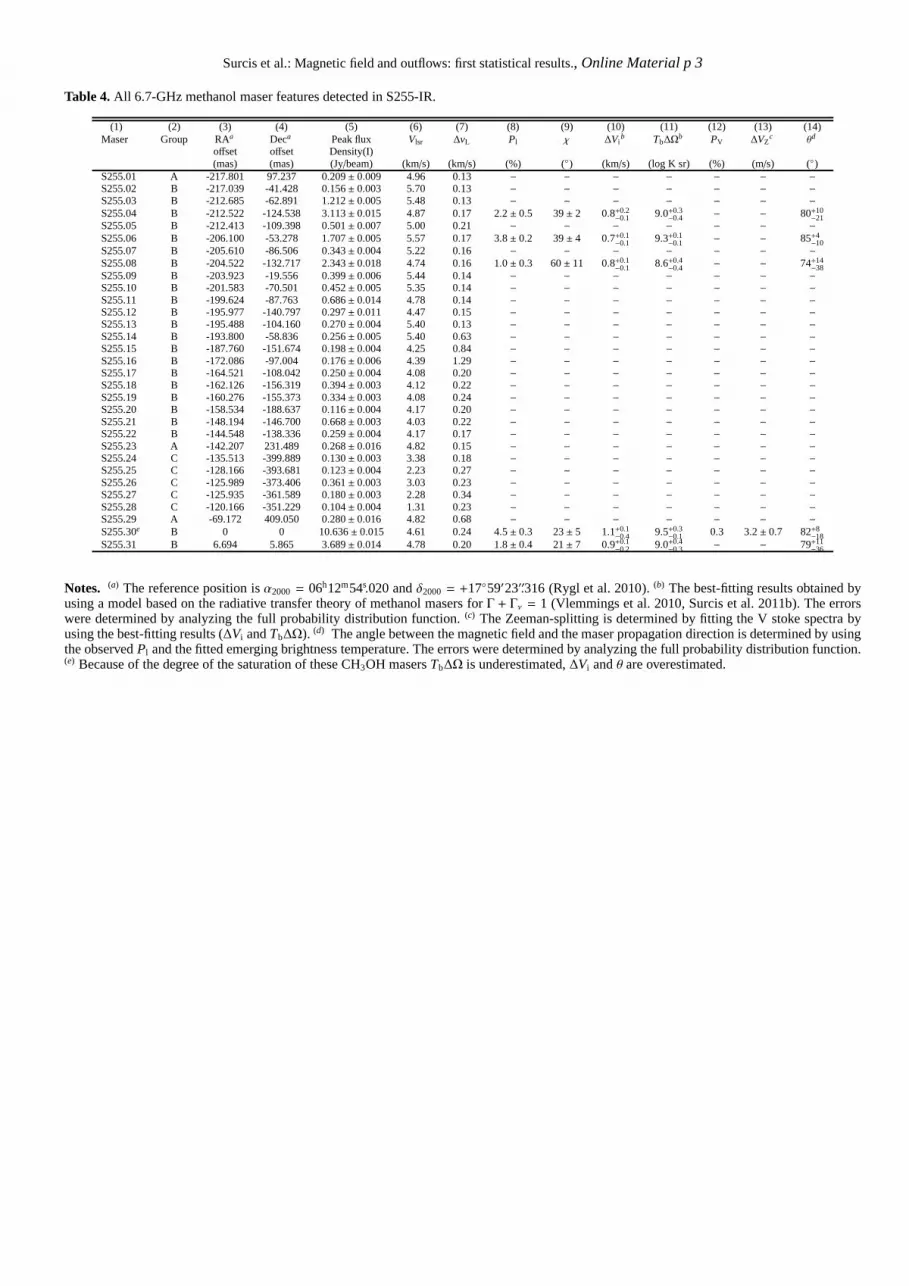
In the left panel of Fig. 4 all the 31 CH3OH maser features areshown, which are listed in Table 4 (named as S255.01– S255.31).The CH3OH maser features can be divided in three groups (A,B, and C). While groups B and C were also detected previously(e.g., Goddi et al. 2007) the maser features of group A were un-detected. The three groups seem to lie on an arch structure per-pendicular to the CO-outflow (PAout = 75, Wang et al. 2011),the easternmost feature of group B appear not to be part of thisstructure. Along this arch structure is possible to observea well-ordered distribution of the maser velocities. Consideringthe sys-temic velocity of S255-IR, i.e.VS255
lsr = +5.2 km s−1 (Wang et
5
Surcis et al.: Magnetic field and outflows: first statistical results.
Fig. 4. Left panel: a view of the CH3OH maser features detected around S255-IR. Right panel: a zoom-in view of group B. The triangles symbolsare the identified CH3OH maser features scaled logarithmically according to their peak flux density (Table 4). The maser LSR radial velocity isindicated by color (the velocity of the protostar isVlsr = +5.2 km s−1, Wang et al. 2011). A 3 Jy beam−1 symbol is plotted for illustration in bothpanels. The linear polarization vectors, scaled logarithmically according to polarization fractionPl, are overplotted. On the right-bottom cornerthe error weighted orientation of the magnetic field (ΦB, see Sect.6.2.1) is also reported, the two dashed segments indicates the uncertainty. Thetwo arrows indicate the direction of the red- and blue-shifted lobe of the bipolar outflow (PAout = 75; Wang et al. 2011).
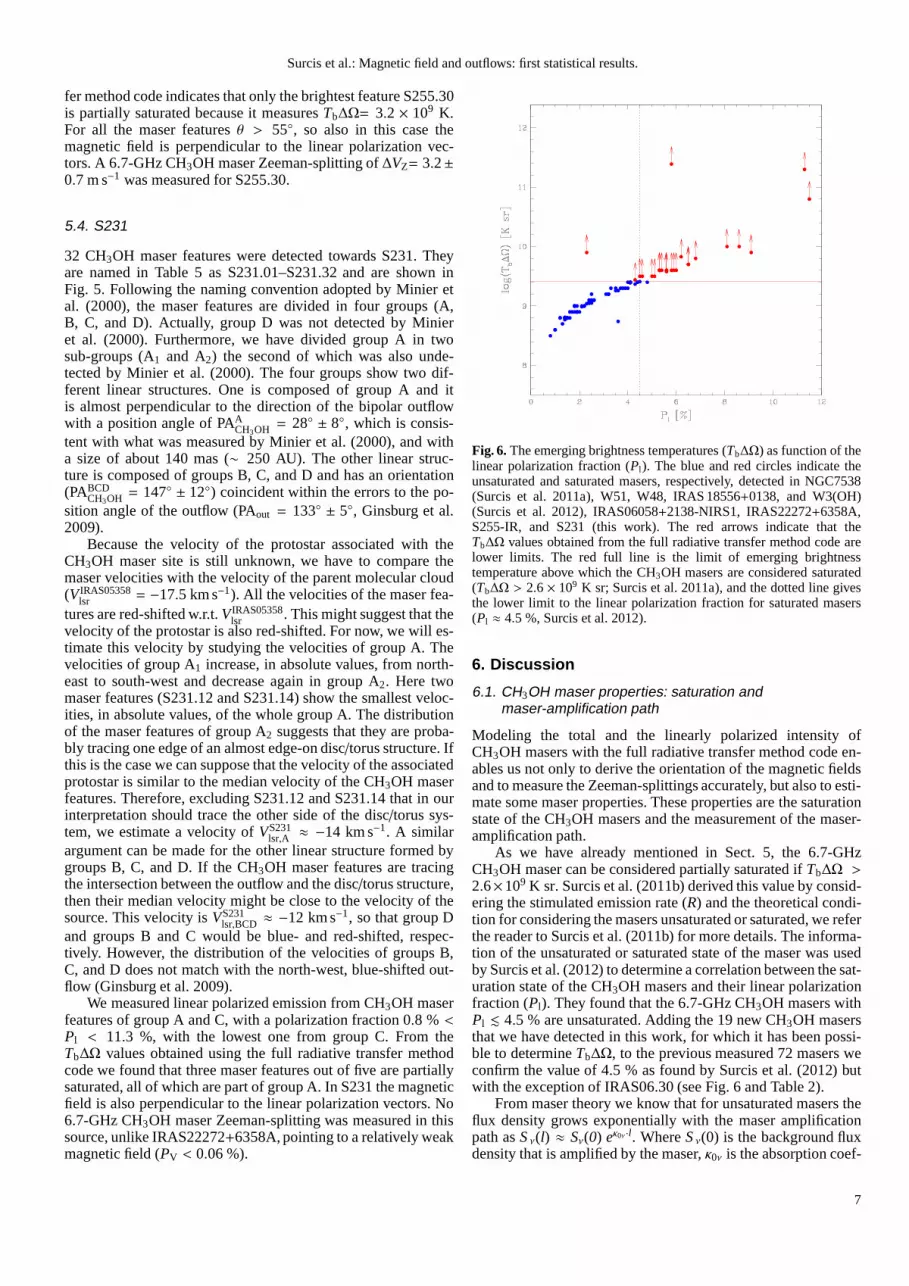
Fig. 5. Left panel: a view of the CH3OH maser features detected around S231. Right panel: a zoom-in view of group A1. The triangles symbolsare the identified CH3OH maser features scaled logarithmically according to their peak flux density (Table 5). The maser LSR radial velocity isindicated by color. 2 and 1 Jy beam−1 symbol is plotted for illustration on left and right panel, respectively. The linear polarization vectors, scaledlogarithmically according to polarization fractionPl, are overplotted. On the right-bottom corner of both panelsthe error weighted orientation ofthe magnetic field (ΦB, see Sect.6.2.1) is also reported, the two dashed segments indicates the uncertainty. The arrow indicates the direction of theblue-shifted lobe of the outflow (PAout = 133; Ginsburg et al. 2009).The dashed line is the best linear fit of the CH3OH maser features of group A(PAA
CH3OH = 28 ± 8), while the dotted line is the best linear fit of the CH3OH maser features of groups B, C, and D (PABCDCH3OH = 147 ± 12) .
al. 2011), group A has red-shifted velocities and group C blue-shifted ones. The velocities of group B are both red-shiftedandblue-shifted w.r.t.VS255
lsr but show a velocity distribution fromnorth to south. The range of velocities of group B is consis-tent with the range measured by Wang et al. (2011) for theno-Keplerian torus, which is perpendicular to the CO-outflow.This agreement in velocity might suggest the association ofthe
CH3OH maser features with the gas surrounding the torus asit was found in NGC7538 (Surcis et al. 2011b) or even a ringstructure like in Cepheus A (Torstensson et al. 2011). The twofeatures S255.30 (the brightest one) and S255.31 might be in-stead associated with the outflow.
A linear polarization fraction between 1% and 4.5% wasmeasured for 5 CH3OH maser features. The full radiative trans-
6
Surcis et al.: Magnetic field and outflows: first statistical results.
fer method code indicates that only the brightest feature S255.30is partially saturated because it measuresTb∆Ω= 3.2 × 10⁹ K.For all the maser featuresθ > 55, so also in this case themagnetic field is perpendicular to the linear polarization vec-tors. A 6.7-GHz CH3OH maser Zeeman-splitting of∆VZ= 3.2±0.7 m s−1 was measured for S255.30.
5.4. S231
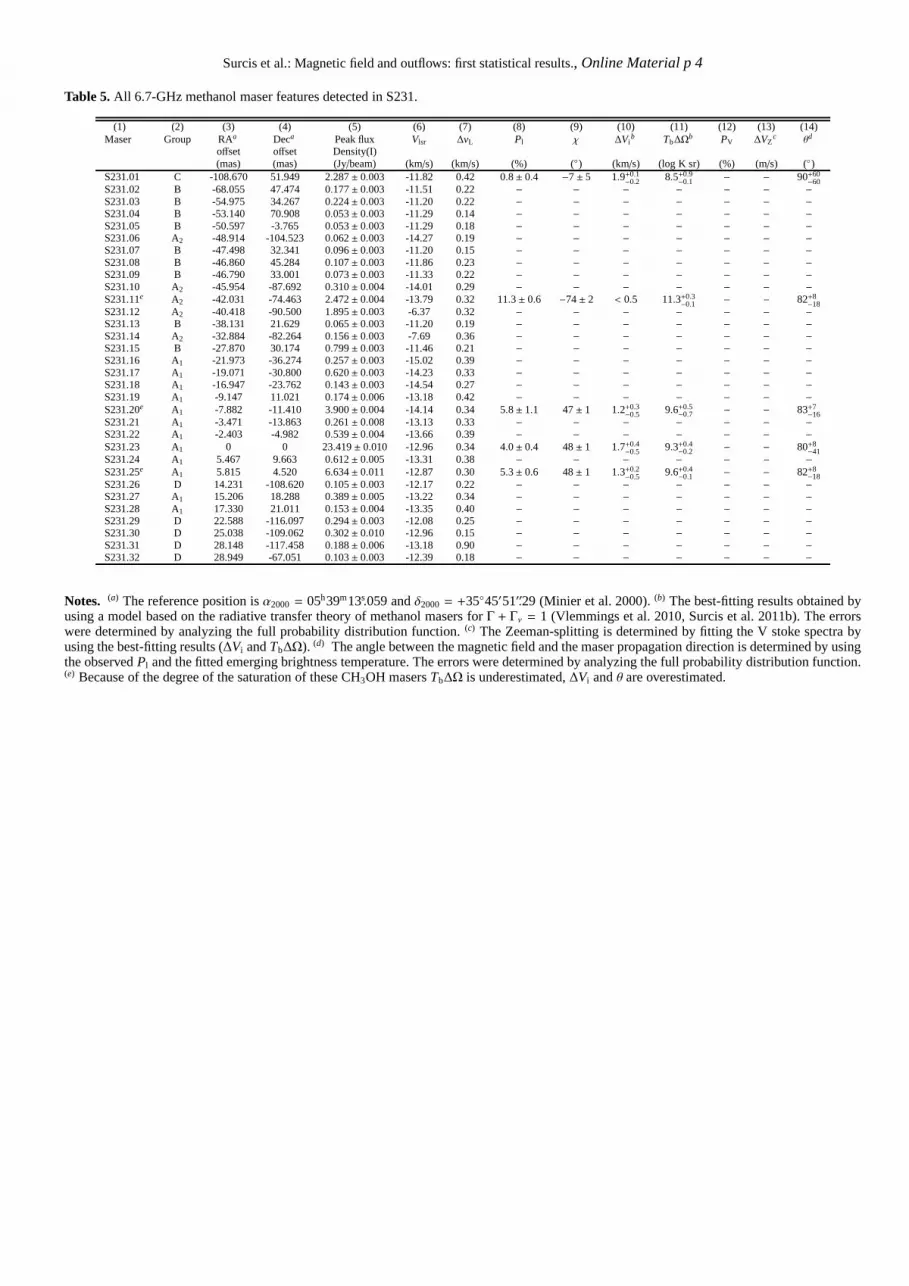
32 CH3OH maser features were detected towards S231. Theyare named in Table 5 as S231.01–S231.32 and are shown inFig. 5. Following the naming convention adopted by Minier etal. (2000), the maser features are divided in four groups (A,B, C, and D). Actually, group D was not detected by Minieret al. (2000). Furthermore, we have divided group A in twosub-groups (A1 and A2) the second of which was also unde-tected by Minier et al. (2000). The four groups show two dif-ferent linear structures. One is composed of group A and itis almost perpendicular to the direction of the bipolar outflowwith a position angle of PAACH3OH = 28 ± 8, which is consis-tent with what was measured by Minier et al. (2000), and witha size of about 140 mas (∼ 250 AU). The other linear struc-ture is composed of groups B, C, and D and has an orientation(PABCD
CH3OH = 147 ± 12) coincident within the errors to the po-sition angle of the outflow (PAout = 133 ± 5, Ginsburg et al.2009).
Because the velocity of the protostar associated with theCH3OH maser site is still unknown, we have to compare themaser velocities with the velocity of the parent molecular cloud(V IRAS05358
lsr = −17.5 km s−1). All the velocities of the maser fea-tures are red-shifted w.r.t.V IRAS05358
lsr . This might suggest that thevelocity of the protostar is also red-shifted. For now, we will es-timate this velocity by studying the velocities of group A. Thevelocities of group A1 increase, in absolute values, from north-east to south-west and decrease again in group A2. Here twomaser features (S231.12 and S231.14) show the smallest veloc-ities, in absolute values, of the whole group A. The distributionof the maser features of group A2 suggests that they are proba-bly tracing one edge of an almost edge-on disc/torus structure. Ifthis is the case we can suppose that the velocity of the associatedprotostar is similar to the median velocity of the CH3OH maserfeatures. Therefore, excluding S231.12 and S231.14 that inourinterpretation should trace the other side of the disc/torus sys-tem, we estimate a velocity ofVS231
lsr,A ≈ −14 km s−1. A similarargument can be made for the other linear structure formed bygroups B, C, and D. If the CH3OH maser features are tracingthe intersection between the outflow and the disc/torus structure,then their median velocity might be close to the velocity of thesource. This velocity isVS231
lsr,BCD ≈ −12 km s−1, so that group Dand groups B and C would be blue- and red-shifted, respec-tively. However, the distribution of the velocities of groups B,C, and D does not match with the north-west, blue-shifted out-flow (Ginsburg et al. 2009).
We measured linear polarized emission from CH3OH maserfeatures of group A and C, with a polarization fraction 0.8 % <Pl < 11.3 %, with the lowest one from group C. From theTb∆Ω values obtained using the full radiative transfer methodcode we found that three maser features out of five are partiallysaturated, all of which are part of group A. In S231 the magneticfield is also perpendicular to the linear polarization vectors. No6.7-GHz CH3OH maser Zeeman-splitting was measured in thissource, unlike IRAS22272+6358A, pointing to a relatively weakmagnetic field (PV < 0.06 %).
Fig. 6. The emerging brightness temperatures (Tb∆Ω) as function of thelinear polarization fraction (Pl). The blue and red circles indicate theunsaturated and saturated masers, respectively, detectedin NGC7538(Surcis et al. 2011a), W51, W48, IRAS 18556+0138, and W3(OH)(Surcis et al. 2012), IRAS06058+2138-NIRS1, IRAS22272+6358A,S255-IR, and S231 (this work). The red arrows indicate that theTb∆Ω values obtained from the full radiative transfer method code arelower limits. The red full line is the limit of emerging brightnesstemperature above which the CH3OH masers are considered saturated(Tb∆Ω > 2.6 × 10⁹ K sr; Surcis et al. 2011a), and the dotted line givesthe lower limit to the linear polarization fraction for saturated masers(Pl ≈ 4.5 %, Surcis et al. 2012).
6. Discussion
6.1. CH3OH maser properties: saturation andmaser-amplification path
Modeling the total and the linearly polarized intensity ofCH3OH masers with the full radiative transfer method code en-ables us not only to derive the orientation of the magnetic fieldsand to measure the Zeeman-splittings accurately, but also to esti-mate some maser properties. These properties are the saturationstate of the CH3OH masers and the measurement of the maser-amplification path.
As we have already mentioned in Sect. 5, the 6.7-GHzCH3OH maser can be considered partially saturated ifTb∆Ω >2.6×10⁹ K sr. Surcis et al. (2011b) derived this value by consid-ering the stimulated emission rate (R) and the theoretical condi-tion for considering the masers unsaturated or saturated, we referthe reader to Surcis et al. (2011b) for more details. The informa-tion of the unsaturated or saturated state of the maser was usedby Surcis et al. (2012) to determine a correlation between the sat-uration state of the CH3OH masers and their linear polarizationfraction (Pl). They found that the 6.7-GHz CH3OH masers withPl . 4.5 % are unsaturated. Adding the 19 new CH3OH masersthat we have detected in this work, for which it has been possi-ble to determineTb∆Ω, to the previous measured 72 masers weconfirm the value of 4.5 % as found by Surcis et al. (2012) butwith the exception of IRAS06.30 (see Fig. 6 and Table 2).
From maser theory we know that for unsaturated masers theflux density grows exponentially with the maser amplificationpath asS ν(l) ≈ Sν(0) eκ0ν ·l. WhereS ν(0) is the background fluxdensity that is amplified by the maser,κ0ν is the absorption coef-
7
Surcis et al.: Magnetic field and outflows: first statistical results.
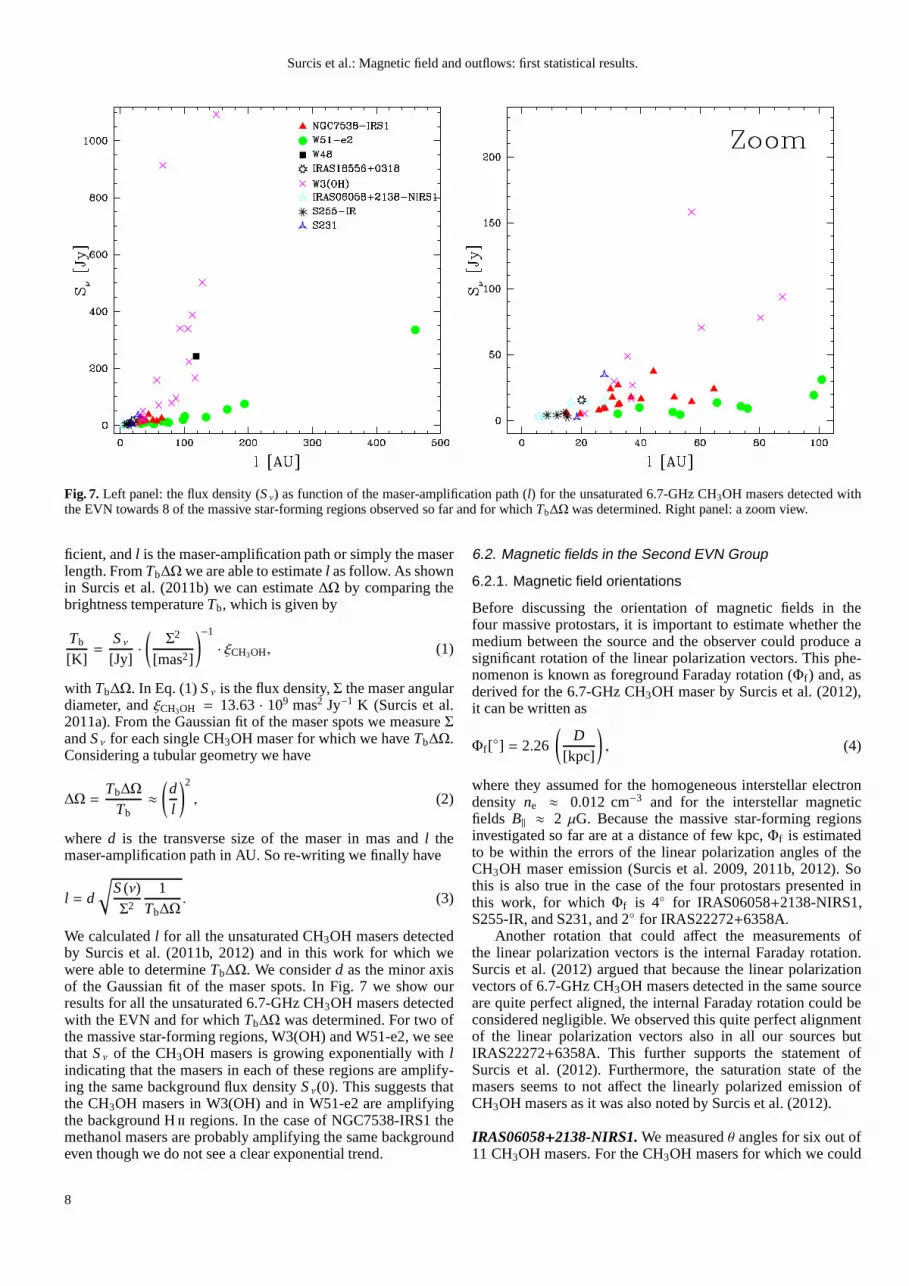
Fig. 7. Left panel: the flux density (S ν) as function of the maser-amplification path (l) for the unsaturated 6.7-GHz CH3OH masers detected withthe EVN towards 8 of the massive star-forming regions observed so far and for whichTb∆Ω was determined. Right panel: a zoom view.
ficient, andl is the maser-amplification path or simply the maserlength. FromTb∆Ω we are able to estimatel as follow. As shownin Surcis et al. (2011b) we can estimate∆Ω by comparing thebrightness temperatureTb, which is given by
Tb
[K]=
S ν[Jy]·(
Σ2
[mas2]
)−1
· ξCH3OH, (1)
with Tb∆Ω. In Eq. (1)S ν is the flux density,Σ the maser angulardiameter, andξCH3OH = 13.63 · 109 mas2 Jy−1 K (Surcis et al.2011a). From the Gaussian fit of the maser spots we measureΣ
andS ν for each single CH3OH maser for which we haveTb∆Ω.Considering a tubular geometry we have
∆Ω =Tb∆Ω
Tb≈
(
dl
)2
, (2)
whered is the transverse size of the maser in mas andl themaser-amplification path in AU. So re-writing we finally have
l = d
√
S (ν)Σ2
1Tb∆Ω
. (3)
We calculatedl for all the unsaturated CH3OH masers detectedby Surcis et al. (2011b, 2012) and in this work for which wewere able to determineTb∆Ω. We considerd as the minor axisof the Gaussian fit of the maser spots. In Fig. 7 we show ourresults for all the unsaturated 6.7-GHz CH3OH masers detectedwith the EVN and for whichTb∆Ω was determined. For two ofthe massive star-forming regions, W3(OH) and W51-e2, we seethat S ν of the CH3OH masers is growing exponentially withlindicating that the masers in each of these regions are amplify-ing the same background flux densityS ν(0). This suggests thatthe CH3OH masers in W3(OH) and in W51-e2 are amplifyingthe background Hii regions. In the case of NGC7538-IRS1 themethanol masers are probably amplifying the same backgroundeven though we do not see a clear exponential trend.
6.2. Magnetic fields in the Second EVN Group
6.2.1. Magnetic field orientations
Before discussing the orientation of magnetic fields in thefour massive protostars, it is important to estimate whether themedium between the source and the observer could produce asignificant rotation of the linear polarization vectors. This phe-nomenon is known as foreground Faraday rotation (Φf ) and, asderived for the 6.7-GHz CH3OH maser by Surcis et al. (2012),it can be written as
Φf [] = 2.26
(
D[kpc]
)
, (4)
where they assumed for the homogeneous interstellar electrondensity ne ≈ 0.012 cm−3 and for the interstellar magneticfields B|| ≈ 2 µG. Because the massive star-forming regionsinvestigated so far are at a distance of few kpc,Φf is estimatedto be within the errors of the linear polarization angles of theCH3OH maser emission (Surcis et al. 2009, 2011b, 2012). Sothis is also true in the case of the four protostars presentedinthis work, for whichΦf is 4 for IRAS06058+2138-NIRS1,S255-IR, and S231, and 2 for IRAS22272+6358A.
Another rotation that could affect the measurements ofthe linear polarization vectors is the internal Faraday rotation.Surcis et al. (2012) argued that because the linear polarizationvectors of 6.7-GHz CH3OH masers detected in the same sourceare quite perfect aligned, the internal Faraday rotation could beconsidered negligible. We observed this quite perfect alignmentof the linear polarization vectors also in all our sources butIRAS22272+6358A. This further supports the statement ofSurcis et al. (2012). Furthermore, the saturation state of themasers seems to not affect the linearly polarized emission ofCH3OH masers as it was also noted by Surcis et al. (2012).
IRAS06058+2138-NIRS1. We measuredθ angles for six out of11 CH3OH masers. For the CH3OH masers for which we could
8
Surcis et al.: Magnetic field and outflows: first statistical results.
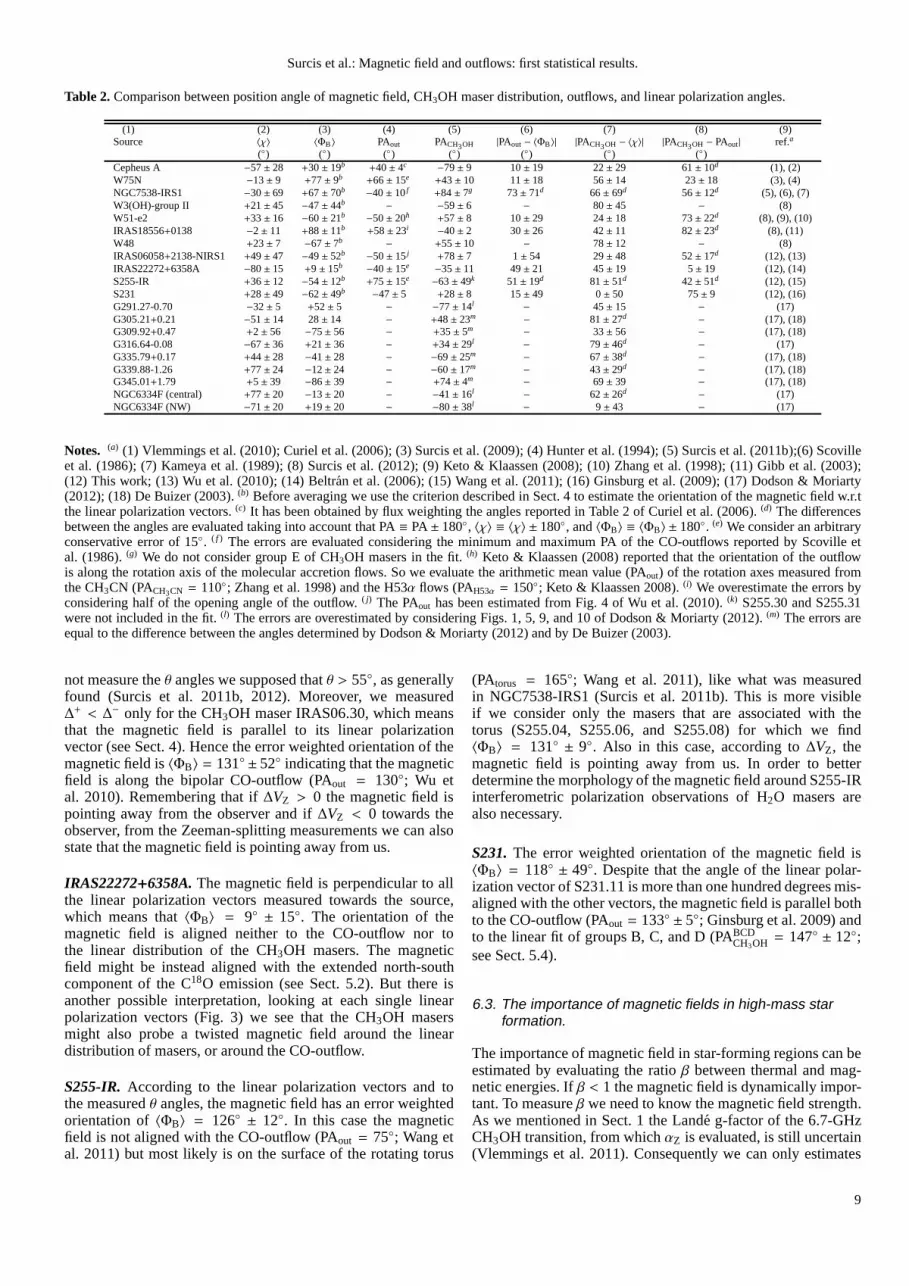
Table 2. Comparison between position angle of magnetic field, CH3OH maser distribution, outflows, and linear polarization angles.
(1) (2) (3) (4) (5) (6) (7) (8) (9)Source 〈χ〉 〈ΦB〉 PAout PACH3OH |PAout − 〈ΦB〉| |PACH3OH − 〈χ〉| |PACH3OH − PAout| ref.a
() () () () () () ()Cepheus A −57± 28 +30± 19b +40± 4c −79± 9 10± 19 22± 29 61± 10d (1), (2)W75N −13± 9 +77± 9b +66± 15e +43± 10 11± 18 56± 14 23± 18 (3), (4)NGC7538-IRS1 −30± 69 +67± 70b −40± 10f +84± 7g 73± 71d 66± 69d 56± 12d (5), (6), (7)W3(OH)-group II +21± 45 −47± 44b − −59± 6 − 80± 45 − (8)W51-e2 +33± 16 −60± 21b −50± 20h +57± 8 10± 29 24± 18 73± 22d (8), (9), (10)IRAS18556+0138 −2± 11 +88± 11b +58± 23i −40± 2 30± 26 42± 11 82± 23d (8), (11)W48 +23± 7 −67± 7b − +55± 10 − 78± 12 − (8)IRAS06058+2138-NIRS1 +49± 47 −49± 52b −50± 15j +78± 7 1± 54 29± 48 52± 17d (12), (13)IRAS22272+6358A −80± 15 +9± 15b −40± 15e −35± 11 49± 21 45± 19 5± 19 (12), (14)S255-IR +36± 12 −54± 12b +75± 15e −63± 49k 51± 19d 81± 51d 42± 51d (12), (15)S231 +28± 49 −62± 49b −47± 5 +28± 8 15± 49 0± 50 75± 9 (12), (16)G291.27-0.70 −32± 5 +52± 5 − −77± 14l − 45± 15 − (17)G305.21+0.21 −51± 14 28± 14 − +48± 23m − 81± 27d − (17), (18)G309.92+0.47 +2± 56 −75± 56 − +35± 5m − 33± 56 − (17), (18)G316.64-0.08 −67± 36 +21± 36 − +34± 29l − 79± 46d − (17)G335.79+0.17 +44± 28 −41± 28 − −69± 25m − 67± 38d − (17), (18)G339.88-1.26 +77± 24 −12± 24 − −60± 17m − 43± 29d − (17), (18)G345.01+1.79 +5± 39 −86± 39 − +74± 4m − 69± 39 − (17), (18)NGC6334F (central) +77± 20 −13± 20 − −41± 16l − 62± 26d − (17)NGC6334F (NW) −71± 20 +19± 20 − −80± 38l − 9± 43 − (17)
Notes. (a) (1) Vlemmings et al. (2010); Curiel et al. (2006); (3) Surciset al. (2009); (4) Hunter et al. (1994); (5) Surcis et al. (2011b);(6) Scovilleet al. (1986); (7) Kameya et al. (1989); (8) Surcis et al. (2012); (9) Keto & Klaassen (2008); (10) Zhang et al. (1998); (11)Gibb et al. (2003);(12) This work; (13) Wu et al. (2010); (14) Beltran et al. (2006); (15) Wang et al. (2011); (16) Ginsburg et al. (2009); (17) Dodson & Moriarty(2012); (18) De Buizer (2003).(b) Before averaging we use the criterion described in Sect. 4 toestimate the orientation of the magnetic field w.r.tthe linear polarization vectors.(c) It has been obtained by flux weighting the angles reported in Table 2 of Curiel et al. (2006).(d) The differencesbetween the angles are evaluated taking into account that PA≡ PA± 180, 〈χ〉 ≡ 〈χ〉 ± 180, and〈ΦB〉 ≡ 〈ΦB〉 ± 180. (e) We consider an arbitraryconservative error of 15. ( f ) The errors are evaluated considering the minimum and maximum PA of the CO-outflows reported by Scoville etal. (1986).(g) We do not consider group E of CH3OH masers in the fit.(h) Keto & Klaassen (2008) reported that the orientation of the outflowis along the rotation axis of the molecular accretion flows. So we evaluate the arithmetic mean value (PAout) of the rotation axes measured fromthe CH3CN (PACH3CN = 110; Zhang et al. 1998) and the H53α flows (PAH53α = 150; Keto & Klaassen 2008).(i) We overestimate the errors byconsidering half of the opening angle of the outflow.( j) The PAout has been estimated from Fig. 4 of Wu et al. (2010).(k) S255.30 and S255.31were not included in the fit.(l) The errors are overestimated by considering Figs. 1, 5, 9, and 10 of Dodson & Moriarty (2012).(m) The errors areequal to the difference between the angles determined by Dodson & Moriarty (2012) and by De Buizer (2003).
not measure theθ angles we supposed thatθ > 55, as generallyfound (Surcis et al. 2011b, 2012). Moreover, we measured∆+ < ∆− only for the CH3OH maser IRAS06.30, which meansthat the magnetic field is parallel to its linear polarizationvector (see Sect. 4). Hence the error weighted orientation of themagnetic field is〈ΦB〉 = 131 ± 52 indicating that the magneticfield is along the bipolar CO-outflow (PAout = 130; Wu etal. 2010). Remembering that if∆VZ > 0 the magnetic field ispointing away from the observer and if∆VZ < 0 towards theobserver, from the Zeeman-splitting measurements we can alsostate that the magnetic field is pointing away from us.
IRAS22272+6358A. The magnetic field is perpendicular to allthe linear polarization vectors measured towards the source,which means that〈ΦB〉 = 9 ± 15. The orientation of themagnetic field is aligned neither to the CO-outflow nor tothe linear distribution of the CH3OH masers. The magneticfield might be instead aligned with the extended north-southcomponent of the C18O emission (see Sect. 5.2). But there isanother possible interpretation, looking at each single linearpolarization vectors (Fig. 3) we see that the CH3OH masersmight also probe a twisted magnetic field around the lineardistribution of masers, or around the CO-outflow.
S255-IR. According to the linear polarization vectors and tothe measuredθ angles, the magnetic field has an error weightedorientation of〈ΦB〉 = 126 ± 12. In this case the magneticfield is not aligned with the CO-outflow (PAout = 75; Wang etal. 2011) but most likely is on the surface of the rotating torus
(PAtorus = 165; Wang et al. 2011), like what was measuredin NGC7538-IRS1 (Surcis et al. 2011b). This is more visibleif we consider only the masers that are associated with thetorus (S255.04, S255.06, and S255.08) for which we find〈ΦB〉 = 131 ± 9. Also in this case, according to∆VZ, themagnetic field is pointing away from us. In order to betterdetermine the morphology of the magnetic field around S255-IRinterferometric polarization observations of H2O masers arealso necessary.
S231. The error weighted orientation of the magnetic field is〈ΦB〉 = 118 ± 49. Despite that the angle of the linear polar-ization vector of S231.11 is more than one hundred degrees mis-aligned with the other vectors, the magnetic field is parallel bothto the CO-outflow (PAout = 133 ± 5; Ginsburg et al. 2009) andto the linear fit of groups B, C, and D (PABCD
CH3OH = 147 ± 12;see Sect. 5.4).
6.3. The importance of magnetic fields in high-mass starformation.
The importance of magnetic field in star-forming regions canbeestimated by evaluating the ratioβ between thermal and mag-netic energies. Ifβ < 1 the magnetic field is dynamically impor-tant. To measureβ we need to know the magnetic field strength.As we mentioned in Sect. 1 the Lande g-factor of the 6.7-GHzCH3OH transition, from whichαZ is evaluated, is still uncertain(Vlemmings et al. 2011). Consequently we can only estimates
9
Surcis et al.: Magnetic field and outflows: first statistical results.
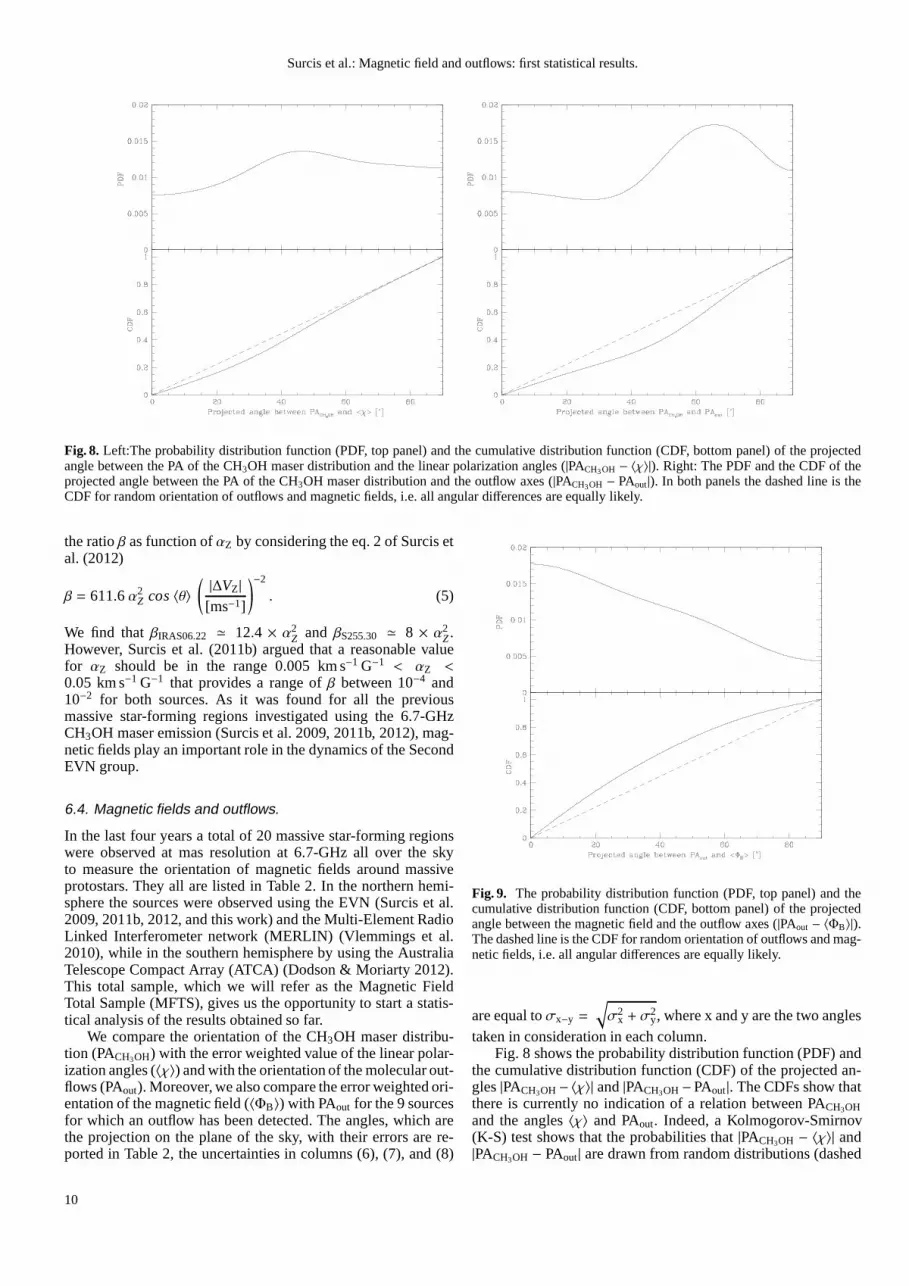
Fig. 8. Left:The probability distribution function (PDF, top panel) and the cumulative distribution function (CDF, bottom panel) of the projectedangle between the PA of the CH3OH maser distribution and the linear polarization angles (|PACH3OH − 〈χ〉|). Right: The PDF and the CDF of theprojected angle between the PA of the CH3OH maser distribution and the outflow axes (|PACH3OH − PAout|). In both panels the dashed line is theCDF for random orientation of outflows and magnetic fields, i.e. all angular differences are equally likely.
the ratioβ as function ofαZ by considering the eq. 2 of Surcis etal. (2012)
β = 611.6 α2Z cos 〈θ〉
(
|∆VZ|[ms−1]
)−2
. (5)
We find thatβIRAS06.22 ≃ 12.4 × α2Z and βS255.30 ≃ 8 × α2
Z .However, Surcis et al. (2011b) argued that a reasonable valuefor αZ should be in the range 0.005 km s−1 G−1 < αZ <0.05 km s−1 G−1 that provides a range ofβ between 10−4 and10−2 for both sources. As it was found for all the previousmassive star-forming regions investigated using the 6.7-GHzCH3OH maser emission (Surcis et al. 2009, 2011b, 2012), mag-netic fields play an important role in the dynamics of the SecondEVN group.
6.4. Magnetic fields and outflows.
In the last four years a total of 20 massive star-forming regionswere observed at mas resolution at 6.7-GHz all over the skyto measure the orientation of magnetic fields around massiveprotostars. They all are listed in Table 2. In the northern hemi-sphere the sources were observed using the EVN (Surcis et al.2009, 2011b, 2012, and this work) and the Multi-Element RadioLinked Interferometer network (MERLIN) (Vlemmings et al.2010), while in the southern hemisphere by using the AustraliaTelescope Compact Array (ATCA) (Dodson & Moriarty 2012).This total sample, which we will refer as the Magnetic FieldTotal Sample (MFTS), gives us the opportunity to start a statis-tical analysis of the results obtained so far.
We compare the orientation of the CH3OH maser distribu-tion (PACH3OH) with the error weighted value of the linear polar-ization angles (〈χ〉) and with the orientation of the molecular out-flows (PAout). Moreover, we also compare the error weighted ori-entation of the magnetic field (〈ΦB〉) with PAout for the 9 sourcesfor which an outflow has been detected. The angles, which arethe projection on the plane of the sky, with their errors are re-ported in Table 2, the uncertainties in columns (6), (7), and(8)
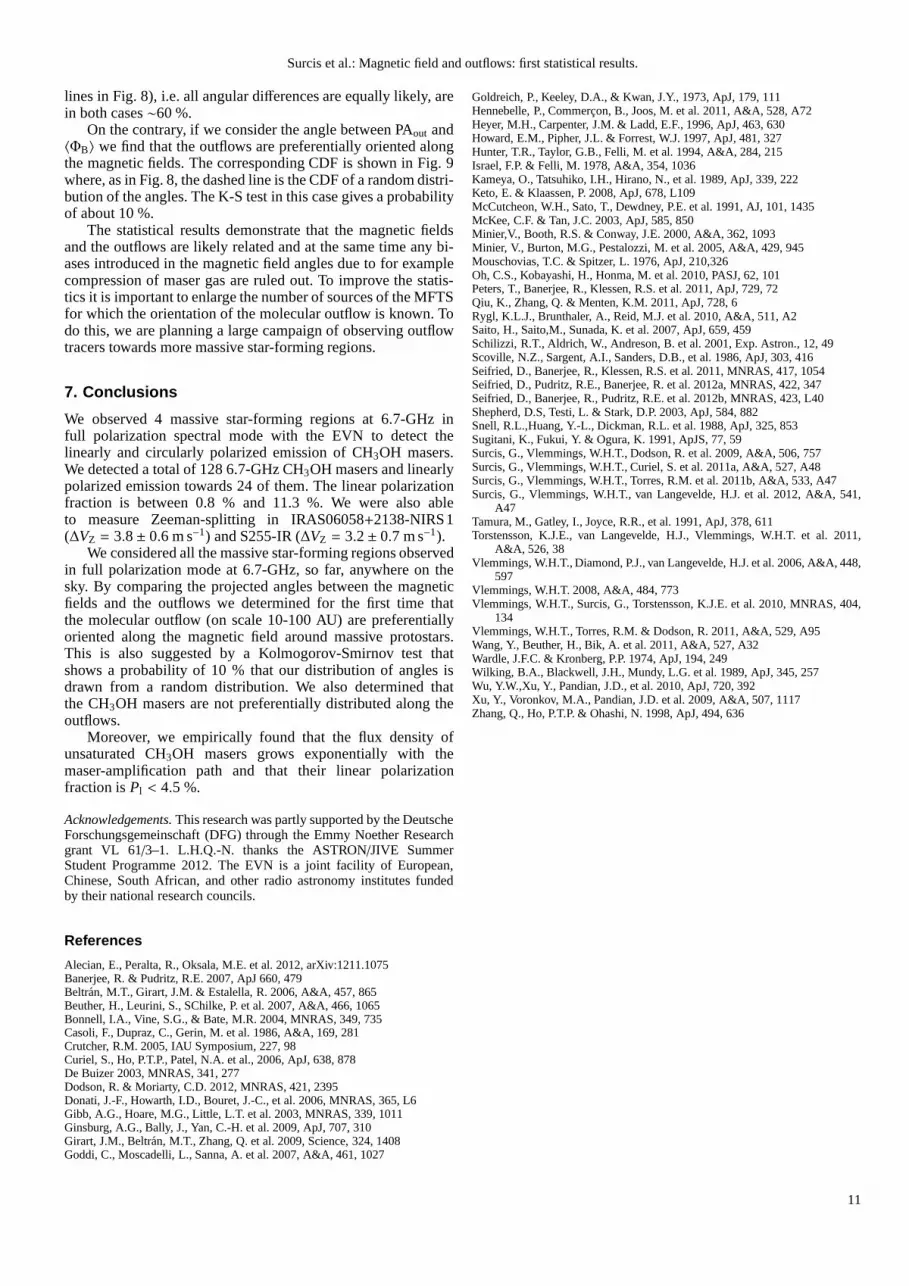
Fig. 9. The probability distribution function (PDF, top panel) andthecumulative distribution function (CDF, bottom panel) of the projectedangle between the magnetic field and the outflow axes (|PAout − 〈ΦB〉|).The dashed line is the CDF for random orientation of outflows and mag-netic fields, i.e. all angular differences are equally likely.
are equal toσx−y =
√
σ2x + σ
2y, where x and y are the two angles
taken in consideration in each column.Fig. 8 shows the probability distribution function (PDF) and
the cumulative distribution function (CDF) of the projected an-gles|PACH3OH− 〈χ〉| and|PACH3OH−PAout|. The CDFs show thatthere is currently no indication of a relation between PACH3OHand the angles〈χ〉 and PAout. Indeed, a Kolmogorov-Smirnov(K-S) test shows that the probabilities that|PACH3OH − 〈χ〉| and|PACH3OH − PAout| are drawn from random distributions (dashed
10
Surcis et al.: Magnetic field and outflows: first statistical results.
lines in Fig. 8), i.e. all angular differences are equally likely, arein both cases∼60 %.
On the contrary, if we consider the angle between PAout and〈ΦB〉 we find that the outflows are preferentially oriented alongthe magnetic fields. The corresponding CDF is shown in Fig. 9where, as in Fig. 8, the dashed line is the CDF of a random distri-bution of the angles. The K-S test in this case gives a probabilityof about 10 %.
The statistical results demonstrate that the magnetic fieldsand the outflows are likely related and at the same time any bi-ases introduced in the magnetic field angles due to for examplecompression of maser gas are ruled out. To improve the statis-tics it is important to enlarge the number of sources of the MFTSfor which the orientation of the molecular outflow is known. Todo this, we are planning a large campaign of observing outflowtracers towards more massive star-forming regions.
7. Conclusions
We observed 4 massive star-forming regions at 6.7-GHz infull polarization spectral mode with the EVN to detect thelinearly and circularly polarized emission of CH3OH masers.We detected a total of 128 6.7-GHz CH3OH masers and linearlypolarized emission towards 24 of them. The linear polarizationfraction is between 0.8 % and 11.3 %. We were also ableto measure Zeeman-splitting in IRAS06058+2138-NIRS1(∆VZ = 3.8± 0.6 m s−1) and S255-IR (∆VZ = 3.2± 0.7 m s−1).
We considered all the massive star-forming regions observedin full polarization mode at 6.7-GHz, so far, anywhere on thesky. By comparing the projected angles between the magneticfields and the outflows we determined for the first time thatthe molecular outflow (on scale 10-100 AU) are preferentiallyoriented along the magnetic field around massive protostars.This is also suggested by a Kolmogorov-Smirnov test thatshows a probability of 10 % that our distribution of angles isdrawn from a random distribution. We also determined thatthe CH3OH masers are not preferentially distributed along theoutflows.
Moreover, we empirically found that the flux density ofunsaturated CH3OH masers grows exponentially with themaser-amplification path and that their linear polarizationfraction isPl < 4.5 %.
Acknowledgements. This research was partly supported by the DeutscheForschungsgemeinschaft (DFG) through the Emmy Noether Researchgrant VL 61/3–1. L.H.Q.-N. thanks the ASTRON/JIVE SummerStudent Programme 2012. The EVN is a joint facility of European,Chinese, South African, and other radio astronomy institutes fundedby their national research councils.
References
Alecian, E., Peralta, R., Oksala, M.E. et al. 2012, arXiv:1211.1075Banerjee, R. & Pudritz, R.E. 2007, ApJ 660, 479Beltran, M.T., Girart, J.M. & Estalella, R. 2006, A&A, 457,865Beuther, H., Leurini, S., SChilke, P. et al. 2007, A&A, 466, 1065Bonnell, I.A., Vine, S.G., & Bate, M.R. 2004, MNRAS, 349, 735Casoli, F., Dupraz, C., Gerin, M. et al. 1986, A&A, 169, 281Crutcher, R.M. 2005, IAU Symposium, 227, 98Curiel, S., Ho, P.T.P., Patel, N.A. et al., 2006, ApJ, 638, 878De Buizer 2003, MNRAS, 341, 277Dodson, R. & Moriarty, C.D. 2012, MNRAS, 421, 2395Donati, J.-F., Howarth, I.D., Bouret, J.-C., et al. 2006, MNRAS, 365, L6Gibb, A.G., Hoare, M.G., Little, L.T. et al. 2003, MNRAS, 339, 1011Ginsburg, A.G., Bally, J., Yan, C.-H. et al. 2009, ApJ, 707, 310Girart, J.M., Beltran, M.T., Zhang, Q. et al. 2009, Science, 324, 1408Goddi, C., Moscadelli, L., Sanna, A. et al. 2007, A&A, 461, 1027
Goldreich, P., Keeley, D.A., & Kwan, J.Y., 1973, ApJ, 179, 111Hennebelle, P., Commercon, B., Joos, M. et al. 2011, A&A, 528, A72Heyer, M.H., Carpenter, J.M. & Ladd, E.F., 1996, ApJ, 463, 630Howard, E.M., Pipher, J.L. & Forrest, W.J. 1997, ApJ, 481, 327Hunter, T.R., Taylor, G.B., Felli, M. et al. 1994, A&A, 284, 215Israel, F.P. & Felli, M. 1978, A&A, 354, 1036Kameya, O., Tatsuhiko, I.H., Hirano, N., et al. 1989, ApJ, 339, 222Keto, E. & Klaassen, P. 2008, ApJ, 678, L109McCutcheon, W.H., Sato, T., Dewdney, P.E. et al. 1991, AJ, 101, 1435McKee, C.F. & Tan, J.C. 2003, ApJ, 585, 850Minier,V., Booth, R.S. & Conway, J.E. 2000, A&A, 362, 1093Minier, V., Burton, M.G., Pestalozzi, M. et al. 2005, A&A, 429, 945Mouschovias, T.C. & Spitzer, L. 1976, ApJ, 210,326Oh, C.S., Kobayashi, H., Honma, M. et al. 2010, PASJ, 62, 101Peters, T., Banerjee, R., Klessen, R.S. et al. 2011, ApJ, 729, 72Qiu, K., Zhang, Q. & Menten, K.M. 2011, ApJ, 728, 6Rygl, K.L.J., Brunthaler, A., Reid, M.J. et al. 2010, A&A, 511, A2Saito, H., Saito,M., Sunada, K. et al. 2007, ApJ, 659, 459Schilizzi, R.T., Aldrich, W., Andreson, B. et al. 2001, Exp.Astron., 12, 49Scoville, N.Z., Sargent, A.I., Sanders, D.B., et al. 1986, ApJ, 303, 416Seifried, D., Banerjee, R., Klessen, R.S. et al. 2011, MNRAS, 417, 1054Seifried, D., Pudritz, R.E., Banerjee, R. et al. 2012a, MNRAS, 422, 347Seifried, D., Banerjee, R., Pudritz, R.E. et al. 2012b, MNRAS, 423, L40Shepherd, D.S, Testi, L. & Stark, D.P. 2003, ApJ, 584, 882Snell, R.L.,Huang, Y.-L., Dickman, R.L. et al. 1988, ApJ, 325, 853Sugitani, K., Fukui, Y. & Ogura, K. 1991, ApJS, 77, 59Surcis, G., Vlemmings, W.H.T., Dodson, R. et al. 2009, A&A, 506, 757Surcis, G., Vlemmings, W.H.T., Curiel, S. et al. 2011a, A&A,527, A48Surcis, G., Vlemmings, W.H.T., Torres, R.M. et al. 2011b, A&A, 533, A47Surcis, G., Vlemmings, W.H.T., van Langevelde, H.J. et al. 2012, A&A, 541,
A47Tamura, M., Gatley, I., Joyce, R.R., et al. 1991, ApJ, 378, 611Torstensson, K.J.E., van Langevelde, H.J., Vlemmings, W.H.T. et al. 2011,
A&A, 526, 38Vlemmings, W.H.T., Diamond, P.J., van Langevelde, H.J. et al. 2006, A&A, 448,
597Vlemmings, W.H.T. 2008, A&A, 484, 773Vlemmings, W.H.T., Surcis, G., Torstensson, K.J.E. et al. 2010, MNRAS, 404,
134Vlemmings, W.H.T., Torres, R.M. & Dodson, R. 2011, A&A, 529,A95Wang, Y., Beuther, H., Bik, A. et al. 2011, A&A, 527, A32Wardle, J.F.C. & Kronberg, P.P. 1974, ApJ, 194, 249Wilking, B.A., Blackwell, J.H., Mundy, L.G. et al. 1989, ApJ, 345, 257Wu, Y.W.,Xu, Y., Pandian, J.D., et al. 2010, ApJ, 720, 392Xu, Y., Voronkov, M.A., Pandian, J.D. et al. 2009, A&A, 507, 1117Zhang, Q., Ho, P.T.P. & Ohashi, N. 1998, ApJ, 494, 636
11
Surcis et al.: Magnetic field and outflows: first statistical results., Online Material p 1
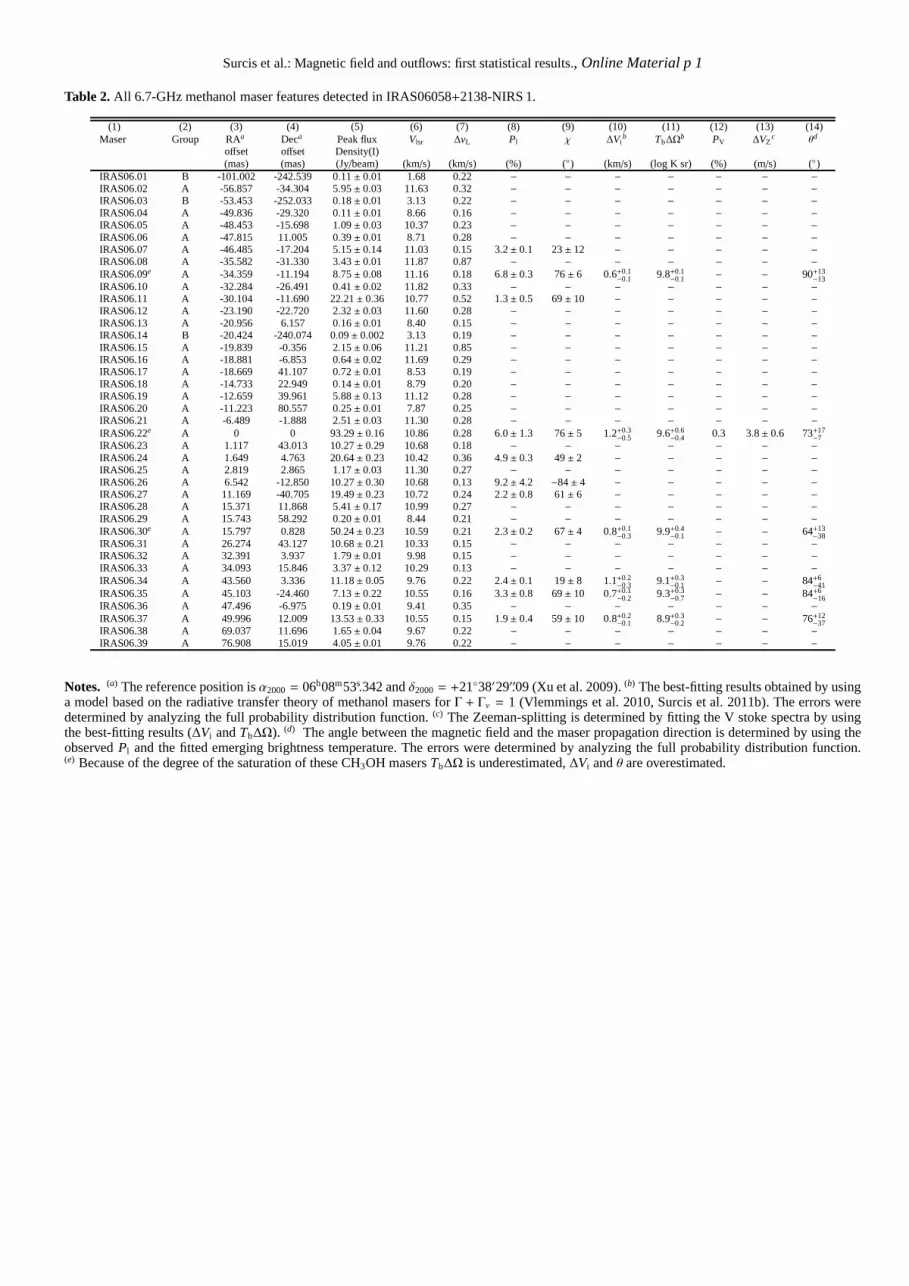
Table 2. All 6.7-GHz methanol maser features detected in IRAS06058+2138-NIRS 1.
(1) (2) (3) (4) (5) (6) (7) (8) (9) (10) (11) (12) (13) (14)Maser Group RAa Deca Peak flux Vlsr ∆vL Pl χ ∆Vi
b Tb∆Ωb PV ∆VZ
c θd
offset offset Density(I)(mas) (mas) (Jy/beam) (km/s) (km/s) (%) () (km/s) (log K sr) (%) (m/s) ()
IRAS06.01 B -101.002 -242.539 0.11± 0.01 1.68 0.22 − − − − − − −IRAS06.02 A -56.857 -34.304 5.95± 0.03 11.63 0.32 − − − − − − −IRAS06.03 B -53.453 -252.033 0.18± 0.01 3.13 0.22 − − − − − − −IRAS06.04 A -49.836 -29.320 0.11± 0.01 8.66 0.16 − − − − − − −IRAS06.05 A -48.453 -15.698 1.09± 0.03 10.37 0.23 − − − − − − −IRAS06.06 A -47.815 11.005 0.39± 0.01 8.71 0.28 − − − − − − −IRAS06.07 A -46.485 -17.204 5.15± 0.14 11.03 0.15 3.2± 0.1 23± 12 − − − − −IRAS06.08 A -35.582 -31.330 3.43± 0.01 11.87 0.87 − − − − − − −IRAS06.09e A -34.359 -11.194 8.75± 0.08 11.16 0.18 6.8± 0.3 76± 6 0.6+0.1
−0.1 9.8+0.1−0.1 − − 90+13
−13IRAS06.10 A -32.284 -26.491 0.41± 0.02 11.82 0.33 − − − − − − −IRAS06.11 A -30.104 -11.690 22.21± 0.36 10.77 0.52 1.3± 0.5 69± 10 − − − − −IRAS06.12 A -23.190 -22.720 2.32± 0.03 11.60 0.28 − − − − − − −IRAS06.13 A -20.956 6.157 0.16± 0.01 8.40 0.15 − − − − − − −IRAS06.14 B -20.424 -240.074 0.09± 0.002 3.13 0.19 − − − − − − −IRAS06.15 A -19.839 -0.356 2.15± 0.06 11.21 0.85 − − − − − − −IRAS06.16 A -18.881 -6.853 0.64± 0.02 11.69 0.29 − − − − − − −IRAS06.17 A -18.669 41.107 0.72± 0.01 8.53 0.19 − − − − − − −IRAS06.18 A -14.733 22.949 0.14± 0.01 8.79 0.20 − − − − − − −IRAS06.19 A -12.659 39.961 5.88± 0.13 11.12 0.28 − − − − − − −IRAS06.20 A -11.223 80.557 0.25± 0.01 7.87 0.25 − − − − − − −IRAS06.21 A -6.489 -1.888 2.51± 0.03 11.30 0.28 − − − − − − −IRAS06.22e A 0 0 93.29± 0.16 10.86 0.28 6.0± 1.3 76± 5 1.2+0.3
−0.5 9.6+0.6−0.4 0.3 3.8± 0.6 73+17
−7IRAS06.23 A 1.117 43.013 10.27± 0.29 10.68 0.18 − − − − − − −IRAS06.24 A 1.649 4.763 20.64± 0.23 10.42 0.36 4.9± 0.3 49± 2 − − − − −IRAS06.25 A 2.819 2.865 1.17± 0.03 11.30 0.27 − − − − − − −IRAS06.26 A 6.542 -12.850 10.27± 0.30 10.68 0.13 9.2± 4.2 −84± 4 − − − − −IRAS06.27 A 11.169 -40.705 19.49± 0.23 10.72 0.24 2.2± 0.8 61± 6 − − − − −IRAS06.28 A 15.371 11.868 5.41± 0.17 10.99 0.27 − − − − − − −IRAS06.29 A 15.743 58.292 0.20± 0.01 8.44 0.21 − − − − − − −IRAS06.30e A 15.797 0.828 50.24± 0.23 10.59 0.21 2.3± 0.2 67± 4 0.8+0.1
−0.3 9.9+0.4−0.1 − − 64+13
−38IRAS06.31 A 26.274 43.127 10.68± 0.21 10.33 0.15 − − − − − − −IRAS06.32 A 32.391 3.937 1.79± 0.01 9.98 0.15 − − − − − − −IRAS06.33 A 34.093 15.846 3.37± 0.12 10.29 0.13 − − − − − − −IRAS06.34 A 43.560 3.336 11.18± 0.05 9.76 0.22 2.4± 0.1 19± 8 1.1+0.2
−0.3 9.1+0.3−0.1 − − 84+6
−41IRAS06.35 A 45.103 -24.460 7.13± 0.22 10.55 0.16 3.3± 0.8 69± 10 0.7+0.1
−0.2 9.3+0.3−0.7 − − 84+6
−16IRAS06.36 A 47.496 -6.975 0.19± 0.01 9.41 0.35 − − − − − − −IRAS06.37 A 49.996 12.009 13.53± 0.33 10.55 0.15 1.9± 0.4 59± 10 0.8+0.2
−0.1 8.9+0.3−0.2 − − 76+12
−37IRAS06.38 A 69.037 11.696 1.65± 0.04 9.67 0.22 − − − − − − −IRAS06.39 A 76.908 15.019 4.05± 0.01 9.76 0.22 − − − − − − −
Notes. (a) The reference position isα2000= 06h08m53s.342 andδ2000= +2138′29′′.09 (Xu et al. 2009).(b) The best-fitting results obtained by usinga model based on the radiative transfer theory of methanol masers forΓ + Γν = 1 (Vlemmings et al. 2010, Surcis et al. 2011b). The errors weredetermined by analyzing the full probability distributionfunction. (c) The Zeeman-splitting is determined by fitting the V stoke spectra by usingthe best-fitting results (∆Vi andTb∆Ω). (d) The angle between the magnetic field and the maser propagation direction is determined by using theobservedPl and the fitted emerging brightness temperature. The errors were determined by analyzing the full probability distribution function.(e) Because of the degree of the saturation of these CH3OH masersTb∆Ω is underestimated,∆Vi andθ are overestimated.
Surcis et al.: Magnetic field and outflows: first statistical results., Online Material p 2
Table 3. All 6.7-GHz methanol maser features detected in IRAS22272+6358A.
(1) (2) (3) (4) (5) (6) (7) (8) (9) (10) (11) (12) (13)Maser RAa Deca Peak flux Vlsr ∆vL Pl χ ∆Vi
b Tb∆Ωb PV ∆VZ
c θd
offset offset Density(I)(mas) (mas) (Jy/beam) (km/s) (km/s) (%) () (km/s) (log K sr) (%) (m/s) ()
IRAS22.01 -173.256 265.579 0.062± 0.004 -10.51 0.23 − − − − − − −IRAS22.02 -138.277 144.333 0.171± 0.005 -10.20 0.16 − − − − − − −IRAS22.03 -123.872 140.640 0.584± 0.005 -10.15 0.23 − − − − − − −IRAS22.04 -115.587 130.711 1.378± 0.005 -10.20 0.22 − − − − − − −IRAS22.05 -101.605 128.204 0.094± 0.006 -10.15 0.26 − − − − − − −IRAS22.06 -97.550 130.402 0.098± 0.008 -10.90 0.17 − − − − − − −IRAS22.07 -69.710 157.776 0.354± 0.007 -10.86 0.24 − − − − − − −IRAS22.08 -69.213 133.293 0.102± 0.008 -10.90 0.19 − − − − − − −IRAS22.09 -67.695 62.641 0.118± 0.005 -9.93 0.14 − − − − − − −IRAS22.10 -65.755 179.375 0.081± 0.005 -11.16 0.17 − − − − − − −IRAS22.11 -65.008 169.689 0.557± 0.008 -10.94 0.20 − − − − − − −IRAS22.12 -64.784 168.640 0.467± 0.008 -10.86 0.21 − − − − − − −IRAS22.13 -56.848 155.579 2.720± 0.008 -10.90 0.21 0.8± 0.2 −75± 5 1.1+0.1
−0.2 8.5+0.4−0.2 − − 77+13
−38IRAS22.14 -47.295 140.812 1.989± 0.008 -10.90 0.23 1.0± 0.1 68± 17 1.2+0.1
−0.2 8.6+0.3−0.1 − − 80+10
−38IRAS22.15 -44.210 129.570 0.310± 0.008 -10.72 0.20 − − − − − − −IRAS22.16 -36.796 121.681 0.629± 0.005 -10.72 0.17 − − − − − − −IRAS22.17 -35.900 130.512 1.245± 0.007 -11.03 0.14 − − − − − − −IRAS22.18 -34.830 143.387 0.221± 0.008 -10.94 0.14 − − − − − − −IRAS22.19 -29.780 96.726 2.658± 0.007 -10.77 0.31 1.7± 0.7 −78± 4 1.5+0.2
−0.2 8.9+0.1−1.0 − − 90+54
−54IRAS22.20 -22.491 87.498 0.321± 0.004 -11.30 0.22 − − − − − − −IRAS22.21 -13.783 47.733 0.220± 0.006 -10.15 0.25 − − − − − − −IRAS22.22 0 0 4.838± 0.005 -12.83 0.30 − − − − − − −IRAS22.23 0.373 -10.288 0.750± 0.004 -12.57 0.26 − − − − − − −IRAS22.24 1.319 29.022 0.217± 0.005 -12.31 0.17 − − − − − − −IRAS22.25 47.668 216.942 0.117± 0.008 -10.99 1.08 − − − − − − −IRAS22.26 215.898 319.664 0.109± 0.008 -10.99 0.15 − − − − − − −
Notes. (a) The reference position isα2000 = 22h28m51s.407 andδ2000 = +6413′41′′.314 (Rygl et al. 2010).(b) The best-fitting results obtained byusing a model based on the radiative transfer theory of methanol masers forΓ + Γν = 1 (Vlemmings et al. 2010, Surcis et al. 2011b). The errorswere determined by analyzing the full probability distribution function. (c) The Zeeman-splitting is determined by fitting the V stoke spectra byusing the best-fitting results (∆Vi andTb∆Ω). (d) The angle between the magnetic field and the maser propagation direction is determined by usingthe observedPl and the fitted emerging brightness temperature. The errors were determined by analyzing the full probability distribution function.
Surcis et al.: Magnetic field and outflows: first statistical results., Online Material p 3
Table 4. All 6.7-GHz methanol maser features detected in S255-IR.
(1) (2) (3) (4) (5) (6) (7) (8) (9) (10) (11) (12) (13) (14)Maser Group RAa Deca Peak flux Vlsr ∆vL Pl χ ∆Vi
b Tb∆Ωb PV ∆VZ
c θd
offset offset Density(I)(mas) (mas) (Jy/beam) (km/s) (km/s) (%) () (km/s) (log K sr) (%) (m/s) ()
S255.01 A -217.801 97.237 0.209± 0.009 4.96 0.13 − − − − − − −S255.02 B -217.039 -41.428 0.156± 0.003 5.70 0.13 − − − − − − −S255.03 B -212.685 -62.891 1.212± 0.005 5.48 0.13 − − − − − − −S255.04 B -212.522 -124.538 3.113± 0.015 4.87 0.17 2.2± 0.5 39± 2 0.8+0.2
−0.1 9.0+0.3−0.4 − − 80+10
−21S255.05 B -212.413 -109.398 0.501± 0.007 5.00 0.21 − − − − − − −S255.06 B -206.100 -53.278 1.707± 0.005 5.57 0.17 3.8± 0.2 39± 4 0.7+0.1
−0.1 9.3+0.1−0.1 − − 85+4
−10S255.07 B -205.610 -86.506 0.343± 0.004 5.22 0.16 − − − − − − −S255.08 B -204.522 -132.717 2.343± 0.018 4.74 0.16 1.0± 0.3 60± 11 0.8+0.1
−0.1 8.6+0.4−0.4 − − 74+14
−38S255.09 B -203.923 -19.556 0.399± 0.006 5.44 0.14 − − − − − − −S255.10 B -201.583 -70.501 0.452± 0.005 5.35 0.14 − − − − − − −S255.11 B -199.624 -87.763 0.686± 0.014 4.78 0.14 − − − − − − −S255.12 B -195.977 -140.797 0.297± 0.011 4.47 0.15 − − − − − − −S255.13 B -195.488 -104.160 0.270± 0.004 5.40 0.13 − − − − − − −S255.14 B -193.800 -58.836 0.256± 0.005 5.40 0.63 − − − − − − −S255.15 B -187.760 -151.674 0.198± 0.004 4.25 0.84 − − − − − − −S255.16 B -172.086 -97.004 0.176± 0.006 4.39 1.29 − − − − − − −S255.17 B -164.521 -108.042 0.250± 0.004 4.08 0.20 − − − − − − −S255.18 B -162.126 -156.319 0.394± 0.003 4.12 0.22 − − − − − − −S255.19 B -160.276 -155.373 0.334± 0.003 4.08 0.24 − − − − − − −S255.20 B -158.534 -188.637 0.116± 0.004 4.17 0.20 − − − − − − −S255.21 B -148.194 -146.700 0.668± 0.003 4.03 0.22 − − − − − − −S255.22 B -144.548 -138.336 0.259± 0.004 4.17 0.17 − − − − − − −S255.23 A -142.207 231.489 0.268± 0.016 4.82 0.15 − − − − − − −S255.24 C -135.513 -399.889 0.130± 0.003 3.38 0.18 − − − − − − −S255.25 C -128.166 -393.681 0.123± 0.004 2.23 0.27 − − − − − − −S255.26 C -125.989 -373.406 0.361± 0.003 3.03 0.23 − − − − − − −S255.27 C -125.935 -361.589 0.180± 0.003 2.28 0.34 − − − − − − −S255.28 C -120.166 -351.229 0.104± 0.004 1.31 0.23 − − − − − − −S255.29 A -69.172 409.050 0.280± 0.016 4.82 0.68 − − − − − − −S255.30e B 0 0 10.636± 0.015 4.61 0.24 4.5± 0.3 23± 5 1.1+0.1
−0.4 9.5+0.3−0.1 0.3 3.2± 0.7 82+8
−18S255.31 B 6.694 5.865 3.689± 0.014 4.78 0.20 1.8± 0.4 21± 7 0.9+0.1
−0.2 9.0+0.4−0.3 − − 79+11
−36
Notes. (a) The reference position isα2000 = 06h12m54s.020 andδ2000 = +1759′23′′.316 (Rygl et al. 2010).(b) The best-fitting results obtained byusing a model based on the radiative transfer theory of methanol masers forΓ + Γν = 1 (Vlemmings et al. 2010, Surcis et al. 2011b). The errorswere determined by analyzing the full probability distribution function. (c) The Zeeman-splitting is determined by fitting the V stoke spectra byusing the best-fitting results (∆Vi andTb∆Ω). (d) The angle between the magnetic field and the maser propagation direction is determined by usingthe observedPl and the fitted emerging brightness temperature. The errors were determined by analyzing the full probability distribution function.(e) Because of the degree of the saturation of these CH3OH masersTb∆Ω is underestimated,∆Vi andθ are overestimated.
Surcis et al.: Magnetic field and outflows: first statistical results., Online Material p 4
Table 5. All 6.7-GHz methanol maser features detected in S231.
(1) (2) (3) (4) (5) (6) (7) (8) (9) (10) (11) (12) (13) (14)Maser Group RAa Deca Peak flux Vlsr ∆vL Pl χ ∆Vi
b Tb∆Ωb PV ∆VZ
c θd
offset offset Density(I)(mas) (mas) (Jy/beam) (km/s) (km/s) (%) () (km/s) (log K sr) (%) (m/s) ()
S231.01 C -108.670 51.949 2.287± 0.003 -11.82 0.42 0.8± 0.4 −7± 5 1.9+0.1−0.2 8.5+0.9
−0.1 − − 90+60−60
S231.02 B -68.055 47.474 0.177± 0.003 -11.51 0.22 − − − − − − −S231.03 B -54.975 34.267 0.224± 0.003 -11.20 0.22 − − − − − − −S231.04 B -53.140 70.908 0.053± 0.003 -11.29 0.14 − − − − − − −S231.05 B -50.597 -3.765 0.053± 0.003 -11.29 0.18 − − − − − − −S231.06 A2 -48.914 -104.523 0.062± 0.003 -14.27 0.19 − − − − − − −S231.07 B -47.498 32.341 0.096± 0.003 -11.20 0.15 − − − − − − −S231.08 B -46.860 45.284 0.107± 0.003 -11.86 0.23 − − − − − − −S231.09 B -46.790 33.001 0.073± 0.003 -11.33 0.22 − − − − − − −S231.10 A2 -45.954 -87.692 0.310± 0.004 -14.01 0.29 − − − − − − −S231.11e A2 -42.031 -74.463 2.472± 0.004 -13.79 0.32 11.3± 0.6 −74± 2 < 0.5 11.3+0.3
−0.1 − − 82+8−18
S231.12 A2 -40.418 -90.500 1.895± 0.003 -6.37 0.32 − − − − − − −S231.13 B -38.131 21.629 0.065± 0.003 -11.20 0.19 − − − − − − −S231.14 A2 -32.884 -82.264 0.156± 0.003 -7.69 0.36 − − − − − − −S231.15 B -27.870 30.174 0.799± 0.003 -11.46 0.21 − − − − − − −S231.16 A1 -21.973 -36.274 0.257± 0.003 -15.02 0.39 − − − − − − −S231.17 A1 -19.071 -30.800 0.620± 0.003 -14.23 0.33 − − − − − − −S231.18 A1 -16.947 -23.762 0.143± 0.003 -14.54 0.27 − − − − − − −S231.19 A1 -9.147 11.021 0.174± 0.006 -13.18 0.42 − − − − − − −S231.20e A1 -7.882 -11.410 3.900± 0.004 -14.14 0.34 5.8± 1.1 47± 1 1.2+0.3
−0.5 9.6+0.5−0.7 − − 83+7
−16S231.21 A1 -3.471 -13.863 0.261± 0.008 -13.13 0.33 − − − − − − −S231.22 A1 -2.403 -4.982 0.539± 0.004 -13.66 0.39 − − − − − − −S231.23 A1 0 0 23.419± 0.010 -12.96 0.34 4.0± 0.4 48± 1 1.7+0.4
−0.5 9.3+0.4−0.2 − − 80+8
−41S231.24 A1 5.467 9.663 0.612± 0.005 -13.31 0.38 − − − − − − −S231.25e A1 5.815 4.520 6.634± 0.011 -12.87 0.30 5.3± 0.6 48± 1 1.3+0.2
−0.5 9.6+0.4−0.1 − − 82+8
−18S231.26 D 14.231 -108.620 0.105± 0.003 -12.17 0.22 − − − − − − −S231.27 A1 15.206 18.288 0.389± 0.005 -13.22 0.34 − − − − − − −S231.28 A1 17.330 21.011 0.153± 0.004 -13.35 0.40 − − − − − − −S231.29 D 22.588 -116.097 0.294± 0.003 -12.08 0.25 − − − − − − −S231.30 D 25.038 -109.062 0.302± 0.010 -12.96 0.15 − − − − − − −S231.31 D 28.148 -117.458 0.188± 0.006 -13.18 0.90 − − − − − − −S231.32 D 28.949 -67.051 0.103± 0.003 -12.39 0.18 − − − − − − −
Notes. (a) The reference position isα2000 = 05h39m13s.059 andδ2000 = +3545′51′′.29 (Minier et al. 2000).(b) The best-fitting results obtained byusing a model based on the radiative transfer theory of methanol masers forΓ + Γν = 1 (Vlemmings et al. 2010, Surcis et al. 2011b). The errorswere determined by analyzing the full probability distribution function. (c) The Zeeman-splitting is determined by fitting the V stoke spectra byusing the best-fitting results (∆Vi andTb∆Ω). (d) The angle between the magnetic field and the maser propagation direction is determined by usingthe observedPl and the fitted emerging brightness temperature. The errors were determined by analyzing the full probability distribution function.(e) Because of the degree of the saturation of these CH3OH masersTb∆Ω is underestimated,∆Vi andθ are overestimated.