the first ultra-high resolution digital terrain model of the shallow-water sector around lipari...
TRANSCRIPT

ANNALS OF GEOPHYSICS, 58, 2, 2015, S0218; doi:10.4401/ag-6746
S0218
The first ultra-high resolution Digital Terrain Model of theshallow-water sector around Lipari Island (Aeolian Islands, Italy)
Alessandro Bosman1, Daniele Casalbore1, Marco Anzidei2,*, Filippo Muccini2,Cosmo Carmisciano2, Francesco Latino Chiocci3
1 Istituto di Geologia Ambientale e Geoingegneria, Consiglio Nazionale delle Ricerche, Rome, Italy2 Istituto Nazionale di Geofisica e Vulcanologia, Rome, Italy3 Sapienza Università di Roma, Dipartimento di Scienze della Terra, Rome, Italy
ABSTRACT
Very high resolution bathymetric map obtained through multibeam echo-sounders data are crucial to generate accurate Digital Terrain Modelsfrom which the morphological setting of active volcanic areas can be an-alyzed in detail. Here we show and discuss the main results from the firstmultibeam bathymetric survey performed in shallow-waters around the is-land of Lipari, the largest and the most densely populated of the AeolianIslands (southern Italy). Data have been collected in the depth range of0.1-150 m and complete the already existent high-resolution multibeambathymetry realized between 100 and 1300 m water depth. The new ultra-high resolution bathymetric maps at 0.1-0.5 m provide new insights on theshallow seafloor of Lipari, allowing to detail a large spectrum of volcanic,erosive-depositional and anthropic features. Moreover, the presented dataallow outlining the recent morphological evolution of the shallow coastalsector of this active volcanic island, indicating the presence of potentialgeo-hazard factors in shallow waters.
1. IntroductionSince the beginning of 1930s, single-beam echo-
sounders were used to produce early remote-sensingbased bathymetric maps. In the last decades, seafloormapping systems have undergone a technological revo-lution, especially through the development of multi-beam echo-sounders (MBES). While the use of theformer single beam sensors remains mainly restrictedto recreational applications, multibeam systems allowedto extensively map continental margins, greatly en-hancing the knowledge on geological and oceano-graphic processes that are sculpturing the seafloor[Augustin et al. 1994, Bourillet et al. 1996]. The mainreason for such improvements in seafloor mapping isthat MBES, with respect to single beam echo-sounders,are equipped with hundreds of narrow adjacent beams
arranged in a fan-like swath of typically 90 to 170 de-grees across, providing very high resolution measure-ments up to few centimeters. MBES mapping alsobenefited from GNSS satellite data to precisely posi-tioning the vessel during surveys, also supported by onboard integrated motion-sensors used to estimate andcorrect continuously the vessel motion (roll, pitch andyaw) during the survey. The GPS satellites of the GlobalNavigation Satellite System (GNSS) provides the preciseposition of the vessel and the MBES sensor during nav-igation even up to a few cm of accuracy, then collectingthe soundings data in the WGS84 geodetic reference sys-tem. Additional sensors are used to determine the speedof sound in the water column along the routes, to cor-rect for the refraction effect of the sound waves in re-sponse to changes in water density due to temperature,conductivity and pressure from shallow to deep waters.Finally, powerful computer systems equipped with ad-vanced computer graphics support navigation data andthe ongoing surveys in real time. The post-processingof large amount of MBES data (in the order of 105-107
of soundings) has the final goal to produce Digital Ter-rain Models (DTM) of the investigated areas at veryhigh resolution, giving unprecedented detailed 3-Dviews of the seafloor. Nowadays MBES technique rep-resents the most significant advance in the field ofseafloor and continental water basins mapping, becom-ing a crucial tool for marine geomorphological studies[Locat and Lee 2002, Morgan et al. 2003, Esposito et al.2006 and references therein, Anzidei et al. 2008, Bosmanet al. 2009, Blondel 2012, Romagnoli et al. 2012, Ro-magnoli et al. 2013a].
With the aim to produce a very high resolution
Article historyReceived February 3, 2015; accepted March 7, 2015.Subject classification:Lipari, Multibeam bathymetry, Seafloor geomorphology, Aeolian Islands, Geohazard.

DTM of the shallow-water sector of the active volcanicisland of Lipari (Aeolian Islands, Italy), an ultra-high res-olution multibeam survey was carried out on Septem-ber 2014. The aim of the paper is to present the technicaldetails of the survey and briefly depict the first resultsarising from the ultra-high resolution multibeam ba-thymetry, evidencing possible implications on recent vol-canism, tectonics and coastal hazard at Lipari Island.
2. The investigated area:tectonic and volcanic framework
Lipari Island is the largest and the most denselypopulated among the Aeolian Islands (southern Tyrrhen-ian Sea; Figure 1 inset). It displays an area of about 38 km2
and represents the culmination of a broad largely sub-marine volcanic edifice (Figure 1) belonging to the Li-pari-Vulcano-Salina volcanic belt [Casalbore et al. 2014c].The eruptive history of Lipari spans between ≈267 kaand medieval ages (AD 776-1220) and can be dividedinto nine epochs of activity interrupted by dormant pe-riods, volcano-tectonic phases and episodes of terraceformation during the Last Interglacial [Calanchi et al.2002, Forni et al. 2013]. Active tectonics along NNW-SSE and subordinate N-S and E-W fault systems con-trolled several volcanic edifices that were active throughtime. Lipari, together with Vulcano and Salina Islands,is located at the northern end of a major NNW-SSEtrending right-lateral strike-slip fault system, known as“Aeolian-Tindari-Letojanni”. The latter has been inter-preted as a tectonically active lithospheric discontinu-ity extending from the Aeolian Islands to the Ioniancoast of Sicily [Serpelloni et al. 2011, Ventura 2013, Bar-reca et al. 2014]. It is worth noting that Lipari Island isonly the tip of a large volcanic edifice that rises about1300 m above the seafloor, reaching a peak of about
602 m above sea level at Mt. Chirica. The submarineportion accounts for about the 80% of the entire arealof the edifice, so that several marine surveys were car-ried out in the last decade to map and characterize themain volcanic and erosive-depositional features off-shore Lipari (Figure 1) [Romagnoli et al. 2013b, Casal-bore et al. 2014a,b,c]. Nevertheless, the use of largeResearch Vessels (R/V Urania and Thetis belonging tothe Consiglio Nazionale delle Ricerche) and the ne-cessity of ensuring safety condition during the naviga-tion, prevented from performing the surveying inshallow-water areas (<−40/−50 m, white area in Fig-ure 1), despite the areas close to the coastline representthe most critical for marine geohazards, especially ingeologically-active setting [Chiocci et al. 2008, Casal-bore et al. 2012, Bosman et al. 2014].
3. The Multibeam bathymetric surveyThe multibeam bathymetric survey covered an
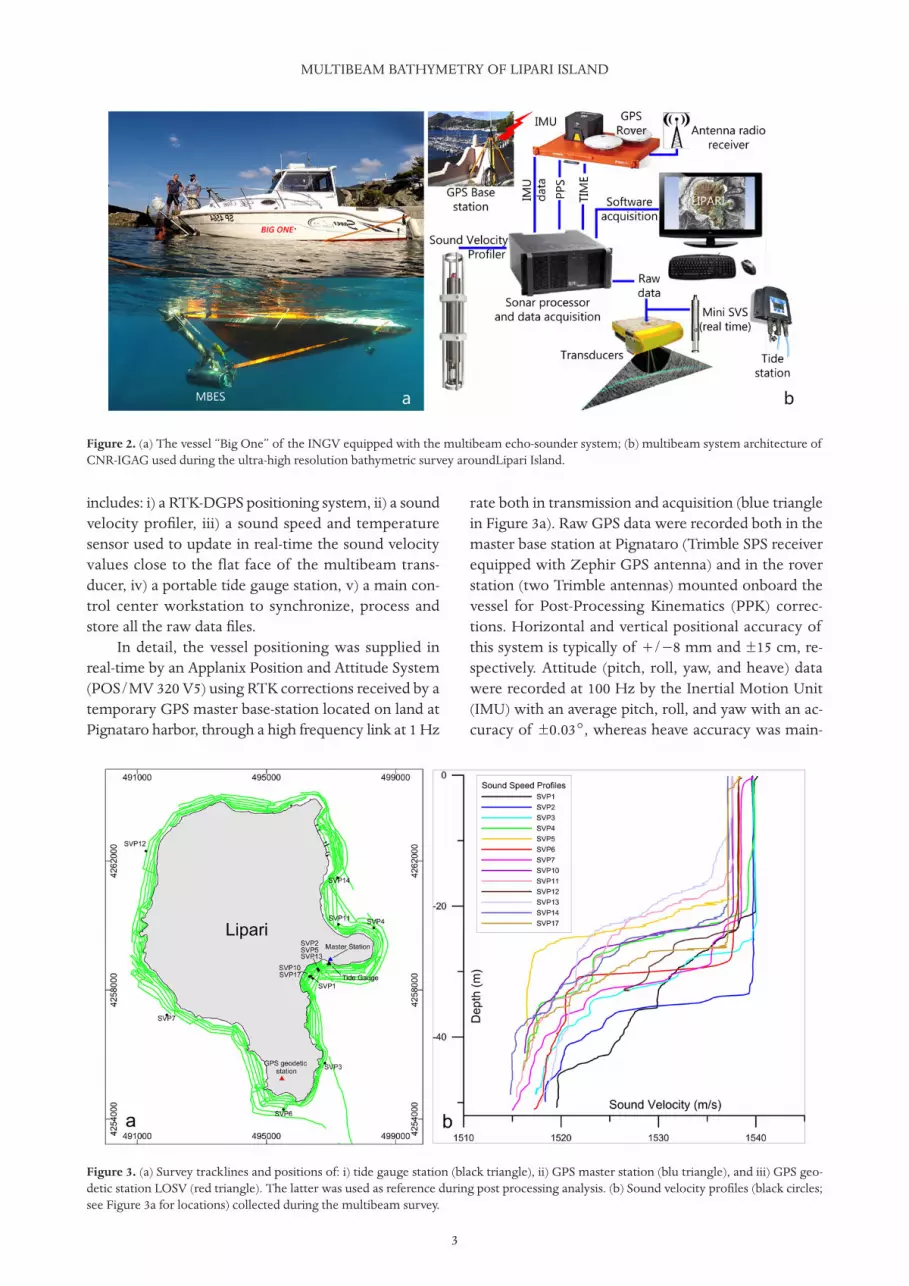
area of 17 km2 and was performed at the end of Sep-tember 2014. Data were collected all around the coastof Lipari Island mostly in the depth range betweenabout 0.5 and 150 m, using a 7 m long boat namedBigOne belonging to the Istituto Nazionale di Geofisicae Vulcanologia (henceforth, INGV; Figure 2a). The ves-sel was equipped with a pole-mount at whose bottomend was installed a ultra-high resolution TeledyneRESON SeaBat 7125 SV2 multibeam system belongingto the Istituto di Geologia Ambientale e Geoingegneriaof the National Research Council (Figure 2a). This sys-tem works at the frequency of 400 kHz emitting up to512 beams across a 140°/165° wide swath; each beamhas a width of 1° × 0.5° (www.iho.int; InternationalHydrographic Organization [2005]). Besides the multi-beam transducer, the system architecture (Figure 2b)
BOSMAN ET AL.
2
Figure 1. Shaded relief of Lipari edifice (modified from Casalbore et al. [2014c]). The white zone shows the area covered by the 2014 ultra-high resolution multibeam surveys discussed in this paper, where shallow-water bathymetric data were lacking from previous surveys.
3
includes: i) a RTK-DGPS positioning system, ii) a soundvelocity profiler, iii) a sound speed and temperaturesensor used to update in real-time the sound velocityvalues close to the flat face of the multibeam trans-ducer, iv) a portable tide gauge station, v) a main con-trol center workstation to synchronize, process andstore all the raw data files.
In detail, the vessel positioning was supplied inreal-time by an Applanix Position and Attitude System(POS/MV 320 V5) using RTK corrections received by atemporary GPS master base-station located on land atPignataro harbor, through a high frequency link at 1 Hz
rate both in transmission and acquisition (blue trianglein Figure 3a). Raw GPS data were recorded both in themaster base station at Pignataro (Trimble SPS receiverequipped with Zephir GPS antenna) and in the roverstation (two Trimble antennas) mounted onboard thevessel for Post-Processing Kinematics (PPK) correc-tions. Horizontal and vertical positional accuracy ofthis system is typically of +/−8 mm and ±15 cm, re-spectively. Attitude (pitch, roll, yaw, and heave) datawere recorded at 100 Hz by the Inertial Motion Unit(IMU) with an average pitch, roll, and yaw with an ac-curacy of ±0.03°, whereas heave accuracy was main-
MULTIBEAM BATHYMETRY OF LIPARI ISLAND
Figure 2. (a) The vessel “Big One” of the INGV equipped with the multibeam echo-sounder system; (b) multibeam system architecture ofCNR-IGAG used during the ultra-high resolution bathymetric survey aroundLipari Island.
Figure 3. (a) Survey tracklines and positions of: i) tide gauge station (black triangle), ii) GPS master station (blu triangle), and iii) GPS geo-detic station LOSV (red triangle). The latter was used as reference during post processing analysis. (b) Sound velocity profiles (black circles;see Figure 3a for locations) collected during the multibeam survey.

tained at ±5% or 5 cm. Lever arm offsets of each in-strument (multibeam transducer, GPS antennas) rela-tive to the Inertial Measurement Unit (IMU) weremeasured at the beginning of the survey, as they serveto reference the multibeam data to true position and toproperly apply motion compensation corrections. Inorder to minimize the offset estimation between themaster GPS antenna, IMU sensor Reference Point andMBES, the devices were placed in an ad-hoc designedbox and pole system.
Survey track lines (green lines in Figure 3a) weremostly run parallel to the isobaths and overlapping at20% to guarantee the full coverage of the seafloor inthe bathymetric range encompassed between the coast-line (or at the minimum distance for safety of naviga-tion) and the deeper multibeam dataset collected in theframework of the MaGIC Project (Figure 1; www.magicproject.it). Patch tests (i.e. ad-hoc sounding lines ac-quired for the calibration of the multibeam sensor) inareas close to the survey zone were daily acquired onflat bottom and steep target between −10 and −60 m:the tests were realized to compute roll, pitch, yaw an-gles and time delay of the MBES and IMU sensors.
Eighteen sound speed profiles were collected dur-ing surveys around Lipari Island using a Valeport SVPto correct for any variation in sound velocity due totemperature and salinity changes throughout the watercolumn at 0.1 m depth intervals (Figures 3a and 3b).Moreover, real-time sound velocity close to the trans-ducer was provided by a Valeport Mini-SVS mountedon its port side, since any error in this value would in-troduce an angular error both in the beam angle andthe ray-tracing.
Tidal correction during surveys was performedusing a portable tide gauge station (Tidemaster Vale-port with accuracy ±0.1% full scale) that was installedalong the pier of Pignataro harbour (black triangle in
Figure 3a) at 5 m water depth. Before the installation,the sensor has been calibrated on site based on the localoceanographic conditions. Tidal data were collectedwith a sampling rate of 4 minutes and thirty secondsof burst interval, successively compared and levelled tothe averaged value recorded at the Ginostra tide gaugestation of the Italian National Tidal Network (seewww.mareografico.it for data and products), located inthe nearby island of Stromboli (Figure 4).
4. Data analysis
GPS data processing To define the geodetic reference frame of the col-
lected data, we used data from the Global PositioningSystem (GPS) satellites analyzed in the Post-ProcessingKinematic (PPK) mode. GPS data processing was per-formed in two steps: in the first we estimated the pre-cise position of the temporary base station with respectto the GPS station LOSV (red triangle in Figure 3a)(LOSV position is: Lat 38°26´44.53˝; Lon 14°56´53.36˝;Height 273.30 m). This station, which is the nearest tothe investigated area, is belonging to the RING nationalGPS network managed by the INGV [Avallone et al.2010]. In the second step, we estimated the RTK-DGPSkinematic positions of the rover GPS placed on boardthe vessel reprocessing the RTK solution using the cor-rections provided by LOSV station .
Data have been post-processed using POSPacMMS Software to reduce horizontal and vertical posi-tioning uncertainties, based on the satellite constella-tion orbits, clock corrections, atmospheric delays coupledwith attitude data (L1+L2, ephemeris precise). Post-processed kinematic techniques were used to generatea Smoothed Best Estimate of Trajectory (SBET) file.SBET file is the output of a post-processing solutionthat tightly integrates the orientation and position data
BOSMAN ET AL.
4
Figure 4. Leveling of tide gauge data collected by the local station installed during surveys at Pignataro harbor (in blue) with respect to av-eraged values from the Ginostra station (in red), located at Stromboli Island (data from the National Tide gauge Network, www.mareografico.it).Sampling rate is four minutes.

5
of the IMU and GPS sensors through statistical filter-ing. SBET solution includes rotational motion aroundthe three axes, as well as heave due to surface waves andGPS tidal variation over the survey period, that were alltied to LOSV station. Finally, the 3D positions of theGPS rover placed on board of the vessel, have been es-timated at a few centimeters level.
Multibeam data processing and DTM generationMultibeam data processing was performed using
Caris Hips and Sips 8.1 [CARIS 2000] encompassing thefollowing steps (Figure 5): a) conversion and import ofmultibeam raw data files (s7k), b) application of tidedata leveled to the Ginostra station, c) importing andreplacing of the new Smoothed Best Estimated Trajec-tory on the raw multibeam data, d) ray-tracing by soundspeed profiling with interpolation by time and/or dis-tance between velocity depth-profiles, e) matching ofmultibeam lines by patch test on specific targets per-formed every day, f ) application of statistical and geo-metrical (angle and distance) filters for each swath toremove coherent/incoherent noise, g) the manual dele-tion of spikes due to single fake soundings during edit-ing. Some 600 × 106 processed soundings were mergedand gridded (e.g. using a weighted averaging algorithm;Ware et al. [1991]) for the generation of DTMs at dif-ferent resolutions: cell size, varying from 0.1 m in veryshallow water (down to −40 m) to 0.5 m at greater
depths. The final DTM in this work was realized withcell-size of 0.5 m (Figure 6). The sub-aerial DTM is ob-
MULTIBEAM BATHYMETRY OF LIPARI ISLAND
Figure 5. Flow chart of the multibeam data processing: (a) GPS and attitude; (b) bathymetric data; (c) backscatter data; (d) DTM merging.See text for details.
Figure 6. Shaded relief map of the ultra-high resolution multibeambathymetry acquired during our surveys with the location of theareas (black squares) discussed in the text and in Figures 7, 8 and 9.Projection UTM 33N, Datum WGS84.
tained from LIDAR data, provided by the Ministero del-l’Ambiente.
Moreover, the multibeam backscatter signal wasprocessed through SIPS SST (Side Scan Tools), apply-ing radiometric and geometric corrections to the data,including slant-range corrections based on the availablebathymetry, as well as corrections for beam pattern ef-fects and time and angle varying gain. SIPS SST also cal-culates the Time Variable Gain (TVG), despeckle andgain normalization (Figure 5). Multibeam backscattermosaic was realized with a pixel size of 0.1 m.
5. The morpho-bathymetric map and preliminaryanalysis
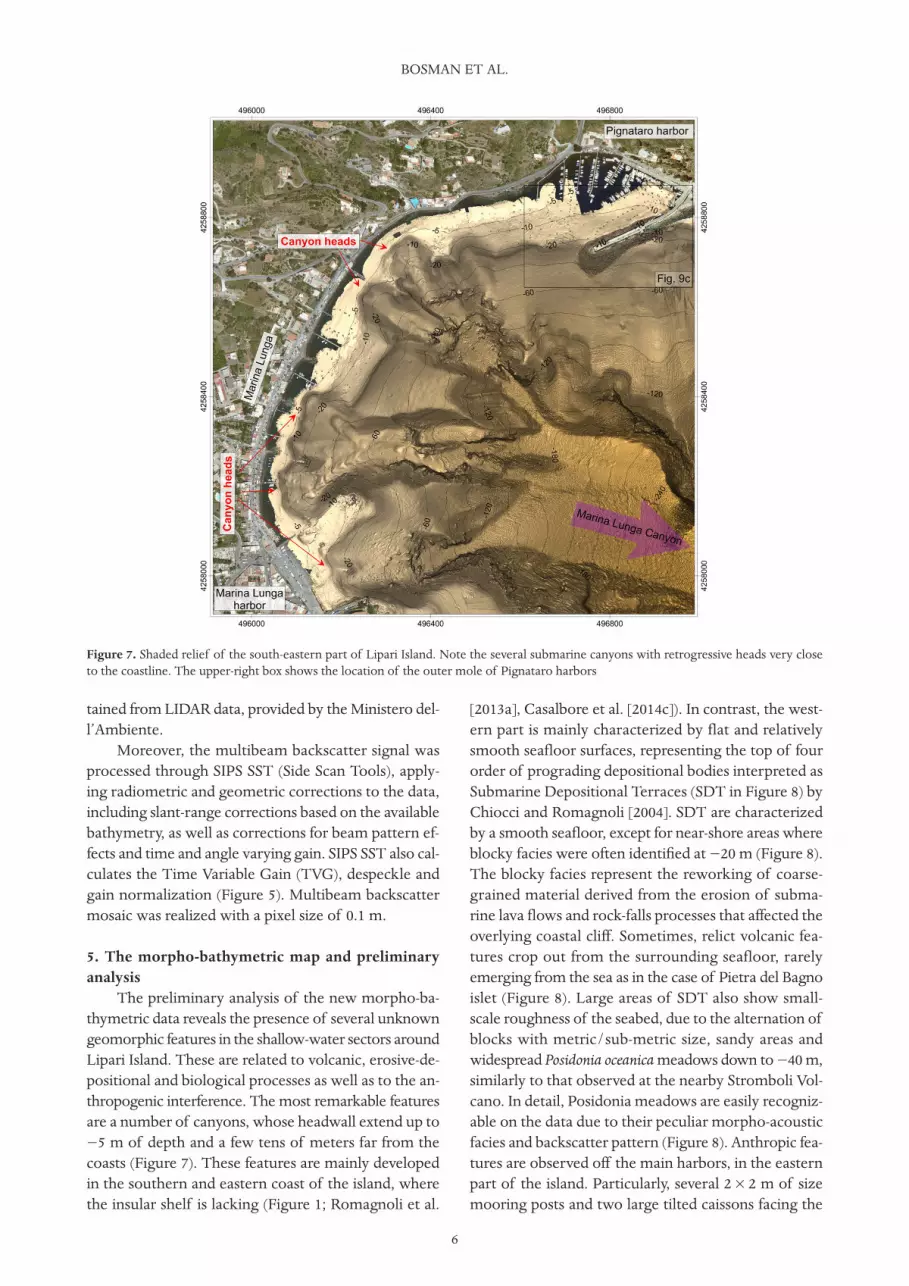
The preliminary analysis of the new morpho-ba-thymetric data reveals the presence of several unknowngeomorphic features in the shallow-water sectors aroundLipari Island. These are related to volcanic, erosive-de-positional and biological processes as well as to the an-thropogenic interference. The most remarkable featuresare a number of canyons, whose headwall extend up to−5 m of depth and a few tens of meters far from thecoasts (Figure 7). These features are mainly developedin the southern and eastern coast of the island, wherethe insular shelf is lacking (Figure 1; Romagnoli et al.
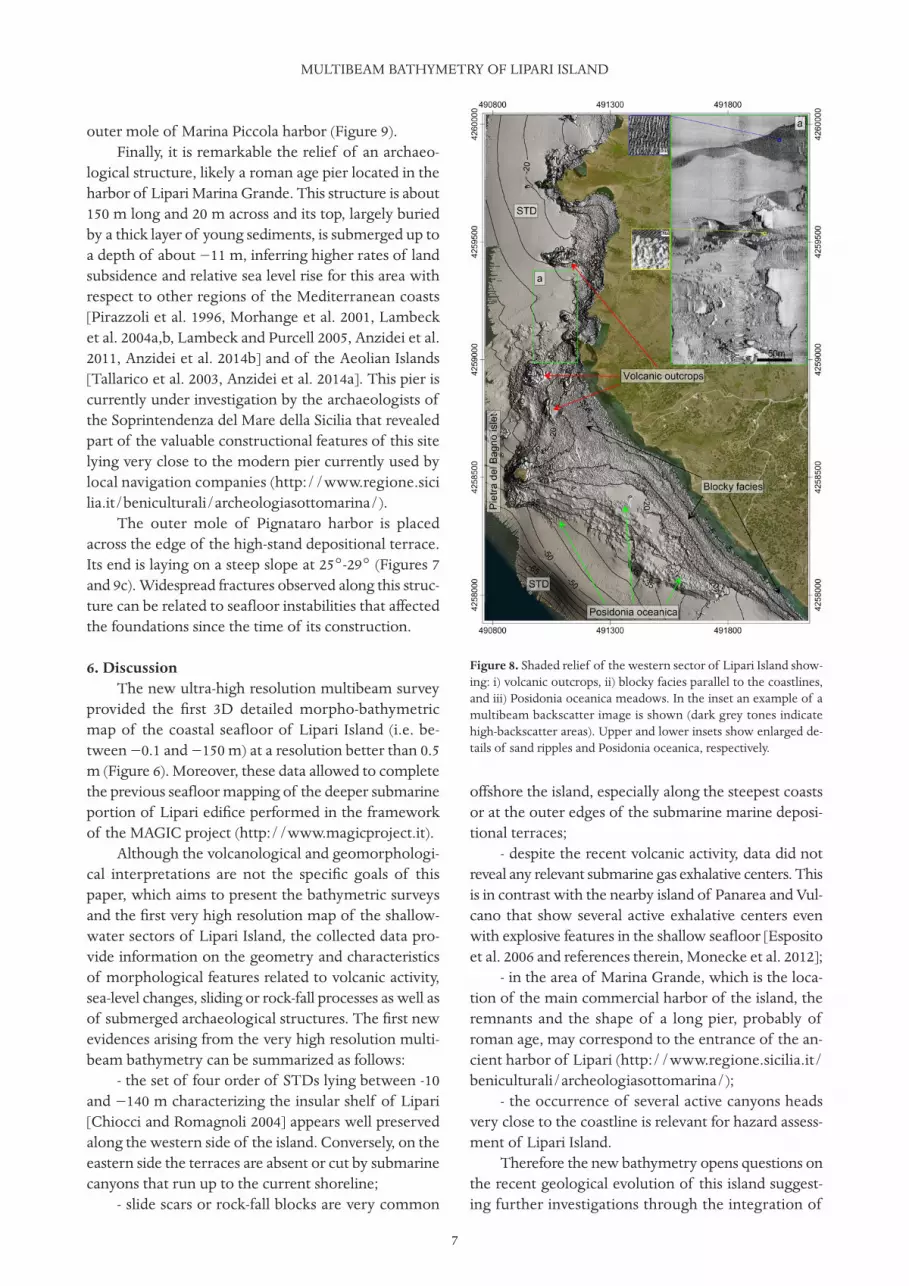
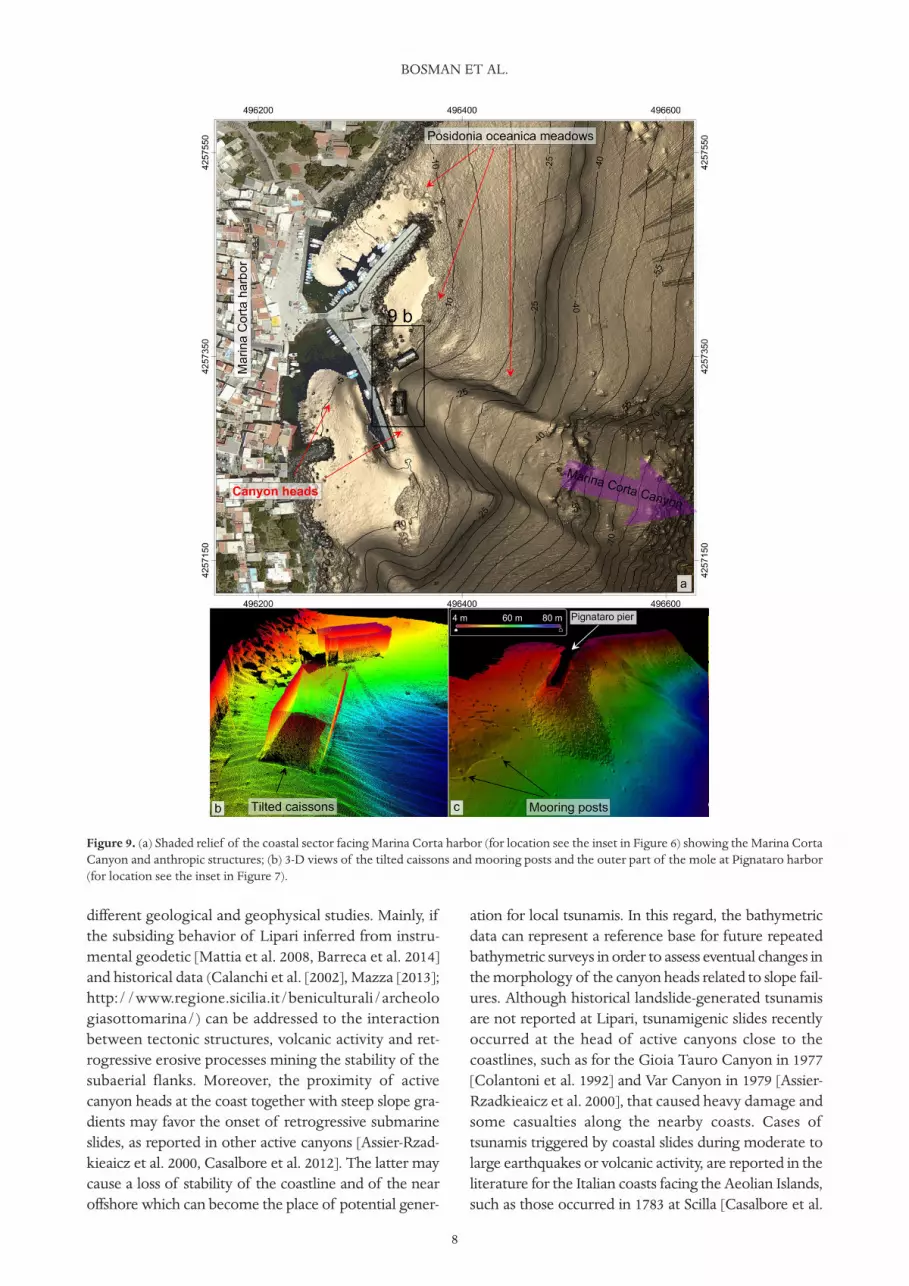
[2013a], Casalbore et al. [2014c]). In contrast, the west-ern part is mainly characterized by flat and relativelysmooth seafloor surfaces, representing the top of fourorder of prograding depositional bodies interpreted asSubmarine Depositional Terraces (SDT in Figure 8) byChiocci and Romagnoli [2004]. SDT are characterizedby a smooth seafloor, except for near-shore areas whereblocky facies were often identified at −20 m (Figure 8).The blocky facies represent the reworking of coarse-grained material derived from the erosion of subma-rine lava flows and rock-falls processes that affected theoverlying coastal cliff. Sometimes, relict volcanic fea-tures crop out from the surrounding seafloor, rarelyemerging from the sea as in the case of Pietra del Bagnoislet (Figure 8). Large areas of SDT also show small-scale roughness of the seabed, due to the alternation ofblocks with metric/sub-metric size, sandy areas andwidespread Posidonia oceanica meadows down to −40 m,similarly to that observed at the nearby Stromboli Vol-cano. In detail, Posidonia meadows are easily recogniz-able on the data due to their peculiar morpho-acousticfacies and backscatter pattern (Figure 8). Anthropic fea-tures are observed off the main harbors, in the easternpart of the island. Particularly, several 2 × 2 m of sizemooring posts and two large tilted caissons facing the
BOSMAN ET AL.
6
Figure 7. Shaded relief of the south-eastern part of Lipari Island. Note the several submarine canyons with retrogressive heads very closeto the coastline. The upper-right box shows the location of the outer mole of Pignataro harbors
7
outer mole of Marina Piccola harbor (Figure 9).Finally, it is remarkable the relief of an archaeo-
logical structure, likely a roman age pier located in theharbor of Lipari Marina Grande. This structure is about150 m long and 20 m across and its top, largely buriedby a thick layer of young sediments, is submerged up toa depth of about −11 m, inferring higher rates of landsubsidence and relative sea level rise for this area withrespect to other regions of the Mediterranean coasts[Pirazzoli et al. 1996, Morhange et al. 2001, Lambecket al. 2004a,b, Lambeck and Purcell 2005, Anzidei et al.2011, Anzidei et al. 2014b] and of the Aeolian Islands[Tallarico et al. 2003, Anzidei et al. 2014a]. This pier iscurrently under investigation by the archaeologists ofthe Soprintendenza del Mare della Sicilia that revealedpart of the valuable constructional features of this sitelying very close to the modern pier currently used bylocal navigation companies (http://www.regione.sicilia.it/beniculturali/archeologiasottomarina/).
The outer mole of Pignataro harbor is placedacross the edge of the high-stand depositional terrace.Its end is laying on a steep slope at 25°-29° (Figures 7and 9c). Widespread fractures observed along this struc-ture can be related to seafloor instabilities that affectedthe foundations since the time of its construction.
6. Discussion The new ultra-high resolution multibeam survey
provided the first 3D detailed morpho-bathymetricmap of the coastal seafloor of Lipari Island (i.e. be-tween −0.1 and −150 m) at a resolution better than 0.5m (Figure 6). Moreover, these data allowed to completethe previous seafloor mapping of the deeper submarineportion of Lipari edifice performed in the frameworkof the MAGIC project (http://www.magicproject.it).
Although the volcanological and geomorphologi-cal interpretations are not the specific goals of thispaper, which aims to present the bathymetric surveysand the first very high resolution map of the shallow-water sectors of Lipari Island, the collected data pro-vide information on the geometry and characteristicsof morphological features related to volcanic activity,sea-level changes, sliding or rock-fall processes as well asof submerged archaeological structures. The first newevidences arising from the very high resolution multi-beam bathymetry can be summarized as follows:
- the set of four order of STDs lying between -10and −140 m characterizing the insular shelf of Lipari[Chiocci and Romagnoli 2004] appears well preservedalong the western side of the island. Conversely, on theeastern side the terraces are absent or cut by submarinecanyons that run up to the current shoreline;
- slide scars or rock-fall blocks are very common
offshore the island, especially along the steepest coastsor at the outer edges of the submarine marine deposi-tional terraces;
- despite the recent volcanic activity, data did notreveal any relevant submarine gas exhalative centers. Thisis in contrast with the nearby island of Panarea and Vul-cano that show several active exhalative centers evenwith explosive features in the shallow seafloor [Espositoet al. 2006 and references therein, Monecke et al. 2012];
- in the area of Marina Grande, which is the loca-tion of the main commercial harbor of the island, theremnants and the shape of a long pier, probably ofroman age, may correspond to the entrance of the an-cient harbor of Lipari (http://www.regione.sicilia.it/beniculturali/archeologiasottomarina/);
- the occurrence of several active canyons headsvery close to the coastline is relevant for hazard assess-ment of Lipari Island.
Therefore the new bathymetry opens questions onthe recent geological evolution of this island suggest-ing further investigations through the integration of
MULTIBEAM BATHYMETRY OF LIPARI ISLAND
Figure 8. Shaded relief of the western sector of Lipari Island show-ing: i) volcanic outcrops, ii) blocky facies parallel to the coastlines,and iii) Posidonia oceanica meadows. In the inset an example of amultibeam backscatter image is shown (dark grey tones indicatehigh-backscatter areas). Upper and lower insets show enlarged de-tails of sand ripples and Posidonia oceanica, respectively.
different geological and geophysical studies. Mainly, ifthe subsiding behavior of Lipari inferred from instru-mental geodetic [Mattia et al. 2008, Barreca et al. 2014]and historical data (Calanchi et al. [2002], Mazza [2013];http://www.regione.sicilia.it/beniculturali/archeologiasottomarina/) can be addressed to the interactionbetween tectonic structures, volcanic activity and ret-rogressive erosive processes mining the stability of thesubaerial flanks. Moreover, the proximity of activecanyon heads at the coast together with steep slope gra-dients may favor the onset of retrogressive submarineslides, as reported in other active canyons [Assier-Rzad-kieaicz et al. 2000, Casalbore et al. 2012]. The latter maycause a loss of stability of the coastline and of the nearoffshore which can become the place of potential gener-
ation for local tsunamis. In this regard, the bathymetricdata can represent a reference base for future repeatedbathymetric surveys in order to assess eventual changes inthe morphology of the canyon heads related to slope fail-ures. Although historical landslide-generated tsunamisare not reported at Lipari, tsunamigenic slides recentlyoccurred at the head of active canyons close to thecoastlines, such as for the Gioia Tauro Canyon in 1977[Colantoni et al. 1992] and Var Canyon in 1979 [Assier-Rzadkieaicz et al. 2000], that caused heavy damage andsome casualties along the nearby coasts. Cases oftsunamis triggered by coastal slides during moderate tolarge earthquakes or volcanic activity, are reported in theliterature for the Italian coasts facing the Aeolian Islands,such as those occurred in 1783 at Scilla [Casalbore et al.
BOSMAN ET AL.
8
Figure 9. (a) Shaded relief of the coastal sector facing Marina Corta harbor (for location see the inset in Figure 6) showing the Marina CortaCanyon and anthropic structures; (b) 3-D views of the tilted caissons and mooring posts and the outer part of the mole at Pignataro harbor(for location see the inset in Figure 7).

9
2014d], in 1905 and 1908 near Pizzo Calabro and Messina[Mastronuzzi et al. 2013]. Similar events also occurred inthe Aeolian Islands during the 2002-2003 eruption ofStromboli volcano [Maramai et al. 2005, Chiocci et al.2008]. Regional tsunamis may also affect the coast of Li-pari, such as in the case of the 2003, M = 6.9 Boumerdèsearthquake in northern Algeria, that struck most of thecoasts of the central Mediterranean, including Italy,causing damages and casualties [Vecchio et al. 2014, andreferences therein]. In this context, the presence of sub-marine canyons with high slopes near the coastline is acritical condition for the propagation of tsunami wavesapproaching the coast [Weiss 2008].
At Lipari, the steepest seafloor areas are close thetown of Lipari with its industrial and touristic activitiesand coastal installations, therefore this area is particu-larly sensitive for potential geo-hazard. Further analysisof the morpho-bathymetric maps, in combination withadditional marine (seismic, seafloor sampling, etc.) andaerial surveys are needed to better constraint the recentevolution of the island as well as to assess coastal dy-namics and related hazard. In particular, the realizationof a very high resolution terrestrial DTM, like for otheractive Italian volcanoes [Achilli et al. 1998, Baldi et al.2006, Baiocchi et al. 2007, Pesci et al. 2007] and its inte-gration with the present multibeam bathymetry willrepresent a further step for a comprehensive analysis ofcoastal hazards, including tsunami modeling for nearand far-field sources and coastal slides, similarly to thatwas realized for the nearby Panarea Island [Fabris et al.2010] or in continental volcanoes [Baiocchi et al. 2007].
7. ConclusionThe ultra-high resolution multibeam swath-ba-
thymetry at 0.1-0.5 m performed in the shallow waterssurrounding the coast of Lipari Island, allowed to com-plete the already existent DTMs for this area. Data re-vealed the presence of morphological structures whichrepresent a potential marine geohazard for this activevolcanic island. Particularly, the possible interaction be-tween tectonic structures, volcanic activity and retro-gressive erosive processes can threaten the stability ofthe submarine flanks of the Lipari edifice, with conse-quent natural hazards. Therefore, due to the presenceof industrial installations and touristic activities, thisarea deserves the same monitoring and hazard assess-ment effort of any active volcano-tectonic regionwithin an urbanized area.
Acknowledgements. This study has been funded by DPC-INGV Project V3 (Multi-disciplinary analysis of the relationships be-tween tectonic structures and volcanic activity), Regione Liguria(Scancoast), the Italian Ministry of Education, University and Re-search within the National Research Program 2011-2013 PRIN (Re
sponse of morphoclimatic system dynamics to global changes and relatedgeomorphologic hazard), Ritmare project for the implementation ofthe multibeam equipment and the Ministero dell’Ambiente e dellaTutela del Territorio e del Mare-Geoportale Nazionale with licenseCreative Commons 3.0 Italy (CC BY-SA-3.0IT) for providing the ter-restrial LIDAR data. We gratefully acknowledge the DPC Projectcoordinators Raffaele Azzaro and Rosanna De Rosa and Guido Ven-tura for insightful discussion, Riccardo Vagni, Captain of INGV ves-sel and Tenente di Vascello Paolo Margadonna of the Capitaneria diPorto at Lipari and Commander Marco Miuccio of the Capitaneriadi Porto at Salina, for their valuable support during surveys.
ReferencesAchilli, V., P. Baldi, L. Baratin, C. Bonini, E. Ercolani, S.
Gandolfi, M. Anzidei and F. Riguzzi (1998). Digitalphotogrammetric survey on the island of Vulcano,Acta Vulcanologica, 10, 1-6.
Anzidei, M., M.L. Carapezza, A. Esposito, G. Giordano,M. Lelli and L. Tarchini (2008). The Albano MaarLake high resolution bathymetry and dissolved CO2budget (Colli Albani volcano, Italy): Constrains tohazard evaluation, Journal of Volcanology and Ge-othermal Research, 171, 258-268; doi:10.1016/j.jvol-geores.2007.11.024.
Anzidei, M., F. Antonioli, K. Lambeck, A. Benini andM. Soussi (2011). New insights on the relative sealevel change during Holocene along the coasts ofTunisia and western Libya from archaeological andgeomorphological markers, Quaternary Interna-tional, 232, 5-12.
Anzidei, M., M. Esposito and M. Benini (2014a). Evi-dence of active subsidence at Basiluzzo Island (Ae-olian Islands, southern Italy) inferred from a Romanage wharf, Quaternary International, 288, 158-167;doi:10.1016/j.quaint.2012.01.019.
Anzidei, M., K. Lambeck, F. Antonioli, S. Furlani, G.Mastronuzzi, E. Serpelloni and G. Vannucci (2014b).Coastal structure, sea-level changes and vertical mo-tion of the land in the Mediterranean, Geological So-ciety, London, Special Publications, 388 (1), 453-479.
Assier-Rzadkieaicz, S., P. Heinrich, P.C. Sabatier, B. Savoyeand J.F. Bourillet (2000). Numerical modelling of alandslide-generated tsunami: the 1979 Nice event,Pure and Applied Geophysics, 157 (10), 1707-1727.
Augustin, J.M., C. Edy, B. Savoye and E. Le Drezen(1994). Sonar mosaic computation from multibeamechosounder, Oceans’94, 2, 433-438.
Avallone, A., G. Selvaggi, E. D’Anastasio, N. D’Agosti-no, G. Pietrantonio, F. Riguzzi, E. Serpelloni, M. An-zidei, G. Casula, G. Cecere, C. D’Ambro-sio, P. DeMartino, R. Devoti, L. Falco, M. Mattia, M. Rossi, F.Obrizzo, U. Tammaro and L. Zarrilli (2010). TheRING network: improvement of a GPS velocityfield in the central Mediterranean, Annals of Geo-physics, 53 (2), 39-54.
MULTIBEAM BATHYMETRY OF LIPARI ISLAND

Baiocchi, V., M. Anzidei, A. Esposito, U. Fabiani, G. Pie-trantonio and F. Riguzzi (2007). Integér bathymétrieet lidar, Géomatique, 55, 32-35.
Baldi, P., M. Fabris, M. Marsella, R. Monticelli and V.Achilli (2006). Application of Digital Terrain Modelto volcanology, Annals of Geophysics, 49 (4/5),1059-1066.
Barreca, G., V. Bruno, F. Cultrera, M. Mattia, C. Mona-co and L. Scarfì (2014). New insights in the geody-namics of the Lipari-Vulcano area (Aeolian Archi-pelago, southern Italy) from geological, geodeticandseismological data, Journal of Geodynamics, 82, 150-167; http://dx.doi.org/10.1016/j.jog.2014.07.003.
Blondel, P. (2012). Bathymetry and its applications, In-Tech, 148 pp.; ISBN 978-953-307-959-2.
Bosman, A., F.L. Chiocci and C. Romagnoli (2009).Morpho-structural setting of Stromboli volcano, re-vealed by high-resolution bathymetry and backscat-ter data of its submarine portions, Bulletin ofVolcanology, 71, 1007-1019.
Bosman, A., D. Casalbore, C. Romagnoli and F.L. Chi-occi (2014). Formation of an ‘a’ lava delta: insightsfrom time-lapse multibeam bathymetry and directobservations during the Stromboli 2007 eruption,Bulletin of Volcanology, 76 (7), 1-12.
Bourillet, J.F., C. Edy, F. Rambert, C. Satra and B.Loubrieu (1996). Swath mapping system processing:Bathymetry and cartography, Marine GeophysicalResearches, 18 (2-4), 487-506.
Calanchi, N., F. Lucchi, P.A. Pirazzoli, C. Romagnoli,C.A. Tranne, U. Radtke, J.L. Reyss and P.L. Rossi(2002). Late quaternary relative sea level changesand vertical movements at Lipari (Aeolian Islands),Journal of Quaternary Science, 17 (5-6), 459-467.
CARIS (2000). CARIS-HIPS (Hydrographic Informa-tion Processing System) and SIPS Professional v. 5.2Software User Guide: MA-HIPS-UG-02-02; on linehttp://www.caris.com/.
Casalbore, D., A. Bosman and F.L. Chiocci (2012). Studyof recent small-scale landslides in geologically ac-tive marine areas through repeated multibeam sur-veys: examples from the southern Italy, In: SubmarineMass Movements and Their Consequences, SpringerNetherlands, 573-582.
Casalbore, D., A. Bosman, C. Romagnoli and F.L. Chi-occi (2014a). Submarine mass-movements on vol-canic islands: Examples from the Aeolian Archipelago(Italy), Engineering Geology for Society and Terri-tory, vol. 4, Lollino et al. (eds.), 199-203.
Casalbore, D., A. Bosman, C. Romagnoli and F.L. Chi-occi (2014b). Large-scale seafloor waveforms on theflanks of insular volcanoes (Aeolian Archipelago,Italy), with inferences about their origin, Marine Ge-
ology, 355, 318-329.Casalbore, D., A. Bosman, C. Romagnoli, M. Di Filippo
and F.L. Chiocci (2014c). Morphology of Lipari off-shore (southern Tyrrhenian Sea), Journal of Maps,1-10.
Casalbore, D., A. Bosman, D. Ridente and F.L. Chiocci(2014d). Coastal and submarine landslides in the tec-tonically-active Tyrrhenian Calabrian Margin (south-ern Italy): examples and geohazard implications,In: Submarine Mass Movements and their Conse-quences, Springer International Publishing, 261-269.
Chiocci, F.L., and C. Romagnoli (2004): Terrazzi depo-sizionali sommersi nelle Isole Eolie (Sicilia), In: F.L.Chiocci, S. D’Angelo and C. Romagnoli (eds.), Atlasof Submerged Depositional Terraces along the Ital-ian Coasts, Memorie Descrittive della Carta Geo-logica d’Italia, Istituto Poligrafico dello Stato (Roma),APAT, 58, 81-114.
Chiocci, F.L., C. Romagnoli, P. Tommasi and A. Bosman(2008). The Stromboli 2002 tsunamigenic subma-rine slide: characteristics and possible failure mech-anisms, Journal of Geophysical Research: Solid Earth(1978-2012), 113, B10102; doi:10.1029/2007JB005172.
Colantoni, P., M. Gennesseaux, J.R. Vanney, A. Ulzega,G. Melegari and A. Trombetta (1992). Processi dina-mici del canyon sottomarino di Gioia Tauro (MareTirreno), Giornale di Geologia, 3, 54/2, 199-213.
Esposito, A., G. Giordano and M. Anzidei (2006). The2002-2003 submarine gas eruption at Panarea Island(Aeolian archipelago, Italy): structure and volcanol-ogy of the seafloor and implications for hazard eval-uation, Marine Geology, 227, 119-134.
Fabris, M., P. Baldi, M. Anzidei, A. Pesci, G. Bortoluzziand S. Aliani (2010). High resolution topographicmodel of Panarea Island by fusion of photogram-metric, lidar and bathymetric digital terrain models,The Photogrammetric Record, 25, 132, 382-401.
Forni, F., F. Lucchi, A. Peccerillo, C.A. Tranne, P.L. Rossiand M.L. Frezzotti (2013). Stratigraphy and geologicalevolution of the Lipari volcanic complex (centralAeolian archipelago), Geological Society, London,Memoirs 2013, 37, 213-279; doi:10.1144/M37.10.
International Hydrographic Organization (2005). Man-ual on hydrography, Publication C-13, 1st edition,May 2005, International Hydrographic Bureau, Mu-nich.
Lambeck, K., F. Antonioli, A. Purcell and S. Silenzi(2004a). Sea-level change along the Italian coast forthe past 10,000 yrs., Quaternary Science Reviews,23, 1567-1598.
Lambeck, K., M. Anzidei, F. Antonioli, A. Benini and A.Esposito (2004b). Sea level in Roman times in thecentral Mediterranean and implications for recent
BOSMAN ET AL.
10

11
change, Earth and Planetary Science Letters, 224,563-575.
Lambeck, K., and A. Purcell (2005). Sea-level change inthe Mediterranean since the LGM: Model predic-tions for tectonically stable areas, Quaternary Sci-ence Reviews, 24, 1969-1988.
Locat, J., and H.J. Lee (2002). Submarine landslides: ad-vances and challenges, Canadian Geotechnical Jour-nal, 39, 193-212.
Maramai, A., L. Graziani and S. Tinti (2005). Tsunamisin the Aeolian Islands (southern Italy): a review, Ma-rine Geology, 215, 11-21.
Mastronuzzi, G., H. Brückner, P.M. De Martini and H.Regnauld (2013). Tsunami: from the open sea to thecoastal zone and beyond, In: S. Mambretti (ed.),Tsunami: Primary Causes to Mitigation, WIT Press,Southampton, 168, 1-36.
Mattia, M., M. Palano, V. Bruno, F. Cannavò, A. Bonac-corso and S. Gresta (2008). Tectonic features of theLipari-Vulcano complex (Aeolian archipelago, Italy)from 10 years (1996-2006) of GPS data, Terra Nova,20 (5), 370-377.
Mazza, A. (2013). Scavo subacqueo in località Sotto-monastero, Lipari (ME). Prima campagna 8-15 set-tembre 2013, Relazione preliminare della campagnadi scavo 2013, Soprintendenza del Mare della Siciliae Università degli Studi di Sassari (http://www.regione.sicilia.it/beniculturali/archeologiasottomarina/).
Monecke, T., S. Petersen, M.D. Hannington, M. An-zidei, A. Esposito, G. Giordano, D. Garbe-Schönberg,N. Augustin, B. Melchert and M. Hocking (2012).Explosion craters associated with shallow subma-rine gas venting off Panarea Island, Italy, Bulletin ofVolcanology, 74 (9), 1937-1944.
Morgan, L.A., W.C. Shanks III, D.A. Lovalvo, S.Y. John-son, W.J. Stephenson, K.L. Pierce, S.S. Harlan, C.A.Finn, G. Lee, M. Webring, B. Schulze, J. Duhn, R.Sweeney and L. Balistrieri (2003). Exploration anddiscovery in Yellowstone Lake: results from high-res-olution sonar imaging, seismic reflection profiling,and submersible studies, Journal of Volcanology andGeothermal Research, 122, 221-242.
Morhange, C., J. Laborel and A. Hesnard (2001). Changesof relative sea level during the past 5000 years inthe ancient harbour of Marseilles, southern France,Palaeogeography, Palaeoclimatology, Palaeooecol-ogy, 166, 319-329.
Pesci, A., M. Fabris, D. Conforti, F. Loddo, P. Baldi and M.Anzidei (2007). Integration of ground-based laserscanner and aerial digital photogrammetry for topo-graphic modelling of Vesuvio volcano, Journal of Vol-canology and Geothermal Research, 162 (3), 123-138.
Pirazzoli, P.A., J. Laborel and S.C. Stiros (1996). Coastalindicators of rapid uplift and subsidence: examplesfrom Crete and other eastern Mediterranean sitesm,Zeitschrift für Geomorphologie, N.F. Suppl.-Bd.,102, 21-35.
Romagnoli, C., D. Casalbore and F.L. Chiocci (2012). LaFossa Caldera breaching and submarine erosion (Vul-cano Island, Italy), Marine Geology, 303-306, 87-98.
Romagnoli, C., D. Casalbore, A. Bosman, R. Braga andF.L. Chiocci (2013a). Submarine structure of Vul-cano volcano (Aeolian Islands) revealed by high-res-olution bathymetry and seismo-acoustic data, MarineGeology, 338, 30-45.
Romagnoli, C., D. Casalbore, G. Bortoluzzi, A. Bosman,F.L. Chiocci, F. D’Oriano, F. Gamberi, M. Ligi andM. Marani (2013b). Bathy-morphological setting ofthe Aeolian Islands, Geological Society, London,Memoirs, 37, 27-36; doi:10.1144/M37.4
Serpelloni, E., R. Bürgmann, M. Anzidei, P. Baldi, B.Mastrolembo Ventura and E. Boschi (2011). Strainaccumulation across the Messina Straits and kine-matics of Sicily and Calabria from GPS data and dis-location modeling, Earth and Planetary ScienceLetters, 298, 347-360; doi:10.1016/j.epsl.2010.08.005.
Tallarico, A., M. Dragoni, M. Anzidei and A. Esposito(2003). Modeling long-term ground deformation dueto the cooling of a magma chamber: case of Basi-luzzo Island, Aeolian Islands, Italy, Journal of Geo-physical Research, 108 (B12), 2568; doi:10.1029/2002JB002376.
Vecchio, A., M. Anzidei and V. Carbone (2014). New in-sights on the tsunami recording of the May 21, 2003,Mw 6.9 Boumerdès earthquake from tidal dataanalysis, Journal of Geodynamics, 79, 39-49.
Ventura, G. (2013). Kinematics of the Aeolian volcan-ism (southern Tyrrhenian Sea) from geophysicaland geological data, In: F. Lucchi, A. Peccerillo, J.Keller, C.A. Tranne and P.L. Rossi (eds.), The Aeo-lian Islands Volcanoes, Geological Society, London,Memoirs, 37, 3-11.
Ware, C., W. Knight and D. Wells (1991). Memory inten-sive statistical algorithms for multibeam bathymet-ric data, Computers & Geosciences, 17 (7), 985-993.
Weiss, R. (2008). Sediment grains moved by passingtsunami waves: Tsunami deposits in deep water,Marine Geology, 250, 251-257.
Corresponding author: Marco Anzidei,Istituto Nazionale di Geofisica e Vulcanologia, Rome, Italy;email: [email protected].
© 2015 by the Istituto Nazionale di Geofisica e Vulcanologia. Allrights reserved.
MULTIBEAM BATHYMETRY OF LIPARI ISLAND