the iras view of the local universe
TRANSCRIPT
arX
iv:a
stro
-ph/
0006
005v
1 1
Jun
200
0
The Hidden UniverseASP Conference Series, Vol. ,R.C. Kraan-Korteweg, P.A. Henning and H. Andernach, eds.
The IRAS view of the Local Universe
Will Saunders1, Kenton D’Mellow1, Helen Valentine1, Brent Tully2
1University of Edinburgh, UK. 2University of Hawaii, USA.
Esperanza Carrasco1, Bahram Mobasher2, Steve Maddox3, George Hau4
1INAOE, Mexico. 2STSCI, USA. 3University of Nottingham, UK.4Universidad Catholica, Santiago, Chile.
Will Sutherland1, Dave Clements2, Lister Staveley-Smith3
1ATC, ROE, UK. 2 University of Cardiff, UK. 3CSIRO, Australia.
Abstract.We summarise results for the predicted density and peculiar velocity fields
from the PSCz survey, consisting of redshifts for 15,000 IRAS galaxies covering84% of the sky to a depth of 25, 000 km s−1. We have used a generalisationof the Path Interchange Zeldovich Approximation technique to determine thevelocity field; the most remarkable feature being a coherent large-scale flowalong the baseline connecting the Local Supercluster, Centaurus and the ShapleyConcentration. Comparison of the predicted and observed bulk flows gives avalue of β = 0.50 ± 0.1.
We re-examine the PSCz dipole, with improved redshift completeness atlow-latitudes and using PIZA to estimate real-space distances. We find thedipole to be stable between 80 and 180 h−1Mpc, although there appears to be asignificant contribution to the dipole around 200h−1Mpc. The overall misalign-ment with the CMB dipole remains at 20. The implied value of β depends onthe exact treatment; we derive values in the range β = 0.40−0.55 with statisticalerror ±0.1.
We also present the density field and a preliminary dipole analysis from thealmost completed Behind The Plane survey, which extends the PSCz to cover93% of the sky including the proposed core of the Great Attractor. We finda density peak at (325,−5, 3500 km s−1), about half as massive as Centaurusor Pavo-Indus, and forming part of a continuous filament linking them acrossthe Plane. We also find evidence for a much larger ‘Greater Attractor’ directlybehind the GA, at a distance of 125h−1Mpc, and more massive than the Shapleyconcentration.
At large distances the dipole direction is in much improved agreement withthe CMB: at 250 − 300 h−1Mpc, the misalignment is only 5 − 10, and this isconsistent with the shot noise errors. The J3-weighted dipole, which in principalis expected to agree better with the CMB, gives a misalignment of 13. Thedipole direction is somewhat dependent on the corrections made for the redshiftincompleteness, and may also be affected by unquantified incompleteness in theBTP survey close to the Galactic Centre. The dipole amplitude implies a valuefor the parameter β of 0.44 ± 0.1. Values much larger than β = 0.5, while notformally ruled out, cause very unlikely-looking rocket effects.
1
2 Saunders et al.
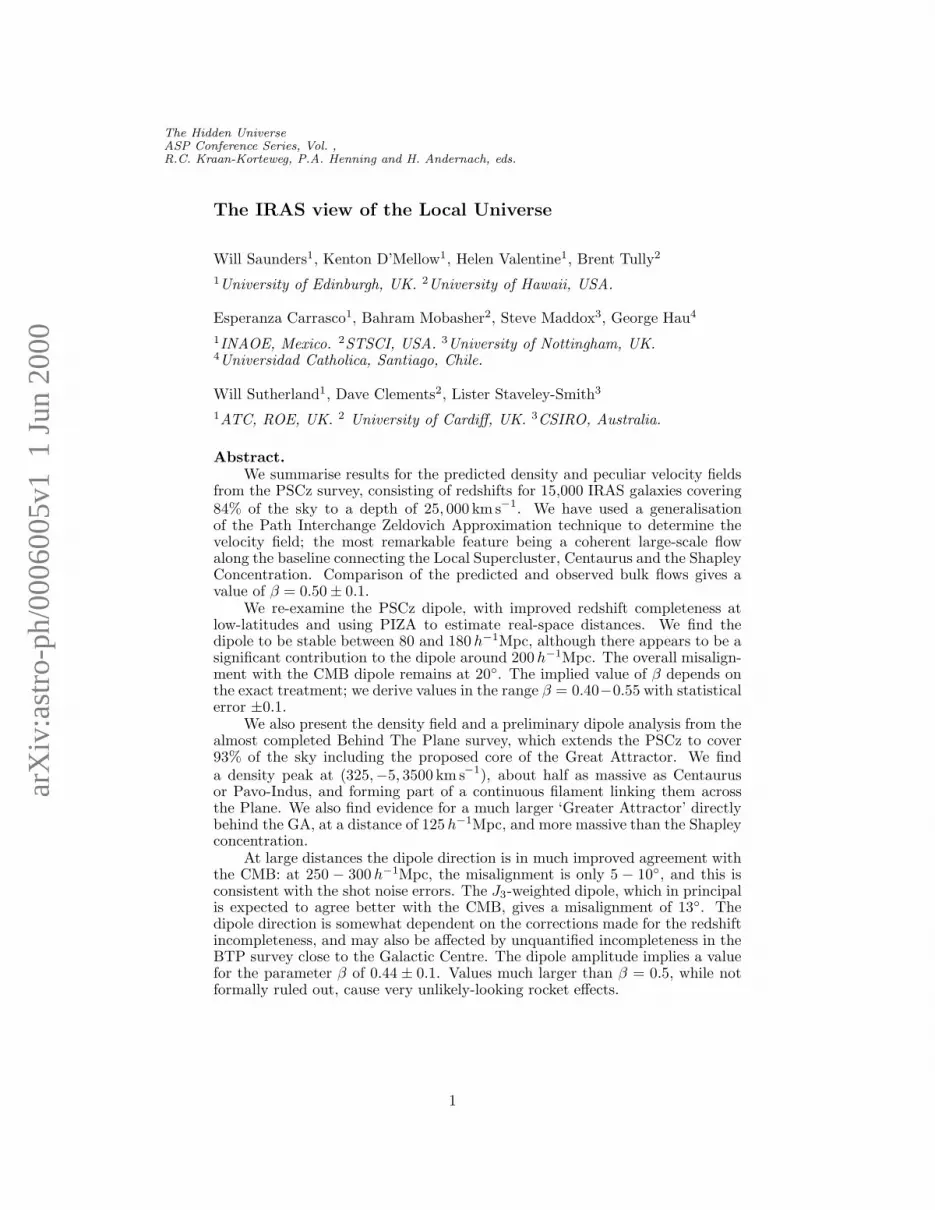
Figure 1. PSCz and BTP galaxy catalogues and masks in galactic coordinates.
1. Introduction
Redshift surveys of galaxies can be used to infer the dynamics of the Local Universe.Comparison with observed peculiar velocities allows determination of the mass associ-ated with galaxies (usually parameterised by the the quantity β ≃ Ω0.6/b), and alsoreconstruction of the initial conditions. Because gravity is extensive, accurate predic-tions formally require uniform surveys with infinite depth and complete sky coverage;failing that, we need a depth much larger than the region of interest, and with coveragegaps small enough to interpolate over. IRAS surveyed 96% of the sky with negligibleextinction, tracing the large-scale structure to a depth of at least 20, 000 km s−1. Forthese reasons, IRAS-based surveys have dominated this field for the last decade. TheIRAS dipole has remained astonishingly stable in direction over this period, despitethe ever-increasing depth and sky coverage of the follow-up redshift surveys. However,the amplitude has increased continuously, with extra contributions uncovered at largerdistances and lower latitudes.
The Point Source Calatog Redshift Survey (PSCz) consists of essentially all galax-ies in the PSC, down to its nominal flux limit of 0.6 Jy, across the 84% of the sky whereextinction was estimated to be low enough (AB < 2m) to allow reasonably completeoptical identifications and spectroscopy with 2-metre class telescopes. The PSCz data isnow available from http://www-astro.physics.ox.ac.uk/∼wjs/pscz.html; also there avail-able is the full, labelled 3D density distribution, using the Fourier interpolation methodpresented in Saunders and Ballinger (2000). The catalogue and main science papers todate are summarised in Saunders et al. (2000a).
The PSC itself is useable much deeper into the Plane. The Behind The PlaneSurvey extends the PSCz to cover the entire 93% of the sky with useable PSC data,and is now almost completed. The remaining size of the Zone of Avoidance is just 4%of the sky, and this is hopefully small enough to interpolate over with confidence. Thesky distribution for both surveys is shown in Figure 1.

Saunders et al. 3
2. The PSCz velocity field and the Path Interchange Zeldovich Approxi-mation
A linear theory reconstruction of the velocity field and comparison with the Mark IIIdataset was been performed by Branchini et al. (1999). However, the heavy smoothingneeded to make linear theory applicable seriously compromises the detail with whichsuch comparisons can be done.
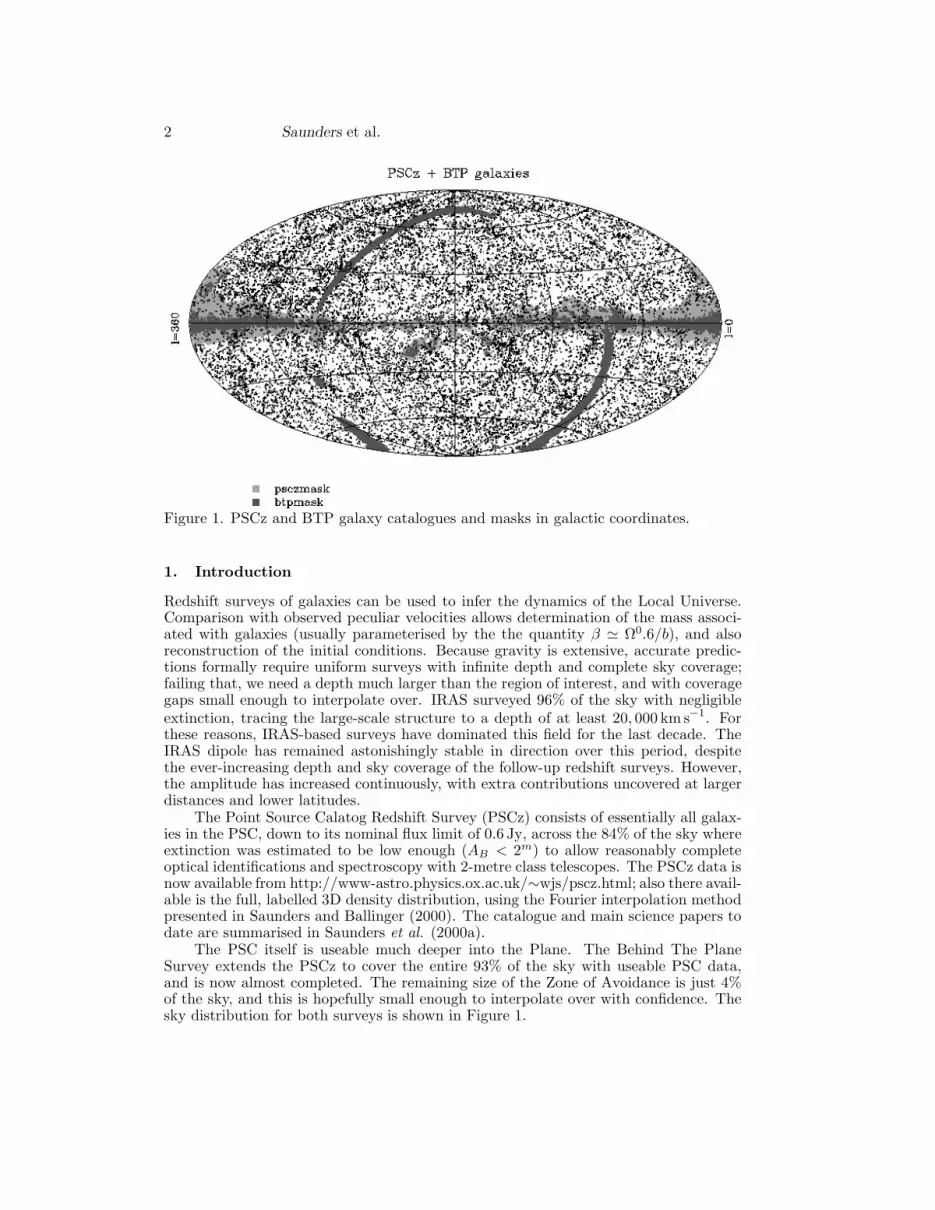
The PIZA algorithm, originally presented by Croft and Gaztanaga (1997), is aquasi-linear method for reconstructing the velocity field from galaxy surveys, allowingthe full resolution of the data to be kept. The basic idea is wonderful and very sim-ple: to Zeldovich order, velocities and trajectories depend in a fixed way on the scalefactor; so minimising the action is equivalent to minimising the rms trajectories of thegalaxies. Given a set of uniform initial positions and the current galaxy positions, theleast-action solution is found by setting up arbitrary trajectories and swapping pairs toreduce the action. The formalism can be readily adapted to minimise (for a given β)the real-space trajectories from redshift-space information. With more complexity, thechanges in selection function for individual galaxies caused by peculiar velocities canalso be included, though we have found doing this leads to instabilities without anyimprovement in accuracy, and this is not done here. This and edge effects lead to asystematic velocity underestimation of ∼ 20% in comparison with simulations. Furtherdetails are presented in Valentine, Saunders and Taylor (2000). The resulting veloc-ity field in the Supergalactic Plane is shown in Figure 2. The flow field is dominatedby infall into the Supergalactic Plane, and coherent flow along it involving the LocalSupercluster, Centaurus and the Shapley Concentration.
3. Comparison with observed peculiar velocities
The velocity field predicted from PIZA can be compared with observations. The derivedtrajectory of the Local Group is robust, with weak dependence on how the mask is filledor the input β. Comparison of this trajectory with the CMB dipole gives β = 0.53±0.1.A comparison of the bulk flow as a function of radius with the MarkIII dataset impliesa value for β of 0.5 ± 0.15.
We have also undertaken a new comparison with the SFI dataset of peculiar veloci-ties of Spiral Galaxies (Giovanelli et al. 1998). We have calculated the average peculiarvelocity with respect to the Local Group, of galaxies in redshift slices, so as to be asclosely as possible comparable to Giovanelli et al. . We find reasonable agreement in am-plitude, though there are significant directional differences, for β = 0.55±0.1 (Table 1).
We agree with Giovanelli et al. that most of the dipole is generated within 5000 km s−1.However, we do find substantial contribution to the dipole beyond this distance (see be-low), even though our derived velocity dipole at this distance is in excellent agreementwith the CMB. The sum derived by Giovanelli et al. is a galaxy-weighted vector sum,rather than volume-weighted. Therefore, a good agreement between velocity vector andCMB dipole does not necessarily imply that a cosmic rest frame has been reached.
Shell VSFI (l, b)SFI VPIZA (l, b)PIZA
0-2000 270 ± 80 (245, 49)± 19 338 (237,41)1500-3500 410 ± 69 (255, 21)± 12 404 (265,51)2500-4500 620 ± 76 (255, 15)± 11 471 (271,45)3500-5500 585 ± 92 (265, 19)± 13 550 (285,36)4500-6500 544 ± 98 (270, 16)± 15 508 (284,31)
Table 1. SFI vs PSCz peculiar velocities with respect to shells of galaxies. PSCzreconstruction assumes β = 0.5.
4 Saunders et al.
Figure 2. Reconstructed velocity field in the Supergalactic Plane. The Great Attractorregion is at 10 o’clock.
4. PSCz dipole
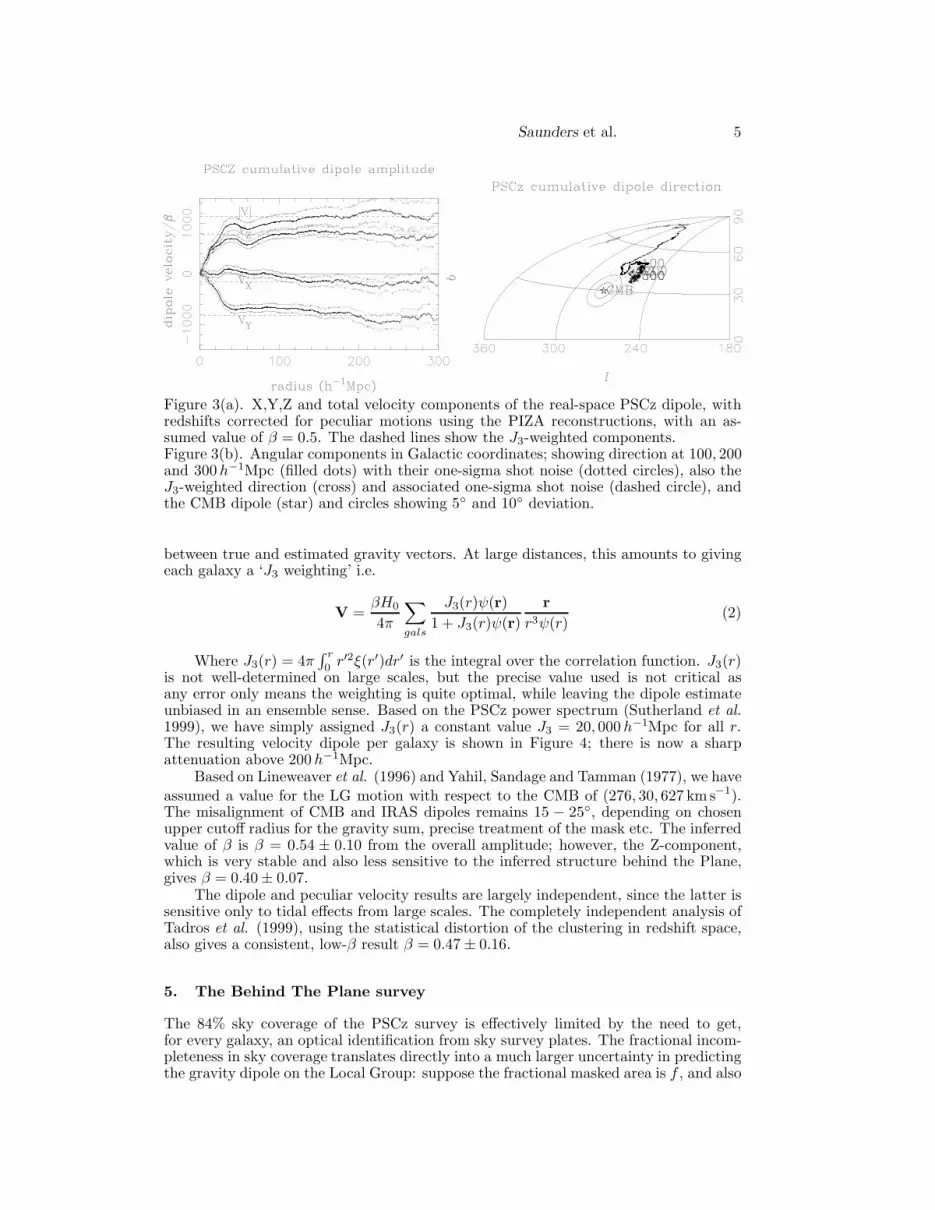
In the course of the BTP survey, we also took several hundred new reshifts for low-latitude PSCz galaxies, giving an overall redshift incompleteness for bright galaxies of70 galaxies (0.5%). A further 230 galaxies (1.5%) without redshifts are assumed fromtheir optical and/or infrared appearance to be beyond 30, 000 km s−1. In the original,publicly available survey, there was known incompleteness at lower redshifts towardsthe Galactic anti-centre as discussed by Saunders et al. (2000a) and whose effect onthe dipole is discussed in Rowan-Robinson et al. (2000). It is appropriate then torecalculate the dipole analysed by Rowan-Robinson et al. . We have corrected forpeculiar velocities using PIZA as above, with β = 0.5 for self-consistency betweengravity and velocity dipoles. The mask is filled in via the Fourier interpolation methodof Saunders and Ballinger (2000). The revised dipole is presented in Figure 3. Thedipole is remarkably stable between 125− 180 h−1Mpc, However, it shows a significantshift at 180−220 h−1Mpc in the X and Y components. This shift is seen in the analysisof Rowan-Robinson et al. , and is too large to be attributed to the small remainingredshift incompleteness. It remains when the interpolated galaxies in the Plane arereplaced by randomly distributed galaxies at the mean density, so it is not due to theinterpolation either. It does not appear to be associated with any single particularstructure.
In linear theory, the contribution to the velocity dipole per galaxy is
V(r) =βH0
4π
r
r3ψ(r)(1)
where ψ is the selection function. In Figure 4, we plot the amplitude of this velocity asa function of distance for the PSCz. The dipole contribution per galaxy is remarkablyconstant in the range 20−100 h−1Mpc. Nearby, the contribution is large because of the1/r2 term, but at least the numbers of galaxies involved are small and the structuresthey reside in are real and well-sampled. At large distances, the contribution blows upbecause ψ falls off much faster than 1/r2, and the dipole becomes increasingly dominatedby shot noise (e.g. Taylor and Valentine 1999). Strauss et al. (1992) derived an optimalweighting scheme, in the sense of producing the minimum variance ensemble difference
Saunders et al. 5
Figure 3(a). X,Y,Z and total velocity components of the real-space PSCz dipole, withredshifts corrected for peculiar motions using the PIZA reconstructions, with an as-sumed value of β = 0.5. The dashed lines show the J3-weighted components.Figure 3(b). Angular components in Galactic coordinates; showing direction at 100, 200and 300 h−1Mpc (filled dots) with their one-sigma shot noise (dotted circles), also theJ3-weighted direction (cross) and associated one-sigma shot noise (dashed circle), andthe CMB dipole (star) and circles showing 5 and 10 deviation.
between true and estimated gravity vectors. At large distances, this amounts to givingeach galaxy a ‘J3 weighting’ i.e.
V =βH0
4π
∑
gals
J3(r)ψ(r)
1 + J3(r)ψ(r)
r
r3ψ(r)(2)
Where J3(r) = 4π∫ r
0r′2ξ(r′)dr′ is the integral over the correlation function. J3(r)
is not well-determined on large scales, but the precise value used is not critical asany error only means the weighting is quite optimal, while leaving the dipole estimateunbiased in an ensemble sense. Based on the PSCz power spectrum (Sutherland et al.1999), we have simply assigned J3(r) a constant value J3 = 20, 000 h−1Mpc for all r.The resulting velocity dipole per galaxy is shown in Figure 4; there is now a sharpattenuation above 200 h−1Mpc.
Based on Lineweaver et al. (1996) and Yahil, Sandage and Tamman (1977), we have
assumed a value for the LG motion with respect to the CMB of (276, 30, 627 km s−1).The misalignment of CMB and IRAS dipoles remains 15 − 25, depending on chosenupper cutoff radius for the gravity sum, precise treatment of the mask etc. The inferredvalue of β is β = 0.54 ± 0.10 from the overall amplitude; however, the Z-component,which is very stable and also less sensitive to the inferred structure behind the Plane,gives β = 0.40 ± 0.07.
The dipole and peculiar velocity results are largely independent, since the latter issensitive only to tidal effects from large scales. The completely independent analysis ofTadros et al. (1999), using the statistical distortion of the clustering in redshift space,also gives a consistent, low-β result β = 0.47 ± 0.16.
5. The Behind The Plane survey
The 84% sky coverage of the PSCz survey is effectively limited by the need to get,for every galaxy, an optical identification from sky survey plates. The fractional incom-pleteness in sky coverage translates directly into a much larger uncertainty in predictingthe gravity dipole on the Local Group: suppose the fractional masked area is f , and also

6 Saunders et al.
Figure 4. Linear theory velocity generated at the Local Group for a galaxy in the PSCfor a galaxy of given distance. The dashed line shows the effect of the J3-weighting.
that this is large and compact enough that we have essentially no information aboutthe distribution behind the mask. Then we can think of the sky as consisting of 1/findependent contributions to the dipole, one of which is unknown, giving a fractionaluncertainty in the measured dipole vector of
√
f/(1 − f). Thus even 10% missing skycoverage can lead to a error of 1/3 in the dipole. The bulk of the dipole is generatedaround 40 h−1Mpc, at which distance the correlation length r0 subtends just 5, so gapsmuch larger than this are too large to interpolate usefully and lead to large errors inthe dipole.
The IRAS PSC data itself is reliable to much lower latitudes, although genuinegalaxies are outnumbered by Galactic sources with similar IRAS properties. Previousattempts to go further into the Plane have either been restricted to the Arecibo decli-nation range, or have relied on optical identifications from Sky Survey Plates. Becausethe extinction may be several magnitudes or more, they have inevitably suffered fromprogressive and unquantifiable incompleteness as a function of latitude. Hence in 1994we embarked on a program, parallel with the PSCz survey, to systematically identifyand get redshifts for low latitude IRAS galaxies wherever the PSC data allowed - es-sentially limited only by IRAS coverage and confusion, to 93% of the sky. A detaileddescription is given in the associated poster paper (Saunders et al. 2000b). The iden-tification program is complete; and we have found over 200 galaxies which were notincluded in the 1.2Jy survey but should have been. The BTP sky distribution is shownalong with the PSCz in Figure 1. At low latitudes towards the Galactic centre, thePSC is not complete to our nominal flux limit of 0.6 Jy, and the density of identifiedBTP galaxies reflect this. This incompleteness is interpreted, quantified and correctedfor in the poster paper. Notwithstanding this, the huge overdensity of galaxies in theGreat Attractor region (325,±5) is obvious; as is the Puppis supercluster (250, 0) andthe extension from Perseus (150,-10) and Pegasus (95,-10) into the Plane.
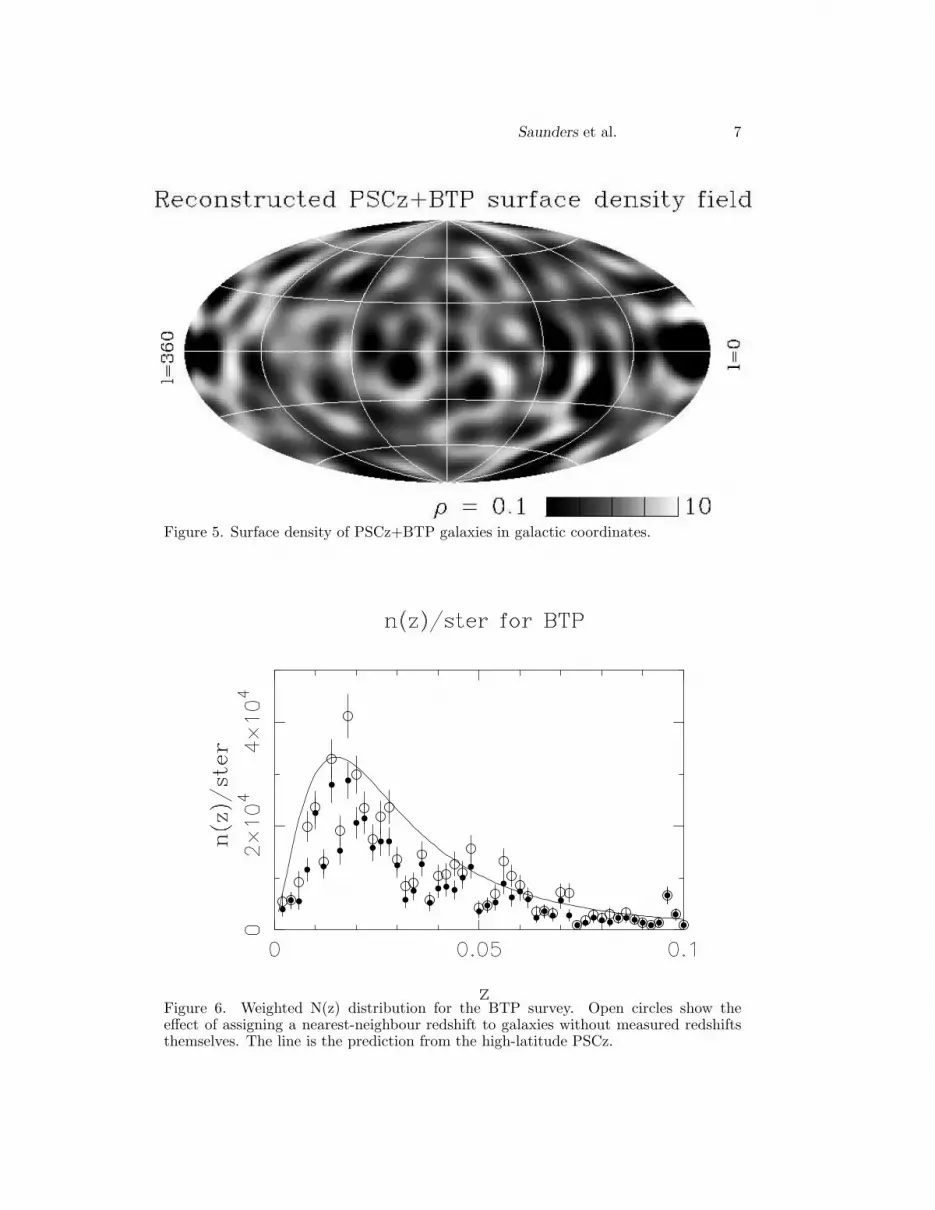
The overall surface density of IRAS galaxies in the BTP area, when corrected forknown incompleteness, is 78% of the PSCz average. Unquantified incompletenessescould conceivably push this up to the average value, but clearly we can rule out largeoverall overdensity behind the Plane. We have used the Fourier interpolation techniqueto find the projected surface density of the PSCz+BTP galaxy distribution; this isshown in Figure 5. In addition to the above features, we see the Ophiucus Sperclusterclearly at (0,10) and the local void behind the Galactic Centre.
Saunders et al. 7
Figure 5. Surface density of PSCz+BTP galaxies in galactic coordinates.
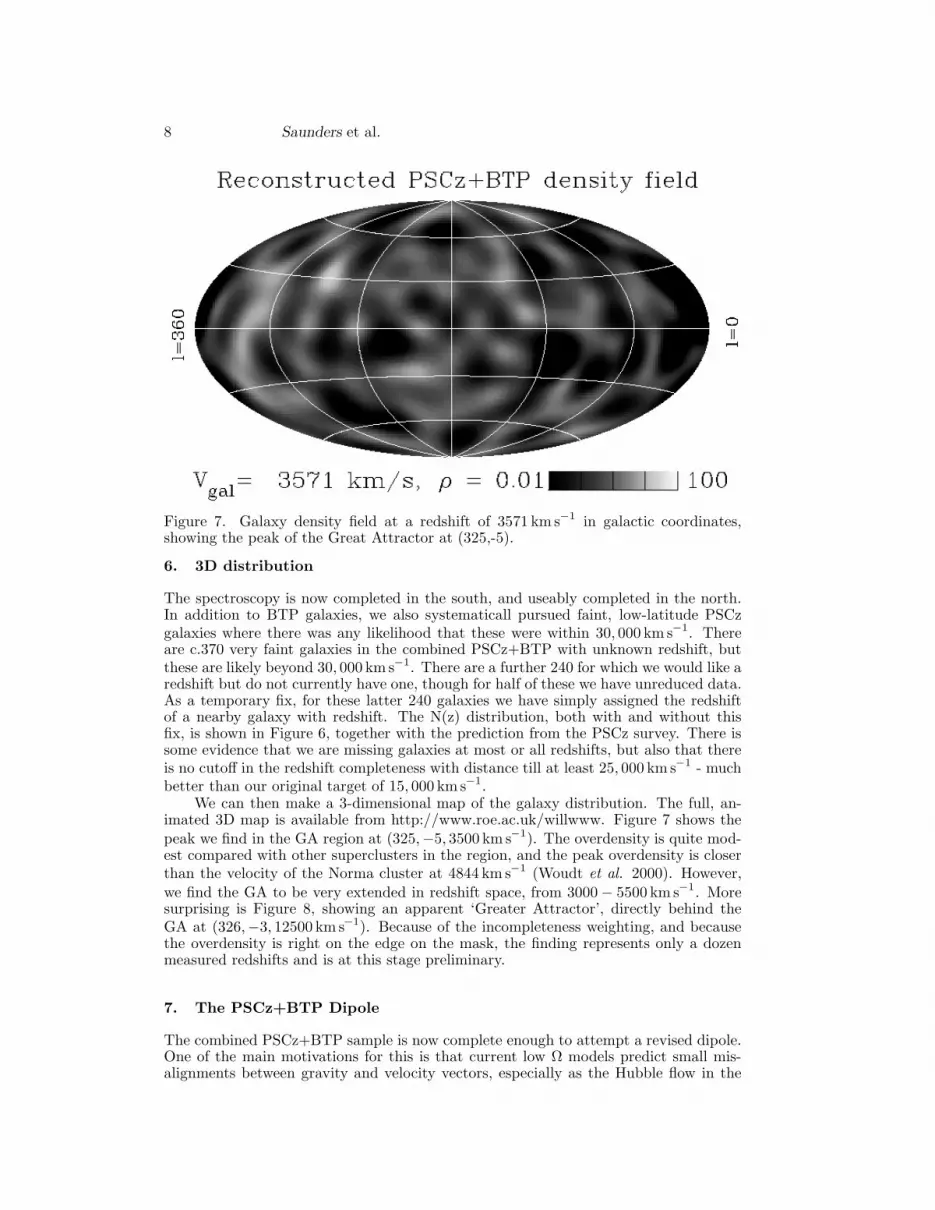
Figure 6. Weighted N(z) distribution for the BTP survey. Open circles show theeffect of assigning a nearest-neighbour redshift to galaxies without measured redshiftsthemselves. The line is the prediction from the high-latitude PSCz.
8 Saunders et al.
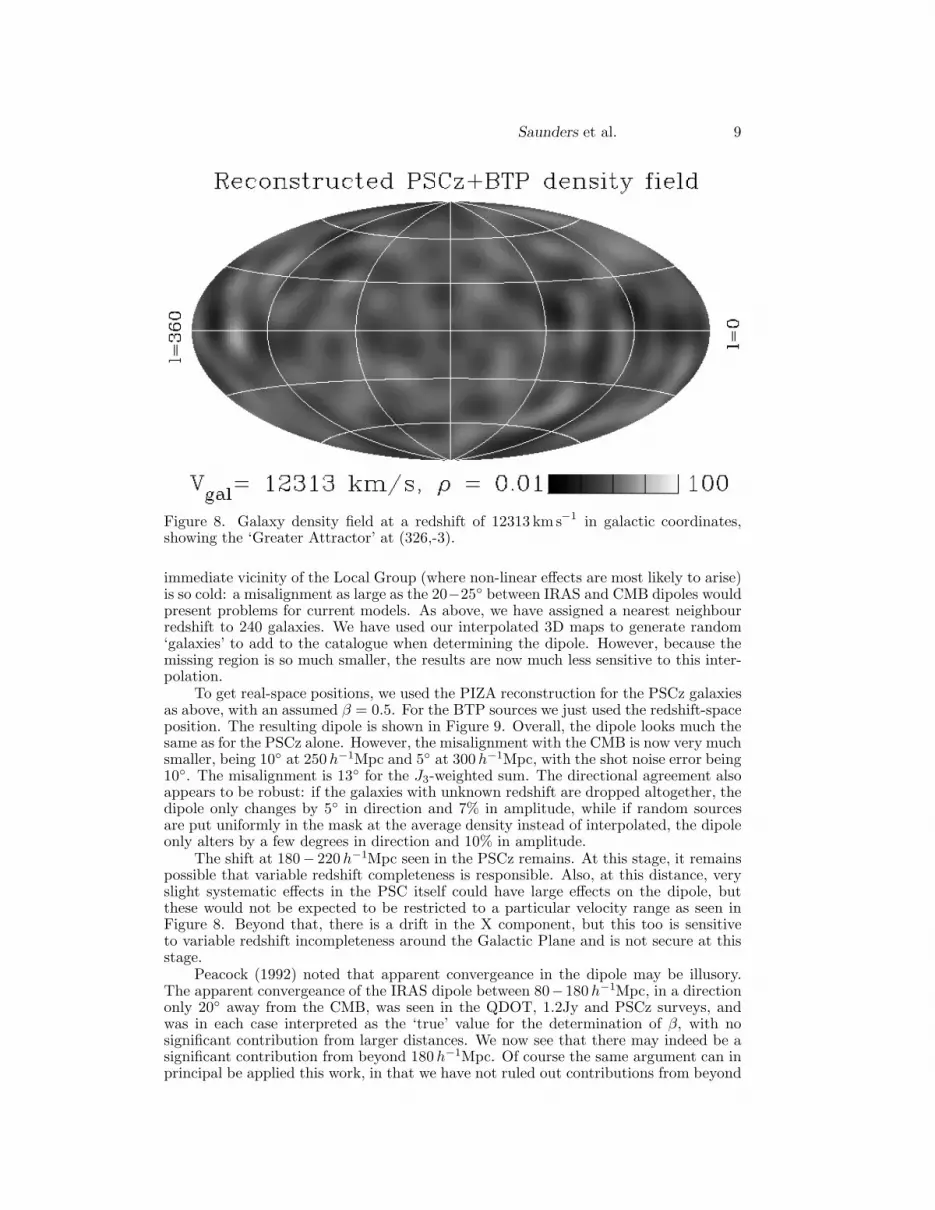
Figure 7. Galaxy density field at a redshift of 3571 km s−1 in galactic coordinates,showing the peak of the Great Attractor at (325,-5).
6. 3D distribution
The spectroscopy is now completed in the south, and useably completed in the north.In addition to BTP galaxies, we also systematicall pursued faint, low-latitude PSCzgalaxies where there was any likelihood that these were within 30, 000 km s−1. Thereare c.370 very faint galaxies in the combined PSCz+BTP with unknown redshift, butthese are likely beyond 30, 000 km s−1. There are a further 240 for which we would like aredshift but do not currently have one, though for half of these we have unreduced data.As a temporary fix, for these latter 240 galaxies we have simply assigned the redshiftof a nearby galaxy with redshift. The N(z) distribution, both with and without thisfix, is shown in Figure 6, together with the prediction from the PSCz survey. There issome evidence that we are missing galaxies at most or all redshifts, but also that thereis no cutoff in the redshift completeness with distance till at least 25, 000 km s−1 - muchbetter than our original target of 15, 000 km s−1.
We can then make a 3-dimensional map of the galaxy distribution. The full, an-imated 3D map is available from http://www.roe.ac.uk/willwww. Figure 7 shows thepeak we find in the GA region at (325,−5, 3500 km s−1). The overdensity is quite mod-est compared with other superclusters in the region, and the peak overdensity is closerthan the velocity of the Norma cluster at 4844 km s−1 (Woudt et al. 2000). However,
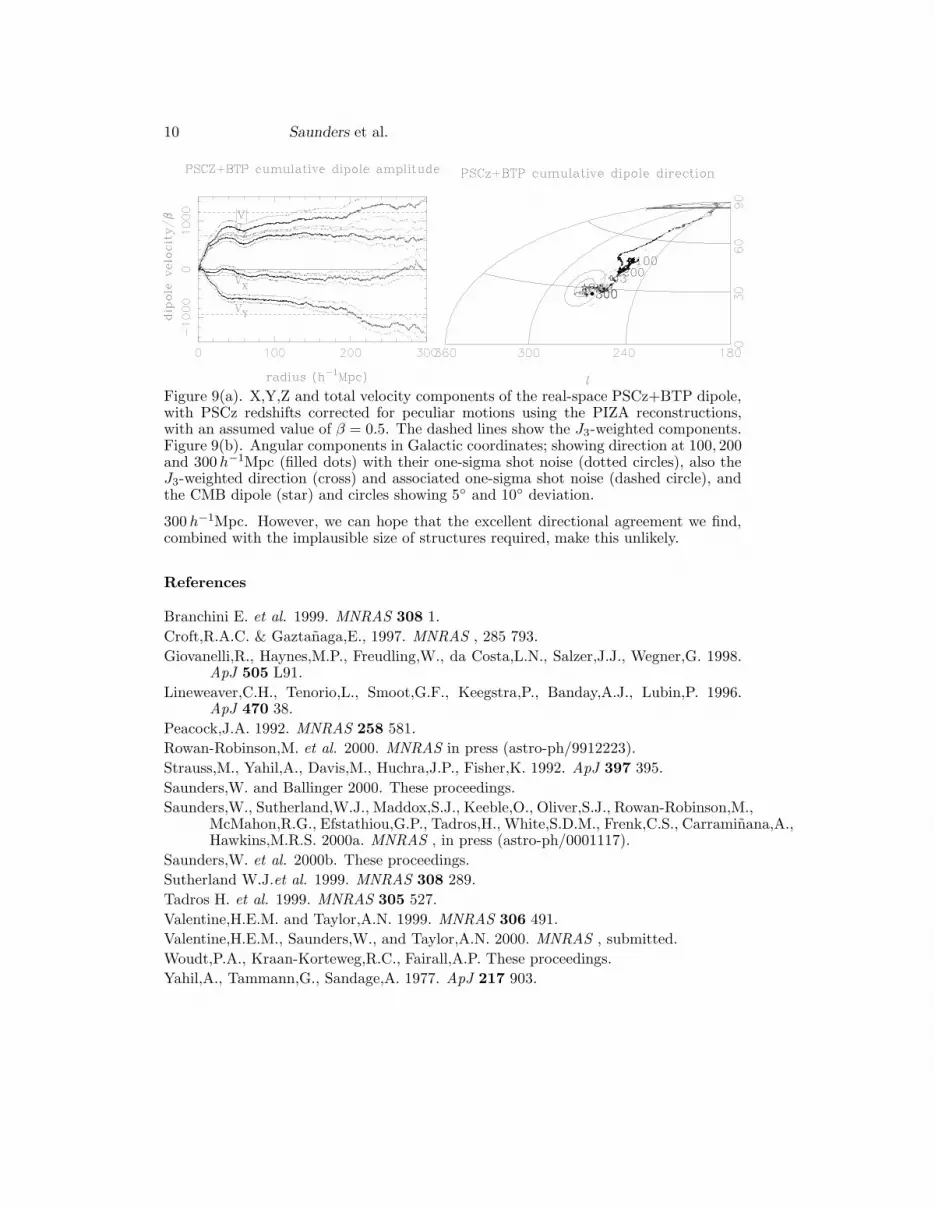
we find the GA to be very extended in redshift space, from 3000 − 5500 km s−1. Moresurprising is Figure 8, showing an apparent ‘Greater Attractor’, directly behind theGA at (326,−3, 12500 km s−1). Because of the incompleteness weighting, and becausethe overdensity is right on the edge on the mask, the finding represents only a dozenmeasured redshifts and is at this stage preliminary.
7. The PSCz+BTP Dipole
The combined PSCz+BTP sample is now complete enough to attempt a revised dipole.One of the main motivations for this is that current low Ω models predict small mis-alignments between gravity and velocity vectors, especially as the Hubble flow in the
Saunders et al. 9
Figure 8. Galaxy density field at a redshift of 12313 km s−1 in galactic coordinates,showing the ‘Greater Attractor’ at (326,-3).
immediate vicinity of the Local Group (where non-linear effects are most likely to arise)is so cold: a misalignment as large as the 20−25 between IRAS and CMB dipoles wouldpresent problems for current models. As above, we have assigned a nearest neighbourredshift to 240 galaxies. We have used our interpolated 3D maps to generate random‘galaxies’ to add to the catalogue when determining the dipole. However, because themissing region is so much smaller, the results are now much less sensitive to this inter-polation.
To get real-space positions, we used the PIZA reconstruction for the PSCz galaxiesas above, with an assumed β = 0.5. For the BTP sources we just used the redshift-spaceposition. The resulting dipole is shown in Figure 9. Overall, the dipole looks much thesame as for the PSCz alone. However, the misalignment with the CMB is now very muchsmaller, being 10 at 250 h−1Mpc and 5 at 300 h−1Mpc, with the shot noise error being10. The misalignment is 13 for the J3-weighted sum. The directional agreement alsoappears to be robust: if the galaxies with unknown redshift are dropped altogether, thedipole only changes by 5 in direction and 7% in amplitude, while if random sourcesare put uniformly in the mask at the average density instead of interpolated, the dipoleonly alters by a few degrees in direction and 10% in amplitude.
The shift at 180− 220 h−1Mpc seen in the PSCz remains. At this stage, it remainspossible that variable redshift completeness is responsible. Also, at this distance, veryslight systematic effects in the PSC itself could have large effects on the dipole, butthese would not be expected to be restricted to a particular velocity range as seen inFigure 8. Beyond that, there is a drift in the X component, but this too is sensitiveto variable redshift incompleteness around the Galactic Plane and is not secure at thisstage.
Peacock (1992) noted that apparent convergeance in the dipole may be illusory.The apparent convergeance of the IRAS dipole between 80−180 h−1Mpc, in a directiononly 20 away from the CMB, was seen in the QDOT, 1.2Jy and PSCz surveys, andwas in each case interpreted as the ‘true’ value for the determination of β, with nosignificant contribution from larger distances. We now see that there may indeed be asignificant contribution from beyond 180h−1Mpc. Of course the same argument can inprincipal be applied this work, in that we have not ruled out contributions from beyond
10 Saunders et al.
Figure 9(a). X,Y,Z and total velocity components of the real-space PSCz+BTP dipole,with PSCz redshifts corrected for peculiar motions using the PIZA reconstructions,with an assumed value of β = 0.5. The dashed lines show the J3-weighted components.Figure 9(b). Angular components in Galactic coordinates; showing direction at 100, 200and 300 h−1Mpc (filled dots) with their one-sigma shot noise (dotted circles), also theJ3-weighted direction (cross) and associated one-sigma shot noise (dashed circle), andthe CMB dipole (star) and circles showing 5 and 10 deviation.
300 h−1Mpc. However, we can hope that the excellent directional agreement we find,combined with the implausible size of structures required, make this unlikely.
References
Branchini E. et al. 1999. MNRAS 308 1.
Croft,R.A.C. & Gaztanaga,E., 1997. MNRAS , 285 793.
Giovanelli,R., Haynes,M.P., Freudling,W., da Costa,L.N., Salzer,J.J., Wegner,G. 1998.ApJ 505 L91.
Lineweaver,C.H., Tenorio,L., Smoot,G.F., Keegstra,P., Banday,A.J., Lubin,P. 1996.ApJ 470 38.
Peacock,J.A. 1992. MNRAS 258 581.
Rowan-Robinson,M. et al. 2000. MNRAS in press (astro-ph/9912223).
Strauss,M., Yahil,A., Davis,M., Huchra,J.P., Fisher,K. 1992. ApJ 397 395.
Saunders,W. and Ballinger 2000. These proceedings.
Saunders,W., Sutherland,W.J., Maddox,S.J., Keeble,O., Oliver,S.J., Rowan-Robinson,M.,McMahon,R.G., Efstathiou,G.P., Tadros,H., White,S.D.M., Frenk,C.S., Carraminana,A.,Hawkins,M.R.S. 2000a. MNRAS , in press (astro-ph/0001117).
Saunders,W. et al. 2000b. These proceedings.
Sutherland W.J.et al. 1999. MNRAS 308 289.
Tadros H. et al. 1999. MNRAS 305 527.
Valentine,H.E.M. and Taylor,A.N. 1999. MNRAS 306 491.
Valentine,H.E.M., Saunders,W., and Taylor,A.N. 2000. MNRAS , submitted.
Woudt,P.A., Kraan-Korteweg,R.C., Fairall,A.P. These proceedings.
Yahil,A., Tammann,G., Sandage,A. 1977. ApJ 217 903.