the low energy two-photon spectrum of pyrazine using the phosphorescence photoexcitation method
TRANSCRIPT
Chemical Physics 10 (1975)415-432 0 North-Holland Publishing Company
THE LOW ENERGY TWO-PHOTON SPECTRUM OF PYRAZINE USlNG THE PHOSPHORESCENCE PHOTOEXCITATION METHOD
Peter ESHERICK’, Paul ZINSLl’$ and M.A. EL-SAYED Deportnro~r of Chcmis~_v~. lJnr~w~rfy of California. I.os A~&T. California 90021. USA
Rcvlscd manuscript received 16 June 1975
The two-photon phosphorescence excitation spectrum of neat pyrazinc crystal at 1.6 R has been examined in the region
68004250 A. A discussion of two-photon allowed and vibronically induced transitions is given. The thcoretiwl discussion shows that. due to the added possibility of vioromc mi*tng in the intcrmediatc state. in gcncral mom non-totally symmetric vibrarions arc cxpccled to show inlcttsity in a symmetry forbidden two-photon spectrum than in a forbidden one-photon spectrum. An cctimarc of the rclativc intcnsitics of allowed. and vibronically induced (n.n*) two photon transitions in
pyrazinc have been wrrtcd out using the Cl cncrgies and hl0 transition moments obtained by Wadt and Goddard. Compar- ison of thcsc results with the normalized spectrum obtained with polarized light indicates the absorptions observed in the qion 30,000 -3: 000 cm -’ are analyzable in terms of a sinde clcctronic transition with a forbidden origin which coincides
with the D,, - Ag one-photon transition origin. Scvcral ol the prominent false origins appearing in this region have been rcntalivcly assigned and indicate that, unhkc symmetric modes. frc
9 ucncies of asymmetric vibrations are significantly akr-
cd in the cscitcd state. A lower limit of 0.8 cV is set for the ‘BJu-
two pyrazinc lone pair orbitals.
Bzg splitting which results rrom the interactions of rhc
1. Introduction
The lowest excited states of pyrazine have been
studied extensively for many years since they are
fundamental in the understanding of the interaction of lone pair orbit& [ 1-6. 16- 181. The lowest energy
electronic absorption, which occurs near 3200 A. has an oscillator strength of 0.01 which is typical for sym- metry allowed n + A* transitions. At higher cnergics (h < 2650 A) the stronger (f= 0.10 to 1 .O) rr -+ A* transitions are observed in direct correlation to the n + IT* states of benzene [I 1.
The in- and out-of-phase combinations of the lone pair orbitals of the two nitrogens give rise to two ex- cited nn* states. of symmetry 1B3u and IBzg. Transi- tions to the ‘6 3” state are (one-photon) electric dipole allowed, whereas transitions to the IBzg are forbidden. The energy ordering and splitting between these two
’ Present address: IBM. Thomas 1. Watson Research Center,
Yorktown Heights, N.Y.
’ t Present adress: institute of Applied Physics, University of Bern. Bern. Switzerland.
* Contribution No. 3381.
states is of considerable interest since it directly re- lates to the interaction between the lone pair orbitals.
An early assignment of the pyrazine vapor phase spectrum by Ito et al. [I!]. implied that both n + 11’ transitions (IBzB and ‘B,,) were present in the 3200 A band, separated by as littlc as a few hundred cm-‘. This was Iater supported by spectra of pyrazine in various solids at low temperatures where a weak ab-
sorption band - 400 cm-l lower than the allowed lB3” origin was observed (31. These results were sup-
ported by the expectation [7j of very little overlap of lone pair orbitals localized on para nitrogens. which implied only a slight bonding type stabilization of the symmetrically combined lone pair molecular orbital (MO) when compared to the asymmetric and anti- bonding hI0.
However higher resolution vapor spectra by Innes and co-workers [4,5) contiadicted Ito’s assignment and described the entire band as a single electronic transition, with the observed weak, diffuse bands at- tributed to vibronic mixing with a rrn* state. The recent rotational analysis of the diffuse bands by lnnes 161 has identified the b,, mode ulol as respons-

ible for mixing lBZU. mr*. character into the tBju transition.
Early calculations (7.8 j on pyrazinc mr‘ states using a limited (n + n) basis SCI MO approach gave a tB3”-- tBZF splitting of only a t’ew hundred cm-l. with ‘6
21! lowest. A similar result was obtained from an ex-
cilon model [3] which assumed the nrrL cxcjtations were highly localized. however this assumption was shown [9] to not be generally valid. More extensive considerations and calculations by Hoffman [IO] indi- catcd that “through bond” interaction of the lone pairs, through delocalization into !he o framework of the molecule. was of greater magnitude and opposite sign than the “through space” direct overlap interac- tier.. The symmetry allowed interaction of n+ with lower energy bonding states pushes n+ to higher cner- gy. whereas interaction of n_ with antibonding o* states lowers n_.
All electron SCF ground state calculations 11 I ] de- monstrated the need for including delocalization of the n orbitals into the u framework and yielded an n+-n_ MO cncrgy separation of more than 2.5 eV which would place tBaF higher than t&. Conligura- tion interaction (Cl) calculations on the excited states using a limited basis set hi0 approach arrive at ‘821!-‘Bj, splittings of I .8:! and I .34 eV [ 11.13]. Most recently an extensive Cl calculation by Wadt and Goddard [ 14.151 in a valence bond model which was found panicularly suitable for calculating nrr* state energies gave a IBzp- tB3, splitting of 1.30 eV.
Among recently published papers (6, l6- 181 there is general agrccm,cnr that the lowest energy absorp- tion band of pyrazinc is due to transitions to a ‘Bg,, state alone. Vibronic transitions involving tB3”. tBZU mixing have now also been identified in the low-tem- perature solid phase spectra [ 16,181, which brings these spectra into agreement with the high resolution vapor spectra results. However there still exists some controversy as to how much higher in energy than the lB3” state the second mr* state, tB,,. lies. On the basis of increased Iine broadening observed in the pyrazine absorption spectrum at energies more than 800 cm-l from the singlet origin, Hochstrasser and Marzacco [ 191 have proposed that there is a second nn* state between 500 and 1500 cm-l above the low- est nn‘. From spectra of methyl-pyrazines, Moomaw et al. [20] arrives at a similar conclusion. Photoelec- tron spectra [21] have confirmed a large splitting be-
tween the lone pair molecular orbitals. with the asym- metric n the lower energy MO, however no experiment to data has clearly identified at what energy the tBz+ n+ II* state does exist, or has even placed a firm lower bound on the 1B3U-1B21! spitting.
The purpose of this study has been to determine the symmetry of the lowest excited singlet and to ob- tain information on the splitting of the n,n* slates via a new and independent approach. The two-photon excitation spectrum technique. recently introduced by Ilochstrasser, Wessel and Sung 122,231 was found to be particularly suitable for this study of pyrazine, since its g + g selection rule allows us to investigate one-photon forbidden transitions, in particular the transit ions to tB1,. Not only does this allow direct ob- servation of IB-,,, but it also allows the study of pre- viously unobserved asymmetric vibrations in the ‘B,, excited state.
This paper shall first discuss the information ob- tainable by two-photon spectroscopy in a thea>retical section. After briefly reviewing the application of a Herzberg-Teller expansion to the theory of vibroni- tally Induced transitions, the intensity of a two-pho- ton vibronic transition to the lBJU state relative to the symmetry allowed transition to the IBzg state will be calculated from a knowledge of MO transition dipoles. This discussion not only will allow us to identify lines resulting from vibronic transitions involving tBju or belonging to tBZg but will also help in the symmetry assignment of the asymmetric vibrations. The experi- mental section then identifies several new asymmetric vibration frequencies in the B3,, excited singlet. and. further, places a distinct lower limit on the energy of ‘B 2g; specificaIIy. above the lowst lB*,, (n.n’).
2. Theory
l
Whereas electric dipole selection rules for one- photon transitions require the direct product of the initial and final state representations (in the molecule’s symmetry group) to transform like one of the spatial coordinates (x, y. z), for two-photon transitions this direct product must transform like a product of the coordinates (x*. xy, xz, etc.). When the molecule possesses a center of symmetry, this clearly results in reversing the one photon g ++ u selection rule to a g + g or u + u selection rule for two-photon absorp-
Cons. Whether the molecular symmetry group includes inversion symmetry or not. we expect these two-pho- ton selection rules to significantly espand the num-
bcr of states accessible to spectroscopic study. We now concentrate in detail on the excitation paths in two-photon absorption.
The extension of the conventional absorption cross section o to two-photon absorptions defines the two- photon cross section 6 such that a photon flux F
(photons/cm2 s) induces an absorption CJ= 6F. For o in cm2/moiecule. the two-photon absorption cross section will then have the units cm4 s/molecule- pho- ton. Under the (electric) dipole transition approxima- tion 6 is given by [24] 1
6 (v) = (e2/fic)~(Iq )(hu,)g~“pl I”, (I)
where g(u) is a line shape function with J&v) du = I. For the two photons, frequencies v, and v2 and polar-
izations ei and e2, AI is defined by
rlf =e, *(A + B).e?, (2)
where for transitions between the initial SIDIC I g) and
final state I /)
A = C(gIrli) (ilrlf)/(Ej-lrul), (34 i
B = zyrl/)(gl~li~l(Ei- au,). (3b)
and hv, + hv, = E,.
The two terms arise in that either photon 1 or 2 may initiate the process via the virtual transition to the intermediate state Ii). If the two photons have the same energy, then B is the transpose of A and the matrix sum will be symmetric with respect to the interchange of photons 1 and 2.
Eq. (3) immediately illustrates the selection rule that for a two-photon transition from a totally sym-
metric ground state, the final state must transform
like a product of spatial coordinates. The sum over intermediate states can be resiricted to include only those states known to have oscillator strength in tran- sitions from the ground state. In general this requires that the electronic state Ii) transform like one of the coordinates, but it is also possible for a “forbidden” state to gain oscillator strength through vibronic (vibrationaMectronic) interactions involving asym- metric vibrations. Vibronic mixing can similarly affect
the i-rftransition as well as theg-+ i and thus relax
electronic selection rules, allowing new tnnsitions when either the ground or fmal state involves vibra-
tional motion along asymmetric normal modes.
3.1. Vibronic perturbariotrs
For the sake of clarity in the symbols used. we will briefly review rhc Herzberg-Teller perturbation ap preach to vibronic interactions, and then return to the
specific problem of two-photon transitions. An cigen-
state I Giy(r: Q)) of the full molecular hamiltonian 5X. with electronic and vibrational quantum numbers i and Y, and energy Eiy will be expressed in the Byrn- Oppenheimer approximation as:
I+‘(r;Q)) = 19’(r:Q)>lx~(Q)). (4)
where I+i(r;Q)) is an eigen-function of the electronic
homiltonian91,
wCI@i(~;Q)) = Ej(@)l+‘(r;Q),. (5)
The I+‘(r;Q)) and Ei(Q) dcpcnd paramctricaiiy on the nuclear positions. cxpresscd in terms of displace- ments along the vibrational normal coordinates Q = (Q, ,. , Q,,. . . , QN). This Q dependence is describ- ed by expanding the electronic.functions in terms of an equilibrium configuration basis set:
l@&(r)) = I+i(r;QO)). Ei = Ei(QO). (6)
I+‘(cQ)) 2 l&r)) + ~~iIO~(r)) x,;(Q). (7)
where the mixing coefficients x,,(Q) are given, IO first order in the Herzberg-Teller expansion by
hki(Q) = CQi Xii a
i (8)
where Hi= FJstelaQilQ=o. (9)
Let us now consider the effect of vibronic mixing on the transition moment between the ground and
~&~“states. Ignoring vibronic mixing in the ground
state and defining a zero-order transition moment
mgi=(9~lrl@~), (W
418 i? Esherick et ab/Lov eflergy nvo.phoron specmrm of pymzine
we have
(11)
The first term is the original zero-order moment with a Franck-Condon overlap factor (dlx:). Added to this $ the intensity derived from the vibronic mixing of #-, with states &. It is easily shown from (9) that for a given Qj. the coeffisient Xgi will be zero unless the product of 0; and & transfoms like the normal coordinate Qj-
We L:OW return to the calculation of the cross sec- tion 6. Since in our experiment the two photons are of equal energy, we need only calculate A from eq. (3~9. The initial state is assumed to be the zero vibrational level of the ground state. For transitions to $J”
We now follow Hochstrasser et al. [23] in noting that if the initial photon energy, hvl, is far off resonance from the intermediate state energy, Ei.cl then the energy denominator will be nearly constant with re- spect to the vibrational quantum number p Replacing the energy denominator with an average energy dif- ference, q.- hv,, allows the use of the theorem Z,, I$) <XL I= I. Eq. (12) then simplifies to
Af” = c_&- i Ei-hv,
(X~l(~glrl9’)(~‘lll~f)lX~). (13)
Substituting in (13) the explicit dependence of the electronic functions found to first order in Q in eq. (7), the integrations over electronic and vibrational coor- dinates can again be separated, as in the one-photon case. We shall again exclude vibronic mixing in the ground state, but shall include the possibility of mix- ing in either the intermediate or final states. Multipiy- ing out the terms, using the mik abreviation for the transition moment, and dropping those higher than fint order in the ting COeffkktl~S x&i Or xk/, re-
suits in a sum of four terms:
+fngimk/~ik::+mgkmif~~i](~lQiIXt, . I (14)
The first term is equivalent to the allowed part of a one-photon spectrum, with the remaining terms re- presenting the vibronically induced intensity. Note that the one- and two-photon eqs. (11) and (14) share idcnt ical matrix elements over vibrational coordinates wirhin the approximations herein. This leads to the conclusion that the degree of allowance of vibronic in- duced spectra in two-photon spectra, (relative to the allowed part) is similar to that in one-photon spectra.
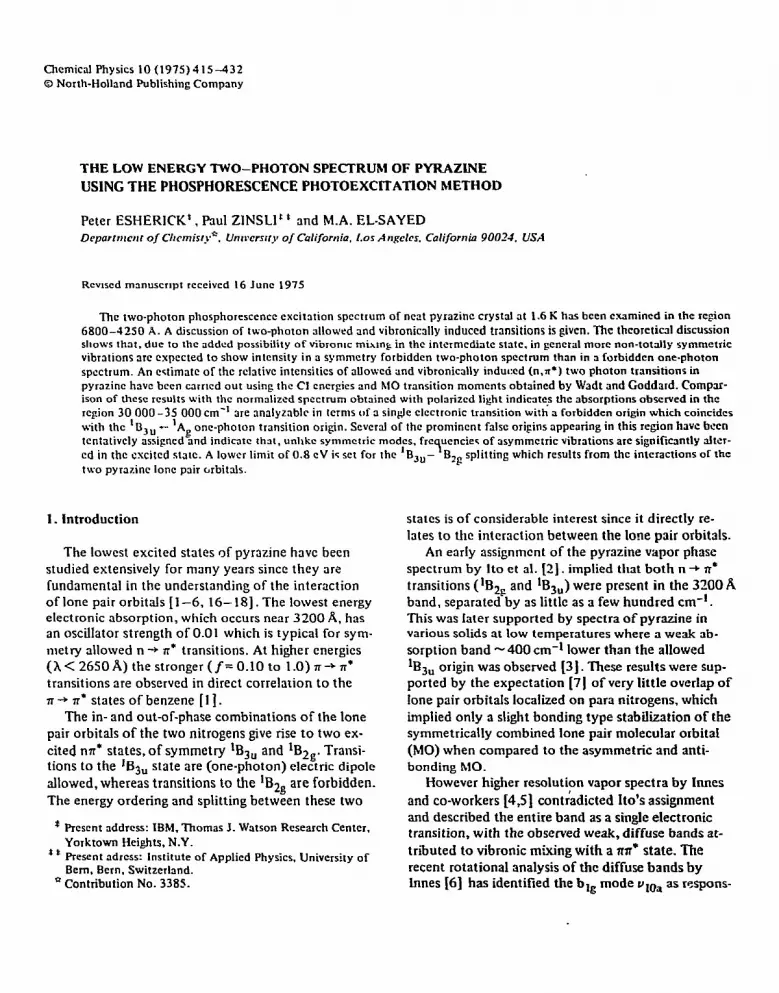
In fig. 1 we have shown schematically the four coupl- ing schemes which appear in eq. (14). Of the three “vibronic” terms, the first relates to vibronic mixing in the final state (fig. lb), adding intensity to the i-f transition via mj&. The last two terms (fig. 1c.d) arise with vibronic mixing in the intermediate states, and result in adding either mg& intensity to theg + i tran- sition or m&f intensity to the i+ftransition.
Eq. (14) can be simplied by noting that for each term of the form
I (dl I 1
Fig. I. Two-photon alloved coupling schemes: (a) allowed process; (b). (c) and (dj viironic induced processes. In (b)
viironic interaction is in the linal state while in (c) and Cd) viitonic intenction is in the intermediate slate. In (b), (c) and and (d), Ii) and If) states are of u symmetry while Ig) and I k) an! g states.
which arises from the intermediate state i = 0 mixing
with another state k = 6, there is a related term in the sum
mzb ~,,fh~b + m@ “bf h’&,
wheni=bandk=a. The mixing coefficients in both cases are of iden-
tical magnitudes, but due !o the presence of the
Ei - Ek denominatpr in X$,. they are of opposite phase: A&, = - (A’,,,)‘. The combined contribution of these fwo terms to eq. (14) is thus given by:
(15)
which, when incorporated into eq. (14) leads to:
Had we chosen to include vibronic mixing in the ground state. then eq. (16) would also include a term similar to the final state mixing term:
Two points should be stressed. First, the selection rules defined by group theory apply to the total (efec- tronic 8 vibration [ @ spin]) symmetry of the initial and final states, and are not modified by what, if any,
vibronic perturbations are involved in making a transi-
tion allowed. Second, compare the available vibronic coupling schemes by which symmetry forbidden ones
as opposed to two-photon transitions can gain intens-
ity. A one-photon transition has primarily vibronic
mixing of allowed state into the forbidden final state
as a means of gaining intensity, requiring certain vi- bronic matrix elements to be finite. This type of final state mixing is similarly available to a two-photon
transition, however even if the vibronic matrix ele-
ments necessary for intensity lo be derived from final
state mixing are small. there remains the possibility that vibronic mixing of intermediate states will pro-
vide transition probability. This additional degree of
freedom implies that roughly twice as many asym- metric modes are likely lo be observed in a symmetry
forbidden two-photon spectrum as in a forbidden one- photon spectrum. Note, however. that the three pos- sible vibronic mixing schemes may all contribute in- tensity to a transition, or their relative phases may bc such as to cancel each other. Thus any attempt at numerical calculations musf pay careful attenlion to
these relative phases if it is to be accurate in any way.
On the other hand, crude estimates, ignoring intcrfcr-
ence, can be made to Identify transitions which must be weak due fo individually small matrix rlelents.
3. Application of theory to pyrazine
This paper will now seek to answer the following
specific questions related to pyrazine. 1. Since we are interested in locating the second
n,rr* transition. ‘B 2g, what can WC expect for the in- tensity of two-photon transitions to this state? In particular. how does it compare in intensity to other nearby g states. and how intcnsc is it cxpcctcd to bc
relative to the vibronically induced transitions to the
lowest cncrgy lB3” or higher energy u symmetry
singlet states?
2. Two-photon rransitions to ‘BJ, will occur only via vibronic perturbations. What asymmetric modes are expected to dominate in this process? In the pre-
vious section it was shown that vibronic intensity can
be derived via vibronic coupling in either the intcr-
mediate or the final state. The question then arises:
Do these coupling routes give rise to comparable in-
tensity predictions. or does one route consistently
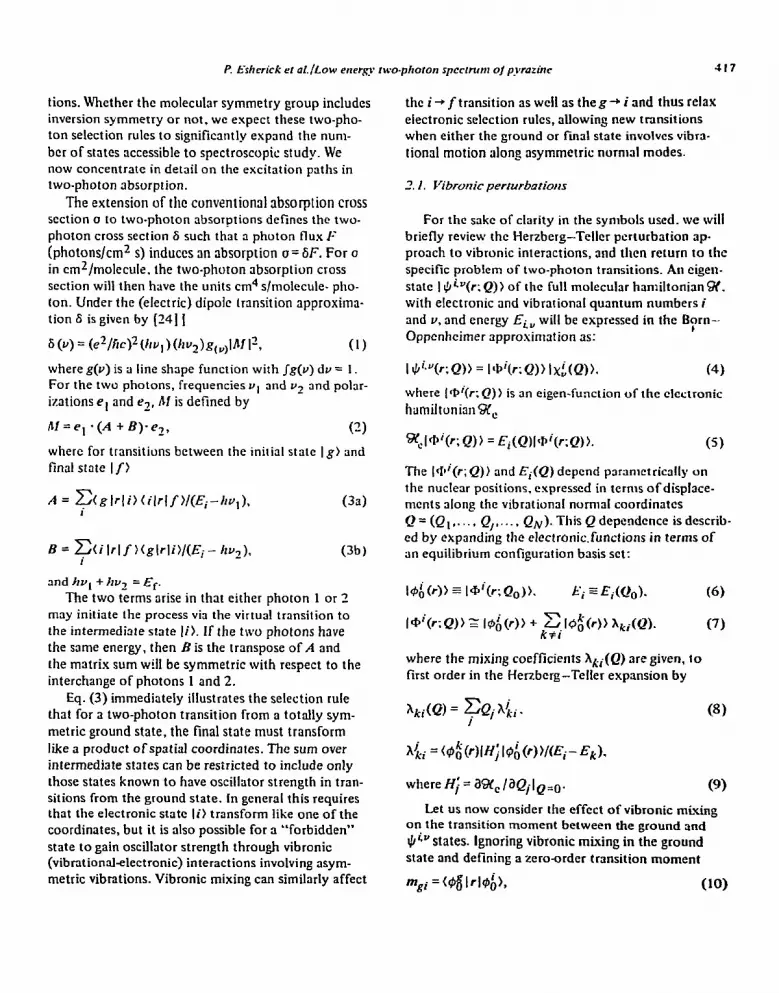
Table 1 Allowed two-photon trsnsitions under D,b
Final st31e
Inler- mediate
BI” %U
bl
420
Table 2
R Esherick er d/Low energy two-phoron specfnrm of pyraxne
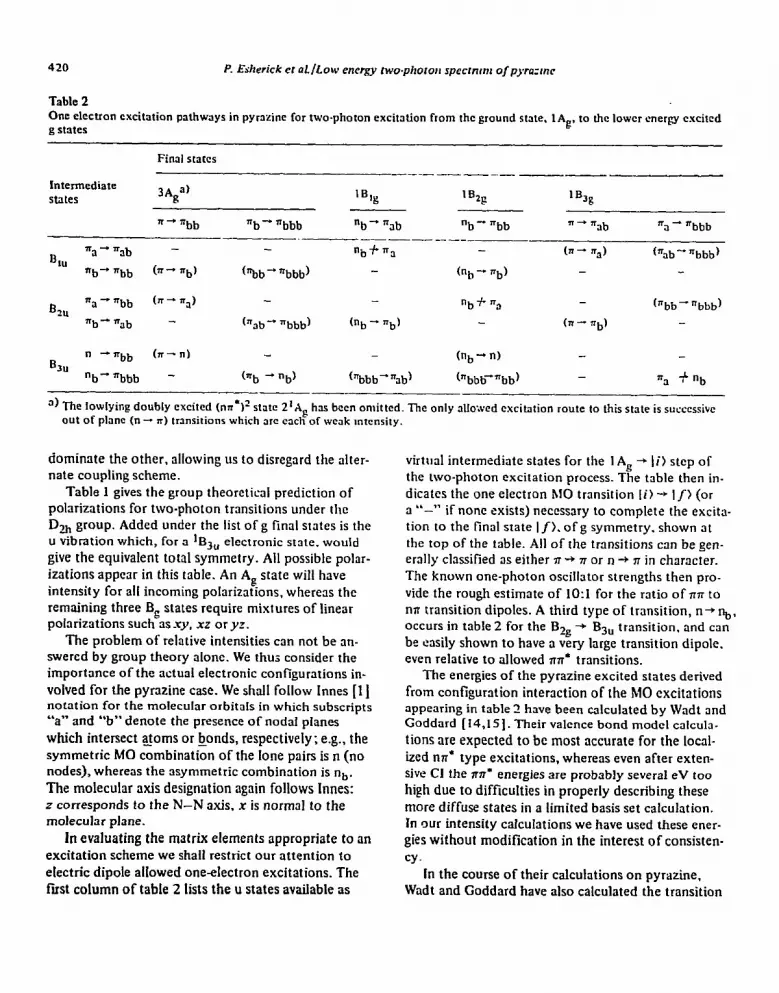
One clcctron excitation pathways in pyrazine for two-photon excitation from the ground state. lAg. to the lower energy cxcitcd g states
Final stats ___~----_
Intermediate
states 3Aga’ ‘B,g ’ Bzg ‘B3g
““bb “b - nbbb “b - “ab “b - nbb ~-----
%I - nbbb
B “a”5b - nbf7r3 (n - 4) (‘%b - nbbb)
IU *b’ “bb (n- nb) (“bb - *bbb) (“b - nb) -
0 ?I - ‘rbb (n - nrr) -
zu “b+“a (“bb- “bbb)
nb-=ab - %b - “bbb) (“b - nb) (n - nb)
B n -“bb (n-n) (nb - n)
3u “b-‘bbb - (nb 4 nb) (‘bbb-‘5bj (nbbb-nbb) -
=a + “b
‘) The lowlying doubly excited (nn*12 sI;Ivz ZIA I
has been omitted. The only alloxed excitation route to this state is successive out of planc (n - n) mnsirions which arc each of weak Intensity.
dominate the other, allowing us to disregard the alter- nate coupling scheme.
Table 1 gives the group theoretical prediction of polarizations for two-photon transitions under the DZh group. Added under the list of g final slates is the u vibration which, for a lBsu electronic state. would give the equivalent total symmetry. A!! possible polar- izations appear in this table. An A, state will have intensity for a!! incoming polarizations, whereas the remaining three B, states require mixtures of linear polarizations such as _ry, xz or yz.
The problem of relative intensities can not be an- swered by group theory alone. We thus consider the importance of the actual electronic configurations in- volved for the pynzine case. We shall follow Innes [l ] notation for Ihe molecular orbitals in which subscripts
“a” and “b” denote the presence of nodal planes which intersect a_toms or bonds, respectively; e.g., the symmetric MO combination of the lone pairs is n (no nodes), whereas the asymmetric combination is nb.
The molecular axis designation again follows Innes: z corresponds to the N-N axis. x is normal to the molecular plane.
In evaluating the matrix elements appropriate to an excitation scheme we shall restrict our attention to electric dipole allowed one-electron excitations. The fist column of table 2 lists the u states available as
virtual intermediate states for the I A, --c !i) step of the Iwo-photon excitation process. The table then in- dicates the one electron MO transition Ii) -+ I/) (or 3 “_” . of none exists) necessary to complete the excita- tion to the final state If). of g symmetry, shown at the top of the table. All of the transitions can be gen- erally classified as either 713 7r or n + n in character. The known one-photon oscillator strengths then pro- vide the rough estimate of IO:1 for the ratio of nl~ to nn transition dipoles. A third type of transition, n+s, occurs in table 2 for the BZg -+ B,, transition. and can
be easily shown to have a very large transition dipole. even relative to allowed ~TIT* transitions.
The energies of the pyrazine excited states derived from configuration interaction of the MO excitations appearing in table 2 have been calculated by Wadt and Goddard [ 14,151. Their valence bond model calcul~~-
tions are expected to bc most accurate for the local- ized nrr* type excitations. whereas even after exten- sive Cl the nn* energies are probably several eV too high due to difficulties in properly describing these more diffuse states in a limited basis set calculation. In our intensity calculations we have used these ener- gies without modification in the interest of consisten-
cy. In the course of their calculations on pyrazine.
Wadt and Goddard have also calculated the transition

P. Es/wick et nI./Low ctrcrg)’ two-photon spcctrunl ofpymzine 421
moments between each hI0 of n or n character. To summarize their results [ 141, the n + II transitions be- tween excited states in table 2 all have nearly identical transition moments between 1.74 and 1.92, i- atomic units, whereas the n.n transition moment was found to be 0.1 18. The n.rr transitions from the ground state to 1 lBj, and 2 ‘B 3U (column 1, table 2) are rcspective- ly a factor of 2 and 3 higher than the above number. The n + nb excitation was found to have a transition moment of 1.84. The B,, and B,, nn* transition mo- ments in rhe first column are all nearly equal around I .3, however these transitions are very sensitive to con- figuration interaction. In benzene, symmetry dictates that this configuration interaction result in a complete cancellation of the transition dipoles for excitation to the B,, and B2” states: the observed intensity is de- rived solely from vibronic effects. The observed oscil- lator strengths [I] in pyrazine for these states allows a rough determination of the extent of configuration interaction for these states. Assuming the relative oscil- lator strengths of the first two B,, states are - I:5 im- plies that the coefficients for the two MO’s in IB,, are 0.94(7ra4 nab) -0.36(n, + nbb) whereas in 2B,, they are 0.36(n,-+~) + 0.94(7r,, + Q,). Similarly, the rta -+ K,,~ and nb --c nab MO coefficients for the
two lowest B2” states can be obtained from their re-
lative oscillator strengths and energies. Although these numbers are very crude, they are sufficiently accurate for our purpose since the sum (3) is taken over all pos- sible configurations.
3. I. Synzmetry allowed two-photon trarrsitiorrs
The results of using the MO transition moments and Cl energies calculated by Wadt and Goddard [ 1 S] for estimating two-photon transition intensities are shown in table 3 for six g MO configurations, however the A, and BBfi mr* states require a linear combination of (at least) the two h10 contigurations shown for each symmetry. The relative intensities of these allow- ed transitions were all calculated with hvl =i~v2 fixed at 7, eV, independent of the actual final state energy. This corresponds to the photon energy at which the first absorptions are actually observed in pyrazine, and will simplify the comparison of intensities arising from different g states. Furthermore, the numbers shown are directly applicable to the calculation of vibronic intensity due to final state mixing.
Table 3 Calculated two-photon transition matrix clemcnts (A) of pyrazinc g st3tcs3)
I’inal
st31c
Intcr- /l x 166 mcdhtc km*/er&
sym- merry
Relative in2nsity
IPrll x 10’2
3Ag
r*nbb
‘bv”bbb
%” B2” B JU
B III
!2” JU
%u B3”
B 1U B3”
BIU B ?.u
BI” I’ 2u
-j.Oxb) 10.0 v
-0.2 xx
-4.9 i:
3.5 YY -0.09 xx
0.2 yx -1.4 xy
-0.3 2x -7 .OXi
5.8 .‘I’
10.7 y:
25 100
0.05
24 12.0 0.01
0.35 c)
14 c)
58 --)
68 c)
3) Values calculated xsumc IIU = 2.0 cV irrespective of the
actual final state cncrjg. b, Polarization.
‘) A normalization factor of l/4 for E oricntcd at 45” to the molecular axes has been included.
These calculations are of course very approximate since the full effects of configuration interaction on the wave functions and transition dipoles have not
been included. This shortcoming is of course most serious in calculations involving the high energy nnc states. For example. configuration interaction in the 3A, or B3g states could result in complete cancelIa- tion of tie matrix elements and a redistribution of the intensity to higher energy A
to the effect in the B,, and B and B3g states (similar
2” states). A further source of error in these calculations would be an un- forseen interference between finite matrix elements appearing in eq. (3) via different intermediate states. This would again be most serious for the A, and BSg final states where each of the four u (an’) intermedi- ates contribute comparable matrix elements rowards the intensity. By comparison a single intermediate
412 P. Eshcrick CI al./l.orv energy rwo-photon spectrum ofpyrazine
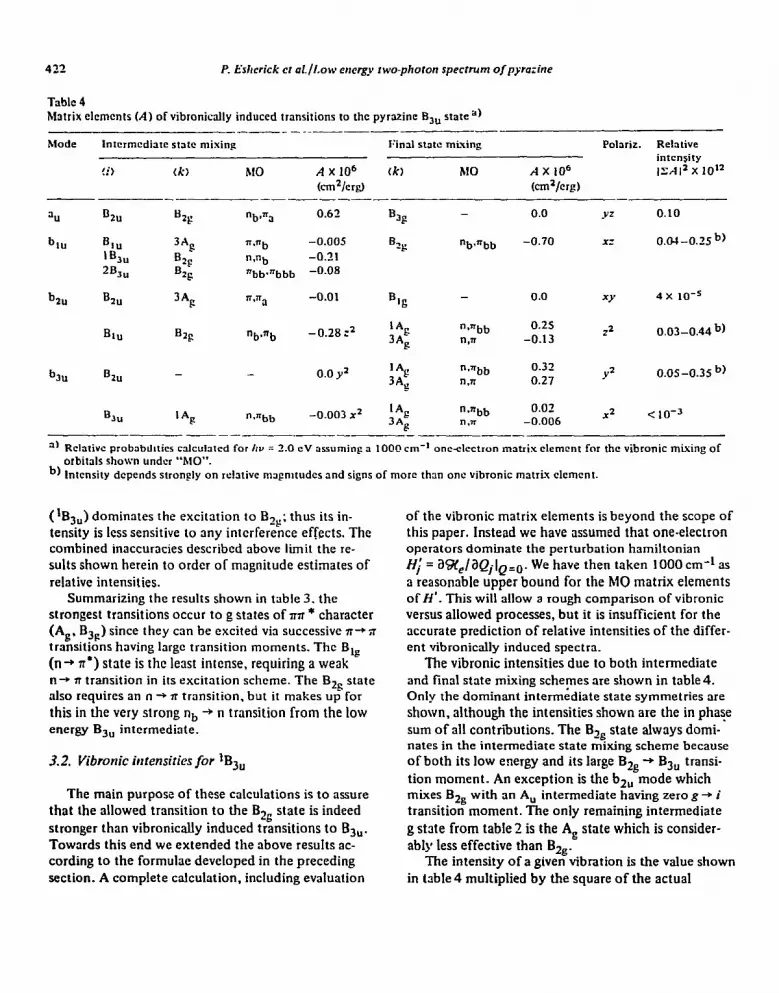
Table 4 Matrix elcmcnts (A) of vibronically induced transitions to the pyrazine Bju state”)
I___ _ ____-- -
Mode Intcrmcdiare state mixing IGal slow mbing Pohriz. Relarive
intensity
!i) tk, hf0 A x IO6 tk) hl0 AX 106 ISA 12 x 10’2
km%rfi) kln2/crg!) ------- -
311 D2” B2g “b+ 0.62 5 - 0.0 YZ 0.10
h” B 1%” 3Ag n.nb -0.005 0 “b*nbb -0.70 XZ 0.04 -0.25 b)
b2u
2B3”
B 2u
82s
B2g
3%
nab
-0.7,1 2g
“bbarbbb -0.08
n.np -0.01 % - 0.0 w 4 x 10-S
BIU B2s “b,=b
b3u Bzu -
-0.28:’ ;2 “Snbb g n,rr
0.0 y2 ‘*g “SHbb
3*g n.n
0.25 12 0.03-0.44 b)
-0.13
0.32 0.27 Y2 o.os-0.35 b)
‘*F “mmbb -0.003 X2 “*nbb -0.006 0.02 X2 C 10-3 “.TI
” Rchrivc probabtillics cahhrcd for /IV = 2.0 CV assuming a 10013 cm-l oncslectron matrix clement for the vibronic mixing of orbirals shown under “MO”.
b, lnicnsiry depends strongly on relarive mapmtudcs and signs of mom than one vibronic matrix elcmcnt.
(‘Bj,) dominates the excitation to B,,; thus its in- tensity is less sensitive to any interference effects. The combined inaccuracies described above limit the re- sults shown herein to order of magnitude estimates of relative intensities.
Summarizing the results shown in table 3. the strongest transitions occur to g states of nst * character (Ag, Bjp) since they can be excited via successive n+;r transitions having large transition moments. The B,, (n+ n’) state is the least intense, requiring a weak n-r n transition in its excitation scheme. The Bzg state also requires an n -+ n transition. but it makes up for
this in the very strong nb + n transition from the low energy B,, intermediate.
3.2. Vibronic intensities for tB3u
The main purpose of these calculations is to assure that the allowed transition to the Bzg state is indeed stronger than vibronically induced transitions to B3”. Towards this end we extended the above results ac- cording to the formulae developed in the preceding section. A complete calculation, including evaluation
of the vibronic matrix elements is beyond the scope of this paper. Instead we have assumed that one-electron operators dominate the perturbation hamiltonian Hi = aWe/aQi~Q=O. We have then taken 1000 cm-t as
3 reasonable upper bound for the MO matrix elements of H’. This will allow a rough comparison of vibronic versus allowed processes, but it is insufficient for the accurate prediction of relative intensities of the differ- ent vibronically induced spectra.
The vibronic intensities due to both intermediate and final state mixing schemes are shown in table 4. Only the dominant intermidiate state symmetries are shown, although the intensities shown are the in phase sum of all contributions. The Bzs state always domi- nates in the intermediate state mixing scheme because of both its Iow energy and its large Big -+ B3, transi- tion moment. An exception is the b,, mode which mixes Bzs with an A, intermediate having zero g + i transition moment. The only remaining intermediate
g state from table 2 is the A, state which is consider- ably less effective than Bzg.
The intensity of a given vibration is the value shown in table 4 multiplied by the square of the actual
P Eslwrick cr al./Low energy two-plloton spectrum of pyrazine 123
vibronic matrix element (relative to 1000 cm-‘). A large vibronic matrix element is expected whenever the atomic centers showing large vibrational displace- ments coincide with centers having high electron density for the MO’S (in parentheses in table 4) being mixed.
The following general conclusions can be drawn even in the absence of values for the vibronic matrix elements:
1. An allowed transition to the BQ state should be at least two orders of magnitude stronger than vibroni- tally induced transitions to B,,.
2. Transitions to au, b tU and b,, modes of the B,, state are all of comparable intensity, whereas the bzu made is expected to be very weak in the vibronic spectrum.
3. In general intensities due to intermediate versus final state mixing are comparable for equal vibronic matrix elements. The a,, and bzu modes, however, cannot induce final state mixing of B3u through one electron terms. Thus these modes must derive intens- ity mainly through intermediate state mixing.
Note that for bJu modes, involvement in intermedi- ate state mixing contributes almost entirely 2) polar- ized intensity, whereas imal state mixing contributes both z2 and y2 in roughly equal proportions. The vibronic matrix elements for the two mixing schemes involve completely different MO’s, and thus the ef- fectiveness of a given scheme can depend strongly on the actual b3u mode involved. This implies that two different b-,, modes, though of identical symmetry, can still show widely different 22:~~~ polarization ratios.
4. Experimental
4.1. Samples
Pyrazine supplied by Aldrich (996) was vacuum sublimed directly into glass sample tubes. Neat crys- tals were then vapor grown in the sealed tubes by the application of very slight temperature gradients (< 1 watt radiating from a source h 2” from the tube) over a period of from 1 to 10 days. Crystals grown in this manner were typically 2 X 2 X 4 mm3 in volume and were used without regard to orientation. A single sample, however, which had been allowed to grow
undisturbed over an approximately two-year period, formed a large crystal > 1 cm3 in volume. This crystal was subsequently oriented along its (100) a~& on a precession camera using molybdenum X-rays (h=0.71). The crystal’s b axis was found to align within 10” of the axis of the sample tube. Contrary to the results of Wheatley, no twinning was observed for this crystal. Due to difficulties in obtaining and/or maintaining optical quality surfaces suitable for polarization ex- periments, this and most other crystals used were studied directly in the tube in which they were grown.
Several unpolarized spectra were also taken on polycrystahine samples to enhance the number of phosphorescent centers. These samples, with their higher proportion of defects, showed slightly wider linewidths and stronger phonon sideband intensities indicating strong coupling of the molecules to the lat- tice. The intensity of the background continuum ob- served at higher energies correlated strongly with the intensity observed for the phonon lines near the origin.
4.1. Eqttipntent
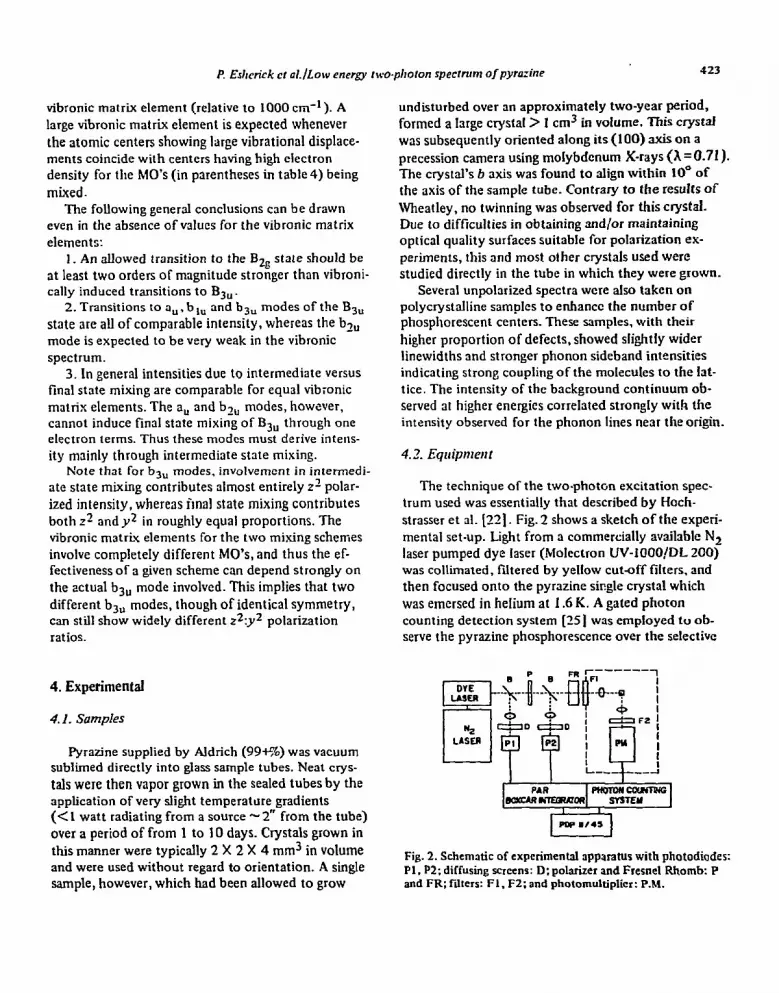
The technique of the two-photon excitation spec- trum used was essentially that described by Hoch- strasser et al. [22]. Fig. 2 shows a sketch of the experi- mental set-up. Light from a commercially available N, laser pumped dye laser (Molectron UV-iOOO!DL 200) was collimated, filtered by yellow cutoff filters. and then focused onto the pyrazine single crystal which was emcrsed in helium at 1.6 K. A gated photon counting detection system [25] was employed to ob- serve the pyrazine phosphorescence over the selective
Fig. 2. Schematic of experimental apparatus with photodiodes: Pl, P2: diffusing screens: D: pokuizer and Fresnel Rhomb: P and FR; filters: Fl. F2; and photomultiplier: P.M.

424 P- t’shcrick et al./l.ow energv two-photon spectrum of pyrazine
interval of 0.1 to 15 ms after each laser flash. This technique greatly reduced the background level intro-
duced by scattered laser light and, at low duty cycles, dark current. A scrics of 11 standard dye solutions (261 covered the range of 4200 to 6700 A. Peak out- put power was about 2 X lo5 watt (6000 A) at a pulse width of - 5 ns. A photodiode 1 (PI ) was used in aligning the laser and for triggering the subsequent electronics. while photodiode 2 (I’?) delivered the reference signal of the laser intensity falling on the crystal. Both photodiodes (MRD 500. Motorola) were mounted following McCall I27 1. Connected to a PAR
Boxcar integrator, they could be used to detect the integrated signal. or to time resolve the laser pulse with a resolution < I ns.
All signals were fed on analog lines to a PDP 11
computer where they were digitized and stored for subsequent normalization of the spectrum.
Wavelength calibration of the dye laser was per- formed by comparison with Fe-Ne lines using a 3-m Jarrell-Ash monochromator. The calibration is ac- curate to better than 20.5 A.
Polarization experiments wcrc performed by tint linearly polarizing the dye laser with an intncavity polarizer. The polarization of the laser Ii& was then rotated from the horizontal by a Fresncl Rhomb (Con- tinental Optical Corp. FRD-43. l/3 +O.C333 wave) placed just prior to the final lens before the sample.
Careful check was made that rotation of *tie rhomb did not deflect the laser beam or otherwise modify anything but its polarization.
The square dependence of the phosphorescence on the laser intensity was tested at fixed wavelengths over two orders of magnitude on both emission peaks and background and was found to be followed within fS%.
4.3. Normalizations procedure
In order to get significant intensity measurements from an excitation spectrum, particularly a two-pho- ton spectrum, careful normalization of the raw data to the excitation intensity must bc performed. Due to the rapid fall of intensity near the wavelength limits of a dye laser, this normalization is particularly im- portant for any extended wavelength scan. However, as the wavelength of a dye laser is scanned, not only does the integrated intensity change, but so does the pulse shape, polarization and. presumably, also the
I I ..00 bSD0
LASER WAVELENGTH Ii, Fig. 3 Importance of normalization of two-photon spccrra: Upper curves correspond lo the raw da13 obraincd upon cxci- Man of J polycrystalline pyrazinc sample with a Rhadaminc 6G Ixcr. The lower curve is obtained by dividing the phos- phorcsccncc signal II B pivcn wavelcn@h by the square of ~hc \ascr intcnsily (energy per pulse) a1 thal wzWe.lcn~th.
mode structure. To properly normalize a two-photon spectrum one must know the integral over time of the square of the instantaneous laser intensity. As a first approximation to this quantity, the square of the in- tcgral of the inrcnsity with time, i.e., the square of the pulse energy, can be used. For a futcd pulse shape this results only in a relative scale change. However, when a dye laser nears its wavelength limits, not only does the peak intensity drop, but the pulse width also nar- rows. This can be loosely corrected for by normalizing not to the pulse energy squared, but rather to some exponent less than 2 (presumably still greater than 1). Normalizing to the first power of the pulse energy would be correct if, for example, the fall off of pulse energy occurred sblely from a reduction of pulse width while the peak intensity remained constant.
All of the spectra shown herein have been normal- ized to the square of the pulse energy without correc- tion for diode spectral response. (The correction is essentially linear with wavelength, with a sensitivity at 4300 A of 47% relative to 6500 A.) However, spectra

t? Edcrick er aL/Low mergy hvo.photon specrntnr of p_srazinc 425
PYRAZINE TWO-PHOTON EXCITATION SPECTRUM
-WAVELENGTH (A) ----
Fig 4. Normalized two-photon excitation spcctrunl of a pyrazinc single crystal a: 1.6 I; obtained with four dyes spanning tic WWC-
length rcfion 5900-6700 A (two photon wavelength 2950-3350 A). Scale factors in the normalization process were adjusted to optimize the matchmg of overlapping regions of adjacent dyes. The arrow indicates the 30057 cm-’ onephoton origin found by
Zalewski et al. 1 IS].
taken with overlapping dyes at (two photon) energies above 37000 cm-‘, where the spectrum is structure- less. are not adequately matched with this exponent. Better agreement of overlapping regions is obtained for these dyes when the normalizing exponent is re- duced to about 1 .S, indicating the need for involve- ment of the pulse shape in a completely accurate normalization procedure.
The baseline signal levels for both the laser and phosphorescence monitors were measured prior to each experiment rather than making them available as adjustable parameters in the normalization procedure. Only the overall scale factors were adjusted in order to match the overlapping regions of adjacent dye spectra. An example of the raw data and the results of normal- ization (to pulse energy squared) is shown in fig. 3 for the Rhodamine 6G dye laser exciting a polycrystalline pyrazine sample.
5. Results
5.1. General features
The normalized two-photon excitation spectrum of a neat pyrazine crystal is shown in fig. 4. The figure spans a wavelength region from about 6700 to 5900 ii obtained with four different dyes. The origin for the single-photon crystal spectrum (as found by Zalcwski) [ 181 is indicated by the arrow at 30057 cm-‘, and as expected for a tB3n state under the g + g selection rules there is no intensity at this origin. At slightly higher energies there is a broad, weak increase in intens- ity, with a width of - ISOcm-t entirely consistent with the description of pyrazine lattice modes given by Ito and Shigeoka [28]. This intensity is presumably derived from the various low frequency asymmetric phonons of the lattice.
The first strong peak in the spectrum occurs 263 cm-t above Zaleski’s origin. It is extremely sharp. barely re- solvable by our laser (ALJ - 1 cm-*) when the crystal is of good quality. There follows than a succession of

426 P. Edwick et d/Low energy hvo-photon spectrum of pyrazine
(a!
I ‘IDo WAVELENGTH (ii)
(b) I 9i
hb
it II c
: ”
3
LL Fig. 5. Norrnalizcd spectrum for an oriented pvrazine crystal with the laser propagating along tie pyrazine cryst~ c axis. In (a)
the laser was polarized with EparalIcl to the a axis and in (b) along the 6 axis.
similarly sharp lines, becoming very dense in the
IOOO- 1800 cm-’ region. Each strong line observed also serves as a false origin for progressions in 590 cm-t. Particularly clear on the first few false origins, there is also a phonon sideband region extending up to about 13Ocm-’ higher energy, equivalent to the highest fre-
quency phonon mode reported by Ito [28]. Thus as the density of sharp lines increases, the background continuum intensity also increases. (Without normal- ization the spectrum appears to have an ever increas- ing background due in part to the higher efficiency of the lower wavelength dyes. With the normalization,
P. Esherick et at/Low energy two.phoron specmm of pyrazine 427
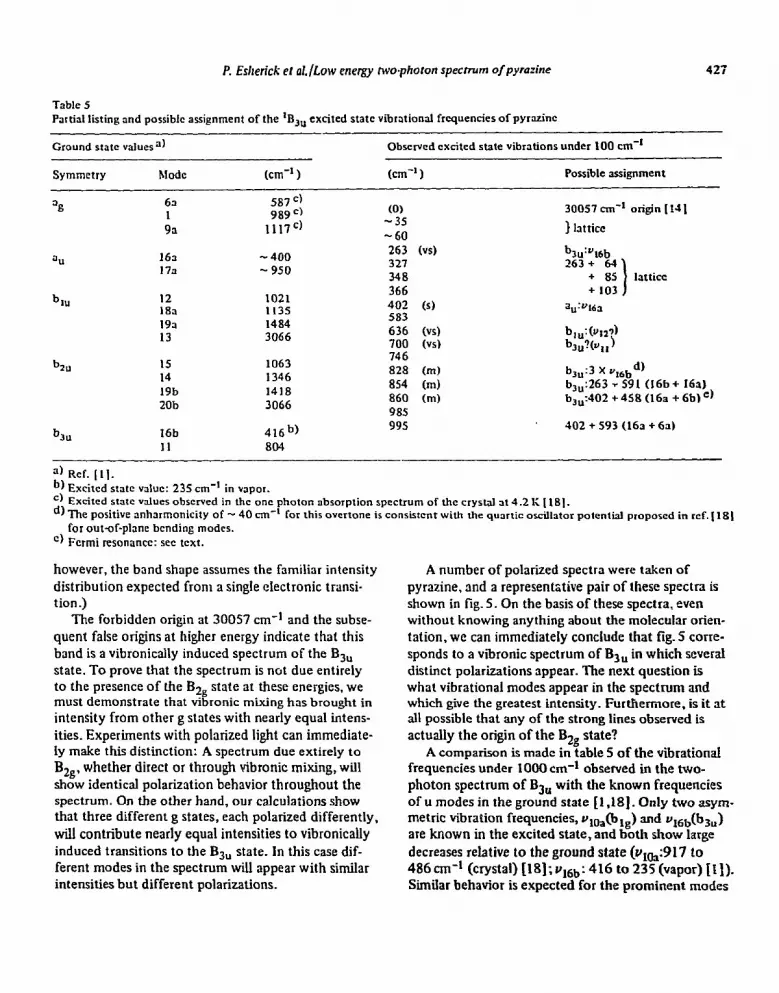
Table 5 Partial listing and possible assignment of the ‘BS, excited state vibrational frequencies of pyrazinc
Ground state values”)
Symmetry Mode (cm-’ )
Observed excited state vibrations under 100 cm-’
km-’ 1 Possible Jssigriment
b ill
b 3u
63 587 ” 1 989 =)
93 1117c)
163 - 400 173 - 950
12 1021 18a 1135 193 1484 13 3066
15 1063 14 1346 19b 1418 20b 3066
416b)
(0) -35 -60 263 (vs) 321 348 366 402 (s) 583 636 (vs) 700 w 746 828 (m) 854 (m) 860 Cm) 985 995 402 + 593 (163 + 6s)
30057 cm-’ origin [ 141
) lattice
b3”:Y16b 263+ 64
+ 85 lattice + 103
a”:“Ma
h&w) h,,?kt,)
bJu:3 X q6bd) b,,:263 y 591 (16b b3,,:402 +458 (16a
I + 16a) f 6b) e,
II 804
a) Ref. [II. b, Excited state value: 23.5 cm-’ in vapor. ‘) Excited state wlues observed in the one photon absorption spectrum of the crystal at 4.2 1; [ 181. d, The positive anharmonicity of - 40 cm-’ for this overtone is consistent with the qunrtic osciktor potential proposed in ref. [ 181
for &t-of-plane bending modes. ‘) Fermi resonance: set text.
however, the band shape assumes the familiar intensity distribution expected from a single electronic transi- tion.)
The forbidden origin at 30057 cm-l and the subse-
quent false origins at higher energy indicate that this band is a vibronically induced spectrum of the B,, state. To prove that the spectrum is not due entirely to the presence of the Bzg state at these energies, we must demonstrate that vibronic mixing has brow&t in
intensity from other g states with nearly equal intens- ities. Experiments with polarized light can immediate- ly make this distinction: A spectrum due extirely to B,,, whether direct or through vibronic mixing, will show identical polarization behavior throughout the spectrum. On the other hand, our calculaiions show that three different g states, each polarized differently, will contribute nearly equal intensities to vibronically induced transitions to the B,, state. In this case dif- ferent modes in the spectrum will appear with similar intensities but different polarizations.
A number of polarized spectra were taken of pyrazine, nnd a representative pair of these spectra is shown in fig. 5. On the basis of these spectra, even without knowing anything about the molecular orien- tation, we can immediately conclude that fig. 5 corre- sponds to a vtbronic spectrum of B,, in which severai distinct polarizations appear. The next question is what vibrational modes appear in the spectrum and which give the greatest intensity. Furthermore. is it at all possible that any of the strong lines observed is actually the origin of the Bzg state?
A comparison is made in table 5 of the vibrational frequencies under 1000 cm-* observed in the two- photon spectrum of B3” with the known frequencies of u modes in the ground state [I ,181. Only two asym- metric vibration frequencies, uloa(blg) and u16b(b3u) are known in the excited state, and both show large decreases relative to the ground state (v,,:917 to 486~~1~’ (crystal) [18];~]~~: 416 to 235 (vapor) [I]). Similar behavior is expected for the prominent modes

428 I? Esherick ct a/./Low energy two.photon spccirurn olp_vra:ine
in the vibronic spectrum since the H,f matrix elcmcnt which gives the Qj mode intensity also perturbs its
potential well and thus its frequency. However a mode can still appear without any frcqucncy shift by obtnin- ing its intensity through intermediate rather than final
state mixing schemes. The result is that a vibrational analysis is not possible by merely comparing observed frequencies to known ground stale values, and thus we must use polarizalion results to identify the sym-
metry species involved.
5.2. Polarizatiorr expcritncrlts
The application of group theory, as in table I, indi- cates what polarizations two photons must have in the molecular axis system in order for a two-photon absorption to occur to a given state. in this section, after translating these molecular polarizations into the crystal axis system. we shall briefly discuss how each
polarization can bc identified in cxpcriments on
oriented single crystals using both polarized and un- polarized light.
The intensity and polarization calculations of the prcccding sections have all bccc carried out relative to molecular axes, and must therefore bc projected onto
the crystal axes for comparison with our spectra. The two molecules of pyrazine’s D,, unit cell [3_9] are oriented with their z (N-N) axes coincident with the
crystal a axis. The molecular plant is rotated about this axis 23” from the ac plane such that the cosZ pro- jection of rhc out-of-plane (x) axis is 85 percent along
b and I5 percent along c. Under the CZ,, site symmetry, the g-u inversion
symmetry is prcservcd. Either A or B, molecular states can give rise to an A and Bt pair of exciton (factor group) states. whereas B, or BJ states generate a pair
of B2 and Bj symmetry exciions (the g-u symmetry is carried over front the molecular state). However. no evidence for factor group (Davydov) splitting of the
lines was observed, and thus polarization ratios should
be equivalent to an oriented gas model. Since each molecular axis projects predominnnt!y
along a single crystals axis, the polarizations predicted
arc easily transformed: the Bzg state will appear with ab polarization, the vibronic transitions to B,, pro- moted by ay, PI,, and b;, modes will show UC. ab and (a2 + b2 + c ) mtcnsity, while the bc polarized bz,, modes should be nearly absent.
Before proceeding to an analysis of the spectra, it will be helpful to discuss some of the peculliarities of two-photon polarizations and how they can be differ-
entiated in polarized excitation spectra of crystals. We will consider. for example. how an a, mode with
ZJ’ z ac polarization can be differentiated from a b,,
mode predicted to have z* +y* 2 a* t c* polarization. The a,, mode requires one photon ofy polarization and a second of z polarization. whereas the b3” can ab-
sorb either two photons of _Y polarization or two of z polGzation. Thus if the laser polarization is aligned perfectly along either the )’ or z molecular axis, only
the b3, modes should be obscrvablc. Translating this into crystal polarizations. if the laser is perfectly aligned along a. b or c the J” mode will disappear.
The b3” mode will be strongest for a and c polar- izations. and bccnuse of the slight projection ofy onto the b axis, iI will also be observable, but weaker, for
this polarization. These predictions have stressed “perfect” alignment. whereas the accuracy of crystal
alignment in our experiments is more like + 10-7-O’. hlisalignment coupled with other depolarizing effects
all tend to weaken the differences between on ac and 02 t c2 polarization. However, even in the limit of a completely depolarized beam, a distinction can be made between these polarizations provided the propaga- tion direction of the laser beam is well defined. With
an unpolarized laser, an a2 + c2 transition will be insen-
sitive to the laser beam’s propagation direction. An ac
polarized transition, however, will be considerably weaker whenever the beam is propagating along either the u or c axes. In general, then, even though polariza- tion experiments appear inconclusive, mixed polariza- tions such as ac or ab can be identified relative to u2 + b2 + c2 by their sensitivity to the alignment of
the crystal relative ro thelaser beam.
5.3. Atralysis of the spectrum
In this section we shall rationalize some of the assignments which we have presented in table 5. The polarized spectra, two of which are shown here, yield
the following results: The dominant polarization for
a11 lines was along the I) axis (note scale change in fig. 5). with all but one (at 700 cm-* ) of the strong false origins shcwing more intensity along c than b.
This confirms the prediction (tables 3 and 4) that the bc polarization should be absent and that all of the ob-

served transitions involve at lcast one photon polarized
along the u axis. A comparison of relative lint intensi-
tics in the spectra of approximately twenty different
crystals along with the polarization results sl~ows that :he lines at 828.854 and 860 cm-t closely follow the
intensity and polarization of the 263 cm-t false origin.
The remaining prominent lines at 402,636 and 700
cm-t all show individually distinct polarization and intensity behavior and are thus each consrdered to be
new f&c origins.
5.3. I. Xarure of the false origiris itr the 0.0 + 1000 crrr-t
regh
By a consideration of both the polarization data
and the sensitivity of particular lines to crystal orienta-
tion in the laser beam, a reasonable assigr,mcnt of
vibrational modes can be made to the prominent false
origins at 263.402.636 and 700cmS1 above the true
origin. Of these four lines. the 403 and 636 arc dis- tincly sensitive to crystal orcintation. They are also observed to be considerably stronger in the unpolariz-
ed spectrum (fig.4) than they arc in fig. 5, where the
laser was polarized parallel to a crystal axis. This clear-
ly indicates that these lines are each of mixed polariza-
tion type. and since every line shows its highest intcns-
ity along u. ob and UC polarizations arc indicated (over bc).
The 636 cm-t line, which has the smallest a/b ratio.
was found to be the only line in this region whose in- tensity was enhanced with the laser polarization at 45” to both P and b axes, identifying this line as ob
polarized. This corresponds to either a b,, mode of
the B3, electronic state, or to the allowed origin of the B,, state. Since several peaks appear with equal or
greater intensity and polarirations that are distinctly
different front that of BZg, the only possible conclu-
sion is that this is a false origin involving a bh, vibra-
tion of the B,, state. The substantial frequency shift
of 385 cm-t necessary to match the 636 cm-t excited state frequency to even the lowest blu ground state
frequency (~~7) is to be expected from a strong
vibronic coupkg of the BJ,, with the B2g state. It is
not immediately evident, however, whether “tz or the slightly higher frequency ulga is the precise bt,, mode
involved here.
Returning to the remaining false origins, the lower frequency two at 263 and 402 cm-t show predominant-
ly u and c polarizations. The 263 is insensitive to
orientation and must thus be a b,, mode with U’ +c’ polarization. The orientation sensitive 403 cm-t lint
shows its strongest intensity with the laser polarized
in the UC plane indicating an au symmetry mode. An
identical assignment is arrived at by matching these two lowest excited state frequencies to the two lowest
in the ground state: the out-of-plane ring Sending modes ~,~~(a~) and v,6b(b3u) Both modes appear near 300 cm-t in the ground state, howcvcr an cxcitcd state value of 235 cm-’ has been assigned to utbb from an
obscrvcd hot band in the vapor. Since the frequency of this mode in pyridinc has been shown to mcrcasc in some solvents [2 I I. our assignment of u,6b(b3u) to thr
763 cm-t line agrees quite well. lcavtng ~~(a,,) to the
402 cm-t line.
Although our calculations show au modes can bc
stronger than bj, modes, the larger intensity and frc-
quency shifts observed for ut6u(bJu) rclativc to
~,~~(a~) can be easily rationali~cd by a consideration
of the relevant vrbronic matrix elcmcnts. WC note
from table 5 that an 3” mode cannot mix the B3,,
(n,rrbb) final state with B3F(rr,rrab) through any one
electron terms. which suggests that this is an cxamplc
of an asymmetric mode appearing due to the addi-
tional degree of freedom provided by intermcdiatc
state mixing. For the latter ~‘3s~. 3, can mix B,, and
BZu by mising nb and rr, orbitals. However. the a,,
mode v,& is 3 ring torsion which does not distort the
local symmetry around the nitrogen. and thus does
not cause n and rr mixing. Alternatively the bju mode
Vt6b displaces the nitrogens out of the ntolecuhtr
plane, and is thus very cfficicnt at mixing the nb and
nb orbitals as required for this mode to gain intensity
through intermediate state mixing. The bj,, mode can
3150 gain intensity through final state mixing unavail-
able to the a,, mode. which not only increases its in- tensity, but also causes a large frcqucncy shifi for the
b,, mode in the cxritcd state which is ncithcr cxpcct-
cd nor observed for the au mode. The last strong false origin to be assigned IS at
700 cm-t. This line shows its highest intensity with
the laser polarized along the u axis and the least in-
tensity along c. This indicates involvement of a and 6 polarized photons, however this line shows none of
the orientation sensitivity of the 636 cm-t line nor any
intensity enhancement for polarized excitation 45” be- tween the a and b axes. This rules out an ab polar&-
tion, and leaves the only remaining possibility: a b,,
430
mode in which a2 + b2 polarizations dominate. Al- though this is consistent with the group theory of
table 1, it is not expected from the transition moment analysis shown in table 4 which predicts any b2 in- tensity to be extremely weak. Vibrcnic mixing of B3,, with either the A, ground state or the doubly excited 2A, (n + nt,J2 state can be invoked to account for this additional b2 (out of plane) intensity, however the n-c rr transition moments involved do not appear
sufficient!y strong to explain the observed u/b intensity ratio. The polarization of the 700 cm-l line thus re- mains somewhat anomalous.
The assignment of the 700 cm-r lint as a b3, mode is supported by the 804 cm-* ground state frequency of the only remaining (after ut6u) b,, mode. This mode (Y,,) should be observed with at least moderate intensity at some frequency lower than 804 cm-l, which makes the 700 cm-’ a reasonable candidate. Assignment of ull to this line should be considered somewhat tenuous.
X3.2. Progressions and combination bands We have shown in the preceding section that the
lower energy strong peaks in the pyrazine two-photon spectrum are best explained as false origins of the B3” electronic state. We shall now extend over the remaind- er of the band our argument that only a single elec- tronic state is observed and that B,, is absent from the entire spectrum shown in fig.4.
The strongest peaks, other than the false origins al- ready described, occur at intervals of 589-597 cm-t from the false origins. This frequency is in reasonable agreement with that observed for progressions in the aa mode usa which also appears prominently in the one-photon spectrum [ 181. The ag character is con- fumed by the identical polarizations of the false origin involved and each subsequent line in the given progres- sion. A slight deviation of the n6a frequency depend- ing tiri the false origin involved supports the conclusion by Zalewski et al. [ 181, that this frequency is perturb- c:.t when ,zoupled to out-of-plane bending modes. The 3yeement between the one- and two-photon spectra on the prominence and general appearance of this mode might support the conclusion that the two are indeed spectra of the same electronic state.
Among the remaining lines in fig. 4 there is a pro- minent group at - 3000 cm-’ which serves as a new set of origins for progressions in 597 cm-l. The two
strongest lines, at 2994 and 3016 cm”, most probably correspond to b,, and b2” C-H stretching modes which occur at - 3066 cm-l in the ground state. The
two lines behave differently in polarized spectra, which in addition to the weaker intensity of these
lines compared to vibronic lines at lower energy, elimi- nates these lines as a possible origin of the B,, state. Further support of their assignment as new Gbronic false origins can be found in their linewidth which is only sligIrr& broader than the sharpest false origin at lower energy. Two overlapping electronic states (B-,, and B,,) would exhibit highly distorted vibrational potentials due to extensive vibronic interaction. which would result in generally broad linewidths. However, the observed two photon spectrum continues to show discrete lines at frequencies as high as 4400 cm-’ above the 30057 cm-l origin. This is in complete con- trast to the one-photon linewidth observations by Hochstrasser and Marzacco [ 191, indicating instead that the observed spectrum (fig.4) is indeed due to on- ly one electronic transition.
Having identified this spectrum as due to a single electronic transition, we have still left unassigned a vast forest of lines observed in the two-photon spec- trum. At most, only 12 lines can be assigned as false origins of B,, involving u vibrations. The progressions in I’&. as well as a weaker progression in the ~,(a,) mode. can be used to assign additional lines. The re- maining lines are most likely due to either overtones in odd quanta of the prominent u modes, or !o com- bination bands of blp, b, or b,, modes with various
u false origins. Because o the potential differences in f the ground and excited states, indicated by the observ- ed frequency shifts, strict harmonic oscillator selec- tion rules of Au = + 1 will be relaxed, allowing moder- ate intensity in the overtone bands. In geneml, how- ever, the other combination bands would be expected
to be considerably weaker. There is at least one example where a combination
band does appear with considerable intensity. In the polarized spectra a doublet appears with b,, polariza- tion at a frequency corresponding to uha added to the first false origin, ur6u-(263 cm-l). Tire extra line can be easily explained as a Fermi resonance with a com- bination band built on the second false origin. For
this second transition to be of the correct symmetry, a mode of bJg symmetry must add to the au false origin at 402 cm-l. Taking the lowest frequency bjg

mode (uhb, assigned alternatively [ 1 ] at 5 16 and 641
cm-t) results in the very rcasonablc assignment of the doublet as a Fermi resonance between uJeb + vsa
(b3,, + as) and vt6a + v6b (a,, + b$ tranSitiOnS in which
the latter has gained intensity by the interaction with the former. Similar resonances may be partly respons-
ible for the many lines of moderate intensity in the interval 1000 cm-1 to 3-000 cm-t above the origin.
6. Discussion: Where is the tB2g state?
In the preceding section WC have analyzed the spec- trum in fig.4 as arising from vibronically induced transitions to a single electronic state, the lowest singlet
B3” (n -, n,,b). This conclusion is based on the follow- ing three specific observations:
1. Two-photon transitions to a BZg state should
show ag modes built on an allowed origin, all showing identical polarization. The fact that the 30057 cm-* origin is both clearly allowed in the one-photon spec- trum and forbidden in the two-photon assigns this origin to an electronic state of u symmetry, reinforc- ing the generally accepted ‘BjU assignment.
2. The observations of different polarizations for different peaks indicates the presence of states of dif-
ferent electronic 8 vibrational symmetry. It is con- veivable that some peaks are allowed transitions to ‘B, while the others are induced by vibronic interac- tiozof ]BJ” with different g states. However, we have shown that the allowed transition to B2g should do- minate the indirect vibronic intensity by a factor of -100. Since the observed peaks, with their varying polarizations, are all of comparable intensity, the direct
B,, transition must not be among them. We have not- ed that this varying polarization behavior extends all the way up to the peaks at 2994 and 3016 cm-t.
3. The observed vibronic bands ail have relatively narrow linewidths. This is true for lines up 10 at least 3500 cm-t, which is not consistent with the presence of a second excited singlet in this region.
This reaves the question: If the B,, state is not in fig.4, where is it? We have extended the wavelength range of our excitation spectrum from beyond that shown to a laser wavelength of 4250 A, at which point the laser light begins to interfere with detection of the phosphorescence emission. As mentioned in section 4.3, the spectra in this region are rather sensitive to the
normalization procedure in attempting to match ad-
jacent and/or overlapping wavelength regions involv- ing different dyes in the laser excitation source. A re- asonably satisfactory agreement is obtained with the exponent choice of - 1.5, however, until a more ex-
tensive normalization procedure is dcvcloped which
will expcrimentdly account for variations in the laser pulse shape. What is observed is a constant or slightly decreasing continuum of intensity up lo about 36200 cm-l, and thereafter increasing intensity. At 5380 A (or two-photon cncrgy of 37200 cm-t) there is a distinct incrcasc in the slope of the normalized spectrum. The spectrum over the remainder of the wavelength scan (stopped at 4250 A = 47000 cm-t in two-photon energy) shows continually increasing in-
tensity without any sign of further structure. The in- tegrated intensity of this region must be very large since broad regions are observed with signal compar- able to that seen only on a few sharp peaks of the vibronic spectrum of B3”.
The observed increase in intensity corresponds very closely in energy to the onset of the first zrr* state (Bl,,), obscrvcd in room temperature solution spectra [3 1,321 at -37430 cm-*. The ‘Bz,(~‘) state. like IF&, can obtain two-photon transition intensity only through vibronic interaction with g states. The ‘BZF
state will certainly dominate in these vibronic intcnc- tions if it lies, in energy, anywhere near the lBzU state. The intensity calculated as due to vibronic mixing with the rnr* s&es (AP and Bsg symmetry) is only slightly greater for tBzU than for tBXU (assuming vibronic matrix elements of equal magnitude). This in- dicates that the considerably higher integrated intensity in the tBzu region must be due to the closeby presence
of the IBze state. As further evidence of this fact, the two-photon spectrum is found to increase in intensity even over the region where the one-photon spectrum is dropping in intensity towards a minimum at -ZlOOA
prior to the onset of the next m? band. The increas- ing intensity towards shorter wavelengths is partidly accounted for by the approach of the virtual inter- mediate state in the two-photon excitation to a re- sonance with the B,, state. It is reasonable to assume. however, that the majority of Ihe intensity is due to presence of the Bzg state at an energy slightly higher than the lirst loll* state, B,,. A lower limit, equal to
the energy of the ITIT* state. is clearly established. Quite likely, overlap of B,, with the HII* B,, state

432 P. Esheriek et aLlLow energy IWO-plrofon spectrum of pyrazine
has resulted in extensive mixing of thcae states such
that a precise distinction between them (in the Bom- Oppenheimer sense) is no longer possible. However, a confirmation of the presence of the IB,, of pyrazine at this energy can be made by a comparison with the
two-photon spectrum of benzene. Precise measurement of the absolute two-photon cross section [33] (which eliminates errors present in excitation spectra tech- niques due to variations in the quantum yield and de- tection sensitivity) for pyrazine and benzene, should show a considerably higher cross section in the region of the lowest nn* states for pyrazine resulting from its “hidden” nn* state, of tBzg symmetry, which is strongly allowed in the two-photon spectrum.
Acknowledgements
The authors would like to gratefully acknowledge and thank professor W.A. Goddard and Dr. W.A. Wadt
for supplying us with their calculational results on pyrazine prior to publication, as well as for calculating the MO transition moments on our behalf, and Mr. L.
Weissman for aiding us with the crystallographic orientation of the pyrazine crystals. We further wish
to thank the U.S. Atomic Energy Commision for its
financial support. P.Z. also wishes to acknowledge a fellowship from the Swiss National Science Founda-
tion.
References
[ 11 K.K. limes. J.P. Byrne and I.C. Ross, J. hfol. Spectrosc. 22 (1367) 125.
121 hl. Ito. R. Shimada. T. Kuraishi and W. hlizushima. J. Chcm. Phys. 26 (1957) 1508.
131 G.W. Robinson and h1.A. El-Sayed. bfol. Phys. 4 (1961) 273.
141 K.K. Innes. J.A. Merritt. W.C. Tmchcr and S.G. Tilford. Nature 187 (1960) 500.
(51 KX. Inncs. J.D. Simmons ad S.G. Tilford. J. hfol. Spectrosc. I I (1963) 257.
161 S.N. Thakur rmd K.K. Innes. J. Mol. Spcctrosc. 52 (1974) 130.
171 S.F. h!ason. J. Chem. Sot. o. 1240 (1959).
181
I91
IlO1
1111 1121
1131
1141
1151 1161
1171
1181
1191
I201
1211
1221
1231
1241 1251 I261 1271 I281 12.91 1301
I311
1321
1331
3) L. Goodman and R.W. l&tr~ell, J..Chem. Phys. 30 (1959) 1131. b) L. Goodman, J. h!ol. Spectrosc. 6 (1961) 109. 1) hl.A. El-Bayoumi and D.R. Kc-runs. J. Chcm. Phys. 36 (1962) 2516. b) D.R. Kcxns and M.A. El-Bayoumi. J. Chcm. Phys. 38 (1963) 1508. a) R. Hoffmann. A. Imamura. W.J. Hehrc. J. Am. Chem. Sot. 90 (1968) 1499. b) R. Hoffmann, Accts. Chcm. Rcs.4 (1971) 1. E. Clcmcnti. J. Chcm. Phys. 46 (1967) 4737. T. Yoneznwa, H. Kato and H. Kate, Thcorct. Chim. Acta 13 (1969) 125. hf. Hackmeyer and J.T. Wltitten. J. Chcm. Phys. 54 (1971) 3739. W.R. Wadt and W.A. Goddard, HI, J. Am. Chcm. Sot.,
to be published (1975). W.A. Goddard, III. private communication. H.K. Hong and C.W. Robinson, J. Mol. Spcctrosc. 52 (1974) I. 1. Suzuka. N. Mikami and hf. lto, J. hfol. Spcctrosc. 52 (1974) 21. E.F. Zakwski. D.S. hlLClure ond D.L. NXXI, 1. Chcm. Phys. 61 (1974) 2964. R.hl. Hochstrasser and C. hfarwcco. J. Chcm. Phys. 49 (1968)971. W.R. hloomaw, h1.R. DeCamp and P.C. Podnrc. Chcm. Phys. Lctt. 14 (1971) 255. E. Hasclbach. Hclv. C’himiw Acta 56 (1973) 2889; also 5s (1972) 25s. R.hl. Hochstrasser. H. Sung and J.E. Wesscl: a) J. Chcm. Phys. 58 (197334694; b) Chcm. Phys. Lett. 24 (1974) 7 and 24 (1974) 168. R.hl. Hochstrasser and J.E. Wessel. Chcm. Phys. Lett. 24 (1974) I. W.L. Pcticolns. Ann. Rev. Phys. Chem. 18 (1967) 233.
P. Esherick. Thesis, Harvard University (1973). Molectron Corp., Sunnyvale. CA 94086. G.H. h!cCsll, Rev. Sci. Instr. 43 (1972) 865. hl. Ito and T. Shigeoka. J. Chcm. Phys. 44 (1966) 1001.
P.J. Wheatley. Act. Cryst. 10 (1957) 182. J.P. Jesson, H.W. Kroto and D.A. Ramsay J. Chcm. Phys. 56 (1972) 6257. F. Halverson and R.C. Hirt, J.Chem. Phys. 19 (1951) 711. U.V. AIlas of Organic Compounds (Plenum Press, New York, 1966). P.R Monson and W.M. hlcclain. J. Chem. Phys. 53 (1970) 29; W-M. hkClain. Accts. Chem. Rcs. 7 (1974) 129.