laser induced phosphorescence imaging for the investigation of evaporating liquid flows
TRANSCRIPT

RESEARCH ARTICLE
Laser induced phosphorescence imaging for the investigationof evaporating liquid flows
Alexandros Charogiannis • Frank Beyrau
Received: 31 October 2012 / Revised: 3 April 2013 / Accepted: 8 April 2013 / Published online: 14 May 2013
� Springer-Verlag Berlin Heidelberg 2013
Abstract The phosphorescence properties of liquid and
gaseous acetone, following excitation at 308 nm, are stud-
ied and utilized in order to overcome two main challenges
of two-phase flow laser induced fluorescence imaging: the
large fluorescence intensity disparity between the two
phases and the ensuing effect of halation. This is achieved
on account of the different phosphorescence decay rates of
the liquid and vapour phases, which allow for a more
favourable signal ratio to be obtained. The benefits of
visualizing the phosphorescence emission, instead of the
fluorescence, are demonstrated by droplet stream experi-
ments set up in different bath gases, at 1 atm and 297 K.
The liquid–vapour interface can be accurately located,
while the vapour surrounding the droplets is clearly visu-
alized without any halation interference. The vapour phase
phosphorescence signal was calibrated in order to quantify
the vapour concentration around an evaporating droplet
stream, and the results are compared to laser induced fluo-
rescence images collected in the present study and results
found in the literature. The effect of halation in the fluo-
rescence images is shown to extend as far as 10 droplet
diameters away from the interface for 161 lm droplets,
resulting in a significant overprediction of acetone vapour
mole fractions in that region. The vapour profile obtained by
laser induced phosphorescence (LIP) imaging agrees with
data found in the literature, for which a halation correction
on fluorescence images was successfully performed. The
demonstrated LIP technique for simultaneous vapour and
liquid phase visualisation is only applicable to oxygen-free
environments, as even trace quantities of oxygen com-
pletely quench the vapour phase phosphorescence emission.
Abbreviations
Dd Average droplet diameter (lm)
E Excitation energy (mJ)
E0 Maximum excitation energy (mJ)
na Acetone number density (molecules cm-3)
na0 Saturated acetone number density (molecules cm-3)
S Fluorescence or phosphorescence signal (counts)
Sd Average inter-droplet separation (lm)
S0 Prompt fluorescence signal (counts)
t Laser sheet thickness (lm)
xa Acetone mole fraction
Xd Distance from droplet centre (lm)
Dt Delay relative to the start of fluorescence emission
(ns)
1 Introduction
Laser diagnostics are well-established powerful tools for
experimental investigations of reactive and non-reactive
flows. Laser induced fluorescence (LIF) is the most com-
monly used technique for planar measurements of con-
centrations, such as the amount of exhaust gas or of the
evaporated fuel in internal combustion engines (Loffler
et al. 2010; Williams et al. 2010). For fuel vaporization
studies, the excited species can be either the evaporating
liquid itself, or a co-evaporating tracer, for example, ace-
tone or 3-pentanone, which is added to a non-fluorescing
parent fuel (Thurber and Hanson 2001; Rothamer et al.
This article is part of the Topical Collection on Application of Laser
Techniques to Fluid Mechanics 2012.
A. Charogiannis � F. Beyrau (&)
Mechanical Engineering Department, Imperial College London,
Exhibition Road, London SW7 2AZ, UK
e-mail: [email protected]
123
Exp Fluids (2013) 54:1518
DOI 10.1007/s00348-013-1518-2

2009). Acetone, in particular, has been widely employed
due to its low toxicity, broadband absorption in the UV and
high vapour pressure, which allows for high seeding con-
centrations already at ambient temperatures. In two-phase
flows, such as evaporating sprays, LIF can be used to
visualize both vapour and liquid phases. Acetone is often
employed in evaporating droplet stream or liquid jet
experiments as its physical and spectral properties facilitate
such studies (Bazile and Stepowski 1995; Connon et al.
1997).
Despite the fact that acetone fluorescence dependencies
on flow properties such as temperature, pressure and
composition are very well investigated (Thurber and
Hanson 1999; Thurber et al. 1998; Braeuer et al. 2006), few
data are available regarding the triplet state phosphores-
cence emission. At this point, it is helpful to introduce the
processes involved in the excitation–deexcitation mecha-
nism of acetone (Schulz and Sick 2005), most clearly
described by means of a Jablonski diagram (Fig. 1). The
absorption of a photon leads to electronic excitation from
the ground electronic state S0 to the first excited singlet
state S1, attributed to the symmetry-forbidden p� n
transition. Following excitation to S1, the first excited
triplet state T1 is readily populated by inter-system cross-
ing. This process describes the transfer of population
between states of different multiplicity and in acetone
occurs very rapidly and with almost 100 % efficiency.
Alternatively, the excited molecule can emit fluorescence
(radiative transition to a state of the same multiplicity) and
return to S0, vibrationally relax to a lower vibrational level,
or decay non-radiatively by internal conversion which is,
however, rather inefficient for the particular tracer. From
T1, the molecule can vibrationally relax, decay radiatively
to S0 by emitting phosphorescence (radiative transition to a
state of different multiplicity), give up its energy to another
ground state molecule via collisionally induced quenching
(mainly self-quenching or oxygen quenching) or give up its
energy to another excited triplet state molecule via a pro-
cess called triplet–triplet annihilation. In the latter case, a
triplet–triplet interaction is described according to which
one molecule will decay non-radiatively to S0, whilst its
excitation energy will be consumed by the other. This
process has previously been accounted for substantially
reducing the phosphorescence lifetime of high concentra-
tion biacetyl vapour (Badcock et al. 1972). Through this
process, the observed phosphorescence quantum yield
depends not only on the collision frequency and efficiency
of collision events with other species (such as oxygen) or
non-excited acetone molecules (through self-quenching),
but also on the excited state population. In that way, the
efficiency of triplet–triplet annihilation, and hence the
phosphorescence quantum yield, will depend on the exci-
tation energy, number density and time available for such
collision events to occur.
For an excitation wavelength of 313 nm at near ambient
conditions, the fluorescence quantum yield of acetone is of
the order of 10-3 (Halpern and Ware 1971; Heicklen 1959;
Koch et al. 2004), with almost all the excited state popu-
lation being transferred to the triplet state T1. The fluo-
rescence lifetime is very short [around 2.4 ns (Halpern and
Ware 1971)] and at near-atmospheric pressures, relatively
unaffected by quenching (Thurber and Hanson 1999).
Despite the fact that these values have been obtained from
acetone vapour experiments, they are equally applicable in
describing the fluorescence lifetime and quantum yield of
liquid acetone as well, as the fluorescence emission from
both phases is limited by extremely efficient inter-system
crossing. In contrast, the phosphorescence emission from
T1 to S0 is slow, due to violation of the spin selection rule,
and strongly subjected to oxygen quenching. In a colli-
sionless environment, the phosphorescence lifetime of
acetone vapour is 200 ls (Groh et al. 1953; Kaskan and
Duncan 1950), whilst at ambient pressure, molecular col-
lisions reduce the lifetime to just a few microseconds (Hu
and Koochesfahani 2002). Virtually, no phosphorescence is
observed in the presence of even minute quantities of
oxygen (Hu and Koochesfahani 2002; Weckenmann et al.
2011).
The phosphorescence properties of liquid acetone have
been assessed by Seitzman and co-workers (Ritchie and
Seitzman 2004; Tran et al. 2005). They reported that
removing any oxygen dissolved in liquid acetone can
greatly increase the phosphorescence lifetime; for example,
following excitation at 266 nm, an increase from 175 ns to
nearly 1 ls was observed. Slightly higher values were
presented for 285 nm excitation, suggesting that the initial
population of lower vibrational levels correlates with
Fig. 1 Jablonski diagram illustrating the radiative and non-radiative
processes of acetone following light absorption. Radiative processes
are shown as straight lines and non-radiative processes as wavy lines
Page 2 of 15 Exp Fluids (2013) 54:1518
123

higher phosphorescence efficiency. In addition, longer
detection wavelengths were shown to display longer life-
times, suggesting that the phosphorescence spectrum shifts
to the red with increasing delay from the initial population
of T1. It should finally be noted that, in addition to oxygen
quenching from any dissolved oxygen, the phosphores-
cence lifetime of liquid acetone is substantially shorter
compared to that of the vapour due to more vigorous self-
quenching (Tran et al. 2006). Despite the fact that this type
of interaction is not efficient (Lozano 1992), the number of
collisions occurring in the liquid is sufficiently large to
render self-quenching a strong deexcitation channel.
As a consequence of the limited availability of acetone
phosphorescence emission data in the literature, the first
aim of this study is to characterize and compare the
emission decays of vapour and liquid acetone, excited at
308 nm, in air and nitrogen bath gases. These measure-
ments reveal the potential for better visualizing acetone
vapour concentrations in the presence of liquid droplets by
addressing two major shortcomings associated with two-
phase flow acetone LIF; the extreme fluorescence intensity
disparity between the two phases and the ensuing intense
halation that obstructs the location of the liquid–vapour
interface and introduces a significant error in the vapour
phase measurement in the vicinity of droplets. Therefore,
visualization experiments of evaporative and non-evapo-
rative acetone droplet streams and their surrounding vapour
fields, by both laser induced fluorescence and laser induced
phosphorescence (LIP), will be carried out in order to
demonstrate the advantages of monitoring the latter. The
final objective of this study is the quantification of the
vapour field around an evaporating droplet stream, by
means of both optical techniques, in an attempt to quanti-
tatively address the suitability of LIP for two-phase flow
imaging.
2 Simultaneous vapour and liquid phase acetone LIF
A major challenge in visualizing the vapour field near
droplets by acetone LIF is that the liquid phase fluores-
cence is more than two orders of magnitude stronger than
the gas phase (Ritchie and Seitzman 2001), mainly as a
consequence of the large number density disparity between
the two phases. Since the commonly utilized intensified
CCD cameras have a limited dynamic range, the experi-
mental parameters are typically adjusted so that the intense
liquid phase signal does not quite saturate the detector.
This, in turn, results to a vapour phase signal which is close
to the noise level of the camera. An additional problem in
discriminating between the two phases is intense halation.
The very strong signal from the liquid introduces a cross-
talk with the neighbouring pixels (which contain the weak
vapour phase signal) and results in an apparent increase in
the spatial extent of the liquid or in an overprediction of the
vapour phase concentration near the interface (Orain et al.
2005). It has been reported, for example, that reliable
measurement of vapour concentrations is not feasible to
within 1 droplet diameter from the droplet surface for 235
and 122 lm droplets (Sahu 2011). Other studies report that
for 230 lm droplets, the extent of halation is of the order of
1–1.5 droplet diameters (Orain et al. 2005). Since halation
is a detector-induced artefact, a non-intensified camera or
EMCCD sensitive to the spectral range of acetone fluo-
rescence would suffer less from the particular effect.
However, intensified cameras are commonly employed in
studies such as the ones cited above, because of their short
exposure times and their superior performance at low light
levels (of the vapour phase signal). In addition, non-
intensified cameras suffer from substantially higher jitter.
In tackling halation, the practice of establishing a cut-off
signal to distinguish between the vapour phase and liquid
phase plus halation signals has been introduced (Bazile and
Stepowski 1995). Other researchers have adopted this
method (Hardalupas et al. 2010; Ammigan and Clack
2009), most commonly by calibrating the saturated acetone
vapour signal independently. The location in the vicinity of
a droplet where the collected signal drops to the saturated
vapour fluorescence level is, however, shifted away from
the droplet surface due to halation. Consequently, the
spatial extent of the droplet is overestimated. Alternatively,
the use of Mie scattering images from ethanol droplets in
order to obtain the radial profile of halation, and thus the
location of the interface, has also been proposed and
practiced (Orain et al. 2005). Frackowiak et al. (2009) have
adopted an entirely different approach in locating the
liquid–vapour interface. They have shown that by masking
the liquid phase fluorescence, an uncontaminated vapour
phase signal up to a certain distance away from the liquid–
vapour interface can be obtained. The fluorescence emis-
sion from the droplet and its subsequent collection by the
detector is then modelled by means of a numerical code,
based on the Lorenz–Mie theory and geometric optics.
Knowledge of the droplet size and acquisition of both
masked and unmasked images of the droplet stream allow
for extrapolation of the vapour field in the proximity of the
droplets, as well as accurate location of the interface. This
method, however, presents some severe drawbacks. Apart
from the inherent complexity of its setup (which necessi-
tates the utilization of a mask) and the application of
numerical methods in order to correct for halation effects,
this tactic cannot be applied in a measurement field where
the droplets are not arranged so that the liquid phase can be
effectively masked, for example, in a spray.
Another method for determining the location of the
liquid–vapour interface of acetone droplets in air was
Exp Fluids (2013) 54:1518 Page 3 of 15
123
proposed by Seitzman and co-workers (Ritchie and Seitz-
man 2004; Tran et al. 2005), based on the simultaneous
phosphorescence and fluorescence imaging of liquid and
vapour acetone. The combined technique utilizes the
phosphorescence signal from liquid acetone to locate the
boundaries of the liquid phase and the fluorescence signal
from the vapour phase to measure the concentration. Since
even trace amounts of oxygen can quench the vapour phase
phosphorescence very efficiently, the liquid phosphores-
cence measurement provides an ‘‘uncontaminated’’ liquid
phase signal (Tran 2008). Despite offering an effective way
to discriminate between the two phases, the challenges
associated with the vapour phase concentration measure-
ment, namely the low signal intensity and halation con-
tamination, are not addressed by this strategy.
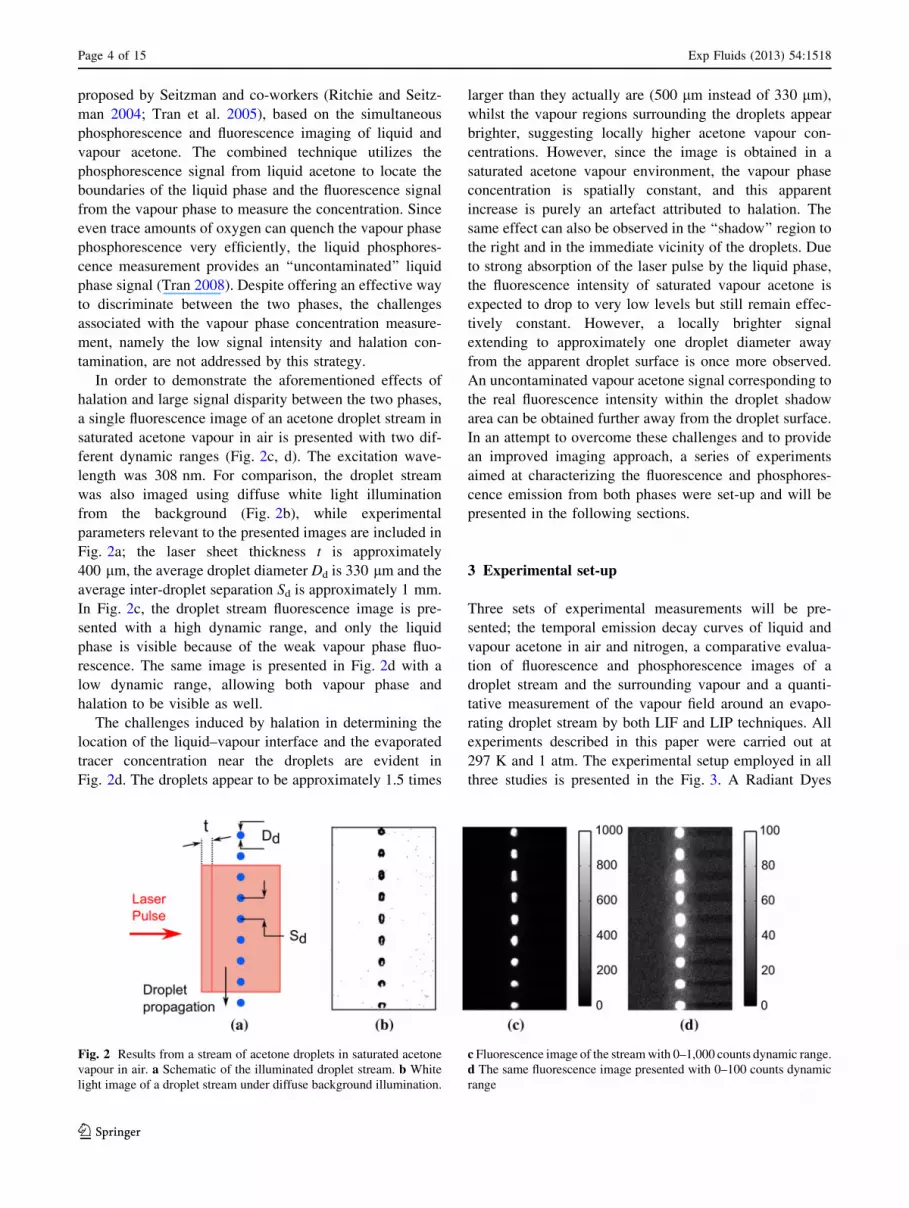
In order to demonstrate the aforementioned effects of
halation and large signal disparity between the two phases,
a single fluorescence image of an acetone droplet stream in
saturated acetone vapour in air is presented with two dif-
ferent dynamic ranges (Fig. 2c, d). The excitation wave-
length was 308 nm. For comparison, the droplet stream
was also imaged using diffuse white light illumination
from the background (Fig. 2b), while experimental
parameters relevant to the presented images are included in
Fig. 2a; the laser sheet thickness t is approximately
400 lm, the average droplet diameter Dd is 330 lm and the
average inter-droplet separation Sd is approximately 1 mm.
In Fig. 2c, the droplet stream fluorescence image is pre-
sented with a high dynamic range, and only the liquid
phase is visible because of the weak vapour phase fluo-
rescence. The same image is presented in Fig. 2d with a
low dynamic range, allowing both vapour phase and
halation to be visible as well.
The challenges induced by halation in determining the
location of the liquid–vapour interface and the evaporated
tracer concentration near the droplets are evident in
Fig. 2d. The droplets appear to be approximately 1.5 times
larger than they actually are (500 lm instead of 330 lm),
whilst the vapour regions surrounding the droplets appear
brighter, suggesting locally higher acetone vapour con-
centrations. However, since the image is obtained in a
saturated acetone vapour environment, the vapour phase
concentration is spatially constant, and this apparent
increase is purely an artefact attributed to halation. The
same effect can also be observed in the ‘‘shadow’’ region to
the right and in the immediate vicinity of the droplets. Due
to strong absorption of the laser pulse by the liquid phase,
the fluorescence intensity of saturated vapour acetone is
expected to drop to very low levels but still remain effec-
tively constant. However, a locally brighter signal
extending to approximately one droplet diameter away
from the apparent droplet surface is once more observed.
An uncontaminated vapour acetone signal corresponding to
the real fluorescence intensity within the droplet shadow
area can be obtained further away from the droplet surface.
In an attempt to overcome these challenges and to provide
an improved imaging approach, a series of experiments
aimed at characterizing the fluorescence and phosphores-
cence emission from both phases were set-up and will be
presented in the following sections.
3 Experimental set-up
Three sets of experimental measurements will be pre-
sented; the temporal emission decay curves of liquid and
vapour acetone in air and nitrogen, a comparative evalua-
tion of fluorescence and phosphorescence images of a
droplet stream and the surrounding vapour and a quanti-
tative measurement of the vapour field around an evapo-
rating droplet stream by both LIF and LIP techniques. All
experiments described in this paper were carried out at
297 K and 1 atm. The experimental setup employed in all
three studies is presented in the Fig. 3. A Radiant Dyes
Fig. 2 Results from a stream of acetone droplets in saturated acetone
vapour in air. a Schematic of the illuminated droplet stream. b White
light image of a droplet stream under diffuse background illumination.
c Fluorescence image of the stream with 0–1,000 counts dynamic range.
d The same fluorescence image presented with 0–100 counts dynamic
range
Page 4 of 15 Exp Fluids (2013) 54:1518
123

XeCl excimer laser (308 nm) was used for excitation of the
liquid and vapour phase tracer set up inside a flow cell
equipped with optical access. Fluorescence and phospho-
rescence images were collected using a CCD camera
(LaVision Imager Intense) attached to an image intensifier
with an S20 multi-alkali photocathode and a P43 phosphor
screen, and equipped with an 85 mm f/1.4D IF Nikon
Nikkor lens. The linearity of the combined intensifier–CCD
camera system was examined using a set of calibrated
neutral density filters and found to be very good. Three
neutral density filters of different optical density (OD) were
used to prevent saturation of the collected signal when
necessary. The transmission and optical density charac-
teristics of the filters are 20 % (OD 0.7), 1 % (OD 2.0) and
0.1 % (OD 3.0), respectively. The spectral flatness of these
filters has been verified experimentally over the relevant
range. The camera lens was blocking the excitation
wavelength very effectively, and hence, no additional filter
had to be used to prevent the collection of any elastic
scattering of the excitation pulse.
A beam sampler was placed at 45� to the plane of
propagation of the laser sheet, directing 10 % of the
excitation energy to a pyroelectric energy sensor (ES245C
from Thorlabs) connected to a power metre (PM100D from
Thorlabs). Pulse energies were recorded for all collected
images. A cylindrical f = 500 mm plano-convex lens was
used to focus the laser sheet down to a thickness of
400 lm, while the height of the laser sheet was adjusted to
25 mm by means of an iris and an f = 500 mm plano-
concave lens. A custom-made droplet generator equipped
with a piezo-electric oscillator was set-up on top of the cell.
The droplet generator electronics are comprised of a
Thurby Thandar Instruments TG210 function generator and
an amplifier, allowing for different frequency signals to be
applied to the piezo-electric crystal with adjustable inten-
sity. Depending on the acetone flow rate to the droplet
generator and the input signal frequency, droplet streams of
different droplet sizes and different inter-droplet separa-
tions can be obtained. The droplet generator was supplied
with liquid acetone via a PTFE line from a pressure vessel,
where bulk acetone was pressurized using nitrogen (1.5 bar
absolute pressure). Four gas lines were used for purging the
cell with nitrogen, saturated acetone vapour in air or sat-
urated acetone vapour in nitrogen. The acetone vapour was
supplied from a seeder purged with air or nitrogen. When
purging the cell, approximately 5 min were allowed for the
cell to fill with the respective gas.
When conducting the liquid phase phosphorescence
decay measurements, a smooth continuous stream rather
than a droplet stream was set-up by switching off the piezo-
control electronics (frequency generator and amplifier) and
adjusting the nitrogen pressure to the vessel. Three pin-
holes of 600, 200 and 100 lm diameter were used, the first
in the emission decay experiments and the other two in the
droplet stream experiments. Initially, a set-up employing a
quartz cuvette filled with liquid acetone was considered,
but was then abandoned. Seitzman and co-workers (Ritchie
and Seitzman 2004; Tran et al. 2005) have previously
attempted to measure the phosphorescence lifetime of
liquid acetone in a similar manner by illuminating bulk
acetone in a cuvette and have reported that due to the
presence of an intense background signal emanating from
the cuvette itself, an unrealistic measurement of the liquid
phase phosphorescence lifetime of 39.5 ls (Ritchie and
Seitzman 2004) was obtained. The particular phenomenon
was not fully apparent in the current attempts made to
characterize liquid acetone phosphorescence in a cuvette;
however, photodissociation of acetone triplets occurred and
was clearly visible in the phosphorescence images, as the
photodissociation products, possibly acetyl radicals form-
ing biacetyl molecules, contributed strongly to the col-
lected phosphorescence signals. The same behaviour has
been reported regarding vapour acetone phosphorescence
measurements in static cells (Lozano 1992). It is therefore
strongly advisable to employ flow cells, in the case of the
vapour, or streams in the case of the liquid, when per-
forming similar measurements.
4 Results and discussion
4.1 Emission decay measurements
The emission decay of acetone vapour in air and nitrogen
was examined by purging the flow cell with the respective
gases and imaging the emission over a 3 ls range. The
excitation energy was set to 20.5 mJ per pulse, and theFig. 3 Schematic of the optical set-up used throughout the emission
decay and droplet stream imaging experiments
Exp Fluids (2013) 54:1518 Page 5 of 15
123
detection delay was varied from 0 to 2.4 ls after the start
of fluorescence emission. The IRO gate and gain were set
to 200 ns and 70 %, necessitating the use of an OD 2.0
neutral density filter for the fluorescence measurements.
The first set of phosphorescence images was collected at a
delay of 200 ns after the start of fluorescence emission in
order to ensure the fluorescence signal would not affect the
phosphorescence measurements through electronic jitter.
The rest of the phosphorescence measurements were per-
formed in 100 ns steps throughout the examined delay
range. Each data point on the decay curves corresponds to a
50 image average of a 350 9 200 pixel region of interest.
This corresponds to a 9.62 9 5.5 mm viewing area. All
data points were normalized to the fluorescence inten-
sity, and their position on the plot relative to the x-axis
corresponds to the IRO delay setting plus half of the gate
time.
In examining the emission decay of liquid acetone, three
different cases were considered; a liquid acetone stream in
air, a liquid acetone stream in nitrogen bath gas and a
previously nitrogen-purged liquid acetone stream in nitro-
gen bath gas. The reason for conducting the third experi-
ment is that the phosphorescence intensity and
phosphorescence lifetime of liquid acetone have been
shown to increase as a result of the removal of dissolved
oxygen from the liquid. In this study, acetone degassing
was performed by repeatedly bubbling nitrogen through the
bulk acetone supply vessel via a pipe equipped with a
sintered end cap. In the case of liquid acetone in nitrogen,
the diffusion of oxygen out of the liquid is ongoing within
the imaging region and, as will be shown later, causes a
noticeable variation in phosphorescence intensity along the
stream. This particular experimental condition is conse-
quently not very well-defined, but the obtained direct
imaging evidence of the effect of oxygen diffusion out of
the liquid stream is considered worth presenting.
The emission decay measurements of liquid acetone
were performed by setting up a 600 lm diameter liquid
stream and collecting images in 100 ns steps using 70 %
intensifier gain. For the nitrogen-purged liquid acetone in
nitrogen bath gas, data were collected in 200 ns steps since
the decay time is substantially longer. As before, each data
point on the decay curves corresponds to a 50 image
average, and its position on the plot relative to the x-axis
corresponds to the IRO delay setting plus half of the gate
time. A 200 ns exposure time starting 100 ns before the
laser pulse was used to collect the prompt fluorescence
signals. The gate time for all phosphorescence measure-
ments was 200 ns. A list of the neutral density filters
employed in the fluorescence and phosphorescence exper-
iments shown in Figs. 4 and 5, along with the phospho-
rescence delay settings applied in both liquid and vapour
acetone studies, is provided in the Table 1. All liquid phase
measurements were performed using the same pulse energy
(20.5 mJ).
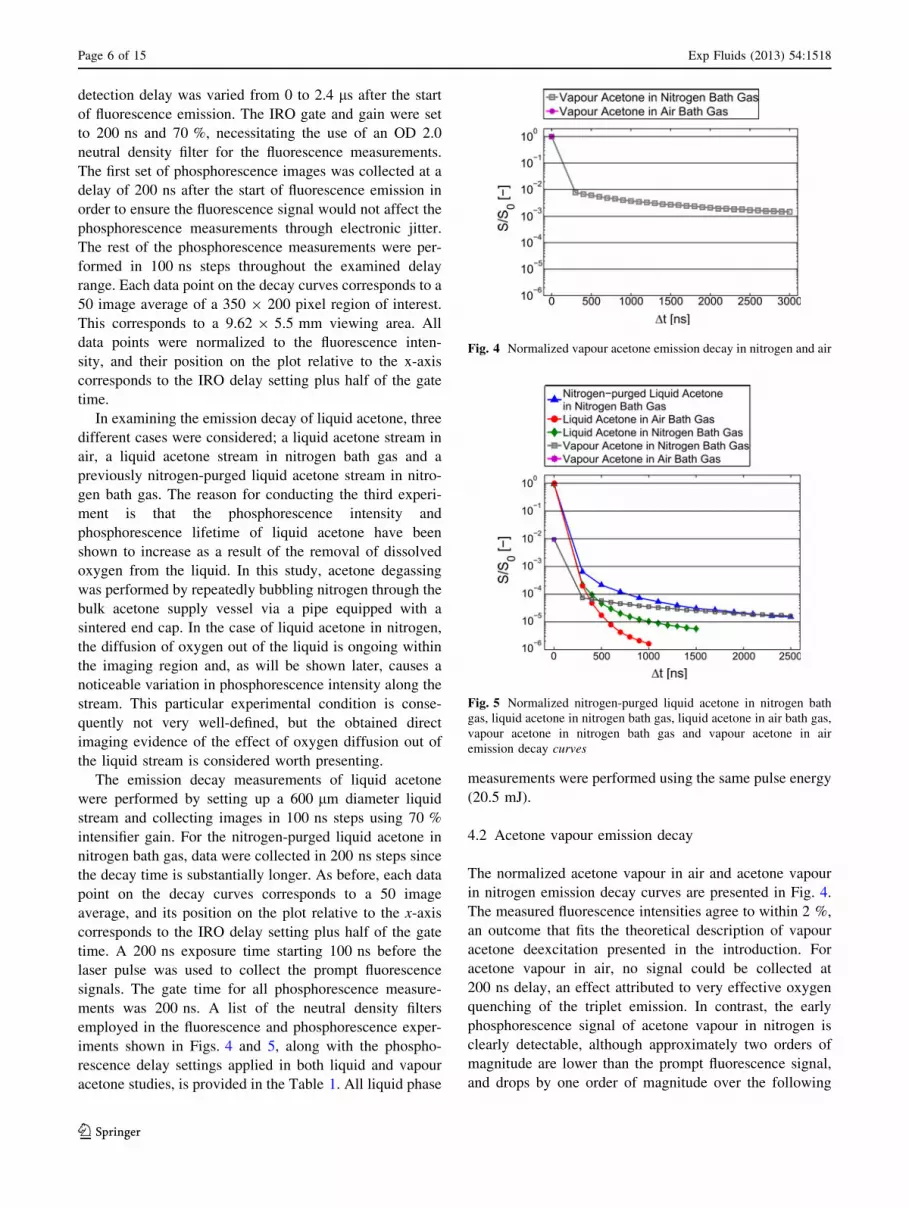
4.2 Acetone vapour emission decay
The normalized acetone vapour in air and acetone vapour
in nitrogen emission decay curves are presented in Fig. 4.
The measured fluorescence intensities agree to within 2 %,
an outcome that fits the theoretical description of vapour
acetone deexcitation presented in the introduction. For
acetone vapour in air, no signal could be collected at
200 ns delay, an effect attributed to very effective oxygen
quenching of the triplet emission. In contrast, the early
phosphorescence signal of acetone vapour in nitrogen is
clearly detectable, although approximately two orders of
magnitude are lower than the prompt fluorescence signal,
and drops by one order of magnitude over the following
Fig. 4 Normalized vapour acetone emission decay in nitrogen and air
Fig. 5 Normalized nitrogen-purged liquid acetone in nitrogen bath
gas, liquid acetone in nitrogen bath gas, liquid acetone in air bath gas,
vapour acetone in nitrogen bath gas and vapour acetone in air
emission decay curves
Page 6 of 15 Exp Fluids (2013) 54:1518
123

3 ls. Both emission decays have recently been examined
for the same delay range, following excitation at 320 nm
(Weckenmann et al. 2011). Although a direct comparison
cannot be made between the current and the aforemen-
tioned study on account of both the higher excitation
wavelength and the lower gate (100 ns) employed in the
latter, it should be noted that very similar trends are
observed amongst the two studies for both decays.
As it has already been noted, vapour acetone phospho-
rescence decays exponentially when measured in a
molecular beam (collision-free environment) with a quoted
lifetime of 200 ls (Groh et al. 1953; Kaskan and Duncan
1950). At ambient conditions, however, where molecular
collisions are frequent, the phosphorescence spectrum
shifts to longer wavelengths with increasing detection
delay (Tran et al. 2005). This trend is attributed to phos-
phorescence emission from lower vibrational levels popu-
lated by vibrational relaxation. Vibrational relaxation
occurs more readily for liquid acetone than for vapour,
suggesting that the particular effect could be even more
pronounced for the latter. The phosphorescence decay of
acetone vapour in nitrogen is consequently expected to be
comprised of a series of exponential components corre-
sponding to deexcitation from different vibrational levels
with different lifetimes. Hence, it is not practical to fit a
single exponential function to the entire data range. For the
purposes of this study, however, the range of interest is
limited to the first few microseconds of the decay, where
the phosphorescence is more intense and the obtained
signals are useful for imaging purposes. Hence, a single
exponential has been fitted to this range with a lifetime of
920 ns.
4.3 Liquid acetone emission decay
Normalized emission decay curves for liquid acetone in air
and nitrogen bath gas and nitrogen-purged liquid acetone in
nitrogen bath gas are presented in Fig. 5; for comparison,
the vapour phase emission decay in nitrogen and the
vapour phase fluorescence in air are also included. All data
points are normalized to the maximum liquid phase fluo-
rescence signal, that of liquid acetone in air. It should be
noted that all three liquid phase fluorescence signals agree
to within 5 % of each other, reflecting the fact that the
effect of oxygen quenching is insignificant in this case. In
fact, liquid acetone fluorescence has been shown to be
independent of bath gas composition for pressures up to
15 bar (Tran et al. 2006). The intensity of acetone vapour
fluorescence in nitrogen is two orders of magnitude lower
than that of liquid acetone in air, and, as noted before,
almost identical to the fluorescence of acetone vapour in
air. At 300 ns after the start of fluorescence emission, the
intensity of liquid acetone phosphorescence in air is only
2.7 times higher than the vapour in nitrogen, whilst 100 ns
later, the vapour phosphorescence is already more intense.
The nitrogen-purged liquid acetone phosphorescence
remains higher than the vapour for almost the entire delay
range; however, the liquid to vapour signal ratio drops from
around 100 for the fluorescence to only around 10 at 300 ns
delay and to 2 at 1 ls delay. The liquid acetone in nitrogen
decay lies between these two cases.
The phosphorescence lifetime of liquid acetone in air is
73 ns, whilst that of nitrogen-purged liquid acetone in
nitrogen bath gas is 214 ns: a threefold increase over the
unpurged case. Longer purging could result in slightly
longer lifetimes; however, the phosphorescence intensity
along the nitrogen-purged stream is reasonably constant,
suggesting that the liquid is nearly depleted of all oxygen.
This is clearly not the case for unpurged liquid acetone in
nitrogen bath gas where the effect of oxygen diffusion out
of the stream can be clearly visualized in the phosphores-
cence images. The removal of any dissolved oxygen along
the stream at a given exposure time results in an increase in
phosphorescence intensity the further the stream travels
inside the cell. In order to demonstrate this effect, two
average images are presented (Fig. 6), one showing the
phosphorescence of a stream of liquid acetone in air and
the other in nitrogen bath gas. Both images were acquired
at 300 ns delay after the start of fluorescence emission with
200 ns gate. Close inspection of the liquid acetone in air
bath gas phosphorescence image reveals that the emission
intensity distribution along the stream is fairly constant. In
comparison, the emission intensity of liquid acetone in
nitrogen bath gas already starts off at a higher value (since
Table 1 List of the optical set-up parameters used in the emission decay measurements (Figs. 4, 5)
Emission decay Fluorescence filters Phosphorescence delay range and filters
Vapour acetone in air OD 2 –
Vapour acetone in N2 OD 2 200–2,900 ns in 100 ns steps
Liquid acetone in air OD 3 and OD 0.7 200–900 ns in 100 ns steps (OD 0.7 for 200 ns delay)
Liquid acetone in N2 OD 3 and OD 0.7 200–1,400 ns in 100 ns steps (OD 0.7 for 200 ns delay)
N2-purged liquid acetone in N2 OD 3 and OD 0.7 200–2,400 ns in 200 ns steps (OD 0.7 for 200 ns and 400 ns delays)
The fluorescence and phosphorescence gate and gain settings (200 ns, 70 %) were identical for all decay measurements. The phosphorescence
delay values are expressed relative to the start of fluorescence emission
Exp Fluids (2013) 54:1518 Page 7 of 15
123
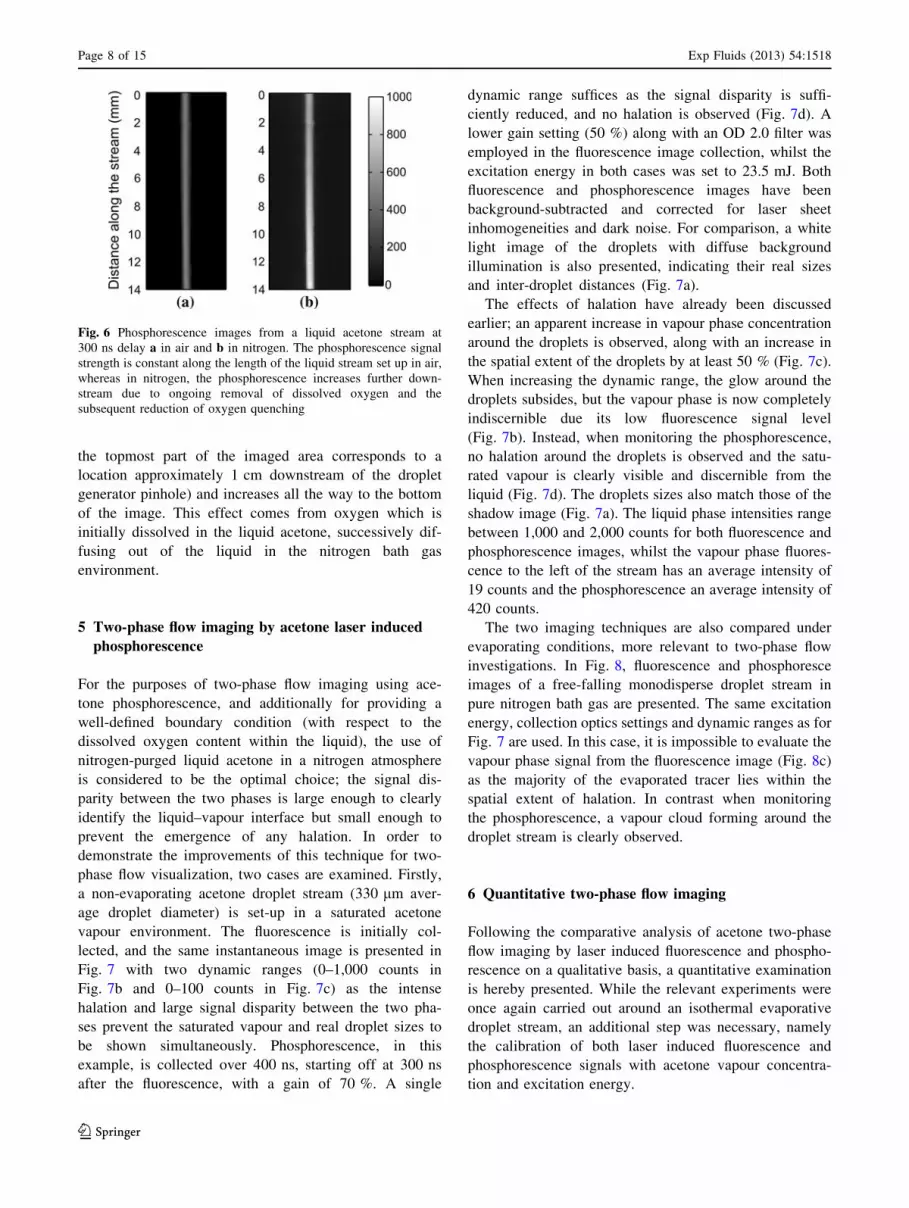
the topmost part of the imaged area corresponds to a
location approximately 1 cm downstream of the droplet
generator pinhole) and increases all the way to the bottom
of the image. This effect comes from oxygen which is
initially dissolved in the liquid acetone, successively dif-
fusing out of the liquid in the nitrogen bath gas
environment.
5 Two-phase flow imaging by acetone laser induced
phosphorescence
For the purposes of two-phase flow imaging using ace-
tone phosphorescence, and additionally for providing a
well-defined boundary condition (with respect to the
dissolved oxygen content within the liquid), the use of
nitrogen-purged liquid acetone in a nitrogen atmosphere
is considered to be the optimal choice; the signal dis-
parity between the two phases is large enough to clearly
identify the liquid–vapour interface but small enough to
prevent the emergence of any halation. In order to
demonstrate the improvements of this technique for two-
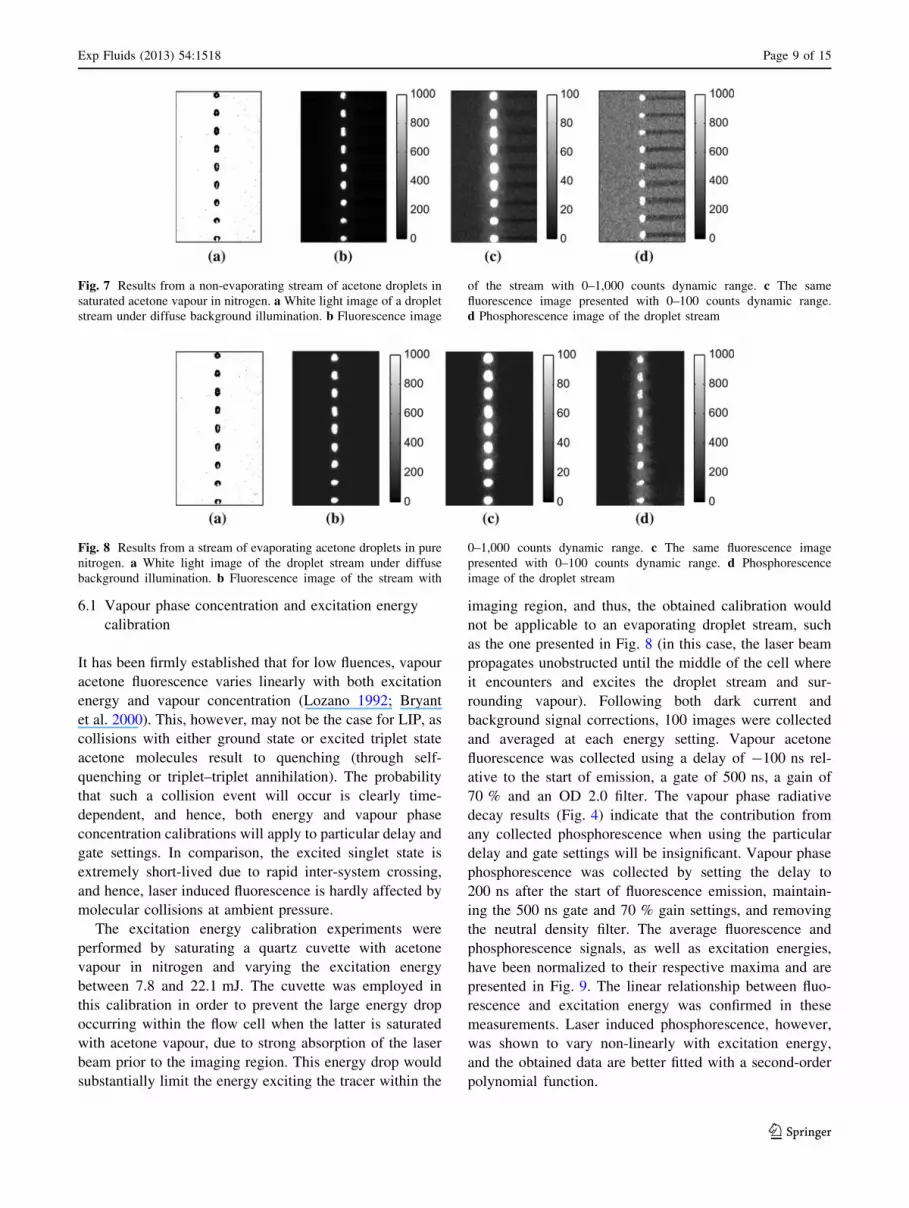
phase flow visualization, two cases are examined. Firstly,
a non-evaporating acetone droplet stream (330 lm aver-
age droplet diameter) is set-up in a saturated acetone
vapour environment. The fluorescence is initially col-
lected, and the same instantaneous image is presented in
Fig. 7 with two dynamic ranges (0–1,000 counts in
Fig. 7b and 0–100 counts in Fig. 7c) as the intense
halation and large signal disparity between the two pha-
ses prevent the saturated vapour and real droplet sizes to
be shown simultaneously. Phosphorescence, in this
example, is collected over 400 ns, starting off at 300 ns
after the fluorescence, with a gain of 70 %. A single
dynamic range suffices as the signal disparity is suffi-
ciently reduced, and no halation is observed (Fig. 7d). A
lower gain setting (50 %) along with an OD 2.0 filter was
employed in the fluorescence image collection, whilst the
excitation energy in both cases was set to 23.5 mJ. Both
fluorescence and phosphorescence images have been
background-subtracted and corrected for laser sheet
inhomogeneities and dark noise. For comparison, a white
light image of the droplets with diffuse background
illumination is also presented, indicating their real sizes
and inter-droplet distances (Fig. 7a).
The effects of halation have already been discussed
earlier; an apparent increase in vapour phase concentration
around the droplets is observed, along with an increase in
the spatial extent of the droplets by at least 50 % (Fig. 7c).
When increasing the dynamic range, the glow around the
droplets subsides, but the vapour phase is now completely
indiscernible due its low fluorescence signal level
(Fig. 7b). Instead, when monitoring the phosphorescence,
no halation around the droplets is observed and the satu-
rated vapour is clearly visible and discernible from the
liquid (Fig. 7d). The droplets sizes also match those of the
shadow image (Fig. 7a). The liquid phase intensities range
between 1,000 and 2,000 counts for both fluorescence and
phosphorescence images, whilst the vapour phase fluores-
cence to the left of the stream has an average intensity of
19 counts and the phosphorescence an average intensity of
420 counts.
The two imaging techniques are also compared under
evaporating conditions, more relevant to two-phase flow
investigations. In Fig. 8, fluorescence and phosphoresce
images of a free-falling monodisperse droplet stream in
pure nitrogen bath gas are presented. The same excitation
energy, collection optics settings and dynamic ranges as for
Fig. 7 are used. In this case, it is impossible to evaluate the
vapour phase signal from the fluorescence image (Fig. 8c)
as the majority of the evaporated tracer lies within the
spatial extent of halation. In contrast when monitoring
the phosphorescence, a vapour cloud forming around the
droplet stream is clearly observed.
6 Quantitative two-phase flow imaging
Following the comparative analysis of acetone two-phase
flow imaging by laser induced fluorescence and phospho-
rescence on a qualitative basis, a quantitative examination
is hereby presented. While the relevant experiments were
once again carried out around an isothermal evaporative
droplet stream, an additional step was necessary, namely
the calibration of both laser induced fluorescence and
phosphorescence signals with acetone vapour concentra-
tion and excitation energy.
Fig. 6 Phosphorescence images from a liquid acetone stream at
300 ns delay a in air and b in nitrogen. The phosphorescence signal
strength is constant along the length of the liquid stream set up in air,
whereas in nitrogen, the phosphorescence increases further down-
stream due to ongoing removal of dissolved oxygen and the
subsequent reduction of oxygen quenching
Page 8 of 15 Exp Fluids (2013) 54:1518
123
6.1 Vapour phase concentration and excitation energy
calibration
It has been firmly established that for low fluences, vapour
acetone fluorescence varies linearly with both excitation
energy and vapour concentration (Lozano 1992; Bryant
et al. 2000). This, however, may not be the case for LIP, as
collisions with either ground state or excited triplet state
acetone molecules result to quenching (through self-
quenching or triplet–triplet annihilation). The probability
that such a collision event will occur is clearly time-
dependent, and hence, both energy and vapour phase
concentration calibrations will apply to particular delay and
gate settings. In comparison, the excited singlet state is
extremely short-lived due to rapid inter-system crossing,
and hence, laser induced fluorescence is hardly affected by
molecular collisions at ambient pressure.
The excitation energy calibration experiments were
performed by saturating a quartz cuvette with acetone
vapour in nitrogen and varying the excitation energy
between 7.8 and 22.1 mJ. The cuvette was employed in
this calibration in order to prevent the large energy drop
occurring within the flow cell when the latter is saturated
with acetone vapour, due to strong absorption of the laser
beam prior to the imaging region. This energy drop would
substantially limit the energy exciting the tracer within the
imaging region, and thus, the obtained calibration would
not be applicable to an evaporating droplet stream, such
as the one presented in Fig. 8 (in this case, the laser beam
propagates unobstructed until the middle of the cell where
it encounters and excites the droplet stream and sur-
rounding vapour). Following both dark current and
background signal corrections, 100 images were collected
and averaged at each energy setting. Vapour acetone
fluorescence was collected using a delay of -100 ns rel-
ative to the start of emission, a gate of 500 ns, a gain of
70 % and an OD 2.0 filter. The vapour phase radiative
decay results (Fig. 4) indicate that the contribution from
any collected phosphorescence when using the particular
delay and gate settings will be insignificant. Vapour phase
phosphorescence was collected by setting the delay to
200 ns after the start of fluorescence emission, maintain-
ing the 500 ns gate and 70 % gain settings, and removing
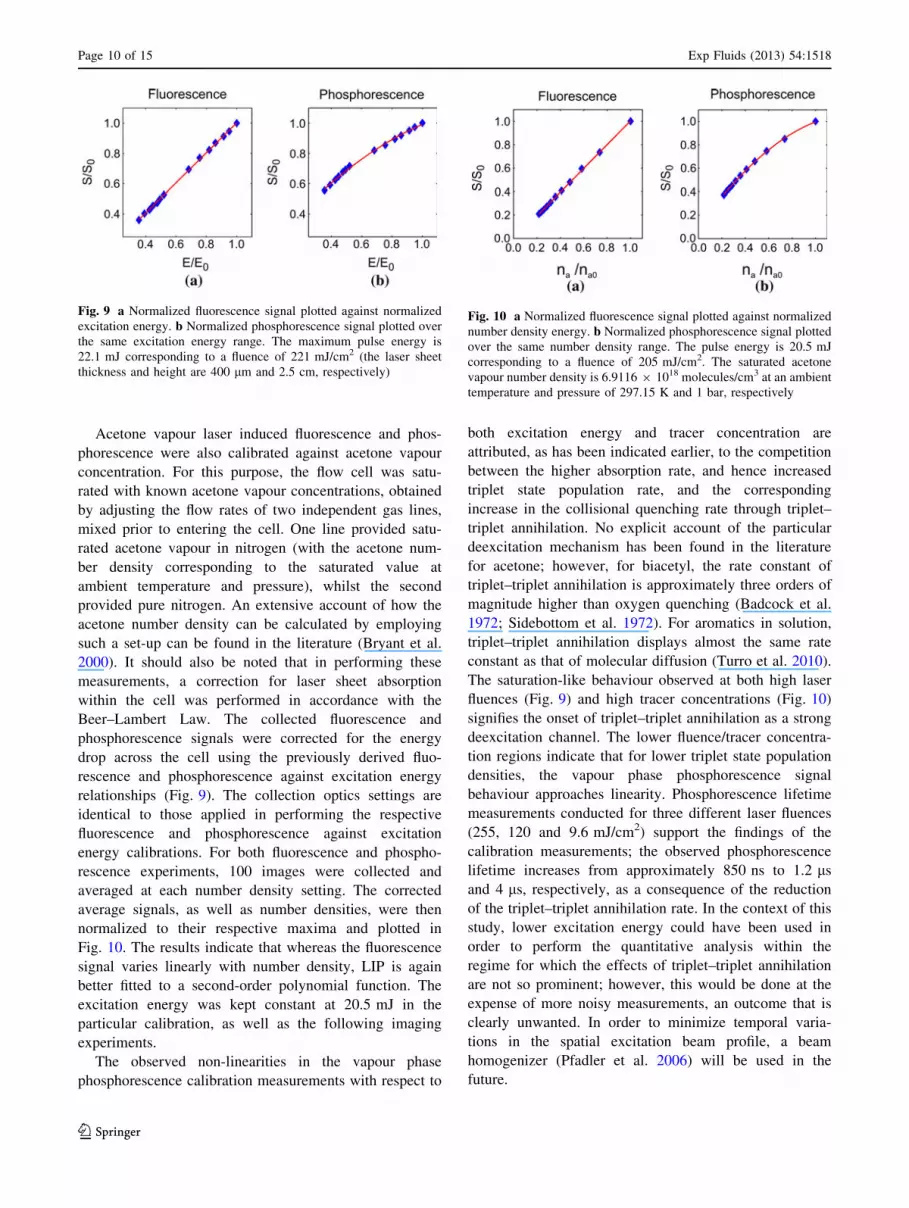
the neutral density filter. The average fluorescence and
phosphorescence signals, as well as excitation energies,
have been normalized to their respective maxima and are
presented in Fig. 9. The linear relationship between fluo-
rescence and excitation energy was confirmed in these
measurements. Laser induced phosphorescence, however,
was shown to vary non-linearly with excitation energy,
and the obtained data are better fitted with a second-order
polynomial function.
Fig. 7 Results from a non-evaporating stream of acetone droplets in
saturated acetone vapour in nitrogen. a White light image of a droplet
stream under diffuse background illumination. b Fluorescence image
of the stream with 0–1,000 counts dynamic range. c The same
fluorescence image presented with 0–100 counts dynamic range.
d Phosphorescence image of the droplet stream
Fig. 8 Results from a stream of evaporating acetone droplets in pure
nitrogen. a White light image of the droplet stream under diffuse
background illumination. b Fluorescence image of the stream with
0–1,000 counts dynamic range. c The same fluorescence image
presented with 0–100 counts dynamic range. d Phosphorescence
image of the droplet stream
Exp Fluids (2013) 54:1518 Page 9 of 15
123
Acetone vapour laser induced fluorescence and phos-
phorescence were also calibrated against acetone vapour
concentration. For this purpose, the flow cell was satu-
rated with known acetone vapour concentrations, obtained
by adjusting the flow rates of two independent gas lines,
mixed prior to entering the cell. One line provided satu-
rated acetone vapour in nitrogen (with the acetone num-
ber density corresponding to the saturated value at
ambient temperature and pressure), whilst the second
provided pure nitrogen. An extensive account of how the
acetone number density can be calculated by employing
such a set-up can be found in the literature (Bryant et al.
2000). It should also be noted that in performing these
measurements, a correction for laser sheet absorption
within the cell was performed in accordance with the
Beer–Lambert Law. The collected fluorescence and
phosphorescence signals were corrected for the energy
drop across the cell using the previously derived fluo-
rescence and phosphorescence against excitation energy
relationships (Fig. 9). The collection optics settings are
identical to those applied in performing the respective
fluorescence and phosphorescence against excitation
energy calibrations. For both fluorescence and phospho-
rescence experiments, 100 images were collected and
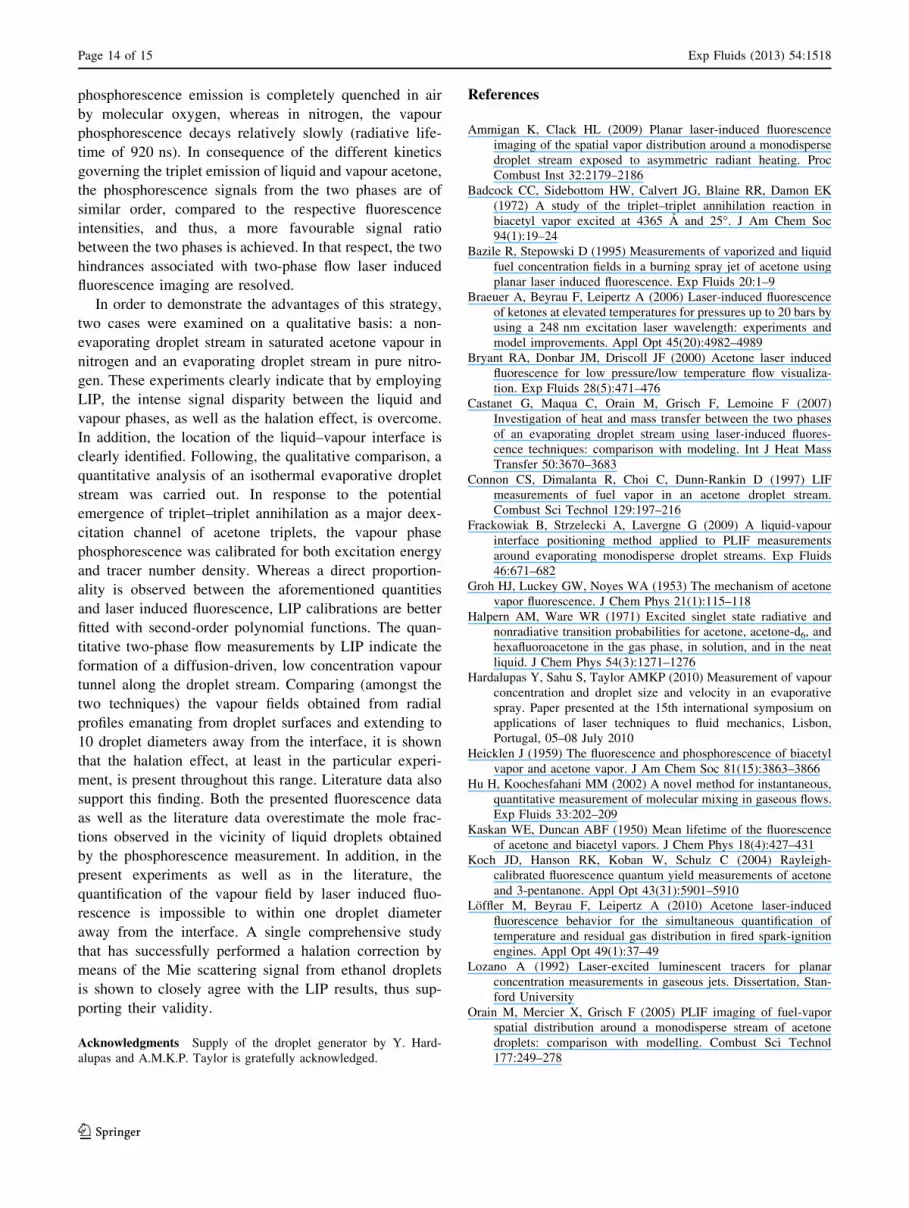
averaged at each number density setting. The corrected
average signals, as well as number densities, were then
normalized to their respective maxima and plotted in
Fig. 10. The results indicate that whereas the fluorescence
signal varies linearly with number density, LIP is again
better fitted to a second-order polynomial function. The
excitation energy was kept constant at 20.5 mJ in the
particular calibration, as well as the following imaging
experiments.
The observed non-linearities in the vapour phase
phosphorescence calibration measurements with respect to
both excitation energy and tracer concentration are
attributed, as has been indicated earlier, to the competition
between the higher absorption rate, and hence increased
triplet state population rate, and the corresponding
increase in the collisional quenching rate through triplet–
triplet annihilation. No explicit account of the particular
deexcitation mechanism has been found in the literature
for acetone; however, for biacetyl, the rate constant of
triplet–triplet annihilation is approximately three orders of
magnitude higher than oxygen quenching (Badcock et al.
1972; Sidebottom et al. 1972). For aromatics in solution,
triplet–triplet annihilation displays almost the same rate
constant as that of molecular diffusion (Turro et al. 2010).
The saturation-like behaviour observed at both high laser
fluences (Fig. 9) and high tracer concentrations (Fig. 10)
signifies the onset of triplet–triplet annihilation as a strong
deexcitation channel. The lower fluence/tracer concentra-
tion regions indicate that for lower triplet state population
densities, the vapour phase phosphorescence signal
behaviour approaches linearity. Phosphorescence lifetime
measurements conducted for three different laser fluences
(255, 120 and 9.6 mJ/cm2) support the findings of the
calibration measurements; the observed phosphorescence
lifetime increases from approximately 850 ns to 1.2 ls
and 4 ls, respectively, as a consequence of the reduction
of the triplet–triplet annihilation rate. In the context of this
study, lower excitation energy could have been used in
order to perform the quantitative analysis within the
regime for which the effects of triplet–triplet annihilation
are not so prominent; however, this would be done at the
expense of more noisy measurements, an outcome that is
clearly unwanted. In order to minimize temporal varia-
tions in the spatial excitation beam profile, a beam
homogenizer (Pfadler et al. 2006) will be used in the
future.
Fig. 9 a Normalized fluorescence signal plotted against normalized
excitation energy. b Normalized phosphorescence signal plotted over
the same excitation energy range. The maximum pulse energy is
22.1 mJ corresponding to a fluence of 221 mJ/cm2 (the laser sheet
thickness and height are 400 lm and 2.5 cm, respectively)
Fig. 10 a Normalized fluorescence signal plotted against normalized
number density energy. b Normalized phosphorescence signal plotted
over the same number density range. The pulse energy is 20.5 mJ
corresponding to a fluence of 205 mJ/cm2. The saturated acetone
vapour number density is 6.9116 9 1018 molecules/cm3 at an ambient
temperature and pressure of 297.15 K and 1 bar, respectively
Page 10 of 15 Exp Fluids (2013) 54:1518
123

6.2 Quantitative acetone vapour measurements
Both laser induced fluorescence and phosphorescence
techniques were applied in order to determine the vapour
distribution around an evaporative droplet stream set up in
nitrogen bath gas at 297 K. Prior to performing the two-
phase flow experiment, a saturated acetone vapour in
nitrogen flow was introduced to the cell and a 100 image
average of the saturated acetone vapour in nitrogen fluo-
rescence signal was obtained. This signal was corrected for
absorption effects through the cell and then used as the cut-
off level between the vapour phase and liquid phase plus
halation signals, following the procedure introduced by
Bazile and Stepowski (1995) and later adopted by other
researchers (Hardalupas et al. 2010; Ammigan and Clack
2009). Subsequently, the vapour cloud forming around the
droplets was quantified using this measurement and the
previously obtained number density calibration.
In monitoring the phosphorescence, the optical set-up
used in the calibration experiments was kept unaltered.
Prior to introducing the droplet stream, 100 images of sat-
urated acetone vapour in nitrogen phosphorescence were
collected and averaged. The resulting phosphorescence
signal was used to distinguish between the liquid and
vapour phases in the same way as with the fluorescence. The
vapour field around the droplet stream was quantified by
means of this threshold and the number density calibration.
Dark current and background contributions were subtracted
from both fluorescence and phosphorescence images, while
white image corrections were also performed. Finally, both
fluorescence and phosphorescence images were corrected
for pulse energy variation by means of the energy calibra-
tion curves. The resulting quantitative images, along with a
shadow image of the droplet stream obtained under diffuse
background illumination, are presented in Fig. 11.
In producing the particular droplet stream, the droplet
generator was equipped with a 100 lm pinhole. The flow
rate through the droplet generator was 3.3 ml/s, whilst the
resonance frequency of the generator electronics was set to
25 kHz; the respective theoretically calculated average
droplet size was 161 lm (Pergamalis 2002). Measured
diameters from both shadow and phosphorescence images
are virtually identical and in good agreement with the
calculations. The fluorescence image, instead, is plagued
by strong halation that forces the location of the liquid–
vapour interface away from the actual droplet surfaces.
Hence, it provides no realistic information regarding the
location of the liquid–vapour interface or droplet sizes. The
vapour distribution obtained from the phosphorescence
image suggests that a low concentration (mole fraction of
up to 0.05) vapour tunnel surrounds the droplet stream,
while adjacent and in between the droplets, the acetone
mole fraction rises to beyond 0.10. A saturated or near-
saturated acetone vapour concentration (mole fraction of
approximately 0.28) is only encountered immediately
adjacent to the droplets. In order to examine more closely
the extent of halation in the fluorescence image and com-
pare the vapour fields obtained by both imaging techniques
amongst each other, and with those obtained by other
researchers, radial profiles of acetone vapour distributions
emanating from droplet surfaces have been collected and
averaged over 10 droplets. As the droplet size and shape
showed periodic variations with respect to the distance
between an individual droplet and the droplet generator tip,
equidistant droplets from 10 different fluorescence and
phosphorescence images were selected. The results are
presented in Fig. 12. The radial profile obtained from the
161 lm droplet stream phosphorescence images suggests
that the vapour tunnel formed around the droplet stream
extends radially to approximately 10 droplet diameters
away from the droplet surfaces and represents the radial
diffusion of acetone vapour. In the immediate vicinity of
the droplets, the vapour mole fraction increases rapidly
to the saturated value. The profile obtained from the
Fig. 11 Quantitative mole fraction results from a stream of evapo-
rating acetone droplets in nitrogen. a Schematic of the illuminated
droplet stream. b White light image of the droplet stream under
diffuse background illumination. c Fluorescence image of the droplet
stream. d Phosphorescence image of the droplet stream
Exp Fluids (2013) 54:1518 Page 11 of 15
123

fluorescence images indicates that a vapour phase mea-
surement is not feasible to within 1.5 droplet diameter
away from the droplet surfaces. At greater distances, the
effect of halation results in an overestimation of the entire
vapour field which extends to nearly 10 droplet diameters.
Orain et al. (2005) have studied the radial profile of the
acetone vapour tunnel forming around a 230 lm mono-
disperse droplet stream at 298 K. They present results with
and without a halation correction; the former obtained by
quantifying the spatial extent and intensity of halation by
means of the Mie scattering signal from ethanol droplets.
From the uncorrected profile, mole fractions can be first
evaluated at a distance of slightly more than half a droplet
diameter away from the droplet surfaces, whilst the mole
fraction distribution coincides with the one obtained from
the corrected images at a distance slightly larger than 2
droplet diameters away from the droplet surfaces. The
spatial extent of halation is shorter than the one observed in
the present study, and this can be attributed to the fol-
lowing two reasons. Firstly, the inter-droplet separation
(measured between the centres of two adjacent droplets) in
the present study is approximately 2.5 droplet diameters,
whereas in the case of Orain and co-workers, it is 3.5. As a
result, the radial distribution measurement across a par-
ticular droplet suffers less severely from halation contri-
butions from the other two neighbouring droplets.
Secondly, the implemented halation correction is incom-
plete, as the authors admit. This is also evident from the
fact that the first mole fraction measurement is not attained
immediately adjacent to the droplet surface but approxi-
mately 0.2 droplet diameters away from it. Comparing the
corrected profile with the one obtained presently by means
of the LIP technique, it also becomes apparent that the
former is not completely free of halation; despite the fact
that the overall trend is very similar, it appears that the
corrected profile consistently overestimates the acetone
vapour mole fraction measurement. However, both the
experimental and numerical results, presented in another
study by Castanet et al. (2007) for 170 lm droplets injected
in ambient air, agree very well with the mole fraction
profile obtained by LIP imaging. In an attempt to account
for halation effects, Castanet and co-workers have suc-
cessfully utilized the technique previously introduced by
Orain and co-workers.
Another quantitative account of the radial acetone
vapour distribution around a droplet stream is provided by
Frackowiak et al. (2009). In this study, the halation is
suppressed by masking the droplets using an aperture in the
field of view, thus obtaining the vapour field directly from
a fluorescence measurement in the interval between
approximately 1.5 droplets diameters away from the
droplet surfaces up to more than 10 droplet diameters away
from the stream. A comparison of the radial profiles
obtained with and without the mask reveals that the
blooming effect extends as far as 10 droplet diameters
away from the droplet surfaces for 173 and 238 lm
droplets. The present study confirms this observation for
the examined range of up to 10 droplet diameters away
from the liquid–vapour interface. For 173 lm droplets at
22.4 �C, the agreement between measured radial profile by
Frackowiak and co-workers (with the implementation of
the mask) and the present study is good. The numerical
results, however, overestimate the experimental measure-
ments of both studies. Additionally, the phosphorescence
results suggest a much sharper increase in the acetone
vapour concentration in the vicinity of the droplet stream
(0.5 droplet diameters away from the droplet surface) than
the numerical results under consideration. The experiments
by Castanet et al. (2007) also appear to support the former.
In order to demonstrate the applicability of the LIP
technique over a wide range of droplet diameters, further
experiments were conducted for two evaporative droplet
streams of 124 and 226 lm droplet diameters. The vapour
phase quantification procedure for both droplet streams was
identical to the one adopted before, as were all optical set-
up parameters. Once again, no halation effects are detected
and the observed droplet sizes match those of the theoret-
ical calculation. Single-shot images of both droplet streams
are presented in Fig. 13.
Having provided an account of the applicability of LIP
for the investigation of evaporative droplet streams, the
potential application of the technique to different studies
will now be discussed. In internal combustion engines,
spray diagnostics are often conducted by doping a base
fuel, which is ‘‘transparent’’ for the employed excitation
wavelength, with a co-evaporating tracer. Acetone, for
example, has been employed in the design and experi-
mental investigation of a multi-component mixture, com-
prised of three tracers and three base fuels of different
Fig. 12 Average radial profiles of vapour acetone mole fractions (xa)
plotted against the distance from the droplet centre normalized to the
average droplet diameter (Xd/Dd), obtained by both laser induced
fluorescence and phosphorescence imaging
Page 12 of 15 Exp Fluids (2013) 54:1518
123

volatilities, in an attempt to match the volatility range of
commercial automotive fuels (Williams et al. 2010; Ste-
vens et al. 2007). In particular, acetone was the low-vola-
tility fuel tracer, with the low-volatility base fuel
component being isopentane. The applicability of the LIP
technique in this case is subject to the doping concentration
of acetone, which should be high enough to ensure ade-
quate signal levels from both vapour and liquid phases. In
addition, the phosphorescence properties of the acetone/
solvent mixture would have to be calibrated in a similar
manner to this study, in order to account for any collisional
quenching effect by the base fuel. Also, the application of
another excitation wavelength may be useful. Generally,
longer excitation wavelengths result in increased phos-
phorescence efficiency and longer liquid and vapour phase
lifetimes; following intersystem crossing, the excited triplet
state acetone molecules migrate closer to the thermalisation
level, for which the dissociation quantum yield is very low.
Excitation at 320 nm, for example, is highly recommended
when employing the particular technique (Weckenmann
et al. 2011). Despite the fact that liquid acetone phospho-
rescence displays spectral variations depending on the
excitation wavelength (Tran et al. 2005), for the purposes
of the LIP technique, it is preferable to collect the phos-
phorescence signal over the longest spectral range possible,
in order to enhance the signal level.
Another important aspect that must be considered prior
to expanding the LIP technique to more general experi-
ments is the effect of reduced laser fluence, as a result of
absorption across a flow field, on vapour phase concen-
tration measurements. As it has already been noted, in the
case of phosphorescence, a lower fluence will enhance the
phosphorescence efficiency and, hence, the signal drop
cannot be straightforwardly calculated on the basis of the
Beer–Lambert law. Assuming a flow field that is imaged
across 5 cm, the maximum drop in pulse energy would
result for a fully saturated acetone vapour environment;
under these conditions and for a temperature of 297 K and
excitation at 308 nm, the laser energy would drop to
approximately 57 % of its original value. In the case of
fluorescence, this corresponds to a 57 % decrease in the
vapour signal intensity. In order to quantify the corre-
sponding decrease in the vapour phase phosphorescence
signal, the phosphorescence against energy curve can be
used (Fig. 9). In this case, the phosphorescence signal
corresponding to 57 % of the original excitation energy is
only reduced to approximately 74 % of its original value.
This 17 % disparity between the fluorescence and phos-
phorescence measurements represents the maximum error
that could be induced in a vapour tracer concentration
measurement under the particular conditions. If the vapour
concentration varies across the flow field, and hence, the
laser pulse is not so strongly absorbed, this error would be
substantially reduced. The use of longer excitation wave-
lengths would help diminish this inaccuracy due to reduced
absorption and hence reduced triplet–triplet annihilation
effects; for example, at 320 nm, the absorption cross sec-
tion is reduced to 32 % of the equivalent value at 308 nm
(Lozano 1992). Additionally, reducing the laser fluence by
either reducing the excitation energy or increasing the laser
sheet thickness would also assist in the minimization of the
particular error.
7 Conclusions
Two-phase flow visualization using acetone fluorescence
was shown to present two significant challenges: the large
intensity disparity between the two phases that forces the
vapour phase signal to near noise levels and the ensuing
effect of halation around the droplets. In an attempt to
overcome these obstacles, a strategy using the phospho-
rescence, rather than the fluorescence emission of liquid
and vapour acetone, is presented. Phosphorescence lifetime
data are, therefore, collected by examining the emission
decays of liquid and vapour acetone at different boundary
conditions, following excitation at 308 nm. In air, liquid
acetone phosphorescence is shown to decay extremely fast
(73 ns) due to the presence of dissolved oxygen within the
tracer. By purging liquid acetone with nitrogen, the effect
of oxygen quenching is reduced, and the lifetime of
nitrogen-purged liquid acetone in a nitrogen atmosphere
increases to 213 ns. When the case of unpurged acetone in
nitrogen bath gas was examined, it was demonstrated that
due to oxygen diffusion out of the liquid, an increase in
both phosphorescence signal strength and lifetime would
ensue. This effect was present even within the confines of
the imaging field, and thus, it is strongly advised to purge
liquid acetone prior to using it in two-phase flow imaging
experiments by LIP. With regard to acetone vapour, the
Fig. 13 Single-shot LIP images of evaporative 124 and 226 lm
droplet streams injected in an ambient nitrogen environment (297 K,
1 atm)
Exp Fluids (2013) 54:1518 Page 13 of 15
123
phosphorescence emission is completely quenched in air
by molecular oxygen, whereas in nitrogen, the vapour
phosphorescence decays relatively slowly (radiative life-
time of 920 ns). In consequence of the different kinetics
governing the triplet emission of liquid and vapour acetone,
the phosphorescence signals from the two phases are of
similar order, compared to the respective fluorescence
intensities, and thus, a more favourable signal ratio
between the two phases is achieved. In that respect, the two
hindrances associated with two-phase flow laser induced
fluorescence imaging are resolved.
In order to demonstrate the advantages of this strategy,
two cases were examined on a qualitative basis: a non-
evaporating droplet stream in saturated acetone vapour in
nitrogen and an evaporating droplet stream in pure nitro-
gen. These experiments clearly indicate that by employing
LIP, the intense signal disparity between the liquid and
vapour phases, as well as the halation effect, is overcome.
In addition, the location of the liquid–vapour interface is
clearly identified. Following, the qualitative comparison, a
quantitative analysis of an isothermal evaporative droplet
stream was carried out. In response to the potential
emergence of triplet–triplet annihilation as a major deex-
citation channel of acetone triplets, the vapour phase
phosphorescence was calibrated for both excitation energy
and tracer number density. Whereas a direct proportion-
ality is observed between the aforementioned quantities
and laser induced fluorescence, LIP calibrations are better
fitted with second-order polynomial functions. The quan-
titative two-phase flow measurements by LIP indicate the
formation of a diffusion-driven, low concentration vapour
tunnel along the droplet stream. Comparing (amongst the
two techniques) the vapour fields obtained from radial
profiles emanating from droplet surfaces and extending to
10 droplet diameters away from the interface, it is shown
that the halation effect, at least in the particular experi-
ment, is present throughout this range. Literature data also
support this finding. Both the presented fluorescence data
as well as the literature data overestimate the mole frac-
tions observed in the vicinity of liquid droplets obtained
by the phosphorescence measurement. In addition, in the
present experiments as well as in the literature, the
quantification of the vapour field by laser induced fluo-
rescence is impossible to within one droplet diameter
away from the interface. A single comprehensive study
that has successfully performed a halation correction by
means of the Mie scattering signal from ethanol droplets
is shown to closely agree with the LIP results, thus sup-
porting their validity.
Acknowledgments Supply of the droplet generator by Y. Hard-
alupas and A.M.K.P. Taylor is gratefully acknowledged.
References
Ammigan K, Clack HL (2009) Planar laser-induced fluorescence
imaging of the spatial vapor distribution around a monodisperse
droplet stream exposed to asymmetric radiant heating. Proc
Combust Inst 32:2179–2186
Badcock CC, Sidebottom HW, Calvert JG, Blaine RR, Damon EK
(1972) A study of the triplet–triplet annihilation reaction in
biacetyl vapor excited at 4365 A and 25�. J Am Chem Soc
94(1):19–24
Bazile R, Stepowski D (1995) Measurements of vaporized and liquid
fuel concentration fields in a burning spray jet of acetone using
planar laser induced fluorescence. Exp Fluids 20:1–9
Braeuer A, Beyrau F, Leipertz A (2006) Laser-induced fluorescence
of ketones at elevated temperatures for pressures up to 20 bars by
using a 248 nm excitation laser wavelength: experiments and
model improvements. Appl Opt 45(20):4982–4989
Bryant RA, Donbar JM, Driscoll JF (2000) Acetone laser induced
fluorescence for low pressure/low temperature flow visualiza-
tion. Exp Fluids 28(5):471–476
Castanet G, Maqua C, Orain M, Grisch F, Lemoine F (2007)
Investigation of heat and mass transfer between the two phases
of an evaporating droplet stream using laser-induced fluores-
cence techniques: comparison with modeling. Int J Heat Mass
Transfer 50:3670–3683
Connon CS, Dimalanta R, Choi C, Dunn-Rankin D (1997) LIF
measurements of fuel vapor in an acetone droplet stream.
Combust Sci Technol 129:197–216
Frackowiak B, Strzelecki A, Lavergne G (2009) A liquid-vapour
interface positioning method applied to PLIF measurements
around evaporating monodisperse droplet streams. Exp Fluids
46:671–682
Groh HJ, Luckey GW, Noyes WA (1953) The mechanism of acetone
vapor fluorescence. J Chem Phys 21(1):115–118
Halpern AM, Ware WR (1971) Excited singlet state radiative and
nonradiative transition probabilities for acetone, acetone-d6, and
hexafluoroacetone in the gas phase, in solution, and in the neat
liquid. J Chem Phys 54(3):1271–1276
Hardalupas Y, Sahu S, Taylor AMKP (2010) Measurement of vapour
concentration and droplet size and velocity in an evaporative
spray. Paper presented at the 15th international symposium on
applications of laser techniques to fluid mechanics, Lisbon,
Portugal, 05–08 July 2010
Heicklen J (1959) The fluorescence and phosphorescence of biacetyl
vapor and acetone vapor. J Am Chem Soc 81(15):3863–3866
Hu H, Koochesfahani MM (2002) A novel method for instantaneous,
quantitative measurement of molecular mixing in gaseous flows.
Exp Fluids 33:202–209
Kaskan WE, Duncan ABF (1950) Mean lifetime of the fluorescence
of acetone and biacetyl vapors. J Chem Phys 18(4):427–431
Koch JD, Hanson RK, Koban W, Schulz C (2004) Rayleigh-
calibrated fluorescence quantum yield measurements of acetone
and 3-pentanone. Appl Opt 43(31):5901–5910
Loffler M, Beyrau F, Leipertz A (2010) Acetone laser-induced
fluorescence behavior for the simultaneous quantification of
temperature and residual gas distribution in fired spark-ignition
engines. Appl Opt 49(1):37–49
Lozano A (1992) Laser-excited luminescent tracers for planar
concentration measurements in gaseous jets. Dissertation, Stan-
ford University
Orain M, Mercier X, Grisch F (2005) PLIF imaging of fuel-vapor
spatial distribution around a monodisperse stream of acetone
droplets: comparison with modelling. Combust Sci Technol
177:249–278
Page 14 of 15 Exp Fluids (2013) 54:1518
123
Pergamalis H (2002) Droplet impingement onto quiescent and
moving liquid surfaces. Dissertation, Imperial College London
Pfadler S, Beyrau F, Loffler M, Leipertz A (2006) Application of a
beam homogenizer to planar laser diagnostics. Opt Express
14(22):10171–10180
Ritchie BD, Seitzman JM (2001) Quantitative acetone PLIF in two-
phase flows. Paper presented at the 39th aerospace sciences
meeting and exhibit, Reno, Nevada, 08–11 January 2001
Ritchie BD, Seitzman JM (2004) Simultaneous imaging of vapor and
liquid spray concentration using combined acetone fluorescence
and phosphorescence. Paper presented at the 42nd aerospace
science meeting and exhibit, Reno, Nevada, 05–08 January 2004
Rothamer DA, Snyder JA, Hanson RK, Steeper RR, Fitzgerald RP
(2009) Simultaneous imaging of exhaust gas residuals and
temperature during HCCI combustion. Proc Combust Inst
32:2869–2876
Sahu S (2011) Experimental study of isothermal and evaporative
sprays. Dissertation, Imperial College London
Schulz C, Sick V (2005) Tracer-LIF diagnostics: quantitative
measurement of fuel concentration, temperature and fuel/air
ratio in practical combustion systems. Prog Energy Combust Sci
31(1):75–121
Sidebottom HW, Badcock CC, Calvert JG, Rabe BR, Damon EK
(1972) Lifetime studies of the biacetyl excited singlet and triplet
states in the gas phase at 25�. J Am Chem Soc 94(1):13–19
Stevens RE, Ma H, Stone CR, Walmsley HL, Cracknell R (2007) On
planar laser-induced fluorescence with multi-component fuel and
tracer design for quantitative determination of fuel concentration
in internal combustion engines. Proc Inst Mech Eng Pt D
221(6):713–724
Thurber MC, Hanson RK (1999) Pressure and composition depen-
dences of acetone laser-induced fluorescence with excitation at
248, 266, and 308 nm. Appl Phys B 69(3):229–240
Thurber MC, Hanson RK (2001) Simultaneous imaging of temper-
ature and mole fraction using acetone planar laser-induced
fluorescence. Exp Fluids 30(1):93–101
Thurber MC, Grisch F, Kirby BJ, Votsmeier M, Hanson RK (1998)
Measurements and modeling of acetone laser-induced fluores-
cence with implications for temperature-imaging diagnostics.
Appl Opt 37(21):4963–4978
Tran T (2008) Acetone planar laser-induced fluorescence and
phosphorescence for mixing studies of multiphase flows at high
pressure and temperature. Dissertation, Georgia Institute of
Technology
Tran T, Kochar Y, Seitzman J (2005) Measurements of liquid acetone
fluorescence and phosphorescence for two-phase fuel imaging.
Paper presented at the 43rd aerospace sciences meeting and
exhibit, Reno, Nevada, 10–13 January 2005
Tran T, Kochar Y, Seitzman J (2006) Measurements of acetone
fluorescence and phosphorescence at high pressures and tem-
peratures. Paper presented at the 44th aerospace sciences
meeting and exhibit, Reno, Nevada, 09–12 January 2006
Turro NJ, Ramamurthy V, Scaiano JC (2010) Modern molecular
photochemistry of organic molecules, 1st edn. University
Science Books, Sausalito, CA
Weckenmann F, Bork B, Oldenhof E, Lamanna G, Weigand B, Bohm
B, Dreizler A (2011) Single acetone droplets at supercritical
pressure: droplet generation and characterization of PLIFP.
Z Phys Chem 225:1417–1431
Williams B, Ewart P, Wang X, Stone R, Ma H, Walmsley H,
Cracknell R, Stevens R, Richardson D, Fu H (2010) Quantitative
planar laser-induced fluorescence imaging of multi-component
fuel/air mixing in a firing gasoline-direct-injection engine:
effects of residual exhaust gas on quantitative PLIF. Combust
Flame 157(10):1866–1878
Exp Fluids (2013) 54:1518 Page 15 of 15
123