the knowledge economy and education and training in south asia
TRANSCRIPT

DRAFT
The Knowledge Economy and Education and Training in South Asia: A Mapping Exercise of Available Survey Data
Michelle Riboud, Yevgeniya Savchenko, and Hong Tan
I. Introduction Globalization and the knowledge economy pose numerous challenges as well as opportunities for developing countries, not least of all in the area of skills development. Expanding trade and globalization of production and capital create pressures for economies to restructure, making it imperative to retrain those made redundant in declining industries and upgrade skills for others employed in new industries. The increased global flow of information made possible by new IT technologies in the knowledge economy also creates demand for higher-level cognitive skills and for continuous learning over the work-life, as skills acquired in schools and in the workplace become obsolete more quickly and new and more complex skills are needed to respond to accelerating technological change. How educational and training systems respond to these sweeping changes and the challenges they pose will have far reaching implications for economic growth and competitiveness of countries in the South Asia Region, and for income growth, employment, job creation, and poverty reduction. Some effects of globalization and the knowledge economy on the growing relative demand for skills are well known. Economists have documented diverging trend changes in the earnings distributions by level of education for many developing countries and regions in the late 1980s and 1990s, paralleling similar trends in OECD countries that started earlier in the 1970s. Some have attributed this global phenomenon to skill-biased technological change in which the diffusion of skill-intensive advanced technologies developed in OECD countries generates a corresponding but lagged pattern of change in relative skills demand in developing countries. How important an influence skill-biased technology has on relative pay by skill level will also depend on supply side changes in skills and on the speed of globalization. Education and training policies, as well as policies regarding trade liberalization and market orientation, can offset demand shifts and thus mitigate the effects of skill-biased technology on relative pay by skill level. Policymakers in the region are already grappling with the challenges of reforming national education and training systems. In India, for example, the release of a report on the Knowledge Economy has sparked policy interest in how to reposition education and workforce skills to take advantage of the opportunities afforded by the knowledge economy. Pakistan, recognizing the imperative of expanding access to post-school vocational education and training, has established NAVTEC – an apex training body to develop and implement a scaled-up national training strategy for the workforce. The World Bank is also helping SAR governments in Bangladesh, India and Sri Lanka with sector studies and/or projects on education, vocational training, and labor markets.

2
Objectives of Regional Mapping Exercise This paper seeks to complement and inform these ongoing initiatives through a cross-country study of education and training in the South Asia Region. The focus is on India, Pakistan, Sri Lanka and Bangladesh, countries for which data on education and training are available from several sources. The objectives of this first-phase mapping exercise are to:
• identify and assemble available household and firm-level survey data in the four countries covering the period from the 1990s to the most recent year for which data are available;
• document and compare trends in the education and training of the workforce in these four countries, as well as associated changes in the earnings of different education and demographic groups; and
• ascertain what kinds of economic analyses can be done with existing data about the life-cycle choices individuals, families and employers make about education, pre-employment VET and in-service training, and the outcomes of such human capital investments on school-to-work transitions, employment, earnings and productivity growth.
The preliminary findings reported here suggest that the available data on education and training, while limited, are relatively robust and amenable to more technically rigorous analysis. Improvements in survey design and sustained collection of better data on education and training should, over time, allow governments in the region to better monitor the skill requirements from globalization and the knowledge economy and to design and implement education and training policies that address those skill needs. Data Sources The regional mapping exercise relies principally on two main data sources: 1. Household and Labor Force Surveys. The SASHD team has compiled, or is currently assembling, cross-sectional household and labor force surveys for each of the four SAR countries. All contain information on level of educational attainment (technical and vocational training is less well covered), demographic attributes, employment, wages and salaries or incomes, industry of employment, and region of residence. Labor force surveys (LFS) are available annually in Sri Lanka and periodically in Pakistan, while household surveys with education, employment and earnings are available for selected years in India (selected rounds of the National Sample Survey or NSS) and Pakistan (Integrated Household Survey or PIHS). For Bangladesh, the Household Income and Expenditure Survey (BHIES) is available but for only 1 round in 2000. 2. Investment Climate Surveys. For each of the four SAR countries, cross-sectional information on enterprise-based training (from in-company programs, and from external public and private sector training providers) is available from firm-level surveys of manufacturing establishments, conducted sometime between 2002 and 2004. The
3
exceptions are India, which has 2 surveys – 2000 and 2002 – and is planning a third in 2005, and Sri Lanka, which fielded a survey in 2004 covering both manufacturing and rural enterprises. For these countries, the cross-sectional relationships between education, training and outcomes – on firm productivity and wages – can be investigated, as well as simple hypotheses about the demand-side roles of trade, investment, foreign direct investment (FDI), and SBTC.1 Overview of the Report The results of this mapping exercise are organized around five sections. Section II begins by providing an overview of the stocks and flows of human capital in South Asia, and how the educational composition of the workforce has changed over the past two decades. Section III presents estimates of the returns to formal schooling, calculated separately by level of education and gender, as well as some evidence on how the returns to schooling have increased over time, especially for those with more education. Section IV examines the school-to-work transitions of different demographic groups, and how this is facilitated by both education and post-school training. Section V assembles available information on post-school vocational training and uses them to paint a broad brush picture of post-school training in South Asia, and the effects of training on wage outcomes. Section VI uses firm-level Investment Climate surveys to characterize the incidence and determinants of in-service training in the manufacturing sector of four South Asian countries. It presents estimates of the productivity and wage effects of employers investing in the in-service training of their workforce. The final section summarizes the main findings from the different sections, identifies areas for future research and offers some concluding remarks.
1 A third source of data – annual or periodic industrial surveys – was identified as being potentially useful but was not ultimately used in this initial mapping exercise because of time limitations. These data, which may be establishment-level information or grouped industry-state level information aggregated (at the 3-digit level) from annual surveys, can provide time-series information on the changing skills composition of workers as well as relative wages by occupation. Such industry-state level data for India have been used previously by Berman, Somanathan and Tan (2004) to look at SBTC in the context of trade liberalization in India in the mid-1990s. A short firm-level panel data set (1999-2003) is available for Bangladesh, a longer 3-digit industry-state aggregated data base (1984-1998) is available for India, and a comparable industry-province time series can be developed for Sri Lanka covering the 1992-2003 period.
4
II. Trends in Educational Attainment: Stocks and Flows
We begin by looking at the evolution of educational attainment in South Asia over a period of two to four decades depending on the country. We first examine the distribution of educational attainment or “stock of human capital” in the population at different points in time. This “stock” of human capital at a given time may be characterized by the percentage of the total population 15 years and older that completed different levels of education: illiterate, primary, secondary and above secondary (that is, having tertiary education). We then turn our attention to the speed at which each country is upgrading the skills of its population. To study “flows” or changes in the human capital stock over time, we compare changes in educational achievement across cohorts of individuals born at different points in time. Data Sources Our data for this exercise are based on household surveys. In India and Pakistan where time-series data are available, we use several rounds of the National Sample Survey (NSS) of India and the Pakistan Integrated Household Surveys (PIHS) for several roughly comparable years. We use secondary data from Barro and Lee (2004)2 for the other countries in the region – Sri Lanka and Bangladesh – and for several East Asian comparator countries, namely Malaysia and China. The Barro-Lee classification of educational levels is based on the criteria adopted by the International Standard Classification of Education (ISCED, 1976). The distribution of skills in the population (stock of human capital at a given time) is estimated by looking at the percentage of the total population aged 15 or more which has attained the following four educational levels3: is illiterate, has completed primary schooling, has completed secondary, or has achieved a level of education above secondary. In all cases, this refers to the highest level of education attained.
The “Stock of Skills” in the Population The “stock of skills” or distribution of educational attainment at a given point in time is a reflection of past investments in education. When the mean years of schooling is low in a country, it is well known that the distribution looks like a pyramid. The base, which corresponds to the fraction of the population with no education or with less than primary
2 Barro, Robert J, and Lee, Jong-Wha (2000), “International Data on Educational Attainment: Updates and Implications”, CID Working Paper, No. 42. 3 For India, the NSS defines the following education levels as follows: illiterate – not literate, literate through attending NFEC/AEC, TLC, others, literate but below primary; primary – primary or middle school completed; secondary – secondary or higher secondary; above secondary – graduate and above. For Pakistan, the PIHS education categories are: illiterate – not literate, completed classes 1-4 (less than primary); primary – completed classes 5-9 (primary or middle school completed); secondary – completed classes 10-13 (secondary or higher secondary); and above secondary – BA, BS and above.

5
education, is relatively wide; the middle and top sections taper off to reflect the smaller shares of the population with higher levels of education. This pattern characterizes India, Pakistan and Bangladesh for the last two decades as may be seen in Figures 2.1 and 2.2. Over time, as these countries have upgraded the skills of the population with a bottom-up strategy, the base has narrowed and the middle sections have become wider. Nevertheless, even today, about half of the population aged 15 and older are still illiterate in India or Bangladesh. The same pattern characterizes Pakistan with an even larger proportion of illiterates.
Figure 2.1 Educational Attainment in India and Pakistan
Figure 2.2 Educational Attainment in Sri Lanka and Bangladesh
When countries pursue their investments in education to the point where more adults have primary education than are illiterate, the education distribution takes on a diamond shape. This has been the case of Sri Lanka since the early 1960s. From 1985 to the present, which is depicted in the right panel of Figure 2.2, the middle sections have
India: population 15 years and over
58%2.9%
8.5% 24.5%64%
4.7%16%
27%53%
4.7%
25%12%
47%32%
16%5.5%
2000
1994
1984
2004
V - illiterate, V - primary, V - secondary, V - above secondary
Pakistan: population 15 years and over
12%20%
2.6%
61%23%
12%3.3%
72%17.2%
8.8%1.8%
65%
2001
1994
1985
V - illiterate, V - primary, V - secondary, V - above secondary
Bangladesh: population 15 years and over
54%
1.7%14.4%
21.0%63%
3.0%14%
33%50%
2.5%
29%14%
2000
1995
1985
■ – illiterate, ■ –primary, ■ – secondary, ■ – above secondary
Sri Lanka: population 15 years and over
12%0.3%
26.7%45.8%
27%
2.1%48%
34%16%
1.2%
43%43%
14%34%
50%3%
2000
1995
1985
1960
■ – illiterate, ■ – primary ■ – secondary, ■ – above secondary

6
continued to grow and today, over 80 percent of the population has completed either primary (34 percent) or secondary education (50 percent). Educational progress, however, has not been to the point where the education distribution resembles an inverted pyramid shape.
How does South Asia compare with East Asian countries such as China or Malaysia which have enjoyed longer periods of economic and total factor productivity growth? The region is clearly far behind East Asia, as is apparent from Figure 2.3. The proportion of the population that is illiterate today in India is similar to that observed in China in the late 1970s, or in the late 1960s in Malaysia. The fraction of the population who completed secondary education today in India (16 percent) is half of what prevailed in China in the late 1970s. Pakistan and Bangladesh lag even further behind. It is only at the level of tertiary education that the countries in South Asia resemble their East Asian counterparts. With 3 to 5 percent of the population having completed university education, India may actually have a slight advantage over China and be on par with Malaysia. But taking into account the population as a whole, South Asia lags behind East Asia by about 30 years. A quick comparison with other parts of the world4 also shows that the distribution of educational attainment in South Asia today is similar to that observed in Latin American countries in the 1960s. Only Sri Lanka – a clear outlier – did much better but its comparative advantage has gradually been eroded over time.
Figure 2.3 Educational attainment in Malaysia and China
Investment Climate Surveys (ICS) which were conducted worldwide between 2000 and 2004 provide another useful source of information to compare the stocks of human capital across regions. These are broadly comparable firm-level surveys that the World Bank has fielded in the manufacturing sector of over 40 developing countries to get employers’ assessments of the business environment in the country, including indicators of governance, predictability of economic policy, the judicial system, access to finance,
4 See World Bank (2003), “Closing the Gap in Education and Technology” by D. de Ferranti et al.
Malaysia: population 15 years and over
25%46%
2%
16%42%
36%5%
50%38.6%
10.1%1.5%
27%
2000
1980
1960
V - illiterate, V - primary, V - secondary, V - above secondary
China: population 15 years and over
34%31%
1%
18%34%
45%3%
40%27.5%
31.4%0.9%
34%
2000
1980
1975
V - illiterate, V - primary, V - secondary, V - above secondary

7
and general constraints to business operations.5 In addition to these indicators, the ICS elicited information on the educational distribution of the workforce. These are shown in Figure 2.4 by level of education, separately for six regions in which country ICS samples are weighted using the firm size-distribution of India as the norm.6 The figure suggests that South Asia’s stock of human capital is not much different from that of the Middle East and North Africa region and lags behind most regions in the world.
Figure 2.4 Distribution of workforce by level of education in manufacturing, 2000-2004
Flows of Human Capital: Investments in the education of new generations
Looking at the distributions of educational attainment in various countries, it is clear that South Asia’s stock of human capital is still low compared to other parts of the world. However, there is evidence of continuous skill upgrading over time in the region. How rapid has been this progress? Has it been different across countries, and how likely will South Asia catch up with other regions? These are the questions we now try to answer.
5 To ensure comparability of Investment Climate Surveys (ICS) across countries, a sampling frame is used based on the distribution of private firms in each country, by sector, size, numbers of employees, and location. Each ICS includes information on firm size (number of employees, sales and assets); years in operation; sales, debt and growth performance; sources of finance; and a mix of qualitative and quantitative indicators of the business environment. 6 The countries in South Asia include India (2002), Pakistan (2002), and Sri Lanka (2003). The countries that make up the other comparator regions are: Africa – 11 countries, 2,387 firms, countries are Eritrea (2002), Ethiopia (2002), Kenya (2003), Mali (2003), Mozambique (2001), Nigeria (2001), Senegal (2003), South Africa (2003), Tanzania (2003), Uganda (2003), Zambia (2002); EAP – 4 countries, 3,083 firms, countries are Cambodia (2003), China (2002), Indonesia (2003), Philippines (2003); ECA – 3 countries, 280 firms, countries are Kosovo (2003), Montenegro (2003), Serbia (2003); LAC – 8 countries, 5,112 firms, countries are Bolivia (2000), Brazil (2003), Ecuador (2003), El Salvador (2003), Guatemala (2003), Honduras (2003), Nicaragua (2003), Peru (2002); and MENA – 5 countries, 2,889 firms, countries are Algeria (2002), Egypt (2004), Morocco (2004), Oman (2003), and Syria (2003).
Pe r c e n ta g e o f w o r k fo r c e w ith c e r ta in le v e l o f e d u c a t io n b y r e g io n
0 %1 0 %2 0 %3 0 %4 0 %5 0 %6 0 %7 0 %8 0 %9 0 %
1 0 0 %
E u ro p e a n dC e n tra l As ia
E a s t As iaa n d P a c ific
L a tin Am e ricaa n d
C a rrib e a n
Africa Mid d le E a s ta n d N o rth
Africa
S o u th As ia
s o m e p rim a ry e d u ca tio n s o m e m id d le /s e co n d a ry s ch o o l e d u ca tio ns o m e h ig h e r s ch o o l e d u ca tio n s o m e u n ive rs i ty e d u ca tio n

8
Trends in enrollment rates over time, if available, could provide answers to these questions. However, the limited availability of household surveys at different points in time for all countries in the region makes it difficult to use enrollment rates to compare trends over time. To overcome this difficulty, we use data from the most recently available survey and look at age cohorts of individuals born at different periods of time: for example, individuals age 50-59 years in 2000 were born in the 1940s, while those aged 40-49 were born in the 1950s, and so on. With this perspective, it is possible to identify changes in investments in education across different generations, and to compare the speed at which skills upgrading took place. Since this only requires using the most recent survey, we were able to add information on additional countries in the South Asia region, namely Nepal, Bhutan, and Maldives.7 For purposes of comparison across regions, we also add similar data on Malaysia, a fast-growing country from East Asia.
Figure 2.5 Proportion of population who attained at least grade 58
Share of population attained at least Grade 5, %
48.0
77.2
56.9
65.6
95.4
65.1
96.3
0
10
20
30
40
50
60
70
80
90
100
50-59 40-49 30-39 20-29 15-19
Age group
Bangladesh00Bhutan03India04Maldives04Nepal02-03Pakistan01-02Sri Lanka99-00Malaysia04
Source: Leopold R. Sarr & Authors calculations for India and Malaysia Figure 2.5 depicts changes in primary school achievement across generations, ranging from those now in their 50s to those aged 15-19 at the time of the surveys. Once again, Sri Lanka is the outlier in the South Asia region. Over 70 percent of Sri Lankans born in the late 1940s had already completed at least 5 years of education and continuous progress over the following 40 years led to practically universal primary education. For 7 Bhutan Living Standard Survey (2003), Nepal Living Standard Survey 2002/2003, Maldives Vulnerability ad Poverty Assessment (2004) 8 Sources: Bangladesh Household Income and Expenditure Survey (2000), Bhutan Living Standard Survey (2003), India National Sample Survey (2004), Maldives Vulnerability ad Poverty Assessment (2004), Nepal Living Standard Survey (2002/2003), Pakistan Integrated Household Survey (2001/2002), Sri Lanka Integrated Survey (1999-2000)

9
all other countries, the starting point was much lower, ranging from 5 percent for Bhutan to 35 percent for India. Countries which started with the lowest educational level showed a faster pace of improvements. The most spectacular changes took place in the Maldives and in Bhutan. Over a twenty year period, Maldives was able to increase access to primary education to practically 90 percent of children and catch up with Sri Lanka. Bhutan moved from a situation where only a tiny proportion of children could go to school to a situation where almost half of children spend at least 5 years in school. Nepal also stands out with a 4.5 fold increase in the proportion of children completing at least 5 years of schooling. India, Bangladesh and Pakistan made slower progress. Over a period of four decades, those three countries increased about 2.5 fold the proportion of children who completed at least a primary education. India continues to fare better than Bangladesh, and Bangladesh better than Pakistan. These differences, however, are not extremely large and may be overstated since the India data refer to 2004 while they refer to the year 2000 for the other two countries. To some extent, this result is surprising in the case of Pakistan whose enrollment data showed stagnation for a number of years before the most recent take-off in the early 2000s. Based on previous analysis, one would have expected a greater difference between Pakistan and Bangladesh and better performance for Bangladesh. Some further analysis is warranted there. Possibly, transition rates have continued to improve in Pakistan even though there was not greater access to early grades. At this level of education, only Sri Lanka can be compared to Malaysia; both countries have the same starting and ending points although Malaysia’s speed towards universal primary education has been faster. A number of points stand out when we turn our attention to levels of education beyond primary, middle and/or secondary education. See figures 2.6 and 2.7. First, efforts on upgrading skills beyond primary education have been steady in the region. Trend lines in the region are broadly parallel for attainment of at least 10 years of schooling, the exceptions being Sri Lanka and Maldives which have experienced faster progress for the youngest generation. The Maldives in particular, is now getting close to Sri Lanka which has the highest indicator for grade 10. Second, Sri Lanka no longer appears as an outlier with respect to achievement of 12 years of schooling9. Its efforts have been concentrated on basic education, but much less so on levels of schooling beyond that. While 48 percent of children from the youngest generation achieved at least 10 years of schooling10, the proportion drops by more than half for 12 years of schooling and India practically performs just as well. Third, the surprising result for Bangladesh (vis a vis Pakistan) mentioned earlier is even more striking here as, on all counts (10 or 12 years of schooling), Bangladesh fares worse than Pakistan, a fact that seems contrary to what is usually known about both countries. A more thorough analysis of other data sources is needed to confirm or refute these findings.
9 Estimates for Sri Lanka are lower than and not fully consistent with those provided by Barro and Lee (op.cit). This discrepancy may be due to the fact that Barro and Lee do not measure completion of a full cycle but only “some” primary or secondary education. Labor force surveys also give low estimates 10 The numbers on secondary school attainment are significantly lower than those reported by Barro and Lee

10
Figure 2.6 Proportion of population attaining at least grade 10
Share of population attained at least Grade 10, %
48.4
67.0
19.6
13.7
29.7
35.5
23.926.3
0
10
20
30
40
50
60
70
50-59 40-49 30-39 20-29
Age group
Bangladesh00Bhutan03India04Maldives04Nepal02-03Pakistan01-02Sri Lanka99-00Malaysia04
Source: Leopold Remi Sarr, Authors calculations for India and Malaysia
Figure 2.7 Proportion of population attaining at least grade 12
Share of population attained at least Grade 12, %
5.84.1
18.0
23.2
6.3
12.9
19.9
28.6
0
5
10
15
20
25
30
50-59 40-49 30-39 20-29
Age group
Bangladesh00Bhutan03India04Maldives04Nepal02-03Pakistan01-02Sri Lanka99-00Malaysia04
Source: Leopold R. Sarr & Authors calculations for India and Malaysia

11
The final point that emerges from these two figures is that catch-up with East Asia in terms of education is unlikely, at least in the medium-term. With the exception of the Maldives, no country in the region has adopted a path that will enable it to reach education levels attained by Malaysia over the near future if that country continues to invest in its human capital at the same rate as before. In fact, differences between South Asia countries and Malaysia are larger for younger than for older generations suggesting that the gap is widening over time. It is worth noting that India, Sri Lanka and Malaysia shared practically the same starting point for grade 12 completion (the 50-59 year old cohorts in figure 2.7) but their trends diverged over time. Table 2.1 provides similar information disaggregated by gender for the youngest cohorts completing at least grades 5, 10 and 12. In countries which have made most progress in education, such as Sri Lanka, Maldives and the comparator country Malaysia, the proportion of girls achieving a given number of years of schooling is larger than that of boys. The reverse – higher levels of attainment by males than females – is generally true for the other South Asian countries at all three grade levels, except for Bangladesh at the level of primary education.
Table 2.1 Educational Attainment at Selected Levels of Education Share of population age 15-19 who attained at least Grade 5
Bangladesh Bhutan India Maldives Nepal Pakistan Sri
Lanka Malaysia Male 64.1 55.1 81.9 95.1 74.5 67.5 95.1 96.3 Female 67.5 41.4 71.6 95.7 56.3 46.7 95.8 96.4 All 65.6 48.0 77.2 95.4 65.1 56.9 95.4 96.3
Share of population age 20-29 who attained at least Grade 10
Bangladesh Bhutan India Maldives Nepal Pakistan Sri
Lanka Malaysia Male 28.3 19.3 35.8 34.4 33.5 33.7 45.7 62.9 Female 12.6 9.5 23.6 37.1 17.2 19.5 51.1 71.3 All 19.6 13.7 29.7 35.5 23.9 26.3 48.4 67.0
Share of population age 20-29 who attained at least Grade 12
Bangladesh Bhutan India Maldives Nepal Pakistan Sri
Lanka Malaysia Male 8.9 5.7 21.3 22.2 9.2 16.0 16.8 25.2 Female 3.3 2.9 14.6 24.6 4.2 10.0 22.9 32.2 All 5.8 4.1 18.0 23.2 6.3 12.9 19.9 28.6
It is clear that despite ongoing progress, the speed at which South Asia countries currently upgrade the skills of their population will not allow them to catch up quickly with other parts of the world, in particular East Asia. Comparisons across countries in terms of enrollment rates at the secondary level confirm this conclusion based on generational changes in educational attainment. A similar conclusion also holds in the case of tertiary education. Although South Asia, India in particular, was close to East Asia in terms of “stock of human capital” in higher education with 3 to 6 percent of the

12
population having completed university education, differences in enrollment rates suggest that those two regions are not making similar efforts in terms of flows of human capital. South Asia is clearly lagging behind (see figure 2.8), with the implication that levels of tertiary education attainment are likely to diverge further over time. Figure 2.8 Gross Enrollment Rates of Secondary and Tertiary Education, 2002 and 2003
Gross enrollment rate in secondary education 2002 (%)
0
10
20
30
40
50
60
70
80
90
100
Afganistan*
Pakistan Nepal Bangladesh India Maldives China Malaysia Sri Lanka
Source: World Bank Indicators
Gross enrollment rate in tertiary education 2003 (%)
0
5
10
15
20
25
30
Maldives Afganistan* Pakistan* Nepal Bangladesh Sri Lanka** India China Malaysia

13
III. Returns to Investments in Education
The previous section documented the current status of human capital accumulation in South Asia both in terms of the distribution of skills in the population at a given time and in terms of changes in amounts invested in education over time. We now turn our attention to the use of those skills by the labor market, and their profitability or rate of return. We ask several questions: Is the profitability of investments in education in South Asia similar to what is observed in other countries? How does it differ by level of education and gender? And how have these returns to education changed over time? Data Sources and Methodology To calculate rates of returns to education we use household surveys for India (NSS), Pakistan (PIHS), Bangladesh (BHIES) and labor force surveys for Sri Lanka. For three countries, we have surveys at different points in time covering about one decade in the case of Sri Lanka and Pakistan, and two decades in the case of India. In Bangladesh, only the 2000 BHIES household survey is available so that no comparisons of trends in schooling returns are possible. We focus on the sample of males and females age 15-64 years, who work for salaries or wages, excluding the self-employed and those with non-wage employment11. We use information on their wages and salaries, as well as cash and in-kind payments in their primary occupation or employment, to calculate hourly wages adjusting for effective hours of work last week. Following the standard methodology popularized by Mincer, we estimate the following wage model by ordinary least squares (OLS):
),,,()log( LOCATIONOTHEREXPEDUCfnhourlywage iiii = The dependent variable, the logarithm of hourly wage, is regressed on the following vector of explanatory variables:
• EDUC consists of five 0,1 indicator variables (six in the case of India) for levels of schooling completed: literate, below primary= 1 if person is literate, but has not completed primary education; primary=1 if primary is the highest level of education completed; middle=1 if middle is the highest level of education completed; secondary and higher secondary=1 if secondary or higher secondary is the highest level of education completed; tertiary=1 if completed any level of tertiary; technical education dummy (India only)=1 if has any technical education. In the regression analysis, the “illiterate” group is the omitted category.
11 Since the focus of this section is on the returns to one’s human capital, we exclude non-wage earners for whom no compensation is reported, as well as the self-employed whose income also includes a component that reflects returns to capital.

14
• EXP measures years of potential experience, measured as age – education – 5 (in the case of Pakistan) or 6 (in the other three countries), and its quadratic EXP2 or years of potential experience squared
• OTHER is a vector of individual attributes, including male = 1 if the respondent is male, STSC = 1 if the person belongs to a scheduled tribe or cast (only for India), and regular worker = 1 for regular workers (those who receive monthly or annual salaries) and 0 for casual (those who are paid on a daily basis)
• LOCATION controls for location, where urban = 1 if the household lives in an urban area, and 0 if in rural; the Sri Lanka LFS distinguishes between urban, rural and estate location, and to reflect this possibility, both urban and rural dummies are used with “estate” location as the omitted category.
The underlying human capital model establishes a link between investments in different levels of education, as proxied by foregone earnings while in school, and the value that the labor market attributes to skills thus acquired The estimated coefficients on the different educational categories allow us to calculate what the corresponding annualized private rates of return are to completing that level of education. Several caveats are important to note. First, this analysis does not pretend to capture the full social value of human capital for a country (non-market benefits and possible externalities are not measured). Furthermore, neither government spending on education nor direct outlays by families are counted. What the analysis provides are estimates of “private” rates of return. The omission of families’ outlays is unlikely to have an important effect as it is well known from international experience that foregone earnings represent the bulk of private costs. In addition, this effect may be offset by the omission, on the benefit side, of earnings from secondary jobs. One additional point is that investments in education are measured crudely by the number of years that it normally takes to reach a given level of education (for example, five years for primary education). The data do not allow us to take into account class repetition nor the quality of education. Despite those caveats, these estimates of private rates of return can provide useful first insights into the interaction between skills demand and supply, and changes over time in this supply-demand balance. Wage Regressions for South Asia Table 3.1 reports the wage regressions estimated for each of the four South Asia countries using the most recent year’s available data. From the empirical evidence based on numerous studies in many countries and covering very different periods of time, one would expect to find earnings increasing with level of educational attainment and, for any given level of education, earnings increasing with years of labor market experience although at a decreasing rate. The results from South Asia are fully consistent with these expectations. Investing in formal education is profitable in all countries and additional investment increases earnings substantially. Despite some well-founded concerns about the low quality of primary education, having gotten some schooling – even without completing

15
primary education – provides a significant wage gain. The wage gains from completing higher levels of education - secondary and above - are significantly greater than for primary education (we discuss this further below). The estimated wage-experience profiles are also consistent with wages increasing with labor force experience although at a decreasing rate.
Table 3.1 Wage Regressions for South Asia
Year 2004 2001/2002 2000/2001 2000 Country India Sri Lanka Pakistan Bangladesh Literate, below primary 0.195 0.057 0.108 0.206
(12.53) (2.36) (4.69) (4.37) Primary 0.249 0.185 0.225 0.289
(18.38) (7.44) (12.63) (11.16) Middle 0.461 0.341 0.421
(34.31) (13.52) (18.72) Secondary & Higher Secondary 0.717 0.606 0.788
(52.25) (24.08) (44.38) Secondary 0.481 (10.77) High 0.521 (10.43) Tertiary 1.329 0.875 1.397 0.906
(79.64) (26.31) (61.34) (20.61) Technical Education dummy 0.18 n.a n.a. n.a.
(10.87) Potential experience (years) 0.056 0.026 0.06 0.038
(53.99) (18.63) (36.90) (12.81) Potential experience squared -0.001 -0.001 -0.001 -0.001
(-39.40) (-16.76) (-27.69) (-10.83) Male 0.446 0.403 1.089 0.946
(47.68) (40.72) (63.42) (34.29) Urban 0.221 0.271 0.189 0.368
(26.06) (12.69) (15.73) (17.31) Rural 0.059
(3.03) SC/ST indicator 0.005
(0.67) Regular worker indicator 0.798 0.362 0.50
(81.86) (33.31) (20.45) Constant -0.219 2.163 0.581 0.559
(-13.29) (68.73) (21.32) (12.05) Number of observations 39.190 20,838 16,200 6359 R-square 0.546 0.292 0.396 0.384 Table 3.1 also reports several other noteworthy points. First, as might be expected, regular workers command higher wages than casual workers for any given level of education and experience. A similar observation applies to workers located in cities as

16
compared to rural areas or estates (in the case of Sri Lanka). Second, belonging to a scheduled tribe or caste in India does not have any significant impact on earnings, after controlling for the level of education and other personal attributes. For those disadvantaged groups, the difficulty is access to education but for those who succeed in doing so, the returns are no different than that for the population at large. Finally, one observes a striking difference in the earnings received by men and women, with men on average earning 40 to 100 percent higher wages than women for a given level of education, and controlling for other attributes. This point is elaborated further below. The wage regression results are broadly similar across all four countries, but there are some differences. For instance, the returns to incomplete education in Sri Lanka are very low compared to the other countries. Sri Lanka is also noteworthy for the relatively lower return to investments in higher education as well as its much flatter wage-experience profile, which may reflect the increased supply of tertiary educated relative to their demand. Another point that stands out is the very large wage premium that men receive in Pakistan and Bangladesh relative to observationally comparable women workers. Rates of Return to Education Comparing the profitability of investments in different levels of education, and how they vary over time and across countries, is greatly facilitated by calculating standardized rates of return to education. Taking into account the number of years that is “normally” required to achieve any particular level of education, one can use the coefficients of the regression to calculate standardized rates of return. The “normal” time-to-complete each education level is summarized below:
• Primary – primary coefficient / 5 years for all countries • Middle – middle minus primary coefficients / 3 years for India and Pakistan, and
4 for Sri Lanka • Secondary and higher secondary – secondary minus middle coefficients / 3 years
for India and Pakistan, and 4 years for Sri Lanka • Tertiary – tertiary minus secondary coefficients / 4 years for India and Pakistan,
and 3 years for Sri Lanka.12 The resulting calculations are interpreted as the rate of return for one additional year of schooling at a given level of education. Table 3.2 shows the rates of return to different levels of education in India, Sri Lanka, Pakistan and Bangladesh. Except for Bangladesh, estimates are calculated at three points in time – early 1990s, late 1990s and early 2000s. In India, the profitability of each year of primary education is 8.5 percent on average. Each of the following three years of middle education has an average return of between 8.4 and 10.7 percent. Table 3.2 also 12 NOTE: due to specifics of education system in Bangladesh, the levels of education, and therefore, the methodology to calculated returns, differ from other countries. Primary – primary coefficient / 5 years, secondary – secondary – primary coefficients / 5 years, high – high-secondary coefficients/ 2 years, tertiary – tertiary – high coefficients/ 4 years

17
shows that the profitability of such investments tends to rise with level of educational attainment, most dramatically in India and Pakistan and to a lesser extent in Sri Lanka.
Table 3.2 Rate of Return to Schooling by Education Level INDIA NSS 1993 NSS 1999 NSS 2004 primary 8.3 8.5 8.5 middle 9.5 8.4 10.7 Secondary 23.3 22.7 16.8 higher secondary 11.7 15.0 16.3 Tertiary 12.6 15.2 18.9
SRI LANKA LFS 1992/1993 LFS
1997/1998 LFS 2001/2002 Primary 5.6 5.0 5.8 Middle 13.2 12.1 11.6 Secondary 10.6 7.8 8.8 higher secondary 14.4 16.0 18.4 Tertiary 7.1 9.9 9.6
PAKISTAN PHIS
1993/1994 PHIS
1996/1997 PHIS 2000/2001 Primary 4.4 4.5 4.8 Middle 5.7 6.4 6.6 Secondary 9.5 9.3 14.2 higher secondary 10.1 11.4 13.9 Tertiary 13.5 11.5 13.9 BANGLADESH BHIES 2000 Primary 8.1 Secondary 7.2 High 3.2 Tertiary 10.3
There is also evidence that rates of return to higher secondary and tertiary education increased over time in all three countries for which we have time-series figures. These increased returns were most pronounced for India. Between the early 1990s and 2004, the returns to higher secondary rose from 11 to 16 percent and from 12 to 19 percent for tertiary education. More modest increases in returns were registered for Pakistan and Sri Lanka over the same decade. In Sri Lanka, for example, the corresponding increases in returns were 14 to 18 percent for higher secondary and 7 to 9 percent for tertiary education. These time trends resemble similar increases in the relative returns to higher education reported in other regions, including Latin America13, and may reflect the effects of globalization and / or skill-biased technological change (SBTC).
13 For evidence from Brazil and Mexico, two countries with long time-series data on the returns to education, see Blom, Holm-Nielsen, and Verner (2001), “Education, Earnings and Inequality in Brazil: 1982-1998”; and Lachler (1998), “Education and Earnings Inequality in Mexico”.

18
Gender Gap One of the striking findings in the last section was the size of the wage differentials between men and women by level of education. While gender differences in gross wages of the order of 30-40 percent are not uncommon in other countries, those differences usually narrow when wages are standardized by education, age, hours of work and other individual characteristics. In South Asia, on the other hand, even after standardization, gender-related wage differentials ranging between 50 percent in India or Sri Lanka to almost 300 percent in Bangladesh or Pakistan are still observable. There are many possible explanations for this, including type of employment, sector, discrimination, and the like. Without attempting to provide a full analysis, it is worth exploring further what insights available data can provide us.
Table 3.3 Rate of Return to Schooling by Education Level and Gender INDIA NSS 1993 NSS 1999 NSS 2004 Female Male Female Male Female Male Primary 5.5 8.0 6.9 8.2 6.7 8.2 Middle 14.3 8.7 9.3 8.2 10.3 8.2 Secondary 45.0 20.1 42.0 20.0 31.5 20.0 Higher secondary 13.7 10.8 14.6 14.2 20.7 14.2 Tertiary 9.4 12.8 11.5 15.6 16.8 15.6 SRI LANKA LFS 1992/1993 LFS 1997/1998 LFS 2001/2002 Female Male Female Male Female Male Primary 2.6 5.7 1.5 7.1 1.9 7.6 Middle 18.2 12.0 13.7 11.7 17.8 10.0 Secondary 11.5 10.2 9.6 7.1 10.0 8.1 Higher secondary 8.5 17.0 13.6 16.5 14.7 19.6 Tertiary 9.3 5.6 14.2 6.2 11.7 7.5 PAKISTAN PHIS 1993/1994 PHIS 1996/1997 PHIS 2000/2001 Female Male Female Male Female Male Primary 4.3 4.3 12.9 4.0 5.4 4.1 Middle 13.1 5.6 7.2 6.5 17.1 6.2 Secondary 12.1 9.0 17.2 8.1 30.2 12.3 Higher secondary 7.6 9.8 12.8 11.2 18.5 11.9 Tertiary 15.4 13.3 11.2 11.0 18.9 11.9 BANGLADESH BHIES 2000 Female Male Primary 9.8 7.8 Secondary 7.5 6.9 High 15.0 1.1 Tertiary 10.0 10.5
Table 3.3 shows estimates of the rates of return to investments in different levels of education for men and women. They are calculated from wage regressions estimated separately for men and women that control for work experience, location and type of employment. One finding common to all countries is the sharp change observed after

19
India, 2004
0.0
0.5
1.0
1.5
2.0
2.5
3.0
3.5
4.0
4.5
illit erate lit erate,below
primary
primary middle sec andhigher sec
tert iary
Pakistan, 2000/01
0.0
0.5
1.0
1.5
2.0
2.5
3.0
3.5
4.0
4.5
illit erate lit erate, lessthan primary
primary lower sec sec andhigher sec
tert iary
M en Women
Sri Lanka, 2001/02
0.0
0.5
1.0
1.5
2 .0
2.5
3 .0
3.5
4 .0
4.5
illit erate lit erate, lessthan primary
primary lower sec sec andhigher sec
tert iary
Bangladesh, 2000
0.0
0.5
1.0
1.5
2 .0
2.5
3 .0
3.5
4 .0
4.5
illit erate lit erate, lessthan primary
primary secondary high tert iary
primary education. While returns to primary education are significantly higher (or broadly similar in Pakistan) for men than for women, returns to higher levels of education, especially at secondary and tertiary levels, are substantially higher for women. Estimates of average wage ratios – even standardized – thus hide an important phenomenon, namely, that access to higher levels of education allows women to reduce the gender gap. For example, when comparing wages of men and women who are otherwise similar (for example, regular workers living in urban areas with some 20 years of experience) in India, one can observe in figure 3.1 that the relative wage differential drops by half when the level of education is secondary or higher. This pattern is particularly strong in India and Pakistan, somewhat less in Sri Lanka where it is not observed for those with higher secondary education.
Figure 3.1 Predicted log Hourly Wage by Gender and Level of Education14
These results suggest that the following result: in countries where access to higher levels of education is more difficult for women than for men for social or other reasons, and where the labor force participation of women is still very low, women who succeed in overcoming these obstacles do relatively well in the labor market. Part of those high returns to education can be attributed not only to investments in education (better quality of education may be another dimension) but also to greater motivation and ability of the minority of educated women entering in the labor market. 14 These predictions are calculated for regular workers who live in urban areas and have 20 years of experience. In addition, in India they do not belong to SCST and do not have technical education.

20
Changes over time in returns to education Figure 3.2 graphs the estimated returns to different levels of schooling for all available years. For each country, the data are shown separately for males and females. The figure suggests the following results. First, returns to education have grown over time especially for higher levels of education, namely, higher secondary and tertiary education. Second, as noted earlier, returns to education are especially high for females and they too grow over time. Finally, the returns tend to be higher for the high growth countries (India, Pakistan) and lower for slower growing Sri Lanka.
Figure 3.2 Returns to Education Over Time by Schooling Level and Gender
Pakistan: Rate of return to education 1993, 1997, 2001Males
0.0
5.0
10.0
15.0
20.0
25.0
30.0
35.0
40.0
primary middle secondary higher secondary tertiary
PHIS 1993/1994 PHIS 1996/1997 PHIS 2000/2001
Pakistan: Rate of return to education 1993, 1997, 2001Females
0.0
5.0
10.0
15.0
20.0
25.0
30.0
35.0
40.0
primary middle secondary higher secondary tertiary
PHIS 1993/1994 PHIS 1996/1997 PHIS 2000/2001
Sri Lanka: Rate of return to education 1992, 1997, 2002 Males
0.0
5.0
10.0
15.0
20.0
25.0
30.0
35.0
40.0
primary middle secondary higher secondary tertiary
LFS 1992/1993 LFS 1997/1998 LFS 2001/2002
Sri Lanka: Rate of return to education 1992, 1997, 2002 Females
0.0
5.0
10.0
15.0
20.0
25.0
30.0
35.0
40.0
primary middle secondary higher secondary tertiary
LFS 1992/1993 LFS 1997/1998 LFS 2001/2002
India: Rate of return to education 1983, 1987, 1993, 1999, 2004Males
0.0
5.0
10.0
15.0
20.0
25.0
30.0
35.0
40.0
primary middle secondary higher secondary tertiary
NSS 1983 NSS 1988 NSS 1993 NSS 1999 NSS 2004
India: Rate of return to education 1983, 1987, 1993, 1999, 2004Females
0.05.0
10.015.020.0
25.030.035.0
40.045.0
primary middle secondary higher secondary tertiary
NSS 1983 NSS 1988 NSS 1993 NSS 1999 NSS 2004

21
These results suggest that the demand for highly educated and skilled workers is increasing in South Asia, faster than the supply of graduates and that this phenomenon coincides with periods of fast growth. This is consistent with the evidence observed in other developing and developed countries and with the hypothesis that openness to trade, rapid growth and technological innovations fuel an increasing demand for skilled relative to unskilled labor. Education and training policies have not yet responded to the needs and signals provided by the labor market.

22
IV. School-To-Work Transitions In this section, we turn to the issue of how individuals completing different levels of education fare as they enter the labor market. We ask several questions about youth defined as those age 15-29 years old: What are unemployment rates for youth like in the four countries? Does more education facilitate school-to-work transitions? Are job search and school-to-work transitions improved through additional post-school training? These issues are of considerable interest to policymakers concerned about high rates of open unemployment among youth in South Asia, especially the most educated. They raise thorny questions about whether high rates of youth unemployment reflect the low quality and workplace relevance of education, or alternatively rates of economic growth in the region that are inadequate to generate sufficient new jobs to meet the rising inflow of new labor market entrants. Definitions of Labor Force States In comparing the school-to-work transitions of youth across the four South Asian countries, we need first to define broadly comparable measures of the different labor force states – employed, unemployed, and out-of-the labor force. Broadly similar definitions of these three labor force states are possible with the available household surveys in India (NSS) and Bangladesh (BHIES), and with the labor force surveys in Sri Lanka and Pakistan.15 In all four countries, the past week is the reference period and this is used to define:
• employed - either working, engaged in economic activity (work),16 or employed but not at work due to sickness or other reasons,
• unemployed – not engaged in economic activity (work), and either making tangible efforts to seek 'work' or being available for employment if 'work' is available17, and
• not in the labor force - not engaged in any economic activity (work) and also not available for 'work'.
Unemployment Rates by Education Unemployment rates by level of educational attainment are estimated for all years in which household or labor force surveys were available in each of the four South Asian countries. The surveys available in each country, and survey years, are listed below:
15 In Pakistan, the household surveys (PIHS) use the past month as the reference period for defining employment status, which lowers estimates of open unemployment in Pakistan relative to the other countries since the likelihood of working at least 1 hour in past four weeks is likely to be much higher. Fortunately, the LFS uses the past week as the reference period for defining unemployment status. 16 NSS (2004) defines economic activities as self-employment, an employer, or a helper in a household enterprise, regular salary or wage employee, casual wage laborer, or employed but not at work due to sickness or other reasons. 17 In Bangladesh, an individual is unemployed if not working but is available for work, which includes seeking employment or not actively seeking.

23
• India – NSS rounds 43, 50, 55 and 60 (1988, 1993, 1999 and 2004). • Sri Lanka – LFS 1992, 1995, 1998, 2000 and 2002. • Pakistan – LFS 1993/94, 1996/97, 1999/00, and 2003/04 • Bangladesh – BHIES 2000.
Table 4.1 reports the open unemployment rates estimated for the economically active population age 15-65 years in each South Asian country, separately by survey year (where available) and by level of educational attainment. Several points stand out: First, open unemployment rates estimated for the four South Asian countries are quite low. In India, Pakistan and Bangladesh, open unemployment rates in the most recent year available fall in the range between 4.3 percent (Pakistan) and 5.6 percent (Bangladesh), with India sandwiched in between at 5.1 percent. Sri Lanka is the outlier in this group recording an open unemployment rate of 8.9 percent, or almost double that of the other SAR countries. Second, the three countries with long time-series labor force data – India, Pakistan and Sri Lanka – exhibit quite different time trends in open unemployment. The unemployment rate for Sri Lanka shows a downward secular time trend (from 15 to 9 percent between 1992 and 2002), while the unemployment rate in Pakistan rises secularly over time, from 2 to over 4 percent between 1993 and 2003. In the case of India, open unemployment rates vary within a narrow band of under 4 to over 5 percent over the 1988 to 2004 period, with what appears to be a slight rising time trend after 1993. Third, open unemployment rates for the economically active population tend to rise with level of educational attainment in all four SAR countries. This is most pronounced in India, Pakistan and Sri Lanka where unemployment rates for university graduates are double or almost triple that of those with primary school education. In Bangladesh, there is much less differentiation by education level, with open unemployment rates for primary school leavers being almost the same as those of university graduates. Finally, the data show different time trends of unemployment by level of educational attainment for the three countries with time-series data. In Pakistan, the rise in overall unemployment rates from 1993-2003 is mirrored in rising unemployment rates across all educational groups. In Sri Lanka, the opposite trend is apparent, with declines over time in the unemployment rates for all educational groups (except one) from the high levels of unemployment prevailing in the early 1990s. The one exception – university graduates or above – buck the overall declining trend, rising over this period from 3.6 percent in 1995 to 8.9 percent in 2002. In India, by contrast, unemployment rates for those with secondary education or lower show a rising trend from 1993 onwards, while unemployment rates for those with upper secondary and a college degree or above either fall over time or remain roughly unchanged.

24
Table 4.1 Unemployment Rates by Level of Education Economically Active Population Ages 15-65 for Available Survey Years
INDIA Unemployment Rates by Education Level of Education / Year 1987/88 1993/94 1999/00 2004
Illiterate 2.98 2.05 2.97 2.74 Literate, less than primary 3.34 2.02 2.92 3.15 Primary 4.92 2.79 3.62 4.29 Middle 7.98 5.02 5.62 6.03 Secondary 11.69 7.98 7.44 7.81 Higher Secondary n.a. 11.09 10.17 9.20 Graduate and above 13.06 11.99 11.14 11.86 Total 5.11 3.88 4.73 5.07 Source: NSS, various rounds
SRI LANKA Unemployment Rates by Education
Level of Education / Year 1992 1995 1998 2000 2002 Illiterate 2.98 1.97 1.14 1.32 1.16 Literate, less than primary 4.83 3.32 2.44 1.02 2.07 Primary 9.65 7.56 4.93 4.17 3.85 Middle 21.63 17.1 11.92 9.47 10.67 Secondary 22.37 18.53 13.43 11.06 13.4 Higher Secondary 26.09 23.71 19.33 16.45 18.47 Graduate and above 6.31 3.63 6.93 5.61 8.82 Total 14.88 12.73 9.16 7.52 8.96 Source: LFS, various years
PAKISTAN Unemployment Rates by Education
Level of Education / Year 1993-94 1997-98 1999-00 2001-02 2003-04 Illiterate 0.71 1.08 2.17 2.05 1.83 Literate, less than primary 1.28 1.57 4.13 4.27 3.37 Primary 1.65 2.21 3.50 3.57 3.57 Middle 2.69 4.04 7.06 5.51 5.43 Secondary 6.14 6.63 6.95 7.37 8.80 Higher Secondary 5.30 6.87 6.65 8.96 9.86 Graduate and above 5.05 6.08 5.93 7.80 8.21 Total 1.88 2.65 3.87 4.03 4.29 Source: PLFS, various years
BANGLADESH Unemployment Rates by Education
Level of Education / Year 2000 Illiterate 3.81 Literate, less than primary 5.90 Primary 7.85 Secondary 8.24 Higher 8.27 Graduate and above 7.15 Total 5.57 Source: BHIES 2000

25
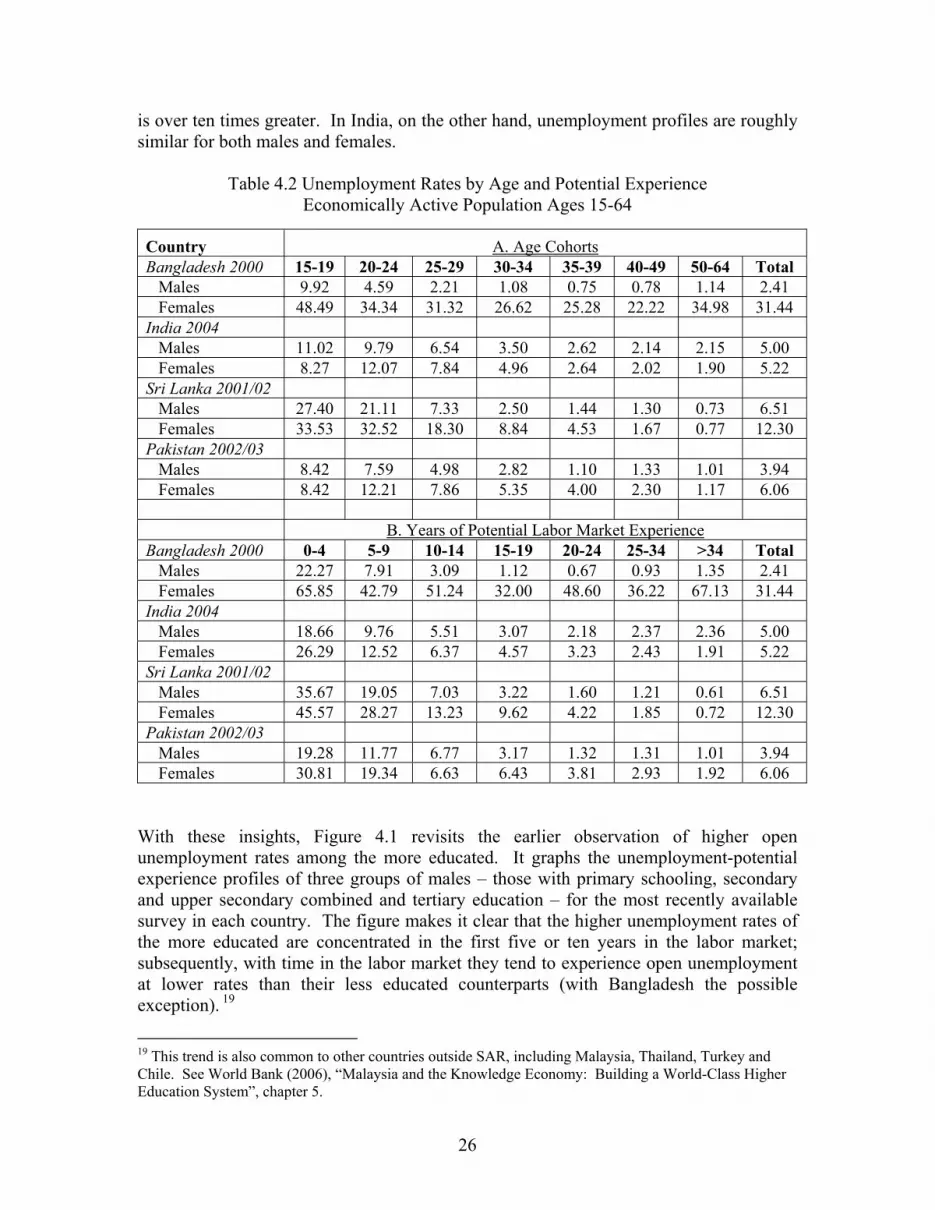
Youth Unemployment and School-to-work Transitions These aggregate unemployment rates, even when disaggregated by level of educational attainment, are not very informative about the issues of youth unemployment and the dynamics of job search that underlie school-to-work transitions of different educational groups. The higher unemployment rates for more educated workers observed in common across all four countries are the outcome of both age-related and time-in-the-labor market factors. They mix up workers in different age categories that might, at the same age, include both fresh out-of-school university graduates as well as workers with several years of labor market experience. And they combine males and females who may have very different career aspirations and job search experiences. To see this, Table 4.2 presents unemployment rates estimated for the most recently available household or labor force survey in each country, disaggregated by gender, age cohorts between 15 and 65 years, and years of potential work experience intervals where potential experience is defined as age minus age started primary school (5 years for Pakistan, 6 years for Bangladesh, India, and Sri Lanka) minus years of education18. Panel A highlights the fact that high open unemployment rates are essentially a youth unemployment problem. Indeed, in all four countries, open unemployment rates of 20-24 year olds are significantly higher than that of prime age males 40-49 year olds. In Bangladesh, the unemployment rates of young males are under 5 percent versus 1 percent for prime age males; the corresponding figures are 12 and 2 percent in India, 21 and 2 percent in Sri Lanka, and 7 and 1 percent in Pakistan, respectively. This perspective – that high youth unemployment is the outcome of a time-dependent job search process – is reinforced by recasting unemployment in terms of years of potential experience after schooling completion. Unemployment profiles are initially higher (one and a half to three times higher in the 1-4 years of potential experience interval as compared to 14-19 years of age interval) but then fall off more quickly with time in the labor market than profiles related to chronological age. Information is scarce initially, both about available jobs and the quality of job matches, so search tends to be concentrated early in the labor market. Some school leavers find a job match quickly and enter employment, while others remain on the market for another period and continue job search. With new information, the latter adjusts expectations – about wages and career goals – and either enters employment or continues search for another period, and so on. This process generates an unemployment distribution with time in the labor market as shown in Table 4.2, Panel B. Finally, Table 4.2 indicates that females of all ages are more likely to be unemployed than males at any education, age or potential experience interval, the exception being females in India. In Pakistan and Sri Lanka, unemployment-potential experience profiles for females are one and a half to two times that of males; in Bangladesh, this gender gap
18 If years of education were not available, we imputed the average years of education which a person would have at completion of certain educational level without repeating or postponing any classes
26
is over ten times greater. In India, on the other hand, unemployment profiles are roughly similar for both males and females.
Table 4.2 Unemployment Rates by Age and Potential Experience Economically Active Population Ages 15-64
Country A. Age Cohorts Bangladesh 2000 15-19 20-24 25-29 30-34 35-39 40-49 50-64 Total Males 9.92 4.59 2.21 1.08 0.75 0.78 1.14 2.41 Females 48.49 34.34 31.32 26.62 25.28 22.22 34.98 31.44 India 2004 Males 11.02 9.79 6.54 3.50 2.62 2.14 2.15 5.00 Females 8.27 12.07 7.84 4.96 2.64 2.02 1.90 5.22 Sri Lanka 2001/02 Males 27.40 21.11 7.33 2.50 1.44 1.30 0.73 6.51 Females 33.53 32.52 18.30 8.84 4.53 1.67 0.77 12.30 Pakistan 2002/03 Males 8.42 7.59 4.98 2.82 1.10 1.33 1.01 3.94 Females 8.42 12.21 7.86 5.35 4.00 2.30 1.17 6.06 B. Years of Potential Labor Market Experience Bangladesh 2000 0-4 5-9 10-14 15-19 20-24 25-34 >34 Total Males 22.27 7.91 3.09 1.12 0.67 0.93 1.35 2.41 Females 65.85 42.79 51.24 32.00 48.60 36.22 67.13 31.44 India 2004 Males 18.66 9.76 5.51 3.07 2.18 2.37 2.36 5.00 Females 26.29 12.52 6.37 4.57 3.23 2.43 1.91 5.22 Sri Lanka 2001/02 Males 35.67 19.05 7.03 3.22 1.60 1.21 0.61 6.51 Females 45.57 28.27 13.23 9.62 4.22 1.85 0.72 12.30 Pakistan 2002/03 Males 19.28 11.77 6.77 3.17 1.32 1.31 1.01 3.94 Females 30.81 19.34 6.63 6.43 3.81 2.93 1.92 6.06
With these insights, Figure 4.1 revisits the earlier observation of higher open unemployment rates among the more educated. It graphs the unemployment-potential experience profiles of three groups of males – those with primary schooling, secondary and upper secondary combined and tertiary education – for the most recently available survey in each country. The figure makes it clear that the higher unemployment rates of the more educated are concentrated in the first five or ten years in the labor market; subsequently, with time in the labor market they tend to experience open unemployment at lower rates than their less educated counterparts (with Bangladesh the possible exception). 19
19 This trend is also common to other countries outside SAR, including Malaysia, Thailand, Turkey and Chile. See World Bank (2006), “Malaysia and the Knowledge Economy: Building a World-Class Higher Education System”, chapter 5.

27
Figure 4.1 Unemployment Rates by Education and Potential Experience Males Age 15-64 Years20
This pattern suggests that the more educated tend to search more intensively for a good job match. One interpretation is that they have more specific skills than the general education received by their less-educated counterparts, and as such they need more time to find a job match requiring those specific skills. Alternatively, the more educated enter the labor market with higher career goals and wage expectations which are more difficult to match with available employment opportunities. The more educated may also come from higher income households able to support their job search over an extended period of time; by contrast, less-educated youth unable to finance job search may begin working (that is, leave unemployment) more quickly.
20 In Bangladesh unlike other countries unemployment is calculated at secondary level, not secondary and higher secondary
0-4 5-9' 10-14'
15-19
20-24
25-34
>34
05
1015202530354045
yrs of experience
India 2004
0-4 5-9' 10-14'
15-19 20-2425-34
>34
05
1015202530354045
yrs of experience
Sri Lanka 2002
0-45-9
10-14 15-
19 20-24 25-
34 >34
05
101520253035
40
45
yrs of experience
Pakistan 2004
0-45-9'
10-14'15-19
20-24 25-
34 >34
05
1015
2025
30
35
40
45
Bangladesh 2000
primary seco ndary&higher seco ndary tertiary

28
INDIA: Males 1993-2004
0
5
10
15
20
25
30
35
0-4 5-9' 10-14' 15-19 20-24 25-34 >34
PAKISTAN: Males 1993-2004
0
5
10
15
20
25
0-4 5-9' 10-14' 15-19 20-24 25-34 >34
SRI LANKA: Males 1992-2002
0
10
20
30
40
50
60
0-4 5-9' 10-14' 15-19 20-24 25-34 >34
years of experienceprimary, 93secondary and higher secondary, 93tertiary, 93primary, 02secondary and higher secondary, 02tertiary, 02
Figure 4.2 Unemployment Trends by Education
Have these unemployment rate potential experience profiles changed over time as suggested by the aggregate unemployment rate figures reported earlier? Figure 4.2 graphs these profiles for males in the three countries with long time-series data, by 3 education groups and at two points in time – 1992 or 1993 and 2002 or 2004. For India, the aggregate data revealed a rising trend in unemployment rates after 1993. Figure 4.2 confirms that unemployment profiles for those with primary education shifted upwards over time, while those for tertiary graduates shifted downwards. In the case of Pakistan, aggregate increases in unemployment rates over time are mirrored by modest upward shifts of profiles for those with primary education and larger upward shifts for tertiary graduates. Sri Lanka, which experienced a secular decline in aggregate unemployment rates, saw downward shifts in unemployment profiles for those with primary education and larger upward shifts for tertiary graduates.

29
Training and School-to-work transitions – The Case of Sri Lanka The previous graphical analyses for the four South Asian countries suggested that while more educated youth may experience higher initial rates of open unemployment, their subsequent likelihood of remaining unemployed declines more with time in the labor market as compared to their less educated peers. Here, we examine this stylized fact more closely for Sri Lanka, taking advantage of the existence of a long annual time-series of LFS which include relatively detailed information about the early years in the labor force and about post-school training. The school to work transition of Sri Lankan youth is of particular concern to policymakers because of the long time many youth appear to spend in job search between leaving school and finding employment. According to the 2002 LFS, almost 85 percent of youth age 15-29 years who are currently unemployed report not ever having a job. This figure rises from about 75 percent for those with lower secondary education to almost 95 percent for university graduates. While these figures highlight the seriousness of this issue, they can be misleading as we noted above: they mix more and less educated youth with different years of potential work experience and thus different amounts of time spent in job search. Here, we look at the same issue from another perspective, that of time to first job after completing schooling. 21 Another question that we examine is whether school-to-work transitions are aided by post-school training, holding constant the level of education? This issue is also of considerable interest to policymakers concerned with high rates of youth unemployment and keenly interested in knowing whether additional training after formal education is an effective strategy for reducing youth unemployment. This issue can be addressed using information from the LFS on whether individuals received post-school formal or informal training, as well as the duration of that training. Estimating Time-to-First Job Studying school-to-work transitions require information on the date of first employment after schooling completion.22 The challenge of using the Sri Lanka LFS is to determine the date of first recorded employment23 for each individual with a given level of education, from which the time taken from schooling completion to first employment can be calculated. Beginning in 1996, the LFS asked the employed how long they have been
21 The analysis in this section draws upon Tan and Chandrasiri (2004), “Training and Labor Market Outcomes in Sri Lanka”, which also appears as Chapter 5 in a SASHD report, “Treasures of the Education System in Sri Lanka: Restoring Performance, Expanding Opportunities and Enhancing Prospects”, 2004. 22 None of the household or labor force surveys in SAR countries elicit this kind of information though the Sri Lanka LFS comes closest. 23 We caution that the first “recorded” employment is not necessarily the first job; some individuals may have had several jobs prior to the recorded job, so time-to-first “recorded” job may overstate duration of job search. But it is the only employment spell for which information is available. It may be desirable to revise the LFS to explicitly elicit information on year of labor market entry and year of first job.

30
on their current job, so the start date of that job can be ascertained.24 For the unemployed, the LFS asked whether they have ever had a job and, if so, how long it had been since the previous job.25 If the prior job is assumed to be of similar duration as those held by their currently employed peers (about 2 years), then this information and the intervening unemployment spell can be used to determine the start date of the previous job. For those who have never had a job, the duration of search for a first job is still ongoing (or censored). Finally, an adjustment is made to search time for those with technical and vocational training—time spent in training is subtracted to reflect their withdrawal from active job search while undergoing training. These time-to-first-job calculations were done for 39,000 individuals from the pooled sample of LFS covering the 1996-2002 period, and restricted to those with some schooling up to university graduates, and with 0-10 years of potential work experience to keep the focus on youth. Figure 4.3 presents graphically the resulting distributions of time-to-employment for different levels of schooling attainment.26
Figure 4.3 Time-To-First-Job by Level of Schooling Attainment
Source: Tan and Chandrasiri (2004), “Training and Labor Market Outcomes in Sri Lanka”.
24 The 1996 LFS also started asking detailed questions on years of schooling from which more precise schooling completion dates can be calculated. 25 The intervening unemployment spell is reported in several intervals, ranging from several months to an open ended 5 or more years. Some assumptions are needed to impute duration (in years) of unemployment to these categories. 26 Note that these graphs understate time-to-first-job because they include ongoing (censored) job search of the sample of unemployed youth who have still not found employment at the time of LFS enumeration.
05
1015
200
510
1520
0 2 4 6 8 10 0 2 4 6 8 10 0 2 4 6 8 10
Primary LowerSec UpperSec
GCE O/L GCE A/L Degree
Per
cent
Fin
ding
Firs
t Job
Years to First JobGraphs by edlvl

31
Several points emerge in Figure 4.3. First, those with less schooling - primary and lower secondary passes - are more likely to face protracted job search before securing their first employment. Their distributions of time-to-first-employment are concentrated around 4-7 years after completion of schooling. Second, most of those completing upper secondary and with GCE O-level or A-level qualifications find their first job fairly soon after schooling completion. Their distributions of time-to-first-job are concentrated around 0-4 years, tapering off with time in the labor market. Finally, the school-to-work transition of degree graduates resembles more that of youth with lower secondary schooling than that of those with GCE A-level qualifications. Their distribution is bi-modal – some find a job within the first year, while many others appear to take longer, about 3-5 years after graduation from university.27 Survival Models of Time-To-First Job These figures do not control for other factors that may also shape school-to-work transitions, such as gender, household characteristics, location and receipt of post-school technical and vocational training. The joint effects of schooling attainment and these other factors on time-to-employment can be studied within a regression framework that accounts explicitly for the fact that one part of the sample is still actively searching for the first job, that is, with incomplete (censored) time-to-employment.28 Table 4.3 reports the results of estimating this regression model for the sample of youth as a whole, and separately by training status, so as to investigate how receipt of technical and vocational training affects school-to-work transitions. The results in Table 4.3 make several points. First, compared to youth with primary schooling, more educated groups find employment much faster though, as suggested by Figure 4.2, degree graduates are more like those with upper secondary than (say) those with GCE O or A-level qualifications. Second, gender differences are important, and males appear to find employment faster than females. A contributing factor to this gender gap may be marital status, since marriage is often associated with withdrawal from the labor market and thus delayed time-to-employment. Location also matters: job search is longer in urban areas, and varies across provinces (not reported here).29 Finally,
27 These distributions of time-to-employment appear to tell a consistent story about how low levels of schooling attainment disadvantage youth in their job search while higher level school qualifications facilitate the school-to-work transition. But the job search of degree graduates stands apart – many experience fairly long job search before finding employment. Are the durations of job search reasonable? The mean time-to-employment is fairly long, and may suggest that individuals are not reporting prior employment accurately, for example, ignoring casual work and reporting only formal jobs; another contributing factor is the assumption that the first “recorded” employment is also the first job, which would tend to overstate time-to-first job. 28 Survival models are ideally suited for studying the determinants of time to a failure event, in this case time taken to find a job after schooling completion, and accommodating censored spells of job search. Such models may be fit using alternative distributional assumptions about the underlying process, but the one used here is the lognormal distribution. 29 Relative to the Western Province (the omitted province), job search is longer in the Central, South and Sabaragamuwa Provinces, and shorter in the North-West, North-Central and Uva Provinces.

32
trends estimated by year dummy variables (not reported here) indicate that overall length of job search has declined over time in parallel with falling overall unemployment rates. What about the effects of training? The first column of Table 4.3 indicates that formal and informal training are both associated with shorter search time, with informal training appearing to have a larger impact (-0.10) than formal or certificated training (-0.07). The second and third columns, reporting results estimated separately by training status, make the additional point that while having more education reduces time to employment for both groups, the impact of education is more pronounced for the group with training. To see this, compare the relative contributions of different levels of education to shortening time-to-employment—in the group without training, this peaks with the upper secondary group; in contrast, the contribution of schooling rises linearly with level of education to a peak at degree graduates. In other words, education and training interact positively to reduce time spent in job search.
Table 4.3 Time-to-first-job With and Without Post-School Training Dependent variable: All Youth Without Training With Training Time-to-Employment Coefficient z-stat Coefficient z-stat Coefficient z-stat Lower secondary -0.329 -15.6 -0.340 -15.8 -0.166 -1.7 Upper secondary -0.471 -24.2 -0.492 -24.7 -0.294 -3.1 GCE O-Level -0.434 -21.0 -0.448 -20.9 -0.284 -3.0 GCE A-Level -0.454 -20.8 -0.445 -19.4 -0.350 -3.6 Degree -0.340 -10.8 -0.276 -8.1 -0.459 -4.2 Formal training -0.069 -6.0 Informal training -0.106 -5.2 Male -0.070 -8.1 -0.069 -7.3 -0.077 -4.0 Married 0.113 9.6 0.136 10.4 0.028 1.0 Urban 0.030 2.9 0.049 4.1 -0.040 -1.8 Provincial dummies Yes Yes Yes Constant 1.964 54.0 1.979 50.2 1.771 14.7 Sample size 33,206 26,274 6,932 Number finding jobs 24,605 19,678 4,927 Source: Sri Lanka LFS, 1996-2002. Notes : The regressions are estimated by maximum likelihood using a parametric survival-time model fit with a lognormal distribution. About one-quarter of the sample were censored. The regression model included control variables for parental education and for LFS years.

33
V. Post-School Training in the Labor Market This section turns to an exploration of the pre-employment and on-the-job training that individuals may get after completing formal education. The analysis reported earlier of post-school training and school-to-work transitions in Sri Lanka already suggests that training can improve labor market outcomes of youth, complementing that of formal education. Here, we identify household and labor force surveys in the other South Asian countries that include post-school training information to provide a broad overview of post-school training in South Asia, its incidence among individuals with different levels of education, and some early findings on the impacts of training on wages. Surveys with post-school training Information on post-school training is South Asia is limited. The labor force surveys of Sri Lanka and Pakistan have elicited information on post-school vocational training since the early 1990s. In the other South Asian countries, such information is rarely asked, and if asked, only periodically. Our review identified the following surveys with training information:
• Sri Lanka – LFS 1992 -2002, asked all individuals whether they had received vocational training, and if so, whether training was formal or informal, as well as the duration of training. Information on the types of vocational training received is elicited but rarely coded. In addition to the usual LFS questions, the survey asked about current occupation and sector of employment.
• India – NSS Round 60 (2004) asked individuals about vocational training for the
first time in 2004, and restricted questions to those with a minimum middle school education and between ages 15-29 years. Conditional on training, the survey asked about field of training, name of the training institution, duration of training, whether received degree, diploma or certificate from the institution, and whether training was useful in current job or in taking up another job. The NSS also elicited information on occupation and sector of employment
• Pakistan – The LFS (1993-2004), and the PIHS 1997 asked individuals about
whether they had completed vocational and technical training. In addition, the surveys elicited information on occupation and employer characteristics such as industry and 4 employment size categories.
• Bangladesh – BHIES 1995 asked, for just one year, whether respondents had
received any vocational training, training type and length, training institution, and whether training was useful for current work. Information on occupation and industry of employment is available but these data cannot be linked to individual employment and wage data to study the labor market outcomes of getting vocational training.

34
Incidence of Post-School Training Table 5.1 shows the proportion of the population age 15-64 years old30 reporting vocational training by educational attainment and gender in India, Bangladesh, Pakistan, and Sri Lanka. This table is based on the most recent survey available for each country, typically in the early 2000s for India, Pakistan and Sri Lanka and 1995 in the case of Bangladesh. The table indicates that the incidence of post-school vocational training is quite low in South Asia. The incidence of post-school training is lowest in Pakistan (about 2.4 percent), about 4.0 to 4.7 percent in India and Bangladesh, and in excess of 12 percent in Sri Lanka. Overall levels aside, there is a strong tendency across countries for the incidence of training to rise with the level of educational attainment. For example, of the Sri Lankan population with lower secondary education, about 12 percent had also received vocational training as compared to the 24.7 percent of graduates. It is also worth noting that the incidence of post-school vocational training peaks at or after high school, after which it declines before peaking again after the first degree. These two points are when individuals end formal education and get post-school vocational or technical training, either to become a skilled worker after high school, or to become a professional after completing tertiary education. Table 5.1 also shows that women are less likely to receive post-school vocational training as compared to their male counterparts with the same level of education. In India, 4.4 percent of men get vocational training versus just 3.6 percent of women. The corresponding gender differences in Sri Lanka are 15.1 and 9.1 percent, and in Pakistan 3.6 and 1.2 percent, respectively. Bangladesh appears to be an anomaly in South Asia, with women being more likely to get vocational training (5.8 percent) as compared to males (4.6 percent). The reason for this is unclear, and requires further study. Which occupation groups are most likely to receive vocational training? Even though definitions of occupations vary from one country to another, the figures reported in Table 5.2 suggest that professionals, technicians and clerical personnel in South Asia are more likely than other occupational groups to get vocational training.31 This makes sense since these are occupations that tend to include a high proportion of the highly educated. Sri Lanka and Pakistan also have relatively high shares of plant and machine operators and assemblers, and craft workers who received training. The occupations with the lowest share of individuals getting vocational training are employees in sales, services and agriculture where educational requirements are low.
30 In the India NSS Round 60, the training question was only asked of youth age 15-29 years who had completed middle school. 31 Bangladesh is excluded from the table because its occupational classification system differs so dramatically from that used in the other South Asian countries as to be completely non-comparable.

Table 5.1 Percent of Population Age 15-64 Getting Any Vocational Training by Education and Gender
Education INDIA Education BANGLADESH Education SRI LANKA Education PAKISTAN
All M F
All M F All M F Al
l M F
Illiterate n.a. n.a. n.a.
Illiterate 1.5 1.4 2.7
Illiterate 1.2 2.0 0.4
No formal 0.9 1.7 0.5
Below
primary 2.1 2.6 1.3
Primary n.a. n.a. n.a.
Primary 4.3 4.4 0.0
Primary 4.7 6.0 2.0
Primary 2.5 3.0 1.7
Middle 0.9 0.7 1.1 Secondary
VI-VIII 9.2 8.1 49.5 Lower
secondary 9.8 11.4 4.2
Middle 2.5 3.1 1.4
Secondary 4.0 4.4 3.4 Secondary,
class IX 11.1 11.3 0.0 Upper
secondary 17.4 18.7 13.7
Secondary 4.3 5.1 3.0
Higher secondary 8.3 8.9 7.4
School Certificate 13.3 12.5 67.5
GCE O level 25.0 24.8 25.3
Higher secondary
6.4 7.4 4.7
Diploma certificate 58.6 62.7 48.4
Higher Certificate 19.7 19.7 18.6
GCE A level 37.4 36.0 39.2
Graduate 16.8 17.1 16.3 B.A.
General 11.1 11.3 0.0
Graduate 34.5 35.1 33.8
Degree 8.6 10.7 4.8
B.A.
Honors 6.7 6.7 0.0
Post-graduate 18.2 18.1 18.3
M.A. and above 27.5 27.5 0.0
Post-graduate 45.1 42.1 48.4
Post-graduate
7.6 8.5 5.6
Total 4.0 4.4 3.6
Total 4.7 4.6 5.8
Total 12.0 15.1 9.1
Total 2.4 3.6 1.2
Source: NSS 60 (2004) Source: BHIES 1995 Source: Sri Lanka LFS 2002 Source: Pakistan LFS 2004
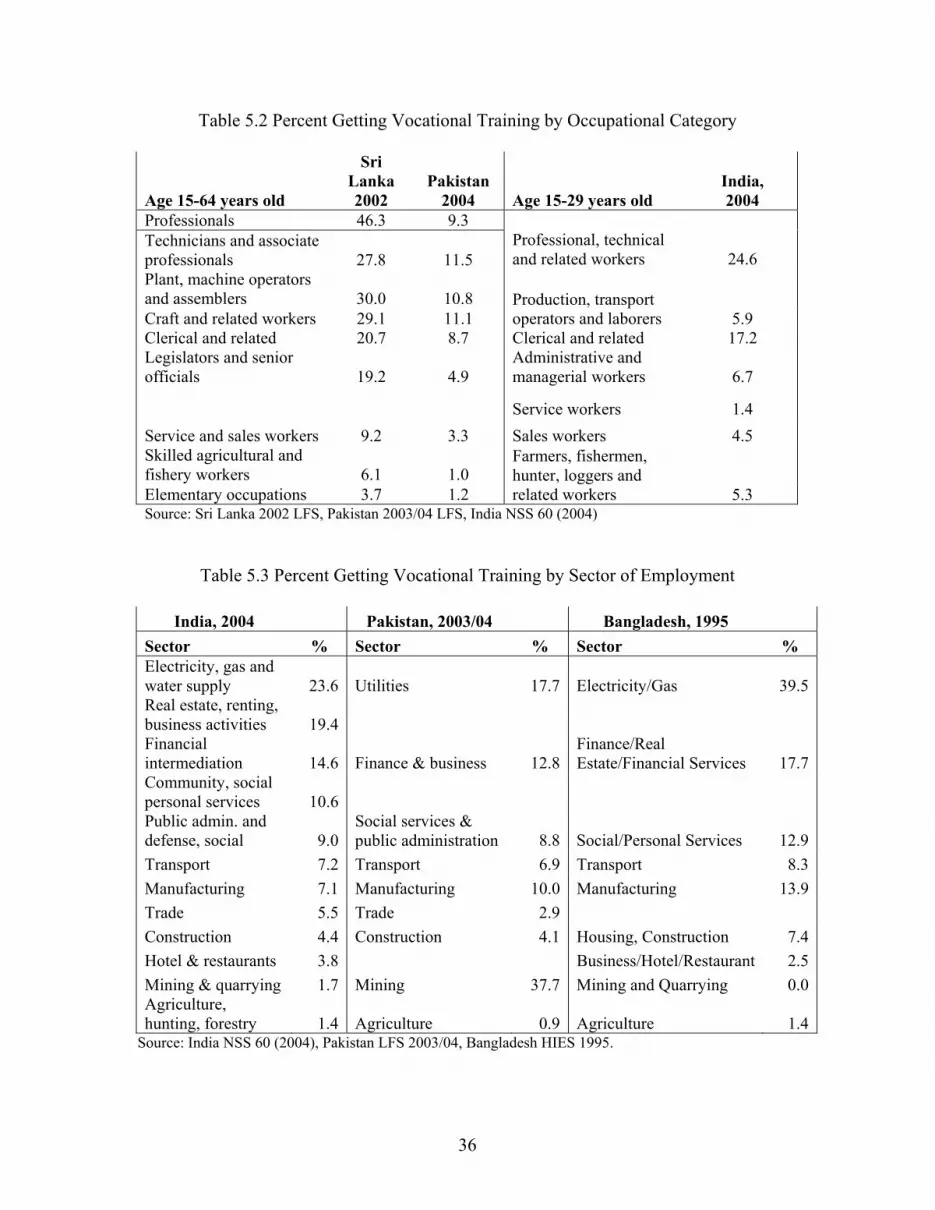
36
Table 5.2 Percent Getting Vocational Training by Occupational Category
Age 15-64 years old
Sri Lanka 2002
Pakistan 2004 Age 15-29 years old
India, 2004
Professionals 46.3 9.3 Technicians and associate professionals 27.8 11.5
Professional, technical and related workers 24.6
Plant, machine operators and assemblers 30.0 10.8 Craft and related workers 29.1 11.1
Production, transport operators and laborers 5.9
Clerical and related 20.7 8.7 Clerical and related 17.2 Legislators and senior officials 19.2 4.9
Administrative and managerial workers 6.7
Service workers 1.4 Service and sales workers 9.2 3.3 Sales workers 4.5 Skilled agricultural and fishery workers 6.1 1.0 Elementary occupations 3.7 1.2
Farmers, fishermen, hunter, loggers and related workers 5.3
Source: Sri Lanka 2002 LFS, Pakistan 2003/04 LFS, India NSS 60 (2004)
Table 5.3 Percent Getting Vocational Training by Sector of Employment
India, 2004 Pakistan, 2003/04 Bangladesh, 1995
Sector % Sector % Sector % Electricity, gas and water supply 23.6 Utilities 17.7 Electricity/Gas 39.5Real estate, renting, business activities 19.4 Financial intermediation 14.6 Finance & business 12.8
Finance/Real Estate/Financial Services 17.7
Community, social personal services 10.6 Public admin. and defense, social 9.0
Social services & public administration 8.8 Social/Personal Services 12.9
Transport 7.2 Transport 6.9 Transport 8.3Manufacturing 7.1 Manufacturing 10.0 Manufacturing 13.9Trade 5.5 Trade 2.9 Construction 4.4 Construction 4.1 Housing, Construction 7.4Hotel & restaurants 3.8 Business/Hotel/Restaurant 2.5Mining & quarrying 1.7 Mining 37.7 Mining and Quarrying 0.0Agriculture, hunting, forestry 1.4 Agriculture 0.9 Agriculture 1.4
Source: India NSS 60 (2004), Pakistan LFS 2003/04, Bangladesh HIES 1995.

37
The incidence of post-school training also varies across sectors. Table 5.3 tabulates the percent of the workforce getting post-school training by sector of employment. In Bangladesh, India and Pakistan, the utility sector tends to have the highest share of employees with post-school training (39.5, 17.7 and 23.6 percent respectively), followed broadly by real estate and finance, and public administration and social services. In the manufacturing sector, a relatively smaller percentage of workers receive post-school training, ranging from 7 percent in India to 10 percent in Pakistan and to 14 percent in Bangladesh. The sectors with the smallest share of workers getting vocational training are trade, construction, hotel and restaurant businesses, and agriculture. There are striking and unexplained differences in the extent of training in the mining sector, with over 37 percent of employees in Pakistan getting training as compared to under 2 percent in India and none in Bangladesh. Finally, Table 5.4 reports the principal sources of post-school vocational training for Bangladesh and India. In Bangladesh, about 31 percent of workers who get training do so in government training institutions, a figure that is especially high for females (over 53 percent) as compared to males (about 29 percent). Private training institutions are an important source of training for males, and “other family members” are an important informal source of training for females. In India, Industrial Training Institutes (ITIs) and Industrial Training Centers (ITCs) are by far the most important sources of vocational training (over 27 percent of trainees), especially among males (39 percent); in contrast, females were more likely to have gotten vocational training from Tailoring, Embroidery and Stitch Craft Institutes (22 percent). It is unclear what institutes fall into the “other institutes”category.
Table 5.4 Percent Getting Training by Source of Vocational Training
Bangladesh: Training institutions All Male FemaleGovernment institution 30.8 29.4 53.5 Private institution 27.0 28.3 4.3 From family member 13.8 12.5 34.2 Private Employer 7.4 7.6 3.9 NGO 1.5 1.4 4.1 Public Sector Employer 0.8 0.8 0.0 Other 18.8 19.9 0.0
Source: Bangladesh HIES 1995
India: Training institutions32 Total Male FemaleIndustrial Training Institutes (ITIs) / Centers ( ITCs) 27.3 38.9 7.2 Tailoring, Embroidery and Stitch Craft Institutes 8.8 0.9 22.5 Polytechnics 5.8 7.6 2.8 Secondary schools offering vocational courses 5.2 5.6 4.6 Other Institutes 52.8 47.0 62.9
Source: India NSS 2004
32 More detailed breakdowns of training by training institution are found in Annex 5.3
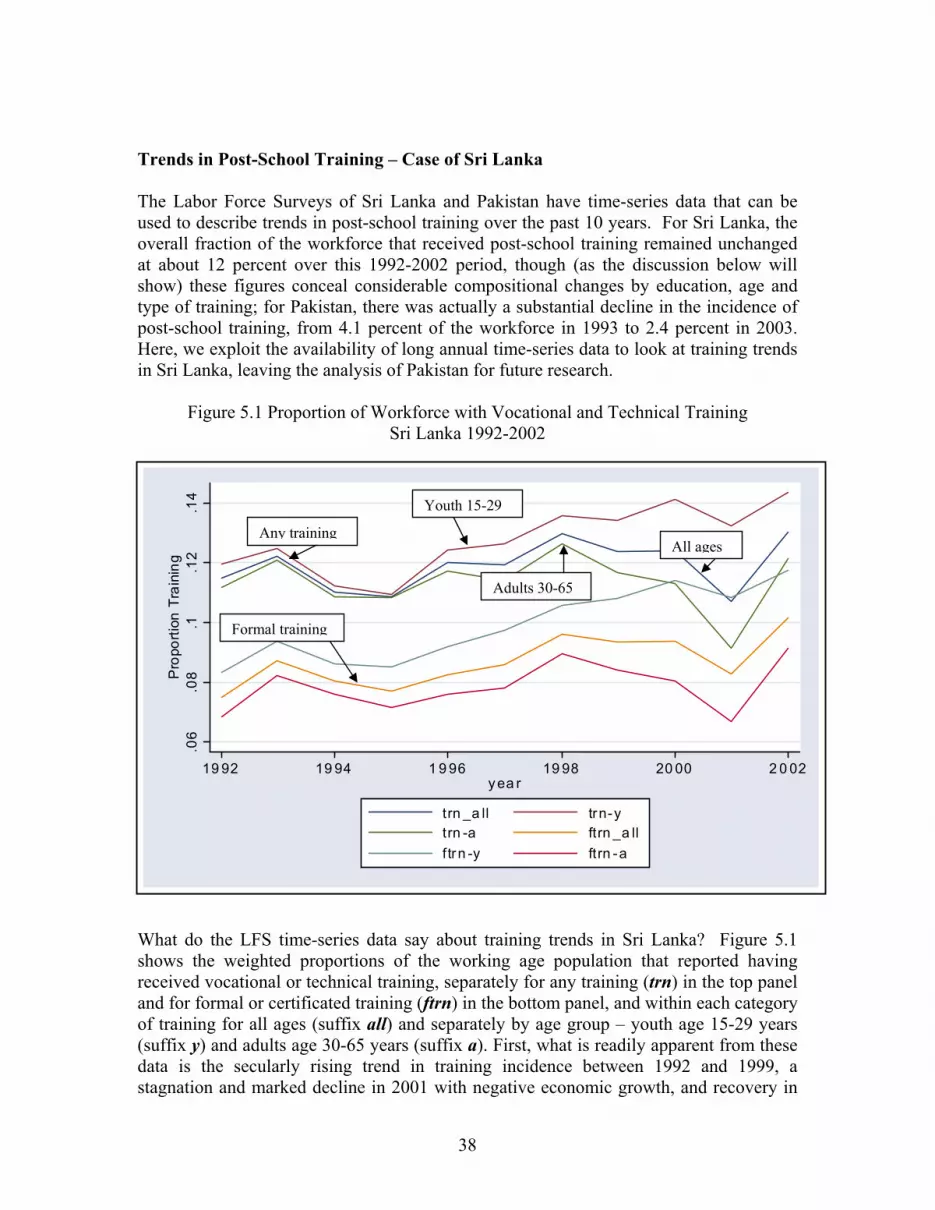
38
Trends in Post-School Training – Case of Sri Lanka The Labor Force Surveys of Sri Lanka and Pakistan have time-series data that can be used to describe trends in post-school training over the past 10 years. For Sri Lanka, the overall fraction of the workforce that received post-school training remained unchanged at about 12 percent over this 1992-2002 period, though (as the discussion below will show) these figures conceal considerable compositional changes by education, age and type of training; for Pakistan, there was actually a substantial decline in the incidence of post-school training, from 4.1 percent of the workforce in 1993 to 2.4 percent in 2003. Here, we exploit the availability of long annual time-series data to look at training trends in Sri Lanka, leaving the analysis of Pakistan for future research.
Figure 5.1 Proportion of Workforce with Vocational and Technical Training Sri Lanka 1992-2002
What do the LFS time-series data say about training trends in Sri Lanka? Figure 5.1 shows the weighted proportions of the working age population that reported having received vocational or technical training, separately for any training (trn) in the top panel and for formal or certificated training (ftrn) in the bottom panel, and within each category of training for all ages (suffix all) and separately by age group – youth age 15-29 years (suffix y) and adults age 30-65 years (suffix a). First, what is readily apparent from these data is the secularly rising trend in training incidence between 1992 and 1999, a stagnation and marked decline in 2001 with negative economic growth, and recovery in
.06
.08
.1.1
2.1
4P
ropo
rtion
Tra
inin
g
19 92 19 94 1 9 96 19 98 20 00 2 0 02yea r
trn _a ll trn-ytrn -a ftrn _a llf trn -y ftrn -a
Any training
Formal training
Youth 15-29
Adults 30-65
All ages
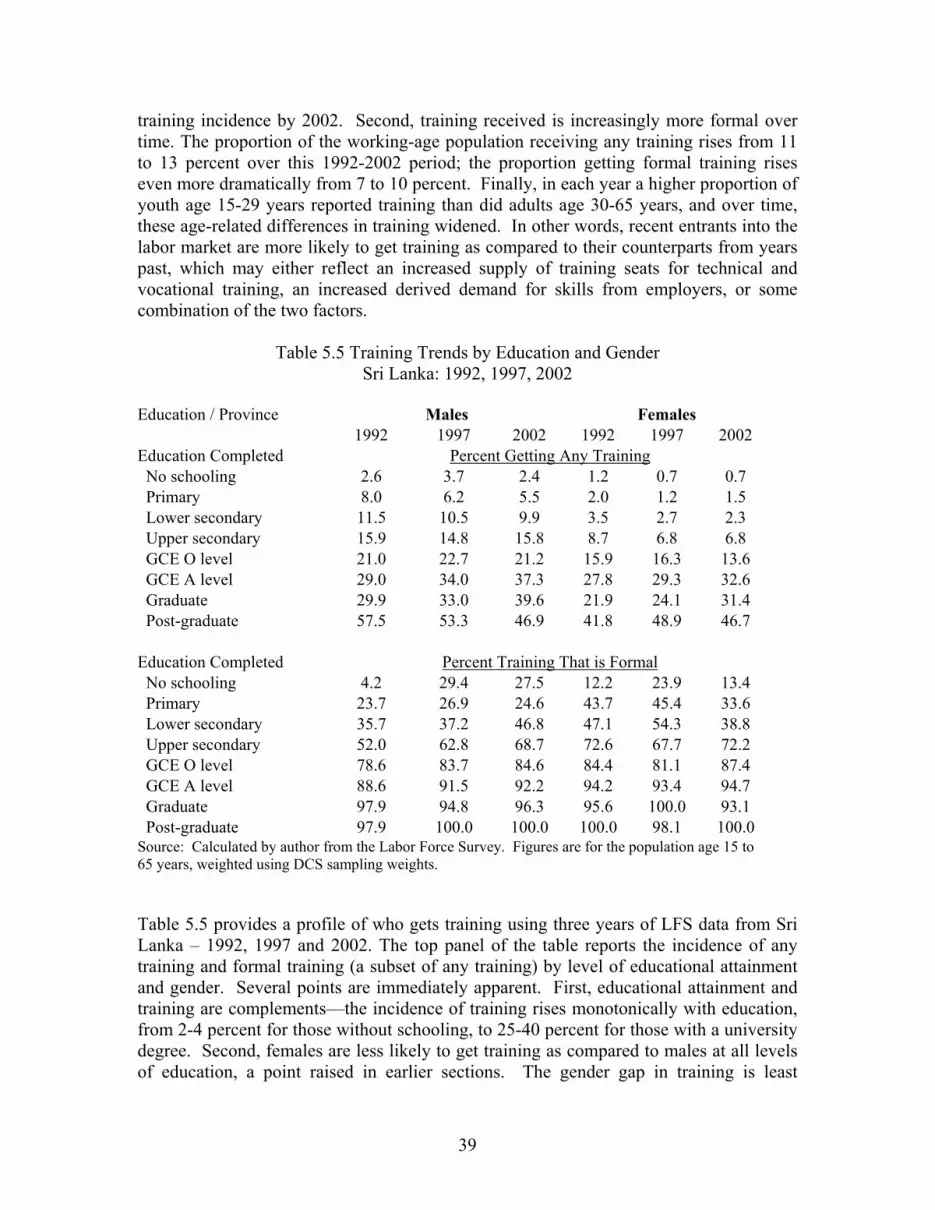
39
training incidence by 2002. Second, training received is increasingly more formal over time. The proportion of the working-age population receiving any training rises from 11 to 13 percent over this 1992-2002 period; the proportion getting formal training rises even more dramatically from 7 to 10 percent. Finally, in each year a higher proportion of youth age 15-29 years reported training than did adults age 30-65 years, and over time, these age-related differences in training widened. In other words, recent entrants into the labor market are more likely to get training as compared to their counterparts from years past, which may either reflect an increased supply of training seats for technical and vocational training, an increased derived demand for skills from employers, or some combination of the two factors.
Table 5.5 Training Trends by Education and Gender Sri Lanka: 1992, 1997, 2002
Education / Province Males Females 1992 1997 2002 1992 1997 2002 Education Completed Percent Getting Any Training No schooling 2.6 3.7 2.4 1.2 0.7 0.7 Primary 8.0 6.2 5.5 2.0 1.2 1.5 Lower secondary 11.5 10.5 9.9 3.5 2.7 2.3 Upper secondary 15.9 14.8 15.8 8.7 6.8 6.8 GCE O level 21.0 22.7 21.2 15.9 16.3 13.6 GCE A level 29.0 34.0 37.3 27.8 29.3 32.6 Graduate 29.9 33.0 39.6 21.9 24.1 31.4 Post-graduate 57.5 53.3 46.9 41.8 48.9 46.7 Education Completed Percent Training That is Formal No schooling 4.2 29.4 27.5 12.2 23.9 13.4 Primary 23.7 26.9 24.6 43.7 45.4 33.6 Lower secondary 35.7 37.2 46.8 47.1 54.3 38.8 Upper secondary 52.0 62.8 68.7 72.6 67.7 72.2 GCE O level 78.6 83.7 84.6 84.4 81.1 87.4 GCE A level 88.6 91.5 92.2 94.2 93.4 94.7 Graduate 97.9 94.8 96.3 95.6 100.0 93.1 Post-graduate 97.9 100.0 100.0 100.0 98.1 100.0 Source: Calculated by author from the Labor Force Survey. Figures are for the population age 15 to 65 years, weighted using DCS sampling weights.
Table 5.5 provides a profile of who gets training using three years of LFS data from Sri Lanka – 1992, 1997 and 2002. The top panel of the table reports the incidence of any training and formal training (a subset of any training) by level of educational attainment and gender. Several points are immediately apparent. First, educational attainment and training are complements—the incidence of training rises monotonically with education, from 2-4 percent for those without schooling, to 25-40 percent for those with a university degree. Second, females are less likely to get training as compared to males at all levels of education, a point raised in earlier sections. The gender gap in training is least

40
pronounced at higher levels of education beginning with GCE O-levels. Third, there is a rising trend between 1992 and 2002 in the incidence of training among the more highly educated, beginning with the GCE A-levels, for both males and females. Fourth, among those trained, the less educated tend to receive training that is primarily informal (that is, non-certificated) while the more educated tend to get formal training. Finally, echoing Figure 5.1, the trend over time is towards receipt of formal credentialed training, especially for males starting with lower secondary education and above, but not for females at all levels of education.
Table 5.6 Percent Trained by Age Group and Education
Education level Youth Age 15-29 Adults Age 30-65 1992 1997 2002 1992 1997 2002 Education Completed Percent Getting Any Training No schooling 1.2 3.5 1.4 1.7 1.1 1.2 Primary 5.1 4.2 4.0 5.1 3.7 3.4 Lower secondary 6.8 5.9 5.7 8.2 7.3 6.6 Upper secondary 11.7 10.5 10.7 13.6 11.1 11.8 GCE O level 16.8 17.1 15.1 20.0 21.3 19.1 GCE A level 24.9 30.0 35.8 33.1 32.9 33.4 Graduate 27.4 24.0 28.7 26.0 30.4 37.5 Post-graduate 41.6 40.4 53.9 54.6 52.4 46.2 Source: calculated from Sri Lanka LFS, weighted using DCS sampling weights.
What do training profiles look like as individuals complete formal schooling and acquire work experience in the labor market? Table 5.6 reports training data from the LFS by educational attainment separately for two broad age groups—youth age 15-29 years and adults age 30 years and above—for insights into these training-age profiles. Two points stand out. First, among youth, there is a dramatic increase in the incidence of training for those with GCE A-levels and above, but not for those with GCE O-levels and below. Among adults between 30-65 years, the only group to show a rising trend in training is university graduates. Similar age-related differences in training – but across all education groups – were shown in Figure 5.1. Second, at each level of education, a roughly equal or higher proportion of adults report having training as compared to similarly educated youth, which is consistent with a cumulative probability of training that rises as an individual ages, though at a slower pace as they become older. Post-School Training and Wages What are the labor market outcomes of these investments in post-school training? Chief among the labor market outcomes of policy interest are unemployment, job search and earnings. Section IV looked at the relationship between receipt of training and the duration of job search, or school-to-work transitions. Here, we ask whether post-school training affects wages, and if so, how the returns to vocational training compare to those from investments in formal education.

41
We estimate broadly comparable wage models for India, Pakistan and Sri Lanka, using the most recent survey available, and including all individuals age 15-64 years who worked for wages and salaries last week (India, Sri Lanka) or last month (Pakistan). We calculated the logarithm of hourly wages based on the reported number of hours worked in the relevant interval, and regressed it on indicator variables for post-school training, individual characteristics – years of education, sex, a quadratic measure of potential work experience – indicator variables for employment status and caste (India), and geographic location. The results are reported in Table 5.7.
Table 5.7 Post-School Training and Wages – India, Pakistan and Sri Lanka
Dependent variable: log(hourly wage) INDIA33 PAKISTAN SRI LANKA Independent variables Years of education 0.084 0.072 0.072 0.079 0.078 (21.09)** (65.73)** (65.75)** (54.80)** (53.35)** Formal vocational training 0.08 0.065 0.046 0.170 0.211 (2.55)* (2.90)** (1.91)T (13.68)** (15.22)** On-the-job training 0.035 (1.94)T Informal voc/tech training 0.035 (1.46) Male indicator 0.340 0.62 0.62 0.328 0.333 (14.5)** (31.41)** (31.41)** (33.47)** (33.89)** Urban location 0.190 0.211 0.211 0.294 0.297 (11.0)** (20.65)** (20.60)** (13.47)** (13.63)** Rural location 0.035 0.04 (1.76) (1.99)* SC/ST indicator -0.003 (-0.15) Years of Potential Experience 0.065 0.061 0.061 0.025 0.025 (7.83)** (40.46)** (40.48)** (17.67)** (17.66)** Experience squared -0.001 -0.001 -0.001 -0.000 -0.000
(-2.53)* (-
30.52)** (-30.53)** (-14.66)** (-
14.71)** Regular worker dummy 0.626 (34.32)** Constant 0.27 1.106 1.103 2.078 2.084 (4.66)** (41.05)** (40.88)** (77.87)** (78.13)** Observations 8,299 11,589 11,589 21,328 21,328 R-squared 0.29 0.40 0.40 0.25 0.25 Source: India NSS, 2004, Pakistan HIES, 1997, Sri Lanka LFS, 2001/2002 Note: T – significant at 10%;* significant at 5%; ** significant at 1%
The returns to post-school training are positive and statistically significant in all three countries even after controlling for educational attainment and other worker attributes. In
33 In India question about vocational training was asked only to 15-29 year olds who have completed middle school

42
India, the returns to formal vocational training are about 8 percent, almost equivalent to the 8.4 percent return to an additional year of education. In Pakistan, when receipt of vocational training and on-the-job training are used to define a single “any training” indicator variable, the returns to any formal training (6.5 percent) are only slightly lower than the returns to education of 7.2 percent. When the two training measures are entered separately, the returns to vocational training (4.6 percent) are higher than on-the-job training returns (3.5 percent), estimates that are still significant but only at the 10 percent level. In Sri Lanka, formal vocational training is associated with relatively high returns of 17 percent, more than double the returns to an additional year of formal education. Differentiating between formal and informal vocational training results in statistically significant returns to formal vocational training of 21 percent, whereas the returns to informal training of 3.5 percent are not significant.

43
VI. In-Service Training from Employers While education decisions are household and individual-based, the closer individuals get to the world of work the more post-school skill development become joint decisions with employers. Information on employers, and what skills they require, is typically not elicited in household or labor force surveys; in the best of cases, they may ask about industry or employer size. To get insights into the demand-side factors that shape skills demand of employers and in-service training, we turn to firm-level surveys to study the in-service training practices of manufacturing firms in South Asia, their determinants, and their consequences for labor productivity and wages.34 In South Asia, comparable information on in-service training was elicited from employers as part of the Investment Climate Surveys (ICS) in the four countries. The
ICS asked employers detailed questions about their workforce and training practices; these data, together with information on different enterprise attributes and production, allow us to ask not only which firms provide in-service training, who they train, how much, and where they get training, but also what are the productivity and wage outcomes of training. Similar ICS have been fielded in many developing countries, so that the in-service training practices of South Asian firms can be compared to that of similar firms in other countries. Such comparisons across countries can provide insights into whether or not the incidence of in-service training in South Asia is low, and if it is, to help policymakers design training policies to remedy identified weaknesses in the training
practices of South Asian firms. We ask several questions: How much in-service training goes on in manufacturing enterprises, and do firms in South Asia train more or less than their competitors, both regionally and globally? If levels of enterprise training are low, what factors constrain employers from providing training to their employees? Who are the main providers of
34 This section draws heavily on two studies – Tan and Savchenko (2005), on “In-Service Training in India: Evidence from the Investment Climate Survey”, and Tan and Savchenko (2006) on “In-Service Training in Bangladesh: Under-Investment despite Productivity and Wage Gains from Training”.
Box 1: Investment Climate Surveys (ICS) Investment Climate Surveys have been fielded by the World Bank in over 40 developing countries. Each ICS includes information on establishment size (number of employees, sales and assets); years in operation; sales, debt and growth performance; sources of finance; and a mix of qualitative and quantitative assessments by employers of the business environment in the country, including indicators of governance, predictability of economic policy, the judicial system, access to finance, and general constraints to business operations. In addition, many ICS include modular questions on firm competitiveness and workforce skills. Detailed information is collected on enterprise innovation, research and development, use of new technologies, the education and skills of workers, wages and productivity. The module on training practices asks about formal training provided by employers, number of workers training by occupation and source of training, and it distinguishes between in-house training and training obtained from various external training providers, both public and private. Source: World Bank Investment Climate Surveys

44
in-service training – employers, public training institutions, private sector providers, or other firms? What are the factors that shape employer decisions to provide employees with training? Is investing in in-service training worthwhile, in terms of improving levels of productivity in the firms, as well as beneficial to workers in the form of higher wages? Figure 6.1 compares levels of in-service training in India, Pakistan, Bangladesh and Sri Lanka. Estimates are presented with and without adjustments to reflect differences in the firm size distribution of ICS samples across countries, specifically the fact that the Bangladesh ICS included a higher proportion of large firms (which tend to train), while the India ICS has a more representative sample of firms of different sizes. The simple un-weighted tabulations of the ICS suggest that the incidence of in-service training in Sri Lanka is highest (at 37 percent), followed by Bangladesh, India and Pakistan (26, 17 and 8 percent respectively). The weighted incidence of in-service training using the size distribution of India as the norm yields the same country rankings, but reduces cross-country disparities – training incidence in Bangladesh falls to 22 percent, the incidence for Sri Lanka drops to 25 percent, while that for Pakistan is unchanged at 8 percent.
Figure 6.1 Incidence of In-Service Training in South Asia
Incidence of formal training(%)
0.00
5.00
10.00
15.00
20.00
25.00
30.00
35.00
40.00
Pakistan India02 Bangladesh Sri Lanka
unweightedweighted
How does South Asia compare with other regions? Figure 6.2 makes it clear that training incidence in South Asia is among the lowest in the world, being less than half that of the average for Europe and Central Asia, East Asia and Latin America.35 But this training
35 The cross-country and regional averages are based upon ICS data from 35 countries and a total of 17,941 firm respondents. The regional composition are as follows: Africa: 11 countries, 2,387 firms, countries are Eritrea, Ethiopia, Kenya, Mali, Mozambique, Nigeria, Senegal, South Africa, Tanzania, Uganda, and Zambia; East Asia and Pacific: 5 countries, 3,985 firms, countries are Cambodia, China, Indonesia, Malaysia and Philippines; Eastern Europe and Central Asia: 3 countries, 280 firms, countries are Kosovo, Montenegro, and Serbia; Latin America and Caribbean: 8 countries, 5,112 firms, countries are Bolivia, Brazil, Ecuador, El Salvador, Guatemala, Honduras, Nicaragua, and Peru; Middle East and North Africa: 5 countries, 2,889 firms, countries are Algeria, Egypt, Morocco, Oman, and Syria; South Asia: 6 countries, 4,466 firms, countries are Bangladesh, Bhutan, India, Nepal, Pakistan, Sri Lanka.

45
Incidence of formal training by region (%)
0.0
10.0
20.0
30.0
40.0
50.0
60.0
Middle Eastand North
Africa
South Asia Europe andCentral Asia
Africa Latin Americaand Carribean
East Asia andPacific
deficit is especially pronounced when South Asian countries are compared to individual East Asian countries (the bottom panel), such as Malaysia (training incidence is twice as high) and China (three times higher). If an educated and trained workforce is critical for technological change and for the Knowledge Economy, then low levels of education and this post-school training deficit puts South Asia at a distinct competitive disadvantage relative to its East Asian neighbors.
Figure 6.2 Incidence of Formal In-Service Training in Manufacturing Regional Averages and Country Means
Who is getting training? The ICS in all four South Asian countries included questions about which groups of workers received in-service training and how many were trained. Table 6.1 tabulates the percent of workers getting in-service in each one of four skill occupations: managers, professionals, production workers and non-production workers, separately by country, and weighted by firm size (using the Indian norm) to make the estimates comparable across the four countries. The cross-country rankings of share of workers trained, or “training intensity”, vary with per capital income and years of schooling of the workforce in the country. Sri Lanka has the highest training intensity, India the second highest, followed by
Pakistan and Bangladesh. In Sri Lanka, 10 percent of managers, 11 percent of professionals, 22 percent of production workers and 6 percent of non-production workers received in-service training. In India, the corresponding figures are between 6 and 7 percent of managers, professionals and production workers, and about 3 percent of non-production workers get in-service training. In Bangladesh and Pakistan, firms extend in-service training to only a small fraction of its workforce, averaging 3 percent of professionals, 2 percent of managers, 1.2 percent of production workers and less than 0.5 percent of non-production workers.
Incidence of formal training by country (% )
0 10 20 30 40 50 60 70 80 90 100
PakistanIndonesia
EgyptPhilippines
MoroccoIndia
BangladeshEthiopiaZambia
SriLankaMontenegro
SerbiaAlgeria
TanzaniaMalaysia
KenyaElSalvadorGuatemala
PeruBrazilChina

46
Table 6.1 Share of Workers Trained By Skill Group – South Asia
Country Managers Professionals Production Non-production
workers Bangladesh 1.9 3.0 1.2 0.4 India 6.0 7.3 7.0 2.9 Pakistan 2.0 3.5 3.3 0.4 Sri_Lanka 10.4 11.3 22.4 6.0
Source: ICS for respective countries. Note: Estimates weighted using the India firm size distribution. How do these estimates for South Asia compare to the fast-growing economies of East Asia. A World Bank study (1997) for Malaysian manufacturing estimated the overall proportion of workers receiving in-service formal training in 1994 to be 22 percent. That survey indicated that 24 percent of managers, 32 percent of technicians and between 13 and 16 percent of production workers received formal in-house training. It appears that South Asian employers are not only less likely to provide in-service training to their workers as compared to employers in other regions, conditional on providing training, they extend training opportunities to a smaller fraction of their workforce as compared to their counterparts in other regions, especially those in East Asia. This training deficit in terms of proportion of workers trained is especially significant in the case of Bangladesh and Pakistan. What are the main sources of in-service training in South Asia? Table 6.2 presents information on the in-house and external sources of in-service training in Bangladesh, India and Sri Lanka (Pakistan is excluded since its ICS does not distinguish external training sources). Conditional on a positive response to the in-service training question, employers were asked about whether training was from in-house company training programs, or from external sources such as universities, vocational education and training (VET) schools, government training institutes, private training institutes and partner firms. For expositional convenience, these external sources of training may also be clustered into two groups: public training providers (including universities, VET schools and government institutes) and private sector training providers (private training institutes and partner firms).

47
Table 6.2 Percent of Firms Training by Source – South Asia
Country Formal Training External sources conditional on training
Any In-house training
External training
University Private partners
Govt. institute
Private institute
VET school
Bangladesh 24.1 17.7 13.1 6.9 25.7 17.6 19.8 31.1 India 16.9 13.8 8.0 10.2 10.2 34.7 53.1 46.3 Pakistan 8.15 6.63 5.04 29.20 18.66 33.91 49.93 34.73 Sri Lanka 25.0 15.7 18.0 7.6 15.9 59.1 41.3 n.a.
Source: ICS for Bangladesh, India, Pakistan and Sri Lanka. Note: Estimates are weighted using the size distribution of India as the norm. Several points stand out from Table 6.2. First, while enterprises in all South Asian countries rely on both in-house and external training providers, in-house programs are generally a more common source of training than external training providers (with Sri Lanka being the exception). In Bangladesh, about 18 percent of enterprises report having in-house programs and 13 percent report external training; in India and Sri Lanka, the corresponding figures are 14 and 8 percent, and 16 and 18 percent, respectively. Pakistan has the lowest training incidence in the region with 7 percent of firms offering in-house training and 5 percent – external. Second, Indian and Sri Lankan firms tend to emphasize both public and private training institutes (between 35 to 60 percent of firms) as external sources for their in-service training. In contrast, Bangladeshi firms tend to report VET schools (31 percent) and private sector partner firms (26 percent) as the most important sources of external training. Pakistani enterprises use private institutes (50 percent), VET schools (35 percent) and government institutes (34 percent) for external training. Constraints on Investing in Training What accounts for the relatively low levels of in-service training in South Asia? Two broad sets of hypotheses have been suggested in the literature. First, the business environment may not be conducive to investments of any kind, whether physical or human. Second, there may be specific market or policy-induced failures that inhibit less than socially optimal levels of worker training. Figure 6.3 shows how firms in South Asia rank the severity of different investment climate constraints elicited in IC surveys. India, Bangladesh, Pakistan and Sri Lanka rank “taxation”, “economic and regulatory uncertainty”, and “access to finance” as the top three constraints to doing business. Poorly developed capital markets may make it difficult for employers to finance in-service training. “Skills and education of available workers” are not ranked as being highly constraining as compared to other factors such as access to land, transportation and telecommunications, suggesting that South Asian employers may, as yet, not recognize the importance of worker skills for improving productivity. By contrast, Malaysian employers facing labor and skills shortages ranked skills availability as the top constraint and many firms responded by intensively providing in-service training to its workforce (World Bank 2005).

48
Figure 6.3 Rankings of Investment Climate Constraints in South Asia
Investment Climate Constraints Rated Severe or Very Severe
0.00 10.00 20.00 30.00 40.00 50.00
telecommunications
acess to land
transportation
skills and education of available w orkers
labor regulations
access to f inance (e.g. cost of collateral)
economic and regulatory policyuncertainty
tax rates
Bangladesh
Pakistan
Sri Lanka
India 2002
Source: IC surveys for the 4 South Asian countries Information on why employers might invest little in training was not elicited in the South Asian ICS but is available in the World Business Environment Survey (WBES) for a broad range of developing countries (see Batra and Stone 2004).36 WBES asked respondents to rank a series of statements about what factors influenced their decisions on investing in training workers. Figure 6.4 graphs these WBES rankings separately for firms that train (using in-house or external facilities) and for those that do not, listing rankings of major reasons by the order cited by non-training firms. Firms that do not train are substantially more likely than firms that do to agree with the following key reasons for not training. First, a majority of non-training firms identified technologies they were using as “mature”, and hence did not require training or skills upgrading to use new technology. Second, many cited “lack of affordability of training” because of limited funding resources, which might suggest a weakness in financial markets. Third, many alluded to the high labor turnover of trained staff, an externality which prevents them from recouping the cost of training employees. Finally, many employers opined that informal on-the-job training was adequate or that skilled workers were readily available; both reasons are suggestive of low skill requirements, possibly from use of mature technologies. Separate WBES tabulations by region indicate that these are the same key constraints cited by the small sample of firms from South Asia that participated in the WBES.
36 The World Business Environment Survey (WBES) was an enterprise survey fielded using a standard core questionnaire to more than 10,000 firms in 80 countries between late 1998 and mid-2000 to investigate issues concerning the investment climate and firm performance. The analyses reported in Batra and Stone (2004b) are based on a special survey module administered in 28 of the WBES countries that focused on issues of competition, trade, and firm capabilities in terms of technology, and worker training.

49
Figure 6.4 Ranking of Reasons for Not Providing In-Service Training
Source: Batra and Stone (2004) using data from World Business Environment Survey. Correlates of In-Service Training Are the incentives for employers to provide in-service training shaped by integration into global markets and by the Knowledge Economy? To provide insights into the possible roles that these two factors play in training, Figure 6.5 compares the incidence of training in the four South Asian countries by two crude proxy variables for the export orientation and technology level of the enterprise. The firm’s export orientation is measured by an indicator variable, with a value of 1 if the firm exports and 0 otherwise, and the technology level of firms is captured by an indicator variable for whether enterprises engage in research and development (R&D. 37 Figure 6.5 suggests that firms in South Asia that export or are engaged in R&D activities are more likely to report in-service training, as compared to those that do not. The differential incentive to train by export status is most apparent for Pakistan, India and Sri Lanka; for Bangladesh, training incidence is not strongly correlated with export orientation. Export orientation can have a salutary effect on training to produce high quality products meeting the exacting standards of foreign buyers, and to increase labor productivity to meet competitive pressures (Tan and Batra 1995; Batra and Stone 2004). There is also support for the training-technology hypothesis. The second panel of Figure 6.5 strongly indicates that the incidence of in-service training is higher in enterprises that engage in R&D activities, a result that holds true equally across all four South Asian countries. This training-technology relationship is consistent with studies that suggest that effective use of new technology requires a more skilled and trained workforce (Enos 1962; Bell and Pavitt, 1992).
37 Studies have used several proxy measures for technological capabilities, including investments in research and development (R&D), the percent of the workforce dedicated to R&D, the presence of technology licensing agreements, recent introduction of new products, or the adoption of new technologies within the last three years.
Reasons for Not Training Workers More
1.00 1.50 2.00 2.50 3.00 3.50 4.00
Skepticism about benefits of training
Adequate skills acquired from school
Lack of know ledge about techniques
Skilled w orkers hired elsew here
Adequate in-house informal training
Costly of high labor turnover
Unaffordable due to f irms limited resources
Mature technology used & new w orkrs proficient
Extent of Agreement with Reason (5=Maximimum)
Firms that used external facilitiesfor trainingFirms that used own facilities fortrainingFirms that did not train
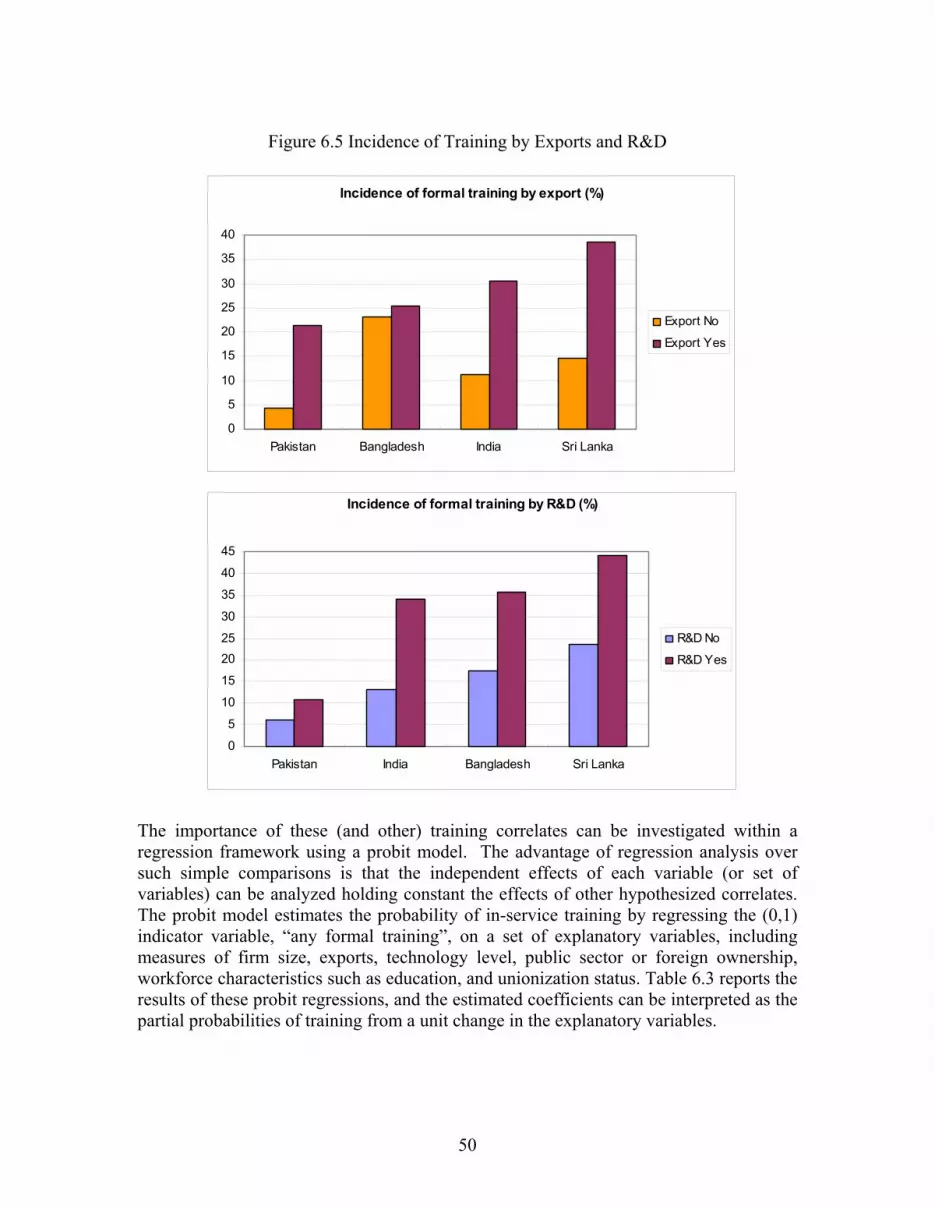
50
Incidence of formal training by R&D (%)
0
5
10
15
2025
30
35
40
45
Pakistan India Bangladesh Sri Lanka
R&D No
R&D Yes
Figure 6.5 Incidence of Training by Exports and R&D
The importance of these (and other) training correlates can be investigated within a regression framework using a probit model. The advantage of regression analysis over such simple comparisons is that the independent effects of each variable (or set of variables) can be analyzed holding constant the effects of other hypothesized correlates. The probit model estimates the probability of in-service training by regressing the (0,1) indicator variable, “any formal training”, on a set of explanatory variables, including measures of firm size, exports, technology level, public sector or foreign ownership, workforce characteristics such as education, and unionization status. Table 6.3 reports the results of these probit regressions, and the estimated coefficients can be interpreted as the partial probabilities of training from a unit change in the explanatory variables.
Incidence of formal training by export (%)
0
5
10
15
20
25
30
35
40
Pakistan Bangladesh India Sri Lanka
Export No
Export Yes

51
Table 6.3 Probits of Any Formal In-Service Training Country India Bangladesh Pakistan Sri Lanka Dependent variable Probability of any formal training
Small firms (16-100 workers) 0.58 1.24 0.11 0.11 (5.02)*** (2.80)*** (0.37) (0.29) Medium firms (101-250 workers) 0.88 1.29 0.84 0.23 (5.10)*** (2.88)*** (2.06)* (0.53) Large firms (over 250 workers) 1.40 1.56 1.55 0.97 (7.25)*** (3.42)*** (3.57)*** (2.09)* Average years of education 0.02 0.03 0.04 0.03 (0.99) (1.89)* (2.07)* (2.25)* Education of general manager -0.51 -0.05 0.35 0.11 (-3.13)*** (-2.84)*** (3.19)*** (2.84)*** Share of female workers 0.19 -0.16 1.54 0.18 (0.68) (-0.65) (2.51)** (0.63) Age of the firm 0.00 0.00 0.01 -0.01 (0.14) (-1.01) (1.93)* (-1.50) Unionization dummy 0.22 0.55 0.36 -0.34 (1.71)* (4.09)*** (1.08) (-1.48) Export dummy 0.33 0.24 0.39 0.53 (3.04)*** (1.79)* (1.44) (2.57)** R&D dummy 0.27 0.15 0.47 0.60 (2.61)** (1.31) (2.23)* (2.31)** Foreign ownership dummy 0.29 -0.29 0.29 0.03 (1.19) (-1.04) (0.55) (0.15) Government ownership dummy 0.53 1.04 n.a. 0.30 (2.06)* (2.11)* (1.14)
Intercept term -1.60 -1.61 -10.61 -1.95 (-4.18)*** (-3.08)*** (-5.24)*** (-3.71)*** R-square 0.22 0.09 0.53 0.24 Number of observations 1426 974 771 411 Source: South Asia ICS, various years Notes: All regressions include controls for missing values, location and industry * statistically significant at 10%, ** significant at 5%, *** significant at 1%.
Several points emerge from Table 6.3. First, the incidence of training rises with establishment size, a common finding in all countries for which data are available, and reflects size-related differences in access to finance, scale economies in training provision, education levels of workers, managerial capabilities and use of new technologies. Second, some support is found for the hypotheses that the demand for in-service training is shaped by export-orientation and technology. In India and Sri Lanka, both variables are positive and statistically significant; in Bangladesh, exports are positive and marginally significant, while in Pakistan, it is R&D that is positive and statistically significant.

52
Evidence that formal education and post-school training are complementary forms of human capital also emerges in Table 6.3. The probability of training rises with the average years of schooling attainment of the firm’s workforce, a result consistent with the empirical evidence from many developing countries.38 Educated workers are not only more productive in performing given tasks, but they benefit more from training than less educated workers. A related hypothesis – that more educated managers know the benefits of training and are thus more likely to implement in-service training – found mixed support. Firms with more educated general managers were more likely to train in Pakistan and Sri Lanka; in India and Bangladesh, the opposite and counter-intuitive result was found. Finally, the share of females in the workforce was not significantly related to the likelihood of training, except in Pakistan where firms were more likely to train the greater the share of female employees. Productivity and Wage Outcomes of Training Provision of in-service training only makes sense if employers’ investments in the training and skills-upgrading of employees yield positive returns in the form of higher productivity and profits.39 In making these investment decisions, employers also need to decide where to get this training, and who should get this training. An important consideration will be what types of training yields the highest impact on the bottom line, and which workers will benefit most from the training. If training yields positive impacts on productivity, employers also need to determine whether, or how much, to share productivity gains from training with workers in the form of higher wages. This calculus will depend on how transferable skills gained from training are to other potential employers (see Becker 1976; Tan 1980; Acemoglu and Pischke 1998). We address these questions using the ICS data for the four countries. For the productivity analysis, a production function approach is used.40 The dependent variable – the logarithm of value added – is regressed on the logarithms of capital (book value of physical plant and equipment assets), employment, measures of in-service training and a vector of control variables for worker attributes (mean years of education), location and industry. The analysis experimented with alternative measures of in-service
38 See Tan and Batra 1995 for estimates on the education-training relationship from five developing countries in East Asia and Latin America; Tan 2000 and World Bank (1997, 2005) for related training analyses for Malaysia. 39 Cross-sectional studies have found a strong positive association between in-service training and productivity and wage levels of firms (Tan and Batra 1995; Batra and Stone 2004). Panel studies, based on longitudinal firm surveys that elicited repeated information on the training practices of the same firms, have also found evidence that training, especially when it is repeated, leads to higher productivity growth and wages (see Dearden, Reed and Van Reenen 2000 for Britain; Tan 2000 for Malaysia; Tan and Lopez-Acevedo 2003 for Mexico). 40 Production functions are economic models used to measure the average relationships between output and the inputs used to produce that output, such as capital equipment, labor, intermediate inputs and raw materials, and energy. Production functions are estimated in logarithmic form so that the estimated parameters can be interpreted as elasticities. Some studies use a gross output measure, whereas others (including this one) rely on a value-added specification because of lack of information on input deflators.
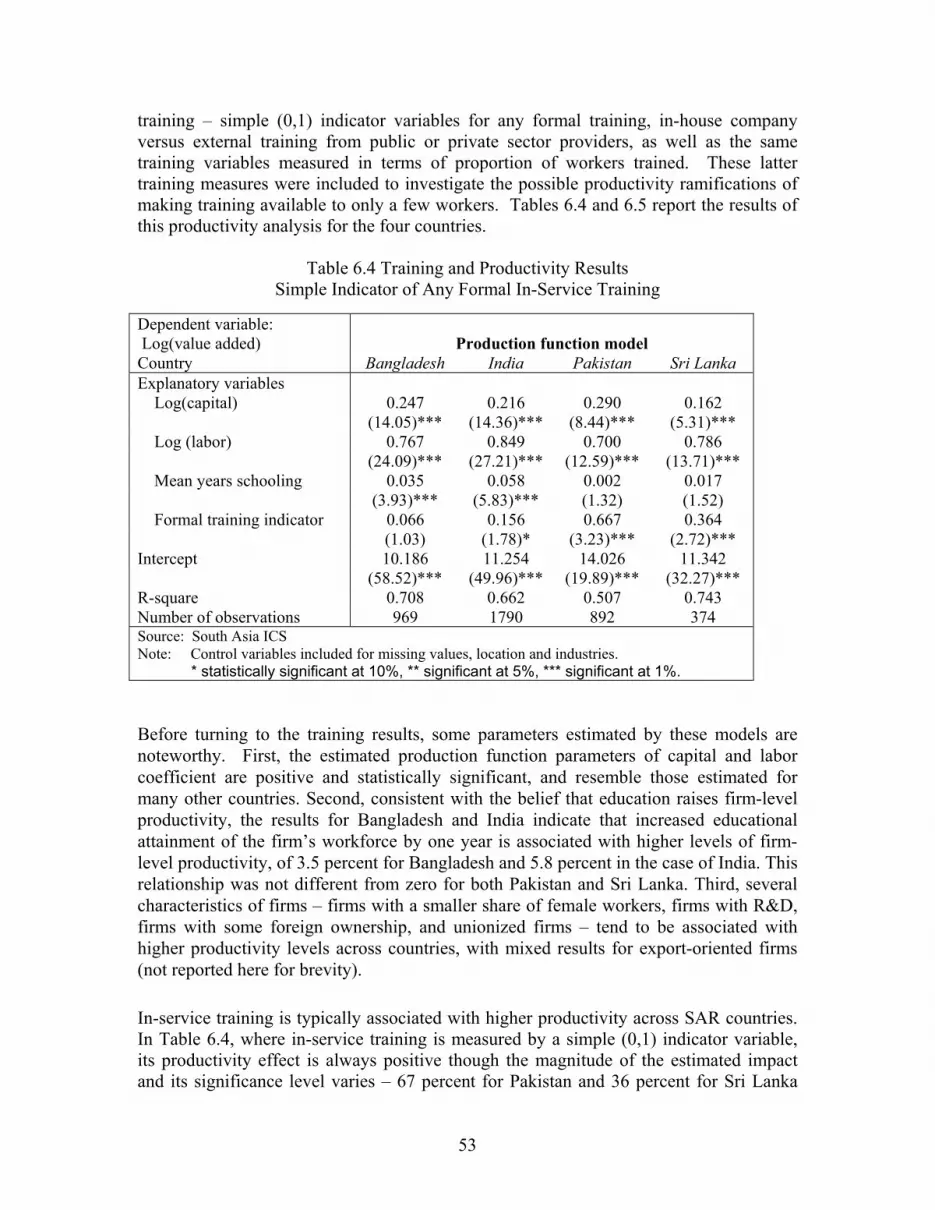
53
training – simple (0,1) indicator variables for any formal training, in-house company versus external training from public or private sector providers, as well as the same training variables measured in terms of proportion of workers trained. These latter training measures were included to investigate the possible productivity ramifications of making training available to only a few workers. Tables 6.4 and 6.5 report the results of this productivity analysis for the four countries.
Table 6.4 Training and Productivity Results Simple Indicator of Any Formal In-Service Training
Dependent variable: Log(value added) Production function model Country Bangladesh India Pakistan Sri Lanka Explanatory variables
Log(capital) 0.247 0.216 0.290 0.162 (14.05)*** (14.36)*** (8.44)*** (5.31)*** Log (labor) 0.767 0.849 0.700 0.786 (24.09)*** (27.21)*** (12.59)*** (13.71)*** Mean years schooling 0.035 0.058 0.002 0.017 (3.93)*** (5.83)*** (1.32) (1.52) Formal training indicator 0.066 0.156 0.667 0.364
(1.03) (1.78)* (3.23)*** (2.72)*** Intercept 10.186 11.254 14.026 11.342 (58.52)*** (49.96)*** (19.89)*** (32.27)*** R-square 0.708 0.662 0.507 0.743 Number of observations 969 1790 892 374 Source: South Asia ICS Note: Control variables included for missing values, location and industries. * statistically significant at 10%, ** significant at 5%, *** significant at 1%. Before turning to the training results, some parameters estimated by these models are noteworthy. First, the estimated production function parameters of capital and labor coefficient are positive and statistically significant, and resemble those estimated for many other countries. Second, consistent with the belief that education raises firm-level productivity, the results for Bangladesh and India indicate that increased educational attainment of the firm’s workforce by one year is associated with higher levels of firm-level productivity, of 3.5 percent for Bangladesh and 5.8 percent in the case of India. This relationship was not different from zero for both Pakistan and Sri Lanka. Third, several characteristics of firms – firms with a smaller share of female workers, firms with R&D, firms with some foreign ownership, and unionized firms – tend to be associated with higher productivity levels across countries, with mixed results for export-oriented firms (not reported here for brevity). In-service training is typically associated with higher productivity across SAR countries. In Table 6.4, where in-service training is measured by a simple (0,1) indicator variable, its productivity effect is always positive though the magnitude of the estimated impact and its significance level varies – 67 percent for Pakistan and 36 percent for Sri Lanka

54
(both significant at 1% level), 16 percent for India (significant at 10% level) and 7 percent for Bangladesh though not significantly different from zero. In Table 6.5, when training is measured by the share of the workforce training (first column for each country), its effect on productivity is positive and statistically significant only for Bangladesh and Sri Lanka. In Pakistan, the effect of share of workers trained is positive though not significant, which is curious given the strong positive result using a simple indicator measure. When training is distinguished by source (second column for each country), only external training has a positive productivity impact, but then only for India and for Sri Lanka. In-house training also has a positive estimated effect, but it never attains statistical significance.
Table 6.5 Training and Productivity Results Share of Workers Trained and In-house versus External Sources of Training
Dependent variable: Log(VA) Production Function Model Bangladesh India Pakistan Sri Lanka Log(capital) 0.246 0.248 0.216 0.207 0.286 0.29 0.162 0.162 (14.07) (14.07) (14.41) (13.11) (8.27) (8.40) (5.34) (5.30) Log (labor) 0.768 0.767 0.859 0.829 0.741 0.716 0.808 0.768 (24.30) (23.98) (28.32) (25.06) (13.61) (12.84) (14.31) (13.21)Mean education 0.032 0.034 0.058 0.062 0.003 0.003 0.019 0.017 (3.65) (3.82) (5.76) (5.96) (1.71) (1.65) (1.72) (1.58) Training measures Share trained 0.575 0.285 0.351 0.715 (3.36) (1.66) (0.65) (3.19) In-house training 0.089 0.069 0.397 0.151 (1.19) (0.65) (1.62) (0.97) External training -0.009 0.397 0.113 0.393 (-0.11) (2.96) (0.37) (2.53) Constant 10.202 10.189 11.217 11.36 13.972 13.97 11.27 11.418 (58.94) (58.21) (50.03) (48.41) (19.71) (19.74) (32.30) (32.25)Controls Missing values Yes Yes Yes Yes Yes Yes Yes Yes City Yes Yes Yes Yes Yes Yes Yes Yes Industry Yes Yes Yes Yes Yes Yes Yes Yes R-squared 0.71 0.708 0.662 0.648 0.501 0.503 0.745 0.747 Sample size: 969 969 1790 1660 892 892 374 374 Source: ICA surveys, SAR countries
For the wage analysis, we use a wage model that exploits all the occupation-specific information elicited in the ICA surveys. For each one of 5 or 6 skill groups – managers, professionals, skilled production and unskilled production workers, and non-production employees – firms reported not only the number of workers trained (though not by source), but also mean monthly wages. This means that the wage model can be estimated for the pooled sample of occupations across all firms that had usable occupation-specific
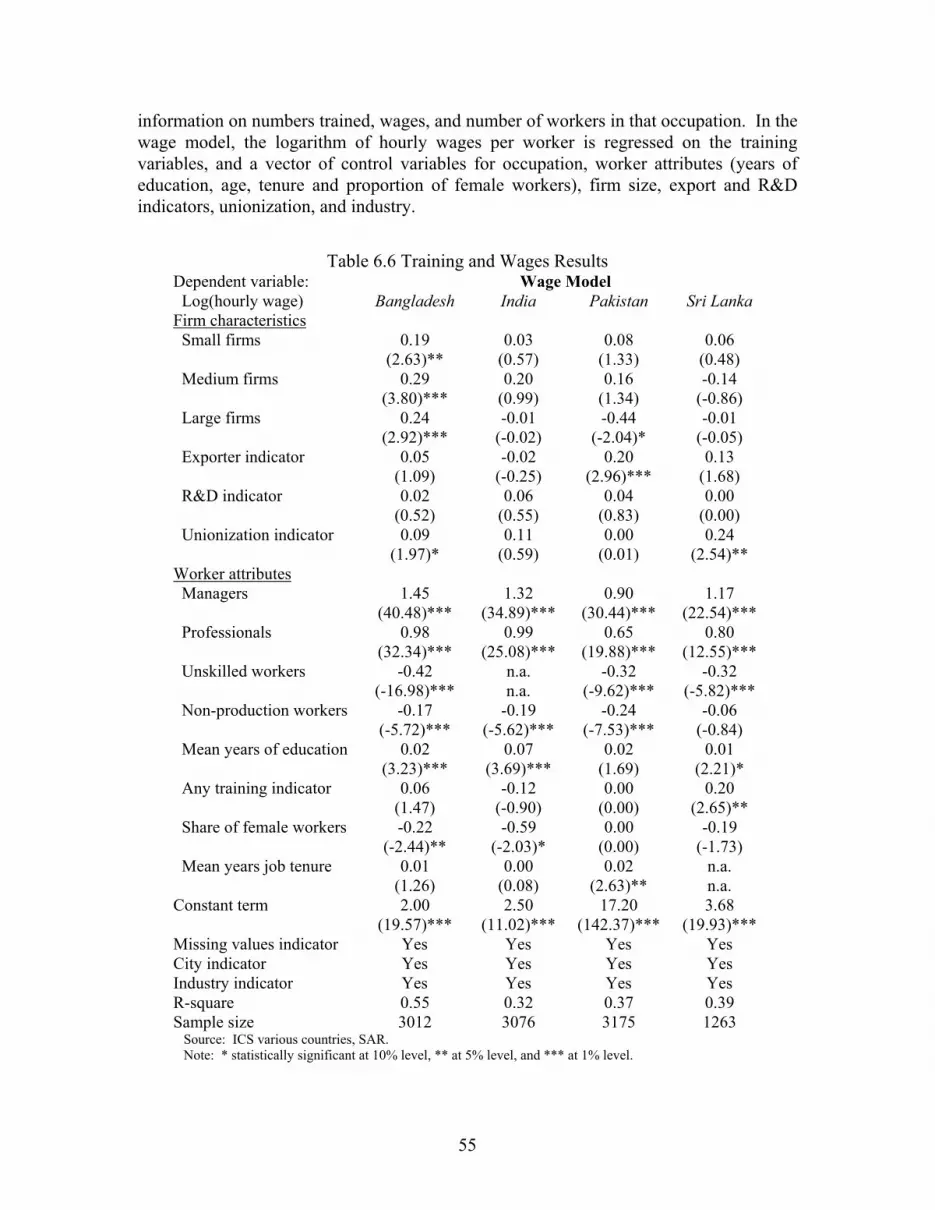
55
information on numbers trained, wages, and number of workers in that occupation. In the wage model, the logarithm of hourly wages per worker is regressed on the training variables, and a vector of control variables for occupation, worker attributes (years of education, age, tenure and proportion of female workers), firm size, export and R&D indicators, unionization, and industry.
Table 6.6 Training and Wages Results Dependent variable: Wage Model Log(hourly wage) Bangladesh India Pakistan Sri Lanka Firm characteristics Small firms 0.19 0.03 0.08 0.06 (2.63)** (0.57) (1.33) (0.48) Medium firms 0.29 0.20 0.16 -0.14 (3.80)*** (0.99) (1.34) (-0.86) Large firms 0.24 -0.01 -0.44 -0.01 (2.92)*** (-0.02) (-2.04)* (-0.05) Exporter indicator 0.05 -0.02 0.20 0.13 (1.09) (-0.25) (2.96)*** (1.68) R&D indicator 0.02 0.06 0.04 0.00 (0.52) (0.55) (0.83) (0.00) Unionization indicator 0.09 0.11 0.00 0.24 (1.97)* (0.59) (0.01) (2.54)** Worker attributes Managers 1.45 1.32 0.90 1.17 (40.48)*** (34.89)*** (30.44)*** (22.54)*** Professionals 0.98 0.99 0.65 0.80 (32.34)*** (25.08)*** (19.88)*** (12.55)*** Unskilled workers -0.42 n.a. -0.32 -0.32 (-16.98)*** n.a. (-9.62)*** (-5.82)*** Non-production workers -0.17 -0.19 -0.24 -0.06 (-5.72)*** (-5.62)*** (-7.53)*** (-0.84) Mean years of education 0.02 0.07 0.02 0.01 (3.23)*** (3.69)*** (1.69) (2.21)* Any training indicator 0.06 -0.12 0.00 0.20 (1.47) (-0.90) (0.00) (2.65)** Share of female workers -0.22 -0.59 0.00 -0.19 (-2.44)** (-2.03)* (0.00) (-1.73) Mean years job tenure 0.01 0.00 0.02 n.a. (1.26) (0.08) (2.63)** n.a. Constant term 2.00 2.50 17.20 3.68 (19.57)*** (11.02)*** (142.37)*** (19.93)*** Missing values indicator Yes Yes Yes Yes City indicator Yes Yes Yes Yes Industry indicator Yes Yes Yes Yes R-square 0.55 0.32 0.37 0.39 Sample size 3012 3076 3175 1263 Source: ICS various countries, SAR. Note: * statistically significant at 10% level, ** at 5% level, and *** at 1% level.

56
Tables 6.6 and 6.7 report the regression results for the wage model. Controlling for location and industry, firm characteristics have mixed effects on wages, usually higher in larger firms (Bangladesh), firms that are unionized (Bangladesh and Sri Lanka), and are export-oriented (Pakistan). However, in all countries wage premiums are not associated with firms doing R&D. In terms of worker characteristics, employers pay higher wages for a more educated and experienced workforce (education effects are particularly significant), but tend to pay lower wages when the workforce is predominantly female. Compared to the omitted skill group – skilled production workers41 - managers and professional are paid more, while unskilled and non-production workers receive lower pay. Relative wages across these broad occupations appear to be similar across countries. In-service has mixed effects on wages in South Asia. When training is measured as a simple indicator variable for receipt of any formal in-service training, its wage effects never attain statistical significance except in Sri Lanka. See Table 6.6. Similarly, when the source of training is distinguished, again using indicator variables, only in-house training is statistically significant, and then only for Sri Lanka where any training was associated with positive wage gains. When training is measured by the proportion of workers trained in each occupational group, training is associated with positive and statistically significant wage gains in both Sri Lanka and Bangladesh, where previously no significant wage effects were found using the any training indicator. In Pakistan and India, no significant wage effects were found for training, however measured.
Table 6.7 Training and Wages Results
Training by Source and Share of Workers Trained Dependent variable: Wage Models Log(wage) Bangladesh India Pakistan Sri Lanka Indicator In-house training 0.052 -0.126 0.00 0.138 (1.23) (-0.88) 0.00 (1.91)* External Training -0.006 0.314 0.00 0.096 Intensity (-0.11) (1.22) 0.00 (1.28) share trained 0.24 -0.288 0.00 0.379 (3.30)*** (-1.11) 0.00 (4.41)*** R-square 0.547 0.548 0.37 0.368 0.37 0.37 0.387 0.392 Sample size 3012 3012 3076 3076 3175 3175 1263 1263 Source: ICS from SAR countries Note: See Table 6.6 for complete model specifications and statistical significance
41 In India, the ICS does not distinguish between skilled and unskilled production workers, so the omitted skill group are production workers.

57
VII. Concluding Remarks The SAR regional mapping exercise – focusing on India, Pakistan, Sri Lanka and Bangladesh – sought, using available household, labor force and firm-level surveys to (1) document and compare trends in the education and post-school training of the workforce in the four countries, and (2) identify what kinds of economic analyses can be done on the life-cycle choices individuals, families and employers make about education, pre-employment VET and in-service training, and outcomes of human capital investments on school-to-work transitions, employment, wage and productivity growth. The findings reported here on skills development over the life-cycle in SAR are preliminary, but they suggest that existing education and training-related data from household, labor force and firm surveys are capable of yielding empirically robust findings and insights that are consistent with economic theory. Examples include the following findings that broadly follow the structure of the policy note:
• Despite continuous progress and commitment towards education, the stock of human capital in South Asia is still low compared to other parts of the world, in particular compared to East Asia. About half of the adult population in the largest countries is still illiterate. Except for the Maldives, none of the countries currently upgrade the skills of its population at a speed that will allow them to “catch up” quickly with East Asia and the rest of the world.
• Progress has been unequal over time across countries. Sri Lanka is clearly an
outlier with an early achievement of universal primary education and the Maldives are rapidly getting close to Sri Lanka. Among all other countries, Bhutan and Nepal which started with the lowest educational levels, showed a faster pace of improvements, yet not rapid enough to catch up with India, Bangladesh and Pakistan.
• Despite increased investments in education over time, the returns to higher
secondary and tertiary-level education have remained high and even increased relative to lower levels of schooling, suggesting a rising relative demand for higher levels of education. Education policies have not yet responded to this increased demand.
• There is a large gender gap in wages for given levels of education and work
experience, especially in Pakistan and Bangladesh. As levels of education increase, the gender gap is dramatically reduced by significantly higher returns to education for women than for men, but those higher relative returns are still inadequate to eliminating the gender gap completely.
• Overall unemployment rates are higher for the more educated groups in South
Asia. These gross figures obscure the fact that more educated youth have higher initial rates of unemployment during the school-to-work transition, but lower
58
unemployment rates as compared to other groups as they acquire more experience in the labor market.
• The available data on post-school vocational education and training suggest that
investments in VET facilitate school-to-work transitions and yield wage returns of roughly comparable or greater magnitude as those from education. The incidence of post-school training in SAR is not high. For Sri Lanka, there is evidence of a rising trend in the incidence of post-school formal training.
• A low proportion of manufacturing firms in SAR invest in the training of their
employees, and SAR and MENA are the two regions with the lowest incidence of training. Firms that train tend to be larger, export-oriented, and innovators; while we cannot draw causal inferences from cross-section data, the results suggest that training firms are more productive and they tend to pay above average wages.
However, the data mapping exercise revealed considerable room for improvement in the kinds of questions asked in labor force and household surveys, especially those pertaining to education and training. For many kinds of labor market analysis, for example, it is important to know when (or at what age) individuals complete formal schooling so that the school-to-work transition (or years of potential work experience in the labor market) can be determined with greater accuracy. Several surveys ask about post-school training but none attempt to identify when that training took place – right after finishing formal education as pre-employment training, in response to a spell or unemployment, or as part of in-service training sponsored by the employer? Clearly, the motivation and financing for this training would differ depending upon when training occurred. It would useful if surveys could distinguish between training at labor market entry, and training in the last 2-3 years, and about the training provider, whether public or private sector.

59
REFERENCES
Acemoglu, D. and Angrist, J. (1999), “How Large Are the Social Returns to Education? Evidence from Compulsory Schooling Laws”, mimeo, MIT.
Acemoglu, D. (1998). “Why Do New Technologies Complement Skills? Directed Technical Change and Wage Inequality.” Quarterly Journal of Economics 113: 1055–89.
Barro, Robert J. and Lee Jong-Wha (2000), “International Data on Educational Attainment: Updates and Implications”, CID Working Paper, No. 42.
Batra, Geeta, and Andrew Stone (2004). “Investment Climate, Capabilities and Firm Performance: Evidence from the World Business Environment Survey.” World Bank Investment Climate Unit, Washington, DC.
Gary S. Becker (1975), Human Capital, 2nd edition, New York, NY: National Bureau of Economic Research.
Dearden, Lorraine, Howard Reed, and John Van Reenan (2000). “Who Gains When Workers Train? Training and Corporate Productivity in a Panel of British Industries”. Working Paper 00/04, Institute of Fiscal Studies, University College, London.
Duraisamy, P, (2000): Changes in Returns to Education in India: 1983-94: By Gender, Age-Cohort and Location, Economic Growth Centre Discussion Paper No.815, Yale University.
Dutta, P.V., (2004): The Structure of Wages in India, 1983-1999, PRUS Working Paper No 25, University of Sussex, Falmer, Brighton, BN1 9SN, UK.
Mincer, Jacob (1974). “Schooling, Experience and Earnings”. National Bureau of Economic Research.
Tan, Hong and Geeta Batra (1995). “Enterprise Training in Developing Countries: Incidence, Productivity Effects, and Policy Implications.” Occasional Paper 9, World Bank, Private Sector Development Department, Washington, DC.
Tan, Hong and Gladys Lopez-Acevedo (2003). “Mexico: In-Firm Training for the Knowledge Economy.” Policy Research Working Paper 29571, World Bank, Washington, DC.
Tan, Hong and Sunil Chandrasiri (2004). “Training and Labor Market Outcomes in Sri Lanka.” World Bank Institute Working Paper, chapter in World Bank (2005), Treasures of the Education System in Sri Lanka.
Tan, Hong and Yevgeniya Savchenko (2005), “In-Service Training in India: Evidence from the Investment Climate Survey”, chapter in World Bank (2005), Skills Development in India: The Vocational Education and Training System.
Tan, Hong and Yevgeniya Savchenko (2006), “In-Service Training in Bangladesh: Under-Investment despite Productivity and Wage Gains from Training”, chapter in World Bank (2006), The Bangladesh Vocational Education and Training System: An Assessment.

60
Tan, Hong (2005). The Skills Challenge of New Technology: Training, Technology, and Productivity Growth in Malaysian Manufacturing in the 1990s. Washington, D.C.: World Bank Institute.
World Bank (2003), Closing the Gap in Education and Technology, D. de Ferranti et al, Latin American and Carribean Studies, Washington DC.
World Bank (2006), Malaysia and the Knowledge Economy: Building a World-Class Higher Education System”, chapter 5, Report prepared by East Asia Region for the Economic Planning Unit, Prime Minister’s Department.
World Bank. 2005c. Treasures of the Education System in Sri Lanka: Restoring Performance, Expanding Opportunities and Enhancing Prospects. Colombo: World Bank

61
Annex 3.1 INDIA NSS 38(1983/1984) NSS 43 (1987/1988) NSS 50 (1993/1994) Sample : All Men Women All Men Women All Men Women Dependent variable: Logarithm of hourly wages Logarithm of hourly wages Logarithm of hourly wages literate, below primary 0.107 0.103 0.058 0.177 0.143 0.086 0.107 0.103 0.058 (11.21) (10.17) (2.17) (13.57) (10.02) (2.78) (11.21) (10.17) (2.17) primary 0.212 0.22 0.07 0.23 0.192 0.161 0.212 0.22 0.07 (22.56) (22.26) (2.59) (18.77) (14.49) (5.11) (22.56) (22.26) (2.59) middle 0.384 0.377 0.408 0.42 0.377 0.428 0.384 0.377 0.408 (35.78) (34.15) (10.68) (31.59) (26.97) (10.65) (35.78) (34.15) (10.68) secondary and higher secondary 0.712 0.671 0.998 0.762 0.673 1.072 0.712 0.671 0.998 (64.14) (57.78) (30.29) (61.08) (49.95) (34.68) (64.14) (57.78) (30.29) tertiary 1.123 1.094 1.314 1.288 1.197 1.56 1.123 1.094 1.314 (76.76) (70.68) (33.16) (89.53) (76.87) (45.72) (76.76) (70.68) (33.16) technical education 0.161 0.14 0.126 0.195 0.182 0.136 0.161 0.14 0.126 (10.90) (8.90) (3.23) (14.05) (12.22) (4.14) (10.90) (8.90) (3.23) male dummy 0.473 0.486 0.473 (69.78) (55.86) (69.78) urban dummy 0.266 0.294 0.154 0.186 0.151 0.173 0.266 0.294 0.154 (40.28) (40.99) (9.85) (20.66) (13.71) (10.38) (40.28) (40.99) (9.85) scst dummy -0.012 -0.042 0.063 0.07 0.013 0.175 -0.012 -0.042 0.063 (-1.98) (-5.94) (4.93) (8.54) (1.28) (11.74) (-1.98) (-5.94) (4.93) experience 0.04 0.046 0.021 0.051 0.058 0.035 0.04 0.046 0.021 (45.50) (46.78) (10.13) (48.76) (48.26) (15.80) (45.50) (46.78) (10.13) experience squared -0.001 -0.001 0 -0.001 -0.001 -0.001 -0.001 -0.001 0 (-38.92) (-38.60) (-10.17) (-37.69) (-35.42) (-13.86) (-38.92) (-38.60) (-10.17) regular worker dummy 0.62 0.602 0.637 0.612 0.591 0.568 0.62 0.602 0.637 (85.46) (77.53) (34.36) (66.93) (58.99) (27.54) (85.46) (77.53) (34.36) intercept -0.392 0.018 -0.128 -0.388 0.119 -0.216 -0.392 0.018 -0.128 (-30.75) (1.34) (-4.50) (-24.95) (6.25) (-6.61) (-30.75) (1.34) (-4.50) R-sq 0.447 0.406 0.322 0.526 0.409 0.455 0.447 0.406 0.322 number of observations 81521 61856 19665 47568 33812 13756 81521 61856 19665

62
Annex 3.1 – INDIA (continued) NSS 55 (1999/2000) NSS 60 (2004) Sample All Men Women Sample All Men Women Dependent variable Logarithm of hourly wages Dependent variable Logarithm of hourly wages literate, below primary 0.181 0.156 0.187 literate, below primary 0.195 0.157 0.248 (19.84) (15.66) (8.52) (12.53) (9.13) (6.83)primary 0.28 0.262 0.24 primary 0.249 0.233 0.198 (30.08) (26.23) (9.72) (18.38) (15.53) (6.12)middle 0.438 0.42 0.398 middle 0.461 0.439 0.414 (47.78) (43.23) (14.91) (34.31) (30.03) (11.69)secondary and higher secondary 0.8 0.729 1.126
secondary and higher secondary 0.717 0.656 0.972
(86.03) (72.98) (46.18) (52.25) (44.01) (27.27)tertiary 1.355 1.277 1.619 tertiary 1.329 1.229 1.64 (120.79) (104.55) (58.81) (79.64) (66.71) (41.15)technical education 0.268 0.272 0.292 technical education 0.18 0.179 0.162 (17.51) (16.96) (6.61) (10.87) (9.90) (4.07)male dummy 0.423 male dummy 0.446 (68.19) (47.68) urban dummy 0.219 0.215 0.217 urban dummy 0.221 0.201 0.292 (37.78) (34.39) (15.31) (26.06) (21.99) (13.83)scst dummy 0.037 0.019 0.088 scst dummy 0.005 -0.014 0.079 (6.77) (3.03) (7.40) (0.67) (-1.54) (4.32)experience 0.052 0.055 0.046 experience 0.056 0.06 0.047 (70.26) (65.86) (27.17) (53.99) (51.59) (19.96)experience squared -0.001 -0.001 -0.001 experience squared -0.001 -0.001 -0.001 (-53.78) (-48.88) (-23.08) (-39.40) (-37.34) (-15.55) regular worker dummy 0.68 0.679 0.62 regular worker dummy 0.798 0.815 0.666 (99.06) (92.80) (34.52) (81.86) (78.22) (26.17)intercept -0.075 0.352 -0.035 intercept -0.219 0.23 -0.18 (-6.57) (29.15) (-1.35) (-13.29) (13.21) (-4.86) R-sq 0.552 0.52 0.519 R-sq 0.546 0.519 0.529number of observations 80108 61614 18494 number of observations 39190 30682 8508

63
Annex 3.2 PAKISTAN PHIS 1993/1994 PHIS 1996/1997 PHIS 2000/2001 Sample : All Men Women All Men Women All Men Women Dependent variable: Logarithm of hourly wages Logarithm of hourly wages Logarithm of hourly wages literate, below primary 0.173 0.152 0.868 0.037 0.01 0.428 0.108 0.071 0.213 (5.55) (4.97) (3.12) (1.01) (0.29) (1.55) (4.69) (3.20) (1.90) primary 0.22 0.213 0.212 0.223 0.198 0.636 0.225 0.193 0.247 (14.79) (14.48) (1.85) (14.46) (13.32) (4.78) (12.63) (11.31) (2.75) lower secondary 0.39 0.379 0.602 0.415 0.393 0.847 0.421 0.376 0.752 (21.00) (20.66) (4.27) (22.79) (22.44) (5.39) (18.72) (17.54) (5.98) secondary and higher secondary 0.643 0.619 0.913 0.675 0.627 1.27 0.788 0.691 1.506 (45.13) (43.17) (12.41) (47.23) (44.87) (15.02) (44.38) (39.90) (20.53) tertiary 1.183 1.151 1.455 1.174 1.106 1.775 1.397 1.216 2.288 (65.56) (62.50) (17.97) (60.72) (57.60) (17.92) (61.34) (53.16) (28.69) male dummy 0.377 0.65 1.089 (19.14) (32.89) (63.42) urban dummy 0.214 0.22 0.182 0.215 0.196 0.414 0.189 0.169 0.25 (21.32) (21.83) (3.37) (21.17) (19.68) (6.95) (15.73) (14.24) (5.46) experience 0.056 0.058 0.047 0.06 0.063 0.052 0.06 0.062 0.062 (38.95) (39.60) (6.93) (39.86) (42.44) (7.02) (36.90) (38.96) (10.10) experience squared -0.001 -0.001 -0.001 -0.001 -0.001 -0.001 -0.001 -0.001 -0.001 (-31.12) (-31.52) (-6.22) (-30.63) (-32.84) (-5.45) (-27.69) (-29.85) (-7.41) intercept 1.008 1.368 1.061 1.152 1.794 0.864 0.581 1.696 0.289 (37.95) (66.29) (10.60) (42.76) (85.78) (8.02) (21.32) (71.00) (3.28) R-sq 0.422 0.417 0.444 0.405 0.373 0.498 0.396 0.266 0.402 number of observations 10553 9887 666 11589 10813 776 16200 14155 2045

64
Annex 3.3 SRI LANKA
LFS 1992/1993 LFS 1997/1998 LFS 2001/02 Sample : All Men Women All Men Women All Men Women Dependent variable: Logarithm of hourly wages Logarithm of hourly wages Logarithm of hourly wages literate, below primary 0.039 0.062 0.101 0.017 0.071 -0.042 0.057 0.092 0.024 (1.87) (2.38) (3.76) (0.86) (2.52) (-1.44) (2.36) (2.84) (0.63) primary 0.224 0.279 0.318 0.172 0.245 0.052 0.185 0.245 0.059 (10.58) (10.76) (11.33) (8.24) (8.54) (1.54) (7.44) (7.51) (1.41) lower secondary 0.485 0.522 0.61 0.337 0.406 0.243 0.341 0.377 0.308 (23.00) (20.13) (22.11) (15.68) (13.85) (7.12) (13.52) (11.47) (7.32) secondary and higher secondary 0.852 0.857 0.926 0.553 0.591 0.532 0.606 0.615 0.621 (42.03) (33.54) (35.48) (25.85) (19.89) (16.47) (24.08) (18.46) (15.38) tertiary 1.088 1.074 1.143 0.828 0.798 0.877 0.875 0.849 0.909 (36.79) (29.72) (29.67) (26.07) (18.05) (18.82) (26.31) (18.75) (17.82) male dummy 0.302 0.381 0.403 (31.99) (40.98) (40.72) urban dummy -0.13 -0.134 -0.153 0.277 0.448 0.033 0.271 0.402 0.089 (-9.35) (-8.55) (-7.61) (16.64) (21.26) (1.20) (12.69) (14.95) (2.47) rural dummy -0.244 -0.259 -0.28 0.041 0.216 -0.207 0.059 0.219 -0.19 (-17.15) (-16.18) (-13.68) (2.76) (11.31) (-8.76) (3.03) (8.77) (-5.97) experience 0.03 0.031 0.031 0.023 0.028 0.013 0.026 0.033 0.014 (21.34) (19.88) (15.84) (17.21) (17.20) (5.75) (18.63) (19.86) (5.86) experience squared -0.000 -0.000 -0.001 -0.000 -0.000 -0.000 -0.000 -0.001 -0.000 (-18.13) (-16.06) (-13.75) (-15.93) (-14.95) (-6.87) (-16.76) (-17.50) (-5.64) regular worker dummy 0.324 0.305 0.365 0.362 0.332 0.447 (32.19) (26.01) (18.93) (33.31) (27.22) (19.70) intercept 2.392 2.661 2.493 2.273 2.373 2.65 2.163 2.316 2.466 (89.11) (73.29) (58.54) (86.64) (66.13) (64.12) (68.73) (55.03) (49.05) R-sq 0.258 0.219 0.249 0.281 0.245 0.282 0.292 0.255 0.302 number of observations 24535 19168 12563 23229 15421 7808 20838 14009 6829
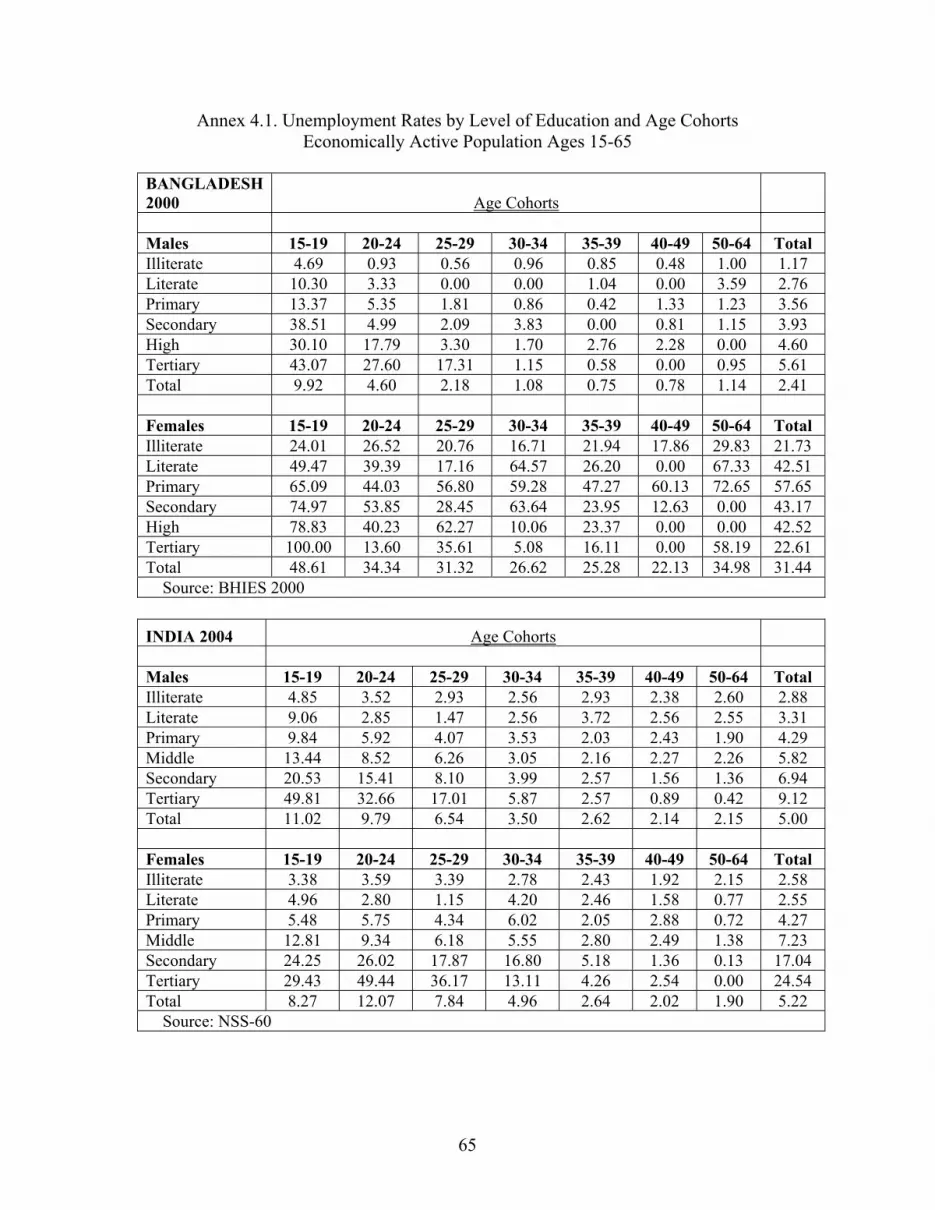
65
Annex 4.1. Unemployment Rates by Level of Education and Age Cohorts Economically Active Population Ages 15-65
BANGLADESH 2000 Age Cohorts Males 15-19 20-24 25-29 30-34 35-39 40-49 50-64 Total Illiterate 4.69 0.93 0.56 0.96 0.85 0.48 1.00 1.17 Literate 10.30 3.33 0.00 0.00 1.04 0.00 3.59 2.76 Primary 13.37 5.35 1.81 0.86 0.42 1.33 1.23 3.56 Secondary 38.51 4.99 2.09 3.83 0.00 0.81 1.15 3.93 High 30.10 17.79 3.30 1.70 2.76 2.28 0.00 4.60 Tertiary 43.07 27.60 17.31 1.15 0.58 0.00 0.95 5.61 Total 9.92 4.60 2.18 1.08 0.75 0.78 1.14 2.41 Females 15-19 20-24 25-29 30-34 35-39 40-49 50-64 Total Illiterate 24.01 26.52 20.76 16.71 21.94 17.86 29.83 21.73 Literate 49.47 39.39 17.16 64.57 26.20 0.00 67.33 42.51 Primary 65.09 44.03 56.80 59.28 47.27 60.13 72.65 57.65 Secondary 74.97 53.85 28.45 63.64 23.95 12.63 0.00 43.17 High 78.83 40.23 62.27 10.06 23.37 0.00 0.00 42.52 Tertiary 100.00 13.60 35.61 5.08 16.11 0.00 58.19 22.61 Total 48.61 34.34 31.32 26.62 25.28 22.13 34.98 31.44 Source: BHIES 2000
INDIA 2004 Age Cohorts Males 15-19 20-24 25-29 30-34 35-39 40-49 50-64 Total Illiterate 4.85 3.52 2.93 2.56 2.93 2.38 2.60 2.88 Literate 9.06 2.85 1.47 2.56 3.72 2.56 2.55 3.31 Primary 9.84 5.92 4.07 3.53 2.03 2.43 1.90 4.29 Middle 13.44 8.52 6.26 3.05 2.16 2.27 2.26 5.82 Secondary 20.53 15.41 8.10 3.99 2.57 1.56 1.36 6.94 Tertiary 49.81 32.66 17.01 5.87 2.57 0.89 0.42 9.12 Total 11.02 9.79 6.54 3.50 2.62 2.14 2.15 5.00 Females 15-19 20-24 25-29 30-34 35-39 40-49 50-64 Total Illiterate 3.38 3.59 3.39 2.78 2.43 1.92 2.15 2.58 Literate 4.96 2.80 1.15 4.20 2.46 1.58 0.77 2.55 Primary 5.48 5.75 4.34 6.02 2.05 2.88 0.72 4.27 Middle 12.81 9.34 6.18 5.55 2.80 2.49 1.38 7.23 Secondary 24.25 26.02 17.87 16.80 5.18 1.36 0.13 17.04 Tertiary 29.43 49.44 36.17 13.11 4.26 2.54 0.00 24.54 Total 8.27 12.07 7.84 4.96 2.64 2.02 1.90 5.22 Source: NSS-60

66
PAKISTAN 2003/2004 Age cohorts Males 15-19 20-24 25-29 30-34 35-39 40-49 50-64 Total Illiterate 4.48 2.32 1.37 1.03 0.98 1.06 0.57 1.60 Literate 9.16 3.74 1.84 1.06 1.00 0.57 1.63 3.22 Primary 6.84 2.91 1.91 2.00 1.27 1.07 1.45 2.87 Middle 11.65 8.37 4.41 2.22 1.11 1.62 0.94 5.30 Secondary 18.46 14.23 9.64 4.19 0.66 2.46 2.08 7.92 Tertiary n.a. 21.94 11.65 7.91 2.33 0.76 1.84 6.75 Total 8.42 7.59 4.98 2.82 1.10 1.33 1.01 3.94 Females 15-19 20-24 25-29 30-34 35-39 40-49 50-64 Total Illiterate 2.98 3.22 2.61 2.29 2.82 2.39 1.26 2.46 Literate 6.67 12.08 0.00 0.00 0.00 4.88 0.00 5.55 Primary 10.74 12.28 15.65 13.21 16.20 2.98 0.00 11.10 Middle 15.26 8.40 4.54 0.00 0.00 0.00 0.00 7.81 Secondary 27.89 26.00 18.03 17.34 10.05 3.12 0.00 19.75 Tertiary n.a. 35.88 17.67 10.80 0.90 0.00 0.00 15.95 Total 8.42 12.21 7.86 5.35 4.00 2.30 1.17 6.06 Source: Pakistan LFS 2003/2004
SRI LANKA 2001/2002 Age cohorts Males 15-19 20-24 25-29 30-34 35-39 40-49 50-64 Total Illiterate 4.88 6.10 1.30 0.00 0.77 0.00 0.00 0.88 Literate 12.48 7.46 3.25 0.51 0.48 0.83 0.52 1.64 Primary 17.77 10.61 4.20 1.38 0.44 1.31 0.48 3.36 Middle 30.17 19.34 6.82 2.66 1.53 1.47 0.86 8.79 Secondary 44.65 31.26 9.63 3.95 3.09 1.75 0.98 10.04 Tertiary 77.19 2.62 29.29 4.74 0.00 0.00 2.69 5.52 Total 27.40 21.11 7.33 2.50 1.44 1.30 0.73 6.51 Females 15-19 20-24 25-29 30-34 35-39 40-49 50-64 Total Illiterate 8.19 3.85 0.00 1.37 0.00 1.12 0.56 1.02 Literate 12.36 8.08 5.48 1.91 2.72 0.97 0.39 2.21 Primary 22.79 14.52 8.08 2.13 2.88 2.82 0.94 5.29 Middle 31.34 21.59 12.25 10.97 3.74 1.60 0.91 12.56 Secondary 48.95 45.07 24.84 11.99 7.96 1.84 1.06 21.41 Tertiary 100.00 34.02 32.26 15.02 3.22 0.00 1.52 12.72 Total 33.53 32.52 18.30 8.84 4.53 1.67 0.77 12.30 Source: LFS 2001, 2002

67
Annex 4.2 Unemployment Rates by Education and Years of Potential Work Experience Economically Active Population Ages 15-65
BANGLADESH 2000 Years of Potential Work Experience Males 0-4 5-9 10-14 15-19 20-24 25-34 >34 Total Illiterate 5.54 3.57 0.81 0.57 0.93 0.64 1.17 Literate 9.32 5.26 0.00 0.00 0.63 2.40 2.76 Primary 19.27 7.22 1.83 1.21 0.59 1.09 1.29 3.56 Secondary 26.55 1.82 4.54 1.08 1.22 0.12 1.49 3.93 High 20.50 12.11 3.00 2.20 1.84 1.63 0.00 4.60 Tertiary 42.50 14.44 5.92 0.59 0.00 0.76 0.00 5.61 Total 22.27 7.91 3.09 1.12 0.67 0.93 1.35 2.41 Females 0-4 5-9 10-14 15-19 20-24 25-34 >34 Total Illiterate 12.59 26.58 20.14 20.74 20.37 23.47 21.73 Literate 0.00 49.47 35.66 28.17 74.78 22.81 51.34 42.51 Primary 71.66 41.64 64.27 47.74 59.80 49.63 76.96 57.65 Secondary 73.18 42.91 48.93 22.06 22.57 25.48 0.00 43.17 High 62.57 69.85 17.21 12.37 46.11 0.00 0.00 42.52 Tertiary 34.60 28.41 17.56 6.94 8.28 0.00 58.19 22.61 Total 65.85 42.79 51.24 32.00 48.60 36.22 67.13 31.44 Source: BHIES 2000
PAKISTAN 2003/2004 Years of Potential Work Experience Males 0-4 5-9 10-14 15-19 20-24 25-34 >34 Total Illiterate 3.61 4.43 2.34 1.37 1.01 0.82 1.60 Literate 11.85 5.61 3.83 0.47 0.93 1.24 3.22 Primary 6.56 4.21 1.70 2.15 1.05 1.36 2.87 Middle 9.63 11.11 7.46 3.73 1.41 1.41 1.13 5.30 Secondary 19.94 15.89 11.17 5.52 0.71 2.24 1.95 7.92 Tertiary 22.38 12.39 8.15 2.03 1.31 1.51 0.24 6.75 Total 19.28 11.77 6.77 3.17 1.32 1.31 1.01 3.94 Females 0-4 5-9 10-14 15-19 20-24 25-34 >34 Total Illiterate 3.61 4.43 2.34 1.37 1.01 0.82 1.60 Literate 11.85 5.61 3.83 0.47 0.93 1.24 3.22 Primary 6.56 4.21 1.70 2.15 1.05 1.36 2.87 Middle 9.63 11.11 7.46 3.73 1.41 1.41 1.13 5.30 Secondary 19.94 15.89 11.17 5.52 0.71 2.24 1.95 7.92 Tertiary 22.38 12.39 8.15 2.03 1.31 1.51 0.24 6.75 Total 19.28 11.77 6.77 3.17 1.32 1.31 1.01 3.94 Source: Pakistan LFS 2003/2004

68
SRI LANKA 2001/2002 Years of Potential Work Experience Males 0-4 5-9 10-14 15-19 20-24 25-34 >34 Total Illiterate 4.88 6.10 1.30 0.44 0.00 0.88 Literate 10.32 9.40 4.56 0.58 0.63 0.59 1.64 Primary 19.10 13.92 7.74 2.61 1.15 1.23 0.44 3.36 Middle 30.82 19.71 7.15 2.73 1.52 1.47 0.83 8.79 Secondary 42.17 20.43 6.21 3.84 2.63 1.54 0.77 10.04 Tertiary 21.18 29.29 4.74 0.00 0.00 1.39 2.97 5.52 Total 35.67 19.05 7.03 3.22 1.60 1.21 0.61 6.51 Females 0-4 5-9' 10-14' 15-19 20-24 25-34 >34 Total Illiterate 8.19 3.85 0.00 0.55 0.82 1.02 Literate 13.18 6.20 8.67 2.32 2.25 0.39 2.21 Primary 25.91 23.50 3.97 6.38 3.82 3.07 0.89 5.29 Middle 31.55 22.08 12.37 10.64 4.15 1.60 0.88 12.56 Secondary 52.69 33.89 16.40 11.44 5.93 1.01 1.42 21.41 Tertiary 33.70 31.76 14.79 3.23 0.00 1.55 0.00 12.72 Total 45.57 28.27 13.23 9.62 4.22 1.85 0.72 12.30 Source: LFS 2001, 2002
INDIA 2004 Years of Potential Work Experience Males 0-4 5-9 10-14 15-19 20-24 25-34 >34 Total Illiterate 2.81 4.58 3.72 2.37 2.86 2.46 2.88 Literate 9.06 3.51 1.79 2.54 3.01 2.60 3.31 Primary 8.88 8.93 5.64 3.58 2.83 2.09 2.39 4.29 Middle 12.72 9.54 6.69 3.46 2.14 2.30 2.27 5.82 Secondary 20.76 11.59 6.24 2.77 1.66 1.60 1.39 6.94 Tertiary 25.90 10.06 2.73 1.71 0.41 0.46 0.59 9.12 Total 18.66 9.76 5.51 3.07 2.18 2.37 2.36 5.00 Females 0-4 5-9 10-14 15-19 20-24 25-34 >34 Total Illiterate 1.20 4.03 3.75 2.83 2.62 1.90 2.58 Literate 5.44 3.16 0.13 5.13 1.48 1.77 2.55 Primary 0.24 7.61 3.53 5.16 4.42 2.16 2.69 4.27 Middle 11.56 10.86 6.86 5.96 2.78 2.85 1.21 7.23 Secondary 25.27 24.02 16.60 11.34 4.75 0.37 0.18 17.04 Tertiary 44.88 22.67 7.57 4.85 0.62 0.00 0.00 24.54 Total 26.29 12.52 6.37 4.57 3.23 2.43 1.91 5.22 Source: NSS-60

69
Annex 5.1 Percent Trained by Field of Training and Average Duration of Training
India 2004
Training field All Male Female Weeks of training
Computer trades 25.3 24.6 26.5 45.2 Electrical and electronic engineering trades 15.6 22.9 2.9 83.5 Mechanical engineering trades 12.7 19.4 1.2 95.4 Textile related work 11.2 1.3 28.5 41.1 Health and paramedical services related work 6.5 4.8 9.4 94.6 Driving and motor mechanic work 4.2 6.5 0.2 40.8 Office and business related work 3.2 2.1 5.0 44.9 Civil engineering and building construction 3.2 4.4 1.0 107.4 Artisan/craftsman/cottage based production 1.7 1.2 2.7 60.9 Childcare, nutrition, pre-schools and crèche 1.2 0.0 3.3 38.1 Beautician, hairdressing and related work 0.9 0.0 2.5 47.2 Non-crop based agricultural activities 0.9 1.3 0.1 60.0 Creative arts/artists 0.8 0.9 0.7 99.3 Catering, nutrition, hotels and restaurant work 0.8 0.7 0.9 99.8 Chemical engineering trades 0.6 0.6 0.7 68.2 Printing technology related work 0.6 0.4 0.9 48.5 Agriculture/crop production/food preservation 0.4 0.5 0.1 85.1 Photography and related work 0.3 0.5 0.0 59.4 Leather related work 0.2 0.3 0.1 56.0 Journalism, mass communication, media work 0.1 0.1 0.0 147.9 Other 9.5 7.4 13.2 46.9
Source: India NSS 60
Annex 5.2 Percent Trained by Training Field, Bangladesh 1995
Training field All Male Female Transport Mechanic 15.83 16.77 Cottage industry 10.11 10.4 5.36 Tailoring, embroidery 7.33 6.25 25.49 Polytechnic 6.47 6.69 2.65 Agriculture, live stock 6.38 5.83 15.59 Weaving 6.04 5.92 8.03 Typing, shorthand 5.52 5.59 4.33 Health, family planning 4.59 3.36 25.38 Electrical related work 4.15 4.39 Computer related 0.87 0.92 Others 32.72 33.87 13.18
Source: Bangladesh HIES, 1995

70
Annex 5.3 Percent Trained and Duration of Training by Training Institution, India 2004
Training institutions All Male Female Weeks of training
Industrial Training Institutes (ITIs) / Industrial Training centers( ITCs) 27.31 38.87 7.25 79.2 Tailoring, Embroidery and Stitch Craft Institutes 8.81 0.92 22.49 38.8 Polytechnics 5.85 7.62 2.77 125.1 School offering vocational courses (Secondary, Higher Secondary level) 5.21 5.57 4.57 67.1 Hospital and Medical Training Institutes 2.74 2.93 2.41 105.0 Institutes run by Companies/ Corporations 2.41 2.12 2.91 67.4 Recognized Motor Driving Schools 2.38 3.63 0.19 19.3 Nursing Institutes 2.21 0.20 5.68 103.0 UGC (first degree level) 1.88 2.08 1.52 99.7 Small Industries Service Institutes/ District Industries Centers/ Toll Room Centers 1.65 1.48 1.93 35.7 Nursery Teachers’ Training Institutes 1.35 0.06 3.58 41.6 Institutes giving Diploma in Pharmacy 1.13 1.32 0.80 71.0 Institute for Secretariat Practices 0.81 0.45 1.43 45.6 Recognized Beautician Schools 0.56 0.00 1.54 47.1 Institutes for Journalism and Mass Communication 0.48 0.66 0.18 59.7 National Open School 0.44 0.38 0.53 56.1 Hotel Management Institutes 0.41 0.28 0.64 118.1 Handloom/ Handicraft Design Training Centers/ KVIC 0.41 0.08 0.98 47.7 Institutes offering training for Agricultural Extension 0.38 0.60 0.00 73.7 Community Polytechniques/ Jansiksha Sansthan 0.32 0.27 0.41 35.3 Fashion Technology Institutes 0.30 0.17 0.51 60.2 Rehabilitation/Physiotherapy/Ophthalmic and Dental Institutes 0.10 0.15 0.01 74.9 Food craft and Catering Institutes 0.09 0.14 0.00 48.0 Training provided by Carpet Weaving Centers… 0.02 0.00 0.07 12.0 Other Institutes 32.77 30.00 37.57 44.2
Source: India NSS 60