the influence of diurnal temperatures on the hydrochemistry of a tufa-depositing stream
TRANSCRIPT

HYDROLOGICAL PROCESSESHydrol. Process. 17, 3421–3441 (2003)Published online 21 August 2003 in Wiley InterScience (www.interscience.wiley.com). DOI: 10.1002/hyp.1301
The influence of diurnal temperatures on thehydrochemistry of a tufa-depositing stream
R. Drysdale,1* S. Lucas1 and K. Carthew2
1 Environmental Geoscience Group, School of Environmental and Life Sciences, Geography Building, The University of Newcastle,Callaghan, NSW 2308, Australia
2 Department of Physical Geography, Macquarie University, North Ryde, NSW 2109, Australia
Abstract:
At-a-station diurnal variations in carbonate hydrochemistry were measured during four observation periods at DavysCreek, a tufa-depositing stream in central NSW, Australia. Major ion concentrations and continuously loggedmeasurements of specific conductivity, pH and temperature showed that changes in the amount of CaCO3 depositedupstream of the study reach were directly related to changes in diurnal water temperatures, which control the rate ofCO2 efflux to the atmosphere. The greatest upstream losses occurred during the mid-afternoon water temperature peak,whereas the lowest upstream losses occurred at sunrise, when water temperatures were at their lowest. Cloudy daysat all times of the year produced small diurnal water temperatures ranges (c. 2–5 °C) and, consequently, relativelysmall changes in upstream CaCO3 loss (23–50 mg L�1) through the day. Clear sunny days, especially during summermonths, produced large diurnal water temperature changes (up to c. 11 °C), which in turn triggered diurnal changesin upstream CaCO3 loss of up to 100 mg L�1. By implication, the active reach of tufa deposition must advancedownstream and increase in length during the evening and vice versa during the day. Given that the temperature ofDavys Creek waters are a function of insolation, changes in the reach of tufa deposition under baseflow conditionsare a direct function of the prevailing weather. This has implications for the palaeoclimatic interpretation of fossil tufadeposits. Copyright 2003 John Wiley & Sons, Ltd.
KEY WORDS tufa; travertine; CaCO3 deposition; hydrochemistry; Australia; diurnal; data logging
INTRODUCTION
Tufa is a chemical sedimentary deposit formed from CaCO3-rich spring waters emerging from aquifersbearing a high proportion of karst rock (Altunel and Hancock, 1994; Liu et al., 1995; Pentecost, 2001). Thesource groundwaters rise to the surface with CO2 levels much higher than those of the overlying atmosphere.As a consequence, rapid CO2 outgassing occurs immediately upon emergence, causing the waters to becomesupersaturated with respect to CaCO3 as they move downstream. This triggers carbonate deposition (usually inthe form of calcite) as crusts on streambeds, lake floors and valley sides (Chafetz and Folk, 1984; Pentecost andViles, 1994; Ford and Pedley, 1996). In some instances, deposition may be mediated by biological processes,particularly the photosynthetic behaviour of microbes (Pedley, 2000). However, tufa deposition always takesplace in waters that thermodynamically favour calcite precipitation, so determining the extent of the bioticrole is difficult (Spiro and Pentecost 1991; Pentecost, 1994, 1995).
Tufas are well represented in the Late Quaternary geological record, where they constitute a potentiallyvaluable source of palaeoclimate information (Pedley et al., 2000; Arenas et al., 2000; Szabo et al., 1996).However, the interpretation of tufa palaeoenvironments is hindered by an incomplete understanding ofmodern tufa-deposition processes. Although the general physico-chemical mechanisms of deposition are well
* Correspondence to: R. Drysdale, Environmental Science Group, School of Environmental and Life Sciences.E-mail: [email protected]
Received 23 August 2002Copyright 2003 John Wiley & Sons, Ltd. Accepted 18 December 2002

3422 R. DRYSDALE, S. LUCAS AND K. CARTHEW
understood (Lorah and Herman, 1988), the way in which deposition responds to shifts in climatic parametersat a range of temporal scales remains largely unresearched.
Studies of seasonal changes in stream-water evolution indicate that rates of downstream increase in calcitesupersaturation levels vary throughout the year, which has implications for the length of reach over whichactive tufa deposition occurs (Lorah and Herman, 1988; Drysdale, 2001). In a recent study, the rate of stream-water evolution and, consequently, the length of reach over which tufa deposition occurs was shown to varypositively with discharge (Drysdale et al., 2002), which has significant palaeoenvironmental implications.Only a few studies to date have examined how tufa deposition varies over smaller temporal scales, such asthe diurnal cycle (e.g. Barnes, 1965; Dandurand et al., 1982; Lorah and Herman, 1988; Spiro and Pentecost,1991; Pentecost, 1994; Drysdale et al., 2002). Most such studies show that at-a-station stream chemistry canvary significantly through the diurnal cycle. This can influence longitudinal sampling campaigns becausethe hydrochemistry at a sampling point will reflect both time- (i.e. period of the day) and space-dependent(i.e. distance from spring) components of stream-water evolution. If this is ignored, the validity of bothqualitative and quantitative analyses of downstream trends may be compromised. In addition, at-a-stationdiurnal variations may be of profound importance with regards to factors controlling the pattern of diurnalvariations over periods greater than a single day. Identification of such factors may prove useful for interpretingtufa palaeoenvironments.
Of the diurnal studies in tufa-depositing streams to date, most have been conducted over single periods of24 h or less (e.g. Barnes, 1965; Dandurand et al., 1982; Lorah and Herman, 1988; Spiro and Pentecost, 1991;Pentecost, 1994); some have involved only a few measurements through the diurnal cycle (e.g. Cole andBatchelder, 1969; Amundson and Kelly, 1987). We are unaware of any study that documents diurnal changesin tufa-depositing streams over extended periods (i.e. days to weeks), although carbonate groundwater-fedstreams that do not deposit tufa have been the subject of recent investigations (e.g. Neal et al., 2000, 2002).
The logistical difficulties of diurnal studies are immediately obvious: in order to evaluate longer termchanges in stream chemistry without the need for persistent water sampling, continuous measurements ofstream parameters are required. These measurements must be related to ion data from shorter term watersampling campaigns. In this study, we use a combination of water sampling and continuously loggedmeasurements of pH, specific conductivity and temperature to study the diurnal hydrochemistry of DavysCreek, a small tufa-depositing stream in central NSW, Australia. We address the following questions: (i) towhat extent does at-a-station stream chemistry vary during the diurnal cycle? (ii) what factors control thesediurnal changes? (iii) what controls the magnitude of diurnal changes over extended periods (days to weeks)under baseflow conditions; (iv) what are the implications of each of the above for CaCO3 deposition? As faras we are aware, this is the first comprehensive study of its type anywhere.
STUDY AREA
Davys Creek (32°400S, 148°400E) is a tributary of the Belubula River, a major subcatchment of the LachlanRiver in the central-east portion of the Murray–Darling Basin, south-eastern Australia (Figure 1). The upperand middle reaches of the creek’s catchment comprise Middle Ordovician volcanics (Walli Andesite), whereasthe lower reaches are underlain principally by Late Ordovician limestones (Cliefden Caves Limestone Group),which rest unconformably on the volcanics (Webby and Packham, 1982; Figure 1).
Tufa deposition occurs along two reaches of the creek. The upper reach is fed perennially by a series ofdiscrete in-channel and streambank seepages. For most of the year, the uppermost segment of this reachconsists of a chain of pools, which only become interconnected following sustained rainfall. Perennialflow commences at Twin Gully, about 2Ð5 km downstream of the most upstream seepages (Figure 1). Tufadeposition commences c. 500 m downstream of Twin Gully and has formed small dams and cascades over ac. 350 m segment of the channel.
Copyright 2003 John Wiley & Sons, Ltd. Hydrol. Process. 17, 3421–3441 (2003)

TEMPERATURE INFLUENCES ON A TUFA-DEPOSITING STREAM 3423
Figure 1. Location and geology of the study area. The bottom segment is a long section of Davys Creek showing the position of thedata-logging site and the major hydrogeological features
Copyright 2003 John Wiley & Sons, Ltd. Hydrol. Process. 17, 3421–3441 (2003)

3424 R. DRYSDALE, S. LUCAS AND K. CARTHEW
The upper reach is separated from its lower counterpart by a dry-valley section, above which upstreamsurface waters sink progressively into the creek bed within a few hundred metres of the limestone–andesitecontact. A fault brings groundwaters to the surface a further c. 300 m downstream (Figure 1). This resurgencerepresents a combination of the sinking waters derived from the upstream andesite subcatchment and autogenicrecharge of the limestone subcatchment. Rapid CO2 outgassing results in tufa precipitation for c. 500 m alongthe lower reach before the waters reach the Davys Creek–Belubula River junction.
The upper reach, which is the focus of this study, is unusual in the sense that the tufa source waters rise involcanics, and are not of karstic origin. However, stable carbon isotope values from the tufas (�9Ð7 š 0Ð4‰;n D 11; Drysdale, unpublished data) suggest that the total dissolved carbon is of biogenic origin (Hoefs,1997), and is close to the mean value for local speleothems (�8Ð3 š 1Ð2‰, n D 154: McDonald, 2000). Inaddition, the groundwater temperature is c. 16 °C all year, which is identical to air temperatures within localcaves (McDonald, 2000). Taken together, these data rule out a geothermal source for the waters. The mostprobable origin of the spring waters is rising water tables brought about by progressive post-European landclearance. Dryland salinity is widespread in the region (Hill, 1999). The upper reaches of Davys Creek containsalinity scalds, and boreholes and groundwater seepages have relatively high specific conductivities (up to2000 µs cm�1) dominated by NaC and Cl�. These waters also contain abundant dissolved Ca2C and HCO3
�(up to 328 mg L�1 of CaCO3 equivalent) and CO2 levels approaching 100 times that of the open atmosphere.It is the significant downstream outgassing of the latter that triggers tufa deposition along sections of thestreambed.
The instrumentation and water-sampling site chosen for this study is situated along a small bedrock channelsegment at the downstream limit of tufa deposition along the study reach. Dye-tracing experiments show thatthe waters take approximately 3–6 h to reach the site from Twin Gully (Figure 1). All sampling was conductedduring non-drought conditions, when this reach carries a near-stable baseflow discharge of 3–5 L s�1. Anyeffects of discharge variability on the downstream evolution of the waters (Drysdale et al., 2002) can beignored. During El Nino (drought) conditions, flow reduces to 1–2 L s�1; no sampling was conducted underthese conditions.
The deployment site is ideal for studying diurnal changes in water properties because it represents theposition where the waters attain their maximum residence time for that specific tufa-depositing reach, and isthus where diurnal changes should be maximized (Barnes, 1965; Pentecost, 1994). By contrast, locations closerto the groundwater source would experience little exposure to ambient conditions, and hydrochemical changeswould be minimized (Barnes, 1965). Therefore, under baseflow or near-to-baseflow conditions, seepage-watercomposition should alter very little, and at-a-station diurnal fluctuations in both specific conductivity (SC)and Ca2C –HCO3
� will reflect diurnal changes in the amount of CaCO3 deposited by the waters upstream, i.e.before they reach the station. However, the seepage-water composition will change during storm events as aresult of surface runoff (i.e. diluted SC) and immediately following such events as a result of the flushing ofsalts from the salinity-affected unsaturated zone (i.e. increased SC). When these salt pulses enter the streamsystem, diurnal changes may be absent or depressed.
METHODS
Field campaigns were conducted in February, April, July and December 2000 (Table I). During each campaign,a Greenspan Technology CTDP300 data logger was programmed to collect continuous readings of SC (asµs cm�1 at 25 °C), pH and temperature at 15-min intervals for periods ranging from 5 to 26 days (Table I). Thelogger was calibrated prior to deployment using pH (6Ð86 and 9Ð18) and conductivity (0 and 1412 µs cm�1)standards.
Hand-held water quality meter measurements were undertaken to check the reliability of data loggermeasurements. Laboratory calibration experiments showed that relative changes in the pH and conductivityof a continuously varying solution recorded by bench-top meters matched those recorded by the data logger,
Copyright 2003 John Wiley & Sons, Ltd. Hydrol. Process. 17, 3421–3441 (2003)

TEMPERATURE INFLUENCES ON A TUFA-DEPOSITING STREAM 3425
Table I. Summary of sampling periods and data collection for each field campaign
Parameters February 2000 April 2000 July–August 2000 December 2000
Logging period 13:15 12/2/00 to 05:00 24/4/00 to 17:45 26/7/00 to 19:30 6/12/00 to08:00 27/2/00 20:45 29/4/00 00:00 5/8/00 00:00 1/1/01
Hand-held meter Yes No Yes YesmeasurementsWater sampling n.a. 00:00 29/4/00 to 16:40 26/7/00 to 16:50 6/12/00 toperiod 21:00 29/4/00 17:35 28/7/00 14:30 8/12/00Number of water n.a. 12 15 34samplesCa2CC HCO3
� No Yes Yes YesOther major anions No No Yes YesOther major cations No No Yes Yes
but were ‘offset’ according to the ionic composition of the waters. In addition, the logger usually tookbetween 1 and 2 h to stabilize following calibration. Although the logger recorded true fluctuations in solutioncomposition once it stabilized, the absolute values were not precisely the same as those of the bench-topmeters. In the belief that an offset would persist in the field, a programme of hand-held meter measurementswas included to verify the logger data. In February, July and December, the pH, temperature and SC weremeasured at regular intervals using hand-held meters, which were calibrated using the same standards asthose used for the data logger. A YSI 100 SC/temperature and a Metrohm 704 pH meter were used duringthese campaigns. In April 2000, SC, pH and temperature were measured using a Eutech Cyberscan PC10.However, this pH sensor could not be calibrated satisfactorily in the field, so hand-held pH meter data fromthis campaign are not reported here.
In all campaigns except February, water samples for ion analyses were collected so that diurnal changes inSC could be quantified in terms of relative changes in upstream CaCO3 deposition (Table I). Samples werecollected at intervals during the diurnal cycle in clean acid-rinsed plastic containers. In April, samples werecollected for Ca2C and HCO3
� analyses only, whilst for July and December major anions (Cl�, SO42� and
NO3�) and cations (Mg2C, NaC and KC) were also measured. Bicarbonate was measured potentiometrically
to the pH c. 4Ð5 endpoint within 30 min of collection using standardized c. 0Ð02 M HCl. Remaining anionswere measured using a Waters ion chromatograph. All cations were measured on HNO3-acidified samplealiquots using an ARL 3520 ICP–AES (inductively coupled plasma–atomic emission spectroscopy). In caseswhere SC fluctuations could be attributed solely to Ca2C and HCO3
� changes, paired Ca2C and conductivityvalues were correlated and, where considered valid, regression was used to establish a time-series of diurnalCaCO3 changes.
The full hydrochemical data sets for July and December were processed through the program PCWATEQ
(Rollins, 1984), which calculates the charge-balance error, dissolved CO2 (as both total CO2 and PCO2 ) andcalcite saturation index (SIcalcite) for each sample. Although Ca2C and HCO3
� analyses were conducted onApril samples, we were unable to generate these indices owing to the lack of pH data.
PCO2 is calculated from
PCO2 D ˛HCO3�˛HC
K1KCO2
where the prefix ˛ is the activity, and K1 and KCO2 are the equilibrium constants for carbonic acid (H2CO3) andCO2 respectively (White, 1988). The values of these and other reaction constants in the CaCO3 –H2O–CO2
system are known for the full range of ambient temperatures (Drever, 1982), whereas the activities aredetermined from measured HCO3
� concentrations and pH.
Copyright 2003 John Wiley & Sons, Ltd. Hydrol. Process. 17, 3421–3441 (2003)

3426 R. DRYSDALE, S. LUCAS AND K. CARTHEW
SIcalcite is calculated from
SIcalcite D log
(˛Ca2C ð ˛CO2�
3
Kcalcite
)
where Kcalcite is the equilibrium constant for calcite.PCO2 and SIcalcite are derived from in situ measurements of pH and temperature, and analysis of Ca2C and
HCO3� from water samples (Ford and Williams, 1989). In carbonate waters, the dominant control on PCO2
is pH. Thus, if pH changes recorded by a data logger can be validated using hand-held meter measurements,a surrogate time-series of PCO2 can be derived from continuous measurements of pH alone. Establishing atime-series for SIcalcite is slightly more complex. However, if SC can be shown to change principally becauseof variations in Ca2C (and HCO3
�), then ˛Ca2C can be estimated from SC data because ˛Ca2C is principallya function of Ca2C concentration (Drever, 1982). The parameter, ˛CO2�
3 , is calculated from HCO3� and pH.
However, ˛CO2�3 variations are a direct function of pH in the normal pH range of carbonate waters. Given that
Kcalcite is known for ambient temperatures (White, 1988), SC and pH can be used as surrogates for ˛Ca2C and˛CO2�
3 respectively, and a reliable SIcalcite time-series generated. At the very least, these time-series shouldprovide an indication of relative diurnal shifts in PCO2 and SIcalcite. Similar time-series have been generatedby Neal et al. (2002) but using a slightly different approach from that utilized here.
RESULTS
Logger data and hand-held meter measurements
February 2000. The data logger was deployed for a 16-day period in February 2000 (Table I). The SC,pH and temperature data were collected by hand-held meters on six occasions over the first 30 h of logging,covering almost the full range of logged values for the same period. The time-series for each logged parameteris shown in Figure 2 with the hand-held meter measurements superimposed over their respective time-series.The correlation coefficients for each pair of measurements (Table II) show that the fluctuations recorded bythe logger, although offset on an absolute scale, match closely those measured by the hand-held meter.
Logged SC, pH and temperature each show consistent diurnal changes (Figure 2), although the magnitudeof change varies through the observation period. For a given cycle, peak conductivities typically occurbetween 0700 to 0800 hours (Table III) and decrease steadily until the late afternoon to early evening (1630to 1900 hours), after which they increase. The water temperature follows a similar although not identical trend,with minimum and maximum temperatures recorded 1–2 h earlier than the maximum and minimum SC valuesrespectively. The pH also fluctuates throughout the day, with minima occurring between 2230 and 0130 hours(Table III). The pH rises through the morning, steadily at first then rapidly, and peaks between midday andmid-afternoon (1100–1500 hours). Thus, although all three parameters show clear diurnal fluctuations, noneis in perfect phase with either of the other two. Days recording the lowest diurnal fluctuations in pH and SCexperienced the lowest water temperature ranges. In addition, SC and water temperature are closely inversely
Table II. Correlation coefficients for each pair of hand-held-meter and data-logger measurements
Parameters February 2000 April 2000 July 2000 December 2000
Tlogger versus Thand-held 1Ð00 0Ð98 0Ð99 1Ð00pHlogger versus pHhand-held 0Ð95 n.a. 0Ð96 0Ð90SClogger versus SChand-held 0Ð99 0Ð92 0Ð98 0Ð97Ca2C versus SClogger n.a. 0Ð96 0Ð34 0Ð96HCO3
� versus SClogger n.a. 0Ð92 0Ð65 0Ð99Observations 6 12 14 33
Copyright 2003 John Wiley & Sons, Ltd. Hydrol. Process. 17, 3421–3441 (2003)

TEMPERATURE INFLUENCES ON A TUFA-DEPOSITING STREAM 3427
a)
b)
c)
1150
1190
1230
1270
1310
SC
(lo
gger
)
1260
1300
1340
1380
1420
SC
(ha
nd-h
eld
met
er)
10
14
18
22
26
30
12/020:00
14/020:00
16/020:00
18/020:00
20/020:00
22/020:00
24/020:00
26/020:00
28/020:00
Date/time
Tem
pera
ture
(de
g. C
)
7.8
8.0
8.2
8.4
8.6
8.8
pH (
logg
er)
8.00
8.05
8.10
8.15
8.20
8.25
pH (
hand
-hel
d m
eter
)
Hand held
Hand held
Hand held
Figure 2. Logged and hand-held meter measurements of SC, temperature and pH for February 2000
Table III. The timing of temperature, SC and pH minima and maxima for each logging period
Parameter February 2000 April 2000 July 2000 December 2000
SC minimum 1630–1900 1700–1900 1530–1700 1500–1800SC maximum 0700–0800 0830–0930 0800–0900 0700–0800Temperature minimum 0600–0800 0730–0830 0830–0900 0730–0800Temperature maximum 1530–1730 1515–1600 1500–1545 1530–1630pH minimum 2230–0130 n.a. 2000–0100 2200–0000pH maximum 1100–1500 n.a. 1300–1500 1400–1600
related. Together, these suggest that water temperature plays an important role in controlling the diurnalchemistry.
April 2000. The data logger was deployed for six consecutive days at the end of April 2000. Neither hand-held nor logger pH measurements are available for April 2000 owing to calibration problems. The temperatureand SC observations using the hand-held meter are superimposed over their respective logger time-series in
Copyright 2003 John Wiley & Sons, Ltd. Hydrol. Process. 17, 3421–3441 (2003)

3428 R. DRYSDALE, S. LUCAS AND K. CARTHEW
Figure 3. The similarity in patterns and the high correlation coefficients (Table II) demonstrate the excellentagreement between logger and hand-held meter values, although as for February, the values are slightly offset.
The logged parameters show systematic diurnal variations. The SC values again virtually mirror those oftemperature. Maximum water temperatures occur between 1500 and 1600 hours each day (Table III), whereasSC minima occur around 2–3 h later; minimum water temperatures occur around 1–2 h before maximumconductivities.
July–August 2000. The data logger measured continuously for 9 days over July–August 2000 (Figure 4).Spot measurements of temperature, pH and SC during the initial part of this period mirrored the loggerpatterns and returned high correlation coefficients (Table II), despite the large absolute differences in values.Consistent diurnal changes prevail for all parameters for most of the logging period. The timing of maximumand minimum values for pH is comparable to those from February (Table III). Water temperatures reach theirlowest further into the morning and their maximum slightly earlier in the afternoon compared with otherperiods (Table III), reflecting the shorter winter insolation period. Minima in SC also occur slightly earlier,suggesting that water temperature is at least partly controlling conductivity shifts.
During this campaign a longer term decline in SC, in addition to the diurnal signal, is evident for all butthe first day and a half of measurement. Although the magnitude of diurnal changes in SC match those oftemperature, there is no obvious longer term temperature shift that might explain the longer term decline inSC. Thus, other factors appear to be controlling this decline, a point that will be addressed further in a latersection.
December 2000. The data logger continuously measured water quality for 25 days during December 2000,with hand-held meter measurements carried out over the first 2 days (Figure 5). Very strong correlationsbetween paired hand-held meter and logger measurements for all three parameters (Table II) again confirmthe reliability of the logger to record genuine diurnal hydrochemical changes. As with previous campaigns, all
a)
b)
1400
1450
1500
1550
1600
1650
1700
SC
(da
ta lo
gger
)
1100
1150
1200
1250
1300
SC
(ha
nd-h
eld
met
er)
5
10
15
20
25
24/04 0:00
25/04 0:00
26/04 0:00
27/04 0:00
28/04 0:00
29/04 0:00
30/04 0:00
Date/time
Wat
er te
mpe
ratu
re (
deg.
C)
Hand-held
Hand-held
Figure 3. Logged and hand-held meter measurements of SC and temperature for April 2000
Copyright 2003 John Wiley & Sons, Ltd. Hydrol. Process. 17, 3421–3441 (2003)

TEMPERATURE INFLUENCES ON A TUFA-DEPOSITING STREAM 3429
a)
b)
c)
1500
1600
1700
1800
1900
2000
SC
(da
ta lo
gger
)
1100
1150
1200
1250
1300
1350
1400
SC
(ha
nd-h
eld
met
er)Hand-held
8.20
8.30
8.40
8.50
8.60
8.70
8.80
8.90
pH (
data
logg
er)
8.25
8.30
8.35
8.40
8.45
8.50
8.55
8.60
pH (
hand
-hel
d m
eter
)
4
6
8
10
12
14
16
26/07 0:00
27/07 0:00
28/07 0:00
29/07 0:00
30/07 0:00
31/07 0:00
1/08 0:00
2/08 0:00
3/08 0:00
4/08 0:00
5/08 0:00W
ater
tem
pera
ture
(de
g. C
)
Hand-held
Hand-held
Figure 4. Logged and hand-held meter measurements of SC, temperature and pH for July 2000
three parameters fluctuate consistently throughout the diurnal cycle. Not surprisingly, the timing of maximaand minima of all three parameters is comparable to February (Table III).
Lower amplitude diurnal shifts in both pH and SC tend to coincide with days when water temperature rangeswere also relatively low (Figure 5). In addition, longer term changes in SC are evident, although unlike Julythese appear to mirror longer term shifts in maximum and minimum temperatures. The relationship betweenthe magnitude of diurnal SC changes and stream temperatures will be considered further in the discussion.
Water sample data
Major ions. The complete ion analyses, including calcite saturation indices, charge balance errors and carbondioxide concentrations, can be viewed at the following web address: http://www.newcastle.edu.au/discipline/geography/staff students/staff/r drysdale/table.htm. Only pH, temperature, SC, Ca2C and HCO3
� data arereported here (Table IV). During each campaign, both Ca2C and HCO3
� fluctuate throughout the day, reflectingabsolute changes in the degree of upstream loss of CaCO3 prior to the waters reaching the measurement site.The lowest values occur during the mid- to late afternoon period (1500 to 1800 hours), whereas the highestvalues were recorded from waters sampled between 0500 and 1000 hours (Table IV). These closely matchthe timing of maximum and minimum changes in SC recorded by the data logger (Table III).
Copyright 2003 John Wiley & Sons, Ltd. Hydrol. Process. 17, 3421–3441 (2003)

3430 R. DRYSDALE, S. LUCAS AND K. CARTHEW
a)
b)
c)
1400
1500
1600
1700
1800
1900
SC
(da
ta lo
gger
)
1100
1150
1200
1250
1300
1350
SC
(ha
nd-h
eld
met
er)Hand-held
7.7
7.9
8.1
8.3
8.5
8.7
pH (
data
logg
er)
7.8
8.0
8.2
8.4
8.6
pH (
hand
-hel
d m
eter
)Hand-held
12
16
20
24
28
32
6/12 0:00
10/12 0:00
14/12 0:00
18/12 0:00
22/12 0:00
26/12 0:00
30/12 0:00
3/01 0:00
Date/time
Wat
er te
mpe
ratu
re (
deg.
C)
Hand-held
Figure 5. Logged and hand-held meter measurements of SC, temperature and pH for December 2000
Correlations between logger SC and both Ca2C and HCO3� for all three campaigns were statistically
significant (Table II), indicating that coupled changes in these ions owing to changes in upstream CaCO3 lossare largely responsible for the fluctuations in SC. However, the correlations for July are much weaker thanthose for both April and December, suggesting that changes in other ions also may be forcing SC variations.The NaC, Cl� and, to a lesser extent, Mg2C data for both July and December show longer term trends, whichcan be attributed to recent recharge. For July, these ions increased steadily over the water-sampling campaign(Figure 6c), which was a period of light but persistent rainfall. Water-depth values recorded by the data loggeralso show a small but steady increase in relative creek levels between 26 and 29 July (Figure 6a), no doubtin response to the recharge. Thus, the water-sampling period of July occurred at the onset of a salt pulse,which moved slowly through the system in the days following, as shown by the declining logger SC valuesfrom 28 July onwards (Figure 4). In December, the sampling period occurred 5 days after a 3-day rainfallevent (28Ð8 mm recorded over 3 days at nearby Cowra: Australian Bureau of Meteorology data). Figure 6dshows that the same ions and water depth decrease over the water sampling period, indicating the ‘tail-end’ orrecessional stage of a similar salt-flushing episode. The c. 2-day pattern for Mg2C in both July and Decemberis confounded by diurnal changes (Figure 6c and f), which probably result from its incorporation into calcite
Copyright 2003 John Wiley & Sons, Ltd. Hydrol. Process. 17, 3421–3441 (2003)

TEMPERATURE INFLUENCES ON A TUFA-DEPOSITING STREAM 3431
Table IV. Summary of hand-held meter measurement and water sample Ca2C and HCO3� data for April, July and December
2000. The ion data are in mg L�1. SIc and PCO2 are the log calcite saturation indices (dimensionless units) and CO2 partialpressures (in log atmospheres)—see text for explanation
Date and time °C pH SC Ca2C HCO�3 Date and time °C pH SC Ca2C HCO�
3
April 2000 December 2000
29/04/2000 0:00 15Ð5 n.a. 1181 98 522 06/12/2000 16:50 28Ð2 8Ð22 1203 70 47829/04/2000 2:00 15Ð1 n.a. 1184 97 525 06/12/2000 18:20 26Ð7 8Ð21 1226 76 50029/04/2000 4:00 14Ð8 n.a. 1193 99 528 06/12/2000 19:20 25Ð5 8Ð15 1244 78 51529/04/2000 6:00 14Ð5 n.a. 1201 100 530 06/12/2000 20:20 24Ð2 8Ð08 1260 82 53529/04/2000 8:00 14Ð0 n.a. 1212 101 536 06/12/2000 22:00 22Ð1 8Ð01 1283 90 55629/04/2000 10:00 14Ð9 n.a. 1200 101 529 06/12/2000 23:30 21Ð1 8Ð03 1286 92 56629/04/2000 12:00 16Ð9 n.a. 1179 98 520 07/12/2000 5:20 18Ð4 8Ð08 1299 100 58229/04/2000 14:00 18Ð8 n.a. 1160 95 506 07/12/2000 7:00 18Ð0 8Ð08 1296 100 57529/04/2000 16:00 19Ð5 n.a. 1148 92 501 07/12/2000 9:00 19Ð3 8Ð22 1282 95 56429/04/2000 18:00 18Ð9 n.a. 1155 92 505 07/12/2000 10:00 20Ð6 8Ð20 1266 92 55729/04/2000 20:00 17Ð1 n.a. 1172 94 508 07/12/2000 11:00 21Ð9 8Ð27 1225 88 54029/04/2000 21:00 16Ð7 n.a. 1178 95 512 07/12/2000 12:00 23Ð0 8Ð32 1223 84 517
07/12/2000 13:00 23Ð4 8Ð25 1208 81 50707/12/2000 14:00 23Ð3 8Ð28 1205 78 498
July 2000 07/12/2000 15:00 23Ð3 8Ð28 1206 78 49807/12/2000 16:00 24Ð1 8Ð23 1203 77 501
26/07/2000 16:40 10Ð6 8Ð39 1230 87 522 07/12/2000 17:00 24Ð4 8Ð25 1195 74 49026/07/2000 19:10 9Ð3 8Ð29 1247 92 531 07/12/2000 18:00 24Ð2 8Ð26 1194 72 48726/07/2000 21:05 8Ð8 8Ð28 1251 93 540 07/12/2000 19:00 23Ð4 8Ð18 1207 77 49426/07/2000 23:15 8Ð4 8Ð33 1274 95 554 07/12/2000 20:00 22Ð2 8Ð08 1233 83 52027/07/2000 7:06 7Ð1 8Ð33 1305 94 543 07/12/2000 21:00 20Ð8 8Ð02 1256 88 54227/07/2000 9:10 6Ð9 8Ð39 1243 89 521 07/12/2000 22:00 19Ð7 8Ð06 1271 91 55527/07/2000 11:20 8Ð6 8Ð46 1258 88 522 07/12/2000 23:00 18Ð7 8Ð06 1276 92 56327/07/2000 13:10 9Ð6 8Ð53 1245 84 502 08/12/2000 0:00 17Ð9 8Ð05 1287 100 57827/07/2000 15:30 10Ð0 8Ð51 1207 79 481 08/12/2000 5:10 15Ð5 8Ð08 1290 100 58127/07/2000 17:30 9Ð0 8Ð47 1244 86 497 08/12/2000 6:15 15Ð4 8Ð11 1290 99 58427/07/2000 19:50 8Ð3 8Ð36 1285 87 518 08/12/2000 7:30 15Ð5 8Ð14 1286 98 57927/07/2000 22:45 6Ð9 8Ð35 1312 90 531 08/12/2000 8:30 16Ð3 8Ð21 1279 97 57528/07/2000 7:30 6Ð2 8Ð34 1386 94 561 08/12/2000 9:30 17Ð9 8Ð29 1261 93 55828/07/2000 9:10 6Ð7 8Ð41 1387 95 563 08/12/2000 10:30 19Ð8 8Ð26 1237 88 54028/07/2000 17:35 10Ð6 8Ð33 1340 84 528 08/12/2000 11:30 22Ð2 8Ð33 1213 81 519
08/12/2000 12:30 24Ð0 8Ð34 1192 76 49408/12/2000 13:30 25Ð9 8Ð38 1171 70 48008/12/2000 14:30 27Ð0 8Ð38 1156 66 464
during CaCO3 deposition (Figure 6b and e). The relative variations in NaC, Mg2C and Cl� for December areless than half those for July; variation in KC is similar for both periods, but this ion has little bearing on SCowing to its very low concentration. The net result is that the influence on SC of ‘background’ variations inNaC, Mg2C and Cl� is less significant for December than for July (Figure 6g–i): the December Ca2C andHCO3
� data explain 92% and 98% of the total variation in logger SC respectively, whereas the correspondingvalues for July are 12% and 42% (Table II). For April, when no other ion data are available, the power ofCa2C and HCO3
� in explaining variations in SC is similar to that of December. Consequently, SC can beused as a surrogate for continuous CaCO3 variations for both April and December (but not for July), andreliable time-series of diurnal at-a-station CaCO3 changes have been compiled for both periods (Figure 7band c).
Copyright 2003 John Wiley & Sons, Ltd. Hydrol. Process. 17, 3421–3441 (2003)

3432 R. DRYSDALE, S. LUCAS AND K. CARTHEW
July
Dec
emb
era)
d)g)
b)e)
h)
c)f)
i)
1650
1700
1750
1800
1850
1900
1950
2000
SC (logger)
0.0
2.0
4.0
6.0
8.0
10.0
Relative depth (cm)
SC
Dep
th
3.0
3.5
4.0
4.5
5.0
5.5
6.0 26
/07
0:00
27/0
70:
0028
/07
0:00
29/0
70:
0030
/07
0:00
31/0
70:
00
Dat
e/tim
e
Concentration (meq L-1)
Chl
orid
eS
odiu
mM
agne
sium
6.0
6.5
7.0
7.5
8.0
8.5
9.0
9.5
HCO3- (meq L-1)
3.0
3.5
4.0
4.5
5.0
5.5
6.0
Ca2+ (meq L-1)B
icar
bona
teC
alci
um
1450
1500
1550
1600
1650
1700
1750
1800
SC (logger)
0.0
2.0
4.0
6.0
8.0
10.0
Relative depth (cm)
Con
d @
25
Dep
th (
m)
024681012
Concentration (meq L-1)
Cal
cium
Bic
arbo
nate
3.0
3.5
4.0
4.5
5.0
5.5
6.0 06
/12
12:0
007
/12
0:00
07/1
212
:00
08/1
20:
0008
/12
12:0
009
/12
0:00
09/1
212
:00
Dat
e/tim
e
Concentration (meq L-1)M
agne
sium
Sod
ium
Chl
orid
e
Chl
orid
e
r2 = 0
.59
r2 = 0
.03
1500
1600
1700
1800
1900
2000
3.0
3.5
4.0
4.5
5.0
5.5
SC (logger)
Jul
Dec
Sod
ium
r2 = 0
.65
r2 = 0
.01
1500
1600
1700
1800
1900
2000
3.0
3.5
4.0
4.5
SC (logger)
Jul
Dec
Mag
nesi
um
r2 = 0
.43
r2 = 0
.71
1500
1600
1700
1800
1900
2000
3.0
4.0
5.0
6.0
7.0
Con
cent
ratio
n (m
eq L
-1)
SC (logger)
Jul
Dec
Figu
re6.
Diu
rnal
NaC ,
Cl�
and
Mg2C
ion
patte
rns
for
July
2000
(a–
c)an
dD
ecem
ber
2000
(d–
f),a
ndco
rrel
atio
nsbe
twee
nSC
and
Cl�
(g),
NaC
(h)
and
Mg2C
(i)
for
both
July
and
Dec
embe
r20
00.
Not
eth
atal
lio
nda
taar
epl
otte
din
mill
i-eq
uiva
lent
spe
rlit
re
Copyright 2003 John Wiley & Sons, Ltd. Hydrol. Process. 17, 3421–3441 (2003)

TEMPERATURE INFLUENCES ON A TUFA-DEPOSITING STREAM 3433
a)
b)
c)
120
160
200
240
280
6/12 0:00 9/12 0:00 12/12 0:00
15/12 0:00
18/12 0:00
21/12 0:00
24/12 0:00
27/12 0:00
30/12 0:00
2/01 0:00
Date/time
Pre
dict
ed C
aCO
3 (m
g L-
1 )
200
220
240
260
280
300
24/04 0:00
24/04 12:00
25/04 0:00
25/04 12:00
26/04 0:00
26/04 12:00
27/04 0:00
27/04 12:00
28/04 0:00
28/04 12:00
29/04 0:00
29/04 12:00
30/040:00
Pre
dict
ed C
aCO
3 (m
g L-
1 )
200
220
240
260
280
300
12/02 0:00
14/02 0:00
16/02 0:00
18/02 0:00
20/02 0:00
22/02 0:00
24/02 0:00
26/02 0:00
28/020:00
Pre
dict
ed C
aCO
3 (m
g L-
1 )
Figure 7. Derived diurnal CaCO3 variations for February, April and December 2000
For February 2000, no water samples were collected. However, given the strong relationships betweenhand-held meter SC and logger SC (February), and between SC and Ca2C for April and December (Table II),it is possible to compile a similar CaCO3 time-series for February by, first, converting all logger SC data forFebruary 2000 into hand-held SC values using regression, then transforming the latter into CaCO3-equivalentusing the regression equation of SC versus Ca2C for December 2000. The SC versus Ca2C data for Aprilwas not considered because the hand-held SC meter used for the April campaign differed from that used inDecember and February, and we cannot verify its relationship to the YSI meter. The resulting time-series forFebruary is shown in Figure 7a.
Table V summarizes the changes in CaCO3 for each of the three campaigns. The highest diurnal CaCO3
changes occurred during December, when the station experienced an amplitude of 101 mg L�1; three otherdays in December experienced fluctuations of 100 mg L�1. The lowest maximum diurnal changes occurred in
Copyright 2003 John Wiley & Sons, Ltd. Hydrol. Process. 17, 3421–3441 (2003)

3434 R. DRYSDALE, S. LUCAS AND K. CARTHEW
April (31 mg L�1), which also recorded the lowest minimum change (23 mg L�1). There is a general tendencyfor the diurnal CaCO3 changes to reflect water temperature ranges: in terms of the maximum CaCO3 rangesfor each period, December scored the highest and had the highest temperature range, whereas April scoredthe lowest and had the lowest temperature range. This pattern breaks down when one examines the minimumdiurnal changes: December had the highest minimum CaCO3 change (50 mg L�1), yet the temperature rangewas only 3Ð6 °C, whereas the lowest minimum (April: 27 mg L�1) had the highest diurnal temperature range(5Ð5 °C). Clearly, temperature range alone may not explain all CaCO3 changes. This will be explored furtherin the discussion.
Diurnal changes in PCO2 and the calcite saturation index. Changes in the CaCO3 composition of tufa-depositing waters are driven by CO2 flux from the stream waters to the atmosphere and the consequent effectof this flux on SIcalcite. Figure 8a and b shows the diurnal trends in PCO2 and SIcalcite for the 2-day water-sampling periods of July and December. There is no PCO2 and SIcalcite data for February or April becausewater samples were not collected for the former and there are no pH data for the latter. Although the datain Figure 8a and b are limited in continuity and temporal resolution, the diurnal patterns for both parametersare quite consistent. The greater temporal resolution of the December series permits more precise estimatesto be made of the timing of SIcalcite and PCO2 changes. The highest PCO2 values occur during the late evening,whereas the lowest occur during the early to mid-afternoon. For SIcalcite, the minimum values occur in thelate evening and the highest are confined to the late morning to early afternoon period.
A better understanding of the nature and timing of PCO2 and SIcalcite changes can be gained by generatingtime-series of PCO2 and SIcalcite, which would provide greater temporal resolution than the grab-sample data.As noted earlier, PCO2 is largely a function of pH. Figure 8c and d indicates that PCO2 derived from thewater samples collected in July and December is strongly correlated with the corresponding instantaneouspH values of the data logger. The standard errors of estimate for the independent variable (pH) for July andDecember are 0Ð04 and 0Ð05 respectively, which is insignificant compared with typical diurnal ranges of upto 10 times these values (Figures 2, 3 and 5 and Table IV). Therefore, logged pH can be used legitimatelyas a surrogate for PCO2 for these two campaigns. As discussed previously, the major requirements for areliable time-series of SIcalcite are strong correlations between ˛Ca2C and logger SC, and between ˛CO2�
3and logger pH. Only the December data satisfy these criteria (Figure 8e and f); for the July campaign,the correlation between ˛Ca2C and logger SC is not significant owing to longer-term variations in non-carbonate ions, and a lack of reliable pH data precludes us from generating a SIcalcite time-series from theApril data.
It is now possible to deconstruct the precise detail of the diurnal changes. The temperature, SC andderived PCO2 and SIc data for one randomly chosen day in December is sufficient to elucidate this detail(Figure 9) because the diurnal changes are consistent for each day of each respective campaign. The SC value
Table V. Maximum and minimum diurnal CaCO3 changes, and the corresponding temperature maximum, minimumand range, for each logging period
Parameter February 2000 April 2000 December 2000
Max. diurnal change in CaCO3 (mg L�1) 67 31 101Temperature minimum and maximum ( °C) 17.3–25.7 9.4–15.8 18.5–29.1Temperature range ( °C) 8.4 6.4 10.6Min. diurnal change in CaCO3 (mg L�1) 26 23 50Temperature minimum and maximum ( °C) 20.4–22.7 12.3–17.6 21.2–24.8Temperature range ( °C) 2.3 5.3 3.6Mean diurnal change in CaCO3 (mg L�1) 49 27 87Mean diurnal temperature range ( °C) 5.4 5.5 11Number of days 15 6 25
Copyright 2003 John Wiley & Sons, Ltd. Hydrol. Process. 17, 3421–3441 (2003)

TEMPERATURE INFLUENCES ON A TUFA-DEPOSITING STREAM 3435
a) July 2000 d) December 2000
b) December 2000 e) December 2000
c) July 2000 f) December 2000
-3.1
-3.0
-2.9
-2.8
-2.7
-2.6
-2.5
26 Jul0:00
27 Jul0:00
28 Jul0:00
29 Jul0:00
Date/time
PC
O2
(log
atm
)P
CO
2 (lo
g at
m)
PC
O2
(log
atm
)
1.0
1.1
1.2
1.3
1.4
SI c
alci
te
PCO2SIc
-3.0
-2.8
-2.6
-2.4
-2.2
06 Dec0:00
07 Dec0:00
08 Dec0:00
09 Dec0:00
Date/time
0.8
0.9
1.0
1.1
1.2
1.3
1.4S
I cal
cite
SIc
r 2 = 0.92n = 14SE = 0.04
-3.1
-3.0
-2.9
-2.8
-2.7
-2.6
8.2 8.3 8.4 8.5 8.6
Logger pH
r 2 = 0.89n = 31SE = 0.05
-2.9
-2.8
-2.7
-2.6
-2.5
-2.4
-2.3
7.8 7.9 8.0 8.1 8.2 8.3 8.4
Logger pH
PC
O2
(log
atm
)
r 2 = 0.96n = 32SE = 2.73 × 10⁻⁵
6.0E-04
8.0E-04
1.0E-03
1.2E-03
1.4E-03
1.6E-03
1550 1600 1650 1700 1750 1800
Logger SC
αCa2
+
r 2 = 0.93n = 31SE = 3.59 × 10⁻⁶
1.0E-05
3.0E-05
5.0E-05
7.0E-05
9.0E-05
7.8 7.9 8.0 8.1 8.2 8.3 8.4
Logger pH
αCO
32-
PCO2
Figure 8. (a and b) Diurnal variations in PCO2 and calcite saturation for July and December 2000. (c and d) Correlations between PCO2 andlogger pH for July and December. (e and f) Correlations between SC and both ˛Ca2C and ˛CO2�
3 for December 2000.
reaches a maximum by early morning (a in Figure 9) and decreases to a minimum by mid- to late afternoon(b). The decline in SC commences shortly after water temperatures begin to rise (c). This temperatureincrease is accompanied by a sharp decrease in PCO2 (d). Water temperature peaks by mid-afternoon (e),but by this stage PCO2 has reached its minimum (f). As temperature falls, PCO2 rises. However, this riseoccurs (f) before SC has reached its minimum (b). The SC value begins to rise in the late afternoon andcontinues steadily until reaching a plateau in the evening. The temperature fall virtually mirrors the rise inSC. However, the sharp rise in PCO2 , which commenced mid-afternoon, is arrested during the evening andbegins to decrease steadily (g). The likely factors controlling these diurnal changes will be discussed in thenext section.
Copyright 2003 John Wiley & Sons, Ltd. Hydrol. Process. 17, 3421–3441 (2003)

3436 R. DRYSDALE, S. LUCAS AND K. CARTHEW
Figure 9. Diurnal variations in temperature, SC, PCO2 and calcite saturation for 17 December 2000. See text for explanation of a to g
DISCUSSION
Controls on an individual diurnal cycle
The general nature of the diurnal trends observed at Davys Creek is similar to that documented at othersites around the world (Barnes, 1965; Dandurand et al., 1982; Spiro and Pentecost, 1991; Pentecost, 1994):at-a-station minima in dissolved ions (measured as SC or dissolved CaCO3) usually occur in the mid-afternoonwhen water temperature reaches its maximum and PCO2 is closest to atmospheric levels, whereas maximumion concentrations between sunrise and mid-morning coincide with minimum water temperatures and PCO2
peaks.At Davys Creek, continuous measurements show that increasing water temperatures in the morning trigger
reductions in PCO2 . This in turn produces a sharp increase in SIcalcite, shortly after which SC begins tofall as a result of CaCO3 deposition. The recorded fluctuations in CaCO3 are attributed to variationsin the amount of carbonate deposited upstream before the waters reach the monitoring site. Thus, underconditions of near-constant seepage water composition, which holds true for baseflow conditions, the reachof carbonate deposition retreats upstream during the day and advances downstream during the evening, asshown schematically in Figure 10. The entire diurnal cycle is driven by insolation via water temperaturechanges, which control the rate of CO2 outgassing and the amount of CaCO3 held in solution via the inverserelationship between temperature and dissolved CaCO3 and CO2. During the evening, the temperature-inducedincrease in PCO2 cannot be the result of extra CO2 uptake by the stream water. Instead, it is caused by areduction in the amount of upstream CO2 loss, which gives rise to the apparent PCO2 increase in Figure 9.The stream is a net loser of CO2 and will remain so as long as its PCO2 is greater than that of the coexistingatmosphere. Similarly, the stream is not gaining dissolved CaCO3 during the evening, but is losing less to thesolid phase along the reach upstream of the monitoring station (Figure 10).
The only unexplained anomaly from Figure 9 is the slow but steady decrease in PCO2 that commences mid-to late evening (g in Figure 9). This persists until mid-morning, after which the rate of decrease increasesmarkedly. The mid-evening reduction in PCO2 contradicts the trend in water temperature, which is decreasing atthe same time and thus should promote CO2 retention. The answer is apparent when total CO2 is plotted againsttemperature and PCO2 for December. The PCO2 starts to decrease when total CO2 reaches maximum levels(Figure 11a). Total CO2 mimics water temperatures for most of the cycle (Figure 11b). From approximatelymidnight, total CO2 reaches a plateau, even though water temperature continues to decrease. The plateauxof dissolved CO2 represent the minimum amount of outgassing that occurs along the reach upstream of themonitoring site during the two diurnal cycles. The total CO2 cannot increase further without an additionalsource of CO2. This source is not available: the stream is always a net loser of CO2 along its entire length
Copyright 2003 John Wiley & Sons, Ltd. Hydrol. Process. 17, 3421–3441 (2003)

TEMPERATURE INFLUENCES ON A TUFA-DEPOSITING STREAM 3437
Distance downstream
Dis
solv
ed C
aCO
3
Location ofmeasurement station
night-time trend
daytime trend
springs
Dow
nstr
eam
day
time
loss
Dow
nstr
eam
nig
ht-t
ime
loss
Daytime reachNight-time reach
Figure 10. Conceptual model of downstream changes in dissolved CaCO3 during the diurnal cycle
because of the large pressure gradient that exists between the stream and the atmosphere. As total CO2 remainsapproximately constant, PCO2 must decrease as temperature decreases because PCO2 is positively related tototal CO2 concentration but inversely related to temperature (White, 1988). Therefore, although PCO2 slowlydecreases over the period mid-evening to dawn for each of the logging periods (Figure 9), total CO2 remainsapproximately constant.
Longer term controls on diurnal changes
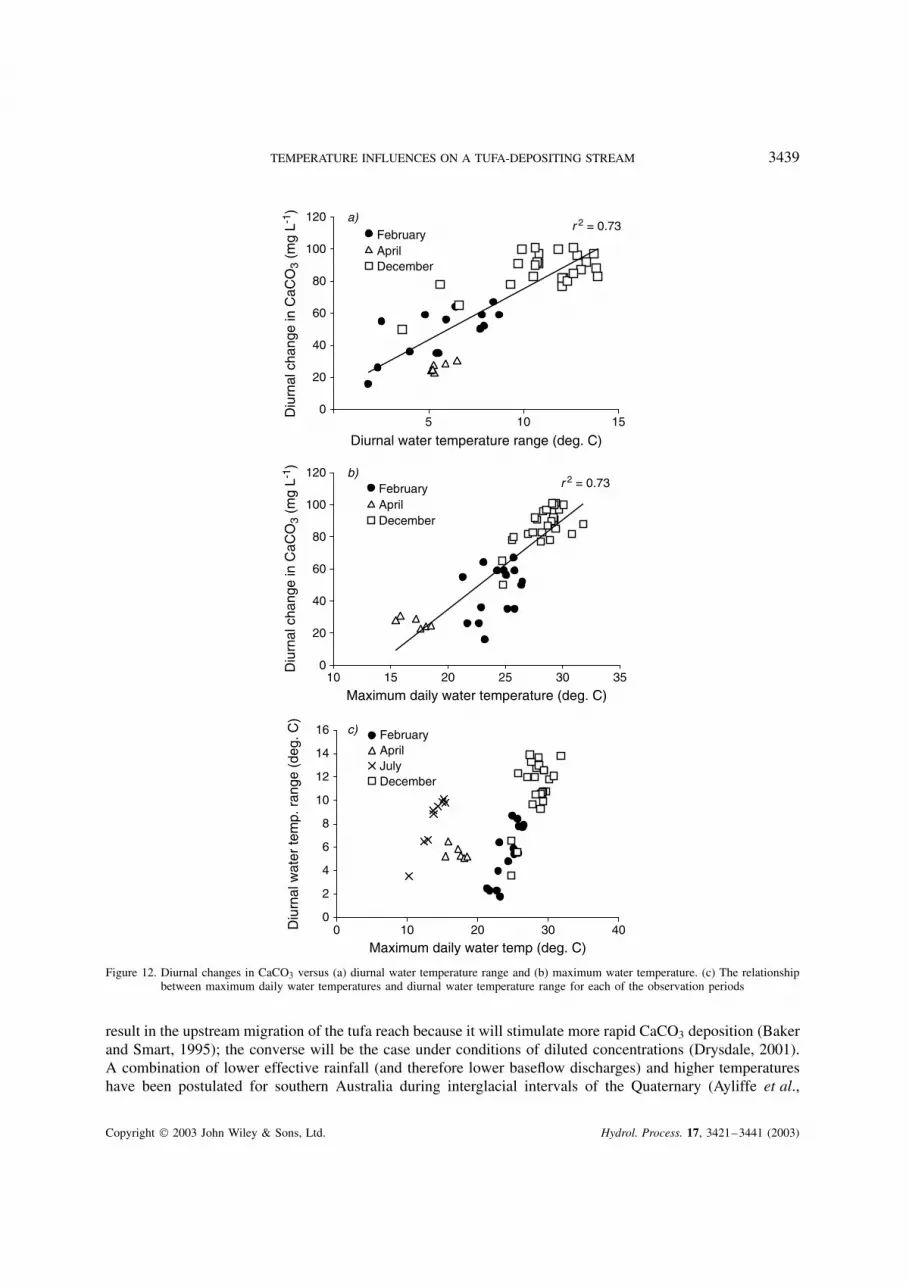
It is clear from the above that water temperature is the driving force behind the diurnal changes in theamount of CaCO3 deposition occurring upstream of the monitoring site. To what extent do changes in day-to-day diurnal temperature ranges affect the amount of day-to-day CaCO3 losses? The data in Figures 2–5 andTable V suggest that day-to-day changes in water temperature range are synchronous with and sympathetic tothe diurnal ranges in CaCO3 deposition: as the water temperature range decreases (e.g. owing to one or moreconsecutive cloudy days), the amount of diurnal CaCO3 change also decreases. In Figure 12a, temperaturerange and CaCO3 range are plotted for February, April and December. For each individual monitoring period,the correlation coefficients are statistically significant (p < 0Ð05; r D 0Ð84, 0Ð73, 0Ð62 respectively), and thecorrelation coefficient for the composite data is stronger again (r D 0Ð85). Therefore, water temperaturevariations not only account for the diurnal change observed during a single day, but day-to-day changesin water temperature range explain about three-quarters of the variation in day-to-day changes in the amountof upstream CaCO3 deposition. In addition, the amount of upstream diurnal CaCO3 loss is positively related tomaximum water temperature (Figure 12b). This is largely because the highest water temperature ranges tend tooccur on days with the highest maxima at a given time (i.e. season) of the year (Figure 12c). The correlationin Figure 12b relates only to data from December and February, both summer months that experiencedcomparable mean maximum (31Ð2 versus 32Ð0 °C) and minimum air temperatures (14Ð5 versus 18Ð2 °C), andmean diurnal air temperature ranges (16Ð3 versus 13Ð7 °C) for the year of observation (Australian Bureauof Meteorology data for Cowra, located 40 km west-south-west of Cliefden). For these two periods, greaterupstream CaCO3 losses occur as maximum daily water temperature increases. This is partly because diurnalwater temperature ranges tend to increase as maximum water temperatures increase at a given time of theyear (Figure 12c).
Copyright 2003 John Wiley & Sons, Ltd. Hydrol. Process. 17, 3421–3441 (2003)

3438 R. DRYSDALE, S. LUCAS AND K. CARTHEW
-2.8
-2.7
-2.6
-2.5
-2.4
-2.3
0.006
0.007
0.008
0.009
0.010
10
15
20
25
30
6/1212:00
7/12 0:00 7/1212:00
8/12 0:00 8/1212:00
9/12 0:00
Date/time
0.006
0.007
0.008
0.009
0.010
Total CO2
PCO2
Total CO2
Water temp.
Tota
l CO
2 (g
L-1
)To
tal C
O2
(g L
-1)
PC
O2
(log
atm
)W
ater
tem
p. (
deg.
C)
Figure 11. (a) Total CO2 and PCO2 , and (b) total CO2 and temperature through the December 2000 water sampling period
Given that stream-water temperature is a direct function of ambient temperatures, the amount of tufadeposited along the upstream reach at Davys Creek is therefore a function of daily weather patterns for agiven set of seepage-water conditions. When diurnal ranges are low owing to cloud cover, the amount oftufa deposited between the seepage zone and the monitoring site decreases, whereas the opposite occursduring sunny days when the temperature range is greater. Furthermore, days with higher air temperaturescoincide with larger diurnal water temperature ranges, with consequent higher diurnal CaCO3 ranges. Thisshould translate into lower rates of upstream deposition during winter months compared with summer months,although we cannot confirm this here because the daily SC variations for the July time-series are affected bysignificant changes in non-carbonate species. This is certainly an area for further study.
Implications for climate change
The above results have implications for interpreting tufa palaeoenvironments and on predicting the likelyresponse of tufa-depositing streams to future climate change. Under warmer climate conditions, tufa depositionalong a given stream will be focused along segments more proximal to the springs because the waterswill evolve more rapidly. Conversely, during periods of increased cloudiness or decreased temperatures,downstream migration of deposition will prevail. However, such situations will only prevail if base-flowdischarges and water composition do not change markedly (Drysdale, 2001; Drysdale et al., 2002). Dischargeincreases will extend the reach of tufa deposition for waters of a given initial composition because thewaters will require a much longer stream distance over which to evolve to a highly supersaturated state,whereas the opposite will occur under lower discharges (Drysdale et al., 2002). Clearly, future work could bedirected towards determining the relative importance of discharge and temperature. In terms of seepage-watercomposition, increased Ca2C and HCO3
� concentrations under a fixed temperature and discharge regime will
Copyright 2003 John Wiley & Sons, Ltd. Hydrol. Process. 17, 3421–3441 (2003)
TEMPERATURE INFLUENCES ON A TUFA-DEPOSITING STREAM 3439
a)
b)
c)
r 2 = 0.73
0
20
40
60
80
100
120
5 10 15
Diurnal water temperature range (deg. C)
Diu
rnal
cha
nge
in C
aCO
3 (m
g L-
1 )
FebruaryAprilDecember
0
2
4
6
8
10
12
14
16
0 10 20 30 40
Maximum daily water temp (deg. C)
Diu
rnal
wat
er te
mp.
ran
ge (
deg.
C)
FebruaryAprilJulyDecember
r 2 = 0.73
0
20
40
60
80
100
120
10 15 20 25 30 35
Maximum daily water temperature (deg. C)
Diu
rnal
cha
nge
in C
aCO
3 (m
g L-
1 )
FebruaryAprilDecember
Figure 12. Diurnal changes in CaCO3 versus (a) diurnal water temperature range and (b) maximum water temperature. (c) The relationshipbetween maximum daily water temperatures and diurnal water temperature range for each of the observation periods
result in the upstream migration of the tufa reach because it will stimulate more rapid CaCO3 deposition (Bakerand Smart, 1995); the converse will be the case under conditions of diluted concentrations (Drysdale, 2001).A combination of lower effective rainfall (and therefore lower baseflow discharges) and higher temperatureshave been postulated for southern Australia during interglacial intervals of the Quaternary (Ayliffe et al.,
Copyright 2003 John Wiley & Sons, Ltd. Hydrol. Process. 17, 3421–3441 (2003)

3440 R. DRYSDALE, S. LUCAS AND K. CARTHEW
1998). Under such conditions, increased ion concentrations are also likely. This combination of hydroclimaticconditions would almost certainly cause the reach of tufa deposition to migrate upstream.
CONCLUSIONS
In this study we have shown that the amount of tufa deposition that occurs along a given stream reachvaries over the diurnal cycle according to insolation-driven shifts in water temperature, which control the rateof downstream CO2 efflux. The greatest daily changes in deposition for each observation period occurredwhen diurnal water temperature ranges were at their maximum, whereas the lowest values coincided withminimum temperature ranges. Furthermore, the highest water temperature ranges correlated with days ofhighest maximum temperatures, with the greatest ranges in summer. Therefore, diurnal variations in CaCO3
should be greatest in summer, although this needs to be tested more rigorously in a future study. Giventhat water temperatures are an indirect function of air temperatures via solar radiation receipt, day-to-dayvariations in tufa deposition at Davys Creek under approximately constant discharge conditions are dependentupon the prevailing weather. The next step is to determine the nature and magnitude of diurnal trends undercontrasting discharge/water composition conditions.
ACKNOWLEDGEMENTS
The authors thank the owners of Boonderoo and Werribee Stations for providing access to the Davys Creekcatchment, Bruce Howlett and Denis Marsh of the Orange Speleological Society for field assistance, and MrLawrie Henderson for drafting Figure 1. We also thank two anonymous reviewers and Dr John Webb (LaTrobe University) for their very helpful comments.
REFERENCES
Altunel E, Hancock PL. 1994. Morphology and structural setting of Quaternary travertines at Pamukkale, Turkey. Geological Journal 28:335–346.
Amundson R, Kelly E. 1987. The chemistry and mineralogy of a CO2-rich travertine depositing spring in the California Coast Range.Geochimica et Cosmochimica Acta 51: 2883–2890.
Arenas C, Gutierrez F, Osacar C, Sancho C. 2000. Sedimentology and geochemistry of fluvio-lacustrine tufa deposits controlled by evaporitesolution subsidence in the central Ebro Depression, NE Spain. Sedimentology 47: 883–909.
Ayliffe LK, Marianelli PC, Moriarty KC, Wells RT, McCulloch MT, Mortimer GE, Hellstrom JC. 1998. 500 ka precipitation record fromsoutheastern Australia: evidence for interglacial relative aridity. Geology 26: 147–150.
Baker A, Smart PL. 1995. Recent flowstone growth rates: field measurements in comparison to theoretical predictions. Chemical Geology122: 121–128.
Barnes I. 1965. Geochemistry of Birch Creek, Inyo County, California, a travertine depositing creek in an arid climate. Geochimica etCosmochima Acta 29: 85–112.
Chafetz HS, Folk RL. 1984. Travertine: depositional morphology and the bacterially constructed constituents. Journal of SedimentaryPetrology 54: 289–316.
Cole GA, Batchelder GL. 1969. Dynamics of an Arizona travertine-forming stream. Journal of the Arizona Academy of Science 5: 271–283.Dandurand JL, Gout R, Hoefs J, Menschel G, Schott J, Usdowski E. 1982. Kinetically controlled variations of major components and carbon
and oxygen isoptopes in a calcite-precipitating spring. Chemical Geology 36: 299–315.Drever JI. 1982. The Geochemistry of Natural Waters . Prentice-Hall: Upper Saddle River, New Jersey; 388 pp.Drysdale RN. 2001. Factors Controlling the hydrochemistry of Louie creek, a travertine-depositing stream in the seasonally wet tropics of
northern Australia. Marine and Freshwater Research 52: 793–804.Drysdale RN, Taylor MP, Ihlenfeld C. 2002. Factors controlling the chemical evolution of travertine-depositing rivers of the Barkly karst,
northern Australia. Hydrological Processes 16: 2941–2962.Ford TD, Pedley HM. 1996. A review of tufa and travertine deposits of the world. Earth-Science Reviews 41: 117–175.Ford DC, Williams PW. 1989. Karst Hydrology and Geomorphology . Unwin Hyman: London.Hill WL. 1999. A report on an examination of dryland salinity processes on three central west New South Wales farms. Unpublished Masters
thesis, The University of New England, Armidale, NSW; 131 pp.Hoefs J. 1997. Stable Isotope Geochemistry , 4th edn. Springer-Verlag: Berlin; 201 pp.Liu Z, Svensson U, Dreybrodt W, Yuan DX, Buhmann D. 1995. Hydrodynamic control of inorganic calcite precipitation in Huanglong
Ravine, China: field measurements and theoretical prediction of deposition rates. Geochimica et Cosmochimica Acta 59: 3087–3097.
Copyright 2003 John Wiley & Sons, Ltd. Hydrol. Process. 17, 3421–3441 (2003)

TEMPERATURE INFLUENCES ON A TUFA-DEPOSITING STREAM 3441
Lorah MM, Herman JS. 1988. The chemical evolution of a travertine depositing stream: geochemical processes and mass transfer reactions.Water Resources Research 24: 1541–1552.
McDonald J. 2000. Late Quaternary palaeoclimate reconstruction of central NSW as inferred from stable isotope and trace elementgeochemistry of speleothems. Unpublished BSc Honours thesis, The University of Newcastle, NSW; 102 pp.
Neal C, Jarvie HP, Howarth SM, Whitehead PG, Williams RJ, Neal M, Harrow, M, Wickham H. 2000. The water quality of the RiverKennet: initial observations on a lowland chalk stream impacted by sewage inputs and phosphorus remediation. The Science of the TotalEnvironment 251/252: 477–496.
Neal C, Watts C, Williams RJ, Neal M, Hill L, Wickham H. 2002. Diurnal and longer term patterns in carbon dioxide and calcite saturationfor the River Kennet, south-eastern England. The Science of the Total Environment 282/283: 205–231.
Pedley HM. 2000. Ambient temperature freshwater microbial tufas. In Microbial Sediments , Riding RE, Awramik SM (eds). Springer-Verlag:Berlin; 179–186.
Pedley HM, Hill I, Denton P, Brasington J. 2000. Three-dimensional modelling of a Holocene tufa system in the Lathkill Valley, northDerbyshire, using ground-penetrating radar. Sedimentology 47: 721–737.
Pentecost A. 1994. Formation of laminate travertines at Bagno Vignone, Italy. Geomicrobiology Journal 12: 239–251.Pentecost A. 1995. Geochemistry of carbon dioxide in six travertine-depositing waters of Italy. Journal of Hydrology 167: 263–278.Pentecost A. 2001. Microdistribution of algae in an Italian thermogene travertine. Archiv fur Hydrobiologie 152: 439–449.Pentecost A, Viles HA. 1994. A review and assessment of travertine classification. Geographie Physique et Quaternaire 48: 305–314.Rollins L. 1987. PCWATEQ . Computer program, Shadoware: Woodland, CA.Spiro B, Pentecost A. 1991. One day in the life of a stream—a diurnal inorganic carbon mass balance for a travertine-depositing stream
(Waterfall Beck, Yorkshire). Geomicrobiology Journal 9: 1–11.Szabo J, Bush CA, Benson L. 1996. Uranium-series dating of carbonate (tufa) deposits associated with Quaternary fluctuations of Pyramid
Lake, Nevada. Quaternary Research 45: 271–281.Webby BD, Packham GH. 1982. Stratigraphy and regional setting of the Cliefden Caves Limestone Group (Late Ordovician), central-western
New South Wales. Journal of the Geological Society of Australia 29: 297–317.White WB. 1988. Geomorphology and Hydrology of Karst Terrains . Oxford University Press: New York; 464 pp.
Copyright 2003 John Wiley & Sons, Ltd. Hydrol. Process. 17, 3421–3441 (2003)