the impact of fdi on domestic firm innovation
TRANSCRIPT
Policy Research Working Paper 9672
The Impact of FDI on Domestic Firm Innovation
Evidence from Foreign Investment Deregulation in China
Yan Liu Xuan Wang
Finance, Competitiveness and Innovation Global Practice May 2021
Pub
lic D
iscl
osur
e A
utho
rized
Pub
lic D
iscl
osur
e A
utho
rized
Pub
lic D
iscl
osur
e A
utho
rized
Pub
lic D
iscl
osur
e A
utho
rized

Produced by the Research Support Team
Abstract
The Policy Research Working Paper Series disseminates the findings of work in progress to encourage the exchange of ideas about development issues. An objective of the series is to get the findings out quickly, even if the presentations are less than fully polished. The papers carry the names of the authors and should be cited accordingly. The findings, interpretations, and conclusions expressed in this paper are entirely those of the authors. They do not necessarily represent the views of the International Bank for Reconstruction and Development/World Bank and its affiliated organizations, or those of the Executive Directors of the World Bank or the governments they represent.
Policy Research Working Paper 9672
This paper studies the impact of foreign direct investment on domestic firms’ innovation in China. It provides causal evidence by exploiting China’s foreign direct investment deregulation in 2002 and employs a difference-in-differ-ence estimation strategy. Using a matched firm-patent data set from 1998 to 2007, the results show that the quantity and quality of domestic firms’ innovation ben-efit from foreign direct investment. Moreover, the paper emphasizes the importance of knowledge spillover from foreign direct investment in similar technology domains. The analysis examines the role of horizontal foreign direct
investment and foreign direct investment in technologically close industries—industries that share similar technology domains. The findings show that foreign direct investment in technologically close industries generates much bigger positive spillovers than horizontal foreign direct investment. The paper also shows that knowledge spillover from for-eign direct investment in similar technology domains is not driven by input-out linkages. Moreover, the spillover effect is stronger in cities with higher human capital stock and firms with higher absorptive capacity.
This paper is a product of the Finance, Competitiveness and Innovation Global Practice. It is part of a larger effort by the World Bank to provide open access to its research and make a contribution to development policy discussions around the world. Policy Research Working Papers are also posted on the Web at http://www.worldbank.org/prwp. The authors may be contacted at [email protected].

The Impact of FDI on Domestic Firm Innovation: Evidence from Foreign
Investment Deregulation in China
Yan Liu1
Xuan Wang2
JEL classification: F2, O1, O3
Keywords: Foreign Direct Investment, innovation, spillover, technological closeness
1 Corresponding author. World Bank Group, Finance, Competitiveness and Innovation GP. [email protected]. 2 University of Michigan. [email protected].

2
I. Introduction
Innovation is an essential driver of economic growth and policy makers make huge efforts to encourage
innovation, such as human capital investment and support for research and development (R&D). But
developing countries find it hard to close the technology gap with rich countries on their own. They often seek to open their markets and attract foreign direct investment (FDI) in the belief that FDI can spur
domestic innovation and industry upgrading. However, we still have no clear evidence on whether FDI
promotes domestic firms’ innovation or not.
The relationship between FDI and domestic firms’ innovation is not clear in theory. On the one hand,
foreign firms can disseminate cutting-edge technology, hire and train local workers, generating positive
effects on domestic firms’ innovation. The presence of FDI in the same industry could lower the cost of
domestic firms’ innovation through multiple channels, including demonstration effect, supplier sharing and labor mobility (Javorcik and Spatareanu 2009; Alfaro and Rodriguez-Clare 2004; Alfaro-Ureña et al. 2019;
Bai et al. 2020). Besides the traditional horizontal FDI spillover effect, researchers have recently realized
the importance of spillover within similar technology domains, because knowledge can be transferred to
firms that share similar industry know-how and talent input. Fons-Rosen et al. (2017) find that FDI can boost domestic firms’ productivity and innovation if foreign firms enter sectors that are technologically
close to domestic firms. FDI could also induce learning and upgrading in upstream and downstream firms
through input-output linkages (Javorcik 2004, 2008). On the other hand, FDI could hurt domestic firms’ performance through the competition effect, heightened competition can discourage domestic firms’
innovation (Aghion et al. 2005). If the technology gap between home and host countries is too big or
domestic firms lack sufficient absorptive capacity, they would not be able to assimilate the knowledge
brough by FDI (Zhang et al. 2010). Ultimately, the impact of FDI on domestic firms’ innovation remains an underexplored topic.
This paper provides causal evidence on whether domestic firms become more innovative after being
exposed to FDI. We consider two main measures of FDI presence: the traditional horizontal FDI, measured by the share of FDI in the same industry; and technologically close FDI, measured by the FDI from
industries that share similar technological domains. 3 We explore China’s FDI deregulation in 2002 upon
joining the WTO, which exogenously increased the share of FDI in deregulated industries. The deregulation
offers a great opportunity to examine the causal effects of FDI on domestic firms’ innovation. China has been the largest FDI recipient among developing countries. FDI fueled China’s sizzling economic growth
3 Two industries are technologically close if they have largely overlapping technological domains. Detailed methodologies for measuring technologically close FDI is explained in Section 2.2.

3
in the past three decades and dramatically transformed China’s export portfolio. During the same period,
Chinese firms also significantly improved their indigenous innovation capabilities, China’s PCT patent application increased from 276 in 1999 to 58,990 in 2019, surpassing the United States to be the largest
PCT patent applicant. What role did FDI play in stimulating China’s innovation capability? How does the
effect vary by patent type, local human capital, and domestic firms’ absorptive capacity? Does FDI
discourage domestic firms’ innovation through the competition effect? These are the questions on which this paper seeks to shed light.
To test the impact of FDI deregulation on innovation, we combine three main data sets: a
comprehensive data set of all medium and large manufacturing enterprises in China between 1998 and 2007, patent application data from the State Intellectual Property Office (SIPO), and patent citation data. We
measure two dimensions of innovation activities: output quantity (number of patent application), and
quality (type of patent applications, patent grants, and patent citations).
The deregulation in 2002 allows us to use a difference-in-difference estimation strategy to establish the causal impact of FDI. China liberalized 112 of its 425 four-digit manufacturing industries for FDI, and we
show that these industries indeed received more foreign investment after 2002. To examine whether our
DID design is valid, we first show graphical evidence that before 2001 patent applications in treatment and control groups follow similar patterns. Our event study confirms this point by showing that the estimated
difference in patent application before 2001 is tiny in magnitude and not statistically significant. In the
graphical evidence we demonstrate domestic firms in treatment group become more innovative right after
the reform. Lastly, we provide IV-DID estimation to quantify the economic magnitude of such spillovers.
Our analysis yields several interesting findings. First, we find a strong and persistent spillover effect
of both horizontal FDI and FDI from technologically close industries. Second, the increase of patent
applications mainly comes from utility model and invention patent, liberalized industries see more invention patent grants and these patents get more citations, suggesting that the quality of domestic firms’
innovation also improved. Third, the competition effect outweighs agglomeration effects in local markets,
horizontal FDI in the same city negatively affects domestic firms’ innovation while horizontal FDI from
other cities generate positive effects. Finally, we show that local human capital stock and domestic firms’ absorptive capacity can hugely magnify positive spillovers. This informs policy makers about the important
factors to focus on to reap the benefits from FDI.
Specifically, we construct a technological closeness measure between industry pairs to explore a novel
channel of FDI spillovers from technologically close industries. To the best of our knowledge, our paper is the first to establish causal relationship between technologically close FDI and domestic firms’ innovation.

4
Our work builds on and contributes to two main strands of literature. First, this paper ties into a growing
body of literature on FDI and innovation. Javorcik et al. (2018) examined the relationship between the presence of foreign affiliates and product upgrading by Turkish manufacturing firms. The paper found
Turkish firms in sectors and regions more likely to supply foreign affiliates tend to introduce more complex
products. Guadalupe et al. (2012) used a panel dataset of Spanish manufacturing firms to show that
multinational firms acquire the most productive domestic firms, which, on acquisition, conduct more product and process innovation and adopt foreign technologies, leading to higher productivity. Iacovone et
al. (2009) examined the impact of FDI on the industry structure, productivity, and the rate of innovation of
domestic firms in Mexico. The paper studied the entry of Wal-Mart into Mexico following the 1994 North American Free Trade Agreement. Top Mexican manufacturers that supply to Wal-Mart increased their
R&D spending as well as outlays on technology acquisitions as the number of Wal-Mart shops in their state
went up. Cheung and Ping (2004) used provincial data from 1995 to 2000 to study the impact of FDI on
domestic patent applications in China. They found positive spillovers from FDI on the number of domestic patent applications for all three types of patents. Girma et al. (2009) investigated the relationship between
inward FDI and product innovation by Chinese state-owned enterprises (SOEs). Hu and Jefferson (2009)
found the growth of FDI in China stimulated a surge in patent application. Fu (2008) studied the impact of FDI on regional innovation in China. The paper showed that FDI had a significant positive impact on the
overall regional innovation capacity, and the strength of this positive effect depends on the absorptive
capacity and innovation-complementary assets in the host region. Zhang (2017) explored FDI spillovers on
domestic firms’ research activities in China. FDI was found to contribute positively to provincial patent application. However, previous studies usually use aggregate FDI or patent application data and suffer from
endogeneity issues. These studies also did not consider patent citations to measure innovation quality.
Second, literature abounds in identifying spillover effects of FDI, with mixed findings from different studies. Liu (2002) investigated whether FDI affects domestic firms’ productivity using data on 29
manufacturing industries over 1993-1998 in the Shenzhen Special Economic Zone of China. The paper
found positive effect from FDI on both the level and growth rate of domestic firms’ productivity. Liu (2008)
and Lu et al. (2017) found negative effect of horizontal FDI on domestic firms’ productivity level but positive effect on productivity growth. Many papers documented significant positive spillovers of vertical
FDI through supply chain linkages (Javorcik 2004 and 2008, Havranek and Irsova 2011, Blalock and
Gertler 2008, Liu, Wang and Wei 2009). The establishment of MNC affiliates can often benefit upstream
firms that supply to them as well as downstream firms that procure from MNC affiliates. The effects are conditioned by a variety of factors, including domestic firms’ absorptive capacity (Blyde et al. 2005; Reyes
2017), geographical distance from foreign-owned firms (Bwalya 2006, Halpern and Murakozy 2007), FDI’s
source country (Javorcik and Spatareanu 2011), motivation, level of foreign ownership, local sourcing
5
intensity, sectors in which domestic and foreign firms operate in (Havranek and Irsova 2011), technological
gaps between domestic firms and foreign firms (Crescenzi et al., 2020; Zhang et al., 2010) and so on.
This paper is most closely related to two papers. Lu et al. (2017) documented negative effect of
horizontal FDI on domestic firms’ productivity, but positive effect on productivity growth. Our paper
corroborates the positive effect on productivity growth due to the positive effect on domestic firms’
innovation. As (Hall 2011) points out, the presence of more innovative firms eventually translates into productivity improvements. Our paper focuses on the important source of productivity growth – innovation,
and justifies the conclusion in Lu et at. (2017). Jiang et al. (2019) studies the productivity and innovation
performance of international joint ventures by exploiting the changes in FDI policy in 2002. Their paper documented benefits from foreign technology in terms of innovation and productivity that go far beyond
the joint venture, not only to the Chinese joint venture parent firm but also to entrepreneurs at firms’
upstream from and in the same industry as the joint venture. Jiang et al. (2019) used total patent applications
and new product share to measure innovation. Our paper uses more detailed innovation metrics, estimates the dynamic effect of FDI exposure, and highlights a novel channel of spillovers – FDI from technologically
close industries.
Innovation deserves more attention as productivity measures such as labor productivity and total factor productivity (TFP) are often contaminated by firm-specific input costs, product quality, and market power
(Cusolito and Maloney 2018). Innovation measures – in this paper’s case patent applications, grants, and
citations – better capture the improvement in technology and the introduction of new products, processes,
and services to the marketplace.
The rest of the paper is organized as follows: section II introduces the background of FDI liberalization
in China, our data and estimation strategy. Section III shows empirical results. Section IV tests the validity
of our identification strategy and conducts various robustness checks. Section V explores mechanisms through domestic firms’ absorptive capacity, local human capital, and competition vs. agglomeration.
Section VI concludes and offers some policy implications.
II. Estimation strategies
2.1 FDI regulations in China
China began its reform and opening up policy in 1978. However, FDI was only allowed in four
designated Special Economic Zones (SEZs) in the early 1980s, and foreign investors were required to have local partners. Chinese government first allowed wholly foreign owned enterprises in 1986 and offered tax
6
incentives to export-oriented joint ventures and foreign enterprises with advanced technologies. Despite
these early policy encouragements, FDI inflows remained limited until 1992.
In the spring of 1992, Deng Xiaoping delivered his famous speech on deepening reform and opening-
up by attracting foreign investment. Chinese government subsequently made a series of major policy
reforms to improve investment climate, with a focus on attracting FDI in infrastructure and manufacturing
industries to boost exports. Encouraged by policy supports, more than 48,000 new foreign enterprises were established in 1992, and the actual use of foreign capital reached 11 billion US dollars, a 150 percent jump
from 1991. FDI continued to surge in the following years, as more and more multinational corporations
(MNCs) accelerated their investment in China. As of 2001, about 400 of the world’s top 500 MNCs have entered China. Most of them were in capital and technology-intensive industries, including Motorola, Nokia,
Ericsson, Siemens, Volkswagen, and General Motors. However, during 1992 to 2001, only some cities
were open to FDI (mostly coastal cities, provincial capital cities and special economic zones). FDI was also
restricted or forbidden in a range of industries, especially services sectors such as financial services, wholesale and retail and professional services.
Marked by China’s accession to WTO, China’s integration into the world economy has come to a new
level. To meet the WTO requirements, China substantially revised many laws and regulations on trade and FDI. Average import tariff was reduced from 17.2 in 2001 to 13.8 in 2002, the steepest single year drop in
our sample period 1998-2007. China also liberalized FDI in a wide range of sectors and moved from local
opening up to the whole country. Chinese government further removed export performance and local
content requirement to comply with the “Agreement on Trade-Related Investment Measures (TRIMS).”4 Financial services, telecom and communication, construction and a range of services sectors were gradually
opened. As a result of these liberalization measures, FDI inflows continued to grow rapidly, average annual
FDI inflows during 2001-2009 reached 72 billion US dollars, twice the level during 1992-2000.
The Chinese government also sought to attract high quality FDI in alignment with the transformation
of domestic economy. China has used tax incentives and other preferential policies to attract FDI in strategic
sectors since 1986, and began to publish the “Catalogue of Industries for Guiding Foreign Investment”
since 1995. The catalogue was updated in 1997. On March 11, 2002, Chinese government published the 2002 catalogue to replace the 1997 version, the new catalogue went into effect on April 1, 2002. China
4 The Agreement on Trade-Related Investment Measures (TRIMS) recognizes that certain investment measures can restrict and distort trade. It states that WTO members may not apply any measure that discriminates against foreign products or that leads to quantitative restrictions, both of which violate basic WTO principles. A list of prohibited TRIMS, such as local content requirements, is part of the Agreement. The TRIMS Committee monitors the operation and implementation of the Agreement and allows members the opportunity to consult on any relevant matters.

7
liberalized 112 of its 425 4-digit manufacturing industries for FDI in 2002. These industries have
experienced a surge of FDI inflows since 2002. Advanced technologies, know-how, equipment, and products brought by foreign firms greatly accelerated domestic firms’ development.
This paper uses an IV-DID approach to mitigate endogeneity issues. Specifically, we use the sectoral
FDI liberalization in 2002 as an IV for the presence of foreign-invested enterprises. The paper thus
compares the performance of domestic firms in the treatment group (industries that became more open for FDI) with that in the control group (industries that didn’t have any changes in FDI regulations, have mixed
changes or became more restrictive for FDI) in two periods: before and after China’s FDI liberalization in
2002. China continues to revise the catalogue in 2004, 2007, 2011, 2015, 2017 and 2019, but this paper focuses on the 2002 liberalization as it is by far the most significant wave of liberalization in the study
period.
Figure 1. FDI inflows into China
Source: MOFCOM, China.
The catalogue classifies industries into four types: (1) encouraged; (2) permitted; (3) restricted; and (4) prohibited. This paper assigns values from 1 to 4 to the four types and compares how the score changed
from the 1997 catalogue to 2002 catalogue. Positive changes mean FDI in the industry became more
encouraged after 2002, while negative changes indicate the industry became more restricted in terms of
FDI after 2002. Among the 425 4-digit industries, 112 became more encouraged, 300 remained unchanged, 5 industries had mixed changes, and 7 became more restricted. The government had multiple objectives for
changes in FDI regulations. While a primary goal was to promote export and industry upgrading, the central
government also encouraged FDI in less-developed areas, tried to protect infant domestic industries from foreign competition, improved environmental standards and weighed potential labor market effects. As a
result, many industries that became more open to FDI were not knowledge-intensive industries, such as
manufacturing of food and beverages, dairy products, manufacturing of animal feed etc.
0
50
100
150
1982 1986 1990 1994 1998 2002 2006 2010 2014 2018
billi
on U
SD
FDI inflows (billion USD)
8
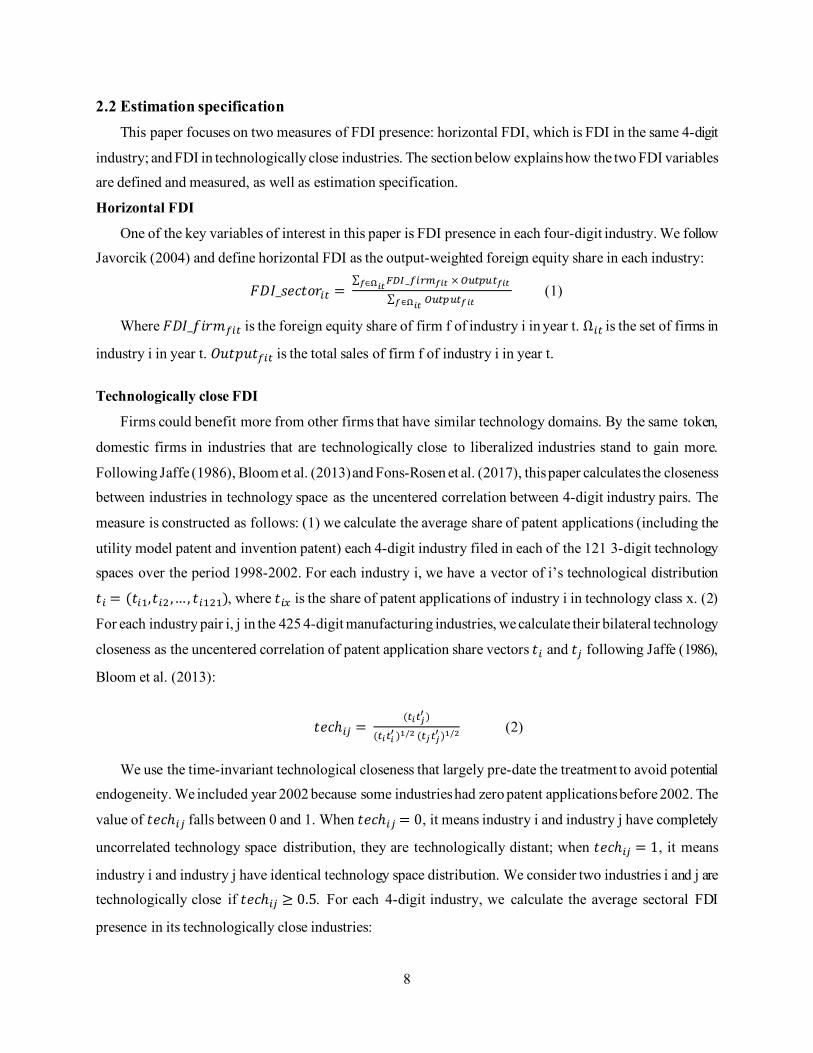
2.2 Estimation specification This paper focuses on two measures of FDI presence: horizontal FDI, which is FDI in the same 4-digit
industry; and FDI in technologically close industries. The section below explains how the two FDI variables are defined and measured, as well as estimation specification.
Horizontal FDI
One of the key variables of interest in this paper is FDI presence in each four-digit industry. We follow Javorcik (2004) and define horizontal FDI as the output-weighted foreign equity share in each industry:
𝐹𝐹𝐹𝐹𝐹𝐹_𝑠𝑠𝑠𝑠𝑠𝑠𝑠𝑠𝑠𝑠𝑠𝑠𝑖𝑖𝑖𝑖 = ∑ 𝐹𝐹𝐹𝐹𝐹𝐹_𝑓𝑓𝑖𝑖𝑓𝑓𝑓𝑓𝑓𝑓𝑓𝑓𝑓𝑓 × 𝑂𝑂𝑂𝑂𝑖𝑖𝑂𝑂𝑂𝑂𝑖𝑖𝑓𝑓𝑓𝑓𝑓𝑓𝑓𝑓∈Ω𝑓𝑓𝑓𝑓
∑ 𝑂𝑂𝑂𝑂𝑖𝑖𝑂𝑂𝑂𝑂𝑖𝑖𝑓𝑓𝑓𝑓𝑓𝑓𝑓𝑓∈Ω𝑓𝑓𝑓𝑓 (1)
Where 𝐹𝐹𝐹𝐹𝐹𝐹_𝑓𝑓𝑓𝑓𝑠𝑠𝑓𝑓𝑓𝑓𝑖𝑖𝑖𝑖 is the foreign equity share of firm f of industry i in year t. Ω𝑖𝑖𝑖𝑖 is the set of firms in
industry i in year t. 𝑂𝑂𝑂𝑂𝑠𝑠𝑂𝑂𝑂𝑂𝑠𝑠𝑓𝑓𝑖𝑖𝑖𝑖 is the total sales of firm f of industry i in year t.
Technologically close FDI
Firms could benefit more from other firms that have similar technology domains. By the same token,
domestic firms in industries that are technologically close to liberalized industries stand to gain more.
Following Jaffe (1986), Bloom et al. (2013) and Fons-Rosen et al. (2017), this paper calculates the closeness between industries in technology space as the uncentered correlation between 4-digit industry pairs. The
measure is constructed as follows: (1) we calculate the average share of patent applications (including the
utility model patent and invention patent) each 4-digit industry filed in each of the 121 3-digit technology spaces over the period 1998-2002. For each industry i, we have a vector of i’s technological distribution
𝑠𝑠𝑖𝑖 = (𝑠𝑠𝑖𝑖1,𝑠𝑠𝑖𝑖2 ,… , 𝑠𝑠𝑖𝑖121), where 𝑠𝑠𝑖𝑖𝑖𝑖 is the share of patent applications of industry i in technology class x. (2)
For each industry pair i, j in the 425 4-digit manufacturing industries, we calculate their bilateral technology
closeness as the uncentered correlation of patent application share vectors 𝑠𝑠𝑖𝑖 and 𝑠𝑠𝑗𝑗 following Jaffe (1986),
Bloom et al. (2013):
𝑠𝑠𝑠𝑠𝑠𝑠ℎ𝑖𝑖𝑗𝑗 = (𝑖𝑖𝑓𝑓𝑖𝑖𝑗𝑗
′ )
(𝑖𝑖𝑓𝑓𝑖𝑖𝑓𝑓′ )1/2 (𝑖𝑖𝑗𝑗𝑖𝑖𝑗𝑗
′ )1/2 (2)
We use the time-invariant technological closeness that largely pre-date the treatment to avoid potential endogeneity. We included year 2002 because some industries had zero patent applications before 2002. The
value of 𝑠𝑠𝑠𝑠𝑠𝑠ℎ𝑖𝑖𝑗𝑗 falls between 0 and 1. When 𝑠𝑠𝑠𝑠𝑠𝑠ℎ𝑖𝑖𝑗𝑗 = 0, it means industry i and industry j have completely
uncorrelated technology space distribution, they are technologically distant; when 𝑠𝑠𝑠𝑠𝑠𝑠ℎ𝑖𝑖𝑗𝑗 = 1, it means
industry i and industry j have identical technology space distribution. We consider two industries i and j are technologically close if 𝑠𝑠𝑠𝑠𝑠𝑠ℎ𝑖𝑖𝑗𝑗 ≥ 0.5. For each 4-digit industry, we calculate the average sectoral FDI
presence in its technologically close industries:

9
𝐹𝐹𝐹𝐹𝐹𝐹_𝑠𝑠𝑠𝑠𝑠𝑠ℎ𝑠𝑠𝑐𝑐𝑠𝑠𝑠𝑠𝑠𝑠𝑖𝑖𝑖𝑖 =∑ 𝐹𝐹𝐹𝐹𝐹𝐹_𝑠𝑠𝑠𝑠𝑠𝑠𝑖𝑖𝑠𝑠𝑓𝑓𝑗𝑗𝑓𝑓𝑗𝑗∈Ω,j≠i
𝑛𝑛 (3)
Ω is the set of industries that are technologically close to industry i; n is the number of industries in Ω.
While China liberalized 112 manufacturing industries in 2002, we expect industries that are technologically close to these treatment industries to benefit more from knowledge spillovers.
Technologically close FDI is a new channel that lies at the core of innovation spillovers. It is distinct
from input-output linkages through vertical FDI, it directly captures knowledge spillovers from similar
technology spaces. This paper estimates the impact of horizontal and technologically close FDI in the main regressions, and controls vertical FDI as a robustness check to show that knowledge spillovers from
technologically close FDI exist even when vertical FDI spillovers are controlled for.
This paper uses the following baseline specification:
𝑦𝑦𝑓𝑓𝑖𝑖𝑖𝑖 = 𝛼𝛼𝑓𝑓 + 𝛾𝛾𝑖𝑖 + 𝛿𝛿1𝐹𝐹𝐹𝐹𝐹𝐹_𝑠𝑠𝑠𝑠𝑠𝑠𝑠𝑠𝑠𝑠𝑠𝑠𝑖𝑖𝑖𝑖 + 𝛿𝛿2𝐹𝐹𝐹𝐹𝐹𝐹_𝑠𝑠𝑠𝑠𝑠𝑠ℎ𝑠𝑠𝑐𝑐𝑠𝑠𝑠𝑠𝑠𝑠𝑖𝑖𝑖𝑖 + 𝑋𝑋𝑓𝑓𝑖𝑖𝑖𝑖′ 𝛽𝛽+ 𝜀𝜀𝑓𝑓𝑖𝑖𝑖𝑖 (4)
Where f, i, and t denote the firm, four-digit industry and year respectively. 𝑦𝑦𝑓𝑓𝑖𝑖𝑖𝑖 measures the innovation
output of domestic firms, which includes total patent application, design patent application, utility model patent application, invention patent application, invention patent grant, cumulative citation of invention
patent after 5 years of publication. 𝛼𝛼𝑓𝑓 is firm fixed effect; 𝛾𝛾𝑖𝑖 is year fixed effect; 𝐹𝐹𝐹𝐹𝐹𝐹_𝑠𝑠𝑠𝑠𝑠𝑠𝑠𝑠𝑠𝑠𝑠𝑠𝑖𝑖𝑖𝑖 is the
horizontal FDI measure defined as output-weighted foreign equity share in each four-digit industry;
𝐹𝐹𝐹𝐹𝐹𝐹_𝑠𝑠𝑠𝑠𝑠𝑠ℎ𝑠𝑠𝑐𝑐𝑠𝑠𝑠𝑠𝑠𝑠𝑖𝑖𝑖𝑖 is the simple average of FDI presence in all industries that are technologically close to
industry i in year t. 𝑋𝑋𝑓𝑓𝑖𝑖𝑖𝑖′ are time varying firm level controls, including firm sales, firm capital-labor ratio,
exporter status, and SOE dummy.
Industries that have more technological breakthroughs could be more likely to attract FDI. This will
bias the OLS estimate upward. On the contrary, FDI may prefer to enter industries where Chinese firms are less competitive, this can lead to downward biases in the OLS estimation. To alleviate the endogeneity of
horizontal FDI, the paper instruments horizontal FDI with changes in sectoral FDI policies in 2002. We
also construct an IV for technologically close FDI: 𝐹𝐹𝐼𝐼_𝑠𝑠𝑠𝑠𝑠𝑠ℎ𝑠𝑠𝑐𝑐𝑠𝑠𝑠𝑠𝑠𝑠𝑖𝑖𝑖𝑖 = ∑ 𝑇𝑇𝑠𝑠𝑠𝑠ℎ𝑠𝑠𝑐𝑐𝑠𝑠𝑠𝑠𝑠𝑠𝑖𝑖𝑗𝑗𝑗𝑗 𝑖𝑖𝑓𝑓 𝑗𝑗≠𝑖𝑖 ×
𝑠𝑠𝑠𝑠𝑠𝑠𝑡𝑡𝑠𝑠𝑓𝑓𝑠𝑠𝑡𝑡𝑠𝑠× 𝑂𝑂𝑠𝑠𝑠𝑠𝑠𝑠02𝑖𝑖𝑖𝑖/𝑁𝑁. 𝑇𝑇𝑠𝑠𝑠𝑠ℎ𝑠𝑠𝑐𝑐𝑠𝑠𝑠𝑠𝑠𝑠𝑖𝑖𝑗𝑗 is a dummy variable that equals one if industry i and industry
j are technologically close. N denotes the total number of technologically close industries for industry
i.
The first stage regressions are shown below:

10
𝐹𝐹𝐹𝐹𝐹𝐹_𝑠𝑠𝑠𝑠𝑠𝑠𝑠𝑠𝑠𝑠𝑠𝑠𝑖𝑖𝑖𝑖 = 𝛼𝛼𝑓𝑓 + 𝛾𝛾𝑖𝑖 + 𝜃𝜃1𝑠𝑠𝑠𝑠𝑠𝑠𝑡𝑡𝑠𝑠𝑓𝑓𝑠𝑠𝑡𝑡𝑠𝑠 × 𝑂𝑂𝑠𝑠𝑠𝑠𝑠𝑠02𝑖𝑖𝑖𝑖 + 𝜃𝜃2𝐹𝐹𝐼𝐼_𝑠𝑠𝑠𝑠𝑠𝑠ℎ𝑠𝑠𝑐𝑐𝑠𝑠𝑠𝑠𝑠𝑠𝑖𝑖𝑖𝑖 + 𝑋𝑋𝑓𝑓𝑖𝑖𝑖𝑖′ 𝛽𝛽 + 𝜀𝜀𝑖𝑖𝑖𝑖 (5)
𝐹𝐹𝐹𝐹𝐹𝐹_𝑠𝑠𝑠𝑠𝑠𝑠ℎ𝑠𝑠𝑐𝑐𝑠𝑠𝑠𝑠𝑠𝑠𝑖𝑖𝑖𝑖 = 𝛼𝛼𝑓𝑓 + 𝛾𝛾𝑖𝑖 + 𝜃𝜃3𝑠𝑠𝑠𝑠𝑠𝑠𝑡𝑡𝑠𝑠𝑓𝑓𝑠𝑠𝑡𝑡𝑠𝑠 × 𝑂𝑂𝑠𝑠𝑠𝑠𝑠𝑠02𝑖𝑖𝑖𝑖 + 𝜃𝜃4𝐹𝐹𝐼𝐼_𝑠𝑠𝑠𝑠𝑠𝑠ℎ𝑠𝑠𝑐𝑐𝑠𝑠𝑠𝑠𝑠𝑠𝑖𝑖𝑖𝑖 + 𝑋𝑋𝑓𝑓𝑖𝑖𝑖𝑖′ 𝛽𝛽 + 𝜀𝜀𝑖𝑖𝑖𝑖 (6)
𝛼𝛼𝑓𝑓 is firm fixed effect, 𝛾𝛾𝑖𝑖 is year fixed effect. 𝑠𝑠𝑠𝑠𝑠𝑠𝑡𝑡𝑠𝑠𝑓𝑓𝑠𝑠𝑡𝑡𝑠𝑠× 𝑂𝑂𝑠𝑠𝑠𝑠𝑠𝑠02𝑖𝑖𝑖𝑖 is the interaction between the
treatment dummy and the post 2002 dummy, 𝐹𝐹𝐼𝐼_𝑠𝑠𝑠𝑠𝑠𝑠ℎ𝑠𝑠𝑐𝑐𝑠𝑠𝑠𝑠𝑠𝑠𝑖𝑖𝑖𝑖 is the IV for technologically close FDI, 𝑋𝑋𝑓𝑓𝑖𝑖𝑖𝑖′
are time varying firm level controls. Firm level controls are the same as in specification (1). Treatment is
defined as whether FDI in an industry became more encouraged after 2002. It takes the value of 1 if yes, and 0 if otherwise.
2.3 Data
Panel data on industrial firms
The main data used in this paper is the Annual Survey of Industrial Firms (ASIF). The ASIF database is a nationwide mandatory survey administered annually by the National Bureau of Statistics (NBS) in
China to firms in mining industries, manufacturing industries and utility industries. NBS uses the ASIF
database to compute China’s GDP, and the aggregate information is published in the official China
Statistics Yearbooks. It contains many firms distributed across more than 600 four-digit industries and throughout China’s 31 provinces, autonomous regions, and municipalities. Firms in the sample account for
95 percent of total Chinese industrial output and 98 percent of total Chinese industrial exports (Eberhardt,
Helmers, and Yu, 2011). We use the ASIF database for the 1998-2007 period. The sample covers all state-owned enterprises (SOEs) and private companies with annual sales above 5 million RMB (about 600,000-
660,000 US dollars based on exchange rate during that period). The number of firms covered in the sample
increased steadily from around 165,000 in 1998 to 336,000 in 2007.
The database contains more than 100 variables covering firms’ basic information, financial and operational information. Basic information includes the unique identifier, firm name, legal representative,
detailed address, year of incorporation, main product, industry affiliation, and ownership structure.
Financial and operational information cover most items in firms’ balance sheet, profit and loss statement, as well as cash flow statement.
This paper constructs a ten-year panel based on the unique firm identifier, firm name, firm legal
representative, telephone number, address and industry. For sample period 1998 to 2002, the database used
China’s 1994 industry classification (GB/T 4754-1994). From 2003 and onwards, the sample adopted the 2002 industry classification (GB/T 4754-2002). We use a concordance table developed by Brandt et al.
(2012) to convert industry code for 1998-2002 period to 2002 industry classification. The final sample has
425 four-digit manufacturing industries.
11
Patent application data China grants three types of patents: design patent, utility model patent, and invention patent. The
invention patent protects “any new technical solution relating to a product, a process or improvement”. The
State Intellectual Property Office of China (SIPO) conducts a thorough investigation as to the novelty,
inventiveness, and usefulness of the innovation before issuing the patent. It could take years to grant an invention patent. A utility model patent protects “any new technical solution relating to the shape, structure,
or combination thereof, of a product which is fit for practical use”. It is not subject to a substantive
examination as in the case of an invention patent. The utility model patent is often seen as an improvement in functionality rather than an entirely new solution. A design patent protects “any new design of the shape,
pattern, color, or combination thereof, of a product, which creates an aesthetic feeling and is fit for industrial
application”.
This paper used the linked database for SIPO patents and ASIF firms from 1998 to 2009 to obtain firm level patent applications for all three types of patents. This database was constructed under the “Chinese
Patent Data Project” and is publicly available. The paper matches firm names in the ASIF database (1998-
2009) with patent assignees from SIPO database. This exact matching was supplemented with strict substring matching to limit loss of potentially true matches. The paper also adopted manual checks to ensure
match quality. Eventually, the paper obtained more than 1.1 million matches for firms in the ASIF database.
Among these matches, nearly 400,000 were design patents, more than 424,000 were utility model patents,
and about 332,000 were invention patents. Please see He et al. (2016) (Construction of a database linking SIPO patents to firms in China’s annual survey of industrial enterprises 1998-2009) for details on this
database.
Patent citation data
The patent citation data tracks all forward citations of each utility model and invention patent filed in
China. As the universe of patents are limited to patents filed in China, citation by scholarly articles or
patents filed in foreign countries are not counted. This paper calculated the cumulative citation of each patent after 5 years of publication. The number of citations a patent receives often reflects the technological
importance of the patent for the development of subsequent technologies, and thus measures the economic
value of inventions (Hall et al. 2005).
FDI regulations data

12
We manually constructed the FDI regulations data by comparing the 1997 and 2002 Catalogue for the
Guidance of Foreign Investment Industries. The 2002 revision was substantial and in strict accordance with the commitments made by China’s central government in its negotiations with WTO members before 2001.
The changes are plausibly exogenous to China’s domestic situations, as the process took 15 years and
involved numerous negotiations with many WTO member countries.
The Catalogue classifies sectors and products into four categories: (1) FDI was encouraged; (2) FDI was permitted, these industries and products are not listed in the Catalogue; (3) FDI was restricted; and (4)
FDI was prohibited. We first map each industry and product to the 4-digit industry in 2002 industry
classification, then assign value 1 to all industries that are encouraged, 2 to permitted industries, 3 to restricted industries, and 4 to prohibited industries. We do these two steps for the 1997 and 2002 Catalogue
respectively, and then calculate the change in FDI policy for each industry from 1997 to 2002. Positive
changes indicate the industry became more restricted after 2002, while negative changes mean the industry
became more open to FDI. About 300 industries experienced no changes in FDI regulations. Five industries had mixed changes, where one or more products in the industry became more open while one or more
products became more restricted. We consider the industries that became more open to FDI the treatment
group, all other industries are the control group.
Prefecture level human capital stock data
To test how local human capital stock affects FDI spillovers, we use China’s population census data in 2000
and calculate the share of adult population aged between 18-55 with a bachelor’s degree or above at the
prefecture level. We used the 2000 data to mitigate endogeneity, as FDI liberalization in 2002 could induce labor migration, which affects local human capital stock afterwards.
Summary statistics
From pre-treatment period to post-treatment period, FDI presence intensified in most sectors (Table 1). The increase was most notable in electronics and telecommunication equipment, the industry was already
dominated by foreign firms before 2002 and foreign equity share further grew by 17.4 percentage points.
This was followed by optical equipment (8.4 percentage points), special purpose machinery (7.5 percentage
points) and chemicals (7 percentage points). Foreign equity share shrank slightly in tobacco, food manufacturing, chemical fiber, wood and leather products, and dropped by 32 percentage points in recycling.
Table 1. Changes in output-weighted foreign equity share at 2-digit industry level
2-digit Industry 1998-2001 2002-2007 Diff
Food processing 17.3% 19.7% 2.4%
Food manufacturing 31.0% 30.6% -0.4%

13
Beverage manufacturing 21.9% 26.9% 5.1%
Tobacco 0.2% 0.1% -0.1% Textiles 15.6% 17.5% 1.9%
Garment and footwear 33.5% 36.1% 2.6% Leather, furs and related products 44.7% 41.3% -3.4%
Wood and wood products 19.7% 16.7% -3.0% Furniture 34.2% 40.6% 6.4%
Paper and paper products 21.7% 25.2% 3.5% Printing 20.7% 23.2% 2.4%
Cultural and sports goods 50.0% 51.4% 1.4%
Petroleum and coke 6.2% 8.8% 2.6% Chemicals and chemical products 13.2% 20.1% 7.0%
Pharmaceuticals 14.8% 17.7% 2.9% Chemical fiber 16.7% 14.6% -2.1%
Rubber products 23.1% 29.1% 5.9% Plastic products 31.4% 33.6% 2.1%
Non-metallic mineral products 11.0% 13.2% 2.2%
Ferrous metal processing 4.4% 9.1% 4.8% Non-ferrous metal processing 7.1% 9.9% 2.8%
Metal products 24.5% 26.5% 1.9% General purpose machinery 16.0% 19.3% 3.3%
Special purpose machinery 10.7% 18.2% 7.5% Transport equipment 18.2% 23.6% 5.5%
Electrical machinery and equipment 24.9% 29.5% 4.6% Electronics and telecommunication equipment 53.6% 71.0% 17.4%
Optical instruments 51.5% 59.8% 8.4%
Art and other manufacturing 32.0% 33.1% 1.1% Recycling 58.1% 26.3% -31.8%
Note: This table shows the output-weighted foreign equity share at 2-digit manufacturing industry level
during the pre-treatment (1998-2001) and post-treatment (2002-2007) periods, and their differences.
Table 2 shows the summary statistics on domestic firm characteristics and their patenting behavior in
pre-treatment and post-treatment periods. Compared with pre-treatment period, domestic firms in the post-
treatment sample are much younger, have higher sales, much higher capital-labor ratio, less export-oriented,
and much less likely to be SOEs. Domestic firms’ patent application also skyrocketed during the study period. Average annual patent applications nearly quadrupled from 12,812 during 1998-2001 to 47,755
during 2002-2007. Invention patent applications increased most rapidly. In pre-treatment period, the

14
probability of a firm applying for invention patent was merely 0.51 percent. The probability more than
doubled during 2002-2007, to 1.38 percent. Among firms that applied for invention patents, each firm on average filed 3.55 invention patent applications per year in 1998-2001, and 6.18 invention patent
applications per year during 2002-2007. Utility model patent applications also ballooned.
Table 2. Summary statistics of key variables
1998-2001 2002-2007 Diff
Firm age 14.14 8.91 -5.23***
Sales 9.59 9.99 0.4*** Capital-labor ratio 144.71 212.89 68.18***
Exporter status 19.37% 16.42% -2.95%*** New product share 2.91% 2.88% -0.03%
SOE 24.44% 6.39% -18.05%***
Prob. Of applying for design patent 1.14% 1.18% 0.04% Prob. Of applying for utility model patent 1.42% 2.03% 0.62%***
Prob. Of applying for invention patent 0.51% 1.38% 0.87%*** Avg. design patent application 6.04 8.32 2.28***
Avg. utility patent application 3.66 4.8 1.14*** Avg. invention patent application 3.55 6.18 2.63**
Avg. invention patent grant 3.7 5.8 2.1**
Avg. invention patent citation 0 0.0175 0.0175***
Note: This table compares firm characteristics and their patent application, invention patent grant and citation between pre-treatment and post-treatment periods.
We provide graphical evidence of the effect of FDI liberalization and test the parallel trend assumption.
Patent application patterns in treatment and control groups are largely in parallel during the pre-treatment period, but total patent applications and invention patent applications in treatment industries began to
outpace those in control industries since FDI liberalization (Figure 2, upper panel). Similarly, industries
that are more technologically close to liberalized industries experience faster growth in their patent applications after 2002 (Figure 2, bottom panel).

15
Figure 2. Domestic firms’ patent application trends
Note: Figure 2 plots the trend in domestic firms’ total and invention patent application by group over time. The upper panel shows how domestic firms in industries that opened up for FDI in 2002 compare with domestic firms in other
industries in patent application. The bottom panel compares patent application patterns in domestic firms that have above median technological closeness (High) to liberalized industries with those that have below median technological
closeness (Low).
III. Empirical results
3.1 Event study
We first conduct an event study to show the effect of FDI liberalization on domestic firms’ patent
applications over time. As the liberalization happened in 2002, we use 2001 as the baseline, and estimate the panel fixed effects (FE) model below:
For horizontal FDI:
ln𝑂𝑂𝑡𝑡𝑠𝑠𝑠𝑠𝑡𝑡𝑠𝑠𝑓𝑓𝑖𝑖𝑖𝑖 = 𝛼𝛼𝑓𝑓 + 𝛾𝛾𝑖𝑖 + ∑ 𝑇𝑇2001+𝑖𝑖6𝑖𝑖=−3 × 𝑠𝑠𝑠𝑠𝑠𝑠𝑡𝑡𝑠𝑠𝑓𝑓𝑠𝑠𝑡𝑡𝑠𝑠𝑖𝑖 + 𝑋𝑋𝑓𝑓𝑖𝑖𝑖𝑖′ 𝛽𝛽+ 𝜀𝜀𝑓𝑓𝑖𝑖𝑖𝑖 (7)

16
To deal with the large number of zero in patent applications, we use ln(1 + 𝑂𝑂𝑡𝑡𝑠𝑠𝑠𝑠𝑡𝑡𝑠𝑠𝑓𝑓𝑖𝑖𝑖𝑖) as ln𝑂𝑂𝑡𝑡𝑠𝑠𝑠𝑠𝑡𝑡𝑠𝑠𝑓𝑓𝑖𝑖𝑖𝑖.
𝛼𝛼𝑓𝑓 is firm fixed effect, 𝛾𝛾𝑖𝑖 is year fixed effect. We control year dummies to reflect common shocks to all
firms in each year, and time varying firm characteristics 𝑋𝑋𝑓𝑓𝑖𝑖𝑖𝑖′ , which includes firm sales, capital-labor ratio,
exporter status, and SOE dummy. ∑ 𝑇𝑇2001+𝑖𝑖6𝑖𝑖=−3 × 𝑠𝑠𝑠𝑠𝑠𝑠𝑡𝑡𝑠𝑠𝑓𝑓𝑠𝑠𝑡𝑡𝑠𝑠𝑖𝑖 estimates the dynamic treatment effect.
For technologically close FDI, we divide industries into two groups based on 𝐹𝐹𝐼𝐼_𝑠𝑠𝑠𝑠𝑠𝑠ℎ𝑠𝑠𝑐𝑐𝑠𝑠𝑠𝑠𝑠𝑠𝑖𝑖2002 .
Industries with above median 𝐹𝐹𝐼𝐼_𝑠𝑠𝑠𝑠𝑠𝑠ℎ𝑠𝑠𝑐𝑐𝑠𝑠𝑠𝑠𝑠𝑠𝑖𝑖2002 in 2002 have higher FDI presence in their technologically
close industries post 2002, while industries with below median 𝐹𝐹𝐼𝐼_𝑠𝑠𝑠𝑠𝑠𝑠ℎ𝑠𝑠𝑐𝑐𝑠𝑠𝑠𝑠𝑠𝑠𝑖𝑖2002 have lower exposure to
FDI in technologically close industries. We compare the two groups of industries’ patent application pattern as follows:
ln𝑂𝑂𝑡𝑡𝑠𝑠𝑠𝑠𝑡𝑡𝑠𝑠𝑓𝑓𝑖𝑖𝑖𝑖 = 𝛼𝛼𝑓𝑓 + 𝛾𝛾𝑖𝑖 + ∑ 𝑇𝑇2001+𝑖𝑖6𝑖𝑖=−3 × 𝑡𝑡𝑎𝑎𝑠𝑠𝑎𝑎𝑠𝑠 𝑓𝑓𝑠𝑠𝑚𝑚𝑓𝑓𝑡𝑡𝑡𝑡 𝐹𝐹𝐼𝐼_𝑠𝑠𝑠𝑠𝑠𝑠ℎ𝑠𝑠𝑐𝑐𝑠𝑠𝑠𝑠𝑠𝑠𝑖𝑖 + 𝑋𝑋𝑓𝑓𝑖𝑖𝑖𝑖′ 𝛽𝛽 + 𝜀𝜀𝑓𝑓𝑖𝑖𝑖𝑖 (8)
The graphical results are presented in Figure 3 and Figure 4. Total patent applications in treatment
industries were similar to that in control industries before 2001 but shows a clear upward trend since T+1, indicating positive spillovers from FDI exposure in the same industry. The upper right panel shows the
effect on design patent applications. Horizontal FDI seems to have no major effect on domestic firms’
design patent applications, the coefficients remained insignificant throughout the study period. The effects
are much stronger and more significant for utility model patent and invention patent applications. Treatment industries show a similar pre-trend as control industries, suggesting that the two groups are largely
comparable. Utility model patent application in treatment group jumped immediately after FDI
liberalization and the gap continued to widen, while it took more time for domestic firms in treatment industries to file more invention patent applications. This makes sense as it is easier for domestic firms to
start minor innovations (utility model patent) after initial FDI exposure.
Figure 3. Event study estimation: Horizontal FDI liberalization and domestic firms’ patent application

17
Note: The figure displays the estimated coefficients on patent application difference between industries that were
opened up for FDI in 2002 and those that did not (control group) and the 95% confidence interval.
Similarly, our event study manifests that domestic firms that are technologically close to liberalized
industries have parallel trends in patent applications with domestic firms that are technologically distant
(Figure 4). Exposure to FDI in technologically close industries still has no effect on domestic firms’ design patent applications but demonstrates strong and persistent positive effects on utility model patent and
invention patent applications. Unlike horizontal FDI, FDI presence in technologically close industries
generate positive effects on domestic firms’ utility model and invention patent applications immediately after exposure. This is probably because foreign firms in the same industry compete directly with domestic
firms, therefore it could take longer for domestic firms to adapt and benefit from horizontal FDI.
Figure 4. FDI liberalization in technologically close industries and domestic firms’ patent application

18
Note: The figure displays the estimated coefficients on patent application difference between industries that have
above median 𝐹𝐹𝐼𝐼_𝑠𝑠𝑠𝑠𝑠𝑠ℎ𝑠𝑠𝑐𝑐𝑠𝑠𝑠𝑠𝑠𝑠𝑖𝑖2002 and those that are below median (control group) and the 95% confidence interval.
Above median 𝐹𝐹𝐼𝐼_𝑠𝑠𝑠𝑠𝑠𝑠ℎ𝑠𝑠𝑐𝑐𝑠𝑠𝑠𝑠𝑠𝑠𝑖𝑖2002 indicates the industry is more technologically close to liberalized industries.
3.2 Main results As invention patent represents the most high-quality innovation, the empirical results below will
primarily focus on the effect of FDI presence on domestic firms’ invention patent application. Table 3
reports the results from reduced form regression. Column 1 shows the simultaneous effect of exposure to
FDI, and column 2-4 shows the lagged effect from FDI exposure after 1 to 3 years. As our patent application data is only up to 2009, 3-year lagged patent application is missing for firms in 2007 ASIF database. That
is why the number of observations for column 4 is smaller. Invention patent application from domestic
firms in treatment industries will be 0.3 percent higher than that from control groups in the same year of FDI exposure. The effect grows steadily to 0.9 percent three years after exposure. The effect is much larger
for domestic firms in industries that are technologically close to liberalized industries. The
contemporaneous effect on domestic firms in technologically close industries is 3.55 percent, ten times the
effect of horizontal FDI. The effect from technologically close FDI remains stable even after three years of exposure.
Table 3. Reduced Form results: invention patent application
(1) (2) (3) (4)
T T+1 T+2 T+3
Dependent variable: Invention patent application
Treatment × Post02 0.00320** 0.00394** 0.00756*** 0.00913***
(0.00144) (0.00160) (0.00177) (0.00182)
Treatment × Post02 × Techclose 0.0355*** 0.0398*** 0.0433*** 0.0383*** (0.00443) (0.00508) (0.00545) (0.00560)
Observations 1,383,715 1,383,715 1,383,715 1,151,980

19
Firm FE Y Y Y Y
Year FE Y Y Y Y Time varying firm controls Y Y Y Y
Note: Table 3 reports dynamic effects of exposure to horizontal and technologically close FDI on domestic firms’
invention patent application based on reduced form regression. The dependent variable is domestic firms’ invention patent application. Column (1) reports the effect in the year of exposure, while column (2)-(4) reports lagged effect
after 1-3 years of exposure. Time varying firm controls include firm sales, capital-labor ratio, export status and
SOE dummy. Robust standard errors in parentheses. *** p<0.01, ** p<0.05, * p<0.1.
Fixed effects results
Results from panel fixed effects regressions show that both horizontal and technologically close FDI are positively associated with domestic firms’ invention patent application (Table 4). A one percentage
point increase in an industry’s foreign equity share is associated with 0.06 percent increase in domestic
firms’ total patent application in the same year. The positive effect increases over time, which is largely expected as it takes time for technological spillovers to diffuse. After 2 years the effect is nearly twice as
large as the simultaneous effect. A one percentage point increase in foreign equity share in technologically
close industries raises domestic firms’ invention patent application in the same year by 0.15 percent, three
times the effect of horizontal FDI. The positive effect from technologically close FDI also increases over time. The coefficients are all significant at 1% confidence level, and the magnitudes are economically
significant.
Table 4. Fixed Effects model: invention patent application
(1) (2) (3) (4)
T T+1 T+2 T+3
Dependent variable: Invention patent application
FDI_sector 0.0577*** 0.0781*** 0.0978*** 0.0909***
(0.00687) (0.00759) (0.00834) (0.00905)
FDI_techclose 0.148*** 0.157*** 0.165*** 0.162*** (0.0123) (0.0129) (0.0138) (0.0153)
Observations 1,383,715 1,383,715 1,383,715 1,151,980
Firm FE Y Y Y Y Year FE Y Y Y Y
Time varying firm controls Y Y Y Y
Note: Table 4 reports dynamic effects of exposure to horizontal and technologically close FDI on domestic firms’ invention patent application based on firm fixed effects model. The dependent variable is domestic firms’ invention
patent application. Column (1) reports the effect in the year of exposure, while column (2)-(4) reports lagged effect
20
after 1-3 years of exposure. Time varying firm controls include firm sales, capital-labor ratio, export status and
SOE dummy. Robust standard errors in parentheses. *** p<0.01, ** p<0.05, * p<0.1.
IV model
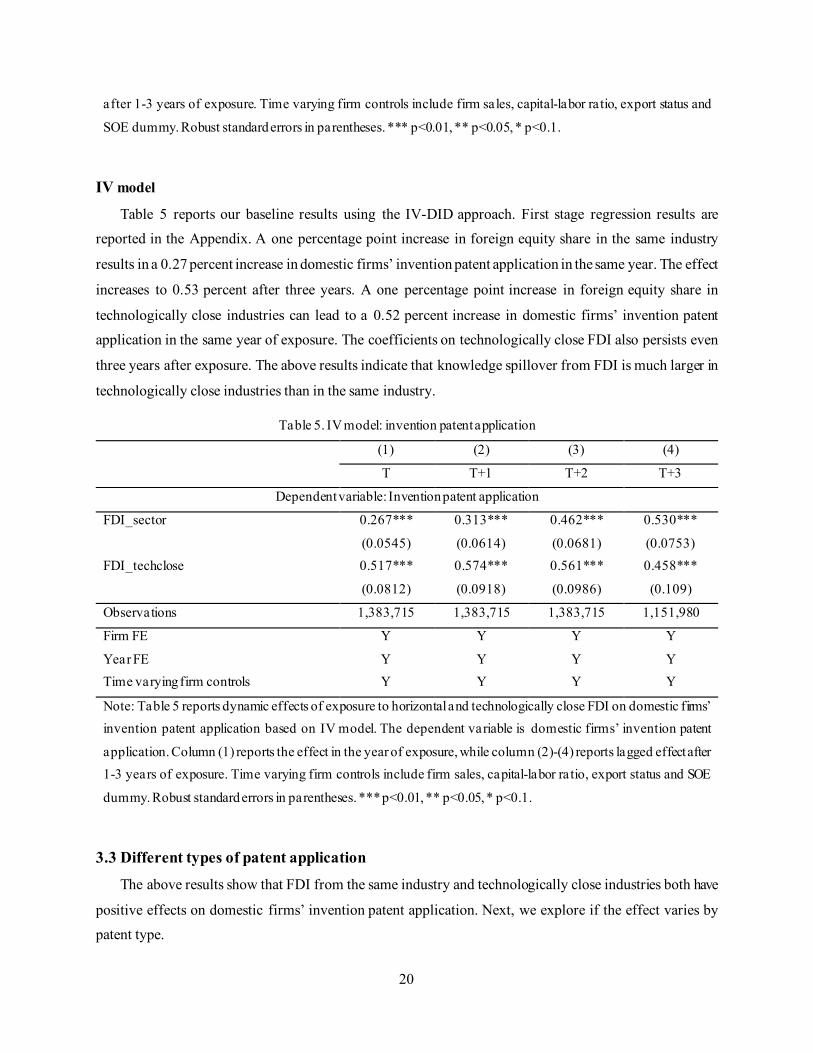
Table 5 reports our baseline results using the IV-DID approach. First stage regression results are reported in the Appendix. A one percentage point increase in foreign equity share in the same industry
results in a 0.27 percent increase in domestic firms’ invention patent application in the same year. The effect
increases to 0.53 percent after three years. A one percentage point increase in foreign equity share in
technologically close industries can lead to a 0.52 percent increase in domestic firms’ invention patent application in the same year of exposure. The coefficients on technologically close FDI also persists even
three years after exposure. The above results indicate that knowledge spillover from FDI is much larger in
technologically close industries than in the same industry.
Table 5. IV model: invention patent application
(1) (2) (3) (4)
T T+1 T+2 T+3
Dependent variable: Invention patent application
FDI_sector 0.267*** 0.313*** 0.462*** 0.530***
(0.0545) (0.0614) (0.0681) (0.0753)
FDI_techclose 0.517*** 0.574*** 0.561*** 0.458***
(0.0812) (0.0918) (0.0986) (0.109)
Observations 1,383,715 1,383,715 1,383,715 1,151,980
Firm FE Y Y Y Y
Year FE Y Y Y Y Time varying firm controls Y Y Y Y
Note: Table 5 reports dynamic effects of exposure to horizontal and technologically close FDI on domestic firms’ invention patent application based on IV model. The dependent variable is domestic firms’ invention patent
application. Column (1) reports the effect in the year of exposure, while column (2)-(4) reports lagged effect after 1-3 years of exposure. Time varying firm controls include firm sales, capital-labor ratio, export status and SOE
dummy. Robust standard errors in parentheses. *** p<0.01, ** p<0.05, * p<0.1.
3.3 Different types of patent application
The above results show that FDI from the same industry and technologically close industries both have
positive effects on domestic firms’ invention patent application. Next, we explore if the effect varies by patent type.

21
Table 6 presents IV results on domestic firms’ design patent application and utility model patent
application. Horizontal FDI seems to have positive effect on domestic firms’ design patent application initially, but the effect disappears two years after FDI exposure. FDI in technologically close industries
does not have a significant effect on design patent application in the first three years, but can be negative
in the fourth year. Panel B shows the effect on utility model patent application. Both horizontal and
technologically close FDI have strong, positive, and increasing effect on domestic firms’ utility model patent application, but the effect from horizontal FDI is larger. This is contrary to the case for invention
patent application, where the effect of horizontal FDI is smaller in the beginning of exposure and only
exceeds the effect from technologically close FDI three years after exposure. This is intuitive as it is easier to conduct minor innovation through imitating the technology of foreign competitors.
Table 6. IV model: patent application by type
(1) (2) (3) (4)
T T+1 T+2 T+3
Panel A. Dependent variable: Design patent application
FDI_sector 0.130** 0.109* 0.0759 -0.00205
(0.0576) (0.0595) (0.0617) (0.0677)
FDI_techclose 0.0744 0.0152 -0.0756 -0.209**
(0.0873) (0.0849) (0.0873) (0.0973)
Panel B. Dependent variable: Utility model patent application
FDI_sector 0.645*** 0.678*** 0.814*** 0.836***
(0.0725) (0.0769) (0.0829) (0.0921)
FDI_techclose 0.318*** 0.418*** 0.455*** 0.430***
(0.106) (0.116) (0.124) (0.135)
Observations 1,383,715 1,383,715 1,383,715 1,151,980
Firm FE Y Y Y Y
Year FE Y Y Y Y Time varying firm controls Y Y Y Y
Note: Table 6 reports dynamic effects of exposure to horizontal and technologically close FDI on domestic firms’
design and utility model patent application based on IV model. Column (1) reports the effect in the year of exposure, while column (2)-(4) reports lagged effect after 1-3 years of exposure. Time varying firm controls include firm
sales, capital-labor ratio, export status and SOE dummy. Robust standard errors in parentheses. *** p<0.01, **
p<0.05, * p<0.1.
22
3.4 Patent quality: Invention patent grant and invention patent citation
Previous results have shown that exposure to FDI – both in the same industry and in technologically
close industries – could stimulate domestic firms’ invention and utility model patent application. While patent application is often used to measure innovation output, the simple count of patent applications does
not reflect the true value of these innovations. Patent grants are more suitable than patent applications in
measuring the usefulness or creativity of a firm’s innovation because the approval requirements are usually much higher than the application requirements for a patent (Santacreu and Zhu 2018). Patent citation is also
widely used to measure the quality of patents. We obtained patent citation data from TekGlory and
calculated the cumulative citation for every published invention patent citation five years after the
publication date. This section uses invention patent grant and invention patent citation to test if exposure to FDI promotes high-quality innovation.
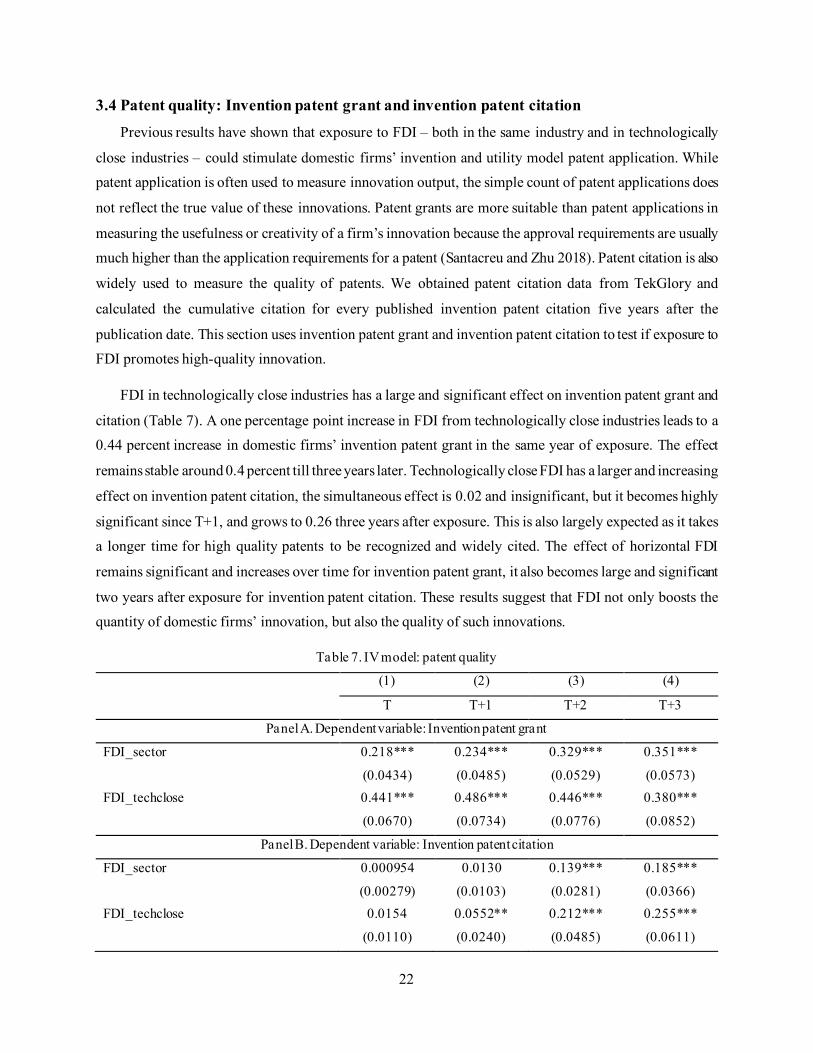
FDI in technologically close industries has a large and significant effect on invention patent grant and
citation (Table 7). A one percentage point increase in FDI from technologically close industries leads to a 0.44 percent increase in domestic firms’ invention patent grant in the same year of exposure. The effect
remains stable around 0.4 percent till three years later. Technologically close FDI has a larger and increasing
effect on invention patent citation, the simultaneous effect is 0.02 and insignificant, but it becomes highly
significant since T+1, and grows to 0.26 three years after exposure. This is also largely expected as it takes a longer time for high quality patents to be recognized and widely cited. The effect of horizontal FDI
remains significant and increases over time for invention patent grant, it also becomes large and significant
two years after exposure for invention patent citation. These results suggest that FDI not only boosts the quantity of domestic firms’ innovation, but also the quality of such innovations.
Table 7. IV model: patent quality
(1) (2) (3) (4)
T T+1 T+2 T+3
Panel A. Dependent variable: Invention patent grant
FDI_sector 0.218*** 0.234*** 0.329*** 0.351***
(0.0434) (0.0485) (0.0529) (0.0573)
FDI_techclose 0.441*** 0.486*** 0.446*** 0.380***
(0.0670) (0.0734) (0.0776) (0.0852)
Panel B. Dependent variable: Invention patent citation
FDI_sector 0.000954 0.0130 0.139*** 0.185***
(0.00279) (0.0103) (0.0281) (0.0366)
FDI_techclose 0.0154 0.0552** 0.212*** 0.255***
(0.0110) (0.0240) (0.0485) (0.0611)

23
Observations 1,383,715 1,383,715 1,383,715 1,151,980
Firm FE Y Y Y Y Year FE Y Y Y Y
Time varying firm controls Y Y Y Y
Note: Table 7 reports dynamic effects of exposure to horizontal and technologically close FDI on domestic firms’
innovation quality based on IV model. The dependent variable in panel A is invention patent grant and the dependent variable in panel B is cumulative citation for invention patents five years after publication. Column (1)
reports the effect in the year of exposure, while column (2)-(4) reports lagged effect after 1-3 years of exposure. Time varying firm controls include firm sales, capital-labor ratio, export status and SOE dummy. Robust standard
errors in parentheses. *** p<0.01, ** p<0.05, * p<0.1.
IV. Validity of IV and robustness checks The validity of our identification strategy hinges on two conditions: (1) FDI liberalization led to an
increase in foreign equity share in the industry; (2) variations across industries in the changes in FDI
regulations do not affect domestic firms’ patent application through channels other than FDI entry. In
previous regressions we already demonstrated the first condition. This section will test if treatment and the timing of treatment are correlated with unobservable factors that affect domestic firms’ innovation. We also
conduct other robustness checks to rule out the effect of vertical FDI, tariff changes, and the threshold for
technologically close FDI.
4.1 Expectation effect before treatment
While we have included year fixed effects in all the regressions, the estimation could still be biased if
the Chinese government chose to liberalize FDI regulations in 2002 in anticipation of diverging innovation
patterns in the treatment and control industries.
However, as Lu et al. (2017) has shown, the FDI deregulation in 2002 was part of the requirements of
China’s WTO accession, the lengthy and unpredictable negotiations dragged on for more than 15 years
with the 150 WTO member countries. There should not be any anticipation of China’s WTO accession in
previous years. We conduct a placebo test as Lu et al. (2017) did using the pre-treatment sample (1998-2001), and assign year 1999, 2000 and 2001 as the time of treatment respectively. If the two groups of
industries show significantly different innovation behavior during pre-treatment period, this could suggest
anticipation effect.
Table 8 reports results from the placebo test. All the coefficients are insignificant, indicating no
expectation effect prior to 2002.

24
Table 8. Expectation effect
(1) (2) (3)
Fake treatment year 1999 2000 2001
Dependent variable: Invention patent application
FDI_sector 0.00344 0.0380 -0.0244
(0.0522) (0.0538) (0.0452)
FDI_techclose 0.0859 0.0343 -0.0224 (0.0865) (0.181) (0.137)
Observations 362,907 362,907 362,907
Firm FE Y Y Y Year FE Y Y Y
Time varying firm controls Y Y Y
Note: Table 8 reports the expectation effect of FDI liberalization prior to 2002 on domestic firms’ innovation based
on IV model. The dependent variable is invention patent application. Column (1)-(3) report the effect from fake treatment year 1999, 2000, and 2001 respectively. Time varying firm controls include firm sales, capital-labor ratio,
export status and SOE dummy. Robust standard errors in parentheses. *** p<0.01, ** p<0.05, * p<0.1.
4.2 Randomly assign treatment industries and treatment time
We run a placebo test by randomly assigning treatment industries for each year during 1999 to 2006.
We leave out 1998 and 2007 so there is at least one year in the pre-treatment and post-treatment period. For each year from 1999 to 2006, we randomly select 112 industries for treatment, and interact the fake
treatment dummy with the fake treatment year to generate the fake 𝑠𝑠𝑠𝑠𝑠𝑠𝑡𝑡𝑠𝑠𝑓𝑓𝑠𝑠𝑡𝑡𝑠𝑠 × 𝑂𝑂𝑠𝑠𝑠𝑠𝑠𝑠02𝑖𝑖𝑖𝑖 . We then
calculate the effect on technologically close FDI: 𝐹𝐹𝐼𝐼_𝑠𝑠𝑠𝑠𝑠𝑠ℎ𝑠𝑠𝑐𝑐𝑠𝑠𝑠𝑠𝑠𝑠𝑖𝑖𝑖𝑖 = ∑ 𝑇𝑇𝑠𝑠𝑠𝑠ℎ𝑠𝑠𝑐𝑐𝑠𝑠𝑠𝑠𝑠𝑠𝑖𝑖𝑗𝑗𝑗𝑗 𝑖𝑖𝑓𝑓 𝑗𝑗≠𝑖𝑖 ×
𝑠𝑠𝑠𝑠𝑠𝑠𝑡𝑡𝑠𝑠𝑓𝑓𝑠𝑠𝑡𝑡𝑠𝑠× 𝑂𝑂𝑠𝑠𝑠𝑠𝑠𝑠02𝑖𝑖𝑖𝑖/𝑡𝑡.
We then use reduced form to estimate the effect of sectoral FDI liberalization on domestic firms’
invention patent application through two channels: horizontal FDI and technologically close FDI. We run
the randomized treatment industry assignment for 50 times for each of the eight years. The regression coefficients from the 400 trials are shown in Figure 5. The distribution of both coefficients is centered
around zero. Coefficients from the true treatment is 0.003 for 𝑠𝑠𝑠𝑠𝑠𝑠𝑡𝑡𝑠𝑠𝑓𝑓𝑠𝑠𝑡𝑡𝑠𝑠× 𝑂𝑂𝑠𝑠𝑠𝑠𝑠𝑠02 and 0.0355 for
𝐹𝐹𝐼𝐼_𝑠𝑠𝑠𝑠𝑠𝑠ℎ𝑠𝑠𝑐𝑐𝑠𝑠𝑠𝑠𝑠𝑠. The coefficient on horizontal FDI from the true treatment is significantly different from the
mean coefficient from randomized trials at 95% level, while the coefficient on technologically close FDI is significantly different from the mean coefficient from randomized trials at 99% level. These observations
suggest that the positive and significant effect of horizontal and technologically close FDI on domestic
firms’ patent application is unlikely to be driven by omitted variables.

25
Figure 5. Placebo test with random assignment of treatment industries and treatment timing
Note: To test if the positive and significant effect of horizontal and technologically close FDI on domestic firms’ patent application is driven by omitted variables, we randomly assign 112 industries as treatment industries, and use
the same reduced form specification to estimate the coefficients of 𝑠𝑠𝑠𝑠𝑠𝑠𝑡𝑡𝑠𝑠𝑓𝑓𝑠𝑠𝑡𝑡𝑠𝑠 × 𝑂𝑂𝑠𝑠𝑠𝑠𝑠𝑠02 and 𝐹𝐹𝐼𝐼_𝑠𝑠𝑠𝑠𝑠𝑠ℎ𝑠𝑠𝑐𝑐𝑠𝑠𝑠𝑠𝑠𝑠. We run
the randomized trial 50 times for each year during 1999 to 2006. The figure shows the distribution of estimated coefficients from the 400 trials. The left panel has a mean of 0.00068 and standard deviation of 0.013, while the right
panel has a mean of -0.00003 and a standard deviation of 0.004.
4.3 Vertical spillovers from FDI
Previously we focused on the effect of horizontal and technologically close FDI. Many studies have
documented positive spillovers on domestic firms’ TFP and patent application from vertical FDI (Havranek
and Irsova 2011; Blalock and Gertler 2008; Liu, Wang, and Wei 2009; Javorcik 2004, 2008; Fons-Rosen et al. 2017; Lu et al. 2017; Liu et al. 2019). How does vertical FDI affect domestic firms’ patent application?
Is the effect from technologically close FDI robust when vertical FDI is controlled for? The paper calculates
upstream and downstream FDI based on China’s 2002 Input-Output Table. There are only 72 manufacturing industries in the 2002 IO table, we use a concordance table to map each four-digit industry from the
manufacturing firm dataset to an industry in the IO table.
Upstream FDI
𝐹𝐹𝐹𝐹𝐹𝐹_𝑠𝑠𝑠𝑠𝑠𝑠𝑠𝑠𝑠𝑠𝑠𝑠𝑠𝑠𝑖𝑖𝑂𝑂𝑂𝑂𝑠𝑠𝑖𝑖𝑓𝑓𝑠𝑠𝑢𝑢𝑓𝑓 = ∑ 𝛽𝛽𝑠𝑠𝑓𝑓𝑓𝑓 𝑖𝑖𝑓𝑓 𝑓𝑓≠𝑠𝑠 × 𝐹𝐹𝐹𝐹𝐹𝐹_𝑠𝑠𝑠𝑠𝑠𝑠𝑠𝑠𝑠𝑠𝑠𝑠𝑓𝑓𝑖𝑖 (9)
Where 𝛽𝛽𝑠𝑠𝑓𝑓 is the ratio of inputs purchased by sector s from sector m.
Downstream FDI
𝐹𝐹𝐹𝐹𝐹𝐹_𝑠𝑠𝑠𝑠𝑠𝑠𝑠𝑠𝑠𝑠𝑠𝑠𝑗𝑗𝑖𝑖𝑑𝑑𝑠𝑠𝑑𝑑𝑛𝑛𝑠𝑠𝑖𝑖𝑓𝑓𝑠𝑠𝑢𝑢𝑓𝑓 = ∑ 𝛽𝛽𝑗𝑗𝑗𝑗𝑗𝑗 𝑖𝑖𝑓𝑓 𝑗𝑗≠𝑗𝑗 × 𝐹𝐹𝐹𝐹𝐹𝐹_𝑠𝑠𝑠𝑠𝑠𝑠𝑠𝑠𝑠𝑠𝑠𝑠𝑗𝑗𝑖𝑖 (10)

26
Where 𝛽𝛽𝑗𝑗𝑗𝑗 is the ratio of sector j’s output supplied to sector k.
Instruments for upstream and downstream FDI are ∑ 𝛽𝛽𝑠𝑠𝑓𝑓𝑓𝑓 𝑖𝑖𝑓𝑓 𝑓𝑓≠𝑠𝑠 × 𝑠𝑠𝑠𝑠𝑠𝑠𝑡𝑡𝑠𝑠𝑓𝑓𝑠𝑠𝑡𝑡𝑠𝑠× 𝑂𝑂𝑠𝑠𝑠𝑠𝑠𝑠02𝑖𝑖𝑖𝑖 ,
∑ 𝛽𝛽𝑗𝑗𝑗𝑗𝑗𝑗 𝑖𝑖𝑓𝑓 𝑗𝑗≠𝑗𝑗 × 𝑠𝑠𝑠𝑠𝑠𝑠𝑡𝑡𝑠𝑠𝑓𝑓𝑠𝑠𝑡𝑡𝑠𝑠× 𝑂𝑂𝑠𝑠𝑠𝑠𝑠𝑠02𝑗𝑗𝑖𝑖, respectively.
Table 9 reports the effect of four FDI channels on domestic firms’ invention patent application. Horizontal and technologically close FDI still have large and highly significant effects on domestic firms’
invention patent application. The coefficients are also very similar to those in our baseline IV model,
indicating that knowledge spillovers from technologically close FDI is distinct from vertical spillovers
through input-output linkages. FDI from upstream industries start to generate positive effects on domestic firms’ invention patent application after two years of initial exposure, and the effect is larger than all other
channels. FDI in upstream industries could provide higher quality inputs, equipment, and machinery for
domestic firms, which are essential for innovation. FDI from downstream industries does not have any significant effect.
Table 9. IV model: Four measures of FDI presence
(1) (2) (3) (4)
T T+1 T+2 T+3
Dependent variable: Invention patent application
FDI_sector 0.269*** 0.285*** 0.372*** 0.400***
(0.0517) (0.0596) (0.0659) (0.0715)
FDI_techclose 0.539*** 0.544*** 0.482*** 0.341***
(0.0949) (0.109) (0.116) (0.125)
FDI_upstream -0.0246 0.195 0.623*** 0.884***
(0.141) (0.149) (0.158) (0.162)
FDI_downstream -0.0498 0.0171 0.0119 0.0432
(0.0653) (0.0683) (0.0701) (0.0747)
Observations 1,383,715 1,383,715 1,383,715 1,151,980
Firm FE Y Y Y Y
Year FE Y Y Y Y Time varying firm controls Y Y Y Y
Note: Table 9 tests if vertical FDI affects the coefficients on horizontal and technologically close FDI. The
dependent variable is invention patent application. Column (1)-(4) report the simultaneous effect, and the effect
after 1-3 years of FDI exposure respectively. Time varying firm controls include firm sales, capital-labor ratio, export status and SOE dummy. Robust standard errors in parentheses. *** p<0.01, ** p<0.05, * p<0.1.

27
4.4 Control changes in output and input tariff
During our study period, there were also significant tariff reductions for both imports and exports.
Average tariffs on Chinese exports were reduced from 10 in 1998 to 8.13 in 2007, and the average tariff China imposed on imported goods was cut from 18.67 in 1998 to 10.77 in 2007. The cut was most dramatic
in 2002, from 17.11 in 2001 to 13.84. Several papers have shown that changes in tariffs have significant
impact on domestic firms’ innovation (Liu et al. 2021; Liu and Qiu 2016; Bombardini et al. 2018). To control for the effect of tariff changes on firm innovation, we add changes in export, import, and input
import tariffs in the baseline regression. We obtained export and import tariff data from WITS-TRAINS
database at four-digit ISIC level, then mapped each ISIC industry to a four-digit industry. We calculated
changes in tariff rate from 2000 to the midpoint in post-treatment period (2005) for each four-digit Chinese industry. For input import tariff, we use China’s 2002 Input-Output Table to impute changes in imported
input tariffs. Specifically, we ran the regression below using the same IV in the baseline regression:
ln𝑦𝑦𝑓𝑓𝑖𝑖𝑖𝑖 = 𝛼𝛼𝑓𝑓 + 𝛾𝛾𝑖𝑖 + 𝛿𝛿1𝐹𝐹𝐹𝐹𝐹𝐹_𝑠𝑠𝑠𝑠𝑠𝑠𝑠𝑠𝑠𝑠𝑠𝑠𝑖𝑖𝑖𝑖 + 𝛿𝛿2𝐹𝐹𝐹𝐹𝐹𝐹_𝑠𝑠𝑠𝑠𝑠𝑠ℎ𝑠𝑠𝑐𝑐𝑠𝑠𝑠𝑠𝑠𝑠𝑖𝑖𝑖𝑖 + 𝛿𝛿3𝐹𝐹𝐹𝐹𝐹𝐹_𝑂𝑂𝑂𝑂𝑠𝑠𝑠𝑠𝑠𝑠𝑠𝑠𝑡𝑡𝑓𝑓𝑖𝑖𝑖𝑖 +𝛿𝛿4𝐹𝐹𝐹𝐹𝐹𝐹_𝑚𝑚𝑠𝑠𝑑𝑑𝑡𝑡𝑠𝑠𝑠𝑠𝑠𝑠𝑠𝑠𝑡𝑡𝑓𝑓𝑖𝑖𝑖𝑖 + 𝑋𝑋𝑓𝑓𝑖𝑖𝑖𝑖′ 𝛽𝛽 + ∆𝑠𝑠𝑒𝑒𝑂𝑂_𝑠𝑠𝑡𝑡𝑠𝑠𝑓𝑓𝑓𝑓𝑓𝑓2000−2005 ×𝑃𝑃𝑠𝑠𝑠𝑠𝑠𝑠02 + ∆𝑓𝑓𝑓𝑓𝑂𝑂_𝑠𝑠𝑡𝑡𝑠𝑠𝑓𝑓𝑓𝑓𝑓𝑓2000−2005 ×𝑃𝑃𝑠𝑠𝑠𝑠𝑠𝑠02 + ∆𝑓𝑓𝑡𝑡𝑂𝑂𝑂𝑂𝑠𝑠_𝑓𝑓𝑓𝑓𝑂𝑂_𝑠𝑠𝑡𝑡𝑠𝑠𝑓𝑓𝑓𝑓𝑓𝑓2000−2005× 𝑃𝑃𝑠𝑠𝑠𝑠𝑠𝑠02 + 𝜀𝜀𝑓𝑓𝑖𝑖𝑖𝑖 (11)
The coefficients are largely the same with previous results when tariff changes were controlled for (Table 10). This shows the positive effect on innovation is not due to tariff reductions during the study
period. Reduction in export tariff has a significant positive impact on domestic firms’ patent application for
all patent types, while reduction in input tariff tends to have a negative impact.
Table 10. IV model: four channels of FDI and control for tariff changes
(1) (2) (3) (4)
T T+1 T+2 T+3
Dependent variable: Invention patent application
FDI_sector 0.311*** 0.332*** 0.403*** 0.432***
(0.0479) (0.0555) (0.0614) (0.0663)
FDI_techclose 0.549*** 0.551*** 0.458*** 0.294**
(0.0994) (0.113) (0.120) (0.128)
FDI_upstream -0.160 0.0435 0.456*** 0.710***
(0.155) (0.162) (0.171) (0.173)
FDI_downstream -0.101 -0.0412 -0.0376 -0.00806 (0.0653) (0.0672) (0.0684) (0.0731)
Observations 1,383,715 1,383,715 1,383,715 1,151,980
Firm FE Y Y Y Y Year FE Y Y Y Y

28
Tariff changes Y Y Y Y
Time varying firm controls Y Y Y Y
Note: Table 10 tests if the positive effect of horizontal and technologically close FDI on domestic firms’ innovation still exists when tariff changes are controlled for. The dependent variable is invention patent application. Column
(1)-(4) report the simultaneous effect, and the effect after 1-3 years of FDI exposure respectively. Time varying firm controls include firm sales, capital-labor ratio, export status and SOE dummy. Tariff changes include export,
import and input import tariff changes from 2000 to 2005. Robust standard errors in parentheses. *** p<0.01, **
p<0.05, * p<0.1.
4.5 Robustness of technological closeness
This paper considers two industries are technologically close if the correlation of their technology space
distribution is equal to or greater than 0.5. How sensitive are the results to the choice of technological
closeness cutoff point? Table 11 displays the results when the cutoff point is set at 0.4 and 0.6 respectively.
The coefficients of horizontal FDI remains similar to baseline IV results. When the cutoff point is 0.4, technologically close FDI have a much smaller positive effect on domestic firms’ innovation. When the
cutoff point is 0.6, the coefficient of FDI_techclose is around 0.7 from T to T+2, significantly above 0.5 in
the baseline results. The effect also becomes more significant. This suggests that knowledge spillovers from technologically close FDI increase with technological closeness between sectors.
Table 11. Robustness check: Technological closeness cutoff point Dependent var: invention patent application
(1) (2) (3) (4) T T+1 T+2 T+3
Panel A. Technological closeness cutoff point = 0.4 FDI_sector 0.241*** 0.305*** 0.461*** 0.523***
(0.0510) (0.0579) (0.0652) (0.0713) FDI_techclose 0.114*** 0.158*** 0.165*** 0.118**
(0.0371) (0.0429) (0.0467) (0.0497) Panel B. Technological closeness cutoff point = 0.6
FDI_sector 0.276*** 0.314*** 0.462*** 0.541***
(0.0587) (0.0660) (0.0730) (0.0813) FDI_techclose 0.734*** 0.754*** 0.724*** 0.634*** (0.0926) (0.106) (0.112) (0.119) Observations 1,383,715 1,383,715 1,383,715 1,151,980 Firm FE Y Y Y Y Year FE Y Y Y Y Time varying firm controls Y Y Y Y Note: Table 11 tests if our results are robust using different cutoff points for technological closeness. The dependent variable is invention patent application. Panel A defines technological closeness as any pair of

29
industries with a closeness index above 0.4, Panel B defines technological closeness with a cutoff point of 0.6.
Column (1)-(4) report the simultaneous effect, and the effect after 1-3 years of FDI exposure respectively. Time varying firm controls include firm sales, capital-labor ratio, export status and SOE dummy. Tariff changes
include export, import and input import tariff changes from 2000 to 2005. Robust standard errors in parentheses. *** p<0.01, ** p<0.05, * p<0.1.
V. Mechanism This section explores the mechanisms of innovation spillovers, including domestic firms’ absorptive
capacity, availability of talent in the local labor market, as well as competition effect through local and non-
local FDI.
5.1 Domestic firms’ absorptive capacity
Domestic firms do not benefit from the presence of FDI equally. Domestic firms that have higher absorptive capacity stand to gain more than domestic firms that are unable to assimilate advanced
technology from foreign firms. A domestic firm’s absorptive capacity is usually defined as the firm’s ability
to recognize the value of new information, assimilate it, and apply it to commercial ends (Cohen and
Levinthal, 1990). Domestic firm’s absorptive capacity determines the extent to which it can utilize knowledge spillovers from FDI. Various literature has documented this phenomenon (Girma, 2005;
Kinoshita, 2000; Castellani and Zanfei, 2003; Zhang et al., 2010; Lu et al., 2017). Kokko (1994) used
industry level data in Mexico to test whether FDI spillovers depend on the technological distance between foreign and domestic firms. The results suggested that advanced MNC technologies or large technology
gaps alone do not constitute unsurmountable obstacles to spillovers, but that spillovers are less likely in
industries with both large technology gaps and high foreign equity share. Using ASIF data during 1998-
2003, Zhang et al. (2010) found that the positive effect of FDI on domestic firms’ productivity is stronger when domestic firms are larger, and when the technology gap between FDI and the domestic firms is
intermediate. Using a cross-section of more than 25,000 domestic manufacturing firms in 78 low- and
middle-income countries from the World Bank’s Enterprise Survey, Farole and Winkler (2015) found that domestic firms with low and high productivity level benefit more from FDI spillovers than domestic firms
with medium productivity. Lu et al. (2017) found that horizontal FDI has negative and statistically
significant effects on both SOEs and domestic non-SOEs, but the negative effect is slightly smaller for
SOEs.
Previous studies have used various indicators to measure the absorptive capacity of domestic firms.
Some papers measure the technology gap between foreign and domestic firms as the difference of the
average TFP of foreign firms in an industry and the TFP of a domestic firm (Kokko, 1994; Zhang et al.,
30
2010). Some used R&D expenditure and ownership structure as proxies for absorptive capacity (Lu et al.,
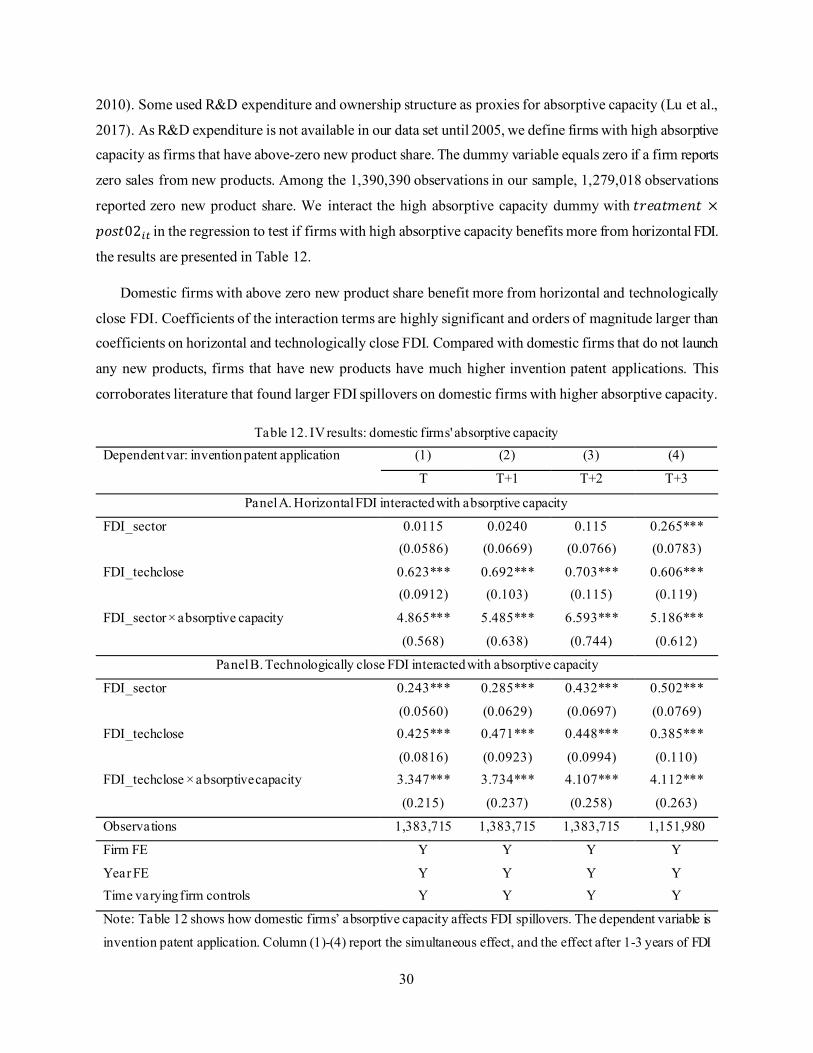
2017). As R&D expenditure is not available in our data set until 2005, we define firms with high absorptive capacity as firms that have above-zero new product share. The dummy variable equals zero if a firm reports
zero sales from new products. Among the 1,390,390 observations in our sample, 1,279,018 observations
reported zero new product share. We interact the high absorptive capacity dummy with 𝑠𝑠𝑠𝑠𝑠𝑠𝑡𝑡𝑠𝑠𝑓𝑓𝑠𝑠𝑡𝑡𝑠𝑠 ×
𝑂𝑂𝑠𝑠𝑠𝑠𝑠𝑠02𝑖𝑖𝑖𝑖 in the regression to test if firms with high absorptive capacity benefits more from horizontal FDI.
the results are presented in Table 12.
Domestic firms with above zero new product share benefit more from horizontal and technologically
close FDI. Coefficients of the interaction terms are highly significant and orders of magnitude larger than coefficients on horizontal and technologically close FDI. Compared with domestic firms that do not launch
any new products, firms that have new products have much higher invention patent applications. This
corroborates literature that found larger FDI spillovers on domestic firms with higher absorptive capacity.
Table 12. IV results: domestic firms' absorptive capacity Dependent var: invention patent application (1) (2) (3) (4)
T T+1 T+2 T+3
Panel A. Horizontal FDI interacted with absorptive capacity
FDI_sector 0.0115 0.0240 0.115 0.265***
(0.0586) (0.0669) (0.0766) (0.0783)
FDI_techclose 0.623*** 0.692*** 0.703*** 0.606***
(0.0912) (0.103) (0.115) (0.119)
FDI_sector × absorptive capacity 4.865*** 5.485*** 6.593*** 5.186***
(0.568) (0.638) (0.744) (0.612)
Panel B. Technologically close FDI interacted with absorptive capacity
FDI_sector 0.243*** 0.285*** 0.432*** 0.502***
(0.0560) (0.0629) (0.0697) (0.0769)
FDI_techclose 0.425*** 0.471*** 0.448*** 0.385***
(0.0816) (0.0923) (0.0994) (0.110)
FDI_techclose × absorptive capacity 3.347*** 3.734*** 4.107*** 4.112***
(0.215) (0.237) (0.258) (0.263)
Observations 1,383,715 1,383,715 1,383,715 1,151,980
Firm FE Y Y Y Y
Year FE Y Y Y Y Time varying firm controls Y Y Y Y
Note: Table 12 shows how domestic firms’ absorptive capacity affects FDI spillovers. The dependent variable is
invention patent application. Column (1)-(4) report the simultaneous effect, and the effect after 1-3 years of FDI

31
exposure respectively. Absorptive capacity equals one if a firm sold new products in that year, and zero otherwise.
Time varying firm controls include firm sales, capital-labor ratio, export status and SOE dummy. Robust standard errors in parentheses. *** p<0.01, ** p<0.05, * p<0.1.
5.2 Local human capital stock
Related to domestic firms’ absorptive capacity, the availability of talent in the local labor market is instrumental for maximizing knowledge spillovers generated by FDI. This paper uses the share of
population aged between 18 and 55 with a bachelor’s degree or above at the prefecture level as a measure
of talent availability. We calculated prefecture level college population share using the population census in 2000. The pre-treatment talent availability mitigates endogeneity issues. We then add college population
share and its interaction term with horizontal FDI and technologically close FDI in the baseline IV
regression. Results are reported in Table 13. The coefficients on horizontal and technologically close FDI
remains significant but become smaller than the baseline results. The interaction terms have large and highly significant impact on domestic firms’ invention patent application. A unit increase in the interaction
term of horizontal FDI and college population share results in a 5.7-6.2 percent increase in invention patent
application. A unit increase in the interaction term between technologically close FDI and college population share leads to a 6.6-8 percent increase in invention patent application. These results highlight
the importance of human capital in learning and absorbing knowledge spillovers from FDI.
Table 13. IV results: local human capital
Dependent var: invention patent application (1) (2) (3) (4)
T T+1 T+2 T+3
Panel A. Horizontal FDI interacted with human capital
FDI_sector 0.0892 0.156** 0.289*** 0.334***
(0.0586) (0.0671) (0.0752) (0.0839)
FDI_techclose 0.500*** 0.559*** 0.544*** 0.440***
(0.0815) (0.0921) (0.0990) (0.109)
FDI_sector × college share 5.732*** 5.051*** 5.586*** 6.166*** (1.051) (1.159) (1.297) (1.395)
Panel B. Technologically close FDI interacted with human capital
FDI_sector 0.247*** 0.294*** 0.445*** 0.515***
(0.0544) (0.0614) (0.0681) (0.0754)
FDI_techclose 0.252*** 0.324*** 0.335*** 0.239**
(0.0836) (0.0950) (0.103) (0.112)
FDI_techclose × college share 8.047*** 7.558*** 6.825*** 6.581***
(0.942) (1.038) (1.083) (1.131)

32
Observations 1,382,897 1,382,897 1,382,897 1,151,377
Firm FE Y Y Y Y Year FE Y Y Y Y
Time varying firm controls Y Y Y Y
Note: Table 13 shows how prefecture level human capital affects FDI spillovers. The dependent variable is
invention patent application. Column (1)-(4) report the simultaneous effect, and the effect after 1-3 years of FDI exposure respectively. College share is the share of population aged between 18-55 that has a Bachelor’s degree or
above at prefecture level in 2000. Time varying firm controls include firm sales, capital-labor ratio, export status and SOE dummy. Robust standard errors in parentheses. *** p<0.01, ** p<0.05, * p<0.1.
5.3 Competition vs. agglomeration: Local vs. non-local FDI
Many studies found FDI spillovers tend to be larger for domestic firms that are in proximity to foreign firms (Lu et al., 2017; Wang and Wu, 2016; Audretsch and Feldman, 2004). The agglomeration effect could
magnify FDI spillovers for nearby domestic firms through labor pooling, sharing suppliers, economy of
scale and scope, frequent and spontaneous knowledge exchange (Krugman, 1991; Jaffe et al., 1993; Glaeser et al., 1992; Beaudry and Schiffauerova, 2009). However, domestic firms also suffer from higher
competition if they are close to foreign firms, especially if their products are primarily sold in the local
markets. Foreign firms may also attract the best talents in the same region, straining domestic firms’
innovative capacity.
To test if local FDI affects domestic firms’ innovation differently from non-local FDI, we construct
local and non-local FDI measures as follows:
𝐹𝐹𝐹𝐹𝐹𝐹_𝑠𝑠𝑠𝑠𝑠𝑠𝑠𝑠𝑠𝑠𝑠𝑠_𝑐𝑐𝑠𝑠𝑠𝑠𝑡𝑡𝑐𝑐𝑖𝑖𝑠𝑠𝑖𝑖 = ∑ 𝐹𝐹𝐹𝐹𝐹𝐹_𝑓𝑓𝑖𝑖𝑓𝑓𝑓𝑓𝑓𝑓𝑓𝑓𝑓𝑓𝑓𝑓 × 𝑂𝑂𝑂𝑂𝑖𝑖𝑂𝑂𝑂𝑂𝑖𝑖𝑓𝑓𝑓𝑓𝑓𝑓𝑓𝑓𝑓𝑓∈Ω𝑓𝑓𝑓𝑓𝑓𝑓
∑ 𝑂𝑂𝑂𝑂𝑖𝑖𝑂𝑂𝑂𝑂𝑖𝑖𝑓𝑓𝑓𝑓𝑓𝑓𝑓𝑓𝑓𝑓∈Ω𝑓𝑓𝑓𝑓𝑓𝑓 (12)
𝐹𝐹𝐹𝐹𝐹𝐹_𝑠𝑠𝑠𝑠𝑠𝑠𝑠𝑠𝑠𝑠𝑠𝑠_𝑡𝑡𝑠𝑠𝑡𝑡𝑐𝑐𝑠𝑠𝑠𝑠𝑡𝑡𝑐𝑐𝑖𝑖𝑠𝑠𝑖𝑖 = ∑ 𝐹𝐹𝐹𝐹𝐹𝐹_𝑓𝑓𝑖𝑖𝑓𝑓𝑓𝑓𝑓𝑓𝑓𝑓𝑓𝑓 × 𝑂𝑂𝑂𝑂𝑖𝑖𝑂𝑂𝑂𝑂𝑖𝑖𝑓𝑓𝑓𝑓𝑓𝑓𝑓𝑓∈Ω𝑓𝑓𝑓𝑓 − ∑ 𝐹𝐹𝐹𝐹𝐹𝐹_𝑓𝑓𝑖𝑖𝑓𝑓𝑓𝑓𝑓𝑓𝑓𝑓𝑓𝑓𝑓𝑓 × 𝑂𝑂𝑂𝑂𝑖𝑖𝑂𝑂𝑂𝑂𝑖𝑖𝑓𝑓𝑓𝑓𝑓𝑓𝑓𝑓𝑓𝑓∈Ω𝑓𝑓𝑓𝑓𝑓𝑓
∑ 𝑂𝑂𝑂𝑂𝑖𝑖𝑂𝑂𝑂𝑂𝑖𝑖𝑓𝑓𝑓𝑓𝑓𝑓𝑓𝑓∈Ω𝑓𝑓𝑓𝑓 −∑ 𝑂𝑂𝑂𝑂𝑖𝑖𝑂𝑂𝑂𝑂𝑖𝑖𝑓𝑓𝑓𝑓𝑓𝑓𝑓𝑓𝑓𝑓∈Ω𝑓𝑓𝑓𝑓𝑓𝑓 (13)
Where c denotes city. 𝐹𝐹𝐹𝐹𝐹𝐹_𝑠𝑠𝑠𝑠𝑠𝑠𝑠𝑠𝑠𝑠𝑠𝑠_𝑐𝑐𝑠𝑠𝑠𝑠𝑡𝑡𝑐𝑐𝑖𝑖𝑠𝑠𝑖𝑖 is the output-weighted foreign equity share in industry i in
city c at time t. 𝐹𝐹𝐹𝐹𝐹𝐹_𝑠𝑠𝑠𝑠𝑠𝑠𝑠𝑠𝑠𝑠𝑠𝑠_𝑡𝑡𝑠𝑠𝑡𝑡𝑐𝑐𝑠𝑠𝑠𝑠𝑡𝑡𝑐𝑐𝑖𝑖𝑠𝑠𝑖𝑖 is the output-weighted foreign equity share in industry i at time t
in all other cities excluding city c. We use 𝑂𝑂𝑂𝑂𝑖𝑖𝑂𝑂𝑂𝑂𝑖𝑖𝑓𝑓𝑓𝑓2001∑ 𝑂𝑂𝑂𝑂𝑖𝑖𝑂𝑂𝑂𝑂𝑖𝑖𝑓𝑓𝑓𝑓2001𝑓𝑓
× 𝑠𝑠𝑠𝑠𝑠𝑠𝑡𝑡𝑠𝑠𝑓𝑓𝑠𝑠𝑡𝑡𝑠𝑠 × 𝑂𝑂𝑠𝑠𝑠𝑠𝑠𝑠02𝑖𝑖𝑖𝑖 as the IV for local FDI
and �1 − 𝑂𝑂𝑂𝑂𝑖𝑖𝑂𝑂𝑂𝑂𝑖𝑖𝑓𝑓𝑓𝑓2001∑ 𝑂𝑂𝑂𝑂𝑖𝑖𝑂𝑂𝑂𝑂𝑖𝑖𝑓𝑓𝑓𝑓2001𝑓𝑓
� × 𝑠𝑠𝑠𝑠𝑠𝑠𝑡𝑡𝑠𝑠𝑓𝑓𝑠𝑠𝑡𝑡𝑠𝑠 × 𝑂𝑂𝑠𝑠𝑠𝑠𝑠𝑠02𝑖𝑖𝑖𝑖 as the IV for non-local FDI. The results of local and
non-local FDI on domestic firms’ invention patent application and citation are reported in table 14.
Exposure to horizontal FDI in the same city has a negative effect on domestic firms’ innovation. A one percentage point increase in local foreign equity share could reduce a domestic firm’s invention patent

33
application by 1.6 percent in the same year. The negative effect declines over time, though the magnitude
remains large. Horizontal FDI from other cities generates large and increasing spillovers on domestic firms’ invention patent application. The coefficient increases from 0.66 in the same year to 0.78 three years after
exposure. This suggests that the competition effect dominates in local market. Foreign firms in the same
city not only take a slice of business away from domestic firms, but also attract the best talents. The double
whammy impedes domestic firms’ innovation efforts. The positive effect of technologically close FDI remains highly significant over time, the magnitude becomes smaller than horizontal FDI in other cities.
Table 14. Heterogeneous treatment effect: local vs. nonlocal FDI
(1) (2) (3) (4)
T T+1 T+2 T+3
Dependent variable: Invention patent application
FDI_sector_local -1.609*** -1.392*** -1.211*** -1.033**
(0.475) (0.428) (0.448) (0.465)
FDI_sector_non-local 0.656*** 0.649*** 0.753*** 0.777*** (0.148) (0.141) (0.147) (0.154)
FDI_techclose 0.367*** 0.443*** 0.444*** 0.355***
(0.108) (0.109) (0.113) (0.120)
Observations 1,383,713 1,383,713 1,383,713 1,151,978
Firm FE Y Y Y Y Year FE Y Y Y Y
Time varying firm controls Y Y Y Y
Note: Table 14 reports the effect of local horizontal FDI, non-local horizontal FDI and technologically close FDI
on domestic firms’ innovation. The dependent variable is invention patent application. Column (1)-(4) report the simultaneous effect, and the effect after 1-3 years of FDI exposure respectively. Time varying firm controls include
firm sales, capital-labor ratio, export status and SOE dummy. Robust standard errors in parentheses. *** p<0.01, ** p<0.05, * p<0.1.
VI. Conclusion This paper estimated how exposure to FDI affects domestic firms’ innovation behavior through
multiple channels. Leveraging China’s revision of the “Catalogue of Industries for Guiding Foreign
Investment” in 2002, the paper used a difference-in-differences approach to mitigate the endogeneity issues. Among the 425 four-digit manufacturing industries in our sample, 112 industries became more open to FDI
after 2002. FDI policy changes strongly predict FDI presence in the 425 industries since 2002. Using a
matched firm-patent database and patent citation database, this paper found significant positive spillovers
from FDI on domestic firms’ quantity and quality of innovation outputs. A one percentage point increase

34
in foreign equity share in the same four-digit industry could raise domestic firms’ utility model patent
applications by 0.65 percent in the same year, and raise invention patent applications by 0.27 percent in the same year. The positive effect increases over time. In addition to horizontal FDI, FDI from technologically
close industries generates a much larger impact on domestic firms’ invention patent applications. FDI in
technologically close industries can generate twice as large knowledge spillovers as horizontal FDI does.
This result is not driven by input-output linkages with FDI and tariff changes.
Our identification strategy is valid as demonstrated through a battery of robustness checks. The event
study confirms treatment and control groups had parallel trends in patent applications before treatment.
There was no expectation effect before treatment, the effect is unlikely to be driven by unobservable factors, and it remains robust when vertical FDI and tariff changes are controlled for. The results are also robust to
different technological closeness cutoff points. The more technologically close industries are to liberalized
industries, the more domestic firms benefit from FDI liberalization. Finally, the paper also sheds light on
possible mechanisms, including the absorptive capacity of domestic firms, local human capital stock, and competition vs. agglomeration. We found larger spillovers for domestic firms with higher absorptive
capacity. A higher share of adult population with at least a bachelor’s degree proves instrumental for
maximizing knowledge spillovers from FDI. Horizontal FDI in the same city negatively affects domestic firms’ innovation through the competition effect.
Our results have important policy implications. We found that FDI not only benefits domestic firms in
the same industry, it generates much larger spillovers in technologically close industries and downstream
industries. Only considering horizontal spillovers would underestimate the overall effect of FDI on domestic firms. Our findings also underscore the various factors that condition such knowledge spillovers
and emphasize the role of human capital in absorbing and assimilating knowledge spillovers from FDI. The
stock of human capital hugely magnifies the positive knowledge spillovers. To maximize the benefits FDI brings, governments need to invest in human capital and help domestic firms develop enough absorptive
capacity.

35
References Aghion, P., Bloom, N., Blundell, R., Griffith, R. and Howitt, P., 2005. Competition and innovation: An inverted-U
relationship. The quarterly journal of economics, 120(2), pp.701-728. Alfaro, L. and Rodriguez-Clare, A., 2004. Multinationals and linkages: evidence from Latin America. Economia, 4(2),
pp.113-170. Alfaro-Urena, A., Manelici, I. and Vasquez, J.P., 2019. The effects of joining multinational supply chains: New
evidence from firm-to-firm linkages. Available at SSRN 3376129.
Audretsch, D.B. and Feldman, M.P., 2004. Knowledge spillovers and the geography of innovation. In Handbook of regional and urban economics (Vol. 4, pp. 2713-2739). Elsevier.
Bai, J., Barwick, P.J., Cao, S. and Li, S., 2020. Quid Pro Quo, Knowledge Spillover, and Industrial Quality Upgrading: Evidence from the Chinese Auto Industry. NBER Working Paper, (w27644).
Beaudry, C. and Schiffauerova, A., 2009. Who's right, Marshall or Jacobs? The localization versus urbanization debate. Research policy, 38(2), pp.318-337.
Blalock, G. and Gertler, P.J., 2008. Welfare gains from foreign direct investment through technology transfer to local suppliers. Journal of international Economics, 74(2), pp.402-421.
Bloom, N., Schankerman, M. and Van Reenen, J., 2013. Identifying technology spillovers and product market
rivalry. Econometrica, 81(4), pp.1347-1393. Blyde, J., Kugler, M. and Stein, E., 2005. Exporting vs. Local Sourcing by Multinational Subsidiaries: Which
Determines Foreign Direct Investment Spillovers?. mimeo. Bombardini, Matilde, Bingjing Li, and Ruoying Wang. 2018. “Import Competition and Innovation: Theory and
Evidence from China.” working paper. Bwalya, S.M., 2006. Foreign direct investment and technology spillovers: Evidence from panel data analysis of
manufacturing firms in Zambia. Journal of development economics, 81(2), pp.514-526.
Castellani, D. and Zanfei, A., 2003. Technology gaps, absorptive capacity and the impact of inward investments on productivity of European firms. Economics of Innovation and New Technology, 12(6), pp.555-576.
Cheung, K.Y. and Ping, L., 2004. Spillover effects of FDI on innovation in China: Evidence from the provincial data. China economic review, 15(1), pp.25-44.
Cohen, W.M. and Levinthal, D.A., 1990. Absorptive capacity: A new perspective on learning and innovation. Administrative science quarterly, pp.128-152.
Crescenzi, R., Dyevre, A. and Neffke, F., 2020. Innovation catalysts: how multinationals reshape the global geography of innovation.
Cusolito, A.P. and Maloney, W.F., 2018. Productivity revisited: Shifting paradigms in analysis and policy. World
Bank Publications. Eberhardt, M., Helmers, C. and Yu, Z., 2011. Is the dragon learning to fly? An analysis of the Chinese patent explosion.
An Analysis of the Chinese Patent Explosion (November 29, 2011). The University of Nottingham Research Paper, (2011/16).

36
Farole, T. and Winkler, D., 2015. The role of foreign firm characteristics, absorptive capacity and the institutional
framework for FDI spillovers. Journal of Banking and Financial Economics, (1 (3)), pp.77-112. Fons-Rosen, C., Kalemli-Ozcan, S., Sorensen, B.E., Villegas-Sanchez, C. and Volosovych, V., 2017. Foreign
investment and domestic productivity: Identifying knowledge spillovers and competition effects (No. w23643). National Bureau of Economic Research.
Fu, X., 2008. Foreign direct investment, absorptive capacity and regional innovation capabilities: evidence from China. Oxford Development Studies, 36(1), pp.89-110.
Girma, S., 2005. Absorptive capacity and productivity spillovers from FDI: a threshold regression analysis. Oxford bulletin of Economics and Statistics, 67(3), pp.281-306.
Girma, S., Gong, Y. and Görg, H., 2009. What determines innovation activity in Chinese state-owned enterprises?
The role of foreign direct investment. World Development, 37(4), pp.866-873. Glaeser, E.L., Kallal, H.D., Scheinkman, J.A. and Shleifer, A., 1992. Growth in cities. Journal of political economy,
100(6), pp.1126-1152. Guadalupe, M., Kuzmina, O. and Thomas, C., 2012. Innovation and foreign ownership. American Economic
Review, 102(7), pp.3594-3627. Hall, B.H., 2011. Innovation and productivity (No. w17178). National bureau of economic research.
Hall, B.H., Jaffe, A. and Trajtenberg, M., 2005. Market value and patent citations. RAND Journal of economics,
pp.16-38. Halpern, L. and Muraközy, B., 2007. Does distance matter in spillover? 1. Economics of Transition, 15(4), pp.781-
805. Havranek, T. and Irsova, Z., 2011. Estimating vertical spillovers from FDI: Why results vary and what the true effect
is. Journal of International Economics, 85(2), pp.234-244. He, Z.L., Tong, T.W., Zhang, Y. and He, W., 2016. Construction of a database linking SIPO patents to firms in China’s
Annual Survey of Industrial Enterprises 1998-2009. Tilburg University working paper. Hu, A.G. and Jefferson, G.H., 2009. A great wall of patents: What is behind China's recent patent explosion?. Journal
of Development Economics, 90(1), pp.57-68.
Iacovone, L., Javorcik, B., Keller, W. and Tybout, J., 2009. Walmart in Mexico: The impact of FDI on innovation and industry productivity. University of Colorado.
Jaffe, A.B., 1986. Technological opportunity and spillovers of R&D: evidence from firms' patents, profits and market value.
Jaffe, A.B., Trajtenberg, M. and Henderson, R., 1993. Geographic localization of knowledge spillovers as evidenced by patent citations. the Quarterly journal of Economics, 108(3), pp.577-598.
Javorcik, B.S, 2004. Does foreign direct investment increase the productivity of domestic firms? In search of spillovers
through backward linkages. American economic review, 94(3), pp.605-627. Javorcik, B.S. and Spatareanu, M., 2009. Tough love: do Czech suppliers learn from their relationships with
multinationals?. Scandinavian Journal of Economics, 111(4), pp.811-833.

37
Javorcik, B.S. and Spatareanu, M., 2011. Does it matter where you come from? Vertical spillovers from foreign direct
investment and the origin of investors. Journal of Development Economics, 96(1), pp.126-138. Javorcik, B.S., 2008. Can survey evidence shed light on spillovers from foreign direct investment?. The World Bank
Research Observer, 23(2), pp.139-159. Javorcik, B.S., Lo Turco, A. and Maggioni, D., 2018. New and improved: Does FDI boost production complexity in
host countries?. The Economic Journal, 128(614), pp.2507-2537. Jiang, Kun., Qiu, Larry D., Keller, Wolfgang., Ridley, Willian. 2019. International joint ventures and internal vs.
external technology transfer: evidence from China. NBER working paper No. 24455. Kinoshita, Y., 2000. R&D and technology spillovers via FDI: Innovation and absorptive capacity.
Kokko, A., 1994. Technology, market characteristics, and spillovers. Journal of development economics, 43(2),
pp.279-293. Krugman, P., 1991. Increasing returns and economic geography. Journal of political economy, 99(3), pp.483-499.
Liu, Q. and Qiu, L.D., 2016. Intermediate input imports and innovations: Evidence from Chinese firms' patent filings. Journal of International Economics, 103, pp.166-183.
Liu, Q., Lu, R. and Yang, C., 2019. International joint ventures and technology diffusion: Evidence from China. The World Economy, 43(1), pp.146-169.
Liu, Q., Lu, R., Lu, Y. and Luong, T.A., 2021. Import competition and firm innovation: Evidence from China. Journal
of Development Economics, 151, p.102650. Liu, X., Wang, C. and Wei, Y., 2009. Do local manufacturing firms benefit from transactional linkages with
multinational enterprises in China?. Journal of International Business Studies, 40(7), pp.1113-1130. Liu, X., Wang, C. and Wei, Y., 2009. Do local manufacturing firms benefit from transactional linkages with
multinational enterprises in China?. Journal of International Business Studies, 40(7), pp.1113-1130. Liu, Z., 2002. Foreign direct investment and technology spillover: Evidence from China. Journal of comparative
Economics, 30(3), pp.579-602. Liu, Z., 2008. Foreign direct investment and technology spillovers: Theory and evidence. Journal of Development
Economics, 85(1-2), pp.176-193.
Lu, Y., Tao, Z. and Zhu, L., 2017. Identifying FDI spillovers. Journal of International Economics, 107, pp.75-90. Reyes, J.D., 2017. FDI spillovers and high-growth firms in developing countries. The World Bank.
Santacreu, A.M. and Zhu, H., 2018. What Does China’s Rise in Patents Mean? A Look at Quality vs. Quantity. Economic Synopses, pp.1-2.
Wang, C.C. and Wu, A., 2016. Geographical FDI knowledge spillover and innovation of indigenous firms in China. International Business Review, 25(4), pp.895-906.
Zhang, L., 2017. The knowledge spillover effects of FDI on the productivity and efficiency of research activities in
China. China economic review, 42, pp.1-14. Zhang, Y., Li, H., Li, Y. and Zhou, L.A., 2010. FDI spillovers in an emerging market: the role of foreign firms' country
origin diversity and domestic firms' absorptive capacity. Strategic Management Journal, 31(9), pp.969-989.
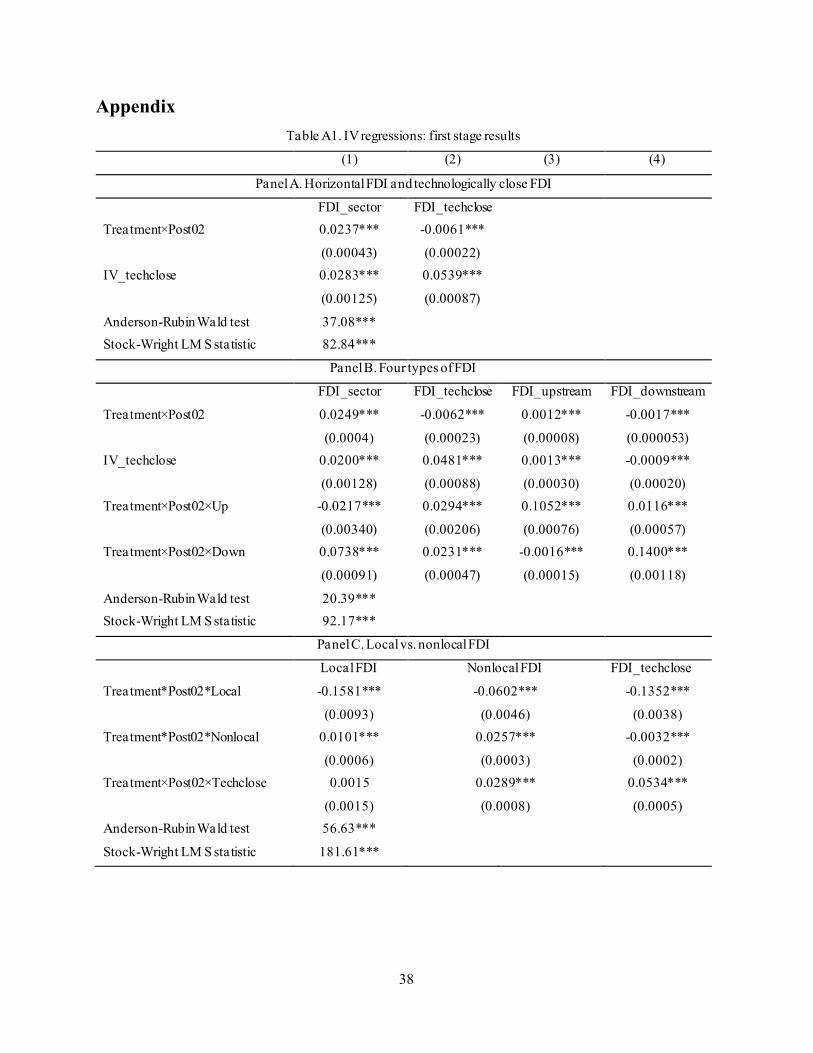
38
Appendix Table A1. IV regressions: first stage results
(1) (2) (3) (4)
Panel A. Horizontal FDI and technologically close FDI
FDI_sector FDI_techclose
Treatment×Post02 0.0237*** -0.0061***
(0.00043) (0.00022)
IV_techclose 0.0283*** 0.0539***
(0.00125) (0.00087)
Anderson-Rubin Wald test 37.08***
Stock-Wright LM S statistic 82.84***
Panel B. Four types of FDI
FDI_sector FDI_techclose FDI_upstream FDI_downstream
Treatment×Post02 0.0249*** -0.0062*** 0.0012*** -0.0017***
(0.0004) (0.00023) (0.00008) (0.000053)
IV_techclose 0.0200*** 0.0481*** 0.0013*** -0.0009***
(0.00128) (0.00088) (0.00030) (0.00020)
Treatment×Post02×Up -0.0217*** 0.0294*** 0.1052*** 0.0116***
(0.00340) (0.00206) (0.00076) (0.00057)
Treatment×Post02×Down 0.0738*** 0.0231*** -0.0016*** 0.1400***
(0.00091) (0.00047) (0.00015) (0.00118)
Anderson-Rubin Wald test 20.39***
Stock-Wright LM S statistic 92.17***
Panel C. Local vs. nonlocal FDI
Local FDI Nonlocal FDI FDI_techclose
Treatment*Post02*Local -0.1581*** -0.0602*** -0.1352***
(0.0093) (0.0046) (0.0038)
Treatment*Post02*Nonlocal 0.0101*** 0.0257*** -0.0032***
(0.0006) (0.0003) (0.0002)
Treatment×Post02×Techclose 0.0015 0.0289*** 0.0534***
(0.0015) (0.0008) (0.0005) Anderson-Rubin Wald test 56.63***
Stock-Wright LM S statistic 181.61***