fdi and economic growth
TRANSCRIPT
XU 1
FDI and Economic Growth
DONG NI, CLAIRE, XU
DEC.03 2012
Abstract
The purpose of this paper is to examine the influence of
foreign direct investment on per capita GDP growth. Employing a
data set from 1965 to 2005 for 88 countries, I build a model I
use the ordinary least squares technique to estimate the linear
regression equation that shows how GDP per capita is affected by
saving, population growth, education and FDI. Overall, the
results supports that the countries with a high level of FDI
could increase economic development.
Introduction
A question that has long been discussed and addressed by
economists is what makes countries rich or poor? The answer lies
in how countries differ in terms of: population growth, state of
technology, institutions in place, level of global involvement,
climate, colonization history, slavery, natural resources and
culture. In this paper, I will focus on globalization, which is
crucial for the process of economic development. Romer (1990),
Grossman & Helpman (1991), and Barro & Sala-i-martin (1995)
indicate that a more liberal view regarding trade with other
countries, the greater the ability to boost technological
advances. Taking East Asia as an example, most of the countries
have experienced spectacular GDP growth in the last few decades
since their participation in the international economy (World
Bank, 1993).
International trade provides innovative technological
knowledge to foreign countries, which enhances the rate of growth.
In other words, cross-border movements play an important factor
in economic development. Globalization is known for the feature
XU 2
of economic integration. My investigation into the effects of
foreign direct integration (FDI), which is one of the components
of the integration, is the focus on this paper. FDI is a
significant contributor to the development in burgeoning
countries. FDI occurs when companies invest in a host nation to
take advantage of economic opportunities, which can range from
resource and labor abundance to favorable economic policies. FDI
may seem as exploitation exacted by foreign investors, but there
are mutual benefits to be gained. In order for foreign firms to
reap the benefits to produce with cheaper labor, the existing
technology and know-how needs to be implemented in the host
nations.
The hypothesis of this paper is to demonstrate that foreign
direct investment has a positive impact on the economic growth
over the long run. Section 1 of this research paper is a review
of literature discussing the relationship between FDI and the
growth rate of GDP per capita. Section 2 introduces the data
used to test the hypothesis. A long-run growth equation has been
built, which will be tested by ordinary least squares (OLS), and
the results are analyzed in section 3. The last section concludes
the research results and findings.
I. Literature Reviews
My hypothesis is to illustrate that FDI has a discernible
positive influence on economic growth, which is supported by
Alfaro (2003), Naveed & Shabbir (2006), Batten & Vo (2009), and
Cieslik & Tarsalewska (2011). The methodology employed to answer
this encompassing question involves the implementation of
econometric techniques (e.g. fixed effect, control variable and
leader-follower), and the usage of static and dynamic panel data
and cross-country data. The following is a review of the selected
XU 3
literature that discusses and investigates the issues of FDI from
different perspectives.
Alfaro (2003) examines the relationship between the FDI and
economic growth. It is determined that the branches of government
responsible for economic growth considered easing the
restrictions on FDI as the best strategy to attract more foreign
investments. Alfaro (2003) investigates whether the FDI inflows
in different economic sectors (i.e. primary, manufacturing and
services) have different effects on economic growth. Alfaro
(2003) uses cross section regressions to test the direct impact
of various types of FDI on GDP growth. The variables he adopts
are control variables (initial income, human capital and human
capital), growth variables (inflation) and independent variables
(openness). Using the data of 47 countries from 1981 to 1999 to
test the hypothesis, Alfaro (2003) finds that more than 60% of
private capital flows are FDI. FDI in the primary sector has a
negative effect on growth; FDI in the manufacturing sector has a
positive effect; FDI in the service sector has an ambiguous
effect. Therefore, Alfaro’s investigation implies that not all
forms of FDI will stimulate economic growth.
The goal of Naveed & Shabbir’s (2006) paper is to study the
effects of trade openness and FDI on GDP growth. It argues that
FDI is important for developing countries in an economic growth
process through technological diffusion of new ideas and
technologies. Naveed & Shabbir (2006) input two variables into
Barro’s equation in their research. They use a control set
variables to analyze the data of 23 developed countries from 1971
to 2000: the dependent variable is the growth rate of GDP, and
the independent variables that are used in fixed effect
regression are log of GDP, openness ratio and FDI ratio. Naveed &
Shabbir (2006) use a statistical hypothesis test, the Granger
causality test, to examine the relationship among the variables.
XU 4
The results indicate that only trade openness causes GDP to
change, while reverse causality fails. The empirical study
concludes that openness to trade is positively related to GDP
growth, but the impact of FDI is still insignificant regarding
economic growth.
Batten & Vo (2009) adopt the panel data technique to
investigate how the economic growths of 79 countries are affected
by FDI during the time period from 1980 to 2003. The four
variables examined in the data are: FDI inflows, gross FDI flows,
stock of FDI inflows, and gross stock of FDI. In addition, they
also consider the strength of the relationship between FDI and
GDP when countries have different levels in terms of economic,
educational, and institutional conditions. Batten & Vo (2009)
come to the conclusion that the influence of FDI on economic
growth is a strong positive correlation for the countries with a
lower growth rate of population, inflation and risk, a higher
level of educational achievement and stock development. They
conclude that before making the decision to reform the cross-
border investment policy, countries need to take into account the
purpose of foreign governments and how it will accelerate GDP
growth as well.
Cieslik & Tarsalewska (2011) conduct an investigation of the
link between openness and economic growth in developing countries.
More specifically, they divide the external openness into two
parts: openness to FDI, and openness to international trade to
study how these two affect GDP growth respectively. Cieslik &
Tarsalewska (2011) employ the leader-follower model to test 97
developing countries from 1974 to 2006, and generate results by
using static and dynamic panel data. The empirical results tell
that both FDI and international trade have positive relationships
with economic growth, and are statistically significant at 5% and
10% respectively. Moreover, they point out that the role of
XU 5
openness to FDI is more important than openness to trade, because
1% increases in international trade causes 0.02% increases in GDP
per capita, while 1% increases in FDI causes 0.10% increases in
GDP per capita.
II. Data Source
Using the data from a sample of 89 developed and developing
countries the impact of FDI on economic growth was investigated.
The selected countries are chosen based on the availability of
data. The data used to test my hypothesis are adopted from the
Penn World Table 7.1 are GDP per capita, population and
consumption share of output, which are used to calculate the of
growth rate of GDP, growth rate of population and average saving
rate between 1965 and 2005. Additionally, the other two variables
are education in 2005 (the percentage of population over the age
of 25 with a secondary education), which is from the UNESCO
Institute for Statistics (UIS) yearbook, and foreign direct
investment (FDI) net inflows from 1982 to 2005, which is
collected from World Bank.
FDI inflows are the value made by foreigners coming into the
host country, while the outflows are the value flowing outside
the country. FDI net inflows are the difference between inflows
and outflows. The FDI net inflow is expressed as the percentage
of FDI inflows to GDP. In the paper, the weakness of the source
is that the data of FDI net inflows before 1982 is limited, and
only a few countries’ FDI are reported. Therefore, the small
sample size may reduce the precision and affect the accuracy of
the results. In order to mitigate the imprecision, I calculate
the average FDI net inflow by adding up all FDI net inflows from
1982 to 2005 and taking the average of the sums. The positive FDI
net inflows suggest that the value of recouping the investment by
XU 6
foreign company is less than the value of capital newly invested
in the host country.
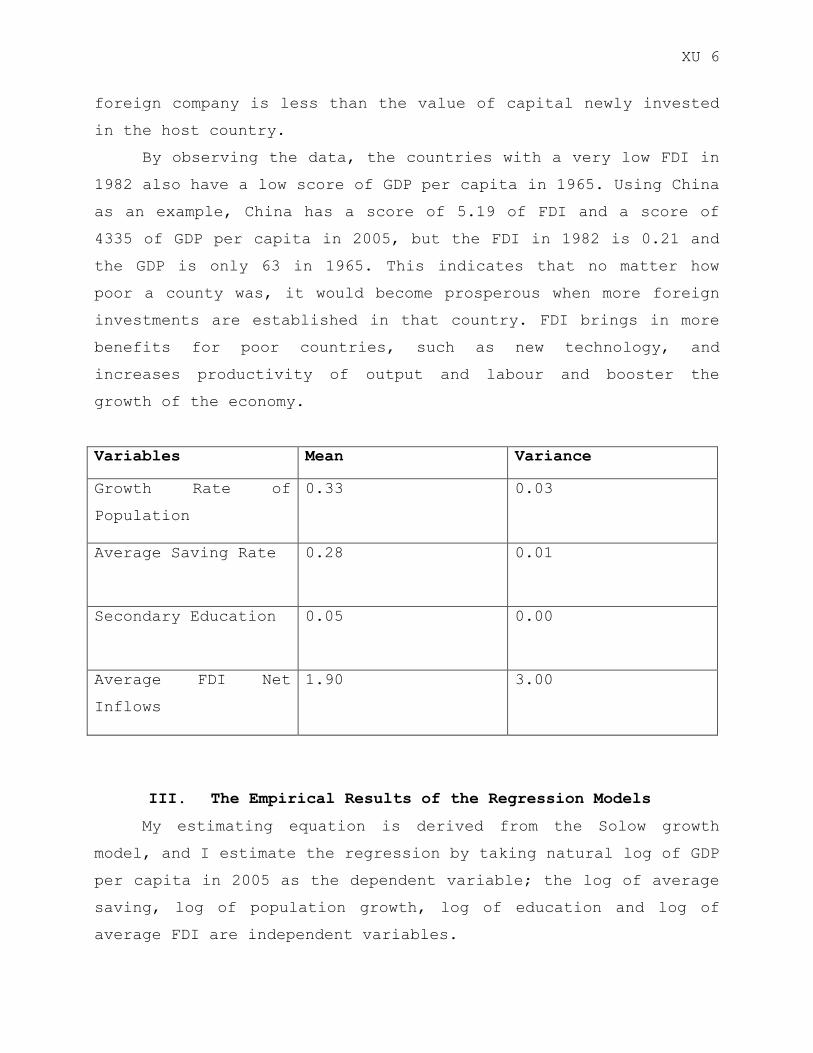
By observing the data, the countries with a very low FDI in
1982 also have a low score of GDP per capita in 1965. Using China
as an example, China has a score of 5.19 of FDI and a score of
4335 of GDP per capita in 2005, but the FDI in 1982 is 0.21 and
the GDP is only 63 in 1965. This indicates that no matter how
poor a county was, it would become prosperous when more foreign
investments are established in that country. FDI brings in more
benefits for poor countries, such as new technology, and
increases productivity of output and labour and booster the
growth of the economy.
Variables Mean Variance
Growth Rate of
Population
0.33
0.03
Average Saving Rate 0.28
0.01
Secondary Education 0.05
0.00
Average FDI Net
Inflows
1.90 3.00
III. The Empirical Results of the Regression Models
My estimating equation is derived from the Solow growth
model, and I estimate the regression by taking natural log of GDP
per capita in 2005 as the dependent variable; the log of average
saving, log of population growth, log of education and log of
average FDI are independent variables.
XU 7
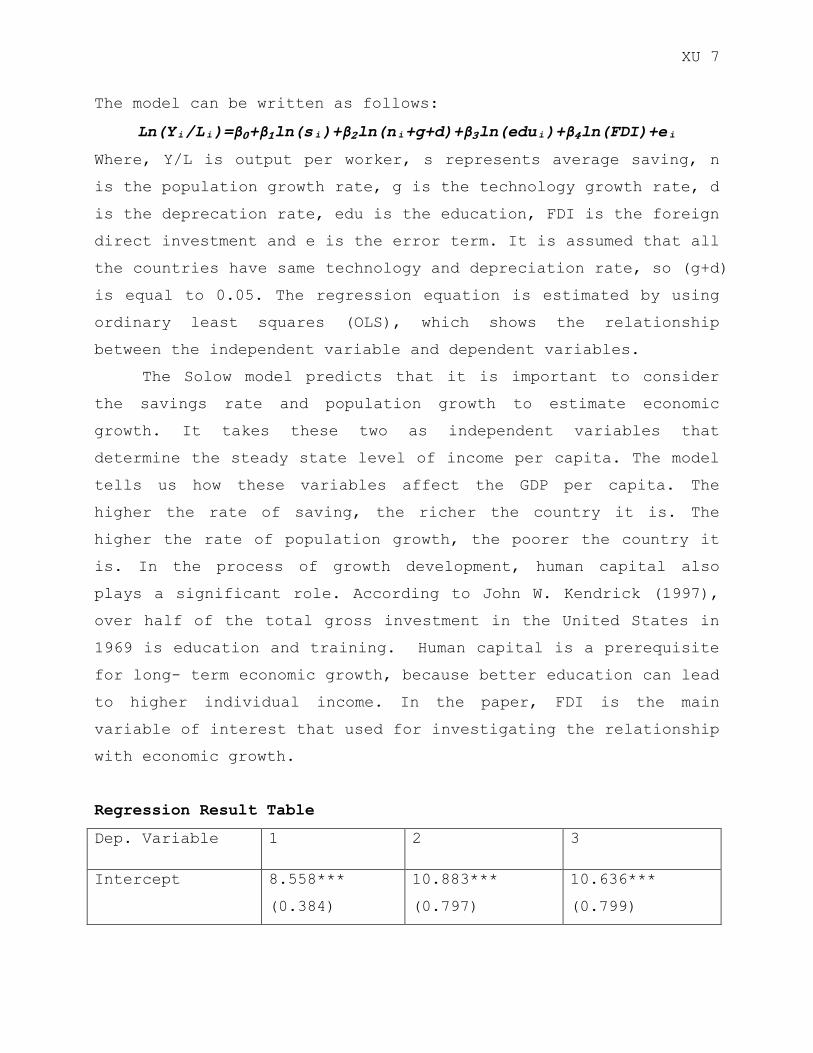
The model can be written as follows:
Ln(Yᵢ/Lᵢ)=β₀+β₁ln(sᵢ)+β₂ln(nᵢ+g+d)+β₃ln(eduᵢ)+β₄ln(FDI)+eᵢ
Where, Y/L is output per worker, s represents average saving, n
is the population growth rate, g is the technology growth rate, d
is the deprecation rate, edu is the education, FDI is the foreign
direct investment and e is the error term. It is assumed that all
the countries have same technology and depreciation rate, so (g+d)
is equal to 0.05. The regression equation is estimated by using
ordinary least squares (OLS), which shows the relationship
between the independent variable and dependent variables.
The Solow model predicts that it is important to consider
the savings rate and population growth to estimate economic
growth. It takes these two as independent variables that
determine the steady state level of income per capita. The model
tells us how these variables affect the GDP per capita. The
higher the rate of saving, the richer the country it is. The
higher the rate of population growth, the poorer the country it
is. In the process of growth development, human capital also
plays a significant role. According to John W. Kendrick (1997),
over half of the total gross investment in the United States in
1969 is education and training. Human capital is a prerequisite
for long- term economic growth, because better education can lead
to higher individual income. In the paper, FDI is the main
variable of interest that used for investigating the relationship
with economic growth.
Regression Result Table
Dep. Variable 1 2 3
Intercept 8.558***
(0.384)
10.883***
(0.797)
10.636***
(0.799)
XU 8
Log(s) 1.155***
(0.200)
1.171***
(0.190)
1.092***
(0.192 )
Log(n+0.05) -1.485***
(0.175)
-1.323***
(0.173)
-1.303***
(0.171)
Log(edu) 0.670***
(0.204)
0.631***
(0.203)
Log(FDI) 0.155*
(0.086)
R2 Adj.
No. Obs
0.625
(89)
0.663
(89)
0.672
(89)
Notes: Standard Errors in parentheses
*** Indicates significance at the 1% level; **Indicates significance at the 5%
level; *Indicates significance at the 10% level
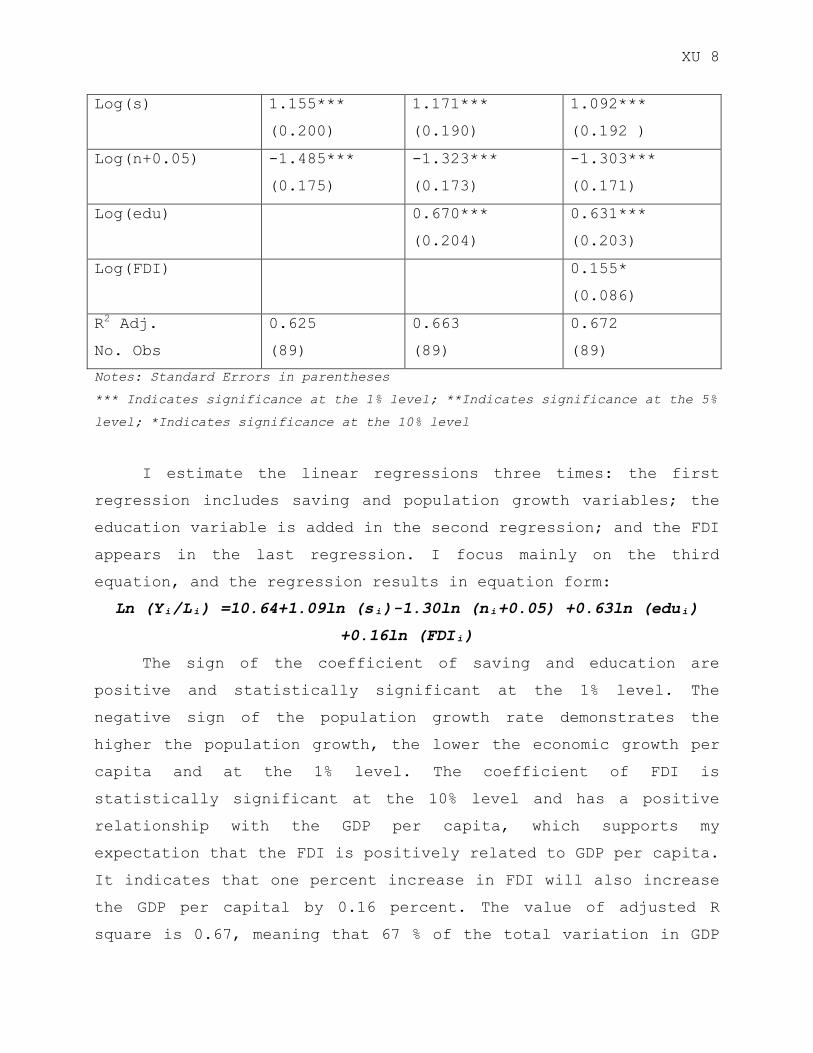
I estimate the linear regressions three times: the first
regression includes saving and population growth variables; the
education variable is added in the second regression; and the FDI
appears in the last regression. I focus mainly on the third
equation, and the regression results in equation form:
Ln (Yᵢ/Lᵢ) =10.64+1.09ln (sᵢ)-1.30ln (nᵢ+0.05) +0.63ln (eduᵢ)
+0.16ln (FDIᵢ)
The sign of the coefficient of saving and education are
positive and statistically significant at the 1% level. The
negative sign of the population growth rate demonstrates the
higher the population growth, the lower the economic growth per
capita and at the 1% level. The coefficient of FDI is
statistically significant at the 10% level and has a positive
relationship with the GDP per capita, which supports my
expectation that the FDI is positively related to GDP per capita.
It indicates that one percent increase in FDI will also increase
the GDP per capital by 0.16 percent. The value of adjusted R
square is 0.67, meaning that 67 % of the total variation in GDP
XU 9
per capital is explained by saving, population growth, education
and FDI. The adjusted R-square in the third regression increases
from 62% to 67% after adding the FDI, which signifies that the
variable helps to improve the accuracy of the results.
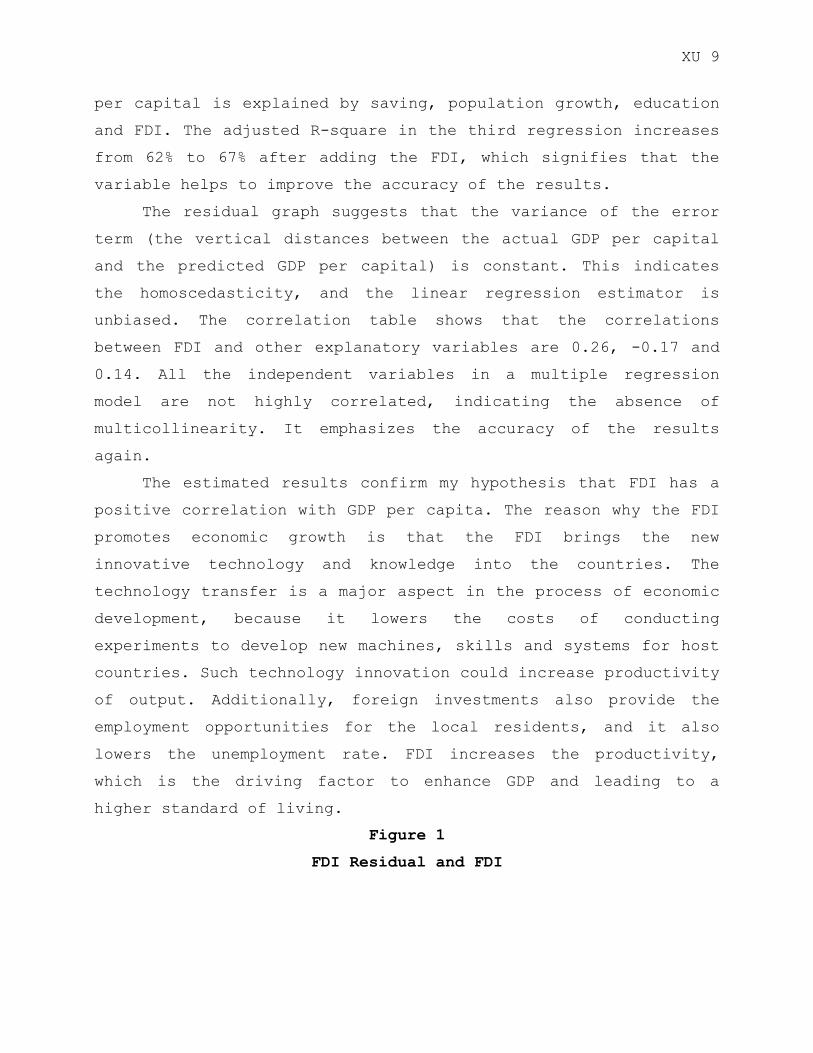
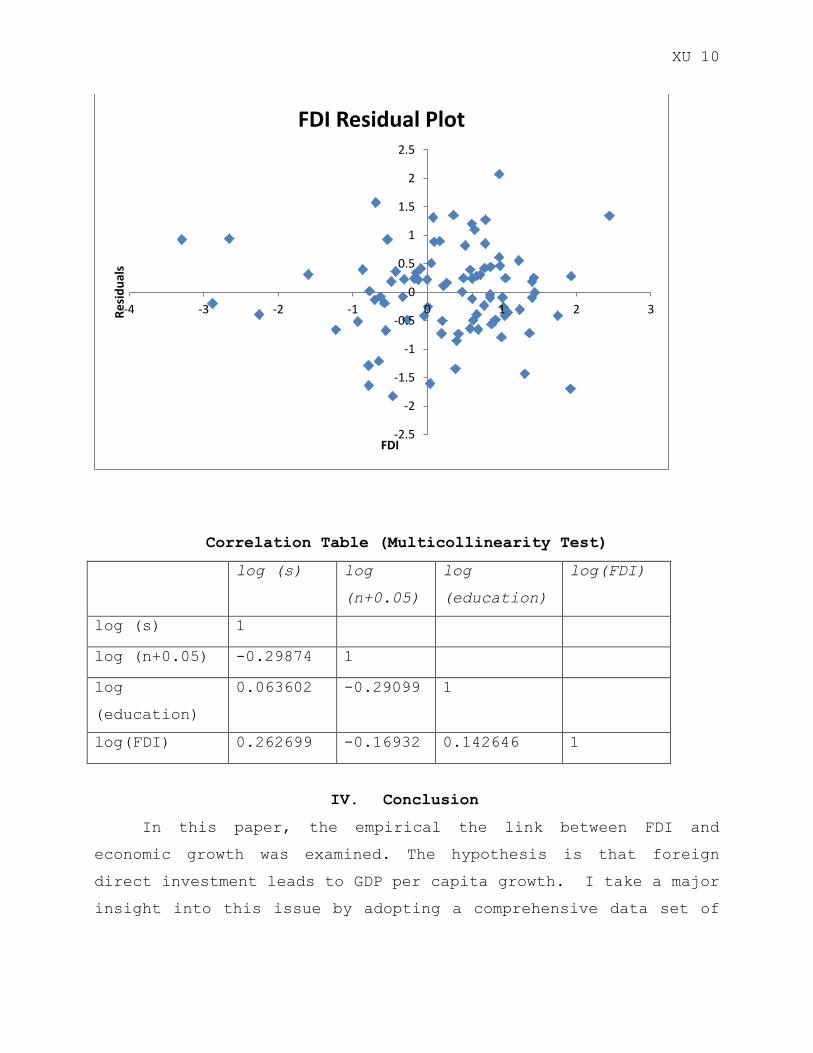
The residual graph suggests that the variance of the error
term (the vertical distances between the actual GDP per capital
and the predicted GDP per capital) is constant. This indicates
the homoscedasticity, and the linear regression estimator is
unbiased. The correlation table shows that the correlations
between FDI and other explanatory variables are 0.26, -0.17 and
0.14. All the independent variables in a multiple regression
model are not highly correlated, indicating the absence of
multicollinearity. It emphasizes the accuracy of the results
again.
The estimated results confirm my hypothesis that FDI has a
positive correlation with GDP per capita. The reason why the FDI
promotes economic growth is that the FDI brings the new
innovative technology and knowledge into the countries. The
technology transfer is a major aspect in the process of economic
development, because it lowers the costs of conducting
experiments to develop new machines, skills and systems for host
countries. Such technology innovation could increase productivity
of output. Additionally, foreign investments also provide the
employment opportunities for the local residents, and it also
lowers the unemployment rate. FDI increases the productivity,
which is the driving factor to enhance GDP and leading to a
higher standard of living.
Figure 1
FDI Residual and FDI
XU 10
Correlation Table (Multicollinearity Test)
log (s) log
(n+0.05)
log
(education)
log(FDI)
log (s) 1
log (n+0.05) -0.29874 1
log
(education)
0.063602 -0.29099 1
log(FDI) 0.262699 -0.16932 0.142646 1
IV. Conclusion
In this paper, the empirical the link between FDI and
economic growth was examined. The hypothesis is that foreign
direct investment leads to GDP per capita growth. I take a major
insight into this issue by adopting a comprehensive data set of
-2.5
-2
-1.5
-1
-0.5
0
0.5
1
1.5
2
2.5
-4 -3 -2 -1 0 1 2 3Re
sid
ual
s
FDI
FDI Residual Plot
XU 11
89 countries from 1965 to 2005, and the selection of countries
and time period are based on the availability of the data.
Using the growth model to analyze long-run economic growth
by looking at the four variables (i.e. saving, population growth,
education and FDI), I find that FDI inflow contributes to the
development effort of a country and is significantly causing GDP
per capital to grow. Additionally, the regression equation of my
study also emphasizes the influences of FDI on other independent
variables are noticeable and cannot be ignored. The correlation
between FDI and economic growth is strong and positive for the
countries with a lower growth rate of population, a higher rate
of saving and higher level of educational achievement. It is
found that 1% increases in FDI causes 0.16% increases in GDP per
capita. In the recent academic literature, Batten & Vo (2009)
examine the effect of FDI on GDP growth when countries with
different level economic, educational, and institutional
conditions. Cieslik & Tarsalewska (2011) indicate that 1%
increases in FDI causes 0.10% increases in GDP per capita. Their
final results confirm the exogenous component of FDI does exert a
robust, positive influence on economic growth.
Consequently, my findings highlight the importance for
countries extending productions to another county, because the
considerations of the lower costs and higher efficiency may
generate more profits and make them wealthier. In order to create
national incentive to attract the technology and skills into
their countries, some policies should be implemented by
governments, such as the removal of restrictive trade regulations,
lower tariffs and taxes, free trade agreements, and finial
support for foreign investment enterprise.
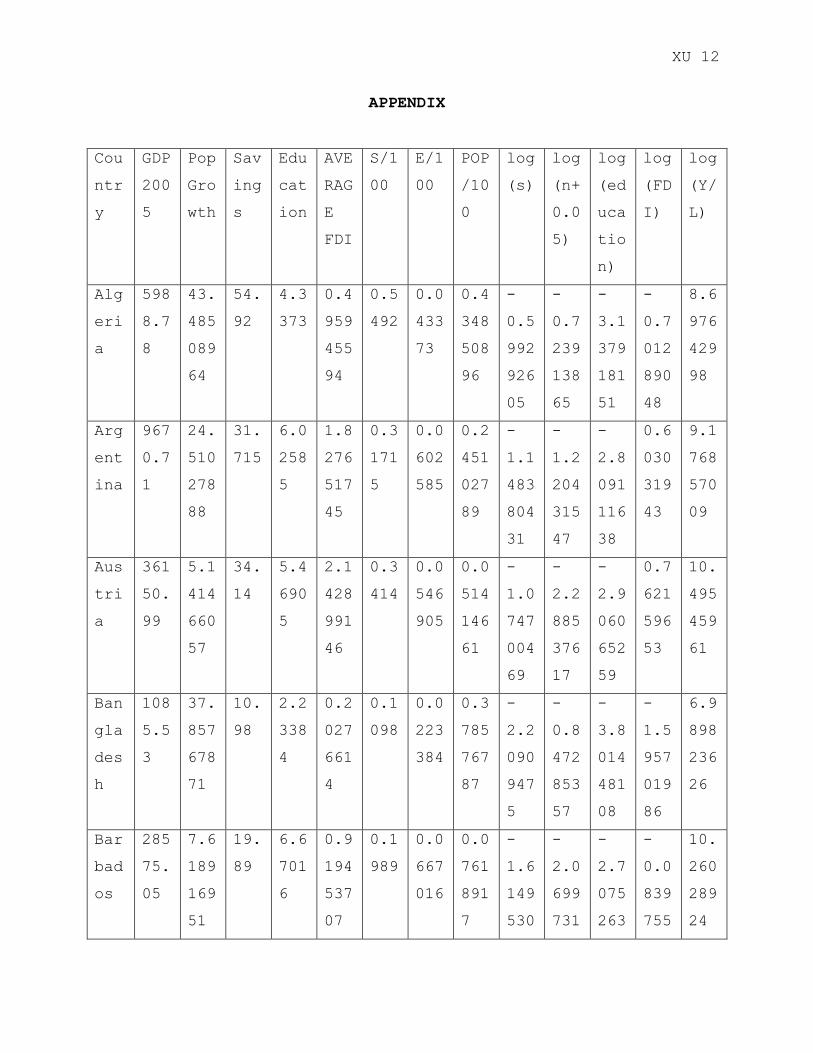
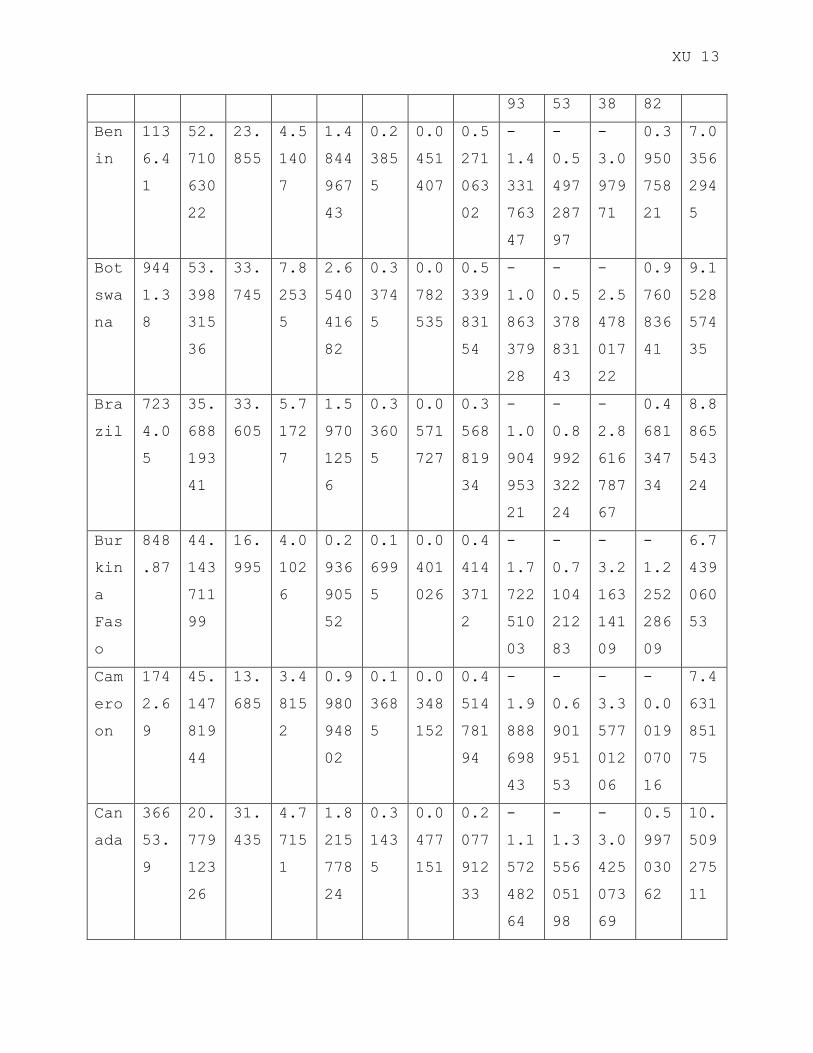
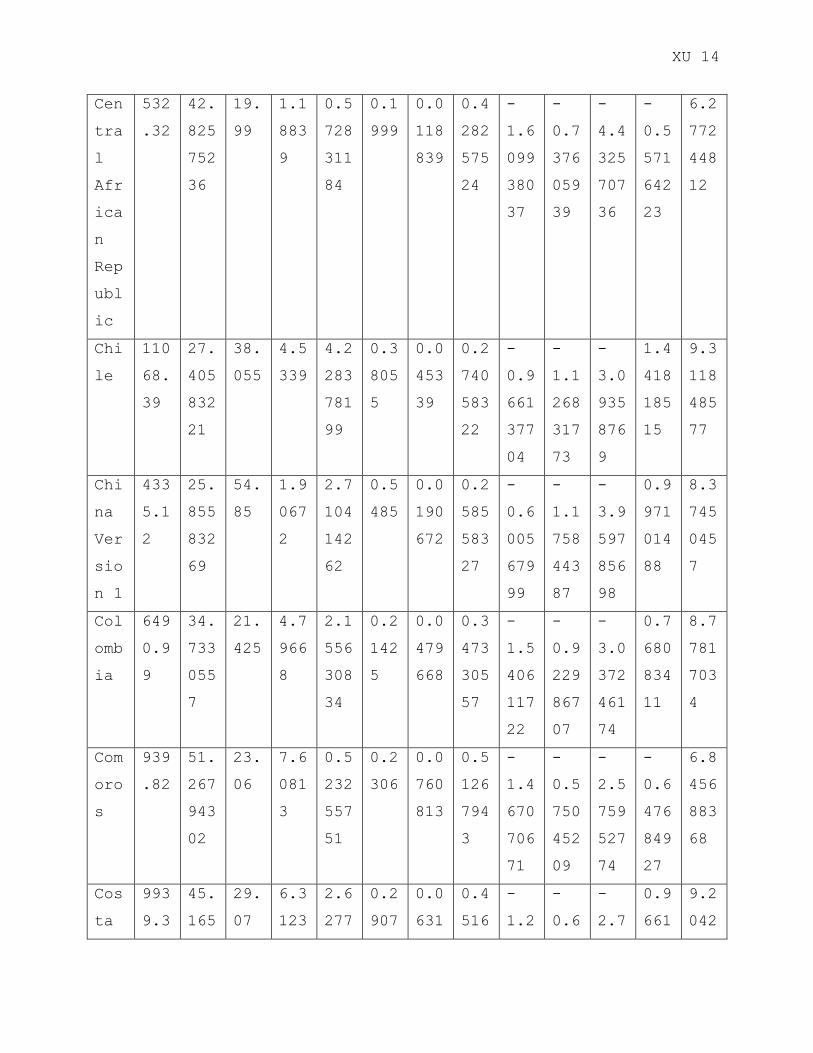
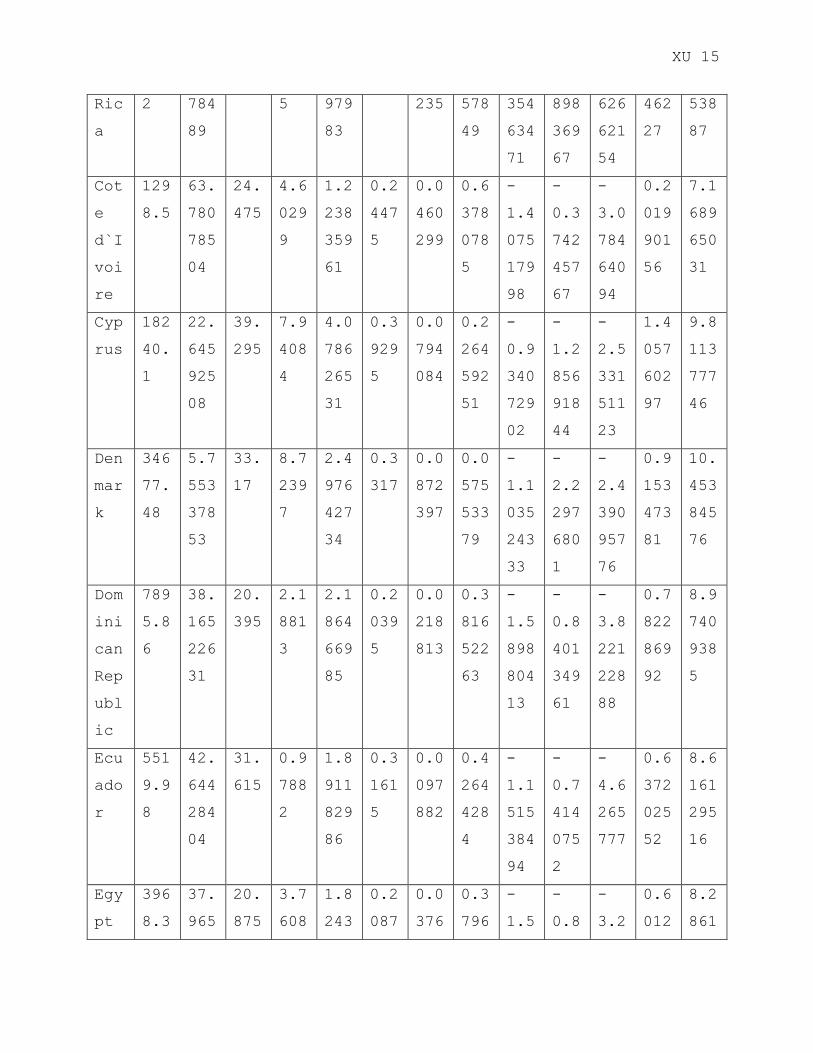
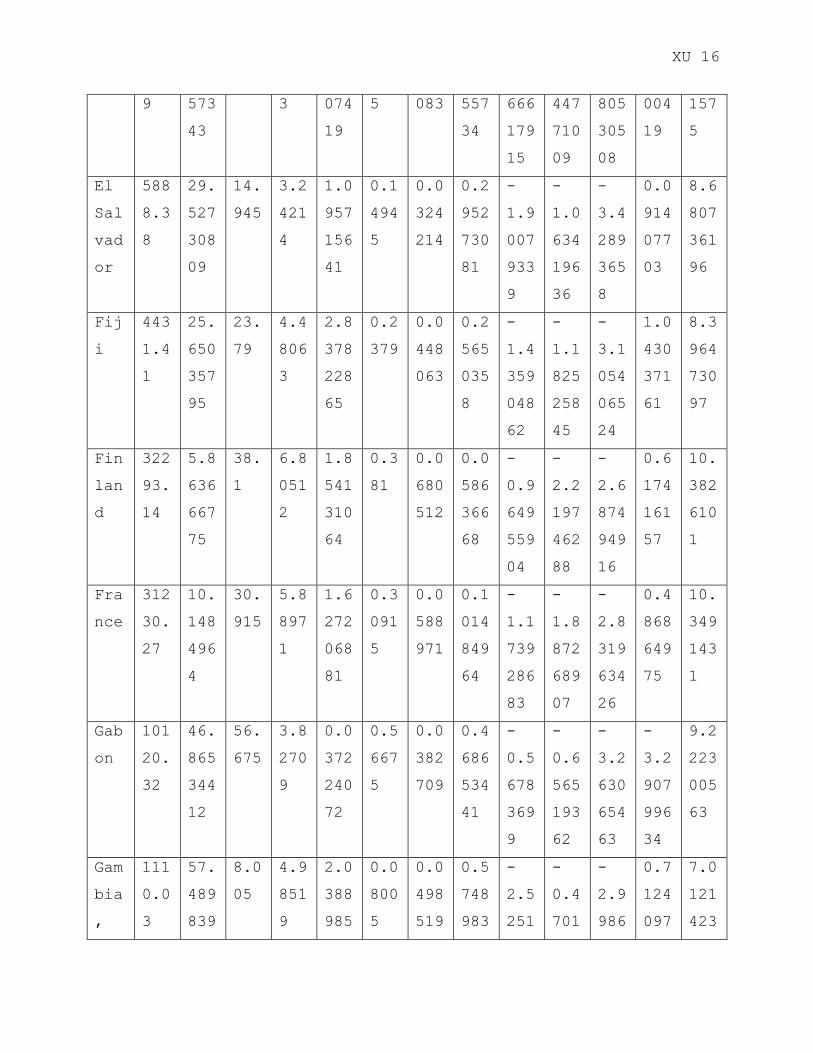
XU 12
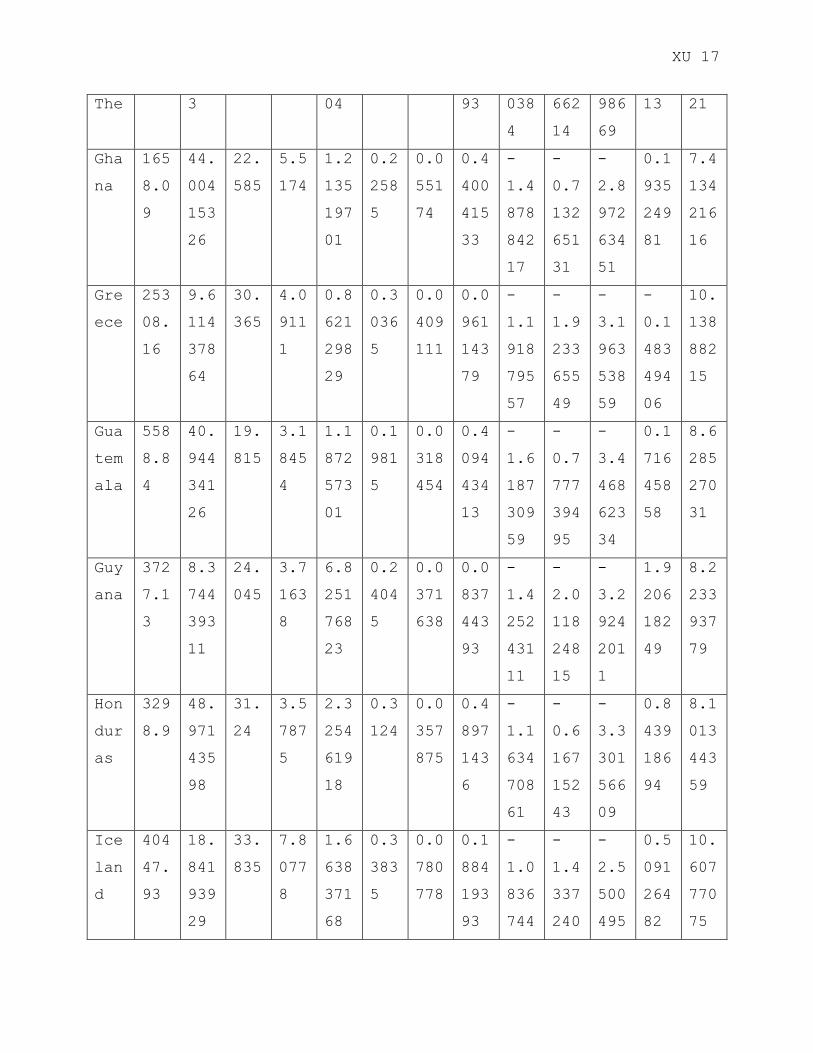
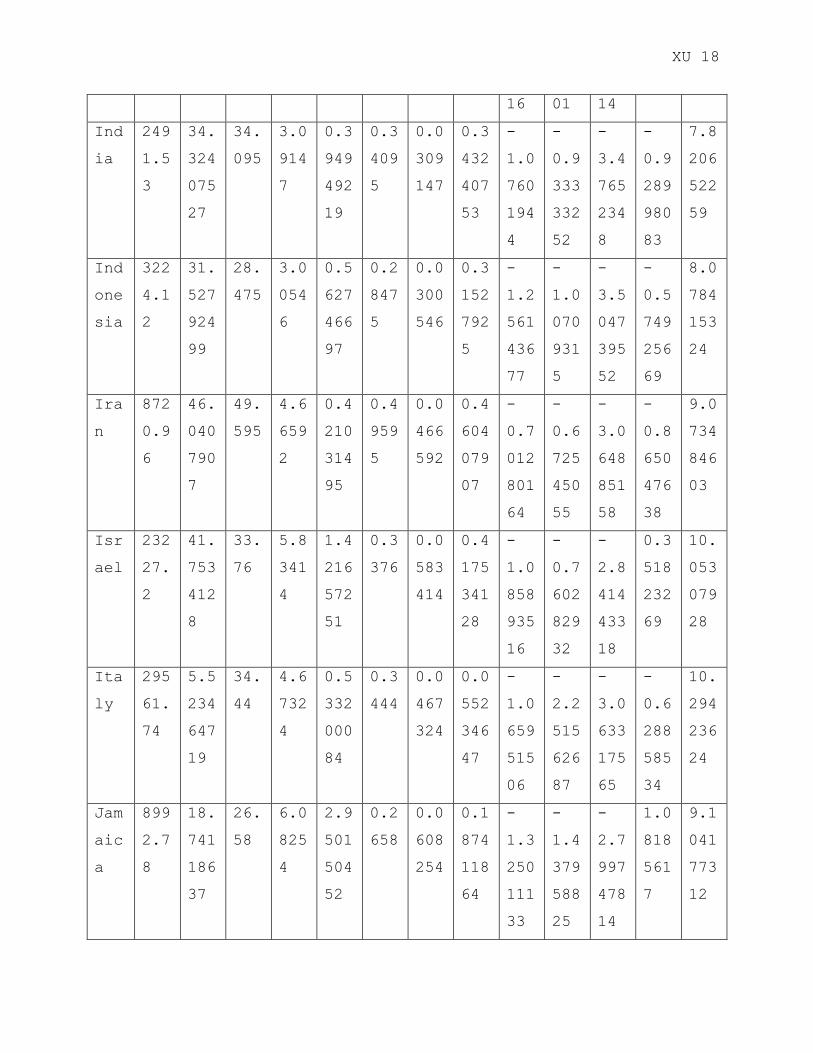
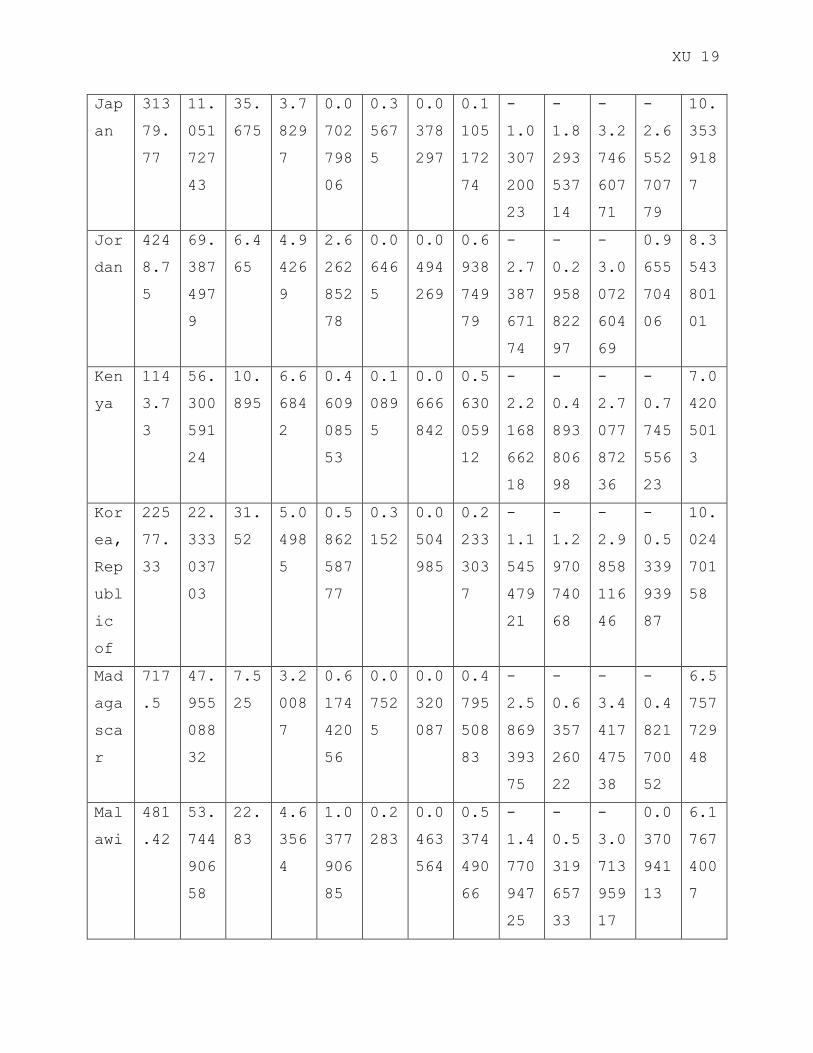
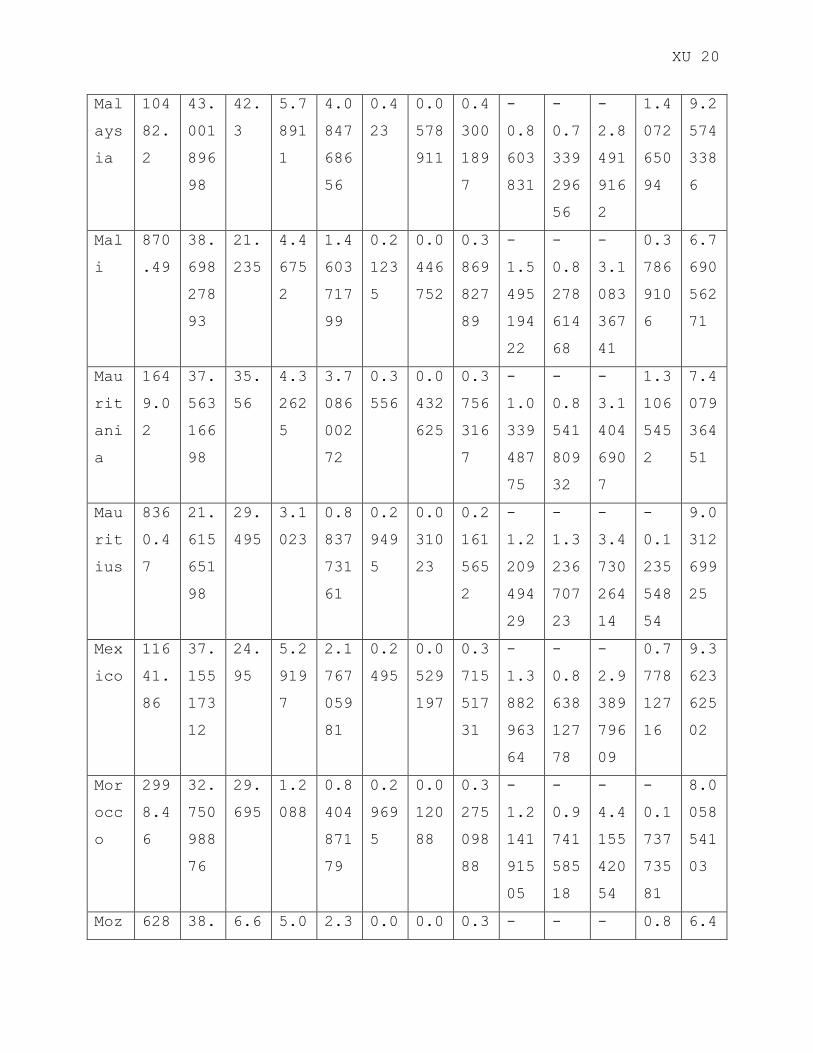
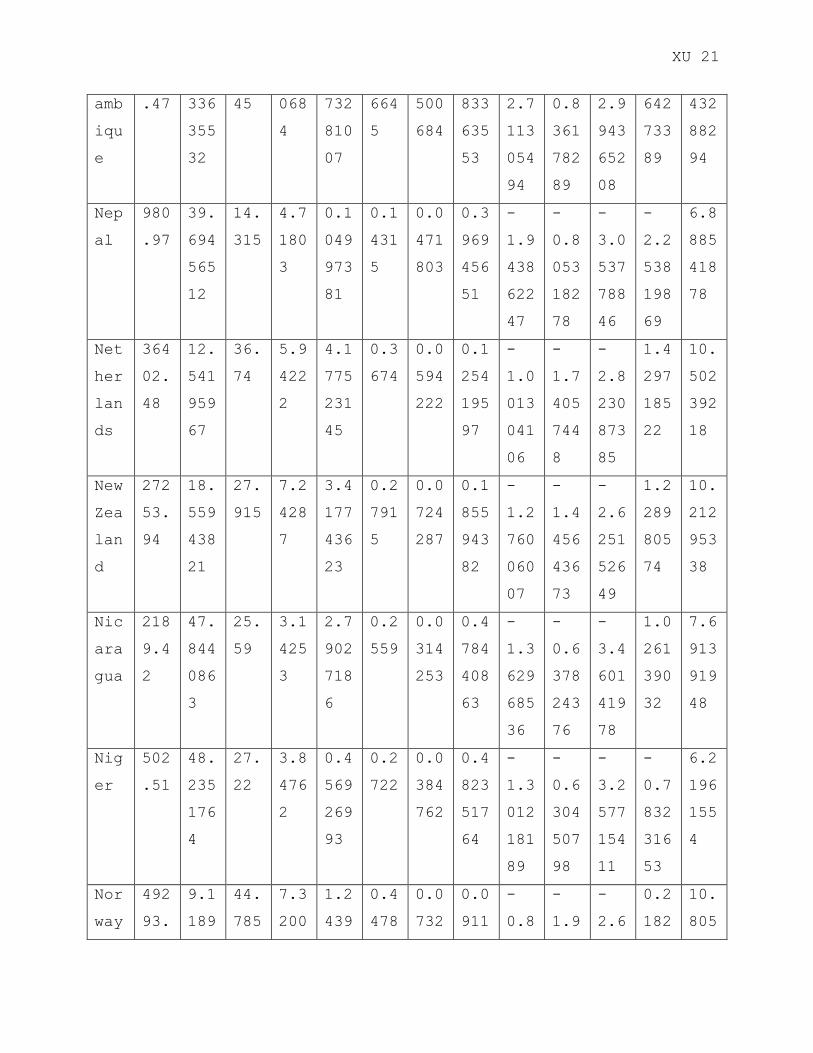
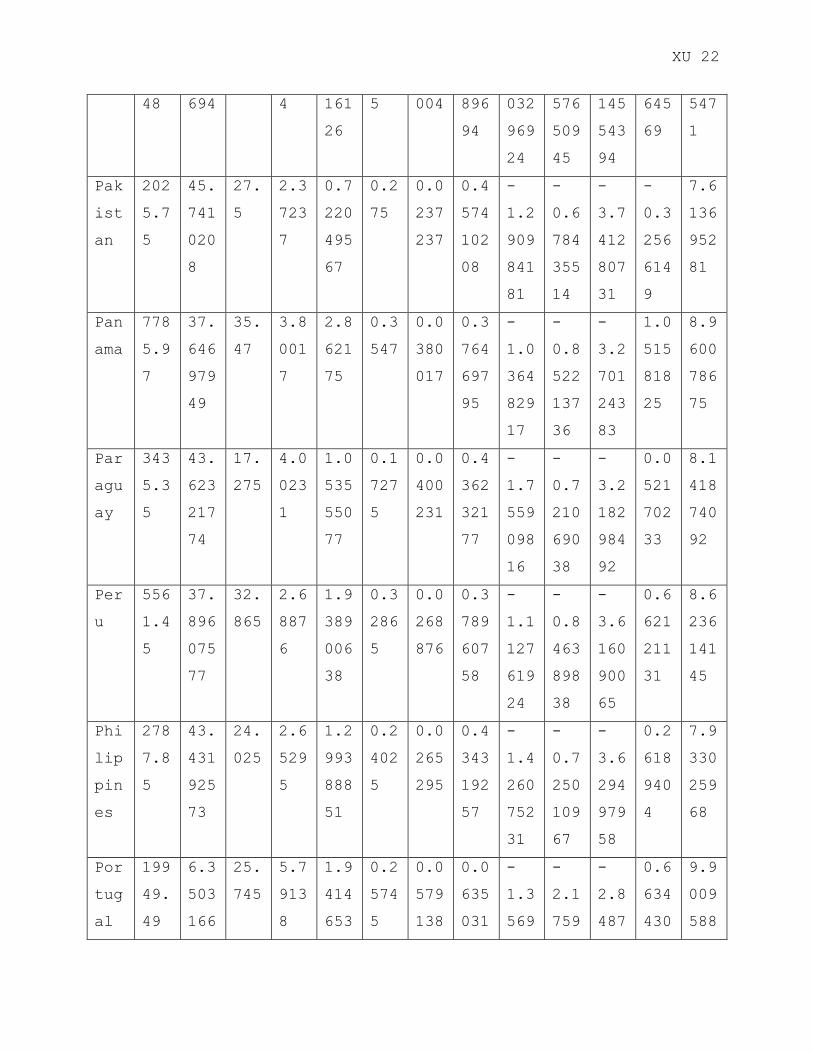
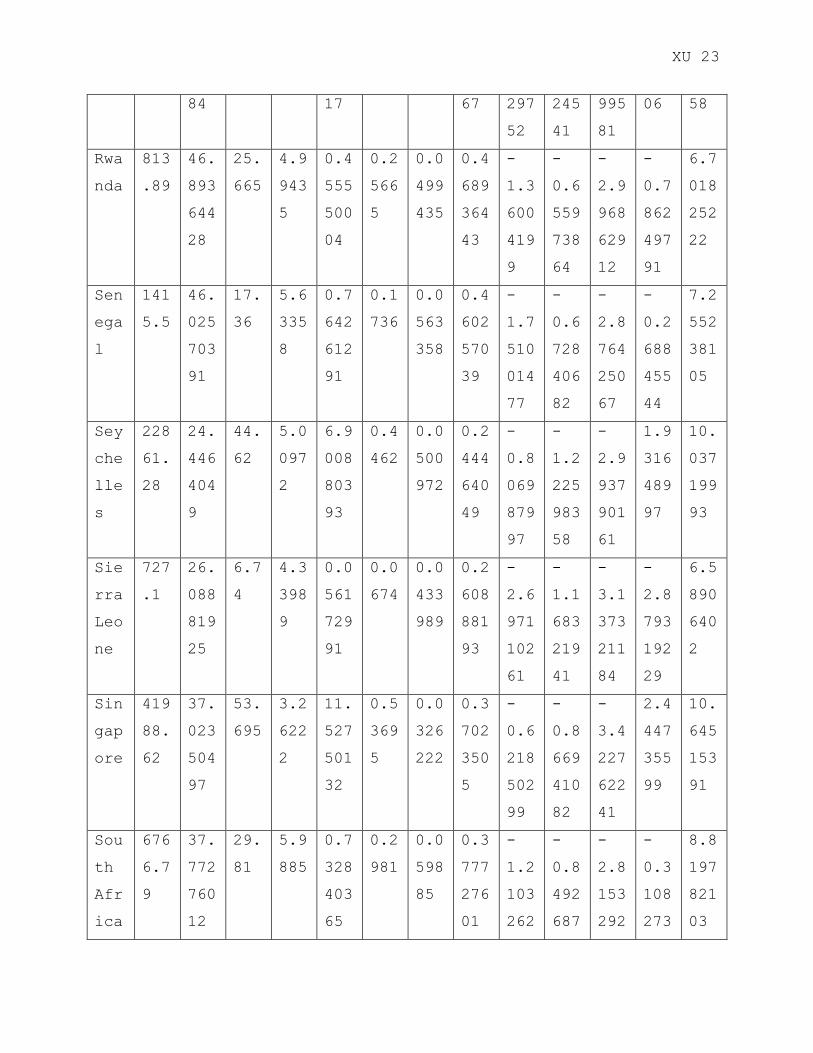
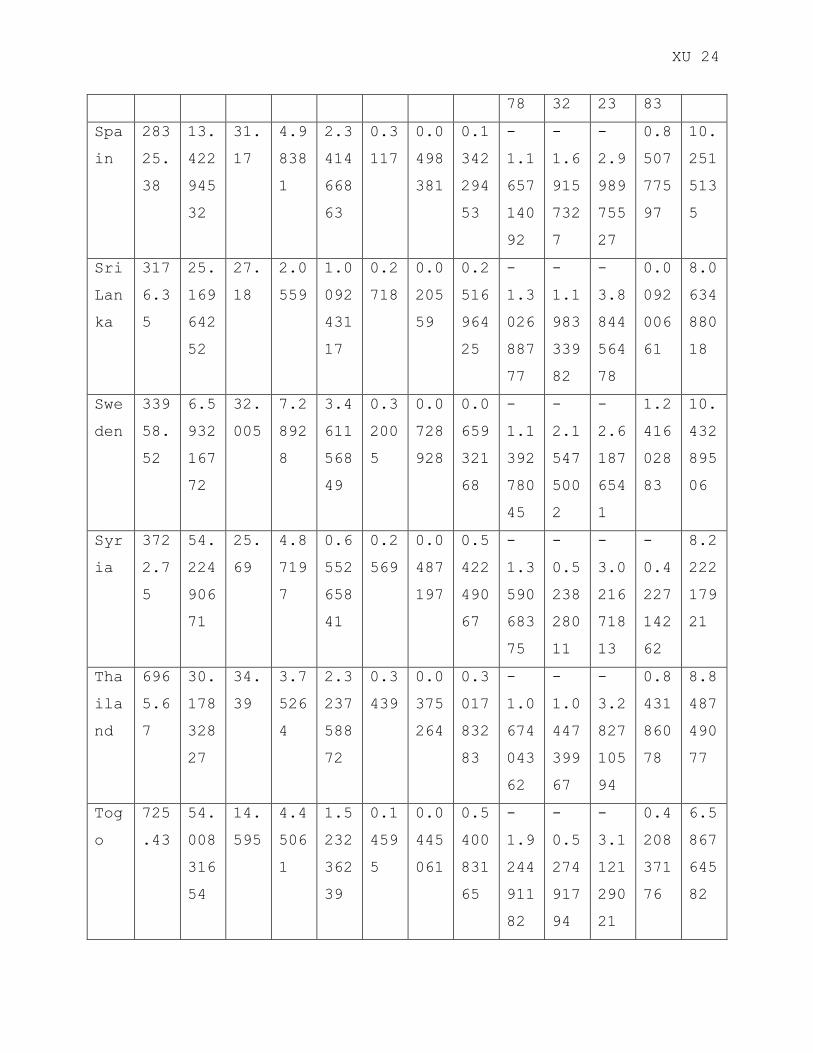
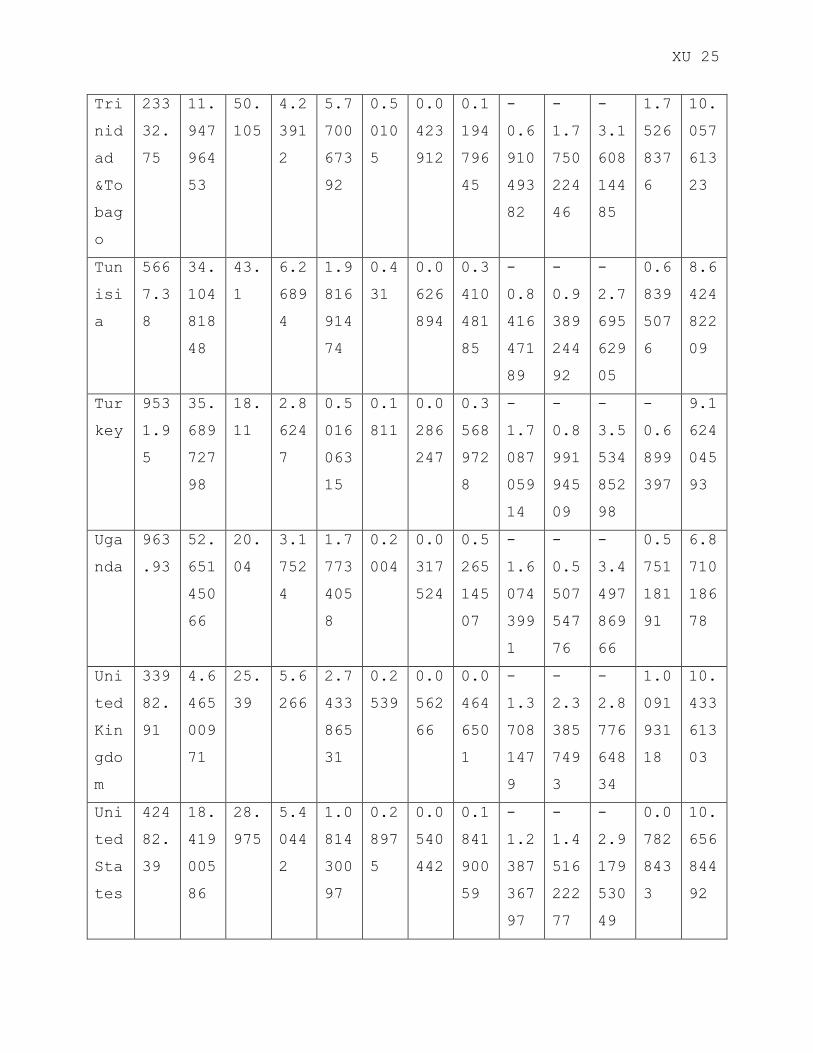
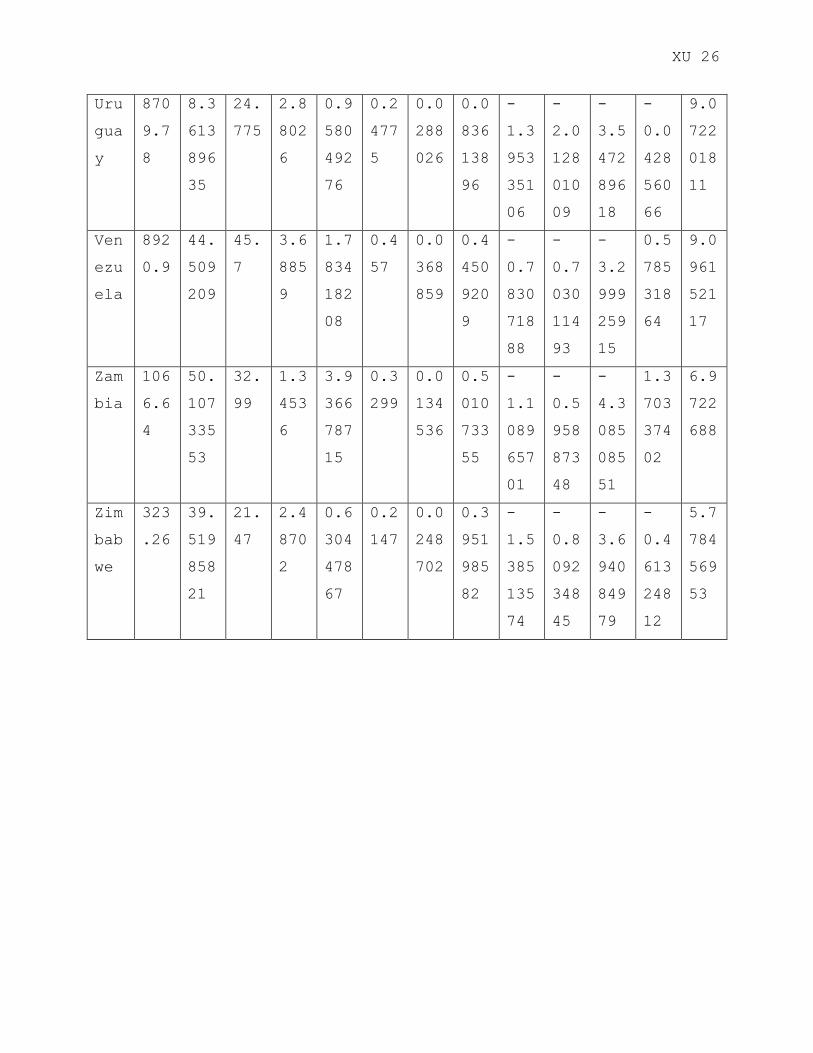
APPENDIX
Cou
ntr
y
GDP
200
5
Pop
Gro
wth
Sav
ing
s
Edu
cat
ion
AVE
RAG
E
FDI
S/1
00
E/1
00
POP
/10
0
log
(s)
log
(n+
0.0
5)
log
(ed
uca
tio
n)
log
(FD
I)
log
(Y/
L)
Alg
eri
a
598
8.7
8
43.
485
089
64
54.
92
4.3
373
0.4
959
455
94
0.5
492
0.0
433
73
0.4
348
508
96
-
0.5
992
926
05
-
0.7
239
138
65
-
3.1
379
181
51
-
0.7
012
890
48
8.6
976
429
98
Arg
ent
ina
967
0.7
1
24.
510
278
88
31.
715
6.0
258
5
1.8
276
517
45
0.3
171
5
0.0
602
585
0.2
451
027
89
-
1.1
483
804
31
-
1.2
204
315
47
-
2.8
091
116
38
0.6
030
319
43
9.1
768
570
09
Aus
tri
a
361
50.
99
5.1
414
660
57
34.
14
5.4
690
5
2.1
428
991
46
0.3
414
0.0
546
905
0.0
514
146
61
-
1.0
747
004
69
-
2.2
885
376
17
-
2.9
060
652
59
0.7
621
596
53
10.
495
459
61
Ban
gla
des
h
108
5.5
3
37.
857
678
71
10.
98
2.2
338
4
0.2
027
661
4
0.1
098
0.0
223
384
0.3
785
767
87
-
2.2
090
947
5
-
0.8
472
853
57
-
3.8
014
481
08
-
1.5
957
019
86
6.9
898
236
26
Bar
bad
os
285
75.
05
7.6
189
169
51
19.
89
6.6
701
6
0.9
194
537
07
0.1
989
0.0
667
016
0.0
761
891
7
-
1.6
149
530
-
2.0
699
731
-
2.7
075
263
-
0.0
839
755
10.
260
289
24
XU 13
93 53 38 82
Ben
in
113
6.4
1
52.
710
630
22
23.
855
4.5
140
7
1.4
844
967
43
0.2
385
5
0.0
451
407
0.5
271
063
02
-
1.4
331
763
47
-
0.5
497
287
97
-
3.0
979
71
0.3
950
758
21
7.0
356
294
5
Bot
swa
na
944
1.3
8
53.
398
315
36
33.
745
7.8
253
5
2.6
540
416
82
0.3
374
5
0.0
782
535
0.5
339
831
54
-
1.0
863
379
28
-
0.5
378
831
43
-
2.5
478
017
22
0.9
760
836
41
9.1
528
574
35
Bra
zil
723
4.0
5
35.
688
193
41
33.
605
5.7
172
7
1.5
970
125
6
0.3
360
5
0.0
571
727
0.3
568
819
34
-
1.0
904
953
21
-
0.8
992
322
24
-
2.8
616
787
67
0.4
681
347
34
8.8
865
543
24
Bur
kin
a
Fas
o
848
.87
44.
143
711
99
16.
995
4.0
102
6
0.2
936
905
52
0.1
699
5
0.0
401
026
0.4
414
371
2
-
1.7
722
510
03
-
0.7
104
212
83
-
3.2
163
141
09
-
1.2
252
286
09
6.7
439
060
53
Cam
ero
on
174
2.6
9
45.
147
819
44
13.
685
3.4
815
2
0.9
980
948
02
0.1
368
5
0.0
348
152
0.4
514
781
94
-
1.9
888
698
43
-
0.6
901
951
53
-
3.3
577
012
06
-
0.0
019
070
16
7.4
631
851
75
Can
ada
366
53.
9
20.
779
123
26
31.
435
4.7
715
1
1.8
215
778
24
0.3
143
5
0.0
477
151
0.2
077
912
33
-
1.1
572
482
64
-
1.3
556
051
98
-
3.0
425
073
69
0.5
997
030
62
10.
509
275
11
XU 14
Cen
tra
l
Afr
ica
n
Rep
ubl
ic
532
.32
42.
825
752
36
19.
99
1.1
883
9
0.5
728
311
84
0.1
999
0.0
118
839
0.4
282
575
24
-
1.6
099
380
37
-
0.7
376
059
39
-
4.4
325
707
36
-
0.5
571
642
23
6.2
772
448
12
Chi
le
110
68.
39
27.
405
832
21
38.
055
4.5
339
4.2
283
781
99
0.3
805
5
0.0
453
39
0.2
740
583
22
-
0.9
661
377
04
-
1.1
268
317
73
-
3.0
935
876
9
1.4
418
185
15
9.3
118
485
77
Chi
na
Ver
sio
n 1
433
5.1
2
25.
855
832
69
54.
85
1.9
067
2
2.7
104
142
62
0.5
485
0.0
190
672
0.2
585
583
27
-
0.6
005
679
99
-
1.1
758
443
87
-
3.9
597
856
98
0.9
971
014
88
8.3
745
045
7
Col
omb
ia
649
0.9
9
34.
733
055
7
21.
425
4.7
966
8
2.1
556
308
34
0.2
142
5
0.0
479
668
0.3
473
305
57
-
1.5
406
117
22
-
0.9
229
867
07
-
3.0
372
461
74
0.7
680
834
11
8.7
781
703
4
Com
oro
s
939
.82
51.
267
943
02
23.
06
7.6
081
3
0.5
232
557
51
0.2
306
0.0
760
813
0.5
126
794
3
-
1.4
670
706
71
-
0.5
750
452
09
-
2.5
759
527
74
-
0.6
476
849
27
6.8
456
883
68
Cos
ta
993
9.3
45.
165
29.
07
6.3
123
2.6
277
0.2
907
0.0
631
0.4
516
-
1.2
-
0.6
-
2.7
0.9
661
9.2
042
XU 15
Ric
a
2 784
89
5 979
83
235 578
49
354
634
71
898
369
67
626
621
54
462
27
538
87
Cot
e
d`I
voi
re
129
8.5
63.
780
785
04
24.
475
4.6
029
9
1.2
238
359
61
0.2
447
5
0.0
460
299
0.6
378
078
5
-
1.4
075
179
98
-
0.3
742
457
67
-
3.0
784
640
94
0.2
019
901
56
7.1
689
650
31
Cyp
rus
182
40.
1
22.
645
925
08
39.
295
7.9
408
4
4.0
786
265
31
0.3
929
5
0.0
794
084
0.2
264
592
51
-
0.9
340
729
02
-
1.2
856
918
44
-
2.5
331
511
23
1.4
057
602
97
9.8
113
777
46
Den
mar
k
346
77.
48
5.7
553
378
53
33.
17
8.7
239
7
2.4
976
427
34
0.3
317
0.0
872
397
0.0
575
533
79
-
1.1
035
243
33
-
2.2
297
680
1
-
2.4
390
957
76
0.9
153
473
81
10.
453
845
76
Dom
ini
can
Rep
ubl
ic
789
5.8
6
38.
165
226
31
20.
395
2.1
881
3
2.1
864
669
85
0.2
039
5
0.0
218
813
0.3
816
522
63
-
1.5
898
804
13
-
0.8
401
349
61
-
3.8
221
228
88
0.7
822
869
92
8.9
740
938
5
Ecu
ado
r
551
9.9
8
42.
644
284
04
31.
615
0.9
788
2
1.8
911
829
86
0.3
161
5
0.0
097
882
0.4
264
428
4
-
1.1
515
384
94
-
0.7
414
075
2
-
4.6
265
777
0.6
372
025
52
8.6
161
295
16
Egy
pt
396
8.3
37.
965
20.
875
3.7
608
1.8
243
0.2
087
0.0
376
0.3
796
-
1.5
-
0.8
-
3.2
0.6
012
8.2
861
XU 16
9 573
43
3 074
19
5 083 557
34
666
179
15
447
710
09
805
305
08
004
19
157
5
El
Sal
vad
or
588
8.3
8
29.
527
308
09
14.
945
3.2
421
4
1.0
957
156
41
0.1
494
5
0.0
324
214
0.2
952
730
81
-
1.9
007
933
9
-
1.0
634
196
36
-
3.4
289
365
8
0.0
914
077
03
8.6
807
361
96
Fij
i
443
1.4
1
25.
650
357
95
23.
79
4.4
806
3
2.8
378
228
65
0.2
379
0.0
448
063
0.2
565
035
8
-
1.4
359
048
62
-
1.1
825
258
45
-
3.1
054
065
24
1.0
430
371
61
8.3
964
730
97
Fin
lan
d
322
93.
14
5.8
636
667
75
38.
1
6.8
051
2
1.8
541
310
64
0.3
81
0.0
680
512
0.0
586
366
68
-
0.9
649
559
04
-
2.2
197
462
88
-
2.6
874
949
16
0.6
174
161
57
10.
382
610
1
Fra
nce
312
30.
27
10.
148
496
4
30.
915
5.8
897
1
1.6
272
068
81
0.3
091
5
0.0
588
971
0.1
014
849
64
-
1.1
739
286
83
-
1.8
872
689
07
-
2.8
319
634
26
0.4
868
649
75
10.
349
143
1
Gab
on
101
20.
32
46.
865
344
12
56.
675
3.8
270
9
0.0
372
240
72
0.5
667
5
0.0
382
709
0.4
686
534
41
-
0.5
678
369
9
-
0.6
565
193
62
-
3.2
630
654
63
-
3.2
907
996
34
9.2
223
005
63
Gam
bia
,
111
0.0
3
57.
489
839
8.0
05
4.9
851
9
2.0
388
985
0.0
800
5
0.0
498
519
0.5
748
983
-
2.5
251
-
0.4
701
-
2.9
986
0.7
124
097
7.0
121
423
XU 17
The 3 04 93 038
4
662
14
986
69
13 21
Gha
na
165
8.0
9
44.
004
153
26
22.
585
5.5
174
1.2
135
197
01
0.2
258
5
0.0
551
74
0.4
400
415
33
-
1.4
878
842
17
-
0.7
132
651
31
-
2.8
972
634
51
0.1
935
249
81
7.4
134
216
16
Gre
ece
253
08.
16
9.6
114
378
64
30.
365
4.0
911
1
0.8
621
298
29
0.3
036
5
0.0
409
111
0.0
961
143
79
-
1.1
918
795
57
-
1.9
233
655
49
-
3.1
963
538
59
-
0.1
483
494
06
10.
138
882
15
Gua
tem
ala
558
8.8
4
40.
944
341
26
19.
815
3.1
845
4
1.1
872
573
01
0.1
981
5
0.0
318
454
0.4
094
434
13
-
1.6
187
309
59
-
0.7
777
394
95
-
3.4
468
623
34
0.1
716
458
58
8.6
285
270
31
Guy
ana
372
7.1
3
8.3
744
393
11
24.
045
3.7
163
8
6.8
251
768
23
0.2
404
5
0.0
371
638
0.0
837
443
93
-
1.4
252
431
11
-
2.0
118
248
15
-
3.2
924
201
1
1.9
206
182
49
8.2
233
937
79
Hon
dur
as
329
8.9
48.
971
435
98
31.
24
3.5
787
5
2.3
254
619
18
0.3
124
0.0
357
875
0.4
897
143
6
-
1.1
634
708
61
-
0.6
167
152
43
-
3.3
301
566
09
0.8
439
186
94
8.1
013
443
59
Ice
lan
d
404
47.
93
18.
841
939
29
33.
835
7.8
077
8
1.6
638
371
68
0.3
383
5
0.0
780
778
0.1
884
193
93
-
1.0
836
744
-
1.4
337
240
-
2.5
500
495
0.5
091
264
82
10.
607
770
75
XU 18
16 01 14
Ind
ia
249
1.5
3
34.
324
075
27
34.
095
3.0
914
7
0.3
949
492
19
0.3
409
5
0.0
309
147
0.3
432
407
53
-
1.0
760
194
4
-
0.9
333
332
52
-
3.4
765
234
8
-
0.9
289
980
83
7.8
206
522
59
Ind
one
sia
322
4.1
2
31.
527
924
99
28.
475
3.0
054
6
0.5
627
466
97
0.2
847
5
0.0
300
546
0.3
152
792
5
-
1.2
561
436
77
-
1.0
070
931
5
-
3.5
047
395
52
-
0.5
749
256
69
8.0
784
153
24
Ira
n
872
0.9
6
46.
040
790
7
49.
595
4.6
659
2
0.4
210
314
95
0.4
959
5
0.0
466
592
0.4
604
079
07
-
0.7
012
801
64
-
0.6
725
450
55
-
3.0
648
851
58
-
0.8
650
476
38
9.0
734
846
03
Isr
ael
232
27.
2
41.
753
412
8
33.
76
5.8
341
4
1.4
216
572
51
0.3
376
0.0
583
414
0.4
175
341
28
-
1.0
858
935
16
-
0.7
602
829
32
-
2.8
414
433
18
0.3
518
232
69
10.
053
079
28
Ita
ly
295
61.
74
5.5
234
647
19
34.
44
4.6
732
4
0.5
332
000
84
0.3
444
0.0
467
324
0.0
552
346
47
-
1.0
659
515
06
-
2.2
515
626
87
-
3.0
633
175
65
-
0.6
288
585
34
10.
294
236
24
Jam
aic
a
899
2.7
8
18.
741
186
37
26.
58
6.0
825
4
2.9
501
504
52
0.2
658
0.0
608
254
0.1
874
118
64
-
1.3
250
111
33
-
1.4
379
588
25
-
2.7
997
478
14
1.0
818
561
7
9.1
041
773
12
XU 19
Jap
an
313
79.
77
11.
051
727
43
35.
675
3.7
829
7
0.0
702
798
06
0.3
567
5
0.0
378
297
0.1
105
172
74
-
1.0
307
200
23
-
1.8
293
537
14
-
3.2
746
607
71
-
2.6
552
707
79
10.
353
918
7
Jor
dan
424
8.7
5
69.
387
497
9
6.4
65
4.9
426
9
2.6
262
852
78
0.0
646
5
0.0
494
269
0.6
938
749
79
-
2.7
387
671
74
-
0.2
958
822
97
-
3.0
072
604
69
0.9
655
704
06
8.3
543
801
01
Ken
ya
114
3.7
3
56.
300
591
24
10.
895
6.6
684
2
0.4
609
085
53
0.1
089
5
0.0
666
842
0.5
630
059
12
-
2.2
168
662
18
-
0.4
893
806
98
-
2.7
077
872
36
-
0.7
745
556
23
7.0
420
501
3
Kor
ea,
Rep
ubl
ic
of
225
77.
33
22.
333
037
03
31.
52
5.0
498
5
0.5
862
587
77
0.3
152
0.0
504
985
0.2
233
303
7
-
1.1
545
479
21
-
1.2
970
740
68
-
2.9
858
116
46
-
0.5
339
939
87
10.
024
701
58
Mad
aga
sca
r
717
.5
47.
955
088
32
7.5
25
3.2
008
7
0.6
174
420
56
0.0
752
5
0.0
320
087
0.4
795
508
83
-
2.5
869
393
75
-
0.6
357
260
22
-
3.4
417
475
38
-
0.4
821
700
52
6.5
757
729
48
Mal
awi
481
.42
53.
744
906
58
22.
83
4.6
356
4
1.0
377
906
85
0.2
283
0.0
463
564
0.5
374
490
66
-
1.4
770
947
25
-
0.5
319
657
33
-
3.0
713
959
17
0.0
370
941
13
6.1
767
400
7
XU 20
Mal
ays
ia
104
82.
2
43.
001
896
98
42.
3
5.7
891
1
4.0
847
686
56
0.4
23
0.0
578
911
0.4
300
189
7
-
0.8
603
831
-
0.7
339
296
56
-
2.8
491
916
2
1.4
072
650
94
9.2
574
338
6
Mal
i
870
.49
38.
698
278
93
21.
235
4.4
675
2
1.4
603
717
99
0.2
123
5
0.0
446
752
0.3
869
827
89
-
1.5
495
194
22
-
0.8
278
614
68
-
3.1
083
367
41
0.3
786
910
6
6.7
690
562
71
Mau
rit
ani
a
164
9.0
2
37.
563
166
98
35.
56
4.3
262
5
3.7
086
002
72
0.3
556
0.0
432
625
0.3
756
316
7
-
1.0
339
487
75
-
0.8
541
809
32
-
3.1
404
690
7
1.3
106
545
2
7.4
079
364
51
Mau
rit
ius
836
0.4
7
21.
615
651
98
29.
495
3.1
023
0.8
837
731
61
0.2
949
5
0.0
310
23
0.2
161
565
2
-
1.2
209
494
29
-
1.3
236
707
23
-
3.4
730
264
14
-
0.1
235
548
54
9.0
312
699
25
Mex
ico
116
41.
86
37.
155
173
12
24.
95
5.2
919
7
2.1
767
059
81
0.2
495
0.0
529
197
0.3
715
517
31
-
1.3
882
963
64
-
0.8
638
127
78
-
2.9
389
796
09
0.7
778
127
16
9.3
623
625
02
Mor
occ
o
299
8.4
6
32.
750
988
76
29.
695
1.2
088
0.8
404
871
79
0.2
969
5
0.0
120
88
0.3
275
098
88
-
1.2
141
915
05
-
0.9
741
585
18
-
4.4
155
420
54
-
0.1
737
735
81
8.0
058
541
03
Moz 628 38. 6.6 5.0 2.3 0.0 0.0 0.3 - - - 0.8 6.4
XU 21
amb
iqu
e
.47 336
355
32
45 068
4
732
810
07
664
5
500
684
833
635
53
2.7
113
054
94
0.8
361
782
89
2.9
943
652
08
642
733
89
432
882
94
Nep
al
980
.97
39.
694
565
12
14.
315
4.7
180
3
0.1
049
973
81
0.1
431
5
0.0
471
803
0.3
969
456
51
-
1.9
438
622
47
-
0.8
053
182
78
-
3.0
537
788
46
-
2.2
538
198
69
6.8
885
418
78
Net
her
lan
ds
364
02.
48
12.
541
959
67
36.
74
5.9
422
2
4.1
775
231
45
0.3
674
0.0
594
222
0.1
254
195
97
-
1.0
013
041
06
-
1.7
405
744
8
-
2.8
230
873
85
1.4
297
185
22
10.
502
392
18
New
Zea
lan
d
272
53.
94
18.
559
438
21
27.
915
7.2
428
7
3.4
177
436
23
0.2
791
5
0.0
724
287
0.1
855
943
82
-
1.2
760
060
07
-
1.4
456
436
73
-
2.6
251
526
49
1.2
289
805
74
10.
212
953
38
Nic
ara
gua
218
9.4
2
47.
844
086
3
25.
59
3.1
425
3
2.7
902
718
6
0.2
559
0.0
314
253
0.4
784
408
63
-
1.3
629
685
36
-
0.6
378
243
76
-
3.4
601
419
78
1.0
261
390
32
7.6
913
919
48
Nig
er
502
.51
48.
235
176
4
27.
22
3.8
476
2
0.4
569
269
93
0.2
722
0.0
384
762
0.4
823
517
64
-
1.3
012
181
89
-
0.6
304
507
98
-
3.2
577
154
11
-
0.7
832
316
53
6.2
196
155
4
Nor
way
492
93.
9.1
189
44.
785
7.3
200
1.2
439
0.4
478
0.0
732
0.0
911
-
0.8
-
1.9
-
2.6
0.2
182
10.
805
XU 22
48 694 4 161
26
5 004 896
94
032
969
24
576
509
45
145
543
94
645
69
547
1
Pak
ist
an
202
5.7
5
45.
741
020
8
27.
5
2.3
723
7
0.7
220
495
67
0.2
75
0.0
237
237
0.4
574
102
08
-
1.2
909
841
81
-
0.6
784
355
14
-
3.7
412
807
31
-
0.3
256
614
9
7.6
136
952
81
Pan
ama
778
5.9
7
37.
646
979
49
35.
47
3.8
001
7
2.8
621
75
0.3
547
0.0
380
017
0.3
764
697
95
-
1.0
364
829
17
-
0.8
522
137
36
-
3.2
701
243
83
1.0
515
818
25
8.9
600
786
75
Par
agu
ay
343
5.3
5
43.
623
217
74
17.
275
4.0
023
1
1.0
535
550
77
0.1
727
5
0.0
400
231
0.4
362
321
77
-
1.7
559
098
16
-
0.7
210
690
38
-
3.2
182
984
92
0.0
521
702
33
8.1
418
740
92
Per
u
556
1.4
5
37.
896
075
77
32.
865
2.6
887
6
1.9
389
006
38
0.3
286
5
0.0
268
876
0.3
789
607
58
-
1.1
127
619
24
-
0.8
463
898
38
-
3.6
160
900
65
0.6
621
211
31
8.6
236
141
45
Phi
lip
pin
es
278
7.8
5
43.
431
925
73
24.
025
2.6
529
5
1.2
993
888
51
0.2
402
5
0.0
265
295
0.4
343
192
57
-
1.4
260
752
31
-
0.7
250
109
67
-
3.6
294
979
58
0.2
618
940
4
7.9
330
259
68
Por
tug
al
199
49.
49
6.3
503
166
25.
745
5.7
913
8
1.9
414
653
0.2
574
5
0.0
579
138
0.0
635
031
-
1.3
569
-
2.1
759
-
2.8
487
0.6
634
430
9.9
009
588
XU 23
84 17 67 297
52
245
41
995
81
06 58
Rwa
nda
813
.89
46.
893
644
28
25.
665
4.9
943
5
0.4
555
500
04
0.2
566
5
0.0
499
435
0.4
689
364
43
-
1.3
600
419
9
-
0.6
559
738
64
-
2.9
968
629
12
-
0.7
862
497
91
6.7
018
252
22
Sen
ega
l
141
5.5
46.
025
703
91
17.
36
5.6
335
8
0.7
642
612
91
0.1
736
0.0
563
358
0.4
602
570
39
-
1.7
510
014
77
-
0.6
728
406
82
-
2.8
764
250
67
-
0.2
688
455
44
7.2
552
381
05
Sey
che
lle
s
228
61.
28
24.
446
404
9
44.
62
5.0
097
2
6.9
008
803
93
0.4
462
0.0
500
972
0.2
444
640
49
-
0.8
069
879
97
-
1.2
225
983
58
-
2.9
937
901
61
1.9
316
489
97
10.
037
199
93
Sie
rra
Leo
ne
727
.1
26.
088
819
25
6.7
4
4.3
398
9
0.0
561
729
91
0.0
674
0.0
433
989
0.2
608
881
93
-
2.6
971
102
61
-
1.1
683
219
41
-
3.1
373
211
84
-
2.8
793
192
29
6.5
890
640
2
Sin
gap
ore
419
88.
62
37.
023
504
97
53.
695
3.2
622
2
11.
527
501
32
0.5
369
5
0.0
326
222
0.3
702
350
5
-
0.6
218
502
99
-
0.8
669
410
82
-
3.4
227
622
41
2.4
447
355
99
10.
645
153
91
Sou
th
Afr
ica
676
6.7
9
37.
772
760
12
29.
81
5.9
885
0.7
328
403
65
0.2
981
0.0
598
85
0.3
777
276
01
-
1.2
103
262
-
0.8
492
687
-
2.8
153
292
-
0.3
108
273
8.8
197
821
03
XU 24
78 32 23 83
Spa
in
283
25.
38
13.
422
945
32
31.
17
4.9
838
1
2.3
414
668
63
0.3
117
0.0
498
381
0.1
342
294
53
-
1.1
657
140
92
-
1.6
915
732
7
-
2.9
989
755
27
0.8
507
775
97
10.
251
513
5
Sri
Lan
ka
317
6.3
5
25.
169
642
52
27.
18
2.0
559
1.0
092
431
17
0.2
718
0.0
205
59
0.2
516
964
25
-
1.3
026
887
77
-
1.1
983
339
82
-
3.8
844
564
78
0.0
092
006
61
8.0
634
880
18
Swe
den
339
58.
52
6.5
932
167
72
32.
005
7.2
892
8
3.4
611
568
49
0.3
200
5
0.0
728
928
0.0
659
321
68
-
1.1
392
780
45
-
2.1
547
500
2
-
2.6
187
654
1
1.2
416
028
83
10.
432
895
06
Syr
ia
372
2.7
5
54.
224
906
71
25.
69
4.8
719
7
0.6
552
658
41
0.2
569
0.0
487
197
0.5
422
490
67
-
1.3
590
683
75
-
0.5
238
280
11
-
3.0
216
718
13
-
0.4
227
142
62
8.2
222
179
21
Tha
ila
nd
696
5.6
7
30.
178
328
27
34.
39
3.7
526
4
2.3
237
588
72
0.3
439
0.0
375
264
0.3
017
832
83
-
1.0
674
043
62
-
1.0
447
399
67
-
3.2
827
105
94
0.8
431
860
78
8.8
487
490
77
Tog
o
725
.43
54.
008
316
54
14.
595
4.4
506
1
1.5
232
362
39
0.1
459
5
0.0
445
061
0.5
400
831
65
-
1.9
244
911
82
-
0.5
274
917
94
-
3.1
121
290
21
0.4
208
371
76
6.5
867
645
82
XU 25
Tri
nid
ad
&To
bag
o
233
32.
75
11.
947
964
53
50.
105
4.2
391
2
5.7
700
673
92
0.5
010
5
0.0
423
912
0.1
194
796
45
-
0.6
910
493
82
-
1.7
750
224
46
-
3.1
608
144
85
1.7
526
837
6
10.
057
613
23
Tun
isi
a
566
7.3
8
34.
104
818
48
43.
1
6.2
689
4
1.9
816
914
74
0.4
31
0.0
626
894
0.3
410
481
85
-
0.8
416
471
89
-
0.9
389
244
92
-
2.7
695
629
05
0.6
839
507
6
8.6
424
822
09
Tur
key
953
1.9
5
35.
689
727
98
18.
11
2.8
624
7
0.5
016
063
15
0.1
811
0.0
286
247
0.3
568
972
8
-
1.7
087
059
14
-
0.8
991
945
09
-
3.5
534
852
98
-
0.6
899
397
9.1
624
045
93
Uga
nda
963
.93
52.
651
450
66
20.
04
3.1
752
4
1.7
773
405
8
0.2
004
0.0
317
524
0.5
265
145
07
-
1.6
074
399
1
-
0.5
507
547
76
-
3.4
497
869
66
0.5
751
181
91
6.8
710
186
78
Uni
ted
Kin
gdo
m
339
82.
91
4.6
465
009
71
25.
39
5.6
266
2.7
433
865
31
0.2
539
0.0
562
66
0.0
464
650
1
-
1.3
708
147
9
-
2.3
385
749
3
-
2.8
776
648
34
1.0
091
931
18
10.
433
613
03
Uni
ted
Sta
tes
424
82.
39
18.
419
005
86
28.
975
5.4
044
2
1.0
814
300
97
0.2
897
5
0.0
540
442
0.1
841
900
59
-
1.2
387
367
97
-
1.4
516
222
77
-
2.9
179
530
49
0.0
782
843
3
10.
656
844
92
XU 26
Uru
gua
y
870
9.7
8
8.3
613
896
35
24.
775
2.8
802
6
0.9
580
492
76
0.2
477
5
0.0
288
026
0.0
836
138
96
-
1.3
953
351
06
-
2.0
128
010
09
-
3.5
472
896
18
-
0.0
428
560
66
9.0
722
018
11
Ven
ezu
ela
892
0.9
44.
509
209
45.
7
3.6
885
9
1.7
834
182
08
0.4
57
0.0
368
859
0.4
450
920
9
-
0.7
830
718
88
-
0.7
030
114
93
-
3.2
999
259
15
0.5
785
318
64
9.0
961
521
17
Zam
bia
106
6.6
4
50.
107
335
53
32.
99
1.3
453
6
3.9
366
787
15
0.3
299
0.0
134
536
0.5
010
733
55
-
1.1
089
657
01
-
0.5
958
873
48
-
4.3
085
085
51
1.3
703
374
02
6.9
722
688
Zim
bab
we
323
.26
39.
519
858
21
21.
47
2.4
870
2
0.6
304
478
67
0.2
147
0.0
248
702
0.3
951
985
82
-
1.5
385
135
74
-
0.8
092
348
45
-
3.6
940
849
79
-
0.4
613
248
12
5.7
784
569
53
XU 27
Bibliography
Alfaro, L. "Foreign Direct Investment and Growth: Does the Sector
Matter." Harvard Business School (2003): 1-31. Print.
Barro, R. J., and X. Sala-i-Martin. Economic growth and
convergence across the United States (1990)Print.
Batten, Jonathan A., and Xuan Vinh Vo. "An Analysis of the
Relationship between Foreign Direct Investment and Economic
Growth." Applied Economics 41.13-15 (2009): 1621-41. Print.
Cieslik, Andrzej, and Monika Tarsalewska. "External Openness and
Economic Growth in Developing Countries." Review of
Development Economics 15.4 (2011): 729-44. Print.
Grossman, G. M., and E. Helpman. "Trade, Knowledge Spillovers,
and Growth." European Economic Review 35.2 (1991): 517-26.
Print.
Heston, A., R. Summers, and B. Aten (2012): “Penn World Table
Version 7.1,” Discussion paper, Center for International
Comparisons of Production, Income and Prices at the University
of Pennsylvania. Retrieved from
http://pwt.econ.upenn.edu/php_site/pwt_index.php.
Kendrick, J. W. "The Formation and Stocks of Total Capital." NBER
Books (1997)Print.
Mankiw, N. G., D. Romer, and D. N. Weil. "A Contribution to the
Empirics of Economic Growth." The quarterly journal of
economics 107.2 (1992): 407-37. Print.
XU 28
Naveed, Amjad, and Ghulam Shabbir. "Trade Openness, FDI and
Economic Growth: A Panel Study." Pakistan Economic and Social
Review 44.1 (2006): 137-54. Print.
Romer, P. Endogenous technological change (1991)Print.
UNESCO-UIS (2012). World Data on Education.
Retrieved from http://stats.uis.unesco.org/
World Bank(2012), foreign direct investment, net inflows (% of
GDP), World Bank, Washington, D.C. Retrieved from
http://data.worldbank.org/indicator/BX.KLT.DINV.WD.GD.ZS