empirical analysis of fdi and tax incentives on the economic growth in the republic of macedonia
TRANSCRIPT
Elizabeta Dzambaska, M.Sc.Institute of Economics SkopjeE-mail: [email protected]
EMPIRICAL ANALYSIS OF FDI AND TAX INCENTIVES ON THEECONOMIC GROWTH IN THE REPUBLIC OF MACEDONIA
AbstractTheoretical approach for this analysis is the new
growth theory and extended Solow’s model. This paperanalyses the effects of investment and fiscal policymeasures as determinants of total factor productivity inthe Republic of Macedonia. The empirical analyses arecondu using the data for capital, labor, grossinvestment, FDI and tax revenue as determinants ofeconomic growth in the Republic of Macedonia in the pastperiod. Multiple linear regressions analysis usedquarterly data for the period 2005-2011. The calculationsof statistical parameters are obtained by softwarepackage XLSTAT 2012.
The results show that foreign direct investments arenot statistically significant. Although various fiscalmeasures create favorable conditions for foreigninvestors, these are not the source of economic growth inthe Republic of Macedonia. Gross investments are thosethat increase the constant level of capital in thecountry and they are of particular importance foreconomic growth. The impact of taxes and contributions ispositive and statistically significant. This is peculiardue to the low level of taxes that should reflect intolong-term declining trend, but could be explained withthe specific circumstances over the analyzed period.
Key words: neoclassical growth model, taxincentives, foreign direct investment, economicgrowth, Republic of MacedoniaJEL Classification: E62; O11; O38
Introduction
The neoclassical growth model known as Solow-Swanmodel (1956) considers the long-run economic growth. Thismodel explains the economic growth with the capitalaccumulation, productivity, population growth andtechnological progress as the dominant drivers ofeconomic growth. The model recognized the significance ofthe positive impact of technology on growth, but it isconsidered as exogenous. The basic assumption of theneoclassical model for the diminishing returns to scaleof capital accumulation and exogenous technologicalprogress, limits the strategy only to the measures thatcan improve productivity. The only way to accelerategrowth is through the productivity. The model predicts
convergence to a steady state. Output per capita in the steady state is determined by the saving rate. Accomplishing
“steady-state” level of output and certain growth ratemeans that national savings rate must grow at a same rateas population growth. Policy measures like tax cuts andinvestment subsidies can affect a steady-state level ofoutput, but not for long-run.
The development of endogenous growth theory has provided many new insights into the sources of economic growth. The
essence of the new theory is that growth is a consequence of rational economic decisions. Companies expand resources on research and development to secure profitable innovations.
Individuals invest in education to develop human capital and increase lifetime earnings. Governments increase growth by
providing public inputs, encouraging foreign direct investments, and enhancing educational opportunities.
Through the aggregation of these individual decisions the rate of growth becomes a variable of choice, and hence a variable
that can be affected by the tax policies of governments.It is striking that most recent empirical research
has focused on testing the neoclassical growth model,with revisions and extensions, rather than testing theempirical implications of endogenous growth models. Partof the explanation, suggested by Mankiw (1995)1 may bethat the emphasizing immeasurable variables, such asknowledge these models have appealed to moretheoretically inclined economists, with the result that
1 Ross Jaime (2003), Development Theory and the Economics of Growth,The University of Michigan Press p. 167-172
few attempts have been made to evaluate them. Anotherexplanation arises from the intrinsic difficulty ofevaluating models based on large technologicalexternalities in an open economy setting because acrucial question is whether or not these large externaleffects of physical or human stock are internal tonational economies.
The main goal of the research is to evaluate theinfluence of investments (domestic and foreigninvestments) and tax revenue on economic growth in theRepublic of Macedonia.
Hence, in this paper we use neoclassical extendedSolow’s model that assume that total factor productivityis endogenous and determinated of domestic and foreigninvestments and taxation policy. The focus is on theassumption that foreign direct investments and thechanges in the tax policy significantly affect themovement of economic growth in the Republic of Macedonia.The interest for that analyses came for several reasons:first the process of globalization has increased thestock and movements of FDI in the world especially in thedevelopment countries. Thus for developing countries FDIbecame an important source of funding. Second, FDIeffects on economic growth are main objective in a lot ofstudies. The findings of these analyses are quitecontradicting. Some assume beneficial effects resultingfrom FDI on economic growth2 while others3 claim that FDI2Harbinger Singh, Kwong W Jun (2995), Some New Evidence ondeterminats of Foreign Direct Investment in Developing Countries,World Bank Policy Research Working Paper no. 1531, Burcu Türkan,Alpel Duman, I Hakan Yetkiner, (2008), How Does FDI and EconomicGrowth Affest Each Others? The OECD case, Izmir University ofEconomics) Working Paper no. 08/07; Borensztein, De gregorio, Lee(1998), How does foreign direct investment affect economic growth,Journal of International Economics, 45 (1), p. 115-135 3 Svetlana Ledyaeva, Mikael Linden, (2006), Foreign Direct Investmentand Economic Growth: Empirical Evidence from Russia Region, BOFITDiscussion Paper no. 17/2006, Peter Nunnenkamp, Julius Spatz (2003),Foreign Direct Investment and Economic Growth in DevelopingCountries: Now Relevant Are Host Country and IndustryCharacteristics, Kieln Working Paper no. 1176, Lyroudi Katerina,Papanastasion John, Vamvakidis Athanasios (2004), Foreign DirectInvestment and Economic Growth in Transitions Economies, ASECU SouthEastern Europe Journals of Economics 1
hinders economic growth. The third, economies createspecific policies like application of the special regimeof taxation, tax exemptions, facilitated institutionalprocedures for the foreign investor’s entry in thedomestic market and other policy of attracting FDI.Studies confirm the compromises that the countries aredoing in terms of fiscal policy do not cause drasticchanges in decision-making for investment abroad. “Taxrelief is like dessert. It’s nice when you have it, butdoes not help much if the meal is gone.”4
Assessment of the relationship among grossinvestment, FDI, tax revenue and economic growth in theRepublic of Macedonia is made by multiple linearregression analysis, using quarterly data for the period2005-2011 year. The base theoretical model for settingthe statistical model for empirical analysis is theproduction function by Coob Daglas and the extended Solowmodel with contributions of Romer (1990). Thecalculations of statistical parameters are obtained bysoftware package XLSTAT 2012.
1. Review of the macroeconomic situation in the Republic of Macedonia
Economic growth is the increase in the amount ofgoods and services produced by an economy over time. Itis conventionally measured at the present rate ofincrease in real GDP. The rate of growth in Republic ofMacedonia5 is in the focus of analysis. Figure 1 shows usthe trend of GDP. Republic of Macedonia experienced adecline in GDP in year 1990. This situation was typicalfor all economies in transition. Until 1995, theMacedonian economy experienced negative growth rates ofGDP. In 1996 for the first time after independencepositive growth rate were achieved and this trend ofpositive growth rates continued until 2001. Due to the
4 Morisset Jacquese, Pirnia Neda, (2000), How Tax Policy andIncentives Affect Foreign Direct Investment, The World Bank andInternational Advisory Service, p. 55 The purpose of the model is to show the changes in the level ofoutput in the Republic of Macedonia. So, the trend of growth isexplained with changes in the growth rate over the time. Real GDP isdependent variable in the model.
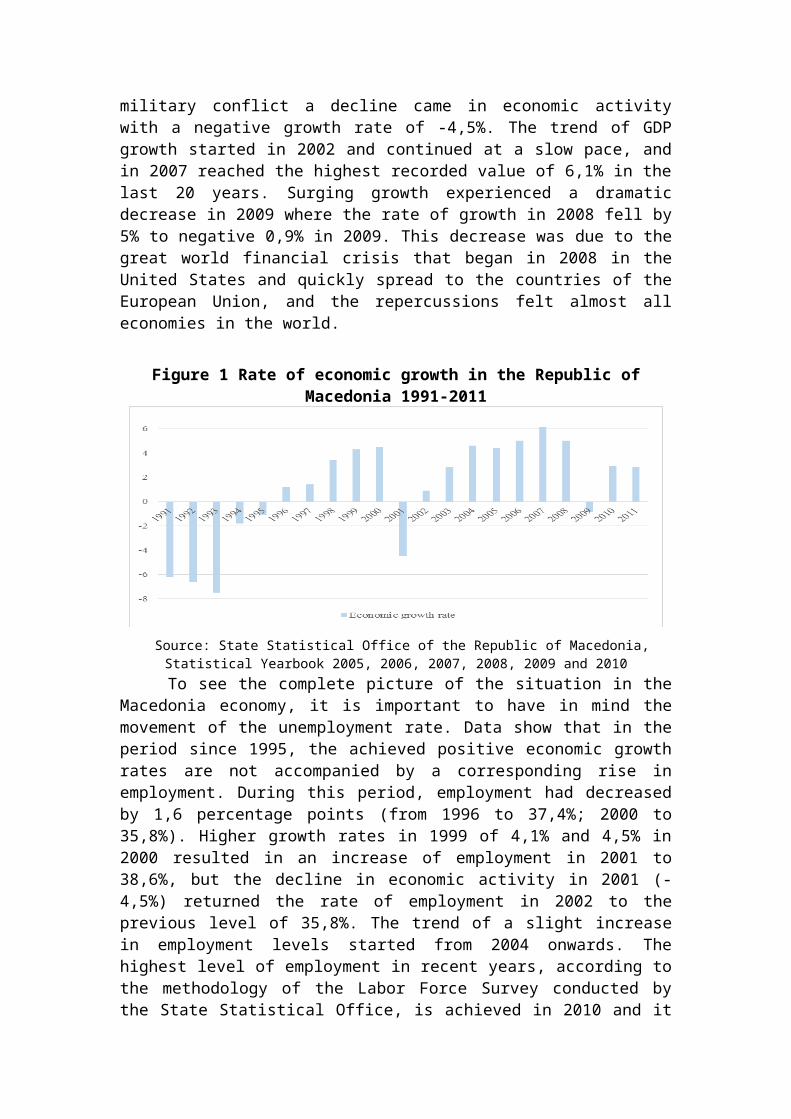
military conflict a decline came in economic activitywith a negative growth rate of -4,5%. The trend of GDPgrowth started in 2002 and continued at a slow pace, andin 2007 reached the highest recorded value of 6,1% in thelast 20 years. Surging growth experienced a dramaticdecrease in 2009 where the rate of growth in 2008 fell by5% to negative 0,9% in 2009. This decrease was due to thegreat world financial crisis that began in 2008 in theUnited States and quickly spread to the countries of theEuropean Union, and the repercussions felt almost alleconomies in the world.
Figure 1 Rate of economic growth in the Republic ofMacedonia 1991-2011
Source: State Statistical Office of the Republic of Macedonia,Statistical Yearbook 2005, 2006, 2007, 2008, 2009 and 2010To see the complete picture of the situation in the
Macedonia economy, it is important to have in mind themovement of the unemployment rate. Data show that in theperiod since 1995, the achieved positive economic growthrates are not accompanied by a corresponding rise inemployment. During this period, employment had decreasedby 1,6 percentage points (from 1996 to 37,4%; 2000 to35,8%). Higher growth rates in 1999 of 4,1% and 4,5% in2000 resulted in an increase of employment in 2001 to38,6%, but the decline in economic activity in 2001 (-4,5%) returned the rate of employment in 2002 to theprevious level of 35,8%. The trend of a slight increasein employment levels started from 2004 onwards. Thehighest level of employment in recent years, according tothe methodology of the Labor Force Survey conducted bythe State Statistical Office, is achieved in 2010 and it
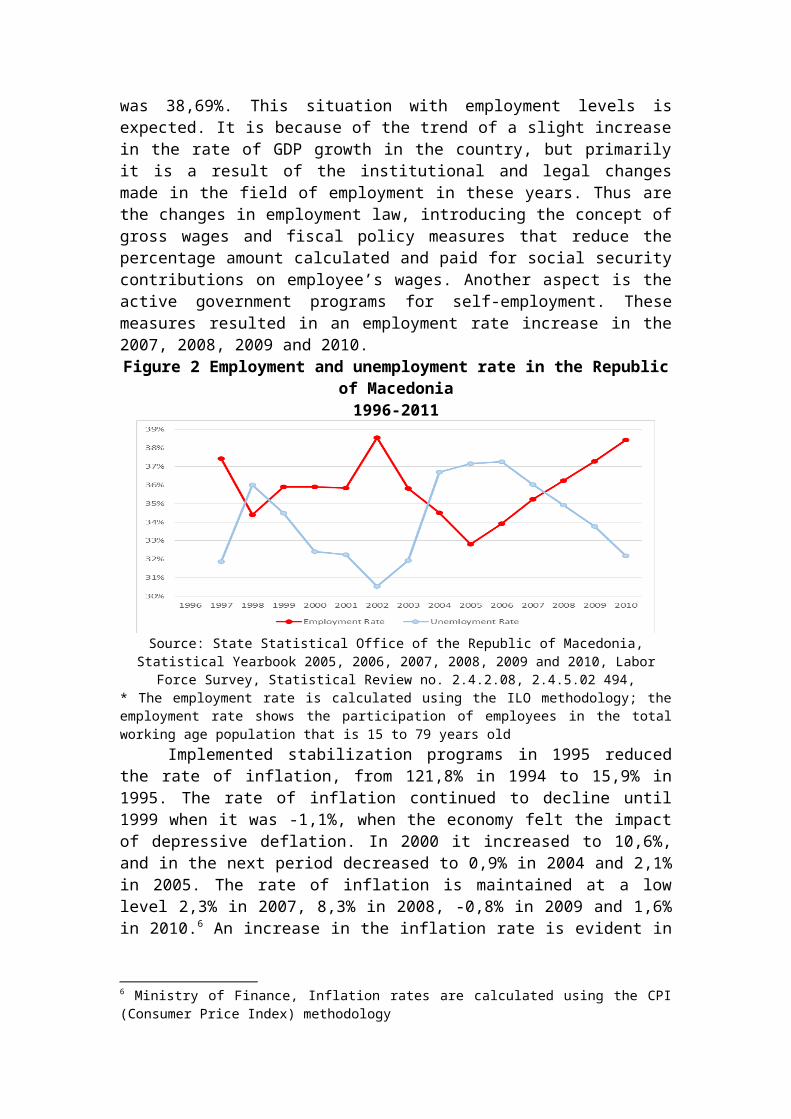
was 38,69%. This situation with employment levels isexpected. It is because of the trend of a slight increasein the rate of GDP growth in the country, but primarilyit is a result of the institutional and legal changesmade in the field of employment in these years. Thus arethe changes in employment law, introducing the concept ofgross wages and fiscal policy measures that reduce thepercentage amount calculated and paid for social securitycontributions on employee’s wages. Another aspect is theactive government programs for self-employment. Thesemeasures resulted in an employment rate increase in the2007, 2008, 2009 and 2010.Figure 2 Employment and unemployment rate in the Republic
of Macedonia 1996-2011
Source: State Statistical Office of the Republic of Macedonia,Statistical Yearbook 2005, 2006, 2007, 2008, 2009 and 2010, Labor
Force Survey, Statistical Review no. 2.4.2.08, 2.4.5.02 494,* The employment rate is calculated using the ILO methodology; theemployment rate shows the participation of employees in the totalworking age population that is 15 to 79 years old
Implemented stabilization programs in 1995 reducedthe rate of inflation, from 121,8% in 1994 to 15,9% in1995. The rate of inflation continued to decline until1999 when it was -1,1%, when the economy felt the impactof depressive deflation. In 2000 it increased to 10,6%,and in the next period decreased to 0,9% in 2004 and 2,1%in 2005. The rate of inflation is maintained at a lowlevel 2,3% in 2007, 8,3% in 2008, -0,8% in 2009 and 1,6%in 2010.6 An increase in the inflation rate is evident in
6 Ministry of Finance, Inflation rates are calculated using the CPI(Consumer Price Index) methodology
the past two years, but it is still at low level at 3,3%in 2012.
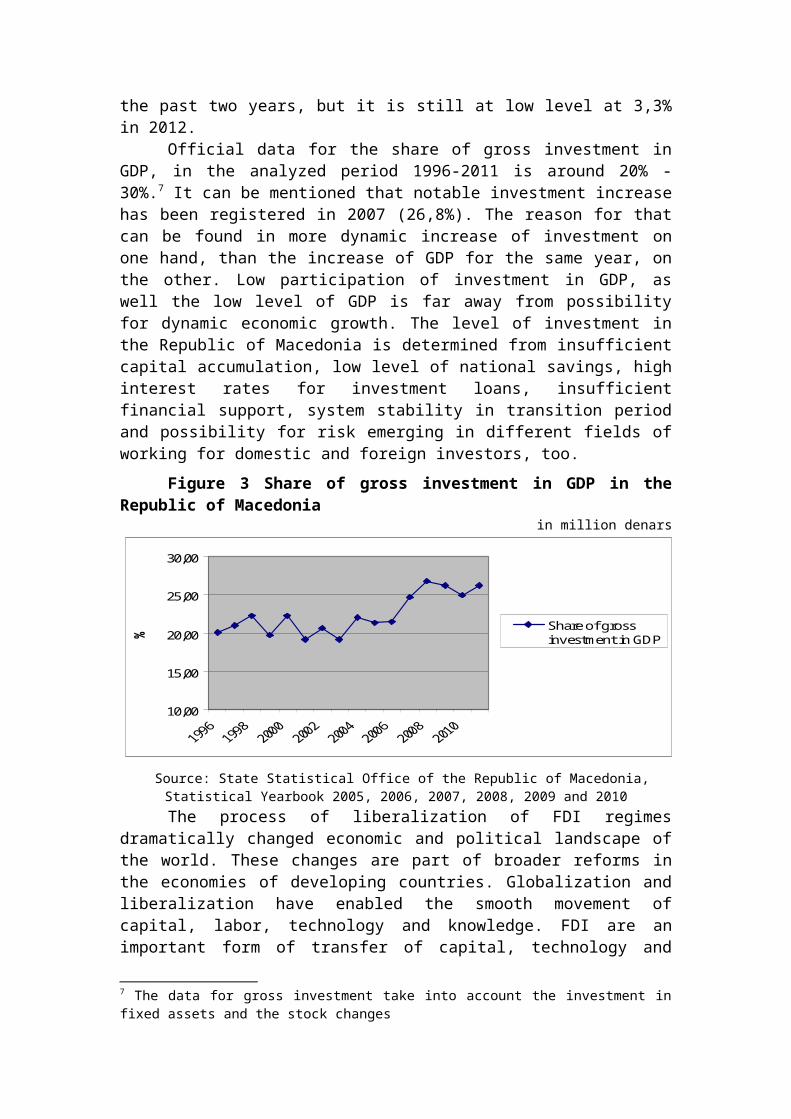
Official data for the share of gross investment inGDP, in the analyzed period 1996-2011 is around 20% -30%.7 It can be mentioned that notable investment increasehas been registered in 2007 (26,8%). The reason for thatcan be found in more dynamic increase of investment onone hand, than the increase of GDP for the same year, onthe other. Low participation of investment in GDP, aswell the low level of GDP is far away from possibilityfor dynamic economic growth. The level of investment inthe Republic of Macedonia is determined from insufficientcapital accumulation, low level of national savings, highinterest rates for investment loans, insufficientfinancial support, system stability in transition periodand possibility for risk emerging in different fields ofworking for domestic and foreign investors, too.
Figure 3 Share of gross investment in GDP in theRepublic of Macedonia
in million denars
10,00
15,00
20,00
25,00
30,00
% Share of grossinvestment in GDP
Source: State Statistical Office of the Republic of Macedonia,Statistical Yearbook 2005, 2006, 2007, 2008, 2009 and 2010The process of liberalization of FDI regimes
dramatically changed economic and political landscape ofthe world. These changes are part of broader reforms inthe economies of developing countries. Globalization andliberalization have enabled the smooth movement ofcapital, labor, technology and knowledge. FDI are animportant form of transfer of capital, technology and
7 The data for gross investment take into account the investment infixed assets and the stock changes
knowledge. For developing countries they are a way toactivate their potential. Also FDI complement domesticinvestment activity that positively effects economicgrowth. Movements of FDI worldwide show an increasingtrend.
Basic prerequisites for attracting foreign directinvestments are: political and macroeconomic stability ofthe country, favorable business environment,infrastructure development and credibility of governmentpolicy. The use of restrictive monetary and fiscal policyin recent years has enabled the achievement ofmacroeconomic stability in the Republic of Macedonia. Butthis stability does not bear economic growth. The lastfinancial and global crisis caused recession in the wholeworld. Increased inflation rate and jobless growthdisturbed the established macroeconomic stability, andthat made Republic of Macedonia more risky country forforeign investors. Political instability is anotherimportant factor that discourages FDI.
Economies use different combinations of measures tostimulate economic activity and increase anddiversification of investments in certain regions andareas. Particularly significant are fiscal incentivesthat attract foreign direct investments in developingcountries. Fiscal measures to encourage FDI economies aredifferent types of tax incentives, special customsmeasures and the establishment of institutions thatprovide information, legal and organizational support toforeign investors. Project funding for communicationinfrastructure (construction and maintenance of roadinfrastructure, air transport, telecommunications andother forms of communication connectivity) improvement,undertaking activities and investments for research anddevelopment (R & D) and projects targeted for increasinghuman capital are other ways that Government isattracting FDI.
Republic of Macedonia pays special attention toestablish a better business environment. Specialgovernment measures are made to ensure favorableconditions for foreign investors. These measures include:institutional framework for investors, providing welldeveloped infrastructure network and a lot of legal and
fiscal advantages. In our paper, we focus on taxincentives for attracting FDI.
Tax conditions are designed to be favorable forforeign investors. Tax incentives may be related toreducing tax rates or reducing the tax base. Governmentsmay decide to reduce the tax rate on corporate income taxto attract FDI in specific sectors or regions. Manycountries have implemented this type of tax incentive toincrease FDI, especially for transition economies anddeveloping countries. The lists of countries that haveimplemented tax incentives include Hong Kong, Indonesia,Ireland, Cambodia, Estonia, and others. The Republic ofMacedonia also used it. The corporate tax rate initiallywas 30%.8 In the period of 1997 till 2006 the corporatetax rate was 15%.9 In the 2007 the calculations forcorporate tax was made by 12%10 and from 1 January 2008 is10 %11.
Changing the model for tax base calculations in200912 represent another benefit for investors. Accordingto this model tax base is calculated as amount reduced bytax credits, tax breaks and exemptions. Only non-deductible expenses and realized profit are accounted. Ifprofits are accumulated and reinvested to expand theactivity it is not subject to taxation.
Similar incentive is the application of the taxexemption period (tax holidays). Tax holidays includeexemption from payment of corporate income tax for acertain period of time (e.g. 5 years). This usually
8 Law on Corporate Income Tax, article 28, Official Gazette ofRepublic of Macedonia, 80/939 Law on Corporate Income Tax, article 11, Official Gazette ofRepublic of Macedonia, 71/9610Law on Corporate Income Tax, article 37, Official Gazette ofRepublic of Macedonia, 139/2006 11 Law on Corporate Income Tax, article 28, Official Gazette ofRepublic of Macedonia 79/2013 (previous amendments 33/95, 43/95,71/96, 5/97, 28/98, 11/2001, 2/2002, 44/2002, 51/2003, 120/2005,139/2006, 160/2007, 159/2008, 85/2010, 47/2011, 135/2011) p. 11,www.ujp.gov.mk 12 The tax base is calculated according to the so called “Estonianmodel”. This model is based to the tax system in Estonia.Calculations of the tax base take into the tax credits and taxexemptions. Only non-deductible expenses and realized profit areaccounted.
refers to the newly-scale enterprises and companies. Mostof these companies or corporations are exempt from othertax liabilities in the specified period determined astime exemption. Developing countries and economies intransition use it as a way for the country to become anattractive destination for foreign direct investment.
The Republic of Macedonia established TechnologicalIndustrial Development Zones (TIDZ). Investors inTechnological Industrial Development Zones are entitledto personal and corporate income tax exemption for thefirst 10 years. Investors are exempt from payment ofvalue added tax and customs duties for goods, rawmaterials, equipment and machines. Moreover, up to€500.000,00 can be granted as incentive towards buildingcosts depending on the value of the investment and thenumber of employees. Land in a TIDZ in Macedonia isavailable under long-term lease for a period of up to 99years.13
The tax system predicts special tax incentive if theproduction activities in the technological industrialzones are from the IT area (software development,hardware assembling, digital recording, computer chipsetc.), scientific research activity and new technologieswith high environmental standards. Investors in TIDZs whooperate in these areas are exempt from the liability forsubmission of a guarantee as collateral for any customsarrears.
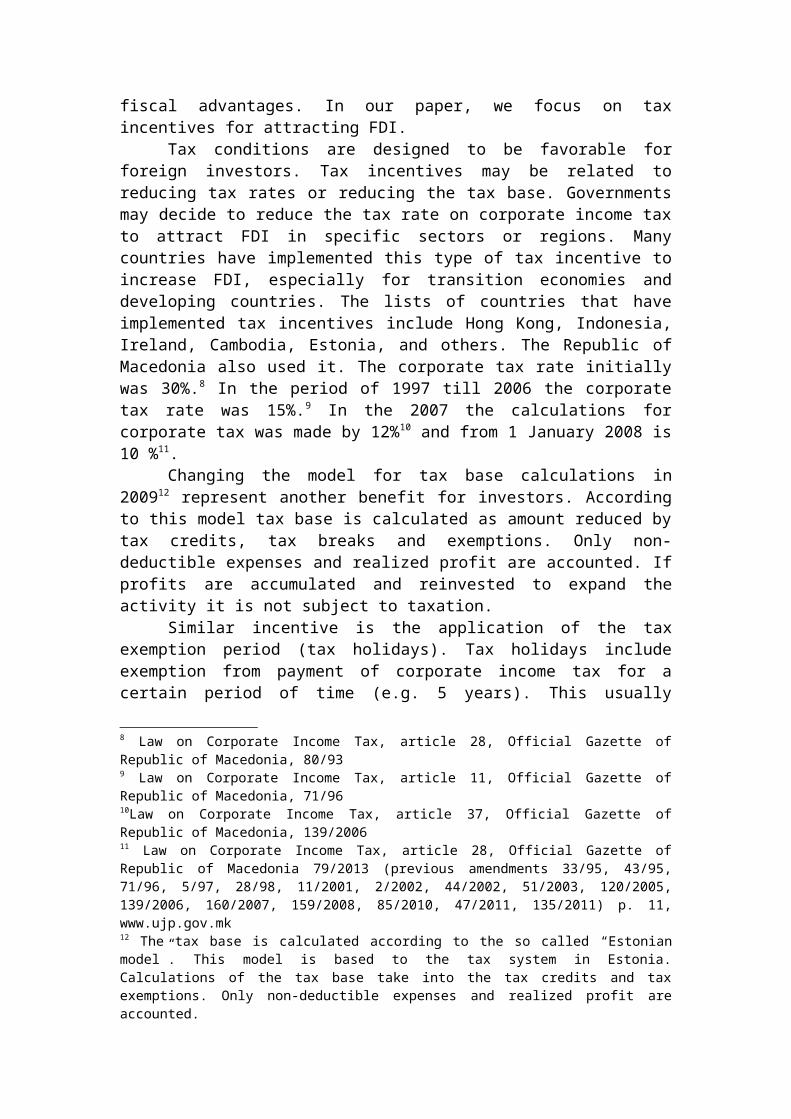
Also, there have been changes in the area of socialcontributions.
13 Law of Technological Industrial Zones, article 5,6,7 and 8,Official Gazette of Republic of Macedonia 14/2007
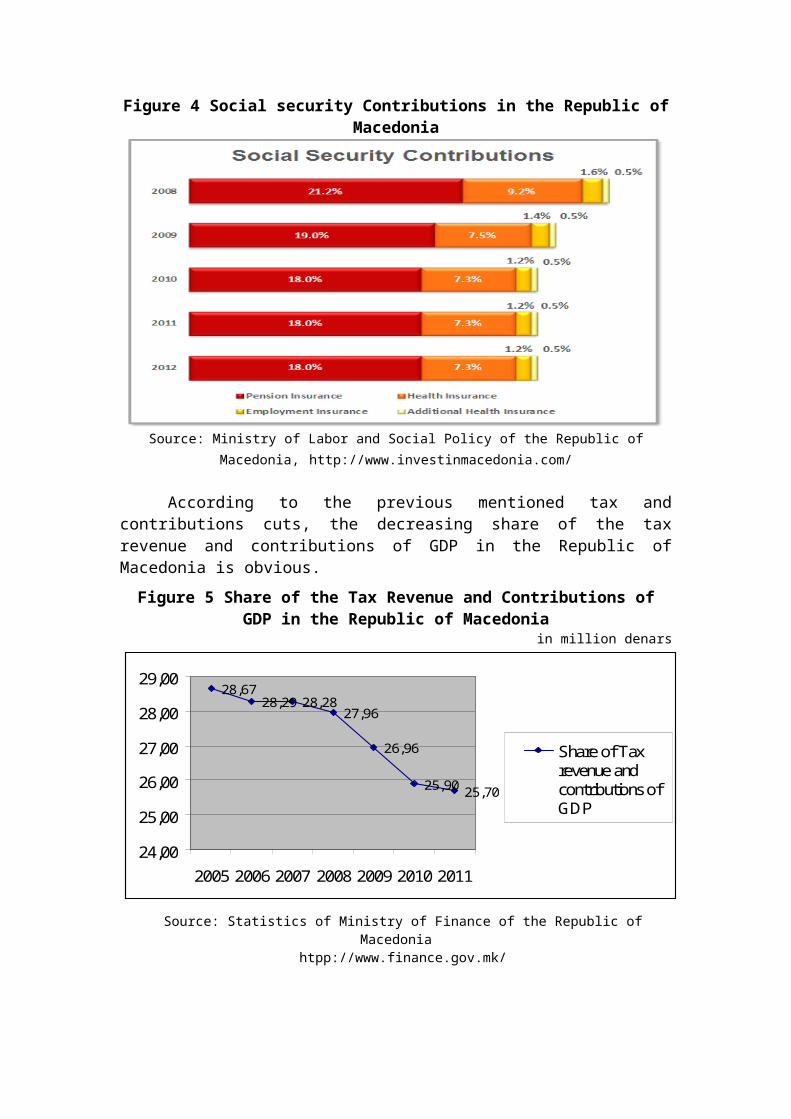
Figure 4 Social security Contributions in the Republic ofMacedonia
Source: Ministry of Labor and Social Policy of the Republic ofMacedonia, http://www.investinmacedonia.com/
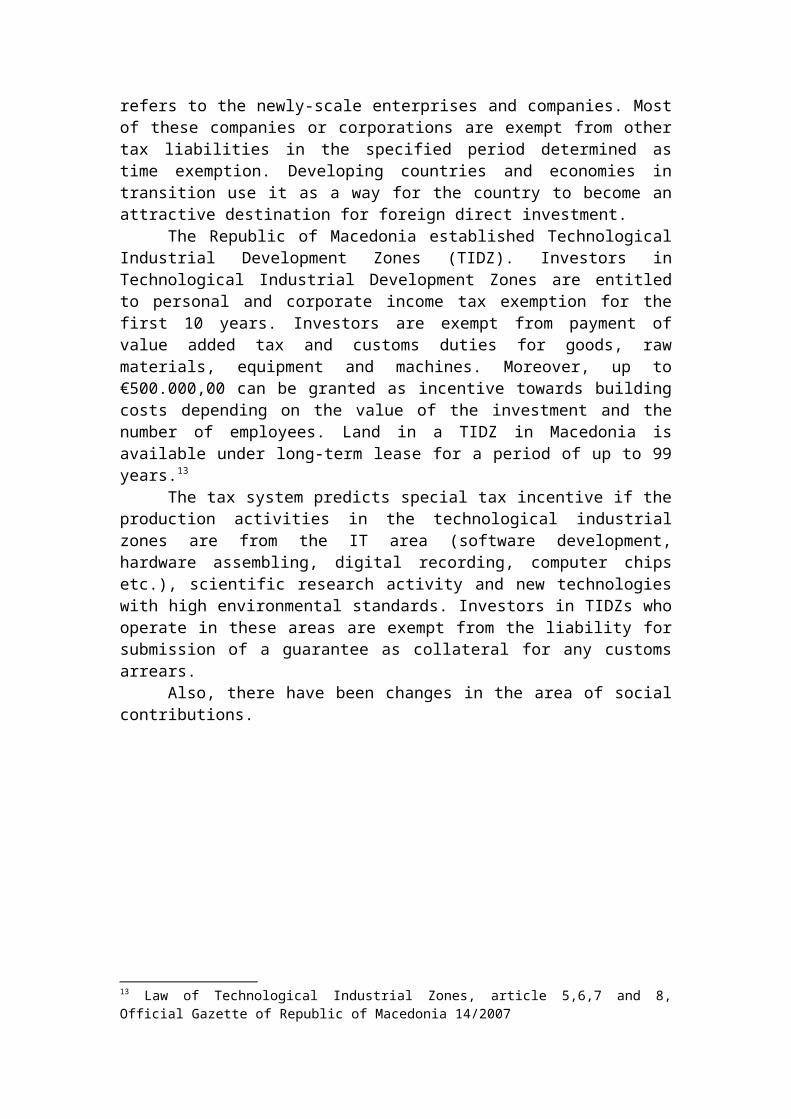
According to the previous mentioned tax andcontributions cuts, the decreasing share of the taxrevenue and contributions of GDP in the Republic ofMacedonia is obvious.Figure 5 Share of the Tax Revenue and Contributions of
GDP in the Republic of Macedoniain million denars
28,6728,29 28,28
27,96
26,96
25,90 25,70
24,00
25,00
26,00
27,00
28,00
29,00
2005 2006 2007 2008 2009 2010 2011
Share of Taxrevenue andcontributions ofGDP
Source: Statistics of Ministry of Finance of the Republic ofMacedonia
htpp://www.finance.gov.mk/
The share of tax revenue and contributions in GDPhas not decreased straight forward with the reduction ofthe tax rate, which has much faster rate of decline.There is a slight drop of less than one percentage pointof the share of tax revenue and contributions in GDP in2007. The share was 28,28% in 2007 and 27,96% in 2008.This trend continued in the following years.
Apart of previously mentioned terms and undertakenmeasures to attract foreign investors the FDI inflow islow. Compared to the other countries in the group oftransition economies, the Republic of Macedonia is rankedin the group of countries with the lowest inflows andoutflows of FDI.14 The range of the inflows and outflowsof FDI, for the period 2006-2012 is below 0,5 billion $.
The figure 6 presents the trend line of the FDI as ashare of GDP in the Republic of Macedonia. The highestshare was reached in the 2007 and it was 8,5%. Theminimal FDI share 1,4 % of GDP was in 2012.
Figure 6 FDI share in GDP of the Republic of Macedoniain million €
2,4
5,9
1,6
6,6
8,5
6
2,2 2,3
4,5
1,40
2
4
6
8
10
2003 2004 2005 2006 2007 2008 2009 2010 2011 2012FDI % of GDP
Source: National Bank of the Republic of Macedonia
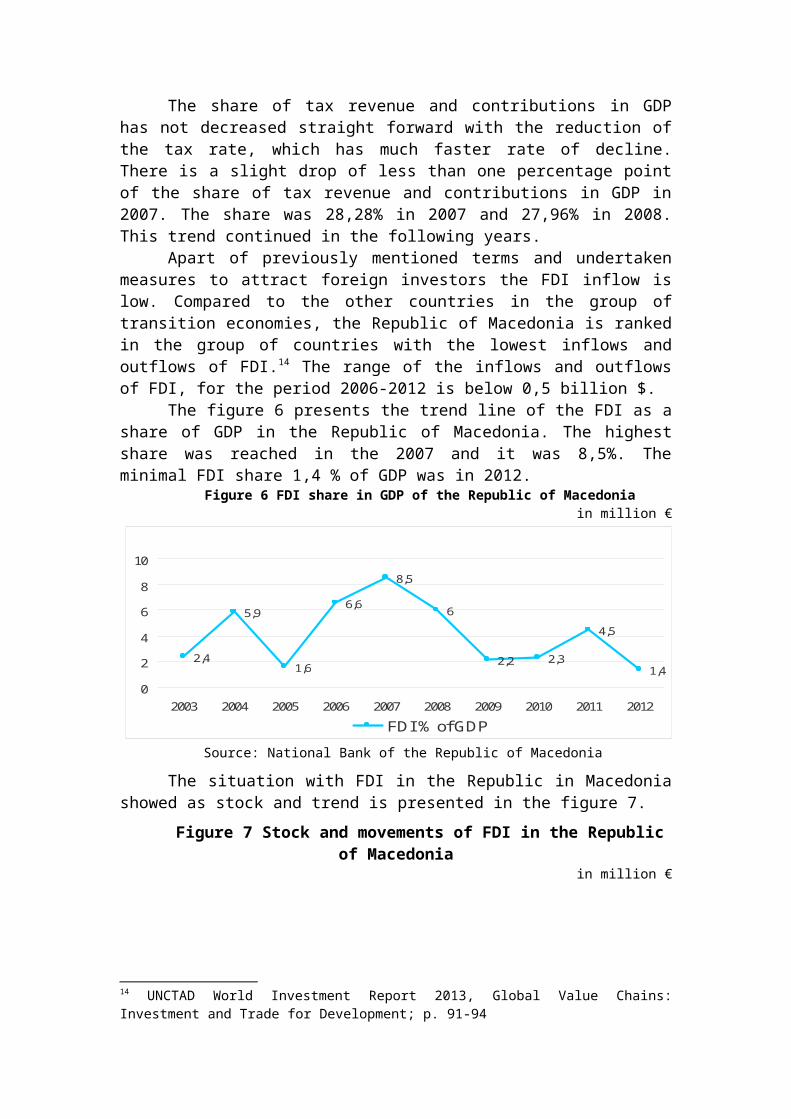
The situation with FDI in the Republic in Macedoniashowed as stock and trend is presented in the figure 7.
Figure 7 Stock and movements of FDI in the Republicof Macedonia
in million €
14 UNCTAD World Investment Report 2013, Global Value Chains:Investment and Trade for Development; p. 91-94
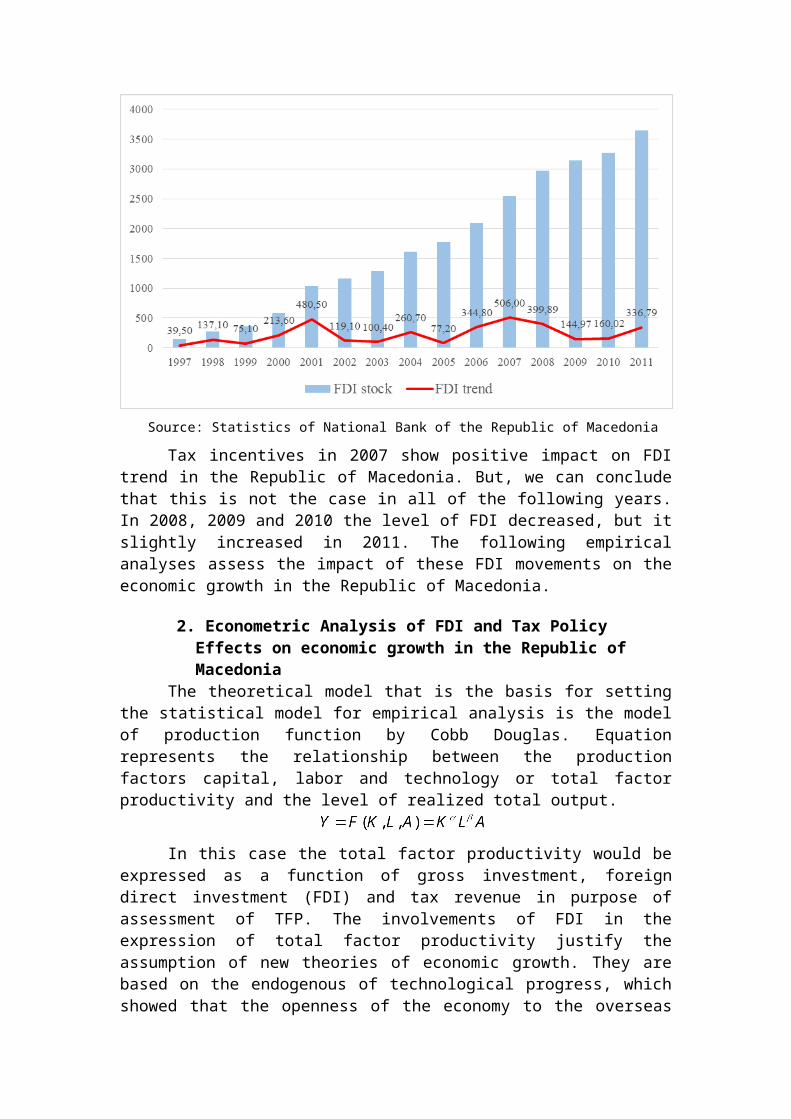
Source: Statistics of National Bank of the Republic of Macedonia
Tax incentives in 2007 show positive impact on FDItrend in the Republic of Macedonia. But, we can concludethat this is not the case in all of the following years.In 2008, 2009 and 2010 the level of FDI decreased, but itslightly increased in 2011. The following empiricalanalyses assess the impact of these FDI movements on theeconomic growth in the Republic of Macedonia.
2. Econometric Analysis of FDI and Tax Policy Effects on economic growth in the Republic of Macedonia
The theoretical model that is the basis for settingthe statistical model for empirical analysis is the modelof production function by Cobb Douglas. Equationrepresents the relationship between the productionfactors capital, labor and technology or total factorproductivity and the level of realized total output.
In this case the total factor productivity would beexpressed as a function of gross investment, foreigndirect investment (FDI) and tax revenue in purpose ofassessment of TFP. The involvements of FDI in theexpression of total factor productivity justify theassumption of new theories of economic growth. They arebased on the endogenous of technological progress, whichshowed that the openness of the economy to the overseas
can generate growth in real GDP in the long run. Theeffects of tax policy are expressed by the variable taxrevenue which shows the changes in the level of fiscalrevenue as a result of the use of fiscal incentives forFDI.
Variables that determine TFP that we take inconsideration are the gross investment in the economy,foreign direct investment and tax revenue. The functionhas the following nonlinear form:
Model is transformed into lin-log model with thefollowing expression:
Y – Real GDP; K – Physical capital; L – Labor (number of employees and/or hours of
work); GI– Gross investment (% of GDP); FDI– Foreign Direct Investment (% of GDP); Tax– Income tax and contributions (% of GDP); – Free article; ….. – Coefficients to be evaluated; Gross domestic product is dependent variable in the
model. The independent variables that determine themovement of the dependent variable are capital, labor,gross investment, foreign direct investment and taxrevenues as a share of GDP. The estimated coefficients (
….. ) define the elasticity of GDP and analyzedindependent variables. Theoretical findings suggestpositive values for all the coefficients of theindependent variables.
The basic factors that determine economic growth arecapital and labor. It is generally known that thecontribution of physical capital and labor are positive.The core Cobb Douglas equation determines economic growthonly through these two factors calculated withmathematical terms according to which the share of
capital in economic growth is 1/3, while labor isaccounted for 2/3.
Gross investment as a variable resulting from thedecomposition of total factor productivity should reflectinvestment activity in the country. The idea is to make apresentation on the situation with investment as anengine of economic growth. Gross investment categoryincorporates investment and net investment return ofconstant capital (depreciation). Investments whether, itis domestic or foreign net investments increase thephysical capital goods in the economy. Thereby increasedpotential levels of GDP allow higher real GDP to berealized. Theory and empirical experience has confirmedthis positive effect.
Situation with the foreign direct investment issomething different and not exactly clear. Thetheoretical logic suggests a positive impact of foreigndirect investment and economic growth. Above all they areadequately complementing the investment activity throughexternal (foreign) inflows. FDI positively affects theeconomy in increasing the productivity and efficiency ofboth physical and human capital, increasing the level ofphysical and human capital and increasing thecompetition, it also allows technology transfer and itencourages innovative activity and research. However,empirical research does not always confirm the above-defined positive determination. Therefore we canconfidently assume that foreign direct investment willshow positive depending on the level of GDP in theRepublic of Macedonia.
The impact of tax policy and economic growthreflects the independent variable tax revenues andcontributions expressed as a percentage of GDP. The ratioof total tax revenue and GDP (tax revenue / GDP) is thetotal picture of the average tax rate. In a number ofstudies that empirically test the relationship betweentaxation and economic growth confirm the negative impactof aggregate average tax rate, but there are studies thatdeny this claim. It is important to highlight thatchanges in the tax burden heavily affect economic growth,depending on the fact whether the analysis concerns thedeveloped economies or developing countries. Developing
countries are subject to greater influence caused by taxchanges. On the other side, developed countries show thatsuch changes insignificantly affect economic growth. Inour analysis, the independent variable tax revenue as apercentage of GDP is expected to have a positive andsignificant impact on economic growth.
Table 1 Symbols, description and expected sign of the variables inthe regression
Symbol Description of theexplanatory variable
Expected sign inthe regression
Physical capital +
Labor, number ofemployees
+
Gross investment(as a percentage of
GDP)+
Foreign directinvestment
(as a percentage ofGDP)
+/-
Tax Revenue
Income tax andcontributions
(as a percentage ofGDP)
+/-
Note: "+" represents positive attitude, "-" a negative attitude, "0" and "+ and -" aretheoretically ambiguous relationship with the dependent variable
The calculation of the lin-log model is made withmultiple linear regressions using the software packageXLSTAT, 2012. The database used in the regressionconsists of quarterly data for the period 2005 to 2011for the Republic of Macedonia. They are provided byprimary and secondary sources of data from the StateStatistical Office of the Republic National Bank of theRepublic of Macedonia, Ministry of Finance of theRepublic of Macedonia as well as the database for theRepublic of Macedonia from International Monetary Fund.
In estimating the parameters of statistical analysismodel the method of least squares is used with theassessment. Significant assumptions that should beconsidered in the interpretation of the regression
parameters are multicollinearity, heteroscedasticity andautocorrelation statistical errors.
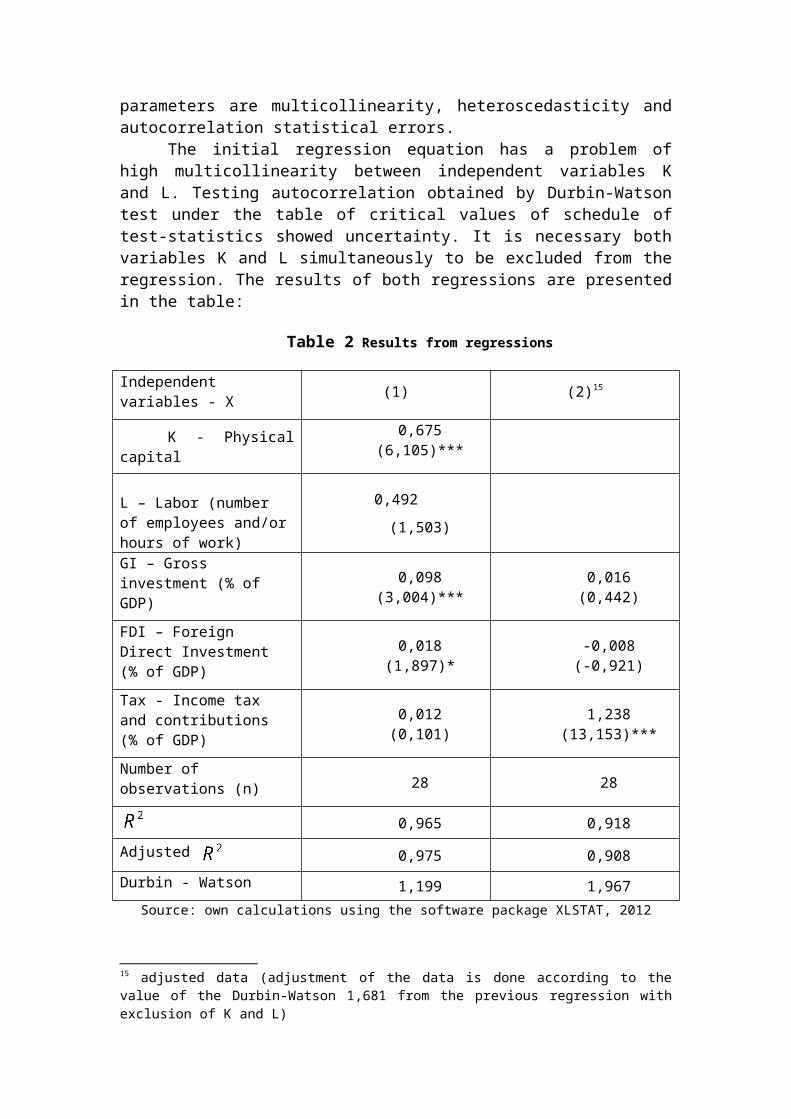
The initial regression equation has a problem ofhigh multicollinearity between independent variables Kand L. Testing autocorrelation obtained by Durbin-Watsontest under the table of critical values of schedule oftest-statistics showed uncertainty. It is necessary bothvariables K and L simultaneously to be excluded from theregression. The results of both regressions are presentedin the table:
Table 2 Results from regressions
Independent variables - X (1) (2)15
K - Physicalcapital
0,675(6,105)***
L – Labor (number of employees and/orhours of work)
0,492(1,503)
GI – Gross investment (% of GDP)
0,098(3,004)***
0,016(0,442)
FDI – Foreign Direct Investment (% of GDP)
0,018(1,897)*
-0,008(-0,921)
Tax - Income tax and contributions (% of GDP)
0,012(0,101)
1,238(13,153)***
Number of observations (n) 28 28
0,965 0,918Adjusted 0,975 0,908Durbin - Watson 1,199 1,967
Source: own calculations using the software package XLSTAT, 2012
15 adjusted data (adjustment of the data is done according to thevalue of the Durbin-Watson 1,681 from the previous regression withexclusion of K and L)
Method of least squares is an acceptablecriterion for correctness of the model. Diagram ofdistribution of residuals shows no presence ofheteroscedasticity. (Annex number 1). The equation hasthe following form:
Ln (Y) = -0,9752+ 1,6183Е-02*Ln(GI)-8,4572E-3*Ln(FDI)+1,2376*Ln(Tax)
The evaluation of the model by the method of leastsquares R2 shows that about 92% (0,918) of the variationin the dependent variable can be explained by variationsof all independent variables included in the model. Theindependent variables included in the model havesuccessfully determined the relative dependence ofeconomic growth in the Republic Macedonia. The resultsfrom the criteria for evaluation of the model,correlation matrix, and test for the multicollinearityand the estimated value for the parameters are presentedin the annex number 2.
Variables gross investment (GI) and foreign directinvestment (FDI) did not show statistically significantimpact. According to these results FDI have a negativeimpact on economic growth in the analyzed period of theRepublic of Macedonia. Special interests in interpretingthe results of regression parameters cause theindependent variable tax revenues and contributions.According to the results of the regressions tax revenueshow a positive and statistically significant effect,with a significance level of 1%. Their impact is greatestwhen the regression analysis excludes physical capitaland employment.
The Republic of Macedonia in the currenttransitional period, had low rates of economic growtheven negative in same periods (Figure 1). In creation ofthe macroeconomic policy measures special attentionshould be paid to conventional growth factors – physicalcapital and employment. The level of physical capital islow and any slight increase positively affects economicgrowth in the country. The analysis confirmed that thecontribution of physical capital is primarily due to net
domestic investments component of gross investment,analyzed as an independent variable in the regressions.
Gross investments are those that increase the constantlevel of physical capital in the country and are ofparticular importance for economic growth in the country.Foreign direct investment does not show statisticallysignificant. Although various fiscal measures favor andcreate favorable conditions for foreign investment, theyare not a source of economic growth in the Republic ofMacedonia. Specifically when the analyses excludephysical capital and employment, their impact is not onlyimportant but also negative.
Tax incentives can contribute to achieving economicgrowth, but only in the long term and when countryreaches a certain level of economic growth. Manyempirically analyses confirmed the theoretical claim thatchanges in tax policy show greater effects in developingeconomies, unlike developed economies. The rare case inanalysis is a statistically significant positive impactof taxes and contributions and economic growth. This can beexplained as a result of accidental overlap of fewthings. The economic growth rate in the 2007 is thehighest evident growth rate in the last period in theRepublic of Macedonia. The share of tax revenue andcontributions in GDP has not decreased straight forwardwith the reduction of the tax rate, which has much fasterrate of decline. There is a slight drop of less than onepercentage point of the share of tax revenue andcontributions in GDP in the same year. So, this exceedsthe negative impact of reduced tax revenues.
CONCLUSIONIn the recent years, the economics of growth is the
subject of intense theoretical and empirical research.Some of it has adopted and extended the neoclassicalgrowth model as formalized by Robert Solow and Swan,while retaining the assumptions of constant returns toscale and exogenous technical progress. Others have takenmore radical departures from the neoclassical model bybringing in increasing returns to scale and attempting tomodel technological change. That represents theendogenous growth theory. In both cases these efforts tryto explain the process of economic growth in developedand developing countries.
Theoretical approach for this analysis is the newgrowth theory and extended Solow’s model. This paperanalyses the effects of investment and fiscal policymeasures as determinants of total factor productivity inthe Republic of Macedonia. The empirical analyses areconducted using the data for capital, labor, grossinvestment, FDI and tax revenue as determinants ofeconomic growth in the Republic of Macedonia in the pastperiod.
The results for capital and labor show greatpositive statistical impact on economic growth in theRepublic of Macedonia. This is not unexpected accordingto the fact that capital and labor are basic source ofeconomic growth. Multicolinearity coefficient confirm thehigh correlation between them and the economic growth andthey are excluded from the second regressions. Variablesgross investment (GI) did not show statisticallysignificant impact. Macroeconomic stability, applicationof special tax measures and incentives, creation of freetrade zones have contributed to some increases of FDI.But the trend of FDI in Macedonia showed no statisticallysignificant impact on economic growth. According to theseresults FDI have a negative impact on economic growth inthe analyzed period of the Republic of Macedonia. Theindependent variable, tax revenues and contributionscause special interests in interpreting the results ofregression parameters. According to the results of theregressions tax revenue show a positive and statistically
significant effect, with a significance level of 1%. Thisis not a usual relationship, it is coincidence. Thepositive effect of high economic growth, especially in2007 overlap the negative impact of reduced level of taxrevenue and contributions in the same year.
The aim of the fiscal policy should be to increasethe investments in the Republic of Macedonia. This can beachieved by measures that stimulate domestic and foreigninvestments. This research confirms that in the analyzedperiod, tax incentives contribute to some increase ofFDI. Future tax measures should follow the samedirection. The improvement of the infrastructure networkwill also contribute in increasing domestic and foreigndirect investments. The trend of reduction in socialsecurity contributions in the Republic of Macedonia willhave positive effect on the economic growth. That measurewill create favorable terms for investors to increase thenumber of employees. This will also have greater impacton employment, than reducing the tax rate on personalincome.
References:1. Addison Tony, Roe Alan, (2006), Fiscal policy for
Development: Poverty, Reconstruction and Growth(Studies on Development Economics and Policy),Palgrave Macmillan;
2. Атанасовски Живко, (2004), Јавни финансии,Економски факултет, Скопје;
3. Barro J. Robert, (1990), Macroeconomics, HarvardUniversity;
4. Barro J. Robert and Sala-i-Martin X,(1995),Economic Growth, New York, McGraw-Hill;
5. Borensztein, De gregorio, Lee (1998), How doesforeign direct investment affect economic growth,Journal of International Economics, 45 (1)
6. Ефтимоски Димитар, (2009), Економски раст, Основнитеоретски концепти и модели, Универзитет „Св.Климент Охридски“ – Битола, Факултет заадминистрација и менаџмент на информациски системи;
7. Feldstein M, Harioca C, (1980),Domestic Saving andInternational Capital Flows, The Economic Journal,90;
8. Gittens Dexter, (2006), The effect of foreigndirect investments on the accumulation of humancapital in developing countries and thereimplication for future growth, Fortham University;
9. Invest in Macedonia,htpp://investinmacedonia.com.mk
10. Lovrinčevič, Mikulič, Marič, (2005), Priljevinozemnog kapitala – Utjecaj na nacionalnu štednju,domače investicije I bilancu placanja –tranzicijskih zemalja Srednje I Istočne europe,Ekonomski institut u Zagrebu, Zagreb
11. Kesner – Škreb Marina, (1996-1999), Tax policy andeconomic growth, Croatian Economic Survey;
12. Myles D. Gareth, (2000), Taxation and EconomicGrowth, Fiscal Studies, Vol. 21 , no 1 p.p. 141-168
13. Myles D. Gareth, (2007), Economic Growth and TheRole of Taxation, OECD
14. Ministry of Finance of the Republic of Macedonia,htpp://finance.gov.mk
15. Ministry of Labour and Social Policy of theRepublic of Macedonia, htpp://mtsp.gov.mk
16. Morisset Jacquese, Pirnia Neda, (2000), How TaxPolicy and Incentives Affect Foreign DirectInvestment, The World Bank and InternationalAdvisory Service
17. National Bank of the Republic of Macedonia,htpp://nbrm.mk
18. Schaup Raphael, (2004), Assessing the Effect ofForeign Direct Investment on Economic Growth inDeveloping Countries with the Extended Solow Model,Institute for Sociology, University Zurich;
19. Svetska Banka (2001), Babič, Pufnik, Stučka,Teorija i stvarnost inozemnih stranih ulaganja usvjetu I tranzicijskim zemaljama s posebnim osvrtomna Hrvatsku, HNB, Zagreb
20. UNCTAD World Investment Report 2013 (2013), GlobalValue Chains: Investment and Trade for Development;
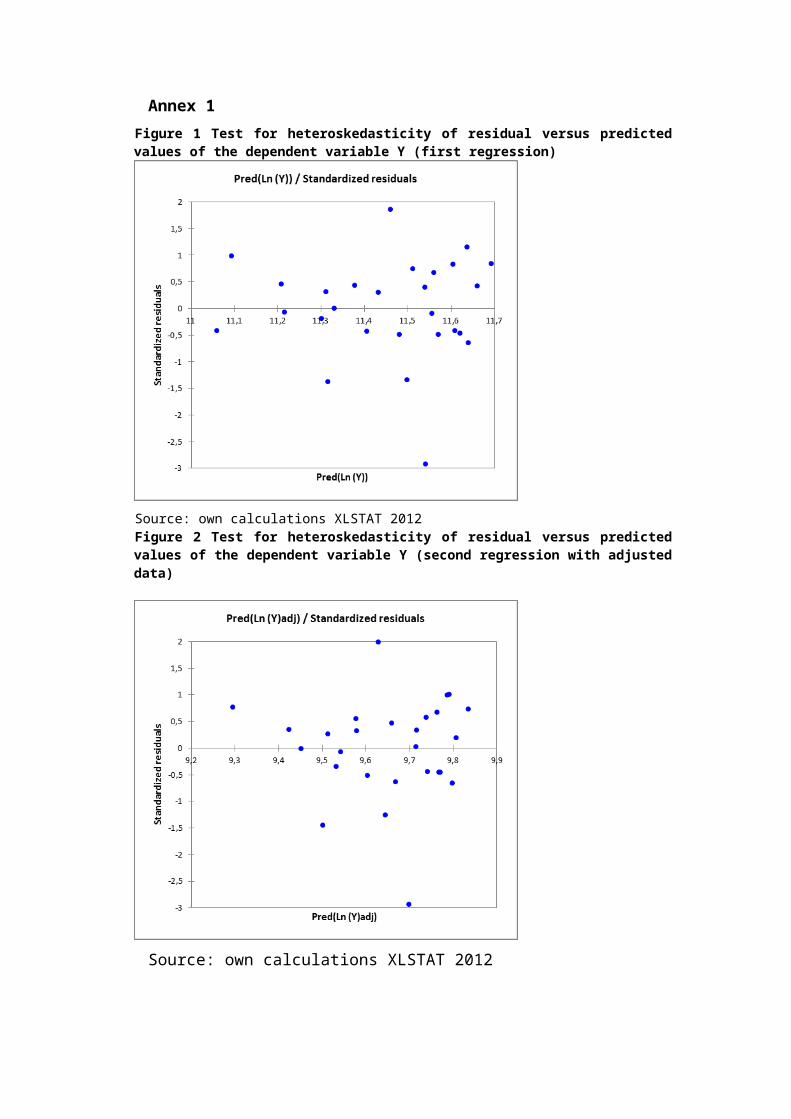
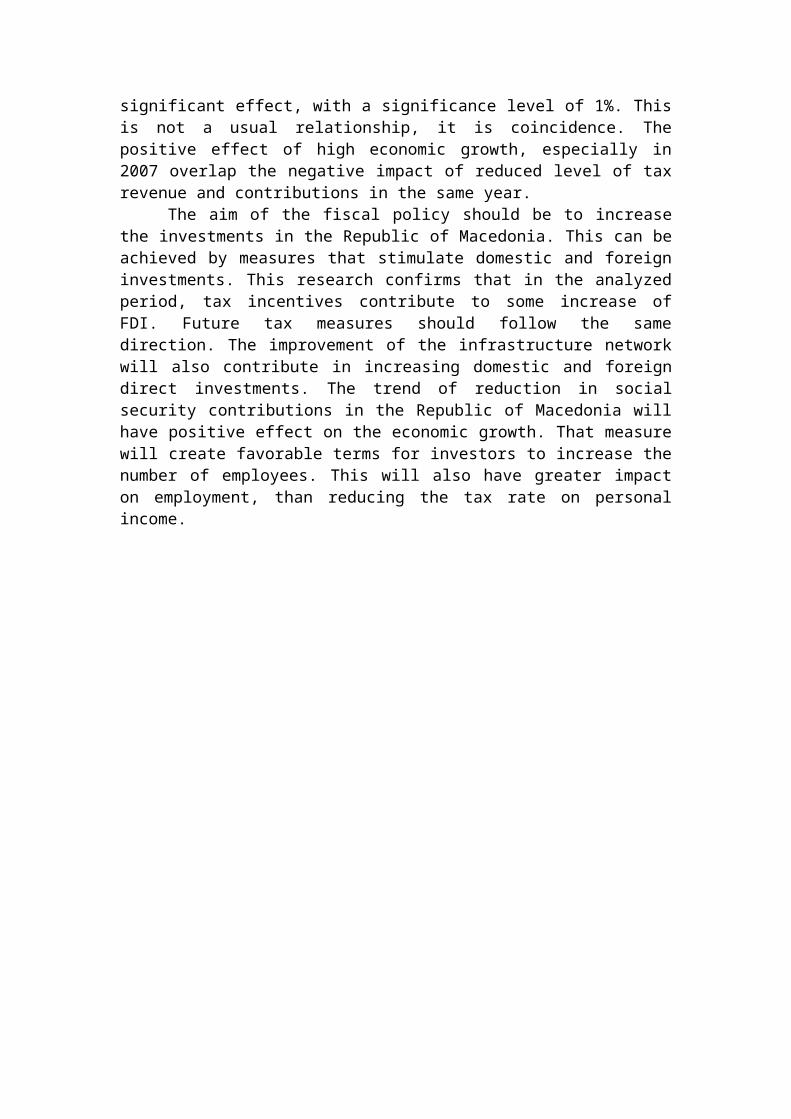
Annex 1Figure 1 Test for heteroskedasticity of residual versus predictedvalues of the dependent variable Y (first regression)
Source: own calculations XLSTAT 2012Figure 2 Test for heteroskedasticity of residual versus predictedvalues of the dependent variable Y (second regression with adjusteddata)
Source: own calculations XLSTAT 2012
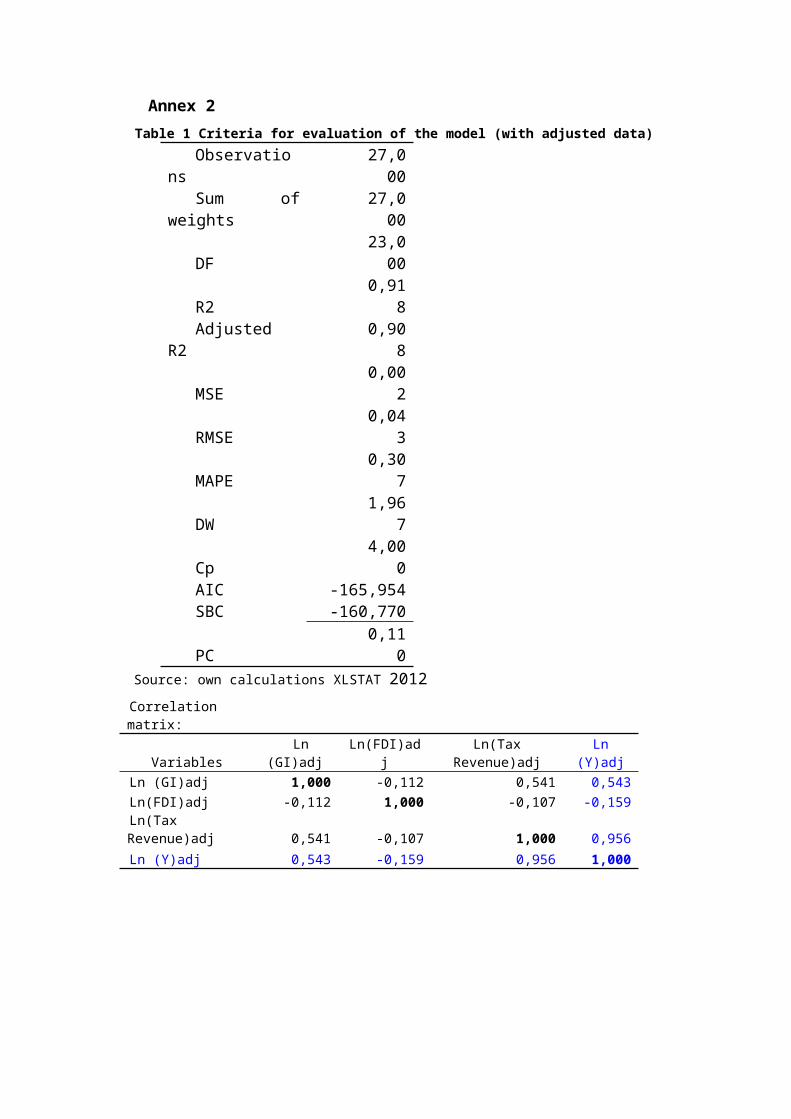
Annex 2Table 1 Criteria for evaluation of the model (with adjusted data)
Observations
27,000
Sum ofweights
27,000
DF23,000
R20,91
8Adjusted
R20,90
8
MSE0,00
2
RMSE0,04
3
MAPE0,30
7
DW1,96
7
Cp4,00
0AIC -165,954SBC -160,770
PC0,11
0Source: own calculations XLSTAT 2012Correlationmatrix:
VariablesLn
(GI)adjLn(FDI)ad
jLn(Tax
Revenue)adjLn
(Y)adjLn (GI)adj 1,000 -0,112 0,541 0,543Ln(FDI)adj -0,112 1,000 -0,107 -0,159Ln(TaxRevenue)adj 0,541 -0,107 1,000 0,956Ln (Y)adj 0,543 -0,159 0,956 1,000
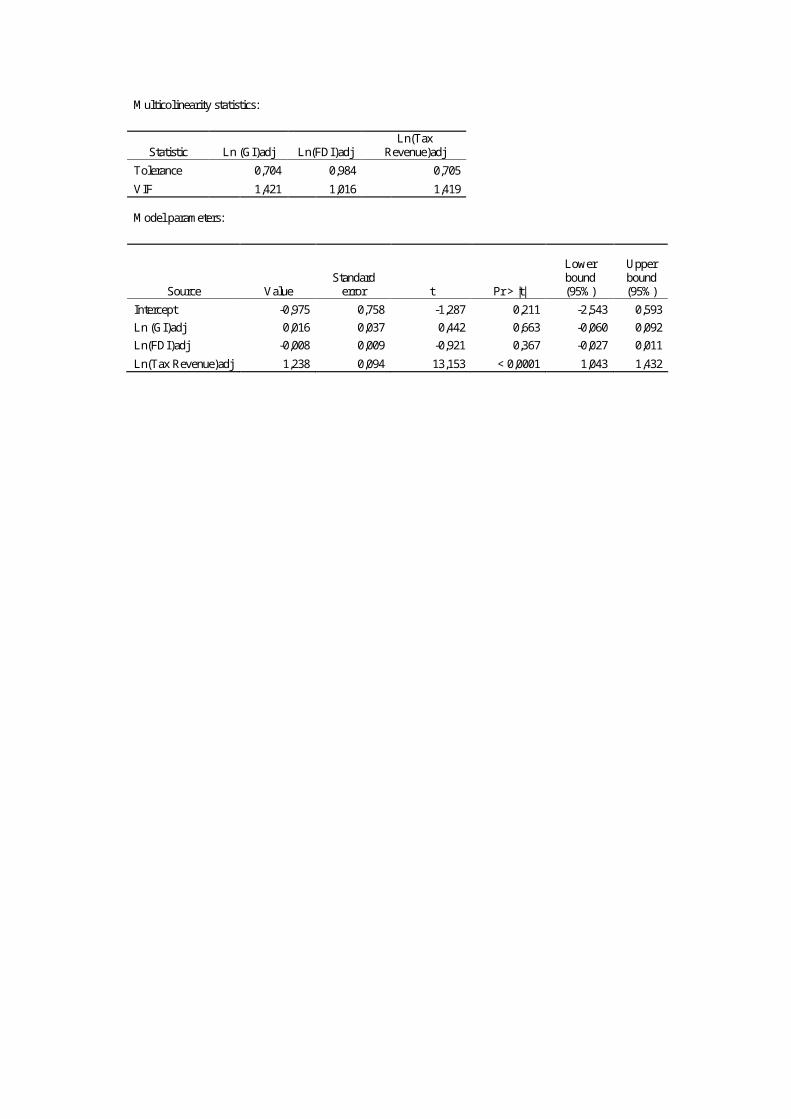
M ulticolinearity statistics:
Statistic Ln (GI)adj Ln(FDI)adj Ln(Tax
Revenue)adj Tolerance 0,704 0,984 0,705 VIF 1,421 1,016 1,419 M odel parameters:
Source Value Standard error t Pr > |t|
Lower bound (95% )
Upper bound (95% )
Intercept -0,975 0,758 -1,287 0,211 -2,543 0,593 Ln (GI)adj 0,016 0,037 0,442 0,663 -0,060 0,092 Ln(FDI)adj -0,008 0,009 -0,921 0,367 -0,027 0,011 Ln(Tax Revenue)adj 1,238 0,094 13,153 < 0,0001 1,043 1,432