fdi and job creation in china
TRANSCRIPT

FDI and Job Creation in China
Sune Karlsson, Örebro University
Nannan Lundin, Research Institute of Industrial Economics and Örebro University
Fredrik Sjöholm, Research Institute of Industrial Economics and Örebro University
and Ping He, National Bureau of Statistics of China
Working Paper Series Vol. 2007-24 November 2007
The views expressed in this publication are those of the author(s) and do not necessarily reflect those of the Institute. No part of this book may be used reproduced in any manner whatsoever without written permission except in the case of brief quotations embodied in articles and reviews. For information, please write to the Centre.
The International Centre for the Study of East Asian Development, Kitakyushu

1
FDI and Job Creation in China♣
Sune Karlsson (Örebro University)
Nannan Lundin (Research Institute of Industrial Economics and Örebro University)
Fredrik Sjöholm (Research Institute of Industrial Economics and Örebro University)
Ping He (National Bureau of Statistics of China)
Abstract
This paper examines the effect of FDI on job creation in the Chinese manufacturing sector. As one of the world’s largest recipients of FDI, China has arguably benefited from foreign multinational enterprises in various respects. However, one of the main challenges for China, and other developing countries, is job-creation, and the effect of FDI on job creation is uncertain. The effect depends on the amount of jobs created within foreign firms as well as the effect of FDI on job creation in domestic firms. We analyze FDI and job creation in China using a large sample of manufacturing firms for the period 1998-2004. Our results show that FDI has positive effects on employment growth. The positive effect of job creation in foreign firms is associated with their firm characteristics and, in particular, their access to export markets. There also seems to be a positive indi-rect effect on job creation in domestically owned firms, presumably caused by spillovers.
Keywords: China, Employment, Foreign Direct Investment, Job Creation JEL codes: J21, J23, F23
♣ Corresponding author: Fredrik Sjöholm, Research Institute of Industrial Economics, P.O. Box 55665, SE-102 15 Stockholm, Sweden. Email: [email protected]. We are grateful for comments and suggestions by participants in the ETSG conference in Athens in 2007. Fredrik Sjöholm gratefully acknowledges financial support from the Torsten and Ragnar Söderberg Foundations. This study was also partially funded by Japan Society for the Promotion of Sciences grant #18530224 as part of the project "Market Structure and Firm Behavior in East Asia's Developing Economies" coordinated by Eric D. Ramstetter of the International Centre for the Study of East Asian Development.

2
1 Introduction
Job creation is arguably one of the main challenges for developing countries.
Improvements in human welfare that have a broad basis are difficult to achieve without a
substantial increase in modern sector employment. Without such employment, people
must continue to seek a meager existence in agriculture or the informal sector.
As an example, Asia Development Bank (2005) suggests there to be a need for
creating at least 750 million new jobs in Asia over the next decade if the positive
development with high economic growth and rapidly decreasing poverty rates is to
continue. The figure can be compared to Asia’s present labor force of 1.7 billion. Such a
massive creation of new jobs is obviously a huge challenge and requires a broad set of
policies. In the context of job creation, Felipe and Hasan (2006, p.7) argue for the need
for industrial policy to “… promote diversification of production activities into new areas,
facilitate restructuring of existing activities, and foster coordination between public and
private entities to make all of this happen.” It seems quite obvious that Foreign Direct
Investment (FDI) and Multinational Enterprises (MNEs) could play an important role in
such industrial change with their knowledge of markets, technologies and distribution
channels (e.g. UNCTAD, 2007). It is also clear that FDI has greatly contributed to
developing East Asia’s growth and industrial development (e.g. Dobson and Chia, 1997).
Despite its high empirical and policy relevance, the contribution of FDI to job creation in
developing countries has been little explored so far.

3
This paper aims at examining the effect of FDI on job creation in China, based on
firm-level information of the Chinese manufacturing sector during the period 1998-2004.
We examine both a direct employment effect, i.e. jobs created in foreign MNEs, and an
indirect employment effect, i.e. the effect of FDI on jobs created in domestically owned
firms. As discussed above, there are reasons to expect that foreign MNEs can be impor-
tant in job creation. However, the positive effect on jobs created within the foreign MNEs
is not necessarily accompanied by a similar development in domestic firms. Two
opposing effects on employment in domestic firms can be considered; a positive effect on
suppliers and from various types of spillovers and a negative effect from increased
competition.
For a preview of our results, we find that foreign firms have a comparably high
growth in employment. This high growth is caused by favorable firm characteristics such
as high capital intensities and productivity, and in particular by their access to export
markets. Regarding the indirect effect, the empirical analysis finds positive effects of FDI
on private domestically-owned firms, presumably because spillovers and learning or
demonstration effects are more important than the competition effect.
The remainder of this paper is organized as follows. In Section 2, we provide a
theoretical overview of potential channels through which FDI may affect job creation and
discuss some previous studies. The dataset and descriptive statistics are presented in
Section 3 and we perform the empirical analysis in Section 4. We then conclude in
Section 5.

4
2 FDI and Job Creation
Economic growth in developing countries rests on a shift from agriculture and informal
services and the ability of the manufacturing sector to absorb labor thus becomes a
critical factor (Lewis, 1954). The total amount of people employed outside agriculture
and the informal sector can presumably be affected by inflows of FDI. FDI might, for
instance, increase the country’s competitiveness by combining firm- and country-specific
assets (e.g. Blonigen, 1997). This typically involves combining access to foreign markets
and modern technology with a large supply of cheap labor. Such a combination of firm-
and country-specific assets has frequently improved and expanded existing host-country
industries, introduced production in new industries, and changed the comparative
advantage of the host country (Lipsey, 2004; 2006).
In addition to introducing new industries and establishing new firms in the host
country, inflows of FDI can increase employment through establishing linkages with
domestic firms through purchases of locally produced goods and services. It is also
possible that FDI introduces new and better quality inputs to be used in the production of
upstream domestic firms, thus making them more competitive and enabling them to
expand production and employment.
There is another effect, however, which suggests that inflows of FDI might
decrease employment in domestic firms. This will happen if foreign firms increase the
competition for domestic firms and force them to exit the market or downsize their
workforce. It could be imagined that such a crowding-out effect is important when
foreign MNEs do not only focus on export markets, but also target the domestic market.

5
There are at least two different channels through which such crowding out can take place.
First, MNEs have firm-specific advantages, which give them a competitive edge against
their domestic competitors despite a comparatively poor knowledge of local conditions.
Second, MNEs might also raise the wage levels and press up the wages of their domestic
competitors (Lipsey and Sjöholm, 2004a). Such wage increases will deter job growth in
domestic firms when their cost advantages are diminishing.
2.1 The Chinese Context
While the Chinese economy keeps growing at a rapid pace and FDI continues to flow
into China, job creation is becoming one of the main economic challenges. One of the
key reasons behind the job creation pressure is the large dismantling of state-owned
enterprises. The Chinese labor force consists of a staggering 779 million people (National
Bureau of Statistics, 2006, Table 5-1) and it is predicted to grow at an annual rate of 1.3
percent over the next few decades, putting a great deal of emphasis on the ability to
generate enough employment opportunities (Chow et al., 1999, p. 483). The situation is
further complicated by the large number of Chinese workers in the informal sector. At
least 85 million Chinese are estimated to a make living in the informal sector (Cai et al.,
2005). Bringing these people into modern sector employment would be tremendously
beneficial for overall welfare in China.
Manufacturing seems to be the best possibility for modern sector employment
expansion. The Chinese manufacturing sector is large, although the exact size is unknown
and presumably underestimated in official statistics. For instance, Banister (2005) claims

6
that the official figures underestimate the number of workers in township and village
enterprises and the number of unregistered workers and estimate manufacturing
employment to about 100 million workers, or about twice the size of total G7
manufacturing employment. Unfortunately, there are signs of stagnating and even
declining Chinese manufacturing employment. Official labor statistics put manufacturing
employment at about 98 million in 1996 and about 83 million in 2002 (National Bureau
of Statistics, 2006, Table 5-5). Banister’s estimates show a similar declining trend. The
lack of job creation in manufacturing is problematic in view of labor force growth and the
large informal sector. One consequence is that China is experiencing rapidly increasing
inequality, which to some extent is caused by stagnating incomes in agriculture and the
informal sector and increasing incomes in the formal modern sector (Lindbeck, 2007).
2.2 Previous Studies
Few studies examine employment growth in foreign- and domestically-owned firms. One
notable exception is Alvarez and Görg (2007) who examine growth in employment at a
plant level in Chilean manufacturing between 1990 and 2000. Their results suggest no
major differences between employment growth in multinational and non-multinational
firms. The authors note that the results could be biased by a selection of only surviving
plants. Adjusting this potential bias by a Heckman procedure does not change their
results. Based on a sample of Chinese state-owned enterprises, for the period 1999 to
2003, Gong et al. (2006) examine the effect of privatization and foreign acquisition on
employment. Their results suggest that domestic privatization leads to lower employment

7
growth while foreign acquisition increases employment, as compared to firms that
remained state-owned.
There is also a literature that examines the employment effect of foreign
acquisitions in terms of employment composition. Most of these papers examine the
employment composition in developed countries (e.g. Almeida, 2003; Huttunen, 2005).
One exception is Lipsey and Sjöholm (2002, pp. 10-11) which examines changes in
employment in Indonesian plants after foreign acquisitions during the period 1975-1999.
Foreign acquisitions were found to target relatively large domestic plants and the
acquisitions were followed by different kinds of employment changes for blue- and white
collar workers: the number of blue-collar workers increased by 38 percent from one year
before the acquisition until two years after, whereas the number of white-collar workers
declined by 27 percent.
While there are at least a few studies comparing employment growth in foreign-
and domestically-owned firms, there are, to the best of our knowledge, no previous
studies on how FDI affects employment in domestically owned firms. There is, however,
a very large literature on how FDI affects domestic firms in other respects. It has, for
instance, been shown that FDI can have both positive and negative effects on domestic
firms’ productivity (Görg and Greenaway, 2004; Lipsey and Sjöholm, 2005) and that it
tends to increase exports and wages in domestic firms (Swenson, 2007; Lipsey and
Sjöholm, 2004b).
8
3 Data and Descriptive Statistics
The data used in the paper has been compiled by the National Bureau of Statistics of
China (NBS). The dataset is based on a census of large- and medium-sized enterprises
and a representative sample of small enterprises with more than 10 employees and an
annual turnover above 5 million RMB for the period 1998-2004. Depending on the year
of calculation, the dataset covers 60-69 percent of total employment in the Chinese
manufacturing sector in the investigated period.
The available firm-level economic variables include employment, wages, sales,
value-added, export and fixed assets. The industry code at the four-digit level and a
region code make it possible to aggregate the firm-level information up to the industry-
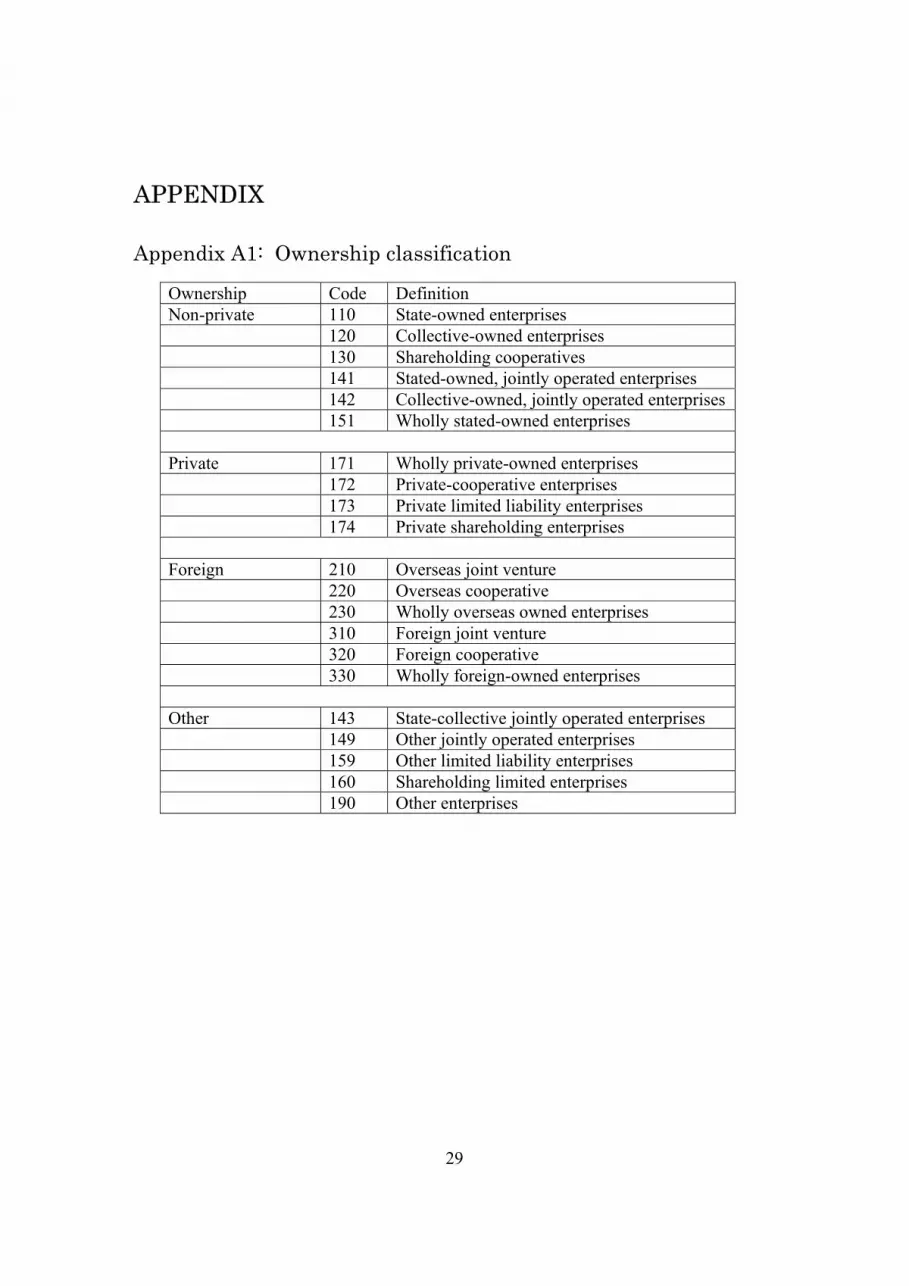
and regional level. Using the ownership indicator, we create four different ownership
categories: non-private domestic firms, private domestic firms, foreign firms and other
firms. Non-private firms consist of state-owned enterprises and collective firms, entirely
foreign-owned firms and joint ventures with foreign co-owners and other firms primarily
consisting of shareholding enterprises. A more detailed classification is given in Table
A1 in the appendix.
Table 1 about here
Table 1 shows some descriptive statistics of the Chinese manufacturing sector by
ownership. The number of private firms is, by far, the largest ownership category: about
10,000 private firms in 1998 increased more than tenfold to over 112,000 in 2004. This is
truly a remarkable development and a reflection of the dynamic private sector growth in

9
China. According to officials at the National Bureau of Statistics, some of the increase is
caused by an improved coverage of the sample survey on small firms, however. Foreign
firms and firms with other ownership categories have also increased by about 30 and 300
percent, respectively. The number of foreign firms is more than 55,000 in 2004, only
second to private-domestic firms. In contrast to the dynamic development in the private
and foreign sectors, the number of non-private domestic firms has declined by more than
50 percent and amounts to 36,000 firms in 2004.
Comparing characteristics of firms by different kinds of ownership, we see that
foreign firms are relatively capital intensive with high levels of productivity and wages.
They are of about the same size as non-private domestic firms and other firms and
substantially larger than private domestic firms. The main difference between foreign and
domestic firms is the export orientation: about half of the production in foreign firms is
exported.
The figures suggest that foreign firms are important as employers. However,
from the descriptive statistics, we cannot draw the conclusion that they are important
creators of new jobs. The reason is that the above figures might be caused by foreign
firms acquiring domestic firms with little changes in total employment. One possibility
would be to examine the effect of takeovers on employment, but the data does not allow
for such an analysis since the identification code of a firm changes after a takeover.
Instead, in table 2, we look at employment growth in firms of different ownership over
the periods 1998-2001 and 2001-2004. Only firms present in both years are included.
Table 2 about here

10
The figures show that employment growth in non-private domestic firms has been nega-
tive in both periods: firms present in both 1998 and 2001 saw their labor force decline by
14 percent and the corresponding figure for firms present in both 2001 and 2004 is 17
percent. The category “other firms” also shows negative employment growth in the first
period and a positive but small growth in the second period. Private firms, domestic as
well as foreign ones, show positive growth in both periods. In the first period, private-
domestic firms increased their labor force by 19 percent, almost twice as much as the
increase in foreign firms. The situation changed in the second period when foreign firms
increased their labor force by more than 24 percent, i.e. slightly more than private-
domestic firms. To sum up, both private-domestic and foreign firms have increased their
number of employees by two-digit figures in both periods.
Some of the observed differences in employment growth between ownership groups
could be caused by differences in the sector distribution of firms. Therefore, we show the
development in the five largest sectors in Table 2. The previous results seem to hold at a
more disaggregated level: employment has declined in non-private domestic firms and
increased, with some exceptions, in private-domestic and foreign owned firms.
4 Empirical Analysis
4.1 Direct effects of FDI
There is clearly a substantial difference in the ability of different types of firms to create
jobs. The above figures show that employment growth has been high in foreign-owned

11
firms, even higher in private domestic firms and negative in non-private firms. This
pattern is relatively stable when disaggregating to the industry level and the difference in
performance cannot simply be explained by firms with different ownership being active
in different sectors of the economy. To shed some light on the underlying causes of
employment growth, we model employment growth as a function of firm characteristics,
industry characteristics, regional characteristics and conditions at the macro level. This
set of variables captures much of the diversity of the Chinese economy, both across
industries and regions. Controlling for the differences in the environment faced by firms
allows us to estimate the effect of firm-specific characteristic on job growth. The data on
small firms is unfortunately quite limited and in order to retain the small (by Chinese
standards!) firms in the empirical analysis, we are forced to limit the number of variables
in the estimated model. Regional and industry dummies proxies for (near) time invariant
regional and industry specific characteristics and time dummies capture time varying
economy wide factors. Since some of the firm characteristics are time invariant (notably
ownership), we do not include firm-specific effects in the model. Many of the firm-
specific variables are likely to be endogenous in a model for employment and we use the
first lag of these variables to protect against endogeneity bias. More specifically, the
basic model we estimate is given by
itRjind
tiwitititit
εdummyRegdummyIndβ
dummyYearOwnershipβλFirmαXXX∆
++
++++=−=
∑∑∑∑−
__
_ lnlnln 1
β
β, (1)
where i is index for firms, j is index for industries and t is index for year. The variables
included in the model are:

12
itX : Employment.
itFirm : A vector of lagged firm characteristics, i.e. firm size measured by
employment, the export share of total sales, labor productivity, average
wage and capital intensity (see Table A2 in the appendix).
iOwnership : Ownership dummy variables indicating the four ownership categories
defined in the previous section.
tYear : Year dummy variables.
jIndustry : Industry dummy variables at the four-digit level.
dummyReg _ : Regional dummy variables at the two-digit province-level.
The firm-specific variables control for the most important factors influencing firm
performance. Lagged firm size will capture the effect of employment in the previous year
on employment growth and export share controls for the importance of access to inter-
national markets. Labor productivity and capital intensity control for the efficiency-
related factors and the average wage can indirectly capture skill differences between
employees.
Table 3 about here
The OLS estimates for our preferred specification are displayed in column (4) of Table 3,
and columns (1) through (3) show more parsimonious specifications. The dummy
variable for “other” firms is omitted as the reference category. The export share is a
13
particularly interesting explanatory variable since it measures a firm’s ability to
overcome the constraints of the domestic market and is closely related to whether the
firm is foreign owned. To further investigate the effect of the export share, we include
interaction terms with the ownership dummies to measure the differential effect of the
export share.
The negative coefficient of −0.016 on the ownership dummy for non-private
domestic firms implies that employment growth is 1.6 percent lower than in the reference
group. The dummy variable for foreign firms also has a negative and significant
coefficient, which suggests employment growth to be 4.5 percent lower than the
reference group, while private firms have 0.4 percent higher employment growth. This is
in stark contrast with the summary statistics in Table 2 and column (1) of Table 3 where
both foreign and private firms display considerably higher job growth than “other” firms,
while non-private firms experience a considerable decrease in employment. In other
words, being foreign owned or privately held does not in itself cause higher job growth.
Instead, these firms display higher job growth because they differ in other firm
characteristics.
Turning to the other firm characteristics, we find positive and significant
coefficient estimates except for the firm size variable. Large firms grow relatively slowly
but firms with high labor productivity, high wages and high capital intensities grow
relatively fast. The results are in accordance with most previous studies. It might be
particularly interesting to note that high capital intensity leads to high employment
growth which runs against the commonly held perception that labor intensive technology
generates more employment opportunities. One possible explanation is that capital

14
intensive technology leads to higher quality or lower prices of products and thereby a
stronger growth in employment.
The coefficient on export share is significant and positive. It implies a relatively
strong effect on employment growth, i.e. on average, if export intensity increases by 1
percent, it will generate an increase in employment growth by 4.9 percent for the
reference category “other” firms. The interaction terms show a significantly higher effect
of 8 percent for foreign firms, while non-private and private domestic firms do not differ
significantly from the “other” firms. It thus appears that foreign firms are considerably
more adept at leveraging their access to foreign markets and turning this into job growth.
One methodological problem is, as previously said, that our panel is unbalanced.
We only have information on surviving firms and ownership might, for instance, affect
the likelihood of survival. The OLS estimates might thus suffer from selection bias. In
addition, firm exit implies a job growth of −100% for that firm and period. While it is
possible to include this in the data set, it would lead to huge outliers which can distort the
results by themselves. We correct for these problems using the Heckman two-step
procedure where firm survival and employment growth, conditional on survival, are
modeled as two separate processes. In the first step, we estimate a probit model for firm
survival, the selection equation, as
dummyg
dummyIndβdummyYearOwnershipβλFirmα
ZSurvivalP
R
jindtiwitit
ti
_Re
__ Z
)()(ˆ,
∑∑∑∑ +++++=
Φ=
β
β . (2)

15
The firm control variables included in the selection equation are firm size, capital inten-
sity, export share and average wage. We also control for the ownership-, year-, regional-
and industry (at the two-digit level) specific effects by including dummy variables.
Column (5) of Table 3 reports the estimates of the selection equation. It is noteworthy
that foreign firms have a significantly higher survival probability than “other” firms and
that both private and non-private domestic firms have a significantly lower survival
probability. The estimated coefficients for the remaining variables, with the exception of
capital intensity, have the expected sign and are significant. Turning to the equation for
employment growth in column (6), the significant coefficients of the Mills ratio and the
implied estimate of the correlation between equations of 0.29 confirm that it is necessary
to correct for the sample selection effect. Nevertheless, the Heckman two-step estimates
are very similar to the OLS estimates in column (4). The only notable difference is that
the positive coefficient on the ownership dummy variable of private firms is no longer
significant. Recall, however, that these estimates are conditional on firm survival and do
not take account of the employment effect of failing firms. The marginal effects, ( )ix
yE∂
∂ ,
reported in column (7) account for this by also considering the effect on the survival
probability of a change in an explanatory variable. The marginal effects are calculated at
the sample means of the explanatory variables and reflect a step change from 0 to 1,
rather than the derivative for the ownership dummies. The marginal effects are once more
close to our other estimates and there is no change in the qualitative conclusions.

16
4.2 Indirect effect of FDI
The above discussion focuses on employment within foreign firms. There are, as pre-
viously said, reasons to expect that the entry of foreign firms can have positive as well as
negative effects on employment in domestic firms. Positive effects could be caused by
the support of linkage industries or demonstration effects and negative effects could be
caused by increased competition.
We try to identify this indirect effect by relating the FDI intensity (measured by
the share of production by foreign firms) of a sector to employment growth in domestic
firms. It should be noted that there are several potential problems with this approach.
First, the definition of a sector is important. The more narrowly-defined is the industry
classification we choose, the more weight will be put on the competition effect and the
less on the linkage effect. Therefore, we try with industry classifications at both two- and
four-digit levels of the Chinese industry classification, which is similar to the industry
classification in ISIC Rev.3. The two-digit classification includes 29 industries and the
four-digit classification includes 477 industries.
The second related issue is how the geographic distinction of a market should be
defined. This is an important issue in such a large country as China. As an example, will
a foreign firm in Shanghai use suppliers from the Guangdong province and increase
competition for firms in the Guangdong province? There are no theoretical answers to
this question and, once more, we adopt a pragmatic approach and use two different
geographic classifications, at the national and the regional level, which divide the 31
provinces of China into 3 regions: east, mid and west.

17
Taking our previous model (1) as the starting point, we add the FDI intensity and the
Herfindahl index as a measure of the competitive pressure as explanatory variables. The
ownership dummies and the interactions with the export share are dropped since we
estimate the model separately for the subsamples of domestic private and non-private
firms. The model for employment growth is thus
itRjind
tjtitititit
εdummyRegdummyIndβ
dummyYearIndustryλFirmαXXX∆
++
++++=−=
∑∑∑−
__
_lnlnln 1
β
βδ ,(3)
where jtIndustry represents the FDI intensity and the Herfindahl index at the two- or
four-digit industry-level for the relevant region or at the national level. For the estimates
of the Heckman sample selection model, we make similar modifications to the selection
equation but do not add the FDI intensity or the Herfindahl index.
The results are shown in Table 4 for private firms and Table 5 for non-private
firms. For clarity, we have only included the coefficients on the FDI intensity and the
Herfindahl index. The coefficients on the other included control variables only changed
marginally as compared to the previously shown results in Table 3.1
The OLS estimates show that FDI tends to increase employment growth in
domestic private firms (Table 4) within the same two-digit industry at the national level,
while competition, as measured by the Herfindahl index, does not yield any significant
effect. There are no signs of a geographic effect of FDI at a two-digit level. The effect of
FDI seems even more robust at a four-digit level of industry aggregation where the
1 The complete results are available from the authors upon request.

18
coefficient for FDI is positive and statistically significant at both the national and the
regional level whereas the Herfindahl index is insignificant at the four-digit level. The
estimated effects are smaller when controlling for unobserved heterogeneity across firms
by including fixed firm effect and FDI intensity is only significant at the national level.
There is a distinct possibility that the lagged FDI intensity is endogenous, i.e. that
foreign firms invest in certain industry sectors or regions in anticipation of a favorable
development. To control for the possible endogeneity, we also estimate equation (3) with
instrumental variables using instruments calculated at the industry and regional level.
Specifically, we instrument the FDI intensity with the R&D and import intensities for the
industry sector (four or two digit) at the national or regional level as well as the industry’s
and region’s share of total patent applications, share of government S&T funding and the
share of foreign S&T funding (A more detailed variable definition can be found in
Appendix A2).2 The IV estimates for private firms are reported in the third block of Table
4. Correcting for the possible endogeneity of FDI, the effect of the FDI intensity is no
longer significant although we still find a positive effect except at the regional four-digit
level.3 We also test the null hypothesis that the lagged FDI intensity is exogenous and fail
to reject this at the 5% level except at the national two-digit level.
2 Naturally, it can also be argued that the FDI variables are endogenous in the model (1) used to assess the direct effects of FDI on employment growth. The paucity of data on small firms prevents us from constructing appropriate firm-level instruments that can be used with equation (1). When the FDI intensity is measured at the industry/regional level, our data allows for the construction of instruments at the industry/regional level and we take advantage of this to assess the endogeneity of FDI. 3 The Sargan test of the overidentifying restrictions rejects the validity of some of the instruments for some combinations of industry and regional classifications; the R&D intensity is dropped for the national two-digit level and the R&D intensity and the patent share are dropped for the regional two-digit level.

19
Finally, in the Heckman two-step estimation, the results are similar to the OLS
estimates and the statistically significant coefficients on Mills ratio suggest that it is
necessary to correct the sample selection bias caused by attrition. The marginal effects,
taking account of the possibility that firms might cease to exist, are very close to the two-
step estimates due to the high probability of survival.
To sum up, FDI seems to increase employment in private-domestic firms within
the same sector. The results are stronger at the four-digit level than at the four-digit level.
This is surprising in view of the previous discussion. We would expect the negative
competition effect on employment to be relatively important at the four-digit level and
the positive linkage effect to be relatively important at the two-digit level. The result
leads us to the much studied and debated issue of spillovers from FDI to domestic firms.
The positive effect within narrowly defined industries is consistent with the existence of
such spillovers. Swenson (2007) finds evidence of such spillovers in terms of export
behavior in China. She argues that this is caused by information on foreign markets and
technologies flowing from foreign to domestic firms. Such flows could stem from
demonstration effects or job turnover when employees in foreign firms join domestic
competitors. It is also worthwhile to mention the literature on spillovers in China that
looks at productivity in domestic firms. There are several such studies, and some of them
find a positive effect of FDI on the productivity of domestic firms (See e.g. Cheung and
Lin, 2003, Hale and Long 2007). It is plausible that more productive firms will grow
faster, as is seen in our econometric results.
Next we turn our attention to the effect of FDI on employment growth in non-
private firms. The results are shown in Table 5 and differ substantially from those in

20
Table 4. We find no signs of a positive effect of the lagged FDI intensity. The estimates
are in general small and insignificant. The only significant estimates are the fixed effect
estimates at the regional two-digit level and the IV estimates4 at the regional two-digit
level and the national four-digit level, which are all negative. It should perhaps not come
as a surprise that foreign firms have a positive effect on private firms, but impose a
potential negative competition effect on non-private firms. The latter are still to a large
extent operating outside normal market economic restrictions and the presence of FDI
leads to slower growth, and even contraction of employment in non-private firms.
5 Concluding remarks
FDI is considered to be one of the key driving forces behind the spectacular economic
growth in China in the last two decades. However, academic research and public policy
discussions tend to ignore the effect of FDI on job creation. This is unfortunate,
considering the large importance of job creation in developing countries. This paper
contributes to this issue by providing empirical results on the effect of FDI on job
creation in China, based on a large firm-level data set for the period 1998-2004.
The descriptive statistics suggest that both FDI and private domestic firms have
relatively high employment growth, as compared to non-private domestic firms. The
4 The exogeneity of the lagged FDI intensity is rejected for the regional two-digit level and the national four-digit level. The exogeneity of the import intensity is rejected and this instrument is dropped for the national two-digit level.

21
cross-ownership comparison also shows that FDI firms, in general, have more
advantageous firm characteristics as compared to firms with other kinds of ownership.
It is important to distinguish between the sources of favorable employment
growth. Is it a pure ownership effect and/or an outcome of other firm characteristics that
may yield a positive effect of employment growth? In the first step econometric analysis,
we investigate the direct ownership effect and find that employment growth is strongly
correlated with firm characteristics such as high productivity, capital intensity and wage.
Furthermore, the higher export share, as a proxy for access to international markets, gives
foreign firms additional competitive advantages as compared to domestic firms.
In the second empirical analysis, we look into the indirect effect of FDI in terms
of spillovers and competition. From a theoretical point of view, the effect of FDI on job
creation can be both positive and negative, depending on the strength of the spillover
effect and competition, which are simultaneously at work. Interestingly, we find that the
spillover effect of FDI seems more important than the competition effect, in particular on
private domestic firms and even at a highly disaggregated industry level. In contrast, such
a positive indirect effect of FDI is not observed among non-private domestic firms.
Based on the empirical analysis, we conclude that FDI has contributed to job
creation in the Chinese manufacturing sector through its access to international markets
and other firm characteristics which favor growth in employment and through positive
effects on employment in private-domestic firms.

22
References
Almeida, Rita (2003), “The Effects of Foreign Owned Firms on the Labour Market”, IZA Discussion Paper No. 785.
Alvarez, Roberto and Holger Görg (2007), “Multinationals as Stabilizers? Economic Crisis and Plant Employment Growth”, IZA Discussion Paper No. 2692.
Asian Development Bank (2005), Labor Markets in Asia: Promoting Full, Productive, and Decent Employment, Manila: Asian Development Bank
Banister, Judith (2005), “Manufacturing Employment in China”, Monthly Labor Review, July, 2005.
Blonigen, Bruce (1997) “Firm-Specific Assets and the Link Between Exchange Rates and Foreign Direct Investment”, American Economic Review, 87, 3, 447-65.
Cai, Fang, Meiyan Wang, and Yang Du (2005), “China’s Labor Markets on Crossroad”, China & World Economy, 13, 1, 32-46.
Cheung, K. Y and P. Lin (2004), “Spillover effects of FDI on innovation in China: evidence from the provincial data”. China Economic Review, 15, 25-44.
Chow, C.K.W., Fung, M.K.Y., and N.H. Yue (1999), “Job Turnover in China: A Case Study of Shanghai’s Manufacturing Enterprises”, Industrial Relations, 38, 4, 482-503.
Dobson, Wendy and Siow Yue Chia (1997), Eds., Multinationals and East Asian Inte-gration, Singapore: Institute of Southeast Asian Studies.
Felipe, Jesus and Rana Hasan (2006), The Challenge of Job Creation in Asia, Asian De-velopment Bank, ERD Policy Brief, No. 44.
Gong, Y.D., Görg, H. and S. Maioli (2006), Employment effects of privatization and foreign acquisition of Chinese state-owned enterprises. Research paper 2006/32. Leverhulme Centre for research and Economic Policy (GEP), Nottingham.
Görg, Holger and David Greenaway (2004), “Much Ado About Nothing? Do Domestic Firms Really Benefit from Foreign Direct Investment?”, World Bank Research Observer, 19, 2, 171-97.
Hale, G. and Long C. (2007), ”Are There Productivity Spillovers from Foreign Direct Investment in China?”, Working paper at Federal Reserve Bank of San Francisco.
Huttunen, K. (2005), “The Effect of Foreign Acquisition on Employment and Wages: Evidence from Finnish Establishments”, Review of Economics and Statistics, forthcoming.
Lewis, W. Arthur (1954), Economic Development with Unlimited Supplies of Labour, Manchester School of Economic and Social Studies, 22, 2, 139-191.
Lindbeck, A. (2007), “Economic-social Interaction in China” Economics of Transition, forthcoming.

23
Lipsey, Robert E. (2004), “Home- and Host-Country Effects of Foreign Direct Invest-ment.” In Robert E. Baldwin and L. Alan Winters (eds.), Challenges to Globalization, Chicago, University of Chicago Press.
Lipsey, Robert E. (2006), “Measuring the Impacts of FDI in Central and Eastern Europe”, National Bureau of Economic Research Working Paper No. 12808.
Lipsey, R.E. and F. Sjöholm (2002), “Foreign Firms and Indonesian Manufacturing Wages: An Analysis with Panel Data”, NBER Working Paper No. 9417. Lipsey, Robert E., and Fredrik Sjöholm (2004a), “FDI and Wage Spillovers in Indonesian Manufacturing”, Review of World Economics, 140, 2, 321-332.
Lipsey, Robert E., and Fredrik Sjöholm (2004b), “Foreign Direct Investment, Education, and Wages in Indonesian Manufacturing”, Journal of Development Economics, 73, 415-422.
Lipsey, Robert E. and Fredrik Sjöholm (2005), Host Country Impacts of Inward FDI: Why Such Different Answers?, in Blomström, M., Graham, E., and T. Moran (eds.) “The Impact of Foreign Direct Investment on Development: New Measurements, New Out-comes, New Policy Approaches”, Washington D.C: Institute for International Economics.
National Bureau of Statistics (2006), China Statistical Yearbook, Beijing: China Statistical Press.
Swenson, Deborah L. (2007), “Multinationals and the Creation of Chinese Trade Link-ages”, National Bureau of Economic Research Working Paper No. 13271.
UNCTAD (2007), The Least Developed Countries Report, Geneva: UNCTAD

24
Table 1. Firm characteristics by ownership
Firm characteristics
Domestic Non-private
Foreign Domestic Private
Other
1998 2004 1998 2004 1998 2004 1998 2004
Number of firms 85543 36268 23817 55248 9974 112856 10341 43379 Average employment per firm, headcount 352 281 304 309 150 127 497 320 Export as a share of sales (%) 7.9 7.0 45.9 48.3 13.1 13.4 9.6 9.4 Average annual wage per employee, 1000 Yuan 6.5 11.3 12.0 16.6 6.8 10.6 7.5 12.1 Value added per employee, 1000 Yuan 114.5 249.5 259.6 369.1 209.1 283.8 168.6 306,5 Fixed assets (capital ) per employee, 1000 Yuan 42.3 67.2 106.5 104.6 41.3 51.3 55.2 78.8 Note: The nominal values of fixed assets and value-added are deflated by producer price index (PPI) at the three-digit industry level and wage is deflated by an annual consumer price index (CPI).

25
Table 2. Employment and employment growth by ownership and sector
Firms existing both 1998 and 2001
Firms existing both 2001 and 2004
Ownership Number of firms
Employment1998
Employment2001
Growth 1998-2001
Numberof firms
Employment2001
Employment2004
Growth 2001-2004
Domestic non-private 31919 14762545 12658873 -14.3% 15987 7319868 6062059 -17.2% Foreign 13939 4739187 5237500 10.5% 18903 6529004 8118380 24.3% Domestic private 3963 631799 751690 19.0% 15064 2384847 2870745 20.4%
Total
Other 4130 2606045 2428156 -6.8% 8094 4392152 4463280 1.6% Domestic non-private 1737 1277583 1119767 -12.4% 737 480768 424221 -11.8% Foreign 1028 313019 336074 7.4% 1298 413289 463078 12.0% Domestic private 380 74581 85246 14.3% 1574 304234 356902 17.3% Textile
Other 300 342707 310397 -9.4% 543 550788 522171 -5.2% Domestic non-private 3737 1346829 1161815 -13.7% 1819 543249 459812 -15.4% Foreign 616 163115 179139 9.8% 762 204599 228771 11.8% Domestic private 328 70821 69975 -1.2% 1298 251423 270135 7.4%
Non-metallic metal
Other 457 269502 242837 -9.9% 806 391785 373013 -4.8% Domestic non-private 754 1490880 1306723 -12.4% 350 991916 825911 -16.7% Foreign 100 44066 45582 3.4% 98 38455 45807 19.1% Domestic private 103 19371 23179 19.7% 297 46884 71722 53.0% Ferrous metal
Other 94 125866 115351 -8.4% 146 276716 305914 10.6% Domestic non-private 1817 1641486 1411438 -14.0% 969 853789 633780 -25.8% Foreign 393 214113 209314 -2.2% 509 223419 276305 23.7% Domestic private 136 25348 32937 29.9% 523 100284 136222 35.8%
Transport equipment
Other 197 146664 119849 -18.3% 372 206784 232341 12.4% Domestic non-private 404 321963 259482 -19.4% 195 151497 130371 -13.9% Foreign 900 493094 599365 21.6% 1171 786394 1145731 45.7% Domestic private 57 14461 16091 11.3% 188 33237 43366 30.5%
Computer, tele-com equipment
Other 107 80712 78275 -3.0% 229 187571 200413 6.8%

26
Table 3. Determinants of employment growth OLS estimates Heckman two-step estimates (1) (2) (3) (4) (5) (6) (7) Dependent variable Emp. growth Emp. growth Emp. growth Emp. growth Survival Emp. growth Marginal effectsNon-private (dummy)
-0.033***(0.002)
-0.017***(0.002)
-0.016***(0.002)
-0.016***(0.002)
-0.094***(0.010)
-0.017***(0.002)
-0.018
Foreign (dummy)
0.037***(0.002)
-0.020***(0.002)
-0.035***(0.002)
-0.045***(0.002)
0.122***(0.012)
-0.044***(0.002)
-0.042
Private (dummy)
0.032***(0.002)
0.005** (0.002)
0.004** (0.002)
0.004** (0.002)
-0.115***(0.010)
0.003 (0.002)
0.001
Lagged firm size (employment)
- -0.061***(0.001)
-0.063***(0.002)
-0.063***(0.001)
- -0.062* (0.001)
-0.061
Lagged firm size (sales) - - - - 0.172***(0.002)
- -0.002
Lagged Export share
- - 0.062***(0.007)
0.049***(0.005)
0.166***(0.011)
0.051***(0.005)
0.053
Lagged labor productivity
- 0.059***(0.001)
0.059***(0.001)
0.059***(0.001)
- 0.061***(0.001)
0.060
Lagged Average wage
- 0.095***(0.001)
0.094***(0.001)
0.094***(0.001)
0.076***(0.004)
0.095***(0.001)
0.096
Lagged Capital intensity
- 0.024***(0.001)
0.025***(0.001)
0.025***(0.001)
-0.001 (0.002)
0.025***(0.0004)
0.025
Lagged export share X Domestic dummy
- - - -0.009 (0.006)
- -0.009 (0.006)
-0.009
Lagged export share X Foreign dummy
- - - 0.031***(0.006)
- 0.031***(0.006)
0.031
Lagged export share X private dummy
- - - 0.002 (0.006)
- 0.003 (0.006)
0.003
Year dummy Yes Yes Yes Yes Yes Yes - Industry dummy (four-digit) Yes Yes Yes Yes - Yes - Industry dummy (two-digit) Yes - - Regional dummy (two-digit) Yes Yes Yes Yes Yes Yes - No of Obs. 646195 640581 640579 640579 673652 640579 - R2 0.01 0.11 0.11 0.11 - - - Mills ratio
- - - - - -0.078***(0.014)
-
Note: Robust standard errors within brackets. * - significant at a 10 percent level; ** - significant at a five percent level; *** - significant at a one percent level.

27
Table 4. The effect of FDI on employment in private domestic firms
National level two-digit
Regional leveltwo-digit
National level four-digit
Regional levelfour-digit
Herfindahl (lagged)
-1.245** (0.589)
-0.554** (0.213)
0.049 (0.057)
-0.013 (0.030)
OLS
FDI intensity (lagged)
0.066** (0.024)
0.040 (0.050)
0.078*** (0.016)
0.057*** (0.013)
Fixed Effect
Herfindahl (lagged)
-0.619 (0.853)
-0.546* (0.286)
0.035 (0.058)
0.031 (0.035)
FDI intensity (lagged)
0.052* (0.031)
-0.024 (0.051)
0.046** (0.019)
0.008 (0.018)
Herfindahl (lagged)
-2.956** (1.495)
-0.619** (0.162)
0.134 (0.141)
-0.076* (0.041)
IV
FDI intensity (lagged)
0.336 (0.268)
0.265 (0.163)
0.859 (0.540)
-0.019 (0.181)
Herfindahl (lagged)
-1.092 (0.796)
-0.538** (0.172)
0.047 (0.058)
-0.014 (0.029)
Marginal effect
-1.063 -0.524 0.046 -0.013
FDI intensity (lagged)
0.066** (0.026)
0.043 (0.037)
0.078*** (0.017)
0.058*** (0.014)
Marginal effect
0.065 0.042 0.076 0.056
Heckman two-step
Mills ratio 0.604*** (0.066)
0.603*** (0.066)
0.605*** (0.066)
0.605*** (0.066)
Note: Robust standard errors within brackets. * - significant at a 10 percent level; ** -
significant at a five percent level; *** - significant at a one percent level.

28
Table 5. The effect of FDI on employment in non-private domestic firms
National level two-digit
Regional leveltwo-digit
National level four-digit
Regional levelfour-digit
Herfindahl (lagged)
0.633 (0.419)
-0.068 (0.072)
0.020 (0.037)
-0.039* (0.016)
OLS
FDI intensity (lagged)
0.000 (0.035)
0.009 (0.023)
-0.003 (0.15)
0.006 (0.010)
Fixed Effect
Herfindahl (lagged)
0.840 (0.616)
-0.139 (0.170)
0.042 (0.043)
0.015 (0.022)
FDI intensity (lagged)
-0.007 (0.026)
-0.063* (0.037)
0.009 (0.015)
0.007 (0.013)
Herfindahl (lagged)
1.190* (0.687)
-0.082 (0.077)
-0.045 (0.057)
-0.062** (0.025)
IV
FDI intensity (lagged)
-0.054 (0.130)
-0.211** (0.087)
-0.610** (0.281)
-0.191 (0.121)
Herfindahl (lagged)
0.643 (0.521)
-0.068 (0.075)
0.020 (0.037)
-0.030** (0.014)
FDI intensity (lagged)
0.001 (0.020)
0.011 (0.020)
-0.002 (0.012)
0.006 (0.008)
Heckman two-step
Mills ratio 0.077*** (0.019)
0.077*** (0.019)
0.077*** (0.019)
0.078**** (0.019)
Note: Robust standard errors within brackets. * - significant at a 10 percent level; ** -
significant at a five percent level; *** - significant at a one percent level.
29
APPENDIX
Appendix A1: Ownership classification
Ownership Code Definition Non-private 110 State-owned enterprises 120 Collective-owned enterprises 130 Shareholding cooperatives 141 Stated-owned, jointly operated enterprises 142 Collective-owned, jointly operated enterprises 151 Wholly stated-owned enterprises Private 171 Wholly private-owned enterprises 172 Private-cooperative enterprises 173 Private limited liability enterprises 174 Private shareholding enterprises Foreign 210 Overseas joint venture 220 Overseas cooperative 230 Wholly overseas owned enterprises 310 Foreign joint venture 320 Foreign cooperative 330 Wholly foreign-owned enterprises Other 143 State-collective jointly operated enterprises 149 Other jointly operated enterprises 159 Other limited liability enterprises 160 Shareholding limited enterprises 190 Other enterprises

30
Appendix A2: Construction of variables
Variable name Definition Firm level variables
Employment growth log (number of employees )t - log (number of employees )t-1
Firm size log (number of employees)
Labor productivity log ( real value-added/ number of employees)
Average wage log (real annual wage bill /number of employees)
Capital intensity log (real capital stock /number of employees)
Export share Export /total sales
Industry/regional-level variables FDI intensity The share of sales by FDI firms in total sales at the
four-digit or two –digit industry levels
Herfindahl index ∑=
N
i iS1
2 , where iS is the market share, in terms of
sales of the thi firm in industry j at the four-digit or two-digit level
R&D intensity R&D expenditure to sales ratio at the industry/regional level
Technology import intensity Technology import expenditure to sales ratio at the industry/regional level
Patent share The industry/region’s share of total patent applications
Government S&T funding The industry/region’s share of total government S&T funding
Foreign S&T funding The industry/regions share of total foreign S&T funding