the genetic basis of singing ability - minerva access
TRANSCRIPT

THE GENETIC BASIS OF
SINGING ABILITY:
A TWIN STUDY
Yi Ting Tan
(ORCID: 0000-0002-5797-6907)
Submitted in total fulfilment of the requirement of the degree of
Doctor of Philosophy
September, 2016
Melbourne Conservatorium of Music
THE UNIVERSITY OF MELBOURNE
Produced on Archival Quality Paper
i
Abstract
Music is a human universal, an integral part of all known human culture. While most
people possess the capacity for music perception and production, individual
differences in various forms of music abilities are evident in the general population.
The diversity in abilities has sparked intense debates regarding the relative
importance of nature and nurture in shaping music ability. While in recent years,
researchers have begun to explore the genetic basis of music perception abilities, the
interrogation of the genetic basis of music production abilities has been relatively
scarce. Singing is an ideal paradigm for investigating the genetic basis of music
ability; it is a universal, multifaceted music ability that is spontaneously emergent
and shaped by formal and informal music learning environments. The present study
therefore employed a twin study design to investigate the genetic basis of singing
ability and estimate the relative contribution of genetic and environmental factors
influencing singing ability using a comprehensive set of singing tasks and measures.
The study also aimed to identify environmental factors associated with singing
ability and examine whether these factors have a genetic component, and whether
shared genetic influences might explain the association between singing ability and
these factors. The twin study was conducted online using a purpose-built online
program Let’s Hear Twins Sing, which enabled twins to participate regardless of
their geographical location. The 30 minutes online twin study comprised three
singing tasks (vocal pitch-matching, singing a familiar song, and melody imitation),
two music perception tasks and a questionnaire on music and singing background.
The study took approximately 30 minutes to complete and the study data were
captured online in real-time and saved on a server for subsequent analyses. The final
sample consisted of 70 monozygotic (55 female; 15 male) and 38 dizygotic (24
female; 7 male; 7 male-female) twin pairs (mean age = 32.4 years), the majority were
recruited through the Australian Twin Registry. Univariate genetic modelling
revealed that both the objectively-assessed singing ability across all tasks and self-
rated singing ability had similarly significant and substantial genetic components (A
= 69-72%). Additive genetic influences also contributed significantly to the variation
observed in various singing task measures, with moderate to large heritabilities (A =
44-71%), negligible to moderate common environmental (C = 0-37%) and moderate
unique environmental (E = 19-40%) influences. Significant moderate to large genetic
components were also estimated for environmental variables associated with singing
ability: instrumental expertise (A = 68%), years of music training (A = 46%), and
public singing engagement (A = 66%). Bivariate genetic analyses revealed that the
associations between singing ability and both instrumental expertise and years of
music training were mediated significantly by shared additive genetic influences. The
novel findings therefore provided preliminary evidence for the role of genes in
influencing singing ability and formal music training, as well as a partially shared
genetic basis for singing ability and music training. The promising results establish a
valuable background that encourages further behavioural and molecular genetic
interrogations into the genetic bases of various types of music abilities.

ii
Declaration
This is to certify that
1. The thesis comprises only my original work toward the PhD, except where
indicated in the Preface.
2. Due acknowledgement has been made in the text to all other material used.
3. The thesis is less than 100,000 words in length, exclusive of tables, maps,
bibliographies and appendices.
_________________________
Yi Ting Tan, September 2016

iii
Preface
The content of Chapter 2 (The Genetic Basis of Music Ability) in this thesis was
adapted from the following multi-authored publication in which the candidate was
the first author.
Tan, Y. T., McPherson, G. E., Peretz, I., Berkovic, S. F., & Wilson, S. J.
(2014). The genetic basis of music ability. Frontiers in Psychology, 5.
The layout and the tasks of the online program, Let’s Hear Twins Sing, as outlined in
Chapter 5, were designed by the candidate, with advice from her supervisors and
Professor Isabelle Peretz. The program itself was entirely developed and
implemented in Adobe Flash by Mr. Mark Solly.
The study was primarily funded by an internal grant from the Melbourne
Neuroscience Institute. This PhD was also supported by the International
Postgraduate Research Scholarship (IPRS) and Australian Postgraduate Award
(APA) funded by the Australian Government, as well as John Hodgson Scholarship
and Faculty Small Grant awarded by the Melbourne Conservatorium of Music.

iv
Acknowledgements
First and foremost, I would like to thank all the twins who volunteered their time to
take part in the online twin study, especially those who helped to remind or persuade
their twin to participate, as well as those who helpfully introduced the study to other
potential participants — this study would not have been possible without their
interest and willingness to participate. I am also very thankful to the staff at the
Australian Twin Registry, especially Ms Jenny Boadle, Ms Janine Lam and Ms Shaie
O’ Brien, for their help and support throughout the entire recruitment phase.
I would also like to thank my supervisors, Professor Gary McPherson and Professor
Sarah Wilson for generously sharing their wealth of knowledge and research
experience with me throughout my candidature. The work in this thesis could not
have been achieved without their guidance, support and encouragement. A special
thanks also goes to Associate Professor Neil McLachlan, Professor Isabelle Peretz
and Professor Sam Berkovic, who had provided helpful insight and feedback on
methodological development and interpretation of the behavioural and genetic
findings, and Mr. Mark Solly for his help with implementing the online program.
I am also extremely grateful for the expert advice offered by Professor Yi Xu, Dr.
Robert Kirkpatrick, Professor Nick Martin, Associate Professor Hermine Maes, and
many other helpful researchers on the OpenMx Bevavioral Genetics Forum. I really
appreciate them taking the time to respond to my questions on sound analysis or
behavioural genetic analysis via email or the forum. Their patience and willingness
to help a newbie researcher whom they have never met before really inspire me to do
the same when the opportunity arises. I would also like to thank Dr. Sandy Clarke
from the statistical department, not only for her professional advice in statistics, but
also for her friendship and prayers these past few years.
A big thank-you also goes out to my dear friends and fellow colleagues, Solange
Glasser and Valerie Yap. I feel very blessed to have such faithful friends during this
long PhD journey, whose presence remind me that I am not alone in this battle, and
often lend a listening ear to me and encourage me to keep going. I would also like to
thank my dear parents, my family and friends who have constantly supported me
with their love, words of encouragement and prayers. An exceptionally big thank-
you to my dear sister Evelyn, for being one of the greatest blessings in my life —
taking such good care of me and offering her unconditional love and support while I
was swamped with my research. Finally, I would like to thank God, who has truly
been with me through all the ups and downs that I have encountered, sustaining me
physically, emotionally and spiritually. This PhD journey has led me into a deeper
experience of His faithfulness and grace. Without Him, I am nothing.
But He said to me, "My grace is sufficient for you, for my power is made
perfect in weakness." Therefore I will boast all the more gladly about my
weaknesses, so that Christ's power may rest on me. (2 Corinthians 12:9)

v
Table of Contents
THESIS OVERVIEW - 1 -
GENETIC BASIS OF MUSIC ABILITY - 9 -
2.1 The Nature of Music Ability ..................................................................... - 9 -
2.2 Behavioural Genetic Approaches ............................................................ - 11 -
2.2.1 Familial aggregation ......................................................................... - 11 -
2.2.2 Twin studies ...................................................................................... - 12 -
2.2.2.1 Structural equation modelling (SEM) ....................................... - 15 -
2.2.3 Segregation analysis ......................................................................... - 19 -
2.3 Molecular Genetic Approaches ............................................................... - 20 -
2.3.1 Linkage analysis ............................................................................... - 20 -
2.3.2 Association analysis ......................................................................... - 22 -
2.3.3 Exome sequencing ............................................................................ - 23 -
2.3.4 Copy number variation (CNV) analysis ........................................... - 24 -
2.4 Genetic Evidence for Music Ability and Music-Related Phenotypes ..... - 26 -
2.4.1 Music perception .............................................................................. - 26 -
2.4.1.1 Basic music perception abilities ................................................ - 33 -
2.4.1.2 Higher level music perception abilities ..................................... - 34 -
2.4.1.3 Music memory ........................................................................... - 39 -
2.4.1.4 Music listening .......................................................................... - 41 -
2.4.1.5 Congenital amusia ..................................................................... - 42 -
2.4.1.6 Absolute pitch ............................................................................ - 43 -
2.4.2 Music production .............................................................................. - 48 -
2.4.2.1 Music performance .................................................................... - 49 -
2.4.2.2 Music practice ........................................................................... - 50 -
2.4.2.3 Music flow ................................................................................. - 51 -
2.4.2.4 Music creativity ......................................................................... - 52 -
2.4.2.5 Singing participation ................................................................. - 55 -
2.4.2.6 Singing accuracy ....................................................................... - 56 -
2.4.2.7 Rhythm production .................................................................... - 57 -
2.4.3 Music accomplishments ................................................................... - 58 -
2.4.4 Music culture .................................................................................... - 60 -
2.5 Summary .................................................................................................. - 61 -
ENVIRONMENTAL DETERMINANTS OF MUSIC ABILITY - 65 -
3.1 Definition ................................................................................................. - 65 -
3.2 The Cultural Environment ....................................................................... - 65 -
3.3 The Home Environment .......................................................................... - 68 -
3.4 The Formal Music Learning Environment .............................................. - 71 -
3.4.1 The role of music teacher ................................................................. - 71 -
3.4.2 Music training and music practice .................................................... - 72 -
3.5 The Genetic and Environmental Determinants of Music Ability:
A Summary .............................................................................................. - 81 -

vi
THE NATURE OF SINGING ABILITY - 84 -
4.1 The Typical Developmental Trajectory for Singing ................................ - 84 -
4.2 A Neurocognitive Model of Singing ....................................................... - 86 -
4.2.1 The vocal sensorimotor loop ............................................................ - 86 -
4.3 Neural Correlates of Singing ................................................................... - 88 -
4.3.1 Pitch and melody perception and auditory feedback processing ...... - 88 -
4.3.2 Auditory-motor mapping .................................................................. - 89 -
4.3.2.1 An experience-dependent network for the auditory-motor
control of singing ....................................................................... - 89 -
4.3.3 Vocal motor control .......................................................................... - 90 -
4.3.4 Somatosensory feedback processing ................................................ - 91 -
4.3.5 Dual-stream model for singing ......................................................... - 91 -
4.4 The Evaluation of Singing Ability ........................................................... - 92 -
4.4.1 Tasks ................................................................................................. - 93 -
4.4.1.1 Imitative singing tasks ............................................................... - 93 -
4.4.1.2 Recollective singing tasks ......................................................... - 95 -
4.4.2 Measures ........................................................................................... - 96 -
4.4.2.1 Pitch segmentation and extraction methods .............................. - 97 -
4.4.2.2 Objective measures of pitch accuracy ....................................... - 99 -
4.5 Singing: An Ideal Model for Genetic Analysis ..................................... - 102 -
4.5.1 Singing is a multifaceted music ability........................................... - 102 -
4.5.2 Singing is a universal musical behaviour ....................................... - 104 -
4.5.3 Singing is shaped by both formal and informal music learning
environments .................................................................................. - 105 -
4.5.4 Singing ability has received minimal research attention ................ - 105 -
4.6 Aims and Hypotheses ............................................................................ - 108 -
METHODOLOGICAL DEVELOPMENT - 110 -
5.1 Rationale for an Online Twin Study ...................................................... - 110 -
5.2 Program Development ........................................................................... - 111 -
5.2.1 Program design ............................................................................... - 111 -
5.2.1.1 Lack of control over participant behaviour ............................. - 112 -
5.2.1.2 Lack of control over participant dropout ................................. - 117 -
5.2.1.3 Multiple participation or fraud ................................................ - 118 -
5.2.1.4 Potential ethical issues ............................................................. - 121 -
5.2.2 Technical considerations ................................................................ - 122 -
5.2.2.1 Software requirements ............................................................. - 122 -
5.2.2.2 Hardware requirement ............................................................. - 124 -
5.2.2.3 Online data collection and storage .......................................... - 125 -
5.3 Online Task Development ..................................................................... - 125 -
5.3.1 Singing tasks ................................................................................... - 126 -
5.3.1.1 Sing The Note Task ................................................................. - 126 -
5.3.1.2 Sing The Tune Task................................................................. - 127 -
5.3.1.3 Happy Birthday Singing Task ................................................. - 130 -
5.3.2 Music perception tasks ................................................................... - 133 -
5.3.2.1 Match The Note Task .............................................................. - 134 -
5.3.2.2 Happy Birthday Melody Perception Task ............................... - 134 -
5.3.3 “Twist your tongue!” Tongue Twister Task ................................... - 135 -
5.3.4 Questionnaire .................................................................................. - 137 -

vii
5.4 Piloting of Program ............................................................................... - 140 -
5.5 Troubleshooting of Program .................................................................. - 142 -
METHODS - 145 -
6.1 Participants ............................................................................................ - 145 -
6.1.1 Recruitment .................................................................................... - 146 -
6.1.1.1 Recruitment via the Australian Twin Registry (ATR) ............ - 146 -
6.1.1.2 Other recruitment approaches.................................................. - 149 -
6.1.2 Demographics ................................................................................. - 151 -
6.1.2.1 Zygosity information ............................................................... - 151 -
6.1.2.2 Language and music background profile ................................ - 152 -
6.2 Data Processing Procedure .................................................................... - 155 -
6.2.1 De-identification of participants ..................................................... - 155 -
6.2.2 Data processing for the singing tasks ............................................. - 156 -
6.2.2.1 Coarse demarcation of pitch segments .................................... - 157 -
6.2.2.2 Obtaining sampled f0 for the labelled pitch segments ............. - 162 -
6.2.2.3 Fine-grained pitch segmentation ............................................. - 164 -
6.2.2.4 Computing the median f0 ......................................................... - 171 -
6.2.3 Data processing for the tongue twister task .................................... - 172 -
6.2.4 Re-identification of participants ..................................................... - 172 -
6.2.5 Issues encountered during data processing ..................................... - 172 -
6.2.5.1 Octave error in Sing The Note and Sing The Tune Tasks ....... - 172 -
6.2.5.2 Failure to adhere to task instructions ....................................... - 173 -
6.2.5.3 Missing data due to human error or poor recording quality of
the sound data .......................................................................... - 173 -
6.2.5.4 Missing data due to technical issues ........................................ - 174 -
6.3 Performance Measures .......................................................................... - 174 -
6.3.1 Pitch deviation (PD) ....................................................................... - 175 -
6.3.2 Interval deviation (ID) .................................................................... - 176 -
6.3.3 Key deviation (KD) ........................................................................ - 179 -
6.3.4 Categorical measures ...................................................................... - 181 -
6.3.5 Measures for the tongue twister task .............................................. - 181 -
6.3.6 Summary of task measures ............................................................. - 182 -
6.4 Proposed Statistical Analyses ................................................................ - 183 -
6.4.1 Investigate the genetic basis of singing ability (Aim 1) ................. - 183 -
6.4.1.1 Descriptive statistics of singing task performance .................. - 183 -
6.4.1.2 Univariate genetic analyses ..................................................... - 183 -
6.4.2 Investigate the genetic bases of environmental components
associated with singing ability (Aim 2) .......................................... - 185 -
6.4.2.1 Identification of singing and music background components . - 185 -
6.4.2.2 Univariate genetic analyses ..................................................... - 186 -
6.4.2.3 Bivariate genetic analyses ....................................................... - 186 -
6.4.3 Secondary analyses ......................................................................... - 188 -
BEHAVIOURAL FINDINGS - 190 -
7.1 Task Performance .................................................................................. - 190 -
7.1.1 Music and singing tasks .................................................................. - 190 -
7.1.2 Tongue twister task ......................................................................... - 195 -

viii
7.2 Self-Reported Interests and Abilities in Music and Singing ................. - 196 -
7.3 Singing and Music Background Components ....................................... - 197 -
7.3.1 Singing and music background components .................................. - 201 -
7.4 Potential Confounding Variables Influencing Task Performance ......... - 204 -
7.4.1 Demographic variables: Sex, age, years of education .................... - 204 -
7.4.2 Absolute pitch ability ..................................................................... - 207 -
7.4.3 Self-reported abilities and interests in singing and music .............. - 207 -
7.4.4 Parents’ abilities and interests in singing and music ...................... - 210 -
7.4.5 Speech and language characteristics............................................... - 211 -
7.4.5.1 Median speaking fundamental frequency and speech range ... - 211 -
7.4.5.2 Language characteristics ......................................................... - 212 -
7.4.6 Potential confounds in self-ratings and background components .. - 214 -
7.5 Summary of Key Behavioural Findings ................................................ - 217 -
DISCUSSION OF BEHAVIOURAL FINDINGS - 220 -
8.1 Task Measures ....................................................................................... - 220 -
8.2 Self-Rated Abilities and Interests in Singing and Music ....................... - 229 -
8.3 Confounding Variables Influencing Task Performance ........................ - 230 -
8.4 Summary of Discussion ......................................................................... - 234 -
GENETIC FINDINGS - 237 -
9.1 The Genetic Basis of Singing Ability .................................................... - 237 -
9.1.1 Intraclass correlations ..................................................................... - 237 -
9.1.1.1 Task measures ......................................................................... - 237 -
9.1.1.2 Self-reported interests and abilities in singing and music ....... - 238 -
9.1.2 Preliminary testing of the equality of covariances, means and
variances ......................................................................................... - 239 -
9.1.2.1 Testing equality of covariances between sexes of the same
zygosity.................................................................................... - 239 -
9.1.2.2 Testing equality of means and variances or equality of
thresholds within twin pairs and across zygosities .................. - 241 -
9.1.3 Univariate genetic analyses ............................................................ - 242 -
9.1.3.1 Task measures ......................................................................... - 242 -
9.1.3.2 Self-reported interests and abilities in music and singing ....... - 244 -
9.2 The Genetic Bases of Environmental Components Associated with
Singing Ability ...................................................................................... - 245 -
9.2.1 Intraclass correlations of environmental components .................... - 245 -
9.2.2 Preliminary testing of the equality of covariances, means and
variances ......................................................................................... - 246 -
9.2.2.1 Testing equality of covariances across sexes within the same
zygosity.................................................................................... - 247 -
9.2.2.2 Testing equality of means and variances or equality of
thresholds within twin pairs and across zygosities .................. - 247 -
9.2.3 Univariate genetic analyses of environmental components ........... - 248 -
9.2.4 Bivariate genetic analyses of singing ability and environmental
components ..................................................................................... - 249 -
9.2.4.1 Instrumental Expertise and the objective task measures ......... - 250 -
9.2.4.2 Years of Music Training and the objective task measures ...... - 252 -

ix
9.2.4.3 Personal Singing and the singing measures............................. - 254 -
9.2.4.4 Family Singing and the singing measures ............................... - 256 -
9.2.4.5 Public Singing and the singing measures ................................ - 258 -
9.2.4.6 Music Listening and task measures ......................................... - 260 -
9.3 Summary of Key Genetic Findings ....................................................... - 262 -
9.3.1 Results pertaining to the genetic basis of singing ability ............... - 262 -
9.3.2 Results pertaining to the genetic bases of environmental
components associated with singing ability ................................... - 263 -
DISCUSSION OF GENETIC FINDINGS - 265 -
10.1 Investigating the Genetic Basis of Singing Ability ............................... - 265 -
10.1.1 Objectively-assessed singing ability across all tasks ...................... - 265 -
10.1.2 Sing The Note Task ........................................................................ - 266 -
10.1.3 Happy Birthday Singing Task ........................................................ - 267 -
10.1.4 Sing The Tune Task ........................................................................ - 269 -
10.1.5 Self-reported abilities and interests in singing and music .............. - 271 -
10.1.6 Match The Note Task ..................................................................... - 273 -
10.2 Investigating the Genetic Bases of Environmental Components
Associated with Singing Ability ............................................................ - 274 -
10.2.1 Components related to formal music training ................................ - 274 -
10.2.2 Singing-related components ........................................................... - 277 -
10.2.3 Music Listening .............................................................................. - 279 -
10.3 Summary of Discussion ......................................................................... - 280 -
CONCLUSION - 283 -
11.1 Summary of Thesis ................................................................................ - 283 -
11.2 Implications for Research ...................................................................... - 284 -
11.3 Implications for Music Education ......................................................... - 287 -
11.4 Study Limitations .................................................................................. - 289 -
11.5 Future Directions ................................................................................... - 290 -
11.6 Conclusion ............................................................................................. - 291 -
APPENDICES - 294 -
Appendix A Recruitment Information ................................................................. - 294 -
Appendix B Troubleshooting Instructions ........................................................... - 301 -
Appendix C Programming Codes ........................................................................ - 306 -
Appendix D Information from the Principal Components Analyses ................... - 375 -
Appendix E SEM Fit Statistics ............................................................................ - 378 -

x
List of Abbreviations
A ......................... Proportion of trait variance due to additive genetic effects
ACC ................... Anterior cingulate cortex
AIC ..................... Akaike’s Information Criterion
aINS ................... Anterior insula
AP ...................... Absolute pitch
ATR ................... Australian Twin Registry
AVP ................... Arginine vasopressin
Bpm .................... Beats per minute
C ......................... Proportion of trait variance due to common environmental effects
CNV ................... Copy number variation
CNVR ................ Copy number variable regions
dPFC .................. Dorsal prefrontal cortex
dPMC ................. Dorsal premotor cortex
DZ ...................... Dizygotic
DZF .................... Dizygotic female twins
DZM ................... Dizygotic male twins
DZO ................... Dizygotic opposite-sex twins
E ......................... Proportion of trait variance due to unique environmental effects
f0 ......................... Fundamental frequency
FTP ..................... File Transfer Protocol
GWAS ................ Genome-Wide Association Study
HDAC ................ Histone-Deacetylase
ICC ..................... Intraclass correlations
ID ....................... Mean absolute interval deviation
IFG ..................... Inferior frontal gyrus
IPS ...................... Intraparietal sulcus
KD ...................... Key deviation
KMT ................... Karma Music Test
LOD ................... Logarithm of odds score
LTD .................... Long-Term Depression

xi
M1 ...................... Primary motor cortex
MBEA ................ Montreal Battery of Evaluation of Amusia
Mdn .................... Median
MIDI .................. Musical Instrument Digital Interface
MZ ..................... Monozygotic
MZF ................... Monozygotic female twins
MZM .................. Monozygotic male twins
NGS ................... Next-Generation Sequencing
PAG ................... Periaqueductal grey
PCM ................... Pulse-code modulation
PD ...................... Mean absolute pitch deviation
PPL ..................... Posterior probability of linkage
PPLD .................. Posterior probability of linkage disequilibrium
PT ....................... Planum temporale
R2 ........................ Multiple correlation squared; measure of strength of association
rMZ ...................... Intraclass correlation of monozygotic twins
rDZ ...................... Intraclass correlation of dizygotic twins
SD ....................... Standard deviation
SEM ................... Structural equation modelling
Sib RR ................ Sibling relative risk
SINGCOMB ...... Combined singing score (averaged from all singing task measures)
SMDT ................ Swedish Musical Discrimination Test
SMA ................... Supplementary motor area
SNP .................... Single-nucleotide polymorphism
SP ....................... Seashore Pitch Test
SPT ..................... Cortex of the dorsal Sylvian fissure at the parieto-temporal junction
ST ....................... Seashore Time Test
STG .................... Superior temporal gyrus
STS ..................... Superior temporal sulcus
VBA ................... Visual Basic for Applications
VSL .................... Vocal sensorimotor loop
WAV .................. Waveform Audio File Format
xii
Gene nomenclature
ADCY8 ............... Adenylate Cyclase 8
ATP5J ................. ATP Synthase, H+ Transporting, Mitochondrial Fo Complex
Subunit F6
ATP5L ................ ATP Synthase, H+ Transporting, Mitochondrial Fo Complex
Subunit G
AVPR1A ............. Arginine Vasopressin Receptor 1A
CASP8 ................ Caspase 8
CCR4 .................. C-C Motif Chemokine Receptor 4
CDH7 ................. Cadherin 7, Type 2
CDH19 ............... Cadherin 19, Type 2
CHRNA9 ............ Cholinergic Receptor, Nicotinic, Alpha Polypeptide 9
CLN8 .................. Ceroid-lipofuscinosis, neuronal 8
COMT ................ Catechol-O-methyltransferase
DOPEY2 ............. Dopey Family Member 2
DUSP1 ............... Dual Specificity Protein Phosphatase 1
EPHA7 ............... Ephrin Type-A Receptor 7
FAM49B ............. Family with Sequence Similarity 49, Member B
FKBP8 ............... FK506 Binding Protein 8
FOS .................... FBJ Murine Osteosarcoma Viral Oncogene Homolog
FOXP1 ............... Forkhead Box P1
FOXP2 ............... Forkhead Box P1
GALM ................. Galactose Mutarotase (Aldose 1-Epimerase)
GATA2 ............... GATA Binding Protein 2
GPR98 ................ G Protein-Coupled Receptor 98
GRIN2B .............. Glutamate Receptor, Ionotropic, N-Methyl D-Aspartate 2B
GSG1L ............... Germ Cell-Specific Gene 1-Like
GZMA ................. Granzyme A
HDAC4 ............... Histone Deacetylase 4
HDC ................... Histone Deacetylase Complex
IL1A ................... Interleukin 1, Alpha
IL1B ................... Interleukin 1, Beta;
KCTD8 ............... Potassium Channel Tetramerization Domain Containing 8
KLF4 .................. Kruppel-Like Factor 4

xiii
LOXHD1 ............ Lipoxygenase Homology Domains 1
NDFIP1 .............. Nedd4 Family Interacting Protein 1
NPTN ................. Neuroplastin
NRGN ................. Neurogranin
PCDH7 ............... Protocadherin 7
Pcdha 1-9 ........... Protocadherin Alpha 1 to 9
PDGFRA ............ Platelet-Derived Growth Factor Receptor, Alpha Polypeptide
PHOX2B ............ Paired-Like Homeobox 2b
RAPGEF5 .......... Rap Guanine Nucleotide Exchange Factor (GEF) 5
RGS9 .................. Regulator of G-Protein Signaling 9
ROBO1 ............... Roundabout Guidance Receptor 1
SLC6A4 .............. Solute Carrier Family 6 (Neurotransmitter Transporter, Serotonin),
Member 4
SNCA .................. Synuclein, Alpha
TPH1 .................. Tryptophan Hydroxylase 1
TRPA1 ................ Transient Receptor Potential Cation Channel, Subfamily A,
Member 1
UGT8 ................. Uridine Diphosphate Glycosyltransferase 8
UNC5C ............... UNC-5 Homolog C (C. elegans)
USH2A ............... Usher Syndrome 2A
VLDLR ............... Very Low Density Lipoprotein Receptor
ZDHHC11 .......... Zinc Finger, DHHC-Type Containing 11

xiv
List of Tables
Table 2.1. The Number of Genetic Studies Investigating Various Music Traits . - 27 -
Table 2.2. Summary of Behavioural Genetic Studies Investigating Various
Music Traits ........................................................................................ - 28 -
Table 2.3. Summary of Molecular Genetic Studies Investigating Various Music
Traits ................................................................................................... - 31 -
Table 5.1. Breakdown of the Components in Let’s Hear Twins Sing! .............. - 112 -
Table 5.2. A Breakdown of the Incidence of the Different Types of Intervals in
Sing The Tune Task .......................................................................... - 129 -
Table 5.3. Timeline of Methodological and Program Development ................. - 141 -
Table 5.4. Timeline of Program Troubleshooting .............................................. - 143 -
Table 6.1. Demographic Characteristics of the Final Sample ............................ - 146 -
Table 6.2. Recruitment Summary of Twins Approached by the Australian Twin
Registry (ATR) ................................................................................. - 147 -
Table 6.3. Breakdown of Final Sample According to Zygosity Type ............... - 151 -
Table 6.4. Breakdown of Zygosity Determination of the Final Sample ............ - 152 -
Table 6.5. Language and Music Background Profile of the Final Sample ........ - 153 -
Table 6.6. Measures Used to Assess Performance in the Music, Singing and
Tongue-Twister Tasks ...................................................................... - 182 -
Table 7.1. Group Performance in the Objective Singing and Music Tasks
(Untransformed) ................................................................................ - 191 -
Table 7.2. Group Performance of the Sample in the Objective Singing and Music
Tasks (Transformed) ......................................................................... - 192 -
Table 7.3. Bivariate Correlations of the Objective Task Measures ................... - 193 -
Table 7.4. Singing Accuracy Distribution of the Participants by the Three
Categories ......................................................................................... - 194 -
Table 7.5. Speech Range and Median Speaking Fundamental Frequency of the
Tongue Twister Task ........................................................................ - 195 -
Table 7.6. Descriptive Statistics of Self-Reported Music and Singing Interests
and Abilities ...................................................................................... - 196 -
Table 7.7. Extracted Components from the Principal Components Analyses ... - 199 -
Table 7.8. Descriptive Statistics of the Composite Scores of the Components
Derived from the Questionnaire ....................................................... - 200 -
Table 7.9. Bivariate Correlations of the Composite Scores of the Components - 200 -
Table 7.10. Correlations between the Background Components and the Task
Measures .......................................................................................... - 201 -
Table 7.11. Summary of Simple Regression Analysis for Personal Singing
Predicting Task Measures ................................................................ - 201 -
Table 7.12. Summary of Simple Regression Analysis for Family Singing
Predicting Task Measures ................................................................ - 202 -
Table 7.13. Summary of Simple Regression Analysis for Public Singing
Predicting Task Measures ................................................................ - 202 -
Table 7.14. Summary of Simple Regression Analysis for Music Listening
Predicting Task Measures ................................................................ - 202 -
Table 7.15. Summary of Simple Regression Analysis for Instrumental Expertise
Predicting Task Measures ................................................................ - 203 -

xv
Table 7.16. Summary of Simple Regression Analysis for Years of Music
Training Predicting Task Measures ................................................. - 204 -
Table 7.17. Results of t-tests and Descriptive Statistics for Task Performances
by Males and Females ...................................................................... - 205 -
Table 7.18. Summary of Simple Regression Analysis for Age Predicting Task
Peformance ...................................................................................... - 206 -
Table 7.19. Summary of Simple Regression Analysis for Years of Education
Predicting Task Performance ........................................................... - 206 -
Table 7.20. Results of t-tests and Descriptive Statistics for Task Performances
by AP/Non-AP Possessors ............................................................... - 208 -
Table 7.21. Summary of Simple Regression Analysis for Self-Rated Singing
Ability Predicting Task Measures.................................................... - 209 -
Table 7.22. Summary of Simple Regression Analysis for Self-Rated Music
Ability Predicting Task Measures.................................................... - 209 -
Table 7.23. Summary of Simple Regression Analysis for Self-Rated Singing
Interest Predicting Task Measures ................................................... - 209 -
Table 7.24. Summary of Simple Regression Analysis for Self-Rated Music
Interest Predicting Task Measures ................................................... - 210 -
Table 7.25. Summary of Simple Regression Analysis for Parents’ Interests and
Abilities in Singing and Music Predicting SINGCOMB ................. - 211 -
Table 7.26. Summary of Simple Regression Analysis for Median Speaking
Fundamental Frequency Predicting Singing Task Measures of
Males ................................................................................................ - 211 -
Table 7.27. Summary of Simple Regression Analysis for Median Speaking
Fundamental Frequency Predicting Singing Task Measures of
Females ............................................................................................ - 212 -
Table 7.28. Summary of Simple Regression Analysis for Unpaced Speech Range
Predicting Singing Task Measures .................................................. - 212 -
Table 7.29. Results of t-tests and Descriptive Statistics for Task Performances
by Tonal/Non-Tonal Language Speakers ........................................ - 213 -
Table 7.30. Results of t-tests and Descriptive Statistics for Task Performances
by Monolingual/ Bilingual Participants ........................................... - 213 -
Table 7.31. Results of t-tests and Descriptive Statistics for the Questionnaire
Responses of Males and Females .................................................... - 215 -
Table 7.32. Summary of Simple Regression Analysis for Years of Education
Predicting Questionnaire Responses ................................................ - 216 -
Table 7.33. Summary of Simple Regression Analysis for Age Predicting
Questionnaire Responses ................................................................. - 216 -
Table 8.1. Comparison of Task Performance by Musician and Non-Musicians
in Previous Studies and Current Study ............................................ - 229 -
Table 9.1. Intraclass Correlations of the MZ and DZ Groups for the Objective
Tasks ................................................................................................ - 238 -
Table 9.2. Intraclass Correlations of MZ and DZ Groups for Self-Ratings of
Abilities and Interests (N = 99) ........................................................ - 238 -
Table 9.3. Likelihood Ratio Chi-Square Values (∆χ2) for Tests of Equality of
Covariances ...................................................................................... - 240 -
Table 9.4. Likelihood Ratio Chi-Square Values (∆χ2) for Tests of Equality of
Means and Variances for Continuous Variables .............................. - 241 -
Table 9.5. Likelihood Ratio Chi-Square Values (∆χ2) for Tests of Equality of
Thresholds for Ordinal Variables .................................................... - 241 -

xvi
Table 9.6. Results of Univariate Genetic Modelling Showing Genetic (A),
Common Environmental (C), and Unique Environmental (E)
Influences on Continuous and Categorical Measures of Singing and
Music Tasks ..................................................................................... - 243 -
Table 9.7. Results of Univariate Genetic Modelling Showing Genetic (A),
Common Environmental (C), and Unique Environmental (E)
Influences on Self-Rated Abilities and Interests in Music and
Singing (N = 99) .............................................................................. - 244 -
Table 9.8. Intraclass Correlations of MZ and DZ Groups for Singing and Music
Background Components ................................................................. - 246 -
Table 9.9. Likelihood Ratio Chi-Square Values (∆χ2) for Tests Concerning
Equality of Covariances of the Environmental Components ........... - 247 -
Table 9.10. Likelihood Ratio Chi-Square Values (∆χ2) for Tests Concerning Equality
of Means and Variances of the Environmental Components ........... - 248 -
Table 9.11. Results of Univariate Genetic Modelling Showing Additive Genetic
(A), Common Environmental (C), and Unique Environmental (E)
Influences on Music and Singing Background Components ........... - 248 -
Table 9.12. Proportions of the Phenotypic Correlations between Instrumental
Expertise and the Objective Task Measures due to A, C and E ....... - 250 -
Table 9.13. Bivariate Model-Fitting Results for the Associations between
Instrumental Expertise and the Objective Task Measures ............... - 251 -
Table 9.14. Proportions of Phenotypic Correlations between Years of Music
Training and the Objective Task Measures due to A, C and E ........ - 252 -
Table 9.15. Bivariate Model-Fitting Results for the Associations between Years
of Music Training and the Objective Task Measures ...................... - 253 -
Table 9.16. Proportions of the Phenotypic Correlations between Personal Singing
and the Singing Measures due to A, C and E ................................... - 254 -
Table 9.17. Bivariate Model-Fitting Results for the Associations between
Personal Singing and the Singing Measures .................................... - 255 -
Table 9.18. Proportions of the Phenotypic Correlations between Family Singing
and the Singing Measures due to A, C and E ................................... - 256 -
Table 9.19. Bivariate Model-Fitting Results for the Associations between
Family Singing and the Singing Measures ...................................... - 257 -
Table 9.20. Portions of the Phenotypic Correlations between Public Singing and
the Singing Measures due to A, C and E .......................................... - 258 -
Table 9.21. Bivariate Model-Fitting Results for the Associations between Public
Singing and the Singing Measures................................................... - 259 -
Table 9.22. Portions of the Phenotypic Correlations between Music Listening and
the Singing Measures due to A, C and E .......................................... - 260 -
Table 9.23. Bivariate Model-Fitting Results for the Associations between Music
Listening and the Singing Measures ................................................ - 261 -
Table D-1. Factor Loadings for the First Principal Components Analysis Using
Direct Oblimin Rotation .................................................................. - 376 -
Table D-2. Factor Loadings for the Second Principal Components Analysis Using
Direct Oblimin Rotation .................................................................. - 377 -
Table E-1. Univariate Model-Fitting Results Testing Equality of Covariances for
Continuous Task Measures .............................................................. - 379 -
Table E-2. Univariate Model-Fitting Results Testing Equality of Means and
Variances for Continuous Task Measures ....................................... - 380 -

xvii
Table E-3. Univariate Model-Fitting Results Testing Equality of Covariances for
Categorical Singing Measures ........................................................ - 381 -
Table E-4. Univariate Model-Fitting Results Testing Equality of Means and
Variances for Categorical Singing Measures .................................. - 382 -
Table E-5. Univariate Model-Fitting Results Testing Equality of Covariances
for Self-Rated Interests and Abilities in Singing and Music .......... - 383 -
Table E-6. Univariate Model-Fitting Results Testing Equality of Means and
Variances for Self-Rated Interests and Abilities in Singing and
Music .............................................................................................. - 384 -
Table E-7. Univariate Model-Fitting Results Testing Equality of Covariances
for Singing and Music Background Components ........................... - 385 -
Table E-8. Univariate Model-Fitting Results Testing Equality of Means and
Variances for Singing and Music Background Components .......... - 386 -
Table E-9. Univariate Model-Fitting Results for Continuous Task Measures . - 387 -
Table E-10. Univariate Model-Fitting Results for Categorical Singing Task
Measures ......................................................................................... - 388 -
Table E-11. Univariate Model-Fitting Results for Self-rated Abilities and
Interests ........................................................................................... - 389 -
Table E-12. Univariate Model-Fitting Results for Singing and Music Background
Components .................................................................................... - 390 -
Table E-13. Results of Univariate Genetic Modelling Showing Genetic (A),
Common Environmental (C), and Unique Environmental (E)
Influences on Continuous Measures (Adjusted for Age, Sex and
Years of Music Training) ............................................................... - 391 -
Table E-14. Bivariate Model-Fitting Results Testing Equality of Means and
Variances Within Twin Pairs and Across Zygosities for Instrumental
Expertise and the Objective Task Measures ................................... - 392 -
Table E-15. Bivariate Model-Fitting Results Testing Equality of Means and
Variances Within Twin Pairs and Across Zygosities for Years of
Music Training and the Objective Task Measures ......................... - 393 -
Table E-16. Bivariate Model-Fitting Results Testing Equality of Means and
Variances Within Twin Pairs and Across Zygosities for Personal
Singing and the Singing Measures ................................................. - 394 -
Table E-17. Bivariate Model-Fitting Results Testing Equality of Means and
Variances Within Twin Pairs and Across Zygosities for Family
Singing and the Singing Measures ................................................. - 395 -
Table E-18. Bivariate Model-Fitting Results Testing Equality of Means and
Variances Within Twin Pairs and Across Zygosities for Public
Singing and the Singing Measures ................................................. - 396 -
Table E-19. Bivariate Model-Fitting Results Testing Equality of Means and
Variances Within Twin Pairs and Across Zygosities for Music
Listening and the Singing Measures ............................................... - 397 -

xviii
List of Figures
Figure 2.1. Music ability and its constituent perception and production subskills.
.......................................................................................................... - 11 -
Figure 2.2. Classic ACE model ........................................................................... - 13 -
Figure 2.3. The bivariate Cholesky model .......................................................... - 18 -
Figure 2.4. A schematic representation of the genetic determinants influencing
music ability and music-related traits. .............................................. - 63 -
Figure 3.1. A schematic representation of the environmental determinants of
music ability ..................................................................................... - 83 -
Figure 4.1. The schema of the vocal sensorimotor loop (VSL) .......................... - 88 -
Figure 4.2. The vocal sensorimotor loop updated with new findings ................. - 92 -
Figure 4.3. Singing ability and its constituent perception and production
subskills. ......................................................................................... - 103 -
Figure 5.1. Set-up page of Let’s Hear Twins Sing! .......................................... - 113 -
Figure 5.2. Sound volume calibration page of Let’s Hear Twins Sing! ........... - 114 -
Figure 5.3. Microphone detection page of Let’s Hear Twins Sing! ................. - 114 -
Figure 5.4. Basic layout of the online tasks in Let’s Hear Twins Sing! ........... - 115 -
Figure 5.5. Screenshot from the questionnaire. ................................................ - 116 -
Figure 5.6. Demographic information page of the online program .................. - 119 -
Figure 5.7. Additional identifiable information required from non-ATR
participants ..................................................................................... - 120 -
Figure 5.8. Welcome page of the online program. ........................................... - 121 -
Figure 5.9. Browser and Adobe Flash Player version detection implemented at
the beginning of the program.......................................................... - 123 -
Figure 5.10. Screenshot from Sing The Note Task ............................................. - 127 -
Figure 5.11. The five tonal patterns that were used in the melody imitation task
for female participants .................................................................... - 128 -
Figure 5.12. Screenshot from Sing The Tune Task ............................................ - 130 -
Figure 5.13. Screenshot from Happy Birthday Singing Task (first condition). .. - 132 -
Figure 5.14. Screenshot from Happy Birthday Singing Task (third condition). . - 132 -
Figure 5.15. Screenshot from Match The Note Task. ......................................... - 135 -
Figure 5.16. Happy Birthday in C major, with one note altered. ........................ - 135 -
Figure 5.17. Happy Birthday in A major, with one note altered. ....................... - 135 -
Figure 5.18. Screenshot from the tongue-twister task. ....................................... - 136 -
Figure 5.19. Questions about childhood engagement in singing and musical
activities. ......................................................................................... - 138 -
Figure 5.20. Questions about the frequency of singing across a range of
settings ............................................................................................ - 138 -
Figure 5.21. Assessment of music ability of self, twin and parents on a 7-point
Likert type scale.............................................................................. - 139 -
Figure 6.1. Startup window of ProsodyPro (version 6.0 beta). ......................... - 157 -
Figure 6.2. TextGrid window in the Praat environment. The sound waveform is
displayed in the top panel, followed by the spectrogram with the
frequency curve in the middle panel, and the annotation tiers are
displayed in the bottom panel. ........................................................ - 158 -
Figure 6.3. Labelling the coarse pitch segments in the first tier of the annotation

xix
panel of the TextGrid window. ....................................................... - 159 -
Figure 6.4. Labelling of pitch segments from song files containing more than
one phrase. ...................................................................................... - 159 -
Figure 6.5. Use of the Pause Window of ProsodyPro (version 6.0 beta) to
proceed to the next sound file in the destination folder. ................. - 160 -
Figure 6.6. Fundamental frequency (f0) contour of a participant’s trial from
Sing The Tune Task (5th novel melody). ....................................... - 161 -
Figure 6.7. Fundamental frequency (f0) contour of a participant’s trial from
Sing The Tune Task when an inappropriate pitch range was selected,
causing octave errors in the display. ............................................... - 161 -
Figure 6.8. Startup window of the Praat script to estimate the fundamental
frequency at the sampled time intervals. ........................................ - 163 -
Figure 6.9. Fundamental frequency and absolute f0 velocity profiles of a trial
from Sing The Tune Task (1st novel melody) ................................ - 165 -
Figure 6.10. An illustration of the two fuzzy sets of absolute velocity regions
(low and high) ................................................................................. - 167 -
Figure 6.11. Fundamental frequency and absolute f0 velocity profiles of a trial
from Sing The Tune Task (1st novel melody ................................. - 168 -
Figure 6.12. Fundamental frequency and absolute f0 velocity profiles of a trial
from Sing The Tune Task (1st novel melody) ................................ - 170 -
Figure 6.13. Happy Birthday presented in F major ........................................... - 176 -
Figure 6.14. Happy Birthday with a transposition error in Bar 5 ....................... - 178 -
Figure 6.15. The first melody is Happy Birthday performed by a participant with
a transposition error in Bar 5 .......................................................... - 179 -
Figure 6.16. The four notes considered for the computation of the key deviation
(KD) measure in Happy Birthday Singing Task ............................ - 179 -
Figure 6.17. The transposed Happy Birthday example from Figure 6.14. ......... - 180 -
Figure 6.18. The full bivariate Cholesky model ................................................. - 187 -
Figure 8.1. Illustration of how interval deviation (ID) might incur a greater penalty
than pitch deviation (PD) on singing inaccuracies ......................... - 226 -
Figure D-1. Scree plot of the first principal components analysis using direct
oblimin rotation. ............................................................................. - 375 -

- 1 -
THESIS OVERVIEW
Music is widely regarded as a human universal (Blacking, 1995; Brown, 1991) and a
fundamental component of the human design (Welch & Adams, 2003). Music’s
ubiquity across all cultures, its importance in social and religious practices, its evocative
power in eliciting and communicating a myriad of emotions, the sheer pleasure one
experiences from music-making and music listening… all of these properties suggest
that music is a realm worthy of careful exploration, so as to understand this special
attribute which makes us uniquely human.
While not everyone is able to play a musical instrument, all humans possess an
endogenous musical instrument: our vocal apparatus. Humans are therefore equipped
with the necessary physical capacity to make music vocally. In addition, the ability to
sing appears to emerge spontaneously without requiring formal musical training. From
approximately two months onwards, infant babbling already contains definite musical
features such as pitch and rhythmic patterns (Tafuri & Villa, 2002), and by age two, a
clear distinction between speaking and singing behaviour emerges as infants begin to
sing short phrases of melodies (Dowling, 1984; Gembris, 2006). Some researchers have
also observed that in the majority of the general population, good pitch-matching skill
appears to develop naturally with age without the need for formal instruction (Bentley,
1969).
Despite its early emergence, singing ability, whether self-reported or objectively
measured, seems to vary across the general population (Amir, Amir, & Kishon-Rabin,
2003; Pfordresher & Brown, 2007). A sizeable portion of the population believe that
they are not able to sing in tune. In a sample of 1,105 university students, 59% reported
that they could not accurately imitate melodies (Pfordresher & Brown, 2007). In another
sample of 2,000 university students, approximately 17% of the students believed that
they were “tone deaf” (Cuddy, Balkwill, Peretz, & Holden, 2005). While tone deafness
(scientifically known as congenital amusia) in reality refers to a pitch perception deficit

- 2 -
(Peretz, Champod, & Hyde, 2003), the general public tend to associate tone deafness
with a low level of singing ability, as revealed by a factor analysis in the same study.
Even though difficulty in pitch discrimination would understandably affect singing
accuracy, the actual prevalence of congenital amusia is low, and estimated to be less
than 4% (Henry & McAuley, 2010; Kalmus & Fry, 1980; Pfeifer & Hamann, 2015).
The stark difference in the proportions of people who self-report as inaccurate singers
and people who are classified as congenital amusics suggest two possibilities. One
possibility is that the general population may be unduly harsh on their singing ability. A
study conducted by Dalla Bella, Giguère, and Peretz (2007) supported this, as the
majority of the participants (N = 62) drawn from the general population were able to
sing a familiar melody with reasonable accuracy, making few pitch interval errors that
exceeded one semitone. Their pitch accuracy further improved when they sang at a
slower tempo. The findings were replicated in a follow-up study comprising 39
participants with no formal music training (Dalla Bella & Berkowska, 2009). In another
study, 87% of the participants were able to imitate novel 4-note melodies accurately,
within one semitone from the pitch targets (Pfordresher & Brown, 2007). Another
possibility is that out-of-tune singing may occur independently from a pitch perception
deficit. Several studies have confirmed this. Pfordresher and Brown (2007) reported that
10 to 15% of the participants made pitch errors exceeding one semitone from the targets
when imitating novel melodies, despite possessing comparable pitch discrimination
ability as that of accurate singers. Dalla Bella et al. (2007) also described two
participants who were markedly out-of-tune when singing a familiar melody, and yet
performed above average for the pitch perception task. Hutchins and Peretz (2012)
demonstrated that both musically trained and musically untrained groups of participants
were more accurate pitch-matching manually using a slider than matching the same
target pitches vocally. Their overall findings also suggested there are possibly multiple
causes underlying inaccurate singing, an opinion already espoused by Dalla Bella and
Berkowska (2009), whose study findings showed a diversity of poor singing
“phenotypes”.
The variability in singing ability in the general population as well as the diverse patterns
of inaccurate singing lead us to ask: What could have caused such variability in

- 3 -
singing? Are some people naturally good singers, or do environmental factors have an
overriding influence on singing ability?
There is evidence that gives credence to both positions. Anecdotally, singing ability
appears to cluster in families (e.g., the Jackson 5, the Bee Gees and the Osmonds).
Findings from a behavioural study also suggested there may be an inborn aspect to
singing accuracy. Watts, Murphy, and Barnes-Burroughs (2003) identified individuals
who had no formal vocal training and yet consistently performed better on pitch-
matching tasks, even when compared with trained singers who had at least three years
of professional vocal training. A large study involving 1,008 participants from 73
extended Mongolian families also yields evidence that pitch accuracy in singing may be
heritable in this population (estimated heritability of 40%) and possibly associated with
a linkage region on chromosome 4q (Park et al., 2012).
On the other hand, the influence of cultural environment on singing abilities is
particularly evident in some non-Western cultures. Compared with children from
Western culture, Zimbabwean children display precocious singing ability (Koops, 2011;
Kreutzer, 2001). Likewise, Gambian and Venda children are also “expected to be
musical” because in their musically-rich cultural environment, there are frequent
opportunities for music participation (Koops, 2011; Radocy & Boyle, 2012). While the
ability to harmonise is considered a specialised singing skill in Western societies, part-
singing is an indispensable element in the Fijian singing culture, whereas singing in
unison and solo singing are not commonly practised (Russell, 1997). In Western culture,
however, various social and cultural influences may have created an environment where
singing participation is no longer commonplace (Whidden, 2010). This may be why a
considerable portion of the Western population possess such low self-perceptions of
their own singing proficiency (Cuddy et al., 2005; Pfordresher & Brown, 2007). These
findings suggest that the development of singing expertise can be influenced by one's
exposure to culture-specific musical expectations, activities and forms.
The nature-nurture question is not foreign to the domain of music. In fact, it has been
the subject of much debate for over a century. Initially people might have believed more
readily in the existence of inborn predisposition to the development of music expertise,
based on anecdotal accounts as well as case studies of musical child prodigies and

- 4 -
families (Galton, 1876). Advances in the field of behavioural science, however, with its
increased emphasis on carefully designed scientific studies, have brought about
significant change which sees the importance of environmental factors being
increasingly lauded by educationists and psychologists in the development of musical
expertise. Propositions of the existence of natural endowment have been relegated by
some to the realms of “folk psychology” (Sloboda, 2005), as if such a standpoint is
unlikely to be substantiated by rigorous scientific research. Some have even gone as far
as suggesting that innate talent is a “myth” (Howe, Davidson, & Sloboda, 1998), and
expert performance in music can be chiefly explained by deliberate practice over an
extended period (Ericsson, Krampe, & Tesch-Römer, 1993). Despite this, there remain
staunch proponents of the existence of predisposed inter-individual variability in music
abilities (Gagné, 2004; Lykken, 1998; Simonton, 2005; Winner, 2000), as well as many
others who at least deem it premature to discredit the nature account totally without
judicious scientific inquiry. Examples include the commentaries by numerous noted
researchers (Plomin, 1998; Rowe, 1998; Rutter, 1998; Sternberg, 1998; Vitouch, 1998),
in response to the contentious review by Howe et al. (1998).
Indeed, in the most comprehensive meta-analysis on the heritability of human traits to
date, based on twin studies over the past 50 years, there was compelling evidence that
all human traits are heritable, with an estimated average heritability of 49% across all
traits (Polderman et al., 2015). Therefore, instead of imposing a false dichotomy
between nature and nurture, a more pertinent question to ask is: What are the relative
contributions of nature and nurture to singing ability, or music ability in general?
Although numerous environmental factors influencing music and singing ability have
been identified (Aherne, 2011; Atterbury & Silcox, 1993; Brand, 1986; Persellin, 2006),
most of these studies have only examined these environmental components in and of
themselves, without considering how genes may influence or interact with them
(Sternberg, 1998; Vinkhuyzen, Van Der Sluis, De Geus, Boomsma, & Posthuma, 2010).
A few studies published recently have spearheaded a paradigm shift to reconcile the
roles of genes and environment in the development of music ability, and in particular,
examining environmental factors in light of potential genetic influences. A meta-
analysis revealed that although deliberate practice is positively correlated with expert
performance in various domains, it could only account for 21% of the variance in music

- 5 -
performance, which implies that a large percentage of individual differences in music
ability remain unexplained (Macnamara, Hambrick, & Oswald, 2014). Moreover, a
genetic basis for music practice has been reported by two different twin studies, with
estimated heritabilities ranging from 38% to 69% (Hambrick & Tucker-Drob, 2014;
Mosing, Madison, Pedersen, Kuja-Halkola, & Ullén, 2014). Both studies also revealed
that the correlation between music practice and music ability is partially mediated by
shared genetic influences. In addition, Hambrick and Tucker-Drob (2014) observed
gene-environment interactions whereby a genetic contribution to music accomplishment
was larger for participants who engaged in music practice (heritability = 43%) as
compared to those who reported no music practice (heritability = 1%). It is therefore
warranted that more studies should continue in this direction and explore the
relationship between environmental factors and music ability using genetically sensitive
experimental designs.
A survey of the handful of genetic studies on music ability reveals that a majority have
placed undue emphasis on tests of music perception such as pitch and rhythm
discrimination to operationalise music ability (Tan, McPherson, Peretz, Berkovic, &
Wilson, 2014). Music production abilities however, are equally important in defining
musicality (McPherson & Hallam, 2008). Singing ability, in particular, is worthy of
greater attention. Of all the music production abilities, the ability to sing is distinct from
the others because it appears to be a natural human disposition. Its early and
spontaneous emergence, ubiquitous existence in human societies and functional
importance in the social context allow the investigation of singing ability to provide
fruitful insights into the origins of music behaviour (Peretz, 2009). So far, there has only
been one familial molecular genetics study on singing ability as measured by a vocal
pitch-matching task (Park et al., 2012). Given the multi-faceted nature of singing
ability, a simple pitch-matching task is unlikely to fully capture singing ability in all its
complexity, nor enable the identification of aspects of singing ability that are more
heritable compared to those that are more influenced by environmental factors such as
music training. Furthermore, there have not been any behavioural genetics studies that
formally assess singing ability through objective measures. In previous twin studies,
singing ability only featured as a subcomponent of musical ability and the competence
levels were based on self-report questionnaires. The reliability of these findings may
thus be disputable (Coon & Carey, 1989; Vinkhuyzen, Van Der Sluis, Posthuma, &

- 6 -
Boomsma, 2009). Consequently, there is an apparent gap in the literature for studies
that examine singing ability objectively while taking both genetic and environmental
influences into account.
Given that singing entails manifold nested subskills, as well as its status as the most
universal means of music making, it provides a valuable model for investigating the
genetic basis of music abilities. Such genetic interrogation can help advance knowledge
about the level at which genetic factors and gene-environment interplay shape complex
human behaviours. From a music education perspective, understanding the extent to
which individual differences in singing and music abilities are explained by genetic
influences will provide compelling grounds for the development of more individually
tailored educational and community-based music learning programs, which are better
suited to a person’s background, skills and abilities. This can potentially help foster
positive experiences with singing and music, thereby motivating individuals to maintain
active engagement in these activities across the lifespan and enjoy the numerous
physical, cognitive, emotional and social benefits music and singing afford.
In view of the research gaps identified above, as well as the appropriateness of singing
ability as a model to interrogate the genetic basis of music ability, this thesis aimed to
investigate the relative contributions of genetic and environmental components
underpinning singing ability using a classical twin design. It was the first twin study to
examine the heritability of singing ability in depth, using both objectively-assessed
tasks and measures of singing ability, as well as subjectively-assessed singing ability
based on self-report. Furthermore, following the examples of recent behavioural genetic
studies on music ability, this study aimed to identify environmental factors associated
with singing ability in order to explore whether these factors are also underpinned by
genetic influences, and whether some of these genetic influences were also implicated
in singing ability.
Besides interrogating the genetic basis of singing ability, the use of assorted singing
tasks also enabled the current thesis to inspect how singing proficiency varied across
tasks or measures. Collectively, the behavioural and genetic findings presented in this
thesis served to advance our understanding of the nature of singing ability and provide
insights into the individual differences in singing proficiency across the population.

- 7 -
This thesis is organised into three main parts. The first part (Chapters 2 to 4) reviews the
literature pertaining to the nature of music ability and singing ability. Chapter 2 covers
the genetic basis of music ability and provides an introduction to the behavioural and
molecular genetic approaches commonly employed in music genetic studies, followed
by the accumulated genetic evidence for music ability and music-related phenotypes to
date. In Chapter 3, an overview of the environmental determinants of music ability is
presented, grouped according to cultural, home and formal music learning
environments. This chapter concludes with a consolidation of the genetic and
environmental determinants of music ability in a schematic representation. The nature
of singing ability is detailed in Chapter 4, beginning with an outline of the typical
developmental trajectory for singing ability, followed by a description of a
neurocognitive model of singing and the neural correlates underlying the sensory-motor
control of singing. The chapter then built a case for singing as an ideal model for
investigating the genetic basis of music ability. This chapter concludes with a statement
of study aims and hypotheses which are then addressed in the subsequent chapters.
In the second part of the thesis, methods developed to conduct the study are first
described in Chapter 5, including the design and development of an online singing and
music program, as well as the technical development of this online software. The study
methods are then described in Chapter 6, including the details about the participants,
task measures, how the acoustical data were processed, the study procedure, and the
proposed statistical analyses for the behavioural and genetic analyses.
Chapters 7 to 11 form the third part of the thesis. To contextualise the subsequent
genetic findings, Chapter 7 reports the descriptive statistics of the singing and music
task performances, self-reported interests and abilities in singing and music, and the
singing and music background components that were extracted from the questionnaire.
The rest of the chapter examines potential variables that might have confounded task
performance and questionnaire responses. A discussion of these behavioural findings is
provided in Chapter 8. The genetic findings are then detailed in Chapter 9, organised
according to the study aims and hypotheses. The intraclass correlations of monozygotic
and dizygotic twins and the estimated genetic and environmental contribution on the
various singing task measures and self-rated abilities and interests are reported first,

- 8 -
followed by the genetic analyses on the singing and music background components
associated with singing ability. The possibility of partially shared genetic basis between
the background components and singing ability is then interrogated by bivariate genetic
analyses. The genetic findings are discussed in Chapter 10. Finally, Chapter 11 provides
a summary of the key findings and discusses their broader implications on research and
education. The limitations of the current study and recommendations for future work are
then presented, followed by some concluding comments.

- 9 -
GENETIC BASIS OF
MUSIC ABILITY
2.1 The Nature of Music Ability
The term “music ability”, owing to the heterogeneous nature with which the phenotype
presents itself, can be considered as a generic, umbrella term which encompasses
assorted musical subskills. The multifaceted nature of music ability means that it could
refer to one or more subskills that can be so diverse that they are mutually exclusive
(Levitin, 2012). For example, music ability could mean being able to label or produce a
pitch without external reference (i.e., absolute pitch), or technical prowess in playing an
instrument, or creative power in composing an opus.
While different researchers may have different concepts about what music ability
should entail (Law & Zentner, 2012), to adequately account for the various ways music
ability presents itself, it can be delineated into a number of component skills that are
broadly categorised as perceptual or productive music skills for the purpose of this
literature review. The fractionation of music ability into different musical sub-
phenotypes is also beneficial for uncovering the genetic basis of music ability (Levitin,
2012; Tan et al., 2014). Given the heterogeneity of the phenotype for music ability, it is
unlikely that there exists one single “music” gene that influences all assorted musical
skills. Instead, as with other complex human traits, music ability and its sub-phenotypes
are likely influenced by multiple genes with different effect sizes (Plomin, Owen, &
McGuffin, 1994). Delineating music ability into more precisely defined sub-phenotypes
will thus enable molecular genetic studies to detect genes implicated in each subskill
with greater sensitivity and also direct more research efforts toward those subskills that
have been scantly researched (Tan et al., 2014).

- 10 -
The subskills considered in the two broad categories of music perception and
production abilities are adapted from two studies that have covered a wide scope of
music perception and production skills, respectively, in their development of assessment
measures of these skills (Law & Zentner, 2012; McPherson, 1995). Figure 2.1 shows a
tree diagram of music ability and its constituent music perception and production
subskills. Music perception comprises six main subskills in evaluating pitch, melody,
tuning (chord intonation), rhythm, tempo and timbre (Law & Zentner, 2012), whereas
music production consists of seven main types of music performance skills, namely the
abilities to sight-read, to perform rehearsed music from a score, to perform from
memory, to play by ear, to improvise, to compose and to arrange music. The first five of
these music production skills overlap with the types of music performance skills
identified by McPherson (1995). Composing and arranging music are added to the
figure because these abilities can also be considered important forms of music
production ability. As these seven types of music production abilities assess music
production at a macroscopic level, six additional subskills (in the dashed oval)
analogous to the music perception subskills are appended to the music production skills
to clarify the musical subskills needed for the execution of a music performance. In
addition, the arrow pointing from music production to music perception indicates how
music production abilities are essentially contingent on music perception abilities.
Although the musical subskills listed in Figure 2.1 are by no means exhaustive, they
serve to provide a useful heuristic for the ensuing literature review on the genetic and
environmental determinants of music ability presented in Chapters 2 and 3. It will be
apparent from the literature reviews that some of the musical subskills, such as those
pertaining to music perception, have featured more frequently and prominently in
current research, while others have received comparatively less attention. There are also
other forms of music ability that have not been investigated in the nature-nurture debate
and this lies beyond the scope of the current literature review. Examples include musical
expressivity to convey emotions through music performance, and when listening,
musical sensitivity to discern the emotional content of a piece of music.

- 11 -
Figure 2.1. Music ability and its constituent perception and production subskills.
In the remainder of this chapter, Sections 2.2 and 2.3 describe the behavioural and
molecular genetic approaches commonly used in human genetic analyses and Section
2.4 then provides an overview of what is currently known about the genetic basis of
music ability, by consolidating the behavioural and molecular genetic findings on
music-related traits that have been investigated to-date.
2.2 Behavioural Genetic Approaches
2.2.1 Familial aggregation
One of the first questions asked in human genetic analysis is whether a trait clusters in
families above chance level. Familial aggregation can address this question by
comparing whether the prevalence of a trait is higher within the family of a proband1
than what is expected in the general population (Naj, Park, & Beaty, 2012). This
1 A proband is the first person within a family who is ascertained to exhibit the trait of interest.

- 12 -
approach is non-invasive because only phenotypic information is gathered from the
families and controls. One common measure arising from familial aggregation is the
sibling recurrence-risk ratio (λs), which determines the proportion of proband siblings
also exhibiting the studied trait, relative to the population prevalence. The magnitude
and patterns of familial correlations observed in familial aggregation studies can yield
useful clues to the roles played by genes and the environment (Naj et al., 2012). While a
λs close to 1 suggests genetic influences are unimportant, higher values (>5) indicate
that a genetic hypothesis is worth pursuing (Mitry et al., 2011). A related measure is the
sibling relative risk (sib RR), which is the ratio of the proband λs to the control λs.
It is important to note, however, that familial aggregation measures such as λs may be
inflated by ascertainment bias (Guo, 1998). Moreover, familial aggregation only serves
to determine the existence of familial clustering. It does not seek to explain how much
of the familial clustering is due to genetic or environmental factors. Such questions can
be addressed through follow-up studies, such as twin and adoption studies.
2.2.2 Twin studies
Twin studies take a step further to investigating genetic influences by disentangling the
relative contributions of genetic and environmental factors on trait variation (Verweij,
Mosing, Zietsch, & Medland, 2012). Using twin studies, the effects of additive genetic
influences, common environment (shared environment), and unique (unshared)
environment on the variation of a trait within a sample or population can be estimated.
Common environmental influences include family environment, which are experienced
similarly by each pair of twins raised in the same household. Unique environmental
influences, on the other hand, refer to divergent experiences that are only experienced
by one twin and not the other, such as different social groups or education.
Monozygotic (MZ) twins share nearly 100% of their genes whereas dizygotic (DZ)
twins share on average 50% of their genes.
As the degree of within-twin-pair similarity for a trait is essentially the sum of effects
due to shared genes and common environmental influences, it can be inferred that any
excess of MZ similarity relative to DZ similarity is due to a greater degree of shared
genes between the MZ twin pairs, hence suggesting a genetic basis for the trait.

- 13 -
In univariate twin analyses, the most basic model is the ACE model, which decomposes
the total trait variance into the proportion of variance due to additive genetic (A), shared
environmental (C) and unique environmental (E) effects (Eaves, Last, Young, & Martin,
1978; Neale & Cardon, 1992). A graphical representation of the model is shown in
Figure 2.2.
Figure 2.2. Classic ACE model. The single-headed arrows (a, c, e) are the path coefficients that
reflect the effects of latent variables, ie. additive genetic (A), common environmental (C), and
unique environmental (E) influences, on the observed trait of the twins. The curved double-
headed arrows across the top represent the correlations between a pair of twins for a particular
latent variable; rMZ is the correlation between an MZ twin pair, whereas rDZ is the correlation
between a DZ twin pair.
As can be observed from Figure 2.2, MZ twin pairs correlate perfectly for the additive
genetic component A as they share almost 100% of their genes. DZ twin pairs, however,
only correlate 0.5 for A since they share on average 50% of their genes. As for the
common environmental component C, the correlation is 1 for both MZ twin pairs and
DZ twin pairs, assuming both twins were raised in the same household. Unique
environmental influences, E is uncorrelated between the twins. In addition to A, C and
E, non-additive genetic effects such as dominance (D) can potentially be a source of
trait variance.
A rudimentary way to estimate the variance components would be to compute the
intraclass correlations (ICC) for MZ and DZ twins separately and algebraically solve for
A C E
Twin 1’s
trait
A C E
Twin 2’s
trait
rMZ = 1
rDZ = 0.5
a c e
rMZ = 1
rDZ = 1
a c e

- 14 -
the variance components using Falconer’s formula (Rijsdijk & Sham, 2002). The total
trait variance in an ACE model can be expressed as
V = A + C + E
If the total variance is standardised (i.e., scaled to 1), the equation is expressed as
a2 + c2 + e2 = 1
where a2, c2 and e2 are the standardised squared path coefficients representing the
covariances between a twin pair due to additive genetic (A), common environmental (C)
and unique environmental (E) effects, respectively.
As the similarity or correlation between a pair of twins is the sum of the genetic and
common environmental effects, the intraclass correlation coefficients, r, of MZ twins
and DZ twins are therefore
rMZ = a2 + c2
rDZ = 0.5a2 + c2
Solving algebraically the above equations will therefore yield the following solutions:
a2 = 2(rMZ - rDZ)
c2 = 2rDZ – rMZ
e2 = 1 – rMZ
By examining the ICCs, we can therefore assess the relative importance of A, C and E
on the trait variance. For instance, if rMZ is approximately twice the size of rDZ, based on
Falconer’s formula, c2 is negligible whereas a2 explains a large proportion of the trait
variance. In contrast, if rMZ and rDZ are of comparable magnitude, c2 is likely to be large
while a2 is negligible.
The Falconer approach, however, while adequate as a preliminary gauge of expected
contributions of the different variance components, has some serious limitations. For

- 15 -
example, negative estimates of variance components may arise, preventing meaningful
interpretation of the results. Moreover, confidence intervals cannot be estimated for the
parameters. In addition, it is not possible to estimate the parameters in more complex
models, such as testing for sex differences or simultaneously analysing more than one
trait, nor is it possible to compare the relative goodness-of-fit of one model to another
(Rijsdijk & Sham, 2002). Therefore, twin analyses now typically use structural equation
modelling (SEM) to estimate the variance components by means of maximum
likelihood model-fitting techniques. The relative merits of SEM include providing
useful information about parameter estimates, confidence intervals and model-fitting
(Rijsdijk & Sham, 2002). OpenMx is a specialised software which can perform SEM in
R, an open-source software environment for statistical computing (Neale et al., 2016).
The following section describes in greater detail how univariate and bivariate genetic
analyses are typically conducted using SEM.
2.2.2.1 Structural equation modelling (SEM)
In SEM, model parameters are estimated by iteratively adjusting the values of the
unknown parameters until the discrepancies between actual data and the predicted
model are minimised. The optimal parameter estimates for a particular model can be
estimated using the maximum-likelihood criterion, where maximum log-likelihood will
yield parameter estimates that result in the least discrepancy between actual data and the
fitted model (Rijsdijk & Sham, 2002).
a) Univariate analysis
Testing equality of means, variances and covariances
Prior to fitting univariate ACE models to estimate the variance components for the task
and questionnaire measures, basic assumptions concerning the equality of means and
variances within twin pairs and across zygosity were tested. In an ACE model, the
means and variances within twin pairs and across zygosity are set to be equal, as it is
assumed that all twins in the sample come from the same base population, regardless of
zygosity. To test the validity of this assumption, a saturated model in which the means,
variances and covariance were free to vary within twin-pairs and across zygosity was
first built. Subsequent nested models with increasing constraints imposed on means and
variances were then fitted and the goodness-of-fit of the nested models relative to the
- 16 -
saturated model were evaluated by likelihood ratio chi-square difference tests. A non-
significant chi-square difference (p > .05) between a model and the saturated model
means that the model is not significantly different from the saturated model, and
therefore the imposed constraints on the means and variances remain compatible with
the data. Conversely, a significant p value indicates that the current model is a poor fit
to the data and suggests that the current imposed constraint of equal means or variances
across co-twin or zygosity may not be valid. In such cases, univariate analysis for the
particular measure would not proceed further.
Similarly, covariances of the various zygosity groups can be constrained to test for
potential sex limitation effects in the variation of a trait. There are two types of sex-
limitation effects; quantitative sex limitation is said to occur if magnitudes of the
genetic or environmental variances differ between sexes, whereas qualitative sex
limitation refers to instances where variation of a trait is caused by different types of
genes for males and females. A lower DZO covariance compared to those of DZM and
DZF is often indicative of a qualitative sex limitation. Therefore, to assess whether a
quantitative sex limitation was present, models that constrained the covariances between
male and female twins of the same zygosities to be equal were built (i.e., CovMZF =
CovMZM; CovDZF = CovDZM) and compared with the saturated model. If the covariances
could be equated without significant worsening of model fit, this would suggest an
absence of quantitative sex differences and thus both the female and male groups of the
same zygosity could be combined. Correspondingly, if the covariance of the DZF, DZM
and DZO groups could all be equated without significant deterioration of model fit from
the saturated model, this would suggest a lack of evidence for qualitative sex
differences, thus allowing all three DZ groups to be pooled.
Model-fitting
For each performance measure derived from the tasks and questionnaire, in addition to
fitting the full ACE model, where all three model parameters (A, C and E) were
estimated, nested submodels such as AE, CE and E were fitted to the data. The AE
model was built from the full ACE model by dropping the C parameter. Likewise, the
CE and E submodels were built by dropping A and both A and C, respectively. The
goodness-of-fit of the submodels was compared to the full ACE model by likelihood
ratio tests. If the chi-square difference between a nested submodel and the full ACE

- 17 -
model was significantly different, this meant that the dropped parameter was
significantly greater than zero, thus suggesting its importance in explaining the trait
variance. Besides goodness-of-fit, the principle of parsimony was also taken into
account when choosing the best-fitting model. According to the principle of parsimony,
the simpler, nested submodel with fewer parameters is preferred over the full ACE
model, provided that there is no significant worsening of fit, as indicated by the chi-
square difference statistic. To this end, Akaike’s Information Criterion (AIC) is used to
determine the best-fit model (Akaike, 1987). AIC adjusts the chi-square statistic for the
number of estimated parameters, and it can be used to compare models that are fitted to
the same data, even if they are not nested (Schermelleh-Engel, Moosbrugger, & Müller,
2003). Among all the competing models fitted to the same data, the model with the
lowest or most negative AIC offers the best balance between goodness-of-fit and
parsimony. However, one study has cautioned against using AIC to determine the best-
fitting model in the case of discrete (e.g., ordinal) data, as it was shown that the AIC-
guided model tended to choose the incorrect model and resulted in upward-biased
parameter estimates, especially when the sample size was small (Sullivan & Eaves,
2002). Although the same study showed that AIC model selection was robust for
continuous data and hence the caution above was unlikely to be applicable in this case,
both the parameter estimates from the full ACE model and the submodel with the
lowest AIC were examined for completeness.
b) Bivariate analyses
While univariate genetic modelling allows the estimation of the proportion of variances
due to A, C, and E for a single variable, bivariate analysis can be employed to examine
the extent to which genetic and environmental influences explain the association
between two traits.
One common bivariate model is the Cholesky decomposition model, where the first
trait’s latent A, C, E factors are loaded on both traits, while the second trait’s latent A, C
and E factors are only loaded on the second trait. Figure 2.3 shows an illustration of the
bivariate Cholesky model.
After fitting the full bivariate ACE model, additional submodels can be fitted to the data
to test the significance of correlations due to A, C and E, respectively. This is achieved

- 18 -
by removing the additive genetic, shared, or unique environmental influences common
to both traits (i.e., constraining a21, c21 or e21 to zero) in turn in each submodel, and
examine whether the removal of a21, c21 or e21 would deteriorate the fit to the data
significantly relative to the full bivariate ACE model. Significant fit deterioration will
be reflected by a significant chi-square difference test (p < .05) from the full bivariate
ACE model, and it indicates that the dropped component a21, c21 or e21 is significant in
explaining the association between both traits. For instance, if a submodel which
constrained a21 to zero significantly differs from the full bivariate model, it suggests that
shared additive genetic influences significantly mediate the association between the two
traits, which means the two traits have a partially shared genetic basis.
Figure 2.3. The bivariate Cholesky model. The measured/observed traits for Twin 1 and for
Twin 2 are shown in the boxes. Latent factors are shown as circles. a11, c11, e11 and a22, c22, e22
are the additive genetic, common environmental and unique environmental effects acting on
Trait 1 and Trait 2, respectively, whereas a21, c21, e21 are the additive genetic, common
environmental and unique environmental influences common to both Trait 1 and Trait 2.
There are some criticisms surrounding the validity of twin studies given that the twin
design is built on a number of assumptions (Richardson & Norgate, 2005). For instance,
the “equal environment” assumption presupposes that regardless of zygosity, all twins
a11
A1 C1 A2 C2
E1 E2
Trait 1 Trait 2
Twin 1
a21
e11 e21
c11
c21
e22
a22 c22
A1 C1 A2 C2
E1 E2
Trait 1 Trait 2
Twin 2
a21
e11 e21
c11
c21
e22
a22 c22 a11
rMZ
= 1
rDZ
= 0.5
rMZ
= 1
rDZ
= 0.5
rMZ
= 1
rDZ
= 1
rMZ
= 1
rDZ
= 1
- 19 -
raised together experience equally similar common environments. Some research,
however, suggests that MZ twins may be treated more similarly than DZ twins (Plomin
et al., 1976, but see Borkenau et al., 2002).
Besides twin studies, heritability can also be estimated from family pedigrees.
Heritability in the narrow sense (h2) is the ratio of the additive genetic variance to the
total phenotypic variance of a trait, which is equivalent to the standardised additive
genetic component, a2. Since the magnitude of h2 can indicate the statistical power for
discovering the causal genes of a trait, heritability estimation serves as a good precursor
to molecular genetic studies (Bochud, 2012). If the h2 estimates of multiple related traits
are available, the trait with the best h2 estimate can be chosen for subsequent gene
mapping. In human research, the general consensus is that h2 estimates below 0.2 are
considered low, those between 0.2 and 0.5 are moderate, and estimates above 0.5
indicate high heritability. High h2 estimates suggest that the genotype is closely
correlated with the trait phenotype, but it should be noted that this does not necessarily
imply that every gene associated with the trait has a large effect on the phenotype
(Visscher, Gordon, & Neale, 2008). Some limitations of heritability estimation include a
lack of information on the mode of inheritance of the trait, and the possibility that h2
estimates may vary across populations or with time. In large pedigrees, there may also
be cohort effects across different generations living under different socioeconomic
circumstances, which may confound the “equal environment” within the sample
population (Bochud, 2012).
2.2.3 Segregation analysis
After estimating the heritability of a trait of interest, the mode of inheritance of the trait
can be elucidated through segregation analysis. Different segregation models
representing various inheritance patterns of the trait are fitted to the family data. Using
maximum likelihood procedures, the genetic model of best fit (i.e., the inheritance
pattern which best explains how the trait is transmitted down the family line) can be
identified. An important measure from segregation analysis is the segregation ratio,
which is the proportion of offspring who inherit the trait of interest from a parent
(Strachan & Read, 1999). The expected segregation ratios for autosomal dominant

- 20 -
inheritance2 and autosomal recessive inheritance3 are 0.5 and 0.25, respectively. As
these expected segregation ratios are for Mendelian traits, deviation from these values
indicate that the trait of interest may have incomplete penetrance, be predisposed by
several genes in different loci, or that it is determined by both genetic and
environmental factors. For instance in a study by Theusch and Gitschier (2011),
absolute pitch was reported to have a segregation ratio of .089, which suggests that the
trait is not inherited in a simple Mendelian fashion. Similar to familial aggregation, a
potential problem with segregation analysis is ascertainment bias, which may inflate the
segregation ratio (Nandram, Jai-Won, & Hongyan, 2011; Strachan & Read, 1999). It is
possible, however, to statistically correct for this type of inflation (Li, Chakravarti, &
Halloran, 1987; Li & Mantel, 1968; Nandram et al., 2011; Yao & Tai, 2000).
Segregation analysis often serves as a precursor to parametric linkage analysis, as the
latter requires the inheritance pattern of the studied trait to be specified (Schnell & Sun,
2012).
2.3 Molecular Genetic Approaches
2.3.1 Linkage analysis
Once the genetic basis of a trait has been established using some of the above-
mentioned methods, the next step is to conduct linkage analysis to map the potential
genetic loci predisposing the trait. Linkage analysis requires each family member of a
large family, or of several family pedigrees to be genotyped, typically using single-
nucleotide polymorphism (SNP) arrays. If a genetic locus is thought to predispose a
trait, family members who share the same markers near this locus should exhibit greater
trait resemblance compared to those who do not share the markers. Therefore, linkage
analysis aims to identify the markers on the SNP array that are commonly present in
participants within or across pedigrees who exhibit the trait of interest. It should be
noted that the identified markers are not the actual genes predisposing a trait; they are
2 A pattern of inheritance in which a phenotype can be expressed in individuals who have received just
one copy of a particular gene on an autosome (non-sex chromosome). An example of a trait with
autosomal dominant inheritance is brown eyes. 3 A pattern of inheritance in which a phenotype is expressed only in individuals who have received two
copies of a particular gene on an autosome (non-sex chromosome). An example of a trait with autosomal
recessive inheritance is blue eyes.
- 21 -
merely known locations on the genome that are near the gene of interest (Carey, 2003a).
“Linkage” is said to occur when two gene loci that are in close proximity on the same
chromosome are inherited together. In other words, if a marker is commonly shared
among family members with the trait of interest, this marker is likely to be in linkage
with the actual locus of the trait.
There are two common approaches to estimate linkage. The non-parametric or model-
free linkage analysis basically tests whether relatives exhibiting the trait of interest share
more alleles than would be expected by chance (Xu, Bull, Mirea, & Greenwood, 2012).
In contrast, parametric or model-based linkage analysis requires the specification of the
mode of inheritance, as ascertained by segregation analysis. Linkage is then tested by
comparing the probability of obtaining the current test data if a marker locus and the
trait locus are linked, to the probability of obtaining the test data if the two loci are not
linked (Schnell & Sun, 2012). The ratio of the two probabilities expressed on a
logarithmic scale is known as the LOD score. LOD scores are computed across all
markers for each pedigree and then summed across different pedigrees. A LOD score ≥
3 is typically considered significant evidence for linkage, as it indicates that the odds
that the two loci are linked and inherited together are greater than 1000 to 1.
Alternatively, a LOD score ≤ -2 is considered significant evidence to reject linkage. In
general, scores within the range of -2 < x < 3 are regarded as inconclusive evidence for
linkage, with those between 2 ≤ x < 3 warranting additional study.
Linkage analysis is often successful in identifying Mendelian traits with a simple mode
of inheritance, such as Huntington’s disease. It has been less effective for complex traits
predisposed by multiple genes as each gene individually exerts only a small effect on
the trait (Nsengimana & Bishop, 2012). Large sample sizes are therefore needed to
obtain adequate statistical power to detect linkage. Statistical power can also be
increased by performing multipoint analysis (i.e., using multiple markers
simultaneously), allowing more precise identification of the trait locus (Lathrop,
Lalouel, Julier, & Ott, 1984).
As parametric linkage analysis requires the pattern of inheritance to be specified,
misspecification of the genetic model may lead to loss of power (Schnell & Sun, 2012).
While this potential problem can be alleviated by testing more than one genetic model,

- 22 -
multiple-testing issues increase the likelihood of false positives (Weeks, Lehner,
Squires-Wheeler, Kaufmann, & Ott, 1990). A further shortcoming of linkage analysis is
that the identified linkage region typically contains numerous genes. Fine-mapping of
the linkage region is therefore necessary to narrow down the locus and determine the
possible causative gene (Carey, 2003b). With the development of exome sequencing
technologies (see Section 2.3.3, p. 23), fine-mapping is now less essential as all genes in
the linkage region can be quickly analysed.
2.3.2 Association analysis
Association analysis is a statistical method used to investigate the association between a
genetic variant and a trait (Carey, 2003b). Association analysis can be used to test
potential genetic variants that lie in significant linkage regions. It can also be employed
when there are well-founded reasons to suspect a gene’s involvement in predisposing a
trait. An association analysis can either adopt a population-based design involving
unrelated cases and controls, or a family-based design in which relatives of cases serve
as controls for the study.
In the candidate gene approach, statistical tests are performed to determine whether the
cases have a higher frequency of a particular allelic variant4 of the candidate gene, as
compared with the controls. The possible association between an allelic variant and the
trait of interest may yield valuable information about the variant’s role in the biological
pathway of the trait. One major limitation of candidate gene studies is that only specific
allelic variants are investigated; the success of an association study thus hinges on the
accuracy of a researcher’s “educated guess” of the potential candidate genes. Moreover,
if the trait of interest is complex and multiple genes are involved, the candidate gene
approach is not able to detect the influence of the predisposing genes in other loci.
By contrast, a genome-wide association study (GWAS) can be conducted without prior
knowledge of potential candidate genes. It involves an “agnostic” or non-candidate
driven search of the entire human genome, typically using SNP arrays with a large
number of common SNP markers found throughout the genome (Sun &
4 Allelic variant is a particular alternate form of an allele.
- 23 -
Dimitromanolakis, 2012). If certain SNPs have a higher incidence in the cases relative
to the controls, this will indicate a possible association of these SNPs with the trait of
interest.
GWAS is a useful approach to find novel candidate genes predisposing a trait of
interest, especially if the biological pathway of the trait is not well-understood. It is also
possible to identify multiple genetic contributors to a complex trait, even if each of
these may be conferring only a small effect (Reich & Lander, 2001). The downside is
that to identify such SNPs of low effect size, large sample sizes are needed to achieve
adequate power (typically thousands or even tens of thousands of cases and controls)
(Spencer, Su, Donnelly, & Marchini, 2009). However, large sample sizes may give rise
to confounding factors such as population stratification and cryptic relatedness that
result in false positives (Nsengimana & Bishop, 2012). Moreover, GWAS does not
identify complete genes; it only identifies the genomic regions possibly associated with
the trait, which in some cases may not even have a protein-coding gene in the vicinity.
A common problem faced by both the candidate gene approach and GWAS is the
minimal replication of significant results across association studies (Lewis & Knight,
2012). Researchers must therefore exercise caution and critically examine the validity of
published association studies, and make prudent design decisions for their own
association studies (Attia et al., 2009).
2.3.3 Exome sequencing
With the advancement of high-throughput next-generation sequencing (NGS)
technologies, exome sequencing has emerged as a rapid and cost-effective method for
human genetic analysis (Singleton, 2011). The exome is the portion of the genome
containing protein-coding information and represents about 1.5% of the whole genome.
Exome sequencing is based on the assumption that changes in exons may modify the
function of proteins coded by exons, thereby leading to changes in the phenotype. By
targeting the exome instead of the entire genome, exome sequencing presents a cost-
and time-effective means to find possible genetic variants predisposing a trait. Exome
sequencing uses sequence capture methods to selectively capture exons from a DNA

- 24 -
sample and enrich the available information from each sample, before using high-
throughput sequencing to identify coding variants in the exome (Ku et al., 2012).
Since the publication of the first proof-of-concept study which used exome sequencing
to identify causal variants for a rare Mendelian disorder (Ng et al., 2009), exome
sequencing has shown much promise in discovering coding variants for both Mendelian
and non-Mendelian traits (Singleton, 2011). Like GWAS, exome sequencing can be
performed without the foreknowledge of potential candidate genes or genetic variants.
Its usefulness has also been shown in the diagnosis of disorders characterised by genetic
heterogeneity (Singleton, 2011). Another advantage of exome sequencing is that it can
identify uncommon causal variants predisposing rare Mendelian traits, which cannot be
identified through linkage studies due to inadequate study power (Singleton, 2011).
Ultimately, exome sequencing may become a valuable genetic screening and diagnostic
tool, allowing robust diagnoses to be reached rapidly and cost-effectively (Ku et al.,
2012). However, it has some limitations. For instance, some regions of interest in the
exome are difficult to sequence with the current technology, and the large amount of
sequencing data generated poses computational challenge for analysis. Moreover,
exome sequencing is unable to detect large deletions or rearrangements in the genome,
and there is a major risk of false positives due to difficulties determining the biological
relevance of coding variants to the trait of interest.
2.3.4 Copy number variation (CNV) analysis
Copy number variants are structural variants (>1,000 base pairs) whose copy numbers
deviate from those found in the human reference genome. Such variation in the genome
(known as copy number variation) includes insertions, deletions, duplications,
inversions and translocations (Wain, Armour, & Tobin, 2009). More than 300 known
causal genes for diseases are found to overlap with CNVs (Sebat et al., 2004),
highlighting the impact CNVs may exert on genetic mechanisms and phenotypic
variation. Understanding the functional impact of CNVs, therefore, offers a fruitful
means of elucidating the genetic basis of complex phenotypes.

- 25 -
There are several approaches to CNV detection. Microarray-based CNV analysis
techniques typically use SNP arrays or aCGH (array comparative genomic
hybridisation) platforms to detect copy number gains or losses in the test sample
compared with a reference sample (Alkan, Coe, & Eichler, 2011). CNV detection can
also be achieved through a sequencing-based approach.
CNV analysis has shown its utility in the diagnosis of syndromes with heterogeneous
phenotypes (Coughlin II, Scharer, & Shaikh, 2012). However, understanding the
significance and effect of detected CNVs on a trait of interest remains challenging. In
addition, microarray-based CNV analysis has a number of drawbacks. Copy neutral
alterations (such as inversions and translocations) that do not cause a change in the total
amount of genetic material cannot be identified by the microarray-based approach, even
though such alterations are potentially deleterious. The microarray-based approach is
also less sensitive in detecting duplications than deletions.
Given the continued advancement in sequencing technologies, sequencing-based
approaches are likely to supersede microarray-based CNV analysis. In time, the ability
of NGS to detect various forms of genetic variants (including small insertions/deletions
and copy neutral variants) will improve and the cost of massive parallel sequencing will
become less expensive. Nevertheless, this approach has not yet reached maturity and
standard protocols and measures for sequencing-based CNV analysis have not been
established. Moreover, the bioinformatics infrastructure, support and cost required for
managing, analysing and storing large amounts of sequencing data need to be carefully
considered (Teo, Pawitan, Ku, Chia, & Salim, 2012). In addition, the relatively short
read lengths of NGS pose mapping issues in aligning the sequenced reads with the
reference genome, especially in the duplicated regions of the genome. Thus, as with a
microarray-based approach, copy number duplications remain less detectable than
deletions with the sequencing-based method. Longer read lengths afforded by
improvements in sequencing technology will potentially mitigate this issue.
- 26 -
2.4 Genetic Evidence for Music Ability and Music-
Related Phenotypes
Studies on the genetic basis of music ability are relatively scarce compared with more
extensive investigation conducted on the nature of language ability (for recent reviews
of the genetic findings on speech and language, see Newbury and Monaco, 2010;
Carrion-Castillo et al., 2013; Graham and Fisher, 2013; Raskind et al., 2013; Szalontai
and Csiszar, 2013). Fortunately, the advent of molecular genetics in the post-genomic
era holds much promise for improving understanding in this relatively underexplored
field. This section consolidates the various music-related phenotypes investigated in
behavioural and molecular genetic studies in the last three decades (Table 2.1). The
behavioural genetic studies prior to that are not included in this review as the few
genetic investigations on music ability lacked scientific rigour or suffered from small
sample sizes (see Rowley, 1988 for a review of the early behavioural genetic studies on
music ability) .
2.4.1 Music perception
From Table 2.1, it can be observed that the majority of studies (61%) have focused on
music perception abilities. These include basic musical perception abilities such as the
perception of pitches and note durations, higher level music perception abilities such as
the perception of melody, rhythm and musical patterns, music listening behaviour, and
uncommon music perception ability (absolute pitch ability), and deficit (congenital
amusia). Recent genetic findings on each of these traits will be outlined in this section.
The main findings from the behavioural and molecular genetic findings are summarised
in Table 2.2 and Table 2.3, respectively.

- 27 -
Table 2.1. The Number of Genetic Studies Investigating Various Music Traits
Music
Ability
Category
Music subskill No. of
studies
Authors
Music
perception
Basic music
perception
abilities
3 Pulli et al. (2008); Oikkonen et al. (2014);
Ullén et al. (2014)
Higher level
music perception
abilities
7 Alcock et al. (2000); Drayna et al. (2001); Pulli
et al. (2008); Ukkola et al. (2009); Ukkola-
Vuoti et al. (2013); Oikkonen et al. (2014);
Ullén et al. (2014); Seesjärvi et al. (2015); Liu
et al. (2016)
Music memory 2 Granot et al. (2007); Granot et al. (2013)
Music listening 2 Ukkola-Vuoti et al. (2011); Kanduri, Raijas, et
al. (2015)
Congenital
amusia
1 Peretz, Cummings, and Dubé (2007)
Absolute pitch 10 Profita & Bidder (1988); Gregersen & Kumar
(1996); Baharloo et al. (1998); Gregersen et al.
(1999); Baharloo et al. (2000); Gregersen et al.
(2001); Theusch, Basu, & Gitscher (2009);
Theusch & Gitschier (2011); Gregersen et al.
(2013); Gervain et al. (2013)
Music
production
Music
performance
1 Kanduri, Kuusi, et al. (2015)
Music practice* 2 Mosing et al. (2014); Hambrick &Tucker-Drob
(2014)
Music flow* 1 Butkovic et al. (2015)
Music
creativity*
3 Ukkola et al. (2009); Ukkola-Vuoti et al.
(2013); Oikkonen et al. (2016)
Singing
participation*
2 Coon & Carey (1989); Morley et al. (2012)
Singing accuracy 1 Park et al. (2012)
Rhythm
production
1 Alcock et al. (2000)
Music accomplishments* 3 Coon & Carey (1989); Vinkhuyzen et al.
(2009); Hambrick & Tucker-Drob (2014)
Music culture 2 Pamjav et al. (2012); Brown et al. (2013)
*based on subjective, self-report measures

- 28 -
Table 2.2. Summary of Behavioural Genetic Studies Investigating Various Music Traits
Trait Type of study Findings
Basic music perception
abilities
Pedigree study (Pulli et al., 2008);
15 Finnish musical families (N=234)
Heritability estimates for SP: 57%; ST: 21%
Pedigree study (Ukkola et al., 2009);
19 Finnish musical families (N=343)
Heritability estimates for SP: 52%; ST: 10%
Pedigree study (Oikkonen et al., 2014);
76 Finnish families (N=767)
Heritability estimates for SP: 68%; ST: 21%
Twin study (Ullén et al., 2014);
2,569 twin pairs
Heritability estimates for pitch discrimination:
M: A = 12% [0-35%]; F: A = 30% [9-52%]
Higher level music perception
abilities
Twin study (Drayna et al., 2001);
284 female twin pairs
Melodic perception ability: A = 71% [61-78%] (continuous measure)
or A = 80% [65-90%] (dichotomous categories)
Twin study (Ullén et al., 2014; Mosing et al.;
2014);
2,569 twin pairs
Melody discrimination:
M: A = 31% [5-53%]; F: A = 61% [50-66%]; Combined: A = 59% [43-
64%]
Rhythm discrimination:
M: A = 41% [7-59%]; F: A = 52% [23-59%]; Combined: A = 50% [33-
57%]
Twin study (Seesjärvi et al., 2015);
113 twin pairs
MBEA scale test: A: 58% [42-70%]
OTA out-of-key test: C: 61% [49-70%]
OTA off-beat test: E: 82% [61-100%]
Pedigree study (Pulli et al., 2008);
15 Finnish musical families (N=234) Heritability estimates for KMT: 42%; COMB: 48%
Pedigree study (Ukkola et al., 2009);
19 Finnish musical families (N=343) Heritability estimates for KMT: 39%; COMB: 44%
Pedigree study (Oikkonen et al., 2014);
76 Finnish families (N=767) Heritability estimates for KMT: 46%; COMB: 60%
Congenital amusia Familial aggregation (Peretz et al, 2007);
9 proband families & 10 control families
λs: 10.8 [CI: 8-13.5]
λo: 2.3 [CI: 0-5]

- 29 -
Trait Type of study Findings
Absolute pitch (AP) Family segregation analysis (Profita & Bidder,
1988);
35 AP probands from 19 families
SR: .24 to .37
Familial aggregation (Gregersen & Kumar,
1996);
101 AP probands
λs: ~20
Familial aggregation (Baharloo et al., 1998);
92 self-reported AP probands
520 non-AP probands
λs: ~7.5 [CI: 2.2-21.2]
(controlled for early music training)
Familial aggregation (Gregersen et al., 1999);
2,707 tertiary music students
Sib RR: ~8.3
Familial aggregation (Baharloo et al., 2000);
74 AP-1 probands with 113 siblings
625 controls
λs: 7.8-15.1
(controlled for early music training)
Familial aggregation (Gregersen et al., 2001);
1,067 music theory students Sib RR: ~12.2
Family segregation analysis (Theusch &
Gitschier, 2011);
1,463 families with AP-1 probands
SR: .089 [SE: .006]
Twin study (Theusch & Gitschier, 2011);
14 MZ and 31 DZ female twin pairs CCRMZ: 78.6%; CCRDZ: 45.2%
Music practice Twin study (Mosing, Madison, Pedersen, Kuja-
Halkola & Ullén; 2014);
2,569 twin pairs
Hours of music practice:
M: A = 69% [56-75%]; F: A = 41% [26-56%]
Twin study (Hambrick & Tucker-Drob, 2014);
850 twin pairs
A = 38%; C = 44%; E = 19%
Music flow Twin study (Butkovic, Ullén, Mosing, 2015);
2,570 twin pairs
Heritability: 40%
Music creativity Pedigree study (Ukkola et al., 2009);
19 Finnish musical families (N=343)
Heritability for Music creativity: 84%; Composing: 40%; Arranging:
46%; Improvising: 62%
Pedigree study (Oikkonen et al., 2016);
79 Finnish families (N=474)
Heritability for Composing: 33.3%; Arranging: 33.4%; Improvising:
11.6%; Non-musically creative: 28.9%

- 30 -
Trait Type of study Findings
Participation in singing
activities
Twin study (Coon & Carey, 1989);
850 twin pairs
M: A = 71%; F: A = 20%
Singing
(pitch accuracy)
Pedigree study (Park et al., 2012);
73 extended families (N=1,008)
Heritability: 40% [CI: 20.4-59.6%]
Music accomplishments Twin study (Coon & Carey, 1989);
850 twin pairs
Heritability estimates for
Vocational interest in music: M: A = 21%; F: A = 17%
Instrumental music engagement: M: A = 30%; F: A = 14%
Professional music engagement: M: A = 38%; F: A = 10%
Receiving music prizes: M: A = 38%; F: A = 20%
Twin study (Vinkhuyzen et al., 2009);
1,685 Netherlands twin pairs (12-24 years)
Musical aptitude: M: A: 66% [52-77%]; F: A: 30% [16-36%]
Exceptional musical talent: A: 86% [22-98%]
Twin study (Hambrick & Tucker-Drob, 2014);
850 twin pairs
A = 26% (Practice: A = 43%; No practice: A = 1%)
Note. λs: Sibling recurrence risk; λo: Offspring recurrence risk; CCRMZ: Casewise Concordance rate for MZ twins; CCRDZ: Casewise concordance rate for DZ
twins; CI: 95% confidence interval; COMB: Combined test scores of KMT, SP and ST; A: Additive genetic variance (heritability); C: common/shared
environmental variance; E: Unique environmental variance; F: females; KMT: Karma Music Test; M: males; MBEA: Montreal Battery of Evaluation of
Amusia; OTA: Online Test of Amusia; SE: Standard error; SP: Seashore’s Pitch Discrimination Test; ST: Seashore’s Time Discrimination Test; Sib RR:
Sibling relative risk; SR: Segregation ratio
95% confidence intervals or standard errors are provided in square brackets where available

- 31 -
Table 2.3. Summary of Molecular Genetic Studies Investigating Various Music Traits
Trait Study type/ Participants Locus
implicated
Gene implicated
Perception of
pitch and
rhythm
Genome-wide linkage study
(Pulli et al., 2008);
15 musical families (N=234)
4q22 UNC5C
8q13-21
TRPA1
Candidate-gene association study
(Ukkola et al., 2009);
19 musical families (N=343)
12q14-q15 AVPR1A
RS1+RS3
haplotype
Genome-wide CNV analysis
(Ukkola-Vuoti et al., 2013);
5 extended families,
172 unrelated individuals
5q31.1 Pcdha 1-9
8q24.22 ADCY8
Genome-wide linkage and
association study (Oikkonen et al.,
2014);
3q21.3 GATA2
76 families (N=767) 4p15-q24 PCDH7,
PDGFRA,
KCTD8,
CHRNA9,
PHOX2B
Genome-wide positive selection
analysis (Liu et al., 2016)**
Best positive selection regions:
12q15-q21.2; 2p13
148 participants 12p13.1 GRIN2B
2q13 IL1A, IL1B
1q32.3-41 USH2A
3p13 FOXP1
5q11-q12 GZMA
5q14.3 GPR98
7p15.3 RAPGEF5
9p24.2 VLDLR
17q24 RGS9
Music memory Candidate-gene association study
(Granot et al., 2007);
82 university students
12q14-q15 AVPR1A
RS1+RS3
haplotype
17q11.2 SLC6A4
HTTLPR
Pharmacological study (Granot et
al., 2013); 50 male participants
AVP
Music listening Candidate-gene association study
(Ukkola-Vuoti et al., 2011);
31 families (N=437)
12q14-q15 AVPR1A
active current
music listening:
RS1+AVR
haplotype;
lifelong active
music listening:
RS1+RS3
haplotype

- 32 -
Trait Study type/ Participants Locus
implicated
Gene implicated
Music listening Genome-wide transcriptome study
(Kanduri et al., 2015a)**;
48 adult participants
4q22.1 SNCA
2q37.3 HDAC4
8q24.21 FAM49B
Absolute pitch
(AP)
Genome-wide linkage study
(Theusch, Basu & Gitschier,
2009);
73 AP families*
8q24 ADCY8
8q24.21 FAM49B
7q22.3,
8q21.11,
9p21.3
-
53 AP multiplex families,
36 synaesthesia multiplex families
6q14.1-16.1
EPHA7
2q24.1; 2q22.1
Pharmacological study (Gervain et
al., 2013); 24 adult male
participants
HDAC enzyme
Music
performance
Genome-wide transcriptome study
(Kanduri et al, 2015b)**;
20 professional musicians
4q22.1 SNCA
8p23 CLN8
14q24.3 FOS
21q22.2 DOPEY2
Music creativity Genome-wide CNV analysis
(Ukkola-Vuoti et al., 2013);
5 extended families,
172 unrelated individuals
5p15 ZDHHC11
2p22.1
GALM
2p12, 3p14.1,
3q28 -
Genome-wide linkage analysis
(Oikkonen et al., 2016)**;
79 families (n=474) & 103
unrelated participants
16p12.1
(arranging) GSG1L
4q22.1
(composing) SNCA
18q21 (non-
musically
creative)
CDH7, CDH19
Choir
participation
Candidate gene association study
(Morley et al., 2012); 262 amateur
choir singers, 261 controls
17q11.2 SLC6A4
(17q11.2)
Singing (pitch
accuracy)
Genome-wide linkage and
association study; exome
sequencing; CNV analysis (Park et
al., 2012); 73 families (N=1008)
4q23
4q26 UGT8
Rhythm
perception and
production
Candidate gene study (Lai et al.,
2001); A three-generation family
pedigree
7q31 FOXP2
Note. CNV: copy number variation. For full names of the gene symbols, please refer to the List
of Abbreviations.
* Families with at least two AP possessors who were not simply a parent-child relative pair
* *Due to the large number of differentially expressed genes found in these studies, only more
notable genes such as those implicated in other music studies are listed. For comprehensive
information on all the differentially expressed genes, please refer to the respective articles.

- 33 -
2.4.1.1 Basic music perception abilities
The genetic basis of basic musical auditory capacities was investigated by Järvelä and
her collaborators in several large molecular genetic studies (Oikkonen et al., 2014; Pulli
et al., 2008). These abilities were measured with the pitch and time tests from the
Seashore Measures of Musical Talents, in which participants were asked to detect
differences in the pitch and duration of 50 paired tones (Seashore, Lewis, & Saetveit,
1960). Three separate studies from the same laboratory reported high heritability
estimates (52-68%) for pitch discrimination ability and low to moderate heritability (10-
21%) for note duration perception (Oikkonen et al., 2014; Pulli et al., 2008; Ukkola,
Onkamo, Raijas, Karma, & Järvelä, 2009).
In contrast, a large Swedish twin study which used a similar paired pitch discrimination
paradigm only found modest heritability estimates (A = 12-30%) for pitch perception
ability, with significant sex differences (Ullén, Mosing, Holm, Eriksson, & Madison,
2014). While significant and moderate genetic influences (A = 30%) were estimated for
female twins, significant common environmental influences (C = 38%) were estimated
for male twins, which led the researchers to surmise possible etiological difference in
the pitch perception ability of males and females. Taken together, the majority of the
evidence suggests that genetic influences play a significant role in the variation of basic
musical auditory abilities in the general population.
As shown in Table 2.3, number of possible genetic substrates underlying basic music
perception have been reported by Järvelä and colleagues. Genome-wide linkage analysis
revealed some evidence of linkage on chromosome 10 (LOD = 1.67) for pitch
discrimination, and on chromosome 4q (LOD = 1.18) for note duration discrimination
(Pulli et al., 2008). A subsequent larger-scaled genome-wide linkage and association
study (Oikkonen et al., 2014) also found evidence that chromosome 4 was implicated in
music perception. For pitch discrimination, the best linkage (posterior probability of
linkage [PPL] = 0.86) was obtained at 4p14, with some evidence of linkage (PPL =
0.68) also observed at 22q11.21. In addition, the chromosomal region 3q21.3 was found
to be associated with pitch and note duration discrimination.

- 34 -
Interestingly, some of these implicated chromosomal loci contain genes that are
expressed in the auditory pathway. For instance, the PCDH7 gene is located next to
4p14, and is known to be expressed in the developing cochlea of chicken and the
amygdala of mice (Hertel, Redies, & Medina, 2012; Lin et al., 2012), providing
suggestive evidence for the gene’s role in music perception and music-evoked
emotions. On the other hand, located close to 3q21.3 is the GATA2 transcription factor,
which likely plays an important role in the development of cochlear hair cells and the
inferior colliculus (Haugas, Lilleväli, Hakanen, & Salminen, 2010; Lahti, Achim, &
Partanen, 2013). The inferior colliculus is a core structure in the peripheral auditory
pathways for music perception, supporting the initial integration of pitch, direction and
loudness information (McLachlan & Wilson, 2010). Moreover, GATA2 is expressed in
dopaminergic neurons (Scherzer et al., 2008), which release dopamine during pleasure-
evoking activities such as music listening and performance (Salimpoor, Benovoy,
Larcher, Dagher, & Zatorre, 2011). Finally, the region 22q11.21 is linked to DiGeorge
syndrome (also known as 22q11.2 deletion syndrome), which typically includes
symptoms of conductive and sensorineural hearing losses (Digilio, Marino, Capolino, &
Dallapiccola, 2005).
2.4.1.2 Higher level music perception abilities
The abilities to perceive tonal and rhythmic structure in music are understandably more
cognitively advanced forms of music perception abilities as compared to pairwise
discrimination of pitches or note durations. Since the dawn of the new millennium, there
has been increasing evidence supporting the presence of genetic influences underlying
higher level musical perception abilities.
A twin study conducted in 2001 investigated melodic perception ability by asking twins
to judge whether snippets of familiar melodies contained incorrect pitches that rendered
them "out-of-tune" (Drayna, Manichaikul, De Lange, Snieder, & Spector, 2001). A
substantial genetic component (A = 71-80%) was found, with no effect of common
environmental influences. High heritability estimates (A = 58-59%) for melodic
perception were also reported by two other recent twin studies using paired melody
discrimination tasks in which the second melody may have a different pitch from the
first (Seesjärvi et al., 2015; Ullén et al., 2014). Intriguingly, in the latter study, the

- 35 -
abilities to detect violation of tonal and rhythmic structure of a melody by an errant tone
were found to be explained mostly by common environmental influences (C = 61%) and
unique environmental influences (E = 82%), respectively (Seesjärvi et al., 2015). The
researchers proposed that the discrepant heritability estimates for melodic perception
and tonal structure perception could be due to differences in task demands, as violation
of melodic or rhythmic structure may rely more on implicit or prior musical knowledge,
whereas pairwise comparison of melodies may impose a greater cognitive load on
working memory, which may conceivably be influenced by a larger genetic component.
The high heritability estimate for paired discrimination of rhythmic sequences (A =
50%) as reported by (Ullén et al., 2014) is also in line with the working memory
explanation.
Järvelä’s research team investigated the ability to discern melodic and rhythmic patterns
(referred to as auditory structuring ability) using the Karma Music Test (KMT) in two
family pedigree studies and reported sizeable genetic influences (39-46%) for this
ability (Oikkonen et al., 2014; Pulli et al., 2008; Ukkola et al., 2009). In addition, these
studies also obtained moderate to high heritability estimates of 44-60% for the
combined score of the KMT and Seashore’s pitch and time tasks. In the earlier study,
genome-wide linkage analysis revealed promising evidence of linkage at 4q22 for KMT
(LOD = 2.91) and significant evidence of linkage (LOD = 3.33) for the combined score
(Pulli et al., 2008). The subsequent genome-wide linkage and association study also
found some evidence of linkage for 4q21.23–22.1, and 4q24 being linked to the KMT
(Oikkonen et al., 2014). A possible candidate gene at 4q22 is the netrin receptor
UNC5C. Netrins are responsible for directing axon extension and cell migration during
neural development, and studies have shown interactions between netrins and robo
family receptors (Stein & Tessier-Lavigne, 2001). One such receptor, ROBO1, is a
candidate gene for dyslexia (Carrion-Castillo et al., 2013). The results indicate possible
shared molecular substrates between music and language, which is further strengthened
by previous behavioural findings that KMT significantly predicts dyslexia (Karma,
2002).
The genome-wide linkage and association study also found potential linkage evidence
(PPL = 0.57) for KMT at 16q21-22.1 (Oikkonen et al., 2014), which overlaps with a
previously proposed hearing impairment locus (Basit et al., 2011). Furthermore,

- 36 -
association analysis conducted in the study revealed that KMT was associated with
5q31.3 (posterior probability of linkage disequilibrium [PPLD] = 0.61), 1p31.1 (PPLD
= 0.70) and 11q21 (PPLD = 0.58). While the associations at 1p31.1 and 11q21 could not
be linked to any known gene near these loci, the gene NDFIP1 is located at 5q31.3 and
has a function in immune signalling regulation (Wang, Tong, & Ye, 2012). In addition,
this study also revealed that some of the chromosomal regions showing evidence of
linkage for the combined score (KMT and Seashore’s pitch and time tasks) contain
genes implicated in the auditory pathway. For instance, the linked region 18q12.3-21.1
contains the gene LOXHD1 which is expressed in the inner ear hair cells and would
result in auditory defects in the case of mutation (Grillet et al., 2009). In another linked
region, 4p12-q12, the gene PDGFRA is expressed in the cochlea of mice (Ballana et al.,
2008) and the gene KCTD8 is expressed in the spiral ganglion, a group of nerve cells in
the cochlea.
In a genome-wide CNV analysis, Järvelä and her collaborators detected several copy
number variable regions (CNVRs) containing genes that influence neurodevelopment,
learning and memory (Ukkola-Vuoti et al., 2013). Notably, a deletion on 5q31.1 was
present in some participants with a low combined score on the Karma Music Test and
the Seashore’s pitch and time tasks. This particular region covers the protocadherin-α
gene cluster (Pcdha 1-9), which is involved in the synaptogenesis and maturation of
serotonergic projection neurons, as well as learning and memory (Fukuda et al., 2008;
Katori et al., 2009). The authors proposed Pcdha as a plausible candidate for music
perception since learning and memory are important for music perception and the
development of musical expertise (McLachlan, Marco, Light, & Wilson, 2013). Also
noteworthy was the identification of a large duplicated region on 8q24.22 in an
individual with a low combined score, which happens to overlap with a major linkage
region for absolute pitch (Theusch, Basu, & Gitschier, 2009). Duplication in the
putative AP linkage region may have a negative impact on pitch perception, since large
duplications are potentially detrimental to neurodevelopment (Almal & Padh, 2012;
Grayton, Fernandes, Rujescu, & Collier, 2012).
In addition, a candidate gene study by Järvelä and her team demonstrated significant
associations between the haplotype RS1 and RS3 of the AVPR1A gene on chromosome
12q and the combined score for Karma Music Test and the Seashore’s pitch and time

- 37 -
tasks (Ukkola et al., 2009). Arginine vasopressin has been implicated in social cognition
and behaviour (Bielsky, Hu, Szegda, Westphal, & Young, 2004; Depue & Morrone-
Strupinsky, 2005; Ferguson, Young, & Insel, 2002; Hammock & Young, 2005) and in
social and spatial memory (Aarde & Jentsch, 2006; Ferguson et al., 2002). Its
association with auditory structuring ability in this study suggests a potential link
between music perception and human social functioning. Interestingly, an association
between an AVPR1A polymorphism (in conjunction with a SLC6A4 polymorphism) and
music memory have also been previously reported by another research group (Granot et
al., 2007; see also Granot, Uzefovsky, Bogopolsky, & Ebstein, 2013 for findings from
the follow-up study) .
More recently, Järvelä and her collaborators conducted genome-wide selection analysis
on the music perception ability of 148 Finnish participants, as measured by the
combined score for Karma’s music test as well as Seashore’s pitch and note duration
perception tasks (Liu et al., 2016). Using a case-control design (74 cases with high
combined scores and 74 controls with low combined scores), the researchers identified
12 chromosomal regions showing differential positive selection signals between cases
and controls using several haplotype-based and frequency-based selection methods. The
three best case-specific positive selection regions were namely 12q15-q21.2, 12q21.2,
and 2p13, which contain many brain-related genes.
Several genes found within the positive selection regions are involved in inner-ear
development and auditory perception, two of which are GPR98 and USH2A. GPR98 at
5q14.3 is necessary for proper development of auditory hair bundles (McGee et al.,
2006) and has a possible function in birdsong (Pfenning et al., 2014). USH2A at 1q32.3-
41 is also required in the development of cochlear hair cells, which influence hearing
sensitivity (Liu et al., 2007). Both GRP98 and USH2A have also been associated with
Usher syndrome, which includes symptoms of deafness. Some genes found within the
positive selection regions were also implicated in cognition and memory (e.g., GRIN2B,
IL1B and RAPGEF5). GRIN2B at 12p13.1 is involved in learning and neural plasticity
in the temporal lobe (Kauppi, Nilsson, Adolfsson, Eriksson, & Nyberg, 2011; Milnik et
al., 2012). It is also one of the expressed genes in the singing control network of the
zebra finch (Pfenning et al., 2014; Whitney et al., 2014). IL1B at 2q14 is linked to
cognition and working memory (Benke et al., 2011; McClay et al., 2011) and
- 38 -
RAPGEF5 at 7p15.3 may also have implications in learning and memory (Kawasaki et
al., 1998; Ostroveanu, Van Der Zee, Eisel, Schmidt, & Nijholt, 2010). It is noteworthy
that an earlier genome-wide linkage and association study on music perception ability
identified genes associated with inner-ear development and cognition (Oikkonen et al.,
2014). On the other hand, GZMA at 5q11-q12 is known to be involved in
neurodegeneration and has been observed to be downregulated after music listening
(Iłz̈ecka, 2011).
Located within the positive selection region on chromosome 17, RGS9 gene (17q24) is
putatively associated with reward mechanisms, as the longer splice variant of the gene
(RGS9-2) has been reported to interact with dopamine receptors in the striatum
(Taymans, Leysen, & Langlois, 2003). As already noted, dopamine release has been
linked to music-induced reward (Salimpoor et al., 2011) and recent studies have shown
that other genes associated with the dopaminergic pathways are upregulated after
performing and listening to music (Kanduri, Kuusi, et al., 2015; Kanduri, Raijas, et al.,
2015). Notably, RGS2, another gene from the RGS family, was upregulated after music
listening and has been implicated in vocal learning in songbirds (Clayton, 2000). The
researchers therefore conjecture that RGS proteins may be potential candidate genes for
the evolution of music, but their associations with music aptitude need to be further
elucidated.
Interestingly, approximately 5% of the identified candidate genes (e.g., FOXP1, RGS9,
GRIN2B, GPR98, VLDLR) are related to song perception and production in songbirds
(Pfenning et al., 2014; Whitney et al., 2014), which suggest a possible cross-species
evolutionary conservation of genes associated with auditory perception. Among these
candidate genes, FOXP1 at 3p13 and VLDLR at 9p24.2 are known to be involved in
language development (Chen, Heston, Burkett, & White, 2013; Vernes et al., 2007),
which may possibly indicate a common genetic and evolutionary background for music
and language.
One major limitation of the study by Liu et al. (2016) is that the large positive selection
regions spanned numerous genes, making it difficult to interpret the functional
importance of these regions, especially since the functions of many of the identified
genes remain unknown. As such, the authors only described in detail the genes

- 39 -
important in brain function, hearing, and the singing network of songbirds, and more
functional studies on the other candidate genes are warranted.
As for a possible genetic substrate underlying rhythm perception, one study has reported
that in a three-generation family pedigree (KE family) with multiple probands of severe
speech and language disorder, the affected individuals also showed impairment in
rhythm perception and production, while their pitch perception and production abilities
remained intact (Alcock, Passingham, Watkins, & Vargha-Khadem, 2000). Subsequent
gene sequencing showed that the affected KE family members has a point mutation in
the FOXP2 gene (Lai, Fisher, Hurst, Vargha-Khadem, & Monaco, 2001). These
findings suggest a possible shared genetic basis for speech and rhythm, while pitch-
based music abilities are likely to be influenced by other genetic factors (Peretz, 2009).
2.4.1.3 Music memory
There is evidence that six to eight-month old infants have already developed long-term
memories for music and are able to distinguish between familiar and novel music
(Plantinga & Trainor, 2003; Saffran, Loman, & Robertson, 2000). In addition, exposure
to melodies presented prenatally for three weeks elicits significant heart rate change in
one-month old infants compared to unexposed controls, suggesting that newborn infants
are capable of retaining music representations up to six weeks following prenatal
exposure (Granier-Deferre, Bassereau, Ribeiro, Jacquet, & DeCasper, 2011). Genetic
determinants of memory have been reported in the broader literature, with some studies
indicating that memory ability can be predicted by a particular SNP Val66Met variant
of the BDNF gene (Egan et al., 2003; Hariri et al., 2003). BDNF is evident in the
hippocampus (a structure fundamental to new learning and memory) and has been
implicated in neuronal growth, survival and maturation, including arborisation and
synaptic plasticity in the adult brain (Park & Poo, 2012).
Granot and colleagues (2007) investigated the possible association of phonological and
music memory with the genes AVPR1A and SLC6A4 . The rationale for targeting these
two genes included a previously reported relationship between arginine vasopressin
(AVP) and spatial and social memory (Aarde & Jentsch, 2006; Ferguson et al., 2002).
There is also evidence that serotonin interacts with AVP in the hypothalamus (Albers,
- 40 -
Karom, & Smith, 2002) and that serotonin increases the secretion of AVP (Gálfi et al.,
2005). This points to a possible epistatic relationship5 between the gene AVPR1A, which
contains the blueprint to synthesise the AVP receptor, and the gene SLC6A4, which is
the serotonin transporter protein crucial for regulating serotonin supply to serotonin
receptors. In view of this, Granot and colleagues genotyped 82 university students with
minimal music training for the AVPR1A (RS1 and RS3 haplotypes) and the SLC6A4
(HTTLPR) polymorphisms using population-based and family-based association
analyses. Specifically, the music memory performance of the participants was assessed
using four melodic memory tests and two rhythmic memory tests. Results revealed
significant gene by gene epistatic interactions between the AVPR1A and SLC6A4
polymorphisms for two melodic memory tasks (as measured by the Gordon melodic
imagery subtest from the Musical Aptitude Profile, and the interval subtest from the
Montreal Battery of Evaluation of Amusia), one rhythmic memory task (Seashore’s
rhythm perception task), and one phonological memory task, even after applying
conservative Bonferroni corrections for multiple testing. This provides initial evidence
for an epistatic relationship between AVPR1A and SLC6A4 polymorphisms that may be
linked to short-term memory for music, or more generally, to phonological memory.
In a follow-up study, AVP was administered intranasally to 50 male adults with little or
no music training in a double-blind, placebo-controlled, crossover study (Granot,
Uzefovsky, Bogopolsky, & Ebstein, 2013). At the end of each session (AVP/placebo),
the participants’ music working memory was assessed using the melodic imagery
subtest from Gordon’s Musical Aptitude Profile and the interval subtest from the
MBEA, whereas their verbal working memory was assessed with the forward and
backward digit span tasks. While AVP administration was not found to significantly
affect the performance in the digit span task, a complex pattern emerged for the music
memory tasks. For the MBEA test, in both sessions, the group that received AVP first
performed worse than the group that received placebo first. For Gordon’s music test,
both groups performed significantly better in the second session, while a marginal
session effect and a Group × Session interaction effect were observed. It was also found
that in the group that received AVP first, their music memory scores were significantly
positively correlated with affective state scores. The researchers posited that the
5 The interaction between genes at two different loci.

- 41 -
complex findings suggest that the intriguing detrimental effects of AVP on music
memory may be mediated by mood, attention and arousal, such that only those who
scored low on happiness and attentiveness were negatively affected by AVP in terms of
their music working memory. In light of music’s propensity for modulating arousal and
AVP’s influence on mood and arousal, it is conceivable that the documented
associations between AVP and music perception, creativity and memory could reflect
individual differences in arousal and attention modulation rather than individual
differences in cognitive or social abilities per se.
2.4.1.4 Music listening
Listening to music is a ubiquitous behaviour evident in all known human cultures.
Järvelä and her team investigated the role of AVPR1A gene polymorphisms in active
and passive music listening behaviour in 31 Finnish families using family-based
association analysis (Ukkola-Vuoti et al., 2011). They found that current active music
listening was significantly associated with the RS1 and AVR haplotype, whereas
lifelong active music listening was significantly associated with the RS1 and RS3
haplotype. A shared genetic basis for the frequency of lifelong active music listening
and music perception ability was suggested by the authors, as the same haplotype (RS1
and RS3) was previously demonstrated to be associated with music perception (Ukkola
et al., 2009). Given the well-established role of arginine vasopression in mediating
social behaviour (Bielsky et al., 2004; Depue & Morrone-Strupinsky, 2005; Ferguson et
al., 2002; Hammock & Young, 2005), the current finding suggests that music listening
may share common neurobiological substrates with social attachment and
communication.
Recently, the same Finnish research group investigated the effect of listening to
classical music on the human transcriptome (i.e., all the RNA transcripts in a cell that
are read from the DNA code) using genome-wide transcriptional profiling (Kanduri,
Raijas, et al., 2015). It was found that in participants with high musical experience
(based on years of music training or music perception ability), several genes implicated
in dopamine secretion, transport and signaling were upregulated (i.e., increasingly
expressed), which converged with previous evidence of music listening inducing
dopaminergic release and transmission (Salimpoor et al., 2011; Sutoo & Akiyama,

- 42 -
2004). Most notably, one of the most upregulated genes was SNCA, a known risk gene
for Parkinson’s disease (Oczkowska, Kozubski, Lianeri, & Dorszewska, 2013; Scherzer
et al., 2008). Interestingly, SNCA is located on the most significant linkage region for
music perception ability, 4q22.1 (Oikkonen et al., 2014; Pulli et al., 2008). In addition,
SNCA is regulated by GATA2, a transcription factor which has a possible association
with music perception ability (Oikkonen et al., 2014). Other upregulated genes in
participants with high musical experience included those that are associated with
learning, memory and cognition (e.g., SNCA, NRGN, NPTN), synaptic function and
neurotransmission (e.g., SNCA, HDAC4, FKBP8), neuroprotection and neurogenesis
(e.g., SNCA, KLF4), and auditory cortical activation and absolute pitch (e.g., FAM49B,
HDAC4). It is worth noting that some of the upregulated genes (e.g., SNCA, NRGN,
RGS2) are also known to be associated with song perception and production in
songbirds (Wada et al., 2006), which suggests a potential cross-species shared
evolutionary background for sound perception. On the other hand, several of the
downregulated genes (e.g., ATP5J, ATP5L, GZMA, CASP8) are involved in
neurodegenerative processes. Taken together, the downregulation of genes implicated in
neurodegeneration and the upregulation of genes involved in neurogenesis and
neuroprotection indicate that music listening may have a neuroprotective role and
supports the utility of music therapy as a potential means for managing
neurodegenerative diseases.
2.4.1.5 Congenital amusia
While most people in the general population commonly engage in music listening
behaviour, there are some individuals who cannot enjoy listening to music due to a fine-
grained pitch perception deficit, known as congenital amusia. Commonly known as
“tone deafness”, congenital amusia is a fine-grained pitch perception deficit
characterised by the inability to detect “wrong” notes in melodies, despite normal
intellect, language and hearing abilities (Peretz & Hyde, 2003). It is uncommon in the
general population, with an estimated population prevalence of 4% or less (Henry &
McAuley, 2010; Kalmus & Fry, 1980; Pfeifer & Hamann, 2015). While the
neurological basis of congenital amusia has been well-investigated (Hyde et al., 2007;
Loui, Alsop, & Schlaug, 2009; Mandell, Schulze, & Schlaug, 2007; Mignault Goulet,

- 43 -
Moreau, Robitaille, & Peretz, 2012; Peretz & Hyde, 2003), few studies have explored
its genetic basis.
In the first familial aggregation study on congenital amusia, Peretz et al. (2007)
administered an online amusic diagnostic test to 13 amusic probands and 17 controls, as
well as 58 family members of the probands (from 9 large families) and 58 family
members of the controls (from 10 families). The results showed that 39% of first-degree
relatives have congenital amusia, whereas only 3% of controls were similarly
diagnosed. Notably, the λs for congenital amusia was 10.8, whereas the offspring
recurrence risk was much lower at 2.3. While the high λs suggests a probable genetic
basis for congenital amusia, Peretz and colleagues speculated that exposure to an
enriched musical environment may mitigate the risk for offspring of amusic probands.
However, Mignault Goulet and colleagues (2012) reported that after four weeks of daily
music listening, the music perception scores and electrophysiological measures of seven
amusic children (aged 10-12 years) did not vary essentially. This suggests that daily
music listening is insufficient to improve pitch perception performance or stimulate
neuroplasticity in amusic children.
2.4.1.6 Absolute pitch
Absolute pitch (AP) or “perfect pitch” is the rare music ability of being able to identify
or produce pitches without relying on an external reference. It has an estimated
prevalence of less than 1 in 10,000 (Bachem, 1955), although some recent studies have
suggested the prevalence could be closer to 1 in 1,500 (Profita & Bidder, 1988). While
AP is neither a prerequisite nor a predictor for outstanding musicianship, its rarity and
the musical advantages it confers have generated much research interest into its
etiology. Altogether, 24% of the genetic studies on music ability have investigated AP.
It has been observed that AP appears to cluster within families. A segregation study by
Profita and Bidder (1988) reported significant familial incidence for AP in 19 families,
with a segregation ratio estimated to lie between 0.24 to 0.37. Based on the segregation
ratio, the researchers surmised that the etiology of AP is possibly an autosomal
dominant gene with incomplete penetrance. A more recent segregation analysis on a
larger sample, however, yielded a low segregation ratio of .089, which suggests that AP

- 44 -
was unlikely to be inherited in a simple Mendelian fashion (Theusch & Gitschier,
2011). Within this larger sample, however, the casewise concordance rate for AP among
identical twin pairs (78.6%) was significantly different from that of non-identical twin
pairs (45.2%), which suggests a genetic basis for AP.
Several familial aggregation studies also demonstrated evidence of familial clustering of
AP. In their familial aggregation study, Gregersen and Kumar (1996) reported a sibling
recurrence risk-ratio (λs) estimate of 20, meaning that siblings of AP possessors are
approximately 20 times more likely to develop AP compared to the general population.
Gregersen and colleagues subsequently conducted two more familial aggregation
studies and reported sibling relative risk (sib RR) estimates of 8.3 and 12.2, respectively
(Gregersen, Kowalsky, Kohn, & Marvin, 1999, 2001). In other words, the siblings of
the AP possessors in these studies have 8.3 and 12.2 times greater likelihood of
developing AP compared to the siblings of the controls. It is worth noting that high
familial aggregation estimates do not necessarily point to a strong genetic basis for AP,
since familial aggregation does not distinguish between genetic and environmental
influences.
Evidence from several studies have indicated that environmental factors such as early
music training may also contribute to the development of AP (Gregersen, Kowalsky, &
Li, 2007; Miyazaki, 1988; Profita & Bidder, 1988; Sergeant, 1969; Wilson, Lusher,
Martin, Rayner, & McLachlan, 2012). Baharloo and colleagues (Baharloo, Johnston,
Service, Gitschier, & Freimer, 1998) therefore controlled for early music training by
recruiting only families where participants and one or more of their siblings had
received music training before 6 years of age, and the sibling recurrence risk-ratio (λs)
for this study was estimated to be 7.5 (Gregersen, 1998). In a subsequent study (ref),
Baharloo and colleagues estimated the sibling recurrence risk-ratio for the highest level
of AP ability (termed AP-1) and reported that after controlling for early music training,
the estimated λs ranged from 7.8 to 15.1, with a greater likelihood of the true value
being near the upper end of the range. The consistent sizeable estimates of λs from
various familial aggregation studies with or without controlling for early music training
suggests that genetic influences likely play a key role in the development of AP.

- 45 -
More recently, evidence suggests that multiple genetic factors may be involved in the
etiology of AP (Theusch & Gitschier, 2011). A segregation analysis performed on 1,463
AP-1 probands yielded a segregation ratio of .089, which is considerably lower than the
estimate from the small AP sample in Profita and Bidder (1988) and the segregation
ratios of 0.25 and 0.5 for autosomal recessive and autosomal dominant inheritance,
respectively. This suggests that AP was not inherited in a simple Mendelian fashion.
However, genetic factors likely play a role since within this larger sample, 11 out of 14
MZ twin pairs were concordant for AP-1 in comparison to only 14 out of 31 DZ twin
pairs. These results yielded a significantly different casewise concordance rate of 78.6%
and 45.2%, respectively.
Other supporting evidence for a possible genetic basis for AP comes from ethnicity
effects observed in music students. While Gregersen et al. (1999) reported an overall sib
RR of 8.3 for AP in 2,707 tertiary music students, a higher sib RR of 11.1 was observed
for an Asian subsample. Gregersen et al. (2001) also reported that in a sample of 1,067
music theory students, Chinese, Korean and Japanese students had a substantially higher
incidence of AP (47.5%) compared to Caucasian students (9%). A possible genetic
explanation could be that the frequencies of susceptibility alleles may vary in different
ethnic groups (Gregersen et al., 1999). Although some other researchers have attributed
this “Asian advantage” to early tone-language exposure (Henthorn & Deutsch, 2007),
this is unlikely to fully account for the higher incidence of AP among all Asian ethnic
subgroups since essentially, Korean and Japanese are not tone languages (Kubozono,
2012; Sohn, 1999; Zatorre, 2003). Further analysis of Gregersen’s 2001 study data
revealed that the age of onset of music training and exposure to a “fixed do” training
method before the age of 7 were the only strong predictors of AP acquisition in this
sample (Gregersen et al., 2007).
Possible ethnicity effects for AP can also be observed from a genome-wide linkage
study of 73 families of European, East Asian, Ashkenazi Jewish and Indian descent
(Theusch et al., 2009) in the United States and Canada. In each family there were at
least two AP possessors, not limited to a parent-child relative pair. Non-parametric
multipoint linkage analyses were suggestive of linkage on chromosomes 8q24.21 (LOD
= 2.330) and 8q21.11 (LOD = 2.069) for the European/Ashkenazi Jewish/Indian
combined dataset. Notably, one of the four genes found near the linkage peak on
- 46 -
8q24.21 was ADCY8, which is expressed almost exclusively in the brain and is
implicated in learning and memory processes (De Quervain & Papassotiropoulos, 2006;
Ludwig & Seuwen, 2002; Wong et al., 1999). When only the subset of 45 AP families
of European descent was examined, there was strong evidence of linkage on
chromosome 8q24.21 (LOD = 3.464 at SNP rs3057), suggesting that at least one gene
within this linkage region could predispose AP in individuals of European descent. Two
such genes are FAM49B, a protein coding gene, and ADCY8, which is implicated in
learning and memory. A number of other linkage peaks were found in the European
families, namely on loci 8q21.11 (LOD = 2.236), 7q22.3 (LOD = 2.074) and 9p21.3
(LOD = 2.048). These peaks suggest that different genetic factors may underpin the
etiology of AP, even within the same population. The linkage region on 7q22.3 was also
observed in a subset of 19 AP families of East Asian ancestry, albeit with a smaller
linkage peak (LOD approximately 1 to 1.5). These findings support a strong genetic
contribution to AP, which is likely to be heterogeneous. In other words, AP may be
predisposed by different genetic variants at different chromosomal regions, both within
and across populations of different ancestries.
A recently published study investigated the genetic relationship between AP and
synaesthesia through a combined genome-wide linkage analysis of 53 multiplex
families with AP (i.e., families in which multiple family members have AP) and 36
multiplex families with synaesthesia (Gregersen et al., 2013). Interestingly, 28 of the
126 AP possessors from the AP families reported synaesthesia, while eight synaesthesia
families had a member with AP. Separate non-parametric linkage analysis of the AP
and synaesthesia datasets revealed overlaps in several linkage regions (LOD > 2),
especially on chromosomes 2 and 6. Given this overlap and the hypothesis that the two
phenotypes may be jointly influenced by genes underpinning brain structural and
functional connectivity, the researchers combined the AP and synaesthesia datasets for
analysis. This revealed significant linkage on chromosome 6q14.1-6q16.1 (LOD =
4.68), where notably, a small linkage peak (LOD = 1.72) had been reported for the
subset of 45 AP families of European ancestry studied by Theusch and colleagues
(2009). Upon sequencing several potential candidate genes in this region, Gregersen and
colleagues found that AP possessors from four of the AP multiplex families shared one
or more of three non-synonymous variants of the gene EPHA7. EPHA7 has been
implicated in brain development, particularly establishing neural connectivity between

- 47 -
auditory cortex and other cortical regions with the thalamus (North, Clifford, &
Donoghue, 2013; Torii, Hackett, Rakic, Levitt, & Polley, 2013). Since neuroimaging
studies have reported that both AP and synaesthesia are marked by atypical structural
and functional connectivity (Dovern et al., 2012; Loui, Li, Hohmann, & Schlaug, 2011;
Rouw & Scholte, 2007), it is conceivable that EPHA7 variants may influence these two
phenotypes. More research involving extensive resequencing on the EPHA7 gene is
needed in order to confirm its involvement. Using parametric linkage analysis, a more
complex pattern of linkage was also observed on chromosome 2 in the combined AP
and synaesthesia dataset, with a heterogeneity LOD score of 4.7 at SNP rs1482308 on
2q24.1. When only the AP families were considered, a maximum heterogeneity LOD
score of 3.93 was observed at SNP rs6759330 on 2q22.1.
Inherent neuroanatomical differences between AP and non-AP possessors may also be
genetically influenced. AP possessors show increased leftward asymmetry of the
planum temporale (PT) due to a significantly smaller right mean PT volume compared
with non-AP possessors (Keenan, Thangaraj, Halpern, & Schlaug, 2001; Wilson,
Lusher, Wan, Dudgeon, & Reutens, 2009). Keenan et al. (2001) suggested that the
“pruning” of the right PT may be prenatally determined rather than due to early music
training, since non-AP musicians with early music training do not manifest similar
asymmetry. Wilson et al. (2009) subsequently demonstrated a striking difference in the
right mean PT volumes of musicians with AP and quasi-absolute pitch (participants
who scored between 20-90% on a note-naming test), even though the age of onset of
music training did not differ significantly between these groups. Other supporting
evidence comes from the discovery of an adult AP possessor, R.M., who had minimal
music training but was able to perform a pitch memory task at a level indistinguishable
from AP musicians. This case suggests that an early onset of music training (or any
music training) may not be necessary for AP to emerge (Ross, Olson, & Gore, 2003),
and that AP and non-AP possessors may be using different pitch processing
mechanisms (McLachlan, Marco, & Wilson, 2013) that in part, reflect genetically
influenced neuroanatomical differences.
Apart from this one documented case of a musically-naïve AP possessor (Ross et al.,
2003), most AP possessors report early onset of music training (Levitin & Zatorre,
2003; Miyazaki & Ogawa, 2006; Russo, Windell, & Cuddy, 2003), which indicates a

- 48 -
possible critical time window for the development of AP. Previous studies have found
that the inhibition of HDAC (histone-deacetylase), an enzyme which serves as a “brake”
to critical-period neuroplasticity, could reopen the critical window and alter music
preference or enable recovery from amblyopia in adult mice (Putignano et al., 2007;
Silingardi, Scali, Belluomini, & Pizzorusso, 2010; Yang, Lin, & Hensch, 2012). In view
of this, Gervain et al. (2013) investigated whether the administration of valproate, a
HDAC inhibitor may potentially reopen the critical period for AP development and
facilitate pitch naming ability in 24 musically naïve adult males. Using a randomised,
double-blind, placebo-controlled crossover study, during each treatment arm, the
participants took either valproate or placebo capsules over the course of 15 days and
underwent daily 10-minute pitch association online training from days 8 to 14 before
taking the AP assessment task on day 15. Results showed that in the first treatment arm,
the valproate group performed significantly above chance level but the placebo group
performed at chance level. Intriguingly, in the second treatment arm, no significant
difference in performance was observed between the two groups as both performed at
chance level. It was suggested that the worse performance in both groups during the
second treatment arm could be due to a memory conflict whereby the set of pitches
learned in the first treatment interfered with those learned in the second treatment. From
these results, the researchers concluded that the significant findings from the first
treatment arm offered a preliminary, proof-of-concept demonstration that valproate has
an effect on AP perception, potentially by reactivating critical period learning through
HDAC inhibition. It is noteworthy, however, that no significant correlation between AP
performance and valproate levels in the blood was observed.
2.4.2 Music production
This section will describe the genetic findings of various music production abilities such
as singing accuracy and music creativity (music improvising, arranging and
composing), as well as other traits related to music production such as music flow,
music practice, and singing participation.

- 49 -
2.4.2.1 Music performance
The Finnish research group behind numerous molecular genetics studies on music
(Kanduri, Raijas, et al., 2015; Oikkonen et al., 2014; Pulli et al., 2008; Ukkola-Vuoti et
al., 2013; Ukkola-Vuoti et al., 2011; Ukkola et al., 2009) recently investigated the effect
of performing music on the human transcriptome in 10 musicians by conducting
genome-wide transcriptional profiling (Kanduri, Kuusi, et al., 2015). Peripheral blood
samples from 10 professional musicians before and after a 2-hour concert performance
and 10 musician controls before and after a 2-hour session without music exposure were
analysed and compared. Similar to their transcriptome study on music listening
(Kanduri, Raijas, et al., 2015), music performance was observed to upregulate several
genes involved in dopaminergic neurotransmission, one of which was SNCA (alpha-
synuclein), a gene on chromosome 4q22.1 previously identified as a strong candidate
for music perception ability (Oikkonen & Järvelä, 2014; Pulli et al., 2008), listening to
classical music (Kanduri, Raijas, et al., 2015), and a possible early biomarker for
Parkinson’s disease (Scherzer et al., 2008). In addition, other motor behavior-related
genes including CCR4 and FOS were also upregulated, which may potentially shed light
on the molecular mechanisms for executing music-related fine motor skills. Other
upregulated genes included those implicated in learning and memory (e.g., FOS, HDC,
CLN8, DOPEY2), and biological processes crucial for neuronal survival and
neuroprotection such as calcium ion and iron ion homeostases (e.g., SNCA, FOS,
CLN8).
It is noteworthy that this study also found some genes known to be involved in song
perception and production in songbirds (e.g., SNCA, FOS, DUSP1) upregulated in
music performance, suggesting possible evolutionary conservation in sound perception
or production molecular mechanisms. In addition, several of the upregulated genes such
as SNCA, FOS, CLN8 and DOPEY2 have been implicated in neuropsychiatric or
neurodegenerative disorders (Byun et al., 2013; Scherzer et al., 2008; Smith et al., 1997;
Vantaggiato et al., 2009). The researchers therefore conjectured that modulation of these
genes by music performance may serve to explain music’s therapeutic effects (Conrad,
2010).

- 50 -
2.4.2.2 Music practice
While music practice is often construed as an environmental variable (see Section 3.4.2,
p. 72), two recent studies have demonstrated that music practice itself not only has a
genetic basis, but its association with music ability is also mediated by shared genetic
influences. The aforementioned Swedish twin study by Ullén et al. (2014) which
investigated music perception using the Swedish Musical Discrimination Test (SMDT)
also collected data on hours of music practice, yielding a sum-score estimate of total
hours of music practice accumulated by each participant (Mosing, Madison, et al.,
2014). Participants who did not have music training were thus given a score of 0. There
was a significant sex difference on hours of music practice, with males accumulating
more hours of practice than females. Univariate genetic analyses were thus performed
separately for male and female twins, yielding considerable heritability estimates of
69% and 21% for males and females, respectively. Bivariate genetic modelling was
conducted between music practice and each of the measures of music ability to
determine the relative genetic and environmental contributions to the correlation
between music practice and music ability. Model-fitting results revealed significant
genetic correlations between music practice and all measures of music ability in both
males and females (i.e., pitch, melody and rhythm discrimination), except for pitch
discrimination ability in female twins. On the other hand, common environmental
influences were significant in explaining the associations between music practice and
melody discrimination in males, as well as pitch discrimination in both males and
females. Unique environmental influences were not essential in explaining the
correlation between music practice and any of the music ability measures. Taken
together, the findings suggest that the relationship between music practice and musical
auditory discrimination was mainly explained by shared genetic influences and (for
pitch and melody discrimination) some shared common environmental influences.
Hambrick and Tucker-Drob (2014) also found evidence for gene-environment
correlation and interaction between music practice and music accomplishment. Using
data from over 800 twins from the National Merit Twin Study in 1962, music practice
was constructed as a trichotomous variable: frequently, occasionally or none at all.
Univariate genetic analysis revealed a moderate heritability estimate of 38%. Bivariate
model-fitting results indicated that the percentages of shared genetic, common

- 51 -
environmental and unique environmental influences between music practice and music
accomplishment were 23%, 69% and 25%, respectively, which suggests that music
practice and music accomplishment shared a high proportion of common environmental
influences and modest amounts of genetic and unique environmental influences. In
addition, a gene-environment interaction between music practice and music
accomplishment was observed, which suggests the importance of music practice in the
expression of genetic influences on music accomplishment (see Section 2.4.3, p. 58).
Collectively, these two studies challenge many of the beliefs held by proponents of
deliberate practice. First, there is a genetic basis for music practice, with heritability
estimates ranging from 21% to 69%. This indicates that regarding music practice as a
pure environmental variable is untenable. Second, gene-environment correlations were
observed between music practice and music ability or accomplishment. While Mosing,
Madison, et al.’s findings (2014) indicate that the association between music practice
and music perception was largely genetically mediated, music practice and music
accomplishment only shared a small proportion of genetic influences in Hambrick &
Tucker-Drob’s study (2014). This is likely due to the different ways in which music
ability and accomplishment were defined in the two studies. Music accomplishment
appeared to be more closely related to music production ability as it included items such
as receiving music prizes or engaging in public music performance. The large
proportion of unique genetic influences on music accomplishment not shared with
music practice could potentially be explained by other genetically influenced factors
such as music aptitude and motor abilities (Hambrick & Tucker-Drob, 2014). Finally,
the findings regarding gene-environment interaction on music practice and music
accomplishment challenge the prevailing conception that genetic influences on music
expertise will become attenuated with practice (Ericsson, 2006). The research evidence
from Hambrick & Tucker-Drob (2014) suggests a contrasting view, whereby genetic
effects on music accomplishment become magnified and more fully expressed when
fostered by music practice.
2.4.2.3 Music flow
While technically not a music production ability, music-specific flow, defined as a
pleasurable state of complete and effortless absorption in musical activity, is without

- 52 -
doubt closely associated with music-making. Music-specific flow and openness-to-
experience are two important predictors of music practice (Butkovic, Ullén, & Mosing,
2015), and in the large Swedish twin study on music aptitude conducted by Ullén and
his team, the researchers reported that genetic influences explained 40% and 55% of the
variation in music flow and openness, respectively, with negligible common
environmental influences (Butkovic et al., 2015). Moreover, multivariate genetic
modelling reveal significant genetic (A) and unique environmental (E) correlations
between music practice and music flow, as well as between music practice and
openness. Specifically, approximately 76% of the correlation between music practice
and music flow and 75% of the correlation between music practice and openness were
explained by shared genetic influences. The association between openness and music
flow was also mediated by shared genetic influences to a large extent (61%). The shared
genetic influences observed among these variables suggest that genetic influences
predisposing an individual to be more open also play a part in influencing one to
experience more music flow and engage in more music practice. While association does
not necessary imply causation, it is plausible that higher openness encourages one to
seek out new musical experiences, and the pleasurable state of flow one experiences
during music-making may serve as an intrinsic motivation for more music practice
(Butkovic et al., 2015).
2.4.2.4 Music creativity
Although a study has previously shown that music-accompanied creative dance
performance was associated with SLC6A4 and AVPR1A (Bachner-Melman et al., 2005),
the genetic basis of music creativity was first investigated in 19 Finnish musical
families using a web-based questionnaire by Järvelä’s team (Ukkola et al., 2009).
Participants were asked about their music background and participation in creative
music activities, such as music composition, improvisation or arrangement. The
findings indicated that creative functions in music may have a strong genetic component
in this sample population, with a heritability estimate of .84. A significant positive
association between music creativity and high music perception test scores was also
observed. However, no significant associations between music creativity and the
polymorphisms of candidate genes such as TPH1, COMT and AVPR1A were found.

- 53 -
Ukkola-Vuoti et al. (2013) performed a subsequent CNV analysis on five
multigenerational Finnish families and 172 unrelated individuals using the same music
creativity questionnaire. A “creative phenotype” was characterised by engagement in
one or more creative music activities (composing, improvising or music arranging).
Results showed that a deletion on 5p15.33 was present in 48% of family members and
28% of unrelated participants who exhibited the creative phenotype, while a duplication
on 2p22.1 was present in 27% of creative family members in two families. The region
2p22.1 contains the gene GALM, which is associated with serotonin transporter binding
potential in the human thalamus (Liu et al., 2011). The medial geniculate nucleus of the
thalamus forms part of the auditory pathways, and more generally has been implicated
in music-related functions such as beat perception (McAuley, Henry, & Tkach, 2012),
sensorimotor synchronisation (Krause, Schnitzler, & Pollok, 2010) and musical imagery
(Goycoolea et al., 2007). Other studies have found a link between the serotonin
transporter gene (SLC6A4) and music-related functions such as choir participation
(Morley et al., 2012) and creative dance (Bachner-Melman et al., 2005).
On the other hand, deletions in three CNV regions (2p12, 3p14.1 and 3q28) occurred
quite commonly in individuals from two or more families without the creative
phenotype, with frequencies ranging from 19% to 31%. The authors acknowledged the
preliminary nature of their findings, highlighting their use of uncorrected multiple
comparisons. Replication of the findings is clearly warranted, including the potential
use of objective measures of music creativity in future research.
The same Finnish research group recently performed genome-wide linkage analysis on
a large Finnish sample consisting of 474 participants from 79 families and 103 unrelated
individuals to investigate the engagement in three forms of music creativity
(composing, arranging and improvising) using a more detailed questionnaire (Oikkonen
et al., 2016). The heritabilities for the various phenotypes estimated from the family
data are moderate in general (composing: 33.3%; arranging: 33.4%; non-musically
creative: 28.9%), with the exception of improvising which has a low heritability
estimate of 11.6%. The researchers suggested that the much lower heritability estimates
for music creativity as compared to that from Ukkola et al. (2009) were likely to be
more robust estimates, as these were estimated using a much larger sample with more
carefully delineated musically creative phenotypes. The phenotypes with moderate

- 54 -
heritabilities were then selected for genome-wide linkage analysis. For arranging,
suggestive linkage evidence was observed at 16p12.1-q12.1 (LOD = 2.75), which is
near the previously identified chromosomal region for music perception (Oikkonen et
al., 2014). The best linkage evidence in the region was obtained at 16p12.1 (LOD =
4.22), in the intron6 of the GSG1L gene, which is implicated in fast synaptic
transmission in the central nervous system (Shanks et al., 2012). Suggestive linkage
evidence at 4q22.1 was found for composing (LOD = 2.15), which overlaps with the
previously identified loci (4q22-23) for music perception ability (Oikkonen et al., 2014;
Pulli et al., 2008) and is in the vicinity of the implicated locus (4q26) for vocal pitch-
matching accuracy (Park et al., 2012). Furthermore, two recent human transcriptome
studies have reported that the SNCA gene at 4q22 was observed to be one of the most
up-regulated genes after music listening and music performance (Kanduri, Kuusi, et al.,
2015; Kanduri, Raijas, et al., 2015). These finding therefore add credence to the
chromosome 4 region being a candidate region for various music-related traits and
suggests a common genetic background for these traits. Functional analysis of putative
genes in the implicated chromosomal region for composing indicated an
overrepresentation of the cerebellar long-term depression (LTD) pathway: 17 out of the
141 known genes involved in the LTD pathway were found in the analysis for genes
suggestively associated with composing. Notably, the LTD pathway is purportedly a
cellular model for synaptic plasticity and memory (Collingridge, Peineau, Howland, &
Wang, 2010), which may be favourable cognitive attributes for music composing.
Interestingly, the LTD pathway also comprises AMPA receptors (AMPAR), including
the aforementioned GSG1L gene suggestively associated with arranging. The results
therefore imply that individual differences in genes affecting the LTD pathway may
potentially influence music creativity.
Interestingly, there was significant linkage evidence for a non-musically creative
phenotype (musically trained individuals who do not engage in music composing or
arranging activities) at 18q21 (LOD 3.09). The best linkage evidence in the region is in
the vicinity of the CDH7 (Cadherin 7, Type 2) and CDH19 (Cadherin 19, Type 2) genes
from the cadherin family, which has been linked to neuropsychiatric conditions such as
schizophrenia (Redies, Hertel, & Hübner, 2012). CDH7 is also implicated in the vocal
6 A segment of the DNA that does not code for proteins.

- 55 -
development of songbirds (Matsunaga & Okanoya, 2008). The significant linkage
region at 18q21 has also been associated with the 18q deletion syndrome which may
cause hearing loss and intellectual disability and is adjacent to a previously identified
loci (18q23-21.1) for music perception ability (Oikkonen et al., 2014).
One limitation of the study by Oikkonen et al. (2016) is that the creative phenotypes
used in this study were not defined quantitatively by objective testing nor were they
indicative of actual creative ability. Therefore, there is a possibility that these
phenotypes may reflect a willingness or motivation to engage in music creativity rather
than the actual ability itself.
2.4.2.5 Singing participation
Coon and Carey (1989) analysed the music ability of 11th grade twins by extracting
music-related questionnaire data from an earlier study (Loehlin & Nichols, 1976). For
participation in singing activities, the heritability estimates were reported as 71% for
males and 20% for females, while the corresponding shared environment estimates were
8% and 59% respectively. The significant gender difference in the estimates indicates
that a shared environment exerted a stronger effect on females than males, while
heritability was much higher in males than females. The researchers suggested this may
be due to a stereotypical perception that singing is a feminine activity and therefore,
males might require greater interest and intrinsic ability to take part in such activities.
As this study relied on self-reported data and did not objectively assess the singing
ability of the twin pairs, more investigation is warranted to ascertain the genetic
contribution to singing ability.
Similar to the association study on music memory by Granot et al. (2007), a candidate
gene association study by Morley et al. (2012) tested the relationship between choir
membership and allelic variants of the genes AVPR1A and SLC6A4. An overall
association with choral singer status was observed at the STin2 (intron 2) polymorphism
in the SLC6A4 gene, with the STin2 9-repeat and 12-repeat alleles7 being more common
in choral singers, and the 10-repeat alleles more common in non-musically active
7 Allelic variants that differ by the number of repeat units, resulting in alleles of different lengths.

- 56 -
controls. No significant differences in allele frequencies were observed between the two
groups for other SLC6A4 and AVPR1A polymorphisms. Previous studies have reported
possible involvement of STin2 in personality traits and reward behaviour (Kazantseva et
al., 2008; Saiz et al., 2010; Zhong et al., 2009). SLC6A4 polymorphisms (together with
AVPR1A) have also been linked to participation in creative dance (Bachner-Melman et
al., 2005). As several studies have observed associations between AVPR1A
polymorphisms and certain music traits (Granot et al., 2007; Ukkola-Vuoti et al., 2011;
Ukkola et al., 2009), the non-significant AVPR1A association in this study led the
authors to speculate that the observed STin2 effect may predispose social behavioural
characteristics (i.e.. a “predisposed to group activity” phenotype) rather than music
ability per se.
2.4.2.6 Singing accuracy
Across all cultures humans have a propensity to sing. From two months onwards,
infants begin to produce "musical babbling" containing definite music features such as
pitch and rhythmic patterns (Welch, 2006). Most children begin imitating songs at
approximately age two, by age four they can sing complete songs, and by age 5 most of
them can accurately reproduce entire songs (McPherson & Williamon, 2006; Parncutt,
2006).
Although it is likely that variability in children’s singing competency is, in part,
attributable to environmental factors, such as early music exposure and training, a
behavioural study has suggested there may also be an inborn aspect to singing accuracy.
Watts et al. (2003) identified individuals who received no professional vocal training
yet were described by professional voice teachers as “exhibiting expressed singing
talent”. These individuals showed consistently superior performance on pitch-matching
tasks, especially in the absence of external auditory feedback, even when compared with
trained singers who had at least three years of professional vocal training.
Park et al. (2012) investigated the genetic factors underpinning singing ability by
conducting family-based linkage and association analyses on 1,008 participants from 73
extended Mongolian families. They administered a pitch production accuracy test and
found that 357 of the participants (35.4%) were accurate pitch-matchers, reliably

- 57 -
singing the target pitches with deviations of less than one semitone. Using pedigree
data, the heritability of singing accuracy was reported as 40%. A genome-wide linkage
analysis was then conducted, with the most significant linkage peak observed on 4q23
(LOD = 3.1 at marker D4S2986). The findings overlap with regions on chromosome 4q,
where there is linkage evidence for music perception ability (Oikkonen et al., 2014;
Pulli et al., 2008). A family-based association analysis performed at the 4q23 linkage
peak using 53 of the families revealed that SNP rs12510781 was most significantly
associated with singing accuracy. This is an intergenic SNP near the gene UGT8, whose
encoded protein is highly expressed in the brain, especially the substantia nigra (see
online supplementary Figure S2 of Park et al., 2012). UDP glycosyltransferase 8
catalyses the transfer of galactose to ceramide, an essential step in the biosynthesis of
galactocerebrosides, which are implicated in myelin sheath formation. The researchers
also utilised exome sequencing to find other potential candidate SNPs and discovered a
non-synonymous SNP (rs4148254) in UGT8 on 4q26 that was significantly associated
with singing accuracy. In addition, CNV analysis using an array comparative genomic
hybridisation (aCGH) platform showed that a copy number loss at 5.6kb (5,600 base
pairs) upstream of UGT8 may be negatively associated with singing accuracy. Although
environmental factors such as education and music training were not considered in this
study, the researchers argued that because the participants resided in an isolated region
with homogeneous culture and most were educated in the same school without
additional music training, environmental factors were unlikely to impact greatly on the
results. In other words, this study yields evidence that singing accuracy may be heritable
in this population and possibly associated with the gene UGT8 on chromosome 4q.
2.4.2.7 Rhythm production
So far, no genetic studies have focused specifically on rhythm production ability. A
study investigating speech and language disorder in a family pedigree showed that the
affected family members were impaired in rhythm perception and production (Alcock et
al., 2000), and all of them had a mutated copy of the FOXP2 gene (Lai et al., 2001)
- 58 -
2.4.3 Music accomplishments
In addition to examining participation in singing activities in 11th grade twins, Coon
and Carey (1989) used the music-related questionnaire data from Loehlin and Nichols
(1976) to investigate other aspects of self-reported music ability, including vocational
interest in music, instrumental music experience, professional music engagement, and
receiving music prizes. Their results showed that while there were significant genetic
influences across all the variables excluding music vocational interest, the effects of a
shared environment were almost always larger across all the variables, with the
exception of singing participation (see Section 2.4.2.5, p. 55) and professional music
engagement in male twins. Apart from the extremely high heritability (A = 71%) of
singing participation for male twins, the other heritability estimates typically ranged
from 10% to 38%, whereas shared environmental estimates were between 18% to 76%
(see Table 2.2, p. 28 for details).
Genetic analyses performed separately on twins concordant for private music lessons
and concordant for no music lessons revealed interesting gene-environment interaction
effects. Excluding music vocational interest for male twins, relatively higher heritability
estimates were observed for the other four variables for both male and female twins
without formal music training (A = 29-116%)8 compared to twins with music training (A
= -21-57%). In particular, significant group differences in genetic and common
environmental influences were observed for out-of-school music performance
experience, whereby twins without music training had large heritability estimates and
low estimates for common environmental influences while twins with music training
showed the opposite trend. Based on the results, the researchers proposed a strong
shared environmental component in music ability which is augmented by formal music
training.
A recent twin study also used the same twin data to investigate the genetic and
environmental contributions of music accomplishment. Hambrick & Tucker-Drob
(2014) constructed a dichotomous music accomplishment variable from the National
Merit Twin Study data (Loehlin & Nichols, 1976), based on the endorsement of one or
8 The differences between MZ and DZ correlations of twin pairs concordant for music lessons or no
music lessons for some variables were too great, which resulted in A estimates that exceeded 100% and C
estimates that were less than 0%.

- 59 -
more questionnaire items pertaining to music prizes received or out-of-school music
performance experience. Similar to the findings from Coon and Carey (1989), although
the heritability estimate was significant, the common environmental component was
considerably larger (A = 26%; C = 61%, E = 12%). Intriguingly, a gene-environment
interaction effect was observed, where the heritability estimate for music
accomplishment was substantially higher for twins who practised occasionally or
frequently (A = 43%) than for twins who did not engage in music practice at all (A =
1%), whereas the common environmental component was much lower for twins who
practised (C = 43%) than for twins who did not practice (C = 86%). This led the
researchers to infer that music practice helps to express the genetic potential for music
accomplishment. Although the findings contradict the somewhat related gene-
environment interaction effect found between music ability and music training from
Coon and Carey (1989), it is worth noting that Hambrick and Tucker-Drob (2014) still
obtained similar results when they performed genetic modelling solely on twins with
formal music training, which indicated that the interaction effect is indeed between
music accomplishment and music practice, not music training per se.
Interestingly, higher heritability estimates for music ability were obtained in a more
recent Netherlands twin study involving 1,685 twin pairs aged 12 to 24 years
(Vinkhuyzen et al., 2009). Using a self-report questionnaire, this study examined the
heritability of domain-specific aptitude (defined as ability within the normal range) and
exceptional talent. In particular, the participants were asked to rate their level of
competence in various domains such as music, arts, language and sports. For self-
reported music aptitude, the heritability estimates for males and females were 66% and
30% and the estimates for common environmental influences were 8% and 54%,
respectively. As for self-reported exceptional music talent, the heritability estimate was
92% with no shared environment effect. The researchers concluded that genetic
influences possibly account for a large extent of the variation in aptitude and
exceptional talent across domains, including intellect, creativity, and sporting ability. As
the above twin studies were based on self-reports of music ability, it is uncertain
whether self-reported music ability truly reflected actual music ability, thus raising
concerns about the reliability of the findings.
- 60 -
2.4.4 Music culture
Similar to music practice, music culture is usually conceived as an environmental factor
influencing music ability (see Section 3.2, p. 65). Intriguingly, a relationship between
music culture and genes has been demonstrated in several recent studies. In one study,
traditional songs from 39 African cultures were classified by their music characteristics
such as yodeling and tempo. When the music styles of the various African cultures were
compared with a database of African genotypes, a correlation between genes and music
culture was found, which suggests that cultures that are musically similar also exhibit
greater genetic similarity. Notably, the researchers also discovered that the correlation
between music culture and geographical distance was weaker than the correlation
between music culture and genes (Callaway, 2007).
Similarly, in the first comparative phylogenetic study of genetics and folk music,
Pamjav, Juhász, Zalán, Németh, and Damdin (2012) established a relationship between
folk music styles in 31 Eurasian cultures and genetic distance, with maternal lineages
more strongly linked with folk music traditions than paternal lineages. Specifically, it
was found that significantly similar folk music cultures could predict significant genetic
connections in 82% of the cases examined. Interestingly, the reverse was not true; close
genetic connections were only able to predict similar folk music styles in 28% of the
cases. The researchers speculated that a close genetic relation between two populations
is indicative of prior physical and biological contact between ancestors of both
populations, which may have in turn brought about an interaction and transmission of
musical cultures between the two groups, resulting in the similar folk music styles. The
study also identified a common musical style that was prevalent in a large subset of the
cultures studied, most of which were closely related genetically. This led the researchers
to posit the potential existence of a common musical “parent language” from which
various folk music traditions branched out and evolved.
Brown et al. (2014) also demonstrated a statistically significant correlation between folk
song structure and mitochondrial DNA variation in nine indigenous Taiwanese
populations, even after controlling for geographical proximity. Notably, although a
significant correlation between language and genes in the populations studied was also
found, the correlation became insignificant after controlling for geographical proximity.

- 61 -
In addition, the correlation between music and language was insignificant, which
indicates that the genetic components of music and language may be partially distinct.
In particular, an examination of the population structure for genes, music and language
for the nine indigenous populations revealed greater similarities in the population
structures between music and genes as compared to language and genes. Taken
together, the findings suggest the possibility of the coevolution of music and genes and
promote the use of music as a novel cultural marker for the study of population
migration history, which can serve to complement more extensively researched markers
such as language.
Collectively, convergent findings from diverse cultural samples give credence to a link
between music culture and genes. This is particularly noteworthy since music cultural
environment is a well-established environmental factor influencing music ability. The
observed relationship between genes and music culture therefore highlights the
importance of underlying genetic influences in shaping the music environment of a
human culture.
2.5 Summary
In this chapter, the genetic correlates of different aspects of music ability and music-
related phenotypes were examined. A schematic representation of the genetic
determinants of music ability reviewed is presented in Figure 2.4.
Several twin studies and family pedigree studies have estimated the heritabilities for
various music-related phenotypes, and demonstrated sizeable heritabilities particularly
for pitch and melodic perception, music creativity, singing accuracy and self-reported
music accomplishments (see Table 2.2, p. 28).
In addition, a few recent twin studies have demonstrated that the association between
music ability and certain correlates are mediated by significant shared genetic
influences, such as between music ability and intelligence (Mosing, Pedersen, Madison,
& Ullén, 2014), music ability and music practice (Hambrick & Tucker-Drob, 2014;
Mosing, Madison, et al., 2014), music practice and openness, and music practice and

- 62 -
music flow proneness (Butkovic et al., 2015). This suggests the possibility that the same
set or sets of genes are exerting influence on music ability and factors that contribute to
music ability.
To date, some promising and converging findings have begun to emerge. Several loci
on chromosome 8q have been implicated in more than one music-related phenotype. For
instance, loci 8q21 and 8q24 have been implicated in absolute pitch ability and music
perception (Pulli et al., 2008; Theusch et al., 2009; Ukkola-Vuoti et al., 2013).
Similarly, loci on chromosome 4 have been implicated in music perception and music
composing (Oikkonen et al., 2014; Oikkonen et al., 2016; Pulli et al., 2008), while the
neighbouring locus 4q23 has been implicated in pitch accuracy of singing (Park et al.,
2012).
A number of genes have featured quite prominently in music genetics research thus far.
In recent transcriptome studies, SNCA on chromosome 4q22.1 has emerged as a
potential candidate gene for music listening and music performance in musically
experienced individuals (Kanduri, Kuusi, et al., 2015; Kanduri, Raijas, et al., 2015).
These findings are particularly noteworthy given that the locus 4q22 and nearby 4q23
are also implicated in music perception, music composing and vocal pitch-matching
ability (Oikkonen et al., 2014; Oikkonen et al., 2016; Park et al., 2012; Pulli et al.,
2008). Given the role of SNCA in dopamine-related functions and music’s association
with dopamine release, as well as SNCA‘s implication in song perception, learning and
production in songbirds, it appears that SNCA is a strong contender for influencing
music behaviour. Moreover, the putative links between SNCA and other songbird-
related genes (e.g., GRIN2B, FOXP1, VLDLR, RGS9, FOS) and various music traits
indicate the possibility of cross-species evolutionary conservation for auditory
perception and vocal production (Kanduri, Kuusi, et al., 2015; Kanduri, Raijas, et al.,
2015; Liu et al., 2016; Oikkonen et al., 2016)
Apart from SNCA, the gene AVPR1A on chromosome 12q has been implicated in music
listening (Ukkola-Vuoti et al., 2011), music perception (Ukkola et al., 2009), and music
memory (Granot et al., 2007; Granot, Israel-Kolatt, et al., 2013). On the other hand, the
gene SLC6A4 has been associated with music memory (Granot et al., 2007) and choir
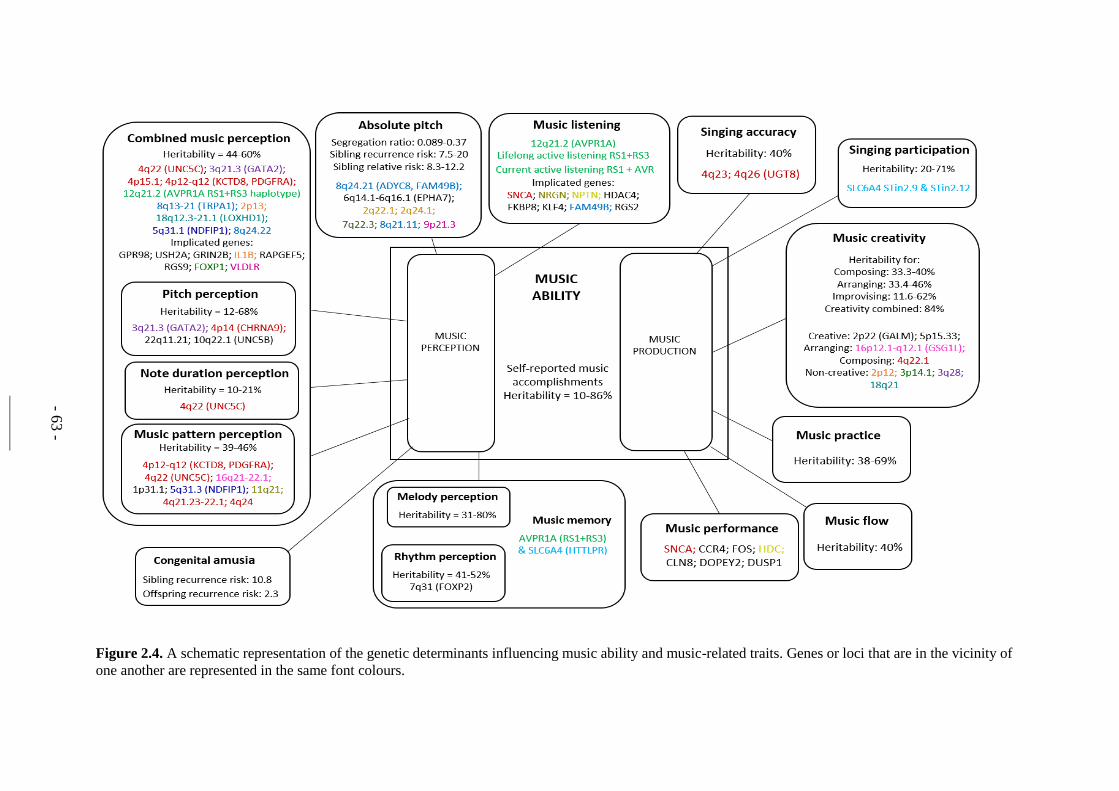
- 63 -
Figure 2.4. A schematic representation of the genetic determinants influencing music ability and music-related traits. Genes or loci that are in the vicinity of
one another are represented in the same font colours.

- 64 -
participation (Morley et al., 2012). The role of AVPR1A in social cognition and
behaviour has been well-investigated, as has the possible interaction between AVPR1A
and SLC6A4 in communicative behaviour. The associations of these two genes with
various music functions raises the intriguing possibility of an overlap in the
neurobiological basis of music functions and social behaviour.
Finally, it is interesting to note that recent studies have found evidence of genetic
influences for variables such as music practice and music culture, which have until now
been commonly regarded as environmental factors. Given the pervasive influence of
genetic factors on a vast array of human traits (Polderman et al., 2015), however, it is
not surprising to observe a growing body of genetic evidence for music ability and
music-related traits.
The exciting developments and emerging evidence in music genetics research thus
make the stance of radical environmentalism increasingly implausible. It is
understandable that some may be uncomfortable with the notion of music ability being
influenced by genes, as they are concerned with ethical implications that may
potentially arise if genetic makeup is used as a basis to reserve music learning resources
for a select few and exclude the less endowed from having the opportunity to learn
music. It should be recognised, however, that both biological determinism and radical
environmentalism are problematic, and that a complete account of music ability and the
development of expertise requires both genetic and environmental factors and their
interaction to be considered.

- 65 -
ENVIRONMENTAL
DETERMINANTS OF
MUSIC ABILITY
3.1 Definition
According to Gembris and Davidson (2002), environmental factors that influence the
development of music ability can be broadly understood as “the sum of all external
conditions that bear on musical experiences and activities”. They can also be more
narrowly defined as “the regularly recurring situations that impact on musical
experience and activities” (p. 18).
In this chapter, the environmental factors that have been documented to affect the
development of music ability are organised and discussed in terms of three main
environmental contexts: the cultural environment, the home environment, and the
formal music learning environment. Finally, the genetic and environmental
determinants discussed in both Chapter 2 and the current chapter will be summarised
and schematically represented in Section 3.5 (p. 81).
3.2 The Cultural Environment
Our cultural environment plays a crucial role in influencing the ways we interact with
music and how our soundscape is shaped (Bond, 2011; Hannon & Trainor, 2007). Such
cultural influences commence spontaneously and subconsciously: infants begin to
perceive pitch and meter in a culture-specific manner from approximately one year of
age onwards (Trehub, 2006), and the basic music competency necessary for music
engagement in one’s culture is typically developed within the first 10 years of life

- 66 -
(Gembris, 2006). Interestingly, while musical enculturation enhances culture-specific
melodic perception ability with age, it also brings about a relative decrease in sensitivity
for non-culture-specific tonal music structure (Lynch & Eilers, 1991; Morrongiello,
1992).
Depending on the sociocultural norms, the definition of music ability, the methods of
music learning, and the forms of musical participation all vary from one culture to
another. In the next few paragraphs, some examples highlighting the importance of
musical enculturation are described. For a more comprehensive survey of how music
learning and development vary across countries due to differences in culture and
education system, please refer to Hargreaves and North (2002).
Both cultural environment and home environment are important breeding grounds for
music ability to develop through informal learning contexts. A musically rich
sociocultural environment may result in earlier development of music abilities as
compared to another culture where music assumes a lesser social function (Kelley &
Sutton-Smith, 1987). This is particularly evident in some non-Western cultures such as
the African culture, where music is part and parcel of everyday life, seamlessly
incorporated into various work, social, religious and familial settings (Primos, 2002).
The notion of learning music formally in a classroom situation is foreign to many
Africans. The inseparability of music and dance in the African culture means that
musical activities are informally learned through exposure and active participation,
through oral transmission and memorisation. Notably, memorisation in this case does
not suggest rote learning, but rather the framework for past musical materials is
memorised in order to provide fodder for future improvisation, recreation and variation.
Musical creativity is therefore an important element in the African music culture, where
children are encouraged and expected to develop musical creativity from a young age
for their personal and social development, such as by making up songs during singing
games. As a result of this pervasive music enculturation, widespread musical
achievements can be readily observed in various African cultures. For instance, while
many people from the Western general population provide low ratings of their singing
ability (Cuddy et al., 2005; Pfordresher & Brown, 2007), Zimbabwean children and
Anang children from Nigeria display precocious singing ability (Koops, 2011; Kreutzer,

- 67 -
2001; Messinger, 1958). Likewise, Gambian and Venda children from Africa are also
"expected to be musical" because in their musically-enriched cultural environment,
there are frequent opportunities for music participation (Blacking, 1995; Koops, 2011;
Radocy & Boyle, 2012). Interestingly, while African children are expected to learn to
sing and dance without exception, it was noted that they acquire these skills at different
rates (Primos, 2002, p. 438).
South America is also blessed with a rich multicultural musical heritage (Oliveira,
2002). It is the cradle of various distinct South American musical forms such as bossa
nova and tropicália. These popular and folk musical traditions are indispensable in the
daily lives of the majority of the South Americans, who acquire and promulgate these
musical traditions through informal social contexts, such as in games, bars and
nightclubs, or families, rather than through formal music instruction.
In Portugal, members of local communities can learn how to read and perform music
through participation in Bandas filarmónicas, which are local amateur bands (Brucher,
2013). Regardless of one’s age or skill level, Bandas provide the locals with
opportunities to play music together and perform publicly at local sacred and secular
events, thereby playing an important role in fostering community music-making and
transmitting Portuguese musical traditions across generations (Brucher, 2013; Mota,
2002).
Given the extensive evidence that the development of musical expertise can be
influenced by one's exposure to culture-specific musical activities and forms, music
education researchers therefore recommend the provision of culturally-relevant music
listening and music making experiences to young children as a strategy to cultivate and
shape their understanding of music (Bartel & Cameron, 2007).
On a different note, several studies have observed that cultures in which tonal languages
are spoken may have a singing advantage over their Western counterparts. Chinese first-
graders were reported to have better singing abilities than age-matched American
children. Likewise, American preschool children who speak both Cantonese and
English were observed to have superior vocal pitch-matching ability than children who
speak only English (Trollinger, 2004). It may be possible that the better singing

- 68 -
accuracy of the tonal language speakers in these studies was facilitated by increased
pitch experiences (Tsang, Friendly, & Trainor, 2011). Other researchers have also
observed a higher incidence of absolute pitch among tonal language speakers (Deutsch,
Dooley, Henthorn, & Head, 2009; Deutsch, Henthorn, Marvin, & Xu, 2006). It is also
possible, however, that the enhanced vocal pitch-matching and pitch perception abilities
were due to ethnicity effects, thereby indicating genetic influences (Gregersen et al.,
2001; Hove, Sutherland, & Krumhansl, 2010; Theusch et al., 2009).
3.3 The Home Environment
As the level of musical ability ultimately attained is associated with the quality and
extent of musical exposure (Trehub, 2006), it is not surprising that both anecdotal
experiences and empirical evidence have supported the important role played by family
environment in musical development, especially from infancy to childhood (Gembris &
Davidson, 2002).
A considerable body of evidence from infant research has suggested that humans
demonstrate musical predispositions and propensities from a young age, even at the
prenatal stage (Trainor, Tsang, & Cheung, 2002; Trehub, 2001; Trehub, 2006; Winkler,
Háden, Ladinig, Sziller, & Honing, 2009; Zentner & Kagan, 1996). From approximately
seventh month in utero, the inner ear of a human foetus begins to function, marking the
onset of auditory learning and memory (Gembris, 2006). The capacity for music
perception at the prenatal stage is apparent from studies showing that the foetus can feel
rhythms and hear melodic inflections in speech and music (Moon & Fifer, 2000). There
is also evidence that neonates can remember melodies heard prenatally (Hepper, 1991;
Satt, 1984) and develop long-term neural representations of these melodies (Partanen,
Kujala, Tervaniemi, & Huotilainen, 2013).
Informal music learning in a home setting is especially important for infants at the
preverbal stage. By using nonverbal interaction in a quasi-musical manner (e.g.,
motherese at elevated pitch levels), parents are their infants’ first music mentors through
intuitive musical parenting (Noy, 1968; Papoušek & Papoušek, 1995; M. Papoušek,
1996). In such infant-directed communication, musical content such as pitch, melody,

- 69 -
rhythm and dynamics are introduced incidentally to infants, and serve to nurture their
basic musical competency. Tafuri and Villa (2002) observed a positive correlation
between the frequency of maternal singing and the frequency and quality of infant
musical babbling. The parent-child emotional connection in such intuitive musical
parenting is also likely to have a positive influence on an infant’s music learning
process (Gembris & Davidson, 2002), given that the emotional aspect of a learning
experience can help strengthen memory for knowledge acquired (Levitin, 2006).
Children often exhibit their inherently musical nature through spontaneous musical
behaviours such as vocalisations and dance movements (Bond, 2012; Marsh & Young,
2006). Parents and caregivers need to be cognizant of these musical behaviours in the
home environment and encourage their occurrence (Trehub, 2006). For instance,
vocalisations usually emerge at 6 to 8 weeks of infancy (Papoušek & Papoušek, 1995).
Parents can vocally imitate these vocalisations to positively reinforce such behaviour.
By encouraging vocal play and allowing infants frequent opportunities for vocal
exploration and imitation, singing ability can be nurtured in the home environment
(Mang, 2003; Welch, 2005; Young, 2002). Singing practice or experience has been
found to increase the number of distinct tones children can sing by 30%, as well as
accelerate the age onset for vocal pitch-matching (Jersild & Bienstock, 1931;
Levinowitz, 1989a; Phillips, 1992).
Parents can also actively create a musically rich family environment to foster music
development in children. One way of achieving this is through participation in musical
activities as a family, such as singing and playing instruments together, attending
concerts and discussing music (Gembris & Davidson, 2002). Parent-initiated musical
behaviours were observed to be significantly correlated with the early onset of singing
in children (Howe, Davidson, Moore, & Sloboda, 1995). Custodero (2006) also
observed that children who were regularly involved in music-making with their parents
developed a huge song repertoire which they would use when engaging in singing
activities by themselves. Several other behavioural studies have also reported
moderately low to strong correlations between a musical family environment and the
vocal achievement of young children (Aherne, 2011; Atterbury & Silcox, 1993;
Kirkpatrick, 1962; McPherson & Williamon, 2006; Persellin, 2006; Shelton, 1965).

- 70 -
Being brought up in a ‘musical family’ has also been demonstrated to have a positive
effect on the music aptitude of preschool children. Mallett (2000) found that home
musical environment positively correlated with preschool children’s music aptitude as
measured by Audie (1989), a preschool appropriate music aptitude game devised by
Edwin E. Gordon. Interestingly, no relationship was found between home musical
environment and the music aptitude scores of school-aged children (Aherne, 2011;
Atterbury & Silcox, 1993; Brand, 1985, 1986). It is possible that these findings suggest
that home musical environment has a more significant impact on children’s early
musical development before school begins, but its importance diminishes when other
environments (e.g., classroom music environment, formal music learning environment)
become more influential settings for music exposure and engagement. Despite this,
parents can still exert positive influence on their children’s musical development by
actively supporting formal music learning.
Several empirical studies found that parental involvement and interest in their child’s
music learning is positively correlated with the latter’s musical achievement (Brand,
1986; Creech, 2010; but see Gagné, 1999; Sloboda & Howe, 1991) . Such involvement
includes monitoring music practices and touching base regularly with the music teacher.
A biographical study of successful Polish classical musicians found that parental
support of their music learning (e.g., in selecting the right music teachers and
monitoring progress) strongly influenced these musicians’ decision to pursue classical
music as a career (Gembris & Davidson, 2002). A series of studies conducted by
Davidson, Sloboda, Howe and Moore in the 1990s also consistently found the parent-
teacher relationship to be crucial for a child’s musical development (Davidson, Howe,
Moore, & Sloboda, 1996, 1998; Davidson, Howe, & Sloboda, 1997; Davidson, Sloboda,
& Howe, 1995/1996). The importance of parental support and involvement in positively
influencing music learning outcomes appears to diminish as children get older,
however. Davidson et al. (1995/1996) found that the high music achievers in their
sample experienced consistent and strong parental support in their music learning until
age 11, after which they became more self-motivated to practise music regularly. In
contrast, the low music achievers and those who eventually quit reported weak parental
support during their initial music learning and increasingly forceful parental pressure
during adolescence. This finding therefore demonstrates the value of early and
consistent parental support in encouraging formal music learning.

- 71 -
Interestingly, while parental support is important for musical development, parental
music expertise is not essential for a child’s music ability to flourish. Sloboda and Howe
(1991) found that surprisingly, parents of students with average musical abilities have
significantly greater music expertise and interest than the parents of exceptionally
talented students. Similarly, in a study analysing the family environment of 20 of the
most talented American concert pianists, Sosniak (1985) found that the parents of these
pianists were no more musically active than a representative sample of the American
general population. Sloboda and Davidson (1996) also identified support and
encouragement from non-musician parents as one of the key determinants of music
expertise.
3.4 The Formal Music Learning Environment
Some researchers have suggested that while basic musical competence can be
developed naturally through informal learning in one’s cultural and family
environments up until puberty, formal or explicit music training is essential in order to
attain amateur to professional levels of music ability (Lehmann, 1997).
The formal music learning environment supports the acquisition of procedural and
declarative knowledge pertaining to music. The procedural knowledge includes the
motor skills to play a musical instrument, the aural skills to process and analyse musical
stimuli, and the visual skills to comprehend music notation, whereas declarative
knowledge includes facts about music, such as the theory and history of music.
As the impartment of musical skills and knowledge is a key feature of the formal music
learning environment, the instructional figure (i.e., the teacher), understandably plays a
central role in this environment.
3.4.1 The role of music teacher
Music teachers not only help their students develop music abilities, but also serve as
musical role models and shape their musical tastes as well as values and motivation

- 72 -
towards music (Gembris & Davidson, 2002). Music teachers who are friendly and
skilled have been identified as one of the factors influencing musical expertise (Sloboda
& Davidson, 1996). In particular, the first music teacher appears to be of special import
in influencing subsequent musical achievement (Davidson et al., 1998). It was observed
that children who are high-achieving musically have positive perceptions about their
first teachers’ musical skills and personality, whereas music learners with low
achievements viewed their first teachers in the opposite manner (Davidson et al.,
1995/1996). With increasing age and self-motivation, however, the high music
achievers were observed to value the professional qualities of the teacher over
personality. From these findings, one can infer that personable qualities of teachers may
set a positive emotional climate that helps motivate younger children to learn music,
especially in the initial learning stages (Gembris & Davidson, 2002). In addition, music
teachers may help support music development by teaching students good music
practising strategies, which is an important music-related skill (Lehmann, 1997).
While music teachers undoubtedly play an important role in the development of musical
expertise, especially in the first stages of music learning, much of the research findings
are in fact limited to the domain of classical music, and thus may not be generalisable to
other musical domains. For example, it is observed that formal music instruction is not
as important in jazz music, where much of a teacher’s role is replaced by self-learning
through listening and analysing the recordings of famous jazz musicians (Gruber,
Degner, & Lehmann, 2004).
The next section will describe empirical findings relating to musical skills and abilities
that are facilitated by formal music training, and demonstrate how such musical
development is supported by physiological and neurological evidence.
3.4.2 Music training and music practice
In the pitch domain, several behavioural studies that compared musically-trained
participants (referred to as musicians) and non-musically trained participants (referred
to as non-musicians) report that musicians exhibit enhanced pitch discrimination ability
for both pure and complex tone stimuli, as demonstrated by significantly smaller pitch
discrimination thresholds or more accurate detection of fine pitch changes than non-

- 73 -
musicians (Bianchi, Santurette, Wendt, & Dau, 2016; Kishon-Rabin, Amir, Vexler, &
Zaltz, 2001; Micheyl, Delhommeau, Perrot, & Oxenham, 2006; Spiegel & Watson,
1984; Tervaniemi, Just, Koelsch, Widmann, & Schröger, 2005). In particular, Kishon-
Rabin et al. (2001) showed that pitch discrimination thresholds decrease (i.e., better
pitch discrimination abilities) as a function of years of music training, and musicians
with more than 15 years of music training exhibit less variance in their discrimination
thresholds compared to musicians with fewer years of training. Schellenberg and
Moreno (2010) also showed that musicians showed superior pitch processing ability in
terms of pitch processing speed and pitch discrimination ability than non-musicians,
although both groups were comparable in general intelligence (g). Interestingly, the
enhanced pitch processing ability of musicians was only limited to tone stimuli that
were within the typical pitch range for music, and not for extremely high pitches. This
indicates that the superior pitch processing was a result of music training.
Given that instrumental music typically involves performing melodies and not isolated
pitches, it is not surprising that other behavioural studies show that musicians
demonstrated better interval and melodic contour processing. For example, Zarate,
Ritson and Poeppel showed that musicians performed better than non-musicians in
interval discrimination, even when discriminating between melodic intervals with
altered timbres (Zarate, Ritson, & Poeppel, 2013) or starting pitches (Zarate, Ritson, &
Poeppel, 2012). Musicians were also able to detect alterations in melodic contours
(Morrongiello & Roes, 1990; Morrongiello, Roes, & Donnelly, 1989; Schön, Magne, &
Besson, 2004), distinguish between different melodies (Orsmond & Miller, 1999),
recognise melodic transposition (Cuddy & Cohen, 1976), key changes (Halpern, 1984)
and imitate a novel tonal melody (Oura & Hatano, 1988) better than non-musicians.
Moreover, music training was shown to positively impact on higher-order melodic
processing ability, such as the understanding of tonal hierarchy (Cuddy & Cohen, 1976;
Koelsch, Jentschke, Sammler, & Mietchen, 2007; Krumhansl & Shepard, 1979;
Pechstedt, Kershner, & Kinsbourne, 1989).
Besides enhanced music processing ability, several studies have shown that
instrumental music training plays a positive role in improving pitch accuracy in singing
(Amir, Amir, & Kishon-Rabin, 2003; Dalla-Bella, Giguère, & Peretz, 2007; Moreti,
2006; Murry, 1990; Nikjeh et al., 2009; Watts, Murphy, & Barnes-Burroughs, 2003, but

- 74 -
see also Zarate, Delhommeau, Wood, & Zatorre, 2010). In particular, Nikjeh et al.
(2009) reported that not only do musicians display superior pitch discrimination and
pitch production abilities compared to non-musicians, the two abilities are significantly
correlated only in instrumental musicians, suggesting the possibility that music training
strengthens the association between pitch perception and vocal pitch production.
In the rhythm domain, a body of behavioural evidence indicates superior timing abilities
of musicians compared to non-musicians across a broad range of tasks. In terms of
perceptual timing abilities, musicians are more accurate than non-musicians in
discriminating time interval durations (Rammsayer & Altenmüller, 2006), and detecting
timing or tempo changes in music sequences (Jones et al., 1995; Jones & Yee, 1997;
Lim et al., 2003; Rammsayer & Altenmüller, 2006; Yee et al., 1994; Drake & Botte,
1993; but see Manning, 2016). Musicians also perform better than non-musicians in
motor timing tasks, demonstrating greater accuracy and lower variability in
performance than non-musicians in isochronous tapping tasks (Aschersleben, 2002;
Aschersleben & Prinz, 1995; Chen, Penhune, & Zatorre, 2008; Krause, Pollok, &
Schnitzler, 2010; Repp, 2000, 2010; Repp & Doggett, 2007; Repp, London, & Keller,
2013), whereby tapping accuracy appears to improve with increased music training
(Repp, 1999).
While music training is demonstrated to bring about a general enhancement in music
processing and production skills, differential training-specific enhancements can be
observed amongst musicians. For instance, professional conductors exhibit superior
auditory spatial processing in peripheral auditory spaces than pianists, possibly because
as a conductor, they often need to direct their attention to a particular musician or
orchestral section while monitoring the entire orchestra at the same time (Nager,
Kohlmetz, Altenmüller, Rodriguez-Fornells, & Münte, 2003). In addition, musicians
who play by ear display superior melodic encoding ability over musicians who rely less
on aural practising strategies (Seppänen, Brattico, & Tervaniemi, 2007; Tervaniemi,
Rytkönen, Schröger, Ilmoniemi, & Näätänen, 2001). Furthermore, percussionists
demonstrate superior timing perception and motor synchronisation abilities than other
musicians (Cameron & Grahn, 2014; Ehrlé & Samson, 2005; Krause, Pollok, et al.,
2010).

- 75 -
Music development due to formal music training is not only evident at a behavioural
level. The development of musical skills are in fact accompanied by adaptive
physiological, anatomical and neurological changes in musicians. For instance, brass
musicians and singers were found to have increased lung capacity as a result of their
music training (Sundberg, 1987; Tucker, Horvath, & Faulkner, 1971). Similarly, due to
differences in the way they play their instruments, pianists and violinists were observed
to exhibit significantly different forearm motions as characterised by supination and
pronation, respectively (Wagner, 1988).
As the musicians’ brain has been regarded as a useful model to study neuroplasticity
(Habib & Besson, 2009; Zatorre, 2005), a considerable body of evidence has accrued
documenting widespread experience-dependent structural and functional changes in the
brain due to music training (please refer to Herholz & Zatorre, 2012; Merrett & Wilson,
2013 for recent comprehensive reviews on this subject). In addition, Merrett and Wilson
(2013) examined at times discrepant neural evidence in light of possible mediating
factors, such as age of onset of music training, type and instrument of training). Among
other things, these reviews indicate that musicians exhibit enhanced encoding of pitch
patterns at the brainstem level (Hannon & Trainor, 2007; Wong, Skoe, Russo, Dees, &
Kraus, 2007), greater auditory evoked responses and grey matter concentration in the
auditory cortex (Bermudez, Lerch, Evans, & Zatorre, 2009; Bermudez & Zatorre, 2005;
Schneider et al., 2002; Shahin, Bosnyak, Trainor, & Roberts, 2003), increased grey
matter density in Broca’s area and the planum temporale (Keenan et al., 2001; Sluming
et al., 2002), and larger fibre density in the anterior corpus callosum (Schlaug, Jancke,
Huang, & Steinmetz, 1995).
Many of the neural changes that have been documented are specific to the instrument of
training or the type of training undertaken (Merrett, Peretz, & Wilson, 2013), providing
compelling proof that the observed neuroplasticity results from the music training. For
example, Pantev, Roberts, Schulz, Engelien, and Ross (2001) demonstrated that
violinists and trumpeters exhibited enhanced neuronal representations in the auditory
cortex for their instrument tones, as compared to sine tones. Similar findings were
reported for pianists (Pantev et al., 1998), as well as violinists and flautists (Margulis,
Misna, Uppunda, Parrish, & Wong, 2009). In the motor cortex, differential cortical
representations were also observed for different types of musicians. While singers have

- 76 -
an enlarged cortical representation of the vocal tract in the motor cortex (Kleber,
Birbaumer, Veit, Trevorrow, & Lotze, 2007), pianists and violinists exhibited enlarged
hand representation that differs in shape, size and laterality due to their respective
instruments (Bangert & Schlaug, 2006; Elbert, Pantev, Wienbruch, Rockstroh, & Taub,
1995). Instrument-specific neural responses were also reported in the sensorimotor
cortex, cerebellum and brainstem (Gebel, Braun, Kaza, Altenmüller, & Lotze, 2013;
Strait, Chan, Ashley, & Kraus, 2012). Moreover, musicians whose training emphasises
playing by ear and improvisation showed an advantage over classically trained
musicians in detecting deviant pitch contours in complex melodies, which corresponds
with differential auditory evoked responses in the two groups (Tervaniemi et al., 2001).
The evidence discussed thus far clearly establishes that formal music instruction
facilitates the development of numerous music-related skills in the pitch and rhythmic
domains. There is, however, research evidence showing that music training is not
crucial for the development of certain music abilities. For example, one study found that
good auditory structuring ability (i.e., the ability to detect pitch or rhythmic patterns in
music sequences) is not dependent on music training (Karma, 2007). Bigand and
Poulin-Charronnat (2006) also reviewed a set of studies illustrating that formal music
training is not necessary for the acquisition of certain music abilities, such as abstracting
the underlying musical structure of a piece of music (e.g., comprehending the structural
similarity underlying a musical theme and its variations) (Bigand, 1990), learning a new
musical idiom (e.g., serialism) (Bigand, D'Adamo, & Poulin, 2003; Bigand, Perruchet,
& Boyer, 1998), forming appropriate musical expectancies (Bharucha & Stoeckig,
1986, 1987; Bigand & Pineau, 1997; Bigand, Poulin, Tillmann, Madurell, & D'Adamo,
2003; Tillmann, Bigand, & Pineau, 1998), perceiving tension and release in music
(Bigand & Parncutt, 1999; Bigand, Parncutt, & Lerdahl, 1996; Bigand & Pineau, 1996),
and understanding the emotional content of a piece of music (Bigand, Tillmann, Poulin-
Charronnat, & Manderlier, 2005; Bigand, Vieillard, Madurell, Marozeau, & Dacquet,
2005).
On the other hand, there is evidence that the development of some musical abilities are
not only predicated on music training per se, but are also strongly associated with the
age of onset of music training. Specifically, numerous studies have reported a
relationship between AP ability and early onset of music training (Costa-Giomi,

- 77 -
Gilmour, Siddell, & Lefebvre, 2001; Levitin & Zatorre, 2003; Miyazaki, 1988;
Miyazaki & Rakowski, 2002; Russo et al., 2003). For example, Sergeant (1969) found a
substantial negative correlation of -0.983 between the age of onset of music training and
the incidence of AP in musicians. Baharloo et al. (Baharloo et al., 1998) also indicated
that 78% of the AP possessors in their musician sample began music training before 6
years of age. Early onset of music training appears to facilitate the development of
motor-related musical skills in particular (but see Furuya et al., 2015). Expert pianists
and world-famous violinists were observed to commence music training earlier than
amateur or lesser experts (Ericsson et al., 1993; Howe et al., 1995; Krampe & Ericsson,
1995; Manturzewska, 1979, 1990). In laboratory-based studies, musicians with early
music training also showed superior visual-motor and auditory-motor skills compared to
those who began training later (Pantev et al., 1998; Penhune, 2011; Schlaug et al.,
1995), and such early training facilitation remains evident even after accounting for
total years of training (Bailey & Penhune, 2010; Watanabe, Savion-Lemieux, &
Penhune, 2007). Furthermore, although musicians understandably have less hand-skill
asymmetry than non-musicians due to their use of both hands in playing an instrument,
musicians with early training exhibited further reduced hand-skill asymmetry compared
to late-trained musicians (Jäncke, Schlaug, & Steinmetz, 1997).
The effects of early training are evident from neural studies, where compared to late-
trained musicians, early-trained musicians had a relatively larger anterior corpus
callosum (Schlaug et al., 1995), early-trained violinists had relatively larger cortical left-
hand representation (Elbert et al., 1995), and early-trained pianists exhibited stronger
auditory neural responses to piano tones (Pantev et al., 1998).
Besides onset and duration, another important parameter of music training is the amount
of practice. "If at first you don't succeed, try, try again." As this old adage has
prescribed, music practice in the formal music learning environment exerts important
influence on the development of music expertise. In particular, deliberate practice,
which is characterised by goal-directed, efficient practice and rectification of
weaknesses, has been propounded as a key mediator in the acquisition of musical
expertise (Lehmann, 1997).

- 78 -
For instance, an investigation into the level of engagement in music-related activities of
three groups of expert violinists with different levels of accomplishment revealed that
while all three groups of violinists spent 50-60 hours per week on music-related
activities, the three groups could be discriminated by the amount of solitary weekly
practice: the two most accomplished groups of violinists spent about 25 hours in solitary
practice whereas the least accomplished group of experts spent about 10 hours (Ericsson
et al., 1993). In addition, Ericsson et al. (1993) observed that by the age of 20,
professional and highly accomplished expert violinists had already accumulated over
10,000 hours of solitary practice, which is 2,500 and 5,000 hours more than what was
reported by less accomplished expert violinists at the same age. Several other studies by
Ericsson and collaborators also indicate that the total amount of music practice accrued
over the lifetime by expert musicians corresponds with their respective levels of
behavioural performances in music-related tasks (Krampe & Ericsson, 1995; Krampe &
Ericsson, 1996).
Besides evidence of the influence of deliberate practice on musical achievement at the
highest expert level, other researchers have demonstrated an association between
practice and music performance at other proficiency levels (for more details see the
meta-analysis by Platz et al., 2014). For example, correlations of .57 to .67 between
accumulated music practice and music performance were reported for music beginners
with up to three years of music training (Hallam, 1998; McPherson, 2005). Moderate
correlations (r = .30 to .46) were reported for school-aged children (Jabusch, Young, &
Altenmüller, 2007; Sloboda, Davidson, Howe, & Moore, 1996; Sloboda, Davidson,
Moore, & Howe, 1994). Notably, Sloboda et al. (1994) observed that at all age groups
investigated, the more proficient students consistently reported significantly higher
amountsof accumulated practice. Data from Sloboda et al. (1996) also indicated that
regardless of one’s perceived “talent”, attaining the highest level (Grade 8) of the
Associated Board (ABRSM) graded music examinations required similar amounts of
practice. Moreover, music students who won prizes in a national level music
competition in Germany reported a greater amount of regular and pre-competition
music practice per week, compared to the unplaced competitors (Lehmann, 1997).
Moderate to high correlations (.44 to .86) between accumulated practice and
instrumental performance accuracy were also demonstrated at the tertiary level among
university music majors (Ericsson et al., 1993; Jabusch et al., 2007).

- 79 -
Other measures of instrumental performance expertise, such as music accompaniment
skills and sight-reading skills, also showed an influence of deliberate practice. Studies
reveal moderate correlations of .36 to .57 between sight-reading performance and
practice-related predictors such as the number of pieces sight-read, the number of piano
accompaniment performances and the number of hours practising sight-reading
(Kopiez, 2012; Kornicke, 1992; Meinz, 2000; Meinz & Hambrick, 2010). Moderate to
large correlations (.42 to .72) were also reported between piano accompaniment
experience and the accuracy of piano accompaniment performance (Lehmann &
Ericsson, 1996; Tufflash, 2002).
Although it has been amply demonstrated that deliberate practice positively correlates
with musical expertise, several recent studies have challenged the dominating influence
of deliberate practice on music ability. Ruthsatz, Detterman, Griscom, and Cirullo
(2008) found that although practice is a mediating factor for expert musical
performance, other factors such as intelligence and domain-specific skills are necessary
to explain outstanding musical achievement. Moreover, in a study investigating
potential predictors influencing motor virtuosity in 24 musically active pianists, Furuya
et al. (2015) discovered that neither age of music training onset nor accumulated hours
of music practice before the age of 20 were significant predictors for motor virtuosity,
as measured by the maximal rate of alternately striking two piano keys repeatedly with
the right thumb and little finger. Instead, two significant predictors that emerged from
the regression analysis were single finger tapping rate and the strength of the elbow
extensor muscle. The authors therefore inferred that genetic predisposition may
influence finger movement agility, as other evidence has indicated the role of genes in
influencing muscle fibre composition (Park, Brown, Park, Cohn, & Chance, 1988). The
authors, however, acknowledged that specific strength training of the elbow extensor
could potentially enhance the rate of keystrokes, and may be construed as a form of
deliberate practice.
In addition, a large Swedish twin study by Mosing, Madison, et al. (2014) found that in
identical twin pairs, the difference in hours of practice was not a significant predictor of
differences in music ability for pitch, melody and rhythm perception. The findings
indicated that when genes were controlled for, the supposed causal influence of music

- 80 -
practice on music ability disappeared. Furthermore, a meta-analysis of 88 studies
revealed that deliberate practice accounted for 26% or less of the individual differences
in performance in each major domain studied. Specifically, deliberate practice only
explained 21% of the variance in music performance (Macnamara et al., 2014). Those
findings were challenged by another meta-analysis conducted by Platz et al. (2014)
which only focused on 13 music performance studies purportedly with more robust
measures of deliberate practice, and yielded a large aggregated effect size (rc) of .61 ;
95% CI: [.54, .67] (but see the response from Hambrick et al, 2014).
Taken together, while research evidence suggests an undeniable association between
music practice and music ability, findings from other studies indicate that the amount of
music practice or music training per se are unlikely to fully account for the variation in
music ability. It is possible that the variation in ability could be explained by individual
differences in the ease and speed of skill acquisition, which has been regarded by some
as the "hallmark of natural abilities" (Gagné, 1999; Heller & Ziegler, 1998). In a study
conducted by Sloboda and Howe (1991) which investigated the biographical precursors
of musical excellence through interview, it was found that the rate with which one
progressed through graded music examinations before admission to a music specialist
school was "the most clear predictor of later exceptionality" (Sloboda & Howe, 1991).
Similarly, in a study investigating the amount of practice needed for chess players to
attain expert level, Gobet and Campitelli (2007) estimated that although on average
about 11,000 hours were needed, the hours of practice required to attain expertise varied
substantially from 3,016 hours to 23,608 hours. Some players were also reported to
accumulate more than 25,000 hours of practice without achieving expert level (Chassy
& Gobet, 2010).
The differences in the rate of learning can be observed at a neurological level. In one
study, participants were classified as slow or fast learners in an auditory discrimination
training task. Differences in behavioral performance were reflected in differential
patterns of training-induced functional activation on fMRI (functional magnetic
resonance imaging) between the two groups (Gaab, Gaser, & Schlaug, 2006). Compared
with the slow learners, fast learners recruited the left supramarginal gyrus and left
Heschl's gyrus to a greater extent during the post-training phase. (Jäncke, Gaab,
Wüstenberg, Scheich, & Heinze, 2001) obtained similar findings for participants who

- 81 -
improved at a frequency discrimination task, and exhibited a different short-term
functional activation pattern than those who showed no improvement.
Likewise, (Zatorre, Delhommeau, & Zarate, 2012) found that participants who learned a
micromelody task more quickly had relatively steeper fMRI BOLD (blood-oxygen-level
dependent) responses to pitch changes in their auditory cortex, even before they trained
on the task. These findings may indicate the presence of genetic influences in music
learning capacity.
Some variables associated with music training, such as intelligence and openness-to-
experience, have been shown to be genetically influenced (Butkovic et al., 2015;
Corrigall & Schellenberg, 2015; Corrigall, Schellenberg, & Misura, 2013; Hille &
Schupp, 2015). The effect of genetic influences therefore should not be discounted in
music ability research, even when considering ostensible environmental factors like
music training and practice (see also Section 2.4.2.2 for evidence of the heritability of
music practice and the genetic correlation between music practice and music ability,
p. 50).
3.5 The Genetic and Environmental Determinants of
Music Ability: A Summary
To summarise the research reviewed thus far, Figure 2.4 (p. 63) and Figure 3.1 below
present schematic representations of the genetic and environmental determinants of
music ability, respectively. It is apparent from Figure 2.4 that extensive regions in
chromosomes 4 (in red font) contain promising genetic evidence for various music
skills, particularly those pertaining to music perception, but also music production skills
such as singing, music performing and composing. In addition, genetic loci on
chromosomes 8 (in blue font) and 12 (in green font) also appear to exert an influence on
various types of music perception skills.
Although the investigation of the genetic basis of music ability is still in its infancy, it is
interesting to observe from Figure 3.1 that numerous music skills and even certain
environmental variables, such as cultural environment and music practice (highlighted
in yellow) have a genetic component. The three main environmental contexts reviewed

- 82 -
in this chapter have been shown to influence various music perception and music
production skills, although the extent and the types of skills influenced may vary. For
instance, in terms of music production skills, while instrumental performance abilities
are primarily developed in the formal music learning environment, singing ability is
observed to be shaped by all three environments, whether informally through the
cultural and home environments, or through formal music learning.
The unanimous contribution of the three main environmental contexts to singing
development makes singing ability a particularly suitable model to study the genetic
basis of music ability as it provides a sufficient and balanced consideration of
environmental factors. The next chapter therefore examines singing ability in greater
detail, including its developmental trajectory, a neurocognitive model of singing, the
tasks and measures commonly used to evaluate singing ability in research studies, and a
discussion of why singing ability provides an ideal paradigm for genetic analysis. The
chapter concludes with the rationale, aims and hypotheses of the empirical study
reported in this thesis.

- 83 -
Figure 3.1. A schematic representation of the environmental determinants of music ability. The variables highlighted in yellow are also genetically
influenced.

- 84 -
THE NATURE OF
SINGING ABILITY
This chapter focuses specifically on singing ability. In the following section, the typical
age-related developmental trajectory of singing ability is described.
4.1 The Typical Developmental Trajectory for Singing
Although singing ability emerges spontaneously in the human population, there is
general consensus that the subsequent development of singing ability is also dependent
on maturational as well as experiential factors (Davidson, McKernon, & Garnder, 1981;
Hedden, 2012; Stadler Elmer, 2006; Welch, 1985). Therefore, it should be noted that
while the developmental trajectory of singing ability below documents the typical age-
related developmental milestones for singing, considerable individual differences may
exist with regards to the age at which one attains each milestone (Gembris, 2006).
0-2 months
The earliest vocal behaviour manifested by newborn babies such as crying and babbling
may already exhibit certain musical features such as pitch and rhythmic patterning and
phrasing, as well as variation of intensity (Vihman, 1996).
3-6 months
Infants begin to develop vocal control and start exploring the voice through vocal play
around this time (M. Papoušek, 1996). The pitch content of an infant’s vocalisations is
influenced by the prosodic features of the mother tongue (Meltzoff, 2002; Welch,
2006), but descending melodic contours are prevalent in the first few months of infancy
(Fox, 1990). Some infants are able to match single pitches vocally (Kessen, Levine, &
Wendrich, 1979), and the vocal exchange between parent and infant is marked by a high

- 85 -
incidence of reciprocal imitation of vocal patterns (Masataka, 1999; M. Papoušek,
1996). As noted in Section 3.3 (p. 68), such nonverbal quasi-musical communication
(e.g., Motherese) between parent and child as well as maternal singing have positive
impact on the quality and frequency of infant musical babbling (H. Papoušek, 1996;
Tafuri & Villa, 2002).
12-18 months
More experimentation with the voice ensues, as the child tries to explore the vocal range
and what can be done with one’s voice through vocal play (Gembris, 2006). An
increasing distinction between singing and speech also emerges by the end of the first
year (Gembris, 2006). First actual singing is observed between 6 to 18 months, which is
characterised by monosyllabic glissando vocal improvisations that are narrow in range
(Dowling, 1999).
2 years
At two years of age, children can sing short one-line phrases and reproduce music
intervals with some degree of accuracy (Gembris, 2006). They are also able to sing brief
phrases with recognisable melodic contours and rhythmic patterns (Dowling, 1999). By
this age, singing is reliably distinct from speech (Tsang et al., 2011).
3-4 years
One-phrase singing is rarer at this age, as children can typically sing three different
phrases by now (Dowling, 1988, 1999). Children at this age also like to improvise and
create “pot-pourri” songs by combining phrases or fragments from different songs
(Moog, 1976). By the age of 4, children are able to reproduce the majority of the lyrical
and rhythmic content as well as the formal structure of a song (Shuter-Dyson & Gabriel,
1981).
6-7 years
Children are able to comfortably sing with a full octave range or even one and a half
octaves (from G3 to C5) around this age (Davidson, 1994; Tsang et al., 2011). It was
observed from a study that about 67% of first-grade children had a singing range
exceeding one octave (Wassum, 1979).

- 86 -
8 years
The average child can sing a song accurately by the age of 8, and according to some
researchers, the level of singing ability will plateau off at this point unless the child
undertakes formal music instruction and practice (Gembris, 2006).
10-11 years
At 10 years of age, children typically have a nearly two-octave singing range, spanning
F3 to D#5 (Moore, 1991; Tsang et al., 2011), and by 11 years old, out-of-tune singing is
a rare phenomenon (Howard, Angus, & Welch, 1994; Welch, 1979; Welch, 2000).
Another study reported that approximately 98% of sixth-grade children in a large
sample had a singing range exceeding one octave (Wassum, 1979).
4.2 A Neurocognitive Model of Singing
Even though singing ability typically develops with age, individual differences in
singing ability are commonly observed in the general population (Amir et al., 2003;
Dalla Bella et al., 2007; Pfordresher & Brown, 2007). Diverse patterns of inaccurate
singing have been reported, which indicates that there are possibly different underlying
causes to poor singing phenotypes (Dalla Bella & Berkowska, 2009). For instance,
some possible causes for inaccurate singing may be poor motor control of the vocal
organs, a pitch perception or memory deficit, or problems with sensorimotor translation
that hamper the mapping of perceptual information to the correct vocal response
(Hutchins & Peretz, 2012). In order to better contextualise the various possible causes
of singing accuracy, the following section will outline a recent neurocognitive account
which has gained traction in the current state of singing research.
4.2.1 The vocal sensorimotor loop
Dalla Bella and his team proposed a neurocognitive model of singing that focused on
the core role of the vocal sensorimotor loop (VSL) of singing as a model for the singing
network (Figure 4.1) (Berkowska & Dalla Bella, 2009a; Dalla Bella, Berkowska, &
Sowinski, 2011). Partly inspired by Levelt’s Perceptual loop theory (1989) for speech,
in this model, pitch and temporal information are retrieved from memory and then

- 87 -
translated into vocal-motor responses during auditory-motor mapping. The translated
motor representations guide subsequent motor planning to generate singing output. The
sung output then becomes an auditory input which forms a feedback loop, enabling the
singer to constantly self-monitor and compare the actual vocal output with the planned
output as dictated by the internal pitch and temporal information accessed from
memory. The singer is thus able to make use of the auditory feedback to make online
corrections to adjust the motor output accordingly.
The VSL model takes into consideration two different scenarios for singing: with or
without an external auditory stimulus. Singing a familiar song without an external
auditory cue requires the retrieval of the song’s pitch and temporal information from the
long-term memory, followed by fine motor planning and production. On the other hand,
vocally matching an external auditory stimulus involves the perceptual analysis of the
auditory input and retaining the information in working (short-term) memory. This
information is then utilised during auditory-motor mapping of appropriate motor
representations to guide motor planning and generate vocal output. In both scenarios,
the vocal output will serve as auditory feedback to enable self-monitoring and
correction of vocal response.
The VSL model describes two distinct perceptual pathways. The overt perceptual
pathway is necessary for an individual to discriminate pitch differences, such as judging
pitch direction. In the case of individuals with pitch perception deficits, such as those
with congenital amusia, it is possible that the overt perceptual pathway is
malfunctioning or underdeveloped (Berkowska & Dalla Bella, 2009a). Several studies
have reported however, that despite impaired pitch discrimination ability, some
congenital amusics are able to vocally produce intervals in the right direction (Dalla
Bella, Gigùre, & Peretz, 2009; Griffiths, 2008; Loui, Guenther, Mathys, & Schlaug,
2008). These findings suggest that auditory perception and action are dissociable and
may belong to two separate processing streams (Griffiths, 2008). Moreover, the
observation that pitch production ability is preserved to some degree despite impaired
pitch perception may be taken as an evidence that another pitch perception pathway
exists, guiding vocal production covertly in a less fine-tuned manner (Berkowska &
Dalla Bella, 2009a). The existence of a second covert perceptual pathway may explain
the observations that singers unconsciously adjust their voice in the opposite direction

- 88 -
when counteracting pitch-shifted auditory feedback, even when the pitch change is
imperceptible to them (Hafke, 2008).
Figure 4.1. The schema of the vocal sensorimotor loop (VSL). The putative brain regions
associated with the functional components of the VSL are indicated in grey. SMA:
supplementary motor area; ACC: anterior cingulate cortex; dPFC: dorsal prefrontal cortex; SPT:
cortex of the dorsal Sylvian fissure at the parieto-temporal junction. Adapted from “Disorders of
pitch production in tone deafness,” by Dalla Bella et al. (2011), Frontiers in Psychology,
2(164), p.5.
4.3 Neural Correlates of Singing
The following section provides an outline of the putative neural correlates of singing,
with reference to the above model where appropriate. For a detailed review of the
neural substrates of singing, please refer to Zarate (2013).
4.3.1 Pitch and melody perception and auditory feedback
processing
As a pitch or melody is perceived, it is transmitted and processed along the ascending
auditory pathway (cochlear nucleus, superior olive, inferior colliculus, lateral lemniscus,
and the medial geniculate nucleus of the thalamus) before being further processed in the
primary auditory cortex within Heschl’s gyrus (Griffiths, Uppenkamp, Johnsrude,
Josephs, & Patterson, 2001). A pitch-sensitive area in right lateral Heschl’s gyrus is
thought to be responsible for conscious pitch perception (Bendor & Wang, 2006;

- 89 -
Griffiths, 2003), whereas additional auditory cortical areas beyond Heschl’s gyrus, such
as the right superior temporal gyrus (STG), planum polare and planum temporale, are
enlisted to process pitch changes and melodic phrases (Hyde, Peretz, & Zatorre, 2008;
Patterson, Uppenkamp, Johnsrude, & Griffiths, 2002; Zatorre, Evans, & Meyer, 1994).
In particular, for pitch comparison within a melody, right auditory and frontal cortical
areas are observed to manifest increased activity. For comparing melodies of the same
key, bilateral STG and auditory cortical areas along the STG are extensively activated
whereas for the comparison of melodies in different keys, additional recruitment of the
intraparietal sulcus (IPS) has been observed (Foster & Zatorre, 2010).
Sound stimuli of different timbres are also reported to be processed by different areas of
the auditory cortex. Specifically, functional imaging studies have revealed that an area
within the anterior STG shows stronger activation to music than the human voice
(Angulo-Perkins et al., 2014; Fedorenko, McDermott, Norman-Haignere, & Kanwisher,
2012; Leaver & Rauschecker, 2010; Rogalsky, Rong, Saberi, & Hickok, 2011), whereas
there are apparently functionally distinct regions within the superior temporal sulcus
(STS) that are involved in vocal timbre processing. Specifically, anterior STS and
posterior STS have been implicated in familiar and unfamiliar voice recognition,
respectively (Kriegstein & Giraud, 2004; Warren, Scott, Price, & Griffiths, 2006).
Posterior STS may also be involved more generally in processing spectral changes in
sound over time (Warren et al., 2006).
4.3.2 Auditory-motor mapping
The anterior insula is implicated in the sensory-motor control of vocalisation as it is a
multimodal association area that integrates different modalities and serves as a gateway
for sending both auditory information and somatosensory information to the anterior
cingulate cortex (ACC).
4.3.2.1 An experience-dependent network for the auditory-motor
control of singing
Some studies have demonstrated that the neural substrates for auditory-motor mapping
are different for novice and experienced singers (Zarate, Wood, & Zatorre, 2010; Zarate

- 90 -
& Zatorre, 2008). In singing tasks with pitch-shifted auditory feedback, information
from the auditory feedback is thought to be processed and extracted by the STG and
STS of the auditory cortex as well as the IPS. The IPS has been implicated in the
translation of sensory input for motor planning (Astafiev et al., 2003; Grefkes, Ritzl,
Zilles, & Fink, 2004; Tanabe, Kato, Miyauchi, Hayashi, & Yanagida, 2005). In the case
of pitch-shifted auditory feedback, Zatorre and colleagues speculated that auditory
information is translated in the IPS into spatial frequency information (Foster & Zatorre,
2010; Zatorre, Halpern, & Bouffard, 2010). They also argued that when participants
have to adjust their vocal output to compensate for pitch-shifted auditory feedback,
individuals with minimal vocal training recruit the dorsal premotor cortex (dPMC) more
than the experienced singers, whereby the dPMC is thought to utilise the spatial
frequency information received from the IPS via the insula to prepare an appropriate
vocal motor response. On the other hand, for experienced singers, instead of recruiting
the dPMC, the spatial frequency information from the IPS is sent to the ACC via the
anterior insula to generate suitable motor plans (Zarate, Wood, et al., 2010; Zarate &
Zatorre, 2008). Moreover, experienced singers appear to be able to disengage the right
anterior insula to ignore somatosensory feedback where necessary (Kleber, Zeitouni,
Friberg, & Zatorre, 2013).
Interestingly, other research has shown that pitch discrimination training alone does not
improve singing accuracy nor enable the enlistment of training-sensitive neural
correlates for auditory-motor mapping (Zarate, Delhommeau, et al., 2010).
4.3.3 Vocal motor control
Several brain regions are implicated in vocal motor control and it has been proposed
that vocal motor control in humans follows a hierarchical pattern (Zarate, 2013). At the
first level, the reticular formation of the pons and medulla is directly connected to motor
neurons of the phonatory muscles. These connections enable the phonatory muscles to
receive input from the brain and generate complete vocal patterns. The second level
consists of the periaqueductal gray (PAG) and the anterior cingulate cortex (ACC),
which are implicated in voluntary initiation and emotional or motivational intonation in
vocalisations (Jürgens, 2002, 2009). The highest level comprises the primary motor
cortex (M1) and its modulatory brain regions (e.g., cerebellum, putamen and globus

- 91 -
pallidus), which are involved in the production of learned vocalisations in speech and
song. As M1 also has direct connections with the motor neurons of the phonatory
muscles which bypasses the first and second levels, lesions to brain regions at either the
second or third level of the vocal motor control hierarchy will lead to selective
impairment in certain types of vocalisations and not destroy all vocalisations.
4.3.4 Somatosensory feedback processing
Somatosensory information, such as the awareness of articulator placement and
respiration are transmitted along the ascending somatosensory pathway to the primary
and secondary somatosensory areas (S1 and S2). Notably, S1 is posteriorly adjacent to
the portion of M1 which is in charge of phonation (e.g., vocalisation and articulator
movement) (Penfield & Rasmussen, 1950). In addition, S1 is observed to be
incrementally activated as a function of vocal training and practice (Kleber, Veit,
Birbaumer, Gruzelier, & Lotze, 2010).
4.3.5 Dual-stream model for singing
Converging neural findings have supported a dual-stream model of singing with two
dissociable pathways for auditory perception and vocal production, respectively (Zarate,
2013). With reference to the VSL, Zarate (2013) proposed that the covert perception
route or ventral stream, likely consists of a pathway linking the auditory cortex
(STG/STS) to the inferior frontal gyrus (IFG) which processes identity information of a
sound object. On the other hand, the overt vocal production route or dorsal stream,
comprises the auditory cortex (STG/STS), IPS, anterior insula, dPMC and ACC. The
dorsal stream is potentially involved in the spectrotemporal processing of auditory
information and executing appropriate motor commands based on the processed
information (Figure 4.2).

- 92 -
Figure 4.2. The vocal sensorimotor loop (Berkowska & Dalla Bella, 2009a; Dalla Bella et al.,
2011) updated with findings from Zarate and Zatorre (2008); Zarate, Wood, et al. (2010). Brain
regions linked by the red arrows represent the overt pitch production route (dorsal stream),
whereas brain regions linked by the blue arrow represent the covert pitch perception route
(ventral stream). Orange boxes indicate brain regions implicated in auditory processing, green
boxes for vocal motor control, and purple for multimodal processing. ACC: anterior cingulate
cortex; aINS: anterior insula; dPMC: dorsal premotor cortex; IFG: inferior frontal gyrus; IPS:
intraparietal sulcus; STG: superior temporal gyrus; STS: superior temporal sulcus. Adapted
from “The neural control of singing,” by Zarate (2013), Frontiers in Human Neuroscience
7(Jun), p.8.
4.4 The Evaluation of Singing Ability
To assess singing ability in a study setting, researchers in the past few decades have
used several types of tasks as well as a variety of metrics for accuracy. In the following
section, the typical tasks and measures used to assess singing ability will be surveyed.
As pitch accuracy is fundamental to in-tune singing, there is a common consensus
among researchers and professional singing pedagogues alike that pitch accuracy is a
key yardstick of singing ability (Hutchins & Peretz, 2012; Watts et al., 2003). In
addition, pitch accuracy in singing relies in part on the ability to accurately perceive
pitches, which has been demonstrated to have a genetic component (see Section 2.4.1.1,
p. 33). In the current thesis, singing ability was therefore assessed in terms of pitch

- 93 -
accuracy. In view of this, only tasks and measures pertaining to pitch accuracy will be
discussed in this section.
4.4.1 Tasks
Singing ability can be evaluated with a variety of tasks such as song-singing or pitch-
matching tasks. It is often advisable to use different types of tasks to evaluate singing
ability as individuals may exhibit varying success for each task, due in part to the fact
that different tasks may recruit partially different components of the singing network
(Dalla Bella, 2015). Therefore, establishing a comprehensive understanding of singing
proficiency requires a good range of tasks.
There are two main types of singing tasks – imitative and recollective. Imitative tasks
require participants to listen to external auditory stimuli and vocally match the target
pitches, whereas recollective tasks typically require participants to sing a song from
memory, with or without lyrics. While a few other singing tasks have also been used in
singing research, such as sight-singing or improvised singing (Brown, Martinez, &
Parsons, 2006; Mishra, 2014), these tasks are less common because formal music
training and singing experience are most likely required to perform these tasks.
Moreover, improvised singing tasks are difficult to assess using objective measures. In
contrast, imitative and recollective tasks do not pose these constraints, thus enabling all
people to participate. The two types of tasks and the components of these tasks are
described below.
4.4.1.1 Imitative singing tasks
Imitative singing tasks are generally deconstructed singing tasks, in which the ability to
vocally match a single pitch, interval or short melodic sequences are assessed. As these
tasks involve matching the exact pitches of the auditory stimuli, it is important to ensure
the stimuli presented are of an appropriate range and register for the participants
according to their sex and age, so that any pitch inaccuracy that arises is not due to
register limitations (Demorest et al., 2015). In these tasks, a set of range-appropriate
pitches, intervals or novel melodies are typically presented over a number of trials, in a
randomised or pseudo-random order.

- 94 -
The three commonly used imitative singing tasks are as follows:
a) Single pitch
Single pitch-matching tasks have been used in numerous research studies to assess
singing ability, possibly due to the ease of constructing and administering such task
(Goetze, Cooper, & Brown, 1990; Hutchins, Zarate, Zatorre, & Peretz, 2010;
Pfordresher & Brown, 2007; Watts et al., 2003). A variant of this task can be used to
investigate the dissociation between the proposed pitch perception and production
pathways in the brain. Such task typically involves altering the auditory feedback of the
participant’s vocal output and asking the participant to either ignore the altered feedback
and maintain the produced pitch, or compensate for the altered feedback by adjusting
one’s vocal output to suit the perceived pitch height (Hafke, 2008; Zarate & Zatorre,
2008). One concern for the single pitch-matching task, however, is that the task is so
deconstructed that success in this task may not generalise to good singing ability in real-
world settings.
b) Melodic intervals or short melodic sequences
Sometimes interval or melody-matching tasks are also used in conjunction with the
single pitch-matching task, as some researchers have noted that there is a difference in
task performance between the two (Pfordresher & Brown, 2007; Wise & Sloboda,
2008). This difference may be due to the greater memory demands of interval and
melody-matching tasks as well as the richer tonal context that they afford. This richer
tonal context ensures greater ecological validity for these tasks.
c) Novel songs
Some researchers have also used unfamiliar songs to assess singing ability, although
this is not widely practised. For instance, in the AIRS Test Battery of Singing Skills
(ATBSS), an unfamiliar tonal song “We Are One” is presented to the participants twice
before they have to sing it back. The song comprises five phrases of varying melodic
contours and is of moderate musical and linguistic difficulty, thus allowing for
improvement in memory and performance over a number of test sessions (Cohen,
2015).

- 95 -
When choosing auditory stimuli for imitative tasks, researchers need to take into
consideration how timbre may influence pitch-matching accuracy. Research has shown
that inexperienced or inaccurate singers generally perform better if the timbre of the
auditory stimuli is similar to their own voice (Green, 1990; Hutchins & Peretz, 2012;
Yarbrough, Green, Benson, & Bowers, 1991), and vocal stimuli are generally more
accurately matched than non-vocal stimuli such as sine-wave models (Price, Yarbrough,
Jones, & Moore, 1994). Therefore, using different timbres for the same imitative task
may be useful for the identification of individuals whose pitch-matching abilities are
differentially affected by timbre (Demorest et al., 2015; Hutchins & Peretz, 2012; Price
et al., 1994).
4.4.1.2 Recollective singing tasks
In these tasks, participants are usually asked to sing a familiar song from memory. Such
tasks have also been commonly used for assessing singing (Berkowska & Dalla Bella,
2013; Pfordresher & Brown, 2007; Rutkowski, 1990; Rutkowski & Miller, 2003a) and
it has been reported that people generally perform better for recollective singing tasks
than imitative singing tasks (Berkowska & Dalla Bella, 2013). Researchers typically
choose songs that are extremely familiar and widely sung in their culture, e.g., Happy
Birthday or Brother John. It is also necessary to consider the participant’s age when
choosing a familiar song to ensure the difficulty and vocal range of the familiar song is
appropriate for the age group (Erman, 1981).
The singing of familiar songs from memory can be assessed using different conditions
to investigate whether singing accuracy varies with each condition. For instance,
research has shown that adults in the general population are typically more accurate
when singing familiar songs on neutral syllables such as ‘la’ compared to singing with
lyrics (Berkowska & Dalla Bella, 2009b, 2013), although congenital amusics exhibited
the opposite pattern (Dalla Bella & Berkowska, 2009), and studies involving children
also reported mixed findings (Goetze et al., 1990; Lange, 2000; Levinowitz, 1989b;
Smale, 1988). According to Dalla Bella et al. (2007), singing familiar songs at a
prescribed slower tempo also appears to have a positive effect on pitch-matching
accuracy than singing at a self-determined tempo.

- 96 -
Besides singing tasks, in order to determine whether poor-pitch singing is accompanied
by a concurrent pitch perception deficit, some researchers have included a pitch
discrimination task as a subcomponent for singing ability assessment (Bradshaw &
McHenry, 2005; Demorest et al., 2015; Hutchins & Peretz, 2012).
4.4.2 Measures
Pitch accuracy in singing can be evaluated by subjective or objective measures.
Subjective assessment of singing ability is typically conducted by music experts, such
as musicians, singers and music educators (Dalla Bella, 2015; Hébert, Racette, Gagnon,
& Peretz, 2003; Racette, Bard, & Peretz, 2006; Schön, Lorber, Spacal, & Semenza,
2004; Wise & Sloboda, 2008), and allows quick and easy assessment of singing ability
with generally high interrater reliability (Guerrini, 2006; Rutkowski & Miller, 2003b).
Some researchers have considered subjective rating to be the easiest way to reliably
assess song-singing ability (Demorest & Pfordresher, 2015; Wise & Sloboda, 2008), as
objective acoustic analyses for songs are time-consuming and challenging at present,
especially for songs with lyrics (Dalla Bella, 2015). However, a major shortcoming of
subjective assessment is that the subjective rating is rather general and does not provide
enough detail about the properties of the inaccuracies present in the singing
performance (Dalla Bella, 2015; Demorest et al., 2015). Furthermore, though the
interrater agreement is usually high, some studies have documented inconsistencies
among expert raters (Kinsella, Prior, & Murray, 1988; Prior, Kinsella, & Giese, 1990).
In view of these limitations, objective measures have been employed in recent studies as
they afford more precise and reliable estimations of pitch accuracy (Dalla Bella &
Berkowska, 2009; Dalla Bella et al., 2007; Murayama, Kashiwagi, Kashiwagi, &
Mimura, 2004; Pfordresher, Brown, Meier, Belyk, & Liotti, 2010) and provide rich
quantitative information to profile singing ability and differentiate among various poor
singing phenotypes. In addition, findings based on quantitative objective measures are
more easily compared across tasks and studies (Dalla Bella, 2015).
Before examining some common objective measures for pitch accuracy in singing, the
methods to segment and extract pitches from raw singing data in acoustic analyses are
first described.

- 97 -
4.4.2.1 Pitch segmentation and extraction methods
Prior to the advancement of computer technology in the past two decades, singing
researchers lacked the technical resources to assess singing accuracy objectively. A
more objective assessment of singing accuracy in those times would require the use of a
quartz tuner to quantify each sung pitch, which is a very labour-intensive process
(Green, 1990; Price, 2000). Fortunately, the progress in acoustic speech analysis has
brought about the development of useful software such as CSpeech (Milenkovic &
Read, 1992), Computerized Speech Lab (Kay Elemetrics, 2001), and Praat (Boersma &
Weenink, 2013). These software programs or applications allow the user to visualise the
recorded sound and facilitate the measurement of its acoustic properties such as pitch,
intensity and duration. In addition to these standalone programs, researchers have
developed pitch extraction methods that can be run in the Matlab environment, with a
popular example the YIN algorithm (De Cheveigné, 2002). Singing research has greatly
benefited from the development of these software applications and methods, and
numerous studies investigating singing have reported their use for objective assessment
of singing accuracy (Pfordresher et al., 2010; Trollinger, 2003; Zarate, Delhommeau, et
al., 2010) . Among these, Praat and YIN are the most commonly used as they are freely
available for download online (although YIN would need to be run in Matlab, which
needs to be purchased).
While it is no longer difficult to generate a fundamental frequency curve from a sound
file for visualisation and analysis purposes, there is, however, still a lack of consensus
on determining the portion of a pitch to be segmented such that it is representative of
the actual sung note
One of the most prevalent methods has been to select the middle section of a sustained
note manually by visual inspection. The rationale behind this is that the middle portion
of a note tends to be more stable than the onset and transition or offset sections, where
perturbations in fundamental frequency tend to occur. Researchers, however, vary in
their choice of the duration of the middle portion. The length of the middle portion has
ranged from 0.5 second (Bradshaw & McHenry, 2005), 1 second (Watts & Hall, 2008),
2 seconds (Estis, Coblentz, & Moore, 2009) to 4 seconds (Moore, Keaton, & Watts,

- 98 -
2007). Other studies do not prescribe a fixed duration for the selected segment, but may
either choose the middle 50% of each sound sample (Amir et al., 2003), or exclude the
boundary segments of each pitch (Demorest & Clements, 2007; Hutchins et al., 2010;
Larrouy-Maestri, Lévêque, Schön, Giovanni, & Morsomme, 2013; Larrouy-Maestri,
Magis, & Morsomme, 2014; Nikjeh et al., 2009; Pfordresher et al., 2010) .
Although it is understandable why researchers would select a steady-state portion of a
sung pitch for subsequent acoustic analysis, some researchers have also suggested that
selecting the most stable portion may overlook inaccuracies (e.g., glides) that occurred
near the boundaries of each note, which could yield important information about one’s
singing ability (Salvador, 2010). However, Pfordresher (2007) noted that using different
pitch segmentation strategies on the voice samples of the four least and most accurate
participants in his study produced minimal differences in the determination of the mean
fundamental frequency of each pitch segment, as the strategies still yielded .99
reliability.
Another commonly used segmentation strategy is to identify vowel onset of a sung pitch
and mark it as the onset of a pitch. There are two reasons for this: it has been observed
that vowel onsets are usually synchronised with the pulses in a song (Sundberg &
Bauer-Huppmann, 2007). Moreover, vowel onsets are often easy to identify visually as
vowels are always voiced (Dalla Bella et al., 2009; Murayama et al., 2004). While many
studies use visual inspection to manually mark the vowel onsets and perform pitch
segmentation (Berkowska & Dalla Bella, 2013; Dalla Bella & Berkowska, 2009;
Larrouy-Maestri & Morsomme, 2014), Tremblay-Champoux, Dalla Bella, Phillips-
Silver, Lebrun, and Peretz (2010) ran a script called EasyAlign (Goldman, 2011) within
Praat to identify the vowel onsets and segment the pitches in a semi-automatic manner.
Similarly, Demorest and Pfordresher (2015) also ran an automated Matlab algorithm to
identify note onsets. While the method of using vowel onsets to segment pitches has its
merits, the efficacy of such semi-automatic or automatic segmentation strategies is
largely dependent on the syllables uttered by the singer. Demorest et al. (2015) have
noted that in certain singing tasks, if participants are asked to sing using a neutral
syllable with a stop consonant such as “doo” instead of one with a liquid consonant like
“la”, it will presumably be easier to perform the segmentation. On the other hand, in

- 99 -
song-singing tasks that involve lyrics, such strategies may not be as effective in parsing
the individual pitches.
In sum, the current pitch segmentation strategies have several challenges. First, the
strategies often involve manual selection of pitch segments by visual inspection, which
is time consuming and labour intensive. Moreover, the selection of a stable portion of
the pitch is usually based on an arbitrary decision of the researcher, which may vary
from study to study or even within a study among different experimenters (Granot,
Israel-Kolatt, et al., 2013). The labour intensive and subjective nature of the prevalent
pitch segmentation methods may potentially affect inter- and even intra-rater reliability,
especially when large samples of singing performance are involved. While pitch
segmentation methods relying on semi-automatic or automatic detection of vowel
onsets hold some promise, the efficacy of such method in song-singing tasks with lyrics
is uncertain due to the variability of attacks and cutoffs of the sung lyrics (Demorest et
al., 2015). It is hoped that future technological advancement will improve current
procedures and enable acoustic analyses to be conducted in a more automatic fashion
(Dalla Bella, 2015). In the current study, some of the aforementioned challenges in pitch
segmentation were mitigated through the development of a novel semi-automatic pitch
segmentation method (see Section 6.2.2, p. 156).
4.4.2.2 Objective measures of pitch accuracy
There are two main types of objective metrics that are used to evaluate pitch accuracy:
absolute pitch and relative pitch measures. Both types of measures are described below.
a) Absolute pitch metrics
Absolute pitch metrics generally compute the pitch difference (in cents or semitones)
between each produced note and the target pitch and compute the mean across the entire
task.
The direction of pitch error (i.e., the produced pitch is higher or lower than the target)
can be taken into account by noting whether the sign of the deviation is positive or
negative. Mean signed pitch deviation is computed by averaging all the signed pitch
errors for the entire task. However, if a participant makes pitch errors in both directions

- 100 -
throughout the task, this measure could cause the positive and negative deviations to
cancel each other out and overestimate the participant’s singing accuracy. Mean
absolute pitch deviation which averages the absolute values of all the pitch errors can
thus avoid this potential pitfall (Dalla Bella, 2015).
b) Relative pitch metrics
While absolute pitch metrics can be computed for all singing tasks, whether it is
matching single- pitch, interval, melodic sequences or songs, relative pitch metrics are
only applicable to singing tasks that consist of two or more pitches per trial. This metric
is computed by measuring the size of every two consecutive pitches (i.e., an interval)
produced, and calculating the difference between each sung interval with the
corresponding target interval. Similar to the absolute pitch metrics, the sign of the
interval error will indicate whether the produced interval is smaller (negative) or larger
(positive) than the target interval. Taking the averages across all the signed interval
errors and absolute interval errors will yield the mean signed interval deviation and
mean absolute interval deviation, respectively (Berkowska & Dalla Bella, 2013;
Hutchins et al., 2010; Pfordresher & Brown, 2007; Pfordresher et al., 2010) . It has been
reported in one study that the mean absolute interval deviation is significantly and
highly correlated with subjective ratings of pitch accuracy for Happy Birthday (r = .87,
p < .01) (Larrouy-Maestri et al., 2013). However, it should be noted that mean absolute
interval deviation will be less sensitive than mean absolute pitch deviation in detecting
and duly penalising unintentional key changes during singing.
For both absolute and relative pitch measures, it is possible to compute percentage
accuracy scores by calculating the number of correct pitches or intervals sung based on
a benchmark for accuracy (Dalla Bella, 2015). Some studies have adopted an accuracy
criterion that considers all pitch or interval deviations less than one semitone (in
absolute terms) from the target pitch or interval as accurate, although some researchers
have argued that this criterion may not be stringent enough (Dalla Bella, 2015). Other
studies have therefore used deviations of less than a quartertone (half a semitone) in
absolute terms as the accuracy criterion.
In interval or melody singing tasks, some studies have also used the number of contour
errors made as an accuracy measure (e.g., Dalla Bella et al., 2007), which is a less

- 101 -
stringent criterion than the above measures, as it only penalises melodic intervals that
are sung in the wrong direction compared to the corresponding target intervals.
c) Other singing ability measures
Several studies have also utilised other measures to assess singing ability.
Pitch stability measures the ability to sustain each pitch stably and is obtained by
computing the standard deviation within each extracted pitch segment and taking the
mean across the task (Dalla Bella & Berkowska, 2009; Dalla Bella et al., 2007).
Pitch precision examines the consistency in producing a pitch over all the trials of the
same target pitch or interval. It is obtained by computing the standard deviation
separately for all the trials with the same target pitch or interval, and then taking the
mean across all the standard deviations computed (Pfordresher et al., 2010).
For singing research studies that focus on identifying inaccurate singers, certain criteria
can be used to dichotomise the absolute and relative pitch metrics described above to
distinguish poor-pitch singers from accurate singers. For instance, some studies have
used a mean absolute pitch or interval deviation which exceeds a fixed cut-off value
such as 0.5 or 1 semitone to indicate poor-pitch singing ability (Berkowska & Dalla
Bella, 2013; Demorest & Clements, 2007; Hutchins & Peretz, 2012; Hutchins, Roquet,
& Peretz, 2012; Pfordresher & Brown, 2007; Pfordresher et al., 2010) . However, other
studies have shown that using a fixed cut-off of a quartertone may be overly stringent as
it classified 64-84% of participants in a study as poor-pitch singers (Berkowska & Dalla
Bella, 2013). In addition, the norms for singing accuracy or precision may differ for
different tasks or different sample populations. Some researchers therefore expound the
use of variable criterion to differentiate accurate and inaccurate singers, such as
classifying pitch or interval deviations beyond 2 standard deviations from the mean of
the sample population for the task (Dalla Bella, 2015). This variable cut-off was
demonstrated to yield a more reasonable percentage (28%) of poor-pitch singers
(Berkowska & Dalla Bella, 2013), although the variability may also make it difficult to
define poor-pitch singing consistently across tasks or studies (Dalla Bella, 2015).

- 102 -
Each measure examined above has its own merits and may be helpful to tease apart
diverse patterns of pitch inaccuracies (Dalla Bella, 2015). For example, if an individual
has low accuracy for absolute pitch metrics but high accuracy for relative pitch metrics,
this would indicate that the individual has possibly made pitch transposition errors in
the task. However, the assortment of tasks and singing ability measures may make it
potentially difficult to compare results across studies if each study uses a different set of
tasks and measures.
More recently, there has been a push for singing ability researchers to adopt a
standardised approach to assessing singing accuracy, using a common set of tasks and
measures. A recent initiative is the Seattle Singing Ability Protocol (SSAP) developed
by several leading researchers in the field, which aims to devise a minimum set of
singing tasks that can be easily administered and evaluated through objective or
subjective means (Demorest et al., 2015). If the protocol becomes the ‘golden standard’
in singing ability assessment, it may help to expand the state of knowledge about the
prevalence, patterns and causes of inaccurate singing across different populations, how
various types of singing inaccuracies vary as a function of age or training, and the
neural correlates of poor-pitch singing. This standard protocol could also be used to
evaluate the efficacy of singing interventions (Demorest et al., 2015).
4.5 Singing: An Ideal Model for Genetic Analysis
The above sections provided an overview of singing ability, outlining its typical
developmental stages and neural correlates, and describing how singing ability is
usually evaluated in research settings. Utilising the information reviewed in this chapter
and the two previous chapters, this section presents several arguments to demonstrate
why singing is an ideal paradigm for investigating the genetic basis of music ability.
4.5.1 Singing is a multifaceted music ability
Singing is a complex, multifaceted music ability which enlists an extensive range of
music perception and production subskills. Although singing is essentially a form of
music production ability, music perception ability is also crucial in singing due to the

- 103 -
complex auditory-motor interactions that occur between music perception and music
production during singing or other music performances (Zatorre, Chen, & Penhune,
2007). As the neurocognitive model presented in Section 4.2 has elucidated, music
perception ability is necessary in singing not only to perceive external auditory input,
but also to monitor auditory feedback of one’s voice for effective control of the pitch
produced. Figure 4.3 shows the music perception and production subskills involved in
singing, as adapted from the figure on music ability and its constituent music subskills
in Figure 2.1 (p. 11).
As evident from Figure 4.3, singing encompasses most of the constituent subskills of
music ability listed in Figure 2.1 (except for music composing and music arranging).
This indicates that singing is representative of music ability. Moreover, singing ability
is commonly regarded as an indicator of music ability in many different cultures
(Sloboda, Wise, & Peretz, 2005), which affirms its suitability to be used to investigate
the genetic basis of music ability.
Figure 4.3. Singing ability and its constituent perception and production subskills.
Singing Ability
Music Perception
Abilities Music Production
Abilities
Sight-singing
Singing from score
Singing by memory
Singing by imitation
Improvised singing
Pitch
Melody
Tuning
Rhythm
Tempo
Timbre
Discrimination of:
Mu
sic
per
form
an
ce
Production of:
Pitch
Melody
Tuning
Rhythm
Tempo
Timbre

- 104 -
4.5.2 Singing is a universal musical behaviour
Besides being a multifaceted music ability, singing is also a universal musical behaviour
present across all known human cultures (Lomax, 1968). The human voice is possibly
the first musical instrument, and as noted in Section 4.1 (p. 84), singing ability emerges
early and spontaneously at around 6 to 18 months of age. Singing’s ubiquity in various
cultures and its spontaneous development set it apart from other music performance
abilities, which typically require formal instrumental learning. Despite its spontaneous
emergence, diversity in singing abilities is still evident across the general population
(Dalla Bella et al., 2007). Even in cultures where singing behaviour is commonly
practised in everyday life, different rates of singing ability development across
individuals can be observed (see Section 3.2, p. 65). The inter-individual variability in
singing ability and the rate of singing skill acquisition even in musically-rich cultures
make it reasonable to expect that singing ability has a heritable component, and allows
assessment of both novice and trained experts.
It has been shown in Section 4.3 (p. 88) that there is now an emergent understanding of
the neurobiological basis of singing ability, and how the neural substrates may vary
depending on one’s singing experience and expertise. The presence of training-induced
neuroplasticity, however, does not preclude the possibility of pre-existing neurological
differences that are present even prior to vocal training (Merrett et al., 2013).
Anecdotally, some individuals appear to possess a natural ability to sing in tune (Watts
et al., 2003), and singing ability has been observed to cluster in families (e.g., the
Jackson 5). It is therefore conceivable that such pre-training interindividual behavioural
and neurological variability is genetically influenced. Compared to other music
production abilities that require formal learning, greater pre-training interindividual
variability can be expected from singing, making it highly suitable for genetic analysis.
This is further bolstered by the fact that evidence of genetic influences have already
been reported for some of the subskills of singing ability (e.g., pitch, melody and
rhythm discrimination), as described in Sections 2.4.1.1 (p. 33) and 2.4.1.2 (p. 34).

- 105 -
4.5.3 Singing is shaped by both formal and informal music
learning environments
As discussed earlier in Section 3.5 (p. 81), singing is arguably the only music
production ability which is jointly influenced by a formal music learning environment,
as well as informal music learning environments such as cultural and family
environments (as shown in Figure 3.1, p. 83). Other music production abilities such as
instrumental performance abilities and even composing and arrangement, are principally
developed in the formal music learning environment, especially in Western culture. This
makes it difficult for instrumental production abilities to fully account for
environmental influences from other contexts such as culture and home environments.
Moreover, studying the performance abilities of expert musicians appears to treat music
as an elite skill instead of fully capturing the essence of music as a universal human
behaviour. Singing ability, however, is not only able to reflect a greater range of
environmental contexts, its ubiquity also makes it representative of music ability in the
general population. Singing ability, therefore, is arguably a more appropriate music
production skill to investigate the genetic basis of music ability than other music
production abilities.
4.5.4 Singing ability has received minimal research
attention
Table 2.1 (p. 26) shows that the majority (61%) of the genetic investigations on music
abilities and music-related traits have focused on music perception skills. In many of
these studies, music perception abilities are referred to as “music aptitude”, which
implies that music perception ability in and of itself can encapsulate what it means to be
“musical”. Music production abilities, however, are equally important, and are probably
more salient and demonstrable forms of music ability than music perception per se.
While there has been increasingly more genetic studies in recent years that focus on
music production abilities (see Section 2.4.2, p. 48), the only studies that have
investigated singing ability have only assessed singing with (i) self-report measures of
participation in singing activities (Section 2.4.2.5, p. 55), and (ii) simple single-pitch
vocal imitation tasks (Section 2.4.2.6, p. 56).
- 106 -
Although vocal pitch-matching is an important subskill of singing, it is not sufficiently
complex to exemplify singing ability in everyday life. As singing proficiency may vary
considerably depending on the complexity and nature of the singing task, it is therefore
preferable to use different types of singing tasks to evaluate singing ability in order to
establish a comprehensive profile of singing proficiency (Berkowska & Dalla Bella,
2013). In view of the promising heritability estimate (40%) reported by Park et al.
(2012) for vocal pitch-matching, more research attention is clearly warranted to
investigate the genetic basis of singing ability with a comprehensive range of singing
tasks, which would offer greater ecological validity to the findings.
Moreover, although it has been demonstrated in several recent studies that music
perception ability and formal music training (measured in terms of the total amount of
music practice) have a partially overlapping genetic basis (see Section 2.4.2.2, p. 50),
the possibility of a shared genetic basis between singing ability and formal music
training has not been similarly investigated to date. As music perception ability is a
subskill of singing ability (Figure 4.3), it is conceivable that singing ability and formal
music training may also have shared genetic influences.
To summarise, singing ability, being a universal, multifaceted music ability that is
spontaneously emergent and shaped by formal and informal music learning
environments, is an ideal model to investigate the genetic basis of music ability and
deserves more careful examination using a variety of singing tasks. The next step to
consider is: What is a suitable genetic approach to study singing ability?
As noted earlier in Section 4.5.3, the development of singing ability is not contingent on
formal music learning, and cultural and family environments also play an important
role. It follows then that any pre-training behavioural and neurological differences in
singing ability can be a result of genetic influences or environmental influences from
cultural and family musical environments. It will therefore be expedient to use a genetic
approach that can disentangle genetic influences from environmental influences due to
formal training as well as pre-training environmental influences such as family and
culture.

- 107 -
A twin study (Section 2.2.2, p. 12) is particularly suited for this purpose. The twin study
design estimates the relative contributions of genetic and environmental factors on trait
variation, and distinguishes between the effects of common (or shared) and unique
environmental factors. In the context of music ability, common environmental
influences include the family musical environment, which is experienced in like manner
by each twin pair raised in the same household. Unique environmental influences, on
the other hand, can account for divergent musical experiences within the twin pair, such
as differences in duration and type of formal music training. It is therefore clear that the
twin study design may be extremely effective in disentangling genetic and
environmental influences on singing ability, and thus estimating the extent to which
singing ability is genetically influenced in a population.

- 108 -
4.6 Aims and Hypotheses
Having established the rationale for conducting a twin study to investigate the genetic
basis of singing ability in the previous section, this section will describe the aims and
hypotheses of the thesis.
The primary aim of the current twin study was to address a fundamental question:
A. Is there a sizeable genetic component for singing ability?
To this end, singing ability was determined in the two following ways:
i. Objectively, using a comprehensive range of singing tasks and objective
pitch accuracy measures.
ii. Subjectively, based on self-report of singing ability by participants
With reference to the primary aim, it was hypothesised that:
1) Objectively-assessed singing ability across all tasks would be
significantly influenced by genetic factors, as demonstrated by
significantly higher intraclass correlations for MZ compared to DZ
twins, and a significant heritability estimate in univariate genetic
modelling.
Specifically:
a. The ability to vocally match single pitches would have a significant
genetic component, as demonstrated by higher intraclass correlations
for MZ compared to DZ twins, and a significant heritability estimate
in univariate genetic modelling.
b. The ability to sing a familiar song in tune would have a significant
genetic component, as demonstrated by higher intraclass correlations
for MZ compared to DZ twins, and a significant heritability estimate
in univariate genetic modelling.
c. The ability to sing new melodies in tune would have a significant
genetic component, as demonstrated by higher intraclass correlations
for MZ compared to DZ twins, and a significant heritability estimate
in univariate genetic modelling.

- 109 -
2) Subjectively-assessed singing ability (based on self-report) would have a
significant genetic component, as demonstrated by higher intraclass
correlations for MZ compared to DZ twins, and a significant heritability
estimate in univariate genetic modelling.
In addition to the main aim above, the current study also aimed to address the
following question:
B. Is there evidence of genetic influences on the environmental components
associated with singing ability?
To investigate this, a singing and music background questionnaire was used to
identify environmental factors associated with singing ability.
It was hypothesised that:
1) Environmental factors related to formal music training would have a
significant genetic component, as demonstrated by significantly higher
intraclass correlations for MZ compared to DZ twins, and a significant
heritability estimate in univariate genetic modelling.
2) Singing ability and environmental factors related to formal music training
would have a partially shared genetic basis, as demonstrated by a significant
additive genetic correlation between singing ability and these environmental
factors.
To address the aims and hypotheses, it was necessary to consider how to develop the
methodology for the study. The next chapter details the methodological development
process for an online program, Let’s Hear Twins Sing!, which was purpose-designed for
this study.

- 110 -
METHODOLOGICAL
DEVELOPMENT
This chapter describes the methodological development of the online twin study.
Section 5.1 explains the rationale for conducting an online study and Sections 5.2 and
5.3 recount the development process of the online program and detail the tasks and
questionnaire that comprise the program. Finally, Section 5.4 gives an account of the
piloting of the online program, and discusses some of the technical issues that arose and
the troubleshooting measures undertaken.
5.1 Rationale for an Online Twin Study
In order to conduct a twin study, the first and foremost question was to consider the
source of recruitment. The most effective means of recruitment for the purpose of the
current study was through the Australian Twin Registry (ATR), one of the largest
volunteer twin registries in the world, that has enrolled over 33,000 pairs of Australian
twins since its formation. As the ATR twins could live anywhere in Australia, it was
vital that participation was broadly available to interested twins regardless of their
geographical location, so as to maximise the response rate and the sample size of the
study. Although it would be ideal to arrange for interested participants to commute to
Melbourne and take part in the study in a carefully controlled laboratory-based setting,
this was not logistically nor financially feasible. A viable and more cost-effective
alternative was therefore to design and develop an online program which could be
accessed by participants via the internet, and also have the functionality to reliably
capture and record singing data from the participants in real-time, so that the data could
be retrieved and analysed subsequently.

- 111 -
To the researcher’s knowledge, none of the existing studies in the field of singing
research have collected singing data in an online setting using a program with real-time
sound recording capability. In view of this, the online program Let’s Hear Twins Sing!
(http://twinsing.sollysweb.com) was jointly designed by the author and her two
supervisors, with the advice of Professor Isabelle Peretz, a professor of psychology
from the University of Montreal and the co-director of the international laboratory for
Brain, Music, and Sound research (BRAMS). The program was created on the Adobe
Flash platform by an experienced programmer who has worked on the development of
other music-based projects within the Clinical, Auditory, and Affective Neuroscience
(CAAN) Lab in the Melbourne School of Psychological Sciences in The University of
Melbourne. As the online program Let’s Hear Twins Sing! pioneered online real-time
recording and collection of singing data, the current study was probably the world’s first
singing study to be conducted online.
5.2 Program Development
The order of tasks and estimated duration for completing each task are summarised in
Table 5.1. In total, the online program comprised six main tasks (three singing tasks,
two music perception tasks and one tongue twister task) and a singing and music
background questionnaire. The estimated time of completion of the study was
approximately 30 minutes. Before describing each task in detail, the following section
will discuss the methodological and technical issues that need to be taken into
consideration in developing the online program.
5.2.1 Program design
Musch and Reips (2000) and Nosek, Banaji and Greenwald (2002) have highlighted
concerns regarding web-based research that researchers need to take into consideration
when conducting studies online. Most of the issues pertain to the researcher not being
present to monitor the study participant, as opposed to a laboratory setting. Examples
include the lack of control over participant behaviour during the study, the lack of
control over dropout or participant motivation in taking part, the possibility of
participating multiple times or fraud, and potential ethical issues such as ensuring
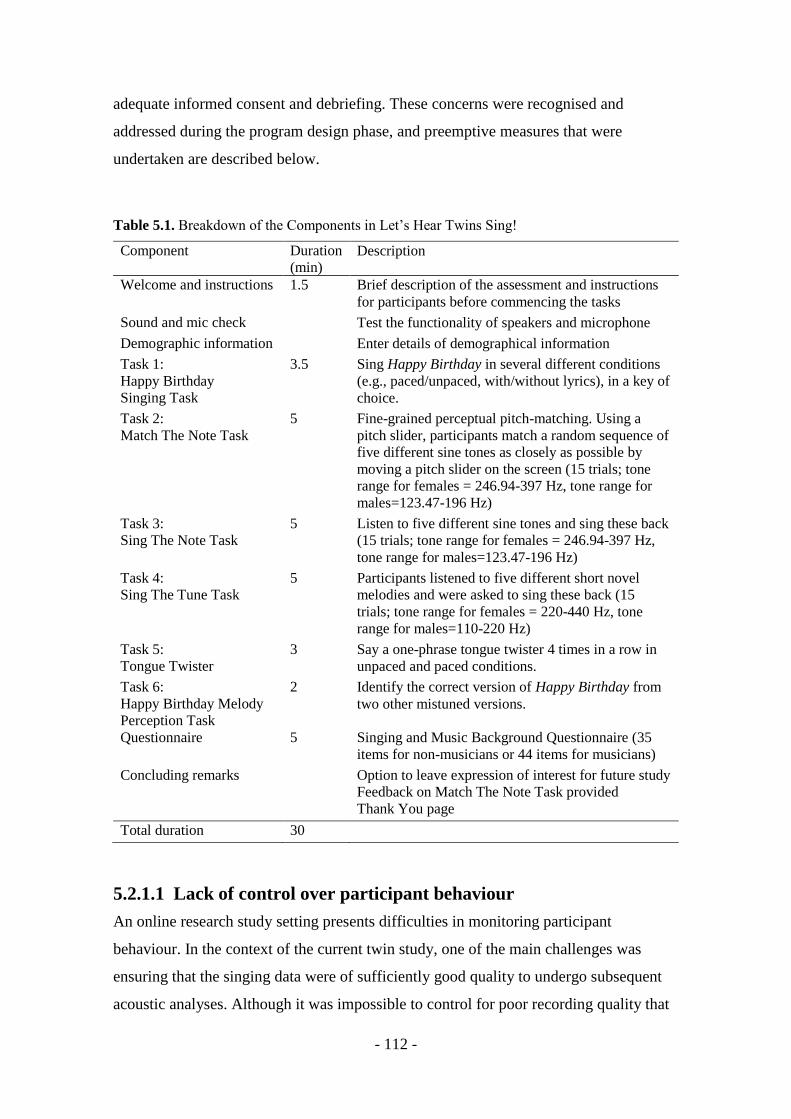
- 112 -
adequate informed consent and debriefing. These concerns were recognised and
addressed during the program design phase, and preemptive measures that were
undertaken are described below.
Table 5.1. Breakdown of the Components in Let’s Hear Twins Sing!
Component Duration
(min) Description
Welcome and instructions 1.5 Brief description of the assessment and instructions
for participants before commencing the tasks
Sound and mic check Test the functionality of speakers and microphone
Demographic information Enter details of demographical information
Task 1:
Happy Birthday
Singing Task
3.5 Sing Happy Birthday in several different conditions
(e.g., paced/unpaced, with/without lyrics), in a key of
choice.
Task 2:
Match The Note Task
5 Fine-grained perceptual pitch-matching. Using a
pitch slider, participants match a random sequence of
five different sine tones as closely as possible by
moving a pitch slider on the screen (15 trials; tone
range for females = 246.94-397 Hz, tone range for
males=123.47-196 Hz)
Task 3:
Sing The Note Task
5 Listen to five different sine tones and sing these back
(15 trials; tone range for females = 246.94-397 Hz,
tone range for males=123.47-196 Hz)
Task 4:
Sing The Tune Task
5 Participants listened to five different short novel
melodies and were asked to sing these back (15
trials; tone range for females = 220-440 Hz, tone
range for males=110-220 Hz)
Task 5:
Tongue Twister
3 Say a one-phrase tongue twister 4 times in a row in
unpaced and paced conditions.
Task 6:
Happy Birthday Melody
Perception Task
2 Identify the correct version of Happy Birthday from
two other mistuned versions.
Questionnaire 5 Singing and Music Background Questionnaire (35
items for non-musicians or 44 items for musicians)
Concluding remarks Option to leave expression of interest for future study
Feedback on Match The Note Task provided
Thank You page
Total duration 30
5.2.1.1 Lack of control over participant behaviour
An online research study setting presents difficulties in monitoring participant
behaviour. In the context of the current twin study, one of the main challenges was
ensuring that the singing data were of sufficiently good quality to undergo subsequent
acoustic analyses. Although it was impossible to control for poor recording quality that
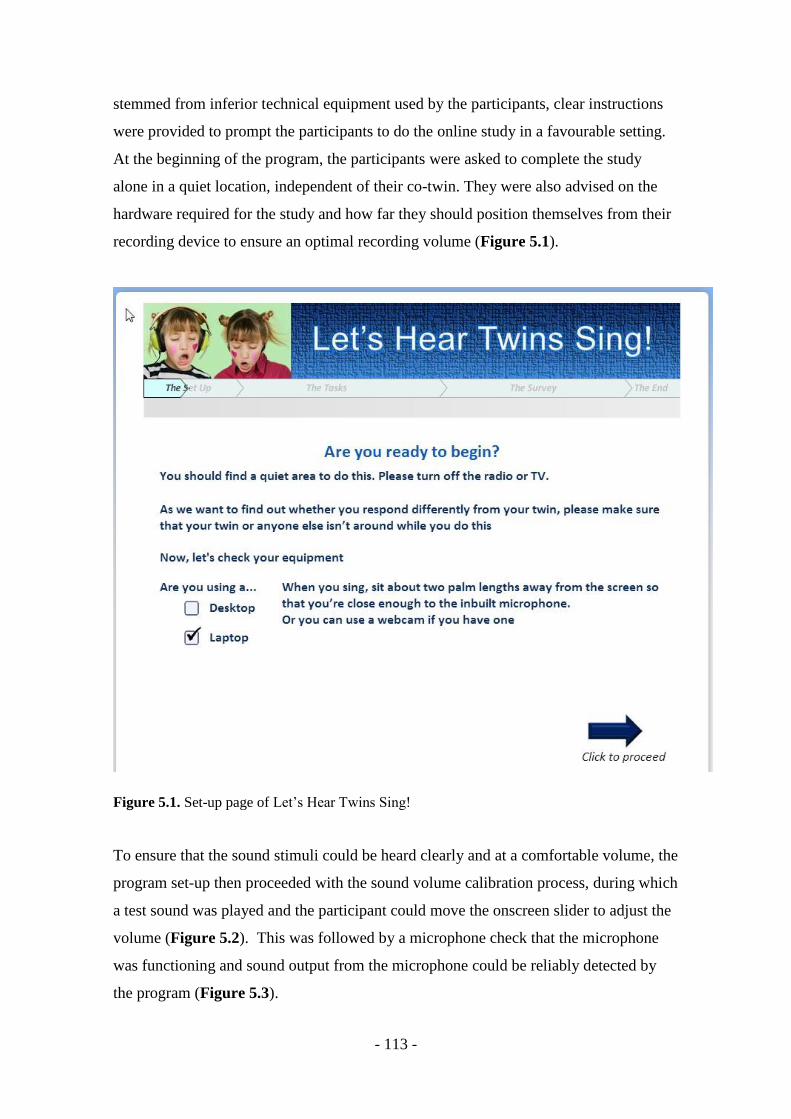
- 113 -
stemmed from inferior technical equipment used by the participants, clear instructions
were provided to prompt the participants to do the online study in a favourable setting.
At the beginning of the program, the participants were asked to complete the study
alone in a quiet location, independent of their co-twin. They were also advised on the
hardware required for the study and how far they should position themselves from their
recording device to ensure an optimal recording volume (Figure 5.1).
Figure 5.1. Set-up page of Let’s Hear Twins Sing!
To ensure that the sound stimuli could be heard clearly and at a comfortable volume, the
program set-up then proceeded with the sound volume calibration process, during which
a test sound was played and the participant could move the onscreen slider to adjust the
volume (Figure 5.2). This was followed by a microphone check that the microphone
was functioning and sound output from the microphone could be reliably detected by
the program (Figure 5.3).

- 114 -
Figure 5.2. Sound volume calibration page of Let’s Hear Twins Sing!
Figure 5.3. Microphone detection page of Let’s Hear Twins Sing!

- 115 -
As the researcher was unable to explain the tasks to the participants in person, care was
taken to ensure that task instructions were worded as clearly and simply as possible (see
figures from Section 5.3, p. 125). In addition, for the singing and pitch perception tasks
that involved listening to sound stimuli, at the beginning of each new trial, the green
musical note icon would blink once to prompt the participant to click on it in order to
listen to the sound stimulus of this trial. To prevent participants from clicking the record
button before listening to the stimulus, the record button remained disabled (as shown
by its greyed out state) until the sound stimulus has ceased playing (Figure 5.4).
Figure 5.4. Basic layout of the online tasks in Let’s Hear Twins Sing! A task progress bar at
near the top of the screen indicates the participant’s progress in the current task. The green
button with musical icon will glow and blink at the beginning of every trial to prompt the
participant to click on it to hear the music stimulus. The record button will remain disabled until
the music stimulus of the current trial has been played.
Another challenge of a web-based study is the possibility that participants may
inadvertently miss responding to some trials or questionnaire items. To prevent such
Disabled record button
Button will glow and blink
once at the beginning of
each new trial
Task progress bar

- 116 -
occurrences, the blue “Click to proceed” arrow in the lower right hand corner of the
screen would only be activated (indicated by the appearance of the ‘Click to proceed’
text under the blue arrow) when the participant had successfully completed the entire
singing or music task, or when each questionnaire item on the screen received a
response (Figure 5.5).
Figure 5.5. Screenshot from the questionnaire. As no responses have been made, the blue arrow
in the lower right hand corner is inactive, making it impossible to proceed to the next screen.
Once responses have been made to all the questionnaire items, the text “Click to proceed”
appears under the arrow, indicating that the arrow is active.
In sum, the lack of control over participant behaviour was minimised by providing clear
instructions in the program and by implementing a forced selection design to ensure that
the participants would navigate through the tasks and questionnaire correctly.

- 117 -
5.2.1.2 Lack of control over participant dropout
Besides being unable to monitor participant behaviour during the study, it is also not
possible to exercise control over participant dropout in an online research setting, given
the setting is voluntary in nature. As a result, if participants found the online study too
lengthy, too challenging or too boring, they may not be interested or motivated enough
to complete the study. This is an important issue to deal with, because participant
dropout results in incomplete data and reduces the amount of useable data for analysis.
Some deliberations were therefore made towards the program design.
First, while the current study aimed to assess singing ability with a comprehensive
range of tasks, it was necessary to balance comprehensiveness with a consideration of
the length of the study. For instance, an online study which takes one hour or more than
one sitting to complete would be untenable, as many people would not be motivated to
complete such a lengthy study. The current online study therefore endeavoured to be as
short as possible, with an estimated duration of 30 minutes while still collecting an
adequate amount of data for analysis. In view of this, for the perceptual and vocal
imitation tasks (i.e., Match The Note Task, Sing The Note Task and Sing The Tune
Task), five different stimuli were used. Each stimulus was presented in three trials,
resulting in a total of 15 trials per task. Having five different stimuli in 15 trials per task
was deemed sufficient to allow for a reasonable estimation of a participant’s singing
proficiency on a particular task, while also maintaining enough variety and challenge to
keep the participant motivated and engaged. Moreover, to minimise missing data, the
study was designed to be completed in one sitting without the option to save progress
for later completion.
Apart from task duration, the order with which the tasks were presented could also
encourage or deter participants from completing the entire study. After completing the
equipment setup procedure and filling in the demographic information, the participants
commenced the study tasks with Happy Birthday Singing Task, as it was considered the
most familiar, and therefore, the least intimidating. It was then followed by Match The
Note Task, to offer some variety and provide an activity other than singing. Sing The
Note Task, which was the vocal analogue of Match The Note Task came next, before
progressing to Sing The Tune Task, which was relatively harder. After completing all
- 118 -
the singing tasks, the tongue twister task then infused a light-hearted fun element to the
study. This was followed by Happy Birthday Melody Perception Task, before
concluding with the music and singing background questionnaire.
Clipart with encouraging text such as “Well done!”, “Awesome!” and “Keep it up!”
accompanied by sound effects appeared after each task was completed, so as to provide
the participants with some form of positive reinforcement to persevere. Within each
task, the participants were able to keep track of their progress from the task progress bar
situated near the top of the screen (Figure 5.4), which also served to motivate the
participants to keep going.
Finally, financial incentives were offered to encourage participants and their co-twins to
complete the study. Each twin pair where both individuals completed the online study
was eligible to enter an iPad Mini lucky draw to win two iPad mini 2 (16gb with Wi-Fi)
with retina displays. Moreover, in conjunction with the Twins Plus Festival 2015 in
Melbourne, an exclusive promotion was conducted in which WISH eGift cards valued
at $40 each were given to the first 40 pairs of twins who completed the online study
during the promotional period (10AM AEST Sunday 22 March 2015 to 11:59PM AEST
Sunday 5 April 2015).
5.2.1.3 Multiple participation or fraud
A challenge commonly faced by internet-based research studies is the likelihood of
having the same participant respond to the study multiple times, or having unverified
individuals accessing and attempting the online study. To minimise such possibilities,
invited access to the study was carefully implemented. In the case of twins recruited
from the ATR, they received an invitation email from the ATR containing information
and a web-link to the study. When the ATR participants accessed the online program,
on the demographic information page they were asked to enter a unique ATR ID, as
well as supply identifying information such as their name and birthdate (Figure 5.6).
This information enabled the researcher to verify the ATR participants’ identities with
the Twin Registry.
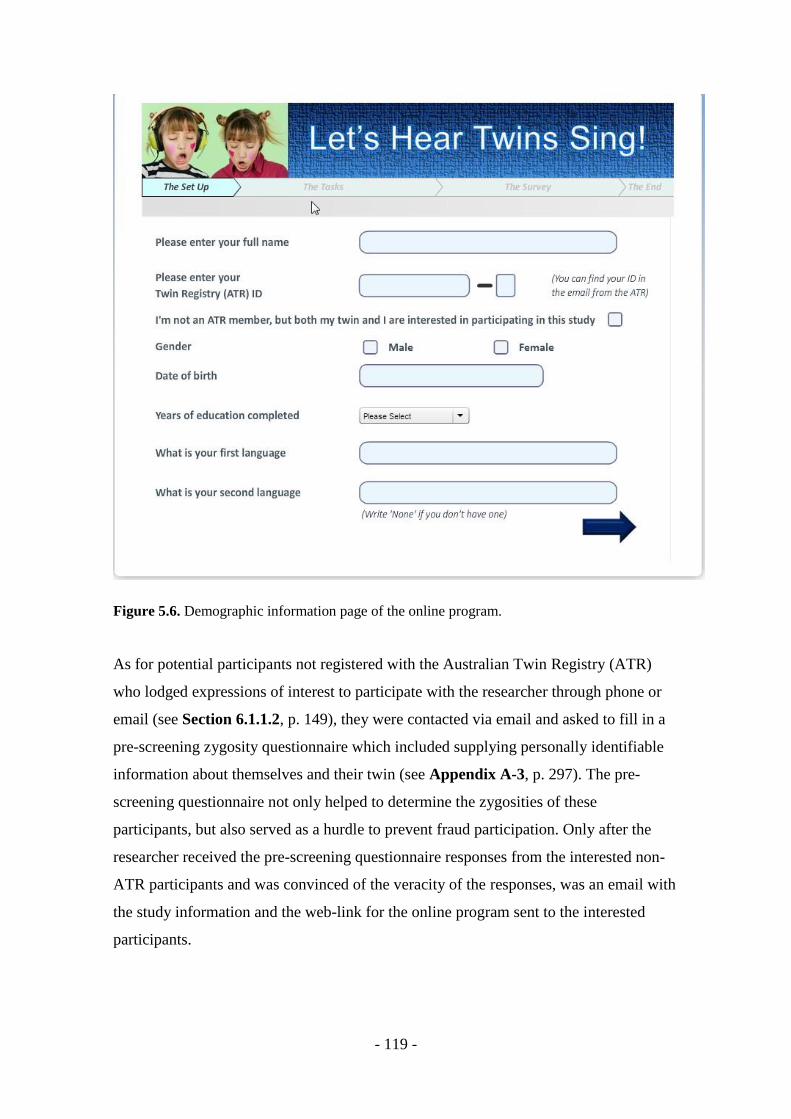
- 119 -
Figure 5.6. Demographic information page of the online program.
As for potential participants not registered with the Australian Twin Registry (ATR)
who lodged expressions of interest to participate with the researcher through phone or
email (see Section 6.1.1.2, p. 149), they were contacted via email and asked to fill in a
pre-screening zygosity questionnaire which included supplying personally identifiable
information about themselves and their twin (see Appendix A-3, p. 297). The pre-
screening questionnaire not only helped to determine the zygosities of these
participants, but also served as a hurdle to prevent fraud participation. Only after the
researcher received the pre-screening questionnaire responses from the interested non-
ATR participants and was convinced of the veracity of the responses, was an email with
the study information and the web-link for the online program sent to the interested
participants.

- 120 -
On the demographical information page in the program (Figure 5.6), non-ATR
participants were required to select a checkbox indicating their non-ATR status, which
would then take them to another page where they were again asked to state their
zygosity as well as supply their co-twin’s name (Figure 5.7). Such identifying
information was utilised subsequently to cross-check with responses from their co-twins
as a further check of its veracity.
Figure 5.7. Additional identifiable information required from non-ATR participants.
To summarise, the prerequisite for all participants (whether or not registered with the
ATR) to take part in the online study through rigorous invited access, and the need for
participants to supply verifiable, identifiable information in the online program not only
helped to prevent fraud participation, but also made it unlikely that individuals would
participate multiple times.

- 121 -
5.2.1.4 Potential ethical issues
There are also concerns in the online research setting that the absence of the researcher
may result in participants not receiving adequate informed consent. To ensure that all
the participants had sufficient information to make an informed decision about
participation, a web-link to the information sheet (see Appendix A-4, p. 299) was
provided in the recruitment email. Moreover, the welcome page of the online program
included a link to the information sheet, to ensure that the participants were given
adequate opportunity to understand what the study entailed before deciding to proceed
(Figure 5.8). It was also worded clearly on the welcome page that the decision to
proceed through the program was considered implied consent to participate.
Figure 5.8. Welcome page of the online program.
In adherence with the University of Melbourne Human Research Ethics guidelines, the
information sheet provided details of the purpose of the study, as well as what

- 122 -
participation involved and the expected time commitment. The information sheet also
clearly stated that involvement in the project was voluntary and that participants were
free to withdraw consent at any time. In addition, participants were assured of the
confidentiality of the data they supplied and their right to withdraw any unprocessed
data previously supplied if they chose to withdraw from the study. Contact details of the
principal and student researchers as well as those of the Executive Officer of the Human
Research Ethics Committee at the University of Melbourne were also available on the
information sheet in case participants had any concerns about the study.
As the targeted age range for the participants was 15 years and above, for minors
between the age range of 15-17 years, parental consent were first sought by the ATR, by
sending the parents the invitation email with the study information attached. The parents
could then consent to or decline participation on their children’s behalf by replying to
the invitation email. If consent were given by the parents, the ATR then contacted the
minors about the online study using the children’s email addresses provided by the
parents.
The study was independently reviewed and received ethics clearance from the
Australian Twin Registry and the University of Melbourne’s Behavioural and Social
Sciences Human Ethics Sub-Committee (Ethics ID: 1238728) as having significant
scientific value and meeting all necessary ethical requirements.
5.2.2 Technical considerations
Being the first online research study that involved recording singing data in real-time,
the current study had to address a number of technical challenges in order for the online
program to be properly accessed and run smoothly for the majority of participants. The
considerations and measures undertaken are described below.
5.2.2.1 Software requirements
The online program was created on the Adobe Flash platform, a multimedia software
platform that is frequently used to produce animations, browser games, and internet
applications. To run the program, participants needed to have Adobe Flash Player

- 123 -
installed on their personal computer, a free software that could be downloaded from the
Adobe Flash Player website (https://get.adobe.com/flashplayer/). Once the Adobe Flash
Player was installed, the online program could be run from any web browser. To
increase the likelihood of the program being able to run smoothly during the study,
using the most up-to-date versions of the web browser and Adobe Flash Player to access
the program was recommended. To facilitate this, upon accessing the web link to the
online study, the program would check and inform whether the participant’s web
browser and Adobe Flash player plugin were up-to-date. If the browser or the Flash
player was not the latest version available, participants were prompted to click on a link
on the screen to update the browser or Flash player accordingly (Figure 5.9).
Figure 5.9. Browser and Adobe Flash Player version detection implemented at the beginning of
the program.
In addition, if a participant noticed that the program failed to load and thus was unable
to proceed with the study, troubleshooting instructions were available from a web-link
on the same screen to navigate participants through possible explanations and solutions

- 124 -
(see Appendix B-1, p. 302). Participants still having problems following this were
requested to contact the researcher directly, using the contact details supplied in the
instructions.
5.2.2.2 Hardware requirement
a) Desktop or laptop computers
To run the online program successfully, desktop or laptop computers were essential.
This is because the Adobe Flash Player could only be run on Windows, Macintosh and
Linux web platforms, and not mobile devices such as Android or Apple smartphones or
tablets. To ensure that interested participants were aware of the hardware requirements,
the invitation email sent to the participants clearly stipulated the need to use a desktop
or laptop computer to run the program. In addition, the link to the troubleshooting
instructions on the start screen of the program (Appendix B-1, p. 302) included this
information.
b) Recording capabilities
As the online study’s main aim was to capture and assess singing ability, it was
necessary for the participant’s computer to be able to detect singing input. While most
laptop computers and newer models of desktop computers have inbuilt microphones,
some computers need to use an external microphone (such as a computer microphone,
headset or web camera) to run the program and perform the tasks. To ensure that the
participants had functional recording hardware to do the online study, prior to
commencing the singing and music tasks, they were guided through a microphone
check (Figure 5.3, p. 114). Participants whose voice could not be detected by the
program could not continue with the study since the “Click to proceed” arrow in the
lower right corner of the screen could only be activated if sound was detected. To assist
participants who were unable to proceed, a troubleshooting link was provided at the
bottom of the screen which helped participants identify and rectify any microphone
detection problems (Appendix B-2, p. 304). Phone and email details of the researcher
were also available in the troubleshooting guide if participants required direct
assistance.

- 125 -
5.2.2.3 Online data collection and storage
To ensure maximal online data security, the data of the participants collected by the
online program was stored on a highly secure, password-protected FTP (file transfer
protocol) server hosted by the developer of the online program. Each participant’s data
was saved in a separate folder on the server. For participants from the Australian Twin
Registry (ATR), their folders were named according to their respective ATR IDs. As for
non-ATR participants, their folder names consisted of randomly-generated characters
and they were only identifiable by accessing the text file in the data folder that
contained their sociodemographic information.
Each participant’s folder contained: 1) sound recordings from the three singing tasks; 2)
sound recordings from the tongue twister task; 3) a text file detailing the participant’s
pitch-matching responses (in Hz) for all 15 trials of Match The Note Task; 4) a text file
containing the participant’s sociodemographic information, and responses from Happy
Birthday Melody Perception Task and the music and singing background questionnaire.
To ensure high fidelity of the sound recordings, each trial of the singing and tongue
twister tasks was saved separately in WAV (waveform audio) format, which is an
uncompressed audio file format. The quality of the recording devices and presence of
any background noises in the recordings, however, were user-end factors beyond the
researcher’s control.
Finally, to maximise the amount of data collected from the participants in the event of
intentional or unintentional dropout (e.g., due to an internet connection problem or
program freeze), the sound data from the participants were perpetually saved to the
server after each trial, as opposed to only saving all the data at the end of the program,
as the latter would result in no data being saved to the server in the case of dropout early
or in the middle of the study.
5.3 Online Task Development
The following subsections describe the online tasks and questionnaire items that
constituted the study.

- 126 -
5.3.1 Singing tasks
The main focus of study was to assess singing ability using a comprehensive range of
singing tasks. Based on the two main types (imitative and recollective) of singing tasks
reviewed in Section 4.4.1 (p. 93), the three following singing tasks were selected for the
study.
5.3.1.1 Sing The Note Task
In view of the fact that a vocal pitch-matching task is probably the most prevalent task
used in singing research (Demorest & Pfordresher, 2015), a pitch-matching task was
selected to facilitate comparison of the current study findings with other research studies
that have used similar tasks.
This task also served as the vocal counterpart of a perceptual pitch-matching task
(Match The Note Task) which will be described in Section 5.3.2 (p. 133). Comparison
of the performance of these two tasks would help distinguish participants with both
perceptual and vocal imitation deficits, from those whose inaccuracy was only restricted
to one domain, with other variables being held constant.
Two gender-specific sets of sine tones were constructed in Audacity (version 1.3.13
Beta), using its build-in sine tone generator from the “Generate” menu. Each sine tone
had a duration of one second, and was set to an amplitude value of one, the maximum
possible volume attainable without clipping. The sine tones were exported from
Audacity and saved as WAV 16-bit PCM (pulse code modulation) format, which is an
uncompressed audio format to ensure ideal audio quality.
The set for female participants consisted of sine tone pitches B3 (246.94 Hz), C#4
(277.18 Hz), D#4 (311.13 Hz), F4 (349.23 Hz) and G4 (392 Hz), whereas the set for
male participants was an octave lower, comprising the pitches B2 (123.47 Hz), C#3
(138.59 Hz), D#3 (155.56 Hz), F3 (174.61 Hz) and G3 (196 Hz). The sine tone stimuli
were of the same fundamental frequencies as the ones used in a pitch-matching task by
Hutchins and Peretz (2012). These six pitches were chosen as stimuli to ensure they fell
within a comfortable singing range (which spanned a minor sixth from the lowest to
highest pitch) for the participants.

- 127 -
Each of the five pitch stimuli was presented three times in a randomised order,
constituting 15 trials altogether. In each trial, participants were asked to vocally imitate
the sine tone presented and maintain this steady pitch for 5 s. Figure 5.10 shows an
image of the screen presented to participants while performing this task.
Figure 5.10. Screenshot from Sing The Note Task.
5.3.1.2 Sing The Tune Task
A second, more complex imitative singing task was also used to assess the singing
ability of the participants. Imitating melodic sequences is understandably more
challenging than imitating single pitches, as a greater cognitive load is incurred in order
to perceive, recall and reproduce a string of successive melodic intervals correctly. As
noted in Section 4.4.1.1 (p. 93), the richer tonal context of melody imitation also lends
greater ecological validity to the singing assessment.

- 128 -
In this singing task, five seven-note novel melodies of varying difficulty were
constructed with reference to the 48 four-note tonal patterns used by Sinor (1984) in her
research investigating the relative difficulty of each pattern for preschool-aged children
(Figure 5.11). Specifically, each seven-note melody was created by selecting two four-
note tonal patterns of similar difficulty that could be meaningfully combined to form a
musically sensible short melody. The five melodic stimuli in this task were constructed
with the intention of incorporating a good range of ascending and descending musical
intervals from the diatonic scale. As evident from Table 5.2, with the exception of
diminished fifth (i.e., tritone), major sixth, and minor and major sevenths, other
intervals were all present in the five stimuli. The melodic stimuli were constructed using
Sibelius 7 with a MIDI piano timbre at a tempo of 100 bpm (beats per min).
Figure 5.11. The five tonal patterns that were used in the melody imitation task for female
participants. The tonal patterns for male participants were an octave lower.
(a)
(b)
(c)
(d)
(e)

- 129 -
Table 5.2. A Breakdown of the Incidence of the Different Types of Intervals in Sing The Tune
Task
Interval Name U m2 M2 m3 M3 P4 d5 P5 m6 M6 m7 M7 8ve
Semitones 0 1 2 3 4 5 6 7 8 9 10 11 12
Ascending (n) N/A 1 7 3 0 0 0 1 1 0 0 0 1
Descending (n) N/A 1 5 4 1 1 0 1 1 0 0 0 0
Total 2 2 12 7 1 1 0 2 2 0 0 0 1
Note. U: unison; m: minor; M: major; P: perfect; d: diminished; 8ve: octave
The rationale for using seven-note tonal patterns in this task was to make the two
melody singing tasks used in this study (i.e., the current task and a familiar song
production task) as closely matched as possible, in terms of the length of each phrase
and the variety of intervals used. This would facilitate the comparison of the
performances in these two tasks solely along the familiar versus novel dimension with
other variables potentially affecting voice accuracy largely held constant. In addition,
human working memory capacity was reported to be approximately seven (plus minus)
two items (Baddeley, 1994; Miller, 1994), a seven-note novel melody will therefore be
of a suitable length for participants to imitate vocally.
The span of the melodic stimuli was constrained to A3-A4 (220-440 Hz) for females
and A2-A3 (110-220 Hz) for males, which falls within the typical female and male
singing ranges. Just like in Sing The Note Task, the five novel melodies were presented
three times each in a randomised order, totalling 15 trials. In each trial, by clicking the
green musical note icon (Figure 5.12), the melody would be played twice, separated by
a short interposing silence of 0.5s. The repetition of the melodic stimuli was achieved
by converting the original MIDI files to WAV files, and using Audacity to manipulate
the stimuli by inserting a 0.5 second silence in between two instances of each melody.
Participants could click on the icon to listen to the melody as many times as they
wished, because the task was meant to test singing ability more than memory. Once
they were ready, they could click on the record button and imitate the melody.

- 130 -
Figure 5.12. Screenshot from Sing The Tune Task.
5.3.1.3 Happy Birthday Singing Task
Finally, a recollective singing task was included in the study. Using a familiar song
production task in the assessment enabled singing ability to be evaluated in a condition
that was as close as possible to a real world context, thereby ensuring good ecological
validity (Welch, 1994).
Happy Birthday was chosen as the familiar song for a number of reasons. First, being a
celebratory song commonly sung during birthdays in many different cultures, Happy
Birthday is a song most people are familiar with. The participants therefore could be
expected to easily recall the song and sing it without needing external reference, and
any pitch errors made by the participants were unlikely to be due to memory problems
(Demorest & Pfordresher, 2015). Furthermore, even though Happy Birthday is widely
known and sung, it presents a number of challenges, including the octave leap in the
third phrase, as well as the presence of other wide intervals (4th, 5th and 6th) in the song.

- 131 -
Therefore, Happy Birthday was deemed an adequately challenging song to assess one’s
singing ability in terms of pitch accuracy.
In this task, participants were asked to sing Happy Birthday from memory in a key of
their choice under several different conditions: (i) with lyrics at a self-determined
tempo, (ii) without lyrics (on the syllable “la”) at a self-determined tempo, and (iii)
without lyrics (on the syllable “la”) at a prescribed tempo of 120 beats per minute
(bpm). These conditions were imposed on the task because singing accuracy may vary
with each condition, with better pitch accuracy expected when the song is sung on a
neutral syllable and at a prescribed moderate tempo (see Section 4.4.1.2, p. 95).
Specifically, the tempo 120 bpm was chosen as the prescribed tempo, based on previous
findings which suggest that people generally prefer listening to music at a tempo of
approximately 120 bpm (Moelants, 2002).
For the first condition, the participants sang Happy Birthday at a self-determined tempo
with lyrics. A fictional context for singing Happy Birthday was provided (“it is Ashley's
birthday today”), and the participants were asked to click the “Record” button before
commencing to sing Happy Birthday for Ashley (Figure 5.13). Once the song was
finished, the same button was clicked to terminate the recording process. As with the
other singing tasks, the program was designed such that participants would not be able
to repeat a trial and they could only proceed forward to the next trial.
In the second condition, the participants were asked to sing Happy Birthday again, at a
self-determined tempo and key, but this time using the syllable “la”. In the final
condition, the participants sang Happy Birthday as per the second condition, but at a
prescribed tempo of 120 bpm (Figure 5.14). The participants clicked on a drum icon on
the screen to listen to the song rhythm delivered with a MIDI snare drum timbre,
constructed using Sibelius 7. The snare drum was used to produce the rhythm of Happy
Birthday at the prescribed pace instead of a pitched instrument, due to the consideration
that the latter might unduly influence the participants' subsequent starting pitch for the
song, which could have a negative impact on their singing accuracy if the starting pitch
was not suitable for their singing range.

- 132 -
Figure 5.13. Screenshot from Happy Birthday Singing Task (first condition).
Figure 5.14. Screenshot from Happy Birthday Singing Task (third condition).

- 133 -
After listening once to the rhythm, participants had the option to replay the rhythm for
two more times. The participants were then asked to sing the song at the prescribed
tempo on their own in two separate trials.
The final condition was expected to elicit the best singing accuracy out of the three
conditions due to singing on a neutral syllable at a prescribed tempo. In addition, the
first two conditions essentially served as practice runs which gave participants the
chance to warm up their voices, familiarise themselves with the general task procedures,
and also experiment with the ideal key for them to sing the song comfortably. As such,
the two trials sung in the final condition should give the most optimal estimate of a
participant’s singing proficiency in this task. In view of this, during analysis, only these
two trials in the final condition were used to assess the participants’ performance of this
task, whereby the mean pitch accuracy from the two final trials were averaged. In
instances where one of the recordings from the paced condition was not available (e.g.,
corrupted or was not uploaded onto the server successfully), singing data from the
second condition (self-determined tempo on syllable “la”) was used as the replacement.
In cases where both recordings from the prescribed tempo condition were unavailable,
recordings from the first two conditions were used for analysis instead. The rationale for
using the average of two trials to determine singing proficiency was to ensure
consistency of singing performance can be taken into account. Exceptions were made
when only one trial was available from the entire task, whereby the pitch accuracy
would only be computed from the single trial.
5.3.2 Music perception tasks
As inaccurate pitch production in singing can occur with or without a deficit in pitch
perception (see Section 4.2.1, p. 86), two perceptual tasks were included in the study to
investigate the fine-grained pitch discrimination ability and melody perception ability of
the participants, and to examine the relationship between music perception and singing
ability in this sample.

- 134 -
5.3.2.1 Match The Note Task
The two sets of gender-specific pitch stimuli used in Sing The Note Task were used in
this task. The set for female participants consisted of sine tone pitches B3 (246.94 Hz),
C#4 (277.18 Hz), D#4 (311.13 Hz), F4 (349.23 Hz) and G4 (392 Hz), whereas the set
for male participants was an octave lower, comprising the pitches B2 (123.47 Hz), C#3
(138.59 Hz), D#3 (155.56 Hz), F3 (174.61 Hz) and G3 (196 Hz). The rationale for
selecting the exact same stimuli as Sing The Note Task was to make the two pitch-
matching tasks analogous and facilitate the comparison between perceptual and vocal
pitch-matching abilities when timbre and pitch range were held constant.
The method for assessing fine-grained pitch discrimination ability in this task was
adapted from the perceptual pitch-matching task of Hutchins and Peretz (2012). In
particular, participants were asked to listen to a sine tone by clicking on a musical note
icon, and then asked to locate a match for the tone by moving a knob along a pitch
slider displayed on the screen with the computer mouse. The slider spanned an octave
and along its length contained a continuous spectrum of sine tones (A2 to A3 for males;
A3 to A4 for females) that played in real-time when the participant moved the knob
along the slider. Each of the five sine tones was presented three times in a randomised
order, resulting in a total of 15 trials. In each trial, the participants could listen to the
tone and move the knob along the slider as many times as they required, although it was
not possible to do both simultaneously (Figure 5.15). Once the participants were
satisfied that they had located a match for the tone on the pitch slider, they clicked the
“Found a match!” button to proceed to the next trial.
5.3.2.2 Happy Birthday Melody Perception Task
In order to ascertain that the participants had a robust internal representation of Happy
Birthday in their long term memory, participants were asked to listen to three renditions
of Happy Birthday and identify the correct version from two other modified versions
that had one note altered, as shown in Figure 5.16 and Figure 5.17. The three versions
were constructed with a MIDI piano timbre in Sibelius 7 and each version was in a
different key. Success in this task helped eliminate the possibility that any pitch
inaccuracy in Happy Birthday Singing Task was due to low familiarity with the song.

- 135 -
Figure 5.15. Screenshot from Match The Note Task.
Figure 5.16. Happy Birthday in C major, with one note altered.
Figure 5.17. Happy Birthday in A major, with one note altered.
5.3.3 “Twist your tongue!” Tongue Twister Task
The relationship between music and language processing in the brain has long been
contended. Thus far, the evidence related to shared pitch processing mechanisms in
music and language has been mixed (Patel, Wong, Foxton, Lochy, & Peretz, 2008;
Peretz, 2009). While many previous studies focused on the relationship between speech

- 136 -
and music perception, the current study hoped to explore possible relationships between
the pitch production aspects of participants’ singing and speech by comparing the task
performances of the participants on the singing tasks with their median fundamental
frequency and pitch range for a tongue-twister task.
In this task, the one-phrase tongue-twister “She sells sea shells by the sea shore” was
presented to the participants on-screen and they were asked to recite the tongue-twister
four times consecutively at a self-determined tempo (Figure 5.18).
Figure 5.18. Screenshot from the tongue-twister task.
In a similar manner to the final condition of Happy Birthday Singing Task, the second
part of this task asked the participants to listen to the rhythm of the tongue-twister
delivered at a prescribed tempo (150 beats per minute with a MIDI snare drum timbre,
constructed using Sibelius 7) before reciting the tongue-twister four times consecutively
at that tempo over two attempts. As per Happy Birthday Singing Task, the two trials in

- 137 -
the prescribed tempo condition were intended to be used to assess performance in this
task (but see Section 7.1.2, p. 195).
The syllabic length of the chosen tongue-twister and its four repetitions ensured that this
task matched the length and structure of Happy Birthday Singing Task as closely as
possible.
5.3.4 Questionnaire
Besides the singing and music tasks, the online program included a comprehensive
questionnaire to identify possible factors that might influence a participant’s
performance of the singing and music tasks. Taking into account the strong influence
that family musical environment exerts on singing and music ability during childhood,
the first part of the questionnaire asked the participants about their level of engagement
in singing and musical activities at home during their childhood, indicating the
frequency of these activities on a 5-point Likert scale (Figure 5.19). As current level of
singing engagement might also have an impact on singing ability, the participants were
then asked to indicate their current frequency of singing across a range of settings (e.g.,
by themselves, with family and friends, in a group) on a 5-point Likert scale (Figure
5.20).
In order to make a comparison between self-perception of singing and music abilities
with objective assessments from the singing and music tasks, participants were asked to
assess their singing and music abilities on a 7-point Likert scale, as well as their level of
interest in music and singing. Moreover, each twin was asked to estimate the level of
interest and ability of their co-twin and their parents in singing and music (Figure 5.21).

- 138 -
Figure 5.19. Questions about childhood engagement in singing and musical activities.
Figure 5.20. Questions about the frequency of singing across a range of settings.

- 139 -
Figure 5.21. Assessment of music ability of self, twin and parents on a 7-point Likert type
scale.
To examine whether having AP ability has a positive effect on the performance of the
singing tasks, participants were asked to report whether they possess AP. Taking into
account the possibility that some participants might not fully understand what AP
ability entails, a simple definition of AP ability as well as its colloquial term (i.e.,
perfect pitch) were provided. Furthermore, as several genetic studies have demonstrated
the genetic basis and familial nature of AP ability, participants were asked about the
presence of AP in family members.
Finally, to investigate the effect of any formal music training on singing and music
ability, participants were asked about the type and duration of any formal music training
undertaken, self-assessed level of instrumental ability, peak and current music practice
intensity, as well as time since last regular practice. In addition, given that self-
motivation plays a key role in successful instrumental learning, participants were asked
to assess their level of motivation when learning the instrument on a 7-point Likert
scale.
At the conclusion of the study, participants were encouraged to remind their co-twins to
participate in the study. Those who were keen to participate in future follow-up studies

- 140 -
were also asked to leave their email addresses. The online program then provided
feedback to the participants on their performance in the perceptual pitch-matching task
(Match The Note Task), before concluding with a Thank You page. All sound
recordings and questionnaire data from the participants were stored on a highly secure,
password-protected FTP server.
5.4 Piloting of Program
After the programmer finished building the program in early April 2013, and prior to
the commencement of recruitment in early May 2013, the program was piloted for four
weeks, by the researcher, the researcher’s supervisors, the ATR personnel, as well as the
colleagues and personal contacts of the researcher (N = 13). The pilot testers assessed
the program’s capability to be run on their own computers and navigated through the
program, noting the presence of any program bugs and providing suggestions for
improvement. Several pilot testers (N = 3) were initially unable to load the program
successfully on their computer, the loading issues were reported to the programmer,
who rectified the problem and the pilot testers did not report further technical issues. All
the tasks and sound stimuli were also tested to ensure they could be loaded successfully.
Task instructions were checked to correct any spelling errors and to improve clarity of
expression. The data of the pilot testers that were saved on the FTP server were also
examined to ensure they were intact and could be accessed and opened to process the
data.
The timeline of the entire program development phase is outlined in Table 5.3.

- 141 -
Table 5.3. Timeline of Methodological and Program Development
Year Month Description
2012 May to
September
Commenced the methodological development process:
Researched possible tasks to use in the study
Researched possible items to include in the questionnaire
Considered possible methodological and technical issues that need
to be addressed in an online study setting
Formulated the tasks and questionnaire items
Revised the methodology and tasks based on feedback from
supervisors and advisor (Professor Isabelle Peretz)
September Commenced working on the program design and layout
Revised the program design and layout based on feedback from
supervisors and advisor
Made initial contact with the Australian Twin Registry (ATR) to
discuss the feasibility of recruiting twin participants from the
registry
2012/2013 November to
January
Developed detailed storyboard for the design and layout of the
online program using Microsoft Powerpoint
Revised the storyboard based on feedback from supervisors and
advisor
Discussed the technical aspects of program development with the
programmer (i.e., how to implement the program design, layout
and functionality)
Developed study information sheet and recruitment email for the
study
Submitted formal application to the ATR (December) to recruit
participants from the registry
Submitted application to the Human Research Ethics Sub-
Committee (HESC) of Behavioural and Social Sciences at the
University of Melbourne
2013 February to
April
Final revisions of the program design and layout as well as
wording of study instructions prior to coding
Constructed the task stimuli using Audacity and Sibelius 7
Programmer commenced coding the online program
Received application approval from the ATR and ethics approval
from the HESC
April to May Programmer completed coding the online program.
Commenced piloting and debugging of online program
(N = 13)
Made final revisions to the wording of task description and
graphics of the program
May Commenced recruitment

- 142 -
5.5 Troubleshooting of Program
Despite the numerous pre-emptive measures undertaken to counteract some of the
common issues encountered in an online research setting (as detailed in Section 5.2,
p. 111), some user-end technical problems still arose during the recruitment phase. The
most prevalent issues included a program loading problem, a microphone detection
problem, and program freezes and saving problem. In view of these problems, after
approximately two months of recruitment (May to July 2013), the ATR advised
recruitment to be put on hold until the technical issues were addressed satisfactorily.
The recruitment eventually recommenced in late November 2013 after four months of
intensive troubleshooting.
Table 5.4 detailed the timeline of the program troubleshooting and the action
undertaken to address the problems.
As described in Sections 5.2.2.1 and 5.2.2.2 (pp. 122-125), the program loading and
microphone detection problems were addressed by providing troubleshooting
instructions to guide the participants to solve the problems themselves, and also
providing the contact details of the researcher to offer direct technical assistance if
needed. It is likely that some potential participants were unable to meet the hardware
and software requirements and therefore were prevented from taking part, despite their
interest in the study. To help such participants to take part, those residing in Melbourne
were given the option in their recruitment email to complete the online study at the
University of Melbourne, using technical equipment supplied by the researchers.
The problem with program freezes was harder to rectify, as both the researcher and the
program developer could not replicate such problems when testing the online program
themselves across multiple computers and browsers. It was possible that the program
freezes occurred as a result of sudden dropout of the internet connection, thereby
disrupting the online data saving process, or due to participants using less-than-ideal
technical equipment to access the program. Some participants were therefore unable to
complete the entire study due to these technical issues, resulting in incomplete data.

- 143 -
Table 5.4. Timeline of Program Troubleshooting
Month/Yr Description of problem Action taken
May to
July 2013
Missing data from a sizeable number
of initial participants (10 out of 35):
mostly questionnaire data. Possible
problem with the final saving process
Program could not load at the
beginning (blank screen)
Created another website specifically for
participants to redo the questionnaire
Modified recruitment email and study
information to make it clearer that the
program would not run on mobile devices
Implemented additional functionality at the
beginning of the program to check if the
internet browser and Adobe Flash plugin
were up-to-date and advising participants to
download the latest versions
Created a link at the beginning of the
program with troubleshooting instructions to
enable participants to identify and rectify
possible causes for the problem
Ran program on various internet browsers
and operating systems (OS) to determine
whether the problem was browser or OS-
specific.
Microphone not detected by the
program
Created a link at the soundcheck page with
troubleshooting instructions to enable
participants to identify and rectify possible
causes for the problem
Some of the fonts were not displaying
properly on Apple Macintosh OS
Rectified the font problem on Macintosh OS
Program froze in the middle of a task
or during data saving. As the
participant data was only saved at two
points of the program, making it
especially vulnerable to missing data
when internet dropped out.
Identified possible issue with intermittent
internet connection. Modified the program
such that participants’ data were saved after
every screen to minimise missing data
Aug to
Nov 2013
Intermittent internet connections still
causing program freezes and data
saving problem
Modified the program to show internet
connection error message when it occurred
and lead the participant back to redo the
previous trial which failed to save. Program
would attempt data saving for 5 times before
proceeding with the next trial
The duration of the data saving
process after each screen was too long
Modified the program to speed up the saving
process by saving the recording data
asynchronously and simultaneously
Nov 2013
to 2014
Some participants still encountered
program freezes in the middle of the
program (right before Sing The Tune
Task)
Unable to further identify or rectify problem
with the program. A pared down version of
the program (from Sing The Tune Task
onwards) was created to enable the
participants to complete the study

- 144 -
Since the participants were identifiable from their ATR ID and also demographic
details, the ATR were able to contact them on the research team’s behalf to give them
the opportunity to complete the study if they had previously encountered technical
difficulties. Depending on the point in the program they encountered the program
freeze, the participants could choose to redo the study from the beginning, commence
from the final singing task, or just complete the questionnaire, using specific web-links
supplied by the present author.
In addition, to minimise the effect of incomplete data due to technical issues, perpetual
saving of participant’s data throughout the program was implemented to maximise data
collection. To speed up the data saving process after each screen, the programmer also
modified the program such that each audio file was saved in asynchronous chunks
simultaneously.
Although much effort was made to address these technical difficulties, potential
participants might still have been deterred from attempting or completing the study. The
lack of control over the technical equipment used by participants, however, was a
necessary trade-off in order to allow twins the chance to participate in the study
regardless of their geographical location. As the current study was the first study in the
field to involve large scale online recording and collection of singing data across
locations, in retrospect, the pilot testing conducted prior to recruitment might not have
been sufficiently extensive to anticipate the technical issues that arose during the
recruitment phase. As a result, many of the technical issues were only identified and
addressed after recruitment had commenced. While such arrangement was not ideal and
might have detrimentally affected the study response rate, the experience of
troubleshooting the technical issues was nonetheless valuable and served as helpful
pointers for future researchers to consider when they design similar online studies.

- 145 -
METHODS
This chapter comprises six main sections describing the participants recruited, the
materials used, the study procedure, data processing procedure, study measures and
proposed statistical analyses.
6.1 Participants
Altogether, 293 individuals participated in the study, 245 of which were registered with
the ATR, which was the study’s main source of recruitment. Among all the participants,
there were 111 pairs of twins who completed the study: 73 pairs of MZ twins (58
female pairs; 15 male pairs) and 38 pairs of DZ twins (24 female pairs, 7 male pairs and
7 opposite-sex pairs). When the singing data were processed (see Section 6.2.2, p. 156),
two pairs of non-ATR MZ female twins were aurally assessed to have done the study in
a half-hearted manner while all the recorded data from an ATR MZ female twin (ATR
ID: 57336-1) were corrupted. As such, data from these three pairs of twins were deemed
unusable and were excluded from the subsequent analysis.
The final sample included for data analysis therefore consisted of 108 complete twin
pairs: 55 MZ female (MZF), 15 MZ male (MZM), 24 DZ female (DZF), 7 DZ male
(DZM) and 7 DZ opposite-sex (DZO) pairs. The basic demographic characteristics of
the final sample are summarised in Table 6.1. The participants were aged between 15
and 80 (M = 32.36, SD = 12.15), and 76.4% of the participants were female. Most of the
participants from the study were highly educated: More than 70% reporting an
education level of at least Tertiary Year 3, and approximately 20% reporting an
education level of Tertiary Year 6 and above.

- 146 -
Table 6.1. Demographic Characteristics of the Final Sample
Males Females All
N 51 (23.6%) 165 (76.4%) 216
Monozygotic twins 30 110 140 (70 pairs)
Dizygotic twins 21 55 76 (38 pairs)
Mean age (SD) 35.10 (13.89) 31.51 (11.47) 32.36 (12.15)
Age range 18-66 15-80 15-80
Education
Secondary 5 (9.8%) 38 (23.5%) 43 (20.2%)
Year 9 - 6 (3.7%) 6 (2.8%)
Year 10 1 (2.0%) 7 (4.3%) 8 (3.8%)
Year 11 2 (3.9%) 12 (7.4%) 14 (6.6%)
Year 12 2 (3.9%) 13 (8.0%) 15 (7.0%)
Tertiary undergraduate 25 (49.0%) 67 (41.4%) 92 (43.2%)
Year 1 2 (3.9%) 5 (3.1%) 7 (3.3%)
Year 2 2 (3.9%) 7 (4.3%) 9 (4.2%)
Year 3 10 (19.6%) 28 (17.3%) 38 (17.8%)
Year 4 11 (21.6%) 27 (16.7%) 38 (17.8%)
Tertiary graduate 21 (41.2%) 57 (35.2%) 78 (36.6%)
Year 5 7 (13.7%) 28 (17.3%) 35 (16.4%)
≥ Year 6 14 (27.5%) 29 (17.9%) 43 (20.2%)
Missing - 3 3
The following subsection reports the methods of recruitment employed in the study.
6.1.1 Recruitment
Recruitment officially commenced on 9 May 2013 and concluded on 5 April 2015.
While the ATR was the main source of recruitment, due to lower-than-expected
response rate (possible reasons discussed in Section 6.1.1.1, p. 148), participants were
also recruited through other avenues (Section 6.1.1.2, p. 149).
6.1.1.1 Recruitment via the Australian Twin Registry (ATR)
The ATR is a non-profit national twin registry established in 1981, whose goal is to
facilitate and support medical and scientific studies involving twins. One of the largest
volunteer twin registries in the world, the ATR has enrolled over 33,000 pairs of
Australian twins since its formation. The investigators of the current study therefore
engaged the ATR’s services to invite ATR-registered twins to participate in the study.

- 147 -
Participant recruitment officially commenced following a media launch organised by
the ATR at the Melbourne Conservatorium of Music (9 May 2013), which helped to
publicise the twin study through the media and encouraged twins across Australia to
participate in the study.
Following the media launch, on behalf of the investigators of the study, the ATR sent
invitation emails and study information sheets to a subset of twins on the registry (see
Appendix A-1, p. 295 and Appendix A-4, p. 299). The invitation email specified that
monozygotic (MZ) and dizygotic (DZ) twin pairs aged 15 and above, with no diagnosed
hearing deficits or vocal cord lesions (e.g., nodules, polyps and cysts), no current mental
illness (excluding anxiety and/or depression), and no history of brain injury, stroke,
genetic or neurological disorders could participate in the study. In addition, the ATR
sent the invitation email and study information to individuals who expressed interest
about the study after learning about it from the media.
In total, 1,692 pairs of ATR twins were approached in nine rounds of mail-outs. The
total number of participants recruited from the ATR was n = 245, including 89 complete
twin pairs and 67 single twins whose co-twins did not participate. The recruitment
summary of each zygosity group from the ATR is detailed in Table 6.2.
Table 6.2. Recruitment Summary of Twins Approached by the Australian Twin Registry (ATR)
Zygosity
Group
No. of
pairs
approached
No. of
complete pairs
participated
No. of single
twins
participated
No. of pairs who
explicitly
declined
participation
No. of pairs
who did not
respond
MZF 447 49 (11.0%) 19 (2.1%) 20 (4.5%) 359 (80.3%)
MZM 256 10 (3.9%) 7 (1.4%) 12 (4.7%) 227 (88.7%)
DZF 655 19 (2.9%) 34 (2.6%) 22 (3.4%) 580 (88.5%)
DZM 234 6 (2.6%) 5 (1.1%) 21 (9.0%) 202 (86.3%)
DZO 100 5 (5%) 2 (1.0%) 9 (9%) 84 (84%)
Total 1692 89 (5.3%) 67 (2.0%) 84 (5.0%) 1452 (85.8%)
Note. MZ: Monozygotic (identical); DZ: dizygotic (non-identical); F: female; M: male; O:
opposite-sex. Percentages are in brackets.
The participant recruitment rate was 7.3% (i.e., sum of percentage of complete pairs
who participated and percentage of single twins who participated), which was

- 148 -
substantially lower than what would normally be expected of an online survey
(approximately 20% to 40%, see Nulty, 2008) . Factors that may have accounted for the
low response rate are discussed below.
a) Duration of online study
Although the balance between study duration and comprehensiveness of assessment
was already carefully weighed during the program development phase (see Section
5.2.1.2, p. 117), its relatively long duration (~30 minutes) might have still deterred some
from participating. The quality assurance calls conducted by the ATR to some of the
non-participating twins confirmed that while some twins were interested in
participating, they tended to put off doing the online study until they could find a more
ideal time and setting to complete the study in one sitting. Despite the two rounds of
reminder emails that were sent out subsequent to the invitation email, it was possible
that many twins eventually just forgot to complete the online study.
b) The nature of the study
The online study’s focus on assessing singing ability using actual singing tasks might
have deterred some twins. Although the participants could do the singing tasks in the
privacy and comfort of their own home, some twins still might have felt daunted by the
nature of the singing tasks. The considerably lower participation rates (and higher
percentages of participant expressly declining to participate) of the ATR male twins
might also reflect a commonly held stereotype by many males from the Western
population that singing is a feminine activity (Adler & Harrison, 2004; Ashley, 2009;
Gates, 1989; Green, 1997).
c) Requirement of multimedia software and hardware
The hardware and software requirements of the study (see Section 5.2.2, p. 122) might
have prevented some twins from participating, despite being interested. This was
supported by a number of twins who contacted the ATR or the researcher requiring
technical assistance to run the online study. As detailed in Sections 5.4 and 5.5 (pp.
140-145), while the online program was piloted to ensure that it could run smoothly on
most operating systems and up-to-date internet browsers, it was not possible to
guarantee the successful running of the program in all possible scenarios due to the
variability of the equipment owned by the participants. The lack of adequate or up-to-

- 149 -
date technical equipment thus might have discouraged potential participants from taking
part.
6.1.1.2 Other recruitment approaches
Due to the lower-than-expected response rate from the ATR twins, four recruitment
approaches were added to enhance the response rate to the study.
a) iPad Mini Lucky Draw
At the recommendation of the project coordinators at the ATR, an iPad Mini lucky draw
was introduced as an incentive for both members of a twin pair to participate. In
particular, when both twins completed the online study (ATR or non-ATR recruited),
the twin pair was entered into the lucky draw to win two iPad mini 2 (16gb with Wi-Fi)
with retina display, one for each twin.
The lucky draw was conducted on 13 April 2015 at 3pm at the Melbourne
Conservatorium of Music, using a computer randomised process in Microsoft Excel.
The winning pair of twins were a pair of ATR-recruited female MZ twins (ATR ID:
55759), who were notified of the outcome by the ATR. Orders for two iPad Minis were
placed via the online Apple Store and delivered to their home address on 15 April 2015.
b) Campus-wide recruitment and the option of doing the assessment on-campus
Recruitment was extended to University of Melbourne staff and students as well as the
broader community. Online advertisements about the study were posted through the
community events listing of websites, such as the Australian Broadcasting
Corporation’s Big Diary. The researcher was also invited to talk about the study and
invite listeners to participate during a radio interview on 3RRR, as part of the show
“Hullaballoo”. Online advertisements were also posted on the University of
Melbourne’s Online Notices system of the student portal and the Graduate Student
Association E-Newsletter. In addition, recruitment posters were put up around the
Parkville and Southbank campuses of the University (Appendix A-2, p. 296). Affiliated
residential colleges were also contacted and consent was given to disseminate
information about the study to the college residents via email through the college

- 150 -
administration. In total, seven complete twin pairs were recruited from the University of
Melbourne.
To assist participants who might have been prevented from doing the study due to
inadequate technical equipment, those in Melbourne (including twins approached by the
ATR) were provided with the option to do the online study at the University of
Melbourne Parkville campus. In total, two Melbourne participants opted to do the study
on campus.
c) Personal contacts
The researcher utilised social media to disseminate the study information to personal
contacts and their friends who might be interested in participating. In total, 15 complete
twin pairs were recruited through this method.
d) Participation at the Twins Plus Festival
The researcher was invited by the ATR to set up a booth to promote the study at the
Twins Plus Festival held on 22 March 2015. The Twins Plus Festival is a triennial event
organised by the ATR and the biggest twins festival in the southern hemisphere. More
than 2000 families with twins attended the Festival, thereby providing access to a large
pool of potential recruits. In order to increase the attractiveness of the study among
other research studies that had booths during the Festival, an exclusive promotion was
conducted in conjunction with the Festival. WISH eGift cards valued at $40 were given
to the first 40 pairs of twins who completed the online study during the promotional
period (10AM AEST Sunday 22 March 2015 to 11:59PM AEST Sunday 5 April 2015).
This promotion was also extended to interested participants at the University of
Melbourne and publicised via the University of Melbourne’s Online Notices system of
the student portal and the Graduate Student Association E-Newsletter. During the
Festival, interested participants were given the option to complete the study onsite in a
quiet, secluded area on the Festival premises using laptops provided by the researcher.
One pair of twins completed the assessment this way and 32 individuals left expressions
of interest with the researchers at the Festival, and they were subsequently contacted by
the ATR and provided with the study information. Altogether, nine pairs of twins
completed the online assessment during the promotional period and received the $40
WISH eGift cards as reimbursement.
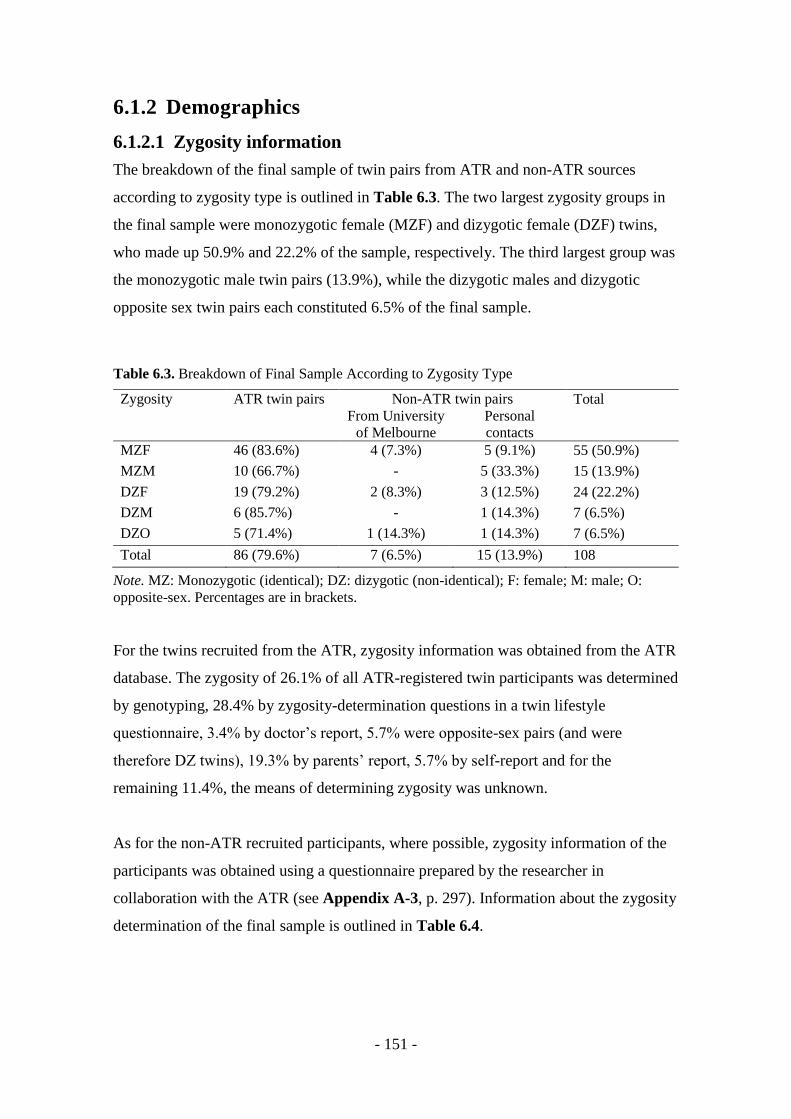
- 151 -
6.1.2 Demographics
6.1.2.1 Zygosity information
The breakdown of the final sample of twin pairs from ATR and non-ATR sources
according to zygosity type is outlined in Table 6.3. The two largest zygosity groups in
the final sample were monozygotic female (MZF) and dizygotic female (DZF) twins,
who made up 50.9% and 22.2% of the sample, respectively. The third largest group was
the monozygotic male twin pairs (13.9%), while the dizygotic males and dizygotic
opposite sex twin pairs each constituted 6.5% of the final sample.
Table 6.3. Breakdown of Final Sample According to Zygosity Type
Zygosity ATR twin pairs Non-ATR twin pairs Total
From University
of Melbourne
Personal
contacts
MZF 46 (83.6%) 4 (7.3%) 5 (9.1%) 55 (50.9%)
MZM 10 (66.7%) - 5 (33.3%) 15 (13.9%)
DZF 19 (79.2%) 2 (8.3%) 3 (12.5%) 24 (22.2%)
DZM 6 (85.7%) - 1 (14.3%) 7 (6.5%)
DZO 5 (71.4%) 1 (14.3%) 1 (14.3%) 7 (6.5%)
Total 86 (79.6%) 7 (6.5%) 15 (13.9%) 108
Note. MZ: Monozygotic (identical); DZ: dizygotic (non-identical); F: female; M: male; O:
opposite-sex. Percentages are in brackets.
For the twins recruited from the ATR, zygosity information was obtained from the ATR
database. The zygosity of 26.1% of all ATR-registered twin participants was determined
by genotyping, 28.4% by zygosity-determination questions in a twin lifestyle
questionnaire, 3.4% by doctor’s report, 5.7% were opposite-sex pairs (and were
therefore DZ twins), 19.3% by parents’ report, 5.7% by self-report and for the
remaining 11.4%, the means of determining zygosity was unknown.
As for the non-ATR recruited participants, where possible, zygosity information of the
participants was obtained using a questionnaire prepared by the researcher in
collaboration with the ATR (see Appendix A-3, p. 297). Information about the zygosity
determination of the final sample is outlined in Table 6.4.

- 152 -
Table 6.4. Breakdown of Zygosity Determination of the Final Sample
Zygosity determination method ATR twins Non-ATR twins Total
DNA genotyping 46 (26.1%) 0 46 (21.3%)
Zygosity questionnaire 50 (28.4%) 0 50 (23.1%)
DZO twins 10 (5.7%) 4 (10.0%) 14 (6.5%)
Doctor report 6 (3.4%) 4 (10.0%) 10 (4.6%)
Parent report 34 (19.3%) 10 (25.0%) 44 (20.4%)
Self-report 10 (5.7%) 22 (55.0%) 32 (14.8%)
Unknown 20 (11.4%) 0 20 (9.3%)
Total 176 40 216
While the zygosity of only 21.3% of our final sample was determined through DNA
genotyping, it is worth noting that numerous studies have affirmed that questionnaire-
based zygosity determination, which typically comprises questions about physical
resemblance and confusion by others (Cederlöf, Friberg, Jonsson, & Kaij, 1961;
Pedersen & Lichtenstein, 2000), has a high level of validity upon ascertainment by
genotyping, with reported accuracy of 91% to 98% (Bonnelykke, Hauge, Holm,
Kristoffersen, & Gurtler, 1989; Charlemaine et al., 1997; Chen et al., 1999; Christiansen
et al., 2003; Jackson, Snieder, Davis, & Treiber, 2001; Ooki, Yamada, Asaka, &
Hayakawa, 1990; Peeters, Van Gestel, Vlietinck, Derom, & Derom, 1998; Song et al.,
2010; Spitz et al., 1996; Torgersen, 1979).
6.1.2.2 Language and music background profile
The language and music background profile of the final sample are shown in Table 6.5.
The vast majority (96.7%) of the participants reported a non-tonal language as their first
language, with 91.5% of the participants listing English as their first language.
Approximately 28% of the participants also spoke a second language. Among these
participants, 32.2% reported speaking a tonal second language (Chinese or a Chinese
dialect e.g., Hokkien or Cantonese), whereas English, French and Italian were the three
most common non-tonal second languages reported.

- 153 -
Table 6.5. Language and Music Background Profile of the Final Sample
Males Females All
N 51 (23.6%) 165 (76.4%) 216
First language
Non-tonal 46 (90.2%) 160 (98.8%) 206 (96.7%)
English 44 (86.3%) 151 (93.2%) 195 (91.5%)
Spanish - 4 (2.5%) 4 (1.9%)
Dutch - 4 (2.5%) 4 (1.9%)
German - 1 (0.6%) 1 (0.5%)
Afrikaans 2 (3.9%) - 2 (0.9%)
Tonal 5 (9.8%) 2 (1.2%) 7 (3.3%)
Chinese 4 (7.8%) 2 (1.2%) 6 (2.8%)
Teochew 1 (2%) - 1 (0.5%)
Missing - 3 3
Second language 18 (35.3%) 41 (25.3%) 59 (27.7%)
Non-tonal 13 (72.2%) 27 (65.9%) 40 (67.8%)
English 6 (33.3%) 10 (24.4%) 16 (27.1%)
French 3 (16.7%) 6 (14.6%) 9 (15.3%)
Italian 1 (5.6%) 5 (12.2%) 6 (10.2%)
Swahili - 2 (4.9%) 2 (3.4%)
Dutch - 1 (2.4%) 1 (1.7%)
Greek - 1 (2.4%) 1 (1.7%)
German 1 (5.6%) 1 (2.4%) 2 (3.4%)
Tamil 1 (5.6%) 1 (2.4%) 2 (3.4%)
Japanese 1 (5.6%) 1 (1.7%)
Tonal 5 (27.8%) 14 (34.1%) 19 (32.2%)
Cantonese - 4 (9.8%) 4 (6.8%)
Hokkien 1 (5.6%) 1 (1.7%)
Chinese 4 (22.2%) 10 (24.4%) 14 (23.7%)
Absolute pitch
possessor
1 (2%) 7 (4.5%) 8 (3.9%)
Missing 1 8 9
Received music
training
42 (85.7%) 135 (86%) 177 (85.9%)
Missing 2 8 10
Years of music training
≤ 5 28 (70%) 76 (58.4%) 104 (61.2%)
6-10 years 6 (15%) 40 (30.8%) 46 (27.1%)
11-15 years 5 (12.5%) 13 (10%) 18 (10.6%)
> 16 years 1 (2.5%) 1 (0.8%) 2 (1.2%)
Missing 2 5 7
Mean years of music
training (SD)
4.65 (3.78) 4.67 (4.63) 4.66 (3.98)

- 154 -
Males Females All
Main instrument
String 15 (35.7%) 16 (11.8%) 31 (17.5%)
Guitar 14 (33.3%) 8 (5.9%) 22 (12.4%)
Violin 1 (2.4%) 6 (4.4%) 7 (4.0%)
Viola 2 (1.5%) 2 (1.1%)
Woodwind 2 (4.8%) 29 (21.4%) 31 (17.5%)
Flute 1 (2.4%) 15 (11.1%) 16 (9.0%)
Clarinet 11 (8.1%) 11 (6.2%)
Recorder 1 (2.4%) 3 (2.2%) 4 (2.3%)
Brass 7 (16.6%) 4 (3.0%) 11 (6.2%)
Saxophone 3 (7.1%) 2 (1.5%) 5 (2.8%)
Trumpet 3 (7.1%) 2 (1.5%) 5 (2.8%)
Tuba 1 (2.4%) 1 (0.6%)
Keyboard 14 (33.4%) 54 (40.0%) 68 (38.5%)
Piano 13 (31.0%) 51 (37.8%) 64 (36.2%)
Keyboard 1 (2.4%) 3 (2.2%) 4 (2.3%)
Voice 4 (9.5%) 23 (17.0%) 27 (15.3%)
Others* 9 (6.7%) 9 (5.1%)
Missing 2 8 10
*Include euphonium, harp, oboe, organ, piano accordion and tin whistle
Despite the definition and description provided in the program, some participants,
especially those without music training, still might not have comprehended what
possessing absolute pitch meant and therefore misjudged themselves or their co-twins as
possessing absolute pitch (AP). Hence, as a precaution, only instances where self-
reports of AP were confirmed by the co-twin’s report were considered for analysis. In
other words, if a participant claimed to possess AP and yet his/her co-twin’s report did
not reflect this, it was determined that this participant did not possess AP.
Based on this criterion, eight participants (3.9%; 7 females and 1 male) reported
possessing AP. Out of the self-reported AP possessors, two were non-related DZ
participants, and the remaining 6 were 3 pairs of MZ female twins. The prevalence of
AP in the current sample (3.9%) is higher than the estimates for the general population
in previous studies (1 in 10,000 and 1 in 1,500; see Section 2.4.1.6, p. 43), but lower
than the values reported for music majors in tertiary institutions (4.7 to 24.6%;
Gregersen et al., 1999).

- 155 -
As for information on music background, the majority (85.9%) of the final sample was
musically-trained (mean years of training = 4.66, SD = 3.98), approximately 61% of
which had 5 years or less of music training. Among the musically-trained participants,
the most prevalent musical instruments learned were the piano (36.2%), followed by
voice (15.3%) and the guitar (12.4%). There was a slight difference in popular
instrument choice between male and female participants. While the piano was the
predominant musical instrument of choice for females (37.8%), the two most prevalent
musical instruments learned by males were the guitar (33.3%) and the piano (31.0%). In
instances where participants listed more than one musical instrument, only the first one
listed was regarded as their main instrument.
6.2 Data Processing Procedure
Before commencing data processing, the following steps were undertaken to access,
download and de-identify the participants’ data that were saved on the online server.
6.2.1 De-identification of participants
At the conclusion of the recruitment phase, FileZilla (Version 3.10.1.1), an FTP (File
Transfer Protocol) client, was used to access and download the data from the secure
online FTP server for subsequent data processing.
To prevent confirmation bias that might arise during the data processing phase from
knowledge of the zygosity of the twin pairs, de-identification of the participants was
undertaken to ensure the researcher was blind. Specifically, each participant was
assigned a Twin ID as well as a Participant ID. First, all 108 complete twin pairs (both
ATR and non-ATR) in the final sample were assigned a new Twin ID spanning from
001 to 108. Each twin in a twin pair was assigned the suffix “A” or “B” according to his
or her birth order. Second, each participant was assigned a random Participant ID from
1 to 216, using the RAND() function in Microsoft Excel.
The rationale for having two IDs for each participant was as such: Twin IDs were
needed so that a unified identification system could be used for both ATR and non-ATR

- 156 -
twin pairs. The random assignment of Participant IDs was also necessary to allow the
twin pairs to be sufficiently randomised in order to achieve an ideal blind analysis,
where the researcher had no knowledge of a participant’s identity nor the identity of
his/her co-twin (MacCoun & Perlmutter, 2015).
The participant folders downloaded from the server were thus assembled in a new folder
and each was relabelled according to the Participant ID. In the data processing phase,
participant data was processed one by one in the order of the randomly assigned
Participant IDs. As the main data text file contained the name and other identifying
details of a participant, the questionnaire data was processed only after all the acoustical
data from every participant had been processed.
6.2.2 Data processing for the singing tasks
A particular challenge in assessing singing tasks objectively is the segmentation of
individual pitches in a melody (Demorest & Pfordresher, 2015). Accurate segmentation
of pitches is crucial in order to determine the fundamental frequency that is
representative of each stable pitch region, so that a participant’s pitch accuracy can be
reliably assessed. The pitch segmentation process is often done manually, and decisions
such as where a pitch ends and where the next pitch begins are subjectively based on
visual and auditory inspection. As a result, the procedure is very time-consuming and
subject to individual rater bias (Dalla Bella, 2015; Demorest & Pfordresher, 2015).
In this study, a novel, semi-automatic approach was developed to facilitate the
processing of singing data from the melodic singing tasks, i.e., Happy Birthday Singing
Task and Sing The Tune Task. This method only required a preliminary “coarse”
labelling of the pitch segments, and subsequently the onset and offset of the stable
portion of each individual pitch were more precisely determined automatically by
running an algorithm which utilised the rate of change of the fundamental frequency f0
(henceforth referred to as f0 velocity) for fine-grained pitch segmentation.
The entire data processing procedure consisted of four main steps; the first two steps
were performed in the Praat environment (version 5.4.01; Boersma & Weenink, 2014) ,

- 157 -
while the third and fourth steps were carried out in Microsoft Excel 2013. The
procedure is described in detail as follows.
6.2.2.1 Coarse demarcation of pitch segments
As the first step, preliminary coarse segmentation of the pitches was achieved by
running ProsodyPro version 6.0 beta, a Praat script (Xu, 2013) in the Praat environment.
Although ProsodyPro has multiple functionalities aimed at facilitating the batch
processing of large amounts of sound data, the current study mainly utilised its batch
processing as well as sound segmentation and labelling features. The following is a
brief sketch of the five-step workflow for the initial coarse pitch segmentation:
1. Run ProsodyPro script in Praat. When the startup window appears (Figure 6.1),
select the “Label sentences” radio button and set the folder destination to the
appropriate folder which contains the data of a de-identified participant.
Figure 6.1. Startup window of ProsodyPro (version 6.0 beta).

- 158 -
2. Click OK and three windows are generated as a result. The window of interest is
the TextGrid window, which displays the sound waveform, spectrogram and
annotation panels (Figure 6.2). By clicking along the first annotation tier,
starting from the onset of the first note and ending on the offset of the last note,
demarcate boundaries for each pitch, using the fundamental frequency (f0) curve
displayed on the spectrogram as a guide. To demarcate two adjacent pitches,
click approximately in the middle portion of the transitional region between the
pitches, although precision is not essential. Use auditory judgment to also guide
the decision of demarcating pitch boundaries.
Figure 6.2. TextGrid window in the Praat environment. The sound waveform is displayed in the
top panel, followed by the spectrogram with the frequency curve in the middle panel, and the
annotation tiers are displayed in the bottom panel.
3. Click on each of the demarcated boundaries to label the pitch segments in order.
As illustrated in Figure 6.3, if there are 7 pitches in the sound file, label the
pitch segments from 1 to 7.
Sound
waveform
Spectogram with
frequency curve
Annotation
tiers

- 159 -
Figure 6.3. Labelling the coarse pitch segments in the first tier of the annotation panel of the
TextGrid window.
4. If there are gaps or spaces along the f0 curve that need to be excluded from the
fundamental frequency estimation, label such segments as ‘g’. As for regions
within a pitch that need to be excluded due to noise, label such segments as ‘n’.
If the sound file contains more than one phrase (such as in the case of Happy
Birthday Singing Task), label the segment in between the phrases as ‘p’ and in
each new phrase, label the pitch segments anew from 1 (Figure 6.4). This
labelling facilitated the subsequent export of fundamental frequency data onto
the Excel spreadsheet.
Figure 6.4. Labelling of pitch segments from song files containing more than one phrase.

- 160 -
5. After the labelling of pitch segments in the current sound file is completed, go to
the Pause Window (Figure 6.5) and click ‘Next’ to proceed to the next sound
file in the participant’s folder to label its segments. One can click ‘Back’ to
revisit previously labelled files, or click ‘jump’ to skip to other files according to
their file order in the folder. Click ‘Done’ when all the sound files have been
labelled.
Figure 6.5. Use of the Pause Window of ProsodyPro (version 6.0 beta) to proceed to the next
sound file in the destination folder.
During the labelling step, the appropriate range (in Hz) for the maximum and minimum
pitches as well as other parameters were determined by visual inspection of the f0 curve
and listening to the sound file. It is especially crucial to recognise that the appropriate
pitch ranges for female and male participants were different as the pitch stimuli for
female participants in Sing The Note Task and Sing The Tune Task were one octave
higher than those of the male participants. If the f0 curve’s contour displayed according
to the default settings in Praat was not consistent with the expected f0 contour, this could
be rectified by readjusting the maximum or minimum pitch values (Choose “Pitch
settings…” from the Pitch Menu in Praat).
As an illustration of the importance of selecting the appropriate pitch range, Figure 6.6
shows the pitch contour of the fifth novel melody of Sing The Tune Task sung by a
female participant (see Figure 5.11e, p. 128), with the maximum and minimum pitches
of the range specified as 500 Hz and 150 Hz respectively. Visual inspection reveals that
the contour corresponded well with the expected contour of the stimulus.
In contrast, when the maximum pitch was set too low (to 300 Hz), the pitch contour
became distorted as octave errors occurred for the second and fourth notes (Figure 6.7).

- 161 -
Other parameters can also be adjusted from the Advanced pitch settings in the Pitch
menu to lessen the impact of noise (by raising the silence threshold), enhance the pitch
detection of softer sound files (by lowering the voicing threshold), or to rectify octave
errors (by adjusting octave cost or octave jump cost), based on visual inspection.
Figure 6.6. Fundamental frequency (f0) contour of a participant’s trial from Sing The Tune Task
(5th novel melody).
Figure 6.7. Fundamental frequency (f0) contour of a participant’s trial from Sing The Tune Task
when an inappropriate pitch range was selected, causing octave errors in the display.

- 162 -
The appropriate parameter values often varied from one participant to another (and in
some cases, from one task to another), depending on factors such as participant sex,
voice quality, and vocal range, as well as the recording quality. Therefore, suitable
parameter values were recorded in an excel file during the labelling step, as this
information was needed for the subsequent step.
6.2.2.2 Obtaining sampled f0 for the labelled pitch segments
For each sound file segmented, ProsodyPro automatically generates a text file with a
‘.label’ extension that contains information about the start time and end time of each
labelled segment. The label file has the exact same name as the corresponding sound
file. A second Praat script written by the researcher (Appendix C-1, p. 307) was then
run to estimate the f0 values (in Hz) in each labelled segment, sampled at 0.01s
intervals.
Upon running the script, a startup window appeared (Figure 6.8). For this, after
assigning the appropriate folder destinations, enter the pitch analysis parameters in the
fields according to the suitable parameter values that have been determined during the
pitch segment labelling step. Click “OK” and the script automatically generates the
estimated f0 values for all the labelled segments in each sound file of the folder. The f0
values were saved in text files sharing the same name as the corresponding sound and
label files, but with a .samplef0 extension (e.g., “song1.samplef0”). Each samplef0 file
contained three columns: The first column contained the segment labels (e.g., ‘1’, ‘g’,
‘p’), the second column contained the sampling time series, and the third column
contained the corresponding f0 values (Hz).

- 163 -
Figure 6.8. Startup window of the Praat script to estimate the fundamental frequency at the
sampled time intervals.
The fundamental frequency (f0) data were exported into Microsoft Excel 2013 by
running an Excel VBA macro specially written for the purpose (Appendix C-2, p. 309).
The exported f0 data were saved in individual Excel files according to tasks. In the case
of Sing The Note Task and Sing The Tune Task, the f0 data were organised into five
separate spreadsheets in the Excel file, one for each stimulus. The f0 data from the three
trials of each stimulus were distributed into three separate columns in each spreadsheet.
As for Happy Birthday Singing Task, the f0 data from each trial was exported to a
separate spreadsheet. In each spreadsheet, the f0 data were distributed into four separate
columns, according to the four phrases of Happy Birthday.

- 164 -
After all the f0 data were exported to the spreadsheets, the following fine-grained
segmentation algorithm was run to automatically determine boundaries of each pitch
segment with greater precision.
6.2.2.3 Fine-grained pitch segmentation
a) Generating the f0 velocity profile
An Excel VBA macro was written to run a fine-grained segmentation process. First,
undefined f0 values and regions marked ‘n’ (i.e., noise that needed to be excluded) were
removed from the numbered segments. Undefined f0 values might occur occasionally
where Praat was unable to detect or estimate the f0 at a particular sampled time point.
The ‘g’ segments were padded with zeros for f0 values to facilitate subsequent f0
velocity calculations. All the f0 values in the numbered segments were then converted
from Hz to cents. Using central differentiation, the rate of change of f0 (in cents) at time
ti in a phrase was computed with the following formula, where the instantaneous rate of
change of f0 at a time point i equals the change in f0 over the change in time between the
next time point i + 1 and the previous time point i - 1:
𝑣𝑖 = 𝑓0𝑖+1 − 𝑓0𝑖−1
𝑡𝑖+1 − 𝑡𝑖−1
The two-point central differentiation is commonly used to calculate derivatives due to
its speed, simplicity, and accuracy (Bahill et al., 1982). For time points preceding or
succeeding ‘g’ segments, calculation of f0 velocities were omitted to prevent generating
spuriously large f0 velocities due to the zero f0 values of the ‘g’ segments.
For the purpose of the subsequent fine-grained pitch segmentation, absolute f0 velocity
was computed. The absolute f0 velocities were scaled to a tenth of the original values so
that displaying both the f0 and the absolute f0 velocity profiles on the same graph would
be possible.
Figure 6.9 shows a participant’s f0 and absolute f0 velocity profiles from a trial in Sing
The Tune Task (first novel melody; see Figure 5.11a, p. 128). The peaks of the absolute
f0 velocity coincided with where the participant transitioned from one pitch to another,

- 165 -
and that the regions of low absolute f0 velocities corresponded with the regions where
individual pitches were held with relative steadiness. Thus, a suitable onset and offset
could be estimated with good precision for each pitch segment by determining a
threshold that separates the regions of low f0 velocities from the regions of high f0
velocities. The fine-grained demarcation of pitch segment boundaries could in turn aid
the robust estimation of the mean or median f0 for each pitch segment for subsequent
data analyses. The use of f0 velocity information to determine stable pitch segments is a
novel approach in the field.
Figure 6.9. Fundamental frequency and absolute f0 velocity profiles of a trial from Sing The
Tune Task (1st novel melody; see Figure 5.11a, p. 128).
b) Determining the segmentation threshold
Thresholding is a well-established area in the field of image processing; many
thresholding algorithms have been developed to automatically convert greyscale images
into binary (e.g., black and white) images according to the threshold determined by the
algorithm. In view of the similar nature of binary image thresholding with the current
aim of finding a threshold to differentiate the high and low f0 velocity regions, the
efficacy of various image thresholding algorithms was explored (for a comprehensive
review of image thresholding methods, see Sezgin and Sankur, 2004) . One thresholding
algorithm in particular, the fuzzy entropic thresholding method, consistently yielded
good thresholds distinguishing the two f0 velocity regions (Shanbhag, 1994) and was
thus adopted in the fine-grained pitch segmentation process to estimate the absolute
0
100
200
300
400
500
600
700
0.00 1.00 2.00 3.00 4.00 5.00
Time
F0
Absolute velocity
(scaled to 1/10)

- 166 -
velocity threshold. The following is an outline of Shanbhag’s fuzzy entropic
thresholding algorithm.
Two key definitions underpinned the algorithm:
Fuzzy: (Mathematics) maths of or relating to a form of set theory in which set
membership depends on a likelihood function.
Entropy: (communication theory) a numerical measure of the uncertainty of an
outcome
Essentially, this algorithm works on the principle that the absolute velocity profile
comprised two fuzzy sets; one set (high V) corresponds to the high absolute velocity
values and the other set (low V) corresponds to the low values. For a certain threshold T
which segregates the two sets, membership values were calculated for all the absolute
velocity values (rounded up to the closest integer) inside each set, to reflect the degree
of likelihood that a particular absolute velocity value belongs to the set. In the current
algorithm, the membership value of a particular absolute velocity value i is dependent
on the proximity of i to the threshold T. The further i is away from T, the greater the
degree of certainty that it belongs to the current set.
As an illustration, Figure 6.10 showed an example of a horizontal number line
representing the absolute velocity values from Vmin to Vmax. A threshold T segregates
the velocity values into high V and low V regions. It can be recognised that a velocity
value at threshold T has an equal 50% chance or maximum uncertainty of being
assigned to the high V region or the low V region, while an absolute velocity value of
Vmin would have 100% probability or maximum certainty of belonging to the low V
region (and the velocity value of Vmax has 100% probability of belonging to the high V
region). Therefore, it follows that the membership values within a region span from 0.5
to 1.

- 167 -
Figure 6.10. An illustration of the two fuzzy sets of absolute velocity regions (low and high)
and how the membership value (ML or MH) of a particular velocity value varies from 0.5 to 1
depending on its position in the set.
In the current algorithm, the membership value ML for an absolute velocity value i in the
low V region is determined by the following equation
𝑀𝐿 = 0.5 + 0.5× ∑ 𝑝(𝑘)𝑇
𝑘=𝑖
∑ 𝑝(𝑘)𝑇𝑘=1
where p(k) is the relative frequency of an absolute velocity value k occurring in the
phrase.
The membership value MH of an absolute velocity value j in the high V region is
computed by the following equation
𝑀𝐻 = 0.5 + 0.5× ∑ 𝑝(𝑘)
𝑗𝑘=𝑇+1
∑ 𝑝(𝑘)𝑉𝑚𝑎𝑥𝑘=𝑇+1
where Vmax is the maximum absolute velocity value rounded up to the closest integer.
The entropy EL associated with the low V region below threshold T will then be
𝐸𝐿 = − ∑𝑝(𝑘)
∑ 𝑝(𝑖)𝑇𝑖=1
×log (𝑀𝐿)
𝑇
𝑘=1
Vmin Vmax T
Low V
region High V
region
ML
1 0.5 MH
1

- 168 -
Similarly, the entropy EH associated with the high V region above threshold T can be
shown as
𝐸𝐻 = − ∑𝑝(𝑘)
∑ 𝑝(𝑖)𝑉𝑚𝑎𝑥𝑖=𝑇+1
×log (𝑀𝐻)
𝑉𝑚𝑎𝑥
𝑘=𝑇+1
In this algorithm, the optimum threshold is where EL is approximately equal to EH,
which indicates that an absolute velocity value at the optimum T threshold has almost
equal average uncertainty of being in low V region as in the high V region. Therefore,
by iteratively setting T from the minimum to the maximum absolute velocity values, the
optimum T is selected where |EL-EH| is the minimum.
For Sing The Tune task example in Figure 6.9, an optimum threshold of 80 was found
using the fuzzy entropic thresholding algorithm. As can be seen from Figure 6.11, the
chosen threshold T is effective in segregating the high and low f0 velocity regions.
Figure 6.11. Fundamental frequency and absolute f0 velocity profiles of a trial from Sing The
Tune Task (1st novel melody), with the threshold (T=80) determined by Shanbhag’s fuzzy
entropic thresholding algorithm.
0
100
200
300
400
500
600
700
0.00 1.00 2.00 3.00 4.00 5.00
Time
F0
Absolute Velocity
(scaled to 1/10)
Threshold
T= 80

- 169 -
c) Refined pitch boundary segmentation
Using the optimum segmentation threshold for the phrase, iterative searches were
conducted from both ends of each coarsely demarcated pitch segment to identify more
precise boundaries of each segment. The 5-step procedure is as follows:
i. From the beginning of the coarse segment till 1/3 of the segment, search for the
first absolute velocity value for which the value as well as the succeeding two
absolute velocity values all fall below the optimum threshold. The time
corresponding to that absolute velocity value will be established as the onset of
the refined pitch segment.
ii. If no suitable candidate is found from (i), from the same search area in (i), find
the first absolute velocity value for which the value and the next absolute
velocity value both fall below the optimum threshold. Set the corresponding
sampled time as the refined pitch segment onset.
iii. If no suitable candidate is found after (i) and (ii), repeat the search in the search
area for the first absolute velocity value which falls below the segmentation
threshold and set the corresponding sampled time as the refined pitch segment
onset.
iv. If there is no absolute velocity value below the segmentation threshold within
the search area, find the lowest absolute velocity value within the search
segment and set the corresponding sampled time as the refined pitch segment
onset.
v. Repeat the same procedure for the end of the coarse segment.
After experimenting with search areas of varying widths, it was found that setting the
search area to occur 1/3 from the beginning or the end of the coarse pitch segments
yielded more reliable results. If the search area was set too wide (e.g., from the
beginning to the middle of the segment), the resultant refined pitch segment might be
too narrow (since absolute velocity values toward the middle of the pitch segment tend
to be lower and have greater likelihood of fulfilling the (i) criterion). The narrow refined
pitch segment, however, would not be fully representative of the pitch sung by the

- 170 -
participant, especially if the participant had difficulty holding the pitch steady (e.g., the
fourth pitch segment in Figure 6.11). Conversely, if the search area was set to be less
than 1/3, there would be a greater likelihood that the absolute velocities considered in
the search area were all above the optimum threshold, rendering the iterative search less
effective.
After the new boundaries for all the pitch segments in the phrase were determined by
the refined segmentation procedure, a graph displaying the f0 curve, absolute f0
velocities (scaled by 1/10), the optimum threshold as well as the onsets and offsets of
the refined pitch segments was generated for the phrase (Figure 6.12). Additionally,
median f0, mean f0, standard deviation and durations of the refined pitch segments were
computed and displayed on the Excel spreadsheet.
Figure 6.12. Fundamental frequency and absolute f0 velocity profiles of a trial from Sing The
Tune Task (1st novel melody), with onset and offset of each refined pitch segment displayed.
The suitability of the refined boundaries in a phrase were examined from the graph
generated. If certain boundaries were deemed unsatisfactory, a section of the VBA code
for the segmentation procedure was modified to manually select more appropriate
boundaries based on visual inspection of the graph and f0 velocity information. A new
graph was then generated and computations pertaining to the refined pitch segments
recalculated.
0
100
200
300
400
500
600
700
0.00 1.00 2.00 3.00 4.00 5.00
Time
F0
Onset
Offset
Absolute Velocity
(scaled to 1/10)
Threshold
T= 80

- 171 -
The procedure for setting the pitch boundaries in Sing The Note Task was more
straightforward than the above described pitch segmentation procedure for the melodic
singing tasks. While the data from Sing The Note Task also underwent the pitch
segment labelling and f0 estimation processes detailed in Sections 6.2.2.1 and 6.2.2.2
(pp. 157-164), determining the optimum threshold and refining the pitch segmentation
boundaries were unnecessary for this task. This is because in each trial of the task, the
first two seconds of vocalisation were selected as the final pitch segment to be analysed.
The rationale for selecting the first two seconds of vocalisation related to the notion that
variability in participants’ task performance was likely to be evident in the first two
seconds. Consider the example of a participant who was initially inaccurate in matching
the target pitch but gradually slid up to the correct pitch in the middle of the
vocalisation. Computing the mean or median f0 from the two-second pitch segment
would judiciously reflect the pitch inaccuracy, whereas taking the mean or median f0
from the entire five seconds of vocalisation would understate the pitch inaccuracy at the
beginning, causing the participant to appear more accurate than in reality.
The VBA macro for the fine-grained segmentation procedure of Happy Birthday
Singing Task is available in Appendix C-3 (p. 319). As the fine-grained segmentation
procedure of Sing The Tune Task is exactly the same, the macro for the task not
included.
6.2.2.4 Computing the median f0
After all the recordings from the singing tasks were processed using the procedure
described above, the median f0 values computed from the refined pitch segments were
transferred to specially formatted spreadsheet templates to compute the task measures,
with one spreadsheet for each task.
Although both mean and median f0 were computed for the tasks, median f0 was
ultimately chosen to represent the pitch height of a pitch segment as it was
comparatively more robust against extreme values of f0 within a pitch segment due to
potential artifacts in the Praat-estimated f0 curve (Dalla Bella, 2015).

- 172 -
6.2.3 Data processing for the tongue twister task
In the Praat environment, after appropriate pitch range and other pitch parameters were
determined for a tongue-twister sound file, a specially written Praat script was run to
obtain the median f0 as well as the interquantile range (5th to 95th percentiles) of the
vocalisation (Appendix C-4, p. 340). This information was saved to a text file and then
subsequently transferred to a central excel spreadsheet containing all the participants’
tongue-twister median f0 and speech ranges.
6.2.4 Re-identification of participants
After all the data processing for the singing tasks and the tongue-twister task was
completed blind, the participants were re-identified by their Twin IDs, such that the
processed data could now be grouped by twin pairs. Questionnaire data and Match The
Note Task data were then exported from the text files to the respective Excel
spreadsheets. Once all the participants’ data was transferred to the appropriate
spreadsheets, each twin pair’s zygosity was finally revealed. Data of twin pairs was then
grouped according to zygosity.
Finally, Excel VBA macros were run to transfer all the twin data from the various
zygosity groups into one central data spreadsheet in Excel, one row per twin, to
facilitate subsequent analyses in the SPSS and R environments. In the central data
spreadsheet, fields with missing data were coded “9999”, while empty fields due to non-
applicable questions (e.g., questions about music training for non-musically trained
participants) were coded “-9”.
6.2.5 Issues encountered during data processing
Several issues were observed while processing participants’ data and thus, the following
measures were taken to mitigate each of these issues.
6.2.5.1 Octave error in Sing The Note and Sing The Tune Tasks
In Sing The Note Task and Sing The Tune Task, it was observed that a few participants
made octave errors when matching the pitch or melodic stimuli. Special considerations

- 173 -
were given to participants who made consistent octave errors throughout all trials of a
task. In such instances, their f0 data was adjusted higher or lower by one octave so that
they were of the same register as the target pitches. This would prevent them from being
excessively penalised by the pitch deviation measure (see Section 6.3.1, p. 175).
However, in instances where the octave errors made throughout the task appeared to be
random and inconsistent, no adjustments were made to the f0 data.
6.2.5.2 Failure to adhere to task instructions
Although the participants were asked to sing on “la” in the final two paced trials of
Happy Birthday Singing Task, some participants sang with lyrics instead. In total,
approximately 19% of the final two paced trials were sung with lyrics. Data processing
of these trials proceeded as normal because the pitch segmentation process could still be
applied successfully on songs with lyrics.
For Sing The Tune Task, as the melody was presented twice in each trial, some
participants misunderstood and sang the melody twice in a row. In such cases, only
their first attempt at the melody was processed, as these participants might have become
more accurate during the second performance due to practice effects.
For Sing The Note Task, instead of following the instructions to hold the pitch steady
for five seconds, some participants only held it steady for a shorter duration (e.g., 0.5 s
or 1 s). As the duration in such cases was less than the intended two-second duration
required for analysis, the entire vocalisation was used for the computation of the median
f0.
6.2.5.3 Missing data due to human error or poor recording quality of
the sound data
Some participants started singing before or while they pressed the record button. As a
result, the first few notes of their singing performance might be missing from the sound
file. Some participants also inadvertently pressed the record and stop button in quick
succession, and therefore failed to record their singing attempt during a trial
successfully. There were also some participants who laughed or spoke during a
recording, which meant that Praat was unable to reliably estimate the f0 in those sections

- 174 -
of the recording. Across the three singing tasks, the percentages of missing notes due to
these user end errors ranged from 0.25% to 1.74%.
In addition, some of the participants’ sound data was of poor quality due to their
computer recording device, which caused systematic partial corruption to occur in every
sound file (i.e., consistently in its front, middle or at the end). This resulted in partial
loss of f0 data from each trial.
In the case of partially missing f0 data, during the initial pitch segment labelling process,
only the intact pitch segments were labelled according to their expected order in the
phrase. For example, if the first note of every trial in Sing The Tune Task was
consistently missing due to a recording problem, the remaining pitch segments would be
labelled from 2 to 7, and not from 1 to 6. This ensured that the f0 data would be
correctly exported and compared with the corresponding pitch targets in the specially
formatted Excel spreadsheets for the tasks.
6.2.5.4 Missing data due to technical issues
Some of the participants experienced technical issues such as freezing of the program or
an intermittent internet connection when they attempted the online study. As a result,
the amount of data available from each participant for processing and analysis varied
from task to task. Out of the total number of 216 participants, 215 of them had singing
data available for Happy Birthday Singing Task, whereas 214 and 209 had data from
Sing The Note Task and Sing The Tune Task, respectively. As for Match The Note
Task, 211 participants’ data were available. Across the four tasks, 3.8% of data were
missing due to technical issues. Specifically, the percentage of files missing from
Happy Birthday Singing Task, Sing The Note Task, Sing The Tune Task and Match
The Note Task were 1.7%, 3.2%, 5.0% and 2.3%, respectively.
6.3 Performance Measures
The following section describes the performance measures used to assess the ability of
the participants on music and singing tasks, as well as the tongue twister task.

- 175 -
6.3.1 Pitch deviation (PD)
In all the musical and singing tasks, the pitch deviation (PD) measure was used to assess
pitch accuracy by summing and averaging the absolute differences between the
produced pitches and the target pitches. The measure was expressed in cents, the
logarithmic unit of measure for musical intervals. It is more perceptually and musically
relevant to express pitch differences in cents since human perception of pitch
differences is not linear but logarithmic with respect to fundamental frequency. In equal
temperament tuning, the octave is divided into twelve semitones where each semitone is
equivalent to 100 cents.
The pitch deviation (in cents) was computed using the following equation
PD =
∑ |1200× log2𝑓𝑖
𝑟𝑖|𝑛
𝑖=1
𝑛
where fi is the fundamental frequency (in Hz) of the ith pitch produced by the
participant, ri is the fundamental frequency of the corresponding reference pitch, and n
is the total number of trials in the task. The smaller the PD, the better the pitch accuracy.
The reason for averaging across absolute differences instead of signed differences was
to prevent pitch deviations that were in opposite directions from cancelling each other
out, thereby under-penalising a participant’s pitch errors.
Unlike the other musical and singing tasks which have prescribed target pitches or
melodies, it was more challenging to compute the PD for Happy Birthday Singing Task,
as the participants could begin the song in whatever pitch they chose. Thus, it was
necessary to include a preliminary step to extrapolate the target pitches of Happy
Birthday from the participants’ singing, by using pitch information from the first phrase
sung, as well as the intervallic information from the melody of Happy Birthday.
As the first, second and fourth notes of the first phrase of Happy Birthday are the same
pitch, the average f0 (in Hz) of these three notes (in Hz) was computed to serve as the
starting reference pitch. Instead of basing the starting reference pitch on only the first

- 176 -
note, using an average of the three notes was considered more appropriate as it could
yield a more stable estimate of the starting pitch and help prevent minor inflections in
the first note from skewing the subsequent reference pitches and unnecessarily
penalising the participants for pitch deviation errors. Using the known intervallic
information of Happy Birthday, the subsequent reference pitches could be derived using
the following equation:
𝑟𝑖 = 2𝑖𝑛𝑡12 ×𝑟𝑖−1
where ri is the fundamental frequency (in Hz) of the reference pitch in the ith position of
the song, ri-1 is the fundamental frequency of the preceding reference pitch, and int is
the interval (in semitones) between the current and previous reference pitches. For
illustration purposes, Figure 6.13 shows Happy Birthday and the intervallic
relationships between the adjacent pitches of the song.
Figure 6.13. Happy Birthday presented in F major. The numbers below show the intervallic
relationship (in semitones) between two adjacent pitches. The 1st, 2nd and 4th pitches from a
participant’s recorded attempt were averaged to form the starting reference pitch, from which
other pitches were computed using the known intervals of the song.
The PD measure is particularly useful for Happy Birthday Singing Task as it was
sensitive to transposition errors made by participants to a different key in the middle of
the song.
6.3.2 Interval deviation (ID)
For the melodic singing tasks (i.e., Happy Birthday Singing Task and Sing The Tune
Task), it was important to assess intervallic accuracy given that actively maintaining the
correct interval relationships between adjacent pitches is integral to success in these
Averaged to form the starting reference pitch
- 177 -
tasks. Therefore, in addition to PD, interval deviation (ID) was computed by averaging
the absolute differences between the produced intervals and the reference intervals of
the target pitches.
The interval deviation (in cents) for each trial was therefore computed as follows
𝐼𝐷𝑡𝑟𝑖𝑎𝑙 =∑ |𝑝𝑟𝑜𝑑𝑢𝑐𝑒𝑑 𝑖𝑛𝑡𝑒𝑟𝑣𝑎𝑙𝑖| − |𝑟𝑒𝑓𝑒𝑟𝑒𝑛𝑐𝑒 𝑖𝑛𝑡𝑒𝑟𝑣𝑎𝑙𝑖|
𝑛𝑖=2
𝑛
=
∑ |1200× log2𝑓𝑖
𝑓𝑖−1| − |1200× log2
𝑟𝑖
𝑟𝑖−1|𝑛
𝑖=2
𝑛
where fi is the fundamental frequency (in Hz) of the ith pitch produced by the
participant, ri is the fundamental frequency of the corresponding reference pitch of the
stimulus, and n is the total number of pitches in the stimulus of the task. Averaging
IDtrial across the total number of trials in the task would yield ID, with a small ID
reflecting good melodic accuracy.
Interval deviation has been used as an objective measure of pitch accuracy in numerous
studies (Berkowska & Dalla Bella, 2009b; Dalla Bella & Berkowska, 2009; Dalla Bella
et al., 2007; Peter Q. Pfordresher, Steven Brown, Kimberly M. Meier, Michel Belyk, &
Mario Liotti, 2010). Its ecological validity has been shown in a recent study, where a
high and significant correlation was observed between interval deviation and the
subjective perceptual ratings of expert singing judges (Larrouy-Maestri et al., 2013).
ID alone however, is not adequate as a measure of pitch accuracy, as it does not
sufficiently penalise cases where participants transposed to another key in the middle of
a melody. As an example, consider the situation where a participant sang Happy
Birthday in F major and then transposed to C major two notes into the third phrase
(Figure 6.14).

- 178 -
Figure 6.14. Happy Birthday with a transposition error in Bar 5. The numbers below show the
intervallic relationship (in semitones) between two adjacent pitches, for both the actual intervals
sung by the participant and the reference intervals.
As can be observed, there was only one interval error (5 semitones or 500 cents) made
at the point of transposition. The ID in this case was thus 20.8 cents (500 cents averaged
across 24 intervals), which was less than a quarter tone. This measure would therefore
give the false impression that the participant was an accurate singer, although any judge
who listened to the recording would have likely given a low rating due to the
transposition error.
In contrast, the measure PD would consider the last 11 pitches to each have deviated
five semitones (500 cents) from the corresponding reference pitches in the accurate
version of Happy Birthday (Figure 6.15), thus yielding a PD of 220 cents
(500 𝑐𝑒𝑛𝑡𝑠 ×11 𝑝𝑖𝑡𝑐ℎ𝑒𝑠
25 𝑝𝑖𝑡𝑐ℎ𝑒𝑠). This indicates that the participant, on average, made pitch
deviation errors of 2.2 semitones, thereby correctly demonstrating that the participant
was not an accurate singer. Due to the above considerations, it is therefore essential to
include PD as a measure of melodic singing tasks, to detect whether a consistent tonal
centre is maintained and to penalise accordingly.
Sung
Intervals: 0 2 -2 5 -1 -4 0 2 -2 7 -2 -5 0 7 -3 -4 -1 -2 8 0 -1 -4 2 -2
Reference
Intervals: 0 2 -2 5 -1 -4 0 2 -2 7 -2 -5 0 12 -3 -4 -1 -2 8 0 -1 -4 2 -2
Interval
Deviation
(ID): 0 0 0 0 0 0 0 0 0 0 0 0 0 -5 0 0 0 0 0 0 0 0 0 0
Average ID: 5/24 ≈ 0.208 semitones = 20.8 cents
F major C major

- 179 -
Figure 6.15. The first melody is Happy Birthday performed by a participant with a transposition
error in Bar 5. The second melody is the reference melody. The numbers below show the pitch
differences (in semitones) between the participant’s pitch and the corresponding reference pitch.
6.3.3 Key deviation (KD)
Another measure useful for evaluating key transposition error in Happy Birthday
Singing Task is key deviation (KD). Similar to the tonal centre deviation measure
detailed by Larrouy-Maestri and Morsomme (2014), four notes that are important to the
tonal hierarchy of the melody form the basis of the computation of KD: the first notes of
the first three phrases and the final note of the melody. For ease of reference, these four
notes will be called Note 1, Note 2, Note 3 and Note 4 subsequently (Figure 6.16).
Notes 1, 2 and 3 constitute the dominant of the key while Note 4 is the tonic. Together,
the four notes are able to provide clues to any shift of tonal centre, phrase by phrase.
Figure 6.16. The four notes considered for the computation of the key deviation (KD) measure
in Happy Birthday Singing Task. The expected intervals between Notes 2 and 1, Notes 3 and 1,
and Notes 4 and 1 are 0, 0 and 500 cents, respectively.
Pitch
Difference: ------------------None--------------------------------- -5 -5 -5 -5 -5 -5 -5 -5 -5 -5 -5
Participant
Reference
Note 1 Note 2 Note 3 Note 4
0 cent
0 cent
500 cents

- 180 -
The intervals between Note 2 and Note 1, Note 3 and Note 1, and Note 4 and Note 1
were therefore calculated and compared to the expected intervals of these notes
according to the melody of Happy Birthday. It is clear from Figure 6.16 that Notes 1, 2
and 3 are expected to be the same pitches, and so the expected interval between these
notes is 0. In contrast, the expected interval between Note 4 and Note 1 is five
semitones (i.e., 500 cents).
The key deviation (KD) measure was thus the average of the absolute differences
between the produced intervals and the expected intervals and was computed as follows
𝐾𝐷 = |1200× log2
𝑁𝑜𝑡𝑒 2𝑁𝑜𝑡𝑒 1| + |1200× log2
𝑁𝑜𝑡𝑒 3𝑁𝑜𝑡𝑒 1| + |1200× log2
𝑁𝑜𝑡𝑒 4𝑁𝑜𝑡𝑒 1 − 500|
3
where Notes 1, 2, 3 and 4 represent the fundamental frequencies (in Hz) of the four
notes
In the transposed example from Figure 6.14, the KD was calculated to be
0+0+|0−500|
3=
500
3= 166.67 cents (Figure 6.17), thereby demonstrating that this
measure is able to penalise key transposition error appropriately.
Figure 6.17. The transposed Happy Birthday example from Figure 6.14. The interval between
Note 1 and Note 4 was 0 cents instead of 500 cents due to the transposition.
Note 1 Note 2 Note 3 Note 4
0 cent
0 cent
0 cent

- 181 -
6.3.4 Categorical measures
In addition to the three types of continuous measures described above, categorical
measures were also constructed from the continuous measures using a 50-cent cutoff
criterion. Specifically, participants with mean deviation less than 50 cent in a
continuous measure were classified as Category 1, participants with mean deviation
between 50 to 100 cents were classified as Category 2, and participants with mean
deviation 100 cents and above were classified as Category 3. By this definition,
Category 1 were the accurate singers, Category 2 were the moderately inaccurate
singers, Category 3 were the highly inaccurate singers. The rationale for having
categorical measures alongside continuous measures was to better compare the
incidence of accurate and inaccurate singers using the accuracy categories. In addition,
categorical measures might be deemed ‘coarser’ estimates of pitch accuracy, it had been
previously reported that most people can only reliably discern pitch deviations in
singing that exceeded 50 cents while pitch errors as high as 40 cents were not reliably
judged as out of tune (Hutchins et al., 2012; Vurma & Ross, 2006). As such, using
categorical measures to characterise singing proficiency might correspond better with
perceptual judgment of singing accuracy.
6.3.5 Measures for the tongue twister task
A number of studies on poor-pitch singing have observed that some poor-pitch singers
show little or no variation in pitch (Blind, 1938; Joyner, 1969; Roberts & Davies, 1975),
while speech range and speech fundamental frequency has emerged as strong predictor
of pitch-matching accuracy in preschool children (Trollinger, 2003). Therefore,
measures for speech fundamental frequency (f0) and speech range were computed for
this task.
The median speech fundamental frequency (in Hz) was used as a measure for speech
fundamental frequency. Median was preferred over mean in this case since the quality
of the speech recordings was largely dependent on the participants’ recording devices
and the environment they undertook the online assessment. Thus, it was possible that
the quality of some of the speech data would be degraded due to noise introduced by the
recording devices or background noise. These noises, interspersed amid the tongue

- 182 -
twister recording, might be spuriously represented as outlier fundamental frequencies by
Praat. The mean fundamental frequency computed across the entire tongue twister
recording would therefore be unduly influenced by these pitch outliers. In contrast, the
median fundamental frequency is a more robust measure against noisy recordings.
Due to the same considerations, instead of simply taking the difference between the
maximum and minimum fundamental frequency detected for the tongue twister
recording as the measure of pitch range, a more robust 5%-95% interquantile range
(IQR), i.e., the difference (in cents) between the fundamental frequencies at the 95th
percentile and the 5th percentile, was used as the speech range measure (Goldman,
2007).
In addition to computing the above two measures for the two paced trials (by averaging
across the two trials), both measures were also computed for the unpaced trial.
6.3.6 Summary of task measures
Table 6.6 summarises the measures used in the various objective music and singing
tasks.
Table 6.6. Measures Used to Assess Performance in the Music, Singing and Tongue-Twister
Tasks
Match The Note
Task
Sing The Note
Task
Happy Birthday
Singing Task
Sing The Tune
Task
Tongue-
twister
MatchTheNote PD SingTheNote PD HappyBirthday PD SingTheTune PD median
speech f0
MatchTheNote PD
(category)
SingTheNote PD
(category)
HappyBirthday PD
(category)
SingTheTune PD
(category)
5%-95%
IQR
HappyBirthday ID SingTheTune ID
HappyBirthday ID
(category)
SingTheTune ID
(category)
HappyBirthday
KD
HappyBirthday
KD (category)
Note. PD: pitch deviation; ID: interval deviation; KD: key deviation; f0: fundamental frequency;
IQR: interquantile range

- 183 -
In addition, a combined singing score (SINGCOMB) was constructed by averaging all
the continuous measures from the three singing tasks. A categorical SINGCOMB
measure was then constructed from the continuous SINGCOMB measure, in the same
manner as described in Section 6.3.4 (p. 181).
6.4 Proposed Statistical Analyses
6.4.1 Investigate the genetic basis of singing ability (Aim 1)
6.4.1.1 Descriptive statistics of singing task performance
In order to address the first aim, descriptive statistics of the singing task measures were
first computed to investigate how the singing proficiency of the sample varied
according to each task or measure. Although several studies have asserted that non-
normality of variables generally do not affect the robustness of structural equation
modelling using maximum likelihood estimation methods (which would be employed
for the current study’s genetic analyses) (Iacobucci, 2010; Lei & Lomax, 2005; Olsson,
Foss, Troye, & Howell, 2000), for the sake of caution, transformation would be
performed if the distribution of any measure was considerably skewed or kurtotic.
The general consensus within the field of structural equation modelling research is that
absolute skewness and kurtosis values less than 1 indicate slight non-normality,
between 1.0 to around 2.3 indicate moderate non-normality and above 2.3 indicate
severe non-normality (Lei & Lomax, 2005). In view of this, task measures with absolute
skewness and kurtosis values above 1.0 were transformed.
In addition to the singing task measures, descriptive statistics were also computed for
MatchTheNote PD as well as self-rated singing ability, singing interest, music ability
and music interest. Bivariate correlations between the task measures were also
computed.
6.4.1.2 Univariate genetic analyses
The following procedure were then undertaken to test each hypothesis in Aim 1:
- 184 -
1) Compute the intraclass correlations for the MZ twins (rMZ) and the DZ twins
(rDZ) separately for each of the continuous and categorical singing task measure
(SINGCOMB, SingTheNote PD, HappyBirthday PD, HappyBirthday ID,
HappyBirthday KD, SingTheTune PD and SingTheTune ID). Similarly,
compute the rMZ and rDZ for self-rated singing ability.
2) For each measure, determine whether rMZ is significantly higher than rDZ using
Fisher’s r to Z transformation. Significantly higher rMZ would suggest a sizeable
genetic component for the measure.
3) After ensuring the assumptions of equality of means, variances and covariances
were met, conduct univariate genetic modelling to estimate the additive genetic
(A), common environmental (C) and unique environmental (E) components of
each task measure.
All the above proposed genetic analyses were performed in the R environment (version
3.2.1) using the OpenMx package (version 2.2.4). The univariate genetic models were
estimated based on raw data using full information maximum likelihood (FIML)
modelling, which is the generally preferred approach for model estimation, as it is able
to utilise datasets with missing values automatically and flexibly (OpenMx
Development Team, 2015).
When computing the intraclass correlations and conducting the univariate genetic
modelling, as best practice, all the measures were adjusted for age and sex effects to
prevent biased estimation of the twin correlations and model parameters (McGue &
Bouchard Jr, 1984). In addition, to control for possible birth order effects, the ordering
of a twin pair as twin 1 and twin 2 was randomised for the same sex twin groups (MZF,
MZM, DZF, DZM). In the DZO group, the female twin was always assigned as twin 1
while the male was assigned as twin 2, in accordance to standard practice in twin
methodology (Neale & Maes, 2004).
Besides following the above procedure to specifically test the genetic hypotheses
pertaining to singing ability, the same procedure was also used to estimate the rMZ, rDZ,

- 185 -
and A, C, E components of the following measures: MatchTheNote PD, self-rated
singing interest, self-rated music interest and self-rated music ability.
The OpenMx scripts that were used to run the above analyses are included in Appendix
C-5 to Appendix C-11 (pp. 342-367).
6.4.2 Investigate the genetic bases of environmental
components associated with singing ability (Aim 2)
6.4.2.1 Identification of singing and music background components
Before testing the genetic hypotheses in Aim 2, underlying components in the music
and singing background questionnaire were first identified by conducting principal
component analysis on the Z-scores of each questionnaire item.
The following assumptions were tested prior to conducting principal component
analysis:
a) Factorability: All items correlated at least .3 with one or more other items.
b) Sampling adequacy: Kaiser-Meyer-Olkin measure was above 0.6 and Bartlett’s
test of sphericity was significant. The diagonals of the anti-image correlation
matrix were all above 0.5.
c) Each item shared some common variance with other items: communalities were
above 0.3 for all items.
Both varimax and oblimin rotations of the factor loading matrix were examined to
investigate whether the solutions arising from both rotations were similar, and which
one offered the best defined factor structure. The scree plot was also used to determine
the number of components underlying the questionnaire items. To ensure that the
components were reasonably well-defined, items that failed to meet a minimum criteria
of having a primary factor loading of at least 0.4, and having a cross-loading of at least
0.3 with another component were removed. Suitable labels best describing the latent
construct of each component were then generated.
The internal consistency of each component was also examined using Cronbach’s alpha.
If the removal of any questionnaire item resulted in substantial increases in a

- 186 -
component’s alpha, it was removed to improve the internal consistency of the
component. A composite score for each component was then computed by averaging
the Z-scores of the questionnaire items that loaded primarily on that component.
Based on the composite scores of the underlying components, descriptive statistics were
generated to investigate how the components varied within the study sample and
determine whether transformation was necessary for any component that was
considerably skewed or kurtotic.
6.4.2.2 Univariate genetic analyses
To test the first hypothesis in Aim 2, the procedure described in Section 6.4.1.2 (p. 183)
was used to estimate the rMZ, rDZ, and A, C, E components of the music and singing
background components so that the genetic influences on each component could be
determined.
6.4.2.3 Bivariate genetic analyses
To test the second hypothesis, bivariate genetic modelling was used to determine the
extent and significance of shared additive genetic (A), common environmental (C) and
unique environmental influences (E) between the singing task measures and the music
and singing background components. In addition, additional bivariate genetic analyses
between MatchTheNote PD and background components related to formal music
training were also performed, since significant shared genetic influences between music
perception ability and the amount of music practice had been previously reported
(Mosing et al., 2014).
Each singing task measure and each background component were first fitted with a full
bivariate Cholesky decomposition model (Figure 6.18). Three submodels which
removed shared A, C and E influences (i.e., a21, c21 or e21) in turn from the full bivariate
model were then fitted. The importance of shared additive genetic influences in
explaining the association between the two variables would be demonstrated if
constraining the shared additive genetic influences (a21) to zero resulted in a significant
deterioration in model fit as compared to the full model. In addition, the significance of

- 187 -
shared additive genetic influences would also be evident if the confidence interval of the
additive genetic correlation did not include zero.
Figure 6.18. The full bivariate Cholesky model. The background component and task measure
of Twin 1 and Twin 2 are shown in the boxes. a11, c11, e11 and a22, c22, e22 are the additive
genetic, common environmental and unique environmental effects acting on the background
component and the task measure, respectively, whereas a21, c21, e21 are the additive genetic,
common environmental and unique environmental influences shared by both the component and
the task measure. Three submodels were constructed by removing a21, c21 and e21 from the full
model, respectively.
The contributions of shared A, C, and E influences to the phenotypic correlation are
computed as follows:
𝐶𝑜𝑟𝑟𝑒𝑙𝑎𝑡𝑖𝑜𝑛 𝑑𝑢𝑒 𝑡𝑜 𝐴 = √𝐴1×𝑟𝐴×√𝐴2
𝐶𝑜𝑟𝑟𝑒𝑙𝑎𝑡𝑖𝑜𝑛 𝑑𝑢𝑒 𝑡𝑜 𝐶 = √𝐶1×𝑟𝐶×√𝐶2
𝐶𝑜𝑟𝑟𝑒𝑙𝑎𝑡𝑖𝑜𝑛 𝑑𝑢𝑒 𝑡𝑜 𝐸 = √𝐸1×𝑟𝐸×√𝐸2
where rA, rC, and rE are the additive genetic, common environmental and unique
environmental correlations, whereas A1, C1, E1 and A2, C2, E2 are the univariate
heritabilities of trait 1 and trait 2 in the bivariate model, respectively.
a11
A1 C1 A2 C2
E1 E2
Background
Component
Twin 1
a21
e11 e21
c11
c21
e22
a22 c22
A1 C1 A2 C2
E1 E2
Twin 2
a21
e11 e21
c11
c21
e22
a22 c22 a11
rMZ
= 1
rDZ
= 0.5
rMZ
= 1
rDZ
= 0.5
rMZ
= 1
rDZ
= 1
rMZ
= 1
rDZ
= 1
Background
Component Task Measure Task Measure

- 188 -
Similar to the univariate genetic analyses, all the bivariate models were also adjusted for
age and sex effects. The OpenMx script used to conduct bivariate genetic modelling is
available in Appendix C-12 (p. 367).
6.4.3 Secondary analyses
To investigate potential confounding variables that might influence task performance,
the following secondary analyses were performed.
Specifically, independent t-tests were used to compare if there were significant
differences in each task measure between:
a) Males and females
b) Participants with and without AP
c) Tonal language speakers and non-tonal language speakers
d) Monolingual and bilingual participants
Simple regressions were used to investigate whether the following variables were
significant predictors of each task measure:
a) Age
b) Years of education
c) Self-rated interests and abilities in music and singing
d) Parents’ interests and abilities in music and singing
e) Singing and music background components
f) Speech range and median speaking frequency (from the tongue twister task)
Estimates of parents’ music and singing abilities and interests were computed by taking
the mean of the Z-scores from both twins’ ratings of their parents. In cases where the
rating from one twin was unavailable (due to missing data or if they rated “I don’t
know” for that variable), the rating score would be computed solely based on the
available rating from the co-twin.
As the median speaking frequency was likely to differ in range for male and female
participants, simple regressions were performed separately for male and female.

- 189 -
Finally, potential confounding effects of demographic variables (sex, age and years of
education) on music and singing background components as well as self-rated interests
and abilities in music and singing were investigated using independent t-tests and
simple regressions.
All the descriptive statistics and secondary analyses were conducted using IBM SPSS
Statistics Version 19 (IBM Corp., 2010).
To better contextualise the genetic findings that will be reported in Chapter 8, Chapter 7
will commence the results section by reporting the descriptive statistics of the task
measures and questionnaire components, as well as the results from the secondary
analyses which addressed potential confounding variables in the study.

- 190 -
BEHAVIOURAL
FINDINGS
This chapter presents the behavioural findings, which include descriptive statistics of
the task performances (Section 7.1), self-ratings of abilities and interests in music and
singing (Section 7.2), as well as components extracted from the singing and music
background questionnaire (Section 7.3). Investigation of potential confounding
variables that might have influenced task performance and questionnaire responses are
also reported in this chapter.
7.1 Task Performance
7.1.1 Music and singing tasks
The performances of the participants in the objective singing and music tasks are
summarised in Table 7.1. The wide-ranging minimum and maximum deviation values
for each task reveal the heterogeneity in singing and music perception abilities among
the participants. A comparison of the task means and medians shows that the task
median was lower than the mean in all instances, especially for Sing The Note Task and
Sing The Tune Task. It was therefore deemed more appropriate to interpret group
performance with the medians for the raw data.
The most accurately performed tasks were the single pitch-matching tasks, both
perceptually and vocally. Match The Note Task (perceptual pitch-matching) had a
median deviation of 13.76 cents whereas Sing The Note Task had a median deviation of
28.31 cents. Happy Birthday Singing Task was also relatively well performed; all three
task measures (PD, ID and KD) had median deviations of approximately 40 cents. The
most difficult task was Sing The Tune Task, which involves vocally matching novel
short melodies. In this task, participants exhibited less pitch deviation (median = 54.03)

- 191 -
as compared to interval deviation (median = 65.82). For the combined singing score
(SINGCOMB), the median pitch deviation was 50.90 cents, lower than Sing The Tune
Task, but higher than the median deviations from Sing The Note Task and Happy
Birthday Singing Task.
Table 7.1. Group Performance in the Objective Singing and Music Tasks (Untransformed)
N*
(Total
= 216)
Mean
(cents)
Median
(cents)
SD Min Max Skew-
ness
Kurto-
sis
SINGCOMB 208 81.43 50.90 76.68 12.49 374.10 1.73 2.30
SingTheNote PD 214 111.00 28.31 192.24 5.88 991.69 2.60 6.35
HappyBirthday PD 215 67.75 41.31 61.27 10.84 350.45 1.90 3.55
HappyBirthday ID 215 52.26 40.51 37.83 12.16 366.59 3.52 22.59
HappyBirthday KD 215 64.34 41.79 57.31 7.74 334.28 2.08 4.86
SingTheTune PD 209 97.38 54.03 110.34 9.92 646.95 2.48 7.20
SingTheTune ID 209 93.00 65.82 77.58 10.75 519.23 1.63 3.85
MatchTheNote PD 211 36.52 13.76 56.42 1.87 487.30 3.87 21.88
Note. ID: Interval deviation; KD: Key deviation; PD: Pitch deviation; SINGCOMB: Combined
singing score
* The number of analysed samples varies from task to task due to missing data (see Sections
6.2.5.3 and 6.2.5.4)
As evident from Table 7.1, the skewness and kurtosis of the task measures were
indicative of non-normality: the skewness of the task measures ranged from 1.63 to 3.87
while the kurtosis ranged from 3.55 to 22.59. All the task measures thus underwent
natural log (ln) transformation such that their skewness and kurtosis values fell below 1.
The descriptive statistics of the transformed continuous measures are shown in Table
7.2. An improvement in the normality of the measures was evident from the absolute
values of the skewness and kurtosis falling below 1.
All subsequent references to the continuous task measures in this thesis refer to the
transformed task measures. All subsequent references to Public Singing in this thesis
refer to the transformed measure.
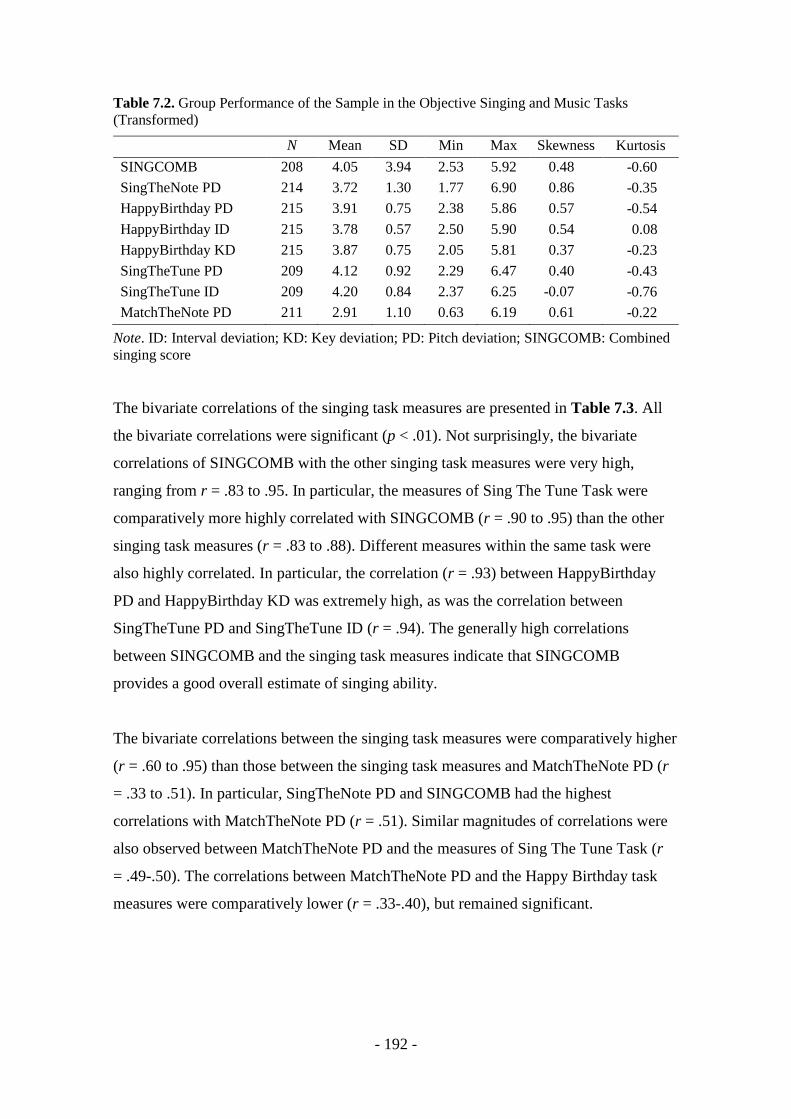
- 192 -
Table 7.2. Group Performance of the Sample in the Objective Singing and Music Tasks
(Transformed)
N Mean SD Min Max Skewness Kurtosis
SINGCOMB 208 4.05 3.94 2.53 5.92 0.48 -0.60
SingTheNote PD 214 3.72 1.30 1.77 6.90 0.86 -0.35
HappyBirthday PD 215 3.91 0.75 2.38 5.86 0.57 -0.54
HappyBirthday ID 215 3.78 0.57 2.50 5.90 0.54 0.08
HappyBirthday KD 215 3.87 0.75 2.05 5.81 0.37 -0.23
SingTheTune PD 209 4.12 0.92 2.29 6.47 0.40 -0.43
SingTheTune ID 209 4.20 0.84 2.37 6.25 -0.07 -0.76
MatchTheNote PD 211 2.91 1.10 0.63 6.19 0.61 -0.22
Note. ID: Interval deviation; KD: Key deviation; PD: Pitch deviation; SINGCOMB: Combined
singing score
The bivariate correlations of the singing task measures are presented in Table 7.3. All
the bivariate correlations were significant (p < .01). Not surprisingly, the bivariate
correlations of SINGCOMB with the other singing task measures were very high,
ranging from r = .83 to .95. In particular, the measures of Sing The Tune Task were
comparatively more highly correlated with SINGCOMB (r = .90 to .95) than the other
singing task measures (r = .83 to .88). Different measures within the same task were
also highly correlated. In particular, the correlation (r = .93) between HappyBirthday
PD and HappyBirthday KD was extremely high, as was the correlation between
SingTheTune PD and SingTheTune ID (r = .94). The generally high correlations
between SINGCOMB and the singing task measures indicate that SINGCOMB
provides a good overall estimate of singing ability.
The bivariate correlations between the singing task measures were comparatively higher
(r = .60 to .95) than those between the singing task measures and MatchTheNote PD (r
= .33 to .51). In particular, SingTheNote PD and SINGCOMB had the highest
correlations with MatchTheNote PD (r = .51). Similar magnitudes of correlations were
also observed between MatchTheNote PD and the measures of Sing The Tune Task (r
= .49-.50). The correlations between MatchTheNote PD and the Happy Birthday task
measures were comparatively lower (r = .33-.40), but remained significant.

- 193 -
Table 7.3. Bivariate Correlations of the Objective Task Measures
SINGCOMB SingTheNote
PD
HappyBirthday
PD
HappyBirthday
ID
HappyBirthday
KD
SingTheTune
PD
SingTheTune
ID
MatchTheNote
PD
SINGCOMB 1
SingTheNote
PD
.85** 1
HappyBirthday
PD
.88** .65** 1
HappyBirthday
ID
.85** .65** .88** 1
HappyBirthday
KD
.83** .60** .93** .80** 1
SingTheTune
PD
.95** .76** .76** .76** .71** 1
SingTheTune ID .90** .64** .72** .73** .67** .94** 1
MatchTheNote
PD
.51** .51** .35** .40** .33** .50** .49** 1
Note. ID: Interval deviation; KD: Key deviation; PD: Pitch deviation; SINGCOMB: Combined singing score
**p < .01

- 194 -
Table 7.4 presents the distribution of participants in terms of the three categorical
measures of performance in the various singing tasks.
Table 7.4. Singing Accuracy Distribution of the Participants by the Three Categories
N Category 1 (n)
(<50 cents)
Category 2 (n)
(50≤x<100 cents)
Category 3 (n)
(≥100 cents)
SINGCOMB 208 102 (49.0%) 52 (25.0%) 54 (26.0%)
SingTheNote PD 214 142 (66.4%) 19 (8.9%) 53 (24.8%)
HappyBirthday PD 215 127 (59.1%) 44 (20.5%) 44 (20.5%)
HappyBirthday ID 215 132 (61.4%) 62 (28.8%) 21 (9.8%)
HappyBirthday KD 215 126 (58.6%) 50 (23.3%) 39 (18.1%)
SingTheTune PD 209 95 (45.5%) 57 (27.3%) 57 (27.3%)
SingTheTune ID 209 79 (37.8%) 62 (29.7%) 68 (32.5%)
Note. ID: Interval deviation; KD: Key deviation; PD: Pitch deviation; SINGCOMB: Combined
singing score
In terms of SINGCOMB, slightly less than half (49.0%) of the participants were
classified as Category 1, whereas approximately one quarter of participants belonged to
Category 2 and Category 3, respectively. This suggests that in the current sample, based
on performance across all singing tasks, approximately 50% of the participants were
accurate singers, whereas the other 50% were inaccurate singers, of which half of them
were highly inaccurate, missing target notes by more than one semitone (Category 3).
The percentages of Category 1 participants (accurate singers) in the other task measures
also corresponded with the descriptive statistics reported for the continuous measures
(Table 7.2). SingTheNote PD was the most well-performed singing task measure,
indicated by approximately 66% of the participants classified as Category 1, whereas
59-61% of the participants belonged to Category 1 for the various HappyBirthday task
measures. In Happy Birthday Singing Task, the number of Category 1 participants was
slightly greater for ID than for PD and KD, indicating that accurate interval singing was
relatively easier than absolute pitch and key accuracy on this task. Sing The Tune Task
was the most challenging task, with only approximately 38-46% of participants in
Category 1. For this task, there were fewer Category 1 participants for ID (37.8%)
compared to PD (45.5%), and there were more highly inaccurate Category 3 participants
for ID (32.5%) than for PD (27.3%).

- 195 -
Interestingly, although Sing The Note Task had the highest percentage (66.4%) of
accurate singers, it also had one of the highest proportions of Category 3 singers
(24.8%). In contrast, HappyBirthday ID had the least number of Category 3 participants
(9.8%), suggesting most participants were either accurate or just moderately inaccurate
(Category 2) by this measure. However, HappyBirthday PD and HappyBirthday KD
have approximately twice as many Category 3 participants compared to HappyBirthday
ID. This strongly indicates that many participants made key transposition errors when
singing a familiar tune, which detrimentally affected their accuracy in terms of PD and
KD, while leaving ID relatively intact.
For Happy Birthday Melody Perception Task, out of the 193 participants who did not
have missing data for this task, 100% of them identified the correct Happy Birthday
melody from the other two slightly altered versions. This suggests that pitch and key
deviations for Happy Birthday Singing Task do not reflect a lack of familiarity with the
tune.
7.1.2 Tongue twister task
The descriptive statistics of the speech ranges and median speaking fundamental
frequency (f0) from the tongue twister task are presented in Table 7.5. The units of the
measures are in cents and Hz.
Table 7.5. Speech Range and Median Speaking Fundamental Frequency of the Tongue Twister
Task
N Mean SD Min Max Skewness Kurtosis
Unpaced male median f0
(Hz)
49 114.59 15.25 82.62 149.43 0.19 -0.47
Unpaced female median
f0 (Hz)
147 192.98 26.63 113.00 271.92 -0.01 0.32
Unpaced range (cents) 196 869.93 291.46 246.86 1807.85 0.52 -0.10
Paced male median f0
(Hz)
50 119.49 18.18 92.26 170.38 0.69 0.05
Paced female median f0
(Hz)
152 198.66 29.57 116.03 338.93 0.76 3.28
Paced range (cents) 202 743.58 265.15 153.87 1884.47 1.05 1.65

- 196 -
Not surprisingly, the median speaking f0 of male participants was considerably lower
than that of female participants, as confirmed by a significant independent samples t-
tests comparing the two, for both unpaced and paced conditions (unpaced: t(145.71) =
25.34, p < .001; paced: t(137.60) = 22.52, p < .001).
Dependent samples t-tests comparing the speech ranges of the unpaced and paced
conditions revealed significant differences in the two conditions, with wider speech
ranges in the unpaced conditions, t(193) = 8.537, p < .001. During acoustical
processing, it was observed that many of the participants tended to recite the tongue
twister in a monotonous, chant-like manner during the paced condition, which could
have caused the significantly lower speaking ranges in the paced condition. In view of
this, the unpaced speech range was used for subsequent analyses because it was likely to
be more representative of the participants’ actual speech range in spontaneous speech.
7.2 Self-Reported Interests and Abilities in Music and
Singing
Descriptive statistics of the participants’ self-ratings for Music Interest, Music Ability,
Singing Interest and Singing Ability on 7-point Likert type scales are summarised in
Table 7.6. Of the four variables, Singing Ability had the lowest mean rating (M = 3.66,
SD = 1.68), followed by Music Ability (M = 4.03, SD = 1.70), Singing Interest (M =
4.79, SD = 1.89) and Music Interest (M = 5.68, SD = 1.38). The mean ratings suggest
that while participants of the present study have a generally low opinion of their singing
abilities, most of them reported a high level of music interest.
Table 7.6. Descriptive Statistics of Self-Reported Music and Singing Interests and Abilities
N Mean SD Skewness Kurtosis
Singing Ability 207 3.66 1.68 -0.04 -0.85
Music Ability 207 4.03 1.70 -0.28 -0.79
Singing Interest 207 4.79 1.89 -0.51 -0.91
Music Interest 207 5.68 1.38 -1.06 0.61

- 197 -
7.3 Singing and Music Background Components
To identify underlying components of the questionnaire items on singing and music
background, principal component analysis was conducted on the Z-scores of the
questionnaire items.
All 13 questionnaire items related to singing and music background correlated at least
0.30 with one or more other items, suggesting reasonable factorability. The Kaiser-
Meyer-Olkin measure of sampling adequacy was .85, above the recommended value of
0.60, and Bartlett’s test of sphericity was significant (χ2(78) = 1296.73, p < .001). The
diagonals of the anti-image correlation matrix were also all above 0.50. The
communalities were between 0.54 to 0.83, all of which were above the minimum
suggested value of 0.30. This further confirmed that each item shared some common
variance with other items. Fulfilment of the above criteria was used to justify that all 13
items were suitable to undergo principal components analysis.
Principal components analysis using both varimax and direct oblimin rotations were
performed to identify underlying components and determine which rotation offered the
best defined factor structure. The varimax and oblimin solutions were similar; both
revealed the presence of four components explaining 72% of the variance, but direct
oblimin rotation provided the best defined factor structure. The four factor solution was
also corroborated by the ‘levelling off’ of eigenvalues on the scree plot after four
factors. All items in this analysis had primary loadings over 0.45, which exceeded the
minimum criterion of 0.40 for primary factor loading. The scree plot and the factor
loading matrix for the final solution are available in Figure D-1 and Table D-1 of
Appendix D (pp. 375-377).
The four extracted components were labelled ‘Family Singing’, ‘Public Singing’,
‘Personal Singing’ and ‘Music Listening’. As evident from Table 7.7, Family Singing
comprised questionnaire items that describe singing activities with family members,
whereas Public Singing denoted current singing activities as a solo performer, in a
group setting or with friends. As the third factor contained items describing singing
alone during childhood and at present, it was termed Personal Singing. Finally, Music

- 198 -
Listening was labelled as such as it contained items that described engagement in music
listening activities during one’s childhood.
Internal consistency for each component was examined using Cronbach’s alpha. The
alphas were moderate to high: 0.87 for Family Singing (5 items), 0.78 for Public
Singing (3 items), 0.77 for Music Listening (3 items) and 0.76 for Personal Singing (2
items). All items in each component were retained as the removal of any item did not
cause a component’s alpha to increase greatly.
In addition, a second principal components analysis was performed on participants with
music training (n = 169) using the 13 questionnaire items mentioned above as well as 6
items related to musically trained participants’ instrumental training background, in
order to investigate whether there was an underlying factor for instrumental training
background. All 19 items correlated at least 0.30 with one or more other items,
suggesting reasonable factorability. The Kaiser-Meyer-Olkin measure of sampling
adequacy was 0.84, above the recommended value of 0.60, and Bartlett’s test of
sphericity was significant (χ2(171) = 1690.21, p < .001). The diagonals of the anti-image
correlation matrix were also all above 0.50. The communalities were between 0.38 to
0.83, all of which were above the minimum suggested value of 0.30, further confirming
that each item shared some common variance with other items. Fulfilment of the above
criteria indicates that all 19 items were suitable to undergo principle components
analysis. Principal components analysis using both varimax and oblimin rotations
indicated that all items relating to the participants’ instrumental background converged
to form one component. The primary loadings of items within this factor ranged from
0.57 to 0.78, using oblimin rotation. This component is therefore termed Instrumental
Expertise (see Table D-2 of Appendix D for the factor loading matrix for the final
solution, p. 377). Internal consistency for Instrumental Expertise was examined using
Cronbach’s alpha. The alpha for the 6 items in Instrumental Expertise was low (0.56),
indicating that the items in this factor were not internally consistent. It was observed
that removing the item ‘Years since last regular practice’ resulted in a substantial
increase in alpha to 0.81. In view of this, the above-mentioned item was removed from
the Instrumental Expertise component. The questionnaire items contained in the
Instrumental Expertise component are shown in Table 7.7.

- 199 -
Table 7.7. Extracted Components from the Principal Components Analyses
Component Questionnaire items
Family Singing In my childhood, an adult family member/s sang with me
In my childhood, an adult family member/s sang to me
In my childhood, an adult family member/s taught me songs
In my childhood, I sang with my siblings/friends
How often do you currently sing with your family?
Public Singing How often do you currently sing in a choir/group?
How often do you currently sing as a solo performer?
How often do you currently sing with your friends?
Personal Singing In my childhood, I sang by myself
How often do you currently sing by yourself?
Music Listening In my childhood, music was present around my home
In my childhood, I listened to music
In my childhood, my family attended live musical events together
Instrumental
Expertise
How good are you on this instrument/voice?
What was your level of motivation to learn this instrument/voice?
How many days do you practise now every week?
How many years of training have you had on this instrument/voice?
Weekly peak practice duration (when you were most interested in
learning your instrument/voice)
Composite scores were created for each of the five components by taking the average of
the Z-scores of each item that had their primary loadings for the particular factor.
Descriptive statistics of the five components are presented in Table 7.8. Apart from
Public Singing, which was positively skewed (indicating that the majority of the
participants had a low degree of public singing engagement), all other components had
absolute skewness and kurtosis values less than 1, which indicated only slight non-
normality. Therefore, Public Singing underwent natural log transformation and the
skewness and kurtosis values of the transformed measure were .51 and -.47,
respectively. All subsequent references to Public Singing in this thesis refer to the
transformed measure.

- 200 -
Table 7.8. Descriptive Statistics of the Composite Scores of the Components Derived from the
Questionnaire
N Mean SD Min Max Skewness Kurtosis
Personal Singing 207 0.00 0.90 -2.49 1.43 -0.54 -0.11
Family Singing 207 0.00 0.81 -1.90 1.81 -0.08 -0.35
Public Singing 207 0.00 0.83 -0.83 3.25 1.39 1.85
Public Singing
(transformed)
207 0.52 0.41 0.00 1.63 0.51 -0.47
Music Listening 207 0.00 0.83 -1.99 1.28 -0.40 -0.83
Instrumental
Expertise
169 0.04 0.75 -1.02 2.24 0.89 0.35
Table 7.9 shows the bivariate correlations of the composite scores. The correlations
between the composite scores of the items were significant (p < .01), with correlation
strengths ranging from low to moderate (r = .30 to .53). In particular, Family Singing
was moderately correlated with Personal Singing (r = .51) and with Public Singing (r
= .53), whereas Instrumental Expertise was less strongly correlated with Personal
Singing (r = .30) for participants with formal music training.
Table 7.9. Bivariate Correlations of the Composite Scores of the Components
Personal
Singing
Family
Singing
Public
Singing
Music
Listening
Instrumental
Expertise
Personal Singing 1
Family Singing .51** 1
Public Singing .44** .45** 1
Music Listening .46** .53** .37** 1
Instrumental
Expertise
.30** .40** .39** .42** 1
**p < .01
The relationship between the background components and the objective task measures
were also examined through bivariate correlations (Table 7.10). All the background
components and singing task measures were significantly correlated (p < .01), with low
to moderate correlation strengths (|r| = .23 to .48). Not surprisingly, MatchTheNote PD
was not significantly correlated with the three singing components. However, it was
significantly correlated with Music Listening and Instrumental Expertise (p < .01 and p
< .05, respectively), although the size of the correlation was small (|r| = .18). On the
whole, the significant correlations indicate that greater singing and music engagement
were associated with better objective singing accuracy and music perception.

- 201 -
Table 7.10. Correlations between the Background Components and the Task Measures
Personal
Singing
Family
Singing
Public
Singing
Music
Listening
Instrumental
Expertise
SINGCOMB -.35** -.44** -.42** -.47** -.39**
SingTheNote PD -.23** -.32** -.32** -.38** -.27**
HappyBirthday PD -.35** -.41** -.38** -.43** -.32**
HappyBirthday ID -.38** -.45** -.41** -.41** -.28**
HappyBirthday KD -.30** -.35** -.30** -.37** -.26**
SingTheTune PD -.37** -.43** -.43** -.48** -.42**
SingTheTune ID -.34** -.42** -.41** -.41** -.39**
MatchTheNote PD -.08 -.11 -.06 -.18** -.18*
Note. ID: Interval deviation; KD: Key deviation; PD: Pitch deviation; SINGCOMB: Combined
singing score
*p < .05; **p < .01
7.3.1 Singing and music background components
Simple regression analyses were also performed to examine whether singing and music
background components significantly predict task performance. The results are
summarised in Tables 7.11 through 7.16.
Table 7.11. Summary of Simple Regression Analysis for Personal Singing Predicting Task
Measures
N B SE B β R2 F t
SINGCOMB 204 -0.32 .06 -.35 .13 28.82* -5.37*
SingTheNote PD 206 -0.33 .10 -.23 .05 11.20* -3.35*
HappyBirthday PD 207 -0.29 .06 -.35 .12 28.05* -5.30*
HappyBirthday ID 207 -0.24 .04 -.38 .14 33.48* -5.79*
HappyBirthday KD 207 -0.25 .06 -.30 .09 19.93* -4.46*
SingTheTune PD 205 -0.38 .07 -.37 .14 32.67* -5.72*
SingTheTune ID 205 -0.32 .06 -.34 .11 25.91* -5.09*
MatchTheNote PD 204 -0.09 .09 -.08 .01 1.20 -1.10
Note. ID: Interval deviation; KD: Key deviation; PD: Pitch deviation; SINGCOMB: Combined
singing score
*p < .001

- 202 -
Table 7.12. Summary of Simple Regression Analysis for Family Singing Predicting Task
Measures
N B SE B β R2 F t
SINGCOMB 204 -0.44 .06 -.44 .20 48.78* -6.99*
SingTheNote PD 206 -0.51 .11 -.32 .10 23.08* -4.80*
HappyBirthday PD 207 -0.38 .06 -.41 .16 40.20* -6.34*
HappyBirthday ID 207 -0.32 .04 -.45 .21 53.26* -7.30*
HappyBirthday KD 207 -0.33 .06 -.35 .13 29.32* -5.42*
SingTheTune PD 205 -0.50 .07 -.43 .19 46.56* -6.82*
SingTheTune ID 205 -0.44 .07 -.42 .17 42.45* -6.52*
MatchTheNote PD 204 -0.15 .10 -.11 .01 2.47 -1.57
Note. ID: Interval deviation; KD: Key deviation; PD: Pitch deviation; SINGCOMB: Combined
singing score
*p < .001
Table 7.13. Summary of Simple Regression Analysis for Public Singing Predicting Task
Measures
N B SE B β R2 F t
SINGCOMB 204 -0.83 .13 -.42 .18 43.17* -6.57*
SingTheNote PD 206 -1.02 .21 -.32 .10 23.59* -4.86*
HappyBirthday PD 207 -0.71 .12 -.38 .15 34.94* -5.91*
HappyBirthday ID 207 -0.58 .09 -.41 .17 42.50* -6.52*
HappyBirthday KD 207 -0.57 .12 -.30 .09 20.78* -4.56*
SingTheTune PD 205 -0.97 .14 -.43 .18 45.23* -6.73*
SingTheTune ID 205 -0.85 .13 -.41 .17 41.26* -6.42*
MatchTheNote PD 204 -0.16 .19 -.06 .00 0.72 -0.85
Note. ID: Interval deviation; KD: Key deviation; PD: Pitch deviation; SINGCOMB: Combined
singing score
*p < .001
Table 7.14. Summary of Simple Regression Analysis for Music Listening Predicting Task
Measures
N B SE B β R2 F t
SINGCOMB 204 -0.46 .06 -.47 .22 56.36** -7.51**
SingTheNote PD 206 -0.60 .10 -.38 .15 35.33** -5.94**
HappyBirthday PD 207 -0.39 .06 -.43 .18 45.79** -6.77**
HappyBirthday ID 207 -0.29 .04 -.41 .17 42.42** -6.51**
HappyBirthday KD 207 -0.34 .06 -.37 .14 33.23** -5.76**
SingTheTune PD 205 -0.54 .07 -.48 .23 60.76** -7.80**
SingTheTune ID 205 -0.42 .07 -.41 .17 41.06** -6.41**
MatchTheNote PD 204 -0.24 .09 -.18 .03 7.05* -2.66*
Note. ID: Interval deviation; KD: Key deviation; PD: Pitch deviation; SINGCOMB: Combined
singing score
*p < .01; **p < .001

- 203 -
Table 7.15. Summary of Simple Regression Analysis for Instrumental Expertise Predicting
Task Measures
N B SE B β R2 F t
SINGCOMB 167 -0.40 .07 -.39 .15 25.23** -5.46**
SingTheNote PD 168 -0.42 .12 -.27 .07 12.86** -3.59**
HappyBirthday PD 169 -0.31 .07 -.32 .10 19.39** -4.40**
HappyBirthday ID 169 -0.20 .06 -.28 .08 13.81** -3.72**
HappyBirthday KD 169 -0.25 .07 -.26 .07 12.18** -3.49**
SingTheTune PD 168 -0.49 .08 -.42 .18 35.20** -5.93**
SingTheTune ID 168 -0.43 .08 -.39 .15 30.08** -5.48**
MatchTheNote PD 169 -0.25 .19 -.18 .03 5.87* -2.42*
Note. ID: Interval deviation; KD: Key deviation; PD: Pitch deviation; SINGCOMB: Combined
singing score
*p < .05; **p < .001
All the singing and music background components emerged as significant predictors of
singing task measures, accounting for significant proportions of the variance in the task
measures. For SINGCOMB, Music Listening accounted for the largest proportion of the
variance (R2 = 22%), followed by Family Singing (R2 = 20%), Public Singing (R2 =
18%), Instrumental Expertise (R2 = 15%), and Personal Singing (R2 = 13%).
Notably, Music Listening explained a relatively greater proportion of the variance (R2 =
14-23%) in the singing task measures compared to the other components (Table 7.14).
Personal Singing, Family Singing and Public Singing explained 5-14%, 10-21%, and 9-
18% of the variances in the singing task measures, respectively (Tables 7.11 to 7.13).
Instrumental Expertise also explained 7-18% of the variances in the singing task
measures (Table 7.15); it accounted for relatively greater proportions (R2 = 15-18%) of
the variance in the measures of Sing The Tune Task as compared to the variance (R2 =
7-10%) in the measures of Sing The Note Task and Happy Birthday Singing Task. It is
possible that Sing The Tune Task was more influenced by instrumental expertise as
compared to other tasks because aural skills constitute an important component of
formal music training.
Not surprisingly, for MatchTheNote PD, none of the singing-related background
components were significant predictors. Only Music Listening and Instrumental
Expertise significantly predicted MatchTheNote PD, both explaining 3% of variance in
the measure (p < .01 and p < .05, respectively).

- 204 -
As the regression analyses for Instrumental Expertise only applied to participants with
music training, to examine the influence of formal music training on the task
performance of all participants, additional regression analyses were performed with
Years of Music Training as the predictor variable. Analyses revealed that Years of
Music Training was a significant predictor of performance for all the task measures (p
< .001), explaining 21% of the variance in SINGCOMB and significant proportions (R2
= 11-20%) of the variance in other measures (Table 7.16).
Table 7.16. Summary of Simple Regression Analysis for Years of Music Training Predicting
Task Measures
N B SE B β R2 F t
SINGCOMB 197 -0.10 .01 -.46 .21 53.00* -7.28*
SingTheNote PD 198 -0.13 .02 -.40 .16 37.25* -6.10*
HappyBirthday PD 199 -0.08 .01 -.42 .17 40.95* -6.40*
HappyBirthday ID 199 -0.05 .01 -.35 .12 26.56* -5.15*
HappyBirthday KD 199 -0.07 .01 -.36 .13 29.37* -5.42*
SingTheTune PD 198 -0.10 .02 -.44 .20 47.38* -6.88*
SingTheTune ID 198 -0.09 .01 -.40 .16 37.26* -6.10*
MatchTheNote PD 199 -0.09 .02 -.33 .11 24.39* -4.94*
Note. ID: Interval deviation; KD: Key deviation; PD: Pitch deviation; SINGCOMB: Combined
singing score
*p < .001
7.4 Potential Confounding Variables Influencing Task
Performance
7.4.1 Demographic variables: Sex, age, years of education
Independent samples t-tests revealed that males generally performed more poorly on all
of the transformed task measures (Table 7.17). Female participants performed
significantly better than male participants on most of the task measures (p < .05), except
for SingTheTune ID and HappyBirthday KD, both of which also approached
significance (p < .1). The effect sizes of the significant sex differences were small to
medium, however, ranging from .19 to .25.

- 205 -
Table 7.17. Results of t-tests and Descriptive Statistics for Task Performances by Males and Females
Task measure Group 95% CI for Mean
Difference
Males Females
M SD n M SD n t df Sig. r
SINGCOMB 4.31 0.78 49 3.97 0.80 159 0.08, 0.59 2.59 206 .01 .18
SingTheNote PD 4.23 1.22 51 3.56 1.28 163 -1.06, -0.26 -3.26 212 .00 .22
HappyBirthday PD 4.16 0.67 51 3.83 0.76 164 -0.56, -0.09 -2.75 213 .01 .19
HappyBirthday ID 4.03 0.56 51 3.70 0.54 164 -0.51, -0.16 -3.78 213 .00 .25
HappyBirthday KD 4.04 0.68 51 3.81 0.77 164 -0.46, 0.01 -1.88 213 .06 .13
SingTheTune PD 4.38 0.89 49 4.04 0.92 160 0.04, 0.63 2.24 207 .03 .15
SingTheTune ID 4.38 0.79 49 4.15 0.85 160 -0.04, 0.50 1.70 207 .09 .12
MatchTheNote PD 3.40 1.21 50 2.76 1.02 161 -0.98, -0.29 -3.67 209 .00 .25
Note. ID: Interval deviation; KD: Key deviation; PD: Pitch deviation; SINGCOMB: Combined singing score
Variables with significant task differences are in bold

- 206 -
Simple linear regressions were performed on each task measure with age and years of
education. Age was found to be a significant predictor for the MatchTheNote PD. The
older the participant, the greater the mean pitch deviation, β = .31, t(209) = 4.71, p < .01
(Table 7.18). A significant proportion of the variance in this measure was explained by
age, as evident from the significant F value (F(1, 209) = 22.1) and R2 effect size (R2
= .10), p < .001. Age was not a significant predictor for all the other task measures
(p > .05). Similarly, Years of Education was not a significant predictor for any of the
task measure (p > .05; Table 7.19).
Table 7.18. Summary of Simple Regression Analysis for Age Predicting Task Performance
N B SE B β R2 F t
SINGCOMB 208 0.01 .01 .10 .01 2.00 1.41
SingTheNote PD 214 0.01 .01 .07 .01 1.17 1.08
HappyBirthday PD 215 0.00 .00 .01 .00 0.03 0.18
HappyBirthday ID 215 0.00 .00 .08 .01 1.51 1.23
HappyBirthday KD 215 0.00 .00 .02 .00 0.07 0.27
SingTheTune PD 209 0.01 .01 .13 .02 3.38 1.84
SingTheTune ID 209 0.01 .01 .13 .02 3.50 1.87
MatchTheNote PD 211 0.03 .00 .31 .10 22.10** 4.71**
Note. ID: Interval deviation; KD: Key deviation; PD: Pitch deviation; SINGCOMB: Combined
singing score
**p < .01
Table 7.19. Summary of Simple Regression Analysis for Years of Education Predicting Task
Performance
N B SE B β R2 F t
SINGCOMB 207 0.00 .02 .01 .00 0.01 0.07
SingTheNote PD 211 -0.03 .04 -.06 .00 0.76 -0.87
HappyBirthday PD 212 0.01 .02 .03 .00 0.13 0.37
HappyBirthday ID 212 0.01 .02 .03 .00 0.17 0.41
HappyBirthday KD 212 0.01 .02 .04 .00 0.39 0.62
SingTheTune PD 208 0.01 .03 .01 .00 0.04 0.19
SingTheTune ID 208 0.00 .02 .01 .00 0.01 0.09
MatchTheNote PD 209 -0.03 .03 -.06 .00 0.75 -0.87
Note. ID: Interval deviation; KD: Key deviation; PD: Pitch deviation; SINGCOMB: Combined
singing score
p > .05 for all measures

- 207 -
7.4.2 Absolute pitch ability
Independent samples t-tests showed that self-reported AP possessors achieved
significantly better performance than non-AP possessors in SINGCOMB, Happy
Birthday Singing Task and Sing The Tune Task. In particular, large effect sizes (r = .84
to .88) were observed for SINGCOMB and the measures of Happy Birthday Singing
Task (Table 7.20).
7.4.3 Self-reported abilities and interests in singing and
music
Simple regressions revealed that all four self-ratings of abilities and interests were
significant predictors of the performance on all of the task measures (Tables 7.21-7.24).
In general, self-rated abilities explained a greater proportion of the variance in the task
performances compared to self-rated interests. Specifically, self-rated singing ability
explained 42% of the variance in SINGCOMB, thus suggesting that self-perceived
singing ability is a reliable indicator of objective singing ability. Similarly, self-rated
music ability explained 41% of the variance in SINGCOMB, whereas self-rated singing
and music interests only explained 27% and 23%, respectively. For the Happy Birthday
task measures, self-rated singing ability explained 31% to 39% of the variance while
self-rated music ability explained 27% to 35% of the variance. Self-rated singing
interest also explained a relatively higher proportion (R2 = 18-25%) of the variance in
the Happy Birthday task measures than self-rated music interest (R2 = 13-16%). For
Sing The Tune Task, self-rated singing and music abilities explained substantial
proportions (R2 = 33-39%) of the variance in the measures, while self-rated singing and
music interests explained comparatively smaller proportions (R2 = 21-28%).
Compared to the two melodic singing tasks, self-rated singing and music abilities
explained relatively smaller proportions (R2 = 29-30%) of the variance in SingTheNote
PD, whereas self-rated singing and music interests explained an even smaller proportion
(R2 = 15-16%) of the variance.

- 208 -
Table 7.20. Results of t-tests and Descriptive Statistics for Task Performances by AP/Non-AP Possessors
Task measure Group 95% CI for
Mean
Difference
AP possessors Non-AP possessors
M SD n M SD n t df Sig. r
SINGCOMB 3.32 0.37 8 4.08 0.81 196 -1.09, -0.44 -5.28* 9.91 .00 .86
SingTheNote PD 3.27 0.72 8 3.75 1.31 198 -0.44, 1.40 1.03 204 .30 .07
HappyBirthday PD 3.32 0.30 8 3.93 0.77 199 0.35, 0.87 5.18* 11.25 .00 .84
HappyBirthday ID 3.28 0.20 8 3.80 0.57 199 0.34, 0.70 6.31* 12.15 .00 .88
HappyBirthday KD 3.20 0.28 8 3.89 0.76 199 0.44, 0.94 6.05* 11.60 .00 .87
SingTheTune PD 3.27 0.69 8 4.16 0.92 197 -1.54, -0.24 -2.71 203 .01 .19
SingTheTune ID 3.29 0.51 8 4.23 0.84 197 -1.54, -0.36 -3.18 203 .00 .22
MatchTheNote PD 2.56 1.29 8 2.92 1.09 196 -0.43, 1.13 0.90 202 .37 .06
Note. ID: Interval deviation; KD: Key deviation; PD: Pitch deviation; SINGCOMB: Combined singing score
Variables with significant task differences are in bold
*Satterthwaite approximation employed due to unequal group variances.

- 209 -
Table 7.21. Summary of Simple Regression Analysis for Self-Rated Singing Ability Predicting
Task Measures
N B SE B β R2 F t
SINGCOMB 204 -0.31 .03 -.65 .42 146.40** -12.10**
SingTheNote PD 206 -0.41 .05 -.53 .29 81.19** -9.01**
HappyBirthday PD 207 -0.28 .03 -.62 .39 128.59** -11.34**
HappyBirthday ID 207 -0.20 .02 -.60 .35 112.07** -10.59**
HappyBirthday KD 207 -0.25 .03 -.56 .31 91.30** -9.56**
SingTheTune PD 205 -0.34 .03 -.62 .39 128.69** -11.34**
SingTheTune ID 205 -0.29 .03 -.58 .33 101.99** -10.10**
MatchTheNote PD 204 -0.12 .05 -.18 .03 6.57* -2.56*
Note. ID: Interval deviation; KD: Key deviation; PD: Pitch deviation; SINGCOMB: Combined
singing score
*p < .05; **p < .001
Table 7.22. Summary of Simple Regression Analysis for Self-Rated Music Ability Predicting
Task Measures
N B SE B β R2 F t
SINGCOMB 204 -0.30 .03 -.64 .41 139.22** -11.80**
SingTheNote PD 206 -0.42 .05 -.55 .30 87.36** -9.35**
HappyBirthday PD 207 -0.26 .03 -.59 .35 108.67** -10.43**
HappyBirthday ID 207 -0.18 .02 -.52 .27 76.56** -8.75**
HappyBirthday KD 207 -0.24 .03 -.54 .29 82.69** -9.09**
SingTheTune PD 205 -0.34 .03 -.62 .39 127.45** -11.29**
SingTheTune ID 205 -0.28 .03 -.57 .33 99.81** -9.99**
MatchTheNote PD 204 -0.15 .04 -.24 .06 12.20* -3.49*
Note. ID: Interval deviation; KD: Key deviation; PD: Pitch deviation; SINGCOMB: Combined
singing score
*p < .001; **p < .001
Table 7.23. Summary of Simple Regression Analysis for Self-Rated Singing Interest Predicting
Task Measures
N B SE B β R2 F t
SINGCOMB 204 -0.22 .03 -.52 .27 74.84** -8.65**
SingTheNote PD 206 -0.27 .04 -.39 .16 37.39** -6.12**
HappyBirthday PD 207 -0.20 .022 -.50 .25 68.98** -8.31**
HappyBirthday ID 207 -0.15 .02 -.49 .24 63.62** -7.97**
HappyBirthday KD 207 -0.17 .03 -.43 .18 46.33** -6.81**
SingTheTune PD 205 -0.25 .03 -.51 .26 69.81** -8.36**
SingTheTune ID 205 -0.22 .03 -.49 .24 65.50** -8.09**
MatchTheNote PD 204 -0.09 .04 -.16 .02 5.05* -2.25*
Note. ID: Interval deviation; KD: Key deviation; PD: Pitch deviation; SINGCOMB: Combined
singing score
*p < .05; **p < .001

- 210 -
Table 7.24. Summary of Simple Regression Analysis for Self-Rated Music Interest Predicting
Task Measures
N B SE B β R2 F t
SINGCOMB 204 -.28 .04 -.48 .23 61.05** -7.81**
SingTheNote PD 206 -.36 .06 -.38 .15 34.59** -5.88**
HappyBirthday PD 207 -.22 .04 -.40 .16 39.56** -6.29**
HappyBirthday ID 207 -.16 .03 -.38 .15 34.81** -5.90**
HappyBirthday KD 207 -.20 .04 -.36 .13 30.96** -5.56**
SingTheTune PD 205 -.35 .04 -.53 .28 78.74** -8.87**
SingTheTune ID 205 -.28 .04 -.46 .21 53.04** -7.28**
MatchTheNote PD 204 -.13 .06 -.16 .03 5.50* -2.35*
Note. ID: Interval deviation; KD: Key deviation; PD: Pitch deviation; SINGCOMB: Combined
singing score
*p < .05; **p < .001
While the self-rated abilities and interests were also significant predictors of
MatchTheNote PD, the proportions of variance explained by the self-ratings for this
measure were considerably smaller as compared to the singing tasks. Among all the
self-ratings, self-rated music ability explained 6% of the variance in MatchTheNote PD.
The other self-ratings, however, only explained 2-3% of the variance for this measure.
7.4.4 Parents’ abilities and interests in singing and music
Results showed that the participants’ perceptions of their parents’ abilities and interests
in singing and music were significant predictors of the participants’ combined singing
score, explaining 9% to 20% of the variance, p < .001. From Table 7.25, it can be
observed that while all the predictors were significant, the perceived abilities and
interests of mothers appeared to explain greater proportions (16% to 20%) of the
variance in SINGCOMB compared to those of fathers (9% to 16%). For both parents,
singing ability explained relatively greater proportions of participants’ SINGCOMB,
while music interest explained a smaller proportion. The fact that parents’ singing
abilities were relatively strong predictors of SINGCOMB provide support that singing
ability has a heritable component.

- 211 -
Table 7.25. Summary of Simple Regression Analysis for Parents’ Interests and Abilities in
Singing and Music Predicting SINGCOMB
N B SE B β R2 F t
Singing Ability (Mum) 200 -.40 .06 -.45 .20 49.38* -7.03*
Music Ability (Mum) 206 -.38 .06 -.43 .19 47.30* -6.88*
Singing Interest (Mum) 204 -.38 .06 -.43 .18 44.85* -6.70*
Music Interest (Mum) 206 -.35 .06 -.40 .16 39.08* -6.25*
Singing Ability (Dad) 197 -.34 .06 -.40 .16 35.96* -6.00*
Music Ability (Dad) 206 -.28 .06 -.34 .11 25.86* -5.09*
Singing Interest (Dad) 204 -.31 .06 -.37 .14 31.94* -5.65*
Music Interest (Dad) 206 -.25 .06 -.30 .09 19.73* -4.44*
Note. ID: Interval deviation; KD: Key deviation; PD: Pitch deviation; SINGCOMB: Combined
singing score
*p < .001
7.4.5 Speech and language characteristics
7.4.5.1 Median speaking fundamental frequency and speech range
Regression analyses revealed that with the exception of HappyBirthday PD and
HappyBirthday KD, male median speaking fundamental frequency (f0) in the tongue-
twister task was a significant predictor of performance of the majority of the singing
task measures, explaining 8% to 13% of the variance, p < .05 (Table 7.26). Specifically,
lower median speaking f0 was associated with larger deviations in the measures. In
contrast, for female participants, median speaking f0 was not a significant predictor of
any of the singing task measures (Table 7.27). The findings suggest a link between low
median speaking f0 and low pitch accuracy in singing in male participants.
Table 7.26. Summary of Simple Regression Analysis for Median Speaking Fundamental
Frequency Predicting Singing Task Measures of Males
n B SE B β R2 F t
SINGCOMB 48 -0.02 .01 -.33 .11 5.51* -2.35*
SingTheNote PD 49 -0.03 .01 -.33 .11 5.87* -2.42*
HappyBirthday PD 49 -0.01 .01 -.19 .04 1.69 -1.30
HappyBirthday ID 49 -0.01 .01 -.29 .08 4.24* -2.06*
HappyBirthday KD 49 -0.01 .01 -.13 .02 0.78 -0.88
SingTheTune PD 48 -0.02 .01 -.36 .13 6.89* -2.63*
SingTheTune ID 48 -0.02 .01 -.31 .09 4.79* -2.19*
Note. ID: Interval deviation; KD: Key deviation; PD: Pitch deviation; SINGCOMB: Combined
singing score
*p < .05

- 212 -
Table 7.27. Summary of Simple Regression Analysis for Median Speaking Fundamental
Frequency Predicting Singing Task Measures of Females
n B SE B β R2 F t
SINGCOMB 146 0.00 .00 -.05 .00 0.37 -0.61
SingTheNote PD 146 0.00 .00 -.06 .00 0.47 -0.68
HappyBirthday PD 147 0.00 .00 .01 .00 0.01 0.07
HappyBirthday ID 147 0.00 .00 -.01 .00 0.02 -0.15
HappyBirthday KD 147 0.00 .00 -.03 .00 0.09 -0.30
SingTheTune PD 147 0.00 .00 -.03 .00 0.09 -0.31
SingTheTune ID 147 0.00 .00 -.03 .00 0.16 -0.40
Note. ID: Interval deviation; KD: Key deviation; PD: Pitch deviation; SINGCOMB: Combined
singing score
p > .05
On the other hand, unpaced speech range from the tongue twister task was not found to
be a significant predictor of any of the singing task measues, p > .05 (Table 7.28).
Table 7.28. Summary of Simple Regression Analysis for Unpaced Speech Range Predicting
Singing Task Measures
N B SE B β R2 F t
SINGCOMB 194 0.00 0.00 .00 .00 0.00 0.05
SingTheNote PD 195 0.00 0.00 .00 .00 0.00 0.04
HappyBirthday PD 196 0.00 0.00 -.05 .00 0.43 -0.65
HappyBirthday ID 196 0.00 0.00 .05 .00 0.43 0.65
HappyBirthday KD 196 0.00 0.00 -.01 .00 0.01 -0.12
SingTheTune PD 195 0.00 0.00 .00 .00 0.00 0.06
SingTheTune ID 195 0.00 0.00 .04 .00 0.36 0.60
Note. ID: Interval deviation; KD: Key deviation; PD: Pitch deviation; SINGCOMB: Combined
singing score
*p < .05
7.4.5.2 Language characteristics
Independent samples t-tests revealed that in general, there were no significant
differences between tonal language speakers and non-tonal language speakers on the
various singing task measures. A significant group difference (p = .04) was observed for
SingTheTune ID in favour of tonal language speakers, but the effect size was small
(r = .14; Table 7.29). Independent samples t-tests comparing monolingual and bilingual
participants revealed no significant difference on all the singing task measures. For
SingTheTune ID however, there appeared to be a trend (p = .07) in favour of bilingual
participants (Table 7.30).

- 213 -
Table 7.29. Results of t-tests and Descriptive Statistics for Task Performances by Tonal/Non-Tonal Language Speakers
Task measure Group 95% CI for Mean
Difference
t df Sig. r Tonal language speakers Non-tonal language speakers
M SD n M SD n
MatchTheNote (PD) 2.87 0.85 25 2.92 1.14 184 -0.42, 0.51 0.19 207 .08 .01
SingTheNote PD 3.61 1.17 25 3.75 1.31 186 -0.40, 0.69 0.53 209 .36 .04
HappyBirthday PD 3.75 0.82 25 3.93 0.75 187 -0.13, 0.50 1.14 210 .25 .08
HappyBirthday ID 3.67 0.52 25 3.80 0.57 187 -0.12, 0.36 1.02 210 .31 .07
HappyBirthday KD 3.68 0.82 25 3.89 0.75 187 -0.10, 0.53 1.33 210 .70 .09
SingTheTune PD 3.83 0.95 24 4.16 0.92 184 -0.73, 0.06 -1.66 206 .10 .11
SingTheTune ID 3.87 0.79 24 4.24 0.84 184 -0.73, -0.02 -2.07 206 .04 .14
SINGCOMB 3.80 0.81 24 4.09 0.81 183 -0.63, 0.06 -1.63 205 .11 .11
Note. ID: Interval deviation; KD: Key deviation; PD: Pitch deviation; SINGCOMB: Combined singing score. Variable with significant task differences is in bold.
Table 7.30. Results of t-tests and Descriptive Statistics for Task Performances by Monolingual/ Bilingual Participants
Task measure Group 95% CI for Mean
Difference
t df Sig. r Monolingual Bilingual
M SD n M SD n
MatchTheNote PD 2.92 1.14 151 2.90 1.02 58 -0.32, 0.35 0.09 207 0.93 .01
SingTheNote PD 3.73 1.31 153 3.76 1.26 58 -0.42, 0.37 -0.14 209 0.89 .01
HappyBirthday PD 3.92 0.74 153 3.88 0.81 59 -0.19, 0.27 0.33 210 0.74 .02
HappyBirthday ID 3.80 0.58 153 3.72 0.52 59 -0.09, 0.25 0.93 210 0.35 .06
HappyBirthday KD 3.87 0.75 153 3.85 0.78 59 -0.21, 0.25 0.19 210 0.85 .01
SingTheTune PD 4.19 0.91 151 3.97 0.96 57 -0.06, 0.50 1.55 206 0.12 .11
SingTheTune ID 4.27 0.84 151 4.03 0.84 57 -0.02, 0.50 1.84 206 0.07 .13
SINGCOMB 4.09 0.80 150 3.96 0.83 57 -0.13, 0.37 0.97 205 0.33 .07
Note. ID: Interval deviation; KD: Key deviation; PD: Pitch deviation; SINGCOMB: Combined singing score

- 214 -
7.4.6 Potential confounds in self-ratings and background
components
Independent samples t-tests and simple regression analyses were conducted to examine
whether demographic factors might have potentially confounded responses to the
questionnaire, such as self-rated abilities and interests in singing and music, as well as
the singing and music background components identified from the principal
components analyses. Results are presented in Tables 7.31-7.33.
No significant sex differences were found for the self-ratings, Years of Music Training,
Instrumental Expertise, and Public Singing, although a trend towards significance (p
= .052) was observed for self-rated Singing Interest, where male participants had a
lower mean rating for self-rated Singing Interest (Table 7.31). Males also had
significantly lower means than females for Personal Singing, Family Singing and Music
Listening. The effect sizes were small for Music Listening and Personal Singing (r
= .20), and medium for Family Singing (r = .29).
Years of Education emerged as a significant predictor for self-rated Music Interest,
Personal Singing, and Family Singing (p < .05), explaining 2%, 6% and 3% of the
variance in these variables, respectively (Table 7.32). The more years of education a
participant has, the lower the self-rated Music Interest, Personal Singing and Family
Singing components. Age, on the other hand, did not significantly predict any of the
questionnaire responses (Table 7.33).

- 215 -
Table 7.31. Results of t-tests and Descriptive Statistics for the Questionnaire Responses of Males and Females
Questionnaire measure Group 95% CI for Mean
Difference
Males Females
M SD n M SD n t df Sig. r
Music Interest 5.64 1.40 50 5.69 1.38 157 -0.28, 0.36 -0.24 205 .81 .02
Music Ability 3.94 1.70 50 4.06 1.71 157 -0.25, 0.39 -0.42 205 .67 .03
Singing Interest 4.34 1.78 50 4.94 1.91 157 0.00, 0.63 -1.95 205 .05 .14
Singing Ability 3.38 1.54 50 3.75 1.71 157 -0.10, 0.54 -1.37 205 .17 .10
Personal Singing -0.32 1.03 50 0.10 0.83 157 0.14, 0.71 2.98 205 .00 .20
Family Singing -0.42 0.80 50 0.13 0.77 157 -0.80, -0.30 -4.37 205 .00 .29
Public Singing 0.51 0.43 50 0.52 0.40 157 -0.13, 0.13 0.05 205 .96 .00
Music Listening -0.30 0.76 50 0.09 0.83 157 0.13, 0.65 2.97 205 .00 .20
Instrumental Expertise -0.03 0.73 40 0.06 0.76 129 -0.36, 0.17 -0.69 167 .49 .05
Years of Music Training 4.67 4.63 47 4.65 3.78 152 -1.33, 1.30 -0.03 197 .98 .00
Note. ID: Interval deviation; KD: Key deviation; PD: Pitch deviation; SINGCOMB: Combined singing score
Variables with significant task differences are in bold.

- 216 -
Table 7.32. Summary of Simple Regression Analysis for Years of Education Predicting
Questionnaire Responses
N B SE B β R2 F t Sig.
Singing Ability 207 -.02 .03 -.06 .00 0.69 -0.83 .41
Music Ability 207 -.01 .03 -.02 .00 0.11 -0.33 .74
Singing Interest 207 -.03 .03 -.08 .01 1.17 -1.08 .28
Music Interest 207 -.05 .03 -.14 .02 3.93* -1.98* .05
Personal Singing 207 -.09 .02 -.25 .06 13.05* -3.61* .00
Family Singing 207 -.05 .02 -.17 .03 6.05* -2.46* .02
Public Singing 207 -.02 .01 -.12 .02 3.11 -1.77 .08
Music Listening 207 -.03 .02 -.09 .01 1.79 -1.34 .18
Instrument Expertise 169 -.01 .02 -.04 .00 0.29 -0.54 .59
Years of Music Training 199 .19 .11 .12 .02 2.96 1.72 .09
Note. ID: Interval deviation; KD: Key deviation; PD: Pitch deviation; SINGCOMB: Combined
singing score
*p < .05
Table 7.33. Summary of Simple Regression Analysis for Age Predicting Questionnaire
Responses
N B SE B β R2 F t
Singing Ability 207 .00 .01 .02 .00 0.10 0.31
Music Ability 207 -.00 .01 -.03 .00 0.24 -0.49
Singing Interest 207 .00 .01 .03 .00 0.14 0.38
Music Interest 207 -.01 .01 -.06 .00 0.84 -0.92
Personal Singing 207 -.01 .01 -.07 .01 1.01 -1.01
Family Singing 207 -.01 .01 -.12 .01 2.91 1.60
Public Singing 207 -.00 .00 -.12 .01 1.13 -1.06
Music Listening 207 -.00 .01 -.04 .00 0.29 -0.54
Instrument Expertise 169 -.01 .01 -.16 .03 4.57 2.26
Years of Music Training 199 -.05 .02 -.14 .02 3.76 -1.94
Note. ID: Interval deviation; KD: Key deviation; PD: Pitch deviation; SINGCOMB: Combined
singing score
p > .05

- 217 -
7.5 Summary of Key Behavioural Findings
Key behavioural findings presented in this chapter are summarised as follows in point
form:
• The majority of the participants performed well on the objective singing and
music tasks, as evident from the positively skewed distributions of the
continuous measures.
• The most accurately performed tasks (in terms of lower median deviations) were
the perceptual and vocal pitch-matching tasks, followed by Happy Birthday
Singing Task, and the melody imitation task.
• Opposite trends of task measure proficiency were observed for the two melodic
singing tasks. While participants performed better on ID as compared to PD for
Happy Birthday Singing Task, for Sing The Tune Task, better performance was
observed for PD than ID. This suggests that the participants were focusing on
different aspects of the melodies for these two tasks.
• All singing task measures were significantly correlated (p < .01). The bivariate
correlations of SINGCOMB with the other singing task measures were very
high, ranging from r = .83 to .95, of which the correlations with SingTheTune
PD and SingTheTune ID were comparatively higher (r = .90 to .95). Different
measures within the same singing task were also highly correlated (r = .88
to .94). The significant correlations across the various singing task measures
suggest that performance across the tasks reflects general singing ability. Hence,
SINGCOMB is a useful combined measure to assess the impact of other
variables on general singing ability.
• In terms of the SINGCOMB categorical measure, the incidence of accurate
singers (Category 1: < 50 cents deviation) was nearly 50% of the study sample.
Approximately 25% of the sample were moderately inaccurate (Category 2:
between 50 and 100 cents deviation), while the remaining participants were
highly inaccurate singers (Category 3: > 100 cents deviation) (Table 7.4).

- 218 -
• Based on self-reported abilities and interests in singing and music, participants
of the present study generally reported low levels of perceived singing ability (M
= 3.66, SD = 1.68), and high levels of music interest (M = 5.68, SD = 1.38).
• MatchTheNote PD was significantly correlated with the singing task measures
(p < .01). In particular, MatchTheNote PD was most highly correlated with
SingTheNote PD and SINGCOMB (r = .51), followed by SingTheTune PD and
SingTheTune ID (r = .49-.50). The correlations with the Happy Birthday task
measures were relatively lower (r = .33-.40).
• The following variables were found to influence task performance:
o Sex: Female participants performed significantly better than male
participants on the majority of singing task measures (except for
HappyBirthday KD and SingTheTune ID), with small to medium effect
sizes (r = .15-.25).
o Age: Age was a significant predictor of MatchTheNote PD task (R2 =
10%), with older participants being less accurate on the task.
o Self-reported AP ability: Self-reported AP possessors performed
significantly better than non-AP possessors in SINGCOMB and the
melodic singing tasks (Happy Birthday Singing Task and Sing The Tune
Task), with especially large effect sizes for SINGCOMB and the Happy
Birthday task measures (r = .84-.88).
o Self-rated abilities and interests in music and singing: Self-rated
singing and music abilities explained 41-42% of the variance in
SINGCOMB, whereas self-rated singing and music interests explained
23-27% of the variance.
o Perception of parents’ abilities and interests in singing and music:
Perception of parents’ abilities and interests in singing and music
explained 9-20% of the variance in SINGCOMB. Perceived abilities and
interests of mother in singing and music explained greater proportions
(16-20%) of the variance in SINGCOMB compared to those of the father
(9-16%).

- 219 -
o Singing and music background components (Personal Singing, Family
Singing, Public Singing, Music Listening, Instrumental Expertise and
Years of Music Training): The six background components explained
13-22% of the variance in SINGCOMB. Among them, Music Listening,
Years of Music Training and Family Singing explained the largest
proportions of the variance (20-22%).
o Male median speaking frequency: Median speaking frequency of male
participants in the tongue twister recitation task was a significant
predictor of the majority of singing task measures, explaining 8% to 13%
of the variance.
o Tonal language: Tonal language speakers had significantly better
performance on SingTheTune ID than non-tonal language speakers,
although the effect size was small (r = .14).
• The following variables were found to influence self-ratings of abilities and
interests and singing and music background components:
o Sex: Female participants had significantly higher means for Personal
Singing, Family Singing and Music Listening. The effect sizes for the
sex differences were small to moderate (r = .19-.29).
o Years of Education: Years of Education was a significant predictor for
self-rated Music Interest, Personal Singing and Family Singing (R2 = 2-
6%), whereby participants with more years of education had lower
means for these variables.

- 220 -
DISCUSSION OF
BEHAVIOURAL FINDINGS
This chapter will discuss the key behavioural findings from Chapter 7. Specifically, the
singing proficiency of the participants demonstrated in various task measures will be
discussed and compared with relevant findings from previous studies. The relationship
between self-rated abilities and interests in singing and music and objectively assessed
singing ability will also be considered. Finally, the confounding variables that
influenced task performance will also be discussed.
8.1 Task Measures
In this sample, the distributions of all of the objective singing task measures were
positively skewed and departed from normality. This indicates that the majority of the
participants were reasonably proficient at the singing tasks, while a smaller proportion
were less accurate. Although a possible explanation for the general proficiency could be
that the majority of the participants (85.9%) were musically trained, with over 4 years of
music training on average (M = 4.66; SD = 3.98), similar positively-skewed
distributions in singing and music ability were observed in a sample of 50 occasional
singers with no formal music training (Berkowska & Dalla Bella, 2013). The similar
distributions across studies, therefore, suggest that the current study sample is
representative of the general population in terms of singing proficiency. This is also in
line with previous studies that have shown that the majority of the general population
can sing in tune (Dalla Bella & Berkowska, 2009; Dalla Bella et al., 2007; Pfordresher
& Steven, 2007).
In terms of singing proficiency across all task measures (represented by the categorical
measure of SINGCOMB), it was demonstrated that nearly half (49%) of the participants

- 221 -
were accurate singers by the 50-cent criterion (i.e., Category 1). Based on the 100-cent
criterion (i.e., Category 1 and Category 2), however, the percentage of accurate singers
increased to nearly three-quarters (74%) of the sample (Table 7.4, p. 194). This
indicates that 26% of the participants were deemed inaccurate singers by the 100-cent
criterion, which is higher than the 10-15% incidence of inaccurate singers reported by
other studies using the same criterion (Dalla Bella & Berkowska, 2009; Dalla Bella et
al., 2007; Pfordresher & Brown, 2007). It is possible that the singing tasks used in the
current study were more challenging than those in the previous studies, which increased
the percentage of inaccurate singers. In particular, participants were least successful on
Sing The Tune Task, which in turn detrimentally affected SINGCOMB, since the
correlations between SINGCOMB and measures of Sing The Tune Task were
comparatively higher than SINGCOMB’s correlations with other singing task measures.
Among the singing tasks, Sing The Note Task was the most accurately performed task
in terms of median deviation (28.31 cents) and percentage of accurate singers by the 50-
cent criterion (Category 1: 66.4%). The mean PD (111 cents) for the entire sample was
substantially larger than the median, however, which suggests that the mean PD was
skewed upwards by a minority who performed poorly on the task. Other studies using
similar vocal pitch-matching tasks have reported mean pitch deviations ranging from 38
to 140 cents for non-musicians, and 17 to 50 cents for musicians (Amir et al., 2003;
Berkowska & Dalla Bella, 2013; Hutchins, Larrouy-Maestri, & Peretz, 2014; Hutchins
& Peretz, 2012). The mean PD for Sing The Note Task therefore fell within the range of
the mean pitch deviation for non-musicians in similar tasks, whereas the median PD for
Sing The Note Task was of similar magnitude as the mean pitch deviations for
musicians. Notably, similar to Sing The Note Task, Amir et al. (2003) also used sine
tones as stimuli and obtained a mean PD of 50 cents for musicians and 130 cents for
non-musicians, which were very similar in order of magnitudes with the median PD
(28.31) and mean PD (111 cents) of Sing The Note Task, respectively.
For the melodic singing tasks, participants performed better on Happy Birthday Singing
Task than Sing The Tune task, especially in terms of ID. The mean and median ID for
Happy Birthday Singing Task (52.26 and 40.51 cents, respectively) were comparable to
the mean interval deviations reported in other studies investigating proficiency in
singing familiar songs, which ranged from approximately 44 to 60 cents for non-

- 222 -
musicians, and 30 to 62 cents for musicians (Berkowska & Dalla Bella, 2013; Dalla
Bella et al., 2007; Hutchins et al., 2014; Larrouy-Maestri & Morsomme, 2014). In the
only other study which utilised key deviation (referred to as tonal centre deviation) as a
measure for singing a familiar song, the mean KD reported by Larrouy-Maestri and
Morsomme (2014) for non-musicians singing Happy Birthday was 42.33 cents, whereas
trained singers had a mean KD of approximately 26 cents. The mean KD (M = 64.34
cents) of the current study was therefore higher than the values reported for both non-
musicians and trained singers in Larrouy-Maestri and Morsomme (2014), but the
median KD obtained in the current study (41.79 cents) was comparable to the mean KD
of non-musicians in that study. It is possible that the relatively better key accuracy in
Larrouy-Maestri and Morsomme (2014) might be due to the fact that they only included
non-musicians who did not make any contour errors in their analyses, whereas in the
current study no such provisions were made.
Although the median ID and KD for Happy Birthday Singing Task were similar in
magnitude in the current sample, there was greater variability for KD performance as
evident from its wider standard deviation. Moreover, the incidence of inaccurate singing
for the two measures differed considerably. Using the 100-cent criterion, only
approximately 10% of the participants were inaccurate in singing Happy Birthday
(Category 3) in terms of ID, whereas the estimate of inaccurate singers increased by
nearly twofold (18.1%) if KD was considered. This serves to demonstrate the sensitivity
of the KD measure in identifying key transposition errors that were otherwise
undetected by interval deviation. Apart from ID and KD, the inclusion of pitch
deviation (PD) as an additional measure for Happy Birthday Singing Task remained
expedient, nonetheless, as it facilitated comparisons with other singing tasks that
typically use PD as an accuracy measure.
Based on the 100-cent criterion (Category 3), the incidence of inaccurate singers as
defined by PD, ID and KD of Happy Birthday Singing Task ranged from 9.8% to
20.5%, which is in line with the 10% to 20% prevalence of poor-pitch singing in the
general population estimated by previous studies (Dalla Bella & Berkowska, 2009;
Dalla Bella et al., 2007; Pfordresher & Brown, 2007, 2009; Pfordresher et al., 2010) .
However, using the 50-cent criterion (Categories 2 and 3), the percentage of inaccurate
- 223 -
singers defined by the various Happy Birthday task measures was considerably higher,
at approximately 40%.
On the other hand, using the 50-cent criterion, an even higher percentage of participants
(54.5-62.2%) were inaccurate for Sing The Tune Task, demonstrating this task’s higher
difficulty level compared to the other singing tasks. Incidentally, the proportion of
inaccurate singers for Sing The Tune Task was strikingly close to the percentage of
university students (59%) who self-reported that they could not accurately imitate
melodies (Pfordresher & Brown, 2007). The mean PD (M = 97.38 cents) obtained for
Sing The Tune Task was lower than the mean pitch deviations reported for non-
musicians in similar tasks imitating four-note and six-note novel melodies (M = 123.58
to 126.40 cents) (Berkowska & Dalla Bella, 2013; Pfordresher & Brown, 2007). On the
other hand, the median PD for Sing The Tune Task (54.03 cents) was comparable but
slightly higher than the mean pitch deviation (M ≈ 40 cents) for musically-trained
participants (mean years of formal music training = 4.65) in another study which used
five-note melodic stimuli (Wise & Sloboda, 2008). In particular, the median PD and ID
values for Sing The Tune Task (54.03 and 65.82cents, respectively) were also higher
than those reported by Berkowska and Dalla Bella (2013), which examined non-
musicians’ ability to imitate six-note novel melodies (34.4 and 74.4 cents, respectively).
The higher median deviations observed in the current study could be due to the longer
length (seven notes) of the melodic stimuli, which might have increased the task
difficulty and made the task challenging even for participants with prior music training.
Wise and Sloboda (2008) had shown that novel melody length negatively impacted
singing accuracy. In addition, several studies on pitch memory have demonstrated that
melody length has an effect on pitch memory (Boh, Herholz, Lappe, & Pantev, 2011;
Kumar et al., 2013). Therefore, using seven-note melodies for Sing The Tune Task
possibly imposed a greater memory load and had a greater impact on the accuracy of
recall and pitch-matching. Even though the length of the novel melodic stimuli in the
current study presumably fell within the average working memory span of seven plus
minus two (Miller, 1994), empirical studies have demonstrated that the melodic
memory capacity for most people is limited to four different pitches (Boh et al., 2011).
However, behavioural and electrophysiological evidence have also indicated that
musically trained participants were able to encode tonal sequences with up to 8 different
pitches (Boh et al., 2011).

- 224 -
Memory demands have not been considered a major cause for inaccurate singing in
some previous studies (e.g., Pfordresher & Brown, 2007, Hutchins & Peretz, 2011),
possibly because the novel melodic stimuli used in these studies have not been
sufficiently complex to induce memory-related vocal imitation inaccuracies (Hutchins
& Peretz, 2012). In the present study, the use of seven-note novel melodies comprising
a comprehensive range of interval sizes was likely challenging enough to impact pitch
recall and in turn, pitch-matching ability. This was supported by the observation that
some participants had problems recalling the correct length of the melodies and either
shortened or lengthened the melodies during the task.
As the two melodic singing tasks differentially enlisted the long-term and short-term
auditory memory systems, comparison of the performance measures for the two tasks
may reveal some important differences concerning how melodic information is encoded
and represented in long-term and short-term memory. A comparison of the categorical
measures of the two tasks shows that using either the 50-cent or 100-cent criterion, the
percentage of participants deemed accurate for HappyBirthday ID was higher than the
percentage for HappyBirthday PD, whereas the percentage of accurate participants for
SingTheTune PD was higher than that for SingTheTune ID (see Table 7.4, p. 194).
These results are in line with those of Berkowska and Dalla Bella (2013) when the
median ID and PD values (referred to as the relative and absolute pitch accuracy values)
of the familiar song (ID: 44.2; PD: 126.4) and novel melody-matching tasks (ID: 74.7;
PD: 34.4) were compared.
The opposite effects of proficiency for the two tasks may stem from the different
salience of interval information in short-term and long-term memory. It has been
demonstrated in several studies that interval information is not readily processed and
represented in short-term memory (Dowling, 1978; Dowling & Bartlett, 1981). Instead,
increasing evidence shows that novel melodies are likely to be encoded in short-term
memory in terms of absolute pitch levels (Attneave & Olson, 1971; Deutsch, 1978;
Dowling, 1999), contour (Dowling & Bartlett, 1981) and possibly key (Bartlett &
Dowling, 1980). In contrast, interval information is a salient property of melodies in
long-term memory, as indicated by several studies (Deutsch, 1972; Dowling & Bartlett,
1981; Dowling, Kwak, & Andrews, 1995; Dowling, Tillman, & Ayers, 2002), as well as
the observation that even non-musicians can transpose familiar melodies to other keys
- 225 -
while maintaining the correct intervallic relationships between notes (Attneave &
Olson, 1971; Dowling, 1978; Dowling & Fujitani, 1971). The disparity between the
salience of interval information in short-term and long-term memory may suggest that
interval information takes time and repeated exposure to be consolidated in the memory
system (Andrews & Dowling, 1991; Creel & Tumlin, 2012; Patel, 2008).
Animal studies with birds and monkeys have shown that species other than humans tend
to encode sounds predominantly in terms of absolute pitch and are generally insensitive
to relative pitch cues. In contrast, humans show relative pitch processing ability even
from infancy (Chang & Trehub, 1977; Cohen, Thorpe, & Trehub, 1987; Plantinga &
Trainor, 2005; Trainor & Trehub, 1992; Trehub, 2001; Trehub, Thorpe, &
Morrongiello, 1985; Trehub & Trainor, 1990, 1993; Trehub, Trainor, & Unyk, 1993),
suggesting that relative pitch encoding is a more cognitively sophisticated ability than
absolute pitch encoding (Honing, 2014; Hulse, Takeuchi, & Braaten, 1992; Izumi,
2001; Plantinga & Trainor, 2005). Although there is evidence that absolute pitch
information is also stored in long-term memory (Halpern, 1988; Levitin, 1994), it has
also been shown that relative pitch information nonetheless serves as a more prominent
cue for melody recognition (Creel & Tumlin, 2012).
In light of these findings, the better retained relative pitch information in long-term
memory may explain why participants were more accurate in terms of ID in Happy
Birthday Singing Task. On the other hand, the tendency for short-term memory to
encode melodic information more strongly in terms of absolute pitch levels may
conceivably explain the relatively better PD performance in Sing The Tune Task.
Another possible explanation for these opposite effects in task performance could be
that PD and ID were differentially sensitive in the two melodic singing tasks.
Participants might have been more accurate in terms of HappyBirthday ID because it
was not as sensitive in detecting key transposition error as HappyBirthday PD or KD, as
explained previously in Section 6.3.2 (p. 176). Similarly, the larger SingTheTune ID
relative to SingTheTune PD could be due to ID incurring a higher penalty than PD in
the event that a participant made pitch errors in the middle of a melody. One example
involved an instance where a participant was asked to imitate Tune 5 (Figure 8.1a) but
inadvertently made a mistake in the penultimate pitch (Figure 8.1b). The average

- 226 -
deviation in terms of PD is 2 𝑠𝑒𝑚𝑖𝑡𝑜𝑛𝑒𝑠
7 𝑛𝑜𝑡𝑒𝑠≈ 29 cents, whereas the average deviation in
terms of ID is 2+2 𝑠𝑒𝑚𝑖𝑡𝑜𝑛𝑒𝑠
6 𝑖𝑛𝑡𝑒𝑟𝑣𝑎𝑙𝑠≈ 66 cents. The disparity in the two measures is even
greater if a participant made note-switching errors, such as the one shown in Figure
8.1c. In terms of PD, the average deviation is 3+3 𝑠𝑒𝑚𝑖𝑡𝑜𝑛𝑒𝑠
7 𝑛𝑜𝑡𝑒𝑠≈ 85 cents, whereas for ID,
the average deviation becomes 3+6+3 𝑠𝑒𝑚𝑖𝑡𝑜𝑛𝑒𝑠
6 𝑖𝑛𝑡𝑒𝑟𝑣𝑎𝑙𝑠≈ 200 cents, which is quite severe for a
relatively minor error. It was observed during data processing that these types of errors
were not uncommon, therefore it is possible that the difference in computation for these
two measures resulted in worse performance for ID in Sing The Tune Task. However,
the fact that such errors occurred in Sing The Tune Task may point to a relatively weak
representation of relative pitch information in short-term memory compared to the
representation of absolute pitch information.
Figure 8.1. Illustration of how interval deviation (ID) might incur a greater penalty than pitch
deviation (PD) on singing inaccuracies. Fig. 8.1(a) shows the reference melody (Tune 5). Fig.
8.1(b) illustrates a pitch error in the penultimate note. Fig. 8.1(c) illustrates a note switching
error (betweeen the 3rd and 4th notes).

- 227 -
Finally, across all tasks, the participants were most proficient in perceptual pitch-
matching (MatchTheNote PD). Their performance in perceptual pitch-matching was
superior to vocal pitch-matching (SingTheNote PD), although the two pitch-matching
tasks were moderately correlated (r = .51, p < .01). The sizeable yet non-perfect
correlation between perceptual and vocal pitch-matching tasks suggests that accurate
vocal pitch-matching is not simply dependent on pitch perception ability. This is
consistent with the vocal sensorimotor loop (VSL) described in Section 4.2.1 (p. 86)
which highlights the importance of other functional components such as auditory-motor
mapping and motor planning in singing ability.
Several other studies that used both perceptual and vocal pitch-matching tasks have
reported similar positive relationship between the two tasks (Amir et al., 2003; Hutchins
et al., 2014; Hutchins & Peretz, 2012). In particular, the perceptual pitch-matching task
in the present study was similar to the one used in studies by Hutchins and colleagues
(Hutchins et al., 2014; Hutchins & Peretz, 2012), albeit in their study, synthesised voice
timbre was used. The mean PD for Match The Note Task was considerably higher than
the mean deviations reported for both musicians (M ≤ 2 cents) and non-musicians (M =
10-13 cents) in the aforementioned studies by Hutchins and colleagues. Interestingly,
the median PD for Match The Note Task (13.76 cents) corresponded well with the mean
deviation of non-musicians in those studies. In addition, the mean PD for Match The
Note Task was of similar magnitude as the mean pitch deviation (M = 44 cents) reported
in another perceptual pitch-matching study which used bassoon timbre for the stimuli
(Demorest, 2001).
Conceivably, the superior performance of both non-musicians and musicians in the
studies by Hutchins and colleagues may be due to the use of synthesised voice timbre,
which might sound more familiar to participants than sine tones, thereby enhancing
their pitch-matching accuracy. On the other hand, the sine tones used in the current
study and the bassoon timbre used in Demorest (2001) might be less familiar to the
study participants and hence reduced the mean pitch-matching accuracy in these studies.
Another possible explanation could be the difference in age range of the sample. The
age range of the participants in Hutchins and Peretz (2012) was 18 to 30, whereas the
age range of the current sample was 15 to 80. Age was found to be a significant
predictor of MatchTheNote PD performance, where older participants made larger pitch

- 228 -
deviation errors. This could be indicative of an age-related hearing deterioration that
affected the older participants’ task performance. While the study information clearly
stipulated that only individuals with no diagnosed hearing deficits could participate, it
was not possible to screen for such deficits in an online study. Further, the online nature
of the study made it difficult to prevent user-end error or ensure that the study setting
was uniform for all participants. For instance, some participants might have used a
laptop touchpad to move the onscreen slider, which could result in less precision
compared to using a mouse. The similar order of magnitudes between the current
perceptual pitch-matching results and other laboratory-based pitch-matching studies
nonetheless supports the viability of online studies for collecting large amount of
participant data on such tasks.
In general, it appears that for the majority of the task measures in the current study, the
mean values were often in keeping with the mean values reported for non-musicians
using similar measures, whereas the median values were similar to the mean values
reported for musicians. Conceivably, non-musically trained participants in the current
sample might have performed considerably poorer than those with musical training,
which caused the mean values of the task measures to be unduly inflated, even though
the median values and the highly skewed distributions of the task measures suggest that
most of the participants performed well for the objective tasks. Post-hoc analyses were
therefore conducted to compare the differences in task performances between musicians
and non-musicians in the current sample with those from other studies that used similar
tasks and measures. To ensure that the musician and non-musician groups in the current
study were matched with those of previous studies, the definitions of musicians and
non-musicians from the aforementioned studies were adopted when computing task
measure means for the two groups, that is, musicians are those who received seven
years of music training or more, and non-musicians as those who received less than a
year of formal music training. Table 8.1 shows a comparison of the task performances
by the musicians and non-musicians in the current sample with those from previous
studies.
It can be observed from Table 8.1 that the task measure means of the musician group in
the current study corresponded closely with the median values of the overall current
study sample. This serves to confirm that formal music training indeed contributed to

- 229 -
the low median values observed across the tasks. In contrast, the non-musician group of
the current study appeared to have substantially higher means than the mean values
obtained by non-musicians from other studies. This suggests that the non-musicians
from the current sample were generally less proficient in the objective tasks than the
non-musician samples from similar studies.
Table 8.1. Comparison of Task Performance by Musician and Non-Musicians in Previous
Studies and Current Study
Task measures Previous studies Current study
Non-
musicians
Musicians
Non-
musicians
(n = 33)
Musicians
(n = 52)
Overall mean
and median
(N = 216)
MatchTheNote
PD
M = 10-44 M < 2 M = 78.08 M =
20.21
M = 36.52;
Mdn = 13.76
SingTheNote PD M = 38-140 M = 17-
50
M = 265.34 M =
39.08
M = 111.00;
Mdn = 28.31
HappyBirthday
ID
M = 44-60 M = 30-
62
M = 73.37 M =
43.30
M = 52.26;
Mdn = 40.51
HappyBirthday
KD
M ≈ 42 M ≈ 26 M = 99.73 M =
43.03
M = 64.34;
Mdn = 41.79
SingTheTune PD M = 124-
126
Mdn ≈ 34.4
M ≈ 40 M = 173.75 M =
48.15
M = 97.38;
Mdn = 54.03
SingTheTune ID M ≈ 40
Mdn ≈ 74.4
- M = 141.67 M =
60.40
M = 93.00;
Mdn = 65.82
Note. Musicians: ≥ 7 years of formal music training; Non-musicians: < 1 year of formal music
training; M: mean; Mdn: median.
8.2 Self-Rated Abilities and Interests in Singing and
Music
While the positively skewed distributions of the task measures clearly indicated the
generally high performance of participants in the singing and music perception tasks, it
is interesting to note from the subjective ratings that the participants generally held
conservative perceptions of their own music and singing abilities. This was evident
from the mean self-rated singing and music abilities being slightly above and below the
midpoint of the 7-point Likert scale (3.66 and 4.03, respectively), while their mean self-
rated singing and music interests were considerably higher (4.79 and 5.68, respectively).
Interestingly, the mean self-rating for singing ability obtained in this study was very

- 230 -
similar to the ratings of self-declared tone-deaf participants in Wise and Sloboda (2008)
when asked to rate their performance on singing tasks using a 7-point Likert scale (M =
3.69). The observation that objectively assessed singing ability was better than self-
reported singing ability corroborates with past findings showing that most people
actually sing better than they believe they can (Dalla Bella et al., 2007; Pfordresher &
Brown, 2007).
Regression results showed that all four self-ratings were nonetheless significant
predictors of objective singing task performance. In particular, self-rated singing and
music abilities were able to explain as much as 41-42% of the variance in SINGCOMB,
whereas self-rated singing and music interests explained smaller proportions (27% and
23%, respectively). This suggests that the current sample of participants were relatively
reliable in their self-assessments of abilities.
8.3 Confounding Variables Influencing Task
Performance
An interesting observation arising from the findings was that female participants
performed significantly better than male participants on most of the task measures, even
though the effect sizes were small to medium (r = .15-.25). These differences in task
performance were unlikely to be due to sex differences in formal music training, as
there were no significant sex differences for either Instrumental Expertise or Years of
Music Training. However, males were observed to have significantly lower scores for
Personal Singing, Family Singing and Music Listening than females, which may
account for their generally poorer performance in the singing and music tasks. It is
possible that lower engagement in music listening and singing activities can have a
negative impact on singing ability and music perception.
As expected, the performance of self-reported AP possessors on the music and singing
tasks was found to be significantly superior to non-AP possessors, with especially large
effect sizes for the Happy Birthday task measures and SINGCOMB (r = .84 to .88). The
facilitation of performance of Happy Birthday Singing Task by AP ability may be
explained by the notion that AP is an ability rooted in long-term memory, which enables

- 231 -
the recognition and labelling of pitch height based on internal absolute pitch
representations (Levitin, 1999). As Happy Birthday Singing Task appeared to rely more
heavily on accessing melodic information from long-term memory, it is possible that the
long-term memory representations of absolute pitches conferred an advantage for AP
possessors to perform accurately for this task. For instance, the AP possessors may have
had an advantage over non-AP possessors in remembering the most optimal key or the
ideal starting pitch to sing Happy Birthday, which would allow them to successfully
navigate the octave leap in the third phrase.
Importantly, participants’ estimates of their parents’ music and singing interests and
abilities also emerged as significant predictors of SINGCOMB. This may be indicative
of a potential genetic transmission of singing and music abilities from parents to
offspring. It is also possible that parental interests and abilities in music and singing
were crucial in shaping a musical home environment, which in turn, influence their
children’s musical skills, as several studies have demonstrated (Brand, 1986; Ilari,
Moura, & Bourscheidt, 2011; McPherson, 2009; Zdzinski, 1996). Although it was not
possible to determine whether genes or environment exert a stronger influence on
singing ability through simple regression analyses, this could be addressed by
subsequent genetic analyses which would disentangle the relative contributions of
genetic and environmental components on singing ability. The observation that
mothers’ ratings explained a greater proportion (16-20%) of SINGCOMB compared to
fathers’ ratings (9-16%) may also suggest that mothers play a bigger role in creating a
musically-rich home environment than fathers. Although gender differences in musical
parenting have not been well-researched, the ubiquitous nature of maternal singing
across all cultures (Trehub & Schellenberg, 1995; Trehub & Trainor, 1998), and
anecdotal accounts of maternal influence on children’s musical outcomes indicate that
this is an area worthy of further investigation (Petersen, 2012).
While all five components (Personal Singing, Family Singing, Public Singing, Music
Listening, Instrumental Expertise) that emerged from the singing and music background
questionnaire were significant predictors of the singing task measures, it is of interest
that Music Listening and Family Singing accounted for large proportion of the variance
in SINGCOMB (20-22%) and also generally explained a greater proportion of each
singing task measure than the other components. As these two components comprised

- 232 -
questions mostly pertaining to music listening, music exposure and engagement in
singing activities with family members during childhood, this finding may be indicative
of the importance of exposure to music and singing during the formative years in
shaping singing ability. On the other hand, Instrumental Expertise and Public Singing
accounted for 15% and 18% of the variance in SINGCOMB, respectively, while
Personal Singing accounted for the least proportion (13%) among all components. In
particular, Instrumental Expertise was able to explain a relatively greater proportion of
the variance of measures for Sing The Tune Task (15-18%) compared to the measures
for the other two singing tasks (7-10%), suggesting that instrumental training is
especially advantageous for imitating novel melodies. This suggestion is consistent with
the observation that perceiving and imitating novel melodies constitute part of the aural
training for musicians.
Evidence from several studies corroborate this finding. Short-term and long-term music
training have been demonstrated to enhance the ability to encode melodies and detect
deviant tones (Fujioka, Trainor, Ross, Kakigi, & Pantev, 2004; Herholz, Lappe, &
Pantev, 2009; Lappe, Herholz, Trainor, & Pantev, 2008; Van Zuijen, Simoens,
Paavilainen, Naatanen, & Tervaniemi, 2006; Van Zuijen, Sussman, Winkler, Näätänen,
& Tervaniemi, 2005). Pitch imagery acuity was also stronger in participants with longer
music training (Janata & Paroo, 2006). A link between auditory working memory and
vocal production has been proposed by Schulze and Koelsch (2012), whereby
sensorimotor codes that guide vocal production are implicated in the representation and
rehearsal of auditory information in working memory. This proposition may serve to
explain the influence of short-term pitch memory on the performance of Sing The Tune
Task.
Interestingly, Years of Music Training, one of the items that constituted Instrumental
Expertise, was able to explain a greater proportion of the variance in SINGCOMB
(21%) and all the task measures (11-20%) as compared to Instrumental Expertise (3-
18%; Tables 7.15 and 7.16; pp. 203-204). This suggests that other constituents of
Instrumental Expertise may be less strongly associated with singing task performance
than Years of Music Training. For both melodic singing tasks, the influence of Years of
Music Training on the PD measures were greater than its effect on the ID measures.
This observation is in line with a study which reported that musical experience has a

- 233 -
smaller effect on relative pitch judgments than absolute pitch judgments (Dowling,
1978). Similar to Instrumental Expertise, Years of Music Training explained a relatively
greater proportion of the variance of Sing The Tune Task (16-20%) than other singing
tasks (12-17%).
Intriguingly, Years of Education was a significant predictor of self-rated Music Interest,
Personal Singing and Family Singing, with a negative relationship between Years of
Education and these varaibles. This suggests that participants with more years of
education tended to score lower on these variables. The current findings appear to be at
odds with past evidence demonstrating significant positive correlations between
education level and interest in classical music (McManus & Furnham, 2006), as well as
between familial music and singing frequency and academic performance (Maule &
Hilpold, 2013). Although Years of Education was a significant predictor, it is worth
noting that Years of Education explained only a small proportion of the variance in
these variables (2-6%).
Another intriguing finding is that tonal language speakers performed significantly better
than non-tonal language speakers in terms of SingTheTune ID, albeit only with a small
effect size (r = .14). This finding may point to facilitation of relative pitch processing by
tonal languages, which is in keeping with past research showing an ethnicity effect for
relative pitch processing (Hove et al., 2010).
Also interesting was the finding that the median speaking fundamental frequency (f0) of
male participants in the tongue-twister task was a significant predictor of most of the
singing task measures, explaining 8% to 13% of the variance in these measures.
Specifically, male participants with lower median speaking f0 tended to perform less
accurately. While the relationship between singing accuracy and speech range or
speaking frequency in adults has not been well explored, Trollinger (2003) found that
speaking f0 was a significant predictor of vocal pitch-matching accuracy in pre-
schoolers. More investigation is warranted to examine whether male participants with
median lower speaking f0 had a motor control deficit that may have impacted on both
their speaking f0 as well as other singing ability. As lower pitches are typically produced
with thicker and more relaxed vocal folds and higher pitches are produced by stretching
and increasing the tension on vocal folds, it may be possible that some male participants

- 234 -
with lower speaking f0 lacked the motor coordination skills to manipulate the tension of
their vocal folds effectively to sing in tune. As speech range was not observed to be a
significant predictor of singing accuracy in the current sample, it is presumed that the
potential issue with controlling the vocal folds’ tension have lesser impact on male
participants’ speaking range than singing range, since singing range is usually much
wider and requires more precise control of the vocal folds to produce and sustain a
desired pitch.
8.4 Summary of Discussion
On the whole, most participants performed well on the singing and music tasks, as
evident from the positively skewed distributions of the continuous measures, which
were consistent with findings from previous studies that demonstrate that the majority
of the general population can sing in tune. In particular, the mean values of the task
measures were considerably larger than the median values, and were mostly comparable
to the mean values for non-musicians using similar task measures. On the other hand,
the median values of the task measures were generally consistent with the mean values
for musicians in previous studies that used similar tasks. This suggests that the large
variability and highly skewed distributions observed for the various task measures in the
current study are due in part to differences in formal music training. The comparable
magnitudes of task measures between current and previous findings demonstrates the
viability of running objective singing and music tasks through online programs.
The large significant bivariate correlations of SINGCOMB with the other singing task
measures ( r = .83 to .95) demonstrate that SINGCOMB reliably reflects general singing
ability across all tasks and is therefore a useful combined measure to assess the impact
of other variables on general singing ability. The incidence of inaccurate singers as
measured by the SINGCOMB categorical measure was 51% and 26% by the 50-cent
and 100-cent criteria, respectively. These estimates of inaccurate singers were much
higher than the 10-20% prevalence of poor-pitch singing in the general population
estimated by previous studies, even though the majority of the participants (85.9%) in
this study had music training. The higher prevalence of inaccurate singers may be due to
relatively higher difficulty of the singing tasks in this study, especially for Sing The

- 235 -
Tune Task, where 54.5% to 62.2% of the sample were inaccurate singers by the 50-cent
criterion.
Notably, large proportion of variance (R2 = 42%) in SINGCOMB can be explained by
self-reported singing ability, which indicates that participants were relatively reliable in
their self-assessment of singing ability, thereby lending credence to the reliability of
similar studies that were based on perceived music and singing abilities.
Looking at specific task measures, it was observed that there were opposite trends in
behavioural performance for PD and ID measures of the two melodic singing tasks
(Happy Birthday Singing Task and Sing The Tune Task). This may be explained by the
different manner in which melodic information is encoded in short-term and long-term
memory. In long-term memory, melodies are more strongly represented in terms of their
relative pitch information, which may have resulted in the superior ID performance for
Happy Birthday Singing Task. In short-term memory, interval information appears to be
processed secondary to absolute pitch information, which may serve to explain the
relatively better PD performance in Sing The Tune Task.
A significant and moderate correlation was observed between Match The Note Task and
its vocal counterpart, Sing The Note Task (r = .51). This was consistent with evidence
from several previous studies that also used perceptual and vocal pitch-matching tasks
and found a positive relationship between the two tasks. While the correlation between
the two tasks were sizeable, the non-perfect correlation suggests that accurate vocal
pitch-matching is not solely dependent on pitch perception ability. This is consistent
with the vocal sensorimotor loop (VSL) described in Section 4.2.1 (p. 86) which
highlights the importance of other components such as auditory-motor mapping and
motor planning in singing ability.
Several variables were found to influence task performance. In particular, male
participants performed significantly worse than female participants on the majority of
singing task measures, which could be due to the significantly lower engagement in
Personal Singing, Family Singing and Music Listening by male participants. All singing
and music background components (Personal Singing, Family Singing, Public Singing,
Music Listening, Instrumental Expertise and Years of Music Training) were significant
predictors of SINGCOMB, explaining 13-22% of the variance. Among them, Music

- 236 -
Listening, Years of Music Training and Family Singing explained the largest
proportions of the variance (20-22%). The finding that Music Listening and Family
Singing accounted for a greater proportion of the variance in SINGCOMB supports the
importance of familial exposure to singing and music during the formative years in
shaping singing ability. Moreover, the observation that Instrumental Expertise explained
a relatively greater proportion of the variance in Sing The Tune Task (15-18%) than the
other singing tasks (7-10%) is consistent with previous findings demonstrating the
enhancement of melody encoding ability, pitch imagery acuity and auditory working
memory by music training.
Perception of parents’ abilities and interests in singing and music were also significant
predictors of SINGCOMB and explained 9-20% of the variance. As the significant
relationship between singing ability and perceived abilities and interests of parents
might reflect either genetic or environmental influences on singing ability, genetic
modelling of the singing data of twins would therefore be beneficial in disentangling the
relative contributions of genes and the environment. The genetic findings from the twin
analyses are reported in the next chapter.

- 237 -
GENETIC FINDINGS
The genetic findings presented in this chapter address the two main aims of the study,
namely, to estimate the genetic component of singing ability, and to investigate the
genetic bases of environmental components that were associated with singing ability.
9.1 The Genetic Basis of Singing Ability
9.1.1 Intraclass correlations
9.1.1.1 Task measures
Table 9.1 presents the intraclass correlations (ICC) of the MZ and DZ groups for the
continuous and categorical measures of the objective tasks (see Section 6.3 for
description of measures, p. 174). All the measures were adjusted for the effects of age
and sex via regression to prevent biased estimation of the twin correlations and model
parameters.
The MZ twins exhibited considerably higher similarity than the DZ twins on all of the
continuous task measures (rMZ = .63-.82; rDZ = -.02-.48). In particular, the ICCs of the
MZ twins were significantly larger than those of the DZ twins for SINGCOMB,
SingTheNote PD, HappyBirthday ID, SingTheTune PD and MatchTheNote PD, as
demonstrated by the Fisher’s r to Z transformation (p < .01) for all effects.
As for the categorical measures, rMZ was significantly higher than rDZ for all measures,
apart from SingTheTune ID. This indicates that compared to the continuous measures, a
greater number of categorical measures showed significant differences in rMZ and rDZ.

- 238 -
Table 9.1. Intraclass Correlations of the MZ and DZ Groups for the Objective Tasks
Task measure N rMZ rDZ Z
SINGCOMB 100 .82 [.73, .89] .41 [.11, .64] 3.34**
SINGCOMB (category) 100 .81 [.62, .92] .43 [.04, .71] 3.09**
SingTheNote PD 106 .71 [.57, .81] .06 [-.25, .37] 3.92**
SingTheNote PD (category) 106 .83 [.61, .94] .24 [-.24, .64] 4.47**
HappyBirthday PD 107 .73 [.60, .83] .48 [.20, .69] 1.94
HappyBirthday PD (category) 107 .78 [.56, .90] .51 [.11, .78] 2.31*
HappyBirthday ID 107 .69 [.54, .79] .29 [-.03, .55] 2.63**
HappyBirthday ID (category) 107 .74 [.50, .88] .08 [-.35, .48] 4.16**
HappyBirthday KD 107 .65 [.48, .76] .46 [.17, .68] 1.33
HappyBirthday KD (category) 107 .79 [.58, .91] .41 [.01, .70] 3.04**
SingTheTune PD 101 .74 [.61, .83] .31 [-.01, .56] 2.92**
SingTheTune PD (category) 101 .72 [.49, .86] .36 [-.03, .67] 2.46*
SingTheTune ID 101 .66 [.50, .78] .47 [.17, .68] 1.31
SingTheTune ID (category) 101 .62 [.37, .79] .36 [-.05, .68] 1.62
MatchTheNote PD 103 .63 [.46, .75] -.02 [-.34, .30] 3.58**
Note. DZ: Dizygotic twins; ID: Interval deviation; KD: Key deviation; MZ: Monozygotic twins;
N: Number of twin pairs; PD: Pitch deviation; SINGCOMB: Combined singing score.
Task measures with category in parentheses refer to the categorical task measures (see Section
6.3.4, p. 181). Values in brackets are the 95% confidence intervals.
Measures where differences between rMZ and rDZ are statistically significant are shown in bold.
*p < .05; **p < .01.
9.1.1.2 Self-reported interests and abilities in singing and music
Table 9.2 presents the ICCs for the self-ratings of the MZ and DZ groups.
Table 9.2. Intraclass Correlations of MZ and DZ Groups for Self-Ratings of Abilities and
Interests (N = 99)
Self-ratings rMZ rDZ Z
Singing Ability .87 [.77, .93] .54 [.22, .76] 3.36**
Music Ability .83 [.72, .90] .35 [.01, .62] 3.80**
Singing Interest .76 [.61, .86] .14 [-.21, .45] 3.95**
Music Interest .74 [.56, .85] .10 [-.28, .46] 3.92**
Note. DZ: Dizygotic twins; MZ: Monozygotic twins; N: Number of twin pairs
Values in brackets are the 95% confidence intervals.
Measures where differences between rMZ and rDZ are statistically significant are shown in bold.
**p < .01.
MZ twins were significantly more alike than DZ twins for self-reported singing ability
(rMZ = .87; rDZ = .54), self-reported music ability (rMZ = .83; rDZ = .35), and music and
singing interests (rMZ = .74-.76; rDZ = .10-.14). In both MZ and DZ groups, the ICCs for
the self-reported abilities were higher than the ICCs for self-reported interests.
- 239 -
Taken together, the MZ group exhibited significantly higher ICCs than the DZ group
across a range of variables. These greater similarities between MZ twin pairs relative to
DZ twin pairs are indicative of genetic influences. Genetic structural equation modelling
(SEM) was thus performed to determine the relative genetic and environmental
contributions to the measures with greater precision.
9.1.2 Preliminary testing of the equality of covariances,
means and variances
Prior to conducting univariate analyses to test the hypotheses of the first aim,
preliminary testing of the equality of covariances between sexes of the same zygosity
(i.e., between MZF and MZM; between DZF, DZM and DZO) were tested for all the
objective singing and music measures and the self-ratings of interests and abilities. In
addition, equality of means and variances within twin pairs and across zygosities (i.e.,
between Twin 1 and Twin 2; between MZ and DZ) were also tested for the continuous
task measures. For ordinal variables such as the categorical measures of the singing
tasks and self-rated interests and abilities, equality of thresholds were tested instead of
equality of means and variances. Effects of age and sex on the variables were adjusted
via regression.
9.1.2.1 Testing equality of covariances between sexes of the same
zygosity
The likelihood ratio chi-square values for the tests of equality of covariances are
presented in Table 9.3. The detailed fit statistics are available in Appendices E-1 (p.
379), E-3 (p. 381), and E-5 (p. 383).
For the continuous task measures and the self ratings, covariances of MZF and MZM
twin pairs could be equated without significant deterioration of fit, as could the
covariances of the DZF, DZM and DZO twin pairs. This indicates the absence of
quantitative and qualitative sex differences, thus supporting subsequent genetic analyses
for these variables to be performed using one MZ group and one DZ group.

- 240 -
Table 9.3. Likelihood Ratio Chi-Square Values (∆χ2) for Tests of Equality of Covariances
Variables N Equality of Covariances Between
MZF & MZM MZF & MZM;
DZF & DZM
MZF & MZM;
DZF, DZM & DZO
SINGCOMB 100 0.01 0.08 0.00
SINGCOMB (category) 100 0.01 0.18 0.00
SingTheNote PD 106 0.06 0.51 0.25
SingTheNote PD (category) 106 0.09 0.86 2.04
HappyBirthday PD 107 0.79 0.12 0.16
HappyBirthday PD (category) 107 4.48* 1.05 0.27
HappyBirthday ID 107 0.04 0.35 0.09
HappyBirthday ID (category) 107 1.73 0.07 1.29
HappyBirthday KD 107 2.58 0.52 0.12
HappyBirthday KD (category) 107 4.64* 0.36 0.01
SingTheTune PD 101 0.05 1.58 0.00
SingTheNote PD (category) 101 0.09 0.86 2.04
SingTheTune ID 101 0.04 0.02 0.01
SingTheTune PD (category) 101 1.00 0.02 0.47
MatchTheNote PD 103 0.14 0.01 0.01
Singing Ability 99 1.16 0.88 1.44
Music Ability 99 0.07 1.34 1.22
Singing Interest 99 0.31 0.87 0.71
Music Interest 99 1.61 0.05 2.22
Note. DZF: Dizygotic female twins; DZM: Dizygotic male twins; DZO: Dizygotic opposite sex
twins;
ID: Interval deviation; KD: Key deviation; MZF: Monozygotic female twins; MZM:
Monozygotic male twins
N: Number of twin pairs; PD: Pitch deviation; SINGCOMB: Combined singing score.
Task measures with category in parentheses refer to the categorical task measures (see Section
6.3.4, p. 181).
*p < .05.
For the singing task accuracy categories, there was significant deterioration of fit for
HappyBirthday PD and HappyBirthday KD when equating the covariances of MZF and
MZM twin pairs (p = 0.03). However, given the multiple comparisons made (3
comparisons per measure), the adjusted p value after applying Bonferroni correction
was p = 0.05
3≈ 0.017. In other words, if the adjusted p value was considered, there
would not be a significant deterioration of fit for the two categorical measures. As the
covariances could be equated between sexes of the same zygosity for most of the
variables, quantitative and qualitative sex limitation effects were therefore not modelled,
and the genetic modelling for each variable was conducted with one MZ group and one
DZ group.

- 241 -
9.1.2.2 Testing equality of means and variances or equality of
thresholds within twin pairs and across zygosities
The likelihood ratio chi-square values for the tests of equality of means and variances
and equality of thresholds are presented in Table 9.4 and Table 9.5, respectively. The
detailed fit statistics are available in Tables E-2 (p. 380), E-4 (p. 382), and E-6 (p. 384)
in Appendix E.
Table 9.4. Likelihood Ratio Chi-Square Values (∆χ2) for Tests of Equality of Means and
Variances for Continuous Variables
Variables N Equality of
means across
twin order
Equality of
means & variances
across twin order
Equality of
means & variances
across zygosities
SINGCOMB 100 0.61 0.70 1.82
SingTheNote PD 106 2.18 0.42 0.47
HappyBirthday PD 107 1.14 0.55 2.15
HappyBirthday ID 107 0.93 3.03 2.76
HappyBirthday KD 107 0.06 3.18 3.16
SingTheTune PD 101 0.73 1.46 2.16
SingTheTune ID 101 0.90 2.33 1.51
MatchTheNote PD 103 0.59 0.33 0.07
Note. ID: Interval deviation; KD: Key deviation; N: Number of twin pairs; PD: Pitch deviation;
SINGCOMB: Combined singing score.
p > .05.
Table 9.5. Likelihood Ratio Chi-Square Values (∆χ2) for Tests of Equality of Thresholds for
Ordinal Variables
Variables N Equality of thresholds
across twin order
Equality of thresholds
across zygosities
SINGCOMB (category) 100 1.70 1.38
SingTheNote PD (category) 106 7.95 0.42
HappyBirthday PD (category) 107 3.21 3.11
HappyBirthday ID (category) 107 4.30 2.20
HappyBirthday KD (category) 107 2.24 2.22
SingTheTune PD (category) 101 3.30 1.73
SingTheTune ID (category) 101 2.18 1.07
Singing Ability 99 17.63 6.34
Music Ability 99 15.97 7.42
Singing Interest 99 6.21 7.07
Music Interest 99 19.45 6.75
Note. ID: Interval deviation; KD: Key deviation; N: Number of twin pairs; PD: Pitch deviation;
SINGCOMB: Combined singing score.
Task measures with category in parentheses refer to the categorical task measures (see Section
6.3.4, p. 181).
p > .05.

- 242 -
No significant deterioration of model fit was observed for any of the continuous or
ordinal variables when means and variances or thresholds were equated within twin
pairs and across zygosities. Univariate genetic analyses were thus performed on all
variables.
9.1.3 Univariate genetic analyses
As the small sample size of the current twin study offered little statistical power, this
may potentially lead to biased heritability estimates in the reduced models, especially
for the ordinal measures (Medland & Hatemi, 2009; Sullivan & Eaves, 2002). In view
of this limitation, only full ACE model results will be discussed.
9.1.3.1 Task measures
The parameter estimates derived from the univariate genetic modelling performed on
the continuous and categorical task measures are shown in Table 9.6. Effects of age and
sex were adjusted via regression. The detailed fit statistics are presented in Tables E-9
and E-10 in Appendix E (pp. 387-388).
Table 9.6 shows that apart from HappyBirthday KD and SingTheTune ID, all the other
continuous task measures had significant heritability estimates (as shown by confidence
intervals that excluded zero) of moderate to large magnitudes, and negligible to
moderate common environmental influences (A = 44-71%, C = 0-29%). Unique
environmental influences were significant for all measures (E = 19-48%).
In particular, the additive genetic influences for SINGCOMB were large, explaining
69% of the variance, while common and unique environmental influences only
accounted for 11% and 19% of the variance, respectively.
The heritability estimates for SingTheNote PD, SingTheTune PD and HappyBirthday
ID were similarly high (A = 68-71%). Interestingly, the estimated heritabilities for
different measures of the same singing task tended to vary considerably. For Happy
Birthday Singing Task, additive genetic influences on HappyBirthday ID were
considerably greater (A = 68%) than those on HappyBirthday PD (A = 44%) and

- 243 -
HappyBirthday KD (A = 26%). As for Sing The Tune Task, SingTheTune PD had a
significant and substantial additive genetic component (A = 71%) whereas SingTheTune
ID had a moderate heritability estimate (A = 28%). As mentioned earlier, the heritability
estimates of HappyBirthday KD and SingTheTune ID did not reach statistical
significance.
A large genetic component (A = 60%) was also estimated for perceptual pitch-matching
(MatchTheNote PD). For both perceptual and vocal pitch-matching (i.e., Match The
Note Task and Sing The Note Task), the confidence intervals of the heritability
estimates did not overlap with those of the common environment estimates. This
supports the prevailing importance of additive genetic influences compared to
environmental influences in explaining the variance observed for these two tasks.
Table 9.6. Results of Univariate Genetic Modelling Showing Genetic (A), Common
Environmental (C), and Unique Environmental (E) Influences on Continuous and Categorical
Measures of Singing and Music Tasks
Task Measure N A C E
SINGCOMB 100 .69 [.27, .87] .11 [.00, .52] .19 [.13, .29]
SINGCOMB (category) 100 .70 [.04, .90] .09 [.00, .67] .21 [.10, .40]
SingTheNote PD 106 .69 [.54, .79] .00 [.00, .24] .31 [.21, .46]
SingTheNote PD (category) 106 .79 [.19, .91] .00 [.00, .52] .21 [.09, .44]
HappyBirthday PD 107 .44 [.11, .80] .29 [.00, .65] .28 [.19, .40]
HappyBirthday PD (category) 107 .59 [.00, .90] .20 [.00, .75] .21 [.09, .42]
HappyBirthday ID 107 .68 [.27, .78] .00 [.00, .38] .32 [.22, .46]
HappyBirthday ID (category) 107 .72 [.29, .87] .00 [.00, .34] .28 [.13, .53]
HappyBirthday KD 107 .26 [.00, .72] .37 [.00, .68] .37 [.26, .53]
HappyBirthday KD (category) 107 .72 [.03, .90] .06 [.00, .67] .22 [.10, .42]
SingTheTune PD 101 .71 [.31, .80] .01 [.00, .50] .29 [.20, .42]
SingTheTune PD (category) 101 .63 [.00, .84] .07 [.00, .69] .30 [.16, .53]
SingTheTune ID 101 .28 [.00, .73] .36 [.00, .69] .36 [.25, .52]
SingTheTune ID (category) 101 .57 [.00, .79] .05 [.00, .64] .37 [.21, .63]
MatchTheNote PD 103 .60 [.34, .74] .00 [.00, .20] .40 [.26, .59]
Note. ID: Interval deviation; KD: Key deviation; N: Number of twin pairs; PD: Pitch deviation;
SINGCOMB: Combined singing score. Task measures with category in parentheses refer to the
categorical task measures (see Section 6.3.4, p. 181).
Values in brackets are the 95% confidence intervals.
Significant parameter estimates (whose interval values do not pass through zero) are shown in
bold.

- 244 -
A comparison of the ACE estimates of the continuous task measures (Table 9.6) and the
corresponding categorical measures showed that the heritability estimates for the
categorical measures were generally higher than the continuous measures (apart from
SingTheTune PD), albeit with wider confidence intervals due to reduced statistical
power for ordinal measures. Nonetheless, SingTheNote PD, HappyBirthday ID,
HappyBirthday KD and SINGCOMB had non-zero-crossing confidence intervals for
their heritability estimates, indicating significant genetic components.
The relative sizes of genetic influences across tasks were generally consistent between
the continuous and categorical singing task measures. In particular, both the continuous
and categorical measures for SINGCOMB yielded similar heritability estimates (A = 69-
70%). In contrast, the heritability estimate for HappyBirthday KD (category) was
substantially higher (A = 72%) than the corresponding continuous HappyBirthday KD
(A = 26%). SingTheTune ID (category) also had a larger additive genetic component (A
= 57%) than the continuous measure of SingTheTune ID (A = 28%). Contrastingly,
SingTheTune PD (category) had a smaller genetic component (A = 63%) than
SingTheTune PD (A = 71%).
9.1.3.2 Self-reported interests and abilities in music and singing
The estimates from the full ACE models of the self-ratings are shown in Table 9.7.
Effects of age and sex were adjusted via regression. The detailed fit statistics are
presented in Table E-11 in Appendix E (p. 389).
Table 9.7. Results of Univariate Genetic Modelling Showing Genetic (A) Common
Environmental (C), and Unique Environmental (E) Influences on Self-Rated Abilities and
Interests in Music and Singing (N = 99)
Self-rating A C E
Singing Ability .72 [.27, .91] .13 [.00, .56] .15 [.09, .25]
Music Ability .81 [.40, .88] .00 [.00, .39] .19 [.12, .31]
Music Interest .65 [.15, .78] .00 [.00, .45] .35 [.22, .54]
Singing Interest .72 [.35, .95] .00 [.00, .33] .28 [.05, .44]
Note. Values in brackets are the 95% confidence intervals.
Significant parameter estimates (whose interval values do not pass through zero) are shown in
bold.

- 245 -
A large genetic component was estimated for self-rated singing ability (A = 72%), with
low common and unique environmental influences (C = 13%; E = 15%). Similar
heritability was estimated for self-rated singing interest (A = 72%), with the latter
having a negligible common environmental component.
Self-rated music ability had the highest heritability estimate of all four self-ratings (A =
81%) while self-rated music interest had a relatively lower heritability than the other
three self-ratings (A = 65%). Nonetheless, for all four self-ratings, both additive genetic
influences as well as unique environmental influences were significant, as evident from
the confidence intervals that did not contain zero. Common environmental influences
(C) did not reach statistical significance for any of the variables. In particular, the 95%
confidence intervals of A and C did not overlap for self-rated singing interest and music
ability, highlighting the importance of additive genetic influences for these two
variables.
9.2 The Genetic Bases of Environmental Components
Associated with Singing Ability
To investigate the genetic basis of environmental components associated with singing
ability, the five singing and music background components (i.e., Personal Singing,
Family Singing, Public Singing, Music Listening, and Instrumental Expertise) were
examined. As Instrumental Expertise only applied to participants with music training,
non-musically trained participants were excluded from the genetic analyses performed
on this component. In view of this, Years of Music Training (which was collected for
both the musically and non-musically trained participants) was also examined in the
genetic analyses, serving as a proxy for Instrumental Expertise.
9.2.1 Intraclass correlations of environmental components
Table 9.8 presents the age-and sex-corrected ICCs for the singing and music
background components for the MZ and DZ groups.

- 246 -
Table 9.8. Intraclass Correlations of MZ and DZ Groups for Singing and Music Background
Components
Components N rMZ rDZ Z
Personal Singing 99 .53 [.33, .69] .43 [.13, .66] 0.60
Family Singing 99 .63 [.45, .76] .65 [.42, .80] -0.16
Public Singing 99 .72 [.57, .82] .25 [-.09, .54] 3.01**
Music Listening 99 .64 [.46, .76] .54 [.26, .73] 0.71
Instrument Expertise 74 .72 [.55, .83] .19 [-.19, .51] 2.82**
Years of Music Training 106 .86 [.78, .92] .55 [.28, .74] 3.04**
Note. Values in brackets are the 95% confidence intervals.
Measures where differences between rMZ and rDZ are statistically significant are shown in bold.
**p < .01.
MZ twins were significantly more alike than DZ twins for Years of Music Training,
Instrumental Expertise, and Public Singing (p < .01; rMZ = .72-.86; rDZ = .19-.55), as
demonstrated by the significant Z scores derived from Fisher’s r to Z transformation.
This indicates that these variables were likely to have sizeable genetic influences. For
Music Listening and Personal Singing, MZ twins were also more alike than DZ twins,
but to a degree that did not reach statistical significance (rMZ = .53-.64; rDZ = .43-.54).
Interestingly, MZ twins and DZ twins exhibited comparable similarity in Family
Singing (rMZ = .63; rDZ = .65), which suggested that a negligible genetic component
could be expected for this component.
9.2.2 Preliminary testing of the equality of covariances,
means and variances
Prior to performing univariate genetic modelling on the environmental components,
preliminary testing of the equality of covariances between sexes of the same zygosity
(i.e., between MZF and MZM; between DZF, DZM and DZO) were conducted. In
addition, equality of means and variances within twin pairs and across zygosities (i.e.,
between Twin 1 and Twin 2; between MZ and DZ) were also tested for the
environmental components. Effects of age and sex were adjusted via regression.

- 247 -
9.2.2.1 Testing equality of covariances across sexes within the same
zygosity
The likelihood ratio chi-square values for the tests of equality of covariances are
presented in Table 9.9. The detailed fit statistics are available in Table E-7 in
Appendix E (p. 385).
For all the environmental components, covariances of MZF and MZM twin pairs could
be equated without significant deterioration of fit, as could the covariances of the DZF,
DZM and DZO twin pairs. This indicates the absence of quantitative and qualitative sex
differences, supporting subsequent genetic analyses for these variables to be performed
using one MZ group and one DZ group.
Table 9.9. Likelihood Ratio Chi-Square Values (∆χ2) for Tests Concerning Equality of
Covariances of the Environmental Components
Variables N Equality of Covariances Between
MZF & MZM MZF & MZM;
DZF & DZM
MZF & MZM;
DZF, DZM & DZO
Personal Singing 99 0.76 0.17 0.16
Family Singing 99 1.53 1.00 0.10
Public Singing 99 0.01 0.47 2.06
Music Listening 99 3.45 0.98 0.58
Instrumental Expertise 74 0.00 0.64 1.57
Years of Music Training 106 1.23 1.41 0.98
Note. DZF: Dizygotic female twins; DZM: Dizygotic male twins; DZO: Dizygotic opposite sex
twins;
MZF: Monozygotic females; MZM: Monozygotic males; N: Number of twin pairs
p > .05.
9.2.2.2 Testing equality of means and variances or equality of
thresholds within twin pairs and across zygosities
The likelihood ratio chi-square values for the tests of equality of means and variances of
the environmental components are presented in Table 9.10. The detailed fit statistics are
presented in Table E-8 in Appendix E (p. 386). The means and variances of all the
environmental components could be equated within twin pairs and across zygosities
without significant deterioration of fit, thus indicating that all the preliminary conditions
were fulfilled and univariate genetic analyses could be conducted on all the variables.

- 248 -
Table 9.10. Likelihood Ratio Chi-Square Values (∆χ2) for Tests Concerning Equality of Means
and Variances of the Environmental Components
Variables N Equality of means
across twin order
Equality of
means & variances
across twin order
Equality of
means & variances
across zygosities
Personal Singing 99 3.04 0.37 4.42
Family Singing 99 1.22 0.06 1.61
Public Singing 99 4.87 0.44 5.92
Music Listening 99 3.63 0.10 0.45
Instrumental
Expertise
74 5.29 3.89 3.17
Years of Music
Training
106 4.70 1.87 2.04
Note. N: Number of twin pairs. p > .05.
9.2.3 Univariate genetic analyses of environmental
components
The estimates from the full ACE models for the singing and music background
components are shown in Table 9.11. Effects of age and sex were adjusted via
regression. The detailed fit statistics are presented in Table E-12 in Appendix E (p.
390).
Table 9.11. Results of Univariate Genetic Modelling Showing Additive Genetic (A), Common
Environmental (C), and Unique Environmental (E) Influences on Music and Singing
Background Components
Variables N A C E
Personal Singing 99 .33 [.00, .69] .23 [.00, .60] .44 [.30, .64]
Family Singing 99 .00 [.00, .40] .63 [.25, .74] .37 [.26, .50]
Public Singing 99 .66 [.09, .78] .03 [.00, .55] .32 [.22, .46]
Music Listening 99 .14 [.00, .69] .49 [.00, .71] .38 [.26, .53]
Instrumental Expertise 74 .68 [.20, .80] .00 [.00, .44] .32 [.20, .48]
Years of Music Training 106 .46 [.14, .88] .38 [.00, .69] .15 [.10, .23]
Note. Values in brackets are the 95% confidence intervals. Significant parameter estimates
(whose interval values do not pass through zero) are shown in bold.
The heritability estimates of the singing and music background components were wide
ranging: Family Singing has negligible genetic influences (A = 0%), Music Listening
has a low heritability estimate (A = 14%), Personal Singing and Years of Music
Training have moderate estimates (A = 33% and 46%), and Public Singing and
Instrumental Expertise have substantial genetic influences (A = 66% and 68%). Among

- 249 -
the variables, only the heritability estimates of Public Singing, Instrumental Expertise
and Years of Music Training reached statistical significance, as demonstrated by the
confidence intervals shown in Table 9.11. While the common environmental influences
were minimal for Public Singing and Instrumental Expertise, the variances in Music
Listening and Family Singing were largely explained this (C = 49% and 63%,
respectively). In particular, Family Singing was the only variable with a significant
common environmental component.
9.2.4 Bivariate genetic analyses of singing ability and
environmental components
Bivariate genetic analyses were conducted to examine the relationship between each
singing task measure and each environmental component associated with singing
ability. The bivariate model-fitting results for the preliminary tests of equality of means
and variances within and across twins and zygosities are presented in Tables E-14 to E-
19 of Appendix E (pp. 392-397). For the bivariate model between Instrumental
Expertise and HappyBirthday ID, there was significant deterioration of fit from the
saturated bivariate model when means and variances were equated across MZ and DZ
(p = .04; see Table E-14 in Appendix E, p. 392). However, given the multiple
comparisons made (3 comparisons per measure), the adjusted p value after applying
Bonferroni correction was p = 0.05
3≈ 0.017. In other words, if the adjusted p value was
considered, there would not be a significant deterioration of fit for this bivariate model.
Bivariate genetic analyses were therefore performed to investigate the association
between each singing task measure and environmental component.
Results of bivariate genetic analyses testing the correlations between every music and
singing background component and the task measures are shown in Tables 9.12 through
9.23. For each component, the table outlining the contribution of shared additive
genetic, common environmental and unique environmental influences to the association
between the component and the task measures is presented first, followed by the table
detailing the bivariate model fitting results. As evident from the wide confidence
intervals of the genetic and environmental correlations presented, the small sample size
of the present study lacked the power to determine the magnitudes of these correlations
with greater precision. In view of this, the reporting and the subsequent interpretation of

- 250 -
the bivariate genetic results will place greater emphasis on the statistical significance
rather than the magnitude of the genetic and environmental correlations.
As Instrumental Expertise and Years of Music Training were of direct relevance to the
hypotheses relating to Aim 2, the bivariate modelling findings related to these two
components are presented first, followed by the other four components.
9.2.4.1 Instrumental Expertise and the objective task measures
Notably, Instrumental Expertise had significant additive genetic correlations with all of
the singing task measures as well as MatchTheNote PD (Table 9.12). Specifically, the
correlations due to additive genetic influences between Instrumental Expertise and the
task measures ranged from -.28 (SingTheNotePD and MatchTheNote PD) to -.52
(SingTheTune PD), and were observed to predominantly account for the phenotypic
correlations.
Table 9.12. Proportions of the Phenotypic Correlations between Instrumental Expertise and the
Objective Task Measures due to A, C and E
Task Measure N Phenotypic correlation
Due to Additive
Genetic (A)
Due to Common
Environment (C)
Due to Unique
Environment (E) Total
SINGCOMB 72 -.50 [-.67, -.17] .08 [-.24, .22] .00 [-.08, .07] -.42**
SingTheNote PD 73 -.28 [-.44, -.09] .00 [-.19, .16] -.04 [-.14, .04] -.32**
HappyBirthday PD 74 -.47 [-.63, -.13] .08 [-.25, .23] .03 [-.06, .11] -.36**
HappyBirthday ID 74 -.30 [-.55, -.01] .03 [-.23, .22] -.03 [-.14, .07] -.30**
HappyBirthday KD 74 -.44 [-.59, -.15] .09 [-.20, .23] .06 [-.03, .15] -.29**
SingTheTune PD 73 -.52 [-.67, -.18] .07 [-.24, .19] .01 [-.08, .09] -.44**
SingTheTune ID 73 -.49 [-.63, -.19] .07 [-.22, .19] .01 [-.08, .09] -.41**
MatchTheNote PD 74 -.28 [-.49, -.04] .00 [-.19, .15] .02 [-.07, .11] -.26*
Note. ID: Interval deviation; KD: Key deviation; N: Number of twin pairs; PD: Pitch deviation;
SINGCOMB: Combined singing score.
Values in brackets are the 95% confidence intervals. Significant genetic and environmental
correlations (confidence intervals do not include zero) are shown in bold.
*p < .05; **p < .01.
In addition, reduced bivariate models which constrained additive genetic correlations to
zero all resulted in significant worsening of model fit when compared to the full
bivariate models (Table 9.13), thereby demonstrating the central role of shared additive
genetic influences in explaining the associations between Instrumental Expertise and the

- 251 -
task measures. In contrast, both common and unique environmental correlations were
not statistically significant.
Table 9.13. Bivariate Model-Fitting Results for the Associations between Instrumental
Expertise and the Objective Task Measures
Associated trait Model EP -2LL df AIC ∆χ2 ∆df p-
value
Comparison
model
SINGCOMB ACE 15 738.77 362 14.77 - - - -
rA = 0 14 747.79 363 21.79 9.01 1 0.00** ACE
rC = 0 14 739.12 363 13.12 0.35 1 0.56 ACE
rE = 0 14 738.79 363 12.79 0.01 1 0.91 ACE
SingTheNote
PD
ACE 15 996.56 368 260.56 - - - -
rA = 0 14 1001.51 369 263.51 4.95 1 0.03* ACE
rC = 0 14 996.56 369 258.56 0.00 1 1.00 ACE
rE = 0 14 997.73 369 259.73 1.17 1 0.28 ACE
HappyBirthday
PD
ACE 15 744.41 369 6.41 - - - -
rA = 0 14 751.95 370 11.95 7.54 1 0.01* ACE
rC = 0 14 744.67 370 4.67 0.26 1 0.61 ACE
rE = 0 14 744.90 370 4.90 0.49 1 0.48 ACE
HappyBirthday
ID
ACE 15 639.60 369 -98.40 - - - -
rA = 0 14 643.57 370 -96.43 3.97 1 0.05* ACE
rC = 0 14 639.68 370 -100.32 0.08 1 0.77 ACE
rE = 0 14 640.06 370 -99.94 0.46 1 0.50 ACE
HappyBirthday
KD
ACE 15 765.87 369 27.87 - - - -
rA = 0 14 773.08 370 33.08 7.21 1 0.01* ACE
rC = 0 14 766.36 370 26.36 0.49 1 0.48 ACE
rE = 0 14 767.74 370 27.74 1.88 1 0.17 ACE
SingTheTune
PD
ACE 15 820.15 363 94.15 - - - -
rA = 0 14 829.18 364 101.18 9.03 1 0.00** ACE
rC = 0 14 820.48 364 92.48 0.33 1 0.56 ACE
rE = 0 14 820.16 364 92.16 0.02 1 0.90 ACE
SingTheTune
ID
ACE 15 791.04 363 65.04 - - - -
rA = 0 14 799.95 364 71.95 8.92 1 0.00** ACE
rC = 0 14 791.33 364 63.33 0.29 1 0.59 ACE
rE = 0 14 791.13 364 63.13 0.09 1 0.77 ACE
MatchTheNote
PD
ACE 15 937.15 365 207.15 - - - -
rA = 0 14 942.25 366 210.25 5.10 1 0.02* ACE
rC = 0 14 937.15 366 205.15 0.00 1 1.00 ACE
rE = 0 14 937.34 366 205.34 0.18 1 0.67 ACE
Note. AIC: Akaike’s Information Criterion; df; Degrees of freedom; EP: Estimated parameters; ID:
Interval deviation; KD: Key deviation; PD: Pitch deviation; SINGCOMB: Combined singing score; -2LL:
-2 log likelihood; ∆df: Change in degrees of freedom; ∆χ2: Change in chi-square test.
*p < .05; **p < .01. Significant genetic and environmental correlations (confidence intervals do not
include zero) are shown in bold.

- 252 -
9.2.4.2 Years of Music Training and the objective task measures
Similar to Instrumental Expertise, Years of Music Training also had significant additive
genetic correlations with all of the singing task measures and MatchTheNote PD, albeit
with the exception of HappyBirthday ID (Table 9.14). The magnitude of the
correlations due to shared additive genetic influences between Years of Music Training
and the task measures ranged from -.27 (SingTheNote PD) to -.44 (SingTheTune PD),
accounting for a large proportion of the phenotypic correlations. All the common and
unique environmental correlations were not statistically significant.
Table 9.14. Proportions of Phenotypic Correlations between Years of Music Training and the
Objective Task Measures due to A, C and E
Task Measure N Phenotypic correlation
Due to Additive
Genetic (A)
Due to Common
Environment (C)
Due to Unique
Environment (E) Total
SINGCOMB 91 -.38 [-.65, -.07] -.07 [-.38, .20] -.01 [-.06, .04] -.46**
SingTheNote PD 92 -.27 [-.51, -.01] -.10 [-.35, .12] -.02 [-.09, .04] -.39**
HappyBirthday PD 93 -.39 [-.66, -.09] -.04 [-.35, .23] .02 [-.04, .07] -.42**
HappyBirthday ID 93 -.26 [-.52, .05] -.05 [-.36, .19] -.03 [-.10, .03] -.34**
HappyBirthday KD 93 -.32 [-.62, -.01] -.08 [-.39, .22] .05 [-.02, .11] -.35**
SingTheTune PD 92 -.44 [-.65, -.10] .03 [-.32, .22] -.02 [-.08, .04] -.43**
SingTheTune ID 92 -.39 [-.64, -.10] .00 [-.31, .24] .00 [-.06, .06] -.39**
MatchTheNote PD 93 -.30 [-.53, -.05] -.06 [-.30, .15] .02 [-.05, .09] -.34**
Note. ID: Interval deviation; KD: Key deviation; N: Number of twin pairs; PD: Pitch deviation;
SINGCOMB: Combined singing score.
Values in brackets are the 95% confidence intervals. Significant genetic and environmental
correlations (confidence intervals do not include zero) are shown in bold.
**p < .01.
The importance of shared additive genetic influences in explaining the relationship
between Years of Music Training and the task measures (except for HappyBirthday ID)
was also evident from the significant deterioration in model fit when additive genetic
correlations were constrained to zero (Table 9.15). The results therefore demonstrated
that the associations between Years of Music Training and the task measure were
significantly mediated by shared additive genetic influences.

- 253 -
Table 9.15. Bivariate Model-Fitting Results for the Associations between Years of Music
Training and the Objective Task Measures
Associated
trait
Model EP -2LL df AIC ∆χ2 ∆df p-
value
Comparison
model
SINGCOMB ACE 15 1404.73 392 620.73 - - - -
rA = 0 14 1411.01 393 625.01 6.28 1 0.01* ACE
rC = 0 14 1404.85 393 618.85 0.12 1 0.73 ACE
rE = 0 14 1405.02 393 619.02 0.29 1 0.59 ACE
SingTheNote
PD
ACE 15 1658.67 398 862.67 - - - -
rA = 0 14 1663.00 399 865.00 4.33 1 0.04* ACE
rC = 0 14 1659.26 399 861.26 0.59 1 0.44 ACE
rE = 0 14 1659.31 399 861.31 0.64 1 0.42 ACE
HappyBirthday
PD
ACE 15 1410.20 399 612.20 - - - -
rA = 0 14 1417.03 400 617.03 6.83 1 0.01* ACE
rC = 0 14 1410.25 400 610.25 0.05 1 0.82 ACE
rE = 0 14 1410.52 400 610.52 0.32 1 0.57 ACE
HappyBirthday
ID
ACE 15 1307.46 399 509.46 - - - -
rA = 0 14 1310.00 400 510.00 2.54 1 0.11 ACE
rC = 0 14 1307.55 400 507.55 0.09 1 0.76 ACE
rE = 0 14 1308.66 400 508.66 1.2 1 0.27 ACE
HappyBirthday
KD
ACE 15 1436.65 399 638.65 - - - -
rA = 0 14 1440.62 400 640.62 3.97 1 0.05* ACE
rC = 0 14 1436.86 400 636.86 0.20 1 0.65 ACE
rE = 0 14 1438.42 400 638.42 1.77 1 0.18 ACE
SingTheTune
PD
ACE 15 1490.09 393 704.09 - - - -
rA = 0 14 1496.90 394 708.90 6.81 1 0.01* ACE
rC = 0 14 1490.11 394 702.11 0.01 1 0.90 ACE
rE = 0 14 1490.43 394 702.43 0.34 1 0.56 ACE
SingTheTune
ID
ACE 15 1466.10 393 680.10 - - - -
rA = 0 14 1473.01 394 685.01 6.91 1 0.01* ACE
rC = 0 14 1466.10 394 678.10 0.00 1 1.00 ACE
rE = 0 14 1466.10 394 678.10 0.00 1 0.96 ACE
MatchTheNote
PD
ACE 15 1587.52 395 797.52 - - -
rA = 0 14 1593.19 396 801.19 5.67 1 0.02* ACE
rC = 0 14 1587.79 396 795.79 0.27 1 0.61 ACE
rE = 0 14 1587.86 396 795.86 0.34 1 0.56 ACE
Note. AIC: Akaike’s Information Criterion; df; Degrees of freedom; EP: Estimated parameters;
ID: Interval deviation; KD: Key deviation; PD: Pitch deviation; SINGCOMB: Combined
singing score; -2LL: -2 log likelihood; ∆df: Change in degrees of freedom; ∆χ2: Change in chi-
square test.
*p < .05. Significant genetic and environmental correlations (confidence intervals do not
include zero) are shown in bold.

- 254 -
9.2.4.3 Personal Singing and the singing measures
For Personal Singing, only the additive genetic correlations with SINGCOMB,
SingTheTune PD and SingTheTune ID were significant, ranging from -.41 to -.49
(Table 9.16). In keeping with these findings, constraining the additive genetic
correlation between Personal Singing and these three measures to zero resulted in
significant deterioration in model fit from the full bivariate ACE models (Table 9.17).
This highlights the importance of shared additive genetic influences in explaining the
associations between these measures and Personal Singing.
All the other genetic and environmental correlations between Personal Singing and the
task measures were not found to be significant, even though in terms of their magnitude.
The correlations due to additive genetic influences appeared to explain a considerable
proportion of the phenotypic correlations between Personal Singing and various
measures (Table 9.16).
Table 9.16. Proportions of the Phenotypic Correlations between Personal Singing and the
Singing Measures due to A, C and E
Task Measure N Phenotypic correlation
Due to Additive
Genetic (A)
Due to Common
Environment (C)
Due to Unique
Environment (E) Total
SINGCOMB 97 -.44 [-.60,-.10] .11 [-.22,.25] -.02 [-.10,.04] -.35**
SingTheNote PD 98 -.10 [-.36,.20] -.06 [-.32,.16] -.06 [-.16,.02] -.22**
HappyBirthday PD 99 -.30 [-.56,.06] .02 [-.31,.25] -.06 [-.16,.02] -.34**
HappyBirthday ID 99 -.21 [-.53,.13] -.12 [-.41,.16] -.05 [-.15,.04] -.38**
HappyBirthday KD 99 -.25 [-.52,.12] -.03 [-.37,.22] -.01 [-.12,.08] -.29**
SingTheTune PD 98 -.49 [-.60,-.23] .15 [-.10,.23] -.04 [-.12,.03] -.38**
SingTheTune ID 98 -.41 [-.58,-.10] .07 [-.23,.22] .00 [-.09,.08] -.34**
Note. ID: Interval deviation; KD: Key deviation; N: Number of twin pairs; PD: Pitch deviation;
SINGCOMB: Combined singing score.
Values in brackets are the 95% confidence intervals. Significant genetic and environmental
correlations (confidence intervals do not include zero) are shown in bold.
**p < .01.

- 255 -
Table 9.17. Bivariate Model-Fitting Results for the Associations between Personal Singing and
the Singing Measures
Associated
trait
Model EP -2LL df AIC ∆χ2 ∆df p-
value
Comparison
model
SINGCOMB ACE 15 904.24 400 104.24 - - - -
rA = 0 14 910.38 401 108.38 6.13 1 0.01* ACE
rC = 0 14 904.61 401 102.61 0.36 1 0.55 ACE
rE = 0 14 904.61 401 102.61 0.37 1 0.55 ACE
SingTheNote
PD
ACE 15 1165.49 406 353.49 - - - -
rA = 0 14 1165.88 407 351.88 0.39 1 0.53 ACE
rC = 0 14 1165.68 407 351.68 0.19 1 0.67 ACE
rE = 0 14 1167.56 407 353.56 2.07 1 0.15 ACE
HappyBirthday
PD
ACE 15 907.43 407 93.43 - - - -
rA = 0 14 910.10 408 94.10 2.67 1 0.10 ACE
rC = 0 14 907.44 408 91.44 0.01 1 0.93 ACE
rE = 0 14 909.29 408 93.29 1.86 1 0.17 ACE
HappyBirthday
ID
ACE 15 794.29 407 -19.71 - - - -
rA = 0 14 795.58 408 -20.42 1.3 1 0.25 ACE
rC = 0 14 794.70 408 -21.30 0.41 1 0.52 ACE
rE = 0 14 795.39 408 -20.61 1.11 1 0.29 ACE
HappyBirthday
KD
ACE 15 930.94 407 116.94 - - - -
rA = 0 14 932.70 408 116.70 1.76 1 0.18 ACE
rC = 0 14 930.98 408 114.98 0.04 1 0.84 ACE
rE = 0 14 931.03 408 115.03 0.09 1 0.77 ACE
SingTheTune
PD
ACE 15 980.58 401 178.58 - - - -
rA = 0 14 989.74 402 185.74 9.15 1 0.00** ACE
rC = 0 14 981.70 402 177.70 1.12 1 0.29 ACE
rE = 0 14 981.67 402 177.67 1.09 1 0.30 ACE
SingTheTune
ID
ACE 15 956.75 401 154.75 - - - -
rA = 0 14 963.51 402 159.51 6.76 1 0.01* ACE
rC = 0 14 956.91 402 152.91 0.16 1 0.69 ACE
rE = 0 14 956.75 402 152.75 0.00 1 0.95 ACE
Note. AIC: Akaike’s Information Criterion; df; Degrees of freedom; EP: Estimated parameters;
ID: Interval deviation; KD: Key deviation; PD: Pitch deviation; SINGCOMB: Combined
singing score; -2LL: -2 log likelihood; ∆df: Change in degrees of freedom; ∆χ2: Change in chi-
square test.
Significant genetic and environmental correlations (confidence intervals do not include zero) are
shown in bold.
*p < .05; **p < .01.

- 256 -
9.2.4.4 Family Singing and the singing measures
In contrast with the bivariate genetic modelling results reported thus far, the
associations between Family Singing and all the singing task measures were
demonstrated to be significantly mediated by shared common environmental influences,
ranging from -.27 (SingTheNote PD) to -.46 (HappyBirthday PD and HappyBirthday
KD) (Table 9.18). This was also evident from the significant fit deterioration in the
reduced models that constrained the shared common environmental correlations
between Family Singing and the singing measures to zero (Table 9.19).
Table 9.18. Proportions of the Phenotypic Correlations between Family Singing and the
Singing Measures due to A, C and E
Task Measure N Phenotypic correlation
Due to Additive
Genetic (A)
Due to Common
Environment (C)
Due to Unique
Environment (E) Total
SINGCOMB 97 .03 [-.23,.19] -.43 [-.59,-.16] -.05 [-.11,.01] -.45**
SingTheNote PD 98 -.01 [-.27,.19] -.27 [-.46,-.01] -.03 [-.11,.04] -.31**
HappyBirthday PD 99 .10 [-.15,.22] -.46 [-.59,-.21] -.04 [-.12,.03] -.40**
HappyBirthday ID 99 .00 [-.30,.18] -.37 [-.55,-.09] -.07 [-.15,.00] -.44**
HappyBirthday KD 99 .10 [-.17,.21] -.46 [-.59,-.19] .00 [-.08,.09] -.36**
SingTheTune PD 98 -.05 [-.35,.14] -.37 [-.56,-.07] -.02 [-.10,.05] -.44**
SingTheTune ID 98 -.02 [-.32,.16] -.41 [-.60,-.10] .00 [-.09,.08] -.43**
Note. ID: Interval deviation; KD: Key deviation; N: Number of twin pairs; PD: Pitch deviation;
SINGCOMB: Combined singing score.
Values in brackets are the 95% confidence intervals.
**p < .01. Significant genetic and environmental correlations (confidence intervals do not
include zero) are shown in bold.

- 257 -
Table 9.19. Bivariate Model-Fitting Results for the Associations between Family Singing and
the Singing Measures
Associated
trait
Model EP -2LL df AIC ∆χ2 ∆df p-
value
Comparison
model
SINGCOMB ACE 15 825.14 400 25.14 - - - -
rA = 0 14 825.23 401 23.23 0.09 1 0.77 ACE
rC = 0 14 833.62 401 31.62 8.48 1 0.00** ACE
rE = 0 14 827.54 401 25.54 2.40 1 0.12 ACE
SingTheNote
PD
ACE 15 1088.57 406 276.57 - - - -
rA = 0 14 1088.57 407 274.57 0.00 1 0.96 ACE
rC = 0 14 1092.80 407 278.80 4.23 1 0.04* ACE
rE = 0 14 1089.25 407 275.25 0.68 1 0.41 ACE
HappyBirthday
PD
ACE 15 832.56 407 18.56 - - - -
rA = 0 14 833.43 408 17.43 0.87 1 0.35 ACE
rC = 0 14 842.20 408 26.20 9.64 1 0.00** ACE
rE = 0 14 833.97 408 17.97 1.41 1 0.23 ACE
HappyBirthday
ID
ACE 15 716.80 407 -97.20 - - - -
rA = 0 14 716.80 408 -99.20 0.00 1 1.00 ACE
rC = 0 14 723.00 408 -93.00 6.20 1 0.01* ACE
rE = 0 14 720.37 408 -95.63 3.57 1 0.06 ACE
HappyBirthday
KD
ACE 15 851.93 407 37.93 - - - -
rA = 0 14 852.50 408 36.50 0.56 1 0.45 ACE
rC = 0 14 861.05 408 45.05 9.11 1 0.00** ACE
rE = 0 14 851.93 408 35.93 0.00 1 0.99 ACE
SingTheTune
PD
ACE 15 908.00 401 106.00 - - - -
rA = 0 14 908.16 402 104.16 0.16 1 0.69 ACE
rC = 0 14 913.71 402 109.71 5.71 1 0.02* ACE
rE = 0 14 908.44 402 104.44 0.45 1 0.50 ACE
SingTheTune
ID
ACE 15 878.61 401 76.61 - - - -
rA = 0 14 878.62 402 74.62 0.02 1 0.90 ACE
rC = 0 14 884.76 402 80.76 6.16 1 0.01* ACE
rE = 0 14 878.62 402 74.62 0.01 1 0.90 ACE
Note. AIC: Akaike’s Information Criterion; df; Degrees of freedom; EP: Estimated parameters;
ID: Interval deviation; KD: Key deviation; PD: Pitch deviation; SINGCOMB: Combined
singing score; -2LL: -2 log likelihood; ∆df: Change in degrees of freedom; ∆χ2: Change in chi-
square test.
*p < .05; **p < .01. Significant genetic and environmental correlations (confidence intervals do
not include zero) are shown in bold.

- 258 -
9.2.4.5 Public Singing and the singing measures
While Public Singing had moderate and significant phenotypic correlations with the
singing task measures (r = -.30 to -.44), only the correlation due to shared unique
environmental influences between Public Singing and SingTheTune ID was statistically
significant (Table 9.20). This was also demonstrated in Table 9.21, whereby
constraining the unique environmental correlation to zero caused significant worsening
of model fit from the full model. All the other genetic and environmental correlations
were not statistically significant.
For most of the task measures, the contribution of shared environmental influences to
the correlation with Public Singing was generally larger than the contribution of
additive genetic influences (except for SingTheNote PD and HappyBirthday ID).
Table 9.20. Portions of the Phenotypic Correlations between Public Singing and the Singing
Measures due to A, C and E
Task Measure N Phenotypic correlation
Due to Additive
Genetic (A)
Due to Common
Environment (C)
Due to Unique
Environment (E) Total
SINGCOMB 97 -.12 [-.48,.14] -.27 [-.52,.04] -.03 [-.10,.03] -.42**
SingTheNote PD 98 -.14 [-.41,.18] -.13 [-.43,.06] -.05 [-.13,.03] -.32**
HappyBirthday PD 99 -.18 [-.52,.09] -.23 [-.48, .09] .03 [-.05,.10] -.38**
HappyBirthday ID 99 -.26 [-.53,.06] -.15 [-.45,.08] -.03 [-.11,.05] -.44**
HappyBirthday KD 99 -.06 [-.42,.19] -.28 [-.51,.05] .04 [-.05,.13] -.30**
SingTheTune PD 98 -.15 [-.48,.16] -.22 [-.51,.06] -.06 [-.14,.01] -.43**
SingTheTune ID 98 .01 [-.38,.22] -.35 [-.56,.02] -.08 [-.18,-.01] -.42**
Note. ID: Interval deviation; KD: Key deviation; N: Number of twin pairs; PD: Pitch deviation;
SINGCOMB: Combined singing score.
Values in brackets are the 95% confidence intervals.
**p < .01. Significant genetic and environmental correlations (confidence intervals do not
include zero) are shown in bold.

- 259 -
Table 9.21. Bivariate Model-Fitting Results for the Associations between Public Singing and
the Singing Measures
Associated trait Model EP -2LL df AIC ∆χ2 ∆df p-
value
Comparison
model
SINGCOMB ACE 15 555.76 400 -244.24 - - - -
rA = 0 14 556.45 401 -245.55 0.69 1 0.41 ACE
rC = 0 14 557.66 401 -244.34 1.90 1 0.17 ACE
rE = 0 14 557.01 401 -244.99 1.25 1 0.26 ACE
SingTheNote PD ACE 15 816.24 406 4.24 - - - -
rA = 0 14 816.83 407 2.83 0.59 1 0.44 ACE
rC = 0 14 816.64 407 2.64 0.40 1 0.53 ACE
rE = 0 14 817.65 407 3.65 1.41 1 0.23 ACE
HappyBirthday
PD
ACE 15 560.10 407 -253.90 - - - -
rA = 0 14 561.72 408 -254.28 1.62 1 0.20 ACE
rC = 0 14 561.84 408 -254.16 1.73 1 0.19 ACE
rE = 0 14 560.55 408 -255.45 0.44 1 0.51 ACE
HappyBirthday
ID
ACE 15 443.33 407 -370.67 - - - -
rA = 0 14 445.65 408 -370.35 2.32 1 0.13 ACE
rC = 0 14 443.84 408 -372.16 0.51 1 0.47 ACE
rE = 0 14 443.74 408 -372.26 0.42 1 0.52 ACE
HappyBirthday
KD
ACE 15 586.31 407 -227.69 - - - -
rA = 0 14 586.49 408 -229.51 0.18 1 0.67 ACE
rC = 0 14 588.90 408 -227.10 2.59 1 0.11 ACE
rE = 0 14 587.00 408 -229.00 0.69 1 0.40 ACE
SingTheTune PD ACE 15 637.28 401 -164.72 - - - -
rA = 0 14 638.06 402 -165.94 0.79 1 0.38 ACE
rC = 0 14 638.33 402 -165.67 1.05 1 0.30 ACE
rE = 0 14 640.03 402 -163.97 2.75 1 0.10 ACE
SingTheTune ID ACE 15 608.95 401 -193.05 - - - -
rA = 0 14 608.96 402 -195.04 0.00 1 0.95 ACE
rC = 0 14 612.35 402 -191.65 3.40 1 0.07 ACE
rE = 0 14 613.32 402 -190.68 4.37 1 0.04* ACE
Note. AIC: Akaike’s Information Criterion; df; Degrees of freedom; EP: Estimated parameters;
ID: Interval deviation; KD: Key deviation; PD: Pitch deviation; SINGCOMB: Combined
singing score; -2LL: -2 log likelihood; ∆df: Change in degrees of freedom; ∆χ2: Change in chi-
square test.
*p < .05. Significant genetic and environmental correlations (confidence intervals do not
include zero) are shown in bold.

- 260 -
9.2.4.6 Music Listening and task measures
Similar to the bivariate modelling results between Personal Singing and the singing task
measures, Music Listening also demonstrated significant additive genetic correlations
with SingTheTune PD, SingTheTune ID and SINGCOMB, ranging from -.33
(SINGCOMB) to -.49 (SingTheTune PD) (Table 9.22). In keeping with this, there was
significant deterioration of model fit when the correlations due to shared additive
genetic influences between Music Listening and these three measures were constrained
to zero (Table 9.23).
All the other genetic and environmental correlations were not statistically significant,
even though there were significant and moderate phenotypic correlations (r = -.37 to
-.48) between Music Listening and all the singing task measures.
Table 9.22. Portions of the Phenotypic Correlations between Music Listening and the Singing
Measures due to A, C and E
Task Measure N Phenotypic correlation
Due to Additive
Genetic (A)
Due to Common
Environment (C)
Due to Unique
Environment (E) Total
SINGCOMB 97 -.33 [-.63,.00] -.09 [-.41,.19] -.04 [-.12, .02] -.46**
SingTheNote PD 98 -.18 [-.45,.12] -.12 [-.40,.12] -.07 [-.16,.01] -.37**
HappyBirthday PD 99 -.24 [-.59,.08] -.14 [-.44,.19] -.03 [-.12,.04] -.41**
HappyBirthday ID 99 -.18 [-.53,.13] -.18 [-.48,.14] -.04 [-.12,.04] -.40**
HappyBirthday KD 99 -.16 [-.53,.16] -.20 [-.49,.16] -.01 [-.10,.08] -.37**
SingTheTune PD 98 -.49 [-.65,-.16] .03 [-.30,.17] -.02 [-.10,.05] -.48**
SingTheTune ID 98 -.37 [-.62,-.07] -.04 [-.34,.20] -.01 [-.09,.06] -.42**
Note. ID: Interval deviation; KD: Key deviation; N: Number of twin pairs; PD: Pitch deviation;
SINGCOMB: Combined singing score.
Values in brackets are the 95% confidence intervals.
**p < .01. Significant genetic and environmental correlations (confidence intervals do not
include zero) are shown in bold.

- 261 -
Table 9.23. Bivariate Model-Fitting Results for the Associations between Music Listening and
the Singing Measures
Associated
trait
Model EP -2LL df AIC ∆χ2 ∆df p-value Comparison
model
SINGCOMB ACE 15 836.91 400 36.91 - - - -
rA = 0 14 840.80 401 38.80 3.89 1 0.05* ACE
rC = 0 14 837.13 401 35.13 0.22 1 0.64 ACE
rE = 0 14 838.80 401 36.80 1.89 1 0.17 ACE
SingTheNote
PD
ACE 15 1096.92 406 284.92 - - - -
rA = 0 14 1098.22 407 284.22 1.30 1 0.25 ACE
rC = 0 14 1097.68 407 283.68 0.76 1 0.38 ACE
rE = 0 14 1100.29 407 286.29 3.37 1 0.07 ACE
HappyBirthday
PD
ACE 15 848.60 407 34.60 - - - -
rA = 0 14 850.69 408 34.69 2.10 1 0.15 ACE
rC = 0 14 849.20 408 33.20 0.61 1 0.44 ACE
rE = 0 14 849.31 408 33.31 0.72 1 0.40 ACE
HappyBirthday
ID
ACE 15 737.60 407 -76.40 - - - -
rA = 0 14 738.70 408 -77.30 1.10 1 0.29 ACE
rC = 0 14 738.60 408 -77.40 1.00 1 0.32 ACE
rE = 0 14 738.38 408 -77.62 0.78 1 0.38 ACE
HappyBirthday
KD
ACE 15 871.67 407 57.67 - - - -
rA = 0 14 872.66 408 56.66 0.99 1 0.32 ACE
rC = 0 14 872.97 408 56.97 1.31 1 0.25 ACE
rE = 0 14 871.69 408 55.69 0.02 1 0.88 ACE
SingTheTune
PD
ACE 15 913.21 401 111.21 - - - -
rA = 0 14 921.76 402 117.76 8.55 1 0.00** ACE
rC = 0 14 913.23 402 109.23 0.02 1 0.89 ACE
rE = 0 14 913.52 402 109.52 0.31 1 0.58 ACE
SingTheTune
ID
ACE 15 895.03 401 93.03 - - - -
rA = 0 14 901.22 402 97.22 6.20 1 0.01* ACE
rC = 0 14 895.07 402 91.07 0.04 1 0.84 ACE
rE = 0 14 895.11 402 91.11 0.09 1 0.77 ACE
Note. AIC: Akaike’s Information Criterion; df; Degrees of freedom; EP: Estimated parameters;
ID: Interval deviation; KD: Key deviation; PD: Pitch deviation; SINGCOMB: Combined
singing score; -2LL: -2 log likelihood; ∆df: Change in degrees of freedom; ∆χ2: Change in chi-
square test.
*p < .05; **p < .01. Significant genetic and environmental correlations (confidence intervals do
not include zero) are shown in bold.
- 262 -
9.3 Summary of Key Genetic Findings
The key genetic findings presented in this chapter are summarised in point form below.
9.3.1 Results pertaining to the genetic basis of singing
ability
• For SINGCOMB, rMZ (.81-.82) was significantly higher than rDZ (.41-.43) for
both the continuous and categorical measures. Univariate genetic modelling
estimated a significant and substantial genetic component for SINGCOMB: A =
69% (continuous measure); A = 70% (categorical measure).
• Univariate genetic modelling estimated significant genetic components for the
following continuous measures, with moderate to high heritability estimates:
SingTheNote PD, HappyBirthday PD, HappyBirthday ID and SingTheTune PD
(A = 44-71%). Significant genetic components were also estimated for
SingTheNote PD (category), HappyBirthday ID (category) and HappyBirthday
KD (category), with high heritability estimates (A = 72-79%).
• The heritability estimate of HappyBirthday ID (A = 68%) was higher than that of
HappyBirthday PD (A = 44%), whereas the reverse was observed in Sing The
Tune Task, where the heritability estimate of SingTheTune PD (A = 71%) was
higher than SingTheTune ID (A = 28%). In both tasks, the singing measure with
the higher heritability estimate was also observed to have relatively better
behavioural performance.
• The heritability estimates for the categorical measures of HappyBirthday KD
and SingTheTune ID were much higher (A = 72% and 57%) than the heritability
estimates for the corresponding continuous measures (A = 26% and 28%).
• For MatchTheNote PD, rMZ was also significantly higher than rDZ. Univariate
genetic modelling estimated a significant and substantial genetic component for
MatchTheNote PD: A = 60%.
- 263 -
• For self-reported singing ability, rMZ (.87) was significantly higher than
rDZ.(.54). Univariate genetic modelling estimated a significant and substantial
genetic component for self-reported singing ability: A = 72%.
• For self-reported music ability, music interest and singing interest, rMZ was also
significantly higher than rDZ. Significant and substantial heritabilities were also
estimated for these measures (A = 65-81%).
9.3.2 Results pertaining to the genetic bases of
environmental components associated with singing
ability
• For music and singing background components, rMZ was significantly higher
than rDZ for Instrumental Expertise, Years of Music Training and Public Singing.
Significant and substantial heritabilities (A = 46-68%) were estimated for these
measures based on univariate genetic modelling. On the other hand, significant
common environmental influences were estimated for Family Singing (C =
63%).
• Bivariate genetic analyses showed that significant shared additive genetic
influences mediated the associations between:
o Instrumental Expertise and all the singing task measures.
o Years of Music Training and all the singing task measures (except
HappyBirthday ID).
• Bivariate genetic analyses also showed that significant shared additive genetic
influences mediated the associations between:
o Personal Singing and the task measures SINGCOMB, SingTheTune PD,
and SingTheTune ID.
o Music Listening and the task measures SINGCOMB, SingTheTune PD,
and SingTheTune ID.
o Instrumental Expertise and MatchTheNote PD.
o Years of Music Training and MatchTheNote PD.

- 264 -
• Bivariate genetic analyses also showed that significant shared common
environmental influences mediated the associations between:
o Family Singing and all the singing task measures.

- 265 -
DISCUSSION OF
GENETIC FINDINGS
This chapter discusses the genetic findings in light of the two main aims outlined in
Section 4.6, namely, to investigate the genetic basis of singing ability and the genetic
bases of environmental components associated with singing ability. The discussion will
also examine whether the findings confirmed the hypotheses stipulated a priori and
whether the findings corroborate with evidence from previous studies.
10.1 Investigating the Genetic Basis of Singing Ability
10.1.1 Objectively-assessed singing ability across all tasks
Overall, the significantly larger ICC in MZ twins compared to DZ twins for
SINGCOMB and the large genetic contribution (A = 69-70%) on SINGCOMB
confirmed the first hypothesis of the primary aim of the study. In particular, the findings
provide strong evidence that there are substantial genetic influences underlying the
variation of singing ability in the current twin sample, when singing proficiency across
all tasks is considered as a collective whole. Notably, the heritability estimates of
SINGCOMB using either continuous or categorical measures were highly consistent
with each other (A = 69% to 70%), thus further strengthening the evidence for the
genetic basis of singing ability.
Univariate genetic modelling conducted on each of the singing task measures also
showed significant genetic influences for most tasks, with moderate to large
heritabilities (26-71%) and negligible to moderate common environmental influences
(0-37%). These heritability estimates were also corroborated by the significantly larger
ICCs in MZ twins compared to DZ twins for most of the task measures. In the

- 266 -
subsequent sections, the genetic influences on each singing task will be discussed in
greater detail.
10.1.2 Sing The Note Task
The significantly higher ICCs of the MZ twins relative to the DZ twins as well as the
substantial genetic influences (A = 69%) estimated for SingTheNote PD served to
demonstrate that the ability to vocally match single pitches has a significant genetic
component, thus confirming part (a) of the first hypothesis. Moreover, the additive
genetic contribution (A) to variances in Sing The Note Task were significantly greater
than the contribution of common environmental (C) influences, which supports the role
played by genetic factors in influencing basic vocal pitch-matching ability.
Apart from the current study, only one other genetic study has assessed vocal pitch-
matching ability (Park et al., 2012). In their pedigree study of a Mongolian population,
Park et al. (2012) reported a moderate heritability of 40% of pitch-matching ability. The
relatively lower heritability estimate in Park et al. (2012) compared to the current study
may reflect their use of a different measure for pitch accuracy (i.e., difference limen
instead of average pitch deviation). In addition, the pitch stimuli used in their study
comprised complex tones instead of sine tones used in the current study. Another
feasible explanation could be a possible Gene × Practice interaction effect on singing
ability. Hambrick and Tucker-Drob (2014) previously demonstrated a Gene × Practice
interaction effect on music accomplishment, where participants with more practice were
observed to have a considerably larger genetic component for music accomplishment
than participants who did not report any music practice. Conceivably, the high
percentage (86%) of musically trained participants in the current sample may have
contributed to the higher heritability estimate for Sing The Note Task, whereas the
lower heritability estimate in Park et al. (2012) may be due to the minimal out-of-school
music training undertaken by most of the participants.
In the same study, Park et al. (2012) identified chromosomal loci 4q23, 4q26 and the
gene UGT8 as potential genetic correlates for vocal pitch-matching ability. This finding
is promising in light of the evidence from previous molecular genetic studies
implicating the nearby locus 4q22 in music perception ability (e.g., Pulli et al., 2008;

- 267 -
Oikkonen et al., 2014). Given that unimpaired perception of external pitch stimuli is
important for accurate vocal imitation of pitch, it is thus plausible that music perception
and vocal pitch-matching may share a common genetic locus on chromosome 4q.
As vocal pitch-matching is a fundamental skill for singing, the large heritable
component estimated for SingTheNote PD serves to bolster the case for a genetic basis
of singing ability.
10.1.3 Happy Birthday Singing Task
In general, the MZ and DZ ICCs and results of univariate genetic modelling on the
various measures of Happy Birthday Singing Task provided support for part (b) of the
first hypothesis, which predicted a significant genetic contribution underlying the ability
to sing a familiar song accurately.
In terms of the continuous measures, HappyBirthday ID yielded a high heritability
estimate (A = 68%), whereas HappyBirthday PD and HappyBirthday KD showed
moderate genetic influences of 44% and 26%, respectively. It is worth noting that the
heritability estimates appeared to correspond with performance on the task measures:
the measure with the highest heritability estimate (ID) was the best performed measure,
while the measure with the lowest heritability estimate (KD) was the least well-
performed measure (in terms of median deviation; see Table 7.1, p. 191).
In Section 8.1 (p. 225), it was argued that the relatively better performance of
HappyBirthday ID may be due to greater salience of relative pitch information in long-
term memory as compared to absolute pitch information (Deutsch, 1972; Dowling &
Bartlett, 1981; Dowling et al., 1995; Dowling et al., 2002). Conceivably, the differential
heritability estimates of the various measures of Happy Birthday Singing Task may
reflect how familiar melodies are encoded and represented in long-term memory, with
stronger music cues in long-term memory (i.e., relative pitch cues) underpinned by
greater genetic influences. Following this line of reasoning, the fact that significant and
moderate genetic influences were also estimated for HappyBirthday (PD) is consistent
with past evidence indicating that absolute pitch information is stored in long-term
music memory (Halpern, 1988; Levitin, 1994), albeit occupying less prominence than

- 268 -
relative pitch information (Creel & Tumlin, 2012). The larger genetic effects on
HappyBirthday ID may therefore imply that ID is a more well-defined phenotypic
marker for the ability to sing familiar songs, and thus can be used by future molecular
genetic studies to investigate the possibility genetic substrates underlying this type of
singing ability. The suitability of ID as a phenotype for singing familiar songs is also
supported by a previous behavioural finding which demonstrated that mean absolute
interval deviation significantly and highly correlated with subjective expert ratings of
pitch accuracy for Happy Birthday (Larrouy-Maestri et al., 2013).
Intriguingly, while the genetic influences for the continuous measure of HappyBirthday
KD were moderate (A = 26%) and statistically insignificant, the heritability estimate for
the corresponding categorical measure for KD was significant and markedly higher (A =
72%). This suggests that the similarity between identical twins was substantially greater
when the ability to stay in key was considered in terms of three broad accuracy or
expertise categories rather than as a continuous measure. Although the heritabilities for
the categorical measures of HappyBirthday PD and HappyBirthday ID were also higher
than their continuous counterparts, the differences between continuous and categorical
measures for PD and ID were not as large.
Being the first study to estimate the heritabilities of melodic singing tasks, there are no
previous genetic studies with which the current findings can be compared in order to
make inferences about the discrepant heritability estimates between the continuous and
categorical KD measures. Previous behavioural studies have however reported that most
listeners, even those with music training, are only able to discern pitch deviations in
singing that exceed 50 cents; even pitch errors as high as 40 cents are not reliably
judged as out of tune (Hutchins et al., 2012; Vurma & Ross, 2006). In addition, Mauch,
Frieler, and Dixon (2014) has noted that even in a sample of accurate singers, a median
absolute intonation drift (i.e., key deviation) of 11 cents was observed during the course
of the recording where participants were asked to sing Happy Birthday accompanied
thrice in a row. Collectively, the aforementioned evidence indicates that slight deviation
in key centre is inevitable even in accurate singers, and average key deviations below 50
cents may be too subtle to be deemed inaccurate by subjective perceptual judgment. As
such, the categorical KD measure may be a more ecologically valid measure to assess
the ability to maintain a reliable tonal centre than the continuous KD measure. If this is

- 269 -
true, based on the categorical KD measure, the ability to maintain a consistent tonal
centre may have a significant and sizeable genetic component. This finding is
preliminary and needs to be replicated by future genetic research using larger samples
of participants.
This interpretation is consistent with previous work showing that the ability to perceive
a distortion of the tonal centre of a familiar song is genetically influenced. Using a
distorted tunes test that required participants to judge whether familiar song fragments
were in-tune or had been distorted melodically (i.e., an abrupt shift of tonal centre in the
middle of the fragment), Drayna et al. (2001) found large genetic influences (A = 71%)
explaining the variation of task performance in a female twin sample. This heritability
estimate for tonal perception ability of familiar songs is strikingly similar to the current
heritability estimate for the ability to maintain a stable tonal centre while singing a
familiar song. Given the possibility of a common genetic locus for single pitch
discrimination and vocal pitch-matching on chromosome 4q, it is conceivable that the
perception and production of tonal centre may also have a shared genetic basis. More
in-depth genetic investigations are warranted to investigate this idea further.
10.1.4 Sing The Tune Task
Finally, part (c) of the first hypothesis was supported by the significantly higher MZ
relative to DZ ICC and large heritability estimate of SingTheTune PD.
The findings indicate that in the current sample, genetic factors were important in
explaining the variation observed in the ability to imitate novel melodies.
Similar to Happy Birthday singing task, the heritabilities estimated for the task
measures from Sing The Tune Task were also very different. In terms of the continuous
measures, although SingTheTune PD demonstrated significant and large genetic
influences (A = 71%) similar to those of SingTheNote PD and HappyBirthday ID, the
genetic influences estimated for SingTheTune ID were moderate (A = 28%) and failed
to reach significance.
Importantly, as with Happy Birthday singing task, the magnitudes of the heritability
estimates for Sing The Tune Task were observed to correspond with the behavioural

- 270 -
performance. Participants, on the whole, showed better performance in terms of
SingTheTune PD than SingTheTune ID. Correspondingly, the heritability estimate for
SingTheTune PD was higher than that of SingTheTune ID. Following the same line of
explanation as that proposed for the measures in Happy Birthday Singing Task, it is
possible that the disparity between the heritability estimates of PD and ID in Sing The
Tune Task point to preferential encoding of novel melodies in terms of absolute pitches
rather than intervals in short-term memory, before interval information undergoes
consolidation in long-term memory (see Section 8.1, p. 225). The large heritability
estimate for SingTheTune PD may therefore be indicative of a strong genetic
component underlying the superiority of absolute pitch encoding mechanisms in the
short-term retention of music. Furthermore, the sizeable genetic component may
suggest that SingTheTune PD is a more suitable phenotypic marker for the ability to
sing novel tunes which can facilitate the identification of accurate genotype for this type
of singing ability.
While no genetic studies to date have investigated the heritability of the ability to
vocally imitate novel melodies, two twin studies have reported high heritability
estimates (58-59%) for the perception of novel melodies using paired discrimination
tasks (Mosing, Madison, et al., 2014; Seesjärvi et al., 2015). As perceiving and
encoding novel melodies with high integrity in short-term memory is a pre-requisite for
subsequent effective manipulation of the melodic information in the working memory,
the substantial genetic influences found for these tasks may be an indication of a
sizeable genetic component for short-term music memory. Provisional evidence of
possible genetic correlates for short-term music memory can be seen in a candidate gene
study which showed that certain polymorphisms of the genes AVPR1A and SLC6A4
were associated with short-term music memory (Granot et al., 2007). The link between
AVPR1A polymorphisms and short-term music memory was also supported by evidence
from Ukkola et al. (2009), who reported associations between AVPR1A gene
polymorphisms and other music perception tasks such as pitch, rhythm and music
pattern discrimination.

- 271 -
10.1.5 Self-reported abilities and interests in singing and
music
As the validity of self-report data has been questioned, the presence of both objectively-
assessed singing ability and self-reported singing ability allowed the current study the
unique opportunity to compare the estimated genetic influences of both. Remarkably,
the heritability estimates of self-rated singing ability and SINGCOMB corresponded
extremely well (A = 72% and 69%, respectively), even down to the confidence interval
ranges. The congruent heritabilities suggest that in this sample, subjectively-assessed
singing ability was a reliable reflection of objectively-assessed singing ability of the
participants, which was corroborated by simple regression analyses that established self-
reported singing ability as a significant predictor of SINGCOMB. The significant and
large heritability estimate of self-rated singing ability thus served to confirm the second
hypothesis of the primary aim of the study (see Section 4.6, p. 108).
Univariate genetic modelling performed on self-rated music ability and self-rated
singing and music interests also revealed that significant genetic influences explained
the variance in these self-ratings, with high heritability estimates ranging from 65%
(Music Interest) to 81% (Music Ability) and statistically insignificant common
environmental influences.
The high heritability estimate obtained for self-reported music ability in the current
study appears to contradict the findings from two twin studies that have used the
Loehlin and Nichols National Merit Twin Sample (Coon & Carey, 1989; Hambrick &
Tucker-Drob, 2014). Both studies reported that music accomplishments were influenced
predominantly by common environmental influences. Hambrick and Tucker-Drob
(2014) did find, however, an interaction effect between genes and practice whereby the
effect of genetic influences on music accomplishments was reported to be larger than
that of a common environment for musically trained participants who reported
practising (A = 59%; C = 27%), while the reverse was true for trained participants who
did not practise (A = 1%; C = 76%). On the other hand, Vinkhuyzen et al. (2009) also
found considerable genetic influences (A = 66%) for self-rated music aptitude in male
twins and moderate genetic influences (A = 30%) in females. Interestingly, when self-
rated exceptional music aptitude was assessed as a dichotomous variable (outstanding

- 272 -
vs. normal) in their study, a substantial genetic component (A = 86%) was reported,
which is similar to the heritability estimate for self-rated music ability in the current
study.
Presumably, the difference in heritability estimates for self-reported music ability of the
present study and those reported by Coon & Carey (1989) and Hambrick & Tucker-
Drob (2014) stemmed from the use of different constructs to represent music ability.
While the current study asked the participants to rate their perceived music ability on a
7-point Likert scale, music ability in Coon & Carey (1989) was based on vocational
interest in music, instrumental music experience, engagement in non-amateur musical
performances, and music prizes received. Hambrick and Tucker-Drob (2014), on the
other hand, used endorsement of one or more questionnaire items pertaining to music
prizes received or out-of-school music performance experience to construct a
dichotomous music accomplishment variable (see Section 2.4.3, p. 58). In contrast, the
self-rated exceptional music aptitude in Vinkhuyzen et al. (2009) and the self-rated
music ability of the current study are probably tapping into similar constructs, which
may explain the congruence in the heritability of self-reported music ability in these two
studies.
While no previous genetic studies have looked specifically at the heritability of self-
rated singing ability and interest, the large genetic component found for singing interest
(A = 72%) in the current study is comparable to the heritability estimate reported by
Coon and Carey (1989) for singing participation in male twins (A = 71%). In contrast,
singing participation in female twins in that study had a larger contribution of common
environmental factors relative to genetic factors (A = 20%; C = 59%). The large
disparity in heritability estimates between the current sample and the female twins in the
study by Coon and Carey (1989) is somewhat surprising, especially considering the
current sample has a large percentage of female twins (76.4%). A possible explanation
is that the measures in the two studies assessed different constructs; while the current
study explicitly asked the participants about their level of interest in singing, the
singing-related questions in Coon and Carey (1989) typically asked participants about
their level of involvement in singing activities such as singing in choirs or small groups
and taking voice lessons. These authors suggest that the gender stereotyping of singing
activities as feminine activities could have resulted in the higher heritability estimate for

- 273 -
male twins, as more inherent interest in singing might be essential for males to
participate in singing activities (Coon and Carey, 1989). On the other hand, peer
influence might have prompted female twins to engage in singing, even if they might
not be inclined to do so by nature, thereby resulting in the larger common
environmental influences. When understood in this context, the current study finding of
a large heritability estimate for singing interest corroborates previous research.
10.1.6 Match The Note Task
Similar to its vocal counterpart (i.e., SingTheNote PD), variation in perceptual pitch-
matching ability was also demonstrated to be explained by a significant and large
additive genetic component (A = 60%) and a moderate unique environmental
component (E = 40%), as measured by MatchTheNote PD. Strong evidence for a
substantial genetic basis for pitch perception ability comes from the observation that
even by considering the lower bound of the confidence interval (i.e., 34%) as a
conservative estimate for heritability, it can still be argued that genetic influences
moderate in magnitude were important for pitch perception. In addition, the non-
overlapping confidence intervals between the estimates for genetic (A) and common (C)
environmental influences further demonstrate the importance of genetic influences in
explaining the variance in pitch perception ability.
A possible genetic basis for fine pitch discrimination was previously proposed by
Cebrian and Janata (2010), who observed that the acuity of auditory mental
representations of pitches in the working memory of many participants without music
training were comparable to those of participants with substantial music training. Two
genetic studies provided evidence of significant genetic influences for pitch perception
ability using tasks involving paired pitch discrimination judgment. While Mosing,
Madison, et al. (2014) found significant yet modest genetic influences (A = 30%) for the
pitch perception of female twins, a number of large Finnish pedigree studies reported
high heritability estimates ranging from 52% to 68% in their pedigree sample
(Oikkonen et al., 2014; Pulli et al., 2008; Ukkola et al., 2009). The large heritability
estimate of MatchTheNote PD obtained in the current study is therefore consistent with
the findings from the majority of studies using similar tasks, suggesting a sizeable
genetic component underlying basic pitch discrimination ability.

- 274 -
Several chromosomal loci containing genes implicated in the auditory pathway have
been identified as possible genetic substrates for pitch perception in various molecular
genetic studies (Kanduri, Raijas, et al., 2015; Liu et al., 2016; Oikkonen et al., 2014;
Ukkola et al., 2009). For instance, the chromosome region 3q21.3 was shown to be
strongly associated with Seashore pitch test and the combined music perception score in
a genome-wide linkage and association study (Oikkonen et al., 2014). Located near this
region is the GATA2 gene, a transcription factor whose function includes regulating the
development of the inner ear and the inferior colliculus (Haugas et al., 2010; Lahti et al.,
2013), which in turn are implicated in tonotopic mapping. This makes GATA2 a likely
candidate gene for basic pitch discrimination ability. The PCDH7 gene (protocadherin
7) at 4p15.1, which is located next to the best linkage evidence for Seashore Pitch Test
(4p14), was also demonstrated to play a role in cochlear development (Lin et al., 2012).
Similarly, a recent genome-wide study found positive selection of genes related to
auditory pathway development (e.g., GPR98 at 5q14.3 and USH2A at 1q32.3-41) in
participants with high combined music perception scores (Liu et al., 2016).
Importantly, increasing evidence has emerged for the involvement of chromosome 4q in
music ability. A wide linkage region spanning 4p15 to 4q24 was observed for pitch and
rhythm discrimination as well as auditory structuring ability (Oikkonen et al., 2014),
which partially replicated an earlier study finding relating to the contribution of
chromosome 4q22 in music perception (Pulli et al., 2008). Interestingly, chromosome
4q22 harbours the gene SNCA, which is regulated by the aforementioned GATA2 gene
and was shown to be increasingly expressed in musically-trained participants after
listening to classical music (see Section 2.4.1.1, p. 33).
10.2 Investigating the Genetic Bases of Environmental
Components Associated with Singing Ability
10.2.1 Components related to formal music training
Both Instrumental Expertise and its subcomponent Years of Music Training were
demonstrated to have significant genetic components with moderate to large heritability
estimates (A = 68% and 46%, respectively). This confirmed the first hypothesis of the

- 275 -
second aim of the study, which predicted a significant genetic contribution for
environmental components related to formal music training. As Years of Music
Training is clearly related to and may be regarded as a coarser indicator of the amount
of accumulated music practice, the moderate heritability estimate for Years of Music
Training in the current study corroborates two recent twin studies that have reported
moderate to large heritabilities (A = 38% to 69%) for music practice (Hambrick &
Tucker-Drob, 2014; Mosing, Madison, et al., 2014)
Although common environmental influences were not statistically significant for both
variables, the moderate magnitude of the common environmental component (C = 38%)
suggests that common environmental factors are also necessary to explain the variation
in Years of Music Training in the sample. The proposed importance of common
environmental influences is reasonable, because in the case of music training, parents
would usually let both twins take music lessons, instead of depriving one of them the
opportunity.
It is interesting to note, however, that genetic influences were larger than common
environmental influences, indicating that identical twin pairs correlate more highly than
non-identical twins in terms of the duration of formal music training. This suggests that
there is a genetic basis for persisting with music training, which may in turn be linked to
one’s interest and motivation towards music learning. It is possible that the motivation
to learn music might have stemmed from sibling rivalry, which, incidentally, was
reported to have a substantial genetic component (A = 52%) in a previous twin study
(Pike & Atzaba-Poria, 2003). The sizeable heritability estimate for self-reported music
interest lends support to this claim. In addition, the relatively higher heritability estimate
for Instrumental Expertise, which comprised items such as motivation level for
instrumental learning and peak weekly practice duration, as compared to Years of
Music Training, also gives credence to the importance of these factors in influencing the
genetic contribution to Years of Music Training. Furthermore, music flow (i.e., the state
of total absorption in musical activity) was demonstrated to have a moderate heritable
component (A = 40%) and substantial shared genetic influences with accumulated music
practice in a recent study (Butkovic et al., 2015). Thus, it is possible that the genetic
influences underlying music flow might also contribute to the genetic component of
Years of Music Training.

- 276 -
The predominant influence of genetic factors on Instrumental Expertise, however, was
contrary to the findings of Coon and Carey (1989) for instrumental music engagement,
which was reported to have low to moderate genetic influences and substantial common
environmental influences. One possible explanation could be that the Instrumental
Expertise component in the present study included items such as self-rated instrumental
ability and motivation level for instrumental learning, whereas instrumental music
engagement in Coon and Carey (1989) primarily reflected involvement and
participation only, without personal assessment of expertise and motivation. As
involvement does not necessarily imply expertise, it is reasonable to consider
Instrumental Expertise as a better gauge of a participant’s instrumental training.
Notably, bivariate genetic analyses also demonstrated that Instrumental Expertise and
Years of Music Training have significant shared additive genetic influences with the
singing task measures, which confirmed the second hypothesis of the second aim of the
study. This predicted a partially shared genetic basis between these components and
singing ability. The current study is the first to demonstrate that the association between
formal music training and singing ability is significantly mediated by shared genetic
influences. In addition, the significant genetic overlap between formal music training
and music perception ability (as measured by MatchTheNote PD) observed in the
current study is consistent with previous evidence of significant genetic correlations
between accumulated music practice and music perception ability (Mosing, Madison, et
al., 2014).
Collectively, the findings appear to corroborate molecular genetic evidence of a putative
common genetic locus at 4q22-23 for music aptitude (as measured by music perception
ability) and vocal pitch-matching accuracy (Oikkonen et al., 2014; Park et al., 2012;
Pulli et al., 2008). It is possible that an underlying common genetic factor predisposes
both pitch perception and production ability, which may also enable one’s music ability
to be better facilitated by music training. Interestingly, unlike additive genetic
influences, neither common nor unique environmental influences were statistically
significant in explaining the associations between formal music training and the task
measures. This suggests that the environmental effects influencing singing ability may
be different from those influencing instrumental music training. It is also possible that
- 277 -
the current study is underpowered to detect significant environmental correlations
between the two.
10.2.2 Singing-related components
Of the three singing-related background components, only Public Singing had a
significant and large genetic component (A = 66%), albeit with a wide confidence
interval. As the items constituting Public Singing include singing together with or in the
presence of others (e.g., with friends, in a choir or as a soloist), Public Singing may be
reflective of a social component. Sociability has been previously demonstrated to have
significant additive and dominant genetic components in a twin study (Olson, Vernon,
Harris, & Jang, 2001). In addition, a polymorphism of SLC6A4 which was associated
with cooperative behaviour (Saiz et al., 2010) was found to be associated with choir
participation in a candidate gene study (Morley et al., 2012). These findings support the
possibility that the social aspects of singing may account for the significant genetic
influences observed for Public Singing.
Bivariate genetic analyses did not reveal any significant shared genetic and
environmental influences between Public Singing and the singing tasks, except for the
significant unique environmental correlation with SingTheTune ID. This was somewhat
intriguing, especially considering the significant and high heritability estimate of Public
Singing in univariate genetic modelling. Besides the possibility that the small sample
size lacked the statistical power to detect significant genetic or environmental
correlations between Public Singing and most of the task measures, another possibility
is that the genetic influences underlying singing accuracy are distinct from those
underlying Public Singing, which relates more to social factors. This is somewhat in
line with the findings from Morley et al. (2012), who reported no significant association
between choir participation and the AVPR1A polymorphisms, which were reportedly
associated with music perception ability (Ukkola et al., 2009). The researchers
conjectured that the significant association of choir participation with SLC64 may
suggest a predisposition to group activity. It is thus plausible that in the current study,
Public Singing may be a phenotype for social singing behaviour rather than a phenotype
for singing ability per se, which may have therefore resulted in distinct genetic
influences for the two variables.

- 278 -
Conversely, Family Singing had a significant and substantial common environmental
component (C = 63%) and an insignificant, negligible genetic component. This result
suggests that identical and non-identical twins raised in the same homes probably
experienced equally similar family music and singing environment in childhood.
Importantly, this result supports the validity of the equal-environment assumption,
which is a crucial assumption for the classical twin design (Rijsdijk & Sham, 2002).
The equal-environment assumption stipulates that identical and non-identical twin pairs
are similarly correlated in experiencing environmental conditions that are important to
the trait of interest. As Family Singing mostly consisted of items pertaining to
childhood engagement in singing activities with one’s family, it can be considered as a
trait-relevant environmental exposure for subsequent singing ability.
Interestingly, Family Singing was shown to have significant shared common
environmental influences with all the singing task measures. This points to the
importance of a conducive family singing environment in shaping a child’s subsequent
singing ability. As mentioned in Section 3.3 (p. 68), numerous studies have already
detailed how a musically rich family environment can positively impact on the musical
outcome of children (Brand, 1986; Custodero, Rebello Britto, & Brooks-Gunn, 2003;
Ilari et al., 2011; McPherson, 2009; Zdzinski, 1996).
Univariate genetic modelling revealed that neither additive genetic nor common
environmental influences were statistically significant in explaining the variance in
Personal Singing; only unique environmental influences were significant (E = 44%).
Despite having a moderate heritability estimate (A = 33%), the non-significance of the
genetic influences was somewhat surprising, as one might have expected the heritability
estimates of Personal Singing and self-reported singing interest to be similar. As
Personal Singing only contains two components that asked participants to indicate how
often they sang by themselves in childhood as well as currently, it is possible that this
component is not a good indicator of singing interest because having a twin sibling
might mean that there was little opportunity for twins to sing by themselves during
childhood, and hence most twins might not have rated this component highly. It is also
possible that the small twin sample was underpowered to detect the significance of the
genetic contribution on Personal Singing through univariate genetic analysis.

- 279 -
10.2.3 Music Listening
Apart from Family Singing, among the music and singing background components,
Music Listening had the lowest heritability estimate (A = 14%) and was not statistically
significant. It is interesting to note that Music Listening and Family Singing were the
two most important predictors of SINGCOMB among the background components, yet
both variables had the lowest heritability estimates. In a similar fashion to Family
Singing, Music Listening may be reflecting, in part, the childhood family music
environment which helped shape subsequent singing ability. The low and statistically
insignificant genetic influences on Music Listening thus served to bolster the equal-
environment assumption, confirming that identical and non-identical twin pairs were
similarly correlated in terms of childhood music environment. Fulfilling the equal-
environment assumption in turn affirms that the greater MZ twin similarity relative to
DZ twin similarity on the objective task measures truly reflects genetic influences, thus
giving credence to the genetic findings of the current study (Rijsdijk & Sham, 2002).
In the present study, the Music Listening component likely represents a passive music
listening behaviour during childhood that was determined mostly by the parents or other
family members. It is possible that the heritability estimate for music listening may have
been higher if the music background questionnaire contained questions asking
participants about their current or lifelong music listening frequency, and differentiated
clearly between active and passive music listening. Ukkola-Vuoti et al. (2011) reported
that current active listening and active listening across the lifetime were significantly
associated with music perception ability and the AVPR1A haplotypes, whereas passive
music listening (current or over the lifetime) was not significantly associated with music
discrimination. Furthermore, Kanduri, Raijas, et al. (2015) observed an upregulation of
the gene SNCA in musically-trained participants after listening to classical music. SNCA
is located at 4q22, which has been proposed along with nearby loci to be a putative
chromosomal region important for music aptitude (Oikkonen et al., 2014; Park et al.,
2012; Pulli et al., 2008). Interestingly, other genes that were increasingly expressed
include HDAC4 (2q37.3) and FAM49B (8q24.21), both of which have been suggested to
be potentially linked to absolute pitch ability (Gervain et al., 2013; Theusch et al.,
2009).

- 280 -
Bivariate genetic analyses revealed that both Music Listening and Personal Singing
have significant genetic correlations with Sing The Tune task measures and
SINGCOMB. This means that some genetic influences which bear on the performance
in Sing The Tune Task (and the combined singing score in general) may also predispose
the frequency with which participants listened to music during childhood, and the
frequency with which they sang or currently sing by themselves. As Sing The Tune
Task requires good pitch and melodic processing ability and the ability to translate
melodic information into appropriate vocal-motor codes, it is conceivable that inherent
abilities or inclinations for music listening and exploring one’s own singing voice may
partially contribute to the genetic component for the Sing The Tune task measures.
10.3 Summary of Discussion
In relation to the primary aim of the study (i.e., determining whether there is a sizeable
genetic component for singing ability), genetic analyses revealed that there are
substantial genetic influences underlying the variance of singing proficiency across all
singing tasks, as shown by the large genetic contribution (A = 69-70%) on SINGCOMB,
thus confirming the first hypothesis of the primary aim. In addition, sub-hypotheses
were confirmed as significant genetic influences were estimated for some of the singing
measures used to assess the abilities to vocally match single pitches (A = 69%), sing a
familiar song (A = 44-72%), and imitate novel melodies (A = 71%)
For each of the two melodic singing tasks, it was observed that the singing measure
with relatively better behavioural performance also had a correspondingly higher
heritability estimate compared to other measures of the same task. It was speculated that
the better behavioural performance and higher heritability estimates reflect the
preferential encoding of relative pitch and absolute pitch in long-term and short-term
music memory, respectively.
The second hypothesis of the primary aim was confirmed by the significant genetic
component estimated for subjectively-assessed singing ability based on self-report (A =
72%). The similarity in the heritability estimates of self-rated singing ability and

- 281 -
SINGCOMB suggests that in this sample, self-reported singing ability was a reliable
reflection of objectively-assessed singing ability of participants.
Finally, the significant and considerable genetic influences estimated for perceptual and
vocal pitch-matching were consistent with previous findings from behavioural and
molecular genetic studies.
With reference to the second aim of the study (i.e., determining the genetic basis of
environmental components associated with singing ability), significant genetic
influences were estimated for environmental components related to formal music
training (i.e., Instrumental Expertise and Years of Music Training). The findings were
in line with two recent twin studies that have reported moderate to large heritabilities (A
= 38% and 69%) for music practice. Bivariate genetic analyses also revealed a partially
shared genetic basis between these components related to music training and singing
ability. Similarly, the associations between music perception ability and these training-
related components were demonstrated to be mediated by significant shared additive
genetic influences. The findings are in line with previous evidence of significant genetic
correlations between music perception ability and accumulated music practice (Mosing,
Madison, et al., 2014).
As for other singing and music background components, the large genetic component (A
= 66%) for Public Singing might be reflective of the social aspect of singing, rather than
a phenotype for singing ability per se. The negligible genetic influences for Family
Singing and Music Listening suggest that identical and non-identical twin pairs were
similarly correlated in terms of childhood singing and music environment. These results
provide promising evidence for the equal-environment assumption, which is a crucial
assumption for the classical twin design.
The significant shared common environmental influences between Family Singing and
all the singing task measures may point to the importance of a conducive family singing
environment in shaping subsequent singing ability of children. Finally, Sing The Tune
Task and SINGCOMB had significant genetic correlations with Personal Singing and
Music Listening, which led to the speculation that inherent abilities or inclinations for

- 282 -
music listening and singing by oneself may partially contribute to the genetic
components of these singing measures.

- 283 -
CONCLUSION
11.1 Summary of Thesis
Singing ability is probably the most universal and multi-faceted form of music making
that encompasses a range of music perception and production subskills. Investigating
the genetic basis of singing ability is thus an important step towards developing a
greater understanding of the genetic basis of music ability.
In this thesis, the genetic basis of singing ability was examined using a twin study
design, which is effective in disentangling the relative contributions of genetic and
environmental influences on the variation of a trait in a population.
The study sought to interrogate two main research questions: 1) Is there a sizeable
genetic component for singing ability?; 2) Is there evidence of genetic influences on the
environmental components associated with singing ability?
To answer the first question, singing ability was both objectively and comprehensively
assessed using three singing tasks, as well as subjectively-assessed based on self-
reports. Univariate genetic analyses confirmed the main study hypothesis by
demonstrating the presence of significant and substantial genetic influences (A = 69-
70%) underlying the variation in singing ability across all tasks. In particular, there were
evidence of significant genetic contribution to the ability to vocally match single pitches
(A = 69%), to sing a familiar song (A = 44-68%) and to sing novel melodies (A = 71%),
although the heritability estimates in each task varied depending on the task measure
used. The significant and large heritability estimate for self-rated singing ability (A =
72%) was consistent with the sizeable genetic influences found for objectively-assessed
singing ability, thereby strengthening the case for the genetic basis of singing ability. In
addition, the congruent heritability estimates between self-rating and objective

- 284 -
assessment lend support to the reliability of findings from previous genetic studies that
utilised self-report measures (Vinkhuyzen et al., 2009).
The second research question was addressed by identifying environmental components
associated with singing ability from a singing and music background questionnaire and
estimating the genetic influences on these components using univariate genetic
analyses. The significant genetic components (A = 46% and 68%) estimated for Years
of Music Training and Instrumental Expertise confirmed the study hypothesis which
predicted a significant genetic contribution for environmental components related to
formal music training. Moreover, bivariate genetic analyses demonstrating significant
genetic correlations between the two components and singing ability also supported the
second hypothesis which predicted a partially shared genetic basis between formal
music training and singing ability. While significant genetic correlations between music
perception ability and accumulated music practice have been previously reported, this
study was the first to report a similar finding for singing ability and formal music
training. These promising results therefore help establish the genetic bases of
environmental components associated with singing ability.
11.2 Implications for Research
For a long time, in the field of developmental psychology and music education research,
many have argued in favour of the overriding importance of nurture in the development
of music ability (Howe et al., 1998; Lehmann, 1997; Sloboda, 1996), to the extent that
the importance of nature has not been given its due consideration. In line with recent
music genetic research (Mosing, Madison, et al., 2014; Oikkonen et al., 2014; Park et
al., 2012; Pulli et al., 2008; Ukkola et al., 2009), the current twin study challenged this
prevailing view and demonstrated that both singing ability and music perception ability
have substantial genetic components. Moreover, the study showed that some ostensibly
“environmental” variables that were associated with singing and music perception were
also significantly influenced by genetic factors. The undeniable role played by genes in
influencing music and singing ability was further strengthened by the evidence that the
associations between the singing task measures and environmental components relating
to formal music training were significantly mediated by shared additive genetic
- 285 -
influences. These findings give clear indication that an extreme “environmentalist”
account of music and singing development is untenable. The importance of genetic
influences is unlikely to be limited to merely conferring innate anatomical or
physiological advantages that enable some individuals to become expert singers and
musicians. Rather, according to the current findings and other recent genetic research,
the impact of genes in shaping music and singing ability is likely to be much more far-
reaching.
In view of this, it is hoped that the findings from the current study will attract more
research efforts into uncovering the genetic basis of other music abilities and music-
related traits, such as those pertaining to individual differences in learning and
motivation. In this respect, behavioural genetics is especially valuable in interrogating
the interplay between genes and the environment and how this affects individual
differences in musical traits. The utility of behavioural genetics in disentangling genetic,
common environmental and unique environmental influences may sway researchers to
put aside their “nurture bias” and give greater consideration to the impact of genetic
influences by measuring environmental effects using genetically sensitive research
designs. For instance, potential gene-environment correlations between music ability
and related environmental variables can be detected through bivariate twin modelling,
as was demonstrated in the present study.
Linking the genetic findings of the current study back to the vocal sensorimotor loop
(VSL) proposed by Dalla Bella (see Section 4.2.1, p. 86), it can be observed that the
current findings provide preliminary evidence of genetic influences on several
components of the VSL. For instance, the genetic influences on Match The Note Task
demonstrate the heritability of the pitch perception component of the VSL. The memory
components (both long-term and short-term) of the VSL are also likely to be
underpinned by genetic factors, as reflected by the genetic influences on vocal imitation
tasks that rely on short-term music memory system (i.e., Sing The Note Task and Sing
The Tune Task), and familiar song recall task (Happy Birthday Singing Task) that
recruits long-term memory. The genetic effects were particularly salient for task
measures (SingTheTune PD, HappyBirthday ID) that correspond with the preferential
encoding of music in terms of absolute pitch and relative pitch information in short-term
and long-term memory systems, respectively, thereby providing support that the large

- 286 -
genetic influences are likely to pertain to the memory components of the VSL. It is also
possible, however, that the other components further down the loop (e.g., auditory-
motor mapping and motor planning) were genetically influenced. This may be indicated
by the large heritable component estimated for SINGCOMB, which considered the
overall singing accuracy across all singing tasks, regardless of the memory system
enlisted. It may be possible for subsequent behavioural genetic studies with larger
sample sizes to shed light on the heritability of each VSL component using multivariate
genetic models that estimate the proportion of genetic influences shared among different
singing measures, and the proportion that is unique to a particular measure. For
instance, given that Sing The Note Task is the vocal counterpart of Match The Note
Task, the estimated shared genetic influences between the two measures probably
reflect the genetic influences on music perception, which is common to both tasks,
whereas the genetic influences specific to Sing The Note Task possibly indicate the
genetic effects on the auditory-motor mapping and motor planning components.
Findings from behavioural genetic research thus help form a strong basis for conducting
molecular studies aimed at discovering the genetic correlates of various music and
singing abilities.
Molecular genetic investigations can uncover the actual genetic mechanism by which
gene expression may be conditional on environmental factors, and how gene expression
in turn affects neurophysiological processes and ultimately influences musical
behaviour. As music ability is likely to be influenced by multiple genes of small effect,
elucidation of the actual genetic mechanisms of singing ability is expected to be
challenging, since small genetic effects are usually hard to be detected reliably. It is thus
all the more necessary to encourage more research efforts into such genetic
investigations in order to advance understanding of the complexity of genotype-
phenotype relationships in music ability, and how genetic influences may explain the
heterogeneity of music learning outcomes both within and across individuals. The
selection of suitable phenotypic markers is integral to the identification of more accurate
and precise genotypes through molecular studies. As discussed in Section 9.1 (p. 237),
based on heritability estimates obtained in the current study, mean absolute pitch
deviation appears to be a good phenotypic marker for singing ability in tasks that enlist
short-term music memory (i.e., single pitch-matching and melody imitation tasks),
whereas mean absolute interval deviation may be a suitable marker for the ability to

- 287 -
sing familiar songs, due to the salience of interval information in long-term music
memory. The behavioural genetic findings of the current study therefore provide a
useful point of departure for future research that is interested to investigate the
molecular basis of singing.
Ultimately, it is hoped that molecular genetics and neuroscientific research may
eventually provide substantive evidence for inherent musical capacity in human beings.
11.3 Implications for Music Education
Recognising the importance of genetic influences in explaining individual differences in
singing and music ability has important implications for music education. The current
findings and other similar recent work serves to encourage music educators to take into
account the role of genes when devising music teaching strategies. Some music
pedagogues may be uncomfortable with accepting the influence of genetic factors in the
acquisition of music ability because of erroneous beliefs that this may promote social
inequality through selective allocation of resources to certain individuals while
depriving others of the opportunities (Kovas, Tikhomirova, Selita, Tosto, & Malykh,
2016). In reality, however, genetic information can potentially be used to optimise
music learning for everyone by devising more informed and well-tailored music
education and intervention programs that recognise individual differences in musical
strengths and weaknesses and are suited to each individual’s musical capacity.
Despite the well-documented benefits and value of music education, the
Commonwealth Government’s National Review of Music Education revealed that the
situation in Australian music education has reached a “critical point” (Pascoe et al.,
2005), with a dearth of music education opportunities in Australian schools and
communities. The review received one of the largest public responses to a government
inquiry, and established an immediate priority for improving and sustaining the quality
and status of music education in schools. Such effort is especially critical in view of the
fact that active music participation has declined among Australian adults. It is
conceivable that “one-size-fits-all” music education approach may not be effective in
eliciting the same degree of learning outcomes or fostering positive music and singing
- 288 -
experiences in everyone, which in turn may diminish interest and motivation in music
learning and engagement.
To develop teaching strategies that will maximise music learning success for each
person, a better understanding of the roles played by genes and environment in the
aetiology of music ability is thus necessary. It is hoped that continued research efforts in
this field will eventually lead to the identification of genetic and environmental markers
that can account for individual differences in music ability. Based on the preliminary
findings from this study, the numerous singing task measures showing sizeable genetic
influences can potentially be used as phenotypic markers for singing ability. Subsequent
genetic studies can explore possible gene × environment interactions to determine
whether the genetic effects on these phenotypic markers vary as a function of putative
environmental markers, such as Family Singing, Music Listening and Years of Music
Training, as identified in the current study. For instance, gene × environment
interactions may reveal that the genetic influences on one singing phenotype may
diminish as instrumental expertise increases, whereas the genetic influences on another
aspect of singing ability may become less important as the amount of music listening
increases. Understanding the interplay between genetic and environmental influences
would therefore help music educators or parents to develop teaching strategies that will
be particularly effective to address a certain area of singing or music ability, according
to a child’s need. Moreover, understanding how genetic influences on a music or
singing phenotype may vary with age will help parents and music educators to know the
time window during which an ability will be most malleable to intervention or training
strategies. For example, if the genetic influences on a certain music or singing skill are
demonstrated to increase with age in a manner similar to the heritability of IQ, until a
plateau is reached at some point, it is likely that implementing early childhood
intervention or training would be especially beneficial for the development and
acquisition of this particular skill.
The above examples serve to demonstrate how genetic knowledge can be beneficial for
improving the music learning outcomes of all children through the joint efforts of
scientists, educators and policy makers in integrating music-related genetic,
neuroscientific and educational research findings to develop and implement more
efficacious music teaching methods.
- 289 -
11.4 Study Limitations
While the current study has reported many promising findings, there are a number of
limitations. First, as noted in Section 6.1.1 (p. 148), the response rate to the online twin
study was extremely low, with a recruitment rate of approximately 7% from the
Australian Twin Registry. As a result, the sample size for the current twin study was
comparatively smaller than other recent twin studies (Hambrick & Tucker-Drob, 2014;
Mosing, Madison, et al., 2014), albeit comparable in size with that of Seesjärvi et al.
(2015). Although this causes overall power limitations, significant genetic influences
remained evident across various tasks and measures. Moreover, the significantly
different ICCs between MZ and DZ twins across the majority of the task measures
demonstrated the importance of genetic influences in explaining the variation in singing
and music perception abilities.
Second, the majority of the current sample was female (76.4%). While no sex-limitation
effects were detected prior to genetic modelling (see Section 9.1.2, p. 239), and sex was
also included as a covariate in the genetic models, it is conceivable that the findings of
the current study are more applicable to females rather than being representative of the
general population. A larger sample of male twins is necessary to reliably test for sex-
limitation effects and explore whether the relative contribution of genetic and
environmental influences in task variance may differ between males and females.
Third, although it was indicated in the invitation email and information sheet that no
prior singing and music background was required to participate in the study, musically-
trained participants still constituted approximately 86% of the final sample (Table 6.1,
p. 146). There is potentially a selection bias, whereby the current sample was more
musically inclined than the general population. This, however, is unlikely to have
significant bearing on the observed main findings. Although not reported in Chapter 9,
univariate genetic analyses that adjusted for the effects of age, sex and years of music
training were initially conducted for all the objective task measures. After bivariate
genetic analyses revealed that most of the task measures and years of music training had
significant shared genetic influences, the abovementioned univariate genetic modelling
results were excluded from the main findings because the partially shared genetic basis
between the task measures and years of music training implies that adjusting for the

- 290 -
effects of years of music training may cause the genetic influences on the age, sex and
music training-adjusted task measures to be underestimated. Despite the likely
underestimation of genetic effects, apart from Sing The Tune Task, most of the
measures of other music and singing tasks as well as the combined singing score still
showed significant genetic influences after adjusting for the effects of years of music
training (see Table E-13 in Appendix E, p. 391). These results therefore attest to the
importance of genetic factors in the variation of singing and music abilities.
Finally, the online nature of the twin study meant that it was not conducted in a
carefully controlled laboratory setting. Although pre-emptive measures were undertaken
during program development to mitigate potential issues that arise from conducting a
study online (see Section 5.3.1, p. 126), it was not possible to control for every factor.
11.5 Future Directions
In light of the limitation in sample size of the current study, larger twin studies should
conducted in the future to confirm the positive findings from the present study. It is
hoped that the larger sample would comprise more male twins, more non-musically
trained participants, and a more even distribution of MZ and DZ twin pairs. Replication
of the positive findings from the current study by a larger twin study would establish,
beyond question, that singing ability has a substantial genetic component.
Moreover, a larger twin sample likely provides sufficient power to run more complex
genetic analyses and allow more meaningful interpretations to be drawn from the
results. For example, the shared genetic and environmental influences mediating the
associations between the task measures and environmental variables could be more
reliably estimated, which would include determining the extent (in terms of percentage)
to which genetic or environmental factors were shared. In addition, a larger-scaled twin
study would also make it possible to conduct multivariate genetic modelling and
examine how much genetic or environmental factors are shared among different singing
task measures, among singing tasks and music perception tasks, or among the task
measures and other related traits such as cognitive ability or motivation.

- 291 -
A larger twin sample also increases the utility of running other sophisticated genetic
models. For example, univariate genetic models with age as the moderating variable
could help to investigate how the relative contribution of genetic and environmental
factors to music and singing abilities may vary at different ages or stages of
development. Similarly, potential variation in genetic and environmental influences due
to differences in music training duration could be explored by using years of music
training as a moderating variable. Such investigations may enable a better
understanding of the non-static nature of genetic effects on trait variation and help
identify interesting trends in the variation of heritability and environmental influences
with age or with level of music expertise.
Furthermore, subsequent behavioural genetic investigations into singing and music
abilities would be enhanced if twin registries from other countries or cultures could be
utilised in order to study the effects of socio-cultural environment on the heritability
estimates of music abilities and music-related traits. As compared to what was observed
in the current study, it is conceivable that singing or music ability may be subjected to a
stronger environmental component relating to the cultural environment, which
incorporates singing and music making activities into everyday community living, such
as the African culture (Blacking, 1995; Primos, 2002).
Prior to the current twin study, few genetic studies had investigated the genetic basis of
music production ability. It is therefore hoped that the promising results from the
present study will become a driving force for subsequent twin studies to explore the
genetic basis of other music production abilities. If more behavioural genetic studies are
able to demonstrate consistent genetic influences for various music abilities and
determine the degree of shared genetic influence among these traits, this will support
subsequent research efforts to conduct molecular genetic studies to identify the genetic
determinants and mechanisms of singing and music abilities.
11.6 Conclusion
The current twin study is the first to investigate and establish the genetic basis of
singing ability by objectively assessing singing accuracy across a comprehensive set of

- 292 -
singing tasks. The substantial genetic component found for objectively-assessed singing
ability was also supported by subjectively-assessed singing ability, which revealed a
heritability estimate of similar magnitude. In addition, the study provided novel
evidence for a partially shared genetic basis between singing ability and formal music
training. These findings set a valuable background for subsequent behavioural and
molecular genetic studies to continue the investigation of the role of genetic factors in
influencing various forms of music ability.
While the current findings highlight the importance of genetic influences on singing
ability, it should be recognised that the results do not in any way negate the value and
necessity of conducive home and formal music learning environments in the
development of music and singing ability. Parents and music educators are still obliged
to create environments that will be favourable for music development, with due
consideration of individual differences in music ability and interest, so as to optimise
music learning experiences and outcomes. Ultimately, by gaining a more complete
picture of the contributions and interplay of genes and environment in the neurobiology
of music learning and music ability, the current study and other music genetic studies
hope to enable more people to enjoy and maintain lifelong singing and music
engagement, so as to reap the physical, mental, emotional and social benefits singing
and music have to offer. This captures the ethos that was elegantly expressed by
William Byrd, the Renaissance English composer in 1588, in the preface of his
songbook Psalms, Sonnets and Songs,
“Since singing is so good a thing, I wish all men would learn to sing.”

- 293 -
Appendices

- 294 -
Appendix A
RECRUITMENT
INFORMATION

- 295 -
Appendix A-1 Recruitment Email for ATR Twins

- 296 -
Appendix A-2 Recruitment Poster for On-Campus
Participant Recruitment

- 297 -
Appendix A-3 Pre-Screening Zygosity Questionnaire for
Non-ATR Twins
1. Are you part of a set of:
a) Twins
b) Triplets
c) Quadruplets
d) Quintuplets
e) Septuplets
f) Octuplets
g) Others
2. Gender: Male/Female
3. Date of Birth (DD/MM/YYYY): ___________________
4. Which country were you and your twin born in? ___________________
5. (If country of birth was Australia) Which State or Territory were you and your twin
born in?
6. Are you the older twin? Yes/No
7. First Name: ___________________ Preferred Name: ___________________
8. Surname: _____________________ Previous Surname: _________________
Contact details (please provide at least one of the following)
9. Home Phone: __________________
10. Mobile: _______________________
11. Email: ________________________
12. Are you and your twin IDENTICAL or NON-IDENTICAL?
a) Identical
b) Non-identical
c) Not sure

- 298 -
13. How did you find out you were IDENTICAL or NON-IDENTICAL?
a) We think of ourselves this way
b) We were always told we were by our parents
c) We had a DNA test
d) The Doctor/Obstetrician/Midwife told us/our parents
e) We are male/female twins
f) Other reasons: ___________________
14. Do you and your twin have the same eye colour? Yes/No
15. Do you and your twin have similar height, weight and natural hair colour and
texture? Yes/No
16. Were you and your twin usually mistaken for one another by non-family members
as children? Yes/No

- 299 -
Appendix A-4 Study Information Sheet
Dear Twin Registry Member,
We would like to invite you and your twin to participate in an online assessment for our study: Investigating
the Genetic Basis of Singing Ability: A Twin Study. This project will form part of Ms Yi Ting Tan’s
doctoral dissertation.
What is the study about?
Nature or nurture? For centuries, many have been intrigued by the expression of musical abilities. Singing
behaviour is ideal for such investigation because it is a universal trait present in all human societies and
emerges early in human development. Interestingly, singing ability varies across individuals. We have all
heard accounts of “singing families” whose family members appear to possess naturally good singing
abilities. On the other hand, there are also people who cannot seem to carry a tune, even though they may
have other forms of musical abilities, such as playing musical instruments or appreciating music. Brain
research has already shown how the “singing network” in our brain varies with singing ability. This means
it is possible that there is a genetic component to singing ability.
Our study will be the world’s first twin study to investigate the genetic basis of singing ability through an
interactive online assessment. It aims to explore the relative contributions of genetic and environmental
components to singing ability. The online assessment is designed to be fun and engaging, and you can
perform the simple tasks in the comfort and privacy of your own home. Participating in this study does not
require any singing or musical experience. Rather, we invite people from all musical backgrounds to
participate. This will allow us to have a representative set of results to conduct meaningful analyses.
Who is eligible?
We are seeking the participation of identical and non-identical twins aged 15 and above, with no diagnosed
hearing deficits or vocal cord lesions (e.g., nodules, polyps and cysts), no current mental illness (excluding
anxiety and/or depression), and no history of brain injury, stroke, genetic or neurological disorders.
Please note that you will need access to a computer with Adobe Flash Player (this is free and easy to
download on all types of computers), a computer microphone (inbuilt or external; e.g., webcam or
computer headset), and internet capability to participate. Tablets, iPads and smart phones are unable to be
used for the online assessment.
What is involved?
Participation involves the completion of an online assessment, comprising of 6 main singing related tasks
and a questionnaire.
The singing related section consists of:
Brief background questionnaire - includes general questions about your name, gender, date of
birth, first language and ethnicity, and education and employment level.
Familiar song singing task - sing a familiar song in several different conditions (e.g., at a self-
determined pace or a prescribed pace, with or without lyrics), starting at any pitch that is most
comfortable for you.
Manual pitch-matching task - match a series of pitches by moving a pitch slider.
Vocal pitch-matching task - sing a series of pitches that have been played to you.
Vocal melody-matching task - sing several short melodies that have been played to you.

- 300 -
Tongue twister task - one-phrase tongue twister in unpaced and paced conditions.
Distorted tune task - identify the correct version of a familiar song from several mistuned
versions.
The questionnaire component includes questions about your childhood musical environment, musical
expertise, interest in singing and self-assessment of singing ability.
Your responses to certain tasks will be audio-recorded for subsequent data analysis. You will be shown
how to do this by the online program. We estimate that the total time commitment required of you will take
approximately 30 minutes.
What are the benefits of taking part in the study and what kind of feedback will be provided to the
participants?
We hope that you will find the online singing assessment fun and engaging, and that you will enjoy being
able to help our study, which may eventually lead to the development of more sophisticated classroom
singing training programs that take into account differences between individuals, such as musical ability.
Once the study arising from this research has been completed, a brief summary of the findings will be
available to you. It is also possible that the results will be presented at scientific conferences and scientific
journals.
Every twin pair where both twins have completed the entire online singing ability survey will also be
eligible to enter a lucky draw at the end of the recruitment period. Each twin from the winning twin pair
will be awarded an iPad mini with retina display. For more information about the lucky draw, please
refer to the iPad mini lucky draw terms and conditions.
As an exclusive promotion in line with the 2015 Twins Plus Festival, the first 40 pairs of twins who
both complete the entire online singing ability survey between 10AM AEST Sunday 22 March 2015 and
11:59PM AEST Sunday 5 April 2015, will be entitled to receive a $40 WISH eGift card, one for each
twin. For more information about the promotion, please refer to the $40 WISH eGift card Promotion
terms and conditions.
Participation is voluntary.
You are under no obligation to take part in this study and you are free to withdraw at any stage. You may
ask questions and request written information about the study at any time. Should you wish to withdraw at
any stage, or to withdraw any unprocessed data you have supplied, you are free to do so without prejudice.
How will my confidentiality be protected?
All data collected for the study will remain confidential. It will be used only for the purposes of investigating
singing ability. It will be stored securely, with access limited to members of the research team. The
information you provide to the study will not be made available to anyone outside of the research team and
the Australian Twin Registry without your consent.
The research team will not share personal information among family members without the approval of the
individual concerned. The results of the research will be published in a form that will not allow individuals
to be identified.
Where can I get further information?
Should you require any further information, or have any concerns, please do not hesitate to contact Ms Yi
Ting Tan on 0434 498 242 or via e-mail [email protected], or Prof Sarah Wilson on (03) 8344
7391 or via e-mail [email protected], or Prof Gary McPherson on (03) 8344 7889 or via email
[email protected]. Should you have any concerns about the conduct of the project, you are
welcome to contact the Executive Officer, Human Research Ethics, The University of Melbourne, on ph:
8344 2073, or fax: 9347 6739.
Thank you for taking the time to consider this study.
Sincerely,
Ms Yi Ting Tan BMus (Hons)
Prof Sarah Wilson Bsc (Hons), PhD, MAPS, CCN
Prof Gary McPherson DipMusEd, MMusEd, PhD
PhD candidate in Musicology
Melbourne Conservatorium of Music
Professor & Deputy Head of School,
Melbourne School of Psychological Sciences
Ormond Chair and Director, Melbourne Conservatorium of Music

- 301 -
Appendix B
TROUBLESHOOTING
INSTRUCTIONS

- 302 -
Appendix B-1 Troubleshooting Instructions for Problem
with Loading the Program
Having problems? You can contact Yi Ting, the researcher of this study at:
0434498242 (mobile) or [email protected] (email) for troubleshooting
assistance.
Or you can follow the flowchart below to self-troubleshoot:
Are you using a
desktop/laptop? Others
Sorry! The survey can only be
loaded on a desktop/laptop. It
does not support smartphones
(iphone, android or Windows
phone), tablets and iPads
Is Javascript enabled for your browser?
Check at:
http://www.enable-javascript.com/
If it’s not enabled, please enable Javascript
following the instructions on the website
Is Adobe Flash Player installed on your browser?
Check at:
http://get.adobe.com/flashplayer/
Is it the latest version? Install from the link above,
restart browser and try
loading the survey again
No
Yes No
Yes
No
Great! You may
now proceed
with the survey
Does it work? Yes
Yes
No

- 303 -
Try to do a clean install of Flash Player
Follow instructions at:
http://forums.adobe.com/thread/928315
Does it work?
Use another browser to load
the survey, preferably
Firefox or Chrome. If
necessary, run through the
procedure in this flowchart
again with the new browser
Yes
No Great! You may
now proceed with
the survey
Does it work?
Yes
No
Still not working?
For technical assistance, please contact Yi Ting
using the contact information above the flowchart
Clear the Flash Player cache
To do this, go to:
http://www.macromedia.com/support/documentation/en/flashplaye
r/help/settings_manager07.html
Click “Delete all sites”
Yes No
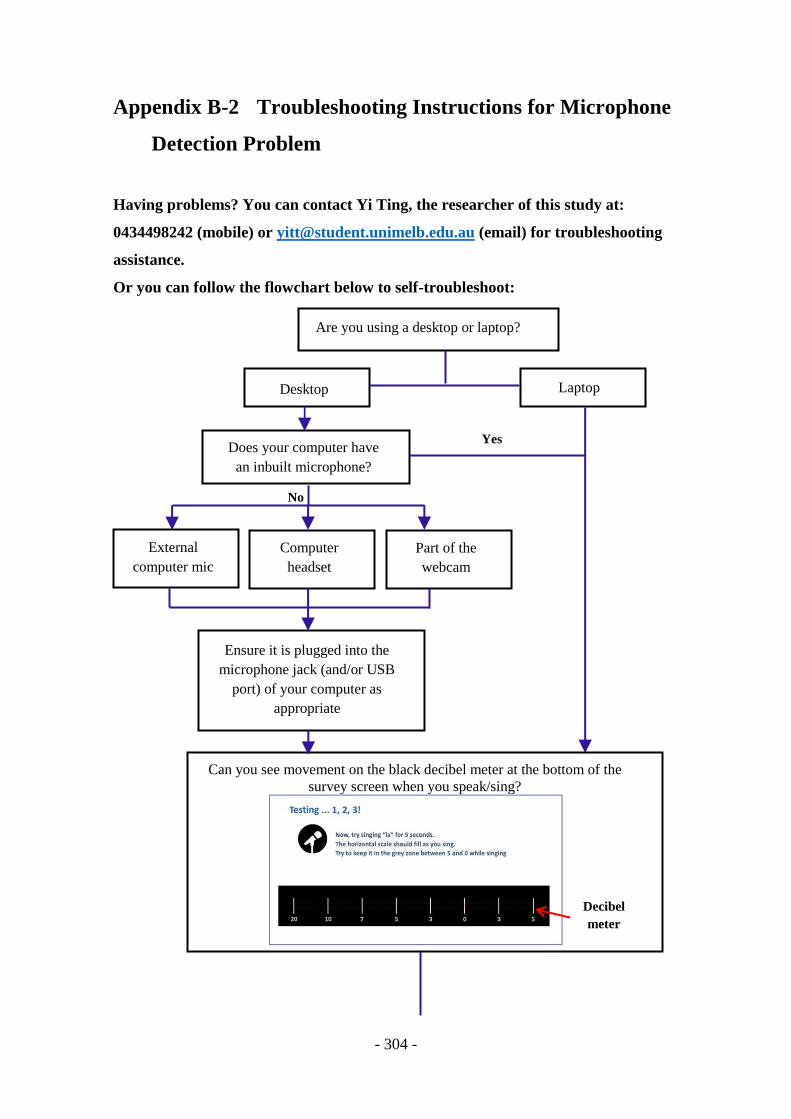
- 304 -
Appendix B-2 Troubleshooting Instructions for Microphone
Detection Problem
Having problems? You can contact Yi Ting, the researcher of this study at:
0434498242 (mobile) or [email protected] (email) for troubleshooting
assistance.
Or you can follow the flowchart below to self-troubleshoot:
Are you using a desktop or laptop?
Laptop
Does your computer have
an inbuilt microphone?
Desktop
Computer
headset Part of the
webcam
Ensure it is plugged into the
microphone jack (and/or USB
port) of your computer as
appropriate
External
computer mic
Yes
No
Can you see movement on the black decibel meter at the bottom of the
survey screen when you speak/sing?
Decibel
meter

- 305 -
Try clapping close to the
microphone. Does the “Click
to proceed” arrow appear?
Yes
Great! You may now
proceed with the survey
No
Volume
indicator
Go back and retry
the previous step
1) Right click anywhere within the box with blue outline until
you see a menu appear:
2) Select “Settings…” and then click on the microphone tab
3) Check that the correct microphone is selected
4) Try speaking (or singing) and check that there is movement
(green line) on the volume indicator (on the left)
5) Click close

- 306 -
Appendix C
PROGRAMMING CODES

- 307 -
Appendix C-1 Praat script for estimating f0 values
# This Praat script gets the sampled f0 values estimated by Praat and
output the values in a text file
# Note: TextGrid and WAV files must have the same file names and be in
the same directory.
form Get F0
comment Directory of sound files
text sound_directory F:\participant\folder\number\
sentence Sound_file_extension .wav
comment Directory of TextGrid files
text textGrid_directory F:\participant\folder\number\
sentence TextGrid_file_extension .label
comment Pitch analysis parameters
positive time_step 0.01
positive minimum_pitch 200
positive maximum_pitch 600
positive voicing_threshold 0.45
positive silence_threshold 0.03
positive octave_jump_cost 0.35
positive octave_cost 0.01
endform
#Read all files in a folder
Create Strings as file list... list
'sound_directory$'*'sound_file_extension$'
numberOfFiles = Get number of strings
for ifile to numberOfFiles
# Extract sampled f0 using the specified pitch settings
filename$ = Get string... ifile
Read from file... 'sound_directory$'/'filename$'
soundname$ = selected$ ("Sound",1)
To Pitch (ac)... time_step minimum_pitch 15 no silence_threshold
voicing_threshold octave_cost octave_jump_cost 0.14 maximum_pitch
Rename: "pitch"
#Delete any existing old f0 files with the same name
filedelete 'sound_directory$''soundname$'.samplef0
# Write-out the header (copy if necessary)
resultfile$ = "'sound_directory$''soundname$'.samplef0"
titleline$ = "intervalname'tab$'SampleTime'tab$'F0(Hz)'newline$'"
fileappend "'resultfile$'" 'titleline$'
# Open a TextGrid by the same name:
gridname$ =
"'textGrid_directory$''soundname$''textGrid_file_extension$'"
if fileReadable (gridname$)
Read from file... 'gridname$'
numberOfIntervals = Get number of intervals... 1
# Get the sampled f0 from each labelled segment

- 308 -
for k from 1 to numberOfIntervals
select TextGrid 'soundname$'
label$ = Get label of interval... 1 'k'
if label$ <> ""
# calculates the onset and offset
onset = Get starting point... 1 'k'
offset = Get end point... 1 'k'
#Get sampled f0 at 0.01 s intervals
for i to (offset-onset)/0.01
time = onset + i*0.01
selectObject: "Pitch pitch"
pitch = Get value at time: time, "Hertz", "Linear"
# Save result to text file:
resultline$ =
"'label$''tab$''time''tab$''pitch''newline$'"
fileappend "'resultfile$'" 'resultline$'
endfor
endif
endfor
# Remove the TextGrid object from the object list
select TextGrid 'soundname$'
Remove
endif
# Remove the temporary objects from the object list
select Sound 'soundname$'
Remove
select Strings list
# and move on to the next sound file
endfor
# clean up
select all
Remove

- 309 -
Appendix C-2 VBA macro to export f0 data from .sampledf0
files onto Excel spreadsheet
Sub ReadSamplef0 ()
'=======reading samplef0 files from a participant's folder for all
three tasks
Const adOpenStatic = 3
Const adLockOptimistic = 3
Const adCmdText = &H1
Dim intRow As Integer
Dim num As Integer
Dim ctr As Integer
Dim fileCtr As Integer
Dim cellAlpha As String
Dim refcol As Integer
Dim currFile As String
Dim currfolder As String
Dim file1 As String
Dim filefront As String
Dim fileHBD As String
Dim fileSTN As String
Dim fileSTT As String
Dim taskCtr As Integer
Dim taskName As String
Dim trialNo As String
Dim gender As String
Dim FilePath As String
Dim fileName As String
Dim lineCtr As Integer
currfolder = "216" '=====Change accordingly
gender = "female" '=====Change accordingly
'========file destination
filefront = "F:\PhDstuff\complete pairs analysis\2015 New Proc\"
'========file names for the exported f0, organised by tasks
fileHBD = filefront & currfolder & "\" & currfolder & "_HBDraw.xlsx"
fileSTN = filefront & currfolder & "\" & currfolder & "_STNraw.xlsx"
fileSTT = filefront & currfolder & "\" & currfolder & "_STTraw.xlsx"
file1 = ".samplef0"
For taskCtr = 1 To 3
'====Happy Birthday Singing Task
If taskCtr = 1 Then
Workbooks.Add
ActiveWorkbook.SaveAs fileName:= _
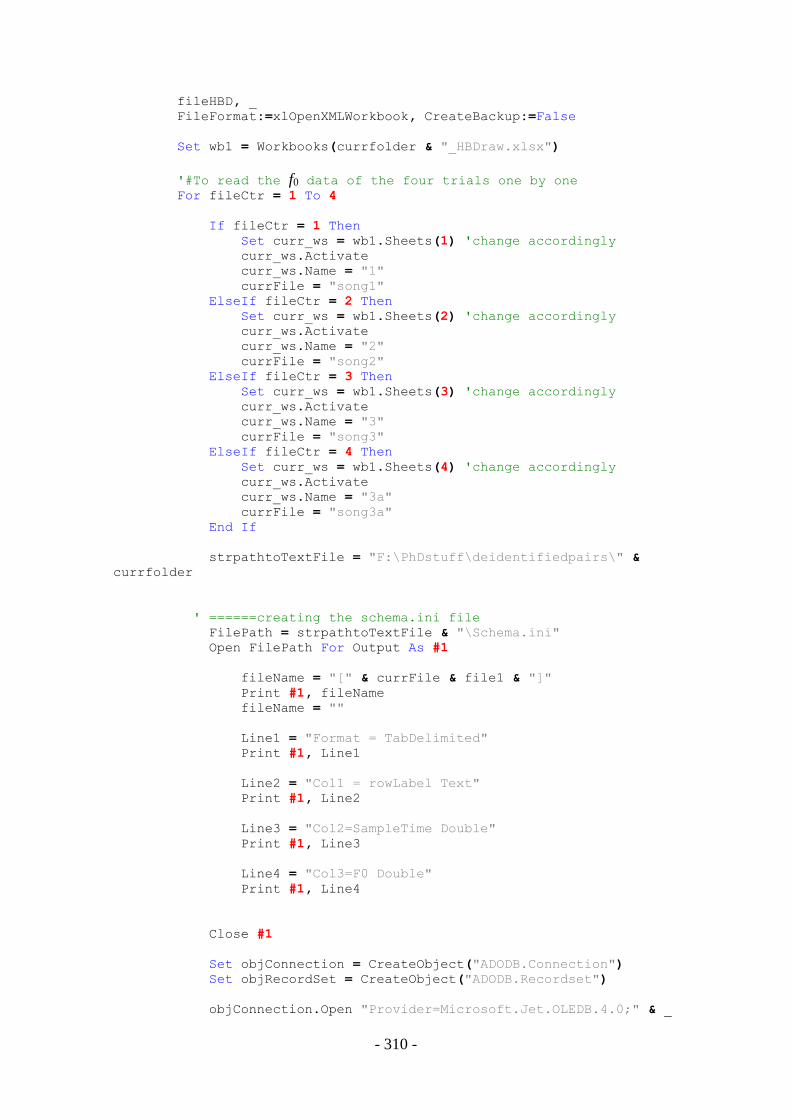
- 310 -
fileHBD, _
FileFormat:=xlOpenXMLWorkbook, CreateBackup:=False
Set wb1 = Workbooks(currfolder & "_HBDraw.xlsx")
'#To read the f0 data of the four trials one by one
For fileCtr = 1 To 4
If fileCtr = 1 Then
Set curr_ws = wb1.Sheets(1) 'change accordingly
curr_ws.Activate
curr_ws.Name = "1"
currFile = "song1"
ElseIf fileCtr = 2 Then
Set curr_ws = wb1.Sheets(2) 'change accordingly
curr_ws.Activate
curr_ws.Name = "2"
currFile = "song2"
ElseIf fileCtr = 3 Then
Set curr_ws = wb1.Sheets(3) 'change accordingly
curr_ws.Activate
curr_ws.Name = "3"
currFile = "song3"
ElseIf fileCtr = 4 Then
Set curr_ws = wb1.Sheets(4) 'change accordingly
curr_ws.Activate
curr_ws.Name = "3a"
currFile = "song3a"
End If
strpathtoTextFile = "F:\PhDstuff\deidentifiedpairs\" &
currfolder
' ======creating the schema.ini file
FilePath = strpathtoTextFile & "\Schema.ini"
Open FilePath For Output As #1
fileName = "[" & currFile & file1 & "]"
Print #1, fileName
fileName = ""
Line1 = "Format = TabDelimited"
Print #1, Line1
Line2 = "Col1 = rowLabel Text"
Print #1, Line2
Line3 = "Col2=SampleTime Double"
Print #1, Line3
Line4 = "Col3=F0 Double"
Print #1, Line4
Close #1
Set objConnection = CreateObject("ADODB.Connection")
Set objRecordSet = CreateObject("ADODB.Recordset")
objConnection.Open "Provider=Microsoft.Jet.OLEDB.4.0;" & _

- 311 -
"Data Source=" & strpathtoTextFile & ";" & _
"Extended
Properties=""text;HDR=YES;FMT=Delimited"""
objRecordSet.Open "SELECT * FROM " & currFile & file1, _
objConnection, adOpenStatic, adLockOptimistic,
adCmdText
'#Write the f0 values of each of the 4 phrases into separate columns
For ctr = 1 To 4
If ctr = 1 Then
cellAlpha = "A"
ElseIf ctr = 2 Then
cellAlpha = "I"
ElseIf ctr = 3 Then
cellAlpha = "Q"
ElseIf ctr = 4 Then
cellAlpha = "Y"
End If
refcol = Range(cellAlpha & 1).Column
intRow = 51
If ctr = 1 Or ctr = 2 Or ctr = 3 Then
Do While objRecordSet(0) <> "p"
Cells(intRow, refcol) = objRecordSet(0)
Cells(intRow, refcol + 1) = objRecordSet(1)
Cells(intRow, refcol + 2) = objRecordSet(2)
intRow = intRow + 1
objRecordSet.MoveNext
Loop
Do Until objRecordSet(0) <> "p"
objRecordSet.MoveNext
Loop
ElseIf ctr = 4 Then
Do Until objRecordSet.EOF
Cells(intRow, refcol) = objRecordSet(0)
Cells(intRow, refcol + 1) = objRecordSet(1)
Cells(intRow, refcol + 2) = objRecordSet(2)
intRow = intRow + 1
objRecordSet.MoveNext
Loop
End If
Next ctr ‘#go to the next phrase in the trial
objRecordSet.Close
objConnection.Close
Set objRecordSet = Nothing
Set objConnection = Nothing

- 312 -
If fileCtr < 4 Then
Sheets.Add after:=ActiveSheet
End If
Next fileCtr ‘#go to the next trial
wb1.Save
'====Sing The Note Task
ElseIf taskCtr = 2 Then
Workbooks.Add
ActiveWorkbook.SaveAs fileName:= _
fileSTN, _
FileFormat:=xlOpenXMLWorkbook, CreateBackup:=False
Set wb2 = Workbooks(currfolder & "_STNraw.xlsx")
taskName = "singTheNote_" & gender 'female/male
If gender = "female" Then
‘#Info from each of the 5 pitch stimuli saved on a
separate spreadsheet
For fileCtr = 1 To 5
If fileCtr = 1 Then
Set curr_ws = wb2.Sheets(1) 'change accordingly
curr_ws.Activate
curr_ws.Name = "B3"
currFile = "B3"
ElseIf fileCtr = 2 Then
Set curr_ws = wb2.Sheets(2) 'change accordingly
curr_ws.Activate
curr_ws.Name = "CS4"
currFile = "CS4"
ElseIf fileCtr = 3 Then
Set curr_ws = wb2.Sheets(3) 'change accordingly
curr_ws.Activate
curr_ws.Name = "DS4"
currFile = "DS4"
ElseIf fileCtr = 4 Then
Set curr_ws = wb2.Sheets(4) 'change accordingly
curr_ws.Activate
curr_ws.Name = "F4"
currFile = "F4"
ElseIf fileCtr = 5 Then
Set curr_ws = wb2.Sheets(5) 'change accordingly
curr_ws.Activate
curr_ws.Name = "G4"
currFile = "G4"
End If
strpathtoTextFile = "F:\PhDstuff\deidentifiedpairs\" &
currfolder

- 313 -
'#For each stimulus, f0 data of each of the 3 trials saved in
separate columns
For ctr = 1 To 3
If ctr = 1 Then 'trial a
trialNo = "_1"
cellAlpha = "A"
ElseIf ctr = 2 Then 'trial b
trialNo = "_2"
cellAlpha = "I"
ElseIf ctr = 3 Then 'trial c
trialNo = "_3"
cellAlpha = "Q"
End If
'===== creating the schema.ini file
FilePath = strpathtoTextFile & "\Schema.ini"
Open FilePath For Output As #1
fileName = "[" & taskName & currFile & trialNo &
file1 & "]"
Print #1, fileName
fileName = ""
Line1 = "Format = TabDelimited"
Print #1, Line1
Line2 = "Col1 = rowLabel Text"
Print #1, Line2
Line3 = "Col2=SampleTime Double"
Print #1, Line3
Line4 = "Col3=F0 Double"
Print #1, Line4
Close #1
'========================
Set objConnection = CreateObject("ADODB.Connection")
Set objRecordSet = CreateObject("ADODB.Recordset")
objConnection.Open "Provider=Microsoft.Jet.OLEDB.4.0;"
& _
"Data Source=" & strpathtoTextFile & ";" & _
"Extended
Properties=""text;HDR=YES;FMT=Delimited"""
objRecordSet.Open "SELECT * FROM " & taskName &
currFile & trialNo & file1, _
objConnection, adOpenStatic,
adLockOptimistic, adCmdText
refcol = Range(cellAlpha & 1).Column
intRow = 51
Do Until objRecordSet.EOF

- 314 -
Cells(intRow, refcol) = objRecordSet(0)
Cells(intRow, refcol + 1) = objRecordSet(1)
Cells(intRow, refcol + 2) = objRecordSet(2)
intRow = intRow + 1
objRecordSet.MoveNext
Loop
objRecordSet.Close
objConnection.Close
Set objRecordSet = Nothing
Set objConnection = Nothing
Next ctr
If fileCtr < 5 Then
Sheets.Add after:=ActiveSheet
End If
Next fileCtr
ElseIf gender = "male" Then
' if male
For fileCtr = 1 To 5
If fileCtr = 1 Then
Set curr_ws = wb2.Sheets(1) 'change accordingly
curr_ws.Activate
curr_ws.Name = "B2"
currFile = "B2"
ElseIf fileCtr = 2 Then
Set curr_ws = wb2.Sheets(2) 'change accordingly
curr_ws.Activate
curr_ws.Name = "CS3"
currFile = "CS3"
ElseIf fileCtr = 3 Then
Set curr_ws = wb2.Sheets(3) 'change accordingly
curr_ws.Activate
curr_ws.Name = "DS3"
currFile = "DS3"
ElseIf fileCtr = 4 Then
Set curr_ws = wb2.Sheets(4) 'change accordingly
curr_ws.Activate
curr_ws.Name = "F3"
currFile = "F3"
ElseIf fileCtr = 5 Then
Set curr_ws = wb2.Sheets(5) 'change accordingly
curr_ws.Activate
curr_ws.Name = "G3"
currFile = "G3"
End If
strpathtoTextFile = "F:\PhDstuff\deidentifiedpairs\" &
currfolder

- 315 -
For ctr = 1 To 3
If ctr = 1 Then 'trial a
trialNo = "_1"
cellAlpha = "A"
ElseIf ctr = 2 Then 'trial b
trialNo = "_2"
cellAlpha = "I"
ElseIf ctr = 3 Then 'trial c
trialNo = "_3"
cellAlpha = "Q"
End If
'===== creating the schema.ini file
FilePath = strpathtoTextFile & "\Schema.ini"
Open FilePath For Output As #1
fileName = "[" & taskName & currFile & trialNo
& file1 & "]"
Print #1, fileName
fileName = ""
Line1 = "Format = TabDelimited"
Print #1, Line1
Line2 = "Col1 = rowLabel Text"
Print #1, Line2
Line3 = "Col2=SampleTime Double"
Print #1, Line3
Line4 = "Col3=F0 Double"
Print #1, Line4
Close #1
'========================
Set objConnection =
CreateObject("ADODB.Connection")
Set objRecordSet = CreateObject("ADODB.Recordset")
objConnection.Open
"Provider=Microsoft.Jet.OLEDB.4.0;" & _
"Data Source=" & strpathtoTextFile & ";"
& _
"Extended
Properties=""text;HDR=YES;FMT=Delimited"""
objRecordSet.Open "SELECT * FROM " & taskName &
currFile & trialNo & file1, _
objConnection, adOpenStatic,
adLockOptimistic, adCmdText
refcol = Range(cellAlpha & 1).Column
intRow = 51

- 316 -
Do Until objRecordSet.EOF
Cells(intRow, refcol) = objRecordSet(0)
Cells(intRow, refcol + 1) = objRecordSet(1)
Cells(intRow, refcol + 2) = objRecordSet(2)
intRow = intRow + 1
objRecordSet.MoveNext
Loop
objRecordSet.Close
objConnection.Close
Set objRecordSet = Nothing
Set objConnection = Nothing
Next ctr
If fileCtr < 5 Then
Sheets.Add after:=ActiveSheet
End If
Next fileCtr
End If
wb2.Save
'====Sing The Tune Task
ElseIf taskCtr = 3 Then
Workbooks.Add
ActiveWorkbook.SaveAs fileName:= _
fileSTT, _
FileFormat:=xlOpenXMLWorkbook, CreateBackup:=False
'
Set wb3 = Workbooks(currfolder & "_STTraw.xlsx")
taskName = "singTheTune_" & gender
'#f0 data of each of the five novel tunes read into separate
spreadsheet
For fileCtr = 1 To 5
If fileCtr = 1 Then
Set curr_ws = wb3.Sheets(1) 'change accordingly
curr_ws.Activate
curr_ws.Name = "3"
currFile = "3"
ElseIf fileCtr = 2 Then
Set curr_ws = wb3.Sheets(2) 'change accordingly
curr_ws.Activate
curr_ws.Name = "6"
currFile = "6"
ElseIf fileCtr = 3 Then
Set curr_ws = wb3.Sheets(3) 'change accordingly
curr_ws.Activate
curr_ws.Name = "8"
currFile = "8"
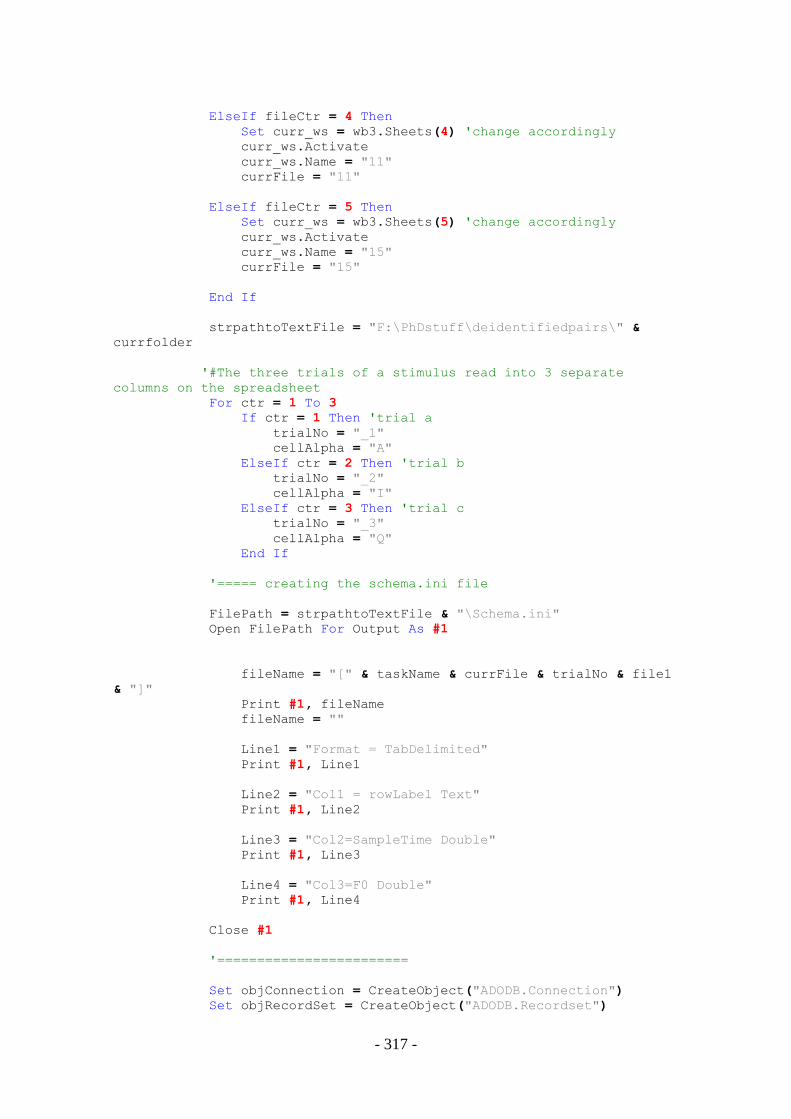
- 317 -
ElseIf fileCtr = 4 Then
Set curr_ws = wb3.Sheets(4) 'change accordingly
curr_ws.Activate
curr_ws.Name = "11"
currFile = "11"
ElseIf fileCtr = 5 Then
Set curr_ws = wb3.Sheets(5) 'change accordingly
curr_ws.Activate
curr_ws.Name = "15"
currFile = "15"
End If
strpathtoTextFile = "F:\PhDstuff\deidentifiedpairs\" &
currfolder
'#The three trials of a stimulus read into 3 separate
columns on the spreadsheet
For ctr = 1 To 3
If ctr = 1 Then 'trial a
trialNo = "_1"
cellAlpha = "A"
ElseIf ctr = 2 Then 'trial b
trialNo = "_2"
cellAlpha = "I"
ElseIf ctr = 3 Then 'trial c
trialNo = "_3"
cellAlpha = "Q"
End If
'===== creating the schema.ini file
FilePath = strpathtoTextFile & "\Schema.ini"
Open FilePath For Output As #1
fileName = "[" & taskName & currFile & trialNo & file1
& "]"
Print #1, fileName
fileName = ""
Line1 = "Format = TabDelimited"
Print #1, Line1
Line2 = "Col1 = rowLabel Text"
Print #1, Line2
Line3 = "Col2=SampleTime Double"
Print #1, Line3
Line4 = "Col3=F0 Double"
Print #1, Line4
Close #1
'========================
Set objConnection = CreateObject("ADODB.Connection")
Set objRecordSet = CreateObject("ADODB.Recordset")

- 318 -
objConnection.Open "Provider=Microsoft.Jet.OLEDB.4.0;" & _
"Data Source=" & strpathtoTextFile & ";" & _
"Extended
Properties=""text;HDR=YES;FMT=Delimited"""
objRecordSet.Open "SELECT * FROM " & taskName & currFile &
trialNo & file1, _
objConnection, adOpenStatic, adLockOptimistic,
adCmdText
refcol = Range(cellAlpha & 1).Column
intRow = 51
Do Until objRecordSet.EOF
Cells(intRow, refcol) = objRecordSet(0)
Cells(intRow, refcol + 1) = objRecordSet(1)
Cells(intRow, refcol + 2) = objRecordSet(2)
intRow = intRow + 1
objRecordSet.MoveNext
Loop
objRecordSet.Close
objConnection.Close
Set objRecordSet = Nothing
Set objConnection = Nothing
Next ctr
If fileCtr < 5 Then
Sheets.Add after:=ActiveSheet
End If
Next fileCtr
wb3.Save
End If
Next taskCtr
End Sub

- 319 -
Appendix C-3 VBA macro for fine-grained pitch
segmentation for Happy Birthday Singing Task
Sub HappyBirthdayPitchSegmentation()
Dim S1a As Integer 'row number of start of segment
Dim S1b As Integer ‘row number of end of segment
Dim S2a As Integer
Dim S2b As Integer
Dim S3a As Integer
Dim S3b As Integer
Dim S4a As Integer
Dim S4b As Integer
Dim S5a As Integer
Dim S5b As Integer
Dim S6a As Integer
Dim S6b As Integer
Dim S7a As Integer
Dim S7b As Integer
Dim S8a As Integer 'just in case it goes up to 8 notes per phrase
Dim S8b As Integer
Dim S1m As Integer
Dim S2m As Integer
Dim S3m As Integer
Dim S4m As Integer
Dim S5m As Integer
Dim S6m As Integer
Dim S7m As Integer
Dim S8m As Integer
Dim S1r As Integer
Dim S2r As Integer
Dim S3r As Integer
Dim S4r As Integer
Dim S5r As Integer
Dim S6r As Integer
Dim S7r As Integer
Dim S8r As Integer
Dim S1s As Integer
Dim S2s As Integer
Dim S3s As Integer
Dim S4s As Integer
Dim S5s As Integer
Dim S6s As Integer
Dim S7s As Integer
Dim S8s As Integer
Dim transDur As Double
Dim frontnum As Integer
Dim backnum As Integer
Dim initFront As Integer
Dim initBack As Integer
Dim refcol As Integer
Dim rownum As Integer

- 320 -
Dim p60 As Double 'name of best threshold determined
Dim cellAlpha As String
Dim a As Integer
Dim b As Integer
Dim c As Integer
Dim d As Integer
Dim e As Integer
Dim F As Integer
Dim i As Integer
Dim j As Integer
Dim sumV As Double
Dim avgV As Double
Dim sdV As Double
Dim sdF As Double
Dim avgF As Double
Dim medF As Double
Dim ctr As Integer
Dim folderCtr As Integer
Dim firstRow As Integer
Dim lastRow As Integer
Dim SA As Integer
Dim SB As Integer
Dim SM As Integer
Dim SN As Integer
Dim roundNo As Integer
Dim count As Integer
Dim velArr() As Double
Dim currVal As Integer
Dim lastX As Integer
Dim lowH As Double
Dim highH As Double
Dim currLM As Double
Dim currHM As Double
Dim currLPG As Double
Dim currHPG As Double
Dim currH As Double
Dim minH As Double
Dim bestT As Integer
Dim totalItem As Integer
Dim signchange As Integer
Dim currCell As Double
Dim currsign As Integer
'change to the Excel file with the sampled f0 data
Set wb = Workbooks("240_HBDraw.xlsx")
For folderCtr = 1 To 4 'process the f0 data from each trial one by
one
Set curr_ws = wb.Sheets(folderCtr)
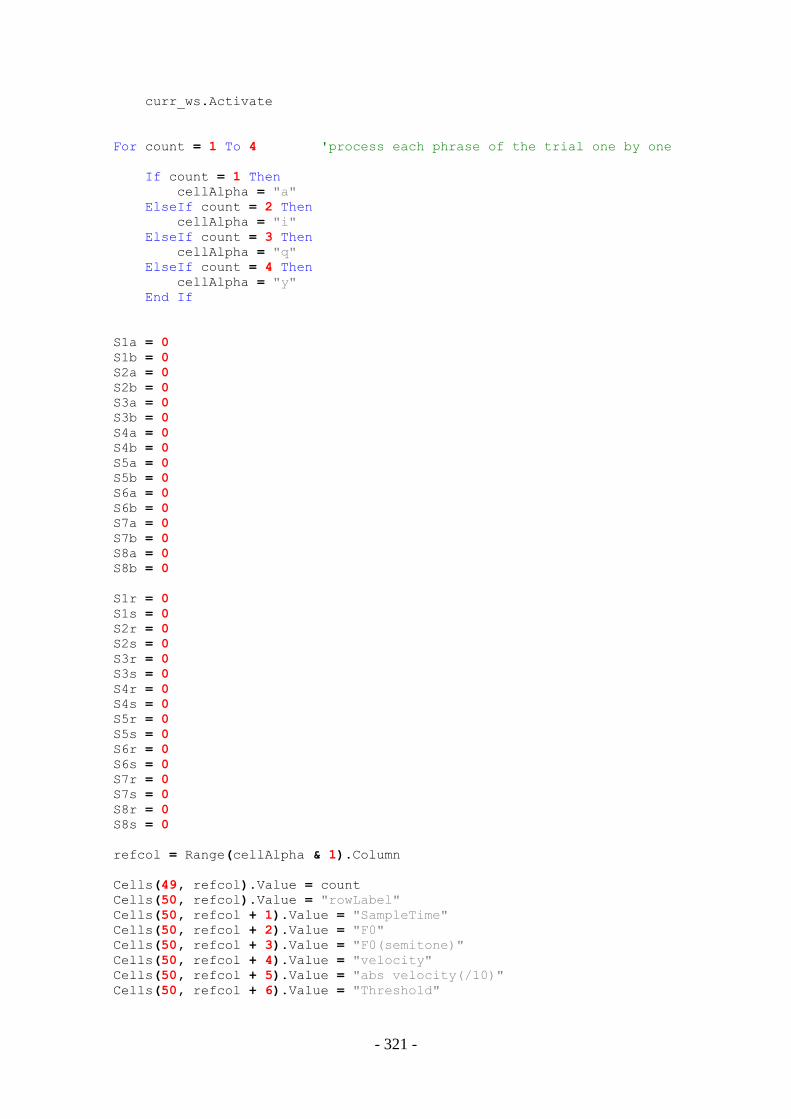
- 321 -
curr_ws.Activate
For count = 1 To 4 'process each phrase of the trial one by one
If count = 1 Then
cellAlpha = "a"
ElseIf count = 2 Then
cellAlpha = "i"
ElseIf count = 3 Then
cellAlpha = "q"
ElseIf count = 4 Then
cellAlpha = "y"
End If
S1a = 0
S1b = 0
S2a = 0
S2b = 0
S3a = 0
S3b = 0
S4a = 0
S4b = 0
S5a = 0
S5b = 0
S6a = 0
S6b = 0
S7a = 0
S7b = 0
S8a = 0
S8b = 0
S1r = 0
S1s = 0
S2r = 0
S2s = 0
S3r = 0
S3s = 0
S4r = 0
S4s = 0
S5r = 0
S5s = 0
S6r = 0
S6s = 0
S7r = 0
S7s = 0
S8r = 0
S8s = 0
refcol = Range(cellAlpha & 1).Column
Cells(49, refcol).Value = count
Cells(50, refcol).Value = "rowLabel"
Cells(50, refcol + 1).Value = "SampleTime"
Cells(50, refcol + 2).Value = "F0"
Cells(50, refcol + 3).Value = "F0(semitone)"
Cells(50, refcol + 4).Value = "velocity"
Cells(50, refcol + 5).Value = "abs velocity(/10)"
Cells(50, refcol + 6).Value = "Threshold"

- 322 -
firstRow = 51
lastRow = Range(cellAlpha & Rows.count).End(xlUp).Offset(0).Row
'last row
'to pad all the f0 values in 'g' segments with 0
i = firstRow
Do While i <= lastRow
If Range(cellAlpha & i).Value = "g" Then
Cells(i, refcol + 2).Value = 0
End If
i = i + 1
Loop
'and delete all the undefined values in the numbered segments
i = firstRow
Do While i <= lastRow
If ((Range(cellAlpha & i).Value = "1" Or Range(cellAlpha &
i).Value = "2" Or Range(cellAlpha & i).Value = "3" Or Range(cellAlpha
& i).Value = "4" Or Range(cellAlpha & i).Value = "5" Or
Range(cellAlpha & i).Value = "6" Or Range(cellAlpha & i).Value = "7")
And IsEmpty(Cells(i, refcol + 2).Value) = True) Or Range(cellAlpha &
i).Value = "n" Then
Range(Cells(i, refcol), Cells(i, refcol + 7)).Delete
(xlShiftUp)
Else
i = i + 1
End If
Loop
'recalculate lastRow again after the shifts
lastRow = Range(cellAlpha & Rows.count).End(xlUp).Offset(0).Row
'last row
'to find the start and end of each coarse segment (a to b)
For ctr = 1 To 8
i = firstRow
Do While Cells(i, refcol).Value <> ctr And i <= lastRow
i = i + 1
Loop
'if i already reaches Lastrow + 1. means there's no such segment
If i = lastRow + 1 Then
frontnum = 0
backnum = 0
Else
frontnum = i
Do While Cells(i, refcol).Value = ctr
i = i + 1
Loop
backnum = i - 1
End If
If ctr = 1 Then
S1a = frontnum

- 323 -
S1b = backnum
ElseIf ctr = 2 Then
S2a = frontnum
S2b = backnum
ElseIf ctr = 3 Then
S3a = frontnum
S3b = backnum
ElseIf ctr = 4 Then
S4a = frontnum
S4b = backnum
ElseIf ctr = 5 Then
S5a = frontnum
S5b = backnum
ElseIf ctr = 6 Then
S6a = frontnum
S6b = backnum
ElseIf ctr = 7 Then
S7a = frontnum
S7b = backnum
ElseIf ctr = 8 Then
S8a = frontnum
S8b = backnum
End If
Next ctr
For ctr = 1 To 8
If ctr = 1 Then
rownum = S1a
ElseIf ctr = 2 Then
rownum = S2a
ElseIf ctr = 3 Then
rownum = S3a
ElseIf ctr = 4 Then
rownum = S4a
ElseIf ctr = 5 Then
rownum = S5a
ElseIf ctr = 6 Then
rownum = S6a
ElseIf ctr = 7 Then
rownum = S7a
ElseIf ctr = 8 Then
rownum = S8a
End If
If rownum <> 0 Then
Range(Cells(rownum, refcol), Cells(rownum, refcol + 6)).Select
'color the beginning of segment.
With Selection.Interior
.Pattern = xlSolid
.PatternColorIndex = xlAutomatic
.Color = 65535
.TintAndShade = 0
.PatternTintAndShade = 0
End With
End If

- 324 -
Next ctr
'===========================
'convert f0 in Hz into semitones
For rownum = firstRow To lastRow
If Cells(rownum, refcol + 2).Value = 0 Then
Cells(rownum, refcol + 3).Value = 0
Else
Cells(rownum, refcol + 3).Value = 1200 * Log(Cells(rownum,
refcol + 2).Value) / Log(2) 'semitone f0 of the next row
End If
Next rownum
'calculate absolute f0 velocity
For rownum = firstRow + 1 To lastRow
If Cells(rownum, refcol + 2).Value = 0 Or Cells(rownum - 1, refcol
+ 2).Value = 0 Or Cells(rownum + 1, refcol + 2).Value = 0 Then 'if
current row, prev row or next row has f0 = 0 (i.e., g segment), assign
velocity as NULL
Cells(rownum, refcol + 4).Value = ""
Else 'compute f0 velocity according to central differentiation only
when the next row and the previous row don't have 0.
Cells(rownum, refcol + 4).Value = (Cells(rownum + 1, refcol +
3).Value - Cells(rownum - 1, refcol + 3).Value) / (Cells(rownum + 1,
refcol + 1).Value - Cells(rownum - 1, refcol + 1).Value)
End If
If Cells(rownum, refcol + 4).Value <> "" Then
Cells(rownum, refcol + 5).Value = Abs(Cells(rownum, refcol +
4).Value) / 10 'absolute f0 velocity (divided by 10 to scale it such
that it fits on the same graph as the f0 graph)
End If
Next rownum
'===Using Shanbhag's fuzzy entropy method to find the best threshold
to separate high f0 velocity regions from low velocity regions in each
phrase
totalItem = WorksheetFunction.CountA(Range(Cells(firstRow + 1, refcol
+ 5), Cells(lastRow - 1, refcol + 5)))
lastX = Int(WorksheetFunction.Max(Range(Cells(firstRow + 1, refcol +
5), Cells(lastRow - 1, refcol + 5)))) + 1 'the last filled bin
minH = 1000000
ReDim velArr(lastX, 3)
'read the f0 velocity values (as Integer type) into the respective
array bins - first dimension of the array
'to compute the frequency of all the rounded off f0 velocity values
For i = firstRow + 1 To lastRow - 1
If Cells(i, refcol + 5).Value <> "" Then 'to prevent counting all
the 0 empty values

- 325 -
currVal = Int(Cells(i, refcol + 5).Value) + 1 'round the
current f0 velocity to the next largest integer.
Else
currVal = 0
End If
velArr(currVal, 2) = velArr(currVal, 2) + 1 'histogram value
Next i
'compute incidence (frequency/total number of f0 velocity values) in
column 2 and cumulative precentage in column 3
For i = 1 To lastX
velArr(i, 1) = i
velArr(i, 2) = velArr(i, 2) / totalItem
For j = 1 To i
velArr(i, 3) = velArr(i, 3) + velArr(j, 2)
Next j
velArr(i, 3) = velArr(i, 3) 'convert to cumulative percentage
Next i
'let threshold value vary from 1 to the maximum absolute f0 velocity
value, and iteratively search for the best threshold using Shanbhag
entropy method
For i = 1 To lastX
lowH = 0 'reset everything to 0
highH = 0
currH = 0
'to prevent them from selecting the extreme f0 velocity values
(front and end)
If velArr(i, 3) > 0 And velArr(i, 3) < 1 Then
For j = 1 To i
currLPG = velArr(j, 2)
currLM = 0.5 + (velArr(i, 3) - velArr(j, 3)) / (2 *
velArr(i, 3)) 'low membership value
lowH = lowH - (currLPG / velArr(i, 3)) * Log(currLM)
Next j
For k = i + 1 To lastX
currHPG = velArr(k, 2)
currHM = 0.5 + (velArr(k, 3) - velArr(i, 3)) / (2 * (1 -
velArr(i, 3))) 'high membership value
highH = highH - (currHPG / (1 - velArr(i, 3))) *
Log(currHM)
Next k
currH = lowH - highH
If currH < minH Then
minH = currH
bestT = i
End If

- 326 -
End If
Next i
Cells(firstRow, refcol + 7).Value = bestT
Cells(firstRow + 1, refcol + 7).Value = velArr(bestT, 3) 'cumulative
percentage
Cells(firstRow + 2, refcol + 7).Value = minH
Cells(firstRow + 3, refcol + 7).Value = totalItem
Erase velArr
p60 = bestT
For rownum = firstRow + 1 To lastRow
'to fill the last column of the phrase with the threshold value
Cells(rownum, refcol + 6).Value = p60
Next rownum
'=====
'Use the best threshold to determine the onset and offset of the
stable segments one by one
'frontnum and backnum = the best onset and offset values
'S1 to S8
For ctr = 1 To 8
If ctr = 1 Then
SA = S1a + 1 'S1a+1 is the first cell with abs velocity value
SB = S1b
ElseIf ctr = 2 Then
SA = S2a
SB = S2b
ElseIf ctr = 3 Then
SA = S3a
SB = S3b
ElseIf ctr = 4 Then
SA = S4a
SB = S4b
ElseIf ctr = 5 Then
SA = S5a
SB = S5b
ElseIf ctr = 6 Then
SA = S6a
SB = S6b
ElseIf ctr = 7 Then
SA = S7a
SB = S7b
ElseIf ctr = 8 Then
SA = S8a
SB = S8b
End If
frontnum = 0
backnum = 0 'resetting to 0
If SA <> 0 And SB <> 0 Then

- 327 -
frontnum = SA
backnum = SB
initFront = SA
initBack = SB
'If the frontnum or backnum happens to not have an absolute f0
velocity value (e.g., when the segment is next to a gap)
If IsEmpty(Cells(frontnum, refcol + 5)) Then
frontnum = SA + 1
initFront = SA + 1
End If
If IsEmpty(Cells(backnum, refcol + 5)) Then
backnum = SB - 1
initBack = SB - 1
End If
SM = frontnum + CInt((backnum - frontnum + 1) / 3) - 1
SN = backnum - CInt((backnum - frontnum + 1) / 3) + 1
'color the SM and SN cells (the end points of the onset and
offset search boundaries in each segment)
Range(Cells(SM, refcol), Cells(SM, refcol + 6)).Select
With Selection.Interior
.Pattern = xlSolid
.PatternColorIndex = xlAutomatic
.Color = 4891391 'orange in decimal
.TintAndShade = 0
.PatternTintAndShade = 0
End With
Range(Cells(SN, refcol), Cells(SN, refcol + 6)).Select
With Selection.Interior
.Pattern = xlSolid
.PatternColorIndex = xlAutomatic
.Color = 14204670 'light pink
.TintAndShade = 0
.PatternTintAndShade = 0
End With
Range(Cells(frontnum, refcol), Cells(frontnum, refcol +
6)).Select 'color the beginning of segment.
With Selection.Interior
.Pattern = xlSolid
.PatternColorIndex = xlAutomatic
.Color = 65535
.TintAndShade = 0
.PatternTintAndShade = 0
End With
'to determine the stable segment onset (i.e., frontnum)
For roundNo = 1 To 3
If roundNo = 1 Then
Do Until frontnum = SM Or Abs(Cells(frontnum, refcol +
5).Value) <= p60 And Abs(Cells(frontnum + 1, refcol + 5).Value) <= p60
And Abs(Cells(frontnum + 2, refcol + 5).Value) <= p60
frontnum = frontnum + 1
Loop

- 328 -
'if the end of the search boundary is reached without
finding a suitable candidate, start from the beginning of the search
boundary and begin round 2 of search
If frontnum = SM And Not (Abs(Cells(frontnum, refcol +
5).Value) <= p60 And Abs(Cells(frontnum + 1, refcol + 5).Value) <= p60
And Abs(Cells(frontnum + 2, refcol + 5).Value) <= p60) Then
frontnum = initFront
End If
ElseIf roundNo = 2 Then
Do Until frontnum = SM Or Abs(Cells(frontnum, refcol +
5).Value) <= p60 And Abs(Cells(frontnum + 1, refcol + 5).Value) <= p60
frontnum = frontnum + 1
Loop
'if the end of the search boundary is reached without
finding a suitable candidate, start from the beginning of the search
boundary and begin round 3 of search
If frontnum = SM And Not (Abs(Cells(frontnum, refcol +
5).Value) <= p60 And Abs(Cells(frontnum + 1, refcol + 5).Value) <=
p60) Then
frontnum = initFront
End If
ElseIf roundNo = 3 Then
Do Until frontnum = SM Or Abs(Cells(frontnum, refcol +
5).Value) <= p60
frontnum = frontnum + 1
Loop
'if the end of the search boundary is reached without
finding a suitable candidate, let best onset be the smallest value in
the search boundary, if all are above T
If frontnum = SM And Not (Abs(Cells(frontnum, refcol +
5).Value) <= p60) Then
frontnum = initFront +
WorksheetFunction.Match(WorksheetFunction.Min(Range(Cells(initFront,
refcol + 5), Cells(SM, refcol + 5))), Range(Cells(initFront, refcol +
5), Cells(SM, refcol + 5)), 0) - 1
End If
End If
Next roundNo
'to determine the stable segment offset (i.e., backnum)
For roundNo = 1 To 3
If roundNo = 1 Then
Do Until backnum = SN Or Abs(Cells(backnum, refcol +
5).Value) <= p60 And Abs(Cells(backnum - 1, refcol + 5).Value) <= p60
And Abs(Cells(backnum - 2, refcol + 5).Value) <= p60
backnum = backnum - 1
Loop

- 329 -
If backnum = SN And Not (Abs(Cells(backnum, refcol +
5).Value) <= p60 And Abs(Cells(backnum - 1, refcol + 5).Value) <= p60
And Abs(Cells(backnum - 2, refcol + 5).Value) <= p60) Then 'reached
the end
backnum = initBack 'reset backnum to original
value
End If
ElseIf roundNo = 2 Then
Do Until backnum = SN Or Abs(Cells(backnum, refcol +
5).Value) <= p60 And Abs(Cells(backnum - 1, refcol + 5).Value) <= p60
backnum = backnum - 1
Loop
If backnum = SN And Not (Abs(Cells(backnum, refcol +
5).Value) <= p60 And Abs(Cells(backnum - 1, refcol + 5).Value) <= p60)
Then 'reached the end
backnum = initBack 'reset backnum to original
value
End If
ElseIf roundNo = 3 Then
Do Until backnum = SN Or Abs(Cells(backnum, refcol +
5).Value) <= p60
backnum = backnum - 1
Loop
If backnum = SN And Not (Abs(Cells(backnum, refcol +
5).Value) <= p60) Then 'reached the end
backnum = SN +
WorksheetFunction.Match(WorksheetFunction.Min(Range(Cells(SN, refcol +
5), Cells(initBack, refcol + 5))), Range(Cells(SN, refcol + 5),
Cells(initBack, refcol + 5)), 0) - 1
'let backnum be the smallest value in the range,
if all are above T
End If
End If
Next roundNo
'color the frontnum and backnum cells
Range(Cells(frontnum, refcol), Cells(frontnum, refcol +
6)).Select
With Selection.Interior
.Pattern = xlSolid
.PatternColorIndex = xlAutomatic
.Color = 14599344 'steel gray
.TintAndShade = 0
.PatternTintAndShade = 0
End With
Range(Cells(backnum, refcol), Cells(backnum, refcol +
6)).Select

- 330 -
With Selection.Interior
.Pattern = xlSolid
.PatternColorIndex = xlAutomatic
.Color = 15631086 'magenta
.TintAndShade = 0
.PatternTintAndShade = 0
End With
'S_r and S_s store the best onset and offset of each segment,
respectively
If ctr = 1 Then
S1r = frontnum
S1s = backnum
ElseIf ctr = 2 Then
S2r = frontnum
S2s = backnum
ElseIf ctr = 3 Then
S3r = frontnum
S3s = backnum
ElseIf ctr = 4 Then
S4r = frontnum
S4s = backnum
ElseIf ctr = 5 Then
S5r = frontnum
S5s = backnum
ElseIf ctr = 6 Then
S6r = frontnum
S6s = backnum
ElseIf ctr = 7 Then
S7r = frontnum
S7s = backnum
ElseIf ctr = 8 Then
S8r = frontnum
S8s = backnum
End If
End If
Next ctr
'################################################
'insert any modifications for R values here.e.g., S3r = 173
'S1r = S1a
'S2r = S2a
'S3r = S3a
'S4r = S4a
'S5r = S5a
'S6r = S6a
'S7r = S7a
'insert any modifications for S values here.e.g., S3s = 173
'S5s = 217
'S2s = 91
'S7r = 266
'S7s = 280
'#############################################

- 331 -
'display the following variables on the spreadsheet
Cells(1, refcol).Value = "Point r"
Cells(1, refcol + 1).Value = "Time"
Cells(1, refcol + 2).Value = "f0"
Cells(1, refcol + 3).Value = "Point s"
Cells(1, refcol + 4).Value = "Time"
Cells(1, refcol + 5).Value = "f0"
Cells(2, refcol).Value = 1
Cells(3, refcol).Value = 2
Cells(4, refcol).Value = 3
Cells(5, refcol).Value = 4
Cells(6, refcol).Value = 5
Cells(7, refcol).Value = 6
Cells(8, refcol).Value = 7
Cells(9, refcol).Value = 8
Cells(11, refcol).Value = "Stable"
Cells(11, refcol + 1).Value = "mean f0"
Cells(11, refcol + 2).Value = "sd"
Cells(11, refcol + 3).Value = "median f0"
Cells(11, refcol + 4).Value = "Transition"
Cells(11, refcol + 5).Value = "sd"
Cells(11, refcol + 6).Value = "duration"
Cells(12, refcol).Value = 1
Cells(13, refcol).Value = 2
Cells(14, refcol).Value = 3
Cells(15, refcol).Value = 4
Cells(16, refcol).Value = 5
Cells(17, refcol).Value = 6
Cells(18, refcol).Value = 7
Cells(19, refcol).Value = 8
Cells(20, refcol).Value = "mean sd"
Cells(12, refcol + 4).Value = 1
Cells(13, refcol + 4).Value = 2
Cells(14, refcol + 4).Value = 3
Cells(15, refcol + 4).Value = 4
Cells(16, refcol + 4).Value = 5
Cells(17, refcol + 4).Value = 6
Cells(18, refcol + 4).Value = 7
Cells(19, refcol + 4).Value = 8
Cells(20, refcol + 4).Value = "mean sd"
Cells(22, refcol).Value = "Stable"
Cells(22, refcol + 1).Value = "mean abs vel"
Cells(22, refcol + 2).Value = "sd"
Cells(22, refcol + 3).Value = "Zero crossings"
Cells(22, refcol + 4).Value = "mean abs vel"
Cells(22, refcol + 5).Value = "sd"
Cells(22, refcol + 6).Value = "Zero crossings"
Cells(23, refcol).Value = 1
Cells(24, refcol).Value = 2
Cells(25, refcol).Value = 3
Cells(26, refcol).Value = 4
Cells(27, refcol).Value = 5

- 332 -
Cells(28, refcol).Value = 6
Cells(29, refcol).Value = 7
Cells(30, refcol).Value = 8
Cells(31, refcol).Value = "average"
i = 2
For ctr = 1 To 8
If ctr = 1 Then
frontnum = S1r
backnum = S1s
ElseIf ctr = 2 Then
frontnum = S2r
backnum = S2s
ElseIf ctr = 3 Then
frontnum = S3r
backnum = S3s
ElseIf ctr = 4 Then
frontnum = S4r
backnum = S4s
ElseIf ctr = 5 Then
frontnum = S5r
backnum = S5s
ElseIf ctr = 6 Then
frontnum = S6r
backnum = S6s
ElseIf ctr = 7 Then
frontnum = S7r
backnum = S7s
ElseIf ctr = 8 Then
frontnum = S8r
backnum = S8s
End If
If frontnum <> 0 And backnum <> 0 Then
sdF = WorksheetFunction.StDev(Range(Cells(frontnum, refcol +
3), Cells(backnum, refcol + 3)))
avgV = WorksheetFunction.Average(Range(Cells(frontnum, refcol
+ 5), Cells(backnum, refcol + 5)))
sdV = WorksheetFunction.StDev(Range(Cells(frontnum, refcol +
5), Cells(backnum, refcol + 5)))
Cells(i, refcol + 1).Value = Cells(frontnum, refcol + 1).Value
'time of r
Cells(i, refcol + 4).Value = Cells(backnum, refcol + 1).Value
'time of s
Cells(i, refcol + 2).Value = Cells(frontnum, refcol + 2).Value
'f0 for r
Cells(i, refcol + 5).Value = Cells(backnum, refcol + 2).Value
'f0 for s
avgF = WorksheetFunction.Average(Range(Cells(frontnum, refcol
+ 2), Cells(backnum, refcol + 2)))
medF = WorksheetFunction.Quartile(Range(Cells(frontnum, refcol
+ 2), Cells(backnum, refcol + 2)), 2)
Cells(i + 10, refcol + 1).Value = avgF
Cells(i + 10, refcol + 3).Value = medF

- 333 -
Cells(i + 10, refcol + 2).Value = sdF
Cells(i + 21, refcol + 1).Value = avgV * 10 'rescale it back
by 10
Cells(i + 21, refcol + 2).Value = sdV * 10
End If
i = i + 1
Next ctr
'the transition regions seg 1 to 7
For ctr = 1 To 7
If ctr = 1 Then
a = S1s
b = S1b
c = S2a
d = S2r
If c = 0 Then 'if there's a missing segment
If S3a <> 0 Then
c = S3a
d = S3r
ctr = ctr + 1
ElseIf S4a <> 0 Then
c = S4a
d = S4r
ctr = ctr + 2
ElseIf S5a <> 0 Then
c = S5a
d = S5r
ctr = ctr + 3
ElseIf S6a <> 0 Then
c = S6a
d = S6r
ctr = ctr + 4
ElseIf S7a <> 0 Then
c = S7a
d = S7r
ctr = ctr + 5
ElseIf S8a <> 0 Then
c = S8a
d = S8r
ctr = ctr + 6
Else
Exit For
End If
End If
ElseIf ctr = 2 Then
a = S2s
b = S2b
c = S3a
d = S3r

- 334 -
'if the next segment is missing, let the next nonzero segment
be the new c and d and jump to the next ctr
If c = 0 Then
If S4a <> 0 Then
c = S4a
d = S4r
ctr = ctr + 1
ElseIf S5a <> 0 Then
c = S5a
d = S5r
ctr = ctr + 2
ElseIf S6a <> 0 Then
c = S6a
d = S6r
ctr = ctr + 3
ElseIf S7a <> 0 Then
c = S7a
d = S7r
ctr = ctr + 4
ElseIf S8a <> 0 Then
c = S8a
d = S8r
ctr = ctr + 5
Else
Exit For
End If
End If
ElseIf ctr = 3 Then
a = S3s
b = S3b
c = S4a
d = S4r
'if the next segment is missing, let the next nonzero segment
be the new c and d and jump to the next ctr
If c = 0 Then
If S5a <> 0 Then
c = S5a
d = S5r
ctr = ctr + 1
ElseIf S6a <> 0 Then
c = S6a
d = S6r
ctr = ctr + 2
ElseIf S7a <> 0 Then
c = S7a
d = S7r
ctr = ctr + 3
ElseIf S8a <> 0 Then
c = S8a
d = S8r
ctr = ctr + 4
Else
Exit For
End If
End If
ElseIf ctr = 4 Then

- 335 -
a = S4s
b = S4b
c = S5a
d = S5r
'if the next segment is missing, let the next nonzero segment
be the new c and d and jump to the next ctr
If c = 0 Then
If S6a <> 0 Then
c = S6a
d = S6r
ctr = ctr + 1
ElseIf S7a <> 0 Then
c = S7a
d = S7r
ctr = ctr + 2
ElseIf S8a <> 0 Then
c = S8a
d = S8r
ctr = ctr + 3
Else
Exit For
End If
End If
ElseIf ctr = 5 Then
a = S5s
b = S5b
c = S6a
d = S6r
'if the next segment is missing, let the next nonzero segment
be the new c and d and jump to the next ctr
If c = 0 Then
If S7a <> 0 Then
c = S7a
d = S7r
ctr = ctr + 1
ElseIf S8a <> 0 Then
c = S8a
d = S8r
ctr = ctr + 2
Else
Exit For
End If
End If
ElseIf ctr = 6 Then
a = S6s
b = S6b
c = S7a
d = S7r
'if the next segment is missing, let the next nonzero segment
be the new c and d and jump to the next ctr
If c = 0 Then
If S8a <> 0 Then
c = S8a
d = S8r

- 336 -
ctr = ctr + 1
Else
Exit For
End If
End If
ElseIf ctr = 7 Then
a = S7s
b = S7b
c = S8a
d = S8r
End If
'if the current segment and the next segment are both present
If b <> 0 And c <> 0 Then
sdF = WorksheetFunction.StDev(Range(Cells(a, refcol + 3),
Cells(b, refcol + 3)), Range(Cells(c, refcol + 3), Cells(d, refcol +
3)))
avgV = WorksheetFunction.Average(Range(Cells(a, refcol +
5), Cells(b, refcol + 5)), Range(Cells(c, refcol + 5), Cells(d, refcol
+ 5)))
sdV = WorksheetFunction.StDev(Range(Cells(a, refcol + 5),
Cells(b, refcol + 5)), Range(Cells(c, refcol + 5), Cells(d, refcol +
5)))
transDur = Cells(d, refcol + 1).Value - Cells(a, refcol +
1).Value
Cells(ctr + 11, refcol + 5).Value = sdF
Cells(ctr + 11, refcol + 6).Value = transDur
Cells(ctr + 22, refcol + 4).Value = avgV * 10
Cells(ctr + 22, refcol + 5).Value = sdV * 10
End If
Next ctr
'mean sd for f0 in stable segment
Cells(20, refcol + 2).Value =
WorksheetFunction.Average(Range(Cells(12, refcol + 2), Cells(19,
refcol + 2)))
'mean sd for f0 in transition area (between one stable segment to the
next)
If WorksheetFunction.CountA(Range(Cells(12, refcol + 5), Cells(19,
refcol + 5))) <> 0 Then
Cells(20, refcol + 5).Value =
WorksheetFunction.Average(Range(Cells(12, refcol + 5), Cells(19,
refcol + 5)))
End If
'mean duration for transition areas
If WorksheetFunction.CountA(Range(Cells(12, refcol + 6), Cells(19,
refcol + 6))) <> 0 Then
Cells(20, refcol + 6).Value =
WorksheetFunction.Average(Range(Cells(12, refcol + 6), Cells(19,
refcol + 6)))

- 337 -
End If
'mean absolute velocity in stable segments
Cells(31, refcol + 1).Value =
WorksheetFunction.Average(Range(Cells(23, refcol + 1), Cells(30,
refcol + 1)))
'mean absolute velocity in transition areas
If WorksheetFunction.CountA(Range(Cells(23, refcol + 4), Cells(30,
refcol + 4))) <> 0 Then
Cells(31, refcol + 4).Value =
WorksheetFunction.Average(Range(Cells(23, refcol + 4), Cells(30,
refcol + 4)))
End If
'mean sd for abs vel in stable segments
Cells(31, refcol + 2).Value =
WorksheetFunction.Average(Range(Cells(23, refcol + 2), Cells(30,
refcol + 2)))
'mean sd for abs vel in transition areas
If WorksheetFunction.CountA(Range(Cells(23, refcol + 5), Cells(30,
refcol + 5))) <> 0 Then
Cells(31, refcol + 5).Value =
WorksheetFunction.Average(Range(Cells(23, refcol + 5), Cells(30,
refcol + 5)))
End If
'=====draw the f0 and the absolute f0 velocity (scaled by 1/10) graphs
Dim r1 As Range 'the freq (y axis)
Dim r2 As Range
Dim r3 As Range
Dim r4 As Range
Dim r5 As Range
Dim xr1 As Range 'the time (x axis)
Dim xr2 As Range
Dim xr3 As Range
Set r1 = ActiveSheet.Range(Cells(firstRow, refcol + 2), Cells(lastRow,
refcol + 2)) 'f0 values
Set r2 = ActiveSheet.Range(Cells(2, refcol + 2), Cells(9, refcol + 2))
'R values
Set r3 = ActiveSheet.Range(Cells(2, refcol + 5), Cells(9, refcol + 5))
'S values
Set r4 = ActiveSheet.Range(Cells(firstRow + 1, refcol + 5),
Cells(lastRow, refcol + 5)) 'abs vel values
Set r5 = ActiveSheet.Range(Cells(firstRow, refcol + 6), Cells(lastRow,
refcol + 6)) 'threshold values
Set xr1 = ActiveSheet.Range(Cells(firstRow, refcol + 1),
Cells(lastRow, refcol + 1))
Set xr2 = ActiveSheet.Range(Cells(2, refcol + 1), Cells(9, refcol +
1)) 'time at onset
Set xr3 = ActiveSheet.Range(Cells(2, refcol + 4), Cells(9, refcol +
4)) 'time at offset
ActiveSheet.Shapes.AddChart.Select
ActiveChart.ChartType = xlXYScatterLinesNoMarkers

- 338 -
ActiveChart.SeriesCollection.NewSeries
ActiveChart.SeriesCollection(1).Name = "=""F0"""
ActiveChart.SeriesCollection(1).XValues = xr1
ActiveChart.SeriesCollection(1).Values = r1
ActiveChart.SeriesCollection.NewSeries
ActiveChart.SeriesCollection(2).Name = "=""S"""
ActiveChart.SeriesCollection(2).XValues = xr3
ActiveChart.SeriesCollection(2).Values = r3
ActiveChart.SeriesCollection(2).ChartType = xlXYScatter
ActiveChart.SeriesCollection.NewSeries
ActiveChart.SeriesCollection(3).Name = "=""R"""
ActiveChart.SeriesCollection(3).XValues = xr2
ActiveChart.SeriesCollection(3).Values = r2
ActiveChart.SeriesCollection(3).ChartType = xlXYScatter
ActiveChart.SeriesCollection.NewSeries
ActiveChart.SeriesCollection(4).Name = "=""absVel(/10)"""
ActiveChart.SeriesCollection(4).XValues = xr1
ActiveChart.SeriesCollection(4).Values = r4
ActiveChart.SeriesCollection(4).ChartType =
xlXYScatterLinesNoMarkers
ActiveChart.SeriesCollection.NewSeries
ActiveChart.SeriesCollection(5).Name = "=""p60"""
ActiveChart.SeriesCollection(5).XValues = xr1
ActiveChart.SeriesCollection(5).Values = r5
ActiveChart.SeriesCollection(5).ChartType =
xlXYScatterLinesNoMarkers
ActiveChart.SeriesCollection(2).Select
With Selection
.MarkerStyle = 2
.MarkerSize = 6
End With
ActiveChart.SeriesCollection(4).Select
With Selection.Format.Line
.Visible = msoTrue
.Weight = 1.25
End With
ActiveChart.Axes(xlCategory).MinimumScale = Int(Cells(firstRow,
refcol + 1).Value)
ActiveChart.Parent.Cut
DoEvents
Cells(33, refcol).Select
ActiveSheet.Paste
Application.CutCopyMode = False
Next count
Range("AF1").Value = "Song Duration"
Range("AF2").Value = "1st sampled time"
Range("AF3").Value = "last sampled time"
Range("AF4").Value = "duration"
Range("AF5").Value = "bpm"

- 339 -
Range("AG2").Value = Range("B51").Value
Range("AG3").Value = Cells(lastRow, refcol + 1).Value
Range("AG4").Value = Range("AG3").Value - Range("AG2").Value
Range("AG5").Value = 25 / (Range("AG4").Value / 60)
Range("AG8").Value = "mean stable sd"
Range("AG9").Value = WorksheetFunction.Average(Range("C12:C17"),
Range("K12:K17"), Range("S12:S18"), Range("AA12:AA17"))
Range("AG11").Value = "mean transition sd"
Range("AG12").Value = WorksheetFunction.Average(Range("F12:F17"),
Range("N12:N17"), Range("V12:V18"), Range("AD12:AD17"))
Next folderCtr
wb.Save
End Sub

- 340 -
Appendix C-4 Praat script for Computing Tongue Twister
Measures
form ReadTongueTwisterData
#to compute median pitch and 5th to 95th quantile of speaking range in
tongue twister
comment Directory of sound files
text sound_directory F:\PhDstuff\deidentifiedpairs\230\
positive time_step 0.01
positive minimum_pitch 120
positive maximum_pitch 400
positive voicing_threshold 0.4
positive silence_threshold 0.03
positive octave_jump_cost 0.9
positive octave_cost 0.01
endform
# Write-out the header (copy if necessary)
resultfile$ = "'sound_directory$'tongueTwisterinfo.txt"
appendFileLine: "'resultfile$'","Legend: median q5 q10 q90 q95
90%range 80%range"
appendFileLine:
"'resultfile$'","'minimum_pitch''tab$''maximum_pitch''tab$''voicing_th
reshold''tab$''silence_threshold''tab$''octave_jump_cost''tab$''octave
_cost'"
tmin = 0
tmax = 0
appendFileLine: "'resultfile$'","'tmin''tab$''tmax''tab$'"
n = numberOfSelected ("Sound")
for i to n
sound [i] = selected ("Sound", i)
endfor
# Median pitches of all selected sounds:
for i to n
selectObject: sound [i]
To Pitch (ac)... time_step minimum_pitch 15 no silence_threshold
voicing_threshold octave_cost octave_jump_cost 0.14 maximum_pitch
fileappend "'resultfile$'" 'i''newline$'
# appendFileLine: "'resultfile$'","timeStart: 'tmin'"
# appendFileLine: "'resultfile$'","timeEnd: 'tmax'"
median = Get quantile: tmin, tmax, 0.50, "Hertz"
q05 = Get quantile: tmin, tmax, 0.05, "Hertz"
q10 = Get quantile: tmin, tmax, 0.10, "Hertz"
q90 = Get quantile: tmin, tmax, 0.90, "Hertz"
q95 = Get quantile: tmin, tmax, 0.95, "Hertz"
range90 = q95-q05

- 341 -
range80 = q90-q10
appendFileLine:
"'resultfile$'","'median''tab$''q05''tab$''q10''tab$''q90''tab$''q95''
tab$''range90''tab$''range80''newline$'"
Remove
endfor
# Restore selection:
selectObject ( ) ; deselect all objects
for i from 1 to n
plusObject: sound [i]
endfor

- 342 -
Appendix C-5 OpenMx Script for Testing Equality of
Covariances for Continuous Measure
# --------------------------------------------------------------------
# Adapted from twinHetAceCon.R by Hermine Maes (09 21 2014)
# Univariate Heterogeneity Twin Analysis model to estimate causes of
variation
# Matrix style model - Raw data - Continuous data
# -------|---------|---------|---------|---------|---------|---------
#read output into text file
sink("F:/PhDstuff/complete pairs analysis/2015 New
Proc/AceOutput/Het5Sat_AS_lnNewSingComb.txt", append=TRUE, split=TRUE)
# Load Library
require(OpenMx)
require(psych)
# --------------------------------------------------------------------
# PREPARE DATA
#================================
cat("\n")
# Select Variable for Analysis
Vars <- 'var1'
combVars <- c('Age','Sex', Vars) #,'yrsTraining'
nvInit <- 3
nv <- 1 # number of variables
ntv <- nv*2 # number of total variables
selVars <- paste(combVars,c(rep(1,nvInit),rep(2,nvInit)),sep="")
#eg c('ht1','wt1,'ht2','wt2')
#Select Data for Analysis
mzfData <- subset(twinData2015, ZygosityGrp==1, selVars)
dzfData <- subset(twinData2015, ZygosityGrp==2, selVars)
mzmData <- subset(twinData2015, ZygosityGrp==3, selVars)
dzmData <- subset(twinData2015, ZygosityGrp==4, selVars)
dzoData <- subset(twinData2015, ZygosityGrp==5, selVars)
colnames(mzfData)=colnames(dzfData)=colnames(mzmData)=colnames(dzmData
)=colnames(dzoData)=c('Age1','Sex1','t1','Age2','Sex2','t2')
#if error message says that the starting values are infeasible try to
scale the values up.
# mzfData[,3] <- mzfData[,3]*5
# dzfData[,3] <- dzfData[,3]*5
# dzoData[,3] <- dzoData[,3]*5
# mzmData[,3] <- mzmData[,3]*5
# dzmData[,3] <- dzmData[,3]*5
#
# mzfData[,6] <- mzfData[,6]*5
# dzfData[,6] <- dzfData[,6]*5
# dzoData[,6] <- dzoData[,6]*5
# mzmData[,6] <- mzmData[,6]*5
# dzmData[,6] <- dzmData[,6]*5
describe(mzfData)
describe(dzfData)

- 343 -
describe(mzmData)
describe(dzmData)
describe(dzoData)
# Generate Descriptive Statistics
colMeans(mzfData,na.rm=TRUE)
colMeans(dzfData,na.rm=TRUE)
colMeans(mzmData,na.rm=TRUE)
colMeans(dzmData,na.rm=TRUE)
colMeans(dzoData,na.rm=TRUE)
cat("\n")
cov(mzfData,use="complete")
cov(dzfData,use="complete")
cov(mzmData,use="complete")
cov(dzmData,use="complete")
cov(dzoData,use="complete")
cat("\n")
# Set Starting Values
svMe <- 3 # start value for means
svVa <- 5 # start value for variance
lbVa <- 0.0001 # start value for lower bounds
svVas <- diag(svVa,ntv,ntv) # assign start values to diagonal
of matrix
lbVas <- diag(lbVa,ntv,ntv) # assign lower bounds values to
diagonal of matrix
# --------------------------------------------------------------------
# PREPARE MODEL
# Saturated Model
# Algebra for expected Mean Matrices in MZ & DZ twins
# Matrix for expected Mean
intercept_mzm <- mxMatrix( type="Full", nrow=1, ncol=ntv,
free=TRUE,
values= svMe,
labels=c("mMZm1","mMZm2"), name="MeanMzm" )
intercept_mzf <- mxMatrix( type="Full", nrow=1, ncol=ntv,
free=TRUE,
values= svMe,
labels=c("mMZf1","mMZf2"), name="MeanMzf" )
intercept_dzm <- mxMatrix( type="Full", nrow=1, ncol=ntv,
free=TRUE,
values= svMe,
labels=c("mDZm1","mDZm2"), name="MeanDzm" )
intercept_dzf <- mxMatrix( type="Full", nrow=1, ncol=ntv,
free=TRUE,
values= svMe,
labels=c("mDZf1","mDZf2"), name="MeanDzf" )
intercept_dzo <- mxMatrix( type="Full", nrow=1, ncol=ntv,
free=TRUE,
values= svMe,
labels=c("mDZo1","mDZo2"), name="MeanDzo" )
# Matrix for moderating/interacting variable
defSex <- mxMatrix( type="Full", nrow=1, ncol=2, free=FALSE,
labels=c("data.Sex1","data.Sex2"), name="Sex")
# Matrices declared to store linear Coefficients for covariate
B_Sex <- mxMatrix( type="Full", nrow=1, ncol=1, free=TRUE,

- 344 -
values= .01, label="betaSex", name="bSex" )
meanSex <- mxAlgebra( bSex%*%Sex, name="SexR")
#age
defAge <- mxMatrix( type="Full", nrow=1, ncol=2, free=FALSE,
labels=c("data.Age1","data.Age2"), name="Age")
# Matrices declared to store linear Coefficients for covariate
B_Age <- mxMatrix( type="Full", nrow=1, ncol=1, free=TRUE,
values= .01, label="betaAge", name="bAge" )
meanAge <- mxAlgebra( bAge%*%Age, name="AgeR")
#***************************************************************
# Algebra for expected Mean and Variance/Covariance Matrices in MZ &
DZ twins
meanGMZf <- mxAlgebra( MeanMzf + AgeR + SexR , name="expMeanGMZf")
meanGDZf <- mxAlgebra( MeanDzf + AgeR + SexR , name="expMeanGDZf")
meanGMZm <- mxAlgebra( MeanMzm + AgeR + SexR , name="expMeanGMZm")
meanGDZm <- mxAlgebra( MeanDzm + AgeR + SexR , name="expMeanGDZm")
meanGDZo <- mxAlgebra( MeanDzo + AgeR + SexR , name="expMeanGDZo")
defs_mzm <- list( intercept_mzm, defSex, B_Sex, meanSex, defAge,
B_Age, meanAge)
defs_mzf <- list( intercept_mzf, defSex, B_Sex, meanSex, defAge,
B_Age, meanAge)
defs_dzm <- list( intercept_dzm, defSex, B_Sex, meanSex, defAge,
B_Age, meanAge)
defs_dzf <- list( intercept_dzf, defSex, B_Sex, meanSex, defAge,
B_Age, meanAge)
defs_dzo <- list( intercept_dzo, defSex, B_Sex, meanSex, defAge,
B_Age, meanAge)
# Algebra for expected Variance/Covariance Matrices in MZ & DZ twins
covMZf <- mxMatrix( type="Symm", nrow=ntv, ncol=ntv, free=TRUE,
values=svVas, lbound=lbVas, labels=c("vMZf1","cMZf21","vMZf2"),
name="covMZf" )
covDZf <- mxMatrix( type="Symm", nrow=ntv, ncol=ntv, free=TRUE,
values=svVas, lbound=lbVas, labels=c("vDZf1","cDZf21","vDZf2"),
name="covDZf" )
covMZm <- mxMatrix( type="Symm", nrow=ntv, ncol=ntv, free=TRUE,
values=svVas, lbound=lbVas, labels=c("vMZm1","cMZm21","vMZm2"),
name="covMZm" )
covDZm <- mxMatrix( type="Symm", nrow=ntv, ncol=ntv, free=TRUE,
values=svVas, lbound=lbVas, labels=c("vDZm1","cDZm21","vDZm2"),
name="covDZm" )
covDZo <- mxMatrix( type="Symm", nrow=ntv, ncol=ntv, free=TRUE,
values=svVas, lbound=lbVas, labels=c("vDZo1","cDZo21","vDZo2"),
name="covDZo" )
# Expectation objects for Multiple Groups
expMZf <- mxExpectationNormal( covariance="covMZf",
means="expMeanGMZf", dimnames=c('t1','t2') )
expDZf <- mxExpectationNormal( covariance="covDZf",
means="expMeanGDZf", dimnames=c('t1','t2') )
expMZm <- mxExpectationNormal( covariance="covMZm",
means="expMeanGMZm", dimnames=c('t1','t2') )
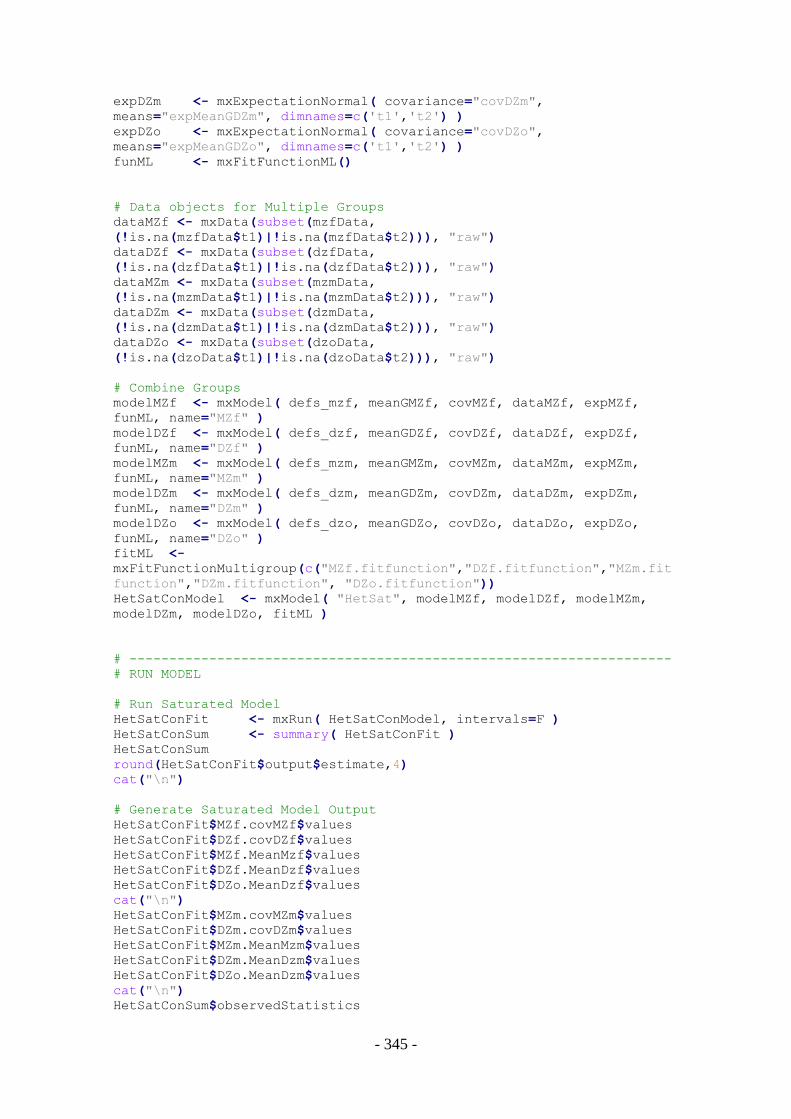
- 345 -
expDZm <- mxExpectationNormal( covariance="covDZm",
means="expMeanGDZm", dimnames=c('t1','t2') )
expDZo <- mxExpectationNormal( covariance="covDZo",
means="expMeanGDZo", dimnames=c('t1','t2') )
funML <- mxFitFunctionML()
# Data objects for Multiple Groups
dataMZf <- mxData(subset(mzfData,
(!is.na(mzfData$t1)|!is.na(mzfData$t2))), "raw")
dataDZf <- mxData(subset(dzfData,
(!is.na(dzfData$t1)|!is.na(dzfData$t2))), "raw")
dataMZm <- mxData(subset(mzmData,
(!is.na(mzmData$t1)|!is.na(mzmData$t2))), "raw")
dataDZm <- mxData(subset(dzmData,
(!is.na(dzmData$t1)|!is.na(dzmData$t2))), "raw")
dataDZo <- mxData(subset(dzoData,
(!is.na(dzoData$t1)|!is.na(dzoData$t2))), "raw")
# Combine Groups
modelMZf <- mxModel( defs_mzf, meanGMZf, covMZf, dataMZf, expMZf,
funML, name="MZf" )
modelDZf <- mxModel( defs_dzf, meanGDZf, covDZf, dataDZf, expDZf,
funML, name="DZf" )
modelMZm <- mxModel( defs_mzm, meanGMZm, covMZm, dataMZm, expMZm,
funML, name="MZm" )
modelDZm <- mxModel( defs_dzm, meanGDZm, covDZm, dataDZm, expDZm,
funML, name="DZm" )
modelDZo <- mxModel( defs_dzo, meanGDZo, covDZo, dataDZo, expDZo,
funML, name="DZo" )
fitML <-
mxFitFunctionMultigroup(c("MZf.fitfunction","DZf.fitfunction","MZm.fit
function","DZm.fitfunction", "DZo.fitfunction"))
HetSatConModel <- mxModel( "HetSat", modelMZf, modelDZf, modelMZm,
modelDZm, modelDZo, fitML )
# --------------------------------------------------------------------
# RUN MODEL
# Run Saturated Model
HetSatConFit <- mxRun( HetSatConModel, intervals=F )
HetSatConSum <- summary( HetSatConFit )
HetSatConSum
round(HetSatConFit$output$estimate,4)
cat("\n")
# Generate Saturated Model Output
HetSatConFit$MZf.covMZf$values
HetSatConFit$DZf.covDZf$values
HetSatConFit$MZf.MeanMzf$values
HetSatConFit$DZf.MeanDzf$values
HetSatConFit$DZo.MeanDzf$values
cat("\n")
HetSatConFit$MZm.covMZm$values
HetSatConFit$DZm.covDZm$values
HetSatConFit$MZm.MeanMzm$values
HetSatConFit$DZm.MeanDzm$values
HetSatConFit$DZo.MeanDzm$values
cat("\n")
HetSatConSum$observedStatistics

- 346 -
length(HetSatConSum$parameters[[1]])
HetSatConSum$degreesOfFreedom
HetSatConFit$output$Minus2LogLikelihood
HetSatConSum$AIC
cat("\n")
# Use Helper Functions
parameterSpecifications(HetSatConFit)
tableFitStatistics(HetSatConFit)
mxCompare(HetSatConFit)
cat("\n")
# --------------------------------------------------------------------
# RUN SUBMODELS
#TESTING EQUALITY OF COVARIANCES
#constrain covariances of MZF and MZM to be equal
eqcMZModel <- mxModel(HetSatConFit, name="eqcMZ" )
eqcMZModel <- omxSetParameters(eqcMZModel, label =
c("cMZf21","cMZm21"),free=TRUE, values = 0, newlabels = 'cMZ21')
eqcMZFit <- mxRun( eqcMZModel, intervals=F )
mxCompare(HetSatConFit, eqcMZFit)
cat("\n")
#constrain covariances of MZF and MZM to be equal, and DZF and DZM to
be equal
eqcDZModel <- mxModel(eqcMZFit, name="eqcDZ" )
eqcDZModel <- omxSetParameters(eqcDZModel , label =
c("cDZf21","cDZm21"),free=TRUE, values = 0, newlabels = 'cDZ21')
eqcDZFit <- mxRun( eqcDZModel , intervals=F )
mxCompare(eqcMZFit, eqcDZFit)
cat("\n")
# constrain covariances of MZF and MZM to be equal, and DZO to be
equal to those of DZM and DZF.
eqMZDZAllModel <- mxModel(eqcMZFit, name="eqMZDZAll" )
eqMZDZAllModel <- omxSetParameters(eqMZDZAllModel, label =
c("cDZf21","cDZm21","cDZo21"),free=TRUE, values = 0, newlabels =
'cDZ21')
eqMZDZAllFit <- mxRun( eqMZDZAllModel, intervals=F )
mxCompare(eqcDZFit, eqMZDZAllFit)
cat("\n")
# # ------------------------------------------------------------------
# # Print Comparative Fit Statistics
SatNested <-
list(eqMeansTwinFit,eqMeansSSZygFit,eqMeansAllZygFit,eqVarsTwinFit,
eqVarsSSZygFit, eqVarsAllZygFit, eqcMZFit,eqcDZFit,eqMZDZAllFit)
mxCompare(HetSatConFit, SatNested)
cat("\n")
sink()

- 347 -
Appendix C-6 OpenMx Script for Testing Equality of Means
and Variances for Continuous Measure
# --------------------------------------------------------------------
# Adapted from twinSatCon.R by Hermine Maes (08 28 2014)
#
# Univariate Twin Saturated model to estimate means and (co)variances
across multiple groups
# Matrix style model - Raw data - Continuous data
# -------|---------|---------|---------|---------|---------|---------|
#read output into text file
sink("F:/PhDstuff/complete pairs analysis/2015 New
Proc/AceOutput/twinSatAgeSexMZDZallobjTasks.txt", append=TRUE,
split=TRUE)
# Load Libraries
library(OpenMx)
library(psych)
# --------------------------------------------------------------------
# PREPARE DATA
# Load Data
#change Vars to variable of interest
Vars <- 'var1'
combVars <- c('Age','Sex', Vars)
nvInit <- 3
nv <- 1 # number of variables
ntv <- nv*2 # number of total variables
selVars <- paste(combVars,c(rep(1,nvInit),rep(2,nvInit)),sep="")
#eg c('ht1','wt1,'ht2','wt2')
#Select Data for Analysis
mzData <- subset(twinData2015, Zygosity==1, selVars)
dzData <- subset(twinData2015, Zygosity==2, selVars)
colnames(mzData)=colnames(dzData)=c('Age1','Sex1','t1','Age2','Sex2','
t2')
cat("mzData\n")
describe(mzData)
cat("\n")
cat("\n")
cat("dzData\n")
describe(dzData)
cat("\n")
cat("\n")
# Set Starting Values
svMe <- 0 # start value for means
svVa <- 1 # start value for variance
lbVa <- 0.0001 # start value for lower bounds
svVas <- diag(svVa,ntv,ntv) # assign start values to diagonal
of matrix
lbVas <- diag(lbVa,ntv,ntv) # assign lower bounds values to
diagonal of matrix

- 348 -
# --------------------------------------------------------------------
# PREPARE MODEL
intercept_mz <- mxMatrix( type="Full", nrow=1, ncol=ntv,
free=TRUE,
values= svMe, labels=c("mMZ1","mMZ2"),
name="meanMZ" )
intercept_dz <- mxMatrix( type="Full", nrow=1, ncol=ntv,
free=TRUE,
values= svMe, labels=c("mDZ1","mDZ2"),
name="meanDZ" )
# Matrix for covariate: sex
defSex <- mxMatrix( type="Full", nrow=1, ncol=2, free=FALSE,
labels=c("data.Sex1","data.Sex2"), name="Sex")
# Matrices declared to store linear Coefficients for covariate
B_Sex <- mxMatrix( type="Full", nrow=1, ncol=1, free=TRUE,
values= .01, label="betaSex", name="bSex" )
meanSex <- mxAlgebra( bSex%*%Sex, name="SexR")
#Matrix for covariate: age
defAge <- mxMatrix( type="Full", nrow=1, ncol=2, free=FALSE,
labels=c("data.Age1","data.Age2"), name="Age")
# Matrices declared to store linear Coefficients for covariate
B_Age <- mxMatrix( type="Full", nrow=1, ncol=1, free=TRUE,
values= .01, label="betaAge", name="bAge" )
meanAge <- mxAlgebra( bAge%*%Age, name="AgeR")
#***************************************************************
# Algebra for expected Mean and Variance/Covariance Matrices in MZ &
DZ twins
meanGMZ <- mxAlgebra( meanMZ + AgeR + SexR , name="expMeanGMZ")
meanGDZ <- mxAlgebra( meanDZ + AgeR + SexR , name="expMeanGDZ")
defs_mz <- list( intercept_mz, defSex, B_Sex, meanSex, defAge,
B_Age, meanAge)
defs_dz <- list( intercept_dz, defSex, B_Sex, meanSex, defAge,
B_Age, meanAge)
# Algebra for expected Variance/Covariance Matrices in MZ & DZ twins
covMZ <- mxMatrix( type="Symm", nrow=ntv, ncol=ntv, free=TRUE,
values=svVas, lbound=lbVas, labels=c("vMZ1","cMZ21","vMZ2"),
name="covMZ" )
covDZ <- mxMatrix( type="Symm", nrow=ntv, ncol=ntv, free=TRUE,
values=svVas, lbound=lbVas, labels=c("vDZ1","cDZ21","vDZ2"),
name="covDZ" )
# Expectation objects for Multiple Groups
expMZ <- mxExpectationNormal( covariance="covMZ",
means="expMeanGMZ", dimnames=c('t1','t2') )
expDZ <- mxExpectationNormal( covariance="covDZ",
means="expMeanGDZ", dimnames=c('t1','t2') )
# Data objects for Multiple Groups
dataMZ <- mxData( observed=mzData, type="raw" )
dataDZ <- mxData( observed=dzData, type="raw" )

- 349 -
funML <- mxFitFunctionML()
modelMZ <- mxModel( defs_mz, meanGMZ, covMZ, dataMZ, expMZ, funML,
name="MZ" )
modelDZ <- mxModel( defs_dz, meanGDZ, covDZ, dataDZ, expDZ, funML,
name="DZ" )
fitML <-
mxFitFunctionMultigroup(c("MZ.fitfunction","DZ.fitfunction"))
ciCov <- mxCI( c('MZ.covMZ','DZ.covDZ' ))
ciMean <- mxCI( c('MZ.meanMZ','DZ.meanDZ' ))
twinSatConModel <- mxModel( "twinSatCon", modelMZ, modelDZ, fitML,
ciCov, ciMean )
# --------------------------------------------------------------------
# RUN MODEL
# Run Saturated Model
twinSatConFit <- mxRun( twinSatConModel, intervals=F )
twinSatConSum <- summary( twinSatConFit )
twinSatConSum
round(twinSatConFit$output$estimate,4)
# Generate Saturated Model Output
twinSatConFit$MZ.covMZ$values
twinSatConFit$DZ.covDZ$values
twinSatConFit$MZ.MeanMz$values
twinSatConFit$DZ.MeanDz$values
twinSatConSum$observedStatistics
length(twinSatConSum$parameters[[1]])
twinSatConSum$degreesOfFreedom
twinSatConFit$output$Minus2LogLikelihood
twinSatConSum$AIC
# Use Helper Functions
parameterSpecifications(twinSatConFit)
tableFitStatistics(twinSatConFit)
mxCompare(twinSatConFit)
# --------------------------------------------------------------------
# RUN SUBMODELS
# Constrain expected Means to be equal across twin order
eqMeansTwinModel <- mxModel(twinSatConFit, name="eqMeansTwin" )
eqMeansTwinModel <- omxSetParameters( eqMeansTwinModel,
label=c("mMZ1","mMZ2"), free=TRUE, values=svMe, newlabels='mMZ' )
eqMeansTwinModel <- omxSetParameters( eqMeansTwinModel,
label=c("mDZ1","mDZ2"), free=TRUE, values=svMe, newlabels='mDZ' )
eqMeansTwinFit <- mxRun( eqMeansTwinModel, intervals=F )
eqMeansTwinSum <- summary( eqMeansTwinFit )
eqMeansTwinLLL <- eqMeansTwinFit$output$Minus2LogLikelihood
twinSatConLLL <- twinSatConFit$output$Minus2LogLikelihood
chi2Sat_eqM <- eqMeansTwinLLL-twinSatConLLL
pSat_eqM <- pchisq( chi2Sat_eqM, lower.tail=F, 2)
chi2Sat_eqM; pSat_eqM
mxCompare(twinSatConFit, eqMeansTwinFit)
# Constrain expected Means and Variances to be equal across twin order

- 350 -
eqMVarsTwinModel <- mxModel(eqMeansTwinFit, name="eqMVarsTwin" )
eqMVarsTwinModel <- omxSetParameters( eqMVarsTwinModel,
label=c("vMZ1","vMZ2"), free=TRUE, values=svVa, newlabels='vMZ' )
eqMVarsTwinModel <- omxSetParameters( eqMVarsTwinModel,
label=c("vDZ1","vDZ2"), free=TRUE, values=svVa, newlabels='vDZ' )
eqMVarsTwinFit <- mxRun( eqMVarsTwinModel, intervals=F )
eqMVarsTwinSum <- summary( eqMVarsTwinFit )
eqMVarsTwinLLL <- eqMVarsTwinFit$output$Minus2LogLikelihood
tableFitStatistics(eqMeansTwinFit, eqMVarsTwinFit)
tableFitStatistics(twinSatConFit, eqMVarsTwinFit)
subs <- list(eqMeansTwinFit, eqMVarsTwinFit)
mxCompare(twinSatConFit, subs)
# Constrain expected Means and Variances to be equal across twin order
and zygosities
eqMVarsZygModel <- mxModel(eqMVarsTwinModel, name="eqMVarsZyg" )
eqMVarsZygModel <- omxSetParameters( eqMVarsZygModel,
label=c("mMZ","mDZ"), free=TRUE, values=svMe, newlabels='mZ' )
eqMVarsZygModel <- omxSetParameters( eqMVarsZygModel,
label=c("vMZ","vDZ"), free=TRUE, values=svVa, newlabels='vZ' )
eqMVarsZygFit <- mxRun( eqMVarsZygModel, intervals=F )
eqMVarsZygSum <- summary( eqMVarsZygFit )
eqMVarsZygLLL <- eqMVarsZygFit$output$Minus2LogLikelihood
mxCompare(eqMVarsTwinFit, eqMVarsZygFit)
# --------------------------------------------------------------------
# Print Comparative Fit Statistics
SatNested <- list(eqMeansTwinFit, eqMVarsTwinFit, eqMVarsZygFit)
mxCompare(twinSatConFit, SatNested)
sink()

- 351 -
Appendix C-7 OpenMx Script for Testing Equality of
Covariances for Categorical Measure
# -------------------------------------------------------------------
# Adapted from twinSatOrd.R by Hermine Maes (09 08 2015)
# -------|---------|---------|---------|---------|---------|---------
#read output into text file
sink("F:/PhDstuff/complete pairs analysis/2015 New
Proc/AceOutput/SatordACEHet5_AS_crd.txt", append=TRUE, split=TRUE)
# Load Library
require(OpenMx)
require(psych)
# # ------------------------------------------------------------------
# Select variable for analysis
Vars <- 'var1'
combVars <- c('Age','Sex', Vars)
nvInit <- 3
nv <- 1 # number of variables
ntv <- nv*2 # number of total variables
selVars <- paste(combVars,c(rep(1,nvInit),rep(2,nvInit)),sep="")
#eg c('ht1','wt1,'ht2','wt2')
nth <- 2 # number of thresholds; change accordingly
mzfData <- subset(twinData2015, ZygosityGrp==1, selVars)
dzfData <- subset(twinData2015, ZygosityGrp==2, selVars)
mzmData <- subset(twinData2015, ZygosityGrp==3, selVars)
dzmData <- subset(twinData2015, ZygosityGrp==4, selVars)
dzoData <- subset(twinData2015, ZygosityGrp==5, selVars)
colnames(mzfData)=colnames(dzfData)=colnames(mzmData)=colnames(dzmData
)=colnames(dzoData)=c('Age1','Sex1','t1','Age2','Sex2','t2')
mzfData[,3] <- mxFactor( x=mzfData[,3], levels=c(1:3) ) #change
accordingly
mzfData[,6] <- mxFactor( x=mzfData[,6], levels=c(1:3) )
dzfData[,3] <- mxFactor( x=dzfData[,3], levels=c(1:3) )
dzfData[,6] <- mxFactor( x=dzfData[,6], levels=c(1:3) )
mzmData[,3] <- mxFactor( x=mzmData[,3], levels=c(1:3) ) #change
accordingly
mzmData[,6] <- mxFactor( x=mzmData[,6], levels=c(1:3) )
dzmData[,3] <- mxFactor( x=dzmData[,3], levels=c(1:3) )
dzmData[,6] <- mxFactor( x=dzmData[,6], levels=c(1:3) )
dzoData[,3] <- mxFactor( x=dzoData[,3], levels=c(1:3) )
dzoData[,6] <- mxFactor( x=dzoData[,6], levels=c(1:3) )
# Set Starting Values
svLTh <- -3 # start value for first threshold
svITh <- 1 # start value for increments
svTh <- matrix(rep(c(svLTh,(rep(svITh,nth-1)))),nrow=nth,ncol=nv)

- 352 -
# start value for thresholds
lbTh <- matrix(rep(c(-3,(rep(0.001,nth-1))),nv),nrow=nth,ncol=nv)
# lower bounds for thresholds
svCor <- .5 # start value for correlations
lbCor <- -0.99 # lower bounds for correlations
ubCor <- 0.99 # upper bounds for correlations
labThMZf <-
c(paste("t",1:nth,"MZf1",sep=""),paste("t",1:nth,"MZf2",sep=""))
labThDZf <-
c(paste("t",1:nth,"DZf1",sep=""),paste("t",1:nth,"DZf2",sep=""))
labThMZm <-
c(paste("t",1:nth,"MZm1",sep=""),paste("t",1:nth,"MZm2",sep=""))
labThDZm <-
c(paste("t",1:nth,"DZm1",sep=""),paste("t",1:nth,"DZm2",sep=""))
labThDZo <-
c(paste("t",1:nth,"DZo1",sep=""),paste("t",1:nth,"DZo2",sep=""))
# --------------------------------------------------------------------
# PREPARE MODEL
# Saturated Model
# Matrix for covariates
#sex
defSex <- mxMatrix( type="Full", nrow=1, ncol=2, free=FALSE,
labels=c("data.Sex1","data.Sex2"), name="Sex")
# Matrices declared to store linear Coefficients for sex covariate
B_Sex <- mxMatrix( type="Full", nrow=nth, ncol=1, free=TRUE,
values= .01, label="betaSex", name="bSex" )
meanSex <- mxAlgebra( bSex%*%Sex, name="SexR")
#age
defAge <- mxMatrix( type="Full", nrow=1, ncol=2, free=FALSE,
labels=c("data.Age1","data.Age2"), name="Age")
# Matrices declared to store linear Coefficients for age covariate
B_Age <- mxMatrix( type="Full", nrow=nth, ncol=1, free=TRUE,
values= .01, label="betaAge", name="bAge" )
meanAge <- mxAlgebra( bAge%*%Age, name="AgeR")
#***************************************************************
# Algebra for expected Mean and Threshold Matrices in MZ & DZ twins
defs <- list( defSex, B_Sex, meanSex, defAge, B_Age, meanAge)
meanG <- mxMatrix( type="Zero", nrow=1, ncol=ntv, name="meanG" )
thinMZf <- mxMatrix( type="Full", nrow=nth, ncol=ntv, free=TRUE,
values=svTh, lbound=lbTh, labels=labThMZf, name="thinMZf" )
thinDZf <- mxMatrix( type="Full", nrow=nth, ncol=ntv, free=TRUE,
values=svTh, lbound=lbTh, labels=labThDZf, name="thinDZf" )
thinMZm <- mxMatrix( type="Full", nrow=nth, ncol=ntv, free=TRUE,
values=svTh, lbound=lbTh, labels=labThMZm, name="thinMZm" )
thinDZm <- mxMatrix( type="Full", nrow=nth, ncol=ntv, free=TRUE,
values=svTh, lbound=lbTh, labels=labThDZm, name="thinDZm" )
thinDZo <- mxMatrix( type="Full", nrow=nth, ncol=ntv, free=TRUE,
values=svTh, lbound=lbTh, labels=labThDZo, name="thinDZo" )
inc <- mxMatrix( type="Lower", nrow=nth, ncol=nth, free=FALSE,
values=1, name="inc" )
threMZf <- mxAlgebra( expression= inc %*% thinMZf, name="threMZf" )

- 353 -
threDZf <- mxAlgebra( expression= inc %*% thinDZf, name="threDZf" )
threMZm <- mxAlgebra( expression= inc %*% thinMZm, name="threMZm" )
threDZm <- mxAlgebra( expression= inc %*% thinDZm, name="threDZm" )
threDZo <- mxAlgebra( expression= inc %*% thinDZo, name="threDZo" )
threCMZf <- mxAlgebra( expression = threMZf + SexR + AgeR, name =
"threCMZf") #with covariates
threCDZf <- mxAlgebra( expression = threDZf + SexR + AgeR, name =
"threCDZf") #with covariates
threCMZm <- mxAlgebra( expression = threMZm + SexR + AgeR, name =
"threCMZm") #with covariates
threCDZm <- mxAlgebra( expression = threDZm + SexR + AgeR, name =
"threCDZm") #with covariates
threCDZo <- mxAlgebra( expression = threDZo + SexR + AgeR, name =
"threCDZo") #with covariates
# Algebra for expected Variance/Covariance Matrices in MZ & DZ twins
corMZf <- mxMatrix( type="Stand", nrow=ntv, ncol=ntv, free=TRUE,
values=svCor, lbound=lbCor, ubound=ubCor, labels="rMZf",
name="corMZf" )
corDZf <- mxMatrix( type="Stand", nrow=ntv, ncol=ntv, free=TRUE,
values=svCor, lbound=lbCor, ubound=ubCor, labels="rDZf",
name="corDZf" )
corMZm <- mxMatrix( type="Stand", nrow=ntv, ncol=ntv, free=TRUE,
values=svCor, lbound=lbCor, ubound=ubCor, labels="rMZm",
name="corMZm" )
corDZm <- mxMatrix( type="Stand", nrow=ntv, ncol=ntv, free=TRUE,
values=svCor, lbound=lbCor, ubound=ubCor, labels="rDZm",
name="corDZm" )
corDZo <- mxMatrix( type="Stand", nrow=ntv, ncol=ntv, free=TRUE,
values=svCor, lbound=lbCor, ubound=ubCor, labels="rDZo",
name="corDZo" )
# Data objects for Multiple Groups
dataMZf <- mxData( observed=mzfData, type="raw" )
dataDZf <- mxData( observed=dzfData, type="raw" )
dataMZm <- mxData( observed=mzmData, type="raw" )
dataDZm <- mxData( observed=dzmData, type="raw" )
dataDZo <- mxData( observed=dzoData, type="raw" )
# Objective objects for Multiple Groups
expMZf <- mxExpectationNormal( covariance="corMZf", means="meanG",
dimnames=c('t1','t2'), thresholds="threCMZf" )
expDZf <- mxExpectationNormal( covariance="corDZf", means="meanG",
dimnames=c('t1','t2'), thresholds="threCDZf" )
expMZm <- mxExpectationNormal( covariance="corMZm", means="meanG",
dimnames=c('t1','t2'), thresholds="threCMZm" )
expDZm <- mxExpectationNormal( covariance="corDZm", means="meanG",
dimnames=c('t1','t2'), thresholds="threCDZm" )
expDZo <- mxExpectationNormal( covariance="corDZo", means="meanG",
dimnames=c('t1','t2'), thresholds="threCDZo" )
funML <- mxFitFunctionML()
# Combine Groups
modelMZf <- mxModel( "MZf",defs, meanG, corMZf, thinMZf, inc,
threMZf, threCMZf, dataMZf, expMZf, funML )
modelDZf <- mxModel( "DZf", defs, meanG, corDZf, thinDZf, inc,
threDZf, threCDZf, dataDZf, expDZf, funML )
modelMZm <- mxModel( "MZm",defs, meanG, corMZm, thinMZm, inc,
threMZm, threCMZm, dataMZm, expMZm, funML )
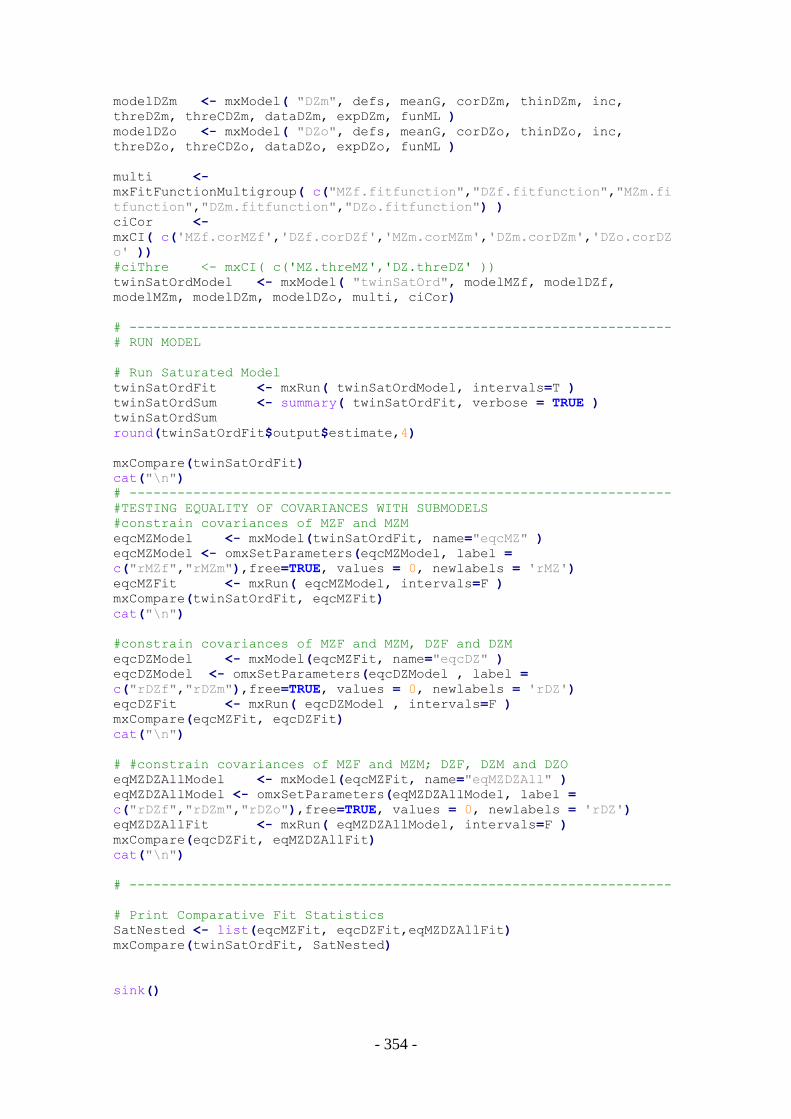
- 354 -
modelDZm <- mxModel( "DZm", defs, meanG, corDZm, thinDZm, inc,
threDZm, threCDZm, dataDZm, expDZm, funML )
modelDZo <- mxModel( "DZo", defs, meanG, corDZo, thinDZo, inc,
threDZo, threCDZo, dataDZo, expDZo, funML )
multi <-
mxFitFunctionMultigroup( c("MZf.fitfunction","DZf.fitfunction","MZm.fi
tfunction","DZm.fitfunction","DZo.fitfunction") )
ciCor <-
mxCI( c('MZf.corMZf','DZf.corDZf','MZm.corMZm','DZm.corDZm','DZo.corDZ
o' ))
#ciThre <- mxCI( c('MZ.threMZ','DZ.threDZ' ))
twinSatOrdModel <- mxModel( "twinSatOrd", modelMZf, modelDZf,
modelMZm, modelDZm, modelDZo, multi, ciCor)
# --------------------------------------------------------------------
# RUN MODEL
# Run Saturated Model
twinSatOrdFit <- mxRun( twinSatOrdModel, intervals=T )
twinSatOrdSum <- summary( twinSatOrdFit, verbose = TRUE )
twinSatOrdSum
round(twinSatOrdFit$output$estimate,4)
mxCompare(twinSatOrdFit)
cat("\n")
# --------------------------------------------------------------------
#TESTING EQUALITY OF COVARIANCES WITH SUBMODELS
#constrain covariances of MZF and MZM
eqcMZModel <- mxModel(twinSatOrdFit, name="eqcMZ" )
eqcMZModel <- omxSetParameters(eqcMZModel, label =
c("rMZf","rMZm"),free=TRUE, values = 0, newlabels = 'rMZ')
eqcMZFit <- mxRun( eqcMZModel, intervals=F )
mxCompare(twinSatOrdFit, eqcMZFit)
cat("\n")
#constrain covariances of MZF and MZM, DZF and DZM
eqcDZModel <- mxModel(eqcMZFit, name="eqcDZ" )
eqcDZModel <- omxSetParameters(eqcDZModel , label =
c("rDZf","rDZm"),free=TRUE, values = 0, newlabels = 'rDZ')
eqcDZFit <- mxRun( eqcDZModel , intervals=F )
mxCompare(eqcMZFit, eqcDZFit)
cat("\n")
# #constrain covariances of MZF and MZM; DZF, DZM and DZO
eqMZDZAllModel <- mxModel(eqcMZFit, name="eqMZDZAll" )
eqMZDZAllModel <- omxSetParameters(eqMZDZAllModel, label =
c("rDZf","rDZm","rDZo"),free=TRUE, values = 0, newlabels = 'rDZ')
eqMZDZAllFit <- mxRun( eqMZDZAllModel, intervals=F )
mxCompare(eqcDZFit, eqMZDZAllFit)
cat("\n")
# --------------------------------------------------------------------
# Print Comparative Fit Statistics
SatNested <- list(eqcMZFit, eqcDZFit,eqMZDZAllFit)
mxCompare(twinSatOrdFit, SatNested)
sink()

- 355 -
Appendix C-8 OpenMx Script for Testing Equality of Means
and Variances and Computing Intraclass Correlations for
Categorical Measure
# --------------------------------------------------------------------
# Adapted from twinSatOrd.R by Hermine Maes (09 08 2015)
# Univariate Twin Saturated model to estimate thresholds and
intraclass correlations across multiple groups
# Matrix style model - Raw data - Ordinal data
# -------|---------|---------|---------|---------|---------|---------
#read output into text file
sink("F:/PhDstuff/complete pairs analysis/2015 New
Proc/AceOutput/SatordACE_AS_crd.txt", append=TRUE, split=TRUE)
# Load Library
require(OpenMx)
require(psych)
# # ------------------------------------------------------------------
# specify variable for analysis
Vars <- 'var1'
combVars <- c('Age','Sex', Vars) #,'yrsTraining'
nvInit <- 3
nv <- 1 # number of variables
ntv <- nv*2 # number of total variables
selVars <- paste(combVars,c(rep(1,nvInit),rep(2,nvInit)),sep="")
nth <- 2 # number of thresholds; change accordingly
mzData <- subset(twinData2015, Zygosity==1, selVars) #MZ
dzData <- subset(twinData2015, Zygosity==2, selVars) #DZ
colnames(mzData)=colnames(dzData)=c('Age1','Sex1','t1','Age2','Sex2','
t2')
# Select Data for Analysis
mzData[,3] <- mxFactor( x=mzData[,3], levels=c(1:3) ) #change
accordingly
mzData[,6] <- mxFactor( x=mzData[,6], levels=c(1:3) )
dzData[,3] <- mxFactor( x=dzData[,3], levels=c(1:3) )
dzData[,6] <- mxFactor( x=dzData[,6], levels=c(1:3) )
# Set Starting Values
svLTh <- -3 # start value for first threshold
svITh <- 1 # start value for increments
svTh <- matrix(rep(c(svLTh,(rep(svITh,nth-1)))),nrow=nth,ncol=nv)
# start value for thresholds
lbTh <- matrix(rep(c(-3,(rep(0.001,nth-1))),nv),nrow=nth,ncol=nv)
# lower bounds for thresholds
svCor <- .5 # start value for correlations
lbCor <- -0.99 # lower bounds for correlations
ubCor <- 0.99 # upper bounds for correlations
labThMZ <-
c(paste("t",1:nth,"MZ1",sep=""),paste("t",1:nth,"MZ2",sep=""))
labThDZ <-
c(paste("t",1:nth,"DZ1",sep=""),paste("t",1:nth,"DZ2",sep=""))

- 356 -
# --------------------------------------------------------------------
# PREPARE SATURATED MODEL
# Algebra for expected Mean & Threshold Matrices in MZ & DZ twins
# Matrices for covariates
defSex <- mxMatrix( type="Full", nrow=1, ncol=2, free=FALSE,
labels=c("data.Sex1","data.Sex2"), name="Sex")
B_Sex <- mxMatrix( type="Full", nrow=nth, ncol=1, free=TRUE,
values= .01, label="betaSex", name="bSex" )
meanSex <- mxAlgebra( bSex%*%Sex, name="SexR")
#age
defAge <- mxMatrix( type="Full", nrow=1, ncol=2, free=FALSE,
labels=c("data.Age1","data.Age2"), name="Age")
B_Age <- mxMatrix( type="Full", nrow=nth, ncol=1, free=TRUE,
values= .01, label="betaAge", name="bAge" )
meanAge <- mxAlgebra( bAge%*%Age, name="AgeR")
#***************************************************************
defs_mz <- list( defSex, B_Sex, meanSex, defAge, B_Age, meanAge)
defs_dz <- list( defSex, B_Sex, meanSex, defAge, B_Age, meanAge)
meanG <- mxMatrix( type="Zero", nrow=1, ncol=ntv, name="meanG" )
thinMZ <- mxMatrix( type="Full", nrow=nth, ncol=ntv, free=TRUE,
values=svTh, lbound=lbTh, labels=labThMZ, name="thinMZ" )
thinDZ <- mxMatrix( type="Full", nrow=nth, ncol=ntv, free=TRUE,
values=svTh, lbound=lbTh, labels=labThDZ, name="thinDZ" )
inc <- mxMatrix( type="Lower", nrow=nth, ncol=nth, free=FALSE,
values=1, name="inc" )
threMZ <- mxAlgebra( expression= inc %*% thinMZ, name="threMZ" )
threDZ <- mxAlgebra( expression= inc %*% thinDZ, name="threDZ" )
threCMZ <- mxAlgebra( expression = threMZ + SexR + AgeR, name =
"threCMZ") #with covariates
threCDZ <- mxAlgebra( expression = threDZ + SexR + AgeR, name =
"threCDZ") #with covariates
# Algebra for expected Variance/Covariance Matrices in MZ & DZ twins
# Intraclass correlations of MZ and DZ twins
corMZ <- mxMatrix( type="Stand", nrow=ntv, ncol=ntv, free=TRUE,
values=svCor, lbound=lbCor, ubound=ubCor, labels="rMZ", name="corMZ" )
corDZ <- mxMatrix( type="Stand", nrow=ntv, ncol=ntv, free=TRUE,
values=svCor, lbound=lbCor, ubound=ubCor, labels="rDZ", name="corDZ" )
# Data objects for Multiple Groups
dataMZ <- mxData( observed=mzData, type="raw" )
dataDZ <- mxData( observed=dzData, type="raw" )
# Objective objects for Multiple Groups
expMZ <- mxExpectationNormal( covariance="corMZ", means="meanG",
dimnames=c('t1','t2'), thresholds="threCMZ" )
expDZ <- mxExpectationNormal( covariance="corDZ", means="meanG",
dimnames=c('t1','t2'), thresholds="threCDZ" )
funML <- mxFitFunctionML()
# Combine Groups
modelMZ <- mxModel( "MZ",defs_mz, meanG, corMZ, thinMZ, inc, threMZ,
threCMZ, dataMZ, expMZ, funML )

- 357 -
modelDZ <- mxModel( "DZ", defs_dz, meanG, corDZ, thinDZ, inc,
threDZ, threCDZ, dataDZ, expDZ, funML )
multi <-
mxFitFunctionMultigroup( c("MZ.fitfunction","DZ.fitfunction") )
ciCor <- mxCI( c('MZ.corMZ','DZ.corDZ' ))
twinSatOrdModel <- mxModel( "twinSatOrd", modelMZ, modelDZ, multi,
ciCor)
# --------------------------------------------------------------------
# Run Saturated Model
twinSatOrdFit <- mxRun( twinSatOrdModel, intervals=T )
twinSatOrdSum <- summary( twinSatOrdFit, verbose = TRUE )
twinSatOrdSum
round(twinSatOrdFit$output$estimate,4)
mxCompare(twinSatOrdFit)
# --------------------------------------------------------------------
# RUN SUBMODELS
# Constrain expected Thresholds to be equal across twin order
eqThresTwinModel <- mxModel(twinSatOrdFit, name="eqThresTwin" )
eqThresTwinModel <- omxSetParameters( eqThresTwinModel,
label=c("t1MZ1","t1MZ2"), free=TRUE, values=svLTh, newlabels='t1MZ' )
for (i in 2:nth) { eqThresTwinModel <-
omxSetParameters( eqThresTwinModel,
label=c(paste("t",i,"MZ1",sep=""),paste("t",i,"MZ2",sep="")),
free=TRUE, values=svITh, newlabels=paste("t",i,"MZ",sep="") ) }
eqThresTwinModel <- omxSetParameters( eqThresTwinModel,
label=c("t1DZ1","t1DZ2"), free=TRUE, values=svLTh, newlabels='t1DZ' )
for (i in 2:nth) { eqThresTwinModel <-
omxSetParameters( eqThresTwinModel,
label=c(paste("t",i,"DZ1",sep=""),paste("t",i,"DZ2",sep="")),
free=TRUE, values=svITh, newlabels=paste("t",i,"DZ",sep="") ) }
eqThresTwinFit <- mxRun( eqThresTwinModel, intervals=F )
eqThresTwinSum <- summary( eqThresTwinFit )
eqThresTwinLLL <- eqThresTwinFit$output$Minus2LogLikelihood
mxCompare(twinSatOrdFit, eqThresTwinFit)
# Constrain expected Thres to be equal across twin order and zygosity
eqThresZygModel <- mxModel(eqThresTwinModel, name="eqThresZyg" )
eqThresZygModel <- omxSetParameters( eqThresZygModel,
label=c("t1MZ","t1DZ"), free=TRUE, values=svLTh, newlabels='t1Z' )
for (i in 2:nth) { eqThresZygModel <-
omxSetParameters( eqThresZygModel,
label=c(paste("t",i,"MZ",sep=""),paste("t",i,"DZ",sep="")), free=TRUE,
values=svITh, newlabels=paste("t",i,"Z",sep="") ) }
eqThresZygFit <- mxRun( eqThresZygModel, intervals=F )
eqThresZygSum <- summary( eqThresZygFit )
eqThresZygLLL <- eqThresZygFit$output$Minus2LogLikelihood
mxCompare(eqThresTwinFit, eqThresZygFit)
# --------------------------------------------------------------------
# Print Comparative Fit Statistics
SatNested <- list(eqThresTwinFit, eqThresZygFit)
mxCompare(twinSatOrdFit, SatNested)
sink()

- 358 -
Appendix C-9 OpenMx Script for Computation of Intraclass
Correlations of Continuous Measures
sink("F:/PhDstuff/complete pairs analysis/2015 New
Proc/AceOutput/rMZrDZ_AS_var.txt", append=TRUE, split=TRUE)
require(OpenMx)
require(psych)
#change to variable of interest
Vars <- 'var1'
combVars <- c('Age','Sex',Vars)
nvInit <- 3
nv <- 1 # number of variables
ntv <- nv*2 # number of total variables
selVars <- paste(combVars,c(rep(1,nvInit),rep(2,nvInit)),sep="")
#eg c('ht1','wt1,'ht2','wt2')
# Select Data for Analysis
mzData <- subset(twinData2015, Zygosity==1, selVars) #MZ
dzData <- subset(twinData2015, Zygosity==2, selVars) #DZ
colnames(mzData)=colnames(dzData)=c('Age1','Sex1','t1','Age2','Sex2','
t2')
mzdat = mxData(mzData,"raw")
dzdat = mxData(dzData,"raw")
defnvars <- mxMatrix(type="Full",nrow=1,ncol=4,free=F,
labels=c("data.Age1","data.Sex1","data.Age2","data.Sex2"),name="xdef")
Beta0mz <-
mxMatrix(type="Full",nrow=1,ncol=1,free=T,values=1,labels="beta0mz",na
me="Beta0mz")
Beta0dz <-
mxMatrix(type="Full",nrow=1,ncol=1,free=T,values=1,labels="beta0mz",na
me="Beta0dz") #Same by zyg.
Betage <-
mxMatrix(type="Full",nrow=1,ncol=1,free=T,values=0,labels="betage",nam
e="Betage")
Betasex <-
mxMatrix(type="Full",nrow=1,ncol=1,free=T,values=0,labels="betasex",na
me="Betasex")
Mzcor <-
mxMatrix(type="Stand",nrow=2,ncol=2,free=T,values=0.5,labels="mzcor",n
ame="Mzcor")
Dzcor <-
mxMatrix(type="Stand",nrow=2,ncol=2,free=T,values=0.5,labels="dzcor",n
ame="Dzcor")
Mzsds <-
mxMatrix(type="Full",nrow=2,ncol=1,free=T,values=1,labels="mzsd",lboun
d=0.0001,name="Mzsds")

- 359 -
Dzsds <-
mxMatrix(type="Full",nrow=2,ncol=1,free=T,values=1,labels="dzsd",lboun
d=0.0001,name="Dzsds")
Mzvar <- mxAlgebra(Mzcor * (Mzsds %*% t(Mzsds)), name="Mzvar",
dimnames=list(c('t1','t2'),c('t1','t2')))
Dzvar <- mxAlgebra(Dzcor * (Dzsds %*% t(Dzsds)), name="Dzvar",
dimnames=list(c('t1','t2'),c('t1','t2')))
Mzmeans <-
mxAlgebra(cbind(Beta0mz+(Betage*xdef[1,1])+(Betasex*xdef[1,2]),
Beta0mz+(Betage*xdef[1,3])+(Betasex*xdef[1,4])), name="Mzmeans",
dimnames=list(NULL,c('t1','t2')))
Dzmeans <-
mxAlgebra(cbind(Beta0dz+(Betage*xdef[1,1])+(Betasex*xdef[1,2]),
Beta0dz+(Betage*xdef[1,3])+(Betasex*xdef[1,4])), name="Dzmeans",
dimnames=list(NULL,c('t1','t2')))
objMZ <- mxExpectationNormal( covariance="Mzvar", means="Mzmeans",
dimnames=c('t1','t2') )
objDZ <- mxExpectationNormal( covariance="Dzvar", means="Dzmeans",
dimnames=c('t1','t2') )
funML <- mxFitFunctionML()
Mzmodel <-
mxModel("MZtwins",Beta0mz,Betage,Betasex,Mzcor,Mzmeans,Mzsds,Mzvar,def
nvars,mzdat,
objMZ,funML)
Dzmodel <-
mxModel("DZtwins",Beta0dz,Betage,Betasex,Dzcor,Dzmeans,Dzsds,Dzvar,def
nvars,dzdat,
objDZ,funML)
fitML <-
mxFitFunctionMultigroup(c("MZtwins.fitfunction","DZtwins.fitfunction")
)
Allmodel1 <-
mxModel("All",Mzmodel,Dzmodel,fitML,mxCI(c("mzcor","dzcor")))
Allrun1 <- mxRun(Allmodel1, intervals=T)
( Allsumm1 <- summary(Allrun1) )
#Covariance matrices:
Allrun1$MZtwins.Mzvar@result
Allrun1$DZtwins.Dzvar@result
#Intraclass correlations of MZ and DZ groups
#Correlation matrices:
Allrun1$MZtwins.Mzcor@values
Allrun1$DZtwins.Dzcor@values
sink()
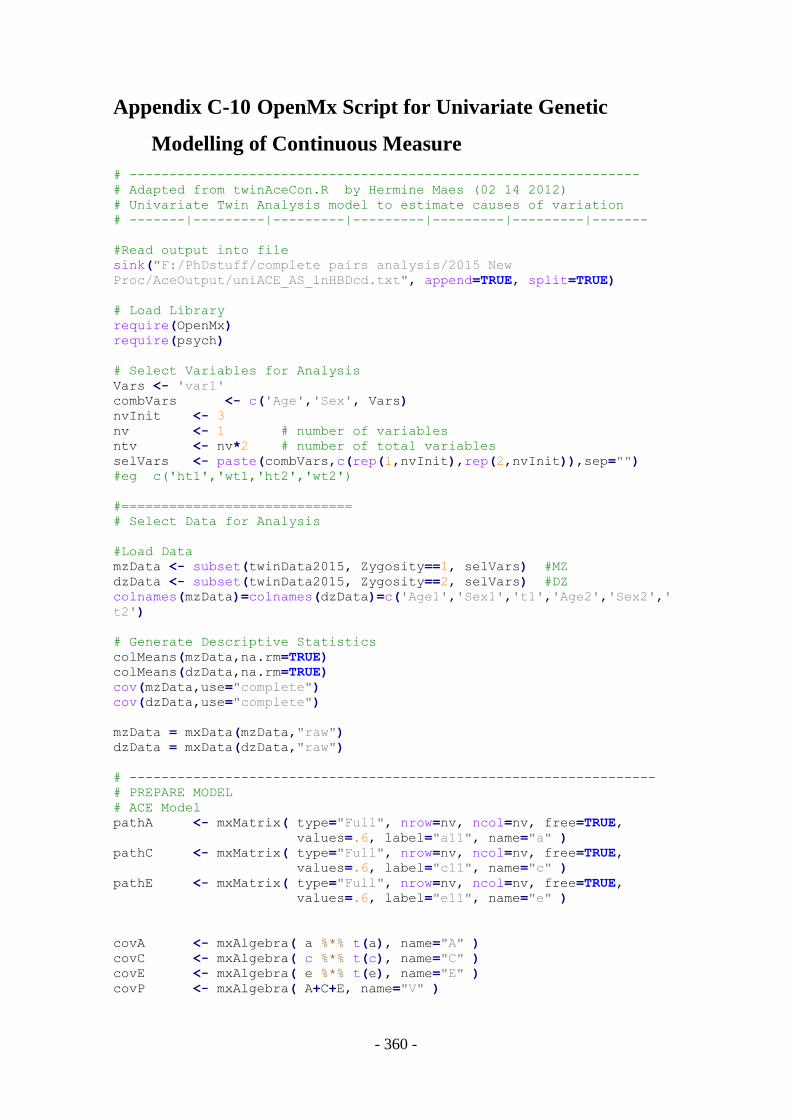
- 360 -
Appendix C-10 OpenMx Script for Univariate Genetic
Modelling of Continuous Measure
# ----------------------------------------------------------------
# Adapted from twinAceCon.R by Hermine Maes (02 14 2012)
# Univariate Twin Analysis model to estimate causes of variation
# -------|---------|---------|---------|---------|---------|-------
#Read output into file
sink("F:/PhDstuff/complete pairs analysis/2015 New
Proc/AceOutput/uniACE_AS_lnHBDcd.txt", append=TRUE, split=TRUE)
# Load Library
require(OpenMx)
require(psych)
# Select Variables for Analysis
Vars <- 'var1'
combVars <- c('Age','Sex', Vars)
nvInit <- 3
nv <- 1 # number of variables
ntv <- nv*2 # number of total variables
selVars <- paste(combVars,c(rep(1,nvInit),rep(2,nvInit)),sep="")
#eg c('ht1','wt1,'ht2','wt2')
#=============================
# Select Data for Analysis
#Load Data
mzData <- subset(twinData2015, Zygosity==1, selVars) #MZ
dzData <- subset(twinData2015, Zygosity==2, selVars) #DZ
colnames(mzData)=colnames(dzData)=c('Age1','Sex1','t1','Age2','Sex2','
t2')
# Generate Descriptive Statistics
colMeans(mzData,na.rm=TRUE)
colMeans(dzData,na.rm=TRUE)
cov(mzData,use="complete")
cov(dzData,use="complete")
mzData = mxData(mzData,"raw")
dzData = mxData(dzData,"raw")
# ------------------------------------------------------------------
# PREPARE MODEL
# ACE Model
pathA <- mxMatrix( type="Full", nrow=nv, ncol=nv, free=TRUE,
values=.6, label="a11", name="a" )
pathC <- mxMatrix( type="Full", nrow=nv, ncol=nv, free=TRUE,
values=.6, label="c11", name="c" )
pathE <- mxMatrix( type="Full", nrow=nv, ncol=nv, free=TRUE,
values=.6, label="e11", name="e" )
covA <- mxAlgebra( a %*% t(a), name="A" )
covC <- mxAlgebra( c %*% t(c), name="C" )
covE <- mxAlgebra( e %*% t(e), name="E" )
covP <- mxAlgebra( A+C+E, name="V" )

- 361 -
# Matrix for expected Mean
intercept <- mxMatrix( type="Full", nrow=1, ncol=ntv, free=TRUE,
values= 5, label="mean", name="Mean" )
#***************************************************************
# Matrix for covariates: Age and Sex
defSex <- mxMatrix( type="Full", nrow=1, ncol=2, free=FALSE,
labels=c("data.Sex1","data.Sex2"), name="Sex")
# Matrices declared to store linear Coefficients for covariate sex
B_Sex <- mxMatrix( type="Full", nrow=1, ncol=1, free=TRUE,
values= .01, label="betaSex", name="bSex" )
meanSex <- mxAlgebra( bSex%*%Sex, name="SexR")
#age
defAge <- mxMatrix( type="Full", nrow=1, ncol=2, free=FALSE,
labels=c("data.Age1","data.Age2"), name="Age")
# Matrices declared to store linear Coefficients for covariate age
B_Age <- mxMatrix( type="Full", nrow=1, ncol=1, free=TRUE,
values= .01, label="betaAge", name="bAge" )
meanAge <- mxAlgebra( bAge%*%Age, name="AgeR")
#***************************************************************
expMean <- mxAlgebra( Mean + AgeR + SexR , name="expMean")
defs <- list( intercept, defSex, B_Sex, meanSex, defAge, B_Age,
meanAge)
covMZ <- mxAlgebra(
rbind( cbind(A+C+E , A+C),
cbind(A+C , A+C+E)), name="expCovMZ" )
covDZ <- mxAlgebra(
rbind( cbind(A+C+E, 0.5%x%A+C),
cbind(0.5%x%A+C , A+C+E)), name="expCovDZ" )
# Objective objects for Multiple Groups
objMZ <- mxExpectationNormal(covariance="expCovMZ",
means="expMean", dimnames=c('t1','t2'))
objDZ <- mxExpectationNormal(covariance="expCovDZ",
means="expMean", dimnames=c('t1','t2'))
funML <- mxFitFunctionML()
rowVars <- rep('vars',nv)
colVars <- rep(c('A','C','E','SA','SC','SE'),each=nv)
estVars <- mxAlgebra(cbind(A,C,E,A/V,C/V,E/V), name="Vars",
dimnames=list(rowVars,colVars))
parameters <- list( pathA, pathC, pathE, covA, covC, covE, covP,
estVars)
modelMZ <- mxModel( parameters, defs, expMean, covMZ, mzData, objMZ,
funML,
name="MZ" )

- 362 -
modelDZ <- mxModel( parameters, defs, expMean, covDZ, dzData, objDZ,
funML,
name="DZ" )
fitML <-
mxFitFunctionMultigroup(c("MZ.fitfunction","DZ.fitfunction"))
AceModel <- mxModel( "ACE", parameters, modelMZ, modelDZ, fitML,
mxCI(c("Vars[1,4:6]")))
# ---------------------------------------------------------------
# RUN MODEL
# Run ACE model
AceFit_cov <- mxRun(AceModel,intervals = T)
AceFitsumm <- summary(AceFit_cov)
AceFitsumm
SatCon <- mxRefModels(AceFit_cov, run=TRUE)
mxCompare(SatCon,AceFit_cov)
# --------------------------------------------------------------------
----------
# FIT SUBMODELS
# Run AE model
AeModel <- mxModel( AceFit_cov, name="AE" )
AeModel <- omxSetParameters( AeModel, labels="c11", free=FALSE,
values=0 )
AeFit_cov <- mxRun(AeModel,intervals=T)
AeFitsumm <- summary(AeFit_cov)
AeFitsumm
mxCompare(AceFit_cov,AeFit_cov)
# Run CE model
CeModel <- mxModel( AceFit_cov, name="CE" )
CeModel <- omxSetParameters( CeModel, labels="a11", free=FALSE,
values=0 )
CeFit_cov <- mxRun(CeModel,intervals=T)
CeFitsumm <- summary(CeFit_cov)
CeFitsumm
mxCompare(AceFit_cov,CeFit_cov)
# Run E model
EModel <- mxModel( AeFit_cov, name="E" )
EModel <- omxSetParameters( EModel, labels="a11", free=FALSE,
values=0 )
EFit_cov <- mxRun(EModel,intervals=T)
EFitsumm <- summary(EFit_cov)
EFitsumm
mxCompare(AceFit_cov,EFit_cov)
AceNested <- list(AeFit_cov,CeFit_cov,EFit_cov)
mxCompare(AceFit_cov,AceNested)
sink()

- 363 -
Appendix C-11 OpenMx Script for Univariate Genetic
Modelling of Categorical Measure
# -------------------------------------------------------------------
# Adapted from twinAceOrdS.R by Hermine Maes (09 08 2015)
# Univariate Twin Analysis model to estimate causes of variation
# Matrix style model - Raw data - Ordinal data
# -------|---------|---------|---------|---------|---------|---------
#read output into text file
sink("F:/PhDstuff/complete pairs analysis/2015 New
Proc/AceOutput/ordACE_AS_var1.txt", append=TRUE, split=TRUE)
# Load Library
require(OpenMx)
require(psych)
# Specify Variables for Analysis
Vars <- 'var1'
combVars <- c('Age','Sex', Vars) #,'yrsTraining'
nvInit <- 3
nv <- 1 # number of variables
ntv <- nv*2 # number of total variables
selVars <- paste(combVars,c(rep(1,nvInit),rep(2,nvInit)),sep="")
#eg c('ht1','wt1,'ht2','wt2')
nth <- 2 # number of thresholds ; change accordingly
mzData <- subset(twinData2015, Zygosity==1, selVars) #note if it's
Zygosity or ZygosityGrp
dzData <- subset(twinData2015, Zygosity==2, selVars)
describe(mzData)
describe(dzData)
colnames(mzData)=colnames(dzData)=c('Age1','Sex1','t1','Age2','Sex2','
t2')
mzData[,1] <- mzData[,1]/100 #divide age by 100 to avoid program
error
mzData[,4] <- mzData[,4]/100
dzData[,1] <- dzData[,1]/100
dzData[,4] <- dzData[,4]/100
mzData[,3] <- mxFactor( x=mzData[,3], levels=c(1:3) )
mzData[,6] <- mxFactor( x=mzData[,6], levels=c(1:3) )
dzData[,3] <- mxFactor( x=dzData[,3], levels=c(1:3) )
dzData[,6] <- mxFactor( x=dzData[,6], levels=c(1:3) )
# Set Starting Values
svLTh <- -3 # start value for first threshold
svITh <- 1 # start value for increments
svTh <- matrix(rep(c(svLTh,(rep(svITh,nth-1)))),nrow=nth,ncol=nv)
# start value for thresholds
lbTh <- matrix(rep(c(-3,(rep(0.001,nth-1))),nv),nrow=nth,ncol=nv)
svCor <- .5 # start value for correlations
lbCor <- -0.99 # lower bounds for correlations

- 364 -
ubCor <- 0.99 # upper bounds for correlations
labThZ <- c(paste("t",1:nth,"Z",sep=""),paste("t",1:nth,"Z",sep=""))
# Set Starting Values
svPa <- .6 # start value for path coefficients
# --------------------------------------------------------------------
# PREPARE MODEL
# ACE Model
# Matrices declared to store a, c, and e Path Coefficients
pathA <- mxMatrix( type="Full", nrow=1, ncol=1, free=TRUE,
values=0, label="a11", name="a" )
pathC <- mxMatrix( type="Full", nrow=1, ncol=1, free=TRUE,
values=0, label="c11", name="c" )
pathE <- mxMatrix( type="Full", nrow=1, ncol=1, free=TRUE,
values=1, label="e11", name="e" )
# Matrices generated to hold A, C, and E computed Variance Components
covA <- mxAlgebra( expression=a %*% t(a), name="A" )
covC <- mxAlgebra( expression=c %*% t(c), name="C" )
covE <- mxAlgebra( expression=e %*% t(e), name="E" )
# Matrix for covariates
#sex
defSex <- mxMatrix( type="Full", nrow=1, ncol=2, free=FALSE,
labels=c("data.Sex1","data.Sex2"), name="Sex")
# Matrices declared to store linear Coefficients for sex covariate
B_Sex <- mxMatrix( type="Full", nrow=nth, ncol=1, free=TRUE,
values= .1, label="betaSex", name="bSex" )
meanSex <- mxAlgebra( bSex%*%Sex, name="SexR")
#age
defAge <- mxMatrix( type="Full", nrow=1, ncol=2, free=FALSE,
labels=c("data.Age1","data.Age2"), name="Age")
# Matrices declared to store linear Coefficients for age covariate
B_Age <- mxMatrix( type="Full", nrow=nth, ncol=1, free=TRUE,
values= .1, label="betaAge", name="bAge" )
meanAge <- mxAlgebra( bAge%*%Age, name="AgeR")
#***************************************************************
defs <- list( defSex, B_Sex, meanSex, defAge, B_Age, meanAge)
# Matrix & Algebra for expected means vector and expected thresholds
meanG <- mxMatrix( type="Zero", nrow=1, ncol=ntv, name="expMean" )
threG <- mxMatrix( type="Full", nrow=nth, ncol=nv, free=TRUE,
values=svTh, lbound=lbTh, labels=labThZ, name="Thre" )
inc <- mxMatrix( type="Lower", nrow=nth, ncol=nth, free=FALSE,
values=1, name="Inc" )
threT <- mxAlgebra( expression= cbind(Inc %*% Thre,Inc %*% Thre),
name="expThre" )
threC <- mxAlgebra( expression = expThre + SexR + AgeR, name =
"expThreC") #with covariates
# Algebra to compute total variances and standard deviations (diagonal
only)
covP <- mxAlgebra( expression=A+C+E, name="V" )

- 365 -
# Algebras generated to hold Parameter Estimates and Derived Variance
Components
rowVars <- rep('vars',nv)
colVars <- rep(c('A','C','E','SA','SC','SE'),each=nv)
estVars <- mxAlgebra( expression=cbind(A,C,E,A/V,C/V,E/V),
name="Vars", dimnames=list(rowVars,colVars))
# Algebra for expected Mean and Variance/Covariance Matrices in MZ &
DZ twins
covMZ <- mxAlgebra( expression= rbind( cbind(V, A+C), cbind(A+C,
V)), name="expCovMZ" )
covDZ <- mxAlgebra( expression= rbind( cbind(V, 0.5%x%A+C),
cbind(0.5%x%A+C, V)), name="expCovDZ" )
# Constraint on variance of Ordinal variables
matUnv <- mxMatrix( type="Unit", nrow=nv, ncol=1, name="Unv1" )
var1 <- mxConstraint( expression=diag2vec(V)==Unv1, name="Var1" )
# Data objects for Multiple Groups
dataMZ <- mxData( observed=mzData, type="raw" )
dataDZ <- mxData( observed=dzData, type="raw" )
# Objective objects for Multiple Groups
expMZ <- mxExpectationNormal( covariance="expCovMZ",
means="expMean", dimnames=c('t1','t2'), thresholds="expThreC" )
expDZ <- mxExpectationNormal( covariance="expCovDZ",
means="expMean", dimnames=c('t1','t2'), thresholds="expThreC" )
funML <- mxFitFunctionML()
ci <- mxCI(c("Vars[1,4:6]"))
# Combine Groups
pars <- list( pathA, pathC, pathE, covA, covC, covE, covP, inc,
matUnv, estVars )
modelMZ <- mxModel( pars, defs, meanG, threG, threT, threC, covMZ,
dataMZ, expMZ, funML, name="MZ" )
modelDZ <- mxModel( pars, defs, meanG, threG, threT, threC, covDZ,
dataDZ, expDZ, funML, name="DZ" )
multi <- mxFitFunctionMultigroup( c("MZ","DZ") )
AceModel <- mxModel( "ACE", pars, var1, modelMZ, modelDZ, multi, ci )
# --------------------------------------------------------------------
# RUN MODELS
# Run ACE Model
#AceFit <- mxRun(AceModel, unsafe=T)
AceFit <- mxRun(AceModel, intervals=T)
AceSumm <- summary(AceFit, verbose = T)
AceSumm
round(AceFit@output$estimate,4)
cat("\n")
round(AceFit$Vars@result,4)
cat("\n")
AceFit$MZ$expThre
cat("\n")
# Run AE model
AeModel <- mxModel( AceFit, name="AE" )
AeModel <- omxSetParameters( AeModel, labels="c11", free=FALSE,
values=0 )
AeFit <- mxRun(AeModel, intervals=T)

- 366 -
AeSumm <- summary(AeFit, verbose = T)
AeSumm
cat("\n")
round(AeFit@output$estimate,4)
cat("\n")
round(AeFit$Vars@result,4)
# Run CE model
CeModel <- mxModel( AceFit, name="CE" )
CeModel <- omxSetParameters( CeModel, labels="a11", free=FALSE,
values=0 )
CeFit <- mxRun(CeModel, intervals=T)
CeSumm <- summary(CeFit, verbose = T)
CeSumm
cat("\n")
round(CeFit@output$estimate,4)
cat("\n")
round(CeFit$Vars@result,4)
# Run E model
eModel <- mxModel( AceFit, name="E" )
eModel <- omxSetParameters( eModel, labels="a11", free=FALSE,
values=0 )
eFit <- mxRun(eModel, intervals=T)
eSumm <- summary(eFit, verbose = T)
eSumm
cat("\n")
round(eFit@output$estimate,4)
cat("\n")
round(eFit$Vars@result,4)
# --------------------------------------------------------------------
# Print Comparative Fit Statistics
AceNested <- list(AeFit, CeFit, eFit)
mxCompare(AceFit,AceNested)
cat("\n")
round(c(AceFit@output$estimate,AeFit@output$estimate,CeFit@output$esti
mate,eFit@output$estimate),4)
cat("\n")
round(rbind(AceFit$Vars@result,AeFit$Vars@result,CeFit$Vars@result,eFi
t$Vars@result),4)
sink()
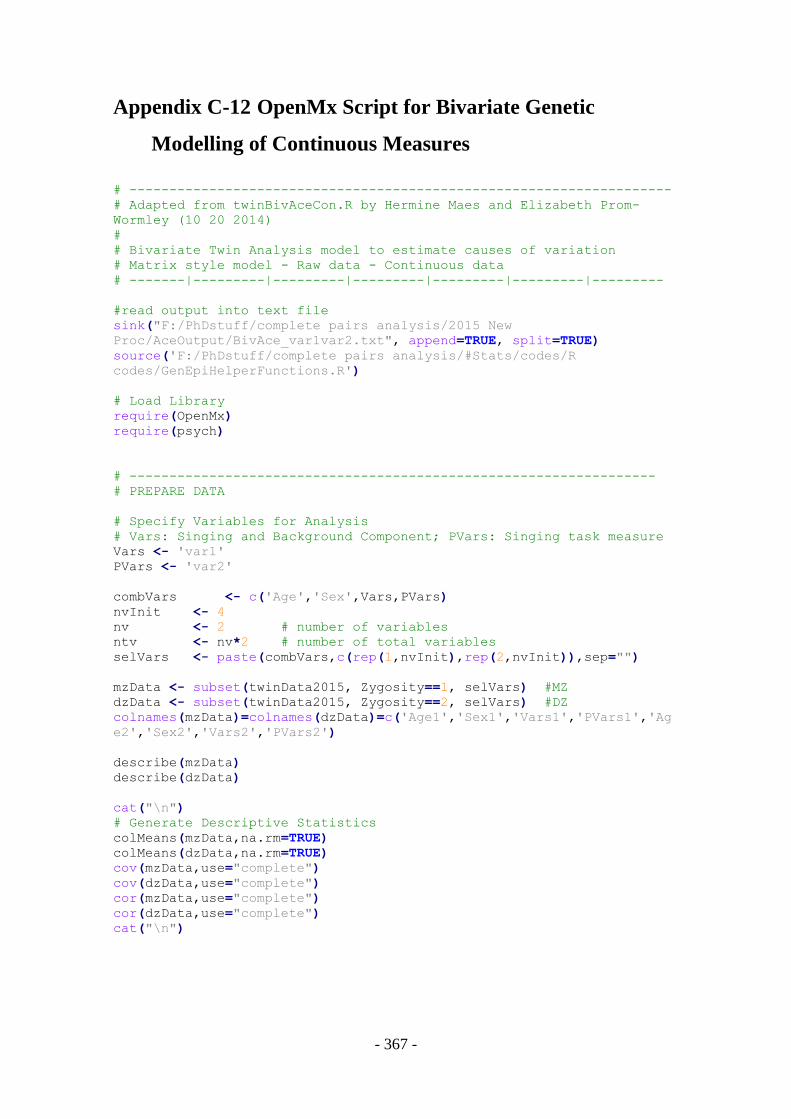
- 367 -
Appendix C-12 OpenMx Script for Bivariate Genetic
Modelling of Continuous Measures
# --------------------------------------------------------------------
# Adapted from twinBivAceCon.R by Hermine Maes and Elizabeth Prom-
Wormley (10 20 2014)
#
# Bivariate Twin Analysis model to estimate causes of variation
# Matrix style model - Raw data - Continuous data
# -------|---------|---------|---------|---------|---------|---------
#read output into text file
sink("F:/PhDstuff/complete pairs analysis/2015 New
Proc/AceOutput/BivAce_var1var2.txt", append=TRUE, split=TRUE)
source('F:/PhDstuff/complete pairs analysis/#Stats/codes/R
codes/GenEpiHelperFunctions.R')
# Load Library
require(OpenMx)
require(psych)
# ------------------------------------------------------------------
# PREPARE DATA
# Specify Variables for Analysis
# Vars: Singing and Background Component; PVars: Singing task measure
Vars <- 'var1'
PVars <- 'var2'
combVars <- c('Age','Sex',Vars,PVars)
nvInit <- 4
nv <- 2 # number of variables
ntv <- nv*2 # number of total variables
selVars <- paste(combVars,c(rep(1,nvInit),rep(2,nvInit)),sep="")
mzData <- subset(twinData2015, Zygosity==1, selVars) #MZ
dzData <- subset(twinData2015, Zygosity==2, selVars) #DZ
colnames(mzData)=colnames(dzData)=c('Age1','Sex1','Vars1','PVars1','Ag
e2','Sex2','Vars2','PVars2')
describe(mzData)
describe(dzData)
cat("\n")
# Generate Descriptive Statistics
colMeans(mzData,na.rm=TRUE)
colMeans(dzData,na.rm=TRUE)
cov(mzData,use="complete")
cov(dzData,use="complete")
cor(mzData,use="complete")
cor(dzData,use="complete")
cat("\n")

- 368 -
# --------------------------------------------------------------------
# PREPARE SATURATED MODEL
# Fit Bivariate Saturated Model
# Set Starting Values
svMe <- c(0,0) # start value for means
laMeMZ <-
c('Vars1_MeanMZ','PVars1_MeanMZ','Vars2_MeanMZ','PVars2_MeanMZ')
laMeDZ <-
c('Vars1_MeanDZ','PVars1_MeanDZ','Vars2_MeanDZ','PVars2_MeanDZ')
svVa <- c(0.5,0.8) # start value for variances
svVas <- diag(svVa,ntv,ntv)
laCvMZ <- paste("covMZ",rev(ntv+1-
sequence(1:ntv)),rep(1:ntv,ntv:1),sep="_")
laCvDZ <- paste("covDZ",rev(ntv+1-
sequence(1:ntv)),rep(1:ntv,ntv:1),sep="_")
intercept_mz <- mxMatrix( type="Full", nrow=1, ncol=ntv,
free=TRUE,
values=svMe, labels=laMeMZ,
name="MeanMZ" )
intercept_dz <- mxMatrix( type="Full", nrow=1, ncol=ntv,
free=TRUE,
values=svMe, labels=laMeDZ,
name="MeanDZ" )
# Matrix for covariates
# sex
defSex <- mxMatrix( type="Full", nrow=1, ncol=ntv, free=FALSE,
labels=c("data.Sex1","data.Sex1","data.Sex2","data.Sex2"), name="Sex")
# Matrices declared to store linear Coefficients for sex covariate
B_Sex <- mxMatrix( type="Full", nrow=1, ncol=1, free=TRUE,
values= .01, label="betaSex", name="bSex" )
meanSex <- mxAlgebra( bSex%*%Sex, name="SexR")
#age
defAge <- mxMatrix( type="Full", nrow=1, ncol=ntv, free=FALSE,
labels=c("data.Age1","data.Age1","data.Age2","data.Age2"), name="Age")
# Matrices declared to store linear Coefficients for age covariate
B_Age <- mxMatrix( type="Full", nrow=1, ncol=1, free=TRUE,
values= .01, label="betaAge", name="bAge" )
meanAge <- mxAlgebra( bAge%*%Age, name="AgeR")
#***************************************************************
# Algebra for expected Mean and Variance/Covariance Matrices in MZ &
DZ twins
meanGMZ <- mxAlgebra( MeanMZ + AgeR + SexR , name="expMeanMZ")
meanGDZ <- mxAlgebra( MeanDZ + AgeR + SexR , name="expMeanDZ")
defs_MZ <- list( intercept_mz, defSex, B_Sex, meanSex, defAge,
B_Age, meanAge)
defs_DZ <- list( intercept_dz, defSex, B_Sex, meanSex, defAge,
B_Age, meanAge)

- 369 -
# Algebra for expected Variance/Covariance Matrices in MZ & DZ twins
covMZ <- mxMatrix( type="Symm", nrow=ntv, ncol=ntv, free=TRUE,
values=svVas, labels=laCvMZ, name="expCovMZ" )
covDZ <- mxMatrix( type="Symm", nrow=ntv, ncol=ntv, free=TRUE,
values=svVas, labels=laCvDZ, name="expCovDZ" )
# Expectation objects for Multiple Groups
expMZ <- mxExpectationNormal( covariance="expCovMZ",
means="expMeanMZ", c('Vars1','PVars1','Vars2','PVars2') )
expDZ <- mxExpectationNormal( covariance="expCovDZ",
means="expMeanDZ", c('Vars1','PVars1','Vars2','PVars2') )
funML <- mxFitFunctionML()
# Data objects for Multiple Groups
dataMZ <- mxData(mzData, "raw")
dataDZ <- mxData(dzData, "raw")
# Combine Groups
SatmodelMZ <- mxModel( defs_MZ, meanGMZ, covMZ, dataMZ, expMZ, funML,
name="MZ" )
SatmodelDZ <- mxModel( defs_DZ, meanGDZ, covDZ, dataDZ, expDZ, funML,
name="DZ" )
fitML <-
mxFitFunctionMultigroup(c("MZ.fitfunction","DZ.fitfunction"))
bivTwinSatModel <- mxModel( "bivTwinSat", SatmodelMZ, SatmodelDZ,
fitML )
bivTwinSatFit <- mxRun(bivTwinSatModel)
bivTwinSatSumm <- summary(bivTwinSatFit)
bivTwinSatSumm
# Generate Saturated Output
# --------------------------------------------------------------------
parameterSpecifications(bivTwinSatFit)
expectedMeansCovariances(bivTwinSatFit)
tableFitStatistics(bivTwinSatFit)
# --------------------------------------------------------------------
# RUN SATURATED SUBMODELS
# Fit Bivariate Model with Equal Means & Variances across Twin Order
and Zygosity
# --------------------------------------------------------------------
# Constrain expected means and variances to be equal across twin order
equateMeansTwinModel <- mxModel(bivTwinSatFit, name="equateMeansTwin",
mxConstraint( expression=MZ.expMeanMZ[1,1:nv]==MZ.expMeanMZ[1,(nv+1):n
tv], name="MeanMZt1eqt2"),
mxConstraint( expression=DZ.expMeanDZ[1,1:nv]==DZ.expMeanDZ[1,(nv+1):n
tv], name="MeanDZt1eqt2")
)
equateMeansTwinFit <- mxRun(equateMeansTwinModel)
tableFitStatistics(bivTwinSatFit, equateMeansTwinFit)
equateMeansVarsTwinModel <- mxModel(equateMeansTwinFit,
name="equateMeansVarsTwin",
mxAlgebra( expression=t(diag2vec(MZ.expCovMZ)), name="expVarMZ"),

- 370 -
mxAlgebra( expression=t(diag2vec(DZ.expCovDZ)), name="expVarDZ"),
mxConstraint( expression=expVarMZ[1,1:nv]==expVarMZ[1,(nv+1):ntv],
name="VarMZt1eqt2"),
mxConstraint( expression=expVarDZ[1,1:nv]==expVarDZ[1,(nv+1):ntv],
name="VarDZt1eqt2")
)
equateMeansVarsTwinFit <- mxRun(equateMeansVarsTwinModel)
tableFitStatistics(bivTwinSatFit, equateMeansVarsTwinFit)
# Constrain expected means and variances to be equal across twin order
and zygosity
equateMeansVarsTwinZygModel <- mxModel(equateMeansVarsTwinFit,
name="equateMeansVarsTwinZyg",
mxConstraint( expression=expVarMZ[1,1:nv]==expVarDZ[1,1:nv],
name="VarMZeqDZ"),
mxConstraint( expression=MZ.expMeanMZ[1,1:nv]==DZ.expMeanDZ[1,1:nv],
name="MeanMZeqDZ")
)
equateMeansVarsTwinZygFit <- mxRun(equateMeansVarsTwinZygModel)
mxCompare(equateMeansVarsTwinFit,equateMeansVarsTwinZygFit)
tableFitStatistics(bivTwinSatFit, list(equateMeansTwinFit,
equateMeansVarsTwinFit, equateMeansVarsTwinZygFit))
# --------------------------------------------------------------------
# PREPARE ACE MODEL
# Set Starting Values
svMe <- c(0,0) # start value for means
laMe <- c('Vars1_Mean','PVars1_Mean','Vars2_Mean','PVars2_Mean')
svPa <- .6 # start value for parameters
svPas <- diag(svPa,nv,nv)
laA <- paste("a",rev(nv+1-sequence(1:nv)),rep(1:nv,nv:1),sep="")
# c("a11","a21","a22")
laD <- paste("d",rev(nv+1-sequence(1:nv)),rep(1:nv,nv:1),sep="")
laC <- paste("c",rev(nv+1-sequence(1:nv)),rep(1:nv,nv:1),sep="")
laE <- paste("e",rev(nv+1-sequence(1:nv)),rep(1:nv,nv:1),sep="")
# Matrices declared to store a, c, and e Path Coefficients
pathA <- mxMatrix( type="Lower", nrow=nv, ncol=nv, free=TRUE,
values=svPas, label=laA, name="a" )
pathD <- mxMatrix( type="Lower", nrow=nv, ncol=nv, free=FALSE,
values=0, label=laD, name="d" )
pathC <- mxMatrix( type="Lower", nrow=nv, ncol=nv, free=TRUE,
values=svPas, label=laC, name="c" )
pathE <- mxMatrix( type="Lower", nrow=nv, ncol=nv, free=TRUE,
values=svPas, label=laE, name="e" )
# Matrices generated to hold A, C, and E computed Variance Components
covA <- mxAlgebra( expression=a %*% t(a), name="A" )
covD <- mxAlgebra( expression=d %*% t(d), name="D" )
covC <- mxAlgebra( expression=c %*% t(c), name="C" )
covE <- mxAlgebra( expression=e %*% t(e), name="E" )
# Algebra to compute total variances and standard deviations (diagonal
only)
covP <- mxAlgebra( expression=A+D+C+E, name="V" )

- 371 -
matI <- mxMatrix( type="Iden", nrow=nv, ncol=nv, name="I")
invSD <- mxAlgebra( expression=solve(sqrt(I*V)), name="iSD")
#this is to help to get stdized paths
# Algebras generated to hold Parameter Estimates and Derived Variance
Components
rowVars <- rep('vars',nv)
colVars <- rep(c('A','D','C','E','SA','SD','SC','SE'),each=nv)
#each variable is repeated, A of Var1, A of var2, D of Var1, D of Var2
estVars <- mxAlgebra( expression=cbind(A,D,C,E,A/V,D/V,C/V,E/V),
name="Vars", dimnames=list(rowVars,colVars))
SA <- mxAlgebra(expression=A/V, name="SA")
SD <- mxAlgebra(expression=D/V, name="SD")
SC <- mxAlgebra(expression=C/V, name="SC")
SE <- mxAlgebra(expression=E/V, name="SE")
# Algebra for expected Mean and Variance/Covariance Matrices in MZ &
DZ twins
intercept <- mxMatrix( type="Full", nrow=1, ncol=ntv, free=TRUE,
values=svMe, labels=laMe, name="Mean" )
# Matrix for moderating/interacting variable
defSex <- mxMatrix( type="Full", nrow=1, ncol=ntv, free=FALSE,
labels=c("data.Sex1","data.Sex1","data.Sex2","data.Sex2"), name="Sex")
# Matrices declared to store linear Coefficients for covariate
B_Sex <- mxMatrix( type="Full", nrow=1, ncol=1, free=TRUE,
values= .01, label="betaSex", name="bSex" )
meanSex <- mxAlgebra( bSex%*%Sex, name="SexR")
#age
defAge <- mxMatrix( type="Full", nrow=1, ncol=ntv, free=FALSE,
labels=c("data.Age1","data.Age1","data.Age2","data.Age2"), name="Age")
# Matrices declared to store linear Coefficients for covariate
B_Age <- mxMatrix( type="Full", nrow=1, ncol=1, free=TRUE,
values= .01, label="betaAge", name="bAge" )
meanAge <- mxAlgebra( bAge%*%Age, name="AgeR")
#***************************************************************
# Algebra for expected Mean and Variance/Covariance Matrices in MZ &
DZ twins
meanT <- mxAlgebra( Mean + AgeR + SexR , name="expMean")
defs <- list( intercept, defSex, B_Sex, meanSex, defAge, B_Age,
meanAge)
covMZ <- mxAlgebra( expression= rbind( cbind(V , A+D+C),
cbind(A+D+C , V)), name="expCovMZ" )
covDZ <- mxAlgebra( expression= rbind( cbind(V,
0.5%x%A+0.25%x%D+C), cbind(0.5%x%A+0.25%x%D+C ,V)), name="expCovDZ" )

- 372 -
# Calculate genetic and environmental correlations
corA <- mxAlgebra( expression=solve(sqrt(I*A))%&%A, name ="rA" )
corC <- mxAlgebra( expression=solve(sqrt(I*C))%&%C, name ="rC" )
corE <- mxAlgebra( expression=solve(sqrt(I*E))%&%E, name ="rE" )
#calculate genetic and environmental correlations due to A, D, C and E
corrA <- mxAlgebra(expression = sqrt(SA[1,1])*rA[2,1]*sqrt(SA[2,2]),
name="corrA")
corrC <- mxAlgebra(expression = sqrt(SC[1,1])*rC[2,1]*sqrt(SC[2,2]),
name="corrC")
corrE <- mxAlgebra(expression = sqrt(SE[1,1])*rE[2,1]*sqrt(SE[2,2]),
name="corrE")
ci <- mxCI
(c("SA[1,1]","SA[2,2]","SD[1,1]","SD[2,2]","SC[1,1]","SC[2,2]","SE[1,1
]","SE[2,2]","rA[2,1]","rC[2,1]","rE[2,1]","corrA","corrC","corrE"))
# Expectation objects for Multiple Groups
expMZ <- mxExpectationNormal( covariance="expCovMZ",
means="expMean", c('Vars1','PVars1','Vars2','PVars2') )
expDZ <- mxExpectationNormal( covariance="expCovDZ",
means="expMean", c('Vars1','PVars1','Vars2','PVars2') )
funML <- mxFitFunctionML()
# Data objects for Multiple Groups
dataMZ <- mxData(mzData, "raw")
dataDZ <- mxData(dzData, "raw")
# Combine Groups
pars <- list( pathA, pathD, pathC, pathE, SA,SD,SC,SE,covA, covD,
covC, covE, covP, matI, invSD, estVars, corA, corC, corE, corrA,
corrC, corrE)
modelMZ <- mxModel( pars, defs, meanT, covMZ, dataMZ, expMZ, funML,
name="MZ" )
modelDZ <- mxModel( pars, defs, meanT, covDZ, dataDZ, expDZ, funML,
name="DZ" )
fitML <-
mxFitFunctionMultigroup(c("MZ.fitfunction","DZ.fitfunction"))
BivAceModelci <- mxModel( "BivACE", pars, modelMZ, modelDZ, fitML,ci)
BivAceModel <- mxModel( "BivACE", pars, modelMZ, modelDZ, fitML)
# --------------------------------------------------------------------
# RUN MODEL
# Run Bivariate ACE model
BivAceFitci <- mxRun(BivAceModelci,intervals=T)
BivAceFit <- mxRun(BivAceModel)
#Rerun the model to avoid the optimality prob.
BivAceFitciAgain <- mxRun(BivAceFitci,intervals=T)
BivAceSumm <- summary(BivAceFitciAgain, verbose = T)
BivAceSumm
# Generate List of Parameter Estimates and Derived Quantities using
formatOutputMatrices
ACEpathMatrices <- c("a","c","e","iSD","iSD %*% a","iSD %*%
c","iSD %*% e","(iSD %*% a)*(iSD %*% a)","(iSD %*% c)*(iSD %*%
c)","(iSD %*% e)*(iSD %*% e)")

- 373 -
ACEpathLabels <-
c("pathEst_a","pathEst_d","pathEst_e","isd","stPathEst_a","stPathEst_c
","stPathEst_e", "st2PathEst_a","st2PathEst_c","st2PathEst_e")
formatOutputMatrices(BivAceFit,ACEpathMatrices,ACEpathLabels,Vars,4)
ACEcovMatrices <- c("A","C","E","V","A/V","C/V","E/V")
ACEcovLabels <-
c("covComp_A","covComp_C","covComp_E","Var","stCovComp_A","stCovComp_C
","stCovComp_E")
formatOutputMatrices(BivAceFit,ACEcovMatrices,ACEcovLabels,Vars,4)
ACEcorMatrices <- c("rA","rC","rE","corrA","corrC","corrE")
ACEcorLabels <- c("rA","rC","rE","corrA","corrC","corrE")
formatOutputMatrices(BivAceFit,ACEcorMatrices,ACEcorLabels,Vars,4)
#Generate submodels: constrain a21, c21, and e21 to 0, respectively
BivAceModelna21 <- mxModel( BivAceFitci, name="ACEna21" )
BivAceModelna21 <- omxSetParameters( BivAceModelna21,
labels=c("a21"), free=FALSE, values=0 )
BivAcena21Fit <- mxRun(BivAceModelna21, intervals=T)
BivAcena21Summ <- summary(BivAcena21Fit)
BivAceModelnc21 <- mxModel( BivAceFitci, name="ACEnc21" )
BivAceModelnc21 <- omxSetParameters( BivAceModelnc21,
labels=c("c21"), free=FALSE, values=0 )
BivAcenc21Fit <- mxRun(BivAceModelnc21, intervals=T)
BivAcenc21Summ <- summary(BivAcenc21Fit)
BivAceModelne21 <- mxModel( BivAceFitci, name="ACEne21" )
BivAceModelne21 <- omxSetParameters( BivAceModelne21,
labels=c("e21"), free=FALSE, values=0 )
BivAcene21Fit <- mxRun(BivAceModelne21, intervals=T)
BivAcene21Summ <- summary(BivAcene21Fit)
BivAceNested <- list(BivAcena21Fit, BivAcenc21Fit, BivAcene21Fit)
tableFitStatistics(BivAceFit,BivAceNested)
#Generate the output of the first submodel: ACEna21
BivAcena21Summ
# Generate List of Parameter Estimates and Derived Quantities using
formatOutputMatrices
ACEpathMatrices <- c("a","c","e","iSD","iSD %*% a","iSD %*%
c","iSD %*% e","(iSD %*% a)*(iSD %*% a)","(iSD %*% c)*(iSD %*%
c)","(iSD %*% e)*(iSD %*% e)")
ACEpathLabels <-
c("pathEst_a","pathEst_d","pathEst_e","isd","stPathEst_a","stPathEst_c
","stPathEst_e", "st2PathEst_a","st2PathEst_c","st2PathEst_e")
formatOutputMatrices(BivAcena21Fit,ACEpathMatrices,ACEpathLabels,Vars,
4)
ACEcovMatrices <- c("A","C","E","V","A/V","C/V","E/V")
ACEcovLabels <-
c("covComp_A","covComp_C","covComp_E","Var","stCovComp_A","stCovComp_C
","stCovComp_E")
formatOutputMatrices(BivAcena21Fit,ACEcovMatrices,ACEcovLabels,Vars,4)
ACEcorMatrices <- c("rA","rC","rE","corrA","corrC","corrE")
ACEcorLabels <- c("rA","rC","rE","corrA","corrC","corrE")
formatOutputMatrices(BivAcena21Fit,ACEcorMatrices,ACEcorLabels,Vars,4)

- 374 -
#Generate the output of the second submodel: ACEnc21
BivAcenc21Summ
# Generate List of Parameter Estimates and Derived Quantities using
formatOutputMatrices
ACEpathMatrices <- c("a","c","e","iSD","iSD %*% a","iSD %*%
c","iSD %*% e","(iSD %*% a)*(iSD %*% a)","(iSD %*% c)*(iSD %*%
c)","(iSD %*% e)*(iSD %*% e)")
ACEpathLabels <-
c("pathEst_a","pathEst_d","pathEst_e","isd","stPathEst_a","stPathEst_c
","stPathEst_e", "st2PathEst_a","st2PathEst_c","st2PathEst_e")
formatOutputMatrices(BivAcenc21Fit,ACEpathMatrices,ACEpathLabels,Vars,
4)
ACEcovMatrices <- c("A","C","E","V","A/V","C/V","E/V")
ACEcovLabels <-
c("covComp_A","covComp_C","covComp_E","Var","stCovComp_A","stCovComp_C
","stCovComp_E")
formatOutputMatrices(BivAcenc21Fit,ACEcovMatrices,ACEcovLabels,Vars,4)
ACEcorMatrices <- c("rA","rC","rE","corrA","corrC","corrE")
ACEcorLabels <- c("rA","rC","rE","corrA","corrC","corrE")
formatOutputMatrices(BivAcenc21Fit,ACEcorMatrices,ACEcorLabels,Vars,4)
#Generate the output of the third submodel: ACEnc21
BivAcene21Summ
# Generate List of Parameter Estimates and Derived Quantities using
formatOutputMatrices
ACEpathMatrices <- c("a","c","e","iSD","iSD %*% a","iSD %*%
c","iSD %*% e","(iSD %*% a)*(iSD %*% a)","(iSD %*% c)*(iSD %*%
c)","(iSD %*% e)*(iSD %*% e)")
ACEpathLabels <-
c("pathEst_a","pathEst_d","pathEst_e","isd","stPathEst_a","stPathEst_c
","stPathEst_e", "st2PathEst_a","st2PathEst_c","st2PathEst_e")
formatOutputMatrices(BivAcene21Fit,ACEpathMatrices,ACEpathLabels,Vars,
4)
ACEcovMatrices <- c("A","C","E","V","A/V","C/V","E/V")
ACEcovLabels <-
c("covComp_A","covComp_C","covComp_E","Var","stCovComp_A","stCovComp_C
","stCovComp_E")
formatOutputMatrices(BivAcene21Fit,ACEcovMatrices,ACEcovLabels,Vars,4)
ACEcorMatrices <- c("rA","rC","rE","corrA","corrC","corrE")
ACEcorLabels <- c("rA","rC","rE","corrA","corrC","corrE")
formatOutputMatrices(BivAcene21Fit,ACEcorMatrices,ACEcorLabels,Vars,4)
sink()

- 375 -
Appendix D
INFORMATION FROM THE
PRINCIPAL COMPONENTS
ANALYSES
Figure D-1. Scree plot of the first principal components analysis using direct oblimin rotation.

- 376 -
Table D-1. Factor Loadings for the First Principal Components Analysis Using Direct Oblimin Rotation
Item Personal Singing Family Singing Public Singing Music Listening
In my childhood, I sang by myself -.82 .02 .06 .08
How often do you currently sing by yourself? -.73 .10 .07 .10
In my childhood, an adult family member/s sang with
me
.05 .90 .00 .05
In my childhood, an adult family member/s sang to me -.07 .87 -.06 .02
In my childhood, an adult family member/s taught me
songs
.04 .86 -.01 .06
How often do you currently sing with your family? -.38 .52 .09 -.09
In my childhood, I sang with my siblings/friends -.36 .45 .14 .13
How often do you currently sing in a choir/group? .08 -.08 .95 -.03
How often do you currently sing as a solo performer? -.04 -.08 .86 .01
How often do you currently sing with your friends? -.16 .22 .61 .03
In my childhood, music was present around my home -.01 .12 -.01 .86
In my childhood, I listened to music -.33 -.21 -.04 .82
In my childhood, my family attended live musical events
together
.25 .30 .17 .65
Note. Factor loadings > .40 are in bold.

- 377 -
Table D-2. Factor Loadings for the Second Principal Components Analysis Using Direct Oblimin Rotation
Item Personal Singing Family Singing Public Singing Music Listening Instrumental
Expertise
In my childhood, I sang by myself -.67 .19 .11 .12 -.11
How often do you currently sing by yourself? -.54 .29 .16 .22 .05
In my childhood, an adult family member/s sang with
me
.08 .91 -.08 .04 -.09
In my childhood, an adult family member/s sang to me -.03 .90 -.05 .02 -.04
In my childhood, an adult family member/s taught me
songs
.05 .87 .00 .04 .08
How often do you currently sing with your family? -.30 .61 .08 -.09 -.09
In my childhood, I sang with my siblings/friends -.26 .48 .16 .17 -.11
How often do you currently sing in a choir/group? .07 -.13 .92 .02 -.04
How often do you currently sing as a solo performer? .00 -.08 .85 .00 -.09
How often do you currently sing with your friends? -.16 .29 .61 -.01 .01
In my childhood, music was present around my home -.09 .07 .07 .88 .09
In my childhood, I listened to music -.48 -.16 -.09 .68 -.24
In my childhood, my family attended live musical
events together
.15 .29 .15 .65 .09
Years since last regular practice .20 .01 .00 .20 .77
How good are you on this instrument/voice? .10 .17 .19 .03 -.76
What was your level of motivation to learn this
instrument/voice?
.02 .02 .26 .09 -.73
How many days do you practise now every week? -.12 -.03 .05 -.02 -.72
How many years of training have you had on this
instrument/voice?
.40 .21 -.01 .17 -.62
Weekly peak practice duration .17 -.01 -.08 .34 -.44
Note. Factor loadings > .40 are in bold.
- 378 -
Appendix E
SEM FIT STATISTICS

- 379 -
Table E-1. Univariate Model-Fitting Results Testing Equality of Covariances for Continuous
Task Measures
Measure Model EP -2LL df AIC ∆χ2 ∆df p-
value
Comparison
model
SINGCOMB 1 27 393.30 181 31.30 - - - -
2 26 393.31 182 29.31 0.01 1 0.92 1
3 25 393.39 183 27.39 0.08 1 0.78 2
4 24 393.40 184 25.40 0.00 1 0.95 3
SingTheNote
PD
1 27 643.81 187 269.81 - - - -
2 26 643.87 188 267.87 0.06 1 0.80 1
3 25 644.38 189 266.38 0.51 1 0.48 2
4 24 644.63 190 264.63 0.25 1 0.61 3
HappyBirthday
PD
1 27 395.90 188 19.90 - - - -
2 26 396.70 189 18.70 0.79 1 0.37 1
3 25 396.82 190 16.82 0.12 1 0.73 2
4 24 396.97 191 14.97 0.16 1 0.69 3
HappyBirthday
ID
1 27 276.76 188 -99.24 - - - -
2 26 276.81 189 -101.19 0.04 1 0.84 1
3 25 277.16 190 -102.84 0.35 1 0.55 2
4 24 277.25 191 -104.75 0.09 1 0.76 3
HappyBirthday
KD
1 27 417.07 188 41.07 - - - -
2 26 419.64 189 41.64 2.58 1 0.11 1
3 25 420.16 190 40.16 0.52 1 0.47 2
4 24 420.28 191 38.28 0.12 1 0.73 3
SingTheTune
PD
1 27 481.96 182 117.96 - - - -
2 26 482.01 183 116.01 0.05 1 0.83 1
3 25 483.59 184 115.59 1.58 1 0.21 2
4 24 483.59 185 113.59 0.00 1 0.96 3
SingTheTune
ID
1 27 452.99 182 88.99 - - - -
2 26 453.03 183 87.03 0.04 1 0.84 1
3 25 453.05 184 85.05 0.02 1 0.88 2
4 24 453.05 185 83.05 0.01 1 0.94 3
MatchTheNote
PD
1 27 565.85 184 197.85 - - - -
2 26 565.99 185 195.99 0.14 1 0.71 1
3 25 566.00 186 194.00 0.01 1 0.91 2
4 24 566.01 187 192.01 0.01 1 0.94 3
Note. AIC: Akaike’s Information Criterion; df; Degrees of freedom; EP: Estimated parameters; ID:
Interval deviation; KD: Key deviation; PD: Pitch deviation; SINGCOMB: Combined singing score; -2LL:
-2 log likelihood; ∆df: Change in degrees of freedom; ∆χ2: Change in chi-square test.
Model 1: Saturated univariate model (means, variances and covariances of twins are allowed to freely
vary); Model 2: Univariate model constraining covariances of MZM and MZF to be equal;
Model 3: Univariate model constraining covariances between MZM and MZF, as well as between DZM
and DZF to be equal;
Model 4: Univariate model constraining covariances between MZM and MZF, as well as between DZM,
DZF and DZO to be equal

- 380 -
Table E-2. Univariate Model-Fitting Results Testing Equality of Means and Variances for
Continuous Task Measures
Measure Model EP -2LL df AIC ∆χ2 ∆df p-
value
Comparison
model
SINGCOMB 1 12 411.48 196 19.48 - - - -
2 10 412.09 198 16.09 0.61 2 0.74 1
3 8 412.79 200 12.79 0.70 2 0.70 2
4 6 414.61 202 10.61 1.83 2 0.40 3
SingTheNote
PD
1 12 654.36 202 250.36 - - - -
2 10 656.54 204 248.54 2.18 2 0.34 1
3 8 656.95 206 244.95 0.41 2 0.81 2
4 6 657.43 208 241.43 0.47 2 0.79 3
HappyBirthday
PD
1 12 413.33 203 7.33 - - - -
2 10 414.47 205 4.47 1.14 2 0.57 1
3 8 415.02 207 1.02 0.55 2 0.76 2
4 6 417.17 209 -0.83 2.15 2 0.34 3
HappyBirthday
ID
1 12 296.26 203 -109.74 - - - -
2 10 297.18 205 -112.82 0.93 2 0.63 1
3 8 300.22 207 -113.78 3.04 2 0.22 2
4 6 302.98 209 -115.02 2.76 2 0.25 3
HappyBirthday
KD
1 12 430.23 203 24.22 - - - -
2 10 430.28 205 20.28 0.06 2 0.97 1
3 8 433.47 207 19.47 3.19 2 0.20 2
4 6 436.63 209 18.63 3.16 2 0.21 3
SingTheTune
PD
1 12 493.48 197 99.48 - - - -
2 10 494.21 199 96.21 0.73 2 0.70 1
3 8 495.66 201 93.66 1.45 2 0.48 2
4 6 497.82 203 91.82 2.16 2 0.34 3
SingTheTune
ID
1 12 465.41 197 71.41 - - - -
2 10 466.31 199 68.31 0.90 2 0.64 1
3 8 468.64 201 66.64 2.33 2 0.31 2
4 6 470.15 203 64.15 1.51 2 0.47 3
MatchTheNote
PD
1 12 572.93 199 174.93 - - - -
2 10 573.52 201 171.52 0.59 2 0.74 1
3 8 573.85 203 167.85 0.33 2 0.85 2
4 6 573.92 205 163.92 0.07 2 0.97 3
Note. AIC: Akaike’s Information Criterion; df; Degrees of freedom; EP: Estimated parameters;
ID: Interval deviation; KD: Key deviation; PD: Pitch deviation; SINGCOMB: Combined
singing score; -2LL: -2 log likelihood; ∆df: Change in degrees of freedom; ∆χ2: Change in chi-
square test.
Model 1: Saturated univariate model (means and variances of twins are allowed to freely vary);
Model 2: Univariate model constraining means within twin pairs to be equal;
Model 3: Univariate model constraining means and variances within twin pairs to be equal;
Model 4: Univariate model constraining means and variances across zygosities to be equal.

- 381 -
Table E-3. Univariate Model-Fitting Results Testing Equality of Covariances for Categorical
Singing Measures
Measure Model EP -2LL df AIC ∆χ2 ∆df p-
value
Comparison
model
SINGCOMB
(Category)
1 27 372.43 181 10.43 - - - -
2 26 372.44 182 8.44 0.01 1 0.94 1
3 25 372.62 183 6.62 0.18 1 0.67 2
4 24 372.62 184 4.62 0.00 1 0.99 3
SingTheNote
PD (Category)
1 27 302.40 187 -71.60 - - - -
2 26 302.49 188 -73.51 0.09 1 0.77 1
3 25 303.34 189 -74.66 0.86 1 0.36 2
4 24 305.39 190 -74.61 2.04 1 0.15 3
HappyBirthday
PD (Category)
1 27 347.01 188 -28.99 - - - -
2 26 351.49 189 -26.51 4.48 1 0.03* 1
3 25 352.54 190 -27.46 1.05 1 0.31 2
4 24 352.81 191 -29.19 0.27 1 0.60 3
HappyBirthday
ID (Category)
1 27 325.40 188 -50.60 - - - -
2 26 327.13 189 -50.87 1.73 1 0.19 1
3 25 327.21 190 -52.79 0.07 1 0.79 2
4 24 328.50 191 -53.50 1.29 1 0.26 3
HappyBirthday
KD (Category)
1 27 352.86 188 -23.14 - - - -
2 26 357.50 189 -20.50 4.64 1 0.03* 1
3 25 357.86 190 -22.14 0.36 1 0.55 2
4 24 357.87 191 -24.13 0.01 1 0.92 3
SingTheTune
PD (Category)
1 27 399.44 182 35.44 - - - -
2 26 400.44 183 34.44 1.00 1 0.32 1
3 25 400.45 184 32.45 0.02 1 0.90 2
4 24 400.92 185 30.92 0.47 1 0.49 3
SingTheTune
ID (Category)
1 27 417.20 182 53.20 - - - -
2 26 418.55 183 52.55 1.34 1 0.25 1
3 25 419.69 184 51.69 1.14 1 0.29 2
4 24 419.71 185 49.71 0.03 1 0.87 3
Note. AIC: Akaike’s Information Criterion; df; Degrees of freedom; EP: Estimated parameters;
ID: Interval deviation; KD: Key deviation; PD: Pitch deviation; SINGCOMB: Combined
singing score; -2LL: -2 log likelihood; ∆df: Change in degrees of freedom; ∆χ2: Change in chi-
square test.
Model 1: Saturated univariate ordinal model (threshold levels and covariances of twins are
allowed to freely vary);
Model 2: Univariate ordinal model constraining covariances of MZM and MZF to be equal;
Model 3: Univariate ordinal model constraining covariances between MZM and MZF, as well
as between DZM and DZF to be equal;
Model 4: Univariate ordinal model constraining covariances between MZM and MZF, as well
as between DZM, DZF and DZO to be equal.
*p < .05

- 382 -
Table E-4. Univariate Model-Fitting Results Testing Equality of Means and Variances for
Categorical Singing Measures
Measure Model EP -2LL df AIC ∆χ2 ∆df p-
value
Comparison
model
SINGCOMB
(Category)
1 12 388.99 196 -3.01 - - - -
2 8 390.69 200 -9.31 1.70 4 0.79 1
3 6 392.07 202 -11.93 1.38 2 0.50 2
SingTheNote
PD (Category)
1 12 314.69 202 -89.31 - - - -
2 8 322.64 206 -89.36 7.95 4 0.09 1
3 6 323.06 208 -92.94 0.42 2 0.81 2
HappyBirthday
PD (Category)
1 12 366.89 203 -39.11 - - - -
2 8 370.09 207 -43.91 3.21 4 0.52 1
3 6 373.21 209 -44.79 3.11 2 0.21 2
HappyBirthday
ID (Category)
1 12 344.81 203 -61.19 - - - -
2 8 349.11 207 -64.89 4.30 4 0.37 1
3 6 351.31 209 -66.69 2.20 2 0.33 2
HappyBirthday
KD (Category)
1 12 372.07 203 -33.93 - - - -
2 8 374.32 207 -39.68 2.24 4 0.69 1
3 6 376.53 209 -41.47 2.22 2 0.33 2
SingTheTune
PD (Category)
1 12 408.99 197 14.99 - - - -
2 8 412.29 201 10.29 3.30 4 0.51 1
3 6 414.02 203 8.02 1.73 2 0.42 2
SingTheTune
ID (Category)
1 12 431.76 197 37.76 - - - -
2 8 433.93 201 31.93 2.18 4 0.70 1
3 6 435.00 203 29.00 1.07 2 0.59 2
Note. AIC: Akaike’s Information Criterion; df; Degrees of freedom; EP: Estimated parameters;
ID: Interval deviation; KD: Key deviation; PD: Pitch deviation; SINGCOMB: Combined
singing score; -2LL: -2 log likelihood; ∆df: Change in degrees of freedom; ∆χ2: Change in chi-
square test.
Model 1: Saturated univariate ordinal model (threshold levels of twins are allowed to freely
vary);
Model 2: Univariate ordinal model constraining threshold levels within twin pairs to be equal;
Model 3: Univariate ordinal model constraining threshold levels across zygosities to be equal.
*p < .05

- 383 -
Table E-5. Univariate Model-Fitting Results Testing Equality of Covariances for Self-Rated
Interests and Abilities in Singing and Music
Measure Model EP -2LL df AIC ∆χ2 ∆df p-
value
Comparison
model
Singing
Ability
1 67 627.82 140 347.82 - - - -
2 66 628.97 141 346.97 1.16 1 0.28 1
3 65 629.85 142 345.85 0.88 1 0.35 2
4 64 631.29 143 345.29 1.44 1 0.23 3
Music Ability 1 67 638.57 140 358.57 - - - -
2 66 638.64 141 356.64 0.07 1 0.79 1
3 65 639.98 142 355.98 1.34 1 0.25 2
4 64 641.20 143 355.20 1.22 1 0.27 3
Singing
Interest
1 67 665.45 140 385.45 - - - -
2 66 665.76 141 383.76 0.31 1 0.58 1
3 65 666.63 142 382.63 0.87 1 0.35 2
4 64 667.34 143 381.34 0.71 1 0.40 3
Music Interest 1 67 544.67 140 264.67 - - - -
2 66 546.28 141 264.28 1.61 1 0.20 1
3 65 546.32 142 262.32 0.05 1 0.83 2
4 64 548.54 143 262.54 2.22 1 0.14 3
Note. AIC: Akaike’s Information Criterion; df; Degrees of freedom; EP: Estimated parameters;
-2LL: -2 log likelihood; ∆df: Change in degrees of freedom; ∆χ2: Change in chi-square test.
Model 1: Saturated univariate ordinal model (threshold levels and covariances of twins are
allowed to freely vary);
Model 2: Univariate ordinal model constraining covariances of MZM and MZF to be equal;
Model 3: Univariate ordinal model constraining covariances between MZM and MZF, as well
as between DZM and DZF to be equal;
Model 4: Univariate ordinal model constraining covariances between MZM and MZF, as well
as between DZM, DZF and DZO to be equal.

- 384 -
Table E-6. Univariate Model-Fitting Results Testing Equality of Means and Variances for Self-
Rated Interests and Abilities in Singing and Music
Measure Model EP -2LL df AIC ∆χ2 ∆df p-
value
Comparison
model
Singing
Ability
1 28 657.84 179 299.84 - - - -
2 16 675.47 191 293.47 17.63 12 0.13 1
3 10 681.81 197 287.81 6.34 6 0.39 2
Music Ability 1 28 676.41 179 318.41 - - - -
2 16 692.38 191 310.38 15.97 12 0.19 1
3 10 699.80 197 305.80 7.42 6 0.28 2
Singing
Interest
1 28 709.23 179 351.23 - - - -
2 16 715.44 191 333.44 6.21 12 0.91 1
3 10 722.50 197 328.50 7.07 6 0.31 2
Music Interest 1 28 579.66 179 221.66 - - - -
2 16 599.11 191 217.11 19.45 12 0.08 1
3 10 605.86 197 211.86 6.75 6 0.34 2
Note. AIC: Akaike’s Information Criterion; df; Degrees of freedom; EP: Estimated parameters;
-2LL: -2 log likelihood; ∆df: Change in degrees of freedom; ∆χ2: Change in chi-square test.
Model 1: Saturated univariate ordinal model (threshold levels of twins are allowed to freely
vary);
Model 2: Univariate ordinal model constraining threshold levels within twin pairs to be equal;
Model 3: Univariate ordinal model constraining threshold levels across zygosities to be equal.

- 385 -
Table E-7. Univariate Model-Fitting Results Testing Equality of Covariances for Singing and
Music Background Components
Measure Model EP -2LL df AIC ∆χ2 ∆df p-
value
Comparison
model
Personal
Singing
1 27 476.82 180 116.82 - - - -
2 26 477.59 181 115.59 0.76 1 0.38 1
3 25 477.76 182 113.76 0.17 1 0.68 2
4 24 477.92 183 111.92 0.16 1 0.69 3
Family
Singing
1 27 414.36 180 54.36 - - - -
2 26 415.88 181 53.88 1.53 1 0.22 1
3 25 416.88 182 52.88 1.00 1 0.32 2
4 24 416.98 183 50.98 0.10 1 0.75 3
Public Singing 1 27 128.16 180 -231.84 - - - -
2 26 128.17 181 -233.83 0.01 1 0.91 1
3 25 794.95 182 430.95 0.47 1 0.49 2
4 24 797.01 183 431.01 2.06 1 0.15 3
Music
Listening
1 27 423.56 180 63.56 - - - -
2 26 427.01 181 65.01 3.45 1 0.06 1
3 25 428.00 182 64.00 0.98 1 0.32 2
4 24 428.57 183 62.57 0.58 1 0.45 3
Instrumental
Expertise
1 27 316.35 142 32.35 - - - -
2 26 316.35 143 30.35 0.00 1 0.95 1
3 25 317.00 144 29.00 0.64 1 0.42 2
4 24 318.57 145 28.57 1.57 1 0.21 3
Years of Music
Training
1 27 77.03 172 -266.97 - - - -
2 26 78.26 173 -267.74 1.23 1 0.27 1
3 25 79.67 174 -268.33 1.41 1 0.24 2
4 24 997.08 175 647.08 0.98 1 0.32 3
Note. AIC: Akaike’s Information Criterion; df; Degrees of freedom; EP: Estimated parameters;
-2LL: -2 log likelihood; ∆df: Change in degrees of freedom; ∆χ2: Change in chi-square test.
Model 1: Saturated univariate model (means, variances and covariances of twins are allowed to
freely vary); Model 2: Univariate model constraining covariances of MZM and MZF to be
equal;
Model 3: Univariate model constraining covariances between MZM and MZF, as well as
between DZM and DZF to be equal;
Model 4: Univariate model constraining covariances between MZM and MZF, as well as
between DZM, DZF and DZO to be equal.

- 386 -
Table E-8. Univariate Model-Fitting Results Testing Equality of Means and Variances for
Singing and Music Background Components
Measure Model EP -2LL df AIC ∆χ2 ∆df p-
value
Comparison
model
Personal
Singing
1 12 496.93 195 106.93 - - - -
2 10 499.97 197 105.97 3.04 2 0.22 1
3 8 500.35 199 102.35 0.38 2 0.83 2
4 6 504.76 201 102.76 4.42 2 0.11 3
Family
Singing
1 12 425.85 195 35.85 - - - -
2 10 427.07 197 33.07 1.22 2 0.54 1
3 8 427.13 199 29.13 0.06 2 0.97 2
4 6 428.74 201 26.74 1.61 2 0.45 3
Public Singing 1 12 156.61 195 -233.39 - - - -
2 10 161.48 197 -232.52 4.87 2 0.09 1
3 8 161.92 199 -236.08 0.44 2 0.80 2
4 6 167.84 201 -234.16 5.92 2 0.05 3
Music
Listening
1 12 451.80 195 61.80 - - - -
2 10 455.43 197 61.43 3.63 2 0.16 1
3 8 455.52 199 57.52 0.09 2 0.95 2
4 6 455.97 201 53.97 0.45 2 0.80 3
Instrumental
Expertise
1 12 329.43 157 15.43 - - - -
2 10 334.72 159 16.72 5.29 2 0.07 1
3 8 338.62 161 16.62 3.90 2 0.14 2
4 6 341.78 163 15.78 3.17 2 0.21 3
Years of Music
Training
1 12 97.17 187 -276.83 - - - -
2 10 101.87 189 -276.13 4.70 2 0.10 1
3 8 103.74 191 -278.26 1.87 2 0.39 2
4 6 105.78 193 -280.22 2.04 2 0.36 3
Note. AIC: Akaike’s Information Criterion; df; Degrees of freedom; EP: Estimated parameters;
ID: Interval deviation; KD: Key deviation; PD: Pitch deviation; SINGCOMB: Combined
singing score; -2LL: -2 log likelihood; ∆df: Change in degrees of freedom; ∆χ2: Change in chi-
square test.
Model 1: Saturated univariate model (means and variances of twins are allowed to freely vary);
Model 2: Univariate model constraining means within twin pairs to be equal;
Model 3: Univariate model constraining means and variances within twin pairs to be equal;
Model 4: Univariate model constraining means and variances across zygosities to be equal.

- 387 -
Table E-9. Univariate Model-Fitting Results for Continuous Task Measures
Measure Model EP -2LL df AIC ∆χ2 ∆df p-
value
Comparison
model
SINGCOMB ACE 7 414.61 202 10.61 - - - -
AE 6 414.78 203 8.78 0.17 1 0.68 ACE
CE 6 427.51 203 21.51 12.90 1 0.00** ACE
E 6 492.30 204 84.30 77.69 2 0.00** ACE
SingTheNote
PD ACE 7 660.29 208 244.29 - - - -
AE 6 660.29 209 242.29 0.00 1 1.00 ACE
CE 6 674.85 209 256.85 14.57 1 0.00** ACE
E 6 706.61 210 286.61 46.33 2 0.00** ACE
HappyBirthday
PD ACE 7 417.17 209 -0.83 - - - -
AE 6 418.35 210 -1.65 1.18 1 0.28 ACE
CE 6 421.55 210 1.55 4.38 1 0.04* ACE
E 6 478.89 211 56.89 61.71 2 0.00** ACE
HappyBirthday
ID ACE 7 303.10 209 -114.90 - - - -
AE 6 303.10 210 -116.90 0.00 1 1.00 ACE
CE 6 312.15 210 -107.85 9.05 1 0.00** ACE
E 6 349.78 211 -72.22 46.68 2 0.00** ACE
HappyBirthday
KD ACE 7 436.63 209 18.63 - - - -
AE 6 438.30 210 18.30 1.68 1 0.20 ACE
CE 6 437.74 210 17.74 1.12 1 0.29 ACE
E 6 482.18 211 60.18 45.56 2 0.00** ACE
SingTheTune
PD ACE 7 497.82 203 91.82 - - - -
AE 6 497.82 204 89.82 0.00 1 0.98 ACE
CE 6 505.61 204 97.61 7.79 1 0.01** ACE
E 6 551.72 205 141.72 53.90 2 0.00** ACE
SingTheTune
ID
ACE 7 470.15 203 64.15 - - - -
AE 6 471.72 204 63.72 1.57 1 0.21 ACE
CE 6 471.42 204 63.42 1.27 1 0.26 ACE
E 6 514.59 205 104.59 44.44 2 0.00** ACE
MatchTheNote
PD
ACE 7 578.55 205 168.55 - - - -
AE 6 578.55 206 166.55 0.00 1 1.00 ACE
CE 6 589.78 206 177.78 11.23 1 0.00** ACE
E 6 605.81 207 191.81 27.26 2 0.00** ACE
Note. AIC: Akaike’s Information Criterion; df; Degrees of freedom; EP: Estimated parameters;
ID: Interval deviation; KD: Key deviation; PD: Pitch deviation; SINGCOMB: Combined
singing score; -2LL: -2 log likelihood; ∆df: Change in degrees of freedom; ∆χ2: Change in chi-
square test.
*p < .05; **p < .01.

- 388 -
Table E-10. Univariate Model-Fitting Results for Categorical Singing Task Measures
Measure Model EP -2LL df AIC ∆χ2 ∆df p-
value
Comparison
model
SINGCOMB ACE 7 392.07 202 -11.93 - - - -
AE 6 392.12 203 -13.88 0.05 1 0.82 ACE
CE 6 396.41 203 -9.59 4.34 1 0.04* ACE
E 6 396.41 203 -9.59 4.34 1 0.04* ACE
SingTheNote
PD ACE 7 323.75 208 -92.25 - - - -
AE 6 323.75 209 -94.25 0.00 1 1.00 ACE
CE 6 329.75 209 -88.25 6.00 1 0.01* ACE
E 6 329.75 209 -88.25 6.00 1 0.01* ACE
HappyBirthday
PD ACE 7 373.21 209 -44.79 - - - -
AE 6 373.53 210 -46.47 0.32 1 0.57 ACE
CE 6 376.32 210 -43.68 3.11 1 0.08 ACE
E 6 376.32 210 -43.68 3.11 1 0.08 ACE
HappyBirthday
ID ACE 7 353.42 209 -64.58 - - - -
AE 6 353.42 210 -66.58 0.00 1 1.00 ACE
CE 6 361.08 210 -58.92 7.66 1 0.01* ACE
E 6 361.08 210 -58.92 7.66 1 0.01* ACE
HappyBirthday
KD ACE 7 376.53 209 -41.47 - - - -
AE 6 376.56 210 -43.44 0.03 1 0.87 ACE
CE 6 380.70 210 -39.30 4.17 1 0.04* ACE
E 6 380.70 210 -39.30 4.17 1 0.04* ACE
SingTheTune
PD ACE 7 414.02 203 8.02 - - - -
AE 6 414.04 204 6.04 0.03 1 0.87 ACE
CE 6 416.62 204 8.62 2.61 1 0.11 ACE
E 6 416.62 204 8.62 2.61 1 0.11 ACE
SingTheTune
ID
ACE 7 435.00 203 29.00 - - - -
AE 6 435.02 204 27.02 0.02 1 0.89 ACE
CE 6 437.03 204 29.03 2.03 1 0.15 ACE
E 6 437.03 204 29.03 2.03 1 0.15 ACE
Note. AIC: Akaike’s Information Criterion; df; Degrees of freedom; EP: Estimated parameters;
ID: Interval deviation; KD: Key deviation; PD: Pitch deviation; SINGCOMB: Combined
singing score; -2LL: -2 log likelihood; ∆df: Change in degrees of freedom; ∆χ2: Change in chi-
square test.
*p < .05.

- 389 -
Table E-11. Univariate Model-Fitting Results for Self-rated Abilities and Interests
Measure Model EP -2LL df AIC ∆χ2 ∆df p-
value
Comparison
model
Singing
Ability
ACE 11 681.81 197 287.81 - - - -
AE 10 681.99 198 285.99 0.17 1 0.68 ACE
CE 10 694.36 198 298.36 12.55 1 0.00** ACE
E 10 694.36 198 298.36 12.55 1 0.00** ACE
Music
Ability
ACE 11 700.07 197 306.07 - - - -
AE 10 700.07 198 304.07 0.00 1 1.00 ACE
CE 10 714.57 198 318.57 14.49 1 0.00** ACE
E 10 714.57 198 318.57 14.49 1 0.00** ACE
Singing
Interest
ACE 11 723.90 197 329.90 - - - -
AE 10 723.90 198 327.90 0.00 1 1.00 ACE
CE 10 734.48 198 338.48 10.58 1 0.00** ACE
E 10 734.48 198 338.48 10.58 1 0.00** ACE
Music
Interest
ACE 11 606.84 197 212.84 - - - -
AE 10 606.84 198 210.84 0.00 1 1.00 ACE
CE 10 612.65 198 216.65 5.81 1 0.02* ACE
E 10 612.65 198 216.65 5.81 1 0.02* ACE
Note. AIC: Akaike’s Information Criterion; df; Degrees of freedom; EP: Estimated parameters;
ID: Interval deviation; KD: Key deviation; PD: Pitch deviation; SINGCOMB: Combined
singing score; -2LL: -2 log likelihood; ∆df: Change in degrees of freedom; ∆χ2: Change in chi-
square test.
*p < .05; **p < .01.

- 390 -
Table E-12. Univariate Model-Fitting Results for Singing and Music Background Components
Measure Model EP -2LL df AIC ∆χ2 ∆df p-
value
Comparison
model
Personal
Singing
ACE 6 504.76 201 102.76 - - - -
AE 5 505.47 202 101.47 0.71 1 0.40 ACE
CE 5 506.11 202 102.11 1.35 1 0.25 ACE
E 4 532.83 203 126.83 28.07 2 0.00** ACE
Family
Singing
ACE 6 428.89 201 26.89 - - - -
AE 5 436.47 202 32.47 7.58 1 0.01* ACE
CE 5 428.89 202 24.89 0.00 1 1.00 ACE
E 4 478.07 203 72.07 49.19 2 0.00** ACE
Public
Singing
ACE 6 167.84 201 -234.16 - - - -
AE 5 167.84 202 -236.16 0.01 1 0.94 ACE
CE 5 173.24 202 -230.76 5.41 1 0.02* ACE
E 4 213.57 203 -192.43 45.73 2 0.00** ACE
Music
Listening
ACE 6 455.97 201 53.97 - - - -
AE 5 459.06 202 55.06 3.09 1 0.08 ACE
CE 5 456.29 202 52.29 0.32 1 0.57 ACE
E 4 499.57 203 93.57 43.60 2 0.00** ACE
Instrumental
Expertise
ACE 6 342.11 163 16.11 - - - -
AE 5 342.11 164 14.11 0.00 1 1.00 ACE
CE 5 349.28 164 21.28 7.17 1 0.01* ACE
E 4 376.71 165 46.71 34.59 2 0.00** ACE
Years of
Music
Training
ACE 6 1022.21 193 636.21 - - - -
AE 5 1024.39 194 636.39 2.17 1 0.14 ACE
CE 5 1031.51 194 643.51 9.30 1 0.00** ACE
E 4 1109.75 195 719.75 87.54 2 0.00** ACE
Note. AIC: Akaike’s Information Criterion; df; Degrees of freedom; EP: Estimated parameters;
ID: Interval deviation; KD: Key deviation; PD: Pitch deviation; SINGCOMB: Combined
singing score; -2LL: -2 log likelihood; ∆df: Change in degrees of freedom; ∆χ2: Change in chi-
square test.
*p < .05; **p < .01.

- 391 -
Table E-13. Results of Univariate Genetic Modelling Showing Genetic (A), Common
Environmental (C), and Unique Environmental (E) Influences on Continuous Measures
(Adjusted for Age, Sex and Years of Music Training)
Task Measure A C E
SINGCOMB .58 [.11, .82] .16 [.00, .57] .26 [.17, .40]
SingTheNote PD .64 [.36, .77] .00 [.00, .23] .36 [.23, .54]
HappyBirthday PD .38 [.00, .78] .31 [.00, .68] .32 [.21, .48]
HappyBirthday ID .65 [.14, .77] .00 [.00, .44] .35 [.23, .51]
HappyBirthday KD .27 [.00, .73] .36 [.00, .68] .38 [.25, .56]
SingTheTune PD .52 [.00, .75] .12 [.00, .59] .36 [.25, .52]
SingTheTune ID .07 [.00, .65] .49 [.00, .67] .45 [.30, .62]
MatchTheNote PD .52 [.28, .69] .00 [.00, .22] .48 [.31, .56]
Note. ID: Interval deviation; KD: Key deviation; PD: Pitch deviation; SINGCOMB: Combined
singing score.
Values in brackets are the 95% confidence intervals.
Significant parameter estimates (whose interval values do not pass through zero) are shown in
bold.

- 392 -
Table E-14. Bivariate Model-Fitting Results Testing Equality of Means and Variances Within
Twin Pairs and Across Zygosities for Instrumental Expertise and the Objective Task Measures
Measure Model EP -2LL df AIC ∆χ2 ∆df p-
value
Comparison
model
SINGCOMB 1 30 714.50 347 20.50 - - - -
2 30 719.74 351 17.74 5.24 4 0.26 1
3 30 725.53 355 15.53 5.79 4 0.22 2
4 30 732.07 359 14.07 6.54 4 0.16 3
SingTheNote
PD 1 30 976.16 353 270.16 - - - -
2 30 984.18 357 270.18 8.02 4 0.09 1
3 30 989.18 361 267.18 5.00 4 0.29 2
4 30 992.58 365 262.58 3.40 4 0.49 3
HappyBirthday
PD 1 30 718.30 354 10.30 - - - -
2 30 724.93 358 8.93 6.63 4 0.16 1
3 30 729.67 362 5.67 4.73 4 0.32 2
4 30 738.96 366 6.96 9.30 4 0.05 3
HappyBirthday
ID
1 30 604.94 354 -103.06 - - - -
2 30 611.79 358 -104.21 6.85 4 0.14 1
3 30 618.99 362 -105.01 7.20 4 0.13 2
4 30 628.99 366 -103.01 10.0 4 0.04* 3
HappyBirthday
KD
1 30 738.31 354 30.31 - - - -
2 30 745.68 358 29.68 7.37 4 0.12 1
3 30 752.29 362 28.29 6.61 4 0.16 2
4 30 761.08 366 29.08 8.78 4 0.07 3
SingTheTune
PD
1 30 792.80 348 96.80 - - - -
2 30 798.54 352 94.54 5.74 4 0.22 1
3 30 805.49 356 93.49 6.96 4 0.14 2
4 30 811.54 360 91.54 6.04 4 0.20 3
SingTheTune
ID 1 30 762.14 348 66.14 - - - -
2 30 768.26 352 64.26 6.12 4 0.19 1
3 30 775.94 356 63.94 7.68 4 0.10 2
4 30 781.84 360 61.84 5.9 4 0.21 3
MatchTheNote
PD 1 30 913.12 350 213.12 - - - -
2 30 920.69 354 212.69 7.57 4 0.11 1
3 30 926.44 358 210.44 5.75 4 0.22 2
4 30 931.89 362 207.89 5.45 4 0.24 3
Note. AIC: Akaike’s Information Criterion; df; Degrees of freedom; EP: Estimated parameters;
ID: Interval deviation; KD: Key deviation; PD: Pitch deviation; SINGCOMB: Combined
singing score; -2LL: -2 log likelihood; ∆df: Change in degrees of freedom; ∆χ2: Change in chi-
square test.
Model 1: Bivariate saturated model (means and variances of twins are allowed to freely vary);
Model 2: Bivariate model constraining means within twin pairs to be equal;
Model 3: Bivariate model constraining means and variances within twin pairs to be equal;
Model 4: Bivariate model constraining means and variances across zygosities to be equal
*p < .05

- 393 -
Table E-15. Bivariate Model-Fitting Results Testing Equality of Means and Variances Within
Twin Pairs and Across Zygosities for Years of Music Training and the Objective Task Measures
Measure Model EP -2LL df AIC ∆χ2 ∆df p-
value
Comparison
model
SINGCOMB 1 30 1391.68 377 637.68 - - - -
2 30 1397.04 381 635.04 5.36 4 0.25 1
3 30 1401.05 385 631.05 4.01 4 0.40 2
4 30 1404.36 389 626.36 3.31 4 0.51 3
SingTheNote
PD
1 30 1644.35 383 878.35 - - - -
2 30 1651.13 387 877.13 6.78 4 0.15 1
3 30 1654.87 391 872.87 3.74 4 0.44 2
4 30 1657.08 395 867.08 2.21 4 0.70 3
HappyBirthday
PD
1 30 1397.01 384 629.01 - - - -
2 30 1402.83 388 626.83 5.82 4 0.21 1
3 30 1406.16 392 622.16 3.34 4 0.50 2
4 30 1410.58 396 618.58 4.41 4 0.35 3
HappyBirthday
ID
1 30 1284.13 384 516.13 - - - -
2 30 1289.62 388 513.62 5.49 4 0.24 1
3 30 1295.99 392 511.99 6.37 4 0.17 2
4 30 1300.36 396 508.36 4.37 4 0.36 3
HappyBirthday
KD
1 30 1419.45 384 651.45 - - - -
2 30 1424.53 388 648.53 5.07 4 0.28 1
3 30 1430.44 392 646.44 5.92 4 0.21 2
4 30 1435.03 396 643.03 4.59 4 0.33 3
SingTheTune
PD
1 30 1474.35 378 718.35 - - - -
2 30 1480.57 382 716.57 6.21 4 0.18 1
3 30 1485.50 386 713.50 4.94 4 0.29 2
4 30 1489.14 390 709.14 3.63 4 0.46 3
SingTheTune
ID
1 30 1449.19 378 693.19 - - - -
2 30 1455.92 382 691.92 6.73 4 0.15 1
3 30 1461.31 386 689.31 5.39 4 0.25 2
4 30 1464.52 390 684.52 3.21 4 0.52 3
MatchTheNote
PD
1 30 1568.25 380 808.25 - - - -
2 30 1575.04 384 807.04 6.79 4 0.15 1
3 30 1578.84 388 802.84 3.80 4 0.43 2
4 30 1583.62 392 799.62 4.77 4 0.31 3
Note. AIC: Akaike’s Information Criterion; df; Degrees of freedom; EP: Estimated parameters;
ID: Interval deviation; KD: Key deviation; PD: Pitch deviation; SINGCOMB: Combined
singing score; -2LL: -2 log likelihood; ∆df: Change in degrees of freedom; ∆χ2: Change in chi-
square test.
Model 1: Bivariate saturated model (means and variances of twins are allowed to freely vary);
Model 2: Bivariate model constraining means within twin pairs to be equal;
Model 3: Bivariate model constraining means and variances within twin pairs to be equal;
Model 4: Bivariate model constraining means and variances across zygosities to be equal

- 394 -
Table E-16. Bivariate Model-Fitting Results Testing Equality of Means and Variances Within
Twin Pairs and Across Zygosities for Personal Singing and the Singing Measures
Measure Model EP -2LL df AIC ∆χ2 ∆df p-
value
Comparison
model
SINGCOMB 1 30 886.14 385 116.14 - - - -
2 30 890.83 389 112.83 4.69 4 0.32 1
3 30 892.06 393 106.06 1.23 4 0.87 2
4 30 898.77 397 104.77 6.71 4 0.15 3
SingTheNote
PD
1 30 1150.77 391 368.77 - - - -
2 30 1158.01 395 368.01 7.24 4 0.12 1
3 30 1158.72 399 360.72 0.71 4 0.95 2
4 30 1164.14 403 358.14 5.42 4 0.25 3
HappyBirthday
PD
1 30 892.74 392 108.74 - - - -
2 30 897.86 396 105.86 5.12 4 0.28 1
3 30 898.89 400 98.89 1.03 4 0.91 2
4 30 903.85 404 95.85 4.96 4 0.29 3
HappyBirthday
ID
1 30 775.85 392 -8.15 - - - -
2 30 781.65 396 -10.35 5.80 4 0.21 1
3 30 784.45 400 -15.55 2.80 4 0.59 2
4 30 790.93 404 -17.07 6.48 4 0.17 3
HappyBirthday
KD
1 30 913.54 392 129.54 - - - -
2 30 917.99 396 125.99 4.44 4 0.35 1
3 30 921.31 400 121.31 3.33 4 0.50 2
4 30 927.21 404 119.21 5.90 4 0.21 3
SingTheTune
PD
1 30 961.40 386 189.40 - - - -
2 30 966.80 390 186.80 5.40 4 0.25 1
3 30 968.77 394 180.77 1.96 4 0.74 2
4 30 976.65 398 180.65 7.89 4 0.10 3
SingTheTune
ID
1 30 936.65 386 164.65 - - - -
2 30 942.34 390 162.34 5.69 4 0.22 1
3 30 945.20 394 157.20 2.86 4 0.58 2
4 30 952.00 398 156.00 6.80 4 0.15 3
Note. AIC: Akaike’s Information Criterion; df; Degrees of freedom; EP: Estimated parameters;
ID: Interval deviation; KD: Key deviation; PD: Pitch deviation; SINGCOMB: Combined
singing score; -2LL: -2 log likelihood; ∆df: Change in degrees of freedom; ∆χ2: Change in chi-
square test.
Model 1: Bivariate saturated model (means and variances of twins are allowed to freely vary);
Model 2: Bivariate model constraining means within twin pairs to be equal;
Model 3: Bivariate model constraining means and variances within twin pairs to be equal;
Model 4: Bivariate model constraining means and variances across zygosities to be equal

- 395 -
Table E-17. Bivariate Model-Fitting Results Testing Equality of Means and Variances Within
Twin Pairs and Across Zygosities for Family Singing and the Singing Measures
Measure Model EP -2LL df AIC ∆χ2 ∆df p-
value
Comparison
model
SINGCOMB 1 30 804.29 385 34.29 - - - -
2 30 809.13 389 31.13 4.85 4 0.30 1
3 30 810.04 393 24.04 0.90 4 0.92 2
4 30 813.53 397 19.53 3.49 4 0.48 3
SingTheNote
PD
1 30 1073.30 391 291.30 - - - -
2 30 1079.84 395 289.84 6.54 4 0.16 1
3 30 1080.12 399 282.12 0.28 4 0.99 2
4 30 1082.51 403 276.51 2.39 4 0.66 3
HappyBirthday
PD
1 30 817.46 392 33.46 - - - -
2 30 823.52 396 31.52 6.06 4 0.19 1
3 30 824.05 400 24.05 0.53 4 0.97 2
4 30 827.40 404 19.40 3.35 4 0.50 3
HappyBirthday
ID
1 30 700.03 392 -83.97 - - - -
2 30 705.21 396 -86.79 5.18 4 0.27 1
3 30 707.59 400 -92.41 2.38 4 0.67 2
4 30 711.81 404 -96.19 4.22 4 0.38 3
HappyBirthday
KD
1 30 833.07 392 49.07 - - - -
2 30 836.80 396 44.80 3.72 4 0.44 1
3 30 839.40 400 39.40 2.61 4 0.63 2
4 30 843.69 404 35.69 4.29 4 0.37 3
SingTheTune
PD
1 30 886.39 386 114.39 - - - -
2 30 890.54 390 110.54 4.15 4 0.39 1
3 30 892.15 394 104.15 1.61 4 0.81 2
4 30 896.06 398 100.06 3.92 4 0.42 3
SingTheTune
ID
1 30 853.72 386 81.72 - - - -
2 30 857.73 390 77.73 4.01 4 0.40 1
3 30 860.13 394 72.13 2.40 4 0.66 2
4 30 863.22 398 67.22 3.09 4 0.54 3
Note. AIC: Akaike’s Information Criterion; df; Degrees of freedom; EP: Estimated parameters;
ID: Interval deviation; KD: Key deviation; PD: Pitch deviation; SINGCOMB: Combined
singing score; -2LL: -2 log likelihood; ∆df: Change in degrees of freedom; ∆χ2: Change in chi-
square test.
Model 1: Bivariate saturated model (means and variances of twins are allowed to freely vary);
Model 2: Bivariate model constraining means within twin pairs to be equal;
Model 3: Bivariate model constraining means and variances within twin pairs to be equal;
Model 4: Bivariate model constraining means and variances across zygosities to be equal

- 396 -
Table E-18. Bivariate Model-Fitting Results Testing Equality of Means and Variances Within
Twin Pairs and Across Zygosities for Public Singing and the Singing Measures
Measure Model EP -2LL df AIC ∆χ2 ∆df p-
value
Comparison
model
SINGCOMB 1 30 535.18 385 -234.82 - - - -
2 30 541.89 389 -236.11 6.71 4 0.15 1
3 30 542.86 393 -243.14 0.97 4 0.91 2
4 30 550.59 397 -243.41 7.74 4 0.10 3
SingTheNote
PD
1 30 792.88 391 10.88 - - - -
2 30 803.11 395 13.11 10.23 4 0.04 1
3 30 803.72 399 5.72 0.61 4 0.96 2
4 30 810.41 403 4.41 6.69 4 0.15 3
HappyBirthday
PD
1 30 540.29 392 -243.71 - - - -
2 30 547.78 396 -244.22 7.49 4 0.11 1
3 30 548.66 400 -251.34 0.88 4 0.93 2
4 30 556.8 404 -251.20 8.13 4 0.09 3
HappyBirthday
ID
1 30 418.54 392 -365.46 - - - -
2 30 425.49 396 -366.51 6.94 4 0.14 1
3 30 428.25 400 -371.75 2.77 4 0.60 2
4 30 436.53 404 -371.47 8.28 4 0.08 3
HappyBirthday
KD
1 30 562.1 392 -221.90 - - - -
2 30 568.29 396 -223.71 6.20 4 0.18 1
3 30 571.68 400 -228.32 3.39 4 0.49 2
4 30 581.07 404 -226.93 9.38 4 0.05 3
SingTheTune
PD
1 30 616.8 386 -155.20 - - - -
2 30 623.01 390 -156.99 6.22 4 0.18 1
3 30 624.75 394 -163.25 1.73 4 0.79 2
4 30 632.94 398 -163.06 8.20 4 0.08 3
SingTheTune
ID
1 30 588.68 386 -183.32 - - - -
2 30 594.83 390 -185.17 6.15 4 0.19 1
3 30 597.28 394 -190.72 2.45 4 0.65 2
4 30 604.43 398 -191.57 7.15 4 0.13 3
Note. AIC: Akaike’s Information Criterion; df; Degrees of freedom; EP: Estimated parameters;
ID: Interval deviation; KD: Key deviation; PD: Pitch deviation; SINGCOMB: Combined
singing score; -2LL: -2 log likelihood; ∆df: Change in degrees of freedom; ∆χ2: Change in chi-
square test.
Model 1: Bivariate saturated model (means and variances of twins are allowed to freely vary);
Model 2: Bivariate model constraining means within twin pairs to be equal;
Model 3: Bivariate model constraining means and variances within twin pairs to be equal;
Model 4: Bivariate model constraining means and variances across zygosities to be equal

- 397 -
Table E-19. Bivariate Model-Fitting Results Testing Equality of Means and Variances Within
Twin Pairs and Across Zygosities for Music Listening and the Singing Measures
Measure Model EP -2LL df AIC ∆χ2 ∆df p-
value
Comparison
model
SINGCOMB 1 30 824.59 385 54.59 - - - -
2 30 829.13 389 51.13 4.53 4 0.34 1
3 30 829.99 393 43.99 0.86 4 0.93 2
4 30 832.63 397 38.63 2.64 4 0.62 3
SingTheNote
PD
1 30 1085.48 391 303.48 - - - -
2 30 1093.99 395 303.99 8.51 4 0.07 1
3 30 1094.23 399 296.23 0.24 4 0.99 2
4 30 1095.62 403 289.62 1.39 4 0.85 3
HappyBirthday
PD
1 30 836.86 392 52.86 - - - -
2 30 841.69 396 49.69 4.83 4 0.31 1
3 30 842.23 400 42.23 0.54 4 0.97 2
4 30 846.13 404 38.13 3.90 4 0.42 3
HappyBirthday
ID
1 30 721.85 392 -62.15 - - - -
2 30 727.46 396 -64.54 5.62 4 0.23 1
3 30 729.78 400 -70.22 2.31 4 0.68 2
4 30 733.97 404 -74.03 4.20 4 0.38 3
HappyBirthday
KD
1 30 856.31 392 72.31 - - - -
2 30 860.15 396 68.15 3.85 4 0.43 1
3 30 863.10 400 63.10 2.94 4 0.57 2
4 30 867.37 404 59.37 4.27 4 0.37 3
SingTheTune
PD
1 30 898.91 386 126.91 - - - -
2 30 903.43 390 123.43 4.52 4 0.34 1
3 30 905.21 394 117.21 1.78 4 0.78 2
4 30 907.94 398 111.94 2.73 4 0.60 3
SingTheTune
ID
1 30 875.99 386 103.99 - - - -
2 30 880.77 390 100.77 4.78 4 0.31 1
3 30 883.45 394 95.45 2.68 4 0.61 2
4 30 885.72 398 89.72 2.27 4 0.67 3
Note. AIC: Akaike’s Information Criterion; df; Degrees of freedom; EP: Estimated parameters;
ID: Interval deviation; KD: Key deviation; PD: Pitch deviation; SINGCOMB: Combined
singing score; -2LL: -2 log likelihood; ∆df: Change in degrees of freedom; ∆χ2: Change in chi-
square test.
Model 1: Bivariate saturated model (means and variances of twins are allowed to freely vary);
Model 2: Bivariate model constraining means within twin pairs to be equal;
Model 3: Bivariate model constraining means and variances within twin pairs to be equal;
Model 4: Bivariate model constraining means and variances across zygosities to be equal

- 398 -
References
Aarde, S. M., & Jentsch, J. D. (2006). Haploinsufficiency of the arginine-vasopressin
gene is associated with poor spatial working memory performance in rats.
Hormones and Behavior, 49(4), 501-508.
Adler, A., & Harrison, S. (2004). Swinging back the gender pendulum: Addressing
boys' needs in music education research and practice. In L. Bartel (Ed.),
Questioning the music education paradigm (pp. 270-289). Toronto: Canadian
Music Educators' Association.
Aherne, S. E. (2011). An Examination of the relationships among home musical
environment, tonal music aptitude, and vocal performance achievement of
kindergarten students. (Unpublished dissertation), University of Delaware.
Albers, H. E., Karom, M., & Smith, D. (2002). Serotonin and vasopressin interact in the
hypothalamus to control communicative behavior. NeuroReport, 13(7), 931-933.
Alcock, K. J., Passingham, R. E., Watkins, K., & Vargha-Khadem, F. (2000). Pitch and
timing abilities in inherited speech and language impairment. Brain and
Language, 75(1), 34-46.
Alkan, C., Coe, B. P., & Eichler, E. E. (2011). Genome structural variation discovery
and genotyping. Nature Reviews Genetics, 12(5), 363-376.
Almal, S. H., & Padh, H. (2012). Implications of gene copy-number variation in health
and diseases. Journal of Human Genetics, 57(1), 6-13.
Amir, O., Amir, N., & Kishon-Rabin, L. (2003). The effect of superior auditory skills
on vocal accuracy. Journal of the Acoustical Society of America, 113(2), 1102-
1108.
Andrews, M. W., & Dowling, W. J. (1991). The Development of Perception of
Interleaved Melodies and Control of Auditory Attention. Music Perception,
8(4), 349-368.
Angulo-Perkins, A., Aubé, W., Peretz, I., Barrios, F. A., Armony, J. L., & Concha, L.
(2014). Music listening engages specific cortical regions within the temporal
lobes: Differences between musicians and non-musicians. Cortex, 59, 126-137.
Aschersleben, G. (2002). Temporal control of movements in sensorimotor
synchronization. Brain and Cognition, 48(1), 66-79.
Aschersleben, G., & Prinz, W. (1995). Synchronizing actions with events: The role of
sensory information. Perception & Psychophysics, 57(3), 305-317.
Ashley, M. (2009). How high should boys sing? Gender, authenticity and credibility in
the young male voice. Burlington: Ashgate Publishing Company.
Astafiev, S. V., Shulman, G. L., Stanley, C. M., Snyder, A. Z., Van Essen, D. C., &
Corbetta, M. (2003). Functional organization of human intraparietal and frontal
cortex for attending, looking, and pointing. Journal of Neuroscience, 23(11),
4689-4699.
Atterbury, B. W., & Silcox, L. (1993). A comparison of home musical environment and
musical aptitude in kindergarten students. UPDATE: Applications of Research
in Music Education, 11(2), 18.
Attia, J., Ioannidis, J. P. A., Thakkinstian, A., McEvoy, M., Scott, R. J., Minelli, C., . . .
Guyatt, G. (2009). How to use an article about genetic association B: Are the
results of the study valid? Journal of the American Medical Association, 301(2),
191-197.

- 399 -
Attneave, F., & Olson, R. R. (1971). Pitch as medium: A new approach to
psychophysical scaling. American Journal of Psychology, 84, 147-166.
Bachem, A. (1955). Absolute pitch. Journal of the Acoustical Society of America, 11,
434-439.
Bachner-Melman, R., Dina, C., Zohar, A. H., Constantini, N., Lerer, E., Hoch, S., . . .
Ebstein, R. P. (2005). AVPR1a and SLC6A4 gene polymorphisms are
associated with creative dance performance. PLos Genetics, 1(3), e42.
Baddeley, A. (1994). The magical number seven: Still magic after all these years?
Psychological Review, 101(2), 353-356.
Baharloo, S., Johnston, P. A., Service, S. K., Gitschier, J., & Freimer, N. B. (1998).
Absolute pitch: An approach for identification of genetic and nongenetic
components. American Journal of Human Genetics, 62(2), 224-231.
Bailey, J. A., & Penhune, V. B. (2010). Rhythm synchronization performance and
auditory working memory in early- and late-trained musicians. Experimental
Brain Research, 204(1), 91-101.
Ballana, E., Wang, J., Venail, F., Estivill, X., Puel, J. L., Arbonès, M. L., & Bosch, A.
(2008). Efficient and specific transduction of cochlear supporting cells by
adeno-associated virus serotype 5. Neuroscience Letters, 442(2), 134-139.
Bangert, M., & Schlaug, G. (2006). Specialization of the specialized in features of
external human brain morphology. European Journal of Neuroscience, 24(6),
1832-1834.
Bartel, L., & Cameron, L. (2007). Understanding the conditions of learning in early
childhood music education. In K. Smithrim & R. Upitis (Eds.), Listen to their
voices: Research and practice in early childhood music (pp. 57-86). Waterloo,
ON, Canada: CMEA.
Bartlett, J., & Dowling, W. J. (1980). Recognition of transposed melodies: A key
distance effect in developmental perspective. Journal of Experimental
Psychology: Human Perception and Performance, 6, 501-515.
Basit, S., Lee, K., Habib, R., Chen, L., Umm, E. K., Santos-Cortez, R. L. P., . . . Leal, S.
M. (2011). DFNB89, a novel autosomal recessive nonsyndromic hearing
impairment locus on chromosome 16q21-q23.2. Human Genetics, 129(4), 379-
385.
Bendor, D., & Wang, X. (2006). Cortical representations of pitch in monkeys and
humans. Current Opinion in Neurobiology, 16(4), 391-399.
Benke, K. S., Carlson, M. C., Doan, B. Q., Walston, J. D., Xue, Q. L., Reiner, A. P., . . .
Fallin, M. D. (2011). The association of genetic variants in interleukin-1 genes
with cognition: Findings from the cardiovascular health study. Experimental
Gerontology, 46(12), 1010-1019.
Bentley, A. (1969). Measurements and development of musical abilities: Some
Research Interests and Findings. Journal of Research in Music Education, 17(1),
41-46.
Berkowska, M., & Dalla Bella, S. (2009a). Acquired and congenital disorders of sung
performance: A review. Advances in Cognitive Psychology, 5(1), 69-83.
Berkowska, M., & Dalla Bella, S. (2009b). Reducing linguistic information enhances
singing proficiency in occasional singers. Annals of the New York Academy of
Sciences, 1169, 108-111.
Berkowska, M., & Dalla Bella, S. (2013). Uncovering phenotypes of poor-pitch singing:
The Sung Performance Battery (SPB). Frontiers in Psychology, 4.

- 400 -
Bermudez, P., Lerch, J. P., Evans, A. C., & Zatorre, R. J. (2009). Neuroanatomical
correlates of musicianship as revealed by cortical thickness and voxel-based
morphometry. Cerebral Cortex, 19(7), 1583-1596.
Bermudez, P., & Zatorre, R. J. (2005). Differences in gray matter between musicians
and nonmusicians. Annals of the New York Academy of Sciences, 1060, 395-399.
Bharucha, J. J., & Stoeckig, K. (1986). Reaction Time and Musical Expectancy.
Priming of Chords. Journal of Experimental Psychology: Human Perception
and Performance, 12(4), 403-410.
Bharucha, J. J., & Stoeckig, K. (1987). Priming of chords: Spreading activation or
overlapping frequency spectra? Perception & Psychophysics, 41(6), 519-524.
Bianchi, F., Santurette, S., Wendt, D., & Dau, T. (2016). Pitch Discrimination in
Musicians and Non-Musicians: Effects of Harmonic Resolvability and
Processing Effort. JARO: Journal of the Association for Research in
Otolaryngology, 17(1), 69-79.
Bielsky, I. F., Hu, S. B., Szegda, K. L., Westphal, H., & Young, L. J. (2004). Profound
impairment in social recognition and reduction in anxiety-like behavior in
vasopressin V1a receptor knockout mice. Neuropsychopharmacology, 29(3),
483-493.
Bigand, E. (1990). Abstraction of Two Forms of Underlying Structure in a Tonal
Melody. Psychology of Music, 18(1), 45-59.
Bigand, E., D'Adamo, D. A., & Poulin, B. (2003). The implicit learning of twelve-tone
music. Paper presented at the ESCOP, Granada, Spain.
Bigand, E., & Parncutt, R. (1999). Perceiving musical tension in long chord sequences.
Psychological Research, 62(4), 237-254.
Bigand, E., Parncutt, R., & Lerdahl, F. (1996). Perception of musical tension in short
chord sequences: The influence of harmonic function, sensory dissonance,
horizontal motion, and musical training. Perception and Psychophysics, 58(1),
125-141.
Bigand, E., Perruchet, P., & Boyer, M. (1998). Implicit learning of an artificial grammar
of musical timbres. Cahiers de Psychologie Cognitive, 17(3), 577-600.
Bigand, E., & Pineau, M. (1996). Context effects on melody recognition: A dynamic
interpretation. Cahiers de Psychologie Cognitive, 15(1), 121-134.
Bigand, E., & Pineau, M. (1997). Global context effects on musical expectancy.
Perception and Psychophysics, 59(7), 1098-1107.
Bigand, E., & Poulin-Charronnat, B. (2006). Are we "experienced listeners"? A review
of the musical capacities that do not depend on formal musical training.
Cognition, 100(1), 100-130.
Bigand, E., Poulin, B., Tillmann, B., Madurell, F., & D'Adamo, D. A. (2003). Sensory
Versus Cognitive Components in Harmonic Priming. Journal of Experimental
Psychology: Human Perception and Performance, 29(1), 159-171.
Bigand, E., Tillmann, B., Poulin-Charronnat, B., & Manderlier, D. (2005). Repetition
priming: Is music special? Quarterly Journal of Experimental Psychology
Section A: Human Experimental Psychology, 58(8), 1347-1375.
Bigand, E., Vieillard, S., Madurell, F., Marozeau, J., & Dacquet, A. (2005).
Multidimensional scaling of emotional responses to music: The effect of musical
expertise and of the duration of the excerpts. Cognition and Emotion, 19(8),
1113-1139.
Blacking, J. (1995). Music, culture, and experience. Chicago, IL.: University of
Chicago Press.

- 401 -
Blind, E. E. (1938). An Experiment with Monotones. Music Educators Journal, 24(5),
37-39.
Bochud, M. (2012). Estimating heritability from nuclear family and pedigree data. In R.
C. Elston, J. M. Satagopan, & S. Sun (Eds.), Statistical Human Genetics:
Methods and Protocols (pp. 171-186). New York: Humana Press; Springer.
Boersma, P., & Weenink, D. (2013). Praat: Doing phonetics by Computer (Version
5.3.49). Retrieved from http://www.fon.hum.uva.nl/praat/download_win.html
Boersma, P., & Weenink, D. (2014). Praat: doing phonetics by computer (Version
5.4.01). Retrieved from http://www.praat.org/
Boh, B., Herholz, S. C., Lappe, C., & Pantev, C. (2011). Processing of complex
auditory patterns in musicians and nonmusicians. PLoS ONE, 6(7).
Bond, V. L. (2011). Before they walk in the door: Environmental influences on musical
ability in early childhood and implications for nurturing the nurturers.
Contributions to Music Education, 38(2), 73-89.
Bond, V. L. (2012). "I'm gonna be a rock singer...and people gonna LOVE me": A case
study of urban preschool students' musical experiences. In L. K. Thompson &
M. R. Campbell (Eds.), Situating inquiry: Expanded venues for music education
research (pp. 13-33). Charlotte, NC: Information Age Publishing.
Bonnelykke, B., Hauge, M., Holm, N., Kristoffersen, K., & Gurtler, H. (1989).
Evaluation of zygosity diagnosis in twin pairs below age seven by means of a
mailed questionnaire. Acta Geneticae Medicae et Gemellologiae, 38(3-4), 305-
313.
Borkenau, P., Riemann, R., Angleitner, A., & Spinath, F. M. (2002). Similarity of
childhood experiences and personality resemblance in monozygotic and
dizygotic twins: A test of the equal environments assumption. Personality and
Individual Differences, 33(2), 261-269.
Bradshaw, E., & McHenry, M. A. (2005). Pitch discrimination and pitch matching
abilities of adults who sing inaccurately. Journal of Voice, 19(3), 431-439.
Brand, M. (1985). Development and validation of the home musical environment scale
for use at the early elementary level. Psychology of Music, 13(10), 40-48.
Brand, M. (1986). Relationship between home musical environment and selected
musical attributes of second grade children. Journal of Research in Music
Education, 34(2), 111-120.
Brown, D. E. (1991). Human Universals. New York: McGraw-Hill.
Brown, S., Martinez, M. J., & Parsons, L. M. (2006). Music and language side by side
in the brain: a PET study of the generation of melodies and sentences. European
Journal of Neuroscience, 23(10), 2791-2803.
Brown, S., Savage, P. E., Ko, A. M. S., Stoneking, M., Ko, Y. C., Loo, J. H., & Trejaut,
J. A. (2014). Correlations in the population structure of music, genes and
language. Proceedings of the Royal Society B: Biological Sciences, 281(1774).
Brucher, K. (2013). Composing Identity and Transposing Values in Portuguese
Amateur Wind Bands. In S. A. Reily & K. Brucher (Eds.), Brass Bands of the
World: Militarism, Colonial Legacies and Local Music Making (pp. 155-176).
New York: Routledge.
Butkovic, A., Ullén, F., & Mosing, M. A. (2015). Personality related traits as predictors
of music practice: Underlying environmental and genetic influences. Personality
and Individual Differences, 74, 133-138.
Byun, K., Kim, D., Bayarsaikhan, E., Oh, J., Kim, J., Kwak, G., . . . Lee, B. (2013).
Changes of calcium binding proteins, c-Fos and COX in hippocampal formation

- 402 -
and cerebellum of Niemann-Pick, type C mouse. Journal of Chemical
Neuroanatomy, 52, 1-8.
Callaway, E. (2007). Music is in our genes. Nature News.
Cameron, D. J., & Grahn, J. A. (2014). Enhanced timing abilities in percussionists
generalize to rhythms without a musical beat. Frontiers in Human Neuroscience,
8(DEC).
Carey, G. (2003a). Chapter 10: Morgan and linkage Human Genetics for the Social
Sciences (pp. 161-180). Thousand Oaks, CA: Sage Publications, Inc.
Carey, G. (2003b). Chapter 11: The association study Human Genetics for the Social
Sciences (pp. 181-192). Thousand Oaks, CA: Sage Publications, Inc.
Carrion-Castillo, A., Franke, B., & Fisher, S. E. (2013). Molecular genetics of dyslexia:
An overview. Dyslexia, 19(4), 214-240.
Cederlöf, R., Friberg, L., Jonsson, E., & Kaij, L. (1961). Studies on similarity diagnosis
in twins with the aid of mailed questionnaires. Human Heredity, 11(4), 338-362.
Chang, H.-W., & Trehub, S. E. (1977). Infants' Perception of Temporal Grouping in
Auditory Patterns. Child Development, 48(4), 1666-1670.
Charlemaine, C., Duyme, M., Aubin, J. T., Guis, F., Marquiset, N., De Pirieux, I., . . .
Pons, J. C. (1997). Twin zygosity diagnosis by mailed questionnaire below age
twelve months. Acta Geneticae Medicae et Gemellologiae, 46(3), 147-156.
Chassy, P., & Gobet, F. (2010). Speed of expertise acquisition depends upon inherited
factors. Talent Development and Excellence, 2(1), 17-27.
Chen, J. L., Penhune, V. B., & Zatorre, R. J. (2008). Moving on time: Brain network for
auditory-motor synchronization is modulated by rhythm complexity and musical
training. Journal of Cognitive Neuroscience, 20(2), 226-239.
Chen, Q., Heston, J. B., Burkett, Z. D., & White, S. A. (2013). Expression analysis of
the speech-related genes FoxP1 and FoxP2 and their relation to singing behavior
in two songbird species. Journal of Experimental Biology, 216(19), 3682-3692.
Chen, W. J., Chang, H. W., Wu, M. Z., Lin, C. C. H., Chang, C., Chiu, Y. N., & Soong,
W. T. (1999). Diagnosis of zygosity by questionnaire and polymarker
polymerase chain reaction in young twins. Behavior Genetics, 29(2), 115-123.
Christiansen, L., Frederiksen, H., Schousboe, K., Skytthe, A., Von Wurmb-Schwark,
N., Christensen, K., & Kyvik, K. (2003). Age- and sex-differences in the
validity of questionnaire-based zygosity in twins. Twin Research, 6(4), 275-278.
Clayton, D. F. (2000). The genomic action potential. Neurobiology of Learning and
Memory, 74(3), 185-216.
Cohen, A. J. (2015). The AIRS Test Battery of Singing Skills: Rationale, item types,
and lifespan scope. Musicae Scientiae, 19(3), 238-264.
Cohen, A. J., Thorpe, L. A., & Trehub, S. E. (1987). Infants' perception of musical
relations in short transposed tone sequences. Canadian journal of psychology,
41(1), 33-47.
Collingridge, G. L., Peineau, S., Howland, J. G., & Wang, Y. T. (2010). Long-term
depression in the CNS. Nature Reviews Neuroscience, 11(7), 459-473.
Conrad, C. (2010). Music for healing: From magic to medicine. The Lancet, 376(9757),
1980-1981.
Coon, H., & Carey, G. (1989). Genetic and environmental determinants of musical
ability in twins. Behavior Genetics, 19(2), 183-193.
Corrigall, K. A., & Schellenberg, E. G. (2015). Predicting who takes music lessons:
Parent and child characteristics. Frontiers in Psychology, 6(MAR).
Corrigall, K. A., Schellenberg, E. G., & Misura, N. M. (2013). Music training,
cognition, and personality. Frontiers in Psychology, 4.

- 403 -
Costa-Giomi, E., Gilmour, R., Siddell, J., & Lefebvre, E. (2001) Absolute pitch, early
musical instruction, and spatial abilities. Vol. 930. Annals of the New York
Academy of Sciences (pp. 394-396).
Coughlin II, C. R., Scharer, G. H., & Shaikh, T. H. (2012). Clinical impact of copy
number variation analysis using high-resolution microarray technologies:
Advantages, limitations and concerns. Genome Medicine, 4(10).
Creech, A. (2010). Learning a musical instrument: The case for parental support. Music
Education Research, 12(1), 13-32.
Creel, S. C., & Tumlin, M. A. (2012). Online Recognition of Music Is Influenced by
Relative and Absolute Pitch Information. Cognitive Science, 36(2), 224-260.
Cuddy, L. L., Balkwill, L.-L., Peretz, I., & Holden, R. R. (2005). Musical difficulties
are rare: a study of "tone deafness" among university students. Annals of the
New York Academy of Sciences, 1060, 311-324.
Cuddy, L. L., & Cohen, A. J. (1976). Recognition of transposed melodic sequences.
Quarterly Journal of Experimental Psychology, 28(2), 255-270.
Custodero, L. A. (2006). Singing practices in 10 families with young children. Journal
of Research in Music Education, 54(1), 37-56.
Custodero, L. A., Rebello Britto, P., & Brooks-Gunn, J. (2003). Musical lives: A
collective portrait of American parents and their young children. Journal of
Applied Developmental Psychology, 24(5), 553-572.
Dalla Bella, S. (2015). Defining Poor-Pitch Singing: A Problem of Measurement and
Sensitivity. Music Perception: An Interdisciplinary Journal, 32(3), 272-282.
Dalla Bella, S., & Berkowska, M. (2009). Singing proficiency in the majority:
Normality and 'phenotypes' of poor singing. Annals of the New York Academy of
Sciences, 1169, 99-107.
Dalla Bella, S., Berkowska, M., & Sowinski, J. (2011). Disorders of pitch production in
tone deafness. Frontiers in Psychology, 2(164).
Dalla Bella, S., Giguère, J. F., & Peretz, I. (2007). Singing proficiency in the general
population. Journal of the Acoustical Society of America, 121(2), 1182-1189.
Dalla Bella, S., Gigùre, J. F., & Peretz, I. (2009). Singing in congenital amusia. Journal
of the Acoustical Society of America, 126(1), 414-424.
Davidson, J. W., Howe, M. J. A., Moore, D. M., & Sloboda, J. A. (1996). The role of
parental influences in the development of musical ability. British Journal of
Developmental Psychology, 14(4), 399-412.
Davidson, J. W., Howe, M. J. A., Moore, D. M., & Sloboda, J. A. (1998). The role of
teachers in the development of musical ability. Journal of Research in Music
Education, 46(1), 141-160.
Davidson, J. W., Howe, M. J. A., & Sloboda, J. A. (1997). Environmental factors in the
development of musical performance skill over the life span. In D. J. Hargreaves
& A. C. North (Eds.), The social psychology of music (pp. 188-206). Oxford:
Oxford University Press.
Davidson, J. W., Sloboda, J. A., & Howe, M. J. A. (1995/1996). The role of parents and
teachers in the success and failure of instrumental learners. Bulletin of the
Council for Research in Music Education, 127(Special Issue: The 15th ISME
International Research Seminar), 40-44.
Davidson, L. (1994). Songsinging by young and old: A developmental approach to
music. In R. Aiello (Ed.), Musical perceptions (pp. 99-130). New York: Oxford
University Press.
Davidson, L., McKernon, P., & Garnder, H. (1981). The acquisition of song: A
developmental approach Documentary report of Ann Arbor Symposium:
- 404 -
Applications of psychology to the teaching and learning of music (pp. 301-315).
Reston, VA: Music Educators National Conference.
De Cheveigné, A. (2002). YIN, a fundamental frequency estimator for speech and
music. Journal of the Acoustical Society of America, 111(4), 1917-1930.
De Quervain, D. J. F., & Papassotiropoulos, A. (2006). Identification of a genetic
cluster influencing memory performance and hippocampal activity in humans.
Proceedings of the National Academy of Sciences of the United States of
America, 103(11), 4270-4274.
Demorest, S. M. (2001). Pitch-Matching Performance of Junior High Boys: A
Comparison of Perception and Production. Bulletin of the Council for Research
in Music Education(151), 63-70.
Demorest, S. M., & Clements, A. (2007). Factors influencing the pitch-matching of
junior high boys. Journal of Research in Music Education, 55(3), 190-203.
Demorest, S. M., & Pfordresher, P. Q. (2015). Singing Accuracy Development from K-
Adult: A Comparative Study. Music Perception: An Interdisciplinary Journal,
32(3), 293-302.
Demorest, S. M., Pfordresher, P. Q., Dalla Bella, S., Hutchins, S., Loui, P., Rutkowski,
J., & Welch, G. F. (2015). Methodological Perspectives on Singing Accuracy:
An Introduction to the Special Issue on Singing Accuracy (Part 2). Music
Perception: An Interdisciplinary Journal, 32(3), 266-271.
Depue, R. A., & Morrone-Strupinsky, J. V. (2005). A neurobehavioral model of
affiliative bonding: Implications for conceptualizing a human trait of affiliation.
Behavioral and Brain Sciences, 28(3), 313-350.
Deutsch, D. (1972). Effect of repetition of standard and of comparison tones on
recognition memory for pitch. J Exp Psychol, 93(1), 156-162.
Deutsch, D. (1978). Delayed pitch comparisons and the principle of proximity.
Perception & Psychophysics, 23, 227-230.
Deutsch, D., Dooley, K., Henthorn, T., & Head, B. (2009). Absolute pitch among
students in an American music conservatory: Association with tone language
fluency. Journal of the Acoustical Society of America, 125, 2398-2403.
Deutsch, D., Henthorn, T., Marvin, E., & Xu, H. (2006). Absolute pitch among
American and Chinese conservatory students: Prevalence differences, and
evidence for a speech-related critical period. Journal of the Acoustical Society of
America, 119(2), 719-722.
Digilio, M. C., Marino, B., Capolino, R., & Dallapiccola, B. (2005). Clinical
manifestations of Deletion 22q11.2 syndrome (DiGeorge/Velo-Cardio-Facial
syndrome). Images in Paediatric Cardiology, 7(2), 23-34.
Dovern, A., Fink, G. R., Fromme, A. C. B., Wohlschläger, A. M., Weiss, P. H., &
Riedl, V. (2012). Intrinsic network connectivity reflects consistency of
synesthetic experiences. Journal of Neuroscience, 32(22), 7614-7621.
Dowling, W. J. (1978). Scale and contour: Two components of a theory of memory for
melodies. Psychological Review, 85, 341-354.
Dowling, W. J. (1984). Development of musical schemata in children's spontaneous
singing. In W. R. Crozier & A. J. Chapman (Eds.), Cognitive Processes in the
Perception of Art (pp. 145-163). Amsterdam: Elsevier Science Publishers B. V.
Dowling, W. J. (1988). Tonal structure and children's early learning of music. In J. A.
Sloboda (Ed.), Generative processes in music: The psychology of performance,
improvisation, and composition (pp. 113-128). Oxford: Clarendon Press.

- 405 -
Dowling, W. J. (1999). The development of music perception and cognition. In D.
Deutsch (Ed.), The psychology of music (2nd ed., pp. 603-627). San Diego, CA:
Academic Press.
Dowling, W. J., & Bartlett, J. C. (1981). The importance of interval information in long-
term memory for melodies. Psychomusicology, 1(1), 30-49.
Dowling, W. J., & Fujitani, D. S. (1971). Contour, Interval, and Pitch Recognition in
Memory for Melodies. Journal of the Acoustical Society of America, 49(2B),
524-531.
Dowling, W. J., Kwak, S.-Y., & Andrews, M. W. (1995). The time course of
recognition of novel melodies. Perception & Psychophysics, 57, 136-149.
Dowling, W. J., Tillman, B., & Ayers, D. F. (2002). Memory and the experience of
hearing music. Music Perception, 19, 249-276.
Drake, C., & Botte, M. C. (1993). Tempo sensitivity in auditory sequences: Evidence
for a multiple-look model. Perception & Psychophysics, 54(3), 277-286.
Drayna, D., Manichaikul, A., De Lange, M., Snieder, H., & Spector, T. (2001). Genetic
correlates of musical pitch recognition in humans. Science, 291(5510), 1969-
1972.
Egan, M. F., Kojima, M., Callicott, J. H., Goldberg, T. E., Kolachana, B. S., Bertolino,
A., . . . Weinberger, D. R. (2003). The BDNF val66met polymorphism affects
activity-dependent secretion of BDNF and human memory and hippocampal
function. Cell, 112(2), 257-269.
Ehrlé, N., & Samson, S. (2005). Auditory discrimination of anisochrony: Influence of
the tempo and musical backgrounds of listeners. Brain and Cognition, 58(1),
133-147.
Elbert, T., Pantev, C., Wienbruch, C., Rockstroh, B., & Taub, E. (1995). Increased
cortical representation of the fingers of the left hand in string players. Science,
270(5234), 305-307.
Elemetrics, K. (2001). CSL Model 4400. Lincoln Park, NJ: Kay Elemetrics
Corporation.
Ericsson, K. A. (2006). The influence of experience and deliberate practice on the
development of superior expert performance. In K. A. Ericsson, N. Charness, P.
Feltovich, & R. R. Hoffman (Eds.), Cambridge handbook of expertise and
expert performance (pp. 685-706). Cambridge: Cambridge University Press.
Ericsson, K. A., Krampe, R. T., & Tesch-Römer, C. (1993). The role of deliberate
practice in the acquisition of expert performance. Psychological Review, 100(3),
363-406.
Erman, C. K. (1981). Vocal pedagogy for the young child. Dissertation Abstracts
International, 20(1), 2436.
Estis, J. M., Coblentz, J. K., & Moore, R. E. (2009). Effects of Increasing Time Delays
on Pitch-Matching Accuracy in Trained Singers and Untrained Individuals.
Journal of Voice, 23(4), 439-445.
Fedorenko, E., McDermott, J. H., Norman-Haignere, S., & Kanwisher, N. (2012).
Sensitivity to musical structure in the human brain. Journal of Neurophysiology,
108(12), 3289-3300.
Ferguson, J. N., Young, L. J., & Insel, T. R. (2002). The neuroendocrine basis of social
recognition. Frontiers in Neuroendocrinology, 23(2), 200-224.
Foster, N. E. V., & Zatorre, R. J. (2010). Cortical structure predicts success in
performing musical transformation judgments. NeuroImage, 53(1), 26-36.
Fox, D. B. (1990). An analysis of the pitch characteristics of infant vocalizations.
Psychomusicology, 9, 21-30.

- 406 -
Fujioka, T., Trainor, L. J., Ross, B., Kakigi, R., & Pantev, C. (2004). A comparison of
automatic melodic contour and interval encoding in musicians and
nonmusicians. Journal of Cognitive Neuroscience, 16, 1010-1021.
Fukuda, E., Hamada, S., Hasegawa, S., Katori, S., Sanbo, M., Miyakawa, T., . . . Yagi,
T. (2008). Down-regulation of protocadherin-α A isoforms in mice changes
contextual fear conditioning and spatial working memory. European Journal of
Neuroscience, 28(7), 1362-1376.
Furuya, S., Oku, T., Miyazaki, F., & Kinoshita, H. (2015). Secrets of virtuoso:
Neuromuscular attributes of motor virtuosity in expert musicians. Scientific
Reports, 5.
Gaab, N., Gaser, C., & Schlaug, G. (2006). Improvement-related functional plasticity
following pitch memory training. NeuroImage, 31(1), 255-263.
Gagné, F. (1999). Nature or nurture? A re-examination of Sloboda and Howe's (1991)
interview study on talent development in music. Psychology of Music, 27(1), 38-
51.
Gagné, F. (2004). Transforming gifts into talents: The DMGT as a developmental
theory. High Ability Studies, 15(2), 119-147.
Gálfi, M., Radács, M., Juhász, A., László, F., Molnár, A., & László, F. A. (2005).
Serotonin-induced enhancement of vasopressin and oxytocin secretion in rat
neurohypophyseal tissue culture. Regulatory Peptides, 127(1-3), 225-231.
Galton, F. (1876). The history of twins as a criterion of the relative powers of nature and
nurture. Royal Anthropological Institute of Great Britain and Ireland Journal, 6,
391-406.
Gates, J. T. (1989). A Historical Comparison of Public Singing by American Men and
Women. Journal of Research in Music Education, 37(1), 32-47.
Gebel, B., Braun, C., Kaza, E., Altenmüller, E., & Lotze, M. (2013). Instrument specific
brain activation in sensorimotor and auditory representation in musicians.
NeuroImage, 74, 37-44.
Gembris, H. (2006). The Development of Musical Abilities. In R. Colwell (Ed.), MENC
Handbook of Musical Cognition and Development. (pp. 124-164). New York:
Oxford University Press.
Gembris, H., & Davidson, J. W. (2002). Environmental Influences. In R. Parncutt & G.
E. McPherson (Eds.), The Science and Psychology of Music Performance:
Creative Strategies for Teaching and Learning (pp. 17-30). New York: Oxford
University Press.
Gervain, J., Vines, B. W., Chen, L. M., Seo, R. J., Hensch, T. K., Werker, J. F., &
Young, A. H. (2013). Valproate reopens critical-period learning of absolute
pitch. Frontiers in Systems Neuroscience, 7(DEC).
Gobet, F., & Campitelli, G. (2007). The role of domain-specific practice, handedness,
and starting age in chess. Developmental Psychology, 43(1), 159-172.
Goetze, M., Cooper, N., & Brown, C. J. (1990). Recent research on singing in the
general music classroom. Bulletin of the Council for Research in Music
Education, 104, 16-37.
Goldman, J. P. (2007). EasyAlign: a friendly automatic phonetic alignment tool under
Praat. Retrieved from http://latlcui,unige.ch/phonetique
Goldman, J. P. (2011). EasyAlign: An automatic phonetic alignment tool under Praat.
Paper presented at the Proceedings of the Annual Conference of the
International Speech Communication Association, INTERSPEECH.
Gordon, E. E. (1989). Audie. Chicago, IL: GIA Publications, Inc.

- 407 -
Goycoolea, M. V., Mena, I., Neubauer, S. G., Levy, R. G., Grez, M. F., & Berger, C. G.
(2007). Musical brains: A study of spontaneous and evoked musical sensations
without external auditory stimuli. Acta Oto-Laryngologica, 127(7), 711-721.
Graham, S. A., & Fisher, S. E. (2013). Decoding the genetics of speech and language.
Current Opinion in Neurobiology, 23(1), 43-51.
Granier-Deferre, C., Bassereau, S., Ribeiro, A., Jacquet, A. Y., & DeCasper, A. J.
(2011). A melodic contour repeatedly experienced by human near-term fetuses
elicits a profound cardiac reaction one month after birth. PLoS ONE, 6(2).
Granot, R. Y., Frankel, Y., Gritsenko, V., Lerer, E., Gritsenko, I., Bachner-Melman,
R., . . . Ebstein, R. P. (2007). Provisional evidence that the arginine vasopressin
1a receptor gene is associated with musical memory. Evolution and Human
Behavior, 28(5), 313-318.
Granot, R. Y., Israel-Kolatt, R., Gilboa, A., & Kolatt, T. (2013). Accuracy of pitch
matching significantly improved by live voice model. Journal of Voice, 27(3),
390.e313-390.320.
Granot, R. Y., Uzefovsky, F., Bogopolsky, H., & Ebstein, R. P. (2013). Effects of
Arginine Vasopressin on musical short-term memory. Frontiers in Psychology,
4.
Grayton, H. M., Fernandes, C., Rujescu, D., & Collier, D. A. (2012). Copy number
variations in neurodevelopmental disorders. Progress in Neurobiology, 99(1),
81-91.
Green, G. A. (1990). The Effect of Vocal Modeling on Pitch-Matching Accuracy of
Elementary Schoolchildren. Journal of Research in Music Education, 38(3),
225-231.
Green, L. (1997). Music, gender, education. NY: Cambridge University Press.
Grefkes, C., Ritzl, A., Zilles, K., & Fink, G. R. (2004). Human medial intraparietal
cortex subserves visuomotor coordinate transformation. NeuroImage, 23(4),
1494-1506.
Gregersen, P. K. (1998). Instant recognition: The genetics of pitch perception. American
Journal of Human Genetics, 62(2), 221-223.
Gregersen, P. K., Kowalsky, E., Kohn, N., & Marvin, E. W. (1999). Absolute pitch:
Prevalence, ethnic variation, and estimation of the genetic component. American
Journal of Human Genetics, 65(3), 911-913.
Gregersen, P. K., Kowalsky, E., Kohn, N., & Marvin, E. W. (2001). Early childhood
music education and predisposition to absolute pitch: Teasing apart genes and
environment. American Journal of Medical Genetics, 98, 280-282.
Gregersen, P. K., Kowalsky, E., Lee, A., Baron-Cohen, S., Fisher, S. E., Asher, J.
E., . . . Li, W. (2013). Absolute pitch exhibits phenotypic and genetic overlap
with synesthesia. Human Molecular Genetics, 22(10), 2097-2104.
Gregersen, P. K., Kowalsky, E., & Li, W. T. (2007). Reply to Henthorn and Deutsch:
Ethnicity versus early environment: Comment on “Early childhood music
education and predisposition to absolute pitch: Teasing apart genes and
environment” by Peter K. Gregersen, Elena Kowalsky, Nina Kohn, and
Elizabeth West Marvin [2000]. American Journal of Medical Genetics, 143A(1),
104-105.
Gregersen, P. K., & Kumar, S. (1996). The genetics of perfect pitch. American Journal
of Human Genetics, (Suppl.), 59, A179.
Griffiths, T. D. (2003) Functional Imaging of Pitch Analysis. Vol. 999. Annals of the
New York Academy of Sciences (pp. 40-49).

- 408 -
Griffiths, T. D. (2008). Sensory Systems: Auditory Action Streams? Current Biology,
18(9), R387-R388.
Griffiths, T. D., Uppenkamp, S., Johnsrude, I., Josephs, O., & Patterson, R. D. (2001).
Encoding of the temporal regularity of sound in the human brainstem. Nature
Neuroscience, 4(6), 633-637.
Grillet, N., Schwander, M., Hildebrand, M. S., Sczaniecka, A., Kolatkar, A., Velasco,
J., . . . Müller, U. (2009). Mutations in LOXHD1, an Evolutionarily Conserved
Stereociliary Protein, Disrupt Hair Cell Function in Mice and Cause Progressive
Hearing Loss in Humans. American Journal of Human Genetics, 85(3), 328-
337.
Gruber, H., Degner, S., & Lehmann, A. C. (2004). Why do some commit themselves in
deliberate practice for many years - and so many do not? Understanding the
development of professionalism in music. In M. Radovan & N. Dordevi (Eds.),
Current issues in adult learning and motivation (pp. 222-235). Ljubljana:
Slovenian Institute for Adult Education.
Guerrini, S. C. (2006). The developing singer: Comparing the singing accuracy of
elementary students on three selected vocal tasks. Bulletin of the Council for
Research in Music Education(167), 21-32.
Guo, S. W. (1998). Inflation of sibling recurrence-risk ratio, due to ascertainment bias
and/or overreporting. American Journal of Human Genetics, 63(1), 252-258.
Habib, M., & Besson, M. (2009). What do music training and musical experience teach
us about brain plasticity? Music Perception, 26(3), 279-285.
Hafke, H. Z. (2008). Nonconscious control of fundamental voice frequency. The
Journal of the Acoustical Society of America, 123(1), 273-278.
Hallam, S. (1998). The predictors of achievement and dropout in instrumental tuition.
Psychology of Music, 26(2), 116-132.
Halpern, A. R. (1984). Organization in memory for familiar songs. Journal of
Experimental Psychology: Learning, Memory, and Cognition, 10(3), 496-512.
Halpern, A. R. (1988). Mental Scanning in Auditory Imagery for Songs. Journal of
Experimental Psychology: Learning, Memory, and Cognition, 14(3), 434-443.
Hambrick, D. Z., Altmann, E. M., Oswald, F. L., Meinz, E. J., & Gobet, F. (2014).
Facing facts about deliberate practice. Frontiers in Psychology, 5(JUL).
Hambrick, D. Z., & Tucker-Drob, E. M. (2014). The genetics of music accomplishment:
Evidence for gene–environment correlation and interaction. Psychonomic
Bulletin and Review, 22(1), 112-120.
Hammock, E. A. D., & Young, L. J. (2005). Microsatellite instability generates
diversity in brain and sociobehavioral traits. Science, 308(5728), 1630-1634.
Hannon, E. E., & Trainor, L. J. (2007). Music acquisition: Effects of enculturation and
formal training on development. Trends in Cognitive Sciences, 11(11), 466-472.
Hargreaves, D. J., & North, A. (2002). Frontiers of International Education: Musical
Development and Learning (1). London, GB: Continuum.
Hariri, A. R., Goldberg, T. E., Mattay, V. S., Kolachana, B. S., Callicott, J. H., Egan, M.
F., & Weinberger, D. R. (2003). Brain-derived neurotrophic factor val66met
polymorphism affects human memory-related hippocampal activity and predicts
memory performance. Journal of Neuroscience, 23(17), 6690-6694.
Haugas, M., Lilleväli, K., Hakanen, J., & Salminen, M. (2010). Gata2 is required for the
development of inner ear semicircular ducts and the surrounding perilymphatic
space. Developmental Dynamics, 239(9), 2452-2469.
Hébert, S., Racette, A., Gagnon, L., & Peretz, I. (2003). Revisiting the dissociation
between singing and speaking in expressive aphasia. Brain, 126(8), 1838-1850.

- 409 -
Hedden, D. (2012). An Overview of Existing Research About Children’s Singing and
the Implications for Teaching Children to Sing. UPDATE: Applications of
Research in Music Education, 30(2), 52-62.
Heller, K. A., & Ziegler, A. (1998). Experience is no improvement over talent.
Behavioral and Brain Sciences, 21(3), 417-418.
Henry, M. J., & McAuley, J. D. (2010). On the prevalence of congenital amusia. Music
Perception, 27(5), 413-417.
Henthorn, T., & Deutsch, D. (2007). Ethnicity versus early environment: Comment on
'Early childhood music education and predisposition to absolute pitch: Teasing
apart genes and environment' by Peter K. Gregersen, Elena Kowalsky, Nina
Kohn, and Elizabeth West Marvin [2000]. American Journal of Medical
Genetics, Part A, 143(1), 102-103.
Hepper, P. G. (1991). An examination of foetal learning before and after birth. Irish
Journal of Psychology, 12, 95-107.
Herholz, S., & Zatorre, R. (2012). Musical Training as a Framework for Brain
Plasticity: Behavior, Function, and Structure. Neuron, 76(3), 486-502.
Herholz, S. C., Lappe, C., & Pantev, C. (2009). Looking for a pattern: An MEG study
on the abstract mismatch negativity in musicians and nonmusicians. BMC
Neuroscience, 10.
Hertel, N., Redies, C., & Medina, L. (2012). Cadherin expression delineates the
divisions of the postnatal and adult mouse amygdala. Journal of Comparative
Neurology, 520(17), 3982-4012.
Hille, A., & Schupp, J. (2015). How learning a musical instrument affects the
development of skills. Economics of Education Review, 44, 56-82.
Honing, H. (2014). Musical Cognition: A Science of Listening. New Brunswick
(U.S.A.) and London (U.K.): Transaction Publishers.
Hove, M. J., Sutherland, M. E., & Krumhansl, C. L. (2010). Ethnicity effects in relative
pitch. Psychonomic Bulletin and Review, 17(3), 310-316.
Howard, D. M., Angus, J. A., & Welch, G. F. (1994). Singing pitching accuracy from
years 3 to 6 in a primary school. Proceedings of the Institute of Acoustics, 16(5),
223-230.
Howe, M. J. A., Davidson, J. W., Moore, D. G., & Sloboda, J. A. (1995). Are there
early childhood signs of musical ability? Psychology of Music, 23, 162-176.
Howe, M. J. A., Davidson, J. W., & Sloboda, J. A. (1998). Innate talents: Reality or
myth? Behavioral and Brain Sciences, 21(3), 399-442.
Hulse, S. H., Takeuchi, A. H., & Braaten, R. F. (1992). Perceptual Invariances in the
Comparative Psychology of Music. Music Perception, 10(2), 151-184.
Hutchins, S., Larrouy-Maestri, P., & Peretz, I. (2014). Singing ability is rooted in vocal-
motor control of pitch. Attention, Perception, & Psychophysics.
Hutchins, S., & Peretz, I. (2012). A frog in your throat or in your ear? Searching for the
causes of poor singing. Journal of experimental psychology. General, 141(1),
76-97.
Hutchins, S., Roquet, C., & Peretz, I. (2012). The vocal generosity effect: How bad can
your singing be? Music Perception, 30(2), 147-159.
Hutchins, S., Zarate, J. M., Zatorre, R. J., & Peretz, I. (2010). An acoustical study of
vocal pitch matching in congenital amusia. Journal of the Acoustical Society of
America, 127(1), 504-512.
Hyde, K. L., Lerch, J. P., Zatorre, R. J., Griffiths, T. D., Evans, A. C., & Peretz, I.
(2007). Cortical thickness in congenital amusia: When less is better than more.
Journal of Neuroscience, 27(47), 13028-13032.

- 410 -
Hyde, K. L., Peretz, I., & Zatorre, R. J. (2008). Evidence for the role of the right
auditory cortex in fine pitch resolution. Neuropsychologia, 46(2), 632-639.
Iacobucci, D. (2010). Structural equations modeling: Fit Indices, sample size, and
advanced topics. Journal of Consumer Psychology, 20(1), 90-98.
IBM Corp. (2010). IBM SPSS Statistics for Windows (Version 19.0). Armonk, NY:
IBM Corp.
Ilari, B., Moura, A., & Bourscheidt, L. (2011). Between interactions and commodities:
musical parenting of infants and toddlers in Brazil. Music Education Research,
13(1), 51-67.
Iłz̈ecka, J. (2011). Granzymes A and B levels in serum of patients with amyotrophic
lateral sclerosis. Clinical Biochemistry, 44(8-9), 650-653.
Izumi, A. (2001). Relative pitch perception in Japanese monkeys (Macaca fuscata).
Journal of Comparative Psychology, 115(2), 127-131.
Jabusch, J.-C., Young, R., & Altenmüller, E. (2007). Biographical predictors of music-
related motor skills in children pianists. Paper presented at the International
Symposium on Performance Science, Porto: Portugal.
Jackson, R. W., Snieder, H., Davis, H., & Treiber, F. A. (2001). Determination of twin
zygosity: A comparison of DNA with various questionnaire indices. Twin
Research, 4(1), 12-18.
Janata, P., & Paroo, K. (2006). Acuity of auditory images in pitch and time. Perception
and Psychophysics, 68(5), 829-844.
Jäncke, L., Gaab, N., Wüstenberg, T., Scheich, H., & Heinze, H. J. (2001). Short-term
functional plasticity in the human auditory cortex: An fMRI study. Cognitive
Brain Research, 12(3), 479-485.
Jäncke, L., Schlaug, G., & Steinmetz, H. (1997). Hand skill asymmetry in professional
musicians. Brain and Cognition, 34(3), 424-432.
Jersild, A. T., & Bienstock, S. F. (1931). The influence of training on the vocal ability
of three-year-old children. Child Development, 4, 272-292.
Jones, M. R., Jagacinski, R. J., Yee, W., Floyd, R. L., & Klapp, S. T. (1995). Tests of
Attentional Flexibility in Listening to Polyrhythmic Patterns. Journal of
Experimental Psychology: Human Perception and Performance, 21(2), 293-307.
Jones, M. R., & Yee, W. (1997). Sensitivity to Time Change: The Role of Context and
Skill. Journal of Experimental Psychology: Human Perception and
Performance, 23(3), 693-709.
Joyner, D. R. (1969). The Monotone Problem. Journal of Research in Music Education,
17(1), 115-124.
Jürgens, U. (2002). Neural pathways underlying vocal control. Neuroscience &
Biobehavioral Reviews, 26(2), 235-258.
Jürgens, U. (2009). The Neural Control of Vocalization in Mammals: A Review.
Journal of Voice, 23(1), 1-10.
Kalmus, H., & Fry, D. B. (1980). On tune deafness (dysmelodia): Frequency,
development, genetics and musical background. Annals of Human Genetics,
43(4), 369-382.
Kanduri, C., Kuusi, T., Ahvenainen, M., Philips, A. K., Lähdesmäki, H., & Järvelä, I.
(2015). The effect of music performance on the transcriptome of professional
musicians. Scientific Reports, 5.
Kanduri, C., Raijas, P., Ahvenainen, M., Philips, A. K., Ukkola-Vuoti, L., Lähdesmäki,
H., & Järvelä, I. (2015). The effect of listening to music on human
transcriptome. PeerJ, 2015(3).

- 411 -
Karma, K. (2002). Auditory structuring in explaining dyslexia. In P. McKevitt, S.
Nuallain, & C. Mulvihill (Eds.), Language, vision and music (pp. 221-230).
Amsterdam/ Philadelphia: John Benjamins Publishing Company.
Karma, K. (2007). Musical aptitude definition and measure validation: Ecological
validity can endanger the construct validity of musical aptitude tests.
Psychomusicology, 19(2), 79-90.
Katori, S., Hamada, S., Noguchi, Y., Fukuda, E., Yamamoto, T., Yamamoto, H., . . .
Yagi, T. (2009). Protocadherin-α family is required for serotonergic projections
to appropriately innervate target brain areas. Journal of Neuroscience, 29(29),
9137-9147.
Kauppi, K., Nilsson, L. G., Adolfsson, R., Eriksson, E., & Nyberg, L. (2011). Kibra
polymorphism is related to enhanced memory and elevated hippocampal
processing. Journal of Neuroscience, 31(40), 14218-14222.
Kawasaki, H., Springett, G. M., Toki, S., Canales, J. J., Harlan, P., Blumenstiel, J.
P., . . . Graybiel, A. M. (1998). A Rap guanine nucleotide exchange factor
enriched highly in the basal ganglia. Proceedings of the National Academy of
Sciences of the United States of America, 95(22), 13278-13283.
Kazantseva, A. V., Gaysina, D. A., Faskhutdinova, G. G., Noskova, T., Malykh, S. B.,
& Khusnutdinova, E. K. (2008). Polymorphisms of the serotonin transporter
gene (5-HTTLPR, A/G SNP in 5-HTTLPR, and STin2 VNTR) and their relation
to personality traits in healthy individuals from Russia. Psychiatric Genetics,
18(4), 167-176.
Keenan, J. P., Thangaraj, V., Halpern, A. R., & Schlaug, G. (2001). Absolute pitch and
planum temporale. NeuroImage, 14(6), 1402-1408.
Kelley, L., & Sutton-Smith, B. (1987). A study of infant musical productivity. In J. C.
Peery, I. W. Peery, & T. W. Draper (Eds.), Music and child development (pp.
35-53). New York: Springer.
Kessen, W., Levine, J., & Wendrich, K. A. (1979). The imitation of pitch in infants.
Infant Behavior & Development, 2, 93-99.
Kinsella, G., Prior, M. R., & Murray, G. (1988). Singing ability after right and left sided
brain damage. A research note. Cortex, 24, 165-169.
Kirkpatrick, W. C. (1962). Relationship between the singing ability of prekindergarten
children and their home musical environment. (doctoral dissertation), University
of Southern California. Dissertation Abstracts International database.
Kishon-Rabin, L., Amir, O., Vexler, Y., & Zaltz, Y. (2001). Pitch discrimination: Are
professional musicians better than non-musicians? Journal of Basic and Clinical
Physiology and Pharmacology, 12(2), 125-143.
Kleber, B., Birbaumer, N., Veit, R., Trevorrow, T., & Lotze, M. (2007). Overt and
imagined singing of an Italian aria. NeuroImage, 36(3), 889-900.
Kleber, B., Veit, R., Birbaumer, N., Gruzelier, J., & Lotze, M. (2010). The brain of
opera singers: Experience-dependent changes in functional activation. Cerebral
Cortex, 20(5), 1144-1152.
Kleber, B., Zeitouni, A. G., Friberg, A., & Zatorre, R. J. (2013). Experience-dependent
modulation of feedback integration during singing: Role of the right anterior
insula. Journal of Neuroscience, 33(14), 6070-6080.
Koelsch, S., Jentschke, S., Sammler, D., & Mietchen, D. (2007). Untangling syntactic
and sensory processing: An ERP study of music perception. Psychophysiology,
44(3), 476-490.
Koops, L. H. (2011). Perceptions of current and desired involvement in early childhood
music instruction. Visions of Research in Music Education, 17.

- 412 -
Kopiez, R. (2012). The role of replication studies and meta-analyses in the search of
verified knowledge. Paper presented at the 12th International Conference on
Music Perception and Cognition (ICMPC), Thessaloniki: University of
Thessaloniki.
Kornicke, L. E. (1992). An exploratory study of individual difference varaibles in piano
sight-reading achievement. (PhD), Indiana University.
Kovas, Y., Tikhomirova, T., Selita, F., Tosto, M. G., & Malykh, S. (2016). How
genetics can help education Behavioural Genetics for Education (pp. 1-23).
Krampe, R. T., & Ericsson, K. A. (1995). Deliberate practise and elite musical
performance. In J. Rink (Ed.), The practise of performance (pp. 84-102).
Cambridge, MA: Cambridge University Press.
Krampe, R. T., & Ericsson, K. A. (1996). Maintaining Excellence: Deliberate Practice
and Elite Performance in Young and Older Pianists. Journal of Experimental
Psychology: General, 125(4), 331-359.
Krause, V., Pollok, B., & Schnitzler, A. (2010). Perception in action: The impact of
sensory information on sensorimotor synchronization in musicians and non-
musicians. Acta Psychologica, 133(1), 28-37.
Krause, V., Schnitzler, A., & Pollok, B. (2010). Functional network interactions during
sensorimotor synchronization in musicians and non-musicians. NeuroImage,
52(1), 245-251.
Kreutzer, N. J. (2001). Song Acquisition among Rural Shona-Speaking Zimbabwean
Children from Birth to 7 Years. Journal of Research in Music Education, 49(3),
198-211.
Kriegstein, K. V., & Giraud, A. L. (2004). Distinct functional substrates along the right
superior temporal sulcus for the processing of voices. NeuroImage, 22(2), 948-
955.
Krumhansl, C. L., & Shepard, R. N. (1979). Quantification of the hierarchy of tonal
functions within a diatonic context. Journal of Experimental Psychology:
Human Perception and Performance, 5(4), 579-594.
Ku, C. S., Cooper, D. N., Polychronakos, C., Naidoo, N., Wu, M., & Soong, R. (2012).
Exome sequencing: Dual role as a discovery and diagnostic tool. Annals of
Neurology, 71(1), 5-14.
Kubozono, H. (2012). Varieties of pitch accent systems in Japanese. Lingua, 122(13),
1395-1414.
Kumar, S., Joseph, S., Pearson, B., Teki, S., Fox, Z. V., Griffiths, T. D., & Husain, M.
(2013). Resource allocation and prioritization in auditory working memory.
Cognitive Neuroscience, 4(1), 12-20.
Lahti, L., Achim, K., & Partanen, J. (2013). Molecular regulation of GABAergic neuron
differentiation and diversity in the developing midbrain. Acta Physiologica,
207(4), 616-627.
Lai, C. S. L., Fisher, S. E., Hurst, J. A., Vargha-Khadem, F., & Monaco, A. P. (2001). A
forkhead-domain gene is mutated in a severe speech and language disorder.
Nature, 413(6855), 519-523.
Lange, D. M. (2000). The effect of the use of text in music instruction on the tonal
aptitude, tonal accuracy, and tonal understanding of kindergarten students.
Dissertation Abstracts International, 60(10), 3623.
Lappe, C., Herholz, S. C., Trainor, L. J., & Pantev, C. (2008). Cortical plasticity
induced by short-term unimodal and multimodal musical training. Journal of
Neuroscience, 28(39), 9632-9639.

- 413 -
Larrouy-Maestri, P., Lévêque, Y., Schön, D., Giovanni, A., & Morsomme, D. (2013).
The evaluation of singing voice accuracy: A comparison between subjective and
objective methods. Journal of Voice, 27(2), 259.e251-259.e255.
Larrouy-Maestri, P., Magis, D., & Morsomme, D. (2014). The evaluation of vocal pitch
accuracy: The case of operatic singing voices. Music Perception, 32(1), 1-10.
Larrouy-Maestri, P., & Morsomme, D. (2014). Criteria and tools for objectively
analysing the vocal accuracy of a popular song. Logopedics Phoniatrics
Vocology, 39(1), 11-18.
Lathrop, G. M., Lalouel, J. M., Julier, C., & Ott, J. (1984). Strategies for multilocus
linkage analysis in humans. Proceedings of the National Academy of Sciences of
the United States of America, 81(11 I), 3443-3446.
Law, L. N. C., & Zentner, M. (2012). Assessing Musical Abilities Objectively:
Construction and Validation of the Profile of Music Perception Skills. PLoS
ONE, 7(12).
Leaver, A. M., & Rauschecker, J. P. (2010). Cortical representation of natural complex
sounds: Effects of acoustic features and auditory object category. Journal of
Neuroscience, 30(22), 7604-7612.
Lehmann, A. C. (1997). The acquisition of expertise in music: Efficiency of deliberate
practice as a moderating variable in accounting for sub-expert performance.
Perception and cognition of music, 161-187.
Lehmann, A. C., & Ericsson, K. A. (1996). Performance without preparation: Structure
and acquisition of expert sight-reading and accompanying performance.
Psychomusicology, 15(1-2), 1-29.
Lei, M., & Lomax, R. G. (2005). The effect of varying degrees of nonnormality in
structural equation modeling. Structural Equation Modeling, 12(1), 1-27.
Levelt, W. J. M. (1989). Speaking: From Intention to Articulation. Cambridge,
Massachusetts: MIT Press.
Levinowitz, L. M. (1989a). An investigation of preschool children's comparative
capability to sing songs with and without words. Bulletin of the Council for
Research in Music Education, 100, 14-19.
Levinowitz, L. M. (1989b). An Investigation of Preschool Children's Comparative
Capability to Sing Songs with and without Words. Bulletin of the Council for
Research in Music Education(100), 14-19.
Levitin, D. J. (1994). Absolute memory for musical pitch: Evidence from the production
of learned melodies. Perception & Psychophysics, 56(4), 414-423.
Levitin, D. J. (1999). Absolute pitch: Self-reference and human memory. International
Journal of Computing Anticipatory Systems, 4, 255-266.
Levitin, D. J. (2006). This is your brain on music: The science of a human obsession.
New York: Plume.
Levitin, D. J. (2012). What does it mean to be musical? Neuron, 73(4), 633-637.
Levitin, D. J., & Zatorre, R. J. (2003). On the Nature of Early Music Training and
Absolute Pitch: A Reply to Brown, Sachs, Cammuso, and Folstein. Music
Perception: An Interdisciplinary Journal, 21(1), 105-110.
Lewis, C. M., & Knight, J. (2012). Introduction to genetic association studies. Cold
Spring Harbor Protocols, 7(3), 297-306.
Li, C. C., Chakravarti, A., & Halloran, S. L. (1987). Estimation of segregation and
ascertainment probabilities by discarding the single probands. Genetic
Epidemiology, 4(3), 185-191.
- 414 -
Li, C. C., & Mantel, N. (1968). A simple method of estimating the segregation ratio
under complete ascertainment. American Journal of Human Genetics, 20(1), 61-
81.
Lim, V. K., Bradshaw, J. L., Nicholls, M. E. R., & Altenmüller, E. (2003). Perceptual
differences in sequential stimuli across patients with musician's and writer's
cramp. Movement Disorders, 18(11), 1286-1293.
Lin, J., Yan, X., Wang, C., Guo, Z., Rolfs, A., & Luo, J. (2012). Anatomical expression
patterns of delta-protocadherins in developing chicken cochlea. Journal of
Anatomy, 221(6), 598-608.
Liu, X., Bulgakov, O. V., Darrow, K. N., Pawlyk, B., Adamian, M., Liberman, M. C., &
Li, T. (2007). Usherin is required for maintenance of retinal photoreceptors and
normal development of cochlear hair cells. Proceedings of the National
Academy of Sciences of the United States of America, 104(11), 4413-4418.
Liu, X., Cannon, D. M., Akula, N., Moya, P. R., Knudsen, G. M., Arentzen, T. E., . . .
McMahon, F. J. (2011). A non-synonymous polymorphism in galactose
mutarotase (GALM) is associated with serotonin transporter binding potential in
the human thalamus: Results of a genome-wide association study. Molecular
Psychiatry, 16(6), 584-594.
Liu, X., Kanduri, C., Oikkonen, J., Karma, K., Raijas, P., Ukkola-Vuoti, L., . . . Järvelä,
I. (2016). Detecting signatures of positive selection associated with musical
aptitude in the human genome. Scientific Reports, 6.
Loehlin, J. C., & Nichols, R. C. (1976). Heredity, Environment and Personality: A
Study of 850 Sets of Twins. Austin: University of Texas Press.
Lomax, A. (1968). Folk Song Style and Culture. New Brunswick: Transaction
Publishers.
Loui, P., Alsop, D., & Schlaug, G. (2009). Tone deafness: A new disconnection
syndrome? Journal of Neuroscience, 29(33), 10215-10220.
Loui, P., Guenther, F. H., Mathys, C., & Schlaug, G. (2008). Action-perception
mismatch in tone-deafness. Current Biology, 18(8), R331-R332.
Loui, P., Li, H. C., Hohmann, A., & Schlaug, G. (2011). Enhanced cortical connectivity
in absolute pitch musicians: A model for local hyperconnectivity. Journal of
Cognitive Neuroscience, 23(4), 1015-1026.
Ludwig, M. G., & Seuwen, K. (2002). Characterization of the human adenylyl cyclase
gene family: cDNA, gene structure, and tissue distribution of the nine isoforms.
Journal of Receptors and Signal Transduction, 22(1-4), 79-110.
Lykken, D. T. (1998). The genetics of genius. In A. Steptoe (Ed.), Genius and the mind:
Studies of creativity and temperament in the historical record (pp. 15-37). New
York: Oxford University Press.
Lynch, M. P., & Eilers, R. E. (1991). Children's Perception of Native and Nonnative
Musical Scales. Music Perception: An Interdisciplinary Journal, 9(1), 121-131.
MacCoun, R., & Perlmutter, S. (2015). Blind analysis: Hide results to seek the truth.
Nature, 526(7572), 187-189.
Macnamara, B. N., Hambrick, D. Z., & Oswald, F. L. (2014). Deliberate Practice and
Performance in Music, Games, Sports, Education, and Professions: A Meta-
Analysis. Psychological Science, 25(8), 1608-1618.
Mallett, C. A. (2000). An examination of parent/caregiver attitudes toward music
instruction, the nature of the home musical environment, and their relationship
to the developmental music aptitude of preschool children. (doctoral
dissertation), University of Nebraska-Lincoln.

- 415 -
Mandell, J., Schulze, K., & Schlaug, G. (2007). Congenital amusia: An auditory-motor
feedback disorder? Restorative Neurology and Neuroscience, 25(3), 323-334.
Mang, E. (2003). Singing competency of monolingual and bilingual children in Hong
Kong. In L. C. R. Yip, C. C. Leung, & W. T. Lau (Eds.), Curriculum Innovation
in Music (pp. 237-242). Hong Kong: Hong Kong Institute of Education.
Manning, F. C., & Schutz, M. (2016). Trained to keep a beat: movement-related
enhancements to timing perception in percussionists and non-percussionists.
Psychological Research, 80(4), 532-542.
Manturzewska, M. (1979). Results of Psychological Research on the Process of Music
Practicing and Its Effective Shaping. Bulletin of the Council for Research in
Music Education(59), 59-61.
Manturzewska, M. (1990). A Biographical Study of the Life-Span Development of
Professional Musicians. Psychology of Music, 18(2), 112-139.
Margulis, E. H., Misna, L. M., Uppunda, A. K., Parrish, T. B., & Wong, P. C. M.
(2009). Selective neurophysiologic responses to music instrumentalists with
different listening biographies. Human Brain Mapping, 30, 267-275.
Marsh, K., & Young, S. (2006). Musical play. In G. E. McPherson (Ed.), The child as
musician: A handbook of musical development (pp. 289-310). Oxford: Oxford
University Press.
Masataka, N. (1999). Preference for infant-directed singing in 2-day old hearing infants
of deaf parents. Developmental Psychology, 35, 1001-1005.
Matsunaga, E., & Okanoya, K. (2008). Expression analysis of cadherins in the songbird
brain: Relationship to vocal system development. Journal of Comparative
Neurology, 508(2), 329-342.
Mauch, M., Frieler, K., & Dixon, S. (2014). Intonation in unaccompanied singing:
Accuracy, drift, and a model of reference pitch memory. Journal of the
Acoustical Society of America, 136(1), 401-411.
Maule, E., & Hilpold, M. (2013). The Influence of Singing on 15-year-old Students
School Performances in Mathematics, Science and Reading Comprehension.
American Journal of Educational Research, 1(8), 294-299.
McAuley, J. D., Henry, M. J., & Tkach, J. (2012). Tempo mediates the involvement of
motor areas in beat perception. Annals of the New York Academy of Sciences,
1252(1), 77-84.
McClay, J. L., Adkins, D. E., Berg, K., Bukszár, J., Khachane, A. N., Keefe, R. S.
E., . . . Van Den Oord, E. J. C. G. (2011). Genome-wide pharmacogenomic
study of neurocognition as an indicator of antipsychotic treatment response in
schizophrenia. Neuropsychopharmacology, 36(3), 616-626.
McGee, J., Goodyear, R. J., McMillan, D. R., Stauffer, E. A., Holt, J. R., Locke, K.
G., . . . Richardson, G. P. (2006). The very large G-protein-coupled receptor
VLGR1: A component of the ankle link complex required for the normal
development of auditory hair bundles. Journal of Neuroscience, 26(24), 6543-
6553.
McGue, M., & Bouchard Jr, T. J. (1984). Adjustment of twin data for the effects of age
and sex. Behavior Genetics, 14(4), 325-343.
McLachlan, N., Marco, D., Light, M., & Wilson, S. (2013). Consonance and pitch.
Journal of Experimental Psychology: General, 142(4), 1142-1158.
McLachlan, N., Marco, D., & Wilson, S. (2013). Pitch and Plasticity: Insights from the
Pitch Matching of Chords by Musicians with Absolute and Relative Pitch. Brain
Sciences, 3(4), 1615-1634.

- 416 -
McLachlan, N., & Wilson, S. (2010). The Central Role of Recognition in Auditory
Perception: A Neurobiological Model. Psychological Review, 117(1), 175-196.
McManus, I. C., & Furnham, A. (2006). Aesthetic activities and aesthetic attitudes:
Influences of education, background and personality on interest and involvement
in the arts. British Journal of Psychology, 97(4), 555-587.
McPherson, G. E. (1995). The Assessment of Musical Performance: Development and
Validation of Five New Measures. Psychology of Music, 23(2), 142-161.
McPherson, G. E. (2005). From child to musician: Skill development during the
beginning stages of learning an instrument. Psychology of Music, 33(1), 5-35.
McPherson, G. E. (2009). The role of parents in children's musical development.
Psychology of Music, 37(1), 91-110.
McPherson, G. E., & Hallam, S. (2008). Musical Potential. In S. Hallam, I. Cross, & M.
Thaut (Eds.), The Oxford Handbook of Music Psychology (pp. 255-264).
Oxford: Oxford University Press.
McPherson, G. E., & Williamon, A. (2006). Giftedness and talent. In G. E. McPherson
(Ed.), The Child as Musician: A Handbook of Musical Development (pp. 239-
256). New York: Oxford University Press.
Medland, S. E., & Hatemi, P. K. (2009). Political science, biometric theory, and twin
studies: A Methodological introduction. Political Analysis, 17(2), 191-214.
Meinz, E. J. (2000). Experience-based attenuation of age-related differences in music
cognition tasks. Psychology and Aging, 15(2), 297-312.
Meinz, E. J., & Hambrick, D. Z. (2010). Deliberate practice is necessary but not
sufficient to explain individual differences in piano sight-reading skill: The role
of working memory capacity. Psychological Science, 21(7), 914-919.
Meltzoff, A. N. (2002). Elements of a developmental theory of imitation. In A. N.
Meltzoff & W. Prinz (Eds.), The imitative mind (pp. 19-41). Cambridge:
Cambridge University Press.
Merrett, D. L., Peretz, I., & Wilson, S. J. (2013). Moderating variables of music
training-induced neuroplasticity: A review and discussion. Frontiers in
Psychology, 4(SEP).
Messinger, J. (1958). Overseas report. Basic College Quarterly, Fall, 20-24.
Micheyl, C., Delhommeau, K., Perrot, X., & Oxenham, A. J. (2006). Influence of
musical and psychoacoustical training on pitch discrimination. Hearing
research, 219(1-2), 36-47.
Mignault Goulet, G., Moreau, P., Robitaille, N., & Peretz, I. (2012). Congenital amusia
persists in the developing brain after daily music listening. PLoS ONE, 7(5).
Milenkovic, P., & Read, C. (1992). CSpeech (Version 4).
Miller, G. A. (1994). The magical number seven, plus or minus two: Some limits on our
capacity for processing information. Psychological Review, 101(2), 343-352.
Milnik, A., Heck, A., Vogler, C., Heinze, H. J., de Quervain, D. J. F., &
Papassotiropoulos, A. (2012). Association of KIBRA with episodic and working
memory: A meta-analysis. American Journal of Medical Genetics, Part B:
Neuropsychiatric Genetics, 159 B(8), 958-969.
Mishra, J. (2014). Factors Related to Sight-Reading Accuracy: A Meta-Analysis.
Journal of Research in Music Education, 61(4), 452-465.
Mitry, D., Williams, L., Charteris, D. G., Fleck, B. W., Wright, A. F., & Campbell, H.
(2011). Population-based estimate of the sibling recurrence risk ratio for
rhegmatogenous retinal detachment. Investigative Ophthalmology and Visual
Science, 52(5), 2551-2555.

- 417 -
Miyazaki, K. (1988). Musical pitch identification by absolute pitch possessors.
Perception & Psychophysics, 44(6), 501-512.
Miyazaki, K., & Ogawa, Y. (2006). Learning Absolute Pitch by Children: A Cross-
Sectional Study. Music Perception: An Interdisciplinary Journal, 24(1), 63-78.
Miyazaki, K., & Rakowski, A. (2002). Recognition of notated melodies by possessors
and nonpossessors of absolute pitch. Perception and Psychophysics, 64(8),
1337-1345.
Moelants, D. (2002). Preferred tempo considered. In C. Stevens, D. Burnham, G.
McPherson, E. Schubert, & J. Renwick (Eds.), Proceedings of the 7th
International Conference on Music Perception and Cognition (pp. 580-583).
Adelaide, Australia: Causal Productions.
Moog, H. (1976). The musical experience of the pre-school child (C. Clarke, Trans.).
London: Schott.
Moon, C. M., & Fifer, W. P. (2000). Evidence of Transnatal Auditory Learning.
Journal of Perinatology, 20(8), S37.
Moore, R. E., Keaton, C., & Watts, C. (2007). The Role of Pitch Memory in Pitch
Discrimination and Pitch Matching. Journal of Voice, 21(5), 560-567.
Moore, R. S. (1991). Comparison of children's and adults' vocal ranges and preferred
tessituras in singing familiar songs. Bulletin of the Council for Research in
Music Education, 107, 13-22.
Moreti, F., Pereira, L. D., & Gielow, I. (2012). Pitch-matching scanning: Comparison of
musicians and non-musicians' performance. Jornal da Sociedade Brasileira de
Fonoaudiologia, 24(4), 368-373.
Morley, A. P., Narayanan, M., Mines, R., Molokhia, A., Baxter, S., Craig, G., . . . Craig,
I. (2012). AVPR1A and SLC6A4 polymorphisms in choral singers and non-
musicians: A gene association study. PLoS ONE, 7(2).
Morrongiello, B. A. (1992). Effects of Training on Children's Perception of Music: A
Review. Psychology of Music, 20(1), 29-41.
Morrongiello, B. A., & Roes, C. L. (1990). Developmental changes in children's
perception of musical sequences: Effects of musical training. Developmental
Psychology, 26(5), 814-820.
Morrongiello, B. A., Roes, C. L., & Donnelly, F. (1989). Children's Perception of
Musical Patterns: Effects of Music Instruction. Music Perception: An
Interdisciplinary Journal, 6(4), 447-462.
Mosing, M. A., Madison, G., Pedersen, N. L., Kuja-Halkola, R., & Ullén, F. (2014).
Practice Does Not Make Perfect: No Causal Effect of Music Practice on Music
Ability. Psychological Science, 25(9), 1795-1803.
Mosing, M. A., Pedersen, N. L., Madison, G., & Ullén, F. (2014). Genetic pleiotropy
explains associations between musical auditory discrimination and intelligence.
PLoS ONE, 9(11).
Mota, G. (2002). Portugal. In D. J. Hargreaves & A. C. North (Eds.), Frontiers of
International Education: Musical Development and Learning (1) (pp. 151-162).
London, GB: Continuum.
Murayama, J., Kashiwagi, T., Kashiwagi, A., & Mimura, M. (2004). Impaired pitch
production and preserved rhythm production in a right brain-damaged patient
with amusia. Brain and Cognition, 56(1), 36-42.
Murry, T. (1990). Pitch-matching accuracy in singers and nonsingers. Journal of Voice,
4(4), 317-321.
- 418 -
Nager, W., Kohlmetz, C., Altenmüller, E., Rodriguez-Fornells, A., & Münte, T. F.
(2003). The fate of sounds in conductors' brains: An ERP study. Cognitive Brain
Research, 17(1), 83-93.
Naj, A. C., Park, Y. S., & Beaty, T. H. (2012). Detecting familial aggregation. In R. C.
Elston, J. M. Satagopan, & S. Sun (Eds.), Statistical Human Genetics: Methods
and Protocols (pp. 119-150). New York: Humana Press; Springer.
Nandram, B., Jai-Won, C., & Hongyan, X. (2011). Maximum likelihood estimation for
ascertainment bias in sampling siblings. Journal of Data Science, 9, 23.
Neale, M. C., Hunter, M. D., Pritikin, J. N., Zahery, M., Brick, T. R., Kirkpatrick, R.
M., . . . Boker, S. M. (2016). OpenMx 2.0: Extended structural equation and
statistical modeling. Psychometrika, 80(2), 535-549.
Neale, M. C., & Maes, H. H. M. (2004). Methodology for Genetic Studies of Twins and
Families. Dordrecht, The Netherlands: Kluwer Academic Publishers B. V.
Newbury, D. F., & Monaco, A. P. (2010). Genetic advances in the study of speech and
language disorders. Neuron, 68(2), 309-320.
Ng, S. B., Turner, E. H., Robertson, P. D., Flygare, S. D., Bigham, A. W., Lee, C., . . .
Shendure, J. (2009). Targeted capture and massively parallel sequencing of 12
human exomes. Nature, 461(7261), 272-276.
Nikjeh, D. A., Lister, J. J., & Frisch, S. A. (2009). The relationship between pitch
discrimination and vocal production: Comparison of vocal and instrumental
musicians. Journal of the Acoustical Society of America, 125(1), 328-338.
North, H. A., Clifford, M. A., & Donoghue, M. J. (2013). 'Til Eph do us part':
Intercellular signaling via Eph receptors and ephrin ligands guides cerebral
cortical development from birth through maturation. Cerebral Cortex, 23(8),
1765-1773.
Noy, P. (1968). The development of musical ability. Psychoanalytic Study of the Child,
23, 332-347.
Nsengimana, J., & Bishop, D. T. (2012). Design considerations for genetic linkage and
association studies. In R. C. Elston, J. M. Satagopan, & S. Sun (Eds.), Statistical
Human Genetics: Methods and Protocols (pp. 237-262). New York: Humana
Press; Springer.
Nulty, D. D. (2008). The adequacy of response rates to online and paper surveys: What
can be done? Assessment and Evaluation in Higher Education, 33(3), 301-314.
Oczkowska, A., Kozubski, W., Lianeri, M., & Dorszewska, J. (2013). Mutations in
PRKN and SNCA genes important for the progress of Parkinson's disease.
Current Genomics, 14(8), 502-517.
Oikkonen, J., Huang, Y., Onkamo, P., Ukkola-Vuoti, L., Raijas, P., Karma, K., . . .
Jarvela, I. (2014). A genome-wide linkage and association study of musical
aptitude identifies loci containing genes related to inner ear development and
neurocognitive functions. Molecular Psychiatry.
Oikkonen, J., & Järvelä, I. (2014). Genomics approaches to study musical aptitude.
BioEssays, 36(11), 1102-1108.
Oikkonen, J., Kuusi, T., Peltonen, P., Raijas, P., Ukkola-Vuoti, L., Karma, K., . . .
Järvelä, I. (2016). Creative Activities in Music ? A Genome-Wide Linkage
Analysis. PLoS ONE, 11(2), e0148679.
Oliveira, A. (2002). South America. In D. J. Hargreaves & A. C. North (Eds.), Frontiers
of International Education: Musical Development and Learning (1) (pp. 187-
201). London, GB: Continuum.

- 419 -
Olson, J. M., Vernon, P. A., Harris, J. A., & Jang, K. L. (2001). The heritability of
attitudes: A study of twins. Journal of Personality and Social Psychology, 80(6),
845-860.
Olsson, U. H., Foss, T., Troye, S. V., & Howell, R. D. (2000). The performance of ML,
GLS, and WLS estimation in structural equation modeling under conditions of
misspecification and nonnormality. Structural Equation Modeling, 7(4), 557-
595.
Ooki, S., Yamada, K., Asaka, A., & Hayakawa, K. (1990). Zygosity diagnosis of twins
by questionnaire. Acta Geneticae Medicae et Gemellologiae, 39(1), 109-115.
OpenMx Development Team. (2015). OpenMx official documentation. Retrieved from
http://openmx.psyc.virginia.edu/docs/OpenMx/latest/
Orsmond, G. I., & Miller, L. K. (1999). Cognitive, musical and environmental
correlates of early music instruction. Psychology of Music, 27(1), 18-37.
Ostroveanu, A., Van Der Zee, E. A., Eisel, U. L. M., Schmidt, M., & Nijholt, I. M.
(2010). Exchange protein activated by cyclic AMP 2 (Epac2) plays a specific
and time-limited role in memory retrieval. Hippocampus, 20(9), 1018-1026.
Oura, Y., & Hatano, G. (1988). Memory for Melodies among Subjects Differing in Age
and Experience in Music. Psychology of Music, 16(2), 91-109.
Pamjav, H., Juhász, Z., Zalán, A., Németh, E., & Damdin, B. (2012). A comparative
phylogenetic study of genetics and folk music. Molecular Genetics and
Genomics, 287(4), 337-349.
Pantev, C., Oostenveld, R., Engelien, A., Ross, B., Roberts, L. E., & Hoke, M. (1998).
Increased auditory cortical representation in musicians. Nature, 392(6678), 811-
814.
Pantev, C., Roberts, L. E., Schulz, M., Engelien, A., & Ross, B. (2001). Timbre-specific
enhancement of auditory cortical representations in musicians. NeuroReport,
12(1), 169-174.
Papoušek, H. (1996). Musicality in infancy research: Biological and cultural origins of
early musicality. In I. Deliège & J. Sloboda (Eds.), Musical beginnings. Origins
and development of musical competence (pp. 37-55). Oxford: Oxford University
Press.
Papoušek, H., & Papoušek, M. (1995). Beginning of human musicality. In R. Steinberg
(Ed.), Music and the mind machine: The psychophysiology and psychopathology
of the sense of music (pp. 27-34). Berlin: Springer.
Papoušek, M. (1996). Intuitive parenting: a hidden source of musical stimulation in
infancy. In I. Deliege & J. Sloboda (Eds.), Musical Beginnings (pp. 88-112).
Oxford: Oxford University Press.
Park, H., Lee, S., Kim, H. J., Ju, Y. S., Shin, J. Y., Hong, D., . . . Seo, J. S. (2012).
Comprehensive genomic analyses associate UGT8 variants with musical ability
in a Mongolian population. Journal of Medical Genetics, 49(12), 747-752.
Park, H., & Poo, M. M. (2012). Neurotrophin regulation of neural circuit development
and function. Nature Reviews Neuroscience, 14(1), 7-23.
Park, J. H., Brown, R. L., Park, C. R., Cohn, M., & Chance, B. (1988). Energy
metabolism of the untrained muscle of elite runners as observed by 31P
magnetic resonance spectroscopy: Evidence suggesting a genetic endowment for
endurance exercise. Proceedings of the National Academy of Sciences of the
United States of America, 85(23), 8780-8784.
Parncutt, R. (2006). Prenatal development. In G. E. McPherson (Ed.), The Child as
Musician: A Handbook of Musical Development (pp. 1-32). Oxford: Oxford
University Press.
- 420 -
Partanen, E., Kujala, T., Tervaniemi, M., & Huotilainen, M. (2013). Prenatal Music
Exposure Induces Long-Term Neural Effects. PLoS ONE, 8(10), e78946.
Pascoe, R., Leong, S., MacCallum, J., Mackinlay, E., Marsh, K., Smith, B. K., . . .
Winterton, A. (2005). National Review of Music Education. Canberra:
Australian Government.
Patel, A. D. (2008). Music, Language and the Brain. New York: Oxford University
Press.
Patel, A. D., Wong, M., Foxton, J., Lochy, A., & Peretz, I. (2008). Speech intonation
perception deficits in musical tone deafness (congenital amusia). Music
Perception, 25(4), 357-368.
Patterson, R. D., Uppenkamp, S., Johnsrude, I. S., & Griffiths, T. D. (2002). The
processing of temporal pitch and melody information in auditory cortex.
Neuron, 36(4), 767-776.
Pechstedt, P. H., Kershner, J., & Kinsbourne, M. (1989). Musical Training Improves
Processing of Tonality in the Left Hemisphere. Music Perception: An
Interdisciplinary Journal, 6(3), 275-298.
Pedersen, N., & Lichtenstein, P. (2000). The Swedish twin registry: A presentation. In
B. Smedby, I. Lundberg, & T. I. A. S∅rensen (Eds.), Scientific evaluation of the
Swedish twin registry. Stockholm: Gotab.
Peeters, H., Van Gestel, S., Vlietinck, R., Derom, C., & Derom, R. (1998). Validation of
a telephone zygosity questionnaire in twins of known zygosity. Behavior
Genetics, 28(3), 159-163.
Penfield, W., & Rasmussen, T. (1950). The Cerebral Cortex of Man: A Clinical Study
of Localization of Function. New York, NY: MacMillan Co.
Penhune, V. B. (2011). Sensitive periods in human development: Evidence from
musical training. Cortex, 47(9), 1126-1137.
Peretz, I. (2009). Music, language and modularity framed in action. Psychologica
Belgica, 49(2-3), 157-175.
Peretz, I., Champod, A. S., & Hyde, K. (2003). Varieties of Musical Disorders: The
Montreal Battery of Evaluation of Amusia. Annals of the New York Academy of
Sciences, 999, 58-75.
Peretz, I., Cummings, S., & Dubé, M.-P. (2007). The genetics of congenital amusia
(tone deafness): A family-aggregation study. American Journal of Human
Genetics, 81(3), 582-588.
Peretz, I., & Hyde, K. (2003). What is specific to music processing? Insights from
congenital amusia. Trends in Cognitive Sciences, 7, 362-367.
Persellin, D. C. (2006). The Effects of Vocal Modeling, Musical Aptitude, and Home
Environment on Pitch Accuracy of Young Children. Bulletin of the Council for
Research in Music Education(169), 39-50.
Petersen, J.-M. (2012). Mothers and music education: The influence and the impact.
Retrieved from https://www.chorusamerica.org/singers/mothers-and-music-
education-influence-and-impact
Pfeifer, J., & Hamann, S. (2015). Revising the diagnosis of congenital amusia with the
Montreal Battery of Evaluation of Amusia. Frontiers in Human Neuroscience,
9(APRIL).
Pfenning, A. R., Hara, E., Whitney, O., Rivas, M. V., Wang, R., Roulhac, P. L., . . .
Jarvis, E. D. (2014). Convergent transcriptional specializations in the brains of
humans and song-learning birds. Science, 346(6215).
Pfordresher, P. Q., & Brown, S. (2007). Poor-pitch singing in the absence of 'tone
deafness'. Music Perception, 25(2), 95-115.

- 421 -
Pfordresher, P. Q., & Brown, S. (2009). Enhanced production and perception of musical
pitch in tone language speakers. Attention, Perception, and Psychophysics,
71(6), 1385-1398.
Pfordresher, P. Q., Brown, S., Meier, K. M., Belyk, M., & Liotti, M. (2010). Imprecise
singing is widespread. The Journal of the Acoustical Society of America, 128(4),
2182-2190.
Pfordresher, P. Q., & Steven, B. (2007). Poor-pitch singing in the absence of "tone
deafness". Music Perception, 25(2), 95-115.
Phillips, K. H. (1992). Teaching kids to sing. New York: Schirmer Books, a division of
Macmillan.
Pike, A., & Atzaba-Poria, N. (2003). Do sibling and friend relationships share the same
temperamental origins? A twin study. Journal of Child Psychology and
Psychiatry and Allied Disciplines, 44(4), 598-611.
Plantinga, J., & Trainor, L. J. (2003). Long-term memory for pitch in six-month-old
infants. Annals of the New York Academy of Sciences, 999, 520-521.
Plantinga, J., & Trainor, L. J. (2005). Memory for melody: Infants use a relative pitch
code. Cognition, 98(1), 1-11.
Platz, F., Kopiez, R., Lehmann, A. C., & Wolf, A. (2014). The influence of deliberate
practice on musical achievement: A meta-analysis. Frontiers in Psychology,
5(JUN).
Plomin, R. (1998). Genetic influence and cognitive abilities. Behavioral and Brain
Sciences, 21(3), 420-421.
Plomin, R., Owen, M. J., & McGuffin, P. (1994). The genetic basis of complex human
behaviors. Science, 264(5166), 1733-1739.
Plomin, R., Willerman, L., & Loehlin, J. C. (1976). Resemblance in appearance and the
equal environments assumption in twin studies of personality traits. Behavior
Genetics, 6(1), 43-52.
Polderman, T. J. C., Benyamin, B., De Leeuw, C. A., Sullivan, P. F., Van Bochoven,
A., Visscher, P. M., & Posthuma, D. (2015). Meta-analysis of the heritability of
human traits based on fifty years of twin studies. Nature Genetics, 47(7), 702-
709.
Price, H. E. (2000). Interval Matching by Undergraduate Nonmusic Majors. Journal of
Research in Music Education, 48(4), 360-372.
Price, H. E., Yarbrough, C., Jones, M., & Moore, R. S. (1994). Effects of Male Timbre,
Falsetto, and Sine-Wave Models on Interval Matching by Inaccurate Singers.
Journal of Research in Music Education, 42(4), 269-284.
Primos, K. (2002). Africa. In D. J. Hargreaves & A. C. North (Eds.), Frontiers of
International Education: Musical Development and Learning (1) (pp. 1-13).
London, GB: Continuum.
Prior, M., Kinsella, G., & Giese, J. (1990). Assessment of musical processing in brain-
damaged patients: implications for laterality of music. Journal of Clinical and
Experimental Neuropsychology, 12, 301-312.
Profita, J., & Bidder, T. G. (1988). Perfect pitch. American Journal of Medical
Genetics, 29(4), 763-771.
Pulli, K., Karma, K., Norio, R., Sistonen, P., Göring, H. H. H., & Järvelä, I. (2008).
Genome-wide linkage scan for loci of musical aptitude in Finnish families:
Evidence for a major locus at 4q22. Journal of Medical Genetics, 45(7), 451-
456.

- 422 -
Putignano, E., Lonetti, G., Cancedda, L., Ratto, G., Costa, M., Maffei, L., & Pizzorusso,
T. (2007). Developmental Downregulation of Histone Posttranslational
Modifications Regulates Visual Cortical Plasticity. Neuron, 53(5), 747-759.
Racette, A., Bard, C., & Peretz, I. (2006). Making non-fluent aphasics speak: Sing
along! Brain, 129(10), 2571-2584.
Radocy, R. E., & Boyle, J. D. (2012). Psychological Foundations of Musical Behaviour
(5th ed.). Springfield, Illinois: Charles C. Thomas Publisher, Ltd.
Rammsayer, T., & Altenmüller, E. (2006). Temporal information processing in
musicians and nonmusicians. Music Perception, 24(1), 37-48.
Raskind, W. H., Peter, B., Richards, T., Eckert, M. M., & Berninger, V. W. (2013). The
genetics of reading disabilities: From phenotypes to candidate genes. Frontiers
in Psychology, 3(JAN).
Redies, C., Hertel, N., & Hübner, C. A. (2012). Cadherins and neuropsychiatric
disorders. Brain Research, 1470, 130-144.
Reich, D. E., & Lander, E. S. (2001). On the allelic spectrum of human disease. Trends
in Genetics, 17(9), 502-510.
Repp, B. H. (1999). Control of expressive and metronomic timing in pianists. Journal of
Motor Behavior, 31(2), 145-164.
Repp, B. H. (2000). Compensation for subliminal timing perturbations in perceptual-
motor synchronization. Psychol Res, 63(2), 106-128.
Repp, B. H. (2010). Sensorimotor synchronization and perception of timing: Effects of
music training and task experience. Human Movement Science, 29(2), 200-213.
Repp, B. H., & Doggett, R. (2007). Tapping to a very slow beat: A comparison of
musicians and nonmusicians. Music Perception, 24(4), 367-376.
Repp, B. H., London, J., & Keller, P. E. (2013). Systematic distortions in musicians'
reproduction of cyclic three-interval rhythms. Music Perception, 30(3), 291-305.
Richardson, K., & Norgate, S. (2005). The equal environments assumption of classical
twin studies may not hold. British Journal of Educational Psychology, 75(3),
339-350.
Rijsdijk, F. V., & Sham, P. C. (2002). Analytic approaches to twin data using structural
equation models. Briefings in bioinformatics, 3(2), 119-133.
Roberts, E., & Davies, A. D. M. (1975). Poor Pitch Singing: Response of Monotone
Singers to a Program of Remedial Training. Journal of Research in Music
Education, 23(4), 227-239.
Rogalsky, C., Rong, F., Saberi, K., & Hickok, G. (2011). Functional anatomy of
language and music perception: Temporal and structural factors investigated
using functional magnetic resonance imaging. Journal of Neuroscience, 31(10),
3843-3852.
Ross, D. A., Olson, I. R., & Gore, J. C. (2003). Absolute pitch does not depend on early
musical training. Annals of the New York Academy of Sciences, 999, 522-526.
Rouw, R., & Scholte, H. S. (2007). Increased structural connectivity in grapheme-color
synesthesia. Nature Neuroscience, 10(6), 792-797.
Rowe, D. C. (1998). Talent scouts, not practice scouts: Talents are real. Behavioral and
Brain Sciences, 21(3), 421-422.
Rowley, P. T. (1988). Identifying genetic factors affecting music ability.
Psychomusicology, 7(2), 195-200.
Russell, J. (1997). A "Place" for Every Voice: The Role of Culture in the Development
of Singing Expertise. Journal of Aesthetic Education, 31(4), 95-109.

- 423 -
Russo, F. A., Windell, D. L., & Cuddy, L. L. (2003). Learning the 'Special Note':
Evidence for a Critical Period for Absolute Pitch Acquisition. Music Perception:
An Interdisciplinary Journal, 21(1), 119-127.
Ruthsatz, J., Detterman, D., Griscom, W. S., & Cirullo, B. A. (2008). Becoming an
expert in the musical domain: It takes more than just practice. Intelligence,
36(4), 330-338.
Rutkowski, J. (1990). The measurement and evaluation of children's singing voice
development. The Quarterly: Center for Research in Music Learning and
Teaching, 1(1-2), 81-95.
Rutkowski, J., & Miller, M. S. (2003a). The effect of teacher feedback and modeling on
first graders' use of singing voice and developmental music aptitude. Bulletin of
the Council for Research in Music Education, 156, 1-10.
Rutkowski, J., & Miller, M. S. (2003b). The effectiveness of frequency of instruction
and individual/small group singing activities on first graders' use of singing
voice and developmental music aptitude. Contribution to Music Education, 30,
23-38.
Rutter, M. (1998). What can we learn from highly developed special skills? Behavioral
and Brain Sciences, 21(3), 422-423.
Saffran, J. R., Loman, M. M., & Robertson, R. R. W. (2000). Infant memory for
musical experiences. Cognition, 77, B15-B23.
Saiz, P. A., Garcia-Portilla, M. P., Herrero, R., Arango, C., Corcoran, P., Morales,
B., . . . Bobes, J. (2010). Interactions between functional serotonergic
polymorphisms and demographic factors influence personality traits in healthy
Spanish Caucasians. Psychiatric Genetics, 20(4), 171-178.
Salimpoor, V. N., Benovoy, M., Larcher, K., Dagher, A., & Zatorre, R. J. (2011).
Anatomically distinct dopamine release during anticipation and experience of
peak emotion to music. Nature Neuroscience, 14(2), 257-264.
Salvador, K. (2010). How Can Elementary Teachers Measure Singing Voice
Achievement? A Critical Review of Assessments, 1994-2009. UPDATE:
Applications of Research in Music Education, 29(1), 40-47.
Satt, B. J. (1984). An investigation into the acoustical induction of intrauterine learning.
(Unpublished dissertation), University of California at Los Angeles.
Schellenberg, E. G., & Moreno, S. (2010). Music lessons, pitch processing, and g.
Psychology of Music, 38(2), 209-221.
Schermelleh-Engel, K., Moosbrugger, H., & Müller, H. (2003). Evaluating the fit of
structural equation models: Tests of significance and descriptive goodness-of-fit
measures. MPR-online, 8, 23-74.
Scherzer, C. R., Grass, J. A., Liao, Z., Pepivani, I., Zheng, B., Eklund, A. C., . . .
Schlossmacher, M. G. (2008). GATA transcription factors directly regulate the
Parkinson's disease-linked gene α-synuclein. Proceedings of the National
Academy of Sciences of the United States of America, 105(31), 10907-10912.
Schlaug, G., Jancke, L., Huang, Y., & Steinmetz, H. (1995). In vivo evidence of
structural brain asymmetry in musicians. Science, 267(5198), 699-701.
Schneider, P., Scherg, M., Dosch, H. G., Specht, H. J., Gutschalk, A., & Rupp, A.
(2002). Morphology of Heschl's gyrus reflects enhanced activation in the
auditory cortex of musicians. Nature Neuroscience, 5(7), 688-694.
Schnell, A. H., & Sun, X. (2012). Model-Based Linkage Analysis of a Quantitative
Trait. In R. C. Elston, J. M. Satagopan, & S. Sun (Eds.), Statistical Human
Genetics: Methods and Protocols (pp. 263-284). New York: Humana Press;
Springer.
- 424 -
Schön, D., Lorber, B., Spacal, M., & Semenza, C. (2004). A selective deficit in the
production of exact musical intervals following right-hemisphere damage.
Cognitive Neuropsychology, 21(7), 773-784.
Schön, D., Magne, C., & Besson, M. (2004). The music of speech: Music training
facilitates pitch processing in both music and language. Psychophysiology,
41(3), 341-349.
Schulze, K., & Koelsch, S. (2012) Working memory for speech and music. Vol. 1252.
Annals of the New York Academy of Sciences (pp. 229-236).
Seashore, C. E., Lewis, D., & Saetveit, J. G. (1960). Seashore Measures of Musical
Talents Manual (2nd ed.). New York: Psychological Corporation.
Sebat, J., Lakshmi, B., Troge, J., Alexander, J., Young, J., Lundin, P., . . . Wigler, M.
(2004). Large-scale copy number polymorphism in the human genome. Science,
305(5683), 525-528.
Seesjärvi, E., Särkämö, T., Vuoksimaa, E., Tervaniemi, M., Peretz, I., & Kaprio, J.
(2015). The Nature and Nurture of Melody: A Twin Study of Musical Pitch and
Rhythm Perception. Behavior Genetics, 1-10.
Seppänen, M., Brattico, E., & Tervaniemi, M. (2007). Practice strategies of musicians
modulate neural processing and the learning of sound-patterns. Neurobiology of
Learning and Memory, 87(2), 236-247.
Sergeant, D. (1969). Experimental investigation of absolute pitch. Journal of Research
in Music Education, 17(1), 135-143.
Sezgin, M., & Sankur, B. (2004). Survey over image thresholding techniques and
quantitative performance evaluation. Journal of Electronic Imaging, 13(1), 146-
168.
Shahin, A., Bosnyak, D. J., Trainor, L. J., & Roberts, L. E. (2003). Enhancement of
neuroplastic P2 and N1c auditory evoked potentials in musicians. Journal of
Neuroscience, 23(13), 5545-5552.
Shanbhag, A. G. (1994). Utilization of Information Measure as a Means of Image
Thresholding. CVGIP: Graphical Models and Image Processing, 56(5), 414-
419.
Shanks, N. F., Savas, J. N., Maruo, T., Cais, O., Hirao, A., Oe, S., . . . Nakagawa, T.
(2012). Differences in AMPA and Kainate Receptor Interactomes Facilitate
Identification of AMPA Receptor Auxiliary Subunit GSG1L. Cell Reports, 1(6),
590-598.
Shelton, J. S. (1965). The influence of home musical environment upon musical
response of first grade children. (doctoral dissertation), George Peabody College
for Teachers.
Shuter-Dyson, R., & Gabriel, C. (1981). The psychology of musical ability. London:
Methuen.
Silingardi, D., Scali, M., Belluomini, G., & Pizzorusso, T. (2010). Epigenetic treatments
of adult rats promote recovery from visual acuity deficits induced by long-term
monocular deprivation. European Journal of Neuroscience, 31(12), 2185-2192.
Simonton, D. K. (2005). Giftedness and genetics: The emergenic-epigenetic model and
its implications. Journal for the Education of the Gifted, 28(3-4), 270-286.
Singleton, A. B. (2011). Exome sequencing: A transformative technology. The Lancet
Neurology, 10(10), 942-946.
Sinor, E. (1984). The singing of selected tonal patterns by preschool children. (PhD
Thesis), Indiana University, Indiana.
Sloboda, J. A. (1996). The acquisition of musical performance expertise:
Deconstructing the "talent" account of individual differences in musical

- 425 -
expressivity. In K. A. Ericsson (Ed.), The road to expert performance:
Empirical evidence from the arts and sciences, sports, and games (pp. 107-126).
Mahwah, NJ: Erlbaum.
Sloboda, J. A. (2005). Exploring the Musical Mind: Cognition, Emotion, Ability,
Function. New York: Oxford University Press, Inc.
Sloboda, J. A., & Davidson, J. W. (1996). The young performing musician. In Deliège,
I. & J. A. Sloboda (Eds.), Musical beginnings: Origins and development of
musical competence (pp. 171-190). Oxford: Oxford University Press.
Sloboda, J. A., Davidson, J. W., Howe, M. J. A., & Moore, D. (1996). The role of
practice in the development of expert musical performance. British Journal of
Psychology, 87(2), 287-309.
Sloboda, J. A., Davidson, J. W., Moore, D., & Howe, M. J. A. (1994). Formal practice
as a predictor of success and failure in instrumental learning. Paper presented at
the Proceedings of the 3rd International Conference on Music Perception and
Cognition, Liege, Belgium.
Sloboda, J. A., & Howe, M. J. A. (1991). Biographical precursors of musical
excellence: An interview study. Psychology of Music, 19, 3-21.
Sloboda, J. A., Wise, K. J., & Peretz, I. (2005). Quantifying tone deafness in the general
population. Annals of the New York Academy of Sciences, 1060, 255-261.
Sluming, V., Barrick, T., Howard, M., Cezayirli, E., Mayes, A., & Roberts, N. (2002).
Voxel-based morphometry reveals increased gray matter density in Broca's area
in male symphony orchestra musicians. NeuroImage, 17(3), 1613-1622.
Smale, M. J. (1988). An investigation of pitch accuracy of four- and five-year-old
singers. Dissertation Abstracts International, 48(8A), 2013.
Smith, D. J., Stevens, M. E., Sudanagunta, S. P., Bronson, R. T., Makhinson, M.,
Watabe, A. M., . . . Rubin, E. M. (1997). Functional screening of 2 Mb of human
chromosome 21q22.2 in transgenic mice implicates minibrain in learning defects
associated with Down syndrome. Nature Genetics, 16(1), 28-36.
Sohn, H.-M. (1999). The Korean Language. Cambridge: Cambridge University Press.
Song, Y. M., Lee, D. H., Lee, M. K., Lee, K., Lee, H. J., Hong, E. J., . . . Sung, J.
(2010). Validity of the zygosity questionnaire and characteristics of zygosity-
misdiagnosed twin pairs in the healthy twin study of Korea. Twin Research and
Human Genetics, 13(3), 223-230.
Sosniak, L. A. (1985). Learning to be a concert pianist. In B. S. Bloom (Ed.),
Developing talent in young people. New York: Ballantine Books.
Spencer, C. C. A., Su, Z., Donnelly, P., & Marchini, J. (2009). Designing genome-wide
association studies: Sample size, power, imputation, and the choice of
genotyping chip. PLos Genetics, 5(5).
Spiegel, M. F., & Watson, C. S. (1984). Performance On Frequency-discrimination
Tasks By Musicians And Nonmusicians. Journal of the Acoustical Society of
America, 76(6), 1690-1695.
Spitz, E., Moutier, R., Reed, T., Busnel, M. C., Marchaland, C., Roubertoux, P. L., &
Carlier, M. (1996). Comparative diagnoses of twin zygosity by SSLP variant
analysis, questionnaire, and dermatoglyphic analysis. Behavior Genetics, 26(1),
55-63.
Stadler Elmer, S. (2006). Vocal creativity: How to analyze children's song making
processes and its developmental qualities. In M. Baroni, A. R. Addressi, R.
Caterina, & M. Costa (Eds.), 9th International Conference on Music Perception
and Cognition, Alma Mater Studiorum University of Bologna (pp. 1732-1739).

- 426 -
Stein, E., & Tessier-Lavigne, M. (2001). Hierarchical organization of guidance
receptors: Silencing of netrin attraction by slit through a Robo/DCC receptor
complex. Science, 291(5510), 1928-1938.
Sternberg, R. J. (1998). If the key's not there, the light won't help. Behavioral and Brain
Sciences, 21(3), 425-426.
Strachan, T., & Read, A. P. (1999). Human Molecular Genetics (2nd ed.). New York:
Wiley-Liss.
Strait, D. L., Chan, K., Ashley, R., & Kraus, N. (2012). Specialization among the
specialized: Auditory brainstem function is tuned in to timbre. Cortex, 48(3),
360-362.
Sullivan, P. F., & Eaves, L. J. (2002). Evaluation of analyses of univariate discrete twin
data. Behavior Genetics, 32(3), 221-227.
Sun, L., & Dimitromanolakis, A. (2012). Identifying Cryptic Relationships. In R. C.
Elston, J. M. Satagopan, & S. Sun (Eds.), Statistical Human Genetics: Methods
and Protocols (pp. 47-58). New York: Humana Press; Springer.
Sundberg, J. (1987). The science of the singing voice. Dekalb, IL: Northern Illinois
University Press.
Sundberg, J., & Bauer-Huppmann, J. (2007). When Does a Sung Tone Start? Journal of
Voice, 21(3), 285-293.
Sutoo, D., & Akiyama, K. (2004). Music improves dopaminergic neurotransmission:
Demonstration based on the effect of music on blood pressure regulation. Brain
Research, 1016(2), 255-262.
Szalontai, A., & Csiszar, K. (2013). Genetic insights into the functional elements of
language. Human Genetics, 132(9), 959-986.
Tafuri, J., & Villa, D. (2002). Musical elements in the vocalisations of infants aged 2 to
8 months. British Journal of Music Education, 19, 73-88.
Tan, Y. T., McPherson, G. E., Peretz, I., Berkovic, S. F., & Wilson, S. J. (2014). The
genetic basis of music ability. Frontiers in Psychology, 5.
Tanabe, H. C., Kato, M., Miyauchi, S., Hayashi, S., & Yanagida, T. (2005). The
sensorimotor transformation of cross-modal spatial information in the anterior
intraparietal sulcus as revealed by functional MRI. Cognitive Brain Research,
22(3), 385-396.
Taymans, J. M., Leysen, J. E., & Langlois, X. (2003). Striatal gene expression of RGS2
and RGS4 is specifically mediated by dopamine D1 and D2 receptors: Clues for
RGS2 and RGS4 functions. Journal of Neurochemistry, 84(5), 1118-1127.
Teo, S. M., Pawitan, Y., Ku, C. S., Chia, K. S., & Salim, A. (2012). Statistical
challenges associated with detecting copy number variations with next-
generation sequencing. Bioinformatics, 28(21), 2711-2718.
Tervaniemi, M., Just, V., Koelsch, S., Widmann, A., & Schröger, E. (2005). Pitch
discrimination accuracy in musicians vs nonmusicians: An event-related
potential and behavioral study. Experimental Brain Research, 161(1), 1-10.
Tervaniemi, M., Rytkönen, M., Schröger, E., Ilmoniemi, R. J., & Näätänen, R. (2001).
Superior formation of cortical memory traces for melodic patterns in musicians.
Learning and Memory, 8(5), 295-300.
Theusch, E., Basu, A., & Gitschier, J. (2009). Genome-wide study of families with
absolute pitch reveals linkage to 8q24.21 and locus heterogeneity. American
Journal of Human Genetics, 85, 112-119.
Theusch, E., & Gitschier, J. (2011). Absolute pitch twin study and segregation analysis.
Twin Research and Human Genetics, 14(2), 173-178.
- 427 -
Tillmann, B., Bigand, E., & Pineau, M. (1998). Effects of global and local contexts on
harmonic expectancy. Music Perception, 16(1), 99-117.
Torgersen, S. (1979). The determination of twin zygosity by means of a mailed
questionnaire. Acta Geneticae Medicae et Gemellologiae, 28(3), 225-236.
Torii, M., Hackett, T. A., Rakic, P., Levitt, P., & Polley, D. B. (2013). EphA signaling
impacts development of topographic connectivity in auditory corticofugal
systems. Cerebral Cortex, 23(4), 775-785.
Trainor, L. J., & Trehub, S. E. (1992). A comparison of infants' and adults' sensitivity to
Western musical structure. Journal of Experimental Psychology: Human
Perception and Performance, 18, 394-402.
Trainor, L. J., Tsang, C. D., & Cheung, V. H. W. (2002). Preference for sensory
consonance in 2-and 4-month-old infants. Music Perception, 20(2), 187-194.
Trehub, S. E. (2001) Musical predispositions in infancy. Vol. 930. Annals of the New
York Academy of Sciences (pp. 1-16).
Trehub, S. E. (2006). Infants as musical connoisseurs. In G. E. McPherson (Ed.), The
Child as Musician: A Handbook of Musical Development (pp. 33-49). New
York: Oxford University Press.
Trehub, S. E., & Schellenberg, E. G. (1995). Music: Its relevance to infants. Annals of
Child Development, 11, 1-24.
Trehub, S. E., Thorpe, L. A., & Morrongiello, B. A. (1985). Infants' perception of
melodies: Changes in a single tone. Infant Behavior and Development, 8(2),
213-223.
Trehub, S. E., & Trainor, L. J. (1990) Chapter 5 Rules for Listening in Infancy. Vol. 69.
Advances in Psychology (pp. 87-119).
Trehub, S. E., & Trainor, L. J. (1993). Listening strategies in infancy: the roots of music
and language development. In S. McAdams & E. Bigand (Eds.), Thinking in
Sound: The Cognitive Psychology of Human Audition (pp. 278-327). London:
Oxford University Press.
Trehub, S. E., & Trainor, L. J. (1998). Singing to infants: Lullabies and play songs.
Advances in Infancy Research, 12, 43-77.
Trehub, S. E., Trainor, L. J., & Unyk, A. M. (1993). Music and speech processing in the
first year of life. Advances in child development and behavior, 24, 1-35.
Trollinger, V. L. (2003). Relationships between Pitch-Matching Accuracy, Speech
Fundamental Frequency, Speech Range, Age, and Gender in American English-
Speaking Preschool Children. Journal of Research in Music Education, 51(1),
78-94.
Trollinger, V. L. (2004). Preschool children's pitch-matching accuracy in relation to
participation in Cantonese-immersion preschools. Journal of Research in Music
Education, 52(3), 218-233.
Tsang, C. D., Friendly, R. H., & Trainor, L. J. (2011). Singing development as a
sensorimotor interaction problem. Psychomusicology: Music, Mind and Brain,
21(1-2), 31-44.
Tucker, A., Horvath, S. M., & Faulkner, M. E. (1971). Electrocardiography and lung
function in brass instrument players. Archives of Environmental Health, 23(5),
327-334.
Tufflash, M. (2002). Predicting individual differences in piano sight-reading skill:
Practice, performance, and instruction. (Unpublished master's thesis), Florida
State University.
Ukkola-Vuoti, L., Kanduri, C., Oikkonen, J., Buck, G., Blancher, C., Raijas, P., . . .
Järvelä, I. (2013). Genome-wide copy number variation analysis in extended

- 428 -
families and unrelated individuals characterized for musical aptitude and
creativity in music. PLoS ONE, 8(2).
Ukkola-Vuoti, L., Oikkonen, J., Onkamo, P., Karma, K., Raijas, P., & Järvelä, I. (2011).
Association of the arginine vasopressin receptor 1A (AVPR1A) haplotypes with
listening to music. Journal of Human Genetics, 56(4), 324-329.
Ukkola, L. T., Onkamo, P., Raijas, P., Karma, K., & Järvelä, I. (2009). Musical aptitude
is associated with AVPR1A-haplotypes. PLoS ONE, 4(5).
Ullén, F., Mosing, M. A., Holm, L., Eriksson, H., & Madison, G. (2014). Psychometric
properties and heritability of a new online test for musicality, the Swedish
Musical Discrimination Test. Personality and Individual Differences, 63, 87-93.
Van Zuijen, T. L., Simoens, V. L., Paavilainen, P., Naatanen, R., & Tervaniemi, M.
(2006). Implicit, intuitive, and explicit knowledge of abstract regularities in a
sound sequence: an event-related brain potential study. Journal of Cognitive
Neuroscience, 18(8), 1292-1303.
Van Zuijen, T. L., Sussman, E., Winkler, I., Näätänen, R., & Tervaniemi, M. (2005).
Auditory organization of sound sequences by a temporal or numerical regularity
- A mismatch negativity study comparing musicians and non-musicians.
Cognitive Brain Research, 23(2-3), 270-276.
Vantaggiato, C., Redaelli, F., Falcone, S., Perrotta, C., Tonelli, A., Bondioni, S., . . .
Bassi, M. T. (2009). A novel CLN8 mutation in late-infantile-onset neuronal
ceroid lipofuscinosis (LINCL) reveals aspects of CLN8 neurobiological
function. Human Mutation, 30(7), 1104-1116.
Vernes, S. C., Spiteri, E., Nicod, J., Groszer, M., Taylor, J. M., Davies, K. E., . . .
Fisher, S. E. (2007). High-throughput analysis of promoter occupancy reveals
direct neural targets of FOXP2, a gene mutated in speech and language
disorders. American Journal of Human Genetics, 81(6), 1232-1250.
Verweij, K. J. H., Mosing, M. A., Zietsch, B. P., & Medland, S. E. (2012). Estimating
Heritability from Twin Studies. In R. C. Elston, J. M. Satagopan, & S. Sun
(Eds.), Statistical Human Genetics: Methods and Protocols (pp. 151-170). New
York: Humana Press; Springer.
Vihman, M. M. (1996). Phonological development. Oxford: Blackwell.
Vinkhuyzen, A. A. E., Van Der Sluis, S., De Geus, E. J. C., Boomsma, D. I., &
Posthuma, D. (2010). Genetic influences on "environmental" factors. Genes,
Brain and Behavior, 9(3), 276-287.
Vinkhuyzen, A. A. E., Van Der Sluis, S., Posthuma, D., & Boomsma, D. I. (2009). The
heritability of aptitude and exceptional talent across different domains in
adolescents and young adults. Behavior Genetics, 39(4), 380-392.
Visscher, P. M., Gordon, S., & Neale, M. C. (2008). Power of the classical twin design
revisited: II detection of common environmental variance. Twin Research and
Human Genetics, 11(1), 48-54.
Vitouch, O. (1998). The rage to drink, or: Frontiers of expertise. Behavioral and Brain
Sciences, 21(3), 428-429.
Vurma, A., & Ross, J. (2006). Production and perception of musical intervals. Music
Perception, 23(4), 331-344.
Wada, K., Howard, J. T., McConnell, P., Whitney, O., Lints, T., Rivas, M. V., . . .
Jarvis, E. D. (2006). A molecular neuroethological approach for identifying and
characterizing a cascade of behaviorally regulated genes. Proceedings of the
National Academy of Sciences of the United States of America, 103(41), 15212-
15217.

- 429 -
Wagner, C. (1988). The pianist’s hand: Anthropometry and biomechanics. Ergonomics,
31(1), 97-131.
Wain, L. V., Armour, J. A., & Tobin, M. D. (2009). Genomic copy number variation,
human health, and disease. The Lancet, 374(9686), 340-350.
Wang, Y., Tong, X., & Ye, X. (2012). Ndfip1 negatively regulates RIG-I-dependent
immune signaling by enhancing E3 ligase smurf1-mediated MAVS degradation.
Journal of Immunology, 189(11), 5304-5313.
Warren, J. D., Scott, S. K., Price, C. J., & Griffiths, T. D. (2006). Human brain
mechanisms for the early analysis of voices. NeuroImage, 31(3), 1389-1397.
Wassum, S. (1979). Elementary school children's vocal range. Journal of Research in
Music Education, 27, 214-226.
Watanabe, D., Savion-Lemieux, T., & Penhune, V. B. (2007). The effect of early
musical training on adult motor performance: Evidence for a sensitive period in
motor learning. Experimental Brain Research, 176(2), 332-340.
Watts, C., Murphy, J., & Barnes-Burroughs, K. (2003). Pitch matching accuracy of
trained singers, untrained subjects with talented singing voices, and untrained
subjects with nontalented singing voices in conditions of varying feedback.
Journal of Voice, 17(2), 185-194.
Watts, C. R., & Hall, M. D. (2008). Timbral influences on vocal pitch-matching
accuracy. Logopedics Phoniatrics Vocology, 33(2), 74-82.
Weeks, D. E., Lehner, T., Squires-Wheeler, E., Kaufmann, C., & Ott, J. (1990).
Measuring the inflation of the LOD score due to its maximization over model
parameter values in human linkage analysis. Genetic Epidemiology, 7(4), 237-
243.
Welch, G. F. (1979). Poor Pitch Singing: A Review of the Literature. Psychology of
Music, 7(1), 50-58.
Welch, G. F. (1985). A Schema Theory of How Children Learn to Sing in Tune.
Psychology of Music, 13(1), 3-18.
Welch, G. F. (1994). The Assessment of Singing. Psychology of Music, 22(1), 3-19.
Welch, G. F. (2000). The developing voice. In L. Thurman & G. F. Welch (Eds.),
Bodymind and voice: Foundations of voice education (pp. 704-717). IA:
National Center for Voice and Speech.
Welch, G. F. (2005). Singing as communication. In D. Miell, R. MacDonald, & D. J.
Hargreaves (Eds.), Musical communication (pp. 239-259). New York: Oxford
University Press.
Welch, G. F. (2006). Singing and vocal development. In G. E. McPherson (Ed.), The
Child as Musician: A Handbook of Musical Development (pp. 311-329). Oxford:
Oxford University Press.
Welch, G. F., & Adams, P. (2003). How is music learning celebrated and developed?
Southwell, UK: British Educational Research Association (BERA).
Whidden, C. (2010). Understanding social-cultural influences affecting non-
participation in singing. UNESCO Observatory, 2(1).
Whitney, O., Pfenning, A. R., Howard, J. T., Blatti, C. A., Liu, F., Ward, J. M., . . .
Jarvis, E. D. (2014). Core and region-enriched networks of behaviorally
regulated genes and the singing genome. Science, 346(6215).
Wilson, S. J., Lusher, D., Martin, C. L., Rayner, G., & McLachlan, N. (2012).
Intersecting factors lead to absolute pitch acquisition that is maintained in a
“fixed do” environment. Music Perception, 29(3), 285-296.
- 430 -
Wilson, S. J., Lusher, D., Wan, C. Y., Dudgeon, P., & Reutens, D. C. (2009). The
neurocognitive components of pitch processing: Insights from absolute pitch.
Cerebral Cortex, 19(3), 724-732.
Winkler, I., Háden, G. P., Ladinig, O., Sziller, I., & Honing, H. (2009). Newborn infants
detect the beat in music. Proceedings of the National Academy of Sciences of the
United States of America, 106(7), 2468-2471.
Winner, E. (2000). The origins and ends of giftedness. American Psychologist, 55(1),
159-169.
Wise, K. J., & Sloboda, J. A. (2008). Establishing an empirical profile of self-defined
"tone deafness": perception, singing performance and self-assessment. Musicae
Scientiae, 12(1), 3-26.
Wong, P. C. M., Skoe, E., Russo, N. M., Dees, T., & Kraus, N. (2007). Musical
experience shapes human brainstem encoding of linguistic pitch patterns. Nature
Neuroscience, 10(4), 420-422.
Wong, S. T., Athos, J., Figueroa, X. A., Pineda, V. V., Schaefer, M. L., Chavkin, C.
C., . . . Storm, D. R. (1999). Calcium-stimulated adenylyl cyclase activity is
critical for hippocampus-dependent long-term memory and late phase LTP.
Neuron, 23(4), 787-798.
Xu, W., Bull, S. B., Mirea, L., & Greenwood, C. M. T. (2012). Model-free linkage
analysis of a binary trait. In R. C. Elston, J. M. Satagopan, & S. Sun (Eds.),
Statistical Human Genetics: Methods and Protocols (pp. 317-345). New York:
Humana Press; Springer.
Xu, Y. (2013). ProsodyPro - A tool for large-scale systematic prosody analysis. In
Proceedings of Tools and Resources for the Analysis of Speech Prosody (TRASP
2013) (pp. 7-10). Aix-en-Provence, France.
Yang, E. J., Lin, E. W., & Hensch, T. K. (2012). Critical period for acoustic preference
in mice. Proceedings of the National Academy of Sciences of the United States
of America, 109(SUPPL.2), 17213-17220.
Yao, Y. C., & Tai, J. J. (2000). Bias correction for segregation ratio estimation in
human genetics. Biometrics, 56(3), 795-800.
Yarbrough, C., Green, G., Benson, W., & Bowers, J. (1991). Inaccurate singers: An
exploratory study of variables affecting pitch-matching. Bulletin for the Council
for Research in Music Education, 107, 23-34.
Yee, W., Holleran, S., & Jones, M. R. (1994). Sensitivity to event timing in regular and
irregular sequences: Influences of musical skill. Perception & Psychophysics,
56(4), 461-471.
Young, S. (2002). Young Children's Spontaneous Vocalizations in Free-Play:
Observations of Two- to Three-Year-Olds in a Day-Care Setting. Bulletin of the
Council for Research in Music Education(152), 43-53.
Zarate, J. M. (2013). The neural control of singing. Frontiers in Human Neuroscience,
7(JUN).
Zarate, J. M., Delhommeau, K., Wood, S., & Zatorre, R. J. (2010). Vocal accuracy and
neural plasticity following micromelody-discrimination training. PLoS ONE,
5(6), 1-15.
Zarate, J. M., Ritson, C. R., & Poeppel, D. (2012). Pitch-interval discrimination and
musical expertise: is the semitone a perceptual boundary? The Journal of the
Acoustical Society of America, 132(2), 984-993.
Zarate, J. M., Ritson, C. R., & Poeppel, D. (2013). The Effect of Instrumental Timbre
on Interval Discrimination. PLoS ONE, 8(9).

- 431 -
Zarate, J. M., Wood, S., & Zatorre, R. J. (2010). Neural networks involved in voluntary
and involuntary vocal pitch regulation in experienced singers.
Neuropsychologia, 48(2), 607-618.
Zarate, J. M., & Zatorre, R. J. (2008). Experience-dependent neural substrates involved
in vocal pitch regulation during singing. NeuroImage, 40(4), 1871-1887.
Zatorre, R. (2005). Music, the food of neuroscience? Nature, 434(7031), 312-315.
Zatorre, R. J. (2003). Absolute pitch: A model for understanding the influence of genes
and development on neural and cognitive function. Nature Neuroscience, 6(7),
692-695.
Zatorre, R. J., Chen, J. L., & Penhune, V. B. (2007). When the brain plays music:
Auditory-motor interactions in music perception and production. Nature
Reviews Neuroscience, 8(7), 547-558.
Zatorre, R. J., Delhommeau, K., & Zarate, J. M. (2012). Modulation of auditory cortex
response to pitch variation following training with microtonal melodies.
Frontiers in Psychology, 3.
Zatorre, R. J., Evans, A. C., & Meyer, E. (1994). Neural mechanisms underlying
melodic perception and memory for pitch. Journal of Neuroscience, 14(4),
1908-1919.
Zatorre, R. J., Halpern, A. R., & Bouffard, M. (2010). Mental reversal of imagined
melodies: A role for the posterior parietal cortex. Journal of Cognitive
Neuroscience, 22(4), 775-789.
Zdzinski, S. F. (1996). Parental Involvement, Selected Student Attributes, and Learning
Outcomes in Instrumental Music. Journal of Research in Music Education,
44(1), 34-48.
Zentner, M. R., & Kagan, J. (1996). Perception of music by infants. Nature, 383, 29.
Zhong, S., Israel, S., Xue, H., Sham, P. C., Ebstein, R. P., & Chew, S. H. (2009). A
neurochemical approach to valuation sensitivity over gains and losses.
Proceedings of the Royal Society B: Biological Sciences, 276(1676), 4181-4188.
Minerva Access is the Institutional Repository of The University of Melbourne
Author/s:Tan, Yi Ting
Title:The genetic basis of singing ability: a twin study
Date:2016
Persistent Link:http://hdl.handle.net/11343/191324
Terms and Conditions:Terms and Conditions: Copyright in works deposited in Minerva Access is retained by thecopyright owner. The work may not be altered without permission from the copyright owner.Readers may only download, print and save electronic copies of whole works for their ownpersonal non-commercial use. Any use that exceeds these limits requires permission fromthe copyright owner. Attribution is essential when quoting or paraphrasing from these works.