the evolution of lung function in newborn screened preschool
TRANSCRIPT
1
The evolution of lung function in
newborn screened preschool
children with cystic fibrosis
A thesis submitted by
Julie Duncan
For the Degree of MD(Res)
From the Respiratory Medicine Research Group
UCL Great Ormond Street Institute of Child Health
December 2018

2
Declaration of Originality
I, Julie Duncan confirm that the work presented in this thesis is my own. Where
information has been derived from other sources, I confirm that this has been indicated
in the thesis.
Ethical and site research and development approval had been granted before my
appointment (Principal Investigator Dr Paul Aurora, with assistance from Ms Jane
Chudleigh). Data from 108 preschool children are presented in this study. All subjects
were recruited equally by myself and Ms Emma Raywood, with some assistance from
Ms Sarah Legg. Children were tested between June 2013 and June 2015. I undertook
measurements (lung function testing and clinical examination) on 124 test occasions,
and in 92 children whose results were included in the final dataset. Two people were
required for each test occasion and I was assisted by a paediatric respiratory
physiologist; most occasions by Ms Emma Raywood, and also Ms Sarah Legg, Ms
Stephanie Rees, Ms Jane Kirkby and Ms Joanne Miles. The remaining children were
tested by two of the above respiratory physiologists when I was not available, and
clinical examination performed by Dr Gwyneth Davies (five subjects), Dr Victor
Ambrose (four subjects), Dr Anjay Pillai (two subjects), Dr Paul Aurora, Dr Martin
Samuels and Ms Jo Miles (one subject each). All clinical data (from diagnosis to
preschool test age) was collected by the author with the assistance of clinicians or
nurse specialists at each tertiary centre. Lung function interpretation was performed by
myself, Ms Emma Raywood and Ms Sarah Legg. Spirometry and plethysmography
data was over-read by a senior physiologist (Ms Jane Kirkby). I performed all the
statistical analyses presented, with guidance from Professor Angie Wade and Ms
Sooky Lum.
All the preschool subjects reported in this thesis were part of a longitudinal study and
had undergone lung function testing as infants; attempted at three months, one year
and two years of age. At one year of age, infants also underwent chest computed
tomography and broncho-alveolar lavage. Chapters five and six present longitudinal
data and include infant measurements collected not by myself, but as part of an earlier
study (Principal Investigator Professor Janet Stocks). Chapter four reports a
comparison of data I collected to a historical cohort of preschool children. Again, this
data was collected in an earlier study (Principal Investigator Professor Janet Stocks),
and not by myself. All longitudinal and comparative data collected as part of previous
studies are reproduced with permission from the Principal Investigator.
3
Abstract
Most morbidity in cystic fibrosis (CF) is due to progressive pulmonary disease.
Recently, small molecule therapies targeting the basic defect of the cystic fibrosis
transmembrane conductance regulator protein have been developed, and newborn
screening (NBS) for CF allows intervention before irreversible lung damage occurs.
Unless the evolution of pulmonary function in young children is known, the optimal age
of starting new therapies or enrolling CF NBS children into interventional trials is
unclear.
The London Cystic Fibrosis Collaboration has studied CF NBS infants longitudinally
from diagnosis, as well as a contemporaneous group of matched healthy controls, and
reported lung function was normal in the NBS CF group at two years of age. This
thesis reports the preschool follow-up of the same infants, and describes the evolution
of lung function to six years of age. The primary hypothesis was that lung function
would remain within the normal range. Secondary aims were to compare preschool
pulmonary function to that measured in children diagnosed with CF a decade earlier,
and to describe which measures in NBS infants could predict preschool lung function.
67 preschool children with CF and 41 healthy controls underwent multiple breath
washout (MBW), specific airway resistance and spirometry measurements. Lung
Clearance Index (LCI), measured by MBW, was abnormal in CF NBS preschool
children, but was better than children diagnosed with CF a decade earlier. The most
significant predictor of abnormal preschool lung function was LCI at two years of age.
Contrary to the hypothesis, compared to contemporaneous controls, lung function
deteriorates at preschool follow-up in CF NBS children managed with standard UK
care. As two year LCI was a significant predictor of later decline, implying that the root
causes of decline were before this age, disease modifying therapies and interventional
trials should be targeted before two years of age.
4
Impact statement
Identifying lung disease early in young children with cystic fibrosis
Cystic fibrosis (CF) is one of the most common inherited diseases, affecting over 10,500
people in the UK. The genetic defect underlying this disease results in thick, sticky mucus
in many of the organs of the body. In the lungs, this abnormal mucus leads to repeated
chest infections and progressive lung damage, which is the main cause of death in patients
with CF.
The mainstay of therapy is antibiotics to treat infections, and assistance in clearing mucus
from the airways with physiotherapy and medication. In the past, research has
concentrated on improving infection management, such as identifying the most effective
antibiotic, or designing a drug to improve mucus clearance. However, individuals may not
become symptomatic from lung infections until early childhood, but we now know that
inflammation and lung damage starts immediately from birth secondary to the genetic
defect. This presents a challenge as disease is difficult to detect in young children as
diagnostic tests are limited. A key question I aim to answer is what disease markers can
we measure in infancy to predict which children deteriorate more rapidly? Can we identify
CF patients in whom disease appears at an early age and prevent any further progression?
A revelation in CF treatment over the past decade has been the development of new
‘modulator’ therapies that go back to the root cause of the defect in CF. They act to correct
or improve the function of the abnormal protein that occurs as a result of the faulty gene.
These novel therapies provide the potential opportunity to intervene earlier in young
children with CF and perhaps prevent the development of lung disease altogether. The
question then is when should we start these modulator therapies in young children?
This work aims to define which tests are most effective at detecting early lung disease, and
what are the future disease outcomes for a child with an abnormal test at a young age. It is
hoped that this research will inform clinicians about which tests are useful in children, and
which disease outcomes can be used in interventional trials. If lung disease is shown to
occur early, and has an impact on future health, this advocates for starting new therapies at
an early age and inclusion of young children in clinical trials. By detecting early disease
and its consequences, we aim to improve longer term health in children with CF.
5
Contents
Declaration of Originality ................................................................................................... 2
Abstract ............................................................................................................................. 3
Impact statement ............................................................................................................... 4
List of figures ..................................................................................................................... 9
List of tables .................................................................................................................... 10
List of abbreviations ........................................................................................................ 13
Acknowledgements ......................................................................................................... 15
Summary of publications and awards related to this thesis ........................................... 16
1 Introduction .............................................................................................................. 17
1.1 Early lung disease in children with cystic fibrosis ............................................ 17
1.1.1 Introduction ................................................................................................ 17
1.1.2 The importance of identifying early lung disease in young children with CF 18
1.1.3 Aim of the thesis ........................................................................................ 19
1.2 The pathophysiology of early lung disease in CF ............................................ 19
1.3 Detecting and monitoring lung disease in young children with CF.................. 21
1.3.1 Measures of pulmonary function............................................................... 22
1.3.2 Imaging techniques ................................................................................... 33
1.3.3 Measures of lung infection and inflammation ........................................... 35
1.4 Studies of early disease monitoring in young children with CF ....................... 36
1.4.1 Newborn screening ................................................................................... 36
1.4.2 Studies in children clinically diagnosed with CF ....................................... 38
1.4.3 Studies in children with CF diagnosed by newborn screening ................ 41
1.5 Hypotheses, aims and objectives .................................................................... 49
1.5.1 Choice of outcome measures ................................................................... 49
1.5.2 Primary hypotheses, aims and objectives ................................................ 50
1.5.3 Secondary hypotheses, aims and objectives ........................................... 51
1.5.4 Structure of thesis ..................................................................................... 53
2 Methods ................................................................................................................... 54
2.1 The LCFC longitudinal studies of children with CF .......................................... 54
2.2 Overview of study design ................................................................................. 55
2.3 Recruitment and measures in the LCFC NBS infant study ............................. 56
2.3.1 Recruitment of infants ............................................................................... 56
2.3.2 Inclusion and exclusion criteria for the LCFC NBS infant study .............. 57
2.3.3 Measures in infancy .................................................................................. 58
2.4 Methodology of the current NBS preschool follow-up study ........................... 59
2.4.1 Ethical approval ......................................................................................... 59
2.4.2 Recruitment of preschool children ............................................................ 59
2.4.3 Inclusion and exclusion criteria ................................................................. 60
6
2.5 Pre-test procedure ............................................................................................ 61
2.5.1 Preparation for lung function tests ............................................................ 61
2.5.2 Test day questionnaire .............................................................................. 62
2.5.3 Anthropometric measurements ................................................................. 62
2.5.4 Clinical examination .................................................................................. 63
2.6 Preschool lung function protocol ...................................................................... 63
2.6.1 Choice of outcome measures ................................................................... 63
2.6.2 Multiple breath washout ............................................................................ 64
2.6.3 Plethysmographic specific airway resistance ........................................... 73
2.6.4 Spirometry ................................................................................................. 78
2.6.5 Summary of test procedure....................................................................... 82
2.7 Post-test procedure .......................................................................................... 84
2.7.1 Microbiology .............................................................................................. 84
2.7.2 Clinician questionnaire .............................................................................. 84
2.7.3 Data integrity and storage ......................................................................... 84
2.8 Summary .......................................................................................................... 85
3 Lung function in newborn screened preschool children with CF ........................... 86
3.1 Introduction ....................................................................................................... 86
3.2 Hypothesis, aims and objectives ...................................................................... 87
3.2.1 Hypothesis ................................................................................................. 87
3.2.2 Aim ............................................................................................................ 87
3.2.3 Objectives .................................................................................................. 87
3.3 Methods ............................................................................................................ 87
3.3.1 Subjects and measurements .................................................................... 87
3.3.2 Statistical analysis ..................................................................................... 88
3.3.3 Power of study .......................................................................................... 89
3.4 Results .............................................................................................................. 89
3.4.1 Recruitment accrual .................................................................................. 89
3.4.2 Background characteristics of children with CF and healthy controls ..... 92
3.4.3 Clinical characteristics of subjects with CF .............................................. 93
3.4.4 Feasibility of study protocol....................................................................... 95
3.4.5 Comparison of preschool lung function in children with CF and healthy controls 97
3.4.6 The effect of age on lung function parameters ....................................... 100
3.4.7 Relationship between lung function measures ....................................... 102
3.5 Discussion ...................................................................................................... 104
3.5.1 Summary of principal findings ................................................................. 104
3.5.2 Review of hypothesis .............................................................................. 104
3.5.3 Comparison of this study to other reports .............................................. 105
3.5.4 Strengths and limitations of the study ..................................................... 106
3.5.5 Meaning of the study, conclusions and future research ......................... 108
7
4 An era comparison of lung function in preschool children with CF ...................... 109
4.1 Introduction ..................................................................................................... 109
4.2 Hypothesis, aims and objectives .................................................................... 110
4.2.1 Hypothesis ............................................................................................... 110
4.2.2 Aim .......................................................................................................... 110
4.2.3 Objectives ................................................................................................ 110
4.3 Methods .......................................................................................................... 110
4.3.1 Subjects ................................................................................................... 110
4.3.2 Study design............................................................................................ 111
4.3.3 Statistical analysis ................................................................................... 112
4.3.4 Power of the study .................................................................................. 112
4.4 Results ............................................................................................................ 113
4.4.1 Subject background characteristics ........................................................ 113
4.4.2 Comparison of lung function primary outcome measures between cohorts 1 and 2 115
4.4.3 Adjustment for control samples between cohorts .................................. 119
4.4.4 Comparison of LCI analysis methods ..................................................... 122
4.5 Discussion ...................................................................................................... 123
4.5.1 Review of hypothesis and principal findings ........................................... 123
4.5.2 Comparison of this study to other reports .............................................. 123
4.5.3 Strengths and limitations of the study ..................................................... 124
4.5.4 Meaning of the study, conclusions and future research ......................... 126
5 Predictors of preschool lung function in newborn screened children with CF ..... 128
5.1 Introduction ..................................................................................................... 128
5.2 Hypothesis, aims and objectives .................................................................... 129
5.2.1 Hypotheses ............................................................................................. 129
5.2.2 Aim .......................................................................................................... 129
5.2.3 Objectives ................................................................................................ 129
5.3 Methods .......................................................................................................... 130
5.3.1 Subjects and measurements .................................................................. 130
5.3.2 Statistical analysis ................................................................................... 130
5.4 Results ............................................................................................................ 133
5.4.1 Subject characteristics ............................................................................ 133
5.4.2 Clinical characteristics of subjects with CF ............................................ 136
5.4.3 Lung function from infancy to preschool age .......................................... 142
5.4.4 Predictors of preschool lung function in NBS children with CF .............. 150
5.5 Discussion ...................................................................................................... 162
5.5.1 Principal findings ..................................................................................... 162
5.5.2 Review of hypotheses ............................................................................. 163
5.5.3 Comparison of this study to other reports .............................................. 164
5.5.4 Limitations of the study ........................................................................... 165
8
5.5.5 Meaning of the study, conclusions and future research ......................... 166
6 Measures of infant lung structure and inflammation as predictors for preschool pulmonary function ........................................................................................................ 167
6.1 Introduction ..................................................................................................... 167
6.2 Hypotheses, aims and objectives .................................................................. 168
6.3 Methods .......................................................................................................... 169
6.3.1 Statistical analysis ................................................................................... 170
6.4 Results ............................................................................................................ 171
6.4.1 Subject characteristics ............................................................................ 171
6.4.2 Lung function, CT score and BAL results ............................................... 173
6.4.3 Associations between CT score, BAL inflammatory markers and preschool lung function ......................................................................................... 175
6.4.4 Evaluation of binary classifiers to predict preschool lung clearance index 178
6.5 Discussion ...................................................................................................... 179
6.5.1 Review of hypotheses ............................................................................. 179
6.5.2 Comparison of this study to other reports .............................................. 179
6.5.3 Strengths and limitations of the study ..................................................... 181
6.5.4 Meaning of the study, unanswered questions and future research ....... 182
7 Discussion ............................................................................................................. 183
7.1 Summary of principal findings ........................................................................ 183
7.2 Strengths and limitations of the study ............................................................ 185
7.2.1 Strengths ................................................................................................. 185
7.2.2 Limitations ............................................................................................... 186
7.3 Meaning of the study ...................................................................................... 192
7.3.1 Abnormal lung function in NBS preschool children ................................ 192
7.3.2 Interventional trials in preschool children with CF .................................. 193
7.3.3 Predicting preschool lung function and optimal timing of new therapies 195
7.4 Unanswered questions and future research .................................................. 196
7.5 Conclusion ...................................................................................................... 197
References .................................................................................................................... 198
Appendices .................................................................................................................... 217
9
List of figures
Figure 1.1: Infant raised volume rapid thoraco-abdominal compression and whole body
plethysmography techniques .......................................................................................... 23
Figure 1.2: Measures at each time point of the London cystic fibrosis collaboration
study of cohort 1 children with CF .................................................................................. 39
Figure 1.3: Lung function in newborn screened infants with CF from 3 months to 1 year
from the London cystic fibrosis collaboration study ........................................................ 43
Figure 2.1: Study protocol at each time point of the London cystic fibrosis collaboration
newborn screened infants longitudinal study ................................................................. 56
Figure 2.2: Pre-test procedure ........................................................................................ 62
Figure 2.3: Equipment for multiple breath washout measurement ................................ 64
Figure 2.4: Facemask, pneumotachometer and connectors for multiple breath washout
......................................................................................................................................... 66
Figure 2.5: Gas bias flow system for multiple breath washout ...................................... 67
Figure 2.6: Preschool children during wash-in and wash-out phases of multiple breath
washout ........................................................................................................................... 70
Figure 2.7: Multiple breath washout trace showing a high quality curve ....................... 71
Figure 2.8: Poor quality multiple breath washout trace .................................................. 72
Figure 2.9: Pressure and time constant calibration of the plethysmograph................... 74
Figure 2.10: Volume calibration of the plethysmograph pneumotachometer ................ 75
Figure 2.11: Preschool children performing plethysmography ...................................... 76
Figure 2.12: Technically acceptable and unacceptable specific airway resistance
recordings ........................................................................................................................ 78
Figure 2.13: A preschool child performing spirometry and examples of incentive games
......................................................................................................................................... 79
Figure 2.14: Examples of acceptable and unacceptable spirometry traces .................. 81
Figure 2.15: Summary of test protocol ........................................................................... 83
Figure 3.1: Recruitment and accrual in cohort 2 children with CF and healthy controls at
preschool age .................................................................................................................. 91
Figure 3.2: Lung clearance index, specific airway resistance and forced expired volume
z-scores in preschool children with CF and controls ...................................................... 99
Figure 3.3: The relationship between preschool lung function primary outcome
measures and age ........................................................................................................ 101
Figure 3.4: The relationship between lung function measures in children with CF and
healthy controls ............................................................................................................. 103
Figure 4.1: Lung function primary outcome measures in children with CF and healthy
controls in both cohorts ................................................................................................. 117
10
Figure 5.1: Trends in somatic growth at each test occasion for subjects with CF and
healthy controls ............................................................................................................. 135
Figure 5.2: Number of intravenous antibiotic courses by the preschool test occasion 138
Figure 5.3: Survival curves for isolation of each bacterial organism............................ 140
Figure 5.4: Lung function z-scores at each test occasion in children with CF and
healthy controls ............................................................................................................. 145
Figure 5.5: Lung clearance index and forced expired volume z-scores plotted against
age in children with CF and healthy controls ................................................................ 147
Figure 5.6: Individual patient trajectories for lung clearance index and forced expired
volume z-scores ............................................................................................................ 148
List of tables
Table 1.1: Quality control for forced expiratory manoeuvres in preschool children ...... 25
Table 3.1: Comparison of background characteristics in children with CF and healthy
controls ............................................................................................................................ 92
Table 3.2: Clinical characteristics and bacterial pathogens in children with CF ............ 94
Table 3.3: Details of treatment in children with CF ........................................................ 95
Table 3.4: Feasibility for each lung function test and the full study protocol for all
children and by diagnosis on first test occasion ............................................................. 96
Table 3.5: Feasibility of each lung function test and the full study protocol by age at first
test (all children) .............................................................................................................. 97
Table 3.6: Comparison of lung function results between children with CF and controls
......................................................................................................................................... 98
Table 4.1: Comparison of background characteristics between cohorts 1 and 2 limited
to children with CF ........................................................................................................ 114
Table 4.2: A comparison of anthropometric and lung function results in cohorts 1 and 2
....................................................................................................................................... 116
Table 4.3: A comparison of the proportions of children with an abnormal lung function
result in cohorts 1 and 2 ................................................................................................ 118
Table 4.4: Upper and lower limits of normal for lung function primary outcome
measures calculated from the study control population ............................................... 119
Table 4.5: Children identified as abnormal using reference equation z-scores and the
study control population to define normality ................................................................. 120
Table 4.6: Multiple linear regression model to account for differences between cohort 1
and 2 control populations .............................................................................................. 121
11
Table 4.7: Multiple breath washout software comparison in both cohorts ................... 123
Table 5.1: Independent variables used for regression analysis ................................... 131
Table 5.2: Background characteristics of subjects at each lung function test from
infancy to preschool age ............................................................................................... 134
Table 5.3: Summary of treatment histories in children with CF ................................... 137
Table 5.4: Summary of microbiological isolates in children with CF ............................ 139
Table 5.5: Age at first isolate of bacterial organisms in children with CF .................... 141
Table 5.6: Number of subjects with bacterial isolates in early infancy, late infancy and
after infancy ................................................................................................................... 141
Table 5.7: Proportion of children with unsuccessful results at each test occasion for
lung function primary outcomes .................................................................................... 142
Table 5.8: Lung function in subjects with CF and healthy controls at infant and
preschool test occasions ............................................................................................... 144
Table 5.9: Mean z-score change between test occasions for each lung function primary
outcome ......................................................................................................................... 149
Table 5.10: Proportion of children with abnormal results at each test occasion for lung
function primary outcomes in subjects with CF ............................................................ 150
Table 5.11: Determinants of preschool lung clearance index z-score by univariable
regression analysis ....................................................................................................... 153
Table 5.12: Final multiple regression models for preschool lung clearance index z-
score .............................................................................................................................. 155
Table 5.13: Determinants of preschool specific airway resistance z-score by univariable
regression analysis ....................................................................................................... 157
Table 5.14: Determinants of preschool forced expired volume by univariable regression
analysis ......................................................................................................................... 160
Table 5.15: Positive and negative predictive values of infant lung function measures
and Pseudomonas status for preschool lung clearance index .................................... 162
Table 6.1: Comparison of preschool growth and lung function in those with and without
computed tomography and broncho-alveolar lavage ................................................... 172
Table 6.2: Clinical characteristics of children with CF assessed at preschool age with
one year broncho-alveolar lavage and computed tomography .................................... 173
Table 6.3: One year and preschool lung function in CF subjects with computed
tomography and broncho-alveolar lavage data ............................................................ 174
Table 6.4: One year computed tomography scores and broncho-alveolar lavage
inflammatory marker results.......................................................................................... 175
Table 6.5: Univariable regression analysis of computed tomography score and
inflammatory markers with preschool lung function primary outcomes ....................... 177

12
Table 6.6: Positive and negative predictive values of CT score and neutrophil elastase
for preschool lung clearance index ............................................................................... 178

13
List of abbreviations
ABPA: Allergic bronchopulmonary aspergillosis
ATS: American Thoracic Society
B: Unstandardised coefficient
BAL: Broncho-alveolar lavage
BMI: Body mass index
BTPS: Body temperature, pressure and water vapour saturated conditions
CEV: Cumulative expired volume
CF: Cystic fibrosis
CFTR: Cystic fibrosis transmembrane conductance regulator
CO2: Carbon dioxide
CT: Computed tomography
DVD: Digital versatile disc
ELISA: Enzyme-linked immunosorbent assay
ERS: European Respiratory Society
FEV0.4: Forced expired volume in 0.4 second (mL)
FEV0.5: Forced expired volume in 0.5 seconds (mL)
FEV0.75: Forced expired volume in 0.75 seconds (mL)
FEV1: Forced expired volume in one second (mL)
FEF25-75: Forced Expiratory Flow between 25% - 75% of expired FVC (mL·s-1)
FEFV: Forced Expiratory Flows and Volumes
FRC: Functional Residual Capacity (mL)
FRCpleth: Functional Residual Capacity (mL) obtained using body plethysmography
FVC: Forced Vital Capacity (mL)
GA: General Anaesthesia
GORD: Gastro-oesophageal reflux disease
He: Helium
HC: Healthy control
HI: Haemophilus influenzae
HRCT: High Resolution CT

14
IL: Interleukin
IRT: Immunoreactive trypsinogen
LCFC: London Cystic Fibrosis Collaboration
LCI: Lung Clearance Index
Log: Logarithmic scale
M: Month
MBW: Multiple Breath Inert Gas Washout
MCP: Monocyte chemoattractant protein
NBS: Newborn Screening
NE: Neutrophil elastase
PA: Pseudomonas aeruginosa
PS: Preschool
Raw: Airway resistance
rhDNase: Recombinant DNase
RVRTC: Raised Volume Rapid Thoraco-abdominal Compression
SA: Staphylococcus aureus
SM: Stenotrophomonas maltophilia
sRaw: Specific airway resistance
sRtot: Specific total airway resistance
TO: Turnover
TNFα: Tumour necrosis factor alpha
URSO: Ursodeoxycholic acid
Y: Year
Z-s Z-score (standard deviation score)
15
Acknowledgements
Firstly I would like to thank my supervisors, Dr Paul Aurora and Professor Andy Bush
for their support throughout this research degree. They have given me such valuable
feedback, often sending back comments on thesis chapters in record time. I count
myself extremely lucky to have worked with two such prestigious researchers.
It was a true privilege to work at the UCL and Great Ormond Street Hospital Institute of
Child Health. Thanks goes to all of the members of the research team and lung
function laboratory, always available to give advice and share their experience. A
particular mention to Emma Raywood who assisted me throughout the whole project,
and whose IT skills were invaluable. I am glad to have gained such a good friend and
wish her all the best in her PhD studies. Thanks also to Janet Stocks and Sooky Lum,
who helped greatly with data summary and advised on analysis, even in retirement,
and Professor Per Gustafsson who provided a wonderful environment for Emma and I
to learn MBW analysis in his Swedish summer house!
I am also lucky to have such a great support network in London, and I must thank all
‘my girls’ for being there in times of struggle. Work colleagues have also been there for
advice, friendship and of course last minute proof reading.
This work would not be possible without the collaboration of all the centres of the
LCFC, whose members attended numerous meetings to advise on the project, and I
thank them for their ongoing input to this longitudinal study. I also thank Action Medical
Research and the Cystic Fibrosis Trust for funding this project.
I was amazed by the dedication and enthusiasm of all the families that participated in
this project; meeting you all was such a privilege, and I hope that this work will
contribute in some way towards improving CF care.
Lastly I would like to thank my family, particularly my parents, for their never-ending
love and support. I can’t quite believe that my niece and nephew were not even born
when I started my studies, it has been such a joy to watch them grow.
Unfortunately, my grandfather passed away towards the end of this work, always ready
with a joke or unexpected compliment to brighten my day. I miss him greatly and
therefore dedicate this work to him.
16
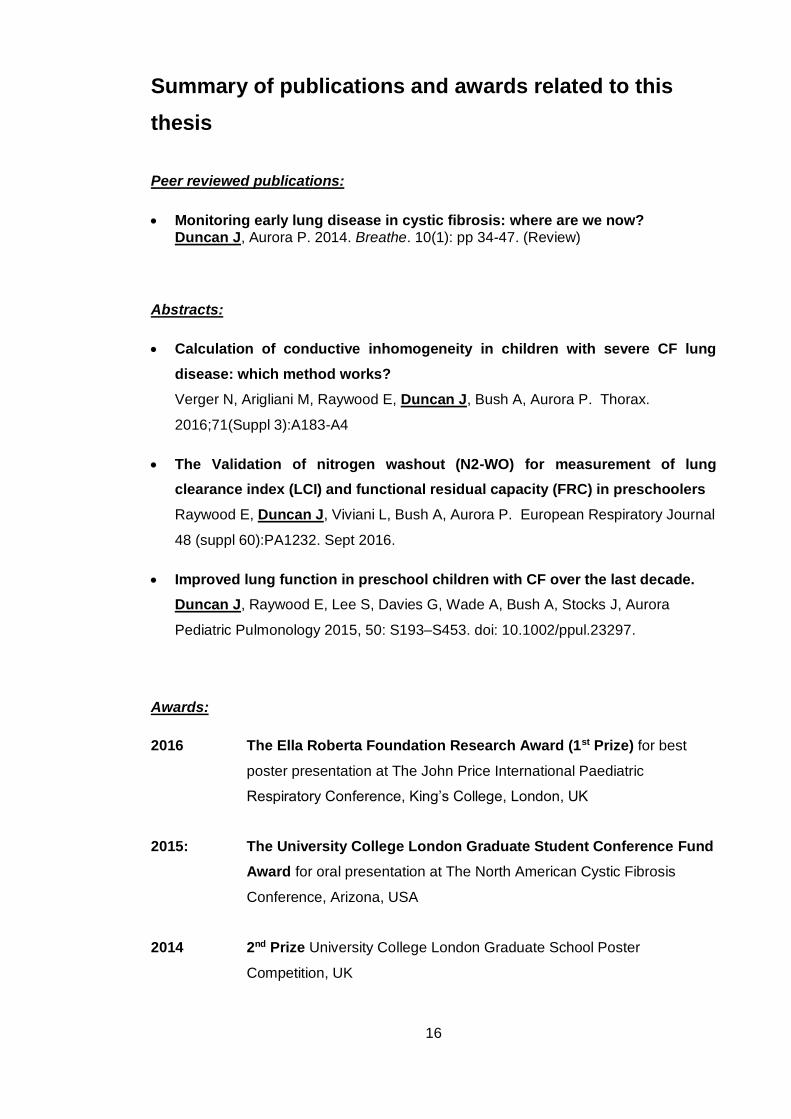
Summary of publications and awards related to this
thesis
Peer reviewed publications:
Monitoring early lung disease in cystic fibrosis: where are we now? Duncan J, Aurora P. 2014. Breathe. 10(1): pp 34-47. (Review)
Abstracts:
Calculation of conductive inhomogeneity in children with severe CF lung
disease: which method works?
Verger N, Arigliani M, Raywood E, Duncan J, Bush A, Aurora P. Thorax.
2016;71(Suppl 3):A183-A4
The Validation of nitrogen washout (N2-WO) for measurement of lung
clearance index (LCI) and functional residual capacity (FRC) in preschoolers
Raywood E, Duncan J, Viviani L, Bush A, Aurora P. European Respiratory Journal
48 (suppl 60):PA1232. Sept 2016.
Improved lung function in preschool children with CF over the last decade.
Duncan J, Raywood E, Lee S, Davies G, Wade A, Bush A, Stocks J, Aurora
Pediatric Pulmonology 2015, 50: S193–S453. doi: 10.1002/ppul.23297.
Awards:
2016 The Ella Roberta Foundation Research Award (1st Prize) for best
poster presentation at The John Price International Paediatric
Respiratory Conference, King’s College, London, UK
2015: The University College London Graduate Student Conference Fund
Award for oral presentation at The North American Cystic Fibrosis
Conference, Arizona, USA
2014 2nd Prize University College London Graduate School Poster
Competition, UK
17
1 Introduction
1.1 Early lung disease in children with cystic fibrosis
1.1.1 Introduction
Cystic fibrosis (CF) affects multiple organ systems, but the major cause of morbidity
and mortality is lung disease. The lungs are essentially normal at birth1, but from early
life, a cascade of infection and inflammation leads to progressive structural damage,
loss of lung function and ultimately respiratory failure. Animal and human studies
indicate that these pathological processes begin shortly after birth2, 3 and it is likely that
early insults determine the progression and severity of subsequent disease. The exact
mechanisms of how infection and inflammation affect the developing lung are still being
described. Furthermore, how early deficit in lung function and structure predicts later
outcome is not fully understood.
CF used to be a disease of early childhood, and in the 1980s life-expectancy was less
than 20 years of age. Children born today with CF are expected to live to at least their
fifth decade4. There have been many advances in CF care over this time period, one
of the most important being the implementation of newborn screening (NBS). This was
adopted nationally in the UK in 20085 and most children with CF are now identified
shortly after birth, before any clinical evidence of lung disease is apparent, and
treatment started within the first few weeks of life. The opportunity to intervene in the
early stages of disease therefore arises, but although in previous studies nutritional
outcomes are clearly improved in NBS infants compared to those clinically diagnosed
with CF, the evidence of benefit on lung health is less clear when the two groups are
compared6.
Our ability to detect and monitor early disease in children with CF has also improved
over the last twenty years. Lung Clearance Index (LCI) measured by the multiple
breath washout (MBW) technique is highly feasible and has been shown to be a
sensitive marker of abnormality in children under six years of age7. Low radiation dose
computed tomography protocols have been developed and these techniques could
potentially serve as regular surveillance measures. As earlier studies were based on
children with a clinical diagnosis of CF, and considering the earlier identification of NBS
infants and associated differences in care between these two groups, we now need to
18
describe how lung disease evolves in NBS children to inform potential interventions in
clinical care, develop appropriate disease surveillance techniques and to power trials of
new treatments.
1.1.2 The importance of identifying early lung disease in young children
with CF
The ultimate goal of NBS is that earlier diagnosis and introduction of treatment in
specialist CF centres will lead to improved outcomes. However most respiratory
treatments in NBS children under six years of age are based on agreed guidelines of
best practice and expert opinion8. There are few completed randomised controlled
trials of commonly used treatments which are recommended from diagnosis in the U.K.
A ground-breaking development in recent years has been the development of small
molecule therapies that target the basic defect of the cystic fibrosis transmembrane
conductance regulator (CFTR) protein, instead of tackling the consequences of its
dysfunction. VX-770 (ivacaftor), a CFTR potentiator, corrects chloride transport in
class III mutations, the commonest of which is p.Gly551Asp, with sweat chloride going
from very abnormal to intermediate levels, improved lung function and less frequent
pulmonary exacerbations9. Subsequently there has been huge interest in developing
similar molecules for more common mutations in CF. The combination CFTR corrector
and potentiator lumacaftor/ivacaftor, although not as strikingly effective as ivacaftor in
class III mutations, showed a reduction in pulmonary exacerbation in patients with the
more common p.Phe508del homozygous mutation10. Preliminary data on triple therapy
show similar efficacy to ivacaftor, even in patients heterozygous for p.Phe508del11, 12.
What follows therefore is the opportunity to identify CF shortly after birth by NBS, start
these potentially curative treatments, and prevent irreversible lung damage from an
early age.
We must, however, proceed with caution. If lung function remains relatively normal in
infancy, these treatments could be delayed, avoiding potential adverse effects on the
developing lung, risks of long-term toxicity and increased treatment burden to patients.
If we can pinpoint when lung disease takes hold and in which children, the appropriate
time to deploy new treatments can be better determined and targeted to susceptible
individuals. Previous work from the London Cystic Fibrosis Collaboration (LCFC) has
suggested that structure and function are so nearly normal in the first two years of life
that these novel treatments could be delayed. Key to achieving these goals is first to

19
understand the natural evolution of lung disease in children with CF up to six years of
age in order to adequately power studies of existing and new treatments.
1.1.3 Aim of the thesis
The overall aim of the thesis is –
To describe the evolution of lung function from diagnosis to six years of age in a
NBS cohort of children with CF managed with standard UK care
To develop the specific hypotheses, aims and objectives stated at the end of this
chapter, it is first important to consider evidence for the following, addressed in the
remainder of the introductory chapter:
How does early pulmonary disease affect lung function in young children with CF
diagnosed by NBS?
What techniques are available to detect and monitor lung disease in children under
six years of age?
What have studies in clinically diagnosed and NBS children with CF shown to date?
1.2 The pathophysiology of early lung disease in CF
CF is a multi-system disease affecting around 1 in 2500-3500 live births with a carrier
frequency of 1 in 25 among Northern Europeans13. It is an autosomal recessive
disorder caused by mutations in a single gene (CFTR) on the long arm of chromosome
7, resulting in a defect in CFTR protein. More than 1900 mutations in the CFTR gene
have been described, and at least 1500 are disease-causing14. Amongst other actions,
this multifunctional protein regulates ion transport across epithelial cells lining the
airways, hepatobiliary system, sweat glands and reproductive tract. As well as
progressive lung damage, manifestations of disease include pancreatic insufficiency,
liver disease and male infertility.
The specific mechanism by which defects in CFTR lead to progressive lung damage
are still debated, and a number of hypotheses have been proposed. CFTR protein
functions as an ATP-gated anion channel found in the apical membranes of epithelial
20
cells. CFTR transports chloride, bicarbonate and thiocyanate ions, but also has an
important role in the regulation of other ion channels, such as the epithelial sodium
channel (ENaC)15. In normal airways, chloride secretion by CFTR and sodium
absorption by ENaC maintain airway surface liquid (ASL) at the depth required for cilia
to beat efficiently, facilitating effective mucociliary clearance. The early ‘high salt’
hypotheses was that defects in CFTR resulted in a high concentration of sodium and
chloride in ASL and subsequently inhibition of anti-microbial proteins, increasing the
risk of infection16. However a later study showed that CF ASL was iso- or hypotonic,
and also appeared to be depleted in CF epithelial cell cultures, which led to the ‘low
volume’ hypothesis17. The theory was that defective CFTR chloride secretion and
sodium absorption by ENaC was thought to lead to a reduced total mass of these two
ions in ASL, a reduced osmotic gradient for water and a dehydrated, reduced volume
ASL causing defective mucociliary clearance, and predisposing to airway infection.
Viral infection also plays an important role in ASL homeostasis. Despite a rebalance of
ion transport to maintain ASL volume under phasic simulation conditions, after a viral
insult this motion-dependent ATP regulation of ASL height was disrupted in vitro in CF
epithelial cells18.
Animal models give further insight into pathophysiological mechanisms of CFTR
dysfunction. CF pigs lacking CFTR display typical features of human disease. They
are born with structural airway abnormalities including underdeveloped nasal sinuses,
narrow proximal airways and hypoplastic submucosal glands19 and show airway
obstruction and air trapping as a likely consequence, even before inflammation can be
detected20. Further studies in this animal model have shown impaired CFTR-related
bicarbonate excretion, increasing the acidity of ASL and inhibiting anti-microbial
defence peptides21. Mucociliary transport is also affected secondary to poor
detachment of mucus from submucosal gland ducts22.
Early human studies1 and more recent animal studies show that there is little evidence
of inflammation in CF lungs at birth2. It is clear however that infection and inflammation
take hold even in the first few months of life3. Young children with CF commonly
develop infection with bacterial pathogens, initially most frequently Staphylococcus
aureus and Haemophilus influenzae. Pseudomonas aeruginosa becomes more
dominant with age, strongly linked to lung function decline and a poorer prognosis23.
Lung disease initially starts in the small airways with mucus plugging and obstruction24.
Repeated bacterial infection drives predominantly neutrophilic inflammation. There is
an exaggerated inflammatory response and necrotic neutrophils release DNA which
21
further increases viscosity of secretions. Necrotic neutrophils also release granule
products, which are pro-inflammatory and tissue damaging. This eventually leads to
bronchiectasis, irreversible lung damage and end-stage lung disease.
Given that in CF the cascade of infection and inflammation starts in early life and
affects the developing lung, robust outcome measures to detect and define when lung
disease occurs are needed so we can then target interventions and test treatment
response. However, measurements in young children pose particular challenges, and
the various options to describe and quantify lung disease in this population is
addressed in the next section.
1.3 Detecting and monitoring lung disease in young children with
CF
Research in adults and older children with CF describing the progression of lung
disease and effectiveness of treatments report robust outcome and monitoring
measures. Serial measurements of the forced expired volume in one second (FEV1)
can be used to define pulmonary exacerbations, response to treatment and be an
outcome measure in clinical trials. Its rate of decline is understood by clinicians as a
monitoring tool and to predict prognosis in their patients. Lung disease in older
patients is also usually more advanced, and structural changes on computed
tomography (CT) can be quantified by robust scoring systems25.
Children below the age of six years present a particular challenge when conventional
monitoring methods are considered. Infants are not able to perform active measures of
lung function. Many centres do not undertake spirometry in children younger than six
years of age, and in the laboratories that do, results are often normal in young children
with CF. The effects of regular monitoring with tests that exposure the developing lung
to ionising radiation, such as CT, mean that they must be implemented with care.
A number of alternative techniques to describe lung disease in young children have
therefore been developed. The following section will summarise the available
monitoring tools and adaptations required to measure lung physiology, structure,
infection and inflammation in younger children, and their role as outcome measures in
clinical trials. Their ability to detect disease and use as surveillance and monitoring
22
tools in clinically diagnosed and NBS cohorts of children will also be discussed in detail
in section 1.4.
1.3.1 Measures of pulmonary function
1.3.1.1 Infant lung function techniques
As infants less than two years are unable perform the forceful manoeuvres required in
many lung function tests such as spirometry, a number of techniques have been
developed that do not require active participation. Two giving the most useful and
reproducible information in early CF lung disease are the raised volume rapid thoraco-
abdominal compression (RVRTC) technique and whole-body plethysmography26. Both
techniques are normally performed under sedation, or when the infant is asleep after
feeding.
In the RVRTC technique27, the lungs are inflated using a bag and mask towards total
lung capacity with three to five breaths to produce an inspiratory pause. A vest
previously wrapped around the infant’s chest is quickly inflated and forces expiration to
residual volume, reaching flow limitation and enabling measurement of forced
expiratory flows and volumes28. 30cm H20 inflation pressure is used when the infant is
relaxed, and this allows flows from a reproducible lung volume to be assessed. The
result is comparable with the expiratory flow volume curve in older children, but the
forced expired volume in half a second (FEV0.5) is normally reported, as most infants
will have reached full expiration in one second due to the more rapid emptying of their
lungs.
Lung volumes can be measured in an infant breathing against a closed shutter in a
plethysmograph29. This device measures unknown lung volumes based on the
principle of Boyle’s law. This states that the product of pressure and volume is
constant for a given mass of confined gas at a constant temperature. The infant
breathes in the plethysmograph via a mask attached to a pneumotachometer which
records air flow and volume. A shutter is then closed for less than ten seconds,
retaining a fixed amount of gas in the lungs. As the infant breathes against the shutter,
this gas expands and contracts in the closed system. If the changes in pressure and
volume in the plethysmograph and the pressure at the mouth at the start of the
23
manoeuvre (assumed equal to atmospheric pressure, but this may not be correct if
there is airflow obstruction) are known, the unknown volume of the lungs can be
calculated. Plethysmographic functional residual capacity (FRCpleth), the lung volume
at the end of a tidal expiration can therefore be measured.
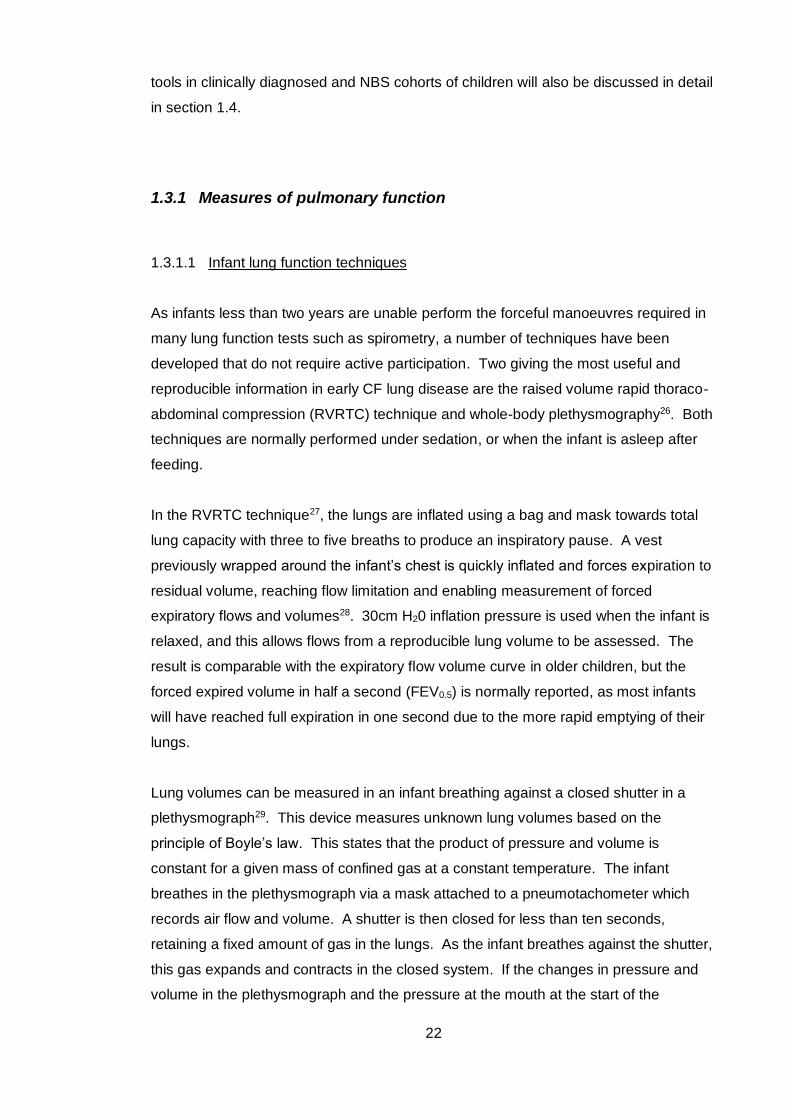
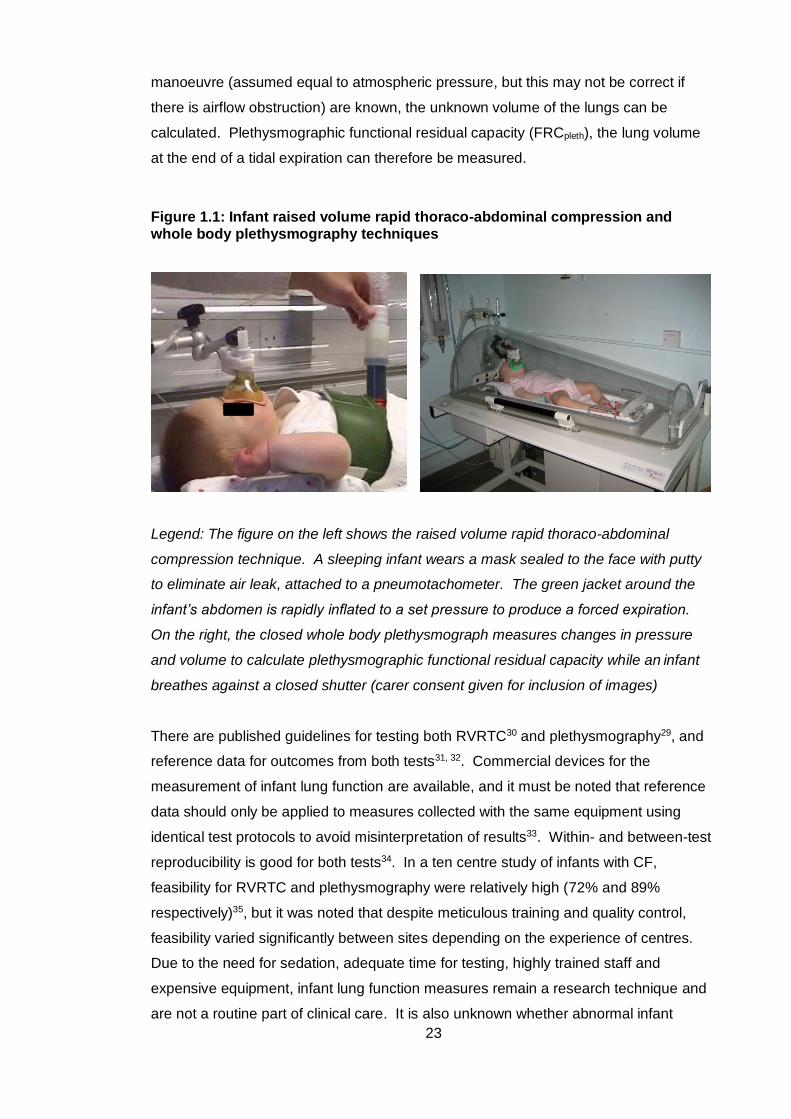
Figure 1.1: Infant raised volume rapid thoraco-abdominal compression and whole body plethysmography techniques
Legend: The figure on the left shows the raised volume rapid thoraco-abdominal
compression technique. A sleeping infant wears a mask sealed to the face with putty
to eliminate air leak, attached to a pneumotachometer. The green jacket around the
infant’s abdomen is rapidly inflated to a set pressure to produce a forced expiration.
On the right, the closed whole body plethysmograph measures changes in pressure
and volume to calculate plethysmographic functional residual capacity while an infant
breathes against a closed shutter (carer consent given for inclusion of images)
There are published guidelines for testing both RVRTC30 and plethysmography29, and
reference data for outcomes from both tests31, 32. Commercial devices for the
measurement of infant lung function are available, and it must be noted that reference
data should only be applied to measures collected with the same equipment using
identical test protocols to avoid misinterpretation of results33. Within- and between-test
reproducibility is good for both tests34. In a ten centre study of infants with CF,
feasibility for RVRTC and plethysmography were relatively high (72% and 89%
respectively)35, but it was noted that despite meticulous training and quality control,
feasibility varied significantly between sites depending on the experience of centres.
Due to the need for sedation, adequate time for testing, highly trained staff and
expensive equipment, infant lung function measures remain a research technique and
are not a routine part of clinical care. It is also unknown whether abnormal infant
24
pulmonary function predicts later clinical outcomes in CF, and how to act on an
abnormal result therefore is also unclear.
RVRTC and plethysmography both clearly discriminate infants with CF from controls in
NBS and clinically diagnosed individuals36-38, reflecting small airway obstruction, gas
trapping and hyperinflation seen in early CF lung disease. Abnormal tests correlate
with structural lung changes on CT39 and inflammation on broncho-alveolar lavage
(BAL)40, 41. In a group of 11 infants, lung function was shown to improve after antibiotic
treatment of a pulmonary exacerbation42, showing potential to detect change after
treatment. RVRTC outcomes were used in the Infant Study of Inhaled Hypertonic
Saline in cystic fibrosis trial, with FEV0.5 showing a minor improvement with treatment43.
The use of infant lung function outcome measures in interventional trials is limited due
to the large numbers that would need to be enrolled; data from a multicentre
observational study estimated that 150 infants would be needed in each treatment arm
to detect a significant treatment effect and sufficiently power an interventional trial35.
1.3.1.2 Lung function measures in preschool children
Spirometry
The preschool period between two and six years of age was previously referred to as
‘silent’ in that conventional lung function tests were not able to be performed, clinical
symptoms are minimal, but lung disease is known to occur. Children less than five
years of age are unable to meet quality control criteria for spirometry outcomes
required by international guidelines in older children and adults44, 45, but it is recognised
that they can reproducibly perform a forced expiratory manoeuvre from as young as 2.5
years of age45. Quality control measures have therefore been adapted taking this into
account, and standards for preschool spirometry were published ten years ago46.
Feasibility of the technique improves with age, and by 5-6 years, most children are able
to reproducibly perform this manoeuvre, but specialist laboratories with experienced
staff are required to maximise success47.
In an age-appropriate, relaxed and enthusiastic environment a maximal forced
expiratory manoeuvre can be easily obtained in a preschool child. Training with games
using bubbles or whistles and computerised incentives (such as blowing out candles)
can help achieve maximal peak flow and vital capacity47. Quality control must include
real-time inspection of flow-volume and volume-time traces. Criteria for preschool
spirometry, adapted from international standards, are summarised in Table 1.1.
25
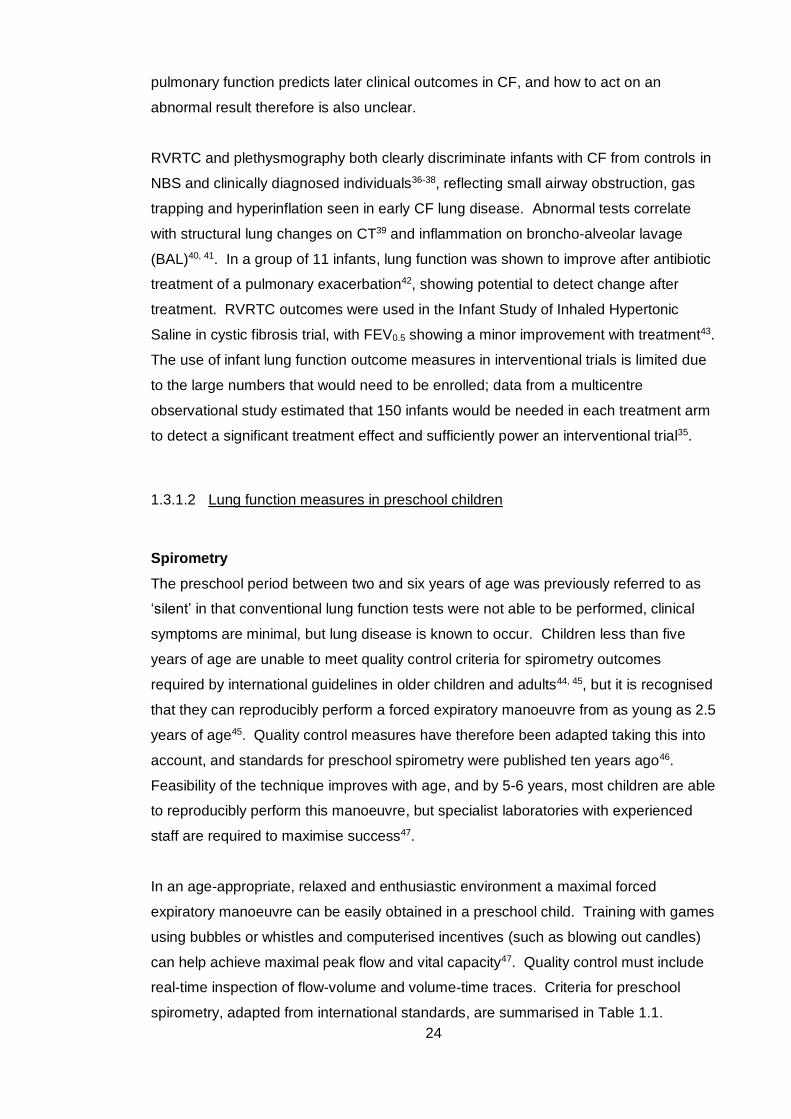
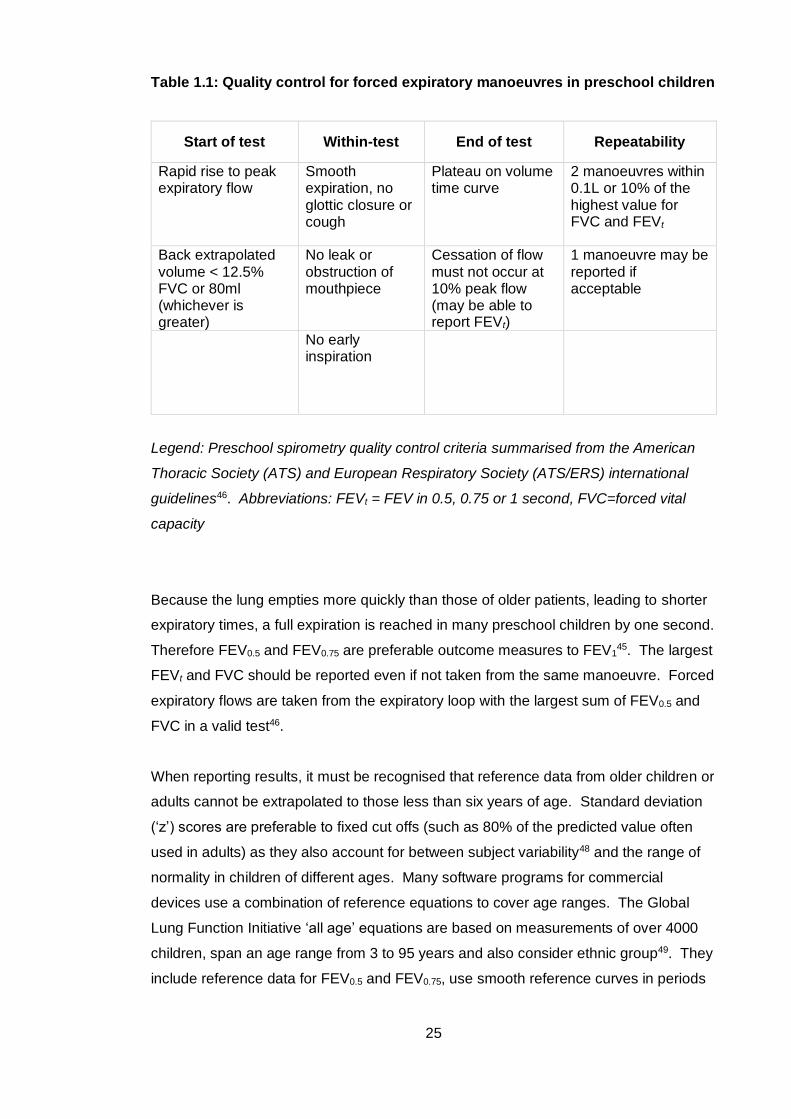
Table 1.1: Quality control for forced expiratory manoeuvres in preschool children
Start of test Within-test End of test Repeatability
Rapid rise to peak expiratory flow
Smooth expiration, no glottic closure or cough
Plateau on volume time curve
2 manoeuvres within 0.1L or 10% of the highest value for FVC and FEVt
Back extrapolated volume < 12.5% FVC or 80ml (whichever is greater)
No leak or obstruction of mouthpiece
Cessation of flow must not occur at 10% peak flow (may be able to report FEVt)
1 manoeuvre may be reported if acceptable
No early inspiration
Legend: Preschool spirometry quality control criteria summarised from the American
Thoracic Society (ATS) and European Respiratory Society (ATS/ERS) international
guidelines46. Abbreviations: FEVt = FEV in 0.5, 0.75 or 1 second, FVC=forced vital
capacity
Because the lung empties more quickly than those of older patients, leading to shorter
expiratory times, a full expiration is reached in many preschool children by one second.
Therefore FEV0.5 and FEV0.75 are preferable outcome measures to FEV145. The largest
FEVt and FVC should be reported even if not taken from the same manoeuvre. Forced
expiratory flows are taken from the expiratory loop with the largest sum of FEV0.5 and
FVC in a valid test46.
When reporting results, it must be recognised that reference data from older children or
adults cannot be extrapolated to those less than six years of age. Standard deviation
(‘z’) scores are preferable to fixed cut offs (such as 80% of the predicted value often
used in adults) as they also account for between subject variability48 and the range of
normality in children of different ages. Many software programs for commercial
devices use a combination of reference equations to cover age ranges. The Global
Lung Function Initiative ‘all age’ equations are based on measurements of over 4000
children, span an age range from 3 to 95 years and also consider ethnic group49. They
include reference data for FEV0.5 and FEV0.75, use smooth reference curves in periods
26
of rapid growth and continuously cover the transition from child to adulthood50. They
are therefore used in this thesis to report spirometric outcomes.
Mechanisms contributing to flow limitation are an important consideration when
describing disease of the peripheral airways. Flow limitation is said to occur when flow
does not increase despite increasing expiratory effort (or jacket pressure for RVRTC).
The linear velocity of gas in the peripheral airways is very low, and resistance in the
periphery of the lung has a lesser contribution to flow limitation during a forced
expiration. Furthermore, if lung disease is regionally heterogeneous there may be
increased flow through non-flow limited distal airways, masking reduced flow in other
more obstructed airways. Therefore abnormal spirometry tends to represent pathology
in the larger airways and is less sensitive to peripheral disease, such as that found in
early CF.
Studies have shown that spirometric values are on average lower in preschool children
with CF when compared to controls, but only a small proportion (9-36%) have an FEVt
below the normal range 7, 47, 51-54. Spirometry is not sensitive to peripheral airway
obstruction, the hallmark of early CF lung disease. Forced expiratory flows are
reduced more than volumes in CF compared to controls52, 53 and may be more
sensitive to abnormality at this age. Although a familiar measure to clinicians,
preschool spirometry in children with CF is so close to that in health that its use has
been limited as an outcome measure in clinical trials as large numbers would be
required to detect any significant intervention effect.
Plethysmography
The theoretical principles of plethysmography using a shutter to create a closed
pressure and volume system were described in section 1.3.1.1. Whilst sleeping or
sedated infants passively complete the manoeuvres necessary to measure FRC, it is
extremely difficult for awake preschool children to tolerate breathing against a closed
shutter. Specific airway resistance (sRaw), a measure also derived from
plethysmography, is a more acceptable test at this age. It is obtained during tidal
breathing, assessing the relationship between airflow and change in plethysmographic
pressure without manoeuvres during airway occlusion55. sRaw is the product of airway
resistance (Raw) and FRC, and is derived by rearranging the equations used for
plethysmographic (‘box’) measurement of these two outcomes56.
27
Raw is calculated using the principle of resistance being equal to pressure divided by
flow, and is the rate of change in alveolar pressure to change in flow measured at the
airway opening. An airway occlusion allows the relationship between change in mouth
pressure (then equal to alveolar pressure) against box pressure to be derived.
Raw = Δ Vbox spont / Δ flow
Δ Vbox occ / ΔPmouth
where Δ Vbox spont is the change in volume of the plethysmograph during spontaneous
breathing, Δ Vbox occ the change in box volume during efforts against an occlusion, and
ΔPmouth the change in mouth (alveolar) pressure against the airway occlusion55. As
described in section 1.3.1.1 FRC is calculated by the change in box volume divided by
the change in box pressure at the mouth (both when breathing against an occlusion),
or:
FRC = Δ Vbox occ / ΔPmouth
These equations are combined to calculate sRaw (Raw x FRC):
sRaw = Δ Vbox spont / Δ flow x Δ Vbox occ
Δ Vbox occ / ΔPmouth ΔPmouth
They can subsequently be simplified, avoiding the need for airway occlusion to
calibrate box pressure changes in terms of alveolar pressure changes:
sRaw = Δ Vbox spont / Δ flow
sRaw has been measured successfully in children from 2 years of age57. Reference
equations are available using measurements from over 2,872 healthy children as part
of the Asthma UK initiative55. However, as part of this study, significant methodological
differences between centres were noted, and a consensus for appropriate breathing
frequency and other quality control factors are yet to be decided. Standard operating
procedures are currently being developed.
As sRaw is a product of airways resistance and FRC it is a useful measure in children
with CF, as both are raised in obstructive lung disease or hyperinflation34. Two main
studies have reported sRaw measures in children with CF7, 54. In both studies sRaw
was significantly higher in children with CF than healthy controls, and was a feasible
28
measure in pre-schoolers (77-81%). In the latter study, sRaw was a useful serial
measurement as it was persistently abnormal over a four-year period, and identified
those with abnormal lung function earlier than spirometry54. A positive correlation has
also been reported with lung clearance index7. sRaw has the potential to detect and
monitor early CF lung disease in experienced laboratories, but its use as an outcome
measure is presently limited by lack of specific methodological guidelines.
Forced oscillation and interrupter techniques
There are other techniques for measuring lung function in children but their role in
detecting abnormalities in CF is less clear. Examples are the forced oscillation
technique (FOT), also known as impulse oscillation, and the interrupter technique.
They are both tidal breathing measures which are relatively easy to perform in pre-
school children.
The forced oscillation technique involves applying a pressure wave of known frequency
to the respiratory system and measuring the resulting flow. Respiratory impedance can
be calculated as it is equal to pressure divided by flow. Oscillation waves generated by
a loudspeaker are applied to the airway opening during tidal breathing. The pressure
signal that is in phase with flow represents respiratory resistance (Rrs), and that not in
phase the reactance (Xrs).
The interrupter technique measures the pressure at the mouth over a series of brief
occlusions during tidal breathing. It assumes that alveolar pressure equilibrates with
mouth pressure during the occlusions. Interrupter resistance (Rint), a measure of
resistance of the respiratory system, is the ratio of pressure at the mouth measured
after an occlusion and flow just before it58.
There are conflicting results of FOT in young children with CF, with some studies
showing abnormal Rrs and Xrs 59, 60 and others normal values54, 61. No relationship was
found in these studies between FOT measures and respiratory infection. Most studies
have shown that Rint does not distinguish young children with CF from healthy controls
and that Rint remains stable over time despite other parameters indicating worsening
disease54, 62. A multicentre study showed that spirometry in preschool children with CF
was a more sensitive measure for detecting abnormality than forced oscillation61.
Therefore, although feasible in preschool children, these techniques are rarely used to
monitor disease in CF.

29
1.3.1.3 The inert gas washout technique
MBW is described here as it is a technique that can be used in both infants and
preschool children. Inert gas washout was first described in the 1940s and examines
gas mixing in the lung63. The bronchial tree divides into progressively smaller airways
resulting in 23 airway generations. This division greatly increases the surface area of
the alveolar membrane to enable efficient gas exchange. The conducting airways
include generations 0-16, where linear velocity of gas is high but gas exchange does
not take place. Spirometry reflects abnormalities mainly in the conducting airways
where changes in linear gas flow affects forced expired flows and volumes.
Generations 17-23 are the intra-acinar airways and alveoli where gas exchange starts
to take place and flow velocity is low. At the entrance to the acinus the contributions to
gas mixing of convection and diffusion become similar64 and this is termed the
‘convection-diffusion front’. Within the acinus, diffusion is the main gas transport
mechanism. Resistance in the peripheral airways make little contribution therefore to
flow limitation measured by spirometry, and abnormal function in these airways can be
masked by normal flow in the distal airways. As gas mixing tests reflect the overall
ventilation homogeneity of the lung, including the peripheral airways where early CF
lung disease starts, they are more likely to reflect abnormality in young children with
milder disease. Ventilation inhomogeneity theoretically can arise from pathology at
three sites; proximally in the conducting airways (convection dependent), in the more
distal airways and acini (diffusion dependent) and at the acinar entrance (diffusion-
convection front)65.
Multiple breath washout involves recording the concentration of an inert tracer gas and
respiratory flow as the subject breathes through a sealed mouthpiece or mask. It is a
tidal breathing measure and therefore can be measured in a sedated or sleeping infant,
or in a passively cooperative preschool child. A mask sealed with putty is used in
younger children and infants to ensure a tight seal and thus no leak during the
washout. A number of inert gases can be used for this technique, but must have low or
no solubility in blood and tissues to ensure they do not participate in gas exchange.
Examples are sulphur hexafluoride (SF6) and helium (He), which are ‘washed in’ to an
equilibrium concentration before the gas supply is disconnected at end expiration, and
the tracer gas ‘washed out’ by breathing air. Resident nitrogen (N2) can also be used,
which does not require a wash-in phase as it is washed out by breathing 100% oxygen
(O2).
30
In a normal lung, the distribution of gas between parallel units is relatively equal.
During the washout phase, the tracer gas concentration progressively decays with
each volume turnover of the lung. The lung clearance index (LCI) reflects the number
of times the functional residual capacity must be ‘turned over’ to bring the tracer gas to
reach a set concentration28, commonly 1/40th of its starting value. This arbitrary cut off
is used as historically it was the limit of the operating range of early N2 gas analysers.
It is a simple way to report overall ventilation inhomogeneity measured during the
washout and is an index of the turnover volume divided by the measured FRC.
LCI = Cumulative Expired Volume
FRC
FRC can be calculated as the initial concentration of tracer gas is measured at the
beginning (Cinit) and end (Cend) of the washout, as is the total volume of gas expired.
FRC = volume of gas expired
(Cinit) - (Cend)
In diseased airways, inflammation, mucus plugging and airway wall damage alter gas
mixing, and it becomes inhomogenous66. Gas is not distributed evenly between lung
units, and washout of gas is faster in some areas and slower in those more poorly
ventilated. Therefore a higher number of turnovers are required to washout the tracer
gas, resulting in a higher LCI. FRC measured by MBW includes only the volume that
equilibrates with tracer gas during tidal breathing, and may be a smaller volume than
that calculated by plethysmography, which measures total thoracic gas67. LCI is
insensitive to a completly occluded airway since gas wash-in and –out does not occur
distal to the blockage.
Methodological considerations
SF6 and N2 are the most commonly used tracer gases recently employed in studies of
young children with CF. Both have advantages and disadvantages. SF6 has no taste,
odour or colour and is non-toxic in concentrations used in MBW devices. However, it is
not licenced for medical use and is a potent greenhouse gas, precluding its use in
some countries. It is also costly and has limited availability, and therefore devices
using lower concentrations of SF6 may be preferable. 100% O2 used to displace
resident N2 in the lungs (N2 washout) is a much more readily available and affordable
31
gas. A wash-in phase is not needed by this method, but time is needed between
washouts for gases in the lungs to re-equilibrate. However, this high concentration of
O2 has been reported to alter tidal breathing in infants, and is therefore less used at
this age68. Different LCI values are obtained during simultaneous N2 and SF6
washouts, thought to be secondary to back-diffusion of tissue N2 into expired gas69, so
results are not directly comparable.
Gas concentrations are measured by a fast gas analyser. A commonly reported
technique in studies of children with CF uses a mass spectrometer with 4% SF6, but
this device and associated equipment is custom made, and not available for
widespread clinical use. A number of commercial devices have been developed for
MBW analysis. The Innocor device (Innovision, Odense, Denmark) uses a photo-
acoustic gas analyser with a gas reservoir bag and 0.1% or 0.2% SF6, a lower
concentration to that commonly used in mass spectrometry. It has been approved by
the Food and Drug Administration for use in the US. It can be used in older children
and a modified method in vitro for potential use in infants has been recently
described70. Other commercial devices use ultrasonic flowmeters in mainstream
(sensor at the sample site) or sidestream (a sample of expired gas is diverted to the
analyser) positions. The Exhalyzer D (Eco Medics AG, Switzerland) uses 4% SF6 in
children under two years of age (avoiding 100% O2 use in infants), and measures
tracer gas concentration via a molar mass mainstream analyser. The lack of
algorithms to account for the effect of temperature and humidity on mainstream molar
mass measurement limits its use in older children in whom it has not yet been
validated. It can be used for N2 wash-out from preschool age, calculating N2
concentration indirectly via O2 (mainstream) and carbon dioxide (CO2) (sidestream)
measurement. The EasyOne Pro (ndd, Medical Technologies, Switzerland) is a further
device for N2 wash-out and measures sidestream molar mass (estimating N2 from
molar mass), but the large equipment deadspace means it is not suitable for use in
infants, and it is yet to be validated in preschool children.
Guidelines for technique and quality control for MBW are available71; specific
guidelines for preschool children have been published46, 72 and are awaited in infants.
In experienced centres, MBW is highly feasible, with success rates of over 80% in
sedated infants and preschool children7, 73. There is greater within-test (30%)74
variability of LCI in infants when compared to pre-school children (5.2%)7 which may
limit its clinical utility in the former age group. Reference data for LCI using 4% SF6
and mass spectrometry have been published for children from two weeks to 19 years
32
of age75. As previously discussed, they are equipment and tracer gas specific, with
higher LCI values reported for N2 washout than when using SF676. To date, reference
data have not been published for the aforementioned N2 wash-out devices, and the
Exhalyser D device measured a higher LCI, FRC and CEV than the EasyOne Pro in a
comparison study77. Comparison to healthy control subjects are therefore required in
studies using these methods of data collection.
Studies using LCI as an outcome measure
Although a technique described for many years, the rejuvenation of interest in using
MBW to detect peripheral airway disease has stemmed from the development of faster
gas analysers and commercial devices. In CF specifically, LCI has been shown to be a
sensitive marker of abnormality in preschool7, 78 and school-aged children51 with mild
disease, leading to a resurgence of this technique for use as a monitoring tool and
outcome measure in clinical trials. Kraemer et al. described lung function in 142
children with CF from 6 to 20 years of age, and found that LCI was the earliest and
strongest measure of progression than any other lung function measure in the study,
including FEV1 and plethysmography79. Two main groups, namely the LCFC, UK and
the Australian Respiratory Early Surveillance Team for cystic fibrosis (AREST-CF,
Australia) have described lung function, including LCI, in cohorts of clinically diagnosed
and NBS children. As these reports are so pertinent to the work in this thesis, they are
described in detail in section 1.4.
As LCI clearly distinguishes between children with CF and healthy controls, and is
more sensitive than spirometry, it has great potential to identify children with early
subtle lung abnormalities and therefore can be used as an outcome measure in clinical
trials. To date, LCI has detected a treatment effect in trials of dornase alpha80, inhaled
hypertonic saline81, 82, ivacaftor83 and ivacaftor/lumacaftor84. Baseline LCI has also
been shown to predict pulmonary exacerbations in children with CF, even in a
subgroup with normal FEV185. Its use is currently limited to centres with facilities to
perform the test, but validation of commercial N2 washout equipment in pre-school
children is currently underway, which should make the test more widely available.
Studies have also shown that MBW washouts to 1/20th of the start concentration, as
opposed to the arbitrary cut off of 1/40th, can significantly shorten the time of testing
without compromising diagnostic information86, 87, but may reduce sensitivity in younger
children86. MBW can be used to inform clinical management in a population where
other lung function tests are difficult to obtain, but it has still not been shown that
regular monitoring of LCI results in an improved outcome88.
33
1.3.2 Imaging techniques
Progressive structural changes, particularly bronchiectasis, are classical findings in
adults with CF89. Abnormalities can also be found in young children; post-mortem
histological specimens have shown bronchiectasis and mucus plugging from as early
as four months of age90. Advances in CT imaging provide the opportunity to view lung
abnormalities in increasing detail, and CT is still considered the gold standard for the
detection of bronchiectasis91. It is much more sensitive than chest radiography in
detecting CF lung disease92. As more sophisticated techniques and scoring systems
are developed, there is opportunity to quantify architectural irregularities, even in
children.
As infants and young children are unable to breath-hold cooperatively, scans are
usually performed under general anaesthesia. Standardisation of lung inflation volume
is particularly important, as the extent of structural change imaged varies with breathing
phase. Images of inspiration and expiration have been compared in children with CF
below five years of age; airway dilatation was detected in 30% of inspiratory scans but
only 9% of expiratory scans93. Therefore recent studies using CT in infants have used
a strict ventilation protocol during acquisition of images to minimise atelectasis, and
administer a ‘breath-hold’ at a set volume (usually at 25cm H20) during the inspiratory
scan3, 94. A standardised agreed protocol between centres is crucial in research
studies to enable comparison of outcomes.
Concerns over radiation exposure in such young children have led to the development
of low-dose scanning techniques95. ‘Limited slice’ protocols are used taking three to six
images at standard anatomical positions in inspiration and repeated in expiration to
minimise radiation dose96. However due to the irregular distribution of lung disease in
CF, limited slice protocols may neither capture all areas of structural abnormality97 nor
provide adequate resolution to quantify early disease39.
A number of scoring systems can be used to quantify structural abnormalities seen on
CT, and therefore may vary in reports from different cohorts. In infants, the LCFC and
AREST-CF groups initially used a modified version of the Brody-II score3, 94. The score
has 95% reproducibility in children between seven and 15 years98 but it is important to
note that it has not been validated in children under seven years. In more recent
studies, AREST-CF use the PRAGMA-CF (Perth-Rotterdam Annotated Grid
Morphometric Analysis for CF) system with an aim to quantify abnormality by
annotating a grid overlaid on axial slices of the scan99. Automated quantitative scoring
34
systems also have potential to be more reproducible scoring measures, but again
require validation in this population. Whilst different scoring systems describe the
extent of similar parameters (such as bronchial dilatation and air trapping), it must be
noted that they are not interchangeable when comparing reports.
CT scores have been shown to improve after treatment for a pulmonary
exacerbation100, dornase alpha101 and inhaled tobramycin102 in older children,
demonstrating the potential to detect a treatment effect in interventional trials.
Abnormalities in early childhood appear to predict lung disease progression, with
abnormal CT score at a mean age of 7.5 years associated with significantly worse lung
function and chest radiograph scores in later life103. However, CT data in infants and
preschool children, and how imaging can predict future decline are scarce, likely due to
concerns over frequent irradiation of developing lungs. The LCFC and AREST-CF
groups have reported CT findings in NBS children with CF under 6 years of age, and
these studies are discussed in detail in section 1.4.
In addition to the limitations of scoring systems and need for general anaesthesia,
cumulative radiation doses in CF patients are a concern, particularly as life expectancy
has increased significantly over the last decade. Magnetic resonance imaging (MRI)
as a non-ionising radiation imaging technique could be an alternative to CT, but it is
less often used in studies of the lungs due to air-tissue interfaces and low proton
density that lead to weak magnetic resonance signals104. Acquisition time is often long
and the environment disconcerting to young children, so many require sedation or
general anaesthesia. However it is a rapidly developing field; techniques of improved
structural protocols and contrast enhanced MRI can clearly show abnormal lung
structure and perfusion even in infants and preschool children when compared to
healthy controls, and can demonstrate response to treatment105, supporting the
development of MRI as an outcome measure. Hyperpolarized gases (typically He or
Xenon) can be administered by inhalation before MRI in order to image ventilation
defects in the lungs in fine detail. A study in children under 16 years of age with CF
showed ventilation imaging was the most sensitive marker of abnormality when
compared to CT, MBW and conventional MRI modalities106. The technique described
requires a single breath hold, so is limited in very young children and infants, but a
proof of concept study has recently been reported in non-sedated infants and
preschool children107. Further development of this method shows promise as a
monitoring technique that does not involve irradiation of young children.
35
1.3.3 Measures of lung infection and inflammation
A common management strategy in adults with CF is sputum culture-based pathogen
surveillance and treatment with an appropriate antibiotic. Even when unwell, many
infants and young children will be non-productive of, or unable to, expectorate sputum.
Oropharyngeal swabs (OPS) are therefore often used in children, by asking the patient
to cough onto a cotton swab placed at the back of the throat, or with a cough
stimulated by placing the swab against the posterior pharynx. Sputum can also be
induced by administration of nebulised hypertonic saline. These methods of collection
have been compared to BAL, the ‘gold standard’ for sampling lower airway
microbiology. As obtaining BAL involves sedation or general anaesthesia, alternative
methods that accurately reflect lower airway infection are preferred. Although OPS
have high specificity and negative predictive value, they have low sensitivity when
compared to BAL, and poor predictive ability to reflect pathogens in the lower
airways108. A within patient comparison of cough swab, induced sputum and BAL in
children aged from six months (72 children under six years of age) showed a higher
number of bacterial isolates in induced sputum when compared to OPS (92% versus
31%)109, agreeing with earlier data showing poor diagnostic value of OPS for lower
airway infection. They also compared induced sputum with single, two and six lobe
BAL, and found more pathogens isolated as more lobes were sampled. Induced
sputum found 69% of pathogens detected by BAL, but in some cases different
organisms were isolated by the two techniques. In conclusion, a combination of
induced sputum and six lobe BAL were proposed for lower airway microbial
surveillance, and BAL could be reserved for those with negative induced sputum or
persistent symptoms.
An ERS taskforce statement was published in 2000 giving guidelines for obtaining,
storing and processing lavage fluid110. It is recommended that lavage is performed in
the most affected lobe, or right middle lobe in the presence of diffuse disease, but there
is no consensus on aliquot volume and number at present. As CF lung disease may
not be uniformly distributed throughout the airway, lavaging a single lobe has the
potential to miss areas of disease111.
As well as pathogens, biomarkers of inflammation can be measured. The number of
available assays is vast, but data on reproducibility of markers scarce. Techniques for
assaying individual markers vary between laboratories, and can be complex and
expensive. The European Cystic Fibrosis Society Clinical Trial Network
Standardisation Committee published a review on BAL biomarkers as outcome
36
measures, and focus on neutrophil count or percentage, neutrophil elastase,
interleukin-6 and interleukin-8 as most useful currently in CF111. Other difficulties with
processing BAL are the varying volumes and dilution of fluid retrieved from each
patient. Values of biomarkers can vary in sequential aliquots, and individual or pooled
aliquots can be analysed111. A recent study reported a high level of concordance
between pooled and non-pooled BAL samples for pathogen identification in young
children with CF, and pooling of BAL did not negatively impact on the detection of
inflammatory biomarkers112. Centres researching the role of BAL in young children with
CF should therefore develop protocols in an attempt to standardise test procedures,
but techniques still vary between reports.
Adverse events (such as fever) are common with BAL but usually minor113. Obtaining
BAL samples to identify pathogens could therefore be a safe and useful surveillance
and outcome measure in children less than six years of age. Inflammatory markers in
BAL have been studied in trials of tobramycin inhalation solution114 and rhDNase115 but
no clear change in any one marker was found. Furthermore, in a randomised
controlled trial of children under five years of age of BAL-directed versus standard
therapy in pseudomonas aeruginosa infection, no difference in the rate of
pseudomonas eradication or CT score was found between the two approaches116. BAL
remains useful in the early stages of trials to describe pathophysiological processes in
CF111, and free neutrophil elastase activity may be a potential marker for more severe
disease, as shown in the AREST-CF studies described in detail in section 1.4. It is a
useful clinical tool when infection is suspected in the face of otherwise negative
microbiology, but it is still an invasive procedure requiring sedation or general
anaesthesia, and without a clear benefit seen when treating infection detected only on
BAL, routine surveillance using this method cannot yet be advocated.
1.4 Studies of early disease monitoring in young children with CF
1.4.1 Newborn screening
Newborn screening for CF in the UK is performed on a blood spot card obtained on
around day five of life using an assay for immunoreactive trypsinogen (IRT). If the
assay result is above a cut off level it is repeated and if persistently raised, DNA
analysis is performed for the four most common CF mutations in the UK population. If
two disease-causing CFTR mutations are found, a sweat test is performed to confirm
37
the diagnosis. In those with one mutation, IRT is repeated and extended CFTR
analysis sent. If the second IRT is raised, again a sweat test is performed. The
median age of diagnosis in the UK was two months in 2017117, and newborn screening
for CF has taken place nationwide since 2007.
Before NBS using the IRT assay became widely available, the diagnosis of CF was
usually made by the detection of clinical signs. Children had often already developed
respiratory symptoms and potentially irreversible lung damage by this time. NBS gives
the opportunity to commence treatment shortly after birth, with an aim to prevent early
pathology, rather than just treat the secondary effects of CF. There has only been one
randomised controlled trial (RCT) of NBS for CF118. The Wisconsin study showed clear
improvement in nutritional markers, but after ten years of follow up, NBS children had
poorer chest radiograph scores, no difference in lung function and, of concern, a higher
rate of Pseudomonas aeruginosa infection compared to those non-NBS6. Since this
study there have been clear improvements in CF care, including segregation and
regular surveillance of patients in specialist centres, the lack of which may have
influenced the Wisconsin findings. This does underscore that screening without proper
treatment facilities may actually be harmful.
Reports of observational studies comparing screened and unscreened cohorts give
evidence for better pulmonary outcomes in NBS groups. The Wisconsin study reported
chest radiograph scores at diagnosis; only 25% of NBS infants had evidence of
established lung disease, compared to half of the clinically diagnosed group6. A recent
Canadian registry study found lower incidence of Pseudomonas aeruginosa and
Staphylococcus aureus in NBS patients compared to those diagnosed clinically within
the same time period119, and the Wisconsin study found later acquisition of
Pseudomonas aeruginosa in NBS infants. In terms of long-term follow up, a study from
the Netherlands showed a slower rate of lung function decline at 12 and 17 years
compared to those clinically diagnosed120, 121. Australian NBS patients showed better
lung function on transfer to adult care than those diagnosed clinically, and improved
survival at 25 years of age122. Overall, in addition to clearly superior nutritional health
in NBS patients, it is accepted that screening for CF can lead to improved outcomes in
lung health, and has additional benefits of cost saving and reduced mortality and
morbidity in early life123.
Longitudinal cohort studies in both groups of children inform us of the evolution of CF
lung disease. The two cohorts with the longest follow up to date of children with CF
38
from diagnosis come from the aforementioned LCFC and AREST-CF groups. The
LCFC report two cohorts; the first of clinically diagnosed children (cohort 1) with CF
and a second cohort of NBS infants (cohort 2) diagnosed with CF around ten years
after cohort 1. AREST-CF have studied children who were diagnosed by NBS. These
studies are therefore discussed in detail in the following section as they form the main
body of literature to inform the research in this thesis.
1.4.2 Studies in children clinically diagnosed with CF
1.4.2.1 The LCFC longitudinal study of clinically diagnosed children with CF
The first longitudinal study from the LCFC is an extensive report of the evolution of lung
function in clinically diagnosed children with CF (cohort 1). The LCFC is a
collaboration between six specialist CF centres in London with an aim to study and
develop methods to monitor early lung disease from diagnosis. This group reported
lung function and structure in children with CF from infancy to school age, and current
follow up in adolescence is underway. Children with CF and contemporaneous healthy
control children were recruited into the first phase of this study from 1999. Infants were
tested shortly after diagnosis (median seven months), and in later infancy (up to 22
months) with follow up in the preschool years (2.5-6 years) and at school age (6-10
years). A summary of measures in these young children with CF at each study time
point is presented in Figure 1.2
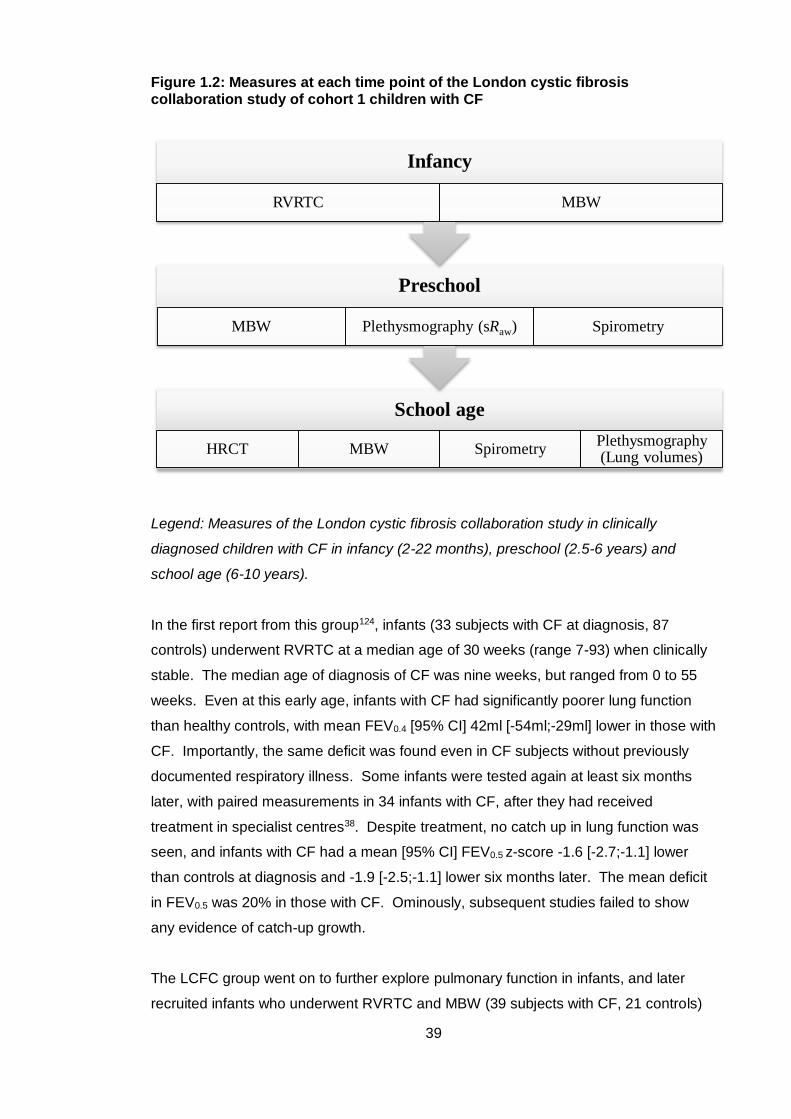
39
Figure 1.2: Measures at each time point of the London cystic fibrosis collaboration study of cohort 1 children with CF
Legend: Measures of the London cystic fibrosis collaboration study in clinically
diagnosed children with CF in infancy (2-22 months), preschool (2.5-6 years) and
school age (6-10 years).
In the first report from this group124, infants (33 subjects with CF at diagnosis, 87
controls) underwent RVRTC at a median age of 30 weeks (range 7-93) when clinically
stable. The median age of diagnosis of CF was nine weeks, but ranged from 0 to 55
weeks. Even at this early age, infants with CF had significantly poorer lung function
than healthy controls, with mean FEV0.4 [95% CI] 42ml [-54ml;-29ml] lower in those with
CF. Importantly, the same deficit was found even in CF subjects without previously
documented respiratory illness. Some infants were tested again at least six months
later, with paired measurements in 34 infants with CF, after they had received
treatment in specialist centres38. Despite treatment, no catch up in lung function was
seen, and infants with CF had a mean [95% CI] FEV0.5 z-score -1.6 [-2.7;-1.1] lower
than controls at diagnosis and -1.9 [-2.5;-1.1] lower six months later. The mean deficit
in FEV0.5 was 20% in those with CF. Ominously, subsequent studies failed to show
any evidence of catch-up growth.
The LCFC group went on to further explore pulmonary function in infants, and later
recruited infants who underwent RVRTC and MBW (39 subjects with CF, 21 controls)
School age
HRCT MBW SpirometryPlethysmography (Lung volumes)
Preschool
MBW Plethysmography (sRaw) Spirometry
Infancy
RVRTC MBW
40
aged two to 22 months73. Again, infants with CF had significantly poorer lung function
than controls. Mean LCI [95% CI] was 1.2 [0.7;1.7] units higher, and FEV0.5 -1.7 [-2.3;-
1.1] lower in those with CF. 22 (56%) of infants had an abnormally high LCI; 13 also
had an abnormal RVRTC outcomes (FEV0.5, FEF25-75 and FVC), and of those with
abnormal RVRTC only six had an abnormal LCI. It was therefore proposed that these
measures could be complementary in infancy, and when used together could detect
disease in 72% of infants.
The next time point of this study was follow up of children in the preschool years.
MBW, sRaw and spirometry were measured in 40 children with CF (mean age [SD] 4.1
[0.9] years) and in 37 age matched controls again when children were clinically well7.
LCI was shown to be the most sensitive marker of disease in preschool children with
CF; 73% had an LCI above the upper limit of normal of the control group, and children
with CF had a mean LCI [95% CI] 2.7 [1.9;3.6] higher. A lower proportion of children
had abnormal sRaw (47%) and FEV0.5 (only 13%). Despite no association being found
in infancy with bacterial isolates and lung function, preschool children infected with
Pseudomonas aeruginosa had significantly higher LCI than those who did not.
Kozlowska et al. then reported forced expiratory flows and volumes (FEFV)
longitudinally from infancy to preschool age, with paired results in 48 children with CF
and 33 controls125. Children with CF had a mean reduction of 7.5% in FEV0.75 and
15.1% in FEF25-75 over the six year study when compared to controls. Those that had
isolated Pseudomonas aeruginosa before any lung function test had a further reduction
in FEFV outcomes (17% in FEV0.75). Importantly, low lung function on infant testing
was not associated with subsequent infection with Pseudomonas aeruginosa, and the
lung function deficit was similar in children who no longer isolated this organism at
preschool test and those who did. This suggests that infection precedes a fall in
functional measures, and isolation of Pseudomonas aeruginosa does not just reflect
poor respiratory status. Furthermore, no association was seen between total courses
of intravenous antibiotics and FEFV parameters.
Finally, this clinically diagnosed cohort was tested between six and ten years of age,
and the ability of preschool LCI and FEV1 to determine the same lung function
measures at school age were reported (48 subjects with CF, 45 controls)51, 126. LCI and
FEV1 were significantly poorer than controls at school age with mean difference [95%
CI] of 3 [2.7;4.4] units and -1.28 [-0.8;-1.8] z-scores respectively. Preschool LCI was
abnormal in 73% of children with CF, and had a positive predictive value of 95% for
any abnormal school age lung function result and negative predictive value of 62%.
41
For FEV1 (only 5% abnormal at preschool test) the positive predictive value of
preschool FEV1 was 100% but negative predictive value 25%. LCI remained normal at
school age in 9 of 11 subjects with normal preschool LCI. LCI was considered a
sensitive marker of early lung disease, as nearly all subjects with abnormal preschool
LCI went on to have abnormal school age lung function, and two thirds had normal LCI
at both preschool and school age test occasions. No significant differences were
observed in any preschool or school age lung function outcome in children who had
ever isolated Pseudomonas aeruginosa and those who had not. In addition to MBW
and spirometry, high resolution CT (HRCT) was performed in 60 subjects with CF at
school age on the same day as pulmonary function tests. 89% of children with
abnormal LCI had abnormal HRCT. LCI was the most highly correlated measure with
total CT score (Spearman’s R 0.77) compared to other lung function measures
(spirometry R=-0.43). Of the nine children with normal LCI, five had abnormal CT and
of nine children with normal CT, five had abnormal LCI. It was therefore suggested
that LCI could be an alternative measure to HRCT, and that CT could be limited to
those with normal LCI, reducing cost and radiation exposure in young children.
In summary, the LCFC studies in clinically diagnosed children with CF show that lung
function is abnormal at diagnosis and does not improve during infancy despite
specialist treatment. In infancy, LCI and RVRTC are complimentary measures and
early infection with Pseudomonas aeruginosa is an important determinant of later lung
function. By the preschool years, LCI is the most sensitive marker of abnormality and
can predict abnormal school age lung function. School age LCI also correlates highly
with abnormalities of lung structure. LCI was therefore proposed to be an important
marker for monitoring early disease and a suitable outcome measure for future clinical
trials. Awaited reports of follow up in adolescence will show how these earlier
measures can predict future decline.
1.4.3 Studies in children with CF diagnosed by newborn screening
1.4.3.1 The LCFC study of NBS infants with CF
After implementation of NBS in the UK, and the subsequent earlier identification and
treatment of children with CF than those presenting with clinical symptoms, the LCFC
recruited a second cohort of infants at diagnosis. In infancy, lung function (RVRTC,
42
plethysmography and MBW) under sedation were measured, with primary outcomes of
FEV0.5, FRCpleth and LCI z-scores recorded for the three tests respectively. Infants
underwent testing around three time points; three months, one year and two years of
age. At one year, HRCT and BAL were performed under general anaesthesia in
addition to lung function measures. At three months (mean age [SD] 11 [2] weeks), a
similar deficit was found to those with a clinical diagnosis of CF, with all lung function
outcomes significantly poorer than the age matched healthy control group36. In 71
infants with CF, mean [95% CI] FEV0.5 z-score was -0.9 [-1.3;0.6] lower, FRCpleth z-
score 0.85 [0.4;1.3] higher and LCI z-score 0.5 [0.1;0.9] higher than controls, and an
abnormal result found in 25%, 18% and 21% respectively. Overall, 44% of infants had
at least one abnormal result.
Infant lung function was repeated in these subjects at one year of age, with the addition
of HRCT and BAL. Unlike those with a clinical diagnosis of CF, lung function showed
an improvement over time in 72 NBS children with paired three month and one year
measurements127. By one year, mean FEV0.5 z-score [95% CI] was only 0.52
[0.89;0.15] lower than controls and increased by 0.59 [0.18;0.99] z-scores from the
three month test. Furthermore, little change was seen in mean LCI (0.24 z-scores
higher) and FRCpleth (0.04 z-scores lower) when compared to controls at one year. The
percentage of CF subjects with abnormal results decreased to 9% for FEV0.5, was 16%
for FRCpleth, and 18% for LCI. Of 33% with any abnormal lung function test at three
months, only 10% remained abnormal at one year. Somatic growth in CF subjects also
improved; there was no difference to the control group at one year of age, and change
in weight between tests was associated with lower (improved) FRCpleth. On linear
regression analysis, Pseudomonas aeruginosa was a significant determinant of one
year FRCpleth and clinician diagnosed wheeze was a predictor of LCI. No significant
associations were found between other bacterial growths, nebulised mucolytic therapy,
treatment for gastro-oesophageal reflux disease, or number of courses of antibiotics
from birth with any of the one year lung function outcomes.
65 infants with CF also had chest HRCT at one year of age94 using controlled
ventilation under general anaesthesia. The Brody-II CT score was used by two
experienced paediatric radiologists blinded to subject clinical and laboratory
information, one of whom was Alan Brody who originally developed the score. The
protocol used rendered more than 20 image ‘slices’ rather than the six used in the
AREST-CF study128. The main finding of this study was that abnormalities were very
mild in infants, so mild in fact that, apart from air trapping, inter- and intra-observer
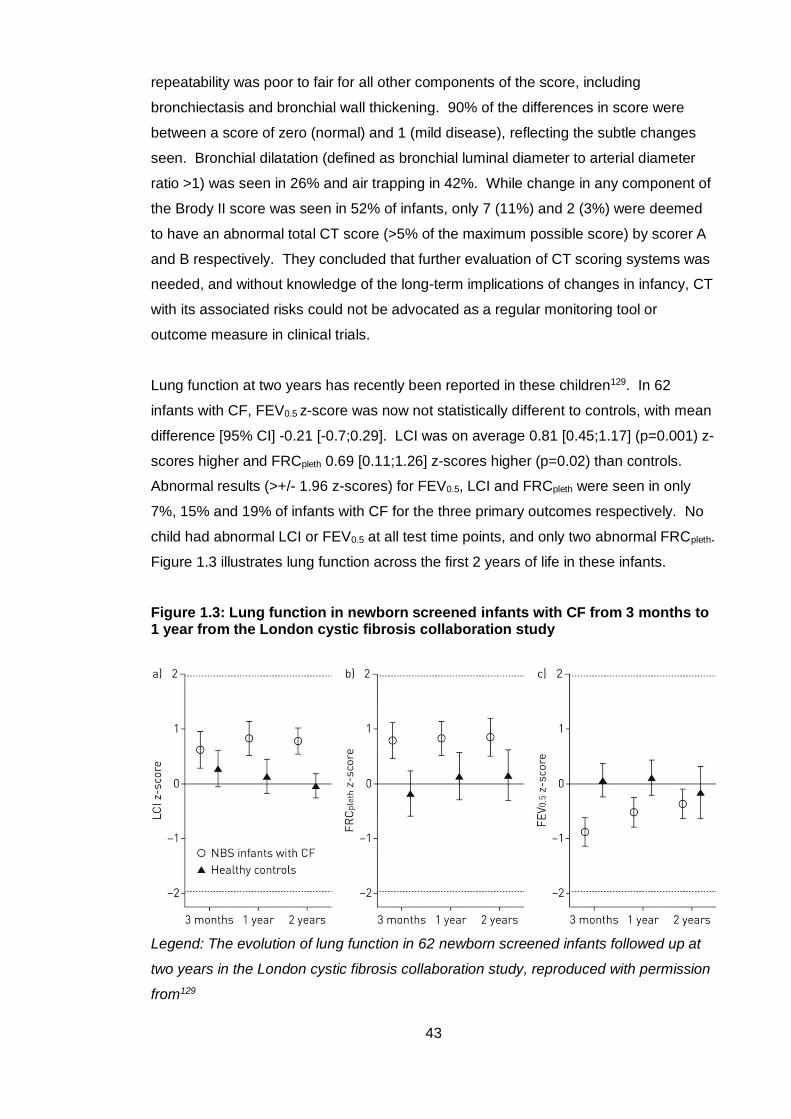
43
repeatability was poor to fair for all other components of the score, including
bronchiectasis and bronchial wall thickening. 90% of the differences in score were
between a score of zero (normal) and 1 (mild disease), reflecting the subtle changes
seen. Bronchial dilatation (defined as bronchial luminal diameter to arterial diameter
ratio >1) was seen in 26% and air trapping in 42%. While change in any component of
the Brody II score was seen in 52% of infants, only 7 (11%) and 2 (3%) were deemed
to have an abnormal total CT score (>5% of the maximum possible score) by scorer A
and B respectively. They concluded that further evaluation of CT scoring systems was
needed, and without knowledge of the long-term implications of changes in infancy, CT
with its associated risks could not be advocated as a regular monitoring tool or
outcome measure in clinical trials.
Lung function at two years has recently been reported in these children129. In 62
infants with CF, FEV0.5 z-score was now not statistically different to controls, with mean
difference [95% CI] -0.21 [-0.7;0.29]. LCI was on average 0.81 [0.45;1.17] (p=0.001) z-
scores higher and FRCpleth 0.69 [0.11;1.26] z-scores higher (p=0.02) than controls.
Abnormal results (>+/- 1.96 z-scores) for FEV0.5, LCI and FRCpleth were seen in only
7%, 15% and 19% of infants with CF for the three primary outcomes respectively. No
child had abnormal LCI or FEV0.5 at all test time points, and only two abnormal FRCpleth.
Figure 1.3 illustrates lung function across the first 2 years of life in these infants.
Figure 1.3: Lung function in newborn screened infants with CF from 3 months to 1 year from the London cystic fibrosis collaboration study
Legend: The evolution of lung function in 62 newborn screened infants followed up at
two years in the London cystic fibrosis collaboration study, reproduced with permission
from129
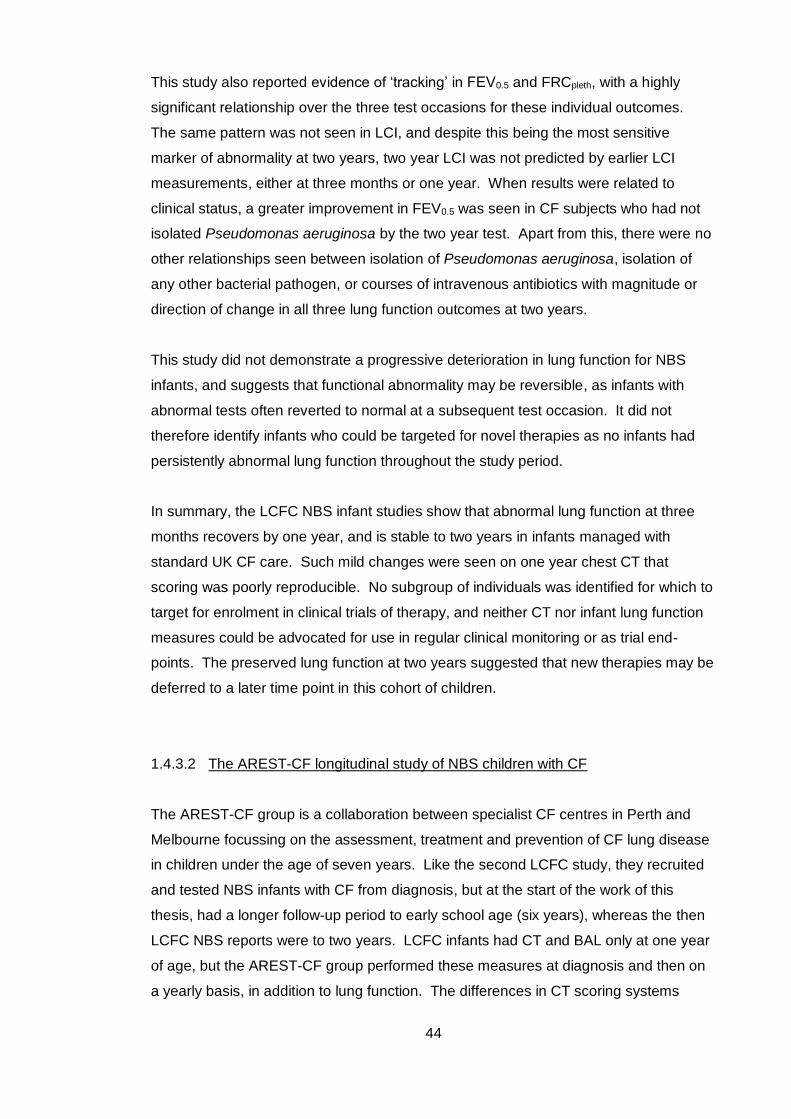
44
This study also reported evidence of ‘tracking’ in FEV0.5 and FRCpleth, with a highly
significant relationship over the three test occasions for these individual outcomes.
The same pattern was not seen in LCI, and despite this being the most sensitive
marker of abnormality at two years, two year LCI was not predicted by earlier LCI
measurements, either at three months or one year. When results were related to
clinical status, a greater improvement in FEV0.5 was seen in CF subjects who had not
isolated Pseudomonas aeruginosa by the two year test. Apart from this, there were no
other relationships seen between isolation of Pseudomonas aeruginosa, isolation of
any other bacterial pathogen, or courses of intravenous antibiotics with magnitude or
direction of change in all three lung function outcomes at two years.
This study did not demonstrate a progressive deterioration in lung function for NBS
infants, and suggests that functional abnormality may be reversible, as infants with
abnormal tests often reverted to normal at a subsequent test occasion. It did not
therefore identify infants who could be targeted for novel therapies as no infants had
persistently abnormal lung function throughout the study period.
In summary, the LCFC NBS infant studies show that abnormal lung function at three
months recovers by one year, and is stable to two years in infants managed with
standard UK CF care. Such mild changes were seen on one year chest CT that
scoring was poorly reproducible. No subgroup of individuals was identified for which to
target for enrolment in clinical trials of therapy, and neither CT nor infant lung function
measures could be advocated for use in regular clinical monitoring or as trial end-
points. The preserved lung function at two years suggested that new therapies may be
deferred to a later time point in this cohort of children.
1.4.3.2 The AREST-CF longitudinal study of NBS children with CF
The AREST-CF group is a collaboration between specialist CF centres in Perth and
Melbourne focussing on the assessment, treatment and prevention of CF lung disease
in children under the age of seven years. Like the second LCFC study, they recruited
and tested NBS infants with CF from diagnosis, but at the start of the work of this
thesis, had a longer follow-up period to early school age (six years), whereas the then
LCFC NBS reports were to two years. LCFC infants had CT and BAL only at one year
of age, but the AREST-CF group performed these measures at diagnosis and then on
a yearly basis, in addition to lung function. The differences in CT scoring systems
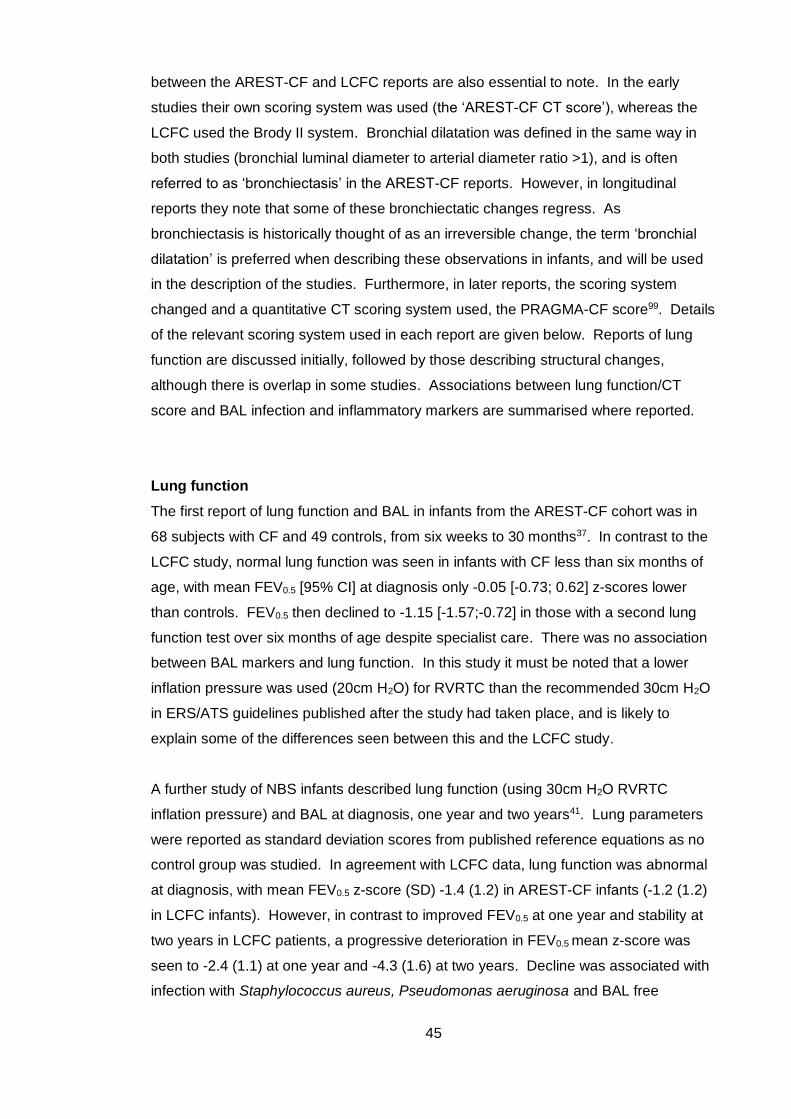
45
between the AREST-CF and LCFC reports are also essential to note. In the early
studies their own scoring system was used (the ‘AREST-CF CT score’), whereas the
LCFC used the Brody II system. Bronchial dilatation was defined in the same way in
both studies (bronchial luminal diameter to arterial diameter ratio >1), and is often
referred to as ‘bronchiectasis’ in the AREST-CF reports. However, in longitudinal
reports they note that some of these bronchiectatic changes regress. As
bronchiectasis is historically thought of as an irreversible change, the term ‘bronchial
dilatation’ is preferred when describing these observations in infants, and will be used
in the description of the studies. Furthermore, in later reports, the scoring system
changed and a quantitative CT scoring system used, the PRAGMA-CF score99. Details
of the relevant scoring system used in each report are given below. Reports of lung
function are discussed initially, followed by those describing structural changes,
although there is overlap in some studies. Associations between lung function/CT
score and BAL infection and inflammatory markers are summarised where reported.
Lung function
The first report of lung function and BAL in infants from the AREST-CF cohort was in
68 subjects with CF and 49 controls, from six weeks to 30 months37. In contrast to the
LCFC study, normal lung function was seen in infants with CF less than six months of
age, with mean FEV0.5 [95% CI] at diagnosis only -0.05 [-0.73; 0.62] z-scores lower
than controls. FEV0.5 then declined to -1.15 [-1.57;-0.72] in those with a second lung
function test over six months of age despite specialist care. There was no association
between BAL markers and lung function. In this study it must be noted that a lower
inflation pressure was used (20cm H2O) for RVRTC than the recommended 30cm H2O
in ERS/ATS guidelines published after the study had taken place, and is likely to
explain some of the differences seen between this and the LCFC study.
A further study of NBS infants described lung function (using 30cm H2O RVRTC
inflation pressure) and BAL at diagnosis, one year and two years41. Lung parameters
were reported as standard deviation scores from published reference equations as no
control group was studied. In agreement with LCFC data, lung function was abnormal
at diagnosis, with mean FEV0.5 z-score (SD) -1.4 (1.2) in AREST-CF infants (-1.2 (1.2)
in LCFC infants). However, in contrast to improved FEV0.5 at one year and stability at
two years in LCFC patients, a progressive deterioration in FEV0.5 mean z-score was
seen to -2.4 (1.1) at one year and -4.3 (1.6) at two years. Decline was associated with
infection with Staphylococcus aureus, Pseudomonas aeruginosa and BAL free
46
neutrophil elastase activity; a doubling of which was associated with mean FEV0.5 z-
score [95% CI] reduction of -0.46 [-0.77;-0.16]. Such a progressive deficit in lung
function was concerning, with no apparent change in clinical status of well infants.
However, custom made equipment for lung function measurement was used, and
reference data to compute z-scores may not have been applicable unless identical test
conditions (equipment and protocols) were in place. Without a control group for
comparison, suspected measurement errors could not be detailed further.
MBW outcomes in infants and their relationship with CT changes were described in a
separate report130. In 49 infants with CF aged 2-25 months, bronchial dilatation was
seen in 27% and air trapping in 49%. However, LCI was not increased in the presence
of CT abnormalities, and the study concluded that LCI could not replace chest CT to
assess structural lung disease in infants.
A more recent publication describes the impact of BAL infection and inflammatory
markers on LCI in 108 infants from diagnosis, at one year and two years of age131.
Significant bacterial or fungal infection on BAL at the time of MBW measurement was
associated with a mean increase in LCI [95% CI] of 0.4 [0.15;0.65] when compared to
those with no infection, in particular with Haemophilus influenzae and Aspergillus
fumigatus (but not Staphylococcus aureus or, surprisingly, Pseudomonas aeruginosa).
In children with paired measurements, an accelerated decline in ventilation
inhomogeneity was seen in those who isolated any ‘pro-inflammatory’ pathogen132
(including Staphylococcus aureus and Pseudomonas aeruginosa) compared with those
who remained infection free, indicating that those with early infection had subsequent
lung function decline. BAL inflammatory markers did not show the same association.
The next follow up point was in early school aged children (four to eight years),
describing the longitudinal effects of pulmonary infection, inflammation and structural
abnormalities in infancy on later lung function133. Only minor differences in FEV0.75
between the CF and control groups were found at school age; children with CF had
mean [95% CI] FEV0.75 8.3% [-15.9;-6.6] lower. These children were the same who
had a significant deficit in RVRTC outcomes in infancy to -4 z-scores in FEV0.5 at two
years, indicating that there was either substantial improvement by school age, or more
likely, that there were errors of performance or interpretation in their infant lung
function.
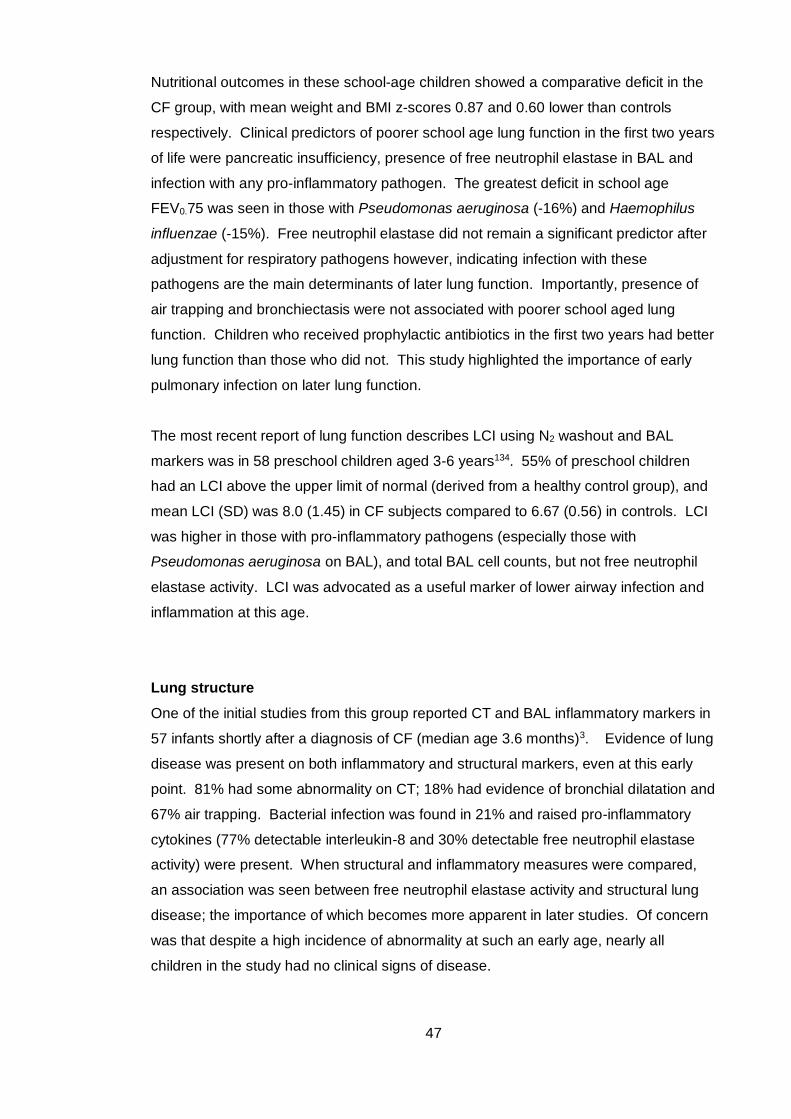
47
Nutritional outcomes in these school-age children showed a comparative deficit in the
CF group, with mean weight and BMI z-scores 0.87 and 0.60 lower than controls
respectively. Clinical predictors of poorer school age lung function in the first two years
of life were pancreatic insufficiency, presence of free neutrophil elastase in BAL and
infection with any pro-inflammatory pathogen. The greatest deficit in school age
FEV0.75 was seen in those with Pseudomonas aeruginosa (-16%) and Haemophilus
influenzae (-15%). Free neutrophil elastase did not remain a significant predictor after
adjustment for respiratory pathogens however, indicating infection with these
pathogens are the main determinants of later lung function. Importantly, presence of
air trapping and bronchiectasis were not associated with poorer school aged lung
function. Children who received prophylactic antibiotics in the first two years had better
lung function than those who did not. This study highlighted the importance of early
pulmonary infection on later lung function.
The most recent report of lung function describes LCI using N2 washout and BAL
markers was in 58 preschool children aged 3-6 years134. 55% of preschool children
had an LCI above the upper limit of normal (derived from a healthy control group), and
mean LCI (SD) was 8.0 (1.45) in CF subjects compared to 6.67 (0.56) in controls. LCI
was higher in those with pro-inflammatory pathogens (especially those with
Pseudomonas aeruginosa on BAL), and total BAL cell counts, but not free neutrophil
elastase activity. LCI was advocated as a useful marker of lower airway infection and
inflammation at this age.
Lung structure
One of the initial studies from this group reported CT and BAL inflammatory markers in
57 infants shortly after a diagnosis of CF (median age 3.6 months)3. Evidence of lung
disease was present on both inflammatory and structural markers, even at this early
point. 81% had some abnormality on CT; 18% had evidence of bronchial dilatation and
67% air trapping. Bacterial infection was found in 21% and raised pro-inflammatory
cytokines (77% detectable interleukin-8 and 30% detectable free neutrophil elastase
activity) were present. When structural and inflammatory measures were compared,
an association was seen between free neutrophil elastase activity and structural lung
disease; the importance of which becomes more apparent in later studies. Of concern
was that despite a high incidence of abnormality at such an early age, nearly all
children in the study had no clinical signs of disease.
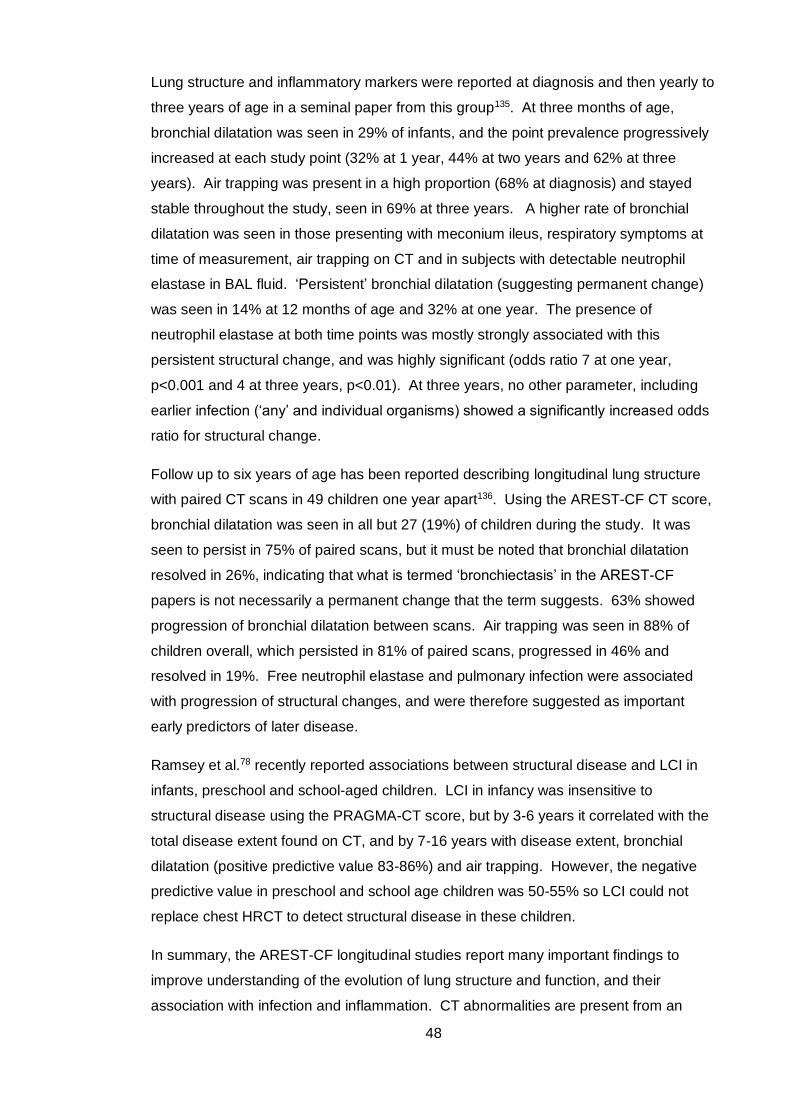
48
Lung structure and inflammatory markers were reported at diagnosis and then yearly to
three years of age in a seminal paper from this group135. At three months of age,
bronchial dilatation was seen in 29% of infants, and the point prevalence progressively
increased at each study point (32% at 1 year, 44% at two years and 62% at three
years). Air trapping was present in a high proportion (68% at diagnosis) and stayed
stable throughout the study, seen in 69% at three years. A higher rate of bronchial
dilatation was seen in those presenting with meconium ileus, respiratory symptoms at
time of measurement, air trapping on CT and in subjects with detectable neutrophil
elastase in BAL fluid. ‘Persistent’ bronchial dilatation (suggesting permanent change)
was seen in 14% at 12 months of age and 32% at one year. The presence of
neutrophil elastase at both time points was mostly strongly associated with this
persistent structural change, and was highly significant (odds ratio 7 at one year,
p<0.001 and 4 at three years, p<0.01). At three years, no other parameter, including
earlier infection (‘any’ and individual organisms) showed a significantly increased odds
ratio for structural change.
Follow up to six years of age has been reported describing longitudinal lung structure
with paired CT scans in 49 children one year apart136. Using the AREST-CF CT score,
bronchial dilatation was seen in all but 27 (19%) of children during the study. It was
seen to persist in 75% of paired scans, but it must be noted that bronchial dilatation
resolved in 26%, indicating that what is termed ‘bronchiectasis’ in the AREST-CF
papers is not necessarily a permanent change that the term suggests. 63% showed
progression of bronchial dilatation between scans. Air trapping was seen in 88% of
children overall, which persisted in 81% of paired scans, progressed in 46% and
resolved in 19%. Free neutrophil elastase and pulmonary infection were associated
with progression of structural changes, and were therefore suggested as important
early predictors of later disease.
Ramsey et al.78 recently reported associations between structural disease and LCI in
infants, preschool and school-aged children. LCI in infancy was insensitive to
structural disease using the PRAGMA-CT score, but by 3-6 years it correlated with the
total disease extent found on CT, and by 7-16 years with disease extent, bronchial
dilatation (positive predictive value 83-86%) and air trapping. However, the negative
predictive value in preschool and school age children was 50-55% so LCI could not
replace chest HRCT to detect structural disease in these children.
In summary, the AREST-CF longitudinal studies report many important findings to
improve understanding of the evolution of lung structure and function, and their
association with infection and inflammation. CT abnormalities are present from an
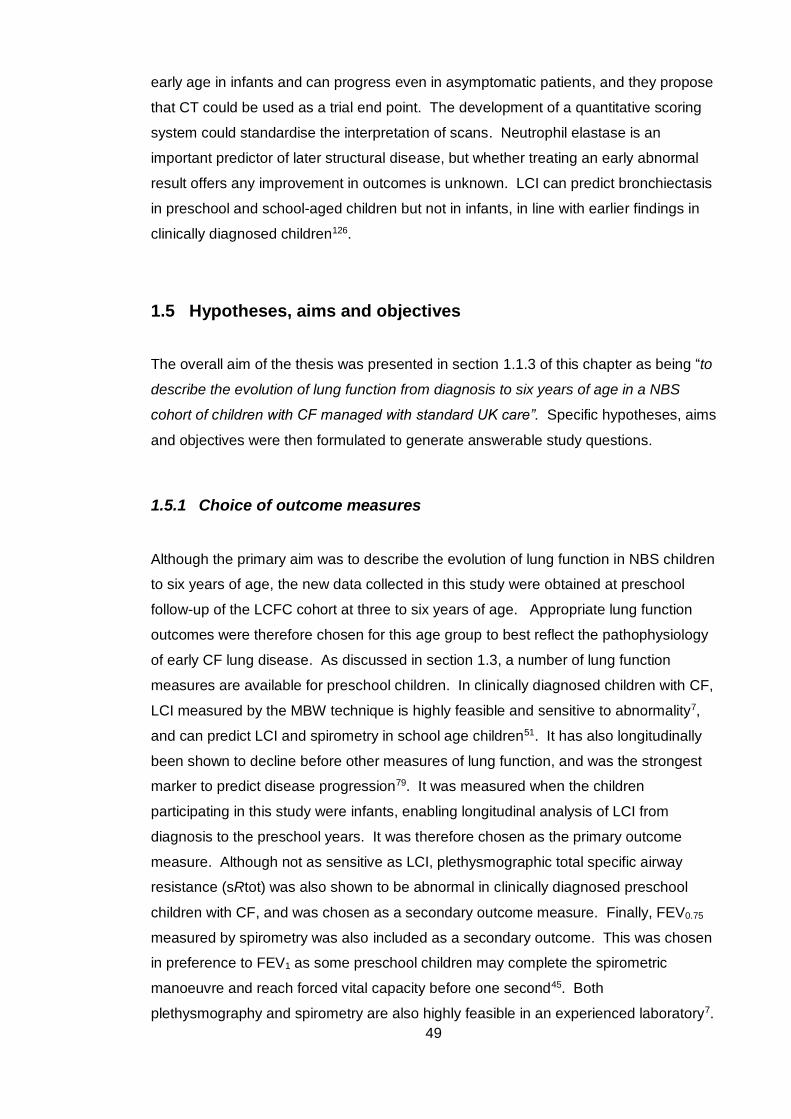
49
early age in infants and can progress even in asymptomatic patients, and they propose
that CT could be used as a trial end point. The development of a quantitative scoring
system could standardise the interpretation of scans. Neutrophil elastase is an
important predictor of later structural disease, but whether treating an early abnormal
result offers any improvement in outcomes is unknown. LCI can predict bronchiectasis
in preschool and school-aged children but not in infants, in line with earlier findings in
clinically diagnosed children126.
1.5 Hypotheses, aims and objectives
The overall aim of the thesis was presented in section 1.1.3 of this chapter as being “to
describe the evolution of lung function from diagnosis to six years of age in a NBS
cohort of children with CF managed with standard UK care”. Specific hypotheses, aims
and objectives were then formulated to generate answerable study questions.
1.5.1 Choice of outcome measures
Although the primary aim was to describe the evolution of lung function in NBS children
to six years of age, the new data collected in this study were obtained at preschool
follow-up of the LCFC cohort at three to six years of age. Appropriate lung function
outcomes were therefore chosen for this age group to best reflect the pathophysiology
of early CF lung disease. As discussed in section 1.3, a number of lung function
measures are available for preschool children. In clinically diagnosed children with CF,
LCI measured by the MBW technique is highly feasible and sensitive to abnormality7,
and can predict LCI and spirometry in school age children51. It has also longitudinally
been shown to decline before other measures of lung function, and was the strongest
marker to predict disease progression79. It was measured when the children
participating in this study were infants, enabling longitudinal analysis of LCI from
diagnosis to the preschool years. It was therefore chosen as the primary outcome
measure. Although not as sensitive as LCI, plethysmographic total specific airway
resistance (sRtot) was also shown to be abnormal in clinically diagnosed preschool
children with CF, and was chosen as a secondary outcome measure. Finally, FEV0.75
measured by spirometry was also included as a secondary outcome. This was chosen
in preference to FEV1 as some preschool children may complete the spirometric
manoeuvre and reach forced vital capacity before one second45. Both
plethysmography and spirometry are also highly feasible in an experienced laboratory7.
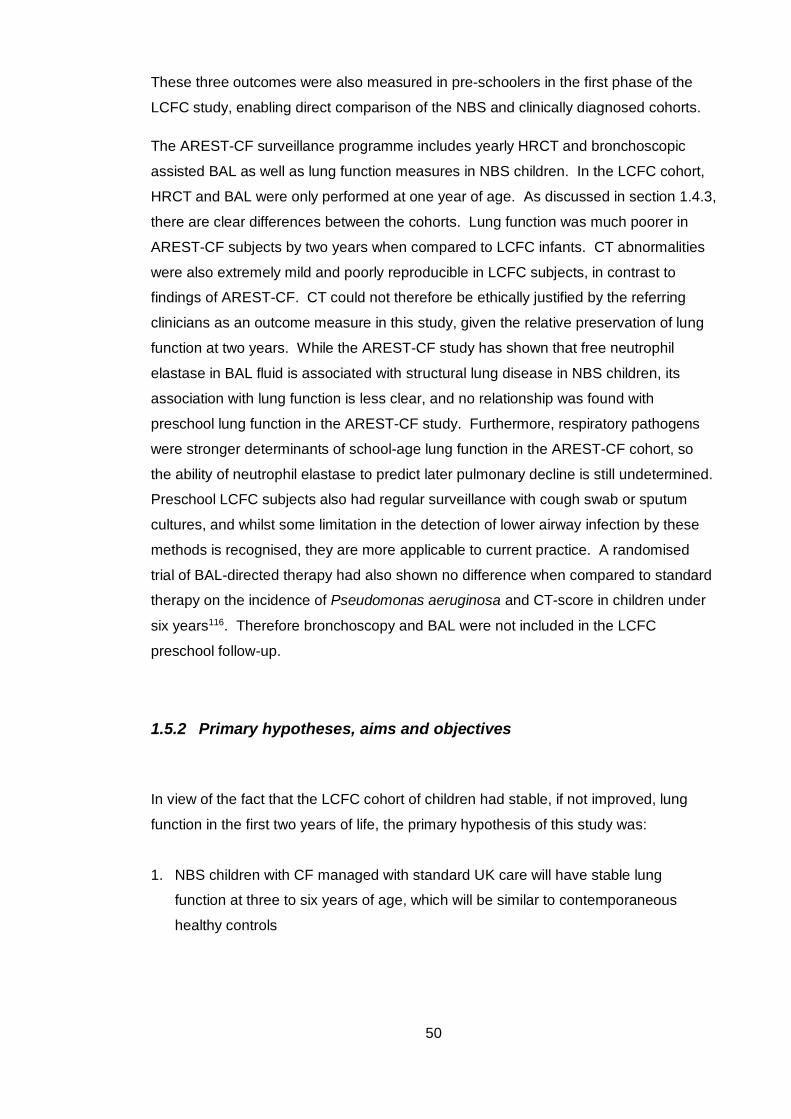
50
These three outcomes were also measured in pre-schoolers in the first phase of the
LCFC study, enabling direct comparison of the NBS and clinically diagnosed cohorts.
The AREST-CF surveillance programme includes yearly HRCT and bronchoscopic
assisted BAL as well as lung function measures in NBS children. In the LCFC cohort,
HRCT and BAL were only performed at one year of age. As discussed in section 1.4.3,
there are clear differences between the cohorts. Lung function was much poorer in
AREST-CF subjects by two years when compared to LCFC infants. CT abnormalities
were also extremely mild and poorly reproducible in LCFC subjects, in contrast to
findings of AREST-CF. CT could not therefore be ethically justified by the referring
clinicians as an outcome measure in this study, given the relative preservation of lung
function at two years. While the AREST-CF study has shown that free neutrophil
elastase in BAL fluid is associated with structural lung disease in NBS children, its
association with lung function is less clear, and no relationship was found with
preschool lung function in the AREST-CF study. Furthermore, respiratory pathogens
were stronger determinants of school-age lung function in the AREST-CF cohort, so
the ability of neutrophil elastase to predict later pulmonary decline is still undetermined.
Preschool LCFC subjects also had regular surveillance with cough swab or sputum
cultures, and whilst some limitation in the detection of lower airway infection by these
methods is recognised, they are more applicable to current practice. A randomised
trial of BAL-directed therapy had also shown no difference when compared to standard
therapy on the incidence of Pseudomonas aeruginosa and CT-score in children under
six years116. Therefore bronchoscopy and BAL were not included in the LCFC
preschool follow-up.
1.5.2 Primary hypotheses, aims and objectives
In view of the fact that the LCFC cohort of children had stable, if not improved, lung
function in the first two years of life, the primary hypothesis of this study was:
1. NBS children with CF managed with standard UK care will have stable lung
function at three to six years of age, which will be similar to contemporaneous
healthy controls

51
The primary aims were:
1. To report lung function in NBS children with CF compared to healthy control
children aged three to six years
2. To describe the evolution of lung function in NBS children with CF from diagnosis to
six years of age
The specific primary objectives were therefore:
1. To measure LCI, sRtot and FEV0.75 using MBW, plethysmography and spirometry in
preschool children with CF and healthy controls (contemporaneous, and also
studied longitudinally), and compare results between the two groups
2. To report lung function longitudinally from diagnosis (~three months) to six years of
age in NBS children with CF
1.5.3 Secondary hypotheses, aims and objectives
The secondary hypotheses were:
1. NBS children will have better lung function than preschool children with a
clinical diagnosis of CF born a decade earlier
2. Infant lung function measures and nutritional markers cannot predict preschool
lung function in NBS children with CF
3. Clinical markers of infection (isolation of bacteria on respiratory samples), and
markers of disease severity (for example courses of intravenous antibiotics) in
infancy will not be significantly associated with preschool lung function primary
outcomes
52
4. Inflammatory markers measured in bronchoalveolar lavage in infancy cannot
predict lung function at three to six years of age
5. Abnormalities on CT (air trapping, bronchial dilatation and total CT score)
measured in infancy cannot predict preschool lung function
The secondary aims were:
1. To compare results of preschool LCI, sRtot and FEV0.75 in NBS children with CF
with the same measures in a previous (non-contemporaneous cohort) of
clinically diagnosed children with CF at the same age
2. To investigate whether measures of lung function, structure, infection,
inflammation and disease severity in infancy can preschool predict lung function
The secondary objectives were:
a) To measure LCI, sRtot and FEV0.75 using MBW, plethysmography and spirometry in
preschool children with CF and healthy controls, and compare results to those
measured in a preschool cohort of children diagnosed with CF a decade earlier
b) To describe the anthropometric characteristics (height, weight and body mass
index) from birth to preschool age in subjects with CF and their association with
preschool lung function (primary outcomes LCI, sRtot and FEV0.75 z-score)
c) To examine whether there is an association between infant lung function measures
(FEV0.5, LCI and FRCpleth) with the preschool lung function primary outcomes
d) To investigate the association between clinical markers in infancy, such as bacterial
isolates, and markers of disease severity, such as courses of intravenous
antibiotics, known to be associated with lung function decline in older children with
preschool lung function
e) To determine the relationship between CT and BAL parameters measured at one
year in the LCFC cohort of NBS children and preschool lung function primary
outcome measures measured at three to six years in the same children
53
1.5.4 Structure of thesis
This thesis is presented in seven chapters. The methodology is presented in Chapter
2, followed by four results chapters. Chapter 3 reports lung function in NBS preschool
children with CF compared to healthy controls. Chapter 4 compares preschool lung
function results in NBS children to those with a clinical diagnosis of CF diagnosed a
decade earlier. Chapters 5 and 6 investigate whether measures of clinical status, lung
function, infection, structure and inflammation can predict preschool lung function in
NBS children with CF. Each results chapter is accompanied by a discussion relative to
the principal findings of each study, and Chapter 7 presents a general discussion of the
implications of results as a whole, with final conclusions and suggestions for future
research.
54
2 Methods
2.1 The LCFC longitudinal studies of children with CF
This thesis compares tests in infancy performed as part of earlier studies of children
with CF by the LCFC. The LCFC was established in the UK in 1999. Five centres
(Great Ormond Street Hospital for Children, The Royal Brompton Hospital, The Royal
London Hospital, University Hospital Lewisham, St. Helier Hospital and King’s College
Hospital) prospectively recruited infants with CF born in South-East England. The aim
was to develop methods to monitor early lung disease in children with CF.
The first phase of the LCFC cohort followed children clinically diagnosed with CF from
diagnosis to adolescence born between 1999 and 2002. Children first had infant lung
function measurements (RVRTC) at diagnosis (~seven months) and repeated at least
six months later. The MBW technique then became available in the laboratory and
further infants were recruited, undergoing MBW and RVRTC age two to 22 months.
Preschool follow up of children at three to six years measured MBW, plethysmographic
specific airway resistance (sRaw) and spirometry. At school age (6-10 years) children
underwent MBW, plethysmography (sRaw and lung volumes) and in addition to lung
function tests HRCT was performed. Reports of longitudinal lung structure and
function from these studies are summarised in section 1.4.2.1.
The introduction of new-born screening in the UK meant that most children with CF
were identified shortly after birth, often before any clinical signs of lung disease were
apparent. The opportunity emerged to study this additional group of children
considering the differences associated with an earlier diagnosis. This second phase of
the LCFC study recruited infants with CF diagnosed by NBS born between 2009 and
2011. The main results in this thesis report lung function of the same NBS infants
during the preschool years (Chapter 3), and include longitudinal data collected from
diagnosis as part of the infant study (Chapters 5 and 6). As the initial recruitment,
measures and protocols in infancy are relevant to the current preschool study they are
summarised below. Chapter 4 compares preschool lung function measurements of
NBS children with the clinically diagnosed cohort, the methodology of this first phase of
the LCFC study is summarised there.
55
2.2 Overview of study design
Data presented in this thesis are measurements from subjects participating in a
prospective longitudinal observational cohort study of lung function, structure and
inflammation in NBS children with CF from diagnosis to preschool age (three to six
years). Lung structure and function up to two years of age (the ‘LCFC NBS infant
study’) have been previously published36, 94, 127, 129 and are summarised in section
1.4.3.1. Infants were recruited and tested as part of an earlier study (not by myself),
Principal Investigator Professor Janet Stocks.
This thesis reports lung function at preschool follow up of LCFC NBS infants.
Preschool children were re-recruited and tested by myself and assistants (detailed on
page 2). Pulmonary function measurements (multiple breath washout,
plethysmographic specific airway resistance and spirometry) were performed in
children with CF and healthy controls at Great Ormond Street Hospital, London UK.
Measures in infancy and at preschool test are summarised in Figure 2.1.
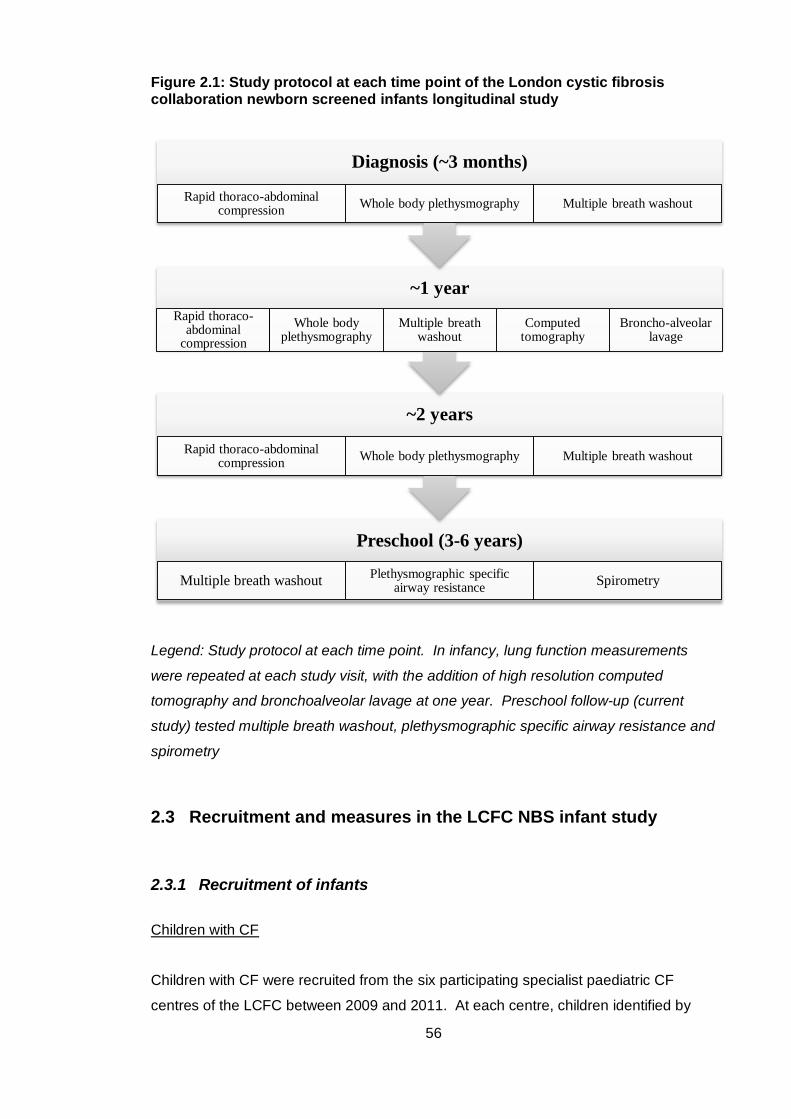
56
Figure 2.1: Study protocol at each time point of the London cystic fibrosis collaboration newborn screened infants longitudinal study
Legend: Study protocol at each time point. In infancy, lung function measurements
were repeated at each study visit, with the addition of high resolution computed
tomography and bronchoalveolar lavage at one year. Preschool follow-up (current
study) tested multiple breath washout, plethysmographic specific airway resistance and
spirometry
2.3 Recruitment and measures in the LCFC NBS infant study
2.3.1 Recruitment of infants
Children with CF
Children with CF were recruited from the six participating specialist paediatric CF
centres of the LCFC between 2009 and 2011. At each centre, children identified by
Preschool (3-6 years)
Multiple breath washoutPlethysmographic specific
airway resistanceSpirometry
~2 years
Rapid thoraco-abdominal compression
Whole body plethysmography Multiple breath washout
~1 year
Rapid thoraco-abdominal
compression
Whole body plethysmography
Multiple breath washout
Computed tomography
Broncho-alveolar lavage
Diagnosis (~3 months)
Rapid thoraco-abdominal compression
Whole body plethysmography Multiple breath washout
57
newborn screening underwent diagnostic sweat testing and if necessary, extended
genotyping for confirmation of the diagnosis. Children diagnosed with CF presenting
with meconium ileus were also included. Children were recruited at a follow up
approximately two weeks after diagnosis by their consultant at the participating centres.
If consent was obtained, infants were enrolled into the LCFC NBS infant study with an
aim to attend the three tests occasions at three months, one year and two years of age.
Healthy infant control subjects
Control subjects were recruited from the Homerton Hospital, London and University
College Hospital, London by research assistants to the LCFC infant study between
2009 and 2011. Eligible subjects were identified from birth lists sent from these
participating centres to the research team, and families contacted after approval from
their General Practitioner. All subjects were term (>36 weeks gestation) and had no
recorded congenital abnormalities, severe illness or known lung disease. If consent
was obtained these families were invited to attend for infant lung function testing and
underwent the same protocol as the CF infants, with the exception of bronchoscopy
and CT at 1 year of age.
2.3.2 Inclusion and exclusion criteria for the LCFC NBS infant study
Healthy control infants
The following inclusion criteria applied when subjects were recruited as infants:
Healthy term infants (born at ≥36 weeks gestation) whose parents
consented to infant lung function measurements
Exclusion criteria:
Diagnosis of respiratory condition (e.g. upper airway abnormality or history
of apnoeic episodes)
Previous hospital admission for respiratory condition (e.g. lower respiratory
tract infection)
Chronic medical condition likely to affect lung function (neonatal lung
disease or neuromuscular, bone, renal or cardiac disease)
History of chronic diarrhoea or failure to thrive
Inability of parents or carers to give informed consent
58
Recruitment contra-indicated because of psycho-social factors
Children with CF
Inclusion criteria:
Infant diagnosed with CF by NBS (positive NBS test, diagnosis confirmed by
sweat test and/or genetic analysis) or presentation with meconium ileus with
diagnostic confirmation of CF referred by one of the six tertiary respiratory
centres in the greater London area
Born at full term (≥36 weeks gestation)
Exclusion criteria:
Additional respiratory or other medical condition likely to affect lung function testing
results
Parents unable to give informed consent
Recruitment contra-indicated because of psycho-social factors
History of upper airway pathology or apnoeic episodes
2.3.3 Measures in infancy
Infant lung function (RVRTC, plethysmography and MBW) was performed shortly after
diagnosis (around three months of age) and repeated in the same children at one and
two years of age. In addition to lung function, HRCT and bronchoscopic assisted BAL
were performed at one year.
On all three test occasions lung function was measured comprising:
RVRTC measuring a forced expiratory flow volume curve, primary outcome
FEV0.5, and secondary outcomes of forced expiratory flows between 25% and
75% of lung volume (FEF25-75) and forced vital capacity (FVC)
Body plethysmography, primary outcome FRCpleth
Multiple breath washout, primary outcome LCI and secondary outcome
FRCMBW
Detailed methodology of infant lung function techniques used in the LCFC NBS infant
study can be found in a previous publication36. At 1 year of age children also
59
underwent volumetric thoracic CT scan performed under general anaesthetic with
adherence to a strict pre- and intra-scan ventilation protocol, scored using the Brody-II
scoring system137. Flexible bronchoscopy and BAL were performed immediately after
CT again with a strict protocol for collection of lavage samples and analysed for
bacterial, fungal and mycobacterial growth, viral immunofluorescence and inflammatory
mediators. Further details of CT and BAL methodology is described in Chapter 6.
2.4 Methodology of the current NBS preschool follow-up study
Original data presented in this thesis was collected at preschool follow-up of subjects
participating in the NBS LCFC infant study between three to six years of age. A more
detailed description of recruitment and measures in this study is therefore presented in
the following sections of this chapter.
2.4.1 Ethical approval
This study was approved by the National Research Ethics Service (NRES) Committee
London- Bloomsbury REC (Ref No: 12/LO1668) and the Local Research Ethics
Committees of each of the six collaborating centres.
2.4.2 Recruitment of preschool children
We identified and compiled data sheets of infants with CF and healthy controls who
took part in the infant LCFC study and had successful measurements (i.e. completed
the full test protocol) on at least one infant test occasion. Parents of children who had
consented to be contacted for future research were contacted to participate in the
preschool follow-up study. Families were contacted by post initially with a written
information sheet detailing the tests involved in the study (Appendix 1), and the
consent form for the study so that they had the opportunity to read this before the test
occasion. Parents were given at least two weeks to do this and were then contacted
by the author or a research assistant (Emma Raywood [ER] and Sarah Legg [SL]) to
discuss participation and to answer any questions regarding testing.

60
2.4.3 Inclusion and exclusion criteria
Healthy control children:
Inclusion criteria at preschool follow-up were as follows:
Age >2 years and < 6 years at time of recruitment
A valid result on at least one infant lung function test occasion
Exclusion criteria:
A new diagnosis (after infant test occasion) of any respiratory condition or upper
airway pathology (including recurrent wheeze, asthma and chronic cough)
Use of medication for reactive airways disease (e.g. bronchodilators) in the twelve
months preceding test occasion
Frequent use of antibiotics for respiratory symptoms (arbitrarily, <5 courses in the
twelve months preceding test occasion)
A new diagnosis of a chronic medical condition likely to affect respiration (i.e.
neuromuscular, bone, renal or cardiac disease)
Symptoms of respiratory illness or the use of medication for respiratory illness in
the three weeks preceding test occasion
Parents unable to give informed consent
Re-recruitment contra-indicated because of psycho-social factors
Children with CF:
Age >2 years and <6 years at time of recruitment
A valid result on at least one infant lung function test occasion
Exclusion criteria:
A new diagnosis of a chronic medical condition likely to affect respiration (i.e. upper
airway pathology, neuromuscular, bone or cardiac disease)
Symptoms of respiratory exacerbation or the use of medication for respiratory
illness in the three weeks preceding test occasion
Parents unable to give informed consent
Re-recruitment contra-indicated because of psycho-social factors
Children with CF were managed on a standardised treatment protocol agreed by
members of the participating centres in the LCFC NBS infant study (Appendix 2).
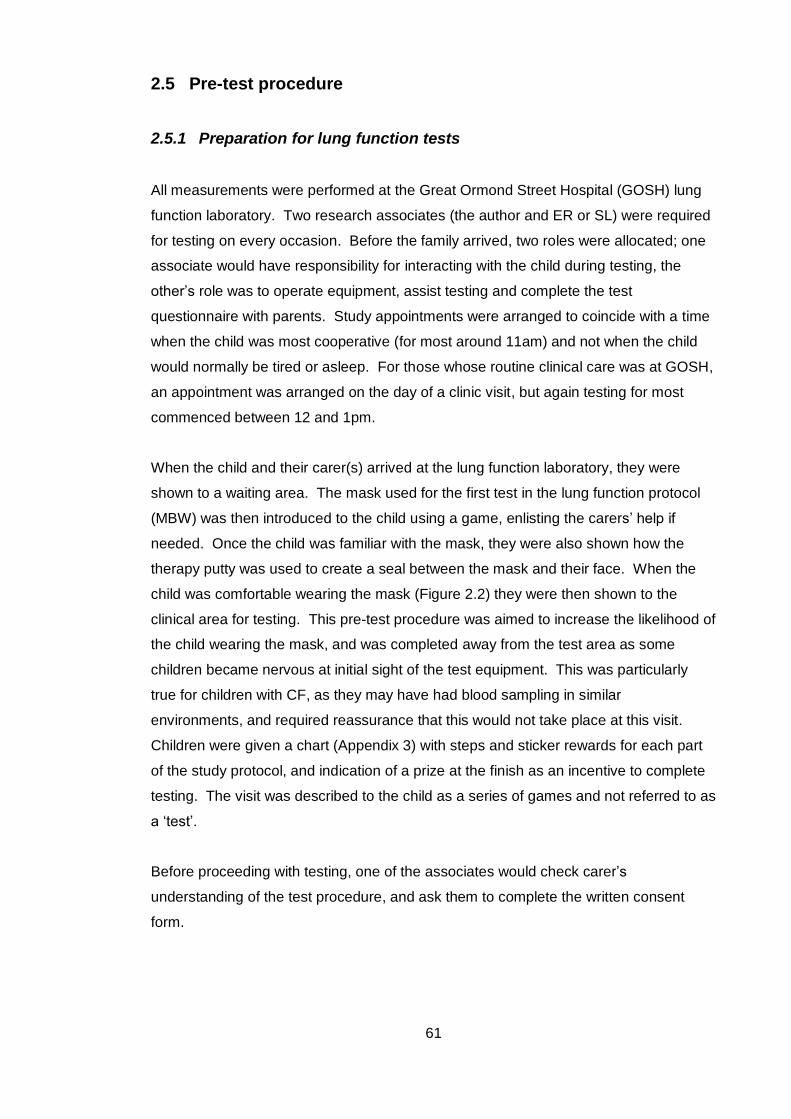
61
2.5 Pre-test procedure
2.5.1 Preparation for lung function tests
All measurements were performed at the Great Ormond Street Hospital (GOSH) lung
function laboratory. Two research associates (the author and ER or SL) were required
for testing on every occasion. Before the family arrived, two roles were allocated; one
associate would have responsibility for interacting with the child during testing, the
other’s role was to operate equipment, assist testing and complete the test
questionnaire with parents. Study appointments were arranged to coincide with a time
when the child was most cooperative (for most around 11am) and not when the child
would normally be tired or asleep. For those whose routine clinical care was at GOSH,
an appointment was arranged on the day of a clinic visit, but again testing for most
commenced between 12 and 1pm.
When the child and their carer(s) arrived at the lung function laboratory, they were
shown to a waiting area. The mask used for the first test in the lung function protocol
(MBW) was then introduced to the child using a game, enlisting the carers’ help if
needed. Once the child was familiar with the mask, they were also shown how the
therapy putty was used to create a seal between the mask and their face. When the
child was comfortable wearing the mask (Figure 2.2) they were then shown to the
clinical area for testing. This pre-test procedure was aimed to increase the likelihood of
the child wearing the mask, and was completed away from the test area as some
children became nervous at initial sight of the test equipment. This was particularly
true for children with CF, as they may have had blood sampling in similar
environments, and required reassurance that this would not take place at this visit.
Children were given a chart (Appendix 3) with steps and sticker rewards for each part
of the study protocol, and indication of a prize at the finish as an incentive to complete
testing. The visit was described to the child as a series of games and not referred to as
a ‘test’.
Before proceeding with testing, one of the associates would check carer’s
understanding of the test procedure, and ask them to complete the written consent
form.
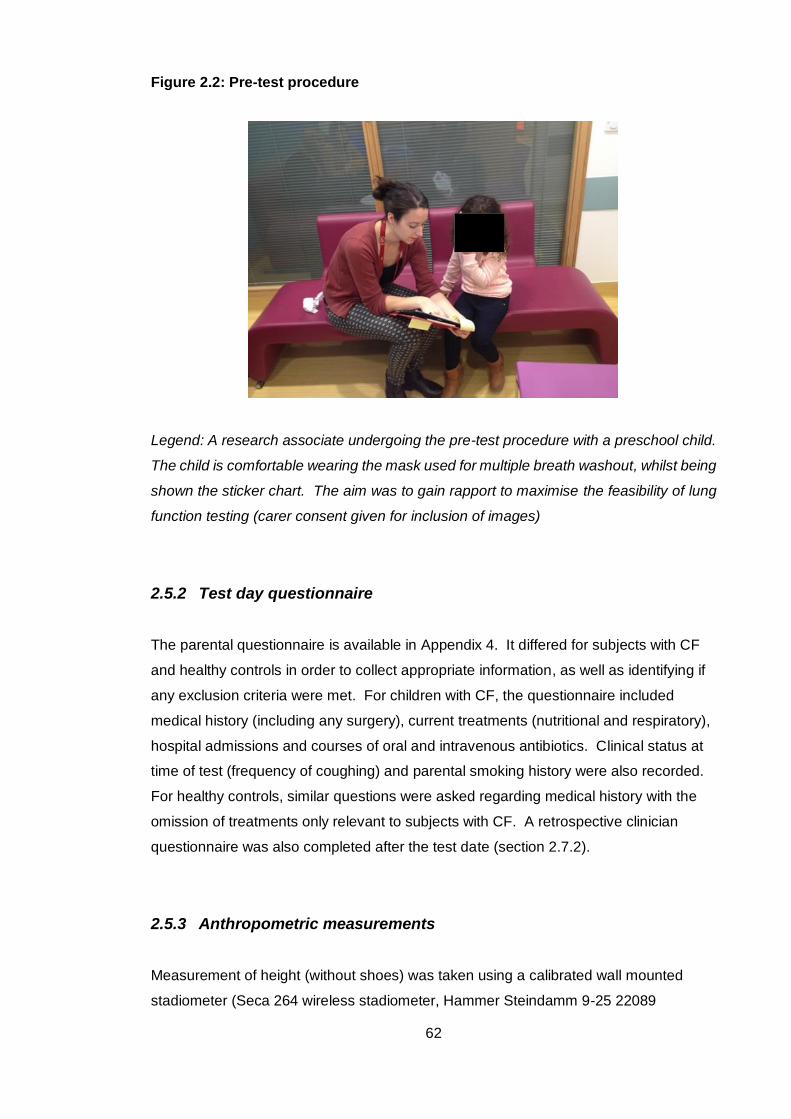
62
Figure 2.2: Pre-test procedure
Legend: A research associate undergoing the pre-test procedure with a preschool child.
The child is comfortable wearing the mask used for multiple breath washout, whilst being
shown the sticker chart. The aim was to gain rapport to maximise the feasibility of lung
function testing (carer consent given for inclusion of images)
2.5.2 Test day questionnaire
The parental questionnaire is available in Appendix 4. It differed for subjects with CF
and healthy controls in order to collect appropriate information, as well as identifying if
any exclusion criteria were met. For children with CF, the questionnaire included
medical history (including any surgery), current treatments (nutritional and respiratory),
hospital admissions and courses of oral and intravenous antibiotics. Clinical status at
time of test (frequency of coughing) and parental smoking history were also recorded.
For healthy controls, similar questions were asked regarding medical history with the
omission of treatments only relevant to subjects with CF. A retrospective clinician
questionnaire was also completed after the test date (section 2.7.2).
2.5.3 Anthropometric measurements
Measurement of height (without shoes) was taken using a calibrated wall mounted
stadiometer (Seca 264 wireless stadiometer, Hammer Steindamm 9-25 22089
63
Hamburg, Germany) to two decimal places with the feet, body and back of head
against the stadiometer with the child looking directly ahead. This was repeated two to
three times until two measurements were within 0.5cm of each other and the mean
value of the two recorded. Sitting height was measured in a similar way with the child
sitting up straight on a stool (height 45.50cm) and calculated by subtracting the stool
height from standing height. Weight was measured without shoes and with minimal
clothing using daily calibrated electronic scales (Marsden MC-250, Marsden W/M
group limited, Henley-on-Thames, Oxfordshire, UK) recorded to two decimal places.
Standard deviation scores for height, weight and body mass index were calculated to
adjust for age and gender.
2.5.4 Clinical examination
Examination was performed by a clinician (the author or Paul Aurora, Ema Kavalinute
and Anjay Pillai). Respiratory rate, signs of respiratory distress, location of crackles or
wheeze (if present) and any other abnormality on examination were recorded. In
addition, pre- and post-test transcutaneous heart rate and O2 saturations were
recorded using a pulse oximeter (Rad-5v, Masimo Corporation, 40 Parker Irvine, CA
92618 USA).
2.6 Preschool lung function protocol
2.6.1 Choice of outcome measures
The following lung function tests were performed, the rationale for each is discussed in
section 1.5.1.
MBW, primary outcome LCI
Whole body plethysmography, primary outcome sRtot
Spirometry, primary outcome FEV0.75
They were performed in the above order as bronchoconstriction or alteration of airway
mechanics can occur with the deep inspiration in forced spirometry, and affect the tidal
breathing that is required for MBW and plethysmography.
64
2.6.2 Multiple breath washout
2.6.2.1 Equipment and calibration
Figure 2.3 shows the laboratory room used for MBW testing. The equipment for gas
analysis, interface with child (mask, pneumotachometer and connectors), pressure
transducer and equipment calibration will be described in following sections.
Figure 2.3: Equipment for multiple breath washout measurement
Legend: Equipment for multiple breath washout measurement in the lung function
laboratory. The child sits on the green chair and investigator on the red chair. The
pneumotachometer, mask and connectors are released from the supporting arm and
held by the investigator during testing
Pneumotachometer, transducer and demodulator
To measure and display flow, a pneumotachometer-transducer-demodulator system
was used. Gas flow was measured by a Fleisch number one pneumotachometer
Preschool chairs for child and investigator
Bias flow system
Facemask, pneumotachometer
and connectors
Mass spectrometer
Gas cylinders (calibration grey, test gas green)
Data collection personal computer
Transducer and delay box
Personal computer for DVD display
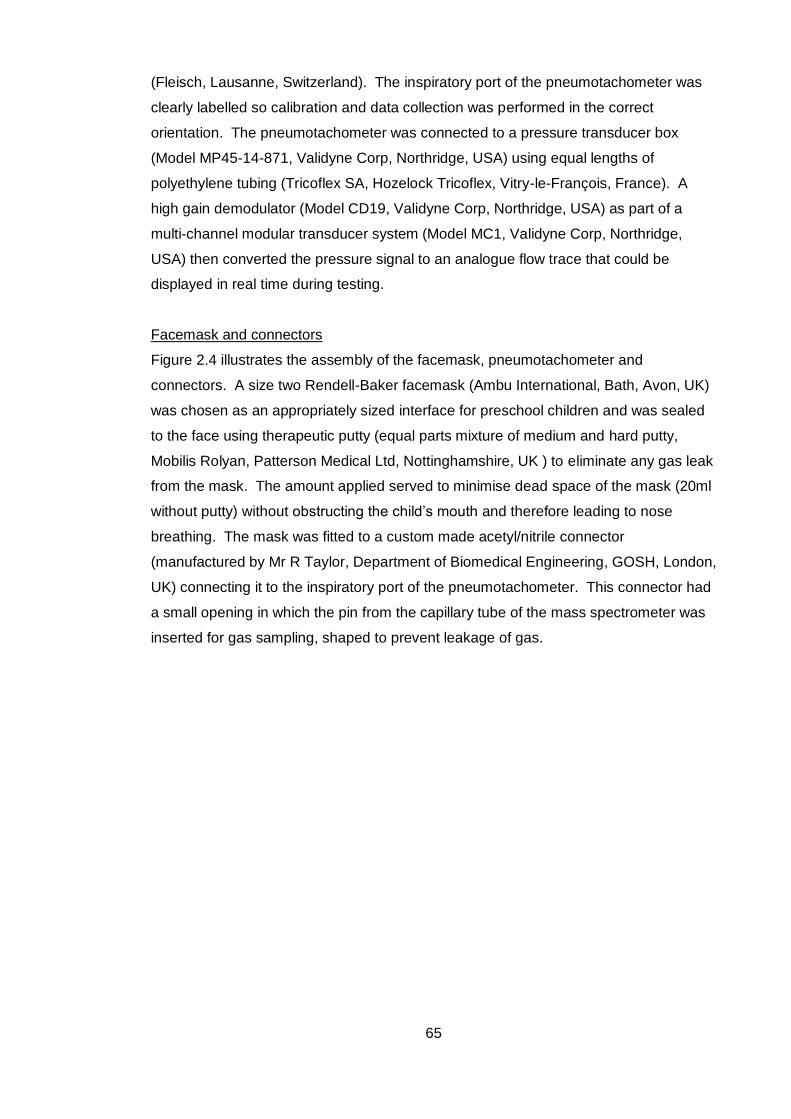
65
(Fleisch, Lausanne, Switzerland). The inspiratory port of the pneumotachometer was
clearly labelled so calibration and data collection was performed in the correct
orientation. The pneumotachometer was connected to a pressure transducer box
(Model MP45-14-871, Validyne Corp, Northridge, USA) using equal lengths of
polyethylene tubing (Tricoflex SA, Hozelock Tricoflex, Vitry-le-François, France). A
high gain demodulator (Model CD19, Validyne Corp, Northridge, USA) as part of a
multi-channel modular transducer system (Model MC1, Validyne Corp, Northridge,
USA) then converted the pressure signal to an analogue flow trace that could be
displayed in real time during testing.
Facemask and connectors
Figure 2.4 illustrates the assembly of the facemask, pneumotachometer and
connectors. A size two Rendell-Baker facemask (Ambu International, Bath, Avon, UK)
was chosen as an appropriately sized interface for preschool children and was sealed
to the face using therapeutic putty (equal parts mixture of medium and hard putty,
Mobilis Rolyan, Patterson Medical Ltd, Nottinghamshire, UK ) to eliminate any gas leak
from the mask. The amount applied served to minimise dead space of the mask (20ml
without putty) without obstructing the child’s mouth and therefore leading to nose
breathing. The mask was fitted to a custom made acetyl/nitrile connector
(manufactured by Mr R Taylor, Department of Biomedical Engineering, GOSH, London,
UK) connecting it to the inspiratory port of the pneumotachometer. This connector had
a small opening in which the pin from the capillary tube of the mass spectrometer was
inserted for gas sampling, shaped to prevent leakage of gas.
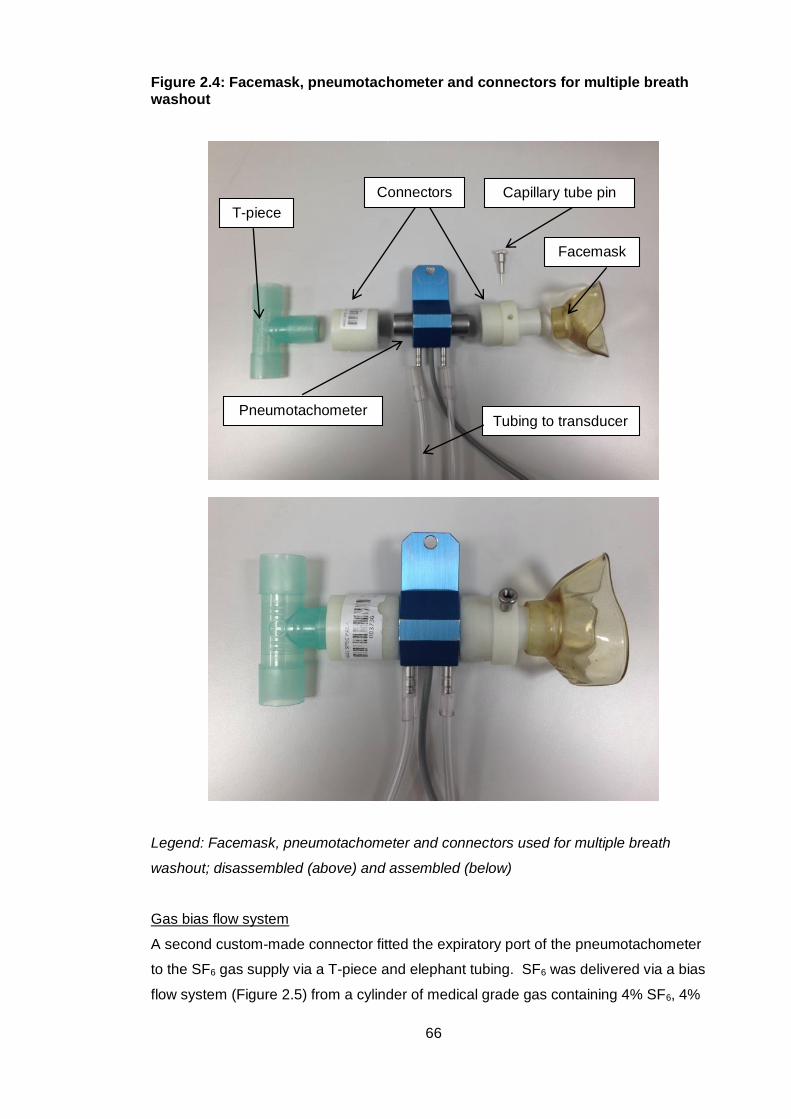
66
Figure 2.4: Facemask, pneumotachometer and connectors for multiple breath washout
Legend: Facemask, pneumotachometer and connectors used for multiple breath
washout; disassembled (above) and assembled (below)
Gas bias flow system
A second custom-made connector fitted the expiratory port of the pneumotachometer
to the SF6 gas supply via a T-piece and elephant tubing. SF6 was delivered via a bias
flow system (Figure 2.5) from a cylinder of medical grade gas containing 4% SF6, 4%
T-piece
Connectors
Pneumotachometer
Capillary tube pin
Facemask
Tubing to transducer
67
He, 21% O2, and balance N2 (British Oxygen Company, Guildford, UK). The gas
cylinder was connected to a first piece of elephant tubing and one port of the T-piece,
the middle port of the T-piece attached to the expiratory port of the pneumotachometer,
then a second length of elephant tubing was connected to the remaining port of the T-
piece with its end open to the atmosphere.
Figure 2.5: Gas bias flow system for multiple breath washout
Legend: In the bias flow circuit, gas is delivered from a cylinder to a t-piece via
elephant tubing. Gas flow is set higher than the subject’s tidal flow rate so the subject
can breathe in the gas to equilibrium concentration whilst excess gas flows into the
atmosphere
Gas analysis
A quadrupole mass spectrometer was used for gas analysis (AMIS 2000, Innovision,
Odense, Denmark), which identifies gases based on their mass-to-charge ratio and
measures the abundance of gas phase ions. The quadrupole refers to four metal
electrode rods arranged so that two positive and two negative rods lie in parallel. Gas
samples are drawn down a capillary tube into a vacuum chamber at a rate of 15ml/min.
Ions are then created by contact with an electrical filament, and then accelerated
towards a detector. A direct current applied to the electrodes determines the overall
positive or negative charge, and an alternating current is also applied, creating an
oscillating electrical field. The voltage is varied so at any one time, only ions of a
certain mass charge ratio (i.e. only one gas of a particular molecular mass) can travel
between the rods to the detector. Others have unstable trajectories, collide with the
Gas delivery from cylinder End of bias flow circuit open to atmosphere
Pneumotachometer flow signal to
pressure transducer Gas signal to mass spectrometer
Subject
68
electrodes, and are therefore filtered out. With this system, rapid cycling of the
electrical field allows up to twelve gases to be measured sequentially, displayed online
and saved for later analysis. The mass spectrometer was set to measure SF6, He, N2,
O2) and CO2. The analogue output from the mass spectrometer was linked to a
personal computer that also displayed input from the demodulator (see below) so that
gas concentration and flow could be displayed in real time during testing.
Calibration and delay switch
The pneumotachometer was calibrated (unheated) before each test with separate
calibration constants for inspiratory and expiratory flows using a custom made 241mL
syringe (Department of Biomedical Engineering, GOSH, London, UK) by the author,
ER or SL. Once calibrated the pneumotachometer was heated to 37 degrees for
testing (Heater model FWS4D, Hugo Sachs Elektronik, March, Germany).
According to manufacturer’s instructions the AMIS 2000 was two point calibrated once
daily using certified concentration calibration gas (alpha-gravimetric standard, British
Oxygen Company, Guildford, UK) containing 3.97% He, 3.98% SF6 , 7.04% CO2, 21%
O2 and 64% N2. Signal to noise ratio of greater than 100 was accepted. A short
calibration was performed immediately before each measurement. To allow for the
delay between the gas bolus measured at the capillary inlet of the mass spectrometer
and processing to the recording software programme, a custom delay switch was used
(Mr E Bergsten, Swedish Defense Research Agency, Department of Defense
Medicine, Linköping, Sweden). The delay was measured daily using a software
programme that recorded a median of ten gas bolus delay measurements and rise
times for SF6, He and CO2 signals. The median delay was then incorporated into the
online recording programme to align flow and gas concentration signals.
Analogue gas flow and volume signals from the demodulator, and gas concentration
from the mass spectrometer were recorded by a personal computer (Compaq 6820s,
Hewlett Packard, Palo Alto, California, USA) in a custom made software programme
(TestPoint, Capital Equipment Corp., Billerica, MA, USA). During the test the software
displayed online flow, volume and SF6 concentration signals. The software corrected
the flow and volume signal for body temperature, pressure, water vapour saturated
(BTPS) conditions and also for changes in gas viscosity of each gas sample, as the
gas composition varied during the test.
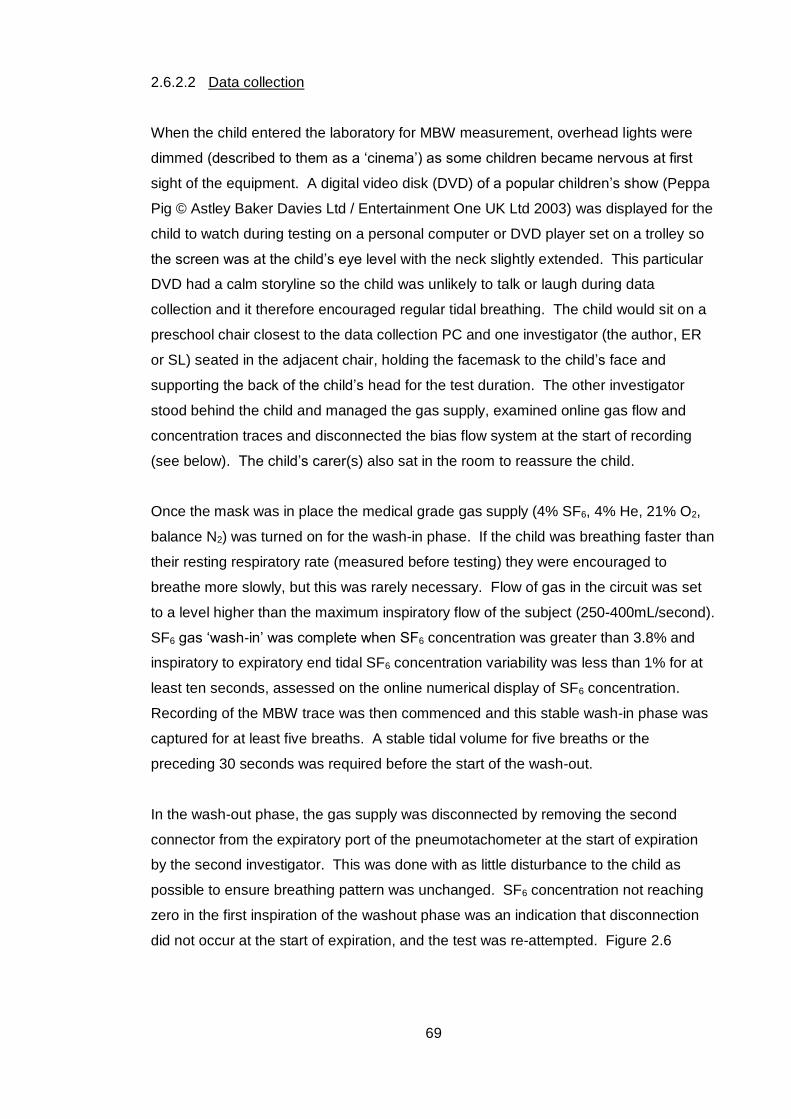
69
2.6.2.2 Data collection
When the child entered the laboratory for MBW measurement, overhead lights were
dimmed (described to them as a ‘cinema’) as some children became nervous at first
sight of the equipment. A digital video disk (DVD) of a popular children’s show (Peppa
Pig © Astley Baker Davies Ltd / Entertainment One UK Ltd 2003) was displayed for the
child to watch during testing on a personal computer or DVD player set on a trolley so
the screen was at the child’s eye level with the neck slightly extended. This particular
DVD had a calm storyline so the child was unlikely to talk or laugh during data
collection and it therefore encouraged regular tidal breathing. The child would sit on a
preschool chair closest to the data collection PC and one investigator (the author, ER
or SL) seated in the adjacent chair, holding the facemask to the child’s face and
supporting the back of the child’s head for the test duration. The other investigator
stood behind the child and managed the gas supply, examined online gas flow and
concentration traces and disconnected the bias flow system at the start of recording
(see below). The child’s carer(s) also sat in the room to reassure the child.
Once the mask was in place the medical grade gas supply (4% SF6, 4% He, 21% O2,
balance N2) was turned on for the wash-in phase. If the child was breathing faster than
their resting respiratory rate (measured before testing) they were encouraged to
breathe more slowly, but this was rarely necessary. Flow of gas in the circuit was set
to a level higher than the maximum inspiratory flow of the subject (250-400mL/second).
SF6 gas ‘wash-in’ was complete when SF6 concentration was greater than 3.8% and
inspiratory to expiratory end tidal SF6 concentration variability was less than 1% for at
least ten seconds, assessed on the online numerical display of SF6 concentration.
Recording of the MBW trace was then commenced and this stable wash-in phase was
captured for at least five breaths. A stable tidal volume for five breaths or the
preceding 30 seconds was required before the start of the wash-out.
In the wash-out phase, the gas supply was disconnected by removing the second
connector from the expiratory port of the pneumotachometer at the start of expiration
by the second investigator. This was done with as little disturbance to the child as
possible to ensure breathing pattern was unchanged. SF6 concentration not reaching
zero in the first inspiration of the washout phase was an indication that disconnection
did not occur at the start of expiration, and the test was re-attempted. Figure 2.6
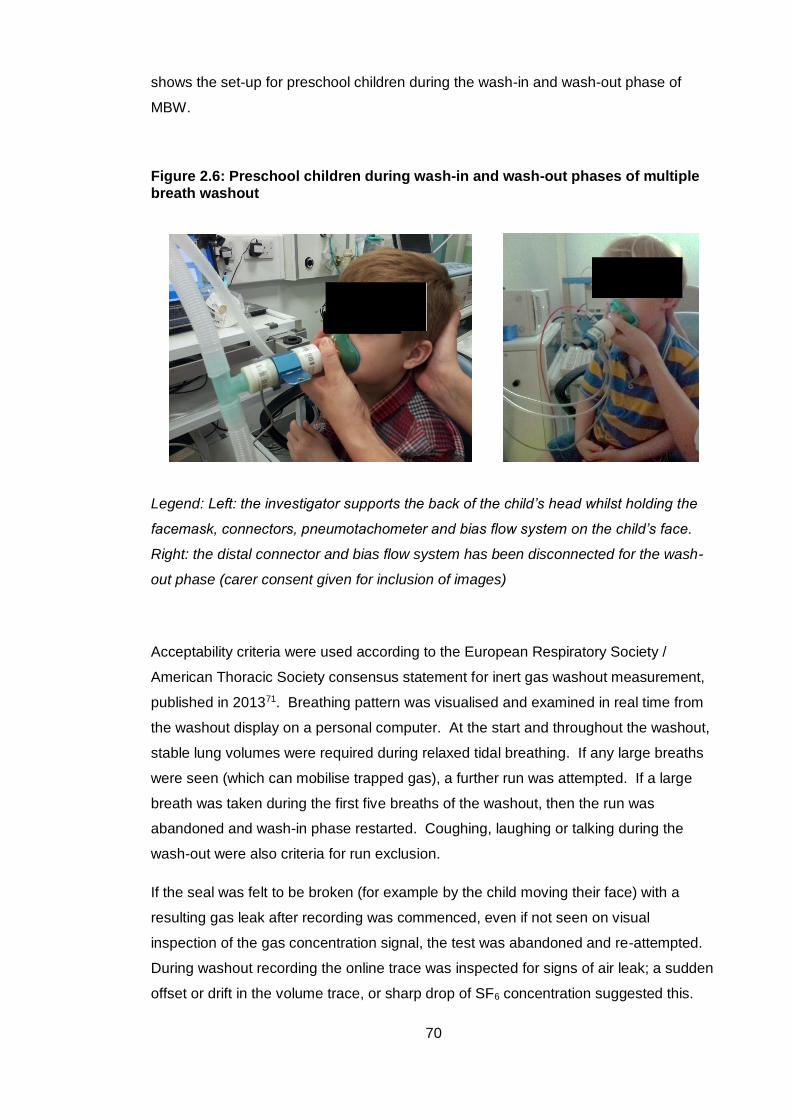
70
shows the set-up for preschool children during the wash-in and wash-out phase of
MBW.
Figure 2.6: Preschool children during wash-in and wash-out phases of multiple breath washout
Legend: Left: the investigator supports the back of the child’s head whilst holding the
facemask, connectors, pneumotachometer and bias flow system on the child’s face.
Right: the distal connector and bias flow system has been disconnected for the wash-
out phase (carer consent given for inclusion of images)
Acceptability criteria were used according to the European Respiratory Society /
American Thoracic Society consensus statement for inert gas washout measurement,
published in 201371. Breathing pattern was visualised and examined in real time from
the washout display on a personal computer. At the start and throughout the washout,
stable lung volumes were required during relaxed tidal breathing. If any large breaths
were seen (which can mobilise trapped gas), a further run was attempted. If a large
breath was taken during the first five breaths of the washout, then the run was
abandoned and wash-in phase restarted. Coughing, laughing or talking during the
wash-out were also criteria for run exclusion.
If the seal was felt to be broken (for example by the child moving their face) with a
resulting gas leak after recording was commenced, even if not seen on visual
inspection of the gas concentration signal, the test was abandoned and re-attempted.
During washout recording the online trace was inspected for signs of air leak; a sudden
offset or drift in the volume trace, or sharp drop of SF6 concentration suggested this.
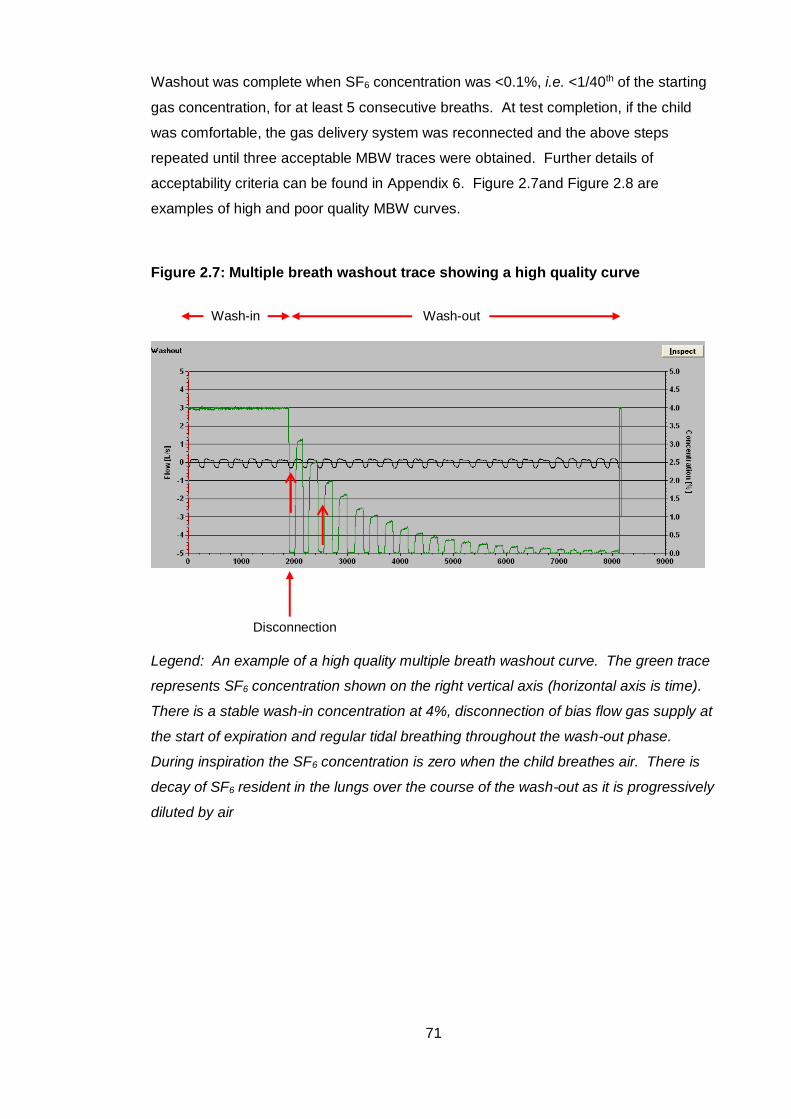
71
Washout was complete when SF6 concentration was <0.1%, i.e. <1/40th of the starting
gas concentration, for at least 5 consecutive breaths. At test completion, if the child
was comfortable, the gas delivery system was reconnected and the above steps
repeated until three acceptable MBW traces were obtained. Further details of
acceptability criteria can be found in Appendix 6. Figure 2.7and Figure 2.8 are
examples of high and poor quality MBW curves.
Figure 2.7: Multiple breath washout trace showing a high quality curve
Legend: An example of a high quality multiple breath washout curve. The green trace
represents SF6 concentration shown on the right vertical axis (horizontal axis is time).
There is a stable wash-in concentration at 4%, disconnection of bias flow gas supply at
the start of expiration and regular tidal breathing throughout the wash-out phase.
During inspiration the SF6 concentration is zero when the child breathes air. There is
decay of SF6 resident in the lungs over the course of the wash-out as it is progressively
diluted by air
Wash-in
Disconnection
Wash-out
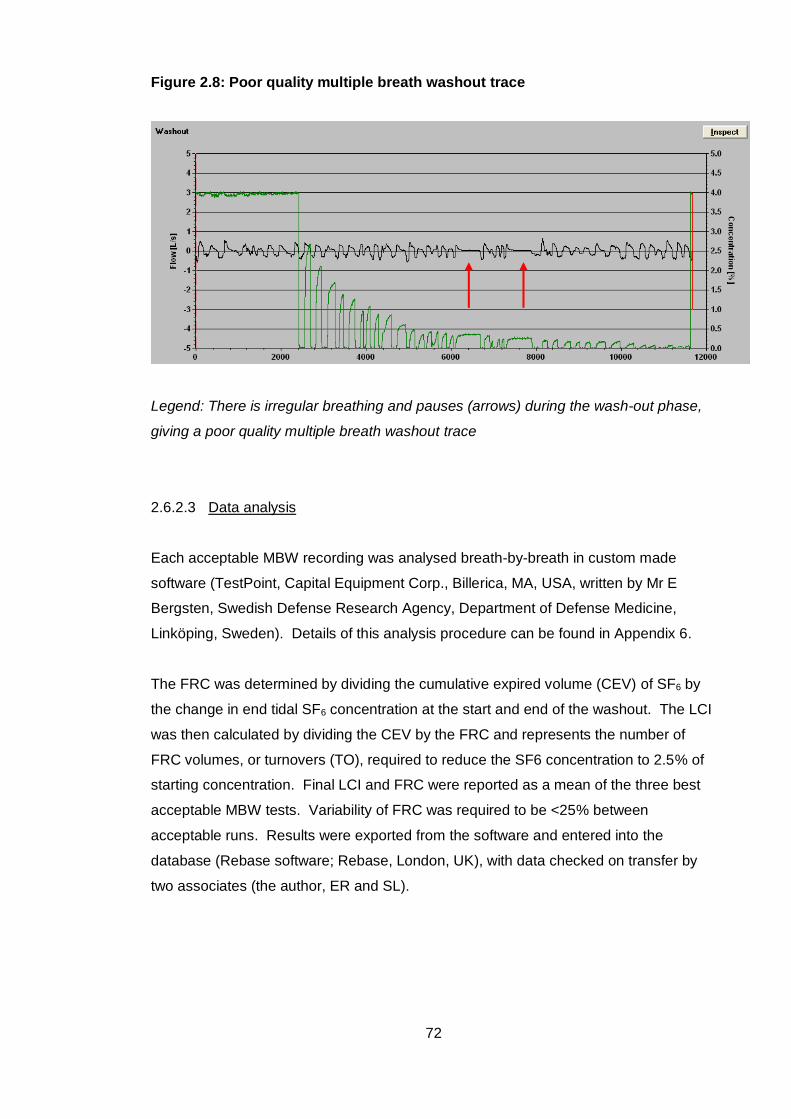
72
Figure 2.8: Poor quality multiple breath washout trace
Legend: There is irregular breathing and pauses (arrows) during the wash-out phase,
giving a poor quality multiple breath washout trace
2.6.2.3 Data analysis
Each acceptable MBW recording was analysed breath-by-breath in custom made
software (TestPoint, Capital Equipment Corp., Billerica, MA, USA, written by Mr E
Bergsten, Swedish Defense Research Agency, Department of Defense Medicine,
Linköping, Sweden). Details of this analysis procedure can be found in Appendix 6.
The FRC was determined by dividing the cumulative expired volume (CEV) of SF6 by
the change in end tidal SF6 concentration at the start and end of the washout. The LCI
was then calculated by dividing the CEV by the FRC and represents the number of
FRC volumes, or turnovers (TO), required to reduce the SF6 concentration to 2.5% of
starting concentration. Final LCI and FRC were reported as a mean of the three best
acceptable MBW tests. Variability of FRC was required to be <25% between
acceptable runs. Results were exported from the software and entered into the
database (Rebase software; Rebase, London, UK), with data checked on transfer by
two associates (the author, ER and SL).
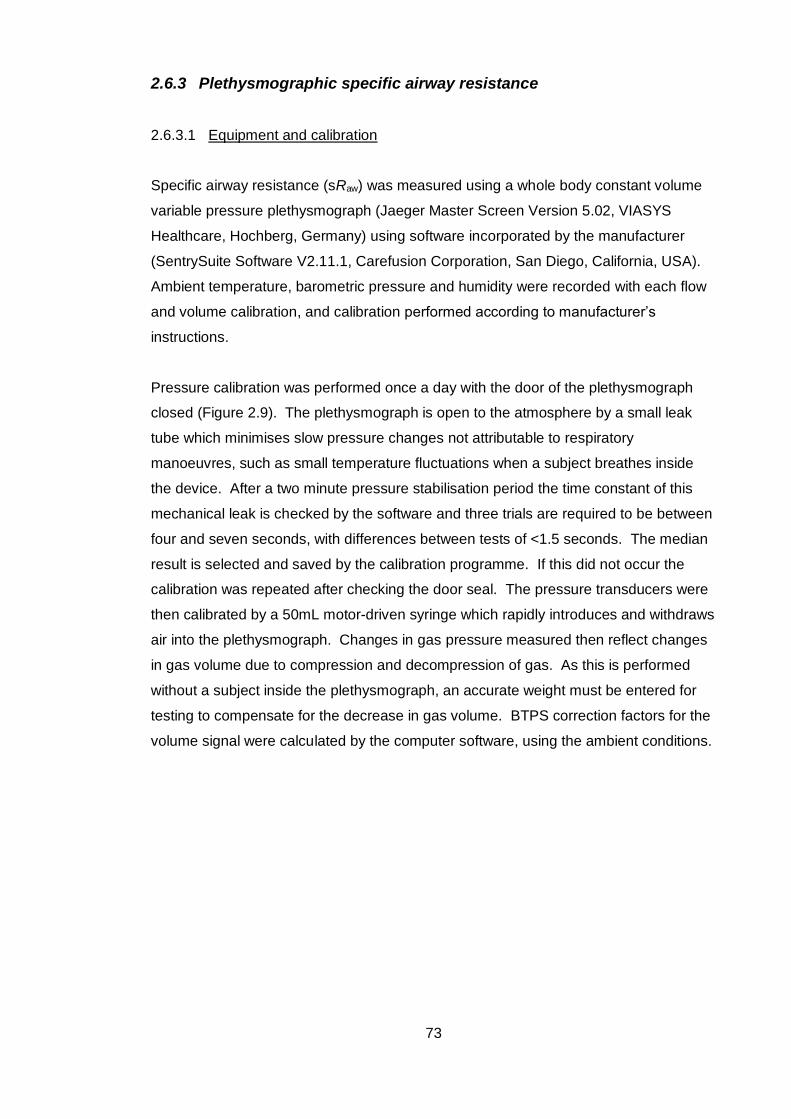
73
2.6.3 Plethysmographic specific airway resistance
2.6.3.1 Equipment and calibration
Specific airway resistance (sRaw) was measured using a whole body constant volume
variable pressure plethysmograph (Jaeger Master Screen Version 5.02, VIASYS
Healthcare, Hochberg, Germany) using software incorporated by the manufacturer
(SentrySuite Software V2.11.1, Carefusion Corporation, San Diego, California, USA).
Ambient temperature, barometric pressure and humidity were recorded with each flow
and volume calibration, and calibration performed according to manufacturer’s
instructions.
Pressure calibration was performed once a day with the door of the plethysmograph
closed (Figure 2.9). The plethysmograph is open to the atmosphere by a small leak
tube which minimises slow pressure changes not attributable to respiratory
manoeuvres, such as small temperature fluctuations when a subject breathes inside
the device. After a two minute pressure stabilisation period the time constant of this
mechanical leak is checked by the software and three trials are required to be between
four and seven seconds, with differences between tests of <1.5 seconds. The median
result is selected and saved by the calibration programme. If this did not occur the
calibration was repeated after checking the door seal. The pressure transducers were
then calibrated by a 50mL motor-driven syringe which rapidly introduces and withdraws
air into the plethysmograph. Changes in gas pressure measured then reflect changes
in gas volume due to compression and decompression of gas. As this is performed
without a subject inside the plethysmograph, an accurate weight must be entered for
testing to compensate for the decrease in gas volume. BTPS correction factors for the
volume signal were calculated by the computer software, using the ambient conditions.
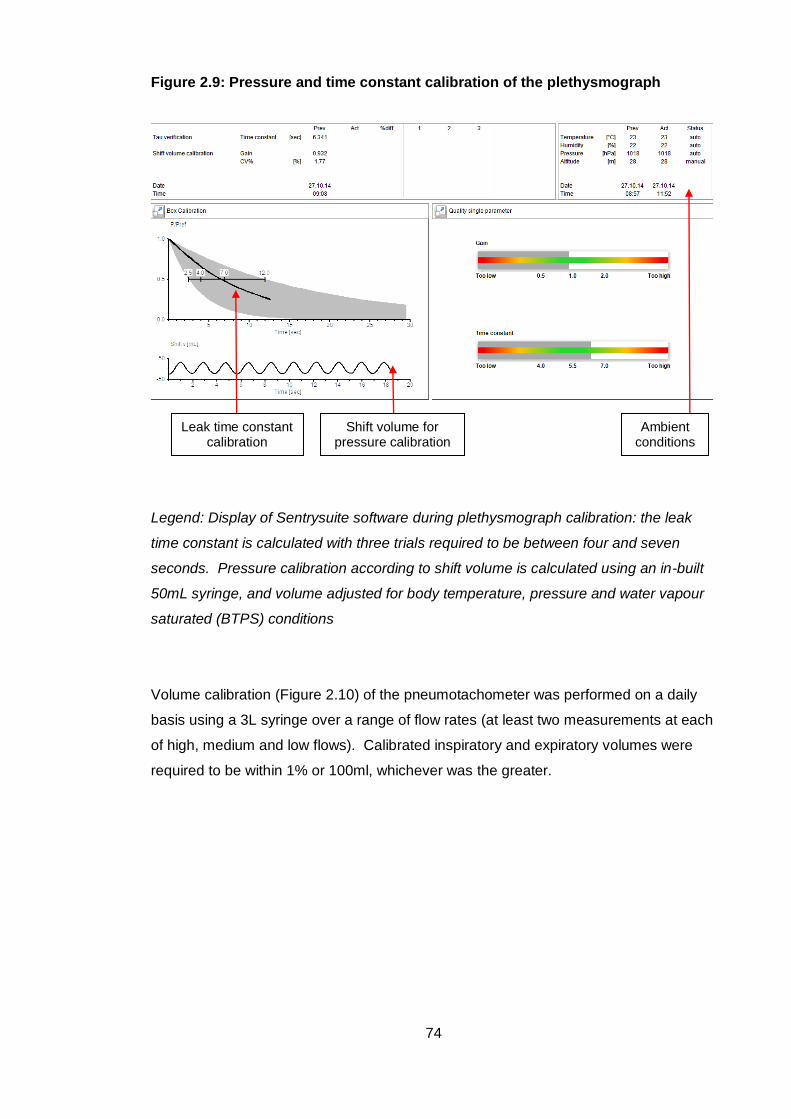
74
Figure 2.9: Pressure and time constant calibration of the plethysmograph
Legend: Display of Sentrysuite software during plethysmograph calibration: the leak
time constant is calculated with three trials required to be between four and seven
seconds. Pressure calibration according to shift volume is calculated using an in-built
50mL syringe, and volume adjusted for body temperature, pressure and water vapour
saturated (BTPS) conditions
Volume calibration (Figure 2.10) of the pneumotachometer was performed on a daily
basis using a 3L syringe over a range of flow rates (at least two measurements at each
of high, medium and low flows). Calibrated inspiratory and expiratory volumes were
required to be within 1% or 100ml, whichever was the greater.
Leak time constant calibration
Ambient conditions
Shift volume for pressure calibration
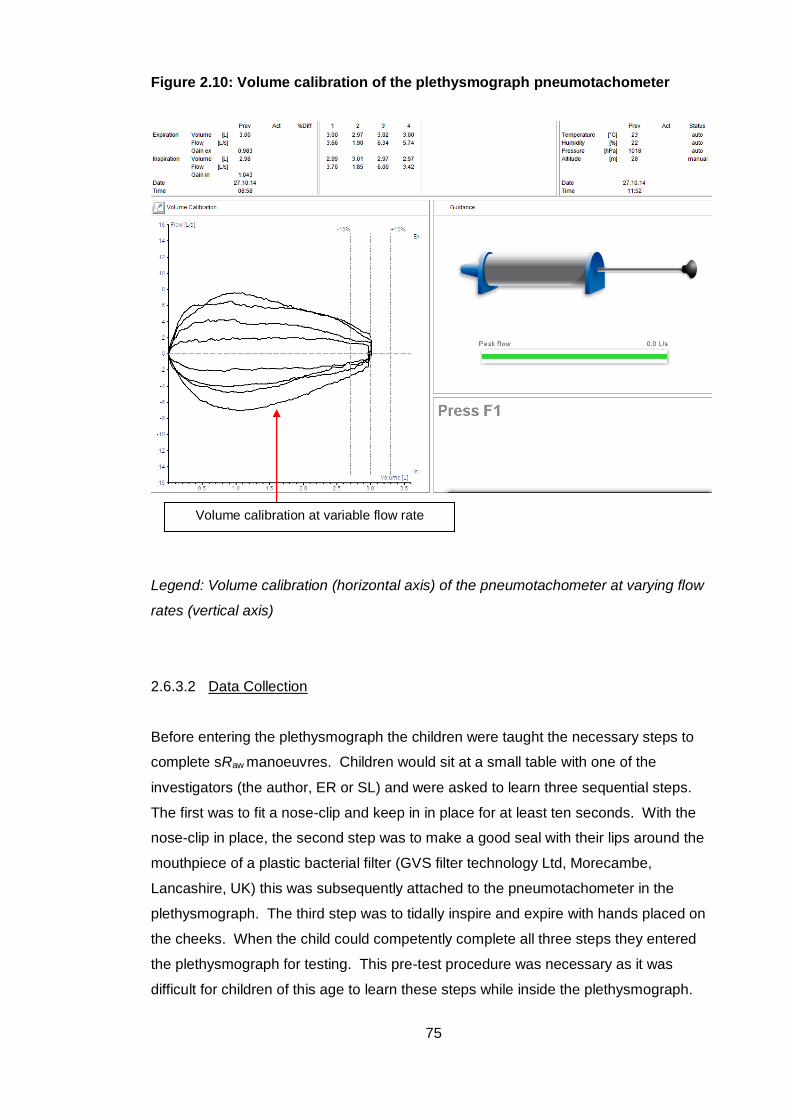
75
Figure 2.10: Volume calibration of the plethysmograph pneumotachometer
Legend: Volume calibration (horizontal axis) of the pneumotachometer at varying flow
rates (vertical axis)
2.6.3.2 Data Collection
Before entering the plethysmograph the children were taught the necessary steps to
complete sRaw manoeuvres. Children would sit at a small table with one of the
investigators (the author, ER or SL) and were asked to learn three sequential steps.
The first was to fit a nose-clip and keep in in place for at least ten seconds. With the
nose-clip in place, the second step was to make a good seal with their lips around the
mouthpiece of a plastic bacterial filter (GVS filter technology Ltd, Morecambe,
Lancashire, UK) this was subsequently attached to the pneumotachometer in the
plethysmograph. The third step was to tidally inspire and expire with hands placed on
the cheeks. When the child could competently complete all three steps they entered
the plethysmograph for testing. This pre-test procedure was necessary as it was
difficult for children of this age to learn these steps while inside the plethysmograph.
Volume calibration at variable flow rate
76
Once seated for testing the height of the chair and pneumotachometer (mounted on a
stand) were adjusted for each child with the neck slightly extended (Figure 2.11) as
flexion of the neck increases upper airway resistance. The door was closed for 30
seconds before beginning the test so that the pressure inside the plethysmograph
could equilibrate. Then the child was asked to undertake the previously learnt
manoeuvres and could hear the investigator’s instruction via a microphone and
speaker inside the plethysmograph. The child was encouraged to breathe at a rate of
30-45 breaths per minute (standard procedure) to minimise the effect of breathing
frequency on the measurement. Some children were able to do this easily with just
verbal cues from the investigators to inspire and expire; others found it easier to follow
an incentive built into the software.
Figure 2.11: Preschool children performing plethysmography
Legend: Preschool children within the plethysmograph wearing a nose-clip breathing
tidally on a bacterial filter attached to a pneumotachometer; left: view of whole
plethysmograph, right: close up of apparatus (carer consent given for inclusion of
images)
The software allowed for 10 pressure-flow loops to be viewed online and saved at any
one time. When a tidal breathing pattern was established and ten acceptable loops
were visualised in real-time, the series was saved. Three sets of acceptable flow-

77
pressure loops were attempted and recorded. No manual adjustment to the loops were
made.
2.6.3.3 Data analysis
After testing, each saved recording was printed and visually inspected (by the author
and ER), and over-read by a senior physiologist (Jane Kirkby [JK]). Total specific
airway resistance (sRtot) was the primary outcome in this study, calculated by the
Sentrysuite plethysmograph software from the slope of a line connecting flow points at
maximal change of plethysmographic volume. Acceptable and unacceptable
recordings are shown in Figure 2.12. Results were exported from the software and
entered into a database (Rebase software; Rebase, London, UK), with data checked
on transfer by two associates (the author, ER and SL).
A quality control score was applied as detailed in Kirkby et al55, which consisted of the
following:
1. Respiratory rate is between 30-45 bpm
2. Breaths are super-imposable (i.e. parallel slopes)
3. Breaths are of similar size and shape
4. Breaths are reasonably closed at zero flow
5. There are no obvious distortions to the breath (e.g. glottic closure, cough,
talking)
6. There is more than one acceptable trial available
More than three of the above criteria had to be met, or the traces were rejected. More
details of the test procedure and quality control for specific airway resistance can be
found in Appendix 7.
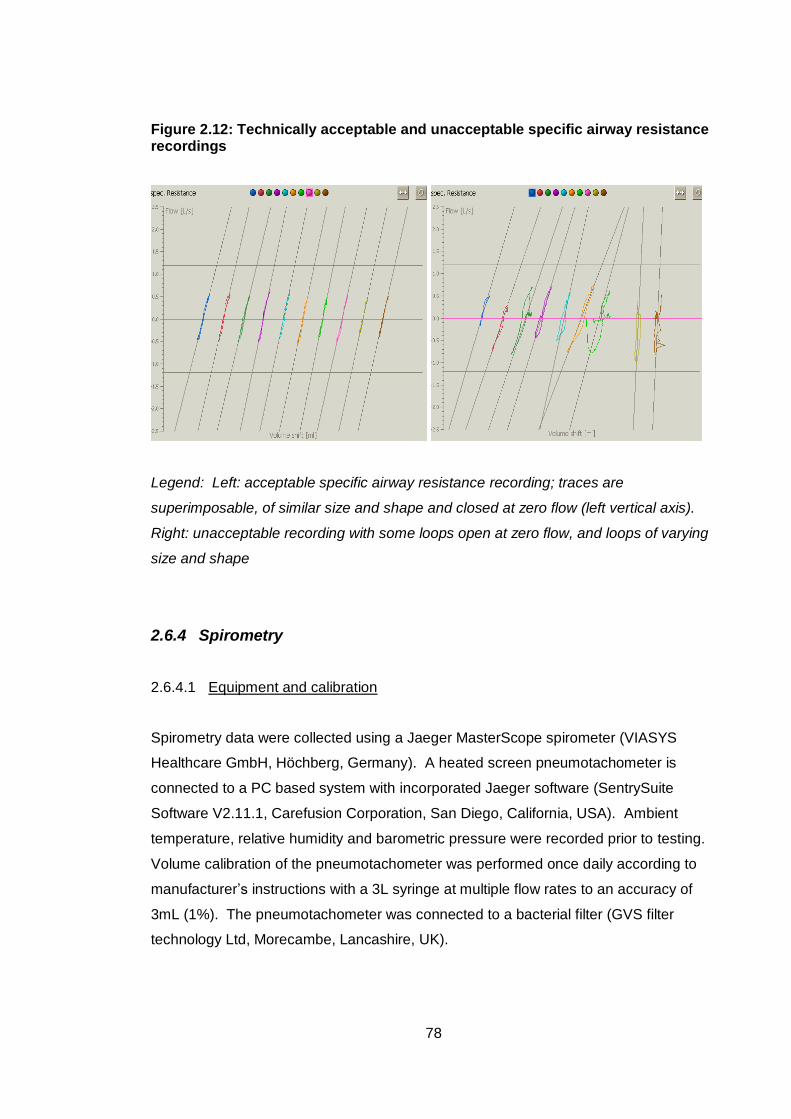
78
Figure 2.12: Technically acceptable and unacceptable specific airway resistance recordings
Legend: Left: acceptable specific airway resistance recording; traces are
superimposable, of similar size and shape and closed at zero flow (left vertical axis).
Right: unacceptable recording with some loops open at zero flow, and loops of varying
size and shape
2.6.4 Spirometry
2.6.4.1 Equipment and calibration
Spirometry data were collected using a Jaeger MasterScope spirometer (VIASYS
Healthcare GmbH, Höchberg, Germany). A heated screen pneumotachometer is
connected to a PC based system with incorporated Jaeger software (SentrySuite
Software V2.11.1, Carefusion Corporation, San Diego, California, USA). Ambient
temperature, relative humidity and barometric pressure were recorded prior to testing.
Volume calibration of the pneumotachometer was performed once daily according to
manufacturer’s instructions with a 3L syringe at multiple flow rates to an accuracy of
3mL (1%). The pneumotachometer was connected to a bacterial filter (GVS filter
technology Ltd, Morecambe, Lancashire, UK).
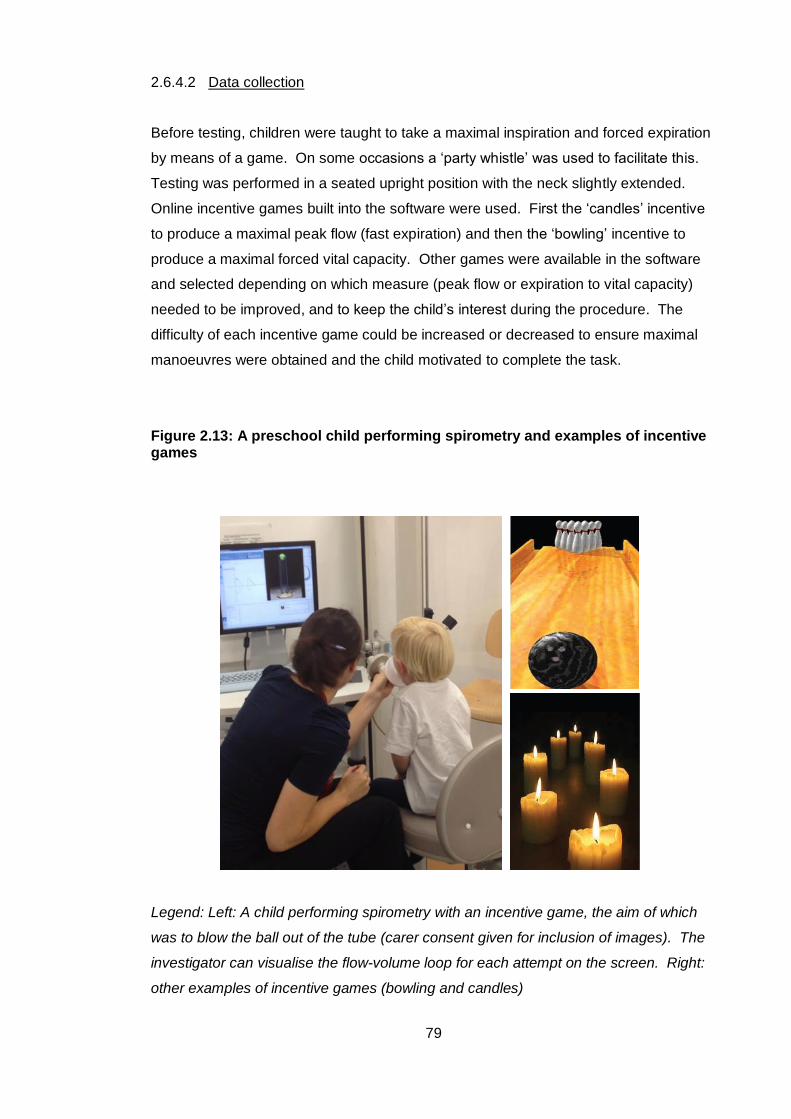
79
2.6.4.2 Data collection
Before testing, children were taught to take a maximal inspiration and forced expiration
by means of a game. On some occasions a ‘party whistle’ was used to facilitate this.
Testing was performed in a seated upright position with the neck slightly extended.
Online incentive games built into the software were used. First the ‘candles’ incentive
to produce a maximal peak flow (fast expiration) and then the ‘bowling’ incentive to
produce a maximal forced vital capacity. Other games were available in the software
and selected depending on which measure (peak flow or expiration to vital capacity)
needed to be improved, and to keep the child’s interest during the procedure. The
difficulty of each incentive game could be increased or decreased to ensure maximal
manoeuvres were obtained and the child motivated to complete the task.
Figure 2.13: A preschool child performing spirometry and examples of incentive games
Legend: Left: A child performing spirometry with an incentive game, the aim of which
was to blow the ball out of the tube (carer consent given for inclusion of images). The
investigator can visualise the flow-volume loop for each attempt on the screen. Right:
other examples of incentive games (bowling and candles)

80
Both Jaeger and SentrySuite software enabled visual inspection of flow-volume and
volume-time traces by the investigator so the effort of each attempt could be judged. A
maximum of 10 attempts could be recorded by both software versions; once this was
reached the attempts were saved to file and a new test file created if needed. The
session was terminated once three or more good quality repeatable manoeuvres were
obtained, or if the child became unsettled or showed signs of fatigue. Acceptable and
unacceptable recordings are shown in Figure 2.14.
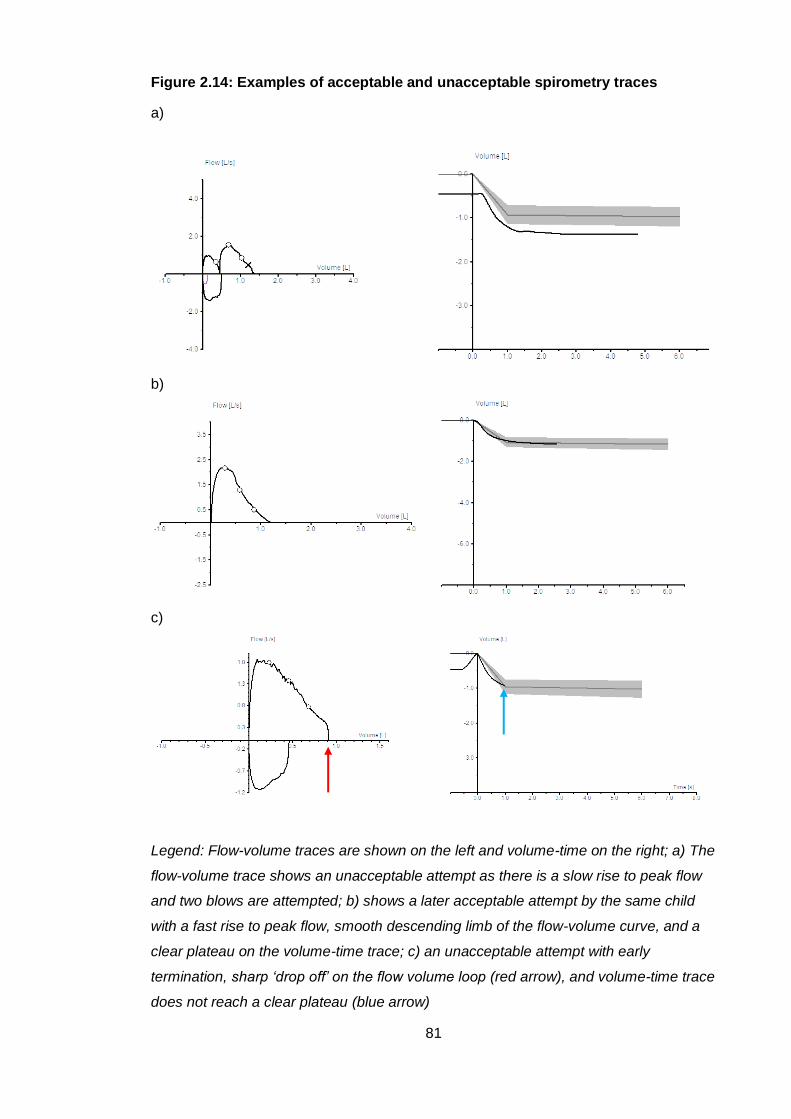
81
Figure 2.14: Examples of acceptable and unacceptable spirometry traces
a)
b)
c)
Legend: Flow-volume traces are shown on the left and volume-time on the right; a) The
flow-volume trace shows an unacceptable attempt as there is a slow rise to peak flow
and two blows are attempted; b) shows a later acceptable attempt by the same child
with a fast rise to peak flow, smooth descending limb of the flow-volume curve, and a
clear plateau on the volume-time trace; c) an unacceptable attempt with early
termination, sharp ‘drop off’ on the flow volume loop (red arrow), and volume-time trace
does not reach a clear plateau (blue arrow)
82
2.6.4.3 Data analysis
Offline quality control was performed by two investigators (the author and ER or SL)
and over-read by a senior physiologist (JK). Acceptable tests were reported in
accordance with ATS/ERS guidelines for preschool spirometry46, with quality control
factors as summarised in section 1.3.1.2. SentrySuite Software allows selection of
acceptable manoeuvres and de-selection of unacceptable manoeuvres. FEV0.75 was
the primary outcome measure reported in this study. Once acceptable traces had been
selected, the software reported the largest FEV0.75 and FVC even if not from the same
manoeuvre. Results were exported from the software and entered into a database
(Rebase software; Rebase, London, UK), with data checked on transfer by two
associates (the author, ER and SL).
2.6.5 Summary of test procedure
A summary of the test procedure is shown in Figure 2.15.
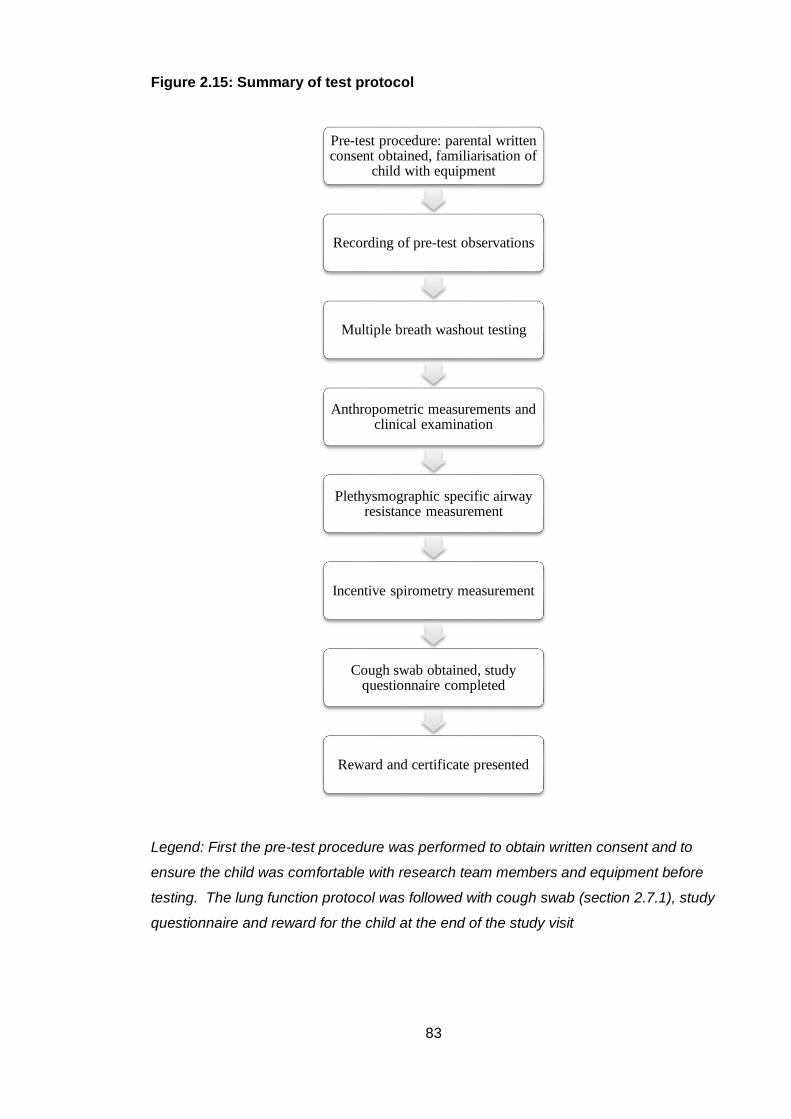
83
Figure 2.15: Summary of test protocol
Legend: First the pre-test procedure was performed to obtain written consent and to
ensure the child was comfortable with research team members and equipment before
testing. The lung function protocol was followed with cough swab (section 2.7.1), study
questionnaire and reward for the child at the end of the study visit
Pre-test procedure: parental written consent obtained, familiarisation of
child with equipment
Recording of pre-test observations
Multiple breath washout testing
Anthropometric measurements and clinical examination
Plethysmographic specific airway resistance measurement
Incentive spirometry measurement
Cough swab obtained, study questionnaire completed
Reward and certificate presented
84
2.7 Post-test procedure
2.7.1 Microbiology
In children with CF an oropharyngeal swab (OPS) was taken using a sterile swab and
container (Transswab, Medical Wire and Equipment Co. Limited, Wiltshire, England).
The child was asked to open the mouth as wide as possible, the swab placed in the
mouth and directed towards the back of the oropharynx, ensuring the cotton bud at the
end of the swab did not touch the oropharynx, and the child asked to cough. The swab
was then placed in culture medium and sent to the microbiology laboratory at Great
Ormond Street Hospital for culture and antibiotic sensitivity of any bacterial or fungal
growth, in accordance with CF Trust guidelines:
(https://www.cysticfibrosis.org.uk/~/media/documents/the-work-we-do/care/consensus-
docs-with-new-address/laboratory-standards.ashx?la=en).
2.7.2 Clinician questionnaire
For children with CF, a clinician questionnaire (Appendix 5) was sent out
retrospectively to the child’s clinician at the tertiary study site to be completed from the
child’s medical records. This was designed to obtain accurate information of medical
history and treatment relevant for subjects with CF. The author visited each
participating centre and completed a record form for each study participant with
medical and/or specialist nursing staff. Treatment was sub-divided into nutritional and
pulmonary therapies completed on a yearly basis. Data could therefore be transferred
from annual review summaries kept by each centre as part of the child’s clinical record.
Complications of CF and other significant medical history was also detailed. Dates and
length of oral and intravenous antibiotic courses, and dates of any positive bacterial or
fungal isolates recorded. This study was not designed or powered to assess which
treatments in early childhood were associated with better lung function outcomes, but
collection of this data allowed exploratory analysis of these factors.
2.7.3 Data integrity and storage
Each subject had been assigned a unique study number in the LCFC NBS infant study.
The same numbers were used to anonymise study questionnaires and lung function

85
data. Paper copies of complete questionnaires and lung function results were kept in a
file for each subject in a locked filing cabinet. Electronic copies were also scanned and
kept in portable document format, saved on a secure hard drive. Subject contact
details and study identification key were kept in a password protected database. Lung
function results and questionnaire data were summarised in a spreadsheet which was
subsequently cross-checked for errors. To facilitate analysis and longer-term storage,
this data was uploaded to a customised database (Re-Base Ltd, London, UK) and re-
checked for errors after transfer.
2.8 Summary
The protocol for the cohort 2 preschool follow up study is summarised above in Figure
2.15. The results of this study will be presented in the following first results chapter.
Methodology for data analysis (and power calculations where indicated) for each
results study are presented in the relevant chapter.
86
3 Lung function in newborn screened preschool
children with CF
3.1 Introduction
It is clear that lung disease is detectable from an early stage, even shortly after birth in
children with CF. However, it is difficult to measure lung function in children under six
years of age. Preschool children pose a particular problem as, unlike infants, they are
too old to sedate adequately and tests requiring active cooperation, such as
spirometry, are often normal in children with CF at this age. The period between two
and six years of age were often termed the ‘silent years’ of lung function. However,
work from the LCFC in clinically diagnosed children with CF (cohort 1) showed that
LCI, measured by the MBW technique, is a sensitive, non-invasive functional marker of
early lung disease in the preschool years, and becomes abnormal before other tests of
lung function7.
These earlier studies were conducted in children whose diagnosis of CF was made
when they had developed clinical signs and symptoms. With the introduction of
newborn screening, children are diagnosed, and therefore treated, much earlier, and
usually before respiratory symptoms arise. In view of this and other improvements in
CF care since clinically diagnosed children were studied, the LCFC recruited a new
cohort of NBS infants who underwent infant pulmonary function tests at three months,
one year and two years of age36, 127, 129. Although lung function was poorer than
controls at three months, an improvement was seen in FEV0.5 at one year of age, and
all primary outcome measures (FEV0.5, FRCpleth and LCI) remained stable throughout
the study with standard UK CF care. Very few infants (7-19% depending on which
measurement is considered) had abnormal lung function at two years of age.
This first results chapter reports follow up of the same LCFC infants in cohort 2,
diagnosed with CF by NBS, between three and six years of age, and investigates
whether lung function stability is maintained to the preschool years.
87
3.2 Hypothesis, aims and objectives
3.2.1 Hypothesis
In view of stable lung function reported at one and two year follow up in cohort 2 of the
LCFC NBS study, the hypothesis was that in children with CF, lung function remains
within the normal range at follow up in the preschool years, when compared to
contemporaneous controls.
3.2.2 Aim
The aim of this study was to report lung function in children with CF and managed with
standard UK CF care, and contemporaneous healthy control children, between three
and six years of age.
3.2.3 Objectives
The specific objective was to measure and compare lung function in preschool children
with CF diagnosed by NBS with an age and gender matched contemporaneous
recruited healthy control group for the following primary outcome measures:
LCI measured using the MBW technique
Specific total airway resistance (sRtot) measured by plethysmography
FEV0.75 measured by spirometry
3.3 Methods
3.3.1 Subjects and measurements
Children with CF were originally recruited as infants born between January 2009 and
July 2011 from the six participating specialist CF centres, and controls from a central
London hospital as part of the LCFC longitudinal study of newborn screened children
with CF. Recruitment in infancy is described in detail in section 2.3.
88
Families who had consented to be contacted for future research and had lung function
data at one or more infant test occasions (three months, one year and two years) were
invited to return for testing at preschool age (three to six years) between June 2013
and June 2015. Exclusion criteria listed in section 2.4.3 were re-visited on initial
telephone contact and in detail using the test day questionnaire (Appendix 4) at the
study visit, to ensure children were still eligible for the study. Children were invited to
attend when well, with no symptoms of, or treatment for, respiratory infection in the
three weeks before their preschool test occasion.
After completing the test day questionnaire and pre-test procedures, lung function
measurements were made in the same laboratory for all subjects in the following order:
MBW using a mass spectrometer-SF6 tracer gas system with mask interface
while the subject was sitting upright, primary outcome LCI z-score, with LCI
reported as the average of three acceptable MBW traces
Plethysmographic specific airway resistance (sRaw), primary outcome sRtot
Incentive spirometry, primary outcome FEV0.75 z-score
If the full protocol was not completed on the first visit, subjects were invited to attend a
second test occasion around six months later. A third test occasion was offered (at any
time after the second test occasion) if the second visit was not complete. Data were
collected retrospectively from each CF centre to describe the clinical course of the
children, and details of current and past medications, courses of intravenous antibiotics
and isolates on cough swab, sputum or BAL were noted. Lung function and clinical
data were exported to a research database, linked by test occasion (Rebase software;
Rebase, London, UK). A more detailed description of the recruitment process,
exclusion criteria, clinical data collection and lung function methodology for the
preschool NBS follow up study is described in Chapter 2.
3.3.2 Statistical analysis
Summary data are presented as mean (SD), median (IQR) or median (range).
Standard deviation scores (z-scores) were calculated using published reference
equations from healthy control data to express growth (height, weight, BMI138) and lung
function parameters (LCI75, sRtot55 and FEV0.7549). Lung function measurements were
made using identical equipment and protocols as reference data. For FEV0.75, ethnicity
specific data were not available at the time of testing, so equations for white individuals
89
were used for all subjects (7/67 children with CF were of non-white ethnicity and 4/41
controls).
For lung function primary outcomes, an abnormal result was defined ≥ 1.96 z-scores
for LCI and sRtot and ≤ -1.96 z-scores for FEV0.75. For group comparisons between
subjects with CF and healthy controls, Chi-squared tests were used for categorical
variables and Mann-Whitney U or student t-tests for numeric data, depending on
whether the data were normally distributed. Differences are presented with 95%
confidence intervals where appropriate. Linear regression analysis was used to
investigate the relationship of lung function parameters with age.
Statistical analyses were conducted using SPSS software (IBM SPSS Statistics for
Windows, Version 24.0). Figures were produced using SPSS and GraphPad Prism
software (version 7.00 for Windows, GraphPad Software, La Jolla, California, USA).
Statistical significance was taken as p<0.05.
3.3.3 Power of study
96 children with CF and 62 controls tested as infants were available for preschool
follow-up (a ratio of 1.5:1). The power calculation accounted for multiple comparisons
(as there were three primary outcomes) calculated as z-scores (expected standard
deviation of 1) and unequal groups. It was estimated that 60 children with CF and 40
controls would detect a difference in SD score of 0.7 (or greater) in the primary lung
function outcomes (LCI, sRtot and FEV0.75) with 80% power at the 5% significance
level. Having said this, the actual numbers recruited were opportunistic and driven by
the size of the original cohort and retention in the study.
3.4 Results
3.4.1 Recruitment accrual
A total of 154 children (92 with CF and 62 healthy controls) had been enrolled as
infants to the NBS LCFC longitudinal study, in whom at least one valid infant lung
function test result had been obtained, and whose families had consented at that time
to be contacted for follow up studies. Attempts to contact all families were made in the
90
first two months of the study period (between June and August 2013), but was on-
going throughout the study duration. If contact details had changed, the child’s CF
centre (or general practitioner for controls) were telephoned in an attempt to obtain
updated contact information.
Of the 92 children with CF, 25 (27%) were unable or ineligible to attend for testing. Five
children were lost to follow up: two children were over six years of age when the study
started, and three families had moved out of area or overseas and were unable to
attend. Five were excluded due to medical co-morbidity: one child had Angelman’s
syndrome, two had severe developmental delay and their parents felt they would not
be able to understand test procedures, one had an immunodeficiency and one had a
cardiac condition (both diagnosed after two years of age). The parents of six children
withdrew consent: two wanted to avoid additional time visiting hospital, two because
they felt their child would be too anxious, or the child declined to participate, one gave
no reason and one family had complex social circumstances (parental illness). A
further eight children were unwell at time of study visit and/or during the study period
and met clinical exclusion criteria. This was most commonly due to subjects receiving
a course of oral or intravenous antibiotics within three weeks of the test date.
Of the 62 healthy controls enrolled as infants, 21 (34%) were unable to be tested.
Seven were lost to follow up: we could not contact four families and three had moved
out of the area or overseas. Five children had co-morbidities and met exclusion
criteria: one had been diagnosed with leukaemia and four had developed recurrent
wheeze and/or had taken treatment for wheezing episodes in the year preceding the
study. Six families withdrew from the study; four because of time constraints and two
felt their child would be too anxious to complete the test procedure. One child was too
unwell with upper respiratory tract infections each time they were contacted to attend.
Of the children that were able to attend, a further two children (one from each group)
either refused or failed all preschool lung function tests. Subsequently 67 in the CF
group and 41 healthy controls attempted testing on at least one occasion and had at
least one successful lung function measure. Recruitment and accrual is summarised in
Figure 3.1.
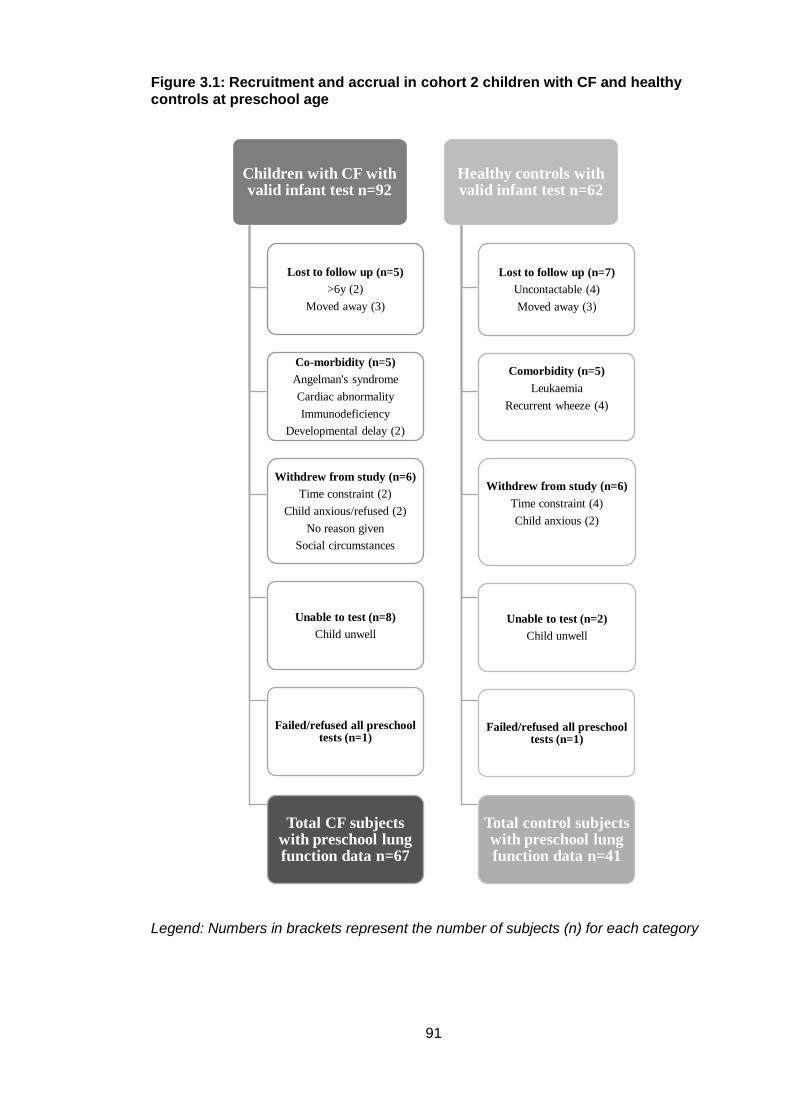
91
Figure 3.1: Recruitment and accrual in cohort 2 children with CF and healthy controls at preschool age
Legend: Numbers in brackets represent the number of subjects (n) for each category
Children with CF with valid infant test n=92
Lost to follow up (n=5)
>6y (2)
Moved away (3)
Co-morbidity (n=5)
Angelman's syndrome
Cardiac abnormality
Immunodeficiency
Developmental delay (2)
Withdrew from study (n=6)
Time constraint (2)
Child anxious/refused (2)
No reason given
Social circumstances
Unable to test (n=8)
Child unwell
Failed/refused all preschool tests (n=1)
Total CF subjects with preschool lung function data n=67
Healthy controls with valid infant test n=62
Lost to follow up (n=7)
Uncontactable (4)
Moved away (3)
Comorbidity (n=5)
Leukaemia
Recurrent wheeze (4)
Withdrew from study (n=6)
Time constraint (4)
Child anxious (2)
Unable to test (n=2)
Child unwell
Failed/refused all preschool tests (n=1)
Total control subjects with preschool lung function data n=41
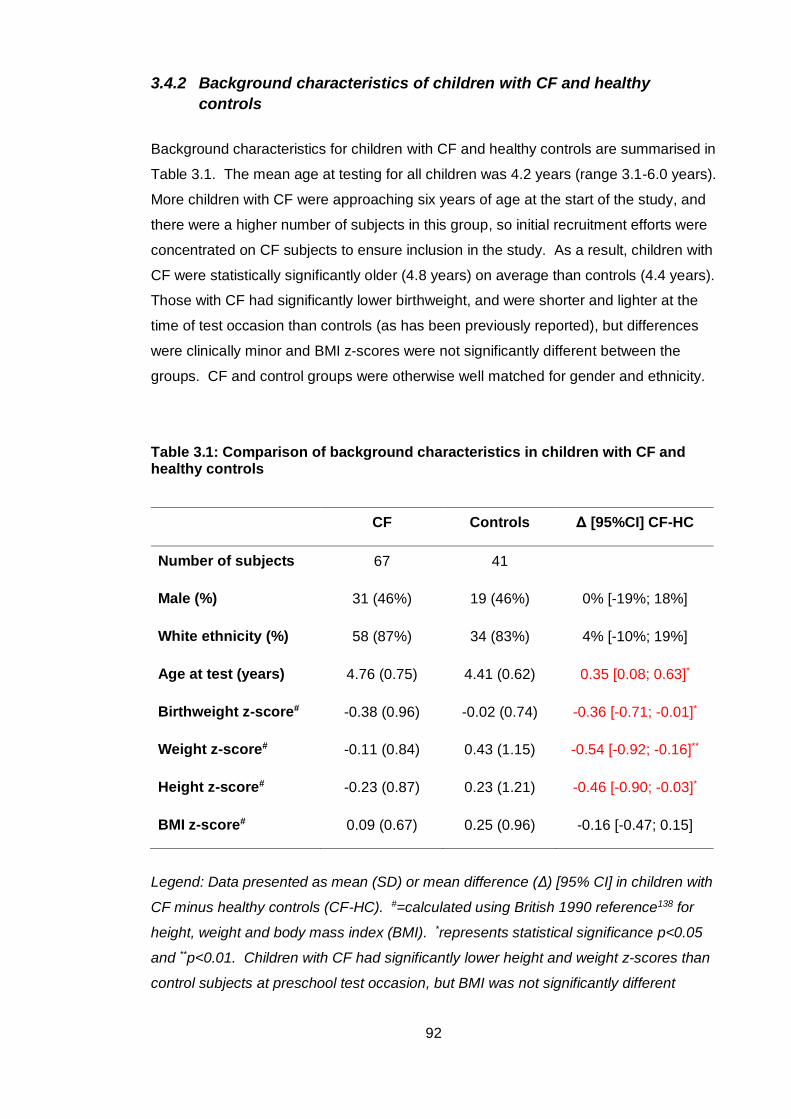
92
3.4.2 Background characteristics of children with CF and healthy
controls
Background characteristics for children with CF and healthy controls are summarised in
Table 3.1. The mean age at testing for all children was 4.2 years (range 3.1-6.0 years).
More children with CF were approaching six years of age at the start of the study, and
there were a higher number of subjects in this group, so initial recruitment efforts were
concentrated on CF subjects to ensure inclusion in the study. As a result, children with
CF were statistically significantly older (4.8 years) on average than controls (4.4 years).
Those with CF had significantly lower birthweight, and were shorter and lighter at the
time of test occasion than controls (as has been previously reported), but differences
were clinically minor and BMI z-scores were not significantly different between the
groups. CF and control groups were otherwise well matched for gender and ethnicity.
Table 3.1: Comparison of background characteristics in children with CF and healthy controls
CF Controls Δ [95%CI] CF-HC
Number of subjects 67 41
Male (%) 31 (46%) 19 (46%) 0% [-19%; 18%]
White ethnicity (%) 58 (87%) 34 (83%) 4% [-10%; 19%]
Age at test (years) 4.76 (0.75) 4.41 (0.62) 0.35 [0.08; 0.63]*
Birthweight z-score# -0.38 (0.96) -0.02 (0.74) -0.36 [-0.71; -0.01]*
Weight z-score# -0.11 (0.84) 0.43 (1.15) -0.54 [-0.92; -0.16]**
Height z-score# -0.23 (0.87) 0.23 (1.21) -0.46 [-0.90; -0.03]*
BMI z-score# 0.09 (0.67) 0.25 (0.96) -0.16 [-0.47; 0.15]
Legend: Data presented as mean (SD) or mean difference (Δ) [95% CI] in children with
CF minus healthy controls (CF-HC). #=calculated using British 1990 reference138 for
height, weight and body mass index (BMI). *represents statistical significance p<0.05
and **p<0.01. Children with CF had significantly lower height and weight z-scores than
control subjects at preschool test occasion, but BMI was not significantly different
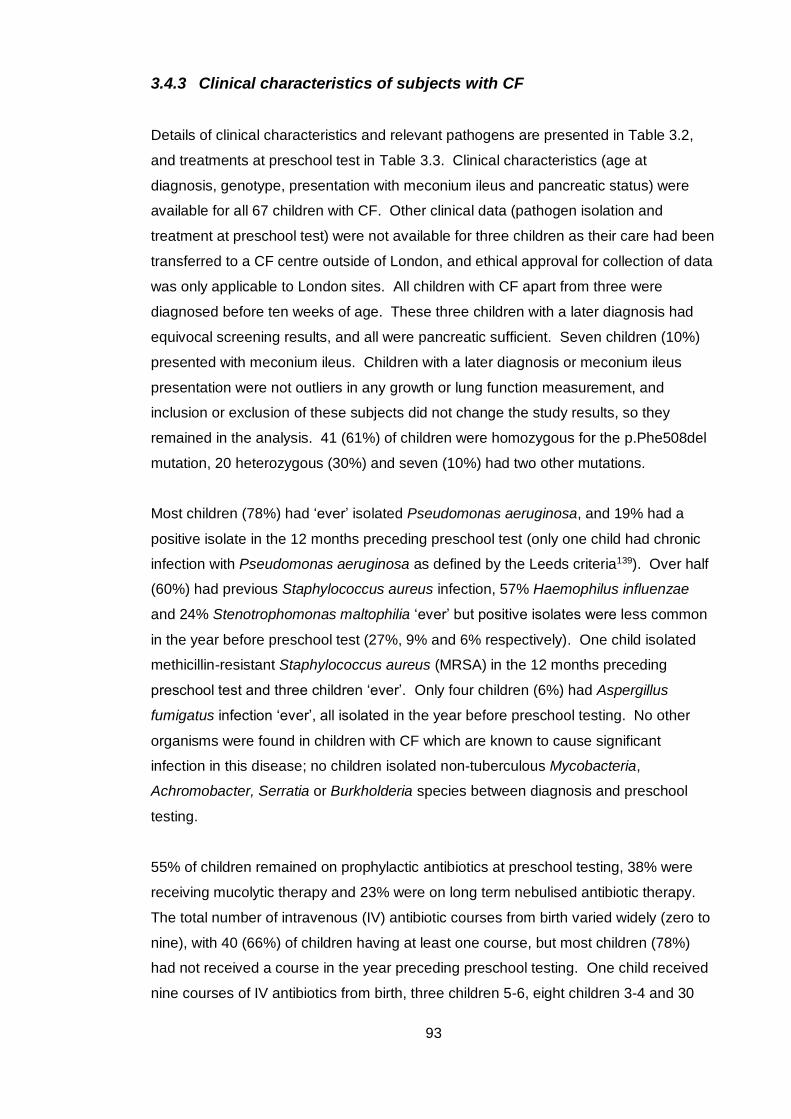
93
3.4.3 Clinical characteristics of subjects with CF
Details of clinical characteristics and relevant pathogens are presented in Table 3.2,
and treatments at preschool test in Table 3.3. Clinical characteristics (age at
diagnosis, genotype, presentation with meconium ileus and pancreatic status) were
available for all 67 children with CF. Other clinical data (pathogen isolation and
treatment at preschool test) were not available for three children as their care had been
transferred to a CF centre outside of London, and ethical approval for collection of data
was only applicable to London sites. All children with CF apart from three were
diagnosed before ten weeks of age. These three children with a later diagnosis had
equivocal screening results, and all were pancreatic sufficient. Seven children (10%)
presented with meconium ileus. Children with a later diagnosis or meconium ileus
presentation were not outliers in any growth or lung function measurement, and
inclusion or exclusion of these subjects did not change the study results, so they
remained in the analysis. 41 (61%) of children were homozygous for the p.Phe508del
mutation, 20 heterozygous (30%) and seven (10%) had two other mutations.
Most children (78%) had ‘ever’ isolated Pseudomonas aeruginosa, and 19% had a
positive isolate in the 12 months preceding preschool test (only one child had chronic
infection with Pseudomonas aeruginosa as defined by the Leeds criteria139). Over half
(60%) had previous Staphylococcus aureus infection, 57% Haemophilus influenzae
and 24% Stenotrophomonas maltophilia ‘ever’ but positive isolates were less common
in the year before preschool test (27%, 9% and 6% respectively). One child isolated
methicillin-resistant Staphylococcus aureus (MRSA) in the 12 months preceding
preschool test and three children ‘ever’. Only four children (6%) had Aspergillus
fumigatus infection ‘ever’, all isolated in the year before preschool testing. No other
organisms were found in children with CF which are known to cause significant
infection in this disease; no children isolated non-tuberculous Mycobacteria,
Achromobacter, Serratia or Burkholderia species between diagnosis and preschool
testing.
55% of children remained on prophylactic antibiotics at preschool testing, 38% were
receiving mucolytic therapy and 23% were on long term nebulised antibiotic therapy.
The total number of intravenous (IV) antibiotic courses from birth varied widely (zero to
nine), with 40 (66%) of children having at least one course, but most children (78%)
had not received a course in the year preceding preschool testing. One child received
nine courses of IV antibiotics from birth, three children 5-6, eight children 3-4 and 30
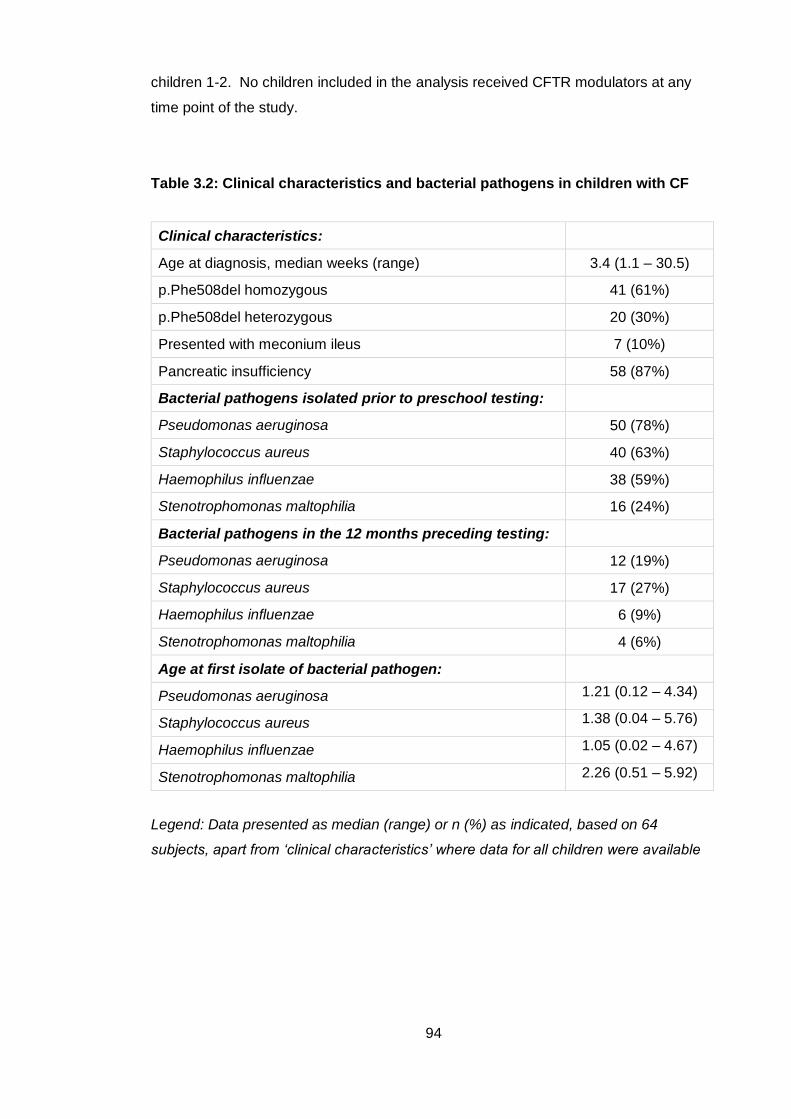
94
children 1-2. No children included in the analysis received CFTR modulators at any
time point of the study.
Table 3.2: Clinical characteristics and bacterial pathogens in children with CF
Clinical characteristics:
Age at diagnosis, median weeks (range) 3.4 (1.1 – 30.5)
p.Phe508del homozygous 41 (61%)
p.Phe508del heterozygous 20 (30%)
Presented with meconium ileus 7 (10%)
Pancreatic insufficiency 58 (87%)
Bacterial pathogens isolated prior to preschool testing:
Pseudomonas aeruginosa 50 (78%)
Staphylococcus aureus 40 (63%)
Haemophilus influenzae 38 (59%)
Stenotrophomonas maltophilia 16 (24%)
Bacterial pathogens in the 12 months preceding testing:
Pseudomonas aeruginosa 12 (19%)
Staphylococcus aureus 17 (27%)
Haemophilus influenzae 6 (9%)
Stenotrophomonas maltophilia 4 (6%)
Age at first isolate of bacterial pathogen:
Pseudomonas aeruginosa 1.21 (0.12 – 4.34)
Staphylococcus aureus 1.38 (0.04 – 5.76)
Haemophilus influenzae 1.05 (0.02 – 4.67)
Stenotrophomonas maltophilia 2.26 (0.51 – 5.92)
Legend: Data presented as median (range) or n (%) as indicated, based on 64
subjects, apart from ‘clinical characteristics’ where data for all children were available
95
Table 3.3: Details of treatment in children with CF
Treatment at preschool test:
Treatment for gastro-oesophageal reflux disease 26 (41%)
Oral antibiotic prophylaxis 35 (55%)
Long term nebulised antibiotic 15 (23%)
Ursodeoxycholic acid 12 (19%)
Nebulised rhDNase 20 (31%)
Nebulised hypertonic saline 11 (17%)
Any mucolytic therapy 24 (38%)
CFTR modulator therapy 0 (0%)
Long term azithromycin 5 (8%)
Treatment for ABPA ‘ever’ 1 (2%)
IV antibiotic courses from birth, median (range) 1 (0-9)
IV antibiotic courses 12 months before test, median (range) 0 (0-2)
Legend: Data presented as median (range) or n (%) as indicated, based on 64
subjects. Abbreviations: rhDNase = recombinant human deoxyribonuclease, ABPA =
allergic bronchopulmonary aspergillosis, IV = intravenous
3.4.4 Feasibility of study protocol
117 subjects (73 children with CF and 44 healthy controls) attended for lung function
measurements. Of children with just one test occasion, one child with CF refused all
tests and one healthy control attempted but failed all tests. A further seven children
(five with CF and two controls) attempted testing but were then excluded from the final
dataset when the test day questionnaire revealed either co-morbidity or illness (despite
pre-test telephone screening).
Of the 116 children attempting any lung function test, a valid result was obtained in 79
(68%) for all three lung function tests (the fully study protocol) on their first visit; 48
(67%) of children with CF and 31 (70%) of controls. MBW had the highest success
rate in both groups. The average number of MBW runs required to obtain three
acceptable traces was 5 (including washouts that were terminated early due to within
test quality control fail). Up to 10 runs were attempted if required and tolerated, and
MBW testing did not exceed one hour. The coefficient of variation for LCI of the three
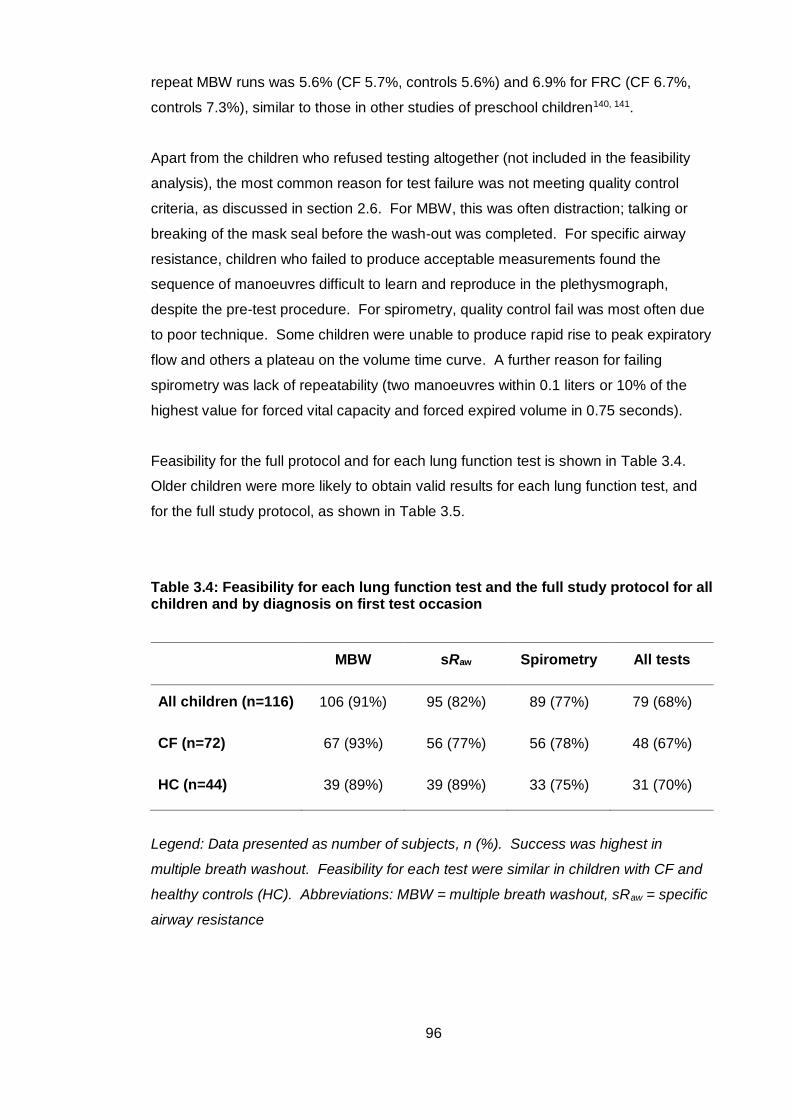
96
repeat MBW runs was 5.6% (CF 5.7%, controls 5.6%) and 6.9% for FRC (CF 6.7%,
controls 7.3%), similar to those in other studies of preschool children140, 141.
Apart from the children who refused testing altogether (not included in the feasibility
analysis), the most common reason for test failure was not meeting quality control
criteria, as discussed in section 2.6. For MBW, this was often distraction; talking or
breaking of the mask seal before the wash-out was completed. For specific airway
resistance, children who failed to produce acceptable measurements found the
sequence of manoeuvres difficult to learn and reproduce in the plethysmograph,
despite the pre-test procedure. For spirometry, quality control fail was most often due
to poor technique. Some children were unable to produce rapid rise to peak expiratory
flow and others a plateau on the volume time curve. A further reason for failing
spirometry was lack of repeatability (two manoeuvres within 0.1 liters or 10% of the
highest value for forced vital capacity and forced expired volume in 0.75 seconds).
Feasibility for the full protocol and for each lung function test is shown in Table 3.4.
Older children were more likely to obtain valid results for each lung function test, and
for the full study protocol, as shown in Table 3.5.
Table 3.4: Feasibility for each lung function test and the full study protocol for all children and by diagnosis on first test occasion
MBW sRaw Spirometry All tests
All children (n=116) 106 (91%) 95 (82%) 89 (77%) 79 (68%)
CF (n=72) 67 (93%) 56 (77%) 56 (78%) 48 (67%)
HC (n=44) 39 (89%) 39 (89%) 33 (75%) 31 (70%)
Legend: Data presented as number of subjects, n (%). Success was highest in
multiple breath washout. Feasibility for each test were similar in children with CF and
healthy controls (HC). Abbreviations: MBW = multiple breath washout, sRaw = specific
airway resistance
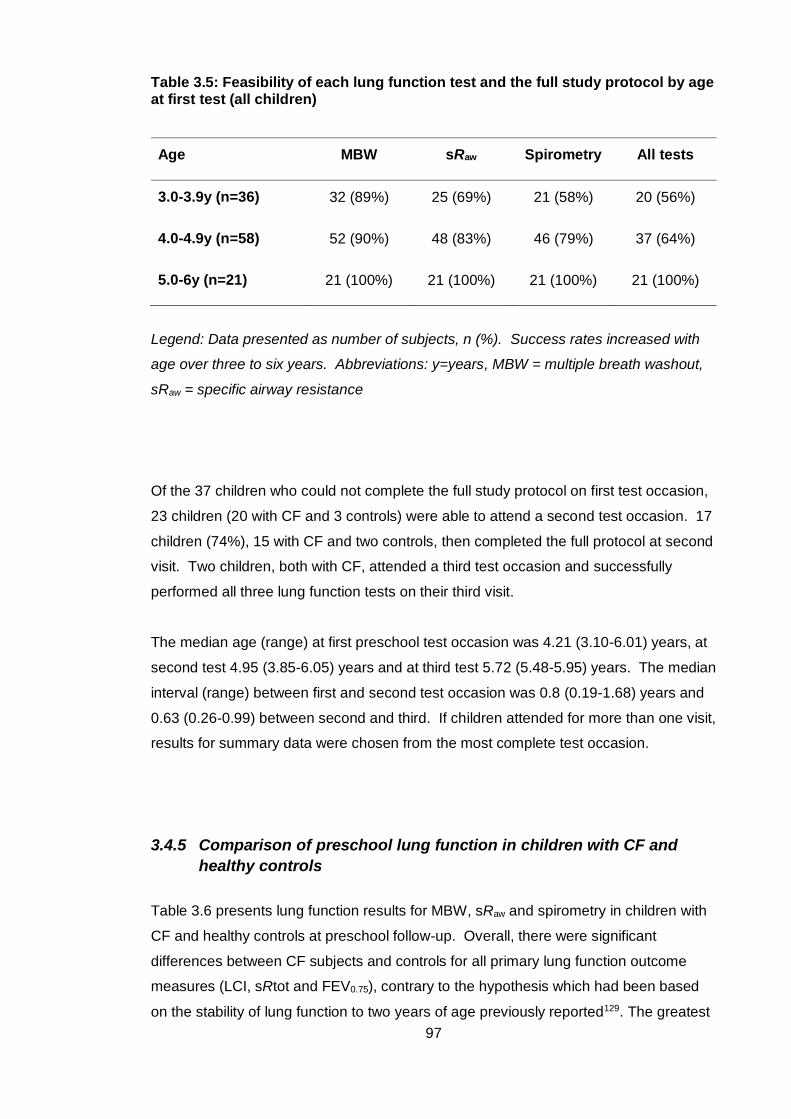
97
Table 3.5: Feasibility of each lung function test and the full study protocol by age at first test (all children)
Age MBW sRaw Spirometry All tests
3.0-3.9y (n=36) 32 (89%) 25 (69%) 21 (58%) 20 (56%)
4.0-4.9y (n=58) 52 (90%) 48 (83%) 46 (79%) 37 (64%)
5.0-6y (n=21) 21 (100%) 21 (100%) 21 (100%) 21 (100%)
Legend: Data presented as number of subjects, n (%). Success rates increased with
age over three to six years. Abbreviations: y=years, MBW = multiple breath washout,
sRaw = specific airway resistance
Of the 37 children who could not complete the full study protocol on first test occasion,
23 children (20 with CF and 3 controls) were able to attend a second test occasion. 17
children (74%), 15 with CF and two controls, then completed the full protocol at second
visit. Two children, both with CF, attended a third test occasion and successfully
performed all three lung function tests on their third visit.
The median age (range) at first preschool test occasion was 4.21 (3.10-6.01) years, at
second test 4.95 (3.85-6.05) years and at third test 5.72 (5.48-5.95) years. The median
interval (range) between first and second test occasion was 0.8 (0.19-1.68) years and
0.63 (0.26-0.99) between second and third. If children attended for more than one visit,
results for summary data were chosen from the most complete test occasion.
3.4.5 Comparison of preschool lung function in children with CF and
healthy controls
Table 3.6 presents lung function results for MBW, sRaw and spirometry in children with
CF and healthy controls at preschool follow-up. Overall, there were significant
differences between CF subjects and controls for all primary lung function outcome
measures (LCI, sRtot and FEV0.75), contrary to the hypothesis which had been based
on the stability of lung function to two years of age previously reported129. The greatest
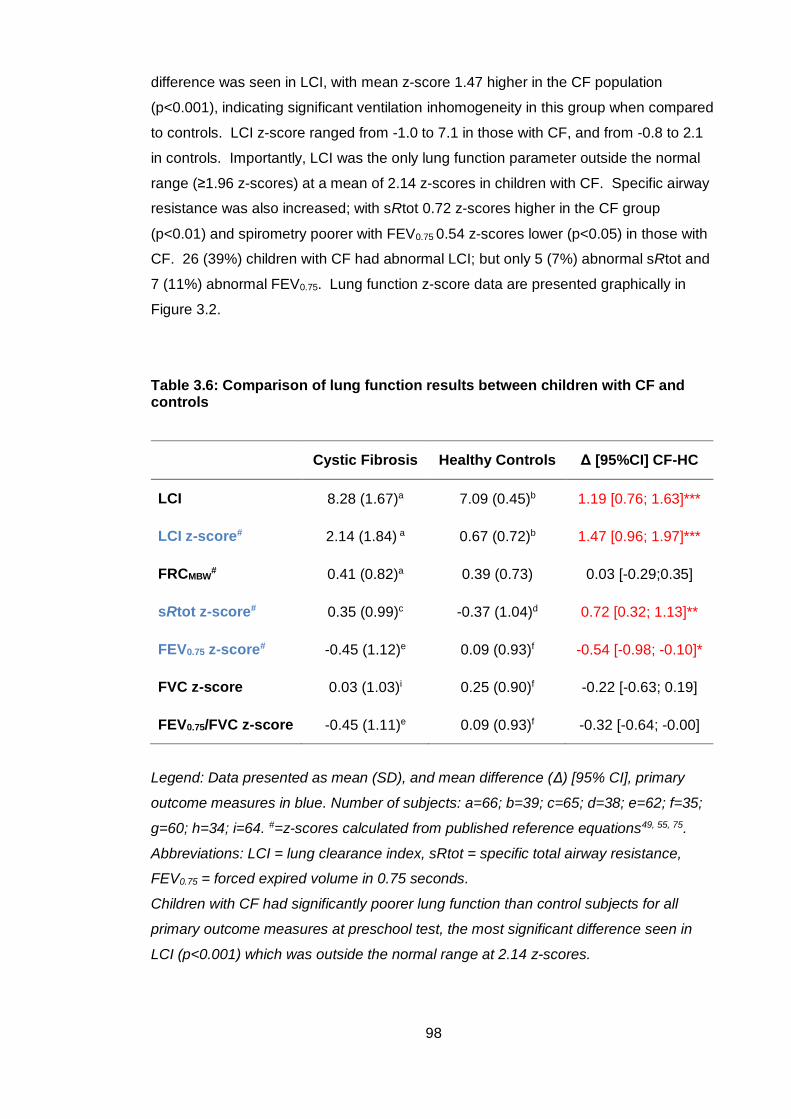
98
difference was seen in LCI, with mean z-score 1.47 higher in the CF population
(p<0.001), indicating significant ventilation inhomogeneity in this group when compared
to controls. LCI z-score ranged from -1.0 to 7.1 in those with CF, and from -0.8 to 2.1
in controls. Importantly, LCI was the only lung function parameter outside the normal
range (≥1.96 z-scores) at a mean of 2.14 z-scores in children with CF. Specific airway
resistance was also increased; with sRtot 0.72 z-scores higher in the CF group
(p<0.01) and spirometry poorer with FEV0.75 0.54 z-scores lower (p<0.05) in those with
CF. 26 (39%) children with CF had abnormal LCI; but only 5 (7%) abnormal sRtot and
7 (11%) abnormal FEV0.75. Lung function z-score data are presented graphically in
Figure 3.2.
Table 3.6: Comparison of lung function results between children with CF and controls
Cystic Fibrosis Healthy Controls Δ [95%CI] CF-HC
LCI 8.28 (1.67)a 7.09 (0.45)b 1.19 [0.76; 1.63]***
LCI z-score# 2.14 (1.84) a 0.67 (0.72)b 1.47 [0.96; 1.97]***
FRCMBW# 0.41 (0.82)a 0.39 (0.73) 0.03 [-0.29;0.35]
sRtot z-score# 0.35 (0.99)c -0.37 (1.04)d 0.72 [0.32; 1.13]**
FEV0.75 z-score# -0.45 (1.12)e 0.09 (0.93)f -0.54 [-0.98; -0.10]*
FVC z-score 0.03 (1.03)i 0.25 (0.90)f -0.22 [-0.63; 0.19]
FEV0.75/FVC z-score -0.45 (1.11)e 0.09 (0.93)f -0.32 [-0.64; -0.00]
Legend: Data presented as mean (SD), and mean difference (Δ) [95% CI], primary
outcome measures in blue. Number of subjects: a=66; b=39; c=65; d=38; e=62; f=35;
g=60; h=34; i=64. #=z-scores calculated from published reference equations49, 55, 75.
Abbreviations: LCI = lung clearance index, sRtot = specific total airway resistance,
FEV0.75 = forced expired volume in 0.75 seconds.
Children with CF had significantly poorer lung function than control subjects for all
primary outcome measures at preschool test, the most significant difference seen in
LCI (p<0.001) which was outside the normal range at 2.14 z-scores.
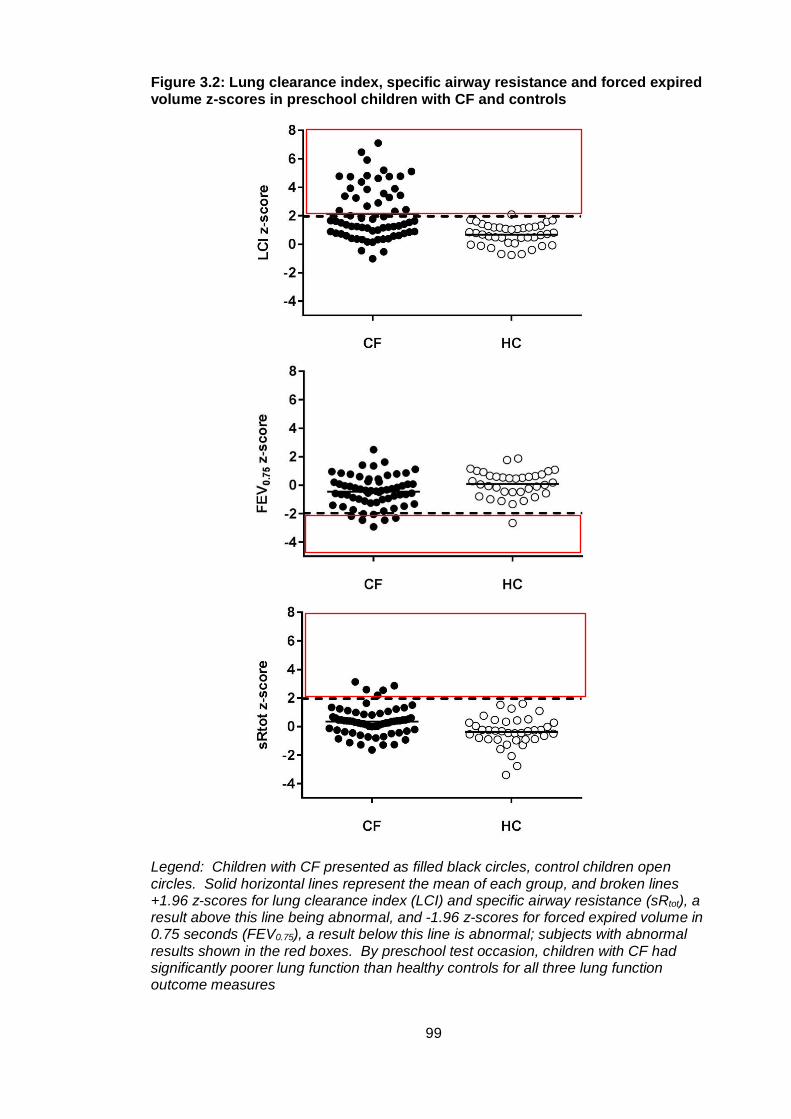
99
Figure 3.2: Lung clearance index, specific airway resistance and forced expired volume z-scores in preschool children with CF and controls
Legend: Children with CF presented as filled black circles, control children open circles. Solid horizontal lines represent the mean of each group, and broken lines +1.96 z-scores for lung clearance index (LCI) and specific airway resistance (sRtot), a result above this line being abnormal, and -1.96 z-scores for forced expired volume in 0.75 seconds (FEV0.75), a result below this line is abnormal; subjects with abnormal results shown in the red boxes. By preschool test occasion, children with CF had significantly poorer lung function than healthy controls for all three lung function outcome measures
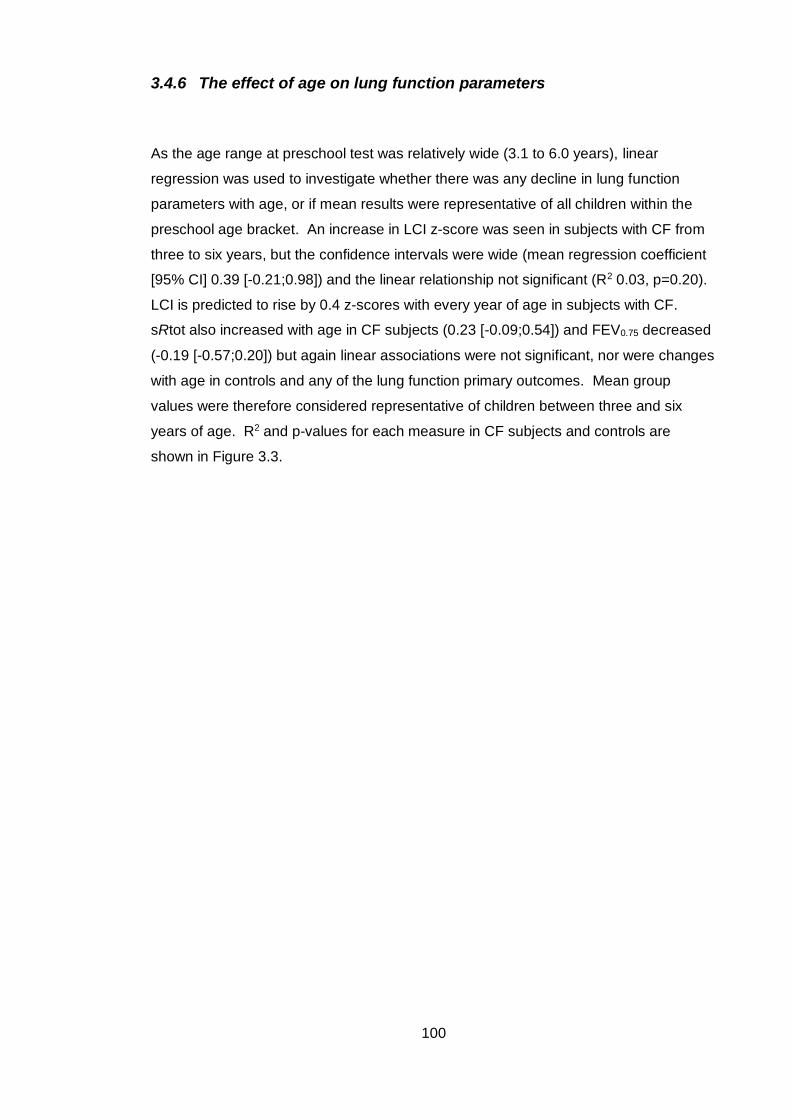
100
3.4.6 The effect of age on lung function parameters
As the age range at preschool test was relatively wide (3.1 to 6.0 years), linear
regression was used to investigate whether there was any decline in lung function
parameters with age, or if mean results were representative of all children within the
preschool age bracket. An increase in LCI z-score was seen in subjects with CF from
three to six years, but the confidence intervals were wide (mean regression coefficient
[95% CI] 0.39 [-0.21;0.98]) and the linear relationship not significant (R2 0.03, p=0.20).
LCI is predicted to rise by 0.4 z-scores with every year of age in subjects with CF.
sRtot also increased with age in CF subjects (0.23 [-0.09;0.54]) and FEV0.75 decreased
(-0.19 [-0.57;0.20]) but again linear associations were not significant, nor were changes
with age in controls and any of the lung function primary outcomes. Mean group
values were therefore considered representative of children between three and six
years of age. R2 and p-values for each measure in CF subjects and controls are
shown in Figure 3.3.
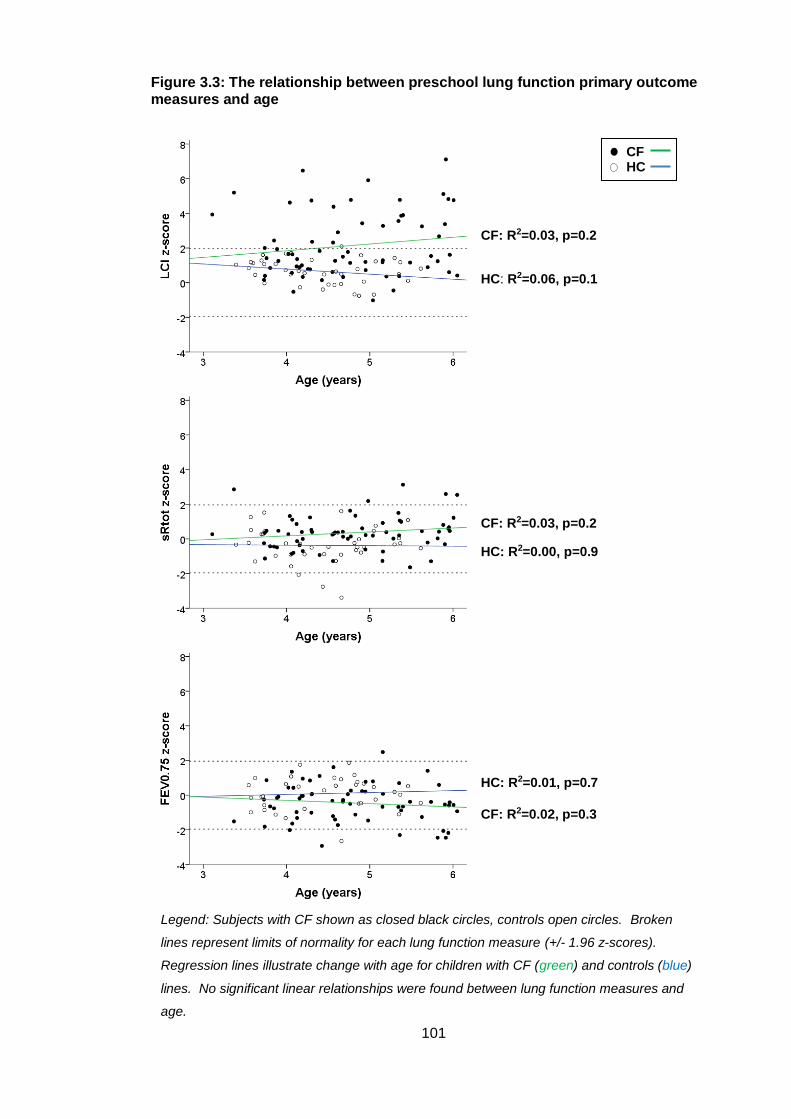
101
Figure 3.3: The relationship between preschool lung function primary outcome measures and age
Legend: Subjects with CF shown as closed black circles, controls open circles. Broken
lines represent limits of normality for each lung function measure (+/- 1.96 z-scores).
Regression lines illustrate change with age for children with CF (green) and controls (blue)
lines. No significant linear relationships were found between lung function measures and
age.
CF: R2=0.03, p=0.2
HC: R2=0.06, p=0.1
CF: R2=0.03, p=0.2
HC: R2=0.00, p=0.9
HC: R2=0.01, p=0.7
CF: R2=0.02, p=0.3
CF HC
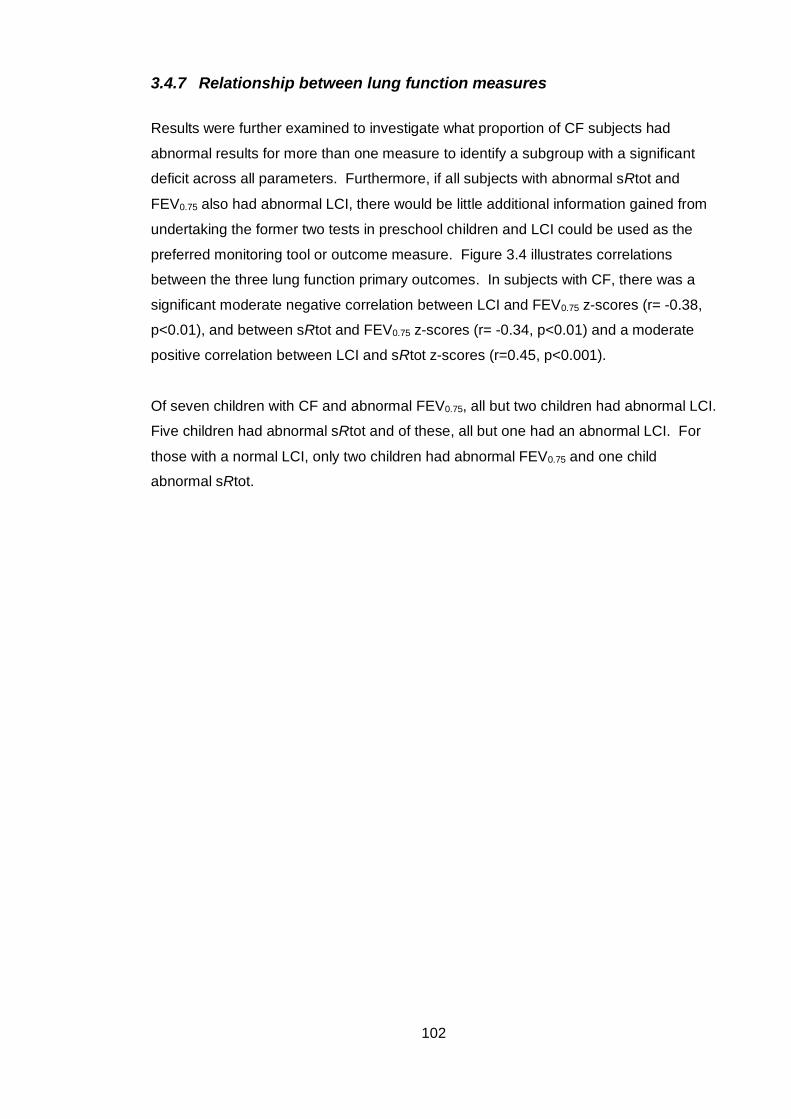
102
3.4.7 Relationship between lung function measures
Results were further examined to investigate what proportion of CF subjects had
abnormal results for more than one measure to identify a subgroup with a significant
deficit across all parameters. Furthermore, if all subjects with abnormal sRtot and
FEV0.75 also had abnormal LCI, there would be little additional information gained from
undertaking the former two tests in preschool children and LCI could be used as the
preferred monitoring tool or outcome measure. Figure 3.4 illustrates correlations
between the three lung function primary outcomes. In subjects with CF, there was a
significant moderate negative correlation between LCI and FEV0.75 z-scores (r= -0.38,
p<0.01), and between sRtot and FEV0.75 z-scores (r= -0.34, p<0.01) and a moderate
positive correlation between LCI and sRtot z-scores (r=0.45, p<0.001).
Of seven children with CF and abnormal FEV0.75, all but two children had abnormal LCI.
Five children had abnormal sRtot and of these, all but one had an abnormal LCI. For
those with a normal LCI, only two children had abnormal FEV0.75 and one child
abnormal sRtot.
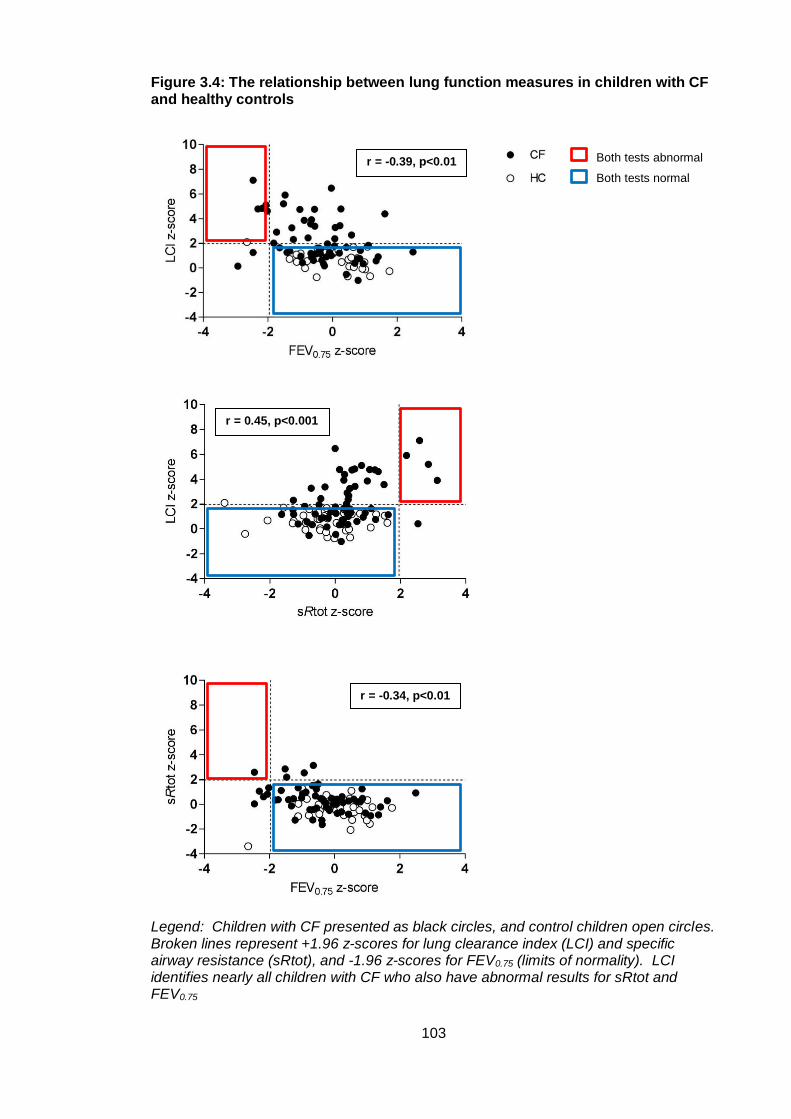
103
Figure 3.4: The relationship between lung function measures in children with CF and healthy controls
Legend: Children with CF presented as black circles, and control children open circles. Broken lines represent +1.96 z-scores for lung clearance index (LCI) and specific airway resistance (sRtot), and -1.96 z-scores for FEV0.75 (limits of normality). LCI identifies nearly all children with CF who also have abnormal results for sRtot and FEV0.75
Both tests abnormal
Both tests normal
r = -0.39, p<0.01
r = 0.45, p<0.001
r = -0.34, p<0.01
104
3.5 Discussion
3.5.1 Summary of principal findings
The principal findings of this study were:
1. NBS preschool children with CF have significantly poorer lung function than
healthy controls for all primary lung function outcomes
2. LCI z-score was the most sensitive marker of abnormality in NBS preschool
children with CF, with 39% having an abnormal result, and only 7% having an
abnormal sRtot z-score and 11% an abnormal FEV0.75 z-score. Nearly all
children with an abnormal sRtot or FEV0.75 z-score also had an abnormal LCI z-
score (4/5 and 5/7 respectively)
3. LCI z-score was the only lung function primary outcome outside the normal
range at 3-6 years in children with CF, with mean (SD) z-score of 2.14 (1.84)
4. Height and weight z-score were significantly poorer than controls in NBS
children with CF, but BMI z-score was not different to controls
3.5.2 Review of hypothesis
The hypothesis of this study was:
‘In view of stable lung function reported at one and two year follow up in cohort 2 of the
LCFC NBS study, the hypothesis was that in children with CF, lung function remains
within the normal range at follow up in the preschool years, when compared to
contemporaneous controls
The principal finding of this study disproves this hypothesis, as LCI z-score was outside
the normal range by three to six years in children with CF, and all lung function primary
outcome measures were significantly worse when compared to controls.
105
3.5.3 Comparison of this study to other reports
The objective of this study was to report lung function in preschool children with CF and
compare it to healthy control subjects. Children with CF had significantly poorer lung
function in all primary outcome measures when compared to controls. Other recent
cross-sectional reports of LCI in NBS children with CF come from the AREST-CF
cohort of children134 at preschool follow up. These are the same children who had
significantly abnormal infant pulmonary function tests (-4.3 z-scores in FEV0.5 from
RVRTC at two years). In their study of 58 children aged three to six years, children
with CF had a higher LCI (mean [SD] 8.00 [1.45] compared to control subjects (6.67
[0.56]). The upper limit of normal was defined from the study control population as
7.71. However, the raw LCI values are not directly comparable to those reported in this
thesis as different tracer gases were used. The AREST-CF group used N2 washout
whereas the LCFC study used SF6 washout, and N2 is known to give higher LCI results
than SF6142.
The proportion of children with abnormal results however can be compared; 55%
children with CF in the AREST-CF study had abnormal LCI compared to 26/67 (39%)
in this thesis. There is a suggestion therefore of a difference between cohorts, in that
the AREST-CF subjects have poorer lung function than those of the LCFC. However,
in the AREST study, a significant proportion (39%) of children had respiratory
symptoms at the time of testing, whereas the LCFC preschool children were
asymptomatic. As pulmonary exacerbations are associated with higher LCI values143,
this alone could have led to the higher proportion of children with abnormal LCI in the
AREST-CF study. A separate report from the AREST-CF group, designed primarily to
correlate CT abnormalities with LCI, reported LCI in a subgroup of 39 preschool
children (some with repeated MBW measurements). A similar proportion of children
(58%) had abnormal LCI, but it is likely that there is overlap between the two studies
and some of the same subjects were reported twice. Clinical symptoms were not
reported in this latter study.
A recent report from Canada is also important to include with respect to preschool LCI
in children with CF144. This study looked at repeated measures of LCI between 2.5 and
six years of age (in 78 children with CF and age matched control subjects); with N2
MBW measurements at enrolment, and one, three, six and 12 months after.
Spirometry was also measured. As found in this thesis FEV0.75 was within the normal
range, but unlike this study there was not a significant difference to control children.
106
LCI was, however, a sensitive marker of abnormality and significantly different to
controls; 67% of children with CF had an abnormal LCI at the first study visit, and LCI
significantly deteriorated on average [95% CI] by 0.40 [0.14;0.66] LCI units per year
(the same rate of decline as shown in this study). This remained true when the
analyses were limited to children without symptoms, with a deterioration of 0.34
[0.08;0.60] LCI units per year. Although the children reported in this thesis did not have
repeated measures, there was a tendency for LCI to increase with age as seen in
Figure 3.3. This is further evidence that LCI is abnormal in the preschool population
and suggests it can deteriorate with age.
Although not the primary focus of this chapter, this study also reported nutritional
markers which are known to be closely associated with lung function outcomes in
children with CF145. Preschool children were found to have significantly poorer height
and weight z-scores than control subjects. These differences were minor, and not
reflected in BMI z-score which showed no difference to controls. Despite the
Wisconsin RCT showing improvement of nutritional outcomes in NBS children
compared to non-NBS children with CF, it seems there is still a difference between
healthy children and those with CF despite current early management of pancreatic
insufficiency. The aforementioned Canadian study investigating the change in
preschool LCI also reported poorer nutrition in CF patients compared to controls144, as
has the AREST-CF group at early school age (4-6 years)133. It may be that minor
nutritional deficits start to become apparent at this age, which was not seen in LCFC
infants129, with a subsequent detrimental effect on lung function.
3.5.4 Strengths and limitations of the study
In agreement with other studies of preschool children7, there was excellent feasibility
for the three lung function tests employed. LCI was the most sensitive marker of
abnormality in this study, and highly feasible in this age group, so there is potential for
its use as a monitoring tool in clinical practice or outcome measure in trials. This is
discussed in more detail in chapter 7.
A mass spectrometer was used for SF6 gas analysis in this study, not available in many
centres, and is mostly therefore a research tool. With the recent development of
commercial N2 wash-out devices using 100% O2 which is freely available, although not
directly comparable to SF6 washout studies, there is potential for MBW to be used in
clinical monitoring using similar methodology to that employed in this study.
107
A further strength of this study is as well as measurements being made in children with
CF, a contemporaneous healthy control group was also studied for comparison.
Although lung function results are reported as z-scores calculated from published
reference equations from healthy subjects using the same methodology and
equipment, the potential misinterpretation of lung function data using reference data is
well documented33. In fact in this study, the control population had a slightly higher
mean (SD) LCI z-score of 0.67 (0.72) than expected. Reasons for this are explored in
Chapter 4, but could be secondary to change in the control population over time. Raw
LCI data were however also still significantly higher (mean [95% CI] 1.19 [0.76; 1.63])
than controls in preschool children with CF in this study.
Lung function tests were performed in a set order for all subjects (MBW first, then
plethysmography and finally spirometry), as deep inspiration required for spirometry
could in theory affect airway calibre and therefore tidal volumes, which would have a
secondary effect on MBW and sRaw measures. Therefore the individual feasibility of
these tests cannot be derived from this study, apart from MBW which was measured
first. Feasibility was lower for plethysmography than MBW, and lower still for
spirometry which may reflect children’s fatigue as the test protocol progressed.
Children were tested when in a stable clinical condition. A minority (five children)
initially tested as infants and available for recruitment at preschool age were too unwell
during the study period to be tested. They either did not meet eligibility criteria (no
cough, course of antibiotics that was not regular treatment or positive bacterial isolation
in the three weeks preceding test), or had spent time in hospital making it difficult for
them to attend the study visit. The implication of loss of subjects to follow up is
discussed in the final chapter of this thesis.
Most children in the CF group perform airway clearance twice daily as part of their
routine care. Techniques for this differ greatly between individuals, and some children
may not have performed airway clearance before lung function testing. A further
limitation of this study was that was not possible to standardise this treatment which
could potentially impact on lung function results; children who had performed effective
airway clearance prior to testing could have had better results because of sputum
clearance, or worse because airways which were completely occluded, and thus silent,
were partially unblocked, giving a new abnormal signal. However, neither in research
nor clinical practice can adherence to treatment such as airway clearance be
objectively determined.

108
3.5.5 Meaning of the study, conclusions and future research
The overall aim of this thesis is to describe the evolution of lung function in children
with CF less than six years of age managed with standard UK CF care. This chapter
reports lung function in preschool children; and shows that despite spirometry and sRaw
being within the normal range, LCI measured by MBW is abnormal by this time point.
In clinically diagnosed preschool children with CF, LCI has been shown to predict lung
function at school age51, with a positive predictive value for preschool LCI 94% to
predict an abnormal school-age result. School age LCI also correlates with
abnormalities on CT at this age126. Longitudinal studies of children with CF to school-
age are needed to investigate whether this relationship also exists in NBS individuals.
LCI is also a useful outcome measure for clinical trials as a non-invasive and sensitive
marker in NBS pre-schoolers, and this will be discussed in detail in the final chapter of
this thesis. To use LCI as a trial end point, power calculations are often based on
historical studies carried out more than ten years ago, but there are many differences
in CF care today compared to this time. A comparison of lung function results between
NBS and clinically diagnosed children with CF would also give insight into any
differences between these two groups, and is explored in the next chapter.
109
4 An era comparison of lung function in preschool
children with CF
4.1 Introduction
Chapter three reported cross-sectional lung function in the LCFC cohort 2 of children
with CF who were diagnosed by NBS. Data were collected from 2013-2015 and
represent the children with CF that we see and treat today. An earlier longitudinal
study was conducted by the LCFC between 2001 and 2005 in children diagnosed
clinically with CF (cohort 1), before NBS was introduced. These children were enrolled
at preschool age to undertake the same lung function tests as the current study,
namely multiple breath washout, plethysmographic sRaw and spirometry. Previous
work has shown that at two years of age, for most infants in cohort 2, lung function was
within the normal range129, and reviewed in chapter 1. However, the work of the
previous chapter has shown that preschool lung function in cohort 2 is abnormal. In
addition to their age and symptoms (many not properly treated) at diagnosis, there are
of course many differences between these cohorts, including new therapies and more
widespread application of standard treatments. An era comparison can give
information as to whether pre-school lung function in children with a NBS and more
recent diagnosis of CF remains better than those diagnosed a decade earlier, or if in
fact the better functional status of cohort 2 was merely transient (i.e. present at age two
years and disappeared by the preschool testing, in which case it would be difficult to
argue the benefits of NBS).
This chapter will compare lung function between the two cohorts to see if the
advantage of the NBS cohort is maintained. The analysis will determine whether
power calculations for interventional studies using lung function outcome measures can
be made with data from clinically diagnosed children with CF, or need to be based on
studies in NBS children (of whom by definition there are rather fewer). It is accepted
from the outset that if any difference is found, the cause of that difference cannot be
determined from this data.
110
4.2 Hypothesis, aims and objectives
4.2.1 Hypothesis
Despite the deterioration in lung function from age two to preschool, MBW, sRaw and
spirometry outcomes remain significantly better in newborn screened preschool
children with CF when compared to children clinically diagnosed a decade earlier.
4.2.2 Aim
The aim was to compare lung function (multiple breath washout, sRaw and spirometry)
in NBS children with CF aged three to six years with the same measurements made in
preschool children in the study performed 10 years earlier.
4.2.3 Objectives
The objectives were:
To measure lung function primary outcomes (LCI, sRtot and FEV0.75) in NBS
children and a contemporaneous healthy control group at three to six years of
age (as reported in chapter 3)
To directly compare these primary outcomes between NBS preschool children
with CF and those with a clinical diagnosis tested a decade earlier at the same
age
4.3 Methods
4.3.1 Subjects
As detailed in chapter three, children with a diagnosis of CF made by NBS and
contemporaneous healthy controls were recruited for lung function testing between
three and six years of age. Data were collected between 2013 and 2015. The
111
recruitment process, study protocol, methodology and eligibility criteria are described in
Chapter 2, section 2.4.
For the historical comparison, data were available for preschool children clinically
diagnosed with CF and healthy controls enrolled in a study performed a decade earlier.
Children had been tested at preschool age between 2001 and 2005 and underwent the
same three lung function tests (MBW, plethysmographic specific airway resistance and
spirometry) at the same centre using identical protocols. For clarity, children
participating in the study between 2001 and 2005 are referred to as cohort 1 and those
tested between 2013 and 2015 cohort 2. Data from cohort 1 were collected as part of
an earlier study (Principal Investigator Professor Janet Stocks), and not by myself.
A detailed description of the methodology employed in the cohort 1 study can be found
in an earlier publication7. This cohort was chosen for comparison as the study was
conducted in a near identical method to the more recent cohort 2 study. There were
minor differences in recruitment between studies as follows. In the cohort 2 study,
children with CF had been recruited from six London tertiary CF centres as infants and
were invited back for testing at preschool age. In cohort 1, initial testing was performed
in preschool children recruited from GOSH, and then extended to other LCFC centres
once feasibility had been established. In addition, not all these children had previous
infant lung function performed. The participating centres were the same in both
cohorts as described in Chapter 2. For healthy control subjects, preschool children in
cohort 1 were recruited from local schools and playgroups, as opposed to a postnatal
ward in cohort 2.
The inclusion and exclusion criteria for subjects with CF and healthy controls were
identical in both cohorts. Subjects performed the three lung function tests (MBW,
plethysmographic specific airway resistance and spirometry) in that order in the same
laboratory at GOSH in both cohorts.
4.3.2 Study design
The study was a cross-sectional comparison of lung function measurements between
preschool children with CF in cohort 1 and cohort 2. Lung function primary outcomes
were compared between children with CF and healthy controls in both cohorts, and
then the CF populations were compared (cohort 1 versus cohort 2).
112
4.3.3 Statistical analysis
Presentation of summary data and group comparison analyses were performed as
described in section 3.3.2. To investigate any effect of different control samples
between cohorts, the mean differences between CF and healthy control children in
cohorts 1 and 2 were compared for LCI z-score (as this was the most sensitive
measure of abnormality in both cohorts, and noted to be higher in cohort 2 controls
than expected in chapter 3). Multiple linear regression was used to describe
differences in the control populations for LCI z-score between cohorts. The regression
model included all subjects (children with CF and healthy controls) with LCI z-score as
the dependent variable. Binary predictors of cohort (coded as 0 for cohort one and 1
for cohort two) and CF (0 for healthy controls and 1 for children with CF) were added to
the model, allowing for an overall shift in average between cohorts, and a difference
attributable to CF (the same difference for each cohort). An interaction term was then
added between CF and cohort to investigate for a significant difference between the CF
minus healthy control mean difference between cohorts. Statistical analyses were
conducted using SPSS software (IBM SPSS Statistics for Windows, Version 24.0).
Figures were produced using SPSS and GraphPad Prism software (version 7.00 for
Windows, GraphPad Software, La Jolla California USA). Statistical significance was
taken as p<0.05.
4.3.4 Power of the study
Lung function data were available for 89 children with CF in cohort 1 and 69 children in
cohort 2 (a ratio of 1.25:1). The power calculation accounted for multiple comparisons
(as there were three primary outcomes) calculated as z-scores (expected standard
deviation of 1) and unequal groups. 43 children in each cohort would detect a
difference in SD score of 0.7 (or greater) in the primary lung function outcomes (LCI,
sRtot and FEV0.75) with 80% power at the 5% significance level. When adjusting for
unequal groups with the known recruitment ratio, 49 children in cohort 1 and 40
children in cohort 2 would detect the same difference in the three outcome measures of
0.7 at the same power and significance level. Therefore the study was adequately
powered to detect a difference between cohorts 1 and 2.
113
4.4 Results
4.4.1 Subject background characteristics
In cohort 1 there were 89 subjects with CF, aged from 3.0-5.9 years and 56 healthy
controls, aged from 2.7 to 5.8 years. There were no significant differences in gender,
ethnicity, age at test or birthweight z-score between children with CF and controls.
Background characteristics limited to children with CF in cohorts 1 and 2 were
compared and are summarised in Table 4.1. Children were well matched for gender
and ethnicity and there was no significant difference in birthweight z-score. There was,
however, a significant difference in age at test between cohorts, with children in cohort
2 older than cohort 1 by six months on average. In cohort 1, apart from five children
with antenatal bowel pathology suggestive of CF and one with a family history, all
children had a clinical diagnosis of CF, with 23 (26%) presenting with meconium ileus,
a significantly larger proportion of children than in cohort 2. As expected, age at
diagnosis was later in cohort 1 who were diagnosed with CF clinically, compared to
those in cohort 2 diagnosed by NBS. There were no significant differences in the
proportion of children with pancreatic insufficient or CF genotypes (p.Phe508del
homozygous and heterozygote) between cohorts.
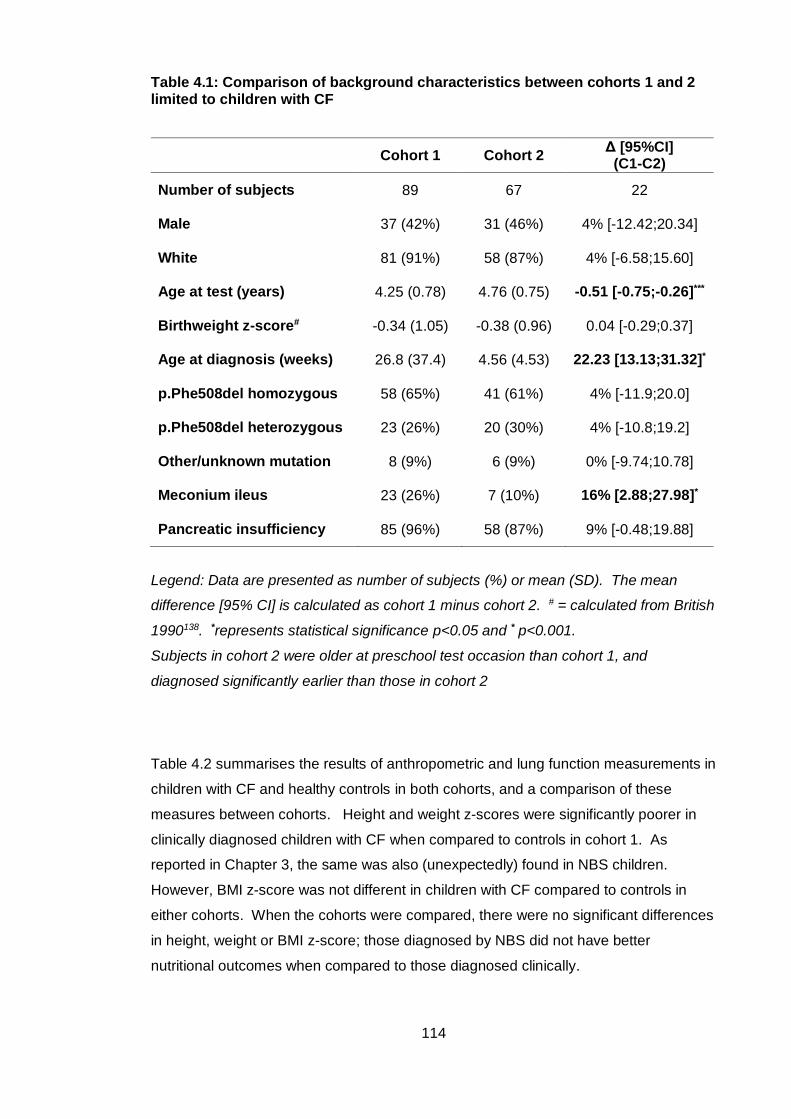
114
Table 4.1: Comparison of background characteristics between cohorts 1 and 2 limited to children with CF
Cohort 1 Cohort 2 Δ [95%CI]
(C1-C2)
Number of subjects 89 67 22
Male 37 (42%) 31 (46%) 4% [-12.42;20.34]
White 81 (91%) 58 (87%) 4% [-6.58;15.60]
Age at test (years) 4.25 (0.78) 4.76 (0.75) -0.51 [-0.75;-0.26]***
Birthweight z-score# -0.34 (1.05) -0.38 (0.96) 0.04 [-0.29;0.37]
Age at diagnosis (weeks) 26.8 (37.4) 4.56 (4.53) 22.23 [13.13;31.32]*
p.Phe508del homozygous 58 (65%) 41 (61%) 4% [-11.9;20.0]
p.Phe508del heterozygous 23 (26%) 20 (30%) 4% [-10.8;19.2]
Other/unknown mutation 8 (9%) 6 (9%) 0% [-9.74;10.78]
Meconium ileus 23 (26%) 7 (10%) 16% [2.88;27.98]*
Pancreatic insufficiency 85 (96%) 58 (87%) 9% [-0.48;19.88]
Legend: Data are presented as number of subjects (%) or mean (SD). The mean
difference [95% CI] is calculated as cohort 1 minus cohort 2. # = calculated from British
1990138. *represents statistical significance p<0.05 and * p<0.001.
Subjects in cohort 2 were older at preschool test occasion than cohort 1, and
diagnosed significantly earlier than those in cohort 2
Table 4.2 summarises the results of anthropometric and lung function measurements in
children with CF and healthy controls in both cohorts, and a comparison of these
measures between cohorts. Height and weight z-scores were significantly poorer in
clinically diagnosed children with CF when compared to controls in cohort 1. As
reported in Chapter 3, the same was also (unexpectedly) found in NBS children.
However, BMI z-score was not different in children with CF compared to controls in
either cohorts. When the cohorts were compared, there were no significant differences
in height, weight or BMI z-score; those diagnosed by NBS did not have better
nutritional outcomes when compared to those diagnosed clinically.
115
4.4.2 Comparison of lung function primary outcome measures between
cohorts 1 and 2
As seen in cohort 2, children with CF in cohort 1 had significantly poorer lung function
than healthy controls for all of the primary outcomes. When children with CF in the two
cohorts were compared, lung function measurements were significantly better in cohort
2, with mean z-score [95% CI] in LCI 0.74 [0.36;1.44] lower, sRtot 0.92 [0.49;1.35]
lower and FEV0.75 0.43 [-0.84;-0.01] higher than children in cohort 1 (Figure 4.1). In
healthy control subjects, there were no significant differences in height, weight or BMI
z-score in the two cohorts. However, a significant difference was seen in LCI and sRtot
z-score; control subjects in cohort 1 had a mean [95% CI] LCI z-score -1.06 [-1.43;-
0.70] lower and sRtot z-score 0.64 [0.20;1.07] higher than healthy controls in cohort 2.
There was no significant difference in FEV0.75 z-score between controls in both cohorts.
The reasons for differences between control groups is investigated further in section
4.4.3. The table also shows the discrepancy between cohort 1 and cohort 2 in the
mean difference (children with CF minus healthy controls). For LCI this was 1.8 z-
scores lower, sRtot 0.28 z-scores lower and FEV0.75 0.47 z-scores higher in cohort 2
when compared to cohort 1.
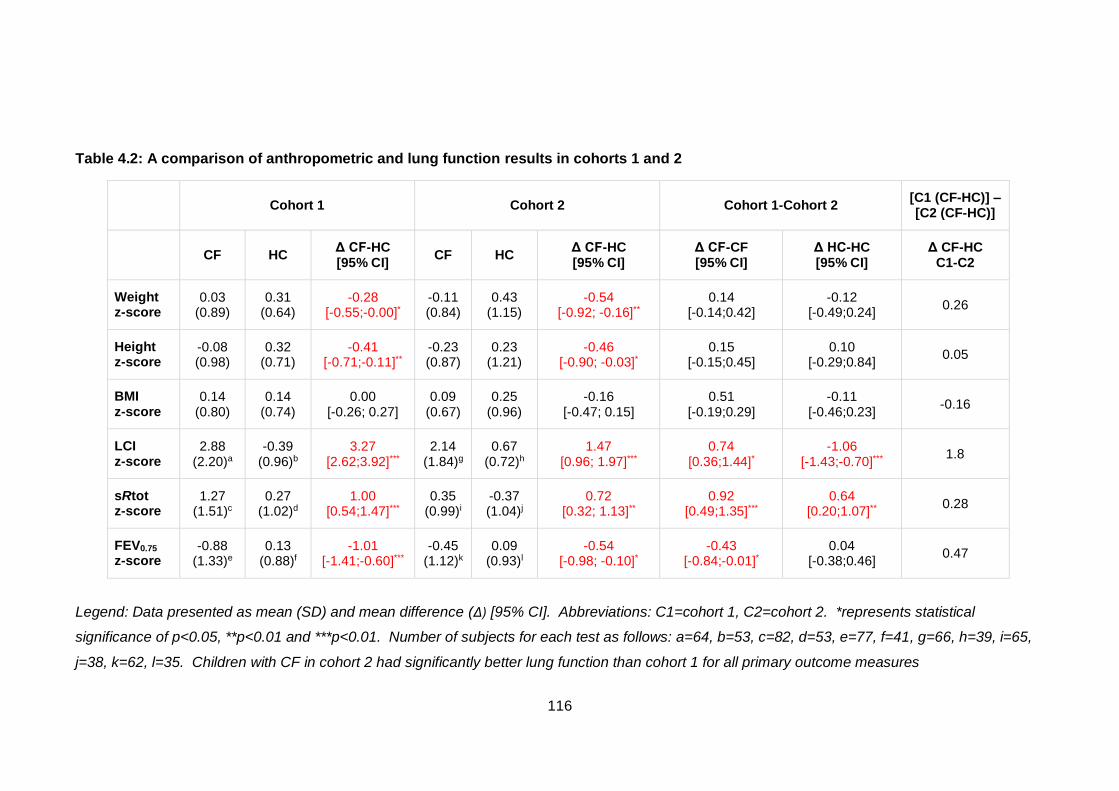
116
Table 4.2: A comparison of anthropometric and lung function results in cohorts 1 and 2
Cohort 1 Cohort 2 Cohort 1-Cohort 2 [C1 (CF-HC)] – [C2 (CF-HC)]
CF HC Δ CF-HC [95% CI]
CF HC Δ CF-HC [95% CI]
Δ CF-CF [95% CI]
Δ HC-HC [95% CI]
Δ CF-HC C1-C2
Weight z-score
0.03 (0.89)
0.31 (0.64)
-0.28 [-0.55;-0.00]*
-0.11 (0.84)
0.43 (1.15)
-0.54 [-0.92; -0.16]**
0.14 [-0.14;0.42]
-0.12 [-0.49;0.24]
0.26
Height z-score
-0.08 (0.98)
0.32 (0.71)
-0.41 [-0.71;-0.11]**
-0.23 (0.87)
0.23 (1.21)
-0.46 [-0.90; -0.03]*
0.15 [-0.15;0.45]
0.10 [-0.29;0.84]
0.05
BMI z-score
0.14 (0.80)
0.14 (0.74)
0.00 [-0.26; 0.27]
0.09 (0.67)
0.25 (0.96)
-0.16 [-0.47; 0.15]
0.51 [-0.19;0.29]
-0.11 [-0.46;0.23]
-0.16
LCI z-score
2.88 (2.20)a
-0.39 (0.96)b
3.27 [2.62;3.92]***
2.14 (1.84)g
0.67 (0.72)h
1.47 [0.96; 1.97]***
0.74 [0.36;1.44]*
-1.06 [-1.43;-0.70]***
1.8
sRtot z-score
1.27 (1.51)c
0.27 (1.02)d
1.00 [0.54;1.47]***
0.35 (0.99)i
-0.37 (1.04)j
0.72 [0.32; 1.13]**
0.92 [0.49;1.35]***
0.64 [0.20;1.07]**
0.28
FEV0.75 z-score
-0.88 (1.33)e
0.13 (0.88)f
-1.01 [-1.41;-0.60]***
-0.45 (1.12)k
0.09 (0.93)l
-0.54 [-0.98; -0.10]*
-0.43 [-0.84;-0.01]*
0.04 [-0.38;0.46]
0.47
Legend: Data presented as mean (SD) and mean difference (Δ) [95% CI]. Abbreviations: C1=cohort 1, C2=cohort 2. *represents statistical
significance of p<0.05, **p<0.01 and ***p<0.01. Number of subjects for each test as follows: a=64, b=53, c=82, d=53, e=77, f=41, g=66, h=39, i=65,
j=38, k=62, l=35. Children with CF in cohort 2 had significantly better lung function than cohort 1 for all primary outcome measures
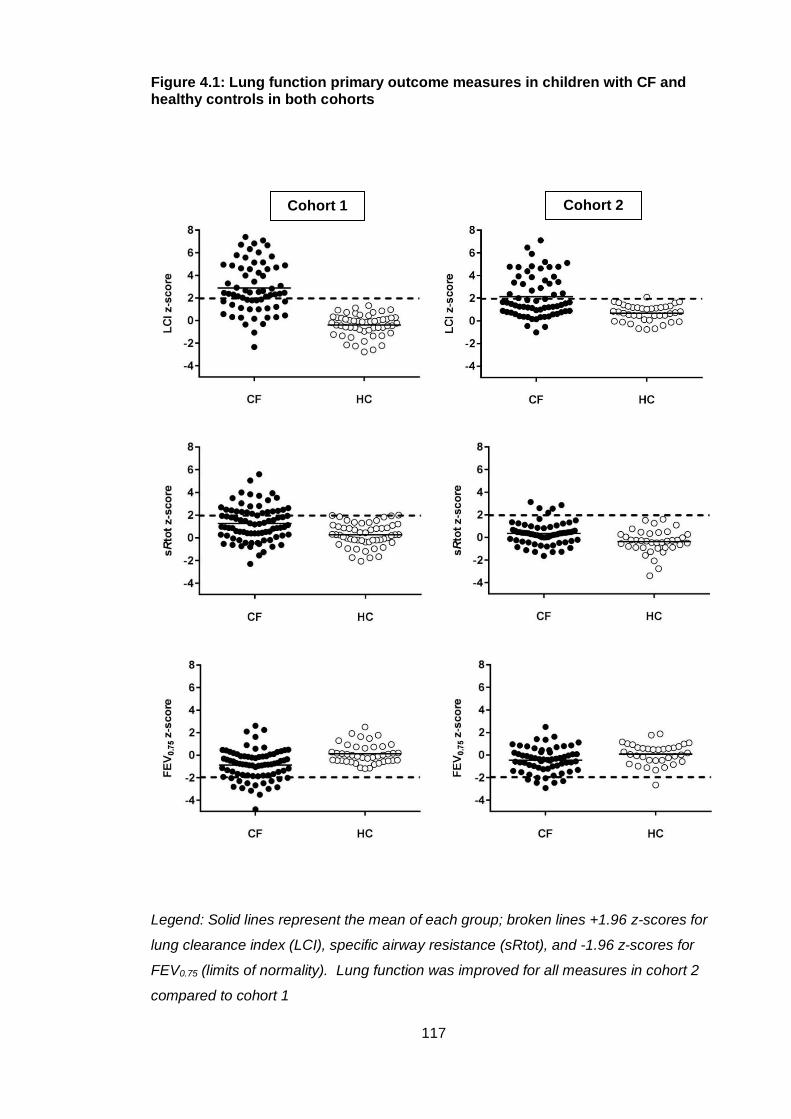
117
Figure 4.1: Lung function primary outcome measures in children with CF and healthy controls in both cohorts
Legend: Solid lines represent the mean of each group; broken lines +1.96 z-scores for
lung clearance index (LCI), specific airway resistance (sRtot), and -1.96 z-scores for
FEV0.75 (limits of normality). Lung function was improved for all measures in cohort 2
compared to cohort 1
Cohort 1 Cohort 2
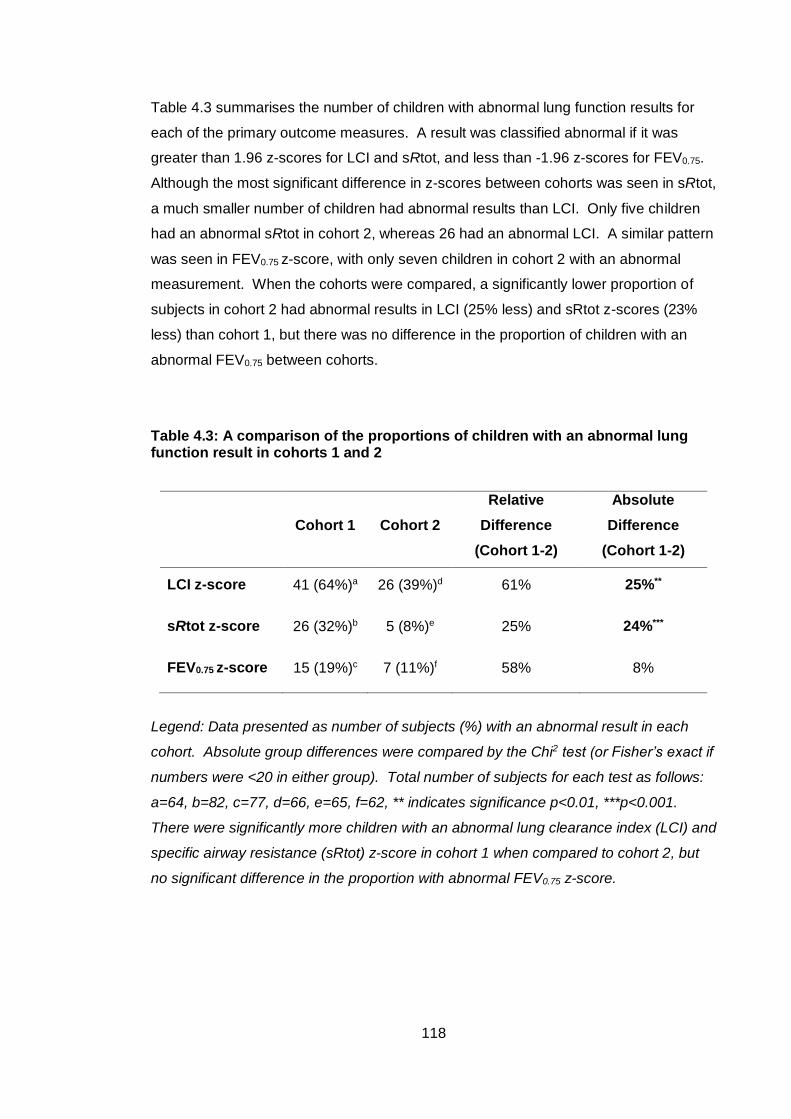
118
Table 4.3 summarises the number of children with abnormal lung function results for
each of the primary outcome measures. A result was classified abnormal if it was
greater than 1.96 z-scores for LCI and sRtot, and less than -1.96 z-scores for FEV0.75.
Although the most significant difference in z-scores between cohorts was seen in sRtot,
a much smaller number of children had abnormal results than LCI. Only five children
had an abnormal sRtot in cohort 2, whereas 26 had an abnormal LCI. A similar pattern
was seen in FEV0.75 z-score, with only seven children in cohort 2 with an abnormal
measurement. When the cohorts were compared, a significantly lower proportion of
subjects in cohort 2 had abnormal results in LCI (25% less) and sRtot z-scores (23%
less) than cohort 1, but there was no difference in the proportion of children with an
abnormal FEV0.75 between cohorts.
Table 4.3: A comparison of the proportions of children with an abnormal lung function result in cohorts 1 and 2
Cohort 1 Cohort 2
Relative
Difference
(Cohort 1-2)
Absolute
Difference
(Cohort 1-2)
LCI z-score 41 (64%)a 26 (39%)d 61% 25%**
sRtot z-score 26 (32%)b 5 (8%)e 25% 24%***
FEV0.75 z-score 15 (19%)c 7 (11%)f 58% 8%
Legend: Data presented as number of subjects (%) with an abnormal result in each
cohort. Absolute group differences were compared by the Chi2 test (or Fisher’s exact if
numbers were <20 in either group). Total number of subjects for each test as follows:
a=64, b=82, c=77, d=66, e=65, f=62, ** indicates significance p<0.01, ***p<0.001.
There were significantly more children with an abnormal lung clearance index (LCI) and
specific airway resistance (sRtot) z-score in cohort 1 when compared to cohort 2, but
no significant difference in the proportion with abnormal FEV0.75 z-score.
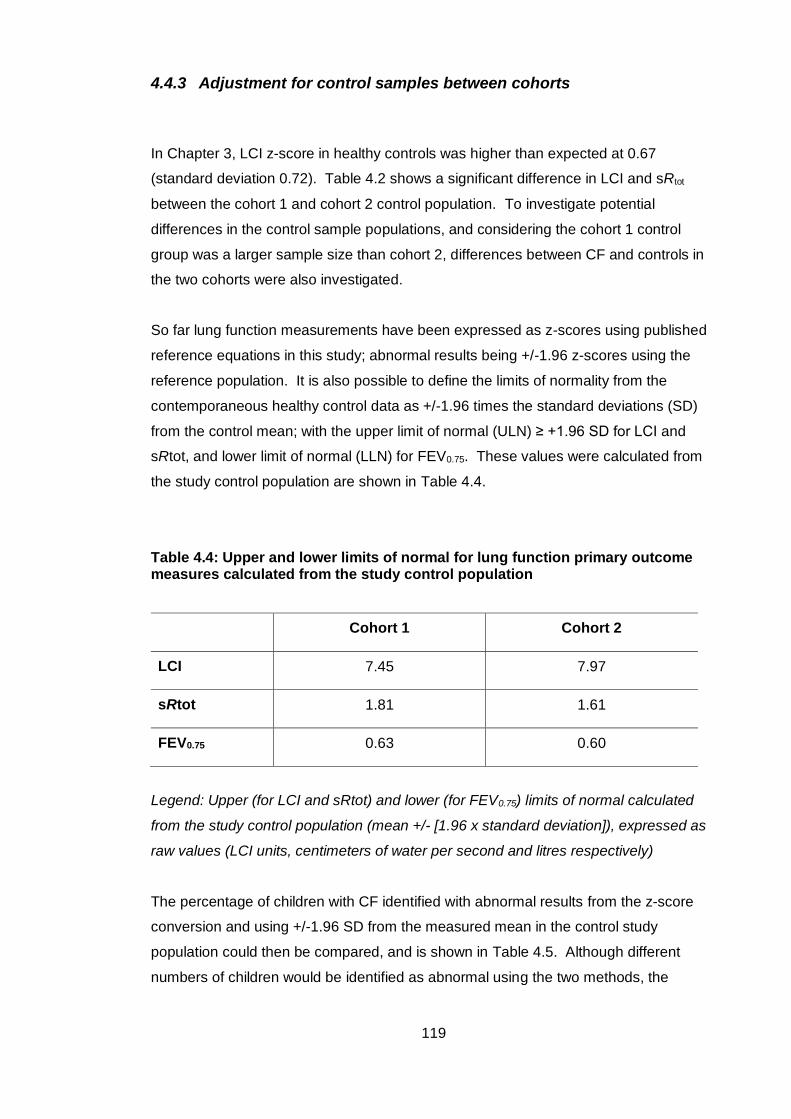
119
4.4.3 Adjustment for control samples between cohorts
In Chapter 3, LCI z-score in healthy controls was higher than expected at 0.67
(standard deviation 0.72). Table 4.2 shows a significant difference in LCI and sRtot
between the cohort 1 and cohort 2 control population. To investigate potential
differences in the control sample populations, and considering the cohort 1 control
group was a larger sample size than cohort 2, differences between CF and controls in
the two cohorts were also investigated.
So far lung function measurements have been expressed as z-scores using published
reference equations in this study; abnormal results being +/-1.96 z-scores using the
reference population. It is also possible to define the limits of normality from the
contemporaneous healthy control data as +/-1.96 times the standard deviations (SD)
from the control mean; with the upper limit of normal (ULN) ≥ +1.96 SD for LCI and
sRtot, and lower limit of normal (LLN) for FEV0.75. These values were calculated from
the study control population are shown in Table 4.4.
Table 4.4: Upper and lower limits of normal for lung function primary outcome measures calculated from the study control population
Cohort 1 Cohort 2
LCI 7.45 7.97
sRtot 1.81 1.61
FEV0.75 0.63 0.60
Legend: Upper (for LCI and sRtot) and lower (for FEV0.75) limits of normal calculated
from the study control population (mean +/- [1.96 x standard deviation]), expressed as
raw values (LCI units, centimeters of water per second and litres respectively)
The percentage of children with CF identified with abnormal results from the z-score
conversion and using +/-1.96 SD from the measured mean in the control study
population could then be compared, and is shown in Table 4.5. Although different
numbers of children would be identified as abnormal using the two methods, the
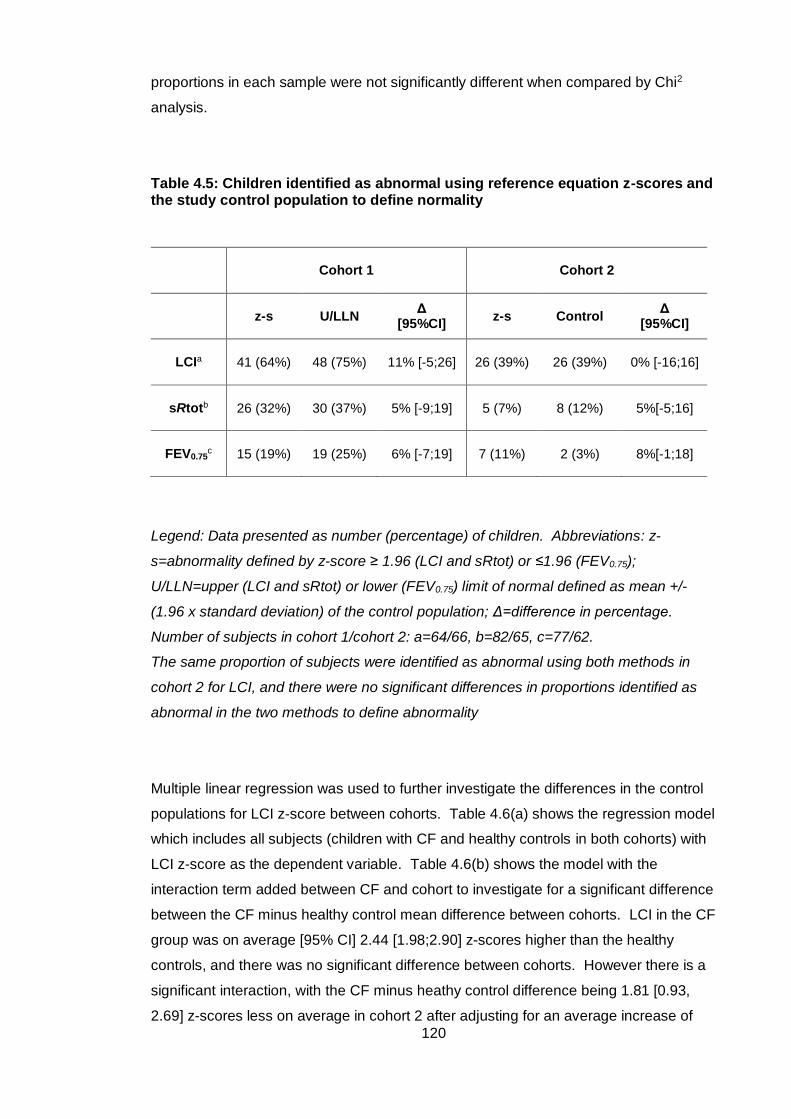
120
proportions in each sample were not significantly different when compared by Chi2
analysis.
Table 4.5: Children identified as abnormal using reference equation z-scores and the study control population to define normality
Cohort 1 Cohort 2
z-s U/LLN Δ
[95%CI] z-s Control
Δ [95%CI]
LCIa 41 (64%) 48 (75%) 11% [-5;26] 26 (39%) 26 (39%) 0% [-16;16]
sRtotb 26 (32%) 30 (37%) 5% [-9;19] 5 (7%) 8 (12%) 5%[-5;16]
FEV0.75c 15 (19%) 19 (25%) 6% [-7;19] 7 (11%) 2 (3%) 8%[-1;18]
Legend: Data presented as number (percentage) of children. Abbreviations: z-
s=abnormality defined by z-score ≥ 1.96 (LCI and sRtot) or ≤1.96 (FEV0.75);
U/LLN=upper (LCI and sRtot) or lower (FEV0.75) limit of normal defined as mean +/-
(1.96 x standard deviation) of the control population; Δ=difference in percentage.
Number of subjects in cohort 1/cohort 2: a=64/66, b=82/65, c=77/62.
The same proportion of subjects were identified as abnormal using both methods in
cohort 2 for LCI, and there were no significant differences in proportions identified as
abnormal in the two methods to define abnormality
Multiple linear regression was used to further investigate the differences in the control
populations for LCI z-score between cohorts. Table 4.6(a) shows the regression model
which includes all subjects (children with CF and healthy controls in both cohorts) with
LCI z-score as the dependent variable. Table 4.6(b) shows the model with the
interaction term added between CF and cohort to investigate for a significant difference
between the CF minus healthy control mean difference between cohorts. LCI in the CF
group was on average [95% CI] 2.44 [1.98;2.90] z-scores higher than the healthy
controls, and there was no significant difference between cohorts. However there is a
significant interaction, with the CF minus heathy control difference being 1.81 [0.93,
2.69] z-scores less on average in cohort 2 after adjusting for an average increase of
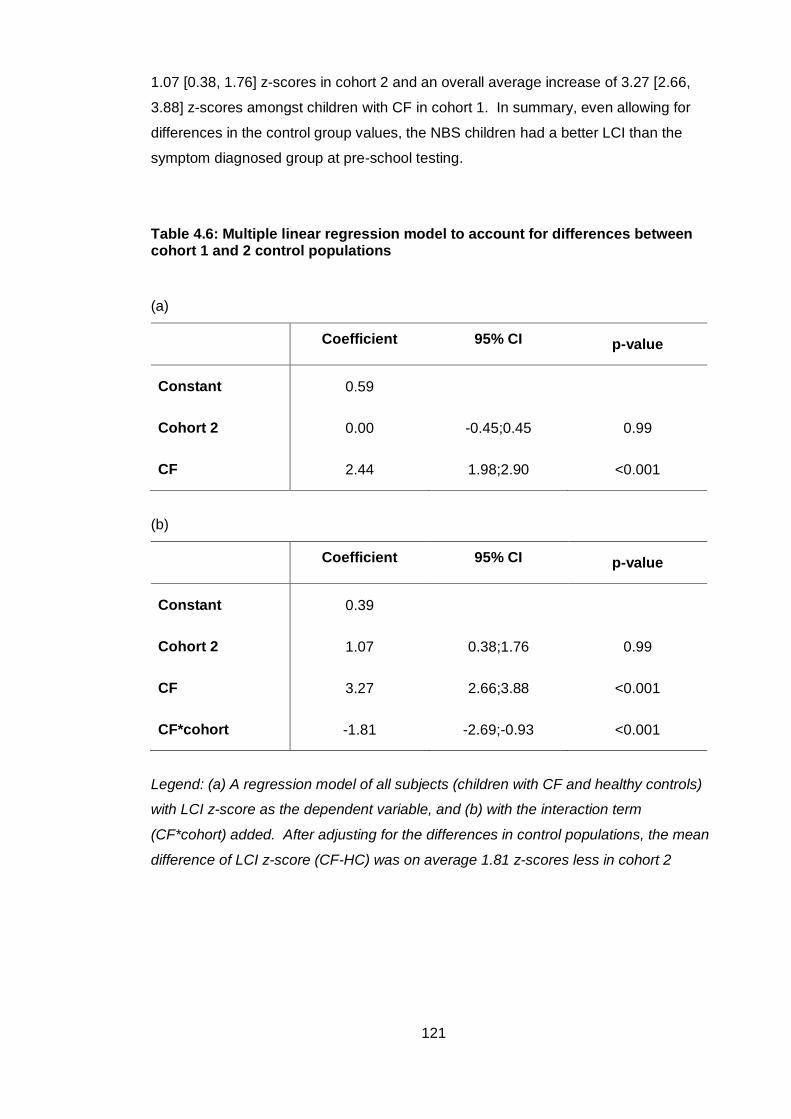
121
1.07 [0.38, 1.76] z-scores in cohort 2 and an overall average increase of 3.27 [2.66,
3.88] z-scores amongst children with CF in cohort 1. In summary, even allowing for
differences in the control group values, the NBS children had a better LCI than the
symptom diagnosed group at pre-school testing.
Table 4.6: Multiple linear regression model to account for differences between cohort 1 and 2 control populations
(a)
Coefficient 95% CI p-value
Constant 0.59
Cohort 2 0.00 -0.45;0.45 0.99
CF 2.44 1.98;2.90 <0.001
(b)
Coefficient 95% CI p-value
Constant 0.39
Cohort 2 1.07 0.38;1.76 0.99
CF 3.27 2.66;3.88 <0.001
CF*cohort -1.81 -2.69;-0.93 <0.001
Legend: (a) A regression model of all subjects (children with CF and healthy controls)
with LCI z-score as the dependent variable, and (b) with the interaction term
(CF*cohort) added. After adjusting for the differences in control populations, the mean
difference of LCI z-score (CF-HC) was on average 1.81 z-scores less in cohort 2
122
4.4.4 Comparison of LCI analysis methods
Differences in LCI z-score results were seen in the two control populations. Data
collection and test procedures were the same in both studies and laboratory standard
operating procedures had not changed over time. The analysis of MBW tests is
performed in custom made software (TestPoint, Capital Equipment Corp., Billerica, MA,
USA). Minor updates were made to the software during the time periods between
cohort 1 and 2 studies, to improve operability. Although these updates should not
change the final result of the analysis, it has been reported that minor changes in
software settings can impact on MBW outcomes146. Both software versions used in the
cohort 1 and 2 analyses were available, so it was possible to compare results in
subjects using both versions. If a higher LCI was seen in the ‘new’ (used in cohort 2
analysis) versus ‘old’ (used in cohort 1) software, the discrepancy in LCI could
therefore be attributed to change in software between the two studies.
4.4.4.1 Differences in software for MBW analysis
To investigate any differences in LCI using different versions of software, ten MBW
tests in healthy control subjects from each cohort were analysed in both ‘old’ (version
a) and ‘new’ (version b) software, as shown in Table 4.7. The differences were
compared using the Wilcoxon paired samples test. There was no significant difference
in LCI analysed in either software version for healthy control subjects in cohort 1 or
cohort 2. In fact, there was a trend for lower LCI values from software version b, the
version used for analysis in cohort 2. The direction of this difference is the opposite to
the discrepancy noted in this study, where cohort 2 control subjects had a higher LCI
than cohort 1 controls. The discrepancy in LCI z-score when comparing the control
populations from cohorts 1 and 2 could not, therefore, be attributed to software
adjustments made between the two study time periods.
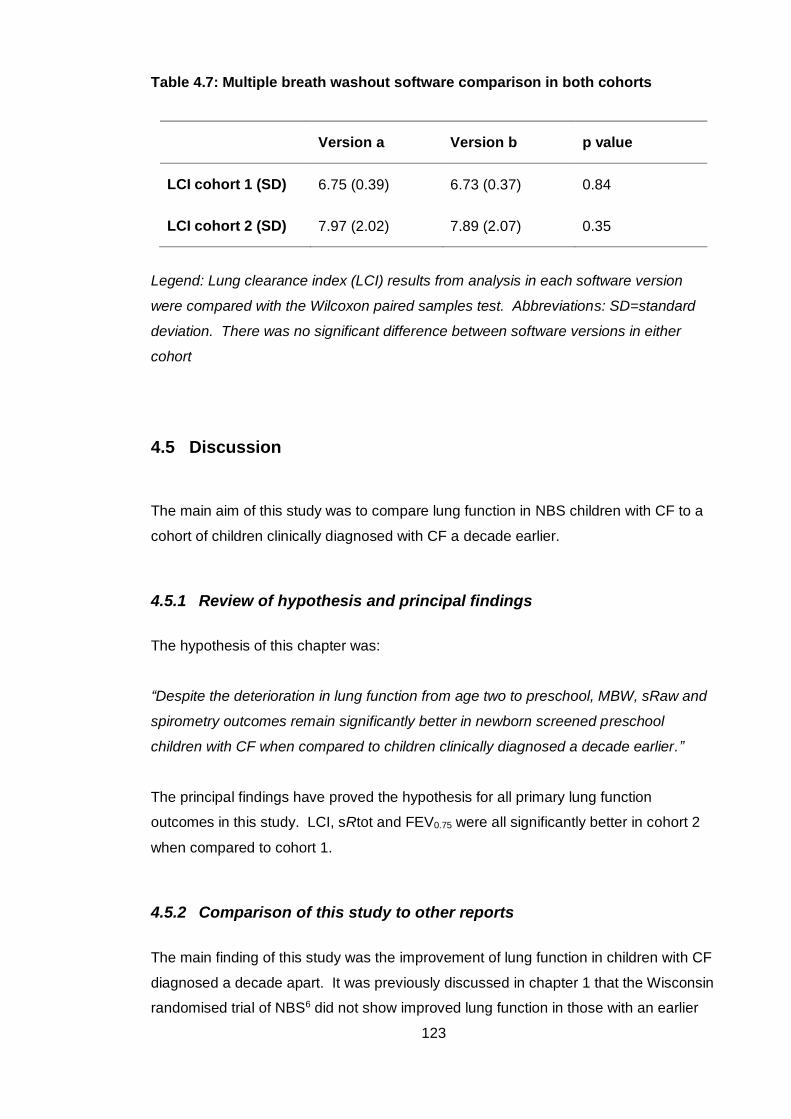
123
Table 4.7: Multiple breath washout software comparison in both cohorts
Version a Version b p value
LCI cohort 1 (SD) 6.75 (0.39) 6.73 (0.37) 0.84
LCI cohort 2 (SD) 7.97 (2.02) 7.89 (2.07) 0.35
Legend: Lung clearance index (LCI) results from analysis in each software version
were compared with the Wilcoxon paired samples test. Abbreviations: SD=standard
deviation. There was no significant difference between software versions in either
cohort
4.5 Discussion
The main aim of this study was to compare lung function in NBS children with CF to a
cohort of children clinically diagnosed with CF a decade earlier.
4.5.1 Review of hypothesis and principal findings
The hypothesis of this chapter was:
“Despite the deterioration in lung function from age two to preschool, MBW, sRaw and
spirometry outcomes remain significantly better in newborn screened preschool
children with CF when compared to children clinically diagnosed a decade earlier.”
The principal findings have proved the hypothesis for all primary lung function
outcomes in this study. LCI, sRtot and FEV0.75 were all significantly better in cohort 2
when compared to cohort 1.
4.5.2 Comparison of this study to other reports
The main finding of this study was the improvement of lung function in children with CF
diagnosed a decade apart. It was previously discussed in chapter 1 that the Wisconsin
randomised trial of NBS6 did not show improved lung function in those with an earlier
124
diagnosis of CF, but the results may have been influenced by a higher rate of
Pseudomonas aeruginosa infection in the NBS group. This study adds to the evidence
of other observational studies suggesting improved pulmonary health in children with
CF over the last ten years.
LCI was the most sensitive discriminator of disease, with very few children with
abnormal airway resistance and spirometry indices in either cohorts. There is much
interest at present in using LCI as an end point in clinical trials and monitoring tool in
children with CF as a non-invasive, non-irradiating measure. This interest developed
out of studies showing the high sensitivity of LCI as a marker of disease, but these
observations were made in studies now more than ten years old in children clinically
diagnosed with CF. This study shows that if LCI is to be used as an outcome measure
in prospective clinical trials, power calculations cannot be based on historical studies,
as there are far fewer children with abnormal results than in studies of those diagnosed
with CF a decade earlier. This finding will be discussed further in Chapter 7.
4.5.3 Strengths and limitations of the study
The main strength of this study was the ability to directly compare two cohorts of
children with CF diagnosed a decade apart. To the author’s knowledge no other group
has been able to make this comparison of lung function measures in preschool children
with the same study design and methodology. The study inclusion and exclusion
criteria were identical and there were only minor differences in the mode of recruitment
for healthy controls. Both cohorts of children were tested at the Great Ormond Street
Hospital lung function laboratory and the protocols for measurement of lung function
had not changed over time.
Both the cohort 1 and 2 studies included a contemporaneous healthy control group for
comparison. The importance of studying a control group and possible misinterpretation
of lung function tests using reference equations has been previously described33. In
this study, a difference was shown in mean LCI and sRtot z-score of the control
populations of cohorts 1 and 2. This made a direct comparison of differences between
children with CF and healthy controls in the two cohorts difficult to interpret. To
account for this, the control group for each lung function primary outcome was used to
define abnormality as the upper or lower limit of normal (Section 4.4.3). This analysis
identified a similar number of subjects with an abnormal result in cohort 2 as the z-

125
score conversion, and the difference in proportion of those with abnormal results was
not statistically significant. Furthermore, a regression analysis to compare the mean
difference between CF and control subjects (cohort 1 versus cohort 2) showed that
NBS children had better LCI when the difference between control populations was
taken into account. Both methods of analysis point towards improved lung function in
cohort 2, strengthening the conclusions.
Reasons for the difference between LCI and sRtot control means between cohorts 1
and 2 were not clear in this study. There were minor differences in recruitment
between studies; preschool children in cohort 1 were recruited from local schools and
playgroups, as opposed to a postnatal ward in cohort 2. Exclusion criteria were
identical between the two studies, and the two methods of recruitment would not be
expected to result in different populations, but it remains possible that this was the
cause of the discrepancy. For LCI, there were no methodological differences between
cohorts in data collection; in fact the same mass spectrometer, pneumotachometer and
connectors were used in both studies. Departmental standard operating procedures
had not changed over time. The only difference was that the location of MBW
equipment had changed between studies, but this would not be expected to result in a
shift in MBW outcomes. In section 4.4.4 I investigated whether any MBW analysis
software changes between cohorts resulted in a higher LCI value, but again there were
no significant differences between either software versions. I was therefore unable to
identify the cause of the healthy control differences seen between cohort 1 and cohort
2 studies.
Despite efforts to match the two cohorts by age, children with CF in NBS cohort 2 were
significantly older than those in cohort 1 at test date, by around 0.5 years. As the
overall study design was longitudinal and the children followed from infancy, some
were approaching their sixth birthday when the preschool follow-up study began.
There were more children in the CF group, and recruitment at the beginning of the
study was concentrated on these children to ensure they were not lost to follow up. As
CF is a progressive disease, lung function can be expected to worsen with age.
Despite being older, these children still had better lung function than cohort 1, and the
difference may have been underestimated with inclusion of children of a higher age.
The rate of change of lung function over the preschool time period was, however,
shown to be minimal in Chapter 3, and therefore the six month discrepancy between
the two cohorts is unlikely to have much influence on the results, although any
difference would reduce the chance of finding improved lung function in NBS cohort 2.
126
The main limitations in this study are the inherent changes over time in which children
in the two cohorts were managed. There are many potential differences during this
period, such as centralisation of care, segregated clinics, earlier start of treatment,
more intensive therapy and increased use of treatments such as mucolytic therapy.
Therefore, this study compares lung function in two cohorts not only diagnosed a
decade apart, and by different methods, but also with very different management
strategies. How much these differences contribute to the change in lung function is not
possible to ascertain, and is outside of the scope of this thesis. Superior lung function
in cohort 2 cannot be attributed to newborn screening per se, but does reflect an
improvement over the time between the study periods. However, if the NBS cohort had
been no better or even inferior than cohort 1, despite modern advances in treatment,
this would have cast grave doubts on the value of screening.
The lung function protocols for both cohorts were examined to investigate any change
in methodology during the time between the two studies. At present there are no
agreed guidelines for the measurement of specific airway resistance. In a multi-centre
study collating reference data for specific airway resistance, Kirkby et al.55 showed
methodological variation between centres and stated that the reference values are only
applicable to studies employing a similar measurement approach. The test conditions
matched those described in this article for the cohort 1 and 2 studies when reviewing
sRaw protocols, and any differences minimised as children were tested in the same
centre. However, without strict guidelines there may have been unintentional and
minor discrepancies in measurement techniques, but with the passage of time it is not
possible within the scope of this thesis to examine this further.
4.5.4 Meaning of the study, conclusions and future research
This chapter adds to the overall aim of the thesis, to describe the evolution of lung
function in NBS children with CF, by showing a clear improvement in lung function at
preschool age over a ten year period. The children we treat with CF today thus have
better pulmonary health than historical cohorts. The main question that remains is,
what factors are responsible for this improvement? As discussed above, it is not
possible to determine the extent to which each of the many management changes over
ten years have contributed to the improvement seen. Some of the predictors of lung
function in the LCFC clinically diagnosed cohort have been described125, and data from

127
the AREST-CF cohort explore which factors, including inflammatory markers, infection
and structural change, are associated with poorer lung function in NBS children with
CF.
The previous two chapters have demonstrated that lung function, although improved to
that seen in those clinically diagnosed ten years ago, is abnormal by the preschool
years in NBS children with CF. Using measurements made in infancy from these
children, the next chapter will go on to explore whether infant lung function or clinical
parameters can predict preschool lung function in the NBS cohort of children.
128
5 Predictors of preschool lung function in newborn
screened children with CF
5.1 Introduction
As new therapies become available for the treatment of CF, especially including those
that can correct the basic CFTR defect,147, 148 there has been a shift over recent years
towards introducing these treatments in ever younger children. However these
molecules are expensive, result in increased treatment burden for families, and have
side effects that could potentially be harmful to infants, particularly during early lung
development, when any adverse effect on airway obstruction will be lifelong. Important
questions that remain are when the optimal time point to start these therapies occurs,
explored in Chapter 3, but also whether any measure in infancy can predict those who
will decline. This would identify a select group of children to target such treatments or
more intensive therapy, and would further allow us to select infants for randomised
controlled trials for whom a beneficial effect is most likely demonstrable.
The preschool children described in chapters three and four were part of the LCFC
longitudinal study of NBS children with CF (section 2.3). In summary, at three months,
lung function for all tests was significantly poorer than a contemporaneous healthy
control population36, but at one and two years of age, LCI and FRCpleth remained stable
and a significant improvement was seen in FEV0.5 over time with treatment in specialist
centres127, 129. At two years, only 7% had abnormal FEV0.5, 15% abnormal LCI and
19% abnormal FRCpleth. Excellent somatic growth was also seen, with no group
differences seen between subjects with CF and controls. The determinants of lung
function were reported, and significant associations seen between a history of
Pseudomonas aeruginosa (higher FRCpleth) and those receiving additional antibiotics or
positive cough swab (lower FEV0.5) at one year, and a greater improvement in FEV0.5 in
subjects who had not isolated Pseudomonas aeruginosa. However there were no
associations with CF treatments, such as courses of intravenous antibiotics. These
studies are discussed in detail in section 1.4.3.2, and their results suggest that novel
treatments for CF could be deferred until after infancy.
This chapter will describe the evolution of lung function in children with CF from
diagnosis to the preschool years, tracking lung function over time in cohort 2,
andspecifically investigate whether any measures (anthropometric, functional or
129
clinical) in infancy can predict worse preschool lung function, and thus a high risk
group.
5.2 Hypothesis, aims and objectives
5.2.1 Hypotheses
The hypotheses were:
a) Infant lung function measures (FEV0.5, FRCpleth and LCI z-scores) and nutritional
markers (height, weight and BMI z-scores) cannot predict preschool lung function
(LCI, sRtot and FEV0.75 z-scores) in NBS children with CF
b) Clinical markers of infection (isolation of bacteria on respiratory samples), cannot
predict preschool lung function, and markers of disease severity (for example
courses of intravenous antibiotics) in infancy will not be significantly associated with
preschool lung function primary outcomes (LCI, sRtot and FEV0.75 z-scores)
5.2.2 Aim
The aim of the study was to describe the evolution of lung function from diagnosis to
the preschool years in NBS children with CF, and to report whether characteristics in
infancy (anthropometric, lung function, bacterial infection and markers of disease
severity) can predict preschool lung function
5.2.3 Objectives
The objectives were:
a) To describe the anthropometric characteristics (height, weight and body mass
index) from birth to preschool age in subjects with CF and their association with
lung function at three to six years of age (primary outcomes LCI, sRtot and FEV0.75
z-score)
130
b) To examine whether there is an association between infant lung function measures
(FEV0.5, LCI and FRCpleth) with the preschool lung function primary outcomes used
in this study
c) To investigate the association between clinical markers in infancy, such as bacterial
isolates, and markers of disease severity, such as courses of intravenous
antibiotics, known to be associated with lung function decline in older children
5.3 Methods
5.3.1 Subjects and measurements
The recruitment process and methodology for the LCFC infant study is described in
section 2.3, and for the preschool NBS follow up study in section 2.4. Data from infants
were collected as part of an earlier study (Principal Investigator Professor Janet
Stocks), and not by myself.
5.3.2 Statistical analysis
Presentation of summary data and group comparison analyses were performed as
described in section 3.3.2. Paired t-tests were used to investigate the change in lung
function outcomes between each test occasion. Regression analysis was used to
investigate the association of subject anthropometric and clinical characteristics, and
infant lung function outcomes with preschool lung function. This was limited to children
with CF as predictors such as disease severity and medical treatments were not
applicable to healthy subjects. Measures known to influence lung function were
specifically chosen as independent variables, and are detailed in Table 5.1. Isolation of
Pseudomonas aeruginosa (PA), Staphylococcus aureus (SA), Haemophilus influenzae
(HI) and Stenotrophomonas maltophilia (SM) were investigated as the positive isolates
found in this cohort. The following independent variables were investigated:
Subjects with CF ‘ever’ isolating each organism
Age of first acquisition of each organism (continuous variable)
To examine the significance of early isolation further, isolation before the first
six months of life, between six months and two years, and between two year
and preschool test were investigated as categorical variables (although these
time periods were arbitrary and analysis post-hoc)
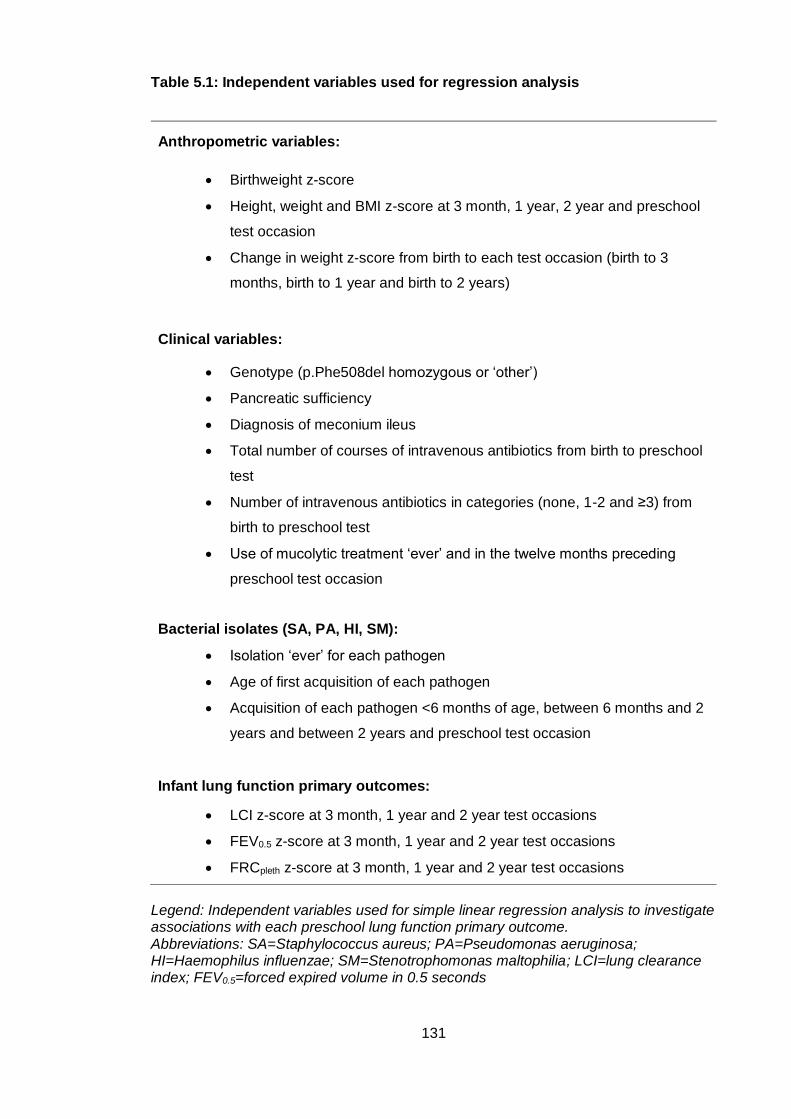
131
Table 5.1: Independent variables used for regression analysis
Anthropometric variables:
Birthweight z-score
Height, weight and BMI z-score at 3 month, 1 year, 2 year and preschool
test occasion
Change in weight z-score from birth to each test occasion (birth to 3
months, birth to 1 year and birth to 2 years)
Clinical variables:
Genotype (p.Phe508del homozygous or ‘other’)
Pancreatic sufficiency
Diagnosis of meconium ileus
Total number of courses of intravenous antibiotics from birth to preschool
test
Number of intravenous antibiotics in categories (none, 1-2 and ≥3) from
birth to preschool test
Use of mucolytic treatment ‘ever’ and in the twelve months preceding
preschool test occasion
Bacterial isolates (SA, PA, HI, SM):
Isolation ‘ever’ for each pathogen
Age of first acquisition of each pathogen
Acquisition of each pathogen <6 months of age, between 6 months and 2
years and between 2 years and preschool test occasion
Infant lung function primary outcomes:
LCI z-score at 3 month, 1 year and 2 year test occasions
FEV0.5 z-score at 3 month, 1 year and 2 year test occasions
FRCpleth z-score at 3 month, 1 year and 2 year test occasions
Legend: Independent variables used for simple linear regression analysis to investigate associations with each preschool lung function primary outcome. Abbreviations: SA=Staphylococcus aureus; PA=Pseudomonas aeruginosa; HI=Haemophilus influenzae; SM=Stenotrophomonas maltophilia; LCI=lung clearance index; FEV0.5=forced expired volume in 0.5 seconds
132
As LCI z-score was the most sensitive marker of abnormality in the 67 children with CF
tested in the preschool years, it was chosen as the primary outcome, and modelled first
as a dependent variable. sRtot z-score and FEV0.75 z-score were then investigated as
secondary outcome dependent variables.
Simple linear regression was performed first to examine the effect of individual
characteristics and infant lung function (independent variables) on each preschool lung
function measure (LCI, sRtot and FEV0.75 z-scores), with each primary lung function
outcome modelled separately as dependent variables. Multiple linear regression was
then used to investigate the combined interactions for independent variables.
The multiple linear regression models are presented in tables. A description of the
headings are as follows:
• ‘n’ represents the number of subjects included in the model
• ‘Coefficients’ describe unstandardized slope coefficients (‘B’) for each variable,
measured in their natural units. ‘B’ represents the change in the dependent variable for
every one unit change in the independent variable. ‘SE’ is the standard error of ‘B’,
used to determine whether ‘B’ is significantly different from zero. The ‘p-value’
indicates whether the independent variable in question is a statistically significant
predictor for the dependent variable. In the multiple regression models, the ‘p-value’ is
calculated after adjusting for the other independent variables. The ‘Constant’ values
(intercept) are presented in the multiple regression models; the value of the dependent
variable when all the independent variables are zero.
• The ‘Model summary’ includes ‘R’, the Pearson correlation coefficient between
the values predicted by the regression model and the actual values of the dependent
variable. It is a measure of the strength of the linear association between the
independent and dependent variables and the model fit, ranging from zero to one;
higher values indicate a stronger association. The ‘Adjusted R2’ is the proportion of
the variance accounted for by the regression model that would be expected in the
population. The ‘p value’ indicated whether the model is statistically significant.
Models were examined to ensure the assumptions of regression were met; linearity, no
multicollinearity or highly influential points, and that errors (residuals) were
homoscedastic and approximately normally distributed. Statistical significance was
taken as p<0.05. To select the most appropriate regression model, forward selection
and backward elimination procedures were used. This involved sequentially entering
variables into the model to investigate whether the overall model fit was improved
133
(more variance explained). If a variable did not improve the model, it was then
removed or ‘eliminated’. The final models therefore consist of the relative contribution
of independent variables significantly associated with the dependent variable, with the
maximum variance explained. An evaluation of binary classifiers is also presented for
preschool LCI z-score using infant lung function tests and Pseudomonas aeruginosa
status as predictor variables.
5.4 Results
5.4.1 Subject characteristics
67 subjects with CF and 41 healthy controls with prior infant lung function results had
the tests repeated at preschool age (three to six years). The background
characteristics of cohort 2 children with CF at the preschool test occasion were
presented in section 3.4.2.
Table 5.2 summarises the age and anthropometric characteristics at each infant lung
function test occasion (three months, one year and two years) and at the preschool test
occasion. Weight, height and BMI z-scores were significantly poorer than controls in
subjects with CF at three months of age, then showed improvement at one and two
years, and BMI z-score remained stable at preschool test. Figure 5.1 illustrates the
trends of growth parameters graphically from infancy to preschool age by test
occasion.
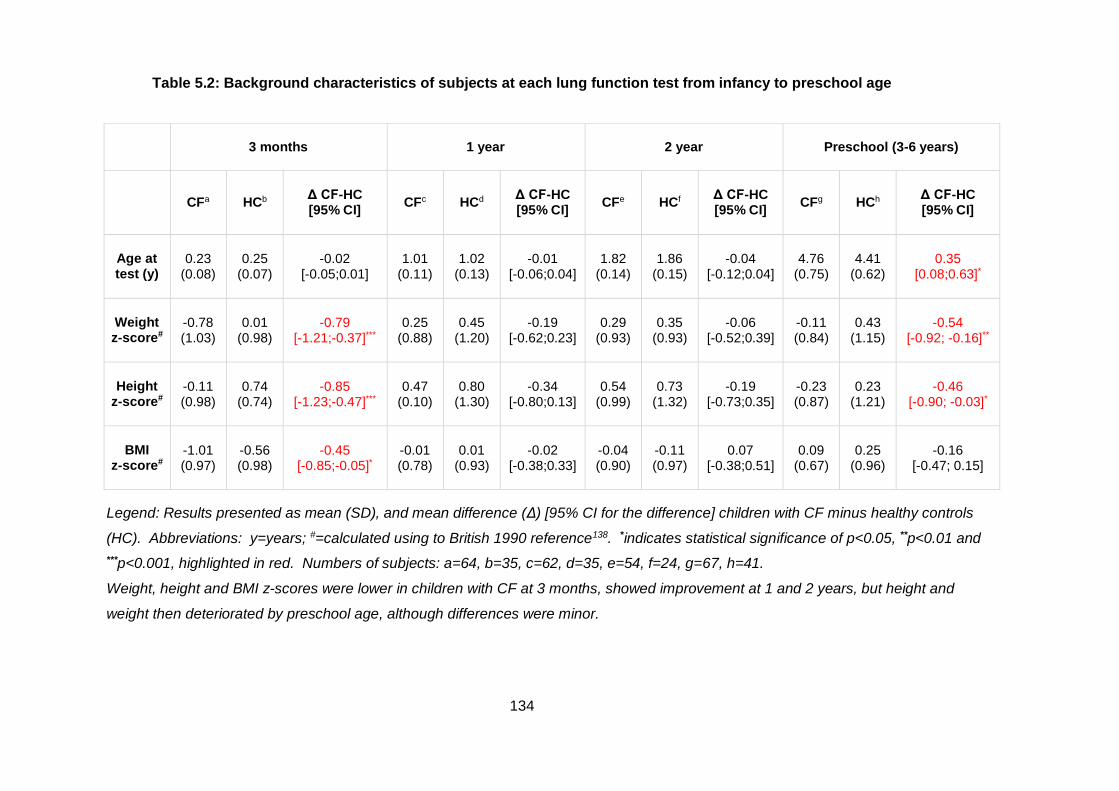
134
Table 5.2: Background characteristics of subjects at each lung function test from infancy to preschool age
3 months 1 year 2 year Preschool (3-6 years)
CFa HCb Δ CF-HC [95% CI]
CFc HCd Δ CF-HC [95% CI]
CFe HCf Δ CF-HC [95% CI]
CFg HCh Δ CF-HC [95% CI]
Age at test (y)
0.23 (0.08)
0.25 (0.07)
-0.02 [-0.05;0.01]
1.01 (0.11)
1.02 (0.13)
-0.01 [-0.06;0.04]
1.82 (0.14)
1.86 (0.15)
-0.04 [-0.12;0.04]
4.76 (0.75)
4.41 (0.62)
0.35 [0.08;0.63]*
Weight z-score#
-0.78 (1.03)
0.01 (0.98)
-0.79 [-1.21;-0.37]***
0.25 (0.88)
0.45 (1.20)
-0.19 [-0.62;0.23]
0.29 (0.93)
0.35 (0.93)
-0.06 [-0.52;0.39]
-0.11 (0.84)
0.43 (1.15)
-0.54 [-0.92; -0.16]**
Height z-score#
-0.11 (0.98)
0.74 (0.74)
-0.85 [-1.23;-0.47]***
0.47 (0.10)
0.80 (1.30)
-0.34 [-0.80;0.13]
0.54 (0.99)
0.73 (1.32)
-0.19 [-0.73;0.35]
-0.23 (0.87)
0.23 (1.21)
-0.46 [-0.90; -0.03]*
BMI z-score#
-1.01 (0.97)
-0.56 (0.98)
-0.45 [-0.85;-0.05]*
-0.01 (0.78)
0.01 (0.93)
-0.02 [-0.38;0.33]
-0.04 (0.90)
-0.11 (0.97)
0.07 [-0.38;0.51]
0.09 (0.67)
0.25 (0.96)
-0.16 [-0.47; 0.15]
Legend: Results presented as mean (SD), and mean difference (Δ) [95% CI for the difference] children with CF minus healthy controls
(HC). Abbreviations: y=years; #=calculated using to British 1990 reference138. *indicates statistical significance of p<0.05, **p<0.01 and
***p<0.001, highlighted in red. Numbers of subjects: a=64, b=35, c=62, d=35, e=54, f=24, g=67, h=41.
Weight, height and BMI z-scores were lower in children with CF at 3 months, showed improvement at 1 and 2 years, but height and
weight then deteriorated by preschool age, although differences were minor.
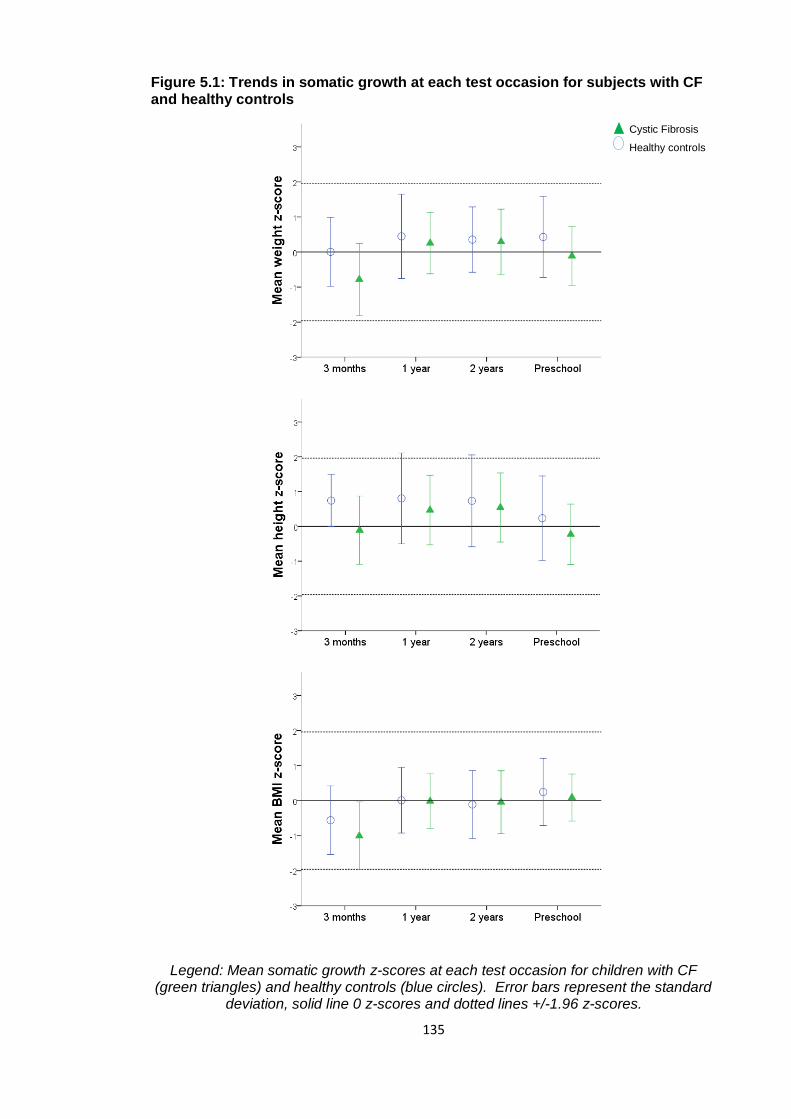
135
Figure 5.1: Trends in somatic growth at each test occasion for subjects with CF and healthy controls
Legend: Mean somatic growth z-scores at each test occasion for children with CF (green triangles) and healthy controls (blue circles). Error bars represent the standard
deviation, solid line 0 z-scores and dotted lines +/-1.96 z-scores.
Cystic Fibrosis
Healthy controls
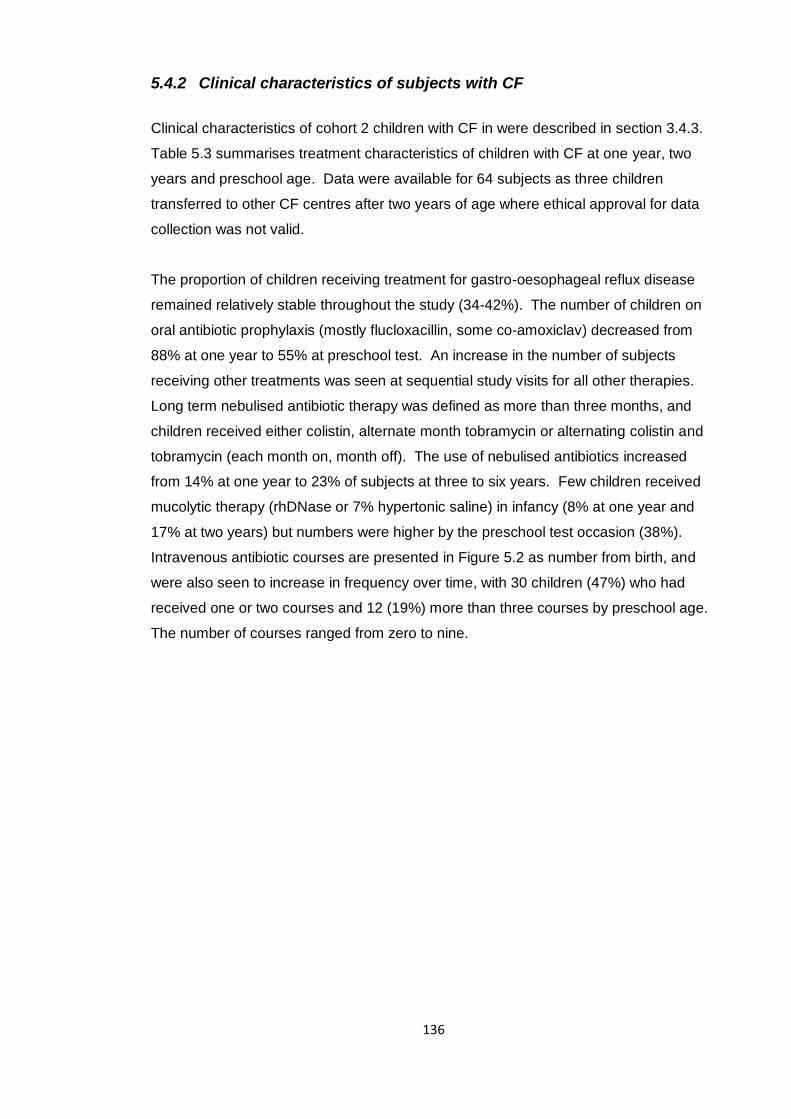
136
5.4.2 Clinical characteristics of subjects with CF
Clinical characteristics of cohort 2 children with CF in were described in section 3.4.3.
Table 5.3 summarises treatment characteristics of children with CF at one year, two
years and preschool age. Data were available for 64 subjects as three children
transferred to other CF centres after two years of age where ethical approval for data
collection was not valid.
The proportion of children receiving treatment for gastro-oesophageal reflux disease
remained relatively stable throughout the study (34-42%). The number of children on
oral antibiotic prophylaxis (mostly flucloxacillin, some co-amoxiclav) decreased from
88% at one year to 55% at preschool test. An increase in the number of subjects
receiving other treatments was seen at sequential study visits for all other therapies.
Long term nebulised antibiotic therapy was defined as more than three months, and
children received either colistin, alternate month tobramycin or alternating colistin and
tobramycin (each month on, month off). The use of nebulised antibiotics increased
from 14% at one year to 23% of subjects at three to six years. Few children received
mucolytic therapy (rhDNase or 7% hypertonic saline) in infancy (8% at one year and
17% at two years) but numbers were higher by the preschool test occasion (38%).
Intravenous antibiotic courses are presented in Figure 5.2 as number from birth, and
were also seen to increase in frequency over time, with 30 children (47%) who had
received one or two courses and 12 (19%) more than three courses by preschool age.
The number of courses ranged from zero to nine.
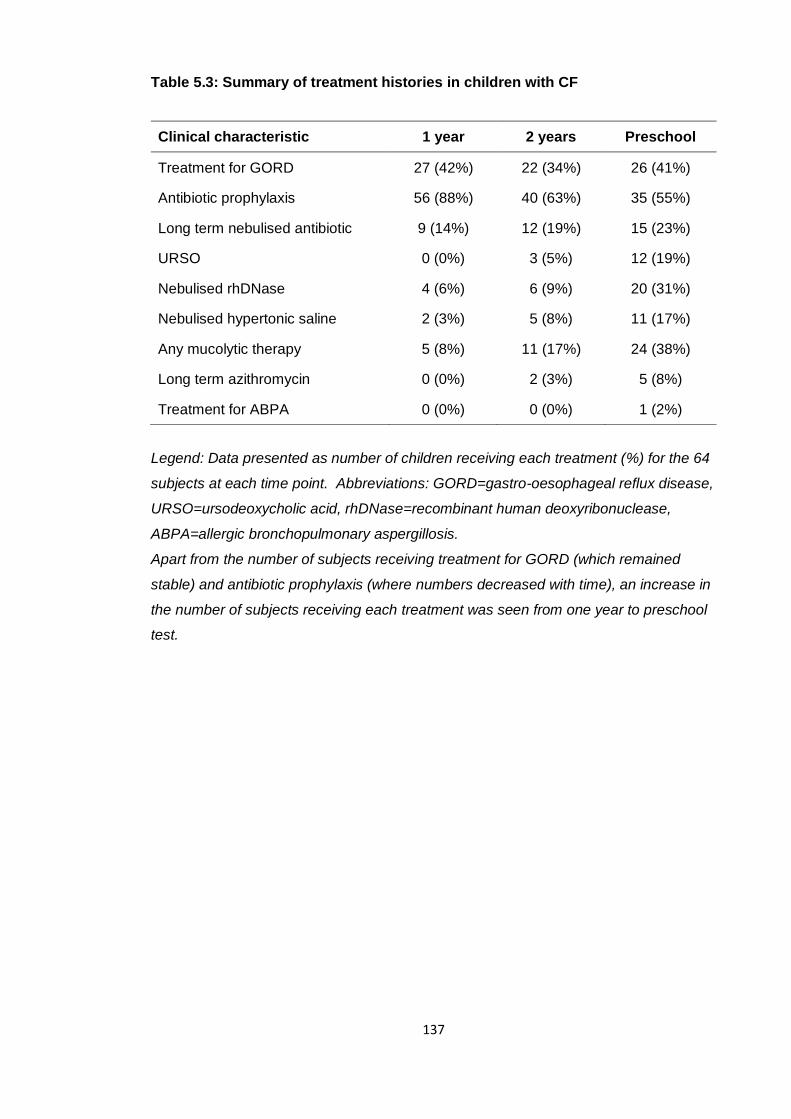
137
Table 5.3: Summary of treatment histories in children with CF
Clinical characteristic 1 year 2 years Preschool
Treatment for GORD 27 (42%) 22 (34%) 26 (41%)
Antibiotic prophylaxis 56 (88%) 40 (63%) 35 (55%)
Long term nebulised antibiotic 9 (14%) 12 (19%) 15 (23%)
URSO 0 (0%) 3 (5%) 12 (19%)
Nebulised rhDNase 4 (6%) 6 (9%) 20 (31%)
Nebulised hypertonic saline 2 (3%) 5 (8%) 11 (17%)
Any mucolytic therapy 5 (8%) 11 (17%) 24 (38%)
Long term azithromycin 0 (0%) 2 (3%) 5 (8%)
Treatment for ABPA 0 (0%) 0 (0%) 1 (2%)
Legend: Data presented as number of children receiving each treatment (%) for the 64
subjects at each time point. Abbreviations: GORD=gastro-oesophageal reflux disease,
URSO=ursodeoxycholic acid, rhDNase=recombinant human deoxyribonuclease,
ABPA=allergic bronchopulmonary aspergillosis.
Apart from the number of subjects receiving treatment for GORD (which remained
stable) and antibiotic prophylaxis (where numbers decreased with time), an increase in
the number of subjects receiving each treatment was seen from one year to preschool
test.
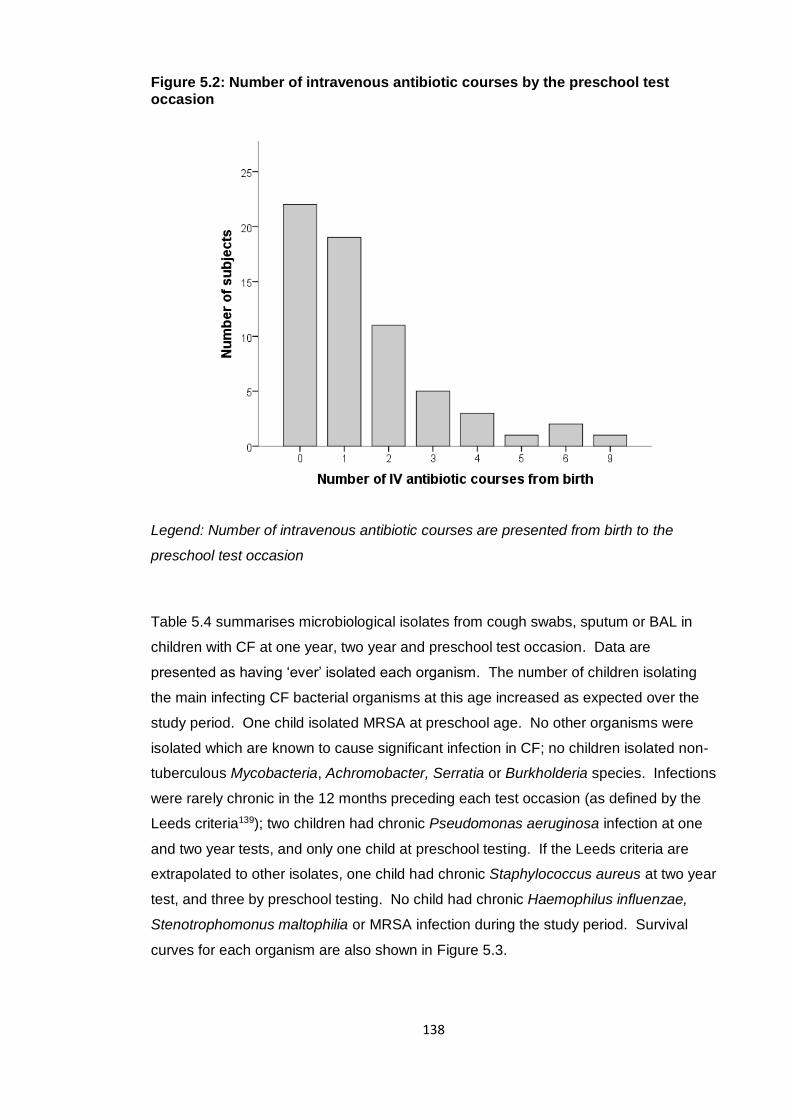
138
Figure 5.2: Number of intravenous antibiotic courses by the preschool test occasion
Legend: Number of intravenous antibiotic courses are presented from birth to the
preschool test occasion
Table 5.4 summarises microbiological isolates from cough swabs, sputum or BAL in
children with CF at one year, two year and preschool test occasion. Data are
presented as having ‘ever’ isolated each organism. The number of children isolating
the main infecting CF bacterial organisms at this age increased as expected over the
study period. One child isolated MRSA at preschool age. No other organisms were
isolated which are known to cause significant infection in CF; no children isolated non-
tuberculous Mycobacteria, Achromobacter, Serratia or Burkholderia species. Infections
were rarely chronic in the 12 months preceding each test occasion (as defined by the
Leeds criteria139); two children had chronic Pseudomonas aeruginosa infection at one
and two year tests, and only one child at preschool testing. If the Leeds criteria are
extrapolated to other isolates, one child had chronic Staphylococcus aureus at two year
test, and three by preschool testing. No child had chronic Haemophilus influenzae,
Stenotrophomonus maltophilia or MRSA infection during the study period. Survival
curves for each organism are also shown in Figure 5.3.
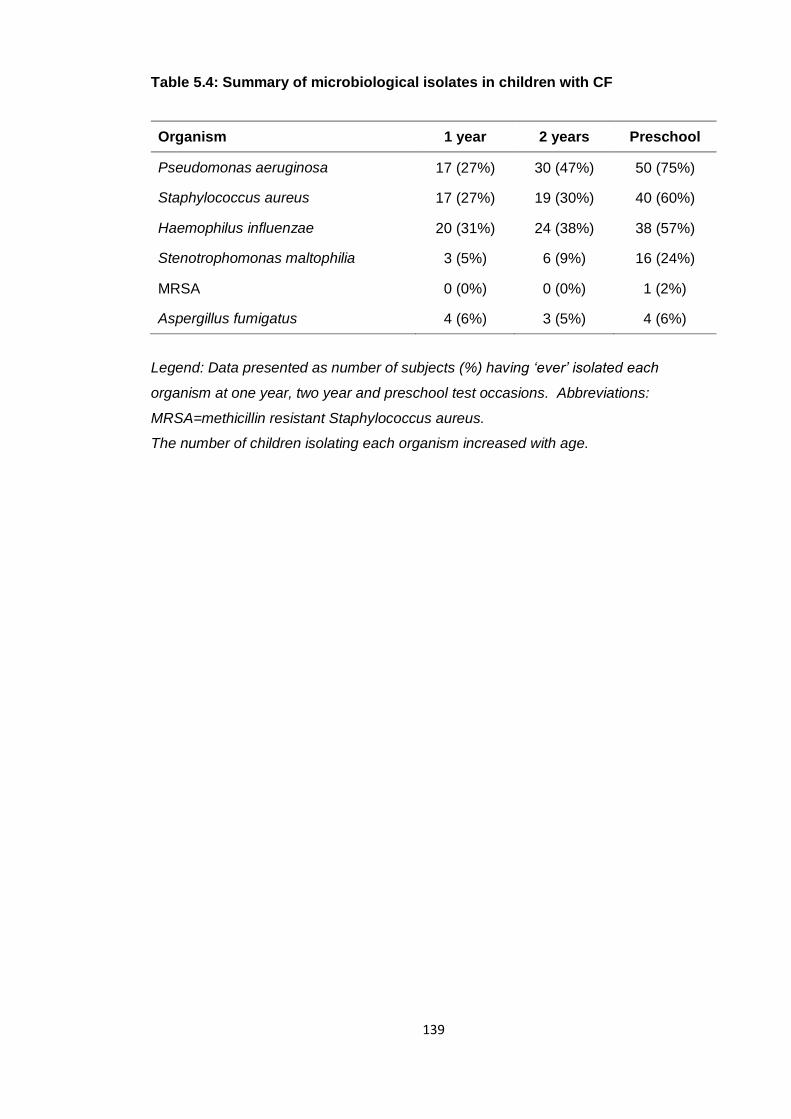
139
Table 5.4: Summary of microbiological isolates in children with CF
Organism 1 year 2 years Preschool
Pseudomonas aeruginosa 17 (27%) 30 (47%) 50 (75%)
Staphylococcus aureus 17 (27%) 19 (30%) 40 (60%)
Haemophilus influenzae 20 (31%) 24 (38%) 38 (57%)
Stenotrophomonas maltophilia 3 (5%) 6 (9%) 16 (24%)
MRSA 0 (0%) 0 (0%) 1 (2%)
Aspergillus fumigatus 4 (6%) 3 (5%) 4 (6%)
Legend: Data presented as number of subjects (%) having ‘ever’ isolated each
organism at one year, two year and preschool test occasions. Abbreviations:
MRSA=methicillin resistant Staphylococcus aureus.
The number of children isolating each organism increased with age.
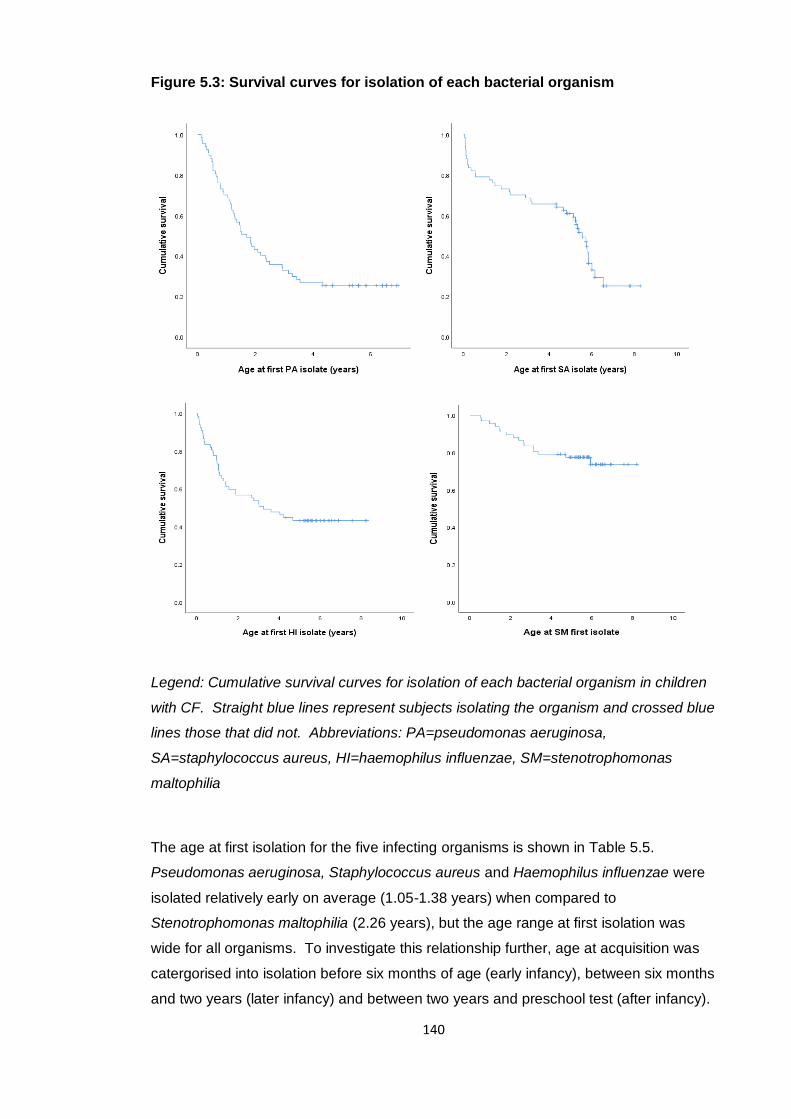
140
Figure 5.3: Survival curves for isolation of each bacterial organism
Legend: Cumulative survival curves for isolation of each bacterial organism in children
with CF. Straight blue lines represent subjects isolating the organism and crossed blue
lines those that did not. Abbreviations: PA=pseudomonas aeruginosa,
SA=staphylococcus aureus, HI=haemophilus influenzae, SM=stenotrophomonas
maltophilia
The age at first isolation for the five infecting organisms is shown in Table 5.5.
Pseudomonas aeruginosa, Staphylococcus aureus and Haemophilus influenzae were
isolated relatively early on average (1.05-1.38 years) when compared to
Stenotrophomonas maltophilia (2.26 years), but the age range at first isolation was
wide for all organisms. To investigate this relationship further, age at acquisition was
catergorised into isolation before six months of age (early infancy), between six months
and two years (later infancy) and between two years and preschool test (after infancy).
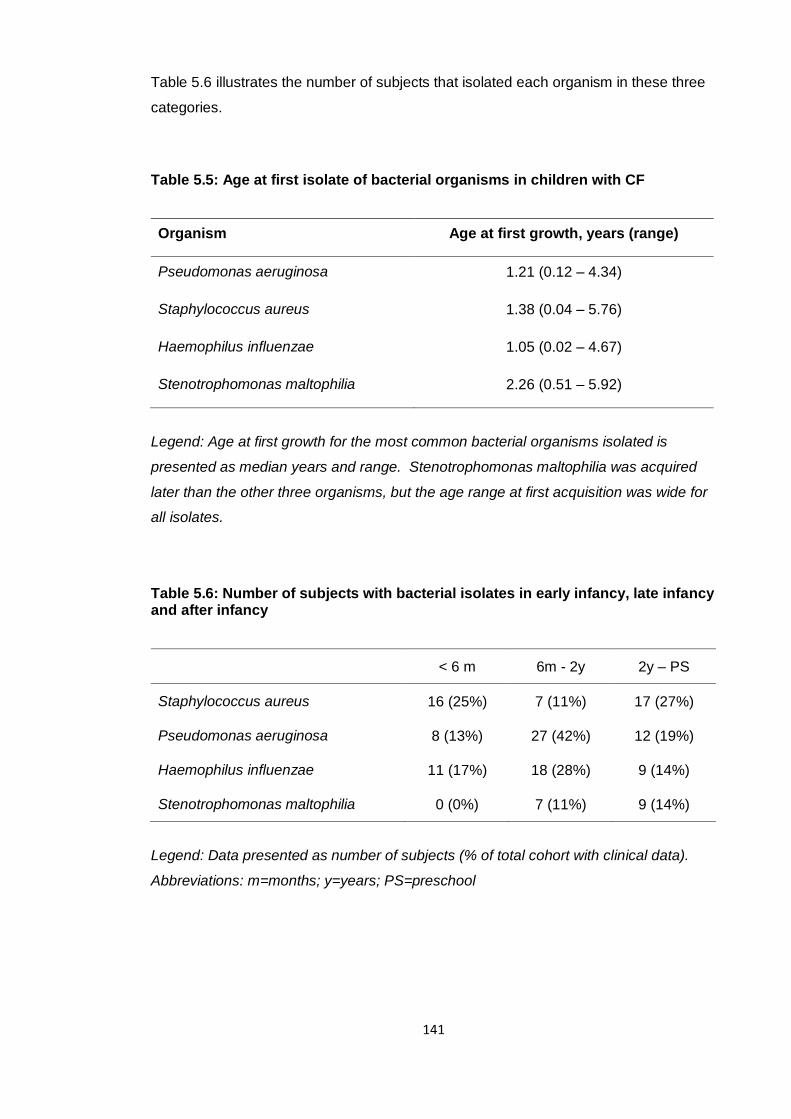
141
Table 5.6 illustrates the number of subjects that isolated each organism in these three
categories.
Table 5.5: Age at first isolate of bacterial organisms in children with CF
Organism Age at first growth, years (range)
Pseudomonas aeruginosa 1.21 (0.12 – 4.34)
Staphylococcus aureus 1.38 (0.04 – 5.76)
Haemophilus influenzae 1.05 (0.02 – 4.67)
Stenotrophomonas maltophilia 2.26 (0.51 – 5.92)
Legend: Age at first growth for the most common bacterial organisms isolated is
presented as median years and range. Stenotrophomonas maltophilia was acquired
later than the other three organisms, but the age range at first acquisition was wide for
all isolates.
Table 5.6: Number of subjects with bacterial isolates in early infancy, late infancy and after infancy
< 6 m 6m - 2y 2y – PS
Staphylococcus aureus 16 (25%) 7 (11%) 17 (27%)
Pseudomonas aeruginosa 8 (13%) 27 (42%) 12 (19%)
Haemophilus influenzae 11 (17%) 18 (28%) 9 (14%)
Stenotrophomonas maltophilia 0 (0%) 7 (11%) 9 (14%)
Legend: Data presented as number of subjects (% of total cohort with clinical data).
Abbreviations: m=months; y=years; PS=preschool
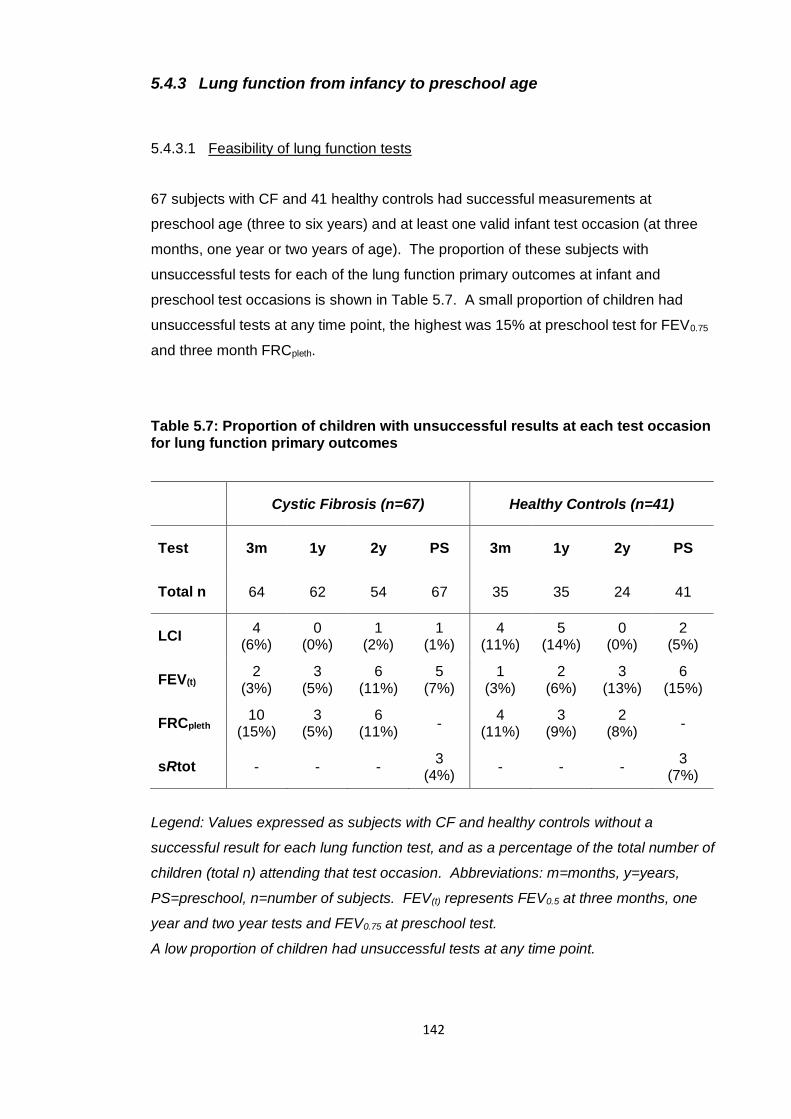
142
5.4.3 Lung function from infancy to preschool age
5.4.3.1 Feasibility of lung function tests
67 subjects with CF and 41 healthy controls had successful measurements at
preschool age (three to six years) and at least one valid infant test occasion (at three
months, one year or two years of age). The proportion of these subjects with
unsuccessful tests for each of the lung function primary outcomes at infant and
preschool test occasions is shown in Table 5.7. A small proportion of children had
unsuccessful tests at any time point, the highest was 15% at preschool test for FEV0.75
and three month FRCpleth.
Table 5.7: Proportion of children with unsuccessful results at each test occasion for lung function primary outcomes
Cystic Fibrosis (n=67) Healthy Controls (n=41)
Test 3m 1y 2y PS 3m 1y 2y PS
Total n 64 62 54 67 35 35 24 41
LCI 4
(6%) 0
(0%) 1
(2%) 1
(1%) 4
(11%) 5
(14%) 0
(0%) 2
(5%)
FEV(t) 2
(3%) 3
(5%) 6
(11%) 5
(7%) 1
(3%) 2
(6%) 3
(13%) 6
(15%)
FRCpleth 10
(15%) 3
(5%) 6
(11%) -
4 (11%)
3 (9%)
2 (8%)
-
sRtot - - - 3
(4%) - - -
3 (7%)
Legend: Values expressed as subjects with CF and healthy controls without a
successful result for each lung function test, and as a percentage of the total number of
children (total n) attending that test occasion. Abbreviations: m=months, y=years,
PS=preschool, n=number of subjects. FEV(t) represents FEV0.5 at three months, one
year and two year tests and FEV0.75 at preschool test.
A low proportion of children had unsuccessful tests at any time point.
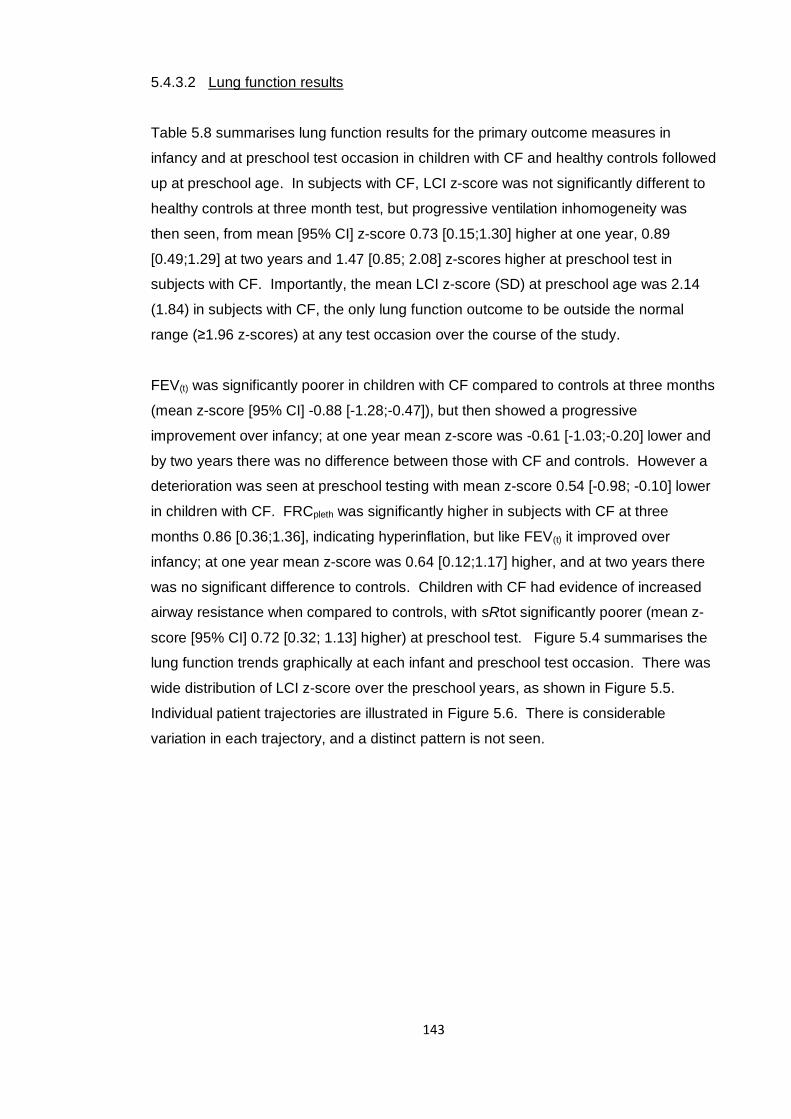
143
5.4.3.2 Lung function results
Table 5.8 summarises lung function results for the primary outcome measures in
infancy and at preschool test occasion in children with CF and healthy controls followed
up at preschool age. In subjects with CF, LCI z-score was not significantly different to
healthy controls at three month test, but progressive ventilation inhomogeneity was
then seen, from mean [95% CI] z-score 0.73 [0.15;1.30] higher at one year, 0.89
[0.49;1.29] at two years and 1.47 [0.85; 2.08] z-scores higher at preschool test in
subjects with CF. Importantly, the mean LCI z-score (SD) at preschool age was 2.14
(1.84) in subjects with CF, the only lung function outcome to be outside the normal
range (≥1.96 z-scores) at any test occasion over the course of the study.
FEV(t) was significantly poorer in children with CF compared to controls at three months
(mean z-score [95% CI] -0.88 [-1.28;-0.47]), but then showed a progressive
improvement over infancy; at one year mean z-score was -0.61 [-1.03;-0.20] lower and
by two years there was no difference between those with CF and controls. However a
deterioration was seen at preschool testing with mean z-score 0.54 [-0.98; -0.10] lower
in children with CF. FRCpleth was significantly higher in subjects with CF at three
months 0.86 [0.36;1.36], indicating hyperinflation, but like FEV(t) it improved over
infancy; at one year mean z-score was 0.64 [0.12;1.17] higher, and at two years there
was no significant difference to controls. Children with CF had evidence of increased
airway resistance when compared to controls, with sRtot significantly poorer (mean z-
score [95% CI] 0.72 [0.32; 1.13] higher) at preschool test. Figure 5.4 summarises the
lung function trends graphically at each infant and preschool test occasion. There was
wide distribution of LCI z-score over the preschool years, as shown in Figure 5.5.
Individual patient trajectories are illustrated in Figure 5.6. There is considerable
variation in each trajectory, and a distinct pattern is not seen.
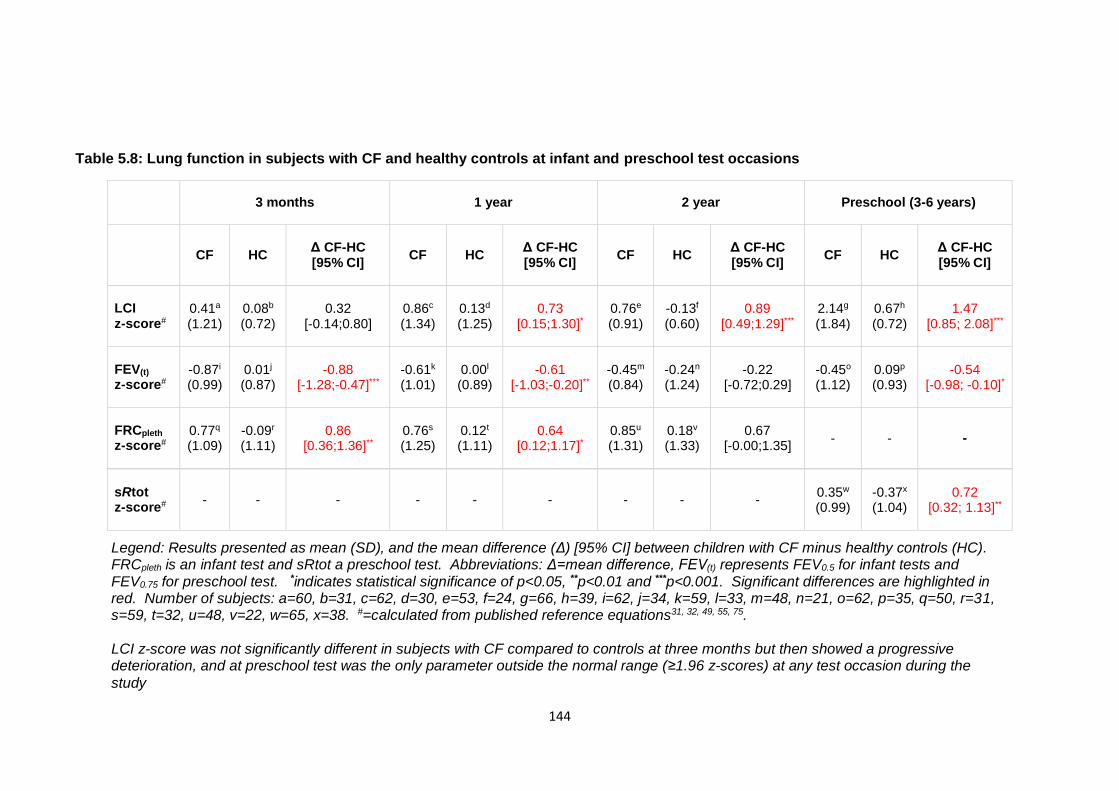
144
Table 5.8: Lung function in subjects with CF and healthy controls at infant and preschool test occasions
3 months 1 year 2 year Preschool (3-6 years)
CF HC Δ CF-HC [95% CI]
CF HC Δ CF-HC [95% CI]
CF HC Δ CF-HC [95% CI]
CF HC Δ CF-HC [95% CI]
LCI z-score#
0.41a (1.21)
0.08b (0.72)
0.32 [-0.14;0.80]
0.86c (1.34)
0.13d (1.25)
0.73 [0.15;1.30]*
0.76e (0.91)
-0.13f (0.60)
0.89 [0.49;1.29]***
2.14g (1.84)
0.67h (0.72)
1.47 [0.85; 2.08]***
FEV(t) z-score#
-0.87i (0.99)
0.01j (0.87)
-0.88 [-1.28;-0.47]***
-0.61k (1.01)
0.00l (0.89)
-0.61 [-1.03;-0.20]**
-0.45m (0.84)
-0.24n (1.24)
-0.22 [-0.72;0.29]
-0.45o (1.12)
0.09p (0.93)
-0.54 [-0.98; -0.10]*
FRCpleth z-score#
0.77q (1.09)
-0.09r (1.11)
0.86 [0.36;1.36]**
0.76s
(1.25)
0.12t (1.11)
0.64 [0.12;1.17]*
0.85u (1.31)
0.18v (1.33)
0.67 [-0.00;1.35]
- - -
sRtot z-score#
- - - - - - - - - 0.35w (0.99)
-0.37x (1.04)
0.72 [0.32; 1.13]**
Legend: Results presented as mean (SD), and the mean difference (Δ) [95% CI] between children with CF minus healthy controls (HC). FRCpleth is an infant test and sRtot a preschool test. Abbreviations: Δ=mean difference, FEV(t) represents FEV0.5 for infant tests and FEV0.75 for preschool test. *indicates statistical significance of p<0.05, **p<0.01 and ***p<0.001. Significant differences are highlighted in red. Number of subjects: a=60, b=31, c=62, d=30, e=53, f=24, g=66, h=39, i=62, j=34, k=59, l=33, m=48, n=21, o=62, p=35, q=50, r=31, s=59, t=32, u=48, v=22, w=65, x=38. #=calculated from published reference equations31, 32, 49, 55, 75. LCI z-score was not significantly different in subjects with CF compared to controls at three months but then showed a progressive deterioration, and at preschool test was the only parameter outside the normal range (≥1.96 z-scores) at any test occasion during the
study
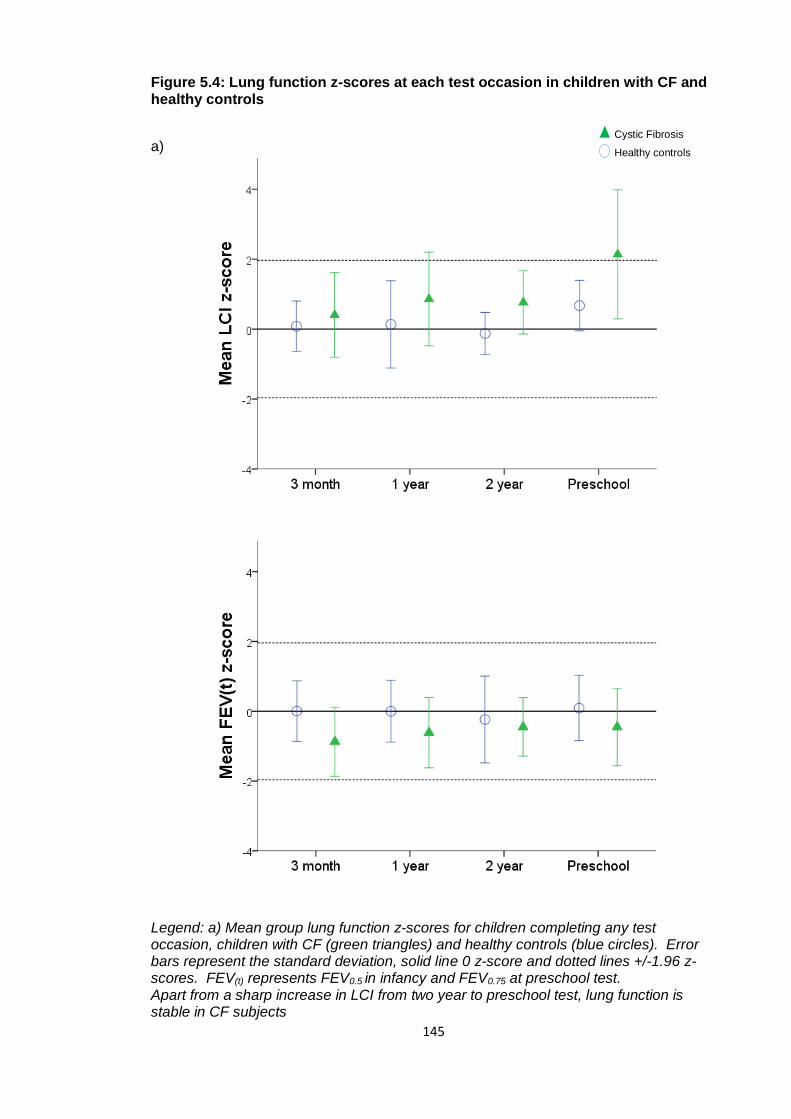
145
Figure 5.4: Lung function z-scores at each test occasion in children with CF and healthy controls
a)
Legend: a) Mean group lung function z-scores for children completing any test occasion, children with CF (green triangles) and healthy controls (blue circles). Error bars represent the standard deviation, solid line 0 z-score and dotted lines +/-1.96 z-scores. FEV(t) represents FEV0.5 in infancy and FEV0.75 at preschool test. Apart from a sharp increase in LCI from two year to preschool test, lung function is stable in CF subjects
Cystic Fibrosis
Healthy controls
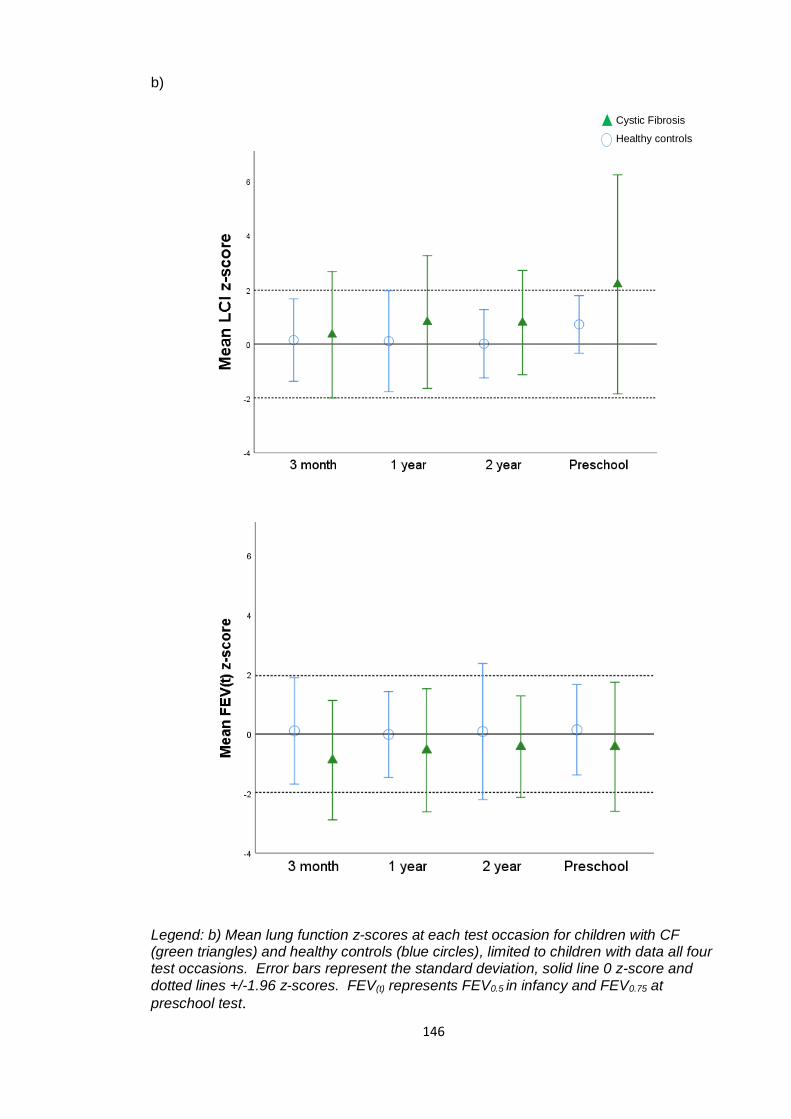
146
b)
Legend: b) Mean lung function z-scores at each test occasion for children with CF (green triangles) and healthy controls (blue circles), limited to children with data all four test occasions. Error bars represent the standard deviation, solid line 0 z-score and dotted lines +/-1.96 z-scores. FEV(t) represents FEV0.5 in infancy and FEV0.75 at
preschool test.
Cystic Fibrosis
Healthy controls
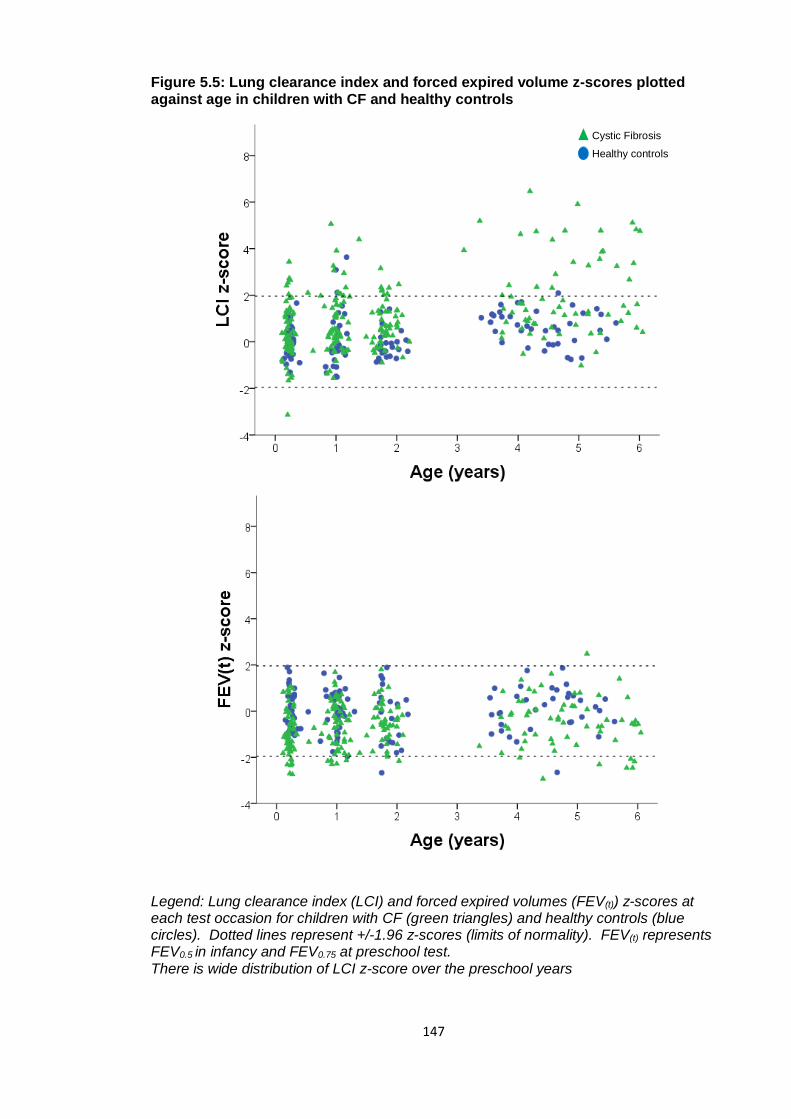
147
Figure 5.5: Lung clearance index and forced expired volume z-scores plotted against age in children with CF and healthy controls
Legend: Lung clearance index (LCI) and forced expired volumes (FEV(t)) z-scores at each test occasion for children with CF (green triangles) and healthy controls (blue circles). Dotted lines represent +/-1.96 z-scores (limits of normality). FEV(t) represents FEV0.5 in infancy and FEV0.75 at preschool test. There is wide distribution of LCI z-score over the preschool years
Cystic Fibrosis
Healthy controls
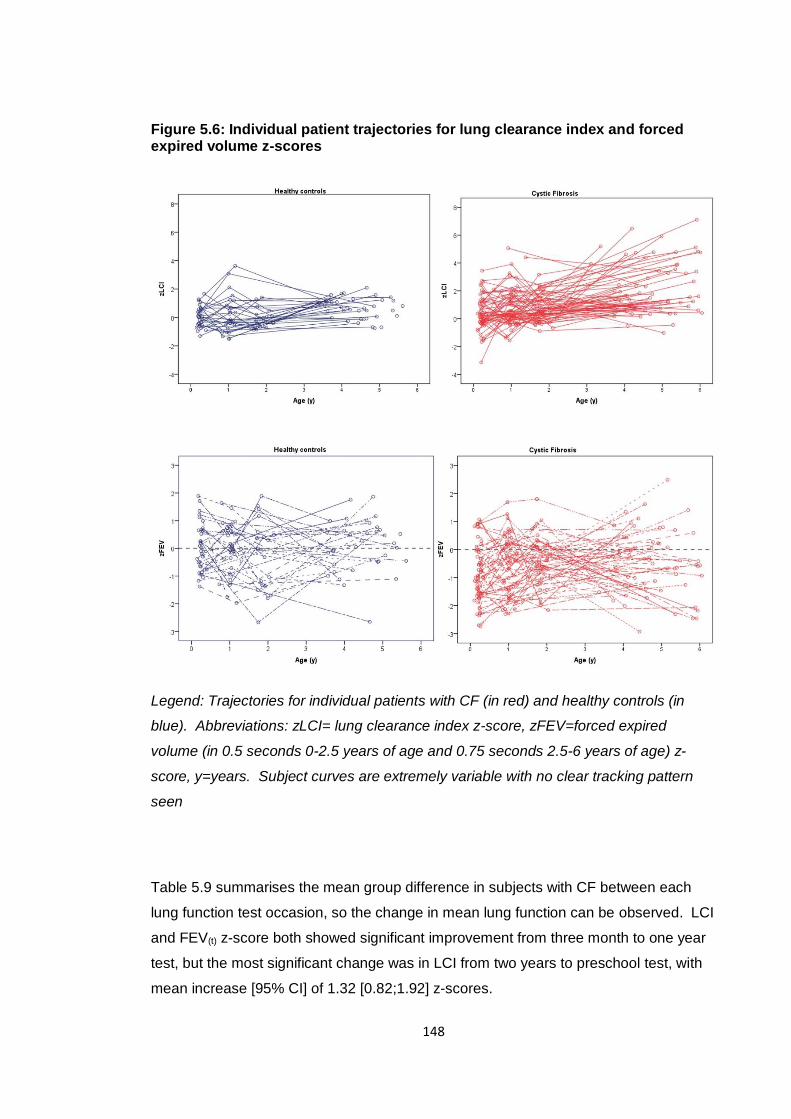
148
Figure 5.6: Individual patient trajectories for lung clearance index and forced expired volume z-scores
Legend: Trajectories for individual patients with CF (in red) and healthy controls (in
blue). Abbreviations: zLCI= lung clearance index z-score, zFEV=forced expired
volume (in 0.5 seconds 0-2.5 years of age and 0.75 seconds 2.5-6 years of age) z-
score, y=years. Subject curves are extremely variable with no clear tracking pattern
seen
Table 5.9 summarises the mean group difference in subjects with CF between each
lung function test occasion, so the change in mean lung function can be observed. LCI
and FEV(t) z-score both showed significant improvement from three month to one year
test, but the most significant change was in LCI from two years to preschool test, with
mean increase [95% CI] of 1.32 [0.82;1.92] z-scores.
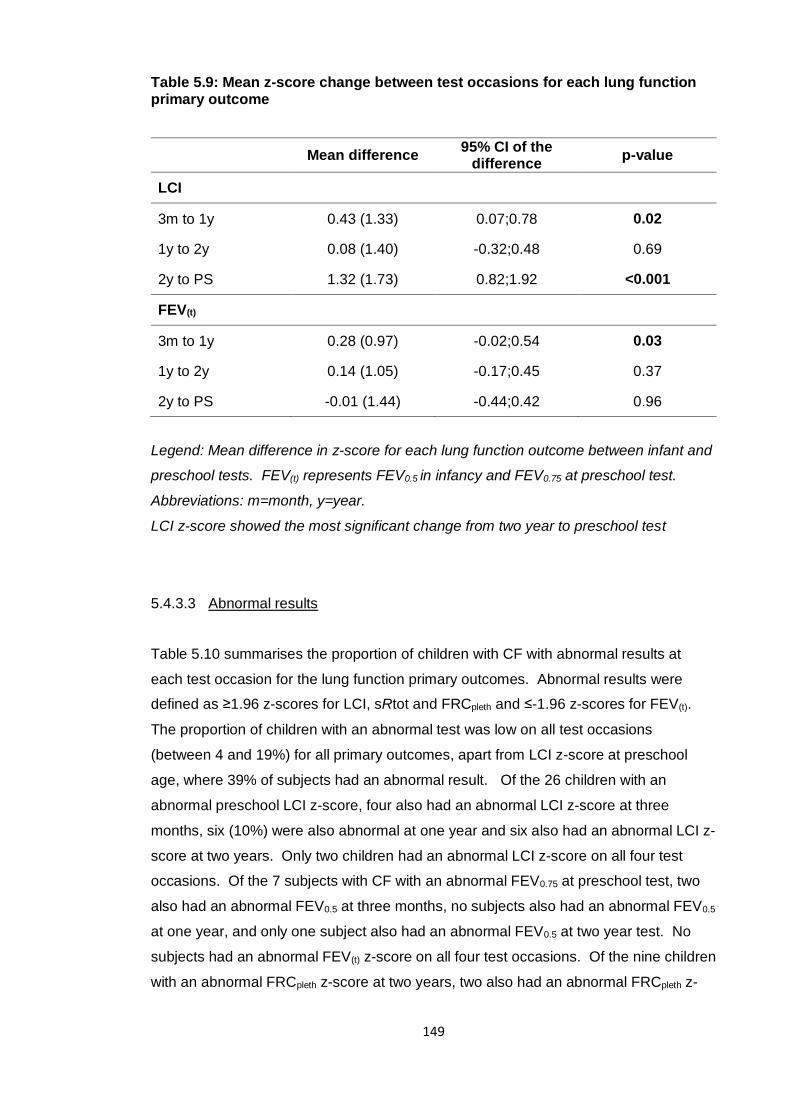
149
Table 5.9: Mean z-score change between test occasions for each lung function primary outcome
Mean difference 95% CI of the
difference p-value
LCI
3m to 1y 0.43 (1.33) 0.07;0.78 0.02
1y to 2y 0.08 (1.40) -0.32;0.48 0.69
2y to PS 1.32 (1.73) 0.82;1.92 <0.001
FEV(t)
3m to 1y 0.28 (0.97) -0.02;0.54 0.03
1y to 2y 0.14 (1.05) -0.17;0.45 0.37
2y to PS -0.01 (1.44) -0.44;0.42 0.96
Legend: Mean difference in z-score for each lung function outcome between infant and
preschool tests. FEV(t) represents FEV0.5 in infancy and FEV0.75 at preschool test.
Abbreviations: m=month, y=year.
LCI z-score showed the most significant change from two year to preschool test
5.4.3.3 Abnormal results
Table 5.10 summarises the proportion of children with CF with abnormal results at
each test occasion for the lung function primary outcomes. Abnormal results were
defined as ≥1.96 z-scores for LCI, sRtot and FRCpleth and ≤-1.96 z-scores for FEV(t).
The proportion of children with an abnormal test was low on all test occasions
(between 4 and 19%) for all primary outcomes, apart from LCI z-score at preschool
age, where 39% of subjects had an abnormal result. Of the 26 children with an
abnormal preschool LCI z-score, four also had an abnormal LCI z-score at three
months, six (10%) were also abnormal at one year and six also had an abnormal LCI z-
score at two years. Only two children had an abnormal LCI z-score on all four test
occasions. Of the 7 subjects with CF with an abnormal FEV0.75 at preschool test, two
also had an abnormal FEV0.5 at three months, no subjects also had an abnormal FEV0.5
at one year, and only one subject also had an abnormal FEV0.5 at two year test. No
subjects had an abnormal FEV(t) z-score on all four test occasions. Of the nine children
with an abnormal FRCpleth z-score at two years, two also had an abnormal FRCpleth z-
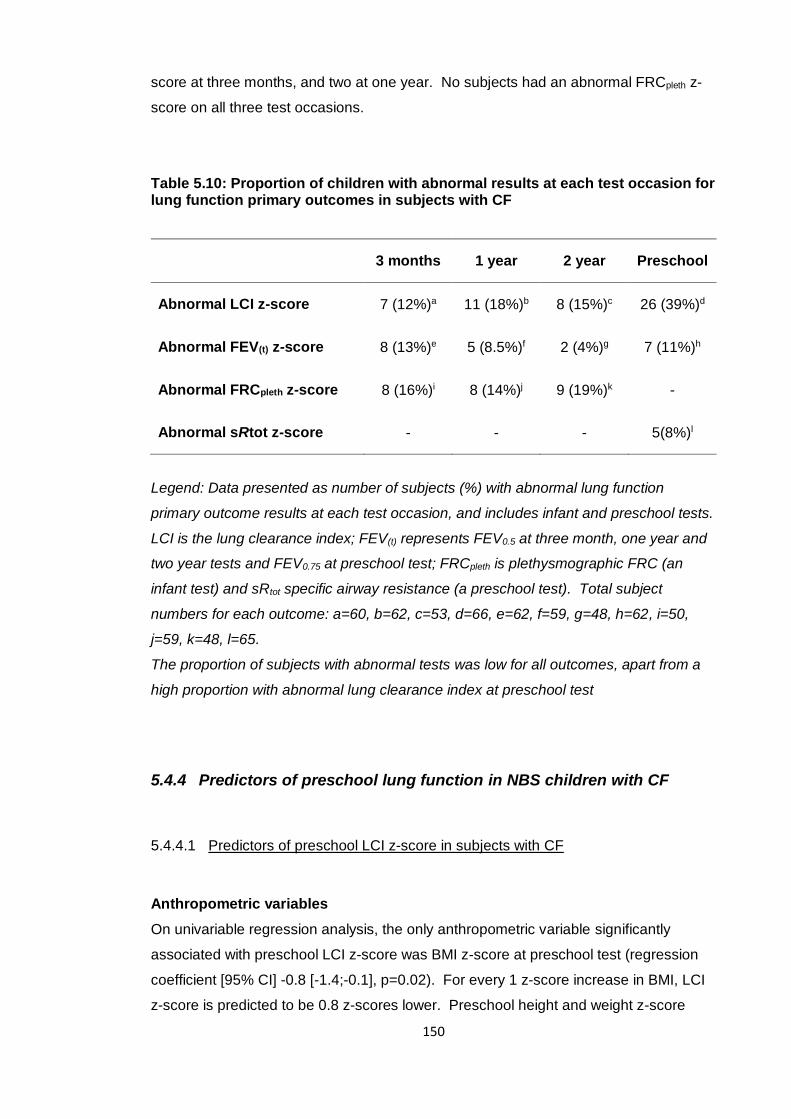
150
score at three months, and two at one year. No subjects had an abnormal FRCpleth z-
score on all three test occasions.
Table 5.10: Proportion of children with abnormal results at each test occasion for lung function primary outcomes in subjects with CF
3 months 1 year 2 year Preschool
Abnormal LCI z-score 7 (12%)a 11 (18%)b 8 (15%)c 26 (39%)d
Abnormal FEV(t) z-score 8 (13%)e 5 (8.5%)f 2 (4%)g 7 (11%)h
Abnormal FRCpleth z-score 8 (16%)i 8 (14%)j 9 (19%)k -
Abnormal sRtot z-score - - - 5(8%)l
Legend: Data presented as number of subjects (%) with abnormal lung function
primary outcome results at each test occasion, and includes infant and preschool tests.
LCI is the lung clearance index; FEV(t) represents FEV0.5 at three month, one year and
two year tests and FEV0.75 at preschool test; FRCpleth is plethysmographic FRC (an
infant test) and sRtot specific airway resistance (a preschool test). Total subject
numbers for each outcome: a=60, b=62, c=53, d=66, e=62, f=59, g=48, h=62, i=50,
j=59, k=48, l=65.
The proportion of subjects with abnormal tests was low for all outcomes, apart from a
high proportion with abnormal lung clearance index at preschool test
5.4.4 Predictors of preschool lung function in NBS children with CF
5.4.4.1 Predictors of preschool LCI z-score in subjects with CF
Anthropometric variables
On univariable regression analysis, the only anthropometric variable significantly
associated with preschool LCI z-score was BMI z-score at preschool test (regression
coefficient [95% CI] -0.8 [-1.4;-0.1], p=0.02). For every 1 z-score increase in BMI, LCI
z-score is predicted to be 0.8 z-scores lower. Preschool height and weight z-score
151
were not significantly associated with preschool LCI z-score. No associations were
found between birthweight z-score or height, weight and BMI z-score at any infant test
occasion. As somatic growth outcomes were significantly lower than controls at three
months in subjects with CF, but then showed improvement to one and two years
(section 5.4.1) and greater infant weight gain is associated with higher FEV(t)149
, change
in weight z-score from birth to each infant lung function test occasion was also
investigated. There was also no association between change in somatic growth (from
birth to three months, birth to one year and birth to two years) with preschool LCI z-
score. ‘Catch up’ growth was not significantly associated with preschool LCI z-score.
Clinical variables
There were no significant associations between homozygous p.Phe508del genotype,
pancreatic insufficiency or presentation with meconium ileus and preschool LCI z-score
on univariable analysis. There were also no significant associations between the use
of mucolytic therapy, medication for gastro-oesophageal reflux disease (‘ever’ or in the
twelve months preceding preschool test), or number of intravenous antibiotic courses
with preschool LCI z-score. Treatments reflecting disease severity were not significant
determinants of preschool LCI z-score.
Bacterial isolates
Bacterial isolates from birth to preschool test, and age of first acquisition for each
organism are summarised in section 5.4.2. 50 children (77%) had isolated PA by
preschool test occasion. Isolation of PA ‘ever’ was not significantly associated with
preschool LCI z-score. A significant association was found however between age at
first acquisition of PA and preschool LCI z-score (regression coefficient [95% CI] -0.31
[-0.57;-0.05], p=0.02). For every year earlier that a child in acquired PA prior to
preschool test, LCI z-score at 3-6 years was 0.3 z-scores higher; later acquisition was
significantly associated with a better preschool LCI z-score. Isolation of PA by six
months of age was significantly associated with higher (worse) preschool LCI z-score
when compared to later or no acquisition (regression coefficient [95% CI] 2.00
[0.52;3.49], p<0.01); isolating PA by six months of age is associated with a higher
preschool LCI z-score.
40 children (62%) had isolated SA, 38 (58%) HI and 16 (25%) SM by preschool test
occasion. Neither isolation of any of the three organisms ‘ever’ nor age at first isolation
were significantly associated with preschool LCI z-score.
152
Infant lung function primary outcomes
No significant association was found between three month or one year LCI z-score and
preschool LCI z-score, but LCI z-score at two years was highly significantly associated
with preschool LCI z-score (regression coefficient [95% CI] 0.89 [0.36;1.43], p=<0.01).
No associations between FEV0.5 z-score at three month, one year and two year tests
and preschool LCI z-score were found by univariable regression analysis. For FRCpleth,
z-score at one year was significantly associated with preschool LCI z-score by
univariable analysis (regression coefficient [95% CI] 0.40 [0.01;0.79], p=0.04. However
there was no association between FRCpleth at two years and preschool LCI z-score.
Table 5.11 summarises the results of simple linear regression analysis for each
independent variable. Significant associations with preschool LCI z-score are
highlighted in red.
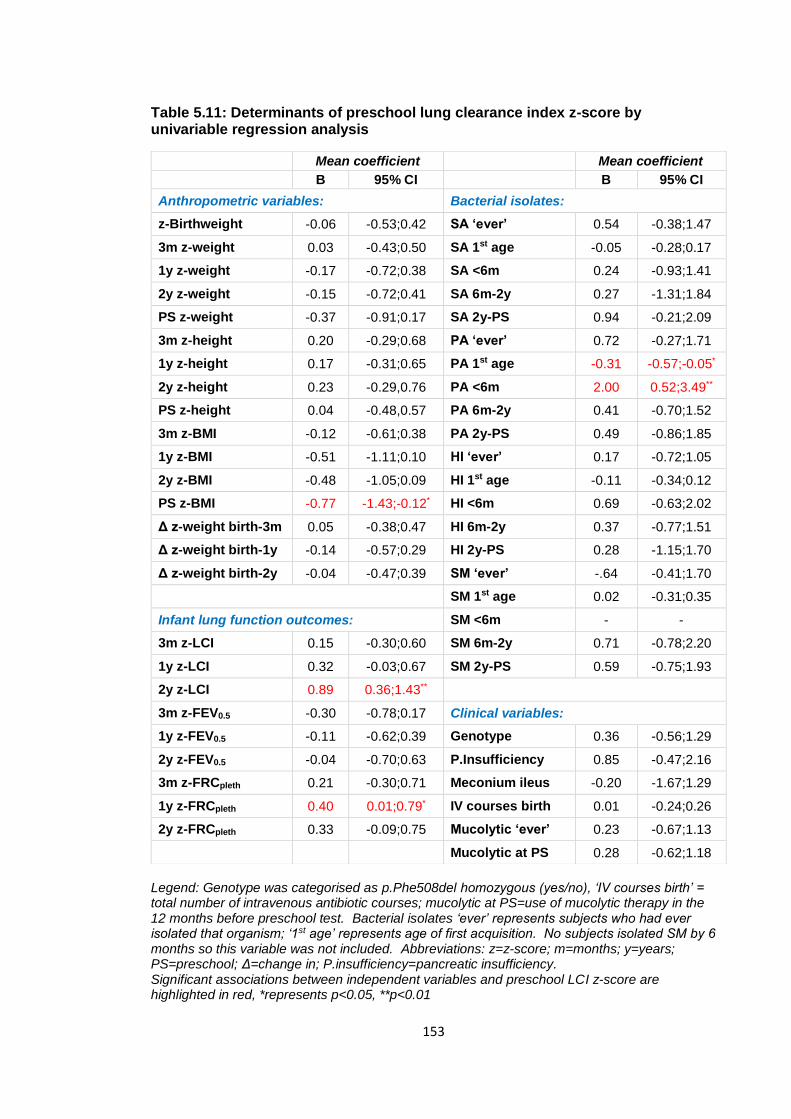
153
Table 5.11: Determinants of preschool lung clearance index z-score by univariable regression analysis
Legend: Genotype was categorised as p.Phe508del homozygous (yes/no), ‘IV courses birth’ = total number of intravenous antibiotic courses; mucolytic at PS=use of mucolytic therapy in the 12 months before preschool test. Bacterial isolates ‘ever’ represents subjects who had ever isolated that organism; ‘1st age’ represents age of first acquisition. No subjects isolated SM by 6 months so this variable was not included. Abbreviations: z=z-score; m=months; y=years; PS=preschool; Δ=change in; P.insufficiency=pancreatic insufficiency. Significant associations between independent variables and preschool LCI z-score are highlighted in red, *represents p<0.05, **p<0.01
Mean coefficient Mean coefficient
B 95% CI B 95% CI
Anthropometric variables: Bacterial isolates:
z-Birthweight -0.06 -0.53;0.42 SA ‘ever’ 0.54 -0.38;1.47
3m z-weight 0.03 -0.43;0.50 SA 1st age -0.05 -0.28;0.17
1y z-weight -0.17 -0.72;0.38 SA <6m 0.24 -0.93;1.41
2y z-weight -0.15 -0.72;0.41 SA 6m-2y 0.27 -1.31;1.84
PS z-weight -0.37 -0.91;0.17 SA 2y-PS 0.94 -0.21;2.09
3m z-height 0.20 -0.29;0.68 PA ‘ever’ 0.72 -0.27;1.71
1y z-height 0.17 -0.31;0.65 PA 1st age -0.31 -0.57;-0.05*
2y z-height 0.23 -0.29,0.76 PA <6m 2.00 0.52;3.49**
PS z-height 0.04 -0.48,0.57 PA 6m-2y 0.41 -0.70;1.52
3m z-BMI -0.12 -0.61;0.38 PA 2y-PS 0.49 -0.86;1.85
1y z-BMI -0.51 -1.11;0.10 HI ‘ever’ 0.17 -0.72;1.05
2y z-BMI -0.48 -1.05;0.09 HI 1st age -0.11 -0.34;0.12
PS z-BMI -0.77 -1.43;-0.12* HI <6m 0.69 -0.63;2.02
Δ z-weight birth-3m 0.05 -0.38;0.47 HI 6m-2y 0.37 -0.77;1.51
Δ z-weight birth-1y -0.14 -0.57;0.29 HI 2y-PS 0.28 -1.15;1.70
Δ z-weight birth-2y -0.04 -0.47;0.39 SM ‘ever’ -.64 -0.41;1.70
SM 1st age 0.02 -0.31;0.35
Infant lung function outcomes: SM <6m - -
3m z-LCI 0.15 -0.30;0.60 SM 6m-2y 0.71 -0.78;2.20
1y z-LCI 0.32 -0.03;0.67 SM 2y-PS 0.59 -0.75;1.93
2y z-LCI 0.89 0.36;1.43**
3m z-FEV0.5 -0.30 -0.78;0.17 Clinical variables:
1y z-FEV0.5 -0.11 -0.62;0.39 Genotype 0.36 -0.56;1.29
2y z-FEV0.5 -0.04 -0.70;0.63 P.Insufficiency 0.85 -0.47;2.16
3m z-FRCpleth 0.21 -0.30;0.71 Meconium ileus -0.20 -1.67;1.29
1y z-FRCpleth 0.40 0.01;0.79* IV courses birth 0.01 -0.24;0.26
2y z-FRCpleth 0.33 -0.09;0.75 Mucolytic ‘ever’ 0.23 -0.67;1.13
Mucolytic at PS 0.28 -0.62;1.18
154
Multiple linear regression models for preschool LCI z-score
Associations between clinical variables (presentation with meconium ileus, pancreatic
insufficiency, genotype, mucolytic treatment ‘ever’ and intravenous antibiotic courses)
and preschool LCI z-score were investigated by multiple linear regression analysis. No
significant associations were found with these variables and preschool LCI z-score.
These results were in agreement with those previously reported in LCFC infants, where
clinical variables and treatments were also not associated with infant lung function
outcomes at any test occasion36, 129. These variables were therefore taken out of the
multiple regression model.
Nutritional outcomes were then entered into a model together; no association was
found between height, weight or BMI z-scores at any test occasion (3 month, 1 year, 2
years or preschool) and preschool LCI z-score.
When bacterial isolates ‘ever’ for PA, SA, HI and SM were entered into the model,
there were no significant associations with preschool LCI z-score. Age of acquisition
for each bacterial isolate were then added to the model. Despite isolation of PA ‘ever’
having no association with preschool LCI z-score, age of acquisition of PA was the only
significant predictor of preschool LCI z-score (mean regression coefficient [95% CI] -
0.27 [-0.53;-0.01], p=0.04).
When categorical age of acquisition for each bacterial isolate (<6 months, 6 months-2
years and 2 years-preschool test) were entered into a model together, isolation of PA
by six months of age remained the only significant predictor of preschool LCI z-score,
with mean regression coefficient [95% CI] 1.62 [0.02;3.23], p=0.02. However only eight
subjects had isolated PA by six months.
To then investigate whether infant lung function tests could predict preschool LCI z-
score after adjustment for other variables, lung function results (FEV0.5, LCI and
FRCpleth z-scores) for each test occasion were then added to the model. First all three
tests at three months were added, then three month tests were removed and all one
year tests added, then one year tests removed and all two year tests added. Two year
LCI z-score was the only infant test significantly associated with preschool LCI z-score,
with mean regression coefficient [95% CI] 0.88 [0.29;1.47], p=0.004.
Table 5.12 shows the final multiple regression models for preschool LCI z-score.
When two year LCI z-score and age of acquisition of PA were entered into a model
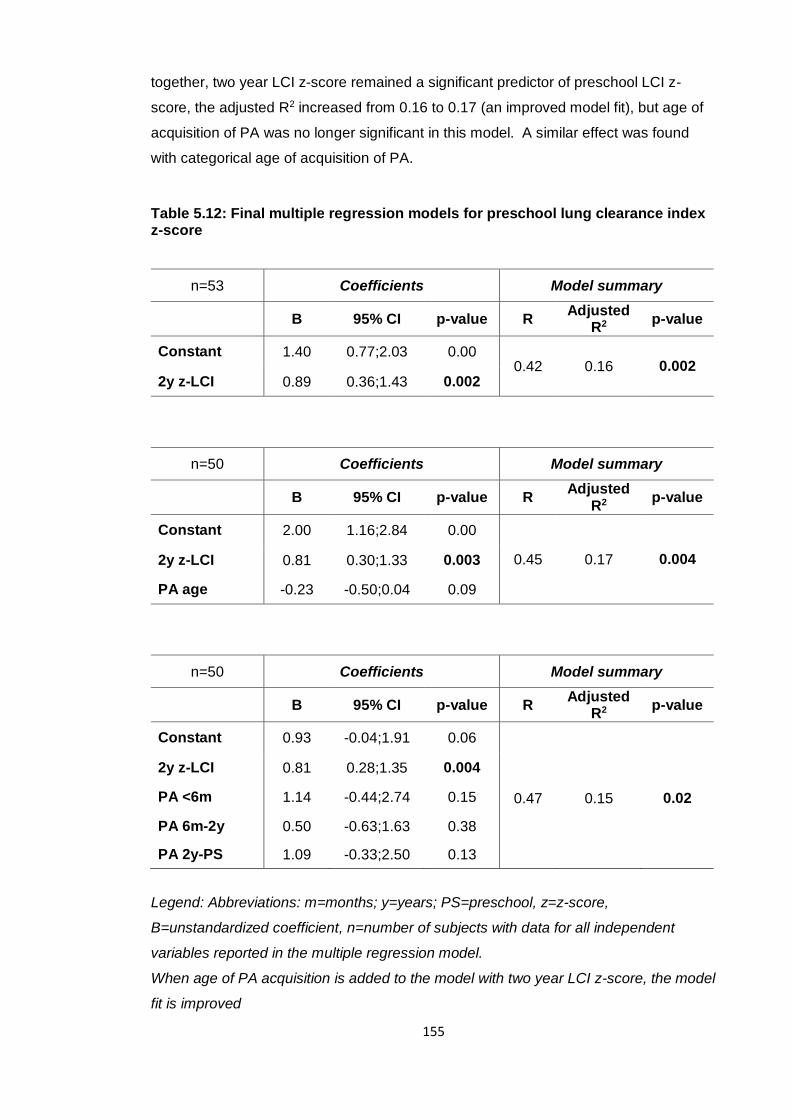
155
together, two year LCI z-score remained a significant predictor of preschool LCI z-
score, the adjusted R2 increased from 0.16 to 0.17 (an improved model fit), but age of
acquisition of PA was no longer significant in this model. A similar effect was found
with categorical age of acquisition of PA.
Table 5.12: Final multiple regression models for preschool lung clearance index z-score
n=53 Coefficients Model summary
B 95% CI p-value R Adjusted
R2 p-value
Constant 1.40 0.77;2.03 0.00 0.42 0.16 0.002
2y z-LCI 0.89 0.36;1.43 0.002
n=50 Coefficients Model summary
B 95% CI p-value R Adjusted
R2 p-value
Constant 2.00 1.16;2.84 0.00
0.45 0.17 0.004 2y z-LCI 0.81 0.30;1.33 0.003
PA age -0.23 -0.50;0.04 0.09
n=50 Coefficients Model summary
B 95% CI p-value R Adjusted
R2 p-value
Constant 0.93 -0.04;1.91 0.06
0.47
0.15
0.02
2y z-LCI 0.81 0.28;1.35 0.004
PA <6m 1.14 -0.44;2.74 0.15
PA 6m-2y 0.50 -0.63;1.63 0.38
PA 2y-PS 1.09 -0.33;2.50 0.13
Legend: Abbreviations: m=months; y=years; PS=preschool, z=z-score,
B=unstandardized coefficient, n=number of subjects with data for all independent
variables reported in the multiple regression model.
When age of PA acquisition is added to the model with two year LCI z-score, the model
fit is improved
156
5.4.4.2 Predictors of preschool sRtot z-score in subjects with CF
Using preschool sRtot z-score as the dependent variable, simple and multiple
regression analyses were used to investigate significant associations with the
independent variables in the same process as preschool LCI z-score. sRtot was
considered a secondary outcome as it identified less children with abnormality (8%)
than preschool LCI z-score (39%), but was still significantly different to controls at
preschool test occasion with mean z-score [95% CI] 0.72 [0.32; 1.13] higher in subjects
with CF.
The only significant association between anthropometric measures and sRtot z-score
on univariable analysis was height at three months (regression coefficient [95% CI]
0.26 [0.01;0.51], but the effect size was small and, albeit statistically significant, is of
minimal clinical significance. Subsequent height z-scores at one and two years were
not significantly associated with preschool sRtot z-score.
As was seen for preschool LCI z-score, PA infection by six months and 2 year LCI z-
score were significantly associated with preschool sRtot (regression coefficients [95%
CI] 1.17 [0.44;1.90], p<0.01 and 0.34 [0.05;0.64], p=0.03 respectively. Isolation of HI
‘ever’ was also a significant determinant of sRtot (0.65 [0.18;1.12], p<0.01), but early
isolation (<6 months) was not significantly associated. Isolation of SM between six and
24 months and SA between 2 year and preschool test also reached significance, but
isolation of these organisms ‘ever’ was not significantly associated with preschool sRtot
z-score. Results of univariable analysis for sRtot z-score are summarised in Table
5.13.
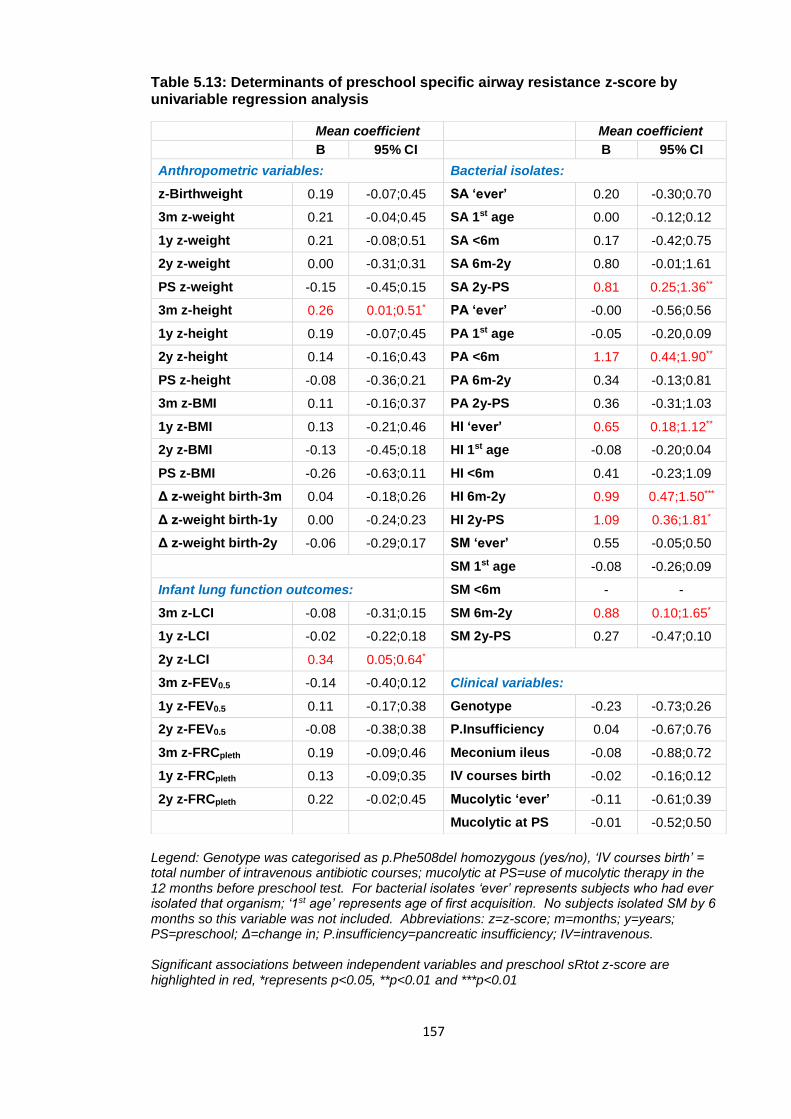
157
Table 5.13: Determinants of preschool specific airway resistance z-score by univariable regression analysis
Legend: Genotype was categorised as p.Phe508del homozygous (yes/no), ‘IV courses birth’ = total number of intravenous antibiotic courses; mucolytic at PS=use of mucolytic therapy in the 12 months before preschool test. For bacterial isolates ‘ever’ represents subjects who had ever isolated that organism; ‘1st age’ represents age of first acquisition. No subjects isolated SM by 6 months so this variable was not included. Abbreviations: z=z-score; m=months; y=years; PS=preschool; Δ=change in; P.insufficiency=pancreatic insufficiency; IV=intravenous. Significant associations between independent variables and preschool sRtot z-score are highlighted in red, *represents p<0.05, **p<0.01 and ***p<0.01
Mean coefficient Mean coefficient
B 95% CI B 95% CI
Anthropometric variables: Bacterial isolates:
z-Birthweight 0.19 -0.07;0.45 SA ‘ever’ 0.20 -0.30;0.70
3m z-weight 0.21 -0.04;0.45 SA 1st age 0.00 -0.12;0.12
1y z-weight 0.21 -0.08;0.51 SA <6m 0.17 -0.42;0.75
2y z-weight 0.00 -0.31;0.31 SA 6m-2y 0.80 -0.01;1.61
PS z-weight -0.15 -0.45;0.15 SA 2y-PS 0.81 0.25;1.36**
3m z-height 0.26 0.01;0.51* PA ‘ever’ -0.00 -0.56;0.56
1y z-height 0.19 -0.07;0.45 PA 1st age -0.05 -0.20,0.09
2y z-height 0.14 -0.16;0.43 PA <6m 1.17 0.44;1.90**
PS z-height -0.08 -0.36;0.21 PA 6m-2y 0.34 -0.13;0.81
3m z-BMI 0.11 -0.16;0.37 PA 2y-PS 0.36 -0.31;1.03
1y z-BMI 0.13 -0.21;0.46 HI ‘ever’ 0.65 0.18;1.12**
2y z-BMI -0.13 -0.45;0.18 HI 1st age -0.08 -0.20;0.04
PS z-BMI -0.26 -0.63;0.11 HI <6m 0.41 -0.23;1.09
Δ z-weight birth-3m 0.04 -0.18;0.26 HI 6m-2y 0.99 0.47;1.50***
Δ z-weight birth-1y 0.00 -0.24;0.23 HI 2y-PS 1.09 0.36;1.81*
Δ z-weight birth-2y -0.06 -0.29;0.17 SM ‘ever’ 0.55 -0.05;0.50
SM 1st age -0.08 -0.26;0.09
Infant lung function outcomes: SM <6m - -
3m z-LCI -0.08 -0.31;0.15 SM 6m-2y 0.88 0.10;1.65*
1y z-LCI -0.02 -0.22;0.18 SM 2y-PS 0.27 -0.47;0.10
2y z-LCI 0.34 0.05;0.64*
3m z-FEV0.5 -0.14 -0.40;0.12 Clinical variables:
1y z-FEV0.5 0.11 -0.17;0.38 Genotype -0.23 -0.73;0.26
2y z-FEV0.5 -0.08 -0.38;0.38 P.Insufficiency 0.04 -0.67;0.76
3m z-FRCpleth 0.19 -0.09;0.46 Meconium ileus -0.08 -0.88;0.72
1y z-FRCpleth 0.13 -0.09;0.35 IV courses birth -0.02 -0.16;0.12
2y z-FRCpleth 0.22 -0.02;0.45 Mucolytic ‘ever’ -0.11 -0.61;0.39
Mucolytic at PS -0.01 -0.52;0.50
158
Multiple linear regression models for preschool sRtot z-score
Multiple linear regression analysis was performed to investigate the relationship
between measures in infancy and preschool sRtot z-score using the same step-wise
method as described above for LCI z-score. No significant associations were found
between preschool sRtot z-score and clinical variables (presentation with meconium
ileus, pancreatic insufficiency, genotype, mucolytic treatment ‘ever’ and intravenous
antibiotic courses) or anthropometric variables (height, weight and BMI z-score) on any
test occasion.
When isolation of pathogens ‘ever’ were investigated, isolation of HI ‘ever’ was
significantly associated with preschool sRtot z-score with mean regression coefficient
[95% CI] 0.65 [0.19;1.18], p=0.01. The age at which any bacterial isolate was acquired
did not have a significant effect. For categorical age of acquisition, isolation of SA
between two year and preschool test, HI between six months and two years and SM
between six months and two years all reached significance.
For any lung function test in infancy (at three months, one year and two years), two
year LCI z-score was the only variable to have a significant association with preschool
sRtot z-score; mean regression coefficient [95% CI] 0.37 [0.02;0.71], p=0.04.
5.4.4.3 Predictors of preschool FEV0.75 in subjects with CF
Univariable associations with preschool FEV0.75 z-score were investigated in the same
process as preschool LCI and sRtot z-score. FEV0.75 was considered a secondary
outcome as it identified less children with abnormality (11%) than preschool LCI z-
score (39%), but was still significantly different to controls at preschool test occasion
with mean z-score [95% CI] -0.54 [-0.98; -0.10] lower in subjects with CF.
On univariable regression analysis, both one year and preschool BMI z-scores were
significantly associated with preschool FEV0.75 z-score (regression coefficient [95% CI]
0.49 [0.14,0.84], p=<0.01; and 0.61 [0.22;0.99], p=<0.01 respectively). Use of
mucolytic ‘ever’ was also a significant determinant (-0.63 [-1.17;-0.09]), p=0.02.
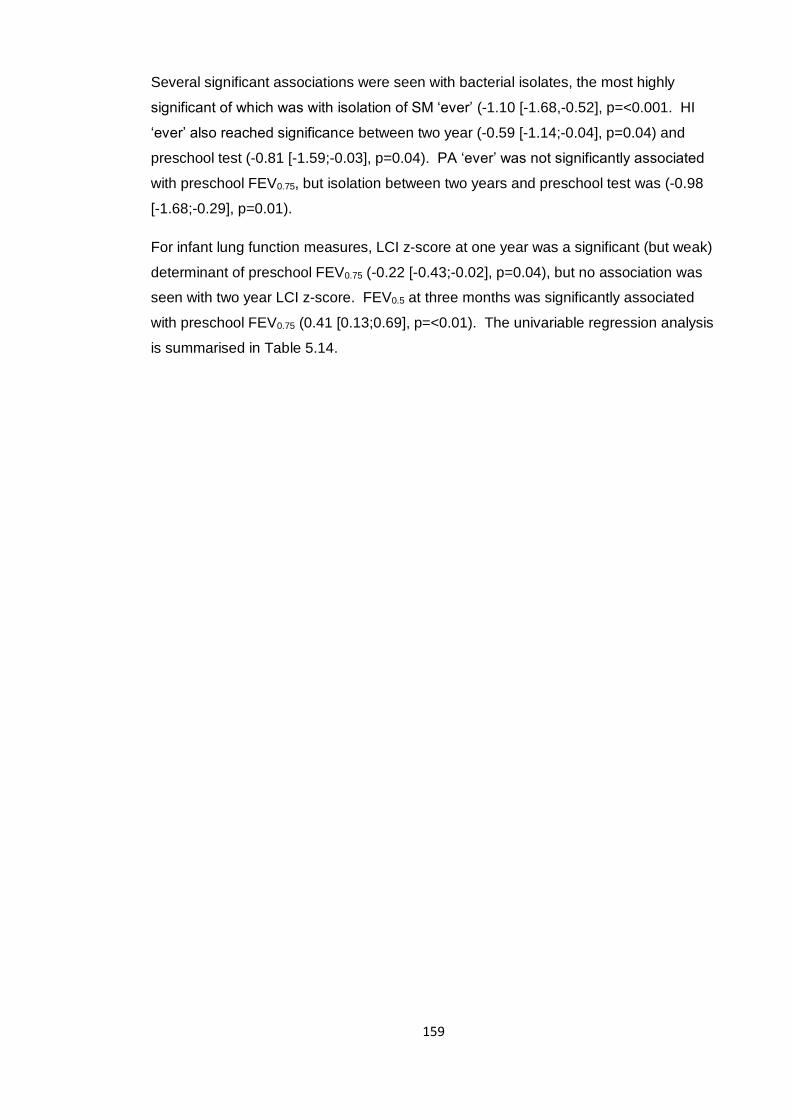
159
Several significant associations were seen with bacterial isolates, the most highly
significant of which was with isolation of SM ‘ever’ (-1.10 [-1.68,-0.52], p=<0.001. HI
‘ever’ also reached significance between two year (-0.59 [-1.14;-0.04], p=0.04) and
preschool test (-0.81 [-1.59;-0.03], p=0.04). PA ‘ever’ was not significantly associated
with preschool FEV0.75, but isolation between two years and preschool test was (-0.98
[-1.68;-0.29], p=0.01).
For infant lung function measures, LCI z-score at one year was a significant (but weak)
determinant of preschool FEV0.75 (-0.22 [-0.43;-0.02], p=0.04), but no association was
seen with two year LCI z-score. FEV0.5 at three months was significantly associated
with preschool FEV0.75 (0.41 [0.13;0.69], p=<0.01). The univariable regression analysis
is summarised in Table 5.14.
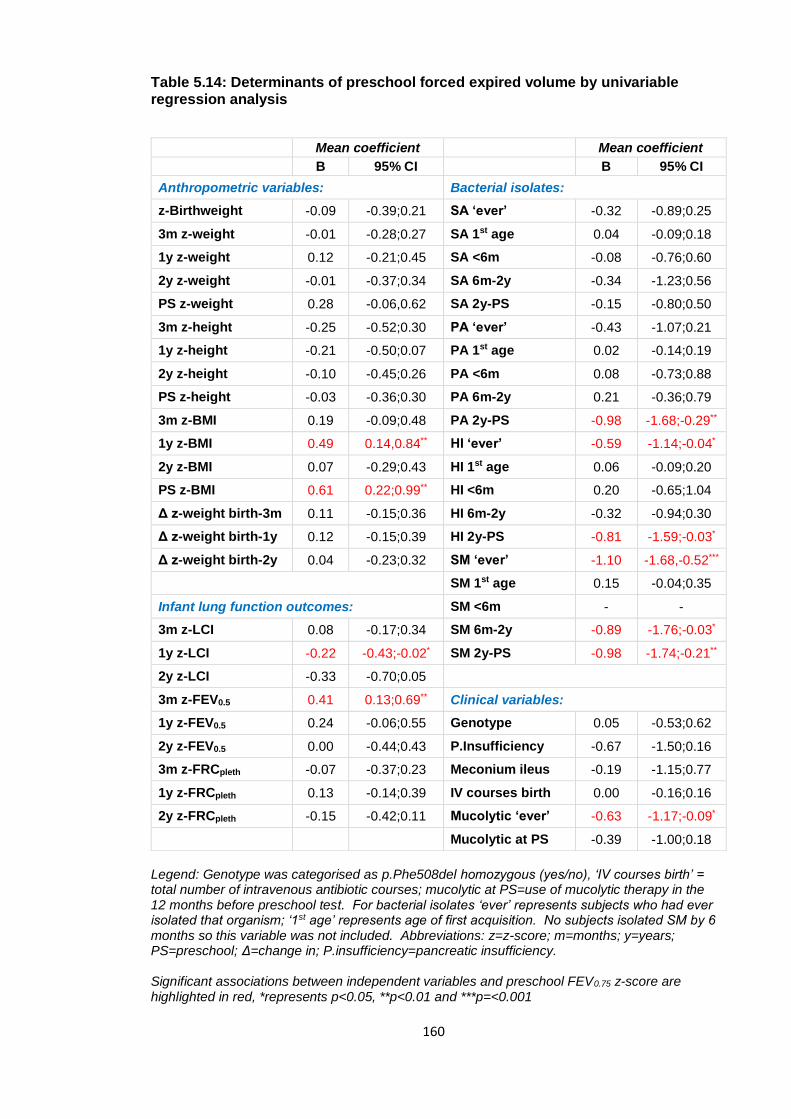
160
Table 5.14: Determinants of preschool forced expired volume by univariable regression analysis
Legend: Genotype was categorised as p.Phe508del homozygous (yes/no), ‘IV courses birth’ = total number of intravenous antibiotic courses; mucolytic at PS=use of mucolytic therapy in the 12 months before preschool test. For bacterial isolates ‘ever’ represents subjects who had ever isolated that organism; ‘1st age’ represents age of first acquisition. No subjects isolated SM by 6 months so this variable was not included. Abbreviations: z=z-score; m=months; y=years; PS=preschool; Δ=change in; P.insufficiency=pancreatic insufficiency. Significant associations between independent variables and preschool FEV0.75 z-score are highlighted in red, *represents p<0.05, **p<0.01 and ***p=<0.001
Mean coefficient Mean coefficient
B 95% CI B 95% CI
Anthropometric variables: Bacterial isolates:
z-Birthweight -0.09 -0.39;0.21 SA ‘ever’ -0.32 -0.89;0.25
3m z-weight -0.01 -0.28;0.27 SA 1st age 0.04 -0.09;0.18
1y z-weight 0.12 -0.21;0.45 SA <6m -0.08 -0.76;0.60
2y z-weight -0.01 -0.37;0.34 SA 6m-2y -0.34 -1.23;0.56
PS z-weight 0.28 -0.06,0.62 SA 2y-PS -0.15 -0.80;0.50
3m z-height -0.25 -0.52;0.30 PA ‘ever’ -0.43 -1.07;0.21
1y z-height -0.21 -0.50;0.07 PA 1st age 0.02 -0.14;0.19
2y z-height -0.10 -0.45;0.26 PA <6m 0.08 -0.73;0.88
PS z-height -0.03 -0.36;0.30 PA 6m-2y 0.21 -0.36;0.79
3m z-BMI 0.19 -0.09;0.48 PA 2y-PS -0.98 -1.68;-0.29**
1y z-BMI 0.49 0.14,0.84** HI ‘ever’ -0.59 -1.14;-0.04*
2y z-BMI 0.07 -0.29;0.43 HI 1st age 0.06 -0.09;0.20
PS z-BMI 0.61 0.22;0.99** HI <6m 0.20 -0.65;1.04
Δ z-weight birth-3m 0.11 -0.15;0.36 HI 6m-2y -0.32 -0.94;0.30
Δ z-weight birth-1y 0.12 -0.15;0.39 HI 2y-PS -0.81 -1.59;-0.03*
Δ z-weight birth-2y 0.04 -0.23;0.32 SM ‘ever’ -1.10 -1.68,-0.52***
SM 1st age 0.15 -0.04;0.35
Infant lung function outcomes: SM <6m - -
3m z-LCI 0.08 -0.17;0.34 SM 6m-2y -0.89 -1.76;-0.03*
1y z-LCI -0.22 -0.43;-0.02* SM 2y-PS -0.98 -1.74;-0.21**
2y z-LCI -0.33 -0.70;0.05
3m z-FEV0.5 0.41 0.13;0.69** Clinical variables:
1y z-FEV0.5 0.24 -0.06;0.55 Genotype 0.05 -0.53;0.62
2y z-FEV0.5 0.00 -0.44;0.43 P.Insufficiency -0.67 -1.50;0.16
3m z-FRCpleth -0.07 -0.37;0.23 Meconium ileus -0.19 -1.15;0.77
1y z-FRCpleth 0.13 -0.14;0.39 IV courses birth 0.00 -0.16;0.16
2y z-FRCpleth -0.15 -0.42;0.11 Mucolytic ‘ever’ -0.63 -1.17;-0.09*
Mucolytic at PS -0.39 -1.00;0.18
161
Multiple linear regression models for preschool FEV0.75 z-score
Multivariable regression analyses were used to investigate the combined effects of
determinants of preschool FEV0.75 z-score. When clinical variables were entered into a
model, both pancreatic insufficiency and mucolytic ‘ever’ had a significant association
with FEV0.75 z-score. None of the anthropometric measures (height, weight or BMI z-
score at three month, one year, two year and preschool test occasion) were
significantly associated with preschool FEV0.75 z-score.
When isolation of pathogens ‘ever’ were entered into a multiple linear regression
model, HI ‘ever’ and SM ‘ever’ were both significantly associated with preschool FEV0.75
z-score. Age of acquisition of each pathogen showed no significant associations in a
multiple regression model together, but categorical age of acquisition of HI between
two year and preschool test was significant and SM between six month and two year,
and SM between two year and preschool all had significant associations with preschool
FEV0.75 z-score.
To examine the relationship between infant lung function tests and preschool FEV0.75 z-
score, all infant lung function tests first at three months, then at one year and then at
two years were entered into a regression model. None of the infant lung function tests
at any test occasion had a significant association with preschool FEV0.75 z-score.
5.4.4.4 Evaluation of binary classifiers to predict preschool lung clearance index
In addition to regression analysis, an evaluation of binary classifiers can be used for
measures in infancy to predict those at preschool age. As LCI z-score was the most
sensitive marker of abnormality in the 67 children with CF tested in the preschool
years, it was chosen as the outcome variable for sensitivity analysis. In children with
CF, infant lung function results (LCI, FEV0.5 and FRCpleth z-scores) were classified as
normal or abnormal. Abnormal tests for LCI and FRCpleth were >1.98 z-scores and for
FEV0.5 <-1.98 z-scores. Pseudomonas aeruginosa status was also included (a
positive isolate being an abnormal result). Two year LCI z-score had the highest
positive predictive value (71%) for preschool LCI z-score, and negative predictive value
of 73%.
162
Table 5.15: Positive and negative predictive values of infant lung function measures and Pseudomonas status for preschool lung clearance index
Variable Positive predictive value Negative predictive value
3 month LCI z-score 57% 63%
1 year LCI z-score 60% 65%
2 year LCI z-score 75% 73%
3 month FEV0.5 z-score 38% 62%
1 year FEV0.5 z-score 20% 58%
2 year FEV0.5 z-score 71% 63%
3 month FRCpleth z-score 25% 63%
1 year FRCpleth z-score 63% 64%
2 year FRCpleth z-score 33% 67%
PA < 6 months 40% 68%
PA 6 months-2 years 43% 72%
PA 2 years-preschool 50% 70%
Legend: Positive and negative predictive values for infant lung function measures and
Pseudomonas status for preschool lung clearance index z-score. Abbreviations:
LCI=lung clearance index, FEV0.5=forced expired volume in 0.5 seconds,
FRCpleth=plethysmographic functional residual capacity, PA=pseudomonas aeruginosa
isolate. Two year LCI z-score had the highest positive and negative predictive values
for preschool LCI z-score
5.5 Discussion
5.5.1 Principal findings
The main results of this study are as follows:
a) In NBS subjects followed up at preschool age, LCI z-score was not significantly
different in subjects with CF compared to controls at three months, but then
showed a progressive deterioration, and at preschool test was the only parameter
outside the normal range (≥1.96 z-scores) at any test occasion during the study.
FEV(t) remained stable throughout infancy and at preschool test occasion
163
b) The only significant association of infant lung function measures and preschool
lung function primary outcomes was between two year LCI z-score and preschool
LCI and sRtot z-scores. Otherwise infant measures did not predict preschool lung
function
c) For bacterial infection, earlier age of acquisition of PA was a determinant of both
preschool LCI z-score, with isolation in the first six months of life having a
significant effect on univariable regression analysis, but this relationship was not
significant on multiple regression analysis when two year LCI z-score was
accounted for. Isolation of HI ‘ever’ was a significant determinant of preschool sRtot
and FEV0.75 z-score, and isolation of SM ‘ever’ was a significant determinant of
preschool FEV0.75 z-score
5.5.2 Review of hypotheses
The hypotheses were:
a) “Infant lung function measures (FEV0.5, FRCpleth and LCI z-scores) and nutritional
markers (height, weight and BMI z-scores) cannot predict preschool lung function
(LCI, sRtot and FEV0.75 z-scores) in NBS children with CF”
This hypothesis was incorrect, as there was a significant association between two year
LCI z-score and preschool LCI and sRtot z-scores. However, nutritional outcomes
were not significant predictors of preschool lung function.
b) “Clinical markers of infection (isolation of bacteria on respiratory samples), cannot
predict preschool lung function, and markers of disease severity (for example
courses of intravenous antibiotics) in infancy will not be significantly associated with
preschool lung function primary outcomes (LCI, sRtot and FEV0.75 z-scores)”
This hypothesis was proven as no significant associations were found between clinical
markers in infancy and preschool lung function in the multiple regression models.
164
5.5.3 Comparison of this study to other reports
This study shows that lung function changes in NBS infants are mild and short-lived
until preschool age when LCI gives a sensitive signal of abnormality. However, as two
year LCI z-score predicts later pulmonary function, lung damage is likely to occur
before this point. This will be discussed further in the final chapter of this thesis.
There were no other significant associations between lung function measures in early
infancy and preschool lung function outcomes. The fact that infant lung function, with
the exception of two year LCI, does not predict preschool measures is not unexpected
considering the transient abnormalities of functional measures seen in NBS infants
earlier in the study. This suggests that preschool determinants are post-natal (rather
than ante-natal) and supports an argument for starting new therapies at an early age.
There was a progressive deterioration seen in LCI z-score with each test when
compared to healthy controls; the mean difference was 0.32 z-scores at three months,
0.73 z-scores at one year, 0.89 z-scores at two years and 1.47 at preschool test. This
is the first study to report the progressive decline of LCI from infancy to preschool age
when compared to healthy controls, and is in keeping with a Canadian study showing
progressive deterioration of LCI in the same subjects with CF on repeated
measurement of LCI over the 3-6 year age range144.
In the regression analyses, a significant association was seen between two year LCI z-
score and preschool LCI z-score, when two year LCI z-score was analysed as a
continuous variable. However, as shown in Table 5.10, only eight infants had
abnormal two year LCI z-score; six of whom had abnormal LCI z-score at both two year
and preschool test. Therefore, if the cut off of +1.96 z-scores to define abnormality
was used to enrol children with CF to interventional trials at two years of age, very few
subjects would be included, but this may represent a small subgroup that could be
targeted for intervention or more aggressive treatment. Although out of the scope of
this thesis, the rate of decline in LCI may be a more important marker for inclusion in
clinical trials, particularly as this and the Canadian study show a progressive
deterioration with age.
An association was seen with early Pseudomonas aeruginosa infection and preschool
LCI, and isolation before six months of age was significantly associated with higher
preschool LCI z-score on univariable analysis. On multiple regression analysis any
association between Pseudomonas aeruginosa and preschool lung function was lost
165
when two year LCI was accounted for. It must be noted that there were only eight
subjects who isolated this organism by six months. The results reported in this chapter
are an exploratory analysis of associations between measures in infancy and preschool
lung function, but with such small numbers in the aforementioned groups, the study is
underpowered. The AREST-CF group have reported progression of structural136 and
functional41 abnormalities in NBS infants isolating this organism. In an earlier
publication of LCFC clinically diagnosed children, Kozlowska and colleagues found
early infection with Pseudomonas aeruginosa before any lung function test (infancy or
preschool) preceded a decline in lung function. However, LCI was not reported in this
study. It may be that the early developing lung is particularly susceptible to infection
with Pseudomonas aeruginosa in the first few months of life, and irreversible damage
may occur, but this is not reflected in tests of infant or preschool lung function in cohort
2.
5.5.4 Limitations of the study
Limitations relating to the collection of clinical data are presented in the final chapter of
this thesis. Although associations between lung function and, for example, bacterial
isolates and CF treatments were investigated, it is recognised that numbers were small
in many of these categories and exploration of any association therefore limited.
A further limitation of the study was the period between two year and preschool test.
The age range for preschool follow was wide, and therefore reporting the average time-
point when lung function became abnormal was limited. However it is difficult to justify
repeated measures in young children, and it would place an unnecessary burden on
the families who had already attended for infant testing under sedation on at least one
occasion. All test occasions are relatively time consuming, and increasing the number
of measurements could lead to reduced follow-up or withdrawal from the study. It was
not possible therefore to describe response to treatment or natural variability of lung
function in these children.

166
5.5.5 Meaning of the study, conclusions and future research
This study has described the evolution of lung function in a NBS cohort of UK children
under six years of age, and investigated factors in early life that may predict decline in
pulmonary function. The implications of these findings for clinical monitoring,
enrolment in interventional trials and timing of new therapies is explored in the
discussion chapter of this thesis. The final results chapter explores predictors of
preschool lung function further, focusing on infant measures of lung structure and
inflammation.
167
6 Measures of infant lung structure and inflammation
as predictors for preschool pulmonary function
6.1 Introduction
In addition to the measurement of lung function, markers of lung structure and
inflammation can be used to monitor disease in young children with CF. Their use
remains controversial in infancy, with concerns around the effect of ionising radiation
on the developing lung if HRCT is used, and the invasive nature of sampling for
inflammatory markers using bronchoscopic assisted BAL. However if either could
predict lung health at a later age, and identify children who are at risk of decline,
surveillance using these methods would be justified.
A ‘gold standard test’ can be considered as one that has a high sensitivity for the
presence of disease and high specificity; one that does not identify abnormality in those
without disease, the ideal being 100% for both. In young children with CF, this gold
standard is likely a test that easily identifies an abnormality that has detrimental
consequences on long term health. At present, there is no agreed gold standard to
identify early lung disease in children with CF. Abnormal markers (whether from lung
function, CT or BAL) have unknown long term outcomes, and the choice of which exact
marker to follow unclear at present.
The AREST-CF group have demonstrated that CT abnormalities can be detected in a
high proportion of infants with CF from three months of age3, and in the first year of life,
bronchial dilatation (32% of subjects) and air trapping (69%) were both detectable in
NBS infants135. This group reported cross-sectional correlations between lung function
(LCI) and CT abnormalities in infants and preschool children78. LCI was insensitive to
structural disease in infants, but by preschool age LCI correlated with total disease
extent. However, at the time of writing, this group have not described whether CT
outcomes measured in infancy can predict lung function in later life.
The relationship between inflammatory markers in BAL and lung function has also
been reported in the AREST-CF cohort. Infants with detectable free neutrophil
elastase, a marker of neutrophilic inflammation, in BAL at three months of age had
significantly poorer lung function in the first two years of life than those who did not41.
They went on to show that neutrophil elastase activity at three months was associated
with persistent bronchial dilatation on two or more sequential CT scans at one and
168
three years of age135. No associations were found with other BAL inflammatory
markers and later lung function outcomes. When neutrophil elastase measured in the
first two years of life was investigated as a determinant for school age lung function,
only a univariable association was found which did not remain significant after
adjustment for respiratory pathogens detected on BAL133. However, early school age
spirometry (FEV0.75) was reported in this study; they have not yet reported longitudinal
relationships between inflammatory markers in infancy and later LCI.
The LCFC NBS cohort of children with CF described in this thesis also underwent CT
and BAL at one year of age. A report of CT abnormalities has previously been
published94. Bronchial dilatation and air trapping were seen in 26% and 42% of infants
respectively at one year of age. However, changes observed on chest CT scan were
so mild that scoring was poorly reproducible between two observers apart from air-
trapping (strong agreement), bronchial dilatation and total CT score (fair agreement).
The aforementioned studies from both the AREST-CF and LCFC groups are discussed
in detail in section 1.4.3.2.
As the ability of CT and BAL inflammatory markers measured in infancy to predict later
lung function in preschool children has not been previously reported, and in view of the
apparent differences between the AREST-CF and LCFC cohorts, this chapter will
investigate the relationship between markers of lung structure and inflammation at one
year and preschool lung function.
6.2 Hypotheses, aims and objectives
The hypotheses were:
1. Inflammatory markers from BAL at one year cannot predict preschool lung
function (LCI, sRtot and FEV0.75) at three to six years of age
2. Abnormalities on CT (air trapping, bronchial dilatation and total CT score)
cannot predict preschool lung function
The aims were to describe associations between CT score and BAL inflammatory
markers in infancy with preschool lung function in NBS children with CF. The objective
was to investigate the relationship between CT and BAL parameters measured at one
year in the LCFC cohort of NBS children and preschool lung function primary outcome
169
measures (LCI, sRtot and FEV0.75 z-scores) measured at three to six years in the same
children.
6.3 Methods
The LCFC infant study design and outcome measures are described in section 2.3. To
summarise the relevant tests investigated in this chapter, at one year of age infants
underwent lung function testing using the RVRTC technique, whole body
plethysmography and MBW, with primary outcomes of FEV0.5, FRCpleth and LCI
respectively. Infants were tested when well; defined as free from respiratory symptoms
for three weeks before the test date. The detailed methodology of infant lung function
measurement in this longitudinal study has been previously published36, 127. In addition,
a CT scan and bronchoscopy were performed within two weeks of lung function tests if
infants remained clinically stable. Data from infants were collected as part of an earlier
study (Principal Investigator Professor Janet Stocks), and not by myself.
Volume controlled thin section chest CT was performed under general anaesthesia, as
described by Thia et al.94. In brief, inspiratory and expiratory scans were obtained
using controlled ventilation. Anonymised scans were scored independently by two
specialist paediatric radiologists (Drs Alan Brody and Alistair Calder), blinded to subject
clinical characteristics. The Brody-II CF-CT scoring system was utilised98. Air trapping,
bronchial dilatation and total CT score were used in the present chapter as the primary
outcomes due to the poor intra- and inter-observer agreement for other CT score
parameters previously reported94. The mean of the two operator scores for each of
these parameters were used. Abnormal scores were defined as a total CT score
greater than 12 (maximum possible 243), any evidence of bronchial dilatation
(maximum possible score 72), or any air trapping (maximum 27)94, 126.
Flexible bronchoscopy was performed after the CT scan under the same general
anaesthetic. A 2.8 mm bronchoscope was inserted via an endotracheal tube. ERS
taskforce guidelines for BAL in children were followed110; four aliquots of normal saline
at a volume of 1ml/kg were instilled and retrieved using low pressure suction, three
from the right middle lobe and one from the lingula. The first returned aliquot from each
lobe was sent for bacterial and fungal culture. Subsequent samples from the right
middle lobe were pooled, centrifuged and the supernatants frozen at -80°C. Cytokines
were measured from pooled samples using the Meso Scale Discovery® Multi- Array
technology (MesoScale Discovery, Gaithersburg, MD, USA). Assays for markers
170
known to reflect pulmonary inflammation were chosen, namely interleukin- (IL) 6, IL-8,
IL-10, tumour necrosis factor alpha (TNFα), monocyte chemoattractant protein-1 (MCP-
1) and neutrophil elastase (NE). Free NE activity was measured using an adapted
ELISA (enzyme-linked immunosorbent assay) technique3. The lower limits of detection
were 0.03 pg/ml for IL-10, 0.04pg/ml for IL-8 and TNFα, 0.06 pg/ml for IL-6, 2pg/ml for
MCP-1 and 200ng/ml for NE. Inflammatory marker analysis was completed in the
Great Ormond Street Hospital microbiology laboratory.
At three to six years of age the same children were invited to return for preschool lung
function testing (MBW, whole body plethysmography and spirometry) as described in
the current study (section 2.6), with primary outcomes of LCI, sRtot and FEV0.75.
6.3.1 Statistical analysis
The sample size was determined by the numbers previously recruited, so no power
calculation was carried out. Published reference equations were used to express
anthropometric data138, infant lung function31, 75, 150 and preschool lung function49, 75, 151
results as z-scores, and were summarised as the mean and standard deviation. Group
comparisons of subjects with and without CT and/or BAL data were investigated with
student t-tests, Chi-squared or Fisher’s exact test as appropriate. CT scores and BAL
inflammatory markers were non-normally distributed and expressed as median and
interquartile range, or range. Cytokine concentrations were log transformed to allow
visual inspection and investigation of any association with preschool lung function
using linear regression analysis. Variation exists in what is considered to be a normal
cytokine profile, so each inflammatory marker was modelled as a continuous
independent variable to investigate whether high (or low) levels were associated with
preschool lung function outcomes.
Preschool lung function primary outcome measures (LCI, sRtot and FEV0.75) were
modelled separately. An evaluation of binary classifiers is also presented for preschool
LCI z-score using infant CT scores and presence of neutrophil elastase in BAL as
predictor variables. Statistical analyses were conducted using SPSS software (IBM
SPSS Statistics for Windows, Version 24.0). Statistical significance was taken as
p<0.05.
171
6.4 Results
6.4.1 Subject characteristics
Of the 67 children with CF with preschool follow up, 48 had HRCT and 49 had BAL
(one child had CT performed outside of the study scoring period). Data for
inflammatory markers were not available for 16 infants due to a processing error, in
that these samples of BAL were frozen before centrifuge. This is required before
supernatant is extracted, therefore it was not possible to use the data for these
subjects. Preschool growth and lung function characteristics of subjects with and
without CT/BAL are summarised in Table 6.1 (those with BAL were those for whom
inflammatory marker data were available). Children with BAL were significantly
younger at preschool test than those without, but there were no significant differences
in growth or lung function results between the two groups. Clinical characteristics are
shown in Table 6.2, and were similar to those described in the full cohort (sections
3.4.3 and 5.4.2). Only one child at one year test and one child preschool test had
chronic PA in the CT group and no children had chronic PA by one year, and only one
at preschool test in the BAL group (Leeds criteria139).
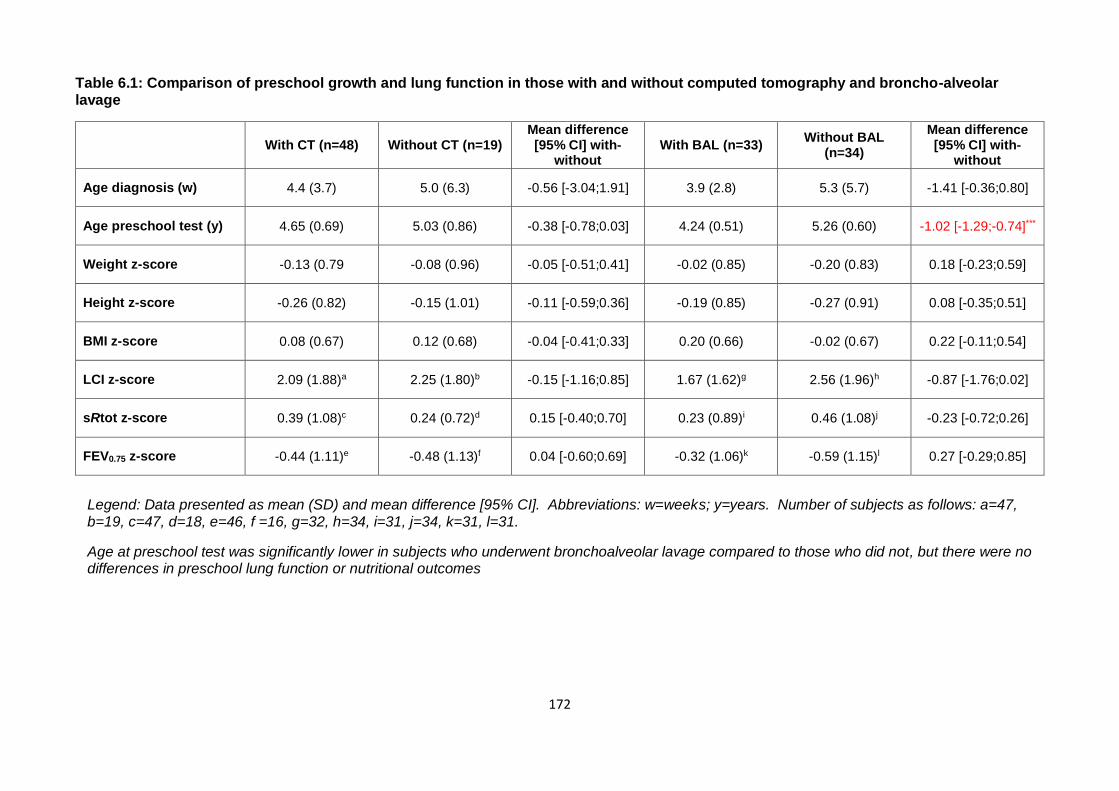
172
Table 6.1: Comparison of preschool growth and lung function in those with and without computed tomography and broncho-alveolar lavage
With CT (n=48) Without CT (n=19) Mean difference [95% CI] with-
without With BAL (n=33)
Without BAL (n=34)
Mean difference [95% CI] with-
without
Age diagnosis (w) 4.4 (3.7) 5.0 (6.3) -0.56 [-3.04;1.91] 3.9 (2.8) 5.3 (5.7) -1.41 [-0.36;0.80]
Age preschool test (y) 4.65 (0.69) 5.03 (0.86) -0.38 [-0.78;0.03] 4.24 (0.51) 5.26 (0.60) -1.02 [-1.29;-0.74]***
Weight z-score -0.13 (0.79 -0.08 (0.96) -0.05 [-0.51;0.41] -0.02 (0.85) -0.20 (0.83) 0.18 [-0.23;0.59]
Height z-score -0.26 (0.82) -0.15 (1.01) -0.11 [-0.59;0.36] -0.19 (0.85) -0.27 (0.91) 0.08 [-0.35;0.51]
BMI z-score 0.08 (0.67) 0.12 (0.68) -0.04 [-0.41;0.33] 0.20 (0.66) -0.02 (0.67) 0.22 [-0.11;0.54]
LCI z-score 2.09 (1.88)a 2.25 (1.80)b -0.15 [-1.16;0.85] 1.67 (1.62)g 2.56 (1.96)h -0.87 [-1.76;0.02]
sRtot z-score 0.39 (1.08)c 0.24 (0.72)d 0.15 [-0.40;0.70] 0.23 (0.89)i 0.46 (1.08)j -0.23 [-0.72;0.26]
FEV0.75 z-score -0.44 (1.11)e -0.48 (1.13)f 0.04 [-0.60;0.69] -0.32 (1.06)k -0.59 (1.15)l 0.27 [-0.29;0.85]
Legend: Data presented as mean (SD) and mean difference [95% CI]. Abbreviations: w=weeks; y=years. Number of subjects as follows: a=47, b=19, c=47, d=18, e=46, f =16, g=32, h=34, i=31, j=34, k=31, l=31.
Age at preschool test was significantly lower in subjects who underwent bronchoalveolar lavage compared to those who did not, but there were no differences in preschool lung function or nutritional outcomes
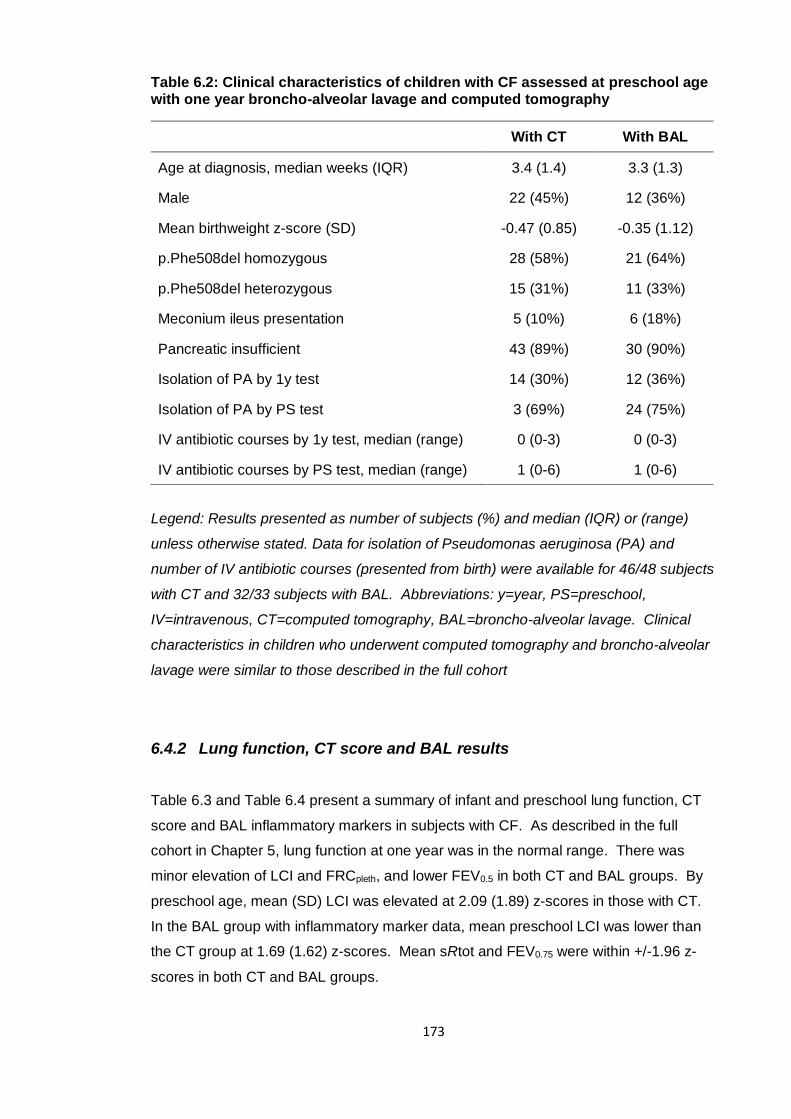
173
Table 6.2: Clinical characteristics of children with CF assessed at preschool age with one year broncho-alveolar lavage and computed tomography
With CT With BAL
Age at diagnosis, median weeks (IQR) 3.4 (1.4) 3.3 (1.3)
Male 22 (45%) 12 (36%)
Mean birthweight z-score (SD) -0.47 (0.85) -0.35 (1.12)
p.Phe508del homozygous 28 (58%) 21 (64%)
p.Phe508del heterozygous 15 (31%) 11 (33%)
Meconium ileus presentation 5 (10%) 6 (18%)
Pancreatic insufficient 43 (89%) 30 (90%)
Isolation of PA by 1y test 14 (30%) 12 (36%)
Isolation of PA by PS test 3 (69%) 24 (75%)
IV antibiotic courses by 1y test, median (range) 0 (0-3) 0 (0-3)
IV antibiotic courses by PS test, median (range) 1 (0-6) 1 (0-6)
Legend: Results presented as number of subjects (%) and median (IQR) or (range)
unless otherwise stated. Data for isolation of Pseudomonas aeruginosa (PA) and
number of IV antibiotic courses (presented from birth) were available for 46/48 subjects
with CT and 32/33 subjects with BAL. Abbreviations: y=year, PS=preschool,
IV=intravenous, CT=computed tomography, BAL=broncho-alveolar lavage. Clinical
characteristics in children who underwent computed tomography and broncho-alveolar
lavage were similar to those described in the full cohort
6.4.2 Lung function, CT score and BAL results
Table 6.3 and Table 6.4 present a summary of infant and preschool lung function, CT
score and BAL inflammatory markers in subjects with CF. As described in the full
cohort in Chapter 5, lung function at one year was in the normal range. There was
minor elevation of LCI and FRCpleth, and lower FEV0.5 in both CT and BAL groups. By
preschool age, mean (SD) LCI was elevated at 2.09 (1.89) z-scores in those with CT.
In the BAL group with inflammatory marker data, mean preschool LCI was lower than
the CT group at 1.69 (1.62) z-scores. Mean sRtot and FEV0.75 were within +/-1.96 z-
scores in both CT and BAL groups.
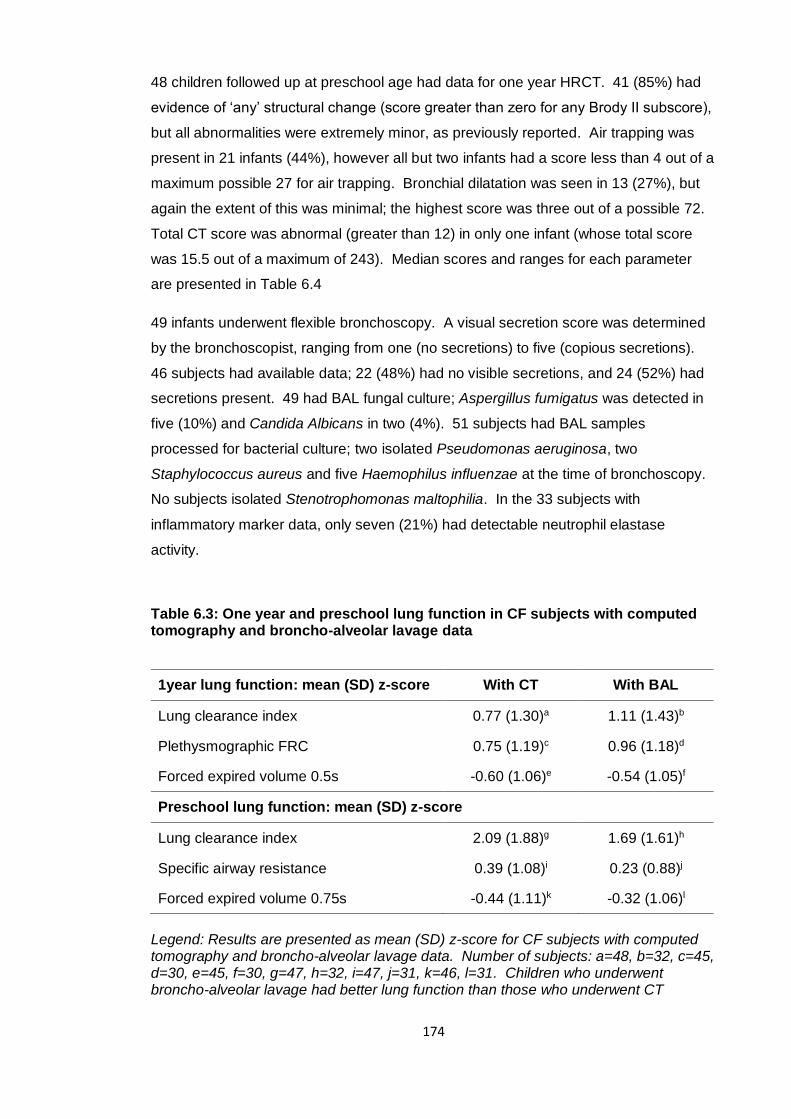
174
48 children followed up at preschool age had data for one year HRCT. 41 (85%) had
evidence of ‘any’ structural change (score greater than zero for any Brody II subscore),
but all abnormalities were extremely minor, as previously reported. Air trapping was
present in 21 infants (44%), however all but two infants had a score less than 4 out of a
maximum possible 27 for air trapping. Bronchial dilatation was seen in 13 (27%), but
again the extent of this was minimal; the highest score was three out of a possible 72.
Total CT score was abnormal (greater than 12) in only one infant (whose total score
was 15.5 out of a maximum of 243). Median scores and ranges for each parameter
are presented in Table 6.4
49 infants underwent flexible bronchoscopy. A visual secretion score was determined
by the bronchoscopist, ranging from one (no secretions) to five (copious secretions).
46 subjects had available data; 22 (48%) had no visible secretions, and 24 (52%) had
secretions present. 49 had BAL fungal culture; Aspergillus fumigatus was detected in
five (10%) and Candida Albicans in two (4%). 51 subjects had BAL samples
processed for bacterial culture; two isolated Pseudomonas aeruginosa, two
Staphylococcus aureus and five Haemophilus influenzae at the time of bronchoscopy.
No subjects isolated Stenotrophomonas maltophilia. In the 33 subjects with
inflammatory marker data, only seven (21%) had detectable neutrophil elastase
activity.
Table 6.3: One year and preschool lung function in CF subjects with computed tomography and broncho-alveolar lavage data
Legend: Results are presented as mean (SD) z-score for CF subjects with computed tomography and broncho-alveolar lavage data. Number of subjects: a=48, b=32, c=45, d=30, e=45, f=30, g=47, h=32, i=47, j=31, k=46, l=31. Children who underwent broncho-alveolar lavage had better lung function than those who underwent CT
1year lung function: mean (SD) z-score With CT With BAL
Lung clearance index 0.77 (1.30)a 1.11 (1.43)b
Plethysmographic FRC 0.75 (1.19)c 0.96 (1.18)d
Forced expired volume 0.5s -0.60 (1.06)e -0.54 (1.05)f
Preschool lung function: mean (SD) z-score
Lung clearance index 2.09 (1.88)g 1.69 (1.61)h
Specific airway resistance 0.39 (1.08)i 0.23 (0.88)j
Forced expired volume 0.75s -0.44 (1.11)k -0.32 (1.06)l
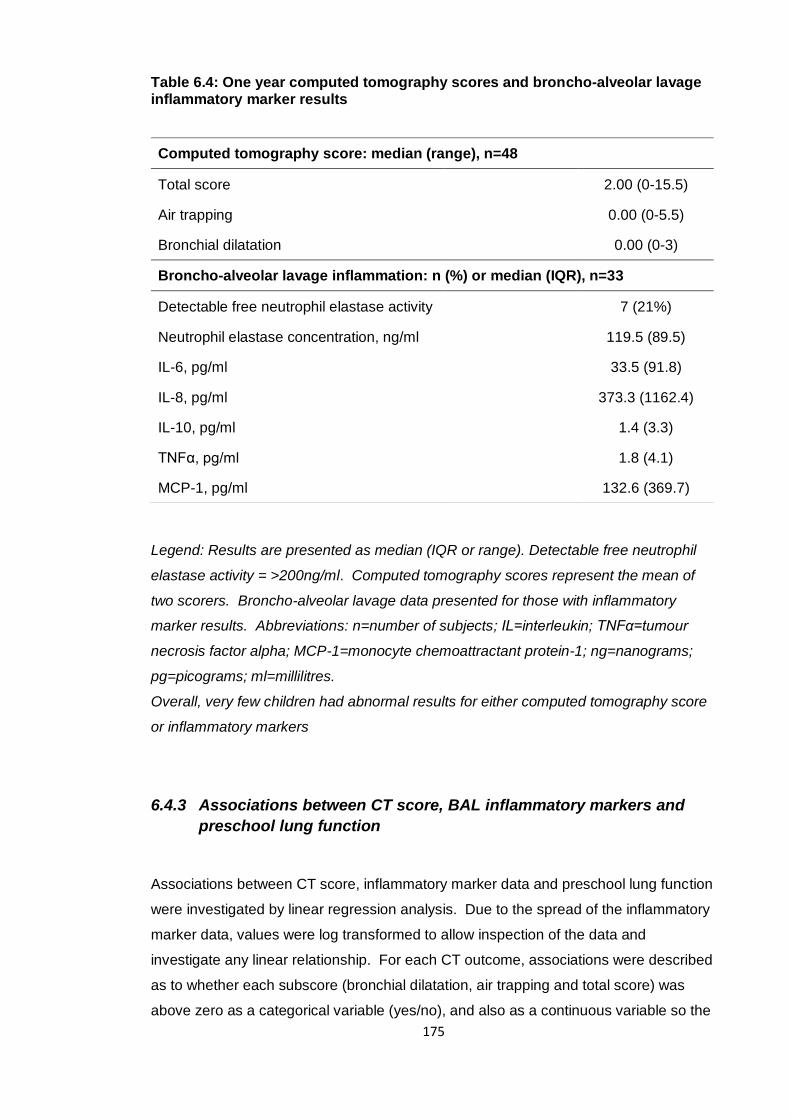
175
Table 6.4: One year computed tomography scores and broncho-alveolar lavage inflammatory marker results
Legend: Results are presented as median (IQR or range). Detectable free neutrophil
elastase activity = >200ng/ml. Computed tomography scores represent the mean of
two scorers. Broncho-alveolar lavage data presented for those with inflammatory
marker results. Abbreviations: n=number of subjects; IL=interleukin; TNFα=tumour
necrosis factor alpha; MCP-1=monocyte chemoattractant protein-1; ng=nanograms;
pg=picograms; ml=millilitres.
Overall, very few children had abnormal results for either computed tomography score
or inflammatory markers
6.4.3 Associations between CT score, BAL inflammatory markers and
preschool lung function
Associations between CT score, inflammatory marker data and preschool lung function
were investigated by linear regression analysis. Due to the spread of the inflammatory
marker data, values were log transformed to allow inspection of the data and
investigate any linear relationship. For each CT outcome, associations were described
as to whether each subscore (bronchial dilatation, air trapping and total score) was
above zero as a categorical variable (yes/no), and also as a continuous variable so the
Computed tomography score: median (range), n=48
Total score 2.00 (0-15.5)
Air trapping 0.00 (0-5.5)
Bronchial dilatation 0.00 (0-3)
Broncho-alveolar lavage inflammation: n (%) or median (IQR), n=33
Detectable free neutrophil elastase activity 7 (21%)
Neutrophil elastase concentration, ng/ml 119.5 (89.5)
IL-6, pg/ml 33.5 (91.8)
IL-8, pg/ml 373.3 (1162.4)
IL-10, pg/ml 1.4 (3.3)
TNFα, pg/ml 1.8 (4.1)
MCP-1, pg/ml 132.6 (369.7)
176
extent of abnormality for each subscore could be investigated. Table 6.5 shows
univariable linear regression analysis of one year CT and BAL results to predict each
preschool lung function primary outcome measure. There were no significant
associations between BAL inflammatory markers, including free neutrophil elastase
activity, and preschool lung function. For CT, the presence of air trapping at one year
was significantly associated with both LCI and sRtot z-scores, and air trapping score
(the extent of air trapping) highly significantly associated with LCI z-score, with mean
regression coefficient [95% CI] 0.72 [0.40;1.01], p<0.001. For every one point increase
in air trapping score at one year, preschool LCI is expected to increase on average by
0.72 z-scores. Total CT score was also significantly associated with preschool LCI z-
score, mean regression coefficient [95% CI] 0.33 [0.18;0.47].
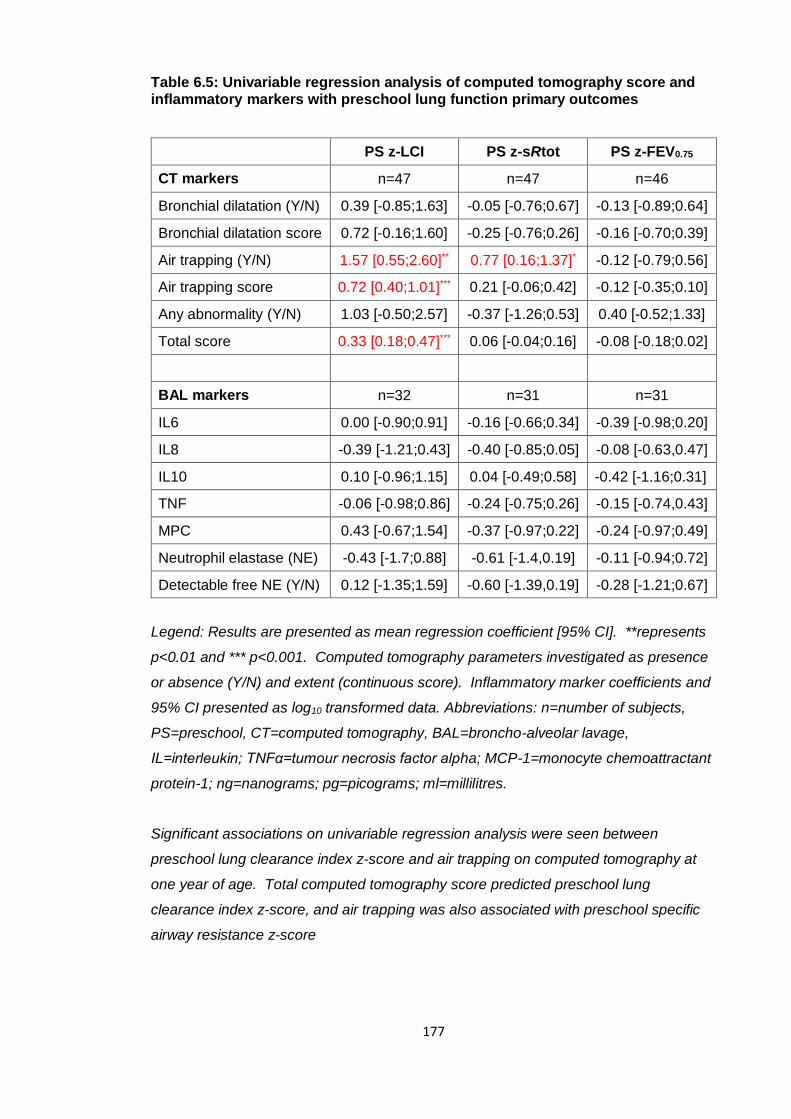
177
Table 6.5: Univariable regression analysis of computed tomography score and inflammatory markers with preschool lung function primary outcomes
PS z-LCI PS z-sRtot PS z-FEV0.75
CT markers n=47 n=47 n=46
Bronchial dilatation (Y/N) 0.39 [-0.85;1.63] -0.05 [-0.76;0.67] -0.13 [-0.89;0.64]
Bronchial dilatation score 0.72 [-0.16;1.60] -0.25 [-0.76;0.26] -0.16 [-0.70;0.39]
Air trapping (Y/N) 1.57 [0.55;2.60]** 0.77 [0.16;1.37]* -0.12 [-0.79;0.56]
Air trapping score 0.72 [0.40;1.01]*** 0.21 [-0.06;0.42] -0.12 [-0.35;0.10]
Any abnormality (Y/N) 1.03 [-0.50;2.57] -0.37 [-1.26;0.53] 0.40 [-0.52;1.33]
Total score 0.33 [0.18;0.47]*** 0.06 [-0.04;0.16] -0.08 [-0.18;0.02]
BAL markers n=32 n=31 n=31
IL6 0.00 [-0.90;0.91] -0.16 [-0.66;0.34] -0.39 [-0.98;0.20]
IL8 -0.39 [-1.21;0.43] -0.40 [-0.85;0.05] -0.08 [-0.63,0.47]
IL10 0.10 [-0.96;1.15] 0.04 [-0.49;0.58] -0.42 [-1.16;0.31]
TNF -0.06 [-0.98;0.86] -0.24 [-0.75;0.26] -0.15 [-0.74,0.43]
MPC 0.43 [-0.67;1.54] -0.37 [-0.97;0.22] -0.24 [-0.97;0.49]
Neutrophil elastase (NE) -0.43 [-1.7;0.88] -0.61 [-1.4,0.19] -0.11 [-0.94;0.72]
Detectable free NE (Y/N) 0.12 [-1.35;1.59] -0.60 [-1.39,0.19] -0.28 [-1.21;0.67]
Legend: Results are presented as mean regression coefficient [95% CI]. **represents
p<0.01 and *** p<0.001. Computed tomography parameters investigated as presence
or absence (Y/N) and extent (continuous score). Inflammatory marker coefficients and
95% CI presented as log10 transformed data. Abbreviations: n=number of subjects,
PS=preschool, CT=computed tomography, BAL=broncho-alveolar lavage,
IL=interleukin; TNFα=tumour necrosis factor alpha; MCP-1=monocyte chemoattractant
protein-1; ng=nanograms; pg=picograms; ml=millilitres.
Significant associations on univariable regression analysis were seen between
preschool lung clearance index z-score and air trapping on computed tomography at
one year of age. Total computed tomography score predicted preschool lung
clearance index z-score, and air trapping was also associated with preschool specific
airway resistance z-score
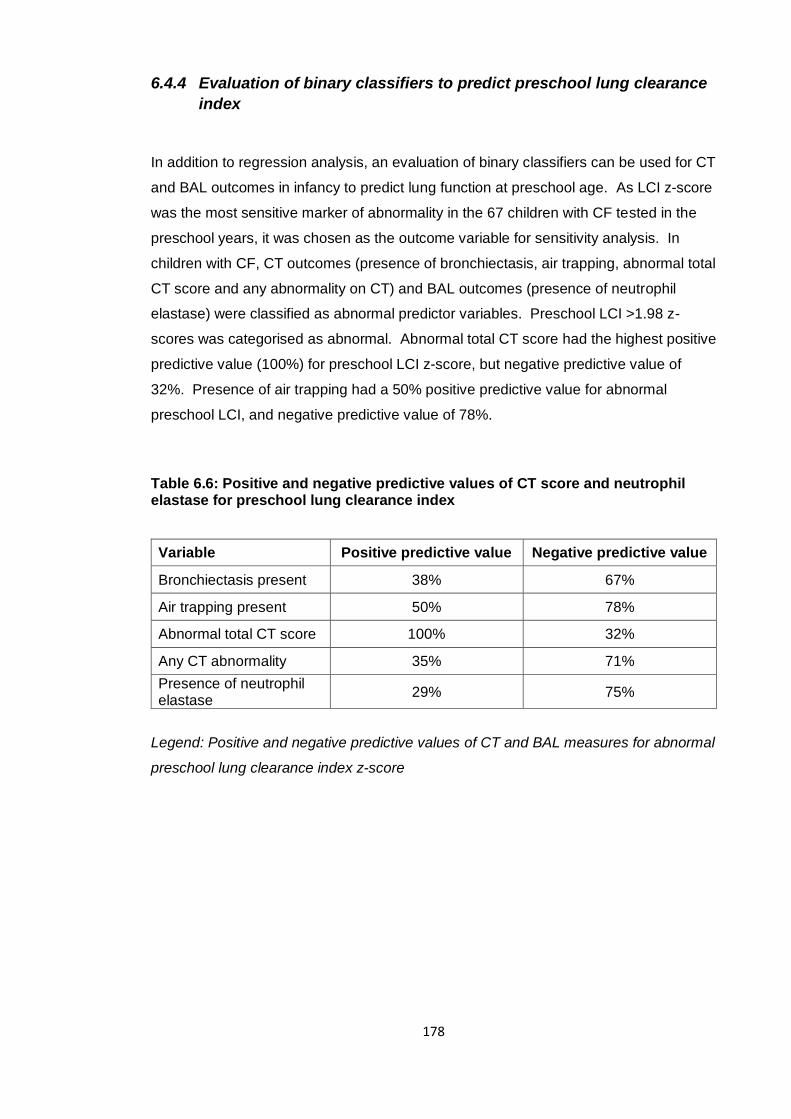
178
6.4.4 Evaluation of binary classifiers to predict preschool lung clearance
index
In addition to regression analysis, an evaluation of binary classifiers can be used for CT
and BAL outcomes in infancy to predict lung function at preschool age. As LCI z-score
was the most sensitive marker of abnormality in the 67 children with CF tested in the
preschool years, it was chosen as the outcome variable for sensitivity analysis. In
children with CF, CT outcomes (presence of bronchiectasis, air trapping, abnormal total
CT score and any abnormality on CT) and BAL outcomes (presence of neutrophil
elastase) were classified as abnormal predictor variables. Preschool LCI >1.98 z-
scores was categorised as abnormal. Abnormal total CT score had the highest positive
predictive value (100%) for preschool LCI z-score, but negative predictive value of
32%. Presence of air trapping had a 50% positive predictive value for abnormal
preschool LCI, and negative predictive value of 78%.
Table 6.6: Positive and negative predictive values of CT score and neutrophil elastase for preschool lung clearance index
Variable Positive predictive value Negative predictive value
Bronchiectasis present 38% 67%
Air trapping present 50% 78%
Abnormal total CT score 100% 32%
Any CT abnormality 35% 71%
Presence of neutrophil elastase
29% 75%
Legend: Positive and negative predictive values of CT and BAL measures for abnormal
preschool lung clearance index z-score
179
6.5 Discussion
6.5.1 Review of hypotheses
In relation to BAL inflammatory markers, the hypotheses was:
1. “Inflammatory markers from BAL at one year cannot predict preschool lung function
(LCI, sRtot and FEV0.75) at three to six years of age”
This hypothesis was proven as there was no association between any BAL
inflammatory markers (including neutrophil elastase concentration or detectable free
neutrophil elastase activity) with any of the preschool lung function primary outcome
measures (LCI, sRtot or FEV0.75 z-score).
In relation to CT score, the hypothesis was:
1. “Abnormalities on CT (air trapping, bronchial dilatation and total CT score) cannot
predict preschool lung function”
The results disproved this hypothesis as significant associations were found between
air trapping and total CT score as predictors for preschool LCI z-score. No
associations were found between CT outcomes and sRtot or FEV0.75 z-scores.
6.5.2 Comparison of this study to other reports
As was true for lung function, only minor abnormalities were seen in CT and BAL
markers at one year in NBS infants with CF. This is further evidence that in this cohort,
children are relatively well during infancy as defined by several different methods of
disease monitoring. It is not surprising that there were few associations between these
minor abnormalities to predict lung function at preschool age. However, despite this,
air trapping and total CT score on one year CT showed significant associations with
preschool lung function in this study. The association between the presence and
extent of air trapping at one year CT and preschool LCI z-score is interesting as both
markers reflect the early abnormalities seen in CF lung disease of small airways with
180
mucus plugging and obstruction24. In this sense, there may be a signal of initial subtle
abnormalities leading to a deficit in function later in life, only detected by a marker
sensitive to early disease such as LCI. Alternatively, both measures may detect, for
example, small amounts of mucus in the airways, but it is not possible to ascertain
which is true from this data. Follow up of these children to school age and adulthood
will determine whether this relates to later structural or functional abnormality, or worse
disease course.
The AREST-CF group reported cross sectional correlation of LCI and HRCT findings
from infancy to school age78. No association was found in infancy between LCI and
PRAGMA-CF scored CT, but by preschool and school age a correlation was found
between LCI and total disease extent on CT, which included air trapping score.
Although not yet published, it would be interesting to see whether any structural
abnormality, such as air trapping in infancy, is also associated with later deficits in
function in the AREST cohort, as seen in the subjects described in this thesis. It is
likely that intervention studies in the very young require long term end points to
determine treatment effects, such as school age spirometry, and this will be discussed
in more detail in Chapter 7.
The AREST-CF group found a strong association between BAL neutrophil elastase and
CT abnormalities; presence of neutrophil elastase at three months was associated with
a higher chance of persistent airway dilatation of seven fold by a year and four fold by
three years135. In the current study, no association was found between one year
neutrophil elastase (or any other inflammatory marker) and preschool lung function.
However the limited number of infants with any elevation in inflammatory markers
reduces the power of this study to determine any significant relationship. The children
that did have inflammatory marker data at one year had an overall lower mean LCI z-
score than the full cohort (1.69 compared to 2.14), and are likely to represent those
with milder disease. It is therefore difficult to draw any solid conclusions regarding BAL
biomarkers and lung function in the LCFC cohort.
Earlier reports from the AREST-CF group describe bronchial dilatation in 32% and air
trapping in 69% of NBS infants with CF at one year135 using a locally derived CT score,
comparable to bronchial dilatation (26%) and air trapping (42%) in the full cohort of the
LCFC at one year using the Brody II score128. Since these publications, a quantitative
score has been developed and used in the AREST-CF studies, (PRAGMA-CF)99, which
allows expression of the ‘extent’ of each CT finding as a percentage of the lung. A
more recent publication using this scoring system reports bronchial dilatation present in
20% and air trapping in 58% in infants aged three months to two years78. The ‘extent’
181
of bronchiectasis was only 0.1% and air trapping 1.3%, so despite a high proportion
having abnormality on CT, the degree of this is mild, as found in the LCFC cohort. It is
also important to note that some of the CT abnormalities were found to regress in the
AREST-CF series, so a single or three slice scan may miss those with intermittent
changes (of which the importance is unknown), or identify a subject with an abnormality
that may resolve.
6.5.3 Strengths and limitations of the study
There was a relatively high rate of follow up of those with one year CT and preschool
lung function, and there were no significant differences in lung function between those
with and without CT data. CT scans were performed using a standardised imaging
protocol with carefully controlled ventilation and were scored in duplicate by
experienced scorers, and BAL markers processed in a research laboratory with skilled
knowledge of current techniques.
The AREST-CF group have reported cross-sectional associations between LCI and CT
score, infection and inflammatory markers78, 130, 134, longitudinal lung structure and
inflammation135, and how infection in infancy relates to school-age spirometry133. This
is the first study to report how markers of lung structure and inflammation in infancy
can predict lung function in the preschool years.
Limitations of this study were that not all subjects in the infant cohort underwent CT
and BAL, and not all subjects with CT and BAL had lung function data at preschool
age, due to loss to follow up or unsuccessful preschool lung function tests. This led to
a reduction in the number of subjects to investigate associations between one year CT
(48 subjects) and inflammatory markers (33 subjects) with preschool lung function.
Inflammatory marker data was limited further due to the processing error of
supernatant. The AREST-CF publications report BAL and CT data in up to 127
children from diagnosis to three years of age135, surpassing the numbers of the LCFC
and resulting in a better powered study.
As described in detail by Thia et al.94 agreement between the two CT scorers was only
reproducible for three of the seven scoring categories in the Brody II CF-CT scoring
system. Therefore only three measures (bronchial dilatation, air trapping and total CT
score) were able to be used as primary outcomes, and to investigate associations with
preschool lung function. The Brody II score was designed to describe abnormalities in
182
CF lung disease, but as changes are very mild in young subjects this may explain why
agreement between scorers was not as strong as expected. This study was designed
as an exploratory analysis of associations between one year lung structure and
inflammation with preschool lung function. There were very few subjects with either
abnormal CT or inflammatory marker data, therefore the chance of finding any true
association with preschool lung function was relatively low.
6.5.4 Meaning of the study, unanswered questions and future research
In this study, no associations was found between BAL inflammatory markers at one
year and preschool lung function. However number of subjects with BAL data were
reduced due to a sample processing error, and those subjects overall had a lower
mean LCI z-score than the full cohort. Neutrophil elastase may still be a useful marker
in infancy, as a strong association with later bronchiectasis was found in the AREST-
CF reports135, and a future report of the ability of infant BAL inflammatory markers to
predict preschool lung function in their cohort is key to clarify this relationship.
Furthermore, with the wealth of data in the AREST-CF cohort, it would be interesting to
investigate whether similar relationships between air trapping and preschool LCI are
also found in their subjects, as shown in the LCFC cohort described in this chapter.
With only minor abnormalities seen in any marker at one year, interventional studies
using these outcome measures should be aimed at children in later life where changes
are more clearly detected.
183
7 Discussion
7.1 Summary of principal findings
The overall aim of this thesis was to describe the evolution of lung function from
diagnosis to six years of age in a NBS cohort of children with CF managed with
standard UK care. This was in order to determine whether lung function remained
stable with standard treatment to the preschool years. It serves to inform two crucial
questions in children of this age group; whether new treatments for CF could be
deferred to a later age, and whether interventional studies of CF treatment in young
children using lung function outcomes should be powered by results in NBS children,
rather than the much larger number who were clinically diagnosed. Furthermore, the
relationship between infant clinical, structural, functional, inflammatory and infection
markers with preschool lung function was explored, to investigate whether a subgroup
of children could be potentially identified for enrolment in such studies, or for more
intensive therapy. To address these questions, the primary and secondary hypotheses
addressed in Chapter 1 were as follows:
Primary hypotheses:
1. NBS children with CF managed with standard UK care will have stable lung
function at three to six years of age, which will be similar to contemporaneous
healthy controls
Secondary hypotheses:
1. NBS children will have better lung function than preschool children with a clinical
diagnosis of CF born a decade earlier
2. Infant lung function measures and nutritional markers cannot predict preschool lung
function in NBS children with CF
3. Clinical markers of infection (isolation of bacteria on respiratory samples), and
markers of disease severity (for example courses of intravenous antibiotics) in
infancy cannot predict preschool lung function
184
4. Inflammatory markers measured in BAL in infancy cannot predict lung function at
three to six years of age
5. Abnormalities on CT (air trapping, bronchial dilatation and total CT score)
measured in infancy cannot predict preschool lung function
The principal findings of this thesis in addressing the primary and secondary
hypotheses were:
Contrary to primary hypothesis 1, the stability or improvement of lung function seen
in infancy in LCFC NBS children with CF at two years was not completely
maintained at three to six years of age. This was shown by LCI z-score which was
outside the normal range at preschool testing. The other preschool lung function
primary outcomes (sRtot and FEV0.75), whilst significantly poorer than controls,
remained within the normal range
In agreement with secondary hypothesis 1, NBS preschool children had
significantly better lung function than those clinically diagnosed with CF born a
decade earlier for all of the lung function primary outcomes
Contrary to secondary hypothesis 2, a significant association was found between
two year LCI z-score and preschool LCI and sRtot z-score
No association was found between infant lung function, nutritional measures,
clinical markers or BAL inflammatory markers and preschool lung function in
agreement with secondary hypotheses 2, 3 and 4
Contrary to secondary hypothesis 5, a significant association was found between
air trapping and total score on one year CT and preschool LCI z-score
185
7.2 Strengths and limitations of the study
7.2.1 Strengths
The main strengths of the study were that lung function measurements were made by
an experienced team and in the same lung function laboratory. There was follow up of
both children with CF and contemporaneous controls over a long time period. This was
also true in cohort 1 diagnosed ten years earlier, with no identifiable differences in lung
function measurement methodology over this time period. The vast majority of lung
function data were collected by the author and two research assistants, but other
experienced researchers at the UCL Great Ormond Street Institute of Child Health lung
function laboratory were available to over-read data, and the resulting meticulous
quality control was a major strength of this study.
There was a good retention rate of preschool children tested as infants, and the subject
numbers met criteria to adequately power the study for the three lung function outcome
measures. Where available, international standards and guidelines for lung function
testing were followed. Serial measurements in the same children with a relatively short
time period between each test occasion resulted in good data capture showing how
lung function evolves in this population. The tests (MBW, sRaw and spirometry) were
performed in the same order in cohort 2 as in cohort 1 to ensure the two studies were
comparable. The employment of three lung function outcomes minimised the chance
of missing any abnormality when assessing the underlying physiology in preschool
children with CF. The importance of this was illustrated in an earlier LCFC report of
cohort 1 undergoing school age CT and LCI126, where of nine children with normal LCI,
five children had abnormal CT, and of nine with normal CT, five had abnormal LCI.
Children were also tested when well and clinically stable in an attempt to eliminate the
effect of a pulmonary exacerbation on lung function results in subjects with CF.
The cooperation of the LCFC enabled accurate records of background characteristics,
clinical status and infection to be collected and adherence to standardised treatment
protocols. The database of infant lung function, structure and BAL markers enabled
detailed investigation of significant predictors of preschool lung function.
A further strength was recruitment of contemporaneous healthy controls who were well
matched to subjects with CF. This was particularly important when it was observed
that controls in cohort 2 had slightly higher values of LCI z-score than expected, and
their inclusion allowed the difference between subjects with CF and controls to be
186
expressed. The importance of including a control group has been well documented152,
and illustrated by the lack of control subjects in the AREST-CF study of lung function in
infants leading to difficult interpretation of forced expiratory volumes in their cohort41.
Expressing results as z-scores means that a comparison can be made to other studies
using the same equipment and software as used to generate the z-score data.
However in the publication of LCI z-scores used in this thesis75, differences were still
seen between international centres collecting healthy control data, and there are
therefore still some limitations when relying on z-scores alone. Addressing these
international differences is important, but out of the scope of this thesis.
7.2.2 Limitations
7.2.2.1 Study design
The cohort 2 preschool follow up study was significantly powered to show a difference
between children with CF and healthy controls. However, when investigating
predictors of preschool lung function, larger numbers would have increased the power
of the subgroup analyses. Nearly all of the infants diagnosed with CF in London during
the infant study recruitment period were enrolled in the study. A wider study in the UK
would have been time-intensive, travel for families from outside London problematic,
and clinical data collection more difficult.
Although the overall feasibility of lung function tests was high in the preschool age
group, there was a difference in success rates between lung function tests; 91% for
MBW, 82% for specific airway resistance and 77% for spirometry. A difference was
also seen between age groups and, as expected, older children had higher success
rates than younger children. Only 56% of subjects less than three years of age
completed the full study protocol on their first visit, 54% between four and five years,
but all subjects over five years completed all three tests. For MBW, 89% of children
under three obtained valid data, rising to 90% between four and five years and 100%
over five years. This is an important consideration when designing trials in preschool
children; particularly if interventions are to be targeted in the younger age group, as it
may not be possible to obtain data in all subjects enrolled.
187
Recruitment in the preschool follow up of cohort 2 was targeted to those with infant
lung function, structure and inflammatory marker data, in order to investigate the
relationship between these outcomes and preschool lung function. Families had been
recruited during the infant phase of the LCFC study and consented to participation in
the follow up study. However, there was likely a larger population of preschool children
at each centre that could have attended for lung function testing, and been recruited to
increase the power of the study. Although they would not have infant data, more
information would be gained for preschool pulmonary function, and the results of such
a study would be a more accurate reflection of preschool patients, and relevant to the
whole clinic population. The ethical approval of the study did not include examination
of records of those who had been approached but declined to participate in the study,
and did not allow recruitment of new subjects.
The choice of lung function outcome measures was discussed in section 1.5.1. Ideally
the outcomes in this study would be compared to a ‘gold standard’ test that defines
disease. As is true for most respiratory diseases, no such standard exists for CF. A
comparison to structural changes on CT or markers of inflammation on BAL were not
therefore possible in the LCFC cohort. The AREST-CF group perform all three of
these measures annually as part of their surveillance protocol. In a report from this
cohort in preschool and school-age children, LCI had a positive predictive value (83-
86%) but poor negative predictive value (50-55%) to detect the presence of bronchial
dilatation on CT performed at the same time using the PRAGMA-CF score78. This
study was reported after data collection for the current LCFC preschool study had been
completed. The decision not to include measures of structure and inflammation in the
current study protocol was in view of the fact that only mild and poorly reproducible CT
changes were seen in the LCFC cohort at one year, and lung function was stable at
two years of age. The Collaboration unanimously felt that CT could not be justified,
and would have led to a more arduous study visit, or multiple visits for the child and
their family, and potential subsequent attrition of subjects. Practically, BAL and CT are
not performed as part of routine clinical surveillance in children with CF in London.
Inclusion of these measures would mean exposure to radiation, and a general
anaesthetic, and could therefore not be justified in order to solely compare to lung
function results. However, as LCI was unexpectedly abnormal by preschool age,
structural abnormalities could also have been more prominent, and CT could potentially
be a useful outcome measure in further studies of NBS preschool children with CF.
Inclusion of CT in preschool follow up of cohort 2 would also help to define any
differences or similarities between the LCFC and AREST-CF cohorts and whether
188
results are comparable between the two CF populations. The role of CT beyond the
first year of life merits further consideration in light of the present data.
7.2.2.2 Longitudinal comparison of infant and preschool lung function tests
The LCFC longitudinal study of cohort 2 was designed to describe the evolution of lung
function from diagnosis of CF to preschool age. However the physiological tests that
can be measured in infancy (less than two years of age) differ to those that are
practical in three to six year old children. Infants were sedated and asleep for lung
function tests, and underwent measurement of plethysmographic FRC. Older awake
children will not tolerate breathing against a closed shutter, so it was not possible to
measure this in preschool children. sRaw, performed in preschool children, requires
active tidal breathing and therefore cannot be measured in infancy. It was possible,
however, to perform a measurement of forced expiration in both infants and preschool
subjects, but different volumes are reported (FEV0.5 versus FEV0.75) and the technique
for acquiring each test differs. The raised volume technique is used in infants, and
active forced spirometry in those older than three years. Whilst similar measures, the
tests are therefore not directly comparable, and it cannot be assumed that FEV0.5 and
FEV0.75 measure the function of the same airway generations at the respective ages.
MBW testing was also performed in both age groups but methodology again differs.
Infants are tested when sedated in the supine position, whereas children over three are
tested sitting upright. Smaller volume (and therefore dead space) masks are used in
infants, but a mask interface was used for both age groups. It has been clearly
documented that LCI is higher (and FRC lower) in the supine compared to sitting
position153, 154, and that LCI measured supine correlates better with CT outcomes that
when measured sitting153. These differences are important to consider when
interpreting changes in LCI between infants and preschool children, or relating
abnormalities in infancy of both MBW and CT outcomes to preschool LCI measured in
the upright position.
7.2.2.3 Blinding of lung function results
As part of the cohort 2 preschool study, clinicians treating children with CF at the
respective centres were sent a report with the results of pulmonary function tests, and
whether any result was abnormal. Therefore the treating clinician was not blinded to
189
the results of testing. Although all centres in the study followed a common treatment
protocol, this may have been adjusted in light of an earlier lung function report and
confound results in certain patients. When the longitudinal design of the study is
considered; treatment change in response to an abnormal infant test may have
influenced the preschool results. As shown in chapters 4 and 5 and previous LCFC
reports129, lung function was normal at two years, abnormal in preschool children but
much improved in cohort 2 when compared to cohort 1. It is still unclear whether this
was due to the introduction of screening, rapid progression of lung function from two to
preschool age, or more intensive monitoring such as pulmonary function tests.
7.2.2.4 Loss of subjects to follow up
The recruitment accrual for the NBS preschool cohort 2 study is summarised in Figure
3.1. 67 children with CF had preschool lung function data out of 92 tested as infants,
and 41 healthy controls out of 62. Of particular interest were children with CF who
withdrew from the study. Some of the families listed time constraints, or that their child
was too anxious or did not want to participate. It may have been that these children
had more frequent visits to hospital because they were more unwell, and their parents
wanted to avoid additional tests. Another important group were children who were too
unwell for testing (eight subjects with CF) and therefore met exclusion criteria despite
multiple attempts at recruitment. Again, these children are likely to have poor lung
function if frequently unwell, but it was not possible to include their results in the study.
If a further follow up study at school age is planned, if willing it would be important to
include these children despite lack of preschool lung function data, to get a
representative sample of the full cohort.
7.2.2.5 Collection of clinical data
Clinical data such as bacterial isolates, courses of intravenous antibiotics and medical
treatments were recorded in this study to investigate associations with preschool lung
function. The information collected was targeted to those known to influence
respiratory disease in CF. Data collected reflected reported therapies, but the study
was not designed to measure adherence. Although data collection from each centre
was as comprehensive as possible, it was recorded retrospectively (an acknowledged
weakness of the study) from clinical records held at each centre, and cross checked
190
with annual assessment summaries and, if available, local databases. In the infant
study, clinical record forms were used at every clinical encounter (~2-3 monthly
outpatient clinic visits). The difficulties with collecting such information in busy clinics,
and incomplete records was apparent in the LCFC infant study155. It would have been
preferable to continue to collect accurate information at each clinical visit up to
preschool test occasion, but this was not possible due to time constraints in clinics, the
vast amount of data that would have to be summarised, and concerns over incomplete
recording of data without dedicated research staff (which would fall outside the
preschool study period). Ideally, longitudinal clinical data would have been collected
prospectively at each clinic visit for children enrolled in the study and stored in a
database for analysis.
This was a multicentre study, and all tertiary centres participating in LCFC studies
managed patients according to an agreed clinical protocol. It was not possible
however to guarantee complete adherence to this protocol and therefore there may
have been some variation in treatment of certain subjects that could potentially
influence preschool lung function results.
Although the majority of care for CF subjects was provided by their specialist CF
centre, children also had access to medical care via a ‘local’ hospital closest to their
home for emergencies, and a general practitioner. Whilst most cough swab or sputum
samples were taken and processed when children attended clinic at their specialist
centres, when acutely unwell and if more convenient for the family to deliver them to
their local hospital or general practitioner, processing may have taken place there.
Communication between local and specialist centres around positive bacterial isolates
is likely to be good, and recorded in the specialist centre records, but this was another
potential source of loss of data. Furthermore, the analysis of microbiological samples
in non-specialised laboratories may have resulted in species misidentification, another
source of error.
Routine surveillance for respiratory pathogens for subjects in this study was by
collection of OPS in children who are either not productive of, or cannot expectorate,
sputum (the majority of infants and preschool children), with the exception of BAL
collected at one year. A recent study compared oropharyngeal swabs, induced sputum
(with hypertonic saline) and BAL samples in children with CF109. This study reported a
much higher rate of pathogen identification using sputum induction and BAL compared
to oropharyngeal swabs. The AREST-CF group perform BAL at diagnosis and
191
annually for subjects in their cohort, and therefore a higher rate of detection of
pathogens is likely when compared to identification by oropharyngeal swabs used in
the LCFC study. However, studies have shown significant inter-lobar differences in
BAL fluid in children with CF, particularly bacterial distribution156, and six lobe lavage
superior to one or two lobe BAL for the identification of pathogens157.
7.2.2.6 Extrapolation of results to other cohorts
LCI z-score was the only lung function outcome to be abnormal at preschool age in this
study. MBW data were collected using custom made equipment, using SF6 as the
tracer gas and a mass spectrometer for detection of gas concentrations. There is
currently much interest in using LCI in clinical monitoring and as an outcome measure
in clinical trials, which becomes increasingly possible when using commercial devices.
Care must be taken when comparing the results of this study with data collected in
other cohorts using different methodological approaches, as the reference values are
tracer gas and device specific.
78% of children had a positive isolate for Pseudomonas aeruginosa by preschool test
in this study. This high rate was seen despite the majority of samples collected by
OPS, apart from one year BAL. It is routine in the UK and part of the shared LCFC
centre protocol to start prophylactic antistaphylococcal antibiotics from diagnosis until
at least two years of age. It is possible that the high rate of Pseudomonas aeruginosa
could be secondary to such treatment protocols, and this is currently being tested in the
START-CF trial (http://www.cfstart.org.uk). Therefore extrapolation of results to
cohorts not employing routine antistaphylococcal prophylaxis must be done cautiously,
as with any other discrepancy in standard clinical care.
In chapter 4, no difference was noted in height, weight or BMI z-score between children
with CF in cohorts 1 and 2. This was unexpected as other studies, in particular the
Wisconsin randomised trial of NBS118 showed nutritional benefit in screened compared
to unscreened children with CF. As poor nutrition can be associated with deficits in
lung function, the abnormalities in anthropometric parameters of children in this study
must be considered when comparing to other cohorts with better (or worse) nutritional
outcomes.
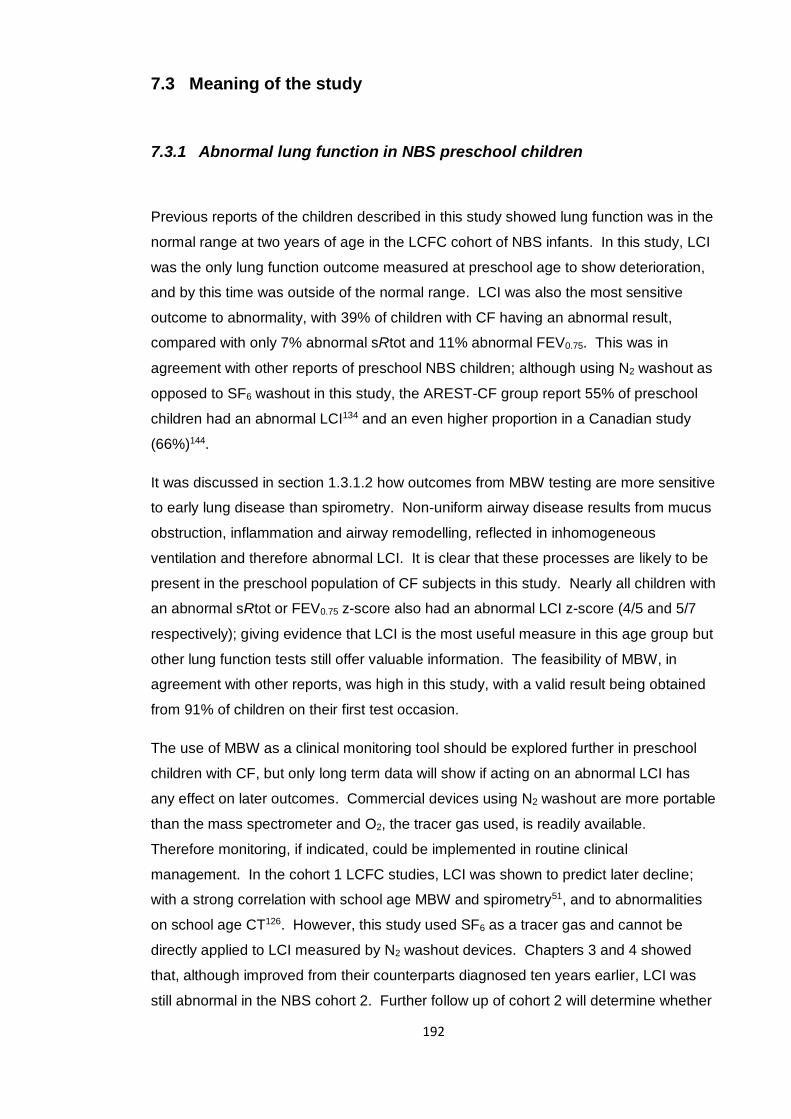
192
7.3 Meaning of the study
7.3.1 Abnormal lung function in NBS preschool children
Previous reports of the children described in this study showed lung function was in the
normal range at two years of age in the LCFC cohort of NBS infants. In this study, LCI
was the only lung function outcome measured at preschool age to show deterioration,
and by this time was outside of the normal range. LCI was also the most sensitive
outcome to abnormality, with 39% of children with CF having an abnormal result,
compared with only 7% abnormal sRtot and 11% abnormal FEV0.75. This was in
agreement with other reports of preschool NBS children; although using N2 washout as
opposed to SF6 washout in this study, the AREST-CF group report 55% of preschool
children had an abnormal LCI134 and an even higher proportion in a Canadian study
(66%)144.
It was discussed in section 1.3.1.2 how outcomes from MBW testing are more sensitive
to early lung disease than spirometry. Non-uniform airway disease results from mucus
obstruction, inflammation and airway remodelling, reflected in inhomogeneous
ventilation and therefore abnormal LCI. It is clear that these processes are likely to be
present in the preschool population of CF subjects in this study. Nearly all children with
an abnormal sRtot or FEV0.75 z-score also had an abnormal LCI z-score (4/5 and 5/7
respectively); giving evidence that LCI is the most useful measure in this age group but
other lung function tests still offer valuable information. The feasibility of MBW, in
agreement with other reports, was high in this study, with a valid result being obtained
from 91% of children on their first test occasion.
The use of MBW as a clinical monitoring tool should be explored further in preschool
children with CF, but only long term data will show if acting on an abnormal LCI has
any effect on later outcomes. Commercial devices using N2 washout are more portable
than the mass spectrometer and O2, the tracer gas used, is readily available.
Therefore monitoring, if indicated, could be implemented in routine clinical
management. In the cohort 1 LCFC studies, LCI was shown to predict later decline;
with a strong correlation with school age MBW and spirometry51, and to abnormalities
on school age CT126. However, this study used SF6 as a tracer gas and cannot be
directly applied to LCI measured by N2 washout devices. Chapters 3 and 4 showed
that, although improved from their counterparts diagnosed ten years earlier, LCI was
still abnormal in the NBS cohort 2. Further follow up of cohort 2 will determine whether
193
preschool LCI has the same predictive ability as that shown in cohort 1, but it is likely
that a similar correlation will be seen, just with fewer abnormal subjects at school age
follow up.
It is yet to be defined exactly what constitutes a clinically meaningful change in LCI,
and whether acting on that change has long term benefits in CF lung disease. A recent
report investigating how LCI can monitor treatment response in preschool children
during a CF pulmonary exacerbation158 gives important information to this point. LCI
was seen to deteriorate with symptoms of an exacerbation relative to baseline, and a
significant treatment effect with antibiotic therapy was seen using LCI as the outcome
measure, but not in FEV1. Further studies will give more insight on how changes in
LCI can help guide clinical decision in preschool children, but an abnormal result along
with pulmonary symptoms in this population should prompt closer monitoring and
consideration of a change in treatment in routine clinical care.
7.3.2 Interventional trials in preschool children with CF
There is still much debate as to whether LCI can be used as a robust outcome
measure in clinical trials of young children with CF. The European CF Society Clinical
Trial Network Standardisation Committee advocated LCI as an outcome measure in
those with mild CF disease159, but a Cystic Fibrosis Foundation Workshop Report did
not encourage the use of LCI in clinical trials due to gaps in knowledge of the
appropriate tracer gas, equipment and standardisation across systems160. Several
trials have been performed to date using LCI as an outcome measure in children with
CF, but few incorporated preschool children or infants. Trials investigating modulator
therapies and hypertonic saline have recruited children over six years of age. A double
blind crossover study of ivacaftor and placebo in patients with at least one p.Gly551Asp
-CFTR mutation and normal FEV1 showed a significant improvement in LCI compared
to placebo (mean change in LCI from baseline [95% CI] was -2·16 [-2·88 to -1·44],
p<0.0001)161. A further study investigated the combination of ivacaftor/lumacaftor in
children over six years using LCI as an outcome measure (which had only shown a
small albeit significant improvement in FEV1 in those over 12 years of age148). LCI
improved on average [95% CI] by -0.88 units [-1.40 to -0.37], p=0.001162. A third
crossover trial comparing isotonic and hypertonic saline reported improved mean LCI in
the hypertonic saline group by 1.16 units [95% CI 0.26 to 2.05], p=0.016, again in
children over six years81. In these reports, no significant change in spirometry
194
outcomes were seen, and using a sensitive measure of abnormality in young children,
such as LCI, allows a much greater power of the study. Of note, currently the FDA has
approved modulator therapy in very young children on demonstrating safety and
reduction of sweat chloride as a biomarker, without mandating a direct demonstration
of efficacy163. It is possible from the data reported here to speculate that in fact efficacy
may be directly measurable from the slope of rise in LCI, even in very young children.
Two studies to date report a treatment effect in infants and preschool children. The
first is a randomised controlled trial of isotonic versus hypertonic saline in children of
median age (range) 2.6 years (0.34-4.95). LCI z-score remained stable in the isotonic
saline group at 0.81 (95% CI -0.40 to 2.02) but was decreased on average by 1.19 z-
scores (95% CI -2.46 to 0.06) in the hypertonic saline group. A significant treatment
effect was reported for LCI z-score of 2.01 (95% CI 0.26 to 3.76), p=0.02. However
numbers were small in each group (13 and 12 in each arm respectively). An early
report of the GOAL (G551D Observational Study) in children aged three to five years
has been published recently; nine subjects with CF treated with ivacaftor undergoing
serial measurements of LCI at baseline, one month and six months164. A 24%
improvement from baseline at one month and 25% at six months was seen (exceeding
the between test reproducibility of 15% in preschool children165).
Although the studies listed above used different equipment, the data presented in this
thesis show there is a signal of abnormality in NBS preschool children managed with
standard UK CF care. Therefore this work supports the inclusion of UK preschool
children with CF as subjects in interventional trials if LCI is used as an outcome
measure. A significant treatment effect, if present, could be detected by change in LCI
in an appropriately powered study.
In chapter 3, it was estimated that 60 children with CF and 40 controls would detect a
difference in SD score of 0.7 (or greater) in the primary lung function outcomes (LCI,
sRtot and FEV0.75) with 80% power at the 5% significance level. Results in this cohort
for sRtot and FEV0.75 z-score were within the normal range. If the power calculation is
performed using only LCI z-score as the outcome measure, from these data only 33
subjects per group would be needed to reach the same power and significance. If
undertaken solely in the UK, a multi-centre study of preschool children would likely be
needed to enrol a sufficient number of subjects, but is practically possible. This, along
with the high feasibility of MBW in this age group, gives further evidence for the
inclusion of preschool children in interventional trials.
195
Lung clearance index has the potential to be an effective patient-centered outcome. It
is a safe, non-invasive test that can be undertaken in an outpatient setting166. The high
feasibility in preschool children shows it is well tolerated. Lung function monitoring is a
common practice for children with CF and their families. A raised LCI is relatively easy
to understand for families as a measure of early disease that may not be apparent with
symptoms or clinical signs. If it is shown to detect early disease and predict later
decline in patients with CF, it can enable families and clinicians to choose a more
intensive treatment course, or encourage them to keep up with recommended
therapies. When longer term consequences of a raised LCI are known, and acting on
an abnormal result can improve outcome, it can reduce delays in patient care that
would be harmful to their wellbeing otherwise.
7.3.3 Predicting preschool lung function and optimal timing of new
therapies
The LCFC study was designed longitudinally to describe the evolution of lung function
in children with CF that we see and treat today. Chapters 5 and 6 reported the
relationship between measures in infancy (lung function, infection, inflammation and
structure) and preschool lung function. The study showed that lung function changes
in NBS infants are mild and short-lived until preschool age when LCI gives a sensitive
signal of abnormality. No tests of lung function in infancy were significant predictors of
preschool lung function, with the exception of two year LCI z-score. The fact that most
infant measures do not predict preschool outcomes is not unexpected considering the
transient abnormalities of function seen in NBS infants earlier in the study.
For the whole group, there was a progressive deterioration in LCI z-score with each
test from diagnosis when compared to healthy controls; the mean difference was 0.32
z-scores at three months, 0.73 z-scores at one year, 0.89 z-scores at two years and
1.47 at preschool test. This is the first study to report the progressive decline of LCI
from infancy to preschool age when compared to healthy controls. The strong
association between two year and preschool LCI (and sRtot) is an important one.
Although two year LCI is on average normal in cohort 2 subjects with CF, it can predict
those who show further decline by the preschool years. Closer analysis of the RCT of
hypertonic saline in children under six years82 show that in subjects less than one year,

196
LCI was normal at baseline and did not change after treatment, all though numbers
were small. Of concern is that by two years of age pathophysiological processes are
apparent in some subjects who continue to deteriorate into later life. The data in this
thesis suggest that the causative factors for later decline occur before two years of age.
Therefore trials of treatments in young children with CF could be targeted before two
years to preserve lung function. It is also proposed that the optimal timing of starting
new treatments, such as modulator therapies that can potentially correct CFTR defects,
is before children reach two years of age.
7.4 Unanswered questions and future research
This longitudinal study reported new data of the pulmonary status of NBS preschool
children with CF, and explored which measures in infancy could potentially predict later
lung function. This was clearly impaired on preschool follow up as shown by abnormal
LCI z-score. The most important unanswered question from this data is what
implication abnormal tests have on the progression of respiratory disease in children
from this cohort. The need for long-term follow up is clear. The natural history of, and
relationship between, infant and preschool measures of lung function, structure and
disease course in later child- and adult-hood are crucial to define whether early
interventions can prevent later decline. Tracking of lung function has been shown in
cohort 1 of the LCFC study; with preschool LCI having a positive predictive value of
95% for any abnormal school age lung function result51. Nearly all subjects with
abnormal preschool LCI went on to have abnormal school age lung function.
Preschool LCI was also highly correlated with structural changes on CT at school age
in cohort 1. Whether these relationships are also seen in cohort 2 remains to be
defined, but if they are, this makes the significance of these early changes even
greater.
This study showed an important association between two year and preschool LCI,
suggesting that pulmonary insults occur in early infancy and have a significant later
impact on lung function. Therefore there is a persuasive argument for targeting new
therapies and trials of current treatment in the first two years of life. Sensitive
measures of abnormality need to be employed; the lung function data in this study
show that LCI is likely to be the most useful outcome measure at least in preschool
children. As MBW is a non-invasive and inexpensive test, many CF centres now have
access to commercial devices and are introducing regular monitoring into their clinics.
Although CT was not performed at preschool age in the children described in this
197
thesis, the AREST-CF data show that structural change is present from an early age
and progresses135. Quantitative CT167 and new techniques in MRI168 are being reported
and outcomes from these imaging modalities could serve as end-points that do not
involve radiation of the developing lung. Potential strategies in the care of children with
CF in the future will therefore include studying current treatments and CFTR
modulators with these outcome measures when introduced soon after diagnosis.
Both the LCFC and AREST-CF cohorts have started to define important predictors of
disease progression in children under six years of age with CF. There are, however,
many unanswered questions of the interplay between lung structure, function, infection
and inflammation and their ability to predict an individual’s risk of later disease. Clinical
research in CF at present is heavily weighted towards disease modulators, and this is
justified by the potential to modify disease from diagnosis. However the cost of these
potentially life long agents is high, and long term side effects unknown. Also, side-
effects in very young children may be unpredictable, as shown by the increased
prevalence of liver function abnormalities in preschool children treated with ivacaftor169.
Further observational studies and long term follow-up in children under six years of age
will further define predictors of later disease, and are crucial to identify those who will
benefit the most from early therapy.
7.5 Conclusion
NBS in children with CF lends the opportunity to identify and ideally prevent decline in
pulmonary health. The overall aim of this thesis was to describe the evolution of lung
function from diagnosis to the preschool years in a NBS cohort of children. Secondary
aims were to investigate which measures in infancy can predict pulmonary function in
preschool children. It can now be concluded that despite normal lung function at two
years of age, children in this cohort showed a significant decline in the preschool years.
As seen in clinically diagnosed children, although improved from those diagnosed ten
years earlier, LCI remained the most sensitive marker of abnormality in those NBS.
When considering the evolution of lung function, LCI at two years of age was the most
significant predictor of preschool lung function. These findings therefore suggest that
interventional trials of current and new therapies can utilise LCI as a marker to define
significant treatment effects in preschool children managed with standard UK care. By
two years of age, a signal exists for future decline, and therefore the optimal timing for
introduction of disease modifying therapies is in infancy, before two years of age.
198
References
1. Ornoy A, Arnon J, Katznelson D, Granat M, Caspi B, Chemke J. Pathological
confirmation of cystic fibrosis in the fetus following prenatal diagnosis. Am J Med
Genet. 1987;28(4):935-47.
2. Stoltz DA, Meyerholz DK, Pezzulo AA, Ramachandran S, Rogan MP, Davis GJ,
et al. Cystic fibrosis pigs develop lung disease and exhibit defective bacterial
eradication at birth. Science translational medicine. 2010;2(29):29ra31.
3. Sly PD, Brennan S, Gangell C, de Klerk N, Murray C, Mott L, et al. Lung
disease at diagnosis in infants with cystic fibrosis detected by newborn screening.
American journal of respiratory and critical care medicine. 2009;180(2):146-52.
4. MacKenzie T, Gifford AH, Sabadosa KA, Quinton HB, Knapp EA, Goss CH, et
al. Longevity of patients with cystic fibrosis in 2000 to 2010 and beyond: survival
analysis of the Cystic Fibrosis Foundation patient registry. Annals of internal medicine.
2014;161(4):233-41.
5. Downing M, Pollitt R. Newborn bloodspot screening in the UK--past, present
and future. Annals of clinical biochemistry. 2008;45(Pt 1):11-7.
6. Farrell PM, Li Z, Kosorok MR, Laxova A, Green CG, Collins J, et al.
Bronchopulmonary disease in children with cystic fibrosis after early or delayed
diagnosis. American journal of respiratory and critical care medicine.
2003;168(9):1100-8.
7. Aurora P, Bush A, Gustafsson P, Oliver C, Wallis C, Price J, et al. Multiple-
breath washout as a marker of lung disease in preschool children with cystic fibrosis.
American journal of respiratory and critical care medicine. 2005;171(3):249-56.
8. Sermet-Gaudelus I, Mayell SJ, Southern KW. Guidelines on the early
management of infants diagnosed with cystic fibrosis following newborn screening.
Journal of cystic fibrosis : official journal of the European Cystic Fibrosis Society.
2010;9(5):323-9.
199
9. Davies JC, Wainwright CE, Canny GJ, Chilvers MA, Howenstine MS, Munck A,
et al. Efficacy and safety of ivacaftor in patients aged 6 to 11 years with cystic fibrosis
with a G551D mutation. American journal of respiratory and critical care medicine.
2013;187(11):1219-25.
10. Boyle MP, Bell SC, Konstan MW, McColley SA, Rowe SM, Rietschel E, et al. A
CFTR corrector (lumacaftor) and a CFTR potentiator (ivacaftor) for treatment of
patients with cystic fibrosis who have a phe508del CFTR mutation: a phase 2
randomised controlled trial. The Lancet Respiratory medicine. 2014;2(7):527-38.
11. Davies JC, Moskowitz SM, Brown C, Horsley A, Mall MA, McKone EF, et al.
VX-659-Tezacaftor-Ivacaftor in Patients with Cystic Fibrosis and One or Two
Phe508del Alleles. The New England journal of medicine. 2018;379(17):1599-611.
12. Keating D, Marigowda G, Burr L, Daines C, Mall MA, McKone EF, et al. VX-
445-Tezacaftor-Ivacaftor in Patients with Cystic Fibrosis and One or Two Phe508del
Alleles. The New England journal of medicine. 2018;379(17):1612-20.
13. Ioannou L, McClaren BJ, Massie J, Lewis S, Metcalfe SA, Forrest L, et al.
Population-based carrier screening for cystic fibrosis: a systematic review of 23 years
of research. Genet Med. 2013.
14. De Boeck K, Zolin A, Cuppens H, Olesen HV, Viviani L. The relative frequency
of CFTR mutation classes in European patients with cystic fibrosis. Journal of cystic
fibrosis : official journal of the European Cystic Fibrosis Society. 2014;13(4):403-9.
15. Stutts MJ, Canessa CM, Olsen JC, Hamrick M, Cohn JA, Rossier BC, et al.
CFTR as a cAMP-dependent regulator of sodium channels. Science (New York, NY).
1995;269(5225):847-50.
16. Smith JJ, Travis SM, Greenberg EP, Welsh MJ. Cystic fibrosis airway epithelia
fail to kill bacteria because of abnormal airway surface fluid. Cell. 1996;85(2):229-36.
17. Matsui H, Grubb BR, Tarran R, Randell SH, Gatzy JT, Davis CW, et al.
Evidence for periciliary liquid layer depletion, not abnormal ion composition, in the
pathogenesis of cystic fibrosis airways disease. Cell. 1998;95(7):1005-15.
200
18. Tarran R, Button B, Picher M, Paradiso AM, Ribeiro CM, Lazarowski ER, et al.
Normal and cystic fibrosis airway surface liquid homeostasis. The effects of phasic
shear stress and viral infections. The Journal of biological chemistry.
2005;280(42):35751-9.
19. Stoltz DA, Meyerholz DK, Welsh MJ. Origins of cystic fibrosis lung disease. The
New England journal of medicine. 2015;372(4):351-62.
20. Adam RJ, Michalski AS, Bauer C, Abou Alaiwa MH, Gross TJ, Awadalla MS, et
al. Air trapping and airflow obstruction in newborn cystic fibrosis piglets. American
journal of respiratory and critical care medicine. 2013;188(12):1434-41.
21. Pezzulo AA, Tang XX, Hoegger MJ, Abou Alaiwa MH, Ramachandran S,
Moninger TO, et al. Reduced airway surface pH impairs bacterial killing in the porcine
cystic fibrosis lung. Nature. 2012;487(7405):109-13.
22. Hoegger MJ, Fischer AJ, McMenimen JD, Ostedgaard LS, Tucker AJ, Awadalla
MA, et al. Impaired mucus detachment disrupts mucociliary transport in a piglet model
of cystic fibrosis. Science (New York, NY). 2014;345(6198):818-22.
23. Henry RL, Mellis CM, Petrovic L. Mucoid Pseudomonas aeruginosa is a marker
of poor survival in cystic fibrosis. Pediatric pulmonology. 1992;12(3):158-61.
24. Tiddens HA, Donaldson SH, Rosenfeld M, Pare PD. Cystic fibrosis lung disease
starts in the small airways: can we treat it more effectively? Pediatric pulmonology.
2010;45(2):107-17.
25. Calder AD, Bush A, Brody AS, Owens CM. Scoring of chest CT in children with
cystic fibrosis: state of the art. Pediatric radiology. 2014;44(12):1496-506.
26. Stocks J, Thia LP, Sonnappa S. Evaluation and use of childhood lung function
tests in cystic fibrosis. Current opinion in pulmonary medicine. 2012;18(6):602-8.
27. Turner DJ, Stick SM, Lesouef PN. A new technique to generate and assess
forced expiration from raised lung volume in infants. American journal of respiratory
and critical care medicine. 1995;151(5):1441-50.
201
28. Stocks J, Lum S. Pulmonary function tests in infants and preschool children. In:
Wilmott RW, Boat TF, Bush A, Chermick V, Deterding RR, Ratjen F, editors. Disorders
of the respiratory tract in children. 8th ed. Philadelphia, PA, USA: Elsevier; 2012. p.
169-210.
29. Stocks J, Godfrey S, Beardsmore C, Bar-Yishay E, Castile R. Plethysmographic
measurements of lung volume and airway resistance. ERS/ATS Task Force on
Standards for Infant Respiratory Function Testing. European Respiratory Society/
American Thoracic Society. The European respiratory journal. 2001;17(2):302-12.
30. ATS/ERS statement: raised volume forced expirations in infants: guidelines for
current practice. American journal of respiratory and critical care medicine.
2005;172(11):1463-71.
31. Nguyen TT, Hoo AF, Lum S, Wade A, Thia LP, Stocks J. New reference
equations to improve interpretation of infant lung function. Pediatric pulmonology.
2013;48(4):370-80.
32. Lum S, Bountziouka V, Wade A, Hoo AF, Kirkby J, Moreno-Galdo A, et al. New
reference ranges for interpreting forced expiratory manoeuvres in infants and
implications for clinical interpretation: a multicentre collaboration. Thorax.
2016;71(3):276-83.
33. Lum S, Hoo AF, Hulskamp G, Wade A, Stocks J. Potential misinterpretation of
infant lung function unless prospective healthy controls are studied. Pediatric
pulmonology. 2010;45(9):906-13.
34. Rosenfeld M, Allen J, Arets BH, Aurora P, Beydon N, Calogero C, et al. An
official American Thoracic Society workshop report: optimal lung function tests for
monitoring cystic fibrosis, bronchopulmonary dysplasia, and recurrent wheezing in
children less than 6 years of age. Annals of the American Thoracic Society.
2013;10(2):S1-s11.
35. Davis SD, Rosenfeld M, Kerby GS, Brumback L, Kloster MH, Acton JD, et al.
Multicenter evaluation of infant lung function tests as cystic fibrosis clinical trial
202
endpoints. American journal of respiratory and critical care medicine.
2010;182(11):1387-97.
36. Hoo AF, Thia LP, Nguyen TT, Bush A, Chudleigh J, Lum S, et al. Lung function
is abnormal in 3-month-old infants with cystic fibrosis diagnosed by newborn screening.
Thorax. 2012;67(10):874-81.
37. Linnane BM, Hall GL, Nolan G, Brennan S, Stick SM, Sly PD, et al. Lung
function in infants with cystic fibrosis diagnosed by newborn screening. American
journal of respiratory and critical care medicine. 2008;178(12):1238-44.
38. Ranganathan SC, Stocks J, Dezateux C, Bush A, Wade A, Carr S, et al. The
evolution of airway function in early childhood following clinical diagnosis of cystic
fibrosis. American journal of respiratory and critical care medicine. 2004;169(8):928-33.
39. Martinez TM, Llapur CJ, Williams TH, Coates C, Gunderman R, Cohen MD, et
al. High-resolution computed tomography imaging of airway disease in infants with
cystic fibrosis. American journal of respiratory and critical care medicine.
2005;172(9):1133-8.
40. Peterson-Carmichael SL, Harris WT, Goel R, Noah TL, Johnson R, Leigh MW,
et al. Association of lower airway inflammation with physiologic findings in young
children with cystic fibrosis. Pediatric pulmonology. 2009;44(5):503-11.
41. Pillarisetti N, Williamson E, Linnane B, Skoric B, Robertson CF, Robinson P, et
al. Infection, inflammation, and lung function decline in infants with cystic fibrosis.
American journal of respiratory and critical care medicine. 2011;184(1):75-81.
42. Pittman JE, Johnson RC, Davis SD. Improvement in pulmonary function
following antibiotics in infants with cystic fibrosis. Pediatric pulmonology.
2012;47(5):441-6.
43. Rosenfeld M, Ratjen F, Brumback L, Daniel S, Rowbotham R, McNamara S, et
al. Inhaled hypertonic saline in infants and children younger than 6 years with cystic
fibrosis: the ISIS randomized controlled trial. Jama. 2012;307(21):2269-77.

203
44. Miller MR, Hankinson J, Brusasco V, Burgos F, Casaburi R, Coates A, et al.
Standardisation of spirometry. The European respiratory journal. 2005;26(2):319-38.
45. Aurora P, Stocks J, Oliver C, Saunders C, Castle R, Chaziparasidis G, et al.
Quality control for spirometry in preschool children with and without lung disease.
American journal of respiratory and critical care medicine. 2004;169(10):1152-9.
46. Beydon N, Davis SD, Lombardi E, Allen JL, Arets HG, Aurora P, et al. An
official American Thoracic Society/European Respiratory Society statement: pulmonary
function testing in preschool children. American journal of respiratory and critical care
medicine. 2007;175(12):1304-45.
47. Kozlowska WJ, Aurora P. Spirometry in the pre-school age group. Paediatr
Respir Rev. 2005;6(4):267-72.
48. Stick S, Tiddens H, Aurora P, Gustafsson P, Ranganathan S, Robinson P, et al.
Early intervention studies in infants and preschool children with cystic fibrosis: are we
ready? The European respiratory journal. 2013;42(2):527-38.
49. Quanjer PH, Stanojevic S, Cole TJ, Baur X, Hall GL, Culver BH, et al. Multi-
ethnic reference values for spirometry for the 3-95-yr age range: the global lung
function 2012 equations. The European respiratory journal. 2012;40(6):1324-43.
50. Stanojevic S, Wade A, Stocks J. Reference values for lung function: past,
present and future. The European respiratory journal. 2010;36(1):12-9.
51. Aurora P, Stanojevic S, Wade A, Oliver C, Kozlowska W, Lum S, et al. Lung
clearance index at 4 years predicts subsequent lung function in children with cystic
fibrosis. American journal of respiratory and critical care medicine. 2011;183(6):752-8.
52. Marostica PJ, Weist AD, Eigen H, Angelicchio C, Christoph K, Savage J, et al.
Spirometry in 3- to 6-year-old children with cystic fibrosis. American journal of
respiratory and critical care medicine. 2002;166(1):67-71.
53. Vilozni D, Bentur L, Efrati O, Minuskin T, Barak A, Szeinberg A, et al.
Spirometry in early childhood in cystic fibrosis patients. Chest. 2007;131(2):356-61.
204
54. Nielsen KG, Pressler T, Klug B, Koch C, Bisgaard H. Serial lung function and
responsiveness in cystic fibrosis during early childhood. American journal of respiratory
and critical care medicine. 2004;169(11):1209-16.
55. Kirkby J, Stanojevic S, Welsh L, Lum S, Badier M, Beardsmore C, et al.
Reference equations for specific airway resistance in children: the Asthma UK initiative.
The European respiratory journal. 2010;36(3):622-9.
56. Nielsen KG. Plethysmographic specific airway resistance. Paediatr Respir Rev.
2006;7 Suppl 1:S17-9.
57. Klug B, Bisgaard H. Specific airway resistance, interrupter resistance, and
respiratory impedance in healthy children aged 2-7 years. Pediatric pulmonology.
1998;25(5):322-31.
58. Beydon N. Interrupter resistance: What's feasible? Paediatric Respiratory
Reviews. 2006;7, Supplement 1(0):S5-S7.
59. Solymar L, Aronsson PH, Sixt R. The forced oscillation technique in children
with respiratory disease. Pediatric pulmonology. 1985;1(5):256-61.
60. Cogswell JJ, Hull D, Milner AD, Norman AP, Taylor B. Lung function in
childhood. III. Measurement of airflow resistance in healthy children. Br J Dis Chest.
1975;69:177-87.
61. Kerby GS, Rosenfeld M, Ren CL, Mayer OH, Brumback L, Castile R, et al. Lung
function distinguishes preschool children with CF from healthy controls in a multi-center
setting. Pediatric pulmonology. 2012;47(6):597-605.
62. Terheggen-Lagro SW, Arets HG, van der Laag J, van der Ent CK. Radiological
and functional changes over 3 years in young children with cystic fibrosis. The
European respiratory journal. 2007;30(2):279-85.
63. Darling RC, Cournand A, Mansfield JS, Richards DW. Studies on the
intrapulmonary mixture of gases. 1. Nitrogen elimination from blood and body tissues
during high oxygen breathing. J Clin Invest. 1940;19(4):591-7.
205
64. Paiva M, Engel LA. Model analysis of gas distribution within human lung acinus.
J Appl Physiol Respir Environ Exerc Physiol. 1984;56(2):418-25.
65. Usemann J, Yammine S, Singer F, Latzin P. Inert gas washout: background
and application in various lung diseases. Swiss medical weekly. 2017;147:w14483.
66. Horsley A. Lung clearance index in the assessment of airways disease. Respir
Med. 2009;103(6):793-9.
67. Gappa M, Ranganathan SC, Stocks J. Lung function testing in infants with
cystic fibrosis: lessons from the past and future directions. Pediatric pulmonology.
2001;32(3):228-45.
68. Singer F, Yammine S, Schmidt A, Proietti E, Kieninger E, Barben J, et al.
Ventilatory response to nitrogen multiple-breath washout in infants. Pediatric
pulmonology. 2013.
69. Sullivan L, Forno E, Pedersen K, Nielsen JG, Weiner DJ. Nitrogen back-
diffusion during multiple-breath washout with 100% oxygen. The European respiratory
journal. 2017;50(3).
70. Shawcross A, Murray CS, Goddard N, Gupta R, Watson S, Horsley A. Accurate
lung volume measurements in vitro using a novel inert gas washout method suitable for
infants. Pediatric pulmonology. 2016;51(5):491-7.
71. Robinson PD, Latzin P, Verbanck S, Hall GL, Horsley A, Gappa M, et al.
Consensus statement for inert gas washout measurement using multiple- and single-
breath tests. The European respiratory journal. 2013;41(3):507-22.
72. Robinson PD, Latzin P, Ramsey KA, Stanojevic S, Aurora P, Davis SD, et al.
Preschool Multiple-Breath Washout Testing. An Official American Thoracic Society
Technical Statement. American journal of respiratory and critical care medicine.
2018;197(5):e1-e19.
73. Lum S, Gustafsson P, Ljungberg H, Hulskamp G, Bush A, Carr SB, et al. Early
detection of cystic fibrosis lung disease: multiple-breath washout versus raised volume
tests. Thorax. 2007;62(4):341-7.
206
74. Sinhal S, Galati J, Baldwin DN, Stocks J, Pillow JJ. Reproducibility of multiple
breath washout indices in the unsedated preterm neonate. Pediatric pulmonology.
2010;45(1):62-70.
75. Lum S, Stocks J, Stanojevic S, Wade A, Robinson P, Gustafsson P, et al. Age
and height dependence of lung clearance index and functional residual capacity. The
European respiratory journal. 2013;41(6):1371-7.
76. Jensen R, Stanojevic S, Gibney K, Salazar JG, Gustafsson P, Subbarao P, et
al. Multiple breath nitrogen washout: a feasible alternative to mass spectrometry. PloS
one. 2013;8(2):e56868.
77. Poncin W, Singer F, Aubriot AS, Lebecque P. Agreement between multiple-
breath nitrogen washout systems in children and adults. Journal of cystic fibrosis :
official journal of the European Cystic Fibrosis Society. 2017;16(2):258-66.
78. Ramsey KA, Rosenow T, Turkovic L, Skoric B, Banton G, Adams AM, et al.
Lung Clearance Index and Structural Lung Disease on Computed Tomography in Early
Cystic Fibrosis. American journal of respiratory and critical care medicine.
2016;193(1):60-7.
79. Kraemer R, Blum A, Schibler A, Ammann RA, Gallati S. Ventilation
inhomogeneities in relation to standard lung function in patients with cystic fibrosis.
American journal of respiratory and critical care medicine. 2005;171(4):371-8.
80. Amin R, Subbarao P, Lou W, Jabar A, Balkovec S, Jensen R, et al. The effect
of dornase alfa on ventilation inhomogeneity in patients with cystic fibrosis. The
European respiratory journal. 2011;37(4):806-12.
81. Amin R, Subbarao P, Jabar A, Balkovec S, Jensen R, Kerrigan S, et al.
Hypertonic saline improves the LCI in paediatric patients with CF with normal lung
function. Thorax. 2010;65(5):379-83.
82. Subbarao P, Stanojevic S, Brown M, Jensen R, Rosenfeld M, Davis S, et al.
Lung clearance index as an outcome measure for clinical trials in young children with
207
cystic fibrosis. A pilot study using inhaled hypertonic saline. American journal of
respiratory and critical care medicine. 2013;188(4):456-60.
83. Davies J, Sheridan H, Bell N, Cunningham S, Davis SD, Elborn JS, et al.
Assessment of clinical response to ivacaftor with lung clearance index in cystic fibrosis
patients with a G551D-CFTR mutation and preserved spirometry: a randomised
controlled trial. The Lancet Respiratory Medicine. 2013;1(8):630-8.
84. Ratjen F, Hug C, Marigowda G, Tian S, Huang X, Stanojevic S, et al. Efficacy
and safety of lumacaftor and ivacaftor in patients aged 6-11 years with cystic fibrosis
homozygous for F508del-CFTR: a randomised, placebo-controlled phase 3 trial. The
Lancet Respiratory medicine. 2017;5(7):557-67.
85. Vermeulen F, Proesmans M, Boon M, Havermans T, De Boeck K. Lung
clearance index predicts pulmonary exacerbations in young patients with cystic fibrosis.
Thorax. 2014;69(1):39-45.
86. Yammine S, Singer F, Abbas C, Roos M, Latzin P. Multiple-breath washout
measurements can be significantly shortened in children. Thorax. 2013;68(6):586-7.
87. Hannon D, Bradley JM, Bradbury I, Bell N, Elborn JS, O'Neill K. Shortened
Lung Clearance Index is a repeatable and sensitive test in children and adults with
cystic fibrosis. BMJ open respiratory research. 2014;1(1):e000031.
88. Aurora P. Multiple-breath inert gas washout test and early cystic fibrosis lung
disease. Thorax. 2010;65(5):373-4.
89. Hansell DM, Strickland B. High-resolution computed tomography in pulmonary
cystic fibrosis. British journal of radiology. 1989;62(733):1-5.
90. Bedrossian CW, Greenberg SD, Singer DB, Hansen JJ, Rosenberg HS. The
lung in cystic fibrosis. A quantitative study including prevalence of pathologic findings
among different age groups. Hum Pathol. 1976;7(2):195-204.
91. Hansell DM. Bronchiectasis. Radiologic Clinics of North America.
1998;36(1):107-28.
208
92. Helbich TH, Heinz-Peer G, Eichler I, Wunderbaldinger P, Gotz M, Wojnarowski
C, et al. Cystic fibrosis: CT assessment of lung involvement in children and adults.
Radiology. 1999;213(2):537-44.
93. Mott LS, Graniel KG, Park J, de Klerk NH, Sly PD, Murray CP, et al.
Assessment of early bronchiectasis in young children with cystic fibrosis is dependent
on lung volume. Chest. 2013.
94. Thia LP, Calder A, Stocks J, Bush A, Owens CM, Wallis C, et al. Is chest CT
useful in newborn screened infants with cystic fibrosis at 1 year of age? Thorax. 2013.
95. Brody AS, Tiddens HA, Castile RG, Coxson HO, de Jong PA, Goldin J, et al.
Computed tomography in the evaluation of cystic fibrosis lung disease. American
journal of respiratory and critical care medicine. 2005;172(10):1246-52.
96. Linnane B, Robinson P, Ranganathan S, Stick S, Murray C. Role of high-
resolution computed tomography in the detection of early cystic fibrosis lung disease.
Paediatr Respir Rev. 2008;9(3):168-74; quiz 74-5.
97. de Jong PA, Nakano Y, Lequin MH, Tiddens HA. Dose reduction for CT in
children with cystic fibrosis: is it feasible to reduce the number of images per scan?
Pediatric radiology. 2006;36(1):50-3.
98. Brody AS, Kosorok MR, Li Z, Broderick LS, Foster JL, Laxova A, et al.
Reproducibility of a scoring system for computed tomography scanning in cystic
fibrosis. Journal of thoracic imaging. 2006;21(1):14-21.
99. Rosenow T, Oudraad MC, Murray CP, Turkovic L, Kuo W, de Bruijne M, et al.
PRAGMA-CF. A Quantitative Structural Lung Disease Computed Tomography
Outcome in Young Children with Cystic Fibrosis. American journal of respiratory and
critical care medicine. 2015;191(10):1158-65.
100. Davis SD, Fordham LA, Brody AS, Noah TL, Retsch-Bogart GZ, Qaqish BF, et
al. Computed tomography reflects lower airway inflammation and tracks changes in
early cystic fibrosis. American journal of respiratory and critical care medicine.
2007;175(9):943-50.
209
101. Robinson TE, Goris ML, Zhu HJ, Chen X, Bhise P, Sheikh F, et al. Dornase alfa
reduces air trapping in children with mild cystic fibrosis lung disease: a quantitative
analysis. Chest. 2005;128(4):2327-35.
102. Nasr SZ, Gordon D, Sakmar E, Yu X, Christodoulou E, Eckhardt BP, et al. High
resolution computerized tomography of the chest and pulmonary function testing in
evaluating the effect of tobramycin solution for inhalation in cystic fibrosis patients.
Pediatric pulmonology. 2006;41(12):1129-37.
103. Sanders DB, Li Z, Brody AS, Farrell PM. Chest computed tomography scores of
severity are associated with future lung disease progression in children with cystic
fibrosis. American journal of respiratory and critical care medicine. 2011;184(7):816-21.
104. Kolodziej M, de Veer MJ, Cholewa M, Egan GF, Thompson BR. Lung function
imaging methods in Cystic Fibrosis pulmonary disease. Respiratory research.
2017;18(1):96.
105. Wielputz MO, Puderbach M, Kopp-Schneider A, Stahl M, Fritzsching E,
Sommerburg O, et al. Magnetic Resonance Imaging Detects Changes in Structure and
Perfusion, and Response to Therapy in Early Cystic Fibrosis Lung Disease. American
journal of respiratory and critical care medicine. 2014.
106. Marshall H, Horsley A, Taylor CJ, Smith L, Hughes D, Horn FC, et al. Detection
of early subclinical lung disease in children with cystic fibrosis by lung ventilation
imaging with hyperpolarised gas MRI. Thorax. 2017;72(8):760-2.
107. Altes TA, Meyer CH, Mata JF, Froh DK, Paget-Brown A, Gerald Teague W, et
al. Hyperpolarized helium-3 magnetic resonance lung imaging of non-sedated infants
and young children: a proof-of-concept study. Clinical Imaging. 2017;45:105-10.
108. Tramper-Stranders GA, van der Ent CK, Wolfs TF. Detection of Pseudomonas
aeruginosa in patients with cystic fibrosis. Journal of cystic fibrosis : official journal of
the European Cystic Fibrosis Society. 2005;4 Suppl 2:37-43.
109. Ronchetti K, Tame JD, Paisey C, Thia LP, Doull I, Howe R, et al. The CF-
Sputum Induction Trial (CF-SpIT) to assess lower airway bacterial sampling in young
210
children with cystic fibrosis: a prospective internally controlled interventional trial. The
Lancet Respiratory medicine. 2018;6(6):461-71.
110. de Blic J, Midulla F, Barbato A, Clement A, Dab I, Eber E, et al.
Bronchoalveolar lavage in children. ERS Task Force on bronchoalveolar lavage in
children. European Respiratory Society. The European respiratory journal.
2000;15(1):217-31.
111. Fayon M, Kent L, Bui S, Dupont L, Sermet I. Clinimetric properties of broncho-
alveolar lavage inflammatory markers in cystic fibrosis. The European respiratory
journal. 2013.
112. McNally P, O'Rourke J, Fantino E, Chacko A, Pabary R, Turnbull A, et al.
Pooling of bronchoalveolar lavage in children with cystic fibrosis does not adversely
affect the microbiological yield or sensitivity in detecting pulmonary inflammation.
Journal of cystic fibrosis : official journal of the European Cystic Fibrosis Society.
2018;17(3):391-9.
113. Wainwright CE, Grimwood K, Carlin JB, Vidmar S, Cooper PJ, Francis PW, et
al. Safety of bronchoalveolar lavage in young children with cystic fibrosis. Pediatric
pulmonology. 2008;43(10):965-72.
114. Noah TL, Ivins SS, Abode KA, Stewart PW, Michelson PH, Harris WT, et al.
Inhaled versus systemic antibiotics and airway inflammation in children with cystic
fibrosis and Pseudomonas. Pediatric pulmonology. 2010;45(3):281-90.
115. Paul K, Rietschel E, Ballmann M, Griese M, Worlitzsch D, Shute J, et al. Effect
of treatment with dornase alpha on airway inflammation in patients with cystic fibrosis.
American journal of respiratory and critical care medicine. 2004;169(6):719-25.
116. Wainwright CE, Vidmar S, Armstrong DS, Byrnes CA, Carlin JB, Cheney J, et
al. Effect of bronchoalveolar lavage-directed therapy on Pseudomonas aeruginosa
infection and structural lung injury in children with cystic fibrosis: a randomized trial.
Jama. 2011;306(2):163-71.
117. Trust CF. UK Cystic Fibrosis Registry Annual Data Report. 2017.
211
118. Farrell PM, Kosorok MR, Laxova A, Shen G, Koscik RE, Bruns WT, et al.
Nutritional Benefits of Neonatal Screening for Cystic Fibrosis. New England Journal of
Medicine. 1997;337(14):963-9.
119. Mak DY, Sykes J, Stephenson AL, Lands LC. The benefits of newborn
screening for cystic fibrosis: The Canadian experience. Journal of cystic fibrosis :
official journal of the European Cystic Fibrosis Society. 2016;15(3):302-8.
120. Dankert-Roelse JE, te Meerman GJ. Long term prognosis of patients with cystic
fibrosis in relation to early detection by neonatal screening and treatment in a cystic
fibrosis centre. Thorax. 1995;50(7):712-8.
121. Merelle ME, Schouten JP, Gerritsen J, Dankert-Roelse JE. Influence of
neonatal screening and centralized treatment on long-term clinical outcome and
survival of CF patients. The European respiratory journal. 2001;18(2):306-15.
122. Dijk FN, McKay K, Barzi F, Gaskin KJ, Fitzgerald DA. Improved survival in
cystic fibrosis patients diagnosed by newborn screening compared to a historical cohort
from the same centre. Arch Dis Child. 2011;96(12):1118-23.
123. McKay K, Wilcken B. Newborn screening for cystic fibrosis offers an advantage
over symptomatic diagnosis for the long term benefit of patients: the motion for.
Paediatric Respiratory Reviews. 2008;9(4):290-4.
124. Ranganathan SC, Dezateux C, Bush A, Carr SB, Castle RA, Madge S, et al.
Airway function in infants newly diagnosed with cystic fibrosis. Lancet.
2001;358(9297):1964-5.
125. Kozlowska WJ, Bush A, Wade A, Aurora P, Carr SB, Castle RA, et al. Lung
function from infancy to the preschool years after clinical diagnosis of cystic fibrosis.
American journal of respiratory and critical care medicine. 2008;178(1):42-9.
126. Owens CM, Aurora P, Stanojevic S, Bush A, Wade A, Oliver C, et al. Lung
Clearance Index and HRCT are complementary markers of lung abnormalities in young
children with CF. Thorax. 2011;66(6):481-8.
212
127. Nguyen TT, Thia LP, Hoo AF, Bush A, Aurora P, Wade A, et al. Evolution of
lung function during the first year of life in newborn screened cystic fibrosis infants.
Thorax. 2013.
128. Thia L, Calder A, Owens C, Stocks J, Bush A, Wallis C, et al. High resolution
computed tomography (HRCT) in one year old CF newborn screened (NBS) infants:
not a useful outcome measure. Pediatric pulmonology. 2012;47:350-.
129. Davies G, Stocks J, Thia LP, Hoo AF, Bush A, Aurora P, et al. Pulmonary
function deficits in newborn screened infants with cystic fibrosis managed with standard
UK care are mild and transient. The European respiratory journal. 2017;50(5).
130. Hall GL, Logie KM, Parsons F, Schulzke SM, Nolan G, Murray C, et al. Air
trapping on chest CT is associated with worse ventilation distribution in infants with
cystic fibrosis diagnosed following newborn screening. PloS one. 2011;6(8):e23932.
131. Simpson SJ, Ranganathan S, Park J, Turkovic L, Robins-Browne RM, Skoric B,
et al. Progressive ventilation inhomogeneity in infants with cystic fibrosis after
pulmonary infection. The European respiratory journal. 2015;46(6):1680-90.
132. Gangell C, Gard S, Douglas T, Park J, de Klerk N, Keil T, et al. Inflammatory
responses to individual microorganisms in the lungs of children with cystic fibrosis. Clin
Infect Dis. 2011;53(5):425-32.
133. Ramsey KA, Ranganathan S, Park J, Skoric B, Adams AM, Simpson SJ, et al.
Early respiratory infection is associated with reduced spirometry in children with cystic
fibrosis. American journal of respiratory and critical care medicine. 2014;190(10):1111-
6.
134. Ramsey KA, Foong RE, Grdosic J, Harper A, Skoric B, Clem C, et al. Multiple-
Breath Washout Outcomes Are Sensitive to Inflammation and Infection in Children with
Cystic Fibrosis. Annals of the American Thoracic Society. 2017;14(9):1436-42.
135. Sly PD, Gangell CL, Chen L, Ware RS, Ranganathan S, Mott LS, et al. Risk
factors for bronchiectasis in children with cystic fibrosis. The New England journal of
medicine. 2013;368(21):1963-70.

213
136. Mott LS, Park J, Murray CP, Gangell CL, de Klerk NH, Robinson PJ, et al.
Progression of early structural lung disease in young children with cystic fibrosis
assessed using CT. Thorax. 2012;67(6):509-16.
137. Brody AS, Klein JS, Molina PL, Quan J, Bean JA, Wilmott RW. High-resolution
computed tomography in young patients with cystic fibrosis: Distribution of
abnormalities and correlation with pulmonary function tests. The Journal of
pediatrics.145(1):32-8.
138. Cole TJ, Freeman JV, Preece MA. British 1990 growth reference centiles for
weight, height, body mass index and head circumference fitted by maximum penalized
likelihood. Statistics in medicine. 1998;17(4):407-29.
139. Lee TWR, Brownlee KG, Conway SP, Denton M, Littlewood JM. Evaluation of a
new definition for chronic Pseudomonas aeruginosa infection in cystic fibrosis patients.
Journal of Cystic Fibrosis. 2003;2(1):29-34.
140. Aurora P, Gustafsson P, Bush A, Lindblad A, Oliver C, Wallis CE, et al. Multiple
breath inert gas washout as a measure of ventilation distribution in children with cystic
fibrosis. Thorax. 2004;59(12):1068-73.
141. Jensen R, Stanojevic S, Klingel M, Pizarro ME, Hall GL, Ramsey K, et al. A
Systematic Approach to Multiple Breath Nitrogen Washout Test Quality. PloS one.
2016;11(6):e0157523.
142. Guglani L, Kasi A, Starks M, Pedersen KE, Nielsen JG, Weiner DJ. Difference
between SF6 and N2 Multiple Breath Washout kinetics is due to N2 back diffusion and
error in N2 offset. Journal of applied physiology (Bethesda, Md : 1985). 2018.
143. Sonneveld N, Stanojevic S, Amin R, Aurora P, Davies J, Elborn JS, et al. Lung
clearance index in cystic fibrosis subjects treated for pulmonary exacerbations. The
European respiratory journal. 2015;46(4):1055-64.
144. Stanojevic S, Davis SD, Retsch-Bogart G, Webster H, Davis M, Johnson RC, et
al. Progression of Lung Disease in Preschool Patients with Cystic Fibrosis. American
journal of respiratory and critical care medicine. 2017;195(9):1216-25.
214
145. Schoni MH, Casaulta-Aebischer C. Nutrition and lung function in cystic fibrosis
patients: review. Clinical nutrition (Edinburgh, Scotland). 2000;19(2):79-85.
146. Summermatter S, Singer F, Latzin P, Yammine S. Impact of Software Settings
on Multiple-Breath Washout Outcomes. PloS one. 2015;10(7):e0132250.
147. Accurso FJ, Rowe SM, Clancy JP, Boyle MP, Dunitz JM, Durie PR, et al. Effect
of VX-770 in persons with cystic fibrosis and the G551D-CFTR mutation. The New
England journal of medicine. 2010;363(21):1991-2003.
148. Wainwright CE, Elborn JS, Ramsey BW, Marigowda G, Huang X, Cipolli M, et
al. Lumacaftor-Ivacaftor in Patients with Cystic Fibrosis Homozygous for Phe508del
CFTR. The New England journal of medicine. 2015;373(3):220-31.
149. den Dekker HT, Sonnenschein-van der Voort AMM, de Jongste JC, Anessi-
Maesano I, Arshad SH, Barros H, et al. Early growth characteristics and the risk of
reduced lung function and asthma: A meta-analysis of 25,000 children. The Journal of
allergy and clinical immunology. 2016;137(4):1026-35.
150. Stocks J, Quanjer PH. Reference values for residual volume, functional residual
capacity and total lung capacity. ATS Workshop on Lung Volume Measurements.
Official Statement of The European Respiratory Society. The European respiratory
journal. 1995;8(3):492-506.
151. Kmietowicz Z. Computed tomography in childhood and adolescence is
associated with small increased risk of cancer. Bmj. 2013;346:f3348.
152. Stocks J, Modi N, Tepper R. Need for healthy control subjects when assessing
lung function in infants with respiratory disease. American journal of respiratory and
critical care medicine. 2010;182(11):1340-2.
153. Ramsey KA, McGirr C, Stick SM, Hall GL, Simpson SJ. Effect of posture on
lung ventilation distribution and associations with structure in children with cystic
fibrosis. Journal of cystic fibrosis : official journal of the European Cystic Fibrosis
Society. 2017;16(6):713-8.
215
154. Smith LJ, Macleod KA, Collier GJ, Horn FC, Sheridan H, Aldag I, et al. Supine
posture changes lung volumes and increases ventilation heterogeneity in cystic
fibrosis. PloS one. 2017;12(11):e0188275.
155. Thia LP. Lung function and structure in Cystic Fibrosis infants one year after
diagnosis by newborn screening [Doctoral thesis]: University College London, UK;
2014.
156. Gutierrez JP, Grimwood K, Armstrong DS, Carlin JB, Carzino R, Olinsky A, et
al. Interlobar differences in bronchoalveolar lavage fluid from children with cystic
fibrosis. The European respiratory journal. 2001;17(2):281-6.
157. Gilchrist FJ, Salamat S, Clayton S, Peach J, Alexander J, Lenney W.
Bronchoalveolar lavage in children with cystic fibrosis: how many lobes should be
sampled? Arch Dis Child. 2011;96(3):215-7.
158. Rayment JH, Stanojevic S, Davis SD, Retsch-Bogart G, Ratjen F. Lung
clearance index to monitor treatment response in pulmonary exacerbations in
preschool children with cystic fibrosis. Thorax. 2018;73(5):451-8.
159. Kent L, Reix P, Innes JA, Zielen S, Le Bourgeois M, Braggion C, et al. Lung
clearance index: evidence for use in clinical trials in cystic fibrosis. Journal of cystic
fibrosis : official journal of the European Cystic Fibrosis Society. 2014;13(2):123-38.
160. Subbarao P, Milla C, Aurora P, Davies JC, Davis SD, Hall GL, et al. Multiple-
Breath Washout as a Lung Function Test in Cystic Fibrosis. A Cystic Fibrosis
Foundation Workshop Report. Annals of the American Thoracic Society.
2015;12(6):932-9.
161. Davies J, Sheridan H, Bell N, Cunningham S, Davis SD, Elborn JS, et al.
Assessment of clinical response to ivacaftor with lung clearance index in cystic fibrosis
patients with a G551D-CFTR mutation and preserved spirometry: a randomised
controlled trial. The Lancet Respiratory medicine. 2013;1(8):630-8.
162. Milla CE, Ratjen F, Marigowda G, Liu F, Waltz D, Rosenfeld M.
Lumacaftor/Ivacaftor in Patients Aged 6-11 Years with Cystic Fibrosis and
216
Homozygous for F508del-CFTR. American journal of respiratory and critical care
medicine. 2017;195(7):912-20.
163. Durmowicz AG, Lim R, Rogers H, Rosebraugh CJ, Chowdhury BA. The U.S.
Food and Drug Administration's Experience with Ivacaftor in Cystic Fibrosis.
Establishing Efficacy Using In Vitro Data in Lieu of a Clinical Trial. Annals of the
American Thoracic Society. 2018;15(1):1-2.
164. Ratjen F, Klingel M, Black P, Powers MR, Grasemann H, Solomon M, et al.
Changes in Lung Clearance Index in Preschool-aged Patients with Cystic Fibrosis
Treated with Ivacaftor (GOAL): A Clinical Trial. American journal of respiratory and
critical care medicine. 2018;198(4):526-8.
165. Oude Engberink E, Ratjen F, Davis SD, Retsch-Bogart G, Amin R, Stanojevic
S. Inter-test reproducibility of the lung clearance index measured by multiple breath
washout. The European respiratory journal. 2017;50(4).
166. Horsley A, Maitra A, Shawcross A, Gilchrist F, Cunningham S, Jones A, et al.
Rapid and portable MBW measurements for clinical application of LCI in routine clinics.
European Respiratory Journal. 2016;48(suppl 60):PA1847.
167. Goris ML, Zhu HJ, Blankenberg F, Chan F, Robinson TE. An automated
approach to quantitative air trapping measurements in mild cystic fibrosis. Chest.
2003;123(5):1655-63.
168. Smith LJ, Collier GJ, Marshall H, Hughes PJC, Biancardi AM, Wildman M, et al.
Patterns of regional lung physiology in cystic fibrosis using ventilation magnetic
resonance imaging and multiple-breath washout. The European respiratory journal.
2018;52(5).
169. Davies JC, Cunningham S, Harris WT, Lapey A, Regelmann WE, Sawicki GS,
et al. Safety, pharmacokinetics, and pharmacodynamics of ivacaftor in patients aged 2-
5 years with cystic fibrosis and a CFTR gating mutation (KIWI): an open-label, single-
arm study. The Lancet Respiratory medicine. 2016;4(2):107-15.
217
Appendices
A1: Carer information sheet for:
a) Carer(s) of children with CF
b) Carer(s) of healthy control children
A2: LCFC standard treatment protocol
A3: Testing day reward chart for participants
A4: Consent forms and carer testing day questionnaire for:
a) Carer(s) of children with CF
b) Carer(s) of healthy control children
A5: Clinician questionnaire
A6: Acceptability criteria and software protocol for MBW analysis
A7: Laboratory protocol for specific airway resistance testing and quality control
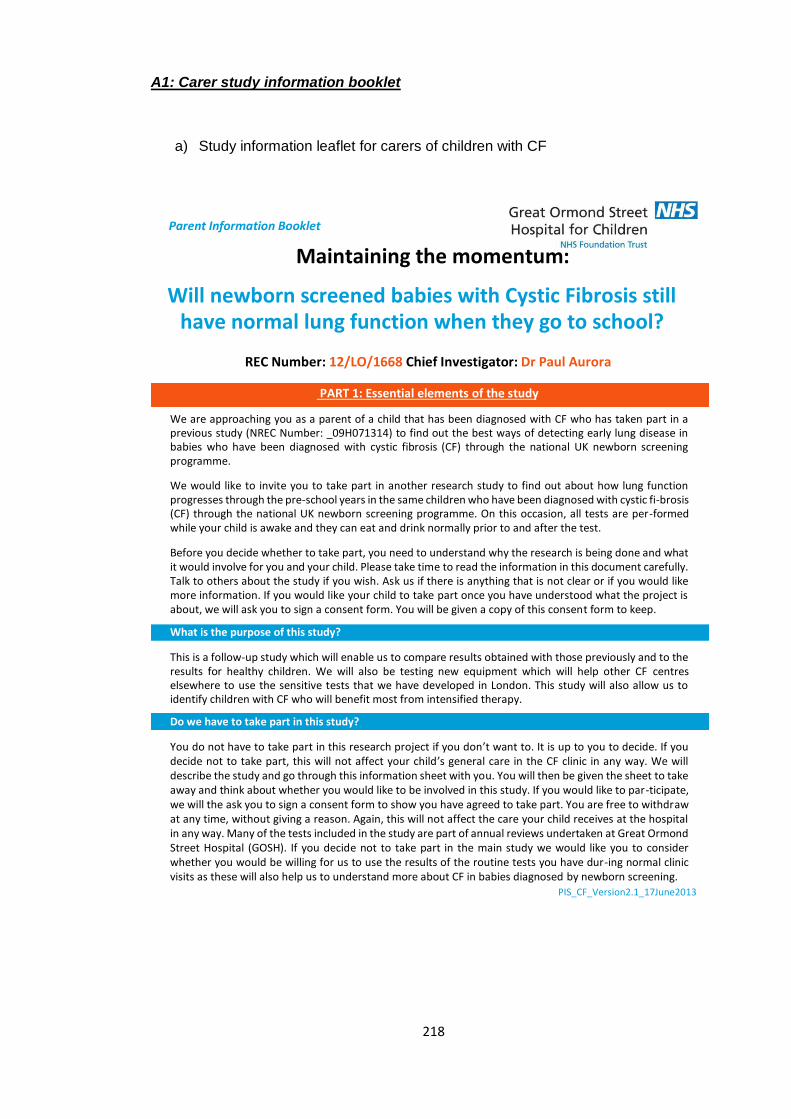
218
A1: Carer study information booklet
a) Study information leaflet for carers of children with CF
Parent Information Booklet
Maintaining the momentum:
Will newborn screened babies with Cystic Fibrosis still have normal lung function when they go to school?
REC Number: 12/LO/1668 Chief Investigator: Dr Paul Aurora
PART 1: Essential elements of the study
We are approaching you as a parent of a child that has been diagnosed with CF who has taken part in a previous study (NREC Number: _09H071314) to find out the best ways of detecting early lung disease in babies who have been diagnosed with cystic fibrosis (CF) through the national UK newborn screening programme. We would like to invite you to take part in another research study to find out about how lung function progresses through the pre-school years in the same children who have been diagnosed with cystic fi-brosis (CF) through the national UK newborn screening programme. On this occasion, all tests are per-formed while your child is awake and they can eat and drink normally prior to and after the test. Before you decide whether to take part, you need to understand why the research is being done and what it would involve for you and your child. Please take time to read the information in this document carefully. Talk to others about the study if you wish. Ask us if there is anything that is not clear or if you would like more information. If you would like your child to take part once you have understood what the project is about, we will ask you to sign a consent form. You will be given a copy of this consent form to keep. What is the purpose of this study? This is a follow-up study which will enable us to compare results obtained with those previously and to the results for healthy children. We will also be testing new equipment which will help other CF centres elsewhere to use the sensitive tests that we have developed in London. This study will also allow us to identify children with CF who will benefit most from intensified therapy. Do we have to take part in this study? You do not have to take part in this research project if you don’t want to. It is up to you to decide. If you decide not to take part, this will not affect your child’s general care in the CF clinic in any way. We will describe the study and go through this information sheet with you. You will then be given the sheet to take away and think about whether you would like to be involved in this study. If you would like to par-ticipate, we will the ask you to sign a consent form to show you have agreed to take part. You are free to withdraw at any time, without giving a reason. Again, this will not affect the care your child receives at the hospital in any way. Many of the tests included in the study are part of annual reviews undertaken at Great Ormond Street Hospital (GOSH). If you decide not to take part in the main study we would like you to consider whether you would be willing for us to use the results of the routine tests you have dur-ing normal clinic visits as these will also help us to understand more about CF in babies diagnosed by newborn screening.
PIS_CF_Version2.1_17June2013
219
What will we have to do if we take part? Whether or not you take part in this study, we will see your child regularly in clinic (just as is the case nor-mally), but if your child takes part in this study, you and your child will have to come in for an extra visit to have the tests described below. At GOSH most of the tests are part of our routine care. We will invite you to Great Ormond St Hospital when your child is around 3-6years of age to measure his/ her lung function. On this occasion, all tests are performed while your child is awake. Each visit will take about 2 hours in total. You can take your child home as soon as the test is complete. What are the tests in the study? 1. Breathing tests Breathing tests for children less than 6 years old are very safe and painless. You can stay with your child while they are being done. These are highly specialised tests which can only be performed at Great Ormond Street Hospital for children. We will arrange the timing of these visits to suit your family and all travel ex-penses will be refunded. Your child will be asked to do the breathing tests by taking deep breaths and blowing through special equip-ment. All tests are performed while your child is awake and they can eat and drink normally prior to and after the tests. The tests do not upset the children, who usually enjoy the process. It usually only takes about an hour to do all the tests but we generally allow two hours to ensure both you and your child are comfortable and relaxed. During the visit a research doctor will examine your child and ask a few health questions. a. Multiple breath washout test This test is designed to find out how evenly your child breathes and will be performed in two ways. The child breathes in a special air mixture through a face mask which contains a small amount of a gas called Sulphur
Hexafluoride (or SF6). SF6 is ‘inert’ which means that it does not cross from your child’s lungs into the blood stream, and has no taste or smell. The gas has been used safely at GOSH in babies and young children for the past 10 years and is used at many other specialist hospitals throughout the world. The child breathes this mixture for a few minutes so that it mixes through the lungs. After a few minutes the gas mix-ture is swapped
for normal air and we measure how quickly the child breathes (or “washes”) out the SF6 from the lungs.
Children with normal lungs quickly wash out SF6 whereas children with early lung disease take longer to clear the gas from their lungs. This is similar to the test that was performed when your child was approximately 3 months, 1 year and 2 years old. b. Airway Resistance The second test measures how big the airways are. In order to do this the child sits in a special cubicle (which looks a bit like a public telephone box) and breathes air through a face mask. The cubicle is transparent and has a door which is closed for 2-3 minutes so that we can record the small pressure changes that occur while your child is breathing. c. Forced expiration This last breathing test measures how quickly your child can breathe out and also reflects airway size. Your child is asked to wear a nose clip (which looks a bit like a swimming nose clip), breathe in deeply and then breathe out as hard and fast as they can through a plastic tube which they hold in their mouth. To help them do this, we use a variety of specially made computer games. Children with lung disease cannot blow out as much air or as quickly as children with normal lungs. 2. Other investigations: While you are at the laboratory, we will also weigh and measure your child, and ask you a few questions about your family and your child’s health. We would also like to know about your views and experiences of being a part of this study. We will ask you to fill out a questionnaire once at the end of the study.

220
Any other measurements or results of tests which will be used for this study are all part of your child’s routine care at your CF centre. What is the questionnaire for? It is important that we know how parents feel about being asked to take part in studies such as this. We would also like to know about your views and experiences of being a part of this study. We will ask you to fill out a questionnaire once at the end of the study. Are there any risks or discomfort for my child? Breathing tests: We do not believe there are any risks or discomfort associated with performing these breathing tests in children. On the contrary, experience has shown that most children of pre-school age, enjoy their visit to the lung function laboratory. Time burden: Attending appointments for the testing sessions could cause some inconvenience as you may need to come in for an additional appointment, but we will ensure that any inconvenience is limited by booking appointments that are suitable to both you and your child where possible.
PART 2: Additional Information to be read before you decide whether to participate or not. Why is this study important? Children with Cystic Fibrosis are more prone to chest infections and repeated infections lead to lung damage. These infections may occur very early in life and some can go unnoticed (because the child does not have an obvious cough or other symptoms). It is very important that the effects of such infections are detected and treated rapidly, using tests like the ones in this study, to prevent irreversible damage to the lungs which may limit the child’s physical ability and lifestyle. Who will this study help? We cannot promise that participating in this study will help your child specifically, but the information we obtain will help improve the treatment of all children born with CF in the future. It will help us to understand more about CF lung disease in the first few years of life, and which test or combination of tests is likely to be most useful in detecting early changes in the lungs.
For your child specifically, the advantages of taking part in the study are that s/he will be monitored very closely throughout the period of the study both by her/his specialist CF team and by the research team. Your child will also have the opportunity to have specialised assessments such as pre-school lung function (breathing) tests. Such tests are not widely available yet, but have been shown to be accurate and reliable in monitoring lung growth and identifying early problems, which can then be treated more promptly. If any problems are picked up as a result of the tests you will be informed and your child’s treatment changed if and as necessary. Results from all these tests will be sent to your consultant who will then be able to discuss them with you. Will my taking part in the study be kept confidential? Yes. We will follow ethical and legal practice and any information about you or your child will be handled in strictest confidence and will only be used in a way that will not allow you or your child to be identified. Your GP will be informed of your involvement in the study with your consent. What will happen if we don’t want to carry on with the study? You can withdraw from the study at any time without having to explain why. You would continue to attend clinic regularly when cough swabs would be taken, and lung function tests would be scheduled between 3-6 years of age as is current routine practice at GOSH.

221
What will happen when the study stops? Once your child is six years old, we will not require you to attend for any additional visits, but would like permission to continue to track your child’s clinical progress (from the information we get at routine clinic visits) so that we can assess how well these early tests predict future outcome at school age. This would not involve any extra effort from you or your family as it would be based on routine medical records. How will I learn about the results of this study? We can send you a summary of the study once all the results have been analysed (approximately 2015). We will be giving talks about the results to other doctors and nurses around the world and will display the findings on the CF Trust’s website . Who is organising and funding the research? Action Medical Research is funding this research, which also has approval from the UK Cystic Fibrosis Trust. Who has reviewed this Study? All research in the NHS is looked at by independent group of people, called a Research Ethics Committee to protect your safety, rights, wellbeing and dignity. This study has been reviewed and given favourable opinion by the Bloomsbury Research Ethics Committee who consider that it is addressing an important question regarding treatment of children with CF and that there will be minimal risk to you or your child if you participate. What if there is a problem? If you have a concern about any aspect of this study, you should ask to speak to your Specialist CF consult-ant, CF nurse or one of the researchers who will do their best to answer your questions. Their contact numbers are at the end of this information sheet. If you remain unhappy and wish to complain formally, you can do this through the NHS Complaints Procedure. Details can be obtained from the hospital PALS service on 020 7829 7862. In the extremely unlikely event that something does go wrong and you or your child are harmed during the research and this is due to someone’s negligence then you may have grounds for a legal action for compensation against The Institute of Child Health / Great Ormond Street Hospital but you may have to pay your legal costs. The normal National Health Service complaints mechanisms will still be available to you (if appropriate). Who can I talk to about this study? Your Specialist CF consultant or any of the research team will be more than happy to talk to you about this study. Their contact details are below:
Dr Paul Aurora, Respiratory Consultant: 0207 405 9200, [email protected]
Dr Julie Duncan, Research Fellow: 0207 762 6947 or 0207 762 6946; [email protected]
You can also contact the CF Trust, with whom we keep in close touch.
Thank you for reading this leaflet, we look forward to seeing you again soon.
222
b) Study information leaflet for carers of healthy control children
Parent Information Booklet
Maintaining the momentum:
Will newborn screened babies with Cystic Fibrosis still have normal lung function when they go to
school?
REC Number: 12/LO/1668 Chief Investigator: Dr Paul Aurora
PART 1: Essential elements of the study We are approaching you as a parent of a child that has been diagnosed with CF who has taken part in a previous study (NREC Number: _09H071314) to find out the best ways of detecting early lung disease in babies who have been diagnosed with cystic fibrosis (CF) through the national UK newborn screening programme. We would like to invite you to take part in another research study to find out about how lung function progresses through the pre-school years in the same children who have been diagnosed with cystic fi-brosis (CF) through the national UK newborn screening programme. On this occasion, all tests are per-formed while your child is awake and they can eat and drink normally prior to and after the test. Before you decide whether to take part, you need to understand why the research is being done and what it would involve for you and your child. Please take time to read the information in this document carefully. Talk to others about the study if you wish. Ask us if there is anything that is not clear or if you would like more information. If you would like your child to take part once you have understood what the project is about, we will ask you to sign a consent form. You will be given a copy of this consent form to keep. What is the purpose of this study? This is a follow-up study which will enable us to compare results obtained with those previously and to the results for healthy children. We will also be testing new equipment which will help other CF centres elsewhere to use the sensitive tests that we have developed in London. This study will also allow us to identify children with CF who will benefit most from intensified therapy. Do we have to take part in this study? You do not have to take part in this research project if you don’t want to. It is up to you to decide. We are sending you this information sheet so you can think about whether you would like to be involved. We will then phone you to discuss this further and answer any questions you may have. You will have further opportunities to ask questions if you bring your child for the breathing tests. We will then ask you to sign a consent form to show you have agreed to take part. You are free to withdraw from this study at any time, without giving a reason. If we take part, what will this involve? We will invite you to Great Ormond St Hospital when your child is around 3-6years of age to measure his/her lung function. On this occasion, all tests are performed while your child is awake. Each visit will take about 2 hours in total. You can take your child home as soon as the test is complete.
PIS_HC_Version2.1_17June2013
223
What are the tests in the study? 1. Breathing tests Breathing tests for children less than 6 years old are very safe and painless, but are only available at a few centres round Britain. We therefore need you to come to Great Ormond Street Hospital for Children (GOSH) for these tests. We will arrange the timing of these visits to suit your family and all travel expenses can be refunded. You can stay with your child all the time that they are being tested. Your child will be asked to do the breathing tests by taking deep breaths and blowing through special equip-ment. All tests are performed while your child is awake and they can eat and drink normally prior to and after the tests. The tests do not upset the children, who usually enjoy the process. It usually only takes about an hour to do all the tests but we generally allow two hours to ensure both you and your child are comfortable and relaxed. During the visit a research doctor will examine your child and ask a few health questions. We use three tests to see how the lungs are developing and growing: a. Multiple breath washout test This test is designed to find out how evenly your child breathes and will be performed in two ways. The child breathes in a special air mixture through a face mask which contains a small amount of a gas called Sulphur
Hexafluoride (or SF6). SF6 is ‘inert’ which means that it does not cross from your child’s lungs into the blood stream, and has no taste or smell. The gas has been used safely at GOSH in babies and young children for the past 10 years and is used at many other specialist hospitals throughout the world. The child breathes this mixture for a few minutes so that it mixes through the lungs. After a few minutes the gas mix-ture is swapped
for normal air and we measure how quickly the child breathes (or “washes”) out the SF6 from the lungs.
Children with normal lungs quickly wash out SF6 whereas children with early lung disease take longer to clear the gas from their lungs. This is similar to the test that was performed when your child was approximately 3 months, 1 year and 2 years old. b. Airway Resistance The second test measures how big the airways are. In order to do this the child sits in a special cubicle (which looks a bit like a public telephone box) and breathes air through a face mask. The cubicle is transparent and has a door which is closed for 2-3 minutes so that we can record the small pressure changes that occur while your child is breathing. c. Forced expiration This last breathing test measures how quickly your child can breathe out and also reflects airway size. Your child is asked to wear a nose clip (which looks a bit like a swimming nose clip), breathe in deeply and then breathe out as hard and fast as they can through a plastic tube which they hold in their mouth. To help them do this, we use a variety of specially made computer games. Children with lung disease cannot blow out as much air or as quickly as children with normal lungs. 2. Other investigations: While you are at the laboratory, we will also weigh and measure your child, and ask you a few questions about your family and your child’s health. We would also like to know about your views and experiences of being a part of this study. We will ask you to fill out a questionnaire once at the end of the study. What is the questionnaire for? It is important that we know how parents feel about being asked to take part in studies such as this. We would also like to know about your views and experiences of being a part of this study. We will ask you to fill out a questionnaire once at the end of the study.

224
Are there any risks or discomfort for my child? Breathing tests: We do not believe there are any risks or discomfort associated with performing these breathing tests in children. On the contrary, experience has shown that most children of pre-school age, enjoy their visit to the lung function laboratory. Time burden: Attending appointments for the testing sessions could cause some inconvenience as you may need to come in for an additional appointment, but we will ensure that any inconvenience is limited by booking appointments that are suitable to both you and your child where possible.
Lung function testing
PART 2: Additional Information to be read before you decide whether to participate or not. Why is this study important? Children with Cystic Fibrosis are more prone to chest infections and repeated infections lead to lung damage. These infections may occur very early in life and some can go unnoticed (because the child does not have an obvious cough or other symptoms). It is very important that the effects of such infections are detected and treated rapidly, using tests like the ones in this study, to prevent irreversible damage to the lungs which may limit the child’s physical ability and lifestyle. Who will this study help? As a parent of a healthy child, participating in this study will not be of any direct benefit to your child, but the information we obtain will help improve the treatment of children with CF. It will help us to understand more about CF lung disease in the first few years of life, and which test, or combination of tests, is likely to be most useful in detecting early changes in the lungs. Will my taking part in the study be kept confidential? Yes. We will follow ethical and legal practice and any information about you or your child will be handled in strictest confidence and will only be used in a way that will not allow you or your child to be identified. Your GP will be informed of your involvement in the study with your consent.
225
Who has reviewed this Study? All research in the NHS is looked at by independent group of people, called a Research Ethics Committee to protect your safety, rights, wellbeing and dignity. This study has been reviewed and given favourable opinion by the Bloomsbury Research Ethics Commitee who consider that it is addressing an important question re-garding treatment of children with CF and that there will be minimal risk to you or your child if you partici-pate. What if there is a problem? In the extremely unlikely event that something does go wrong and you or your child are harmed during the research and this is due to someone’s negligence then you may have grounds for a legal action for compensa-tion but you may have to pay your legal costs. The normal National Health Service complaints mechanisms will still be available to you. Who can I talk to about this study? All members of the pre-school lung function team will be happy to explain the tests and answer your questions. You may phone Dr Julie Duncan, who is carrying out this research, at Great Ormond Street Hospital on 020 7762 6947 or contact her via email [email protected] If you cannot get through on this line, then contact our secretary, Jana Varma (Portex Unit) on 020 7905 2382. Dr Paul Aurora who is organising the study can also contacted via the above telephone numbers.
Finally the Patient Advice and Liaison Service (PALS) can be contacted on 020 7829 7862
Thank you for reading this leaflet, we look forward to seeing you again soon.
Research supported by:
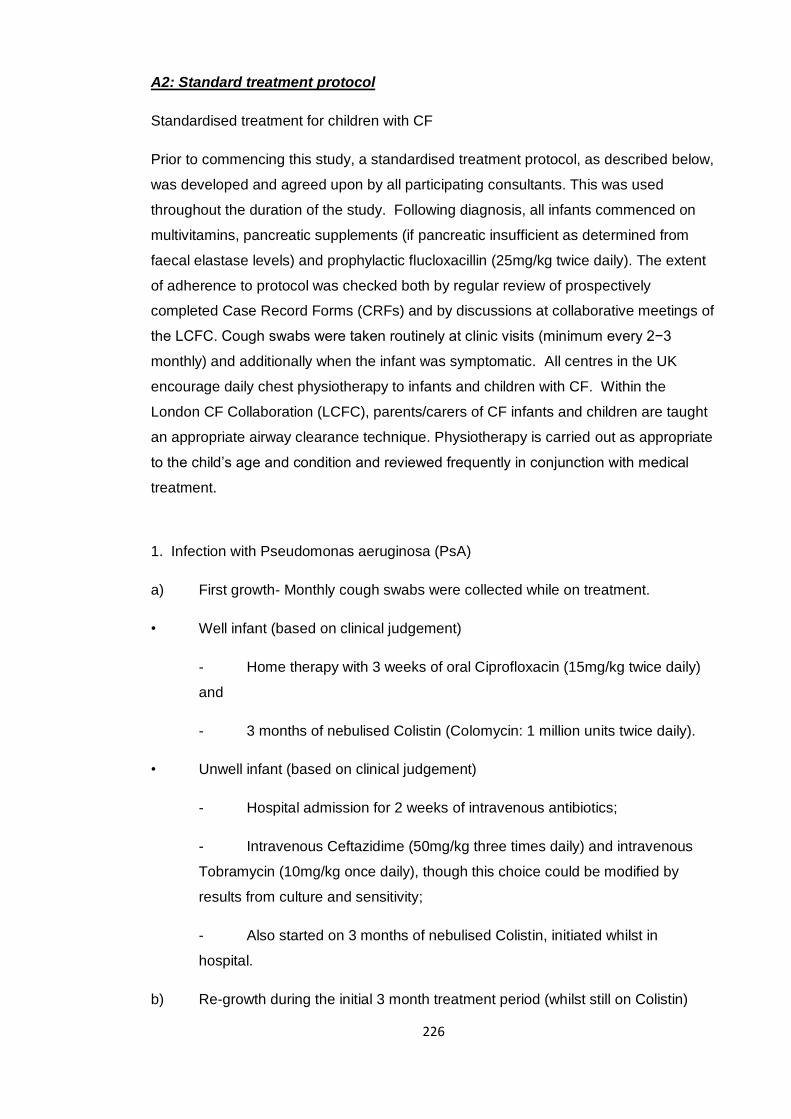
226
A2: Standard treatment protocol
Standardised treatment for children with CF
Prior to commencing this study, a standardised treatment protocol, as described below,
was developed and agreed upon by all participating consultants. This was used
throughout the duration of the study. Following diagnosis, all infants commenced on
multivitamins, pancreatic supplements (if pancreatic insufficient as determined from
faecal elastase levels) and prophylactic flucloxacillin (25mg/kg twice daily). The extent
of adherence to protocol was checked both by regular review of prospectively
completed Case Record Forms (CRFs) and by discussions at collaborative meetings of
the LCFC. Cough swabs were taken routinely at clinic visits (minimum every 2−3
monthly) and additionally when the infant was symptomatic. All centres in the UK
encourage daily chest physiotherapy to infants and children with CF. Within the
London CF Collaboration (LCFC), parents/carers of CF infants and children are taught
an appropriate airway clearance technique. Physiotherapy is carried out as appropriate
to the child’s age and condition and reviewed frequently in conjunction with medical
treatment.
1. Infection with Pseudomonas aeruginosa (PsA)
a) First growth- Monthly cough swabs were collected while on treatment.
• Well infant (based on clinical judgement)
- Home therapy with 3 weeks of oral Ciprofloxacin (15mg/kg twice daily)
and
- 3 months of nebulised Colistin (Colomycin: 1 million units twice daily).
• Unwell infant (based on clinical judgement)
- Hospital admission for 2 weeks of intravenous antibiotics;
- Intravenous Ceftazidime (50mg/kg three times daily) and intravenous
Tobramycin (10mg/kg once daily), though this choice could be modified by
results from culture and sensitivity;
- Also started on 3 months of nebulised Colistin, initiated whilst in
hospital.
b) Re-growth during the initial 3 month treatment period (whilst still on Colistin)

227
• Well infant
- Further 3 weeks of oral Ciprofloxacin.
• Unwell infant
- Hospital admission for intravenous antibiotics and a further 3 months of
nebulised Colistin. If second course of intravenous antibiotics was
inappropriate, 3 weeks of oral Ciprofloxacin was given instead.
c) Regrowth at the end of 3 weeks ciprofloxacin or 3 months nebulised Colistin
• Intravenous antibiotics, and either
- a further 3 months of nebulised Colistin, or
- 28 days of TOBI (300mg twice daily) followed by 3 months of Colistin.
d) Regrowth after IVs and at least 6 months of nebulised Colistin
• Try 28 days nebulised TOBI™ and then continuous nebulised Colistin 1 million
units twice daily for a further six months. In practice this is unlikely to arise during the
study.
(e) Regrowth > 6 months from first growth
• Treat as for first growth.
(f) Chronic Pseudomonas Infection
Defined for analysis purposes by the Leeds criteria:
Never never cultured
Free cultured previously but not in last year
Intermittent cultured in < 50% of samples in past year
Chronic cultured in > 50% of samples in past year
2. Infection with Methicillin Sensitive Staphylococcus Aureus (MSSA)
(a) First growth
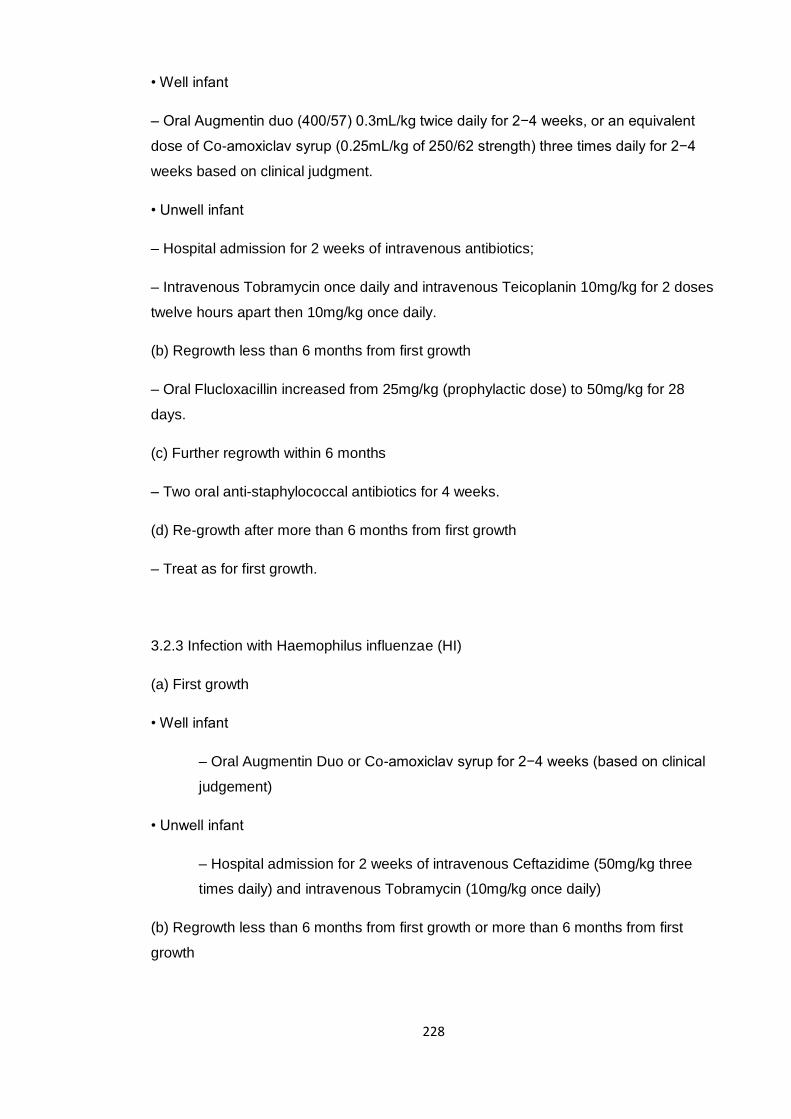
228
• Well infant
– Oral Augmentin duo (400/57) 0.3mL/kg twice daily for 2−4 weeks, or an equivalent
dose of Co-amoxiclav syrup (0.25mL/kg of 250/62 strength) three times daily for 2−4
weeks based on clinical judgment.
• Unwell infant
– Hospital admission for 2 weeks of intravenous antibiotics;
– Intravenous Tobramycin once daily and intravenous Teicoplanin 10mg/kg for 2 doses
twelve hours apart then 10mg/kg once daily.
(b) Regrowth less than 6 months from first growth
– Oral Flucloxacillin increased from 25mg/kg (prophylactic dose) to 50mg/kg for 28
days.
(c) Further regrowth within 6 months
– Two oral anti-staphylococcal antibiotics for 4 weeks.
(d) Re-growth after more than 6 months from first growth
– Treat as for first growth.
3.2.3 Infection with Haemophilus influenzae (HI)
(a) First growth
• Well infant
– Oral Augmentin Duo or Co-amoxiclav syrup for 2−4 weeks (based on clinical
judgement)
• Unwell infant
– Hospital admission for 2 weeks of intravenous Ceftazidime (50mg/kg three
times daily) and intravenous Tobramycin (10mg/kg once daily)
(b) Regrowth less than 6 months from first growth or more than 6 months from first
growth

229
– Oral Augmentin duo or Co-amoxiclav syrup for 2−4 weeks (based on clinical
judgement)
(c) Further regrowth within 6 months
– Clarithromycin (7.5mg/kg twice daily) for 2−4 weeks
3.2.4 Viral Upper Tract Infections (otherwise well child)
• Oral Augmentin duo (400/57) 0.3 mls/kg bd for 2 (minimum) to 4 weeks (clinical
judgment) or equivalent dose of Co-amoxiclav syrup tds <1 year 0.25ml/kg TDS
Augmentin 250/62; >1 - 2 years 5ml TDS Augmentin 250/62 for 2 (minimum) to 4
weeks (clinical judgment)
3.2.5 Respiratory exacerbation with unknown organism, unwell child (clinical judgment)
Depending on severity of exacerbation:
• Oral Augmentin duo (400/57) for 2 to 4 weeks or equivalent dose of Co-amoxiclav
syrup tds (as above) OR
• Intravenous Tobramycin 10 mg/kg once daily and Intravenous Ceftazidime 50mg/kg
three times a day for 2 weeks
NOTE: choice of antibiotic may vary from the protocol depending on culture
sensitivities

230
A3: Study visit reward chart

231
A4: Consent forms and carer test day questionnaire
a) Consent and questionnaire for carer(s) of CF subjects
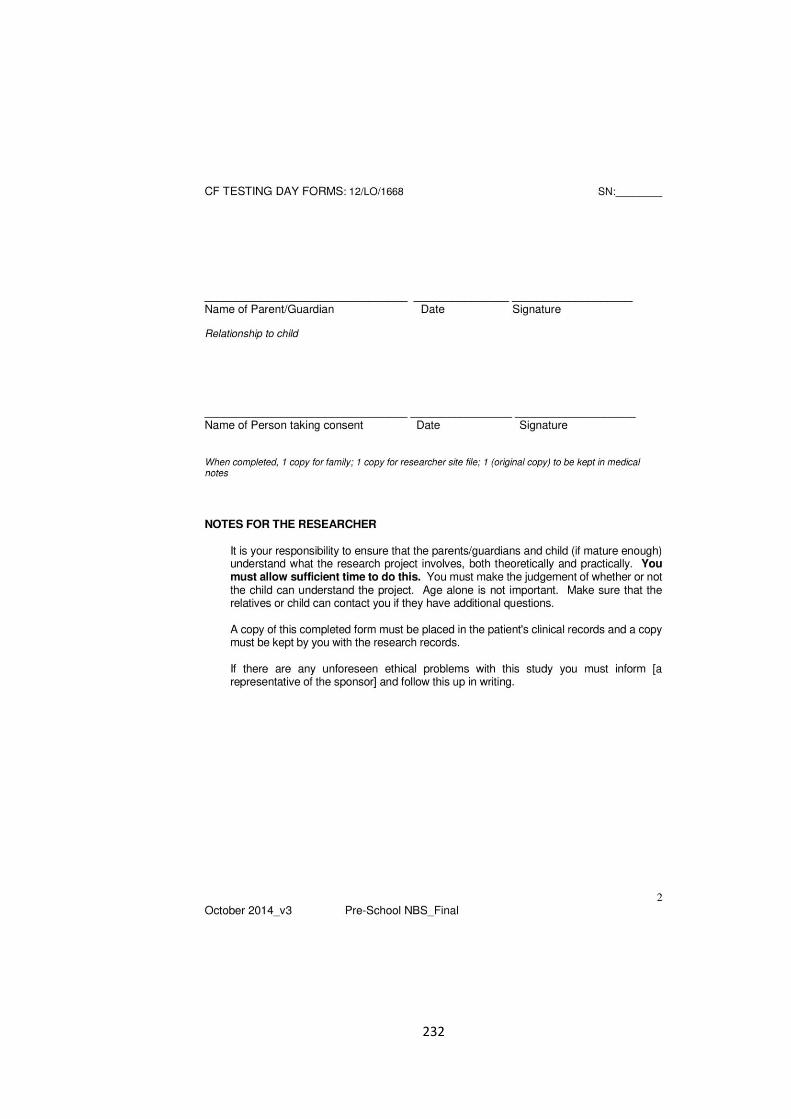
232
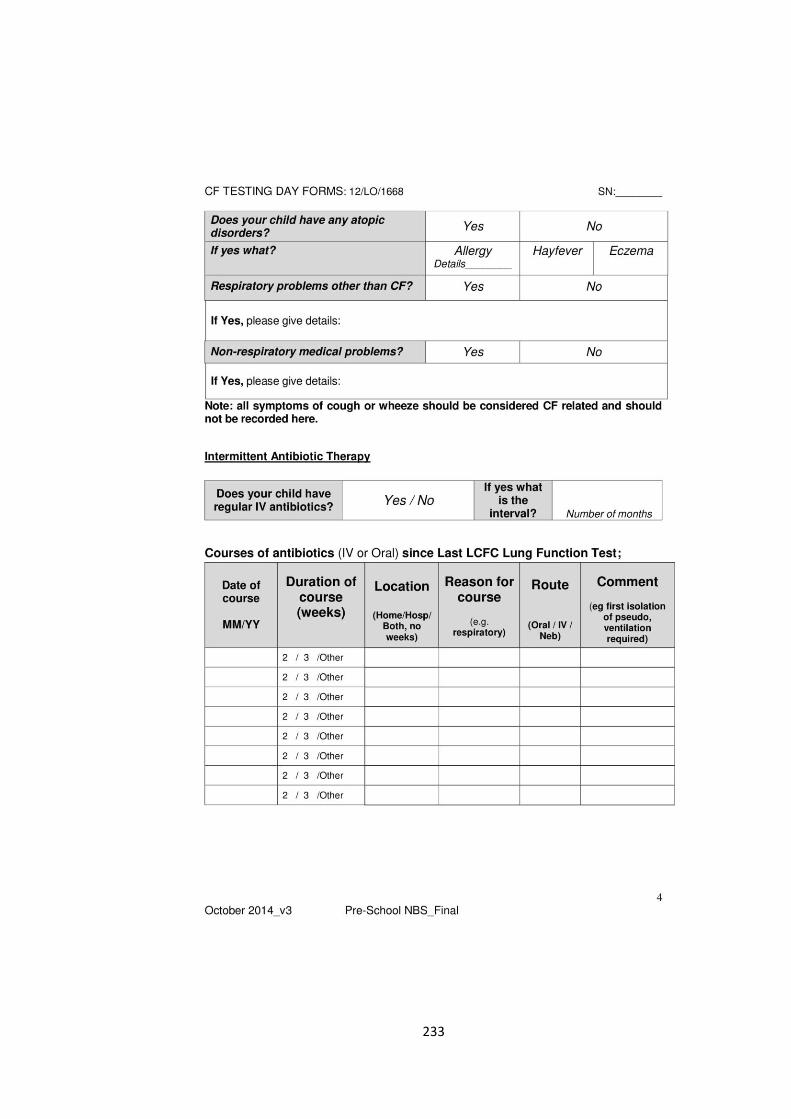
233
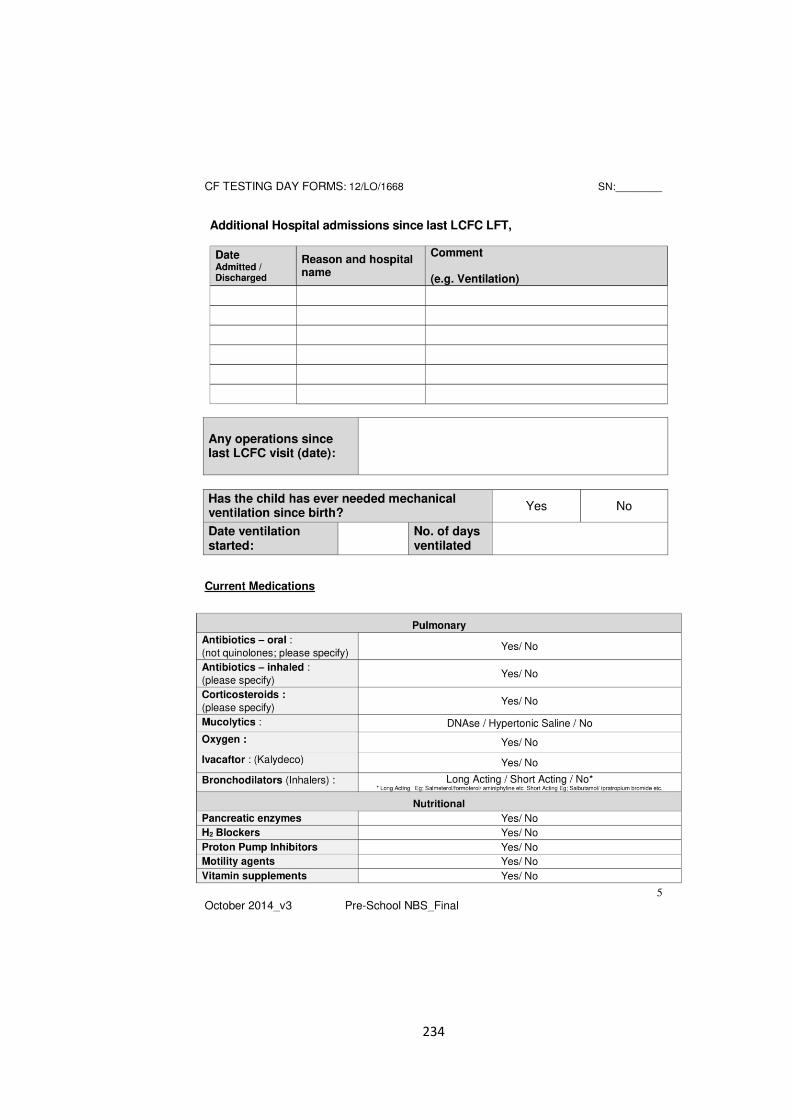
234
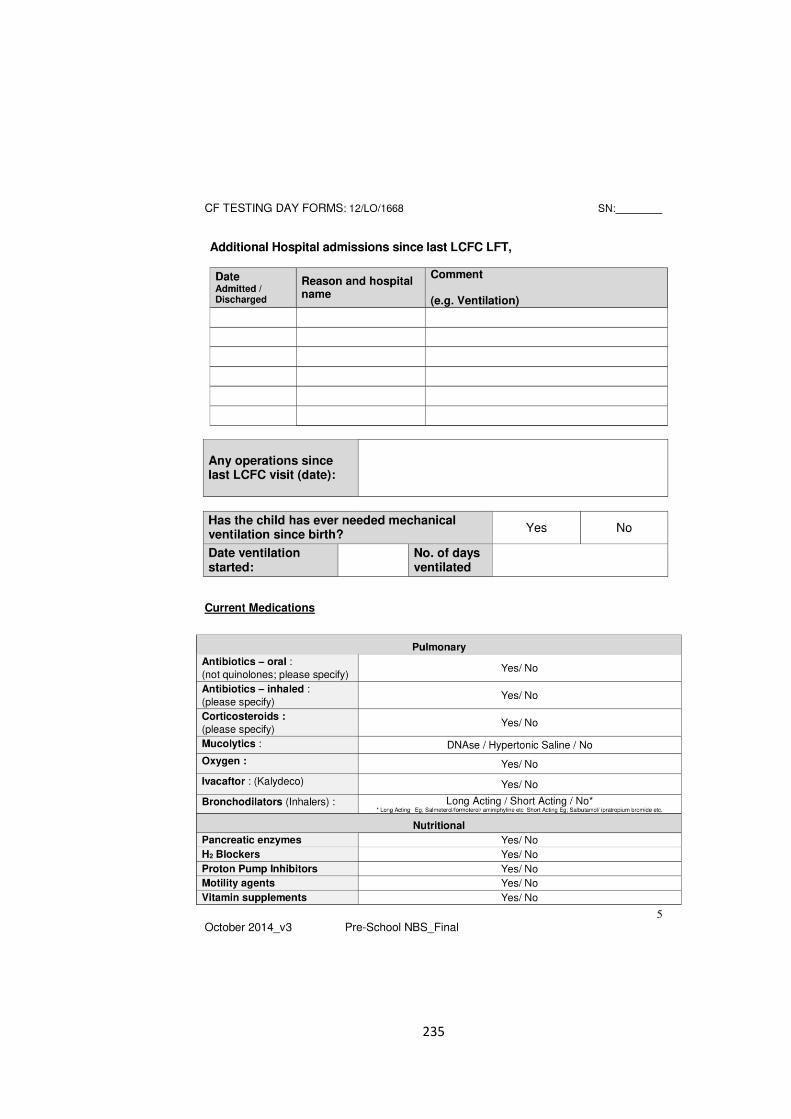
235
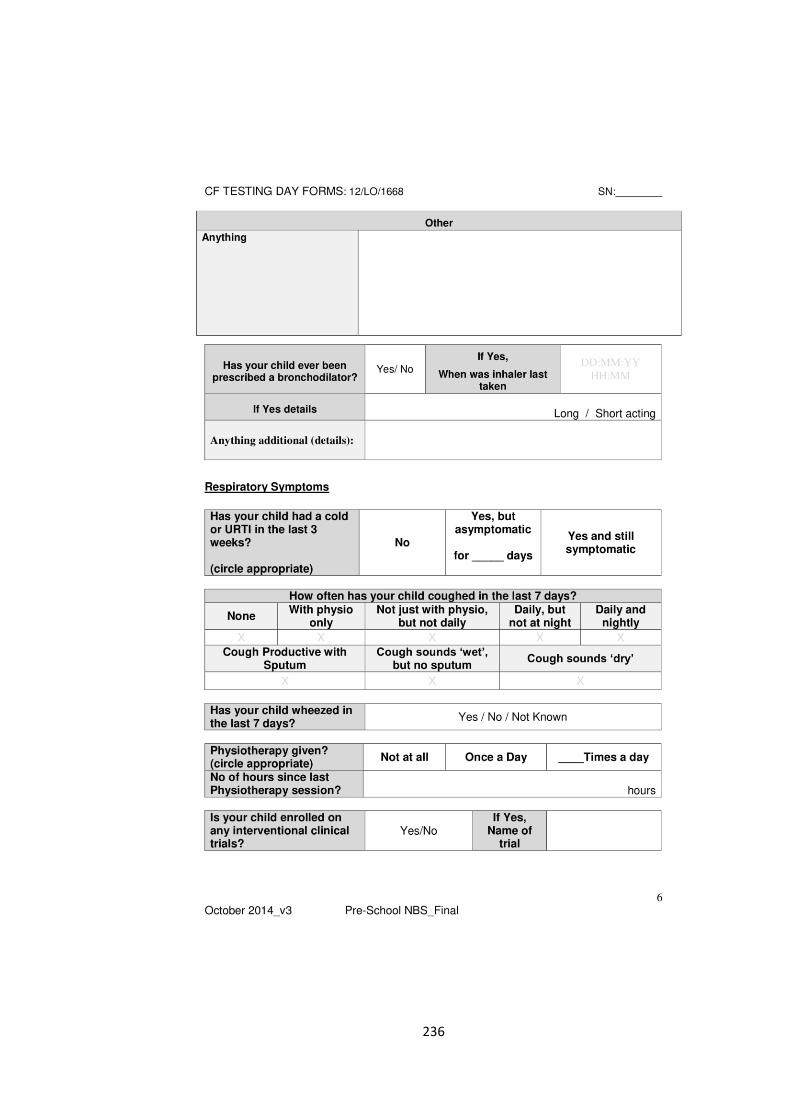
236

237

238
b) Consent and questionnaire for carer(s) of healthy controls
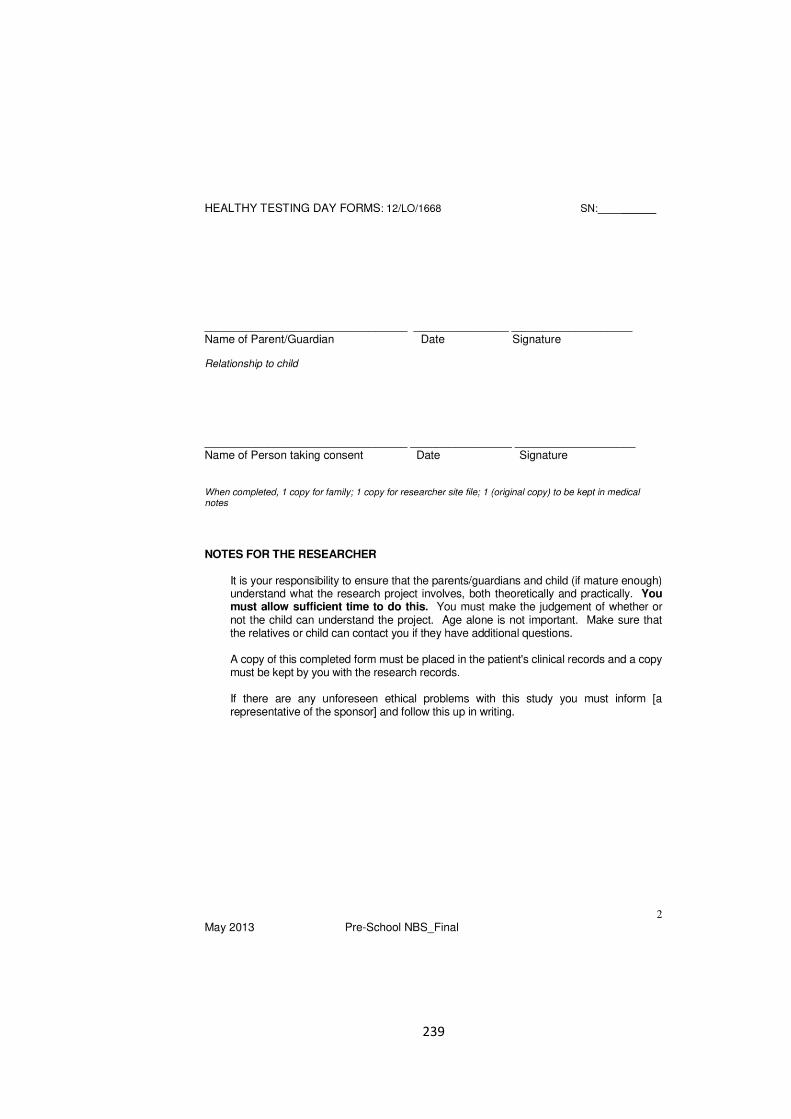
239
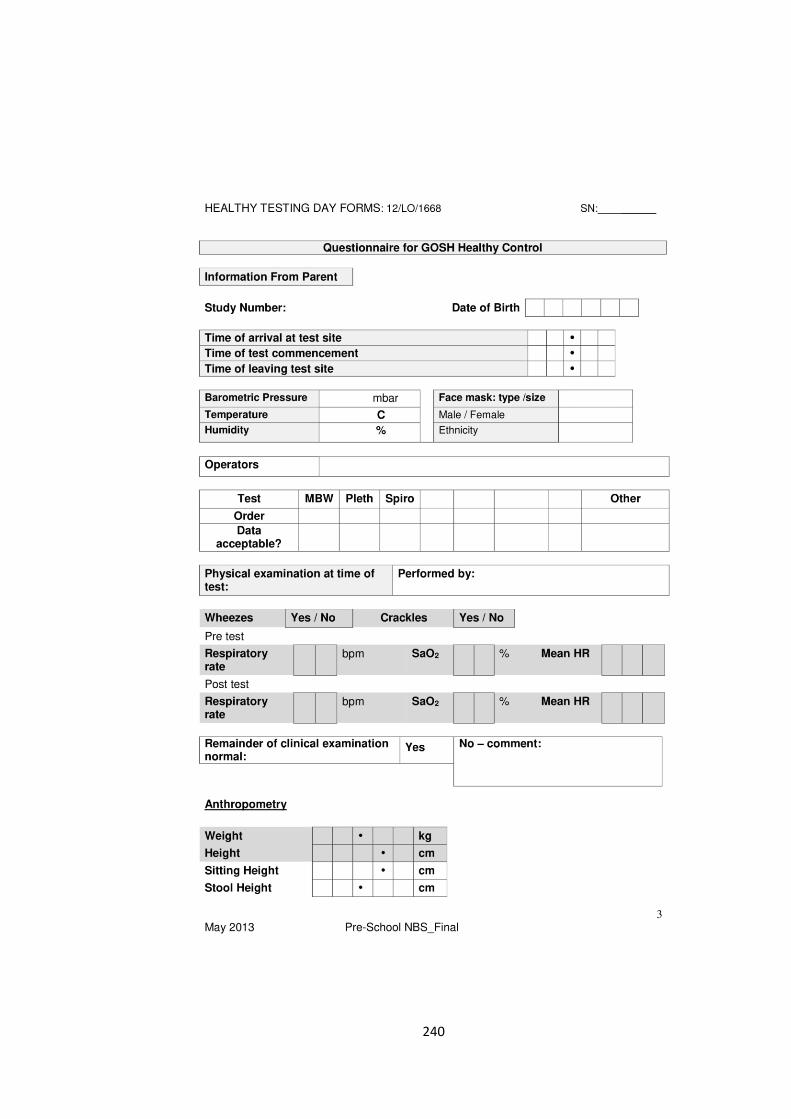
240
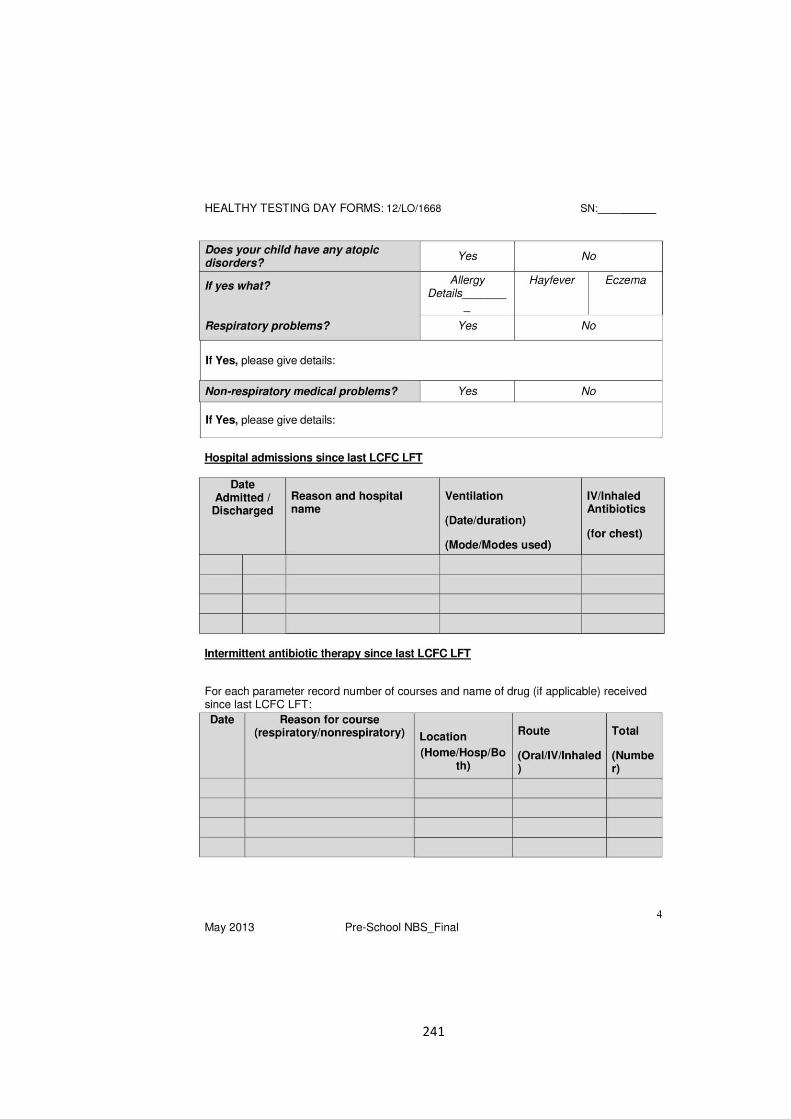
241
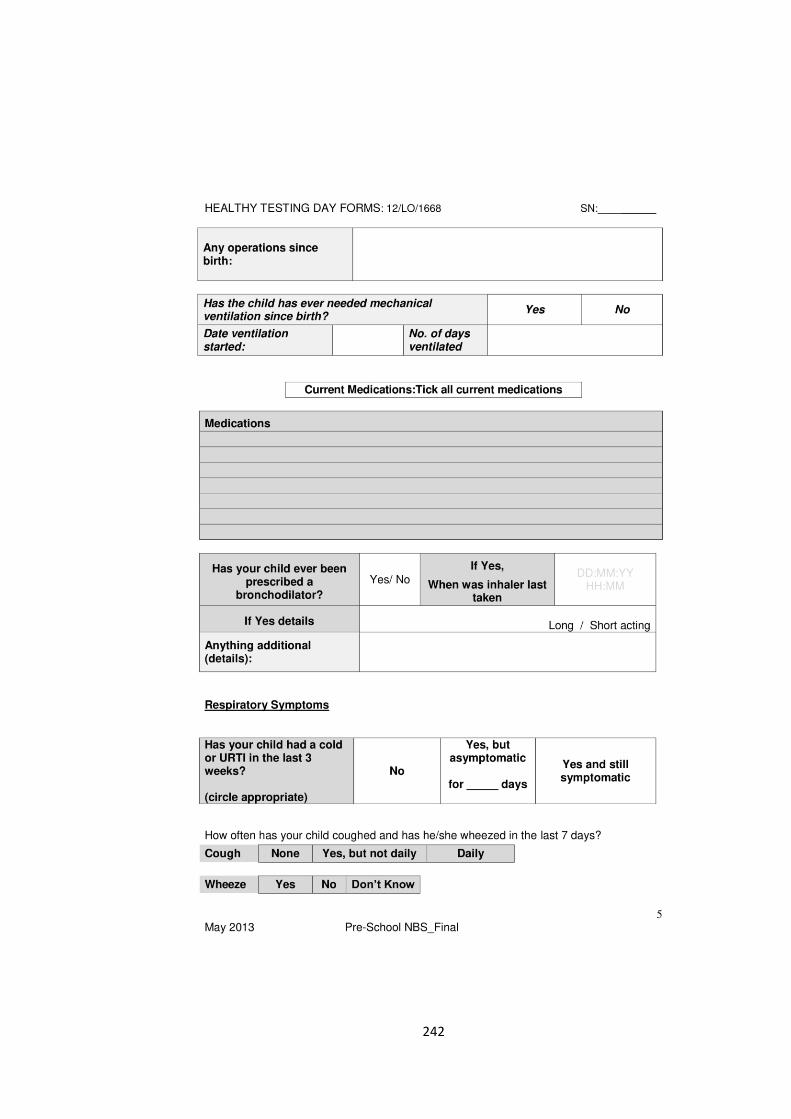
242
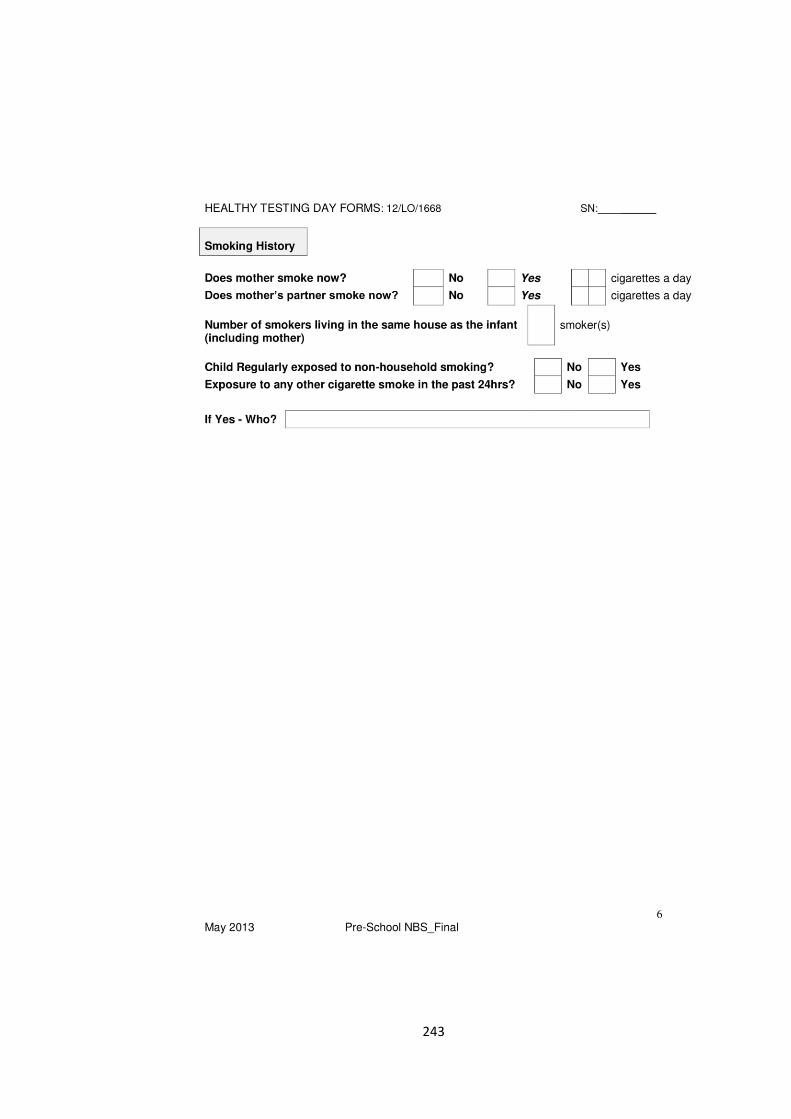
243

244
A5: Clinician questionnaire

245
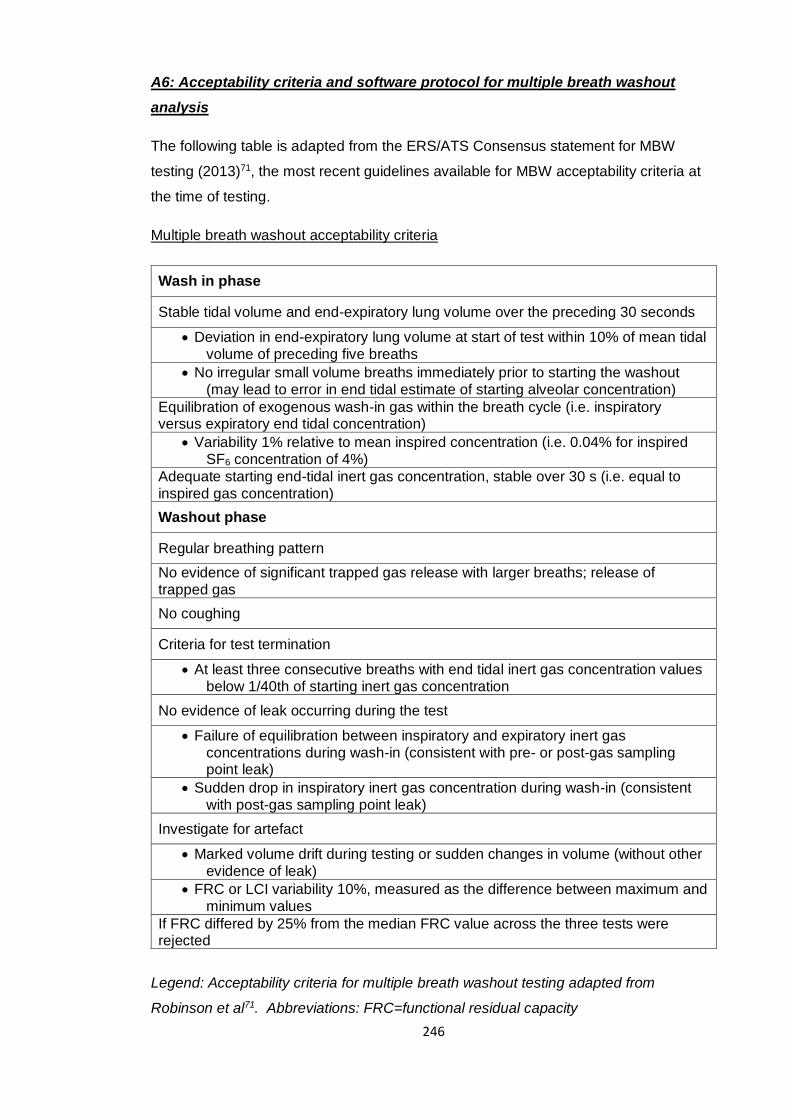
246
A6: Acceptability criteria and software protocol for multiple breath washout
analysis
The following table is adapted from the ERS/ATS Consensus statement for MBW
testing (2013)71, the most recent guidelines available for MBW acceptability criteria at
the time of testing.
Multiple breath washout acceptability criteria
Wash in phase
Stable tidal volume and end-expiratory lung volume over the preceding 30 seconds
Deviation in end-expiratory lung volume at start of test within 10% of mean tidal volume of preceding five breaths
No irregular small volume breaths immediately prior to starting the washout (may lead to error in end tidal estimate of starting alveolar concentration)
Equilibration of exogenous wash-in gas within the breath cycle (i.e. inspiratory versus expiratory end tidal concentration)
Variability 1% relative to mean inspired concentration (i.e. 0.04% for inspired SF6 concentration of 4%)
Adequate starting end-tidal inert gas concentration, stable over 30 s (i.e. equal to inspired gas concentration)
Washout phase
Regular breathing pattern
No evidence of significant trapped gas release with larger breaths; release of trapped gas
No coughing
Criteria for test termination
At least three consecutive breaths with end tidal inert gas concentration values below 1/40th of starting inert gas concentration
No evidence of leak occurring during the test
Failure of equilibration between inspiratory and expiratory inert gas concentrations during wash-in (consistent with pre- or post-gas sampling point leak)
Sudden drop in inspiratory inert gas concentration during wash-in (consistent with post-gas sampling point leak)
Investigate for artefact
Marked volume drift during testing or sudden changes in volume (without other evidence of leak)
FRC or LCI variability 10%, measured as the difference between maximum and minimum values
If FRC differed by 25% from the median FRC value across the three tests were rejected
Legend: Acceptability criteria for multiple breath washout testing adapted from
Robinson et al71. Abbreviations: FRC=functional residual capacity
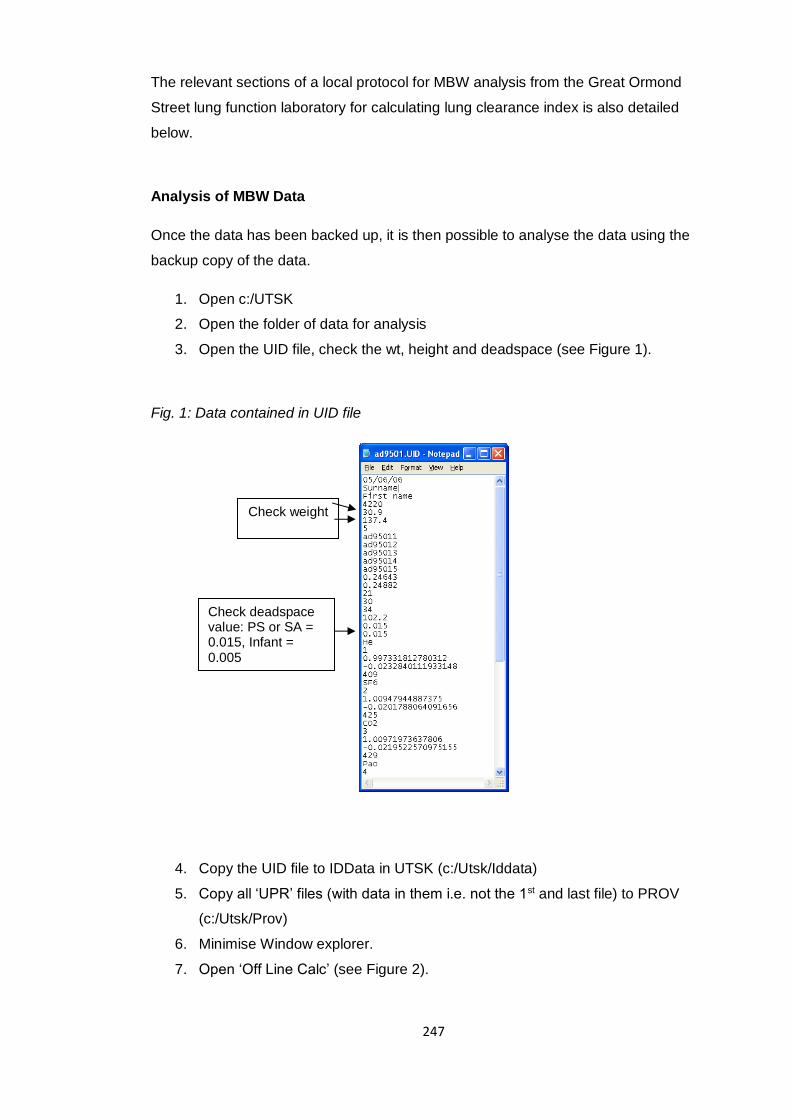
247
The relevant sections of a local protocol for MBW analysis from the Great Ormond
Street lung function laboratory for calculating lung clearance index is also detailed
below.
Analysis of MBW Data
Once the data has been backed up, it is then possible to analyse the data using the
backup copy of the data.
1. Open c:/UTSK
2. Open the folder of data for analysis
3. Open the UID file, check the wt, height and deadspace (see Figure 1).
Fig. 1: Data contained in UID file
4. Copy the UID file to IDData in UTSK (c:/Utsk/Iddata)
5. Copy all ‘UPR’ files (with data in them i.e. not the 1st and last file) to PROV
(c:/Utsk/Prov)
6. Minimise Window explorer.
7. Open ‘Off Line Calc’ (see Figure 2).
Check weight
and height
Check deadspace value: PS or SA = 0.015, Infant = 0.005
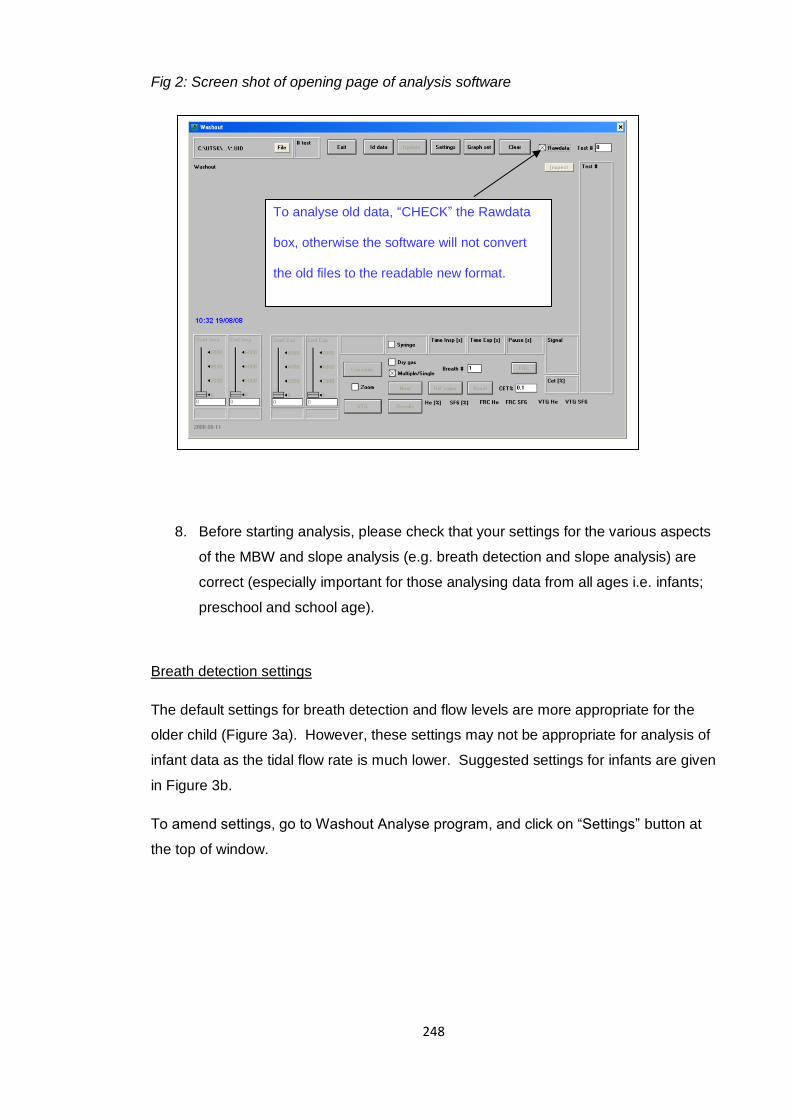
248
Fig 2: Screen shot of opening page of analysis software
8. Before starting analysis, please check that your settings for the various aspects
of the MBW and slope analysis (e.g. breath detection and slope analysis) are
correct (especially important for those analysing data from all ages i.e. infants;
preschool and school age).
Breath detection settings
The default settings for breath detection and flow levels are more appropriate for the
older child (Figure 3a). However, these settings may not be appropriate for analysis of
infant data as the tidal flow rate is much lower. Suggested settings for infants are given
in Figure 3b.
To amend settings, go to Washout Analyse program, and click on “Settings” button at
the top of window.
To analyse old data, “CHECK” the Rawdata
box, otherwise the software will not convert
the old files to the readable new format.
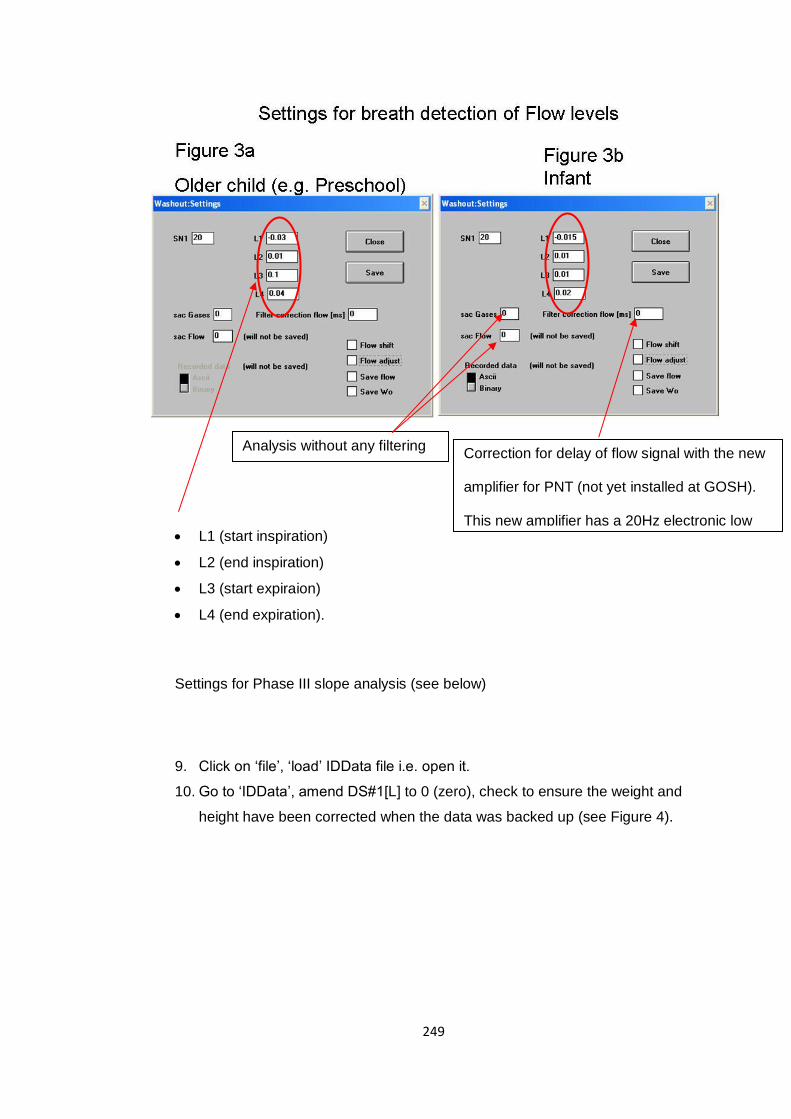
249
L1 (start inspiration)
L2 (end inspiration)
L3 (start expiraion)
L4 (end expiration).
Settings for Phase III slope analysis (see below)
9. Click on ‘file’, ‘load’ IDData file i.e. open it.
10. Go to ‘IDData’, amend DS#1[L] to 0 (zero), check to ensure the weight and
height have been corrected when the data was backed up (see Figure 4).
Correction for delay of flow signal with the new
amplifier for PNT (not yet installed at GOSH).
This new amplifier has a 20Hz electronic low
pass filter. So it should be set to ”0” at GOSH.
Analysis without any filtering
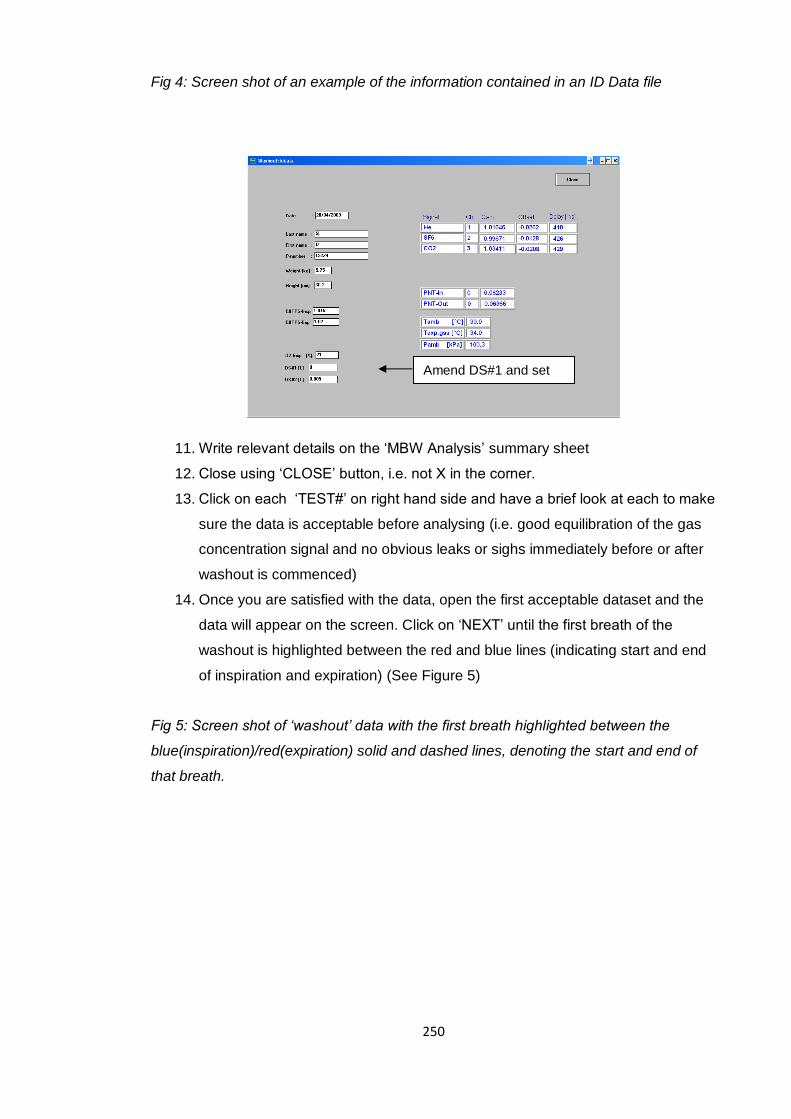
250
Fig 4: Screen shot of an example of the information contained in an ID Data file
11. Write relevant details on the ‘MBW Analysis’ summary sheet
12. Close using ‘CLOSE’ button, i.e. not X in the corner.
13. Click on each ‘TEST#’ on right hand side and have a brief look at each to make
sure the data is acceptable before analysing (i.e. good equilibration of the gas
concentration signal and no obvious leaks or sighs immediately before or after
washout is commenced)
14. Once you are satisfied with the data, open the first acceptable dataset and the
data will appear on the screen. Click on ‘NEXT’ until the first breath of the
washout is highlighted between the red and blue lines (indicating start and end
of inspiration and expiration) (See Figure 5)
Fig 5: Screen shot of ‘washout’ data with the first breath highlighted between the
blue(inspiration)/red(expiration) solid and dashed lines, denoting the start and end of
that breath.
Amend DS#1 and set
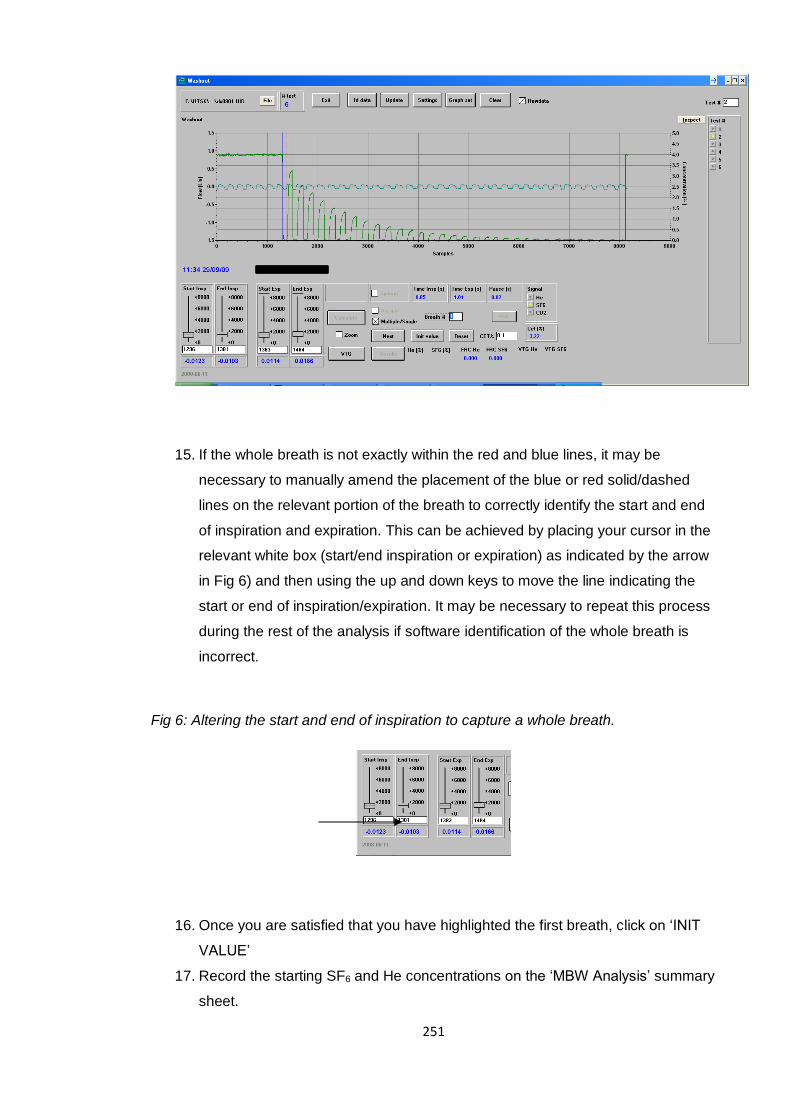
251
15. If the whole breath is not exactly within the red and blue lines, it may be
necessary to manually amend the placement of the blue or red solid/dashed
lines on the relevant portion of the breath to correctly identify the start and end
of inspiration and expiration. This can be achieved by placing your cursor in the
relevant white box (start/end inspiration or expiration) as indicated by the arrow
in Fig 6) and then using the up and down keys to move the line indicating the
start or end of inspiration/expiration. It may be necessary to repeat this process
during the rest of the analysis if software identification of the whole breath is
incorrect.
Fig 6: Altering the start and end of inspiration to capture a whole breath.
16. Once you are satisfied that you have highlighted the first breath, click on ‘INIT
VALUE’
17. Record the starting SF6 and He concentrations on the ‘MBW Analysis’ summary
sheet.
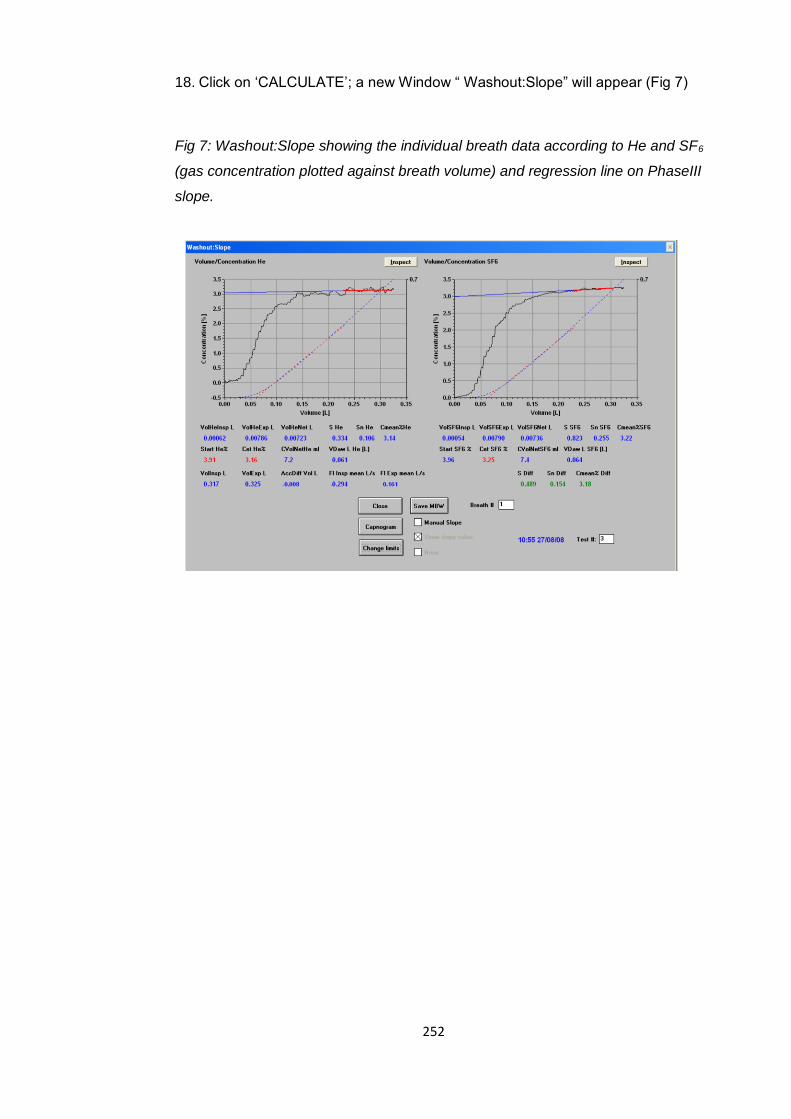
252
18. Click on ‘CALCULATE’; a new Window “ Washout:Slope” will appear (Fig 7)
Fig 7: Washout:Slope showing the individual breath data according to He and SF6
(gas concentration plotted against breath volume) and regression line on PhaseIII
slope.
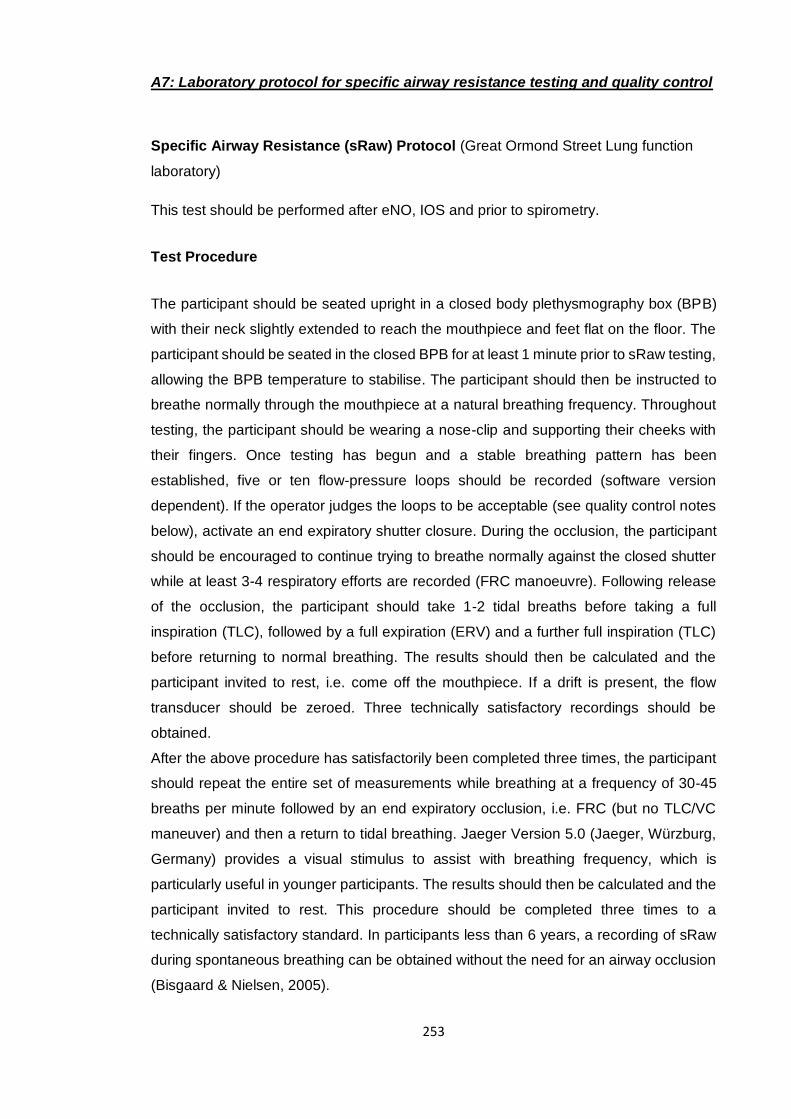
253
A7: Laboratory protocol for specific airway resistance testing and quality control
Specific Airway Resistance (sRaw) Protocol (Great Ormond Street Lung function
laboratory)
This test should be performed after eNO, IOS and prior to spirometry.
Test Procedure
The participant should be seated upright in a closed body plethysmography box (BPB)
with their neck slightly extended to reach the mouthpiece and feet flat on the floor. The
participant should be seated in the closed BPB for at least 1 minute prior to sRaw testing,
allowing the BPB temperature to stabilise. The participant should then be instructed to
breathe normally through the mouthpiece at a natural breathing frequency. Throughout
testing, the participant should be wearing a nose-clip and supporting their cheeks with
their fingers. Once testing has begun and a stable breathing pattern has been
established, five or ten flow-pressure loops should be recorded (software version
dependent). If the operator judges the loops to be acceptable (see quality control notes
below), activate an end expiratory shutter closure. During the occlusion, the participant
should be encouraged to continue trying to breathe normally against the closed shutter
while at least 3-4 respiratory efforts are recorded (FRC manoeuvre). Following release
of the occlusion, the participant should take 1-2 tidal breaths before taking a full
inspiration (TLC), followed by a full expiration (ERV) and a further full inspiration (TLC)
before returning to normal breathing. The results should then be calculated and the
participant invited to rest, i.e. come off the mouthpiece. If a drift is present, the flow
transducer should be zeroed. Three technically satisfactory recordings should be
obtained.
After the above procedure has satisfactorily been completed three times, the participant
should repeat the entire set of measurements while breathing at a frequency of 30-45
breaths per minute followed by an end expiratory occlusion, i.e. FRC (but no TLC/VC
maneuver) and then a return to tidal breathing. Jaeger Version 5.0 (Jaeger, Würzburg,
Germany) provides a visual stimulus to assist with breathing frequency, which is
particularly useful in younger participants. The results should then be calculated and the
participant invited to rest. This procedure should be completed three times to a
technically satisfactory standard. In participants less than 6 years, a recording of sRaw
during spontaneous breathing can be obtained without the need for an airway occlusion
(Bisgaard & Nielsen, 2005).
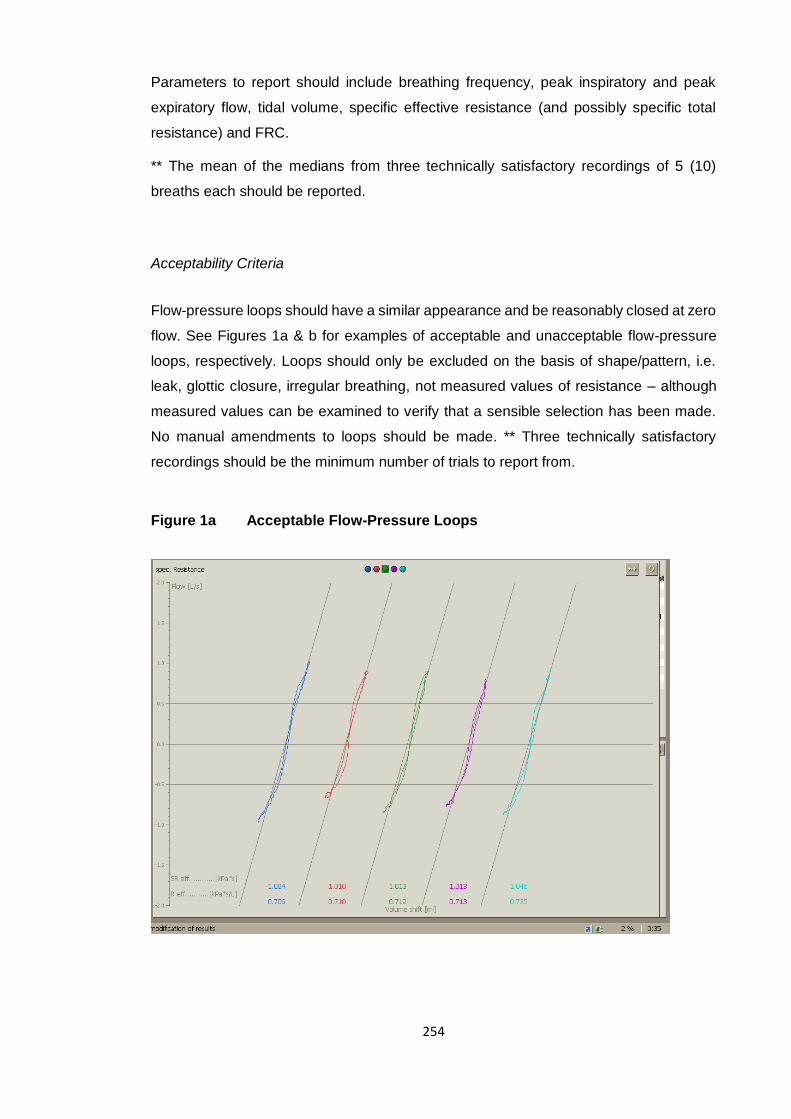
254
Parameters to report should include breathing frequency, peak inspiratory and peak
expiratory flow, tidal volume, specific effective resistance (and possibly specific total
resistance) and FRC.
** The mean of the medians from three technically satisfactory recordings of 5 (10)
breaths each should be reported.
Acceptability Criteria
Flow-pressure loops should have a similar appearance and be reasonably closed at zero
flow. See Figures 1a & b for examples of acceptable and unacceptable flow-pressure
loops, respectively. Loops should only be excluded on the basis of shape/pattern, i.e.
leak, glottic closure, irregular breathing, not measured values of resistance – although
measured values can be examined to verify that a sensible selection has been made.
No manual amendments to loops should be made. ** Three technically satisfactory
recordings should be the minimum number of trials to report from.
Figure 1a Acceptable Flow-Pressure Loops
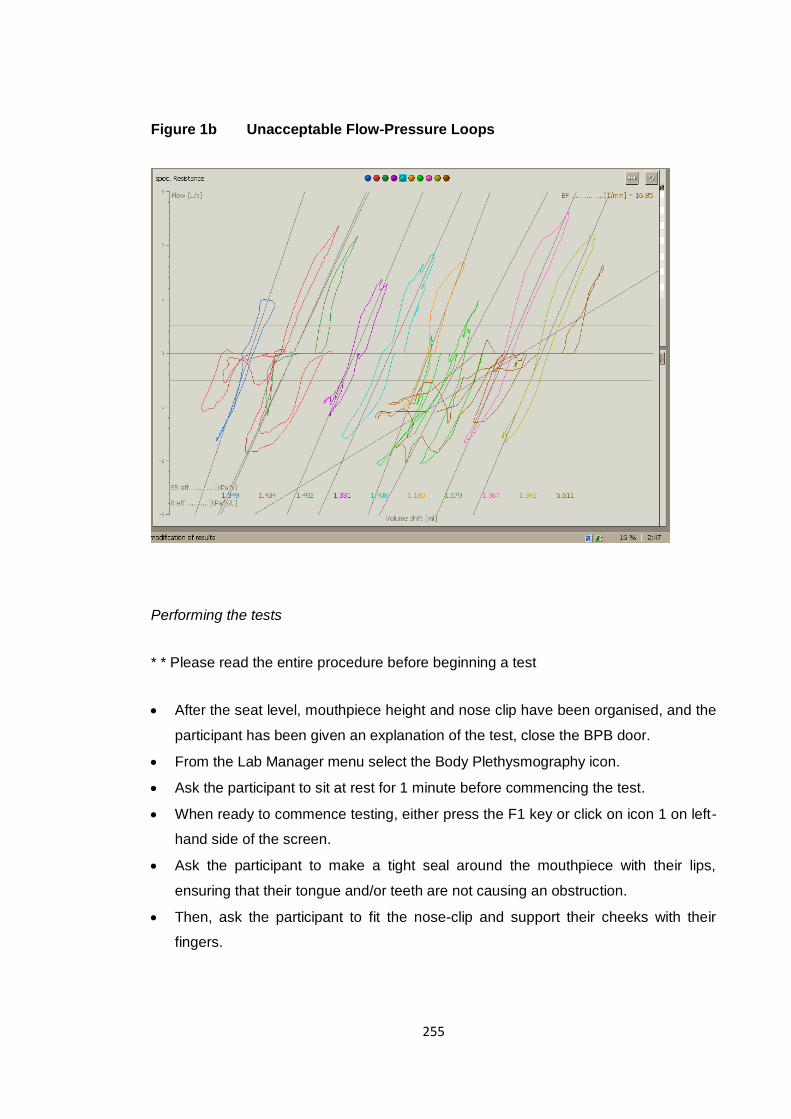
255
Figure 1b Unacceptable Flow-Pressure Loops
Performing the tests
* * Please read the entire procedure before beginning a test
After the seat level, mouthpiece height and nose clip have been organised, and the
participant has been given an explanation of the test, close the BPB door.
From the Lab Manager menu select the Body Plethysmography icon.
Ask the participant to sit at rest for 1 minute before commencing the test.
When ready to commence testing, either press the F1 key or click on icon 1 on left-
hand side of the screen.
Ask the participant to make a tight seal around the mouthpiece with their lips,
ensuring that their tongue and/or teeth are not causing an obstruction.
Then, ask the participant to fit the nose-clip and support their cheeks with their
fingers.
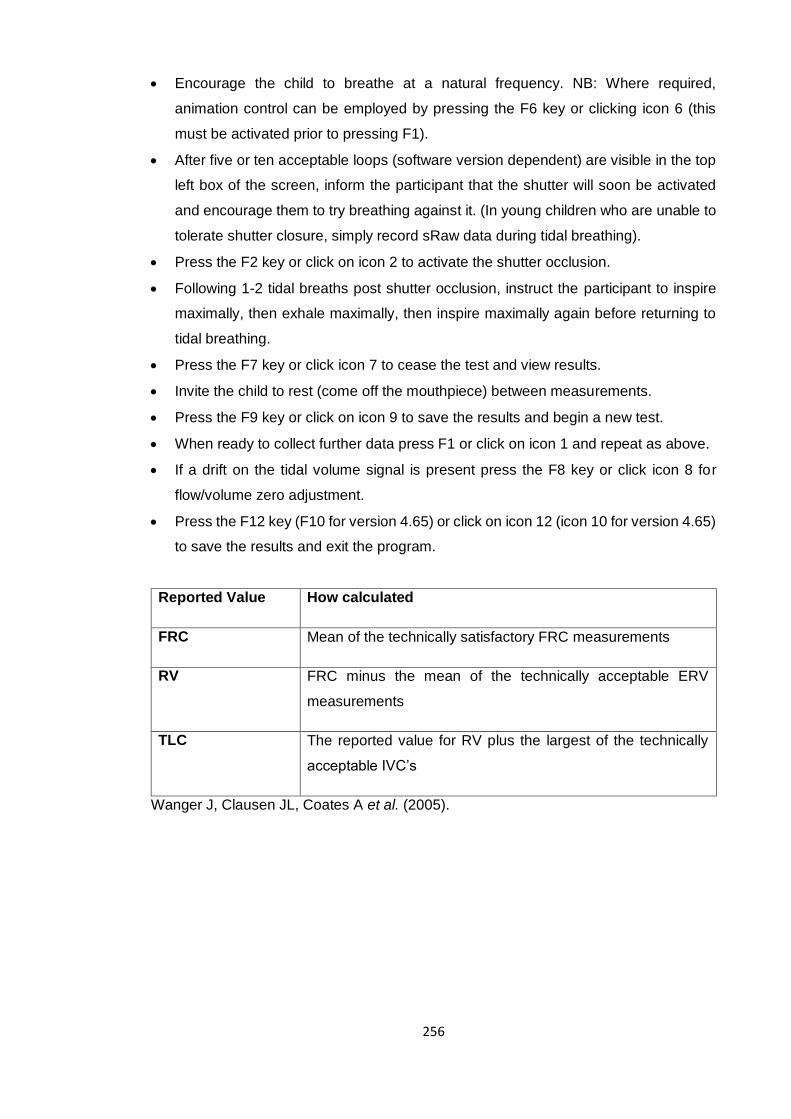
256
Encourage the child to breathe at a natural frequency. NB: Where required,
animation control can be employed by pressing the F6 key or clicking icon 6 (this
must be activated prior to pressing F1).
After five or ten acceptable loops (software version dependent) are visible in the top
left box of the screen, inform the participant that the shutter will soon be activated
and encourage them to try breathing against it. (In young children who are unable to
tolerate shutter closure, simply record sRaw data during tidal breathing).
Press the F2 key or click on icon 2 to activate the shutter occlusion.
Following 1-2 tidal breaths post shutter occlusion, instruct the participant to inspire
maximally, then exhale maximally, then inspire maximally again before returning to
tidal breathing.
Press the F7 key or click icon 7 to cease the test and view results.
Invite the child to rest (come off the mouthpiece) between measurements.
Press the F9 key or click on icon 9 to save the results and begin a new test.
When ready to collect further data press F1 or click on icon 1 and repeat as above.
If a drift on the tidal volume signal is present press the F8 key or click icon 8 for
flow/volume zero adjustment.
Press the F12 key (F10 for version 4.65) or click on icon 12 (icon 10 for version 4.65)
to save the results and exit the program.
Reported Value How calculated
FRC Mean of the technically satisfactory FRC measurements
RV FRC minus the mean of the technically acceptable ERV
measurements
TLC The reported value for RV plus the largest of the technically
acceptable IVC’s
Wanger J, Clausen JL, Coates A et al. (2005).