the effects of occupational class transitions on hypertension: racial disparities among working-age...
TRANSCRIPT
The Effects of Occupational ClassTransitions on Hypertension: RacialDisparities among Working-Age Men
Norman J. Waitzman, PhD, and Ken R. Smith, PhD
IntroductionHypertension is a major risk factor
for heart disease and stroke.' Its higherprevalence among Blacks relative toWhites in the United States is welldocumented2A although the mechanismsunderlying this racial disparity are notfully understood. The distinct income andsocial class gradients exhibited by bloodpressure3-6 suggest that characteristicsassociated with the disproportionate con-centration of Blacks in poverty and low-paying, insecure jobs are partly responsible.
Several epidemiological studies sup-port the view that psychosocial stressamong lower socioeconomic strata contrib-utes to differences in blood pressure,4'69and a review of the literature suggests thatemployment security and other workconditions play a pivotal role.'0 Thepresence of low decision latitude on thejob in the face of high demands, a pattemmost characteristic of jobs with low socialstatus, has been shown to be directlyassociated with the risk of cardiovasculardisease'" and elevated blood pressure.'2-14A separate group of studies on bloodpressure by race7-9 has focused on intemal-ized demands arising from a belief systemthat has been labeled "active coping" or"John Henryism": the perception thatenvironment can be mastered throughindividual determination. These studieshave generally supported an interactiverelationship between John Henryism andlow socioeconomic status leading to el-evated blood pressure among Blacks7-9but not among Whites.9
Most of the above research relatingpsychosocial stress to blood pressure hasdrawn inferences from cross-sectionaldata7-9"2 and has focused on particularsubgroups of the population, such as resi-dents of rural, southem communities7-9;workers within a very limited number of
occupationsl3 or occupational strata7-9; or acohort of relatively young workers.'4 Thefew longitudinal studies that have investi-gated the association between occupationalstrain and blood pressure'-14 are limitedwith respect to sample size and scope, asnoted above, and have not addressed racialdifferences. Furthermore, none has investi-gated the experience of social mobility as apotential factor. Some research has sug-gested that the prospects ofupward occupa-tional mobility are greater for Whites thanfor Blacks.15
We performed a longitudinal analy-sis of occupational class transitions andblood pressure changes among a nation-ally representative sample of Black andWhite men in the United States who werefollowed for 7 to 13 years after receiving abaseline medical examination. Our mea-sures of occupational class were based oncharacteristics that have distinct similari-ties to the demand/latitude characteris-tics in earlier research.'1-'4 While our datado not permit us to include explicitmeasures of active coping in our model,some of the significant correlates of JohnHenryism in earlier studies, such aseducation and occupational status, figureinto our classification scheme.
MethodsStudy Sample
The sample consisted of a cohort ofBlack and White men from the first
Norman J. Waitzman is with the Departmentof Economics and Ken R. Smith is with theDepartment of Family and Consumer Studies,University of Utah, Salt Lake City.
Requests for reprints should be sent toNorman J. Waitzman, PhD, Department ofEconomics, BUC 308, University of Utah, SaltLake City, UT 84112.
This paper was accepted February 15,1994.
American Journal of Public Health 945
Waitzman and Smith
National Health and Nutrition Examina-tion Survey (baseline) and the NationalHealth Examination Follow-Up Survey(follow-up) who were aged 25 to 55 atbaseline; were neither retired nor unableto work owing to sickness at baseline orfollow-up; and had complete blood pres-sure, occupational, and other covariatedata. Men aged 56 or older were excludedfrom the sample because of their low ratesof occupational reporting at follow-uplargely owing to retirement. The baselinesurvey was conducted between 1971 and1975, and the follow-up was conductedbetween 1982 and 1984. Of 2666 males atbaseline who met the above criteria, 149died and 218 were otherwise lost tofollow-up. Missing data for occupationaland other variables were responsible foran additional loss of 317 respondents. Ofthe remaining 1982 respondents who metall the sample selection criteria, 183 wereBlack.
The potential for sample selectionbias is of particular concern in longitudi-nal panel studies because those lost tofollow-up may differ in some nonrandomway from those who remain in thesample.16 Sample selection bias in theregressions was formally tested and cor-rected for, based on the Heckman tech-nique.16"17 The test suggested the absenceof such bias, so results are reportedwithout the sample selection bias correc-tion.
Specification of VariablesThe measurement protocol for blood
pressure was similar but not identicalacross surveys. A single measurementaccording to then-standard guidelines3was taken at baseline while three succes-sive measures during a single exam weretaken at follow-up. Summary data andregression results reported below use thefirst reading at follow-up to preserveconsistency in measurement across thetwo surveys. Results from regressionsusing averages of the second and thirdreadings at follow-up in accordance withcurrent guidelines,2 however, were nearlyidentical to those reported here.
Both dichotomous measures of hyper-tension used in this analysis are based ondefinitions of the lower bounds for mildhypertension (diastolic . 90 mm Hg) orborderline systolic hypertension (systolic> 140 mm Hg) established by the JointNational Committee on Detection, Evalu-ation, and Treatment of High BloodPressure.2 The second measure also incor-porates information on usage of bloodpressure medication. Respondents were
asked whether they were taking pre-scribed blood pressure medication atfollow-up. Information on such medica-tion at baseline was gathered for anationally representative subsample com-prising two thirds of the baseline respon-dents, however, and therefore was notused in the analysis to ensure as large asample as possible. In analyses based onthis subsample, such an adjustment madeno significant difference in the results.
Respondents were overweight if theirbody mass index (weight in kilograms/height in meters squared) at baselineequaled or exceeded that of the 85thpercentile of the body mass distributionamong the adult male population be-tween 1976 and 1980.18 The variable fordaily alcohol consumption was based onself-reports of the amount and frequencyof consumption at baseline and wascalculated as number of drinks per day xreported frequency of drinking x 0.5, with0.5 being an estimate of the amount ofethanol in a shot of liquor, a 5-oz glass ofwine, or a 12-oz glass of beer.19
Occupational ClassificationHealth and labor market studies that
use a scheme for occupational status haveoften relied on census one-digit occupa-tional categories. However, these catego-ries tend to be heterogeneous, give insuffi-cient weight tojob content and its changesover time, and lack a consistent base inlabor market or social theory.2021 Drawingon labor market segmentation theory toovercome these weaknesses,2223 this analy-sis used occupational ratings at the three-digit level for census occupations andincorporated differences in jobs arisingfrom industry characteristics.
According to segmentation theorists,the labor market is roughly split betweena primary market in which jobs arerelatively secure, pay well, and offeropportunities for training and advance-ment, and a secondary market character-ized by low-paying, dead-end jobs. Forthis study, a four-part segmentationscheme, which partitions the primarylabor market into three segments, wasadopted.23 24 The topmost segment (class1) comprises technical and professionaljobs that require several years of generaleducational preparation and involve inde-pendent decision-making and/or supervi-sory responsibilities. Jobs in class 2 arecraft jobs that require several years ofvocational training and also afford latitudein decision making. Occupations in class 3are more often machine paced and subjectto strict timetables, rules, and supervision
than are jobs in the upper two classes, butthey still offer job security and opportuni-ties for advancement. Such security andopportunities in secondary labor marketoccupations (class 4) are minimal eventhough skill requirements may be similarto those for entry-level jobs in class 3.
The four-part segmentation schemewas operationalized on the basis of bothscores on educational and training require-ments for occupations and ratings on theextent to which jobs afford decision-making latitude or require working at arepetitious or set pace, as per the Dictio-nary of Occupational Titles.25 Workerscould be reassigned between the bottomtwo classes based on census industrialcharacteristics. A description of themethod is available from another source.*
Occupational VariablesA respondent could be in any of the
four occupational classes at baseline andat follow-up, suggesting a 4 x 4 classtransition matrix. Cells along the diagonalof such a matrix identify those who werein the same class in both surveys, whereasoff-diagonal cells identify "movers." Be-cause the number of Blacks in the samplein several off-diagonal cells was small, itwas not possible to construct variablesspecifying all 16 occupational transitionsby race. Accordingly, certain cells werecollapsed for use in subsequent regres-sions. In particular, the direction of anoccupational move (up or down) and thedestination (class at follow-up) are thetwo dimensions used to identify occupa-tional transitions. Destination classes areimportant because they are more proxi-mal in time to recorded levels of bloodpressure at follow-up than are classes oforigin. Downward moves may generallybe considered more detrimental to healththan upward moves.
Dummy variables identify specifictransitions that preserve direction anddestination for both Whites and Blacks.The variable "Moved down to class 4," forexample, identifies downward moves from
*See National Auxiliary Publication Service(NAPS) document 05095 for 7 pages ofAppendix-Procedure for Allocating Workersby Occupational Segment. Please order di-rectly from NAPS c/o Microfiche Publications,PO Box 3513, Grand Central Station, NewYork, NY 10163-3513. Enclose with your order(a) $7.75 for paper copy or (b) $4.00 formicrofiche (US only funds from a US bank).For orders from outside the United States andCanada, add postage of $4.50 for paper copy or
$1.50 for microfiche. There is a $15.00 invoicingcharge for all orders filled before payment.
June 1994, Vol. 84, No. 6946 American Journal of Public Health
Occupational Class and Hypertension
class 1, 2, or 3. The "Stayed in class 1, 2, 3,or 4" dummies identify the four groups
that did not change occupational class.The model from which regression
results are reported below incorporatesinteraction terms between race and occu-
pational class transitions. Goodness-of-fitcomparisons between logistic regressionsbased on changes in the likelihood ratioindicate that the interaction terms de-tected in the final model fit the data betterthan simpler models. These results sug-
gest that, in addition to theoretical consid-erations, this is the "best" model on sta-tistical grounds.26,27
Model SpecificationLogistic regressions were run on two
dichotomous measures of hypertension atfollow-up. One measure is an indicator ofuncontrolled hypertension; the othercounts as hypertensive an additional 150respondents on antihypertensive medica-tion whose blood pressure was controlledat follow-up. The two measures were
incorporated to test the extent to whichhypertension control through medicationwas related to occupational class transi-tion.
Use of blood pressure medication atfollow-up was incorporated as a separatecovariate in the regression on uncon-
trolled hypertension. In this regression,such medication was expected to have a
positive relation to changes in bloodpressure, as those who took it would havedone so because their blood pressure was
increasing. However, among hyperten-sives at baseline, those taking medicationat follow-up were expected to have lowerblood pressure than their nonmedicatedcounterparts. Blood pressure medicationwas therefore also interacted with thebaseline measure of hypertension in thisregression, and these expectations were
borne out in the results.The association between occupa-
tional class and high blood pressure was
expected to follow a general inverserelationship.-3 The defining characteris-tics of the occupational segmentationscheme focused the analysis on underly-ing mechanisms for this relationship, suchas demands imposed by machine pacingand the level of decision-making author-ity, as suggested by the literature on
occupational characteristics and bloodpressure.10"2-14 Staying in or moving intolower rather than higher occupationalclasses was therefore expected to beassociated with the largest increases inblood pressure.
The baseline measure of hyperten-sion was incorporated as a covariate ineach regression. Other covariates, such as
overweight, alcohol intake, baseline age,
and aging (the time between baseline andfollow-up exams), were incorporated be-cause of their demonstrated associationwith elevated blood pressure.2 Populationdensity has an inverse association withmeasures of blood pressure,3 perhapsbecause of better access to medical care
or medical information in urbanized ar-
eas. Thus, an indicator variable was
incorporated for residence in the centercity of a standard metropolitan statisticalarea as a proxy for access to generalmedical resources.
ResultsThe distribution of the study sample
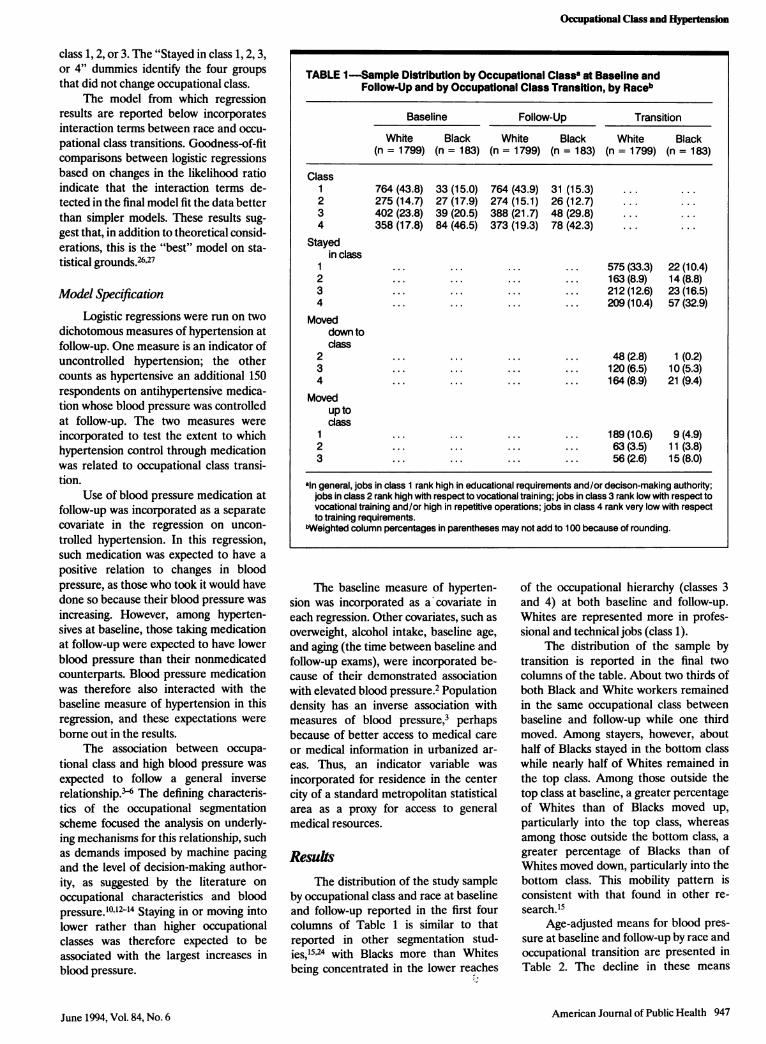
by occupational class and race at baselineand follow-up reported in the first fourcolumns of Table 1 is similar to thatreported in other segmentation stud-ies,15'24 with Blacks more than Whitesbeing concentrated in the lower reaches
of the occupational hierarchy (classes 3and 4) at both baseline and follow-up.Whites are represented more in profes-sional and technical jobs (class 1).
The distribution of the sample bytransition is reported in the final twocolumns of the table. About two thirds ofboth Black and White workers remainedin the same occupational class betweenbaseline and follow-up while one thirdmoved. Among stayers, however, abouthalf of Blacks stayed in the bottom classwhile nearly half of Whites remained inthe top class. Among those outside thetop class at baseline, a greater percentageof Whites than of Blacks moved up,particularly into the top class, whereasamong those outside the bottom class, a
greater percentage of Blacks than ofWhites moved down, particularly into thebottom class. This mobility pattern isconsistent with that found in other re-
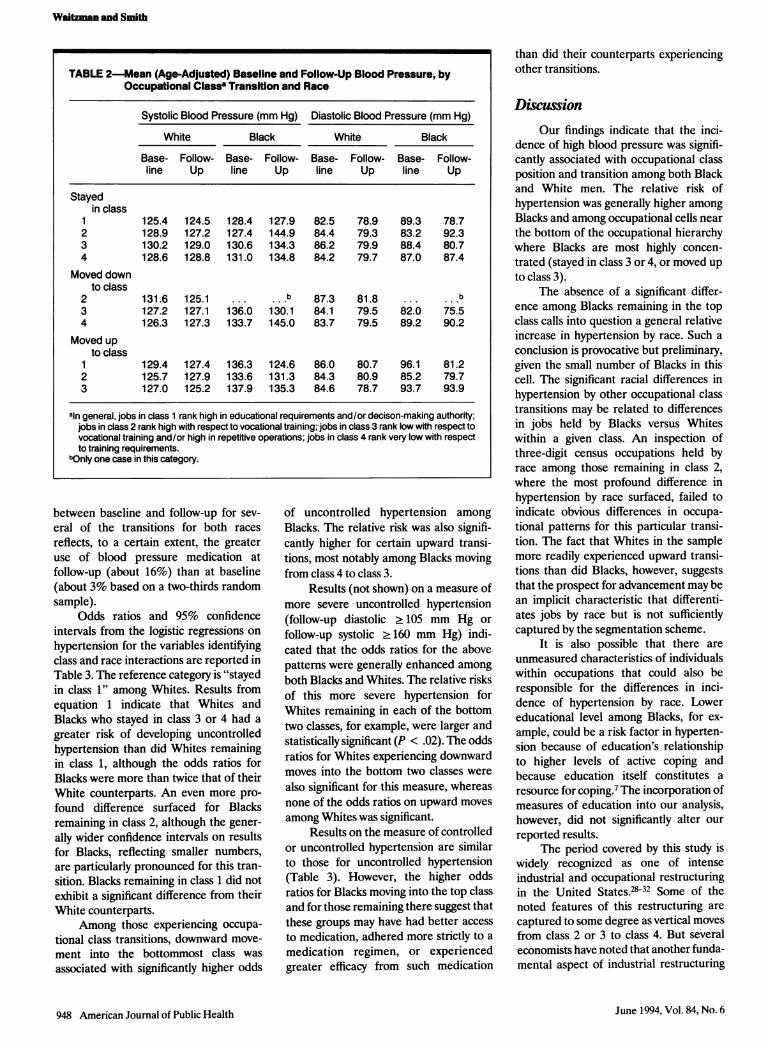
search.'5Age-adjusted means for blood pres-
sure at baseline and follow-up by race and
occupational transition are presented in
Table 2. The decline in these means
American Journal of Public Health 947
TABLE 1 -Sample Distribution by Occupational Classa at Baseline andFollow-Up and by Occupational Class Transition, by Raceb
Baseline Follow-Up Transition
White Black White Black White Black(n = 1799) (n = 183) (n = 1799) (n = 183) (n = 1799) (n = 183)
Class1 764 (43.8) 33 (15.0) 764 (43.9) 31 (15.3) ... ...
2 275 (14.7) 27 (17.9) 274 (15.1) 26 (12.7) ... ...
3 402 (23.8) 39 (20.5) 388 (21.7) 48 (29.8) ... ...
4 358 (17.8) 84 (46.5) 373 (19.3) 78 (42.3) ... ...
Stayedin class
1 ... ... ... ... 575 (33.3) 22 (10.4)2 ... ... ... ... 163 (8.9) 14 (8.8)3 ... ... ... ... 212 (12.6) 23 (16.5)4 ... ... ... ... 209 (10.4) 57 (32.9)
Moveddown todass
2 ... ... ... ... 48 (2.8) 1 (0.2)3 ... ... ... ... 120 (6.5) 10 (5.3)4 ... ... ... ... 164 (8.9) 21 (9.4)
Movedup toclass
1 ... ... ... ... 189 (10.6) 9 (4.9)2 ... ... ... ... 63 (3.5) 11 (3.8)3 ... ... ... ... 56 (2.6) 15 (8.0)
aln general, jobs in class 1 rank high in educational requirements and/or decison-making authority;jobs in class 2 rank high with respect to vocational training; jobs in class 3 rank low with respect tovocational training and/or high in repetitive operations; jobs in class 4 rank very low with respectto training requirements.
bWeighted column percentages in parentheses may not add to 100 because of rounding.
June 1994, Vol. 84, No. 6
Waitzman and Smith
between baseline and follow-up for sev-
eral of the transitions for both races
reflects, to a certain extent, the greateruse of blood pressure medication atfollow-up (about 16%) than at baseline(about 3% based on a two-thirds randomsample).
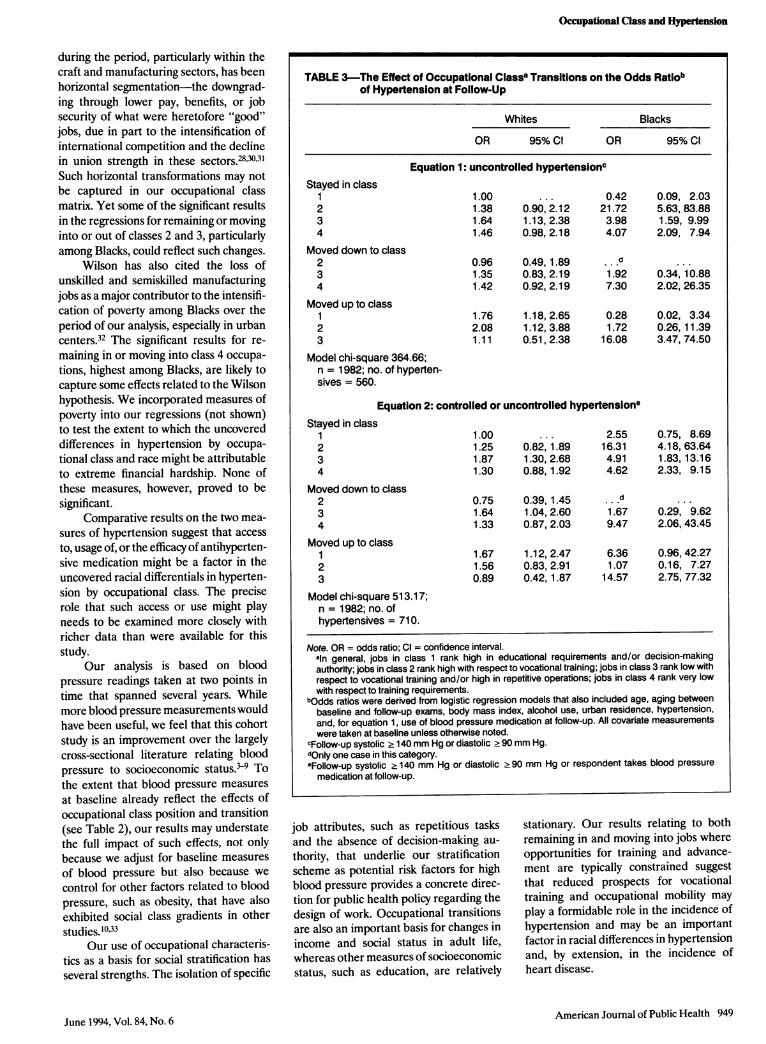
Odds ratios and 95% confidenceintervals from the logistic regressions on
hypertension for the variables identifyingclass and race interactions are reported inTable 3. The reference category is "stayedin class 1" among Whites. Results fromequation 1 indicate that Whites andBlacks who stayed in class 3 or 4 had a
greater risk of developing uncontrolledhypertension than did Whites remainingin class 1, although the odds ratios forBlacks were more than twice that of theirWhite counterparts. An even more pro-found difference surfaced for Blacksremaining in class 2, although the gener-ally wider confidence intervals on resultsfor Blacks, reflecting smaller numbers,are particularly pronounced for this tran-sition. Blacks remaining in class 1 did notexhibit a significant difference from theirWhite counterparts.
Among those experiencing occupa-tional class transitions, downward move-
ment into the bottommost class was
associated with significantly higher odds
of uncontrolled hypertension among
Blacks. The relative risk was also signifi-cantly higher for certain upward transi-tions, most notably among Blacks movingfrom class 4 to class 3.
Results (not shown) on a measure ofmore severe uncontrolled hypertension(follow-up diastolic .105 mm Hg or
follow-up systolic 2160 mm Hg) indi-cated that the odds ratios for the abovepatterns were generally enhanced among
both Blacks and Whites. The relative risksof this more severe hypertension forWhites remaining in each of the bottomtwo classes, for example, were larger andstatistically significant (P < .02). The oddsratios for Whites experiencing downwardmoves into the bottom two classes were
also significant for this measure, whereasnone of the odds ratios on upward moves
among Whites was significant.Results on the measure of controlled
or uncontrolled hypertension are similarto those for uncontrolled hypertension(Table 3). However, the higher oddsratios for Blacks moving into the top classand for those remaining there suggest thatthese groups may have had better access
to medication, adhered more strictly to a
medication regimen, or experiencedgreater efficacy from such medication
than did their counterparts experiencingother transitions.
DiscussionOur findings indicate that the inci-
dence of high blood pressure was signifi-cantly associated with occupational classposition and transition among both Blackand White men. The relative risk ofhypertension was generally higher amongBlacks and among occupational cells nearthe bottom of the occupational hierarchywhere Blacks are most highly concen-
trated (stayed in class 3 or 4, or moved up
to class 3).The absence of a significant differ-
ence among Blacks remaining in the topclass calls into question a general relativeincrease in hypertension by race. Such a
conclusion is provocative but preliminary,given the small number of Blacks in thiscell. The significant racial differences inhypertension by other occupational classtransitions may be related to differencesin jobs held by Blacks versus Whiteswithin a given class. An inspection ofthree-digit census occupations held byrace among those remaining in class 2,where the most profound difference inhypertension by race surfaced, failed toindicate obvious differences in occupa-
tional patterns for this particular transi-tion. The fact that Whites in the samplemore readily experienced upward transi-tions than did Blacks, however, suggeststhat the prospect for advancement may bean implicit characteristic that differenti-ates jobs by race but is not sufficientlycaptured by the segmentation scheme.
It is also possible that there are
unmeasured characteristics of individualswithin occupations that could also beresponsible for the differences in inci-dence of hypertension by race. Lowereducational level among Blacks, for ex-
ample, could be a risk factor in hyperten-sion because of education's relationshipto higher levels of active coping andbecause education itself constitutes a
resource for coping.7 The incorporation ofmeasures of education into our analysis,however, did not significantly alter our
reported results.The period covered by this study is
widely recognized as one of intenseindustrial and occupational restructuringin the United StatesA.2832 Some of thenoted features of this restructuring are
captured to some degree as vertical movesfrom class 2 or 3 to class 4. But several
economists have noted that another funda-mental aspect of industrial restructuring
948 American Journal of Public Health
TABLE 2-Mean (Age-Adjusted) Baseline and Follow-Up Blood Pressure, byOccupational Classa Transition and Race
Systolic Blood Pressure (mm Hg) Diastolic Blood Pressure (mm Hg)
White Black White Black
Base- Follow- Base- Follow- Base- Follow- Base- Follow-line Up line Up line Up line Up
Stayedin class
1 125.4 124.5 128.4 127.9 82.5 78.9 89.3 78.72 128.9 127.2 127.4 144.9 84.4 79.3 83.2 92.33 130.2 129.0 130.6 134.3 86.2 79.9 88.4 80.74 128.6 128.8 131.0 134.8 84.2 79.7 87.0 87.4
Moved downto class
2 131.6 125.1 b 87.3 81.8 ...b
3 127.2 127.1 136.0 130.1 84.1 79.5 82.0 75.54 126.3 127.3 133.7 145.0 83.7 79.5 89.2 90.2
Moved upto class
1 129.4 127.4 136.3 124.6 86.0 80.7 96.1 81.22 125.7 127.9 133.6 131.3 84.3 80.9 85.2 79.73 127.0 125.2 137.9 135.3 84.6 78.7 93.7 93.9
aln general, jobs in class 1 rank high in educational requirements and/or decison-making authority;jobs in class 2 rank high with respect to vocational training; jobs in class 3 rank low with respect tovocational training and/or high in repetitive operations; jobs in class 4 rank very low with respectto training requirements.
bOnly one case in this category.
June 1994, Vol. 84, No. 6
Occupational Class and Hypertension
during the period, particularly within thecraft and manufacturing sectors, has beenhorizontal segmentation-the downgrad-ing through lower pay, benefits, or jobsecurity of what were heretofore "good"jobs, due in part to the intensification ofinternational competition and the declinein union strength in these sectors.283031Such horizontal transformations may notbe captured in our occupational classmatrix. Yet some of the significant resultsin the regressions for remaining or movinginto or out of classes 2 and 3, particularlyamong Blacks, could reflect such changes.
Wilson has also cited the loss ofunskilled and semiskilled manufacturingjobs as a major contributor to the intensifi-cation of poverty among Blacks over theperiod of our analysis, especially in urbancenters.32 The significant results for re-maining in or moving into class 4 occupa-tions, highest among Blacks, are likely tocapture some effects related to the Wilsonhypothesis. We incorporated measures ofpoverty into our regressions (not shown)to test the extent to which the uncovereddifferences in hypertension by occupa-tional class and race might be attributableto extreme financial hardship. None ofthese measures, however, proved to besignificant.
Comparative results on the two mea-sures of hypertension suggest that accessto, usage of, or the efficacy of antihyperten-sive medication might be a factor in theuncovered racial differentials in hyperten-sion by occupational class. The preciserole that such access or use might playneeds to be examined more closely withricher data than were available for thisstudy.
Our analysis is based on bloodpressure readings taken at two points intime that spanned several years. Whilemore blood pressure measurements wouldhave been useful, we feel that this cohortstudy is an improvement over the largelycross-sectional literature relating bloodpressure to socioeconomic status.-9 Tothe extent that blood pressure measuresat baseline already reflect the effects ofoccupational class position and transition(see Table 2), our results may understatethe full impact of such effects, not onlybecause we adjust for baseline measuresof blood pressure but also because we
control for other factors related to bloodpressure, such as obesity, that have alsoexhibited social class gradients in otherstudies.10'33
Our use of occupational characteris-tics as a basis for social stratification hasseveral strengths. The isolation of specific
TABLE 3-The Effect of Occupational Classa Transitions on the Odds Ratiobof Hypertension at Follow-Up
Whites Blacks
OR 95% Cl OR 95% Cl
Equation 1: uncontrolled hypertensioncStayed in class
1 1.00 ... 0.42 0.09, 2.032 1.38 0.90, 2.12 21.72 5.63, 83.883 1.64 1.13, 2.38 3.98 1.59, 9.994 1.46 0.98, 2.18 4.07 2.09, 7.94
Moved down to class2 0.96 0.49, 1.89 d3 1.35 0.83, 2.19 1.92 0.34,10.884 1.42 0.92, 2.19 7.30 2.02, 26.35
Moved up to class1 1.76 1.18, 2.65 0.28 0.02, 3.342 2.08 1.12, 3.88 1.72 0.26,11.393 1.11 0.51, 2.38 16.08 3.47, 74.50
Model chi-square 364.66;n = 1982; no. of hyperten-sives = 560.
Equation 2: controlled or uncontrolled hypertensione
Stayed in class1 1.00 ... 2.55 0.75, 8.692 1.25 0.82,1.89 16.31 4.18, 63.643 1.87 1.30, 2.68 4.91 1.83,13.164 1.30 0.88,1.92 4.62 2.33, 9.15
Moved down to class2 0.75 0.39,1.45 d
3 1.64 1.04, 2.60 1.67 0.29, 9.624 1.33 0.87, 2.03 9.47 2.06, 43.45
Moved up to class1 1.67 1.12, 2.47 6.36 0.96, 42.272 1.56 0.83, 2.91 1.07 0.16, 7.273 0.89 0.42,1.87 14.57 2.75, 77.32
Model chi-square 513.17;n = 1982; no. ofhypertensives = 710.
Note. OR = odds ratio; Cl = confidence interval.amn general, jobs in class 1 rank high in educational requirements and/or decision-makingauthority; jobs in class 2 rank high with respect to vocational training; jobs in class 3 rank low withrespect to vocational training and/or high in repetitive operations; jobs in class 4 rank very lowwith respect to training requirements.
bOdds ratios were derived from logistic regression models that also included age, aging betweenbaseline and follow-up exams, body mass index, alcohol use, urban residence, hypertension,and, for equation 1, use of blood pressure medication at follow-up. All covariate measurementswere taken at baseline unless otherwise noted.
cFollow-up systolic 2 140 mm Hg or diastolic . 90 mm Hg.dOnly one case in this category.eFollow-up systolic .140 mm Hg or diastolic .90 mm Hg or respondent takes blood pressure
medication at follow-up.
job attributes, such as repetitious tasksand the absence of decision-making au-thority, that underlie our stratificationscheme as potential risk factors for highblood pressure provides a concrete direc-tion for public health policy regarding thedesign of work. Occupational transitionsare also an important basis for changes inincome and social status in adult life,whereas other measures of socioeconomicstatus, such as education, are relatively
stationary. Our results relating to bothremaining in and moving into jobs whereopportunities for training and advance-ment are typically constrained suggestthat reduced prospects for vocationaltraining and occupational mobility mayplay a formidable role in the incidence ofhypertension and may be an importantfactor in racial differences in hypertensionand, by extension, in the incidence ofheart disease.
American Journal of Public Health 949June 1994, Vol. 84, No. 6
Waitzman and Smith
To reduce racial disparities in highblood pressure and associated disease andmortality is a prominent public healthgoal of the nation.1 While the PublicHealth Service has specifically singled outthe work site as a valuable arena for bloodpressure screening, education, referral,and control activities,1 our findings sug-gest that certain structural aspects ofworkalso merit attention with respect to thesegoals. l
AcknowledgmentsThis study was supported by National ResearchService Award THS00026 from the Agency forHealth Care Policy and Research.
We would like to thank David Ragland,Joan Bloom, and participants in the BehavioralFactors in Cardiovascular Disease Seminar, allat the University of California, Berkeley;participants in the Writing Seminar at theInstitute for Health Policy Studies, Universityof California, San Francisco; Nancy Krieger,Kaiser Foundation Research Institute; and twoanonymous reviewers and the Editor of theJournal for their helpful comments and sugges-tions on earlier versions of this manuscript.
References1. Healthy People 2000:NationalHealth Promo-
tion and Disease Prevention Objectives.Washington, DC: US Dept of Health andHuman Services; 1990. DHHS publicationPHS 91-50212.
2. 1988 Joint National Committee. The 1988report of the Joint National Committee onDetection, Evaluation and Treatment ofHigh Blood Pressure. Arch Intem Med.1988;148:1023-1038.
3. Blood pressure levels of persons 6-74years: United States, 1971-1974. VitalHealth Stat [11]. 1977; no. 203. DHEWpublication HRA 78-1648.
4. Prineas RJ, Gillum R. US epidemiology ofhypertension in Blacks. In: Hall WD,Saunders E, Shulman N, eds. Hypertensionin Blacks: Epidemiology, Pathophysiology,and Treatment. Chicago, Ill: Year BookMedical Publishers, Inc; 1985:17-36.
5. Syme SL, Oakes TW, Friedman GD,Feldman R, Siegelaub AB, Collen M.Social class and racial differences in bloodpressure. Am J Public Health. 1974;64:619-620.
6. James SA. Psychosocial and environmentalfactors in Black hypertension. In: HallWD, Saunders E, Shulman N, eds. Hyper-tension in Blacks: Epidemiology, Pathophysi-ology, and Treatment. Chicago, Ill: YearBook Medical Publishers, Inc; 1985:132-143.
7. James SA, Hartnett SA, Kalsbeek WB.John Henryism and blood pressure differ-ences among black men. J Behav Med.1983;6:259-278.
8. James SA, La Croix AZ, Kleinbaum DG,Strogatz DS. John Henryism and bloodpressure differences among Black men: II.the role of occupational stressors. J BehavMed. 1984;7:259-275.
9. James SA, Strogatz DS, Wing SB, RamseyDL. Socioeconomic status, John Henryism,and hypertension in blacks and whites.AmJEpidemiol. 1987;126:664-673.
10. Marmot M, Theorell T. Social class andcardiovascular disease: the contribution ofwork. IntJHealth Serv. 1988;18:659-674.
11. Karasek RA, Baker D, Marxer F, AhlbomA, Theorell T. Job decision latitude, jobdemands and cardiovascular disease: aprospective study of Swedish men. Am JPublic Health. 1981;71:694-705.
12. Schnall PL, Pieper C, Schwartz JE, et al.The relationship between "job strain,"workplace diastolic blood pressure, andleft ventricular mass index.JAMA. 1990;263:1929-1935.
13. Theorell T, Perski A, Akerstedt T, et al.Changes in job strain in relation to changesin physiological state: a longitudinal study.Scand J Work Environ Health. 1988;14:189-196.
14. Knox SS, Theorell T, Svensson J, Waller D.The relation of social support and workingenvironment to medical variables associ-ated with elevated blood pressure in youngmales: a structural model. Soc Sci Med.1985;21:525-531.
15. Rumberger RW, Carnoy M. Segmentationin the US labour market: its effects on themobility and earnings of Whites andBlacks. Cambridge JEcon. 1980;4:117-132.
16. Berk RA. An introduction to sampleselection bias in sociological data. AmSociol Rev. 1983;48:386-398.
17. Heckman JJ. Sample selection bias as aspecification error. Econometrica. 1979;45:153-161.
18. Anthropometric reference data and preva-lence of overweight: United States, 1976-
80. Vital Health Stat [11]. 1987; no. 238:6.DHHS publication PHS 87-1688.
19. Schatzkin A, Jones Y, Hoover RN, et al.Alcohol consumption and breast cancer inthe epidemiologic follow-up study of thefirst National Health and Nutrition Exami-nation Survey. N Engl J Med. 1987;316:1169-1173.
20. Scoville J. The development and relevanceof US occupational data. Ind Labor Rela-tions Rev. 1965;19:70-79.
21. Scoville JG. The Job Content of the USEconomy, 1940-1970. New York, NY:McGraw-Hill Book Co; 1969:1-10.
22. Doeringer PB, Piore MJ. Internal LaborMarkets and Manpower Analysis. Armonk,NY: ME Sharpe Inc; 1971.
23. Edwards R. Contested Terrain: The Transfor-mation of the Workplace in the TwentiethCentury. New York, NY: Basic Books Inc;1979.
24. Gordon DM, Edwards R, Reich M. Seg-mented Work; Divided Workers: The Histori-cal Transformation of Labor in the UnitedStates. New York, NY: Cambridge Univer-sity Press; 1982.
25. Dictionary of Occupational Titles. 4th ed.Washington, DC: US Dept of Labor; 1977.
26. Feinberg SE. The Analysis of Cross-Classified Categorical Data. Cambridge,Mass: MIT Press; 1980.
27. Hosmer DW, Lemeshow S. Applied Logis-tic Regression. New York, NY: John Wiley& Sons Inc; 1989.
28. Bluestone B, Harrison B. The Great U-Tum: Corporate Restructuring and the Polar-izing of America. New York, NY: BasicBooks Inc; 1988.
29. Burtless G, ed.A Future ofLousyJobs? TheChanging Structure of US Wages. Washing-ton, DC: The Brookings Institution; 1990.
30. Osterman P. Employment Futures: Reorgani-zation, Dislocation, and Public Policy. Ox-ford, England: Oxford University Press;1988.
31. Pfeffer J, Baron J. Taking the workers backout: recent trends in the structuring ofemployment. Res Organ Behav. 1988;10:257-303.
32. Wilson WJ. The Truly Disadvantaged: TheInner City, the Underclass, and Public Policy.Chicago, Ill: University of Chicago Press;1987.
33. Syme SL, Berkman LF. Social class, suscep-tibility and sickness. Am J Epidemiol.1976;104:1-8.
950 American Journal of Public Health June 1994, Vol. 84, No. 6