the effects of area closures on georges bank
TRANSCRIPT

345
American Fisheries Society Symposium 41:345–368, 2005© 2005 by the American Fisheries Society
1 E-mail: [email protected]
TTTTThe Effects of he Effects of he Effects of he Effects of he Effects of Area Closures on Georges BankArea Closures on Georges BankArea Closures on Georges BankArea Closures on Georges BankArea Closures on Georges Bank
JASON LINK1 AND FRANK ALMEIDA
National Marine Fisheries Service, Northeast Fisheries Science Center,166 Water Street, Woods Hole, Massachusetts 02543, USA
PAGE VALENTINE
U.S. Geological Survey, Woods Hole Field Center, 384 Woods Hole Road,Quisset Campus, Woods Hole, Massachusetts 02543, USA
PETER AUSTER
National Undersea Research Center and Department of Marine Sciences,1084 Shennecossett Road, Groton, Connecticut 06340, USA
ROBERT REID AND JOSEPH VITALIANO
National Marine Fisheries Service, Northeast Fisheries Science Center,74 Magruder Road, Highlands, New Jersey 07732, USA
Abstract. In late 1994, substantial portions of Georges Bank were closed to commercial fishing to assistwith stock rebuilding. These areas were Closed Area I (CAI), located on the western portion of the bank,and Closed Area II (CAII), on the eastern portion. After about 5 years of closure, the southern portion ofCAII and the central portion of CAI, having exhibited substantial increases in biomass and density of seascallops Placopecten magellanicus, were reopened to scallop fishing. Before the industry was allowedentry, we conducted surveys to monitor the recovery of benthic habitat and fauna inside both areas.Sampling sites were selected in a paired station design for an inside–outside comparison representative ofmajor habitat types in each closed area; other stations were chosen to survey the remainder of the closedareas. At each station, we examined a suite of biotic and abiotic variables ranging from substrate type tobenthos to nekton. Our results suggest few differences between the inside–outside paired stations in bothclosed areas for nekton and benthic species composition and species richness. Fish abundance and biomasswere similar inside and outside the closed areas. However, individuals of species such as skates (Rajaspp.), haddock Melanogrammus aeglefinus, and flounders (Pleuronectiformes) were generally largerinside than outside the closed areas. Additionally, habitat type was important in determining the distribution,abundance, biomass, size, and feeding ecology for some of the more benthic-oriented species studied. InCAI, the differences we observed in the suite of biotic metrics are likely a result of the high diversity ofhabitat types, with many of the habitat types composed of higher-relief material (e.g., cobble, gravel,etc.) in the region. The seabed in the southern portion of CAII is a relatively high-energy sand habitat oflow to moderate complexity and has a relatively low vulnerability to trawling and dredging, which mayexplain why there were less pronounced differences in abundance or biomass across habitat types in thatclosed area as compared to CAI. Other parts of closed areas on the northeastern shelf may exhibit moreobvious changes in the same biological metrics due to the presence of more complex habitats and increasedvulnerability to bottom tending fishing gear. Those differences we observed for CAI and CAII may haveimplications for the population dynamics of commercially valuable benthic species, yet that questionremains a major challenge.
IntroductionIntroductionIntroductionIntroductionIntroduction
There has been much recent interest in the effects offishing on habitat and nontarget species and how these
effects can influence populations of economically valu-able species (e.g., Jennings and Kaiser 1998; Benaka1999; Kaiser and de Groot 2000). The general para-digm is that as habitat complexity increases, sensitiv-ity to fishing effects increases, and changes inducedby fishing activities become more extreme (Auster et
LINK ET AL.346
al. 1996; Auster and Langton 1999). Fishing pressureusually supersedes ecological processes and can causea notable decline in benthic macrofauna and habitatcomplexity (Jennings and Polunin 1996; Collie et al.1997, 2000a; Thrush et al. 1998; Auster and Langton1999; Jennings et al. 2002). If habitat effects of fish-ing are reduced or eliminated but insufficient suitablehabitat or food remains for juvenile settlement, it maynot be possible to attain sustainable levels for givenfish stocks or populations. Thus, the utility of area clo-sures (a narrower application of the marine reserveconcept) merits examination in an ad hoc, in situ ex-perimental sense.
There has also been much recent interest in ma-rine protected areas (MPAs), area closures, or marinereserves (see Conover et al. 2000). Year-round, no-takemarine reserves have been identified, particularly, astools that can enhance both populations of exploitedspecies and biodiversity in general (e.g., McManus1998; Auster and Shackell 2000; Mosquera et al. 2000;NRC 2001; Roberts et al. 2001; Ward et al. 2001; Fisherand Frank 2002). However, opportunities to examineclosed areas are generally limited, particularly on thelarge temporal and spatial scales at which fisheries op-erate (i.e., significant fractions of continental shelves).
The effects of fishing activities on the seaflooroff New England are also receiving increased atten-tion from fishery managers, conservationists, fisheryscientists, and fishermen (e.g., Auster et al. 1996;Dorsey and Pederson 1998; Auster and Shackell 2000).Georges Bank was once the prime fishing ground onthe U.S. East Coast. However, overfishing has causedthe decline of the primary groundfish species (e.g.,Atlantic cod Gadus morhua, haddock Melanogrammusaeglefinus, and yellowtail flounder Limandaferruginea), which has led to increasingly restrictivemanagement measures. The bank is an important nurs-ery ground for these and other groundfish species(Smith and Morse 1985; Lough et al. 1989), and largeareas have been closed to fishing to protect recover-ing stocks (Murawski et al. 1997; Fogarty andMurawski 1998). As groundfish populations continueto decline in areas open to fishing, there is increasingpressure to allow access to resources in the closed ar-eas. In addition, fishery managers and other resourcestakeholders are requiring information about the ef-fects of fishing gears and the effects of closed areason the benthic habitats of Georges Bank.
Since 1970, fishery management in New Englandhas included seasonal closures of parts of GeorgesBank to a variety of fishing gears. The boundaries ofthe closed areas have changed over time in responseto fluctuations in spawning grounds and concerns ofmanagement. The continued deterioration of ground-
fish stocks (declining abundance and high exploitationrates) prompted the closure of two areas on Georges Bankand one in southern New England to fishing gears thatcatch groundfish (trawls, gill nets, hook and line, andscallop dredges) in December 1994 (Figure 1). TheGeorges Bank closed areas comprise about 10,900 km2,roughly 25% of the total area of the bank. Closed Area IIwas among the most heavily fished areas on GeorgesBank from 1982 to 1993. The southern part of CAII(south of 41°30’N) was reopened to commercial fishingfor sea scallops Placopecten magellanicus during June15–November 12, 1999, the first time in nearly 5 years.The central portion of CAI was reopened to commercialfishing for sea scallops during October 1, 1999–January12, 2000. The closed areas on Georges Bank have beenexamined with respect to targeted resource species (e.g.,Brown et al. 1998; Murawski et al. 2000); however, nostudies have examined the entire fish and benthic commu-nities simultaneously in these closed areas.
The objective of our study was to evaluate the ef-fects of area closures on nekton and benthic communitycomposition over large areas encompassing a range ofhabitat types. In particular, we examine a suite of abioticand biotic metrics, before the fishery reopened in 1999, todetermine if, after 4.5 years of closure, there werediscernable differences inside versus immediately out-side each of the closed areas.
Geologic, Oceanographic, andGeologic, Oceanographic, andGeologic, Oceanographic, andGeologic, Oceanographic, andGeologic, Oceanographic, andBenthic Benthic Benthic Benthic Benthic Attributes of Georges BankAttributes of Georges BankAttributes of Georges BankAttributes of Georges BankAttributes of Georges Bank
Georges Bank is a shallow (3–150 m) extension of thecontinental shelf of the northeastern United States, cov-ering approximately 40,000 km2 within the 100-misobath. The bank is covered by glacial debris and iseroding; sediment is currently not transported from thecontinent or from adjacent shelves to the bank. Thebank has strong tidal (predominantly northwestern–southeastern) currents and storm currents that transportsand from the bank into deep water. In shallow areas,tidal currents mix the water column and combine withweaker currents to form a broad, clockwise gyre (5–30cm/s) around the bank (Butman et al. 1982; Twichell etal. 1987; Valentine and Lough 1991; Valentine et al.1993). There is a highly energetic peak in the northwith sand ridges up to 20–30 m high and an extensivegravel pavement with a relatively smooth seabed offiner-grained sediments on the deeper southern flank.Sediments are generally sand and gravel with little siltand clay (1–5% by weight) or organic carbon (<0.5%by weight) (Butman et al. 1982; Twichell et al. 1987;Valentine and Lough 1991; Valentine et al. 1993;Theroux and Wigley 1998). The macrobenthic fauna is

EFFECTS OF AREA CLOSURES ON GEORGES BANK 347
generally dominated numerically by crustaceans, annelids,echinoderms, and mollusks and dominated in terms of bio-mass by echinoderms, mollusks, crustaceans, and annelids(Theroux and Wigley 1998).
Closed Area IClosed Area IClosed Area IClosed Area IClosed Area I
The seafloor in Closed Area I covers approximately 3,960km2 with water depths ranging from 55 to 110 m. Thisarea is affected by tidal currents that flow predominantlynorth–south with a mean velocity of 45–60 cm/s and byintermittent storm currents of greater strength (Butman etal. 1982; Twichell et al. 1987; Valentine and Lough 1991;Valentine et al. 1993). The sediment is highly varied,ranging from fine-grained sand in deep water, to gravelpavements and boulder piles associated with sand dunesat intermediate depths, to a mixture of coarse-grained sandand gravel at shallow depths (Butman et al. 1982; Twichellet al. 1987; Valentine and Lough 1991; Valentine et al.1993; Theroux and Wigley 1998).
The predominant seabed features are long east–westtrending sand dunes with steep faces that range up to 20
m in height (Butman et al. 1982; Twichell et al. 1987;Valentine and Lough 1991; Valentine et al. 1993; Therouxand Wigley 1998; P. Valentine, personal observation).The rippled surfaces of the dunes are maintained by tidalcurrents. Strong north–south flowing storm currents areresponsible for forming the dunes, which are relativelystable from year to year. Large areas of the seabed arecovered by pebble-gravel pavement, and some parts arecharacterized by mounds of boulders and cobbles of gla-cial origin. In areas of mixed sand and gravel, the sedi-ment is segregated into large storm sand ripples (up to 30cm high) that are separated by gravel troughs. Deeperparts of the area are floored with fine-grained rippledsand becoming increasingly unrippled as water depthsincrease.
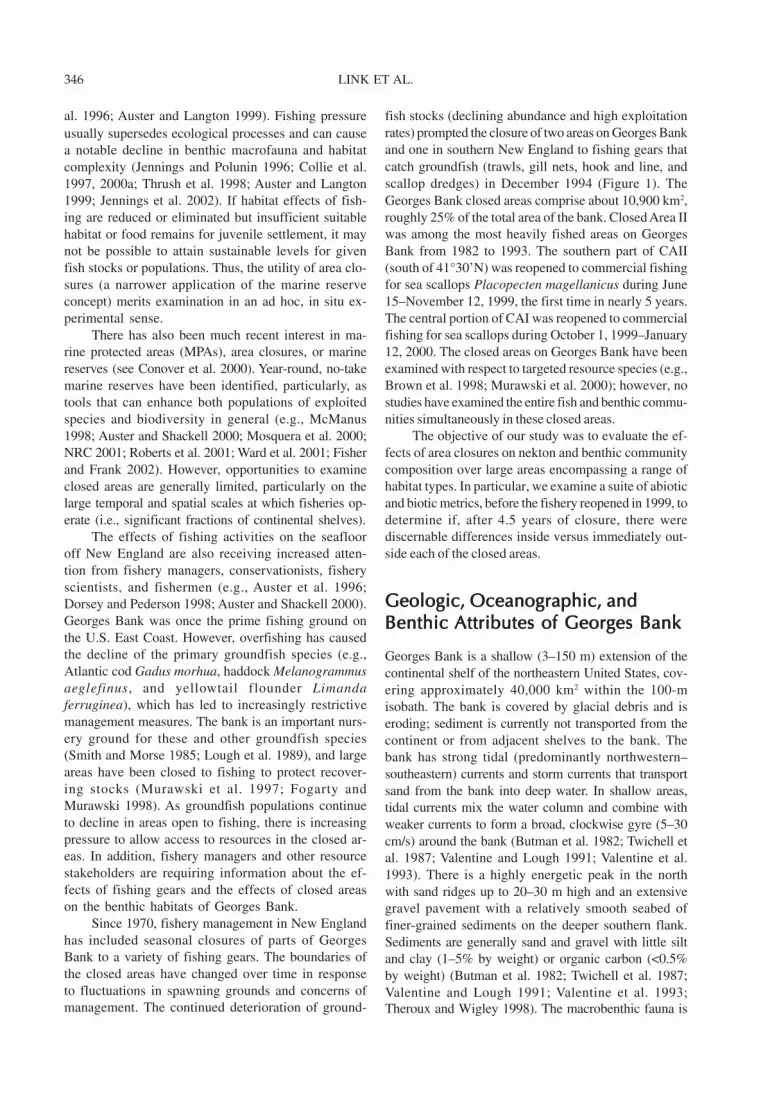
The seafloor can be separated into three mainzones. A moderate-energy zone (Zone 1) with mixedsand and gravel occupies the mid-portion of the closedarea (Figures 2, 3). This zone has tidal and intermit-tent storm currents. It has minimal epifauna on stormsand ripples, with epifauna concentrated on gravel in
Figure 1. Figure 1. Figure 1. Figure 1. Figure 1. Map of the major Closed Areas on Georges Bank and Southern New England with areas re-openedto sea scallop fishery during 1999–2001. Latitude and Longitude are given in decimal degrees.
100m
ClosedArea II
Open15 Aug-30 Sep 2000
Nantucket LightshipClosed Area
Open1 Oct 2000-31 Jan 2001
Closed Area I
HAPC
Open15 Jun-12 Nov 199915 Jun-14 Aug 2000
40.0
41.0
42.0
70.0 69.0 68.0 67.0 66.0
LINK ET AL.348
ripple troughs. However, the epifauna will be coveredby sand during a major storm or during trawling anddredging events. A subsequent storm will form newripples and expose gravel in the troughs. A high-energy
zone (Zone 2) with large dunes, gravel mounds, pebblegravel pavements, and rippled sand migrating over pebblegravel is located in the southern portion of the area. Thiszone is also affected by both tidal and intermittent storm
Figure 2. Figure 2. Figure 2. Figure 2. Figure 2. Map of Closed Area I on Georges Bank, with zonation and locationof sampling sites occupied during the cruises to each area. Latitude andLongitude are given in decimal degrees.
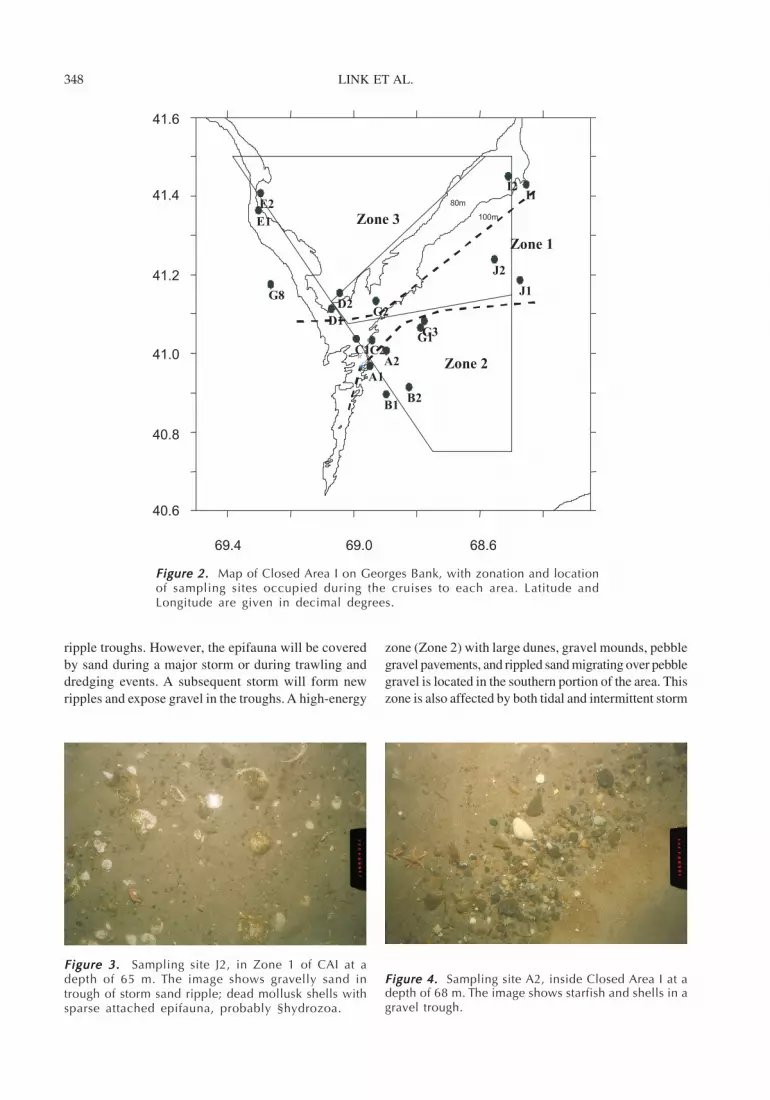
Figure 3. Figure 3. Figure 3. Figure 3. Figure 3. Sampling site J2, in Zone 1 of CAI at adepth of 65 m. The image shows gravelly sand intrough of storm sand ripple; dead mollusk shells withsparse attached epifauna, probably §hydrozoa.
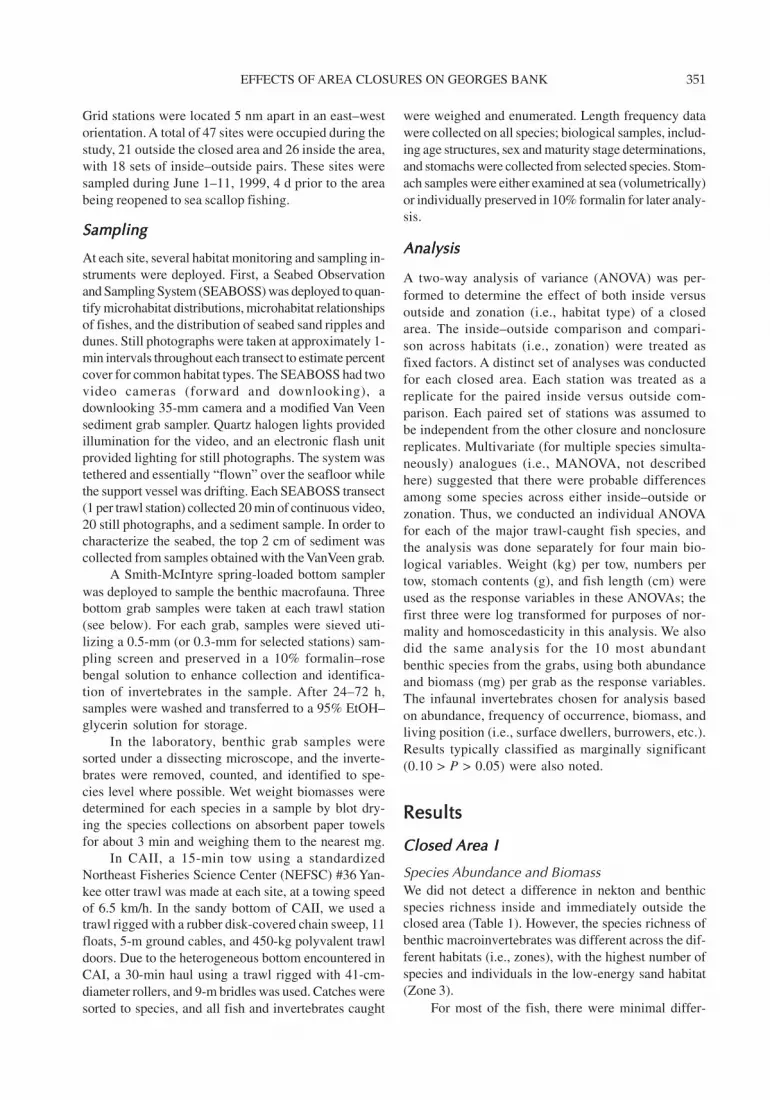
Figure 4. Figure 4. Figure 4. Figure 4. Figure 4. Sampling site A2, inside Closed Area I at adepth of 68 m. The image shows starfish and shells in agravel trough.
69.4 69.0 68.6
41.4
41.0
40.8
40.6
41.2
41.6
E2
E1
G8
G2D2
D1
C2C1
A1
B1B2
A2
G1G3
J2
J1
I1I2
100m
80m
Zone 1
Zone 3
Zone 2

EFFECTS OF AREA CLOSURES ON GEORGES BANK 349
currents. The zone has epifauna on hard bottoms, butepifauna are rare on rippled sand and dunes (Figure 4).Finally, Zone 3 is a low-energy zone with fine-grainedsand and very infrequent weak storm currents or nocurrents. Epifauna are rare in this zone, but burrows arecommon (Figure 5).
Closed Area IIClosed Area IIClosed Area IIClosed Area IIClosed Area II
The seafloor in the southern part of Closed Area II (southof 41°30’N) covers approximately 3,880 km2 (Figure 6).The area slopes gently southeastward with water depthsthat range from 35 m in the northwest to about 90 m in thesoutheast. It is affected by strong tidal currents that flowpredominantly northwest–southeast and has mean tidalcurrent speeds greater than 40 cm/s in the northwesternpart of the study area, diminishing to 10 cm/s in the south-eastern part (Butman et al. 1982; Twichell et al. 1987;Valentine and Lough 1991; Valentine et al. 1993). Thearea is impacted by intermittent storm currents that extendto depths of at least 90 m. The sediment is predominantlysand, with small areas of burrowed muddy outcrops inthe northwestern corner (Butman et al. 1982; Twichell etal. 1987; Valentine and Lough 1991; Valentine et al. 1993;Theroux and Wigley 1998).
The seabed morphology in the northwestern part(between depths of 35–65 m) is characterized byrippled sand bedforms approximately 20–30 cm highwhose crests are aligned northeast–southwest, normalto the strongest tidal flow (Butman et al. 1982; Twichellet al. 1987; Valentine and Lough 1991; Valentine et al.
Figure 5. Figure 5. Figure 5. Figure 5. Figure 5. Sampling site I2, inside Closed Area I at adepth of 88 m. The image shows a red hake on a finesand bottom.
Figure 6. Figure 6. Figure 6. Figure 6. Figure 6. Map of Closed Area II on Georges Bank, with zonation andlocation of sampling sites occupied during the cruises to each area.Latitude and Longitude are given in decimal degrees.
41.6
41.0
40.8
41.4
41.2
67.4 67.0 66.6
60m
80m
100m
2A1A
2B1B
2C1C
MMS1/2D1D
2E1E
1F
1G 2G
2F
3G
3F
3E GN3/4E
4F
4G MMS2/5G
5F 6F
6G
MMS3/6H
7G
7F8F
8E 9E
9D8D
GN4/8C
10C
9B8B
8A
7AG5
6B
7C
6D
7E5E
4D
4B
Zone 1
Zone 2

LINK ET AL.350
1993; Theroux and Wigley 1998; P. Valentine, personalobservation). Sand ripples and bedforms are generallyabsent below 65 m, except for those created by occa-sional storm currents. Movement and reworking of thesediment by bottom currents (and possibly by mobilefishing gear) winnows fine material. Sand contains lessthan 1% combined silt and clay throughout the 65–90-m depth interval, except at several locations in the east-ern part where mud content reaches 1–3%.
This portion of the closed area can be separatedinto two main zones (Figure 6). First is a high-energyzone (Zone 1) in depths of 35–65 m where sand is trans-ported back and forth on a daily basis by tidal currentsand occasionally moved by storm currents (Figure 7).A low-energy zone (Zone 2) in depths of 65–90 m isaffected principally by storm currents (Figure 8).
MethodsMethodsMethodsMethodsMethods
Sampling Site SelectionSampling Site SelectionSampling Site SelectionSampling Site SelectionSampling Site Selection
The overall approach we used for both closed areaswas to examine a series of paired stations inside a closedarea and immediately outside the area. We examined asuite of variables to explore the hypothesis that responsesinside the closure should be different (usually an ex-pected increase) than outside the closure. Stations in-side the closed area were at least 2 nm from the closedarea boundary to ensure that the sites chosen were un-disturbed (i.e., to minimize sampling in areas where fish-ing vessels may have fished illegally). In both CA I andCA II, we assumed no fishing occurred inside the bufferzone within the closed areas. The outside stations werechosen in proximity to the closed area and the related insidepaired station to represent a similar depth, substrate, and
overall similarity of environmental attributes for a givenhabitat type. We did not assume that all areas immediatelyoutside of the closed areas were necessarily impacted con-tinuously by bottom tending fishing gear, but we did as-sume that these locations were susceptible to fishing ef-forts over the past 4.5 years. Vessel monitoring data for thescallop and groundfish fleet has generally supported thisassumption (Northeast Regional Office [NERO] of theNational Marine Fisheries Service [NMFS], unpublisheddata). We do know that a large of amount of fishing effortis regularly concentrated proximal to the closed area bound-aries (NERO, unpublished data).
Closed Area IClosed Area IClosed Area IClosed Area IClosed Area I
Sites in this area were first selected to provide a pairwise(inside versus outside the closed area) experimentaldesign, followed by several stations within the closedarea to survey and to reoccupy sites previouslysampled (Figure 2). A 2 nm buffer zone (Figure 2)was established inside the closed area boundary toensure that the sites chosen were undisturbed. A totalof 18 sites were occupied during the study, 8 outsidethe closed area and 10 inside the area, with 7 sets ofinside–outside pairs. The sites were sampled duringJuly 6–10, 1999.
Closed Closed Closed Closed Closed Area IIArea IIArea IIArea IIArea II
In this area, as in CAI, sampling sites were first se-lected in order to provide a paired station experimen-tal design to allow comparisons between sites insideand outside the closed area. Once paired stations weredetermined, a series of sites in grid form were selectedto survey the rest of the closed area. A 3 nm buffer zone(Figure 6) was established inside the closed area bound-ary to ensure that the sites chosen were undisturbed.
Figure 7. Figure 7. Figure 7. Figure 7. Figure 7. Sampling site 2C, inside Closed Area II at adepth of 49 m (26.8 fm). The image shows many smallsand dollars about 2.8 cm (1.1 in) in diameter amongsand ripples.
Figure 8. Figure 8. Figure 8. Figure 8. Figure 8. Sampling site 9D, outside Closed Area II ata depth of 94 m (51.4 fm). The image shows severalsmall sea scallops ranging in size from 4.3 to 5.3 cm(1.7–2.1 in) and a few dead scallop shells.
EFFECTS OF AREA CLOSURES ON GEORGES BANK 351
Grid stations were located 5 nm apart in an east–westorientation. A total of 47 sites were occupied during thestudy, 21 outside the closed area and 26 inside the area,with 18 sets of inside–outside pairs. These sites weresampled during June 1–11, 1999, 4 d prior to the areabeing reopened to sea scallop fishing.
SamplingSamplingSamplingSamplingSampling
At each site, several habitat monitoring and sampling in-struments were deployed. First, a Seabed Observationand Sampling System (SEABOSS) was deployed to quan-tify microhabitat distributions, microhabitat relationshipsof fishes, and the distribution of seabed sand ripples anddunes. Still photographs were taken at approximately 1-min intervals throughout each transect to estimate percentcover for common habitat types. The SEABOSS had twovideo cameras (forward and downlooking), adownlooking 35-mm camera and a modified Van Veensediment grab sampler. Quartz halogen lights providedillumination for the video, and an electronic flash unitprovided lighting for still photographs. The system wastethered and essentially “flown” over the seafloor whilethe support vessel was drifting. Each SEABOSS transect(1 per trawl station) collected 20 min of continuous video,20 still photographs, and a sediment sample. In order tocharacterize the seabed, the top 2 cm of sediment wascollected from samples obtained with the VanVeen grab.
A Smith-McIntyre spring-loaded bottom samplerwas deployed to sample the benthic macrofauna. Threebottom grab samples were taken at each trawl station(see below). For each grab, samples were sieved uti-lizing a 0.5-mm (or 0.3-mm for selected stations) sam-pling screen and preserved in a 10% formalin–rosebengal solution to enhance collection and identifica-tion of invertebrates in the sample. After 24–72 h,samples were washed and transferred to a 95% EtOH–glycerin solution for storage.
In the laboratory, benthic grab samples weresorted under a dissecting microscope, and the inverte-brates were removed, counted, and identified to spe-cies level where possible. Wet weight biomasses weredetermined for each species in a sample by blot dry-ing the species collections on absorbent paper towelsfor about 3 min and weighing them to the nearest mg.
In CAII, a 15-min tow using a standardizedNortheast Fisheries Science Center (NEFSC) #36 Yan-kee otter trawl was made at each site, at a towing speedof 6.5 km/h. In the sandy bottom of CAII, we used atrawl rigged with a rubber disk-covered chain sweep, 11floats, 5-m ground cables, and 450-kg polyvalent trawldoors. Due to the heterogeneous bottom encountered inCAI, a 30-min haul using a trawl rigged with 41-cm-diameter rollers, and 9-m bridles was used. Catches weresorted to species, and all fish and invertebrates caught
were weighed and enumerated. Length frequency datawere collected on all species; biological samples, includ-ing age structures, sex and maturity stage determinations,and stomachs were collected from selected species. Stom-ach samples were either examined at sea (volumetrically)or individually preserved in 10% formalin for later analy-sis.
AnalysisAnalysisAnalysisAnalysisAnalysis
A two-way analysis of variance (ANOVA) was per-formed to determine the effect of both inside versusoutside and zonation (i.e., habitat type) of a closedarea. The inside–outside comparison and compari-son across habitats (i.e., zonation) were treated asfixed factors. A distinct set of analyses was conductedfor each closed area. Each station was treated as areplicate for the paired inside versus outside com-parison. Each paired set of stations was assumed tobe independent from the other closure and nonclosurereplicates. Multivariate (for multiple species simulta-neously) analogues (i.e., MANOVA, not describedhere) suggested that there were probable differencesamong some species across either inside–outside orzonation. Thus, we conducted an individual ANOVAfor each of the major trawl-caught fish species, andthe analysis was done separately for four main bio-logical variables. Weight (kg) per tow, numbers pertow, stomach contents (g), and fish length (cm) wereused as the response variables in these ANOVAs; thefirst three were log transformed for purposes of nor-mality and homoscedasticity in this analysis. We alsodid the same analysis for the 10 most abundantbenthic species from the grabs, using both abundanceand biomass (mg) per grab as the response variables.The infaunal invertebrates chosen for analysis basedon abundance, frequency of occurrence, biomass, andliving position (i.e., surface dwellers, burrowers, etc.).Results typically classified as marginally significant(0.10 > P > 0.05) were also noted.
ResultsResultsResultsResultsResults
Closed Closed Closed Closed Closed Area IArea IArea IArea IArea I
Species Abundance and BiomassWe did not detect a difference in nekton and benthicspecies richness inside and immediately outside theclosed area (Table 1). However, the species richness ofbenthic macroinvertebrates was different across the dif-ferent habitats (i.e., zones), with the highest number ofspecies and individuals in the low-energy sand habitat(Zone 3).
For most of the fish, there were minimal differ-
LINK ET AL.352
ences in biomass (mean weight per tow; Figure 9; Table2) and abundance (mean number per tow; Figure 10)inside versus outside the closed area. Exceptions werehaddock, cunner, and Atlantic cod, all of which had agreater abundance inside the closed area. Particularly,in Zones 2 and 3, haddock was an order of magnitudemore abundant inside versus outside the closed area.Atlantic cod was twice as abundant inside versus out-side of the closed area. As only 23% of the speciesstudied exhibited even a marginally significant differ-ence inside versus outside the closed area, habitat (i.e.,zone) appeared to be a relatively more important fac-tor than inside–outside the closure for affecting spe-cies abundance and biomass. For example, winter skatewas more abundant in the high-energy mixed substratehabitat (Zone 1) and yellowtail flounder was moreabundant in the low-energy sand habitat (Zone 3).Haddock was more abundant in Zones 2 and 3 than inthe high-energy mixed substrate habitat (Zone 1).
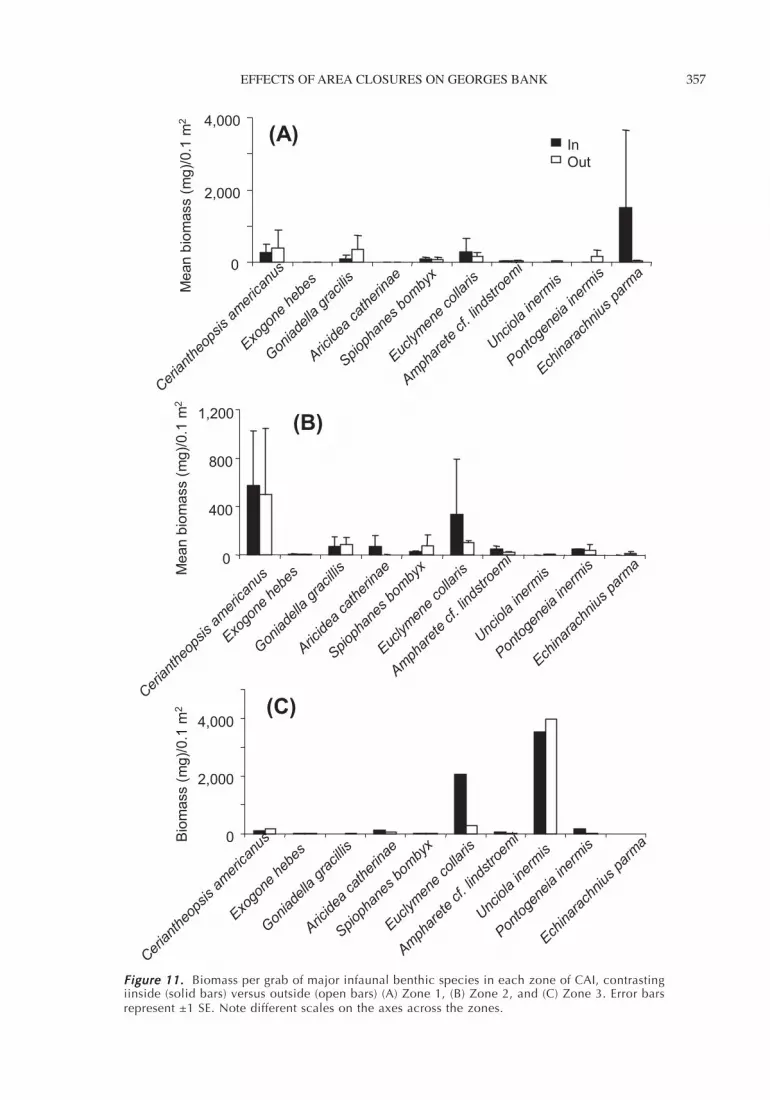
The same pattern was true for species collected inbenthic grabs (Table 3; Figure 11). Only one species ex-hibited a significant difference in biomass (mean weightper grab) inside versus outside the closed area (Figure11; a higher biomass inside for Ampharete cf.lindstroemi). Yet habitat (i.e., zone) was an importantfactor for several species in terms of both abundanceand biomass. In particular, the abundance and biomassof the amphipod Unciola inermis and the biomass ofthe polychaete Aricidea catherinae were significantly
lower in Zone 1 (moderate energy, mixed substrate)compared to Zones 2 and 3 (gravel and sand substrates).Thus, habitat type apparently affected the abundanceand biomass distribution of many benthic invertebratesand demersal fish species in and near CAI.
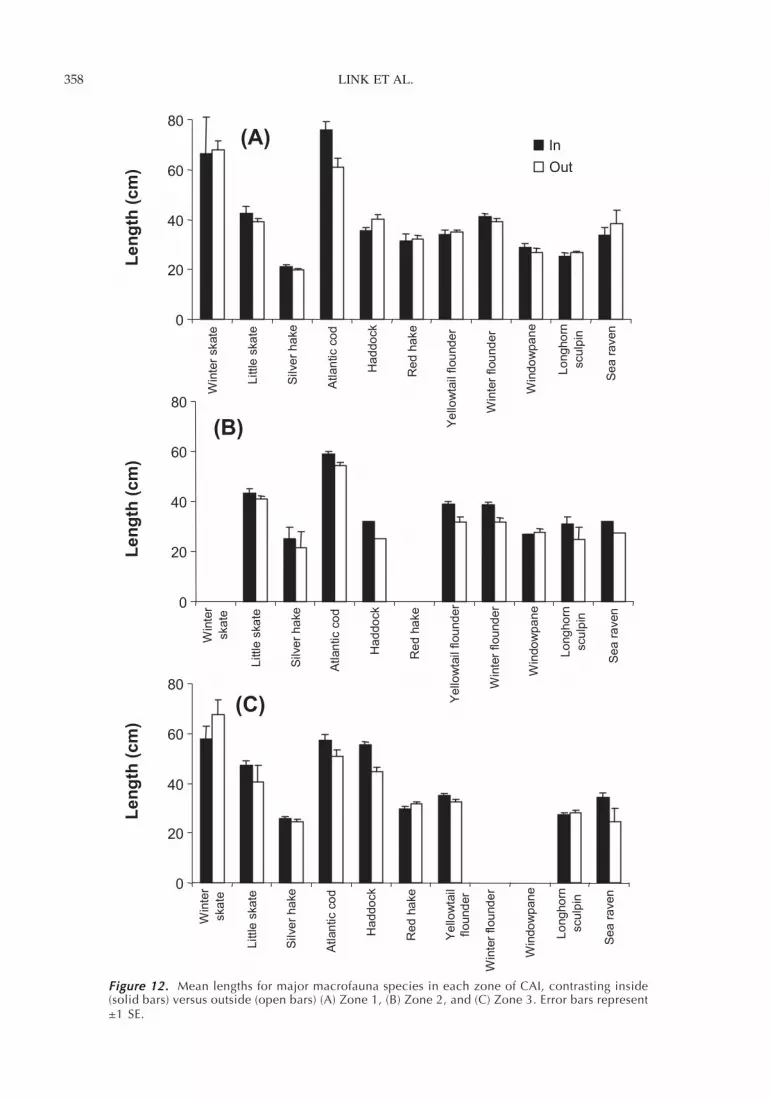
Fish LengthsWe did not detect a difference in the mean length (andlength distributions) of most species inside and imme-diately outside the closed area (Figure 12; Table 2).The exception was haddock, which was approximately5 cm larger inside the closed area. Length differenceswere apparent among habitats (i.e., zones) for fourspecies: haddock (larger lengths in the low energy sandhabitat, Zone 3), red hake (larger lengths in Zone 3),longhorn sculpin (larger lengths in Zone 2), and yel-lowtail flounder (shorter lengths in zone 1) (Table 2).
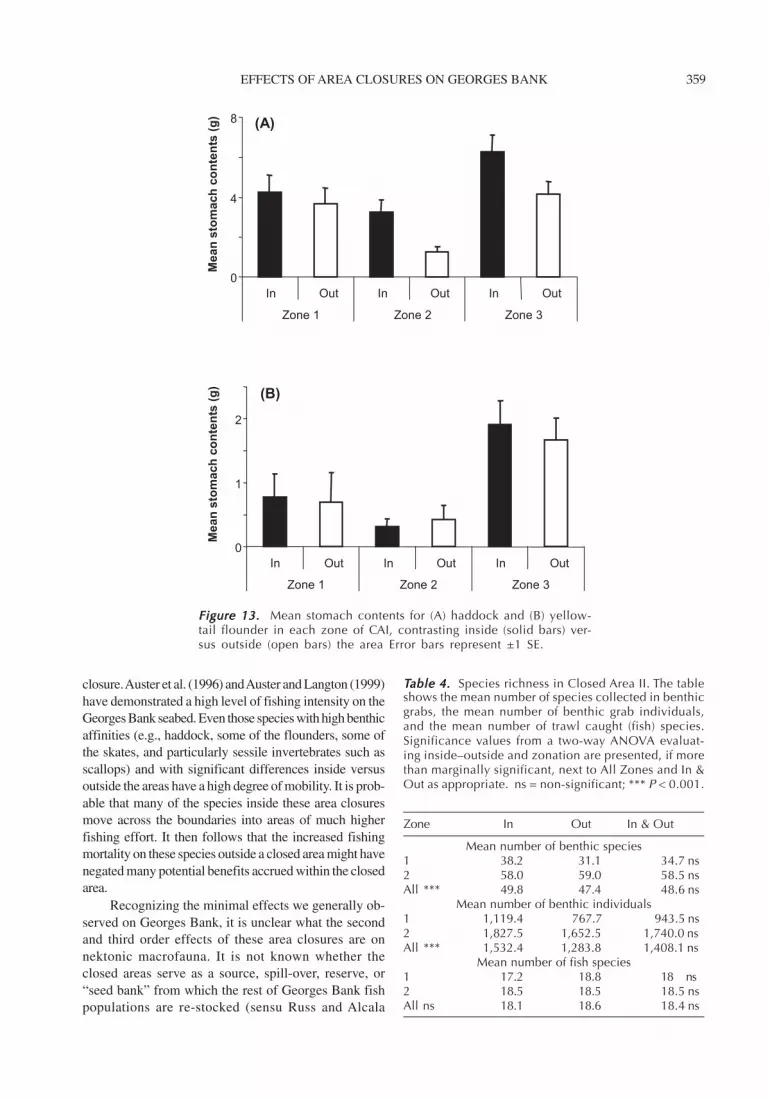
Stomach ContentsOf the two species examined (haddock and yellowtailflounder), there were major differences in stomachcontent amount between inside and immediately out-side the closed area (Figure 13; Table 2). For both spe-cies, notably more food was eaten inside the closedarea. Habitat (i.e., zone) also appeared to be an im-portant factor in determining the amount of food afish ate. Haddock and yellowtail flounder exhibitedsignificant differences in the amount of stomach con-tents among zones, with both species consuming morefood in the low-energy sand habitat (Zone 3).
Closed Closed Closed Closed Closed Area IIArea IIArea IIArea IIArea II
Species Abundance and BiomassAs in CAI, we did not detect a difference in nekton andbenthic species richness inside and immediately out-side the closed area (Table 4). The species richness ofbenthic macroinvertebrates was distinct across habitats(i.e., zones), with the highest number of species andindividuals in the low-energy sand habitat (Zone 2).
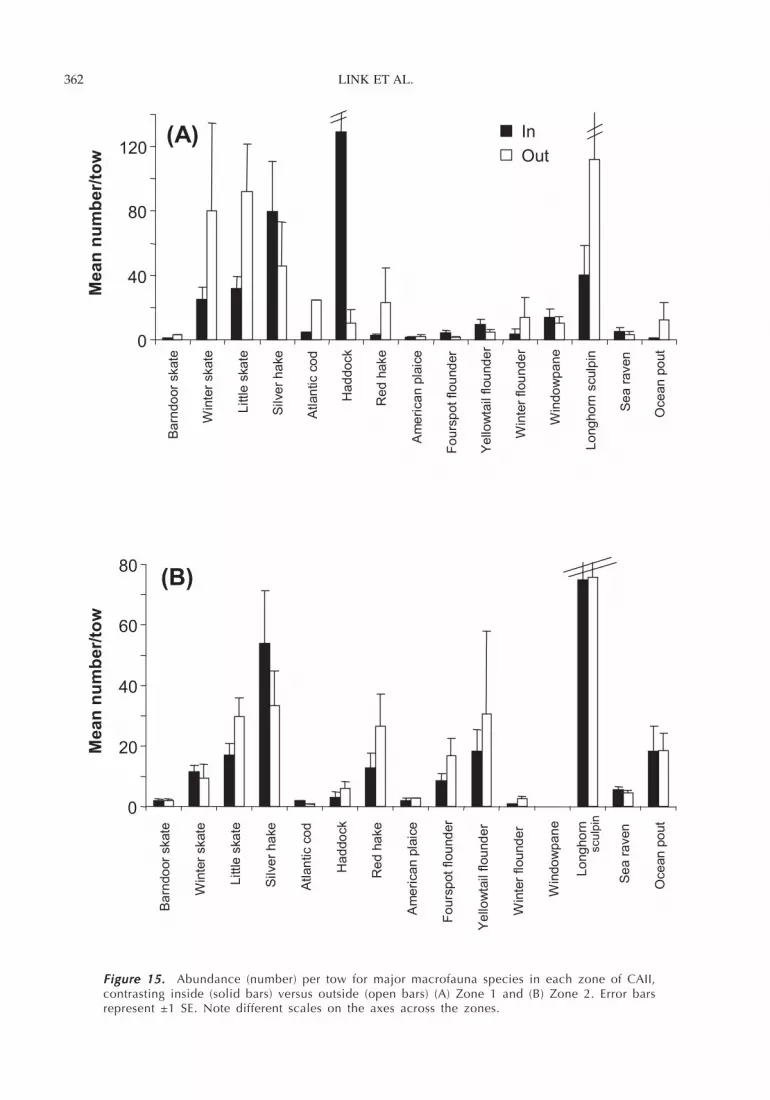
There were few detectable differences in biomass(mean weight per tow; Figure 14; Table 5) and abun-dance (mean number per tow; Figure 15) inside versusoutside the closed area for most of the fish. The notableexception was haddock, which showed greater biom-ass inside the closed area. Habitat (i.e., zone) was animportant factor in determining species abundance andbiomass for haddock, winter skate, and little skate, withall species more abundant in the high-energy sand habi-tat (Zone 1). Fourspot flounder Paralichthys oblongus wasmore abundant in the low-energy sand habitat (Zone 2).However, we did not detect differences for the remainingspecies across the two habitat types.
The species collected in benthic grabs followed asimilar pattern, with only the polychaete Exogone
TTTTTable 1. able 1. able 1. able 1. able 1. Species richness in Closed Area I. The tableshows the mean number of species collected inbenthic grabs, the mean number of benthic grab indi-viduals, and the mean number of trawl caught (fish)species. Significance values from a two-way ANOVAevaluating inside–outside and zonation are presented,if more than marginally significant, next to All Zonesand In & Out as appropriate. ns = non-significant; ?*= 0.05 < P < 0.10.
Zone In Out In & Out
Mean number of benthic speciesMean number of benthic speciesMean number of benthic speciesMean number of benthic speciesMean number of benthic species1 64.0 72.6 68.3 ns2 77.1 61.5 69.3 ns3 88.7 83.7 86.2 nsAll ?* 72.4 69.8 72.3 ns
Mean number of benthic individualsMean number of benthic individualsMean number of benthic individualsMean number of benthic individualsMean number of benthic individuals1 1,190.0 2,040.0 1,615 ns2 888.3 874.8 881.5 ns3 5,355.0 3,364.0 4,359.5 nsAll ?* 1,902.3 1,838.7 1,870.5 ns
Mean number of fish speciesMean number of fish speciesMean number of fish speciesMean number of fish speciesMean number of fish species1 19.5 20.5 20.0 ns2 16.3 17.3 16.8 ns3 17.5 17.5 17.5 nsAll ns 17.6 18.3 18.0 ns

EFFECTS OF AREA CLOSURES ON GEORGES BANK 353
Figure 9. Figure 9. Figure 9. Figure 9. Figure 9. Biomass per tow for major macrofauna species in each zone of CAI, con-trasting inside (solid bars) versus outside (open bars) (A) Zone 1, (B) Zone 2, and (C)Zone 3. Error bars represent ±1 SE. Note different scales on the axes across the zones.
0
50
100
150
200
250
300
350
400
Win
ter
Skate
Little s
kate
Silv
er
hake
Atlantic c
od
Haddock
Red h
ake
Yello
wta
il flounder
Win
ter
flounder
Win
dow
pane
Longhorn
sculp
in
Sea r
aven
Cunner
Ocean p
out
Mea
n w
eigh
t/tow
0
20
40
60
80
100
120
140
160
180
200
Win
ter
skate
Little s
kate
Silv
er
hake
Atla
ntic c
od
Haddock
Red h
ake
Ye
llow
tail
flo
und
er
Win
ter
flounder
Win
dow
pa
ne
Longhorn
sculp
in
Sea r
ave
n
Cunner
Ocea
n p
out
Mea
n w
eigh
t/tow
0
10
20
30
40
50
60
70
80
Win
ter
skate
Little s
kate
Silv
er
hake
Atlantic c
od
Haddock
Red h
ake
Yello
wta
il flounder
Win
ter
flounder
Win
dow
pane
Longhorn
sculp
in
Sea r
aven
Cunner
Ocean p
out
Mea
n w
eigh
t/tow In
Out
A
B
C

LINK ET AL.354
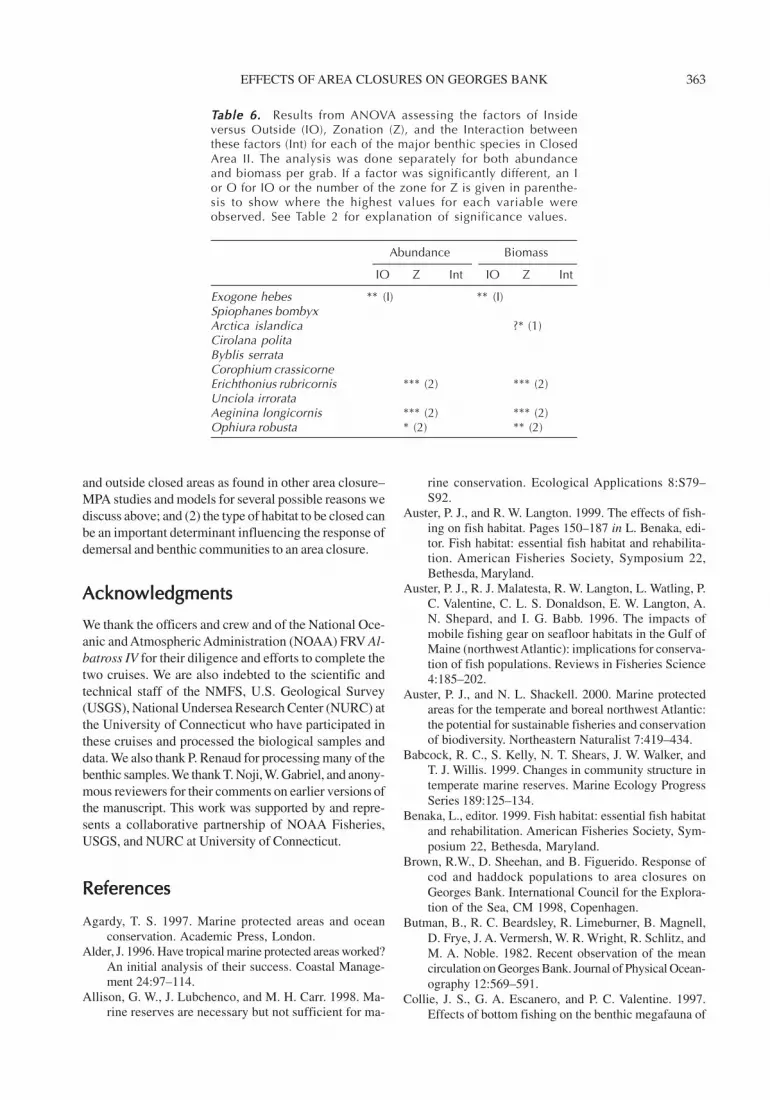
hebes exhibiting a significant difference inside versusoutside the closed area (Table 6; Figure 16; 10 timesmore abundant inside the closure). A few other spe-cies did show a difference across habitats (i.e., zones)in terms of both abundance and biomass (Table 6; Fig-ure 16). In particular, the abundances and biomassesof the amphipod Erichthonius rubricornis, thecaprellid Aeginina longicornis and the brittlestarOphiura robusta were significantly higher in the lower-energy sand habitat (zone 2) compared to the high-energy sand habitat (zone 1).
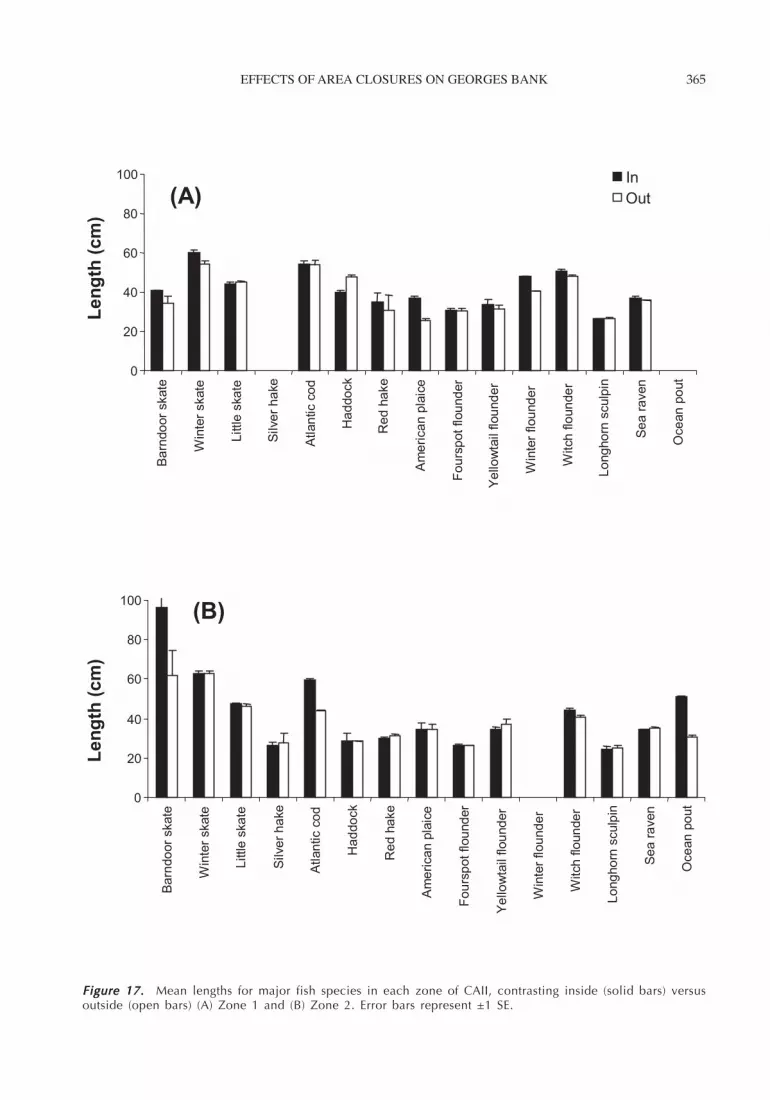
Fish LengthWe did not detect a difference in the mean length (andlength distributions) for 11 of the 15 species we ex-amined inside and immediately outside the closed area(Figure 17; Table 5). However, length differences wereapparent inside versus outside for winter skate, red hake,yellowtail flounder, and winter flounder, all of whichwere larger inside than outside of the closed area. Therewere significant differences in mean length for winter
skate and yellowtail flounder, both larger in the low-energy sand habitat (Zone 2), and for haddock, whichwas larger in the high-energy sand habitat (Zone 1) (Table5).
Stomach ContentsThere were no significant differences in stomach con-tent amount between inside and immediately outsidethe closed area for most species (Figure 18; Table 5).The exceptions to this pattern were winter skate, redhake, and longhorn sculpin, all of which consumed morefood inside the closed area. Habitat (i.e., zone) appearedto be an equally or even more important factor thaninside–outside the closure in determining the amountof food a fish ate. Haddock and winter flounder atemore food in the high–energy sand habitat (Zone 1), whereasyellowtail flounder ate more found in the low-energy sandhabitat (Zone 2).
TTTTTable 2. able 2. able 2. able 2. able 2. Results from ANOVA assessing the factors of Inside versus Outside (IO), Zonation (Z), and theInteraction between these factors (Int) for each of the major species in Closed Area I. The analysis was doneseparately for four main biological variables. The numbers (per tow), weight (kg/tow), and stomach contents(g) were log transformed for this analysis. If a factor was significantly different, an I or O for IO or thenumber of the zone for Z is given in parenthesis to show where the highest values for each variable wereobserved. Significance levels: ?* = P < 0.10; * = P < 0.05; ** = P < 0.01; *** = P < 0.001; and !** = P <0.0001.
Numbers Weight Stomach Length
Species IO Z Int IO Z Int IO Z Int IO Z Int
Winter skate ?* (1) Leucoraja ocellataLittle skate Leucoraja erinaceaSilver hake Merluccius bilinearisAtlantic cod * (I)Haddock ?* (I) ?* (I) ?* (3) !** (I) !** (3) ** (I) ** (3)Red hake *** (3) Urophycis chussYellowtail flounder * (2) ** (3) ** (I) !** (3) !** ** (3)Winter flounder Pseudopleuronectes americanusWindowpane Scophthalmus aquosusLonghorn sculpin ?* (2) Myoxocephalus octodecemspinosusSea ravenCunner ?* (I) * (I) * (2) Tautogolabrus adspersusOcean pout Zoarces americanus

EFFECTS OF AREA CLOSURES ON GEORGES BANK 355
Figure 10. Figure 10. Figure 10. Figure 10. Figure 10. Abundance (number) per tow for major macrofauna species in each zoneof CAI, contrasting inside (solid bars) versus outside (open bars) (A) Zone 1, (B) Zone 2,and (C) Zone 3. Error bars represent ±1 SE. Note different scales on the axes acrossthe zones.
0
50
100
150
200
250
Win
ter
skate
Little s
kate
Silv
er
hake
Atlantic c
od
Haddock
Red h
ake
Yello
wta
il flounder.
Win
ter
flounder
Win
dow
pane
Longhorn
sculp
in
Sea r
aven
Cunner
Ocean p
out
Mea
n nu
mbe
r/tow
0
50
100
150
200
250
300
350
400
Win
ter
skate
Little s
kate
Silv
er
hake
Atlantic c
od
Haddock
Red h
ake
Yello
wta
il
flounder
Win
ter
flounder
Win
dow
pane
Longhorn
sculp
in
Sea r
aven
Cunner
Ocean p
out
Mea
n nu
mbe
r/tow
0
20
40
60
80
100
120
140
Win
ter
skate
Little s
kate
Silv
er
hake
Atlantic c
od
Haddock
Red h
ake
Yello
wta
il
flounder
Win
ter
flounder
Win
dow
pane
Longhorn
sculp
in
Sea r
aven
Cunner
Ocean p
out
Mea
n nu
mbe
r/tow In
Out
(A)
(B)
(C)

LINK ET AL.356
DiscussionDiscussionDiscussionDiscussionDiscussion
There were few detectable differences in the suite of bi-otic variables we studied inside versus immediately out-side the closed areas on Georges Bank. Those speciesthat exhibited significant differences inside versus out-side are species that have a strong benthic affinity. Otherstudies (Lindholm et al. 2004) have shown that the othermajor macrofauna to exhibit notable differences betweeninside and immediately outside of the closed areas areepifaunal sponges. Fish species such as haddock, someof the flounders, some of the skates, and particularly,sessile invertebrates such as scallops (see NEFSC 2001)showed the greatest differences (usually more or larger interms of biomass, abundance, length, and stomach con-tents) inside versus outside the areas. Those species forwhich we did not detect a significant difference were notsurprising since they are highly mobile; the closed areasboundaries were not delineated to enclose the yearly ambitof the adult life phase of finfish, with the exception of thespawning period. These conclusions are generally con-sistent with other studies done for this area that examineda longer time series of data or more explicitly focused onparticular populations (e.g., Brown et al. 1998; Murawskiet al. 2000; NEFSC 2001).
Our results are in distinct contrast to much of theclosed area, MPA, and marine reserves literature (e.g.,Agardy 1997; Lauck et al. 1998; McManus 1998;Babcock et al. 1999; Mosquera et al. 2000; Roberts etal. 2001; Ward et al. 2001; Fisher and Frank 2002; but seeAlder 1996; Allison et al. 1998; Auster and Shackell 2000;and Cote et al. 2001). Many of these studies effectivelyassert that any area closure is inherently valuable, princi-pally because these studies focused on fish species withlow movement rates associated with particular kinds of
habitats (e.g., coral reefs, kelp forests). Few studies havefocused on species that are facultative habitat users andhave adult stages not necessarily tied to particular habitatfeatures (Auster and Langton 1999). Simply closing anarea irrespective of habitat considerations may not be ef-fective, particularly when there is evidence for little, ifany, response for certain types of species or habitats (Austeret al. 1996; Collie et al. 2000b; Cote et al. 2001; Kaiser etal. 2002; Kaiser 2003). Qualitative factors such as habitattype should be considered along with size and geographiclocation when developing new area closures. The dura-tion of an area closure also merits consideration but shouldsimilarly not supplant the type of habitat closed.
It is possible that after 4.5 years of closure, the por-tions of the populations inside the closed areas on GeorgesBank had “seeded” via larval and juvenile exports to theregions outside of the closed areas, making it difficult todetect any significant differences between inside and out-side the closed areas (sensu Russ and Alcala 1996; Roberts1998; McLanahan and Mangi 2000; Lindholm et al. 2001;and Strathamm et al. 2002). It is also possible that oursampling regime, always subject to logistical constraints,limited our power to detect differences. However, we gen-erally did not see, nor have we seen across the time that theareas have been closed, a notable increase in biomass andabundance inside the closed areas for most species, asconfirmed by similar patterns observed in trawl surveysacross Georges Bank (NEFSC, unpublished data). Con-versely, for those species for which we did detect differ-ences, the differences are likely genuine.
Another major consideration is the amount of fishingeffort outside the closed areas on Georges Bank. Cote et al.(2001) have shown that fishing intensity immediately out-side a reserve, coupled with species composition, is one ofthe main factors determining the success of a no-take area
TTTTTable 3. able 3. able 3. able 3. able 3. Results from ANOVA assessing the factors of Inside versus Outside (IO),Zonation (Z), and the Interaction between these factors (Int) for each of the majorbenthic species in Closed Area I. The analysis was done separately for both abun-dance and biomass per grab. If a factor was significantly different, an I or O for IO orthe number of the zone for Z is given in parenthesis to show where the highest valuesfor each variable were observed.
Abundance Biomass
Species IO Z Int IO Z Int
Ceriantheopsis americanusExogone hebesGoniadella gracilisAricidea catherinae ?* (3) * (3)Spiophanes bombyxEuclymene collarisAmpharete cf. lindstroemi ?* (3) ?* (I)Unciola inermis ** (3) ** (3)Pontogeneia inermis ?*Echinarachnius parma
EFFECTS OF AREA CLOSURES ON GEORGES BANK 357
Figure 11. Figure 11. Figure 11. Figure 11. Figure 11. Biomass per grab of major infaunal benthic species in each zone of CAI, contrastingiinside (solid bars) versus outside (open bars) (A) Zone 1, (B) Zone 2, and (C) Zone 3. Error barsrepresent ±1 SE. Note different scales on the axes across the zones.
Cerian
theop
sisam
erica
nus
Exogo
nehe
bes
Goniad
ella gra
cillis
Aricide
a cathe
rinae
Spioph
anes
bomby
x
Euclym
ene co
llaris
Amphare
tecf.
linds
troem
i
Unciol
a inerm
is
Pontog
eneia
inerm
is
Echina
rachn
iuspa
rmaB
iom
ass (
mg)/
0.1
m2
0
2,000
4,000
Cerian
theop
sisam
erica
nus
Exogo
nehe
bes
Goniad
ella gra
cillis
Aricide
a cathe
rinae
Spioph
anes
bomby
x
Euclym
ene co
llaris
Amphare
tecf.
linds
troem
i
Unciol
a inerm
is
Pontog
eneia
inerm
is
Echina
rachn
iuspa
rmaM
ean b
iom
ass (
mg)/
0.1
m2
0
400
800
1,200
Cerian
theop
sisam
erica
nus
Exogo
nehe
bes
Goniad
ella gra
cilis
Aricide
a cathe
rinae
Spioph
anes
bomby
x
Euclym
ene co
llaris
Amphare
tecf.
linds
troem
i
Unciol
a inerm
is
Pontog
eneia
inerm
is
Echina
rachn
iuspa
rma
Mean b
iom
ass (
mg)/
0.1
m2
0
2,000
4,000
In
Out
(A)
(B)
(C)
LINK ET AL.358
Figure 12. Figure 12. Figure 12. Figure 12. Figure 12. Mean lengths for major macrofauna species in each zone of CAI, contrasting inside(solid bars) versus outside (open bars) (A) Zone 1, (B) Zone 2, and (C) Zone 3. Error bars represent±1 SE.
Leng
th (c
m)
Leng
th (c
m)
Leng
th (c
m)
(A)
(B)
(C)
0
20
40
60
80
Win
ter
skate
Little
ska
te
Silve
r h
ake
Atlan
tic c
od
Ha
ddo
ck
Re
d h
ake
Ye
llow
tail
flou
nd
er
Win
ter
flou
nd
er
Win
do
wp
an
e
Lo
ng
ho
rn
scu
lpin
Se
a r
aven
In
Out
0
20
40
60
80
Win
ter
ska
te
Little
ska
te
Silve
r h
ake
Atlan
tic c
od
Ha
ddo
ck
Re
d h
ake
Ye
llow
tail
flou
nd
er
Win
ter
flou
nd
er
Win
do
wp
an
e
Lo
ng
ho
rn
scu
lpin
Se
a r
aven
0
20
40
60
80
Win
ter
ska
te
Little
ska
te
Silve
r h
ake
Atlan
tic c
od
Ha
ddo
ck
Re
d h
ake
Ye
llow
tail
flou
nd
er
Win
ter
flou
nd
er
Win
do
wp
an
e
Lo
ng
ho
rn
scu
lpin
Se
a r
aven
EFFECTS OF AREA CLOSURES ON GEORGES BANK 359
closure. Auster et al. (1996) and Auster and Langton (1999)have demonstrated a high level of fishing intensity on theGeorges Bank seabed. Even those species with high benthicaffinities (e.g., haddock, some of the flounders, some ofthe skates, and particularly sessile invertebrates such asscallops) and with significant differences inside versusoutside the areas have a high degree of mobility. It is prob-able that many of the species inside these area closuresmove across the boundaries into areas of much higherfishing effort. It then follows that the increased fishingmortality on these species outside a closed area might havenegated many potential benefits accrued within the closedarea.
Recognizing the minimal effects we generally ob-served on Georges Bank, it is unclear what the secondand third order effects of these area closures are onnektonic macrofauna. It is not known whether theclosed areas serve as a source, spill-over, reserve, or“seed bank” from which the rest of Georges Bank fishpopulations are re-stocked (sensu Russ and Alcala
Figure 13. Figure 13. Figure 13. Figure 13. Figure 13. Mean stomach contents for (A) haddock and (B) yellow-tail flounder in each zone of CAI, contrasting inside (solid bars) ver-sus outside (open bars) the area Error bars represent ±1 SE.
TTTTTable 4. able 4. able 4. able 4. able 4. Species richness in Closed Area II. The tableshows the mean number of species collected in benthicgrabs, the mean number of benthic grab individuals,and the mean number of trawl caught (fish) species.Significance values from a two-way ANOVA evaluat-ing inside–outside and zonation are presented, if morethan marginally significant, next to All Zones and In &Out as appropriate. ns = non-significant; *** P < 0.001.
Zone In Out In & Out
Mean number of benthic species1 38.2 31.1 34.7 ns2 58.0 59.0 58.5 nsAll *** 49.8 47.4 48.6 ns
Mean number of benthic individuals1 1,119.4 767.7 943.5 ns2 1,827.5 1,652.5 1,740.0 nsAll *** 1,532.4 1,283.8 1,408.1 ns
Mean number of fish species1 17.2 18.8 18 ns2 18.5 18.5 18.5 nsAll ns 18.1 18.6 18.4 ns
(A)
(B)
0
4
8
In Out In Out In Out
Zone 1 Zone 2 Zone 3
Mea
n st
omac
h co
nten
ts (g
)
0
1
2
In Out In Out In Out
Zone 1 Zone 2 Zone 3
Mea
n st
omac
h co
nten
ts (g
)

LINK ET AL.360
Figure 14. Figure 14. Figure 14. Figure 14. Figure 14. Biomass per tow for major macrofauna species in each zone of CAII, contrastinginside (solid bars) versus outside (open bars) (A) Zone 1 and (B) Zone 2. Error bars represent ±1SE. Note different scales on the axes across the zones.
0
40
80
120
160
200
Ba
rndo
or
skate
Win
ter
skate
Little
ska
te
Silve
r h
ake
Atlan
tic c
od
Ha
ddo
ck
Re
d h
ake
Am
eri
ca
n p
laic
e
Fo
urs
pot
flou
nd
er
Ye
llow
tail
flou
nd
er
Win
ter
flou
nd
er
Win
do
wp
an
e
Lo
ng
ho
rn s
culp
in
Se
a r
aven
Oce
an
po
ut
Mea
n w
eigh
t/tow
In
Out
0
10
20
30
Ba
rndo
or
skate
Win
ter
skate
Little
ska
te
Silve
r h
ake
Atlan
tic c
od
Ha
ddo
ck
Re
d h
ake
Am
eri
ca
n p
laic
e
Fo
urs
pot
flou
nd
er
Ye
llow
tail
flou
nd
er
Win
ter
flou
nd
er
Win
do
wp
an
e
Lo
ng
ho
rn s
culp
in
Se
a r
aven
Oce
an
po
ut
Mea
n w
eigh
t/tow
(A)
(B)

EFFECTS OF AREA CLOSURES ON GEORGES BANK 361
1996; Roberts 1998; McLanahan and Mangi 2000;Lindholm et al. 2001; Strathamm et al. 2002). Cer-tainly this could be the case for organisms with a strongbenthic affinity (e.g., haddock, yellowtail flounder,scallops), but whether this is also true for more mobilespecies is also unknown. Other considerations suchas changes in fish growth, consumption, juvenile sur-vival, or production due to area closures are also ef-fectively unexplored. It is also possible that the areaclosures could have caused indirect or higher-orderchanges in predator–prey dynamics, competitor domi-nance, and other inter-specific interactions. Whetherchanges in these rates actually occurred and, if so,whether the changes resulted in population-level ef-fects on economically valuable species is again un-known.
How has the entire benthic community been (ornot been) impacted by these closures? Further analy-sis of the benthic infaunal community data, videos ofbenthic macrofauna and habitat, fish stomach (dietcomposition), and benthic chemistry are underway andshould provide further insight. Yet of the 20 infaunalmacroinvertebrate species we analyzed, only one smallpolychaete, Exogone hebes, showed significantlygreater abundance and biomass inside versus outsidethe closed areas. This would imply a surprisingly lim-ited effect of an area closure on the benthic infaunalcommunity. A number of other species showed sig-nificant differences among habitat zones at each closedarea. These results concur with Jennings et al. (2002),
who showed that water depth and sediment type stronglyinfluenced polychaete populations but that the intensity oftrawling had little effect.
The main result from this work is that there werefew differences in the nekton and benthic communi-ties due to the closed areas. A secondary point is thathabitat type (i.e., benthic substrate in terms of grainsize, sediment dynamics, rugosity, and related seabedfeatures) appears to be a relatively more importantconsideration than inside–outside a closed area. In fact,this was a common contributing factor for many ofthe, albeit few, significant results we observed. Sev-eral studies (e.g., Auster et al. 1996; Collie et al. 2000b;Jennings et al. 2002) have shown that various bioticcommunities and substrate types are differentially af-fected by fishing gears and that habitat types can bethe strongest determinant of benthic community com-position and recovery. In a sense, it was surprisingthat habitat type was relatively more important thanthe effects of opened and closed areas. Yet in anothersense, given the dynamic nature of many of the types ofhabitats we examined, coupled with the relatively rapidrecovery times reported for the benthic communities as-sociated with those habitats, such a conclusion is sen-sible. The relative importance of habitat type when com-pared to the importance of area opening and closures hassome intriguing implications for the future developmentof MPAs and marine reserves. We do not mean to implythat area closures are not important but rather: (1) that thisstudy did not show the obvious changes between inside
TTTTTable 5. able 5. able 5. able 5. able 5. Results from ANOVA assessing the factors of Inside vs. Outside (IO), Zonation (Z), and the Interactionbetween these factors (Int.) for each of the major species in CAII. The analysis was done separately for four mainbiological variables. The Numbers (per tow), Weight (kg per tow), and Stomach contents (g) were log trans-formed for this analysis. If a factor was significantly different, an I or O for IO or the number of the zone for Zis given in parenthesis to show where the highest values for each variable were observed.
Numbers Weight Stomach Length
Species IO Z Int IO Z Int IO Z Int IO Z Int
Barndoor SkateWinter skate * (1) ?* (1) ?* (I)Little skate ?* (1) ?* (1)Silver hakeAtlantic codHaddock ?* ?* (I) ?* (1) * !** (1) **Red hake ** (I) * (I)Fourspot flounder ?* (2)Yellowtail flounder * (2) ?* (I) !**(2) **Winter flounder !** (1) ** ?* (I)Witch flounderWindowpaneLonghorn sculpin * (I)Sea ravenOcean pout
LINK ET AL.362
Figure 15. Figure 15. Figure 15. Figure 15. Figure 15. Abundance (number) per tow for major macrofauna species in each zone of CAII,contrasting inside (solid bars) versus outside (open bars) (A) Zone 1 and (B) Zone 2. Error barsrepresent ±1 SE. Note different scales on the axes across the zones.
0
40
80
120
Ba
rndo
or
skate
Win
ter
skate
Little
ska
te
Silve
r h
ake
Atlan
tic c
od
Ha
ddo
ck
Re
d h
ake
Am
eri
ca
n p
laic
e
Fo
urs
pot
flou
nd
er
Ye
llow
tail
flou
nd
er
Win
ter
flou
nd
er
Win
do
wp
an
e
Lo
ng
ho
rn s
culp
in
Se
a r
aven
Oce
an
po
ut
Mea
n nu
mbe
r/tow
In
Out
0
20
40
60
80
Ba
rndo
or
skate
Win
ter
skate
Little
ska
te
Silve
r h
ake
Atlan
tic c
od
Ha
ddo
ck
Re
d h
ake
Am
eri
ca
n p
laic
e
Fo
urs
pot
flou
nd
er
Ye
llow
tail
flou
nd
er
Win
ter
flou
nd
er
Win
do
wp
an
e
Lo
ng
ho
rnsculp
in
Se
a r
aven
Oce
an
po
ut
Mea
n nu
mbe
r/tow
(A)
(B)
EFFECTS OF AREA CLOSURES ON GEORGES BANK 363
and outside closed areas as found in other area closure–MPA studies and models for several possible reasons wediscuss above; and (2) the type of habitat to be closed canbe an important determinant influencing the response ofdemersal and benthic communities to an area closure.
AcknowledgmentsAcknowledgmentsAcknowledgmentsAcknowledgmentsAcknowledgments
We thank the officers and crew and of the National Oce-anic and Atmospheric Administration (NOAA) FRV Al-batross IV for their diligence and efforts to complete thetwo cruises. We are also indebted to the scientific andtechnical staff of the NMFS, U.S. Geological Survey(USGS), National Undersea Research Center (NURC) atthe University of Connecticut who have participated inthese cruises and processed the biological samples anddata. We also thank P. Renaud for processing many of thebenthic samples. We thank T. Noji, W. Gabriel, and anony-mous reviewers for their comments on earlier versions ofthe manuscript. This work was supported by and repre-sents a collaborative partnership of NOAA Fisheries,USGS, and NURC at University of Connecticut.
ReferencesReferencesReferencesReferencesReferences
Agardy, T. S. 1997. Marine protected areas and oceanconservation. Academic Press, London.
Alder, J. 1996. Have tropical marine protected areas worked?An initial analysis of their success. Coastal Manage-ment 24:97–114.
Allison, G. W., J. Lubchenco, and M. H. Carr. 1998. Ma-rine reserves are necessary but not sufficient for ma-
rine conservation. Ecological Applications 8:S79–S92.
Auster, P. J., and R. W. Langton. 1999. The effects of fish-ing on fish habitat. Pages 150–187 in L. Benaka, edi-tor. Fish habitat: essential fish habitat and rehabilita-tion. American Fisheries Society, Symposium 22,Bethesda, Maryland.
Auster, P. J., R. J. Malatesta, R. W. Langton, L. Watling, P.C. Valentine, C. L. S. Donaldson, E. W. Langton, A.N. Shepard, and I. G. Babb. 1996. The impacts ofmobile fishing gear on seafloor habitats in the Gulf ofMaine (northwest Atlantic): implications for conserva-tion of fish populations. Reviews in Fisheries Science4:185–202.
Auster, P. J., and N. L. Shackell. 2000. Marine protectedareas for the temperate and boreal northwest Atlantic:the potential for sustainable fisheries and conservationof biodiversity. Northeastern Naturalist 7:419–434.
Babcock, R. C., S. Kelly, N. T. Shears, J. W. Walker, andT. J. Willis. 1999. Changes in community structure intemperate marine reserves. Marine Ecology ProgressSeries 189:125–134.
Benaka, L., editor. 1999. Fish habitat: essential fish habitatand rehabilitation. American Fisheries Society, Sym-posium 22, Bethesda, Maryland.
Brown, R.W., D. Sheehan, and B. Figuerido. Response ofcod and haddock populations to area closures onGeorges Bank. International Council for the Explora-tion of the Sea, CM 1998, Copenhagen.
Butman, B., R. C. Beardsley, R. Limeburner, B. Magnell,D. Frye, J. A. Vermersh, W. R. Wright, R. Schlitz, andM. A. Noble. 1982. Recent observation of the meancirculation on Georges Bank. Journal of Physical Ocean-ography 12:569–591.
Collie, J. S., G. A. Escanero, and P. C. Valentine. 1997.Effects of bottom fishing on the benthic megafauna of
TTTTTable 6. able 6. able 6. able 6. able 6. Results from ANOVA assessing the factors of Insideversus Outside (IO), Zonation (Z), and the Interaction betweenthese factors (Int) for each of the major benthic species in ClosedArea II. The analysis was done separately for both abundanceand biomass per grab. If a factor was significantly different, an Ior O for IO or the number of the zone for Z is given in parenthe-sis to show where the highest values for each variable wereobserved. See Table 2 for explanation of significance values.
Abundance Biomass
IO Z Int IO Z Int
Exogone hebes ** (I) ** (I)Spiophanes bombyxArctica islandica ?* (1)Cirolana politaByblis serrataCorophium crassicorneErichthonius rubricornis *** (2) *** (2)Unciola irrorataAeginina longicornis *** (2) *** (2)Ophiura robusta * (2) ** (2)

LINK ET AL.364
Figure 16. Figure 16. Figure 16. Figure 16. Figure 16. Biomass per grab of major infaunal benthic species in each zone of CAII, contrast-ing inside (solid bars) versus outside (open bars) (A) Zone 1 and (B) Zone 2. Error bars represent±1 SE. Note different scales on the axes across the zones.
0
2,000
4,000
6,000
Spioph
anes
bomby
x
Exogo
nehe
bes
Arctica
island
ica(X
10)
Cirolan
a polita
Byblis
serra
ta
Coroph
iumcra
ssico
rne
Erichth
onius
rubric
ornis
Unciol
a irrorat
a
Aegini
nalon
gicorn
is
Ophiur
a robus
taMe
an
bio
ma
ss (
mg
)/0
.1 m
2
In
Out
0
1,000
2,000
3,000
4,000
Spioph
anes
bomby
x
Exogo
nehe
bes
Arctica
islan
dica (X
10)
Cirolan
a polita
Byblis
serra
ta
Coroph
iumcra
ssico
rne
Erichth
onius
rubric
ornis
Unciol
a irrorat
a
Aegini
nalon
gicorn
is
Ophiur
a robus
ta
Me
an
bio
ma
ss (
mg
)/0
.1 m
2
(A)
(B)
EFFECTS OF AREA CLOSURES ON GEORGES BANK 365
Figure 17. Figure 17. Figure 17. Figure 17. Figure 17. Mean lengths for major fish species in each zone of CAII, contrasting inside (solid bars) versusoutside (open bars) (A) Zone 1 and (B) Zone 2. Error bars represent ±1 SE.
Leng
th (c
m)
Leng
th (c
m)
(A)
(B)
0
20
40
60
80
100B
arn
do
or
skate
Win
ter
skate
Little
ska
te
Silve
r h
ake
Atlan
tic c
od
Ha
ddo
ck
Re
d h
ake
Am
eri
ca
n p
laic
e
Fo
urs
pot
flou
nd
er
Ye
llow
tail
flou
nd
er
Win
ter
flou
nd
er
Witch
flo
un
de
r
Lo
ng
ho
rn s
culp
in
Se
a r
aven
Oce
an
po
ut
In
Out
0
20
40
60
80
100
Ba
rndo
or
skate
Win
ter
skate
Little
ska
te
Silve
r h
ake
Atlan
tic c
od
Ha
ddo
ck
Re
d h
ake
Am
eri
ca
n p
laic
e
Fo
urs
pot
flou
nd
er
Ye
llow
tail
flou
nd
er
Win
ter
flou
nd
er
Witch
flo
un
de
r
Lo
ng
ho
rn s
culp
in
Se
a r
aven
Oce
an
po
ut

LINK ET AL.366
Figure 18. Figure 18. Figure 18. Figure 18. Figure 18. Mean stomach contents for major fish species in each zone of CAII, contrasting inside (solid bars)versus outside (open bars) (A) Zone 1 and (B) Zone 2. Error bars represent ±1 SE.
(A)
(B)
0
10
20
30
Win
ter
ska
te
Little
ska
te
Ha
dd
ock
Re
d h
ake
Am
erica
n
pla
ice
Fo
urs
po
tflo
un
de
r
Ye
llow
tail
flo
un
de
r
Win
ter
flo
un
de
r
Witch
flo
un
de
r
Win
do
wp
an
e
Lo
ngh
orn
scu
lpin
Mea
n st
omac
h co
nten
ts (g
)
0
10
20
30W
inte
r
ska
te
Little
ska
te
Ha
dd
ock
Re
d h
ake
Am
erica
n
pla
ice
Fo
urs
po
tflo
un
de
r
Ye
llow
tail
flo
un
de
r
Win
ter
flo
un
de
r
Witch
flo
un
de
r
Win
do
wp
an
e
Lo
ngh
orn
scu
lpin
Mea
n st
omac
h co
nten
ts (g
)
EFFECTS OF AREA CLOSURES ON GEORGES BANK 367
Georges Bank. Marine Ecology Progress Series155:159–172.
Collie, J. S., G. A. Escanero, and P. C. Valentine. 2000a.Photographic evaluation of the impacts of bottom fish-ing on benthic epifauna. ICES Journal of Marine Sci-ence 57:987–1001.
Collie, J. S., S. J. Hall, M. J. Kaiser, and I. R. Poiner.2000b. A quantitative analysis of impacts on shelf-seabenthos. Journal of Animal Ecology 69:785–798.
Conover, D. O., J. Travis, and F. C. Coleman. 2000. Essen-tial fish habitat and marine reserves: an introduction tothe second Mote symposium in fisheries ecology. Bul-letin of Marine Science 66:527–534.
Cote, I. M., I. Mosqueira, and J. D. Reynolds. 2001. Ef-fects of marine reserve characteristics on the protec-tion of fish populations: a meta-analysis. Journal ofFish Biology 59:178–189.
Dorsey, E. M., and J. Pederson. 1998. Summary of Discus-sion and Recommendations from the Conference. pp.140–143 in E. M. Dorsey and J. Pederson, editors.Effects of fishing gear on the sea floor of New En-gland. Conservation Law Foundation, Boston Massa-chusetts.
Fisher, J. A. D., and K. T. Frank. 2002. Changes in finfishcommunity structure associated with an offshore fish-ery closed area on the Scotian Shelf. Marine EcologyProgress Series 240:249–265.
Fogarty, M. J., and S. A. Murawski. 1998. Large-scale dis-turbance and the structure of marine systems: fisheryimpacts on Georges Bank. Ecological Applications8(S1):S6–S22.
Jennings, S., and M. J. Kaiser. 1998. The effects of fishingon marine ecosystems. Advance in Marine Biology34:201–352.
Jennings, S., M. D. Nicholson, T. A. Dinmore, and J. E.Lancaster. 2002. Effects of chronic trawling disturbanceon the production of infaunal communities. MarineEcology Progress Series 243:251–260.
Jennings, S., and N. V. C. Polunin. 1996. Effects of fish-ing effort and catch rate upon the structure and biom-ass of Fijian reef fisheries. Journal of Fish Biology46:28–46.
Kaiser, M. J. 2003. Detecting the effects of fishing on sea-bed community diversity: importance of scale andsample size. Conservation Biology 17:512–520.
Kaiser, M. J., J. S. Collie, S. J. Hall, S. Jennings, and I. R.Poiner. 2002. Modification of marine habitats bytrawling activities: prognosis and solutions. Fish andFisheries 3:114–136.
Kaiser, M. J., and S. J. de Groot. 2000. Effects of fishingon non-target species and habitats. Blackwell Scien-tific Publications, Oxford, UK.
Lauck, T., C. W. Clark, M. Mangel, and G. R. Munro.1998. Implementing the precautionary principle in fish-eries management through marine reserves. Ecologi-cal Applications 8:S72–S78.
Lindholm, J. B., P. J. Auster, M. Ruth, and L. Kaufman.2001. Juvenile fish responses to variations in seafloorhabitats: modeling the effects of fishing and implica-
tions for the design of marine protected areas. Con-servation Biology 15:424–437.
Lindholm, J., P. Auster, and P. Valentine. 2004. Role of alarge marine protected area for conserving landscape at-tributes of sand habitats on Georges Bank (NorthwestAtlantic). Marine Ecology Progress Series 269:61–68.
Lough, R. G., P. C. Valentine, D. C. Potter, P. J. Auditore,G. R. Bolz, J. D. Neilson, and R. I. Perry. 1989. Ecol-ogy and distribution of juvenile cod and haddock inrelation to sediment type and bottom currents on east-ern Georges Bank. Marine Ecology Progress Series56:1–12.
McLanahan, T. R., and S. Mangi. 2000. Spillover of exploit-able fishes from a marine park and its effect on the ad-jacent fishery. Ecological Applications 10:1792–1805.
McManus, J. W. 1998. Marine reserves and biodiversity:toward 20% by 2020. ICLARM Conference Proceed-ings 57:25–29.
Mosquera, I., I. M. Cote, S. Jennings, and J. D. Reynolds.2000. Conservation benefits of marine reserves for fishpopulations. Animal Conservation 3:321–332.
Murawski, S. A., R. Brown, H.-L. Lai, P. J. Rago, and L.Hendrickson. 2000. Large-scale closed areas as a fish-ery-management tool in temperate marine systems: theGeorges Bank experience. Bulletin of Marine Science66:775–798.
Murawski, S. A., J.-J. Maguire, R. K. Mayo, and F. M.Serchuk. 1997. Groundfish stocks and the fishing in-dustry. Pages 27–70 in J. Boreman, B. S. Nakashima,J. A. Wilson, and R. L. Kendall, editors. NorthwestAtlantic groundfish: perspectives on a fishery collapse.American Fisheries Society, Bethesda, Maryland.
NEFSC (Northeast Fisheries Science Center). 2001. Reportof the 32nd Northeast Regional Stock AssessmentWorkshop (32nd SAW): Stock Assessment ReviewCommittee (SARC) consensus summary of assessments.NEFSC Center Reference Document 01-05:58–190.
NRC (National Research Council). 2001. Marine protectedareas: tools for sustaining ocean ecosystems. NationalAcademy Press, Washington, D.C.
Roberts, C. M. 1998. Sources, sinks, and the design of ma-rine reserve networks. Fisheries 24(7):16–19.
Roberts, C. M., J. A. Bohnsack, F. Gell, J. P. Hawkins, andR. Goodridge. 2001. Effects of marine reserves onadjacent fisheries. Science 294:1920–1923.
Russ, G. R., and A. C. Alcala. 1996. Do marine reservesexport adult fish biomass? Evidence from Apo Island,Central Philippines. Marine Ecology Progress Series132:1–9.
Smith, W. G., and W. W. Morse. 1985. Retention of larvalhaddock Melanogrammus aeglefinus in the GeorgesBank region, a gyre-influenced spawning area. Ma-rine Ecology Progress Series 24:1–13.
Strathamm, R. R., T. P. Hughes, A. M. Kuris, K. C.Lindeman, S. G. Morgan, J. M. Pandolfi, and R. R.Warner. 2002. Evolution of local recruitment and itsconsequences for marine populations. Bulletin of Ma-rine Science 70(Supplement):377–396.
Theroux, R. B., and R. L. Wigley. 1998. Quantitative compo-

LINK ET AL.368
sition and distribution of the macrobenthic invertebratefauna of the continental shelf ecosystems of the northeast-ern United States. NOAA Technical Report NMFS 140.
Thrush, S. F., J. E. Hewitt, V. J. Cummings, P. K. Dayton,M. Cryer, S. J. Turner, G. A. Funnell, R. G. Budd, C.J. Milburn, and M. R. Wilkinson. 1998. Disturbanceof the marine benthic habitat by commercial fishing:impacts at the scale of the fishery. Ecological Applica-tions 8:866–879.
Twichell, D. C, B. Butman, and R. S. Lewis. 1987. Shallowstructure, surficial geology, and the processes cur-rently shaping the bank. Pages 31–37 in R. H. Backusand D. W. Bourne, editors. Georges Bank. Massachu-setts Institute of Technology Press, Cambridge.
Valentine, P. C., and R. G. Lough. 1991. The sea floorenvironment and the fishery of eastern Georges Bank -the influence of geologic and oceanographic environ-mental factors on the abundance and distribution offisheries resources of the northeastern United Statescontinental shelf. U.S. Geological Survey Open-File
Report 91-39, Reston, Virginia.Valentine, P. C., E. W. Strom, R. G. Lough, and C. L. Brown.
1993. Maps showing the sedimentary environment ofeastern Georges Bank. U. S. Geological Survey Miscel-laneous Investigations Series, Map I-2279-B, scale1:250,000, 1 sheet, Woods Hole, Massachusetts.
Ward, T. J., D. Heinemann, and N. Evans. 2001. The roleof marine reserves as fisheries management tools: areview of concepts, evidence and international expe-rience. Bureau of Resource Science Kingston, ACT,Australia.