the effect of operational performance and focus on profitability: a longitudinal study of the u.s....
TRANSCRIPT
MANUFACTURING & SERVICEOPERATIONS MANAGEMENT
Vol. 9, No. 4, Fall 2007, pp. 506–517issn 1523-4614 �eissn 1526-5498 �07 �0904 �0506
informs ®
doi 10.1287/msom.1060.0133©2007 INFORMS
The Effect of Operational Performance andFocus on Profitability: A Longitudinal Study of
the U.S. Airline IndustryNikos Tsikriktsis
Management Science and Operations Department, London Business School, Regent’s Park,London NW1 4SA, United Kingdom, [email protected]
We study the impact of operational performance on profitability in the context of the U.S. domestic airlineindustry. In addition, we investigate the impact of focus [Skinner, W. 1974. The focused factory. Har-
vard Bus. Rev. 52(3) 113–121] on profitability in services. We use quarterly data on all major carriers, availablesince the introduction of required reporting of service indicators to the U.S. Department of Transportation. Ouranalysis demonstrates two main points. First, the relationship between operational performance and profitabil-ity is contingent on a company’s operating model; “focused” airlines show a link between late arrivals andprofitability while full-service airlines do not. Also, capacity utilization is a stronger driver of profitability forfull-service airlines than for focused airlines. Second, focused airlines outperform the rest of the industry interms of profitability.
Key words : operational performance; profitability; quality; operations strategy; focus; airlinesHistory : Received: April 15, 2005; accepted: July 27, 2006.
1. IntroductionHow does operational performance affect profitabil-ity in service operations? The service literature hasprimarily focused on either the link between pro-ductivity and profitability or the link between ser-vice quality and profitability. The overall impact ofoperational performance on profitability in serviceorganizations has been largely neglected. This can beattributed primarily to the fact that research on thedrivers of profitability in services has been conductedprimarily by marketing scholars who have focusedon the relationship between quality and profitability(Nelson et al. 1992, Fornell 1992, Anderson et al. 1994,Rust et al. 1995, Loveman 1998). On the other hand,accounting and operations management scholars havefocused on the impact of productivity on profitability(Schefczyk 1993, Smith and Reece 1999).In addition, we want to examine the potential im-
pact of “focus” (Skinner 1974) on profitability. Accord-ing to Skinner (1974), a factory that focuses on anarrow product mix for a particular market niche willoutperform another one, which attempts to achieve abroader mission. The importance of focus for serviceorganizations has been discussed by Heskett (1986),
Swamidass (1991), and Roth and Menor (2003) andhas received limited empirical investigation. Specifi-cally, it has been tested by Huete and Roth (1988) inbanks, by McLaughlin et al. (1995) in the health caresector, and finally by Boyer et al. (2002) through thecase study of Sotheby’s. However, these three previ-ous studies did not test the link between focus andfinancial performance.This paper looks at the role of operations in com-
peting in the airline industry. The objective of ourstudy is to fill a gap in previous empirical researchin the service operations management area by inves-tigating how operational performance (both qualityand productivity) affects profitability. This leads toour first research question: Does operational perfor-mance affect profitability in the airline industry? Inaddition, the notion of “focus” is a key concept inthe field of operations strategy, and we would like totest its impact on profitability in the airline industry.Thus, our second research question: Does operationalfocus lead to higher profitability? We investigate thesequestions in the context of the domestic U.S. air-line industry using objective measures of profitabilityand operational performance. Our empirical results
506
Tsikriktsis: The Effect of Operational Performance and Focus on ProfitabilityManufacturing & Service Operations Management 9(4), pp. 506–517, © 2007 INFORMS 507
are based on longitudinal data that cover 43 quartersfrom 1987 to 1998.The rest of the paper is organized as follows. First,
we describe the industry, review the literature on thelink between operational performance and profitabil-ity, and present our hypotheses. Second, we describethe sample, the measures, and the model estimationprocedures. Next, we present the results followed bythe discussion of our findings. The paper concludeswith a summary of the key contributions, limitations,and future research directions.
2. Background2.1. The U.S. Airline IndustryThe U.S. domestic airline industry is an interestingindustry to study. When the industry was deregu-lated in 1978, nobody could predict how “ugly” itwould look 20 years later. By 1992, the industry’slosses were so huge that they exceeded all the prof-its earned by the industry in its entire 67-year his-tory. PanAm, the world’s largest air carrier, no longerexisted and most major airlines reported severe losses.Moreover, due to the deregulation, the industry wasbombarded by more than 100 entrepreneurial start-ups, mainly small local carriers competing on lowfares. Misguided expansion plans led to overcapacityand Iraq’s invasion into Kuwait caused fuel prices todouble. As a result, the industry’s competitive prior-ities changed dramatically. The old operating modelin which companies were mainly competing on fre-quency of flights, geographic coverage, and elegantservice gave way to a new operating model. In thisnew model, operational excellence became “the nameof the game” (Treacy and Wiersema 1995).In addition, there are two distinct groups within the
10 major U.S. domestic airlines (Lapré and Tsikriktsis2006). Three airlines (Alaska, America West, andSouthwest) fly only within North America. We willrefer to these three airlines as “focused” airlines. Theyuse only one type of airplane (Boeing 737) and tryto avoid congested airports (although Southwest Air-lines operates from some congested airports suchas Philadelphia). They are also characterized by fasterturnaround times and provide frequent, less expensiveservice. We call the other seven carriers “full-service”airlines (American, Continental, Delta, Northwest,
TWA, United, and US Airways). They use the hub-and-spoke system and operate both U.S. domesticand international flights. They have different typesof planes within their fleet, more than one passengerclass (economy, business, and first), and more in-flightservice.
2.2. The Impact of Operational Performance onProfitability in Services
In this section, we briefly review studies that exam-ined the impact of quality and productivity, respec-tively, on profitability in service organizations. Therehas been a movement, primarily in the marketing lit-erature, toward examining the impact of quality onfinancial performance. Empirical findings from theProfit Impact of Marketing Strategies (PIMS) databasesuggested that a link between quality and profitabil-ity might exist for both manufacturing and services(Buzzell and Gale 1987). This triggered a stream ofresearch on the relationships between customer sat-isfaction, customer retention, market share, and prof-itability (Nelson et al. 1992, Fornell 1992, Andersonet al. 1994, Rust et al. 1995, Loveman 1998). Morerecently, operations management scholars have joinedthis stream of research. Voss et al. (2005) have studiedthe relationship between service quality and customersatisfaction, while Zhao et al. (2004) investigated therelationship between the quality systems used in ser-vices and business performance based on case studiesin China.A common theme is noticeable in previous empir-
ical studies; they neglect the potential impact of pro-ductivity on profitability. According to Zeithaml et al.(1996), understanding of the complex relationshipbetween quality of service and profitability requiressimultaneous investigation of other relationships suchas the link between productivity and profitability.Few studies have looked at the relationship between
productivity and profitability in services. Schefczyk(1993) studied the impact of productivity on finan-cial performance in the airline industry. Using dataenvelopment analysis (DEA), he combined multipleoutputs and inputs to develop a measure of totalfactor productivity for a cross section of 15 interna-tional air carriers, and he found that productivity waslinked to return on equity. Smith and Reece (1999)examined the relationship between strategy, produc-tivity, and business performance through field-based
Tsikriktsis: The Effect of Operational Performance and Focus on Profitability508 Manufacturing & Service Operations Management 9(4), pp. 506–517, © 2007 INFORMS
research in a wholesale distribution service setting.They found that productivity (measured by averagemonthly sales documents over number of employ-ees, average monthly sale line items over numberof employees, and yearly dollar sales per warehousesquare footage) was linked to financial performance(measured as an adjusted profit after tax percentage).A common thread between the two studies is thatthey investigated the impact of productivity on prof-itability without examining the potential role of qual-ity. According to Schefczyk (1993), productivity alonedoes not reflect overall performance. Specifically, pro-ductivity does not consider the operational elementsthat matter to the customer such as the flight beingon time, luggage not being lost or mishandled, etc.One of the key frameworks in the area of ser-
vice management which links (among others) quality,productivity, and financial performance is the “ser-vice profit chain” (Heskett et al. 1997). It synthesizesresearch from various disciplines (such as human re-source management, services marketing, and servicesoperations) and posits that certain human resourcepractices lead to capable and satisfied employeeswho, as a result, achieve higher productivity andquality of service. This combination of quality andproductivity ultimately results in superior financialperformance (Loveman 1998, Heskett et al. 1994).Finally, the service profit-chain framework is relatedto “the resource-based view,” according to which theresources and capabilities of an organization serveas a foundation for sustained competitive advantage(Barney 1991, 1995; Wright et al. 1994).Important exceptions to the previous studies that
focused on either quality or productivity includeRoth and Jackson (1995) and Anderson et al. (1997).Roth and Jackson (1995) empirically tested theoperational capabilities-service quality-performance(C-SQ-P) framework in the banking industry usingexclusively perceptual measures. Anderson et al.(1997) examined whether the relationship betweencustomer satisfaction, productivity, and profitabilitywas different between goods and services. Produc-tivity was operationalized as sales per employee andprofitability was measured by return on investment(ROI). Anderson et al. (1997) found that a trade-off between customer satisfaction and productivitywas more likely when (a) customer satisfaction was
more dependent on customization as opposed to stan-dardization, and (b) when it was costly to providehigh levels of both customization and standardiza-tion simultaneously. Their analysis also showed thatfor manufacturing goods, only productivity enhancedprofitability, whereas for services both customer satis-faction and productivity enhanced profitability.Our study differs from the previous studies in sev-
eral ways. First, it differs from the studies that exam-ined in isolation either quality (e.g., Nelson et al. 1992,Fornell 1992, Anderson et al. 1994, Rust et al. 1995,Loveman 1998, Zhao et al. 2004, Voss et al. 2005) orproductivity (e.g., Schefczyk 1993, Smith and Reece1999). It also differs from the study by Roth andJackson (1995) because they used perceptual mea-sures of productivity, quality, and market perfor-mance, whereas we use exclusively objective data thatreduce (but by no means eliminate because there isalways a possibility of random noise in the data)the threat of common method bias. Also, our studydiffers from the Anderson et al. (1997) study in theway we operationalize productivity. Their productiv-ity measure is marketing oriented (sales productivity)while our measures are operational because they cap-ture capacity utilization. Finally, a key difference ofour study is that unlike the previous studies men-tioned above, ours is based on longitudinal data. Oneof the major advantages of a longitudinal study isthat it enables us to incorporate time lags betweenvariables and to move a step closer toward under-standing “cause and effect” in empirical operationsmanagement research.According to D’Aveni (1989), improved utilization
of resources is necessary for increased profitability.Hammesfahr et al. (1993) found that capacity affectsfirm profitability while Banker et al. (1993) concludedthat capacity utilization is associated with changes inoverall profitability. Baltagi et al. (1998) found thatexcess capacity is a fundamental reason for losses inthe U.S. airline industry. Based on these studies andalso the studies discussed in the previous paragraphs,we posit:
Hypothesis 1A. Higher capacity utilization leads toincreased profitability in the U.S. airline industry.
There is a lot of evidence on the impact of qualityon profitability in services. Bad quality leads to dis-satisfaction and dissatisfied customers tend to defect
Tsikriktsis: The Effect of Operational Performance and Focus on ProfitabilityManufacturing & Service Operations Management 9(4), pp. 506–517, © 2007 INFORMS 509
and give bad word of mouth to a company, both ofwhich have a negative impact on profits (Heskett et al.1997, Anderson et al. 1997). In addition, one wouldexpect that strong delivery reliability (flights beingon time) would lead to increased profitability. Theargument is very similar to that for the link betweenquality and profitability often argued by quality theo-rists (Deming 1982, Juran 1988, Garvin 1988). Reliabledeliveries, like good quality, may result in cost reduc-tion (because there is no need for expediting and extralabor) while, on the other hand, customers may bewilling to pay more to do business with a companythat has a better delivery record.Based on these studies and also the studies dis-
cussed in the previous paragraphs that examined theimpact of quality on financial performance, we posit:
Hypothesis 1B. Higher quality leads to increased prof-itability in the U.S. airline industry.
2.3. The Notion of “Focus” in ServiceOperations Strategy
Skinner (1974) introduced the notion of a “focusedfactory.” He suggested that a factory that focuseson a narrow product mix for a particular marketniche would outperform a plant, which attempts toachieve a broader mission. Heskett (1986), Swamidass(1991), and more recently Roth and Menor (2003)have discussed the benefits of focus in the servicemanagement literature. According to Heskett et al.(1997), companies with operating focus (in the servicedelivery system) achieve high profitability.The notion of focus has received limited empiri-
cal testing in services. Huete and Roth (1988) showedthat focused banks (defined as those with a smallerspan, i.e., fewer delivery channels) had less man-agerial complexity. More recently, Boyer et al. (2002)examined the role of focus through the case study ofSotheby’s. Our research attempts to extend this priorempirical work; we investigate the role of focus onfinancial performance, which had not been tested bythe previous two studies.As described in §2.1, carriers in the U.S. airline
industry can be broken down to “focused” airlines(such as Southwest, America West, and Alaska air-lines) and “full-service” airlines (such as Continental,Delta, and United). Focused airlines are known to
fly Boeing 737s from point to point in North Amer-ica only and to have higher levels of coordinationand teamwork exemplified by fast turnaround times(Gittell 2003). On the other hand, full-service air-lines operate several hubs and have many differenttypes of planes within their fleet (Lapré and Scudder2004). Based on the arguments put forward by Skin-ner (1974), Heskett et al. (1997), and Roth and Menor(2003), we posit:
Hypothesis 2. Focused airlines are more profitablethan full-service airlines.
3. Research Methods3.1. SampleWe use data from the U.S. domestic airline industry toinvestigate the relationship between operational per-formance and profitability. Specifically, our study isbased on longitudinal data concerning the 10 majorairlines (Alaska Airlines, America West, AmericanAirlines, Continental, Delta, Northwest, Southwest,TWA, United, and USAir). The U.S. Department ofTransportation classifies an airline as major if the air-line has at least 1% of total U.S. domestic passengerrevenues. The only other major airlines operating inpart of 1988–1998 ceased operations well before 1998:Eastern in 1990 and Pan Am in 1991. Combined, themajor airlines account for more than 93% of revenuepassenger miles for all U.S. airlines. (One revenuepassenger mile is transporting one passenger over onemile in revenue service.)Starting in September 1987, the U.S. Department
of Transportation introduced quarterly quality datareports. Consequently, all major airlines were requiredto collect and report data among others on on-timeperformance and lost baggage. Besides these objectiveindicators of quality, the data also include objectivemeasures of capacity utilization and financial perfor-mance. The data cover the period from the fourthquarter of 1987 through the second quarter of 1998(43 quarters), resulting in a sample of 430 observa-tions (i.e., there are no missing data for any of thevariables).Investigating business performance in terms of
both financial and operational performance with ob-jective data from secondary sources is especiallyappropriate for single industry studies (Venkatramanand Ramanujam 1986). In addition, a single industry
Tsikriktsis: The Effect of Operational Performance and Focus on Profitability510 Manufacturing & Service Operations Management 9(4), pp. 506–517, © 2007 INFORMS
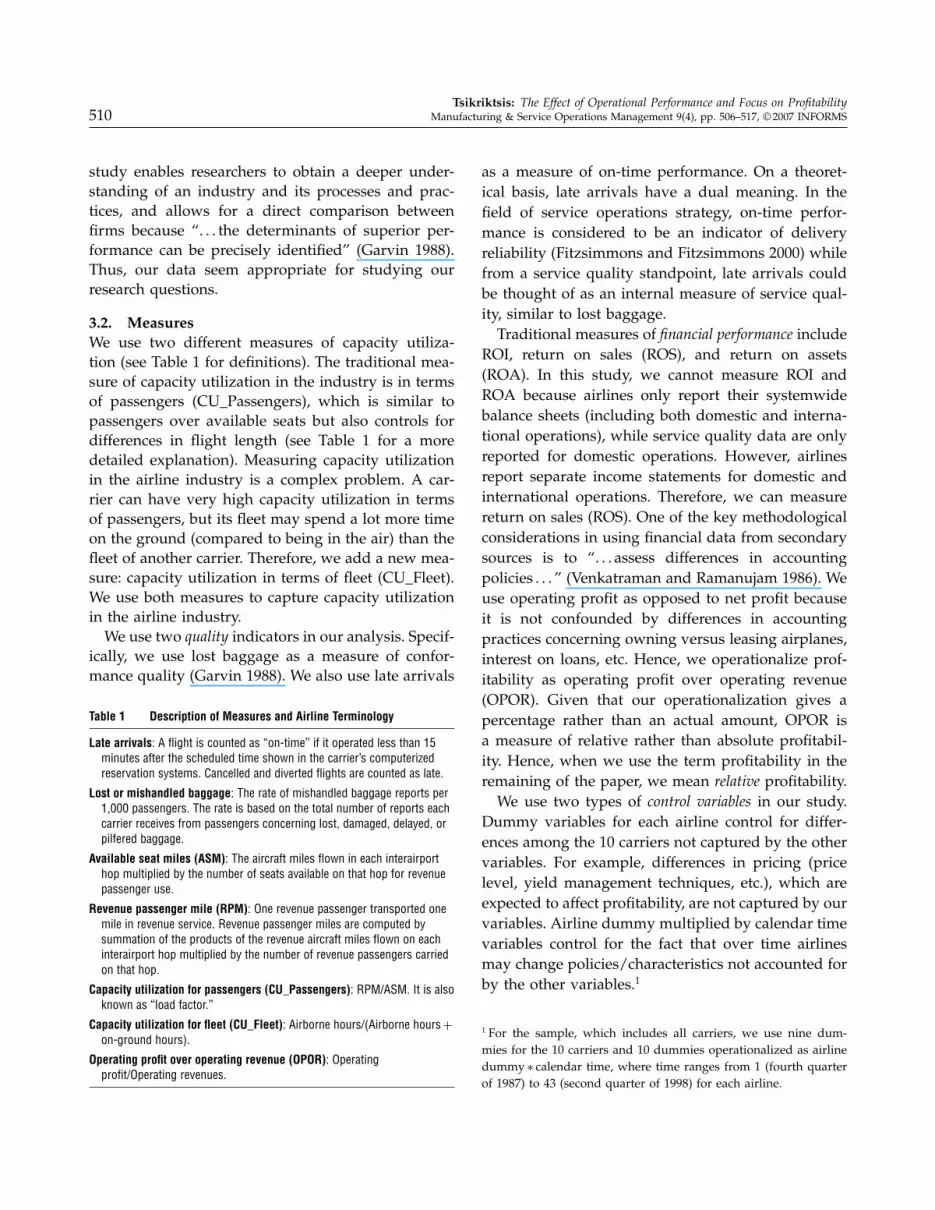
study enables researchers to obtain a deeper under-standing of an industry and its processes and prac-tices, and allows for a direct comparison betweenfirms because “� � � the determinants of superior per-formance can be precisely identified” (Garvin 1988).Thus, our data seem appropriate for studying ourresearch questions.
3.2. MeasuresWe use two different measures of capacity utiliza-tion (see Table 1 for definitions). The traditional mea-sure of capacity utilization in the industry is in termsof passengers (CU_Passengers), which is similar topassengers over available seats but also controls fordifferences in flight length (see Table 1 for a moredetailed explanation). Measuring capacity utilizationin the airline industry is a complex problem. A car-rier can have very high capacity utilization in termsof passengers, but its fleet may spend a lot more timeon the ground (compared to being in the air) than thefleet of another carrier. Therefore, we add a new mea-sure: capacity utilization in terms of fleet (CU_Fleet).We use both measures to capture capacity utilizationin the airline industry.We use two quality indicators in our analysis. Specif-
ically, we use lost baggage as a measure of confor-mance quality (Garvin 1988). We also use late arrivals
Table 1 Description of Measures and Airline Terminology
Late arrivals: A flight is counted as “on-time” if it operated less than 15minutes after the scheduled time shown in the carrier’s computerizedreservation systems. Cancelled and diverted flights are counted as late.
Lost or mishandled baggage: The rate of mishandled baggage reports per1,000 passengers. The rate is based on the total number of reports eachcarrier receives from passengers concerning lost, damaged, delayed, orpilfered baggage.
Available seat miles (ASM): The aircraft miles flown in each interairporthop multiplied by the number of seats available on that hop for revenuepassenger use.
Revenue passenger mile (RPM): One revenue passenger transported onemile in revenue service. Revenue passenger miles are computed bysummation of the products of the revenue aircraft miles flown on eachinterairport hop multiplied by the number of revenue passengers carriedon that hop.
Capacity utilization for passengers (CU_Passengers): RPM/ASM. It is alsoknown as “load factor.”
Capacity utilization for fleet (CU_Fleet): Airborne hours/(Airborne hours+on-ground hours).
Operating profit over operating revenue (OPOR): Operatingprofit/Operating revenues.
as a measure of on-time performance. On a theoret-ical basis, late arrivals have a dual meaning. In thefield of service operations strategy, on-time perfor-mance is considered to be an indicator of deliveryreliability (Fitzsimmons and Fitzsimmons 2000) whilefrom a service quality standpoint, late arrivals couldbe thought of as an internal measure of service qual-ity, similar to lost baggage.Traditional measures of financial performance include
ROI, return on sales (ROS), and return on assets(ROA). In this study, we cannot measure ROI andROA because airlines only report their systemwidebalance sheets (including both domestic and interna-tional operations), while service quality data are onlyreported for domestic operations. However, airlinesreport separate income statements for domestic andinternational operations. Therefore, we can measurereturn on sales (ROS). One of the key methodologicalconsiderations in using financial data from secondarysources is to “� � �assess differences in accountingpolicies � � �” (Venkatraman and Ramanujam 1986). Weuse operating profit as opposed to net profit becauseit is not confounded by differences in accountingpractices concerning owning versus leasing airplanes,interest on loans, etc. Hence, we operationalize prof-itability as operating profit over operating revenue(OPOR). Given that our operationalization gives apercentage rather than an actual amount, OPOR isa measure of relative rather than absolute profitabil-ity. Hence, when we use the term profitability in theremaining of the paper, we mean relative profitability.We use two types of control variables in our study.
Dummy variables for each airline control for differ-ences among the 10 carriers not captured by the othervariables. For example, differences in pricing (pricelevel, yield management techniques, etc.), which areexpected to affect profitability, are not captured by ourvariables. Airline dummy multiplied by calendar timevariables control for the fact that over time airlinesmay change policies/characteristics not accounted forby the other variables.1
1 For the sample, which includes all carriers, we use nine dum-mies for the 10 carriers and 10 dummies operationalized as airlinedummy ∗ calendar time, where time ranges from 1 (fourth quarterof 1987) to 43 (second quarter of 1998) for each airline.
Tsikriktsis: The Effect of Operational Performance and Focus on ProfitabilityManufacturing & Service Operations Management 9(4), pp. 506–517, © 2007 INFORMS 511
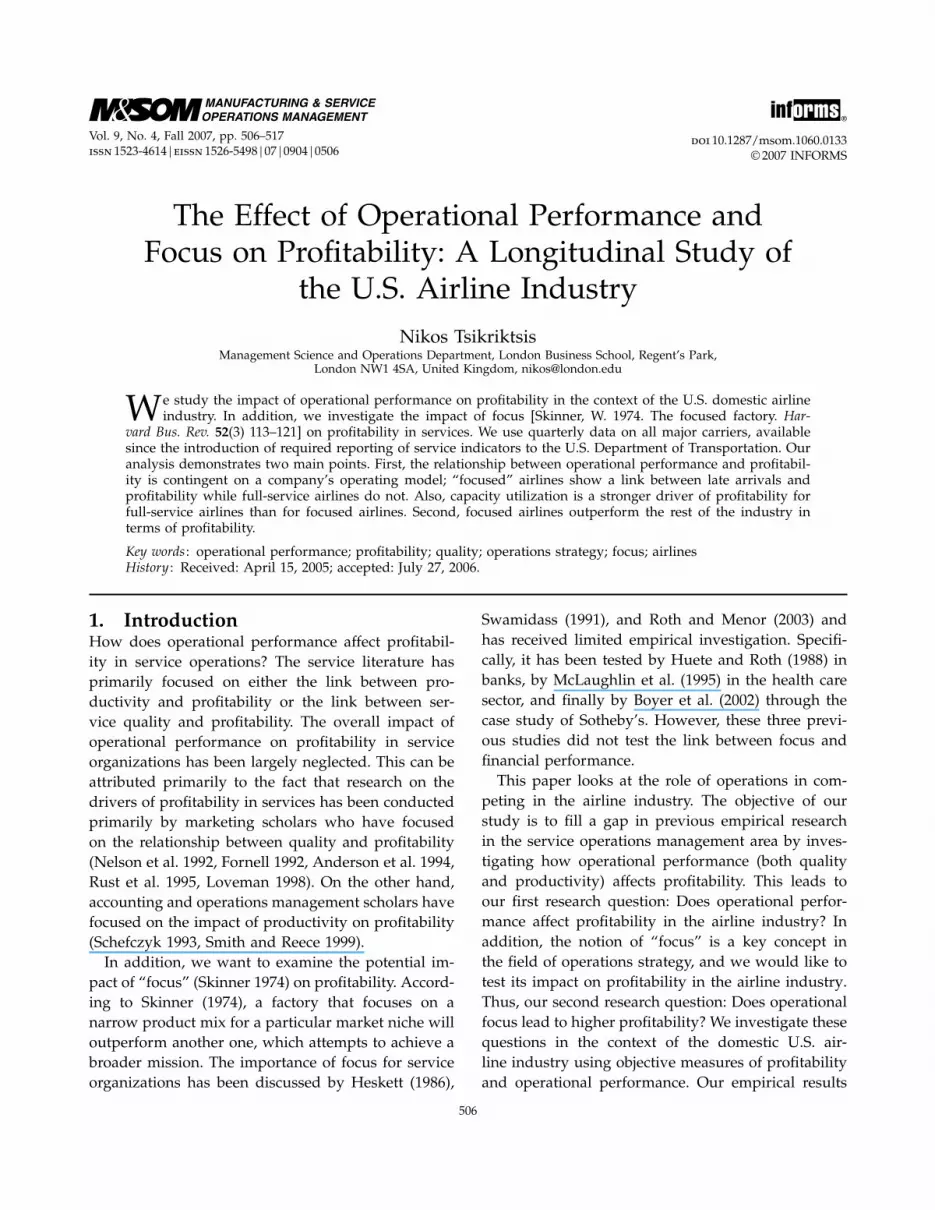
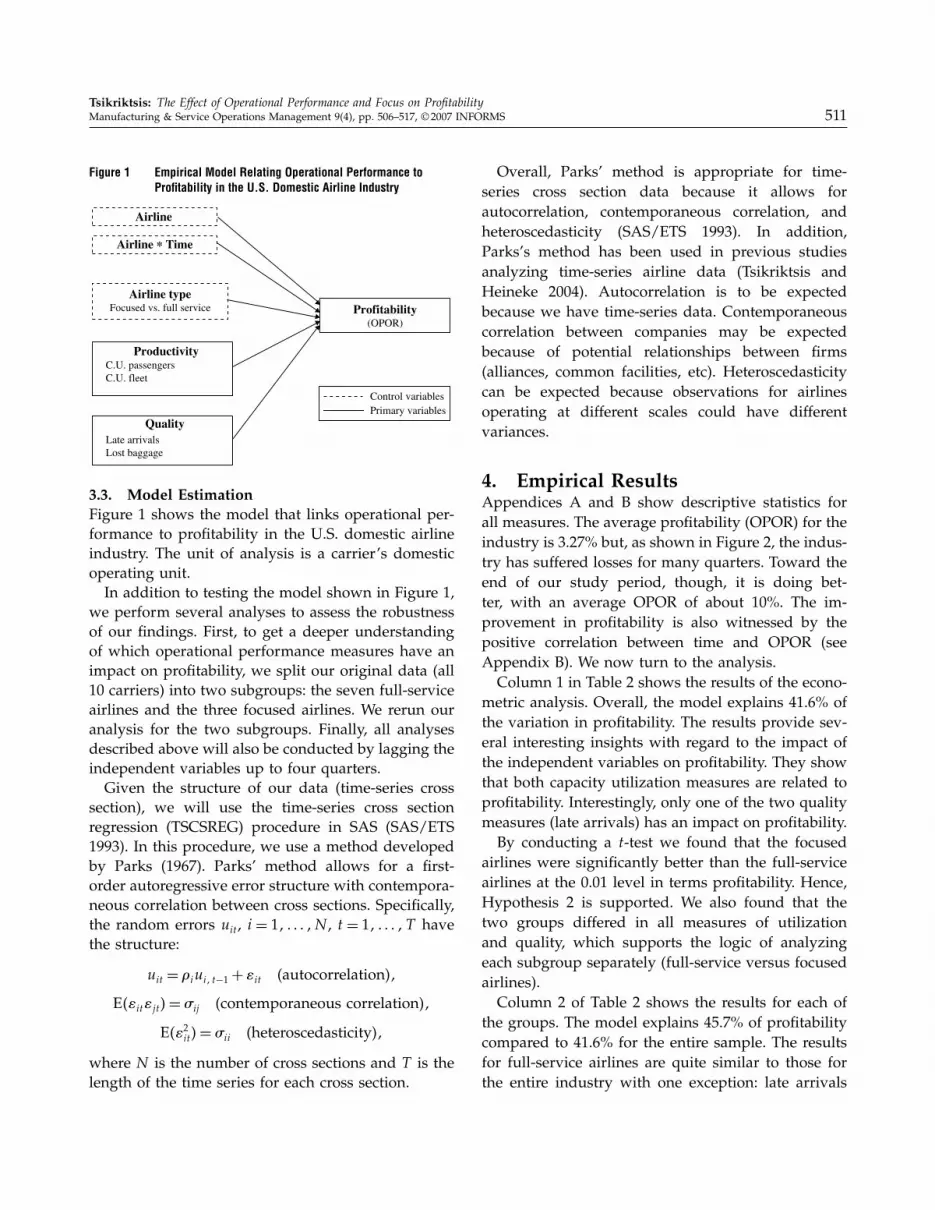
Figure 1 Empirical Model Relating Operational Performance toProfitability in the U.S. Domestic Airline Industry
QualityLate arrivalsLost baggage
Productivity
Profitability(OPOR)
Airline typeFocused vs. full service
Airline
Airline * Time
Control variablesPrimary variables
C.U. passengersC.U. fleet
3.3. Model EstimationFigure 1 shows the model that links operational per-formance to profitability in the U.S. domestic airlineindustry. The unit of analysis is a carrier’s domesticoperating unit.In addition to testing the model shown in Figure 1,
we perform several analyses to assess the robustnessof our findings. First, to get a deeper understandingof which operational performance measures have animpact on profitability, we split our original data (all10 carriers) into two subgroups: the seven full-serviceairlines and the three focused airlines. We rerun ouranalysis for the two subgroups. Finally, all analysesdescribed above will also be conducted by lagging theindependent variables up to four quarters.Given the structure of our data (time-series cross
section), we will use the time-series cross sectionregression (TSCSREG) procedure in SAS (SAS/ETS1993). In this procedure, we use a method developedby Parks (1967). Parks’ method allows for a first-order autoregressive error structure with contempora-neous correlation between cross sections. Specifically,the random errors uit , i = 1� � � � �N , t = 1� � � � � T havethe structure:
uit = �iui� t−1+ it (autocorrelation)�
Eitjt�= ij (contemporaneous correlation)�
E2it�= ii (heteroscedasticity)�
where N is the number of cross sections and T is thelength of the time series for each cross section.
Overall, Parks’ method is appropriate for time-series cross section data because it allows forautocorrelation, contemporaneous correlation, andheteroscedasticity (SAS/ETS 1993). In addition,Parks’s method has been used in previous studiesanalyzing time-series airline data (Tsikriktsis andHeineke 2004). Autocorrelation is to be expectedbecause we have time-series data. Contemporaneouscorrelation between companies may be expectedbecause of potential relationships between firms(alliances, common facilities, etc). Heteroscedasticitycan be expected because observations for airlinesoperating at different scales could have differentvariances.
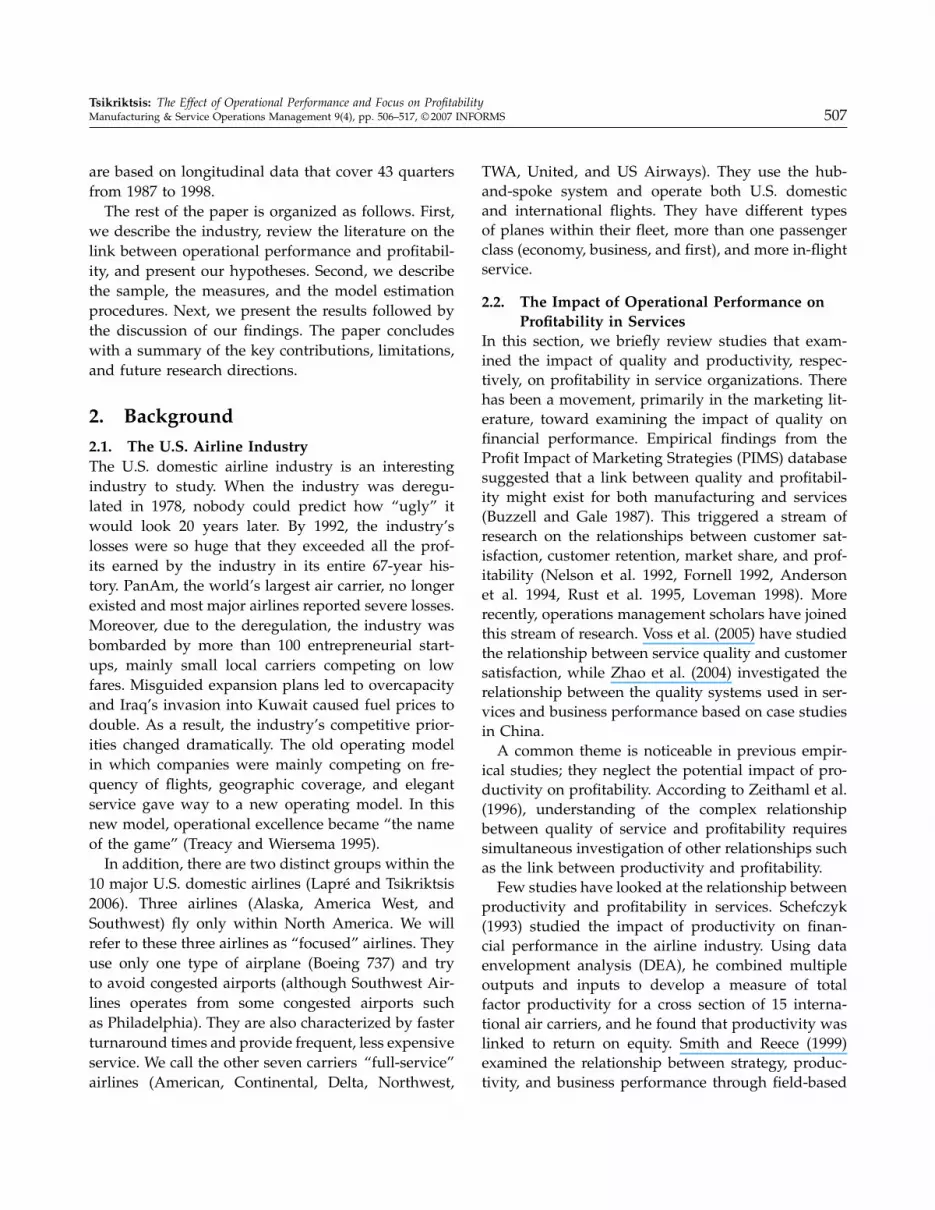
4. Empirical ResultsAppendices A and B show descriptive statistics forall measures. The average profitability (OPOR) for theindustry is 3.27% but, as shown in Figure 2, the indus-try has suffered losses for many quarters. Toward theend of our study period, though, it is doing bet-ter, with an average OPOR of about 10%. The im-provement in profitability is also witnessed by thepositive correlation between time and OPOR (seeAppendix B). We now turn to the analysis.Column 1 in Table 2 shows the results of the econo-
metric analysis. Overall, the model explains 41.6% ofthe variation in profitability. The results provide sev-eral interesting insights with regard to the impact ofthe independent variables on profitability. They showthat both capacity utilization measures are related toprofitability. Interestingly, only one of the two qualitymeasures (late arrivals) has an impact on profitability.By conducting a t-test we found that the focused
airlines were significantly better than the full-serviceairlines at the 0.01 level in terms profitability. Hence,Hypothesis 2 is supported. We also found that thetwo groups differed in all measures of utilizationand quality, which supports the logic of analyzingeach subgroup separately (full-service versus focusedairlines).Column 2 of Table 2 shows the results for each of
the groups. The model explains 45.7% of profitabilitycompared to 41.6% for the entire sample. The resultsfor full-service airlines are quite similar to those forthe entire industry with one exception: late arrivals

Tsikriktsis: The Effect of Operational Performance and Focus on Profitability512 Manufacturing & Service Operations Management 9(4), pp. 506–517, © 2007 INFORMS
Table 2 Results of Regression Analysis
Model 1 Model 2
Unstandardized Unstandardizedcoefficients T -statistic coefficients T -statistic
American 4�37 1�38 4�15 1�32Alaska 6�91∗ 1�88 62�99 0�67America West −5�06 −0�99 49�75 0�52Continental −5�15 −1�40 −5�83 −1�58Delta 1�53 0�45 0�98 0�29Northwest −5�07 −1�33 −5�30 −1�41Southwest 5�36 1�45 62�68 0�66United −3�52 −1�11 −4�56 −1�41USAir −1�27 −0�37 −1�49 −0�44American× time −0�15∗ −1�82 −0�20∗∗ −2�16Alaska× time −0�25∗ −1�79 −0�19 −1�22America West× time 0�13 0�84 0�25 1�50Continental× time 0�12 1�22 0�10 1�03Delta× time 0�06 0�55 0�04 0�38Northwest× time 0�37∗∗∗ 3�37 0�35∗∗∗ 3�33Southwest× time 0�01 0�21 0�03 0�41TWA× time −0�11 −0�77 −0�14 −1�01United× time −0�03 −0�43 −0�05 −0�65USAir× time −0�01 −0�08 −0�03 −0�28CU_Passengers 0�63∗∗∗ 8�56CU_Fleet 4�47∗∗∗ 4�29Lost baggage −0�21 −1�76Late arrivals −0�10∗ −0�86Focused×CU_Passengers 0�62∗∗∗ 5�67Focused×CU_Fleet 3�94∗∗ 2�54Focused× lost baggage 0�25 0�52Focused× late arrivals −0�28∗∗∗ −3�28Full service×CU_Passengers 0�61∗∗∗ 7�20Full service×CU_Fleet 5�19∗∗∗ 3�83Full service× lost baggage −0�38 −1�39Full service× late arrivals −0�01 −0�10R2 0�416 0�457�R2 0�041∗∗
Sample size 430 430
Notes. Dependent variable: profitability (OPOR).∗Signifies significance at 0.10 in a two-tail test, ∗∗ at 0.05, ∗∗∗ at 0.01.
have no impact on profitability for full-service air-lines.The results for focused airlines can be summarized
in two key points. First, similar to full-service airlines,both capacity utilization measures have an impact onprofitability. Second, unlike full-service airlines, latearrivals have a significant impact on the dependentvariable for focused airlines.An advantage of having time-series data is the
opportunity to test for potential lagged effects. Allanalyses described above were also conducted by lag-ging the independent variables up to four quarters.Although the relationships were found to be in thesame direction, their statistical significance was lowerthan the one obtained by conducting the analysis at
time t for all measures. Moreover, the models thatused lagged variables had lower explanatory powercompared to the models shown here.
5. DiscussionAs noted in the literature review, profitability stud-ies in services have typically focused on the impactof either productivity or quality. Our empirical find-ings show that both can have explanatory power.Consequently, neither driver should be ignored a pri-ori. In fact, we found that a company’s operatingmodel can play an important role in this relationship.In the U.S. domestic airline industry, there are twodistinct operating models: full-service airlines andfocused airlines. In these two operating models, dif-ferent dimensions of operational performance driveprofitability. It would be erroneous to conclude forthe entire industry that either productivity or qualityhad no impact on profitability. It may be misleadingto lump all firms in a single industry analysis if firmshave different operating models.To illustrate the importance of operating models,
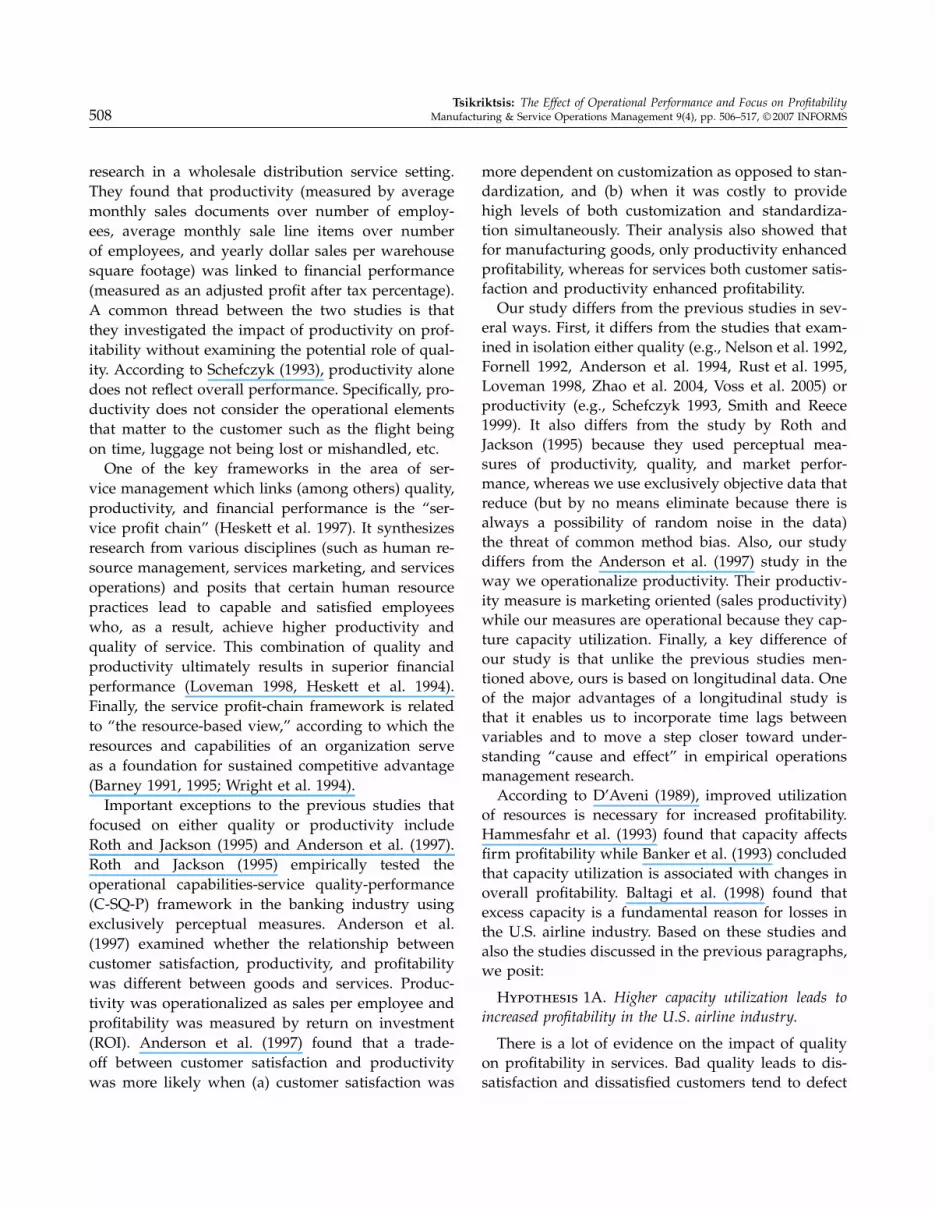
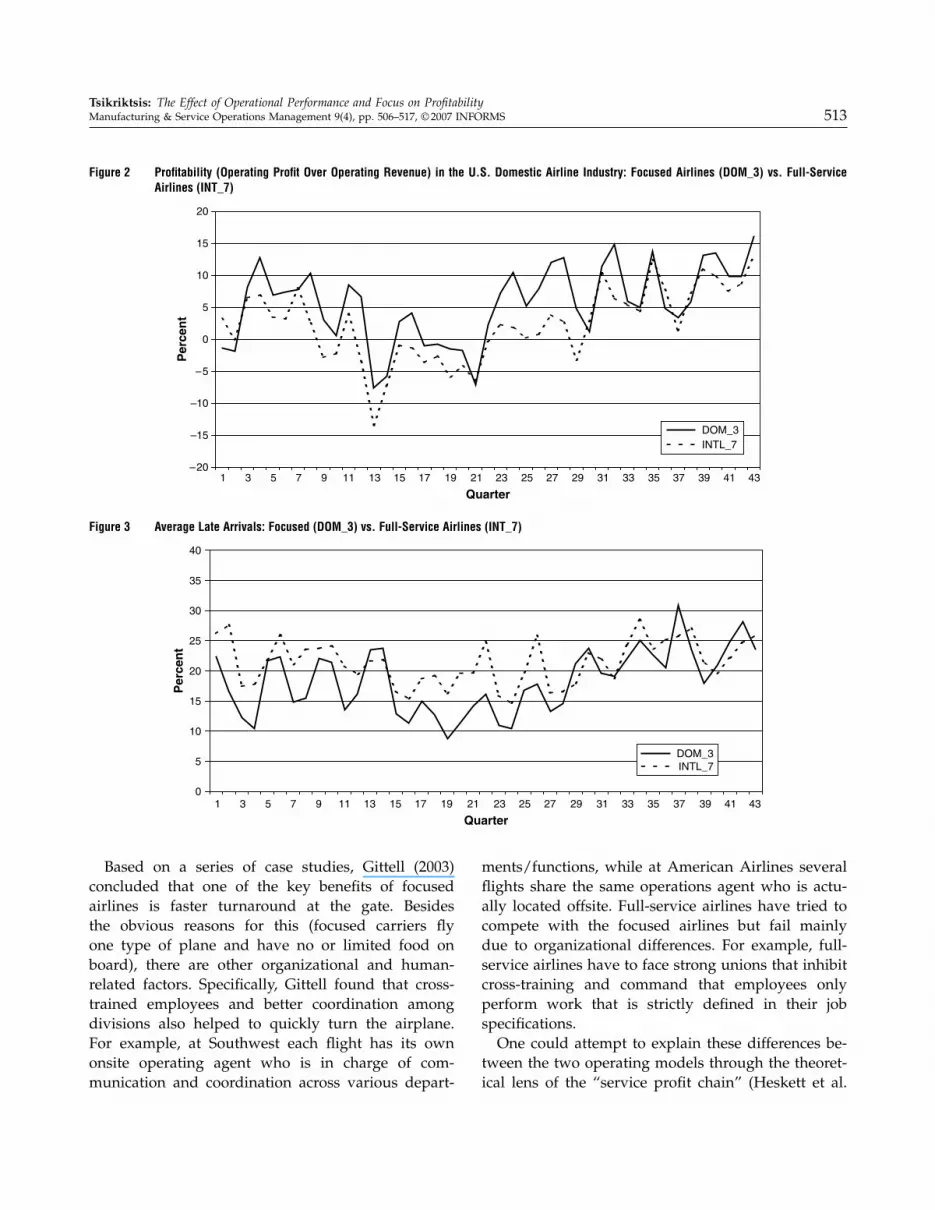
consider our findings for late arrivals. Late arrivalsaffect profitability for focused airlines, whereas theydo not affect profitability for full-service carriers (seeModel 2 in Table 2). This finding can be explained bythe “zone of tolerance” argument used in the servicequality literature (Parasuraman et al. 1990). Accord-ing to this argument, the zone of tolerance is muchtighter for the service quality dimension that is mostcritical to company success. In our case, companiesthat have competitive strength on timeliness seem tohave a very narrow zone of tolerance for lateness, andthat is reflected in their financial performance. Specif-ically, Figure 3 shows that focused airlines have a bet-ter on-time performance record than the rest of theindustry. This is certainly true for the first 28 quartersof our data. Recently, focused airlines have had morelate arrivals and—for some quarters—even more thanthe rest of the industry. As shown in Figure 2, inthe same period (the last 15 quarters) the profitabil-ity gap between focused airlines and the rest of theindustry has narrowed. Figures 2 and 3 combinedwith the results in Table 2 indicate that airlines thathave traditionally been the best on-time performersare penalized financially for being late whereas theothers are not.
Tsikriktsis: The Effect of Operational Performance and Focus on ProfitabilityManufacturing & Service Operations Management 9(4), pp. 506–517, © 2007 INFORMS 513
Figure 2 Profitability (Operating Profit Over Operating Revenue) in the U.S. Domestic Airline Industry: Focused Airlines (DOM_3) vs. Full-ServiceAirlines (INT_7)
–20
–15
–10
–5
0
5
10
15
20
1 3 5 7 9 11 13 15 17 19 21 23 25 27 29 31 33 35 37 39 41 43
Per
cen
t
DOM_3INTL_7
Quarter
Figure 3 Average Late Arrivals: Focused (DOM_3) vs. Full-Service Airlines (INT_7)
0
5
10
15
20
25
30
35
40
DOM_3INTL_7
Per
cen
t
1 3 5 7 9 11 13 15 17 19 21 23 25 27 29 31 33 35 37 39 41 43
Quarter
Based on a series of case studies, Gittell (2003)concluded that one of the key benefits of focusedairlines is faster turnaround at the gate. Besidesthe obvious reasons for this (focused carriers flyone type of plane and have no or limited food onboard), there are other organizational and human-related factors. Specifically, Gittell found that cross-trained employees and better coordination amongdivisions also helped to quickly turn the airplane.For example, at Southwest each flight has its ownonsite operating agent who is in charge of com-munication and coordination across various depart-
ments/functions, while at American Airlines severalflights share the same operations agent who is actu-ally located offsite. Full-service airlines have tried tocompete with the focused airlines but fail mainlydue to organizational differences. For example, full-service airlines have to face strong unions that inhibitcross-training and command that employees onlyperform work that is strictly defined in their jobspecifications.One could attempt to explain these differences be-
tween the two operating models through the theoret-ical lens of the “service profit chain” (Heskett et al.
Tsikriktsis: The Effect of Operational Performance and Focus on Profitability514 Manufacturing & Service Operations Management 9(4), pp. 506–517, © 2007 INFORMS
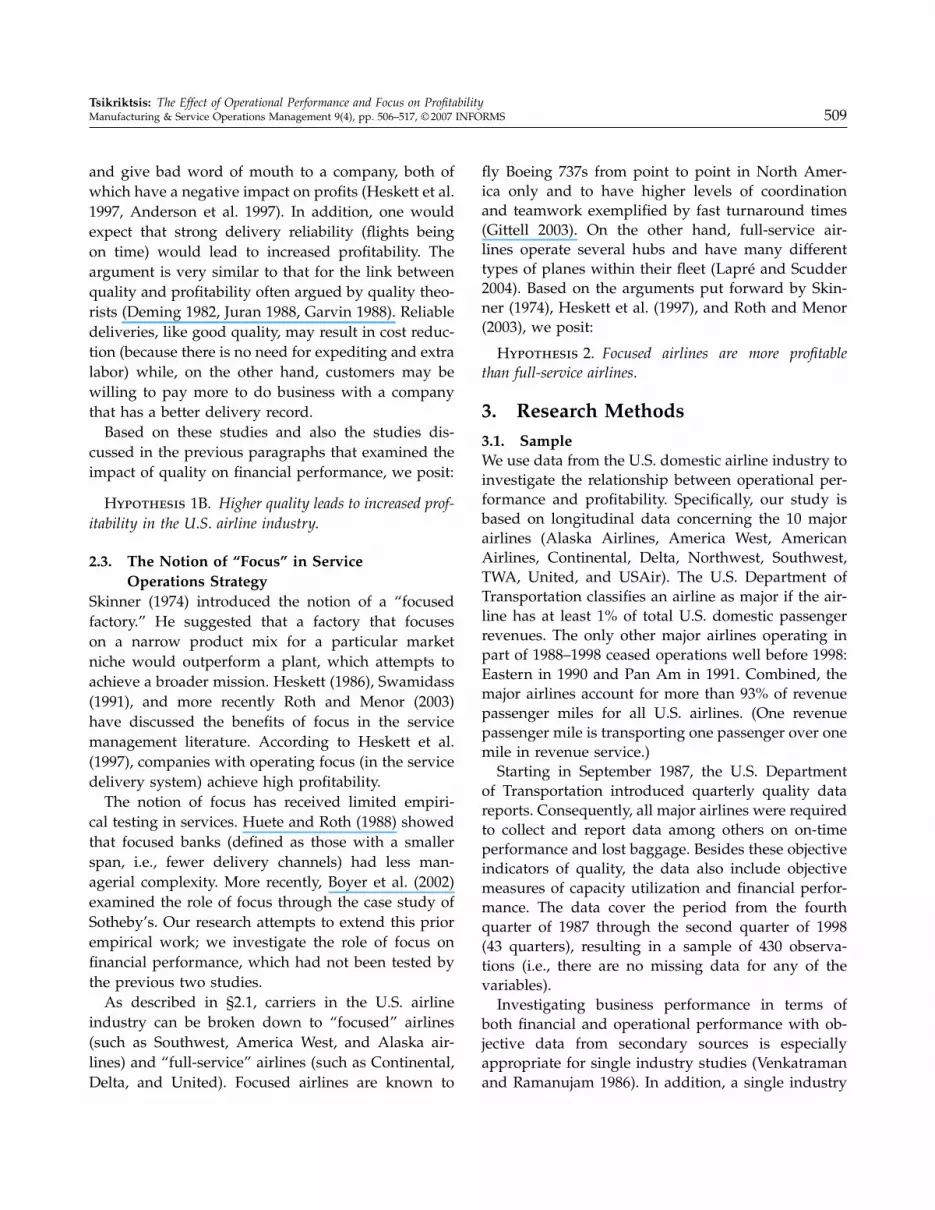
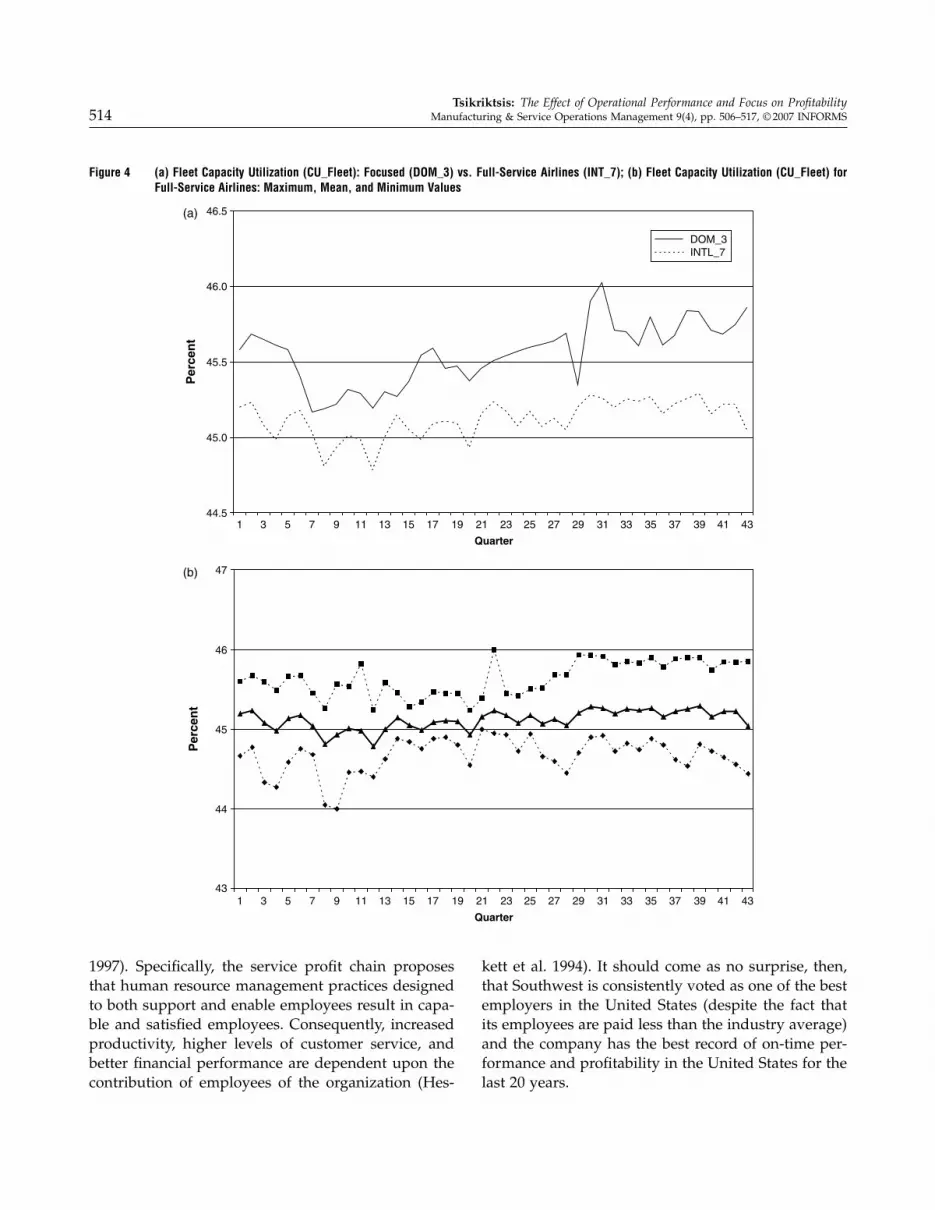
Figure 4 (a) Fleet Capacity Utilization (CU_Fleet): Focused (DOM_3) vs. Full-Service Airlines (INT_7); (b) Fleet Capacity Utilization (CU_Fleet) forFull-Service Airlines: Maximum, Mean, and Minimum Values
44.5
45.0
45.5
46.0
46.5
1 3 5 7 9 11 13 15 17 19 21 23 25 27 29 31 33 35 37 39 41 43
Quarter
1 3 5 7 9 11 13 15 17 19 21 23 25 27 29 31 33 35 37 39 41 43
Quarter
Per
cen
t
43
44
45
46
47
Per
cen
t
DOM_3INTL_7
(a)
(b)
1997). Specifically, the service profit chain proposesthat human resource management practices designedto both support and enable employees result in capa-ble and satisfied employees. Consequently, increasedproductivity, higher levels of customer service, andbetter financial performance are dependent upon thecontribution of employees of the organization (Hes-
kett et al. 1994). It should come as no surprise, then,that Southwest is consistently voted as one of the bestemployers in the United States (despite the fact thatits employees are paid less than the industry average)and the company has the best record of on-time per-formance and profitability in the United States for thelast 20 years.
Tsikriktsis: The Effect of Operational Performance and Focus on ProfitabilityManufacturing & Service Operations Management 9(4), pp. 506–517, © 2007 INFORMS 515
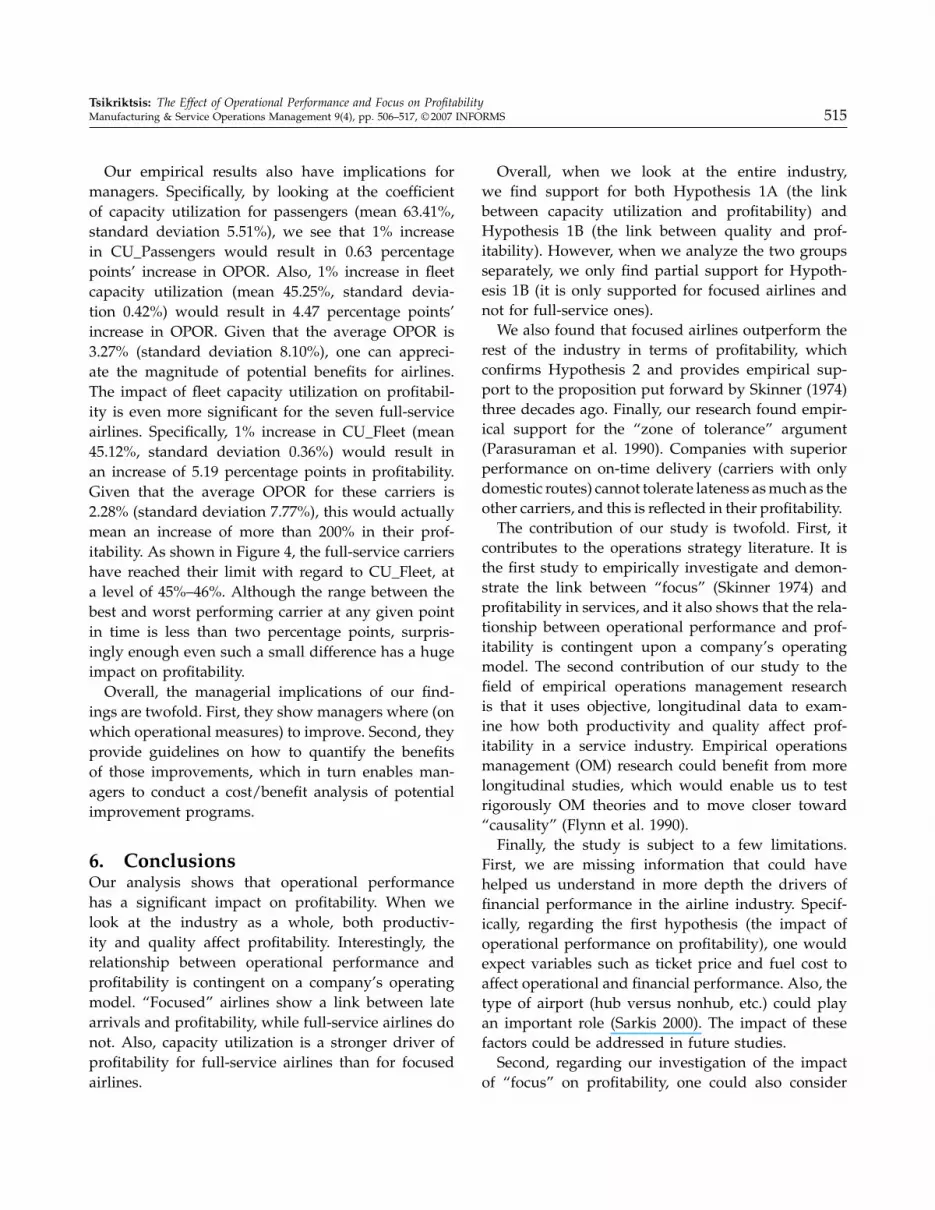
Our empirical results also have implications formanagers. Specifically, by looking at the coefficientof capacity utilization for passengers (mean 63.41%,standard deviation 5.51%), we see that 1% increasein CU_Passengers would result in 0.63 percentagepoints’ increase in OPOR. Also, 1% increase in fleetcapacity utilization (mean 45.25%, standard devia-tion 0.42%) would result in 4.47 percentage points’increase in OPOR. Given that the average OPOR is3.27% (standard deviation 8.10%), one can appreci-ate the magnitude of potential benefits for airlines.The impact of fleet capacity utilization on profitabil-ity is even more significant for the seven full-serviceairlines. Specifically, 1% increase in CU_Fleet (mean45.12%, standard deviation 0.36%) would result inan increase of 5.19 percentage points in profitability.Given that the average OPOR for these carriers is2.28% (standard deviation 7.77%), this would actuallymean an increase of more than 200% in their prof-itability. As shown in Figure 4, the full-service carriershave reached their limit with regard to CU_Fleet, ata level of 45%–46%. Although the range between thebest and worst performing carrier at any given pointin time is less than two percentage points, surpris-ingly enough even such a small difference has a hugeimpact on profitability.Overall, the managerial implications of our find-
ings are twofold. First, they show managers where (onwhich operational measures) to improve. Second, theyprovide guidelines on how to quantify the benefitsof those improvements, which in turn enables man-agers to conduct a cost/benefit analysis of potentialimprovement programs.
6. ConclusionsOur analysis shows that operational performancehas a significant impact on profitability. When welook at the industry as a whole, both productiv-ity and quality affect profitability. Interestingly, therelationship between operational performance andprofitability is contingent on a company’s operatingmodel. “Focused” airlines show a link between latearrivals and profitability, while full-service airlines donot. Also, capacity utilization is a stronger driver ofprofitability for full-service airlines than for focusedairlines.
Overall, when we look at the entire industry,we find support for both Hypothesis 1A (the linkbetween capacity utilization and profitability) andHypothesis 1B (the link between quality and prof-itability). However, when we analyze the two groupsseparately, we only find partial support for Hypoth-esis 1B (it is only supported for focused airlines andnot for full-service ones).We also found that focused airlines outperform the
rest of the industry in terms of profitability, whichconfirms Hypothesis 2 and provides empirical sup-port to the proposition put forward by Skinner (1974)three decades ago. Finally, our research found empir-ical support for the “zone of tolerance” argument(Parasuraman et al. 1990). Companies with superiorperformance on on-time delivery (carriers with onlydomestic routes) cannot tolerate lateness asmuch as theother carriers, and this is reflected in their profitability.The contribution of our study is twofold. First, it
contributes to the operations strategy literature. It isthe first study to empirically investigate and demon-strate the link between “focus” (Skinner 1974) andprofitability in services, and it also shows that the rela-tionship between operational performance and prof-itability is contingent upon a company’s operatingmodel. The second contribution of our study to thefield of empirical operations management researchis that it uses objective, longitudinal data to exam-ine how both productivity and quality affect prof-itability in a service industry. Empirical operationsmanagement (OM) research could benefit from morelongitudinal studies, which would enable us to testrigorously OM theories and to move closer toward“causality” (Flynn et al. 1990).Finally, the study is subject to a few limitations.
First, we are missing information that could havehelped us understand in more depth the drivers offinancial performance in the airline industry. Specif-ically, regarding the first hypothesis (the impact ofoperational performance on profitability), one wouldexpect variables such as ticket price and fuel cost toaffect operational and financial performance. Also, thetype of airport (hub versus nonhub, etc.) could playan important role (Sarkis 2000). The impact of thesefactors could be addressed in future studies.Second, regarding our investigation of the impact
of “focus” on profitability, one could also consider
Tsikriktsis: The Effect of Operational Performance and Focus on Profitability516 Manufacturing & Service Operations Management 9(4), pp. 506–517, © 2007 INFORMS
the concept of “fit” (defined as the degree to which afirm’s operational elements match its business strat-egy) (Venkatraman 1989). The concept of fit (Skinner1969) has also received very limited empirical inves-tigation in service operations (Smith and Reece 1999provide an interesting discussion of the effect of fit onservice performance).Third, future studies could investigate the relation-
ship between quality and productivity in services sim-ilar to the work of Krishnan et al. (2000), who basedon a study of new product development in the soft-ware industry suggest a conceptual model linkingquality and productivity.Finally, we realize that our findings were obtained
in a single industry. Schmenner (1986) classified air-lines as “service factories” because (a) they offer astandardized service (limited customization), (b) thereis relatively low interaction with the customer, and(c) they are more equipment intensive as opposedto labor intensive. This implies that one has to becareful when attempting to generalize these find-ings, especially to professional services, which haveopposite characteristics. Future research should revisitour study in service settings that allow for morecustomization. However, single industry studies arehighly beneficial under certain circumstances (Heskett1990) and this is particularly true in the airlineindustry, where it is extremely important to addresscontext-specific issues such as capacity utilization offleet versus that of passengers. We hope that answersto these questions will help firms to better manageservice operational performance.
Appendix A. Descriptive Statistics
Full-service FocusedAll airlines airlines airlines(N = 430) (N = 301) (N = 129)
Variable Mean St. dev. Mean St. dev. Mean St. dev.
ProfitabilityOperating 3�27 8.10 2�28 7.77 5�59 8.43profit/revenue
QualityLate arrivals 20�49 5.67 21�43 5.07 18�27 6.37Lost baggage 5�91 1.83 6�18 1.80 5�28 1.75
ProductivityCU_Passengers 63�41 5.51 63�91 5.13 62�27 6.18CU_Fleet 45�25 0.42 45�12 0.36 45�56 0.37
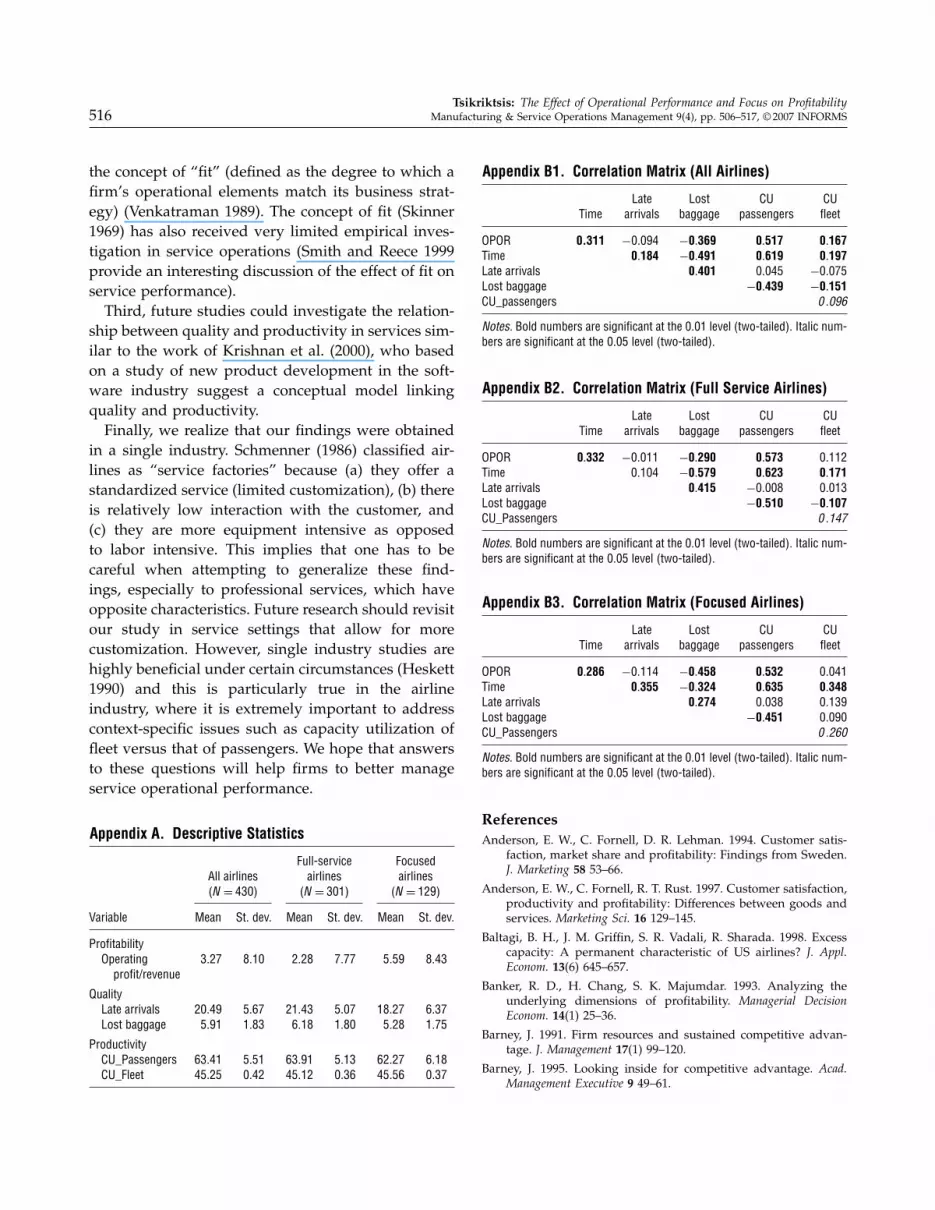
Appendix B1. Correlation Matrix (All Airlines)
Late Lost CU CUTime arrivals baggage passengers fleet
OPOR 0.311 −0�094 −0�369 0�517 0�167Time 0�184 −0�491 0�619 0�197Late arrivals 0�401 0�045 −0�075Lost baggage −0�439 −0�151CU_passengers 0 �096
Notes. Bold numbers are significant at the 0.01 level (two-tailed). Italic num-bers are significant at the 0.05 level (two-tailed).
Appendix B2. Correlation Matrix (Full Service Airlines)
Late Lost CU CUTime arrivals baggage passengers fleet
OPOR 0.332 −0�011 −0�290 0�573 0�112Time 0�104 −0�579 0�623 0�171Late arrivals 0�415 −0�008 0�013Lost baggage −0�510 −0�107CU_Passengers 0 �147
Notes. Bold numbers are significant at the 0.01 level (two-tailed). Italic num-bers are significant at the 0.05 level (two-tailed).
Appendix B3. Correlation Matrix (Focused Airlines)
Late Lost CU CUTime arrivals baggage passengers fleet
OPOR 0.286 −0�114 −0�458 0�532 0�041Time 0�355 −0�324 0�635 0�348Late arrivals 0�274 0�038 0�139Lost baggage −0�451 0�090CU_Passengers 0 �260
Notes. Bold numbers are significant at the 0.01 level (two-tailed). Italic num-bers are significant at the 0.05 level (two-tailed).
ReferencesAnderson, E. W., C. Fornell, D. R. Lehman. 1994. Customer satis-
faction, market share and profitability: Findings from Sweden.J. Marketing 58 53–66.
Anderson, E. W., C. Fornell, R. T. Rust. 1997. Customer satisfaction,productivity and profitability: Differences between goods andservices. Marketing Sci. 16 129–145.
Baltagi, B. H., J. M. Griffin, S. R. Vadali, R. Sharada. 1998. Excesscapacity: A permanent characteristic of US airlines? J. Appl.Econom. 13(6) 645–657.
Banker, R. D., H. Chang, S. K. Majumdar. 1993. Analyzing theunderlying dimensions of profitability. Managerial DecisionEconom. 14(1) 25–36.
Barney, J. 1991. Firm resources and sustained competitive advan-tage. J. Management 17(1) 99–120.
Barney, J. 1995. Looking inside for competitive advantage. Acad.Management Executive 9 49–61.
Tsikriktsis: The Effect of Operational Performance and Focus on ProfitabilityManufacturing & Service Operations Management 9(4), pp. 506–517, © 2007 INFORMS 517
Boyer, K. K., R. Hallowell, A. V. Roth. 2002. E-services: Operatingstrategy—A case study and a method for analyzing operationalbenefits. J. Oper. Management 20 175–188.
Buzzell, R., B. Gale. 1987. The PIMS Principle: Linking Strategy toPerformance. Free Press, New York.
D’Aveni, R. A. 1989. The aftermath of organizational decline: A lon-gitudinal study of the strategic and managerial characteristicsof declining firms. Acad. Management J. 32(3) 577–605.
Deming, W. E. 1982. Quality, Productivity and Competitive Position.Massachusetts Institute of Technology Center for AdvancedEngineering Study, Cambridge, MA.
Fitzsimmons, J. A., M. J. Fitzsimmons. 2000. Service Management:Operations, Strategy and Information Technology. McGraw-Hill,New York.
Flynn, B. B., S. Sakakibara, R. G. Schroeder, K. A. Bates, E. J. Flynn.1990. Empirical research methods in operations management.J. Oper. Management 9(2) 250–284.
Fornell, C. 1992. A national customer satisfaction barometer: TheSwedish experience. J. Marketing 56 6–21.
Garvin, D. 1988. Managing Quality: The Strategic and CompetitiveEdge. Free Press, New York.
Gittell, J. H. 2003. The Southwest Airlines Way: Using the Power ofRelationships to Achieve High Performance. McGraw-Hill, NewYork.
Hammesfahr, J. R. D., J. A. Pope, A. Ardalan. 1993. Strategic plan-ning for production capacity. Internat. J. Oper. Production Man-agement 13(5) 41–53.
Heskett, J. 1986. Managing in the Service Economy. Harvard BusinessSchool Press, Boston, MA.
Heskett, J. L. 1990. Rethinking strategy for service management.D. E. Bowen, R. B. Chase, T. G. Cummings, eds. Service Man-agement Effectiveness. Jossey-Bass, San Francisco, CA, 17–40.
Heskett, J. L., W. E. Sasser, Jr., L. A. Schlesinger. 1997. The ServiceProfit Chain. Free Press, New York.
Heskett, J. L., T. O. Jones, G. W. Loveman, W. E. Sasser, Jr., L. A.Schlesinger. 1994. Putting the service-profit chain to work. Har-vard Bus. Rev. (March–April) 164–174.
Huete, L., A. V. Roth. 1988. The industrialization and span of retailbanks’ delivery systems. Internat. J. Oper. Prod. Management 8(3)46–66.
Juran, J. M. 1988. Juran on Planning for Quality. Free Press, NewYork.
Krishnan, M. S., C. H. Kriebel, S. Kekre, T. Mukhopadhyay. 2000.An empirical analysis of productivity and quality in softwareproducts. Management Sci. 46(6) 745–759.
Lapré, M. A., G. D. Scudder. 2004. Performance improvement pathsin the US airline industry: Linking trade-offs to asset frontiers.Production Oper. Management 13(2) 123–134.
Lapré, M. A., N. Tsikriktsis. 2006. Organizational learning curvesfor customer dissatisfaction: Heterogeneity across airlines.Management Sci. 52(3) 352–366.
Loveman, G. 1998. Employee satisfaction, customer loyalty, andfinancial performance. J. Service Res. 1(1) 18–31.
McLaughlin, C. P., S. Yang, R. van Dierdonck. 1995. Professional ser-vice organizations and focus. Management Sci. 41(7) 1185–1193.
Nelson, E., R. T. Rust, A. Zahorik, R. L. Rose, P. Batalden, B. A.Siemanski. 1992. Do patient perceptions of quality relate tohospital financial performance? J. Health Care Marketing 131–13.
Parasuraman, A., L. L. Berry, V. A. Zeithaml. 1990. Understand-ing, measuring, and improving service quality: Findings froma multiphase research program. Service Breakthroughs: Changingthe Rules of the Game. Free Press, New York.
Parks, R. W. 1967. Efficient estimation of a system of regressionequations when disturbances are both serially and contempo-raneously correlated. J. Amer. Statist. Assoc. 62 500–509.
Roth, A. V., W. E. Jackson III. 1995. Strategic determinants of servicequality and performance: Evidence from the banking industry.Management Sci. 41(11) 1720–1733.
Roth, A. V., L. J. Menor. 2003. Insight into service operations man-agement: A research agenda. Production Oper. Management 12(2)145–164.
Rust, R. T., A. J. Zahorik, T. L. Keiningham. 1995. Return on quality(ROQ): Making service quality financially accountable. J. Mar-keting 59(April) 58–70.
Sarkis, J. 2000. An analysis of the operational efficiency of majorairports in the United States. J. Oper. Management 18(3) 335–351.
SAS/ETS. 1993. User’s Guide Version 6, 2nd ed. SAS Institute Inc.,Cary, NC.
Schefczyk, M. 1993. Operational performance of airlines: An exten-sion of traditional measurement paradigms. Strategic Manage-ment J. 14 301–317.
Schmenner, R. W. 1986. How can service businesses survive andprosper? Sloan Management Rev. 27(3) 21–32.
Skinner, W. 1969. Manufacturing: Missing link in corporate strategy.Harvard Bus. Rev. 47(3) 136–145.
Skinner, W. 1974. The focused factory. Harvard Bus. Rev. 52(3)113–121.
Smith, T. M., J. S. Reece. 1999. The relationship of strategy, fit,productivity and business performance in a services setting.J. Oper. Management 17 145–161.
Swamidass, P. 1991. Empirical science: New frontier in operationsmanagement research. Acad. Management Rev. 16(4) 793–814.
Treacy, M., F. Wiersema. 1995. The Discipline of Market Leaders.Perseus Books, New York.
Tsikriktsis, N., J. Heineke. 2004. The impact of process variationon customer dissatisfaction: Evidence from the U.S. domesticairline industry. Decision Sci. 35(1) 129–142.
Venkatraman, N. 1989. The concept of fit in strategy research:Toward verbal and statistical correspondence. Acad. Manage-ment Rev. 14(3) 423–444.
Venkatraman, N., V. Ramanujam. 1986. Measurement of businessperformance in strategy research: A comparison of approaches.Acad. Management Rev. 11 801–814.
Voss, C., N. Tsikriktsis, B. Funk, D. Yarrow, J. Owen. 2005. Manage-rial choice and performance in service management: A com-parison of private sector organizations with further educationcolleges. J. Oper. Management 23(2) 179–195.
Wright, P. M., G. McMahan, A. McWilliams. 1994. Human resourcesand sustained competitive advantage: A resource-based per-spective. Internat. J. Human Resource Management 5(2) 301–326.
Zeithaml, V. A., L. L. Berry, A. Parasuraman. 1996. The behavioralconsequences of service quality. J. Marketing 60 31–46.
Zhao, X., A. C. L. Yeung, T. S. Lee. 2004. Quality management andorganizational context in selected service industries of China.J. Oper. Management 22(6) 575–587.