the effect of coupling on bubble fragmentation acoustics
TRANSCRIPT

The effect of coupling on bubble fragmentation acoustics
Helen Czerskia) and Grant B. DeaneMarine Physical Laboratory, Scripps Institution of Oceanography, La Jolla, California 92093-0238
(Received 6 October 2009; revised 6 July 2010; accepted 7 October 2010)
Understanding the formation and evolution of bubble populations is important in a wide range of situa-
tions, including industrial processes, medical applications, and ocean science. Passive acoustical tech-
niques can be used to track changes in the population, since each bubble formation or fragmentation
event is likely to produce sound. This sound potentially contains a wealth of information about the
fragmentation process and the products, but to fully exploit these data it is necessary to understand the
physical processes that determine its characteristics. The focus of this paper is binary fragmentation,
when turbulence causes one bubble to split into two. Specifically, the effect that bubble-bubble cou-
pling has on the sound produced is examined. A numerical simulation of the acoustical excitation of
fragmenting bubbles is used to generate model acoustic signals, which are compared with experimental
data. A frequency range with a suppressed acoustic output which is observed in the experimental data
can be explained when coupling is taken into account. In addition, although the driving mechanism of
neck collapse is always consistent with the data for the larger bubble of the newly formed pair, a differ-
ent mechanism must be driving the smaller bubble in some situations.VC 2011 Acoustical Society of America. [DOI: 10.1121/1.3514416]
PACS number(s): 43.30.Nb [KGF] Pages: 74–84
I. INTRODUCTION
Relatively little is known about the evolving bubble
populations in the first second after a wave breaks, due to the
difficulty of making direct measurements. Highly turbulent
conditions cause large bubbles to fragment repeatedly, until
they are small enough for surface tension to stabilize them
by preventing significant distortion. Soon after this, the larg-
est bubbles will rise to the surface and be lost from the popu-
lation. It has been shown that bubbles from breaking waves,1
and particularly the brief existence of larger bubbles,2,3 has
significant consequences for air-sea gas exchange, and so
accurate measurements of the evolving bubble population
are highly desirable.
The evolution of bubble clouds in turbulence is a com-
plex process, and several methods have been used to follow
the rapidly changing bubble population. Optical data4 are
difficult to acquire and require very careful analysis but are
capable of measuring very early bubble populations directly.
Active acoustic methods can be very effective at inferring
the bubble population by measuring its effect on the bulk
acoustic properties of the water.5,6 However, in the first sec-
ond after a wave breaks, very high air fraction will cause sig-
nal attenuation in excess of 100 dB/m, which is too much for
a useful measurement. Passive acoustic techniques have also
been used when individual bubble pulses can be identified,7–9
and these interpret the sounds produced naturally by the
evolving cloud to infer the bubble population within. Passive
acoustic methods have the advantage of being remote and
therefore non-intrusive. Improving these methods is the aim
of the research presented in this paper. It is well-known that
a newly formed bubble oscillates at its natural frequency
(which is determined largely by the bubble radius) and so
the frequency of the acoustic emission has commonly been
used as a proxy for the bubble size.8,10,11 This approach suf-
fices for a quick and simple measurement, but it ignores the
physics of the fragmentation processes by which new bub-
bles are formed in turbulent conditions. A better knowledge
of this physics and the associated mechanisms of sound pro-
duction could improve interpretation of passive acoustic data
significantly.
Many researchers have considered the sounds produced
by bubble oscillation,12–14 but almost all of them studied a
spherical bubble driven by an external periodic pressure oscil-
lation. In nature, oscillations are also likely to be excited by a
single impulsive event associated with bubble formation. Sev-
eral authors15–19 have speculated on the mechanisms which
link the bubble formation event to the sound-producing vol-
ume oscillation. Suggestions have included an internal pres-
sure increase associated with the Laplace pressure, hydrostatic
pressure effects, and shape mode coupling. Most recently,
Deane and Czerski20 showed that the sound produced by a
bubble formed at a nozzle was consistent with the forcing
caused by the rapid collapse of the neck of air left after bubble
pinch-off. This mechanism could also be active when one bub-
ble splits into two during turbulent distortion, and long necks
have been observed at the moment of fragmentation.21 In the
same paper, it was shown that for symmetrical fragmentation
events, this mechanism produces amplitudes similar to those
seen in fragmentation experiments.
The aim of this paper is to examine the effects of bubble-
bubble coupling on the sound produced by a binary fragmenta-
tion event. The two new oscillators are very close, and the
sound radiated by each one would be expected to influence the
other.22,23 The approach here is to use the neck-collapse mech-
anism to drive two axisymmetric bubbles, simulating two bub-
bles just after binary fragmentation. By numerically solving
the equations describing the bubble dynamics for the two
a)Author to whom correspondence should be addressed. Current address:
Graduate School of Oceanography, University of Rhode Island, South Ferry
Road, Narragansett, RI 02882. Electronic mail: [email protected]
74 J. Acoust. Soc. Am. 129 (1), January 2011 0001-4966/2011/129(1)/74/11/$30.00 VC 2011 Acoustical Society of America

coupled bubbles, we can assess the effects of this coupling and
explore its influence on future analysis of passive acoustic
signals.
II. MODEL
The numerical simulations done were straightforward, but
it is important to discuss some of the details and assumptions
involved. The model is summarized here to provide a context
for the details which follow. Before each individual simulation,
the radii of the two new bubbles were specified. The simulation
starts at the moment of separation (pinch-off), when the two
bubbles are assumed to have conical necks which almost touch
at the apex, and the system has cylindrical symmetry. Figure 1
shows the initial bubble shape and the chosen parameters. As
the simulation proceeds, each neck collapses inward toward the
bubble center because of the newly unbalanced surface tension
forces. This rapidly reduces the volume of each individual
bubble and therefore stimulates sound-producing volume
oscillations.20 Each bubble response is calculated using the
Rayleigh-Plesset equation, and the acoustic signal produced by
each bubble is calculated from its surface acceleration [Ref. 13,
Eq. (3.128)]. For each simulation, the user chooses whether to
include non-linear terms in the Rayleigh-Plesset equation and
whether the bubbles are coupled. At the end of the simulation,
the superposed pressure pulses from the two bubbles are calcu-
lated at one meter from the rupture point and these are treated
as simulated data to be compared with the superposed pulses
measured in a fragmentation experiment. The total model
coupled and uncoupled pulses are fitted with two decaying si-
nusoids, which were then compared with the individual pulse
components from each bubble in the pair in order to assess the
effect of the non-linear terms and bubble-bubble coupling.
A. Details of the model calculations
The coupled Rayleigh-Plesset equations used here are
set out below.24 The bubbles are labeled 1 and 2, with equi-
librium radii R1 and R2.
d2r1
dt2¼ �3L
2
dr1
dt
� �2
� 3jr1P0
qR21
� 0:0025x1
2p
� �1=3
x1
dr1
dt
� NðR1; h; tÞ � KR3
2
DR21
d2r2
dt2(1)
d2r2
dt2¼ �3L
2
dr2
dt
� �2
� 3jr2P0
qR22
� 0:0025x2
2p
� �1=3
x2
dr2
dt
� NðR2; h; tÞ � KR3
1
DR22
d2r1
dt2; (2)
where r1,2 are the radii of bubbles 1 and 2 (not the fractional
change in radius, as is used by some authors), t is time, L is 0
or 1 depending on whether the non-linear term in the
Rayleigh-Plesset equation is being included or not, N(R1, ht) is
the forcing on bubble 1 from its own conical neck (discussed
below) and the final term represents the pressure forcing on
bubble 1 from bubble 2 or vice versa. K is 0 or 1 depending on
whether the bubbles are to be coupled or not. Po is the hydro-
static pressure in the water surrounding the bubbles, j is the
polytropic index (assumed to be 1.4 throughout), q is the den-
sity of water, D is the separation of the bubble centers (dis-
cussed below), h is the semi-angle of the conical neck (which
is the same for both bubbles) and x1,2 is the natural frequency
of the bubble.
The third term on the right-hand side of Eqs. (1) and (2)
accounts for damping of the bubble breathing mode oscilla-
tions through radiation losses and thermal effects. The term
used is an approximation following that in Medwin25 for the
damping of a bubble at its natural frequency. For larger bub-
bles like the ones considered here, radiation and thermal
damping are expected to be significantly more important than
viscous damping. A complete calculation would allow the
damping to vary with the driving frequency, as set out by
Prosperetti,12,26 but these full calculations are far more com-
putationally expensive and would only change the value
slightly in this case. An important point to note is that the
damping terms in the Rayleigh-Plesset equation are derived in
frequency space for a steady driving force and a continuous
response.12 The driving term here (the neck collapse) is not
periodic, but we assume that a result correct to first order may
be obtained by simply adding in the non-periodic forcing in
place of a periodic forcing function. This approach produced
reasonable results in Deane and Czerski.20
The Rayleigh-Plesset equations for each bubble are
simultaneously numerically integrated with respect to time
using fourth order Runge-Kutta integration. Each simulation
starts at the point where the bubbles have just separated and
runs for 20 ms. This allows time for at least 30 oscillations
for the larger bubble and more for the smaller bubble, which
is more than adequate to fit the signals.
B. Forcing terms
The rapid volume decrease resulting from the neck col-
lapse is caused by the dynamics of the surface, not by the gas
inside or the water outside the bubble. The inward acceleration
of the bubble wall caused by the small radius of curvature
results in a rapid bubble volume decrease as the neck collapses,
so that a rarefaction propagates outward into the liquid. For a
short period just after pinch-off, the bubble wall displacement,
velocity, and acceleration are all simultaneously directed
inward, and it is this unusual situation that leads to the rarefac-
tion. The bubble is then assumed to respond to the rapid vol-
ume forcing according to the Rayleigh-Plesset equation, and
FIG. 1. (Color online) The bubble configuration assumed in this model at
the point of pinch-off (t ¼ 0). The bubbles have cylindrical symmetry about
their long axis, and each bubble is assumed to have the same conical neck
angle h. R1 is always the radii of the larger bubble.
J. Acoust. Soc. Am., Vol. 129, No. 1, January 2011 H. Czerski and G. B. Deane: Coupling of newly fragmented bubbles 75

the volume forcing is assumed to be spherically symmetric.
The subtleties of this mechanism are discussed in more detail
in Deane and Czerski.20
Previous research20,21 has suggested that the forcing ffrom the conical neck for a bubble with radius R ¼ 2 mm
slowly released from a nozzle can be approximated by
f ðh; tÞ ¼ 9jrPo tan2 h4q2R5 sin h
t469:5tþ1:955: (3)
This equation resulted from a study of one bubble size only,
and for the model described here we need to model bubbles
with a range of radii. Bubbles of different sizes would not be
expected to have the same forcing with time, so it was neces-
sary to estimate the change in the time-dependence of the
forcing term with radius. Close to the start of the cone col-
lapse, we expect the form of the forcing term to remain
unchanged, since it seems reasonable that the shape and size
of the rest of the bubble has little effect at very early times.
We assume that the collapse is entirely driven by surface ten-
sion, dependent only on the cone angle, but after some time
other factors will limit this collapse. To estimate this effect
we chose to use a “window” function to adjust the driving
force in a qualitatively reasonable way for different bubble
radii. The neck-collapse forcing shown in Eq. (3) decays with
time because the rest of the bubble starts to influence the dy-
namics of the collapse. We expect that this forcing will decay
more quickly for smaller bubbles because the rest of the bub-
ble will influence the dynamics after a shorter time. Conse-
quently, we chose to modulate the forcing term in a way that
depends on bubble size. We use an arctangent function
because it is a continuously differentiable function, which
does not produce discontinuities in the time derivatives. In
addition, the cut-off position and steepness is easy to control.
The complete term for the neck-collapse function is
given by
Nðr1; h; tÞ ¼1
2� 1
p
� �tan�1fBðt� AR1Þg
� 9jrPo tan2 h
4q2R51 sin h
t469:5tþ1:955; (4)
where A is a constant with the value of 1 and dimensions of
m�1s. B is a constant with the value 5000 and dimensions of
t�1. A and B were chosen arbitrarily so that a 2 mm bubble
(on which Eq. (3) was based) has forcing which is almost
unchanged, but a 0.5 mm bubble has forcing which only
reaches a peak half as high as the 2 mm bubble. Figure 2
shows that the window function produces a reasonable but
small variation in the forcing function with bubble size. The
actual effect of these constants on the final acoustic signal is
small because the dominant time period for driving the
acoustic signal is the first few hundred microseconds, and
this modulation has a limited effect during that period.
The second forcing term in Eq. (1) describes the effect
of the pressure field radiated by bubble 2 on bubble 1, and
vice versa. The acoustic pressure caused by the first bubble
at 1 m distance is scaled to the pressure produced at the dis-
tance of the center of the second bubble, discussed below.
C. Assumptions and limitations
The parameter D (the distance between the centers of
the new bubbles) is estimated based on the angle h. For bub-
bles produced slowly at a nozzle, the ratio that is the distance
from the conical tip to the rounded end of the bubble divided
by the bubble diameter was observed to be 1.4. The meas-
ured angle h of the conical part of these bubbles is 40�. To
FIG. 2. The effect of the window on the driving
force (see text for a full explanation). The dot-
ted line in each case shows the forcing with
time predicted by Eq. (3) for a 2 mm bubble.
The dashed line shows the magnitude of the
window term used to modulate the output of
Eq. (3), and the heavy solid line shows the
resulting forcing calculated from Eq. (4). The
window used maintains the steep rise at the start
(expected to be the same for all bubbles), but
modulates the forcing with time after that.
76 J. Acoust. Soc. Am., Vol. 129, No. 1, January 2011 H. Czerski and G. B. Deane: Coupling of newly fragmented bubbles

estimate the distance D for other values of h, it was first
assumed that the distance from the bubble center to the coni-
cal point was proportional to cos ~h. However, bubbles frag-
menting in turbulence have very irregular shapes. Figure 3
shows a representative image taken during the experiment
described in Deane and Stokes21 with a silhouette to show an
approximately equivalent event for bubbles shaped as if they
were emerging from a nozzle. Examination of several simi-
lar images from that experiment suggests that the real bubble
spacing is approximately twice that suggested by the simple
nozzle model, so we use a value for D which is given by:
D ¼ 2ðR1 þ R2Þð1þ 1:04 cos hÞ: (5)
This term is important because the acoustic pressure gener-
ated by a bubble falls off as 1/R, and so the value used for Ddetermines the magnitude of the pressure oscillation acting
on the other bubble. Since the bubbles are so close together,
the radiated pressure from the first bubble measured at the
near and far sides of the second bubble will be significantly
different. In this model, we assume that the pressure is uni-
form across the surface of the second bubble and that it can
be represented as the pressure at the bubble centre, i.e., a dis-
tance D away from the first bubble.
For all the acoustic calculations, the bubbles are
assumed spherical. Since the wavelength of the sound pro-
duced is so much larger than the bubble itself (the natural os-
cillation of a 2 mm radius bubble produces sound with a
wavelength of approximately 0.9 m in water), we assume
that the volume oscillation is the important process and that
higher-order details of the shape of that volume are less sig-
nificant. We take the shape into account in calculating the
driving term produced by the bubble neck collapse, but
assume a spherical bubble afterward. Longuet-Higgins27
found that the additional volume due to the distortion of the
bubble when it has a conical neck can be neglected, so we
make no distinction between the radius of curvature of the
top half of the bubble at the point of pinch-off and the radius
of the spherical bubble used for acoustic calculations.
We assume that the acoustic traces can be adequately fitted
with a decaying sinusoid. This form will not match the trace
well within the first period of oscillation when there is signifi-
cant forcing but is a good approximation after that. In addition,
this is the most practical fit to use when analyzing real data
where the exact bubble shapes are unknown, so there is no point
in refining the method for one type of idealized bubble here.
The neck angle is assumed to be the same for both bubbles,
irrespective of the ratio of their radii. We justify this starting
assumption with two points. The first is the observed behavior
when a single bubble emerges from a nozzle. As the bubble
grows, it is joined to the parent body of gas with a neck of air,
and before detachment this neck narrows to a point. At the
moment of pinch-off, the cone of air joined to the parent body
of gas and the cone of air which is part of the bubble have very
similar angles. This seems intuitive; as the neck radius decreases,
the narrowest part of the neck will move along the neck toward
the point where the surface tension parallel to the long axis
of the bubble is approximately balanced. This balance can only
occur if the neck angles are equal. The second point is that the
original motivation for the neck-collapse model is the observed
correlation between the energies of the two bubble fragments,
suggesting symmetry in the dynamics driving the two bubbles
into oscillation. Fragmentation in turbulence is a very dynamic
event and it is unlikely that the bubble necks are conical with
equal angles. However, it is a reasonable starting point for this
model to estimate the magnitude of the driving force.
III. MODEL PROCEDURE
The radius of the initial (parent) bubble was specified.
The parameter L was chosen to include or exclude the non-
linear terms, and the angle h for the neck was specified. A
set of radius ratios r1/r2 for the two new bubbles was defined
and for each value of r1/r2 the radii of the two daughter bub-
bles were calculated by conserving the volume of gas in the
parent bubble.Then Eqs. (1) and (2) were integrated with
time to get the surface displacement as the necks collapsed.
The first simulation allowed the bubbles to interact with
each other (the coupled case) and a separate, second simula-
tion would allow them to respond to their own neck collapse
only, ignoring the influence of the other bubble.
The acceleration of each bubble wall was then used to
calculate the acoustic signal 1 m away from the pinch-off
point for both coupled and uncoupled bubbles, and also the
total acoustic signal due to each pair. These model results
were then treated in the same way as experimental data would
be, and they were analyzed by fitting decaying sinusoids to
each computed acoustic signal. The general expression for a
decaying sinusoid is given by
S1 ¼ A1 cosðx1ðt� t1Þ þ /1Þeð�x1d1tÞ=2: (6)
In general there are five parameters to be fitted: The ampli-
tude A1, frequency x1, start time t1, phase shift /1, and
FIG. 3. A photograph of a real bubble close to the moment of pinch-off,
compared with the silhouette of a two model bubbles with the same shape as
bubbles from nozzles. In this and similar photographs, the complex shape of
a real fragmenting bubble means that the actual bubble separation appears to
be close to twice the separation of the simple model. This is the reason for
the factor of 2 in Eq. (5).
J. Acoust. Soc. Am., Vol. 129, No. 1, January 2011 H. Czerski and G. B. Deane: Coupling of newly fragmented bubbles 77

dimensionless damping constant d1. Because we use simu-
lated data here, the start time is known and so we set t1 ¼ 0,
which results in a four-parameter fit for one bubble and eight
parameters for two bubbles [when we fit the sum of two
decaying sinusoids of the form shown in Eq. (6)]. The eight-
parameter fit from the simulations was then compared with
the results of the experiment described in Deane and Stokes.21
The simplex search method was used to fit each acoustic
trace and then the results were checked by eye. An example
of a complete set of acoustic signals and the fits produced by
each simulation is shown in Fig. 4. Signals for each bubble
in both the coupled and uncoupled situations are fitted and a
separate fit of the total coupled acoustic signal is also made.
Most of the simulations were carried out with a parent bub-
ble radius of 2 mm, because this is approximately the size used
in the experiments by Deane and Stokes, and we would like to
make a direct comparison with those results. A few simulations
were done with 1 mm radius bubbles to see whether non-linear
effects were more important for these smaller bubbles.
The radius ratio r1/r2 was limited to a maximum of 4.
This is because of the uncertainty about both the neck-col-
lapse function for the smaller bubble and the windowing
increases as this ratio increases. These uncertainties arise
because the forcing mechanism for small bubbles is not
well-understood and consequently the simulation results for
very small bubbles should be considered speculative. The ra-
dius ratio ranging from 1 to 4 is sufficient to make a compar-
ison with the majority of the Deane and Stokes results.
The semi-angle of the conical neck is an important pa-
rameter. The analysis in Deane and Stokes21 suggested that a
range of semi-angles could account for the observed distribu-
tion of pressure pulse amplitudes, and a range of angles has
been used in the calculations here. A bubble formed slowly at
a nozzle has a neck angle of 40� and we ran the model for val-
ues of 20�, 30�, 40�, 50�, and 60�. The surface tension used
was always 0.07 Nm�1.
IV. EXPERIMENTAL DATA
The data that we are using for comparison were initially
presented and analyzed in Deane and Stokes.21 The relevant
features of the method will be summarized here for com-
pleteness, but for a full description the reader should consult
the original publication.
Bubbles of approximately 2 mm radius were released
from a nozzle at a rate of one every 2 s. As they rose through
the water column, they passed through a region of turbulence
caused by two opposing but offset jets. In many cases, this
caused them to fragment into two or more daughter bubbles.
A hydrophone placed 25 cm away recorded the acoustic
emissions for subsequent analysis. The experiment was car-
ried out at a depth of approximately 2 m in a large pool,
which reduced the effects of reverberation to insignificant
levels. Binary fragmentation events were fitted with two
decaying sinusoids in a ten-parameter fit as described in Sec.
III. These fitted parameters form the data set that we used to
compare with the numerically simulated data generated for
this study. The original acoustic signals were also available
for comparison and are discussed in Sec. VI. The response
of the hydrophone to a compression or rarefaction is an im-
portant element in the discussions which follow and this was
carefully verified with the experimental hydrophones by
both a squeeze test and discussion with the manufacturer.
V. COUPLING EFFECTS
In addition to our numerical simulations, we carried out
a brief theoretical analysis to show the expected results for a
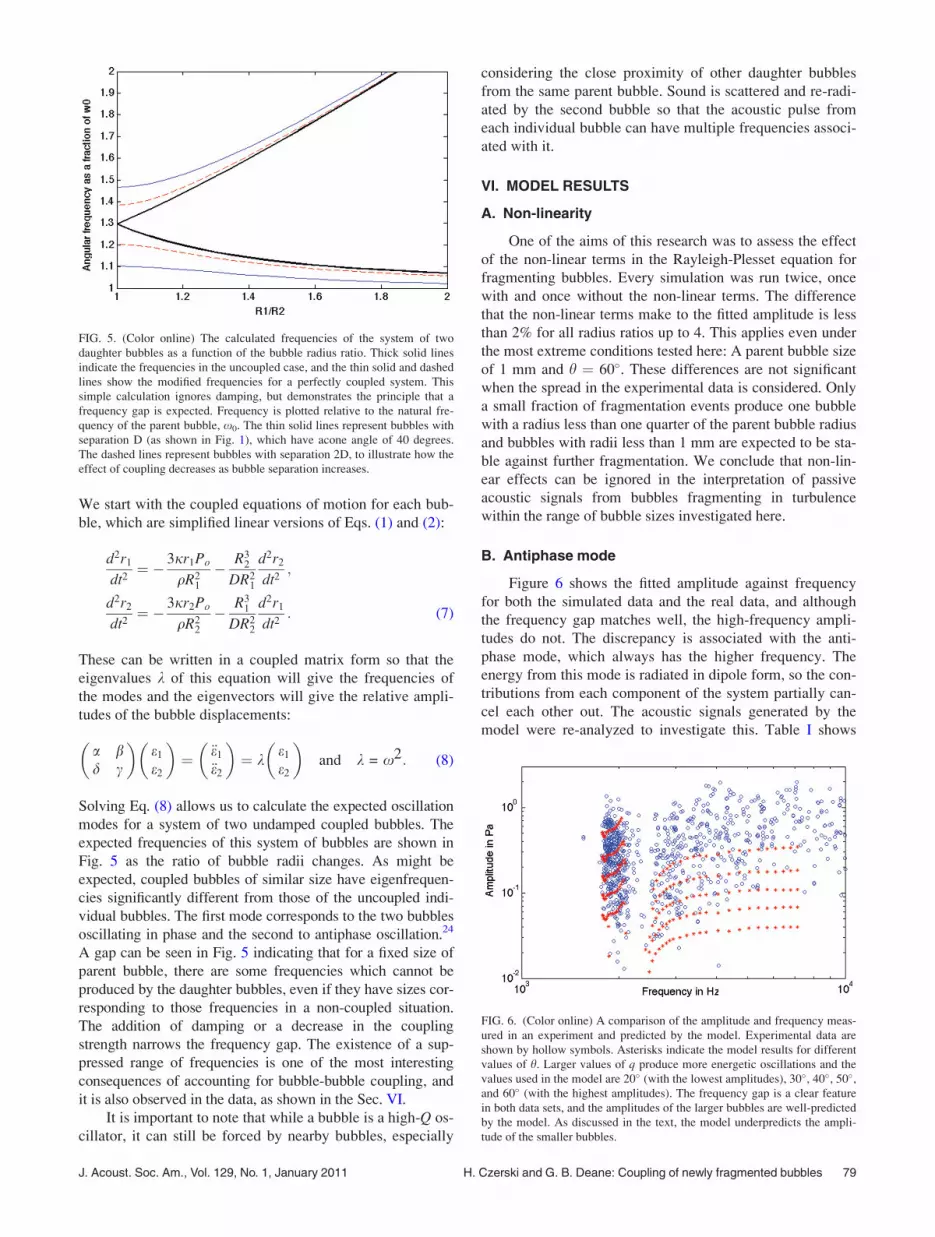
system of coupled bubbles. With the exception of Fig. 5
(which shows the results of this section), all the results
shown in this paper were calculated using the full damping
terms show in Eqs. (1) and (2). However, in this section and
since bubbles of this size have a high quality factor, we will
ignore damping for the purposes of this simple calculation.
FIG. 4. Calculated acoustic signals for a 2 mm
radius parent bubble with h ¼ 40 degrees and
R1/R2 ¼ 3. In each plot, the axes are the same.
The bold line is the calculated acoustic output
in Pascal at 1 m distance and the dotted line is
the sinusoidal fit. The top two plots show the
individual signal from the larger and smaller
bubbles, respectively. The fitted amplitudes A1
and A2 are quoted on each plot. The third plot
shows the eight-parameter fit to the combined
signal, and the part cancellation of the higher
frequency is evident in the fitted amplitude A2.
78 J. Acoust. Soc. Am., Vol. 129, No. 1, January 2011 H. Czerski and G. B. Deane: Coupling of newly fragmented bubbles
We start with the coupled equations of motion for each bub-
ble, which are simplified linear versions of Eqs. (1) and (2):
d2r1
dt2¼ � 3jr1Po
qR21
� R32
DR21
d2r2
dt2;
d2r2
dt2¼ � 3jr2Po
qR22
� R31
DR22
d2r1
dt2: (7)
These can be written in a coupled matrix form so that the
eigenvalues k of this equation will give the frequencies of
the modes and the eigenvectors will give the relative ampli-
tudes of the bubble displacements:
a bd c
� �e1
e2
� �¼ €e1
€e2
� �¼ k
e1
e2
� �and k = x2: (8)
Solving Eq. (8) allows us to calculate the expected oscillation
modes for a system of two undamped coupled bubbles. The
expected frequencies of this system of bubbles are shown in
Fig. 5 as the ratio of bubble radii changes. As might be
expected, coupled bubbles of similar size have eigenfrequen-
cies significantly different from those of the uncoupled indi-
vidual bubbles. The first mode corresponds to the two bubbles
oscillating in phase and the second to antiphase oscillation.24
A gap can be seen in Fig. 5 indicating that for a fixed size of
parent bubble, there are some frequencies which cannot be
produced by the daughter bubbles, even if they have sizes cor-
responding to those frequencies in a non-coupled situation.
The addition of damping or a decrease in the coupling
strength narrows the frequency gap. The existence of a sup-
pressed range of frequencies is one of the most interesting
consequences of accounting for bubble-bubble coupling, and
it is also observed in the data, as shown in the Sec. VI.
It is important to note that while a bubble is a high-Q os-
cillator, it can still be forced by nearby bubbles, especially
considering the close proximity of other daughter bubbles
from the same parent bubble. Sound is scattered and re-radi-
ated by the second bubble so that the acoustic pulse from
each individual bubble can have multiple frequencies associ-
ated with it.
VI. MODEL RESULTS
A. Non-linearity
One of the aims of this research was to assess the effect
of the non-linear terms in the Rayleigh-Plesset equation for
fragmenting bubbles. Every simulation was run twice, once
with and once without the non-linear terms. The difference
that the non-linear terms make to the fitted amplitude is less
than 2% for all radius ratios up to 4. This applies even under
the most extreme conditions tested here: A parent bubble size
of 1 mm and h ¼ 60�. These differences are not significant
when the spread in the experimental data is considered. Only
a small fraction of fragmentation events produce one bubble
with a radius less than one quarter of the parent bubble radius
and bubbles with radii less than 1 mm are expected to be sta-
ble against further fragmentation. We conclude that non-lin-
ear effects can be ignored in the interpretation of passive
acoustic signals from bubbles fragmenting in turbulence
within the range of bubble sizes investigated here.
B. Antiphase mode
Figure 6 shows the fitted amplitude against frequency
for both the simulated data and the real data, and although
the frequency gap matches well, the high-frequency ampli-
tudes do not. The discrepancy is associated with the anti-
phase mode, which always has the higher frequency. The
energy from this mode is radiated in dipole form, so the con-
tributions from each component of the system partially can-
cel each other out. The acoustic signals generated by the
model were re-analyzed to investigate this. Table I shows
FIG. 5. (Color online) The calculated frequencies of the system of two
daughter bubbles as a function of the bubble radius ratio. Thick solid lines
indicate the frequencies in the uncoupled case, and the thin solid and dashed
lines show the modified frequencies for a perfectly coupled system. This
simple calculation ignores damping, but demonstrates the principle that a
frequency gap is expected. Frequency is plotted relative to the natural fre-
quency of the parent bubble, x0. The thin solid lines represent bubbles with
separation D (as shown in Fig. 1), which have acone angle of 40 degrees.
The dashed lines represent bubbles with separation 2D, to illustrate how the
effect of coupling decreases as bubble separation increases.
FIG. 6. (Color online) A comparison of the amplitude and frequency meas-
ured in an experiment and predicted by the model. Experimental data are
shown by hollow symbols. Asterisks indicate the model results for different
values of h. Larger values of q produce more energetic oscillations and the
values used in the model are 20� (with the lowest amplitudes), 30�, 40�, 50�,and 60� (with the highest amplitudes). The frequency gap is a clear feature
in both data sets, and the amplitudes of the larger bubbles are well-predicted
by the model. As discussed in the text, the model underpredicts the ampli-
tude of the smaller bubbles.
J. Acoust. Soc. Am., Vol. 129, No. 1, January 2011 H. Czerski and G. B. Deane: Coupling of newly fragmented bubbles 79

the antiphase cancellation effect on the fitted parameters.
Each individual bubble acoustic signal is fitted with two
decaying sinusoids in an eight-parameter fit. It can be seen
that once the two individual signals are added together and
fitted again, the higher frequency is suppressed. In the case
shown, R1/R2 ¼ 1.3 and the fitting algorithm fails to isolate
the higher frequency. In these cases where there is only one
dominant frequency, the fitting algorithm produces an arti-
fact at a second very low frequency. These have been
removed from the results shown in this paper. The domi-
nance of the lower-frequency mode in this case suggests that
it may not be possible to tell from the acoustic signal that bi-
nary fragmentation has occurred, since the oscillation seen is
at one frequency only.
The reduced total amplitude of the antiphase mode is
not observed in the experimental data, suggesting either that
this mode starts with more energy than the in-phase mode,
or that coupling effects are weak at the larger radius ratios.
We discuss whether assumptions in the model could be re-
sponsible for this discrepancy in Sec. VI D below, but fur-
ther work is required to explain this result.
C. Energy correlation
The original motivation for the symmetrical neck-col-
lapse model was that the large and small bubbles in a pair
were observed to have highly correlated energies. Figure 7
shows two plots comparing the radiated acoustic energy of
one bubble in a pair against the energy of the other bubble
from the same pair. In both cases, the larger bubble is repre-
sented on the x-axis and the smaller bubble on the y-axis.
The experimental data shows highly correlated energies. In
the coupled model data there is a broad correlation over
many orders of magnitude. However, the effect of the can-
cellation from the antiphase mode is evident, and the radi-
ated energy at the lower frequency is almost always greater
than the radiated energy at the higher frequency.
D. General model discussion
The amplitude of modeled coupled bubbles as a function
of frequency for various neck angles is shown in Fig. 6,
along with experimental data. Both modeled and observed
bubble systems show a similar suppressed frequency band at
approximately 2.2 kHz. The distribution of the amplitudes at
the lower frequencies is approximately reproduced by the
range of semi-angles considered, although we have no direct
evidence that different neck angles were responsible for this
amplitude spread in the experimental data. However, the fact
that varying this parameter reproduces the observed ampli-
tude range suggests that the natural variation in bubble
shapes as they fragment (and the consequences for the forc-
ing mechanism) may account for the amplitude spread.
The amplitudes at the higher frequencies for the model
data are almost an order of magnitude smaller than in the ex-
perimental data. This significant discrepancy between the
predicted and observed amplitudes of the higher frequency
radiation could be caused by either assumptions made about
parameters in the model or the applicability of the model
itself. There are several assumptions in the model, which
could account for the discrepancy between the theoretical
and experimental results. These are as follows:
(1) Neglect of the difference between the incident pressure on
the near and far side of each bubble. Geometrical spread-
ing of the acoustic radiation will cause a difference.
(2) The separation of the bubble centers was estimated by a
simple model that was not based on experimental frag-
mentation results. This separation is the largest single
factor controlling the coupling strength.
TABLE I. The individual modeled acoustic outputs from each daughter
bubble can be analyzed separately, before they are added together to form
the total acoustic output of the system. This table shows the results for R1/R2
¼ 1.3, so coupling is expected to be significant. A1and F1 are the fitted am-
plitude and frequency of the lowest frequency fit, and A2 and F2 are the cor-
responding parameters for the higher-frequency fit. Parameters are shown
for each bubble’s acoustic signal individually and then for the fit to the total
signal (which is the sum of the two components). In this case, the fitting
algorithm could not find the high-frequency signal in the total signal, so an
artifact was produced which is not shown here.
A1 F1(Hz) A2 F2(Hz)
Bubble 1 0.165 10 670 �0.06 15 784
Bubble 2 0.049 10 659 0.078 15 699
Total signal 0.183 10 704 — —
FIG. 7. (Color online) The panel on
the left shows the experimental
results for the total acoustic energy
radiated at each frequency and is
taken from Ref. 21, Fig. 8. The panel
on the right shows the equivalent
results from the models described in
this paper. Series A is the basic
model as described in Sec. II. Series
B is a repeat of the simulation with
the bubble separation arbitrarily
halved. Series C shows model data
with a single modification. The cone
angle of the smaller bubble is 20�
greater than the cone angle of the
larger bubble, and this is an example
of a small systematic change which
will approximately produce equipar-
tition of energy.
80 J. Acoust. Soc. Am., Vol. 129, No. 1, January 2011 H. Czerski and G. B. Deane: Coupling of newly fragmented bubbles

(3) The bubbles are not spherical and this could affect cou-
pling if the radiated acoustic signal is not the same in all
directions in the near field.
(4) We assumed that the bubble neck angles are equal in any
single pair. The fact that the energies in a pair are corre-
lated suggests that the neck angles are correlated (see
Fig. 7), but this does not necessarily imply that they are
equal.
We will now examine each of these assumptions to
determine whether they can account for the discrepancy in
small bubble amplitudes seen in Fig. 6.
1. Varying pressure across the bubble surface
The parameter D is used to approximate the separation
of the bubble centers, and the forcing term assumes that the
pressure at any given instant is the same everywhere on the
surface of the bubble. However since the bubbles are sepa-
rated by only a few radii, geometric spreading of the acoustic
energy from the first bubble (assumed to radiate with spheri-
cal symmetry) will mean that the pressure on the near side of
the second bubble is significantly higher than the pressure on
the far side. This is ignored in the simulations described here
because the Rayleigh-Plesset equations assume uniform
pressure across the surface. We can do a simple calculation
to estimate the effect of this assumption by integrating the
pressure over the surface of the bubble while taking the geo-
metric spreading into account. The bubble surface is consid-
ered to be made up of infinitesimally thin rings with the
same axis as the bubble pair axis. The pressure at each dis-
tance is calculated assuming spherically diverging pressure
from the first bubble, and we integrate PdA over the whole
bubble surface. This can then be compared with the equiva-
lent pressure at the bubble center multiplied by the bubble
surface area, the quantity assumed in these calculations. In
this simple calculation, these two quantities fortuitously turn
out to be exactly equal, so we conclude that the method of
using the fixed quantity D does not significantly affect the
model results and is accurate to first order.
2. Bubble separation at the point of pinch-off
The coupled system has two oscillation modes, and the
frequency gap between those two modes for equal-sized bub-
bles depends on the magnitude of the coupling. In this case,
the extent of the interaction between the bubbles is almost
entirely dependent on the bubble separation. We have
assumed here that the separation of the bubble centers D is
related to the neck angle, based on the shapes of bubbles
emerging slowly from a nozzle. This leads to a typical esti-
mate for D being approximately four times the sum of the
bubble radii, given in Eq. (5). This value for D will have a
large influence on the pressure coupling between the bub-
bles, since the radiated pressure decreases as 1/R, and so we
examine its influence on the results here. Figure 8 shows the
effect of repeating the simulations shown in Fig. 6, but with
the separation D arbitrarily changed by factors of 0.5, 0.75,
1, and 1.25. Reducing the coupling has two effects: The fre-
quency gap narrows and the radiated pressure at the higher
frequency increases significantly. Using the value of D as stated
in Eq. (5) leads to a frequency gap which is well-matched with
the gap in the data and also corresponds well with the photo-
graphic evidence. It is likely that the distance which separates
the centers of the bubble volumes will vary from event to event,
and Fig. 8 demonstrates that the tested range of bubble separa-
tions could lead to scatter in the measured high-frequency am-
plitude of about 15%. It seems that the distance D calculated in
Eq. (5) is a reasonable estimate because the width of the fre-
quency gap matches that in the data.
3. Non-spherical bubbles
Real bubbles fragmenting in turbulence are far from
spherical. It is known that the acoustic pulse scattered from
non-spherical bubbles is not spherically symmetrical.28 In
that study, elliptical bubbles only produced significantly
non-spherical scattering when their aspect ratio was above
10. Bubbles fragmenting in turbulence can be highly dis-
torted, but it seems unlikely that the aspect ratio would reach
10 without further fragmentation so this effect is discounted
here. If it were significant during fragmentation events, it
would decrease the effect of one bubble on the other slightly,
since the bubbles in this study have a common long axis.
4. Equal neck angles
The symmetrical neck model was motivated by the high
degree of correlation between the energy of each bubble in a
pair. However, our results show that if the oscillatory energy
for each bubble is approximately equal (a consequence of
having equal neck angles) and the system is coupled, the
radiated energies will not be equal. Figure 7 is a comparison
of radiated energies at each of the two frequencies and shows
the offset. Over many orders of magnitude there is still a
strong correlation in energy, but the asymmetry is clear. The
FIG. 8. (Color online) These are the model results for a 2 mm parent bubble
and a cone angle of 40�. In each series, the distance separating the bubbles
is the distance calculated using the different values of the prefactor J in
Eq. (5). Most of the data shown in this paper were calculated with J ¼ 2,
and here we compare this with values of 1, 1.5, and 2.5. The central black
line shows the expected amplitudes for uncoupled bubbles, for comparison.
It can be seen that uncertainty in the bubble separation makes a considerable
difference to the extent of the coupling. As J increases and the coupling
strength decreases, the antiphase cancellation decreases and the frequency
gap also decreases.
J. Acoust. Soc. Am., Vol. 129, No. 1, January 2011 H. Czerski and G. B. Deane: Coupling of newly fragmented bubbles 81
main assumptions affecting the coupling (detailed in the im-
mediately preceding paragraphs) cannot explain this discrep-
ancy. The effect of the small bubble on the larger bubble is
to force oscillations in antiphase to the original oscillations,
which cancel out a significant fraction of the total energy
radiated at that frequency. This suggests that the smaller
bubble may be systematically more energetic than this model
predicts, compensating for the antiphase effect. There are
two features of our model that could be altered to create this
effect. One is the effect of the windowing process on the
forcing. The other is the assumption of equal neck angles.
For example, an approximate match to the real data is
achieved if the neck angle of the smaller bubble is arbitrarily
chosen to be 20� greater than the neck angle of the larger
bubble. Figure 7 illustrates this. We are not suggesting that
the neck angle of the smaller bubble actually is necessarily
20� higher, but we are simply pointing out that a relatively
modest increase in neck angle is sufficient to account the
equipartition of energy between the oscillatory modes.
VII. COMPARISON OF MODEL RESULTS AND DATA
An important feature of all the total acoustic signals gen-
erated in this study is that they always start with a rarefaction,
and this is also the case for a single bubble released from a
nozzle.20 The acoustic signal generated by the larger bubble
of the pair will have a higher-frequency component generated
by coupling with the smaller bubble, and this may mean that
this larger bubble alone does emit a signal starting with a
compression. However, the hydrophone can only record the
sum of both signals and energy conservation makes it impos-
sible for this initial high-frequency compression of the larger
bubble to radiate with a greater amplitude than the emitted
rarefaction from the smaller bubble. This means that a direct
consequence of having a driving mechanism caused by an
initial volume decrease in both bubbles is that the overall pair
acoustic signal must begin with a rarefaction. However, ex-
amination of the acoustic signals recorded shows that many
binary fragmentation signals begin with a compression.
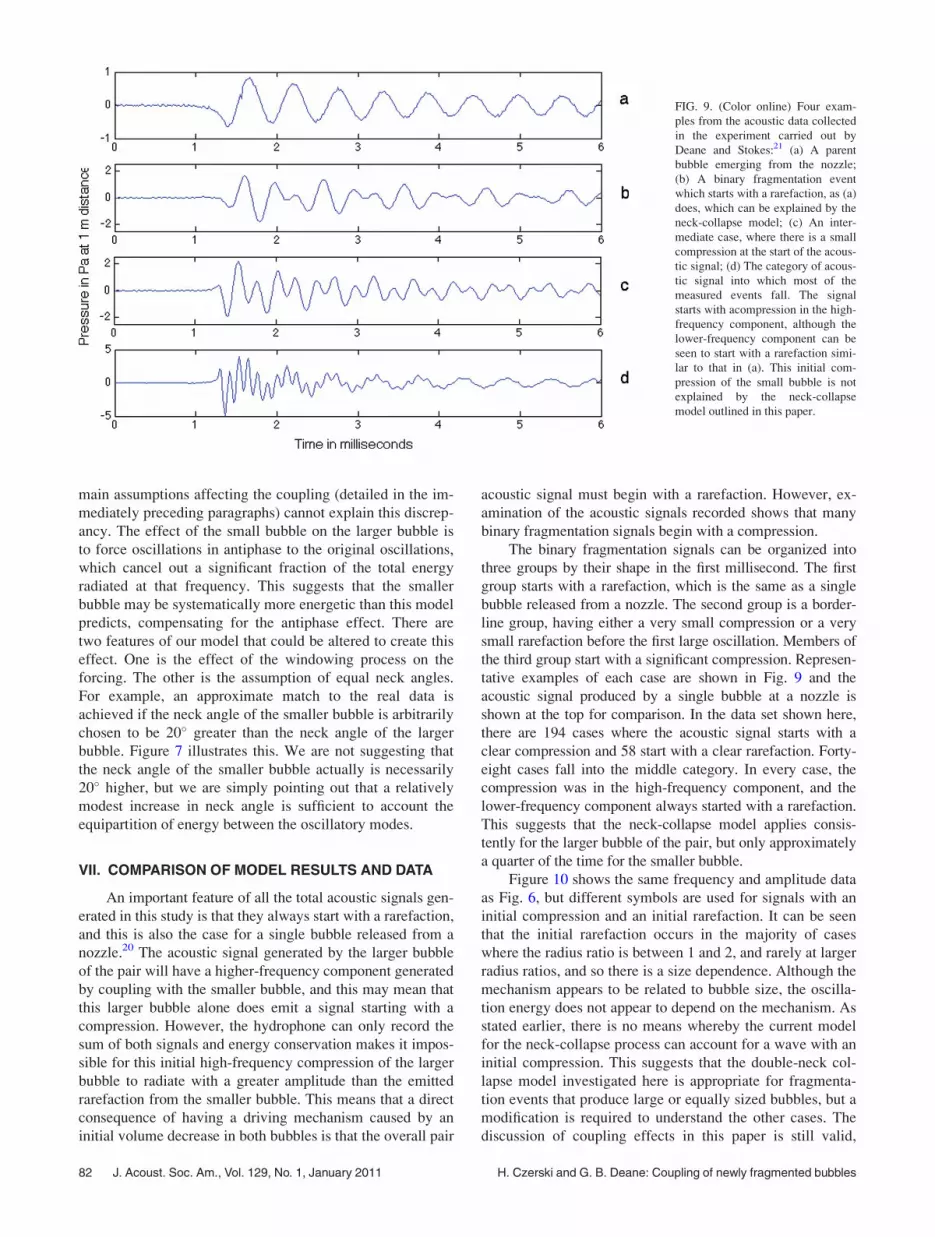
The binary fragmentation signals can be organized into
three groups by their shape in the first millisecond. The first
group starts with a rarefaction, which is the same as a single
bubble released from a nozzle. The second group is a border-
line group, having either a very small compression or a very
small rarefaction before the first large oscillation. Members of
the third group start with a significant compression. Represen-
tative examples of each case are shown in Fig. 9 and the
acoustic signal produced by a single bubble at a nozzle is
shown at the top for comparison. In the data set shown here,
there are 194 cases where the acoustic signal starts with a
clear compression and 58 start with a clear rarefaction. Forty-
eight cases fall into the middle category. In every case, the
compression was in the high-frequency component, and the
lower-frequency component always started with a rarefaction.
This suggests that the neck-collapse model applies consis-
tently for the larger bubble of the pair, but only approximately
a quarter of the time for the smaller bubble.
Figure 10 shows the same frequency and amplitude data
as Fig. 6, but different symbols are used for signals with an
initial compression and an initial rarefaction. It can be seen
that the initial rarefaction occurs in the majority of cases
where the radius ratio is between 1 and 2, and rarely at larger
radius ratios, and so there is a size dependence. Although the
mechanism appears to be related to bubble size, the oscilla-
tion energy does not appear to depend on the mechanism. As
stated earlier, there is no means whereby the current model
for the neck-collapse process can account for a wave with an
initial compression. This suggests that the double-neck col-
lapse model investigated here is appropriate for fragmenta-
tion events that produce large or equally sized bubbles, but a
modification is required to understand the other cases. The
discussion of coupling effects in this paper is still valid,
FIG. 9. (Color online) Four exam-
ples from the acoustic data collected
in the experiment carried out by
Deane and Stokes:21 (a) A parent
bubble emerging from the nozzle;
(b) A binary fragmentation event
which starts with a rarefaction, as (a)
does, which can be explained by the
neck-collapse model; (c) An inter-
mediate case, where there is a small
compression at the start of the acous-
tic signal; (d) The category of acous-
tic signal into which most of the
measured events fall. The signal
starts with acompression in the high-
frequency component, although the
lower-frequency component can be
seen to start with a rarefaction simi-
lar to that in (a). This initial com-
pression of the small bubble is not
explained by the neck-collapse
model outlined in this paper.
82 J. Acoust. Soc. Am., Vol. 129, No. 1, January 2011 H. Czerski and G. B. Deane: Coupling of newly fragmented bubbles

since the driving mechanism only affects the amplitude and
not the frequency of oscillation or the coupling behavior. We
will not speculate on the mechanism driving these small bub-
bles, other than to note that it must be associated with a rapid
volume increase on pinch-off, in order to generate the initial
compression observed.
VII. DISCUSSION
The effect of coupling on frequency (and therefore on the
interpretation of bubble size) is only significant for similarly
sized pairs of bubbles. Understanding of the gap in the fre-
quency histogram in Fig. 6 is clearly important for interpreting
the acoustics of bubbles that start with a known size and then
fragment. However, in a population of naturally occurring bub-
bles (where the parent bubbles have a range of sizes), the size
of the parent bubble is not known. An important question to
address is whether knowledge of the effects of coupling would
have a significant effect on the interpretation of acoustic data
arising from such a situation. Its importance will depend on
the likelihood of different fragmentation ratios. If the probabil-
ity of an equal volume split is high, the effect of coupling
would be more significant, whereas if those events are rare, the
effects of coupling on interpretation would be negligible.
Interpretation of passive acoustic signals from fragmenta-
tion could be affected by coupling in two main ways. The
mixture of the in-phase and antiphase modes for bubbles of
roughly equal size depends on the initial boundary conditions,
which will be altered if the two new bubbles have different
timescales of neck collapse. If the dominant mode is the in-
phase one, the acoustic signal may resemble that of a single
excited large bubble instead of two similarly sized smaller
ones. If the dominant mode is the antiphase mode,the acoustic
radiation from the two bubbles may largely cancel out. This
would reduce the likelihood of detection, and it may explain
our observation that fragmentation events resulting in two
similarly sized bubbles tend to be quiet. Either way, the bub-
ble population would be underestimated. These effects are
mostly likely to matter when the bubbles are similarly sized
(with a radius ratio between one and two) and it might be pos-
sible to correct for them if the fragmentation probability den-
sity function was better known. The case of the in-phase
mode dominating to produce a single frequency signal is dis-
tinguishable from a single excited bubble because the damp-
ing is different (it is greater by a factor of approximately 2).
However, the cases when the antiphase mode dominates so
that the event is very quiet are harder to correct for. Labora-
tory observation might provide an indication of the relative
likelihood of these two events, allowing for a correction.
Bubble coupling and the existence of the in-phase mode
could account for the “type A2” bubbles observed by Medwin
and Beaky.29 These were identified as those which produce an
acoustic signal similar to that of a single spherical bubble, but
with an initial damping almost twice as great as the theoretical
damping. We noticed that this may be explained by a compar-
ison of the acoustic signal from a single new bubble with ra-
dius R (for example, a new bubble formed at a nozzle), and
the acoustic signal produced by a bubble of radius R frag-
menting into two equally sized new bubbles. Our coupled
model predicts that for equally sized daughter bubbles, the
damping of the lower-frequency signal is approximately twice
that expected for the single bubble with the radius of the par-
ent bubble. The higher-frequency component is almost com-
pletely cancelled out, so the acoustic signal from the
fragmenting bubble appears to be that of a single bubble with
twice the expected damping, as they describe. The overall
effect would be to allow the sound pulse from a binary frag-
mentation event to be inadvertently identified as coming from
a single larger bubble, but with an anomalous damping.
A. Model applicability
One of the most obvious effects of coupling is that new
bubble pairs with equal energy partition radiating more
energy at the lower frequency than the higher one. The ener-
gies inferred from analysis of the modeled coupled bubble
acoustic pulses are strongly correlated, but not equal,
whereas an uncoupled analysis of the experimental data
implies equal energy partition. The explanation for the dis-
crepancy is likely to be one of three issues. The first is that
the assumptions made in the simplified model used here are
inadequate, and that the real distorted bubble shapes and sur-
rounding flow field have a strong influence on the acoustic
output. The second is that the neck-collapse model is not
appropriate for smaller bubbles, either because some other
mechanism is driving the smaller bubble or that our assump-
tions for how the neck forcing changes as bubble size
decreases are inadequate. The third is that the simplified
description of bubble interaction presented here does not
apply for bubbles of very different sizes. That is, a fragmen-
tation pair composed of a very large and a very small bubble
may not behave as a coupled system. Further work is
required to understand why the smaller bubble is more ener-
getic than our simple neck-collapse model would predict.
VIII. CONCLUSIONS
It was recently found that the sound emitted by a newly
formed single bubble is consistent with the volume forcing
FIG. 10. (Color online) These are the data shown in Fig. 6, but the circles
represent events where the acoustic signal began with a compression, and
the asterisks indicate events where the acoustic signal began with a rarefac-
tion. It can be seen that rarefaction events are most likely when the two new
bubbles are very similar in size, and that these events do not produce the
highest amplitudes.
J. Acoust. Soc. Am., Vol. 129, No. 1, January 2011 H. Czerski and G. B. Deane: Coupling of newly fragmented bubbles 83

caused by the rapidly collapsing neck of air accompanying
formation. In the research described here, this neck-collapse
model was extended to simulate one bubble fragmenting into
two coupled bubbles, and the resulting calculated acoustic
signals were compared with experimental data. The acoustic
coupling of the two new bubbles had a significant effect on
the amplitude and frequency of the emitted acoustic pulse,
especially when the ratio of the radii of the two new bubbles
was between 1 and 2. For any given parent bubble size, cou-
pling causes a gap in the frequencies that can be produced
because the two new bubbles form a single oscillatory sys-
tem with an in-phase mode and an antiphase mode. The ini-
tial conditions at the moment of fragmentation determine
which mode dominates. The frequency gap is seen in both
the theoretical results and the experimental data of Deane
and Stokes.21 Dominance of the in-phase mode of equal-
sized bubble products from a fragmentation event can also
explain Medwin and Daniels’ observation of A2 type bubble
pulses.
The lower-frequency part of the acoustic signal always
starts with a rarefaction, both in the model results and the ex-
perimental data. This is consistent with the larger bubble
always being driven by neck collapse. The neck-collapse
model also predicts the range of amplitudes seen in the ex-
perimental data for the larger bubble. One quarter of the
acoustic signals observed imply that the small bubble signal
started with a rarefaction and so the double-neck collapse
model can account for these. However, in the remaining
fragmentation events the small bubble oscillation started
with a compression, implying a different or modified driving
mechanism. For example, the jet of water generated by the
collapsing neck may play a dominant role in the excitation
of small bubble products.
The comparison of experimental data and model results
demonstrates that acoustic coupling is important for bubble
fragmentation products of approximately equal size. We
expect that knowledge of these coupling effects will improve
the interpretation of passive acoustic data from bubbles frag-
menting in turbulence.
ACKNOWLEDGMENTS
We would like to thank Dale Stokes and James Uyloan
for help with the experimental data collection. We gratefully
acknowledge financial support from the Office of Naval
Research (Grant No. N00014-04-1-072828) and the National
Science Foundation (Grant No. OCE 07-27140).
1D. M. Farmer, C. L. McNeil, and B. D. Johnson, “Evidence for the impor-
tance of bubbles in increasing air–sea gas flux,” Nature 361, 620–623
(1993).2R. F. Keeling, “On the role of large bubbles in air-sea gas exchange and
supersaturation in the ocean,” J. Mar. Res. 51, 237–271 (1993).
3R. Hamme and S. Emerson, “Mechanisms controlling the global oceanic
distribution of the inert gases argon, nitrogen and neon,” Geophys. Res.
Lett. 29, 35-1–35-4 (2002).4G. Deane and M. D. Stokes, “Scale dependence of bubble creation mecha-
nisms in breaking waves,” Nature 418, 839–844 (2002).5D. M. Farmer, S. Vagle, and A. D. Booth, “A free-flooding acoustical res-
onator for measurement of bubble size distributions,” J. Atmos. Ocean.
Technol. 15, 1132–1146 (1998).6T. Leighton, S. Meers, and P. White, “Propagation through nonlinear
time-dependent bubble clouds and the estimation of bubble populations
from measured acoustic characteristics,” Proc. R. Soc. A 460, 2521–2550
(2004).7H. Medwin and A. C. Daniel, “Acoustical measurements of bubble pro-
duction by spilling breakers,” J. Acoust. Soc. Am. 88, 408–412 (1990).8T. G. Leighton and A. J. Walton, “An experimental study of the sound
emitted from gas bubbles in a liquid,” Eur. J. Phys. 8, 98–104 (1987).9M. R. Loewen and W. K. Melville, “A model of the sound generated by
breaking waves,” J. Acoust. Soc. Am. 90, 2075–2080 (1991).10R. Manasseh, R. F. LaFontaine, J. Davy, I. Shepherd, and Y.-G. Zhu,
“Passive acoustic bubble sizing in sparged systems,” Exp. Fluids 30, 672–
682 (2001).11G. Deane and M. D. Stokes, “The acoustic signature of bubbles fragment-
ing in sheared flow,” J. Acoust. Soc. Am. 120, EL84 (2006).12A. Prosperetti, “Thermal effects and damping mechanisms in the forced
radial oscillations of gas bubbles in liquids,” J. Acoust. Soc. Am. 61, 17–
27 (1977).13T. G. Leighton, The Acoustic Bubble (Academic, London, 1994), p. 155.14M. S. Plesset and A. Prosperetti, “Bubble dynamics and cavitation,” Annu.
Rev. Fluid Mech. 9, 145–185 (1977).15H. C. Pumphrey, J. E. Ffowcs-Williams, “Bubbles as sources of ambient
noise,” IEEE J. Ocean. Eng. 15, 539–567 (1990).16M. S. Longuet-Higgins, “An analytic model of sound production by rain-
drops,” J. Fluid Mech. 214, 395–410 (1990).17R. D. Hollet and R. M. Heitmeyer, “Noise generation by bubbles formed
in breaking waves,” in Sea Surface Sound (Kluwer, Boston, 1998),
pp. 449–462.18R. Manasseh, S. Yoshida, and M. Rudman, “Bubble formation processes
and bubble acoustic signals,” in Proceedings of the Third InternationalConference on Multiphase Flow (ICMF’98), Lyon, France (June 8–12,
1998), paper no. 202.19R. Manasseh, A. Bui, J. Sandercock, and A. Ooi, “Sound emission proc-
esses on bubble detachment,” in Proceedings of the 14th AustralasianFluid Mechanics Conference, Adelaide, South Australia (December 9–14,
2001), edited by Dally, Vol. 1, pp. 857–860.20G. B. Deane and H. Czerski, “A mechanism stimulating sound production
from air bubbles released from a nozzle,” J. Acoust. Soc. Am. 123, EL126
(2008).21G. B. Deane and M. D. Stokes, “The acoustic excitation of air bubbles
fragmenting in sheared flow,” J. Acoust. Soc. Am. 124, 3450–3463
(2008).22M. Ida, “A characteristic frequency of two mutually interacting gas bub-
bles in an acoustic field,” Phys. Lett. A 297, 210–217 (2002).23P. Hsiao, M. Devaud, and J. Bacri, “Acoustic coupling between two air
bubbles in water,” Eur. Phys. J. E 4, 5–10 (2001).24V. Leroy, M. Devaud, and J. Bacri, “The air bubble: Experiments on an
unusual harmonic oscillator,” Am. J. Phys, 70, 1012–1019 (2002).25H. Medwin, Sounds in the Sea (Cambridge University Press, 2005), equa-
tion 6.72b, p. 187.26A. Prosperetti, L. Crum, K. Commander, “Non-linear bubble dynamics,”
J. Acoust. Soc. Am. 83, 502–514 (1988).27M. Longuet-Higgins, “The release of air bubbles from an underwater
nozzle,” J. Fluid Mech. 230, 365–390 (1991).28C. Feuillade and M. F. Werby, “Resonances of deformed gas bubbles in
liquids,” J. Acoust. Soc. Am. 96, 3684–3692 (1994).29H. Medwin and M. M. Beaky, “Bubble sources of the Knudsen sea noise
spectra,” J. Acoust. Soc. Am. 86, 1124–1130 (1989).
84 J. Acoust. Soc. Am., Vol. 129, No. 1, January 2011 H. Czerski and G. B. Deane: Coupling of newly fragmented bubbles