the economic returns of pediatric clinical trials of antihypertensive drugs
TRANSCRIPT
The economic returns of pediatric clinical trials of anti-hypertensive drugs
Carissa M. Baker-Smith, MD, MSa, Daniel K. Benjamin Jr, MD, PhDa,b, Henry G. Grabowski,PhDc, Elizabeth D. Reidb, Barry Mangum, PharmDb, John V. Goldsmith, PhDd, M. DianneMurphy, MDd, Rex Edwardsb, Eric L. Eisenstein, DBAb, Jessica Sun, MDa, Robert M. Califf,MDb, and Jennifer S. Li, MD, MHSa,b
aDepartment of Pediatrics, Duke University Medical Center, Durham, NCbDuke Clinical Research Institute, Durham, NCcDepartment of Economics, Duke University, Durham, NCdU.S. Food and Drug Administration, Rockville, MD
AbstractBackground—Congress has authorized the U.S. Food and Drug Administration (FDA) toprovide industry sponsors with a 6-month extension of drug marketing rights under the PediatricExclusivity Provision if FDA-requested pediatric drug trials are conducted. The cost and economicreturn of pediatric exclusivity to industry sponsors has been shown to be highly variable. Wesought to determine the cost of performing pediatric exclusivity trials within a single therapeuticarea and the subsequent economic return to industry sponsors.
Methods—We evaluated 9 orally administered anti-hypertensive drugs submitted to the FDAunder the Pediatric Exclusivity Provision from 1997–2004 and obtained key elements of theclinical trial designs and operations. Estimates of the costs of performing the studies weregenerated and converted into after-tax cash outflow. Market sales were obtained and convertedinto after-tax inflows based on 6 months of additional patent protection. Net economic return andnet return-to-cost ratios were determined for each drug.
Results—Of the 9 anti-hypertensive agents studied, an average of 2 studies per drug wasperformed, including at least 1 pharmacokinetic study and a safety and efficacy study. The mediancost of completing a pharmacokinetic trial was $862,000 (range: $556,000–1.8 million). Themedian cost of performing safety and efficacy trials for these agents was $4.3 million (range: $2.1million–12.9 million). The ratio of net economic return to cost was 17 (range: 4–64.7).
Conclusion—We found that, within a cohort of anti-hypertensive drugs, the PediatricExclusivity Provision has generated highly variable, yet lucrative returns to industry sponsors.
© 2008 Mosby, Inc. All rights reserved.
Correspondence to: Jennifer S. Li, MD, MHS, P.O. Box 17969, Duke Clinical Research Institute, Durham, NC 27705;[email protected]; fax: (919) 668-7850; phone: (919) 681-2916.
Publisher's Disclaimer: This is a PDF file of an unedited manuscript that has been accepted for publication. As a service to ourcustomers we are providing this early version of the manuscript. The manuscript will undergo copyediting, typesetting, and review ofthe resulting proof before it is published in its final citable form. Please note that during the production process errors may bediscovered which could affect the content, and all legal disclaimers that apply to the journal pertain.
DisclosuresThe Duke Clinical Research Institute was the coordinating center for 2 of the trials of drugs mentioned in this study.
NIH Public AccessAuthor ManuscriptAm Heart J. Author manuscript; available in PMC 2012 April 23.
Published in final edited form as:Am Heart J. 2008 October ; 156(4): 682–688. doi:10.1016/j.ahj.2008.05.001.
NIH
-PA Author Manuscript
NIH
-PA Author Manuscript
NIH
-PA Author Manuscript
Keywordsclinical trials; hypertension; pediatrics; drugs; cost-benefit analysis
In 1997, Congress passed the United States Food and Drug Administration (FDA)Modernization Act. Section 505a of this act, known as the Pediatric Exclusivity Provision,grants 6 months of marketing exclusivity to pharmaceutical companies in exchange fortesting the safety, efficacy, and pharmacokinetics of drugs currently used in the pediatricpopulation.1 Since its inception, sponsors have complied with 173 of the 297 writtenrequests for pediatric studies of on-patent drugs currently prescribed to children.2 This hasresulted in over 130 pediatric labeling changes to date.3 Between 1990 and 1997, only 11agents had undergone sufficient testing of dosing, safety, and efficacy to qualify for andsubsequently undergo pediatric labeling changes.4
Despite the success of this provision (and its renewal under the 2002 Best Pharmaceuticalsfor Children Act and most recently in October 2007), critics contend that the program yieldshighly lucrative returns to the innovator drug industry. The benefits of 6 months ofmarketing protection to the entire moiety are thought to greatly exceed the costs ofperforming the pediatric studies. We recently evaluated the economic return of performingpediatric trials across a broad range of therapeutic indications,5, 6 demonstrating that the costof performing pediatric clinical trials across a broad range of clinical areas was highlyvariable. This prior study, however, examined the economic return associated with a singledrug per clinical indication. The generalizability of these findings within a single clinicalindication was not determined. In the present study, we examine the economic return and thenet return-to-investment ratio of clinical trials for multiple agents within a single clinicalindication. Furthermore, we provide a breakdown of the estimated costs of performing trialsin children based upon our cost modeling approach and identify potential predictors of costin pediatric hypertension studies.
MethodsAnti-hypertensive drug cohort
Between 1997 and 2004, the FDA received completed clinical study reports for 12antihypertensive agents. The clinical study reports were submitted to the FDA under thePediatric Exclusivity Provision. Two of the authors (JL and DB) evaluated the clinical studyreports for the 12 anti-hypertensive agents, including 10 orally administered and 2intravenously administered agents. Due to significant variations in trial design (i.e.,assessments in the intensive care unit versus clinic, severity of illness, length of study),intravenously administered agents were excluded from our analysis. The clinical studyreports for 1 of the orally administered anti-hypertensive agents were incomplete at the timeof our evaluation, and therefore this agent could not be used in our analysis. Of theremaining 9 anti-hypertensive agents, clinical reports were separated by drug and type ofclinical study (safety and efficacy versus pharmacokinetic). Each anti-hypertensive drug wasstudied in children with a safety and efficacy trial, as well as at least 1 pharmacokineticstudy. Pharmacokinetic studies were either single-dose or multi-dose. Bioequivalence orbioavailability studies were often required if a new pediatric formulation was provided in thetrials; these studies were performed in adults. The bioavailability studies compared thepharmacokinetics of suspension versus tablet formulation, while the bioequivalence studiestested the pharmacokinetics of coated tablet versus small tablet formulation.
Baker-Smith et al. Page 2
Am Heart J. Author manuscript; available in PMC 2012 April 23.
NIH
-PA Author Manuscript
NIH
-PA Author Manuscript
NIH
-PA Author Manuscript
Cash outflowsFor an individual anti-hypertensive agent, the net economic return as well as the net return-to-investment ratio was determined by first calculating estimates of cash outflow aspreviously described.5 Cash outflows are approximations of the cost of performing a clinicaltrial. These were generated by using commercially available trial cost estimator software(Fast Track Systems, Inc., Conshohocken, PA). Total costs were generated as the sum ofcontract research organization (CRO) costs, net pharmaceutical costs, per patient site costs,and central laboratory costs. Central laboratory costs were estimated using an internalpricing tool supplied by Covance Central Laboratory Services (Indianapolis, IN). TheCovance Central Laboratory cost estimation resource provides cost in an 8-service template,including costs for database construction, transportation, laboratory services, and specimenmanagement, but excludes costs for drug manufacturing and drug packaging. Laboratorytesting that was not performed centrally—as specified by the clinical study reports—wasestimated as local laboratory testing costs and was included in the average cost per patientvisit. Total values were generated and included low, medium, and high cost estimates foreach trial. Reimbursements for participants were calculated using the trial cost estimatorsoftware and included in total cost estimates. All costs for participation in PK studies wereassumed to be independent of those associated with efficacy studies.
High cost estimates were used to approximate cash outflow and were adjusted for inflation(adjusted total cost) and totaled across trials for a single anti-hypertensive agent. Totaladjusted costs per anti-hypertensive agent were further adjusted for a tax rate of 30% toobtain an after-tax cash outflow value. This value was used to determine the net economicreturn and the net economic return-to-investment ratio per anti-hypertensive agent.
Cash outflow estimates were confirmed by a 2-person review. One author acquired valuesfor cost determinants from the study reports, and another reviewed the data and ensured thatthe data were obtained correctly. All cash outflow estimates were evaluated for accuracy.
Cash inflowsYearly sales data, derived from sales audit data (IMS Health, IMS National SalesPerspective™, 2002–2004, extracted February 2005, Retail & Non-Retail, 2005–2006),were obtained from IMS Health, Inc. (Fairfield, CT).7 All sales figures for the last 3 yearsprior to patent expiration, the last 3 years for which data were available, or for years 2002 to2004 were obtained. To avoid bias, sales figures were adjusted to a reference year of 2005using pharmaceutical consumer price indices. The average of these values was obtained.These values were discounted by 10% to reflect discounts to managed care. Sales estimateswere additionally discounted 8% per year to reflect the expected returns per year for anindividual agent. We also assumed a contribution margin of 50% (sales revenue minusvariable costs; i.e., for every $1 worth of product, the company pays an additional 50 centsin variable costs) and a tax rate of 30% (industry range: 25–35%).8 Resultant adjusted valueswere approximations of the after-tax cash inflow per each anti-hypertensive agent studied.
Net return calculations and procedures for minimizing errorEstimates of net economic return per drug were calculated based upon cash outflows andcash inflows adjusted to their 2005 values. Net return-to-investment ratios were calculated toreflect 6 months of marketing exclusivity by averaging cash inflows over 3 years to obtainan estimate of average annual cash inflow and dividing this value by 2 to obtain a 6-monthestimate. The estimated cash outflow per drug was then subtracted from the 6-month cashinflow estimate to calculate net return. Net return-to-investment per anti-hypertensive agentwas quantified by dividing net return by estimated cash outflow.
Baker-Smith et al. Page 3
Am Heart J. Author manuscript; available in PMC 2012 April 23.
NIH
-PA Author Manuscript
NIH
-PA Author Manuscript
NIH
-PA Author Manuscript
Statistical analysisAll cash inflow and outflow data were imported into SAS version 9.1.3 (Cary, NC).Summary statistics were provided for demographic and cost-related data, and anonparametric approach was employed when appropriate for small samples (Wilcoxon rank-sum test).
ResultsStudy characteristics
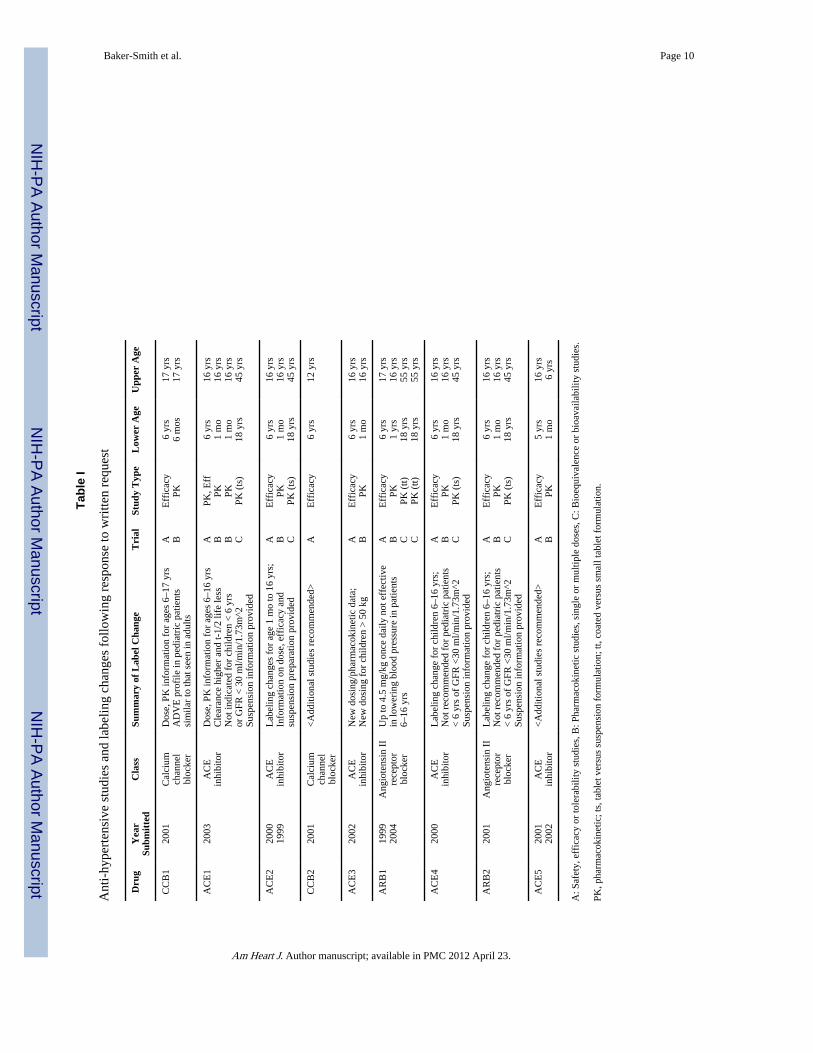
Among the 9 orally administered anti-hypertensive agents, there were 24 clinical studyreports, including 9 safety and efficacy studies, 9 single-dose or multi-dose pharmacokineticstudies, and 6 bioequivalence or bioavailability studies. Twenty-five percent of the studieswere bioequivalence or bioavailability studies and were performed in adults, while theremaining studies (75%) were performed in children. Of the 9 anti-hypertensive agentsstudied, 7 underwent successful labeling changes as a result of the studies.3, 9 Two drugs didnot undergo labeling changes and were found to have insufficient data to support safe and/oreffective use in children. Further studies were recommended for these 2 agents (Table 1).These results may have been due to ineffective dosing.
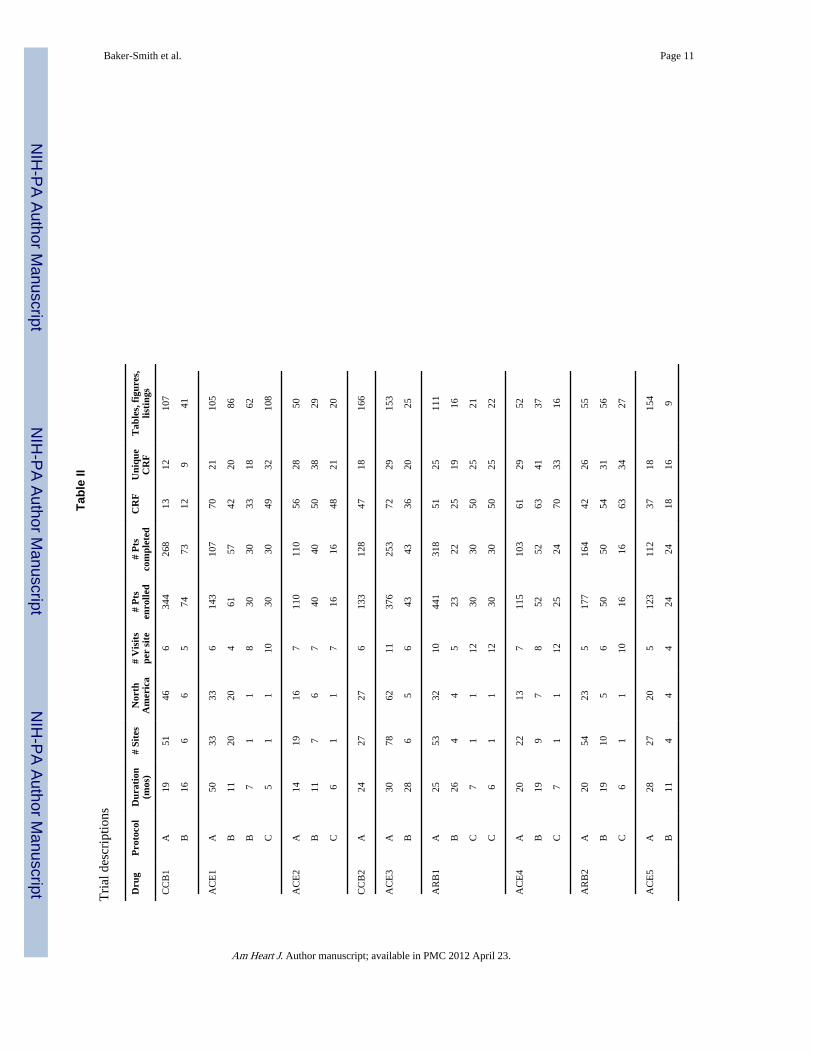
Study reports summaryThe 24 trials enrolled 2506 children. Twenty-one hundred children (84%) completed thestudies. Efficacy studies enrolled approximately 4 times as many children aspharmacokinetic studies (efficacy = 1962, pharmacokinetic = 544). Approximately 20%(399/1962) of children enrolled did not complete the efficacy studies, but nearly all enrolleesof the pharmacokinetic trials completed the studies (537/544; 99%). The median number ofenrollees per antihypertensive agent for all agents reviewed was 51 (range: 16–441), with amedian of 143 subjects (range: 110–441) enrolled in efficacy and safety studies and 30subjects (range: 24–74) enrolled in pharmacokinetic studies (Table 2). The median durationfor all of the studies was 17.5 months (range: 5–50 months). The time to complete efficacystudies was approximately 50% longer in duration than pharmacokinetic studies (median: 24months vs. 16 months). The median duration of bioequivalence studies was 6 months (range:5–7 months).
The median number of case report forms completed per child was 50, and the mediannumber of tables, figures, and listings per study was 51 for all studies. A subject visited astudy site a median of 7 times throughout a trial. Efficacy studies included a greater numberof tables, figures, and listings (107) than pharmacokinetic studies (27) (P = 0.0014).However, there was no statistically significant difference in the number of case report forms(P = 0.46) or in the number of visits completed by subjects (P = 0.48).
Study costs, sales, and cash flowsThe median cost per written request to evaluate a particular anti-hypertensive drug in thiscohort was $6 million (range: $3.8 million–14.2 million). These costs included estimatedcoordinating center, sponsor management, site payment, and central laboratory costs (whenapplicable) adjusted to 2005 dollars. The median value to conduct efficacy and safetyclinicaltrials per drug was $4.3 million (range: $2.1 million–12.9 million), while a similarestimate for pharmacokinetic studies was $862,000 (range: $556,000–1.8 million). Themedian single- or multi-dose pharmacokinetic study cost was $1,117,092 (range: $634,396–1.8 million), while the median cost for a bioequivalence or bioavailability study was$731,856 (range: $555,663–862,457). The difference in study cost for single-dose or multi-dose pharmacokinetic studies versus study costs for bioequivalence and bioavailabilitystudies was statistically significant (P = 0.026). The median cost per enrollee for efficacy
Baker-Smith et al. Page 4
Am Heart J. Author manuscript; available in PMC 2012 April 23.
NIH
-PA Author Manuscript
NIH
-PA Author Manuscript
NIH
-PA Author Manuscript
studies was $31,546 (range: $18,941–$51,179), while the median cost per enrollee forpharmacokinetic studies or bioequivalence/bioavailability studies was $28,982 (range:$13,356–$47,311) and $30,071 (range: $23,851–$35,977), respectively. After-tax cashoutflow, study costs adjusted for inflation and an industry average tax rate of 30% were $4.8million (range: $2.7 million–10.4 million).
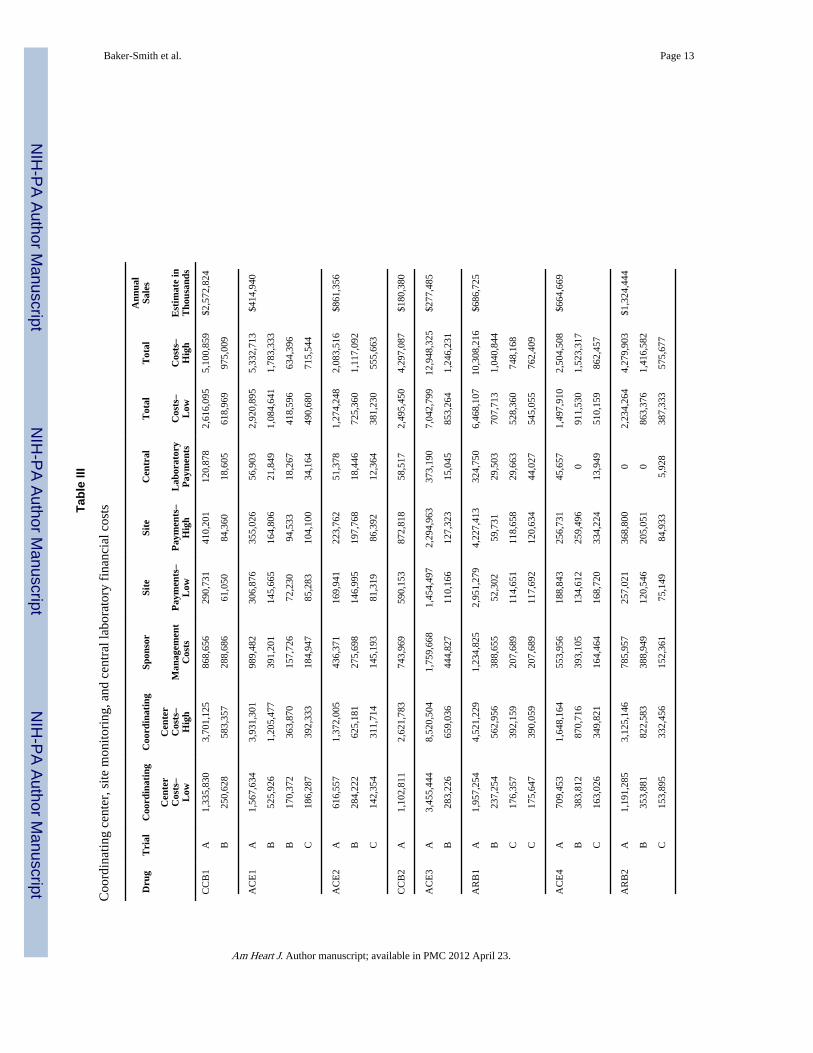
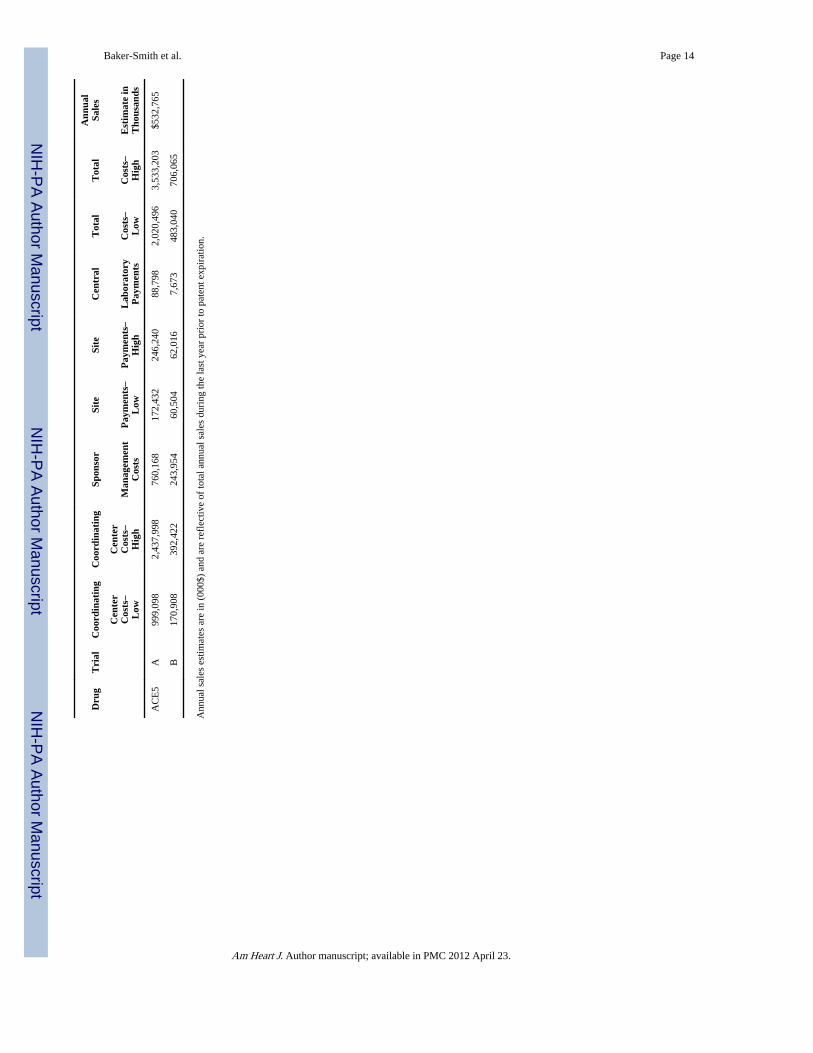
Drug sales also varied extensively. The median annual sales value per drug was $687million (range: $218 million–$2.4 billion). There were 2 blockbuster anti-hypertensiveagents with sales exceeding $1 billion (Table 3). The median 6-month cash inflow per drugwas $60 million (range: $17.5 million–$320 million).
Average sales by drug class were also variable, but formal significance testing of thisdifference was not performed due to small sample sizes.
Net economic return and net economic return-to-investmentNet economic return for 6 additional months of marketing exclusivity varied byantihypertensive drug but remained positive for all drugs for the 6 months of additionalexclusivity (Figure 1). Variation in net sales return greatly exceeded the variability in thecost of performing clinical trials: the standard deviation for cash inflow was $93 million,while the standard deviation in cash outflow per written request was $2.8 million. Allstudies resulted in a positive net return according to our analysis during the 6-month periodof additional marketing exclusivity. The range in net return-to-investment after adjusting fordiscounts, taxes, and inflation far exceeded the cost of studying the drug and ranged from$14.5 million to $316 million (median: $53 million). For every $1 invested, 4 of the 9 agentsstudied had a return of less than $10, and 5 out of 9 had a return of greater than $20 forevery $1 invested. The overall range was $4 to nearly $70 per $1 invested. Sensitivityanalyses that adjusted discount rates for values between 5% and 20%, as well as adjustmentsin the contribution margin for values between 40% and 60%, also revealed positive netreturns for all anti-hypertensive agents reviewed (Figure 1, error bars).
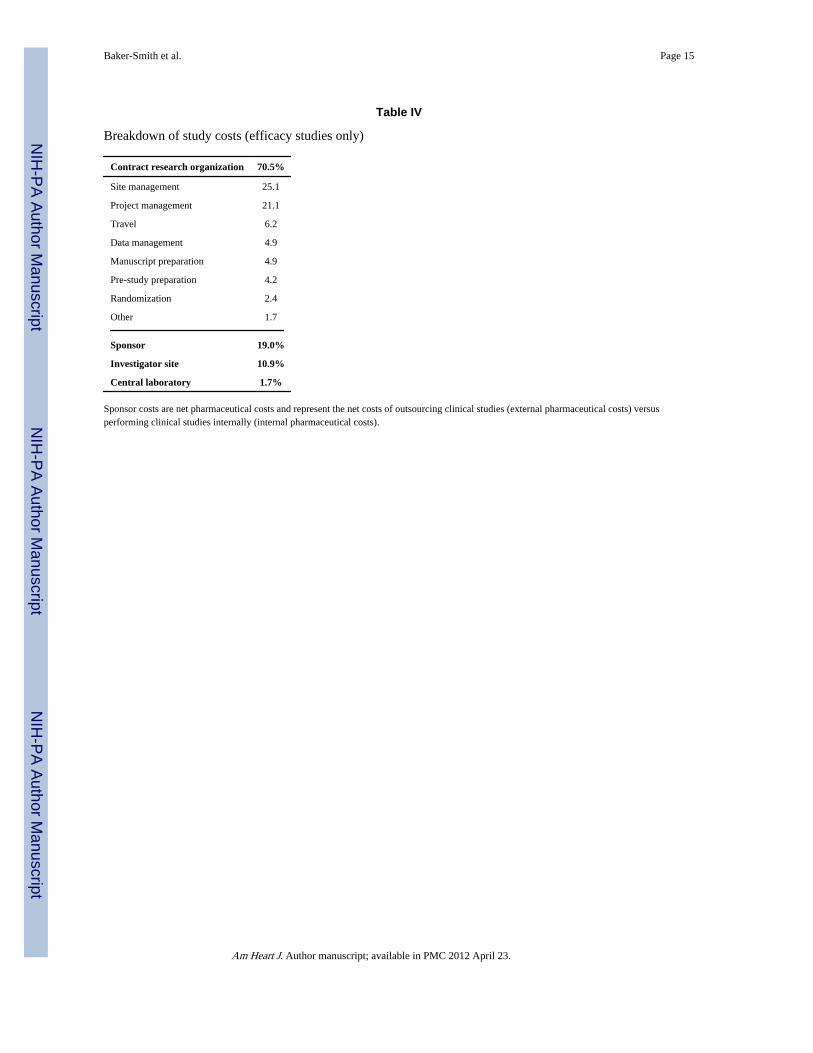
Study cost predictorsCoordinating center, site management, and pharmaceutical costs generated using Fast TrackSystems revealed that, among these cost variables, coordinating research center (CRO) costscomprised the greatest proportion of the total. Forty-one to 73% percent of the total cost forstudying an anti-hypertensive agent was related to coordinating center incurred costs (Table3). A review of coordinating center costs revealed that, for the majority of studies, sitemanagement and project management contributed the greatest percentage to the total costestimate (Table 4).
DiscussionOur study suggests that net economic return-to-investment within the single pediatricindication of hypertension is strongly positive but highly variable. We found that of the 9antihypertensive agents reviewed in this study, not one of the sponsors lost money byparticipating in the Pediatric Exclusivity Program. Furthermore, we found that the netreturn-to-investment as previously reported by Li et al. for a single hypertensive agent wasrelatively low when compared with the estimated net returns within a larger cohort of anti-hypertensive agents. Our most recent findings, coupled with our previous work, suggest thatvariability in the net return-to-investment following participation in the Pediatric ExclusivityProvision exists across and within clinical indications.
The benefits of examining a larger cohort of agents within a single clinical indication are notlimited to sample size, but include the ability to assess for variations in cost that may be
Baker-Smith et al. Page 5
Am Heart J. Author manuscript; available in PMC 2012 April 23.
NIH
-PA Author Manuscript
NIH
-PA Author Manuscript
NIH
-PA Author Manuscript
temporally associated with the introduction of an agent into the market and also with thepopularity of its use among adults. One potential source of variation in the net return isrelated to the degree to which an agent penetrates the adult market. There are an estimated65 million hypertensive adults in the United States, in addition to the estimated 5 millionadults with clinical conditions such as heart failure who are also prescribed anti-hypertensive agents.10, 11 Thus, economic returns on anti-hypertensive drugs are expected tobe high due to large sales volumes of agents while on patent. Agents such as CCB1 andACE2 experienced the greatest net returns-to-investment, with net returns in excess of $316million and $160 million, respectively. Sales data suggest that either the agents were broadlyprescribed or that the inflow cost of such agents greatly exceeded that of other agents,resulting in higher sales values. Another potential source of variation is the order in which aparticular agent is introduced into the market within a specific class of anti-hypertensivedrugs. It is probable that agents with the earliest patents are also the agents with the greatestnet return following exclusivity extension. ACE2 and ARB2 had earlier submission dates(Table 1; patent extension given to the latest submission date). These 2 agents also had thegreatest net return-to-investment within their respective classes. Finally, variation in returncould also be due to lower costs associated with studying the agents with the greatest netreturn and higher costs associated with studying drugs with the lowest net return. Overall,there appeared to be no trend to suggest this finding, and furthermore, sales values greatlyexceeded cost values, and variations in sales greatly exceeded variations in cost.
LimitationsLimitations of our study include the number of agents available for study and the limits ofour market analysis. We obtained the study reports of all anti-hypertensive drugs that hadsuccessfully undergone labeling changes (and 2 additional agents) prior to 2005. Wegenerated cost estimates using software that is commonly used to design budgets forperforming clinical trials. Attempts were made to limit measurement error by using a 2-person review of the data. Sales data were derived from audit information, and all inflowand outflow estimates were approximated in 2005 dollars in order to avoid bias. However,our model is a market-adjusted account of the difference in inflow versus outflow costs as aconsequence of the exclusivity provision. It does not account for the returns required bypharmaceutical companies in order to support the development of new drugs, costs offormulation changes, marketing costs, distribution costs, or costs to society secondary todelayed entry of generics. It also does not account for costs incurred by pharmaceuticalcompanies in choosing to develop 1 agent over another agent. Our model was limited byadditional assumptions. We assumed: (1) fixed costs associated with the introduction ofthese pharmaceutical agents (i.e., warehouse construction, marketing research) occurredearly in the product life-cycle and therefore were assumed to be minimal during theexclusivity period; (2) differences in incremental cash flow were more accurate predictors ofreturn from investment than net profit; and (3) estimates of net return could be obtained bydiscounting tax-adjusted cost and sales values to the date of clinical study report submissionto the FDA for analysis. However, our estimates of incremental cash outflows and inflowswere consistent with previous estimates.4 Finally, we could not measure the potential gain topatients and society by conducting these trials.
PerspectivesDespite the high economic return to industry, these studies have been performed for thebenefit of pediatric health and have provided necessary information for a significantpediatric health problem. Historically, only 25% of drugs used in children have sufficientlabeling information to support their use in children.12 Insufficient labeling information hascontributed to off-label use of agents in children, subjecting them to potential adverse eventsand to exposure to agents with unestablished efficacy. It is therefore important to provide
Baker-Smith et al. Page 6
Am Heart J. Author manuscript; available in PMC 2012 April 23.
NIH
-PA Author Manuscript
NIH
-PA Author Manuscript
NIH
-PA Author Manuscript
appropriate labeling information to ensure benefits for this vulnerable population.4 Prior tothe passage of the Best Pharmaceuticals for Children Act and the Pediatric ExclusivityProvision, legislation to encourage the testing of drugs in children was largely ineffective,and few studies were completed.13 With the rising epidemic of childhood obesity, conditionssuch as hypertension are increasing in prevalence, and now more than 10% of obese childrenand 1.3–5.3% of non-obese children in the United States are hypertensive.14 When oneconsiders the potential impact of untreated hypertension, it is clear that proper testing of thesafety, dosing, and efficacy of antihypertensive agents in children is essential.15–18
Furthermore, uncontrolled hypertension in the pediatric population is associated withincreased morbidity in childhood.19
As a consequence of the 2002 Best Pharmaceuticals for Children Act, severalantihypertensive agents have now been approved for use in the pediatric population. Of the138 labeling changes that have occurred, just over 5% are now approved for use as anti-hypertensive therapies. Ideally all studies will result in labeling changes. However, of the 9agents reviewed in this study, 2 did not. This is problematic because the likelihood that theseagents will be retested is minimal and the prospect of having the necessary safety, efficacy,and dosing data to properly administer these agents to children, unlikely. However, in caseswhere drugs do not undergo labeling changes, there should be more transparency about thefindings of the study. Greater transparency is necessary with regard to safety and/or lack ofefficacy. Currently, labeling information is publicly available on the FDA Web site.20
Passage of the Best Pharmaceuticals for Children Act and the Pediatric ExclusivityProvision have resulted in the most significant increase in the number of label changes fordrugs commonly administered to children to date. Without this provision, few drugs wouldundergo testing for safety, efficacy, and pharmacokinetics in the pediatric population. Therationale for granting pediatric exclusivity independent of label changes is the valueassociated with collecting information for use of agents in children in well-controlled anddesigned trials.21 Previously failed efforts to encourage label changes and the tremendoussuccess of the Pediatric Exclusivity Provision suggest that society may need to bear the costof testing drugs in children under this provision in order to protect future generations.
AcknowledgmentsSources of funding
Dr. Baker-Smith is funded by NIH T32 grant (HL069749-04). Drs. Li and Benjamin received support from theNational Institute of Child Health & Human Development (NICHD) 1U10-HD45962-04 and the U.S. Food andDrug Administration. Drs. Benjamin, Li, and Califf received support from 1UL1RR024128-01.
The views expressed are those of the authors. No official endorsement by the U.S. Food and Drug Administration isprovided or should be inferred.
References1. Department of Health and Human Services, U.S. Food and Drug Administration. [Accessed
November 27, 2007] The Pediatric Exclusivity Provision: January 2001 Status Report to Congress.Available at: http://www.fda.gov/cder/pediatric/reportcong01.pdf.
2. [Accessed November 27, 2007] Approved active moieties to which FDA has issued a writtenrequest for pediatric studies under Section 505A of the Federal Food, Drug, and Cosmetic Act. U.S.Food and Drug Administration Web site. Available at:http://www.fda.gov/cder/Pediatric/wrlist.htm.
3. [Accessed November 27, 2007] Pediatric exclusivity labeling changes. U.S. Food and DrugAdministration Web site. Available at: http://www.fda.gov/cder/pediatric/labelchange.htm.
Baker-Smith et al. Page 7
Am Heart J. Author manuscript; available in PMC 2012 April 23.
NIH
-PA Author Manuscript
NIH
-PA Author Manuscript
NIH
-PA Author Manuscript
4. Breslow LH. The Best Pharmaceuticals for Children Act of 2002: the rise of the voluntary incentivestructure and congressional refusal to require pediatric testing. Harvard J Legis. 2003; 40:133–193.[PubMed: 16594116]
5. Li JS, Eisenstein EL, Grabowski HG, et al. Economic return of clinical trials performed under thepediatric exclusivity program. JAMA. 2007; 297:480–488. [PubMed: 17284698]
6. US General Accounting Office. [Accessed November 27, 2007] Testimony before the Committee onHealth, Education, Labor, and Pensions, US Senate. Pediatric drug research: substantial increase instudies of drugs for some children but challenges remains. GAO-01-705 T. Available at:http://www.gao.gov/new.items/d01705t.pdf.
7. IMS Health home page. Available at: http://www.imshealth.com.
8. Grabowski HG, Vernon JM, Dimasi JA. Returns on research and development for 1990s new drugintroductions. Pharmacoeconomics. 1994; 20(suppl 3):11–29. [PubMed: 12457422]
9. National High Blood Pressure Education Program Working Group on High Blood Pressure inChildren and Adolescents. The fourth report on the diagnosis, evaluation, and treatment of highblood pressure in children and adolescents. Pediatrics. 2004; 114(2 suppl 4th report):555–576.[PubMed: 15286277]
10. Hypertension in America: a national reading. Am J Manag Care. 2005; 11(13 suppl):S383–S385.[PubMed: 16300452]
11. Hunt SA. American College of Cardiology. American Heart Association Task Force on PracticeGuidelines (Writing Committee to Update the 2001 Guidelines for the Evaluation andManagement of Heart Failure). ACC/AHA 2005 guideline update for the diagnosis andmanagement of chronic heart failure in the adult: a report of the American College of Cardiology/American Heart Association Task Force on Practice Guidelines (Writing Committee to Update the2001 Guidelines for the Evaluation and Management of Heart Failure). J Am Coll Cardiol. 2005;46:e1–e82. [PubMed: 16168273]
12. Wilson JT. An update on the therapeutic orphan. Pediatrics. 1999; 104:585–590. [PubMed:10469794]
13. Roberts R. Pediatric drug labeling: improving the safety and efficacy of pediatric therapies. JAMA.2003; 290:905–911. [PubMed: 12928467]
14. Ogden CL, Flegal KM, Carroll MD, et al. Prevalence and trends in overweight among U.S.children and adolescents, 1999–2000. JAMA. 2002; 288:1728–1732. [PubMed: 12365956]
15. Meyer AA, Joharchi MS, Kundt G, et al. Predicting the risk of early atherosclerotic diseasedevelopment in children after repair of aortic coarctation. Eur Heart J. 2005; 26:617–622.[PubMed: 15618050]
16. Belay B, Belamarich P, Racine AD. Pediatric precursors of adult atherosclerosis. Pediatr Rev.2004; 25:4–16. [PubMed: 14702517]
17. Daniels SR. Hypertension-induced cardiac damage in children and adolescents. Blood Press Monit.1999; 4:165–170. [PubMed: 10490869]
18. Strong JP. The natural history of atherosclerosis in childhood. Ann N Y Acad Sci. 1991; 623:9–15.[PubMed: 2042878]
19. Lauer RM, Clarke WR. Childhood risk factors for high adult blood pressure: the Muscatine Study.Pediatrics. 1989; 84:633–641. [PubMed: 2780125]
20. [Accessed April 10, 2008] Pediatric exclusivity labeling changes as of April 10, 2008. U.S. Foodand Drug Administration Web site. Available at:http://www.fda.gov/cder/pediatric/labelchange.htm.
21. Benjamin DK, Smith PB, Murphy MD, et al. Peer-reviewed publication of clinical trials completedfor pediatric exclusivity. JAMA. 2006; 296:1266–1273. [PubMed: 16968851]
Baker-Smith et al. Page 8
Am Heart J. Author manuscript; available in PMC 2012 April 23.
NIH
-PA Author Manuscript
NIH
-PA Author Manuscript
NIH
-PA Author Manuscript
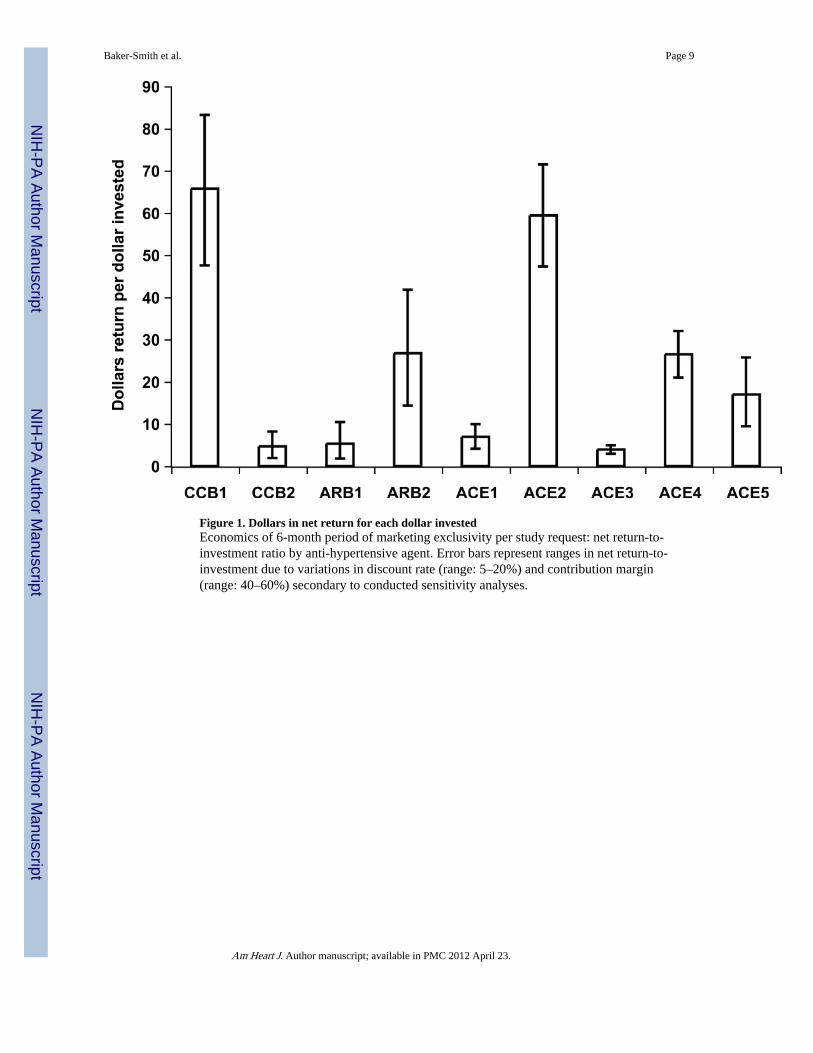
Figure 1. Dollars in net return for each dollar investedEconomics of 6-month period of marketing exclusivity per study request: net return-to-investment ratio by anti-hypertensive agent. Error bars represent ranges in net return-to-investment due to variations in discount rate (range: 5–20%) and contribution margin(range: 40–60%) secondary to conducted sensitivity analyses.
Baker-Smith et al. Page 9
Am Heart J. Author manuscript; available in PMC 2012 April 23.
NIH
-PA Author Manuscript
NIH
-PA Author Manuscript
NIH
-PA Author Manuscript
NIH
-PA Author Manuscript
NIH
-PA Author Manuscript
NIH
-PA Author Manuscript
Baker-Smith et al. Page 10
Tabl
e I
Ant
i-hy
pert
ensi
ve s
tudi
es a
nd la
belin
g ch
ange
s fo
llow
ing
resp
onse
to w
ritte
n re
ques
t
Dru
gY
ear
Subm
itte
dC
lass
Sum
mar
y of
Lab
el C
hang
eT
rial
Stud
y T
ype
Low
er A
geU
pper
Age
CC
B1
2001
Cal
cium
chan
nel
bloc
ker
Dos
e, P
K in
form
atio
n fo
r ag
es 6
–17
yrs
AD
VE
pro
file
in p
edia
tric
pat
ient
ssi
mila
r to
that
see
n in
adu
lts
A BE
ffic
acy
PK6
yrs
6 m
os17
yrs
17 y
rs
AC
E1
2003
AC
Ein
hibi
tor
Dos
e, P
K in
form
atio
n fo
r ag
es 6
–16
yrs
Cle
aran
ce h
ighe
r an
d t-
1/2
life
less
Not
indi
cate
d fo
r ch
ildre
n <
6 y
rsor
GFR
< 3
0 m
l/min
/1.7
3m^2
Susp
ensi
on in
form
atio
n pr
ovid
ed
A B B C
PK, E
ffPK PK
PK (
ts)
6 yr
s1
mo
1 m
o18
yrs
16 y
rs16
yrs
16 y
rs45
yrs
AC
E2
2000
1999
AC
Ein
hibi
tor
Lab
elin
g ch
ange
s fo
r ag
e 1
mo
to 1
6 yr
s;In
form
atio
n on
dos
e, e
ffic
acy
and
susp
ensi
on p
repa
ratio
n pr
ovid
ed
A B C
Eff
icac
yPK
PK (
ts)
6 yr
s1
mo
18 y
rs
16 y
rs16
yrs
45 y
rs
CC
B2
2001
Cal
cium
chan
nel
bloc
ker
<A
dditi
onal
stu
dies
rec
omm
ende
d>A
Eff
icac
y6
yrs
12 y
rs
AC
E3
2002
AC
Ein
hibi
tor
New
dos
ing/
phar
mac
okin
etic
dat
a;N
ew d
osin
g fo
r ch
ildre
n >
50
kgA B
Eff
icac
yPK
6 yr
s1
mo
16 y
rs16
yrs
AR
B1
1999
2004
Ang
iote
nsin
II
rece
ptor
bloc
ker
Up
to 4
.5 m
g/kg
onc
e da
ily n
ot e
ffec
tive
in lo
wer
ing
bloo
d pr
essu
re in
pat
ient
s6–
16 y
rs
A B C C
Eff
icac
yPK
PK (
tt)PK
(tt)
6 yr
s1
yrs
18 y
rs18
yrs
17 y
rs16
yrs
55 y
rs55
yrs
AC
E4
2000
AC
Ein
hibi
tor
Lab
elin
g ch
ange
for
chi
ldre
n 6–
16 y
rs;
Not
rec
omm
ende
d fo
r pe
diat
ric
patie
nts
< 6
yrs
of
GFR
<30
ml/m
in/1
.73m
^2Su
spen
sion
info
rmat
ion
prov
ided
A B C
Eff
icac
yPK
PK (
ts)
6 yr
s1
mo
18 y
rs
16 y
rs16
yrs
45 y
rs
AR
B2
2001
Ang
iote
nsin
II
rece
ptor
bloc
ker
Lab
elin
g ch
ange
for
chi
ldre
n 6–
16 y
rs;
Not
rec
omm
ende
d fo
r pe
diat
ric
patie
nts
< 6
yrs
of
GFR
<30
ml/m
in/1
.73m
^2Su
spen
sion
info
rmat
ion
prov
ided
A B C
Eff
icac
yPK
PK (
ts)
6 yr
s1
mo
18 y
rs
16 y
rs16
yrs
45 y
rs
AC
E5
2001
2002
AC
Ein
hibi
tor
<A
dditi
onal
stu
dies
rec
omm
ende
d>A B
Eff
icac
yPK
5 yr
s1
mo
16 y
rs6
yrs
A: S
afet
y, e
ffic
acy
or to
lera
bilit
y st
udie
s, B
: Pha
rmac
okin
etic
stu
dies
, sin
gle
or m
ultip
le d
oses
, C: B
ioeq
uiva
lenc
e or
bio
avai
labi
lity
stud
ies.
PK, p
harm
acok
inet
ic; t
s, ta
blet
ver
sus
susp
ensi
on f
orm
ulat
ion;
tt, c
oate
d ve
rsus
sm
all t
able
t for
mul
atio
n.
Am Heart J. Author manuscript; available in PMC 2012 April 23.
NIH
-PA Author Manuscript
NIH
-PA Author Manuscript
NIH
-PA Author Manuscript
Baker-Smith et al. Page 11
Tabl
e II
Tri
al d
escr
iptio
ns
Dru
gP
roto
col
Dur
atio
n(m
os)
# Si
tes
Nor
thA
mer
ica
# V
isit
spe
r si
te#
Pts
enro
lled
# P
tsco
mpl
eted
CR
FU
niqu
eC
RF
Tab
les,
fig
ures
,lis
ting
s
CC
B1
A19
5146
634
426
813
1210
7
B16
66
574
7312
941
AC
E1
A50
3333
614
310
770
2110
5
B11
2020
461
5742
2086
B7
11
830
3033
1862
C5
11
1030
3049
3210
8
AC
E2
A14
1916
711
011
056
2850
B11
76
740
4050
3829
C6
11
716
1648
2120
CC
B2
A24
2727
613
312
847
1816
6
AC
E3
A30
7862
1137
625
372
2915
3
B28
65
643
4336
2025
AR
B1
A25
5332
1044
131
851
2511
1
B26
44
523
2225
1916
C7
11
1230
3050
2521
C6
11
1230
3050
2522
AC
E4
A20
2213
711
510
361
2952
B19
97
852
5263
4137
C7
11
1225
2470
3316
AR
B2
A20
5423
517
716
442
2655
B19
105
650
5054
3156
C6
11
1016
1663
3427
AC
E5
A28
2720
512
311
237
1815
4
B11
44
424
2418
169
Am Heart J. Author manuscript; available in PMC 2012 April 23.
NIH
-PA Author Manuscript
NIH
-PA Author Manuscript
NIH
-PA Author Manuscript
Baker-Smith et al. Page 12Pr
otoc
ol: A
= s
afet
y an
d ef
fica
cy s
tudy
, B =
sin
gle-
dose
or
mul
ti-do
se p
harm
acok
inet
ic s
tudy
, C =
bio
avai
labi
lity
or b
ioeq
uiva
lenc
e st
udy
Dur
atio
n, n
umbe
r of
mon
ths
from
sta
rt o
f st
udy
to e
nd o
f st
udy;
# S
ites,
num
ber
of c
linic
al s
ites;
Nor
th A
mer
ica,
num
ber
of N
orth
Am
eric
an s
ites;
CR
F, n
umbe
r of
cas
e re
port
for
ms
per
subj
ect;
Tab
les,
figu
res,
list
ings
, num
ber
of ta
bles
, fig
ures
, and
list
ings
incl
uded
in c
linic
al s
tudy
rep
ort.
Am Heart J. Author manuscript; available in PMC 2012 April 23.
NIH
-PA Author Manuscript
NIH
-PA Author Manuscript
NIH
-PA Author Manuscript
Baker-Smith et al. Page 13
Tabl
e III
Coo
rdin
atin
g ce
nter
, site
mon
itori
ng, a
nd c
entr
al la
bora
tory
fin
anci
al c
osts
Dru
gT
rial
Coo
rdin
atin
gC
oord
inat
ing
Spon
sor
Site
Site
Cen
tral
Tot
alT
otal
Ann
ual
Sale
s
Cen
ter
Cos
ts–
Low
Cen
ter
Cos
ts–
Hig
hM
anag
emen
tC
osts
Pay
men
ts–
Low
Pay
men
ts–
Hig
hL
abor
ator
yP
aym
ents
Cos
ts–
Low
Cos
ts–
Hig
hE
stim
ate
inT
hous
ands
CC
B1
A1,
335,
830
3,70
1,12
586
8,65
629
0,73
141
0,20
112
0,87
82,
616,
095
5,10
0,85
9$2
,572
,824
B25
0,62
858
3,35
728
8,68
661
,050
84,3
6018
,605
618,
969
975,
009
AC
E1
A1,
567,
634
3,93
1,30
198
9,48
230
6,87
635
5,02
656
,903
2,92
0,89
55,
332,
713
$414
,940
B52
5,92
61,
205,
477
391,
201
145,
665
164,
806
21,8
491,
084,
641
1,78
3,33
3
B17
0,37
236
3,87
015
7,72
672
,230
94,5
3318
,267
418,
596
634,
396
C18
6,28
739
2,33
318
4,94
785
,283
104,
100
34,1
6449
0,68
071
5,54
4
AC
E2
A61
6,55
71,
372,
005
436,
371
169,
941
223,
762
51,3
781,
274,
248
2,08
3,51
6$8
61,3
56
B28
4,22
262
5,18
127
5,69
814
6,99
519
7,76
818
,446
725,
360
1,11
7,09
2
C14
2,35
431
1,71
414
5,19
381
,319
86,3
9212
,364
381,
230
555,
663
CC
B2
A1,
102,
811
2,62
1,78
374
3,96
959
0,15
387
2,81
858
,517
2,49
5,45
04,
297,
087
$180
,380
AC
E3
A3,
455,
444
8,52
0,50
41,
759,
668
1,45
4,49
72,
294,
963
373,
190
7,04
2,79
912
,948
,325
$277
,485
B28
3,22
665
9,03
644
4,82
711
0,16
612
7,32
315
,045
853,
264
1,24
6,23
1
AR
B1
A1,
957,
254
4,52
1,22
91,
234,
825
2,95
1,27
94,
227,
413
324,
750
6,46
8,10
710
,308
,216
$686
,725
B23
7,25
456
2,95
638
8,65
552
,302
59,7
3129
,503
707,
713
1,04
0,84
4
C17
6,35
739
2,15
920
7,68
911
4,65
111
8,65
829
,663
528,
360
748,
168
C17
5,64
739
0,05
920
7,68
911
7,69
212
0,63
444
,027
545,
055
762,
409
AC
E4
A70
9,45
31,
648,
164
553,
956
188,
843
256,
731
45,6
571,
497,
910
2,50
4,50
8$6
64,6
69
B38
3,81
287
0,71
639
3,10
513
4,61
225
9,49
60
911,
530
1,52
3,31
7
C16
3,02
634
9,82
116
4,46
416
8,72
033
4,22
413
,949
510,
159
862,
457
AR
B2
A1,
191,
285
3,12
5,14
678
5,95
725
7,02
136
8,80
00
2,23
4,26
44,
279,
903
$1,3
24,4
44
B35
3,88
182
2,58
338
8,94
912
0,54
620
5,05
10
863,
376
1,41
6,58
2
C15
3,89
533
2,45
615
2,36
175
,149
84,9
335,
928
387,
333
575,
677
Am Heart J. Author manuscript; available in PMC 2012 April 23.
NIH
-PA Author Manuscript
NIH
-PA Author Manuscript
NIH
-PA Author Manuscript
Baker-Smith et al. Page 14
Dru
gT
rial
Coo
rdin
atin
gC
oord
inat
ing
Spon
sor
Site
Site
Cen
tral
Tot
alT
otal
Ann
ual
Sale
s
Cen
ter
Cos
ts–
Low
Cen
ter
Cos
ts–
Hig
hM
anag
emen
tC
osts
Pay
men
ts–
Low
Pay
men
ts–
Hig
hL
abor
ator
yP
aym
ents
Cos
ts–
Low
Cos
ts–
Hig
hE
stim
ate
inT
hous
ands
AC
E5
A99
9,09
82,
437,
998
760,
168
172,
432
246,
240
88,7
982,
020,
496
3,53
3,20
3$5
32,7
65
B17
0,90
839
2,42
224
3,95
460
,504
62,0
167,
673
483,
040
706,
065
Ann
ual s
ales
est
imat
es a
re in
(00
0$)
and
are
refl
ectiv
e of
tota
l ann
ual s
ales
dur
ing
the
last
yea
r pr
ior
to p
aten
t exp
irat
ion.
Am Heart J. Author manuscript; available in PMC 2012 April 23.
NIH
-PA Author Manuscript
NIH
-PA Author Manuscript
NIH
-PA Author Manuscript
Baker-Smith et al. Page 15
Table IV
Breakdown of study costs (efficacy studies only)
Contract research organization 70.5%
Site management 25.1
Project management 21.1
Travel 6.2
Data management 4.9
Manuscript preparation 4.9
Pre-study preparation 4.2
Randomization 2.4
Other 1.7
Sponsor 19.0%
Investigator site 10.9%
Central laboratory 1.7%
Sponsor costs are net pharmaceutical costs and represent the net costs of outsourcing clinical studies (external pharmaceutical costs) versusperforming clinical studies internally (internal pharmaceutical costs).
Am Heart J. Author manuscript; available in PMC 2012 April 23.