the development of a comorbidity index with physical function as the outcome
TRANSCRIPT
Journal of Clinical Epidemiology 58 (2005) 595–602
The development of a comorbidity index with physicalfunction as the outcome
Dianne L. Grolla,*, Teresa Tob, Claire Bombardierc, James G. Wrightd
aDepartment of Surgery, Queen’s University, Kingston, Ontario, Canada K7L 2V7bPublic Health Sciences, Health Policy Management University of Toronto, Toronto, Canada M5S 1A8
cInstitute for Work & Health, 481 University Ave, Toronto, Ontario, Canada M5G 2E9dDepartment of Surgery, Public Health Sciences, Health Policy Management and Evaluation, Hospital for Sick Children, University of Toronto
Accepted 14 October 2004
Abstract
Background and Objectives: Physical function is an important measure of success of many medical and surgical interventions. Abilityto adjust for comorbid disease is essential in health services research and epidemiologic studies. Current indices have primarily beendeveloped with mortality as the outcome, and are not sensitive enough when the outcome is physical function. The objective of this studywas to develop a self-administered Functional Comorbidity Index with physical function as the outcome.
Methods: The index was developed using two databases: a cross-sectional, simple random sample of 9,423 Canadian adults and asample of 28,349 US adults seeking treatment for spine ailments. The primary outcome measure was the SF-36 physical function (PF) subscale.
Results: The Functional Comorbidity Index, an 18-item list of diagnoses, showed stronger association with physical function (modelR2 � 0.29) compared with the Charlson (model R2 � 0.18), and Kaplan-Feinstein (model R2 � 0.07) indices. The Functional ComorbidityIndex correctly classified patients into high and low function, in 77% of cases.
Conclusion: This new index contains diagnoses such as arthritis not found on indices used to predict mortality, and the FCI explainedmore variance in PF scores compared to indices designed to predict mortality. � 2005 Elsevier Inc. All rights reserved.
Keywords: Comorbidity; Index; Measurement; Physical function
1. Introduction
Physical function, health status, and perceived quality oflife are important indicators, from the patient’s perspective,of the success of medical and surgical interventions. As aresult, condition-specific and generic measures of health areused ubiquitously to evaluate medical and surgical interven-tions [1]. However, in many types of research it is essential toadjust forother diseases, calledcomorbid diseases, in additionto the disease of concern, which may be related to the out-come(s) of interest. This is of particular importance in re-search conducted in older populations where many chronicillnesses may be present in the same patient [2–14]. Withoutthis adjustment outcomes cannot be attributed to investiga-tive interventions as the patients themselves may differ sub-stantially in prognostic expectations due to their initialcomorbid illnesses [2].
* Corresponding author. Tel.: 613-549-6666 ext. 3310; fax: 613-544-4238.
E-mail address: [email protected] (D.L. Groll).
0895-4356/05/$ – see front matter � 2005 Elsevier Inc. All rights reserved.doi: 10.1016/j.jclinepi.2004.10.018
Prior comorbidity indices have been developed primarilyto predict mortality or administrative outcomes such as lengthof stay in acute care or disease-specific populations [2,15–38]. These indices typically include diagnoses, often asymp-tomatic, such as hypertension, that are important in pre-dicting mortality, and exclude diagnoses, such as arthritis,that impact physical function but are unlikely to result inshort-term mortality. Research using indices designed topredict mortality have concluded that comorbid illnesseshave little relationship with physical disability [39,40], afinding that seems intuitively false but underscores the needto consider the purpose for which an index was designed.
The purpose of this study was to develop a self-administered,general population index of comorbid diseases with physicalfunction as the outcome of interest. The underlying premisewas that diagnoses associated with physical function wouldbe, at least in part, different from those associated with mortal-ity, and therefore, an index designed with physical functionas the outcome would perform better than indices designedwith mortality as the outcome of interest.
D.L. Groll et al. / Journal of Clinical Epidemiology 58 (2005) 595–602596
2. Methods
The Functional Comorbidity Index was developed intwo stages.
2.1. Stage I: identifying potential factors associatedwith physical function
The strategy for item generation, using a published proto-col [41], was to compile an extensive pool of items through acomprehensive literature review and focus groups of patientsand clinicians.
2.2. Literature review
We updated a previous systematic review, published in1999 by Stuck et al. [42], which identified risk factors forfunctional status decline in community-living elderly pa-tients in journal articles published from 1985–1997 (thecomplete list of articles reviewed is available upon request).Our strategy, similar to that of Stuck, searched MEDLINE,EMBASE (Excerpta Medica), PSYCINFO (Psychologicalabstracts), and SOCA (Sociological abstracts). Keyword,title, and abstract were searched using the terms “aged,”“disabled,” “impaired,” “limited,” or “decline,” in combina-tion with “function,” and “study” or “trial.” Additionalsearch terms included risk, lifestyle, quality of life, healthstatus, geriatric assessment, and activities of daily living.Our updated search from 1998–2001 resulted in 35 studiesin addition to the 78 identified by Stuck.
An attempt was made to identify any existing indicesdeveloped with physical function as the development out-come. Twenty-five [2,15–38] comorbidity indices were identi-fied through MEDLINE using the search terms “comorbidity,”“measurement,” “index,” in combination with “physical func-tion,” and “development.” The search did not place limits ondate of publication, but only articles published in Frenchand English were reviewed. Severity of illness indices wereexcluded. Reference lists of the identified articles were exam-ined, as were “related articles” identified by the MEDLINEsearch engine. All indices identified were developed withmortality or administrative outcomes (such as length of stay)as their primary endpoint. One index was found that wasdeveloped exclusively for stroke inpatients, with length ofstay and disability as end points [33].
2.3. Focus groups
Six focus groups were conducted. Each focus group waslimited to a maximum of 10 and a minimum of 6 partici-pants [43]. Three focus groups consisted of members ofthe public who had to have at least one chronic illness,diagnosed by a physician. Participants needed to be adults(over age 18), and were excluded if they were unable tocomplete a 2-hr focus group, or unable to speak and under-stand English. In total, 8 male and 16 female members ofthe public participated.
The remaining three focus groups consisted of health careprofessionals (nurses, physicians, and rehabilitation thera-pists), and where possible, with at least one representativefrom the following fields: neurology, cardiology, ortho-paedics, rheumatology, gerontology, physical medicine, psy-chiatry, respiratory medicine, family practice, or generalinternal medicine. All nurses (n � 10) and rehabilitationtherapists (n � 8) were female; five physicians were male,and four were female. Participants were asked to identifyactivities of daily living that they (or their patients) havedifficulty performing due to health problems. These were dis-cussed and participants ranked them according to what theyconsidered to be most important.
2.4. Stage II: development of index
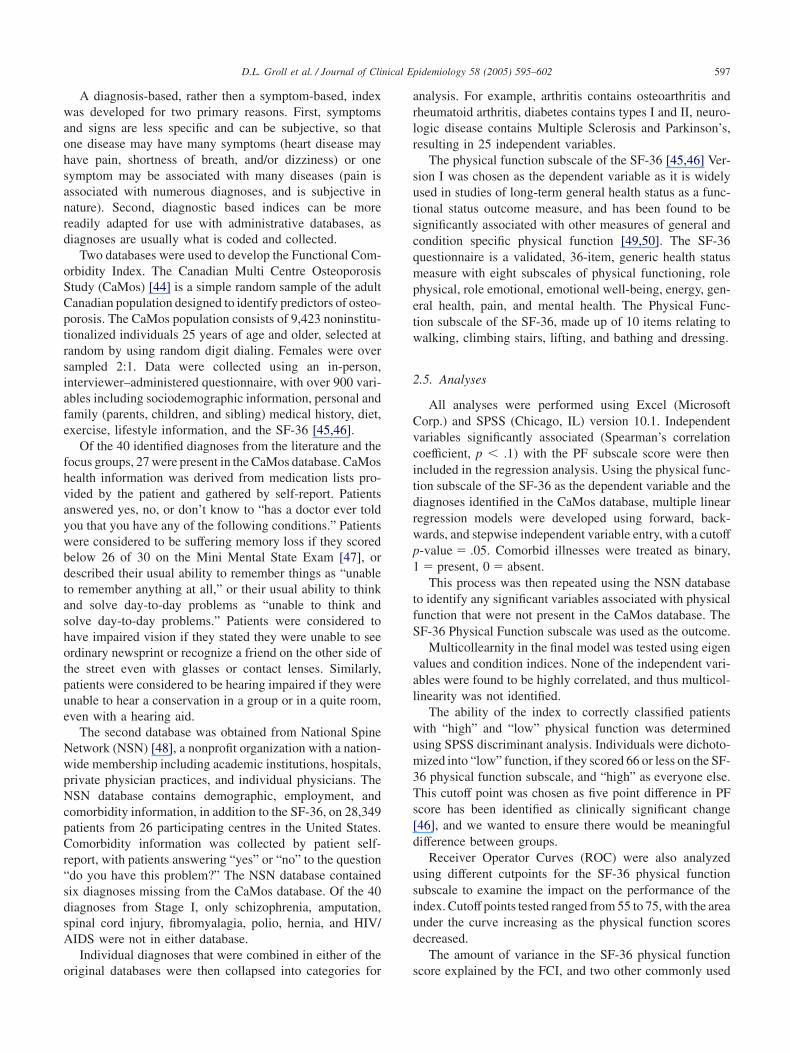
The items generated through the focus groups and litera-ture review were grouped according to clinical and diagnos-tic similarity. For example, “Chronic Obstructive PulmonaryDisease (COPD)” was grouped with other respiratory vari-ables such as “asthma” and “emphysema.” Nonspecific items(signs and symptoms) such as “shortness of breath” wereexcluded. After combining results from the focus groupsand the literature review, 40 diagnoses remained (Table 1).
Table 1Frequency of comorbid illnesses in the CaMos and NSN populations
CaMos (N � 9,423) NSN (N � 28,348)
Comorbidities n % n %
Arthritis 3,097 32.9 6,488 22.9Hypertension 2,668 28.4 5,469 19.3Hearing impairment 1,024 10.9Upper gastrointestional disease 939 10.0 3,421 12.1COPD 768 8.2 1,685 5.9Osteoporosis 723 7.8 1,594 5.6Angina 685 7.3Anemia 872 3.1Depression 668 7.1 5,232 18.5Diabetes 640 6.8 1,879 6.6MI 587 6.2Asthma 541 5.7 102c 4.3Bowel disease 539 5.7 1,606 5.7Dementia 528 5.6Peripheral vascular disease 528 5.6 875 3.1Visual impairment 511 5.4 55c 3.2Cancer 494 5.2 1,008 3.6Anxiety 492 5.2 43c 1.8Stroke/TIA 359 3.8Neurologic disease 254 2.7 645 2.3Liver disease 235 2.5 345 1.2Congestive heart failure (CHF) 213 2.3 3,185 11.2a
Kidney disease 140 1.5 398 1.4Migraine 43 0.5 5,597 19.7b
Back pain 19,466 68.7
Abbreviations: COPD, chronic obstructive pulmonary disease; MI, myo-cardial infarct; TIA, transient ischemic attack.
a Includes all heart disease, not only CHF.b Coded as “frequent headaches” not migraine.c From a subsample on which additional comorbidity data was col-
lected, n � 2,348.
D.L. Groll et al. / Journal of Clinical Epidemiology 58 (2005) 595–602 597
A diagnosis-based, rather then a symptom-based, indexwas developed for two primary reasons. First, symptomsand signs are less specific and can be subjective, so thatone disease may have many symptoms (heart disease mayhave pain, shortness of breath, and/or dizziness) or onesymptom may be associated with many diseases (pain isassociated with numerous diagnoses, and is subjective innature). Second, diagnostic based indices can be morereadily adapted for use with administrative databases, asdiagnoses are usually what is coded and collected.
Two databases were used to develop the Functional Com-orbidity Index. The Canadian Multi Centre OsteoporosisStudy (CaMos) [44] is a simple random sample of the adultCanadian population designed to identify predictors of osteo-porosis. The CaMos population consists of 9,423 noninstitu-tionalized individuals 25 years of age and older, selected atrandom by using random digit dialing. Females were oversampled 2:1. Data were collected using an in-person,interviewer–administered questionnaire, with over 900 vari-ables including sociodemographic information, personal andfamily (parents, children, and sibling) medical history, diet,exercise, lifestyle information, and the SF-36 [45,46].
Of the 40 identified diagnoses from the literature and thefocus groups, 27 were present in the CaMos database. CaMoshealth information was derived from medication lists pro-vided by the patient and gathered by self-report. Patientsanswered yes, no, or don’t know to “has a doctor ever toldyou that you have any of the following conditions.” Patientswere considered to be suffering memory loss if they scoredbelow 26 of 30 on the Mini Mental State Exam [47], ordescribed their usual ability to remember things as “unableto remember anything at all,” or their usual ability to thinkand solve day-to-day problems as “unable to think andsolve day-to-day problems.” Patients were considered tohave impaired vision if they stated they were unable to seeordinary newsprint or recognize a friend on the other side ofthe street even with glasses or contact lenses. Similarly,patients were considered to be hearing impaired if they wereunable to hear a conservation in a group or in a quite room,even with a hearing aid.
The second database was obtained from National SpineNetwork (NSN) [48], a nonprofit organization with a nation-wide membership including academic institutions, hospitals,private physician practices, and individual physicians. TheNSN database contains demographic, employment, andcomorbidity information, in addition to the SF-36, on 28,349patients from 26 participating centres in the United States.Comorbidity information was collected by patient self-report, with patients answering “yes” or “no” to the question“do you have this problem?” The NSN database containedsix diagnoses missing from the CaMos database. Of the 40diagnoses from Stage I, only schizophrenia, amputation,spinal cord injury, fibromyalagia, polio, hernia, and HIV/AIDS were not in either database.
Individual diagnoses that were combined in either of theoriginal databases were then collapsed into categories for
analysis. For example, arthritis contains osteoarthritis andrheumatoid arthritis, diabetes contains types I and II, neuro-logic disease contains Multiple Sclerosis and Parkinson’s,resulting in 25 independent variables.
The physical function subscale of the SF-36 [45,46] Ver-sion I was chosen as the dependent variable as it is widelyused in studies of long-term general health status as a func-tional status outcome measure, and has been found to besignificantly associated with other measures of general andcondition specific physical function [49,50]. The SF-36questionnaire is a validated, 36-item, generic health statusmeasure with eight subscales of physical functioning, rolephysical, role emotional, emotional well-being, energy, gen-eral health, pain, and mental health. The Physical Func-tion subscale of the SF-36, made up of 10 items relating towalking, climbing stairs, lifting, and bathing and dressing.
2.5. Analyses
All analyses were performed using Excel (MicrosoftCorp.) and SPSS (Chicago, IL) version 10.1. Independentvariables significantly associated (Spearman’s correlationcoefficient, p � .1) with the PF subscale score were thenincluded in the regression analysis. Using the physical func-tion subscale of the SF-36 as the dependent variable and thediagnoses identified in the CaMos database, multiple linearregression models were developed using forward, back-wards, and stepwise independent variable entry, with a cutoffp-value � .05. Comorbid illnesses were treated as binary,1 � present, 0 � absent.
This process was then repeated using the NSN databaseto identify any significant variables associated with physicalfunction that were not present in the CaMos database. TheSF-36 Physical Function subscale was used as the outcome.
Multicollearnity in the final model was tested using eigenvalues and condition indices. None of the independent vari-ables were found to be highly correlated, and thus multicol-linearity was not identified.
The ability of the index to correctly classified patientswith “high” and “low” physical function was determinedusing SPSS discriminant analysis. Individuals were dichoto-mized into “low” function, if they scored 66 or less on the SF-36 physical function subscale, and “high” as everyone else.This cutoff point was chosen as five point difference in PFscore has been identified as clinically significant change[46], and we wanted to ensure there would be meaningfuldifference between groups.
Receiver Operator Curves (ROC) were also analyzedusing different cutpoints for the SF-36 physical functionsubscale to examine the impact on the performance of theindex. Cutoff points tested ranged from 55 to 75, with the areaunder the curve increasing as the physical function scoresdecreased.
The amount of variance in the SF-36 physical functionscore explained by the FCI, and two other commonly used
D.L. Groll et al. / Journal of Clinical Epidemiology 58 (2005) 595–602598
indexes; the Kaplan-Feinstein [2] Index (KFI), and the Charl-son [17] index (CI), was compared using the CaMos data-base. The KFI had been developed to predict 5-year mortalityin a cohort of male diabetic patients and contains 12 catego-ries of conditions. Within each category a severity rating of0–3 is assigned based on severity of symptoms. The CI wasdeveloped in a cohort of 559 internal medicine patients topredict 1-year mortality. The CI contains a list of 19 condi-tions each of which is given a weighting of 1 to 6. Weightsare based on the adjusted relative risks from the Cox propor-tional hazard regression model used in the development ofthe index.
Scores were calculated using the methods identified intheir original papers (Charlson [17] and Kaplan-Feinstein[2]). As the data collected in CaMos does not include severityit was assumed that patients were on the mild end of thedisease spectrum whenever a choice was required (as inmild vs. moderate or severe liver disease, and diabetes vs.diabetes with end-organ damage). Similarly the scoring ofthe Kaplan-Feinsten index suffers from the inability to rateseverity based on the information in the databases, so where adisease was present, in the absence of other information, itwas given a “cogent severity” of 1. Uncertainty about sever-ity is common to all secondary or administrative databases.
In all analyses, Body Mass Index (BMI), was used as ameasure of obesity and was calculated by taking weight inkg divided by height2 in meters (w/h2). BMI score wasthen dichotomized with a score of �30 as obese and �30as nonobese.
2.6. Ethics
This protocol received ethical approval from the Queen’sUniversity Health Sciences and Affiliated Teaching Hospi-tals Research Ethics Board and the University of TorontoResearch Ethics Board.
3. Results
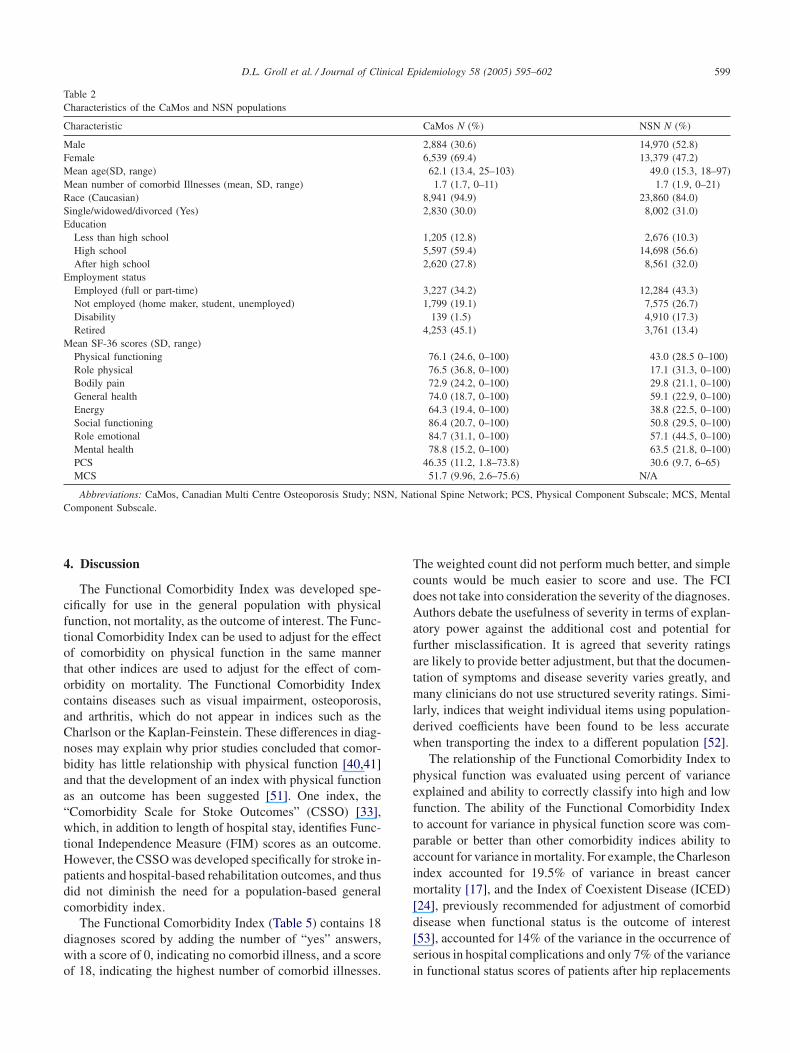
Forty unique diagnoses were identified in both literaturereview and focus groups (Table 1). Table 2 shows the demo-graphic characteristics of participants in the CaMos and NSNpatients. The average age of CaMos participants was 62years (range 25 to 103 years), while the average age of NSNpatients was 49 years (range18 to 97 years). Six thousandseven hundred thirty-four (71.5%) of the CaMos patientsand 19,362 (68.3%) of the NSN patients had at least onecomorbid illness and the mean number of diagnoses was1.7 (SD 1.7) and 1.7 (SD 1.9), respectively.
3.1. Index development
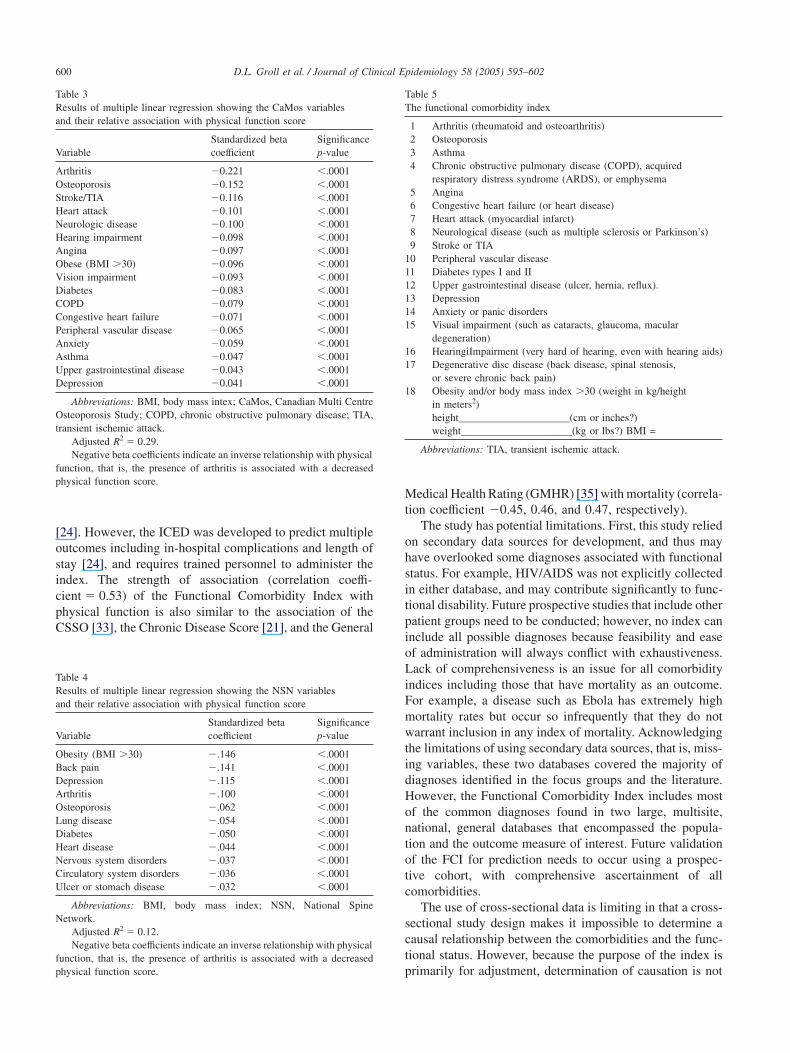
Multiple linear regression identified seventeen variablesfrom the CaMos database that were significantly (p � .001)associated with the SF-36 physical function score (adjusted
R2 � 0.28); arthritis, osteoporosis, asthma, chronic obstruc-tive pulmonary disease (COPD), angina, congestive heartfailure (CHF), prior heart attack (MI), neurologic disease(multiple sclerosis, Parkinson’s disease), prior stroke or tran-sient ischemic attack (TIA), peripheral vascular disease(PVD), diabetes, upper gastrointestinal disease (includingulcers and gastroesophageal reflux), depressed mood, anxi-ety, visual impairment, hearing impairment, and obesity (seeTable 3).
Diagnoses available in the NSN that were found to besignificantly correlated with physical function (Spearman’sp � .1) were entered into multiple linear regression (Table4). The adjusted R2 for the NSN model was 0.12. Back pain,the only variable of those entered that was collected in theNSN but not in the CaMos database, was found to be signifi-cantly associated with physical function (p � .001), and wasincluded in the final Functional Comorbidity Index (Table 5).
Although not considered comorbidities, both age andgender were also evaluated in the regression analysis. Ageincreased the adjusted R2 from 0.28 to 0.33; adding age andgender increased it to 0.34.
3.2. Scoring
The Functional Comorbidity Index was scored as both asimple count (yes/no) and a weighted count of the diagnoses.“Weights” were derived from the standardized beta coeffi-cients from the regression analysis (see Table 4). The stan-dardized beta coefficients show the relative importance ofeach variable in the model, for example, instead of assigninga “1” for each occurrence of disease, arthritis was assigned0.221 and COPD was assigned 0.071, thereby giving arthritismore “weight.”
The comorbidity scores for each patient, derived by asimple count and then derived from a weighted count, wereentered into separate multiple linear regression analysis withphysical function as the outcome variable. Using the simplecount and the weighted count of patient comorbidities pro-vided similar results in terms of variance explained (simplecount model R2 � 0.28 vs. weighted count model R2 �
0.30), and thus, for ease of use we chose and report thesimple count of the number of comorbidities.
The Functional Comorbidity Index scores were correlatedwith both the SF-36 physical function and role physicalsubscale scores (�.53, p � .0001, and �.31, p � .0001),respectively. When the SF-36 physical function subscalescore was dichotomized into “high” and “low,” the Func-tional Comorbidity Index simple count correctly classified76.6% of people, whereas using a weighted count, the Func-tional Comorbidity Index correctly classified 77.0%.
Compared with the Charlson [17] and Kaplan-Feinstein[2] indices The Functional Comorbidity Index accountedfor more variation in the physical function subscale scores(R2 � 0.29, 0.18, and 0.07%, respectively).
D.L. Groll et al. / Journal of Clinical Epidemiology 58 (2005) 595–602 599
Table 2Characteristics of the CaMos and NSN populations
Characteristic CaMos N (%) NSN N (%)
Male 2,884 (30.6) 14,970 (52.8)Female 6,539 (69.4) 13,379 (47.2)Mean age(SD, range) 62.1 (13.4, 25–103) 49.0 (15.3, 18–97)Mean number of comorbid Illnesses (mean, SD, range) 1.7 (1.7, 0–11) 1.7 (1.9, 0–21)Race (Caucasian) 8,941 (94.9) 23,860 (84.0)Single/widowed/divorced (Yes) 2,830 (30.0) 8,002 (31.0)Education
Less than high school 1,205 (12.8) 2,676 (10.3)High school 5,597 (59.4) 14,698 (56.6)After high school 2,620 (27.8) 8,561 (32.0)
Employment statusEmployed (full or part-time) 3,227 (34.2) 12,284 (43.3)Not employed (home maker, student, unemployed) 1,799 (19.1) 7,575 (26.7)Disability 139 (1.5) 4,910 (17.3)Retired 4,253 (45.1) 3,761 (13.4)
Mean SF-36 scores (SD, range)Physical functioning 76.1 (24.6, 0–100) 43.0 (28.5 0–100)Role physical 76.5 (36.8, 0–100) 17.1 (31.3, 0–100)Bodily pain 72.9 (24.2, 0–100) 29.8 (21.1, 0–100)General health 74.0 (18.7, 0–100) 59.1 (22.9, 0–100)Energy 64.3 (19.4, 0–100) 38.8 (22.5, 0–100)Social functioning 86.4 (20.7, 0–100) 50.8 (29.5, 0–100)Role emotional 84.7 (31.1, 0–100) 57.1 (44.5, 0–100)Mental health 78.8 (15.2, 0–100) 63.5 (21.8, 0–100)PCS 46.35 (11.2, 1.8–73.8) 30.6 (9.7, 6–65)MCS 51.7 (9.96, 2.6–75.6) N/A
Abbreviations: CaMos, Canadian Multi Centre Osteoporosis Study; NSN, National Spine Network; PCS, Physical Component Subscale; MCS, MentalComponent Subscale.
4. Discussion
The Functional Comorbidity Index was developed spe-cifically for use in the general population with physicalfunction, not mortality, as the outcome of interest. The Func-tional Comorbidity Index can be used to adjust for the effectof comorbidity on physical function in the same mannerthat other indices are used to adjust for the effect of com-orbidity on mortality. The Functional Comorbidity Indexcontains diseases such as visual impairment, osteoporosis,and arthritis, which do not appear in indices such as theCharlson or the Kaplan-Feinstein. These differences in diag-noses may explain why prior studies concluded that comor-bidity has little relationship with physical function [40,41]and that the development of an index with physical functionas an outcome has been suggested [51]. One index, the“Comorbidity Scale for Stoke Outcomes” (CSSO) [33],which, in addition to length of hospital stay, identifies Func-tional Independence Measure (FIM) scores as an outcome.However, the CSSO was developed specifically for stroke in-patients and hospital-based rehabilitation outcomes, and thusdid not diminish the need for a population-based generalcomorbidity index.
The Functional Comorbidity Index (Table 5) contains 18diagnoses scored by adding the number of “yes” answers,with a score of 0, indicating no comorbid illness, and a scoreof 18, indicating the highest number of comorbid illnesses.
The weighted count did not perform much better, and simplecounts would be much easier to score and use. The FCIdoes not take into consideration the severity of the diagnoses.Authors debate the usefulness of severity in terms of explan-atory power against the additional cost and potential forfurther misclassification. It is agreed that severity ratingsare likely to provide better adjustment, but that the documen-tation of symptoms and disease severity varies greatly, andmany clinicians do not use structured severity ratings. Simi-larly, indices that weight individual items using population-derived coefficients have been found to be less accuratewhen transporting the index to a different population [52].
The relationship of the Functional Comorbidity Index tophysical function was evaluated using percent of varianceexplained and ability to correctly classify into high and lowfunction. The ability of the Functional Comorbidity Indexto account for variance in physical function score was com-parable or better than other comorbidity indices ability toaccount for variance in mortality. For example, the Charlesonindex accounted for 19.5% of variance in breast cancermortality [17], and the Index of Coexistent Disease (ICED)[24], previously recommended for adjustment of comorbiddisease when functional status is the outcome of interest[53], accounted for 14% of the variance in the occurrence ofserious in hospital complications and only 7% of the variancein functional status scores of patients after hip replacements
D.L. Groll et al. / Journal of Clinical Epidemiology 58 (2005) 595–602600
Table 3Results of multiple linear regression showing the CaMos variablesand their relative association with physical function score
Standardized beta SignificanceVariable coefficient p-value
Arthritis �0.221 �.0001Osteoporosis �0.152 �.0001Stroke/TIA �0.116 �.0001Heart attack �0.101 �.0001Neurologic disease �0.100 �.0001Hearing impairment �0.098 �.0001Angina �0.097 �.0001Obese (BMI �30) �0.096 �.0001Vision impairment �0.093 �.0001Diabetes �0.083 �.0001COPD �0.079 �.0001Congestive heart failure �0.071 �.0001Peripheral vascular disease �0.065 �.0001Anxiety �0.059 �.0001Asthma �0.047 �.0001Upper gastrointestinal disease �0.043 �.0001Depression �0.041 �.0001
Abbreviations: BMI, body mass intex; CaMos, Canadian Multi CentreOsteoporosis Study; COPD, chronic obstructive pulmonary disease; TIA,transient ischemic attack.
Adjusted R2 � 0.29.Negative beta coefficients indicate an inverse relationship with physical
function, that is, the presence of arthritis is associated with a decreasedphysical function score.
[24]. However, the ICED was developed to predict multipleoutcomes including in-hospital complications and length ofstay [24], and requires trained personnel to administer theindex. The strength of association (correlation coeffi-cient � 0.53) of the Functional Comorbidity Index withphysical function is also similar to the association of theCSSO [33], the Chronic Disease Score [21], and the General
Table 4Results of multiple linear regression showing the NSN variablesand their relative association with physical function score
Standardized beta SignificanceVariable coefficient p-value
Obesity (BMI �30) �.146 �.0001Back pain �.141 �.0001Depression �.115 �.0001Arthritis �.100 �.0001Osteoporosis �.062 �.0001Lung disease �.054 �.0001Diabetes �.050 �.0001Heart disease �.044 �.0001Nervous system disorders �.037 �.0001Circulatory system disorders �.036 �.0001Ulcer or stomach disease �.032 �.0001
Abbreviations: BMI, body mass index; NSN, National SpineNetwork.
Adjusted R2 � 0.12.Negative beta coefficients indicate an inverse relationship with physical
function, that is, the presence of arthritis is associated with a decreasedphysical function score.
Table 5The functional comorbidity index
1 Arthritis (rheumatoid and osteoarthritis)2 Osteoporosis3 Asthma4 Chronic obstructive pulmonary disease (COPD), acquired
respiratory distress syndrome (ARDS), or emphysema5 Angina6 Congestive heart failure (or heart disease)7 Heart attack (myocardial infarct)8 Neurological disease (such as multiple sclerosis or Parkinson’s)9 Stroke or TIA
10 Peripheral vascular disease11 Diabetes types I and II12 Upper gastrointestinal disease (ulcer, hernia, reflux).13 Depression14 Anxiety or panic disorders15 Visual impairment (such as cataracts, glaucoma, macular
degeneration)16 HearingiImpairment (very hard of hearing, even with hearing aids)17 Degenerative disc disease (back disease, spinal stenosis,
or severe chronic back pain)18 Obesity and/or body mass index �30 (weight in kg/height
in meters2)height_____________________(cm or inches?)weight_____________________(kg or lbs?) BMI =
Abbreviations: TIA, transient ischemic attack.
Medical Health Rating (GMHR) [35] with mortality (correla-tion coefficient �0.45, 0.46, and 0.47, respectively).
The study has potential limitations. First, this study reliedon secondary data sources for development, and thus mayhave overlooked some diagnoses associated with functionalstatus. For example, HIV/AIDS was not explicitly collectedin either database, and may contribute significantly to func-tional disability. Future prospective studies that include otherpatient groups need to be conducted; however, no index caninclude all possible diagnoses because feasibility and easeof administration will always conflict with exhaustiveness.Lack of comprehensiveness is an issue for all comorbidityindices including those that have mortality as an outcome.For example, a disease such as Ebola has extremely highmortality rates but occur so infrequently that they do notwarrant inclusion in any index of mortality. Acknowledgingthe limitations of using secondary data sources, that is, miss-ing variables, these two databases covered the majority ofdiagnoses identified in the focus groups and the literature.However, the Functional Comorbidity Index includes mostof the common diagnoses found in two large, multisite,national, general databases that encompassed the popula-tion and the outcome measure of interest. Future validationof the FCI for prediction needs to occur using a prospec-tive cohort, with comprehensive ascertainment of allcomorbidities.
The use of cross-sectional data is limiting in that a cross-sectional study design makes it impossible to determine acausal relationship between the comorbidities and the func-tional status. However, because the purpose of the index isprimarily for adjustment, determination of causation is not
D.L. Groll et al. / Journal of Clinical Epidemiology 58 (2005) 595–602 601
essential. A longitudinal study of the comorbidity index isneeded to validate the Functional Comorbidity Index anddetermine if the Functional Comorbidity Index will predictfuture function.
The third potential limitation was the use of the SF-36as the measure of physical function. The SF-36 was chosendue to its widespread use in current health services research.Furthermore, studies [1,15] have shown that the SF-36 physi-cal function subscale is highly correlated with other mea-sures of physical function and other quality of life measures,suggesting that other measures of physical function wouldhave obtained similar results. However, future prospectivestudies using other means of measuring physical functionare required.
In summary, the Functional Comorbidity Index, the onlyknown index designed with physical function, is the explicitoutcome of interest. The Functional Comorbidity Index con-tains diagnoses such as arthritis and asthma, not commonlyfound in existing comorbidity indices and accounts for moreof the variance in physical function scores than indicesdeveloped with mortality as an end point. It demonstratessimilar strength of association with physical function as otherindices do with mortality, and is easy to administer andscore. The FCI is currently undergoing further validationand should be a useful tool for both health professionalsand researchers.
Acknowledgments
The authors would like to thank the Canadian MulticentreOsteoporosis Study (CaMos) Research Group and the Na-tional Spine Network for allowing the use of their databases.
This project was supported by the Canadian ArthritisNetwork and the Canadian Institutes for Health Research.
References
[1] Bombardier C, Melfi CA, Paul J, Green R, Hawker G, Wright J,Coyte P. Comparison of a generic and a disease-specific measure ofpain and physical function after knee replacement surgery. Med Care1995;33:131–44.
[2] Kaplan MH, Feinstein AR. The importance of classifying initial com-orbidity in evaluating the outcome of diabetes mellitus. J ChronicDis 1974;27:387–404.
[3] Kishimoto M, Ojima T, Nakamura Y, et al. Relationship between thelevel of activities of daily living and chronic medical conditionsamong the elderly. J Epidemiol 1998;8(5):272–7.
[4] Markides KS, Stroup-Benham CA, Goodwin JS, Perkowski LC,Lichtenstein M, Ray LA. The effect of medical conditions on thefunctional limitations of Mexican-American elderly. Ann Epidemiol1996;6(5):386–91.
[5] Chapleski EE, Lichtenberg PA, Dwyer JW, Youngblade LM, Tsai PF.Morbidity and cormorbidity among Great Lakes American Indians:predictors of functional ability. Gerontologist 1997;37(5):588–97.
[6] Fuchs Z, Blumstein T, Novikov I, et al. Morbidity, comorbidity, andtheir association with disability among the community-dwellingoldest-old in Israel. J Gerontol A Biol Sci Med Sci 1998;53(6):M447–55.
[7] Avlund K, Davidsen M, Schultz-Larsen K. Changes in functionalability from ages 70 to 75. A Danish Longitudinal Study. J AgingHealth 1995;7:254–82.
[8] Lammi UK, Kivela SL, Nissinen A, Punsar S, Puska P, Karvonen M.Predictors of disability in elderly Finnish men—a longitudinalstudy. J Clin Epidemiol 1989;42:1215–25.
[9] Hebert R, Brayne C, Spiegelhalter D. Incidence of functional declineand improvement in a community-dwelling, very elderly population.Am J Epidemiol 1997;145:935–44.
[10] Verbrugge LM, Patrick DL. Seven chronic conditions: their impacton US adults’ activity levels and their use of medical services. AmJ Public Health 1995;85:173–82.
[11] Verbrugge LM, Gates DM, Ike RW. Risk factors for disability amongU.S. adults with arthritis. J CLin Epidemiol 1991;44:167–82.
[12] Berkman LF, Seeman TE, Albert M, Blazer D, Kahn R, Mohs R,et al. High, usual and impaired functioning in community-dwellingolder men and women: findings from the Macarther FoundationResearch Network on successful aging. J Clin Epidemiol 1993;10:1129–40.
[13] Freid LP, Ettinger WH, Lind B, Newman AB, Gardin L. Physicaldisability in older adults: a physiological approach. J Clin Epidemiol1994;47:747–60.
[14] Roos NP, Havens B. Predictors of successful aging: a twelve-yearstudy of Manitoba elderly. Am J Public Health 1991;81:63–9.
[15] Linn BS, Linn MW, Gurel L. Cumulative illness rating scale. J AmGeriatr Soc 1968;16:622–6.
[16] Wright LF. Survival in patients with end-stage renal disease. Am JKidney Dis 1991;17(1):25–8.
[17] Charlson ME, Pompei P, Ales K, MacKenzie CR. A new method ofclassifying prognostic comorbidity in longitudinal studies: develop-ment and validation. J Chronic Dis 1987;40(5):373–83.
[18] Piccirillo JF, Lacy PD, Basu A, Spitznagel EL. Development of anew head and neck cancer specific comorbidity index. Arch Otolaryn-gol Head Neck Surg 2002;128(10):1172–9.
[19] Piccirillo JF. Importance of comorbidity in head and neck cancer.Laryngoscope 2000;110:593–602.
[20] Deyo RA, Cherkin DC, Cio MA. Adapting a clinical comorbidity indexfor use with ICD-9-CM administrative databases. J Clin Epidemiol1992;45:613–9.
[21] Von Korff M, Wagner EH, Saunders K. A chronic disease score fromautomated pharmacy data. J Clin Epidemiol 1992;45(2):197–203.
[22] Rozzini R, Frisoni GB, Ferrucci L, Barbisoni P, Sabatini T, Ranieri P,Guralnik JM, Trabucci M. Geriatric index of comorbidity: valida-tion and comparison with other measures of comorbidity. Age Ageing2002;31(4):277–85.
[23] Romano PS, Roos LL, Jollis JG. Adapting a clinical comorbidity indexfor use with ICD-9-CM administrative data: differing perspectives.J Clin Epidemiol 1993;46:1075–9.
[24] Greenfield S, Apolone G, McNeil BJ, Cleary PD. The importance ofco-existent disease in the occurrence of post-operative complicationsand one-year recovery in patients undergoing total hip replacement.Med Care 1993;31(2):141–54.
[25] Walter LC, Brand RJ, Counsel SR, Palmer RM, Landefeld CS,Fortinsky RH, Covinsky KE. Development and validation of a prog-nostic index for 1-year mortality in older adults after hospitalization.JAMA 2001;285(23):2987–94.
[26] Satariano WA, Ragland DR. The effect of comorbidity on 3-yearsurvival of women with primary breast cancer. Ann Intern Med 1994;120:104.
[27] Desai MM, Bogardus ST, Williams CS, Vitagliano G, Inouye SK.Development and validation of a risk-adjustment index for olderpatients: the high-risk diagnoses for the elderly scale. J Am Geriatr Soc2002;50:478–81.
[28] Normand SL, Morris CN, Fung KS, McNeil BJ, Epstein AM. Develop-ment and validation of a claims based index for adjusting for riskof mortality: the case of acute myocardial infarction. J Clin Epidemiol1995;48(2):229–43.
D.L. Groll et al. / Journal of Clinical Epidemiology 58 (2005) 595–602602
[29] Brailer DJ, Kroch E, Pauly MV, Huang J. Comorbidity-adjusted com-plication risk: a new outcome quality measure. Med Care 1996;34(5):490–505.
[30] Incalzi RA, Capparella O, Gemma A, Landi F, Bruno E, Di Meo F,Carbonin P. The interaction between age and comorbidity contributesto predicting the mortality of geriatric patients in the acute-care hospi-tal. J Intern Med 1997;242(4):291–8.
[31] Polanczyk CA, Rohde LE, Philbin EA, Di Salvo TG. A new casemixadjustment index for hospital mortality among patients with conges-tive heart failure. Med Care 1998;36(10):1489–99.
[32] Elixhauser A, Steiner C, Harris DR, Coffey RM. Comorbidity mea-sures for use with administrative data. Med Care 1998;36:8–27.
[33] Liu M, Tsuji T, Tsujiuchi K, Chino N. Comorbidities in stroke patientsas assessed with a newly developed comorbidity scale. Am J Phys MedRehabil 1999;78(5):416–24.
[34] Fan VS, Au D, Heagerty P, Deyo RA, McDonell MB, Fihn SD.Validation of case-mix measured derived from self-reports of diagno-ses and health. J Clin Epidemiol 2002;55:371–80.
[35] Lyketsos CG, Galik E, Steele C, Steinberg M, Rosenblatt A, Warren A,Sheppard JM, Baker A, Brandt J. The General Medical Health Rating:a bedside global rating of medical comorbidity in patients with demen-tia. J Am Geriatr Soc 1999;47(4):487–91.
[36] Fleming ST, Rastogi A, Dmitrienko A, Johnson KD. A comprehensiveprognostic index to predict survival based on multiple comorbidities:a focus on breast cancer. Med Care 1999;37(6):601–14.
[37] Crabtree HL, Gray CS, Hildreth AJ, O’Connell JE, Brown J. TheComorbidity Symptom Scale: a combined disease inventory and as-sessment of symptom severity. J Am Geriatr Soc 2000;48(12):1674–8.
[38] Klabunde CN, Potosky AL, Legler JM, Warren JL. Development ofa comorbidity index using physician claims data. J Clin Epidemiol2000;53:1258–67.
[39] Extermann M, Overcash J, Lyman G, Parr J, Balducci L. Comorbidityand functional status are independent in older cancer patients. J ClinOncol 1998;16(4):1582–7.
[40] Repetto L, Fratino L, Audisio RA, Venturino A, Gianni W, Vercelli M,Parodi S, Dal Lago D, Gioia F, Monfardini S, Aapro MS, SerrainoD, Zagonel V. Comprehensive geriatric assessment adds informationto Eastern Cooperative Oncology Group performance status in elderlycancer patients: an Italian Group for Geriatric Oncology Study. J ClinOncol 2002;15;20(2):494–502
[41] Streiner DL, Norman GR. Health Measurement Scales. A practicalguide to their development and use. Oxford: Oxford University Press;1996.
[42] Stuck AE, Walthert JM, Nikolaus T, Bula CJ, Hohmann C, Beck J. Riskfactors for functional decline in community-living elderly people: asystematic literature review. Soc Sci Med 1999;48:445–69.
[43] Morgan DL. Planning focus groups. Focus group kit, Volume 2. Thou-sand Oaks, CA: Sage Publications; 1998.
[44] Kreiger N, Tenenhouse A, Joseph L, Mackenzie T, Poliquin S,Brown JB, et al. The Canadian Multicentre Osteoporosis Study(CaMos): background, rationale, methods. Can J Aging 1999;18:376–87.
[45] Ware JE, Sherbourne CD. The MOS 36-item short form health survey(SF-36): 1) Conceptual framework and item selection. Med Care1992;30:473–83.
[46] Ware JE Jr, Snow KK, Kosinski M, et al. SF-36 Health Survey: manualand interpretation Guide. Boston, MA: The Health Institute, NewEngland Medical Centre; 1993.
[47] Crum RM, Anthony JC, Bassett SS, Folstein MF. Population-basednorms for the mini-mental state examination by age and educationallevel. JAMA 1993;18:2386–91.
[48] Fanuele JC, Birkmeyer NJ, Abdu WA, Tosteson TD, Weinstein JN.The impact of spinal problems on the health status of patients: havewe underestimated the effect? Spine 2000;25(12):1509–14.
[49] Lingard EA, Katz JN, Wright J, Wright EA, Sledge CB, et al.Validity and responsiveness of the knee society clinical rating systemin comparison with the SF-36 and WOMAC. JBSB 2001;83-A:1856–64.
[50] Beaton DE, Hogg-Johnson S, Bombardier C. Evaluating changes inhealth status: reliability and responsiveness of five generic healthstatus measures in workers with musculoskeletal disorders. J ClinEpidemiol 1997;50(1):79–93.
[51] Harboun M, Ankri J. Comorbidity indexes: review of the literature andapplication to the elderly population. Rev Epidemiol Sante Publique2001;46:287–98.
[52] Iezzoni LI. Risk Adjustment for measuring health care outcomes.Ann Arbor, MI: Health Administration Press; 1994.
[53] Gijsen R, Hoeymans N, Schellevis FG, Ruwaard D, Satariano WA,van den Bos GAM. Causes and consequences of comorbidity: areview. J Clin Epidemiol 2001;54:661–74.