relationship between human development index & happiness index
TRANSCRIPT
Institute of Business Administration (IBA)
University of Dhaka
RELATIONSHIP BETWEEN HUMAN
DEVELOPMENT INDEX & HAPPINESS INDEX
Course Title: Statistics and Decision Analysis
Course No.: K502
Submitted to
Md. Ershadul Huq
Assistant Professor, SBI
Submitted by
Sanjana Islam (48D, Roll: 14)
Sayed Ashraf Mamun (48D, Roll: 21)
Saidur Rahman Khan (48D, Roll: 38)
Iqbal Mahmud Chowdhury (48D, Roll: 42)
Md. Imrul Kayes (48D, Roll: 43)
Md. Zahidul Islam (48D, Roll: 55)
MBA (Evening Program)
Submission Date: December 31, 2013
ii
TABLE OF CONTENTS
Pg No.
Table of Contents ii
Chapters
1. Introduction 1
2. Analysis of HDI 2013 and Happiness Index 2013 2-3
3. Regression Analysis of HDI and Happiness Index 2013 4-7
4. Conclusion 7
Appendix 8-15
LIST OF TABLES
Pg No.
Table 1: Descriptive Statistics 2
Table 2: Estimated regional Happiness Index values 6
LIST OF ILLUSTRATIONS
Pg No.
Figure 1: Region wise variation in development level 2
Figure 2: Region wise variation in happiness due to social progress 3
Figure 3: Relationship between Human Development Index and Happiness Index 5
Figure 4: Region wise variation in Happiness Index and Human Development Index 6
1
1. Introduction:
Human Development Index (HDI) is a composite measure of indicators along three
dimensions: life expectancy, educational attainment and command over the resources needed
for a decent living1. The three dimensions of HDI are calculated as separate index values -
• A long and healthy life is enumerated with ‘Life expectancy index’
• Educational attainment is calculated with ‘Education index’ which uses data like
‘Mean years of schooling’ and ‘Expected years of schooling’
• A decent standard of living calculated through ‘Income index’ which depends upon
Gross National Income per capita
Finally, the HDI is calculated as the geometric mean of the above stated three normalized
indices. HDI can be viewed as an index of “potential” human development. It helps in
tracking the changes in development levels over time and in comparing development levels in
different countries.
HDI or Development as a whole mostly focuses on the economic development, whereas,
Happiness index attempts to measure beyond the economic aspect of development and tries
to incorporate net environmental impacts, the spiritual and cultural growth of citizens, mental
and physical health and the strength of the corporate and political systems2. Happiness is an
aspiration of every human being, a desirable life, and can be a measure of social progress.
Happiness index is explained by aspects like GDP per capita, social support, healthy life
expectancy, freedom to make life choices, generosity and perceptions of corruption.
This study attempts to understand the relationship between ‘Development’ and ‘Social
progress’ and thus the objective of this study is to find out the relationship between HDI and
Happiness Index. After finding the relationship the study also attempts to estimate the region
wise score of happiness index from the average regional value of HDI. The data are collected
from ‘World Happiness Report 2013’1 and ‘Human Development Report 2013’
2. The data are
shown in the appendix. The statistical tools used in this study are frequency distribution,
mean, correlation and regression analysis etc.
Reference: 1. Helliwell, J., Layard, R., & Sachs, J. (Eds. 2013). World Happiness Report 2013. New York: UN Sustainable
Development Solutions Network.
2. UNDP. (2013). Human Development Report 2013. Retrieved from
http://www.undp.org/content/undp/en/home/librarypage/hdr/human-development-report-2013/
2. Analy
All the d
etc. for b
2012 H
Happin
2
Valid N
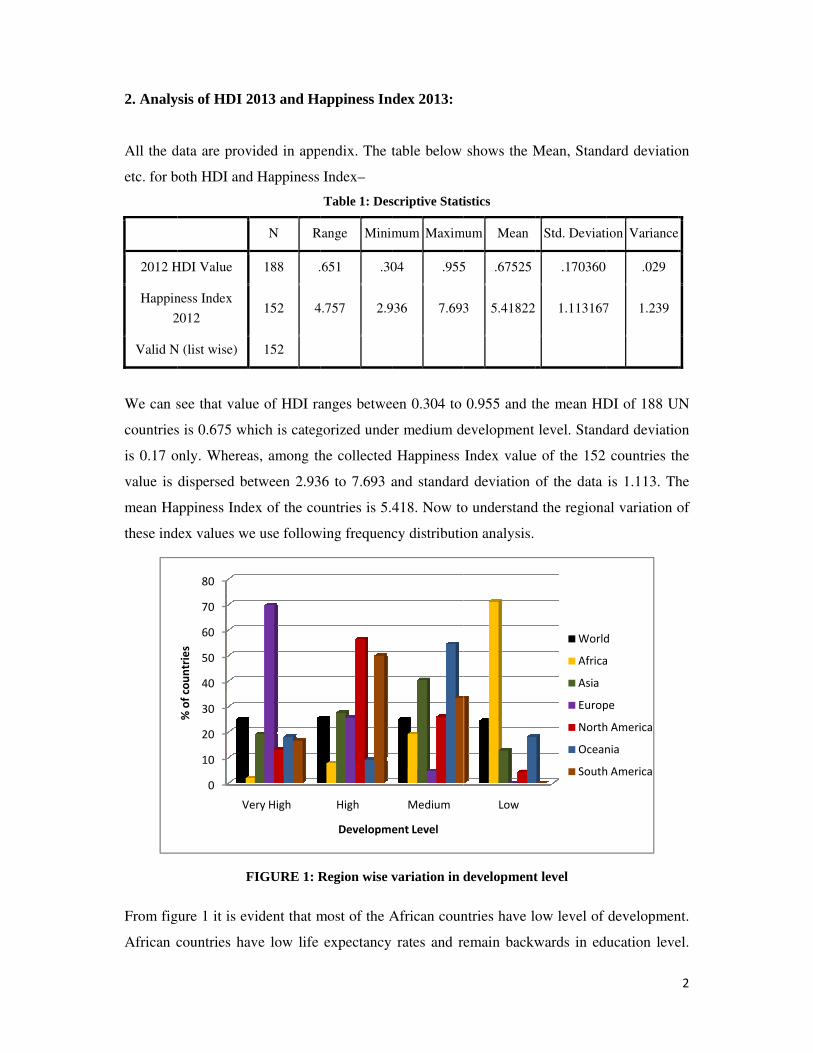
We can s
countries
is 0.17 o
value is
mean Ha
these ind
From fig
African c
ysis of HDI 2
data are prov
both HDI and
HDI Value
ness Index
2012
N (list wise)
see that valu
s is 0.675 wh
only. Wherea
dispersed be
appiness Inde
dex values w
F
gure 1 it is ev
countries ha
0
10
20
30
40
50
60
70
80
V
% of countries
2013 and Ha
vided in app
d Happiness
N R
188 .
152 4
152
ue of HDI ra
hich is categ
as, among th
etween 2.93
ex of the co
e use follow
FIGURE 1: R
vident that m
ave low life
ery High
appiness In
endix. The t
Index–
Table 1: Des
Range Minim
651 .30
4.757 2.9
anges betwe
gorized unde
he collected
6 to 7.693 a
untries is 5.4
wing frequenc
Region wise v
most of the A
expectancy
High
Developme
dex 2013:
table below
scriptive Stati
mum Maxim
04 .955
936 7.693
een 0.304 to
er medium d
Happiness
and standard
418. Now to
cy distributi
variation in d
African coun
rates and r
Medium
ent Level
shows the M
istics
mum Mean
5 .67525
3 5.41822
0.955 and t
development
Index value
d deviation
o understand
on analysis.
development
ntries have l
emain backw
Low
Mean, Stand
Std. Deviati
.170360
1.113167
the mean HD
level. Stand
e of the 152
of the data
d the regiona
t level
ow level of
wards in edu
World
Africa
Asia
Europ
North
Ocean
South
dard deviatio
ion Variance
.029
7 1.239
DI of 188 UN
dard deviatio
countries th
is 1.113. Th
al variation o
developmen
ucation leve
d
a
pe
h America
nia
h America
2
on
N
on
he
he
of
nt.
el.
Hence m
maximum
education
not have
countries
medium
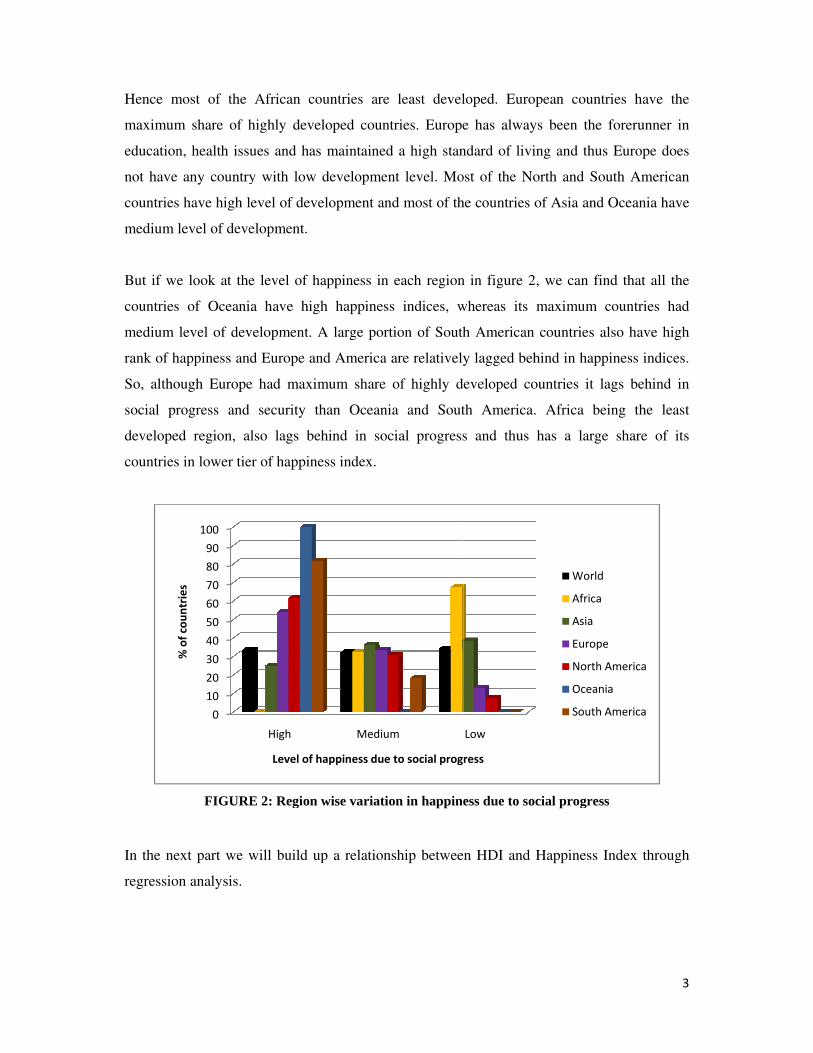
But if we
countries
medium
rank of h
So, altho
social pr
develope
countries
In the ne
regressio
most of the
m share of h
n, health iss
any country
s have high l
level of deve
e look at the
s of Oceani
level of dev
happiness an
ough Europe
rogress and
ed region, a
s in lower tie
FIGURE
ext part we w
on analysis.
0
10
20
30
40
50
60
70
80
90
100
% of countries
African co
highly deve
ues and has
y with low
level of deve
elopment.
e level of ha
ia have high
velopment. A
nd Europe an
e had maxim
d security th
also lags be
er of happine
E 2: Region
will build up
High
Level of h
ountries are
eloped count
s maintained
developmen
elopment an
appiness in
h happiness
A large port
nd America a
mum share
han Oceani
hind in soc
ess index.
wise variatio
p a relations
Medium
happiness due
least devel
tries. Europe
d a high stan
nt level. Mo
d most of th
each region
s indices, w
tion of South
are relatively
of highly d
a and Sout
cial progress
on in happine
ship betwee
m
to social prog
loped. Euro
e has alway
ndard of livi
ost of the No
he countries o
n in figure 2
whereas its
h American
y lagged beh
eveloped co
th America.
s and thus
ess due to so
n HDI and
Low
ress
pean countr
ys been the
ing and thus
orth and Sou
of Asia and
, we can fin
maximum c
countries a
hind in happ
ountries it la
. Africa be
has a large
cial progress
Happiness I
World
Africa
Asia
Europe
North A
Oceani
South A
ries have th
forerunner i
s Europe doe
uth America
Oceania hav
nd that all th
countries ha
lso have hig
piness indice
ags behind i
ing the lea
e share of i
s
Index throug
e
America
a
America
3
he
in
es
an
ve
he
ad
gh
es.
in
ast
its
gh
4
3. Regression Analysis of HDI and Happiness Index 2013:
Now we have, Mean of HDI(x) and Happiness Index(y), = 0.679 and = 5.418
So, the coefficient of correlation, ∑ ∑ ∑
r = 0.766 [detail calculation is shown in appendix]
So it is likely that there remains a strong positive correlation between HDI and Happiness
Index.
Now, the general form of the regression equation is as follows
Where slope ‘b’ of the regression equation, ∑ ∑
So, b = 4.818
and the intercept ‘a’ of the regression equation,
So, a = 2.149
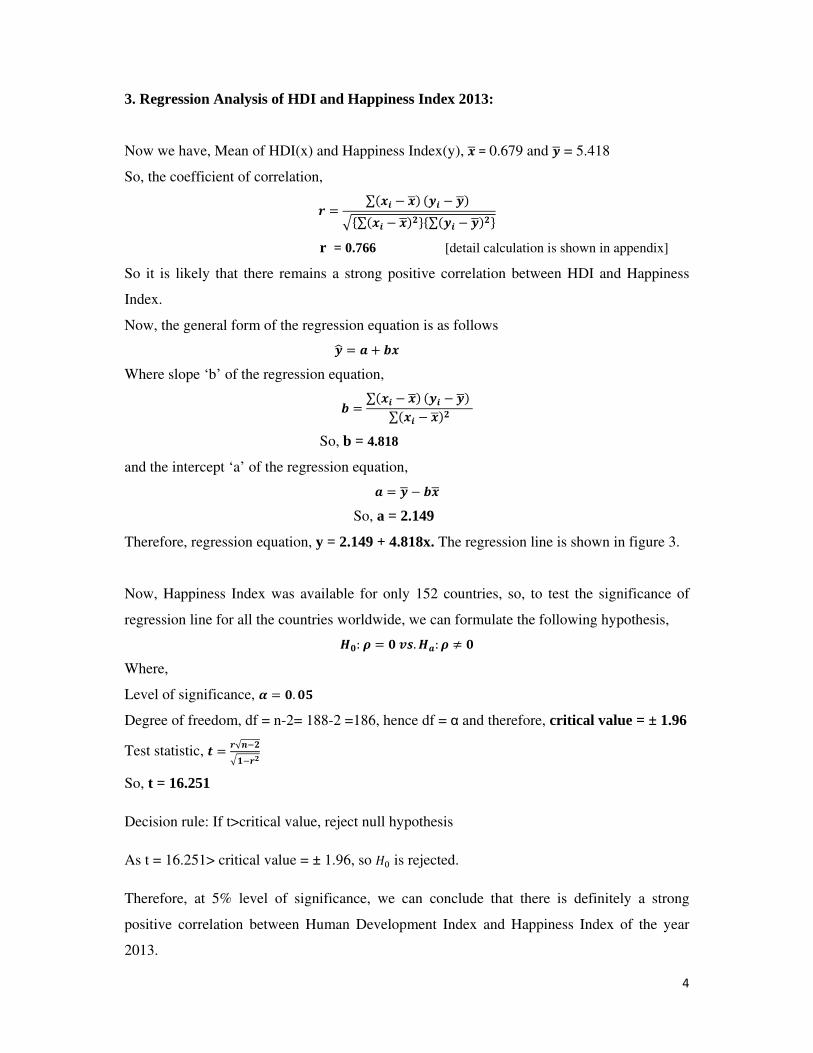
Therefore, regression equation, y = 2.149 + 4.818x. The regression line is shown in figure 3.
Now, Happiness Index was available for only 152 countries, so, to test the significance of
regression line for all the countries worldwide, we can formulate the following hypothesis, : . :
Where,
Level of significance, .
Degree of freedom, df = n-2= 188-2 =186, hence df = α and therefore, critical value = ± 1.96
Test statistic, √
So, t = 16.251
Decision rule: If t>critical value, reject null hypothesis
As t = 16.251> critical value = ± 1.96, so is rejected.
Therefore, at 5% level of significance, we can conclude that there is definitely a strong
positive correlation between Human Development Index and Happiness Index of the year
2013.
5
Linear Regression
Model Summary and Parameter Estimates
Dependent Variable: Happiness Index 2012
Equation
Model Summary Parameter Estimates
R R Square F df1 df2 Sig. Constant b1
Linear 0.766 .587 213.627 1 150 .000 2.149 4.818
The independent variable is HDI 2012.
FIGURE 3: Relationship between Human Development Index and Happiness Index
(calculated with SPSS)
Now, coefficient of determination, r 2 = (0.766)
2 = 0.587 > 0.5
Therefore, 58.7% of total variation of the values of Happiness Index of different countries
can be expalined by the values of Human Development Index. So, level of happiness i.e. life
satisfaction of the citizens of a country is related with the level of development but it depends
on other factors too. Now, using the regression line we can estimate the happiness index for
different regions.
6
The table below shows the estimated happiness indices for different regions -
Table 2: Estimated regional Happiness Index values
Region Mean HDI Happiness Index (found from
regression equation)
World 0.675 5.401
Africa 0.486 4.491
Asia 0.691 5.478
Europe 0.835 6.172
North America 0.735 5.690
Oceania 0.696 5.502
South America 0.729 5.661
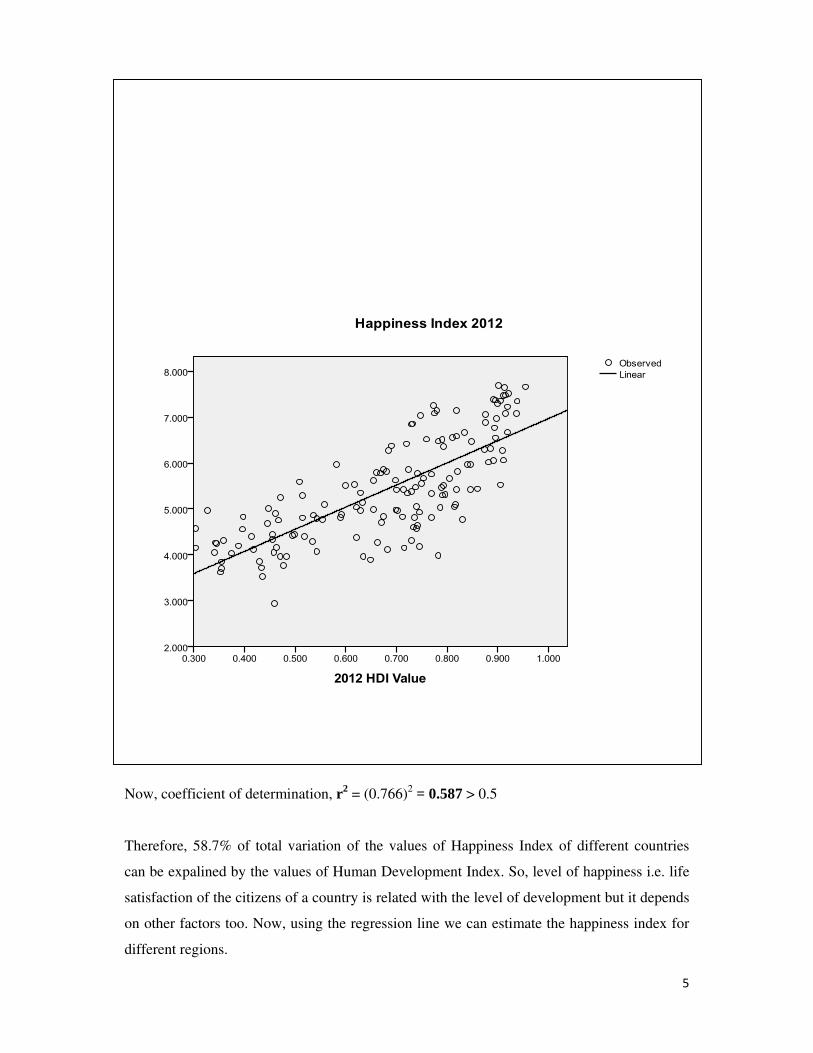
The data are represented in figure 4. The estimated value shows that, on an average, Europe
has the highest happiness index among the regions. Other continents do not fall in the high
level of happiness rank. Africa has low happiness index and the rest of the continents fall in
the medium range.
FIGURE 4: Region wise variation in Happiness Index and Human Development Index
On an average, European countries provide more social support for its citizens and they also
have more or less stable political system and less income inequality. North and South
American countries have comparatively lower level social support for its citizens than
0 0.5 1 1.5 2 2.5 3 3.5 4 4.5 5 5.5 6 6.5
Mean HDI
Happiness Index
South America Oceania North America Europe Asia Africa World
7
Europe. South American countries have high crime rate and hence lag behind in social
security and results in lower happiness of citizens. Most African countries cannot provide
education and other social support to its citizens to maintain a healthy life and they do not
have strong and stable corporate or political systems. The crime level is also high in Africa
and hence African countries have the lowest happiness index. High level of corruption and
income inequality is evident in some Asian countries, specifically the low developed ones
and they also lag behind in GDP, access to education and provision of other social support
towards its citizens. Hence Asian countries do not have higher index of happiness. Overall,
from the relationship between HDI and Happiness Index we can state that desirable life
standards are more evident in European countries and African countries cannot fulfill the
citizen needs and aspirations properly.
4. Conclusion:
Human development and life satisfaction is not the same thing but both are quite similar
conceptually. Most of the key factors that explain happiness index are similar to the human
development variables. From the findings of this study it can be stated that there is a strong
correlation between human development and overall life satisfaction. It can be said that an
unhappy society is not making desirable progress in all aspects of development and similarly
a society with lower development cannot provide desirable life to people. Economic well
being does not always incorporate social well being but a developed nation can provide more
access towards desirable life for its citizens. Due to high correlation between the indices,
analysis of social and economic progress of a society should incorporate both HDI and
Happiness Index.
8
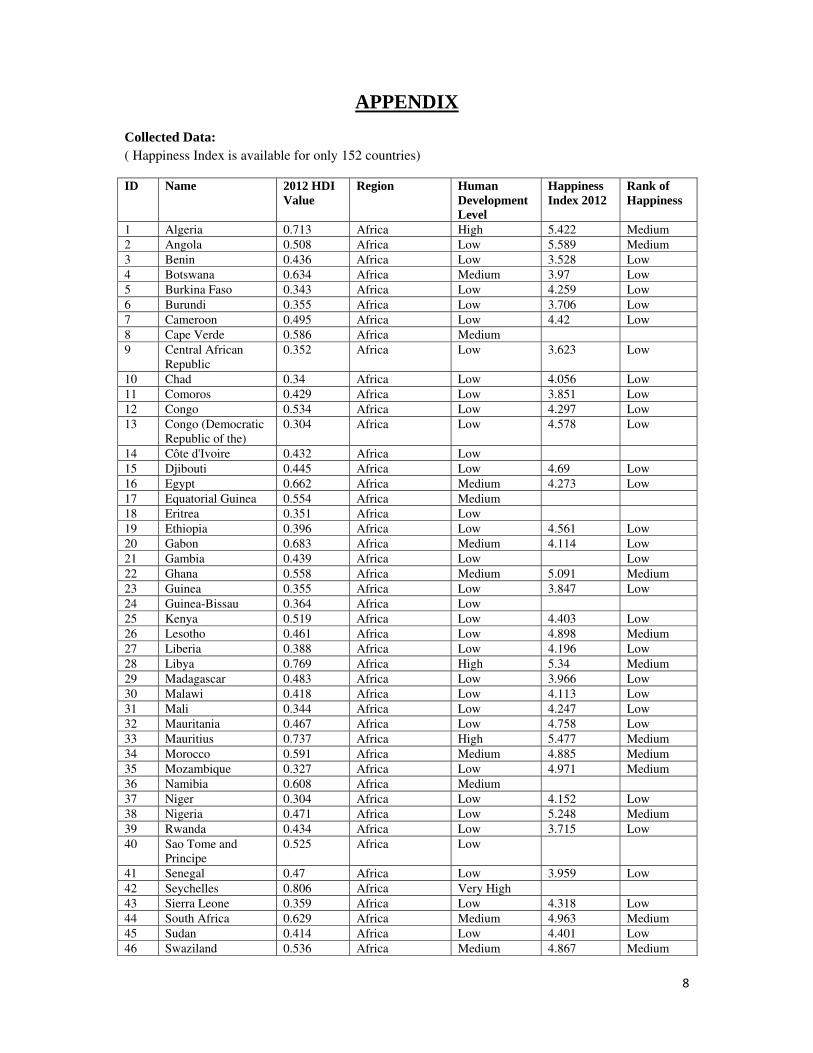
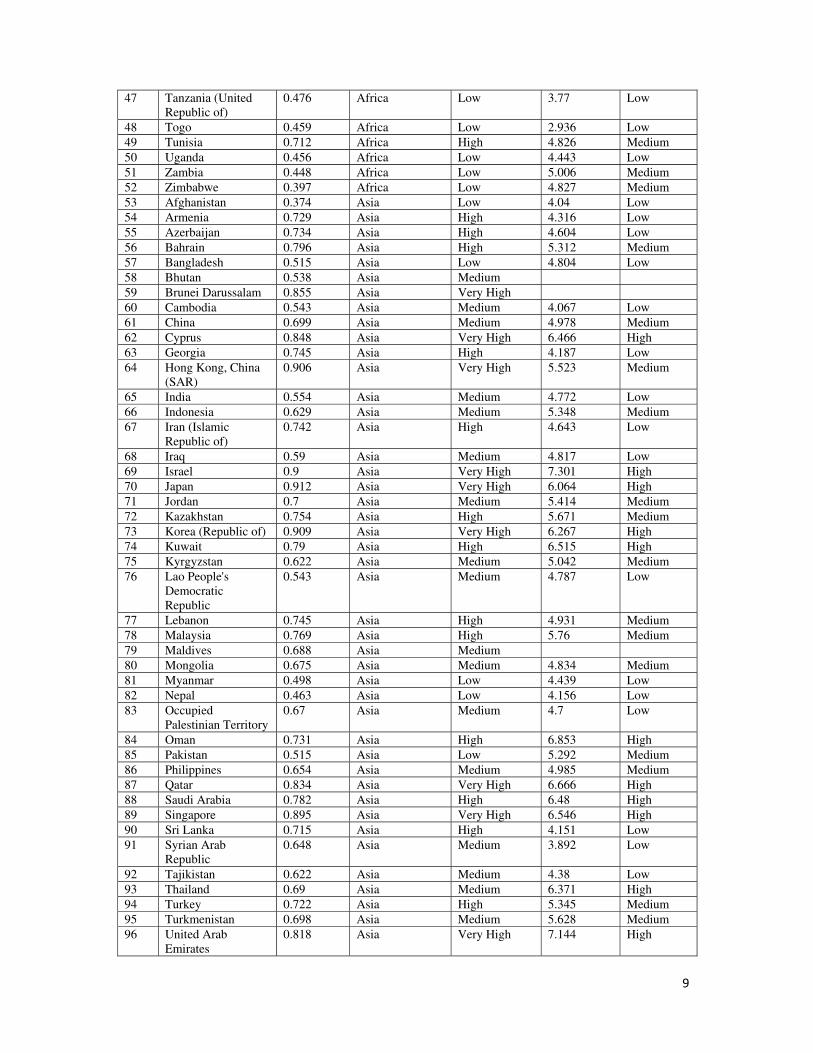
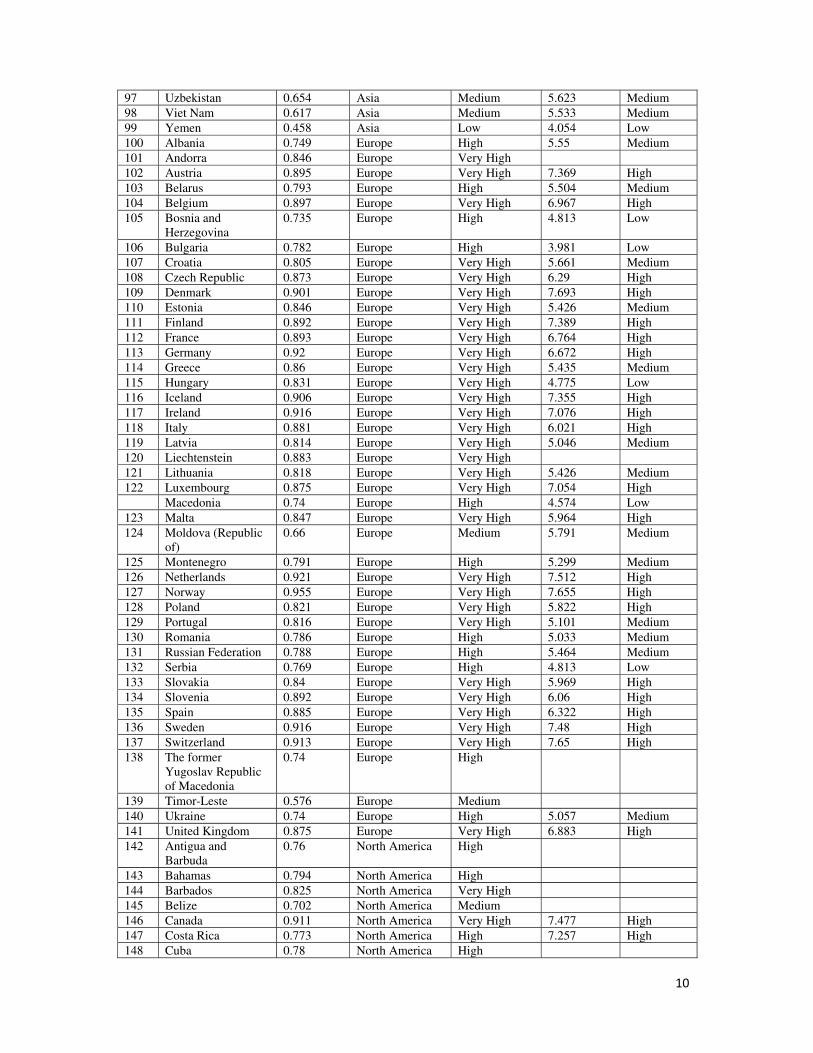
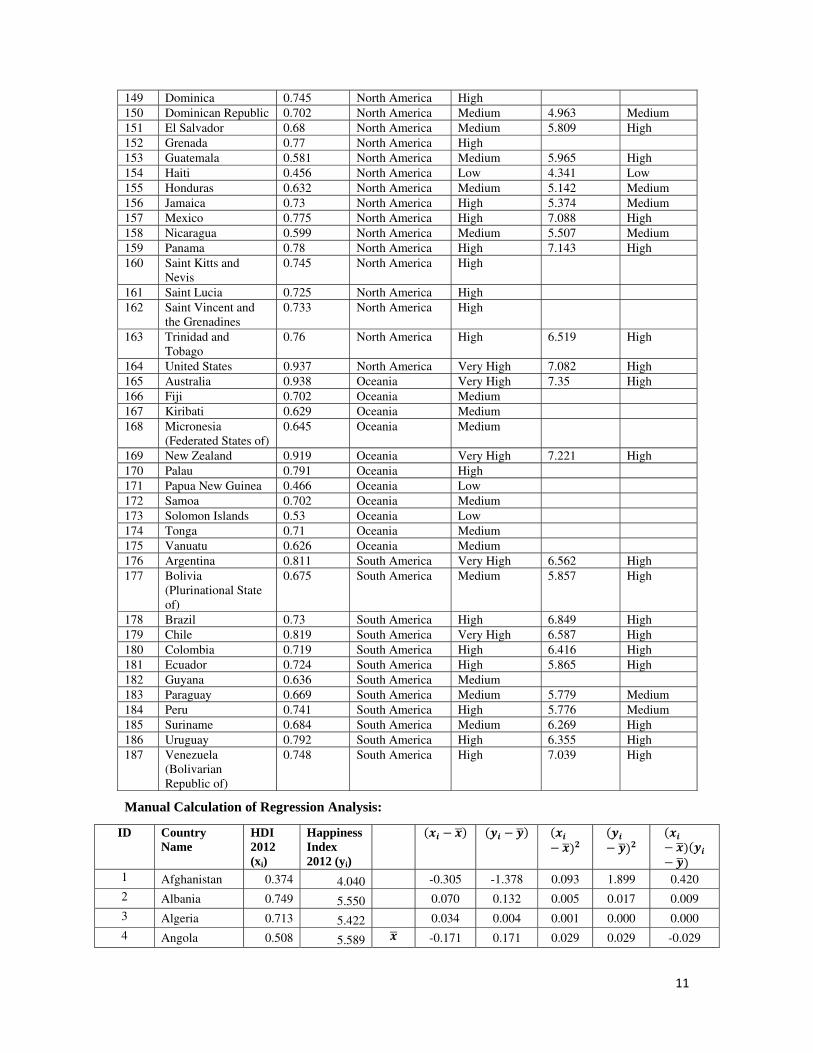
APPENDIX
Collected Data: ( Happiness Index is available for only 152 countries)
ID Name 2012 HDI Value
Region Human Development Level
Happiness Index 2012
Rank of Happiness
1 Algeria 0.713 Africa High 5.422 Medium
2 Angola 0.508 Africa Low 5.589 Medium
3 Benin 0.436 Africa Low 3.528 Low
4 Botswana 0.634 Africa Medium 3.97 Low
5 Burkina Faso 0.343 Africa Low 4.259 Low
6 Burundi 0.355 Africa Low 3.706 Low
7 Cameroon 0.495 Africa Low 4.42 Low
8 Cape Verde 0.586 Africa Medium
9 Central African
Republic
0.352 Africa Low 3.623 Low
10 Chad 0.34 Africa Low 4.056 Low
11 Comoros 0.429 Africa Low 3.851 Low
12 Congo 0.534 Africa Low 4.297 Low
13 Congo (Democratic
Republic of the)
0.304 Africa Low 4.578 Low
14 Côte d'Ivoire 0.432 Africa Low
15 Djibouti 0.445 Africa Low 4.69 Low
16 Egypt 0.662 Africa Medium 4.273 Low
17 Equatorial Guinea 0.554 Africa Medium
18 Eritrea 0.351 Africa Low
19 Ethiopia 0.396 Africa Low 4.561 Low
20 Gabon 0.683 Africa Medium 4.114 Low
21 Gambia 0.439 Africa Low Low
22 Ghana 0.558 Africa Medium 5.091 Medium
23 Guinea 0.355 Africa Low 3.847 Low
24 Guinea-Bissau 0.364 Africa Low
25 Kenya 0.519 Africa Low 4.403 Low
26 Lesotho 0.461 Africa Low 4.898 Medium
27 Liberia 0.388 Africa Low 4.196 Low
28 Libya 0.769 Africa High 5.34 Medium
29 Madagascar 0.483 Africa Low 3.966 Low
30 Malawi 0.418 Africa Low 4.113 Low
31 Mali 0.344 Africa Low 4.247 Low
32 Mauritania 0.467 Africa Low 4.758 Low
33 Mauritius 0.737 Africa High 5.477 Medium
34 Morocco 0.591 Africa Medium 4.885 Medium
35 Mozambique 0.327 Africa Low 4.971 Medium
36 Namibia 0.608 Africa Medium
37 Niger 0.304 Africa Low 4.152 Low
38 Nigeria 0.471 Africa Low 5.248 Medium
39 Rwanda 0.434 Africa Low 3.715 Low
40 Sao Tome and
Principe
0.525 Africa Low
41 Senegal 0.47 Africa Low 3.959 Low
42 Seychelles 0.806 Africa Very High
43 Sierra Leone 0.359 Africa Low 4.318 Low
44 South Africa 0.629 Africa Medium 4.963 Medium
45 Sudan 0.414 Africa Low 4.401 Low
46 Swaziland 0.536 Africa Medium 4.867 Medium
9
47 Tanzania (United
Republic of)
0.476 Africa Low 3.77 Low
48 Togo 0.459 Africa Low 2.936 Low
49 Tunisia 0.712 Africa High 4.826 Medium
50 Uganda 0.456 Africa Low 4.443 Low
51 Zambia 0.448 Africa Low 5.006 Medium
52 Zimbabwe 0.397 Africa Low 4.827 Medium
53 Afghanistan 0.374 Asia Low 4.04 Low
54 Armenia 0.729 Asia High 4.316 Low
55 Azerbaijan 0.734 Asia High 4.604 Low
56 Bahrain 0.796 Asia High 5.312 Medium
57 Bangladesh 0.515 Asia Low 4.804 Low
58 Bhutan 0.538 Asia Medium
59 Brunei Darussalam 0.855 Asia Very High
60 Cambodia 0.543 Asia Medium 4.067 Low
61 China 0.699 Asia Medium 4.978 Medium
62 Cyprus 0.848 Asia Very High 6.466 High
63 Georgia 0.745 Asia High 4.187 Low
64 Hong Kong, China
(SAR)
0.906 Asia Very High 5.523 Medium
65 India 0.554 Asia Medium 4.772 Low
66 Indonesia 0.629 Asia Medium 5.348 Medium
67 Iran (Islamic
Republic of)
0.742 Asia High 4.643 Low
68 Iraq 0.59 Asia Medium 4.817 Low
69 Israel 0.9 Asia Very High 7.301 High
70 Japan 0.912 Asia Very High 6.064 High
71 Jordan 0.7 Asia Medium 5.414 Medium
72 Kazakhstan 0.754 Asia High 5.671 Medium
73 Korea (Republic of) 0.909 Asia Very High 6.267 High
74 Kuwait 0.79 Asia High 6.515 High
75 Kyrgyzstan 0.622 Asia Medium 5.042 Medium
76 Lao People's
Democratic
Republic
0.543 Asia Medium 4.787 Low
77 Lebanon 0.745 Asia High 4.931 Medium
78 Malaysia 0.769 Asia High 5.76 Medium
79 Maldives 0.688 Asia Medium
80 Mongolia 0.675 Asia Medium 4.834 Medium
81 Myanmar 0.498 Asia Low 4.439 Low
82 Nepal 0.463 Asia Low 4.156 Low
83 Occupied
Palestinian Territory
0.67 Asia Medium 4.7 Low
84 Oman 0.731 Asia High 6.853 High
85 Pakistan 0.515 Asia Low 5.292 Medium
86 Philippines 0.654 Asia Medium 4.985 Medium
87 Qatar 0.834 Asia Very High 6.666 High
88 Saudi Arabia 0.782 Asia High 6.48 High
89 Singapore 0.895 Asia Very High 6.546 High
90 Sri Lanka 0.715 Asia High 4.151 Low
91 Syrian Arab
Republic
0.648 Asia Medium 3.892 Low
92 Tajikistan 0.622 Asia Medium 4.38 Low
93 Thailand 0.69 Asia Medium 6.371 High
94 Turkey 0.722 Asia High 5.345 Medium
95 Turkmenistan 0.698 Asia Medium 5.628 Medium
96 United Arab
Emirates
0.818 Asia Very High 7.144 High
10
97 Uzbekistan 0.654 Asia Medium 5.623 Medium
98 Viet Nam 0.617 Asia Medium 5.533 Medium
99 Yemen 0.458 Asia Low 4.054 Low
100 Albania 0.749 Europe High 5.55 Medium
101 Andorra 0.846 Europe Very High
102 Austria 0.895 Europe Very High 7.369 High
103 Belarus 0.793 Europe High 5.504 Medium
104 Belgium 0.897 Europe Very High 6.967 High
105 Bosnia and
Herzegovina
0.735 Europe High 4.813 Low
106 Bulgaria 0.782 Europe High 3.981 Low
107 Croatia 0.805 Europe Very High 5.661 Medium
108 Czech Republic 0.873 Europe Very High 6.29 High
109 Denmark 0.901 Europe Very High 7.693 High
110 Estonia 0.846 Europe Very High 5.426 Medium
111 Finland 0.892 Europe Very High 7.389 High
112 France 0.893 Europe Very High 6.764 High
113 Germany 0.92 Europe Very High 6.672 High
114 Greece 0.86 Europe Very High 5.435 Medium
115 Hungary 0.831 Europe Very High 4.775 Low
116 Iceland 0.906 Europe Very High 7.355 High
117 Ireland 0.916 Europe Very High 7.076 High
118 Italy 0.881 Europe Very High 6.021 High
119 Latvia 0.814 Europe Very High 5.046 Medium
120 Liechtenstein 0.883 Europe Very High
121 Lithuania 0.818 Europe Very High 5.426 Medium
122 Luxembourg 0.875 Europe Very High 7.054 High
Macedonia 0.74 Europe High 4.574 Low
123 Malta 0.847 Europe Very High 5.964 High
124 Moldova (Republic
of)
0.66 Europe Medium 5.791 Medium
125 Montenegro 0.791 Europe High 5.299 Medium
126 Netherlands 0.921 Europe Very High 7.512 High
127 Norway 0.955 Europe Very High 7.655 High
128 Poland 0.821 Europe Very High 5.822 High
129 Portugal 0.816 Europe Very High 5.101 Medium
130 Romania 0.786 Europe High 5.033 Medium
131 Russian Federation 0.788 Europe High 5.464 Medium
132 Serbia 0.769 Europe High 4.813 Low
133 Slovakia 0.84 Europe Very High 5.969 High
134 Slovenia 0.892 Europe Very High 6.06 High
135 Spain 0.885 Europe Very High 6.322 High
136 Sweden 0.916 Europe Very High 7.48 High
137 Switzerland 0.913 Europe Very High 7.65 High
138 The former
Yugoslav Republic
of Macedonia
0.74 Europe High
139 Timor-Leste 0.576 Europe Medium
140 Ukraine 0.74 Europe High 5.057 Medium
141 United Kingdom 0.875 Europe Very High 6.883 High
142 Antigua and
Barbuda
0.76 North America High
143 Bahamas 0.794 North America High
144 Barbados 0.825 North America Very High
145 Belize 0.702 North America Medium
146 Canada 0.911 North America Very High 7.477 High
147 Costa Rica 0.773 North America High 7.257 High
148 Cuba 0.78 North America High
11
149 Dominica 0.745 North America High
150 Dominican Republic 0.702 North America Medium 4.963 Medium
151 El Salvador 0.68 North America Medium 5.809 High
152 Grenada 0.77 North America High
153 Guatemala 0.581 North America Medium 5.965 High
154 Haiti 0.456 North America Low 4.341 Low
155 Honduras 0.632 North America Medium 5.142 Medium
156 Jamaica 0.73 North America High 5.374 Medium
157 Mexico 0.775 North America High 7.088 High
158 Nicaragua 0.599 North America Medium 5.507 Medium
159 Panama 0.78 North America High 7.143 High
160 Saint Kitts and
Nevis
0.745 North America High
161 Saint Lucia 0.725 North America High
162 Saint Vincent and
the Grenadines
0.733 North America High
163 Trinidad and
Tobago
0.76 North America High 6.519 High
164 United States 0.937 North America Very High 7.082 High
165 Australia 0.938 Oceania Very High 7.35 High
166 Fiji 0.702 Oceania Medium
167 Kiribati 0.629 Oceania Medium
168 Micronesia
(Federated States of)
0.645 Oceania Medium
169 New Zealand 0.919 Oceania Very High 7.221 High
170 Palau 0.791 Oceania High
171 Papua New Guinea 0.466 Oceania Low
172 Samoa 0.702 Oceania Medium
173 Solomon Islands 0.53 Oceania Low
174 Tonga 0.71 Oceania Medium
175 Vanuatu 0.626 Oceania Medium
176 Argentina 0.811 South America Very High 6.562 High
177 Bolivia
(Plurinational State
of)
0.675 South America Medium 5.857 High
178 Brazil 0.73 South America High 6.849 High
179 Chile 0.819 South America Very High 6.587 High
180 Colombia 0.719 South America High 6.416 High
181 Ecuador 0.724 South America High 5.865 High
182 Guyana 0.636 South America Medium
183 Paraguay 0.669 South America Medium 5.779 Medium
184 Peru 0.741 South America High 5.776 Medium
185 Suriname 0.684 South America Medium 6.269 High
186 Uruguay 0.792 South America High 6.355 High
187 Venezuela
(Bolivarian
Republic of)
0.748 South America High 7.039 High
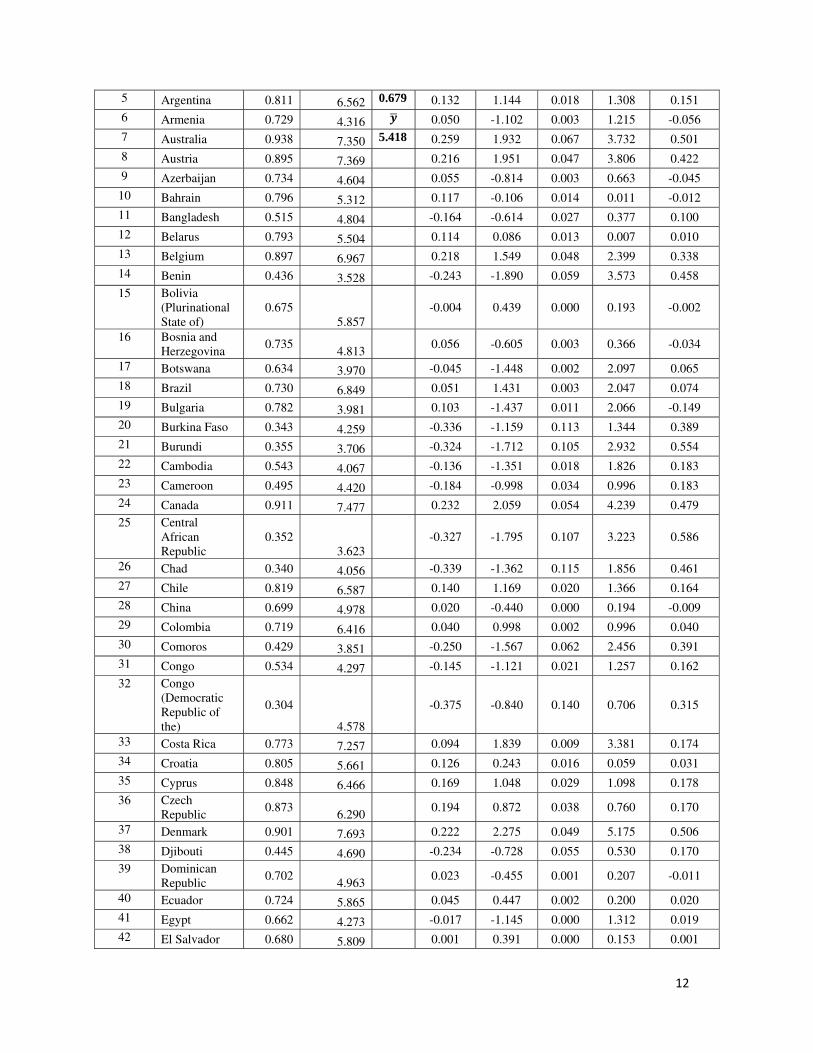
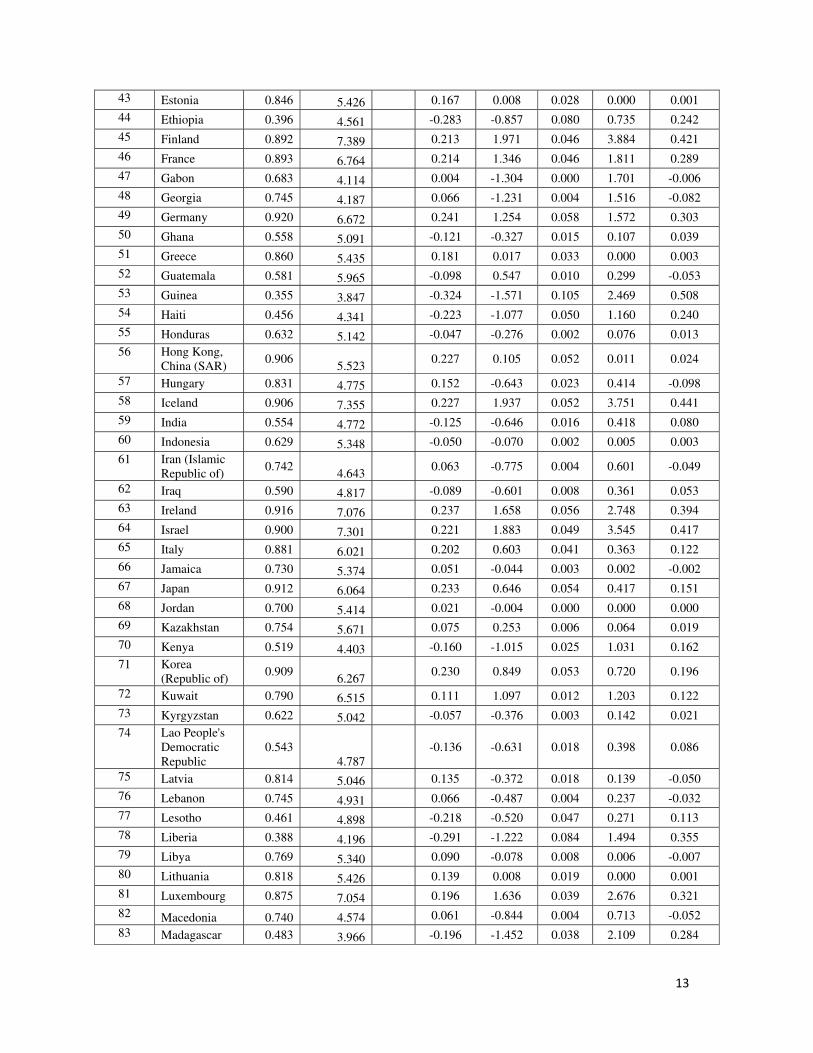
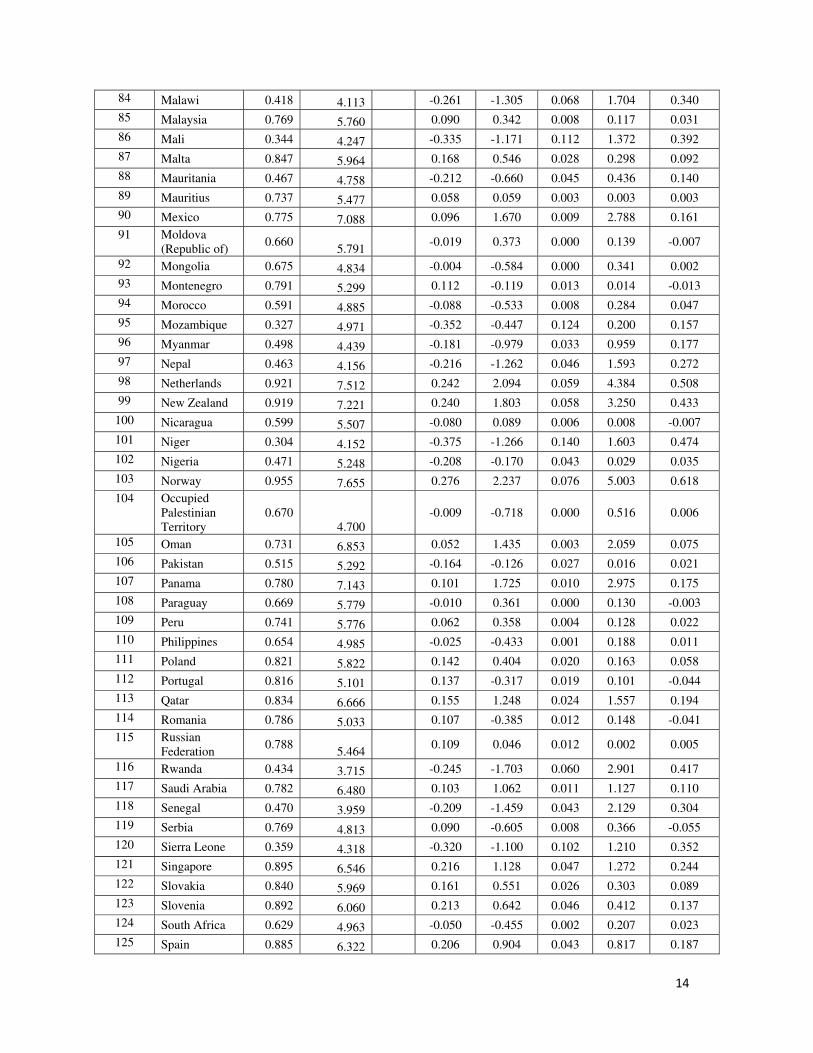
Manual Calculation of Regression Analysis:
ID Country Name
HDI 2012 (xi)
Happiness Index 2012 (yi)
1 Afghanistan 0.374 4.040 -0.305 -1.378 0.093 1.899 0.420
2 Albania 0.749 5.550 0.070 0.132 0.005 0.017 0.009
3 Algeria 0.713 5.422 0.034 0.004 0.001 0.000 0.000
4 Angola 0.508 5.589 -0.171 0.171 0.029 0.029 -0.029
12
5 Argentina 0.811 6.562 0.679 0.132 1.144 0.018 1.308 0.151
6 Armenia 0.729 4.316 0.050 -1.102 0.003 1.215 -0.056
7 Australia 0.938 7.350 5.418 0.259 1.932 0.067 3.732 0.501
8 Austria 0.895 7.369 0.216 1.951 0.047 3.806 0.422
9 Azerbaijan 0.734 4.604 0.055 -0.814 0.003 0.663 -0.045
10 Bahrain 0.796 5.312 0.117 -0.106 0.014 0.011 -0.012
11 Bangladesh 0.515 4.804 -0.164 -0.614 0.027 0.377 0.100
12 Belarus 0.793 5.504 0.114 0.086 0.013 0.007 0.010
13 Belgium 0.897 6.967 0.218 1.549 0.048 2.399 0.338
14 Benin 0.436 3.528 -0.243 -1.890 0.059 3.573 0.458
15 Bolivia
(Plurinational
State of)
0.675
5.857
-0.004 0.439 0.000 0.193 -0.002
16 Bosnia and
Herzegovina 0.735
4.813
0.056 -0.605 0.003 0.366 -0.034
17 Botswana 0.634 3.970 -0.045 -1.448 0.002 2.097 0.065
18 Brazil 0.730 6.849 0.051 1.431 0.003 2.047 0.074
19 Bulgaria 0.782 3.981 0.103 -1.437 0.011 2.066 -0.149
20 Burkina Faso 0.343 4.259 -0.336 -1.159 0.113 1.344 0.389
21 Burundi 0.355 3.706 -0.324 -1.712 0.105 2.932 0.554
22 Cambodia 0.543 4.067 -0.136 -1.351 0.018 1.826 0.183
23 Cameroon 0.495 4.420 -0.184 -0.998 0.034 0.996 0.183
24 Canada 0.911 7.477 0.232 2.059 0.054 4.239 0.479
25 Central
African
Republic
0.352
3.623
-0.327 -1.795 0.107 3.223 0.586
26 Chad 0.340 4.056 -0.339 -1.362 0.115 1.856 0.461
27 Chile 0.819 6.587 0.140 1.169 0.020 1.366 0.164
28 China 0.699 4.978 0.020 -0.440 0.000 0.194 -0.009
29 Colombia 0.719 6.416 0.040 0.998 0.002 0.996 0.040
30 Comoros 0.429 3.851 -0.250 -1.567 0.062 2.456 0.391
31 Congo 0.534 4.297 -0.145 -1.121 0.021 1.257 0.162
32 Congo
(Democratic
Republic of
the)
0.304
4.578
-0.375 -0.840 0.140 0.706 0.315
33 Costa Rica 0.773 7.257 0.094 1.839 0.009 3.381 0.174
34 Croatia 0.805 5.661 0.126 0.243 0.016 0.059 0.031
35 Cyprus 0.848 6.466 0.169 1.048 0.029 1.098 0.178
36 Czech
Republic 0.873
6.290
0.194 0.872 0.038 0.760 0.170
37 Denmark 0.901 7.693 0.222 2.275 0.049 5.175 0.506
38 Djibouti 0.445 4.690 -0.234 -0.728 0.055 0.530 0.170
39 Dominican
Republic 0.702
4.963
0.023 -0.455 0.001 0.207 -0.011
40 Ecuador 0.724 5.865 0.045 0.447 0.002 0.200 0.020
41 Egypt 0.662 4.273 -0.017 -1.145 0.000 1.312 0.019
42 El Salvador 0.680 5.809 0.001 0.391 0.000 0.153 0.001
13
43 Estonia 0.846 5.426 0.167 0.008 0.028 0.000 0.001
44 Ethiopia 0.396 4.561 -0.283 -0.857 0.080 0.735 0.242
45 Finland 0.892 7.389 0.213 1.971 0.046 3.884 0.421
46 France 0.893 6.764 0.214 1.346 0.046 1.811 0.289
47 Gabon 0.683 4.114 0.004 -1.304 0.000 1.701 -0.006
48 Georgia 0.745 4.187 0.066 -1.231 0.004 1.516 -0.082
49 Germany 0.920 6.672 0.241 1.254 0.058 1.572 0.303
50 Ghana 0.558 5.091 -0.121 -0.327 0.015 0.107 0.039
51 Greece 0.860 5.435 0.181 0.017 0.033 0.000 0.003
52 Guatemala 0.581 5.965 -0.098 0.547 0.010 0.299 -0.053
53 Guinea 0.355 3.847 -0.324 -1.571 0.105 2.469 0.508
54 Haiti 0.456 4.341 -0.223 -1.077 0.050 1.160 0.240
55 Honduras 0.632 5.142 -0.047 -0.276 0.002 0.076 0.013
56 Hong Kong,
China (SAR) 0.906
5.523
0.227 0.105 0.052 0.011 0.024
57 Hungary 0.831 4.775 0.152 -0.643 0.023 0.414 -0.098
58 Iceland 0.906 7.355 0.227 1.937 0.052 3.751 0.441
59 India 0.554 4.772 -0.125 -0.646 0.016 0.418 0.080
60 Indonesia 0.629 5.348 -0.050 -0.070 0.002 0.005 0.003
61 Iran (Islamic
Republic of) 0.742
4.643
0.063 -0.775 0.004 0.601 -0.049
62 Iraq 0.590 4.817 -0.089 -0.601 0.008 0.361 0.053
63 Ireland 0.916 7.076 0.237 1.658 0.056 2.748 0.394
64 Israel 0.900 7.301 0.221 1.883 0.049 3.545 0.417
65 Italy 0.881 6.021 0.202 0.603 0.041 0.363 0.122
66 Jamaica 0.730 5.374 0.051 -0.044 0.003 0.002 -0.002
67 Japan 0.912 6.064 0.233 0.646 0.054 0.417 0.151
68 Jordan 0.700 5.414 0.021 -0.004 0.000 0.000 0.000
69 Kazakhstan 0.754 5.671 0.075 0.253 0.006 0.064 0.019
70 Kenya 0.519 4.403 -0.160 -1.015 0.025 1.031 0.162
71 Korea
(Republic of) 0.909
6.267
0.230 0.849 0.053 0.720 0.196
72 Kuwait 0.790 6.515 0.111 1.097 0.012 1.203 0.122
73 Kyrgyzstan 0.622 5.042 -0.057 -0.376 0.003 0.142 0.021
74 Lao People's
Democratic
Republic
0.543
4.787
-0.136 -0.631 0.018 0.398 0.086
75 Latvia 0.814 5.046 0.135 -0.372 0.018 0.139 -0.050
76 Lebanon 0.745 4.931 0.066 -0.487 0.004 0.237 -0.032
77 Lesotho 0.461 4.898 -0.218 -0.520 0.047 0.271 0.113
78 Liberia 0.388 4.196 -0.291 -1.222 0.084 1.494 0.355
79 Libya 0.769 5.340 0.090 -0.078 0.008 0.006 -0.007
80 Lithuania 0.818 5.426 0.139 0.008 0.019 0.000 0.001
81 Luxembourg 0.875 7.054 0.196 1.636 0.039 2.676 0.321
82 Macedonia 0.740 4.574 0.061 -0.844 0.004 0.713 -0.052
83 Madagascar 0.483 3.966 -0.196 -1.452 0.038 2.109 0.284
14
84 Malawi 0.418 4.113 -0.261 -1.305 0.068 1.704 0.340
85 Malaysia 0.769 5.760 0.090 0.342 0.008 0.117 0.031
86 Mali 0.344 4.247 -0.335 -1.171 0.112 1.372 0.392
87 Malta 0.847 5.964 0.168 0.546 0.028 0.298 0.092
88 Mauritania 0.467 4.758 -0.212 -0.660 0.045 0.436 0.140
89 Mauritius 0.737 5.477 0.058 0.059 0.003 0.003 0.003
90 Mexico 0.775 7.088 0.096 1.670 0.009 2.788 0.161
91 Moldova
(Republic of) 0.660
5.791
-0.019 0.373 0.000 0.139 -0.007
92 Mongolia 0.675 4.834 -0.004 -0.584 0.000 0.341 0.002
93 Montenegro 0.791 5.299 0.112 -0.119 0.013 0.014 -0.013
94 Morocco 0.591 4.885 -0.088 -0.533 0.008 0.284 0.047
95 Mozambique 0.327 4.971 -0.352 -0.447 0.124 0.200 0.157
96 Myanmar 0.498 4.439 -0.181 -0.979 0.033 0.959 0.177
97 Nepal 0.463 4.156 -0.216 -1.262 0.046 1.593 0.272
98 Netherlands 0.921 7.512 0.242 2.094 0.059 4.384 0.508
99 New Zealand 0.919 7.221 0.240 1.803 0.058 3.250 0.433
100 Nicaragua 0.599 5.507 -0.080 0.089 0.006 0.008 -0.007
101 Niger 0.304 4.152 -0.375 -1.266 0.140 1.603 0.474
102 Nigeria 0.471 5.248 -0.208 -0.170 0.043 0.029 0.035
103 Norway 0.955 7.655 0.276 2.237 0.076 5.003 0.618
104 Occupied
Palestinian
Territory
0.670
4.700
-0.009 -0.718 0.000 0.516 0.006
105 Oman 0.731 6.853 0.052 1.435 0.003 2.059 0.075
106 Pakistan 0.515 5.292 -0.164 -0.126 0.027 0.016 0.021
107 Panama 0.780 7.143 0.101 1.725 0.010 2.975 0.175
108 Paraguay 0.669 5.779 -0.010 0.361 0.000 0.130 -0.003
109 Peru 0.741 5.776 0.062 0.358 0.004 0.128 0.022
110 Philippines 0.654 4.985 -0.025 -0.433 0.001 0.188 0.011
111 Poland 0.821 5.822 0.142 0.404 0.020 0.163 0.058
112 Portugal 0.816 5.101 0.137 -0.317 0.019 0.101 -0.044
113 Qatar 0.834 6.666 0.155 1.248 0.024 1.557 0.194
114 Romania 0.786 5.033 0.107 -0.385 0.012 0.148 -0.041
115 Russian
Federation 0.788
5.464
0.109 0.046 0.012 0.002 0.005
116 Rwanda 0.434 3.715 -0.245 -1.703 0.060 2.901 0.417
117 Saudi Arabia 0.782 6.480 0.103 1.062 0.011 1.127 0.110
118 Senegal 0.470 3.959 -0.209 -1.459 0.043 2.129 0.304
119 Serbia 0.769 4.813 0.090 -0.605 0.008 0.366 -0.055
120 Sierra Leone 0.359 4.318 -0.320 -1.100 0.102 1.210 0.352
121 Singapore 0.895 6.546 0.216 1.128 0.047 1.272 0.244
122 Slovakia 0.840 5.969 0.161 0.551 0.026 0.303 0.089
123 Slovenia 0.892 6.060 0.213 0.642 0.046 0.412 0.137
124 South Africa 0.629 4.963 -0.050 -0.455 0.002 0.207 0.023
125 Spain 0.885 6.322 0.206 0.904 0.043 0.817 0.187
15
126 Sri Lanka 0.715 4.151 0.036 -1.267 0.001 1.606 -0.046
127 Sudan 0.414 4.401 -0.265 -1.017 0.070 1.035 0.269
128 Suriname 0.684 6.269 0.005 0.851 0.000 0.724 0.005
129 Swaziland 0.536 4.867 -0.143 -0.551 0.020 0.304 0.079
130 Sweden 0.916 7.480 0.237 2.062 0.056 4.251 0.490
131 Switzerland 0.913 7.650 0.234 2.232 0.055 4.981 0.523
132 Syrian Arab
Republic 0.648
3.892
-0.031 -1.526 0.001 2.329 0.047
133 Tajikistan 0.622 4.380 -0.057 -1.038 0.003 1.078 0.059
134 Tanzania
(United
Republic of)
0.476
3.770
-0.203 -1.648 0.041 2.717 0.334
135 Thailand 0.690 6.371 0.011 0.953 0.000 0.908 0.011
136 Togo 0.459 2.936 -0.220 -2.482 0.048 6.161 0.545
137 Trinidad and
Tobago 0.760
6.519
0.081 1.101 0.007 1.212 0.090
138 Tunisia 0.712 4.826 0.033 -0.592 0.001 0.351 -0.020
139 Turkey 0.722 5.345 0.043 -0.073 0.002 0.005 -0.003
140 Turkmenistan 0.698 5.628 0.019 0.210 0.000 0.044 0.004
141 Uganda 0.456 4.443 -0.223 -0.975 0.050 0.951 0.217
142 Ukraine 0.740 5.057 0.061 -0.361 0.004 0.130 -0.022
143 United Arab
Emirates 0.818
7.144
0.139 1.726 0.019 2.978 0.241
144 United
Kingdom 0.875
6.883
0.196 1.465 0.039 2.146 0.288
145 United States 0.937 7.082 0.258 1.664 0.067 2.768 0.430
146 Uruguay 0.792 6.355 0.113 0.937 0.013 0.878 0.106
147 Uzbekistan 0.654 5.623 -0.025 0.205 0.001 0.042 -0.005
148 Venezuela
(Bolivarian
Republic of)
0.748
7.039
0.069 1.621 0.005 2.627 0.113
149 Viet Nam 0.617 5.533 -0.062 0.115 0.004 0.013 -0.007
150 Yemen 0.458 4.054 -0.221 -1.364 0.049 1.861 0.301
151 Zambia 0.448 5.006 -0.231 -0.412 0.053 0.170 0.095
152 Zimbabwe 0.397 4.827 -0.282 -0.591 0.079 0.350 0.166
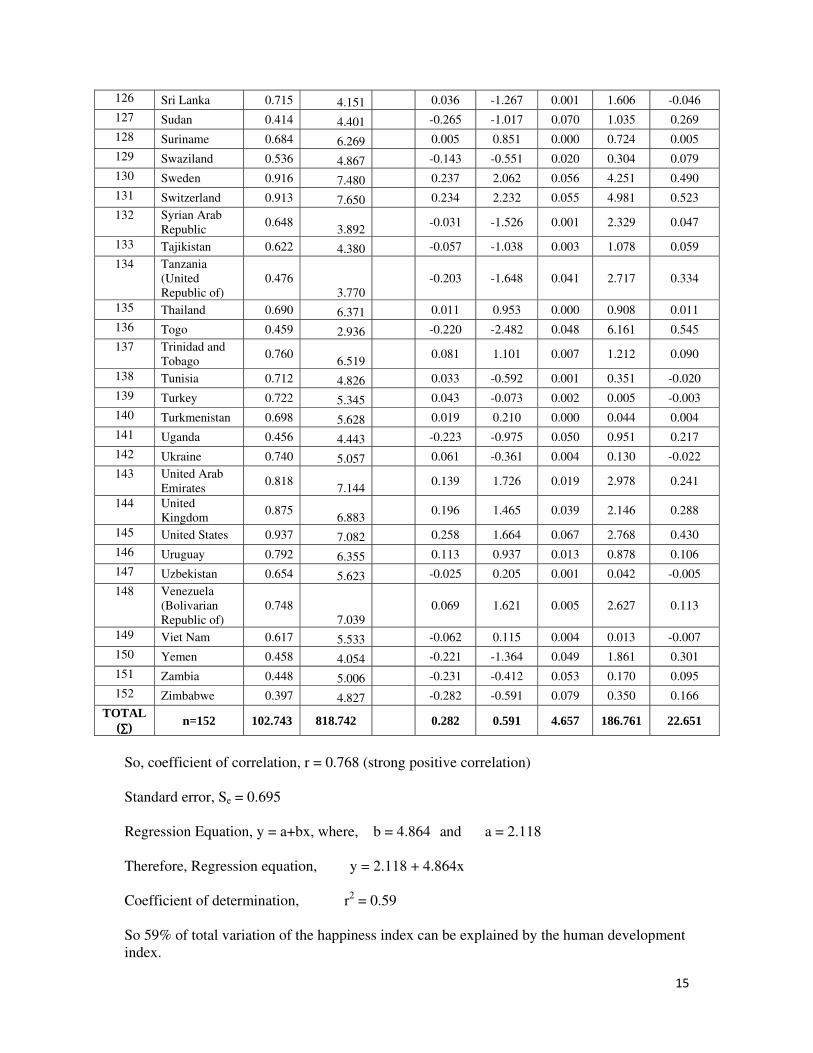
TOTAL (∑) n=152 102.743 818.742 0.282 0.591 4.657 186.761 22.651
So, coefficient of correlation, r = 0.768 (strong positive correlation)
Standard error, Se = 0.695
Regression Equation, y = a+bx, where, b = 4.864 and a = 2.118
Therefore, Regression equation, y = 2.118 + 4.864x
Coefficient of determination, r2 = 0.59
So 59% of total variation of the happiness index can be explained by the human development
index.