the determinants of audit fees - evidence from the voluntary sector
TRANSCRIPT
Afcuunling and Buuntss Ri'seiirth. Viil 31. No. 4. pp. 243-274 i 243
The determinants of audit fees - evidencefrom the voluntary sectorVivien Beattie, Alan Goodacre, Ken Pratt and Joanna Stevenson*
Ahstrad — Given the growing demand for uccounlabilily in the public sector, there is a need to begin to inve.sti-gate audit pricing issues in this sector. This study makes three contributions. First, it develops and es^timates. for thellrst time, a nn»del of audit fee determinants for the charity sector. As in previous private sector company studies,size, organisational complexity and audit firm location are the major determinants. A positive association betweenaudit fees and fees tor non-audit services is also observed. Charity sector factors of empirical significance includethe nature of lhe charity (i.e.. grant-making or fund-raising), its area of activity and ihc importance of trading in-come. Separate nuxlels for granl-making and fund-raising charities rellect the relative complexity of the audit offund-raising charities. Second, the lower auditor concentration in the charity sector market, compared to the privatesector market, permits a more powerful test of whether large firms and/or auditor expertise are rewarded with a feepremium. In the more complex audit cnvirnnmeni of fund-raising charities, the results show that Big Six audil firmsreceive higher audit fees (IS.S'/f. on average) than non-Big Six firms. Also. non-Big Six audit firms with charityexpertise arc rewarded with a fee premium over other non-Big Six firms. Finally, the study demonstrates that thecharity audit fee rate is significantly lower than that of private seclor companies: in fact it is approximately half. Achange in the reporting of charity audit fees is proposed lo reflect any element of "chariiable giving' by the auditfirm. Keywords: audit fees: auditor expertise; charity sector: fee premium; non-audit services.
1. IntroductionThe tnarket for audit services is recognised to besegmented into distinct sub-markets. To date, re-search has focused on the private sector market(which itself comprises di.stinct sub-markets). Theprincipal issues that have been investigated aremarket structure (including the related issues ofmarket concentration, auditor selection and auditorchange) and audit pricing. Early audit pricing stud-ies were motivated by concerns that the top tieraudit firms (then the Big Eight) were earning ex-cess economic rents due to the existence of an oli-gopolistic market structure. Later studies,conducted in a more competitive auditing environ-ment, were motivated by concerns regarding low-balling, and the potential resultant weakening ofauditor independence and reduction in audit quali-ty. Most recently, attention has shifted to examinethe impact of auditor industry specialisation (i.e.,expertise) on audit fees (for example, Peaison andTrompeter, 1994: Craswell, Francis and Taylor,1995; CuUinan, 1998): results to date have beencontradictory.
In addition to the extensive literature on audit
*The authors are, respectively, professor of accounting, sen-ior lecturer, senior lecturer and lecturer at the University ofStirling. They wish to thank the two anonymous referees fortheir helpful, detailed and constructive comments on previousdrafts of this paper. Correspondence should be addressed to DrA, Goodacre. Department of Accounting, Finance and Law.University of Stirling Sliding FK'J 4LA. Tel; 01786 467291;Fax: 01786 467308: Email; Alan.Goodacre^stir.ac.uk
The final version of this paper was accepted in August
pricing in the private sector, there are also a fewstudies that investigate sub-markets within thepublic sector (e.g., Baber. 1983: Baber, Brooks andRicks. 1987). The objective of these studies is toestablish the generalisability of findings regardingaudit fee determinants from the private sector toother audit markets, and also to identify additionalfactors reflecting the unique aspeets of the ac-counting and auditing environment in the publicsector. Moreover, the demand for accountability inthis sector is incteasing and so audit pricing stud-ies of sub-markets within the sector are of impor-tance in their own right. To our knowledge,however, no study has investigated audit pricing inthe voluntary sector.
The voluntary sector is seen to be the "majorthird force (in addition to the private and publicsectors) in society without which much social pro-vision would seize up" (SCVO 1997:4). In manycountries, political and fiscal constraints on thewelfare state are resulting in an increased flow ofpublic resources into the sector, with local govern-ment contracting with the sector to provide serv-ices. The charity sector is the most significantcomponent of the voluntary sector.' Approximately
' There are considerable difficulties associated with defin-ing the charity sector and measuring its si/e. Narrow opera-tional definitions exclude museums, universities, privatecolleges and schools, local enterprise companies, hospitaltrusts, housing associations, friendly societies, trade unions,and places of worship, because they are insufficiently orientedtowards the public benefit, are not sufficienily independent, orinformation is not readily available.
244 ACCOUNTING AND BUSINESS RESEARCH
4% of the paid UK labour force is estimated to beemployed in this sector, with registered charities inEngland and Wales having an income of £16bn in19% (Pianca and Blackwood. 1996:1). This repre-sents approximately 3 ^ % of gross domestic prod-uct (GDP) (Wise, 1995:3). There are approximately187.000 registered charities in England and Walesalone (Pharoah and Smerdon, 1998).-
Currently, public confidence in this sector is low,due to a number of highly publicised scandals andfrauds and poor quality reporting (AccountancvAge, 1998; The Herald. 1999). There is clearly aneed to demonstrate greater accountability if thissector is to achieve its full potential (NCVO.1998). Moreover, accountability must be especial-ly rigorous in this sector due to the weakness of the'customer' (i.e.. beneficiary). The recent creationof unofficial independent monitoring bodies, suchas The Accreditation Bureau for FundraisingOrganisations, seeks to restore the public's trust{Accoimiancy Age, 1998). The independent auditis a key means of providing accountability, but therequirement for an external audit depends on theexact nature of the charity and its location.Incorporated charities whose annual gross incomeis above £250.000, or whose balance sheet totalexceeds £l.4m, are subject to a full statutory auditunder the Companies Act 1985.
Unincorporated charities in England and Walesalso require an audit if annual income or expendi-ture exceeds £250.000 (Charities Act 1993) but inScotland the threshold is £100.000 (Law ReformAct 1990). Charities falling below these thresholdsmay nevertheless have provisions in their govern-ing documents that require an independent audit.Generally, smaller charities may be required to un-dergo an independent examination of their finan-cial statements or to appoint a reporting accountant.
Auditors of charities must comply with theAuditing Practices Board's Auditing Standardsand take into account the additional considerationscontained in the 1996 Practice Note 'The Audit ofCharities" (AFB, 1996). Rule.s on the appointmentand remuneration of auditors are contained in therelevant legislation (e.g.. The Companies Acts, theCharities Act 1993). However, for non-incorporat-ed charities there are no members to ratify auditappointments and there is no formal requirementfor an annual general meeting as a forum for ap-pointment, so the choice of auditor is effectivelyleft to trustees. Audit reports are normally ad-dressed to the trustees or directors (if incorporat-ed), although the charity's governing document orspecific legislation may identify another or other
- One need only look to North American economies to seethe poienlial for growth in ihis seclor. In Canada, for example,expenditure by registered charities represented \2% of GDP in1993 (Bryden. 1996; Sharpe. 1994).
parties to whom the auditor should report. For ex-ample, the British Museum is audited by theNational Audit Office which reports to the Housesof Parliament, under the Museums and GalleriesAct 1992. since the museum is predominantlyfunded by the government. Additionally, there is ageneral statutory duty under the 1993 Act (forEngland and Wales) for auditors to report certainmatters such as misconduct or mismanagement bytrustees directly to the Charities Commission,which is the regulatory body. In Scotland, auditorshave a right (not a duty) to report such matters tothe Lord Advocate. Oddly, charitable companiesare not subject to this reporting duty under currentCompanies Act provisions.
All charities in the UK should adopt theaccounting requirements of The Statement ofRecommended Practice (SORP) Accounting byCharities, issued in 1995 by the CharitiesCommission. This is supplementary to the ac-counting requirements of the Companies Act 1985.Charities Act 1993 and Financial ReportingStandards. The SORP was issued in recognition ofthe need to improve the quality of charity report-ing. The key feature of the SORP is the require-ment for a Statement of Financial Activities(SOFA) in lieu of an Income and ExpenditureAccount, though the latter may still be requiredunder legislation such as the Companies Act. TheSOFA shows all incoming resources (capital andrevenue), direct charitable expenditure separatefrom other expenditure such as fundraising and ad-ministration costs, and a reconciliation of move-ments in the charity's separately identified fundsfor the year.
Auditors in the charity sector must therefore fa-miliarise themselves with the SORP requirementsas well as the legislation and regulations particularto the constitution of their client charity, its gov-erning documents and the additional auditing con-siderations outlined in the APB Practice Note. Allof our sample charities fell within the audit thresh-olds and were subject to the SORP requirement todisclose audit fees in addition to fees "for other fi-nancial services such as taxation advice, consul-tancy, financial advice and accountancy' (SORP.para. 162. p.37).
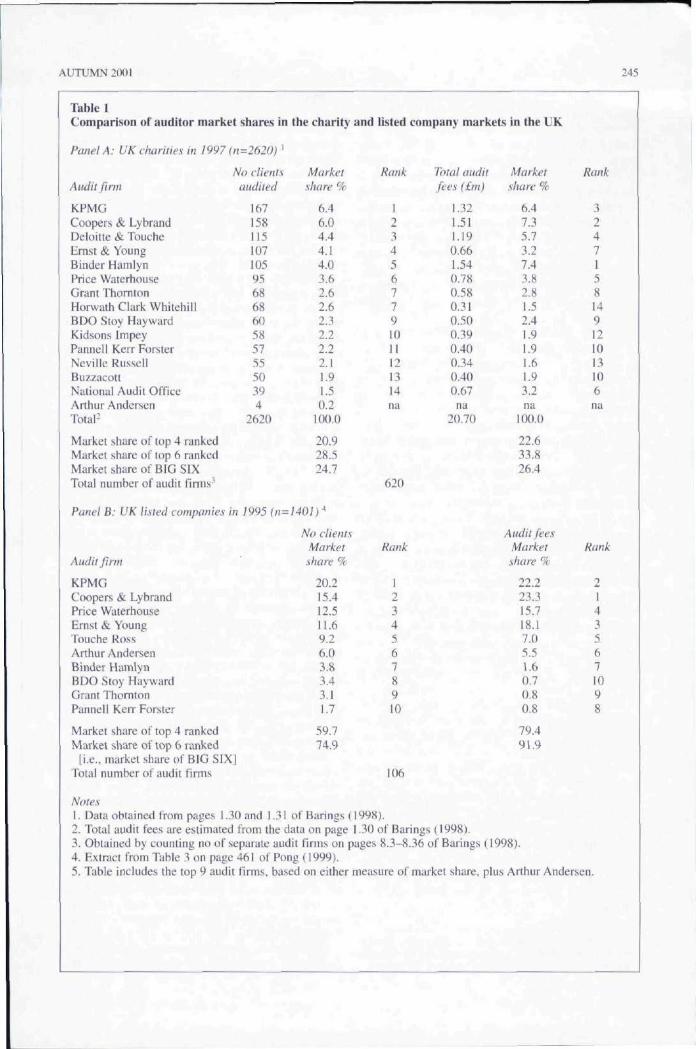
Audit market structure in the charity sector dif-fers substantially from that found in the privatesector. In the UK, the private sector exhibits a highand rising level of supplier concentration. Panel Bof Table 1 (extracted from Pong, 1999: 461) showsthat, in 1995, the Big Six audited 75% of UK list-ed companies and accounted for a market share of92% based on audit fees. The equivalent figuresfor the charity sector (Panel A in Table I taken fromBarings (1998)) show that the Big Six audited just25% in number of the top 2,620 charities and ac-counted for a market share of 26% based on audit
AUTUMN 2001 245
Table 1Comparison of auditor market shares in the charity
Panel A: VK charities in 1997 (n=262()) '
No clientsAudit ft nn
KPMGCoopers & LybrandDeloitte & ToucheEmst & YoungBinder HamlynPrice WaterhouseGrant ThorntonHorwath Ciark WhitehillBDO Stoy HaywardKidsons ImpeyPanneil Kenr ForsterNeville RussellBuzzacottNational Audit OfficeArthur AndersenTotal-
Market share of top 4 rankedMarket share of top 6 rankedMarket share of BIG SIXTotal number of audit firms'
Panel B: UK listed companies in
Audit ftni!
KPMGCoopers & LybrandPrice WaterhouseEmst & YoungTouche RossArthur AndersenBinder HamiynBDO Stoy HaywardGrant ThorntonPanneil Kerr Forster
Market share of top 4 rankedMarket share of top 6 ranked
[i.e.. market share of BIG SIX|Total number of audit firms
Notes
audited
167158115107105956868^5857555di394
2620
1995 (n=M
1. Data obtained from pages 1.30 and 1.31 ol
Marketshare %
6.46.04.44.14.03.62.62.62.32.22.22.11.91.50.2
iOO.O
20.928.524.7
No clientsMarket
share %
20.215.412.5i l .69.26.03.83.43.11.7
59.774.9
and listed
Rank
12345677910ii12i314na
620
Rank
i2345678910
106
Barings (1998).2. Total audit fees are estimated from the data on page3. Obtained by counting no of separate audit4. Extract from Table 3 on page5. Table includes the top 9 audit
461 of Pong
company markets in the UK
Total auditfees (£ni}
i.321.511.190.661.540.780.580.310.500.390.400.340.400.67na
20.70
.30 of Barings (i998).firms on pages 8.3-8(1999).
Marketshare %
6.47.35.73.27.43.82.8i.52.41.91.91.61.93.2na
100.0
22.633.826.4
Audit feesMarketshare %
22.223.315.718.17.05.51.60.70.80.8
79.491.9
36 of Barings (1998).
Rank
3247i5814912iOi3106
na
Hank
2I43567iO98
firms, based on either measure of market share, plus Arthur Andersen.
246 ACCOUNTING AND BUSINESS RESEARCH
fees. Moreover, the composition of the top sixcharity auditors differs from the Big Six. BinderHamlyn, a 'second tier' firm, audits 105 charities.ranking fifth and emerges as the market leaderbased on audit fees. Further, the National AuditOffice also features in the top tier of charity audi-tors, ranking sixth based on audit fees but based ona smaller number of audits. The 'outlier* of the BigSix is Arthur Andersen, who apparently undertookjust four charity audits (Barings. 1998: 8.3).^These differences in market structure provide aunique setting within which to examine the hnksbetween market structure and pricing (an aspectof market conduct) that have concerned previousresearchers.
The different audit risks and audit market struc-ture mean that the charity sector is a valuable set-ting within which to develop and test audit pricingmodels, thereby extending our understanding ofpricing issues generally. Moreover, the growingimportance of this sector in economies worldwide,and the need for a high level of accountability,mean that an understanding of audit fee determi-nants in this sector is important in its own right.The present study has four objectives. First, to de-velop and estimate a model of charity audit fee de-terminants. Second, to assess the existence of aBig Six brand name premium in a market in whichnone of the Big Six firms is considered a special-ist. Third, to test the pricing impact of expertise ina niche market where the Big Six firms have lessdominance than is commonly encountered. Fourth,to undertake an explicit comparison of the level ofcharity audit fees with those prevailing in the pri-vate sector. While the latter does not contribute di-rectly to our general understanding of auditpricing, it will provide preliminary evidence toform the basis of further research on audit risks inthe charity sector.
The remainder of this paper is structured as fol-lows. Section 2 reviews the prior literature onaudit pricing, covering first the private sector andthen the limited number of studies on the publicsector. Studies that specifically examine the im-pact of expertise, in the form of market share, arealso reviewed. Methods are described in Section 3,including a discussion of audit risks in the charitysector, model specification and the procedures forthe comparison of audit fee levels at the sectorallevel. Section 4 deals with sample selection, fol-lowed by the presentation and discussion of resultsin Section 5. A final section summarises and con-cludes.
' However, in 1^44. Anhur Anderson and Binder Hamlyneffectively merged when the tour major UK otTiues of BinderHamlyn were taken under the Arthur Andersen umbrella.
2. Prior literatureThere exists a well-developed literature on the de-terminants of audit fees in the private sector, dat-ing from the seminal article by Simunic (1980).Three principal lines of research have emerged,which focus on the presence of a Big Eight fee pre-mium, the presence of low-balling, and the impactof non-audit services (NAS) provision. The mainobjective of Simunic's study was to investigate theimpact of the audit firm size variable, after con-trolling for cross-sectional differences in auditeecharacteristics. At this time, rising concentrationratios within the market had led to concerns thatthe Big Eight were behaving monopolistically, i.e.,the audit industry was not competitive. In the mar-ket of the late 198{)s, however, the concern wasthat audit firms were 'low-balling", i.e.. quotingfees below cost to secure clients. Thus, this line ofresearch focused on initial audit engagements. Thethird main line of research focused on the impacton audit fees of the provision of NAS by the in-cumbent auditor, amid concerns that such provi-sion impaired auditor independence.
Simunic (1980) develops a pricing tiiodel inwhich the audit fee is determined by differences inloss exposure, differences in the assessed loss-sharing ratio, differences in auditor productionfunctions, and auditor identity. He notes that theobservation of a Big Eight premium, while consis-tent with the extraction of monopoly rents, is alsoconsistent with the existence of product differenti-ation accruing to high reputation. Moreover, thepotential existence of economies of scale wouldoffset both of these factors (Simunic, 1980: 170).
Loss exposure is proxied using auditee size(total assets), complexity (number of consolidatedsubsidiaries, number of industries engaged in. andproportion of foreign assets), and risky asset types(proportion of debtors and proportion of stock).The loss-sharing ratio is proxied by the accountingrate of return, the existence of a net loss in the twoprior years, and the presence of a 'subject to" qual-ification in the current year. Differences in auditorproduction functions are captured by an audittenure variable.
Simunic finds that auditee size is the most im-portant determinant of audit fees. Only the ac-counting rate of return and tenure variables werenot significant in the regression equation, and theoverall explanatory power was 46%. The key vari-able of interest, a Big Fight dummy variable, wasinsignificant. Thus, the hypothesis that price com-petition prevails could not be rejected. Moreover,the negative sign on the coefficient suggested thatthe Big Eight enjoy economies of scale, which arepassed on as lower fees to auditees (Simunic.1980: 187-188).
In subsequent studies, the main control variablesin Simunic"s model have consistently been found
AUTUMN 2(K)1 247
to be significant. The basic specification of theaudit fee model has remained essentially un-changed over the last 20 years, although one ortwo new explanatory variables have been added.^The explanatory power of the model has generallybeen in the region of 70%. The model has been es-timated using many different data sets, drawn fromseveral countries and time periods, in an attempt toassess the generalisability of extant findings and.in some cases, to resolve conflicting findings re-garding the audit fee premium variable.
Studies that focus on the existence of a Big Eight(more recently. Big Six) fee premium includeSimunic (1980), Simon (1985), Palmrose (1986a),Erancis and Simon (1987), Beatty (1993). and Gistand Michaels (1995) in the US; Taylor and Baker(1981). Taffier and Ramalinggam (1982), Chan,Ezzamel and Gwilliam (1993), Brinn. Peel andRoberts (1994). Pong and Whittington (1994). andChe-Ahmad and Houghton (1996) in the UK;Erancis (1984) and Erancis and Stokes (1986) inAustralia; Firth (1985) and Johnson. Walker andWestergaard (1995) in New Zealand; Chung andLindsay (1988) and Anderson and Zeghal (1994)in Canada; Low, Tan and Koh (1990) in Singapore;Lee (1996) and Gul (1999) in Hong Kong; Simon,Teo and Trompeter (1992) in Hong Kong,Malaysia and Singapore; Simon, Ramanan andDugar (1986) in India; and Langendijk (1997) inthe Netherlands.
Results, while inconclusive, are suggestive ofthe existence of a fee premium in the case of smallauditees, but not large auditees (e.g., Palmrose,1986a; Erancis and Simon. 1987; Talfler andRamalinggam. 1982; and Erancis and Stokes.1986). This premium is generally attributed to theexistence of differentiated audit services, consis-tent with the predictions of DeAngelo (1981a).
Studies that focus on the existence of low-balling are of two types: those that focus on realmarkets and those that use data generated from ar-tificial markets. Studies using real market data in-clude Simon and Erancis (1988). Turpen (1990).Ettredge and Greenberg (1990) in the US; Gregoryand Collier (1996) in the UK; Butterworth and
"" Gist (1992. 1994) examines lhe audilee's regulatory com-plexity and finds proxies for Ihi,s factor to he significant ande,\pli(,-ablc ill terms of scale economies and specialisation eJ'-t'ects. Iyer and Iyer( 1996) examine lhe impact of the Big Eightmergers on tees and find none,
- Craswelt and Francis (1999) conclude, following Dye's(1991) anaiylical work, thiit the public disclosure of audit feesin Australia precludes initial engagement discounting ,'iueh asobserved in the U.S. However, ihis conclusion is not consistentwiih the UK evidenee of Gregory and Collier (1996) whoreport a significant discount in a selting where audit fees aredisclosed,
'' There is some evidence that this general finding is contin-gent upon the type of NAS supplied and confined to corporatefinance and tax services rather than consultancy services(E/,zamel et al,. 1997),
Houghton (1995) and Crasweli and Erancis (1999)in Australia. DeAngelo's (1981b) model predictsthat low-balling will occur. Because audit costfunctions are unobservable, fee cutting on initialengagements is used as a proxy for fees cut belowthe cost of conducting the audit. This may result inmodel mis-specification. A significant fee reduc-tion in the initial engagement year is observedin both the US and the UK (Simon and Erancis.1988: -24%; Turpen, 1990: -19%; Ettredge andGreenberg. 1990:-25Vr; Gregory and Collier. 1996;-22%). However, this is not found in Australia.^
Studies that use artificial markets includeSchatzberg (1990. 1994) and Schatzberg andSevcik (1994). Schatzberg (1990) flnds evidenceconsistent with DeAngelo's (1981b) predictionthat low-balling will occur when transactions costsare positive. Schatzberg (1994) and Schatzbergand Sevcik (1994) extend this work to examine therelationship between low-balling (price) and audi-tor independence (quality) and find evidence thaitransactions costs are not a necessary condition forlow-balling to occur. An alternative rationale is theexistence of cross-sectional variation in audit costand quality and an informational advantage thataccrues to an incumbent auditor-client pair regard-ing future variations in these audit dimensions.
The impact of NAS provision has been the focusof several studies including Simunic (1984),Palmrose (1986b), Parkash and Venable (1993)and Davis, Ricchiutc and Trompeter (1993) in theUS; Ezzamel, Gwilliam and Holland (1996, 1997)in the UK; Barkess and Simnett (1994) inAustraiia; and Firth (1997) in Norway. These stud-ies generally show a positive relation betweenaudit and non-audit fees,^ which is interpreted bysome authors as due to knowledge spillover effectsand/or audit production efficiencies and a price-elastic demand for audit services. While other au-thors dispute this interpretation, a satisfactoryalternative has yet to be proposed. Further, usingproduction function data that allows them to con-trol for audit effort. Davis et al. (1993) do not finda significant relation, suggesting that the link is notdue to a pricing premium. Parkash and Venable(1993) distinguish between recurring and non-re-curring NAS. arguing that only recurring NAS arelikely to result in a reduction in perceived auditorindependence. They find that auditees purchasehigher levels of recurring NAS when they engageindustry specialists, which suggests that the selec-tion of an industry specialist is a quality signal thatpermits the auditee to purchase higher levels ofrecurring NAS than would otherwise be the case.
Organisational differences can result in differ-ences with respect to factors that determine thesupply and demand, and thus the fees, for auditservices. A number of studies have examined thedeterminants of audit fees in the context of the
248 ACCOUNTING AND BUSINESS RESEARCH
public sector (Baber, 1983; Beck and Barefield.1986: Baber, Brooks, and Ricks. 1987: Rubin.1988: Ward, Elder, and Kattelus. 1994: Sanders,Allen and Korte, 1995: Deis and Giroux. 1996:and Bandyopadhyay and Kao. 1998).^ These stud-ies are all conducted in North American settings,most frequently the municipal audit tnarket. It isfound that, in addition to the determinants of auditfees in the private sector, additional variables thatreflect the unique aspects of the public sectorenvironment have significant explanatory power(e.g., political factors).
Finally, a recent development in the literature isa focus on the impact of auditor expertise and spe-cialisation. Some studies have found that auditorswith a specialism in a particular sector receive anaudit premium, but others have found that such au-ditors charge lower audit fees. In an early USstudy, Palmrose (1986a) found no evidence of an"industry specialism' premium. Using a large sam-ple of Australian listed companies, Craswell.Francis and Taylor (1995) attempt to disentanglethe two components of the Big Eight fee premium:the general brand name premium and the industryspecialisation premium. Three levels of audit qual-ity are posited and supported by their evidence: atthe highest level specialist Big Eight firms, thennon-specialist Big Eight firms, then non-Big Eightfirms. Matthews, Jubb and Houghton (1997) ex-tend this work to investigate the structure in themarket for audit services in Australia based on thetraditional Big Six/non-Big Six dichotomy and aspecialisation definition of 20% of state industryaudit fee market share, i.e., a four-sector system.Their audit pricing evidence suggests that thesefour sectors collapse into two levels of audit qual-ity. The higher level includes specialist Big Six,non-specialist Big Six and specialist non-Big Six,while the lower level comprises non-specialistnon-Big Six audit firms.^
Using fee data from listed Hong Kong compa-
^ While this paper was under review, we became aware of aworking paper hy Clatworihy, Mellett and Peel (2000) thai ex-amines audit tees in UK NHS trusts. This is n market in whichauditors are appointed by the Audit Commission and privatesector auditors are in the minority. Their model explains 41^cof observed fee variation. Unusually, they find a significantnejiative relationship between audit and NAS fees, supportingthe 'knowledge spillover' hypothesis. No evidence is found ofa Big Six auditor premium. They also report that the ratio ofauditor foes to turnover is less than half that for private health-care companies. This finding is attributed to differences inaudit risk, supply-side factors such as labour cost differentialsand/or demand-side factors, such as the existence of a domi-nant purchaser and regulator.
" Ritson. Jubb and Houghton (1997) develop a continuousmeasure of the extent of change in industry specialisaiion andHnd this variable lo be significant in a mode! of auditorchange. Specialisation is measured as the percentage of louilrevenues earned by the auditor from the auditee's industry(Ritson et al., 1997:10), a measure that avoids the use of a sub-jective cut-off rule.
nies, DeFond, Francis and Wong (2000) find evi-dence of Big Six premia both for general brandname and for industry specialisation. Interestingly,however, they find that a specialist non-Big Sixfirm in one sector discounts fees relative to otheraudit firms. They conclude that Big Six brandname reputation is a necessary foundation onwhich to extract a fee premium based on industryspecialisation.
Researchers have also investigated other auditmarkets that are less dominated by the Big Six.Cullinan (1997, 1998) examined the effect of in-dustry expertise on audit fees in the US multi-etn-ployer pension plan market, a market in which theBig Six firms have a relatively small market share.Results indicated that non-Big Six firms with in-dustry expertise received a fee premium over non-specialist firms, whereas Big Six firms with largermarket shares did not. This suggests that non-BigSix firms may be able to benefit from market spe-cialism in niche assurance service markets. Earlier,Ward et al. (1994) had found that an 'auditor ex-perience' variable was positively associated withaudit fees in their study of US municipalities. Thestudy on school district audits in Texas by Deisand Giroux (1996) found that auditors with greatermarket share charged lower audit fees, as didPearson and Trompeter (1994) in their study of theUS insurance company audit market. Thus, over-all, the evidence for an "expertise" audit fee premi-um is somewhat mixed.
3. Methods3.1. Audit risks in the charity sector
Before describing the audit fee model adopted inthe current study, it is necessary to discuss the na-ture and extent of audit risks in the charity sectorsince these differ somewhat from those encoun-tered in the private sector.
By law, charity trustees have similar responsibil-ities to company directors (i.e. safeguarding assets,annual reporting, compliance with relevant legisla-tion and other regulations, and the prevention anddetection of fraud and error in their financial state-ments by means of internal control systems).Auditors* responsibilities are laid down in statute,the main legislation being the Companies Acts1985 and 1989. Charities Acts 1992 and 1993, andThe Charities (Accounts and Reports) Regulations1995, apd in professional auditing standards issuedby the Auditing Practices Board. Litigation againstauditors in the private sector has become a majorconcern for practising firms in recent years, evi-denced by the 1997 £53m out-of-court settlementpaid by BDO Binder Hamlyn to ADT, a third partyplaintiff. The decision in the ADT case (ADT Ltd vBDO Binder Hamlyn [December 1995], unreport-ed), that an auditor may owe a duty of care to athird party if he makes statements regarding the
AUTUMN 2001 249
audited accounts to that party, caused audit firmsconsiderable anxiety, It seemed to go against thelandmark Caparo decision of 1990 (CaparoIndustries pic v Dickman and Others \ 1990|. I AllER 568) which limited the auditor's duty of careto shareholders as a body (i.e. not to individualshareholders/investors, and certainly not to thirdparties).
Case law suggests therefore that, provided theauditor does not actually assume a duty of care toa third party relying on audited financial state-ments, his duty of care is restricted to those withwhom he has contracted to carry out the audit.According to the Caparo decision, in order for anindividual to take legal action against an auditor,there must firstly be proximity, in the charity sec-tor there is no body of shareholders and thereforeno obvious party to sue an auditor for negligentwork. Gordon, Greenlee and Nitterhousc (1999),in their useful overview of the regulation of UScharities, similarly affirm that, under US legisla-tion, 'individual donors have no standing to bringsuit against charitable organisations in court'. A re-view of UK case law (Sweet & Maxwell's CurrentLciw Cases Database, 1986 to date) failed to revealany cases involving auditors of charities beingsued; the vast majority of the cases dealt with is-sues such as charitable status, property and taxlaw. These observations suggest that litigation lossmay not be a key factor in charity audit risk,though it is possible that the courts might beprepared to extend the duty of care in the case ofvoluntary/public sector bodies. However, 'reputa-tional loss' may be an important consideration inauditors" overall risk assessment.
The external audit of charities also presents risksthat are peculiar to the sector. The AuditingPractices Board (APB) issued a Practice Note(Practice Note 11, October 1996) in which theyidentify five inherent risk factors requiring partic-ular consideration by auditors of charity accounts.First, the extent and complexity of regulation af-fecting the voluntary sector is high, which increas-es the risk that either trustees or directors mayunintentionally breach regulation. Tax rules are es-pecially complex in this area as can be witnessedby the extent of case law arising in recent years.Second, the significance of donations and cash re-ceipts presents problems for the auditor in terms ofvouching completeness of income and controlsover cash handling. Third, the uncertainty of futureincome, whether the source is voluntary or grant-based, creates difficulties for the auditor in assess-ing going concern status. Fourth, the fact thatmany charities rely on voluntary workers, fund-raising on the charities' behalf from widespreadbranches and retail outlets, is a significant risk fac-tor. These volunteers are not controlled by the re-porting entity in the way that employees are, and
their skills, competence and integrity cannot bereadily judged. Finally, the auditor must pay atten-tion to the charity's governing documents to en-sure that it is operating according to its objects,that its trustees are complying with their designat-ed authority, and that its financial activities arecompatible with any restrictions laid down in thosedocuments.
3.2. Charity audit fee modelThe first objective in the present study is to de-
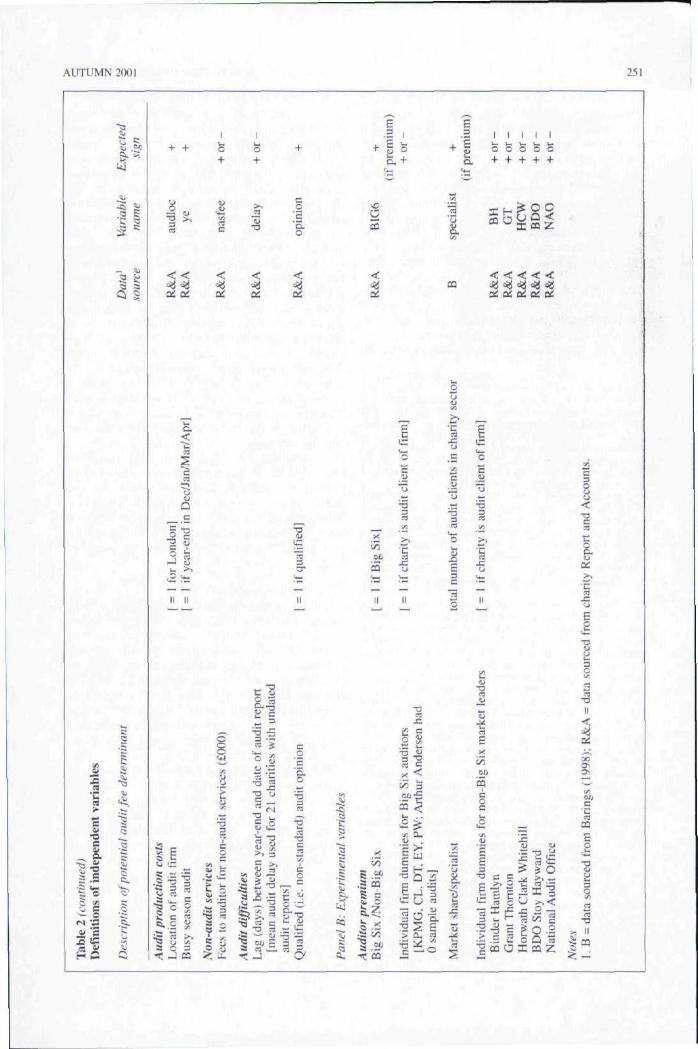
velop and estimate a model of charity audit fee de-terminants. In common with previous studies, ourapproach is to seek to explain the cross-sectionalvariation of audit fees using an OLS regressionmodel. Much of the logic of previous work on pri-vate sector companies is relevant in deriving ourmodel but it is also necessary to consider addition-al potential explanatory variables to capture theunique aspects of charifies. For ease of exposition,the variables used in the basic charity audit feemodel are classified into five mutually non-exclu-sive categories: auditee size, auditee complexity,audit production costs, non-audit services andaudit difficulties and, thus, the general model spec-ification can be summarised as:
audit fee = f (auditee size, auditee complexity, auditproduction costs, non-audit services,audit difficulties)
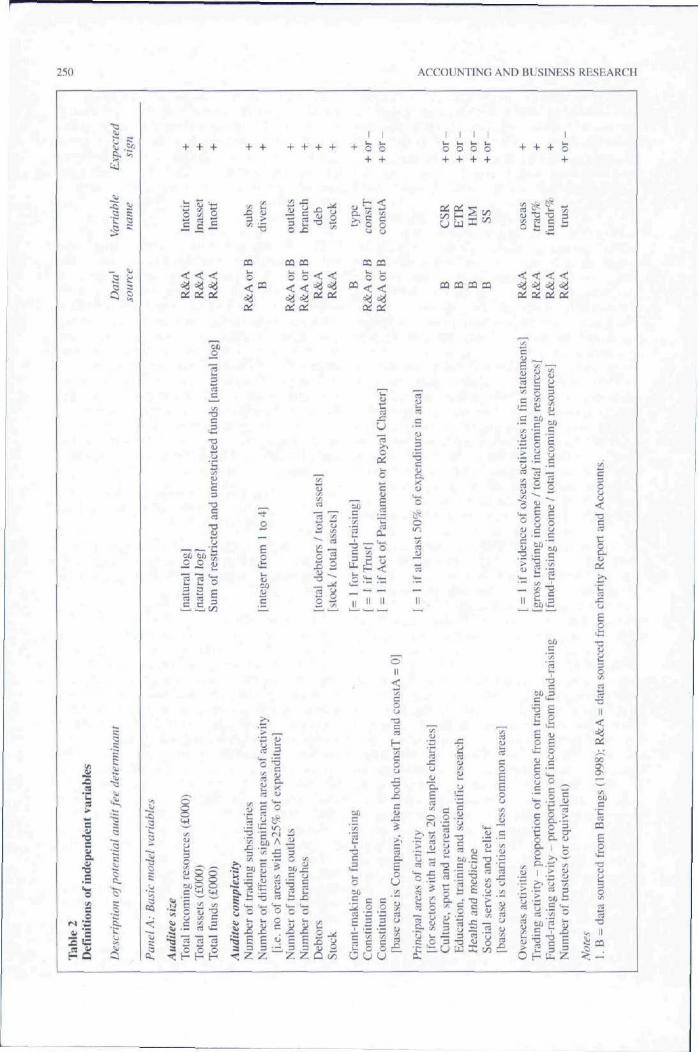
Table 2 (Panel A) provides a full listing of the spe-cific proxy variables used, their definitions, vari-able names, the expected coefficient signs and thesources of the data.
3.2.}. Auditee sizeA financial audit involves the review of the ac-
counting and internal control system and of the fi-nancial transactions of the organisation. Largerorganisations will usually undertake more transac-tions and have larger balance sheet assets and lia-bilities, thereby requiring more audit work. Thus,it is expected that larger charities will generally beassociated with larger audit fees. In private sectorstudies, auditee size has often been proxied bycompany total assets (e.g., Taylor and Baker, 1981;Brinnetal, 1994:Firth, 1997) and occasionally bytotal sales (e.g., Haskins and Williams, 1988; Chanet al., 1993). in public sector studies of local gov-ernment audits, population has been used as thesize proxy (e.g.. Rubin, 1988; Baber et al.. 1987).
The measurement of size in the charity sector isnot straightforward. First, most charities are by na-ture service-providers so the link between outputand assets is not well defined. This link is furtherobscured once the difference between the twomajor types of charity is considered. Grant-makingcharities tend to have relatively high asset levels,but these are often investments of various types
250 ACCOUNTING AND BUSINESS RESEARCH
I IU i—C O
I I I Ik- L. I. l io o o o
o S o^. i2
X)3
Q ;
CQ CQ
O G
< <
ac QC
CQ
ac
03 P3
o o< <
CC DC
03 03 03 CQ
Iu
1
Oft
o«3rt
,
log
ral
3
•oV•c
rest
oE3
CQ
"rtO
ebto
rs
-a
[tot
al
•yilyirt
tota
l[s
toci
'—1
ing
y.
'S
r Fun
d
II
Tru
st;
1!
llai
k-rtCu
u -
Act
o
11
w "O "O•y. rt cO t .3
c
•a
-3i• c
°"§
••J
xi-;^
p S o
r-i i-
^ ^ ^^ C O
- s y =5;.E ^ 5
,*!» __ ^ ^ ,•3 rt rt rta c c 3^ F h- H
.5" CD bu !:: ^
G o o. , i_ u, O v- ^ -j-,
« 5j W C ^ 1> i-
2i X X XX o^ E £ ^ E E Xa 3 3 -1 3 3 oj-^ Z Z Z Z Q
•ortCOa.
•ais
ing
-ac^ 3
0OJJ
akin
EcL I
tion
titu
c
U
tion
3
y.C0u
©II
tIS©•a
yiCQ
.£
y, w
hen
b(
crtCE0
<y.
ase
i
••J
OJ
rt
>
rt
as o
f1
are
ipa
c•ca.
0.1
hari
ti
uD-
ist
20 s
am
*_,rt
wit
h:t
ors
•u
u.' -<—•
reat
ion
• 0
-0
jrt a
n
Ct.
3
" 3
U
earc
h
<u
id s
eien
tifi
re00c
trai
niio
n.ea
t
3-ain
c
med
ian
d
"rtux;
lief
-a
ices
ase
rvi
ial
0in
rt
n ar
e;
0c
in l
ess
CO
y.
• ^
' u
s ch
aas
e i
CJ
OJ
reX
!y:
iviti
e:
rt:/;rt
i J
>
rt
E
le f
ro
0c
3rti
on o
f i
a.cQ .1
acti
\
ouc
• nc3
'3
V -
E.£i>
EG
; • •
prop
orti
ot
1>-•
.'ti
acti
v
=0
-rai
• 0
equi
vale
n
0^-^y.
•ust
ee
u—01_UX
3
z
1...
30(A
rtT3II
<f
=%sQ
00
a\
^v01
are
CQ
5"O
ourc
e
rere
-0i- II
^ -
AUTUMN 2()01 251
^ £
^o
O
g5 1
a: tc
s
H«
oc
u
hari
i
o
.A
c
3
O
lber
a l
eo'c'Q.o
c
"a
C o -5 fli _^ v:
13
- B
! "§• - :^ S E
Bfl T3 ^ _
5 a "^
< I I I I
o o S o S
X H ^ g 9
J E
DO
CQ
O
S £
E nO ^^
S O
>.<to ^
O-S
CQ 2
252 ACCOUNTING AND BUSINESS RESEARCH
and. therefore, are reasonably straightforward toaudit. By contrast, fund-raising charities have rel-atively few assets but there are significant controldifficulties associated with funds raised. Given theproblem of using assets as the size measure, weuse total incoming resources (the closest charityequivalent to company sales), while also recognis-ing the major difference between grant-makingand fund-raising charities via a dummy variable{type). This dummy takes the value of 1 if the char-ity is fund-raising and 0 if grant-making so thehigher audit cost associated with the former will bereflected in an expected positive coefficient. Asthis dummy variable might more usefully be con-sidered an indication of complexity we classify itas such. To test whether the results are sensitive toour choice of size measure, we also use measuresbased on total assets and on total funds (i.e., the
'' They report a bivariate correlalion between sales (S) andassets (A) of 0.98 but do nol report the results of any ftirthcrdiagnostic tests for multicollineurity. They merely assert that"The tact that the slantlard errors [prestiniably toefficienls wasintended] on S and A in Table 3 are slalistically signitlcani atan acceptable level suggests thai it (i.e.. tnulticollinearity) isnol a serious problem". Further. Gregory and Collier (1996:20)report having problems with multicollinearity when they usedthe Pong and Whittington model.
"* A Mackinnon-While-Diividson (see Gtijarati. 1995; 265)test of functional form rejected the linear model and aceepleda log-linear model as potentially appropriate. Euriher evidencefrom a Durbin-Watson test and the Ramsey RESET specifica-tion test (see Gujarati. 1995: 462 ff.) confirmed the linearmodel as inappropriate, but both log-linear and quadraticmodels were acceptable. However, the level of heteroskedas-ticity was much higher for the latter (as Pong and Whittington,1994. conceded).
" A number of standard control variables relating to auditrisk are omitted from the models. Some of the omitted vari-ables (e.g. "loss-making", return on investment) are not rele-vant to non-profit organisations such as charities. Parallelmeasures based on operating surplus/deficit would not capturesimilar risk aspects since charities expect to report deficits.Indeed a deficit could be seen as a measure of success inachieving tbe aims of the charity! "Liquidity' measures, suchas current and quick ratios, are also omitted frotn our modelspecification. In prior studies, the coefficients on these twovariables are typically found to be significantly positive andnegative, respectively. This suggests that either the two vari-ables are collinear (quite likely given their construction) orthat they are proxying for something other ihan liquidity. ForexatTiple, the current ratio includes botb stock and debtors,both of which are difficult to audit suggesting a positive rela-tionship with audit fees. On the other hand, high liquidityshould reduce the likelihood of firm failure, (hereby reducingaudit risk and implying a negative relationship with audit fees.In view of the difficulty in interpreting results for these vari-ables, we have preferred to include stock and debtor measuresseparately in our mixlel specification.
'- Many prior empirical papers have taken the square root(or log) transformation of the number of subsidiaries.Although this has not been adopted in the present paper, addi-tional testing shows that the results are not sensitive to this. InModel I a, for example, adoption of the square root proxy leadsto one very minor change in the significance of variables: tbet-statistic for SS changes from 1.98 to 1-9(3 giving significanceat the lO'yf rather than 5'^ level (in fact the p-value changesfrom 0.049 to 0.059).
sum of restricted and unrestricted funds).Audit costs are likely to benefit from economies
of scale since the cost of assessing the control sys-tem is relatively fixed in nature and sampling the-ory dictates that the cost of transaction testing neednot increase linearly with the number of transac-tions. Thus, the use of a non-transformed size vari-able may not adequately reflect the fee-sizerelationship. Most previous studies have adopted alog transfomiation of the size variable to reflectthis non-linearity. However. Pong and Whittington(1994) argue against the use of a log transfortna-tion of variables, such as size, without explicitconsideration of the underlying relationship. Theyaccommodate economies of scale by using a non-transformed asset variable in addition to itssquared equivalent. They also recognise the diffi-culties associated with each of the two main sizeproxies by incorporating both sales and asset vari-ables in their model. They argue that the resultingmulticollinearity between assets and sales does notpresent a serious problem.*^ Consequently, we alsoassess the usefulness of incorporating both vari-ables in our models.
To establish the most appropriate functionalform of the size measure, preliminary tests of therelationship between charity audit fees and totalincoming resources were undertaken.'" These con-firmed that a linear model is inappropriate, but thatboth a log-linear model and a quadratic model areacceptable: results for both models are reportedlater.
3.2.2. Auditee complexityIt is likely that the level of audit work will in-
crease with the level of auditee complexity. In pre-vious private sector studies, proxies forcomplexity have included the number of sub-sidiaries, the number of industries in which thecompany participates, the number of differentcompany locations and variables relating to assetcomposition. To the extent that relevant parallelproxies exist in the charity sector, they have beenused, and u number of proxies unique to the sectorhave also been identified."
The parallel complexity proxies in the charitysector are the number of trading subsidiaries(.VH/W),'" the number of different significant areasof activity Uliyers). the number of trading outlets(outlets) and the number of branches (branch).The equivalent asset composition proxies, indicat-ing the importance of the relatively 'difficult toaudit' asset-classes stock and debtors, were tneas-ured as the proportion of total assets representedby debtors (deb) and by stock {stock).
Several unique dimensions of complexity in thecharity sector may impact on the level of auditfees. First, the fundamentally different nature offund-raising and grant-tnaking charities was as-
AUTUMN 2001 253
sessed by incorporating the npe binary variable(discussed in the previous section): the cla.ssifica-tion in Barings was adopted here.
Second, it can be hypothesised that a charity'sconstitution might affect the work required of theauditor and, consequently, the audit fee. This couldresult from additional reporting requirements togovernment or regulators, or perhaps from differ-ing trustee (or equivalent) needs for audit assur-ance. This was explored by categorising thecharity as a company, a trust, or one whose consti-tution was set up by Act of Parliament or RoyalCharter. This split was incorporated using dummyvariables for the latter two categories (constT = Iif the charity is a trust. consfA = I if Act ofParliament or Royal Charter), leaving companystatus as the base case.'^ A priori, the expectedsigns on these coefficients are difficult to predict.
While the diversity of activities within a charityis one potential audit fee determinant (alreadyproxied by divers), the specific area of charitableactivity might also be important. This is analogousto the argument supporting the use of industrydutnmies in private sector audit fee studies (e.g.,Simunic (1984) and Barkess and Simnett (1994)both found evidence of significant industry fac-tors). To as.sess this, classifications were extractedfrom Barings and dichotomous variables con-structed for the major areas of activity representedin the sample charities. A charity with at least 50%of its expenditure in a particular area of activitywas classified as having a major interest in thatarea. Five areas of activity had at least 20 samplecharities with a major interest in the area, so wereconsidered for inclusion in the model. One of theseareas, "internationar. was strongly correlated withanother variable (oseas) and was excluded fromthe model as the latter was considered more effec-
'•* The coefficieni on consiT measures the incremental auditfee (log transformed) ft)r charities with a 'trusi' constitutionabove the audit fee for the base case of ii charity with a 'com-pany' constitution: a similar argument applies to consiA.
'"' It is possible that the linancial statements of housinggroup chariiies may differ significantly from other charities(e.g. the amount ol' land stock tnay be expected to be muchhigher) and that this may affect some of the key ratios. Thesensitivity of the results to this was tested in two ways. First,inclusion of an extra dummy variable far charities in this sub-sector was incorporated in ihe basic model 1 la). The coeffi-cient on this dummy w;is insignificant (t-stal - 0,56) and therewas a minor change in the significance of jiLst one of the con-trol variables (divers, marginally ceased to be significant: pvalue = 0,115), Second, the regression was re-estimated ex-cluding all housing group charities: there were no changes invariable significance. We are grateful to one of the referees fordrawing this point to our attention.
' A charity auditor suggested that the variety of differentsources of income also affects the level of audit fees. To Iheextent that charities in a particular sector have similar sourcesof income, this aspect is proxied by ihe "area of activity'dummy vatiables.
tive in capturing charities with significant overseasinvolvement. Thus, four dummy variables repre-senting major areas of activity were included in themodel; these were "culture, sport and recreation(CSR)\ "education, training atid scientific research(ETR)\ "health and medicine (//A/)" and "socialservices and relief (SS)' .^'^ Charities within otherareas of activity acted as the base case.
Other aspects of charities" operations that mayitnpact on audit fees include involvement overseas,significant trading activities, and the importanceof fund-raising activities.''^ Overseas involvement(oseas) was measured dichotomously. taking avalue of 1 if there was any evidence of significantoverseas activity within the financial statements.Trading activities are broadly incorporated in themodel through the variables "number of tradingsubsidiaries' (suh^-) and "number of trading outlets'[outlets). As these two variables are rather crudeindicators of trading activities, an additional vari-able indicating the relative importance of tradingin generating income was also investigated. Thiswas measured as the proportion of total incomingresources relating to gross trading activities(trad%). Similarly, the binary variable (type) basedon Barings categorisation of charities as fund-rais-ing or grant-making only crudely captures the im-portance of fund-raising activities within a charity.So, to capture more accurately the potential in-creased audit costs associated with the difficultiesin control of fund-raising activities, an additionalcontinuous warmble fundr% was incorporated; thismeasures the proportion of total incoming re-sources relating to fund-raising. All three addition-al variables (oseci.s, trud% and fundr%) areexpected to have positive coefficients.
Finally, it is possible that the number of trustees(or equivalent) might affect audit risk. On onehand, it could be argued that a larger number oftrustees might lead to more rigorous governanceand a commensurate reduction in audit risk. On theother hand, a large trustee group might lead toa reduction in each individual's perceived respon-sibility and perhaps fewer meetings, thereby re-sulting in weaker, less robust, organisationalgovernance. The number of trustees was capturedin a variable trust, whose expected sign is, a priori,indeterminate.
3.2.3. Audit production costsIn common with private sector audits, two as-
pects of the audit process are expected to have aneffect on audit fees. The location of the audit staffundertaking the audit will affect the costs of em-ploying audit staff, with higher costs associatedwith the London area. This is proxied by the officelocation of the audit firm undertaking the audit asindicated in the audit report. A dichotomous meas-ure [audioc) is used taking the value I if the location
254 ACCOUNTING AND BUSINESS RESEARCH
was London and 0 if elsewhere, and a positive co-efficient is expected.""
The majority of UK private sector companieshave either December or March year-ends, causingconsiderable seasonality of audit work for auditfirms. It is hypothesised that audits performedaround this busy period will be more costly be-cause of the increased demand for auditors' servic-es. This potential 'busy season" factor is capturedby a dichotomous year-end variable (_v ) that has avalue of 1 if the year-end is in December. January.March or April and 0 otherwise.
3.2.4. Non-audit servicesMany private sector studies in the US (e.g.,
Simunic, 1984; Simon, 1985; Davis et al.; 1993).in Australia (e.g.. Barkess and Simnett. 1994), inNorway (Firth, 1997} and in the UK (Ezzamel etal., 1996) have observed a significant positive as-sociation between audit fees and payments to au-ditors for non-audit services. Several explanationsfor this positive relationship have been proposed,including knowledge spillovers between audit andnon-audit services, but a consensus view has notemerged. The association in the charity sector isinvestigated by inclusion of a continuous variable.the fees payable to auditors for non-audit services(nasfee), in the audit fee model.
3.2.5. Audit difficultiesA qualified audit report, or a long lag between
year end and audit report completion, often re-flects difficulties in the auditee organisation (e.g.,fraud or going-concern problems), potentially in-creasing audit risk. It is expected that this wouldlead to an increased audit fee either because addi-tional audit work is required, or to reflect an ele-ment of insurance premium to compensate theauditor for the additional risk. Positive coefficients
"• The location of ihe charily head office, taken fromBarings, was investigated as an alternative proxy since a sim-ilar variable had been used in a previous study (Brinn et al..1994). This was strongly correlated with audloc so was ex-cluded from the model.
'"' As a sensitivity check, Ihe basic model (Model la) wasalso re-estimated excluding 18 charities with large audit de-lays, taken as longer than a 95*^ one-sided confidence interval(240 days). There were no changes in variable significance.
'" This somewhat lax attitude to audit reporting demonstrat-ed by over \{)7f of the sample charities provides another illus-tration of relatively poor control procedures. The basic model(Model la) was re-estimated including a dummy variable forthose charities with an unsigned audit report. The coefficienton this dummy was insignificant (t-stat -0.12) and there wereno changes in the significance of" other variables.
'^ Mean value imputation is a strategy for dealing withmissing values withoui loss of observations (Little and Rubin.1989). As a sensitivity check, the basic model (Model la) wasre-estimated excluding all 22 charities with an undated auditreport. There were three minor changes in the significance ofcontrol variables: divers and slock ceased to be significant,and the significance of trad'Tc reduced to 5%.
on proxies for these two variables have been foundin previous studies of private sector firms (e.g.,for audit delay: Chan et al., 1993; Ezzamel et al.,1996). However, in charity audits, there is usuallyless pressure to complete the audit within a shortperiod after the accounting year-end. Thus, forcharities, a greater audit 'delay" might also arisebecause the audit firm had been able to schedulethe audit to coincide with 'slack" periods therebybenefiting from reduced marginal staff costs. Thiswould suggest a negative relationship betweenaudit fee and delay. The impact on the level ofaudit fees of a qualified audit report, here taken asany non-standard features in the audit report, is as-sessed using a dummy variable (opinion). Thepotential Impact of audit delay Is explored by in-cluding a continuous audit delay variable (delay),measured as the number of days between the year-end and the date of the audit report.''' Interestingly,the audit report was undated (and. with one excep-tion, also unsigned) for 22 of the sample chari-ties;'*^ the mean audit delay of the other charitieswas imputed for these charities.''*
3.3. Experimental variables concerning auditorpremia3.3.1. Big Six brand name premium
Once a basic model of the determinants of char-ity audit fees has been determined, the presence ofauditor premiums can be assessed. Four specifichypotheses are investigated. Hypothesis one inves-tigates the presence of a large firm audit premiumin the charity sector. The audit market structurewithin the sector is especially useful for exploringthis issue since Big Six auditors do not dominatethe market to the extent that is true for the privatesector. In particular, none of the Big Six can be de-scribed as having expertise in the sector, based onthe usual definition of expertise indicated by 10%market share (e.g., Palmrose. 1986a; Craswell etal., 1995). Thus, any observed premium can be at-tributed to brand name rather than any specificsector expertise.
The hypothesis can be stated in alternative formas:
Hj: The brand name of large audit firms (the BigSix) is rewarded by a fee premium abovenon-Big Six firms in the charity sector.
To test for the existence of a large firm audit pre-mium, a binary variable (BIG6) to identify thosecharities that were audited by one of the Big Sixauditors is incorporated in the regression (Model Ivariants).
If evidence of a premium is found, a fmer levelof detail can be investigated to see whether there isany diversity in reward amongst the Big Six. Thisleads to the second hypothesis:
H^: Individual Big Six firms are rewarded by a
AUTUMN 2001 255
brand name fee premium above non-Big Sixfirms in the charily sector.
This is tested by incorporating dummy variablesfor each of the five Big Six firms (KPMG, CL DT,EY, PW) that are active in the charity sector(Models 4 to 6).
3.3.2. Specialist premiumWhile Big Six auditors do not dominate the
charity sector market, they still command relative-ly large market shares (e.g. KPMG audits 6.4% ofthe Barings 'top 3000"). Ideally, to assess the rela-tive importance of brand name and industry spe-cialisation, a joint analysis would be applied. Theapproach usually adopted to carry out this jointanalysis is to incorporate a 'specialist" variable inaddition to the Big Six dummy variable, with aninteractive term Big Six*"specialist' to see if BigSix specialists earn a premium over non-Big Sixspecialists. Unfortunately, there is likely to be sig-nificant collinearity between 'specialist" and BigSix variables. This can lead to increased standarderrors for the coefficient estimates, tending to re-duce statistical significance, and also the coeffi-cients can be more sensitive to sample data, to theextent that coefficient signs can change on intro-duction of the collinear variable(s) (Gujarati,1995:325-335).
In the current study there was indeed significantcollinearity between the Big Six and 'specialist'
" For example, in the 'All Charities' model (Model la) ihecoefficieni on BIG6 is ().0%3 (t-slat ^ 1.26) when thi.s variableis included wiihoul the spt'cialisi variable. Including the spe-cialisr variable instead oi' BIG6 gave a coefficient estimate of0.0014 (t-stal= 1.80, significant al the 10% level). When bolhvariables were incorporated together, without an interactiveterm, the coefficient for BIG6 changed sign to -0.0871 (t-stat= -0.71) and for speviutis! became insignificant, even thoughit increased in size to 0.0020 (t-stal = 1.62). Inclusion of an in-teractive term as well gave coefficients of -0.1442 (t-stat =-0.53) for BIG6. of 0.0018 (t-stat = 1.17) for specialisl and ofO.(X)O6 (t-stat = 0.23) for the interactive lerm B/G6*spenalisl.For Fund-raising charities (Model 3), the coefficient on BIG6included on its own is 0.1701 (t-slat - 2.00, significant at the5% level). Including the specialisl variable instead of B!G6gave a coefficient estimate of 0,0019 (t-stat- 2,36, significantat the 59c level). When both variables were incorporated to-gether, without an interactive term, the coefficient for B/G6changed sign to -0.0200 (t-stat = -0.13) and for specialisl be-came insignificant, even though it increased in size lo 0.0021(t-stat = 1.35), Inclusion of an interactive term as well gave co-efficients of 0.1716 (t-,slat = 0.60) for S/G6. of 0,0031 (t-sta!= 1.76, significant ai the 10% level) for specialisl and of-0,0023 (t-stat = -0,84) for the interactive term BlG6*spe-cialisi. Collinearily between BIG6 and specialisl variables(and the interactive term) was evident in both seis of models:relatively high condition numbers associated wiih bigh vari-ance proportions were observed (Belsley et al,, 1980, Chapter3), For example, in the 'All Charities' models, a conditionnumber of 12,8 was associated with variance proportions of0.83 and 0,91 for BIC6 and xpecialisr. respectively. With theinteractive term included, the condition number of 26.52 wasassociated with variance proportions of 0.70 (B/G6). 0,34{specialisl) and 0.86 {BIG6*specialist). respectively.
variables. Introduction of the 'specialist' variablechanged the sign of the Big Six coefficient to neg-ative and reduced the significance of both vari-ables.-" This means that sensible interpretation ofthe coefficients on these variables was impossible.In view of this, an alternative approach was adopt-ed, in which separate regressions were estimatedfor Big Six and non-Big Six audit firms: thismethod has been used in previous studies of auditspecialist premia {e.g., Craswell et al., 1995:310-311). In the separate Big Six regressionmodel (details not reported here), there was no ev-idence of a fee premium for expertise in Big Sixfirms. This is not too surprising, given that none ofthe Big Six firms has a particular comparative ex-pertise/specialism over the other Big Six firms.Specialism in non-Big Six firms is discussed fur-ther in the next section.
3.3.3. Non-Big Six specialist premiumThe reduced role of Big Six auditors in the char-
ity sector allows pricing by non-Big Six audittirs tobe investigated, and, in particular, whether there isany evidence of reward for expertise or specialismin the sector. Certainly, some non-Big Six auditfirms (e.g. Binder Hamlyn, Horwath ClarkWhitehill) market themselves on the basis of spe-cific expertise in the charity sector (see adverts onpages 1.4, 8.7, 8.19 and others, in Barings (1998)).but whether this is rewarded in audit pricing is un-clear.
Cullinan (1998: 49-50) discusses various alter-native perspectives on audit pricing and the poten-tial impact of market share conditioned on auditexpertise. If there are no perceived differences inaudit expertise, the impact of higher market sharewill depend on the approach to pricing adopted byfirms. Cost-based pricing would yield lower auditfees as a result of economies of scale reducing per-client costs. If the audit market is characterised bya high degree of concentration, the few firms witha dominant market share could have monopolisticor oligopolistic pricing power, leading to higheraudit fees under market-based pricing. If there areperceived (and actual) differences in sector expert-ise, this will tend to increase overall audit firmcosts and the effect on per-client costs will dependon the number of clients in the sector. The impacton audit fees in a cost-based pricing environmentis indeterminate. In a market-based pricing envi-ronment, greater perceived (and actual) expertiseresults in higher value audits, for which clientswould be willing to pay more since this may re-duee agency costs. Thus, higher market share is asignal of greater expertise, which should result inhigher audit fees. As market concentration is muchlower in the charity sector than in the private sec-tor company audit market, there is less likelihoodof monopolistic/oligopolistic pricing by a few
256 ACCOUNTING AND BUSINESS RESEARCH
market leaders. Consequently, observation of a feepremium is stronger evidence that clients are will-ing to pay higher audit fees to firms with perceivedexpertise in the sector.
Thus, the third hypothesis focuses on non-BigSix firms (where brand name reputation is muchlower) and assesses the impact of expertise onaudit pricing in the charity sector:
H^: Non-Big Six audit firms with expertise arerewarded by a fee premium above other non-Big Six firms in the charity sector.
Expertise is proxied by market share, measured asthe number of charities within the top 2.620 thatare audited by the firm.-' A variable {specialist)representing the audit firm's mar]<.et share is incor-porated in a regression based on charities auditedby non-Big Six audit firms (Model 7).
If evidence of a premium for expertise is found,a finer level of detail can be investigated to seewhether there is any diversity in reward amongstthe non-Big Six market ]eaders in the charity sec-tor. This leads to the fourth hypothesis:
H^: Individual non-Big Six audit firms with ex-pertise are rewarded by a fee premium aboveother non-Big Six firms in the charity sector.
Market leadership was based on the ranking inBarings according to the total number of charitiesaudited, and the total audit fees charged (details inTable 1, Panel A). Five non-Big Six firms rank inthe top nine on at least (me of these two measuresand binary variables are incorporated in the re-gression for these firms (Model 8). Table 2 (PanelB) provides definitions of the experimental vari-ables, their names, expected coefficient signs andthe sources of the data.
3.4. Procedures for cotnparison between charityand company audit fees
The general regression model described aboveseeks to explain the factors within the charity sec-tor that contribute to the level of audit feescharged. A second important issue is to considerthe impact, if any. that the fundamental charitablenature itself might have on audit fees. Anecdotalevidence, prior expectations and preliminaryviews at the data gathering stage of the currentstudy all suggest that charity audit fees are lowerthan those paid by private sector non-charitablecompanies. There are at least three reasons whythis might be the case. First, the risks involved inauditing a charity are certainly different to. and
-' An alternative market share variable, based on total audiifees earned in Ihe charity sector (also taken from Baring.s,1998). was incorporated with similar (unreported) results.
-- An illustration of tbis was noied during data collection.Tbe charity 'Lloyds TSB Foundation for England and Wales'reported that 'Ihe auditors waived their fee for 1996".
might well be less than, those of a non-charitablecompany audit (see Section 3.1 above). Lowerrisks should lead to lower costs for the audit firmand commensurately lower audit fees are expectedif cost-based pricing is followed. Second, it seemslikely that charity audits might be seen by the au-diting profession as a way of supporting the chari-table sector, of 'giving back" to society. Thus, areduced level of audit fees would represent a formof altruism; in effect, a charitable donation is beingmade by the audit firm to the charity.-- Third, thereis the possibility that a lower 'market rate' forcharity audits might encourage audit firms to use]ess experienced staff and reduce audit time in try-ing to minimise losses incurred. The loH'er auditquality implied by this is of great concern in viewof the importance of accountability in maintainingconfidence in the charity sector, and of the key rolethat the independent audit plays in this.
To assess these alternatives, it is necessary tohave some 'hard* evidence on the relative size ofaudit fees in the charity sector. To our knowledge,this issue has not been systematically investigated.Thus our final hypothesis is:
Hji Charities pay lower audit fees than similar-sized private sector companies.
To allow for different organisational sizes, thebasic measure adopted for comparison is audit feescaled by organisation size. i.e.. audit fee perpound of revenue, with revenue measured as totalincoming resources (charities) and total sales(companies); two alternative scale tneasures. totalassets and total funds, are also used to check sen-sitivity. The usefulness of this ratio measure de-pends upon the assumption that marginal auditcosts are constant across the whole range of com-pany and charity sizes. Its limitation is that it doesnot recognise the expected economies of scale inthe audit process. If the size distributions of com-panies and charities are similar, scale economieswill not cause a major problem. However, as wefind that their size distributions differ significant-ly, it is necessary to control further for size to ef-fect a valid audit fee comparison. Initially, asimple size control was investigated by selectingonly the subset of companies that fell within thesize range (based on revenue) of our charity sam-ple. However, even within this truncated range thedistributions of companies and charities are signif-icantly different. There is a much larger concentra-tion of small charities, which would tend toincrease the observed mean 'audit fee per pound ofrevenue" measure for charities. This leads to a biasagainst the hypothesis that charity audit fees willbe lower.
One way to address this problem would be tomatch each charity within the sample with a singlecompany of similar size. However, this has the
AUTUMN 200! 257
limitation that the matched company may haveidiosyncratic audit risks. An alternative approach,preferred here, is effectively to match each charitywith an average similar-sized company (based ontotal revenue). This is achieved by using a boot-strapping method to control for the scaleeconomies in the audit process. This "manufac-tures' a closer size-distribution match between thesample of companies and charities within the sim-ilar size range. From the existing company sample,a stratified random sample was taken to mirror thedistributional properties of the charity sample.Effectively, each charity was matched with a ran-domly chosen company from the group of compa-nies of similar size and the mean audit fee for thecharity and company samples was computed. Thissampling process was repeated 1,000 times to re-duce the sampling bias that would be introduced ifjust one such sample were chosen. This enables adistribution of audit fee sample means to be de-rived, and both the mean and standard error of thedistribution to be estimated (Mooney and Duval,1993).
-' Almost identical results (not reported here) were oblainedfor a sample ba,sed on selecting every alternate charity in thetop 5(X) (n- 176). In tbis model one of the nine significantvariables in Model la ceased to be significant, namely SS witha very marginally insignificant p-vaiue of 0.101, Two of theother eight control variables increased slightly in signitlcance{(tivers to 5'7f. and stock lo I'ii ). The coefficient on the exper-imental variable BIG6 increased to 0.1184 but remained in-significant.
-** Of the charity sample, 84% had year-ends in 1997 and afurther 14% had year-ends in the following three months (to31/03/98). so 98% had year-ends in tbe 15-month period31/12/96 to 31/3/98 inclusive. The Barings publication dead-line means that some of its data, panicularly quantitative fi-nancial dala collected from financial statements, is not fromsources time-coincident wiib those used for the current study.For our charity sample. 58% of the financial statements usedwere coincident with those used in Barings; the rcsi were morerecent than ihose used in Barings by one year (37%). twoyears (4%) or three years (1%). The majority of data items(about 75%) used in tbe currenl study were extracted directlyfrom tbe accounts provided to us by tbe charities. With one ex-ception (auditor market share), the few data items extractedfrom Barings (e.g.. areas of charitable activity, grant-mak-ing/fund-raising categorisation and auditor market share) areof a categorical nature. All of these items are likely fo be rela-tively siable over lime, so the exaci matching in terms of year-end is not critical. Furthermore, charities provide additionaldata lo Barings (Barings. I998;6,III) so any non-financial dataincluded therein is likely to be based on more reccni informa-lion than Ibe available financial statements. While Ibe non-co-incidence in sources for some data items may introduce asource of error into tbe estimated models, we do not believethat ibese errors could be significant.
'-'' Tbis excludes finiincial companies and investment tmsls.Also, the fact that a proportion of sample charity year-ends fallin the tlrst three m(inths of tbe next calendar year (see footnote30) may introduce a small bias in the audit fee comparison.However, inflationary audit fee increases mean tbai this islikely to be a bias af^aiitsi {]nd'ing that charities pay lower auditfees than companies.
4. Sample selectionData from the UK was used, as legislation in thiscountry requires the disclosure of key variables, inparticular, fees for audit and non-audit servicespaid to the auditor. The sample was selected fromthe top 500 charities identified in the 1998 editionof Baring Asset Management Top 3000 Charities(Barings, 1998). This covers a wide variety of dif-ferent types of charity such as the British Council,Wellcome Trust, Oxfam, the Tate Gallery, trainingorganisations (e.g.. Construction Industry TrainingBoard), and some housing associations (e.g.,Notting Hill Housing Group). Entries are pub-lished in respect of the top 2,0(X) charities, but as acharity can qualify for inclusion on any of threecriteria (income, expenditure or funds) approxi-mately 3,000 are published in each edition; in the1998 edition there are 2,620 charities included.Our objective was to achieve a sample that wasrepresentative of the population of major UK char-ities. Given the economic importance of largercharities, all of the top lCK) charities ranked by in-come were included in our sample.-' In recogni-tion of the greater homogeneity expected incharities ranked between 101 and 500, every alter-nate charity was selected to give, overall, a strati-fied sample of 300 charities from the top 500.Based on charity income reported in Barings(1998), the top 500 charities accounted for ap-proximately 76% of the total income of £13.2bn ofthe top "3.000' charities. This suggests thai oursample should capture audit fee determinants for alarge and important part of the charity sector.However, it does not cover the large number ofrelatively small charities in the sector.
Most of the data items required for the study arenot included in Barings (1998), so a considerableamount of data had to be collected manually fromthe charities' annual reports and accounts (seeTable 2 for details). In June 1998, a letter was sentto each of the charities selected, requesting a copyof their latest annual report and accounts, with foi-low-up letters sent in July 1998. All replies re-ceived by September 1998 were included in thestudy.-"*
For the comparison of audit fees paid by compa-nies and charities, company data for 1997 year-ends were sourced from the UKQI list of industrialand commercial companies on Datastream.-^ Theparticular data items extracted were audit fees(Datastream item: 118), total sales (104), total as-sets (392) and shareholders' capital plus reserves(307). Companies whose revenue fell outside theobserved charity size range (based on total incom-ing resources) were eliminated. Thus, 236 largecompanies with sales above £440m and 30 smallcompanies with sales below £300,000 were elimi-nated to leave 1.084 companies.
258 ACCOUNTING AND BUSINESS RESEARCH
Table 3Sample summary
Rank in Barings 'Top 3000'Selection basisPossible sample size
Reason for exclusionAccounts not received from charityAudit fee = £nil/ other reason'Final sample
lypes of charity in final sampleFund-raisingGrant-makingTotal
Types of audit firm in final sample
Fund-raisingGrant-makingTotal
Notes
l-IOOall100
25471
482371
BIG SIXNo %62 43.726 38.288 41.9
1. Other reasons for exclusion were: accounts denominated inaccounts submitted (2); fee requestec (2).
Wl~500every other one
200
583
139
9445139
Non-BIG SIXNo %80 56.342 61.8122 58.1
a foreign currency (1);
Total
300
837
210
14268210
TotalNo14268210
out-of-date or
%
100.0
27.72.370.0
67.632.4100.0
%100.0100.0lt)0.0
incorrect
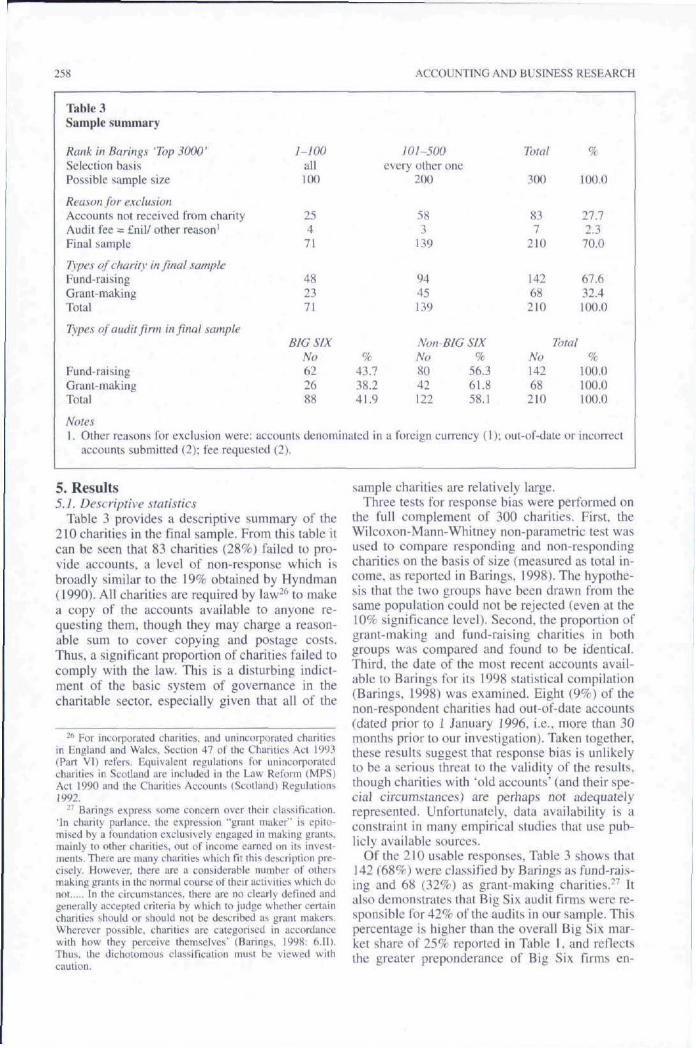
5. Results5.1. Descriptive statistics
Table 3 provides a descriptive summary of the210 charities in the final sample. From this table itcan be seen that 83 charities (28%) failed to pro-vide accounts, a level of non-response which isbroadly similar to the 19% obtained by Hyndman(1990). All charities are required by law"* to makea copy of the accounts available to anyone re-questing them, though they may charge a reason-able sum to cover copying and postage costs.Thus, a significant proportion of charities failed tocomply with the law. This is a disturbing indict-ment of the basic system of governance in thecharitable sector, especially given that all of the
-^ For incorporated charities, and unincorporated charitiesin England and Wales, Section 47 of the Charities Act 1993(Part Vll refers. Equivalent regulations for unincorporatedcharities in Scotland are included in Ihe Law Reform (MPS)Act 1990 and the Charities Accounts (Scotland) Regulations1992.
•'' Barings express some concern over their classitlcation.'In charily parlance, the expression '"grant maker" is epito-mised by a foundation exclusively engaged in making grants,mainly to other charities, out of income earned on its invest-ments. There are many charities which t"it Ihis description pre-cisely. However, there are a considerahle number of otliersmaking grants in the normal course of their activities which donot In the circumstances, there are no clearly defined andgenerally accepted criteria by which to judge whether certaincharities should or should not be described as grant makers.Wherever possible, charities are categorised in accordancewith how they perceive themselves' (Barings. 1998: 6.II).Thus, the dichotomous classification must be viewed withcaution.
sample charities are relatively large.Three tests for response bias were performed on
the full complement of 300 charities. First, theWilcoxon-Mann-Whitney non-parametric test wasused to compare responding and non-respondingcharities on the basis of size (measured as total in-come, as reported in Barings, 1998). The hypothe-sis that the two groups have been drawn from thesame population could not be rejected (even at the10% significance level). Second, the proportion ofgrant-making and fund-raising charities in bothgroups was compared and found to be identical.Third, the date of the most recent accounts avail-able to Barings for its 1998 statistical compilation(Barings, 1998) was examined. Fight (9%) of thenon-respondent charities had out-of-date accounts(dated prior to 1 January 1996. i.e.. more than 30months prior to our investigation). Taken together.these results suggest that response bias is unlikelyto be a serious threat to the validity of the results,though charities with 'old accounts' (and their spe-cial circumstances) are perhaps not adequatelyrepresented. Unfortunately, data availability is aconstraint in many empirical studies that use pub-licly available sources.
Of the 210 usable responses. Table 3 shows that142 (68%) were classified by Barings as fund-rais-ing and 68 (32%) as grant-making charities.-^ Italso demonstrates that Big Six audit firms were re-sponsible for 42% of the audits in our sample. Thispercentage is higher than the overall Big Six mar-ket share of 25% reported in Table 1. and reflectsthe greater preponderance of Big Six firms en-
AUTUMN 2001 259
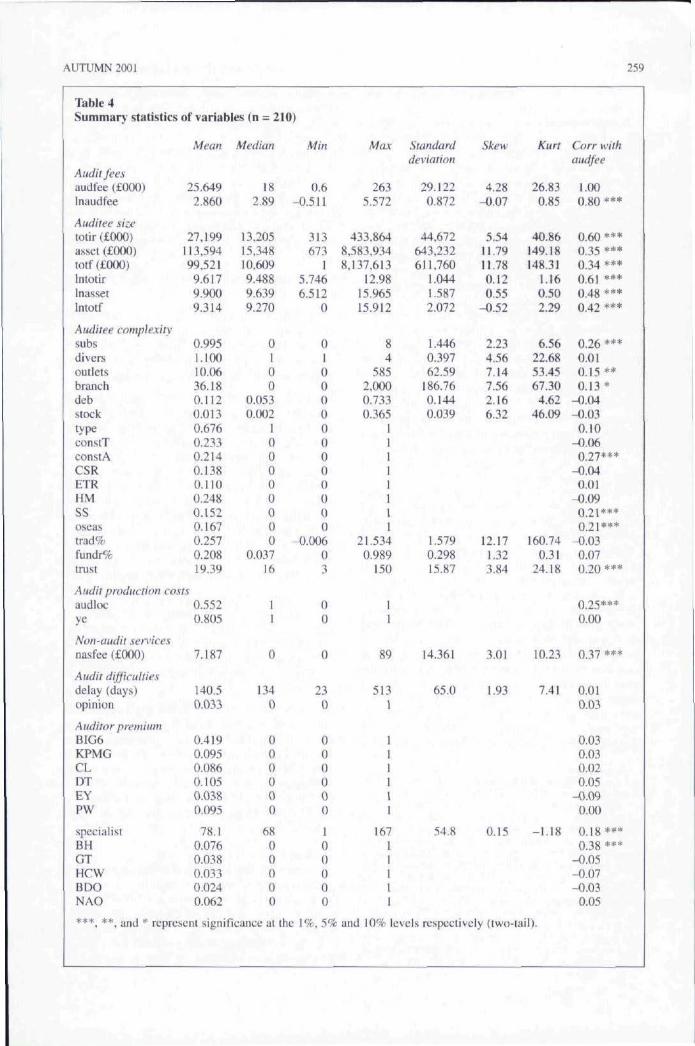
Table 4Summary statistics of variables (n = 210)
Audit feesaudfee (£000)Inaudfee
Audiiee sizetotir (£000)assei (£000)totf (£000)IntotirInassetInlotf
Auditee complexitysubsdiversoutletsbranchdebstocktypeconstTconstACSRETRHMSSoseastrad%fundr%trust
Mean
25.6492.860
27.199113,59499,521
9.6179,9009.314
0.995I.IOO10.0636.180.II20.0130.6760.2330.2140.1380.1100.2480.1520.1670.2570.20819.39
Audit production costsaudlocye
Non-audit servicesnasfee (£000)
Audit difficultiesdelay (days)opinion
Auditor premiumBIG6KPMGCLDTEYPW
specialistBHGTHCWBDONAO
0.5520.805
7.187
140.50.033
0.4190.0950.0860.1050.0380.095
78.10.0760.0380.0330.0240.062
Median
182.89
13.20515.34810.6099.4889.6399.270
0100
0.0530.002
100000000
0.03716
11
0
1340
0()()000
6800000
Min
0.6-0.511
313673
15.7466.512
0
01000000000000
-O.(X}603
00
0
230
000000
[
00000
***. **. and * represent significance at the 1%, 5%
Max
2635.572
433.8648.583,9348,137,613
12.9815.96515.912
84
5852,0000.7330.365
11111111
21.5340.989
150
1i
89
5131
111111
16711111
Standarddeviation
29.1220.872
44.672643,232611.760
1.0441.5872.072
1.4460.39762.59
186.760.1440.039
1.5790.29815.87
14.361
65.0
54.8
Skew
4.28-0.07
5.5411.7911.780.120.55
-0.52
2.234.567.147.562.166.32
12.171.323.84
3.01
1.93
0.15
Kurt
26.830.85
40.86149.18148.31
1.160.502.29
6.5622.6853.4567.30
4.6246.09
160.740.31
24.18
10.23
7.41
-1.18
and 10% levels respectively (two-tail).
Corr withaudfee
1.000.80 ***
0.60 ***0.35 ***0.34 ***0.61 ***0.48 ***0.42 ***
0.26 ***0,010.15 **0.13 *
-0.04-0.03
0.10-0.06
0.27***-0.04
0.01-0.09
0.21***0.21***
-0.030.070.20 ***
0.25***0.00
0.37 ***
0.010.03
0.030.030.020.05
-0.090.00
0.18***0.38 ***
-0.05-0.07-0.03
0.05
260 ACCOUNTING AND BUSINESS RESEARCH
gaged in the audit of larger charities, which formthe basis of our sample.
Table 4 provides summary statistics for each ofthe variables, including non-transformed size vari-ables. Audit fees ranged from £600 to £263,000with a mean of £25.649. Charity size, based ontotal incoming resources Uotir), ranged from a lowof just £313,000-*^ to a high of £433.9m. and aver-aged £27.2m. As in previous studies on privatesector companies, the correlation of 0.60 betweenaudit fees and size is quite strong, suggesting thatsize is a major determinant of charity audit fees.Further, the positively skewed and leptokurtic na-ture of both audit fees and size encourage the useof transformed variables to improve their distribu-tional properties. The alternative measure of sizebased on total assets {as.set) covers a very widerange up to an extremely large £8.584m. and isless strongly correlated with audit fees (correlationcoefficient = 0.35); similar observations relate tothe total funds variable itotf). The wide range andrelatively low correlation for these two size meas-ures reflects the important difference in the natureand level of assets between fund-raising and grant-making charities and is the major reason lor choos-ing total incoming resources as the mostappropriate size proxy.
For the binary variables, the 'mean' value repre-sents the proportion of charities that possess theparticular characteristic. For example, the meanvalue of 0.676 for type shows that 67.6% of thecharities were in the fund-raising classification,leaving 32.4% as grant-making. The constitutionvariables indicate that 23.3% are trusts [amstT).21.4% were set up by Act of Parliament or RoyalCharter [constA) and, therefore, the remaining55.3% are charitable companies. The 'health andmedicine" variable (//A/) shows that almost 25% ofthe sample charities were significantly involved inthis area of activity and that this represents themost common area. On average, gross trading(trad%) accounts for approximately 26%' of in-coming resources, but this relatively large propor-tion needs to be interpreted with care. First, themean is heavily distorted by one or two major out-
-* The total income of the smallest charily in our "top 500'sampling frame according to Barings was £4.7m. Our deflni-tioii »>r lotai incoming resources is slightly different and com-poneni deiails were e\iracted directly from ihe financialstatements rather than Barings. These differences mean ihat asmall number of charilies (approximately 12) would not beclassified within the top 500 based on our measure. However,these charities have been retained within our sample.
-'' The one major outlier of .'il.^ days related lo a charitywhose charitable status was under investigation by the InlandRevenue; one further charity had a delay of 471 days. Theseare the only two sample charities with delays beyond Ihe 10-month time period by which annual reports must be filed withthe Charity Commission and/or with Companies House (S45.The Charities (Accounts and Reports! Regulations 1995 (SIIW5 No. 2724} and S.244( I) of the Companies Act).
hers (the maximum trad% value of 21.53 impliesthat gross trading represented 2153% of total in-coming resources in one particular charity), and sothe median of 0% may be more representative.This more elosely reflects the fact that only 94 ofthe 210 charities (45%) undertook trading activi-ties. Second, further analysis of the basic data re-veals that the net contribution frotn trading (i.e.,after deducting trading expenses) accounts for just5.4% of total incoming resources, on average.
Further points to note from the summary statis-tics are;
• audloc shows that 55.2% of the audit firms wereLondon-based.
• ye indicates that a large proportion (80.5%) ofcharity year-ends are in the audit 'busy-season'around December and March, implying thatcharities have probably not chosen their year-ends in order to fit in with auditor slack periods.
• nasfee has a significant positive correlation withaudit fees and a mean value of £7,187 represent-ing 28% of audit fees. Further analysis showedthat 44% of the charities reported non-zero feesfor non-audit services with just 7% reportingnasfee higher than audit fees. This contrasts withthe UK company results of Ezzamel et al. (1996)who found that non-audit services represent amuch higher proportion of audit fees (87%), that93% of their sample of companies had non-zeronasfee, with 44% reporting higher nasfee thanaudit fees. Non-audit services are apparentlymuch less important in the charity sector.
• delay has a mean of 140 days implying a periodof about 4i/2 months between year-end and auditreport signing.-'^ This compares with mean de-lays of between 53 and 96 days reported for pri-vate sector companies in various internationalstudies (see Carslaw and Kaplan. 1991: 22, andreferences therein).
• the specialist variable is significantly correlatedwith audit fee. suggesting that sector expertisemight be rewarded with a fee premium. Of theindividual audit firm variables. Binder Hamlyn(BH) shows a significant positive correlationwith audit fee size, suggesting the existence of apremium to one of the market leaders in the sec-tor. Deloitte Touche {DT) carried out the mostaudits (10.5%).
5.2. Charity audit fee modelAs expected, the bivariate correlations suggest
that the major determinant of audit fees is the sizeof the charity (with a correlation of 0.60). Otherpotentially important factors (indicated by signifi-cant coiTelations at the 5%. two-tailed, level) in-clude the number of trading subsidiaries isuhs:0.26), the number of trading outlets (outlets: 0.15).
AUTUMN 200] 261
the constitution of the charity when set up by Actof Parliament or Royal Charter (constA: 0.27),principal area of activity in social services and re-lief {SS: 0.21). significant involvement overseas(oseas: 0.21), the number of trustees (tmsi: 0.20).the location of the audit firm {audloc: 0.25) andthe fee paid to the auditor for non-audit services{nasfee: 0.37). However, as virtually all of theseare also significantly correlated with size ilntotir).the outcome of the multivariate analysis is not ea.syto predict. One further observation from the fullcorrelation matrix (not reported) is that, apart fromhigh correlations between alternative size proxies,none of the other correlations between independ-ent variables is particularly high (the highest is0.37). This suggests that multicollinearity may notnormally be a serious problem in the regressionmodel.
5.2.1. Basic modelThe OLS multivariate regression results for the
basic model and the full sample of charities (n =210) are reported in Table 5 (Model la).^" Thismodel uses log transformed total incoming re-sources (Inl(Hir) as the size proxy.
The results for Model la confirm size (lutotir) asthe major audit fee determinant, with a highly sig-nificant t-ratio of 9.01. The positive coefficient of0.4739 implies that, ceteris parihus. audit fees in-crease approximately with the square root of totalincoming resources, consistent with many previ-ous private sector studies (see summary in Chungand Lindsay. 1988: Table 11). Of the seven othervariables that were significantly correlated withaudfee (see Table 4). only three {subs, audloc andnasfee) are confirmed as significant determinantsin the multivariate model (at the 1% level). Twofurther variables are significant at the 1% level{type and trad%), two at the 5% level (stock andSS) and one at the 10% level (divers).
The results suggest that a number of general or-ganisational characteristics, in addition to charac-teristics unique to the charity sector, are associatedwith differences in eharity audit fee levels. In com-mon with private sector studies, the number oftrading subsidiaries {subs) and the proportion oftotal assets represented by year-end stock {stock)
-" ' Notwiihstanding ihe uni-directional allernalive hypothe-ses for approximalely half of the variables, all significancelevels iti Tables 5 and 6 are reported using the more conserva-tive two-tail tests. All procedures were carried out tising theSHAZAM v8.() econometrics program.
' This arjiument was confirmed by one of the charity audi-tors who provided comments on the draft paper: 'SocUd serr-ices/relief charities are often invoheil wiih rheir localaitlhorilies in one way or another, and this tends lo bring inAudit Commission rec/uirenieni.s that add to the cost of theirstatutory aiidil!' Another audilor suggested that social servic-es charities tend to employ a relatively large number of staff:this increases audit risk, audit work and audit fees.
are positively associated with audit fees. These areconsistent with, respectively, the additional auditwork to meet statutory requirements and the un-certainties in valuing and confirming the valuationof stock. The significant negative coefficient onthe diversity measure {divers) is contrary to expec-tation (but see later result for fund-raising sub-sample). However, the coefficient estimate may besomewhat unreliable as the divers variable is foundto be significantly collinear with size measures.
The dummy variable type seeks to capture thefundamentally different nature of fund-raising andgrant-making charities, with the positive coeffi-cient implying that the greater complexity andcontrol difficulties of the former group are reflect-ed in higher audit fees. The form of a charity'sconstitution (company, trust etc.) docs not seem toimpact on audit fees. Generally, the principal areaof activity of a charity does not affect audit feesexcept for those charities within the "social servic-es and relief sector (dummy variable SS), whichhave higher audit fees. As suggested earlier, thismight reflect additional reporting or audit require-ments imposed by the fund-providers as a condi-tion of funding.*' The relative importance oftrading activities in generating income itrad%) is asignificant audit fee determinant, in line with ex-pectations, but the relative importance of tund-raising activities is not.
The significantly positive coefficient on audlocsuggests that, as expected, the higher audit pro-duction costs incurred by London-based auditorsare passed on to charities in higher audit fees.However, there is no evidence of additional feesrelated to audit firm busy periods {ye) or shortaudit delays {delay). These observations are con-sistent with audit firms seeking to minimise in-creased production costs by scheduling charityaudits in slack periods. A non-standard audit report(opinion) does not appear to have a significantimpact on audit fees.
As in previous private sector studies, there is asignificant positive relationship between audit feesand fees paid to auditors for non-audit services(nasfee). Thus, in the charity sector also, there isno evidence that auditors use audit fees as a formof 'loss-leader* nor that cost savings from the jointprovision of audit and consultancy services arepassed on to the charity in the form of lower auditfees (or consultancy fees).
Overall, the adjusted R- of 62% implies that agood proportion of the cross-sectional variation inaudit fees is explained by the model. An appropri-ate comparison can be made with prior studies onsmaller private sector companies, since all but asmall number of charities would be classified assmall in the UK private sector. Thus, our R- of62% is in line with previous studies on smallercompanies (e.g.. 55% by Brinn et al.. 1994: 62%
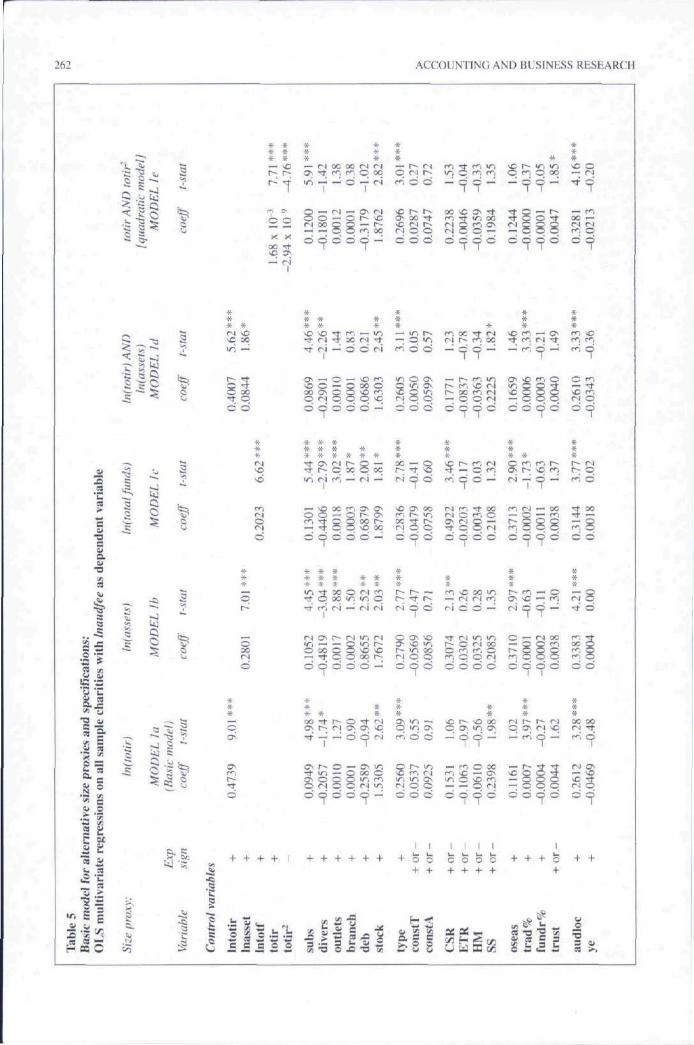
262 ACCOUNTING AND BUSINESS RESEARCH
B
Icat
1f;
TJ
£
0> •
ci!"3
foi
Tab
le 5
Bas
ic m
oi
2.2>
•13
Q.
•o
3
—j2*M
* ^
arit
^3
~
Bs
:=TOcoc.2</!Uac01
aria
OL
S m
ul
Q -
1•- 2
5
'5 -2-* c
,~
.
^j
Q
^'
Q
*"^
"--
Q
-0
i-j
Q^
21—,
0
0
'?
8
, -S•~ fe;-5 ^-Ci? '
. -2?
Var
iabl
e
***rJin
r-00
d
•
: •
o<
ON
[^
d
Con
trol
Vi
Into
tir
*NO00
—
t
CO0d
*•X-
*
: 1
0
_0COr-id
+
Inas
set
* #* #— NO
1.68
?-2
.94
>
„
CM
d
+ + 1
Into
tfto
tir
toti
r^
**0^m
00r-1
0
#*#
ON
00
**
in
. ,
0
0
**#in
rJ
0
00
-T
ON
^\0
subs
— •
0CO
**
r-1r-i
_• ^
or-1
7
***r-11
0
***srr;
1
ON—00
1
r!/-•
* " •
r-i
1 di
vers
00
—
r-J.—1
00
1 +
—
000
**
r0rr,
00.—.
80
***CO00
r-1
r-
00
—
0
000
1 ou
tlet
s
00
0
_0
00
rr,00
0
.^[^^
?500
•K-(^
00—
d
0in
ri
300
ON
0000
bran
cb
ri01
ON
1 ,
—
r-10
NOCOD00
**
r-1
ON[-CO
0
**r-1
r-1
inNOOC0
ON
CT'00inr-10
+
1 de
b
***00
r-i
CO
**m(N
0NO
*.—•30—
OS
CO
—
**
0r-1
r-1
^D[^
^~
K*riNO
r-i
in0
•n—
stoc
k
***5rr,
NDON
»N0
• »
*
*
—
—
m,0rj0
***00
r-r-i
NOrr.00
0
***[—
r-r-i
0
r-r-i0
***ON0r',
0
inr-10
+
type
0
r00r-J00
in00
*o000
: ,
ON
r-3=
^1
m0
?
inin0
m00
I0
cons
tT
rj
0
t^^^
[-in0
ON0*
C
oc*n00
..«[~~
0
n0000
—ON
r-1
==
1D
cons
tA
—
00
r-1r-i0
f i
—
,
0
*
r-1r-1ON
##
--.r-i
0
C
>o0—
,
»n0
I0
CSR
S
^
CO
-0.
000
^
[-—1
CJ
0r-107
NOr-10
r>i0
00
[•
ON
0
rr,
T
10
1 E
TR
rr.
'^
O^V I
m0
f 1
-0.
^^ro0
?
00
80
CO
0
mr-1r^
0
vO>n0
0
NO0=^
10
X
in
—
COON
0
*r-1CO—
m
r-1
0
—
000
0
inm—
m30
r-i0
**COO^—
00
o-r-i0
1
c
s—
r-1—0
NO
—
ON
vD
0
***0
r
rr.• H
*
*
O^r
3.—-
0
r-10—
__
.—1
— '
0
"*"
osea
s
Pt^
5c
***rr.
C0
*rr.
—
rj
rr.
0
1
,Q
0
***r-ON
0
0
+
s
in0
00
rJ
?^p5
NO
—s
—1
—
1
r-101^^
0
?
r-iP
s0
-1-
B
00
—
0
ON
—
-—
3:00
c
—
00r^,00°
—00
[ ^
0
•^
r-1NO—
1-000
c
trus
t
*
, ,00r-1
*
mm
0^—\^OJ0
***r-r-
0
*
-X-
r-1
rr.00rr.rr.0
***00rj
' ^ •
r-j
NOr-J0
audl
oc
0r-i
=Y
0
•^
infrr.0
?
00
CO
g0
00
0f^
00
00
Cp
ON
0
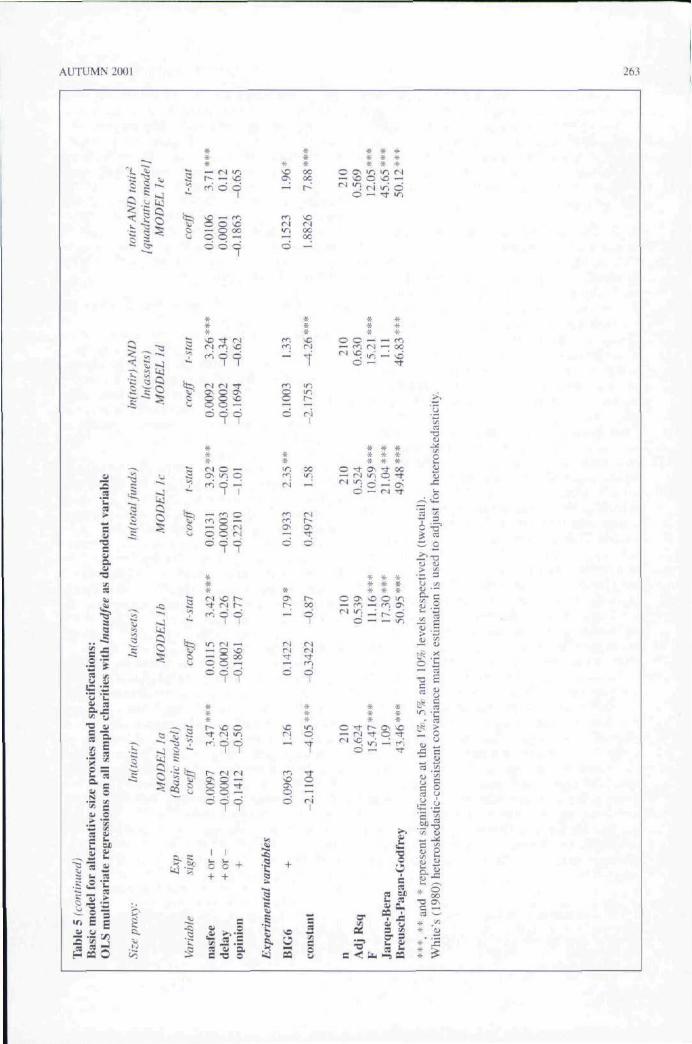
AUTUMN 2(X)1 263
^»
•b
-• -J
d d
r-j ci ^
S S ;£^ T T
o —
— f^i C:
— ^ rJq q r-1d d: ci
JQO
•^ ^ ' t_J ^
^ o o ^
C O +
c -a,2a,c
*0000
O
r j
c
d
*i n
qr-j
*i n
o<n
»r-1
di n
r-1 rJm 00— 00
r-1
-4.
755
ocm
o••—'
o
o0.
6
r-1
• — •
r-i
15.
*
*
i n
.—1
*
*
o
oo
46.
***00
•n
<L>
oc.
qd
OdO — (N
* *
00 — rr, -^
**
o • ^ t^— ri -Tr-1 ^ ^ ;
o —rr-.
O — — m ^
"n
^ 5
cnjutc
igni
c
(X
*
C
o
dasi
PU
u
o00ON
I
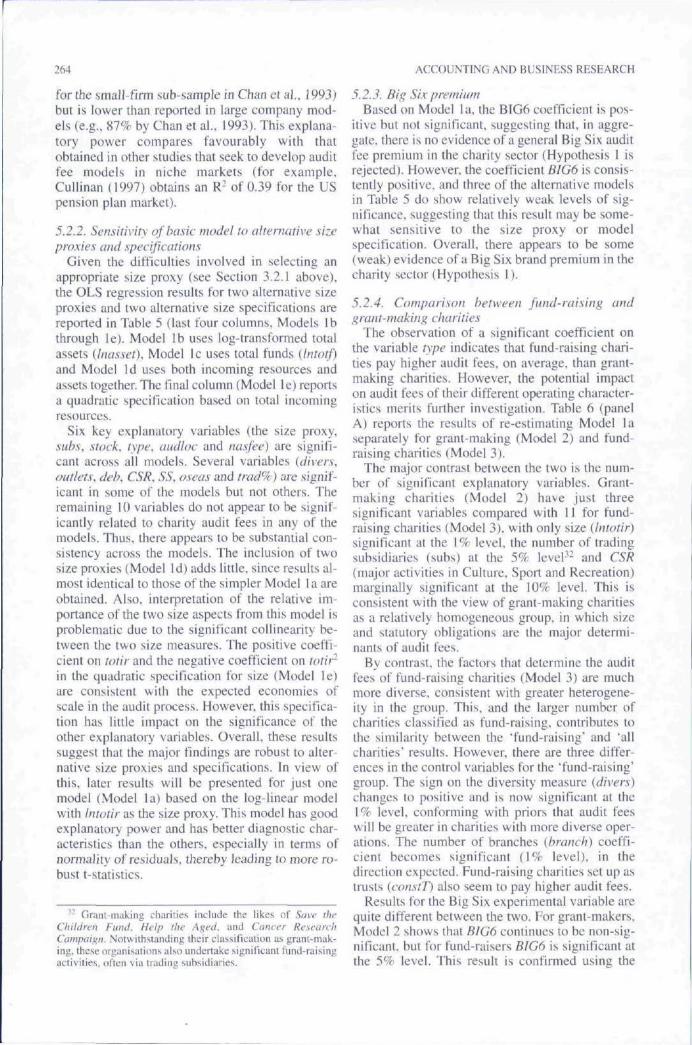
264 ACCOUNTING AND BUSINESS RESEARCH
for the stnall-firm sub-sample in Chan et al., 1993)but is lower than reported in large company mod-els (e.g., 87% by Chan et al., 1993). This explana-tory power compares favourably with thatobtained in other studies that seek to develop auditfee models in niche tnarkets (for example,Cullinan (1997) obtains an R- of 0.39 for the USpension plan market).
5.2.2. Sensitivity of basic model to alternative sizeproxies and specifications
Given the difficulties involved in selecting anappropriate size proxy (see Section 3.2.1 above),the OLS regression results for two alternative sizeproxies and two alternative size specifications arereported in Table 5 (last four columns. Models lbthrough le). Model tb uses log-transformed totalassets ilnasset). Model ic uses total funds {Intotf)and Model Id uses both incoming resources andassets together. The final column (Model le) reportsa quadratic specification based on total incomingresources.
Six key explanatory variables (the size proxy,subs, stock, type, audloc and nasfee) are signifi-cant across all models. Several variables {divers,outlets, deb. CSR. SS, oseas and trad%) are signif-icant in some of the models but not others. Theremaining 10 variables do not appear to be signif-icantly related to charity audit fees in any of themodels. Thus, there appears to be substantial con-sistency across the tiiodels. The inclusion of twosize proxies (Model Id) adds little, since results al-most identical to those of the simpler Model 1 a areobtained. Also, interpretation of the relative im-portance of the two size aspects from this model isproblematic due to the significant eollinearity be-tween the two size measures. The positive coeffi-cient on totir and tbe negative coefficient on totirin the quadratic specification for size (Model le)are consistent with the expected economies ofscale in the audit process. However, this specifica-tion has little itnpact on the significance of theother explanatory variables. Overall, these resultssuggest that the major findings are robust to alter-native size proxies and specifications. In view ofthis, later results will be presented for just onemodel (Model la) based on the log-linear modelwith Iniotir as the size proxy. This model has goodexplanatory power and has better diagnostic char-acteristics than the others, especially in terms ofnormality of residuals, thereby leading to more ro-bust t-statistics.
'- Grant-making charities include the likes of Save theChildren Fund, hlelp the A^eil. and Caitccr RcseanhCampaign. Notwithstanding Iheir classification as grant-mak-ing, these organisaiions also undertake significant fund-raisingactivities, often via trading subsidiaries.
5.2.3. Big Six premiumBased on Model la. the BIG6 coefficient is pos-
itive but not significant, suggesting that, in aggre-gate, there is no evidence of a general Big Six auditfee premium in the charity sector (Hypothesis 1 isrejected). However, the coefficient B}G6 is consis-tently positive, and three of the alternative modelsin Table 5 do show relatively weak levels of sig-nificance, suggesting that this result may be some-what sensitive to the size proxy or modelspecification. Overall, there appears to be some(weak) evidence of a Big Six brand premium in thecharity sector (Hypothesis 1).
5.2.4. Comparison between fund-raising andgrant-making charities
The observation of a significant coefficient onthe variable type indicates that fund-raising chari-ties pay higher audit fees, on average, than grant-making charities. However, the potential impacton audit fees of their different operating character-istics merits further investigation. Table 6 (panelA) reports the results of re-estimating Model laseparately for grant-making (Model 2) and fund-raising charities (Mode! 3).
The major contrast between tbe two is the num-ber of significant explanatory variables. Grant-making charities (Model 2) have just threesignificant variables compared with 11 for fund-raising charities (Model 3). with only size (Intotir)significant at the 1% level, the number of tradingsubsidiaries (subs) at the 5% level-*- and CSR(major activities in Culture, Sport and Recreation)marginally significant at the 10% level. This isconsistent with the view of grant-making charitiesas a relatively homogeneous group, in which sizeand statutory obligations are the major determi-nants of audit fees.
By contrast, the factors that determine the auditfees of fund-raising charities (Model 3) are muchmore diverse, consistent with greater heterogene-ity in the group. This, and the larger number ofcharities classified as fund-raising, contributes tothe similarity between the 'fund-raising' and "allcharities' results. However, there are three differ-ences in the control variables for the 'fund-raising'group. The sign on the diversity measure {divers)chatiges to positive and is now significant at the1% level, conforming with priors that audit feeswill be greater in charities with more diverse oper-ations. The number of branches {branch) coeffi-cient becomes significant (1% level), in thedirection expected. Fund-raising charities set up astrusts (constT) also seem to pay higher audit fees.
Results for the Big Six experimental variable arequite different between the two. For grant-makers.Model 2 shows that B!G6 continues to be non-sig-nificant, but for fund-raisers BIG6 is significant atthe 5% level. This result is confirmed using the
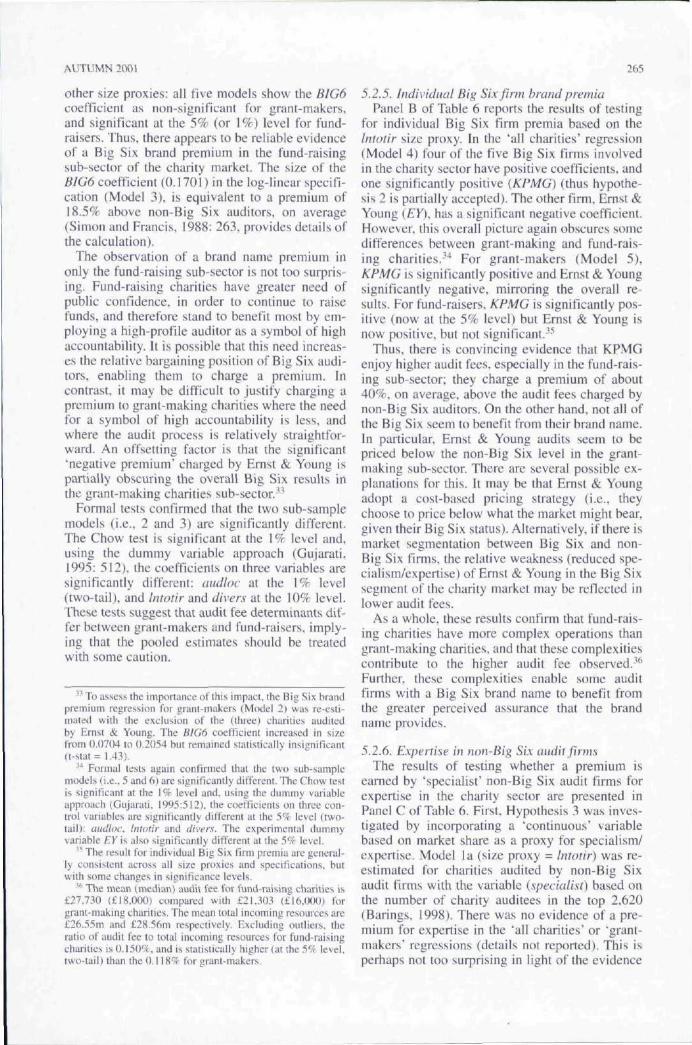
AUTUMN 2001 265
Other size proxies: all five models show the BIG6coefficient as non-significant for grant-makers,and significant at the 5% (or 1%) level for fund-raisers. Thus, there appears to be reliable evidenceof a Big Six brand pretnium in the fund-raisingsub-sector of the charity market. The size of theBtG6 coefficient (0.1701) in the log-linear specifi-cation (Model 3). is equivalent to a premium of18.5% above non-Big Six auditors, on average(Simon and Francis. 1988: 263, provides details oftbe calculation).
The observation of a brand name premium inonly the fund-raising sub sector is not too surpris-ing. Fund-raising charities have greater need ofpublic confidence, in order to continue to raisefunds, and therefore stand to benefit most by em-ploying a high-profile auditor as a symbol o'i highaccountability. It is possible that this need increas-es the relative bargaining position of Big Six audi-tors, enabling them to charge a premium. Incontrast, it may be difficult to justify charging apretnium to grant-making charities where the needfor a symbol of high accountability is less, andwhere the audit process is relatively straightfor-ward. An offsetting factor is that the significant'negative premium" charged by Ernst & Young ispartially obscuring the overall Big Six results inthe grant-making charities sub-sector.'-*
Formal tests confirmed that the two sub-samplemodels (i.e., 2 and 3) are significantly different.The Chow test is significant at the 1% level and,using the dummy variable approach (Gujarati.1995: 512). the coefficients on three variables aresignificantly different: audloc at the 1% level(two-tail), and bUotir and divers at the 10% level.These tests suggest that audit fee determinants dif-fer between grant-tnakers and fund-raisers, imply-ing that the pooled estimates should be treatedwith some caution.
•" To assess ihe importance of this impact. Ihe Big Six brandpremium regression lor grant-makers (Model 2) was re-esli-maled with the exclusion of the (three) eharities auditedby Ernst & Young. The BIG6 coefficient increased in sizefrom 0,0704 to 0.2054 but remained statistically insitinificant(t-stat = 1.43).
-'-* Formal tests again confirmed thai ihe two sub-samplemodels (i.e.. 5 and 6) are significantly different. The Chow teslis significant al the 1% level and. using the dummy variableapproach (Gujarati. 1995:512), the coefficients on three con-trol variables are significantly different al the 5'7( level (Iwo-tail): aiuiloc. Iniotir and divers. The experimental dummyvariable EY is also significantly different at the 5'Xt level.
'" The result for individuai Big Six firm premia are general-ly eonsistent across all size proxies and specifications, butwith some changes in significance levels.
"' The mean (median) audit fee for fund-raising charities is£27.730 (£18.fHH)) compared wlih 01.303 (£16,(H)0) forgrant-making charities. The mean total incoming resources are£26.55ni and £28.56m respectively- Excluding outliers, theralio of audit fee to total incoming resources tor fund-raisingcharities is 0.15O9(, and is slaiistically higher (al the 5'^ level,two-tail) than the 0.11 X9r for grant-makers.
5.2.5. Individual Big Six firm brand premiaPanel B of Table 6 reports the results of testing
for individual Big Six firm premia based on theIntotir size proxy. In the 'all charities' regression(Model 4) four of the five Big Six firms involvedin the charity seetor have positive coefficients, andone significantly positive {KPMG) (thus hypothe-sis 2 is partially accepted). The other firm, Ernst &Young (£10. has a significant negative coefficient.However, this overall picture again obscures somedifferences between grant-making and fund-rais-ing charities.^"* For grant-makers (Model 5),KPMG is significantly positive and Ernst & Youngsignificantly negative, mirroring the overall re-sults. For fund-raisers. KPMG is significantly pos-itive (now at the 5% level) but Ernst & Young isnow positive, but not significant.^^
Thus, there is convincing evidence that KPMGenjoy higher audit fees, especially in the fund rais-ing sub-sector; they charge a premium of about40%, on average, above the audit fees charged bynon-Big Six auditors. On the other hand, not all ofthe Big Six seetn to benefit from their brand name.In particular, Ernst & Young audits seem to bepriced below the non-Big Six level in the grant-making sub-sector. There are several possible ex-planations for this. It may be that Ernst & Youngadopt a cost-based pricing strategy (i.e.. theychoose to price below what the market might bear,given their Big Six status). Alternatively, if there ismarket segmentation between Big Six and non-Big Six firms, the relative weakness (reduced spe-cialism/expertise) of Ernst & Young in the Big Sixsegment of the charity market may be reflected inlower audit fees.
As a whole, these results confirm that fund-rais-ing charities have more complex operations thangrant-making charities, and that these complexitiescontribute to the higher audit fee observed.^^Further, these complexities enable some auditfirms with a Big Six brand name to benefit fromthe greater perceived assurance that the brandname provides.
5.2.6. Expertise in non-Big Six audit firmsThe results of testing whether a premium is
earned by 'specialist' non-Big Six audit firms forexpertise in the charity sector are presented inPanel C of Table 6. First, Hypothesis 3 was inves-tigated by incorporating a 'continuous' variablebased on market share as a proxy for specialism/expertise. Model la (size proxy = Intotir) was re-estimated for charities audited by non-Big Sixaudit firms with the variable (specialist) based onthe number of charity auditees in the top 2.620(Barings. 1998). There was no evidence of a pre-mium for expertise in the 'all charities" or "grant-makers' regressions (details not reported). This isperhaps not too surprising in light of the evidence
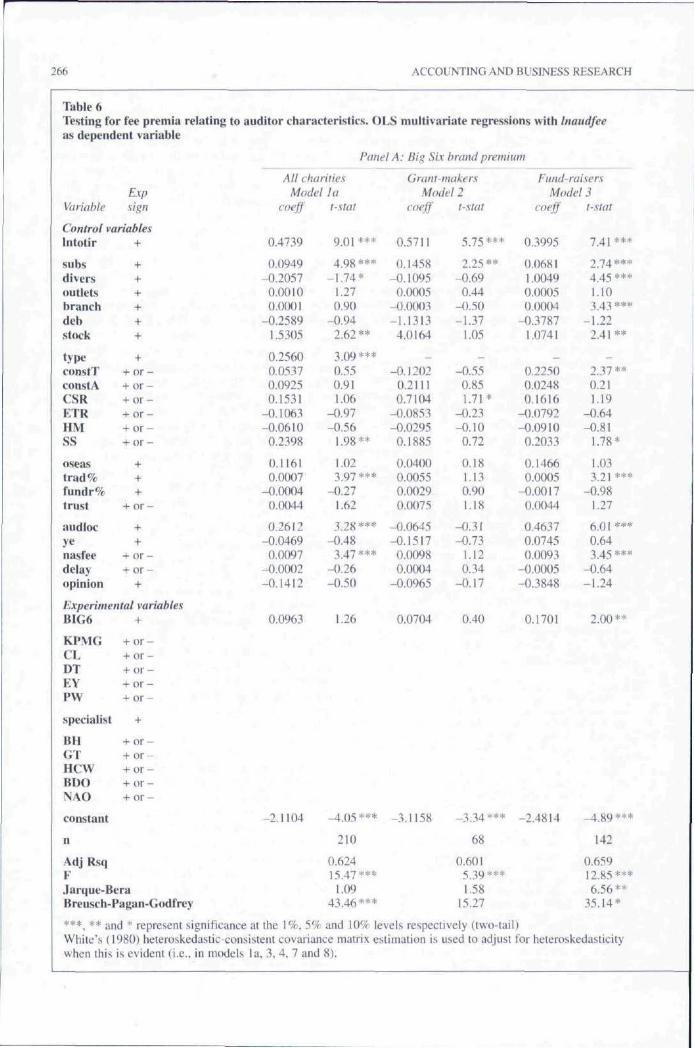
266 ACCOUNTING AND BUSINESS RESEARCH
Table 6Testing for fee premia relating to auditor characteristics. OLS multivariate regressions with Inaudfeeas dependent variable
ExpVariable si^n
Control variablesIntotir +
subs +divers +outlets +brancb +deb +stock +
type +constT + or -constA + or -CSR + or -KTR + or -HM + or -SS + or -
oseas +trad% +fundr% +trust + or -
audloc +ye +nasfee + or -delay + or -opinion +
Experimental variablesBIG6 +
KPMG + or -Cl. + or -DT + or -EY + o r -PW + or -
specialist +
BH + or -GT + or -HCW + or -BDO + or -NAO + or -
constant
n
Adj RsqFJarque-BeraBreusch-Pagan-Godfrey
***, ** and * represent significance
Panel A: Big Six brand premium
All charitiesModel
(-'oeff'
0.4739
0.0949-0.2057
0.00100.0001
-0.25891.5305
0.25600.05370.09250.1531
-0.1063-0.0610
0.2398
0.1I6I0.0007
-0.00040.0044
0.2612-0.0469
0.0097-0.0002-0.1412
0.0963
-2.1104
at the 1%. 5%
lat.stat
9.01***
-1.74*1.270.90
-0.942.62**
^ Qg ***
0.550.911.06
-0.97-0.56
1.98**
1.02
-0.271.62
1 28***-0.48
3.47***-0.26-0,50
1.26
_^ 05***
210
0.62415.47***
1.0943.46***
Grant-makersModel 2
coejf
0.5711
0.1458-0.1095
0.0005-0.0003-1.1313
4.0164
--0.1202
0.21110.7104
-0.0853-0.0295
0.1885
0.04000.00550.00290.0075
-0.0645-0.1517
0.00980.0004
-0.0965
0.0704
-3.1158
t-stat
5 75 ***
2.25**-0.690.44
-0.50-1.37
1.05
--0.550.851.71*
-0.23-0.100.72
0.181.130.901.18
-0.31-0.73
1.120.34
-0.17
0.40
-3.34***
68
0.6015.39***1.58
15.27
Fund-raisersMode! 3
coeff
0.3995
0.06811.00490.00050.0004
-0.37871.0741
-0.22500.02480.1616
-0.0792-0.09100.2033
0.14660.0005
-0.00170.0044
0.46370.07450.0093
-0.0005-0.3848
0.1701
-2.4814
and 10% levels respectively (two-tail)White's {1980) heteroskedastic-consistent covariance matrix estimation is ivi'hen this is evident (i.e.. in models la, 3, 4, 7 and 8).
ised to adjust
t-siat
7.41 ***
2 74***
4.45 ***I . I O3 4"!***
-1.222.41 **
-2 37 **0.211.19
-0.64-0.81
1.78*
1.033 21***
-0.981.27
6.01 ***0.64- 45 ***
-0.64-1.24
2.00**
A go ***
142
0.65912.85***6.56**
35.14*
for heteroskedasticity
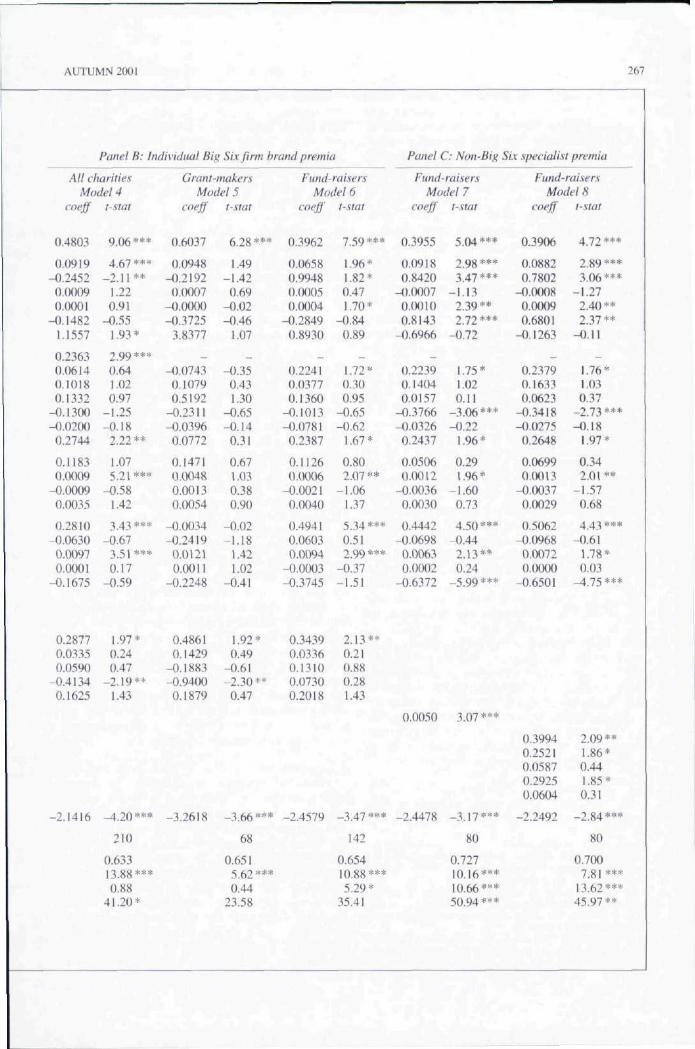
AUTUMN 2001
Allc
Panel B: Individual Big Six firm brand premia
ha ri tiesModel 4
coeff
0.4803
0.0919-0.24520.00090.0001
-0.14821.1557
0.23630.06140.10180.1332
-0.1300-0.020()
0.2744
0.11830.0009
-0.{)(X)90.0035
0.2810-0.06300.00970.0001
-0.1675
0.28770.03350.0590
-0.41340.1625
-2.1416
t-stat
9.06***
4.67 ***-2.11 **
1.220.91
-0.551.93*
2 99 ***
0.641.020.97
-1.25-0.18
2 22 **
1.07c^ 21 ***
-0.581.42
-1 A'X, * * *
-0.673.51 ***0.17
-0.59
1.97*0.240.47
1.43
_^ 20***
210
0.63313.88***0.88
41.20*
Grant-makersModel 5
(^oeff
0.6037
0.0948-0.21920.0007
-0.0000-0.37253.8377
_
-0.07430.10790.5192
-0.2311-0.03960.0772
0.14710.00480.00130.0054
-0.0034-0.2419
0.01210.0011
-0.2248
0.48610.1429
-0.1883-0.94000.1879
-3.2618
t-stal
6.28***
1.49-1.42
0.69-0.02-0.46
1.07
_
-0.350.431.30
-0.65-0.14
0.31
0.671.030.380.90
-fl.O2-1.18
1.421.02
-0.41
1.92 ^'0.49
-0.61-2.30**0.47
-3.66***
68
0.6515.62***0.44
23.58
Fund-raisersModel 6
coeff
0.3962
0.06580.99480.00050.0(K)4
-0.28490.8930
0.22410.03770.1360
-0.1013-0.0781
0,2387
0.1126O.{)006
-0,00210,0040
0.49410.06030.0094
-0.0003-0,3745
0.34390.03360.13100.07300.2018
-2.4579
l-stal
7.59***
1.96*1.82*0.471.70*
-0.840.89
_
1.72*0.300.95
-0.65-0.62
1.67*
0.802.07**
-1.061.37
5.34***0.512 99 ***
-0.37-1.51
2 ] 3 **
0.210.880.281.43
_' 47 ***
142
0.65410.88***5.29*
35.41
Panel ("• Non-Big
Fund-raisersModel 7
coeff
0.3955
0.09180.8420
-0.00070.00100.8! 43
-0.6966
_
0.22390.14040.0157
-0.3766-0.0326
0.2437
0.05060.0012
-0.00360.0030
0.4442-0.0698
0.0063O.(KX)2
-0.6372
0.0050
-2.4478
t-stat
c^ 04 ***
2.98***- 47***
-1.132.39**2 72 ***
-0.72
1.75*1.020.11
-3.06***-0.22
1.96*
0.291.96*
-1.600.73
4.50***-0.44
2.13**0.24
—5 99 ***
3.07***
-3.17***
80
0.72710.16***10.66***50.94***
267
Six specialist premia
Fund raisersModel 8
coeff
0.3906
0.08820.7802
-0.00080.00090.6801
-0.1263
0.23790.16330.0623
-0.3418-0.02750.2648
0.06990.0013
-0.00370.0029
0.5062-0.0968
0.00720.0000
-0.6501
0.39940.25210.05870.29250.0604
-2.2492
t'Stat
4.72***
2.89***3.06***
-1.272.40**2 37 **
-0.11
—1.76*1.030.37
-2 73 ***-0.18
1.97*
0.342.0!**
-i .570.68
4 4" w**
-0.611.78*0.03
^ . 7 5 * * *
2.09**1.86*0.441.85*0.31
-2.84***
80
0.7007.81***
13.62***45.97 **
268 ACCOUNTING AND BUSINESS RESEARCH
above that implies that audits of grant-makers arerelatively straightforward in comparison wilhfund-raiser audits. Relative expertise is most like-ly to be advantageous in the fund-raiser sub-sector.where greater expertise is required and higher ac-countability desired by the charities concerned.
The results for fund-raising charities audited bynon-Big Six audit firms are given in Model 7.Comparison between Model 7 and Model 3 showsthat the explanatory power of the model improvesslightly (adjusted R- = 12.1%). and that most ofthe control variables are similar for non-Big Sixaudited charities, though there are some differ-ences. In particular, deb becomes significant, butstock ceases to be so, charities operating in the "ed-ucation, training and research" area (ETR) seem tohave significantly lower audit fees, and charitieswith a non-standard audit report {opinion) alsohave lower audit fees. This last observation is con-trary to expectation and does not appear to resultfrom any collinearity. This is difficult to ratio-nalise, but one conjecture is that the audit firmrecognises the difficulties that the charity is facingand reduces the audit fee to avoid exacerbating theproblems. The variable of prime interest in Model7 is specialist and this is significantly positive atthe 1% level, suggesting that non-Big Six special-ists do earn a premium for their expertise overnon-Big Six non-specialist firms [Hypothesis 3 isconfirmed).
Mode! 8 investigates whether individual non-Big Six specialist firms earn a premium for theirexpertise. Dummy variables were introduced forthe top 5 non-Big Six audit firms as outlined inSection 3.3. Three firm dummies were significant,one at the 5% level (Binder Hamlyn (BH)). andtwo at the 10% level (Grant Thornton (GT). andBDO Stoy Hayward (BOO)). Thus, there is someevidence that individual non-Big Six market lead-ers in the charity sector obtain a premium overother non-Big Six firms (Hypothesis 4 is accept-ed). While this evidence is consistent with a pre-mium for expertise in the charity sector, it couldalso be explained in terms of a second-tier brandname premium.^^ Our method is unable to distin-guish between these competing explanations.
5.2.7. Regression diagnosticsTo assess the potential impact of outliers on the
regression results, intiuential observations were
" Clatworthy et al. (2000) investigated the presence of asecond-tier premium in Ihc audit tees of NHS Trust bul foundno evidence to siipporl ihis.
' This L-hariiy had an exceplionally high triuF/< variahicthai arose from the scaling on a low level of total incoming re-sources. Ils influence on the trad% coefficient is significant asindicated by a high DFBETA.
"' Unfortunately, the existence of influential and outlier oh-servations is rarely reported in audit fee studies (exceptionsare Turpen( 1990: 67) and Gist and Michaels (1995: 257-8t).
explored using both DFFITS and DFBETASmeasures (Belsley, Kuh and Welsch. 1980, ch. 2).For example, in the basic model (la), one observa-tion was identified as bighly influential, *^ and afurther four or 16 as possibly influential, depend-ing on the criteria adopted. The regression modelwus re-estimated excluding each of these intluen-tial observations individually and together as agroup of five or 17. Essentially, there were fewchanges in the results. The adjusted R- values im-proved and virtually all of the significant variablesremained so. When the groups of possibly influen-tial observations were excluded, just irad% ceasedto be significant and one additional variable{consiT) became positively significant at the 5%level. Overall, the tests suggest that the results arenot driven by outlier observations.^'*
Testing for multicollinearity was carried outusing a principal components approacb, by ob-serving whether the condition indices were belowthe suggested cut-off of 15 and/or not associatedwith high variance proportions on two (or more)variables (Belsley et al.. 1980, Chapter 3).Generally, collinearity was not a problem exceptwhen both B1G6 and specialism variables were in-corporated in a model, as discussed earlier inSection 3.3.2. The assumption that the residualsare normally distributed was tested using theJarque-Bera statistic (Tables 5 and 6, penultimaterow) and accepted in al! four models for "all char-ities' and "grunt-makers*. For "fund-raisers", thenormality of residuals is reduced and is rejected atvarious levels of significance in the differentmodels. However, the violation of the normalityassumption does not appear to be sufficient to in-validate the use of the t-distribution in significancetesting. The assumption of homoskedasticity wasformally assessed using the Breusch-Pagan-Godfrey test (Tables 5 and 6, final row) and reject-ed at the 5% level for Models la through le, andModels 7 and 8. Thus, the significance levels forthe regression coefficients in these models are re-ported using White's (1980) heteroskedastie-con-sistent covariance matrix estimation.
5.3. Charity and private sector audit fees comparedOne of the objectives of this paper is to assess
the impact that the fundamental charitable natureitself might have on audit fees by comparing thesize of audit fees paid by charities with those paidby private sector companies. Panel A of Table 7provides some summary measures for the sampleof charities and the company population within thecharity revenue range. The mean audit fee forcharities of £25.700 is less than one-third of themean company audit fee of £87.400; the medianmeasures show a similar picture. However, thisoverstates the difference between charity and com-pany audit fee levels, due to the limitations of this
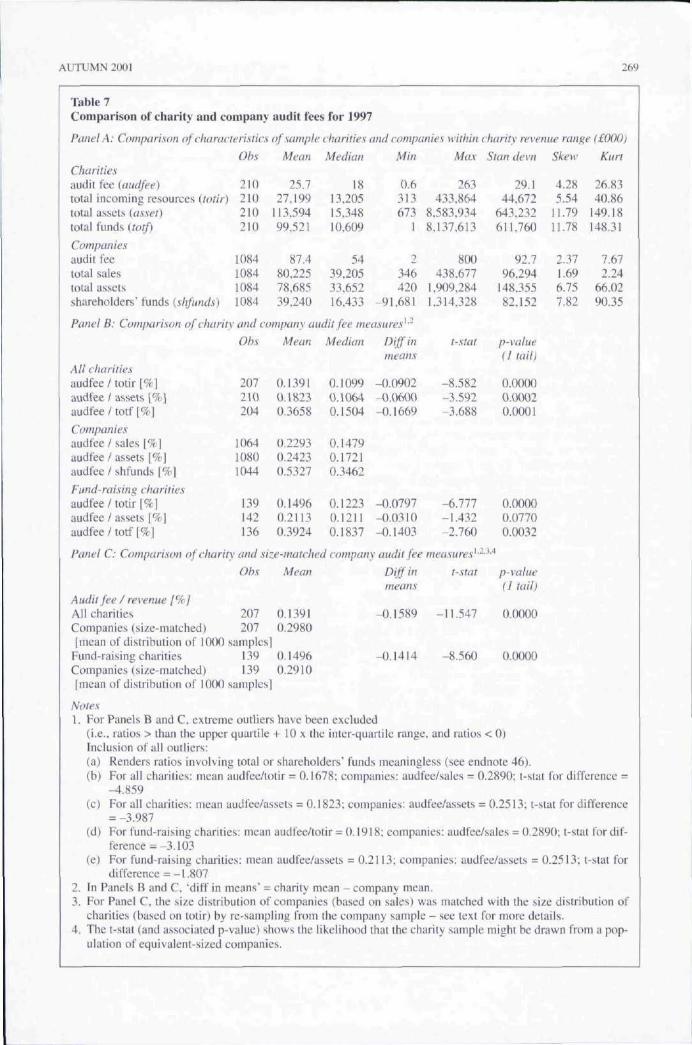
AUTUMN 2(H)1 269
Table 7Comparison of charity and company audit fees for 1997
Panel A: Comparison of charade ristics of sample charities and companies within charity revenue range I.£000)
Charitiesaudit fee (audfee)total incoming resources (totir)total assets (asset)total funds (totf)
Companiesaudit feetotal salestotal assetsshareholders' funds (shfunds)
Panel B: Comparison of charit\
All charitiesaudfee / totir [%]audfee / assets [%]audfee / totf [%]
Companiesaudfee / sales \%\audfee / assets [%]audfee / shfunds \%]
Fund-raising charitiesaudfee/totir \%]audfee / assets (%)audfee / totf \7< ]
Obs
210210210210
1084108410841084
Mean
25.727.199
113.59499.521
87.480.22578,68539,240
Median
1813.20515,34810,609
5439,20533,65216,433
• and company audit fee me
Obs
207210204
106410801044
139142136
Panel C: Comparison ofcharitv and si:
Audit fee / revenue 1%}All charitiesCompanies (size-matched)
Obs
207207
Mean
0.13910.18230.3658
0.22930.24230.5327
0.14960.21130.3924
Median
0.10990.10640.1504
0.14790.17210.3462
0.12230.12110.1837
Mm
0.6313673
1
2346420
-91,681
asures^-
Diffinmeans
-0.0902-0.0600-0.1669
-0.0797-0.0310-0.1403
8.8.
11,
Max
263433,864,583.934,137.613
800438.677,909,284,314.328
t-stat
-8.582-3.592-3.688
-6.111-1.432-2.760
ze-matched company audit fee measures^-
Mean
0.13910.2980
Diffinmeans
-0.1589
t-stat
-11.547
S/an devn
29.144,672
643.232611,760
92.796,294
148,35582,152
p-value(I tail)
0.00000.00020.0001
0.00000.07700.0032
p-value(1 tail)
0.0000
Skew
45
1111
2167
.28
.54
.79
.78
.37
.69
.75
.82
Kurr
26.8340.86
149.18148.31
7.672.24
66.0290.35
[mean of distribution of I(K)O samples]Fund-raising charities 139 0.1496 -0.1414 -8.560 0.0000Companies (size-matched) 139 0.2910[mean of distribution of 1000 samples]
Notes1. For Panels B and C, extreme outliers have been excluded
(i.e., ratios > than the upper quartilc + 10 x the inter-quartile range, and ratios < 0)Inclusion of all outliers:(a) Renders ratios involving total or shareholders' funds meaningless (see endnote 46).(b) For all charities: mean audfee/totir = 0.1678; companies: audfee/sales = 0.2890; t-stat for difference =
^ . 8 5 9(c) For all charities: mean audfee/assets = 0.1823: companies: audfee/assets = 0.2513; t-stat for difference
= -3.987(d) For fund-raising charities: mean audfee/totir- 0.1918: companies: audfee/sales = 0.2890; t-stat for dif-
ference = -3.103(e) For fund-raising charities: mean audfee/assets = 0.2113: companies: audfee/assets = 0.2513; t-stat for
difference = -1.8072. in Panels B and C, 'diff in means" - charity mean - company mean.3. Fur Panel C, the size distribution of companies (based on sales) was matched with the size distribution of
charities (based on totir) by rc-sampUng from the company sample - see text for more details.4. The t-stat (and associated p-value) shows the likelihood that the charity sample might be drawn from a pop-
ulation of equivalent-sized companies.
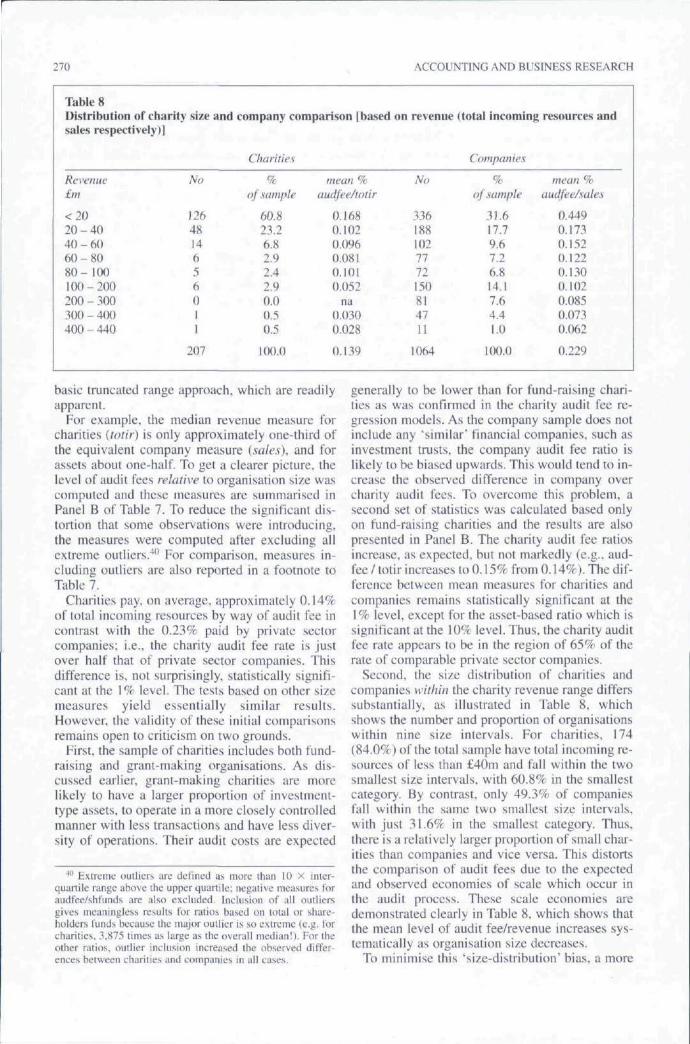
270 ACCOUNTING AND BUSINESS RESEARCH
Table 8Distribution of charity size and company comparison [based onsales respectively)]
Revenue£m
<2020 - 4040-6060-8080- 100100 - 200200 - 300300 - 400400 - 440
No
1264814
56011
207
Charities
of sample
60.823.26.82.92.42.90.00.50.5
100.0
mean %audfee/totir
0.1680.1020.0960.0810.1010.052
na0,0300,028
0.139
revenue
No
3361881021172150814711
1064
(total incoming
Companies
%of sample
31.617.79.67.26.814.17.64.41.0
100.0
resources and
mean %audfee/sales
0,4490.1730.1520.1220.1300.1020.0850.0730.062
0.229
basic truncated range approach, which are readilyapparent.
For example, the median revenue measure forcharities {totir) is only approximately one-third ofthe equivalent company measure (.sales), and lorassets about one-half. To get a clearer picture, thelevel of audit fees relative to organisation size wascomputed and these measures are summarised inPanel B of Table 7. To reduce the significant dis-tortion that some observations were introducing.the measures were computed after excluding allextreme outliers.""' For comparison, measures in-cluding outliers are also reported in a footnote toTable 7.
Charities pay. on average, approximately 0.14%of total incoming resources by way of audit fee incontrast with the 0.23% paid by private sectorcompanies; i.e., the charity audit fee rate is justover half that of private sector companies. Thisdifference is, not surprisingly, statistically signifVcant at the 1% level. The tests based on other sizemeasures yield essentially similar results.However, the validity of these initial comparisonsremains open to criticism on two grounds.
First, the sample of charities includes both fund-raising and grant-making organisations. As dis-cussed earlier, grant-making charities are morelikely to have a larger proportion of investment-type assets, to operate in a more closely controlledmanner with less transactions and have less diver-sity of operations. Their audit costs are expected
""' Extreme outliers are defined us more Ihan 10 X inter-quartile range above the upper quiirlile: negative measures foraudfee/shlunds are also excluded. Inclusion of iill outliersgives meaningless results for ratios based on total or share-holders funds because the major outlier is so extreme (e.g. forcharities. 3.875 times as large as the overall median!). For theother ratios, outlier inclusion increased the observed differ-ences between cbanlies and companies in all cases.
generally to be lower than for fund-raising chari-ties as was confirmed in the charity audit fee re-gression models. As the company sample does notinclude any 'similar' financial companies, such asinvestment trusts, the company audit fee ratio islikely to be biased upwards. This would tend to in-crease the observed difference in company overcharity audit fees. To overcome this problem, asecond set of .statistics was calculated based onlyon fund-raising charities and the results are alsopresented in Panel B. The charity audit fee ratiosincrease, as expected, but not markedly (e.g.. aud-fee / totir increases to 0.15% from 0.14%). The dif-ference between mean measures for charities andcompanies remains statistically significant at the1% level, except for the asset-based ratio which issignificant at the 10% level. Thus, the charity auditfee rate appears to be in the region of 65% of therate of comparable private sector companies.
Second, the size distribution of charities andcompanies within the charity revenue range differssubstantially, as illustrated in Table 8, whichshows the number and proportion of organisationswithin nine size intervals. For charities. 174(84.0%) of the total sample have total incoming re-sources of less than £40m and fall within the twosmallest size intervals, with 60.8% in the smallestcategory. By contrast, only 49.3% of companiesfall within the same two smallest size intervals,with just 31.6% in the smallest category. Thus,there is a relatively larger proportion of small char-ities than companies and vice versa. This distortsthe cotnparison of audit fees due to the expectedand observed economies of scale which occur inthe audit process. These scale economies aredemonstrated clearly in Table 8, which shows thatthe mean level of audit fee/revenue increases sys-tematically as organisation size decreases.
To minimise this 'size-distribution' bias, a more
AUTUMN 2001 271
precisely size-matched sample of companies wasachieved by adopting the 'bootstrapping" methoddescribed earlier. The method, based on total rev-enue, was applied to lest for lower audit fees in thesample of all charities (but with outliers excluded),and in the sub-sample of fund-raising charities.The results are presented in Panel C of Table 7.
For the company sample, now properly size-matched with the all-charities sample, the mean ofthe distribution of audit fee/sales was 0.298%compared with 0.139% for charities. The t-statisticfor the difference in means is - i l .35 indicating avery high level of statistical significance, and con-firming acceptance of hypothesis 5. The resultsbased only on fund-raising charities are similar,with the mean for the size-matched companies of0.291% again being much higher than the meanvalue (0.150%) for the charity sample. Thus, in aproperly size- and type-matched comparison, thecharity audit fee rate is approximately half that ofprivate sector companies.
6. Summary and conclusionsThe study develops and estimates, for the firsttime, a model of charity audit fee determinants. Asin previous private sector company studies, size isthe major determinant. Several dimensions oforganisational complexity (including the numberof subsidiaries, and stock level) and audit firm lo-cation (i.e., London-based) are also important.Specific charity sector factors that contribute in-clude the importance of trading as a source of char-ity income, the major area of activity in which thecharity operates, and the fundamental nature of thecharity (i.e., whether predominantly grant-makingor fund-raising). Separate models are developedfor the latter two categories of charity and the re-sults reflect the relative complexity ot' the audit offund-raising charities. By contrast, grant-makingcharities are relatively straightforward and theiraudit fees typically have just two determinants(size and the number of subsidiaries). Auditors*provision of non-audit services is much less im-portant in the charity sector than the UK companysector. However, the somewhat anomalous posi-tive association between audit fees and NAS,which has been observed persistently for non-charitable companies, is also found in the charitysector, particulariy for fund-raising charities.
The lower auditor concentration in the charitysector provides a valuable opportunity to investi-gate whether large firms and/or auditor expertiseare rewarded with a fee premium. The results showthat Big Six audit firms, on average, receive high-er audit fees for audits of fund-raising (but notgrant-making) charities.,Given that none of theBig Six can be described as having particular ex-pertise in the sector, this premium can be attributedto brand name rather than any specific sector ex-
pertise. The observation of a brand name premiumin only the fund-raising sub-sector is perhaps notsurprising. Fund-raising charities have greaterneed of public confidence, in order to continue toraise funds, and therefore stand to benet"it most byemploying a high-profile auditor as a symbol ofhigh accountability. This may increase the relativebargaining position of Big Six auditors, enablingthem to charge a premium. In contrast, it may bedifficult to justify charging a premium to grant-making charities where the need for a symbol ofhigh accountability is less, and where the auditprocess is relatively straightforward.
The size of the premium is approximately 18.5%on average, somewhat smaller than the premiumimplied in studies of UK private-sector companies.For quoted companies, Chan et al. (1993) found apremium of 36.7%, Ezzamel et al. (1996), 23.5%,and for independent unquoted firms Brinn et al.(1994) found a 28.0% premium. By contrast, nei-ther Che-Ahmad and Houghton (1996), in theirstudy of medium-sized UK companies, norClatworthy et al. (2000) in their study of UKNational Health Service Trusts found any evidenceof a large audit firm premium.
Of the five Big Six auditors active in the charitysector, only KPMG (with the largest number ofcharities audited) consistently earns fee premiums.By contrast, the audit fees charged by Ernst &Young seem to lower than those charged by non-Big Six auditors in grant-making charities.
There is evidence that market-leading non-BigSix audit firms in the sector are rewarded with astatistically significant fee premium in the morecomplex audit environment of fund-raising chari-ties, but the average size of this premium aboveother non-Big Six auditors is not economically sig-nificant (only about 0.5%). However, individualnon-Big Six auditors with expertise (especiallyBinder Hamlyn) do appear to earn economicallysignificant fee premia above other non-Big Sixfirms. Such observations are consistent with a pre-mium either related to charity sector-specific ex-pertise or related to a second-tier brand namepremium, but our research approach is unable todistinguish between these competing explanations.
The study also provides preliminary evidence onthe overall level of fees paid by charities relative tothose prevailing in the private sector. In a properlysize- and type-matched comparison, the charityaudit fee rate is significantly lower than that of pri-vate sector companies: in fact it is approximatelyhalf. The magnitude of this differential raises im-portant issues concerning the reasons for the lowercharity audit fees. While these issues warrant fur-ther investigation, it is likely to be difficult to ex-plain unambiguously the lower charity fees.However, the lower audit fees are certainly consis-tent with auditors perceiving audit risks to be
272 ACCOUNTING AND BUSINESS RESEARCH
lower in the charity sector, and/or with auditoraltruism in not charging the 'market rate".Unfortunately, they are also consistent with lowerquality audits, in which audit firms recognise alower 'market rate' in the charity sector and re-spond by cutting costs to minimise losses incurred.
Currently, the argument that the quality of char-ity audits might be lower than company audits isdifficult to refute. This is potentially damaging toboth charities and their auditors. A change in thereporting of charity audit fees could improve thesituation where there is an element of 'charitablegiving' in the audit fee charged. The gift elementcould be recognised as such in the income sectionof the Statement of Financial Activities and the•fuir audit fee charged against the income.Alternatively, disclosure of the information couldbe included in the notes to the accounts. Eithermethod would provide users of charity financialstatements with a clearer indication of the extent ofaudit work performed and of the level of audit firmaltruism, both of which are hidden under currentreporting practices. This suggestion is consistentwith the move towards the valuation and recogni-tion of gifts and services provided 'in kind' advo-cated by the revised SORP 2^' and might usefullybe included in a future version of the SORP.
Feedback on the results from a small set of char-ity auditors was generally encouragingly support-ive of the main findings.'*- However, a particularlimitation is that the sample of charities was takenfrom the top 500 charities, and it would be dan-gerous to extrapolate the results to the rest of thetop 3,000 or to the large number of much smallerregistered charities.
•" Piiragraphs 107-108 of SORP 2 give details for recogni-tion of 'gifts in kind" and paragraphs 109-110 concern "inlan-gible income". The difficulty associated wiih valuingvoluntary help is recognised in paragraph 110 which recom-mends thill such help should not be accounted for in theSialfinenl of Financial A<iiviiie\. but should be deall with inthe notes to the accounts or in the Trustees' Annual Report.However, valuation of the cost of work carried out hy auditfirms in conducting the annual audit should not present thesame difficulty. In ihe US. FASB Statement No. 116Aicoiiiilinfi for Coiuiibiilions Received and ConirihuiionsMtule includes recommendations on contributed services:'Contribiilions of sen ices are recognized only if the servicesreceived (a) creuie or enlumce assets or (h) require special-ized skills, are provided by individuals possessini; ihose skills,and would typically need to be purchased if not provided bydonation'. The charging of a subsidised audit fee would seemto tit within such a recognition rule.
"*- The 1 inal stage of ihe research process was to obtain somefeedback directly from charity auditors. An executive summa-ry and an earlier drafi of this paper were sent out lo a smallsample of leading charity auditors for iheir comments. Sevencopies were sent oui and. alihough only three replies were re-ceived, these provided several useful insights and additions tothe paper.
ReferencesAccounmncy Ai>i' (1998). 'New charity control." 23 April:
8.Anderson. T. and Zeghal, D. (1994). 'The pricing of auditservices: further evidence from the Canadian tnarket.'Accountiiiii and RHsitiess Research, 24(9?). Spring:1 9 5 - 2 0 7 .
A u d i t i n g P r a c t i c e s B o a r d ( 1 9 9 6 ) . P r a c t i c e N o t e I I : TheAuilil of Charities. London: CCAB Ltd.
Baber, W.R. (1983). 'Towards understanding the role of au-diting in the public sector." Journal of Accounting andEconomics. 5(3), December: 213-227.
Baher, W.R., Brooks. E.H. and Ricks. W.E. (1987). 'Anempirical investigation of the market for audit services inthe public sector.' Journal of Accouniing Research, 25(2):293-.^05.
Bandyopadhyay. S.P. and Kao, J.L. (1998). 'Cotnpetitionand Big Six brand name reputation: evidence from theOntario municipal audit market." Working paper, AAANew Orleans.
Barings. (1998). Baring Asset Managemeni Top 3000Charities I99H: the f>uitie to UK Charities. CaritasDataLimited. London.
Barkess, L, and Simnett, R. (1994). The pricing of otherservices by auditors: independence and pricing issues."Accounting; ami Business Research, 24(94): 99-108.
Beatty, R.P. (1993). 'The economic determinants of auditorcompensation in the initial public offerings market.'Journal of Accountini- Research, 31(2). Autumn:294-302.
Beck, PJ. and Barefield. R.M. (1986). 'An economicanalysis of competitive bidding for public sector audit en-gagements." Journal of Accounting and Public Policv,5(3). Fall: 143-168.
Belslcy. D.A,, Kuh, E. and Welsch. R.E. (1980).Regression Diagnostics: Identifying Influential Data andSources of CoUinearitx. New York: John Wiley & Sons.
Brinn, T.. Peel. M.J. and Roberts, R. (1994). 'Audit fee de-terminants ol' independent & subsidiary unquoted compa-nie.s in the UK - an exploratory study," British AccountingReview.26a): 101-121.
Bryden, J. (1996). "Canada's charities: a need for reform."MP's Report, October
Buiterworth. S. and Houghton, K.A. (1995). 'Auditorswitching: the pricing of audit services." Journal ofBusiness Finance anil Accounting. 22(3), April: 323-344.
Carslaw. C.A.PN. and Kaplan, S.E. (1991), 'An examina-tion of audit delay: further evidence from New Zealand."Accounting and Busines.'^ Research, 22(85): 21-32.
Chan, P., Ezzamel, M. and Gwilliam, D. (1993).'Determinants of audit fees for quoted UK companies.'Journal of Business Finance and Accounting. 20(6):765-786.'
Che-Ahmad. A. and Houghton, K.A. (1996). 'Audit feepremiums of Big Eight firms: evidence from the marketfor medium-si/e UK auditees." Journal of InternationalAccounting. Auditing & Taxation. 5(1): 53-72.
Chung. D.Y. and Lindsay, W.D. (1988). The pricing ofaudit services: the Canadian perspective.' ContemporaryAccounting Research, 5(1), Fall: 19^6.
Clatworthy. M.A.. Mellett, H.J. and Peel. M.J. (2(K)0). 'Themarket for external audit services in the public sector: anempirical analysis of NHS trusts.' Working paper, CardiffBusiness School.
Cra.swell, A.T. and Francis, J.R. (1999). Pricing initialaudit engagements: a test of competing theories.' TheAccounting Review. 74(2), April: 201-216.
Craswell, A.T., Francis. JR. and Taylor, S.L. (1995).
AUTUMN 2001 273
"Auditor brand name reputations and industry specializa-tion.' Journal of Accounting and Economics, 20(3):297-322.
Cullinan. C.P. (1997). "Audit pricing in the pension planaudit market." Accounting ami Business Research. 27(2).Spring: 91-98.
Cullinan. C.P. (1998). 'Evidence of non-Big Six marketspecialization and pricing power in a niche assuranceservice markel." Auditing: A Joiinuil of Practice &Theorw 17(SuppleiTient): 47-51.
Davis. L.R.. Ricchiute. D.N. and Trumpeter. G. (1993)."Audit effort, audit fees and the provision of nonauditservices to audil clienis." The Accounting Revien; 68(1):135-150.
DeAngelo. L.E. (1981a). "Auditor size and audil quality."Journal of Accounting and Economics. 3(3). December:183-199.'
DeAngelo, L.E. (I98ib). 'Auditor independence, "lowballing"', and disclosure regulation." Journal ofAccounting and Economics. 3(2). August: 113-127.
DeFond, M.L.. Francis. J.R. and Wong. T.J. (2000)."Auditor industry specialization and markel segmenta-tion: evidence from Hong Kong." Auditing: A Journal ofPractice & Theory. I9( 1): 49-66.
Deis. D.R. and Giroux. G. (1996). "The effect of auditorchanges on audit fees, audit hours, and audit quality."Journal of Accounting and Public Policy. I5( 1). Spring:55-76.
Dye. R.A. (1991). "Informationally motivated auditor re-placement. " Journal of Accounting and Economics. 14(4).December: 347-374.'
Ettredge. M. and Greenberg. R. (1990). 'Determinants offee cutting on initial audit engagements.' Journal ofAccounting Research. 28( 1). Spring: 198-210.
Ezzamel. M.. Gwilliam. D.R. and Holland. K.M. (1996)."Some empirical evidence from publicly quoted UK com-panies on the relationi^hip between the pricing of auditand non-audit services.' Accounting and BusinessResearch. 21(\y. 3-16.
Ezzamel. M., Gwilliam. D.R. and Holland. K.M. (1997).'The relationship between categories of non-audit servic-es and audit fees: evidence from UK companies." Workingpaper. University of Aberystwyth.
Firth, M. (1985). "An analysis of audit fees and their deter-minants in New 7.cixVdx\iS.' Auditing: A Journal of Practice<e Theory. 4(2). Spring: 23-37.
Firth. M. (1997). "The provision of non-audit services andthe pricing of audit fees." Journal of Business Financeand Accounting. 24(3&4). April: 51 i-525.
Francis. J.R. (1984). 'The effect of audit firm size on auditprices: a study of the Australian market." Journal ofAccounting and Economics. 6(2): 133-151.
Francis. J.R. and Simon. D.T. (1987). "A test of audit pric-ing in the small-client .segment of the US audit market."The Accounting Review. 62(1). January: 145-1,57.
Francis. J.R. and Stokes. D.J. (1986). "Audit prices, prod-uct differentiation, and scale economies: further evidencefrom the Australian market.' Journal of AccountingResearch. 24(2). Autumn: 383-393.
Gist. W.E. (1992). 'Explaining variability in external auditfees." Accounting and Business Research. 23(89): 79-84.
Gist. W.E. (1994). 'A research note on the relationship be-tween regulation and audit firm size on audit fees.'Journal of Accounting. Auditing and Finance. 9(2),Spring:381-396.
Gist, W.E. and Michaels. P. (1995). 'Auditor concentrationand pricing of audit services: public policy and researchimplications." Advances in Public Interest Accounting,(6): 233-271.
Gordon. T.P.. Greenlee, J.S. and Nitterhouse, D. (1999)."Tax-exempt organisation financial data: availability andlimitations.'-4rt7)HH;(>i,i,' Horizons. 13(2). June: 113-128.
Gregory. A. and Collier, P. (1996). 'Audit fees and auditorchange; an investigation of the persistence of fee reduc-tion by type of change." Journal of Business Finance andAccounting. 23( I). January: 13-28.
Gujarati. D.N. (1995). Basic Econometrics 13rd edition).New York: McGraw-Hill.
Gul. F.A. (1999). 'Audit prices, product differentiation andeconomic equilibrium.' Auditing: A Journal of Practice &Theory, 18( 1). Spring: 90-100.
Haskins. M.E. and Williams. D.D. (1988). "The associationbetween client factors and audit fees: a comparison bycountry and by firm." Accounting and Business Research,18(70): 183-190.
Herald. The (1999). "Fifteen Scots charities under investi-gation." 18 February.
Hyndman. N. (1990). 'Charity accounting - an empiricalstudy of the information needs of contributors to UK fundraising charities." Financial Accountability <&Management. 6(4). Winter: 295-307.
Iyer, V.M. and Iyer. G.S. (1996). 'Effect of Big Eight merg-ers on audit fees: evidence from the United Kingdom."Auditing: A Journal of Practice & Theory. 15(2), Fall:123-132.
Johnson. E.N.. Walker. K.B. and Westergaard, E. (1995)."Supplier concentration and pricing of audit services inNew Zealand." Auditing: A Journal of Practice (& Theory,14(2). Fall: 74-89.
Langendijk. H. (1997). "The market for audit services inthe Netherlands." European Accounting Review. 6(2):253-264.
Lee, D.S-Y. (1996). "Auditor market share, product differ-entiation and audit fees." Accounting and BusinessResearch. 26{4y. 315-324.
Little, R.J.A and Rubin. D.B. (1989). "The analysis of so-cial science data with missing values." SociologicalMethods and Research. 18(2/3): 292-326.
Low, L., Tan. P and Koh. H. (1990). 'The determination ofaudit fees: an analysis in the Singapore context." Journalof Business Finance and Accounting. 17(2). Spring:285-295.
Matthews. R.. Jubb, C.A. and Houghton. K.A. (1997). 'Thepremium for specialisation: does it exist for non-Big Sixaudit firms?" Research paper 97-14. Department ofAccounting and Finance. University of Melbourne.
Mooney. C.Z. and Duval. R.D. (1993). Bootstrapping: Anonparametric approach to statistical inference. (SageUniversity Paper series on Quantitative Applications inthe Social Sciences, series no. 07-095). Newbury Park,CA: Sage.
NCVO (1998). Research Quarterly. Issue I, January.London: NCVO.
Palmrose. Z.-V. (1986a). "Audit fees and auditor size: fur-ther evidence." Journal of Accounting Research. 24(1).Spring: 97-^110.
Palmrose. Z.-V. (1986b). 'The effect of non-audit servieeson the pricing of audit services: further evidence." Journalof Accounting Research. 24(2). Autumn: 405^11.
Parkash. M. and Venable. C.F. (1993). "Auditee incentivesfor auditor independence: the case of non-audit services.'The Accounting Review. 68(1). January: 113-133.
Pearson. T. and Trompeter. G. (1994). 'Competition in themarket for audit services: the effects of supplier concen-tration on audit fees.' Contemporary AccountingResearch. lUD. Summer: 115-135.
Pharoah, C. and Smerdon, M. (eds) (1998). Dimensions ofthe Voluntary Sector. London: Charities Aid Foundation.
274 ACCOUNTING AND BUSINESS RESEARCH
Pianca, A. and Blackwood. M. (eds) (1996). Client andAdviser Guide: Charities. London: Tolley PublishingCompany Ltd.
Pong. C.K.M. (1999). "Auditor concentration: a replicationand extension for the UK audit market 1991-1995."Journal of Business Finance and Accounting. 26(3&4):451^75. '
Pong, C.K.M. and Whittington. G. (1994). 'The determi-nants of audit fees: some empirical models.' Journal ofBusiness Finance and Accounting. 21(8): 1.071-1.095.
Ritson. B., Jubb. C.A. and Houghton, K.A. (1997).'Specialisation in the market for audit services: its role inexplaining auditor/client realignment." Research paper97-01. Department of Accounting and Finance,University of Melbourne.
Rubin. M.A. (1988). 'Municipal audit fee detenninants.'The Accounting Review. 63(2): 219-236.
Sanders. G.. Allen, A. and Korte. L. (1995). 'Municipalaudit fees: has increased competition made a difference?"Auditing: A Journal of Practice & Theory. I4( 1). Spring:10,5-114.
Schatzberg, J.W. (1990). 'A laboratory market investiga-tion of low balling in audit pricing." The AccountingReview. 65(2). April: 337-362.
Schatzberg, J.W. (1994). "A new examination of auditor""low ball" pricing: theoretical model and experimentalevidence." Auditing: A Journal of Practice & Theory.l3(Supplementj: 33-55.
Schatzberg. J.W. and Sevcik. G.R. (1994). 'A multiperiodmodel and experimental evidence of independence and"lowballing"." Contemporary Accounting Research,lKD.Summer: 137-174.
Sharpe. D. (1994). A Portrait of Canada's Charities.Toronto: Canadian Centre for Philanthropy.
Simon. D.T. (1985). "The audit services market: additionalempirical evidenee." Auditing: A Journal of Practice &
r/i<wy. 5(1): 71-78.Simon. D.T. and Francis. J.R. (1988). 'The effects of audi-tor change on audit fees: tests of price cutting and pricerecovery." The Accounting Review. 63(2). April: 255-269.
Simon. D.T.. Ramanan. R. and Dugar. A. (1986). 'The mar-ket for audit services in India: an empirical examination.'International Journal of Accounting, 21(2). Spring:27-35.
Simon, D.T.. Teo. S. and Trompeter. G. (1992). 'A com-parative study of the market for audit services in Ht>ngKong. Malaysia and Singapore." International Journal ofAccounting. 27(3): 234-240.
Siniunic. D.A. (1980). 'The pricing of audit services: theo-ry and evidence." Journal of Accounting Research, 18(1):161-190.
Simunic. D.A. (1984). "Auditing, consulting, and auditorindependence." Journal of Accounting Research. 22(2).Autumn: 679-702.
Taffler, R.J. and Ramalinggam. K.S. (1982). 'The determi-nants of the audit fee in the UK: an exploratory study.'Working paper. City University Business School.
Taylor. M.E. and Baker. R.L. (1981). 'An analysis of theexternal audit fee." Accounting and Business Research.12(45). Winter: 55-60.
Turpen. R.A. (1990). 'Differential pricing on auditors' ini-tial engagements: further evidence." Auditing: A Journalof Practice & Theory. 9(2). Spring: 60-76.
Ward. D.D.. Eider. R.J. and Katteius. S.C. (1994). 'Furtherevidence on the determinants of municipal audit fees.'The Accounting Review. 69(2), April: 399-411.
White, H. (1980). 'A heteroscedastic-consistent covariancematrix estimator and a direct test for heteroscedasticity."Econometrica, 48: 817-828.
Wise. D. (1995). Performance Measurement for Charities.London: ICSA Publishing.