the consequences of an increase in heavy goods vehicles for passenger car drivers’ mental workload...
TRANSCRIPT
A
ottte
aoT
erb
©
K
1
Gcitc
B2f
(
0d
Accident Analysis and Prevention 40 (2008) 818–828
The consequences of an increase in heavy goods vehicles for passengercar drivers’ mental workload and behaviour: A simulator study
Dick de Waard a,b,∗, Anje Kruizinga a, Karel A. Brookhuis a,b
a Experimental and Work Psychology, Faculty of Behavioural and Social Sciences, University of Groningen,Grote Kruisstraat 2/1, 9712 TS Groningen, The Netherlands
b Faculty Technology, Policy and Management, Transport Policy and Logistics’ Organisation,Delft University of Technology, Jaffalaan 5, 2628 BX Delft, The Netherlands
Received 5 March 2007; received in revised form 3 September 2007; accepted 23 September 2007
bstract
The effects of an increase in Heavy Goods Vehicles (HGVs) on merging behaviour and on mental workload of motorists during filtering in andut of traffic were studied. Participants drove in a driving simulator in a total of 12 conditions; twice in each of two weather conditions and in threeraffic conditions. The weather conditions were clear weather and foggy weather. The traffic conditions were without HGVs (i.e. only private cars),he current mix of HGVs and private cars, and a condition with a 70% increase of HGVs leading to an HGV column in the slow lane. The focus ofhe study was on assessing effects on behaviour and mental workload during filtering into traffic, and during exiting from the motorway. During thexperiment driving performance was registered, behaviour was observed, self reports were collected, and the participant’s heart rate was recorded.
The results showed that directly after filtering into traffic the variation in driving speed increased and the minimum time headway decreased withn increase in the proportion of HGVs. Joining motorway traffic was considered to involve greater effort and risk in the condition with a columnf HGVs. The effects of the conditions on heart rate are less clear, although the moment when the participants joined the traffic is clearly visible.he effects of weather conditions were limited, drivers adapting their driving behaviour in adverse weather by reducing speed.To exit the motorway is not a difficult manoeuvre. For that reason the lane change from the left hand to the right hand lane that preceded the
xit was analysed. Although increased mental effort was reported and the lane change was visible in the heart rate record, no critical changes as a
esult of increase in proportion of HGVs were found for this manoeuvre. However, in the condition with a column of HGVs, the exit that had toe taken was most frequently missed as HGVs obstructed the view of the exit signs.It is concluded that an increase in HGVs will make merging into traffic more mentally demanding and will decrease safety margins.2007 Elsevier Ltd. All rights reserved.
tor
ilo
B
eywords: Highway; Merging; Truck; HGV; Mental workload; Driving simula
. Introduction
Martens et al. (2007) expect a 70% increase in Heavyoods Vehicles (HGVs) in the Netherlands in the year 2020
ompared with 2000. In the same period they foresee a 30%
ncrease in the number of private cars. The consequences ofhe increase, and the imbalance in increase between privatears and HGVs, are manifold. Congestion will undoubtedly∗ Corresponding author at: Experimental and Work Psychology, Faculty ofehavioural and Social Sciences, University of Groningen, Grote Kruisstraat/1, 9712 TS Groningen, The Netherlands. Tel.: +31 50 363 67 61;ax: +31 50 363 67 84.
E-mail addresses: [email protected] (D. de Waard), [email protected]. Brookhuis).
dahitdiats
001-4575/$ – see front matter © 2007 Elsevier Ltd. All rights reserved.oi:10.1016/j.aap.2007.09.029
ncrease: HGVs occupy more physical space, and the slowane of motorways may be filled predominantly with columnsf HGVs.
Driving in heavy traffic will increase mental workload.rookhuis et al. (1991) found that on a busy ring road, theriver’s mental effort was increased compared with driving onquiet motorway. De Waard (1991) found effects on driver’s
eart rate that coincided with an increase in traffic flow, andn a 4 year field trial in New York Zeitlin (1995) has shownhe effect of high density traffic on mental workload whileriving a vehicle. Increased traffic density has been shown to
ncrease workload and the probability that errors will lead toccidents. As long as drivers can self pace the driving taskhey can compensate for additional load, e.g. by driving morelowly (e.g. Brouwer and Ponds, 1994; Brown et al., 1969).
ysis a
Hpswa
rteHamsiectual
aUaAicabib
tmadedAlm
wpbsmada(bawbpm
MaNo
di
1
2
3
4
5
2
2
fwaiNdo7ss
p3aefiw11dm2
2
D. de Waard et al. / Accident Anal
owever, filtering into traffic is a complex task that is onlyartly self-paced. Drivers have to decide whether to maintainpeed, to accelerate, or to slow down. They also have to decidehen to change lane. These tasks impose high time pressure
nd may lead to overload (e.g. Lundqvist et al., 2000).If traffic flow approaches road capacity, speed will be
educed, ultimately leading to congestion. To alleviate conges-ion, ramp metering programmes have been in use with positiveffects on flow and merging conditions (e.g. Wu et al., 2007).owever, a large increase in HGVs will lead to a different situ-
tion in the acceleration lane; filtering into a column of HGVsay lead to different behaviour from that of joining a mixed
tream of traffic. Hill and Boyle (2007) report that mergingnto heavy traffic on a freeway is one of 18 stressful roadwayvents. They also found that the primary cause of stress asso-iated with HGVs stems from reduced visibility as a result ofhe large vehicles. Hill and Boyle (2007) mention that large vol-mes of HGVs in particular may be of concern for driver stress,s these obstruct vision and reduce the driver’s ability to changeane.
There are more indications that HGVs are related to stressnd safety critical driving manoeuvres. Stuster (1999) in theSA reviewed collision reports, and interviewed truck drivers
nd experts on unsafe driving behaviour in the vicinity of HGVs.ccording to the experts interviewed in that study, the most crit-
cal behaviour is driving with insufficient attention, e.g. using aell phone or driving while fatigued. Criticality here is defineds a combined score based on danger and frequency of theehaviour. The second most critical driving behaviour is merg-ng improperly into traffic, causing an HGV to manoeuvre orrake quickly (Stuster, 1999).
A column of HGVs in the slow lane will also stimulate driverso stay in the faster lane. Dangerous lane change manoeuvres
ay then occur, both during filtering into traffic, and duringlane change from the faster to the slower lane, in particular
irectly before leaving the motorway. An additional negativeffect of a column of HGVs on the slow lane might be that theriver’s view of traffic signs on the road shoulder is blocked.dverse weather conditions may further increase driver work-
oad, as decreased vision affects the ability to estimate safetyargins (Cavallo et al., 1997).Driving behaviour during filtering-in and leaving the motor-
ay can be assessed by looking at driving performancearameters, at the driver’s physiology, by observing overtehaviour, and by self-reports (e.g. De Waard, 2002). Mea-ures of driving performance reflect speed and accuracy of theanoeuvre. In practice these variables are the average and vari-
tion of driving speed, lane keeping, and distance keeping. Foristance keeping, advanced measures that reflect safety marginsre recommended, such as time-headway and time-to-collisionVan der Horst, 1990). These measures take driving speed andehaviour of other vehicles into account. Physiological measuresre useful to assess momentary increases in mental workload
ithout having to disrupt performance as, for instance is requiredy requesting ratings. Heart rate and heart rate variability, inarticular the 0.10 Hz component of variability, are instructiveeasures here (Backs and Seljos, 1994; Fairclough et al., 2005;ph5y
nd Prevention 40 (2008) 818–828 819
ulder, 1992; Mulder et al., 2005). Self-reports can be appliedfter trials, e.g. to assess mental workload on scales such as theASA TLX (Hart and Staveland, 1988), and to obtain ratingsf experienced safety or risk.
To study the effects of an increase in HGVs on passengerriver behaviour a simulator study was performed. The follow-ng hypotheses were evaluated:
. An increase in HGVs will make merging into traffic moredifficult and will require more mental effort,
. Driving behaviour during merging in conditions of increasednumbers of HGVs will be less safe as indicated by headwaysafety margins,
. Reduced visibility will negatively affect the estimation ofsafety margins and will lead to shorter time-headways whilemerging,
. Changing from the fast lane to the slow lane before leavingthe motorway will be more effortful if the slow lane is filledwith HGVs,
. An increase in HGVs will block the driver’s view of (exit)signs, leading to missed exits.
. Method
.1. Simulator
The driving simulator consisted of a vehicle mock-up with aunctional steering wheel, indicators, and pedals. The simulatoras surrounded by three frontal 32-in. diagonal LCD screens,
nd one additional screen on the left-hand side behind the partic-pant, to enable the “look over the left shoulder” when merging.ot surprisingly, without the latter screen it has been found thatrivers focus only on vehicles in front when joining the trafficn the motorway (Sarvi et al., 2004). Each screen provided a0◦ view, leading to a total 280◦ view. The driving simulationoftware was developed by ST Software©, and is capable ofimulating fully interactive traffic.
For the experiment a section of Dutch motorway was pre-ared, consisting of two 3.6 m wide lanes and a hard shoulder ofm. One acceleration lane and three exits provided entrance tond exit from the motorway. The acceleration lane and exits wereach 300 m in length. The distance between the entrance and therst exit, and between the consecutive exits, was 2 km. Signageas according to Dutch motorway regulations, at respectively200 m, 600 m, 300 m and 0 m in advance of the exit. On the200, 600 and 0 m signs, names of the exit destinations wereisplayed. On the 300 m sign a long-distance destination of theotorway was displayed (for examples see De Waard et al.,
005).
.2. Participants
Participants holding valid drivers licences were invited via
ublication boards and word of mouth. Both experienced (i.e.olding at least 5 years their licence and driving more than000 km/year), and inexperienced drivers (holding a licence ± 2ears) were invited.
8 ysis a
wsewo1oo2ad
2
a
b
c
tco
tw“ThtwwrtnsmPa
eH
taoufis
tF
2.4. Performance measures
During the trials driving speed, time-headway, and lane posi-tion were sampled at 10 Hz and stored to disk. During manoeuvre
20 D. de Waard et al. / Accident Anal
A total of 42 drivers participated in the experiment. Thirty twoere experienced drivers, 10 inexperienced. The total group con-
isted of 25 males and 17 females. Nineteen of the males werexperienced drivers. The average age of the experienced driversas 30.5 years (range 23–52 years). They had held their licencesn average 10.4 years and had an average annual mileage of6 000 km (S.D. 13 000). The inexperienced participants weren average 22.5 years old (range 19–28), held their licencen average 2.2 years, and had an average annual mileage of500 km (S.D. 2900). The experienced participants drove on
verage 4.3 h per week on the motorway, while the inexperiencedrivers spent on average 1.1 h each week on the motorway.
.3. Design, conditions, instructions
The following conditions were part of the study:
. Traffic, three levels:• Passenger cars: Only private cars, relative high traffic vol-
ume of a total of 3600 vehicles/h (1800 per lane), averagespeed 110 km/h (Standard deviation, S.D. 9 km/h), aver-age time-headway 2 s in the right hand (merge) lane, 3 s inthe left hand (fast) lane.
• Mix: The 2006 common mix of HGVs and private cars,about 200–250 HGVs/h all in the right hand (slow) lane,about 1500 private cars/h.
• HGV column: A column of HGVs in the slower lane, onaverage 950 HGVs/h, all in the slow lane. Average speed80 km/h, S.D. 4 km/h, average time-headway 2 s. Apartfrom HGVs there were also private cars, mainly in the lefthand lane.
. Visibility, two levels:• Clear: Bright weather.• Fog: Visibility 150 m.
. Repetition:• All conditions were repeated twice.
This accounted for a total of 3 × 2 × 2 = 12 trials per par-icipant. A within-subjects design was used, conditions beingounterbalanced in order over the participants to control forrder-effects.
Participants received the instruction to drive to a specific cityhat was listed on the exit signs. On an exit sign two citiesere mentioned, there were three exits per motorway and two
worlds” (variations of signs), i.e. a total of 12 different cities.he names of the cities were invented, to ensure that all driversad to read the signs closely. All trial runs started on the accelera-ion lane where drivers could accelerate and join the traffic. Thereas always an HGV or a private car driving on the main carriage-ay at the moment the acceleration lane was adjacent to the main
oad. The speed of the vehicle on the main road was at first iden-ical to that of the simulator car, to ensure that they would end upext to each other. From that moment the link between the two
peeds was broken and the participant could either speed up anderge in front of the vehicle, or slow down and merge behind it.articipants were instructed to drive in the left hand (fast) lanes soon as traffic allowed. In this way it could be studied whetherFCtdS
nd Prevention 40 (2008) 818–828
xits would be missed more frequently in the condition of highGV intensity due to blocking the view of the signs.The simulator car was equipped with an automatic gear. A
rial would consist of the following manoeuvres: start the enginend accelerate on the acceleration lane, decide to join the trafficn the main road, merge, change lane to the left hand lane, driventil the exit is spotted, change to the right hand lane, exit traf-c, stop, and fill in questionnaires (see Section 2.6). A practiceession preceded the experiment.
The two manoeuvres selected from each trial, joining theraffic and leaving the motorway, are shown in more detail inig. 1.
ig. 1. The manoeuvres selected for analysis. In the images only the “HGVolumn condition” is depicted, with HGVs (large rectangle), private cars, and
he simulator car (black filled rectangle). Manoeuvres a, b, and c are performeduring filtering into traffic, manoeuvres d and e before and during the exit..D. = standard deviation, THW = time-headway, TTC = time-to-collision.
ysis and Prevention 40 (2008) 818–828 821
apblsdFcrota
2
ut1irgimbcdi
2
isrsPtua
2
wcac
2
MMsp
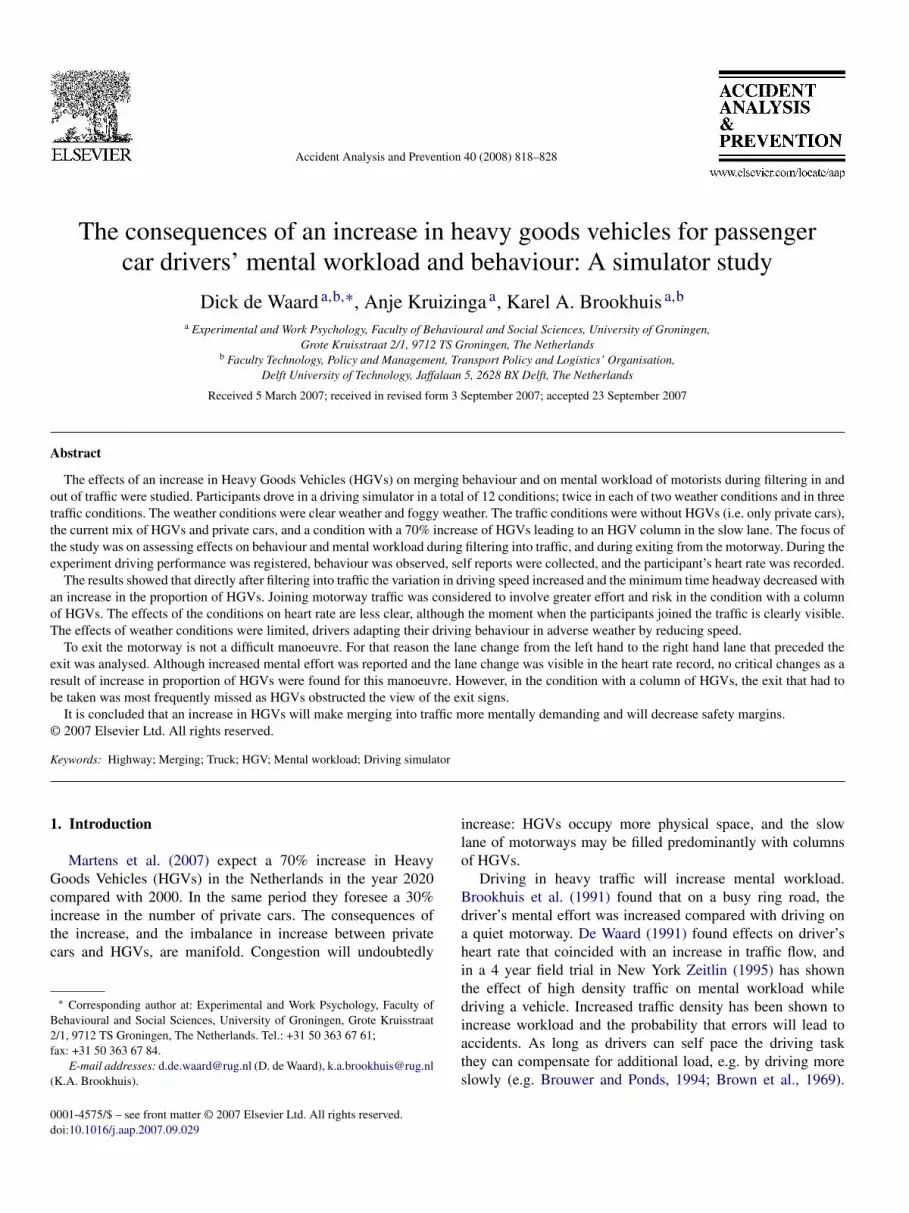
Fig. 2. Average speed (and standard error, S.E., as error bars) in the three trafficand two visibility conditions. Left hand of figure: speed in the acceleration lane(manoeuvre a in Fig. 1). Right hand of figure: speed directly after the mergemanoeuvre (manoeuvre b). Passenger cars = only private cars on the motorway,Mix = 2006 mix of HGV (Heavy Goods Vehicles) and private cars, an HGVnoa
as
a
a
f
(sitet
3
3
D. de Waard et al. / Accident Anal
) (Fig. 1), the average and S.D. of driving speed and lateralosition were determined. Directly after merging (manoeuvre), minimum time-headway and time-to-collision (TTC) to theead vehicle were determined in a timeframe of 5 s to assess howafety-critical the manoeuvre had been. After that, participantsrove in the left hand lane until they spotted the instructed exit.rom that point they were allowed to change to the slow lane toomfortably exit the motorway. The moment of merging into theight hand lane (manoeuvre d) was stored as distance to the startf the exit ramp. Directly after that lane change, the minimumime-headway and TTC to lead cars were determined, again intime frame of 5 s (manoeuvre d).
.5. ECG
The participant’s Electro Cardio Gram (ECG) was registeredsing three small Ag/AgCl electrodes that were attached tohe chest. The R-peak in the ECG signal was detected withms accuracy, time-stamped, and stored to disk. Inter-beat-
nterval times were analysed, and the power spectrum of heartate variation in the 0.10 Hz band were calculated by the pro-ramme CARSPAN (Mulder et al., 1995). Heart rate variability,n particular variability in the 0.10 Hz band is suppressed during
ental effort (e.g. Mulder et al., 2005). Heart rate was comparedetween conditions and with 3-min rest measurements that wereompleted both before and after the experiment. Power spectralata of the 0.10 Hz component were Ln-transformed to reducenter-individual differences in range (Van Roon, 1998).
.6. Questionnaires
After each trial a subjective rating on the unidimensional Rat-ng Scale Mental Effort (RSME, Zijlstra, 1993) was requested,eparately for joining and for exiting traffic. Ratings of expe-ienced risk on 5-point Likert scales were asked for, againeparately for joining the traffic and for merging out of traffic.articipants were asked to indicate “how risky joining [leaving]
he motorway had been”. This type of questionnaire has beensed before by Heino (1996). Also, over each trial a rating ofnnoyance was assessed on a continuous scale.
.7. Observed behaviour
During each trial the location where the participant mergedas recorded; where on the acceleration lane the participant
hanged lane, and whether the participant merged in front orfter the HGV (manoeuvre b). Whether the participant took theorrect exit was also noted (manoeuvres d and e).
.8. Analyses
The data were analysed using the General Linear
odel Repeated Measures test of SPSS. Repeated MeasuresANOVAs were run on speed variables (average and S.D. ofpeed), lateral control variables (average and S.D. of the lateralosition), and headway variables (time-headway and TTC, see
m
a
ext to simulator car when on the acceleration lane, HGV column = a columnf HGVs on the motorway, an HGV next to the simulator car when on thecceleration lane. Clear = clear weather, Fog = visibility about 150 m.
lso Fig. 1). ANOVAs were run on the continuous rating scalecores.
A NewRisk rating was calculated by taking the Mix conditions a reference (i.e. equal to zero):
NewRiskHGV
=
(Risk-ratingMix trial 1 − Risk-ratingHGVs trial 1)
+(Risk-ratingMix trial 2 − Risk-ratingHGVs trial 2)
2
nd
NewRiskpassenger cars
=
(Risk-ratingMix trial 1 − Risk-ratingpassenger cars trial 1)
+(Risk-ratingMix trial 2 − Risk-rating passenger cars trial 2)
2.
The NewRisk parameters are normally distributed allowingor analysis of variance.
Variables were evaluated on main effects of Experiencebetween subjects) and Traffic, Visibility, and Repetition (withinubjects). For Traffic, two contrasts were used, the effect of thencrease in HGV was evaluated by contrasting the ‘Mix’ withhe ‘HGV Column’ condition, the effect of HGV presence wasvaluated by contrasting the ‘Passenger car’ condition with thewo other Traffic conditions.
For all analyses SPSS for Windows version 14.0.2 was used.
. Results
.1. Driving parameters on the acceleration lane:
anoeuvre aIn the left hand part of Fig. 2 the average speed on thecceleration lane is shown (manoeuvre a in Fig. 1). All Traffic

8 ysis a
ctwoto
d3dd
twitaSe0
3m
i
ha
st4cbtoHtdHd
rTTuPr
TR
E
S
E
L
E(
22 D. de Waard et al. / Accident Anal
onditions differed significantly (see Table 1 for the results ofhe statistical tests). Average speed was highest in the conditionith only private cars on the motorway. There were also effectsf Visibility (on average speed was 6.5 km/h lower in condi-ions of fog) and Repetition (during the second trials speed wasn average 8.1 km/h higher).
Variation in speed, S.D. speed, was also larger in con-itions with HGVs (on average 5 km/h, compared with.1 km/h in the condition with only private cars). Experiencedrivers displayed more variation in speed than inexperiencedrivers.
Lateral position in the acceleration lane while driving nexto HGVs or private cars differed between these conditions asell; average position was 0.45 m to the left of the centre
n the Passenger car condition, and 0.72 m to the left in thewo HGV conditions. This means that on average drivers keptlmost 0.30 m more distance from HGVs than from private cars.tandard Deviation of the Lateral Position (SDLP) on the accel-ration lane did not differ between conditions, the average being.196 m.
.2. Driving parameters after joining the traffic:
anoeuvre bDirectly after joining the traffic, manoeuvre b in Fig. 1, driv-ng speed differed significantly between conditions (Fig. 2 right
ditH
able 1esults of the statistic tests on lateral control and speed during filtering into traffic, m
ffect Multivariate Uni
Hotelling’s T Sig. η2 Mea
F(1
peed controlExperience (E) 0.188 0.035 0.158 <1Traffic (T): 0.854 <0.001 0.461HGV presence (T-Pr) 20.6HGV increase (T-In) 6.9Visibility 0.319 0.005 0.242 12.1Repetition 0.798 <0.001 0.444 31.7E × T 0.104 ns 0.094E × T-Pr <1E × T-In 1.3
ffect Multivariate Uni
Hotelling’s T Sig. η2 Mea
F(1
ateral position controlExperience (E) 0.132 0.089 0.117 3.7Traffic (T) 0.369 0.018 0.269HGV presence (T-Pr) 10.3HGV increase (T-In) <1Visibility 0.096 ns 0.087 1.4Repetition 0.036 ns 0.035 1.3E × T 0.084 ns 0.078E × T-Pr 1.2E × T-In <1
: effect of Experience; T: effect of Traffic; T-Pr: effect of HGV present; T-In: effeα < 0.05) are displayed bold.
nd Prevention 40 (2008) 818–828
and part, and Table 2), similar to driving speed in the acceler-tion lane.
Differences in S.D. speed between conditions were bothignificant and large. In particular in the HGV Column condi-ion S.D. Speed was high, on average 7.8 km/h, compared with.8 km/h in the Mix, and 3.4 km/h in the passenger car onlyondition. No main effect for Visibility was found. As mergingehind an HGV will restrict speed choice, post hoc speed data inhe Mix and HGV Column condition were analysed by locationf lane change manoeuvre: in front of the HGV, or behind theGV (see Section 3.5). These data are presented in Fig. 3. In
he Mixed Traffic condition S.D. speed does not differ betweenrivers who join in front or behind the HGV. However, in theGV Column condition S.D. speed is almost twice as large ifrivers change lane in front of the HGV.
After the lane change from the acceleration lane to the mainoad, minimum Time-headway (THW) and minimum Time-o-Collision (TTC) were determined. The smallest minimumHW, on average only 0.66 s (s), was found in the HGV Col-mn condition. In the Mix condition the average was 0.88 s, in theassenger car condition 1.02 s. There was also an effect of expe-ience, the inexperienced drivers keeping on average 0.2 s more
istance. In Fig. 4 THW data are again post hoc split up depend-ng on the location of the merge manoeuvre, in front or behindhe HGV. Differences in minimum THW between the Mix andGV Column condition are small for drivers who merged behindanoeuvre a in Fig. 1 (joining the traffic; (a) driving on the acceleration lane)
variate
n speed S.D. speed
,40) Sig. η2 F(1,40) Sig. η2
ns 0.003 7.20 0.011 0.153
2 <0.001 0.340 7.92 0.008 0.1659 0.012 0.149 <1 ns 0.0000 0.001 0.232 <1 ns 0.0004 <0.001 0.442 <1 ns 0.018
ns 0.001 1.33 ns 0.0326 ns 0.033 <1 ns 0.004
variate
n lateral position S.D. lateral position
,40) Sig. η2 F(1,40) Sig. η2
5 0.060 0.086 1.44 ns 0.035
4 0.003 0.205 <1 ns 0.000ns 0.001 <1 ns 0.005
4 ns 0.035 1.2 ns 0.0298 ns 0.033 <1 ns 0.003
5 ns 0.030 <1 ns 0.013ns 0.001 <1 ns 0.000
ct of HGV increase; Sig., significance level; η2 = η2partial. Significant effects

D. de Waard et al. / Accident Analysis and Prevention 40 (2008) 818–828 823
Table 2Results of the statistic tests on speed and-headway control after filtering into traffic, manoeuvre b in Fig. 1 (joining the traffic; (b) completing the merge)
Effect Multivariate Univariate
Hotelling’s T Sig. η2 Mean speed S.D. speed
F(1,40) Sig. η2 F(1,40) Sig. η2
Speed controlExperience (E) 0.019 ns 0.018 <1 ns 0.018 <1 ns 0.000Traffic (T) 2.220 <0.001 0.690HGV presence (T-Pr) 48.24 <0.001 0.547 43.63 <0.001 0.522HGV increase (T-In) 25.73 <0.001 0.391 14.84 <0.001 0.271Visibility 0.178 0.041 0.151 1.74 ns 0.042 2.67 ns 0.063Repetition 0.108 ns 0.095 2.92 ns 0.068 <1 ns 0.000E × T 0.150 ns 0.131E × T-Pr <1 ns 0.000 2.36 ns 0.056E × T-In 1.54 ns 0.037 <1 ns 0.001
Effect Multivariate Univariate
Hotelling’s T Sig. η2 Time-headway Time to collision
F(1,40) Sig. η2 F(1,40) Sig. η2
Headway controlExperience (E) 0.109 ns 0.098 4.24 0.046 0.096 <1 ns 0.000Traffic (T): 1.297 <0.001 0.565HGV presence (T-Pr) 7.13 0.011 0.151 20.84 <0.001 0.343HGV increase (T-In) 8.99 0.005 0.184 17.60 <0.001 0.306Visibility 0.068 ns 0.063 1.46 ns 0.035 <1 ns 0.018Repetition 0.074 ns 0.069 1.29 ns 0.031 1.49 ns 0.036E × T 0.113 ns 0.101E × T-Pr <1 ns 0.002 <1 ns 0.002
3
S bold.
ttdT
Tcf
FtHo
ol
3
E × T-In
ig., significance level; η2 = η2partial. Significant effects (α < 0.05) are displayed
he HGV. However, smaller minimum THWs were measured inhe HGV Column condition compared with the Mix condition forrivers who merged in front of the HGV. The smallest minimumHWs were measured for drivers merging behind the HGV.
Average time-headway (TTC) shows a similar picture toHW. The lowest values were measured in the HGV Columnondition. There was a main effect of Traffic on TTC, a decreaserom 8.9 s (only private cars) to 4.7 s (HGV Column). The value
ig. 3. Standard deviation (S.D.) of the driving speed on the right hand lane ofhe motorway directly after the merge manoeuvre in the two conditions withGVs, split up by merge manoeuvre relative to HGV on main road. Mix = a mixf HGV and private cars, HGV Column = a column of HGVs on the motorway.
td
FamH
.12 ns 0.072 <1 ns 0.012
f 4.7 s is still above what Minderhout and Hoogendoorn (2001)abelled as uncomfortable (3 s), or dangerous (1.5 s).
.3. Driving parameters before exiting: manoeuvre d
The distance before the exit where drivers changed fromhe left hand to the right hand lane (manoeuvre d in Fig. 1)id not differ between conditions. It was on average 619 m
ig. 4. Average minimum THW on the right hand lane of the motorway directlyfter the merge manoeuvre in the two conditions with HGVs, split up by mergeanoeuvre relative to HGV on main road. Mix = a mix of HGV and private cars,GV column = a column of HGVs on the motorway.

824 D. de Waard et al. / Accident Analysis and Prevention 40 (2008) 818–828
Table 3Results of the statistic tests on headway control during the lane change preceding the exit manoeuvre, manoeuvre d in Fig. 1 (leaving the motorway; (d) changingfrom the fast to the slow lane)
Effect Multivariate Univariate
Hotelling’s T Sig. η2 Time-headway Time to Collision
F(1,40) Sig. η2 F(1,40) Sig. η2
Headway controlExperience (E) 0.066 ns 0.062 2.19 ns 0.052 <1 ns 0.010Traffic (T) 0.686 0.001 0.407HGV presence (T-Pr) 24.52 <0.001 0.380 <1 ns 0.015HGV increase (T-In) 3.88 0.056 0.088 <1 ns 0.011Visibility 0.014 ns 0.014 <1 ns 0.000 <1 ns 0.013Repetition 0.000 ns 0.000 <1 ns 0.000 <1 ns 0.000E × T 0.076 ns 0.071E × T-Pr <1 ns 0.004 <1 ns 0.012
2
S bold
bs
mAcino
3
ET
rer
Ffi13cH
wTnglptptd
p
(r
E × T-In
ig., significance level; η2 = η2partial. Significant effects (α < 0.05) are displayed
efore the start of the exit, i.e. at the location of the second exitign.
After the lane change minimum THW and TTC were deter-ined. There was no effect of condition on TTC (average 13.9 s).verage minimum THW was lowest, 0.81 s, in the Passengerar condition, 1.31 s in the Mixed Traffic condition, and 1.17 sn the HGV Column condition. Differences are statistically sig-ificant between the HGV conditions and the condition withnly passenger cars (see Table 3).
.4. Self-reports
Leaving the motorway was rated on the Rating Scale Mentalffort (RSME) to be less effortful than entering (see Fig. 5,able 4).
When joining the traffic, the HGV Column condition wasated as most effortful. The Passenger car condition was leastffortful. The second time conditions were completed these wereated to be less effortful than the first time.
ig. 5. Average score on the Rating Scale Mental Effort for joining the traf-c and exiting from traffic. The scale has a range from 0 to 150. A rating of2 coincides with the investment of “hardly any effort”, 28 = “a little effort”,8 = “some effort”, 58 = “rather much effort”, 112 = “extreme effort”. Passengerars = Only private cars on the motorway, Mix = a mix of HGV and private cars,GV column = a column of HGVs on the motorway.
a(
a(
TRi
E
R
Sb
.46 ns 0.058 <1 ns 0.012
.
The risk ratings were recalculated in such a way that valuesere compared with the present situation, the Mix condition.his condition was set to be equal to zero (see Section 2.8). Eightew parameters were calculated; two traffic conditions (passen-er cars and HGV Column), by two manoeuvres (entering andeaving the motorway), by two visibility conditions. The newarameters were normally distributed (skewness of all parame-ers between −0.12 and +0.44), and had a range of −4 to +4. Aositive score indicated increased perceived risk compared withhe present situation (Mix condition). A negative score denotedecreased subjective risk.
Main effects were found for Traffic (F(1,39)=25.69,< 0.001, η2
p = 0.397), and the interaction Traffic × Manoeuvre
F(1,39) = 24.1, p < 0.001, η2p = 0.382). Average recalculated
isk ratings for entering the motorway were −0.32 (private cars)nd +0.59 (HGV Column), and for leaving the motorway +0.17
private cars) and +0.22 (HGV Column).The extent to which a condition had been experienced asnnoying was assessed on a continuous scale running from 0not annoying at all) to 50 (very annoying). Average score for
able 4esults of the statistical tests on the rating scale mental effort during filtering
nto traffic, and leaving the motorway (self-reports)
ffect UnivariateTime-headway
F(1,39) Sig. η2
ating scale mental effortExperience (E) <1 ns 0.001Manoeuvre (M) 50.08 <0.001 0.562HGV presence (T-Pr) 17.45 <0.001 0.309HGV increase (T-In) 20.09 <0.001 0.340Visibility 2.43 ns 0.059Repetition 5.98 0.019 0.133E × T-Pr <1 ns 0.006E × T-In 5.62 0.023 0.126
ig., significance level; η2 = η2partial. Significant effects (α < 0.05) are displayed
old.
D. de Waard et al. / Accident Analysis and Prevention 40 (2008) 818–828 825
Ft
tatp
3
einto5fit
lthmtacFm
ImtI
TP
C
PMHT
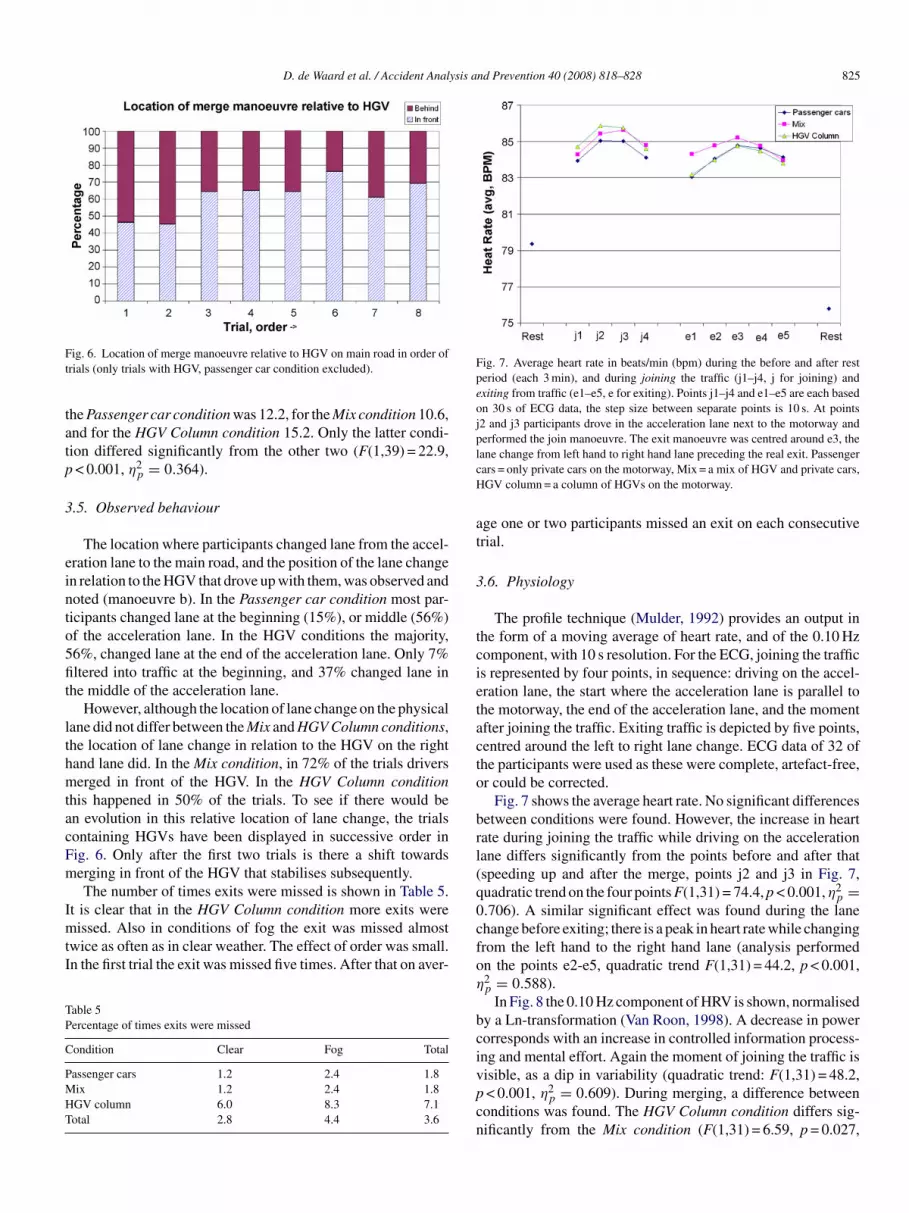
Fig. 7. Average heart rate in beats/min (bpm) during the before and after restperiod (each 3 min), and during joining the traffic (j1–j4, j for joining) andexiting from traffic (e1–e5, e for exiting). Points j1–j4 and e1–e5 are each basedon 30 s of ECG data, the step size between separate points is 10 s. At pointsj2 and j3 participants drove in the acceleration lane next to the motorway andperformed the join manoeuvre. The exit manoeuvre was centred around e3, thelcH
at
3
tcietacto
brl(q
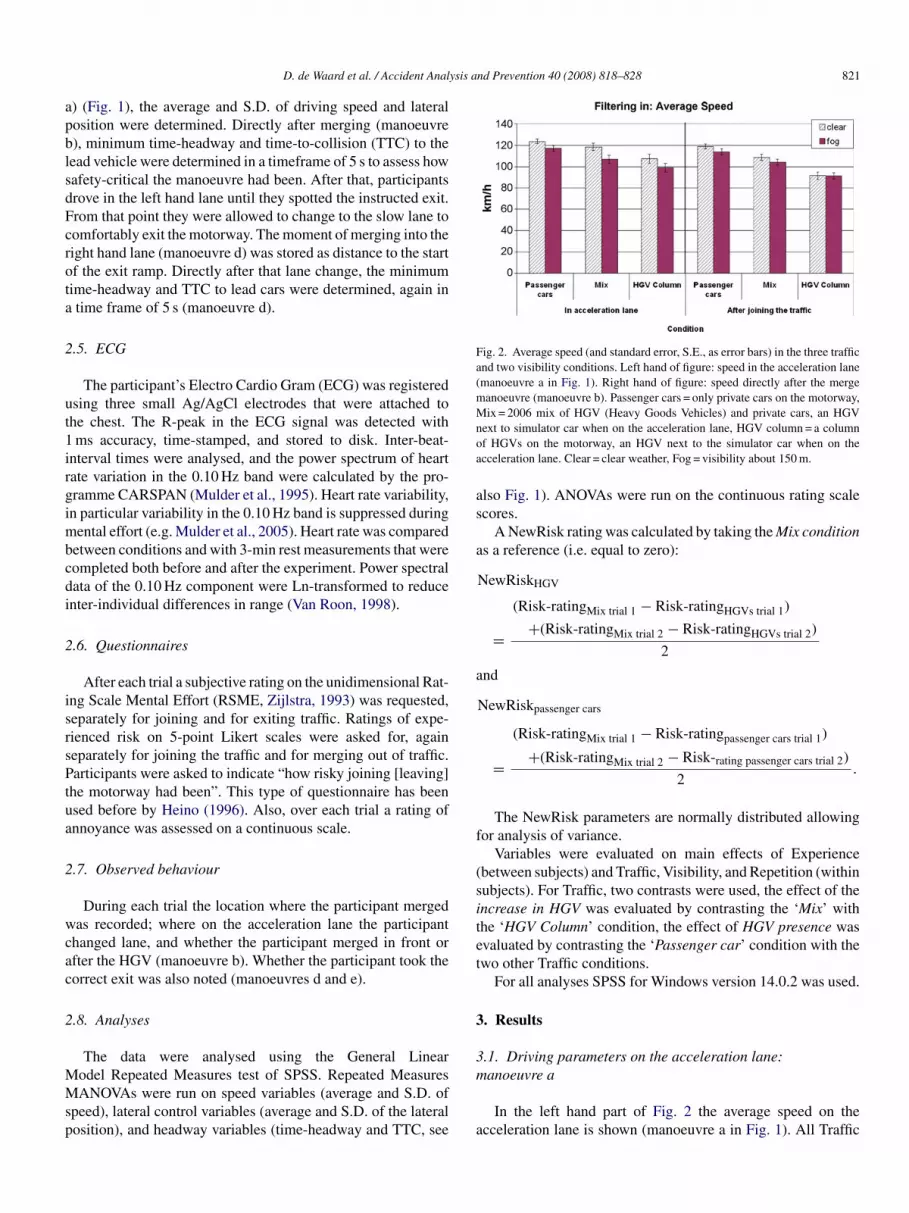
ig. 6. Location of merge manoeuvre relative to HGV on main road in order ofrials (only trials with HGV, passenger car condition excluded).
he Passenger car condition was 12.2, for the Mix condition 10.6,nd for the HGV Column condition 15.2. Only the latter condi-ion differed significantly from the other two (F(1,39) = 22.9,< 0.001, η2
p = 0.364).
.5. Observed behaviour
The location where participants changed lane from the accel-ration lane to the main road, and the position of the lane changen relation to the HGV that drove up with them, was observed andoted (manoeuvre b). In the Passenger car condition most par-icipants changed lane at the beginning (15%), or middle (56%)f the acceleration lane. In the HGV conditions the majority,6%, changed lane at the end of the acceleration lane. Only 7%ltered into traffic at the beginning, and 37% changed lane in
he middle of the acceleration lane.However, although the location of lane change on the physical
ane did not differ between the Mix and HGV Column conditions,he location of lane change in relation to the HGV on the rightand lane did. In the Mix condition, in 72% of the trials driverserged in front of the HGV. In the HGV Column condition
his happened in 50% of the trials. To see if there would ben evolution in this relative location of lane change, the trialsontaining HGVs have been displayed in successive order inig. 6. Only after the first two trials is there a shift towardserging in front of the HGV that stabilises subsequently.The number of times exits were missed is shown in Table 5.
t is clear that in the HGV Column condition more exits wereissed. Also in conditions of fog the exit was missed almost
wice as often as in clear weather. The effect of order was small.n the first trial the exit was missed five times. After that on aver-
able 5ercentage of times exits were missed
ondition Clear Fog Total
assenger cars 1.2 2.4 1.8ix 1.2 2.4 1.8GV column 6.0 8.3 7.1otal 2.8 4.4 3.6
0cfoη
bcivpcn
ane change from left hand to right hand lane preceding the real exit. Passengerars = only private cars on the motorway, Mix = a mix of HGV and private cars,GV column = a column of HGVs on the motorway.
ge one or two participants missed an exit on each consecutiverial.
.6. Physiology
The profile technique (Mulder, 1992) provides an output inhe form of a moving average of heart rate, and of the 0.10 Hzomponent, with 10 s resolution. For the ECG, joining the traffics represented by four points, in sequence: driving on the accel-ration lane, the start where the acceleration lane is parallel tohe motorway, the end of the acceleration lane, and the momentfter joining the traffic. Exiting traffic is depicted by five points,entred around the left to right lane change. ECG data of 32 ofhe participants were used as these were complete, artefact-free,r could be corrected.
Fig. 7 shows the average heart rate. No significant differencesetween conditions were found. However, the increase in heartate during joining the traffic while driving on the accelerationane differs significantly from the points before and after thatspeeding up and after the merge, points j2 and j3 in Fig. 7,uadratic trend on the four points F(1,31) = 74.4, p < 0.001, η2
p =.706). A similar significant effect was found during the lanehange before exiting; there is a peak in heart rate while changingrom the left hand to the right hand lane (analysis performedn the points e2-e5, quadratic trend F(1,31) = 44.2, p < 0.001,2p = 0.588).
In Fig. 8 the 0.10 Hz component of HRV is shown, normalisedy a Ln-transformation (Van Roon, 1998). A decrease in powerorresponds with an increase in controlled information process-ng and mental effort. Again the moment of joining the traffic is
isible, as a dip in variability (quadratic trend: F(1,31) = 48.2,< 0.001, η2p = 0.609). During merging, a difference betweenonditions was found. The HGV Column condition differs sig-ificantly from the Mix condition (F(1,31) = 6.59, p = 0.027,

826 D. de Waard et al. / Accident Analysis a
Fig. 8. Average heart rate variability in the 0.10 Hz band during before and afterrest (each 3 min), and during joining the traffic (j1–j4) and exiting from traffic(e1–e5). At points j2 and j3 participants drove in the acceleration lane next to themotorway and performed the join manoeuvre. The exit manoeuvre was centredaea
η
tt
aF
0ps
F
4
oww
1
2
3
4
round e3, the lane change from left hand to right hand lane preceding the realxit. Passenger cars = only private cars on the motorway, Mix = a mix of HGVnd private cars, HGV Column = a column of HGVs on the motorway.
2p = 0.148). However, the effect is in the opposite directiono that expected, more variability (less effort) being evident inhe HGV Column condition.
Changing lane before exiting also decreased HRV vari-bility in the 0.10 Hz band (quadratic trend on points e2–e5:(1,31) = 11.0, p = 0.002, η2
p = 0.262).Finally, the increase in heart rate and the decrease in the
.10 component of HRV during driving (whole conditions) com-ared with the resting measurements (two times 3 min) were bothignificant (HR: F(1,31) = 12.63, p = 0.001, η2
p = 0.289; HRV:
(1,31) = 15.0, p = 0.001, η2p = 0.326).
. Discussion
In a driving simulator, the effects of an increase in the numberf HGVs on the motorway on drivers’ behaviour and mentalorkload during filtering into traffic, and leaving the motorway,ere studied. Five hypotheses were formulated.
. An increase in HGVs will make merging into traffic moredifficult and will require more mental effort.
Support for this hypothesis was found: the presence ofan HGV while joining the traffic slowed drivers down, butalso increased speed variation. After joining the traffic, speedvariation was greater in conditions with HGVs, and time-headway was shorter compared with the condition with onlypassenger cars. An important difference in behaviour wasfound for the merge manoeuvres behind as opposed to infront of the HGV, as drivers could either speed up and joinin front of the HGV, or slow down and merge behind the
HGV. The latter manoeuvre was more frequent if there wasan HGV column on the main road. When drivers speeded upand changed lane in front of the HGV that was followed bythe largest speed variations after the merge manoeuvre.nd Prevention 40 (2008) 818–828
In the ECG a clear peak was found for the moment thedriver had to take the merge manoeuvre decision. The peakwas visible both in heart rate and in heart rate variability(HRV), indicative of increased mental effort. There were nodifferences found between the three traffic conditions, withthe exception of an effect on HRV in the HGV Column con-dition. That effect however, was in an unexpected direction;more variability (less effort) in the HGV Column condition.A possible explanation for this might be that drivers wereheavily loaded, felt they could not compensate any more, andresigned themselves to the situation. Although this is a tenta-tive conclusion, it is a type of motivational or strategy changethat would account for the effect found in variability, and thishas been found in other areas of research (e.g. Wright et al.,1986; Eubanks et al., 2002). A change in motivation/strategywould also account for the dissociation of physiology andself-reports. The self-reports indicated an increase in effort(and risk) in the HGV conditions. The reason why the HGVColumn condition was rated as most effortful may be thatin self-reports the task demands of the situation were alsoconsidered.
. Driving behaviour during merging in conditions of increasednumbers of HGVs will be less safe as indicated by headwaysafety margins.
Support for this hypothesis was found: after joining thetraffic, drivers’ time-headway was shorter in conditions withHGVs, compared with the condition with only passengercars.
The shortest minimal time-headway values were measuredfor drivers joining the traffic behind the HGV. Nevertheless,even though short time-headways reflect low safety margins,large speed variations and adaptations could be more dan-gerous than slowing down and smoothly merging behind anHGV at short distance.
. Reduced visibility will negatively affect the estimation ofsafety margins and will lead to shorter headways while merg-ing.
No effects of visibility on headway were found. However,drivers’ average speed on the acceleration lane and directlyafter filtering into traffic was lower in conditions of fog.Accordingly, drivers did adapt their behaviour and increasetime margins, the type of behavioural adaptation that is fre-quently found (Summala, 1996). If all traffic, i.e. also theHGVs, on the motorway slow down then this should not leadto problems. In the simulator the speed of the HGVs wascoupled to the simulator car, so traffic on the main road alsodrove slower. In general it can be expected that all traffic willslow down in adverse weather conditions (e.g. Khattak et al.,1998).
Another effect of fog was that relatively more frequentlyexits were missed as a direct effect of reduced visibility.
. Changing from the fast lane to the slow lane before leavingthe motorway will be more effortful if the slow lane is full
with HGVs.Only subjective ratings of effort indicate that this is thecase. Although in the physiological response the lane changemanoeuvre was also noticeable, no differences between traf-

ysis a
5
5
rsiAfuaHridlfttmoHs
vlHwiasHnf
atlttm
(i
rttfiHl2a(d(wewpsFw
tosseawws
A
TlfWfoeof
R
B
B
B
B
B
D. de Waard et al. / Accident Anal
fic conditions were found. There was also no differencebetween conditions in the location where drivers changedfrom the fast to the slow lane.
According to the self-reports, filtering into traffic is judgedto be a more effortful task than leaving the motorway.
. An increase in HGVs will block the driver’s view on (exit)signs, leading to missed exits.
With an HGV Column drivers did not change lane earlierthan in the Passenger car conditions, however, they did missthe exit signs and thereupon the exit more frequently in thatcondition. This seems to confirm the idea by Hill and Boyle(2007) that HGVs are mainly seen as large objects that restrictvision.
. Conclusions
Joining the traffic with an increased proportion of HGVsequires more mental effort, is considered riskier, leads to largerpeed variation, and to shorter time safety margins. Before merg-ng, drivers adapt their speed to the traffic on the main road.fter joining the traffic, minimum time to collision decreases
rom 9 s (Passenger cars only condition) to 5 s (HGV Col-mn condition), rapidly moving in the direction of values thatre described as uncomfortable (i.e. 3 s, see Minderhout andoogendoorn, 2001). With a column of HGVs on the main
oad, drivers complete the merge manoeuvre just as frequentlyn front as behind the HGV. However, in the present Mixed con-ition, 72% merged in front of the HGV. Variation in speed isargest for those who merge in front of the HGV. Merging inront of the HGV means that directly after joining, speed haso be decreased due to another HGV ahead. Joining behindhe HGV is a smoother manoeuvre, but the smallest mini-
um time-headways are found for these manoeuvres. Effectsn physiology are limited, although in the condition with onlyGVs, heart rate variability may reflect resignation to the
ituation.Exiting traffic, or more specifically, the lane change manoeu-
re from the fast to the slow lane before entering the decelerationane, is judged to be more effortful in conditions with onlyGVs, but it was only in the self-reports that negative effectsere found, not in vehicle parameters or physiology. However,
n conditions of an HGV column in the slow lane, the exit signsnd exits were most frequently missed. Drivers could compen-ate for the obstruction of their view of the exit signs by theGVs by changing to the right hand lane earlier, but they didot do that. The dangerous ‘last minute lane change’ that waseared beforehand, was not found either.
In conditions of reduced visibility drivers drove more slowlynd reported increased mental effort, but only when joining theraffic, not when exiting. Effects of driving experience wereimited. Experienced drivers displayed more speed variation inhe acceleration lane, and minimum time-headway after joininghe traffic was smaller. This means that inexperienced drivers
aintained safer margins.If the amount of HGVs continues to increase as predicted
Martens et al., 2007), drivers are likely to miss more exits, lead-ng to unnecessary kilometres driven. Additional signs above the
B
nd Prevention 40 (2008) 818–828 827
oad or in the central reserve may prevent this. Route naviga-ion devices may also help to reduce this problem. However,he main problem probably lies in driving and joining the traf-c, which will be a more demanding task with increases inGVs. The increased task demands imposed upon drivers are
ikely to increase errors and thus accidents (e.g. Brookhuis et al.,003). A further complicating factor will be that we live in angeing society. The proportion of elderly drivers will increasee.g. Waller, 1991). Elderly drivers have problems with takingecisions under time pressure, and with dual task performanceBrouwer and Ponds, 1994; Brouwer et al., 2002). Joining motor-ay traffic is a clear example of a task where difficulties can be
xpected; drivers have to accelerate to be able to merge smoothly,hile time to take a decision is restricted, as the task is not com-letely self-paced. The elderly driver’s typical response is tolow down to create time for decision taking (e.g. Brundell-reij and Ericsson, 2005), while that is actually behaviour thatill make merging more difficult.Perhaps relief can come from new Advanced Driver Assis-
ance Systems (ADAS). These may protect the driver fromverload, or may assist in performing the merge manoeuvreafely. A Blind Spot Detector (Ward and Hirst, 1996) may beuch a device. Future studies could incorporate a condition withlderly drivers and ADAS, to assess the extent of the problemnd to assess potential beneficial effects, as the problems thate will face in 2020 with respect to the 70% increase in HGVill at least lead to uncomfortable, and potentially to unsafe,
ituations.
cknowledgments
This study was commissioned by the Dutch Ministry ofransport (Transportation Research Centre AVV). We would
ike to thank Onno Tool and Michel Lambers of the Ministryor their contributions to the study. We also thank Peter van
olffelaar, Wim van Winsum, and Jeroen Meijer of StSoftwareor creating simulated HGVs and making the driving simulatorperational. Furthermore, we would like to gratefully acknowl-dge the help of Jeremy Hinton in the final stage of preparationf this manuscript, and to thank the two anonymous reviewersor their helpful comments.
eferences
acks, R.W., Seljos, K.A., 1994. Metabolic and cardiorespiratory measures ofmental effort: the effects of level of difficulty in a working memory task. Int.J. Psychophysiol. 16, 57–68.
rookhuis, K.A., De Vries, G., De Waard, D., 1991. The effects of mobiletelephoning on driving performance. Accid. Anal. Prev. 23, 309–316.
rookhuis, K.A., de Waard, D., Fairclough, S.H., 2003. Criteria for driverimpairment. Ergonomics 46, 433–445.
rouwer, W.H., Ponds, R.W.H.M., 1994. Driving competence in older persons.Disabil. Rehabil. 16, 149–161.
rouwer, W.H., Withaar, F.K., Tant, M.L.M., Van Zomeren, A.H., 2002. Atten-
tion and driving in traumatic brain injury: a question of coping with timepressure. J. Head Trauma Rehabilit. 17, 1–15.rown, I.D., Thickner, A.H., Simmonds, D.C.V., 1969. Interference betweenconcurrent tasks of driving and telephoning. J. Appl. Psychol. 53, 419–424.

8 ysis a
B
C
D
D
D
E
F
H
H
H
K
L
M
M
M
M
M
S
S
SV
V
WW
W
W
28 D. de Waard et al. / Accident Anal
rundell-Freij, K., Ericsson, E., 2005. Influence of street characteristics, drivercategory and car performance on urban driving patterns. Transport. Res. PartD 10, 213–229.
avallo, V., Mestre, D., Berthelon, C., 1997. Time-to-collision judgements:visual and spatio-temporal factors. In: Rothengatter, J.A., Carbonell Vaya,E.J. (Eds.), Traffic and Transport Psychology: Theory and Applications.Pergamon, Oxford, pp. 97–111.
e Waard, D., 1991. Driving behaviour on a high-accident-rate motorway inthe Netherlands. In: Weikert, C., Brookhuis, K.A., Ovinius, S. (Eds.), Manin complex systems, Proceedings of the Europe Chapter of the Human Fac-tors Society Annual Meeting 1991. Work Science Bulletin 7. Work ScienceDivision, Department of Psychology, Lund University, Lund, Sweden, pp.113–123.
e Waard, D., 2002. Mental Workload. In: Fuller, R., Santos, J.A. (Eds.), HumanFactors for Highway Engineers. Pergamon, Oxford, UK, pp. 161–175.
e Waard, D., Brookhuis, K.A., Mesken, J., 2005. Evaluation of legibility ofnot properly reflecting signs. Int. J. Ind. Ergon. 35, 645–651.
ubanks, L., Wright, R.A., Williams, B.J., 2002. Reward influence on the heart:cardiovascular response as a function of incentive value at five levels of taskdemand. Motiv. Emotion 26, 139–152.
airclough, S.H., Venables, L., Tattersall, A., 2005. The influence of task demandand learning on the psychophysiological response. Int. J. Psychophysiol. 56,171–184.
art, S.G., Staveland, L.E., 1988. In: Hancock, P.A., Meshkati, N. (Eds.),Development of NASA-TLX (Task Load Index): Results of Empirical andTheoretical Research. Human Mental Workload, North-Holland, Amster-dam, The Netherlands, pp. 139–183.
eino, A., 1996. Risk taking in car driving; perceptions, individual differ-ences and effects of safety incentives. Ph.D. thesis. University of Groningen,Groningen, The Netherlands.
ill, J.D., Boyle, L.N., 2007. Driver stress as influenced by driving maneuversand roadway conditions. Transport. Res. Part F 10, 177–186.
hattak, A.J., Kantor, P., Council, F.M., 1998. Role of adverse weather in keycrash types on limited-access: roadway implications for advanced weathersystems. Transport. Res. Record 1621, 10–19.
undqvist, A., Gerdle, B., Ronnberg, J., 2000. Neuropsychological aspects of
driving after a stroke – in the simulator and on the road. Appl. Cognit.Psychol. 14, 135–150.artens, G., Scheper, W., Hoogendoorn, S., Tool, O., 2007. Onze wegen slibbendicht met vrachtwagens [Our roads are silted up with HGVs]. Verkeerskunde2007 (1), 22–27.
Z
Z
nd Prevention 40 (2008) 818–828
inderhout, M.M., Hoogendoorn, S.P., 2001. Extended Time-to-CollisionSafety Measures for ADAS Safety Assessment. Proceedings on the 5th Inter-national Conference on Technology, Policy, and Innovation. Delft. retrievedJanuary 29, 2007 from http://www.delft2001.tudelft.nl/paper%20files/paper1145.doc.
ulder, L.J.M., 1992. Measurement and analysis methods of heart rate andrespiration for use in applied environments. Biol. Psychol. 34, 205–236.
ulder, L.J.M., De Waard, D., Brookhuis, K.A., 2005. Estimating mentaleffort using heart rate and heart rate variability. In: Stanton, N., Hedge,A., Brookhuis, K.A., Salas, E., Hendrick, H. (Eds.), Handbook of HumanFactors and Ergonomics Methods. CRC Press, Boca Raton, pp. 20-1–20-8.
ulder, L.J.M., Van Roon, A.M., Schweizer, D.A., 1995. CARSPAN Car-diovascular Data Analysis Environment. IEC Progamma, Groningen, TheNetherlands.
arvi, M., Kuwahara, M., Ceder, A., 2004. Freeway ramp merging phenomenain congested traffic using simulation combined with a driving simulator.Comput. Aided Civil Infrastructure Eng. 19, 351–363.
tuster, J., 1999. The unsafe driving acts of motorists in the vicinity of largetrucks. Santa Barbara, CA: Anacapa Sciences. Retrieved January 15, 2007,from http://www.fmcsa.dot.gov/documents/udarepo.pdf.
ummala, H., 1996. Accident risk and driver behaviour. Safety Sci. 22, 103–117.an der Horst, A.R.A., 1990. A time-based analyses of road user behaviour in
normal and critical encounters. Ph.D. thesis, Delft University of Technology,Delft, The Netherlands.
an Roon, A.M., 1998. Short-term cardiovascular effects of mental tasks. Phys-iology, experiments and computer simulation. PhD thesis, University ofGroningen. Groningen, The Netherlands.
aller, P.F., 1991. The older driver. Hum. Factors 33, 499–505.ard, N.J., Hirst, S.J., 1996. Design considerations for a blind spot detector. Int.
J. Vehicle Des. 17, 198–207.right, R.A., Contrada, R.J., Patrane, M.J., 1986. Task difficulty, cardiovascular
response, and the magnitude of goal valence. J. Pers. Soc. Psychol. 51,837–843.
u, J., McDonald, M., Chatterjee, K., 2007. A detailed evaluation oframp metering impacts on driver behaviour. Transport. Res. Part F 10,61–75.
eitlin, L.R., 1995. Estimates of driver mental workload: a long-term field trialof two subsidiary tasks. Hum. Factors 37, 611–621.
ijlstra, F.R.H., 1993. Efficiency in work behavior. A design approach for mod-ern tools. PhD thesis, Delft University of Technology, Delft University Press,Delft, The Netherlands.