the coexistence strategies of the roma and the non-roma population in hungary
TRANSCRIPT
Csepeli, György – Örkény, Antal – Székelyi, Mária – Barna, Ildikó
The coexistence strategies of the Roma and the non-Roma population
in Hungary1
Abstract
In the winter of 2000 a representative survey was carried out in Hungary, to find out what
kind of image is held in the minds of the Hungarian population about the Roma. The most
important question was whether the members of the majority society want to reduce the
segregation of the Roma, and if so, by what means. To answer this question, we aimed to find
out whether the majority think of the Roma as a homogenous group excluded from the society
or on the contrary as a group organized into a stratified society. Based on these views it can be
expounded that which part of the majority would like to exclude the Roma from the society,
who are those who wish to include them through an assimilation strategy and who are the
adherents of an integration strategy.
In our paper we present path models which illustrate the value-structures, patterns of thoughts
leading people of different social status to see the segregation, the assimilation or the
integration strategy as the solution of the “Gypsy issue”. We also examine the estimations for
the number of the Roma population in Hungary, the social structure thought to be as
characteristic of the Roma, stereotypes about them and the attributes of failure, and the extent
to which the discrimination against the Roma is accepted by the respondents.
1 The empirical research, our paper was based on, was made possible by grants of the Hungarian Scientific Research Fund (OTKA T032195).
1
Authors:György Csepeli was born in 1946 in Budapest. He graduated in Russian and psychology from ELTE University at the Faculty of Arts. Since 1972, he has worked at the Institute of Sociology of ELTE. He has the degree of Doctor of Sciences. He has taught extensively courses on social psychology, intergroup relations, anti-Semitism and national identity. His research has focussed on empirical studies of national identity in Hungary and Central Europe. After 1989 he has spent several years at various universities of the United States as a visiting professor. He is a member of the Hungarian Sociological Association, which he chaired in 1993. Since the mid-1990s, his research interests have turned toward the sociological and socio-psychological problems of the Information Society. In 1995, he was involved in the creation of the first National Information Strategy. Later he conducted business intelligence research on telecom database. In June 2002 he was appointed to Political State Secretary at the Ministry of Informatics and Communications.
Antal Örkény is professor of sociology at the Institute of Sociology of Eötvös Loránd University, Budapest. Since 1996 Antal Örkény is the chair of the ELTE-UNESCO Minority Studies Department, and also he is the director of the Minority Research Institute. He has taught extensively courses on social aspects of transition in Central Europe and national identity. His major research fields are cross-national surveys on social justice, national identity and national stereotypes, inter-ethnic relations in the Carpathian Basin, attitudes, negative stereotypes, prejudice against Gypsies, anti-Gypsy attitudes and discriminatory behavior among Hungarian police toward Gypsies. He has published eight monographs until now. Two books of him were published in English: one in 1992 with György Csepeli, titled Ideology and Political Beliefs in Hungary. The Twilight of State Socialism. London and New York: Pinter Publishers, and the other one in 2000 with György Csepeli and Mária Székelyi, titled Grappling with National Identity. How Nations See Each Others in Central Europe. Budapest, Akadémiai Kiadó
Mária Székelyi is professor of sociology. Since 1995 Mária Székelyi is the deputy dean of the faculty. Her major research fields are cross-national surveys on social justice, national identity and national stereotypes, inter-ethnic relations in the Carpathian Basin, attitudes, negative stereotypes, prejudice against Gypsies, anti-Gypsy attitudes and discriminatory behavior among Hungarian police toward Gypsies and research methodology. She has published several articles and four monographs until now. The main ones are: Survival Kit to SPSS., Typotex 2002 (with Ildikó Barna); Grappling with National Identity. How Nations See Each Others in Central Europe, Budapest, Akadémiai Kiadó (with György Csepeli and Antal Örkény).
Ildikó Barna has an M.A. of sociology, now is assistant and also Ph.D. student of sociology at the Social Sciences Faculty of Eötvös Loránd University, Budapest. Her courses include basic and advanced research methods, social statistics and other courses on different sociological researches.Her major research topics are research methodology, multidimensional methods in sociological research. Publications: Survival Kit to SPSS., Typotex 2002 (with Mária Székelyi, second author); The Interpretation of Trust in Empirical Research. In: Sociological Observer, April 2001. (with Mária Székelyi and Antal Örkény, third author); Trends and Delusions. In: Review of Sociology 2000/1. (with Zsuzsa Himesi, first author).
2
Everyday experiences and sociological research coincide in that the minority identified
as Roma in the esteem of the majority have swelled the side of the losers after the transition
(Havas – Kemény 1996). As a structural consequence of the transition the bulk of the Roma
minority got out of the course of the social division of labor, their adult members yet being
able to work became unemployed and the entrants’ chances to get a job practically vanished.
On the other hand the situation of the Roma minority is aggravated by the fact that after the
transition the suppressed prejudices and discriminative intensions existing also in the past
could spread freely and could intensify (Fábián – Erős 1996). Thirdly, since the public’s view
of poverty has changed, the Roma minority had to face not only the animosity triggered by
cultural and ethnical dissimilarity but also the hostile interpretation schemas of poverty
striking the Roma.
Ten years after the transition in the winter of 2000 a representative sample based survey was
carried out, aiming at finding out what kind of image is held in the minds of the Hungarian
population about the Roma. The most important question was whether the members of the
majority society want to reduce the segregation of the Roma, and if so, by what means. To
answer this question, we had to find out whether the majority think of the Roma as a
homogenous group excluded from the society or on the contrary as a group organized into a
stratified society. If the majority see the Roma as a group organized into hierarchy then
necessarily see poor and rich, unsuccessful and successful ones among them. In this case the
members of the majority society should hold a conception about the limiting conditions of
success and possibly also of failure. Based on these views it can be expounded that which part
of the majority would like to exclude the Roma from the society, who are those who wish to
include them through an assimilation strategy and who are the adherents of an integration
strategy.
A part of this question is whether – assuming social entropy – the image of the minority
allows the minority affiliation to be intersected by the stratification categories determining the
success of a member of the majority society (Gellner 1984).
In our paper we would like to present such path models which illustrate the value-structures,
patterns of thoughts leading people of different social status to see the segregation, the
assimilation or the integration strategy as the solution of the “Gypsy issue”.
The structure of the path models to be shown is the following:
3
Figure 1
In our paper each element of the path models will be introduced in turn. We will present the
different indices of the respondents’ social status, moreover their tolerance derived from their
emotions toward different ethnic groups. We examine the estimations for the number of the
Roma population in Hungary, the social structure thought to be as characteristic of the Roma,
stereotypes about them and the attributes of failure. After that we will show the extent to
which the discrimination against the Roma is accepted by the respondents, and finally
whether the segregation, the assimilation or the integration strategy is commonly thought to
be followed by the Roma society.
The social background of the majority, defining social status
Applying the sociological and demographic variables generally used in representative
sociological surveys we considered the respondents’ educational level, household income per
capita, the availability of durable goods, the possession of real estate and personal properties
of great value as well as subjective status as components of social status. Five variables were
available to measure subjective status: the estimation of monthly income on a poor-rich three-
and ten-degree scales, strata self-classification, the relative financial situation of the family
and its dynamics in the past five years. The inclusion of subjective status into the index of
social status is not entirely obvious. Since we would like to define social status as the starting-
point of a model constructed to test tolerance, the acceptance of dissimilarity, indirectly the
absence of racism, we should take into consideration that on a given level of the social
hierarchy we can find people satisfied with their position and also ones being dissatisfied with
it. Dissatisfaction, proven by numerous theories and empirical researches, is one of the
sources of frustration intensifying intolerance and hostility toward others (Postma 1996).
Accepting this logic, satisfaction with one’s social status should also be part of the index of
social status.2
The structure of the principal component can be seen in the table below. 45 percent of the
information of the original variables was preserved in the status index created with principal
component analysis.
2 At the final path-model we will show how the status index free of subjective elements influence the views about the Roma.
4
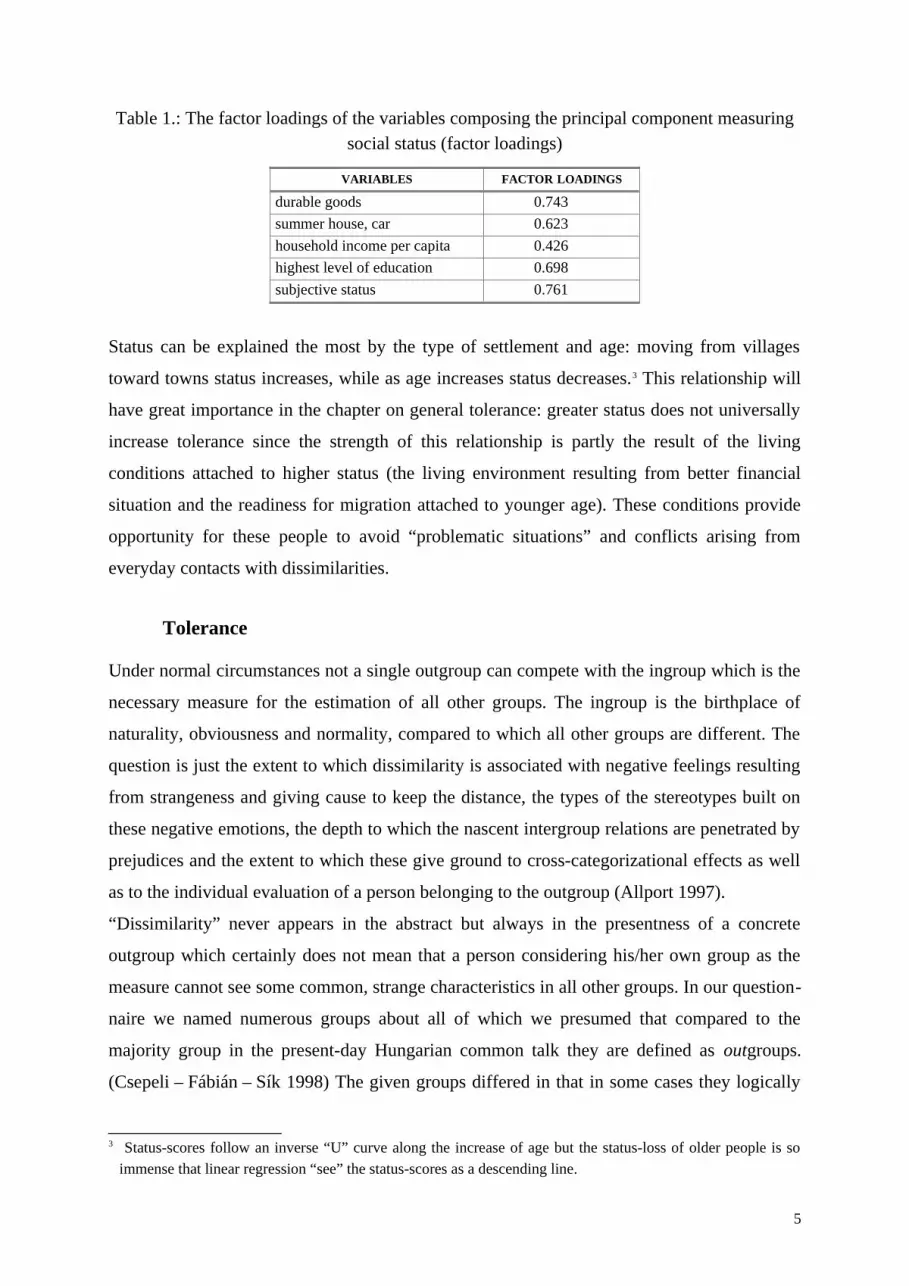
Table 1.: The factor loadings of the variables composing the principal component measuring social status (factor loadings)
VARIABLES FACTOR LOADINGS
durable goods 0.743summer house, car 0.623household income per capita 0.426highest level of education 0.698subjective status 0.761
Status can be explained the most by the type of settlement and age: moving from villages
toward towns status increases, while as age increases status decreases.3 This relationship will
have great importance in the chapter on general tolerance: greater status does not universally
increase tolerance since the strength of this relationship is partly the result of the living
conditions attached to higher status (the living environment resulting from better financial
situation and the readiness for migration attached to younger age). These conditions provide
opportunity for these people to avoid “problematic situations” and conflicts arising from
everyday contacts with dissimilarities.
Tolerance
Under normal circumstances not a single outgroup can compete with the ingroup which is the
necessary measure for the estimation of all other groups. The ingroup is the birthplace of
naturality, obviousness and normality, compared to which all other groups are different. The
question is just the extent to which dissimilarity is associated with negative feelings resulting
from strangeness and giving cause to keep the distance, the types of the stereotypes built on
these negative emotions, the depth to which the nascent intergroup relations are penetrated by
prejudices and the extent to which these give ground to cross-categorizational effects as well
as to the individual evaluation of a person belonging to the outgroup (Allport 1997).
“Dissimilarity” never appears in the abstract but always in the presentness of a concrete
outgroup which certainly does not mean that a person considering his/her own group as the
measure cannot see some common, strange characteristics in all other groups. In our question-
naire we named numerous groups about all of which we presumed that compared to the
majority group in the present-day Hungarian common talk they are defined as outgroups.
(Csepeli – Fábián – Sík 1998) The given groups differed in that in some cases they logically
3 Status-scores follow an inverse “U” curve along the increase of age but the status-loss of older people is so immense that linear regression “see” the status-scores as a descending line.
5
excluded the cross-categorization attached to the respondent’s majority group status while in
other cases they did not.
The effects of the groups have been tested with two questions. The first question regarded
whether the respondent would be willing to permit a member of a group labeled with a given
name to move into his/her neighborhood. In the second question, using nine-degree scales we
aimed at measuring the direction and the strength of the attitude toward the given group.
Among the used group-names quite different categories can be found. There are minorities
fled to Hungary and also ones settled in the country. Besides these, homosexuals, ones being
slaves of extreme racist ideologies (skinheads), others stigmatized by the political rhetoric of
the transition (communists), also the most miserable members of the society (homeless) as
well as drug-addicts can be found.
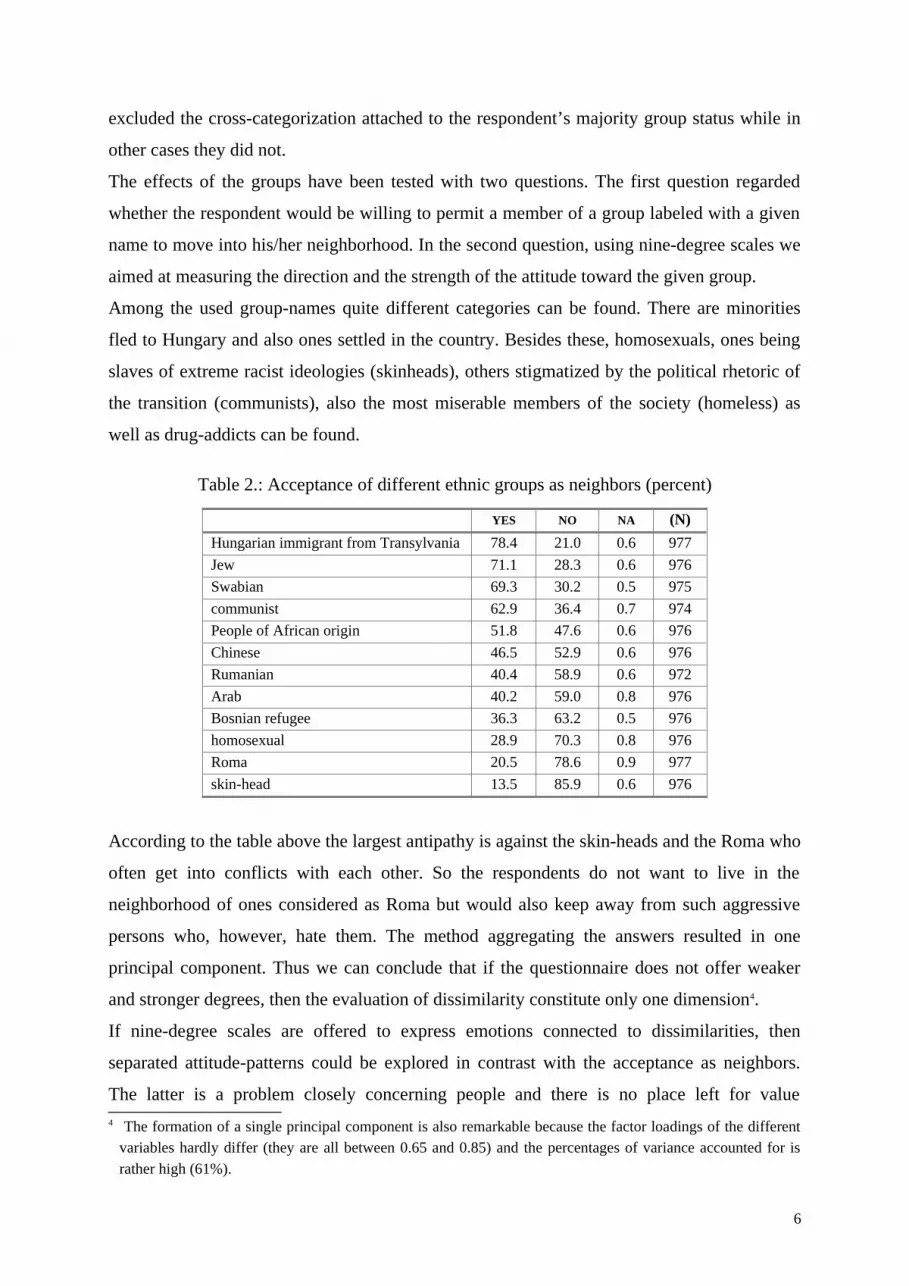
Table 2.: Acceptance of different ethnic groups as neighbors (percent)
YES NO NA (N)Hungarian immigrant from Transylvania 78.4 21.0 0.6 977Jew 71.1 28.3 0.6 976Swabian 69.3 30.2 0.5 975communist 62.9 36.4 0.7 974People of African origin 51.8 47.6 0.6 976Chinese 46.5 52.9 0.6 976Rumanian 40.4 58.9 0.6 972Arab 40.2 59.0 0.8 976Bosnian refugee 36.3 63.2 0.5 976homosexual 28.9 70.3 0.8 976Roma 20.5 78.6 0.9 977skin-head 13.5 85.9 0.6 976
According to the table above the largest antipathy is against the skin-heads and the Roma who
often get into conflicts with each other. So the respondents do not want to live in the
neighborhood of ones considered as Roma but would also keep away from such aggressive
persons who, however, hate them. The method aggregating the answers resulted in one
principal component. Thus we can conclude that if the questionnaire does not offer weaker
and stronger degrees, then the evaluation of dissimilarity constitute only one dimension4.
If nine-degree scales are offered to express emotions connected to dissimilarities, then
separated attitude-patterns could be explored in contrast with the acceptance as neighbors.
The latter is a problem closely concerning people and there is no place left for value 4 The formation of a single principal component is also remarkable because the factor loadings of the different
variables hardly differ (they are all between 0.65 and 0.85) and the percentages of variance accounted for is rather high (61%).
6
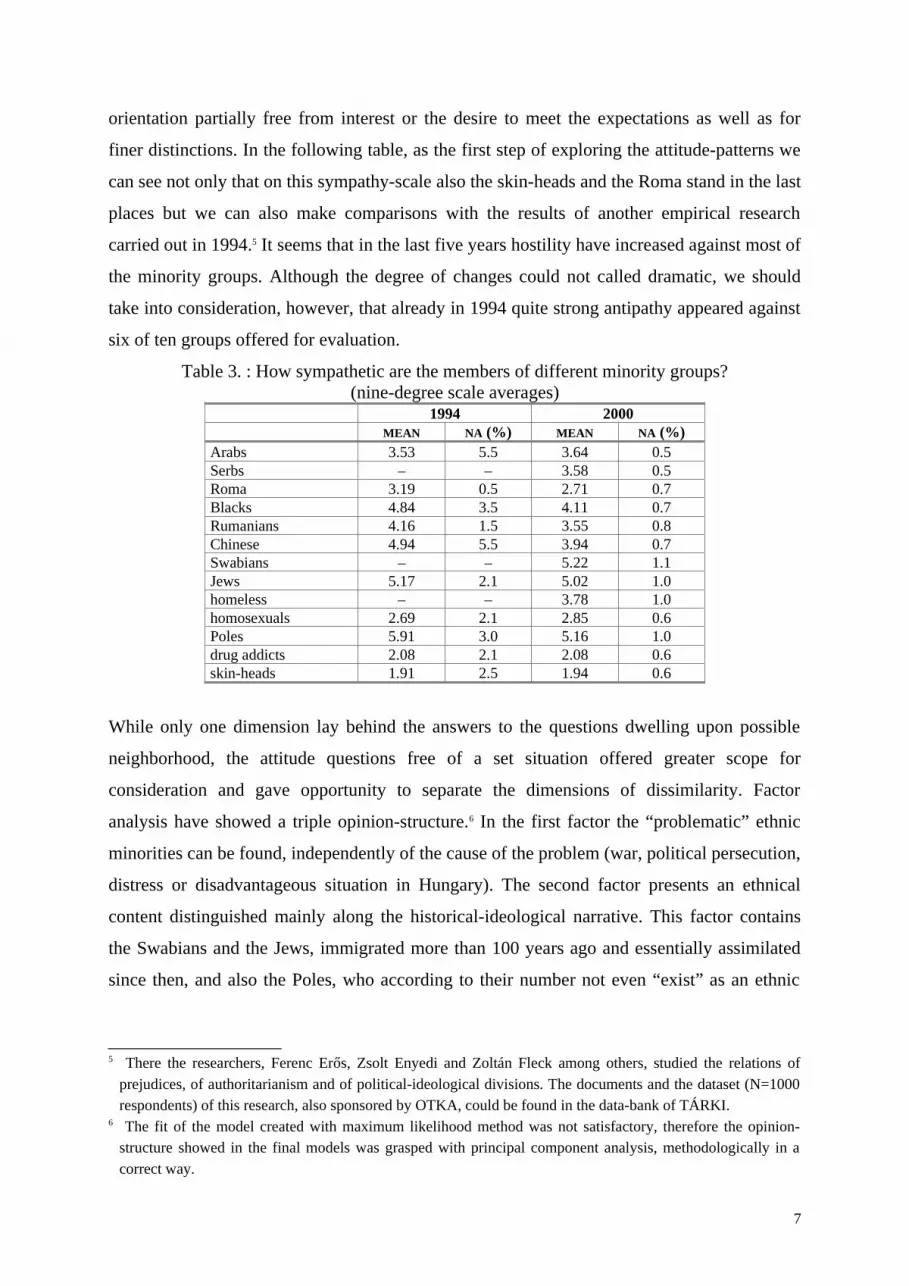
orientation partially free from interest or the desire to meet the expectations as well as for
finer distinctions. In the following table, as the first step of exploring the attitude-patterns we
can see not only that on this sympathy-scale also the skin-heads and the Roma stand in the last
places but we can also make comparisons with the results of another empirical research
carried out in 1994.5 It seems that in the last five years hostility have increased against most of
the minority groups. Although the degree of changes could not called dramatic, we should
take into consideration, however, that already in 1994 quite strong antipathy appeared against
six of ten groups offered for evaluation.
Table 3. : How sympathetic are the members of different minority groups? (nine-degree scale averages)
1994 2000MEAN NA (%) MEAN NA (%)
Arabs 3.53 5.5 3.64 0.5Serbs – – 3.58 0.5Roma 3.19 0.5 2.71 0.7Blacks 4.84 3.5 4.11 0.7Rumanians 4.16 1.5 3.55 0.8Chinese 4.94 5.5 3.94 0.7Swabians – – 5.22 1.1Jews 5.17 2.1 5.02 1.0homeless – – 3.78 1.0homosexuals 2.69 2.1 2.85 0.6Poles 5.91 3.0 5.16 1.0drug addicts 2.08 2.1 2.08 0.6skin-heads 1.91 2.5 1.94 0.6
While only one dimension lay behind the answers to the questions dwelling upon possible
neighborhood, the attitude questions free of a set situation offered greater scope for
consideration and gave opportunity to separate the dimensions of dissimilarity. Factor
analysis have showed a triple opinion-structure.6 In the first factor the “problematic” ethnic
minorities can be found, independently of the cause of the problem (war, political persecution,
distress or disadvantageous situation in Hungary). The second factor presents an ethnical
content distinguished mainly along the historical-ideological narrative. This factor contains
the Swabians and the Jews, immigrated more than 100 years ago and essentially assimilated
since then, and also the Poles, who according to their number not even “exist” as an ethnic
5 There the researchers, Ferenc Erős, Zsolt Enyedi and Zoltán Fleck among others, studied the relations of prejudices, of authoritarianism and of political-ideological divisions. The documents and the dataset (N=1000 respondents) of this research, also sponsored by OTKA, could be found in the data-bank of TÁRKI.
6 The fit of the model created with maximum likelihood method was not satisfactory, therefore the opinion-structure showed in the final models was grasped with principal component analysis, methodologically in a correct way.
7
minority.. Finally the groups, considered deviant to some extent, like homeless, homosexuals,
drug-addicts and skin-heads are on the third factor.
In terms of our final model the first (the acceptance of ethnic dissimilarity) and the third
dimensions (the acceptance of deviant groups) seem to be important since both of them
embody “present-time” sympathies-antipathies, and in this sense we suppose that both of
them influence greatly the conceptions concerning the integration of the Roma into the
majority society.7
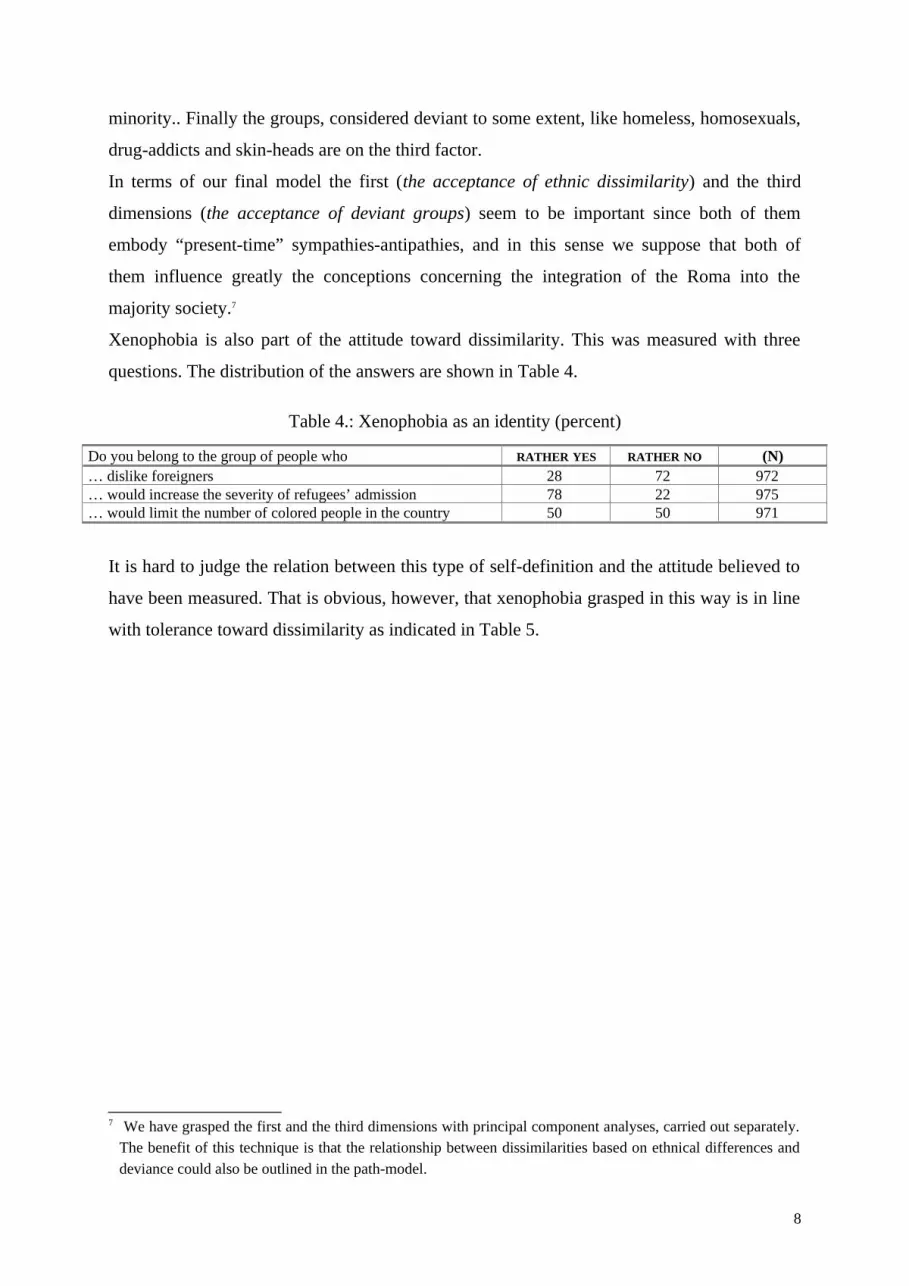
Xenophobia is also part of the attitude toward dissimilarity. This was measured with three
questions. The distribution of the answers are shown in Table 4.
Table 4.: Xenophobia as an identity (percent)
Do you belong to the group of people who RATHER YES RATHER NO (N)… dislike foreigners 28 72 972… would increase the severity of refugees’ admission 78 22 975… would limit the number of colored people in the country 50 50 971
It is hard to judge the relation between this type of self-definition and the attitude believed to
have been measured. That is obvious, however, that xenophobia grasped in this way is in line
with tolerance toward dissimilarity as indicated in Table 5.
7 We have grasped the first and the third dimensions with principal component analyses, carried out separately. The benefit of this technique is that the relationship between dissimilarities based on ethnical differences and deviance could also be outlined in the path-model.
8
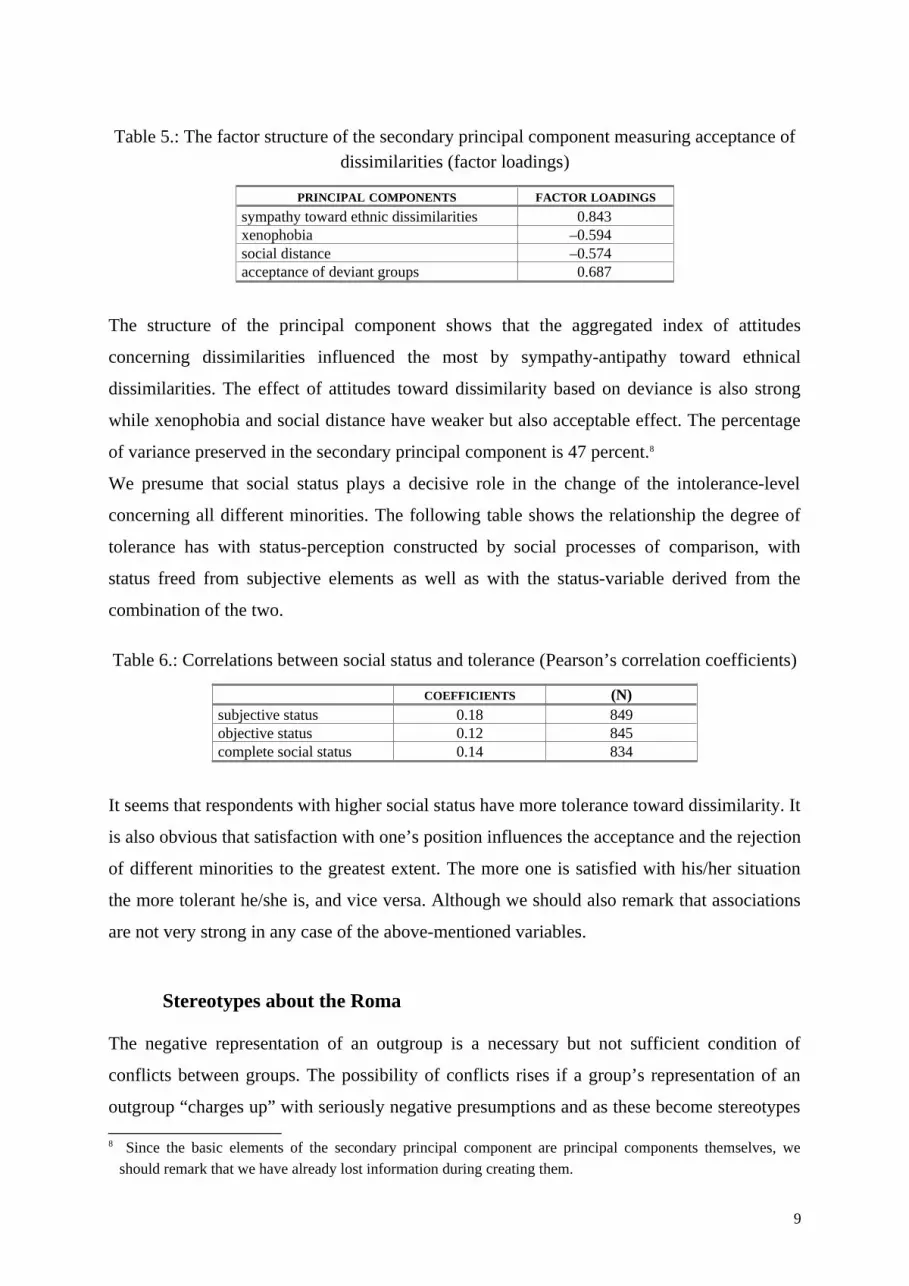
Table 5.: The factor structure of the secondary principal component measuring acceptance of dissimilarities (factor loadings)
PRINCIPAL COMPONENTS FACTOR LOADINGSsympathy toward ethnic dissimilarities 0.843xenophobia –0.594social distance –0.574acceptance of deviant groups 0.687
The structure of the principal component shows that the aggregated index of attitudes
concerning dissimilarities influenced the most by sympathy-antipathy toward ethnical
dissimilarities. The effect of attitudes toward dissimilarity based on deviance is also strong
while xenophobia and social distance have weaker but also acceptable effect. The percentage
of variance preserved in the secondary principal component is 47 percent.8
We presume that social status plays a decisive role in the change of the intolerance-level
concerning all different minorities. The following table shows the relationship the degree of
tolerance has with status-perception constructed by social processes of comparison, with
status freed from subjective elements as well as with the status-variable derived from the
combination of the two.
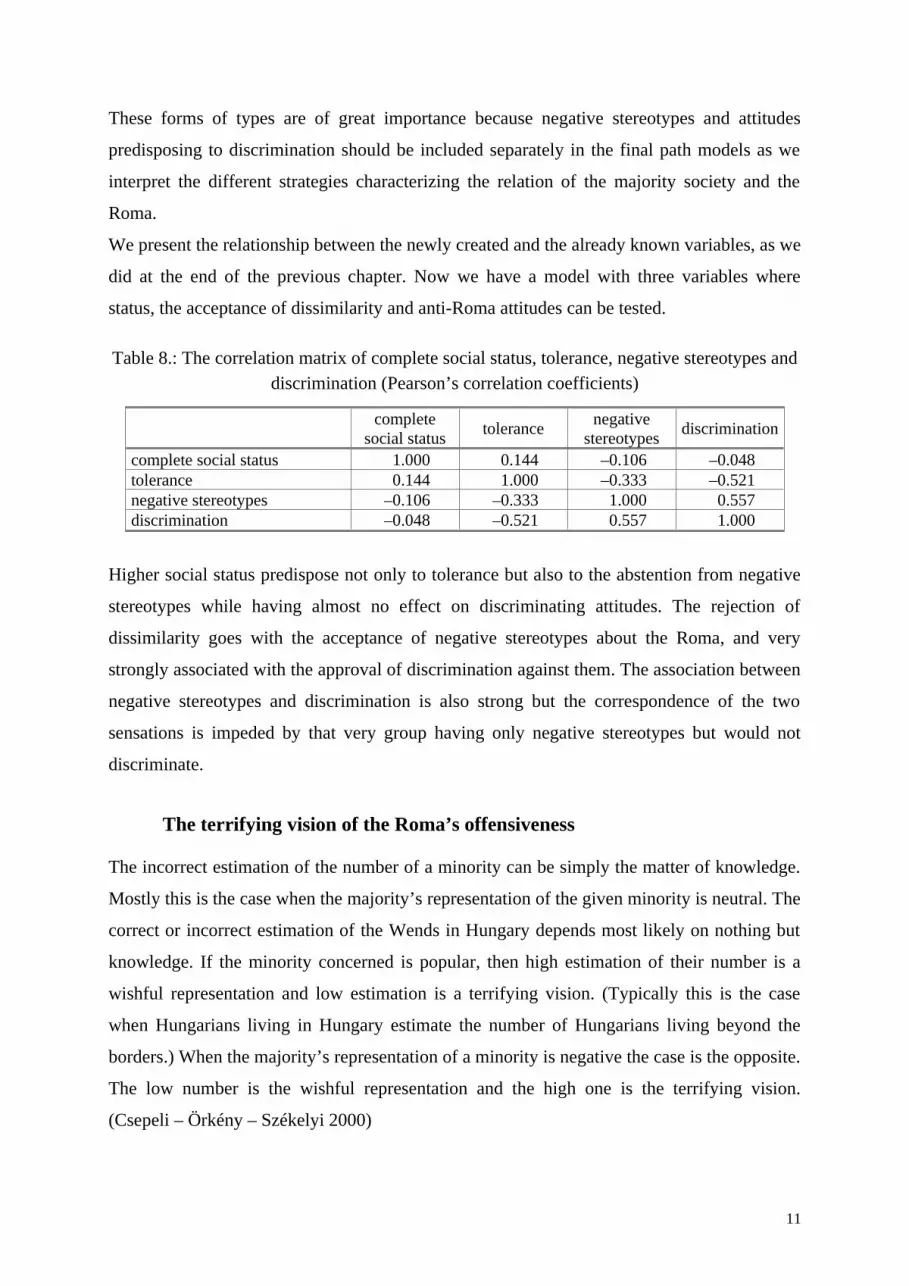
Table 6.: Correlations between social status and tolerance (Pearson’s correlation coefficients)
COEFFICIENTS (N)subjective status 0.18 849objective status 0.12 845complete social status 0.14 834
It seems that respondents with higher social status have more tolerance toward dissimilarity. It
is also obvious that satisfaction with one’s position influences the acceptance and the rejection
of different minorities to the greatest extent. The more one is satisfied with his/her situation
the more tolerant he/she is, and vice versa. Although we should also remark that associations
are not very strong in any case of the above-mentioned variables.
Stereotypes about the Roma
The negative representation of an outgroup is a necessary but not sufficient condition of
conflicts between groups. The possibility of conflicts rises if a group’s representation of an
outgroup “charges up” with seriously negative presumptions and as these become stereotypes
8 Since the basic elements of the secondary principal component are principal components themselves, we should remark that we have already lost information during creating them.
9

they will serve as reasons for keeping the distance from the given group and also for the
willingness to discriminate against the members of it (Horowitz, 1985).
In our questionnaire respondents’ were asked to agree or disagree with two such statements
that contained seriously negative presumptions about the Roma minority. The first statement
said that the problems of the Roma would be solved if they started to work at last and the
second stated that criminal twist runs in the blood of the Roma. The two statements were
aggregated into a heterostereotype index.9
The factor measuring the willingness to discriminate is comprised of answers to the following
statements: the country should not devote money to the Roma’s education in their mother
tongue; it can be only approved that there are certain places of amusement not letting the
Roma in; the increasing number of the Roma endangers the security of the country. Beside
these items also the social distance felt from the Roma, the index of sympathy-antipathy
toward them as well as the variable showing whether the respondent belongs to the group of
people feeling repugnance to the Roma were included in the factor.
The cluster-analysis carried out on the above-mentioned two aggregated indices resulted in
four groups. As the logic of this grouping indicates there is no direct path leading from
negative stereotypes to discrimination. The following table, containing the final results of the
cluster-analysis, shows that beside a strong and a moderate pro-Roma (11and 22 percents,
respectively) and an anti-Roma group (44 percent), also a forth cluster has emerged
characterized by negative stereotypes about the Roma but also by the rejection of
discrimination against them (23 percents).
Table 7.: The construction of anti-Roma attitudes. Clusters along stereotypes and discrimination. (cluster centers and cluster sizes)
STRONG PRO-ROMA ATTITUDES
MODERATE PRO-ROMA ATTITUDES
ONLY NEGATIVE STEREOTYPES
BUT NOT DISCRIMINATIO
N
ANTI-ROMA ATTITUDES
negative stereotypes –1.82 –0.89 0.31 0.71ethnic discrimination –1.63 –0.10 –0.76 0.83the size of clusters (percentage) 11 22 23 44(N) 108 216 226 433
9 Applying principal component analysis to only two variables is quite unusual but since distance is the key-concept of cluster-analysis it was expedient to transform negative stereotypes also into a standardized variable. The only thing that can be said in our excuse is that we wished to grasp Gypsy-hatred in a single dimension, and at the time of the questionnaire’s construction two stereotype-items seemed to be enough for that.
10
These forms of types are of great importance because negative stereotypes and attitudes
predisposing to discrimination should be included separately in the final path models as we
interpret the different strategies characterizing the relation of the majority society and the
Roma.
We present the relationship between the newly created and the already known variables, as we
did at the end of the previous chapter. Now we have a model with three variables where
status, the acceptance of dissimilarity and anti-Roma attitudes can be tested.
Table 8.: The correlation matrix of complete social status, tolerance, negative stereotypes and discrimination (Pearson’s correlation coefficients)
complete social status tolerance negative
stereotypes discrimination
complete social status 1.000 0.144 –0.106 –0.048tolerance 0.144 1.000 –0.333 –0.521negative stereotypes –0.106 –0.333 1.000 0.557discrimination –0.048 –0.521 0.557 1.000
Higher social status predispose not only to tolerance but also to the abstention from negative
stereotypes while having almost no effect on discriminating attitudes. The rejection of
dissimilarity goes with the acceptance of negative stereotypes about the Roma, and very
strongly associated with the approval of discrimination against them. The association between
negative stereotypes and discrimination is also strong but the correspondence of the two
sensations is impeded by that very group having only negative stereotypes but would not
discriminate.
The terrifying vision of the Roma’s offensiveness
The incorrect estimation of the number of a minority can be simply the matter of knowledge.
Mostly this is the case when the majority’s representation of the given minority is neutral. The
correct or incorrect estimation of the Wends in Hungary depends most likely on nothing but
knowledge. If the minority concerned is popular, then high estimation of their number is a
wishful representation and low estimation is a terrifying vision. (Typically this is the case
when Hungarians living in Hungary estimate the number of Hungarians living beyond the
borders.) When the majority’s representation of a minority is negative the case is the opposite.
The low number is the wishful representation and the high one is the terrifying vision.
(Csepeli – Örkény – Székelyi 2000)
11

Knowing the evolved negative stereotypes about the Roma in Hungary, the extent of the
spread of segregation and discrimination attitudes against them, it is not unfounded to suppose
that behind the overestimation of the Roma’s number, possibly tinged by some differences in
knowledge-level, there is, as a matter of fact, the society’s fear that soon the majority of the
population will be Gypsy. Before testing our assumption let us see how did the respondents
estimate the proportion of the Roma for the past, the present and for the future.
Table 9.: The estimated proportion of the Roma population in the whole population (percent)
20 years ago 12.4at the present time 22.4in 20 years 35.4
The respondents’ estimations of the Roma’s number follow a non-linear trend. Based on the
results of sociological researches we know that twenty years ago the actual proportion of the
Roma hardly exceeded five percent of the Hungarian society. Respondents overestimated this
proportion by seven percent on the average. Examining the proportion of the “overestimators”
and of those free of overestimation we can say that 27 percent of the respondents did not
estimate over the Roma’s proportion for that time, twenty years ago. For the present situation
tendencies of overestimation much rather break loose. The present proportion of 7 percent,
according to sociologists, was overestimated by 15 percent on the average and only less than
10 percent (!) of all respondents did not overestimate the Roma’s proportion. The estimation
for the future shows a vision according to which in 20 years every third people in Hungary
will be Roma.
We asked the same questions on proportion-estimation in a survey carried out on a
representative sample of Hungarian police-officers. The estimations of them followed a non-
linear trend as well. They estimated the proportion of the Roma at 11 percent for twenty years
ago, considered the then present-time proportion as 20 percent, and predicted 31 percent for
the future. (Csepeli – Örkény – Székelyi 1997).
If knowledge-level has any part at all that is presumably a function of educational level but
the terrifying vision is rather the function of the willingness to discriminate. To examine the
determinants we have created a regression model with the present-time Roma-estimation as
the dependent and the educational level, the willingness to discriminate against the Roma and
an index of the offensiveness of the Roma society10 as explanatory variables.
10 The index was defined as the difference between future- and present-time estimations for the Roma’s proportion. High values of the index mean that the number of the Roma going to increase dynamically in the following twenty years and therefore the number of Hungarians going to fall necessarily, assuming that the
12
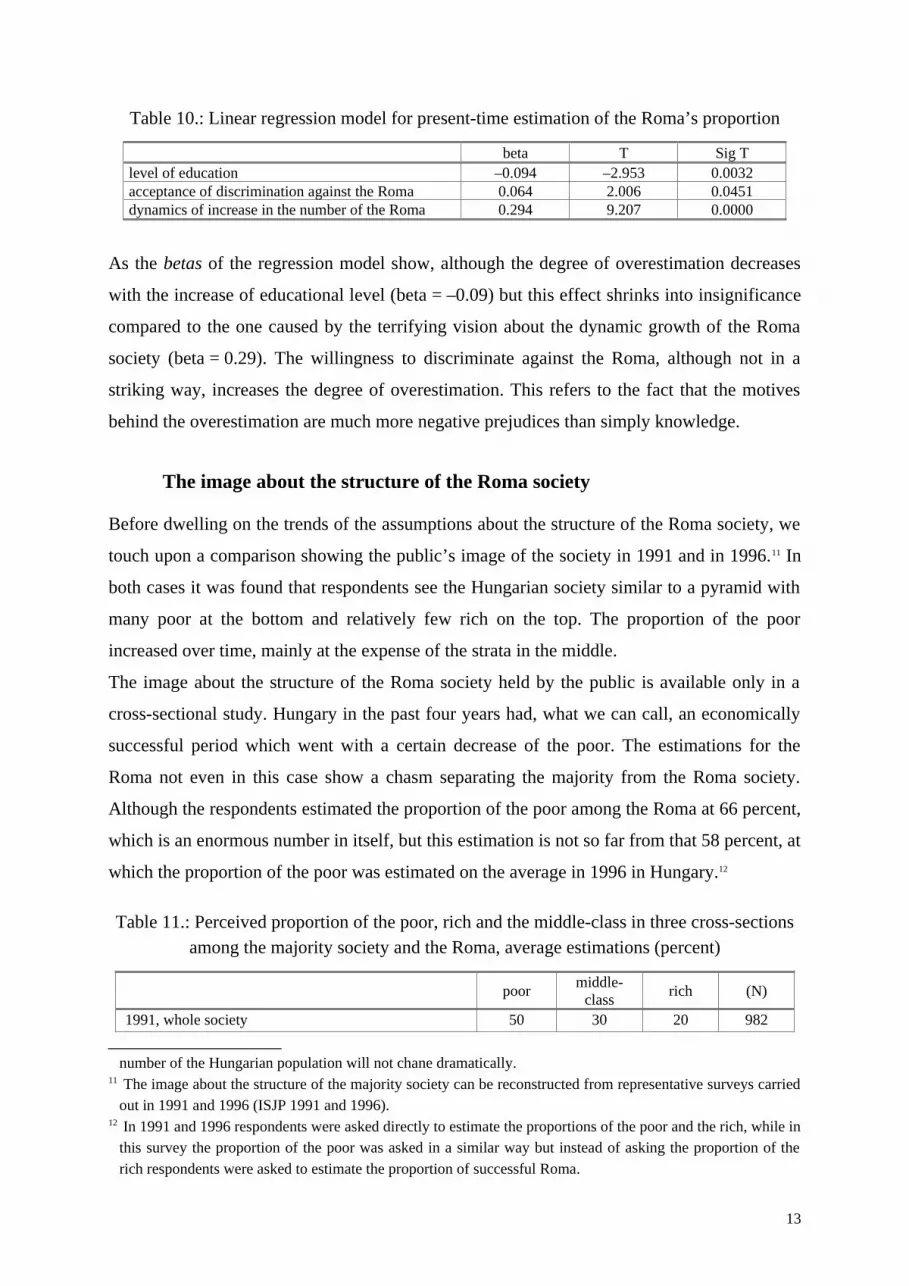
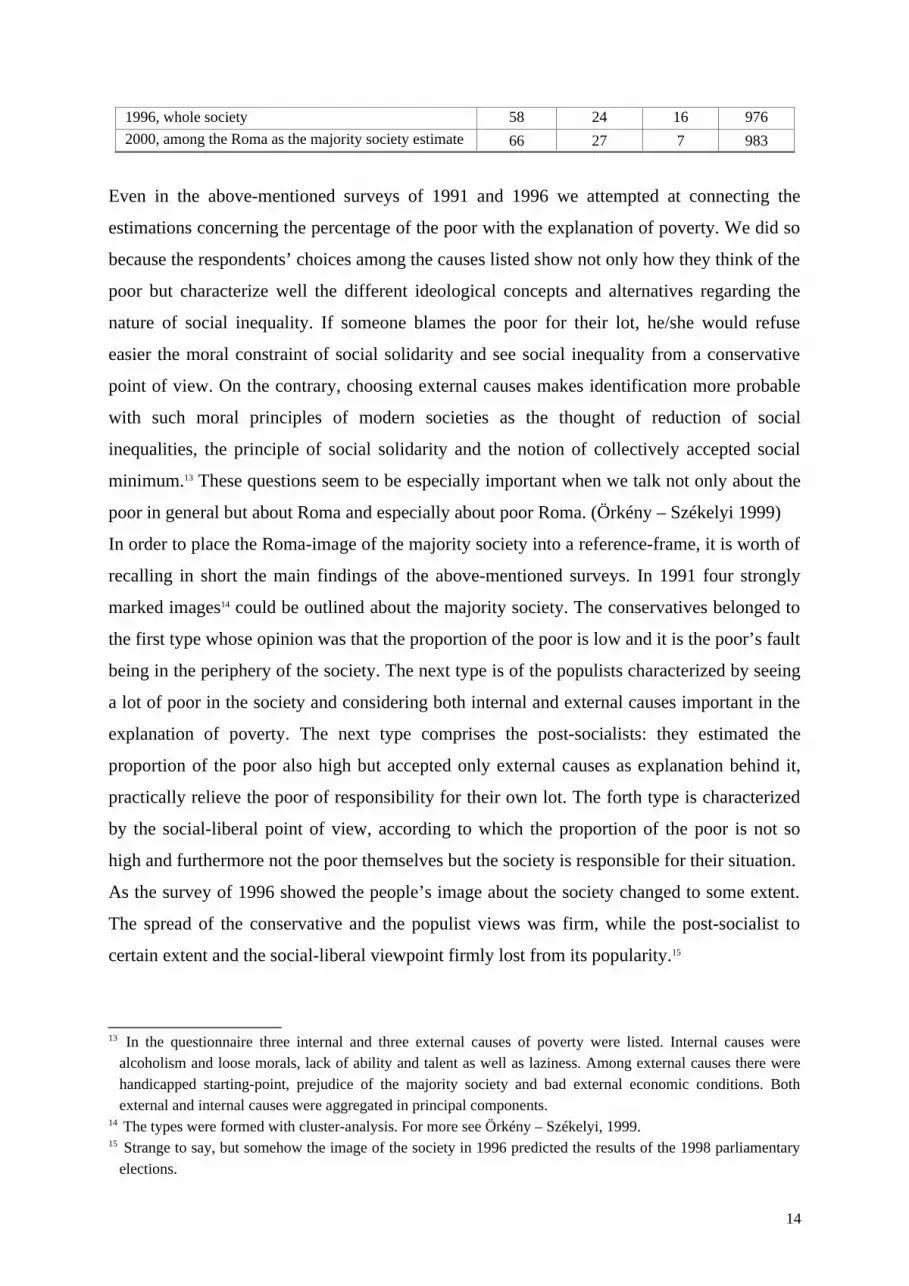
Table 10.: Linear regression model for present-time estimation of the Roma’s proportion
beta T Sig Tlevel of education –0.094 –2.953 0.0032acceptance of discrimination against the Roma 0.064 2.006 0.0451dynamics of increase in the number of the Roma 0.294 9.207 0.0000
As the betas of the regression model show, although the degree of overestimation decreases
with the increase of educational level (beta = –0.09) but this effect shrinks into insignificance
compared to the one caused by the terrifying vision about the dynamic growth of the Roma
society (beta = 0.29). The willingness to discriminate against the Roma, although not in a
striking way, increases the degree of overestimation. This refers to the fact that the motives
behind the overestimation are much more negative prejudices than simply knowledge.
The image about the structure of the Roma society
Before dwelling on the trends of the assumptions about the structure of the Roma society, we
touch upon a comparison showing the public’s image of the society in 1991 and in 1996.11 In
both cases it was found that respondents see the Hungarian society similar to a pyramid with
many poor at the bottom and relatively few rich on the top. The proportion of the poor
increased over time, mainly at the expense of the strata in the middle.
The image about the structure of the Roma society held by the public is available only in a
cross-sectional study. Hungary in the past four years had, what we can call, an economically
successful period which went with a certain decrease of the poor. The estimations for the
Roma not even in this case show a chasm separating the majority from the Roma society.
Although the respondents estimated the proportion of the poor among the Roma at 66 percent,
which is an enormous number in itself, but this estimation is not so far from that 58 percent, at
which the proportion of the poor was estimated on the average in 1996 in Hungary.12
Table 11.: Perceived proportion of the poor, rich and the middle-class in three cross-sections among the majority society and the Roma, average estimations (percent)
poor middle-class rich (N)
1991, whole society 50 30 20 982
number of the Hungarian population will not chane dramatically.11 The image about the structure of the majority society can be reconstructed from representative surveys carried
out in 1991 and 1996 (ISJP 1991 and 1996).12 In 1991 and 1996 respondents were asked directly to estimate the proportions of the poor and the rich, while in
this survey the proportion of the poor was asked in a similar way but instead of asking the proportion of the rich respondents were asked to estimate the proportion of successful Roma.
13
1996, whole society 58 24 16 9762000, among the Roma as the majority society estimate 66 27 7 983
Even in the above-mentioned surveys of 1991 and 1996 we attempted at connecting the
estimations concerning the percentage of the poor with the explanation of poverty. We did so
because the respondents’ choices among the causes listed show not only how they think of the
poor but characterize well the different ideological concepts and alternatives regarding the
nature of social inequality. If someone blames the poor for their lot, he/she would refuse
easier the moral constraint of social solidarity and see social inequality from a conservative
point of view. On the contrary, choosing external causes makes identification more probable
with such moral principles of modern societies as the thought of reduction of social
inequalities, the principle of social solidarity and the notion of collectively accepted social
minimum.13 These questions seem to be especially important when we talk not only about the
poor in general but about Roma and especially about poor Roma. (Örkény – Székelyi 1999)
In order to place the Roma-image of the majority society into a reference-frame, it is worth of
recalling in short the main findings of the above-mentioned surveys. In 1991 four strongly
marked images14 could be outlined about the majority society. The conservatives belonged to
the first type whose opinion was that the proportion of the poor is low and it is the poor’s fault
being in the periphery of the society. The next type is of the populists characterized by seeing
a lot of poor in the society and considering both internal and external causes important in the
explanation of poverty. The next type comprises the post-socialists: they estimated the
proportion of the poor also high but accepted only external causes as explanation behind it,
practically relieve the poor of responsibility for their own lot. The forth type is characterized
by the social-liberal point of view, according to which the proportion of the poor is not so
high and furthermore not the poor themselves but the society is responsible for their situation.
As the survey of 1996 showed the people’s image about the society changed to some extent.
The spread of the conservative and the populist views was firm, while the post-socialist to
certain extent and the social-liberal viewpoint firmly lost from its popularity.15
13 In the questionnaire three internal and three external causes of poverty were listed. Internal causes were alcoholism and loose morals, lack of ability and talent as well as laziness. Among external causes there were handicapped starting-point, prejudice of the majority society and bad external economic conditions. Both external and internal causes were aggregated in principal components.
14 The types were formed with cluster-analysis. For more see Örkény – Székelyi, 1999.15 Strange to say, but somehow the image of the society in 1996 predicted the results of the 1998 parliamentary
elections.
14
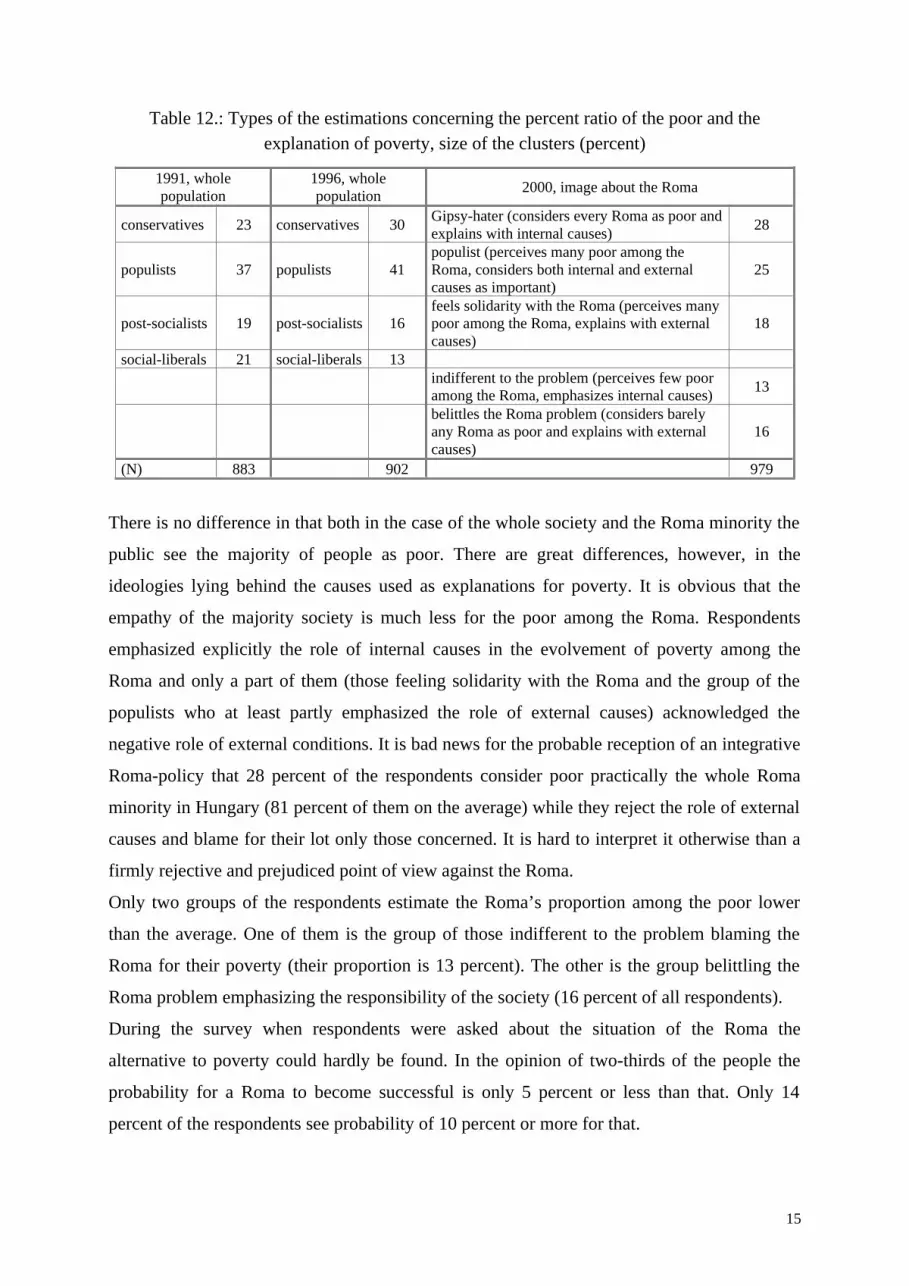
Table 12.: Types of the estimations concerning the percent ratio of the poor and the explanation of poverty, size of the clusters (percent)
1991, whole population
1996, whole population 2000, image about the Roma
conservatives 23 conservatives 30 Gipsy-hater (considers every Roma as poor and explains with internal causes) 28
populists 37 populists 41populist (perceives many poor among the Roma, considers both internal and external causes as important)
25
post-socialists 19 post-socialists 16feels solidarity with the Roma (perceives many poor among the Roma, explains with external causes)
18
social-liberals 21 social-liberals 13indifferent to the problem (perceives few poor among the Roma, emphasizes internal causes) 13
belittles the Roma problem (considers barely any Roma as poor and explains with external causes)
16
(N) 883 902 979
There is no difference in that both in the case of the whole society and the Roma minority the
public see the majority of people as poor. There are great differences, however, in the
ideologies lying behind the causes used as explanations for poverty. It is obvious that the
empathy of the majority society is much less for the poor among the Roma. Respondents
emphasized explicitly the role of internal causes in the evolvement of poverty among the
Roma and only a part of them (those feeling solidarity with the Roma and the group of the
populists who at least partly emphasized the role of external causes) acknowledged the
negative role of external conditions. It is bad news for the probable reception of an integrative
Roma-policy that 28 percent of the respondents consider poor practically the whole Roma
minority in Hungary (81 percent of them on the average) while they reject the role of external
causes and blame for their lot only those concerned. It is hard to interpret it otherwise than a
firmly rejective and prejudiced point of view against the Roma.
Only two groups of the respondents estimate the Roma’s proportion among the poor lower
than the average. One of them is the group of those indifferent to the problem blaming the
Roma for their poverty (their proportion is 13 percent). The other is the group belittling the
Roma problem emphasizing the responsibility of the society (16 percent of all respondents).
During the survey when respondents were asked about the situation of the Roma the
alternative to poverty could hardly be found. In the opinion of two-thirds of the people the
probability for a Roma to become successful is only 5 percent or less than that. Only 14
percent of the respondents see probability of 10 percent or more for that.
15

The attribution-pattern of Roma-poverty is not independent of negative stereotypization. In
the following table this expected relationship is presented verifying our assumption that the
viewpoint blaming the Roma for their poverty is not free of prejudices indeed.
Table 13.: Images about the Roma society and negative stereotypes about them (factor score averages)
indifferent to the problem 0.37Gipsy-hater 0.45populist – 0.05feels solidarity with the Roma – 0.81belittles the Roma problem – 0.10
Gipsy-haters tend to have negative stereotypes the most and they are closely followed by
those indifferent to the problem. According to sense those feeling solidarity with the Roma
are completely free of negative stereotypes and also more positive than negative attitudes can
be found in the case of those belittling the Roma problem. The “double-face” of the populists
show itself not only in that they explain poverty both with external and internal causes but
also in that in point of negative stereotypes they also take an average position: they accept one
part of negative stereotypes and they reject the other.
Examining the proportion of the Roma estimated by different types over time helps to
understand the “inner nature” of the types outlined in connection with the image held about
the Roma society.
16
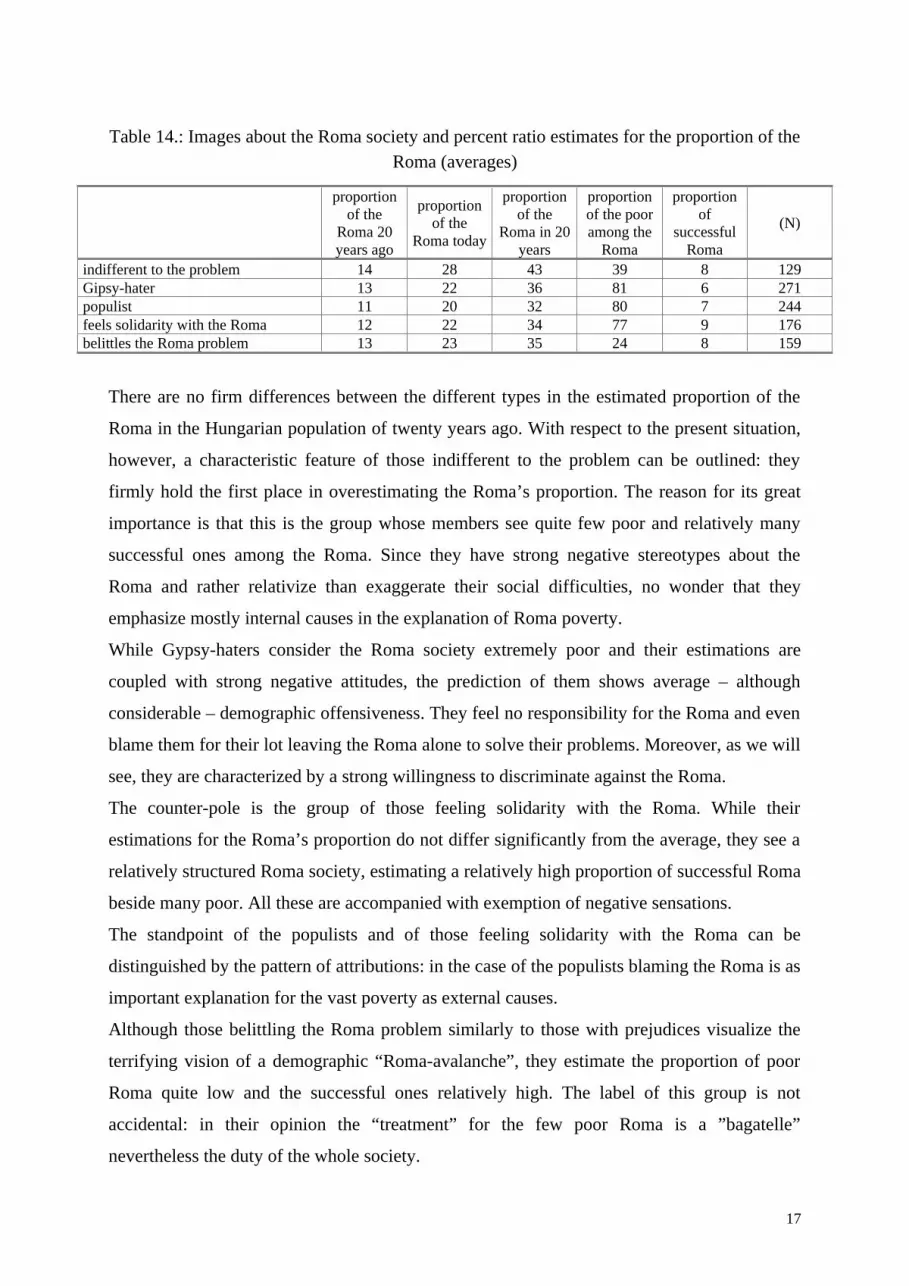
Table 14.: Images about the Roma society and percent ratio estimates for the proportion of the Roma (averages)
proportion of the
Roma 20 years ago
proportion of the
Roma today
proportion of the
Roma in 20 years
proportion of the poor among the
Roma
proportion of
successful Roma
(N)
indifferent to the problem 14 28 43 39 8 129Gipsy-hater 13 22 36 81 6 271populist 11 20 32 80 7 244feels solidarity with the Roma 12 22 34 77 9 176belittles the Roma problem 13 23 35 24 8 159
There are no firm differences between the different types in the estimated proportion of the
Roma in the Hungarian population of twenty years ago. With respect to the present situation,
however, a characteristic feature of those indifferent to the problem can be outlined: they
firmly hold the first place in overestimating the Roma’s proportion. The reason for its great
importance is that this is the group whose members see quite few poor and relatively many
successful ones among the Roma. Since they have strong negative stereotypes about the
Roma and rather relativize than exaggerate their social difficulties, no wonder that they
emphasize mostly internal causes in the explanation of Roma poverty.
While Gypsy-haters consider the Roma society extremely poor and their estimations are
coupled with strong negative attitudes, the prediction of them shows average – although
considerable – demographic offensiveness. They feel no responsibility for the Roma and even
blame them for their lot leaving the Roma alone to solve their problems. Moreover, as we will
see, they are characterized by a strong willingness to discriminate against the Roma.
The counter-pole is the group of those feeling solidarity with the Roma. While their
estimations for the Roma’s proportion do not differ significantly from the average, they see a
relatively structured Roma society, estimating a relatively high proportion of successful Roma
beside many poor. All these are accompanied with exemption of negative sensations.
The standpoint of the populists and of those feeling solidarity with the Roma can be
distinguished by the pattern of attributions: in the case of the populists blaming the Roma is as
important explanation for the vast poverty as external causes.
Although those belittling the Roma problem similarly to those with prejudices visualize the
terrifying vision of a demographic “Roma-avalanche”, they estimate the proportion of poor
Roma quite low and the successful ones relatively high. The label of this group is not
accidental: in their opinion the “treatment” for the few poor Roma is a ”bagatelle”
nevertheless the duty of the whole society.
17
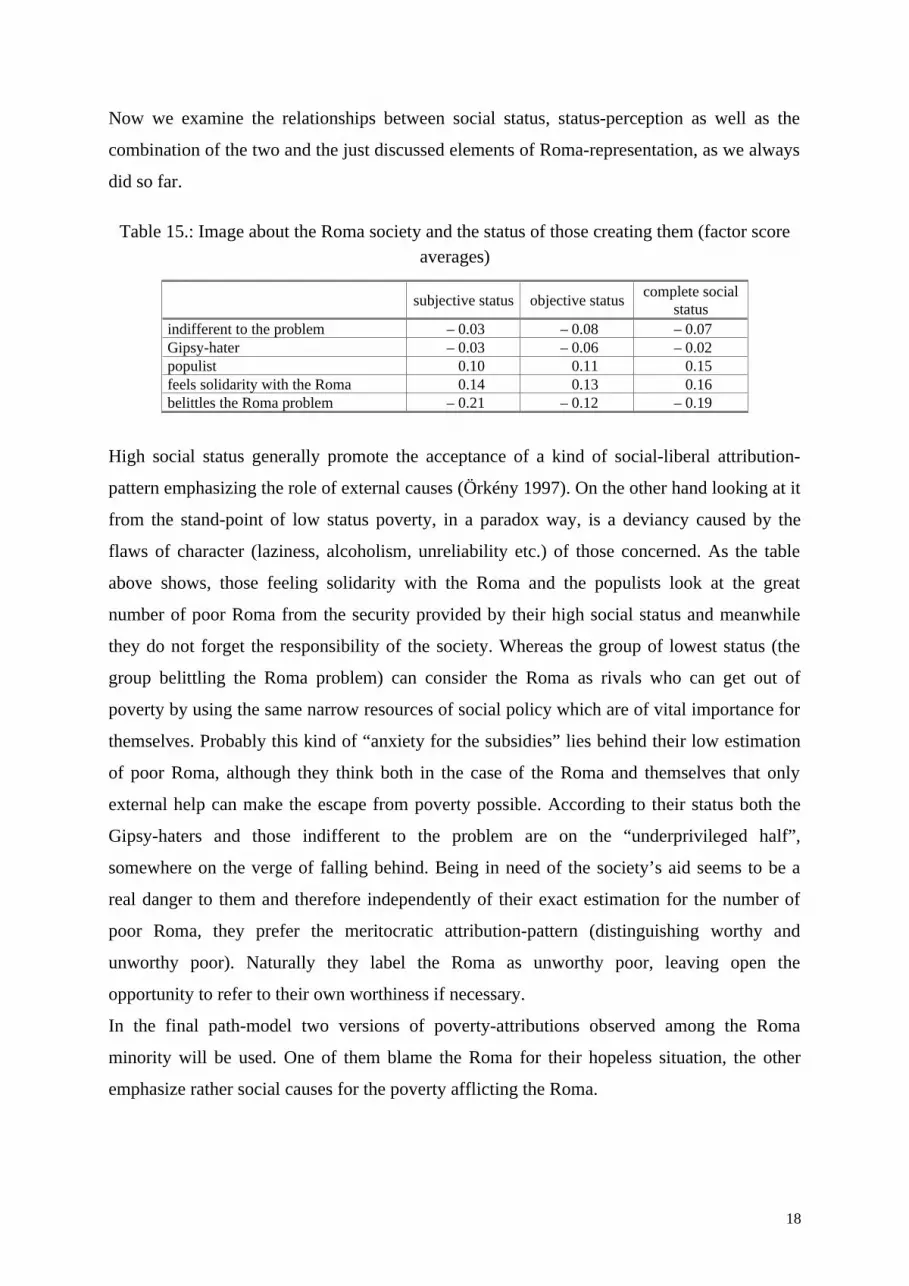
Now we examine the relationships between social status, status-perception as well as the
combination of the two and the just discussed elements of Roma-representation, as we always
did so far.
Table 15.: Image about the Roma society and the status of those creating them (factor score averages)
subjective status objective status complete social status
indifferent to the problem – 0.03 – 0.08 – 0.07Gipsy-hater – 0.03 – 0.06 – 0.02populist 0.10 0.11 0.15feels solidarity with the Roma 0.14 0.13 0.16belittles the Roma problem – 0.21 – 0.12 – 0.19
High social status generally promote the acceptance of a kind of social-liberal attribution-
pattern emphasizing the role of external causes (Örkény 1997). On the other hand looking at it
from the stand-point of low status poverty, in a paradox way, is a deviancy caused by the
flaws of character (laziness, alcoholism, unreliability etc.) of those concerned. As the table
above shows, those feeling solidarity with the Roma and the populists look at the great
number of poor Roma from the security provided by their high social status and meanwhile
they do not forget the responsibility of the society. Whereas the group of lowest status (the
group belittling the Roma problem) can consider the Roma as rivals who can get out of
poverty by using the same narrow resources of social policy which are of vital importance for
themselves. Probably this kind of “anxiety for the subsidies” lies behind their low estimation
of poor Roma, although they think both in the case of the Roma and themselves that only
external help can make the escape from poverty possible. According to their status both the
Gipsy-haters and those indifferent to the problem are on the “underprivileged half”,
somewhere on the verge of falling behind. Being in need of the society’s aid seems to be a
real danger to them and therefore independently of their exact estimation for the number of
poor Roma, they prefer the meritocratic attribution-pattern (distinguishing worthy and
unworthy poor). Naturally they label the Roma as unworthy poor, leaving open the
opportunity to refer to their own worthiness if necessary.
In the final path-model two versions of poverty-attributions observed among the Roma
minority will be used. One of them blame the Roma for their hopeless situation, the other
emphasize rather social causes for the poverty afflicting the Roma.
18
Willingness to discriminate against the Roma
The results found as we studied social distance coupled with negative emotional charge have
been already presented. We just remind the reader that the attitudes toward the Roma were
measured with a nine-degree scale, besides respondents had to answer with ‘yes’ or ‘no’ to
the question whether they belong to the group of people feeling repugnance to the Roma and
finally also with ‘yes’-‘no’ answer-alternatives to the question whether they would let a Roma
to move into their neighborhood.
The willingness to discriminate was tested with three Likert-type questions. Respondents
were asked whether the country should devote money to the Roma’s education in their mother
tongue, whether the respondent approves that there are certain places of amusement not
letting the Roma in and finally whether the increasing number of the Roma endangers the
security of the country.
The way how the majority society discriminate
The heterogenity in the contents of the six items – the three measuring social distance and the
other three the willingness to discriminate – would not give us enough reason to presume the
disposition to discrimination behind each one of them. Principal component analysis showed,
however, that each item has strong relationships with the ban of the Roma from certain places
of amusement and also with the extremely strong statement that the increasing number of the
Roma endangers the security of the country. This fact can convince also the readers that the
values concentrated in this dimension are not only about anti-Roma attitudes but about
explicit discriminating endeavors as well. A respondent’s disapproval of a Roma moving into
his/her neighborhood also means that if they already happened to live there they would be
grateful to be able to attain to have the Roma moved away in whatever way. Moreover this is
why we believe that if someone does not want to devote money from public funds to the
Roma’s education in their mother tongue that is a phase of the undervaluation of Roma
culture. The condensation of social distance and discrimination into a single dimension shows
that a certain part of the majority society want to be separated from the Roma and for the sake
of this they would also take discriminative steps against them.
In the path models we used the principal component measuring the willingness to
discriminate. One of the poles of this means the acceptance, the other the rejection of
discrimination.
19
Those who discriminate
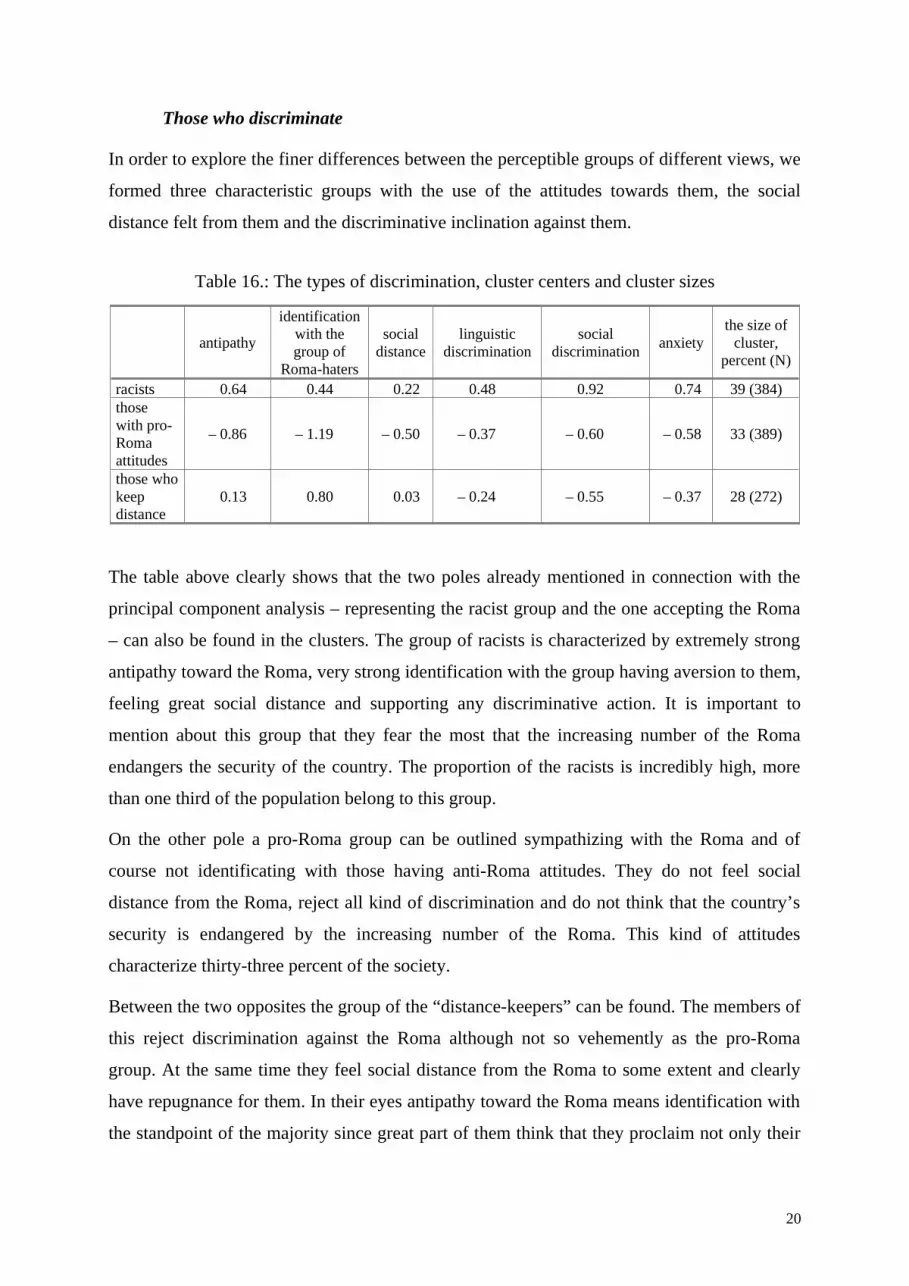
In order to explore the finer differences between the perceptible groups of different views, we
formed three characteristic groups with the use of the attitudes towards them, the social
distance felt from them and the discriminative inclination against them.
Table 16.: The types of discrimination, cluster centers and cluster sizes
antipathy
identification with the group of
Roma-haters
social distance
linguistic discrimination
social discrimination anxiety
the size of cluster,
percent (N)
racists 0.64 0.44 0.22 0.48 0.92 0.74 39 (384)those with pro-Roma attitudes
– 0.86 – 1.19 – 0.50 – 0.37 – 0.60 – 0.58 33 (389)
those who keep distance
0.13 0.80 0.03 – 0.24 – 0.55 – 0.37 28 (272)
The table above clearly shows that the two poles already mentioned in connection with the
principal component analysis – representing the racist group and the one accepting the Roma
– can also be found in the clusters. The group of racists is characterized by extremely strong
antipathy toward the Roma, very strong identification with the group having aversion to them,
feeling great social distance and supporting any discriminative action. It is important to
mention about this group that they fear the most that the increasing number of the Roma
endangers the security of the country. The proportion of the racists is incredibly high, more
than one third of the population belong to this group.
On the other pole a pro-Roma group can be outlined sympathizing with the Roma and of
course not identificating with those having anti-Roma attitudes. They do not feel social
distance from the Roma, reject all kind of discrimination and do not think that the country’s
security is endangered by the increasing number of the Roma. This kind of attitudes
characterize thirty-three percent of the society.
Between the two opposites the group of the “distance-keepers” can be found. The members of
this reject discrimination against the Roma although not so vehemently as the pro-Roma
group. At the same time they feel social distance from the Roma to some extent and clearly
have repugnance for them. In their eyes antipathy toward the Roma means identification with
the standpoint of the majority since great part of them think that they proclaim not only their
20

own personal emotions but at the same time belong to the “long family” of the those having
aversion to the Roma. The proportion of this group is 28 percent.
It is proved by many sociological researches that there is a kind of consensus in the society
concerning Roma-hatred. The sign of this is that the magnitude of anti-Roma attitudes is not
influenced by educational qualifications. It is verified by our research as well. The proportion
of those who tend to discriminate is around 38 percent on all educational levels. The
proportion of the pro-Roma group decrease as educational qualification rises.16 Startlingly a
kind of social consensus start to prevail, according to which tolerance toward the Roma and
the rejection of discrimination against them are considered as deviance.
There is strong relationship between the willingness to discriminate and the image about
poverty which is widespread among the Roma minority. (Of course we cannot know which
causes the other.)
Table 17.: The relationship between the image held about the Roma society and the willingness to discriminate, factor score averages
indifferent to the problem (perceives few poor among the Roma, emphasizes internal causes) .30
Gipsy-hater (considers every Roma as poor and explains with internal causes) .49
populist (perceives many poor among the Roma, considers both internal and external causes as important) – .10
feels solidarity with the Roma (perceives many poor among the Roma, explains with external causes) – .83
belittles the Roma problem (considers barely any Roma as poor and explains by external causes) – .02
The table above has no surprise in store for us. It can be seen that Roma-haters not only
consider the Roma society as poor and blame the Roma themselves for their poverty but this
is also coupled with strong discriminative inclination. Those indifferent to the problem
perceive few poor among the Roma but find the causes of poverty in the Roma themselves
showing also high discriminative potential. Those who belittle the problem relieve the Roma
of responsibility for their burdens in vain because they cannot throw off their anti-Roma
attitudes. The rejection of discrimination is stronger among the populists who explain large-
scale Roma poverty with both internal and external causes. Firmly anti-discriminative the
group feeling solidarity with the Roma whose members estimate many poor among them but
16 The proportion of the pro-Roma group is 38 percent of the lower educated respondents, thirty-five of those with vocational education, twenty-eight of high school graduates and 30 percent of the ones graduated from college or university.
21
emphasize the responsibility of the society for all that. Using internal causes in the
explanation of the small or vast Roma poverty means not only the refusal of social support but
also the oppression of the Roma and their banishment out of the society.
It is also not surprising that negative stereotypes about the Roma lie behind the discriminative
inclination against them (correlation between the two indices is 0.53). There is also very
strong relationship between the rejection of dissimilarity and the discrimination against the
Roma (the correlation is 0.55).
All that shows that the majority separate themselves from the Roma with a cognitive wall
made of negative emotions, malevolent stereotypes, unjust attributes as well as of segregative
and discriminative attitudes. As time goes by it will be harder and harder to break through this
wall of prejudices.
The dimensions of success
Success is the counter-point of marginalization and poverty. Since a great part of the majority
society see the poverty of the Roma as a well-deserved lot, it is not obvious that they can and
inclined to see conditions among the attributes of Roma success which coincides with the
norms of the majority society. The perception of Roma success shows not only the
appreciation for them but by the attributes of success also the way for the Roma to integrate
into the majority society.
According to our preliminary conceptions the success-strategies of the Roma can be
conceived on three ways. The first is to rely on internal resources embodied by talent, will-
power and diligence in our questionnaire. Another possibility is the assimilation strategy
meaning that the member of the minority desiring success lose his/her past identity and
assimilate to the majority society. In these cases the conditions of success are the concealment
of Roma origin, good connections and the luck necessary for everything. The third possible
way to be successful is that the Roma can keep their ethic identity and thus can become a
fully entitled member of the society, in other word can integrate. The integration strategy is
characterized by the acceptance of Roma identity and the helpful social environment.
Our preliminary conceptions were proven by the empirical data since three success-strategy
apperceived in public opinion.17 We have good reason to assume that the choice between
17 The offered causes of success fitted on three factors. The maximum likelihood factor-structure is the following:
22

different success-strategies is not independent of the way of the Roma’s representation whose
elements will be discussed in detail later. To map this we have chosen to show in three
complex path models how the willingness to discriminate can emerge from the attitudes
toward dissimilarity in general and toward the Roma specifically. The way and degree how it
influences the respondents’ views about the Roma’s social integration and the possible
success-strategies will be also presented.
In our first path model we will show the cognitive preliminaries from which that kind of
deeply conservative and anti-Roma success-strategy originate. Their main point is that the
Roma should help themselves and should rely on their own psychological resources.
Figure 2
The first surprise, the path model had for us, is that the way of thinking of these people
considering internal resources as the sine qua non of success can be explained to only a small
extent by the model (the unexplained proportion is 92 percent). The second surprise is that the
willingness to discriminate or the rejection of it do not explain this success-strategy. This
means that among the adherents of this strategy we can find people willing to discriminate
against the Roma and also ones rejecting this view. As the path model shows there can be
several antagonistic views of the society behind the acceptance of this strategy of success.18
First let us present the paths whose terminal point is the acceptance of the success-strategy
based on internal resources. These paths outline those intolerant views, which base the
Roma’s social integration merely on their individual efforts.19
High social status does not guarantee tolerant views itself since among those with relatively
high social status we can also find people who see quite a lot of poor among the Roma,
although they have learnt that negative stereotypes are not comme il faut. Their “good
Internal resourcesAssimilation strategyIntegration strategywill-power0.67diligence0.80talent0.59good connections0.40the concealment of Roma origin0.52luck0.69the acceptance of Roma identity0.49helpful social environment0.61Information content of the factors18%12%8%The fit of the three-factor model is good (the significance of chi-square is greater than 0.05), and it is true for all eight variables that sufficient information of them is preserved by the factors (all communalities are higher than 0.25).
18 These several antagonistic worldviews resulted in that finally this possible way of integration, relying on internal resources, could be explained so weakly by the model.
19 Our starting-point is always higher social status therefore naturally among those with lower social status everything is true on a reversed way.)
23
breeding” conceal the lack of solidarity and they consider internal resources as the tools for
the possible upraise of the Roma. Another path is characteristic to those having high status
and generally inclined to accept dissimilarity while perceive relatively many poor among the
Roma and accept that the integration of them depend on the Roma themselves. This type has a
sophisticated variety characterized by a more simple worldview with many poor and few
successful Roma. This explain Roma poverty with internal causes, couple negative
stereotypes with it and the terminal point is the accentuation of the importance of internal
resources.
In all three standpoints described above a kind of anti-Roma attitude can be revealed since
while they believe that the Roma could integrate by diligence, will-power and talent they
reject the responsibility of the society. Especially extreme belief system occurs behind all
those paths going through the opinion which emphasize the responsibility of the Roma
themselves for their poverty. This standpoint treats the integration of the Roma not only as
their own “domestic affair” but also look upon them as a “genetically problematic” group and
not even want to see any hope for their integration.
Tolerant schemas can also be unfolded from this path model as there are paths leading to the
rejection of internal resources. One kind of these views is held by those with high status who
see many poor among the Roma, explain their poverty with external causes, reject the
negative stereotypes about them and through this they come to the conclusion that one cannot
appeal only to the Roma’s internal resources. Another variety of this tolerant view is when
those with relatively high social status besides the general acceptance of dissimilarity reject
the negative stereotypes about the Roma and deny the exclusiveness of internal resources.
This latter path can be followed through on a more complex way: starting from tolerance
attached to higher social status, going through the rejection of internal causes of poverty,
arriving at the denial of negative stereotypes and finally at the rejection of the success-
strategy based on internal resources.
The picture emerging from this model is variegated and antinomic. Nevertheless we should
pay great attention to the views appealing on the Roma’s internal resources since these very
frequently occur and greatly emphasized in common talk. In the opinions saying that the
Roma could integrate into the majority society, if they worked, if they were talented or if they
had will-power there is also a sincere and tolerant stand-point can be unfolded, according to
which both external social support and individual effort are needed for the Roma to become
an integrated part of the society. But also another intolerant and hostile view can be
24
discovered held by those who take negative stereotypes about the Roma granted, reject social
support and by emphasizing the individual responsibility of the Roma conceal from
themselves and from the world that feel completely no solidarity with them.
The second strategy of success is the assimilation strategy.
Figure 3
The path model including the concealment of Roma origin and ending in the assimilation
strategy has simpler and more consistent structure that the above presented model. The
difference reveals itself also in that the explanatory power of this model is high (14 percent)
taking into account that we talk about opinions and values here. One of the structures of
minority-representation lying in this scheme is the following: those having high social status
tend to accept dissimilarities, to reject negative stereotypes, do not want to discriminate,
nevertheless advocates of the assimilation strategy. There is also another cognitive way of
thinking. Besides that its followers accept dissimilarities, identify themselves with external
attributes of poverty, through rejecting negative stereotypes or (leaving this stage out) directly
they resist discriminative drives and accept assimilation as a possible way of upraise. Another
variant of this scheme leads those accepting dissimilarities to the refusal of internal causes in
the explanation of Roma poverty. When the rejection of internal causes is accompanied by the
refusal of negative stereotypes and discrimination, the terminal point is the acceptance of the
assimilation strategy again.20
The next scheme of thinking starts from status, or rather from high status and the acceptance
of dissimilarities. The model outlines the structure of thinking of those respondents for whom
the perception of many poor and few successful Roma is coupled with the explanation of
Roma poverty by internal causes. If the acceptance of internal attributes is not accompanied
by negative emotional charge, then assimilation is considered as a possible way of uprise. But
if internal causation goes with negative emotional charge (negative stereotypes and
discriminative inclination) then assimilation is rejected.
At least for some sentences it is worth dwelling upon the effect the external and internal
attributes of Roma poverty have on the assimilation success-strategy. If one sees the
responsibility of the society behind Roma poverty then accepts assimilation, irrespectively of 20 Naturally, this scheme of thinking can be reconstructed either for those with lower status or when we take the
paths starting from the acceptance of internal causes. In this case respondents incline to have negative stereotypes and also to discriminate, according to which they refuse the assimilation strategy.
25

the fact whether it is coupled with the rejection of negatively charged stereotypes and
discrimination or not. Therefore those who emphasize social responsibility, consider the
giving up of Roma identity as the sine qua non of success. If someone blames the Roma
themselves for their poverty, then depending on his/her emotive relations to the Roma thinks
differently about assimilation. Having neutral emotions toward them results in the acceptance
of the assimilation strategy, while animosity generates the rejection of it.
Finally another characteristic scheme of thinking can be explored from this path model: those
who approve the thought of tolerance while having no precise idea21 about the Roma society,
showing no kind of emotions – different from the average – towards them are against
assimilation.
Thus in how many sense can we talk about acceptance or rejection of the assimilation
strategy? Agreeing the assimilation of the Roma can conceal a worldview based on solidarity
(the acceptance of external attributes of Roma poverty and the rejection of negative
stereotypes about and discrimination against them) or it can be a pretended point of view
which declares the Roma’s own responsibility for their lot and according to which the only
possible way to success is if the Roma became similar to the members of the majority society.
The rejection of assimilation can have two meanings as well. One of these is a multicultural
point of view taking the acceptance of dissimilarities so seriously that the rejection of
assimilation is inevitable. The refusal of assimilation, however, can conceal also the
willingness of exclusion. If one assumes internal attributions behind Roma poverty, thinks
negative stereotypes about the Roma and supports discrimination against them, then does not
want to integrate the Roma into the majority society.
The third possible success-strategy is based on the integration of the Roma.
Figure 4
Nothing can prove the positive attitude toward the Roma of the integration success-strategy
better than the fact that this strategy goes with the strongest rejection of discrimination.
General tolerance accompanied by high social status leads to the approval of the Roma’s
integration through the strong rejection of negative stereotypes and discrimination. External
21 Beta coefficients measuring the strength of the relationships in the path models are partial. This means that tolerance goes with the rejection of assimilation so that the effect of all other intermediary variables are filtered.
26
attributes, namely the accentuation of social responsibility goes with the acceptance of
integration, internal causation, however, coupled with negative stereotypes and the acceptance
of discrimination, results in the disapproval of integration.
The model can be reconstructed as the path here going not from the estimation of the poor’s
proportion to the percentage of successful Roma but on the other way round. In the new
model a self-fulfilling prophecy can be interpreted. If one thinks that the proportion of the
successful ones is relatively high among the Roma, then regards the integration as the most
effective strategy to their uprise. In the approach of a part of respondents the image of a
relatively high proportion of successful Roma is accompanied by the external attributes for
the situation of the relative few poor ones. Another part of respondents, however, only by
assuming Roma success directly get to the acceptance of integration independently from
attributes, the rejection of negative stereotypes and also from the willingness to discriminate.
According to our promise we have also analyzed those path-models where schemas leading to
success-strategies were reconstructed from status including only objective elements. This kind
of index, indicating the place taken in the hierarchy independently of the satisfaction with
status, switches off the factor of frustration arising from dissatisfaction. Since the status index
used in the previous path-models comprised both subjective and objective aspects, it is small
wonder that the models starting from objective status follow the original path models almost
identically. However, a change is worthy of note, namely that the relationship between
objective status and tolerance became weaker (the standardized regression coefficient (beta)
decreases from 0.14 to 0.11). This means that satisfaction with social position – on whichever
level of the social hierarchy – brings about increased tolerance toward all kind of
dissimilarities and thus – by ways and manners already indicated in the models – results in a
generally more integrative attitude toward the Roma.
While our path-models show the schemas of thinking along which one can get to the possible
Roma success-strategies, we should never forget that the greatest part of the majority society
have anti-Roma attitudes. We would have an easy task, if we had wanted to build up a scheme
of representation whose terminal point was the discrimination against the Roma. If we look
back to our path-models and stop at discrimination for a while, we can clearly see how
consistent the pattern is along which people get from intolerance through negative stereotypes
to discrimination. (In a kind of path-model there is no need to be ashamed about its
explanatory power which is 47 percent for discrimination!) We did not want to show how
emotions about the Roma are organized starting from social distance through the more and
27

more intensive rejection of them to the acceptance of discrimination but that even from this
hopeless situation there can be a way out to the solution.
Conclusions
There are two conclusion we would like to draw the attention of those who do not want to
reconciled to the fact that the Hungarian society stigmatize and expel hundred thousands of
people. According to one of our conclusions the increase in the level of general tolerance
results in the decrease of antipathy against the Roma. If someone aims at reducing the existing
anti-Roma attitudes in the society, probably could achieve its goal faster by increasing the
general level of tolerance, rather doing something directly against Gypsy-hatred. According to
our second conclusion the evaluation of a successful Roma image is suitable itself to extend
the people’s acceptance of emancipation. The more believable the chance is for a break-out
the more possible is that the pure sight of success breaking through the wall of prejudices
promotes the collective integration of the Roma to the majority society.
28

Bibliography
Allport, G. W. (1954) The Nature of Prejudice. Addison–Wesley.
Csepeli, Gy. – Örkény, A. – Székelyi, M. (1997) “Szertelen módszerek”, In: Szöveggyűj-temény a kisebbségi ügyek rendőrségi kezelésének tanulmányozásához. Budapest: COLPI, pp.130–172.
Csepeli, Gy. – Fábián, Z. – Sík, E. (1998) “Xenofóbia és a cigányságról alkotott vélemények”, In: Kolosi, T. – Tóth, I. Gy. – Vukovics, Gy. (ed.) Társadalmi riport 1998. Budapest: TÁRKI, pp.458–489.
Csepeli, Gy. – Örkény, A. – Székelyi, M. (2000) Grappling with National Identity. How Nations See Each Others in Central Europe. Budapest: Akadémiai Kiadó.
Erős, F. (1998) “Etnicitás és identitás – a cigányellenesség dimenziói a mai magyar társadalomban”, In: Erős Ferenc (ed) Megismerés, előítélet, identitás. Budapest: Új Mandátum Kiadó, pp. 237–245.
Fábián, Z. – Erős, F. (1996) “Autoritarizmus és társadalmi tényezők a cigányellenesség magyarázatában”, In: Erős Ferenc (ed) Azonosság és különbözőség. Tanulmányok az identitásról és az előítéletről. Budapest: Scientia Humana, pp. 182–200.
Gellner, E. (1984) Nations and Nationalism. London: Blackwell.
Havas, G. – Kemény I. (1996) „A magyarországi romákról”, Szociológiai Szemle, vol 3. pp. 3–20,
Horowitz, D. (1985) Ethnic Groups in Conflict. Berkeley, Los Angeles: University of California Press.
Kolosi T. (2000) A terhes babapiskóta. Budapest: Osiris
Örkény, A. (1997) Hétköznapok igazsága. Igazságossági felfogások egy nemzetközi összehasonlítás tükrében. Budapest: Uj Mandátum Kiadó
Örkény, A. – Székelyi, M. (1999) „ Igazságosság és társadalomkép”, Századvég, Winter 1999, pp. 87–113.
Postma, K. (1996) Changing Prejudice in Hungary. A Study of the Collapse of State Socialism and its Impact on Prejudice againts Gypsies and Jews. Groningen: Rijksuniversiteit
29