the benefits and costs of informal sector pollution control: traditional mexican brick kilns
TRANSCRIPT

Environment and Development Economics 11: 603–627 C© 2006 Cambridge University Pressdoi:10.1017/S1355770X06003159 Printed in the United Kingdom
The benefits and costs of informal sectorpollution control: Mexican brick kilns
ALLEN BLACKMAN∗, JHIH-SHYANG SHIH, DAVID EVANS, andMICHAEL BATZResources for the Future
STEPHEN NEWBOLDNational Center for Environmental Economics, US EnvironmentalProtection Agency
JOSEPH COOKDepartment of Environmental Sciences and Engineering, University ofNorth Carolina, Chapel Hill
ABSTRACT. In developing countries, the rapid proliferation of informal firms – low-technology unlicensed micro-enterprises – is having significant environmental impacts.Yet environmental management authorities typically ignore such firms. This paperestimates the annual net benefits (benefits minus costs) of controlling particulate emissionsfrom a collection of informal brick kilns in Ciudad Juarez, Mexico and from two of thecity’s leading formal industrial polluters. We find that the annual net benefits of controllingbrick kiln emissions are substantial – in the tens of millions of dollars – and exceed thosefor the two formal industrial facilities by a significant margin. These results suggest that,in some cases, the conventional allocation of pollution control resources across formaland informal polluters may be suboptimal.
1. IntroductionIn developing countries, population growth, rural–urban migration, andregulation have spurred the rapid expansion of an urban informal sectorcomprised of low-technology micro-enterprises largely operating outsidethe purview of the state. Today, the informal sector accounts for over half ofnon-agricultural employment and contributes between a quarter and three-quarters of gross domestic product in both Latin America and Africa (Ranis
∗ Corresponding author: Allen Blackman: 1616 P Street, N.W., Washington, DC20036. Tel: (202) 328-5073. Fax: (202) 939-3460. Email: [email protected]
We are grateful to the Tinker Foundation for financial support; Lisa Crooks, AndresLerner, and Alejandra Palma for excellent research assistance; Francisco Alfaro,Charles Bruce, Bob Currey, Anders Johnson, Antonio Lara, Wen-Whai Li, RobertMarquez, Jesus Reynoso, Carlos Rincon, Allyson Siwik, Gerardo Tarin, VictorValenzuela, Adrian Vazquez, and Rebecca Wong for help with field research anddata collection; and Alan Krupnick, the editor, and three anonymous referees forhelpful comments and suggestions. Remaining errors are our own.

604 Allen Blackman et al.
and Stewart, 1994; Schneider and Enste, 2000). Once popularly viewedas an economic backwater – a collection of street merchants transitioningto salaried jobs – the informal sector is now recognized as a hotbed ofentrepreneurship and innovation (De Soto, 1989).
Unfortunately, for all its economic benefits, there are good reasons tosuspect that the expansion of the informal sector is having significantenvironmental impacts. The main reason is that informal firms, althoughtiny, are exceptionally numerous, and a significant percentage areinvolved in highly polluting activities such as leather tanning, ceramics,metalworking, electroplating, and mining. For example, in Mexico, 38 percent of informal firms are classified as industrial (STPS/DOL, 1992). Also,informal firms generally lack pollution control equipment, and often accessto basic sanitation services. Finally, such firms are typically labor intensiveand situated in poor residential areas. Therefore, their emissions directlyaffect a considerable population of employees and neighbors.
Nevertheless, policy makers have thus far paid little attention to informalpolluters. Industrial environmental management efforts in developingcountries have generally focused exclusively on large formal facilities. Inpart, this bias stems from the perceived difficulty of regulating numeroussmall firms. But a second reason may simply be that the problem is notwell-understood – policy-makers lack information on the magnitude andincidence of the environmental damages caused by informal firms, and onthe costs of mitigating these damages. Little research has been conductedto fill this gap. Collecting the requisite data is difficult since informal firmsare, by their nature, wary of record keeping and monitoring.
This paper presents a benefit–cost analysis of four strategies for reducingair pollution from a collection of approximately 330 informal brick kilnsin Ciudad Juarez, Mexico. Our analysis takes advantage of data on US–Mexico border environmental problems collected in the wake of the 1992North American Free Trade Agreement. We also compare the net benefits(benefits minus costs) of controlling brick kiln emissions to estimates of thenet benefits of controlling emissions from two of the city’s leading formalindustrial polluters.
We find that brick kilns emissions are responsible for serious healthdamages including over a dozen premature mortalities per year. As a result,the annual net benefits of three of the four emissions control strategies forbrick kilns are positive and quite large – in the tens of millions of dollars.We also find that the net benefits of controlling emissions from brick kilnsexceed net benefits of controlling emissions from formal factories by aconsiderable margin, although the size of this margin depends critically onthe actual level of pollution abatement in formal factories. These findingssuggest that, in some cases, the conventional allocation of regulatoryresources across formal and informal polluters may be suboptimal.
A number of caveats are in order. First, to make the analysis tractable, weneglect several factors. Although the emissions sources we analyze generatea variety of pollutants, we focus solely on particulate matter smaller than10 microns (PM10) because it is thought to be responsible for a large pro-portion of the total non-carcinogenic adverse health impacts of air pollution(Pope et al., 1995), and because its effects on human health are relatively

Environment and Development Economics 605
well-understood. In addition, we neglect both secondary PM10 (formedwhen pollutants such as nitrogen oxides and sulfur dioxide undergo chem-ical reactions in the atmosphere) and long-range transport of PM because,as discussed in Section 5.1, neither is likely to be important in our case study.Also, we limit our attention to the effects of PM10 on human morbidity andmortality. We do not consider the effects on visibility, materials damages, ornon-use values. Finally, we restrict attention to human morbidity and mor-tality in Ciudad Juarez and omit estimates of the (far less severe) damages inEl Paso, Texas – Juarez’s nearby sister city.1 Given that we restrict attentionto one type of pollutant, one category of adverse impacts, and a subset ofthe affected population, our estimates of the net benefits of controlling airpollution are a lower bound on the total value of the net benefits.
Second, data limitations constrain our analysis somewhat. Mostimportantly, data on Mexican formal industrial facilities are extremelytightly held. Therefore, as discussed below, PM10 emissions and abatementcosts for the two formal factories in our sample are estimated ratherthan measured. These estimated data are adequate for our purpose – toconvey a general sense of how net benefits of controlling emissions fromformal factories compare with the (more precisely measured) net benefitsof controlling emissions from informal firms.
Third, our analysis of abatement costs ignores implementation costs –the costs regulators pay to compel firms to abate pollution – because thesecosts are highly uncertain and difficult to measure. In the informal sector,implementation costs are likely to be significant. We return to this issue inthe conclusion.
To our knowledge, ours is the first rigorous analysis of the benefitsand costs of informal sector pollution control. The literature on informalsector pollution problems is quite thin. Most of it relies on casestudies and focuses either on distinguishing between successful andunsuccessful environmental management strategies (Blackman, 2000; Billerand Quintero, 1995; Perera and Amin, 1996) or on identifying the driversof informal firms’ environmental performance (Blackman and Bannister,1998). The literature on the link between small and medium enterprises(SMEs) and the environment is somewhat more robust. Policy levers are,again, the main focus (Kennedy, 1999; World Bank, 1998). Although weknow of no rigorous benefit–cost analyses, a number of studies assess themagnitude and incidence of SME pollution. For example, Lanjouw (1997)finds that SMEs are responsible for over 90 per cent of total water pollutionassociated with six important economic sectors in Ecuador (see also, Bartoneand Benavides, 1997 and Dasgupta et al., 2002).
To understand the organization of the paper, it is helpful to provide abrief overview of the four-step method used to estimate the net benefitsof investing in a specific ‘control strategy’ to cut PM10 pollution from anemissions source. First, we use a specially parameterized air dispersion
1 Levels of morbidity and mortality due to brick kiln PM10 in El Paso are abouta seventh of levels in Ciudad Juarez. For a longer version of the paper, whichincludes El Paso in estimates of health damages and discusses the cross-borderimplications of the benefit–cost analysis, see Blackman et al. (2003).

606 Allen Blackman et al.
Table 1. Sectoral contributions to total anthropogenic air pollution inCiudad Juarez
Pollutant
Sector PM SO2 CO NOx HC All
Informal brickmaking (%) 16 43 0 0 2 1Other industry (%) 14 17 0 5 3 1Services (%) 3 2 0 3 23 4Transportation (%) 68 38 99 92 72 95All (%) 100 100 100 100 100 100
Total (tons) 1,510 4,144 452,762 26,115 76,134 560,667
Notes: PM = particulate matter; SO2 = sulfur dioxide; CO = carbon monoxide;NOx = nitrogen oxides; HC = hydrocarbons.Source: Gobierno del Estado de Chihuahua (1998).
model to gauge the extent to which the control strategy improves air qualityin Ciudad Juarez. Second, we use a health effects model to estimate howmany cases of human mortality and morbidity are avoided each year asa result of this improved air quality. Third, we use a valuation model tocalculate the dollar value of the avoided mortality and morbidity. Finally,to arrive at net benefits, we calculate the annualized costs of the controlstrategy and subtract them from our estimate of the dollar value of benefits.
The remainder of the paper is organized as follows. Section 2 brieflydiscusses air pollution in Ciudad Juarez and presents aggregated emissionsinventory data to demonstrate that the city’s informal brick kilns are aleading source of air pollution. Section 3 provides background on informalbrick kilns and presents data needed to estimate the annual net benefitsof controlling PM10 emissions from these sources, including emissionscharacteristics given four different control strategies and the annualizedcosts of each strategy. Section 4 provides similar information for two formalsector facilities. Section 5 discusses the air dispersion, health impacts, andvaluation models used to estimate the benefits of pollution abatement.Section 6 presents our results, and the last section considers the policyimplications of our findings.
2. Air pollution in Ciudad JuarezA sprawling industrial city with a population of over 1.2 million, CiudadJuarez, has the worst air pollution on the US–Mexico border. The cityviolates Mexican federal ambient air quality standards for PM10, ozone,and carbon monoxide. According to official 1996 emissions inventory data –the Sistema Nacional de Informacion de Fuentes Fijas (SNIFF) for the stateof Chihuahua (Gobierno del Estado de Chihuahua, 1998) – automobilesand trucks are the leading source of anthropogenic air pollution in CiudadJuarez (table 1).2 Unfortunately, for a variety of technological and political
2 Naturally occurring particulates from wind erosion and unpaved roads arean important source of particulate matter. However, such particulate matter

Environment and Development Economics 607
Figure 1. Brickyards, formal industrial facilities, and population in Ciudad Juarez
reasons, such sources are notoriously difficult to control (Harrington andMcConnell, 2003). Industry is also a leading source of air pollution.Although Ciudad Juarez is home to over 250 maquiladoras – foreign-ownedplants that have located in the city to reduce labor costs – surprisingly,a collection of 330 informal brick kilns are the city’s leading source ofindustrial air pollution. They contribute 16 per cent of all particulate matterpollution, and 43 per cent of all sulfur dioxide. These statistics alone suggestthat in Ciudad Juarez, the informal sector deserves serious consideration asa potential target for pollution control efforts.
3. Informal brick kilns
3.1 DescriptionCiudad Juarez’s informal brick kilns mainly supply construction companiesspecializing in low-cost housing. The typical kiln is a 10-meter-squareprimitive adobe structure that holds 10,000 bricks, employs five or sixpeople, generates profits on the order of $100 per month, and is firedtwo times a month with scrap wood, sawdust, and other rubbish. Brickkilns use no pollution control devices whatsoever (Blackman and Bannister,1997). The location of the kilns within the city exacerbates their adverseimpact on human health; they are clustered in seven poor neighborhoodsmost of which are residential (figure 1).3 Past efforts to control emissions
is principally comprised of large particles, which are relatively benignepidemiologically. Smaller particulates related to combustion are much moredangerous because they are inhaled deeply into the lungs.
3 When brickmakers squatted in these neighborhoods 25 or 30 years ago, all weresituated on the outskirts of the city. Today, however, most have been envelopedby urban sprawl.

608 Allen Blackman et al.
Table 2. Brick kiln emissions characteristics
Characteristic UnitParameter ordistribution Source
Kiln radius (traditional kiln) m 1.75 Bruce (1999)Kiln radius (NMSU kiln) m 0.37 Bruce (1999)Kiln height m 3.0 Avila et al. (1999)Emissions velocity (traditional
kiln)m/s 0.5 Bruce (1999)
Emissions velocity (NMSU kiln) m/s 1.0 Bruce (1999)Plume temperature (traditional
kiln)◦K 573 Bruce (1999)
Plume temperature (NMSU kiln) ◦K 333 Bruce (1999)Peak emission rate total dry
aerosols 0.5 to 20 microns indiametera
g/sec N(7.83, 2.89) Bruce (1999)
Average emission rate/peakratea
– T(0.2, 0.3,0.4) Bruce (1999)
Gr. PM10/gr. total dry aerosolsa – N(0.7, 0.1) US EPA (1995)Firings/month April to
Septembera– 2 Alfaro (p.c., 2000)b
Firings/month October to Maya – 1 Alfaro (p.c., 2000)b
Hours/firing (traditional kiln)a hours 17 Alfaro (p.c., 2000)b
Hours/firing (NMSU kiln)a hours 8.5 Avila et al. (1999)Number of kilns – See Fig. 1 Tarin (p.c., 2000)b
Location of kilns ◦ See Fig. 1 Valenzuela (p.c.,2000)b
Notes: aUsed to calculate total emissions.bPersonal communication with authors.N(µ,σ ) = normal distribution where µ= mean and σ= standard deviation;T(m1,m2,m3) = triangular distribution with m1 = minimum, m2 = mode, m3 =maximum.
from Ciudad Juarez’s brick kilns have mainly focused on encouragingbrickmakers to substitute clean-burning propane for dirty traditional fuels.Unfortunately, these efforts have been undermined by rising propane prices(see Blackman and Bannister, 1997).
3.2 DataTwo types of data are required to estimate the net benefits of reducing PM10emissions from informal brick kilns: data on the emissions characteristics ofbrick kilns (e.g., dimensions, locations, emissions rates, emissions velocities,and plume temperatures), and data on the efficacy and costs of appropriateemissions control strategies. As a general rule, whenever possible, wehave chosen relatively conservative data that avoids any upwards biasin net benefits; that is, data that yield the lowest average annual ambientconcentrations of PM10 and the highest annualized costs. Data on brickkiln emissions characteristics were obtained from studies conducted bylocal universities and from interviews with local stakeholders (table 2).
Environment and Development Economics 609
Note that we report probability distributions for several parameters. Asdiscussed in section 5.4 below, these probability distributions are used toperform Monte Carlo simulations that account for some of the uncertaintyassociated with source emissions characteristics.
As for data on emissions abatement, we model the four control strategiesthat have received considerable attention from local stakeholders (see, e.g.,JAC, 1999).
NMSU kilns. Researchers at New Mexico State University (NMSU)have designed a low-cost, low-technology pollution control strategy thatinvolves replacing traditional open-topped kilns with pairs of domed kilnsconnected by an underground tunnel fitted with clay-filled screens. NMSUkilns have been found to reduce emissions of PM10 by 99.5 per cent (Avilaet al., 1999). This design is particularly promising because it cuts fuel costsby approximately 50 per cent.
Natural gas. Natural gas burns as cleanly as propane but is considerably lessexpensive. Like propane, it can be used effectively in existing traditionalkilns and requires a minimal investment on the part of individualbrickmakers. However, while propane can be distributed in portable tanks,natural gas requires dedicated pipelines and decompressors – infrastructurethat would have to be built to service the brickyards. We assume thatswitching to natural gas eliminates 99.9 per cent of PM10 emissions.
Relocation. Moving kilns away from densely populated residentialneighborhoods is frequently advocated as a means of reducing exposure tokiln emissions. In 1999, 16 brick kilns in a centrally located brickyard calledFrancisco Villa were moved to Kilometro 20, the brickyard furthest fromCiudad Juarez’s population centers and the one brickyard in which land isplentiful (figure 1). We model this scenario as a wholesale relocation of allthe kilns in Ciudad Juarez to Kilometro 20.
No-burn days. Since the transport of kiln emissions depends on weatherconditions, requiring brickmakers to forego firing on certain days cansignificantly reduce exposure to these emissions. El Paso currently hasa ‘no-burn days’ program that prohibits open-air fires during certainweather conditions, and there has been some discussion of enforcing suchrestrictions in Ciudad Juarez. We model this scenario as a prohibition onfiring on days with low wind speed and high air stability – conditionscorrelated with high particulate exposure (see Blackman et al., 2003 for amore detailed description of the methodology we use to select these days).Because enforcement of no-burn days is bound to be imperfect, we assumeonly half of the kilns scheduled to fire on no-burn days actually foregofiring.
We consider a uniform application of these strategies across brickyardsand within brickyards. For example, for the natural gas strategy, we assumeall kilns in all seven brickyards switch. Thus, for policy purposes, we

610 Allen Blackman et al.
Table 3. Annualized costs of pollution control strategies for brick kilns (1999 $USunless otherwise noted)
Cost categoryNMSU
kilnsNatural
gas RelocationNo-burn
days
CapitalPresent value per kiln 3,000a,b 349e 6,000a,b 0Present value infrastructure 0 1,002,005a 0 0Lifetime of capital (yrs.) 10e 20 10e –Annual costs (r = 12%) 175,214 149,553 350,429 0
Operations and maintenancePer kiln 0 0 0 0Infrastructure 0 100,000d 0 24,692c
Total costs 175,214 249,553 350,429 24,692
Notes: aAlfaro (personal communications, 1995 and 2000).bMarquez (personal communication, 2000).cReynoso (personal communication, 2000).dJohnson (personal communication, 2000).eRFF (1995).
effectively treat all brickmakers in Ciudad Juarez as a single emissionssource.4
Table 3 gives the annualized costs of each of the control strategies. Forthe NMSU kilns strategy, the sole cost is that of building modified kilns. Forthe natural gas strategy, capital costs per kiln are based on RFF survey dataon the conversion of kilns to propane in the early 1990s. Like conversionto propane, conversion to natural gas requires investments in a burner andmodifications that enable the kiln to withstand higher temperatures.5 Forthe relocation strategy, we assume that capital costs are comprised of twoelements: the financing needed to relocate brickmakers’ homes ($4,500),and that needed to build a new kiln ($1,500). Our costs for the no-burndays strategy are based on the administrative costs of a similar program in
4 The principal reason is that brick making – like most informal activities with lowbarriers to entry and slim profit margins – is intensely competitive. Therefore,as the propane project in the early 1990s demonstrated, policy scenarios inwhich only a portion of the city’s brickmakers adopt a cost-increasing or cost-decreasing pollution control strategy are not sustainable, as the adopters are at acost disadvantage or cost advantage (Blackman, 2000).
5 Note that we ignore the effects of NMSU kilns and natural gas on variableproduction costs. The former strategy would reduce variable costs since it cuts fuelcosts by approximately 50 per cent, while the latter strategy would raise variablecosts since natural gas is more expensive than traditional fuel. We assume thatgiven uniform application of these control strategies across all brickyards, pricesin the highly competitive market for bricks would adjust to offset the changes invariable costs. A more rigorous evaluation of these market effects is beyond thescope of this study.

Environment and Development Economics 611
El Paso. This program entails labor costs only: one person-hour per day isdevoted to monitoring weather data, and five person-days are devoted toenforcement for each no-burn day declared. We assume Mexican regulatorylabor costs of $18,000 per person-year.
4. Formal industrial sources
4.1 DescriptionIdeally, in order to assess the relative importance of controlling emissionsfrom informal sources, we would simply compare estimates of the netbenefits of cutting brick kiln PM10 with estimates of the net benefits ofcontrolling emissions from an array of formal sector sources in the city.Unfortunately, however, emissions and abatement cost data for formalsources in Ciudad Juarez either do not exist, or are extremely tightly held.Therefore, we have developed net benefits estimates for a small sample of(two) formal sources using US Environmental Protection Agency models. Indoing so, we have taken care to minimize the likelihood that our methodsbias these estimates downwards, and thereby inappropriately lead to afinding that net benefits of controlling brick kiln PM10 are relatively high bycomparison. Specifically, we have purposely chosen to estimate emissionsfrom formal sector sources that have much higher PM10 emissions thanmost formal facilities in the airshed.6 In addition, given uncertainty aboutabatement investments at the two plants, we present a variety of net benefitsestimates based on different assumptions about such investments.
Although questions have been raised about the reliability of the facility-level data in the SNIFF emissions inventory – indeed, this is the reason weuse US Environmental Protection Agency models instead of these data toestimate PM10 emissions – an alternative ranking of local emissions sourcesis lacking and, therefore, we rely upon the SNIFF to identify the city’s topseven industrial sources of PM10. In the summer of 2001, we interviewedmanagers and engineers of these plants (both in person and by telephone) inan attempt to obtain production data needed to estimate PM10 emission andabatement costs. Two of these seven facilities provided us with the requisitedata: a US-owned gray iron foundry and a Belgian-owned chemical plant.The iron foundry produces table bases. It employs about 140 workers andis located in an industrial park in a densely populated central section ofCiudad Juarez (figure 1). The chemical plant mainly produces hydrofluoricacid. It employs about 150 workers and is located in the sparsely populatedsouthern section of the city.
We used US Environmental Protection Agency emissions factors toestimate emissions from each of the particulate-intensive productionprocesses in the iron foundry and chemical plant (US EPA, 1995).7 Based on
6 Although we know little about how abatement costs at our two sample plantscompare to costs at other plants, we do know that abatement costs are relativelyunimportant in estimating net benefits since benefits of controlling PM10 pollutionare two to three orders of magnitude higher than the costs (tables 5 and 10).
7 In the gray iron foundry, the principal sources of PM10 emissions are, in order ofmagnitude: pouring and cooling of molten iron, handling of sand used to make
612 Allen Blackman et al.
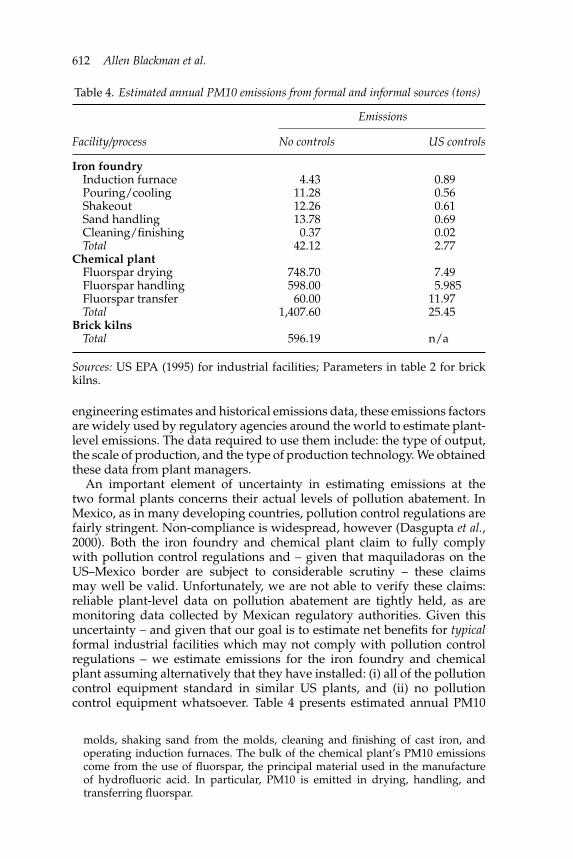
Table 4. Estimated annual PM10 emissions from formal and informal sources (tons)
Emissions
Facility/process No controls US controls
Iron foundryInduction furnace 4.43 0.89Pouring/cooling 11.28 0.56Shakeout 12.26 0.61Sand handling 13.78 0.69Cleaning/finishing 0.37 0.02Total 42.12 2.77
Chemical plantFluorspar drying 748.70 7.49Fluorspar handling 598.00 5.985Fluorspar transfer 60.00 11.97Total 1,407.60 25.45
Brick kilnsTotal 596.19 n/a
Sources: US EPA (1995) for industrial facilities; Parameters in table 2 for brickkilns.
engineering estimates and historical emissions data, these emissions factorsare widely used by regulatory agencies around the world to estimate plant-level emissions. The data required to use them include: the type of output,the scale of production, and the type of production technology. We obtainedthese data from plant managers.
An important element of uncertainty in estimating emissions at thetwo formal plants concerns their actual levels of pollution abatement. InMexico, as in many developing countries, pollution control regulations arefairly stringent. Non-compliance is widespread, however (Dasgupta et al.,2000). Both the iron foundry and chemical plant claim to fully complywith pollution control regulations and – given that maquiladoras on theUS–Mexico border are subject to considerable scrutiny – these claimsmay well be valid. Unfortunately, we are not able to verify these claims:reliable plant-level data on pollution abatement are tightly held, as aremonitoring data collected by Mexican regulatory authorities. Given thisuncertainty – and given that our goal is to estimate net benefits for typicalformal industrial facilities which may not comply with pollution controlregulations – we estimate emissions for the iron foundry and chemicalplant assuming alternatively that they have installed: (i) all of the pollutioncontrol equipment standard in similar US plants, and (ii) no pollutioncontrol equipment whatsoever. Table 4 presents estimated annual PM10
molds, shaking sand from the molds, cleaning and finishing of cast iron, andoperating induction furnaces. The bulk of the chemical plant’s PM10 emissionscome from the use of fluorspar, the principal material used in the manufactureof hydrofluoric acid. In particular, PM10 is emitted in drying, handling, andtransferring fluorspar.

Environment and Development Economics 613
Table 5. Annualized costs of installing PM-10 abatement equipment standard at USplants in Mexican formal industrial facilities (1999 $US)
Facility/process Abatement device Annual abatement cost
Iron foundryInduction furnace pulse jet bag house 13,395Pouring/cooling pulse jet bag house 34,109Shakeout shaker bag house 1,152Sand handling pulse jet bag house 1,164Cleaning/finishing shaker bag house 54Total 49,874
Chemical plantFluorspar drying pulse jet bag house 10,955Fluorspar handling pulse jet bag house 8,750Fluorspar transfer pulse jet bag house 8,281Total 27,986
Sources: US EPA (1998a, 1998b, and 1999b).
emissions for the two plants and for the brick kilns. Note that particulateemissions from the chemical plant are significantly higher than emissionsfrom the iron foundry.
In addition to PM10 emissions, our air dispersion model requires detailedsource-specific data on stack heights, emissions velocities, and plumetemperatures. Managers of the two formal plants did not provide theseparameters. Therefore, we estimated them using publicly available data onUS gray iron foundries and hydrofluoric acid plants (US EPA, 2001).
We used US Environmental Protection Agency (EPA) spreadsheet models(US EPA, 1998a; US EPA, 1999b) along with control technique documenta-tion (US EPA, 1998b) to estimate the costs of particulate control equipmentlikely to be found at the iron foundry and chemical plant (table 5).Based on vendor quotes, these spreadsheet models estimate the annualcosts of installing and operating various types of abatement equipment tocontrol emissions from specified production processes at specified types ofplants. The data inputs required for these models (including engineeringdesign values, operating statistics, electricity prices, and waste disposalcosts) were obtained from a variety of sources including: interviews withplant managers, operating permits for US plants with identical outputs andsimilar scales, INEGI, the International Energy Agency, and interviews withwaste disposal officials in Ciudad Juarez.
5. Benefits estimatesThe benefits of pollution control for an emissions source, or collectionof sources, are the difference between the damages associated withuncontrolled PM10 emissions and the damages associated with controlledPM10 emissions. As discussed in section 1, we use three models to estimatedamages for each scenario: an air dispersion model, a health effects model,and a valuation model. This section discusses each of these models.

614 Allen Blackman et al.
Table 6. Meteorological and topographical data
Data Unit Source
MeteorologyTemperature (hourly) ◦K NCDC (2000)Wind speed m/s NCDC (2000)Random flow vector ◦ NCDC (2000)Stability category – NCDC (2000)Mixing height m US EPA (2000)Topography m INEGI (1992)
5.1 Air dispersion modelThe US EPA’s Industrial Source Complex Short Term 3 (ISCST3) Gaussianplume air dispersion model uses data on emissions source characteristics,local meteorology, and topography to estimate average hourly, daily, andannual concentrations of primary PM10 due to a specific source insidea defined study area.8 We use this model to estimate annual averageconcentrations of primary PM10 due to each of our study sources – brickkilns, the iron foundry, and the chemical plant – at 4,026 arbitrarily chosen‘receptor locations’ in the study area.9 Table 6 details the meteorologicaland topographical data used to parameterize the ISCST3 model. Regardingthe former, the ISCST3 model uses one specific year’s worth of hourly dataon temperature, wind speed, wind direction, and mixing height.
5.2 Health effects model10
To estimate exposure to the PM10 emitted by the various sources,we use INEGI population data at the level of survey units calledareas geoestadısticas basicas (AGEBs). Like census tracts in the United
8 The ISCST model has been one of the US EPA’s chief tools for investigatingviolations of ambient air quality standards (Riswadkar and Kumar, 1994; Patel andKumar, 1998). Note that the ISCST3 model does not have the capability to handlelong-range transport of PM10 or secondary PM10 formed when pollutants such asnitrogen oxides and sulfur dioxide undergo chemical reactions in the atmosphere.Neither phenomenon is likely to be important in our case study, however. Brickkilns in Ciudad Juarez are unlikely to contribute to long-range transport of PM10because they do not have smoke stacks and are unlikely to generate significantsecondary PM10 because they emit little sulfur oxide or nitrogen oxide. Our twoformal sector sources are also unlikely to generate significant secondary PM10 orlong-range transport. As table 4 demonstrates, over 99 per cent of PM10 emittedby both facilities results from handling of various materials at ground level, notcombustion.
9 The receptor locations were chosen by mapping a 365 meter rectangular grid onto the study area; that is, grid points are 365 meters apart. As discussed in the nextsubsection, this spatial detail is needed in order to estimate human exposure tothis air pollution.
10 Our health effects model draws on Cesar et al. (2002) and on the Tracking andAnalysis Framework (TAF), an integrated tool for benefit–cost analysis developedin part by Resources for the Future (Bloyd et al., 1996).

Environment and Development Economics 615
States, AGEBs vary in both size and population (figure 1).11 We assignthe inhabitants of each AGEB a distance-weighted average of PM10concentrations predicted by the ISCST3 model at all receptor locationswithin 800 meters of the AGEB centroid.12 Next, we estimate the healtheffects of this exposure using concentration-response (CR) coefficientsreported in the epidemiological literature. CR coefficients indicate theexpected change in the number of cases of some health endpoint due toa marginal change in exposure to a particular air pollutant. We model 11different health endpoints, which are listed in table 7. We assume thatthese health effects are linear functions of PM10 exposure levels, a commonapproach in the literature (see, e.g., US EPA 1999a).13
Since, as discussed in section 5.3, mortality effects – not morbidityeffects – dominate the total benefits estimates because of the relatively highmonetary value assigned to the avoidance of premature mortality, by farthe most important CR coefficient in table 7 is that for mortality. We makethe relatively conservative assumption – based on a number of US studies(Ostro, 1994) – that a 10 ug/m3 change in daily PM10 results in a 1 per centannual increase in the mortality rate.14 A discussion of the remaining CRcoefficients in table 7 can be found in chapter 8 of Bloyd et al. (1996) and inCesar et al. (2002).
11 Within Ciudad Juarez, AGEB size averages 564,572 m2 with a standard deviationof 783,681 m2. The smallest AGEB is 5,980 m2 and the largest is 8,082,810 m2. AGEBpopulation averages 2,216 with a standard deviation of 1,387. The smallest AGEBhas just three inhabitants and the largest 8,041.
12 We do not assign the inhabitants of each AGEB the average of PM10 concentrationspredicted by the ISCST3 model at all receptor locations within the AGEB, becausethis method would generate unrealistic spikes in exposure in several small AGEBswhere there are a limited number of (arbitrarily located) receptor points and oneof these receptors happens to be in very close proximity to an emissions source.Assigning the inhabitants of each AGEB a distance-weighted average of PM10concentrations predicted by the ISCST3 model at all receptor locations within800 meters of the AGEB centroid results in more conservative exposure estimates.
13 This has the somewhat counterintuitive implication that every one ug/m3 increasein concentration of PM10 has the same marginal health impact regardless of thebaseline concentration of PM10. While some researchers have postulated that thebaseline concentration of PM10 matters because the relationship between ambientlevels of air pollution and human health entails thresholds, the evidence for suchnon-linearities is not very strong (Krupnick, 1996).
14 The CR mortality coefficient we use is virtually identical to a weighted averagedrawn from 40 studies from all over the world that was used by Cesar et al. (2002)to estimate mortality due to PM10 in Mexico City. Our CR mortality coefficientis relatively conservative. For example, in estimating the costs and benefits of theClean Air Act, the US EPA relied on a large-scale study that followed a samplepopulation over time and found that a 10 ug/m3 change in PM10 results in a 3.6 percent annual increase in the mortality rate (Pope et al., 1995; US EPA, 1999a). OtherUS ‘cohort’ studies find even larger effects (e.g., Dockery et al., 1993). A weightedaverage of Mexican studies used by Evans et al. (2000) to estimate mortality due toPM10 in Mexico City (1.4 per cent) is also larger than the mortality CR coefficientwe use.

616A
llenB
lackman
etal.
Table 7. Health effects model inputs
ParameterValue ordistribution Units Source
CR coefficientsCRMORT Mortalities N(1m, 300u) % change mortality rate/(ug/m3) Krupnick (1996)CRRHA Respiratory hospital admissions N(1.39m, 105u) % change RHA rate/(ug/m3) Cesar et al. (2002), pooled estimateCRCHA Cardiocerebrovascular h. admis. N(600u, 93u) % change CHA rate/(ug/m3) Cesar et al. (2002), pooled estimateCRERV Emergency room visits N(311m, 383u) % change ERV rate/(ug/m3) Cesar et al. (2002), pooled estimateCRARSD Adult symptom days N(247m, 59m) days/yr./(ug/m3)/adulta Krupnick et al. (1990)CRARAD Adult restricted activity days N(57.5m, 27.5m) days/yr./(ug/m3)/non-asthmatic adult Ostro (1987)CRCRAD Child restricted activity days N(57.5m, 27.5m) days/yr./(ug/m3)/non-asthmatic child Ostro (1987)b
CRAA Asthma attacks N(6.1m, 3.1m) attacks/(ug/m3)/asthmatic person Ostro et al. (1991)CRCCB Child chronic bronchitis N(1.59m, 805u) cases/yr./(ug/m3)/childa Dockery et al. (1989)CRCCC Child chronic cough N(1.84m, 924u) cases/yr./(ug/m3)/childa Dockery et al. (1989)CRACB Adult chronic bronchitis N(61.5u, 30.7u) cases/yr./(ug/m3)/adulta Abbey et al. (1993)
Population dataCiudad Juarez 1995 – persons per survey unit INEGI (1995)Other parametersBaseline mort. rate Chih. 1997 5.506 deaths/1000 persons/year INEGI (2000)Background RHA rate 4.11 RHA/1000 persons/year Cesar et al. (2002), citing SSA (1996)Background CHA rate 4.03 CHA/1000 persons/year Cesar et al. (2002), citing SSA (1996)Background ERV rate 31.68 ERV/1000 persons year Cesar et al. (2002), citing SSA (1996)Fraction pop. asthmatic 0.05 (US rate) Bloyd et al. (1996)
Notes: aAdults are defined as persons older than 17.bFollowing Cesar et al. (2002), CR functions for CRAD and ARAD are assumed to be the same.m = 10−3.u = 10−6.N(µ,σ ) = normal distribution with µ= mean and σ= standard deviation.

Environment and Development Economics 617
Table 8. Benefits valuation model inputs (1999 $US/case unless otherwise noted)
Parameter(value of. . .)
Work-lossdaysa
(days/case)
Cost ofillnessb
($/case)WTPc
($/case or death)
VSL statistical life [Prtb(1.9M,3.8M,7.5M)(0.33,0.34,0.33)]
ValRHA respiratory hospitaladmission
8 1,870
ValCHA cardio. hospitaladmission
45 5,611
ValERV emergency roomvisit
5 91
ValARSD adult respiratorysymptom day
1 10
ValARAD adult restrictedactivity day
1 10
ValCRAD child restrictedactivity day
1 10
ValAA asthma attack 1 337ValCCB child chronic
bronchitis7 190
ValCCC child chronic cough 7 190ValACB adult chronic
bronchitis7 218
Notes: aSource: Cesar et al. (2002). Work loss days are valued at $17/day, theaverage manufacturing wage for Ciudad Juarez (INEGI, 1995).bSource: Hernandez-Avila et al. (1995).cSource: Rowe et al. (1995) adjusted.Prtb(a)(p) = discrete probability distribution: a = vector of outcomes; p = vectorof probabilities for each.M = 106.
A challenge in estimating morbidity damages is identifying a set ofendpoints that reflects the full range of adverse health effects but that avoidsdouble counting. For example, there is a potential for double counting ifadult restricted activity days that result from relatively acute symptomsare also counted as adult respiratory symptom days that result from alltypes of symptoms. We have dealt with this issue in the conventionalmanner – by restricting some endpoints to subpopulations, subtractingpotentially overlapping categories of endpoints, and carefully selecting howeach endpoint is valued (see Blackman et al., 2003 for details).
5.3 Valuation modelTo estimate the monetary values of health damages avoided by reducingPM10 emissions from our sample sources, we use two different approaches(table 8). To value premature mortalities, we use willingness to pay (WTP)figures obtained from the economics literature. To value morbidity, we use

618 Allen Blackman et al.
the sum of: (i) estimates of the value of work loss days (WLD) based onaverage daily wages in Ciudad Juarez, and (ii) estimates of the cost ofillness (COI) based on a study of health care costs in Mexico (Hernandez-Avila et al., 1995).15 Since, as noted above, the lion’s share of total estimatedbenefits arise from premature mortalities avoided, by far the most importantparameter in the valuation model is the value of a statistical life (VSL).We use a discrete distribution – $1.9 million (33 per cent), $3.8 million(34 per cent), and $7.5 million (33 per cent) – adjusted from Rowe et al.(1995) to value this endpoint. This distribution is relatively conservative.For example, the US EPA used a mean value of $4.8 million per mortalityavoided to assess the benefits of the Clean Air Act (see US EPA 1999a,Appendix H-8).
Unfortunately, to our knowledge, direct estimates of Mexican WTP forreductions in mortality risk are not yet available. Therefore, we use a WTPparameter based on US studies. But given that average income adjusted forpurchasing power parity is approximately four times as high in the UnitedStates as in Mexico, Mexican WTP may be lower than US WTP.16 Culturalfactors may also cause WTP in the two countries to differ. To account forinternational differences in WTP, we use three different values for MexicanWTP based on three different assumptions about the elasticity of WTP withrespect to income (E).17 We assume alternatively that E = 1, E = 0.33, andE = 0. For example, E = 0.33 implies that if average per capita incomeadjusted for purchasing power parity is 10 per cent lower in Mexico thanin the US, then WTP is 3.3 per cent lower. An E between 0.2 and 0.5 issupported by some studies that look at differences in WTP across incomegroups (Alberini et al., 1997; Loehman et al., 1979). Thus, the middle valueof our WTP distribution is $3.80 million assuming E = 0, $2.42 millionassuming E = 0.33, and $0.97 million assuming E = 1.
5.4 UncertaintyWe use Monte Carlo simulation to account for uncertainty associated withthe parameterization of the air dispersion, health impacts, and benefitsvaluation models. That is, where data on probability distributions isavailable (see tables 2, 7, and 8), we treat model parameters as distributions
15 We use the sum of WLD and COI instead of WTP for two reasons. First, MexicanWTP estimates for morbidity endpoints do not exist. Second, excluding WTPyields more conservative estimates of net benefits. Using [COI + WLD + WTP]typically overestimates the true social value of morbidity since WTP includesboth COI and WLD when health care costs are borne by individuals. As discussedabove, our overall strategy is to avoid any upward bias in net benefits estimates.
16 In 1998, per capita gross national product adjusted for purchasing power paritywas $29,240 in the United States and $7,450 in Mexico (World Bank, 2000).
17 The empirical foundations of this second-best approach to estimating internationaldifferences in WTP can be legitimately questioned. Evidence on the topic is sparse.Chestnut et al. (1999) find that median WTP to avoid respiratory symptoms ishigher in Thailand than one would expect from US studies. See also Alberini et al.(1997).

Environment and Development Economics 619
Figure 2. Profile of brick kiln PM10 concentration downwind of Mexico 68
Table 9. Annual health effects of uncontrolled PM10 emissions from brick kilns (meanvalues and 95 per cent confidence intervals)
Number of cases
Health endpoint Low Mean High
Mortality 3 14 33Respiratory hospital admissions 4 15 29Cardio. hospital admissions 2 6 13Emergency room visits 0 605 1,690Adult respiratory symptom days 79,900 379,400 828,600Work loss days 122,100 549,900 1,173,000Adult restricted activity days 1,854 84,620 225,500Child restricted activity days 1,240 56,650 150,900Asthma attacks 8 782 2,075Child chronic bronchitis 0 1,632 4,248Child chronic cough 0 1,901 5,087Adult chronic bronchitis 0 95 242
Source: RFF model.
and we use these distributions to generate 95 per cent confidence intervalsfor model outputs.
6. Results
6.1 Brick kilnsThe air dispersion model results suggest that brick kilns’ impacts arehighly localized geographically. Figure 2, a concentration profile for PM10emissions from the brickyard Mexico 68 on a due north transect, shows thatbrick kilns primarily affect PM10 concentrations within 500 meters. Thisresult stems from the fact that brick kilns have very low stack-heights andemissions velocities.
The health effects model suggests that brick kilns have significant impactson mortality and morbidity (table 9). Most important, the model’s mean

620 Allen Blackman et al.
Table 10. Value of annual morbidity and mortality due to (i) uncontrolled PM10emissions from brick kilns and (ii) controlled and uncontrolled PM10 emissions from
formal industrial facilities (millions of 1999 $US; mean values and 95 per centconfidence intervals)
Value
(E = 1.0) (E = 0.33) (E = 0)Source Mean Low Mean High Mean
Brick kilns 29.25 6.50 53.11 160.10 75.79Iron foundry
US-level controls 0.18 0.07 0.32 0.76 0.45No controls 2.76 1.09 5.00 11.94 7.13Averagea 1.47 0.58 2.66 6.35 3.79
Chemical plantUS-level controls 0.26 0.08 0.47 1.24 0.68No controls 13.15 4.25 23.91 63.26 34.13Averagea 6.71 2.17 12.19 32.25 17.40
Notes: aAverage of ‘no controls’ and ‘US-level controls’ scenarios.E = the elasticity of WTP (willingness to pay) with respect to income adjustedfor purchasing power parity.Source: RFF model.
prediction is that brick kiln emissions are responsible for 14 prematuremortalities per year.
The first row of table 10 presents our estimates of the value of annualmorbidity and mortality due to uncontrolled brick kiln emissions. (Wediscuss the remainder of table 10 in section 6.2). We report three sets ofmean estimates based on different assumptions about the elasticity of WTPwith respect to income. To illustrate the variation in our estimates, we alsopresent the 95 per cent confidence interval for middle elasticity case. Evenwhen this elasticity is assumed to be quite high (E = 1.0), the mean estimateis nearly $30 million. Assuming a middle elasticity value (E = 0.33), themean estimate is $53 million. Assuming that Mexicans and Americans havethe same WTP (E = 0), the mean estimate is $76 million. Note that reducedmortality is by far the largest component of benefits, accounting for overthree-quarters of the total.
Table 11 presents estimates of the annual net benefits of each of the fourbrick kiln pollution control strategies allowing for three different values ofE. For each value of E, the ranking of the control strategies is the same:the net benefits of natural gas and NMSU kilns are virtually the same, thenet benefits of relocation are about half that of natural gas, and the netbenefits of no-burn days are about one-fiftieth that of natural gas. Naturalgas and NMSU kilns have the highest net benefits because they are mosteffective at reducing PM10 emissions. Relocation is ranked third becausethe total benefits of this strategy are about half those for natural gas, whilethe costs are the highest of any of the four strategies. The no-burn days

Environm
entandD
evelopmentE
conomics
621
Table 11. Annual net benefits of pollution control strategies for brick kilns and formal industrial facilities (benefits less costs in millions of 1999$US; mean values and 95 per cent confidence intervals)
Brick kilns Iron foundry Chemical plant
E ScenarioNaturalgas
NMSUkilns Relocation
No-burndays
Baseline =no controlsa
Baseline = 50%US controlsb
Baseline =no controlsa
Baseline = 50%US controlsb
0 High 232.22 231.01 132.05 4.59 16.23 8.12 90.27 45.13Mean 75.46 75.02 43.10 1.49 6.63 3.31 33.42 16.71Low 9.12 9.08 5.20 0.17 1.42 0.71 5.94 2.97
0.33 High 159.69 158.88 90.77 3.09 11.13 5.56 61.99 31.00Mean 52.81 52.52 30.11 1.04 4.63 2.31 23.41 11.70Low 6.24 6.24 3.50 0.12 0.97 0.49 4.14 2.07
1 High 83.53 83.14 47.54 1.64 5.75 2.88 32.25 16.13Mean 28.97 28.85 16.44 0.56 2.53 1.26 12.86 6.43Low 3.21 3.24 1.70 0.06 0.51 0.25 2.24 1.12
Notes: aNet benefit of installing and operating PM10 control equipment standard in a similar US plant, assuming baseline has nocontrols.bNet benefit of installing and operating PM10 control equipment standard in a similar US plant, assuming baseline has equipmentsufficient to achieve 50 per cent of abatement that would result from US-level controls.E = the elasticity of willingness to pay with respect to income adjusted for purchasing power parity.Source: RFF model.

622 Allen Blackman et al.
strategy is ranked last because it generates the lowest total benefits – lessthan one-hundredth of those associated with natural gas.
The mean annual net benefits of all four strategies are quite large for eachof the three assumptions about the value of E. Assuming E = 0.33, the meanannual net benefits range from $53 million for natural gas to $1 millionfor no-burn days. Even the lowest estimates – those at the low end of the95 per cent confidence interval given E = 1 – are positive for all of the controlstrategies.
6.2 Informal vs. formal sourcesTable 10 presents estimates of the annual value of health damages due toPM10 emissions from the formal plants given two alternative emissionscontrol scenarios: (i) absolutely no emissions controls, (ii) US-level controls.In addition, the table presents the average for these two scenarios.
We begin with two points that are fairly obvious, but importantnonetheless. First, the health damages associated with the chemical plantare much higher than those associated with the iron foundry. The mainreason is simply that the chemical plant emits far more PM10 (table 4).Second, the health damages from uncontrolled emissions are much higherthan for controlled emissions – 16 times higher for the iron foundry and50 times higher for the chemical plant. Thus, the magnitude of the healthdamages the formal plants generate depends critically on their investmentsin pollution control.
A comparison of the damages from the formal plants and from thebrick kilns reveals that the former are significantly smaller than the latter,regardless of the assumption made about the level of pollution abatementat the two formal plants (table 10). If we assume that the formal plants haveinstalled abatement devices standard in the US, and if E = 0.33, then themean value of total damages generated by the chemical plant ($0.5 million)and the iron foundry ($0.3 million) are each less than 1 per cent of damagesdue to brick kilns ($53 million). If we assume, alternatively, that emissionsfrom the formal plants are completely uncontrolled, then these percentagesare 45 per cent and 9 per cent.
Given this disparity in damages – and the fact that the costs of PM10emissions controls are relatively small in comparison to the benefits – it isnot surprising that the net benefits of most of the emissions control strategiesfor brick kilns are significantly higher than the net benefits of installingUS-levels of emissions controls at the formal plants. Table 11 presentsestimates of the net benefits of installing emissions controls standard inthe US at the two formal plants given two alternative assumptions aboutthe ‘baseline’ level of pollution control (i.e., the existing level of abatementprior to installing any new equipment): (i) absolutely no controls, and(ii) ‘average’ controls, i.e. the investment needed to eliminate 50 per centof the emissions eliminated by US-level controls. We assume that theannualized costs in the second scenario are half of those in the first. Tosimplify the comparison, we restrict attention to the mean values of totalbenefits and assume E = 0.33.
Of the various pollution control scenarios for formal plants includedin table 11, the greatest net benefits – $23 million – result from installing

Environment and Development Economics 623
US-level controls at the chemical plant assuming a baseline of absolutely noemissions controls. These net benefits are just 44 per cent of the net benefitsof converting traditional brick kilns to natural gas or replacing them withNMSU kilns. Assuming a more realistic average baseline level of control,the net benefits of installing US-level controls in the chemical plant are$12 million, just 22 per cent of the net benefits of converting traditionalbrick kilns to natural gas or replacing them with NMSU kilns.
The net benefits of installing US-level controls at the iron foundry arean order of magnitude lower than the net benefits of installing the samelevel of controls at the chemical plant. Assuming a baseline of absolutelyno emissions control, the net benefits of installing US-level controls at theiron foundry are $5 million, just 9 per cent of the net benefits of convertingtraditional brick kilns to natural gas or replacing them with NMSU kilns.Assuming a more realistic average baseline, the net benefits of installingUS-level controls at the iron foundry are $2 million, just 4 per cent of thenet benefits of converting traditional brick kilns to natural gas or replacingthem with NMSU kilns.
7. ConclusionWe have used a specially parameterized air dispersion model incombination with concentration response coefficients and benefits transfermethods to estimate the net benefits of controlling PM10 from a collection ofinformal brick kilns and two formal industrial facilities in Ciudad Juarez.Our two principal findings are as follows. First, given a wide range ofmodeling assumptions, the benefits of three of four control strategies forbrick kilns – NMSU kilns, natural gas, and relocation – are considerablyhigher than the costs. Second, the net benefits of these three strategies exceedthe net benefits of controlling emissions from the two formal facilities bya considerable margin. However, the size of this margin depends criticallyon the baseline level of pollution abatement in formal factories. In addition,we found that health damages from brick kiln emissions are spatiallyconcentrated in the poor residential neighborhoods surrounding the largestbrickyards. What are the policy implications of these findings?
The fact that our estimates of the net benefits of controlling brick kilnemissions are positive and quite large strongly suggests that, in general,policy makers should at very least include clusters of informal pollutersamong those industrial emissions sources they consider to be potentialtargets for pollution control initiatives. However, the fact that the netbenefits of controlling brick kiln emissions exceed those for two leadingformal industrial sources of air pollution does not necessarily suggest that,in general, policy makers should shift scarce pollution control resourcesaway from industrial facilities and towards clusters of informal polluters.
In deciding how to allocate pollution control resources, policy makersmust consider not only health benefits and abatement costs – the twocomponents of our net benefits estimates – but also implementation costs –the costs environmental management authorities incur in monitoringenvironmental performance, prosecuting non-compliance and, in certaincases, subsidizing abatement costs by, for example, educating managers

624 Allen Blackman et al.
of informal firms about the requirements and options for abatement andproviding equipment and financial assistance. As noted in section 1,developing prospective estimates of implementation costs is difficult andis outside the scope of this study. However, there is good reason to expectthese costs to be higher for clusters of informal polluters than for formalindustrial facilities. Often informal firms are difficult to identify. Even ifthey can be identified, monitoring numerous tiny firms may simply beimpractical for chronically under-manned and under-funded municipalregulatory agencies. In addition, requiring cash-strapped informal firms tobear the costs of pollution control may be unrealistic. Finally, and perhapsmost important, it may be difficult to generate the political will to imposecosts on firms which, as an important employer of the urban poor, are seento perform a vital distributional function.
That said, there is little reason to believe that implementation costs forinformal sources are, in general, prohibitive. Recent case studies – includingcompanion research on brick kilns in northern Mexico – have demonstratedthat a number of strategies can be used to lower implementation costs inthe informal sector (Blackman, 2000; World Bank, 1998; Kennedy, 1999; andWheeler et al., 1999). A common element of many of these strategies isrecruiting local stakeholders – including communities affected by informalsector pollution, organizations representing the informal firms, competitors,and upstream and downstream business contacts – to pressure pollutersto cut emissions, to monitor their environmental performance and, insome cases, to subsidize investments in pollution abatement – in effectto undertake many of the functions traditionally performed by public-sector regulators. For example, in past efforts to convert brick kilns inCiudad Juarez to clean-burning propane, neighborhood organizationsand trade unions pressured brickmakers to switch and monitored theirprogress. Also, local propane companies subsidized investments in propaneburners. The key to motivating stakeholders to undertake these tasks isoften improving public awareness of, and appreciation for, informal sectorpollution problems. Studies like this one may be able to contribute to thiseffort by demonstrating that informal polluters can generate very severehealth damages, and that these damages may be disproportionately visitedon those living nearby.
ReferencesAbbey, D., F. Petersen, P. Mills, and W. Beeson (1993), ‘Long-term ambient
concentrations of total suspended particulates, ozone, and sulfur dioxide andrespiratory symptoms in a non-smoking population’, Archives of EnvironmentalHealth 48: 33–46.
Alberini, A., M. Cropper, T. Fu, A. Krupnick, J. Liu, D. Shaw, and W. Harrington(1997), ‘Valuing health effects of air pollution in developing countries: the case ofTaiwan’, Journal of Environmental Economics and Management 34: 107–126.
Avila, L., C. Bruce, E. Chavez, A. Lara, and R. Marquez (1999), ‘A sustainable solutionto the air pollution problem caused by low-technology brick kilns’, Unpublishedreport, New Mexico State University, Las Cruces.

Environment and Development Economics 625
Bartone, C. and L. Benavides (1997), ‘Local management of hazardous wastesfrom small-scale and cottage industries’, Waste Management and Research 15: 3–21.
Biller, D. and J.D. Quintero (1995), ‘Policy options to address informal sectorcontamination in Latin America: the case of leather tanneries in Bogota, Colombia’,LATEN Dissemination Note #14, The World Bank, Washington, DC.
Blackman, A., S. Newbold, J.-S. Shih, J. Cook, and D. Evans (2003), ‘The benefits andcosts of informal sector pollution control: traditional Mexican brick kilns in Pasodel Norte’, Unpublished report, Resources for the Future, Washington, DC.
Blackman, A. (2000), ‘Informal sector pollution control: what policy options do wehave?’, World Development 28: 2067–2082.
Blackman, A. and G. Bannister (1997), ‘Pollution control in the informal sector: theCiudad Juarez brickmakers’ project’, Natural Resources Journal 27: 829–856.
Blackman, A. and G. Bannister (1998), ‘Community pressure and clean technologyin the informal sector: an econometric analysis of the adoption of propaneby traditional Mexican brickmakers’, Journal of Environmental Economics andManagement 35: 1–21.
Bloyd, C. et al. (1996), ‘Tracking and analysis framework (TAF) documentation anduser’s guide’, Report ANL/DIS/TM-36, Argonne National Laboratory, Argonne.Available at: http://www.lumina.com/taf/index.html.
Bruce, C. (1999), ‘Aerosol characterization of wood-fed brick kiln effluents in CiudadJuarez, Chihuaua, Mexico: a SCERP project progress report’, in L. Avila, C. Bruce,E. Chavez, A. Lara, and R. Marquez, ‘A sustainable solution to the air pollutionproblem caused by low-technology brick kilns’, Unpublished report, New MexicoState University, Las Cruces.
Cesar, H. et al. (2002), ‘Improving air quality in metropolitan Mexico City:An economic evaluation’, Policy Research Working Paper 2785, World Bank,Washington, DC.
Chestnut, L., B. Ostro, and N. Vischit-Vadakan (1999), ‘Transferability of air pollutioncontrol health benefits estimates from the United States to developing countries:evidence from the Bangkok study’, American Journal of Agricultural Economics79:1630–1635.
Dasgupta, S., H. Hettige, and D. Wheeler (2000), ‘What improves environmentalcompliance? Evidence from Mexican industry’, Journal of Environmental Economicsand Management 39: 39–66.
Dasgupta, S., R.E.B. Lucas and D. Wheeler (2002), ‘Plant size, industrial air pollution,and local income: Evidence from Mexico and Brazil’, Environment and DevelopmentEconomics 7: 365–381.
De Soto, H. (1989), The Other Path: The Invisible Revolution in the Third World, NewYork: Harper & Row.
Dockery, D., C. Pope, X. Xu, J. Spengeler, J. Ware, M. Fay, B. Ferris, and F. Speizer(1993), ‘An association between air pollution and mortality in six US cities’, NewEngland Journal of Medicine 329: 1753–1759.
Dockery, D., F. Speizer, and D. Stram (1989), ‘Effects of inhalable particles onrespiratory health of children’, American Review of Respiratory Diseases 139: 587–594.
Evans, J.S. et al. (2000), ‘Contaminacion atmosferica y salud humana en la Ciudadde Mexico’, MIT-IPURGAP Report No. 10, Mexico, DF.
Gobierno del Estado de Chihuahua (Also, Gobierno Municipal de Juarez; Secretarıade Medio Ambiente, Recursos Naturales y Pesca; y Secretarıa de Salud) (1998),Programa de Gestion de la Calidad del Aire de Ciudad Juarez 1998–2002.
Harrington, W. and G. McConnell (2003), ‘Motor vehicles and the environment’,Resources for the Future Report, Washington, DC.

626 Allen Blackman et al.
Hernandez-Avila, M. et al. (1995), ‘Valuacion economica de los beneficios de reducirla contaminacion del aire en la Ciudad de Mexico’, Instituto Nacional de SaludPublica (INSP), Mexico, DF.
INEGI (Instituto Nacional de Estadistica, Geographica e Informatica) (1992), ‘CiudadJuarez’, Carte Topographica H13A25, Aguascalientes.
INEGI (Instituto Nacional de Estadistica, Geographica e Informatica) (1995), ‘Conteode poblacion y vivienda 1995: resultados definitivos’, Chihuahua (CD ROM).
INEGI (Instituto Nacional de Estadistica, Geographica e Informatica) (2000),Registered deaths by state. Available at: www.inegi.gob.mx/poblacion/ingles/demografia/dem_02.html
JAC (Joint Advisory Committee for the Improvement of Air Quality in the CiudadJuarez, Chihuahua/El Paso, Texas/Dona Ana County, New Mexico Air Basin)(1999), ‘Strategic plan’, El Paso.
Kennedy, L. (1999), ‘Cooperating for survival: tannery pollution and joint action inthe Palar Valley (India)’, World Development 27: 1673–1691.
Krupnick, A. (1996), ‘The health benefits of air pollution reduction in Monterrey,Mexico’, Unpublished report, Resources for the Future, Washington, DC.
Krupnick, A., W. Harrington, and B. Ostro (1990), ‘Ambient ozone and acutehealth effects: evidence from daily data’, Journal of Environmental Economics andManagement 18: 1–18.
Lanjouw, P. (1997), ‘Small-scale industry, poverty and the environment: a case studyof Ecuador’, Environment, Growth and Poverty Working Paper No. 18, WorldBank, Washington, DC.
Loehman, E., S. Berg. A. Arroyo, R. Hedinger, J. Schwartz, M. Shaw, W. Fahien, V.De, R. Fishe, D. Rio, W. Rossley, and A. Green (1979), ‘Distributional analysis ofregional benefits and cost of air quality’, Journal of Environmental Economics andManagement 6: 222–43.
National Climate Data Center. (2000), Available at: http://www.ncdc.noaa.gov.Ostro, B. (1987), ‘Air pollution and morbidity revisited: a specification test’, Journal
of Environmental Economics and Management 14: 87–98.Ostro, B. (1994), ‘Estimating the health effects of air pollutants: a method with
an application to Jakarta’, Policy Research Working Paper 1301, World Bank,Washington, DC.
Ostro, B., M. Lipsett, M. Wiener, and J. Selner (1991), ‘Asthmatic response to airborneacid aerosols’, American Journal of Public Health 81: 694–702.
Patel, V. and A. Kumar (1998), ‘Evaluation of three air dispersion models: ISCST2,ISCLT2, and Screen 2 for mercury emissions in an urban area’, EnvironmentalMonitoring and Assessment 53: 259–277.
Perera, L.A.S.R. and A.T.M.N. Amin (1996), ‘Accommodating the informal sector:A strategy for urban environmental management’, Journal of EnvironmentalManagement 46: 3–14.
Pope, D., M. Thun, M. Namboodiri, D. Dockery, J. Evans, F. Speizer, and C. Heath(1995), ‘Particulate air pollution as a predictor of mortality in a prospective studyof US adults’, American Journal of Respiratory Critical Care Medicine 151: 669–674.
Ranis, G. and F. Stewart (1994), ‘V-goods and the role of the urban informal sectorin development’, Yale University Economic Growth Center Discussion PaperNo. 724, New Haven.
RFF (Resources for the Future) (1995), ‘Ciudad Juarez brick kiln survey’,Unpublished data, Washington, DC.
Riswadkar, R. and A. Kumar (1994), ‘Evaluation of the industrial source complexshort-term model in a large-scale multiple source region for different stabilityclasses’, Environmental Monitoring and Assessment 33: 19–32.
Rowe, R., C. Lang, L. Chestnut, D. Latimer, D. Rae, S. Bernow, and D. White (1995),The New York Electricity Externality Study, Dobbs Ferry, NY: Oceana Publications.

Environment and Development Economics 627
Secretarıa de Salud (SSA). (1996), Boletın de Informacion Estadıstica, Volumen II, Danosa la Salud, September, Mexico, DF.
Schneider, F. and D.H. Enste (2000), ‘Shadow economies around the world: size,cause and consequences’, Journal of Economic Literature 38: 77–114.
Secretaria del Trabajo y Prevision Social and US Department of Labor (STPS/DOL).(1992), ‘The informal sector in Mexico’, US Department of Labor Occasional Paperson the Informal Sector No. 1, Washington, DC.
US EPA (US Environmental Protection Agency) (1995), ‘Compilation of air pollutantemission factors (AP-42), fifth edition, Volume I: Stationary point and area sources’,US EPA, Washington, DC. Available at: http://www.epa.gov/ttn/chief/ap42/
US EPA (US Environmental Protection Agency) (1998a), ‘OAQPS control costmanual, fifth edition’, Report EPA 453/b-96-001, US EPA Office of Air Quality andPlanning, Research Triangle Park. Available at: http://www.epa.gov/ttn/catc/products.html#cccinfo
US EPA (US Environmental Protection Agency) (1998b), ‘Stationary source controltechniques document for fine particulate matter’, Report EPA 452/R-97-001,EPA Office of Air Quality and Planning, Research Triangle Park. Available at:http://www.epa.gov/ttn/catc/dir1/finepmtech.pdf
US EPA (US Environmental Protection Agency) (1999a), ‘The benefits and costs ofthe Clean Air Act 1990 to 2010’, Report EPA-410-R-99-001, US EPA, Washington,DC. Available at: http://www.epa.gov/oar/sect812/
US EPA (US Environmental Protection Agency) (1999b), ’CO$T-AIR’ air pollutioncontrol cost spreadsheets (Second edition)’, US EPA Office of Air Quality andPlanning, Research Triangle Park. Available at: http://www.epa.gov/ttn/catc/products.html#cccinfo
US EPA (US Environmental Protection Agency) (2000), ‘Technology transfer networkbulletin board system support center for regulatory air models (SCRAM)’, US EPA,Washington, DC. Available at: http://www.epa.gov/ttn/scram/menu.htm
US EPA (US Environmental Protection Agency) (2001), ‘Aerometric informationretrieval System/AIRS facility subsystem (AIRS/AFS)’, US EPA, Washington, DC.Available at: http://www.epa.gov/enviro/html/airs/airs_query_java.html
Wheeler, D. et al. (1999), Greening Industry: New Roles for Communities, Markets andGovernments, New York: Oxford University Press.
World Bank (1998) ‘Mexico: The Guadalajara Environmental Management Pilot’,Sector Report No. 18071-ME, Washington, DC.
World Bank (2000), ‘World development indicators’. Available at: http://www.worldbank.org/data/databytopic/GNPPC.pdf