the academic guidebook - institut teknologi sepuluh
TRANSCRIPT
UNDERGRADUATE STUDY PROGRAM – DEPARTMENT OF STATISTICS INSTITUT TEKNOLOGI SEPULUH NOPEMBER
THE ACADEMIC GUIDEBOOK
UNDERGRADUATE STUDY PROGRAM Curriculum 2018-2023
DEPARTMENT OF STATISTICS FACULTY OF SCIENCE AND DATA ANALYTICS INSTITUT TEKNOLOGI SEPULUH NOPEMBER
T Building, 2nd Floor, ITS Campus Sukolilo Surabaya 60111
Telp : 031-5943352 Fax : 031-5922940 Email : [email protected] Website : www.its.ac.id/statistics


ACADEMIC GUIDEBOOK 2018-2023
i
UNDERGRADUATE STUDY PROGRAM – DEPARTMENT OF STATISTICS INSTITUT TEKNOLOGI SEPULUH NOPEMBER
THE ACADEMIC GUIDEBOOK
UNDERGRADUATE STUDY PROGRAM Curriculum 2018-2023
DEPARTMENT OF STATISTICS FACULTY OF SCIENCE AND DATA ANALYTICS INSTITUT TEKNOLOGI SEPULUH NOPEMBER
T Building, 2nd Floor, ITS Campus Sukolilo Surabaya 60111
Telp : 031-5943352 Fax : 031-5922940 Email : [email protected] Website : www.its.ac.id/statistics

ACADEMIC GUIDEBOOK 2018-2023
i
UNDERGRADUATE STUDY PROGRAM – DEPARTMENT OF STATISTICS INSTITUT TEKNOLOGI SEPULUH NOPEMBER
FOREWORD Nowdays, The Department of Statiscs, Faculty of Science and Data Analytics, has three Study Programs which are Undergraduate Program (S1), Master Program (S2), and Doctoral Program (S3). Those three Study Programs have been awarded the highest national accreditation A, and even the Undergraduate Program has been awarded an International AUN-QA Certification. All Academics of the Department of Statistics would like to convey our gratitude to Allah S.W.T. who has helped with the publication of “The Academic Guidebook of Undergraduate Program of Department of Statistics, Faculty of Science and Data Analytics ITS, for 2018-2023 Curriculum”. I would like to convey my appreciation especially to the Manager of the Undergraduate Program who has coordinated as well and to all academics department members who have parcipated in planning, formulating, and preparing this guidebook as well as this guidebook can be made. Critism and suggertions from all parties are indispensable for completing this guidebook. Surabaya, July 2020 Head of Department of Statistics Faculty of Science and Data Analytics Institut Teknologi Sepuluh Nopember Dr. Dra. Kartika Fithriasari, M.Si.

ACADEMIC GUIDEBOOK 2018-2023
ii
UNDERGRADUATE STUDY PROGRAM – DEPARTMENT OF STATISTICS INSTITUT TEKNOLOGI SEPULUH NOPEMBER
This page intentionally left blank
ACADEMIC GUIDEBOOK 2018-2023
iii
UNDERGRADUATE STUDY PROGRAM – DEPARTMENT OF STATISTICS INSTITUT TEKNOLOGI SEPULUH NOPEMBER
FOREWORD
I would like to convey my gratitude to Allah S.W.T. so that this Academic Guidebook 2018-2023 for Undergraduate Program, Department of Statistics, was able to completed properly. Thank to all Academics of the Department of Statistics FSAD ITS who participated in the planning, formulating, and preparing this guidebook so that it can be made.
This book is intended as a guide for students and lecturers in conducting 2018-2023 lectures so that it will be more focused and finally we will be able to realize one of the National Objectives to Educating the Nation’s Life.
We realize that in the planning, formulating, compilating, and implementing it is still not perfect, so critism and suggestions from all parties are needed to complete this guidebook as perfect
.
Surabaya, July 2020
Secretary of Department I Department of Statistics, FMKSD-ITS
Dr. Santi Wulan Purnami, M.Si
ACADEMIC GUIDEBOOK 2018-2023
iv
UNDERGRADUATE STUDY PROGRAM – DEPARTMENT OF STATISTICS INSTITUT TEKNOLOGI SEPULUH NOPEMBER
This page intentionally left blank
ACADEMIC GUIDEBOOK 2018-2023
v
UNDERGRADUATE STUDY PROGRAM – DEPARTMENT OF STATISTICS INSTITUT TEKNOLOGI SEPULUH NOPEMBER
DEPARTMENT OF STATISTICS
Dr. Dra. Kartika Fithriasari, M.Si.
Head of Department

ACADEMIC GUIDEBOOK 2018-2023
vi
UNDERGRADUATE STUDY PROGRAM – DEPARTMENT OF STATISTICS INSTITUT TEKNOLOGI SEPULUH NOPEMBER
This page intentionally left blank
ACADEMIC GUIDEBOOK 2018-2023
vii
UNDERGRADUATE STUDY PROGRAM – DEPARTMENT OF STATISTICS INSTITUT TEKNOLOGI SEPULUH NOPEMBER
GRADUATE PROGRAM
Dr. rer. pol. Heri Kuswanto
Secretary of Graduate Study Program
ACADEMIC GUIDEBOOK 2018-2023
viii
UNDERGRADUATE STUDY PROGRAM – DEPARTMENT OF STATISTICS INSTITUT TEKNOLOGI SEPULUH NOPEMBER
This page intentionally left blank
UNDERGRADUATE PROGRAM
ACADEMIC GUIDEBOOK 2018-2023
ix
UNDERGRADUATE STUDY PROGRAM – DEPARTMENT OF STATISTICS INSTITUT TEKNOLOGI SEPULUH NOPEMBER
Dr. Santi Wulan Purnami, M.Si Dr. Vitaratnasari, M.Si Secretary of Department I Secretary of Department II
ACADEMIC GUIDEBOOK 2018-2023
x
UNDERGRADUATE STUDY PROGRAM – DEPARTMENT OF STATISTICS INSTITUT TEKNOLOGI SEPULUH NOPEMBER
This page intentionally left blank
ACADEMIC GUIDEBOOK 2018-2023
xi
UNDERGRADUATE STUDY PROGRAM – DEPARTMENT OF STATISTICS INSTITUT TEKNOLOGI SEPULUH NOPEMBER
TABLE OF CONTENTS
Introduction 1 Vision, Mission, and Objectives 4 Organizational Structure 6 List of Lecturers’ Names 7 List of Lecturer Expertise Area 9 Educational Staffs 12 Accreditation and Certification 13 Awards 14 Facilities 15 Undergraduate Study Program (S1) 17
Visioan and Mission 18 Goals and Objectives 19 Curriculum 22
Learning Outcomes 25 Course Distribution 26 Elective Courses 28 Group of Courses in each RMK 29 Course Syllabus 32
RMK Theory and Statistical Modeling 32 RMK Computational Statistics 73 RMK Business and Industrial Statistics 92 RMK Economic and Finance Statistics 110 RMK Social and Demographic Statistics 125 RMK Environment and Health Statitics 131 RMK General Course 139
Cross-Type Undergraduate Program 163 Practical Work and Final Project 165

ACADEMIC GUIDEBOOK 2018-2023
xii
UNDERGRADUATE STUDY PROGRAM – DEPARTMENT OF STATISTICS INSTITUT TEKNOLOGI SEPULUH NOPEMBER
This page intentionally left blank
ACADEMIC GUIDEBOOK 2018-2023
1
UNDERGRADUATE STUDY PROGRAM – DEPARTMENT OF STATISTICS INSTITUT TEKNOLOGI SEPULUH NOPEMBER
INTRODUCTION
THE HISTORY OF DEPARTMENT OF STATISTICS
At first The Statistics was one of the specialization fields in the Department of Mathematics, Faculty of Science and Natural Sciences (FIPIA) ITS. Along with the development of needs in the society, the Statistics field finally developed into a new department at FIPIA ITS. Since 1983 the Department of Statistics was officially established along with the change in name from FIPIA to FMIPA (Faculty of Mathematics and Natural Sciences) ITS. The establishment of the Department of Statisyics, FMIPA ITS, is based on: PP No 5 of 1980, PP No 27 of 1981, and Keppres No 58 of 1982.
To meet the needs of Statistics experts at the intermediate level, in 1981 the Department of Statistics opened a Diploma-III (D-III) in Statistics Study Program which was approved with the Decree of the Director General of Higher Education (Dirjen DIKTI), Number: 116 / DKTI / Kep / 1984. Along with the growing need for increasing statistical competence and improvement in education levels in Indonesia, in 1999 the Department of Statistics established a Master Study Program (S2) in Statistics. Our Master Study Program was established based on the Decree of the Director General of Higher Education, Number: 253 / DIKTI / Kep / 1999. Furthermore, in 2006 the Department of Statistics opened the Doctoral (S3) Study Program in Statistics. Its establishment was driven by the desire of the potential of the Department of Statistics which able to provide optimum benefits for the development of Statistics in Indonesia. The Doctoral Study Program was approved by the Director General of Higher Education with Decree Number: 3795 / D / T / 2006. So since 2006 the Department of Statistics FMKSD ITS has been having 3 study programs namely:
1. Undergraduate Program (S1) 2. Master Program (S2) 3. Doctoral Program (S3)
In its development, along with the increasing its potential and the development of the academic climate, and supported with the commitment of all academics, the Department of Statistics has grown to become one of the Departments at ITS which becomes a priority choice of the society. Currently, our three study programs have obtained accreditation A from
ACADEMIC GUIDEBOOK 2018-2023
2
UNDERGRADUATE STUDY PROGRAM – DEPARTMENT OF STATISTICS INSTITUT TEKNOLOGI SEPULUH NOPEMBER
the National Accreditation Board for Higher Education (BAN PT). The Undergraduate Program obtains accreditation A with Decree Number: 1155 / SK // BAN-PT / Akred / S / XI / 2015. Whereas the Master Program is accredited A with Decree Number: 016 / BAN-PT / Ak-IX / S-2 / IX / 2011. Meanwhile, the Doctoral Program is accredited B with a score of 352 from BAN PT based on the decision of BAN-PT No. 121 / SK / BAN-PT / Akred / D / V / 2014. In addition to gain recognition at the national level, the quality of the S1 Statistics Study Program has been internationally recognized by the achievement of the international certification of the Asean University Network - Quality Assurance (AUN-QA) in 2015 with Certificate Number: AP99ITSFEB15.
In general, the Department of Statistics aims to develop Statistics and their application in various fields, particularly in Industry and Business, Computing, Financial and Actuarial Economics, Social and Population, Environment and Health. To achieve these objectives, the Department of Statistics established five laboratories as the center for the development and application of statistics, and curriculum development centers. The five laboratories are Business and Industrial Statistics Laboratory, Computational Statistics and Data Science Laboratory, Economics and Financial Data Analytics Laboratory, Social Statistics and Population Studies Laboratory, Health and Environmental Statistics Laboratory. In addition, to maximize learning monitoring and evaluation, the courses in Department of Statistics are collected in Lecture Course groups (RMK), namely RMK Theory, RMK Modeling, RMK Business and Industrial Statistics, RMK Computational Statistics, RMK Economic and Finance Statistics, RMK Health and Environmental Statistics, RMK Social and Demographic Statistics. Furthermore, to monitoring and evaluating the learning process, the RMK Coordinator and the Head of each laboratory have to prepare a draft of courses offered in each semester and a draft of each course for supporting lecturers.
In 2019, the Department of Statistics had 29 lecturers which educational qualifications are 19 doctorates (2 of whom were a professor), and 10 masters (5 of whom were studying for doctorates at home and abroad). To support administrative activities, the Department of Statistics has 17 education personnel which consist of a Head of Subdivision as a coordinator, 3 academic affairs staffs, 1 financial affairs staff, 1 inventory staff, 3 general and equipment affairs staffs, 2 technicians, 2 reading room staffs, and 4 janitors.
ACADEMIC GUIDEBOOK 2018-2023
3
UNDERGRADUATE STUDY PROGRAM – DEPARTMENT OF STATISTICS INSTITUT TEKNOLOGI SEPULUH NOPEMBER
ACADEMIC GUIDEBOOK 2018-2023
4
UNDERGRADUATE STUDY PROGRAM – DEPARTMENT OF STATISTICS INSTITUT TEKNOLOGI SEPULUH NOPEMBER
VISION OF THE DEPARTMENT OF STATISTICS ITS
To become an educational and development institution for statistics and data science with international standard that contributes in science and technology, especially in the fields of Computing, Business and Industry, Economics and Finance, Social and Population, Environment and Health
MISSION OF THE DEPARTMENT OF STATISTICS ITS
1. The mission of the Department of Statistics is to contribute to the development of science and technology in the fields of statistics, data science, and their applications to realize public welfare through education, research, community service, and management based on information and communication technology.
2. The mission of the Department of Statistics in Education field: a. organize undergraduate and graduate study program based on
information and communication technology to produce international quality graduates in the fields of statistics, data science, and their applications;
b. produce graduates who believe and fear God Almighty and have entrepreneurial knowledge.
3. The mission of the Department of Statistics in research is to play an activate role in the development of science and technology in the field of statistics, data science, and their applications through international quality research activities.
4. The mission of the Department of Statistics in community service is to utilize the resources of the department to play an active role in solving problems faced by society, industry, and government.
5. The mission of the Department of Statistics in management: a. professional management of resources in the department in
organizing Tridharma Perguruan Tinggi based on information and communication technology;
b. develop networks and synergize with domestic and foreign universities, industry, society, and government in organizing Tridharma Perguruan Tinggi.
OBJECTIVES OF THE DEPARTMENT OF STATISTICS ITS
1. Produce graduates who are virtuous, excel in statistics, data science, and their application, have a good and independent personality, have professional skills and professional ethics, have high integrity and responsibility, have the ability to develop themselves and compete at the national and international level.
ACADEMIC GUIDEBOOK 2018-2023
5
UNDERGRADUATE STUDY PROGRAM – DEPARTMENT OF STATISTICS INSTITUT TEKNOLOGI SEPULUH NOPEMBER
2. Produce high quality of statistics and data science research and development of for the needs of Computing, Business and Industry, Economics and Finance, Social and Population, and the Environment and Health fields at national and international levels.
3. Develop and expand networks with other tertiary institutions, communities, industries, government institutions, and other institutions at national and international levels based on academic ethics, benefits, and mutual benefits..
4. Fostering an academic atmosphere which is conducive to building an appreciative, participatory and contributive attitude from all academics as well as upholding academic values and academic morals.
5. Make the Department of Statistics as a center of education, research and community service in statistics, data science, and their applications for solving problems in society.
ACADEMIC GUIDEBOOK 2018-2023
6
UNDERGRADUATE STUDY PROGRAM – DEPARTMENT OF STATISTICS INSTITUT TEKNOLOGI SEPULUH NOPEMBER
ORGANIZATIONAL STRUCTURE
Adjusting to ITS Organization and Governance which has been approved by the Minister of Education and Culture and the Menpan nomenclature, in the 2014/2015 academic year the Department of Statistics experienced a change in organizational structure. Currently the Department of Statistics is headed by a Head of Department and two Secretaries of Department. And Graduate Study Program is managed by a Head of Graduate Program. Each laboratory is headed by a Head of Laboratory. In carrying out administrative operations in the Statistics Department, it is coordinated by a Head of Subdivision. The complete organizational structure of the ITS Statistics Department is as follows:
Head of Department : Dr. Kartika Fithriasari, M.Si Secretary of Department I : Dr. Santi Wulan Purnami, M.Si Secretary of Department II : Dr. Vita Ratnasari, S.Si., M.Si Head of Graduate Program : Dr.rer.pol. Dedy Dwi Prastyo, M.Si Head of Laboratory a. Business and Industrial Statistics : Dr. Wibawati, S.Si., M.Si b. Computational Statistics and Data
Science : Prof. Nur Iriawan, MIKom., Ph.D.
c. Economics and Financial Data Analytics
:
Dr. Ir. Setiawan, MS
d. Social Statistics and Population Studies
: Prof. Dr. I Nyoman Budiantara, M.Si
e. Health and Environmental Statistics : Dr. Bambang Widjanarko Otok, M.Si Head of Subdivision : Nivio Artha Diana, ST
ACADEMIC GUIDEBOOK 2018-2023
7
UNDERGRADUATE STUDY PROGRAM – DEPARTMENT OF STATISTICS INSTITUT TEKNOLOGI SEPULUH NOPEMBER
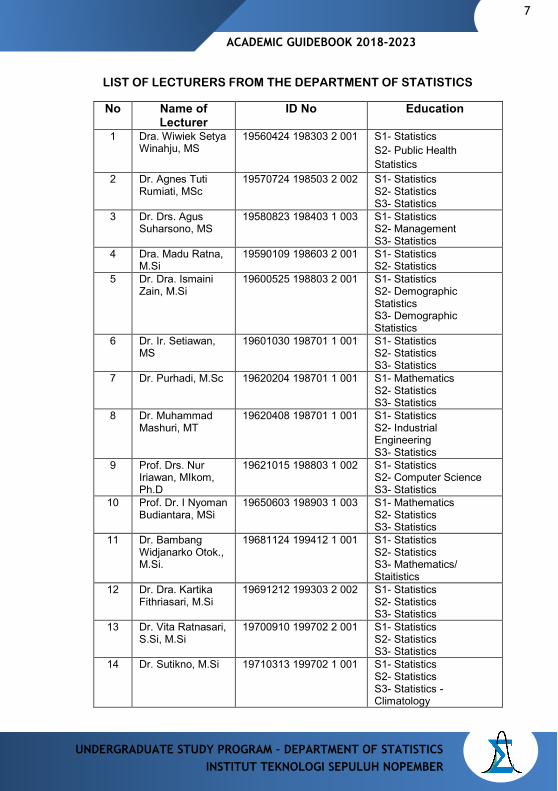
LIST OF LECTURERS FROM THE DEPARTMENT OF STATISTICS
No Name of Lecturer
ID No Education
1 Dra. Wiwiek Setya Winahju, MS
19560424 198303 2 001 S1- Statistics S2- Public Health Statistics
2 Dr. Agnes Tuti Rumiati, MSc
19570724 198503 2 002 S1- Statistics S2- Statistics S3- Statistics
3 Dr. Drs. Agus Suharsono, MS
19580823 198403 1 003 S1- Statistics S2- Management S3- Statistics
4 Dra. Madu Ratna, M.Si
19590109 198603 2 001 S1- Statistics S2- Statistics
5 Dr. Dra. Ismaini Zain, M.Si
19600525 198803 2 001 S1- Statistics S2- Demographic Statistics S3- Demographic Statistics
6 Dr. Ir. Setiawan, MS
19601030 198701 1 001 S1- Statistics S2- Statistics S3- Statistics
7 Dr. Purhadi, M.Sc 19620204 198701 1 001 S1- Mathematics S2- Statistics S3- Statistics
8 Dr. Muhammad Mashuri, MT
19620408 198701 1 001 S1- Statistics S2- Industrial Engineering S3- Statistics
9 Prof. Drs. Nur Iriawan, MIkom, Ph.D
19621015 198803 1 002 S1- Statistics S2- Computer Science S3- Statistics
10 Prof. Dr. I Nyoman Budiantara, MSi
19650603 198903 1 003 S1- Mathematics S2- Statistics S3- Statistics
11 Dr. Bambang Widjanarko Otok., M.Si.
19681124 199412 1 001 S1- Statistics S2- Statistics S3- Mathematics/ Staitistics
12 Dr. Dra. Kartika Fithriasari, M.Si
19691212 199303 2 002 S1- Statistics S2- Statistics S3- Statistics
13 Dr. Vita Ratnasari, S.Si, M.Si
19700910 199702 2 001 S1- Statistics S2- Statistics S3- Statistics
14 Dr. Sutikno, M.Si 19710313 199702 1 001 S1- Statistics S2- Statistics S3- Statistics - Climatology
ACADEMIC GUIDEBOOK 2018-2023
8
UNDERGRADUATE STUDY PROGRAM – DEPARTMENT OF STATISTICS INSTITUT TEKNOLOGI SEPULUH NOPEMBER
No Name of Lecturer
ID No Education
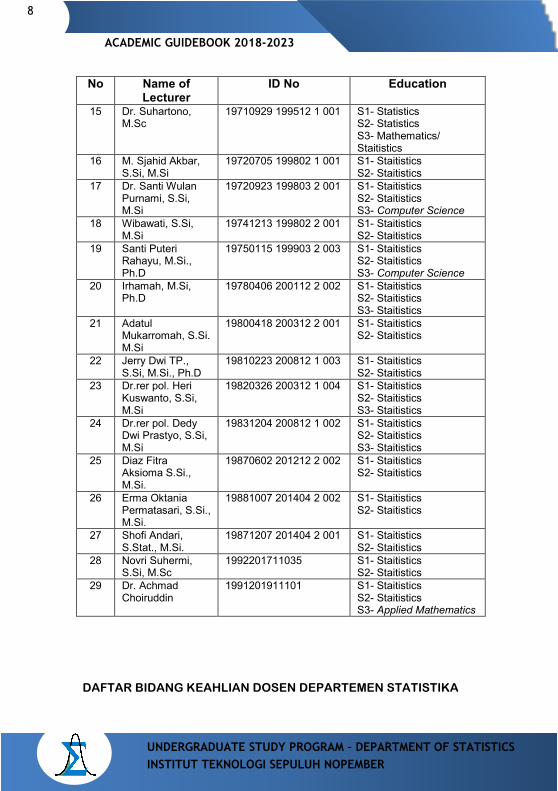
15 Dr. Suhartono, M.Sc
19710929 199512 1 001 S1- Statistics S2- Statistics S3- Mathematics/ Staitistics
16 M. Sjahid Akbar, S.Si, M.Si
19720705 199802 1 001 S1- Staitistics S2- Staitistics
17 Dr. Santi Wulan Purnami, S.Si, M.Si
19720923 199803 2 001 S1- Staitistics S2- Staitistics S3- Computer Science
18 Wibawati, S.Si, M.Si
19741213 199802 2 001 S1- Staitistics S2- Staitistics
19 Santi Puteri Rahayu, M.Si., Ph.D
19750115 199903 2 003 S1- Staitistics S2- Staitistics S3- Computer Science
20 Irhamah, M.Si, Ph.D
19780406 200112 2 002 S1- Staitistics S2- Staitistics S3- Staitistics
21 Adatul Mukarromah, S.Si. M.Si
19800418 200312 2 001 S1- Staitistics S2- Staitistics
22 Jerry Dwi TP., S.Si, M.Si., Ph.D
19810223 200812 1 003 S1- Staitistics S2- Staitistics
23 Dr.rer pol. Heri Kuswanto, S.Si, M.Si
19820326 200312 1 004 S1- Staitistics S2- Staitistics S3- Staitistics
24 Dr.rer pol. Dedy Dwi Prastyo, S.Si, M.Si
19831204 200812 1 002 S1- Staitistics S2- Staitistics S3- Staitistics
25 Diaz Fitra Aksioma S.Si., M.Si.
19870602 201212 2 002 S1- Staitistics S2- Staitistics
26 Erma Oktania Permatasari, S.Si., M.Si.
19881007 201404 2 002 S1- Staitistics S2- Staitistics
27 Shofi Andari, S.Stat., M.Si.
19871207 201404 2 001 S1- Staitistics S2- Staitistics
28 Novri Suhermi, S.Si, M.Sc
1992201711035 S1- Staitistics S2- Staitistics
29 Dr. Achmad Choiruddin
1991201911101 S1- Staitistics S2- Staitistics S3- Applied Mathematics
DAFTAR BIDANG KEAHLIAN DOSEN DEPARTEMEN STATISTIKA
ACADEMIC GUIDEBOOK 2018-2023
9
UNDERGRADUATE STUDY PROGRAM – DEPARTMENT OF STATISTICS INSTITUT TEKNOLOGI SEPULUH NOPEMBER
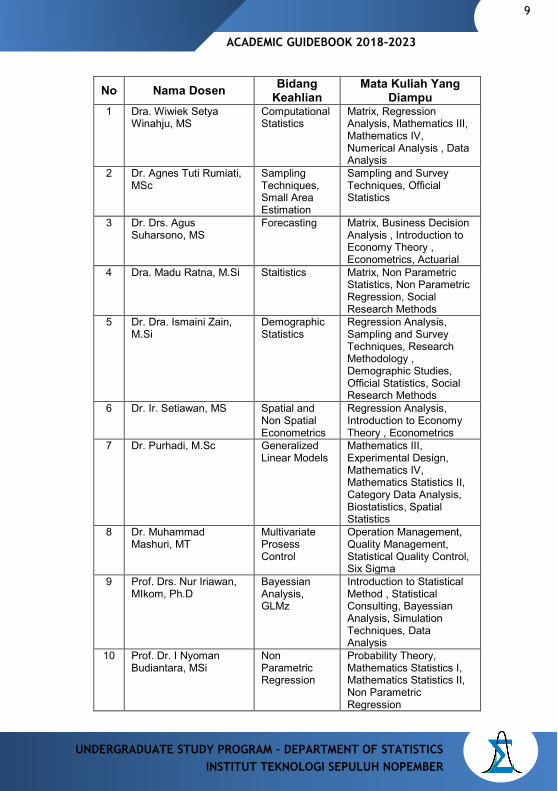
No Nama Dosen Bidang Keahlian
Mata Kuliah Yang Diampu
1 Dra. Wiwiek Setya Winahju, MS
ComputationalStatistics
Matrix, Regression Analysis, Mathematics III, Mathematics IV, Numerical Analysis , Data Analysis
2 Dr. Agnes Tuti Rumiati, MSc
Sampling Techniques, Small Area Estimation
Sampling and Survey Techniques, Official Statistics
3 Dr. Drs. Agus Suharsono, MS
Forecasting Matrix, Business Decision Analysis , Introduction to Economy Theory , Econometrics, Actuarial
4 Dra. Madu Ratna, M.Si Staitistics Matrix, Non Parametric Statistics, Non Parametric Regression, Social Research Methods
5 Dr. Dra. Ismaini Zain, M.Si
Demographic Statistics
Regression Analysis, Sampling and Survey Techniques, Research Methodology , Demographic Studies, Official Statistics, Social Research Methods
6 Dr. Ir. Setiawan, MS Spatial and Non Spatial Econometrics
Regression Analysis, Introduction to Economy Theory , Econometrics
7 Dr. Purhadi, M.Sc Generalized Linear Models
Mathematics III, Experimental Design, Mathematics IV, Mathematics Statistics II, Category Data Analysis, Biostatistics, Spatial Statistics
8 Dr. Muhammad Mashuri, MT
Multivariate Prosess Control
Operation Management, Quality Management, Statistical Quality Control, Six Sigma
9 Prof. Drs. Nur Iriawan, MIkom, Ph.D
Bayessian Analysis, GLMz
Introduction to Statistical Method , Statistical Consulting, Bayessian Analysis, Simulation Techniques, Data Analysis
10 Prof. Dr. I Nyoman Budiantara, MSi
Non Parametric Regression
Probability Theory, Mathematics Statistics I, Mathematics Statistics II, Non Parametric Regression
ACADEMIC GUIDEBOOK 2018-2023
10
UNDERGRADUATE STUDY PROGRAM – DEPARTMENT OF STATISTICS INSTITUT TEKNOLOGI SEPULUH NOPEMBER
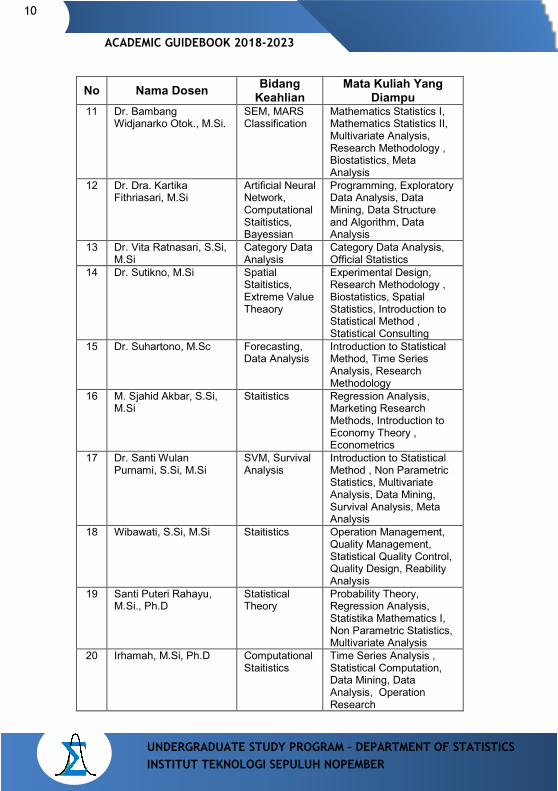
No Nama Dosen Bidang Keahlian
Mata Kuliah Yang Diampu
11 Dr. Bambang Widjanarko Otok., M.Si.
SEM, MARS Classification
Mathematics Statistics I, Mathematics Statistics II, Multivariate Analysis, Research Methodology , Biostatistics, Meta Analysis
12 Dr. Dra. Kartika Fithriasari, M.Si
Artificial Neural Network, ComputationalStaitistics, Bayessian
Programming, Exploratory Data Analysis, Data Mining, Data Structure and Algorithm, Data Analysis
13 Dr. Vita Ratnasari, S.Si, M.Si
Category Data Analysis
Category Data Analysis, Official Statistics
14 Dr. Sutikno, M.Si Spatial Staitistics, Extreme Value Theaory
Experimental Design, Research Methodology , Biostatistics, Spatial Statistics, Introduction to Statistical Method , Statistical Consulting
15 Dr. Suhartono, M.Sc Forecasting, Data Analysis
Introduction to Statistical Method, Time Series Analysis, Research Methodology
16 M. Sjahid Akbar, S.Si, M.Si
Staitistics Regression Analysis, Marketing Research Methods, Introduction to Economy Theory , Econometrics
17 Dr. Santi Wulan Purnami, S.Si, M.Si
SVM, Survival Analysis
Introduction to Statistical Method , Non Parametric Statistics, Multivariate Analysis, Data Mining, Survival Analysis, Meta Analysis
18 Wibawati, S.Si, M.Si Staitistics Operation Management, Quality Management, Statistical Quality Control, Quality Design, Reability Analysis
19 Santi Puteri Rahayu, M.Si., Ph.D
Statistical Theory
Probability Theory, Regression Analysis, Statistika Mathematics I, Non Parametric Statistics, Multivariate Analysis
20 Irhamah, M.Si, Ph.D ComputationalStaitistics
Time Series Analysis , Statistical Computation, Data Mining, Data Analysis, Operation Research
ACADEMIC GUIDEBOOK 2018-2023
11
UNDERGRADUATE STUDY PROGRAM – DEPARTMENT OF STATISTICS INSTITUT TEKNOLOGI SEPULUH NOPEMBER
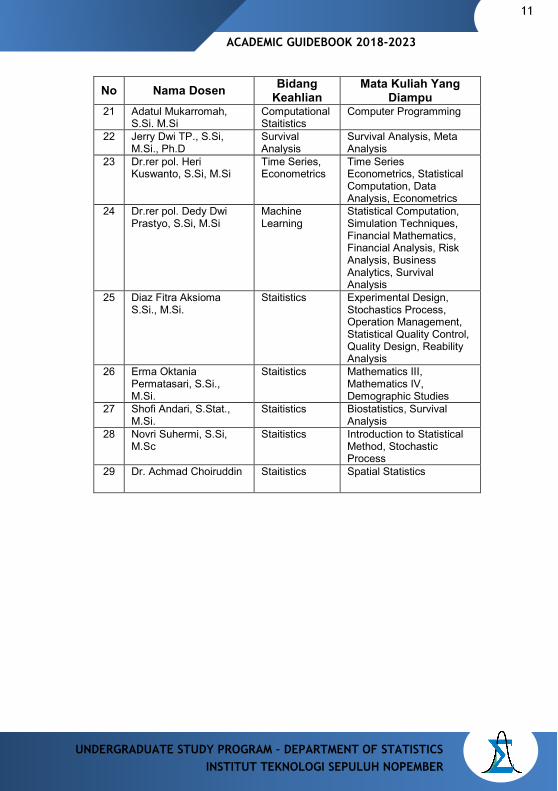
No Nama Dosen Bidang Keahlian
Mata Kuliah Yang Diampu
21 Adatul Mukarromah, S.Si. M.Si
ComputationalStaitistics
Computer Programming
22 Jerry Dwi TP., S.Si, M.Si., Ph.D
Survival Analysis
Survival Analysis, Meta Analysis
23 Dr.rer pol. Heri Kuswanto, S.Si, M.Si
Time Series, Econometrics
Time Series Econometrics, Statistical Computation, Data Analysis, Econometrics
24 Dr.rer pol. Dedy Dwi Prastyo, S.Si, M.Si
Machine Learning
Statistical Computation, Simulation Techniques, Financial Mathematics, Financial Analysis, Risk Analysis, Business Analytics, Survival Analysis
25 Diaz Fitra Aksioma S.Si., M.Si.
Staitistics Experimental Design, Stochastics Process, Operation Management, Statistical Quality Control, Quality Design, Reability Analysis
26 Erma Oktania Permatasari, S.Si., M.Si.
Staitistics Mathematics III, Mathematics IV, Demographic Studies
27 Shofi Andari, S.Stat., M.Si.
Staitistics Biostatistics, Survival Analysis
28 Novri Suhermi, S.Si, M.Sc
Staitistics Introduction to Statistical Method, Stochastic Process
29 Dr. Achmad Choiruddin Staitistics Spatial Statistics
ACADEMIC GUIDEBOOK 2018-2023
12
UNDERGRADUATE STUDY PROGRAM – DEPARTMENT OF STATISTICS INSTITUT TEKNOLOGI SEPULUH NOPEMBER
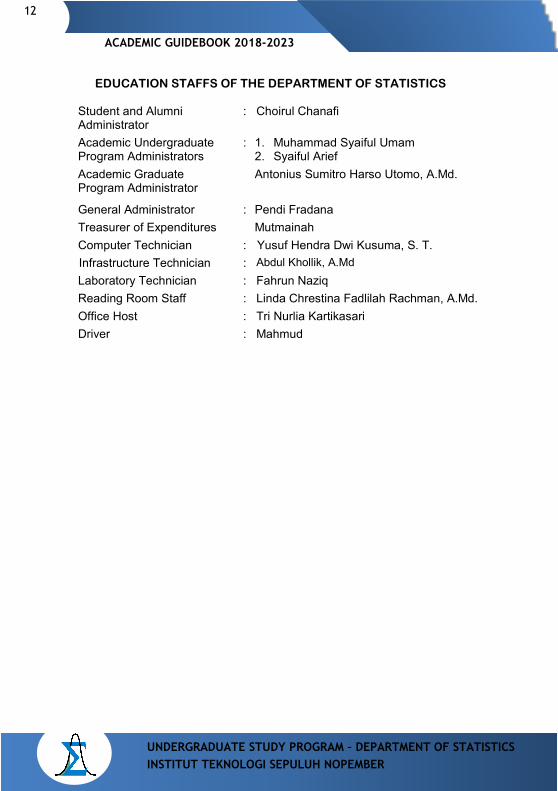
EDUCATION STAFFS OF THE DEPARTMENT OF STATISTICS
Student and Alumni Administrator
: Choirul Chanafi
Academic Undergraduate Program Administrators
: 1. Muhammad Syaiful Umam 2. Syaiful Arief
Academic Graduate Program Administrator
Antonius Sumitro Harso Utomo, A.Md.
General Administrator : Pendi Fradana Treasurer of Expenditures Mutmainah Computer Technician : Yusuf Hendra Dwi Kusuma, S. T. Infrastructure Technician : Abdul Khollik, A.Md Laboratory Technician : Fahrun Naziq Reading Room Staff : Linda Chrestina Fadlilah Rachman, A.Md. Office Host : Tri Nurlia Kartikasari Driver : Mahmud
ACADEMIC GUIDEBOOK 2018-2023
13
UNDERGRADUATE STUDY PROGRAM – DEPARTMENT OF STATISTICS INSTITUT TEKNOLOGI SEPULUH NOPEMBER
ACCREDITATION AND CERTIFICATION
The Undergraduate Study Program of Department of Statistics, Faculty of Science and Data Analytics ITS, has been accredited and certified as follows: 1. ASEAN University Network-Quality Assurance (AUN-QA) 2. Accreditation A from the National Accreditation Board for Higher
Education (BAN PT) with Decree Number: 1155/SK/BAN-PT/Akred/S/ XI/2015.
14
UNDERGRADUATE STUDY PROGRAM – DEPARTMENT OF STATISTICS INSTITUT TEKNOLOGI SEPULUH NOPEMBER
ACADEMIC GUIDEBOOK 2018-2023
AWARDS
The Department of Statistics had succeeded in obtaining awards as follows: 2nd Place Winner in Group I in ITS Management Award 2007 Special Award as The Best Department in Academic Achievement in ITS
Management Award 2007 Special Award of High Performance Award in ITS Management Award 2007 2nd Place Winner of PJBT ITS Awards in 2008 3rd Place Winner of PJBT ITS Awards in 2009 1st Place Winner of PJBT ITS Awards in 2010, 2011 dan 2012 2nd Place Winner of PJBT ITS Awards in 2013 2nd Place Special Award for the SPMI Implementing Study Program in the
Implementation of Internal Quality Assurance System ITS in 2017.
ACADEMIC GUIDEBOOK 2018-2023
15
UNDERGRADUATE STUDY PROGRAM – DEPARTMENT OF STATISTICS INSTITUT TEKNOLOGI SEPULUH NOPEMBER
FACILITIES OF THE DEPARTMENT OF STATISTICS ITS The Statistics Undergraduate Program has 8 (eight) classrooms and 4 laboratories which are equipped with LCDs and air-conditioned rooms, speaker device (amplifier) and large rooms. Besides that, the internet network is available which can be accessed for free around ITS area. Computer Laboratories
• There are 136 computers based on a Core i7 Processor that is connected to the central computer network of the Department of Statistics.
• There are a number of licensed Statistics software packages such as SAS, Minitab, SPSS, Splus and open source software like R and Winbugs etc.
Reading Room of Department of Statistics
The collections in the Reading Room are various such as textbooks, reference books and teaching books, international and national journals, student research results (Final Project / Thesis / Dissertation), Student Practical Work Reports, Lecturer Research Reports, books teaching and others. Reading Room of The Department of Statistics has collections of 2563 journals, 3927 text books, 1747 books of Undergraduate final project, 468 books of Thesis, 14 books of Dissertation, 873 Undergraduate practical work reports. Online Sources of REFERENCES
Lecturers and students of the Department of Statistics can access to several journal publishers or international publications as follows: • www.sciencedirect.com • www.proquest.com • http://www.pubs.amstat.org/loi/tech (technometrics journal) • http://www.infotrac.galergroup.com/itweb/idits (Science journal) • http://www.epubs.siam.org
(SIAM: Society for Industrial and Applied Mathematics Journal)
Students Association
Student Activity Center for developing organizational, leadership, collaboration and statistics professional skills. The name of the student association for the Undergraduate Program is Himpunan Mahasiswa Statistika (HIMASTA-ITS).
16
UNDERGRADUATE STUDY PROGRAM – DEPARTMENT OF STATISTICS INSTITUT TEKNOLOGI SEPULUH NOPEMBER
ACADEMIC GUIDEBOOK 2018-2023
DOMESTIC AND FOREIGN COOPERATIONS
Domestic Cooperations 1. Badan Pusat Statistika (BPS) 2. Badan Meteorologi, Klimatologi, dan Geofisika (BMKG) 3. Badan Perencanaan Pembangunan Kota (Bappeko) Surabaya 4. Badan Perencanaan Pembangunan Daerah (Bappeda) Mojokerto 5. Badan Kependudukan dan Keluarga Berencana Nasional (BKKBN) 6. Dinas Kependudukan dan Pencatatan Sipil (Dispendukcapil) 7. Dinas Koperasi (Dinkop) Surabaya dan East Java 8. Dinas Pendidikan (Dispendik) East Java 9. Dinas Sosial 10. Dinkominfo East Java Province dan Regency/City in East Java 11. Forum Pendidikan Tinggi Statistika (Forstat) 12. Indonesia Security Investment Protection Fund (SIPF) 13. Persatuan Aktuaris Indonesia (PAI) 14. Pelindo 3 15. RS Airlangga University 16. Oncology Hospital 17. Nur Hidayah Jogja Hospital 18. Muhammadiyah Gresik University 19. Wiraraja University 20. Ciputra University 21. International Semen Indonesia (UISI) University 22. Jawa Pos
Foreign Cooperations
1. University of Technology Malaysia (UTM), Malaysia 2. Prince Songkla University, Thailand 3. Institute of Statistics, Natioanl Chiao Tung University (NCTU) Taiwan 4. University of California Davis 5. Tokyo University of Science Japan 6. University Technology Mara (UiTM), Malaysia 7. Universiti Tun Hussein Onn Malaysia (UTHM)

ACADEMIC GUIDEBOOK 2018-2023
17
UNDERGRADUATE STUDY PROGRAM – DEPARTMENT OF STATISTICS INSTITUT TEKNOLOGI SEPULUH NOPEMBER
18
UNDERGRADUATE STUDY PROGRAM – DEPARTMENT OF STATISTICS INSTITUT TEKNOLOGI SEPULUH NOPEMBER
ACADEMIC GUIDEBOOK 2018-2023
Undergraduate Study Program (S1)
Undergraduate Program (S1) of Department of Statistics ITS produces graduates who have taken 144 credits in 8 semesters. The study period is divided into 2 phases, namely the preparatory phase and the undergraduate phase. The preparation phase is taken in the first and second semester with a study load of 36 credits. The Undergraduate phase is taken in third to eighth semester by 108 credits. Since 2019, the Undergraduate Program has opened an international class of IUP (International Undergraduate Program). In addition, the Undergraduate Program has opened a Cross-Type RPL (Past Learning Recognition) program.
Students are declared to have passed the preparatory phase if they have taken all of the study load of the preparation phase which is 36 credits with an GPA of more than 2.0 without an E and D value.
Students are declared to have passed the undergraduate level if they successfully complete 144 credits study load including final project, have an GPA of more than 2.0 without an E and D value, and meet the minimum grade requirement of one foreign language and SKEM.
THE VISION OF UNDERGRADUATE PROGRAM
To become an educational institution for undergraduate level and developing statistics and data science international standard that contribute to science and technology, particularly in the fields of Computing, Business and Industry, Economics and Finance, Social and Population, and Environment and Health.
THE MISSION OF UNDERGRADUATE PROGRAM
1. The mission of the Undergraduate Program of Statistics is to contribute in the development of science and technology in the fields of statistics, data science, and its applications to realize public welfare through education, research, community service, and management based on information and communication technology.
2. The mission of the Undergraduate Program of Statistics in Education field: c. organize undergraduate study program based on information and
communication technology to produce international quality graduates in the fields of statistics, data science, and their applications;
a. produce graduates who believe and fear God Almighty and have entrepreneurial knowledge.
3. The mission of the Department of Statistics in research is to play an activate role in the development of science and technology in the field of statistics,
ACADEMIC GUIDEBOOK 2018-2023
19
UNDERGRADUATE STUDY PROGRAM – DEPARTMENT OF STATISTICS INSTITUT TEKNOLOGI SEPULUH NOPEMBER
data science, and their applications through international quality research activities.
4. The mission of the Department of Statistics in community service is to utilize the resources of the department to play an active role in solving problems faced by society, industry, and government.
5. The mission of the Department of Statistics in management: c. professional management of resources in the department in organizing
Tridharma Perguruan Tinggi based on information and communication technology;
d. develop networks and synergize with domestic and foreign universities, industry, society, and government in organizing Tridharma Perguruan Tinggi.
OBJECTIVES OF UNDERGRADUATE PROGRAM OF THE DEPARTMENT OF STATISTICS ITS
1. To produce graduates with careers as data analysts, data scientists, official statisticians, biostatisticians, credit and business analysts, in industrial fields who have the ability to: - apply statistical methods to solve problems in socio-population,
environmental-health, economics-financial, industrial, and data science - use Statistical Process Control / Quality Control to solve problems in the
industrial field - identify, formulate, collect, code, analyze and interpret data
2. An individual who can contribute to the professional practice of their chosen field through effective communication, leadership, teamwork, service, and a high ethical
3. An individual who will continue life‐ long learning through professional activities and training, the pursuit of higher educational degrees, and individual professional improvement
GOALS OF UNDERGRADUATE PROGRAM OF THE DEPARTMENT OF STATISTICS ITS
Based on the current condition of Human Resources and facilities, the targets and Indicators for achieving the Study Program objectives set for 2018-2023 include:
20
UNDERGRADUATE STUDY PROGRAM – DEPARTMENT OF STATISTICS INSTITUT TEKNOLOGI SEPULUH NOPEMBER
ACADEMIC GUIDEBOOK 2018-2023
A. Graduates’ Quality Goals
The goals of the Undergraduate Program in the next 5 years are: 1. The percentage of graduate GPA for more than 3 GPA is 72%. 2. The percentage of waiting time for graduates working max.4 months is 67%. 3. The percentage of TOEFL score > 500 is 10%. 4. The percentage of graduates working in their fields is 85%. 5. The percentage of study duration < 9 semesters is 90%. 6. The average salary for working at first time is Rp. 3,800,000.00. B. Learning Quality Goals
The quality of learning objectives in the next 5 years are: 1. The ratio of Lecturer to student is 1:20. 2. The ratio of Lecturer to students guided by the final project is 1: 5. 3. The frequency of final project guidance is 10 times. 4. There is a final project and practical work guideline. 5. There is academic guidebook. 6. There are academic guidelines. 7. Percentage of completing final project for less than 1 semester is 90%. 8. Percentage of courses that are equipped with RPS is 100%. 9. Percentage of courses completed with an assessment plan is 80%. 10. Percentage of courses completed with an 80% assignment plan. 11. Percentage of courses that are equipped with an evaluation plan is 80%. 12. Percentage of courses that are equipped with e-learning (share ITS) is 20%. 13. There are SOP about compiling tasks and assignments. 14. There are COURSE LEARNING OUTCOMES measurement tools. 15. There is a tool to measure the suitability of the tasks with the RPS. 16. There is a written policy on academic atmosphere. 17. The number of students who active in international activities (internships,
study exchanges, outbound) is at least 10 students. 18. Percentage of courses that contain the current knowledge and technology is
10%. C. Goals of Study Program Performance Improvements
Goals of improving the performance of Undergraduate Program for 2018-2023 include: 1. Percentage of lecturers who hold doctoral degrees is 90%. 2. The number of professors is 6 people. 3. The number of relevant national collaborations with study programs is 10. 4. The number of international cooperation that is relevant to the study program
as much as 3. 5. The number of studies obtained by lecturers at the national level is 20 titles
per year.
ACADEMIC GUIDEBOOK 2018-2023
21
UNDERGRADUATE STUDY PROGRAM – DEPARTMENT OF STATISTICS INSTITUT TEKNOLOGI SEPULUH NOPEMBER
6. The number of publications in national and international journals is 20 titles per year.
7. The number of PC processor with the current technology is 150 computers. 8. The average percentage of lecturer attendance at lectures is 100%. 9. Funds allocated for student activities is 10%. 10. The number of English classes are 3 classes.
22
UNDERGRADUATE STUDY PROGRAM – DEPARTMENT OF STATISTICS INSTITUT TEKNOLOGI SEPULUH NOPEMBER
ACADEMIC GUIDEBOOK 2018-2023
UNDERGRADUATE PROGRAM CURRICULUM
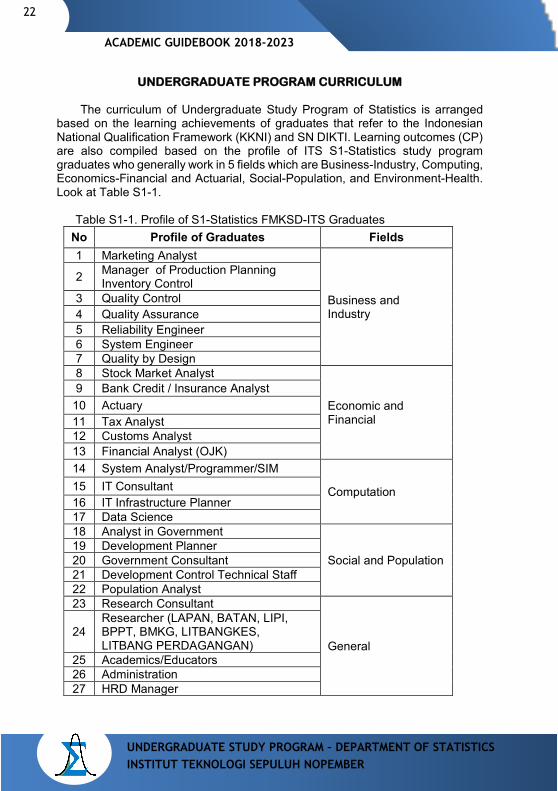
The curriculum of Undergraduate Study Program of Statistics is arranged
based on the learning achievements of graduates that refer to the Indonesian National Qualification Framework (KKNI) and SN DIKTI. Learning outcomes (CP) are also compiled based on the profile of ITS S1-Statistics study program graduates who generally work in 5 fields which are Business-Industry, Computing, Economics-Financial and Actuarial, Social-Population, and Environment-Health. Look at Table S1-1.
Table S1-1. Profile of S1-Statistics FMKSD-ITS Graduates
No Profile of Graduates Fields 1 Marketing Analyst
Business and Industry
2 Manager of Production Planning Inventory Control
3 Quality Control 4 Quality Assurance 5 Reliability Engineer 6 System Engineer 7 Quality by Design 8 Stock Market Analyst
Economic and Financial
9 Bank Credit / Insurance Analyst 10 Actuary 11 Tax Analyst 12 Customs Analyst 13 Financial Analyst (OJK) 14 System Analyst/Programmer/SIM
Computation 15 IT Consultant 16 IT Infrastructure Planner 17 Data Science 18 Analyst in Government
Social and Population 19 Development Planner 20 Government Consultant 21 Development Control Technical Staff 22 Population Analyst 23 Research Consultant
General 24
Researcher (LAPAN, BATAN, LIPI, BPPT, BMKG, LITBANGKES, LITBANG PERDAGANGAN)
25 Academics/Educators 26 Administration 27 HRD Manager
ACADEMIC GUIDEBOOK 2018-2023
23
UNDERGRADUATE STUDY PROGRAM – DEPARTMENT OF STATISTICS INSTITUT TEKNOLOGI SEPULUH NOPEMBER
No Profile of Graduates Fields
28 Government Institution (Department, BPS, etc.)
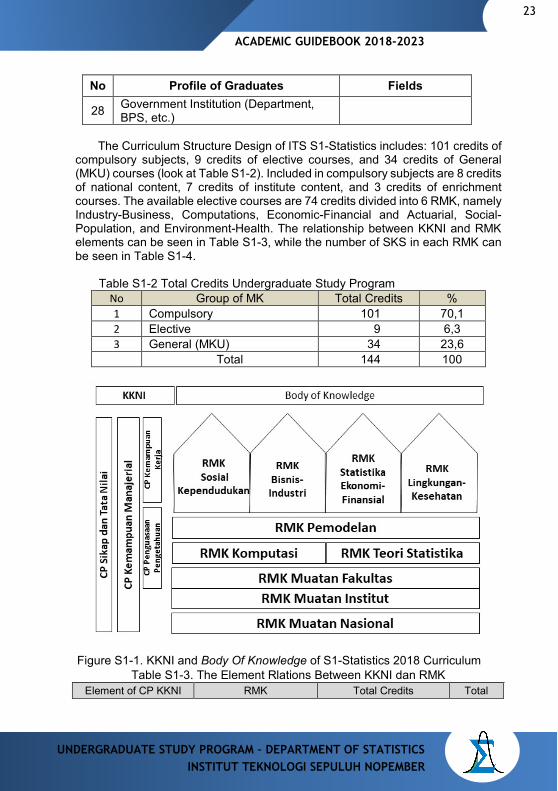
The Curriculum Structure Design of ITS S1-Statistics includes: 101 credits of
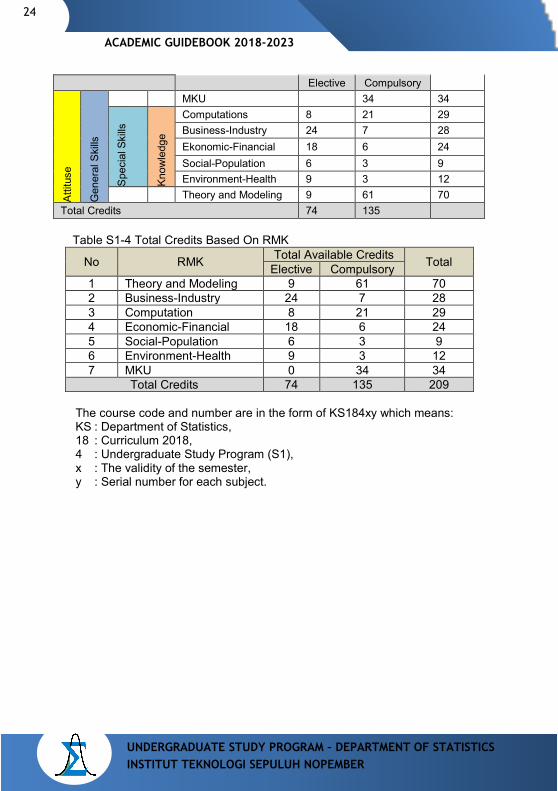
compulsory subjects, 9 credits of elective courses, and 34 credits of General (MKU) courses (look at Table S1-2). Included in compulsory subjects are 8 credits of national content, 7 credits of institute content, and 3 credits of enrichment courses. The available elective courses are 74 credits divided into 6 RMK, namely Industry-Business, Computations, Economic-Financial and Actuarial, Social-Population, and Environment-Health. The relationship between KKNI and RMK elements can be seen in Table S1-3, while the number of SKS in each RMK can be seen in Table S1-4.
Table S1-2 Total Credits Undergraduate Study Program
No Group of MK Total Credits % 1 Compulsory 101 70,1 2 Elective 9 6,3 3 General (MKU) 34 23,6 Total 144 100
Figure S1-1. KKNI and Body Of Knowledge of S1-Statistics 2018 Curriculum Table S1-3. The Element Rlations Between KKNI dan RMK
Element of CP KKNI RMK Total Credits Total
24
UNDERGRADUATE STUDY PROGRAM – DEPARTMENT OF STATISTICS INSTITUT TEKNOLOGI SEPULUH NOPEMBER
ACADEMIC GUIDEBOOK 2018-2023
Elective Compulsory
Attit
use
Gen
eral
Ski
lls
MKU 34 34
Spec
ial S
kills
Know
ledg
e
Computations 8 21 29 Business-Industry 24 7 28 Ekonomic-Financial 18 6 24 Social-Population 6 3 9 Environment-Health 9 3 12
Theory and Modeling 9 61 70 Total Credits 74 135
Table S1-4 Total Credits Based On RMK
No RMK Total Available Credits Total Elective Compulsory 1 Theory and Modeling 9 61 70 2 Business-Industry 24 7 28 3 Computation 8 21 29 4 Economic-Financial 18 6 24 5 Social-Population 6 3 9 6 Environment-Health 9 3 12 7 MKU 0 34 34
Total Credits 74 135 209
The course code and number are in the form of KS184xy which means: KS : Department of Statistics, 18 : Curriculum 2018, 4 : Undergraduate Study Program (S1), x : The validity of the semester, y : Serial number for each subject.
ACADEMIC GUIDEBOOK 2018-2023
25
UNDERGRADUATE STUDY PROGRAM – DEPARTMENT OF STATISTICS INSTITUT TEKNOLOGI SEPULUH NOPEMBER
PROGRAMMED LEARNING OUTCOME UNDERGRADUATE STUDY PROGRAM
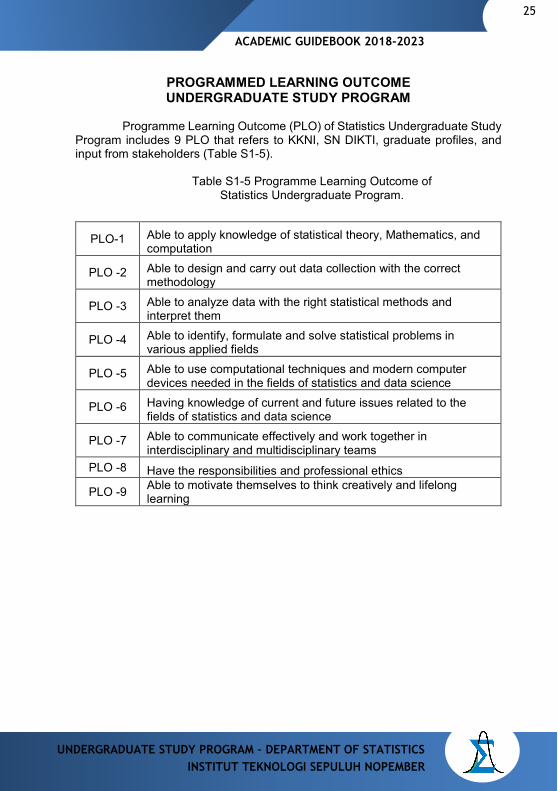
Programme Learning Outcome (PLO) of Statistics Undergraduate Study
Program includes 9 PLO that refers to KKNI, SN DIKTI, graduate profiles, and input from stakeholders (Table S1-5).
Table S1-5 Programme Learning Outcome of
Statistics Undergraduate Program.
PLO-1 Able to apply knowledge of statistical theory, Mathematics, and computation
PLO -2 Able to design and carry out data collection with the correct methodology
PLO -3 Able to analyze data with the right statistical methods and interpret them
PLO -4 Able to identify, formulate and solve statistical problems in various applied fields
PLO -5 Able to use computational techniques and modern computer devices needed in the fields of statistics and data science
PLO -6 Having knowledge of current and future issues related to the fields of statistics and data science
PLO -7 Able to communicate effectively and work together in interdisciplinary and multidisciplinary teams
PLO -8 Have the responsibilities and professional ethics
PLO -9 Able to motivate themselves to think creatively and lifelong learning
26
UNDERGRADUATE STUDY PROGRAM – DEPARTMENT OF STATISTICS INSTITUT TEKNOLOGI SEPULUH NOPEMBER
ACADEMIC GUIDEBOOK 2018-2023
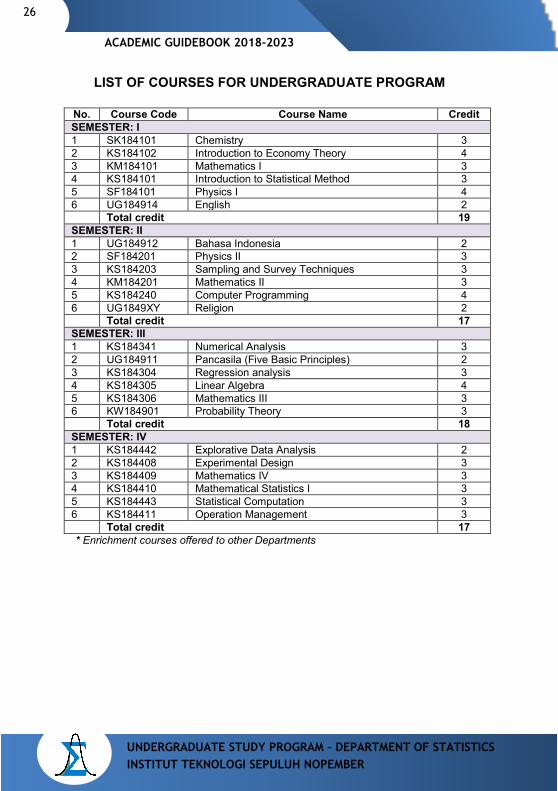
LIST OF COURSES FOR UNDERGRADUATE PROGRAM
No. Course Code Course Name Credit SEMESTER: I 1 SK184101 Chemistry 3 2 KS184102 Introduction to Economy Theory 4 3 KM184101 Mathematics I 3 4 KS184101 Introduction to Statistical Method 3 5 SF184101 Physics I 4 6 UG184914 English 2 Total credit 19 SEMESTER: II 1 UG184912 Bahasa Indonesia 2 2 SF184201 Physics II 3 3 KS184203 Sampling and Survey Techniques 3 4 KM184201 Mathematics II 3 5 KS184240 Computer Programming 4 6 UG1849XY Religion 2 Total credit 17 SEMESTER: III 1 KS184341 Numerical Analysis 3 2 UG184911 Pancasila (Five Basic Principles) 2 3 KS184304 Regression analysis 3 4 KS184305 Linear Algebra 4 5 KS184306 Mathematics III 3 6 KW184901 Probability Theory 3 Total credit 18 SEMESTER: IV 1 KS184442 Explorative Data Analysis 2 2 KS184408 Experimental Design 3 3 KS184409 Mathematics IV 3 4 KS184410 Mathematical Statistics I 3 5 KS184443 Statistical Computation 3 6 KS184411 Operation Management 3 Total credit 17 * Enrichment courses offered to other Departments
ACADEMIC GUIDEBOOK 2018-2023
27
UNDERGRADUATE STUDY PROGRAM – DEPARTMENT OF STATISTICS INSTITUT TEKNOLOGI SEPULUH NOPEMBER
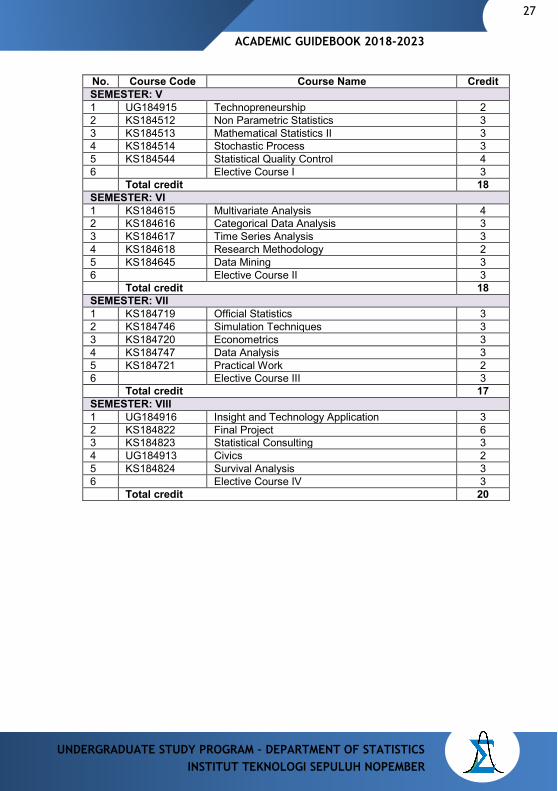
No. Course Code Course Name Credit SEMESTER: V 1 UG184915 Technopreneurship 2 2 KS184512 Non Parametric Statistics 3 3 KS184513 Mathematical Statistics II 3 4 KS184514 Stochastic Process 3 5 KS184544 Statistical Quality Control 4 6 Elective Course I 3 Total credit 18 SEMESTER: VI 1 KS184615 Multivariate Analysis 4 2 KS184616 Categorical Data Analysis 3 3 KS184617 Time Series Analysis 3 4 KS184618 Research Methodology 2 5 KS184645 Data Mining 3 6 Elective Course II 3 Total credit 18 SEMESTER: VII 1 KS184719 Official Statistics 3 2 KS184746 Simulation Techniques 3 3 KS184720 Econometrics 3 4 KS184747 Data Analysis 3 5 KS184721 Practical Work 2 6 Elective Course III 3 Total credit 17 SEMESTER: VIII 1 UG184916 Insight and Technology Application 3 2 KS184822 Final Project 6 3 KS184823 Statistical Consulting 3 4 UG184913 Civics 2 5 KS184824 Survival Analysis 3 6 Elective Course IV 3 Total credit 20
28
UNDERGRADUATE STUDY PROGRAM – DEPARTMENT OF STATISTICS INSTITUT TEKNOLOGI SEPULUH NOPEMBER
ACADEMIC GUIDEBOOK 2018-2023
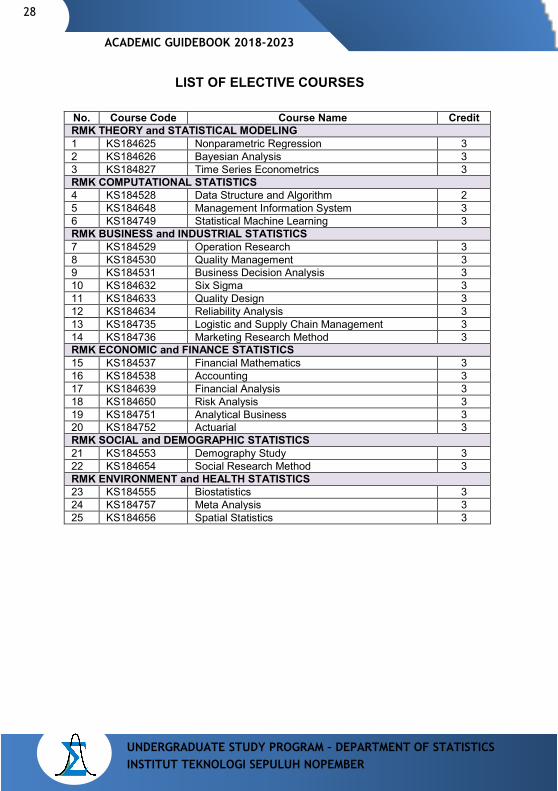
LIST OF ELECTIVE COURSES
No. Course Code Course Name Credit RMK THEORY and STATISTICAL MODELING 1 KS184625 Nonparametric Regression 3 2 KS184626 Bayesian Analysis 3 3 KS184827 Time Series Econometrics 3 RMK COMPUTATIONAL STATISTICS 4 KS184528 Data Structure and Algorithm 2 5 KS184648 Management Information System 3 6 KS184749 Statistical Machine Learning 3 RMK BUSINESS and INDUSTRIAL STATISTICS 7 KS184529 Operation Research 3 8 KS184530 Quality Management 3 9 KS184531 Business Decision Analysis 3 10 KS184632 Six Sigma 3 11 KS184633 Quality Design 3 12 KS184634 Reliability Analysis 3 13 KS184735 Logistic and Supply Chain Management 3 14 KS184736 Marketing Research Method 3 RMK ECONOMIC and FINANCE STATISTICS 15 KS184537 Financial Mathematics 3 16 KS184538 Accounting 3 17 KS184639 Financial Analysis 3 18 KS184650 Risk Analysis 3 19 KS184751 Analytical Business 3 20 KS184752 Actuarial 3 RMK SOCIAL and DEMOGRAPHIC STATISTICS 21 KS184553 Demography Study 3 22 KS184654 Social Research Method 3 RMK ENVIRONMENT and HEALTH STATISTICS 23 KS184555 Biostatistics 3 24 KS184757 Meta Analysis 3 25 KS184656 Spatial Statistics 3
ACADEMIC GUIDEBOOK 2018-2023
29
UNDERGRADUATE STUDY PROGRAM – DEPARTMENT OF STATISTICS INSTITUT TEKNOLOGI SEPULUH NOPEMBER
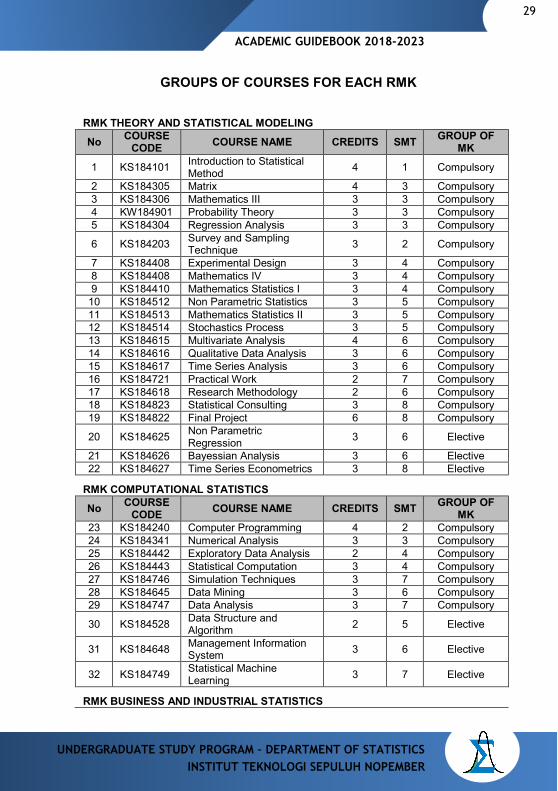
GROUPS OF COURSES FOR EACH RMK
RMK THEORY AND STATISTICAL MODELING No COURSE
CODE COURSE NAME CREDITS SMT GROUP OF MK
1 KS184101 Introduction to Statistical Method 4 1 Compulsory
2 KS184305 Matrix 4 3 Compulsory 3 KS184306 Mathematics III 3 3 Compulsory 4 KW184901 Probability Theory 3 3 Compulsory 5 KS184304 Regression Analysis 3 3 Compulsory
6 KS184203 Survey and Sampling Technique 3 2 Compulsory
7 KS184408 Experimental Design 3 4 Compulsory 8 KS184408 Mathematics IV 3 4 Compulsory 9 KS184410 Mathematics Statistics I 3 4 Compulsory
10 KS184512 Non Parametric Statistics 3 5 Compulsory 11 KS184513 Mathematics Statistics II 3 5 Compulsory 12 KS184514 Stochastics Process 3 5 Compulsory 13 KS184615 Multivariate Analysis 4 6 Compulsory 14 KS184616 Qualitative Data Analysis 3 6 Compulsory 15 KS184617 Time Series Analysis 3 6 Compulsory 16 KS184721 Practical Work 2 7 Compulsory 17 KS184618 Research Methodology 2 6 Compulsory 18 KS184823 Statistical Consulting 3 8 Compulsory 19 KS184822 Final Project 6 8 Compulsory
20 KS184625 Non Parametric Regression 3 6 Elective
21 KS184626 Bayessian Analysis 3 6 Elective 22 KS184627 Time Series Econometrics 3 8 Elective
RMK COMPUTATIONAL STATISTICS No COURSE
CODE COURSE NAME CREDITS SMT GROUP OF MK
23 KS184240 Computer Programming 4 2 Compulsory 24 KS184341 Numerical Analysis 3 3 Compulsory 25 KS184442 Exploratory Data Analysis 2 4 Compulsory 26 KS184443 Statistical Computation 3 4 Compulsory 27 KS184746 Simulation Techniques 3 7 Compulsory 28 KS184645 Data Mining 3 6 Compulsory 29 KS184747 Data Analysis 3 7 Compulsory
30 KS184528 Data Structure and Algorithm 2 5 Elective
31 KS184648 Management Information System 3 6 Elective
32 KS184749 Statistical Machine Learning 3 7 Elective
RMK BUSINESS AND INDUSTRIAL STATISTICS
30
UNDERGRADUATE STUDY PROGRAM – DEPARTMENT OF STATISTICS INSTITUT TEKNOLOGI SEPULUH NOPEMBER
ACADEMIC GUIDEBOOK 2018-2023
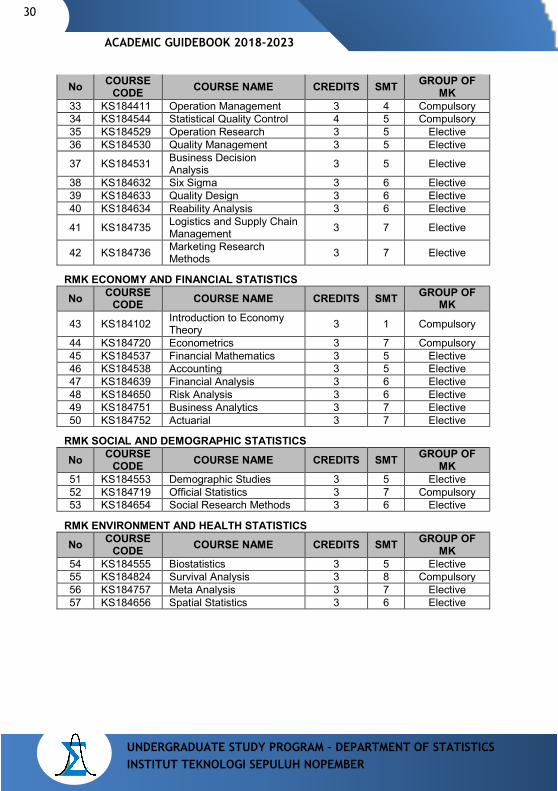
No COURSE
CODE COURSE NAME CREDITS SMT GROUP OF MK
33 KS184411 Operation Management 3 4 Compulsory 34 KS184544 Statistical Quality Control 4 5 Compulsory 35 KS184529 Operation Research 3 5 Elective 36 KS184530 Quality Management 3 5 Elective
37 KS184531 Business Decision Analysis 3 5 Elective
38 KS184632 Six Sigma 3 6 Elective 39 KS184633 Quality Design 3 6 Elective 40 KS184634 Reability Analysis 3 6 Elective
41 KS184735 Logistics and Supply Chain Management 3 7 Elective
42 KS184736 Marketing Research Methods 3 7 Elective
RMK ECONOMY AND FINANCIAL STATISTICS No COURSE
CODE COURSE NAME CREDITS SMT GROUP OF MK
43 KS184102 Introduction to Economy Theory 3 1 Compulsory
44 KS184720 Econometrics 3 7 Compulsory 45 KS184537 Financial Mathematics 3 5 Elective 46 KS184538 Accounting 3 5 Elective 47 KS184639 Financial Analysis 3 6 Elective 48 KS184650 Risk Analysis 3 6 Elective 49 KS184751 Business Analytics 3 7 Elective 50 KS184752 Actuarial 3 7 Elective
RMK SOCIAL AND DEMOGRAPHIC STATISTICS
No COURSE CODE COURSE NAME CREDITS SMT GROUP OF
MK 51 KS184553 Demographic Studies 3 5 Elective 52 KS184719 Official Statistics 3 7 Compulsory 53 KS184654 Social Research Methods 3 6 Elective
RMK ENVIRONMENT AND HEALTH STATISTICS No COURSE
CODE COURSE NAME CREDITS SMT GROUP OF MK
54 KS184555 Biostatistics 3 5 Elective 55 KS184824 Survival Analysis 3 8 Compulsory 56 KS184757 Meta Analysis 3 7 Elective 57 KS184656 Spatial Statistics 3 6 Elective
ACADEMIC GUIDEBOOK 2018-2023
31
UNDERGRADUATE STUDY PROGRAM – DEPARTMENT OF STATISTICS INSTITUT TEKNOLOGI SEPULUH NOPEMBER
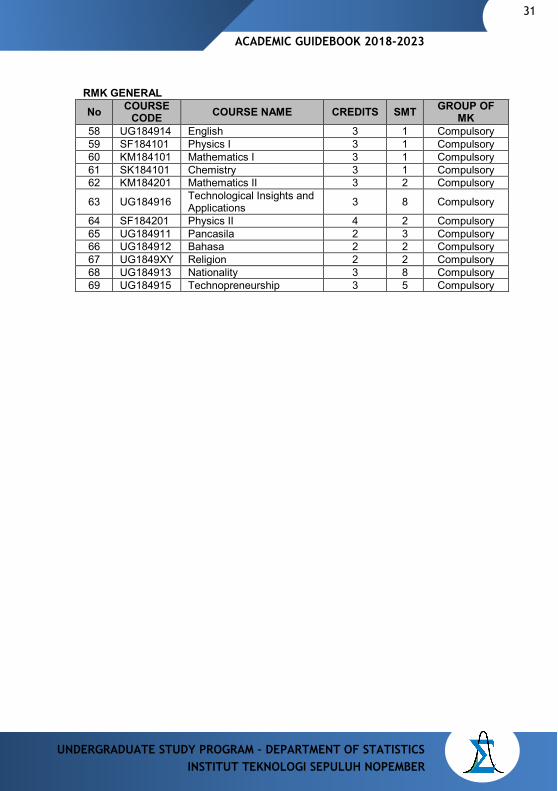
RMK GENERAL No COURSE
CODE COURSE NAME CREDITS SMT GROUP OF MK
58 UG184914 English 3 1 Compulsory 59 SF184101 Physics I 3 1 Compulsory 60 KM184101 Mathematics I 3 1 Compulsory 61 SK184101 Chemistry 3 1 Compulsory 62 KM184201 Mathematics II 3 2 Compulsory
63 UG184916 Technological Insights and Applications 3 8 Compulsory
64 SF184201 Physics II 4 2 Compulsory 65 UG184911 Pancasila 2 3 Compulsory 66 UG184912 Bahasa 2 2 Compulsory 67 UG1849XY Religion 2 2 Compulsory 68 UG184913 Nationality 3 8 Compulsory 69 UG184915 Technopreneurship 3 5 Compulsory
32
UNDERGRADUATE STUDY PROGRAM – DEPARTMENT OF STATISTICS INSTITUT TEKNOLOGI SEPULUH NOPEMBER
ACADEMIC GUIDEBOOK 2018-2023
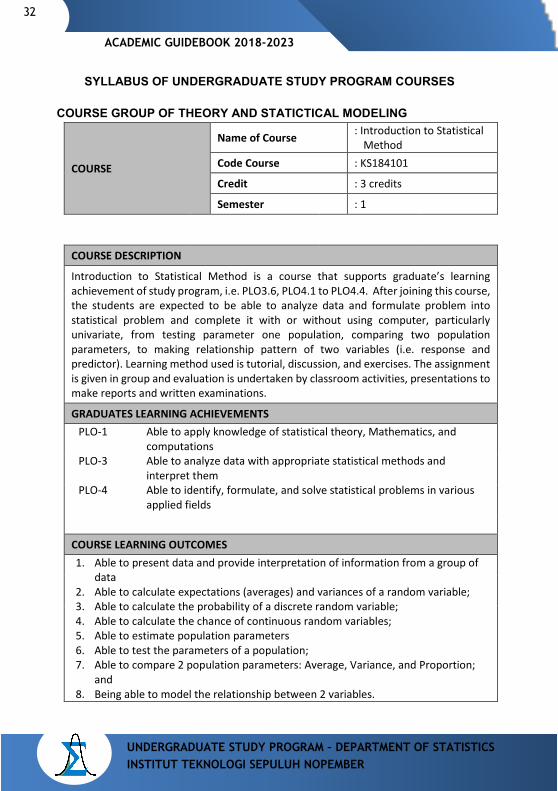
SYLLABUS OF UNDERGRADUATE STUDY PROGRAM COURSES
COURSE GROUP OF THEORY AND STATICTICAL MODELING
COURSE
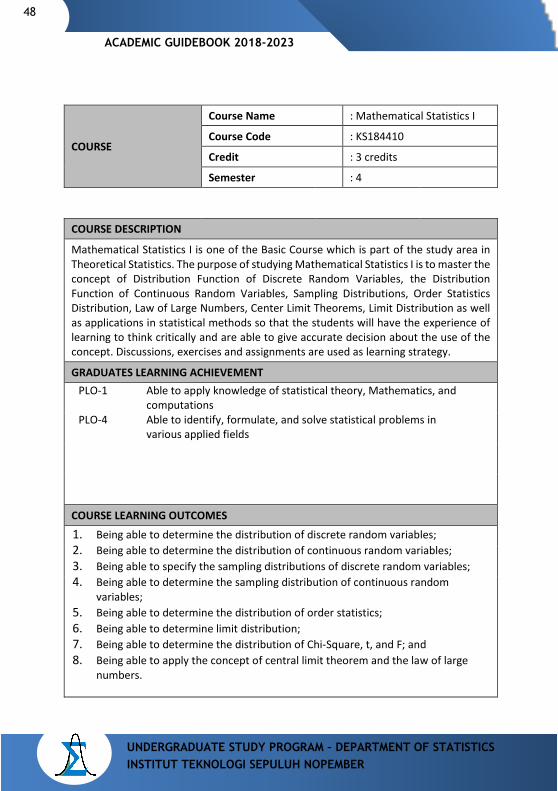
Name of Course : Introduction to Statistical Method
Code Course : KS184101
Credit : 3 credits
Semester : 1
COURSE DESCRIPTION
Introduction to Statistical Method is a course that supports graduate’s learning achievement of study program, i.e. PLO3.6, PLO4.1 to PLO4.4. After joining this course, the students are expected to be able to analyze data and formulate problem into statistical problem and complete it with or without using computer, particularly univariate, from testing parameter one population, comparing two population parameters, to making relationship pattern of two variables (i.e. response and predictor). Learning method used is tutorial, discussion, and exercises. The assignment is given in group and evaluation is undertaken by classroom activities, presentations to make reports and written examinations.
GRADUATES LEARNING ACHIEVEMENTS PLO-1 Able to apply knowledge of statistical theory, Mathematics, and
computations PLO-3 Able to analyze data with appropriate statistical methods and
interpret them PLO-4 Able to identify, formulate, and solve statistical problems in various
applied fields
COURSE LEARNING OUTCOMES 1. Able to present data and provide interpretation of information from a group of
data 2. Able to calculate expectations (averages) and variances of a random variable; 3. Able to calculate the probability of a discrete random variable; 4. Able to calculate the chance of continuous random variables; 5. Able to estimate population parameters 6. Able to test the parameters of a population; 7. Able to compare 2 population parameters: Average, Variance, and Proportion;
and 8. Being able to model the relationship between 2 variables.
ACADEMIC GUIDEBOOK 2018-2023
33
UNDERGRADUATE STUDY PROGRAM – DEPARTMENT OF STATISTICS INSTITUT TEKNOLOGI SEPULUH NOPEMBER
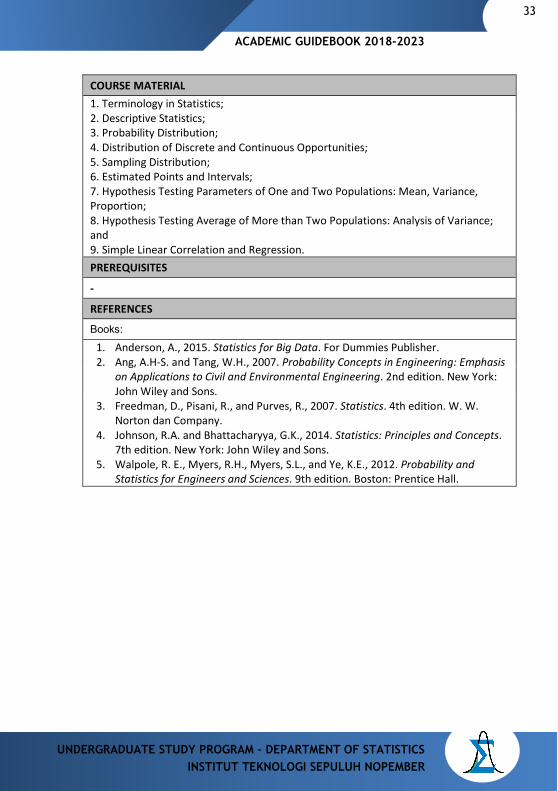
COURSE MATERIAL 1. Terminology in Statistics; 2. Descriptive Statistics; 3. Probability Distribution; 4. Distribution of Discrete and Continuous Opportunities; 5. Sampling Distribution; 6. Estimated Points and Intervals; 7. Hypothesis Testing Parameters of One and Two Populations: Mean, Variance, Proportion; 8. Hypothesis Testing Average of More than Two Populations: Analysis of Variance; and 9. Simple Linear Correlation and Regression. PREREQUISITES
-
REFERENCES
Books: 1. Anderson, A., 2015. Statistics for Big Data. For Dummies Publisher. 2. Ang, A.H-S. and Tang, W.H., 2007. Probability Concepts in Engineering: Emphasis
on Applications to Civil and Environmental Engineering. 2nd edition. New York: John Wiley and Sons.
3. Freedman, D., Pisani, R., and Purves, R., 2007. Statistics. 4th edition. W. W. Norton dan Company.
4. Johnson, R.A. and Bhattacharyya, G.K., 2014. Statistics: Principles and Concepts. 7th edition. New York: John Wiley and Sons.
5. Walpole, R. E., Myers, R.H., Myers, S.L., and Ye, K.E., 2012. Probability and Statistics for Engineers and Sciences. 9th edition. Boston: Prentice Hall.
34
UNDERGRADUATE STUDY PROGRAM – DEPARTMENT OF STATISTICS INSTITUT TEKNOLOGI SEPULUH NOPEMBER
ACADEMIC GUIDEBOOK 2018-2023
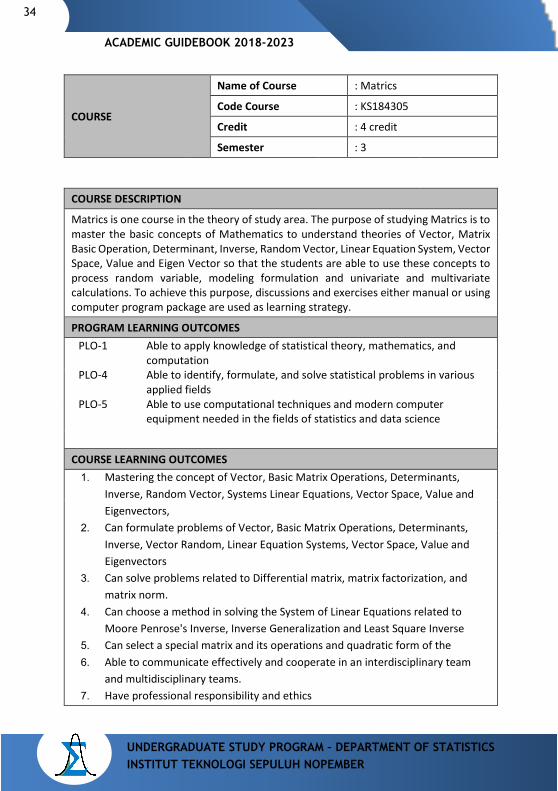
COURSE
Name of Course : Matrics
Code Course : KS184305
Credit : 4 credit
Semester : 3
COURSE DESCRIPTION
Matrics is one course in the theory of study area. The purpose of studying Matrics is to master the basic concepts of Mathematics to understand theories of Vector, Matrix Basic Operation, Determinant, Inverse, Random Vector, Linear Equation System, Vector Space, Value and Eigen Vector so that the students are able to use these concepts to process random variable, modeling formulation and univariate and multivariate calculations. To achieve this purpose, discussions and exercises either manual or using computer program package are used as learning strategy.
PROGRAM LEARNING OUTCOMES PLO-1 Able to apply knowledge of statistical theory, mathematics, and
computation PLO-4 Able to identify, formulate, and solve statistical problems in various
applied fields PLO-5 Able to use computational techniques and modern computer
equipment needed in the fields of statistics and data science
COURSE LEARNING OUTCOMES 1. Mastering the concept of Vector, Basic Matrix Operations, Determinants,
Inverse, Random Vector, Systems Linear Equations, Vector Space, Value and Eigenvectors,
2. Can formulate problems of Vector, Basic Matrix Operations, Determinants, Inverse, Vector Random, Linear Equation Systems, Vector Space, Value and Eigenvectors
3. Can solve problems related to Differential matrix, matrix factorization, and matrix norm.
4. Can choose a method in solving the System of Linear Equations related to Moore Penrose's Inverse, Inverse Generalization and Least Square Inverse
5. Can select a special matrix and its operations and quadratic form of the 6. Able to communicate effectively and cooperate in an interdisciplinary team
and multidisciplinary teams. 7. Have professional responsibility and ethics
ACADEMIC GUIDEBOOK 2018-2023
35
UNDERGRADUATE STUDY PROGRAM – DEPARTMENT OF STATISTICS INSTITUT TEKNOLOGI SEPULUH NOPEMBER
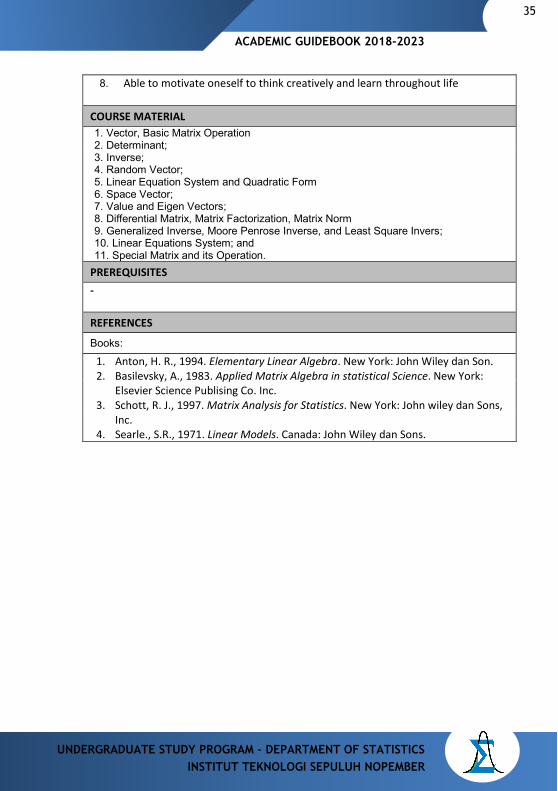
8. Able to motivate oneself to think creatively and learn throughout life
COURSE MATERIAL 1. Vector, Basic Matrix Operation 2. Determinant; 3. Inverse; 4. Random Vector; 5. Linear Equation System and Quadratic Form 6. Space Vector; 7. Value and Eigen Vectors; 8. Differential Matrix, Matrix Factorization, Matrix Norm 9. Generalized Inverse, Moore Penrose Inverse, and Least Square Invers; 10. Linear Equations System; and 11. Special Matrix and its Operation.
PREREQUISITES - REFERENCES
Books: 1. Anton, H. R., 1994. Elementary Linear Algebra. New York: John Wiley dan Son. 2. Basilevsky, A., 1983. Applied Matrix Algebra in statistical Science. New York:
Elsevier Science Publising Co. Inc. 3. Schott, R. J., 1997. Matrix Analysis for Statistics. New York: John wiley dan Sons,
Inc. 4. Searle., S.R., 1971. Linear Models. Canada: John Wiley dan Sons.
36
UNDERGRADUATE STUDY PROGRAM – DEPARTMENT OF STATISTICS INSTITUT TEKNOLOGI SEPULUH NOPEMBER
ACADEMIC GUIDEBOOK 2018-2023
COURSE
Course Name : Mathematics III
Course Code : KS184306
Credit : 3 credit
Semester : 3
COURSE DESCRIPTION
Mathematics III is one of Basic Course which is a part of study area in Mathematics. The purpose of studying Mathematics III is to master the concept of Complex Numerical System, Ordinary Differential System, Function of Some Variables, Maximum, Minimum, Coordinate System, Fold Integral, and application in statistical method so that the students will have the experience of learning to think critically and to take appropriate decision about the use of the concept. Learning strategy used is discussions, exercises, and assignments.
GRADUATES LEARNING ACHIEVEMENTS PLO-1 Able to apply knowledge of statistical theory, mathematics, and
computation PLO-4 Able to identify, formulate, and solve statistical problems in various
applied fields
COURSE LEARNING OUTCOMES 1. Able to understand mathematical concepts which consist of: Sets of complex
numbers, Ordinary Differential Equations, Multivariable Functions (including Cylindrical and Spherical Coordinates) with Partial Differentials and Multiple Integral, Variable Transformations, and Optimization of Closed Form Functions.
2. Able to analyze the relationship between mathematical concepts and mathematical statistical theory and suitable statistical methods
3. Can solve problems related to sets of complex number systems, ordinary differential equations (PDB), separate variables, homogeneous PD, PD extract, factors integrator, linear PD level one, PD Bernoulli, multiple variable function, gradient computation, total differential, implicit, maximum, minimum function, coordinate system and fold integral and its application
4. Able to determine solutions of ordinary differential equations; 5. Able to determine gradients, total differentials, implicit functions,
applications in statistics; 6. Able to communicate effectively and collaborate in interdisciplinary and
multidisciplinary teams. 7. Have responsibility and professional ethics
ACADEMIC GUIDEBOOK 2018-2023
37
UNDERGRADUATE STUDY PROGRAM – DEPARTMENT OF STATISTICS INSTITUT TEKNOLOGI SEPULUH NOPEMBER
8. Able to motivate oneself to think creatively and have longlife learning
COURSE MATERIAL 1. Set of Complex Number System; 2. Ordinary Differential Equation, Separated Variable, Differential Equations,
Homogenous Differential Equation, Extract Differential Equation, Integral Factor, Differential Equation of One Level Linear, and Bernoulli Differential Equation;
3. The functions of several variables, the calculation of Gradient, Total Differential, Implicit Function, Maximum, Minimum; and
4. Coordinate System and Fold Integral and its application. PREREQUISITES
Mathematics II REFERENCES
Books: 1. Anton, H., 1999. Calculus, with analytic Geomery. 6th edition. Singapore: Jhon
Wiley dan Sons, Inc. 2. Erwin KreysZigh, 1983. Advanced Engineering Mathematics. 7th edition. 3. Purcell., 2000. Kalkulus dan Geometri Analsis. jilid I dan II. 4. Purcell, J.E. and Rignon., 2000. Calculus. 8th edition. Prentice Hall. 5. Salas SL, Hille e, 1982. Calculus of One and Several Variables. 4th edition. New
York: Jhon Wiley.
COURSE
Course Name : Probability Theory
Course Code : KW184901
Credit : 3 credit
Semester : 3
COURSE DESCRIPTION
Probability Theory is one of basic courses which is part of study area in statistical theory. The purpose of studying Probability Theory is to master basic concepts of Random Experiment, Random Variable, Probability Space, Distribution Function, Conditional Distribution and Stochastic Freedom, Mathematical Expectation, Moment Generating Function, Characteristic Function, Random Variable Convergence and their applications in statistical method so that the students will have learning experiences to
38
UNDERGRADUATE STUDY PROGRAM – DEPARTMENT OF STATISTICS INSTITUT TEKNOLOGI SEPULUH NOPEMBER
ACADEMIC GUIDEBOOK 2018-2023
think critically and are able to make accurate decisions about the use of these concepts. Discussions, exercises and assignments are used as learning strategy.
GRADUATES LEARNING ACHIEVEMENTS PLO-1 Able to apply knowledge of statistical theory, mathematics, andc
omputation PLO-4 Able to identify, formulate, and solve statistical problems in various
applied fields
COURSE LEARNING OUTCOMES 1. Able to understand the concept of random experiments, random variables ,
probability space, distribution function, conditional distribution and stochastic freedom, mathematical expectation, moment generator function, characteristic function, convergence of random variable
2. Able to formulate random experiment problems, random variables, probability space, distribution function, conditional distribution and stochastic freedom, mathematical expectation, moment generating function, characteristic function of
3. Able to choose the method of determining the convergence of random variables, adapt to probability problems,probability models.
4. Able to formulate problems of random experiments, random variables, probability spaces, distribution functions, conditional distribution and stochastic freedom, mathematical expectation, moment generating function, characteristic function of
5. Adaptable to probability problems,probability models. 6. Able to communicate effectively and cooperate in interdisciplinary and
multidisciplinary teams. 7. Responsible and having professional ethics. 8. Able to think creatively and having longlife learning
COURSE MATERIAL 1. Random Experiment, sample space and event; 2. Probability, Probability Space and its properties; 3. Discrete and Continuous Random Variables as well as its properties; 4. Discrete and Continuous Probability Distributions, Conditional Distributions
and Stochastic Freedom; 5. Mathematical Expectations, Moment Generating Functions (MGF),
Characteristic Functions; and 6. The convergence of Random Variable Sequence.
PREREQUISITES
1. Mathematics I,
ACADEMIC GUIDEBOOK 2018-2023
39
UNDERGRADUATE STUDY PROGRAM – DEPARTMENT OF STATISTICS INSTITUT TEKNOLOGI SEPULUH NOPEMBER
2. Mathematics II, 3. Introduction to Statistical Method.
REFERENCES
Books: 1. Bartoszynski, R. and Bugaj, M.N., 1996. Probability and Statistical Inference. New
York: John Wiley dan Sons. 2. Bhat, B.R., 1981. Modern Probability Theory. New York: John Wiley dan Sons. 3. Hogg, R.V. and Craig, A.T., 1995. Introduction to Mathematical Statistics, 5th
edition. New York: MacMillon. 4. Mood, A.M., Graybill, F.A. and Boes, D.C., 1974. Introduction of the Theory of
Statistics. 4th edition. Tokyo: Mc-Graw Hill. 5. Rohatgi, W.K., 1976. An Introduction to Probability Theory and Mathematical
Statistics. New York: John Wiley and Sons. 6. Salas SL, Hille, E., 1982. Calculus of One and Several Variables. 4th edition. New
York: John Wiley.
40
UNDERGRADUATE STUDY PROGRAM – DEPARTMENT OF STATISTICS INSTITUT TEKNOLOGI SEPULUH NOPEMBER
ACADEMIC GUIDEBOOK 2018-2023
COURSE
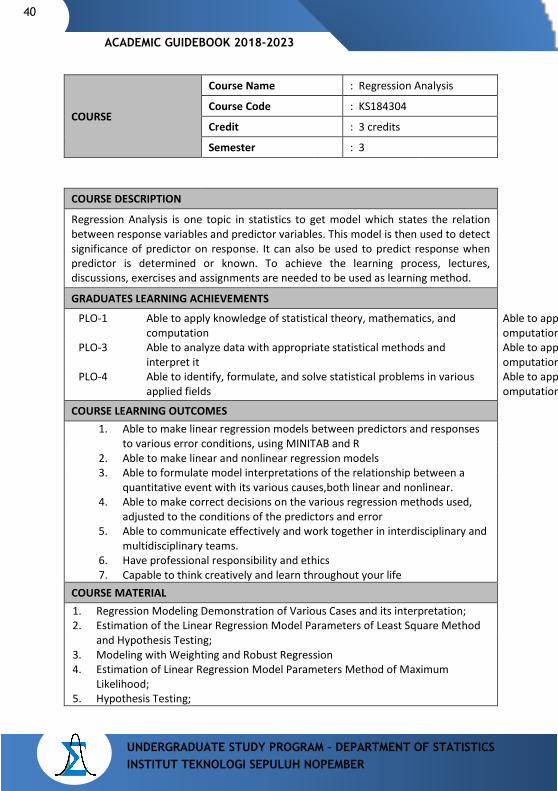
Course Name : Regression Analysis
Course Code : KS184304
Credit : 3 credits
Semester : 3
COURSE DESCRIPTION
Regression Analysis is one topic in statistics to get model which states the relation between response variables and predictor variables. This model is then used to detect significance of predictor on response. It can also be used to predict response when predictor is determined or known. To achieve the learning process, lectures, discussions, exercises and assignments are needed to be used as learning method.
GRADUATES LEARNING ACHIEVEMENTS
PLO-1 Able to apply knowledge of statistical theory, mathematics, and computation
Able to app omputation
PLO-3 Able to analyze data with appropriate statistical methods and interpret it
Able to app omputation
PLO-4 Able to identify, formulate, and solve statistical problems in various applied fields
Able to app omputation
COURSE LEARNING OUTCOMES 1. Able to make linear regression models between predictors and responses
to various error conditions, using MINITAB and R 2. Able to make linear and nonlinear regression models 3. Able to formulate model interpretations of the relationship between a
quantitative event with its various causes,both linear and nonlinear. 4. Able to make correct decisions on the various regression methods used,
adjusted to the conditions of the predictors and error 5. Able to communicate effectively and work together in interdisciplinary and
multidisciplinary teams. 6. Have professional responsibility and ethics 7. Capable to think creatively and learn throughout your life
COURSE MATERIAL 1. Regression Modeling Demonstration of Various Cases and its interpretation; 2. Estimation of the Linear Regression Model Parameters of Least Square Method
and Hypothesis Testing; 3. Modeling with Weighting and Robust Regression 4. Estimation of Linear Regression Model Parameters Method of Maximum
Likelihood; 5. Hypothesis Testing;
ACADEMIC GUIDEBOOK 2018-2023
41
UNDERGRADUATE STUDY PROGRAM – DEPARTMENT OF STATISTICS INSTITUT TEKNOLOGI SEPULUH NOPEMBER
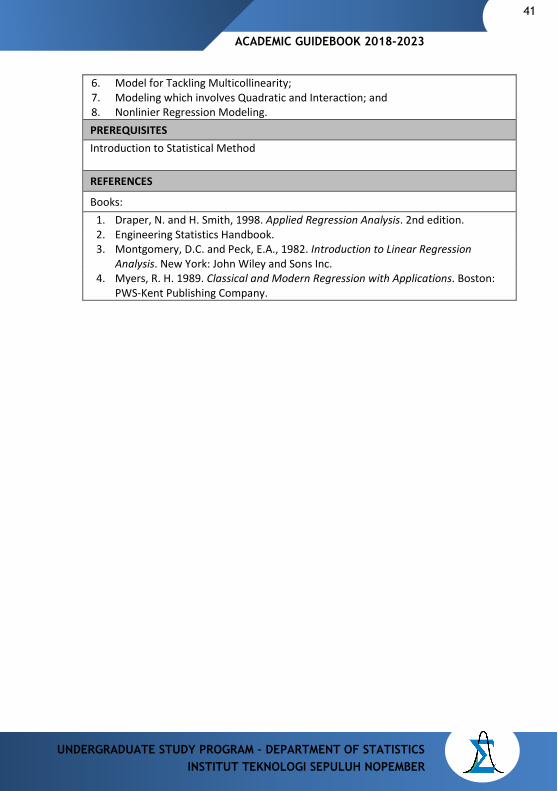
6. Model for Tackling Multicollinearity; 7. Modeling which involves Quadratic and Interaction; and 8. Nonlinier Regression Modeling. PREREQUISITES Introduction to Statistical Method REFERENCES
Books: 1. Draper, N. and H. Smith, 1998. Applied Regression Analysis. 2nd edition. 2. Engineering Statistics Handbook. 3. Montgomery, D.C. and Peck, E.A., 1982. Introduction to Linear Regression
Analysis. New York: John Wiley and Sons Inc. 4. Myers, R. H. 1989. Classical and Modern Regression with Applications. Boston:
PWS-Kent Publishing Company.
42
UNDERGRADUATE STUDY PROGRAM – DEPARTMENT OF STATISTICS INSTITUT TEKNOLOGI SEPULUH NOPEMBER
ACADEMIC GUIDEBOOK 2018-2023
COURSE
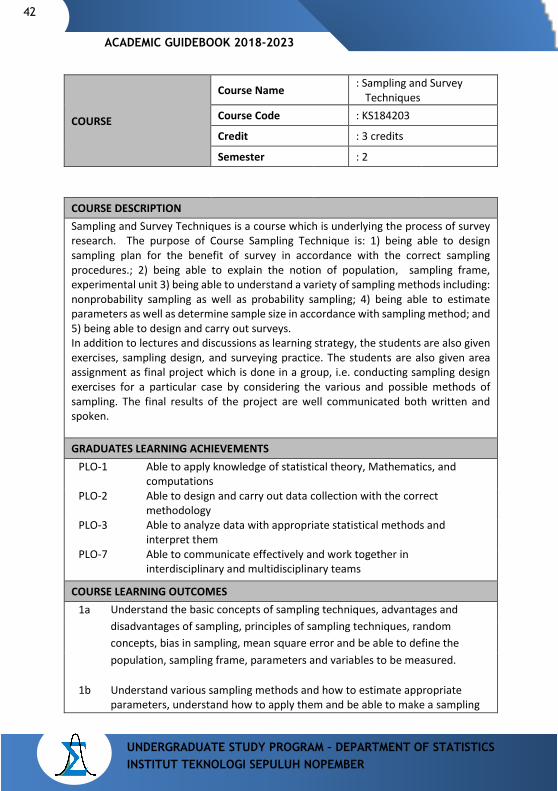
Course Name : Sampling and Survey Techniques
Course Code : KS184203
Credit : 3 credits
Semester : 2
COURSE DESCRIPTION Sampling and Survey Techniques is a course which is underlying the process of survey research. The purpose of Course Sampling Technique is: 1) being able to design sampling plan for the benefit of survey in accordance with the correct sampling procedures.; 2) being able to explain the notion of population, sampling frame, experimental unit 3) being able to understand a variety of sampling methods including: nonprobability sampling as well as probability sampling; 4) being able to estimate parameters as well as determine sample size in accordance with sampling method; and 5) being able to design and carry out surveys. In addition to lectures and discussions as learning strategy, the students are also given exercises, sampling design, and surveying practice. The students are also given area assignment as final project which is done in a group, i.e. conducting sampling design exercises for a particular case by considering the various and possible methods of sampling. The final results of the project are well communicated both written and spoken. GRADUATES LEARNING ACHIEVEMENTS
PLO-1 Able to apply knowledge of statistical theory, Mathematics, and computations
PLO-2 Able to design and carry out data collection with the correct methodology
PLO-3 Able to analyze data with appropriate statistical methods and interpret them
PLO-7 Able to communicate effectively and work together in interdisciplinary and multidisciplinary teams
COURSE LEARNING OUTCOMES 1a Understand the basic concepts of sampling techniques, advantages and
disadvantages of sampling, principles of sampling techniques, random concepts, bias in sampling, mean square error and be able to define the population, sampling frame, parameters and variables to be measured.
1b Understand various sampling methods and how to estimate appropriate parameters, understand how to apply them and be able to make a sampling
ACADEMIC GUIDEBOOK 2018-2023
43
UNDERGRADUATE STUDY PROGRAM – DEPARTMENT OF STATISTICS INSTITUT TEKNOLOGI SEPULUH NOPEMBER
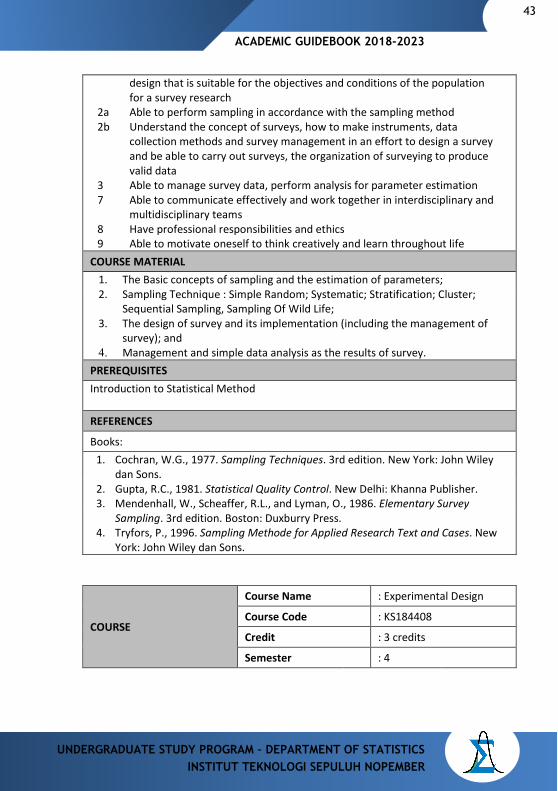
design that is suitable for the objectives and conditions of the population for a survey research
2a Able to perform sampling in accordance with the sampling method 2b Understand the concept of surveys, how to make instruments, data
collection methods and survey management in an effort to design a survey and be able to carry out surveys, the organization of surveying to produce valid data
3 Able to manage survey data, perform analysis for parameter estimation 7 Able to communicate effectively and work together in interdisciplinary and
multidisciplinary teams 8 Have professional responsibilities and ethics 9 Able to motivate oneself to think creatively and learn throughout life
COURSE MATERIAL 1. The Basic concepts of sampling and the estimation of parameters; 2. Sampling Technique : Simple Random; Systematic; Stratification; Cluster;
Sequential Sampling, Sampling Of Wild Life; 3. The design of survey and its implementation (including the management of
survey); and 4. Management and simple data analysis as the results of survey.
PREREQUISITES Introduction to Statistical Method REFERENCES
Books: 1. Cochran, W.G., 1977. Sampling Techniques. 3rd edition. New York: John Wiley
dan Sons. 2. Gupta, R.C., 1981. Statistical Quality Control. New Delhi: Khanna Publisher. 3. Mendenhall, W., Scheaffer, R.L., and Lyman, O., 1986. Elementary Survey
Sampling. 3rd edition. Boston: Duxburry Press. 4. Tryfors, P., 1996. Sampling Methode for Applied Research Text and Cases. New
York: John Wiley dan Sons.
COURSE
Course Name : Experimental Design
Course Code : KS184408
Credit : 3 credits
Semester : 4
44
UNDERGRADUATE STUDY PROGRAM – DEPARTMENT OF STATISTICS INSTITUT TEKNOLOGI SEPULUH NOPEMBER
ACADEMIC GUIDEBOOK 2018-2023
COURSE DESCRIPTION
The purpose of this course is to make the students able to design data collection through experiments and to analyze data of experimental results and interpret them.Theory materials are of a variety of environmental design and of treatment design delivered through lectures and discussions. Likewise the analysis data material is delivered through lectures and discussion as well as practical classes with or without software. In addition, the students are given the assignment of both independent and group to identify the applicability of various designs on the real problems through observation and study area in government agencies or industries where there are research and development activities. The purpose of this assignment is to train the students in order to be able to manage and work in teams as well as being responsible for the work result independently and in groups.
GRADUATES LEARNING ACHIEVEMENTS PLO-1 Able to apply knowledge of statistical theory, mathematics, and
computation PLO-2 Able to design and carry out data collection with correct methodology PLO-3 Able to analyze data with appropriate statistical methods and
interpret it PLO-7 Able communicate effectively and cooperate in interdisciplinary and
multidisciplinary teams
COURSE LEARNING OUTCOMES 1. Explain the use of experimental design concepts indata collection. 2. Can formulate experimental designs with one factor and completely
randomized design 3. Can analyze value comparisons middle treatment with multiple comparison
and contrast methods, as well as tracking changes in response variables through orthogonal polynomial contrast and regression analysis.
4. Able to utilize science and technology to process data onexperimental results.
5. Be able to compile experimental designs with one factor and random designof complete groups, incomplete randomized block design, Latin square design and compiling a two-factor experimental
6. Able to make correct decisions based on experimental results and able to communicate the results of analysis both verbally and in writing
7. Able to communicate Effective and collaborating in an interdisciplinary and multidisciplinary team.
8. Have professional responsibility and work ethics 9. Able to motivate oneself to think creatively and learn lifelong
COURSE MATERIAL
ACADEMIC GUIDEBOOK 2018-2023
45
UNDERGRADUATE STUDY PROGRAM – DEPARTMENT OF STATISTICS INSTITUT TEKNOLOGI SEPULUH NOPEMBER
1. Basic Concepts of Experimental Design; 2. Complete Random Design; 3. Double Orthogonal Contrasts, and Polynomial Contrast 4. Group Random Design; 5. Incomplete Group Random Design; 6. Latin Squares Design; 7. Factorial Design (Fixed, Random, and Mixed models); 8. Mean Square Expectation in the table of Analysis of Variance; 9. 2 k Factorial Design; 10. Fractional Factorial Design; 11. Nested Design; and 12. Split Plot Design. PREREQUISITES Regression Analysis REFERENCES
Books: 1. Box, George EP, William G Hunter, and J Stuart Hunter. 1978. Statistics for
Experimenters an Introduction to Design: Data Analysis and Model Building. John Wiley dan Sons Inc.
2. Hinkelmann K, Kempthorne O.1994. Design and Analysis of Experiments. New York: John Wiley danSons.
3. Kuehl RO. 2000. Design of Experiments: Statistical Principles of Research Design and Analysis.
4. Montgomery, D.C, 2005. Design and Analysis of Experiments. 6th edition. New York: John Wiley dan Sons Inc.
COURSE
Course Name : Mathematics IV
Course Code : KS184409
Credit : 3 credits
Semester : 4
COURSE DESCRIPTION
Mathematics IV is one of the Basic Course which is part of the study area in mathematics. The purpose of studying Mathematics IV is to master the concept of Differential Equations with Operator D, Simultaneous Differential Equations, Completion of Differential Equations series, Gamma and Beta Functions, Fourier Series,
46
UNDERGRADUATE STUDY PROGRAM – DEPARTMENT OF STATISTICS INSTITUT TEKNOLOGI SEPULUH NOPEMBER
ACADEMIC GUIDEBOOK 2018-2023
Laplace Transformation, Partial Differential Equations and boundary value problem and Different Equations up to the application in statistical methods so that the students will have the experience of learning to think critically and be able to give proper decision about the use of the concept. Discussions and exercises as well as assignments are used as learning strategy.
GRADUATES LEARNING ACHIEVEMEMTS PLO-1 Able to apply knowledge of statistical theory, mathematics, and
computation PLO-4 Able to identify, formulate, and solve statistical problems in various
applied fields
COURSE LEARNING OUTCOMES 1. Mastering the PD concept with operator D, Simultaneous PD, PD solution
with series, gamma and beta functions, Forier series, Laplace transformation, partial PD and boundary value problems and finite difference equations and their application
2. Can formulate PD problems with operator D, simultaneous PD, PD solution with series, gamma and beta functions, Forier series, Laplace transformation, partial PD and boundary value problems and finite difference equations and their application
3. Can solve problems related to PD with operator D, simultaneous PD, PD solution with series, gamma and beta functions, Forier series, Laplace transformation, partial PD and boundary value problems and finite difference equations and the application
4. Can choose the method in solving PD, row value problems, difference equations
5. Can adapt to problems in PD with D operators, simultaneous PD, PD solution with series, gamma and beta functions, Forier series, Laplace transformation, Partial PD and the problem of boundary values and different equations
6. Able to communicate effectively and work together in interdisciplinary and multidisciplinary teams
7. Have responsibility and professional ethics 8. Able to motivate oneself to think creatively and learn lifelong
COURSE MATERIAL 1. DE with Operator D, Simultaneous DE, and the solution of DE Series; 2. Gamma and Beta Functions; 3. Fourier series; 4. Laplace Transformation; 5. Partial DE and boundary value problem; and
ACADEMIC GUIDEBOOK 2018-2023
47
UNDERGRADUATE STUDY PROGRAM – DEPARTMENT OF STATISTICS INSTITUT TEKNOLOGI SEPULUH NOPEMBER
6. Differential Equations.
PREREQUISITES Mathematics III REFERENCES
Books: 1. Anton, H., 1999. Calculus, withanalitic Geomery. 6th edition. Singapore: Jhon
Wiley dan Sons Inc. 2. Richardson, C.H., 1981. An Introduction to the Calculus of Finite Difference. 3. Salas SL, and Hille E, 1982. Calculus of One and Several Variables. 4th edition. New
York: Jhon Wiley. 4. Khuri, I.A, “Advance Calculus with Application in Statistics”, Jhon Wiley & Sons,
Inc., Singapore., 2002
48
UNDERGRADUATE STUDY PROGRAM – DEPARTMENT OF STATISTICS INSTITUT TEKNOLOGI SEPULUH NOPEMBER
ACADEMIC GUIDEBOOK 2018-2023
COURSE
Course Name : Mathematical Statistics I
Course Code : KS184410
Credit : 3 credits
Semester : 4
COURSE DESCRIPTION
Mathematical Statistics I is one of the Basic Course which is part of the study area in Theoretical Statistics. The purpose of studying Mathematical Statistics I is to master the concept of Distribution Function of Discrete Random Variables, the Distribution Function of Continuous Random Variables, Sampling Distributions, Order Statistics Distribution, Law of Large Numbers, Center Limit Theorems, Limit Distribution as well as applications in statistical methods so that the students will have the experience of learning to think critically and are able to give accurate decision about the use of the concept. Discussions, exercises and assignments are used as learning strategy.
GRADUATES LEARNING ACHIEVEMENT
PLO-1 Able to apply knowledge of statistical theory, Mathematics, and computations
PLO-4 Able to identify, formulate, and solve statistical problems in various applied fields
COURSE LEARNING OUTCOMES
1. Being able to determine the distribution of discrete random variables; 2. Being able to determine the distribution of continuous random variables; 3. Being able to specify the sampling distributions of discrete random variables; 4. Being able to determine the sampling distribution of continuous random
variables; 5. Being able to determine the distribution of order statistics; 6. Being able to determine limit distribution; 7. Being able to determine the distribution of Chi-Square, t, and F; and 8. Being able to apply the concept of central limit theorem and the law of large
numbers.
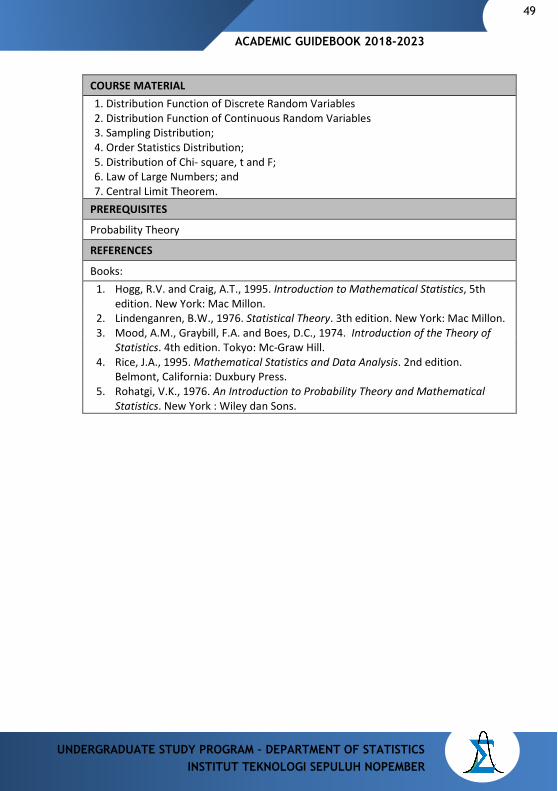
ACADEMIC GUIDEBOOK 2018-2023
49
UNDERGRADUATE STUDY PROGRAM – DEPARTMENT OF STATISTICS INSTITUT TEKNOLOGI SEPULUH NOPEMBER
COURSE MATERIAL 1. Distribution Function of Discrete Random Variables 2. Distribution Function of Continuous Random Variables 3. Sampling Distribution; 4. Order Statistics Distribution; 5. Distribution of Chi- square, t and F; 6. Law of Large Numbers; and 7. Central Limit Theorem.
PREREQUISITES
Probability Theory
REFERENCES
Books: 1. Hogg, R.V. and Craig, A.T., 1995. Introduction to Mathematical Statistics, 5th
edition. New York: Mac Millon. 2. Lindenganren, B.W., 1976. Statistical Theory. 3th edition. New York: Mac Millon. 3. Mood, A.M., Graybill, F.A. and Boes, D.C., 1974. Introduction of the Theory of
Statistics. 4th edition. Tokyo: Mc-Graw Hill. 4. Rice, J.A., 1995. Mathematical Statistics and Data Analysis. 2nd edition.
Belmont, California: Duxbury Press. 5. Rohatgi, V.K., 1976. An Introduction to Probability Theory and Mathematical
Statistics. New York : Wiley dan Sons.
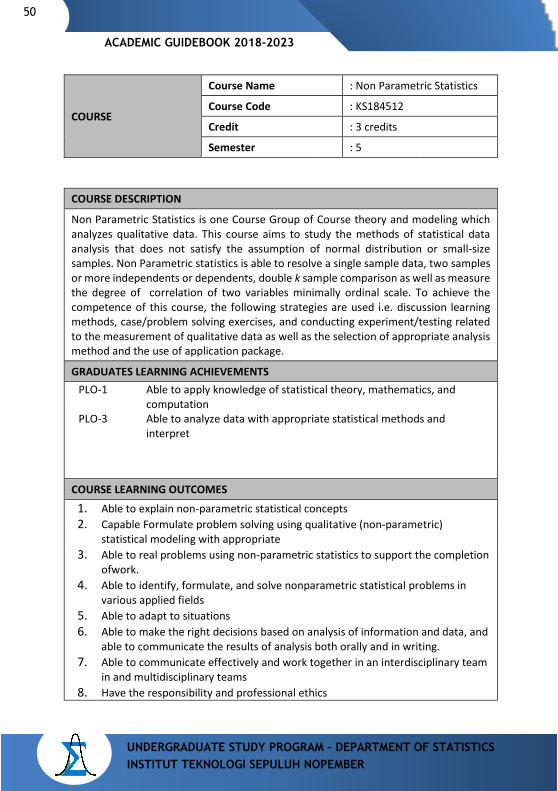
50
UNDERGRADUATE STUDY PROGRAM – DEPARTMENT OF STATISTICS INSTITUT TEKNOLOGI SEPULUH NOPEMBER
ACADEMIC GUIDEBOOK 2018-2023
COURSE
Course Name : Non Parametric Statistics
Course Code : KS184512
Credit : 3 credits
Semester : 5
COURSE DESCRIPTION
Non Parametric Statistics is one Course Group of Course theory and modeling which analyzes qualitative data. This course aims to study the methods of statistical data analysis that does not satisfy the assumption of normal distribution or small-size samples. Non Parametric statistics is able to resolve a single sample data, two samples or more independents or dependents, double k sample comparison as well as measure the degree of correlation of two variables minimally ordinal scale. To achieve the competence of this course, the following strategies are used i.e. discussion learning methods, case/problem solving exercises, and conducting experiment/testing related to the measurement of qualitative data as well as the selection of appropriate analysis method and the use of application package.
GRADUATES LEARNING ACHIEVEMENTS PLO-1 Able to apply knowledge of statistical theory, mathematics, and
computation PLO-3 Able to analyze data with appropriate statistical methods and
interpret
COURSE LEARNING OUTCOMES
1. Able to explain non-parametric statistical concepts 2. Capable Formulate problem solving using qualitative (non-parametric)
statistical modeling with appropriate 3. Able to real problems using non-parametric statistics to support the completion
ofwork. 4. Able to identify, formulate, and solve nonparametric statistical problems in
various applied fields 5. Able to adapt to situations 6. Able to make the right decisions based on analysis of information and data, and
able to communicate the results of analysis both orally and in writing. 7. Able to communicate effectively and work together in an interdisciplinary team
in and multidisciplinary teams 8. Have the responsibility and professional ethics
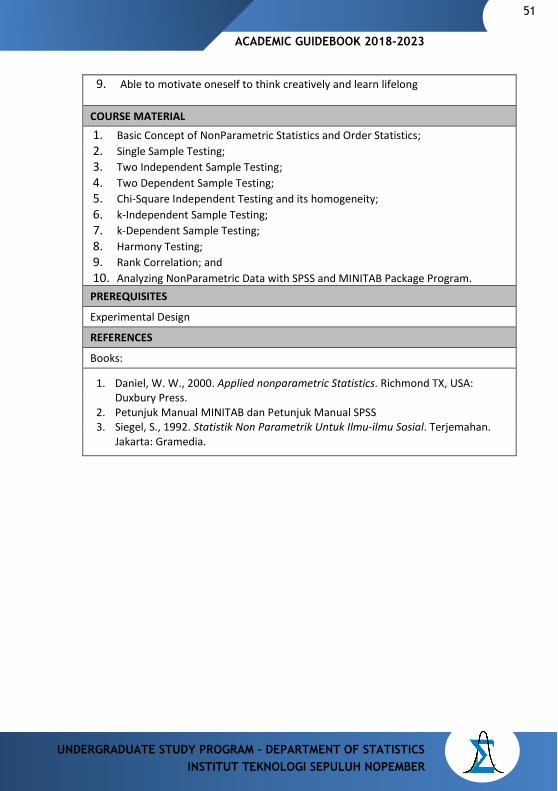
ACADEMIC GUIDEBOOK 2018-2023
51
UNDERGRADUATE STUDY PROGRAM – DEPARTMENT OF STATISTICS INSTITUT TEKNOLOGI SEPULUH NOPEMBER
9. Able to motivate oneself to think creatively and learn lifelong
COURSE MATERIAL
1. Basic Concept of NonParametric Statistics and Order Statistics; 2. Single Sample Testing; 3. Two Independent Sample Testing; 4. Two Dependent Sample Testing; 5. Chi-Square Independent Testing and its homogeneity; 6. k-Independent Sample Testing; 7. k-Dependent Sample Testing; 8. Harmony Testing; 9. Rank Correlation; and 10. Analyzing NonParametric Data with SPSS and MINITAB Package Program.
PREREQUISITES
Experimental Design
REFERENCES
Books:
1. Daniel, W. W., 2000. Applied nonparametric Statistics. Richmond TX, USA: Duxbury Press.
2. Petunjuk Manual MINITAB dan Petunjuk Manual SPSS 3. Siegel, S., 1992. Statistik Non Parametrik Untuk Ilmu-ilmu Sosial. Terjemahan.
Jakarta: Gramedia.
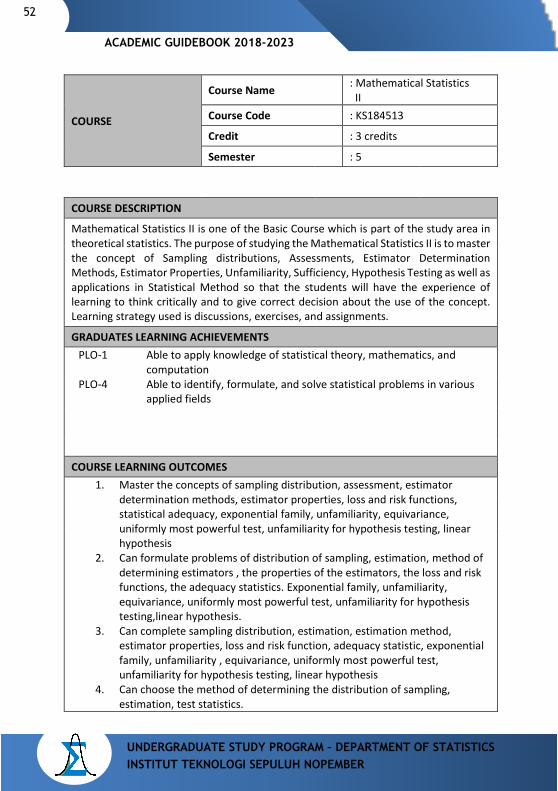
52
UNDERGRADUATE STUDY PROGRAM – DEPARTMENT OF STATISTICS INSTITUT TEKNOLOGI SEPULUH NOPEMBER
ACADEMIC GUIDEBOOK 2018-2023
COURSE
Course Name : Mathematical Statistics II
Course Code : KS184513
Credit : 3 credits
Semester : 5
COURSE DESCRIPTION
Mathematical Statistics II is one of the Basic Course which is part of the study area in theoretical statistics. The purpose of studying the Mathematical Statistics II is to master the concept of Sampling distributions, Assessments, Estimator Determination Methods, Estimator Properties, Unfamiliarity, Sufficiency, Hypothesis Testing as well as applications in Statistical Method so that the students will have the experience of learning to think critically and to give correct decision about the use of the concept. Learning strategy used is discussions, exercises, and assignments.
GRADUATES LEARNING ACHIEVEMENTS PLO-1 Able to apply knowledge of statistical theory, mathematics, and
computation PLO-4 Able to identify, formulate, and solve statistical problems in various
applied fields
COURSE LEARNING OUTCOMES 1. Master the concepts of sampling distribution, assessment, estimator
determination methods, estimator properties, loss and risk functions, statistical adequacy, exponential family, unfamiliarity, equivariance, uniformly most powerful test, unfamiliarity for hypothesis testing, linear hypothesis
2. Can formulate problems of distribution of sampling, estimation, method of determining estimators , the properties of the estimators, the loss and risk functions, the adequacy statistics. Exponential family, unfamiliarity, equivariance, uniformly most powerful test, unfamiliarity for hypothesis testing,linear hypothesis.
3. Can complete sampling distribution, estimation, estimation method, estimator properties, loss and risk function, adequacy statistic, exponential family, unfamiliarity , equivariance, uniformly most powerful test, unfamiliarity for hypothesis testing, linear hypothesis
4. Can choose the method of determining the distribution of sampling, estimation, test statistics.
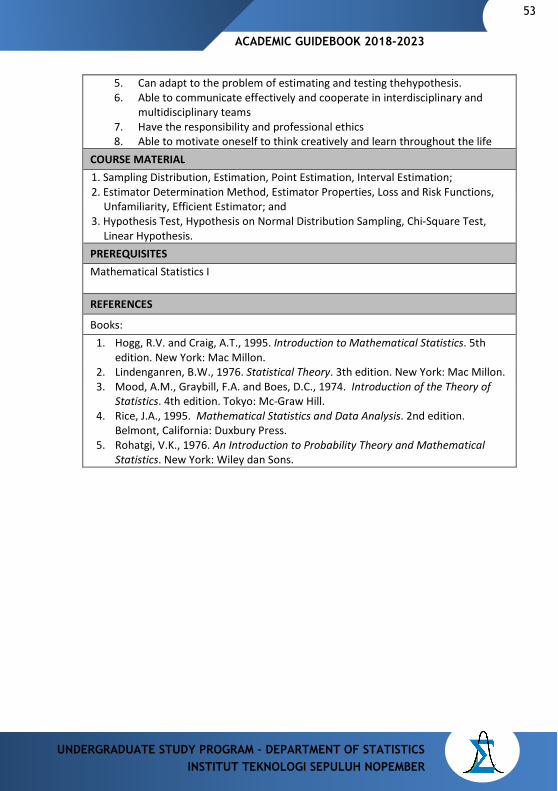
ACADEMIC GUIDEBOOK 2018-2023
53
UNDERGRADUATE STUDY PROGRAM – DEPARTMENT OF STATISTICS INSTITUT TEKNOLOGI SEPULUH NOPEMBER
5. Can adapt to the problem of estimating and testing thehypothesis. 6. Able to communicate effectively and cooperate in interdisciplinary and
multidisciplinary teams 7. Have the responsibility and professional ethics 8. Able to motivate oneself to think creatively and learn throughout the life
COURSE MATERIAL 1. Sampling Distribution, Estimation, Point Estimation, Interval Estimation; 2. Estimator Determination Method, Estimator Properties, Loss and Risk Functions,
Unfamiliarity, Efficient Estimator; and 3. Hypothesis Test, Hypothesis on Normal Distribution Sampling, Chi-Square Test,
Linear Hypothesis. PREREQUISITES Mathematical Statistics I REFERENCES
Books: 1. Hogg, R.V. and Craig, A.T., 1995. Introduction to Mathematical Statistics. 5th
edition. New York: Mac Millon. 2. Lindenganren, B.W., 1976. Statistical Theory. 3th edition. New York: Mac Millon. 3. Mood, A.M., Graybill, F.A. and Boes, D.C., 1974. Introduction of the Theory of
Statistics. 4th edition. Tokyo: Mc-Graw Hill. 4. Rice, J.A., 1995. Mathematical Statistics and Data Analysis. 2nd edition.
Belmont, California: Duxbury Press. 5. Rohatgi, V.K., 1976. An Introduction to Probability Theory and Mathematical
Statistics. New York: Wiley dan Sons.
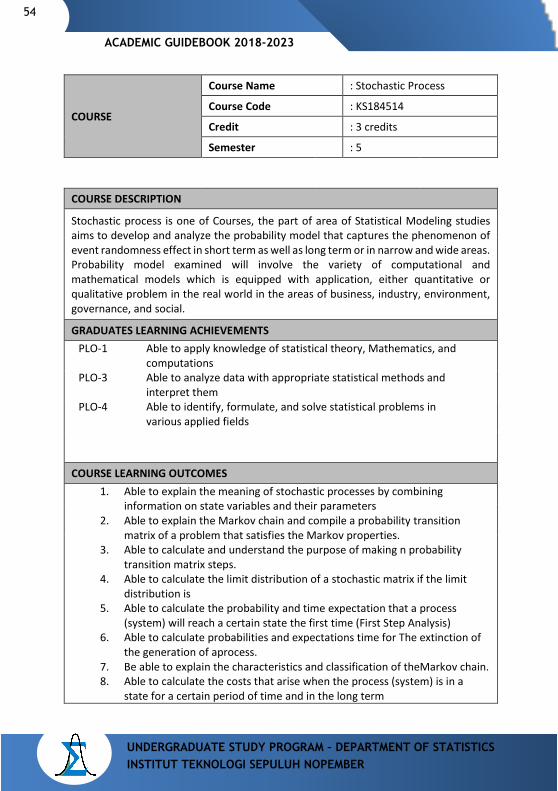
54
UNDERGRADUATE STUDY PROGRAM – DEPARTMENT OF STATISTICS INSTITUT TEKNOLOGI SEPULUH NOPEMBER
ACADEMIC GUIDEBOOK 2018-2023
COURSE
Course Name : Stochastic Process
Course Code : KS184514
Credit : 3 credits
Semester : 5
COURSE DESCRIPTION
Stochastic process is one of Courses, the part of area of Statistical Modeling studies aims to develop and analyze the probability model that captures the phenomenon of event randomness effect in short term as well as long term or in narrow and wide areas. Probability model examined will involve the variety of computational and mathematical models which is equipped with application, either quantitative or qualitative problem in the real world in the areas of business, industry, environment, governance, and social.
GRADUATES LEARNING ACHIEVEMENTS PLO-1 Able to apply knowledge of statistical theory, Mathematics, and
computations PLO-3 Able to analyze data with appropriate statistical methods and
interpret them PLO-4 Able to identify, formulate, and solve statistical problems in
various applied fields
COURSE LEARNING OUTCOMES 1. Able to explain the meaning of stochastic processes by combining
information on state variables and their parameters 2. Able to explain the Markov chain and compile a probability transition
matrix of a problem that satisfies the Markov properties. 3. Able to calculate and understand the purpose of making n probability
transition matrix steps. 4. Able to calculate the limit distribution of a stochastic matrix if the limit
distribution is 5. Able to calculate the probability and time expectation that a process
(system) will reach a certain state the first time (First Step Analysis) 6. Able to calculate probabilities and expectations time for The extinction of
the generation of aprocess. 7. Be able to explain the characteristics and classification of theMarkov chain. 8. Able to calculate the costs that arise when the process (system) is in a
state for a certain period of time and in the long term
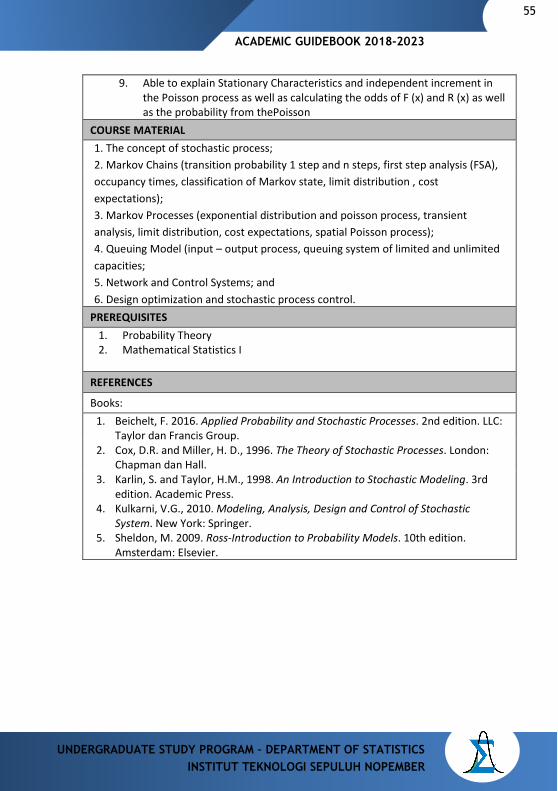
ACADEMIC GUIDEBOOK 2018-2023
55
UNDERGRADUATE STUDY PROGRAM – DEPARTMENT OF STATISTICS INSTITUT TEKNOLOGI SEPULUH NOPEMBER
9. Able to explain Stationary Characteristics and independent increment in the Poisson process as well as calculating the odds of F (x) and R (x) as well as the probability from thePoisson
COURSE MATERIAL 1. The concept of stochastic process; 2. Markov Chains (transition probability 1 step and n steps, first step analysis (FSA), occupancy times, classification of Markov state, limit distribution , cost expectations); 3. Markov Processes (exponential distribution and poisson process, transient analysis, limit distribution, cost expectations, spatial Poisson process); 4. Queuing Model (input – output process, queuing system of limited and unlimited capacities; 5. Network and Control Systems; and 6. Design optimization and stochastic process control.
PREREQUISITES 1. Probability Theory 2. Mathematical Statistics I
REFERENCES
Books: 1. Beichelt, F. 2016. Applied Probability and Stochastic Processes. 2nd edition. LLC:
Taylor dan Francis Group. 2. Cox, D.R. and Miller, H. D., 1996. The Theory of Stochastic Processes. London:
Chapman dan Hall. 3. Karlin, S. and Taylor, H.M., 1998. An Introduction to Stochastic Modeling. 3rd
edition. Academic Press. 4. Kulkarni, V.G., 2010. Modeling, Analysis, Design and Control of Stochastic
System. New York: Springer. 5. Sheldon, M. 2009. Ross-Introduction to Probability Models. 10th edition.
Amsterdam: Elsevier.
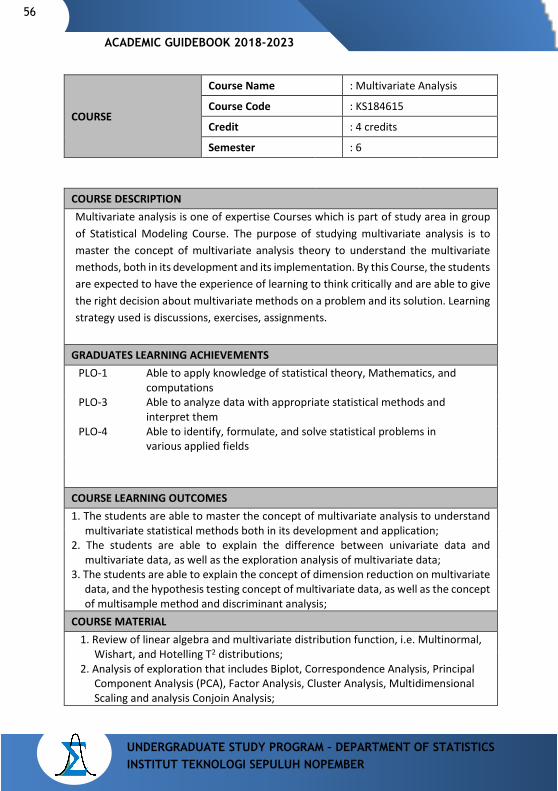
56
UNDERGRADUATE STUDY PROGRAM – DEPARTMENT OF STATISTICS INSTITUT TEKNOLOGI SEPULUH NOPEMBER
ACADEMIC GUIDEBOOK 2018-2023
COURSE
Course Name : Multivariate Analysis
Course Code : KS184615
Credit : 4 credits
Semester : 6
COURSE DESCRIPTION Multivariate analysis is one of expertise Courses which is part of study area in group of Statistical Modeling Course. The purpose of studying multivariate analysis is to master the concept of multivariate analysis theory to understand the multivariate methods, both in its development and its implementation. By this Course, the students are expected to have the experience of learning to think critically and are able to give the right decision about multivariate methods on a problem and its solution. Learning strategy used is discussions, exercises, assignments.
GRADUATES LEARNING ACHIEVEMENTS PLO-1 Able to apply knowledge of statistical theory, Mathematics, and
computations PLO-3 Able to analyze data with appropriate statistical methods and
interpret them PLO-4 Able to identify, formulate, and solve statistical problems in
various applied fields
COURSE LEARNING OUTCOMES 1. The students are able to master the concept of multivariate analysis to understand
multivariate statistical methods both in its development and application; 2. The students are able to explain the difference between univariate data and
multivariate data, as well as the exploration analysis of multivariate data; 3. The students are able to explain the concept of dimension reduction on multivariate
data, and the hypothesis testing concept of multivariate data, as well as the concept of multisample method and discriminant analysis;
COURSE MATERIAL 1. Review of linear algebra and multivariate distribution function, i.e. Multinormal,
Wishart, and Hotelling T2 distributions; 2. Analysis of exploration that includes Biplot, Correspondence Analysis, Principal
Component Analysis (PCA), Factor Analysis, Cluster Analysis, Multidimensional Scaling and analysis Conjoin Analysis;
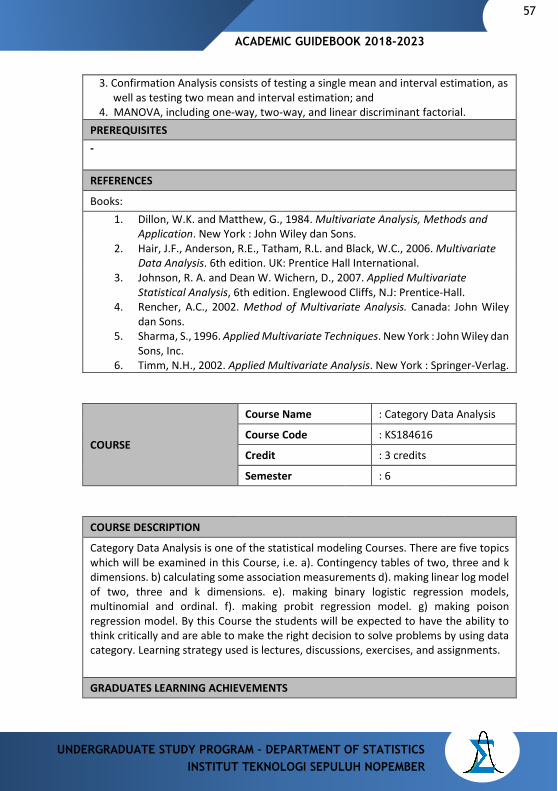
ACADEMIC GUIDEBOOK 2018-2023
57
UNDERGRADUATE STUDY PROGRAM – DEPARTMENT OF STATISTICS INSTITUT TEKNOLOGI SEPULUH NOPEMBER
3. Confirmation Analysis consists of testing a single mean and interval estimation, as well as testing two mean and interval estimation; and
4. MANOVA, including one-way, two-way, and linear discriminant factorial. PREREQUISITES - REFERENCES
Books: 1. Dillon, W.K. and Matthew, G., 1984. Multivariate Analysis, Methods and
Application. New York : John Wiley dan Sons. 2. Hair, J.F., Anderson, R.E., Tatham, R.L. and Black, W.C., 2006. Multivariate
Data Analysis. 6th edition. UK: Prentice Hall International. 3. Johnson, R. A. and Dean W. Wichern, D., 2007. Applied Multivariate
Statistical Analysis, 6th edition. Englewood Cliffs, N.J: Prentice-Hall. 4. Rencher, A.C., 2002. Method of Multivariate Analysis. Canada: John Wiley
dan Sons. 5. Sharma, S., 1996. Applied Multivariate Techniques. New York : John Wiley dan
Sons, Inc. 6. Timm, N.H., 2002. Applied Multivariate Analysis. New York : Springer-Verlag.
COURSE
Course Name : Category Data Analysis
Course Code : KS184616
Credit : 3 credits
Semester : 6
COURSE DESCRIPTION
Category Data Analysis is one of the statistical modeling Courses. There are five topics which will be examined in this Course, i.e. a). Contingency tables of two, three and k dimensions. b) calculating some association measurements d). making linear log model of two, three and k dimensions. e). making binary logistic regression models, multinomial and ordinal. f). making probit regression model. g) making poison regression model. By this Course the students will be expected to have the ability to think critically and are able to make the right decision to solve problems by using data category. Learning strategy used is lectures, discussions, exercises, and assignments.
GRADUATES LEARNING ACHIEVEMENTS
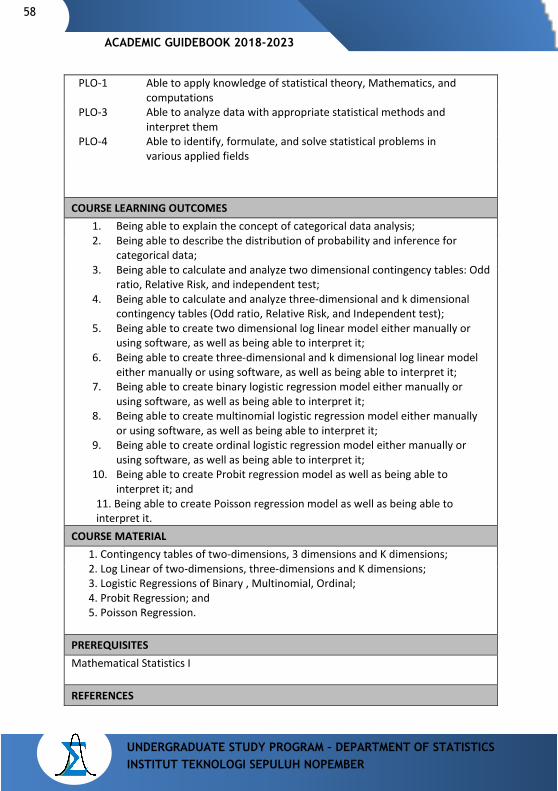
58
UNDERGRADUATE STUDY PROGRAM – DEPARTMENT OF STATISTICS INSTITUT TEKNOLOGI SEPULUH NOPEMBER
ACADEMIC GUIDEBOOK 2018-2023
PLO-1 Able to apply knowledge of statistical theory, Mathematics, and
computations PLO-3 Able to analyze data with appropriate statistical methods and
interpret them PLO-4 Able to identify, formulate, and solve statistical problems in
various applied fields
COURSE LEARNING OUTCOMES 1. Being able to explain the concept of categorical data analysis; 2. Being able to describe the distribution of probability and inference for
categorical data; 3. Being able to calculate and analyze two dimensional contingency tables: Odd
ratio, Relative Risk, and independent test; 4. Being able to calculate and analyze three-dimensional and k dimensional
contingency tables (Odd ratio, Relative Risk, and Independent test); 5. Being able to create two dimensional log linear model either manually or
using software, as well as being able to interpret it; 6. Being able to create three-dimensional and k dimensional log linear model
either manually or using software, as well as being able to interpret it; 7. Being able to create binary logistic regression model either manually or
using software, as well as being able to interpret it; 8. Being able to create multinomial logistic regression model either manually
or using software, as well as being able to interpret it; 9. Being able to create ordinal logistic regression model either manually or
using software, as well as being able to interpret it; 10. Being able to create Probit regression model as well as being able to
interpret it; and 11. Being able to create Poisson regression model as well as being able to interpret it.
COURSE MATERIAL 1. Contingency tables of two-dimensions, 3 dimensions and K dimensions; 2. Log Linear of two-dimensions, three-dimensions and K dimensions; 3. Logistic Regressions of Binary , Multinomial, Ordinal; 4. Probit Regression; and 5. Poisson Regression.
PREREQUISITES Mathematical Statistics I REFERENCES
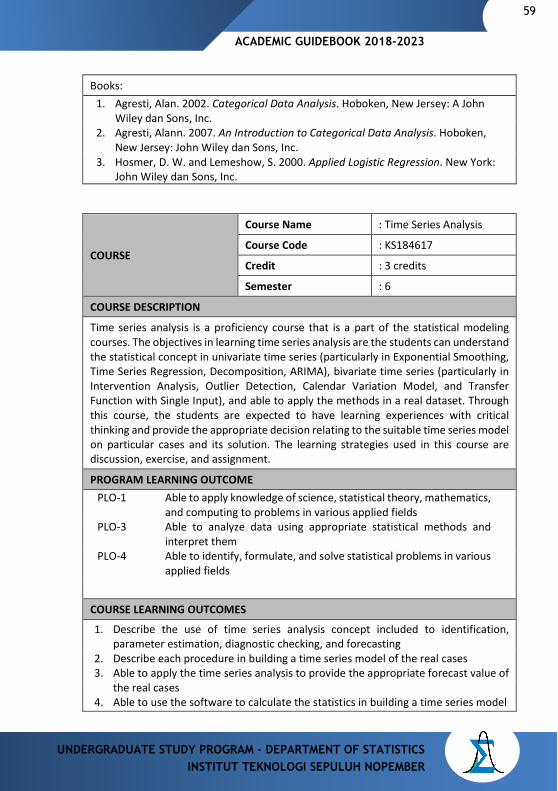
ACADEMIC GUIDEBOOK 2018-2023
59
UNDERGRADUATE STUDY PROGRAM – DEPARTMENT OF STATISTICS INSTITUT TEKNOLOGI SEPULUH NOPEMBER
Books: 1. Agresti, Alan. 2002. Categorical Data Analysis. Hoboken, New Jersey: A John
Wiley dan Sons, Inc. 2. Agresti, Alann. 2007. An Introduction to Categorical Data Analysis. Hoboken,
New Jersey: John Wiley dan Sons, Inc. 3. Hosmer, D. W. and Lemeshow, S. 2000. Applied Logistic Regression. New York:
John Wiley dan Sons, Inc.
COURSE
Course Name : Time Series Analysis
Course Code : KS184617
Credit : 3 credits
Semester : 6
COURSE DESCRIPTION
Time series analysis is a proficiency course that is a part of the statistical modeling courses. The objectives in learning time series analysis are the students can understand the statistical concept in univariate time series (particularly in Exponential Smoothing, Time Series Regression, Decomposition, ARIMA), bivariate time series (particularly in Intervention Analysis, Outlier Detection, Calendar Variation Model, and Transfer Function with Single Input), and able to apply the methods in a real dataset. Through this course, the students are expected to have learning experiences with critical thinking and provide the appropriate decision relating to the suitable time series model on particular cases and its solution. The learning strategies used in this course are discussion, exercise, and assignment.
PROGRAM LEARNING OUTCOME PLO-1 Able to apply knowledge of science, statistical theory, mathematics,
and computing to problems in various applied fields PLO-3 Able to analyze data using appropriate statistical methods and
interpret them PLO-4 Able to identify, formulate, and solve statistical problems in various
applied fields
COURSE LEARNING OUTCOMES
1. Describe the use of time series analysis concept included to identification, parameter estimation, diagnostic checking, and forecasting
2. Describe each procedure in building a time series model of the real cases 3. Able to apply the time series analysis to provide the appropriate forecast value of
the real cases 4. Able to use the software to calculate the statistics in building a time series model
60
UNDERGRADUATE STUDY PROGRAM – DEPARTMENT OF STATISTICS INSTITUT TEKNOLOGI SEPULUH NOPEMBER
ACADEMIC GUIDEBOOK 2018-2023
5. Able to adapt to the current situation 6. Able to provide a suitable decision based on the forecast result of the time series
model and present the result in oral or written 7. Able to communicate effectively and collaborate with the teams in
interdisciplinary and multidisciplinary 8. Have responsibilities and professional ethics 9. Able to motivate themself to think creatively and lifelong learning
COURSE MATERIAL 1. Introduction of Quantitative Forecasting and Time Series Analysis; 2. Exponential Smoothing Model, Time Series Regression, and Decomposition; 3. Stationary Process Concept; 4. Autocorrelation and Partial Autocorrelation; 5. ARMA and ARIMA Model; 6. Seasonal ARIMA Model, Multiplicative, Additive, and Subset; 7. Intervention Model and Outlier Detection; 8. Calendar Variation Model; 9. Transfer Function with Single Input; and 10. Implementation of Time Series Model on the Computer Programming PREREQUISITES Regression Analysis REFERENCES
Books: 1. Bowerman, B.L, O'Connell, R.T. and Koehler, A.B. 2005. Forecasting, Time Series,
and Regression: An Applied Approach, 4th edition. USA: Duxbury Press. 2. Box, G.E.P., Jenkins, G.M., and Reinsel, D., 1994. Time Series Analysis:
Forecasting and Control. 2nd edition. San Fransisco: Holden Day. 3. Cryer, J.D. and Chan, K-S., 2008. Time Series Analysis: with Application in R.
Boston: PWS-KENT Publishing Company. 4. Hanke, J.E. and Wichern, D.W., 2008. Business Forecasting. 9th edition. Prentice
Hall. 5. Wei, W.W.S., 2006. Time Series Analysis: Univariate and Multivariate Methods.
USA: Addison-Wesley Publishing Co.
ACADEMIC GUIDEBOOK 2018-2023
61
UNDERGRADUATE STUDY PROGRAM – DEPARTMENT OF STATISTICS INSTITUT TEKNOLOGI SEPULUH NOPEMBER
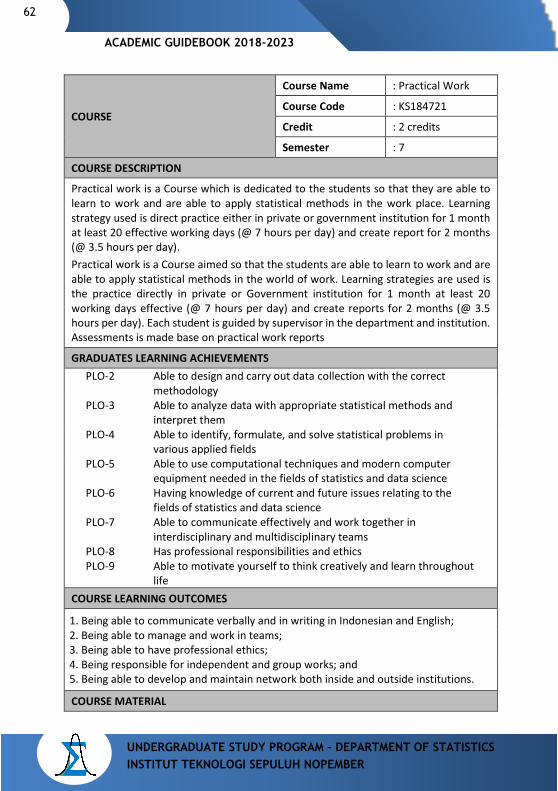
62
UNDERGRADUATE STUDY PROGRAM – DEPARTMENT OF STATISTICS INSTITUT TEKNOLOGI SEPULUH NOPEMBER
ACADEMIC GUIDEBOOK 2018-2023
COURSE
Course Name : Practical Work
Course Code : KS184721
Credit : 2 credits
Semester : 7
COURSE DESCRIPTION
Practical work is a Course which is dedicated to the students so that they are able to learn to work and are able to apply statistical methods in the work place. Learning strategy used is direct practice either in private or government institution for 1 month at least 20 effective working days (@ 7 hours per day) and create report for 2 months (@ 3.5 hours per day). Practical work is a Course aimed so that the students are able to learn to work and are able to apply statistical methods in the world of work. Learning strategies are used is the practice directly in private or Government institution for 1 month at least 20 working days effective (@ 7 hours per day) and create reports for 2 months (@ 3.5 hours per day). Each student is guided by supervisor in the department and institution. Assessments is made base on practical work reports
GRADUATES LEARNING ACHIEVEMENTS PLO-2 Able to design and carry out data collection with the correct
methodology PLO-3 Able to analyze data with appropriate statistical methods and
interpret them PLO-4 Able to identify, formulate, and solve statistical problems in
various applied fields PLO-5 Able to use computational techniques and modern computer
equipment needed in the fields of statistics and data science PLO-6 Having knowledge of current and future issues relating to the
fields of statistics and data science PLO-7 Able to communicate effectively and work together in
interdisciplinary and multidisciplinary teams PLO-8 Has professional responsibilities and ethics PLO-9 Able to motivate yourself to think creatively and learn throughout
life
COURSE LEARNING OUTCOMES
1. Being able to communicate verbally and in writing in Indonesian and English; 2. Being able to manage and work in teams; 3. Being able to have professional ethics; 4. Being responsible for independent and group works; and 5. Being able to develop and maintain network both inside and outside institutions.
COURSE MATERIAL

ACADEMIC GUIDEBOOK 2018-2023
63
UNDERGRADUATE STUDY PROGRAM – DEPARTMENT OF STATISTICS INSTITUT TEKNOLOGI SEPULUH NOPEMBER
1. Preparation of proposals for practical work; 2. Implementation of practical work in the area; 3. Solving the problems faced in the practical workplace; and 4. Preparation of practical work report. PREREQUISITES Students have pursued at least a course of 100 credits. REFERENCES
Books: Guidelines for practical work and final project : Statistics-FMKSD ITS
COURSE
Course Name : Research Methodology
Course Code : KS184618
Credit : 2 credits
Semester : 6
COURSE DESCRIPTION
Research methodology is one of course expertise which is part of study area in group of Statistical Modeling Course. The purpose of studying research methodology is that the students are able to understand the concept and methodology of scientific research, especially stages in applied statistics research , and are able to apply it to a real problem in community. By this course the students are expected to have the experience of learning to think critically and to give the right decision about the stages in conducting appropriate scientific research on a problem and its solution. Learning strategy used is discussions and exercises as well as assignments to create research proposals.
GRADUATES LEARNING ACHIEVEMENTS PLO-2 Able to design and carry out data collection with the correct
methodology PLO-3 Able to analyze data with appropriate statistical methods and
interpret them PLO-4 Able to identify, formulate, and solve statistical problems in
various applied fields PLO-6 Having knowledge of current and future issues relating to the
fields of statistics and data science
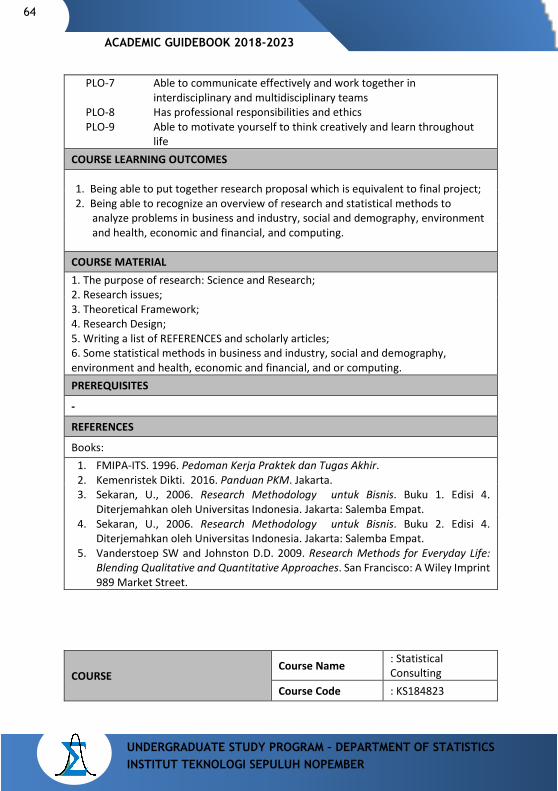
64
UNDERGRADUATE STUDY PROGRAM – DEPARTMENT OF STATISTICS INSTITUT TEKNOLOGI SEPULUH NOPEMBER
ACADEMIC GUIDEBOOK 2018-2023
PLO-7 Able to communicate effectively and work together in
interdisciplinary and multidisciplinary teams PLO-8 Has professional responsibilities and ethics PLO-9 Able to motivate yourself to think creatively and learn throughout
life
COURSE LEARNING OUTCOMES
1. Being able to put together research proposal which is equivalent to final project; 2. Being able to recognize an overview of research and statistical methods to
analyze problems in business and industry, social and demography, environment and health, economic and financial, and computing.
COURSE MATERIAL 1. The purpose of research: Science and Research; 2. Research issues; 3. Theoretical Framework; 4. Research Design; 5. Writing a list of REFERENCES and scholarly articles; 6. Some statistical methods in business and industry, social and demography, environment and health, economic and financial, and or computing. PREREQUISITES
-
REFERENCES
Books: 1. FMIPA-ITS. 1996. Pedoman Kerja Praktek dan Tugas Akhir. 2. Kemenristek Dikti. 2016. Panduan PKM. Jakarta. 3. Sekaran, U., 2006. Research Methodology untuk Bisnis. Buku 1. Edisi 4.
Diterjemahkan oleh Universitas Indonesia. Jakarta: Salemba Empat. 4. Sekaran, U., 2006. Research Methodology untuk Bisnis. Buku 2. Edisi 4.
Diterjemahkan oleh Universitas Indonesia. Jakarta: Salemba Empat. 5. Vanderstoep SW and Johnston D.D. 2009. Research Methods for Everyday Life:
Blending Qualitative and Quantitative Approaches. San Francisco: A Wiley Imprint 989 Market Street.
COURSE Course Name : Statistical
Consulting Course Code : KS184823
ACADEMIC GUIDEBOOK 2018-2023
65
UNDERGRADUATE STUDY PROGRAM – DEPARTMENT OF STATISTICS INSTITUT TEKNOLOGI SEPULUH NOPEMBER
Credit : 3 credits
Semester : 8
COURSE DESCRIPTION
Statistical Consulting course aims at preparing statistics graduates of Department of Statistics to have a maturity analysis of statistics who are qualified to act as statistical consultants in data driven that is able to help solve the clients’ problems. The process of course learning is designed in such away that the students are able to gain experience to resolve the problems by the presence of practical problems in the classroom, either from source or crucial cases at the moment, and able to present the results of their studies, whether spoken or written, to their lecturers and clients. Discussion and argumentation on some sort of alternative solutions on an issue are undertaken intensively to enhance the students’ mastery and maturity of statistical methodology.
GRADUATES LEARNING ACHIEVEMENTS PLO-2 Able to design and carry out data collection with the correct
methodology PLO-3 Able to analyze data with appropriate statistical methods and
interpret them PLO-4 Able to identify, formulate, and solve statistical problems in
various applied fields PLO-6 Having knowledge of current and future issues relating to the
fields of statistics and data science PLO-7 Able to communicate effectively and work together in
interdisciplinary and multidisciplinary teams PLO-8 Has professional responsibilities and ethics PLO-9 Able to motivate yourself to think creatively and learn throughout
life
COURSE LEARNING OUTCOMES 1. Being able to explain the importance of communication skills (written and
spoken) for statistical consultants; 2. Being able to identify an ideal statistical Consultant, so his clients can be
satisfied with his services; 3. Being able to perform nonverbal communication well; 4. Being able to conduct a dialogue with clients to gather information well; 5. Being able to make negotiation that satisfies both parties; 6. Being able to take right decisions based on the analysis of information and
data, as well as to communicate the results of statistical analysis both written and spoken;
7. Being able to develop the idea of solving problems with statistical analysis; 8. Being able to provide guidance in selecting various alternative solutions
independently and groups;
66
UNDERGRADUATE STUDY PROGRAM – DEPARTMENT OF STATISTICS INSTITUT TEKNOLOGI SEPULUH NOPEMBER
ACADEMIC GUIDEBOOK 2018-2023
9. Able to communicate the result of problem solving with statistical methods
both written and spoken.
COURSE MATERIAL 1. Introduction to Statistical Consulting 2. Spoken, written communication, and presentation 3. Satisfactory negotiation for clients and consultant teams 4. How to deal with difficult situations (financial, dead-line, the limitations of data
and methods) 5. Review of Statistical Analysis method for statistical consulting services 6. Writing of grant and tender proposals; 7. The next meeting, the students deal directly with various cases especially in 5
applied areas i.e. industry, business & industrial, economic & financial, social, computing, governance and environmental & health.
PREREQUISITES
Data Analysis
REFERENCES
Books:
-
ACADEMIC GUIDEBOOK 2018-2023
67
UNDERGRADUATE STUDY PROGRAM – DEPARTMENT OF STATISTICS INSTITUT TEKNOLOGI SEPULUH NOPEMBER
COURSE
Course Name : Final Project
Course Code : KS184822
Credit : 6 credits
Semester : 8
COURSE DESCRIPTION
Final Project is a course that aims to enable the students to solve problems in one of 5 applied areas Computation, Business & Industry, Economy & Finance, Social & Demography, and Environment & Health. The Final Project begins from the proposal seminar presentation about 1 hour, data collection, data entry and data analysis and drafting of final project report followed by validation and final project exam.
GRADUATES LEARNING ACHIEVEMENTS PLO-1 Able to apply knowledge of statistical theory, Mathematics, and
computations PLO-2 Able to design and carry out data collection with the correct
methodology PLO-3 Able to analyze data with appropriate statistical methods and
interpret them PLO-4 Able to identify, formulate, and solve statistical problems in
various applied fields PLO-5 Able to use computational techniques and modern computer
equipment needed in the fields of statistics and data science PLO-6 Having knowledge of current and future issues relating to the
fields of statistics and data science PLO-7 Able to communicate effectively and work together in
interdisciplinary and multidisciplinary teams PLO-8 Has professional responsibilities and ethics PLO-9 Able to motivate yourself to think creatively and learn throughout
life
COURSE LEARNING OUTCOMES - COURSE MATERIAL COURSE MATERIAL is tailored to the real issues that become topics. The final project is under the guidance of 1 or 2 supervisors. PREREQUISITES
68
UNDERGRADUATE STUDY PROGRAM – DEPARTMENT OF STATISTICS INSTITUT TEKNOLOGI SEPULUH NOPEMBER
ACADEMIC GUIDEBOOK 2018-2023
Minimum has pursued 120 credits
REFERENCES
Books:
1. Departemen Statistika, 2018. Pedoman Tugas Akhir. 2. FMIPA-ITS, 1996. Pedoman Kerja Praktik dan Tugas Akhir.
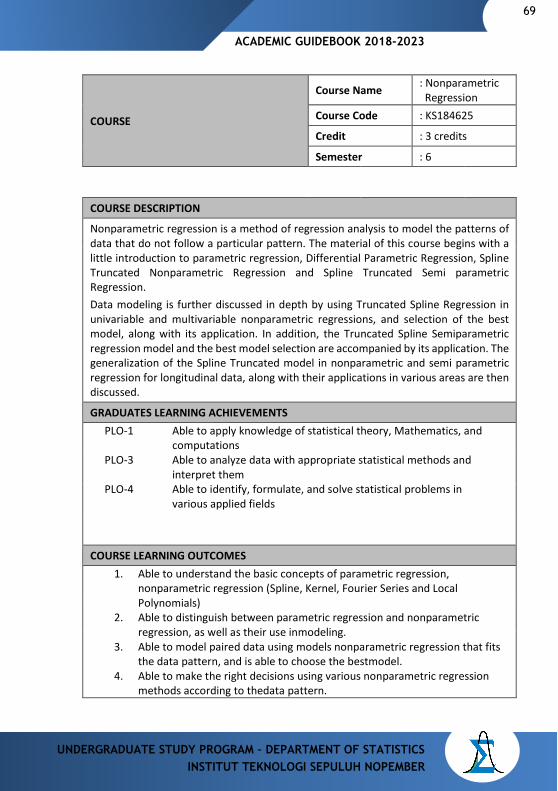
ACADEMIC GUIDEBOOK 2018-2023
69
UNDERGRADUATE STUDY PROGRAM – DEPARTMENT OF STATISTICS INSTITUT TEKNOLOGI SEPULUH NOPEMBER
COURSE
Course Name : Nonparametric Regression
Course Code : KS184625
Credit : 3 credits
Semester : 6
COURSE DESCRIPTION
Nonparametric regression is a method of regression analysis to model the patterns of data that do not follow a particular pattern. The material of this course begins with a little introduction to parametric regression, Differential Parametric Regression, Spline Truncated Nonparametric Regression and Spline Truncated Semi parametric Regression. Data modeling is further discussed in depth by using Truncated Spline Regression in univariable and multivariable nonparametric regressions, and selection of the best model, along with its application. In addition, the Truncated Spline Semiparametric regression model and the best model selection are accompanied by its application. The generalization of the Spline Truncated model in nonparametric and semi parametric regression for longitudinal data, along with their applications in various areas are then discussed.
GRADUATES LEARNING ACHIEVEMENTS PLO-1 Able to apply knowledge of statistical theory, Mathematics, and
computations PLO-3 Able to analyze data with appropriate statistical methods and
interpret them PLO-4 Able to identify, formulate, and solve statistical problems in
various applied fields
COURSE LEARNING OUTCOMES 1. Able to understand the basic concepts of parametric regression,
nonparametric regression (Spline, Kernel, Fourier Series and Local Polynomials)
2. Able to distinguish between parametric regression and nonparametric regression, as well as their use inmodeling.
3. Able to model paired data using models nonparametric regression that fits the data pattern, and is able to choose the bestmodel.
4. Able to make the right decisions using various nonparametric regression methods according to thedata pattern.
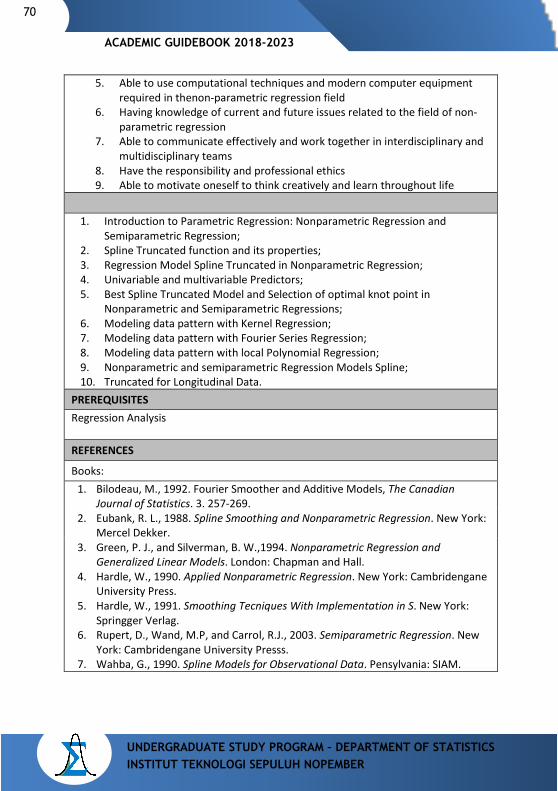
70
UNDERGRADUATE STUDY PROGRAM – DEPARTMENT OF STATISTICS INSTITUT TEKNOLOGI SEPULUH NOPEMBER
ACADEMIC GUIDEBOOK 2018-2023
5. Able to use computational techniques and modern computer equipment
required in thenon-parametric regression field 6. Having knowledge of current and future issues related to the field of non-
parametric regression 7. Able to communicate effectively and work together in interdisciplinary and
multidisciplinary teams 8. Have the responsibility and professional ethics 9. Able to motivate oneself to think creatively and learn throughout life
1. Introduction to Parametric Regression: Nonparametric Regression and
Semiparametric Regression; 2. Spline Truncated function and its properties; 3. Regression Model Spline Truncated in Nonparametric Regression; 4. Univariable and multivariable Predictors; 5. Best Spline Truncated Model and Selection of optimal knot point in
Nonparametric and Semiparametric Regressions; 6. Modeling data pattern with Kernel Regression; 7. Modeling data pattern with Fourier Series Regression; 8. Modeling data pattern with local Polynomial Regression; 9. Nonparametric and semiparametric Regression Models Spline; 10. Truncated for Longitudinal Data.
PREREQUISITES Regression Analysis REFERENCES
Books: 1. Bilodeau, M., 1992. Fourier Smoother and Additive Models, The Canadian
Journal of Statistics. 3. 257-269. 2. Eubank, R. L., 1988. Spline Smoothing and Nonparametric Regression. New York:
Mercel Dekker. 3. Green, P. J., and Silverman, B. W.,1994. Nonparametric Regression and
Generalized Linear Models. London: Chapman and Hall. 4. Hardle, W., 1990. Applied Nonparametric Regression. New York: Cambridengane
University Press. 5. Hardle, W., 1991. Smoothing Tecniques With Implementation in S. New York:
Springger Verlag. 6. Rupert, D., Wand, M.P, and Carrol, R.J., 2003. Semiparametric Regression. New
York: Cambridengane University Presss. 7. Wahba, G., 1990. Spline Models for Observational Data. Pensylvania: SIAM.
ACADEMIC GUIDEBOOK 2018-2023
71
UNDERGRADUATE STUDY PROGRAM – DEPARTMENT OF STATISTICS INSTITUT TEKNOLOGI SEPULUH NOPEMBER
8. Wu, H. and Zhang, J. T., 2006. Nonparametric Regression Method for Longitudinal Data Analisys: Mixed Effects Modeling Approaches. New York : John Wiley and Sons.
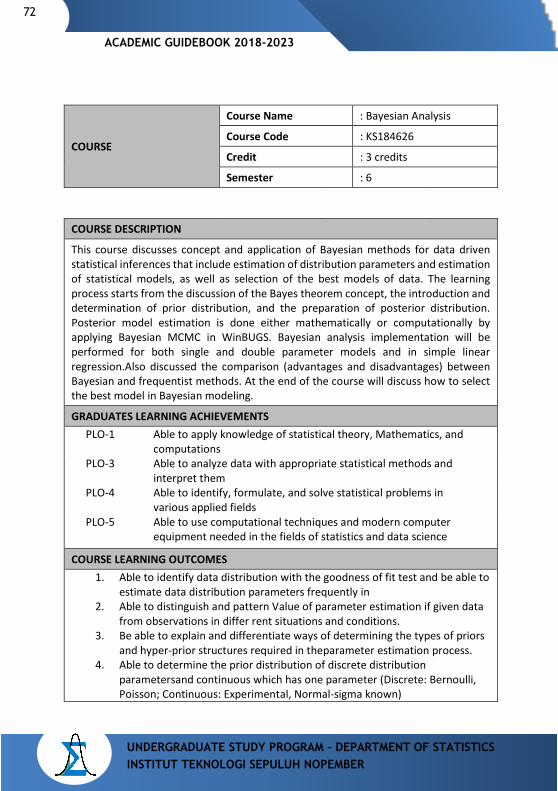
72
UNDERGRADUATE STUDY PROGRAM – DEPARTMENT OF STATISTICS INSTITUT TEKNOLOGI SEPULUH NOPEMBER
ACADEMIC GUIDEBOOK 2018-2023
COURSE
Course Name : Bayesian Analysis
Course Code : KS184626
Credit : 3 credits
Semester : 6
COURSE DESCRIPTION
This course discusses concept and application of Bayesian methods for data driven statistical inferences that include estimation of distribution parameters and estimation of statistical models, as well as selection of the best models of data. The learning process starts from the discussion of the Bayes theorem concept, the introduction and determination of prior distribution, and the preparation of posterior distribution. Posterior model estimation is done either mathematically or computationally by applying Bayesian MCMC in WinBUGS. Bayesian analysis implementation will be performed for both single and double parameter models and in simple linear regression.Also discussed the comparison (advantages and disadvantages) between Bayesian and frequentist methods. At the end of the course will discuss how to select the best model in Bayesian modeling.
GRADUATES LEARNING ACHIEVEMENTS PLO-1 Able to apply knowledge of statistical theory, Mathematics, and
computations PLO-3 Able to analyze data with appropriate statistical methods and
interpret them PLO-4 Able to identify, formulate, and solve statistical problems in
various applied fields PLO-5 Able to use computational techniques and modern computer
equipment needed in the fields of statistics and data science
COURSE LEARNING OUTCOMES 1. Able to identify data distribution with the goodness of fit test and be able to
estimate data distribution parameters frequently in 2. Able to distinguish and pattern Value of parameter estimation if given data
from observations in differ rent situations and conditions. 3. Be able to explain and differentiate ways of determining the types of priors
and hyper-prior structures required in theparameter estimation process. 4. Able to determine the prior distribution of discrete distribution
parametersand continuous which has one parameter (Discrete: Bernoulli, Poisson; Continuous: Experimental, Normal-sigma known)
ACADEMIC GUIDEBOOK 2018-2023
73
UNDERGRADUATE STUDY PROGRAM – DEPARTMENT OF STATISTICS INSTITUT TEKNOLOGI SEPULUH NOPEMBER
5. Be able to determine the posterior distribution of discrete and continuous distribution parameters which have one parameter of
6. Be able to explain the basic principles of Bayesian computation in constructing the posterior distribution of parameters from a numerically parameter data pattern
7. Able to compile a posterior data generator algorithm with a single parameter distribution parameter
8. Able to explain the Markov Cain Monte Carlo concept in theparameter estimation.
9. Able to create and explain doodle structure and posterior estimation program syntax in WinBUGS for a distribution model with a single parameter
10. Able to use WinBUGS to estimate and test parameter hypotheses from distributed data with a single parameter
11. Able to determine the prior distribution of discrete and continuous distribution parameters that have more than one parameter (Discrete: Binomial; Continuous: Normal, Gamma, Weibull).
12. Able to mene Determine the posterior distribution of discrete and continuous distribution parameters that have more than oneparameter.
13. Be able to determine the prior and posterior parameters in a simple linear regression model to estimate a Bayesian linear regression model using WinBUGS
14. Be able to explain and apply the Bayes principle of factors for model selection best
15. Able to communicate effectively and cooperate in interdisciplinary and multidisciplinary teams
16. Have responsibility and professional ethics 17. Able to motivate oneself to think creatively and learn lifelong
COURSE MATERIAL
Bayes theorem, single-parameter estimation model and Multi-parameter model, Bayes computing, MCMC, Gibbs Sampling, MCMC convergence, high-posterior distribution, likelihood, prior, Jeffrey's prior, hyper- Bayesian regression, Selection of the best model (posterior opportunity, Bayes Factor, Deviance, and Distribution Multiplication Structure)
PREREQUISITES
Regression Analysis
REFERENCES
Books:
74
UNDERGRADUATE STUDY PROGRAM – DEPARTMENT OF STATISTICS INSTITUT TEKNOLOGI SEPULUH NOPEMBER
ACADEMIC GUIDEBOOK 2018-2023
1. Albert, J., 2009. Bayesian Computation With R. 2nd edition. New York, USA :
Springer. 2. Gelman, A., Carlin, J. B., Stern, H. S. Dunson, D.B., Vehtari, A. and Rubin, D. B.,
2014. Bayesian Data Analysis. London: Chapman dan Hall. 3. Ghosh, J.K., Delampady, M., and Samanta, T., 2006. An Introduction to Bayesian
Analisis: Theory and Methods. New York, USA : Springer. 4. Kruschke, J.K., 2010. Doing Bayesian Data Analysis: A Tutorial with R and BUGS.
Academic Press. 5. Ntzoufras, I., 2009. Bayesian Modeling Using WinBUGS. New Jersey, USA : John
Wiley dan Sons. 6. Robert, C. P., 2007. The Bayesian Choice: From Decision-Theoretic Foundations to
Computational Implementation. 2nd edition. New York, USA : Springer. 7. Tanner, M. A., 1996. Tools for Statistical Inference: Methods for the Exploration of
Posterior Distributions and Likelihood Functions. 3rd edition. New York : Springer-Verlag.
ACADEMIC GUIDEBOOK 2018-2023
75
UNDERGRADUATE STUDY PROGRAM – DEPARTMENT OF STATISTICS INSTITUT TEKNOLOGI SEPULUH NOPEMBER
COURSE
Course Name : Time Series Econometrics
Course Code : KS184827
Credit : 3 credits
Semester : 8
This course introduces the students to models of econometric finance. This course covers both theoretical and practical aspects of econometric models used by financial institutions, investment banks, central banks, governments, and others. The students will also be introduced to models in financial that may be nonlinear, and time varying models. Specifically, the students will learn how to design, implement, estimate and analyze observed-driven or parameter-driven models.
GRADUATES LEARNING ACHIEVEMENTS PLO-1 Able to apply knowledge of statistical theory, Mathematics, and
computations PLO-3 Able to analyze data with appropriate statistical methods and
interpret them PLO-4 Able to identify, formulate, and solve statistical problems in
various applied fields
COURSE LEARNING OUTCOMES 1. Being able to explain the concept of financial econometric 2. Being able to explain and predict financial return 3. Being able to make predictions of volatility and risk 4. Being able to predict multiple-related series 5. Being able to understand the concept of random walk and cointegration 6. Being able to understand the models for high frequency price dynamic COURSE MATERIAL 1. Prediction of financial return (market efficiency, ARIMA, model evaluation) 2. Prediction of volatility and risk (ARCH, GARCH) 3. Prediction of multiple related series 4. Random walk and cointegration 5. Models of high frequency price dynamic model PREREQUISITES
1. Introduction to Economic Theory, 2. Time Series Analysis, and 3. Regression Analysis
REFERENCES
76
UNDERGRADUATE STUDY PROGRAM – DEPARTMENT OF STATISTICS INSTITUT TEKNOLOGI SEPULUH NOPEMBER
ACADEMIC GUIDEBOOK 2018-2023
Books:
1. Gourieroux, Christian and Jasiax. 2001. Financial Econometrics: Problems, Models and Methods. Princeton University Press.
2. Rachev, Svetlozar T. 2006. Financial Econometrics: From Basics to Advanced Modeling Techniques. Wiley.
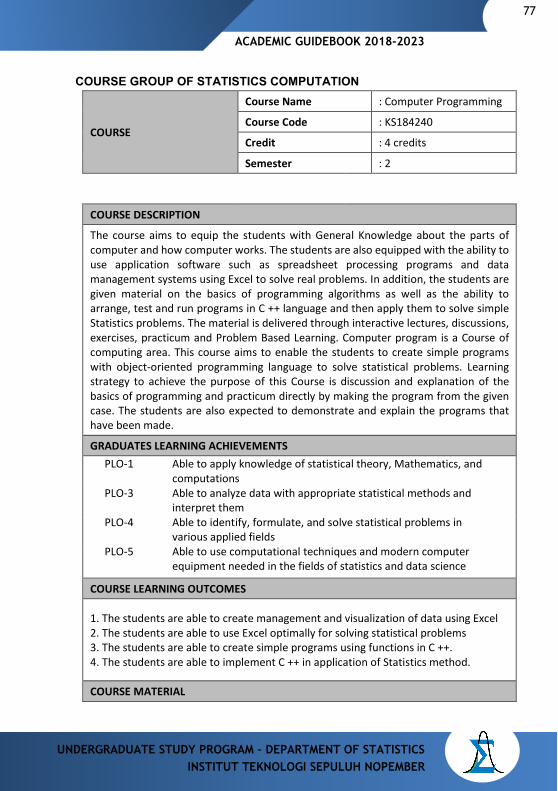
ACADEMIC GUIDEBOOK 2018-2023
77
UNDERGRADUATE STUDY PROGRAM – DEPARTMENT OF STATISTICS INSTITUT TEKNOLOGI SEPULUH NOPEMBER
COURSE GROUP OF STATISTICS COMPUTATION
COURSE
Course Name : Computer Programming
Course Code : KS184240
Credit : 4 credits
Semester : 2
COURSE DESCRIPTION
The course aims to equip the students with General Knowledge about the parts of computer and how computer works. The students are also equipped with the ability to use application software such as spreadsheet processing programs and data management systems using Excel to solve real problems. In addition, the students are given material on the basics of programming algorithms as well as the ability to arrange, test and run programs in C ++ language and then apply them to solve simple Statistics problems. The material is delivered through interactive lectures, discussions, exercises, practicum and Problem Based Learning. Computer program is a Course of computing area. This course aims to enable the students to create simple programs with object-oriented programming language to solve statistical problems. Learning strategy to achieve the purpose of this Course is discussion and explanation of the basics of programming and practicum directly by making the program from the given case. The students are also expected to demonstrate and explain the programs that have been made.
GRADUATES LEARNING ACHIEVEMENTS PLO-1 Able to apply knowledge of statistical theory, Mathematics, and
computations PLO-3 Able to analyze data with appropriate statistical methods and
interpret them PLO-4 Able to identify, formulate, and solve statistical problems in
various applied fields PLO-5 Able to use computational techniques and modern computer
equipment needed in the fields of statistics and data science
COURSE LEARNING OUTCOMES
1. The students are able to create management and visualization of data using Excel 2. The students are able to use Excel optimally for solving statistical problems 3. The students are able to create simple programs using functions in C ++. 4. The students are able to implement C ++ in application of Statistics method.
COURSE MATERIAL
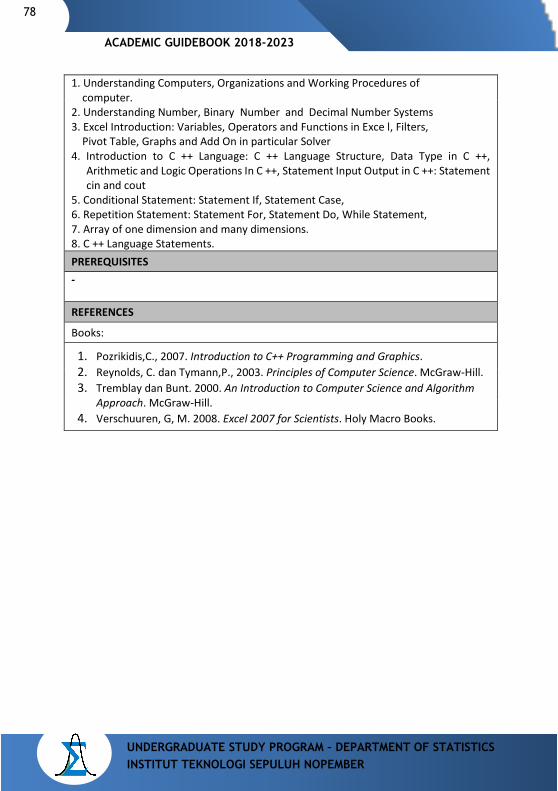
78
UNDERGRADUATE STUDY PROGRAM – DEPARTMENT OF STATISTICS INSTITUT TEKNOLOGI SEPULUH NOPEMBER
ACADEMIC GUIDEBOOK 2018-2023
1. Understanding Computers, Organizations and Working Procedures of computer. 2. Understanding Number, Binary Number and Decimal Number Systems 3. Excel Introduction: Variables, Operators and Functions in Exce l, Filters, Pivot Table, Graphs and Add On in particular Solver 4. Introduction to C ++ Language: C ++ Language Structure, Data Type in C ++,
Arithmetic and Logic Operations In C ++, Statement Input Output in C ++: Statement cin and cout
5. Conditional Statement: Statement If, Statement Case, 6. Repetition Statement: Statement For, Statement Do, While Statement, 7. Array of one dimension and many dimensions. 8. C ++ Language Statements. PREREQUISITES - REFERENCES
Books:
1. Pozrikidis,C., 2007. Introduction to C++ Programming and Graphics. 2. Reynolds, C. dan Tymann,P., 2003. Principles of Computer Science. McGraw-Hill. 3. Tremblay dan Bunt. 2000. An Introduction to Computer Science and Algorithm
Approach. McGraw-Hill. 4. Verschuuren, G, M. 2008. Excel 2007 for Scientists. Holy Macro Books.
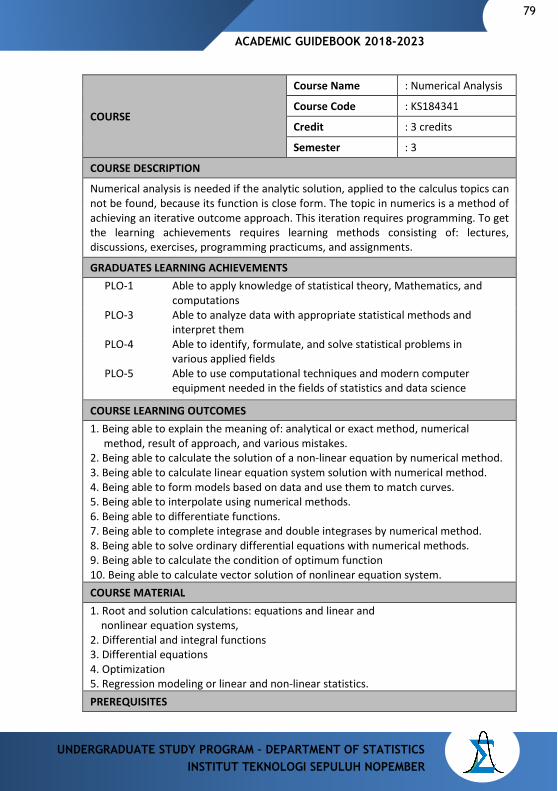
ACADEMIC GUIDEBOOK 2018-2023
79
UNDERGRADUATE STUDY PROGRAM – DEPARTMENT OF STATISTICS INSTITUT TEKNOLOGI SEPULUH NOPEMBER
COURSE
Course Name : Numerical Analysis
Course Code : KS184341
Credit : 3 credits
Semester : 3
COURSE DESCRIPTION
Numerical analysis is needed if the analytic solution, applied to the calculus topics can not be found, because its function is close form. The topic in numerics is a method of achieving an iterative outcome approach. This iteration requires programming. To get the learning achievements requires learning methods consisting of: lectures, discussions, exercises, programming practicums, and assignments.
GRADUATES LEARNING ACHIEVEMENTS PLO-1 Able to apply knowledge of statistical theory, Mathematics, and
computations PLO-3 Able to analyze data with appropriate statistical methods and
interpret them PLO-4 Able to identify, formulate, and solve statistical problems in
various applied fields PLO-5 Able to use computational techniques and modern computer
equipment needed in the fields of statistics and data science
COURSE LEARNING OUTCOMES 1. Being able to explain the meaning of: analytical or exact method, numerical
method, result of approach, and various mistakes. 2. Being able to calculate the solution of a non-linear equation by numerical method. 3. Being able to calculate linear equation system solution with numerical method. 4. Being able to form models based on data and use them to match curves. 5. Being able to interpolate using numerical methods. 6. Being able to differentiate functions. 7. Being able to complete integrase and double integrases by numerical method. 8. Being able to solve ordinary differential equations with numerical methods. 9. Being able to calculate the condition of optimum function 10. Being able to calculate vector solution of nonlinear equation system. COURSE MATERIAL 1. Root and solution calculations: equations and linear and nonlinear equation systems, 2. Differential and integral functions 3. Differential equations 4. Optimization 5. Regression modeling or linear and non-linear statistics. PREREQUISITES
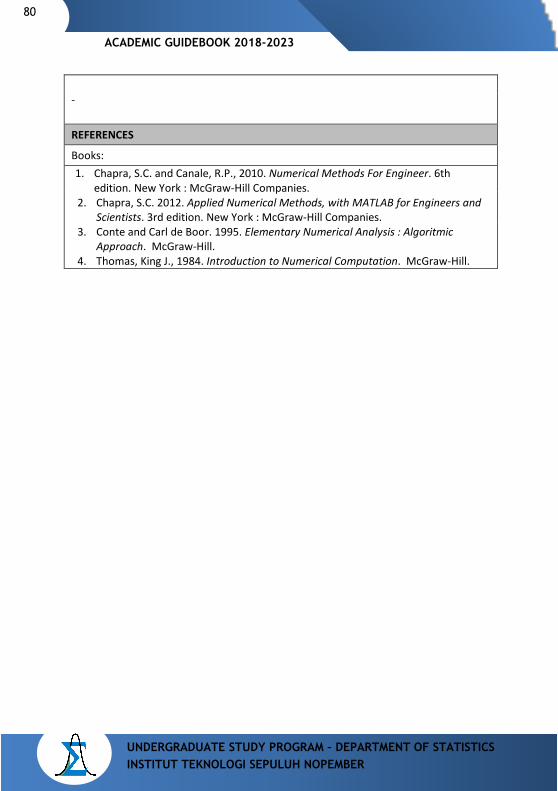
80
UNDERGRADUATE STUDY PROGRAM – DEPARTMENT OF STATISTICS INSTITUT TEKNOLOGI SEPULUH NOPEMBER
ACADEMIC GUIDEBOOK 2018-2023
-
REFERENCES
Books: 1. Chapra, S.C. and Canale, R.P., 2010. Numerical Methods For Engineer. 6th
edition. New York : McGraw-Hill Companies. 2. Chapra, S.C. 2012. Applied Numerical Methods, with MATLAB for Engineers and
Scientists. 3rd edition. New York : McGraw-Hill Companies. 3. Conte and Carl de Boor. 1995. Elementary Numerical Analysis : Algoritmic
Approach. McGraw-Hill. 4. Thomas, King J., 1984. Introduction to Numerical Computation. McGraw-Hill.
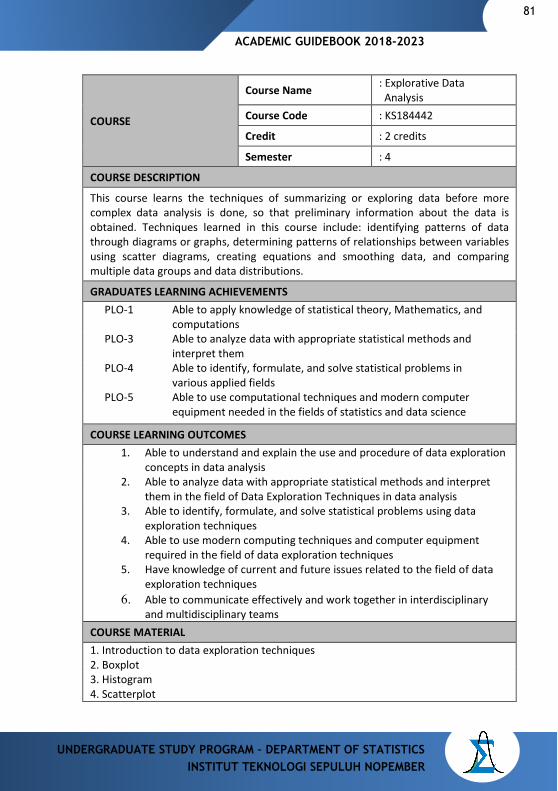
ACADEMIC GUIDEBOOK 2018-2023
81
UNDERGRADUATE STUDY PROGRAM – DEPARTMENT OF STATISTICS INSTITUT TEKNOLOGI SEPULUH NOPEMBER
COURSE
Course Name : Explorative Data Analysis
Course Code : KS184442
Credit : 2 credits
Semester : 4
COURSE DESCRIPTION
This course learns the techniques of summarizing or exploring data before more complex data analysis is done, so that preliminary information about the data is obtained. Techniques learned in this course include: identifying patterns of data through diagrams or graphs, determining patterns of relationships between variables using scatter diagrams, creating equations and smoothing data, and comparing multiple data groups and data distributions.
GRADUATES LEARNING ACHIEVEMENTS PLO-1 Able to apply knowledge of statistical theory, Mathematics, and
computations PLO-3 Able to analyze data with appropriate statistical methods and
interpret them PLO-4 Able to identify, formulate, and solve statistical problems in
various applied fields PLO-5 Able to use computational techniques and modern computer
equipment needed in the fields of statistics and data science
COURSE LEARNING OUTCOMES 1. Able to understand and explain the use and procedure of data exploration
concepts in data analysis 2. Able to analyze data with appropriate statistical methods and interpret
them in the field of Data Exploration Techniques in data analysis 3. Able to identify, formulate, and solve statistical problems using data
exploration techniques 4. Able to use modern computing techniques and computer equipment
required in the field of data exploration techniques 5. Have knowledge of current and future issues related to the field of data
exploration techniques 6. Able to communicate effectively and work together in interdisciplinary
and multidisciplinary teams COURSE MATERIAL 1. Introduction to data exploration techniques 2. Boxplot 3. Histogram 4. Scatterplot
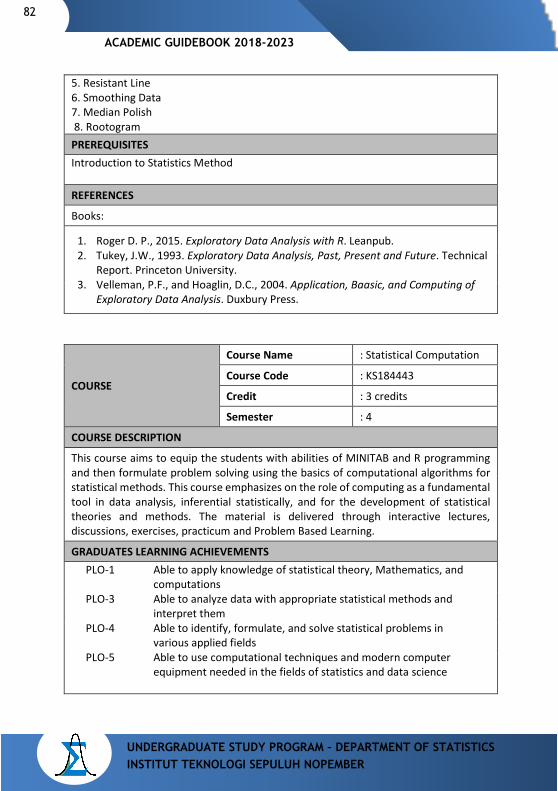
82
UNDERGRADUATE STUDY PROGRAM – DEPARTMENT OF STATISTICS INSTITUT TEKNOLOGI SEPULUH NOPEMBER
ACADEMIC GUIDEBOOK 2018-2023
5. Resistant Line 6. Smoothing Data 7. Median Polish 8. Rootogram PREREQUISITES Introduction to Statistics Method REFERENCES
Books:
1. Roger D. P., 2015. Exploratory Data Analysis with R. Leanpub. 2. Tukey, J.W., 1993. Exploratory Data Analysis, Past, Present and Future. Technical
Report. Princeton University. 3. Velleman, P.F., and Hoaglin, D.C., 2004. Application, Baasic, and Computing of
Exploratory Data Analysis. Duxbury Press.
COURSE
Course Name : Statistical Computation
Course Code : KS184443
Credit : 3 credits
Semester : 4
COURSE DESCRIPTION
This course aims to equip the students with abilities of MINITAB and R programming and then formulate problem solving using the basics of computational algorithms for statistical methods. This course emphasizes on the role of computing as a fundamental tool in data analysis, inferential statistically, and for the development of statistical theories and methods. The material is delivered through interactive lectures, discussions, exercises, practicum and Problem Based Learning. GRADUATES LEARNING ACHIEVEMENTS
PLO-1 Able to apply knowledge of statistical theory, Mathematics, and computations
PLO-3 Able to analyze data with appropriate statistical methods and interpret them
PLO-4 Able to identify, formulate, and solve statistical problems in various applied fields
PLO-5 Able to use computational techniques and modern computer equipment needed in the fields of statistics and data science
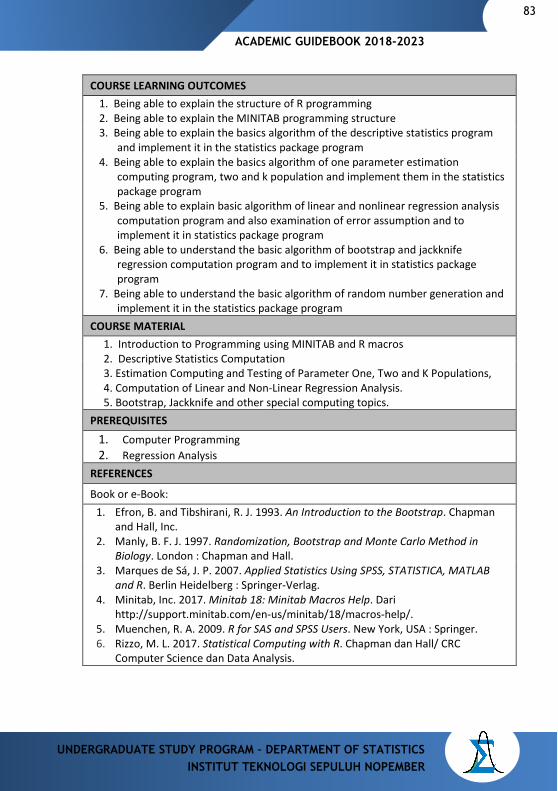
ACADEMIC GUIDEBOOK 2018-2023
83
UNDERGRADUATE STUDY PROGRAM – DEPARTMENT OF STATISTICS INSTITUT TEKNOLOGI SEPULUH NOPEMBER
COURSE LEARNING OUTCOMES 1. Being able to explain the structure of R programming 2. Being able to explain the MINITAB programming structure 3. Being able to explain the basics algorithm of the descriptive statistics program
and implement it in the statistics package program 4. Being able to explain the basics algorithm of one parameter estimation
computing program, two and k population and implement them in the statistics package program
5. Being able to explain basic algorithm of linear and nonlinear regression analysis computation program and also examination of error assumption and to implement it in statistics package program
6. Being able to understand the basic algorithm of bootstrap and jackknife regression computation program and to implement it in statistics package program
7. Being able to understand the basic algorithm of random number generation and implement it in the statistics package program
COURSE MATERIAL 1. Introduction to Programming using MINITAB and R macros 2. Descriptive Statistics Computation 3. Estimation Computing and Testing of Parameter One, Two and K Populations, 4. Computation of Linear and Non-Linear Regression Analysis. 5. Bootstrap, Jackknife and other special computing topics.
PREREQUISITES
1. Computer Programming 2. Regression Analysis
REFERENCES
Book or e-Book: 1. Efron, B. and Tibshirani, R. J. 1993. An Introduction to the Bootstrap. Chapman
and Hall, Inc. 2. Manly, B. F. J. 1997. Randomization, Bootstrap and Monte Carlo Method in
Biology. London : Chapman and Hall. 3. Marques de Sá, J. P. 2007. Applied Statistics Using SPSS, STATISTICA, MATLAB
and R. Berlin Heidelberg : Springer-Verlag. 4. Minitab, Inc. 2017. Minitab 18: Minitab Macros Help. Dari
http://support.minitab.com/en-us/minitab/18/macros-help/. 5. Muenchen, R. A. 2009. R for SAS and SPSS Users. New York, USA : Springer. 6. Rizzo, M. L. 2017. Statistical Computing with R. Chapman dan Hall/ CRC
Computer Science dan Data Analysis.
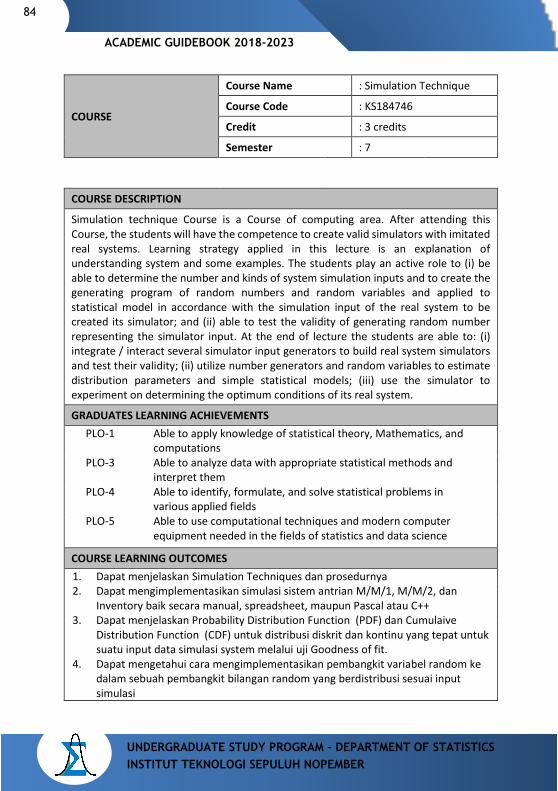
84
UNDERGRADUATE STUDY PROGRAM – DEPARTMENT OF STATISTICS INSTITUT TEKNOLOGI SEPULUH NOPEMBER
ACADEMIC GUIDEBOOK 2018-2023
COURSE
Course Name : Simulation Technique
Course Code : KS184746
Credit : 3 credits
Semester : 7
COURSE DESCRIPTION
Simulation technique Course is a Course of computing area. After attending this Course, the students will have the competence to create valid simulators with imitated real systems. Learning strategy applied in this lecture is an explanation of understanding system and some examples. The students play an active role to (i) be able to determine the number and kinds of system simulation inputs and to create the generating program of random numbers and random variables and applied to statistical model in accordance with the simulation input of the real system to be created its simulator; and (ii) able to test the validity of generating random number representing the simulator input. At the end of lecture the students are able to: (i) integrate / interact several simulator input generators to build real system simulators and test their validity; (ii) utilize number generators and random variables to estimate distribution parameters and simple statistical models; (iii) use the simulator to experiment on determining the optimum conditions of its real system.
GRADUATES LEARNING ACHIEVEMENTS PLO-1 Able to apply knowledge of statistical theory, Mathematics, and
computations PLO-3 Able to analyze data with appropriate statistical methods and
interpret them PLO-4 Able to identify, formulate, and solve statistical problems in
various applied fields PLO-5 Able to use computational techniques and modern computer
equipment needed in the fields of statistics and data science
COURSE LEARNING OUTCOMES 1. Dapat menjelaskan Simulation Techniques dan prosedurnya 2. Dapat mengimplementasikan simulasi sistem antrian M/M/1, M/M/2, dan
Inventory baik secara manual, spreadsheet, maupun Pascal atau C++ 3. Dapat menjelaskan Probability Distribution Function (PDF) dan Cumulaive
Distribution Function (CDF) untuk distribusi diskrit dan kontinu yang tepat untuk suatu input data simulasi system melalui uji Goodness of fit.
4. Dapat mengetahui cara mengimplementasikan pembangkit variabel random ke dalam sebuah pembangkit bilangan random yang berdistribusi sesuai input simulasi
ACADEMIC GUIDEBOOK 2018-2023
85
UNDERGRADUATE STUDY PROGRAM – DEPARTMENT OF STATISTICS INSTITUT TEKNOLOGI SEPULUH NOPEMBER
5. Dapat melakukan pengujian validitas hasil bangkitan bilangan random berdistribusi dengan menggunakan paket program MINITAB dan SPSS
6. Dapat mengintegrasikan beberapa distribusi input simulator menjadi simulator system yang ditirukan.
7. Dapat menguji kevalidan system simulator 8. Dapat membangun simulator baru sebagai system alternative dan mampu
mengevaluasi perbedaan dan perbaikan dari system aslinya 9. Dapat bereksperimen menggunakan simulator sistem yang sudah valid untuk
mengoptimasikan layanan system riil yang ditirukan 10. Dapat mendemonstrasikan dan mempresentasikan karya simulator di kelas COURSE MATERIAL 1. Being able to explain Simulation Technique and its procedure 2. Being able to implement simulation of queuing M / M / 1, M / M / 2, and
Inventory systems either manually, spreadsheet, or Pascal or C ++ 3. Being able explain Probability Distribution Function (PDF) and Cumulative
Distribution Function (CDF) for proper discrete and continuous distribution for a system simulation data input through Goodness of fit test.
4. Being able to know how to implement random variable generator into generator of distributed random numbers according to simulation input
5. Being able to perform the validity test of generated results of distributed random numbers by using MINITAB and SPSS program packages.
6. Being able to integrate some simulator input distributions into simulated system simulator.
7. Being able to test the validity of system simulator 8. Being able to build new simulator as an alternative system and evaluate the
difference and improvement of original system 9. Being able to experiment using a valid system simulator to optimize the service of
simulated real system 10. Being able to demonstrate and present the simulator works in class
PREREQUISITES
Computer Programming REFERENCES
Books: 1. Allen, T.T. 2011. Introduction to Discrete Event Simulation and Agent-based
Modeling: Voting Systems, Health Care, Military, and Manufacturing. London : Springer-Verlag.
2. Altiok, T. and Melamed, B., 2007. Simulation Modeling and Analysis with Arena. Elsevier Inc.
3. Banks, J., Carson II, J.S., Nelson, B.L., and Nicol, D.M., 2001. Discrete Event System Simulation. 3rd edition. Pretice Hall Inc.
86
UNDERGRADUATE STUDY PROGRAM – DEPARTMENT OF STATISTICS INSTITUT TEKNOLOGI SEPULUH NOPEMBER
ACADEMIC GUIDEBOOK 2018-2023
4. Fishman, G.S., 2001. Discrete-Event Simulation Modeling, Programming, and
Analysis. New York : Springer-Verlag. 5. Hoover, S. V, and Perry, R. F., 1990. Simulation: A Problem-Solving Approach.
Addison Wesley. 6. Kleinrock, Leonard. 1975. Queuing Systems Volume I : Theory. John Wiley dan
Sons. 7. Kleinrock, Leonard. 1976. Queuing Systems Volume II : Computer Application.
John Wiley dan Sons. 8. Kobayashi, H., 1989. Modelling and Analysis Evaluation. Addison Wesley. 9. Law, A. M., and Kelton, D. 2000. Simulation Modelling and Analysis. 3rd edition.
McGraw Hill. 10. Robinson, S., 2004. Simulation: The Practice of Model Development and Use.
England : John Wiley dan Sons. 11. Trivedi, K. S., 1982. Probability dan Statistics with Reliability, Queuing and
Computer Science Aplication. Printice Hall.
COURSE
Course Name : Data Mining
Course Code : KS184645
Credit : 3 credits
Semester : 6
COURSE DESCRIPTION
Data mining is one of the expertise courses that is part of study area in the group of computing statistics course. The purpose of Data Mining Course is that the students are able to explore, summarize, and analyze information contained in a large data using method-based computational statistics. By this course the students are expected to have learning experience to think critically and able to provide appropriate decisions on the appropriate Data Mining techniques suitable on a problem and its solution and able to communicate both verbally and in writing. Learning strategy used is discussions, exercises, and assignments (projects). GRADUATES LEARNING ACHIEVEMENTS
PLO-3 Able to analyze data with appropriate statistical methods and interpret them
PLO-4 Able to identify, formulate, and solve statistical problems in various applied fields
PLO-5 Able to use computational techniques and modern computer equipment needed in the fields of statistics and data science
PLO-6 Having knowledge of current and future issues relating to the fields of statistics and data science
COURSE LEARNING OUTCOMES
ACADEMIC GUIDEBOOK 2018-2023
87
UNDERGRADUATE STUDY PROGRAM – DEPARTMENT OF STATISTICS INSTITUT TEKNOLOGI SEPULUH NOPEMBER
1. Can explain the concept of data mining and its application in various fields 2. Able to explain data mining procedures starting from pre-processing to
presenting information 3. Able to identify, formulate, and solve statistical problems using techniques
in Data Mining 4. Able to use computational techniques and modern computer equipment
required in Data Mining 5. Has knowledge of current and upcoming issues related to the Data Mining
field 6. Able to communicate effectively and work together in interdisciplinary and
multidisciplinary teams 7. Has professional responsibilities and ethics 8. Able to motivate yourself to think creatively and learn lifelong
COURSE MATERIAL 1. The basic concept of data mining; 2. Data integration, transformation, data reduction and data discretization; 3. Preprocessing data: Cleaning, missing value, noise; 4. Feature selection / Feature extraction; 5. Mining Association rules: A Priory Methods, Recommender System:
Collaborative Filtering; 6. Unsupervised learning method: Method (Cluster methods): K-Medoid, DB-Scan; 7. Supervised learning method: decision tree, naïve bayes, kNN; 8. Support vector machine (SVM); 9. Support vector regression; 10. Credibility: Evaluating what's been learned.
PREREQUISITES
Multivariate Analysis REFERENCES
Books: 1. Duda,R. O., Hart, P. E., and Stork, D. G., 2000. Pattern Classification, 2nd edition.
Wiley, Interscience. 2. Han,J., Kamber, M.and J. Pei, 2011. Data Mining: Concepts and Techniques.
Morgan Kaufmann. 3rd edition. 3. Hastie, T., Tibshirani, R., and Friedman, J., 2009. The Elements of Statistical
Learning:Data Mining, Inference, and Prediction. 2nd edition. Springer. 4. James, G., Witten, D., Hastie, T., and Tibshirani, R., 2013. An Introduction to
Statistical Learning with Application in R. Springer Inc. 5. Larose, D.T., 2006. Data Mining Methods And Models. John Wiley dan Sons, Inc. 6. Nisbet, R. and Elder, J., 2009. Handbook of Statistical Analysis and Data Mining.
Elsevier.
88
UNDERGRADUATE STUDY PROGRAM – DEPARTMENT OF STATISTICS INSTITUT TEKNOLOGI SEPULUH NOPEMBER
ACADEMIC GUIDEBOOK 2018-2023
7. Tan, P.N. , Steinbach, M. and Kumar, V., 2005. Introduction to Data Mining.
Wiley. 8. Witten, I.H., 2005. Data Mining: Practical Machine Learning Tools and
Techniques. 2nd edition. Elsevier.
COURSE
Course Name : Data Analysis
Course Code : KS184747
Credit : 3 credits
Semester : 7
COURSE DESCRIPTION
This course emphasizes on the students’ ability to apply the methods of statistics that have been studied so far related to the real problem settlement in the area properly and correctly. In addition, the students are equipped with the ability to choose the correct method of analysis, the ability to process and analyze data and out interpretation obtained from statistical software. The students are also required to communicate the results of their analysis in the form of written and spoken reports.
GRADUATES LEARNING ACHIEVEMENTS PLO-3 Able to analyze data with appropriate statistical methods and
interpret them PLO-4 Able to identify, formulate, and solve statistical problems in
various applied fields PLO-5 Able to use computational techniques and modern computer
equipment needed in the fields of statistics and data science PLO-6 Having knowledge of current and future issues relating to the
fields of statistics and data science PLO-7 Able to communicate effectively and work together in
interdisciplinary and multidisciplinary teams
COURSE LEARNING OUTCOMES 1. Being able to recall the concepts in basic and advanced statistics (ANOVA,
regression, experimental design, multivariate analysis, Qualitative Data Analysis, and time series analysis), data management within statistical program packages.
2. Being able to present univariate and multivariate data in the form of tables and graphs using statistical program packages.
3. Being able to estimate the point and interval of one population with normal distribution or not with the help of program package.
4. Being able to model regression (simple, multiple and dummy) and test the required assumptions.
ACADEMIC GUIDEBOOK 2018-2023
89
UNDERGRADUATE STUDY PROGRAM – DEPARTMENT OF STATISTICS INSTITUT TEKNOLOGI SEPULUH NOPEMBER
5. Being able to solve experimental design problems using package program and test the required assumptions.
6. Being able to apply the main Component Analysis and Factor Analysis with the help of statistical program package.
7. Being able to apply Discriminant Analysis and Cluster Analysis with the help of statistical program package
8. Being able to apply Binary Logistic Regression Analysis with the help of statistical program package
9. Being able to formulate a real problem that can be solved by statistical methods 10. Being able to work on the project independently (consultation) 11. Being able to write report and presentation of project well
COURSE MATERIAL 1. Descriptive statistics and introduction of statistical software (MINITAB, SPSS and R) 2. Regression analysis 3. Experimental design 4. Factor analysis 5. Cluster analysis 6. Logistic regression 7. Time Series Analysis PREREQUISITES
1. Time Series Analysis, 2. Multivariate Analysis, 3. Regression Analysis, 4. Category Data Analysis
REFERENCES
Books: 1. Data analysis and Graphic using R: An example Based approach, Cambrigde
Series 2010 2. Modul Ajar Data Analysis II Jurusan Statistika ITS 3. User’s Guide SPSS; MINITAB
COURSE
Course Name : Data Structure and Algorithm
Course Code : KS184528
Credit : 2 credits
Semester : 5
COURSE DESCRIPTION
90
UNDERGRADUATE STUDY PROGRAM – DEPARTMENT OF STATISTICS INSTITUT TEKNOLOGI SEPULUH NOPEMBER
ACADEMIC GUIDEBOOK 2018-2023
Course data structure discusses the preparation of dynamic data. The basic General Knowledge that the students must have is General Knowledge programming. This course is useful for the construction of simulation results data. The stack material provides data processing overview if the stacked data construction, pointer material, queue, and list provide an overview of the data processor in sequence. Material Tree, sort graph and search are useful for sorting data.
GRADUATES LEARNING ACHIEVEMENTS PLO-1 Able to apply knowledge of statistical theory, Mathematics, and
computations PLO-3 Able to analyze data with appropriate statistical methods and
interpret them PLO-4 Able to identify, formulate, and solve statistical problems in
various applied fields PLO-5 Able to use computational techniques and modern computer
equipment needed in the fields of statistics and data science
COURSE LEARNING OUTCOMES 1. Being able to understand the concept of Data Structures for statistical analysis purposes 2. Being able to develop a recursive program for simple cases 3. Being able to undertake data management by LIST method 4. Being able to carry out data sorting by SORT method 5. Being able to arrange data management by STACK method 6. Being able to construct data management for queuing system (Queue) 7. Being able to perform data management with SETS method 8. Being able to construct data with TREE method 9. Being able to perform data decomposition by GRAPH method COURSE MATERIAL 1. Recursive 2. Sequences: List, Sort, Stack and Queue 3. Sets 4. Tree 5. Graph PREREQUISITES
Computer Programming
REFERENCES
Books:
ACADEMIC GUIDEBOOK 2018-2023
91
UNDERGRADUATE STUDY PROGRAM – DEPARTMENT OF STATISTICS INSTITUT TEKNOLOGI SEPULUH NOPEMBER
1. Goodrich, Tamassia and Goldwasser. 2013. Data Structures and Algorithms in Python. ISBN: 978-1-118-29027-9.
2. Lee, Kent D. and Hubbard, Steve. 2015. Data Structures and Algorithms with Python. ISSN 1863-7310 DOI 10.1007/978-3-319-13072-9.
3. Shaffer, Clifford A. 2012. Data Structures and Algorithm Analysis in C++. 3rd edition. ISBN: 048648582X dan 9780486485829.
4. Weiss, M. A. and Wesley,Addison. 2007. Data Structures and Algorithm Analysis in C++. 3rd edition. ISBN-10: 032144146X dan ISBN-13: 9780321441461 .
COURSE
Course Name : Management Information System
Course Code : KS184648
Credit : 3 credits
Semester : 6
COURSE DESCRIPTION Course Management Information System is a Course in computing area. Competencies to be achieved after this Course, the students are able to: (1) understand the concept of computer-based Information Management and Management Information as a means of management to make decision in controlling an organization both academic institutions and modern business world; (2) use information technology to gain competitive advantage for individuals and organizations; and (3) create a management information system in various areas. (4) Learning strategy applied in this lecture, the students are given explanation about understanding computer-based information management and information on human resource management system, finance, manufacturing, marketing and some management of other modern business systems. At the end of this lecture, the students are able create an application of information management system by adding statistical method feature in its application to provide support in decision making. GRADUATES LEARNING ACHIEVEMENTS
PLO-1 Able to apply knowledge of statistical theory, Mathematics, and computations
PLO-3 Able to analyze data with appropriate statistical methods and interpret them
PLO-4 Able to identify, formulate, and solve statistical problems in various applied fields
PLO-5 Able to use computational techniques and modern computer equipment needed in the fields of statistics and data science
92
UNDERGRADUATE STUDY PROGRAM – DEPARTMENT OF STATISTICS INSTITUT TEKNOLOGI SEPULUH NOPEMBER
ACADEMIC GUIDEBOOK 2018-2023
COURSE LEARNING OUTCOMES 1. Being able to explain the basic concept of system 2. Being able to explain information resources 3. Being able to describe information and technology management 4. Being able to design database according to the case 5. Being able to make the information system with MS Office in accordance with the case 6. Being able to use SQL to create a simple information system 7. Being able to analyze existing information systems COURSE MATERIAL 1. The overview of Management Information System; 2. The concept of System and Information System on Organization and Company
Management; The Concept of Information; 3. SIM Structure; Database; 4. Information Processing; 5. Evolution and Application of Computer Based Information System; 6. The Concept of Decision-Making for Information Systems PREREQUISITES
Computer Programming
REFERENCES
Books: 1. Alexander, M. and Kusleika, R., 2016. Access 2016 Bible. 1st edition. Indianapolis,
Indiana, USA : John Wiley and Sons Inc. 2. Churcher, C. 2012. Beginning Database Design : From Novice to Professional, KG,
Berlin, Germany : Springer-Verlag Berlin and Heidelberg GmbH dan Co. 3. Hales, J. 2005. SQL Guide. Boca Raton, United States: Barcharts. 4. Kroenke, Hatch. 1994. Management Information System. McGraw Hill. 5. Oz, E., 2009. Management Information Systems. 6th edition. Thomson Course
Technology. 6. Raymond, McLeod. 1996. Sistem Informasi Manjemen (terjemahan) jilid 1 dan 2.
Prentice Hall. 7. Turban, E., Volonino, L. and Wood, G. R., 2013. Information Technology for
Management: Advancing Sustainable, Profitable Business Growth. 9th edition. John Wiley dan Sons.
8. Turban, E., McLean, E. and Wetherbe, J., 2013. Information Technology for Management: Transforming Organizations in the Digital Economy. 9th edition. John Wiley dan Sons.
9. Viescas, J. L. and Hernandez, M. J., 2014. SQL Queries for Mere Mortals: A Hands-On Guide to Data Manipulation in SQL. 3rd edition. Ann Arbor, Michigan : Edwards Brothers Malloy.
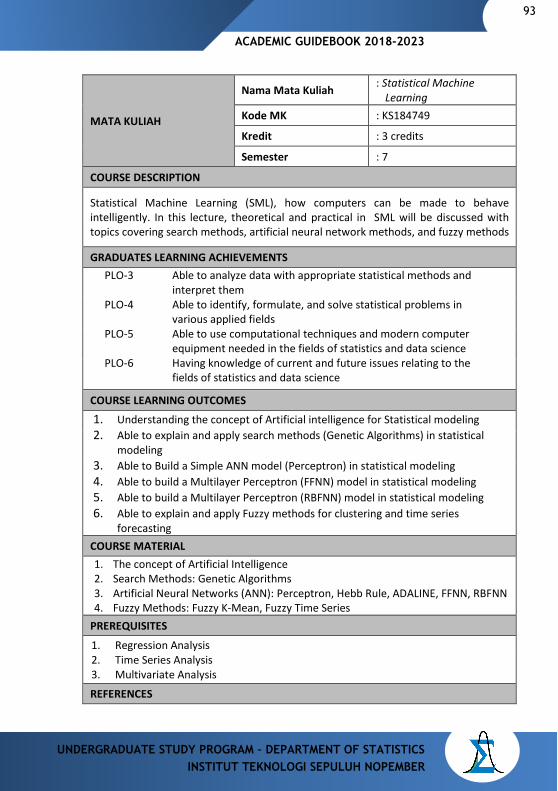
ACADEMIC GUIDEBOOK 2018-2023
93
UNDERGRADUATE STUDY PROGRAM – DEPARTMENT OF STATISTICS INSTITUT TEKNOLOGI SEPULUH NOPEMBER
MATA KULIAH
Nama Mata Kuliah : Statistical Machine Learning
Kode MK : KS184749
Kredit : 3 credits
Semester : 7
COURSE DESCRIPTION
Statistical Machine Learning (SML), how computers can be made to behave intelligently. In this lecture, theoretical and practical in SML will be discussed with topics covering search methods, artificial neural network methods, and fuzzy methods
GRADUATES LEARNING ACHIEVEMENTS PLO-3 Able to analyze data with appropriate statistical methods and
interpret them PLO-4 Able to identify, formulate, and solve statistical problems in
various applied fields PLO-5 Able to use computational techniques and modern computer
equipment needed in the fields of statistics and data science PLO-6 Having knowledge of current and future issues relating to the
fields of statistics and data science
COURSE LEARNING OUTCOMES
1. Understanding the concept of Artificial intelligence for Statistical modeling 2. Able to explain and apply search methods (Genetic Algorithms) in statistical
modeling 3. Able to Build a Simple ANN model (Perceptron) in statistical modeling 4. Able to build a Multilayer Perceptron (FFNN) model in statistical modeling 5. Able to build a Multilayer Perceptron (RBFNN) model in statistical modeling 6. Able to explain and apply Fuzzy methods for clustering and time series
forecasting COURSE MATERIAL 1. The concept of Artificial Intelligence 2. Search Methods: Genetic Algorithms 3. Artificial Neural Networks (ANN): Perceptron, Hebb Rule, ADALINE, FFNN, RBFNN 4. Fuzzy Methods: Fuzzy K-Mean, Fuzzy Time Series
PREREQUISITES
1. Regression Analysis 2. Time Series Analysis 3. Multivariate Analysis
REFERENCES
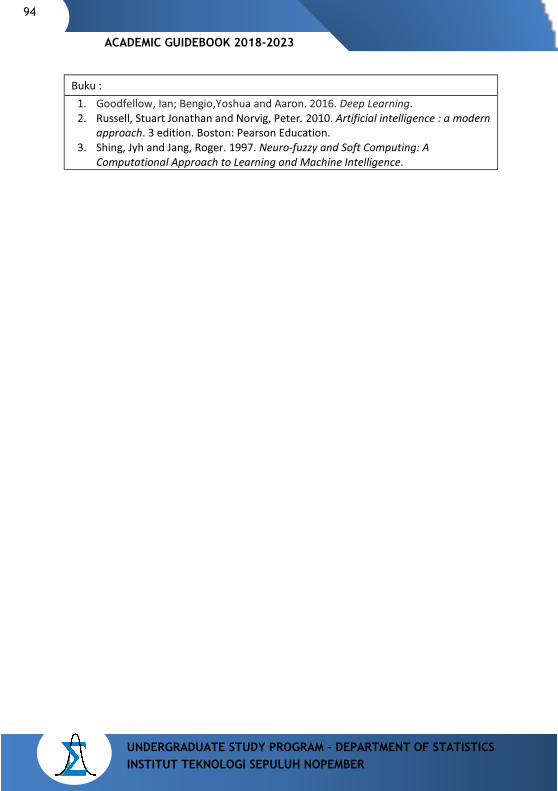
94
UNDERGRADUATE STUDY PROGRAM – DEPARTMENT OF STATISTICS INSTITUT TEKNOLOGI SEPULUH NOPEMBER
ACADEMIC GUIDEBOOK 2018-2023
Buku :
1. Goodfellow, Ian; Bengio,Yoshua and Aaron. 2016. Deep Learning. 2. Russell, Stuart Jonathan and Norvig, Peter. 2010. Artificial intelligence : a modern
approach. 3 edition. Boston: Pearson Education. 3. Shing, Jyh and Jang, Roger. 1997. Neuro-fuzzy and Soft Computing: A
Computational Approach to Learning and Machine Intelligence.
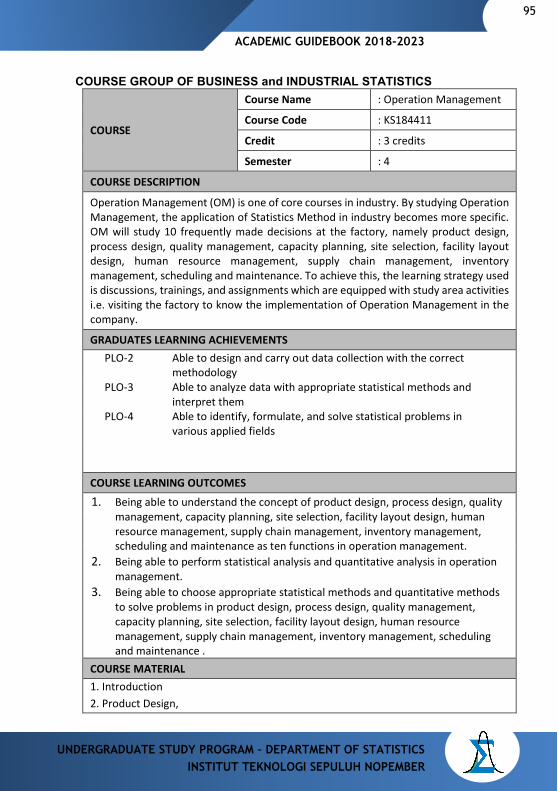
ACADEMIC GUIDEBOOK 2018-2023
95
UNDERGRADUATE STUDY PROGRAM – DEPARTMENT OF STATISTICS INSTITUT TEKNOLOGI SEPULUH NOPEMBER
COURSE GROUP OF BUSINESS and INDUSTRIAL STATISTICS
COURSE
Course Name : Operation Management
Course Code : KS184411
Credit : 3 credits
Semester : 4
COURSE DESCRIPTION
Operation Management (OM) is one of core courses in industry. By studying Operation Management, the application of Statistics Method in industry becomes more specific. OM will study 10 frequently made decisions at the factory, namely product design, process design, quality management, capacity planning, site selection, facility layout design, human resource management, supply chain management, inventory management, scheduling and maintenance. To achieve this, the learning strategy used is discussions, trainings, and assignments which are equipped with study area activities i.e. visiting the factory to know the implementation of Operation Management in the company.
GRADUATES LEARNING ACHIEVEMENTS PLO-2 Able to design and carry out data collection with the correct
methodology PLO-3 Able to analyze data with appropriate statistical methods and
interpret them PLO-4 Able to identify, formulate, and solve statistical problems in
various applied fields
COURSE LEARNING OUTCOMES
1. Being able to understand the concept of product design, process design, quality management, capacity planning, site selection, facility layout design, human resource management, supply chain management, inventory management, scheduling and maintenance as ten functions in operation management.
2. Being able to perform statistical analysis and quantitative analysis in operation management.
3. Being able to choose appropriate statistical methods and quantitative methods to solve problems in product design, process design, quality management, capacity planning, site selection, facility layout design, human resource management, supply chain management, inventory management, scheduling and maintenance .
COURSE MATERIAL 1. Introduction 2. Product Design,
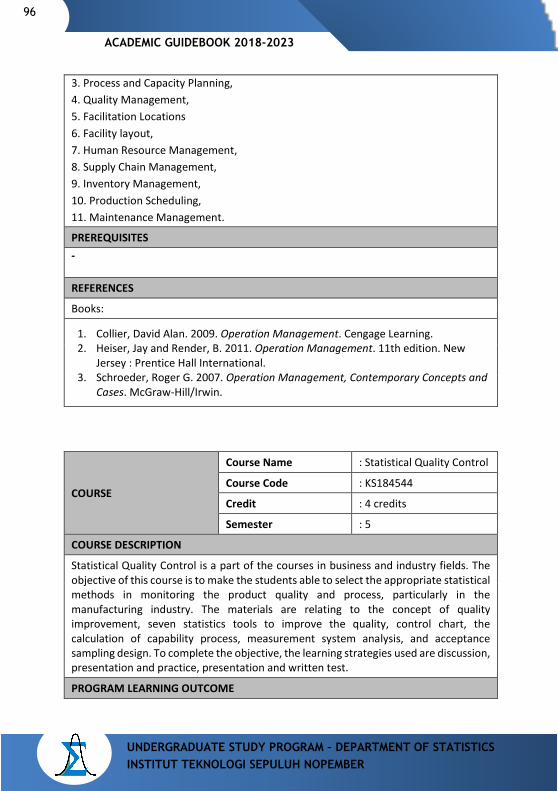
96
UNDERGRADUATE STUDY PROGRAM – DEPARTMENT OF STATISTICS INSTITUT TEKNOLOGI SEPULUH NOPEMBER
ACADEMIC GUIDEBOOK 2018-2023
3. Process and Capacity Planning, 4. Quality Management, 5. Facilitation Locations 6. Facility layout, 7. Human Resource Management, 8. Supply Chain Management, 9. Inventory Management, 10. Production Scheduling, 11. Maintenance Management.
PREREQUISITES - REFERENCES
Books:
1. Collier, David Alan. 2009. Operation Management. Cengage Learning. 2. Heiser, Jay and Render, B. 2011. Operation Management. 11th edition. New
Jersey : Prentice Hall International. 3. Schroeder, Roger G. 2007. Operation Management, Contemporary Concepts and
Cases. McGraw-Hill/Irwin.
COURSE
Course Name : Statistical Quality Control
Course Code : KS184544
Credit : 4 credits
Semester : 5
COURSE DESCRIPTION
Statistical Quality Control is a part of the courses in business and industry fields. The objective of this course is to make the students able to select the appropriate statistical methods in monitoring the product quality and process, particularly in the manufacturing industry. The materials are relating to the concept of quality improvement, seven statistics tools to improve the quality, control chart, the calculation of capability process, measurement system analysis, and acceptance sampling design. To complete the objective, the learning strategies used are discussion, presentation and practice, presentation and written test.
PROGRAM LEARNING OUTCOME
ACADEMIC GUIDEBOOK 2018-2023
97
UNDERGRADUATE STUDY PROGRAM – DEPARTMENT OF STATISTICS INSTITUT TEKNOLOGI SEPULUH NOPEMBER
PLO -1 Able to apply knowledge of science, statistical theory, mathematics, and computing to problems in various applied fields
PLO -2 Able to design and collect data using correct methodology PLO -3 Able to analyze data using appropriate statistical methods and
interpret them PLO -4 Able to identify, formulate, and solve statistical problems in various
applied fields
COURSE LEARNING OUTCOMES 1. Able to apply the knowledge of statistical quality control 2. Able to design and collect the data using the appropriate statistical quality control
method 3. Able to analyze the data using appropriate statistical quality control methods and
interpret the results 4. Able to identify, formulate, and solve the problem in statistical quality control at
various fields COURSE MATERIAL 1. The concept of quality and quality improvement 2. The basic concept in Statistical Process Control 3. Seven statistics tools to improve the quality 4. Variable control chart, Attribute Control Chart 5. Multivariate control chart 6. Measurement System Analysis 7. Analysis of the capability process 8. Design for Attribute acceptance sampling and Variable acceptance sampling 9. Design for MIL-STD 504 and MIL-STD 414 sampling
PREREQUISITES
Introduction to Statistical Methods
REFERENCES
Books: 1. Leavenworth, G.E. and Grant, R.S., 1988. Statistical Quality Control. USA :
McGraw-Hill. 2. Montgomery, D.C., 2012. Introduction to statistical Quality Control. 7th edition.
USA : John Wiley and Sons Inc. 3. Quesenberry, C.P., 1997. SPC Methods for Quality Improvement. USA : John
Wiley and Sons Inc.
98
UNDERGRADUATE STUDY PROGRAM – DEPARTMENT OF STATISTICS INSTITUT TEKNOLOGI SEPULUH NOPEMBER
ACADEMIC GUIDEBOOK 2018-2023
COURSE
Course Name : Operation Research
Course Code : KS184439
Credit : 3 credits
Semester : 4
COURSE DESCRIPTION Operations Research is a discipline that applies analytical tools based on quantitative methods for better decisions. In this course there are several fundamental methods and applications in various fields. Students are given an understanding of basic theories and concepts. In addition, students are also equipped with advanced optimization concepts and procedures and apply them in management concepts. Content provided i.e. Linear Program, Simplex Method, Duality, Sensivity, Queue, Transportation Problems, Problems and Network Analysis. The material is delivered through interactive lectures, discussions, exercises, and Problem Based Learning. COURSE LEARNING OUTCOMES
PLO-1 Able to apply knowledge of statistical theory, Mathematics, and computations
PLO-4 Able to identify, formulate, and solve statistical problems in various applied fields
COURSE MATERIAL 1. Optimization Without Constraints (1-Dimensional Search Method, Gradient
Method, Newton Method, Conjugate Direction Method, Quasi-Newton Method, Linear Equation Solution, Global Search Algorithm)
2. Linear Program (2 dimensional Linear Program, Simplex Method, Duality, Nonsimplex Method, Integer Linear Program)
3. Optimization with Constraints (Problems with Equality Constraints, Problems with Inequality Constraint, Konveks Optimization Issues)
4. Optimization Algorithm with Constraints 5. Multi Objective Optimization
PREREQUISITES
-
REFERENCES
Books:
1. Montgomery, D.C., 2012. An Introduction to Optimization. 4th edition. USA: John Wiley and Sons Inc.
ACADEMIC GUIDEBOOK 2018-2023
99
UNDERGRADUATE STUDY PROGRAM – DEPARTMENT OF STATISTICS INSTITUT TEKNOLOGI SEPULUH NOPEMBER
2. Hillier, F. S. And Lieberman, G. J. Introduction to Operations Research, 6th Ed. McGraw-Hill, Inc. New York, USA. 1995.
3. Taha, H. A. Operations Research: An Introduction, 8th Ed. Pearson Prentice Hall. New York, USA. 2007
COURSE
Course Name : Quality Management
Course Code : KS184530
Credit : 3 credits
Semester : 5
COURSE DESCRIPTION
Quality Management (MM) is one of the study materials in the area of Business and Industry. In PKS studies the technique of monitoring the quality of products and processes, then in MM learning emphasizes on how to manage and improve quality continuously. Therefore in MM Course studies the principles of quality management. Learning strategy is discussions, presentations, assignments and completed with field activities. Field lectures are activities to visit the company to know the implementation of quality management in the company, both manufacturing and services. GRADUATES LEARNING ACHIEVEMENTS
PLO-2 Able to design and carry out data collection with the correct methodology
PLO-3 Able to analyze data with appropriate statistical methods and interpret them
PLO-4 Able to identify, formulate, and solve statistical problems in various applied fields
COURSE LEARNING OUTCOMES 1. Being able to explain the concept of quality management, the benefits of quality
management and principles in quality management. 2. Being able to apply various quality management principles for both service
companies and manufacturers 3. Being able to choose appropriate statistical methods to solve quality and quality
improvement issues COURSE MATERIAL
100
UNDERGRADUATE STUDY PROGRAM – DEPARTMENT OF STATISTICS INSTITUT TEKNOLOGI SEPULUH NOPEMBER
ACADEMIC GUIDEBOOK 2018-2023
1. Definition of quality management, the benefits of quality management and the eight principles of quality management. 2. Model and conceptual framework of quality management 3. Leadership and commitment 4. Policies, strategies and targets in quality management 5. Partnerships and resources 6. The concept of performance measurement 7. Review, audit and self-assessment 8. Change management and guesswork 9. Process management 10. Quality management system 11. Continuous improvement PREREQUISITES - REFERENCES
Books: 1. Desmond, Bell; Bride, Philip Mc; and Wilson, George. 1994. Managing Quality the
institute of management. 1th edition. Butterworth Heineman Ltd. 2. International Standar ISO 9001:2008 3. Pande; S, Peter; Neuman, Robert P.; and Cavanagh, Roland R. 2007. The six sigma
Way, bagaimana GE,Motorolla,dan perusahaan terkenal lainnya mengasah kinerja mereka. Penerbit Andi Yogyakarta.
COURSE
Course Name : Business Decision Analysis
Course Code : KS184531
Credit : 3 credits
Semester : 5
COURSE DESCRIPTION
ACADEMIC GUIDEBOOK 2018-2023
101
UNDERGRADUATE STUDY PROGRAM – DEPARTMENT OF STATISTICS INSTITUT TEKNOLOGI SEPULUH NOPEMBER
The Course of Business Decision Analysis is one of Courses which aims to apply the concept of probability and expectation in decision making problem in Industrial world, Business Economics, Social Government and Health Environment. Learning strategy used is assignments and evaluation based on presentations / tests. GRADUATES LEARNING ACHIEVEMENTS
PLO-1 Able to apply knowledge of statistical theory, Mathematics, and computations
PLO-2 Able to design and carry out data collection with the correct methodology
PLO-3 Able to analyze data with appropriate statistical methods and interpret them
PLO-4 Able to identify, formulate, and solve statistical problems in various applied fields
COURSE LEARNING OUTCOMES 1. Being able to explain description, formalization and cycle in decision analysis 2. Being able to apply diagram and modeling in business decision making. 3. Being able to explain compound events and probability values. 4. Being able to explain preference on risk and utility function 5. Being able to explain compound criteria in certainty and uncertainty. 6. Being able to determine behavioral assumptions and limitations of decision
analysis. 7. Being able to explain Analytic Hierarchy Process (AHP) 8. Being able to explain the decision of profit and cost analysis as well as allocation resources. COURSE MATERIAL 1. Scope and Decision Analysis Cycle 2. Diagrams and Models in Decision Analysis 3. Model and Probability Values 4. Preferences on the Risks and Utilities Functions 5. Compound Criteria in Certainty and Uncertainty, 6. Assumption of Behavior and Limitations of Decision Analysis and Analytic Hierarchy
Process. PREREQUISITES
Introduction to Statistical Method
REFERENCES
Books:
102
UNDERGRADUATE STUDY PROGRAM – DEPARTMENT OF STATISTICS INSTITUT TEKNOLOGI SEPULUH NOPEMBER
ACADEMIC GUIDEBOOK 2018-2023
1. Holloway C. H., 1979. Decision Making Under Uncertainty : Models And Choices.
New Jersey : Prentice-Hall. 2. Mangkusubroto, Kuntoro. 1989. Analisis Keputusan : Pendekatan Sistem Dalam
Man-jemen Usaha Dan Proyek. Cetakan ke-6. Bandung : Ganeca Exact. 3. Saaty. T. L., 1990. Decision Making for Leaders: The Analytic Hierarchy Process
For Decisions In A Complex World. USA : RWS Publications. 4. Sixto, Rios. 1994. Decision Theory and Decision Analysis: Trends and Challenges. 5. Stine, Robert dan Foster, Dean. 2013. Statistics for Business: Decision Making
and Analysis. 3rd edition. Kindle Edition.
COURSE
Course Name : Six Sigma
Course Code : KS184632
Credit : 3 credits
Semester : 6
COURSE DESCRIPTION
Each company aims to gain the maximum profit by providing the best service to customers and all stakeholders. The challenge is how business actors can design and run the work program effectively and efficiently. Also how to perform continuous improvement steps. Six Sigma helps solve problems in systems that view continous process improvement. Topics covered include: the concept of continuous process improvement, sigma size, organizational leadership belt, DMAIC methodology, DMADV, six sigma program used to solve problems faced both in production system and service environment.
GRADUATES LEARNING ACHIEVEMENTS PLO-1 Able to apply knowledge of statistical theory, Mathematics, and
computations PLO-2 Able to design and carry out data collection with the correct
methodology PLO-3 Able to analyze data with appropriate statistical methods and
interpret them PLO-4 Able to identify, formulate, and solve statistical problems in
various applied fields
COURSE LEARNING OUTCOMES
1. Being able to understand the six sigma concepts used to solve company problems
2. Being able to identify and formulate quality issues into six sigma
ACADEMIC GUIDEBOOK 2018-2023
103
UNDERGRADUATE STUDY PROGRAM – DEPARTMENT OF STATISTICS INSTITUT TEKNOLOGI SEPULUH NOPEMBER
3. Being able to perform analysis of quality problems with six sigma method 4. Being able to evaluate the appropriate six sigma method for company problem
COURSE MATERIAL
1. Quality system in general, Identification of all quality functional requirements, Quality improvement method: from QC to SS; History and its recognition
2. Basic concepts of Quality development system, Understanding product or service characteristics.
3. Product and service development; services in the context of SIX SIGMA: components and characteristics to be improved, with the DMAIC or DMADV methodology
4. The concept of sigma and capability process, basic six sigma methods: a. problem solving tools (process mapping, flow chart, check sheet, pareto
analisys, RCA) b. seven tools (affinity, tree, process decision, matric, interrelationship, prioritization, network, other) c. knowledge discovery (run chart, descriptive stat, histogram, explanatory)
5. Six sigma leadership, various levels of belt in six sigma organization. 6. Managing six sigma project; initiatives to quality, short and long term quality,
performance measurement, benefit-cost analysis. 7. Principle measurement and data; measurement and retrieval of data, scale,
reliability and validity of data, R and R study. 8. Six Sigma in marketing, Six Sigma in project - production, Six Sigma in financing,
Six Sigma performance control (designing control mechanism, performance metrics, SCOR model, benchmarking, six sigma-quality improvement in action).
PREREQUISITES
1. Introduction to Statistical Methods, 2. Quality Control Techniques
REFERENCES
Books:
1. Gasperz, Vincent. 2007. Lean Six Sigma for Manufacturing and Service Industries. 2. Gasperz, Vincent. 2008. The Executive Guide to Implementing Lean Six Sigma. 3. Matin, James W. 2006. Lean Six Sigma for Supply Chain Management. Mc Graw
Hill. 4. Pyzdek, Thomas. 2014. The Six Sigma Handbook. 4th edition. USA : Mc Graw Hill.
104
UNDERGRADUATE STUDY PROGRAM – DEPARTMENT OF STATISTICS INSTITUT TEKNOLOGI SEPULUH NOPEMBER
ACADEMIC GUIDEBOOK 2018-2023
COURSE
Course Name : Quality Design
Course Code : KS184633
Credit : 3 credits
Semester : 6
COURSE DESCRIPTION
Quality Design (PK) is one of Courses in the area of industry having study area of designing experiments to determine optimization. The purpose of studying PK is to know the application of Statistics method in determining optimization of single or double response through experimental design, either by Taguchi method or Response Surface method. To achieve the above purpose, the learning strategy used is discussions and exercises as well as presentation assignments that come from the study materials or scientific publications.
GRADUATES LEARNING ACHIEVEMENTS PLO-1 Able to apply knowledge of statistical theory, Mathematics, and
computations PLO-2 Able to design and carry out data collection with the correct
methodology PLO-3 Able to analyze data with appropriate statistical methods and
interpret them PLO-4 Able to identify, formulate, and solve statistical problems in
various applied fields
COURSE LEARNING OUTCOMES 1. Being able to explain basic concepts in Quality by Design and experimental
design 2. Being able to apply standard Orthogonal Array and use it to create
experimental design in Taguchi method 3. Being able to apply modified Orthogonal Array (modification) and use it to
create experimental design in Taguchi method 4. Being able to understand the concept of SN ratios and their types for analyzing
continuous response experimental data in Taguchi method 5. Being able to analyze Optimization through Taguchi method. Understand the
concept of SN ratios and their types to analyze discrete experimental data in Taguchi method
6. Being able to perform data analysis of Taguchi method for multi-response case 7. Being able to use Response Surface method for optimization on single response 8. Being able to use Response Surface method for optimization on double
response COURSE MATERIAL
ACADEMIC GUIDEBOOK 2018-2023
105
UNDERGRADUATE STUDY PROGRAM – DEPARTMENT OF STATISTICS INSTITUT TEKNOLOGI SEPULUH NOPEMBER
1. Taguchi Method: Orthogonal Arrays, Loss function, S / N ratio Optimization for static quality characteristic of continuous and discrete response, Single and Multiple response optimization (TOPSIS method). 2. Surface Response Method: Single and Multiple response optimization (desirability function) PREREQUISITES
Experimental Design REFERENCES
Books: 1. Balavendram, N. 1995. Quality by Design Taguchi Techniques for
IndustrialExperimentation. London : Prentice Hall Internasional. 2. Montgomery. 2008. Design and Analysis of Experiments. 6th edition. 3. Park, Sung H. 1996. Robust Design and analysis for Quality Engineering.
Chapman Hall.
COURSE
Course Name : Reliability Analysis
Course Code : KS184634
Credit : 3 credits
Semester : 6
COURSE DESCRIPTION
Reliability is one of courses in the area of industry having study area to determine the reliability of a tool. The purpose of studying Reliability is to know the application of statistical methods to determine the reliability and maintenance time of a tool and system, and to perform data analysis reliability. To achieve the above purpose, learning strategy used is discussions, practices and presentation assignments that come from scientific publications through journals, proceedings and others.
GRADUATES LEARNING ACHIEVEMENTS PLO-1 Able to apply knowledge of statistical theory, Mathematics, and
computations PLO-3 Able to analyze data with appropriate statistical methods and
interpret them PLO-4 Able to identify, formulate, and solve statistical problems in
various applied fields
106
UNDERGRADUATE STUDY PROGRAM – DEPARTMENT OF STATISTICS INSTITUT TEKNOLOGI SEPULUH NOPEMBER
ACADEMIC GUIDEBOOK 2018-2023
PLO-6 Having knowledge of current and future issues relating to the
fields of statistics and data science PLO-7 Able to communicate effectively and work together in
interdisciplinary and multidisciplinary teams PLO-8 Has professional responsibilities and ethics PLO-9 Able to motivate yourself to think creatively and learn throughout
life
COURSE LEARNING OUTCOMES 1. Being able to understand what will be learned in the whole lecture 2. Being able to understand the basic concept of reliability analysis 3. Being able to understand the concept of time distribution failure 4. Being able to understand the concept of constant failure rate model 5. Being able to understand the concept of time-dependent failure model 6. Being able to understand the concept of reliability of a system 7. Being able to understand the Markov Model concept for dependent system reliability 8. Being able to understand the concept of Maintainability 9. Being able to understand the concept of Availability 10. Being able to understand the concept of examination and maintenance models 11. Being able to understand the concepts of failure data Analysis COURSE MATERIAL 1.The concept of reliability (reliability, maintainability, availability) 2. Failure time distribution (Failure distribution): reliability function, Mean Time to Failure (MTTF), hazard rate function, Bathtub Curve, Conditional reliability, 3. Constant failure rate model (Exponential reliability function, failure models, two parameters exponential distribution, poisson process, redundancy and CFR model), 4.Time-dependent failure models (Weibull Distribution, Normal Distribution, Normal Log Distribution, Gamma Distribution), 5. System Reliability (Systems of Series, parallel, series-parallel combination), Markov model for system reliability, 6. Maintainability, Availability, maintenance inspection models, 7. Maintenance Inspection Model maximizing Availability, 8. Maintenance Inspection Model minimizing the Total Cost of Maintenance 9. Failure Data Analysis (Data collection: complete and censored, Reliability testing, Reliability Growth testing, Identification of failure distribution and Repair, statistical testing) PREREQUISITES
Mathematical Statistics
REFERENCES
Books:
ACADEMIC GUIDEBOOK 2018-2023
107
UNDERGRADUATE STUDY PROGRAM – DEPARTMENT OF STATISTICS INSTITUT TEKNOLOGI SEPULUH NOPEMBER
1. Dhillon, B. S., 2006. Maintainability, maintenance, and reliability for engineers. CRC Press Taylor dan Francis Group.
2. Ebeling, C., 2010. An Introduction to Reliability and Maintainability Engineering. 2nd edition. Canada : Waveland Press, Inc.
COURSE
Course Name : Logistics and Supply Chain Management
Course Code : KS184735
Credit : 3 credits
Semester : 7
COURSE DESCRIPTION
The purpose of this Course is to provide the students General Knowledge and skills to understand the concepts and models in logistics and supply chain management and its application in real cases. The students are also equipped to be skillful in using software applications for any needed lecture materials. By combining the ability to understand real problems, translating them into models and completion methods, the students are expected to have a comprehensive General Knowledge of logistics and supply chain management.
GRADUATES LEARNING ACHIEVEMENTS PLO-1 Able to apply knowledge of statistical theory, Mathematics, and
computations PLO-2 Able to design and carry out data collection with the correct
methodology PLO-3 Able to analyze data with appropriate statistical methods and
interpret them PLO-4 Able to identify, formulate, and solve statistical problems in
various applied fields
COURSE LEARNING OUTCOMES After completing the Logistics and Supply Chain Management course, students are expected to be able to explain the role and scope of logistics management in the industrial applications, using customer service logistics to measure the quality of a service in logistics, using analytical tools in designing logistic networks, explain the role of warehouses in logistics management. , able to evaluate warehousing policies and be able to design a warehouse layout. In addition, students are also expected to be able to explain the role of transportation in logistics management, evaluate different transportation policies and regulate
108
UNDERGRADUATE STUDY PROGRAM – DEPARTMENT OF STATISTICS INSTITUT TEKNOLOGI SEPULUH NOPEMBER
ACADEMIC GUIDEBOOK 2018-2023
operational activities in transportation. In general, students are expected to be able to explain the role of logistics in a country as well as the global context. COURSE MATERIAL
1. Fundamentals of distribution network planning 2. Decision of facility location in distribution network 3. Fundamentals of logistics transportation planning and decisions in logistics
transport 4. System of warehousing and product removal in the warehouse and decisions
involved in it 5. Role of information and communication technology in logistics and supply chain
management PREREQUISITES - REFERENCES
Books: 1. Ballou, Ronald H. 2004. Business Logistics Management. USA: Prentice Hall
International, Inc. 2. Chopra, Sunil. 2007. Supply Chain Management: Strategy, Planning, and
Operation. New Jersey: Prentice Hall International, Inc. 3. Fleischmand et.al. 2003. Quantitative Modelling in Reverse Logistics. Springer. 4. Ghiani, Gianpaolo. 2004. Introduction to Logistics Systems Planning and Control.
California: John Wiley and Sons, Ltd.
COURSE
Course Name : Marketing Research Method
Course Code : KS184736
Credit : 3 credits
Semester : 7
COURSE DESCRIPTION
This course provides an introduction to comprehensive marketing research, and discusses concepts, processes, and techniques and their applications. The students will understand the course deeply and its significance for business enterprise. In addition to overview of marketing research, the Course covers research designs, including qualitative and quantitative data, and quantitative methods used to analyze research data to make decisions
GRADUATES LEARNING ACHIEVEMENTS
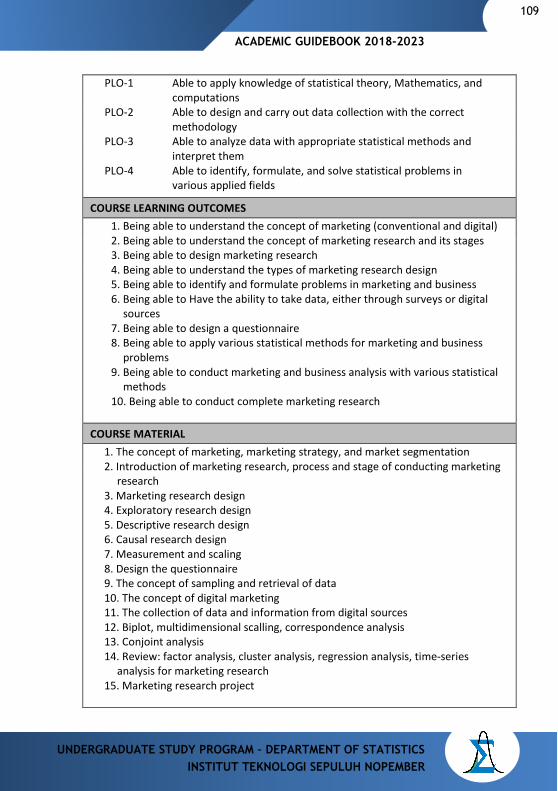
ACADEMIC GUIDEBOOK 2018-2023
109
UNDERGRADUATE STUDY PROGRAM – DEPARTMENT OF STATISTICS INSTITUT TEKNOLOGI SEPULUH NOPEMBER
PLO-1 Able to apply knowledge of statistical theory, Mathematics, and computations
PLO-2 Able to design and carry out data collection with the correct methodology
PLO-3 Able to analyze data with appropriate statistical methods and interpret them
PLO-4 Able to identify, formulate, and solve statistical problems in various applied fields
COURSE LEARNING OUTCOMES 1. Being able to understand the concept of marketing (conventional and digital) 2. Being able to understand the concept of marketing research and its stages 3. Being able to design marketing research 4. Being able to understand the types of marketing research design 5. Being able to identify and formulate problems in marketing and business 6. Being able to Have the ability to take data, either through surveys or digital
sources 7. Being able to design a questionnaire 8. Being able to apply various statistical methods for marketing and business
problems 9. Being able to conduct marketing and business analysis with various statistical
methods 10. Being able to conduct complete marketing research
COURSE MATERIAL 1. The concept of marketing, marketing strategy, and market segmentation 2. Introduction of marketing research, process and stage of conducting marketing
research 3. Marketing research design 4. Exploratory research design 5. Descriptive research design 6. Causal research design 7. Measurement and scaling 8. Design the questionnaire 9. The concept of sampling and retrieval of data 10. The concept of digital marketing 11. The collection of data and information from digital sources 12. Biplot, multidimensional scalling, correspondence analysis 13. Conjoint analysis 14. Review: factor analysis, cluster analysis, regression analysis, time-series
analysis for marketing research 15. Marketing research project
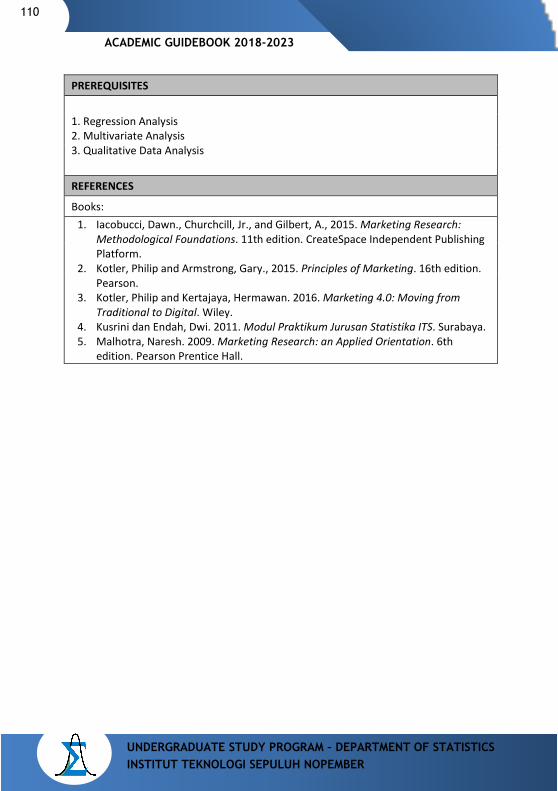
110
UNDERGRADUATE STUDY PROGRAM – DEPARTMENT OF STATISTICS INSTITUT TEKNOLOGI SEPULUH NOPEMBER
ACADEMIC GUIDEBOOK 2018-2023
PREREQUISITES
1. Regression Analysis 2. Multivariate Analysis 3. Qualitative Data Analysis
REFERENCES
Books: 1. Iacobucci, Dawn., Churchcill, Jr., and Gilbert, A., 2015. Marketing Research:
Methodological Foundations. 11th edition. CreateSpace Independent Publishing Platform.
2. Kotler, Philip and Armstrong, Gary., 2015. Principles of Marketing. 16th edition. Pearson.
3. Kotler, Philip and Kertajaya, Hermawan. 2016. Marketing 4.0: Moving from Traditional to Digital. Wiley.
4. Kusrini dan Endah, Dwi. 2011. Modul Praktikum Jurusan Statistika ITS. Surabaya. 5. Malhotra, Naresh. 2009. Marketing Research: an Applied Orientation. 6th
edition. Pearson Prentice Hall.
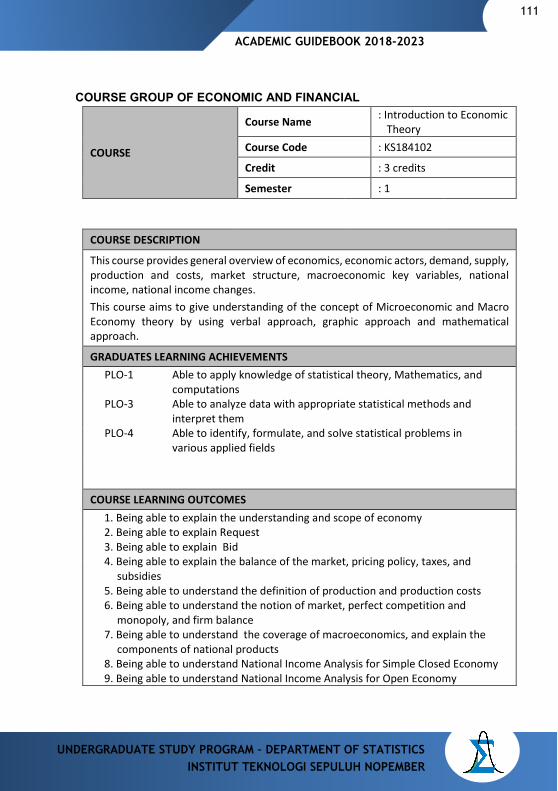
ACADEMIC GUIDEBOOK 2018-2023
111
UNDERGRADUATE STUDY PROGRAM – DEPARTMENT OF STATISTICS INSTITUT TEKNOLOGI SEPULUH NOPEMBER
COURSE GROUP OF ECONOMIC AND FINANCIAL
COURSE
Course Name : Introduction to Economic Theory
Course Code : KS184102
Credit : 3 credits
Semester : 1
COURSE DESCRIPTION
This course provides general overview of economics, economic actors, demand, supply, production and costs, market structure, macroeconomic key variables, national income, national income changes. This course aims to give understanding of the concept of Microeconomic and Macro Economy theory by using verbal approach, graphic approach and mathematical approach.
GRADUATES LEARNING ACHIEVEMENTS PLO-1 Able to apply knowledge of statistical theory, Mathematics, and
computations PLO-3 Able to analyze data with appropriate statistical methods and
interpret them PLO-4 Able to identify, formulate, and solve statistical problems in
various applied fields
COURSE LEARNING OUTCOMES 1. Being able to explain the understanding and scope of economy 2. Being able to explain Request 3. Being able to explain Bid 4. Being able to explain the balance of the market, pricing policy, taxes, and
subsidies 5. Being able to understand the definition of production and production costs 6. Being able to understand the notion of market, perfect competition and
monopoly, and firm balance 7. Being able to understand the coverage of macroeconomics, and explain the
components of national products 8. Being able to understand National Income Analysis for Simple Closed Economy 9. Being able to understand National Income Analysis for Open Economy
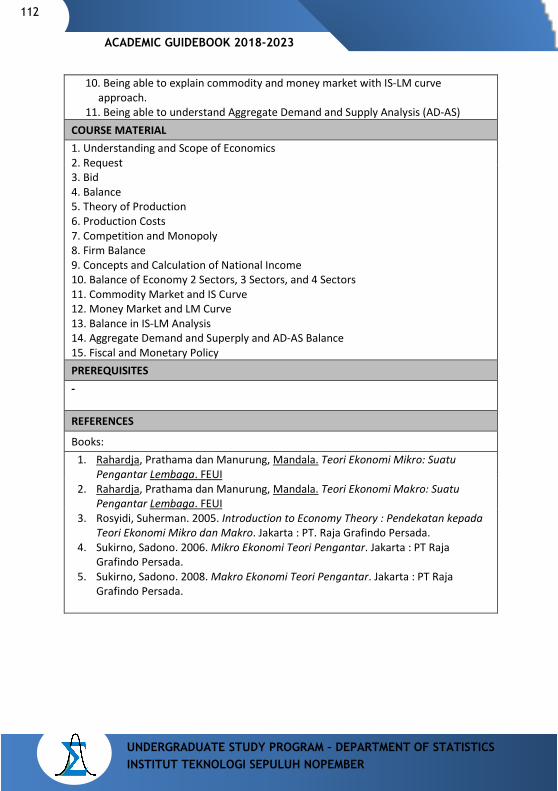
112
UNDERGRADUATE STUDY PROGRAM – DEPARTMENT OF STATISTICS INSTITUT TEKNOLOGI SEPULUH NOPEMBER
ACADEMIC GUIDEBOOK 2018-2023
10. Being able to explain commodity and money market with IS-LM curve
approach. 11. Being able to understand Aggregate Demand and Supply Analysis (AD-AS)
COURSE MATERIAL 1. Understanding and Scope of Economics 2. Request 3. Bid 4. Balance 5. Theory of Production 6. Production Costs 7. Competition and Monopoly 8. Firm Balance 9. Concepts and Calculation of National Income 10. Balance of Economy 2 Sectors, 3 Sectors, and 4 Sectors 11. Commodity Market and IS Curve 12. Money Market and LM Curve 13. Balance in IS-LM Analysis 14. Aggregate Demand and Superply and AD-AS Balance 15. Fiscal and Monetary Policy PREREQUISITES - REFERENCES
Books: 1. Rahardja, Prathama dan Manurung, Mandala. Teori Ekonomi Mikro: Suatu
Pengantar Lembaga. FEUI 2. Rahardja, Prathama dan Manurung, Mandala. Teori Ekonomi Makro: Suatu
Pengantar Lembaga. FEUI 3. Rosyidi, Suherman. 2005. Introduction to Economy Theory : Pendekatan kepada
Teori Ekonomi Mikro dan Makro. Jakarta : PT. Raja Grafindo Persada. 4. Sukirno, Sadono. 2006. Mikro Ekonomi Teori Pengantar. Jakarta : PT Raja
Grafindo Persada. 5. Sukirno, Sadono. 2008. Makro Ekonomi Teori Pengantar. Jakarta : PT Raja
Grafindo Persada.
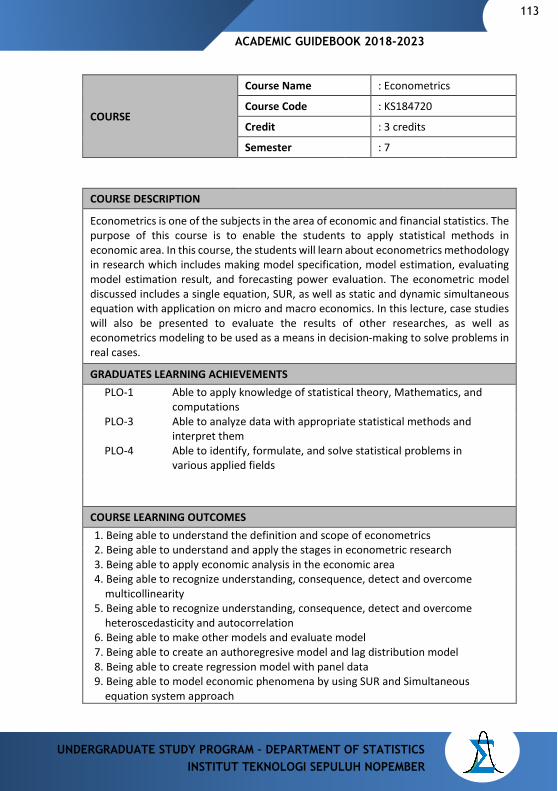
ACADEMIC GUIDEBOOK 2018-2023
113
UNDERGRADUATE STUDY PROGRAM – DEPARTMENT OF STATISTICS INSTITUT TEKNOLOGI SEPULUH NOPEMBER
COURSE
Course Name : Econometrics
Course Code : KS184720
Credit : 3 credits
Semester : 7
COURSE DESCRIPTION
Econometrics is one of the subjects in the area of economic and financial statistics. The purpose of this course is to enable the students to apply statistical methods in economic area. In this course, the students will learn about econometrics methodology in research which includes making model specification, model estimation, evaluating model estimation result, and forecasting power evaluation. The econometric model discussed includes a single equation, SUR, as well as static and dynamic simultaneous equation with application on micro and macro economics. In this lecture, case studies will also be presented to evaluate the results of other researches, as well as econometrics modeling to be used as a means in decision-making to solve problems in real cases.
GRADUATES LEARNING ACHIEVEMENTS PLO-1 Able to apply knowledge of statistical theory, Mathematics, and
computations PLO-3 Able to analyze data with appropriate statistical methods and
interpret them PLO-4 Able to identify, formulate, and solve statistical problems in
various applied fields
COURSE LEARNING OUTCOMES 1. Being able to understand the definition and scope of econometrics 2. Being able to understand and apply the stages in econometric research 3. Being able to apply economic analysis in the economic area 4. Being able to recognize understanding, consequence, detect and overcome
multicollinearity 5. Being able to recognize understanding, consequence, detect and overcome
heteroscedasticity and autocorrelation 6. Being able to make other models and evaluate model 7. Being able to create an authoregresive model and lag distribution model 8. Being able to create regression model with panel data 9. Being able to model economic phenomena by using SUR and Simultaneous
equation system approach
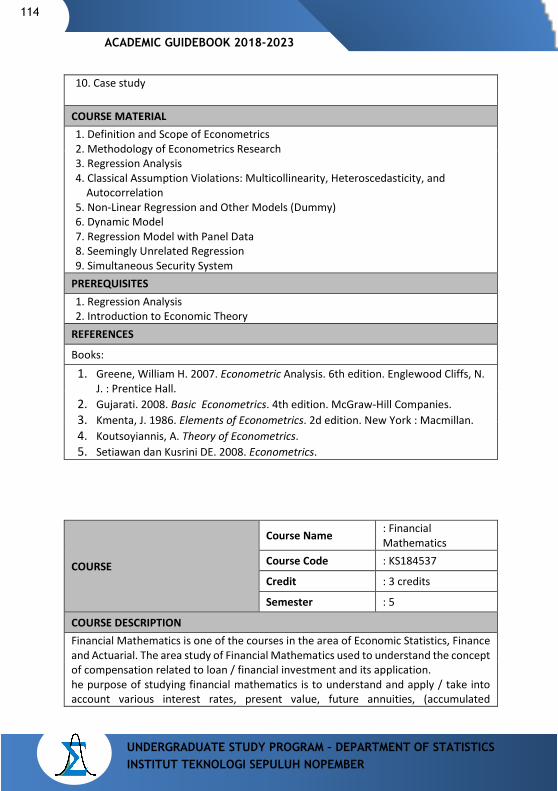
114
UNDERGRADUATE STUDY PROGRAM – DEPARTMENT OF STATISTICS INSTITUT TEKNOLOGI SEPULUH NOPEMBER
ACADEMIC GUIDEBOOK 2018-2023
10. Case study
COURSE MATERIAL 1. Definition and Scope of Econometrics 2. Methodology of Econometrics Research 3. Regression Analysis 4. Classical Assumption Violations: Multicollinearity, Heteroscedasticity, and
Autocorrelation 5. Non-Linear Regression and Other Models (Dummy) 6. Dynamic Model 7. Regression Model with Panel Data 8. Seemingly Unrelated Regression 9. Simultaneous Security System
PREREQUISITES 1. Regression Analysis 2. Introduction to Economic Theory
REFERENCES
Books:
1. Greene, William H. 2007. Econometric Analysis. 6th edition. Englewood Cliffs, N. J. : Prentice Hall.
2. Gujarati. 2008. Basic Econometrics. 4th edition. McGraw-Hill Companies. 3. Kmenta, J. 1986. Elements of Econometrics. 2d edition. New York : Macmillan. 4. Koutsoyiannis, A. Theory of Econometrics. 5. Setiawan dan Kusrini DE. 2008. Econometrics.
COURSE
Course Name : Financial Mathematics
Course Code : KS184537
Credit : 3 credits
Semester : 5
COURSE DESCRIPTION Financial Mathematics is one of the courses in the area of Economic Statistics, Finance and Actuarial. The area study of Financial Mathematics used to understand the concept of compensation related to loan / financial investment and its application. he purpose of studying financial mathematics is to understand and apply / take into account various interest rates, present value, future annuities, (accumulated
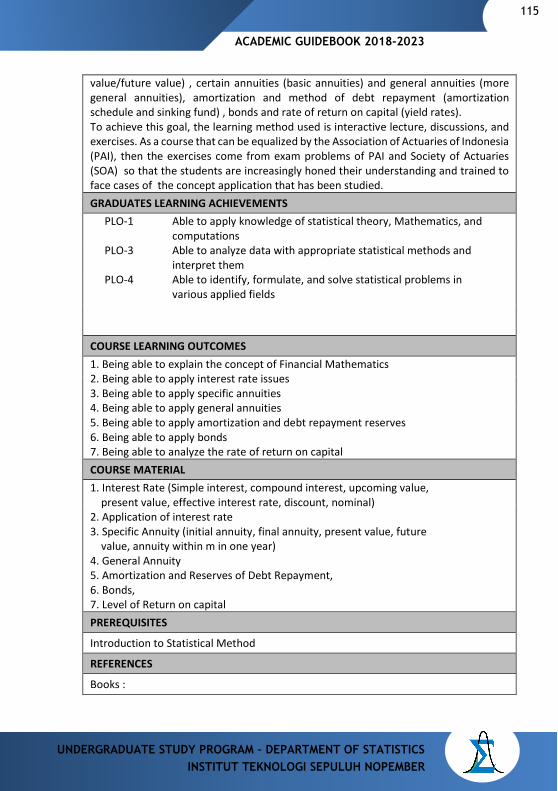
ACADEMIC GUIDEBOOK 2018-2023
115
UNDERGRADUATE STUDY PROGRAM – DEPARTMENT OF STATISTICS INSTITUT TEKNOLOGI SEPULUH NOPEMBER
value/future value) , certain annuities (basic annuities) and general annuities (more general annuities), amortization and method of debt repayment (amortization schedule and sinking fund) , bonds and rate of return on capital (yield rates). To achieve this goal, the learning method used is interactive lecture, discussions, and exercises. As a course that can be equalized by the Association of Actuaries of Indonesia (PAI), then the exercises come from exam problems of PAI and Society of Actuaries (SOA) so that the students are increasingly honed their understanding and trained to face cases of the concept application that has been studied. GRADUATES LEARNING ACHIEVEMENTS
PLO-1 Able to apply knowledge of statistical theory, Mathematics, and computations
PLO-3 Able to analyze data with appropriate statistical methods and interpret them
PLO-4 Able to identify, formulate, and solve statistical problems in various applied fields
COURSE LEARNING OUTCOMES 1. Being able to explain the concept of Financial Mathematics 2. Being able to apply interest rate issues 3. Being able to apply specific annuities 4. Being able to apply general annuities 5. Being able to apply amortization and debt repayment reserves 6. Being able to apply bonds 7. Being able to analyze the rate of return on capital COURSE MATERIAL 1. Interest Rate (Simple interest, compound interest, upcoming value, present value, effective interest rate, discount, nominal) 2. Application of interest rate 3. Specific Annuity (initial annuity, final annuity, present value, future value, annuity within m in one year) 4. General Annuity 5. Amortization and Reserves of Debt Repayment, 6. Bonds, 7. Level of Return on capital PREREQUISITES
Introduction to Statistical Method REFERENCES
Books :
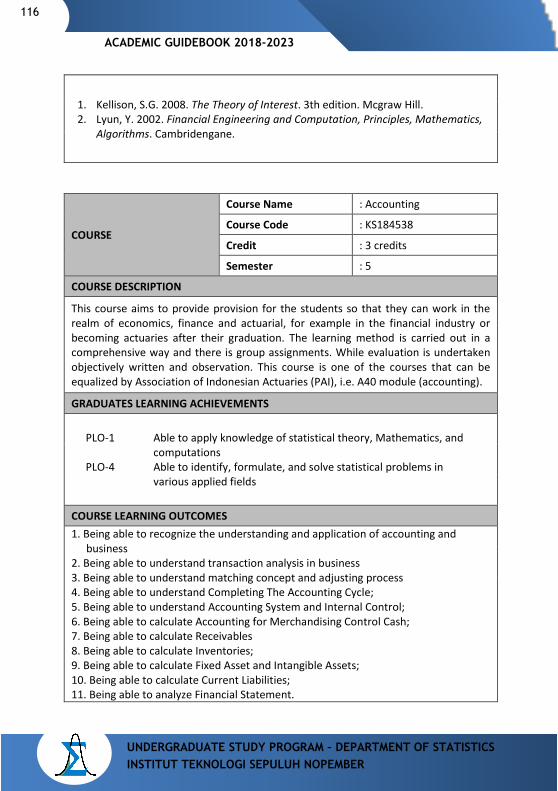
116
UNDERGRADUATE STUDY PROGRAM – DEPARTMENT OF STATISTICS INSTITUT TEKNOLOGI SEPULUH NOPEMBER
ACADEMIC GUIDEBOOK 2018-2023
1. Kellison, S.G. 2008. The Theory of Interest. 3th edition. Mcgraw Hill. 2. Lyun, Y. 2002. Financial Engineering and Computation, Principles, Mathematics,
Algorithms. Cambridengane.
COURSE
Course Name : Accounting
Course Code : KS184538
Credit : 3 credits
Semester : 5
COURSE DESCRIPTION
This course aims to provide provision for the students so that they can work in the realm of economics, finance and actuarial, for example in the financial industry or becoming actuaries after their graduation. The learning method is carried out in a comprehensive way and there is group assignments. While evaluation is undertaken objectively written and observation. This course is one of the courses that can be equalized by Association of Indonesian Actuaries (PAI), i.e. A40 module (accounting).
GRADUATES LEARNING ACHIEVEMENTS
PLO-1 Able to apply knowledge of statistical theory, Mathematics, and computations
PLO-4 Able to identify, formulate, and solve statistical problems in various applied fields
COURSE LEARNING OUTCOMES 1. Being able to recognize the understanding and application of accounting and
business 2. Being able to understand transaction analysis in business 3. Being able to understand matching concept and adjusting process 4. Being able to understand Completing The Accounting Cycle; 5. Being able to understand Accounting System and Internal Control; 6. Being able to calculate Accounting for Merchandising Control Cash; 7. Being able to calculate Receivables 8. Being able to calculate Inventories; 9. Being able to calculate Fixed Asset and Intangible Assets; 10. Being able to calculate Current Liabilities; 11. Being able to analyze Financial Statement.
ACADEMIC GUIDEBOOK 2018-2023
117
UNDERGRADUATE STUDY PROGRAM – DEPARTMENT OF STATISTICS INSTITUT TEKNOLOGI SEPULUH NOPEMBER
COURSE MATERIAL 1. Introduction to Accounting and Business; 2. Transaction Analysis; 3. The Matching Concept and Adjusting Process; 4. Completing The Accounting Cycle; 5. Accounting System and Internal Control; 6. Accounting for Merchandising Control Cash; 7. Receivables; 8. Inventories; 9. Fixed Asset and Intangible Assets; 10. Current Liabilities; 11. Financial Statement Analysis.
PREREQUISITES
-
REFERENCES
Books :
1. Fresss W.R. 2005. Accounting. 1st edition. Internasional Student Thomson South-Western-Hill.
2. Weyangandt, K. and Kieso. 2014. Financial Accounting. 9th edition. John Wiley dan Sons, Inc.
COURSE
Course Name : Financial Analysis
Course Code : KS184639
Credit : 3 credits
Semester : 6
COURSE DESCRIPTION
The financial analysis course has the material intended for the students to know the instrument of investment, including financial markets and their products, understand the dynamic of national and international macroeconomic and its relation with returns from investment products. Learning strategies are regular lectures, guest lectures from practitioners, visiting the Surabaya Stock Exchange, and project assignments. While the evaluation is conducted by examination (written / spoken) and the project.
GRADUATES LEARNING ACHIEVEMENTS PLO-1 Able to apply knowledge of statistical theory, Mathematics, and
computations
118
UNDERGRADUATE STUDY PROGRAM – DEPARTMENT OF STATISTICS INSTITUT TEKNOLOGI SEPULUH NOPEMBER
ACADEMIC GUIDEBOOK 2018-2023
PLO-3 Able to analyze data with appropriate statistical methods and
interpret them PLO-4 Able to identify, formulate, and solve statistical problems in
various applied fields
COURSE LEARNING OUTCOMES 1. Being able to know the instrument of investment 2. Being able to explain why investment is needed, inflation, and its relation to
macroeconomic indicators 3. Being able to explain Multi Level Marketing (MLM), pyramid schemes, ponzi
schemes, and stocks, as well as similarities and differences between them 4. Being able to explain why international oil prices and international gold prices can
fluctuate and their relations to the world's major currency exchange rates 5. Being able to explain the dynamics of property investment value 6. Being able to explain about the types of stock including sharia shares 7. Being able to explain about the types of bond and modeling the yield (coupons) 8. Being able to explain about insurance products and unit link (hybrid product) 9. Being able to explain about mutual funds 10. Being able to understand the characteristics of financial data 11. Being able to analyze the company's financial statements in general 12. Being able to understand the basic concepts of financial ratio analysis 13. Being able to calculate Credit risk (default probability) and analyze it
COURSE MATERIAL 1. Investment Instruments; 2. Financial Markets and its Products; 3. The Dynamics of Macro Economic Condition and its Relation to Investment; 4. Characteristics of Financial Data; 5. Corporate Financial Statements and Financial Ratios; 6. Credit Risk Analysis. PREREQUISITES
Introduction to Economic Theory
REFERENCES
Books :
ACADEMIC GUIDEBOOK 2018-2023
119
UNDERGRADUATE STUDY PROGRAM – DEPARTMENT OF STATISTICS INSTITUT TEKNOLOGI SEPULUH NOPEMBER
1. Borak, S., Härdle, W., and Hafner, C. 2011. Statistics of Financial Market: An Introduction. 3rd edition. Springer.
2. Franke, J., Härdle, W., and Cabrera, B-L. 2010. Statistics of Financial Market: Exercise and Solution. Springer.
3. Härdle, W., Hautsch, N., and Overbeck L. 2008. Applied Quantitative Finance. 2nd edition. Springer.
4. Prihadi, T., 2011. Analisis Laporan Keuangan: Teori dan Aplikasi. PPM Manajemen.
5. Tandelilin, E. 2010. Potfolio dan Investasi. Yogyakarta : Kanisius.
COURSE
Course Name : Risk Analysis
Course Code : KS184650
Credit : 3 credits
Semester : 6
COURSE DESCRIPTION
Risk Analysis is one of the Courses that contains Statistical method to measure risk according to risk and financial theories. The results of risk analysis can be used as one of the basics of decision-making to determine the diversification of risk and investment portfolio. To achieve these objectives, Learning strategy used is discussions, problem based learnings (PBL), and exercises and assignments to perform real data analysis.
GRADUATES LEARNING ACHIEVEMENTS PLO-1 Able to apply knowledge of statistical theory, Mathematics, and
computations PLO-3 Able to analyze data with appropriate statistical methods and
interpret them PLO-4 Able to identify, formulate, and solve statistical problems in
various applied fields
COURSE LEARNING OUTCOMES
1. Being able to understand Concept of Investment Analysis, among others Cash Value, Future Value, Annuity (Final Annuity, Early Annuity and Pending Annuity) and Bond.
2. Being able to understand Risk Management, steps in identification, measurement (Likelihood and Severity), and risk management.
120
UNDERGRADUATE STUDY PROGRAM – DEPARTMENT OF STATISTICS INSTITUT TEKNOLOGI SEPULUH NOPEMBER
ACADEMIC GUIDEBOOK 2018-2023
3. Being able to understand definition and form of Mortality Table, Initial Death,
Probability and Early Death Exposure, Interaction of Initial Death Probability and Severity Losses.
4. Being able to explain the understanding and the occurrence of market risk, and measure market risk using standard deviation method approach, VaR: Historical, VaR: Analytical, and VaR: Monte Carlo Simulation.
5. Being able to compare the risk and return levels of many investment instruments and diversify portfolio.
6. Being able to understand Risk measurement method using non-parametric approach
7. Being able to calculate the risk of many assets that are not mutually free 8. Being able to calculate risks involving exogenous variables 9. Being able to recognize current issues of risk analysis in financial sector
COURSE MATERIAL 1. Understanding risk and measurement in the context of statistics 2. Measurement of risk using descriptive statistics approach 3. Measurement of risk using Value-at-Risk (VaR) 4. Various approaches in calculating both parametric and non-parametric VaR 5. Diversify risk and investment portfolio 6. Measurement of risk for non-single assets that are not mutually free 7. Measurement of risk involving exogenous variables 8. Recent developments in risk modeling.
PREREQUISITES 1. Probability Theory 2. Introduction to Economic Theory
REFERENCES
Books : 1. Basel II Accord documentation. http://www.bis.org/publ/ bebs107.htm 2. Borak, S., Härdle, W., and Hafner, C., 2011. Statistics of Financial Market: An
Introduction. 3rd edition. Springer. 3. Hardle, W., Hautsch, N., and Overbeck L., 2008. Applied Quantitative Finance.
2nd edition. Springer. 4. Hautsch, N., 2012. Econometrics of Financial High-Frequency Data. New York,
Berlin, Heidelberg: Springer Verlag. 5. Jorion, P., 2007. Value at Risk: The New Benchmark for Managing Financial Risk.
3rd edition. McGraw-Hill. 6. Kaas, R., Goovaerts, M., Dhaene, J. and Denuit, M., 2008. Modern Actuarial Risk
Theory. Springer. 7. Klugman, S.A., Panjer, H.H., and Willmotm G.E., 2008. Loss Model : From Data to
Decision. McGraw-Hill.
ACADEMIC GUIDEBOOK 2018-2023
121
UNDERGRADUATE STUDY PROGRAM – DEPARTMENT OF STATISTICS INSTITUT TEKNOLOGI SEPULUH NOPEMBER
8. Tsay, R. S., 2013. An Introduction to Analysis of Financial Data with R. 1st edition. Hoboken, New Jersey: John Wiley dan Sons, Inc.
9. Wei, W. W., 2006. Time Series Analysis Univariate and Multivariate Methods. 2nd edition. Canada: Addison Wesley Publishing Company.
COURSE
Course Name : Business Analytics
Course Code : KS184751
Credit : 3 credits
Semester : 7
COURSE DESCRIPTION Business Analytics lecture is expected to answer the need for information presentation in a fast time in the current era of internet. Today's digital era makes data available in large volumes with a variety of various data types, either for free (on the internet) or not. This makes the method of presenting data becomes very important, especially when associated with the speed (time required) in the presentation of that information. The materials in Business Analytics Course will provide the students with abilities and skills in online data collection, data visualization, analysis and report in the form of documents and dashboards. The results of information obtained will be utilized as business decision-making materials and other related matters. GRADUATES LEARNING ACHIEVEMENTS
PLO-1 Able to apply knowledge of statistical theory, Mathematics, and computations
PLO-3 Able to analyze data with appropriate statistical methods and interpret them
PLO-4 Able to identify, formulate, and solve statistical problems in various applied fields
PLO-5 Able to use computational techniques and modern computer equipment needed in the fields of statistics and data science
COURSE LEARNING OUTCOMES 1. Being able to generate data visualization with traditional methods 2. Being able to generate data visualization with the latest methods 3. Being able to generate visualization for time series data 4. Being able to generate visualization for spatial data 5. Being able to generate visualization for spatio-temporal data 6. Being able to collect data from digital world and analyze it 7. Being able to document data and create reports 8. Being able to create dashboard using R.
122
UNDERGRADUATE STUDY PROGRAM – DEPARTMENT OF STATISTICS INSTITUT TEKNOLOGI SEPULUH NOPEMBER
ACADEMIC GUIDEBOOK 2018-2023
COURSE MATERIAL 1. Data visualization for traditional and current methods 2. Data visualization for time series, spatial, and spatio-temporal data 3. Data collection from internet and how to analyze it 4. Documentation and reporting techniques 5. Dashboard creation.
PREREQUISITES Statistical Computing REFERENCES
Books :
1. Beeley, Chris. 2013. Web Application Development with R Using Shiny. Birmingham: Packt Publishing.
2. Lamigueiro, Oscar Perpiñán. 2014. Displaying Time Series, Spatial, and Space-Time Data with R. Boca Raton: CRC Press.
3. Murrell, Paul. 2012. R Graphics. 2nd edition. Boca Raton: CRC Press. 4. Putler, Daniel S. and Krider, Robert E. 2012. Customer and Business Analytics:
Applied Data Mining for Business Decision Making Using R. Boca Raton: CRC Press.
5. Wickham, Hadley and Grolemund, Garrett. 2016. R for Data Science: Import, Tidy, Transform, Visualize, and Model Data. CA: O’Reilly Media, Inc.
6. Wiliams, Graham J. 2017. The Essentials of Data Science: Knowledengane Discovery Using R. Boca Raton: CRC Press.
7. Xie, Yihui. 2015. Dynamic Documents with R and knitr. 2nd edition. Boca Raton: CRC Press.
COURSE
Course Name : Actuarial
Course Code : KS184752
Credit : 3 credits
Semester : 7
COURSE DESCRIPTION
ACADEMIC GUIDEBOOK 2018-2023
123
UNDERGRADUATE STUDY PROGRAM – DEPARTMENT OF STATISTICS INSTITUT TEKNOLOGI SEPULUH NOPEMBER
Actuarial is one of the courses in Economics, Finance and Actuarial that has one of study area to determine the premium, policy and insurance reserves. The purpose of studying Actuarial is to understand and apply financial mathematical concepts and opportunities to analyze problems in life insurance. Topics to be studied include: survival function, life and selective tables, insurance benefits, life annuities, calculation of premium values, calculation of policy values, and reserves.
GRADUATES LEARNING ACHIEVEMENTS PLO-1 Able to apply knowledge of statistical theory, Mathematics, and
computations PLO-3 Able to analyze data with appropriate statistical methods and
interpret them PLO-4 Able to identify, formulate, and solve statistical problems in
various applied fields
COURSE LEARNING OUTCOMES 1. Being able to understand and apply the concepts of financial mathematic and
opportunities to analyze the problems in life insurance 2. Being able to apply survival model 3. Being able to calculate life table and selection 4. Being able to calculate insurance benefits 5. Being able to calculate life annuities 6. Be able to calculate premium value 7. Being able to calculate the value of policy COURSE MATERIAL 1. Concepts in Financial Mathematics (Compound Interest, Present Value), Upcoming
Value (Accumulated Value), Specific Annuities and Opportunity Sciences, as well as Life Insurance Concepts.
2. The concept of mortality: Survival function, force mortality, 3. Life table and selection concept 4. The Concept of insurance benefit 5. The concept of life annuity 6. The concept of calculating premium value (Net Premiums) 7. The concept of calculating policy value
PREREQUISITES 1. Financial Mathematics 2. Mathematical Statistics I
REFERENCES
Books :
124
UNDERGRADUATE STUDY PROGRAM – DEPARTMENT OF STATISTICS INSTITUT TEKNOLOGI SEPULUH NOPEMBER
ACADEMIC GUIDEBOOK 2018-2023
1. Bower, N.L., Gerber,H.U., Hickman,J.C., Jones,D.A., and Nesbitt, C.J., 1997.
Actuarial Mathematics. The Society of Actuaries. 2. Cunningham, R., Herzog, T. and London, R., 2006. Models for Quantifying Risk. 3. Dickson, D. C.M., Hardy, M. R., and Waters, H.R., 2013. Actuarial Mathematics
for Life Contingent Risk. 3rd edition. Cambridengane University Press. 4. Gupta, A.K., and Varga, T., 2002. An Introduction to Actuarial Mathematics. USA
: Springer. 5. Li J., and Ng, A., 2013. MLC Study manual. Actex Publication, Inc.
ACADEMIC GUIDEBOOK 2018-2023
125
UNDERGRADUATE STUDY PROGRAM – DEPARTMENT OF STATISTICS INSTITUT TEKNOLOGI SEPULUH NOPEMBER
COURSE GROUP OF SOCIAL and POPULATION STATISTICS
COURSE
Course Name : Population Studies
Course Code : KS184553
Credit : 3 credits
Semester : 5
COURSE DESCRIPTION Population Studies is one of expertise courses that is part of study area in Social and Population Statistics Course Group. The purpose of studying Population Studies is that the students are able to find out demographic concepts and / or demographic studies, demographic data sources, introduction to population theory, demographic transition theory, some basic sizes of Demographics, Mortality and Fertility, Death Tables, Application of Death Tables, population mobility, employment and quality population, and also analyze the problem of population using statistical method (simple). By this course the students are expected to have learning experience to think critically and to give the right decision for the solution of demographic problems using statistical methods. Learning strategy used is lectures, discussions, exercises, problem based learnings, and assignments. GRADUATES LEARNING ACHIEVEMENTS
PLO-1 Able to apply knowledge of statistical theory, Mathematics, and computations
PLO-3 Able to analyze data with appropriate statistical methods and interpret them
PLO-4 Able to identify, formulate, and solve statistical problems in various applied fields
COURSE LEARNING OUTCOMES 1. Being able to understand the scope of demography, population studies,
demographic data sources, and identify population issues. 2. Being able to know the theory of population and the theory of demographic
transition and population dynamics. 3. Being able to understand some basic sizes of Demography, Mortality and Fertility,
Death tables, Application of Death Tables, Population Mobility, Employment, and population quality, both in the concept and utilization of population data.
4. Being able to express ideas or thoughts in resolving the population problems both verbally and in writing well.
126
UNDERGRADUATE STUDY PROGRAM – DEPARTMENT OF STATISTICS INSTITUT TEKNOLOGI SEPULUH NOPEMBER
ACADEMIC GUIDEBOOK 2018-2023
COURSE MATERIAL 1. Scope, Definition of Demography and Population Studies 2. Introduction to Population Theory and Demographic Transition 3. Demographic Data Sources. 4. Basic Measures of Demographic Techniques. 5. Understanding Mortality, Fertility, Table of Death And its Application. 6. Population Mobility, Employment, Population Quality and its Application. 7. Statistical Method Approach on Population Issues. PREREQUISITES
1. Introduction to the Statistics Method 2. Regression Analysis
REFERENCES
Books : 1. Adioetomo,S.M. dan Samosir,O.B., 2010. Dasar-Dasar Demografi. Jakarta:
Lembaga Demografi Fakultas Ekonomi UI. 2. Alho., M.J. and Spencer, B.D. 2005. Statistical Demography anda Forecasting.
Springer Series in Statistics (e_book). 3. Coldwell, J.C., 2006. Demographic Transition Theory. Springer Netherlannds
(e_book) 4. Mantra, I.B., 2010. Pengantar Studi Demografi. Yogjakarta: Nur Cahaya.
COURSE
Course Name : Official Statistics
Course Code : KS184 719
Credit : 3 credits
Semester : 7
COURSE DESCRIPTION
Official Statistics is a statistical Course that is applied to the social area of governance. The purpose of studying this course is to provide the students with the ability to use and analyze secondary data which is publication data from the results of government surveys (BPS, Health Office, Manpower Office, Education Office and others). This
ACADEMIC GUIDEBOOK 2018-2023
127
UNDERGRADUATE STUDY PROGRAM – DEPARTMENT OF STATISTICS INSTITUT TEKNOLOGI SEPULUH NOPEMBER
course is expected that the students are able to analyze official data about population, Life Cost Survey (SBH), Consumer Price Index (CPI), inflation, PDRB, Human Development Index (IPM), employment and poverty. The learning strategies used to achieve this competence in the Course are lectures, discussions, exercises and assignments.
GRADUATES LEARNING ACHIEVEMENTS PLO-1 Able to apply knowledge of statistical theory, Mathematics, and
computations PLO-3 Able to analyze data with appropriate statistical methods and
interpret them PLO-4 Able to identify, formulate, and solve statistical problems in
various applied fields
COURSE LEARNING OUTCOMES 1. Being able to explain the role of official statistics and explain various kinds of
secondary data and questionnaires that have been published in BPS 2. Being able to explain data source and how to measure and use the potential data
of villages and regions in the figures (DDA) 3. Being able to perform calculations and explain demographic data 4. Being able to calculate Index number and use it to analyze purchasing power,
SBH, CPI and inflation 5. Being able to explain and understand the PDRB (GRDP- Gross regional domestic
product) 6. Being able to explain and calculate IPM (HDI-Human Development Index) 7. Being able to explain and understand employment indicators. 8. Being able to explain and understand poverty indicators
COURSE MATERIAL 1. Introduction (Understanding and The Role of Official Statistics in Government
Policy) 2. Data Collection of Potential Villages and Sub-Districts 3. Regional in Figures (DDA) 4. Demographic Size 5. Consumer Price Index and Inflation 6. BPS Data (District / Province in Numbers, SBH) 7. Gross Regional Domestic Product (GRDP) 8. Human Development Index (HDI) and Poverty 9. Employment (AK, LFPR- Labor Force Participation Rate and Minimum Wage) PREREQUISITES 1. Regression Analysis 2. Non Parametric Statistics
128
UNDERGRADUATE STUDY PROGRAM – DEPARTMENT OF STATISTICS INSTITUT TEKNOLOGI SEPULUH NOPEMBER
ACADEMIC GUIDEBOOK 2018-2023
REFERENCES
Books : 1. Official Statistics News (BRS) 2. Region in Figures 3. Poverty Data of BPS Version, Poverty Data of BKKBN Version, Report of SBH
Survey Result 4. Hand Out / Lecture Module, Village Potential Book, Village and Sub-District
Monographs 5. Census Report, SUPAS, (BPS), Susenas Report, 6. Report on Calculation Result of CPI and Inflation (BPS), and Inflation Report (BI) 7. IPM Data Report of Indonesia and East Java (BPS), 8. Sakernas Report (employment) 9. Report on IDHS (Indonesian Demographic and Health Survey) result 10. Mantra, Ida Bagus. 1986. Introduction to Demographic Studies. Nur Cahaya 11. Publication of Calculation Result of GRDP (Gross Regional Domestic Product)
and Economic Growth. 12. UI. 2001. Demographic Institute. Journal of Official Statistics and Indonesian
Journal of Demography. University Press.
COURSE
Course Name : Social Research Method
Course Code : KS184555
Credit : 3 credits
Semester : 5
COURSE DESCRIPTION Social Research Method is a statistical course applied to the social area of governance. The purpose of studying this course is to give the students ability to conduct research or social research. This course will study how the steps to be done in social research with settlement using statistical methods. It starts from determining concepts, constructs, propositions, composing questionnaires, validation and reliability techniques, some statistical methods to making social research reports and presenting the results of social research conducted. Learning strategy used to achieve the objectives of this course is discussions, exercises and final project in the form of exercises to conduct social research.
GRADUATES LEARNING ACHIEVEMENTS PLO-1 Able to apply knowledge of statistical theory, Mathematics,
and computations
ACADEMIC GUIDEBOOK 2018-2023
129
UNDERGRADUATE STUDY PROGRAM – DEPARTMENT OF STATISTICS INSTITUT TEKNOLOGI SEPULUH NOPEMBER
PLO-3 Able to analyze data with appropriate statistical methods and interpret them
PLO-4 Able to identify, formulate, and solve statistical problems in various applied fields
PLO-7 Able to communicate effectively and work together in interdisciplinary and multidisciplinary teams
COURSE LEARNING OUTCOMES 1. Being able to understand basic, scope, paradigm, and ethics in social research 2. Being able to know the basic concept of social research implementation 3. Being able to design research methods for a particular social research topic 4. Being able to analyse data from real problems in social research design with simple statistical methods 5. Being able to analyse social research data and communicate the results well
COURSE MATERIAL 1. Understanding Basic and Scope of social research process, 2. Definition of Concepts and Variables as well as Relationship of Social Research Design 3. Composing of Questionnaire Instruments, Validation and Reliability Techniques 4. Primary Data Collection; 5. Data Collection Method; 6. Analysis of social research data PRASAYARAT 1. Sampling Technique 2. Qualitative Data Analysis REFERENCES
Books :
1. Masri Singarimbun, Metode Penelitian dan Survai, LP3ES, Jakarta,1990 2. Dwi Endah.K dan A.Tuti.R. Social Research Methods, Jurusan Statistika
FMIPA-ITS, Surabaya, 2006. 3. DR. Irawan Suhartono, Metode Penelitian Sosial, PT.Remaja Rosdakarya,
Bandung, 2000.
130
UNDERGRADUATE STUDY PROGRAM – DEPARTMENT OF STATISTICS INSTITUT TEKNOLOGI SEPULUH NOPEMBER
ACADEMIC GUIDEBOOK 2018-2023
COURSE GROUP OF ENVIRONMENT AND HEALTH STATISTICS
COURSE
Course Name : Biostatistics
Course Code : KS184555
Credit : 3 credits
Semester : 5
COURSE DESCRIPTION
Biostatistics is a part of statistics course that can be applied to Environmental And Health cases. The objectives of learning biostatistics are to prepare the students relating to the ability in analyzing the medical data, agriculture/fishery/marine using the appropriate statistical methods (quantitative and qualitative). In order to enhance the knowledge about the application of statistics, there are various research designs to be learned, namely Cross-Sectional Study; Case-Control Study; Cohort Study, and other measurements of Epidemiology (Incidence, Prevalence). The learning strategies used in this course are discussion, exercises, and study case (secondary data).
PROGRAM LEARNING OUTCOME PLO-1 Able to apply knowledge of science, statistical theory, mathematics,
and computing to problems in various applied fields
PLO-3 Able to analyze data using appropriate statistical methods and interpret them
PLO-4 Able to identify, formulate, and solve statistical problems in various applied fields
COURSE LEARNING OUTCOMES 1. Able to describe the concept of inferential statistics for the medical/health and
agriculture/fishery data 2. Able to use the medical/health and agriculture/fishery data to solve the task 3. Able to formulate problem-solving in analyzing the medical/health and
agriculture/fishery data with the appropriate interpretation 4. Able to identify, formulate, and solve the biostatistics problem 5. Able to use computational technique and modern computer, including selecting
the appropriate method that used in solving the case of medical/health and agriculture/fishery data
6. Have insight about the current issue and upcoming issue relating to the biostatistics
7. Able to communicate effectively and collaborate with the teams in interdisciplinary and multidisciplinary
8. Have responsibilities and professional ethics 9. Able to motivate themself to think creatively and lifelong learning
COURSE MATERIAL
ACADEMIC GUIDEBOOK 2018-2023
131
UNDERGRADUATE STUDY PROGRAM – DEPARTMENT OF STATISTICS INSTITUT TEKNOLOGI SEPULUH NOPEMBER
1. Introduction to Biostatistics (Definition and Application); 2. Types of Observational Research Designs (Cross-Sectional Study; Case-Control
Study; Cohort Study); 3. Epidemiological Measures (Incidence, Prevalence); 4. Review of Descriptive Statistics and Probabilities; 5. Review of Parametric Statistics; 6. Review of Non-Parametric Statistics; 7. Estimation and Hypothesis Testing for Categorical Data; 8. Analytical Methods for Biostatistics (Measurement of the Effect of Categorical
Data); 9. Confounding and Standardization; 10. The Mantel Haenszel Test; 11. Multiple Logistic Regression; and 12. Hypothesis Testing for Longitudinal Data. PREREQUISITES 1. Non Parametric Statistics 2. Category Data Analysis 3. Sampling and Survey Techniques REFERENCES
Books: 1. Rosner, Bernard. 2006. Fundamentals of Biostatistics. 6th edition. Thomson
Brooks/Cole. 2. M, Last J. 2001. A Dictionary of Epidemiology. 4th edition. Oxford: Oxford
University Press. 3. Pagano, Marcello and Gauvreau, Kimberlee. 2000. Principles of Biostatistics. 2nd
edition. CA, USA : Duxbury Thomson Learning. 4. Modul kuliah 5. W, Wayne Daniel. 1978. Biostatistics : A Foundation for Analysis in The Health
Sciences. 3rd edition. NY : John Wiley dan Sons.
COURSE
Course Name : Survival Analysis
Course Code : KS184824
Credit : 3 credits
Semester : 8
COURSE DESCRIPTION
Survival analysis is one of statistical methods that can be applied in various areas, one of them is in health area. Survival analysis is a statistical method that emphasizes on the time analysis until the occurrence of an event. This lecture teaches the basics of
132
UNDERGRADUATE STUDY PROGRAM – DEPARTMENT OF STATISTICS INSTITUT TEKNOLOGI SEPULUH NOPEMBER
ACADEMIC GUIDEBOOK 2018-2023
survival analysis such as Kaplan Meier survival function, Hazard Function, Hazard ratio, survival regression with parametric and semi parametric approach. To better understand this method, applications in real cases will be taught manually or using software especially SPSS, SAS and R.
GRADUATES LEARNING ACHIEVEMENTS PLO-1 Able to apply knowledge of statistical theory, Mathematics, and
computations
PLO-3 Able to analyze data with appropriate statistical methods and interpret them
PLO-4 Able to identify, formulate, and solve statistical problems in various applied fields
COURSE LEARNING OUTCOMES
1. Able to explain concepts and apply survival analysis theory 2. Able to analyze data with survival methods and interpret them 3. Able to identify, formulate and solve problems in the health / medical field
with survival analysis
COURSE MATERIAL 1. Introduction to ` analysis; 2. Survival Function (Parametric and nonparametric); 3. The log rank (LR) test; 4. Parametric survival regression; 5. The cox proportional Hazard (PH) model; 6. Evaluation of proportional hazards assumptions; 7. The Stratified Cox Regression; 8. Extension of the Cox Proportional Hazards Model for time dependent variable; and 9. Recurrent event data. PREREQUISITES
Mathematics Statistical
REFERENCES
Books :
ACADEMIC GUIDEBOOK 2018-2023
133
UNDERGRADUATE STUDY PROGRAM – DEPARTMENT OF STATISTICS INSTITUT TEKNOLOGI SEPULUH NOPEMBER
1. Cox, D.R. and Oakes, D. 1984. Analysis of Survival Data. Cambridengane : University Printing House
2. David, Collet. 2014. Modelling Survival Data in Medical Research. 3rd edition, Chapman and Hall/CRC.
3. Hosmer, David W., Lemeshow, Stenley. and May, S. 2008. Applied Survival Analysis. Hoboken, New Jersey : John Wiley dan Sons, Inc.
4. Kleinbaum, David G. and Klein, Mitchel. 2012. Survival Analysis: A self-Learning Text. 3rd edition. Springer, Science+Busineness Media, LLC.
5. Le, C. T. 1997. Applied Survival Analysis. John Wiley dan Sons, Inc.
COURSE
Course Name : Meta Analysis
Course Code : KS184757
Credit : 3 credits
Semester : 7
COURSE DESCRIPTION
Meta analysis is a proficiency course that is a part of the Statistical Environmental And Health Courses Group. The objectives in learning meta analysis are that the students can understand the basic concept and statistical methods in meta analysis, interpret the result of meta analysis for development and application in the real case. Students are expected to be experienced in critical thinking and make appropriate decisions using meta analysis to solve the problems. The learning strategies used in this course are discussion, exercises, and assignments.
PROGRAM LEARNING OUTCOME PLO-1 Able to apply knowledge of science, statistical theory,
mathematics, and computing to problems in various applied fields
PLO-3 Able to analyze data using appropriate statistical methods and interpret them
PLO-4 Able to identify, formulate, and solve statistical problems in various applied fields
COURSE LEARNING OUTCOMES
1. Able to describe the concept of meta analysis and implementation in the various fields
2. Able to explain the procedure of meta analysis and select the appropriate methods to solve the problem
134
UNDERGRADUATE STUDY PROGRAM – DEPARTMENT OF STATISTICS INSTITUT TEKNOLOGI SEPULUH NOPEMBER
ACADEMIC GUIDEBOOK 2018-2023
3. Able to analyze the data using the appropriate meta analysis methods efficiently 4. Able to identify, formulate, and solve the problem in the meta analysis 5. Able to use computational technique and modern computer in analyzing the
metadata 6. Have insight about the current issue and upcoming issue relating to the meta
analysis 7. Able to communicate effectively and collaborate with the teams in
interdisciplinary and multidisciplinary 8. Have responsibilities and professional ethics 9. Able to motivate themself to think creatively and lifelong learning
COURSE MATERIAL 1. Review of basic statistics related to meta analysis (statistical significance,
consistency effect, heterogeneity effect size); 2. Effect Size and Precision; 3. Fixed Effect Model, Random Effect, Fixed and Random Effect; 4. Statistics: Cohen's d, Hedenganes g, risk ratio, odds ratio, risk difference,
correlation coefficient, Fisher's z, T-squared, Q, I-squared, forest plot, funnel plot and fail-safe N.
5. Identification and testing the heterogeneity; 6. Subgroup Analysis; 7. Meta regression; 8. Complex Data Structures 9. Publication bias; 10. Power analysis; 11. Reporting the result of Meta Analysis.
PREREQUISITES 1. Regression Analysis 2. Catagory Data Analysis REFERENCES
Books : 1. Bohning, D., Sasivimol, R., and Ronny, K. 2008. Meta Analysis of Binary Data
Using Profile Likelihood. Chapman dan Hall/CRCTaylor dan Francis Group. 2. Borenstein M, Hedenganes LV, Higgins JPT, and Rothstein HR, 2009. Introduction
to Meta-Analysis. John Wiley dan Sons, Ltd. 3. Joachim Hartung, Guido K., and Bimal, K. S. 2008. Statistical Meta Analysis with
Applications. John Wiley dan Sons, Inc., Publication 4. John, E., Hunter, Frank L. and Schmidt. 2004. Methods of Meta Analysis. Sage
Publications, Inc.
ACADEMIC GUIDEBOOK 2018-2023
135
UNDERGRADUATE STUDY PROGRAM – DEPARTMENT OF STATISTICS INSTITUT TEKNOLOGI SEPULUH NOPEMBER
5. Larry, V., Hedenganes, and Ingram, O. 1985. Statistical Method for Meta Analysis. New York : Orlando San Diego.
6. Sterne JAC (editor). 2009. Meta-Analysis in Stata: An updated Collection from the Stata Journal. Stata Press.
7. Whitehead, A. 2002. Meta-Analysis of Controlled Clinical Trials. A. Whitehead Copyright. John Wiley dan Sons, Ltd.
COURSE
Course Name : Spatial Statistics
Course Code : KS184656
Credit : 3 credits
Semester : 6
COURSE DESCRIPTION
The objectives of the spatial statistics course are the students able to design the data collection based on location and analyze the spatial data particularly in the health and environment sectors, and able to interpret the result. The theoretical material from basic spatial concepts to various methods of spatial analysis is conveyed through lectures and discussions. Improving the analytical skills, students are given examples of relevant cases. These examples are resolved with and without software through a practicum in class. In addition, students are given assignments both independently and in groups to find out the application of various real problems, particularly in the environmental and health sectors. The objective of these assignments is to prepare students to be able to manage and work in teams and to be responsible for the results of individual and group work.
PROGRAM LEARNING OUTCOME PLO-1. Able to apply knowledge of science, statistical theory, mathematics, and
computing to problems in various applied fields PLO-3. Able to analyze data using appropriate statistical methods and interpret
them PLO-4. Able to identify, formulate, and solve statistical problems in various applied
fields
COURSE LEARNING OUTCOMES
1. Explain the use of the spatial statistics concept and its implementation in various fields
2. Able to explain spatial statistical procedures and select the appropriate method
136
UNDERGRADUATE STUDY PROGRAM – DEPARTMENT OF STATISTICS INSTITUT TEKNOLOGI SEPULUH NOPEMBER
ACADEMIC GUIDEBOOK 2018-2023
3. Able to analyze the data with appropriate spatial statistical methods and
effective to the problems 4. Able to identify, formulate, and solve statistical problems in the field of spatial
statistics 5. Able to use computational techniques and modern computer that required to
analyze the spatial data 6. Have insight about the current issue and upcoming issue relating to the
biostatistics 7. Able to communicate effectively and collaborate with the teams in
interdisciplinary and multidisciplinary 8. Have responsibilities and professional ethics 9. Able to motivate themself to think creatively and lifelong learning
COURSE MATERIAL 1. The definition of Spatial Statistics; 2. Spatial Data Structure (Point, Area, Lattices, and Point Patterns), Isotropy and
Anisotropy, Stationary and Non Stationary; 3. Exploratory Spatial Data; 4. Sampling Technique and Area Basis Estimation; 5. Spatial Pattern and Spatial Autocorrelation; 6. Spatial Regression Modeling based on the Area and Point (SAR, SEM, GWR,
GWPR, GWLR); and 7. Cases Related to Spatial Analysis (Social, Economic, Health, and Environment).
PREREQUISITES - REFERENCES
Books: 1. Anselin, L. 1988. Spatial Econometrics: Methods and Models. Dordrecht : Kluwer
Academic Publishers. 2. Anselin, L. and Rey, S.J., 2010. Perspective on Spatial Data Analysis. Springer. 3. Arbia, G. 2006. Spatial Econometrics: Statistical Foundations and Applications to
Regional Convergence. Berlin : Springer. 4. Ficher, M.M. and Getis, A., 2010. Handbook of Applied Spatial Analysis Software
Tools, Methods and Applications. Springer-Verlag Berlin Heidelberg. 5. Fotheringham, A.S., Brundson, C., and Charlton, M. 2002. Geographically
Weighted Regression: the analysis of spatially varying relationships. England : John Wiley dan Sons Ltd.
GENERAL COURSE GROUP
ACADEMIC GUIDEBOOK 2018-2023
137
UNDERGRADUATE STUDY PROGRAM – DEPARTMENT OF STATISTICS INSTITUT TEKNOLOGI SEPULUH NOPEMBER
COURSE
Course Name : Islamic Religion
Course Code : UG184901
Credit : 2 credits
Semester : I/II COURSE DESCRIPTION
In this course, the students will learn about Islam and its beliefs includes credence, sharia, morals and Islamic insight to make the students have the comprehend ability in synergizing the development and usage of science and technology to provide the prosperity for the people. The lecture will be conducted in the class in the form of providing materials, assignments, discussions, field lectures and case studies. Thus, the students are able to think and behave based on Islamic values as well as uphold justice and truth. In the end, students will be honest, trustworthy, communicative, intelligent and socially sensitive in making harmonious relationships to create ritual and social fidelity.
PROGRAM LEARNING OUTCOME PLO-7. Able to communicate effectively and successfully in interdisciplinary and
multidisciplinary teams PLO-8. Have the responsibilities and professional ethics COURSE LEARNING OUTCOMES 1. Explaining the essence of human relations with Allah, with other humans, and with
the environment in the Qur'anic paradigm 2. Present the results of conceptual and/or empirical analysis related to the essential
and urgency of Islamic spirituality values as a determinant in the development of building a nation with character
3. Able to consistently behave towards the coherence of the principles of Islamic teachings as the implementation of Iman, Islam, and Ihsan
4. Proficient in presenting the results of individual and group discussion regarding a case (case study) related to the contribution of Islam to the development of world civilization
5. Proficient in analyzing the role optimization problem of the mosque as a center for the Islamic culture development, and a place for the manifestation of the people prosperity
6. Understand the essence of Islamic Religious Education as a component of General Mandatory Subjects and its urgency as spiritual values as the determinants in the development of the building nation's character
7. Understand the substance of religion as one of the basic components of national unity and integrity within the Unitary State of the Republic of Indonesia
8. Understand the relation of Islamic teachings sources and their contextualization in modern life as rahmatan lil alamin
138
UNDERGRADUATE STUDY PROGRAM – DEPARTMENT OF STATISTICS INSTITUT TEKNOLOGI SEPULUH NOPEMBER
ACADEMIC GUIDEBOOK 2018-2023
9. Proficient in the application of Islamic concepts regarding science and technology,
arts, socio-culture, politics, economics, and problems of the people prosperity 10. Understand the contribution of Islam to the development of world civilization and
the strategy of optimizing the role and function of mosques as a center for Islamic culture development
COURSE MATERIAL 1. Ethics and personality 2. National values
PREREQUISITES - REFERENCES 1. Dirjen Pembelajaran dan Kemahasiswaan Kemenristekdikti, Pendidikan Agama
Islam untuk Perguruan Tinggi, Jakarta, Dirjen Belmawa, 2016. 2. Muhibbin, Zainul, dkk, Pendidikan Agama Islam Membangun Karakter
Madani,Surabayaa, ITS Press, 2012. 3. Razaq, Nasruddin, Dinnul Islam, Bandung, Al-Ma,arif, 2005. 4. Iberani, Jamal Syarif dkk, Mengenal Islam, Jakarta: eL-Kahfi, 2003. 5. Imarah, Muhammad, Islam dan Pluralitas Perbedaan dan Kemajemukan dalam
Bingkai Persatuan, Jakarta, Gema Insani, 1999.
COURSE
Course Name : Hindu Religion
Course Code : UG184904
Credit : 2 credits
Semester : I/II COURSE DESCRIPTION Hindu Religion course learn the material regarding the substantial relation between human and Hyang Widdhi (The One Almighty God) to improve faith and credence (Sraddha and bhakti); relation among humans to create the humanist civilization; and relation between human and environment to create prosperity (jagadhita), therefore it is able to form the Hindus and Indonesian humanists who are independent, responsible and caring.
PROGRAM LEARNING OUTCOME PLO-7 Able to communicate effectively and successfully in interdisciplinary and multidisciplinar PLO-8 Have the responsibilities and professional ethics
COURSE LEARNING OUTCOMES Spesific competences: 1. Able to communicate the academic / professional arguments on the objectives and
functions of Hindu religion as a component of general mandatory courses
ACADEMIC GUIDEBOOK 2018-2023
139
UNDERGRADUATE STUDY PROGRAM – DEPARTMENT OF STATISTICS INSTITUT TEKNOLOGI SEPULUH NOPEMBER
2. Able to analyze and implement Hindu spiritual values in building sraddha and bhakti (faith and credence) to God Almighty, in order to create a humanist personality
3. Able to be honest, law-abiding, creative, healthy and adaptive based on Hindu values
4. Able to present the analysis of individual or group discussion regarding a case study related to the contribution of Hinduism to the development of world civilization
5. Able to present a model of society with the capability to build a humanist, aesthetic and globally competitive civilization
Knowledge: 1. Understand the objectives and functions of Hindu religion as a component of
general mandatory courses 2. Proficient in Hindu spiritual values in building sraddha and bhakti (faith and
credence) to God Almighty 3. Understand the concept of Veda as the holy book and the source of Hindu law in
forming an honest, law-abiding, creative, healthy and adaptive personality 4. Understand the contribution of Hinduism to the development of world civilization 5. Understand the concept of a society based on the Tri Hita Karana
COURSE MATERIAL 1. History of Hinduism 2. Brahmavidya / Hindu Theology 3. Veda 4. Humans in a Hindu perspective 5. Hindu ethics / morals 6. Religious arts 7. Harmony 8. Society PREREQUISITES - MAIN REFERENCES Direktorat Jenderal Pembelajaran dan Kemahasiswaan, 2016, Pendidikan Agama Hindu untuk Perguruan Tinggi, Kemenristek Dikti RI
SUPPORTING REFERENCES
1. Singer, Wayan, 2012. Tattwa (Ajaran Ketuhanan Agama Hindu, Surabaya, Paramita
2. Tim Penyusun, 1997, Pendidikan Agama Hindu Untuk Perguruan Tinggi, Hanuman Sakti
3. Wiana, 1994, Bagaimana Hindu Menghayati Tuhan, Manikgeni . 4. Wiana, 1982, Niti Sastra, Ditjen Hindu dan Budha. 5. Titib, 1996, Veda Sabda Suci Pedoman Praktis Kehidupan, Paramita. 6. Pudja, 1997, Teologi Hindu, Mayasari
140
UNDERGRADUATE STUDY PROGRAM – DEPARTMENT OF STATISTICS INSTITUT TEKNOLOGI SEPULUH NOPEMBER
ACADEMIC GUIDEBOOK 2018-2023
COURSE
Course Name : English
Course Code : UG184914
Credit : 2 credits
Semester : I/II COURSE DESCRIPTION In this course, the student will learn the English basic concepts, especially the comprehension in listening, speaking, reading, and writing. Through this course, the students will practice the English basic concepts to communicate the ideas and opinions, both in oral and written academic related to science and technology. PROGRAM LEARNING OUTCOME PLO-6 Having knowledge of current and upcoming issues using statistical and data
science PLO-7 Able to communicate effectively and successfully in interdisciplinary and
multidisciplinary teams COURSE LEARNING OUTCOMES 1. Students are able to write sentences according to the English grammar and
develop ideas in structured sentences in a paragraph 2. Students are able to speak and communicate opinions, arguments, questions,
answers, and contradictions in an academic presentation. 3. Students are able to understand dialogue / conversation and lectures (monologue)
in English. 4. Students are able to understand the reading content actively and critically by
implementing several appropriate reading strategies such as scanning, skimming, and reading for details including strategies to understand vocabulary; and recognize the text structure.
COURSE MATERIAL 1. Developing effective English sentence and paragraph
- Writing good sentences: phrases, clauses, sentences - Developing good paragraphs: topic sentence, supporting sentences,
concluding sentence, coherence, cohesion 2. Oral academic communication.
- Academic discussion and presentations 3. Listening to various conversations and talks.
- Listening to short conversation (part A) - Listening to longer conversation (part B) - Listening to talks (part C)
4. Reading for Understanding: strategies and application - Skimming - Scanning
ACADEMIC GUIDEBOOK 2018-2023
141
UNDERGRADUATE STUDY PROGRAM – DEPARTMENT OF STATISTICS INSTITUT TEKNOLOGI SEPULUH NOPEMBER
- Vocabulary recognition - Reading for details:
• Understanding main ideas • Understanding stated detail information • Understanding unstated detail information • Understanding implied information
- Text pattern organizations PREREQUISITES - MAIN REFERENCES
1. Hogue Ann, Oshima Alice, “Introduction to Academic Writing”, Longman,1997 2. Johnston Susan S, Zukowski Jean/Faust, “Steps to Academic Reading,” heinle,
Canada, 2002 3. Mikulecky, Beatrice S, “Advanced Reading Power”, Pearson Education, New
York, 2007 4. Preiss Sherry, “NorthStar: Listening and Speaking,” Pearson Education, New
York 2009 SUPPORTING REFERENCES
1. Becker Lucinda & Joan Van Emden, “Presentation Skills for Students, Palgrave, Macmillan, 2010
2. Bonamy David, “Technical English,” Pearson Education, New York, 2011 3. Fellag Linda Robinson, “College Reading,” Houghton Mifflin Company, 2006 4. Fuchs Marjorie & Bonner Margaret, “ Focus on Grammar; An Integrated Skills
Approach,” Pearson Education, Inc, 2006 5. Hague Ann, “ First Steps in Academic Writing,” Addison Wesley Publishing
Company, 1996 6. Hockly Nicky & Dudeney Gavin, “How to Teach English with Technology, Pearson
Education Limited, 2007 7. Phillipd Deborah, “ Longman Preparation Course for the TOEFL Test,” Pearson
Education, Inc, 2003 8. Root Christine & Blanchard Karen, “ Ready to Read Now, Pearson Education,
New York, 2005 9. Root Christine & Blanchard Karen, “ Ready to Write, Pearson Education, New
York, 2003 10. Weissman Jerry, “Presenting to Win, the Art of Telling Your Story, Prentice Hall,
2006
COURSE Course Name : Chemistry
Course Code : UG.184101
142
UNDERGRADUATE STUDY PROGRAM – DEPARTMENT OF STATISTICS INSTITUT TEKNOLOGI SEPULUH NOPEMBER
ACADEMIC GUIDEBOOK 2018-2023
Credit : 3 credits
Semester : I COURSE DESCRIPTION Basic Chemistry is a course which is designed for the understanding and application of the concept and scientific chemistry principal exclude specific materials. This approach depends on the requirement of the student to improve the ability relating to the broadened technology analysis instead of the specific materials for the short term relevance. Providing practice materials is also the main aspect to support the teaching and learning of the Basic Chemistry course.
This course is divided into two levels: Main ideas: The three parts in the main part are Material, Structure and Properties, and Transformation. These three concepts are related and turn into basic in learning and understanding phenomena and chemical reactions afterwards. Extension ideas: The concept of the main ideas are developed to be learning in a different chemical system, such as the chemistry of organic compounds and transition elements. For example, the understanding of the concept of chemical bonds and the periodic table is developed to the chemistry approach in transition metals. Thus, the students are able to learn and appreciate the similarities and differences when comparing them to the major metal groups.
The learning strategies used in this course are lecture, discussion, assignments, and practice in the laboratory. PROGRAM LEARNING OUTCOME PLO-1 Able to apply knowledge of science, statistical theory, mathematics, and
computing to problems in various applied fields PLO-6 Having knowledge of current and upcoming issues using statistical and data
science COURSE LEARNING OUTCOMES 1. The students are able to develop an interest in chemistry and create the
knowledge, skills, and attitude that needed to further study in the related field 2. Students are able to be a scientifically educated citizen and ready to face the
challenges of the 21st century 3. Students are able to develop the understanding, skills, and attitudes towards
Practices of Science, including to: a. Understanding the basic concepts of Science b. Demonstrate scientific ability c. Relating the science and society
4. The students are able to develop a mindset to explain the phenomena, approaches, and solve problems in chemical systems that involve students in: a. Understanding the structure, properties and transformations of substances at
the atomic and molecular level and the relation among molecules
ACADEMIC GUIDEBOOK 2018-2023
143
UNDERGRADUATE STUDY PROGRAM – DEPARTMENT OF STATISTICS INSTITUT TEKNOLOGI SEPULUH NOPEMBER
b. Representation connection of submicroscopic, macroscopic and symbolic level in explaining and predicting chemical systems, structures, and properties.
COURSE MATERIAL 1. Main Topic: Atomic Structure; Chemical Bonds; Gas Properties; Acid and Base
Theory; Periodic Table; Mole and Stoichiometry Concept; Chemical Energetics; Reaction Kinetics; Chemical equilibrium.
2. Extension Topics: Chemical Solutions: Acid-base equilibrium, solubility; Organic Chemistry: Introduction, Isomerism, Hydrocarbons, Halogen Derivatives, Hydroxyl Compounds, Carbonyl Compounds, Carboxylic Acid Derivatives, Nitrogen Compounds; Electrochemistry; Introduction to the Transition Element
PREREQUISITES - REFERENCES Tim Dosen Departemen Kimia ITS. 2018. Kimia 1. edisi pertama. Penerbit Media Bersaudara.
COURSE
Course Name : Physics I
Course Code : SF184101
Credit : 3 credits
Semester : 1 COURSE DESCRIPTION In this course, the students will learn to understand the laws of basic physics, Particle kinematics; Particle dynamics; Work and energy; Rotational motion; Vibration and Fluid Mechanics, through simple mathematical explanations and apply the concept including analyzing the material in practicum. The practicum includes physical pendulum, mathematical pendulum, spring constant, fluid viscosity, projectile motion, friction coefficient, and moment of inertia.
PROGRAM LEARNING OUTCOME PLO-1 Able to apply knowledge of science, statistical theory, mathematics, and
computing to problems in various applied fields PLO-6 Having knowledge of current and upcoming issues using statistical and data
science COURSE LEARNING OUTCOMES
The students are able to: 1. Understand the physical quantities and unit, including the characteristics of scalar
and vector quantities 2. Understand the definition of straight and curved motion in graphical and
mathematical including its application
144
UNDERGRADUATE STUDY PROGRAM – DEPARTMENT OF STATISTICS INSTITUT TEKNOLOGI SEPULUH NOPEMBER
ACADEMIC GUIDEBOOK 2018-2023
3. Understand the basic principle of Newton Laws and the types of Force including its
application 4. Understand the concept of Work and Energy, mechanic energy, The principle of
conservation of mechanical energy and its application 5. Apply the concept of impulses and momentum, conservation of momentum,
collisions and their applications 6. Understand the principles of rigid body rotational and translational motion
including its application 7. Understand the concept of rigid body equilibrium and its application 8. Understand the mechanics of objects transition and elasticity including its
application 9. Understand simple harmonic oscillator, superposition of two vibrations and their
application 10. Understand the concepts of hydrostatics and hydrodynamics and their application COURSE MATERIAL Quantities and vectors; Particle kinematics: displacement, velocity, acceleration, straight motion, curved motion (parabolic and circular); relative motion. Dynamics of particles: Newton's Laws I, II and III, types of forces (gravitational force, gravity, tension force, normal force, friction force and spring force), force balance, the application of Newton's laws I, II and III; Work and energy: the concept of work, kinetic energy, potential energy (gravity and spring), the theorem of work energy, the law of conservation of mechanical energy; Impulse and Momentum: impulse, momentum, collision (elastic and inelastic); Rotational dynamics: Angular displacement, angular velocity and angular acceleration, force moment (torque), the center of mass, force moment equilibrium, moment of inertia, rotational kinetic energy, rolling motion, the energy conservation law (translation and rotation); Vibration: simple harmonic motion, the energy of simple harmonic motion, mathematical pendulum, physical pendulum, torsional pendulum, the combination of harmonious vibrations (parallel and perpendicular); Fluid mechanics: hydrostatic pressure, Pascal's principle, Archimedes' principle, surface tension, continuity equation, Bernoulli's equation, viscosity. PREREQUISITES - MAIN REFERENCES 1. Halliday, Resnic, Jearl Walker, 'Fundamental of Physics'. John Wiley and Sons,
10th ed, New York, 2014 2. Douglas C. Giancoli, 'Physics for Scientists and Engineers , Pearson Education,
4th ed, London, 2014 3. Tim Dosen Fisika, "Fisika 1 Mekanika & Termodinamika untuk Sains dan Teknik",
Fisika FIAITS, 2018 4. -, "Petunjuk Praktikum Fisika Dasar", Fisika, MIPA-ITS
ACADEMIC GUIDEBOOK 2018-2023
145
UNDERGRADUATE STUDY PROGRAM – DEPARTMENT OF STATISTICS INSTITUT TEKNOLOGI SEPULUH NOPEMBER
SUPPORTING REFERENCES
1. Sears & Zemanky,"University Physics", Pearson Education, 14thed, USA, 2016 2. Tipler, PA, 'Physics for Scientists and Engineers ‘,6th ed, W.H. Freeman and Co,
New York, 2008
COURSE
Course Name : Mathematics I
Course Code : KM184101
Credit : 3 credits
Semester : 1
COURSE DESCRIPTION In this course, the students will learn the matrix concept, determinant, and system of linear equations, the concept of mathematical thinking in solving the artificial problems, modeling, etc in the technique that related to the differential application. The materials in this course are emphasized on the problem solving of real cases that can be formulated in the one dependent variable function. The materials include: matrix and determinant, system of linear equations, real number system (ordered, absolute value), complex number and algebraic operations, functions and limits in the polar form of the complex number, derivatives including its applications, and indefinite integrals. PROGRAM LEARNING OUTCOME PLO-1 Able to apply knowledge of science, statistical theory, mathematics, and
computing to problems in various applied fields PLO-6 Having knowledge of current and upcoming issues using statistical and data
science COURSE LEARNING OUTCOMES 1. The students understand the matrix and determinant including its properties and
able to solve the system of linear equations, define the eigenvalue and eigenvector.
2. Able to understand the definition of the real number system, the decimal form of the real number, the coordinate of the real number, the properties of sequence, the definition of absolute value, inequalities, the coordinate of the plane, line, the distance of two points, circle, and parabola
3. The students are able to understand the complex number including the algebraic operations, the polar form of the complex number, and the root of the complex number system.
4. Able to understand and calculate the limit function and define the continuity of the simple equations
146
UNDERGRADUATE STUDY PROGRAM – DEPARTMENT OF STATISTICS INSTITUT TEKNOLOGI SEPULUH NOPEMBER
ACADEMIC GUIDEBOOK 2018-2023
5. The students are able to solve the differential of the explicit and implicit function, and apply the chain rule.
6. The students are able to make a graph, perform the derivative test to determine the extreme point, increasing/decreasing function, the concavity, and able to apply these materials to the optimization function, Taylor/Maclaurin series, and calculate the indefinite integral.
7. The students are able to solve the integral task using the fundamental calculus theorem
COURSE MATERIAL 1. The basic concept of matrix algebra, the properties of the determinant of
elementary line operations and linear equation system and transformation, and the eigenvalue and eigenvector.
2. The basic concept of real number system: the definition of the real number system, the decimal form of the real number, the coordinate of the real number, the properties of sequence, the definition of absolute value, inequalities, the coordinate of the plane, line, the distance of two points, circle, and parabola.
3. The basic concept of complex number: addition, multiplication, division, the polar form of the complex number, and the root of the complex number system.
4. The concept of function, limit: Domain, range, linear function, quadratic form and trigonometry, transcendent, function graph, limit function, and continuity.
5. Differential/derivative: the definition of the derivative, the rules of derivative (polynomial, trigonometry, and transcendent), chain rule, and derivative of implicit function
6. The application of derivative: The rate of change, the increasing/decreasing interval, concavity, create a graph with asymptote and peak point, extreme point and the application in optimization, L’hopital theorem, and Taylor/Maclaurin series.
7. The indefinite integral: derivative and antiderivative, indefinite integral, linear properties of indefinite integral, the basic formula of indefinite integral, indefinite integral using substitution.
PREREQUISITES -
REFERENCES 1. Tim Dosen Jurusan Mathematics ITS, Buku Ajar Kalkulus I , Edisi ke-4 Jurusan
Mathematics ITS, 2012 2. Anton, H. dkk, Calculus, 10-th edition, John Wiley & Sons, New York, 2012
SUPPORTING REFERENCES 1. Kreyzig, E, Advanced Engineering Mathematics, 10-th edition, John Wiley &
Sons, Singapore, 2011 2. Purcell, J, E, Rigdon, S., E., Calculus, 9-th edition, Prentice-Hall, New Jersey,
2006 3. James Stewart , Calculus, ed.7, Brooks/cole-Cengage Learning, Canada,2012
ACADEMIC GUIDEBOOK 2018-2023
147
UNDERGRADUATE STUDY PROGRAM – DEPARTMENT OF STATISTICS INSTITUT TEKNOLOGI SEPULUH NOPEMBER
COURSE
Course Name : Mathematics II
Course Code : KM184201
Credit : 3 credits
Semester : 2
COURSE DESCRIPTION This course provides the basic concepts of mathematical thinking (extent solution, the procedures of the solution) for students to solve the real cases and artificial problems, modeling related to the application of integral. This course also creates the ability of the students to pursue the advanced course with basic concepts of mathematics and analysis. The material of this course including: Integration technique concept, finite integral concept, improper integral and its application, polar coordinate and parametric equation including the application of the areas of the plane shapes and arc length, infinite sequences and series, power series, Taylor series, and MacLaurin series. PROGRAM LEARNING OUTCOME PLO-1 Able to apply knowledge of science, statistical theory, mathematics, and
computing to problems in various applied fields PLO-6 Having knowledge of current and upcoming issues using statistical and data
science COURSE LEARNING OUTCOMES 1. Able to understand the basic concepts of integration technique. 2. Able to solve the problem relating to the definite integral 3. Able to apply the definite integral to the areas of the plane shapes, the volume of
solids by the method of rings or the method of disks, the center of mass, the application of Guldin theorem, force, and fluid pressure.
4. Able to understand the polar coordinate system and parametric equation, perform a graph, and apply to the areas of the plane shapes and arc length.
5. Able to calculate the convergence of sequences, test the convergence of the infinite series and calculate the convergence infinite series, transform the function to the Taylor series or the MacLaurin Series.
COURSE MATERIAL 1. The integration concept: Partial integration, rational function integral (linear
factors, quadratic factor), trigonometry function integration, reduction formula, integral using trigonometric substitution (square root expressions)
148
UNDERGRADUATE STUDY PROGRAM – DEPARTMENT OF STATISTICS INSTITUT TEKNOLOGI SEPULUH NOPEMBER
ACADEMIC GUIDEBOOK 2018-2023
COURSE
Course Name : Civics
Course Code : UG184913
Credit : 2 credits
Semester : I/II COURSE DESCRIPTION Civics course provides the knowledge and learning experiences to increase the understanding and awareness relating to: nationalism and respect to the homeland, democratic civilization, being a citizen with an Indonesian personality who is competitive, disciplined and actively participates in creating a harmonious society based on the Pancasila value. Able to perform the good citizen and support the country, the democratic citizen who is citizens with the intelligent, civilized and responsible to
2. Finite integral concept: The area and finite integral, the evaluation of finite integral, calculus fundamental theorem (I), finite integral using substitution, function in the form of finite integral, calculus fundamental theorem (II), and improper integral.
3. The application of finite integral: The areas of plane shapes, the volume of the solid revolution (the disk method and ring method), force and fluid pressure, work, the center of mass, gravity, and Guldin theorem
4. Polar coordinate and parametric equation: The function and graph of polar coordinates, the areas of plane shapes and arc length in polar coordinates, the function in the parametric expression, the parametric function of area and arc length.
5. Infinite sequences and series: Sequences, the convergence of sequences, infinite series, the convergence test and calculate the sum of infinite convergence series, the definition of power series, Taylor series, and Maclaurin series
PREREQUISITES -
MAIN REFERENCES 1. Tim Dosen Jurusan Mathematics ITS, Buku Ajar Kalkulus 2 , Edisi ke-4 Jurusan
Mathematics ITS, 2012 2. Anton, H. dkk, Calculus, 10-th edition, John Wiley & Sons, New York, 2012
SUPPORTING REFERENCES
1. Kreyzig, E, Advanced Engineering Mathematics, 10-th edition, John Wiley & Sons, Singapore, 2011
2. Purcell, J, E, Rigdon, S., E., Calculus, 9-th edition, Prentice-Hall, New Jersey, 2006
3. James Stewart , Calculus, ed.7, Brooks/cole-Cengage Learning, Canada,2012
ACADEMIC GUIDEBOOK 2018-2023
149
UNDERGRADUATE STUDY PROGRAM – DEPARTMENT OF STATISTICS INSTITUT TEKNOLOGI SEPULUH NOPEMBER
the continuity of the country and applying their skills in science, technology and the arts. PROGRAM LEARNING OUTCOME PLO-7 Able to communicate effectively and successfully in interdisciplinary and
multidisciplinary teams PLO-8 Have the responsibilities and professional ethics COURSE LEARNING OUTCOMES Specific competences: 1. Able to communicate the conceptual and empirical arguments relating to the
function and role of the civics course to increase the nationalism 2. Able to have the comprehensive knowledge and synergize the utilization of science
and technology with the element of national law systems include UUD 1945, Legal System and Government, Democracy, Geopolitics and Geostrategy and State Defense Force
3. Able to take the precise decision with emphasizing the national consideration, support the human rights and fair international relations
4. Encourage the attitudes and values system: respect the diversity, able to collaborate, credible, sensitive to society, respect to the society, nation and state of Indonesia
Knowledge: 1. Understand the principle of Civics course in developing the ability of the students
or professional and its urgency for the future of the nation 2. Understand the essence of civics course to have an Indonesian personality, create
nationalism and respect to the homeland, and develop into good and educated citizens (smart and good citizens) in the democratic society, nation and state.
3. Understand the relation of civics course with the values of life and develop into a citizen with an Indonesian personality who is competitive, disciplined and actively participates in creating a harmonious society based on the Pancasila value
4. Understand the application of civics concepts, and develop into a good citizen and support the country, the democratic citizen who is citizens with the intelligent, civilized and responsible to the continuity of the country and applying their skills in science, technology and the arts.
5. Understand the role of civics course in creating the attitudes and values system: respect the diversity, able to collaborate, credible, sensitive to society, respect to the society, nation and state of Indonesia
COURSE MATERIAL 1. The essence of civics course in developing the ability of the students or
professional 2. The essence and urgency of national identity as the component of nation building
and character 3. National integration as one of the parameters of national unity and integrity 4. The constitutional values and norms of the UUD 1945 and the constitutionality of
the statutory provisions under the UUD 1945
150
UNDERGRADUATE STUDY PROGRAM – DEPARTMENT OF STATISTICS INSTITUT TEKNOLOGI SEPULUH NOPEMBER
ACADEMIC GUIDEBOOK 2018-2023
5. The rights and responsibility of the state and citizens in democracy sovereignty of
the people 6. The essence of the instrumentation and practice of Indonesian democracy based
on Pancasila and UUD 1945 7. The historical dynamics of the constitutional, socio-political, cultural and
contemporary contexts of fair law enforcement 8. The insight of Indonesian Archipelagic as a conception and collective perspective
of the Indonesian nationality in the world associations 9. The urgency and challenges of national resilience and state defense force for
Indonesia in building a national collective commitment PREREQUISITES - MAIN REFERENCES Kemenristekdikti. 2016. Modul Pendidikan Kewarganegaraan Untuk Perguruan Tinggi. Jakarta: Dirjen Belmawa Kemenristekdikti SUPPORTING REFERENCES
1. Armaidy Armawi, Geostrategi Indonesia, Jakarta, Direktorat jenderal Pendidikan Tinggi, 2006
2. Azyumardi Azra, paradigma Baru Pendidikan Nasional dan Rekrontruksi dan Demokratisasi, Penerbit Kompas, Jakarta, 2002
3. Bahar, Dr. Saefrodin, “Konteks Kenegaraan, Hak Asasi Manusia, REFERENCES Sinar Harapan, Jakarta, 2000.
4. Kaelan, Pendidikan Kewarganegaraan, UGM Press, Yogyakarta 2005. 5. Slamet Soemiarno, Geopolitik Indonesia, Jakarta, Direktorat Jenderal Pendidikan
Tinggi, 2006.
COURSE
Course Name : Bahasa Indonesia
Course Code : UG184912
Credit : 2 credits
Semester : I/II COURSE DESCRIPTION Bahasa Indonesia course is a part of a mandatory general course. The students will learn the material relating to: (a) the objective or learning and the methods to achieve it; (b) positive personality, enthusiasm, and achievement/skills; (c) the relation of reading and writing; (d) analysis of the problems and the title of scientific passage; (e) the content of the introduction passage and the formulation of the language used; (f) the content of the theoretical basis/literature review and the formulation of the
ACADEMIC GUIDEBOOK 2018-2023
151
UNDERGRADUATE STUDY PROGRAM – DEPARTMENT OF STATISTICS INSTITUT TEKNOLOGI SEPULUH NOPEMBER
language used; (g) the content of the result and discussion and the formulation of the language used; (h) the content of the conclusion and recommendation including the formulation of the language used; (i) presentation and discussion about the scientific passage. Completing the Bahasa Indonesia course, the students are expected to have the skills in writing a scientific paper (proposal/scientific article) using the appropriate Bahasa Indonesia (clear/straightforward, objective, rational/reasonable, interesting, and entertaining) and correct (suitable with the Bahasa Indonesia rules) PROGRAM LEARNING OUTCOME PLO-6 Having knowledge of current and upcoming issues using statistical and data
science PLO-7 Able to communicate effectively and successfully in interdisciplinary and
multidisciplinary teams COURSE LEARNING OUTCOMES 1. Explain the relation between reading and writing skills in academic papers. 2. Explain the rules of a proper and correct Bahasa Indonesia. 3. Explain the analysis of the research problems, give examples of the research
problems which categorize into: actual, original, achievable, and useful. 4. Explain the relation between the title and the research problems. 5. Explain: (a) the content of the introduction passage, (b) the content of the
theoretical basis/literature review, (c) the content of the result and discussion (d) the content of the conclusion and recommendation, (e) the formulation of the language used in a, b, c, d.
6. The students are able to communicate the ideas orally COURSE MATERIAL 1. The relation between reading and writing skills in Bahasa Indonesia. 2. The analysis of the research problems and the title of the scientific passage. 3. Formulation of the language in the introduction passage, the problems
formulation, the objectives, the importance, the literature review, the result and discussion, and the conclusion and recommendation in the scientific paper.
4. Presentation of the scientific paper. PREREQUISITES - REFERENCES
1. Dirjen Pembelajaran dan Kemahasiswaan Kemenristekdikti, Bahasa Indonesia untuk Perguruan Tinggi, Jakarta, Dirjen Belmawa, 2016.
2. Kamus Besar Bahasa Indonesia (daring atau luring), Kemdikbud RI. 3. Hasan Alwi dkk. Tata Bahasa Baku Bahasa Indonesia. Edisi Ketiga., Balai
REFERENCES.
COURSE Course Name : Insight And Technology
Application Course Code : UG184916
152
UNDERGRADUATE STUDY PROGRAM – DEPARTMENT OF STATISTICS INSTITUT TEKNOLOGI SEPULUH NOPEMBER
ACADEMIC GUIDEBOOK 2018-2023
Credit : 3 credits
Semester : 8 COURSE DESCRIPTION
Insight And Technology Application course inspires the student to develop the insight of knowledge, technology, innovation, and its application in society and the environment. As a citizen, the students are expected to have the skill and creativity in utilizing the technology comprehensively. During the course, the students will develop the mindset based on the information transformation thinking model with constructively systemic logical framework matrix and utilize the opensource technology as well as the mobile application. The students will observe the problems, explore the problems, and find an effective solution to achieve the concrete solutions. The development of problem solving in society is based on sustainable development. The emphasized power to be increased is the application of information and communication technology with the improvement in social sensitivity to produce the adaptive person that is involved in a collaboration to achieve the problem solving in the society. The ability to observe and interview directly also supports the skills given to the students, thus the factual data can be used optimally. Towards the end of the lecture, the students are able to create the Real Work Lecture (KKN) proposal according to the facts in society. Utilizing the Information and Communication Technology and involving the skills of each student according to their scientific background creatively for the development in society and the environment. At the end of lectures, the students carry out a Thematic Field Work Lecture (KKN) that emphasizes capacity building in society. Thus, the students as intelligent humans require to be allowed to be part of the solution to the problems in society. PROGRAM LEARNING OUTCOME PLO-7 Able to communicate effectively and successfully in interdisciplinary and
multidisciplinary teams PLO-8 Have the responsibilities and professional ethics COURSE LEARNING OUTCOMES 1. The students understand the outline of the lecture from the beginning to the
implementation of the KKN 2. The students are able to transform the information into something easy to
understand 3. Able to create Logframe matrix 4. Have insight and ability to implement the principles of sustainable development
according to their expertise in solving problems in the society and the environment
5. Able to understand the basic use of technology by optimizing the information and communication technology in solving problems in society and the environment.
6. Able to apply the open source to the information technology to create agency websites
ACADEMIC GUIDEBOOK 2018-2023
153
UNDERGRADUATE STUDY PROGRAM – DEPARTMENT OF STATISTICS INSTITUT TEKNOLOGI SEPULUH NOPEMBER
7. Able to use the applied information technology to solve the common problems in society
8. Able to improve a cooperative attitude, have the social sensitivity and high concern for society and the environment
9. The students are able to be part of the solution to the problems in society. 10. Proficient in using technology and creative in solving problems in the society and
environment. COURSE MATERIAL 1. The Concept of Information Transformation 2. Practice creating a Logframe Matrix 3. Systems theory and systemic thinking 4. Concept of Sustainable Social Development Goals (SDGs) 5. Custome Management System (CMS) Technology 6. Mobile application PREREQUISITES - REFERENCES
1. Buku Transformasi Informasi, Dr.techn. Pujo Aji, ST.MT., ITS Pres., 2016 2. Alfred Watkins and Michel Ehst, “Science, Technology and Innovation: Capacity
Building for Sustainable Growth and Poverty Reduction”, The International Bank for Reconstruction and Development, Washington DC, 2008.
3. Frieder Meyer Krahmer, “Innovation and Sustainable Development-Lesson for Innovation Policies, “ A Springer-Verlag Company, Heidelberg, 1998.
4. Arahan Pelaksanaan Tujuan Pembangunan, Alamat Kontak: Website : sdgs.bappenas.go.id
COURSE
Course Name : Technopreneurship
Course Code : UG184915
Credit : 3 credits
Semester : 5/7 COURSE DESCRIPTION
This course provides the understanding and skills of the students to identify and evaluate the technology-based business opportunities that are suitable with the expertise of the students and develop the business opportunities. This course combines the introduction theorem and integrated practice (Hands-on experience) in developing ideas and business opportunities. Afterward, the students are expected to transform the business opportunities into an effective business plan.
154
UNDERGRADUATE STUDY PROGRAM – DEPARTMENT OF STATISTICS INSTITUT TEKNOLOGI SEPULUH NOPEMBER
ACADEMIC GUIDEBOOK 2018-2023
The main subjects in this course namely: the concept of business and entrepreneurship, entrepreneurship mindset and self-evaluation, creativity and identification of the business opportunities, business model, analysis and evaluation of business opportunities, analysis and market planning, cost analysis and product pricing, team building and human resource planning, financial planning, capitalization, and business plan development. PROGRAM LEARNING OUTCOME PLO-8 Have the responsibilities and professional ethics PLO-9 Able to motivate themselves to think creatively and life-long learning COURSE LEARNING OUTCOMES
Specific competences: 1. Able to adapt in facing the situation and survive in uncertain condition 2. Able to innovate and be creative to produce the technology based
business/product design (prototype) depend on the orientation of the market and utilizing the Science and Technology
3. Able to create the business plan proposal that proper be presented to investors 4. Responsible for the project and the achievements of the teams with prioritizing
business ethics 5. Able to take business risks with the appropriate estimation Knowledge: 1. Able to apply their expertise and utilize the science and technology to solve the
problems of environment and residence, marine, energy and information technology with the concept of sustainable development and creating employment according to their field of expertise
2. Able to make the right decision based on the analysis of the data and information with the insight of sustainable development which includes the aspects of environment and residence, marine, energy and information technology, and prioritizing social care.
COURSE MATERIAL 1. Introduction to Technopreneurs and Business 2. Recognizing Opportunities and Creating Business Ideas 3. Business Feasibility 4. Develop an effective Business Model 5. The Systematics of Business Plan 6. Marketing Management 7. Operations and HR Management 8. Financial Management PREREQUISITES - MAIN REFERENCES 5. Tim Pengembangan Technopreneurship ITS. (2015). Technopreneurship.
Surabaya: ITS Press. SUPPORTING REFERENCES
ACADEMIC GUIDEBOOK 2018-2023
155
UNDERGRADUATE STUDY PROGRAM – DEPARTMENT OF STATISTICS INSTITUT TEKNOLOGI SEPULUH NOPEMBER
2. Barringer, B. R., & Ireland, R. D. (2010). Entrepreneurship: Successfully launching new ventures. Upper Saddle River, N.J: Prentice Hall.
3. International Labor Organization, Generate Your Business Idea. 4. International Labor Organization, Memulai Bisnis. 5. Osterwalder, A., Pigneur, Y., & Clark, T. (2010). Business model generation: A
handbook for visionaries, game changers, and challengers. Hoboken, NJ: Wiley. 6. William, B. K., Sawyer, S. C., Berston, S., (2013). Business: A Practical
Introduction. Upper Saddle River, N.J: Prentice Hall.
BUKU PANDUAN AKADEMIK 2018-2023
156
UNDERGRADUATE STUDY PROGRAM – DEPARTMENT OF STATISTICS INSTITUT TEKNOLOGI SEPULUH NOPEMBER
PROGRAM LINTAS JENIS PRODI SARJANA
ITS menyelenggarakan program Rekognisi Pembelajaran Lampau (RPL) mulai Tahun Akademik 2018/2019. RPL adalah pengakuan atas Capaian Pembelajaran seseorang yang diperoleh dari pendidikan formal atau nonformal atau informal, dan/atau pengalaman kerja ke dalam pendidikan formal. Berdasarkan Peraturan Rektor ITS no 26 Tahun 2018, Tipe RPL yang diselenggarakan di ITS adalah tipe A1, tipe A2 dan tipe B1.
RPL A1 adalah metode pengakuan terhadap hasil belajar yang berasal dari pendidikan formal di Perguruan Tinggi, sama seperti proses Alih Kredit (credit transfer); hasil pengakuan yang diperoleh adalah Keputusan tentang Pengakuan Alih Kredit. Jenis RPL A1 terdiri dari : Lanjut Jenjang, Lintas Jenis, Pindahan dan Lanjut tidak Sebidang. Pada tahun 2019, Prodi Sarjana menyediakan RPL Lintas Jenis. Lintas Jenis adalah program melanjutkan studi dari diploma terapan (vokasi) ke S1 (akademik).
Persyaratan Program Lintas Jenis Prodi Sarjana : (1) Akredirasi Perguruan Tinggi asal minimal B (2) IPK minimal 3,25 (3) Lama studi di Perguruan Tinggi asal maksimal 6 semester (4) Wajib unggah Dokumen melalui http://smits.its.ac.id (5) Ijazah (6) Transkrip dengan skala nilai (7) Sertifikat Akreditasi Perguruan Tinggi Asal pada saat lulus (8) Sertifikat Akreditasi Program Studi Asal pada saat lulus (9) Silabus Mata Kuliah (10) Mengikuti ujian yang meliputi Tes Potensi Akademik (TPA), Tes
Bidang (Teori Statistika, Pengantar Metode Statistik, Metode Statistika, dan Tes Wawancara)
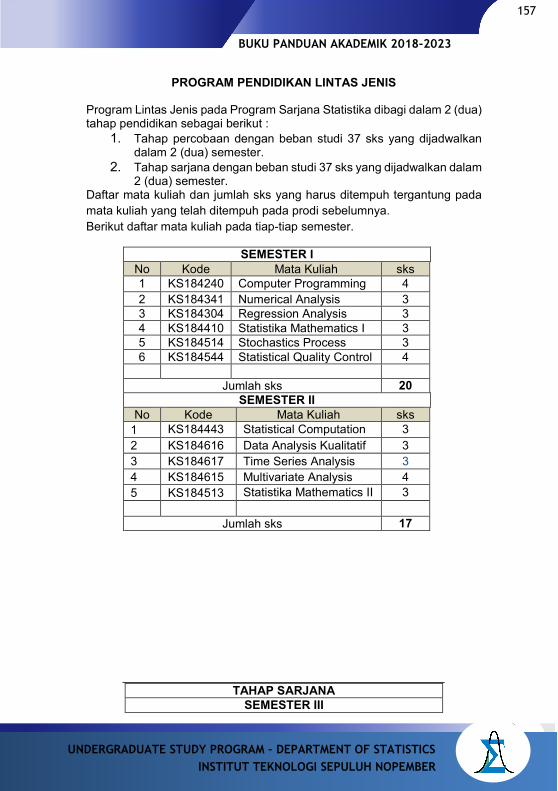
BUKU PANDUAN AKADEMIK 2018-2023
157
UNDERGRADUATE STUDY PROGRAM – DEPARTMENT OF STATISTICS INSTITUT TEKNOLOGI SEPULUH NOPEMBER
PROGRAM PENDIDIKAN LINTAS JENIS
Program Lintas Jenis pada Program Sarjana Statistika dibagi dalam 2 (dua) tahap pendidikan sebagai berikut :
1. Tahap percobaan dengan beban studi 37 sks yang dijadwalkan dalam 2 (dua) semester.
2. Tahap sarjana dengan beban studi 37 sks yang dijadwalkan dalam 2 (dua) semester.
Daftar mata kuliah dan jumlah sks yang harus ditempuh tergantung pada mata kuliah yang telah ditempuh pada prodi sebelumnya. Berikut daftar mata kuliah pada tiap-tiap semester.
SEMESTER I No Kode Mata Kuliah sks 1 KS184240 Computer Programming 4 2 KS184341 Numerical Analysis 3 3 KS184304 Regression Analysis 3 4 KS184410 Statistika Mathematics I 3 5 KS184514 Stochastics Process 3 6 KS184544 Statistical Quality Control 4
Jumlah sks 20 SEMESTER II
No Kode Mata Kuliah sks 1 KS184443 Statistical Computation 3 2 KS184616 Data Analysis Kualitatif 3 3 KS184617 Time Series Analysis 3 4 KS184615 Multivariate Analysis 4 5 KS184513 Statistika Mathematics II 3
Jumlah sks 17
TAHAP SARJANA
SEMESTER III
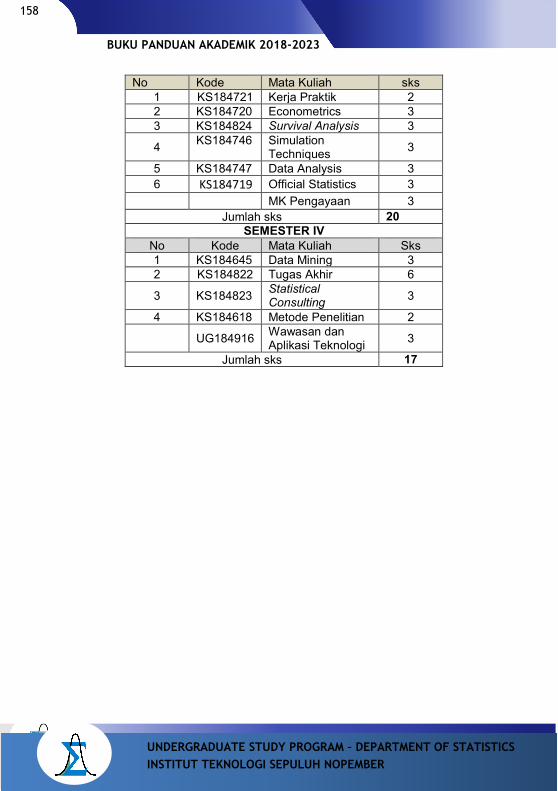
BUKU PANDUAN AKADEMIK 2018-2023
158
UNDERGRADUATE STUDY PROGRAM – DEPARTMENT OF STATISTICS INSTITUT TEKNOLOGI SEPULUH NOPEMBER
No Kode Mata Kuliah sks 1 KS184721 Kerja Praktik 2 2 KS184720 Econometrics 3 3 KS184824 Survival Analysis 3
4 KS184746 Simulation Techniques 3
5 KS184747 Data Analysis 3 6 KS184719 Official Statistics 3 MK Pengayaan 3
Jumlah sks 20 SEMESTER IV
No Kode Mata Kuliah Sks 1 KS184645 Data Mining 3 2 KS184822 Tugas Akhir 6
3 KS184823 Statistical Consulting 3
4 KS184618 Metode Penelitian 2
UG184916 Wawasan dan Aplikasi Teknologi 3
Jumlah sks 17
BUKU PANDUAN AKADEMIK 2018-2023
159
UNDERGRADUATE STUDY PROGRAM – DEPARTMENT OF STATISTICS INSTITUT TEKNOLOGI SEPULUH NOPEMBER
KERJA PRAKTEK DAN TUGAS AKHIR
KERJA PRAKTEK
Untuk memberikan pengalaman dalam merumuskan masalah praktis ke dalam masalah statistik dan pengalaman dalam menerapkan metode statistika untuk menyelesaikan masalah diberbagai bidang pekerjaan, khususnya: bidang industri-bisnis; komputasi; ekonomi, finansial, dan Actuarial; sosial-kependudukan; dan lingkungan-kesehatan. Kerja Praktek merupakan salah satu mata kuliah dengan bobot 2 SKS, yang dapat diambil oleh mahasiswa Program S1 dengan syarat mahasiswa tersebut telah menempuh perkuliahan minimal 100 SKS.
Lama Kerja Praktek adalah 3 bulan dengan perincian 1 bulan kerja praktek di perusahaan/instansi dan 2 bulan pembuatan laporan. Proses pembimbingan dilaksanakan sebelum dimulai kerja praktek, pada saat pelaksanaan kerja praktek dan pada saat penyusunan laporan kerja praktek. Pembimbingan kerja praktek dilakukan oleh dosen pembimbing kerja praktek dan pembimbing dari perusahaan atau instansi terkait. Kerja Praktek dilakukan diperusahaan atau instansi dengan persyaratan mendapat ijin resmi dari perusahaan atau instansi yang bersangkutan. Kriteria Penilaian a. Nilai Kerja Praktek didasarkan pada:
- Pelaksanaan Kerja Praktek - Proses Pembimbingan di Departemen - Laporan Kerja Praktek
b. Tenggang waktu penyelesaian kerja praktek adalah 3 bulan dan apabila melebihi waktu tersebut, digunakan kriteria sebagai berikut, untuk waktu penyelesaian: - 3 bulan < laporan selesai ≤ 4 bulan, maksimal nilai adalah AB - 4 bulan < laporan selesai ≤ 5 bulan, maksimal nilai adalah B - 5 bulan < laporan selesai ≤ 6 bulan, maksimal nilai adalah BC - Laporan selesai > 6 bulan, maksimal nilai adalah C
Prosedur pelaksanaan Kerja Praktek bagi mahasiswa Program Studi S1 Statistika, secara umum sama, sebagaimana yang digambarkan dalam diagram alir berikut:
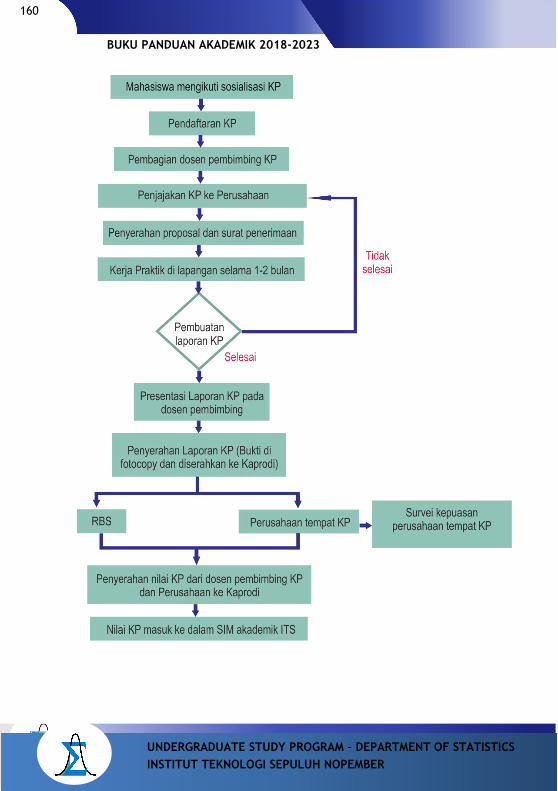
BUKU PANDUAN AKADEMIK 2018-2023
160
UNDERGRADUATE STUDY PROGRAM – DEPARTMENT OF STATISTICS INSTITUT TEKNOLOGI SEPULUH NOPEMBER
BUKU PANDUAN AKADEMIK 2018-2023
161
UNDERGRADUATE STUDY PROGRAM – DEPARTMENT OF STATISTICS INSTITUT TEKNOLOGI SEPULUH NOPEMBER
TUGAS AKHIR
Sebagai puncak kegiatan perkuliahan di Program S1, mahasiswa diwajibkan mengambil Tugas Akhir dengan bobot 6 SKS. Mahasiswa Program S1 diwajibkan mengikuti Seminar Tugas Akhir sebelum ujian Tugas Akhir.
Prosedur pelaksanaan Tugas Akhir (TA), secara rinci dapat dijelaskan sebagai berikut:
1. Sosialisasi Tugas Akhir, meliputi: a. Sosialisasasi Topik Tugas Akhir. Kepala Laboratorium
menyampaikan topik penelitian di Laboratorium masing-masing. b. Sosialisasi Prosedur pembuatan Tugas Akhir. Sekretaris Program
studi-1 mensosialisasikan prosedur TA secara administratif. 2. Pendaftaran TA
a. Pendaftaran TA dibuka saat perwalian. Dimulai hari pertama dan ditutup hari terakhir masa perwalian.
b. Pada saat pendaftaran Mahasiswa mengisi formulir pendaftaran secara online dan menyerahkan: i. Draft proposal ii. Transkrip terakhir iii. Sertifikat Toefl iv. Bukti telah mengikuti seminar 10 kali (Form PP-1)
Draft proposal seperti yang dimaksud pada nomor b. minimal meliputi latar belakang masalah, tujuan dan metodologi yang digunakan. Tujuan pembuatan draft proposal adalah untuk penetapan dosen pembimbing agar sesuai (minimal 90% sesuai).
3. Pembagian Dosen pembimbing TA a. Sekprodi Sarjana bersama para Kalaboratorium menentukan dosen
pembimbing. b. Pembagian dosen pembimbing dilakukan di setiap laboratorium,
berdasarkan : i. Kesesuaian kompetensi dosen, ii. Kapasitas dosen yang disesuaikan dengan aturan dalam
penilaian BAN-PT yaitu, jika jumlah pembimbingan :1-4 orang, maka penilaian akan mendapat skor maksimum (4).
iii. Optional mahasiswa. Mahasiswa diberi kesempatan memilih, tetapi jika seorang dosen telah mendapat beban penuh, maka Sekretaris Prodi I berhak memindahkan ke dosen lain.
iv. Proporsional, artinya proporsional antara jumlah mahasiswa dan jumlah dosen di laboratorium.
c. Pengumuman dosen pembimbing pada paling lambat, minggu ke-1 perkuliahan.
BUKU PANDUAN AKADEMIK 2018-2023
162
UNDERGRADUATE STUDY PROGRAM – DEPARTMENT OF STATISTICS INSTITUT TEKNOLOGI SEPULUH NOPEMBER
4. Pembuatan proposal bersama pembimbing a. Pembuatan proposal bersama pembimbing pada minggu ke-2 dan
3. b. Pembuatan proposal di sini adalah untuk melengkapi draft proposal
yang sudah dibuat pada saat pendaftaran. c. Proposal yang sudah diperbaiki pembimbing dikumpulkan pada
minggu ke-4 di unit Administrasi S1. d. Pada saat pembuatan Proposal mahasiswa harus membawa
formulir PP-2 untuk ditandatangani pembimbing sebagai bukti telah bimbingan minimal 3 kali.
5. Seminar Proposal a. Mahasiswa mendaftar seminar proposal TA dengan menyerahkan
Proposal yang telah diperbaiki dan bukti bimbingan yaitu Form PP-2
b. Sekprodi Sarjana membuat jadwal seminar proposal untuk mahasiswa yang mendaftar seminar proposal pada minggu ke-4 dan diumumkan ke mahasiswa dan dosen pembimbing minimal 2 hari sebelum pelaksanaan seminar.
b. Seminar proposal dilaksanakan pada minggu ke-4 atau 5. c. Setelah seminar proposal mahasiswa diberi kesempatan
memperbaiki proposal dibawah arahan dosen penguji dengan membawa Form PP-3
d. Pengumpulan perbaikan proposal satu minggu setelah jadwal seminar proposal dan disetujui oleh tim penguji proposal. Jika dalam satu semester mahasiswa tidak mengumpulkan proposal yang telah diperbaiki, maka harus melakukan seminar proposal ulang pada semester berikutnya.
6. Proses pembimbingan skripsi a. Proses pembimbingan skripsi berlangsung lebih kurang 10 minggu,
dimulai pada minggu ke-6 dan berakhir pada minggu ke-16. Proses pembimbingan dapat meliputi survey/pengumpulan data, Data Analysis dan cara penulisan.
b. Selama proses pembimbingan mahasiswa harus membawa Form PP-4, sebagai bukti telah bimbingan. Jumlah bimbingan minimal 5 kali
7. Seminar dan ujian TA Prosedur Kegiatan Seminar dan ujian TA adalah sebagai berikut: a. Mahasiswa mendaftar ke bagian administrasi dengan membawa:
i. Draft TA dan makalah dengan jumlah: 1) Masing-masing 3 eksemplar jika tidak ada Co-pembimbing 2) Masing masing 4 eksemplar jika ada Co-pembimbing.
ii. Bukti jumlah bimbingan TA minimal 5 kali (form PP-3) iii. Sertifikat Toefl bagi yang lulus dengan skor 477. Bagi yang
belum lulus, harus diserahkan sebelum yudisium. iv. Bukti Skor SKEM, yaitu skor yang menunjukkan mahasiswa
telah mengikuti kegiatan ekstra kurikuler. Berdasarkan
BUKU PANDUAN AKADEMIK 2018-2023
163
UNDERGRADUATE STUDY PROGRAM – DEPARTMENT OF STATISTICS INSTITUT TEKNOLOGI SEPULUH NOPEMBER
Peraturan Akademik ITS 2014, minimal Skor SKEM adalah 1300 untuk program studi Sarjana Reguler. Sedangkan untuk program studi Sarjana Lintas Jenis tidak persyaratan SKEM.
b. Setelah mendaftar Seminar dan Ujian TA, mahasiswa akan mengikuti 5 langkah berikut:
i. PROSES VALIDASI Mahasiswa melakukan proses validasi sesuai jadwal yang telah disepakati validator (dosen pembimbing). Validasi dilakukan paling lambat 1 hari menjelang seminar tugas akhir. Mahasiswa harus membawa laporan TA dan Form validasi yaitu Form P-1 sebagai bukti telah melakukan validasi.
ii. SEMINAR TUGAS AKHIR Mahasiswa melakukan presentasi TA secara terbuka dihadapan tim penguji dan sejumlah mahasiswa minimal 10 orang. Mahasiswa yang presentasi TA harus memakai baju bawahan hitam, baju atasan putih, dan jas almamater. Seminar tugas akhir dilakukan dengan durasi kurang lebih 45 menit. Penguji menilai mahasiswa dengan Form P-2.
iii. UJIAN TUGAS AKHIR. Setelah dilakukan seminar tugas akhir, mahasiswa mengikuti
ujian lisan secara tertutup. Tim Penguji menilai performa mahasiswa dengan Form P-4. Ujian tugas akhir dilakukan selama 60 menit.
iv. PERBAIKAN MAKALAH Setelah seminar TA, mahasiswa harus memperbaiki makalah
sesuai dengan saran penguji dan pembimbing pada saat sesi presentasi. Mahasiwa harus menyerahkan form perbaikan makalah (Form P-3 dan P-3A) dan makalah yang sudah diperbaiki ke pihak administrasi.
v. PERBAIKAN LAPORAN TA Mahasiswa harus melakukan perbaikan TA segera setelah ujian berlangsung dengan durasi kurang lebih 1 minggu. Selama perbaikan laporan TA mahasiswa membawa Form P-5. Bukti perbaikan laporan TA (Form P-5) diserahkan ke pihak adimistrasi. Laporan TA yang sudah dibukukan ditandatangani oleh Kepala Departemen dengan paraf ketua prodi Sarjana. Selanjutnya buku TA yang sudah ditandatangani, diserahkan ke ruang baca statistika (RBS) dan perpustkaan ITS.
CEK LIST KELENGKAPAN YUDISIUM Mahasiswa harus melengkapi berkas-berkas yang diperlukan untuk yudisium, seperti blanko bebas tanggungan, blanko perbaikan TA, blanko perbaikan makalah, transkrip terbaru dengan nilai TA, surat bebas, sertifikat TOEFL, SKEM terbaru, poster, dan mengupload jurnal/artikel ke POMITS.
Secara umum rangkuman prosedur TA disajikan sebagai berikut :
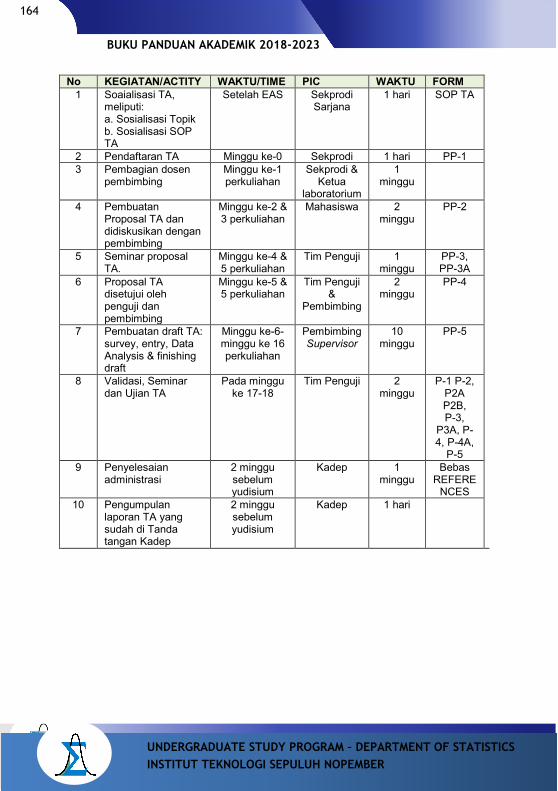
BUKU PANDUAN AKADEMIK 2018-2023
164
UNDERGRADUATE STUDY PROGRAM – DEPARTMENT OF STATISTICS INSTITUT TEKNOLOGI SEPULUH NOPEMBER
No KEGIATAN/ACTITY WAKTU/TIME PIC WAKTU FORM 1 Soaialisasi TA,
meliputi: a. Sosialisasi Topik b. Sosialisasi SOP TA
Setelah EAS Sekprodi Sarjana
1 hari SOP TA
2 Pendaftaran TA Minggu ke-0 Sekprodi 1 hari PP-1 3 Pembagian dosen
pembimbing Minggu ke-1 perkuliahan
Sekprodi & Ketua
laboratorium
1 minggu
4 Pembuatan Proposal TA dan didiskusikan dengan pembimbing
Minggu ke-2 & 3 perkuliahan
Mahasiswa 2 minggu
PP-2
5 Seminar proposal TA.
Minggu ke-4 & 5 perkuliahan
Tim Penguji 1 minggu
PP-3, PP-3A
6 Proposal TA disetujui oleh penguji dan pembimbing
Minggu ke-5 & 5 perkuliahan
Tim Penguji &
Pembimbing
2 minggu
PP-4
7 Pembuatan draft TA: survey, entry, Data Analysis & finishing draft
Minggu ke-6-minggu ke 16 perkuliahan
Pembimbing Supervisor
10 minggu
PP-5
8 Validasi, Seminar dan Ujian TA
Pada minggu ke 17-18
Tim Penguji
2 minggu
P-1 P-2, P2A P2B, P-3,
P3A, P-4, P-4A,
P-5 9 Penyelesaian
administrasi 2 minggu sebelum yudisium
Kadep 1 minggu
Bebas REFERE
NCES 10 Pengumpulan
laporan TA yang sudah di Tanda tangan Kadep
2 minggu sebelum yudisium
Kadep 1 hari
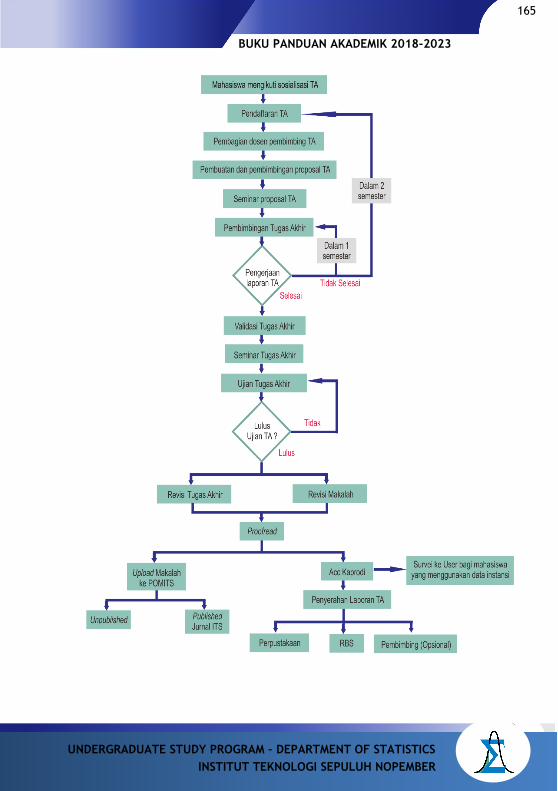
BUKU PANDUAN AKADEMIK 2018-2023
165
UNDERGRADUATE STUDY PROGRAM – DEPARTMENT OF STATISTICS INSTITUT TEKNOLOGI SEPULUH NOPEMBER