cpc guidebook cover_2005_d.indd - sask pork
TRANSCRIPT
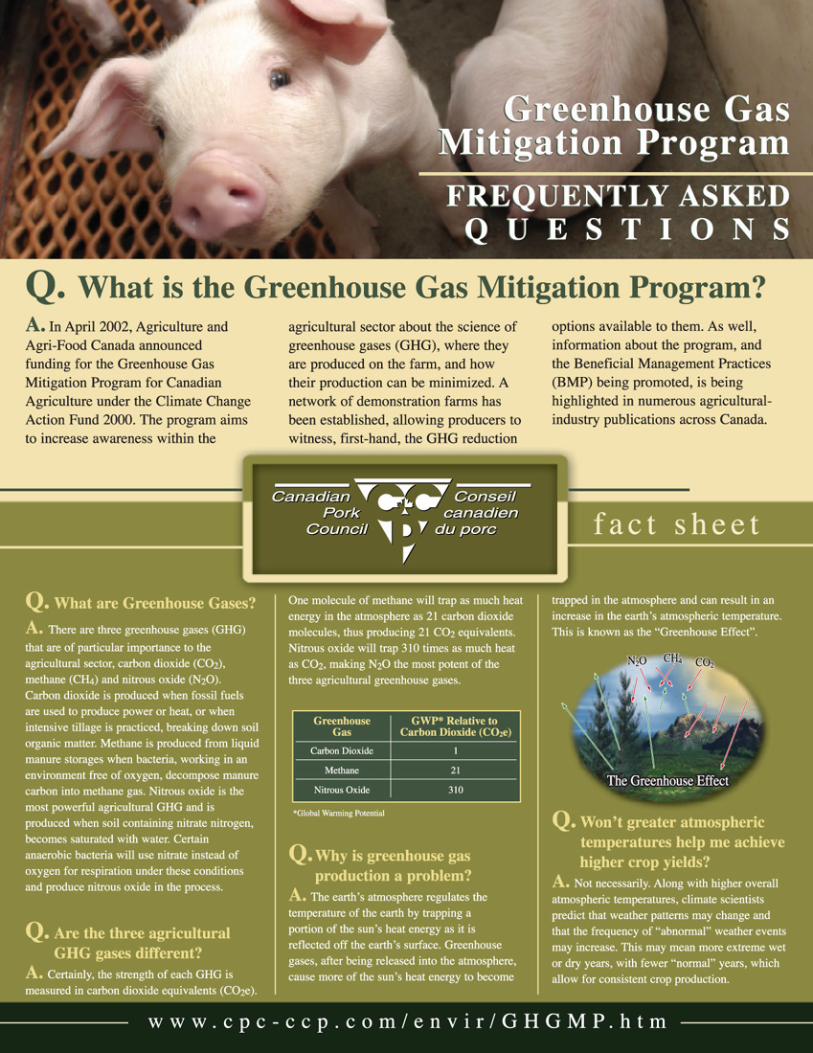
PRACTICES & TECHNOLOGIES AIMED AT REDUCING ENVIRONMENTAL IMPACTS FROM HOG PRODUCTION
SCIENTIFIC & ECONOMIC EVALUATION
Dear fellow producer,
As many of you are aware, the Canadian Pork Council has, and is currently, taking part in numerousenvironmentally based national programs aimed at increasing our understanding of how Canadianpork production can play a role in both food production and continued environmental stewardship.We have had valuable research completed through the Hog Environmental Management Strategy,which later folded into the Livestock Environmental Initiative. We have been involved in developinga National Environmental Management Standard for our industry, and most recently, we havepartnered with other Canadian industry groups in the Greenhouse Gas Mitigation Program forCanadian Agriculture.
Numerous insights concerning how best to integrate pork production and environmentalsustainability have been gained through participation in these programs. A variety of provincial,regional and national programs have been developed through partnerships with provincial porkassociations and governments. The pro-active approach to maintaining environmental integrityembraced by these organizations is to be commended.
The Canadian pork sector is, however, characterized by its diversity. With this in mind, theCanadian Pork Council set out to develop a technology and management guidebook that wouldhighlight the majority of environmental technologies and management practices currently availableto Canadian producers, complete with economic and scientific evaluation.
Some of the technologies analyzed in this resource manual may not be applicable to your region,and some you may have tried already on your operation with varying degrees of success. Thisguidebook outlining “Practices and Technologies Aimed at Reducing Environmental Impactsfrom Hog Production: Scientific and Economic Evaluation” has been designed as a referencefor your operation, and a starting point for management practice evaluation. It will be important toconsider your own farm as you search this guidebook for technology information and considerhow your operation might be different from the case studies evaluated. This will certainly effecthow the economic evaluation will transfer to your personal situation. Also consider that as this isa national initiative, your local regulations may not allow for specific management practices to beimplemented on your operation. We encourage you to contact your provincial pork associationor government before making major changes to your environmental stewardship program andmaintain a close relationship with these groups to avoid becoming non-compliant with localregulations.
We hope that you enjoy this environmental management guidebook that has been provided toyou free of charge by the Canadian Pork Council. We look forward to a continued partnership inmaintaining a viable pork sector operating with the highest level of on-farm environmentalstewardship possible.
Kind regards,
Clare SchlegelPresidentCanadian Pork Council
75 Albert, Suite 1101, Ottawa, Canada $ K1P 5E7 $ Tel: (613) 236-9239 $ Fax: (613) 236-6658 $ www.cpc-ccp.com
AcknowledgementsThe Practices and Technologies Aimed at Reducing Environmental Impacts from Hog Productionguidebook is an initiative of the Canadian Pork Council. The goal was to give hog producers an overviewand brief economic synopsis of the technologies and management practices that exist to help ensurethat hog production occurs in an environmentally friendly manner.
This guidebook was made possible by the efforts of the following experts who provided information,advice, and editing.
Mark Armstrong, Agviro Inc.Gerald Bayne, Saskatchewan Agriculture, Food and Rural RevitalizationKelly Beaulieu, Prairie Agricultural Machinery InstituteBob Betcher, Manitoba Water StewardshipKaren Bolton, Saskatchewan Agriculture, Food and Rural RevitalizationKatherine Buckley, Agriculture and Agri-Food CanadaHarry Burke, Prairie Agricultural Machinery InstituteRobert Chambers, Ontario Ministry of Agriculture and FoodJake DeBruyn, Ontario Ministry of Agriculture and FoodBrian English, Manitoba Agriculture, Food and Rural InitiativesMing Fan, University of GuelphJohn Feddes, University of Alberta, Agricultural, Food and Nutritional ScienceRon Fleming University of GuelphGlenn Friesen, Manitoba Agriculture, Food and Rural InitiativesCliff Hamilton, Centre for Studies in Agriculture, Law and the Environment, U of SGordon Hultgreen, Prairie Agricultural Machinery InstituteMiles JorgensonMohammad Khakbazan, Agriculture and Agri-Food CanadaClaude Lagüe, University of Saskatchewan, Prairie Swine CentreDawn Lawrence, Canadian Pork Council, Canada Quality AssuranceDarrell Lischynski, Prairie Agricultural Machinery InstituteCedric MacLeod, Canadian Pork CouncilPat McGarry, Prairie Farm Rehabilitation AdministrationBernardo Predicala, Prairie Swine CentreJeff Schoenau, University of SaskatchewanIan Seddon, Manitoba Agriculture, Food and Rural InitiativesDoug Small, DHG EngineeringDarren Stovin, Saskatchewan Agriculture, Food and Rural RevitalizationAndre Vézina, Institute de technologie agroalimentaireBen Voss, Clear-Green Environmental Inc.Jarrett Wylde, Prairie Agricultural Machinery InstituteRuurd Zijlstra, Prairie Swine Centre
Final editing, coordination, and production services were provided by Jim Wassermann, Rachel Abrey,Sharon Doepker, and Annette Aquin of the Prairie Agricultural Machinery Institute.

Canada’s ratification of the Kyoto Protocol in December 2002 launched Canada into a new eraof environmental awareness and activity. The Greenhouse Gas Mitigation Program for CanadianAgriculture, established in April 2002, is a program designed to give the Canadian agriculturalcommunity the information it requires to take part in the Kyoto based activities and discussionsthat followed Canada’s becoming a Kyoto signatory country.
This ‘Guidebook for Environmental Management in the Canadian Pork Sector’ is brought to youfree of charge through the Canadian Pork Council’s Greenhouse Gas Mitigation Program withfunding support from Agriculture and Agri-Food Canada.
Although greenhouse gas management continues to be an ever increasing area of environmentalimportance in the Canadian agricultural sector, this guidebook does not focus solely ongreenhouse gas management. Rather, this guidebook seeks to highlight a wide variety oftechnologies and management practices that deliver practical and economical benefits to theCanadian pork sector.
Not all technologies or practices suggested will deliver the same level of increased efficiency orprofitability. The economic analysis that accompanies each technology or practice descriptionshould be considered a starting point only, a rough estimate. Barn operators will need to considerhow a specific technology will apply to their specific situation and incorporate these considerationsinto the economic analysis.
The Canadian Pork Council is pleased to offer you this environmental management resourcemanual. We hope you find the information useful, and that combination of scientific and economicinformation will allow you to make more informed decisions about environmental managementon your operation.
Remember, that a hog operations environmental performance is generally linked to the level ofmanagement efficiency that exists on the farm. Efficient farms are profitable farms. Thetechnologies and management practices described in this guidebook will hopefully help in makingthe link between environmental management and farm profitability on your operation.
For more information on this or other environmental initiatives at the Canadian Pork Council, feelfree to contact us at:
Canadian Pork Council75 rue Albert Street, Suite 1101Ottawa, Ontario, Canada K1P 5E7Phone : (613) 236-9239Fax: (613) 236-6658www.cpc-ccp.com
Sincerely,
Cedric MacLeodGreenhouse Gas Mitigation Program Coordinator
75 Albert, Suite 1101, Ottawa, Canada $ K1P 5E7 $ Tel: (613) 236-9239 $ Fax: (613) 236-6658 $ www.cpc-ccp.com
������������� ������������� ����������� �������������������������
������������� ������������������
������������
����������������� ������������!��"����#�
������$�����
�����%���&'�%�(��()*��+���,�-��.�
�����$������
$$���(''�/�����0���1�����1����
������������
��2������3��(����/!������4��15����6��-�
��������$��$
����7�(8�(� ��8���0(�����!9�'�����/���&�:��!����;�
������������
�������0'��,�'������9<(�����<��*5��*00('��=!��-�6�$>�
����������$�
�� ����+�(��3'���������9�����������4�������������5��6�
$�����������
NewfoundlandPork Producers
Association
$��������0��/(%4����3�(%�����1����$���.�
������������
������0�9*���?(8.0')9��@1��1�.��.�
������������
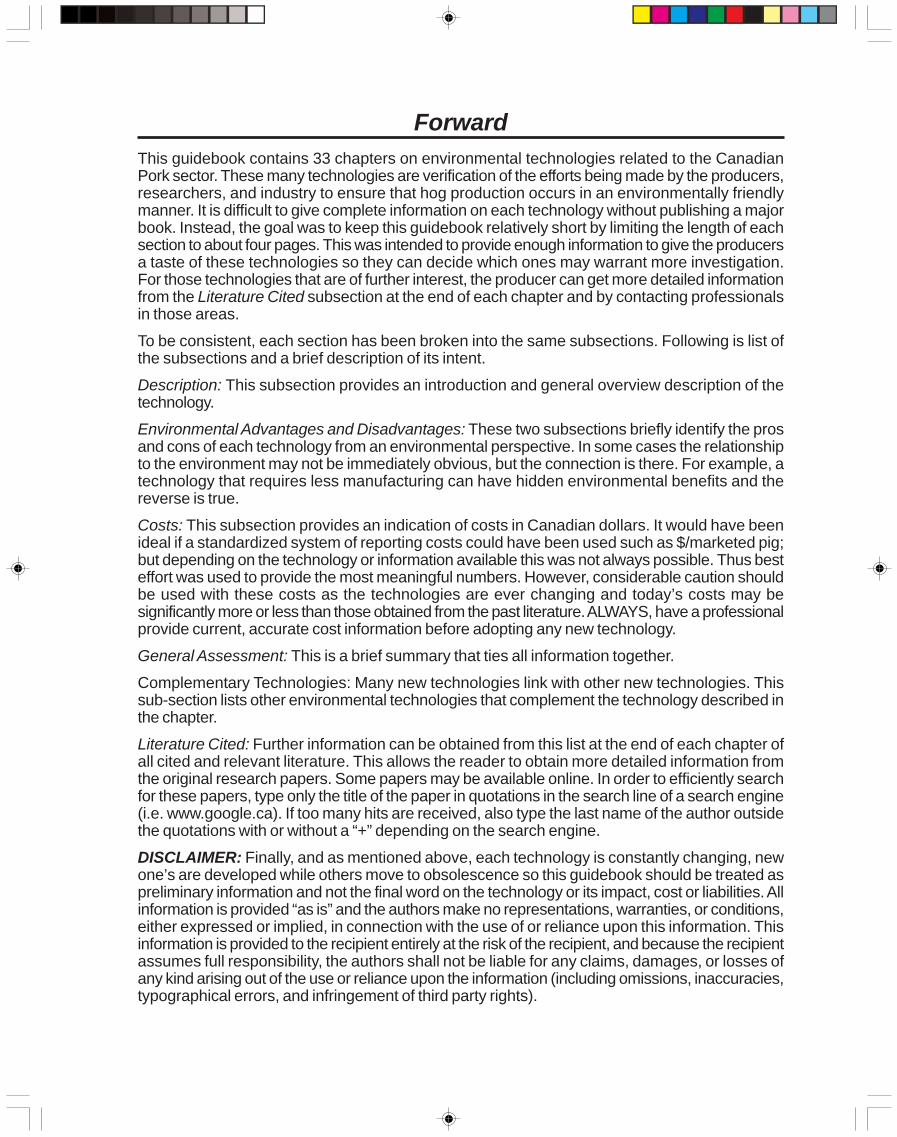
ForwardThis guidebook contains 33 chapters on environmental technologies related to the CanadianPork sector. These many technologies are verification of the efforts being made by the producers,researchers, and industry to ensure that hog production occurs in an environmentally friendlymanner. It is difficult to give complete information on each technology without publishing a majorbook. Instead, the goal was to keep this guidebook relatively short by limiting the length of eachsection to about four pages. This was intended to provide enough information to give the producersa taste of these technologies so they can decide which ones may warrant more investigation.For those technologies that are of further interest, the producer can get more detailed informationfrom the Literature Cited subsection at the end of each chapter and by contacting professionalsin those areas.
To be consistent, each section has been broken into the same subsections. Following is list ofthe subsections and a brief description of its intent.
Description: This subsection provides an introduction and general overview description of thetechnology.
Environmental Advantages and Disadvantages: These two subsections briefly identify the prosand cons of each technology from an environmental perspective. In some cases the relationshipto the environment may not be immediately obvious, but the connection is there. For example, atechnology that requires less manufacturing can have hidden environmental benefits and thereverse is true.
Costs: This subsection provides an indication of costs in Canadian dollars. It would have beenideal if a standardized system of reporting costs could have been used such as $/marketed pig;but depending on the technology or information available this was not always possible. Thus besteffort was used to provide the most meaningful numbers. However, considerable caution shouldbe used with these costs as the technologies are ever changing and today’s costs may besignificantly more or less than those obtained from the past literature. ALWAYS, have a professionalprovide current, accurate cost information before adopting any new technology.
General Assessment: This is a brief summary that ties all information together.
Complementary Technologies: Many new technologies link with other new technologies. Thissub-section lists other environmental technologies that complement the technology described inthe chapter.
Literature Cited: Further information can be obtained from this list at the end of each chapter ofall cited and relevant literature. This allows the reader to obtain more detailed information fromthe original research papers. Some papers may be available online. In order to efficiently searchfor these papers, type only the title of the paper in quotations in the search line of a search engine(i.e. www.google.ca). If too many hits are received, also type the last name of the author outsidethe quotations with or without a “+” depending on the search engine.
DISCLAIMER: Finally, and as mentioned above, each technology is constantly changing, newone’s are developed while others move to obsolescence so this guidebook should be treated aspreliminary information and not the final word on the technology or its impact, cost or liabilities. Allinformation is provided “as is” and the authors make no representations, warranties, or conditions,either expressed or implied, in connection with the use of or reliance upon this information. Thisinformation is provided to the recipient entirely at the risk of the recipient, and because the recipientassumes full responsibility, the authors shall not be liable for any claims, damages, or losses ofany kind arising out of the use or reliance upon the information (including omissions, inaccuracies,typographical errors, and infringement of third party rights).
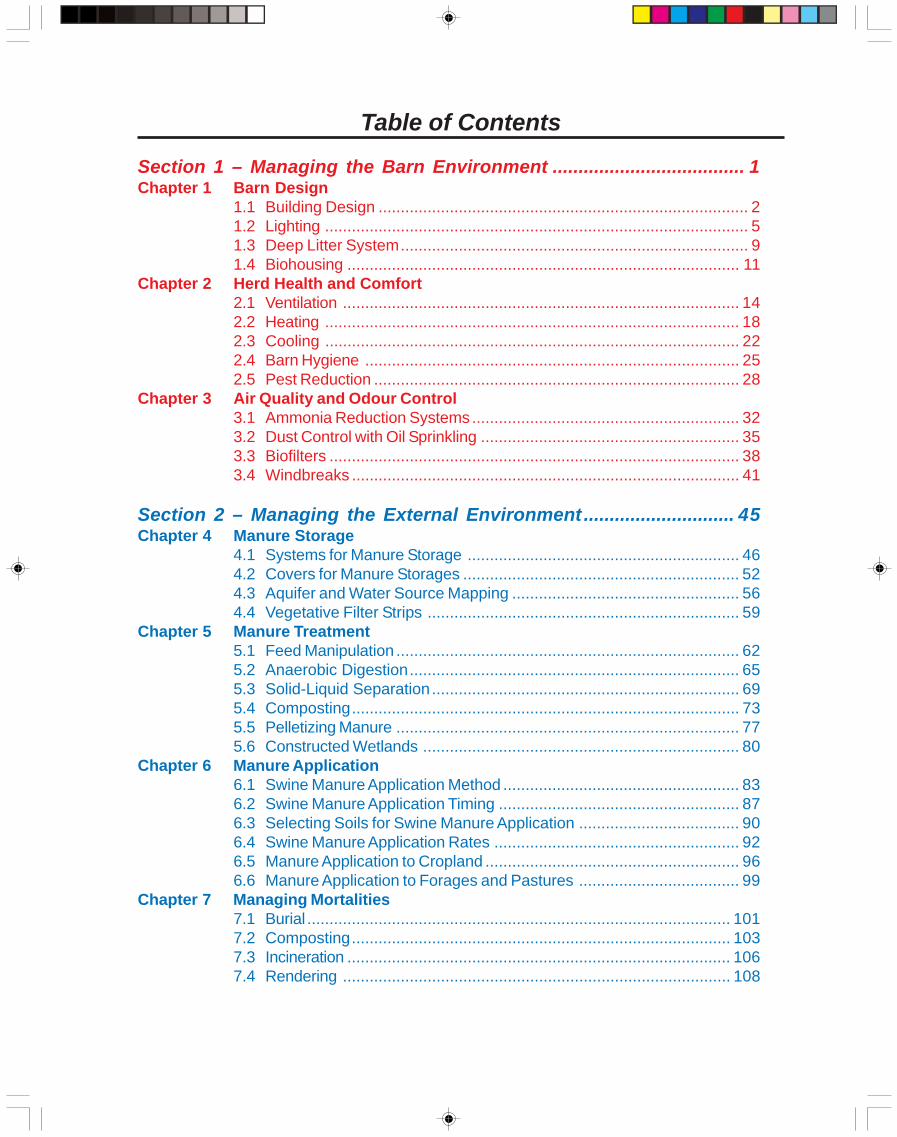
Table of Contents
Section 1 – Managing the Barn Environment ..................................... 1Chapter 1 Barn Design
1.1 Building Design ................................................................................... 21.2 Lighting ............................................................................................... 51.3 Deep Litter System.............................................................................. 91.4 Biohousing ........................................................................................ 11
Chapter 2 Herd Health and Comfort2.1 Ventilation ......................................................................................... 142.2 Heating ............................................................................................. 182.3 Cooling ............................................................................................. 222.4 Barn Hygiene .................................................................................... 252.5 Pest Reduction .................................................................................. 28
Chapter 3 Air Quality and Odour Control3.1 Ammonia Reduction Systems............................................................ 323.2 Dust Control with Oil Sprinkling .......................................................... 353.3 Biofilters ............................................................................................ 383.4 Windbreaks ....................................................................................... 41
Section 2 – Managing the External Environment ............................. 45Chapter 4 Manure Storage
4.1 Systems for Manure Storage ............................................................. 464.2 Covers for Manure Storages .............................................................. 524.3 Aquifer and Water Source Mapping ................................................... 564.4 Vegetative Filter Strips ...................................................................... 59
Chapter 5 Manure Treatment5.1 Feed Manipulation ............................................................................. 625.2 Anaerobic Digestion.......................................................................... 655.3 Solid-Liquid Separation ..................................................................... 695.4 Composting....................................................................................... 735.5 Pelletizing Manure ............................................................................. 775.6 Constructed Wetlands ....................................................................... 80
Chapter 6 Manure Application6.1 Swine Manure Application Method ..................................................... 836.2 Swine Manure Application Timing ...................................................... 876.3 Selecting Soils for Swine Manure Application .................................... 906.4 Swine Manure Application Rates ....................................................... 926.5 Manure Application to Cropland ......................................................... 966.6 Manure Application to Forages and Pastures .................................... 99
Chapter 7 Managing Mortalities7.1 Burial ............................................................................................... 1017.2 Composting..................................................................................... 1037.3 Incineration ...................................................................................... 1067.4 Rendering ....................................................................................... 108
Section 1 - Managing theBarn Environment
2
Chapter 1 Barn Design1.1 Confinement Building Design
DescriptionThe design of the hog barn can affect the environment in many positive ways. Proper integration of thebarn with other farm activities ensures that the hog operation is a net benefit to that environment. Thisis particularly true of the manure, but also applies to the entire hog barn operation. Hog manure mustbe removed from the animal space and eventually transported and stored where it can become a cropnutrient. The air inside the building needs to be conditioned and exchanged with fresh outside air to alesser or greater extent depending upon stocking density, choice of manure handling system, and thequality of the building envelope. Similarly, dust and odours should not be introduced to the surroundingenvironment. Modern technology can effectively manage every environmental impact of the barn design.Owners and builders have a responsibility to understand how choices made in planning the barnaffect the environment throughout the life of the barn.
heat loss at the foundation. Insulating the exterior of the foundation reduces heat loss and improvescomfort. All wall sections must be constructed to prevent rodent infiltration.
Table 1-1. Energy to Produce Common BuildingMaterials.
Decisions based upon energy are a good measureof how the project will manage greenhouse gasemissions (GHG). Almost every aspect of projectplanning has some energy impact, from siting todesign to choice of materials and the constructionschedule. Lower GHG impact will usually benefitthe budget as well.
Building materials require energy to produce(Table 1-1). Energy is also consumed to deliver thematerials to the construction site. Developers cancontrol the total energy impact of the constructionphase by using the least amount of building material,manufacturing materials like concrete as close aspossible to the work site, and even by compressingthe construction schedule to reduce the number oftrips made to and from the construction site.
The typical swine building design relies on concretefor the foundation and wood for the walls and roof.Concrete walls may be used as an alternative towood frame construction. Commercial choicesinclude pre-cast panels, cast-in-place, tilt-up, orplastic forming systems (PFS). Any of these providea durable, pre-finished building shell for a costpremium that may be justified over the life of a25 year business plan. The biggest advantages aredurability and ease of cleaning.
Minimizing the cost of the building shell must notbe done at the expense of its thermal efficiency. Inconventional slatted floor buildings, high qualityinsulation and vapour barriers control heat loss,prevent drafts, and even minimize the rate ofdeterioration. Proper insulation not only helpscontrol heating costs but also provides improvedcomfort year round. An often overlooked problem is
MaterialEnergy to Produce
(BTU/lb)
Plastic – HDPE 44,000
Paint oil-based 42,000
Paint, latex 38,000
Plastic – PVC 30,000
Steel - galvanized 15,000
Steel - mild 14,000
Insulation, fibreglass 13,000
Insulation, cellulose
recycled6,300
Wood – plywood 4,500
Steel - rebar or
recycled3,800
Cement 3,400
Gypsum wall board 2,600
Wood – kiln dried
softwood1,100
Concrete, f.o.b. plant 500
Straw, baled 100
Source: Baird, 1997.
3
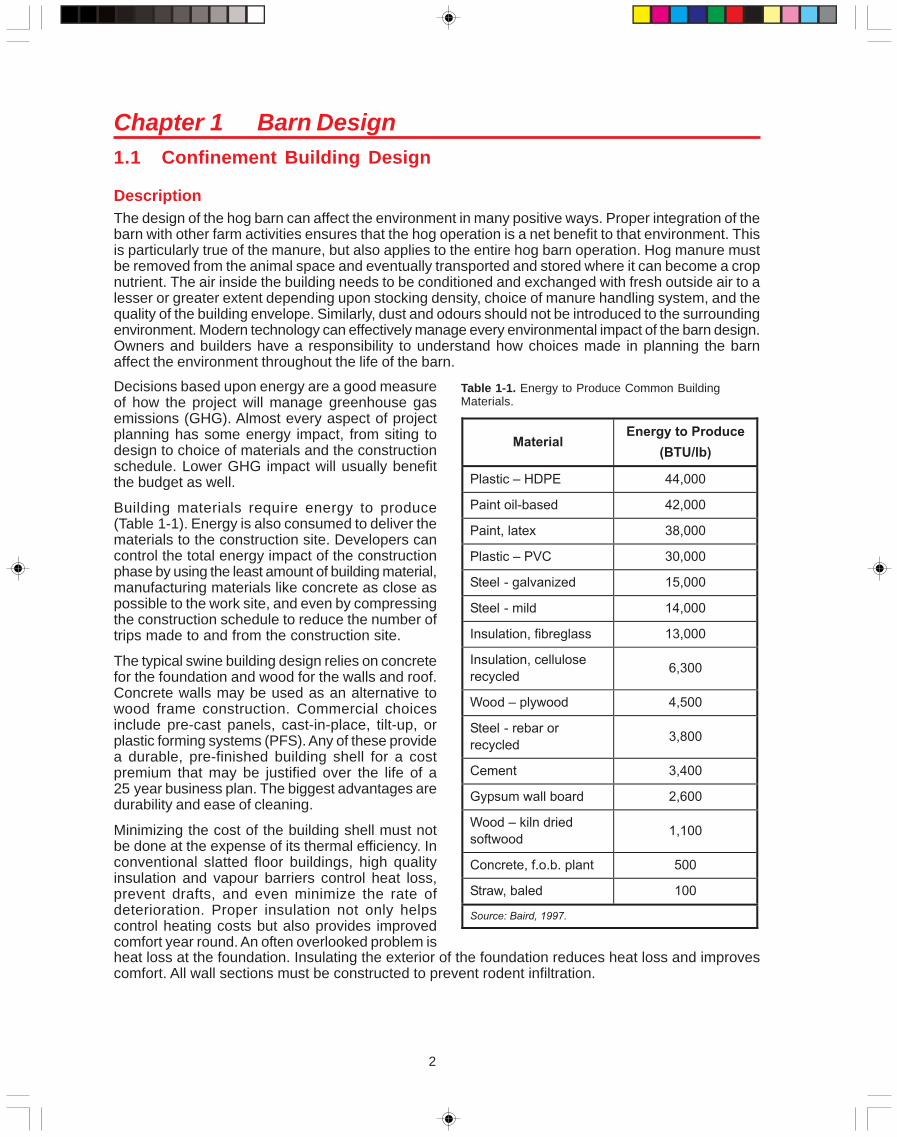
The “conventional” approach to swine barn designhinges on liquefying the manure. Pigs lie onconcrete, wire, or plastic floors that are either fullyslatted or partially slatted to allow manure to fallthrough into holding pits. In some jurisdictions,public opposition to open manure storage hasresulted in manure being held for months directlyunder the animals, a design known as in-barnstorage or “full basement” barns. Such systemsdo not reduce the odours and gases from anaerobicdecomposition, but they do allow for some controlon their discharge to the atmosphere. The buildingacts as a tank cover, and chimney exhaust fanscan be used to discharge the manure odour higherfor better dispersion.
Penning is an important decision. In parts of Canada,
Typical construction involves concrete foundationelements with wood wall and roof.Photo Courtesy: Miles Jorgenson
hog producers have tapped into the oil industry as an economical source of penning steel by using oilfield leftovers for all types of stalls, gates, panels, and hardware. Several types of excellent qualityplastic panels are now available for group pens. The major advantage of this type of penning is itscomparative ease of cleaning. Far less water and detergent will be used in the life of the building whensmooth plastic surfaces are used. Galvanized, painted or coated, and stainless materials cost muchmore than bare steel, but again there can be savings in cleaning cost. There has been a trend towardlarger and larger group sizes, and this has greatly reduced the amount of penning, especially in finisherbarns (Table 1-2). Less penning not only reduces cost but also leads to improved management throughautomated sorting.
Water use can be significantly affected by choices made in the design of the barn. Washing accountsfor a relatively small percentage of water use, but if the water is heated, the energy impact of choosingeasy to wash building elements can be very significant. Wet-dry feeders and liquid feeding systemsmay reduce consumptive waste. A well designed barn should all but eliminate the need to flush manurepits with fresh water.
Designers are constantly challenged to protect a barn owner from functional obsolescence. Functionalobsolescence occurs when the existing barn no longer fits with the herd dynamics or managementpractices of the industry. Sow productivity is constantly evolving as new genetics are introduced andnew production strategies are implemented. A classic example is the relative need for hog finishingspaces. Two decades ago, each sow would produce perhaps 18 piglets per year, pigs grew moreslowly, and pigs were shipped at a weight below 220 lb (100 kg). Today, sows are reaching 28 pigletsper year, pigs grow fast, and finishing pigs are marketed at weights of 250 lb (115 kg) plus. This hashad a huge effect on the space requirement for finishing pigs and change is continuing. Producersshould expect further change (Table 1-3).
Environmental AdvantagesA well-planned barn design can save costs andreduce the impact on the environment. Constructionsavings are possible by choosing the mostenvironmentally appropriate materials and byplanning animal space efficiently. Once operational,the design of the building continues to influenceenvironmental factors like odour, water use, andmanure by-products. By considering the changingneed over the life of the facility, early obsolescencecan be averted.
Hog Class Full Slat Part Slat Bedded
Weanling 2.8 3.1 3.5
Grower 6.7 7.5 8.6
Finisher 8.7 9.7 11.1
Gilts & Sows - 22.5 24.7
Boars - 60.2 79.6
Source: AAFC Code of Practice
Table 1-2. Pig Space by Floor Type (ft2).
4
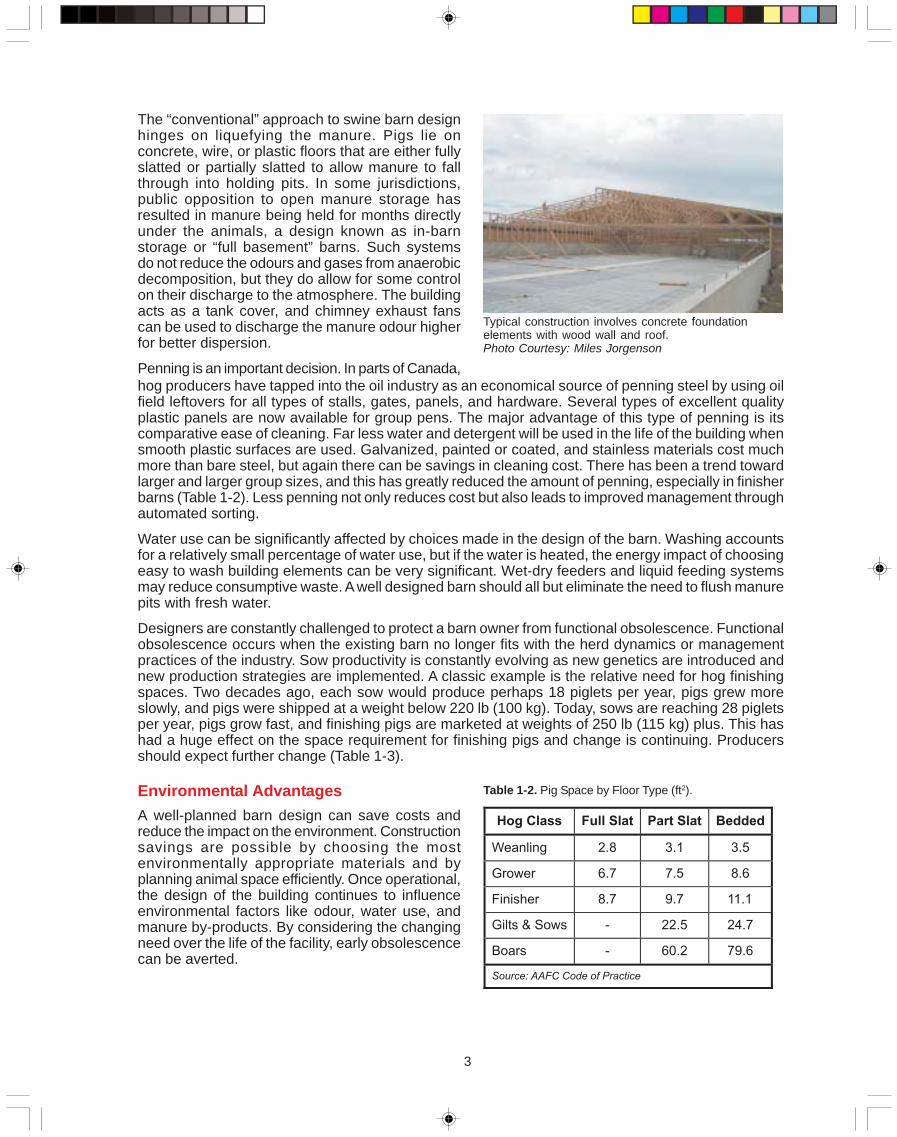
Environmental DisadvantagesLivestock cannot be raised without some impact onthe environment. The design of the buildings in whichthey are raised can only be expected to contain andmanage, not to eliminate, the by-products that resultfrom production of the primary product (i.e. meat). Itis important to understand how planning decisionswill affect the gross output of the facility. There issignificant room to influence the impact of barn odours,water use, manure, and operational energy throughcareful planning.
CostConstruction costs become less significant when
PVC penning and wall liners reduce cleaning timeand water use.Photo Courtesy: Miles Jorgenson
taken over the life of the project. As a line item in the operating budget, most buildings equate to about10% of the overall cost of production. However, it is almost universally challenging to justify highconstruction costs at the time of building because of the difficulty of raising capital.
Table 1-3. It is Difficult to Predict a Building’s Fit 15 Years into the Future.
Change Indicator 1990 2005 2020
“Large” Herd Size, typ. 500 sow 5,000 sow ?
Sow Productivity, typ. 16 pigs/sow/yr 24 pigs/sow/yr ?
Sow & Boar Body Length 6 ft 7 ft + ?
Weaning Age 28 days 18 days ?
Finishing Group Size/Pen 20 250 and up ?
Preferred Market Weight 100 kg 115 kg + ?
Source: Jorgenson, Direct Experience
Costs of several conventional hog buildings are shown in Table 1-4.
There are often extenuating circumstances that dictate whether the use of least cost facilities warrantsconsideration. Modern farms are challenged to manage with hired labour, and there is constant pressureto become more efficient. This usually means that the builder must at least consider using laboursaving technology as much as possible. Labour management is what has driven the move away frombedded housing. As more positive experiences with such options as bioshelters are demonstrated,the tide may turn. Developers must consider the evolving nature of the business and strive to protecttheir investment from premature obsolescence by watching the horizon and ensuring the barn that isbuilt today has a good chance of still working with tomorrow’s industry.
Table 1-4. Cost Ranges of Confinement Hog Buildings.
Finisher Building Nursery Building** Farrowing Building**
1,000 head 600 sows 600 sows
Capital Cost Range $144,730 $300,000 $78,960 $94,740 $710,400 $789,600
Cost/Marketed Hog* $6.40 $13.27 $0.76 $0.91 $6.82 $7.58
* Cost/marketed hog is based upon the assumption that the operation has 2.26 cycles/year.
** Assumes 10 piglets/sow/cycle; 10,413 marketed hogs produced (mortalities taken into account); includes cost ofequipment (feeders, waterers, manure handling).
Sources: Landblom et al, 2001; University of Michigan, 2001; EPA, 2001
5
General AssessmentVery few barns built before 1990 are still in use today. This is partly a result of the destructive nature ofhogs. It is also a result of significant change in the hog industry and in hog production in general.Farms have become fewer and larger causing rapid growth in herd size. Modern engineering hasallowed for more space efficient building designs, especially wider roof spans. Sows continue to beraised in stalls, but there is a movement to larger group sizes at the stages of hog production that hasreduced penning.
Most barns use slatted floors to handle the manure as a liquid slurry. Automation has improved thedependability and efficiency of heating, ventilation, feeding, and watering equipment. Manure regulationshave forced changes in barn design in some jurisdictions, driving the adoption of full basement storagevaults. These trends can be expected to continue as new technology arrives and new ways of raisinghogs are proven beneficial. Producers are wise to continue evaluating barn designs that offer newtechnology, and they must continually test the barn plan against the current needs of a developinganimal species.
Complementary TechnologiesBarn designers have access to the same evolving building technologies of materials and constructiontechniques as other builders. Experience has prevented mistakes in adopting inappropriate industrialand commercial building types to housing for swine. Some new types of buildings have revolutionizedhog housing. The fabric covered hoop shelter or biohousing has proven to be well suited to raisingsome classes of hogs on straw bedding with minimal capital and equipment cost. On the other end ofthe spectrum, concrete wall forming systems have provided an attractive and durable alternative towood frame construction.
Literature CitedAgriculture and Agri-Food Canada. 1993. Recommended code of practice for the care and handling of farm animals: pigs.
Agriculture and Agri-Food Canada Publication 1898/E
Bache, D.H. and J.R. Foster. 1976. Pork production systems with business analyses, the high-investment, high-intensityconfinement system. Pork Industry Handbook. PIH-15. Purdue University Cooperative Extension Service. West Lafayette,IN.
Baird, G., A. Alcorn, and P. Haslam. 1997. The energy embodied in building materials – updated New Zealand coefficientsand their significance. IPENZ Transactions, Vol 24 No. 1/CE.
Bergh, P. 2001. Hogs your way: choosing a hog production system in the Upper Midwest. University of Minnesota Exten-sion Service. BU-07641.
Canadian Wood Council. 2005. Green by design: renewable, durable, sustainable wood. Canadian Wood Council andForest Products Association of Canada on-line publication, http://www.cwc.ca/.
Cement Americas. 2003. Cement, concrete and the environment. May 1, 2003.
Canadian Pork Council (CPC). 1996. Canadian code of practice for environmentally sound hog production.
Environmental Protection Agency (EPA). 2001. Cost methodology report for swine and poultry sectors. EPA #821R01018.
Jorgenson, M., K. McKnight, and I. Stomp. 1995. Selling the public on large hog farms - A success story. CSAE Paper No.95-515.
Koehler, B., B. Lazarus, and B. Buhr. 1996. Swine production networks in Minnesota; resources for decision making.University of Minnesota Department of Applied Economics, Staff Paper P96-6.
Landblom, D.G., W.W. Poland, B. Nelson, and E. Janzen. 2001. An economic analysis of swine rearing systems for NorthDakota. 2001 Annual Report, Swine Section. Dickson Research Extension Center.
Manitoba Agriculture, Food and Rural Initiatives. 2005. Guidelines for estimating swine farrow-finish costs farrow-finishpig production costs assumptions and capital costs. http://www.gov.mb.ca/agriculture/financial/farm2005/cac27s02.html [cited May 20, 2005].
Ontario Ministry of Agriculture, Food and Rural Affairs. 2002. Swine enterprise budgets – October 2002. http://www.gov.on.ca/OMAFRA/english/livestock/swine/facts/info_b_oct2002.pdf [cited May 20, 2005].
6
1.2 Lighting
DescriptionLighting plays a significant role in reproductive andoverall swine production performance. The cost ofelectricity for lighting is a small percentage of the costof production for swine; however, it is possible toreduce energy costs, increase lighting levels, andactually improve performance (Table 1-5) with welldesigned, energy efficient lighting systems. A goodlighting system should provide proper light levelseconomically with low maintenance costs.
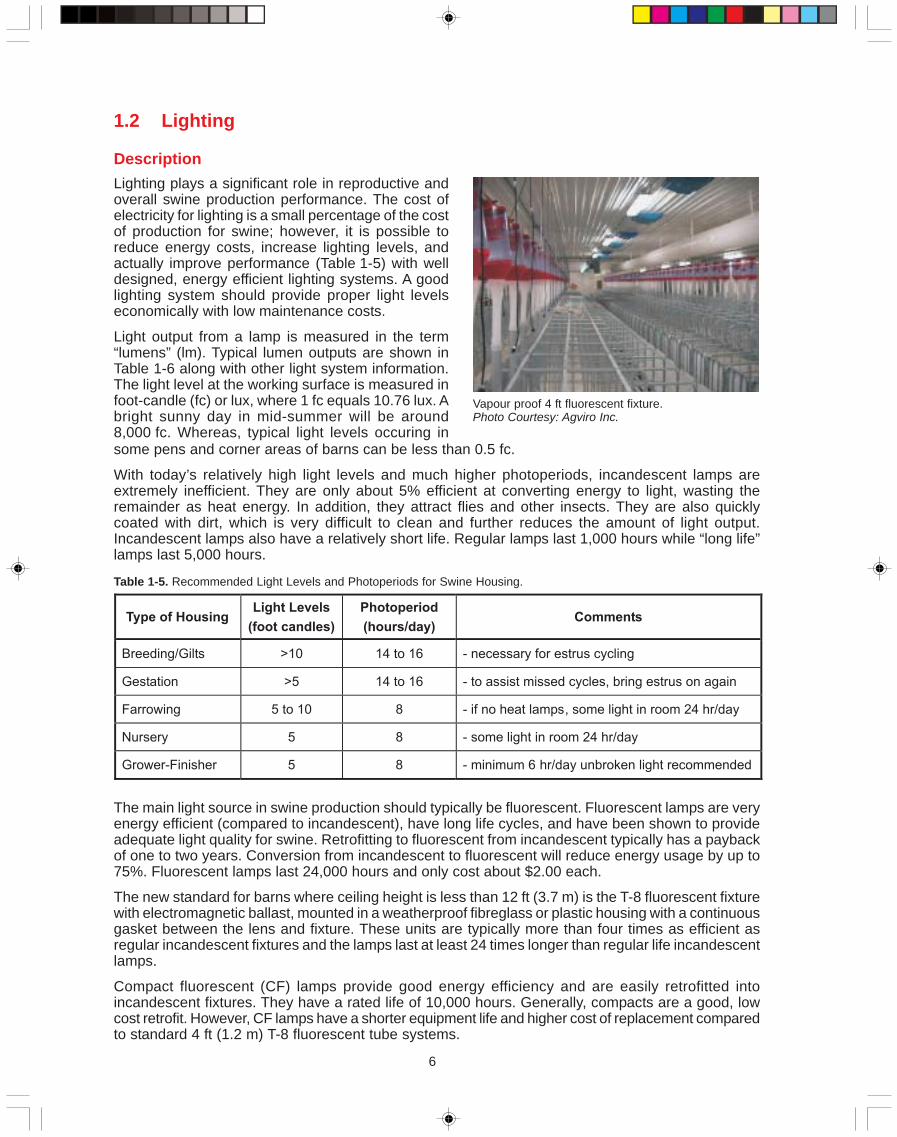
Light output from a lamp is measured in the term“lumens” (lm). Typical lumen outputs are shown inTable 1-6 along with other light system information.The light level at the working surface is measured infoot-candle (fc) or lux, where 1 fc equals 10.76 lux. Abright sunny day in mid-summer will be around8,000 fc. Whereas, typical light levels occuring in
Vapour proof 4 ft fluorescent fixture.Photo Courtesy: Agviro Inc.
some pens and corner areas of barns can be less than 0.5 fc.
With today’s relatively high light levels and much higher photoperiods, incandescent lamps areextremely inefficient. They are only about 5% efficient at converting energy to light, wasting theremainder as heat energy. In addition, they attract flies and other insects. They are also quicklycoated with dirt, which is very difficult to clean and further reduces the amount of light output.Incandescent lamps also have a relatively short life. Regular lamps last 1,000 hours while “long life”lamps last 5,000 hours.
The main light source in swine production should typically be fluorescent. Fluorescent lamps are veryenergy efficient (compared to incandescent), have long life cycles, and have been shown to provideadequate light quality for swine. Retrofitting to fluorescent from incandescent typically has a paybackof one to two years. Conversion from incandescent to fluorescent will reduce energy usage by up to75%. Fluorescent lamps last 24,000 hours and only cost about $2.00 each.
The new standard for barns where ceiling height is less than 12 ft (3.7 m) is the T-8 fluorescent fixturewith electromagnetic ballast, mounted in a weatherproof fibreglass or plastic housing with a continuousgasket between the lens and fixture. These units are typically more than four times as efficient asregular incandescent fixtures and the lamps last at least 24 times longer than regular life incandescentlamps.
Compact fluorescent (CF) lamps provide good energy efficiency and are easily retrofitted intoincandescent fixtures. They have a rated life of 10,000 hours. Generally, compacts are a good, lowcost retrofit. However, CF lamps have a shorter equipment life and higher cost of replacement comparedto standard 4 ft (1.2 m) T-8 fluorescent tube systems.
Table 1-5. Recommended Light Levels and Photoperiods for Swine Housing.
Type of HousingLight Levels
(foot candles)
Photoperiod
(hours/day)Comments
Breeding/Gilts >10 14 to 16 - necessary for estrus cycling
Gestation >5 14 to 16 - to assist missed cycles, bring estrus on again
Farrowing 5 to 10 8 - if no heat lamps, some light in room 24 hr/day
Nursery 5 8 - some light in room 24 hr/day
Grower-Finisher 5 8 - minimum 6 hr/day unbroken light recommended
7
Where barn ceiling height exceeds 12 ft (3.7 m), the more efficient high intensity discharge (HID)fixtures, including metal halide and high pressure sodium, should be considered. They are easier toinstall and maintain and require fewer fixtures to provide the same level of light.
Environmental AdvantagesConverting from incandescent to fluorescent will reduce energy usage by up to 75%. High pressuresodium is even more efficient but normally requires ceilings over 12 ft (3.7 m) high.
Environmental DisadvantagesDespite low capital costs, operating costs of incandescent lighting is high because of shorter livesand less efficiency. Incandescent will also dim over its life, and its efficiency will decrease.
CostsThe economics of converting to fluorescent are very straightforward.
Placing one, 150 watt, regular life incandescent lamp per pen in the center would provide just over3 fc (32 lux). This system would cost about $100 to install and $284 annually to operate. Installingfour, 4 ft (1.2 m) double tube, waterproof T-8 fluorescent fixtures, with one fixture per pair of pens,would provide an increased light level of 5 fc (54 lux) (a 66% increase). This T-8 system would cost$400 to install and only $41/year to operate. For a retrofit, the payback is 1.6 years; for a new facility,the payback is an even faster 1.1 years.
A lighting retrofit from incandescent to vapour proof fluorescent (and some compact fluorescent)fixtures on a 240 sow farrow-to-finish facility realized annual savings of over $5,000. The cost ofelectricity was about $0.07/kWh and the payback was less than two years.
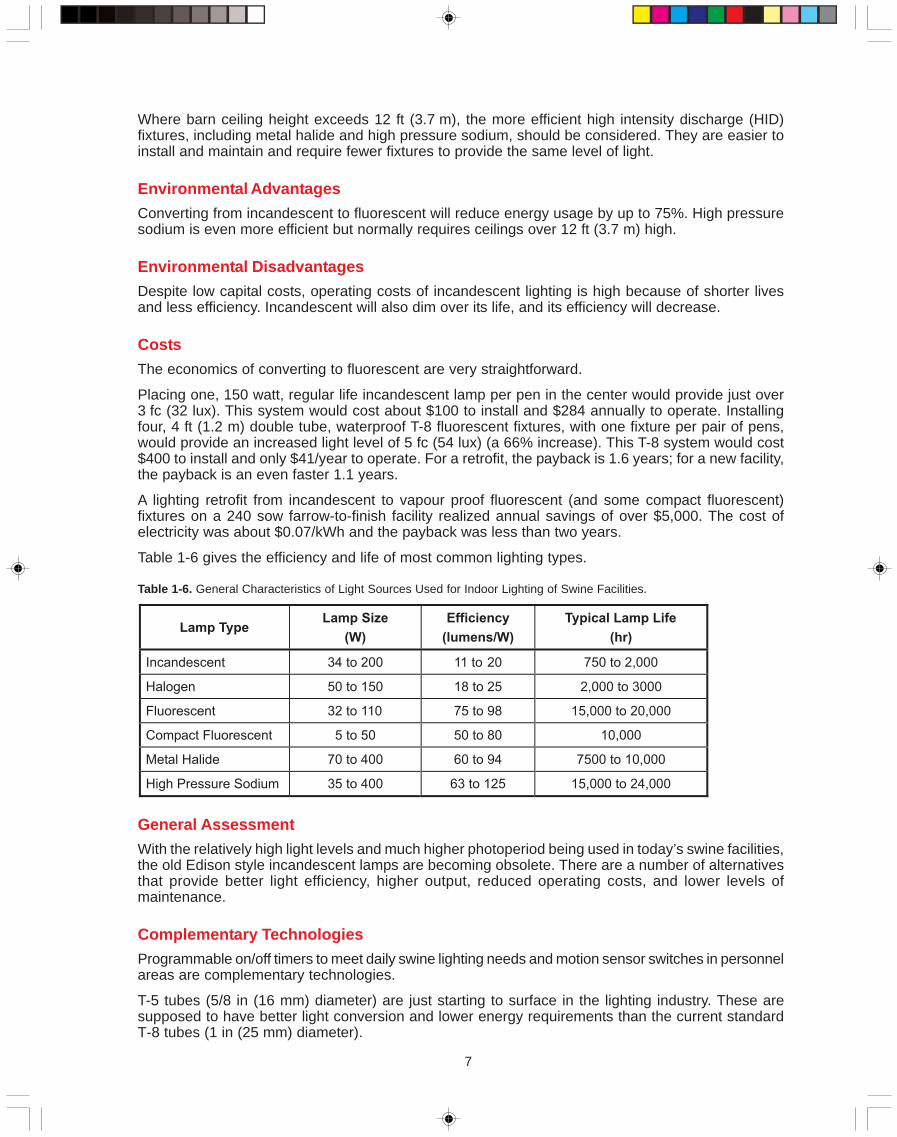
Table 1-6 gives the efficiency and life of most common lighting types.
Table 1-6. General Characteristics of Light Sources Used for Indoor Lighting of Swine Facilities.
Lamp TypeLamp Size
(W)
Efficiency
(lumens/W)
Typical Lamp Life
(hr)
Incandescent 34 to 200 11 to 20 750 to 2,000
Halogen 50 to 150 18 to 25 2,000 to 3000
Fluorescent 32 to 110 75 to 98 15,000 to 20,000
Compact Fluorescent 5 to 50 50 to 80 10,000
Metal Halide 70 to 400 60 to 94 7500 to 10,000
High Pressure Sodium 35 to 400 63 to 125 15,000 to 24,000
General AssessmentWith the relatively high light levels and much higher photoperiod being used in today’s swine facilities,the old Edison style incandescent lamps are becoming obsolete. There are a number of alternativesthat provide better light efficiency, higher output, reduced operating costs, and lower levels ofmaintenance.
Complementary TechnologiesProgrammable on/off timers to meet daily swine lighting needs and motion sensor switches in personnelareas are complementary technologies.
T-5 tubes (5/8 in (16 mm) diameter) are just starting to surface in the lighting industry. These aresupposed to have better light conversion and lower energy requirements than the current standardT-8 tubes (1 in (25 mm) diameter).
8
Literature CitedAmerican Society of Agricultural Engineers. 2005. Lighting systems for agricultural facilities. ASAE EP244.3.
Canada Plan Service. Barn lighting worksheet. CPS Plan 3952 Rev 00.08. Ontario Ministry of Agriculture and Food.
Cook, N.J., J. Chang, R. Borg, W. Robertson, and A.L. Schaefer. 1998. The effects of natural light on measures of meatquality and adrenal responses to husbandry stressors in swine. Canadian Journal of Animal Science. 78(3):293-300.
Hannesson, J. 2005. The effect of light type on gilt performance. Alberta Agriculture, Food and Rural Development.
Simoneau, C., R. Estrada, P. Matton, P.E. Roy, and J.J. Dufour. 1988. Effects of litter size and light regimen imposed duringlactation on ovarian follicular population at weaning in third-parity sows. Journal of Animal Science. 66(10):2606-2613.
Wheelhouse, R.K. and R.R. Hacker. 1982. The effect of four different types of flourescent light on growth, reproductiveperformance, pineal weight and retinal morphology of Yorkshire gilts. Canadian Journal of Animal Science. 62(2):417-424.
9
1.3 Deep Litter Systems
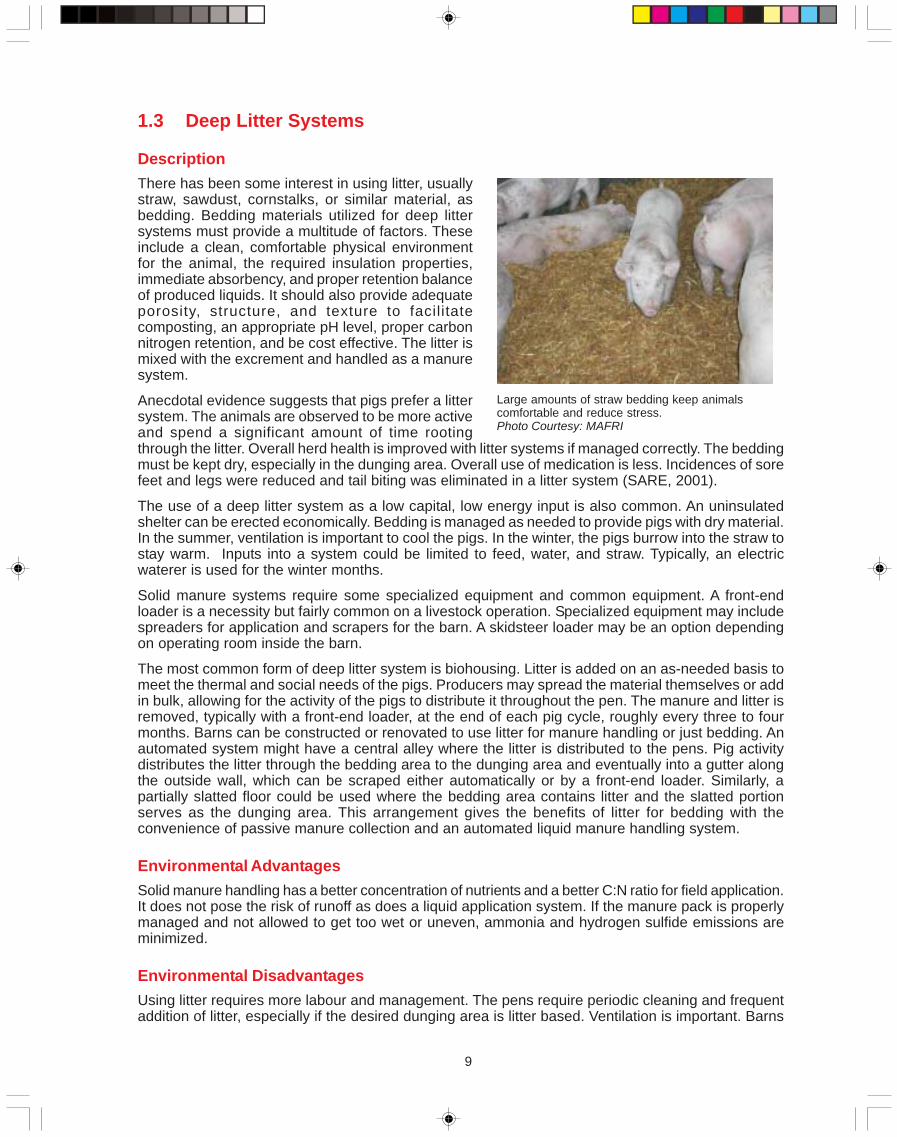
DescriptionThere has been some interest in using litter, usuallystraw, sawdust, cornstalks, or similar material, asbedding. Bedding materials utilized for deep littersystems must provide a multitude of factors. Theseinclude a clean, comfortable physical environmentfor the animal, the required insulation properties,immediate absorbency, and proper retention balanceof produced liquids. It should also provide adequateporosity, structure, and texture to facilitatecomposting, an appropriate pH level, proper carbonnitrogen retention, and be cost effective. The litter ismixed with the excrement and handled as a manuresystem.
Anecdotal evidence suggests that pigs prefer a littersystem. The animals are observed to be more activeand spend a significant amount of time rooting
Large amounts of straw bedding keep animalscomfortable and reduce stress.Photo Courtesy: MAFRI
through the litter. Overall herd health is improved with litter systems if managed correctly. The beddingmust be kept dry, especially in the dunging area. Overall use of medication is less. Incidences of sorefeet and legs were reduced and tail biting was eliminated in a litter system (SARE, 2001).
The use of a deep litter system as a low capital, low energy input is also common. An uninsulatedshelter can be erected economically. Bedding is managed as needed to provide pigs with dry material.In the summer, ventilation is important to cool the pigs. In the winter, the pigs burrow into the straw tostay warm. Inputs into a system could be limited to feed, water, and straw. Typically, an electricwaterer is used for the winter months.
Solid manure systems require some specialized equipment and common equipment. A front-endloader is a necessity but fairly common on a livestock operation. Specialized equipment may includespreaders for application and scrapers for the barn. A skidsteer loader may be an option dependingon operating room inside the barn.
The most common form of deep litter system is biohousing. Litter is added on an as-needed basis tomeet the thermal and social needs of the pigs. Producers may spread the material themselves or addin bulk, allowing for the activity of the pigs to distribute it throughout the pen. The manure and litter isremoved, typically with a front-end loader, at the end of each pig cycle, roughly every three to fourmonths. Barns can be constructed or renovated to use litter for manure handling or just bedding. Anautomated system might have a central alley where the litter is distributed to the pens. Pig activitydistributes the litter through the bedding area to the dunging area and eventually into a gutter alongthe outside wall, which can be scraped either automatically or by a front-end loader. Similarly, apartially slatted floor could be used where the bedding area contains litter and the slatted portionserves as the dunging area. This arrangement gives the benefits of litter for bedding with theconvenience of passive manure collection and an automated liquid manure handling system.
Environmental AdvantagesSolid manure handling has a better concentration of nutrients and a better C:N ratio for field application.It does not pose the risk of runoff as does a liquid application system. If the manure pack is properlymanaged and not allowed to get too wet or uneven, ammonia and hydrogen sulfide emissions areminimized.
Environmental DisadvantagesUsing litter requires more labour and management. The pens require periodic cleaning and frequentaddition of litter, especially if the desired dunging area is litter based. Ventilation is important. Barns
10
will require an increased minimum ventilation rate to accommodate the increased moisture levels.This is also true of the shelters, as many producers try to close the building too tightly to keep the pigswarmer.
CostsThe cost of bedding material itself will depend upon the type of material used and whether the beddingis produced on the farm or is purchased and hauled to the farm. Bedding cost will be determined bycost per bale and the amount of bedding used. It is suggested that 1 to 1.5 large bales are requiredper week per 100 hogs (Canada Plan Service). Bedding material costs are about $3.00/head marketed(White, 2001) amounting to $1,356/year for a 200 head finisher facility. The cost of bedding will bereduced if the material is produced on the farm.
General AssessmentSolid manure handling reduces or eliminates many of the odour complaints associated with liquidmanure handling. It also reduces the risk of runoff during application by concentrating the nutrients inthe manure. The environmental and animal welfare benefits are an offset to the added labour andmanagement time required.
Complementary TechnologiesComposting is a natural fit for a deep litter system. Manure is in solid form and ready for compostingwithout the requirement of solid-liquid separation. The nature of the bedding material can reduce therequired amount of carbon source material to be added to the compost.
Biohousing systems depend on deep litter as an integral part of the system.
Literature CitedBrumm, M.C., J.D. Harmon, and M.S. Honeyman. 1999. Hoop structures for gestating swine. Agricultural Engineers Digest.
AED44. MidWest Plan Service, Iowa State University, Ames, Iowa. February. p. 2-3, 5-7.
Canada Plan Service. Alternative low-cost swine housing. CPC Plan 3550. Ontario Ministry of Agriculture and Food.
Duffy, M. June 1997. Hoops for swine: A good choice for beginning farmers? Ag Decision Maker Newsletter. June.
Duffy, M., and M. Honeyman. Labor requirements for market swine produced in hoop structures. ASL-R1685. LeopoldCenter for Sustainable Agriculture, Ames, Iowa..
Halverson, M. Management in Swedish deep-bedded swine housing systems: background and behaviourial considerations.Conservation for Agriculture’s Future. University of Purdue.
Fangman, T.J., and J.M. Zulovich. 1999. Hoop structures for Missouri swine finishing facilities. University of Missouri-Columbia,MU Extension, Agricultural MU Guide. G2504.
Landblom, D.G., W.W. Poland, B. Nelson, and E. Janzen. 2001. An economic analysis of swine rearing systems for NorthDakota. 2001 Annual Report, Swine Section. Dickson Research Extension Center, North Dakota State University.
Luymes, J.C. 2001. The eco barn: good for animals and good for the environment. In Livestock Environment VI: Proceed-ings of the 6th International Symposium. ASAE Publication number 701P0201. p. 732.
Maltman, J. 2001. Straw systems for feeder pigs. Manitoba Agriculture, Food and Rural Initiatives.
Sustainable Agriculture Research and Education (SARE). 2001. Profitable pork: strategies for hog producers. p 4-6.
White, E. 2001. Manitoba farmer raises indoor-outdoor pigs. Western Producer. Winnipeg Bureau. July 19.
11
1.4 Biohousing
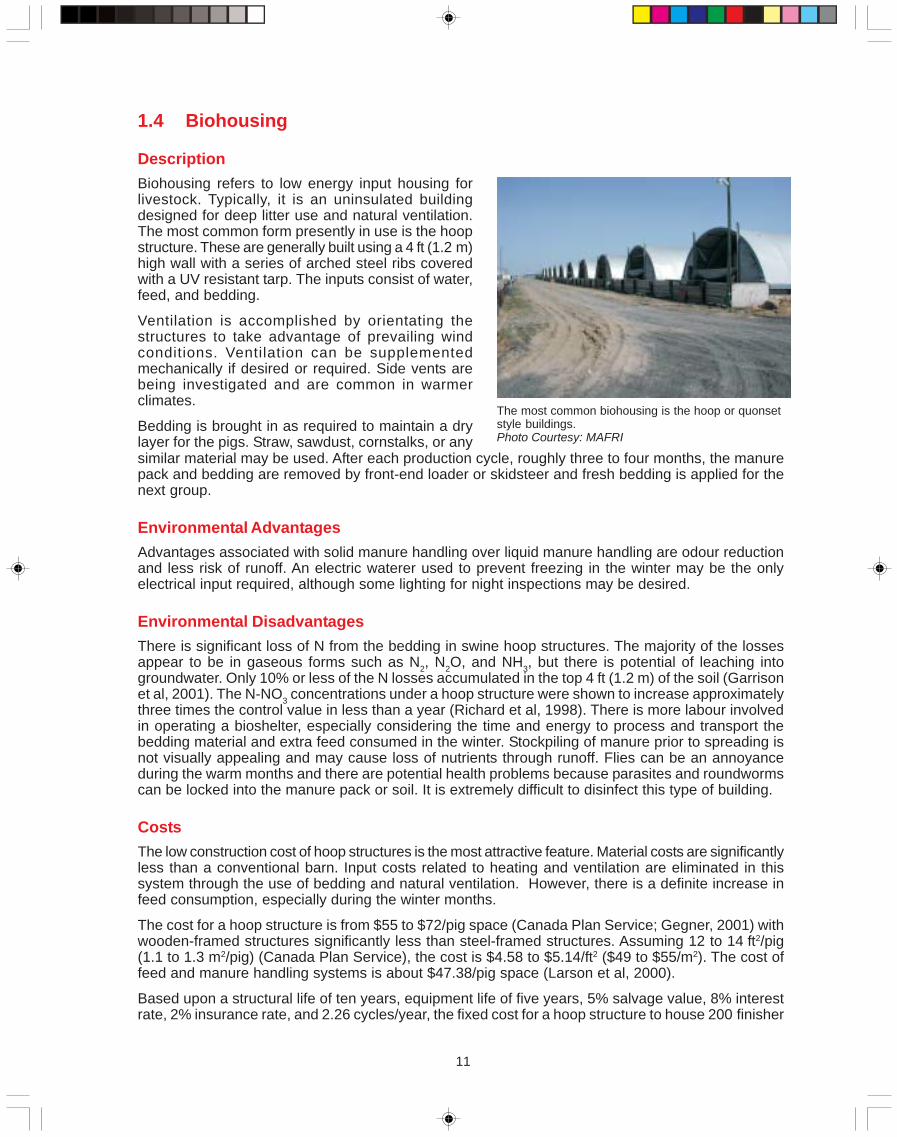
DescriptionBiohousing refers to low energy input housing forlivestock. Typically, it is an uninsulated buildingdesigned for deep litter use and natural ventilation.The most common form presently in use is the hoopstructure. These are generally built using a 4 ft (1.2 m)high wall with a series of arched steel ribs coveredwith a UV resistant tarp. The inputs consist of water,feed, and bedding.
Ventilation is accomplished by orientating thestructures to take advantage of prevailing windconditions. Ventilation can be supplementedmechanically if desired or required. Side vents arebeing investigated and are common in warmerclimates.
Bedding is brought in as required to maintain a drylayer for the pigs. Straw, sawdust, cornstalks, or any
The most common biohousing is the hoop or quonsetstyle buildings.Photo Courtesy: MAFRI
similar material may be used. After each production cycle, roughly three to four months, the manurepack and bedding are removed by front-end loader or skidsteer and fresh bedding is applied for thenext group.
Environmental AdvantagesAdvantages associated with solid manure handling over liquid manure handling are odour reductionand less risk of runoff. An electric waterer used to prevent freezing in the winter may be the onlyelectrical input required, although some lighting for night inspections may be desired.
Environmental DisadvantagesThere is significant loss of N from the bedding in swine hoop structures. The majority of the lossesappear to be in gaseous forms such as N2, N2O, and NH3, but there is potential of leaching intogroundwater. Only 10% or less of the N losses accumulated in the top 4 ft (1.2 m) of the soil (Garrisonet al, 2001). The N-NO3 concentrations under a hoop structure were shown to increase approximatelythree times the control value in less than a year (Richard et al, 1998). There is more labour involvedin operating a bioshelter, especially considering the time and energy to process and transport thebedding material and extra feed consumed in the winter. Stockpiling of manure prior to spreading isnot visually appealing and may cause loss of nutrients through runoff. Flies can be an annoyanceduring the warm months and there are potential health problems because parasites and roundwormscan be locked into the manure pack or soil. It is extremely difficult to disinfect this type of building.
CostsThe low construction cost of hoop structures is the most attractive feature. Material costs are significantlyless than a conventional barn. Input costs related to heating and ventilation are eliminated in thissystem through the use of bedding and natural ventilation. However, there is a definite increase infeed consumption, especially during the winter months.
The cost for a hoop structure is from $55 to $72/pig space (Canada Plan Service; Gegner, 2001) withwooden-framed structures significantly less than steel-framed structures. Assuming 12 to 14 ft2/pig(1.1 to 1.3 m2/pig) (Canada Plan Service), the cost is $4.58 to $5.14/ft2 ($49 to $55/m2). The cost offeed and manure handling systems is about $47.38/pig space (Larson et al, 2000).
Based upon a structural life of ten years, equipment life of five years, 5% salvage value, 8% interestrate, 2% insurance rate, and 2.26 cycles/year, the fixed cost for a hoop structure to house 200 finisher
12
hogs is $3,891 to $4,344 or $8.61 to $9.61/marketed hog. The labour required for a hoop structurefinishing operation is between 0.25 and 0.58 hours/head marketed (Larson et al, 2000; Duffy andHoneyman, 1998). Based upon a labour rate of $12/hour, the annual labour cost is from $1,356 to$3,146 for a 200 head hoop structure, which would include the application of bedding material. Thecost of the bedding material will depend upon the type of material used and whether the bedding isproduced on the farm or is purchased and hauled to the farm. Bedding material costs run from $3.00to $6.90/head marketed (Larson et al, 2000; White, 2001), amounting to $1,356 to $2,378/year for a200 head finisher facility. Bedding cost will be determined by cost per bale and the amount of beddingused. It is suggested that 1 to 1.5 large bales are required per week per 100 hogs (Canada PlanService). Electrical cost will be small unless internal air circulating fans are used. Assuming maintenancecosts are 2% of initial costs, the cost per marketed hog for a hoop structure is $15.01 to $19.92.
Increased costs associated with hoop structures are found in the form of feed, veterinary costs, andlabour. During winter months, feed efficiency is decreased in hoop structures, requiring as much as10% more feed. Swine also take longer to reach market weight; two to three days extra during thesummer and up to ten extra days in winter months (White, 2001). The additional days needed forgrowth translate into additional feed costs and can result in fewer turns per year. While hoop raisedswine are generally healthier than those raised in confinement systems, medical costs may alsoincrease due to the need of treatment for parasites obtained from the soil. Labour required per headis also greater in a hoop facility as compared to a confinement operation.
Compared to a High Rise™ or confinement building with mechanical ventilation, the costs for electricityand fuel are significantly reduced. The cost of bedding may also be reduced if the material is producedon the farm. Additionally, during years of low market price the swine operation can be abandoned andthe building can be used for other functions such as machinery storage, and then returned to swineproduction when the market turns around.
General AssessmentThe low capital costs and benefits of solid manure handling are some major advantages of biohousing.The similar performances and improved animal welfare make biohousing an attractive alternative.Improved management and construction practices, such as installing a liner underneath and carefulsite selection, could reduce the risk of nitrogen leaching.
There is more labour involved in operating a bioshelter, especially considering the time and energy toprocess and transport the bedding material and extra feed consumed.
Complementary TechnologiesComposting is a natural fit. The deep bedding material acts as a high-carbon bulking agent.
Literature CitedBrumm, M.C., J.D. Harmon, M.S. Honeyman, J. Kliebenstein, and J. Zulovich. 1999. Hoop structures for gestating swine.
Agricultural Engineers Digest. AED44. MidWest Plan Service, Iowa State University, Ames, Iowa. February. p. 2-3, 5-7.
Canada Plan Service. Alternative low-cost swine housing. CPS Plan 3550. Ontario Ministry of Agriculture and Food.
Duffy, M. 1997. Hoops for swine: A good choice for beginning farmers? Ag Decision Maker Newsletter. June.
Duffy, M., and M. Honeyman. 1998. Labor requirements for market swine produced in hoop structures. ASL-R1685. LeopoldCenter for Sustainable Agriculture, Ames, Iowa.
Garrison, M.V., T.L. Richard, S.M. Tiquia, and M.S. Honeyman. 2001. Nutrient losses from unlined bedded swine hoopstructures and an associated windrow composting site. ASEAE Annual International Meeting, Sacramento California,USA, July 30 - August 1, 2001. Paper Number: 01-2238.
Gegner, L. 2001. Hooped Shelters for Hogs. Appropriate Technology Transfer for Rural Areas (ARRTA).
Fangman, T.J. and J.M. Zulovich. 1999. Hoop structures for Missouri swine finishing facilities. MU Extension, University ofMissouri-Columbia. Agricultural MU Guide G2504.
13
Koehler, B., B. Lazarus, and B. Buhr. 1996. Swine production networks in Minnesota; resources for decision making. StaffPaper Series, Staff Paper P96-6. University of Minnesota, Department of Applied Economics.
Landblom, D.G., W.W. Poland, B. Nelson, and E. Janzen. 2001. An economic analysis of swine rearing systems for NorthDakota”. 2001 Annual Report, Swine Section. Dickson Research Extension Center, North Dakota State University.
Larson, B., J. Kliebenstein, M. Honeyman, and A. Penner. 2000. Economics of finishing pigs in hoop structures and confine-ment; a summer group. Iowa State University. ASL-R678.
Maltman, J. 2001. Straw systems for feeder pigs. Manitoba Agriculture, Food and Rural Initiatives.
Richard T., J. Harmon, M. Honeyman, J. Creswell. 1998. Hoop structure bedding use, labor, bedding pack temperature,manure nutrient content and nitrogen leaching potential. ASL- R1499. Leopold Center for Sustainable Agriculture,Ames, Iowa.
Richard, T. and S. Smits. 1998. Management of bedded-pack manure from swine hoop structures. Paper No. 984127.American Society of Agricultural Engineers, St. Joseph, Michigan.
Sustainable Agriculture Research and Education (SARE). 2001. Profitable pork: strategies for hog producers. p 4-6.
United States Environmental Protection Agency. 2001. Cost methodology report for swine and poultry sectors. EPA-821-R-01-018.
White, E. 2001. Manitoba farmer raises indoor-outdoor pigs. Western Producer. Winnipeg Bureau. July 19.
14
Chapter 2 Herd Health and Comfort2.1 Ventilation
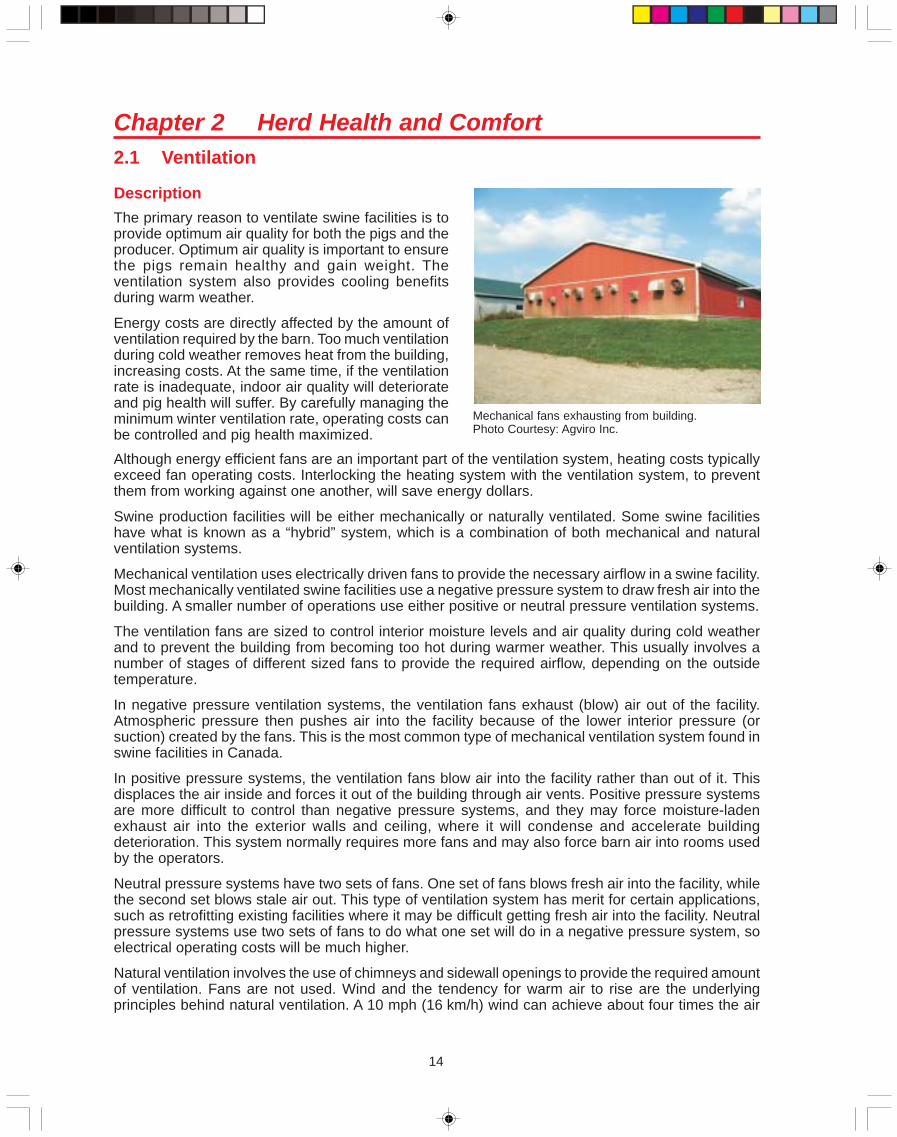
DescriptionThe primary reason to ventilate swine facilities is toprovide optimum air quality for both the pigs and theproducer. Optimum air quality is important to ensurethe pigs remain healthy and gain weight. Theventilation system also provides cooling benefitsduring warm weather.
Energy costs are directly affected by the amount ofventilation required by the barn. Too much ventilationduring cold weather removes heat from the building,increasing costs. At the same time, if the ventilationrate is inadequate, indoor air quality will deteriorateand pig health will suffer. By carefully managing theminimum winter ventilation rate, operating costs canbe controlled and pig health maximized.
Mechanical fans exhausting from building.Photo Courtesy: Agviro Inc.
Although energy efficient fans are an important part of the ventilation system, heating costs typicallyexceed fan operating costs. Interlocking the heating system with the ventilation system, to preventthem from working against one another, will save energy dollars.
Swine production facilities will be either mechanically or naturally ventilated. Some swine facilitieshave what is known as a “hybrid” system, which is a combination of both mechanical and naturalventilation systems.
Mechanical ventilation uses electrically driven fans to provide the necessary airflow in a swine facility.Most mechanically ventilated swine facilities use a negative pressure system to draw fresh air into thebuilding. A smaller number of operations use either positive or neutral pressure ventilation systems.
The ventilation fans are sized to control interior moisture levels and air quality during cold weatherand to prevent the building from becoming too hot during warmer weather. This usually involves anumber of stages of different sized fans to provide the required airflow, depending on the outsidetemperature.
In negative pressure ventilation systems, the ventilation fans exhaust (blow) air out of the facility.Atmospheric pressure then pushes air into the facility because of the lower interior pressure (orsuction) created by the fans. This is the most common type of mechanical ventilation system found inswine facilities in Canada.
In positive pressure systems, the ventilation fans blow air into the facility rather than out of it. Thisdisplaces the air inside and forces it out of the building through air vents. Positive pressure systemsare more difficult to control than negative pressure systems, and they may force moisture-ladenexhaust air into the exterior walls and ceiling, where it will condense and accelerate buildingdeterioration. This system normally requires more fans and may also force barn air into rooms usedby the operators.
Neutral pressure systems have two sets of fans. One set of fans blows fresh air into the facility, whilethe second set blows stale air out. This type of ventilation system has merit for certain applications,such as retrofitting existing facilities where it may be difficult getting fresh air into the facility. Neutralpressure systems use two sets of fans to do what one set will do in a negative pressure system, soelectrical operating costs will be much higher.
Natural ventilation involves the use of chimneys and sidewall openings to provide the required amountof ventilation. Fans are not used. Wind and the tendency for warm air to rise are the underlyingprinciples behind natural ventilation. A 10 mph (16 km/h) wind can achieve about four times the air
15
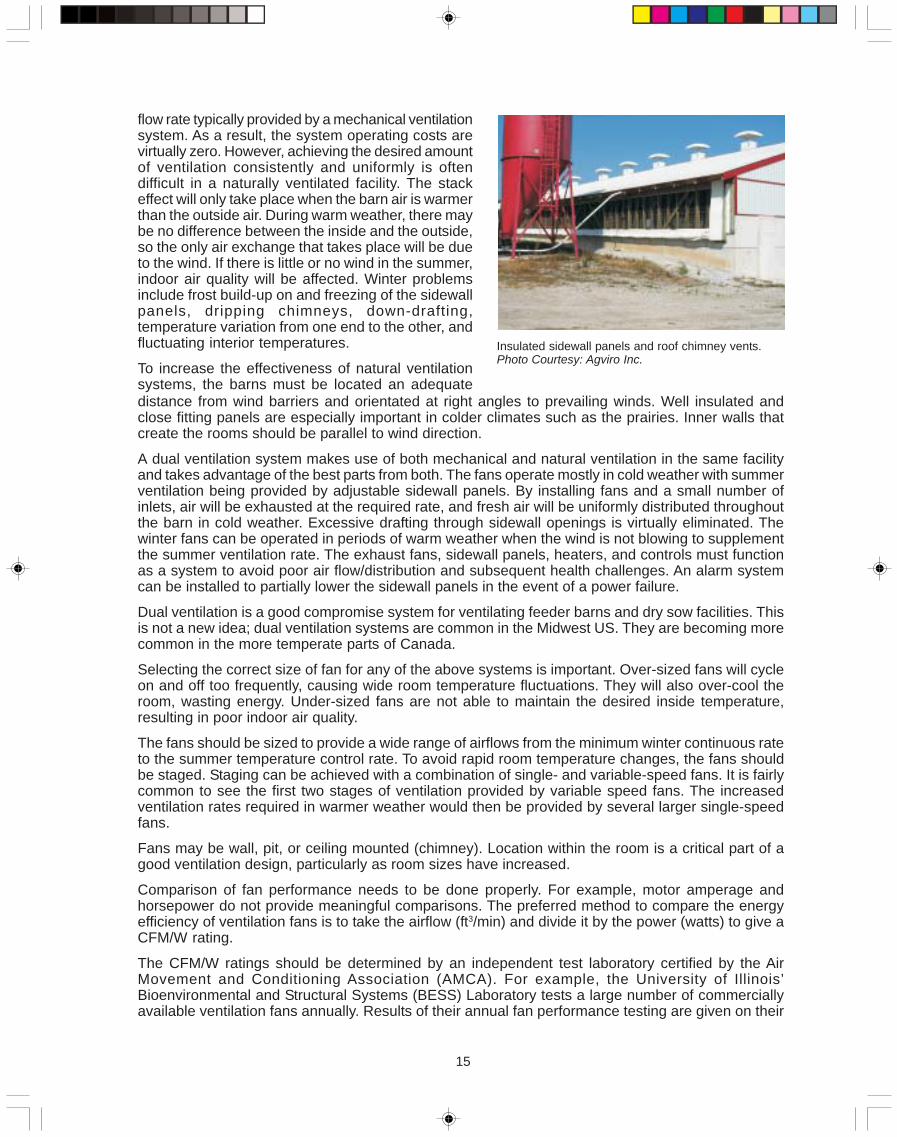
flow rate typically provided by a mechanical ventilationsystem. As a result, the system operating costs arevirtually zero. However, achieving the desired amountof ventilation consistently and uniformly is oftendifficult in a naturally ventilated facility. The stackeffect will only take place when the barn air is warmerthan the outside air. During warm weather, there maybe no difference between the inside and the outside,so the only air exchange that takes place will be dueto the wind. If there is little or no wind in the summer,indoor air quality will be affected. Winter problemsinclude frost build-up on and freezing of the sidewallpanels, dripping chimneys, down-drafting,temperature variation from one end to the other, andfluctuating interior temperatures.
To increase the effectiveness of natural ventilationsystems, the barns must be located an adequate
Insulated sidewall panels and roof chimney vents.Photo Courtesy: Agviro Inc.
distance from wind barriers and orientated at right angles to prevailing winds. Well insulated andclose fitting panels are especially important in colder climates such as the prairies. Inner walls thatcreate the rooms should be parallel to wind direction.
A dual ventilation system makes use of both mechanical and natural ventilation in the same facilityand takes advantage of the best parts from both. The fans operate mostly in cold weather with summerventilation being provided by adjustable sidewall panels. By installing fans and a small number ofinlets, air will be exhausted at the required rate, and fresh air will be uniformly distributed throughoutthe barn in cold weather. Excessive drafting through sidewall openings is virtually eliminated. Thewinter fans can be operated in periods of warm weather when the wind is not blowing to supplementthe summer ventilation rate. The exhaust fans, sidewall panels, heaters, and controls must functionas a system to avoid poor air flow/distribution and subsequent health challenges. An alarm systemcan be installed to partially lower the sidewall panels in the event of a power failure.
Dual ventilation is a good compromise system for ventilating feeder barns and dry sow facilities. Thisis not a new idea; dual ventilation systems are common in the Midwest US. They are becoming morecommon in the more temperate parts of Canada.
Selecting the correct size of fan for any of the above systems is important. Over-sized fans will cycleon and off too frequently, causing wide room temperature fluctuations. They will also over-cool theroom, wasting energy. Under-sized fans are not able to maintain the desired inside temperature,resulting in poor indoor air quality.
The fans should be sized to provide a wide range of airflows from the minimum winter continuous rateto the summer temperature control rate. To avoid rapid room temperature changes, the fans shouldbe staged. Staging can be achieved with a combination of single- and variable-speed fans. It is fairlycommon to see the first two stages of ventilation provided by variable speed fans. The increasedventilation rates required in warmer weather would then be provided by several larger single-speedfans.
Fans may be wall, pit, or ceiling mounted (chimney). Location within the room is a critical part of agood ventilation design, particularly as room sizes have increased.
Comparison of fan performance needs to be done properly. For example, motor amperage andhorsepower do not provide meaningful comparisons. The preferred method to compare the energyefficiency of ventilation fans is to take the airflow (ft3/min) and divide it by the power (watts) to give aCFM/W rating.
The CFM/W ratings should be determined by an independent test laboratory certified by the AirMovement and Conditioning Association (AMCA). For example, the University of Illinois’Bioenvironmental and Structural Systems (BESS) Laboratory tests a large number of commerciallyavailable ventilation fans annually. Results of their annual fan performance testing are given on their
16
website (www.bess.uiuc.edu), as well as being published in a book. CFM/W ratings should be providedfor a range of static pressures. Compare fans at the same static pressure, typically 0.10 in (2.5 mm).The greater the CFM/W rating, the better the efficiency. Check to see if the airflow (CFM) drops off asthe static pressure increases. This means that the fan will perform poorly against wind pressureeffects. The ventilation fans should be sized to match the design ventilation stages.
Environmental AdvantagesGood air quality will be achieved with proper ventilation system design, equipment installation, andmanagement. A properly designed fan-based negative pressure ventilation system will optimizeventilation rates and energy costs. Natural ventilation requires little energy as fans are not required.Electrical operating costs are reduced, noise levels in and around the building are low, and backuppower generation is not required. Dual ventilation takes advantage of the best parts from both methodsof ventilation. By installing fans and some ceiling air inlets, air is exhausted at the required levels anduniformly distributed throughout the barn.
Environmental DisadvantagesIf airflow is too low, air quality deteriorates and challenges pig health. If airflow is too high, heaters willrun too long and waste energy dollars and possibly not even keep the barn warm enough. All fansystems have a dependence on electricity, and fans can be noisy. In systems without natural ventilation,backup power is required. Positive pressure systems are much more complex to control and canaccelerate deterioration of the building from forcing building air into the walls. It may also force poorquality air into hallways and offices. Natural ventilation systems lose effectiveness when there is nowind. They also require barn siting to optimize wind effectiveness and barn room design that allowsairflow. Natural ventilation systems are most suited for livestock that do not require very warmtemperatures such as finishers and dry sows.
CostsThere are a large number of different types and sizes of swine facilities throughout Canada, so astandard price that compares the different ventilation systems has not been established within theindustry. System costs can vary a great deal between facility types, sizes, and system designs. Whenbuilding a new facility or renovating an existing one, the swine operator should get several equipmentcompanies or contractors to quote on their design. Selection of the winning bid can be done based onfactors such as prices, quality or equipment, service, and reputation.
Fan operating costs for swine finishing facilities have been measured over a range from $0.25 to$1.75/hog marketed with the dual system being the lowest and positive pressure being the highest.Operating costs for natural ventilated facilities are minimal and the lowest of all mentioned systems.
General AssessmentNegative pressure systems have become the standard for mechanical ventilation of swine facilities inCanada for a number of reasons. They are easy to control, require few fans yet offer uniform distribution,do not force building air into the walls, and are very reliable at reasonable cost.
Natural ventilation facilities can provide several important advantages to mechanical facilities includinglower electrical costs, reduced noise levels, and natural lighting. The reduced ability to control the airquality for both the livestock and workers is a very tough trade-off. The extra costs in heating thebuilding resulting from this reduced control can easily outweigh the lower electrical operating costs.
Dual ventilation is a good compromise method between mechanical or natural ventilation for theventilation of finisher and dry sow barns. Dual ventilation systems are becoming more commonthroughout Canada.
17
Complementary TechnologiesComplementary technologies of mechanical ventilation systems include controls that can interlock toheating and cooling systems, lighting, feed systems, and provide historical recording. Othertechnologies include monitors for static pressure, H2S, NH3, and alarm systems.
Water sprinkling is also a complementary technology to ventilation when cooling is desired.
Literature CitedASAE Standards. 2002. Design of ventilation systems for poultry and livestock shelters. ASAE EP270.5 FEB03.
Bodman, G. and D. Jones. 1994. Non-mechanical ventilation of MOF swine buildings. Pork Industry Handbook PIH-120.Purdue University, Cooperative Extension Service.
Brunet, L. 1999. Hazardous gases. Factsheet. Agdex #721, Order #99-001. Ontario Ministry of Agriculture and Food.
Choiniere, Y. and J.A. Munroe. 1993. Air quality inside livestock barns. Factsheet. Agdex #400/717, Order #93-001. OntarioMinistry of Agriculture and Food.
Jacobson, L. and J. Chastain. 1994. Fan performance and efficiency for animal ventilation systems. University of Minnesota,Extension Service. FO-00956.
Lemay, S. and L. Chenard. 2001. What should I know about air quality in pig buildings? Prairie Swine Centre Inc.
Lally, J.J. and W.M. Edwards. 2001. Performance Differences in Swine Finishing Facilities with Natural and Tunnel Ventila-tion. Applied Engineering in Agriculture, Vol 17(4), pp: 521-526.
Manitoba Agriculture, Food and Rural Initiatives. 2001. “Ventilating the Feeder Barn in Manitoba”. Sharing Ideas and Infor-mation for Efficient Pork Production. 2001 Volume 15.
Meyer, D. Supplemental Ventilation Systems for Modified Open-front Swine Buildings. Iowa State University. PM1761.
18
2.2 Heating
IntroductionTo provide optimum air quality and environmentalconditions for the pigs, swine facilities in Canadausually have to be heated for some part of the year.Energy usage of heating systems can be quitevariable, which in turn can have a positive or negativeimpact on economics and the environment. A properlydesigned and sized heating system is essential. Over-sized heaters tend to cycle on and off frequently,creating uncomfortable conditions and wastingenergy. Under-sized systems will not be able tomaintain the desired room temperature, adverselyaffecting the health and performance of the pigs. Theproper design, installation, and management of theheating system can reduce producers’ productioncosts and greatly improve animal comfort.
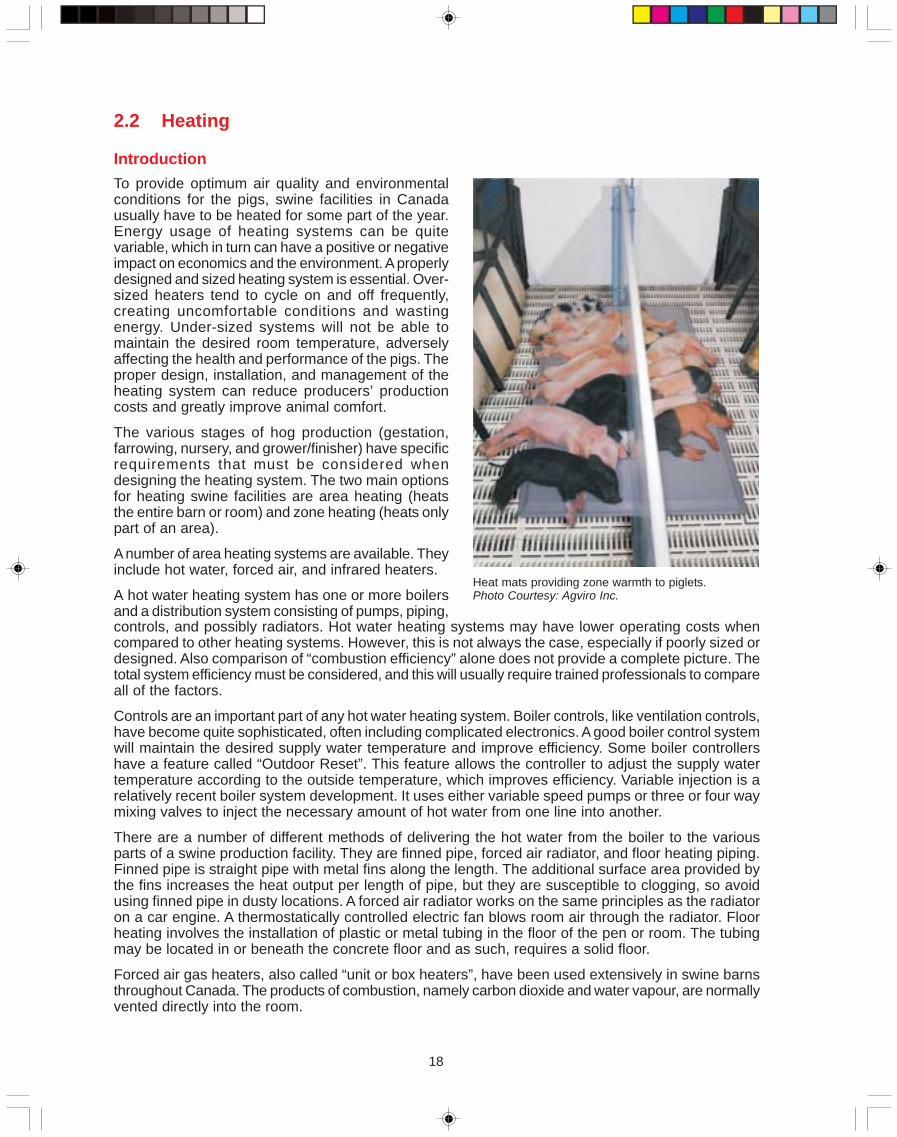
The various stages of hog production (gestation,farrowing, nursery, and grower/finisher) have specificrequirements that must be considered whendesigning the heating system. The two main optionsfor heating swine facilities are area heating (heatsthe entire barn or room) and zone heating (heats onlypart of an area).
A number of area heating systems are available. Theyinclude hot water, forced air, and infrared heaters.
A hot water heating system has one or more boilersand a distribution system consisting of pumps, piping,
Heat mats providing zone warmth to piglets.Photo Courtesy: Agviro Inc.
controls, and possibly radiators. Hot water heating systems may have lower operating costs whencompared to other heating systems. However, this is not always the case, especially if poorly sized ordesigned. Also comparison of “combustion efficiency” alone does not provide a complete picture. Thetotal system efficiency must be considered, and this will usually require trained professionals to compareall of the factors.
Controls are an important part of any hot water heating system. Boiler controls, like ventilation controls,have become quite sophisticated, often including complicated electronics. A good boiler control systemwill maintain the desired supply water temperature and improve efficiency. Some boiler controllershave a feature called “Outdoor Reset”. This feature allows the controller to adjust the supply watertemperature according to the outside temperature, which improves efficiency. Variable injection is arelatively recent boiler system development. It uses either variable speed pumps or three or four waymixing valves to inject the necessary amount of hot water from one line into another.
There are a number of different methods of delivering the hot water from the boiler to the variousparts of a swine production facility. They are finned pipe, forced air radiator, and floor heating piping.Finned pipe is straight pipe with metal fins along the length. The additional surface area provided bythe fins increases the heat output per length of pipe, but they are susceptible to clogging, so avoidusing finned pipe in dusty locations. A forced air radiator works on the same principles as the radiatoron a car engine. A thermostatically controlled electric fan blows room air through the radiator. Floorheating involves the installation of plastic or metal tubing in the floor of the pen or room. The tubingmay be located in or beneath the concrete floor and as such, requires a solid floor.
Forced air gas heaters, also called “unit or box heaters”, have been used extensively in swine barnsthroughout Canada. The products of combustion, namely carbon dioxide and water vapour, are normallyvented directly into the room.
19
An infrared tube or “radiant tube” heater is a long black tube with an air intake, burner, and blower atone end and the exhaust at the other end. Infrared heating directs heat where it is needed - on thepigs and the floor. The floor is warmer directly under the heater and cooler further away. Infraredheaters have quickly gained popularity in the swine industry for use in nursery and grower/finisherfacilities. Many producers like the improved air quality, better heat distribution, and lower energycosts as compared to other heating systems.
The room layout is very important when considering a radiant heater. Since radiant heaters heatobjects, they have mostly been used for pigs housed in pens. Heating nursery or feeder pigs in grouppens is an excellent application, as the pigs can find their desired “thermal comfort zone”.
Creep heating provides zone or spot heating to piglets in farrowing or nursery rooms. A mature sowprefers a room temperature of about 68°F (20°C), while the piglets require much warmer temperaturesof up to 100°F (38°C) when first born. Heat lamps, heat mats, or a combination of the two may beused to provide warmer temperatures for the piglets in the creep area. Heat lamps provide infrared(radiant) heat source for the pigs in the creep area. Energy efficient heat lamps, such as the PAR 38design, are available in either 100 or 175 watts. Heat lamps typically use more energy than heat pads.
Environmental AdvantagesBoiler and infrared tube heating offers better air quality than forced air gas heaters. Infrared heatersonly heat objects and not the entire air space. Creep heating in the farrowing rooms allows the pigletand sows to be comfortable in spite of their different temperature preferences. Heating pads use lessenergy than heat lamps for that application.
Environmental DisadvantagesSolid fuelled boilers typically have greater emissions than oil or gas fired boilers. Forced air gasheaters normally exhaust the products of combustion, such as carbon dioxide, water vapour, andpossibly carbon monoxide, into the room, thus requiring extra ventilation.
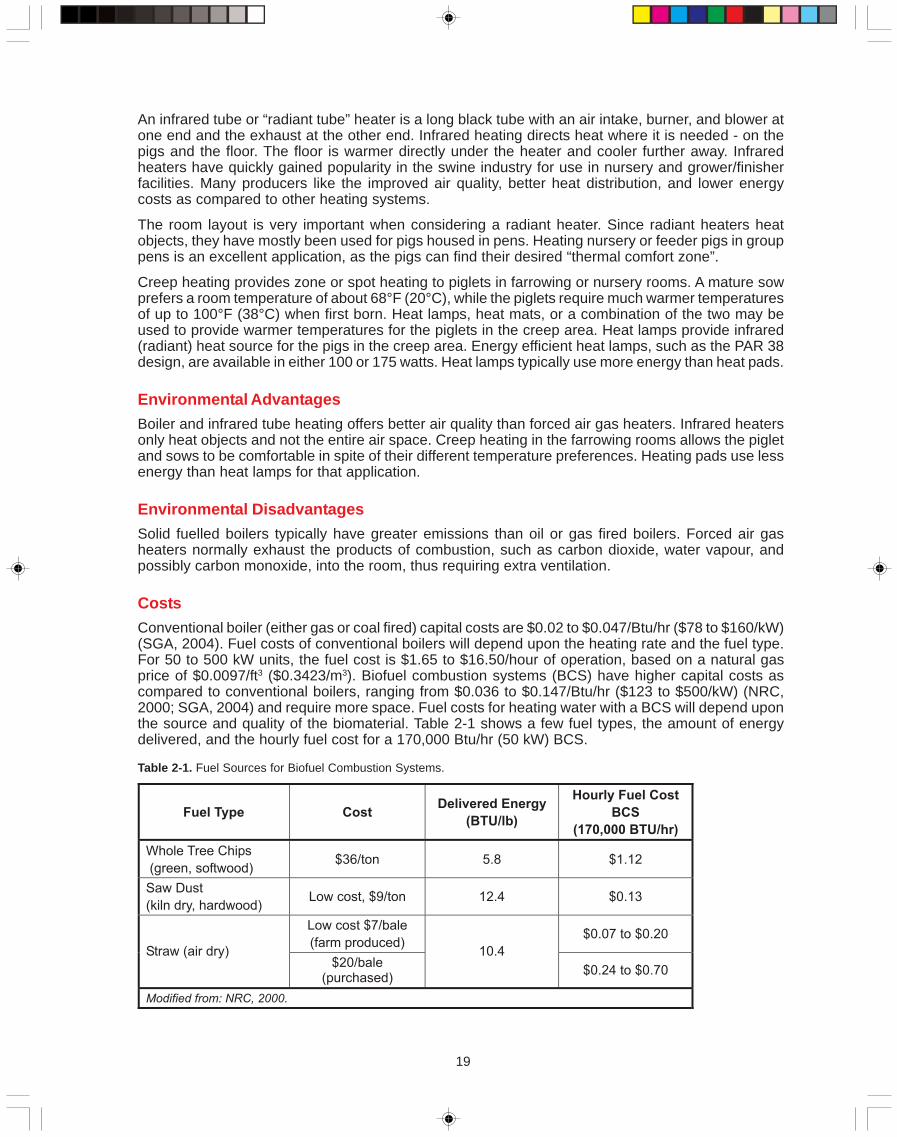
CostsConventional boiler (either gas or coal fired) capital costs are $0.02 to $0.047/Btu/hr ($78 to $160/kW)(SGA, 2004). Fuel costs of conventional boilers will depend upon the heating rate and the fuel type.For 50 to 500 kW units, the fuel cost is $1.65 to $16.50/hour of operation, based on a natural gasprice of $0.0097/ft3 ($0.3423/m3). Biofuel combustion systems (BCS) have higher capital costs ascompared to conventional boilers, ranging from $0.036 to $0.147/Btu/hr ($123 to $500/kW) (NRC,2000; SGA, 2004) and require more space. Fuel costs for heating water with a BCS will depend uponthe source and quality of the biomaterial. Table 2-1 shows a few fuel types, the amount of energydelivered, and the hourly fuel cost for a 170,000 Btu/hr (50 kW) BCS.
Table 2-1. Fuel Sources for Biofuel Combustion Systems.
Fuel Type CostDelivered Energy
(BTU/lb)
Hourly Fuel Cost
BCS
(170,000 BTU/hr)
Whole Tree Chips
(green, softwood)$36/ton 5.8 $1.12
Saw Dust
(kiln dry, hardwood)Low cost, $9/ton 12.4 $0.13
Low cost $7/bale
(farm produced)$0.07 to $0.20
Straw (air dry)$20/bale
(purchased)
10.4
$0.24 to $0.70
Modified from: NRC, 2000.
20
Infrared tube heaters run on either propane or natural gas, have lengths of 20 to 60 ft (6 to 18 m), andare rated from 50,000 to 150,000 Btu/hr (15 to 44 kW) (DRPC, 2005; Feldmann and MacDonald,2000). The cost for tube heaters ranges from $1,475 to $1,624. Based on a natural gas cost of$0.0097 ft3 ($0.3423/m3), the cost per hour of operation per unit at full capacity is $0.49 to $1.47. Fora 1,200 head wean to finish barn, four tube heaters are suggested (Feldmann and MacDonald, 2000),resulting in fuel costs between $1.96 and $5.81/hour of heating.
Forced air heaters (propeller type, blower type, or gas-fired indoor duct) cost from $1,917 to $2,784(Mid-Valley Radiants) for units that are rated at 100,000 to 200,000 Btu/hr. Compared to tube heaters,the cost for heating a 1,200 head barn is higher with the annual cost per hour of heating at $8.72/hour.It is suggested that ventilation capacities need to be increased by 2.5 ft3/min (0.07 m3/min) for every1,000 Btu/hr of heater capacity (Harp and Huhnke, 1992).
Heat pads are more cost efficient than heat lamps. For example, in a room with 10 farrowing crates,although the lamp’s capital costs would only be $530 compared to $1,400 for pads, annual operatingcosts are $804 for lamps but only $332 for pads.
Management of the heating system is critical if energy efficiency is desired. A good quality controllerthat interlocks the heating system with the ventilation system is essential. It will not take long for apoorly set controller to waste thousands of dollars in a heating season.
Hallways or air plenums are commonly used to warm the incoming fresh air before it enters therooms. This reduces cold air drafts and, in periods of extreme cold (below -4°F (-20°C)), prevents theair inlets from frosting up and the rooms from becoming foggy. It is critical to ensure that the preheatplenums are properly designed and managed. If the incoming fresh air is warmed up too much in thepreheat area, the winter temperature exhaust fans in the rooms could begin to operate, wastingenergy. One 2,200 sow farrow to finish facility reduced the preheat temperature by 36°F (20°C) andsaved over $43,000 in one year.
Some infrared heaters now have a two-stage burner that allows a high and a low heat output. Thiscan provide up to a 12% energy savings and 35% less on/off cycling as compared to a single-stageburner (MacDonald, 1996). Many users report improved feed intake and feed conversion, faster daysto market, and reduced mortalities with infrared heaters. Converting from heat lamps to heat padshas a very good payback period. Many producers install both heat lamps and heat pads.
General AssessmentHot water systems have several advantages over forced air gas fired “unit” heaters. Also, the infraredtube radiant heaters have gained considerable popularity over unit heaters with producers due toimproved air quality, better heat distribution, and lower energy costs. For zone heating of piglets, padheaters have several advantages over heat lamps. The selection of a heating system is complex andthe use of qualified professionals is recommended to obtain a system that best matches the specificrequirements.
Complementary TechnologiesNew technologies for heating systems are continually evolving. Sources such as solar or some of theevolving bioenergy sources can harness energy that might be readily available at the site. For example,anaerobic digesters can convert energy from manure into heat. Technologies such as heat exchangersand windbreaks will also reduce energy consumption for heating.
Literature CitedDarby, D.E. and R. Borg. 2002. Hot water heating. Canada Plan Service. Plan 9735.
Detroit Radiant Products Company (DRPC). 2005. Two-stage agricultural gas fired infra-red tube heaters. AG2 Series. http://reverbeerray.com/products/ag2.html [cited June 20, 2005].
Feldmann, T. and R. MacDonald. 2000. Comparing heating systems in a wean to finish facility: 2-stage tube versus brooder.In Swine Housing, Proceedings of First International Conference. October 9-11, 2000, Des Moines, Iowa. ISBN 1-892769-10-7, ASAE pub 701P0001.

21
Harp, S. L. and R.L. Huhnke. 1992. Supplemental heat for swine. Pork Industry Handbook. PIH-57. Purdue UniversityCooperative Extension Service.
MacDonald, R. 1996. Results from two stage infra-red tube heating of swine nurseries. ASAE Paper Number 964086.
MacDonald, R. 2002. Saving money by maximizing energy use efficiency in swine production. Advances in Pork Production.Vol 13, p. 99. Banff Pork Seminar, 2002 Proceedings.
Mid-Valley Radiants. http://www.mid-valleyradiants.com [cited February 20, 2004].
National Resources Canada (NRC). 2000. Buyer’s Guide to small commercial biomass combustion systems. ISBN 0-662-28899-8, Catalogue Number: M92-186/2000E.
SGA Energy Limited. 2004. Small commercial biomass combustion systems: Market study and plan - Summary Report.Natural Resources Canada, Renewable and Electrical Energy Division. http://www2.nrcan.gc.ca/es/erb/erb/english/View.asp?x=469&oid=144 [cited February 25, 2004].
Zhang,Q, Xin, H. 2002. Static and dynamic temperature distribution of heat mats for swine farrowing creep heating. AppliedEngineering in Agriculture. Vol 16(5): 563-569.
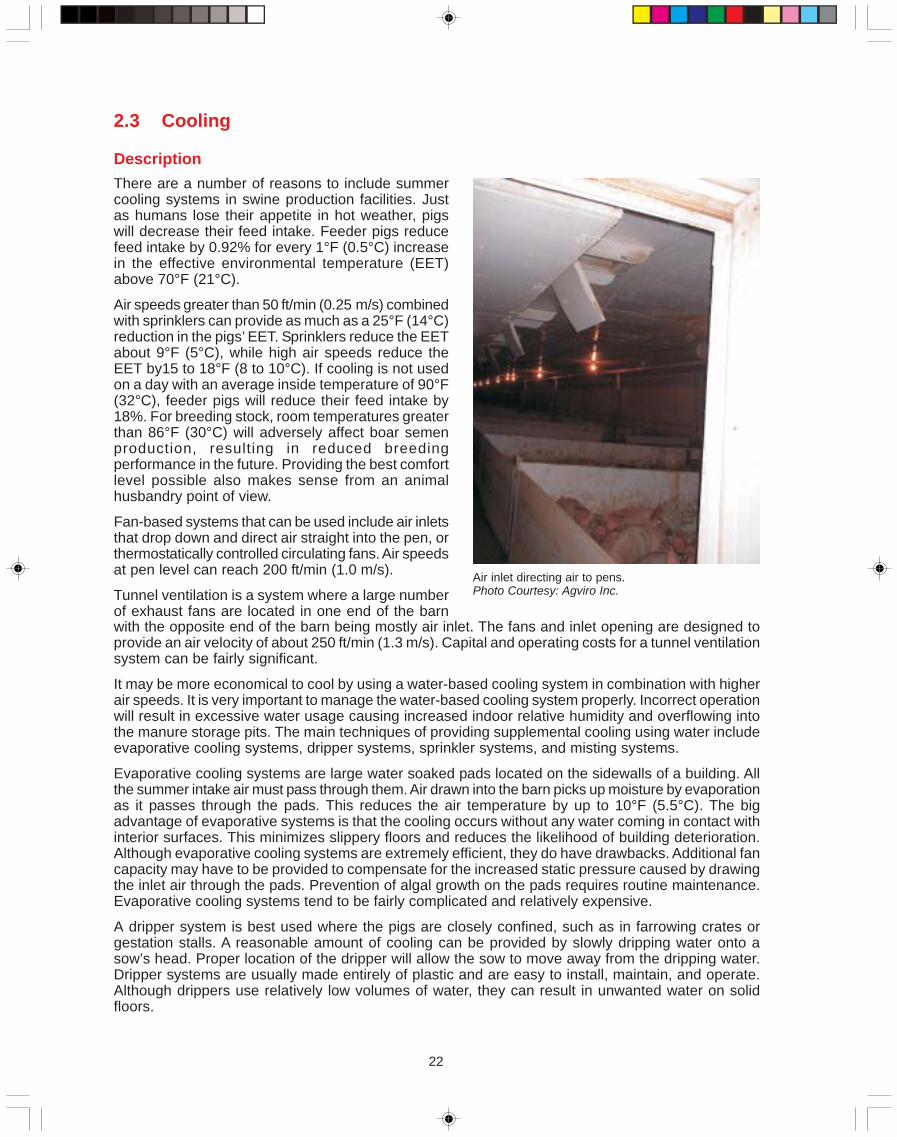
22
2.3 Cooling
DescriptionThere are a number of reasons to include summercooling systems in swine production facilities. Justas humans lose their appetite in hot weather, pigswill decrease their feed intake. Feeder pigs reducefeed intake by 0.92% for every 1°F (0.5°C) increasein the effective environmental temperature (EET)above 70°F (21°C).
Air speeds greater than 50 ft/min (0.25 m/s) combinedwith sprinklers can provide as much as a 25°F (14°C)reduction in the pigs’ EET. Sprinklers reduce the EETabout 9°F (5°C), while high air speeds reduce theEET by15 to 18°F (8 to 10°C). If cooling is not usedon a day with an average inside temperature of 90°F(32°C), feeder pigs will reduce their feed intake by18%. For breeding stock, room temperatures greaterthan 86°F (30°C) will adversely affect boar semenproduction, resulting in reduced breedingperformance in the future. Providing the best comfortlevel possible also makes sense from an animalhusbandry point of view.
Fan-based systems that can be used include air inletsthat drop down and direct air straight into the pen, orthermostatically controlled circulating fans. Air speedsat pen level can reach 200 ft/min (1.0 m/s).
Tunnel ventilation is a system where a large numberof exhaust fans are located in one end of the barn
Air inlet directing air to pens.Photo Courtesy: Agviro Inc.
with the opposite end of the barn being mostly air inlet. The fans and inlet opening are designed toprovide an air velocity of about 250 ft/min (1.3 m/s). Capital and operating costs for a tunnel ventilationsystem can be fairly significant.
It may be more economical to cool by using a water-based cooling system in combination with higherair speeds. It is very important to manage the water-based cooling system properly. Incorrect operationwill result in excessive water usage causing increased indoor relative humidity and overflowing intothe manure storage pits. The main techniques of providing supplemental cooling using water includeevaporative cooling systems, dripper systems, sprinkler systems, and misting systems.
Evaporative cooling systems are large water soaked pads located on the sidewalls of a building. Allthe summer intake air must pass through them. Air drawn into the barn picks up moisture by evaporationas it passes through the pads. This reduces the air temperature by up to 10°F (5.5°C). The bigadvantage of evaporative systems is that the cooling occurs without any water coming in contact withinterior surfaces. This minimizes slippery floors and reduces the likelihood of building deterioration.Although evaporative cooling systems are extremely efficient, they do have drawbacks. Additional fancapacity may have to be provided to compensate for the increased static pressure caused by drawingthe inlet air through the pads. Prevention of algal growth on the pads requires routine maintenance.Evaporative cooling systems tend to be fairly complicated and relatively expensive.
A dripper system is best used where the pigs are closely confined, such as in farrowing crates orgestation stalls. A reasonable amount of cooling can be provided by slowly dripping water onto asow’s head. Proper location of the dripper will allow the sow to move away from the dripping water.Dripper systems are usually made entirely of plastic and are easy to install, maintain, and operate.Although drippers use relatively low volumes of water, they can result in unwanted water on solidfloors.
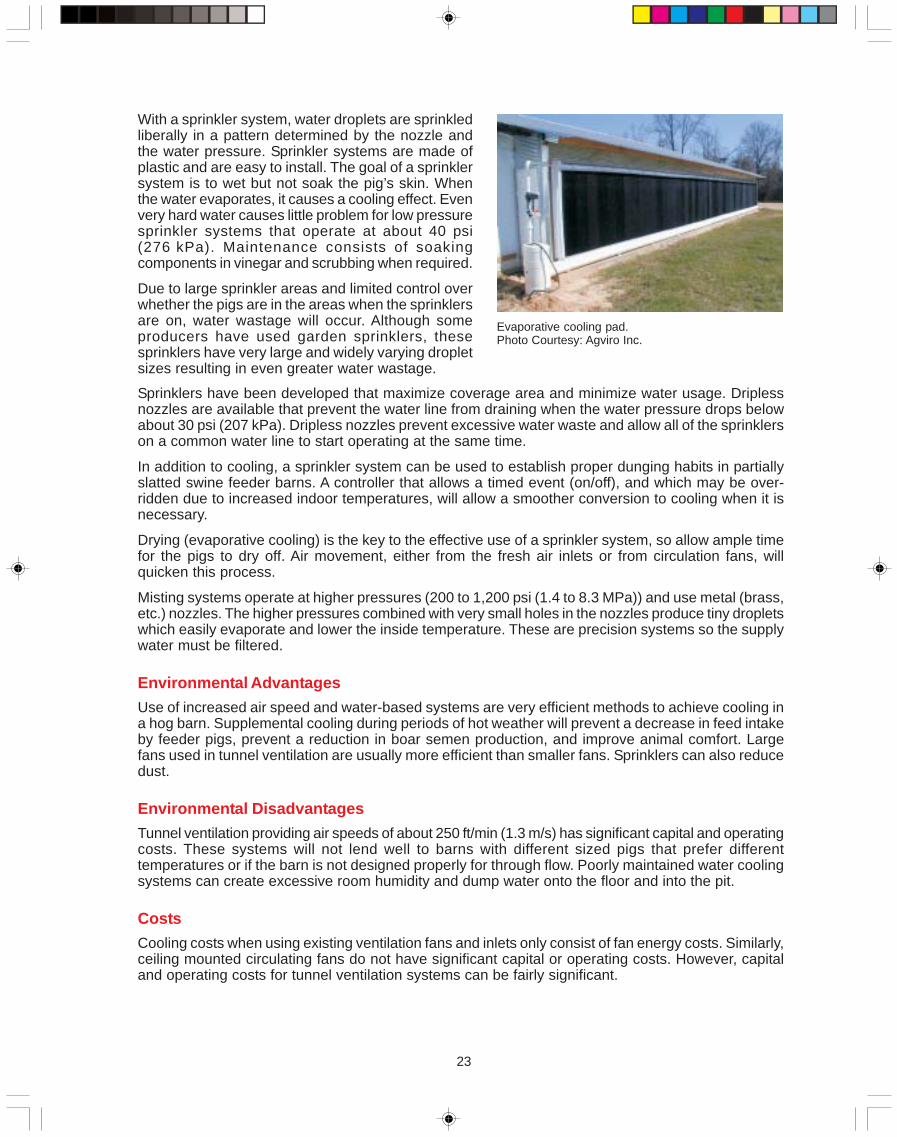
23
With a sprinkler system, water droplets are sprinkledliberally in a pattern determined by the nozzle andthe water pressure. Sprinkler systems are made ofplastic and are easy to install. The goal of a sprinklersystem is to wet but not soak the pig’s skin. Whenthe water evaporates, it causes a cooling effect. Evenvery hard water causes little problem for low pressuresprinkler systems that operate at about 40 psi(276 kPa). Maintenance consists of soakingcomponents in vinegar and scrubbing when required.
Due to large sprinkler areas and limited control overwhether the pigs are in the areas when the sprinklersare on, water wastage will occur. Although someproducers have used garden sprinklers, thesesprinklers have very large and widely varying dropletsizes resulting in even greater water wastage.
Evaporative cooling pad.Photo Courtesy: Agviro Inc.
Sprinklers have been developed that maximize coverage area and minimize water usage. Driplessnozzles are available that prevent the water line from draining when the water pressure drops belowabout 30 psi (207 kPa). Dripless nozzles prevent excessive water waste and allow all of the sprinklerson a common water line to start operating at the same time.
In addition to cooling, a sprinkler system can be used to establish proper dunging habits in partiallyslatted swine feeder barns. A controller that allows a timed event (on/off), and which may be over-ridden due to increased indoor temperatures, will allow a smoother conversion to cooling when it isnecessary.
Drying (evaporative cooling) is the key to the effective use of a sprinkler system, so allow ample timefor the pigs to dry off. Air movement, either from the fresh air inlets or from circulation fans, willquicken this process.
Misting systems operate at higher pressures (200 to 1,200 psi (1.4 to 8.3 MPa)) and use metal (brass,etc.) nozzles. The higher pressures combined with very small holes in the nozzles produce tiny dropletswhich easily evaporate and lower the inside temperature. These are precision systems so the supplywater must be filtered.
Environmental AdvantagesUse of increased air speed and water-based systems are very efficient methods to achieve cooling ina hog barn. Supplemental cooling during periods of hot weather will prevent a decrease in feed intakeby feeder pigs, prevent a reduction in boar semen production, and improve animal comfort. Largefans used in tunnel ventilation are usually more efficient than smaller fans. Sprinklers can also reducedust.
Environmental DisadvantagesTunnel ventilation providing air speeds of about 250 ft/min (1.3 m/s) has significant capital and operatingcosts. These systems will not lend well to barns with different sized pigs that prefer differenttemperatures or if the barn is not designed properly for through flow. Poorly maintained water coolingsystems can create excessive room humidity and dump water onto the floor and into the pit.
CostsCooling costs when using existing ventilation fans and inlets only consist of fan energy costs. Similarly,ceiling mounted circulating fans do not have significant capital or operating costs. However, capitaland operating costs for tunnel ventilation systems can be fairly significant.
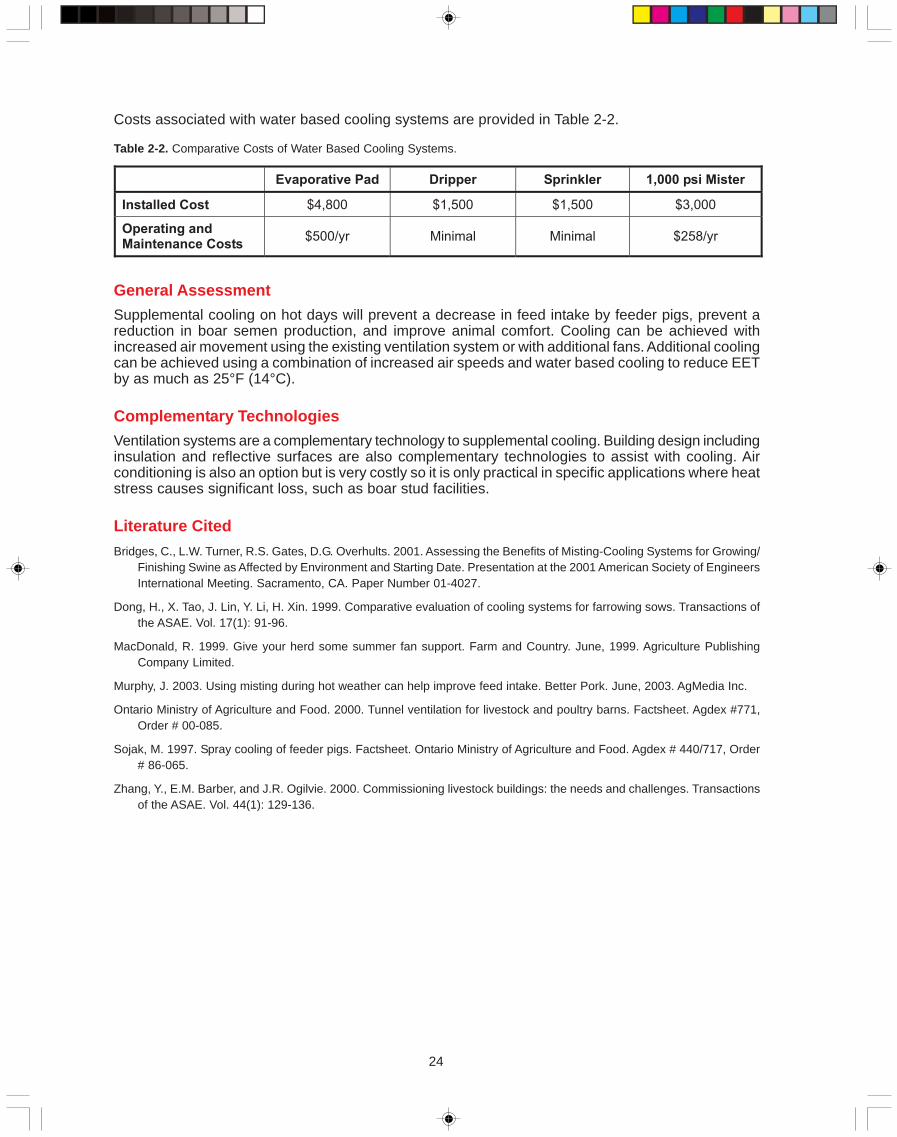
24
Costs associated with water based cooling systems are provided in Table 2-2.
Table 2-2. Comparative Costs of Water Based Cooling Systems.
General AssessmentSupplemental cooling on hot days will prevent a decrease in feed intake by feeder pigs, prevent areduction in boar semen production, and improve animal comfort. Cooling can be achieved withincreased air movement using the existing ventilation system or with additional fans. Additional coolingcan be achieved using a combination of increased air speeds and water based cooling to reduce EETby as much as 25°F (14°C).
Complementary TechnologiesVentilation systems are a complementary technology to supplemental cooling. Building design includinginsulation and reflective surfaces are also complementary technologies to assist with cooling. Airconditioning is also an option but is very costly so it is only practical in specific applications where heatstress causes significant loss, such as boar stud facilities.
Literature CitedBridges, C., L.W. Turner, R.S. Gates, D.G. Overhults. 2001. Assessing the Benefits of Misting-Cooling Systems for Growing/
Finishing Swine as Affected by Environment and Starting Date. Presentation at the 2001 American Society of EngineersInternational Meeting. Sacramento, CA. Paper Number 01-4027.
Dong, H., X. Tao, J. Lin, Y. Li, H. Xin. 1999. Comparative evaluation of cooling systems for farrowing sows. Transactions ofthe ASAE. Vol. 17(1): 91-96.
MacDonald, R. 1999. Give your herd some summer fan support. Farm and Country. June, 1999. Agriculture PublishingCompany Limited.
Murphy, J. 2003. Using misting during hot weather can help improve feed intake. Better Pork. June, 2003. AgMedia Inc.
Ontario Ministry of Agriculture and Food. 2000. Tunnel ventilation for livestock and poultry barns. Factsheet. Agdex #771,Order # 00-085.
Sojak, M. 1997. Spray cooling of feeder pigs. Factsheet. Ontario Ministry of Agriculture and Food. Agdex # 440/717, Order# 86-065.
Zhang, Y., E.M. Barber, and J.R. Ogilvie. 2000. Commissioning livestock buildings: the needs and challenges. Transactionsof the ASAE. Vol. 44(1): 129-136.
Evaporative Pad Dripper Sprinkler 1,000 psi Mister
Installed Cost $4,800 $1,500 $1,500 $3,000
Operating andMaintenance Costs
$500/yr Minimal Minimal $258/yr
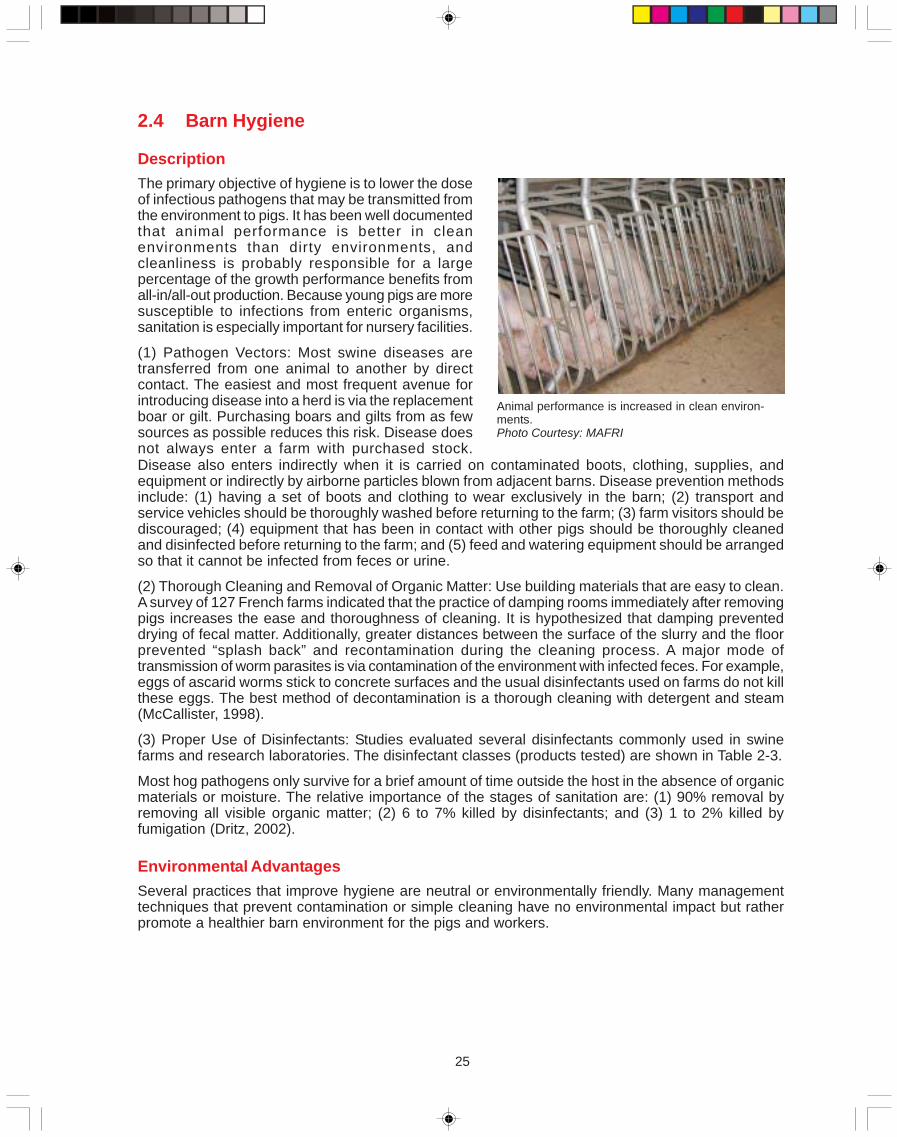
25
2.4 Barn Hygiene
DescriptionThe primary objective of hygiene is to lower the doseof infectious pathogens that may be transmitted fromthe environment to pigs. It has been well documentedthat animal performance is better in cleanenvironments than dirty environments, andcleanliness is probably responsible for a largepercentage of the growth performance benefits fromall-in/all-out production. Because young pigs are moresusceptible to infections from enteric organisms,sanitation is especially important for nursery facilities.
(1) Pathogen Vectors: Most swine diseases aretransferred from one animal to another by directcontact. The easiest and most frequent avenue forintroducing disease into a herd is via the replacementboar or gilt. Purchasing boars and gilts from as fewsources as possible reduces this risk. Disease doesnot always enter a farm with purchased stock.
Animal performance is increased in clean environ-ments.Photo Courtesy: MAFRI
Disease also enters indirectly when it is carried on contaminated boots, clothing, supplies, andequipment or indirectly by airborne particles blown from adjacent barns. Disease prevention methodsinclude: (1) having a set of boots and clothing to wear exclusively in the barn; (2) transport andservice vehicles should be thoroughly washed before returning to the farm; (3) farm visitors should bediscouraged; (4) equipment that has been in contact with other pigs should be thoroughly cleanedand disinfected before returning to the farm; and (5) feed and watering equipment should be arrangedso that it cannot be infected from feces or urine.
(2) Thorough Cleaning and Removal of Organic Matter: Use building materials that are easy to clean.A survey of 127 French farms indicated that the practice of damping rooms immediately after removingpigs increases the ease and thoroughness of cleaning. It is hypothesized that damping preventeddrying of fecal matter. Additionally, greater distances between the surface of the slurry and the floorprevented “splash back” and recontamination during the cleaning process. A major mode oftransmission of worm parasites is via contamination of the environment with infected feces. For example,eggs of ascarid worms stick to concrete surfaces and the usual disinfectants used on farms do not killthese eggs. The best method of decontamination is a thorough cleaning with detergent and steam(McCallister, 1998).
(3) Proper Use of Disinfectants: Studies evaluated several disinfectants commonly used in swinefarms and research laboratories. The disinfectant classes (products tested) are shown in Table 2-3.
Most hog pathogens only survive for a brief amount of time outside the host in the absence of organicmaterials or moisture. The relative importance of the stages of sanitation are: (1) 90% removal byremoving all visible organic matter; (2) 6 to 7% killed by disinfectants; and (3) 1 to 2% killed byfumigation (Dritz, 2002).
Environmental AdvantagesSeveral practices that improve hygiene are neutral or environmentally friendly. Many managementtechniques that prevent contamination or simple cleaning have no environmental impact but ratherpromote a healthier barn environment for the pigs and workers.
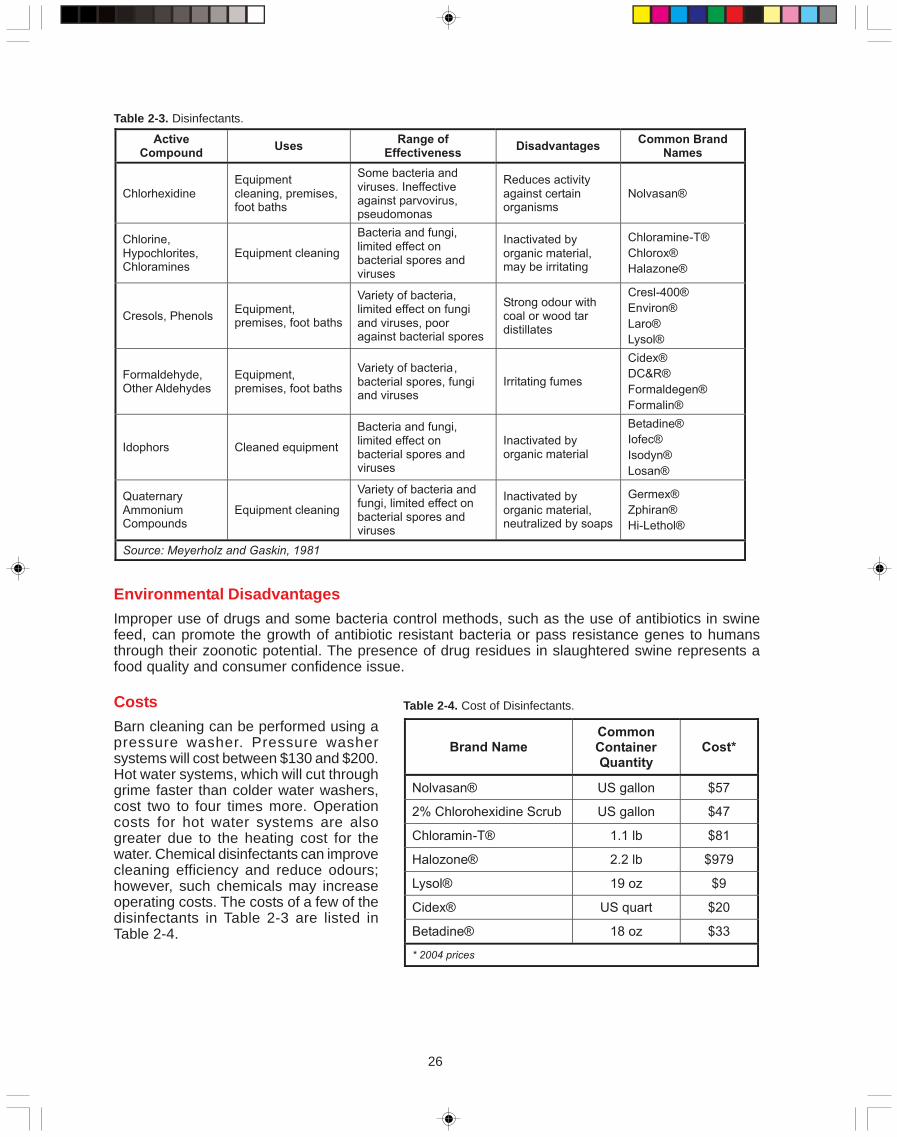
26
Environmental DisadvantagesImproper use of drugs and some bacteria control methods, such as the use of antibiotics in swinefeed, can promote the growth of antibiotic resistant bacteria or pass resistance genes to humansthrough their zoonotic potential. The presence of drug residues in slaughtered swine represents afood quality and consumer confidence issue.
Table 2-3. Disinfectants.
CostsBarn cleaning can be performed using apressure washer. Pressure washersystems will cost between $130 and $200.Hot water systems, which will cut throughgrime faster than colder water washers,cost two to four times more. Operationcosts for hot water systems are alsogreater due to the heating cost for thewater. Chemical disinfectants can improvecleaning efficiency and reduce odours;however, such chemicals may increaseoperating costs. The costs of a few of thedisinfectants in Table 2-3 are listed inTable 2-4.
Table 2-4. Cost of Disinfectants.
ActiveCompound
UsesRange of
EffectivenessDisadvantages
Common BrandNames
ChlorhexidineEquipmentcleaning, premises,foot baths
Some bacteria andviruses. Ineffectiveagainst parvovirus,pseudomonas
Reduces activityagainst certainorganisms
Nolvasan®
Chlorine,Hypochlorites,Chloramines
Equipment cleaning
Bacteria and fungi,limited effect onbacterial spores andviruses
Inactivated byorganic material,may be irritating
Chloramine-T®
Chlorox®
Halazone®
Cresols, PhenolsEquipment,premises, foot baths
Variety of bacteria,limited effect on fungiand viruses, pooragainst bacterial spores
Strong odour withcoal or wood tardistillates
Cresl-400®
Environ®
Laro®
Lysol®
Formaldehyde,Other Aldehydes
Equipment,premises, foot baths
Variety of bacteria,bacterial spores, fungiand viruses
Irritating fumes
Cidex®
DC&R®
Formaldegen®
Formalin®
Idophors Cleaned equipment
Bacteria and fungi,limited effect onbacterial spores andviruses
Inactivated byorganic material
Betadine®
Iofec®
Isodyn®
Losan®
QuaternaryAmmoniumCompounds
Equipment cleaning
Variety of bacteria andfungi, limited effect onbacterial spores andviruses
Inactivated byorganic material,neutralized by soaps
Germex®
Zphiran®
Hi-Lethol®
Source: Meyerholz and Gaskin, 1981
Brand NameCommonContainerQuantity
Cost*
Nolvasan® US gallon $57
2% Chlorohexidine Scrub US gallon $47
Chloramin-T® 1.1 lb $81
Halozone® 2.2 lb $979
Lysol® 19 oz $9
Cidex® US quart $20
Betadine® 18 oz $33
* 2004 prices
27
General AssessmentHygiene in the barn can be a very cost effective and environmentally friendly method of reducingexposure to infectious pathogens. Management to reduce contamination, cleaning of organic matter,and use of disinfectants are all optional methods to improve hygiene. They help to reduce the needfor drugs and biologies to prevent and treat disease.
Complementary TechnologiesConsidering the growing concerns surrounding antibiotic use in food animals, many researchershave been studying alternative methods of disease prophylaxis and growth promotion. Among theseare probiotics, prebiotics, enzymes, diet acidification, fermented liquid feeding, neutraceuticals,minerals, novel antibodies, vaccination, and improved management and husbandry practices.
Literature CitedDritz, S. 2002. Nursery management: hygiene and feeding management practices to ensure healthy pigs. MB Swine Semi-
nar. 2002 Vol. 16.
Foote, K. 2003. The battle of the bugs and other alternatives to antibiotics in pork production. MB Swine Seminar. 2003 Vol.17.
Holley, R. 2002. Pathogenic organisms. Manitoba Livestock Manure Management Initiatives. Project # MLMMI 02-HERS-05.
Keenliside, J. 2000. Current issues in swine veterinary medicine. Alberta Agriculture Bacon Bits. November 29.
Kendall, J. 2004. Surveillance of selected antimicrobial residues in swine slaughtered in provincially inspected abattoirs inAlberta. Alberta Agriculture, Food and Rural Development.
McCallister, M. 1998. Disinfection of swine barns. Veterinary Services Branch, Manitoba Agriculture, Food and Rural Initia-tives.
Meyerholz, G.W. and J. Gaskin. 1981. Selection and use of disinfectants in disease prevention. Pork Industry Handbook.PIH-80. Purdue University.
Morrow, W.E. 1992. Disease prevention, worth more than a thousand cures. Proceedings of the North Carolina HealthyHogs Seminar.
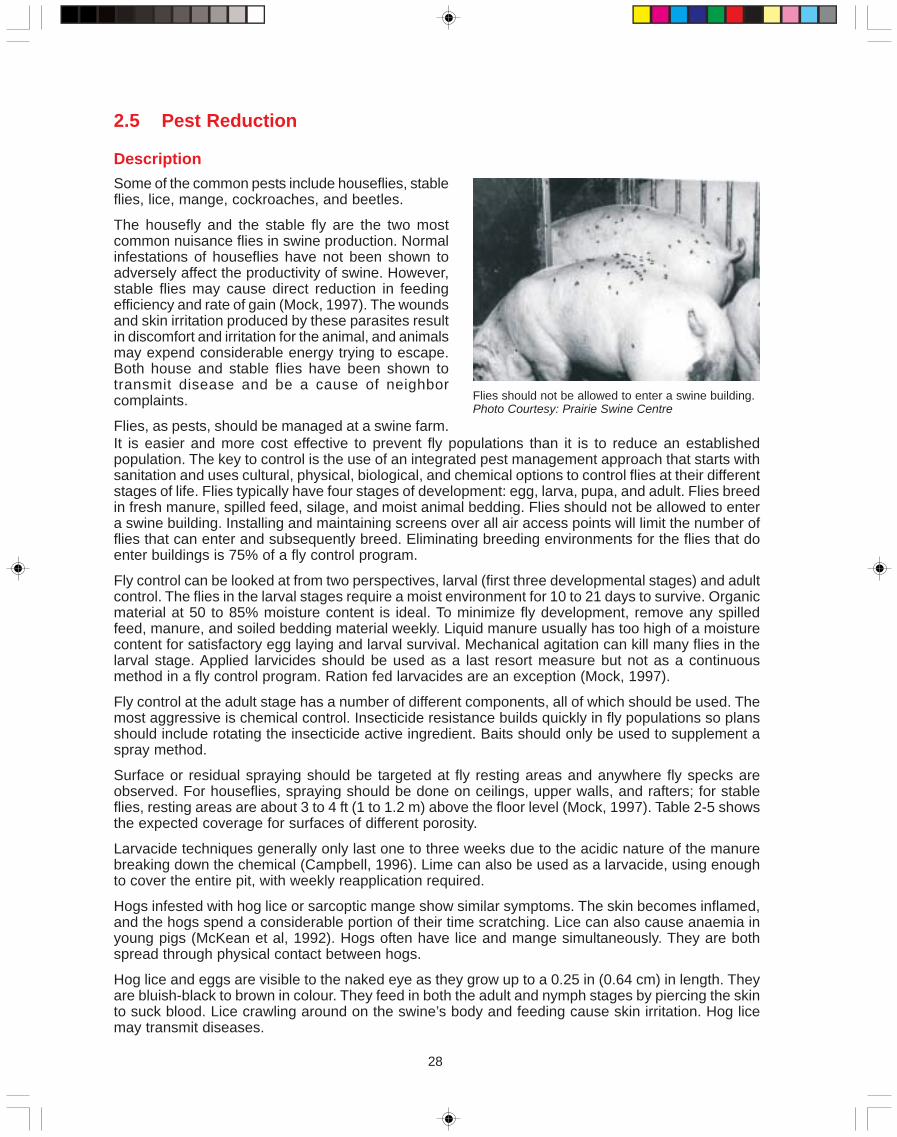
28
2.5 Pest Reduction
DescriptionSome of the common pests include houseflies, stableflies, lice, mange, cockroaches, and beetles.
The housefly and the stable fly are the two mostcommon nuisance flies in swine production. Normalinfestations of houseflies have not been shown toadversely affect the productivity of swine. However,stable flies may cause direct reduction in feedingefficiency and rate of gain (Mock, 1997). The woundsand skin irritation produced by these parasites resultin discomfort and irritation for the animal, and animalsmay expend considerable energy trying to escape.Both house and stable flies have been shown totransmit disease and be a cause of neighborcomplaints.
Flies, as pests, should be managed at a swine farm.
Flies should not be allowed to enter a swine building.Photo Courtesy: Prairie Swine Centre
It is easier and more cost effective to prevent fly populations than it is to reduce an establishedpopulation. The key to control is the use of an integrated pest management approach that starts withsanitation and uses cultural, physical, biological, and chemical options to control flies at their differentstages of life. Flies typically have four stages of development: egg, larva, pupa, and adult. Flies breedin fresh manure, spilled feed, silage, and moist animal bedding. Flies should not be allowed to entera swine building. Installing and maintaining screens over all air access points will limit the number offlies that can enter and subsequently breed. Eliminating breeding environments for the flies that doenter buildings is 75% of a fly control program.
Fly control can be looked at from two perspectives, larval (first three developmental stages) and adultcontrol. The flies in the larval stages require a moist environment for 10 to 21 days to survive. Organicmaterial at 50 to 85% moisture content is ideal. To minimize fly development, remove any spilledfeed, manure, and soiled bedding material weekly. Liquid manure usually has too high of a moisturecontent for satisfactory egg laying and larval survival. Mechanical agitation can kill many flies in thelarval stage. Applied larvicides should be used as a last resort measure but not as a continuousmethod in a fly control program. Ration fed larvacides are an exception (Mock, 1997).
Fly control at the adult stage has a number of different components, all of which should be used. Themost aggressive is chemical control. Insecticide resistance builds quickly in fly populations so plansshould include rotating the insecticide active ingredient. Baits should only be used to supplement aspray method.
Surface or residual spraying should be targeted at fly resting areas and anywhere fly specks areobserved. For houseflies, spraying should be done on ceilings, upper walls, and rafters; for stableflies, resting areas are about 3 to 4 ft (1 to 1.2 m) above the floor level (Mock, 1997). Table 2-5 showsthe expected coverage for surfaces of different porosity.
Larvacide techniques generally only last one to three weeks due to the acidic nature of the manurebreaking down the chemical (Campbell, 1996). Lime can also be used as a larvacide, using enoughto cover the entire pit, with weekly reapplication required.
Hogs infested with hog lice or sarcoptic mange show similar symptoms. The skin becomes inflamed,and the hogs spend a considerable portion of their time scratching. Lice can also cause anaemia inyoung pigs (McKean et al, 1992). Hogs often have lice and mange simultaneously. They are bothspread through physical contact between hogs.
Hog lice and eggs are visible to the naked eye as they grow up to a 0.25 in (0.64 cm) in length. Theyare bluish-black to brown in colour. They feed in both the adult and nymph stages by piercing the skinto suck blood. Lice crawling around on the swine’s body and feeding cause skin irritation. Hog licemay transmit diseases.
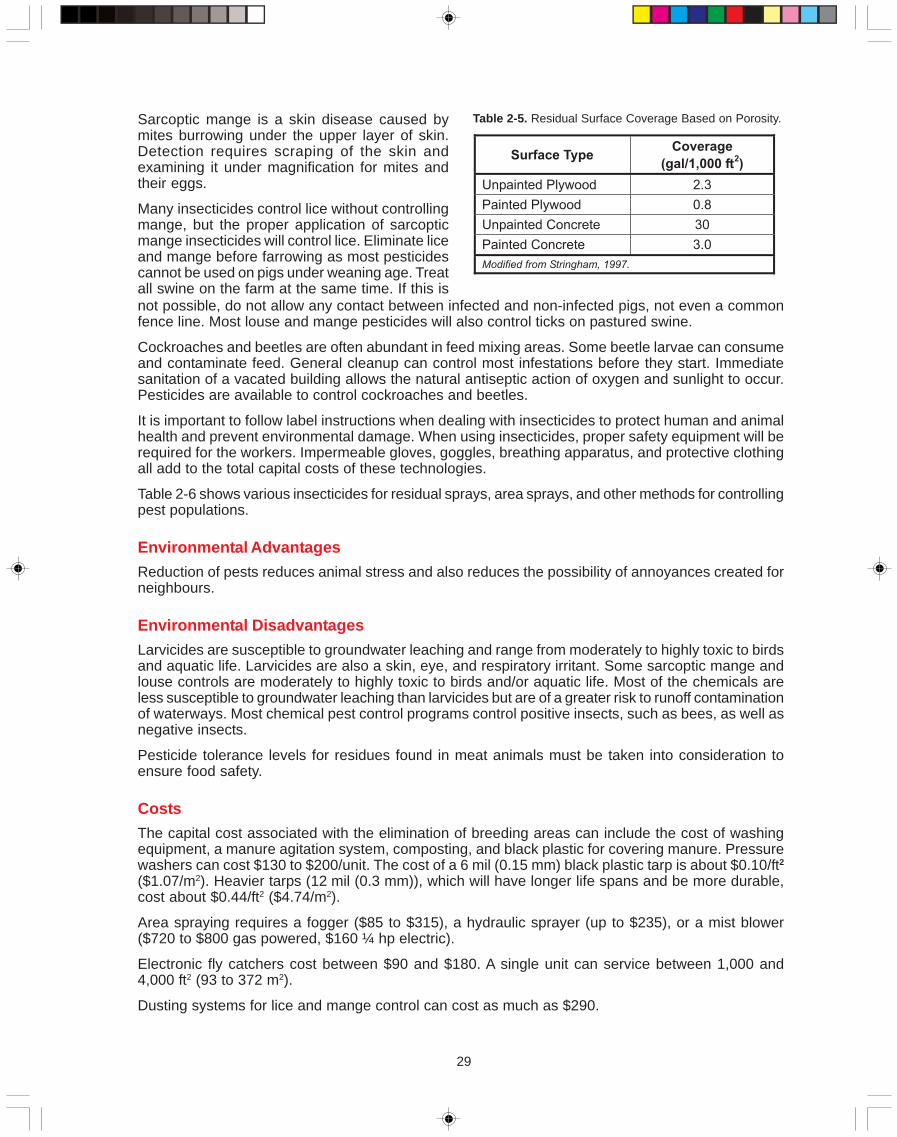
29
Sarcoptic mange is a skin disease caused bymites burrowing under the upper layer of skin.Detection requires scraping of the skin andexamining it under magnification for mites andtheir eggs.
Many insecticides control lice without controllingmange, but the proper application of sarcopticmange insecticides will control lice. Eliminate liceand mange before farrowing as most pesticidescannot be used on pigs under weaning age. Treatall swine on the farm at the same time. If this is
Surface TypeCoverage
(gal/1,000 ft2)
Unpainted Plywood 2.3
Painted Plywood 0.8
Unpainted Concrete 30
Painted Concrete 3.0
Modified from Stringham, 1997.
Table 2-5. Residual Surface Coverage Based on Porosity.
not possible, do not allow any contact between infected and non-infected pigs, not even a commonfence line. Most louse and mange pesticides will also control ticks on pastured swine.
Cockroaches and beetles are often abundant in feed mixing areas. Some beetle larvae can consumeand contaminate feed. General cleanup can control most infestations before they start. Immediatesanitation of a vacated building allows the natural antiseptic action of oxygen and sunlight to occur.Pesticides are available to control cockroaches and beetles.
It is important to follow label instructions when dealing with insecticides to protect human and animalhealth and prevent environmental damage. When using insecticides, proper safety equipment will berequired for the workers. Impermeable gloves, goggles, breathing apparatus, and protective clothingall add to the total capital costs of these technologies.
Table 2-6 shows various insecticides for residual sprays, area sprays, and other methods for controllingpest populations.
Environmental AdvantagesReduction of pests reduces animal stress and also reduces the possibility of annoyances created forneighbours.
Environmental DisadvantagesLarvicides are susceptible to groundwater leaching and range from moderately to highly toxic to birdsand aquatic life. Larvicides are also a skin, eye, and respiratory irritant. Some sarcoptic mange andlouse controls are moderately to highly toxic to birds and/or aquatic life. Most of the chemicals areless susceptible to groundwater leaching than larvicides but are of a greater risk to runoff contaminationof waterways. Most chemical pest control programs control positive insects, such as bees, as well asnegative insects.
Pesticide tolerance levels for residues found in meat animals must be taken into consideration toensure food safety.
CostsThe capital cost associated with the elimination of breeding areas can include the cost of washingequipment, a manure agitation system, composting, and black plastic for covering manure. Pressurewashers can cost $130 to $200/unit. The cost of a 6 mil (0.15 mm) black plastic tarp is about $0.10/ft2
($1.07/m2). Heavier tarps (12 mil (0.3 mm)), which will have longer life spans and be more durable,cost about $0.44/ft2 ($4.74/m2).
Area spraying requires a fogger ($85 to $315), a hydraulic sprayer (up to $235), or a mist blower($720 to $800 gas powered, $160 ¼ hp electric).
Electronic fly catchers cost between $90 and $180. A single unit can service between 1,000 and4,000 ft2 (93 to 372 m2).
Dusting systems for lice and mange control can cost as much as $290.
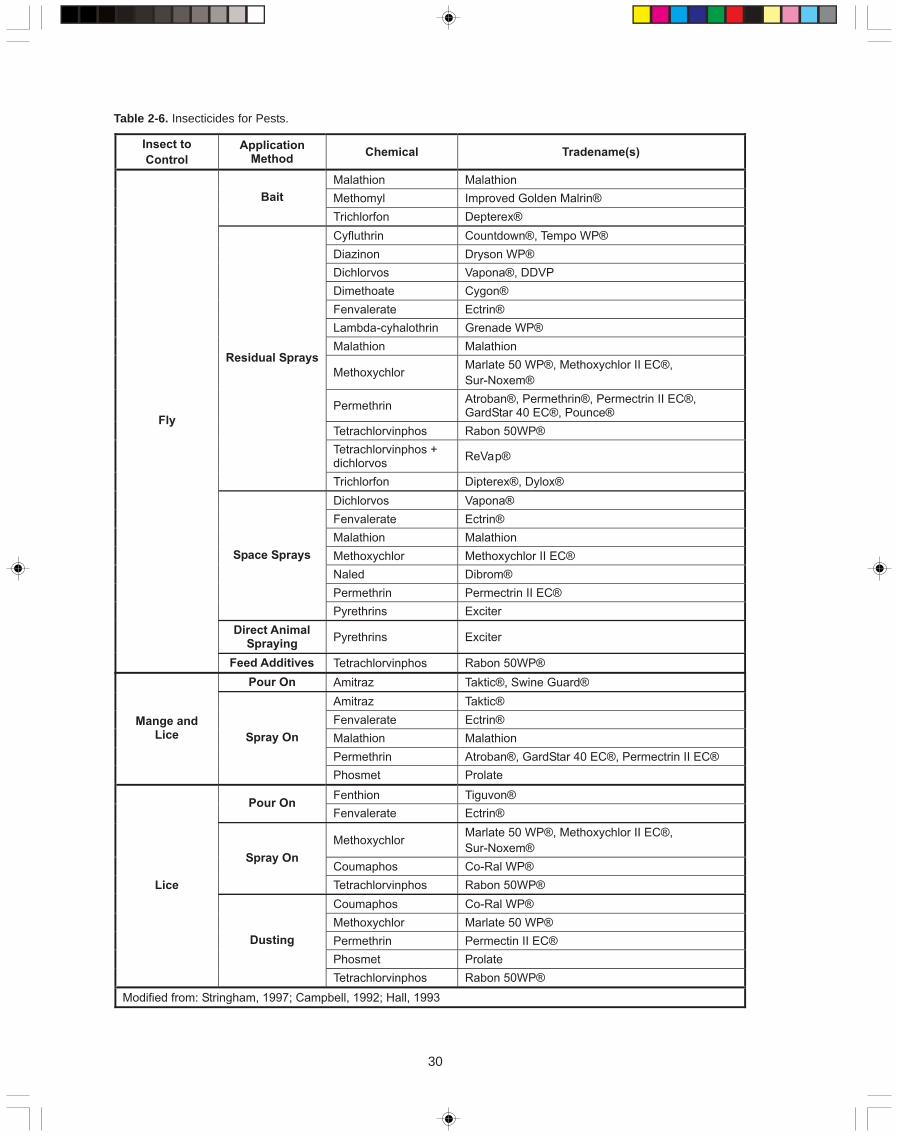
30
Table 2-6. Insecticides for Pests.
Insect to
Control
ApplicationMethod
Chemical Tradename(s)
Malathion Malathion
Methomyl Improved Golden Malrin®Bait
Trichlorfon Depterex®
Cyfluthrin Countdown®, Tempo WP®
Diazinon Dryson WP®
Dichlorvos Vapona®, DDVP
Dimethoate Cygon®
Fenvalerate Ectrin®
Lambda-cyhalothrin Grenade WP®
Malathion Malathion
MethoxychlorMarlate 50 WP®, Methoxychlor II EC®,
Sur-Noxem®
PermethrinAtroban®, Permethrin®, Permectrin II EC®,GardStar 40 EC®, Pounce®
Tetrachlorvinphos Rabon 50WP®
Tetrachlorvinphos +dichlorvos
ReVap®
Residual Sprays
Trichlorfon Dipterex®, Dylox®
Dichlorvos Vapona®
Fenvalerate Ectrin®
Malathion Malathion
Methoxychlor Methoxychlor II EC®
Naled Dibrom®
Permethrin Permectrin II EC®
Space Sprays
Pyrethrins Exciter
Direct AnimalSpraying
Pyrethrins Exciter
Fly
Feed Additives Tetrachlorvinphos Rabon 50WP®
Pour On Amitraz Taktic®, Swine Guard®
Amitraz Taktic®
Fenvalerate Ectrin®
Malathion Malathion
Permethrin Atroban®, GardStar 40 EC®, Permectrin II EC®
Mange andLice Spray On
Phosmet Prolate
Fenthion Tiguvon®Pour On
Fenvalerate Ectrin®
MethoxychlorMarlate 50 WP®, Methoxychlor II EC®,
Sur-Noxem®
Coumaphos Co-Ral WP®Spray On
Tetrachlorvinphos Rabon 50WP®
Coumaphos Co-Ral WP®
Methoxychlor Marlate 50 WP®
Permethrin Permectin II EC®
Phosmet Prolate
Lice
Dusting
Tetrachlorvinphos Rabon 50WP®
Modified from: Stringham, 1997; Campbell, 1992; Hall, 1993
31
Much of the operation costs for eliminating fly breeding areas will be labour. Pressure washing shouldbe done once every two weeks. Cleaning stalls of waste, bedding, and spilled food should be performedweekly, and bedding should be replaced every seven to ten days.
Controlling fly population with baits can add to the labour costs in production, as well as chemicalcosts and electricity costs. Baiting is generally only effective with houseflies, as stable flies feed offthe pigs. Electronic fly catchers electricity costs are $0.30/bulb/1,000 hours of operation. The operatingcosts of mange and lice control are mostly limited to labour and chemical costs.
General AssessmentPest control is very important as stable flies, lice, and mange can reduce weight gain and feed efficiency.The key to pest management is to eliminate a breeding environment, as it is easier to prevent peststhan it is to control them. Chemical solutions, although sometimes necessary, have a greater risk ofenvironmental contamination. Most modern swine operations have few problems with lice or mangeas skilled management preclude these problems.
Complementary TechnologiesGood sanitation and manure management practices help reduce insect problems before they start.Other methods of reducing breeding areas for flies include the use of a manure storage system,proper and timely dead stock disposal, drying solid manure, and soil application.
Literature CitedAdams, J. 2003. Vector: filth flies. In South Carolina Confined Animal Manure Managers Certification Program - Swine.
Chapter 10b. Clemson Extension.
Campbell, J.B. 1996. Fly control in confined livestock production systems. Manure Matters Vol. 2 No. 6.
Campbell, J.B. and B. Straw. 1992. Controlling external swine parasites. University of Nebraska-Lincoln, Cooperative Exten-sion. NebGuide G92-1094A.
Campbell, J., R. Williams, and R. Moon. 1996. A guide for fly control around swine facilities. Pork Industry Handbook PIH-121. Purdue University.
Hall, R.D. 1993 Controlling external parasites of swine. University of Missouri-Columbia, University Extension. PublicationG7020.
McKean, J., K. Holscher, and S. Quisenberry. 1992. External parasite control. Pork Industry Handbook PIH-40. PurdueUniversity.
Mock, D.E. 1997. Lice, mange and other swine insect problems. Kansas State University Agricultural Experiment Stationand Cooperative Extension Service. C-676.
Saskatchewan Agriculture and Food. 1999. Guidelines for establishing and managing livestock operations. SaskatchewanAgriculture and Food, Livestock and Veterinary Operations Branch.
Stringham, M. 1997. Fly management for the hog farm. Swine News Vol. 20, No. 4. May, 1997. North Carolina CooperativeExtension Service. North Carolina State University.
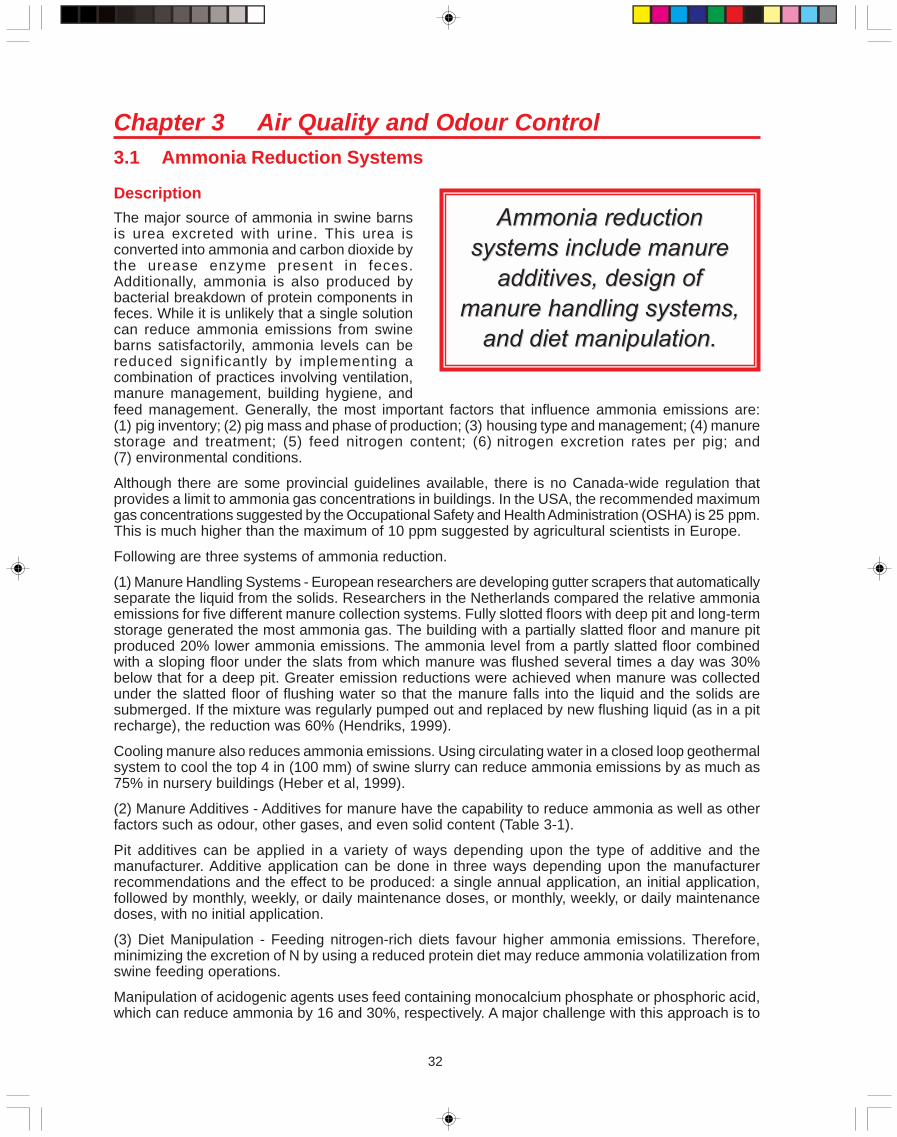
32
Chapter 3 Air Quality and Odour Control3.1 Ammonia Reduction Systems
AAmmmmoonniiaa rreedduuccttiioonn
ssyysstteemmss iinncclluuddee mmaannuurree
aaddddiittiivveess,, ddeessiiggnn ooff
mmaannuurree hhaannddlliinngg ssyysstteemmss,,
aanndd ddiieett mmaanniippuullaattiioonn..
DescriptionThe major source of ammonia in swine barnsis urea excreted with urine. This urea isconverted into ammonia and carbon dioxide bythe urease enzyme present in feces.Additionally, ammonia is also produced bybacterial breakdown of protein components infeces. While it is unlikely that a single solutioncan reduce ammonia emissions from swinebarns satisfactorily, ammonia levels can bereduced significantly by implementing acombination of practices involving ventilation,manure management, building hygiene, andfeed management. Generally, the most important factors that influence ammonia emissions are:(1) pig inventory; (2) pig mass and phase of production; (3) housing type and management; (4) manurestorage and treatment; (5) feed nitrogen content; (6) nitrogen excretion rates per pig; and(7) environmental conditions.
Although there are some provincial guidelines available, there is no Canada-wide regulation thatprovides a limit to ammonia gas concentrations in buildings. In the USA, the recommended maximumgas concentrations suggested by the Occupational Safety and Health Administration (OSHA) is 25 ppm.This is much higher than the maximum of 10 ppm suggested by agricultural scientists in Europe.
Following are three systems of ammonia reduction.
(1) Manure Handling Systems - European researchers are developing gutter scrapers that automaticallyseparate the liquid from the solids. Researchers in the Netherlands compared the relative ammoniaemissions for five different manure collection systems. Fully slotted floors with deep pit and long-termstorage generated the most ammonia gas. The building with a partially slatted floor and manure pitproduced 20% lower ammonia emissions. The ammonia level from a partly slatted floor combinedwith a sloping floor under the slats from which manure was flushed several times a day was 30%below that for a deep pit. Greater emission reductions were achieved when manure was collectedunder the slatted floor of flushing water so that the manure falls into the liquid and the solids aresubmerged. If the mixture was regularly pumped out and replaced by new flushing liquid (as in a pitrecharge), the reduction was 60% (Hendriks, 1999).
Cooling manure also reduces ammonia emissions. Using circulating water in a closed loop geothermalsystem to cool the top 4 in (100 mm) of swine slurry can reduce ammonia emissions by as much as75% in nursery buildings (Heber et al, 1999).
(2) Manure Additives - Additives for manure have the capability to reduce ammonia as well as otherfactors such as odour, other gases, and even solid content (Table 3-1).
Pit additives can be applied in a variety of ways depending upon the type of additive and themanufacturer. Additive application can be done in three ways depending upon the manufacturerrecommendations and the effect to be produced: a single annual application, an initial application,followed by monthly, weekly, or daily maintenance doses, or monthly, weekly, or daily maintenancedoses, with no initial application.
(3) Diet Manipulation - Feeding nitrogen-rich diets favour higher ammonia emissions. Therefore,minimizing the excretion of N by using a reduced protein diet may reduce ammonia volatilization fromswine feeding operations.
Manipulation of acidogenic agents uses feed containing monocalcium phosphate or phosphoric acid,which can reduce ammonia by 16 and 30%, respectively. A major challenge with this approach is to
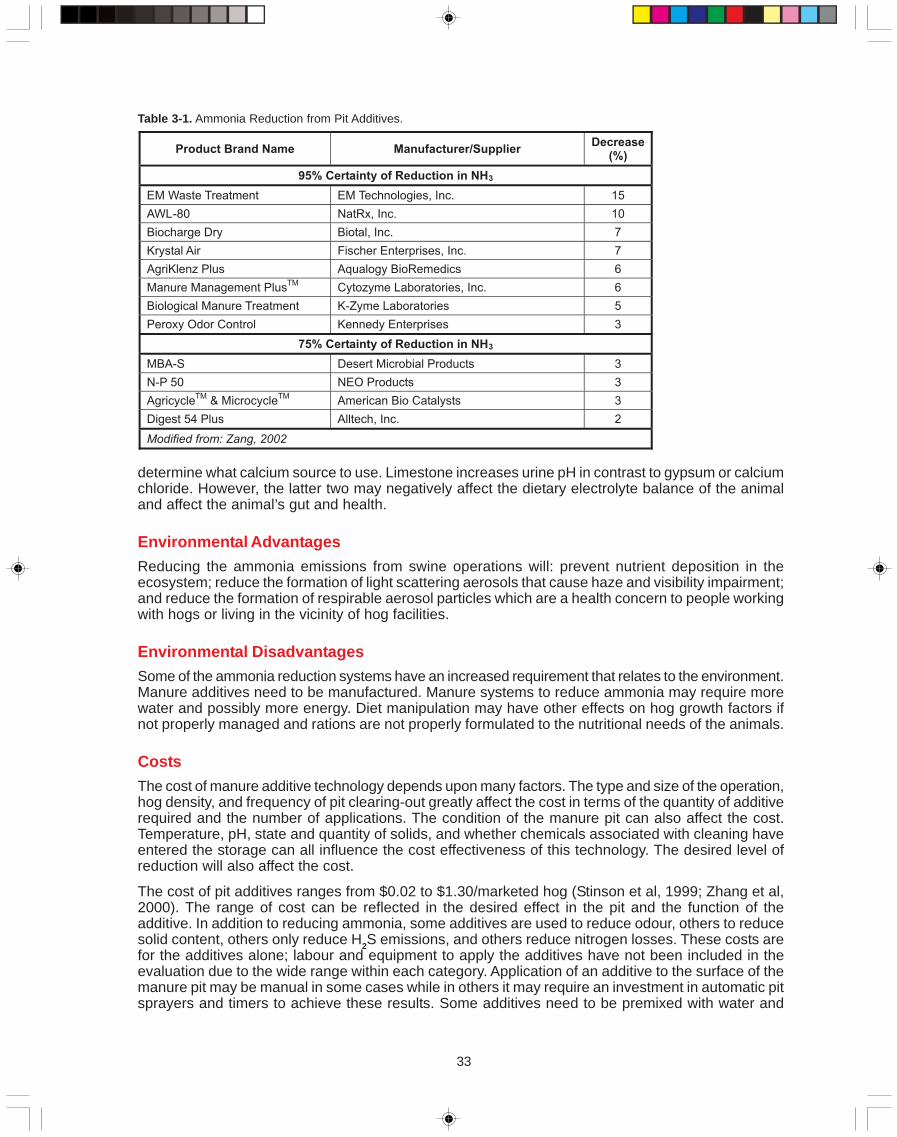
33
determine what calcium source to use. Limestone increases urine pH in contrast to gypsum or calciumchloride. However, the latter two may negatively affect the dietary electrolyte balance of the animaland affect the animal’s gut and health.
Environmental AdvantagesReducing the ammonia emissions from swine operations will: prevent nutrient deposition in theecosystem; reduce the formation of light scattering aerosols that cause haze and visibility impairment;and reduce the formation of respirable aerosol particles which are a health concern to people workingwith hogs or living in the vicinity of hog facilities.
Environmental DisadvantagesSome of the ammonia reduction systems have an increased requirement that relates to the environment.Manure additives need to be manufactured. Manure systems to reduce ammonia may require morewater and possibly more energy. Diet manipulation may have other effects on hog growth factors ifnot properly managed and rations are not properly formulated to the nutritional needs of the animals.
CostsThe cost of manure additive technology depends upon many factors. The type and size of the operation,hog density, and frequency of pit clearing-out greatly affect the cost in terms of the quantity of additiverequired and the number of applications. The condition of the manure pit can also affect the cost.Temperature, pH, state and quantity of solids, and whether chemicals associated with cleaning haveentered the storage can all influence the cost effectiveness of this technology. The desired level ofreduction will also affect the cost.
The cost of pit additives ranges from $0.02 to $1.30/marketed hog (Stinson et al, 1999; Zhang et al,2000). The range of cost can be reflected in the desired effect in the pit and the function of theadditive. In addition to reducing ammonia, some additives are used to reduce odour, others to reducesolid content, others only reduce H2S emissions, and others reduce nitrogen losses. These costs arefor the additives alone; labour and equipment to apply the additives have not been included in theevaluation due to the wide range within each category. Application of an additive to the surface of themanure pit may be manual in some cases while in others it may require an investment in automatic pitsprayers and timers to achieve these results. Some additives need to be premixed with water and
Table 3-1. Ammonia Reduction from Pit Additives.
Product Brand Name Manufacturer/SupplierDecrease
(%)
95% Certainty of Reduction in NH3
EM Waste Treatment EM Technologies, Inc. 15
AWL-80 NatRx, Inc. 10
Biocharge Dry Biotal, Inc. 7
Krystal Air Fischer Enterprises, Inc. 7
AgriKlenz Plus Aqualogy BioRemedics 6
Manure Management PlusTM
Cytozyme Laboratories, Inc. 6
Biological Manure Treatment K-Zyme Laboratories 5
Peroxy Odor Control Kennedy Enterprises 3
75% Certainty of Reduction in NH3
MBA-S Desert Microbial Products 3
N-P 50 NEO Products 3
AgricycleTM
& MicrocycleTM
American Bio Catalysts 3
Digest 54 Plus Alltech, Inc. 2
Modified from: Zang, 2002
34
others need to be spray-applied over the surface as opposed to being poured into the lagoon/pit, thusincreasing labour and equipment costs. It is expected that the costs for labour where maintenancedoses are applied will be much greater than for just a single annual application. If the quantity ofadditive is large due to the size of operation or the frequency of application, a separate room/smallbuilding may be required for the storage of the additive, thus increasing the costs.
Costs associated with manure handling systems are largely capital costs and in most cases arerelated to the barn, manure storage, and manure handling equipment. An example is the system,previously described, to cool the top 4 in (100 mm) of manure that has a capital cost of $38.80/pig ina nursery building (Heber et al, 1999).
General AssessmentThere is no single method that satisfactorily reduces ammonia. For new facilities, selecting buildingand pen designs that reduce the physical wet ammonia emitting surfaces combined with good barnhygiene can result in the highest reduction of ammonia levels in barns. For existing facilities, improvedbarn hygiene combined with proper ventilation could offer acceptable ammonia reduction at minimalcost. Diet manipulation appears to require more study before it can become a generally acceptedpractice.
Complementary TechnologiesVentilation of manure can affect ammonia gas emission rates. Air speeds across manure-coveredsurfaces should not be excessive since the amount of ammonia gas given off by manure increaseswith air speed. Hence, control systems that prevent excess ventilation rates are a complementarytechnology.
Literature CitedHeber, A.J., D.J. Jones, and A.L. Sutton. 1999. Methods and practices to reduce odor from swine facilities. Ag Air Quality
AQ-2. Purdue University Cooperative Extension Service.
Hendricks, H.J.M. and A.M. van de Weerdhof. 1999. Dutch notes on BAT for pig and poultry intensive livestock farming.Ministry of Agriculture, Nature Management and Fisheries, National Reference Centre Agriculture, Netherlands.
Johnson, J. 1997. Evaluation of commercial manure additives. Final Report. Agricultural Utilization Research Institute (AURI),Waseca, MN.
Klooster, C.E. and J.A.M. Voermans. 1993. European perspectives – how are they solving their problems. Proc. Symp.“Meeting the Environmental Challenge”. National Pork Producers Council. November 17-18, 1993 in Minneapolis: 75-99.
Saskatchewan Agriculture, Food and Rural Revitalization. 2004. Establishing and managing livestock operations. ISBN 0-88656-697-5.
Stinson, R., S. P. Lemay, E. M. Barber, and T. Fonstad. 1999. Effectiveness of three manure pit additives. Prairie SwineCentre, 1999 Annual Research Report.
Zhang,Q., J. Feddes, I. Edeogu, M. Nyachoti, J. House, D. Small, C. Liu, D. Mann, and G. Clark. 2000. Odour production,evaluation and control. Manitoba Livestock Manure Management Initiative Inc. Project MLMMI 02-HERS-03.
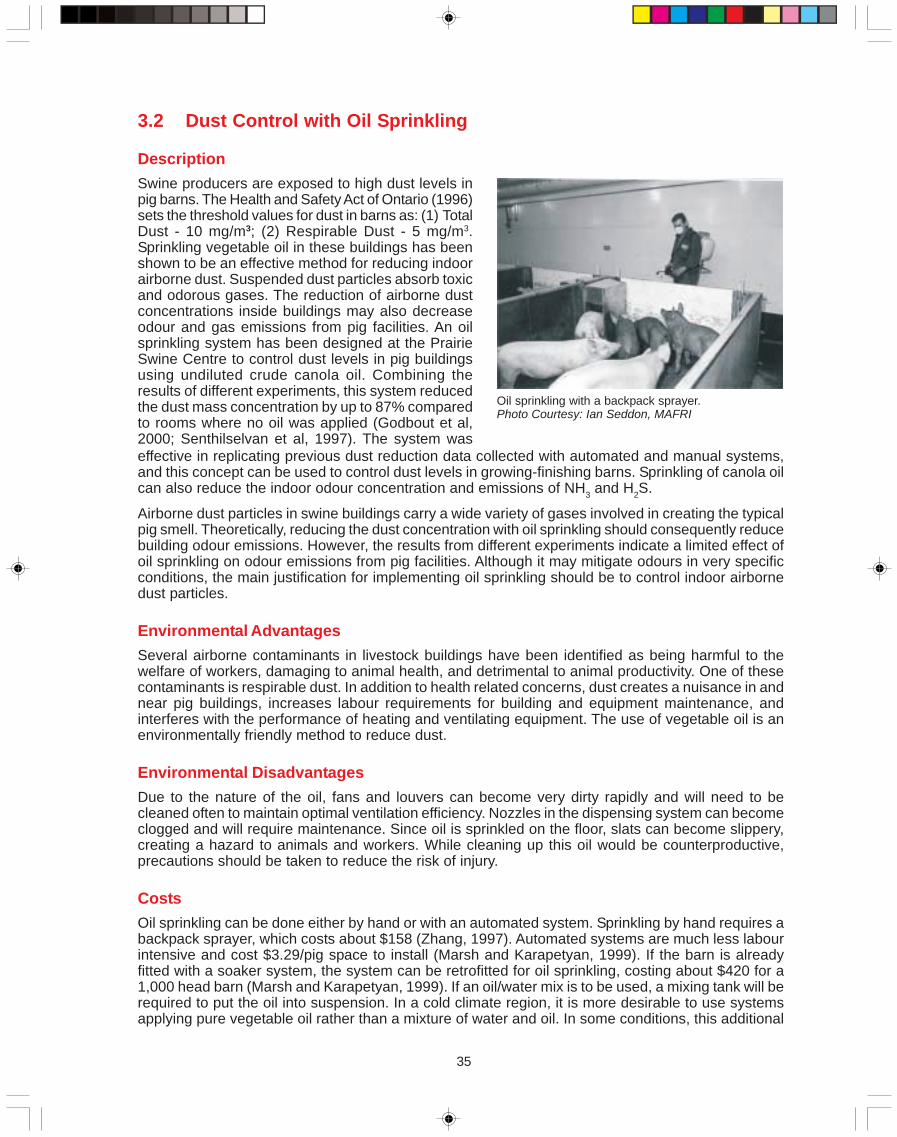
35
3.2 Dust Control with Oil Sprinkling
DescriptionSwine producers are exposed to high dust levels inpig barns. The Health and Safety Act of Ontario (1996)sets the threshold values for dust in barns as: (1) TotalDust - 10 mg/m3; (2) Respirable Dust - 5 mg/m3.Sprinkling vegetable oil in these buildings has beenshown to be an effective method for reducing indoorairborne dust. Suspended dust particles absorb toxicand odorous gases. The reduction of airborne dustconcentrations inside buildings may also decreaseodour and gas emissions from pig facilities. An oilsprinkling system has been designed at the PrairieSwine Centre to control dust levels in pig buildingsusing undiluted crude canola oil. Combining theresults of different experiments, this system reducedthe dust mass concentration by up to 87% comparedto rooms where no oil was applied (Godbout et al,2000; Senthilselvan et al, 1997). The system was
Oil sprinkling with a backpack sprayer.Photo Courtesy: Ian Seddon, MAFRI
effective in replicating previous dust reduction data collected with automated and manual systems,and this concept can be used to control dust levels in growing-finishing barns. Sprinkling of canola oilcan also reduce the indoor odour concentration and emissions of NH3 and H2S.
Airborne dust particles in swine buildings carry a wide variety of gases involved in creating the typicalpig smell. Theoretically, reducing the dust concentration with oil sprinkling should consequently reducebuilding odour emissions. However, the results from different experiments indicate a limited effect ofoil sprinkling on odour emissions from pig facilities. Although it may mitigate odours in very specificconditions, the main justification for implementing oil sprinkling should be to control indoor airbornedust particles.
Environmental AdvantagesSeveral airborne contaminants in livestock buildings have been identified as being harmful to thewelfare of workers, damaging to animal health, and detrimental to animal productivity. One of thesecontaminants is respirable dust. In addition to health related concerns, dust creates a nuisance in andnear pig buildings, increases labour requirements for building and equipment maintenance, andinterferes with the performance of heating and ventilating equipment. The use of vegetable oil is anenvironmentally friendly method to reduce dust.
Environmental DisadvantagesDue to the nature of the oil, fans and louvers can become very dirty rapidly and will need to becleaned often to maintain optimal ventilation efficiency. Nozzles in the dispensing system can becomeclogged and will require maintenance. Since oil is sprinkled on the floor, slats can become slippery,creating a hazard to animals and workers. While cleaning up this oil would be counterproductive,precautions should be taken to reduce the risk of injury.
CostsOil sprinkling can be done either by hand or with an automated system. Sprinkling by hand requires abackpack sprayer, which costs about $158 (Zhang, 1997). Automated systems are much less labourintensive and cost $3.29/pig space to install (Marsh and Karapetyan, 1999). If the barn is alreadyfitted with a soaker system, the system can be retrofitted for oil sprinkling, costing about $420 for a1,000 head barn (Marsh and Karapetyan, 1999). If an oil/water mix is to be used, a mixing tank will berequired to put the oil into suspension. In a cold climate region, it is more desirable to use systemsapplying pure vegetable oil rather than a mixture of water and oil. In some conditions, this additional
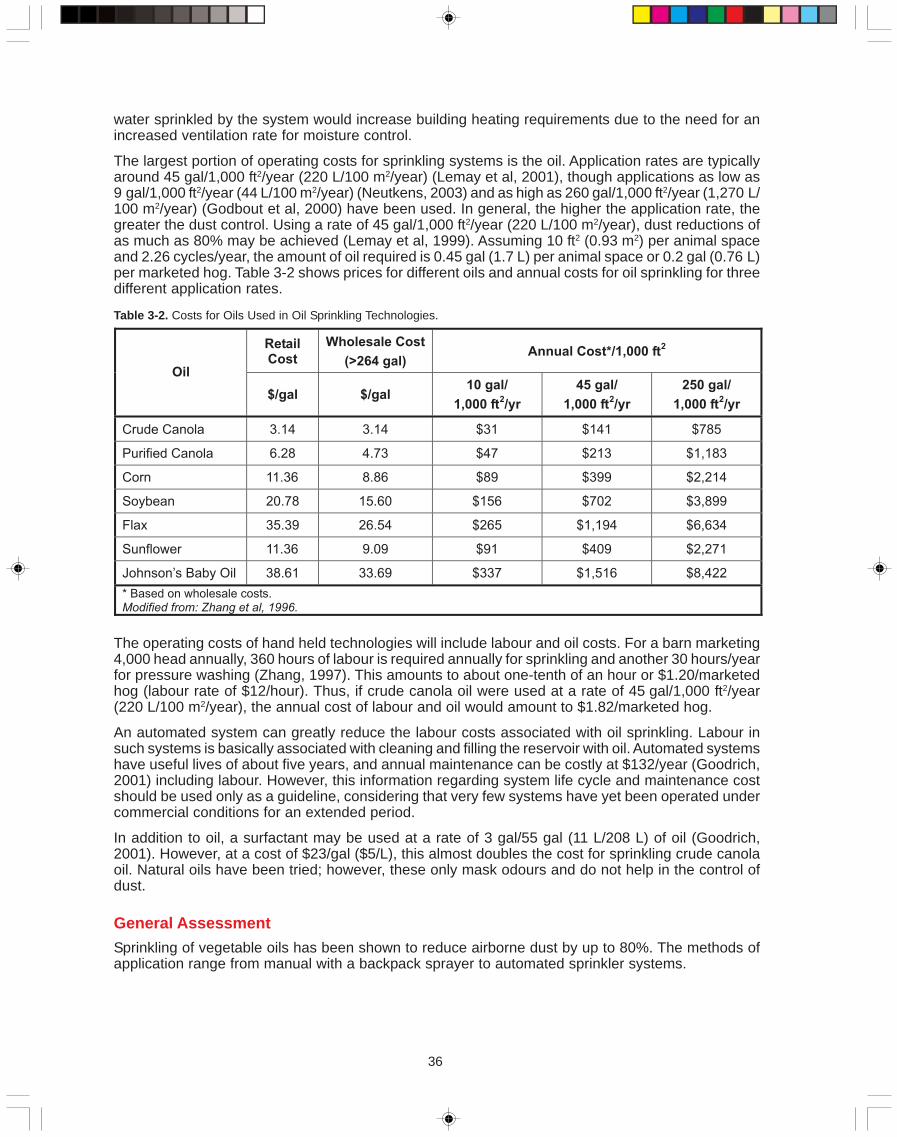
36
water sprinkled by the system would increase building heating requirements due to the need for anincreased ventilation rate for moisture control.
The largest portion of operating costs for sprinkling systems is the oil. Application rates are typicallyaround 45 gal/1,000 ft2/year (220 L/100 m2/year) (Lemay et al, 2001), though applications as low as9 gal/1,000 ft2/year (44 L/100 m2/year) (Neutkens, 2003) and as high as 260 gal/1,000 ft2/year (1,270 L/100 m2/year) (Godbout et al, 2000) have been used. In general, the higher the application rate, thegreater the dust control. Using a rate of 45 gal/1,000 ft2/year (220 L/100 m2/year), dust reductions ofas much as 80% may be achieved (Lemay et al, 1999). Assuming 10 ft2 (0.93 m2) per animal spaceand 2.26 cycles/year, the amount of oil required is 0.45 gal (1.7 L) per animal space or 0.2 gal (0.76 L)per marketed hog. Table 3-2 shows prices for different oils and annual costs for oil sprinkling for threedifferent application rates.
Table 3-2. Costs for Oils Used in Oil Sprinkling Technologies.
RetailCost
Wholesale Cost
(>264 gal)Annual Cost*/1,000 ft
2
Oil
$/gal $/gal10 gal/
1,000 ft2/yr
45 gal/
1,000 ft2/yr
250 gal/
1,000 ft2/yr
Crude Canola 3.14 3.14 $31 $141 $785
Purified Canola 6.28 4.73 $47 $213 $1,183
Corn 11.36 8.86 $89 $399 $2,214
Soybean 20.78 15.60 $156 $702 $3,899
Flax 35.39 26.54 $265 $1,194 $6,634
Sunflower 11.36 9.09 $91 $409 $2,271
Johnson’s Baby Oil 38.61 33.69 $337 $1,516 $8,422
* Based on wholesale costs.Modified from: Zhang et al, 1996.
The operating costs of hand held technologies will include labour and oil costs. For a barn marketing4,000 head annually, 360 hours of labour is required annually for sprinkling and another 30 hours/yearfor pressure washing (Zhang, 1997). This amounts to about one-tenth of an hour or $1.20/marketedhog (labour rate of $12/hour). Thus, if crude canola oil were used at a rate of 45 gal/1,000 ft2/year(220 L/100 m2/year), the annual cost of labour and oil would amount to $1.82/marketed hog.
An automated system can greatly reduce the labour costs associated with oil sprinkling. Labour insuch systems is basically associated with cleaning and filling the reservoir with oil. Automated systemshave useful lives of about five years, and annual maintenance can be costly at $132/year (Goodrich,2001) including labour. However, this information regarding system life cycle and maintenance costshould be used only as a guideline, considering that very few systems have yet been operated undercommercial conditions for an extended period.
In addition to oil, a surfactant may be used at a rate of 3 gal/55 gal (11 L/208 L) of oil (Goodrich,2001). However, at a cost of $23/gal ($5/L), this almost doubles the cost for sprinkling crude canolaoil. Natural oils have been tried; however, these only mask odours and do not help in the control ofdust.
General AssessmentSprinkling of vegetable oils has been shown to reduce airborne dust by up to 80%. The methods ofapplication range from manual with a backpack sprayer to automated sprinkler systems.
37
Complementary Technologies(1) Wet Scrubbers in Ventilation: A wet scrubber is a particle and gas collector that traps fine particlesusing liquid droplets such as water. Wet scrubbing has the advantage of removing particles withoutregular maintenance and can also remove water-soluble gases such as ammonia. Disadvantages ofwet scrubber designs include the need for using a large quantity of water and the disposal of dirtywater (Carpenter and Fryer, 1990).
(2) Dry Filtration: The use of purpose built dry filters in livestock buildings is a method of reducingabout half of the dust mass and some bacterial colony-forming particles. Examples of designs forlivestock buildings include: (a) ceiling mounted; (b) low profile ceiling mounted; and (c) floor-standingwith low-speed air discharge. Manual vacuum cleaning can be required every five days. Dry filtrationin large facilities would only be effective if efforts were made to relegate all dust generating sources(Carpenter and Fryer, 1990).
Literature CitedCarpenter, G.A. and J.T. Fryer. 1990. Air filtration in a piggery: filter design and dust mass balance. Journal of Agricultural
Engineering. 46(3):171-186.
Godbout, S., S.P. Lemay, R. Joncas, J.P. Larouche, D.Y. Martin, J.F. Bernier, R.T. Zijlstra, L. Chénard, A. Marquis, E.M.Barber, and D. Massé. 2000. Oil sprinkling and dietary manipulation to reduce odour and gas emissions from grower/finisher buildings – laboratory scale experiment. 2000 Annual research Report, 35-36. Prairie Swine Centre Inc., Saska-toon, SK, Canada.
Goodrich, P.R. 2001. Best technologies for reducing odor emissions from curtain-sided, deep pit swine finishing buildings.Final report to Minnesota Pork Producers Association, November 2001.
Jansen, A. and J.J.R. Feddes. 1995. Effect of airborne dust on health and performance of growing pigs. Department ofAgricultural, Food and Nutritional Science. Canadian Agricultural Engineering. Vol. 37(3): 211-216.
Lemay, S.P., E.M. Barber, M. Bantle, and D. Marcotte. 1999. An oil sprinkling system for dust control in pig buildings. AnnualResearch Report 1999, 22-23. Prairie Swine Centre Inc., Saskatoon, SK, Canada.
Lemay, S.P., L. Chénard, E.M. Barber, and R. Fengler. 2001. Optimizing of a sprinkling system using undiluted canola oil fordust control in pig buildings. 2000 Annual Research Report, 31-32. Prairie Swine Centre Inc., Saskatoon, SK, Canada.
Marsh, L. and Z. Karapetyan. 1999. An evaluation of alternative approaches to reduce odours from intensive swine opera-tions. Interim Report – Item #428-1999 Appropriations Act. Virginia Department of Environmental Quality.
Neutkens, D. 2003. Odor control tactics pay off. National Hog Farmer, September 15, 2003.
Senthilselvan, A., Y. Zhang, J.A. Dosman, E.M. Barber, L.E. Holfeld, S.P. Kirychuk, Y. Cormier, T.S. Hurst, and C.S. Rhodes.1997. Positive human health effects of dust suppression with canola oil in swine barns. American Journal of Respiratoryand Critical Care Medicine. Vol. 156(2): 410-417.
Riskowski, G.L. 1999. Wet scrubbers for removing dust and gases from fan exhausts. Swine Odor and Waste Management.University of Illinois.
Zhang, Y. 1997. Sprinkling Oil to reduce dust, gases, and odor in swine buildings. MidWest Plan Service. AgriculturalEngineers Digest 42.
Zhang, Y., J.F. Patience, E.M. Barber, and J.J.R. Feddes. 1996. Sprinkling oil to reduce odour and airborne dust in swinebuildings. Final Report to Saskatchewan Agriculture and Food.
Zhang, Y., A. Tanaka, J.A. Dosman, A. Senthilselvan, E.M. Barber, S.P. Kirychuk, L.E. Holfeld, and T. Hurst. 1997. Respira-tory responses of human subjects to air quality in a swine building. In Livestock Environment V, Proceedings of the 5thInternational Livestock Environment Symposium, 655-663. ASAE Publication. St-Joseph, MI: ASAE.
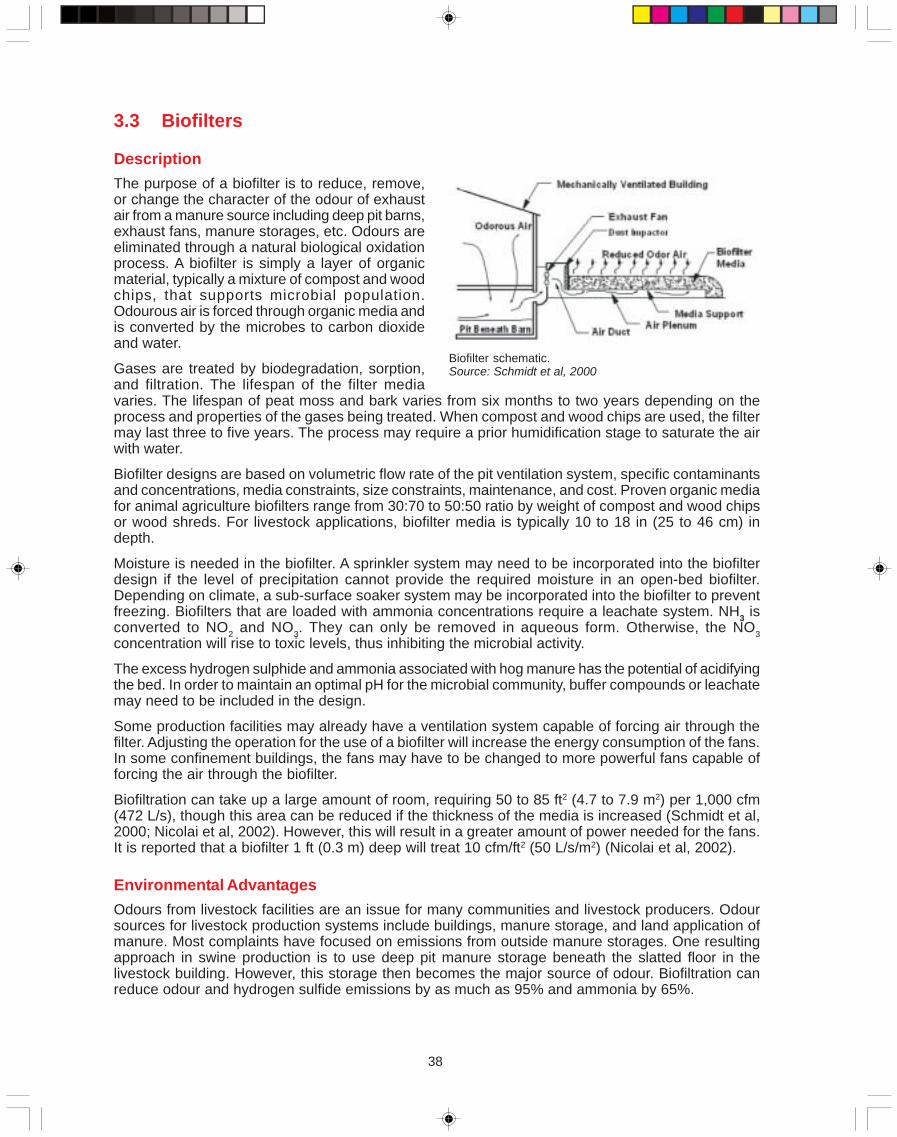
38
3.3 Biofilters
DescriptionThe purpose of a biofilter is to reduce, remove,or change the character of the odour of exhaustair from a manure source including deep pit barns,exhaust fans, manure storages, etc. Odours areeliminated through a natural biological oxidationprocess. A biofilter is simply a layer of organicmaterial, typically a mixture of compost and woodchips, that supports microbial population.Odourous air is forced through organic media andis converted by the microbes to carbon dioxideand water.
Gases are treated by biodegradation, sorption,and filtration. The lifespan of the filter media
Biofilter schematic.Source: Schmidt et al, 2000
varies. The lifespan of peat moss and bark varies from six months to two years depending on theprocess and properties of the gases being treated. When compost and wood chips are used, the filtermay last three to five years. The process may require a prior humidification stage to saturate the airwith water.
Biofilter designs are based on volumetric flow rate of the pit ventilation system, specific contaminantsand concentrations, media constraints, size constraints, maintenance, and cost. Proven organic mediafor animal agriculture biofilters range from 30:70 to 50:50 ratio by weight of compost and wood chipsor wood shreds. For livestock applications, biofilter media is typically 10 to 18 in (25 to 46 cm) indepth.
Moisture is needed in the biofilter. A sprinkler system may need to be incorporated into the biofilterdesign if the level of precipitation cannot provide the required moisture in an open-bed biofilter.Depending on climate, a sub-surface soaker system may be incorporated into the biofilter to preventfreezing. Biofilters that are loaded with ammonia concentrations require a leachate system. NH3 isconverted to NO2 and NO3. They can only be removed in aqueous form. Otherwise, the NO3concentration will rise to toxic levels, thus inhibiting the microbial activity.
The excess hydrogen sulphide and ammonia associated with hog manure has the potential of acidifyingthe bed. In order to maintain an optimal pH for the microbial community, buffer compounds or leachatemay need to be included in the design.
Some production facilities may already have a ventilation system capable of forcing air through thefilter. Adjusting the operation for the use of a biofilter will increase the energy consumption of the fans.In some confinement buildings, the fans may have to be changed to more powerful fans capable offorcing the air through the biofilter.
Biofiltration can take up a large amount of room, requiring 50 to 85 ft2 (4.7 to 7.9 m2) per 1,000 cfm(472 L/s), though this area can be reduced if the thickness of the media is increased (Schmidt et al,2000; Nicolai et al, 2002). However, this will result in a greater amount of power needed for the fans.It is reported that a biofilter 1 ft (0.3 m) deep will treat 10 cfm/ft2 (50 L/s/m2) (Nicolai et al, 2002).
Environmental AdvantagesOdours from livestock facilities are an issue for many communities and livestock producers. Odoursources for livestock production systems include buildings, manure storage, and land application ofmanure. Most complaints have focused on emissions from outside manure storages. One resultingapproach in swine production is to use deep pit manure storage beneath the slatted floor in thelivestock building. However, this storage then becomes the major source of odour. Biofiltration canreduce odour and hydrogen sulfide emissions by as much as 95% and ammonia by 65%.
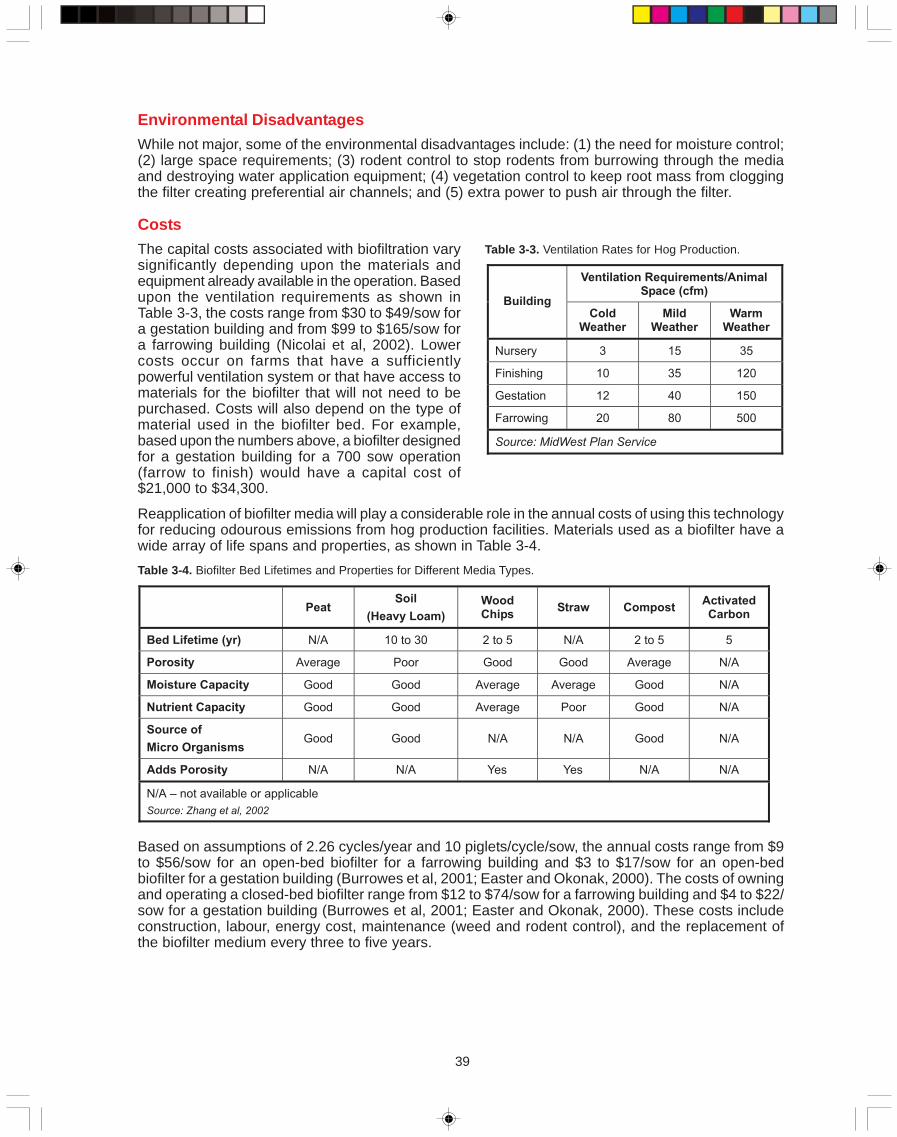
39
Environmental DisadvantagesWhile not major, some of the environmental disadvantages include: (1) the need for moisture control;(2) large space requirements; (3) rodent control to stop rodents from burrowing through the mediaand destroying water application equipment; (4) vegetation control to keep root mass from cloggingthe filter creating preferential air channels; and (5) extra power to push air through the filter.
CostsThe capital costs associated with biofiltration varysignificantly depending upon the materials andequipment already available in the operation. Basedupon the ventilation requirements as shown inTable 3-3, the costs range from $30 to $49/sow fora gestation building and from $99 to $165/sow fora farrowing building (Nicolai et al, 2002). Lowercosts occur on farms that have a sufficientlypowerful ventilation system or that have access tomaterials for the biofilter that will not need to bepurchased. Costs will also depend on the type ofmaterial used in the biofilter bed. For example,based upon the numbers above, a biofilter designedfor a gestation building for a 700 sow operation(farrow to finish) would have a capital cost of
Ventilation Requirements/AnimalSpace (cfm)
BuildingCold
WeatherMild
WeatherWarm
Weather
Nursery 3 15 35
Finishing 10 35 120
Gestation 12 40 150
Farrowing 20 80 500
Source: MidWest Plan Service
Table 3-3. Ventilation Rates for Hog Production.
$21,000 to $34,300.
Reapplication of biofilter media will play a considerable role in the annual costs of using this technologyfor reducing odourous emissions from hog production facilities. Materials used as a biofilter have awide array of life spans and properties, as shown in Table 3-4.
PeatSoil
(Heavy Loam)
WoodChips
Straw CompostActivatedCarbon
Bed Lifetime (yr) N/A 10 to 30 2 to 5 N/A 2 to 5 5
Porosity Average Poor Good Good Average N/A
Moisture Capacity Good Good Average Average Good N/A
Nutrient Capacity Good Good Average Poor Good N/A
Source of
Micro OrganismsGood Good N/A N/A Good N/A
Adds Porosity N/A N/A Yes Yes N/A N/A
N/A – not available or applicable
Source: Zhang et al, 2002
Table 3-4. Biofilter Bed Lifetimes and Properties for Different Media Types.
Based on assumptions of 2.26 cycles/year and 10 piglets/cycle/sow, the annual costs range from $9to $56/sow for an open-bed biofilter for a farrowing building and $3 to $17/sow for an open-bedbiofilter for a gestation building (Burrowes et al, 2001; Easter and Okonak, 2000). The costs of owningand operating a closed-bed biofilter range from $12 to $74/sow for a farrowing building and $4 to $22/sow for a gestation building (Burrowes et al, 2001; Easter and Okonak, 2000). These costs includeconstruction, labour, energy cost, maintenance (weed and rodent control), and the replacement ofthe biofilter medium every three to five years.
40
General AssessmentBiofilters can eliminate up to 95% of the odours coming from manure pits. The key advantage is thatthey are inexpensive to install. They require extra management and costs to setup and operate.However, as an environmentally friendly method to reduce odour from manure pit ventilation systems,biofilters are a reasonable option to consider.
Complementary TechnologiesOdourous air can also be blown through activated carbon canisters. The odour causing compoundsare removed from the air as they are absorbed onto the carbon. The absorptive carbon media mustbe periodically replaced as it becomes saturated with gases, volatile organic compounds, and odorousgas.
Literature CitedBurrowes, P.A., J.P. Witherspoon, C. Quigley, and C. Easter. 2001. Biofilters - wastewater collection and treatment odour
experiences of a sustainable technology in North America. Proceedings of the 1st IWA International Conference onOdour and Volatile Organic Compounds, Measurement, Regulation and Control Techniques. p 453-461.
Easter, C.C. and C.C. Okonak. 2000. Biofilter systems for odor control in wastewater treatment applications, an overview ofissues and options. Proceedings of Odor and VOC 2000, Water Environment Federation.
Mann, D.D., J.C. DeBruyn, and Q. Zhang. 2002. Design and evaluation of an open biofilter for treatment of odour from swinebarns during sub-zero ambient temperatures. Canadian Biosystems Engineering 44:6.21-6.26.
MidWest Plan Service. Mechanical ventilating systems for livestock housing. MWPS-32. MidWest Plan Service, Ames,Iowa.
Nicolai, R., K.A. Janni, and D. Schmidt. 2002. Frequently asked questions about biofilters. University of Minnesota Exten-sion Service, Department of Biosystems and Agricultural Engineering, St. Paul, MN.
Nicolai, R., K. Janni, and D. Schmidt . 2002. Biofilter design information. Baeu-18. University of Minnesota.
Schmidt, D.R., K.A. Janni, and R.E. Nicolai. 2000. Biofilters for odor control. Factsheet. University of Minnesota ExtensionService, Department of Biosystems and Agricultural Engineering, St. Paul, MN.
Zhang, Q., J. Feddes, I. Edeogu, M. Nyachoti, J. House, D. Small, C. Liu, D. Mann, and G. Clark. 2002. Odour production,evaluation and control. Project MLMMI 02-HERS-03, Final Report Submitted to Manitoba Livestock Manure Manage-ment Initiative Inc. October, 2002.
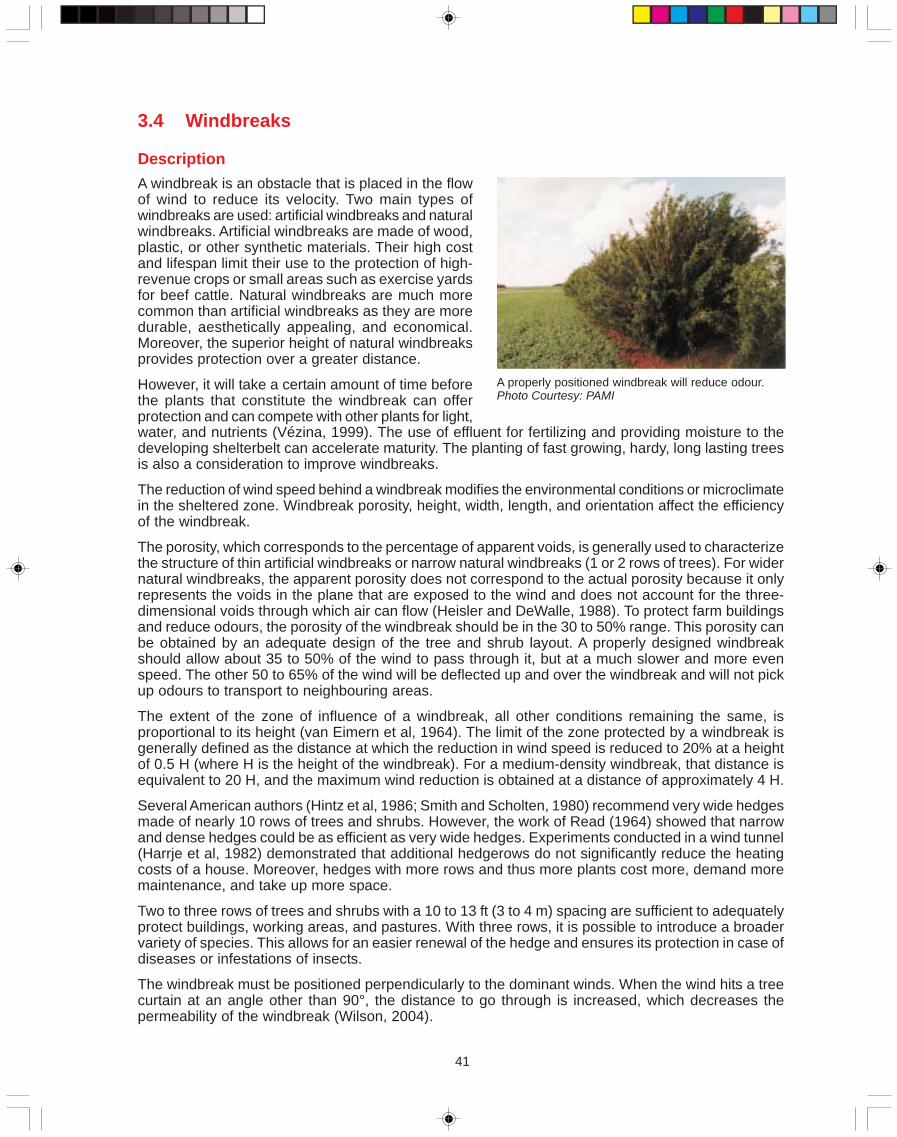
41
3.4 Windbreaks
DescriptionA windbreak is an obstacle that is placed in the flowof wind to reduce its velocity. Two main types ofwindbreaks are used: artificial windbreaks and naturalwindbreaks. Artificial windbreaks are made of wood,plastic, or other synthetic materials. Their high costand lifespan limit their use to the protection of high-revenue crops or small areas such as exercise yardsfor beef cattle. Natural windbreaks are much morecommon than artificial windbreaks as they are moredurable, aesthetically appealing, and economical.Moreover, the superior height of natural windbreaksprovides protection over a greater distance.
However, it will take a certain amount of time beforethe plants that constitute the windbreak can offerprotection and can compete with other plants for light,
A properly positioned windbreak will reduce odour.Photo Courtesy: PAMI
water, and nutrients (Vézina, 1999). The use of effluent for fertilizing and providing moisture to thedeveloping shelterbelt can accelerate maturity. The planting of fast growing, hardy, long lasting treesis also a consideration to improve windbreaks.
The reduction of wind speed behind a windbreak modifies the environmental conditions or microclimatein the sheltered zone. Windbreak porosity, height, width, length, and orientation affect the efficiencyof the windbreak.
The porosity, which corresponds to the percentage of apparent voids, is generally used to characterizethe structure of thin artificial windbreaks or narrow natural windbreaks (1 or 2 rows of trees). For widernatural windbreaks, the apparent porosity does not correspond to the actual porosity because it onlyrepresents the voids in the plane that are exposed to the wind and does not account for the three-dimensional voids through which air can flow (Heisler and DeWalle, 1988). To protect farm buildingsand reduce odours, the porosity of the windbreak should be in the 30 to 50% range. This porosity canbe obtained by an adequate design of the tree and shrub layout. A properly designed windbreakshould allow about 35 to 50% of the wind to pass through it, but at a much slower and more evenspeed. The other 50 to 65% of the wind will be deflected up and over the windbreak and will not pickup odours to transport to neighbouring areas.
The extent of the zone of influence of a windbreak, all other conditions remaining the same, isproportional to its height (van Eimern et al, 1964). The limit of the zone protected by a windbreak isgenerally defined as the distance at which the reduction in wind speed is reduced to 20% at a heightof 0.5 H (where H is the height of the windbreak). For a medium-density windbreak, that distance isequivalent to 20 H, and the maximum wind reduction is obtained at a distance of approximately 4 H.
Several American authors (Hintz et al, 1986; Smith and Scholten, 1980) recommend very wide hedgesmade of nearly 10 rows of trees and shrubs. However, the work of Read (1964) showed that narrowand dense hedges could be as efficient as very wide hedges. Experiments conducted in a wind tunnel(Harrje et al, 1982) demonstrated that additional hedgerows do not significantly reduce the heatingcosts of a house. Moreover, hedges with more rows and thus more plants cost more, demand moremaintenance, and take up more space.
Two to three rows of trees and shrubs with a 10 to 13 ft (3 to 4 m) spacing are sufficient to adequatelyprotect buildings, working areas, and pastures. With three rows, it is possible to introduce a broadervariety of species. This allows for an easier renewal of the hedge and ensures its protection in case ofdiseases or infestations of insects.
The windbreak must be positioned perpendicularly to the dominant winds. When the wind hits a treecurtain at an angle other than 90°, the distance to go through is increased, which decreases thepermeability of the windbreak (Wilson, 2004).
42
Environmental AdvantagesWindbreaks are thought to reduce odour emissions in two ways; deflecting the wind currents up andover the odour source so less odour is collected and carried away, and by promoting the diluting andrising of air currents as they are carried past the odour source. A properly positioned windbreak willreduce the amount of air that moves past a manure storage facility and therefore reduce the movementof unpleasant odours. Environmental advantages from windbreaks also include decreased energycosts and fuel use, as well as fewer problems with snowdrift on manure storages, which may lead tooverflow or structural damage of covers and/or leakage. It has been shown that a strong shelterbeltcan result in buildings within the shelterbelt being as much as 30% more energy efficient as comparedto buildings completely exposed to the elements (PFRA, 2003; Pollack, 2003). Windbreaks can alsoreduce soil erosion and air pollutant transfer (substantial amounts of odorous compounds and ammoniaemitted from swine buildings are absorbed and transported by dust particles). A tree line shelterbeltcan produce some energy in the form of inexpensive fuel for wood burning stoves. Shelterbelts alsoprovide protection and habitat for wildlife and birds. Planting fruit and nut trees in the windbreak canalso provide some food for both humans and animals. Properly spaced and managed shelterbeltscan provide as much benefit as perennial cover, and the roots and shoots, which remain in placeyear-round, help to hold steep slopes in place, capture snow for additional soil moisture, and helpreduce water erosion by slowing water movement during flooding. Plant-based windbreaks act assinks for the chemical constituents of odourous pollution. Volatile organic compounds (VOC’s), whichaccount for the offensive odour in livestock manure, have a distinct affinity for the lipophilic (fats andoils) membranes that cover plant leaves. Researchers have also determined that quantities of VOC’sare absorbed by plant tissues and that the microorganisms that populate the surface of plants alsoabsorb VOC’s and provide pollution collection.
Environmental DisadvantagesA poorly designed windbreak may create problems in wind turbulence, which may actually increaseodour problems. An improperly designed windbreak may cause problems with snow deposition andcreate hazards with visibility and drifting snow. Windbreaks may fail due to high wind speeds thatcause catastrophic failure of the entire system. Trees and/or structures may be lost and may furtherdamage buildings and manure storage units with debris. Gaps in windbreaks may actually acceleratewind flows and lead to erosion and damage to buildings. Windbreaks take long term planning toestablish. Trees and shrubs may require considerable effort to establish in poorer soil conditions. Theloss of cultivable land generally constitutes the principle indirect cost related to the establishment of anatural windbreak. Odours are more concentrated in the area between the source of the odours andthe windbreak than downwind from the windbreak (Bottcher et al, 1999), which can inconvenience theemployees that are working in the immediate surrounding of the barn. On a sunny day, the airtemperature in the zone protected by the windbreak can be as much as 5°F (3ºC) higher than theambient temperature in an unprotected area. During the summer, this temperature rise can increasehuman and animal discomfort.
CostsPrairie Farm Rehabilitation Administration’s (PFRA, Agriculture and Agri-Food Canada) ShelterbeltCentre provides seedlings and plastic mulch free of charge to agricultural producers with more than39 ac (16 ha). Owners of rural land holdings of 1 to 39 ac (0.4 to 16 ha) are eligible for a restricted listof tree and shrub species. Currently this service is available only in Manitoba, Saskatchewan, Alberta,and the B.C. Peace Region.
At a cost of $3 to $5/seedling for regions not within the boundaries of PFRA, the cost of planting ashelterbelt is $1,533 to $3,405/¼ mi ($1,200/¼ mi (402 m) for labour and machinery costs for plantingand maintenance for three years plus $333 to $2,205 for seedlings), depending upon tree/shrubselection and spacing. Thus for a 10 ac (4 ha) property with two shelterbelt rows 16 ft (5 m) apart, thetotal capital requirement is $6,132 to $13,620. Due to the length of time needed for shelterbelts todevelop, temporary structural windbreaks may need to be considered.
In some communities, conservation organizations may provide a planting service at a reduced rate,thus cutting the cost required for this technology. PFRA’s Shelterbelt Centre also provides the use of
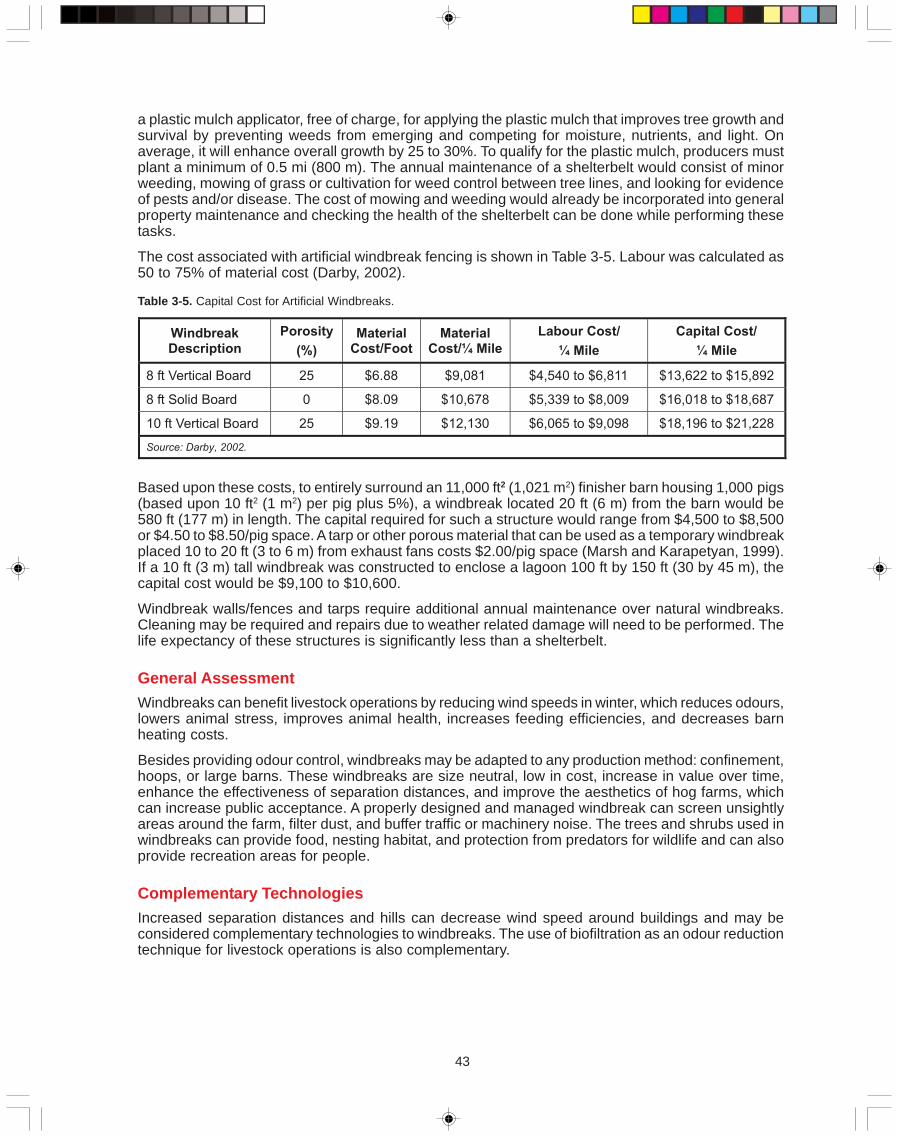
43
a plastic mulch applicator, free of charge, for applying the plastic mulch that improves tree growth andsurvival by preventing weeds from emerging and competing for moisture, nutrients, and light. Onaverage, it will enhance overall growth by 25 to 30%. To qualify for the plastic mulch, producers mustplant a minimum of 0.5 mi (800 m). The annual maintenance of a shelterbelt would consist of minorweeding, mowing of grass or cultivation for weed control between tree lines, and looking for evidenceof pests and/or disease. The cost of mowing and weeding would already be incorporated into generalproperty maintenance and checking the health of the shelterbelt can be done while performing thesetasks.
The cost associated with artificial windbreak fencing is shown in Table 3-5. Labour was calculated as50 to 75% of material cost (Darby, 2002).
WindbreakDescription
Porosity
(%)
MaterialCost/Foot
MaterialCost/¼ Mile
Labour Cost/
¼ Mile
Capital Cost/
¼ Mile
8 ft Vertical Board 25 $6.88 $9,081 $4,540 to $6,811 $13,622 to $15,892
8 ft Solid Board 0 $8.09 $10,678 $5,339 to $8,009 $16,018 to $18,687
10 ft Vertical Board 25 $9.19 $12,130 $6,065 to $9,098 $18,196 to $21,228
Source: Darby, 2002.
Table 3-5. Capital Cost for Artificial Windbreaks.
Based upon these costs, to entirely surround an 11,000 ft2 (1,021 m2) finisher barn housing 1,000 pigs(based upon 10 ft2 (1 m2) per pig plus 5%), a windbreak located 20 ft (6 m) from the barn would be580 ft (177 m) in length. The capital required for such a structure would range from $4,500 to $8,500or $4.50 to $8.50/pig space. A tarp or other porous material that can be used as a temporary windbreakplaced 10 to 20 ft (3 to 6 m) from exhaust fans costs $2.00/pig space (Marsh and Karapetyan, 1999).If a 10 ft (3 m) tall windbreak was constructed to enclose a lagoon 100 ft by 150 ft (30 by 45 m), thecapital cost would be $9,100 to $10,600.
Windbreak walls/fences and tarps require additional annual maintenance over natural windbreaks.Cleaning may be required and repairs due to weather related damage will need to be performed. Thelife expectancy of these structures is significantly less than a shelterbelt.
General AssessmentWindbreaks can benefit livestock operations by reducing wind speeds in winter, which reduces odours,lowers animal stress, improves animal health, increases feeding efficiencies, and decreases barnheating costs.
Besides providing odour control, windbreaks may be adapted to any production method: confinement,hoops, or large barns. These windbreaks are size neutral, low in cost, increase in value over time,enhance the effectiveness of separation distances, and improve the aesthetics of hog farms, whichcan increase public acceptance. A properly designed and managed windbreak can screen unsightlyareas around the farm, filter dust, and buffer traffic or machinery noise. The trees and shrubs used inwindbreaks can provide food, nesting habitat, and protection from predators for wildlife and can alsoprovide recreation areas for people.
Complementary TechnologiesIncreased separation distances and hills can decrease wind speed around buildings and may beconsidered complementary technologies to windbreaks. The use of biofiltration as an odour reductiontechnique for livestock operations is also complementary.
44
Literature CitedBottcher, R.E., R.D. Munilla, and G.R. Baughman. 1999. Controlling dust and odor from buildings using windbreak walls.
Proceedings: 1999 Animal Waste Management Symposium. Raleigh, North Carolina. January 27-28, 1999.
Brandle, J. and S. Finch. 1991. How windbreaks work. University of Nebraska Extension, EC 91-1763-B.
Darby, D. 2002. Fencing and corral cost. Alberta Feedlot Management Guide, Second Edition. 3H1:1-3H1:2.
Harrje, E.T., C.E. Buckley, and G. Heisler. 1982. Building energy reductions: optimum use of windbreaks. Proceedings of theAmerican Society of Civil Engineers, Journal Energy Division, 108:143-154.
Heisler, G.M. and D.R. Dewalle. 1988. Effects of windbreaks structure on wind flow. Agric. Ecosytem. Environ., 22/23: 41-69.
Hintz, D.L., W. Clifton, and B.C. Wight. 1986. Basic windbreak design criteria for farm and ranch headquarters areas andlarge residential lots. United States Department of Agriculture SCS for Tech. Note LI-6, Lincoln, NE, 18 p.
Marsh L. and Z. Karapetyan. 1999. An evaluation of alternative approaches to reduce odors from intensive swine opera-tions. Interim Report - Item #428 - 1999 Appropriations Act. Virginia Department of Environmental Quality.
Pollock, T. 2003. Personal Communications. AAFC-PFRA Shelterbelt Centre, December 3, 2003.
Prairie Farm Rehabilitation Administration (PFRA). 2003. Shelterbelts help cut heating costs. Agriculture and Agri FoodCanada.
Quévillon, M. 1990. Les bovins aiment la foret. Le Builletin des Agriculteurs, Novembre 1990: 12-13.
Read, R.A. 1964. Tree windbreaks for the central Great Plains. United States Department of Agriculture. Agric. Handbookno 250, 68 p.
Smith, M. and H. Scholten. 1980. Planting trees for farmstead shelter. University of Minnesota Agricultural Extension Ser-vice. Extension Bulletin 196, 16 p.
van Eimern, J., R. Karschon, L.A. Razumova, and G.W. Robertson. 1964. Windbreaks and shelterbelts. World Meteorologi-cal Organization Technical Note no 59, 188 p.
Vézina , A., 1999. Les haies brise-vent. Notes de cours. Disponible auprès de l’auteur. 28 p.
Wilson, J. 2004. Windbreak Design. University of Nebraska. NebGuide G96-1304-N.
Section 2 - Managing theExternal Environment
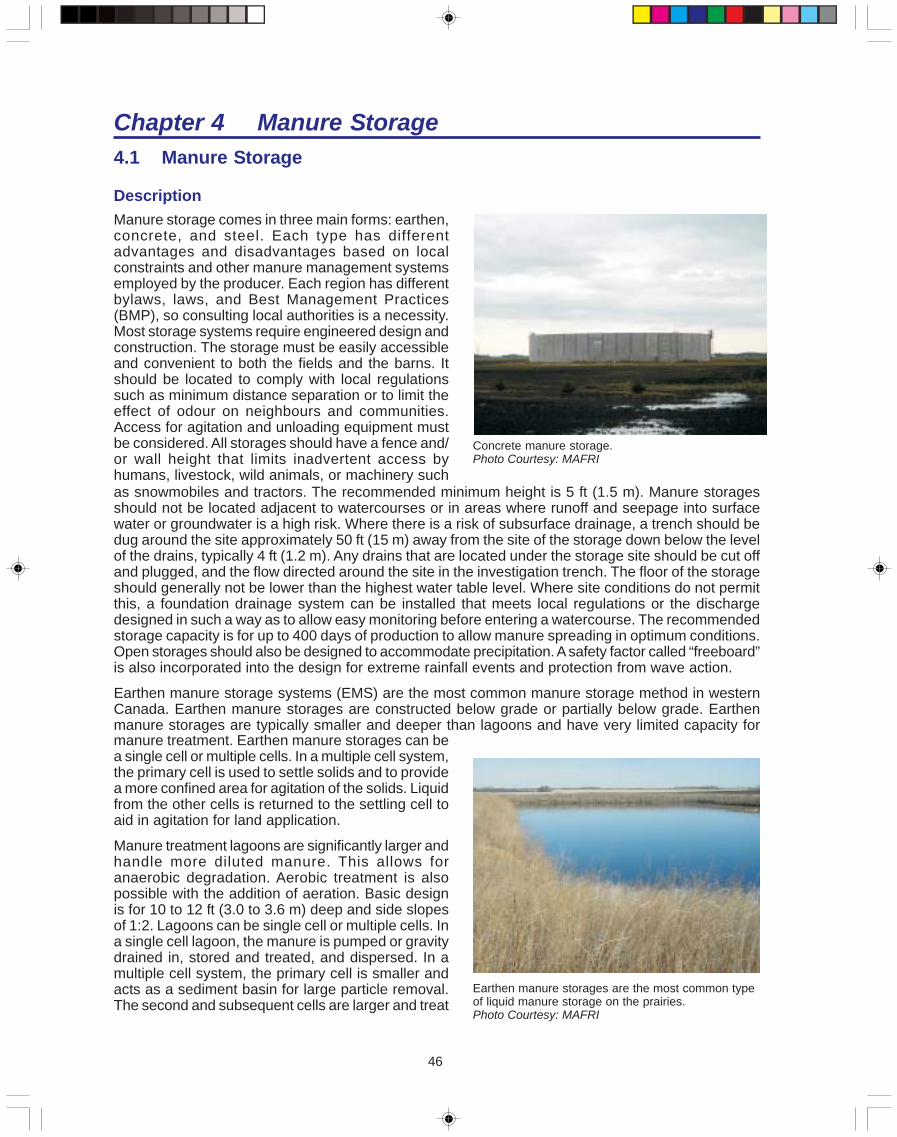
46
Chapter 4 Manure Storage4.1 Manure Storage
DescriptionManure storage comes in three main forms: earthen,concrete, and steel. Each type has differentadvantages and disadvantages based on localconstraints and other manure management systemsemployed by the producer. Each region has differentbylaws, laws, and Best Management Practices(BMP), so consulting local authorities is a necessity.Most storage systems require engineered design andconstruction. The storage must be easily accessibleand convenient to both the fields and the barns. Itshould be located to comply with local regulationssuch as minimum distance separation or to limit theeffect of odour on neighbours and communities.Access for agitation and unloading equipment mustbe considered. All storages should have a fence and/or wall height that limits inadvertent access byhumans, livestock, wild animals, or machinery such
Concrete manure storage.Photo Courtesy: MAFRI
as snowmobiles and tractors. The recommended minimum height is 5 ft (1.5 m). Manure storagesshould not be located adjacent to watercourses or in areas where runoff and seepage into surfacewater or groundwater is a high risk. Where there is a risk of subsurface drainage, a trench should bedug around the site approximately 50 ft (15 m) away from the site of the storage down below the levelof the drains, typically 4 ft (1.2 m). Any drains that are located under the storage site should be cut offand plugged, and the flow directed around the site in the investigation trench. The floor of the storageshould generally not be lower than the highest water table level. Where site conditions do not permitthis, a foundation drainage system can be installed that meets local regulations or the dischargedesigned in such a way as to allow easy monitoring before entering a watercourse. The recommendedstorage capacity is for up to 400 days of production to allow manure spreading in optimum conditions.Open storages should also be designed to accommodate precipitation. A safety factor called “freeboard”is also incorporated into the design for extreme rainfall events and protection from wave action.
Earthen manure storage systems (EMS) are the most common manure storage method in westernCanada. Earthen manure storages are constructed below grade or partially below grade. Earthenmanure storages are typically smaller and deeper than lagoons and have very limited capacity for
Earthen manure storages are the most common typeof liquid manure storage on the prairies.Photo Courtesy: MAFRI
manure treatment. Earthen manure storages can bea single cell or multiple cells. In a multiple cell system,the primary cell is used to settle solids and to providea more confined area for agitation of the solids. Liquidfrom the other cells is returned to the settling cell toaid in agitation for land application.
Manure treatment lagoons are significantly larger andhandle more diluted manure. This allows foranaerobic degradation. Aerobic treatment is alsopossible with the addition of aeration. Basic designis for 10 to 12 ft (3.0 to 3.6 m) deep and side slopesof 1:2. Lagoons can be single cell or multiple cells. Ina single cell lagoon, the manure is pumped or gravitydrained in, stored and treated, and dispersed. In amultiple cell system, the primary cell is smaller andacts as a sediment basin for large particle removal.The second and subsequent cells are larger and treat
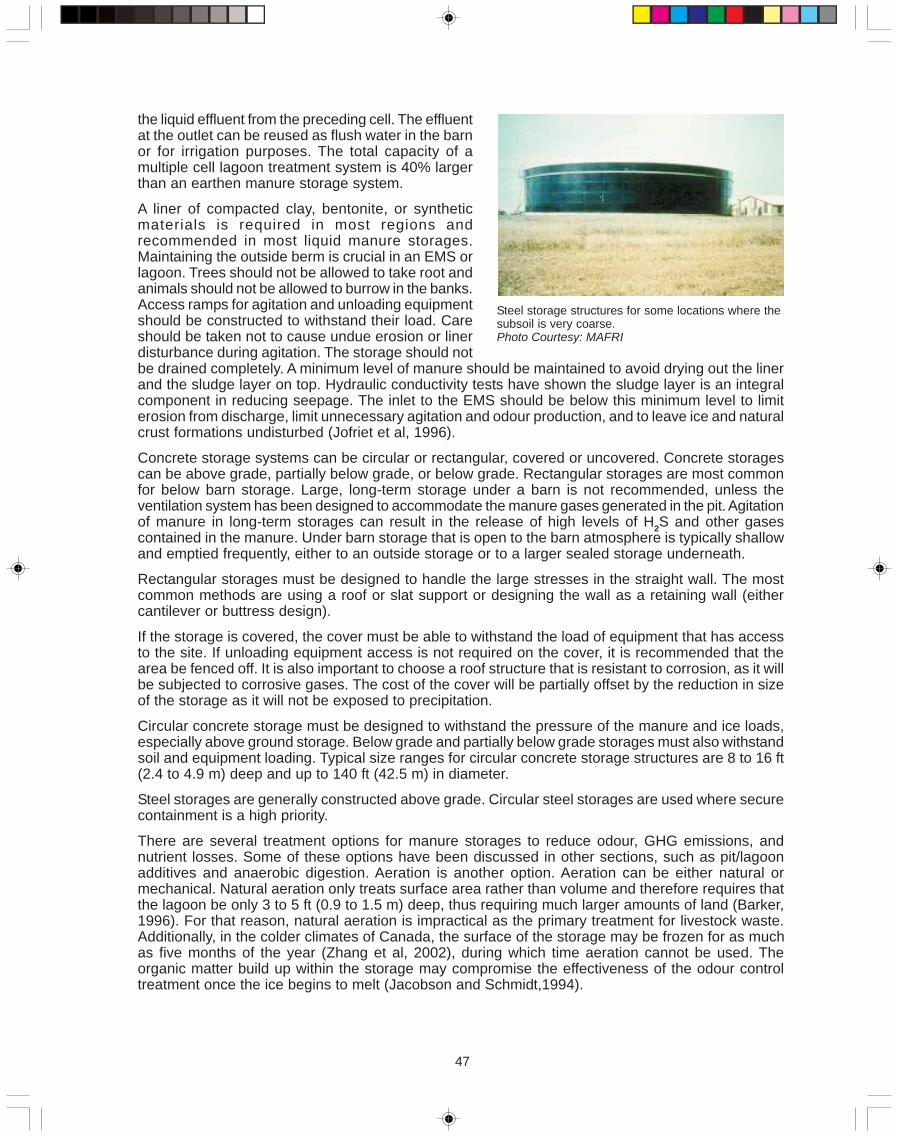
47
the liquid effluent from the preceding cell. The effluentat the outlet can be reused as flush water in the barnor for irrigation purposes. The total capacity of amultiple cell lagoon treatment system is 40% largerthan an earthen manure storage system.
A liner of compacted clay, bentonite, or syntheticmaterials is required in most regions andrecommended in most liquid manure storages.Maintaining the outside berm is crucial in an EMS orlagoon. Trees should not be allowed to take root andanimals should not be allowed to burrow in the banks.Access ramps for agitation and unloading equipmentshould be constructed to withstand their load. Careshould be taken not to cause undue erosion or linerdisturbance during agitation. The storage should not
Steel storage structures for some locations where thesubsoil is very coarse.Photo Courtesy: MAFRI
be drained completely. A minimum level of manure should be maintained to avoid drying out the linerand the sludge layer on top. Hydraulic conductivity tests have shown the sludge layer is an integralcomponent in reducing seepage. The inlet to the EMS should be below this minimum level to limiterosion from discharge, limit unnecessary agitation and odour production, and to leave ice and naturalcrust formations undisturbed (Jofriet et al, 1996).
Concrete storage systems can be circular or rectangular, covered or uncovered. Concrete storagescan be above grade, partially below grade, or below grade. Rectangular storages are most commonfor below barn storage. Large, long-term storage under a barn is not recommended, unless theventilation system has been designed to accommodate the manure gases generated in the pit. Agitationof manure in long-term storages can result in the release of high levels of H2S and other gasescontained in the manure. Under barn storage that is open to the barn atmosphere is typically shallowand emptied frequently, either to an outside storage or to a larger sealed storage underneath.
Rectangular storages must be designed to handle the large stresses in the straight wall. The mostcommon methods are using a roof or slat support or designing the wall as a retaining wall (eithercantilever or buttress design).
If the storage is covered, the cover must be able to withstand the load of equipment that has accessto the site. If unloading equipment access is not required on the cover, it is recommended that thearea be fenced off. It is also important to choose a roof structure that is resistant to corrosion, as it willbe subjected to corrosive gases. The cost of the cover will be partially offset by the reduction in sizeof the storage as it will not be exposed to precipitation.
Circular concrete storage must be designed to withstand the pressure of the manure and ice loads,especially above ground storage. Below grade and partially below grade storages must also withstandsoil and equipment loading. Typical size ranges for circular concrete storage structures are 8 to 16 ft(2.4 to 4.9 m) deep and up to 140 ft (42.5 m) in diameter.
Steel storages are generally constructed above grade. Circular steel storages are used where securecontainment is a high priority.
There are several treatment options for manure storages to reduce odour, GHG emissions, andnutrient losses. Some of these options have been discussed in other sections, such as pit/lagoonadditives and anaerobic digestion. Aeration is another option. Aeration can be either natural ormechanical. Natural aeration only treats surface area rather than volume and therefore requires thatthe lagoon be only 3 to 5 ft (0.9 to 1.5 m) deep, thus requiring much larger amounts of land (Barker,1996). For that reason, natural aeration is impractical as the primary treatment for livestock waste.Additionally, in the colder climates of Canada, the surface of the storage may be frozen for as muchas five months of the year (Zhang et al, 2002), during which time aeration cannot be used. Theorganic matter build up within the storage may compromise the effectiveness of the odour controltreatment once the ice begins to melt (Jacobson and Schmidt,1994).
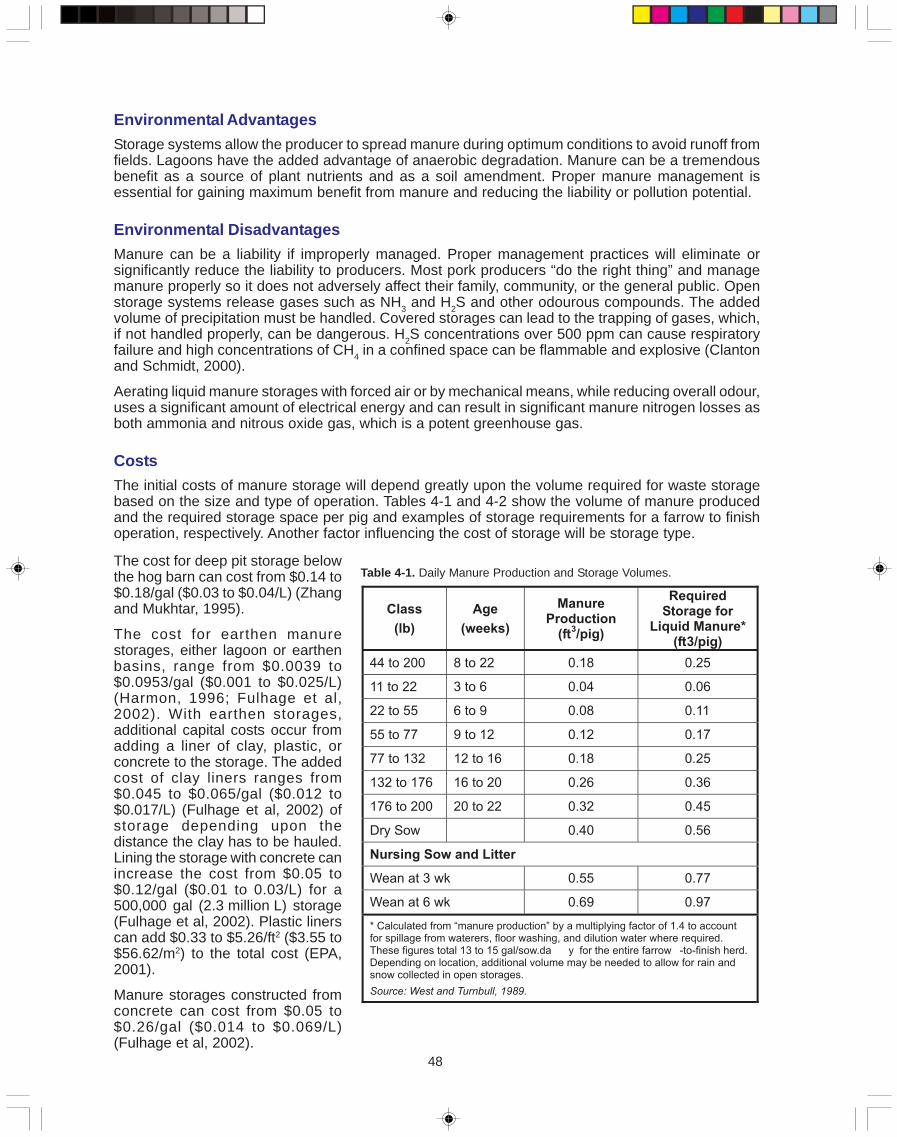
48
Environmental AdvantagesStorage systems allow the producer to spread manure during optimum conditions to avoid runoff fromfields. Lagoons have the added advantage of anaerobic degradation. Manure can be a tremendousbenefit as a source of plant nutrients and as a soil amendment. Proper manure management isessential for gaining maximum benefit from manure and reducing the liability or pollution potential.
Environmental DisadvantagesManure can be a liability if improperly managed. Proper management practices will eliminate orsignificantly reduce the liability to producers. Most pork producers “do the right thing” and managemanure properly so it does not adversely affect their family, community, or the general public. Openstorage systems release gases such as NH3 and H2S and other odourous compounds. The addedvolume of precipitation must be handled. Covered storages can lead to the trapping of gases, which,if not handled properly, can be dangerous. H2S concentrations over 500 ppm can cause respiratoryfailure and high concentrations of CH4 in a confined space can be flammable and explosive (Clantonand Schmidt, 2000).
Aerating liquid manure storages with forced air or by mechanical means, while reducing overall odour,uses a significant amount of electrical energy and can result in significant manure nitrogen losses asboth ammonia and nitrous oxide gas, which is a potent greenhouse gas.
CostsThe initial costs of manure storage will depend greatly upon the volume required for waste storagebased on the size and type of operation. Tables 4-1 and 4-2 show the volume of manure producedand the required storage space per pig and examples of storage requirements for a farrow to finishoperation, respectively. Another factor influencing the cost of storage will be storage type.
Table 4-1. Daily Manure Production and Storage Volumes.The cost for deep pit storage belowthe hog barn can cost from $0.14 to$0.18/gal ($0.03 to $0.04/L) (Zhangand Mukhtar, 1995).
The cost for earthen manurestorages, either lagoon or earthenbasins, range from $0.0039 to$0.0953/gal ($0.001 to $0.025/L)(Harmon, 1996; Fulhage et al,2002). With earthen storages,additional capital costs occur fromadding a liner of clay, plastic, orconcrete to the storage. The addedcost of clay liners ranges from$0.045 to $0.065/gal ($0.012 to$0.017/L) (Fulhage et al, 2002) ofstorage depending upon thedistance the clay has to be hauled.Lining the storage with concrete canincrease the cost from $0.05 to$0.12/gal ($0.01 to 0.03/L) for a500,000 gal (2.3 million L) storage(Fulhage et al, 2002). Plastic linerscan add $0.33 to $5.26/ft2 ($3.55 to$56.62/m2) to the total cost (EPA,2001).
Manure storages constructed fromconcrete can cost from $0.05 to$0.26/gal ($0.014 to $0.069/L)(Fulhage et al, 2002).
Class
(lb)
Age
(weeks)
ManureProduction
(ft3/pig)
RequiredStorage for
Liquid Manure*(ft3/pig)
44 to 200 8 to 22 0.18 0.25
11 to 22 3 to 6 0.04 0.06
22 to 55 6 to 9 0.08 0.11
55 to 77 9 to 12 0.12 0.17
77 to 132 12 to 16 0.18 0.25
132 to 176 16 to 20 0.26 0.36
176 to 200 20 to 22 0.32 0.45
Dry Sow 0.40 0.56
Nursing Sow and Litter
Wean at 3 wk 0.55 0.77
Wean at 6 wk 0.69 0.97
* Calculated from “manure production” by a multiplying factor of 1.4 to accountfor spillage from waterers, floor washing, and dilution water where required.These figures total 13 to 15 gal/sow.da y for the entire farrow -to-finish herd.Depending on location, additional volume may be needed to allow for rain andsnow collected in open storages.
Source: West and Turnbull, 1989.
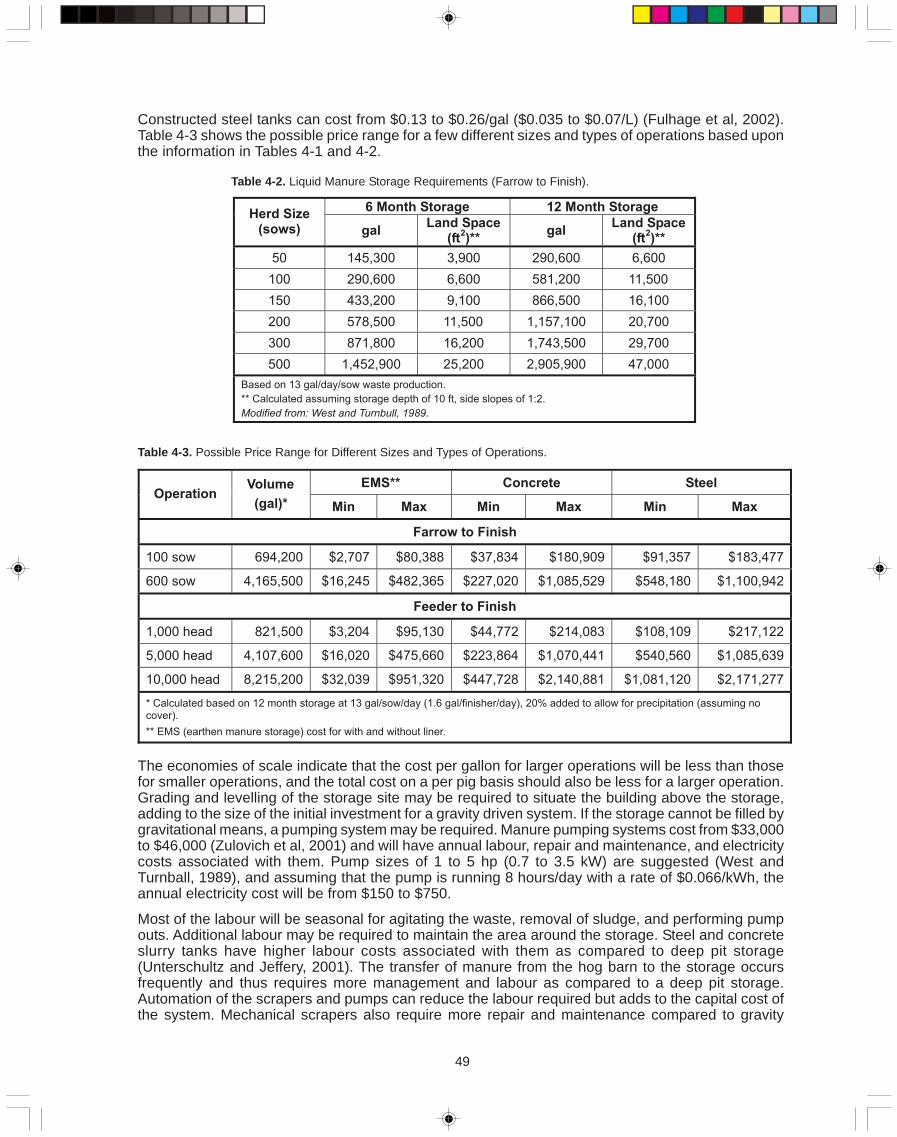
49
Constructed steel tanks can cost from $0.13 to $0.26/gal ($0.035 to $0.07/L) (Fulhage et al, 2002).Table 4-3 shows the possible price range for a few different sizes and types of operations based uponthe information in Tables 4-1 and 4-2.
6 Month Storage 12 Month StorageHerd Size
(sows) galLand Space
(ft2)**
galLand Space
(ft2)**
50 145,300 3,900 290,600 6,600
100 290,600 6,600 581,200 11,500
150 433,200 9,100 866,500 16,100
200 578,500 11,500 1,157,100 20,700
300 871,800 16,200 1,743,500 29,700
500 1,452,900 25,200 2,905,900 47,000
Based on 13 gal/day/sow waste production.
** Calculated assuming storage depth of 10 ft, side slopes of 1:2.
Modified from: West and Turnbull, 1989.
Table 4-2. Liquid Manure Storage Requirements (Farrow to Finish).
The economies of scale indicate that the cost per gallon for larger operations will be less than thosefor smaller operations, and the total cost on a per pig basis should also be less for a larger operation.Grading and levelling of the storage site may be required to situate the building above the storage,adding to the size of the initial investment for a gravity driven system. If the storage cannot be filled bygravitational means, a pumping system may be required. Manure pumping systems cost from $33,000to $46,000 (Zulovich et al, 2001) and will have annual labour, repair and maintenance, and electricitycosts associated with them. Pump sizes of 1 to 5 hp (0.7 to 3.5 kW) are suggested (West andTurnball, 1989), and assuming that the pump is running 8 hours/day with a rate of $0.066/kWh, theannual electricity cost will be from $150 to $750.
Most of the labour will be seasonal for agitating the waste, removal of sludge, and performing pumpouts. Additional labour may be required to maintain the area around the storage. Steel and concreteslurry tanks have higher labour costs associated with them as compared to deep pit storage(Unterschultz and Jeffery, 2001). The transfer of manure from the hog barn to the storage occursfrequently and thus requires more management and labour as compared to a deep pit storage.Automation of the scrapers and pumps can reduce the labour required but adds to the capital cost ofthe system. Mechanical scrapers also require more repair and maintenance compared to gravity
EMS** Concrete SteelOperation
Volume
(gal)* Min Max Min Max Min Max
Farrow to Finish
100 sow 694,200 $2,707 $80,388 $37,834 $180,909 $91,357 $183,477
600 sow 4,165,500 $16,245 $482,365 $227,020 $1,085,529 $548,180 $1,100,942
Feeder to Finish
1,000 head 821,500 $3,204 $95,130 $44,772 $214,083 $108,109 $217,122
5,000 head 4,107,600 $16,020 $475,660 $223,864 $1,070,441 $540,560 $1,085,639
10,000 head 8,215,200 $32,039 $951,320 $447,728 $2,140,881 $1,081,120 $2,171,277
* Calculated based on 12 month storage at 13 gal/sow/day (1.6 gal/finisher/day), 20% added to allow for precipitation (assuming nocover).
** EMS (earthen manure storage) cost for with and without liner.
Table 4-3. Possible Price Range for Different Sizes and Types of Operations.
50
draining gutters or slotted floors. Maintenance costs for storage liners are estimated at 5% (EPA,2001) due to potential damage that can be incurred during sludge removal.
The capital cost associated with mechanical aeration is the purchase of aerators ($2,600 to $9,000each) (Wefering and Zering; Lorimor et al, 1998) More than one aerator may be required to treat amanure storage (Zhang et al, 2002). It is suggested that the horsepower requirement of the aerationsystem is 1 hp/1,000 ft2 (0.8 kW/100 m2) of surface area (Van Kleck, 1982). Aerators have an expectedlife of 10 years (Zhang et al, 2002), and the annual repair and maintenance cost is expected to beabout 2% of the initial investment. The main disadvantage of aeration treatment is the energyrequirement. Based upon the requirement of 1 hp/1,000 ft2 (0.8 kW/100 m2), the required lagoonarea and the assumptions of 24 hours/day operation and an electricity cost of $0.066/kWh, the annualelectricity cost for a 500 sow farrow to finish operation with 12 month storage is about $20,000. Thereare some other costs associated with aeration treatment. A practice to reduce organic loading of thestorage is mechanical separation (Zhang et al, 2002). This would require the use of a solid-liquidseparation technique that will add to the capital and operation costs of the treatment.
General AssessmentStorage is a necessary component in the manure handling system. Selection of a system must considerhow the various factors relate to the specific producer’s requirements. Covered earthen manurestorages with an engineered liner are cost effective systems for large volume manure handling providedthe producer can afford the space requirement of the storage and has an adequate land base onwhich to apply the manure. Concrete storage is an option in regions where EMS or lagoon systemsare not permitted. Circular steel storage is considered to be the most groundwater friendly storagesystem, but its limited capacity and comparative high costs are drawbacks.
Complementary TechnologiesLagoon covers are a complementary technology. A permanent cover can reduce the cost of thestorage by eliminating the need for the extra required volume allowance for precipitation in highrainfall areas.
Literature CitedBarker, J.C. 1996. Lagoon design and management for livestock waste treatment and storage. Water Quality and Waste
Management. North Carolina Cooperative Extension Service. EBAE 103-83.
Clanton, C.J. and D.R. Schmidt. 2000. Sulfur compounds in gases emitted from stored manure. Transactions of the ASAE.Vol. 43(5): 1229-1239.
Environmental Protection Agency (EPA). 2001. Cost methodology report for swine and poultry sectors. EPA-821-R-01-018.
Fulhage, C.D., D.L. Pfost, and J. Feistner. 2002. Storage tanks for liquid livestock manure. University of Missouri - Columbia.MU Extension, EQ-389.
Harmon, J.D. 1996. Swine facility costs in Iowa. ISU Swine Research Report. ASL-1388.
Jacobson, L.J. and D.R. Schmidt. 1994. Manure management practices for the Minnesota pork industry. University ofMinnesota Extension Service FO-06456.
Jofriet, J.C., Y. Zhang, S. Goodman, and E. Skolseg. 1996. Ice pressure in liquid manure tanks. Canadian AgriculturalEngineering 38(1):53-58.
Lakshman, G. 2000. Economic feasibility study to determine the cost and market competitiveness of SEI technology foreliminating odours from hog manure. Final Report. MB Intensive Livestock Manure Management Initiative. MLMMI 99-01-34.
Fulhage, C. and J. Hoehne. Lesson 20: planning and evaluation of manure storage. Livestock and Poultry EnvironmentalStewardship (LPES).
51
Lorimor, J., E. Edwards, and T. Peterson. 1998. Aeration. Iowa Odor Control Demonstration Project. Iowa CooperativeExtension Service. Pm-1754B.
Unterschultz, J.R. and S.R. Jeffery. 2001. Economic evaluation of manure management and farm gate applications: aliterature review of environmental and economic aspects of manure management in Alberta’s livestock sectors. Univer-sity of Alberta, Department of Rural Economy. Project Report #01-03.
Van Kleeck, R. 1982. Swine waste management systems. British Columbia Ministry of Agriculture and Food Waste Manage-ment Fact Sheet. Agdex: 440/721.
Wefering, F. and K. Zering. Economic analysis: partial lagoon aeration of swine wastes.
West, B.S. and J.E. Turnbull. 1989. Swine Manure Systems. Canada Plan Service M-3700.
Wild Rose Agricultural Producers. 2000. Manure storage & application. Manure Management: A Manure ManagementSeries.
Zhang, Q., J. Feddes, I. Edeogu, M. Nyachoti, J. House, D. Small, C. Liu, D. Mann, and G. Clark. 2002. Odour productionevaluation and control. Manitoba Livestock Manure Management Initiative Inc. MLMMI 02-HERS-03.
Zhang, R. and S. Mukhtar. 1995. Selecting manure management systems for swine operations. Iowa State University Exten-sion. PM-1602.
Zulovich, J., R. Massey, J. Lory, A. Millmier, J. Hoehne, and C. Case. 2001. Agronomic and economic impacts of convertingmanure systems. Chapter 6 of Comments to the USEPA on Concentrated Animal Feeding Operation Proposed Rule.
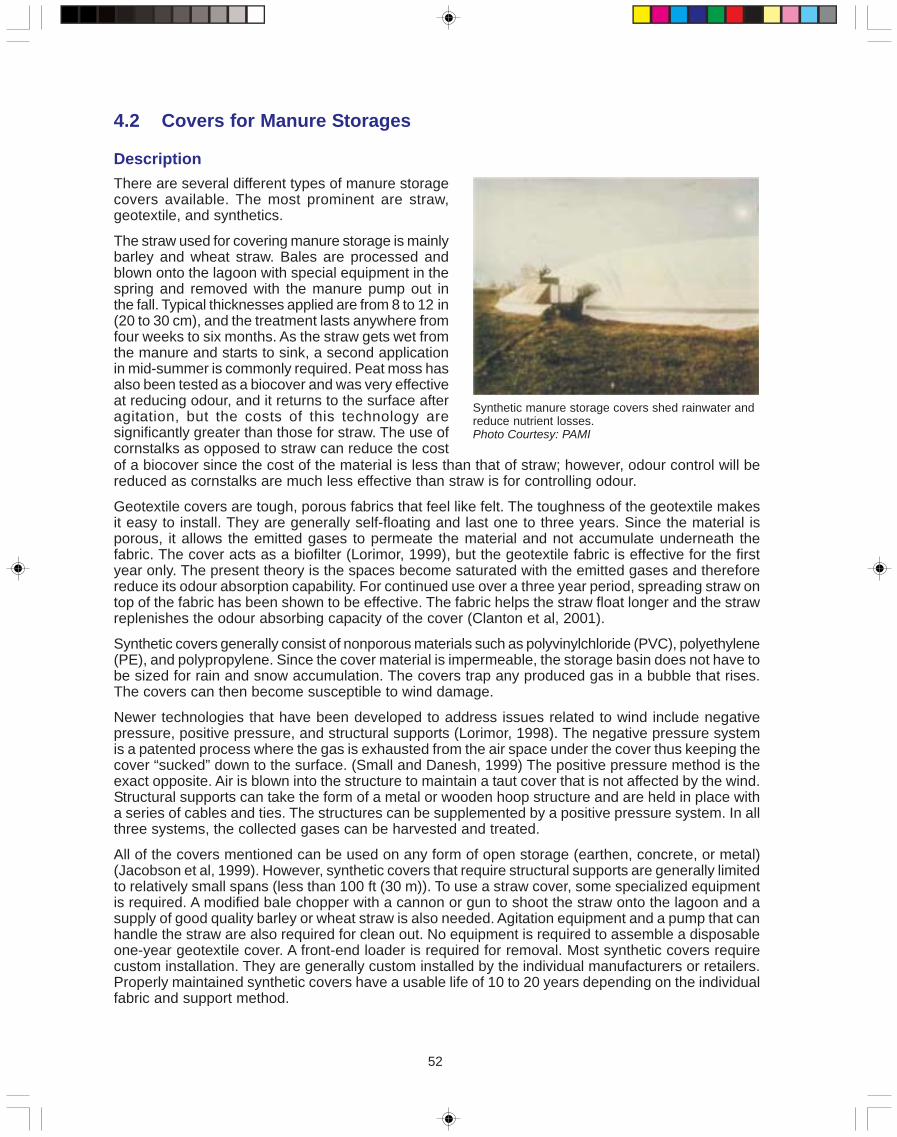
52
4.2 Covers for Manure Storages
DescriptionThere are several different types of manure storagecovers available. The most prominent are straw,geotextile, and synthetics.
The straw used for covering manure storage is mainlybarley and wheat straw. Bales are processed andblown onto the lagoon with special equipment in thespring and removed with the manure pump out inthe fall. Typical thicknesses applied are from 8 to 12 in(20 to 30 cm), and the treatment lasts anywhere fromfour weeks to six months. As the straw gets wet fromthe manure and starts to sink, a second applicationin mid-summer is commonly required. Peat moss hasalso been tested as a biocover and was very effectiveat reducing odour, and it returns to the surface afteragitation, but the costs of this technology aresignificantly greater than those for straw. The use ofcornstalks as opposed to straw can reduce the cost
Synthetic manure storage covers shed rainwater andreduce nutrient losses.Photo Courtesy: PAMI
of a biocover since the cost of the material is less than that of straw; however, odour control will bereduced as cornstalks are much less effective than straw is for controlling odour.
Geotextile covers are tough, porous fabrics that feel like felt. The toughness of the geotextile makesit easy to install. They are generally self-floating and last one to three years. Since the material isporous, it allows the emitted gases to permeate the material and not accumulate underneath thefabric. The cover acts as a biofilter (Lorimor, 1999), but the geotextile fabric is effective for the firstyear only. The present theory is the spaces become saturated with the emitted gases and thereforereduce its odour absorption capability. For continued use over a three year period, spreading straw ontop of the fabric has been shown to be effective. The fabric helps the straw float longer and the strawreplenishes the odour absorbing capacity of the cover (Clanton et al, 2001).
Synthetic covers generally consist of nonporous materials such as polyvinylchloride (PVC), polyethylene(PE), and polypropylene. Since the cover material is impermeable, the storage basin does not have tobe sized for rain and snow accumulation. The covers trap any produced gas in a bubble that rises.The covers can then become susceptible to wind damage.
Newer technologies that have been developed to address issues related to wind include negativepressure, positive pressure, and structural supports (Lorimor, 1998). The negative pressure systemis a patented process where the gas is exhausted from the air space under the cover thus keeping thecover “sucked” down to the surface. (Small and Danesh, 1999) The positive pressure method is theexact opposite. Air is blown into the structure to maintain a taut cover that is not affected by the wind.Structural supports can take the form of a metal or wooden hoop structure and are held in place witha series of cables and ties. The structures can be supplemented by a positive pressure system. In allthree systems, the collected gases can be harvested and treated.
All of the covers mentioned can be used on any form of open storage (earthen, concrete, or metal)(Jacobson et al, 1999). However, synthetic covers that require structural supports are generally limitedto relatively small spans (less than 100 ft (30 m)). To use a straw cover, some specialized equipmentis required. A modified bale chopper with a cannon or gun to shoot the straw onto the lagoon and asupply of good quality barley or wheat straw is also needed. Agitation equipment and a pump that canhandle the straw are also required for clean out. No equipment is required to assemble a disposableone-year geotextile cover. A front-end loader is required for removal. Most synthetic covers requirecustom installation. They are generally custom installed by the individual manufacturers or retailers.Properly maintained synthetic covers have a usable life of 10 to 20 years depending on the individualfabric and support method.
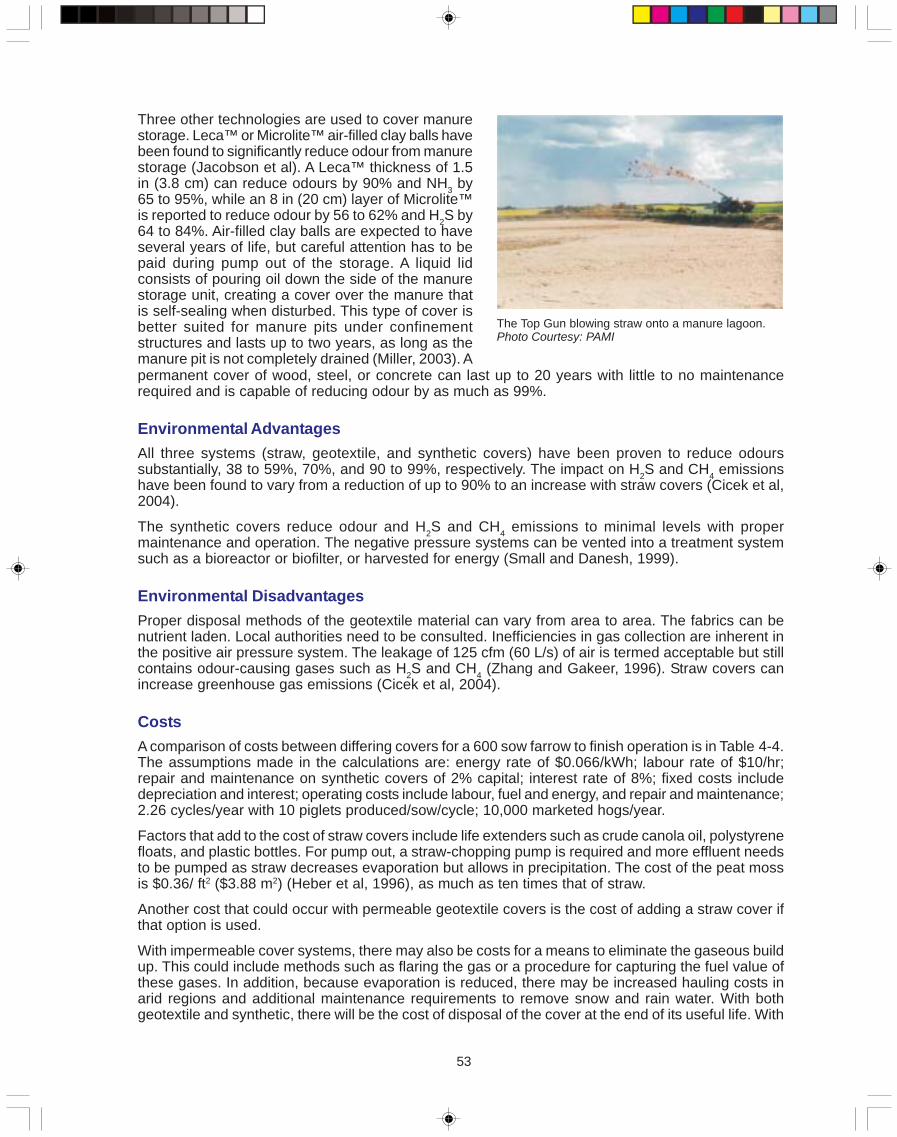
53
Three other technologies are used to cover manurestorage. Leca™ or Microlite™ air-filled clay balls havebeen found to significantly reduce odour from manurestorage (Jacobson et al). A Leca™ thickness of 1.5in (3.8 cm) can reduce odours by 90% and NH3 by65 to 95%, while an 8 in (20 cm) layer of Microlite™is reported to reduce odour by 56 to 62% and H2S by64 to 84%. Air-filled clay balls are expected to haveseveral years of life, but careful attention has to bepaid during pump out of the storage. A liquid lidconsists of pouring oil down the side of the manurestorage unit, creating a cover over the manure thatis self-sealing when disturbed. This type of cover isbetter suited for manure pits under confinementstructures and lasts up to two years, as long as themanure pit is not completely drained (Miller, 2003). Apermanent cover of wood, steel, or concrete can last up to 20 years with little to no maintenancerequired and is capable of reducing odour by as much as 99%.
Environmental AdvantagesAll three systems (straw, geotextile, and synthetic covers) have been proven to reduce odourssubstantially, 38 to 59%, 70%, and 90 to 99%, respectively. The impact on H2S and CH4 emissionshave been found to vary from a reduction of up to 90% to an increase with straw covers (Cicek et al,2004).
The synthetic covers reduce odour and H2S and CH4 emissions to minimal levels with propermaintenance and operation. The negative pressure systems can be vented into a treatment systemsuch as a bioreactor or biofilter, or harvested for energy (Small and Danesh, 1999).
Environmental DisadvantagesProper disposal methods of the geotextile material can vary from area to area. The fabrics can benutrient laden. Local authorities need to be consulted. Inefficiencies in gas collection are inherent inthe positive air pressure system. The leakage of 125 cfm (60 L/s) of air is termed acceptable but stillcontains odour-causing gases such as H2S and CH4 (Zhang and Gakeer, 1996). Straw covers canincrease greenhouse gas emissions (Cicek et al, 2004).
CostsA comparison of costs between differing covers for a 600 sow farrow to finish operation is in Table 4-4.The assumptions made in the calculations are: energy rate of $0.066/kWh; labour rate of $10/hr;repair and maintenance on synthetic covers of 2% capital; interest rate of 8%; fixed costs includedepreciation and interest; operating costs include labour, fuel and energy, and repair and maintenance;2.26 cycles/year with 10 piglets produced/sow/cycle; 10,000 marketed hogs/year.
Factors that add to the cost of straw covers include life extenders such as crude canola oil, polystyrenefloats, and plastic bottles. For pump out, a straw-chopping pump is required and more effluent needsto be pumped as straw decreases evaporation but allows in precipitation. The cost of the peat mossis $0.36/ ft2 ($3.88 m2) (Heber et al, 1996), as much as ten times that of straw.
Another cost that could occur with permeable geotextile covers is the cost of adding a straw cover ifthat option is used.
With impermeable cover systems, there may also be costs for a means to eliminate the gaseous buildup. This could include methods such as flaring the gas or a procedure for capturing the fuel value ofthese gases. In addition, because evaporation is reduced, there may be increased hauling costs inarid regions and additional maintenance requirements to remove snow and rain water. With bothgeotextile and synthetic, there will be the cost of disposal of the cover at the end of its useful life. With
The Top Gun blowing straw onto a manure lagoon.Photo Courtesy: PAMI
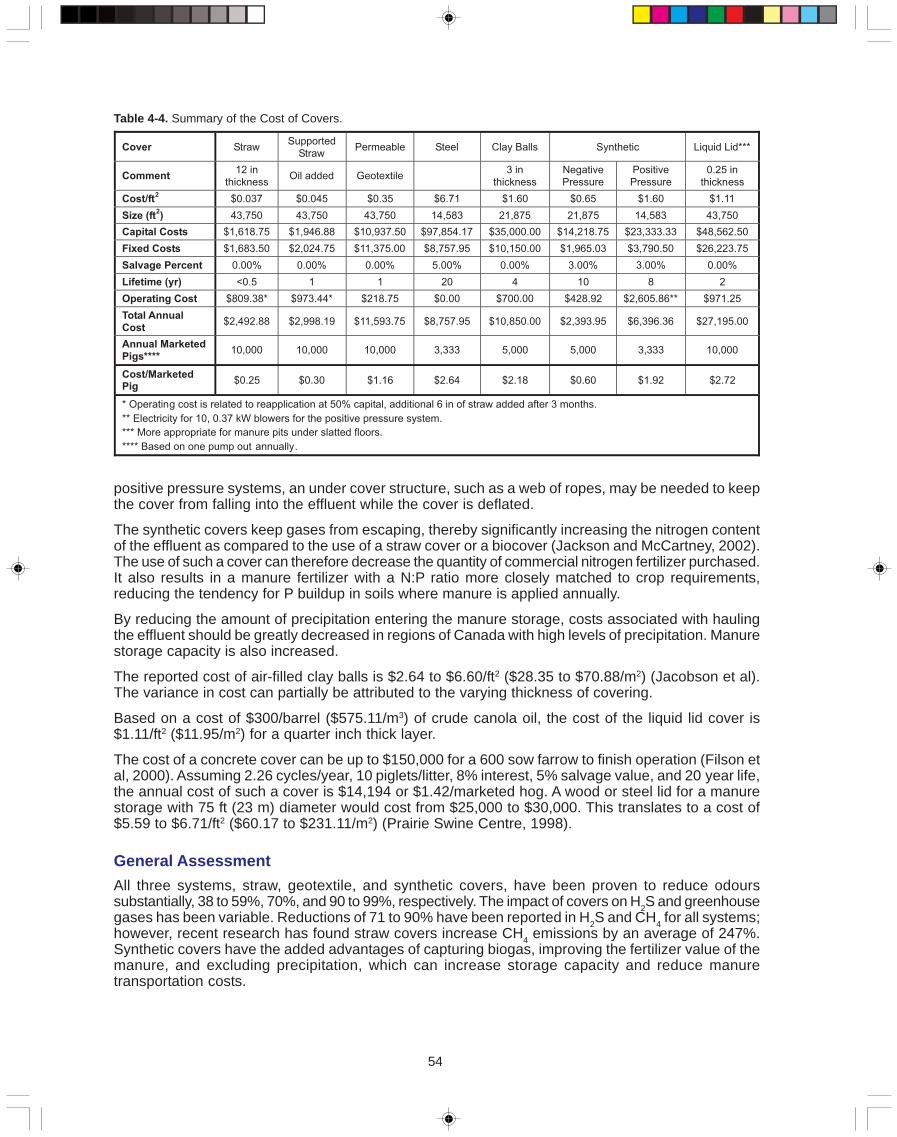
54
positive pressure systems, an under cover structure, such as a web of ropes, may be needed to keepthe cover from falling into the effluent while the cover is deflated.
The synthetic covers keep gases from escaping, thereby significantly increasing the nitrogen contentof the effluent as compared to the use of a straw cover or a biocover (Jackson and McCartney, 2002).The use of such a cover can therefore decrease the quantity of commercial nitrogen fertilizer purchased.It also results in a manure fertilizer with a N:P ratio more closely matched to crop requirements,reducing the tendency for P buildup in soils where manure is applied annually.
By reducing the amount of precipitation entering the manure storage, costs associated with haulingthe effluent should be greatly decreased in regions of Canada with high levels of precipitation. Manurestorage capacity is also increased.
The reported cost of air-filled clay balls is $2.64 to $6.60/ft2 ($28.35 to $70.88/m2) (Jacobson et al).The variance in cost can partially be attributed to the varying thickness of covering.
Based on a cost of $300/barrel ($575.11/m3) of crude canola oil, the cost of the liquid lid cover is$1.11/ft2 ($11.95/m2) for a quarter inch thick layer.
The cost of a concrete cover can be up to $150,000 for a 600 sow farrow to finish operation (Filson etal, 2000). Assuming 2.26 cycles/year, 10 piglets/litter, 8% interest, 5% salvage value, and 20 year life,the annual cost of such a cover is $14,194 or $1.42/marketed hog. A wood or steel lid for a manurestorage with 75 ft (23 m) diameter would cost from $25,000 to $30,000. This translates to a cost of$5.59 to $6.71/ft2 ($60.17 to $231.11/m2) (Prairie Swine Centre, 1998).
General AssessmentAll three systems, straw, geotextile, and synthetic covers, have been proven to reduce odourssubstantially, 38 to 59%, 70%, and 90 to 99%, respectively. The impact of covers on H2S and greenhousegases has been variable. Reductions of 71 to 90% have been reported in H2S and CH4 for all systems;however, recent research has found straw covers increase CH4 emissions by an average of 247%.Synthetic covers have the added advantages of capturing biogas, improving the fertilizer value of themanure, and excluding precipitation, which can increase storage capacity and reduce manuretransportation costs.
Table 4-4. Summary of the Cost of Covers.
Cover StrawSupported
StrawPermeable Steel Clay Balls Synthetic Liquid Lid***
Comment12 in
thicknessOil added Geotextile
3 inthickness
NegativePressure
PositivePressure
0.25 inthickness
Cost/ft2
$0.037 $0.045 $0.35 $6.71 $1.60 $0.65 $1.60 $1.11
Size (ft2) 43,750 43,750 43,750 14,583 21,875 21,875 14,583 43,750
Capital Costs $1,618.75 $1,946.88 $10,937.50 $97,854.17 $35,000.00 $14,218.75 $23,333.33 $48,562.50
Fixed Costs $1,683.50 $2,024.75 $11,375.00 $8,757.95 $10,150.00 $1,965.03 $3,790.50 $26,223.75
Salvage Percent 0.00% 0.00% 0.00% 5.00% 0.00% 3.00% 3.00% 0.00%
Lifetime (yr) <0.5 1 1 20 4 10 8 2
Operating Cost $809.38* $973.44* $218.75 $0.00 $700.00 $428.92 $2,605.86** $971.25
Total Annual
Cost$2,492.88 $2,998.19 $11,593.75 $8,757.95 $10,850.00 $2,393.95 $6,396.36 $27,195.00
Annual Marketed
Pigs****10,000 10,000 10,000 3,333 5,000 5,000 3,333 10,000
Cost/MarketedPig
$0.25 $0.30 $1.16 $2.64 $2.18 $0.60 $1.92 $2.72
* Operating cost is related to reapplication at 50% capital, additional 6 in of straw added after 3 months.
** Electricity for 10, 0.37 kW blowers for the positive pressure system.
*** More appropriate for manure pits under slatted floors.
**** Based on one pump out annually.
55
Complementary TechnologiesThe supplier of the negative air pressure cover offers a compressed air agitation system to providemixing of manure solids under the cover. This technology provides superior agitation to conventionalequipment and eliminates the need to draw back the cover for agitation. This agitation system alsoeliminates the risk of damage to clay liners in the storage, which frequently occurs with conventionalagitation equipment. Biogas energy conversion equipment is also a complementary technology.
Literature CitedCicek, N., X.J. Zhore, Q. Zhang, and M. Tenuta. 2004. Impact of straw cover on greenhouse gas and odor emissions from
manure storage lagoons ssing a flux hood. In the Proceedings of the 2004 ASAE/CSAE Annual International Meeting,August 2004. Paper #04-4054.
Clanton C.J., D.R. Schmidt, R.E. Nicolai, L.D. Jacobson, P.R. Goodrich, K.A. Janni, and J.R. Bicudo. 2001. Geotextile fabric-straw manure storage covers for odor, hydrogen sulfide, and ammonia control. Applied Engineering in Agriculture,17(6): 849-858.
Filson, H., W.T. Henley, B.E. Reding, D. Sand. 2000. Natural and biological odour control methods for swine earthen manurestorage areas. Saskatchewan Agriculture and Food.
Heber, A.J., D.J. Jones, and A. L. Sutton. 1998. Methods and practices to reduce odor from swine facilities. Ag Air QualityAQ-2. Purdue University Extension Service.
Jackson, D. and I. McCartney. 2002. Covers and others: the latest techniques in manure processing, handling and storage.Manitoba Agriculture, Food and Rural Initiatives.
Jacobson L., D.R. Schmidt, R.E. Nicolai, and C.J. Clanton. 1999. Evaluating the use of straw and other floating materials tocontrol odor and gases from pig manure storage units. ASAE Paper #99-4134.
Jacobson, L., J. Lorimor, J. Bicudo, and D. Schmidt. Lesson 43: emission control strategies for manure storage facilities.Livestock and Poultry Environmental Stewardship.
Lorimor, J. 1998. Synthetic covers. Iowa Odor Control Demonstration Project.
Lorimor, J. 1999. Geotextile covers for liquid manure storage. Iowa Manure Maters: Odor and Nutrient Management.
Miller, D. 2003. Odor busters. National Hog Farmer, September 15.
Prairie Swine Centre. 1998. Covering up manure odour. Centered on Swine. Vol. 5(1): 2.
Small D. and S. Danesh. 1999. Development of a negative air pressure cover system for swine earthen manure storages inManitoba. DGH Engineering, MB.
Zhang, Q., J. Feddes, I. Edeogu, M. Nyachoti, J. House, D. Small, C. Liu, D. Mann, and G. Clark. 2002. Odour production,evaluation and control. Manitoba Livestock Manure Management Initiative Inc. Project MLMMI 02-HERS-03, FinalReport.
Zhang Y. and W. Gakeer. 1996. A low cost balloon-type lagoon cover to reduce odour emission. Prairie Swine Centre, 1996Annual Report.
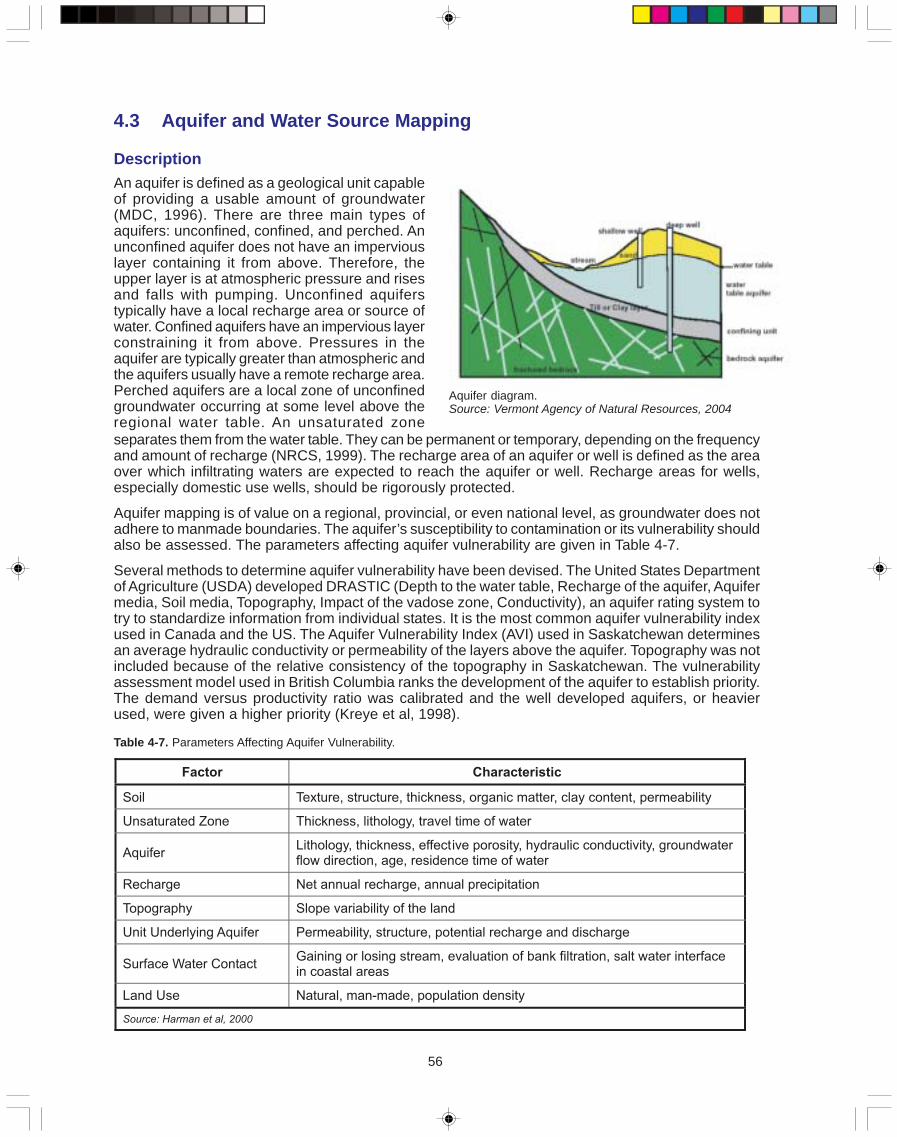
56
4.3 Aquifer and Water Source Mapping
DescriptionAn aquifer is defined as a geological unit capableof providing a usable amount of groundwater(MDC, 1996). There are three main types ofaquifers: unconfined, confined, and perched. Anunconfined aquifer does not have an imperviouslayer containing it from above. Therefore, theupper layer is at atmospheric pressure and risesand falls with pumping. Unconfined aquiferstypically have a local recharge area or source ofwater. Confined aquifers have an impervious layerconstraining it from above. Pressures in theaquifer are typically greater than atmospheric andthe aquifers usually have a remote recharge area.Perched aquifers are a local zone of unconfinedgroundwater occurring at some level above theregional water table. An unsaturated zone
Aquifer diagram.Source: Vermont Agency of Natural Resources, 2004
separates them from the water table. They can be permanent or temporary, depending on the frequencyand amount of recharge (NRCS, 1999). The recharge area of an aquifer or well is defined as the areaover which infiltrating waters are expected to reach the aquifer or well. Recharge areas for wells,especially domestic use wells, should be rigorously protected.
Aquifer mapping is of value on a regional, provincial, or even national level, as groundwater does notadhere to manmade boundaries. The aquifer’s susceptibility to contamination or its vulnerability shouldalso be assessed. The parameters affecting aquifer vulnerability are given in Table 4-7.
Several methods to determine aquifer vulnerability have been devised. The United States Departmentof Agriculture (USDA) developed DRASTIC (Depth to the water table, Recharge of the aquifer, Aquifermedia, Soil media, Topography, Impact of the vadose zone, Conductivity), an aquifer rating system totry to standardize information from individual states. It is the most common aquifer vulnerability indexused in Canada and the US. The Aquifer Vulnerability Index (AVI) used in Saskatchewan determinesan average hydraulic conductivity or permeability of the layers above the aquifer. Topography was notincluded because of the relative consistency of the topography in Saskatchewan. The vulnerabilityassessment model used in British Columbia ranks the development of the aquifer to establish priority.The demand versus productivity ratio was calibrated and the well developed aquifers, or heavierused, were given a higher priority (Kreye et al, 1998).
Factor Characteristic
Soil Texture, structure, thickness, organic matter, clay content, permeability
Unsaturated Zone Thickness, lithology, travel time of water
AquiferLithology, thickness, effective porosity, hydraulic conductivity, groundwaterflow direction, age, residence time of water
Recharge Net annual recharge, annual precipitation
Topography Slope variability of the land
Unit Underlying Aquifer Permeability, structure, potential recharge and discharge
Surface Water ContactGaining or losing stream, evaluation of bank filtration, salt water interfacein coastal areas
Land Use Natural, man-made, population density
Source: Harman et al, 2000
Table 4-7. Parameters Affecting Aquifer Vulnerability.
57
On-site hydrogeological investigations are the responsibility of the producer. A trained professional,such as a hydrogeologist, should conduct the investigations. The barn sites, storage sites, and allapplication areas should be investigated to minimize the possibility of groundwater contamination.Contacting all levels of authority to obtain existing information, documentation, and legal obligationsis always recommended. Digging or boring a test hole and logging the types of materials and layersencountered can determine the geological characteristics of the site. Samples of each soil layer orstrata should be collected and analyzed in a lab. Geophysical methods, such as electromagneticinduction, resistivity, refraction seisomography, and ground penetrating radar can be used to determinegeological characteristics but should be correlated with a test hole and samples for best results(NRCS, 1999). Proposed United States Environmental Protection Agency (EPA) regulations wouldrequire concentrated animal feeding operations (CAFO) to provide an assessment of groundwatervulnerability on permit applications. The permit application would require a detailed evaluation of theproposed barn and manure storage site or sites and identify all lands receiving manure. All surfacewaterbodies and groundwater sources in or near the proposed areas would have to be identified andprovide a hydrogeological report detailing the surface and groundwater contamination potential foreach area. The producer would have to prove there are no hydrogeological links between the proposedareas and the surface or groundwater and that the appropriate preventative measures have beentaken to ensure contamination does not occur. Monitoring of the groundwater would also be theresponsibility of the producer (EPA, 2001). The monitoring system should be developed by ahydrogeologist who should also supervise installation of the wells.
Environmental AdvantagesBy assessing the risks of groundwater contamination on all proposed areas of operation, a producercan make appropriate decisions on the implementation and application of their hog operations toreduce or eliminate the risk. Site selection and facility construction plans could be altered toaccommodate concerns specific to each individual case. Moving the whole operation to a more suitablesite may be an option. Investigation results may dictate what types of storage and application methodsare options. For example, on certain sites, earthen manure storage or lagoons may not be viable butengineered metal storage tanks may be. Manure application to specific areas may be reduced oreliminated.
Environmental DisadvantagesThere are minimal environmental disadvantages associated with hydrogeological investigations. Thetime and cost associated with contracting professionals to perform the survey are the only drawbacks.
CostsOn-site hydrogeological investigations will require a hydrogeologist to analyze the site and prepare areport. At an example rate of $110/hour (Fedeniuk, 2004), the hydrogeologist will require about48 working hours to produce the final report. Four hours of on-farm labour is required to collect andpresent relevant information to the hydrogeologist. Costs for travel, maps, photocopying, reportgeneration, and miscellaneous expenses can be estimated at 15% of labour costs, resulting in a totalcost for the investigation of about $6,000. The added costs can vary greatly depending on the locationof the site (EPA, 2001; Fedeniuk, 2004).
Monitoring groundwater requires the installation of monitoring wells. As many as four or more wellsmay be required depending on site conditions. One well located up-gradient of the manure storage/barn and the other three located down-gradient. The total cost for a 50 ft (15 m) deep well is at least$2,000, which would include drilling, well casing for the first 30 ft (9 m), well screening for the final20 ft (6 m), gravel for the entire length, and a well cap. A single bailer for sampling costs about $46, sothe total capital required is $8,000 for a four-well monitoring system. Drilling costs are representativeof Manitoba and costs will be more in regions of high bedrock. The time of year will also influencedrilling costs as drilling through frozen soil will add to the cost. Required drilling depths will depend onaquifer depth in the region, ranging from as shallow as 12 ft (4 m) to deeper than 50 ft (15 m)(Fedeniuk, 2004).
58
To establish a baseline for annual testing, initial sampling and analysis should be included in thecapital cost. Sampling and analysis requires one hour of on-farm labour per well and approximately$100/sample for laboratory analysis (EPA, 2001; Fedeniuk, 2004) plus shipping and handling, addingat least $448 to the capital cost.
Annual costs will include operation, maintenance, and sampling. Operation and maintenance isestimated at 2% of initial construction costs (EPA, 2001). Sampling should occur twice per year perwell with each sample requiring one hour of farm labour and $100 for laboratory analysis. Laboratoryanalysis could test for levels of coliform (total and fecal), nitrate-nitrogen, ammonia-nitrogen, chloride,and total dissolved solids. The initial sample should be analyzed for a more complete suite ofparameters.
General AssessmentUntil this time, each specific site will have to be evaluated individually, drawing on all available data onthe groundwater for that region. Completion of a geological investigation and implementation ofacceptable technologies and management practices to reduce and eliminate risks demonstrates duediligence.
Complementary TechnologiesThe establishment of a national aquifer database would benefit the long-term development of thelivestock industry.
Literature CitedEnvironmental Protection Agency (EPA). 2004. Managing Manure Nutrients at Concentrated Animal Feeding Operations.
United States Environmental Protection Agency EPA-821-B-04-009.
Environmental Protection Agency (EPA). 2001. Cost methodology report for swine and poultry sectors. United States Envi-ronmental Protection Agency. EPA-821-R-01-018.
Fedeniuk, S. 2004. Personal communications. AAFC-PFRA Brandon. March 3, 2004.
Harman, J., J.E. McLellan, D.L. Rudolph, D. Heagle, C.Pillar, and S. Denhoed. 2000. A proposed framework for managingthe impact of agriculture on groundwater. A report prepared for the Sierra-ALERT Coalition for Submission to Part 2 ofthe Walkerton Inquiry, August 21.
Kreye, R., K. Ronneseth, and M. Wei. 1998. Aquifers, an aquifer classification system for groundwater management inBritish Columbia. British Columbia Ministry of Water, Land and Air Protection.
Maine Department of Conservation. 1996. Aquifer mapping. Main Geological Survey, Water Resources Factsheet.
Natural Resources Conservation Service (NRCS). 1999. Geological and groundwater considerations. National EngineeringHandbook, Part 651, Agricultural Waste Management Field Handbook, Ch.7.
Vermont Agency of Natural Resources. 2004. Pollution prevention planning. Biennial Report to the Vermont Legislature.Department of Environmental Conservation.
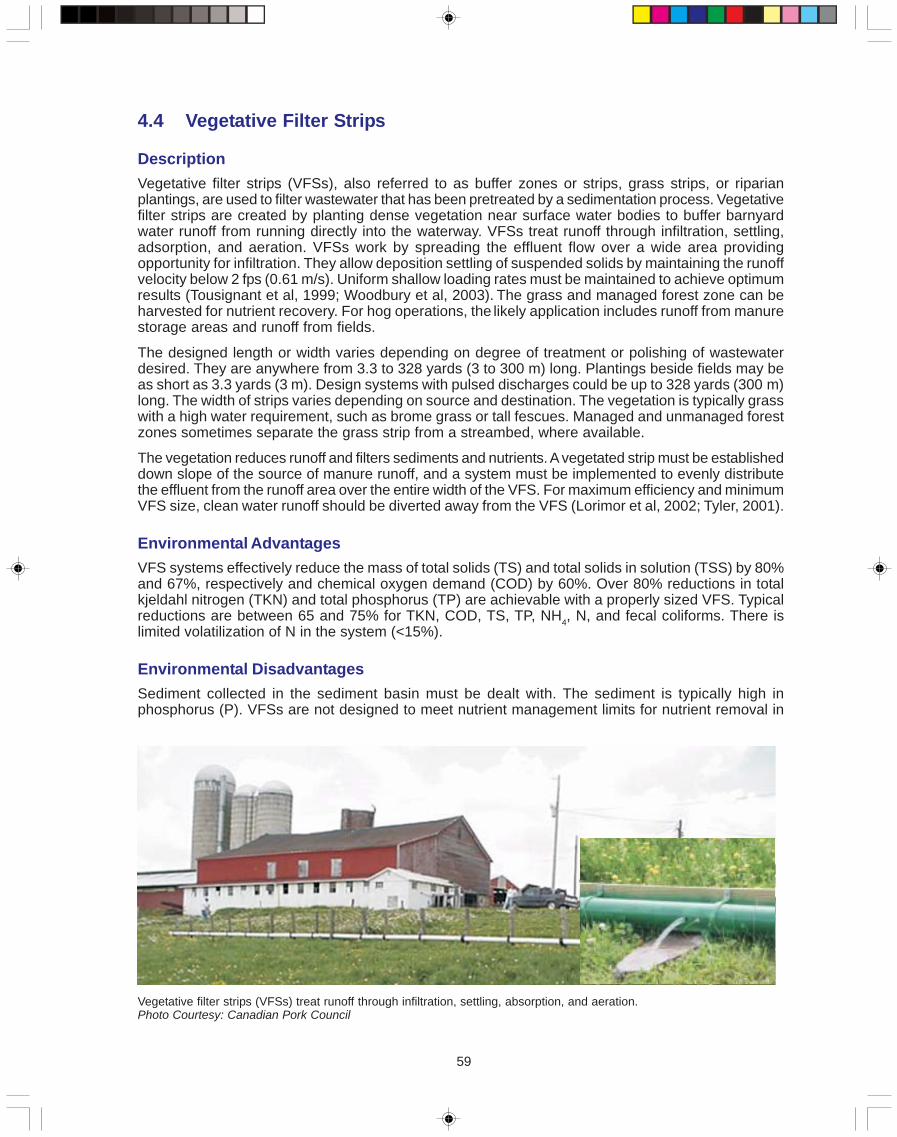
59
4.4 Vegetative Filter Strips
DescriptionVegetative filter strips (VFSs), also referred to as buffer zones or strips, grass strips, or riparianplantings, are used to filter wastewater that has been pretreated by a sedimentation process. Vegetativefilter strips are created by planting dense vegetation near surface water bodies to buffer barnyardwater runoff from running directly into the waterway. VFSs treat runoff through infiltration, settling,adsorption, and aeration. VFSs work by spreading the effluent flow over a wide area providingopportunity for infiltration. They allow deposition settling of suspended solids by maintaining the runoffvelocity below 2 fps (0.61 m/s). Uniform shallow loading rates must be maintained to achieve optimumresults (Tousignant et al, 1999; Woodbury et al, 2003). The grass and managed forest zone can beharvested for nutrient recovery. For hog operations, the likely application includes runoff from manurestorage areas and runoff from fields.
The designed length or width varies depending on degree of treatment or polishing of wastewaterdesired. They are anywhere from 3.3 to 328 yards (3 to 300 m) long. Plantings beside fields may beas short as 3.3 yards (3 m). Design systems with pulsed discharges could be up to 328 yards (300 m)long. The width of strips varies depending on source and destination. The vegetation is typically grasswith a high water requirement, such as brome grass or tall fescues. Managed and unmanaged forestzones sometimes separate the grass strip from a streambed, where available.
The vegetation reduces runoff and filters sediments and nutrients. A vegetated strip must be establisheddown slope of the source of manure runoff, and a system must be implemented to evenly distributethe effluent from the runoff area over the entire width of the VFS. For maximum efficiency and minimumVFS size, clean water runoff should be diverted away from the VFS (Lorimor et al, 2002; Tyler, 2001).
Environmental AdvantagesVFS systems effectively reduce the mass of total solids (TS) and total solids in solution (TSS) by 80%and 67%, respectively and chemical oxygen demand (COD) by 60%. Over 80% reductions in totalkjeldahl nitrogen (TKN) and total phosphorus (TP) are achievable with a properly sized VFS. Typicalreductions are between 65 and 75% for TKN, COD, TS, TP, NH4, N, and fecal coliforms. There islimited volatilization of N in the system (<15%).
Environmental DisadvantagesSediment collected in the sediment basin must be dealt with. The sediment is typically high inphosphorus (P). VFSs are not designed to meet nutrient management limits for nutrient removal in
Vegetative filter strips (VFSs) treat runoff through infiltration, settling, absorption, and aeration.Photo Courtesy: Canadian Pork Council
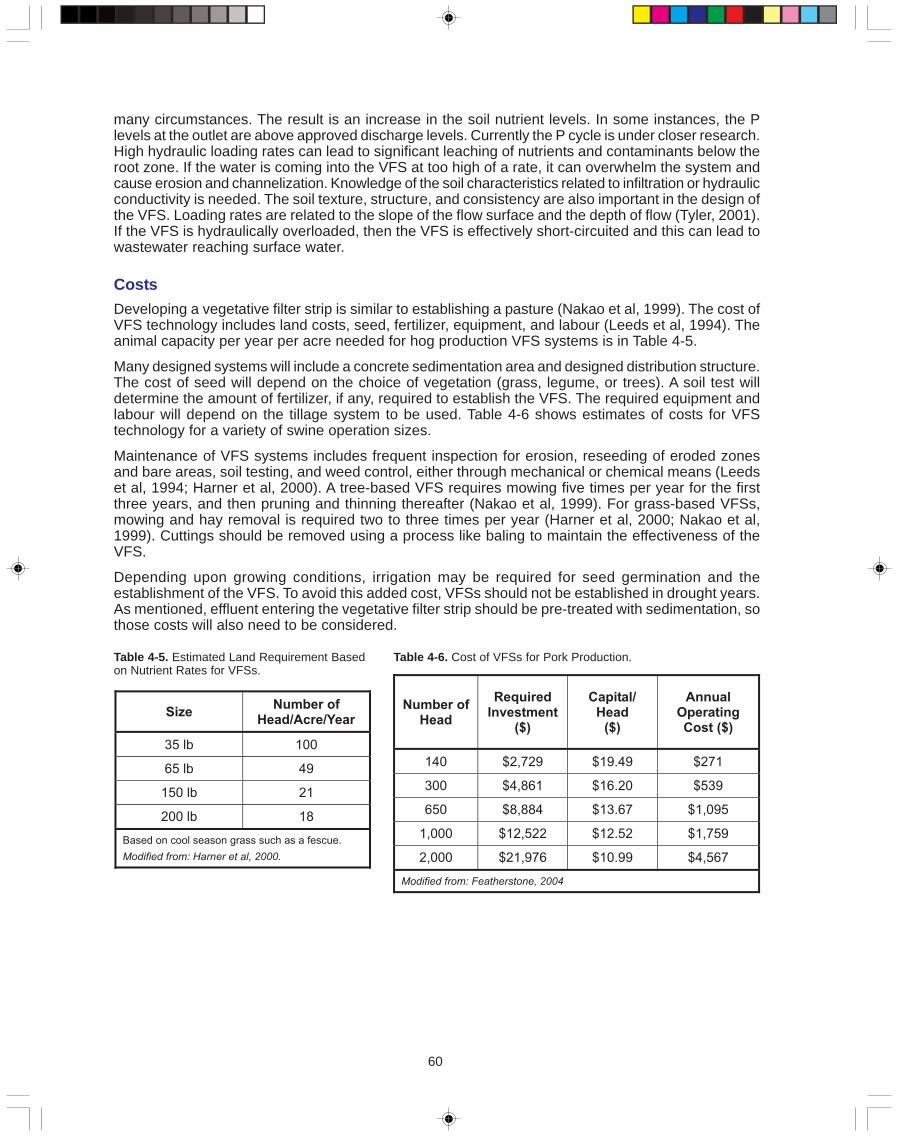
60
many circumstances. The result is an increase in the soil nutrient levels. In some instances, the Plevels at the outlet are above approved discharge levels. Currently the P cycle is under closer research.High hydraulic loading rates can lead to significant leaching of nutrients and contaminants below theroot zone. If the water is coming into the VFS at too high of a rate, it can overwhelm the system andcause erosion and channelization. Knowledge of the soil characteristics related to infiltration or hydraulicconductivity is needed. The soil texture, structure, and consistency are also important in the design ofthe VFS. Loading rates are related to the slope of the flow surface and the depth of flow (Tyler, 2001).If the VFS is hydraulically overloaded, then the VFS is effectively short-circuited and this can lead towastewater reaching surface water.
CostsDeveloping a vegetative filter strip is similar to establishing a pasture (Nakao et al, 1999). The cost ofVFS technology includes land costs, seed, fertilizer, equipment, and labour (Leeds et al, 1994). Theanimal capacity per year per acre needed for hog production VFS systems is in Table 4-5.
Many designed systems will include a concrete sedimentation area and designed distribution structure.The cost of seed will depend on the choice of vegetation (grass, legume, or trees). A soil test willdetermine the amount of fertilizer, if any, required to establish the VFS. The required equipment andlabour will depend on the tillage system to be used. Table 4-6 shows estimates of costs for VFStechnology for a variety of swine operation sizes.
Maintenance of VFS systems includes frequent inspection for erosion, reseeding of eroded zonesand bare areas, soil testing, and weed control, either through mechanical or chemical means (Leedset al, 1994; Harner et al, 2000). A tree-based VFS requires mowing five times per year for the firstthree years, and then pruning and thinning thereafter (Nakao et al, 1999). For grass-based VFSs,mowing and hay removal is required two to three times per year (Harner et al, 2000; Nakao et al,1999). Cuttings should be removed using a process like baling to maintain the effectiveness of theVFS.
Depending upon growing conditions, irrigation may be required for seed germination and theestablishment of the VFS. To avoid this added cost, VFSs should not be established in drought years.As mentioned, effluent entering the vegetative filter strip should be pre-treated with sedimentation, sothose costs will also need to be considered.
SizeNumber of
Head/Acre/Year
35 lb 100
65 lb 49
150 lb 21
200 lb 18
Based on cool season grass such as a fescue.
Modified from: Harner et al, 2000.
Number ofHead
RequiredInvestment
($)
Capital/Head
($)
AnnualOperatingCost ($)
140 $2,729 $19.49 $271
300 $4,861 $16.20 $539
650 $8,884 $13.67 $1,095
1,000 $12,522 $12.52 $1,759
2,000 $21,976 $10.99 $4,567
Modified from: Featherstone, 2004
Table 4-5. Estimated Land Requirement Basedon Nutrient Rates for VFSs.
Table 4-6. Cost of VFSs for Pork Production.
61
General AssessmentVFSs are an effective means of treating barnyard runoff. Significant reduction of all nutrients andcontaminants that are associated with non-point source pollution of surface watercourses andgroundwater is demonstrated. However, this technology does not apply to situations of large quantitiesof raw wastewater. The vegetation can be harvested as a biomass product. A drawback of a VFS isthe lack of nutrient retention. If the producer can realize greater returns by utilizing the nutrients in themanure as a soil amendment or fertilizer additive, a VFS as the primary wastewater treatment maynot be desired. Other forms of treatment with a higher emphasis on nutrient retention should beinvestigated.
Complementary TechnologiesA VFS can be used to treat liquid effluent from some primary treatment systems such as constructedwetlands, if the treatment effectively reduces TSS. Buffer zones, which are similar to VFSs andcontoured buffer strips of perennial vegetation, are a related conservation practice.
Literature CitedFeatherston, J. The role of economics in producers’ waste management decisions. http://tammi.tamu.edu/2RCSAUST.pdf.
Visited February 26, 2004.
Harner, J.P., J.P. Murphy, D.L. Devlin, W.H. Fick, and G.L. Kilgore. 2000. Vegetative filter strip systems for animal feedingoperations. Kansas State University Agricultural Experiment Station and Cooperative Extension Service. MF-2454.
Leeds, R., L.C. Brown, M.R. Sulc, and L. VanLieshout. 1994. Vegetative filter strips: Application, installation and mainte-nance. Ohio State University Extension. Factsheet AEX-467-94.
Lorimor, J., S. Shouse, and W. Miller. 2002. Vegetative filter strips for open feedlot runoff treatment. Solutions for OpenFeedlot Operators, PM1919.
Nakao, M., B. Sohngen, L. Brown, and R. Leeds. 1999. The economics of vegetative filter strips. Ohio State UniversityExtension. Factsheet AE-0006-99.
Tousignant, E., O. Fankhauser, and S. Hurd. 1999. Guidance manual for the design, construction and operations of con-structed wetlands for rural applications in Ontario. Canadapt Program of the Agricultural Adaptation Council, Ontario.
Tyler, E.J. 2001. Hydraulic wastewater loading rates to soils. In On-site wastewater treatment. Proceedings of the 9thInternational Symposium on Individual and Small Community Sewage Systems. ASAE. St. Joseph, MI. P 80 – 86.
Woodbury, B.L., J. Nienaber, and R. Eigenberg. 2003. Performance of a passive feedlot runoff control and treatment sys-tem. Transactions of the ASAE, 46(6): 1525-1530.
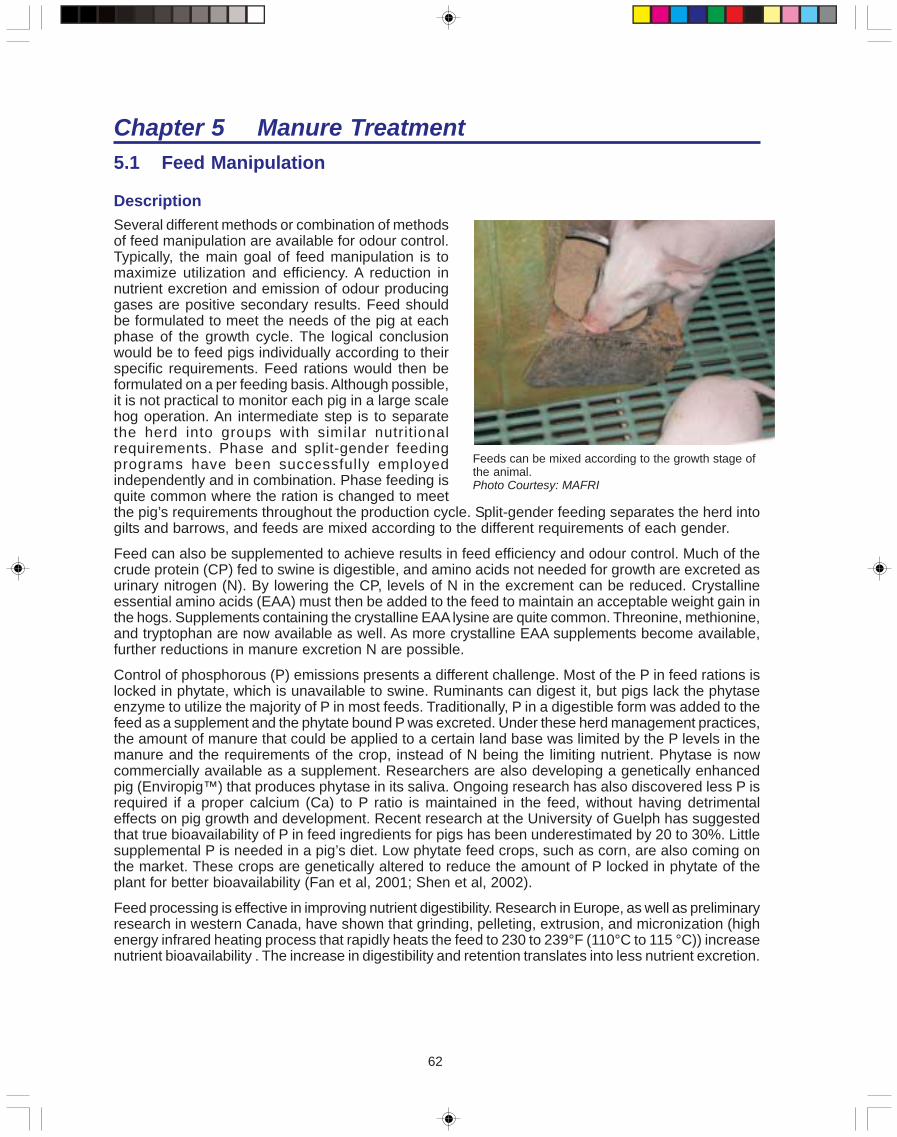
62
Chapter 5 Manure Treatment5.1 Feed Manipulation
DescriptionSeveral different methods or combination of methodsof feed manipulation are available for odour control.Typically, the main goal of feed manipulation is tomaximize utilization and efficiency. A reduction innutrient excretion and emission of odour producinggases are positive secondary results. Feed shouldbe formulated to meet the needs of the pig at eachphase of the growth cycle. The logical conclusionwould be to feed pigs individually according to theirspecific requirements. Feed rations would then beformulated on a per feeding basis. Although possible,it is not practical to monitor each pig in a large scalehog operation. An intermediate step is to separatethe herd into groups with similar nutritionalrequirements. Phase and split-gender feedingprograms have been successfully employedindependently and in combination. Phase feeding isquite common where the ration is changed to meet
Feeds can be mixed according to the growth stage ofthe animal.Photo Courtesy: MAFRI
the pig’s requirements throughout the production cycle. Split-gender feeding separates the herd intogilts and barrows, and feeds are mixed according to the different requirements of each gender.
Feed can also be supplemented to achieve results in feed efficiency and odour control. Much of thecrude protein (CP) fed to swine is digestible, and amino acids not needed for growth are excreted asurinary nitrogen (N). By lowering the CP, levels of N in the excrement can be reduced. Crystallineessential amino acids (EAA) must then be added to the feed to maintain an acceptable weight gain inthe hogs. Supplements containing the crystalline EAA lysine are quite common. Threonine, methionine,and tryptophan are now available as well. As more crystalline EAA supplements become available,further reductions in manure excretion N are possible.
Control of phosphorous (P) emissions presents a different challenge. Most of the P in feed rations islocked in phytate, which is unavailable to swine. Ruminants can digest it, but pigs lack the phytaseenzyme to utilize the majority of P in most feeds. Traditionally, P in a digestible form was added to thefeed as a supplement and the phytate bound P was excreted. Under these herd management practices,the amount of manure that could be applied to a certain land base was limited by the P levels in themanure and the requirements of the crop, instead of N being the limiting nutrient. Phytase is nowcommercially available as a supplement. Researchers are also developing a genetically enhancedpig (Enviropig™) that produces phytase in its saliva. Ongoing research has also discovered less P isrequired if a proper calcium (Ca) to P ratio is maintained in the feed, without having detrimentaleffects on pig growth and development. Recent research at the University of Guelph has suggestedthat true bioavailability of P in feed ingredients for pigs has been underestimated by 20 to 30%. Littlesupplemental P is needed in a pig’s diet. Low phytate feed crops, such as corn, are also coming onthe market. These crops are genetically altered to reduce the amount of P locked in phytate of theplant for better bioavailability (Fan et al, 2001; Shen et al, 2002).
Feed processing is effective in improving nutrient digestibility. Research in Europe, as well as preliminaryresearch in western Canada, have shown that grinding, pelleting, extrusion, and micronization (highenergy infrared heating process that rapidly heats the feed to 230 to 239°F (110°C to 115 °C)) increasenutrient bioavailability . The increase in digestibility and retention translates into less nutrient excretion.
63
Environmental AdvantagesAmmonia emissions can be reduced by 31 to 55%. TKN can be reduced 38 to 60% in fresh manure,and total urinary N can be reduced 28 to 36% by reducing CP and supplementing with crystallineEAA. Typically a 1% reduction in CP results in an 8% reduction in N excretion. Although the resultingreductions in odour emissions are less clear, reductions can be expected.
Environmental DisadvantagesNitrogen and phosphorus are currently the main focus for reduced nutrient excretion. However, excretionof other minerals including potassium (K) may remain high even after diet manipulation. K is notsupplemented but naturally occurs in the feed in quantities higher than required by the pig. Total VOC(volatile organic compounds) or odour emissions do not change but their profile and intensity does.
Barn design may have to be altered to accommodate separating the herd for split-gender and phasefeeding requirements. Feeding equipment may have to be modified or upgraded to mix the properrations (Heber et al, 1999).
CostsPhase feeding can be implemented either through the addition of extra feed lines or through themovement of hogs to different feeding pens as they progress through the phases of the feedingprogram. Each method of implementation can result in additional capital costs in terms of feed linesor feeding pens and increased costs for the labour needed to move hogs between feeding areas. Thereduction in nitrogen excretion through phase feeding is about 9% (Bactawar, 2003) and can result insavings of as much as $2/pig produced in a two phase operation. Adding phases shows a reductionin feed costs of $1/pig produced going from two phase to three phase, or $0.50 going from threephase to four phase (Murphy, 2003). In a properly designed swine facility, additional phases can beimplemented without the need of extra capital investment or labour expenses.
A reduction in feed cost of $1/hog produced has been reported for the use of split gender feeding(Murphy, 2003), but as with phase feeding, additional equipment and labour costs may be necessaryto use this feeding strategy.
Nitrogen excreted by hogs can be reduced through several feed additives. Crystalline amino acidssuch as lysine, methionine, threonine, and tryptophan have been shown to reduce excreted nitrogenby 8.5 to 20%. For diets without EAA, the use of EAA would result in a cost saving. If diets werealready formulated properly, the increased cost in feed for synthetic EAA additives is $1.40 to $3.55/hogproduced to further reduce N excretion. This represents an increase in feed costs of as much as 5%.Ammonia emission reductions of as much as 40% can be obtained through the addition of an organicacid, such as benzoic acid, to feed. The increase in feed cost for a benzoic acid additive is$1.49/marketed hog.
Nitrogen excretion by hogs can also be reduced by the addition of enzymes to feed. While the reductionis small at 5% for an enzyme such as xylanase, use of the enzyme may also reduce feed consumptionand improve feed efficiency. It is reported that at a cost of $1.40 to $1.70/marketed hog, the reductionin feed consumption due to the enzyme while maintaining growth is valued at about $3/hog marketed(Bactawar, 2003), a net savings of $1.30 to $1.60.
The addition of phytase to a swine diet can reduce phosphorus excreted by as much as 40% at a costof $0.47/finished pig in additional feed costs (EPA, 2001). This represents an increase in feed costs ofless than 1%.
Feed processing can reduce nitrogen excretions by 20% and phosphorus excretions by 16%, with thetotal volume of manure produced also being reduced (Farmscape, 2003). Currently, research isunderway to determine the economic feasibility of feed processing.
64
Recent research at the University of Guelph suggests that formulation of swine diets on true digestibleP supply can dramatically reduce the use of supplemental P and phytase and save about $0.75/finisherhog.
Generally, feed mixing and feed delivery errors that may result in as little as 10% change in nutrientlevels can lead to losses of as much as $2/pig produced through an increase in feed consumption(Murphy, 2003). Management and control of feed mixing and delivery is very important to avoid thispotential cost increase.
Improving feed consumption by 0.1 units in finisher hogs can translate into feed savings of as muchas $1.68/pig marketed (Murphy, 2003), thus any additive or feeding strategy that will result in a reductionof feed consumption without adversely affecting the gain of the hog should be considered. A breakeven situation can occur where the cost of additives and/or equipment and labour equals the savingsin feed, and there is also a potential reduction in the amount of phosphorus and/or nitrogen excreted.
General AssessmentFeed management seems to be a win-win situation. By increasing efficiencies in the feed, the producercan optimize growth performance of the hog herd. Also, the neighbours may enjoy the added benefitsof reduced odour emissions and nutrient loading in the environment if proper nutrient managementprocedures are followed.
Complementary TechnologiesThis process benefits any manure treatment and handling system. Less volume of manure and nutrientloading in the manure requires less land base for storage and application. Solid-liquid manure separationis also considered a complementary technology.
Literature CitedAjakaiye, A., M.Z. Fan, T. Archbold, R.R. Hacker, C.W. Forsberg, and J.P. Phillips. 2003. Determination of true digestive
utilization of phosphorus and the endogenous phosphorus outputs associated with soybean meal for growing pigs.American Society of Animal Science. Journal of Animal Science, 81(11): 2766-2775.
Bactawar, B. 2003. Reducing nitrogen levels in hog manure by diet manipulation. Hog Fact Sheet. British Columbia Ministryof Agriculture, Food and Fisheries.
Environmental Protection Agency. 2001. Cost methodology report for swine and poultry sectors. EPA #821R01018.
Fan, M.Z., T. Archbold, W. Sauer, D. Lackeyram, T. Rideout, Y. Gao, C. de Lange, and R.R. Hacker. 2001. Novel methodol-ogy allows simultaneous measurement of true phosphorus digestibility and the gastrointestinal endogenous phospho-rus outputs in studies with pigs. American Society for Nutritional Sciences. Journal of Nutrition, 131(9): 2388-2396.
Farmscape. 2003. U of M study shows micronization reduces manure volumes and nutrient levels. Episode 1149, Janu-ary 3.
Heber, A.J., D.J. Jones, and A.L. Sutton. 1999. Methods and practices to reduce odor from swine facilities. Ag Air Quality,AQ-2. Purdue University, Cooperative Extension Service.
Murphy, J. 2003. Feeding management - $how me the money. Ontario Ministry of Agriculture and Food.
Shen, Y., M.Z. Fan, A. Ajakaiye, and T. Archbold. 2002. Use of the regression analysis technique to determine the truephosphorus digestibility and the endogenous phosphorus output associated with corn in growing pigs. American Soci-ety for Nutritional Science. Journal of Nutrition, 132(6): 1199-1206.
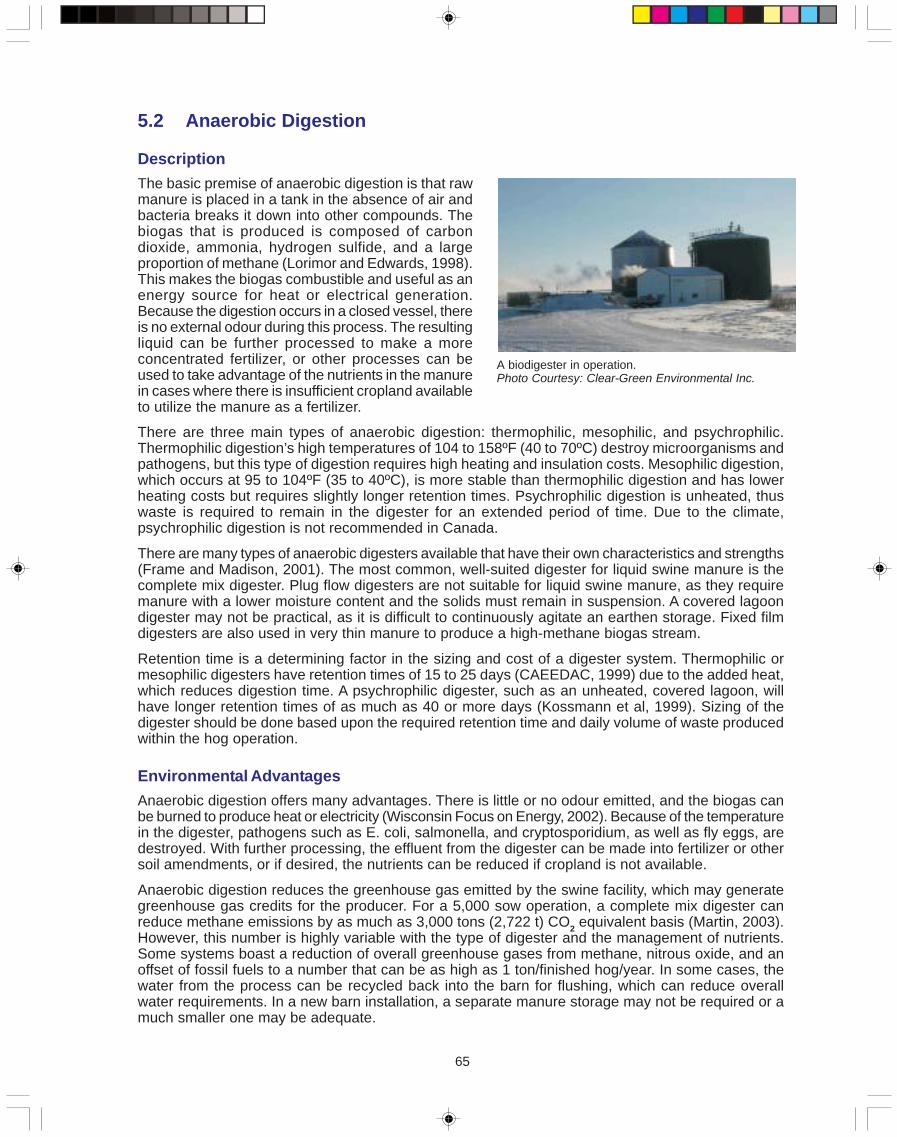
65
5.2 Anaerobic Digestion
DescriptionThe basic premise of anaerobic digestion is that rawmanure is placed in a tank in the absence of air andbacteria breaks it down into other compounds. Thebiogas that is produced is composed of carbondioxide, ammonia, hydrogen sulfide, and a largeproportion of methane (Lorimor and Edwards, 1998).This makes the biogas combustible and useful as anenergy source for heat or electrical generation.Because the digestion occurs in a closed vessel, thereis no external odour during this process. The resultingliquid can be further processed to make a moreconcentrated fertilizer, or other processes can beused to take advantage of the nutrients in the manurein cases where there is insufficient cropland availableto utilize the manure as a fertilizer.
A biodigester in operation.Photo Courtesy: Clear-Green Environmental Inc.
There are three main types of anaerobic digestion: thermophilic, mesophilic, and psychrophilic.Thermophilic digestion’s high temperatures of 104 to 158ºF (40 to 70ºC) destroy microorganisms andpathogens, but this type of digestion requires high heating and insulation costs. Mesophilic digestion,which occurs at 95 to 104ºF (35 to 40ºC), is more stable than thermophilic digestion and has lowerheating costs but requires slightly longer retention times. Psychrophilic digestion is unheated, thuswaste is required to remain in the digester for an extended period of time. Due to the climate,psychrophilic digestion is not recommended in Canada.
There are many types of anaerobic digesters available that have their own characteristics and strengths(Frame and Madison, 2001). The most common, well-suited digester for liquid swine manure is thecomplete mix digester. Plug flow digesters are not suitable for liquid swine manure, as they requiremanure with a lower moisture content and the solids must remain in suspension. A covered lagoondigester may not be practical, as it is difficult to continuously agitate an earthen storage. Fixed filmdigesters are also used in very thin manure to produce a high-methane biogas stream.
Retention time is a determining factor in the sizing and cost of a digester system. Thermophilic ormesophilic digesters have retention times of 15 to 25 days (CAEEDAC, 1999) due to the added heat,which reduces digestion time. A psychrophilic digester, such as an unheated, covered lagoon, willhave longer retention times of as much as 40 or more days (Kossmann et al, 1999). Sizing of thedigester should be done based upon the required retention time and daily volume of waste producedwithin the hog operation.
Environmental AdvantagesAnaerobic digestion offers many advantages. There is little or no odour emitted, and the biogas canbe burned to produce heat or electricity (Wisconsin Focus on Energy, 2002). Because of the temperaturein the digester, pathogens such as E. coli, salmonella, and cryptosporidium, as well as fly eggs, aredestroyed. With further processing, the effluent from the digester can be made into fertilizer or othersoil amendments, or if desired, the nutrients can be reduced if cropland is not available.
Anaerobic digestion reduces the greenhouse gas emitted by the swine facility, which may generategreenhouse gas credits for the producer. For a 5,000 sow operation, a complete mix digester canreduce methane emissions by as much as 3,000 tons (2,722 t) CO2 equivalent basis (Martin, 2003).However, this number is highly variable with the type of digester and the management of nutrients.Some systems boast a reduction of overall greenhouse gases from methane, nitrous oxide, and anoffset of fossil fuels to a number that can be as high as 1 ton/finished hog/year. In some cases, thewater from the process can be recycled back into the barn for flushing, which can reduce overallwater requirements. In a new barn installation, a separate manure storage may not be required or amuch smaller one may be adequate.
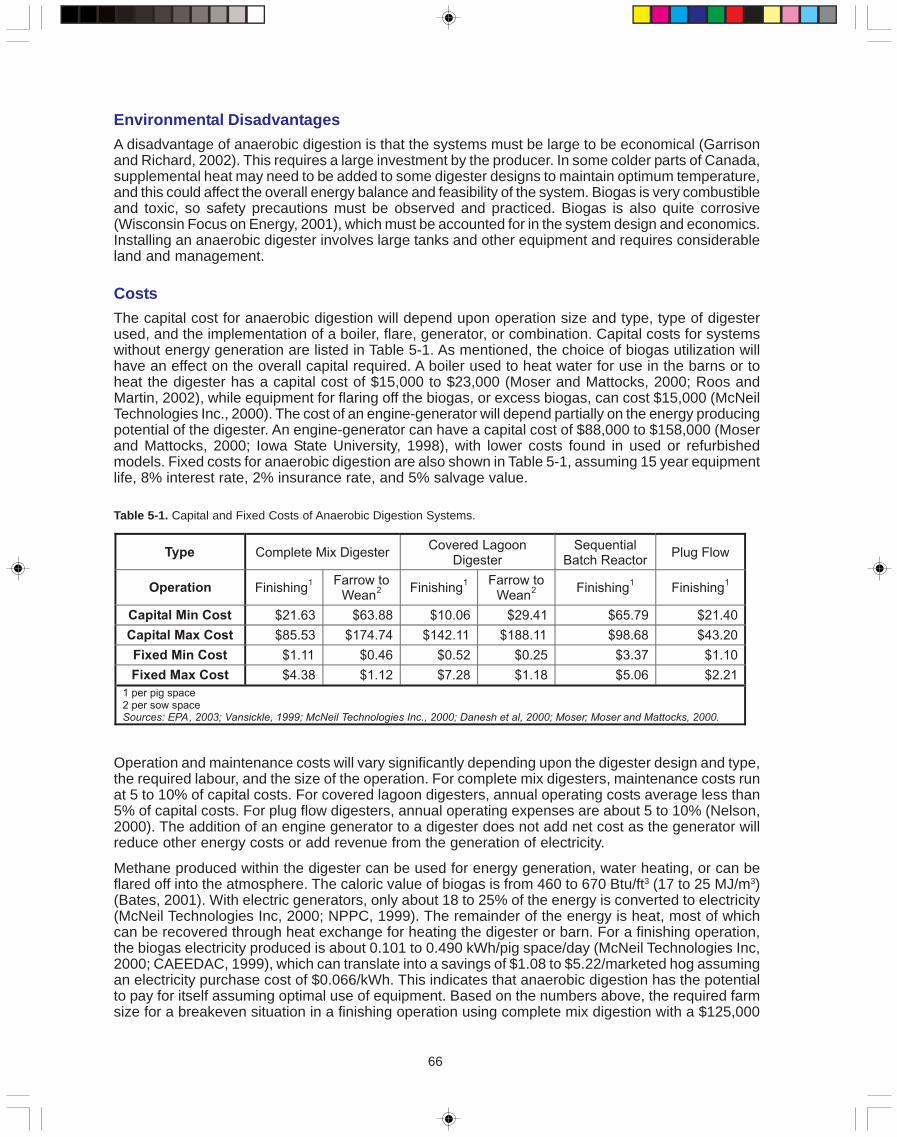
66
Environmental DisadvantagesA disadvantage of anaerobic digestion is that the systems must be large to be economical (Garrisonand Richard, 2002). This requires a large investment by the producer. In some colder parts of Canada,supplemental heat may need to be added to some digester designs to maintain optimum temperature,and this could affect the overall energy balance and feasibility of the system. Biogas is very combustibleand toxic, so safety precautions must be observed and practiced. Biogas is also quite corrosive(Wisconsin Focus on Energy, 2001), which must be accounted for in the system design and economics.Installing an anaerobic digester involves large tanks and other equipment and requires considerableland and management.
CostsThe capital cost for anaerobic digestion will depend upon operation size and type, type of digesterused, and the implementation of a boiler, flare, generator, or combination. Capital costs for systemswithout energy generation are listed in Table 5-1. As mentioned, the choice of biogas utilization willhave an effect on the overall capital required. A boiler used to heat water for use in the barns or toheat the digester has a capital cost of $15,000 to $23,000 (Moser and Mattocks, 2000; Roos andMartin, 2002), while equipment for flaring off the biogas, or excess biogas, can cost $15,000 (McNeilTechnologies Inc., 2000). The cost of an engine-generator will depend partially on the energy producingpotential of the digester. An engine-generator can have a capital cost of $88,000 to $158,000 (Moserand Mattocks, 2000; Iowa State University, 1998), with lower costs found in used or refurbishedmodels. Fixed costs for anaerobic digestion are also shown in Table 5-1, assuming 15 year equipmentlife, 8% interest rate, 2% insurance rate, and 5% salvage value.
Table 5-1. Capital and Fixed Costs of Anaerobic Digestion Systems.
Operation and maintenance costs will vary significantly depending upon the digester design and type,the required labour, and the size of the operation. For complete mix digesters, maintenance costs runat 5 to 10% of capital costs. For covered lagoon digesters, annual operating costs average less than5% of capital costs. For plug flow digesters, annual operating expenses are about 5 to 10% (Nelson,2000). The addition of an engine generator to a digester does not add net cost as the generator willreduce other energy costs or add revenue from the generation of electricity.
Methane produced within the digester can be used for energy generation, water heating, or can beflared off into the atmosphere. The caloric value of biogas is from 460 to 670 Btu/ft3 (17 to 25 MJ/m3)(Bates, 2001). With electric generators, only about 18 to 25% of the energy is converted to electricity(McNeil Technologies Inc, 2000; NPPC, 1999). The remainder of the energy is heat, most of whichcan be recovered through heat exchange for heating the digester or barn. For a finishing operation,the biogas electricity produced is about 0.101 to 0.490 kWh/pig space/day (McNeil Technologies Inc,2000; CAEEDAC, 1999), which can translate into a savings of $1.08 to $5.22/marketed hog assumingan electricity purchase cost of $0.066/kWh. This indicates that anaerobic digestion has the potentialto pay for itself assuming optimal use of equipment. Based on the numbers above, the required farmsize for a breakeven situation in a finishing operation using complete mix digestion with a $125,000
Type Complete Mix DigesterCovered Lagoon
DigesterSequential
Batch ReactorPlug Flow
Operation Finishing1 Farrow to
Wean2 Finishing
1 Farrow toWean
2 Finishing1
Finishing1
Capital Min Cost $21.63 $63.88 $10.06 $29.41 $65.79 $21.40
Capital Max Cost $85.53 $174.74 $142.11 $188.11 $98.68 $43.20
Fixed Min Cost $1.11 $0.46 $0.52 $0.25 $3.37 $1.10
Fixed Max Cost $4.38 $1.12 $7.28 $1.18 $5.06 $2.21
1 per pig space2 per sow spaceSources: EPA, 2003; Vansickle, 1999; McNeil Technologies Inc., 2000; Danesh et al, 2000; Moser; Moser and Mattocks, 2000.
67
generator is about 6,600 finisher spaces, assuming $5.22 in electricity savings per marketed hog, ifthe nutrient value of the digestate is not taken into account. In a farrow-to-wean operation, the valuesare slightly higher since the daily effluent produced per pig space is higher.
In order to maintain optimal operating temperatures in colder climates, waste can be preheated beforeentering the digester but will add to costs.
Factors that affect the methanogenic bacteria can also increase costs by decreasing the effectivenessof the technology. Cleaning agents, disinfectants, salts, heavy metals, ammonia, and antibiotics thatmay enter, or be found in, waste can reduce methane production (NPPC, 1999; Fulhage et al, 1993)and should be monitored carefully. Excess organic material entering the system can result in a loweredpH of the material being digested, inhibiting the bacteria and halting gas production (Fulhage et al,1993).
Manure handling changes and improvements to the barn design can greatly reduce capital costs andimprove overall digester performance by more quickly removing manure for processing. Capital costsrelated to system insulation for maintaining operating temperature can decrease by using the insulatingproperties of soil, mounding it up the sides of the digester or completely burying the digester tank(Jones et al, 1980).
The fertilizer value of the digestate should also be taken into account, as the residuals of digestionstill hold nutrient value. Anaerobic digestion can convert up to 70% of the nitrogen found in hog wasteinto ammonia (McNeil Technologies Inc, 2000).
While the cost of having properly trained personnel operating the digester and generator is higher,gas yields can increase by as much as a factor of three for a properly operated system as comparedto one operated by unskilled labour (CAEEDAC, 1999). The pH of the system must also be monitored,and when the fluid becomes too acidic, costs can be decreased by using swine urine instead of wateror purchased chemicals to make the system more alkaline.
General AssessmentAnaerobic digestion can be a very good method to process manure, thereby reducing the odour,producing valuable end products, and generating energy. In some cases, a complete anaerobicdigestion system can be a net profit centre for the producer. However, the economics of anaerobicdigesters must be determined before deciding to install a system, as there is a large capital investmentrequired (Miranowski et al).
If electricity is to be generated, an arrangement with the local electrical utility must be confirmedbefore the system is finalized. It must also be recognized that operating an anaerobic digester willinvolve some additional management, and this must be accounted as a part of the overall decision toinclude anaerobic digestion as a part of the manure management scheme. The management issue isbeing addressed by some anaerobic digester companies that offer to finance, build, and operate thedigester system. The producer pays a fee to the company, and the company owns the manure andany products generated by the system.
Complementary TechnologiesAfter anaerobic digestion, other processes can be used to utilize the outputs, such as making fertilizeror soil amendments or using boilers for heat generation and electrical generators. If the fertilizervalue of the manure must be consumed, a Sequencing Batch Reactor (SBR) can be used (Fernandeset al, 1991). A SBR uses a combination of anaerobic and aerobic reactions to process manure andconsume nitrogen and carbon from the raw manure.
Literature CitedBates, Judith 2000. Economic evaluation of emission reductions of nitrous oxide and methane in agriculture in the EU. Final
Report. AEA technology Environment, United Kingdom.
Canadian Agricultural End Use Data and Analysis Centre (CAEEDAC). 1999. The economics of biogas in the hog industry.A report prepared for Natural Resources Canada (NRCan).
68
Danesh, S., D. Small, and D. Hodgkinson. 2000. Pilot plant demonstration of a three-stage waste treatment technology.DGH Engineering, St. Andrews, MB.
Environmental Protection Agency (EPA). 2003. AgSTAR Digest, Winter 2003, p.13.
Fernandes L., E. McKyes, M. Wareth, and S. Barrington. 1991. Treatment of liquid swine manure in the sequencing batchreactor under aerobic and anoxic conditions. Canadian Agricultural Engineering, 33:373-379.
Frame, D. and F. Madison. 2001. Anaerobic digesters and methane production. University of Wisconsin. UW ExtensionA3766.
Fulhage, C., D. Sievers, and J.R. Fischer. 1993. Generating methane gas from manure. University of Missouri-ColumbiaUniversity Extension, G1881.
Garrison, M. and T. Richard. 2002. Methane and manure: feasibility analysis of price and policy alternatives. ASAE, PaperNo. 024091.
Iowa State University. 1998. Anaerobic digestion. Iowa Odor Control Demonstration Project. Factsheet PM-1754f.
Jones, D.D., J.C. Nye, and A.C. Dale. 1980. Methane generation from livestock waste. Purdue University CooperativeExtension Service, AE-105.
Kossmann, W., S. Habermehl, T. Hoerz, P. Krämer, B. Klingler, C. Kellner, T. Wittur, F. von Klopotek, A. Krieg, and H. Euler.1999. Biogas - Application and Product Development. Biogas Digest Vol. II. GTZ-GATE, Eschborn, Germany.
Lorimor, J. and G. Edwards. 1998. Anaerobic digestion. Iowa Odor Control Demonstration Project. Iowa State University.PM-1754f.
Martin, J.H. 2003. An assessment of the performance of the Colorado Pork, LLC. anaerobic digestion and biogas utilizationsystem. Order No. 03-007.
Maycher, N. 2003. Greenhouse gas emissions and opportunities for reduction from the Alberta swine industry. ClimateChange Central, Discussion Paper C3-012.
McNeil Technologies Inc. 2000. Assessment of biogas-to-energy generation opportunities at commercial swine operationsin Colorado. Final Report. Department of Energy. Western Regional Biomass Energy Program, WRBEP Contract #55024.
Miranowski J. K. Kleibenstein, T. Alexander, E. Luvaga, J. Rodeckew, and M. Ernst. Viability of methane production byanaerobic digestion on Iowa swine farms. Iowa State University, Management/Economics ASL-R1693.
Moser, M.A. A dozen successful swine waste digesters. RCM Digesters, Inc.
Moser, M.A. and R.P. Mattocks. 2000. Benefits, costs and operating experience at 10 agricultural anaerobic digesters.Eighth International Symposium and Exhibition on Animal, Agricultural and Food Processing Waste. Mariot ConferenceCenter, Des Moines, IA. October 9-12, 2000.
National Pork Producers Council (NPPC). 1999. Odor solutions initiative proposal evaluation summary. NPPC Reference#:82.
Nelson, N. 2000. Agriculture sector strategies. Ch. 9 in North Carolina’s Sensible Greenhouse Gas Reduction Strategies.ASU Energy Centre. Appalachian State University.
Roos, K.F. and J.A. Martin, Jr. 2002. Covered anaerobic lagoon systems for swine waste treatment: concepts and perfor-mances on an AgSTAR charter farm in North Carolina. Conference Proceedings, Water Environment Federation, March.
Stowell, R. and C. Henry. 2002. The economic potential of methane recovery for swine operations: projected impacts ofvarious public-policy scenarios. Manure Matters, Vol. 8(8).
Vansickle, J. 1999. Methane digester: odor reduction breakthrough. National Hog Farmer, August 15.
Wisconsin Focus on Energy. 2002. Farm energy from manure. Renewable Energy Factsheet.
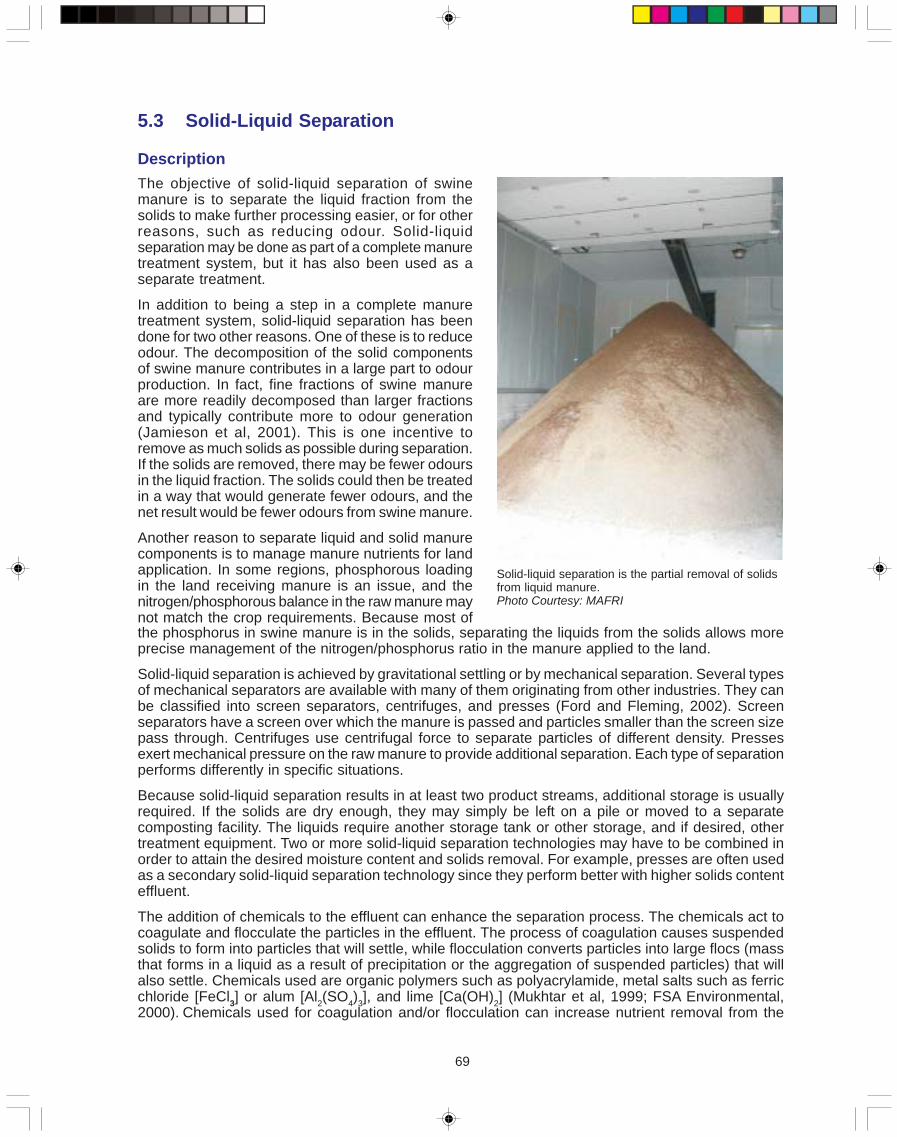
69
5.3 Solid-Liquid Separation
DescriptionThe objective of solid-liquid separation of swinemanure is to separate the liquid fraction from thesolids to make further processing easier, or for otherreasons, such as reducing odour. Solid-liquidseparation may be done as part of a complete manuretreatment system, but it has also been used as aseparate treatment.
In addition to being a step in a complete manuretreatment system, solid-liquid separation has beendone for two other reasons. One of these is to reduceodour. The decomposition of the solid componentsof swine manure contributes in a large part to odourproduction. In fact, fine fractions of swine manureare more readily decomposed than larger fractionsand typically contribute more to odour generation(Jamieson et al, 2001). This is one incentive toremove as much solids as possible during separation.If the solids are removed, there may be fewer odoursin the liquid fraction. The solids could then be treatedin a way that would generate fewer odours, and thenet result would be fewer odours from swine manure.
Another reason to separate liquid and solid manurecomponents is to manage manure nutrients for landapplication. In some regions, phosphorous loadingin the land receiving manure is an issue, and thenitrogen/phosphorous balance in the raw manure maynot match the crop requirements. Because most of
Solid-liquid separation is the partial removal of solidsfrom liquid manure.Photo Courtesy: MAFRI
the phosphorus in swine manure is in the solids, separating the liquids from the solids allows moreprecise management of the nitrogen/phosphorus ratio in the manure applied to the land.
Solid-liquid separation is achieved by gravitational settling or by mechanical separation. Several typesof mechanical separators are available with many of them originating from other industries. They canbe classified into screen separators, centrifuges, and presses (Ford and Fleming, 2002). Screenseparators have a screen over which the manure is passed and particles smaller than the screen sizepass through. Centrifuges use centrifugal force to separate particles of different density. Pressesexert mechanical pressure on the raw manure to provide additional separation. Each type of separationperforms differently in specific situations.
Because solid-liquid separation results in at least two product streams, additional storage is usuallyrequired. If the solids are dry enough, they may simply be left on a pile or moved to a separatecomposting facility. The liquids require another storage tank or other storage, and if desired, othertreatment equipment. Two or more solid-liquid separation technologies may have to be combined inorder to attain the desired moisture content and solids removal. For example, presses are often usedas a secondary solid-liquid separation technology since they perform better with higher solids contenteffluent.
The addition of chemicals to the effluent can enhance the separation process. The chemicals act tocoagulate and flocculate the particles in the effluent. The process of coagulation causes suspendedsolids to form into particles that will settle, while flocculation converts particles into large flocs (massthat forms in a liquid as a result of precipitation or the aggregation of suspended particles) that willalso settle. Chemicals used are organic polymers such as polyacrylamide, metal salts such as ferricchloride [FeCl3] or alum [Al2(SO4)3], and lime [Ca(OH)2] (Mukhtar et al, 1999; FSA Environmental,2000). Chemicals used for coagulation and/or flocculation can increase nutrient removal from the
70
effluent. For example, the addition of a polymer to manure running through a centrifuge separator canincrease the removal of nitrogen from 13% to 31% and phosphorus removal from 66% to 75% (HPSFG,1994).
Environmental AdvantagesWhen solid-liquid separators are used as a part of a complete manure treatment system, thedownstream processes are normally more efficient and effective. Separation can also reduce odourdue to reduction or removal of carbon compounds and nutrient elements that lead to odour generation.In some cases, the solids can be composted directly after separation. If enough solids are removed,the resulting liquid fraction will not need agitation during pump out and may be in a state that can bepumped directly into an irrigation system.
Environmental DisadvantagesWhen the raw manure is separated into liquid and solid fractions, two or more material streams mustbe handled instead of one. Introducing any type of processing equipment brings with it added complexityand management requirements. Also, solid-liquid separation is usually not the only manure treatmentprocess in any given operation, so added processes and complexity usually accompany this treatment.
CostsMechanical solid-liquid separation technologies cost between $7,800 to more than $112,000 (Flemingand MacAlpine, 2003; Watts et al, 2002). These costs do not include the cost for pumps, sumps, floorchannels, and heated shelters, which may be required for operation during winter months (Flemingand MacAlpine, 2003). Mechanical separation units are capable of throughputs of 26 to 7,800 gal/min(2 to 590 L/s) (Fleming and MacAlpine, 2003). Settling tanks or basins cost about $33/sow space, or$9.21 to $13.16/finisher space to construct (Lorimor and Edwards, 1998). Machinery, such as a front-end or skid steer loader, is required for the operation of sedimentation basins.
Labour for cleaning, sludge removal, and repair and maintenance is required for solid-liquid separationtechnologies. Many systems can be fully automated, reducing the labour required for operation (Flemingand MacAlpine, 2003). Maintenance required will depend on the type of separation. Systems withmoving parts will require more maintenance than simple systems such as settling basins or inclinedscreens. Additional cost may occur due to the equipment being prone to corrosion, thus reducingexpected lifetime (Fleming and MacAlpine, 2003).
Table 5-3 shows examples of the cost for different solid-liquid separation technologies for a 200 sowfarrow to finish operation. Assumptions include an electricity rate of $0.066/kWh, interest rate of 8%,salvage value of 10% for all technologies except the settling basin, 5% salvage for the settling basin,labour cost of $12/hour, oil and lube rate of 15% of fuel cost and 3,500 hogs marketed annually. Themachinery used for the settling basin includes an 80 hp (60 kW) tractor with a front-end loaderattachment that is owned by the farm.
Operation costs will include energy requirements of the systems. Pumps for moving effluent arenormally in the 2 to 10 hp (1.5 to 7.5 kW) size (Lorimor and Edwards, 1998) with operating costs of$0.10 to $0.49/hour of operation, assuming an electricity rate of $0.066/kWh. A list of specific capacityand utility costs is shown in Table 5-4 for a variety of separation technologies.
Costs associated with combining the technology of chemical addition with solid-liquid separationtechniques include the cost of chemicals and labour or equipment for adding the chemicals.Polyacrylamide costs $13/lb ($29/kg) and can be incorporated at a rate of 5 ppm (5 mg/L) of waste(Watts et al, 2002). For a 5,000 head space finishing operation producing 0.15 ft3 (0.004 m3) ofwaste/animal/day, the annual chemical cost of adding polyacrylamide is $23.26, or less than$0.01/marketed hog.
Removal of solids makes the liquid easier to pump, thus reducing the complexity of pumping systems.The frequency of sludge removal can also be reduced, lowering associated labour and machinerycosts and potentially reducing wear on storage liners and covers.
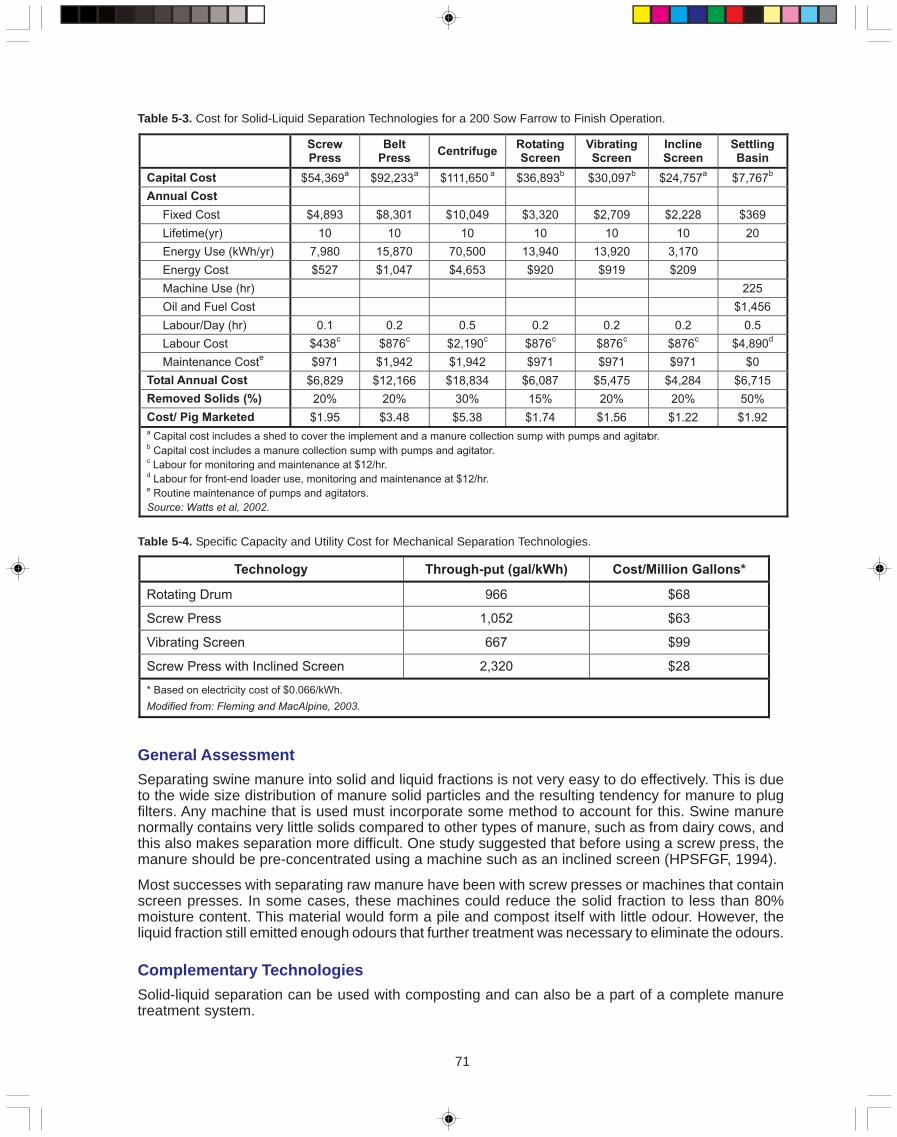
71
General AssessmentSeparating swine manure into solid and liquid fractions is not very easy to do effectively. This is dueto the wide size distribution of manure solid particles and the resulting tendency for manure to plugfilters. Any machine that is used must incorporate some method to account for this. Swine manurenormally contains very little solids compared to other types of manure, such as from dairy cows, andthis also makes separation more difficult. One study suggested that before using a screw press, themanure should be pre-concentrated using a machine such as an inclined screen (HPSFGF, 1994).
Most successes with separating raw manure have been with screw presses or machines that containscreen presses. In some cases, these machines could reduce the solid fraction to less than 80%moisture content. This material would form a pile and compost itself with little odour. However, theliquid fraction still emitted enough odours that further treatment was necessary to eliminate the odours.
Complementary TechnologiesSolid-liquid separation can be used with composting and can also be a part of a complete manuretreatment system.
Table 5-3. Cost for Solid-Liquid Separation Technologies for a 200 Sow Farrow to Finish Operation.
Table 5-4. Specific Capacity and Utility Cost for Mechanical Separation Technologies.
ScrewPress
BeltPress
CentrifugeRotatingScreen
VibratingScreen
InclineScreen
SettlingBasin
Capital Cost $54,369a
$92,233a
$111,650a
$36,893b
$30,097b
$24,757a
$7,767b
Annual Cost
Fixed Cost $4,893 $8,301 $10,049 $3,320 $2,709 $2,228 $369
Lifetime(yr) 10 10 10 10 10 10 20
Energy Use (kWh/yr) 7,980 15,870 70,500 13,940 13,920 3,170
Energy Cost $527 $1,047 $4,653 $920 $919 $209
Machine Use (hr) 225
Oil and Fuel Cost $1,456
Labour/Day (hr) 0.1 0.2 0.5 0.2 0.2 0.2 0.5
Labour Cost $438c
$876c
$2,190c
$876c
$876c
$876c
$4,890d
Maintenance Coste
$971 $1,942 $1,942 $971 $971 $971 $0
Total Annual Cost $6,829 $12,166 $18,834 $6,087 $5,475 $4,284 $6,715
Removed Solids (%) 20% 20% 30% 15% 20% 20% 50%
Cost/ Pig Marketed $1.95 $3.48 $5.38 $1.74 $1.56 $1.22 $1.92a Capital cost includes a shed to cover the implement and a manure collection sump with pumps and agitator.b Capital cost includes a manure collection sump with pumps and agitator.c Labour for monitoring and maintenance at $12/hr.d Labour for front-end loader use, monitoring and maintenance at $12/hr.e Routine maintenance of pumps and agitators.
Source: Watts et al, 2002.
Technology Through-put (gal/kWh) Cost/Million Gallons*
Rotating Drum 966 $68
Screw Press 1,052 $63
Vibrating Screen 667 $99
Screw Press with Inclined Screen 2,320 $28
* Based on electricity cost of $0.066/kWh.
Modified from: Fleming and MacAlpine, 2003.
72
Literature CitedFleming, R. and M. MacAlpine. 2003. Evaluation of mechanical liquid/solid manure separators. Prepared for Ontario Pork.
Project number 02/39.
FSA Environmental. 2000. Alternative systems for piggery effluent treatment. Report prepared for the Environment Protec-tion Agency and the Rural City of Murray Bridge. ISBN 1 876562 23 4.
Ford, M. and R. Fleming. 2002.Mechanical solid-liquid separation livestock manure. Literature Review, Ridgetown College- University of Guelph.
Hog Producers Sustainable Farming Group (HPSFG). 1994. Fan engineering manure separator: operation and perfor-mance. British Columbia Ministry of Agriculture, Food, and Fisheries. Waste Management Factsheet.
Hog Producers Sustainable Farming Group (HPSFG). 1994. Hog slurry separation with a centrifuge. British Columbia Min-istry of Agriculture, Food and Fisheries. Waste Management Fact Sheet Order Number: 382.340-1.
Jamieson, R., R. Gordon, L. Cochrane, H. LeBlanc, S. Tattrie, and B. White. 2001. Evaluation of a mechanical solid-liquidseparator for swine manure. Solid-Liquid Separation of Swine Waste: Final Report.
Lorimor, J. and M. Zhang. 1999. Manure solids separation by filtration with biomaterials. Iowa State University. ASAE Paper99-4070.
Lorimor, J. and E. Edwards. 1998. Solids separation. Iowa Odor Control Demonstration Project. Iowa State UniversityExtension Service, PM-1754i.
Mukhtar, S., J.M. Sweeten, and B.W. Auvermann. 1999. Solid-liquid separation of animal manure and wastewater. TheTexas A&M University System, Texas Agricultural Extension Service.
Watts, P.J., R.W. Tucker, P.A. Pittaway, E.J. McGahan, I.R. Kruger, and S.C. Lott. 2002. Low cost alternatives for reducingodour generation. Milestone 5 Report Part B - Case Studies of Solids Separation Systems’ Milestone No.5 of ProjectNo. 1629, Part B Report, Australian Pork Limited, Canberra, Australia.
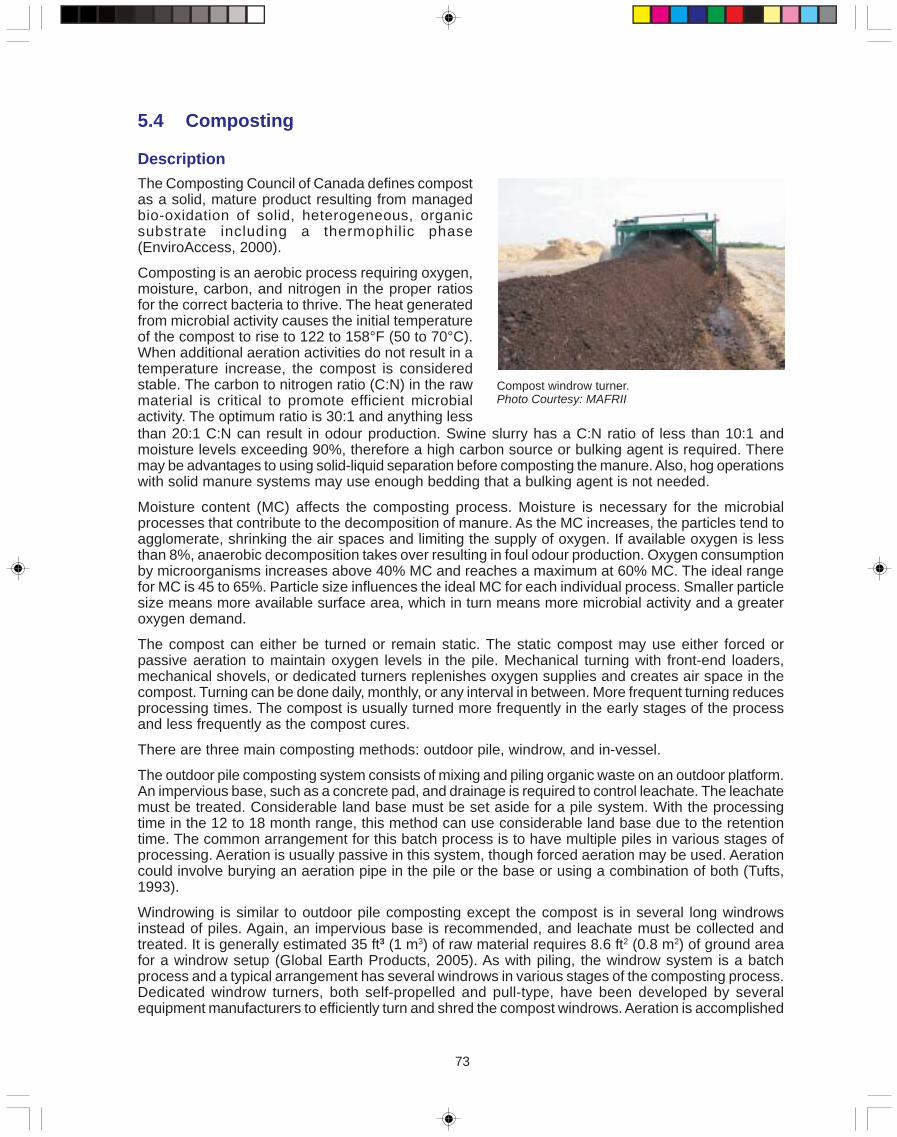
73
5.4 Composting
DescriptionThe Composting Council of Canada defines compostas a solid, mature product resulting from managedbio-oxidation of solid, heterogeneous, organicsubstrate including a thermophilic phase(EnviroAccess, 2000).
Composting is an aerobic process requiring oxygen,moisture, carbon, and nitrogen in the proper ratiosfor the correct bacteria to thrive. The heat generatedfrom microbial activity causes the initial temperatureof the compost to rise to 122 to 158°F (50 to 70°C).When additional aeration activities do not result in atemperature increase, the compost is consideredstable. The carbon to nitrogen ratio (C:N) in the rawmaterial is critical to promote efficient microbialactivity. The optimum ratio is 30:1 and anything less
Compost windrow turner.Photo Courtesy: MAFRII
than 20:1 C:N can result in odour production. Swine slurry has a C:N ratio of less than 10:1 andmoisture levels exceeding 90%, therefore a high carbon source or bulking agent is required. Theremay be advantages to using solid-liquid separation before composting the manure. Also, hog operationswith solid manure systems may use enough bedding that a bulking agent is not needed.
Moisture content (MC) affects the composting process. Moisture is necessary for the microbialprocesses that contribute to the decomposition of manure. As the MC increases, the particles tend toagglomerate, shrinking the air spaces and limiting the supply of oxygen. If available oxygen is lessthan 8%, anaerobic decomposition takes over resulting in foul odour production. Oxygen consumptionby microorganisms increases above 40% MC and reaches a maximum at 60% MC. The ideal rangefor MC is 45 to 65%. Particle size influences the ideal MC for each individual process. Smaller particlesize means more available surface area, which in turn means more microbial activity and a greateroxygen demand.
The compost can either be turned or remain static. The static compost may use either forced orpassive aeration to maintain oxygen levels in the pile. Mechanical turning with front-end loaders,mechanical shovels, or dedicated turners replenishes oxygen supplies and creates air space in thecompost. Turning can be done daily, monthly, or any interval in between. More frequent turning reducesprocessing times. The compost is usually turned more frequently in the early stages of the processand less frequently as the compost cures.
There are three main composting methods: outdoor pile, windrow, and in-vessel.
The outdoor pile composting system consists of mixing and piling organic waste on an outdoor platform.An impervious base, such as a concrete pad, and drainage is required to control leachate. The leachatemust be treated. Considerable land base must be set aside for a pile system. With the processingtime in the 12 to 18 month range, this method can use considerable land base due to the retentiontime. The common arrangement for this batch process is to have multiple piles in various stages ofprocessing. Aeration is usually passive in this system, though forced aeration may be used. Aerationcould involve burying an aeration pipe in the pile or the base or using a combination of both (Tufts,1993).
Windrowing is similar to outdoor pile composting except the compost is in several long windrowsinstead of piles. Again, an impervious base is recommended, and leachate must be collected andtreated. It is generally estimated 35 ft3 (1 m3) of raw material requires 8.6 ft2 (0.8 m2) of ground areafor a windrow setup (Global Earth Products, 2005). As with piling, the windrow system is a batchprocess and a typical arrangement has several windrows in various stages of the composting process.Dedicated windrow turners, both self-propelled and pull-type, have been developed by severalequipment manufacturers to efficiently turn and shred the compost windrows. Aeration is accomplished
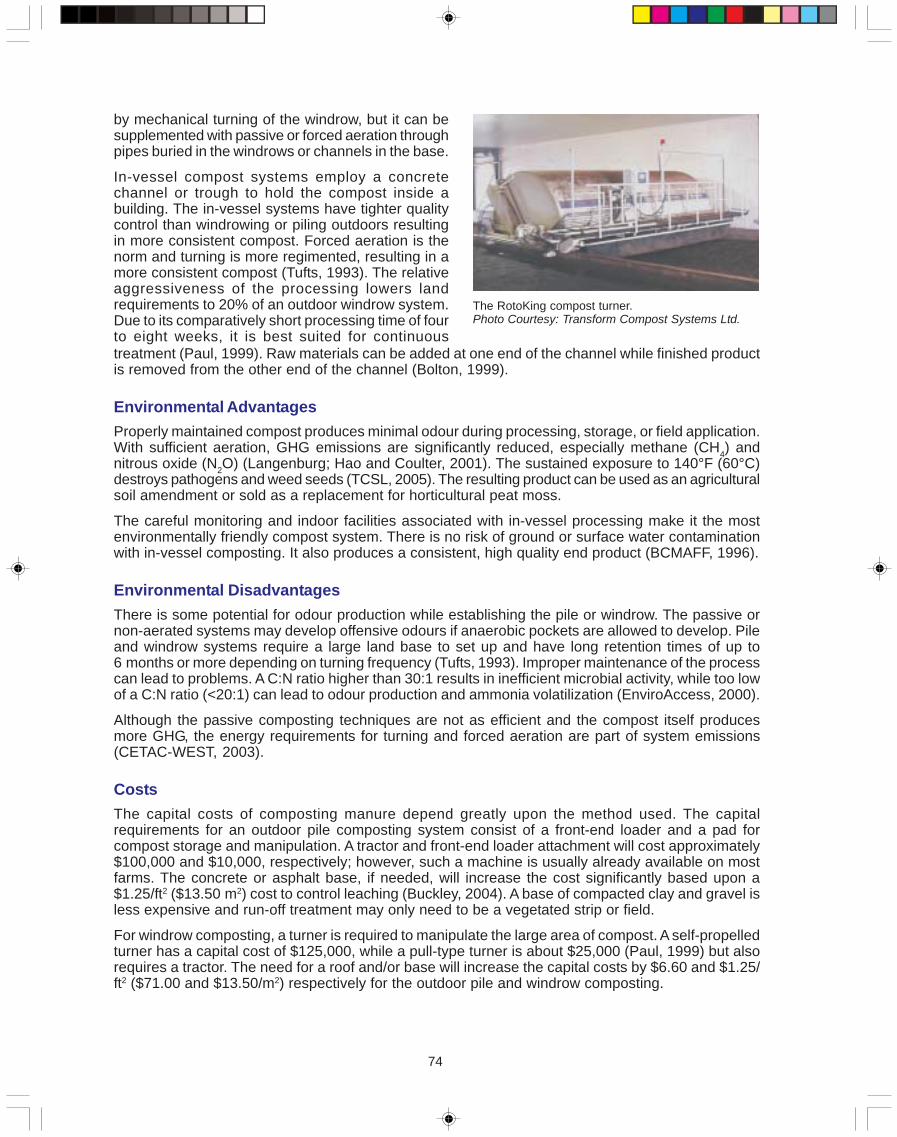
74
by mechanical turning of the windrow, but it can besupplemented with passive or forced aeration throughpipes buried in the windrows or channels in the base.
In-vessel compost systems employ a concretechannel or trough to hold the compost inside abuilding. The in-vessel systems have tighter qualitycontrol than windrowing or piling outdoors resultingin more consistent compost. Forced aeration is thenorm and turning is more regimented, resulting in amore consistent compost (Tufts, 1993). The relativeaggressiveness of the processing lowers landrequirements to 20% of an outdoor windrow system.Due to its comparatively short processing time of fourto eight weeks, it is best suited for continuous
The RotoKing compost turner.Photo Courtesy: Transform Compost Systems Ltd.
treatment (Paul, 1999). Raw materials can be added at one end of the channel while finished productis removed from the other end of the channel (Bolton, 1999).
Environmental AdvantagesProperly maintained compost produces minimal odour during processing, storage, or field application.With sufficient aeration, GHG emissions are significantly reduced, especially methane (CH4) andnitrous oxide (N2O) (Langenburg; Hao and Coulter, 2001). The sustained exposure to 140°F (60°C)destroys pathogens and weed seeds (TCSL, 2005). The resulting product can be used as an agriculturalsoil amendment or sold as a replacement for horticultural peat moss.
The careful monitoring and indoor facilities associated with in-vessel processing make it the mostenvironmentally friendly compost system. There is no risk of ground or surface water contaminationwith in-vessel composting. It also produces a consistent, high quality end product (BCMAFF, 1996).
Environmental DisadvantagesThere is some potential for odour production while establishing the pile or windrow. The passive ornon-aerated systems may develop offensive odours if anaerobic pockets are allowed to develop. Pileand windrow systems require a large land base to set up and have long retention times of up to6 months or more depending on turning frequency (Tufts, 1993). Improper maintenance of the processcan lead to problems. A C:N ratio higher than 30:1 results in inefficient microbial activity, while too lowof a C:N ratio (<20:1) can lead to odour production and ammonia volatilization (EnviroAccess, 2000).
Although the passive composting techniques are not as efficient and the compost itself producesmore GHG, the energy requirements for turning and forced aeration are part of system emissions(CETAC-WEST, 2003).
CostsThe capital costs of composting manure depend greatly upon the method used. The capitalrequirements for an outdoor pile composting system consist of a front-end loader and a pad forcompost storage and manipulation. A tractor and front-end loader attachment will cost approximately$100,000 and $10,000, respectively; however, such a machine is usually already available on mostfarms. The concrete or asphalt base, if needed, will increase the cost significantly based upon a$1.25/ft2 ($13.50 m2) cost to control leaching (Buckley, 2004). A base of compacted clay and gravel isless expensive and run-off treatment may only need to be a vegetated strip or field.
For windrow composting, a turner is required to manipulate the large area of compost. A self-propelledturner has a capital cost of $125,000, while a pull-type turner is about $25,000 (Paul, 1999) but alsorequires a tractor. The need for a roof and/or base will increase the capital costs by $6.60 and $1.25/ft2 ($71.00 and $13.50/m2) respectively for the outdoor pile and windrow composting.
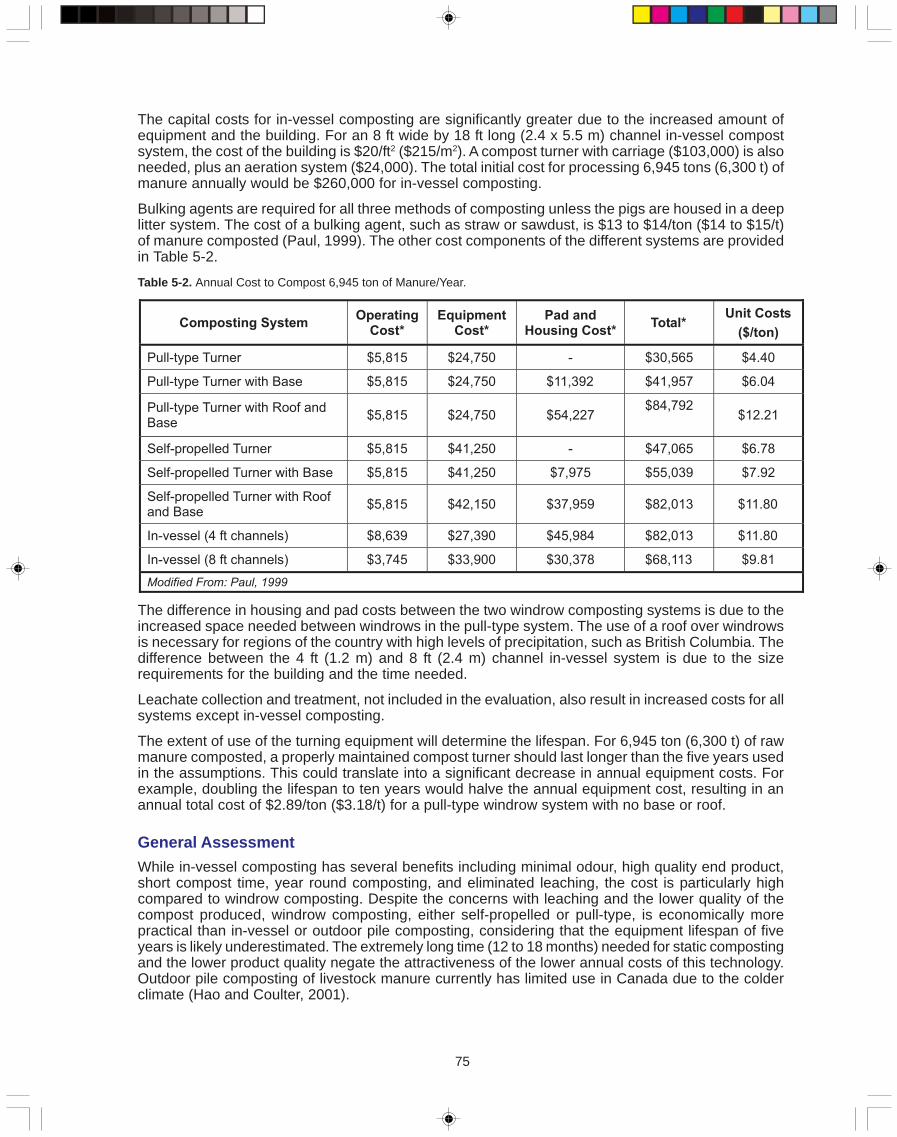
75
The capital costs for in-vessel composting are significantly greater due to the increased amount ofequipment and the building. For an 8 ft wide by 18 ft long (2.4 x 5.5 m) channel in-vessel compostsystem, the cost of the building is $20/ft2 ($215/m2). A compost turner with carriage ($103,000) is alsoneeded, plus an aeration system ($24,000). The total initial cost for processing 6,945 tons (6,300 t) ofmanure annually would be $260,000 for in-vessel composting.
Bulking agents are required for all three methods of composting unless the pigs are housed in a deeplitter system. The cost of a bulking agent, such as straw or sawdust, is $13 to $14/ton ($14 to $15/t)of manure composted (Paul, 1999). The other cost components of the different systems are providedin Table 5-2.
Table 5-2. Annual Cost to Compost 6,945 ton of Manure/Year.
Composting SystemOperating
Cost*Equipment
Cost*Pad and
Housing Cost*Total*
Unit Costs
($/ton)
Pull-type Turner $5,815 $24,750 - $30,565 $4.40
Pull-type Turner with Base $5,815 $24,750 $11,392 $41,957 $6.04
Pull-type Turner with Roof andBase
$5,815 $24,750 $54,227$84,792
$12.21
Self-propelled Turner $5,815 $41,250 - $47,065 $6.78
Self-propelled Turner with Base $5,815 $41,250 $7,975 $55,039 $7.92
Self-propelled Turner with Roofand Base
$5,815 $42,150 $37,959 $82,013 $11.80
In-vessel (4 ft channels) $8,639 $27,390 $45,984 $82,013 $11.80
In-vessel (8 ft channels) $3,745 $33,900 $30,378 $68,113 $9.81
Modified From: Paul, 1999
The difference in housing and pad costs between the two windrow composting systems is due to theincreased space needed between windrows in the pull-type system. The use of a roof over windrowsis necessary for regions of the country with high levels of precipitation, such as British Columbia. Thedifference between the 4 ft (1.2 m) and 8 ft (2.4 m) channel in-vessel system is due to the sizerequirements for the building and the time needed.
Leachate collection and treatment, not included in the evaluation, also result in increased costs for allsystems except in-vessel composting.
The extent of use of the turning equipment will determine the lifespan. For 6,945 ton (6,300 t) of rawmanure composted, a properly maintained compost turner should last longer than the five years usedin the assumptions. This could translate into a significant decrease in annual equipment costs. Forexample, doubling the lifespan to ten years would halve the annual equipment cost, resulting in anannual total cost of $2.89/ton ($3.18/t) for a pull-type windrow system with no base or roof.
General AssessmentWhile in-vessel composting has several benefits including minimal odour, high quality end product,short compost time, year round composting, and eliminated leaching, the cost is particularly highcompared to windrow composting. Despite the concerns with leaching and the lower quality of thecompost produced, windrow composting, either self-propelled or pull-type, is economically morepractical than in-vessel or outdoor pile composting, considering that the equipment lifespan of fiveyears is likely underestimated. The extremely long time (12 to 18 months) needed for static compostingand the lower product quality negate the attractiveness of the lower annual costs of this technology.Outdoor pile composting of livestock manure currently has limited use in Canada due to the colderclimate (Hao and Coulter, 2001).
76
A properly maintained compost heap is an effective method for reducing odours and greenhouse gasemissions as long as there is available land base for storage and retention. It is also effective inreducing water content of the manure if the compost is to be transported long distances.
The compost can be sold in bulk, bagged, or palletized form for off farm use. All compost sold inCanada must comply with the Fertilizers Act and Regulations (Paul et al, 2001).
Complementary TechnologiesA bio-shelter or deep litter operation is well suited for composting as a bulking agent may not berequired.
Mechanical solid-liquid separation technologies could be used. By only composting the solid portionof the manure, less bulking agent is required and greater capacity from a smaller site would berealized. A simple settling tank works quite well and is efficient in a batch process if it is incorporatedas the holding tank. Higher end technologies, such as a screw press or centrifuge, could be usedwhen the consistency of the end product or efficient land usage is a priority (Tufts, 1993).
Literature CitedBolton, K. 1999. Realizing composting opportunities in the western Canadian hog industry. Saskatchewan Agriculture and
Food. 9th Annual Composting Conference, Toronto, November 3-5, 1999.
British Columbia Ministry of Agriculture, Food and Fisheries (BCMAFF). 1996. Site selection for composting. CompostingFactsheet. Order No. 382.500-6, Agdex: 537/727.
Buckley, K. 2004. Agriculture and Agri-Food Canada, Brandon, MB. Personal communications.
CETAC-WEST. 2003. Bio-digester in-vessel composting system. In Hog Manure Management Initiative Technology Demon-stration Project Report. Report prepared for Western Economic Diversification TEAM (Climate Change Action Fund).
EnviroAccess. 2000. Outdoor pile composting: waste and residue treatment for re-use. Technological Fact Sheet, F4-12-00.
Global Earth Products. Marvel. [cited January 12, 2005]. http://www.globalearthproducts.com/marvel_composter.htm.
Hao, X. and G. Coulter. 2001. Manure compost raises greenhouse gas questions. Agriculture and Agri-food Canada, LethbridgeResearch Centre Report, May 2, 2001.
Langenberg, W.J. A “Fresh” Look at Manure - “Compost” - an important “added-value horticultural product”: setting thestandards for certification. Kemptville, ON.
Paul, J. 1999. Developing cost-effective in-vessel composting technology for animal waste composting. The 9th AnnualNational Composting Conference of The Composting Council of Canada, Toronto, Ontario; November 3 - 5, 1999.
Paul, J., C. Wagner-Riddle, A. Thompson, R. Fleming, and M. MacAlpine. 2001. Composting as a strategy to reduce green-house gas emissions. Annual Meeting of the Composting Council of Canada.
Transform Compost Systems Ltd. (TCSL). Welcome to Transform. http://www.transformcompost.com [cited January 21,2005].
Tufts, D. 1993. Composting liquid hog manure: a design proposal. Final report to Canada/Nova Scotia Agreement on theAgricultural Component of the Green Plan.
77
5.5 Pelletizing Manure
DescriptionPelleting is the process of forming fine materialinto pellets. These are defined as small, solid,or densely packed balls or masses. Pelletingequipment has been developed to convert dustsor powders into this homogeneous and easilytransportable form.
The pellets are produced by loose pendular,funicular, and capillary bonds forming betweengrains of the material in the presence ofmoisture. Rotary action causes nucleation and
PPeelllleettiinngg yyiieellddss aa ssttaabbllee,,
hhoommooggeennoouuss,, ggrraannuullaarr
mmaatteerriiaall tthhaatt iiss 5500 ttoo 8800%% ooff
tthhee vvoolluummee ooff tthhee rraaww mmaatteerriiaall..
the densification of the pellets, or mechanical pressure can force the material through a die.
Mechanical press pelleters are common in the waste processing industry and come in two mainstyles: extruders and roller presses. Extruders use screw conveyors to compress the material in acylinder then through a screen or die. A rotary shear is used to cut the pellets, giving them a cylindricalshape. The speed of the extruder screw controls the process speed and pellet quality. The optimumspeed of the screw is determined by the characteristics of the raw material. Optimum moisture contentof the manure is 40% for an extruder machine. Its biggest limitation is that foreign debris or long fibressuch as straw can easily block it. Roller presses come in many different configurations but the processis similar for each one. A roller forces the raw material through a die. Either the roller or the die mayrotate. Again, pellets are sheared off at the appropriate length by a cutter. Moisture content of 20 to25% is considered optimum for a roller press. The feed rate of the raw material dictates the processspeed and the quality of the pellet. Roller presses are able to grind through the large particles thatmay block an extruder but foreign debris, especially rocks and metal, cause severe damage to therollers and dies (Hara, 2001).
Drum and pan pelleters are of the rotary or tumbling style. Fine material is continuously added to arotating pan and wetted by a fine water spray in a pan pelleter, which forms larger particles. Therotating action of the pan or drum causes small, spherical seed type particle formation. Continuedrotation causes a “snowballing” effect resulting in larger particle size. The rotation speed and angle ofthe drum or pan control pellet size. The larger particles are forced to the outside by the rotation wherethey are eventually discharged. The natural selection process ensures uniform pellet size.
Pelleting requires a relatively dry raw material. Raw material moisture content must be maintained inthe 20 to 45% range for optimum performance. Therefore, a dewatering process is required to handleliquid swine manure. Work has been done with pelleting compost, which is an effective moisturereduction process. A separate building will be required to house the equipment. Minimum buildingsize for a rotating drum dryer and pelleter is 36 x 65 ft (11 x 19.5 m). For a solid manure system or ifa fibrous material such as straw is used as the bulking agent, a shredder/decorticator may be requiredto obtain the proper input consistency. To prevent mold formation, the pellets must be dried to 20%moisture content for winter storage and 15% moisture content for summer storage. The pellets aresuitable for resale as a high-end organic fertilizer for residential or commercial use.
Environmental AdvantagesPelleting yields a stable, homogenous, granular material with ammonia residue of less than 0.5 gr/ft3
(1 gm/m3) of air. The nutrients are not lost in the pelleting process, and, therefore are more concentratedin the pellets allowing for more efficient application. Also, the uniformity of the pellet size allows formore precise mechanical application. It is also more cost effective to transport and store the pelletmaterial, as it is 50 to 80% of the initial volume of the raw material. Manure is more stable in pelletform, allowing for better handling characteristics. Pellets can be spread closer to residential areas, asthey do not produce any dust. The pellets do not break down in the soil as quickly, avoiding nutrientoverloading. This also creates an anaerobic environment inside the pellet, slowing the nitrificationprocess and reducing the risk of nitrate leaching.
78
Environmental DisadvantagesThe pelleting process requires high power input to run the machinery and a fuel source for the dryer,if used. Also, the slowing of the nitrification process leads to a greater risk of ammonium leachingcompared to compost. Since the pellets retain their shape longer in the soil, care in application isrequired to avoid ammonium leaching and residual nutrient buildup.
CostsThe pelleting of manure and compost has several pre-processing costs that must be consideredwhen determining the economic feasibility of this technology. Pelleting of compost should include thecosts related to composting of manure, which may include solid-liquid separation, and costs of preparingthe composted material to be pelleted, such as a shredder/decorticator to reduce fibrous material.With manure pelleting, a solid-liquid separation unit will be required unless the hog operation uses adeep litter system, in which case a shredder/decorticator will be needed.
Livestock manure can be pelletized using equipment such as a pin mixer. The pin mixer, capable ofprocessing as much as 10 ft3 (0.28 m3) of manure (10% moisture) per hour costs $23,160 (Hinkle,2003). Based upon manure production figures for finishing hogs, such a unit could service a finishingproduction system as large as 6,000 head, operating for only one hour per day (Hamilton et al, 1997).
The annual fixed cost for a pin mixer is $5,648, assuming a 10 year life (Hinkle, 2003), 8% interestrate, and 2% insurance rate. Annual maintenance of the unit is about $3,829, assuming thatmaintenance requirements are about 10% of capital costs (Hinkle, 2003) due to the number of movingparts. Based on the 15 hp (11 kW) electric engine, electricity costs per year, assuming one hour ofoperation per day and an electricity cost of $0.066/kWh, are about $270. Labour for pelleting willinvolve loading and unloading the unit.
Housing for the pelleting equipment will be required and should be set up with a water supply, as thepelleting process requires the addition of water. In some cases, a binding agent such as wood liquor(lignosulfonate) (Hinkle, 2003) may be required for the formation of the pellets. If the process isperformed daily, storage for the pellet product may be required.
Pellets of swine manure can be applied to fields where the pellets are slowly broken down to releasethe nutrient value to the soil. Pelleting can potentially avoid the reduction of the N:P ratio that is foundin the composting of swine manure (Buckley et al, 2003; Freeze et al, 1999).
General AssessmentPelleting might be an option for farms with insufficient land base for spreading. Pelleting may also bean option if there is a sustainable market for the pellets. However, there are normally more costeffective processes for handling manure for farm use. Research shows the pelleted manure is morecostly than inorganic fertilizers and the market segment that will pay the premium for organic fertilizeris small. As this market segment grows and demand increases, it may become viable.
Complementary TechnologiesComposting is a complementary technology as it accomplishes moisture reduction. A properlymaintained compost operation can provide a consistent raw material for pelleting. However, othersolid-liquid separation processes would also work instead of composting to reduce retention time andspace required, although the larger volume of separated liquid would still need to be disposed.

79
Literature CitedBuckley, K., B. Irvine, and C. Grant. 2003. Managing phosphorus from manure application. Land Resource Management
Research, Research Highlights 2003, AAFC Brandon Research Centre.
Hara, M. 2001. Fertilizer pellets made from composted livestock manure. Food and Fertilizer Technology Center.
Hamilton, D.W., W.G. Luce, and A.D. Heald. 1997. Production and characteristics of swine manure. Oklahoma CooperativeExtension Service. Extension Fact Sheet F-1735.
Hinkle, B. 2003. Mars Mineral. Personal communications.
Freeze B., J. Heigh, F.J. Larney, and A.F. Olson. 1999. Economics of windrow composting and land application of manure.In Manure Management ’99 Workshop, June 22-25, 1999, Saskatoon, SK.
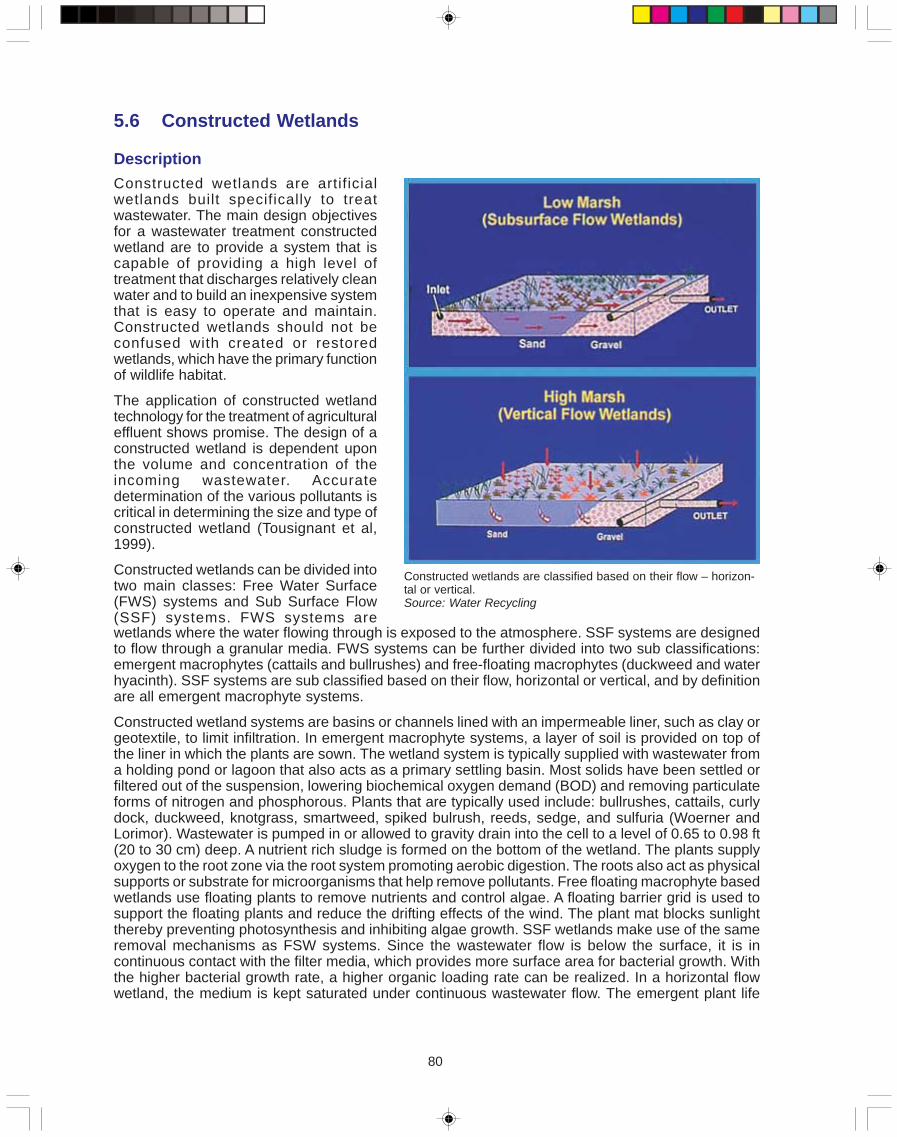
80
5.6 Constructed Wetlands
DescriptionConstructed wetlands are artificialwetlands built specifically to treatwastewater. The main design objectivesfor a wastewater treatment constructedwetland are to provide a system that iscapable of providing a high level oftreatment that discharges relatively cleanwater and to build an inexpensive systemthat is easy to operate and maintain.Constructed wetlands should not beconfused with created or restoredwetlands, which have the primary functionof wildlife habitat.
The application of constructed wetlandtechnology for the treatment of agriculturaleffluent shows promise. The design of aconstructed wetland is dependent uponthe volume and concentration of theincoming wastewater. Accuratedetermination of the various pollutants iscritical in determining the size and type ofconstructed wetland (Tousignant et al,1999).
Constructed wetlands can be divided intotwo main classes: Free Water Surface(FWS) systems and Sub Surface Flow(SSF) systems. FWS systems are
Constructed wetlands are classified based on their flow – horizon-tal or vertical.Source: Water Recycling
wetlands where the water flowing through is exposed to the atmosphere. SSF systems are designedto flow through a granular media. FWS systems can be further divided into two sub classifications:emergent macrophytes (cattails and bullrushes) and free-floating macrophytes (duckweed and waterhyacinth). SSF systems are sub classified based on their flow, horizontal or vertical, and by definitionare all emergent macrophyte systems.
Constructed wetland systems are basins or channels lined with an impermeable liner, such as clay orgeotextile, to limit infiltration. In emergent macrophyte systems, a layer of soil is provided on top ofthe liner in which the plants are sown. The wetland system is typically supplied with wastewater froma holding pond or lagoon that also acts as a primary settling basin. Most solids have been settled orfiltered out of the suspension, lowering biochemical oxygen demand (BOD) and removing particulateforms of nitrogen and phosphorous. Plants that are typically used include: bullrushes, cattails, curlydock, duckweed, knotgrass, smartweed, spiked bulrush, reeds, sedge, and sulfuria (Woerner andLorimor). Wastewater is pumped in or allowed to gravity drain into the cell to a level of 0.65 to 0.98 ft(20 to 30 cm) deep. A nutrient rich sludge is formed on the bottom of the wetland. The plants supplyoxygen to the root zone via the root system promoting aerobic digestion. The roots also act as physicalsupports or substrate for microorganisms that help remove pollutants. Free floating macrophyte basedwetlands use floating plants to remove nutrients and control algae. A floating barrier grid is used tosupport the floating plants and reduce the drifting effects of the wind. The plant mat blocks sunlightthereby preventing photosynthesis and inhibiting algae growth. SSF wetlands make use of the sameremoval mechanisms as FSW systems. Since the wastewater flow is below the surface, it is incontinuous contact with the filter media, which provides more surface area for bacterial growth. Withthe higher bacterial growth rate, a higher organic loading rate can be realized. In a horizontal flowwetland, the medium is kept saturated under continuous wastewater flow. The emergent plant life
81
provides the oxygen flow from the atmosphere to the wetland. Vertical flow SSF systems are operatedas a batch process where the wastewater is applied at timed intervals allowing the filter to drain.Since the system is not constantly saturated, oxygen is more easily transferred by diffusion (Cookand Evans, 2001).
Environmental AdvantagesSeveral physical, chemical, and biological processes take place in a wetland system. On average,wetlands are capable of providing removal rates ranging from 60 to 90% for many pollutants andhave been shown to reduce incoming pathogens numbers by up to five orders of magnitude. Typicalreduction of total kjeldahl nitrogen (TKN), BOD, chemical oxygen demand (COD), total suspendedsolids (TSS), volitile suspended solids (VSS), and pathogens is >90% by concentration. Reduction oftotal phosphorus (TP) ranges from 6 to 70% (Stone et al, 2002).
Environmental DisadvantagesThe phosphorous levels from the outlet of the wetland treatment systems may not meet watercoursedischarge standards. Phosphorous reduction is a physical process. It binds to soil particles with afinite number of exchange/binding sites. This is offset by an effective and efficient sediment basin asa majority of the phosphorous in swine manure is in the solid portion that settles out. Nutrient treatmentcapacity, especially for N, is limited in cold weather. Storage is required to hold wastewater for operationof the constructed wetland in the grazing season.
Wetland managers also have to cope with the grazing and burrowing activity of native wetland speciessuch as muskrats (Rochon et al, 1999). Fencing or other means may be required to exclude muskrats.
CostsThe cost of wetland construction is somewhat similar to the construction of simple earthen manurestorage (Bayne, 1995). While the volume is not as large since the wetland acts as a treatment celladded on to a storage or lagoon, the amount of required land can be larger as the depth is not asgreat. The suggested size for wetlands is 1 ac/65 lb (1,000 m2/7 kg) BOD produced per day (Rieck etal, 1993). Assuming a lagoon removes 50% of BOD, a single acre of land is large enough for 300finishing pig spaces (Rieck et al, 1993). Costs are estimated to be between $32,000 and $45,000/ac(0.4 ha) (Phillips et al, 2001) and will depend partially on availability of equipment and clay for thelining of the wetland.
Constructed wetlands should be nearly maintenance free (NFESC, 1998). On occasion, partial pumpout for application to land may be performed to lower water levels. Associated costs will be maintenanceof pumping systems and water level controls.
Solids that are removed need to be stored and disposed. Storage and application equipment wouldbe costs associated with wetland technology. Additionally, since the nutrient value of the effluent islost (Bayne, 1995) considerations should include higher volume application rates and possiblysupplemental commercial fertilizer.
General AssessmentThe use of constructed wetlands is not a new idea. The most widely used wetland system in NorthAmerica is the free surface (emergent macrophyte) system. This type of system is relatively simple,easy to construct and operate, and is relatively economical. However, Canada’s cold climate providessome challenges to constructed wetland utilization.
Complimentary TechnologiesConstructed wetlands require some form of solid-liquid separation, as they are primarily intended forwastewater systems. Constructed wetland effluent may require some phosphorous reduction beforeit can be discharged into a surface watercourse.
82
Literature CitedBayne, G. 1995. Use of constructed wetlands for treatment of swine manure. Final Report. Saskatchewan Agricultural
Development Fund 94000275/68AV.
Cook, M. and R. Evans. 2001. The use of a constructed wetland for the amelioration of elevated nutrient concentrations inshallow groundwater. North Carolina State University. ASAE Paper 01-2102.
Naval Facilities Engineering Service Center (NFESC). 1998. Constructed wetlands: Cost effective treatment of non-pointsource pollution. NFESC TechData Sheet, TDS-2034-ENV.
Phillips, B.J., P.A. Moore, Jr., D.R. Smith, B.R. Shreve, T.C. Daniel, J. Langston, D.K. Carman, D.R. Edwards, S.J. Formica,and D.C. Wolf. 2001. Constructed wetlands for wastewater remediation at swine rearing facilities. Final Report for Task95-1000 to U.S. EPA. Federal Assistance Project No. 996103030. pp. 64.
Posadas, B.C. 1998. Evaluating the use of constructed wetlands in producing catfish in multi-enterprise farming in Missis-sippi black belt area. Ph.D. Thesis. Mississippi State University, Coastal Research and Extension Center.
Reed, S.C. 1991. Constructed wetlands for wastewater treatment. Biocycle 32(1): 44-49.
Rieck, A., J. Langston, and K. VanDevender. 1993. Constructed wetlands: An approach for animal waste treatment. Univer-sity of Arkansas Cooperative Extension Service. FSA-3005.ar.
Rochon, J.P., R. Gordon, A. Madani, V. Rodd, and L. Cochrane. 1999. Seasonal influences on constructed wetlands fortreatment of agricultural wastewater in Nova Scotia, Canada. ASAE Paper 99-2205.
Stone, K.C., P.G. Hunt, A.A. Szogi, F.J. Humenik, and J.M. Rice. 2002. Constructed wetland design and performance forswine lagoon wastewater treatment. Transactions of the ASAE. Vol. 45(3): 723-730.
Tousignant, E., O. Frankhauser, and S. Hurd. 1999. Guidance manual for the design, construction and operations of con-structed wetlands for rural applications in Ontario. Canadapt Program of the Agricultural Adaptation Council, Ontario.
Water Recycling. Constructed wetland graphic. http://www.waterrecycling.com/contwetlands.htm.
Woerner, B. and J. Lorimor. Alternative treatments to minimize water pollution from open animal feedlots. Iowa State Univer-sity.
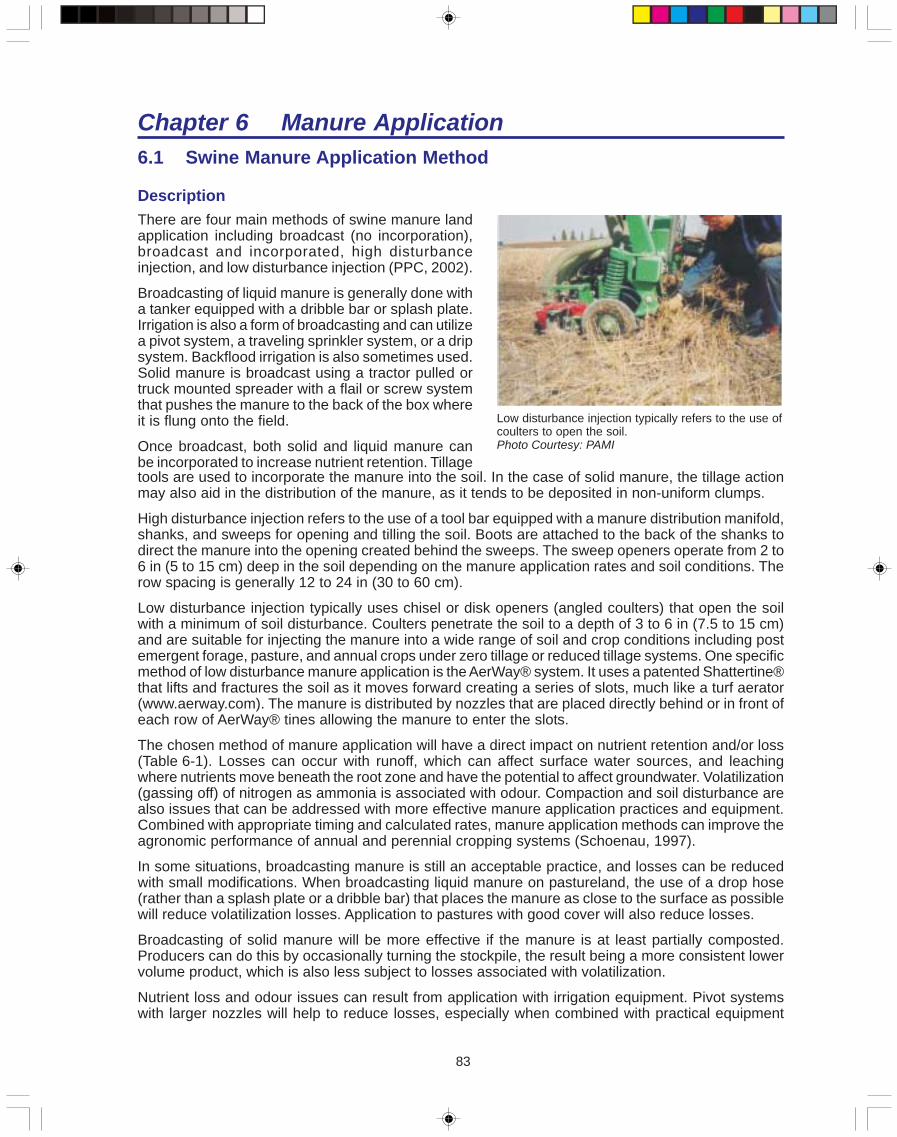
83
Chapter 6 Manure Application6.1 Swine Manure Application Method
DescriptionThere are four main methods of swine manure landapplication including broadcast (no incorporation),broadcast and incorporated, high disturbanceinjection, and low disturbance injection (PPC, 2002).
Broadcasting of liquid manure is generally done witha tanker equipped with a dribble bar or splash plate.Irrigation is also a form of broadcasting and can utilizea pivot system, a traveling sprinkler system, or a dripsystem. Backflood irrigation is also sometimes used.Solid manure is broadcast using a tractor pulled ortruck mounted spreader with a flail or screw systemthat pushes the manure to the back of the box whereit is flung onto the field.
Once broadcast, both solid and liquid manure canbe incorporated to increase nutrient retention. Tillage
Low disturbance injection typically refers to the use ofcoulters to open the soil.Photo Courtesy: PAMI
tools are used to incorporate the manure into the soil. In the case of solid manure, the tillage actionmay also aid in the distribution of the manure, as it tends to be deposited in non-uniform clumps.
High disturbance injection refers to the use of a tool bar equipped with a manure distribution manifold,shanks, and sweeps for opening and tilling the soil. Boots are attached to the back of the shanks todirect the manure into the opening created behind the sweeps. The sweep openers operate from 2 to6 in (5 to 15 cm) deep in the soil depending on the manure application rates and soil conditions. Therow spacing is generally 12 to 24 in (30 to 60 cm).
Low disturbance injection typically uses chisel or disk openers (angled coulters) that open the soilwith a minimum of soil disturbance. Coulters penetrate the soil to a depth of 3 to 6 in (7.5 to 15 cm)and are suitable for injecting the manure into a wide range of soil and crop conditions including postemergent forage, pasture, and annual crops under zero tillage or reduced tillage systems. One specificmethod of low disturbance manure application is the AerWay® system. It uses a patented Shattertine®that lifts and fractures the soil as it moves forward creating a series of slots, much like a turf aerator(www.aerway.com). The manure is distributed by nozzles that are placed directly behind or in front ofeach row of AerWay® tines allowing the manure to enter the slots.
The chosen method of manure application will have a direct impact on nutrient retention and/or loss(Table 6-1). Losses can occur with runoff, which can affect surface water sources, and leachingwhere nutrients move beneath the root zone and have the potential to affect groundwater. Volatilization(gassing off) of nitrogen as ammonia is associated with odour. Compaction and soil disturbance arealso issues that can be addressed with more effective manure application practices and equipment.Combined with appropriate timing and calculated rates, manure application methods can improve theagronomic performance of annual and perennial cropping systems (Schoenau, 1997).
In some situations, broadcasting manure is still an acceptable practice, and losses can be reducedwith small modifications. When broadcasting liquid manure on pastureland, the use of a drop hose(rather than a splash plate or a dribble bar) that places the manure as close to the surface as possiblewill reduce volatilization losses. Application to pastures with good cover will also reduce losses.
Broadcasting of solid manure will be more effective if the manure is at least partially composted.Producers can do this by occasionally turning the stockpile, the result being a more consistent lowervolume product, which is also less subject to losses associated with volatilization.
Nutrient loss and odour issues can result from application with irrigation equipment. Pivot systemswith larger nozzles will help to reduce losses, especially when combined with practical equipment
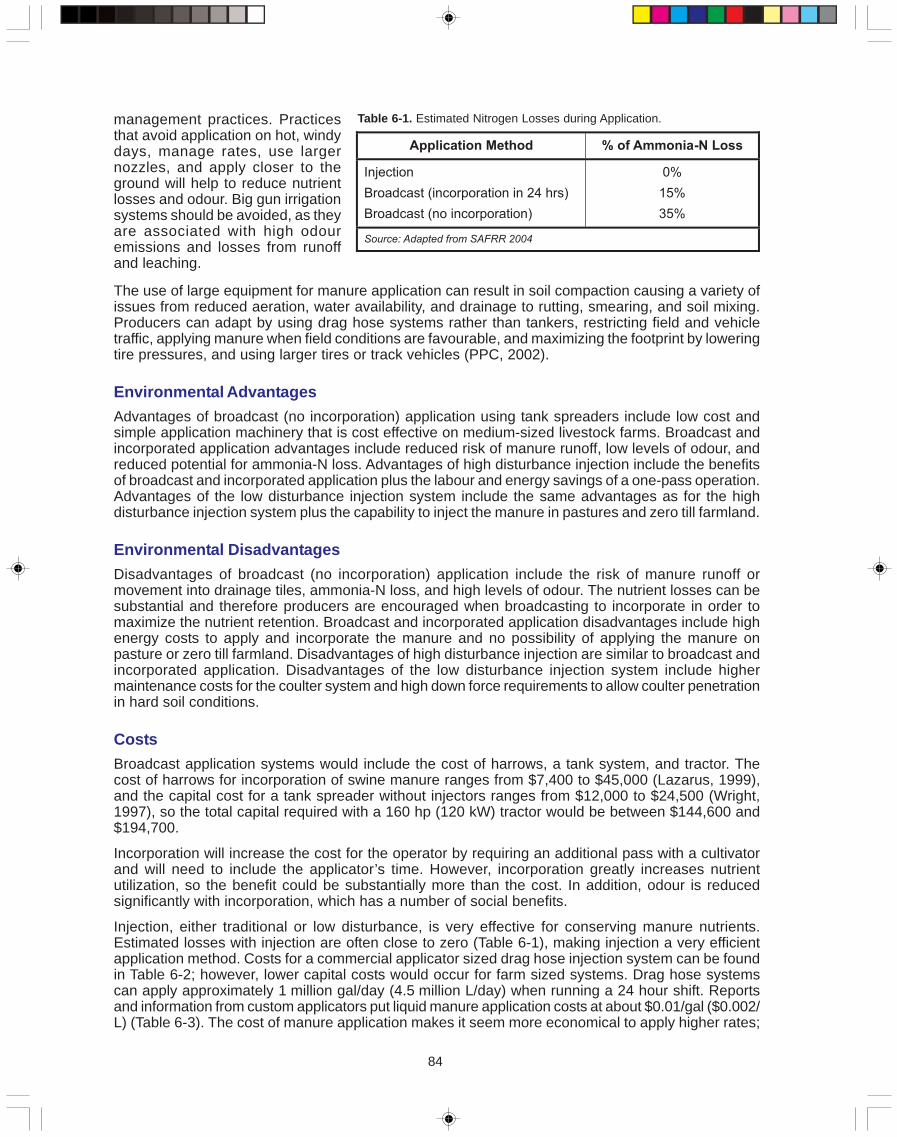
84
management practices. Practicesthat avoid application on hot, windydays, manage rates, use largernozzles, and apply closer to theground will help to reduce nutrientlosses and odour. Big gun irrigationsystems should be avoided, as theyare associated with high odouremissions and losses from runoffand leaching.
Table 6-1. Estimated Nitrogen Losses during Application.
The use of large equipment for manure application can result in soil compaction causing a variety ofissues from reduced aeration, water availability, and drainage to rutting, smearing, and soil mixing.Producers can adapt by using drag hose systems rather than tankers, restricting field and vehicletraffic, applying manure when field conditions are favourable, and maximizing the footprint by loweringtire pressures, and using larger tires or track vehicles (PPC, 2002).
Environmental AdvantagesAdvantages of broadcast (no incorporation) application using tank spreaders include low cost andsimple application machinery that is cost effective on medium-sized livestock farms. Broadcast andincorporated application advantages include reduced risk of manure runoff, low levels of odour, andreduced potential for ammonia-N loss. Advantages of high disturbance injection include the benefitsof broadcast and incorporated application plus the labour and energy savings of a one-pass operation.Advantages of the low disturbance injection system include the same advantages as for the highdisturbance injection system plus the capability to inject the manure in pastures and zero till farmland.
Environmental DisadvantagesDisadvantages of broadcast (no incorporation) application include the risk of manure runoff ormovement into drainage tiles, ammonia-N loss, and high levels of odour. The nutrient losses can besubstantial and therefore producers are encouraged when broadcasting to incorporate in order tomaximize the nutrient retention. Broadcast and incorporated application disadvantages include highenergy costs to apply and incorporate the manure and no possibility of applying the manure onpasture or zero till farmland. Disadvantages of high disturbance injection are similar to broadcast andincorporated application. Disadvantages of the low disturbance injection system include highermaintenance costs for the coulter system and high down force requirements to allow coulter penetrationin hard soil conditions.
CostsBroadcast application systems would include the cost of harrows, a tank system, and tractor. Thecost of harrows for incorporation of swine manure ranges from $7,400 to $45,000 (Lazarus, 1999),and the capital cost for a tank spreader without injectors ranges from $12,000 to $24,500 (Wright,1997), so the total capital required with a 160 hp (120 kW) tractor would be between $144,600 and$194,700.
Incorporation will increase the cost for the operator by requiring an additional pass with a cultivatorand will need to include the applicator’s time. However, incorporation greatly increases nutrientutilization, so the benefit could be substantially more than the cost. In addition, odour is reducedsignificantly with incorporation, which has a number of social benefits.
Injection, either traditional or low disturbance, is very effective for conserving manure nutrients.Estimated losses with injection are often close to zero (Table 6-1), making injection a very efficientapplication method. Costs for a commercial applicator sized drag hose injection system can be foundin Table 6-2; however, lower capital costs would occur for farm sized systems. Drag hose systemscan apply approximately 1 million gal/day (4.5 million L/day) when running a 24 hour shift. Reportsand information from custom applicators put liquid manure application costs at about $0.01/gal ($0.002/L) (Table 6-3). The cost of manure application makes it seem more economical to apply higher rates;
Application Method % of Ammonia-N Loss
Injection
Broadcast (incorporation in 24 hrs)
Broadcast (no incorporation)
0%
15%
35%
Source: Adapted from SAFRR 2004
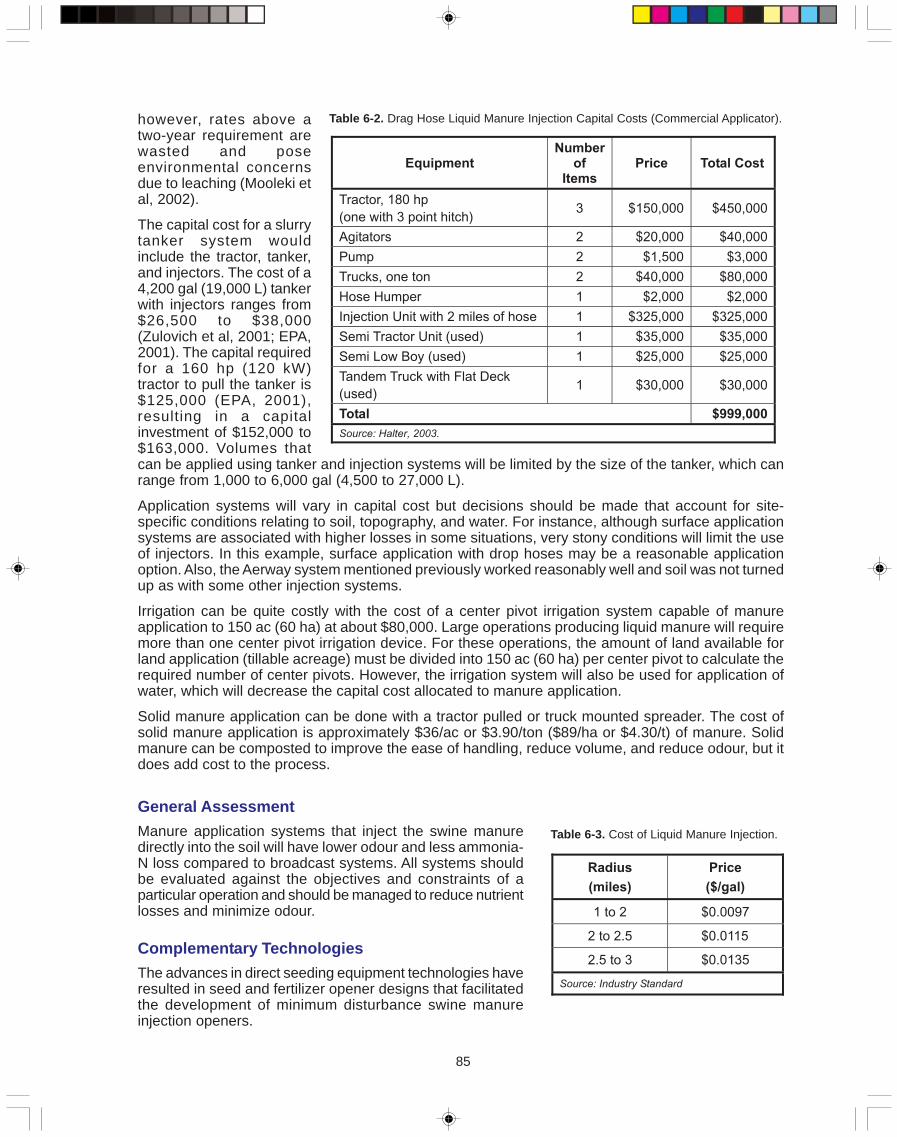
85
can be applied using tanker and injection systems will be limited by the size of the tanker, which canrange from 1,000 to 6,000 gal (4,500 to 27,000 L).
Application systems will vary in capital cost but decisions should be made that account for site-specific conditions relating to soil, topography, and water. For instance, although surface applicationsystems are associated with higher losses in some situations, very stony conditions will limit the useof injectors. In this example, surface application with drop hoses may be a reasonable applicationoption. Also, the Aerway system mentioned previously worked reasonably well and soil was not turnedup as with some other injection systems.
Irrigation can be quite costly with the cost of a center pivot irrigation system capable of manureapplication to 150 ac (60 ha) at about $80,000. Large operations producing liquid manure will requiremore than one center pivot irrigation device. For these operations, the amount of land available forland application (tillable acreage) must be divided into 150 ac (60 ha) per center pivot to calculate therequired number of center pivots. However, the irrigation system will also be used for application ofwater, which will decrease the capital cost allocated to manure application.
Solid manure application can be done with a tractor pulled or truck mounted spreader. The cost ofsolid manure application is approximately $36/ac or $3.90/ton ($89/ha or $4.30/t) of manure. Solidmanure can be composted to improve the ease of handling, reduce volume, and reduce odour, but itdoes add cost to the process.
EquipmentNumber
ofItems
Price Total Cost
Tractor, 180 hp
(one with 3 point hitch)3 $150,000 $450,000
Agitators 2 $20,000 $40,000
Pump 2 $1,500 $3,000
Trucks, one ton 2 $40,000 $80,000
Hose Humper 1 $2,000 $2,000
Injection Unit with 2 miles of hose 1 $325,000 $325,000
Semi Tractor Unit (used) 1 $35,000 $35,000
Semi Low Boy (used) 1 $25,000 $25,000
Tandem Truck with Flat Deck
(used)1 $30,000 $30,000
Total $999,000
Source: Halter, 2003.
Table 6-2. Drag Hose Liquid Manure Injection Capital Costs (Commercial Applicator).however, rates above atwo-year requirement arewasted and poseenvironmental concernsdue to leaching (Mooleki etal, 2002).
The capital cost for a slurrytanker system wouldinclude the tractor, tanker,and injectors. The cost of a4,200 gal (19,000 L) tankerwith injectors ranges from$26,500 to $38,000(Zulovich et al, 2001; EPA,2001). The capital requiredfor a 160 hp (120 kW)tractor to pull the tanker is$125,000 (EPA, 2001),resulting in a capitalinvestment of $152,000 to$163,000. Volumes that
Radius
(miles)
Price
($/gal)
1 to 2 $0.0097
2 to 2.5 $0.0115
2.5 to 3 $0.0135
Source: Industry Standard
Table 6-3. Cost of Liquid Manure Injection.
General AssessmentManure application systems that inject the swine manuredirectly into the soil will have lower odour and less ammonia-N loss compared to broadcast systems. All systems shouldbe evaluated against the objectives and constraints of aparticular operation and should be managed to reduce nutrientlosses and minimize odour.
Complementary TechnologiesThe advances in direct seeding equipment technologies haveresulted in seed and fertilizer opener designs that facilitatedthe development of minimum disturbance swine manureinjection openers.
86
Literature CitedBolton, K. 1999. Managing manure as a fertilizer for prairie agriculture. Proceedings of a Tri-Provincial Conference on
Manure Management: p. 148-157. June 22-25, Saskatoon, Canada.
Halter, S. 2003. Economics of post emergent swine manure application. Draft Report prepared for The Prairie AgriculturalMachinery Institute (unpublished).
Hilborn, D. 1992. Land application of liquid manure in an environmentally responsible manner. Ontario Ministry of Agricul-ture and Food. Factsheet, Agdex #548/743 Order #92/164.
Lazarus, W.F. 1999. Farm machinery economic costs for 1999: Minnesota estimates with adjustments for use in Canada.Staff Paper P99-5. University of Minnesota, Department of Applied Economics, St. Paul, Minnesota.
Mooleki, S.P., J.J. Schoenau, G. Hultgreen, G. Wen, and J.L. Charles. 2002. Effect of rate, frequency and method of liquidswine manure application on soil nitrogen availability, crop performance and N use efficiency in east-centralSaskatchewan. Canadian Journal of Soil Science. 82: 457-467.
Prairie Agricultural Machinery Institute (PAMI). 2001. The pork producer’s guide to managing swine manure: A practicalguide for farmers and applicators. ISBN 0 9696896-5-9.
The Prairie Province’s Committee (PPC) on Livestock Development and Manure Management. 2002. Tri-provincial manureapplication and use guidelines: Saskatchewan. Saskatchewan Agriculture, Food and Rural Revitalization, Alberta Agri-culture, Food and Rural Development, and Manitoba Agriculture and Food.
Saskatchewan Agriculture, Food and Rural Revitalization (SAFRR). 2002. Farm machinery custom and rental rate guide2002. ISBN 0-88656-690-8.
Schoenau, J.J. 1997. Soil fertility benefits from swine manure addition. Sask Pork Industry Symposium, Saskatoon,Saskatchewan, November 13-14, 1997.
Schoenau, J.J. and B. Assefa. 2004. Land application and handling of manure. In Manure Research Findings and Technolo-gies from Science to Social Issues. Alberta Agriculture, Food and Rural Development, Technical Services Division.
United States Environmental Protection Agency (EPA). 2001. Cost methodology report for swine and poultry sectors. UnitedStates Environmental Protection Agency, Office of Water. EPA-821-R-01-018.
Wright, P. 1997. Survey of Manure spreading costs around York, New York. Presented at the ASAE Annual InternationalMeeting, Minneapolis, Minnesota, August 10-14, 1997. Paper #97-2040.
Zulovich, J., R. Massey, J. Lory, A. Millmier, J. Hoehne, and C. Case. 2001. Agronomic and economic impacts of convertingmanure systems. Ch. 6 of Comments to the USEPA on the Concentrated Animal Feeding Operation Proposed Rule.
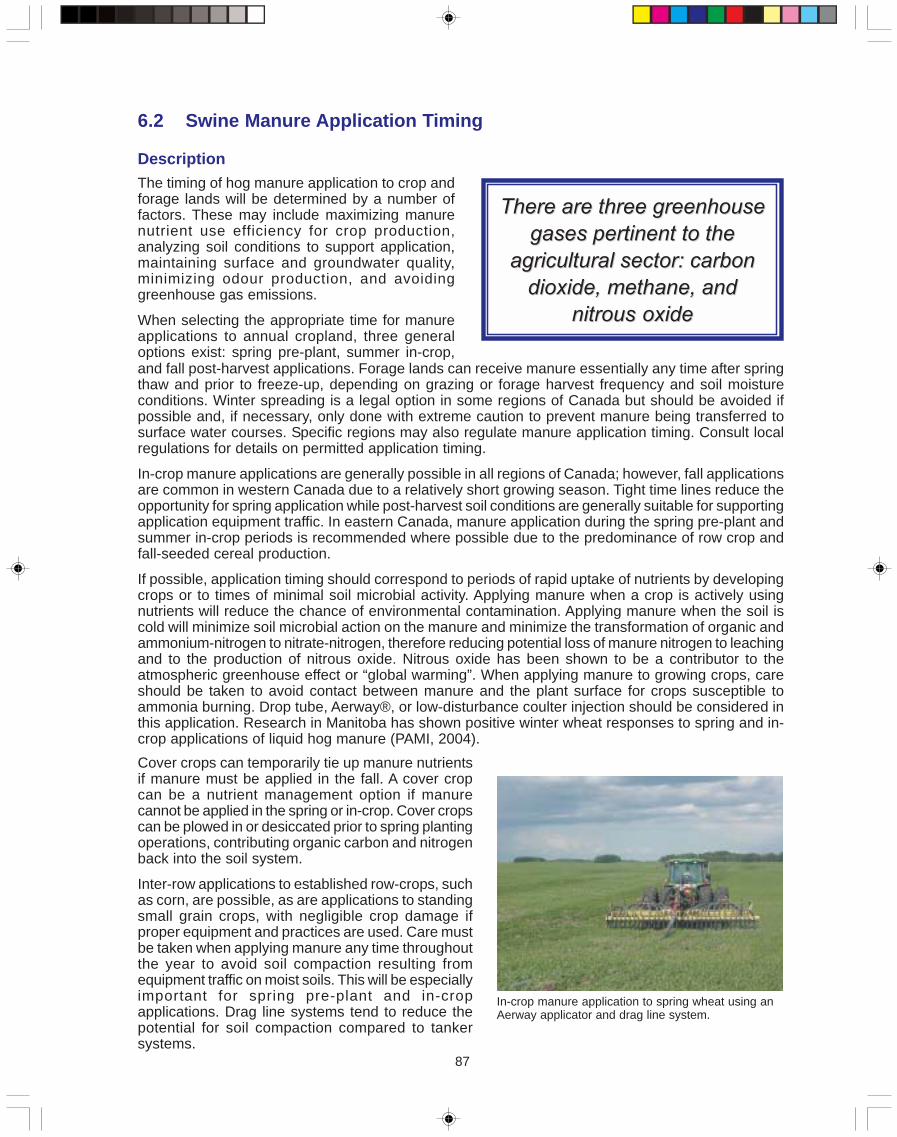
87
6.2 Swine Manure Application Timing
DescriptionThe timing of hog manure application to crop andforage lands will be determined by a number offactors. These may include maximizing manurenutrient use efficiency for crop production,analyzing soil conditions to support application,maintaining surface and groundwater quality,minimizing odour production, and avoidinggreenhouse gas emissions.
When selecting the appropriate time for manureapplications to annual cropland, three generaloptions exist: spring pre-plant, summer in-crop,
TThheerree aarree tthhrreeee ggrreeeennhhoouussee
ggaasseess ppeerrttiinneenntt ttoo tthhee
aaggrriiccuullttuurraall sseeccttoorr:: ccaarrbboonn
ddiiooxxiiddee,, mmeetthhaannee,, aanndd
nniittrroouuss ooxxiiddee
and fall post-harvest applications. Forage lands can receive manure essentially any time after springthaw and prior to freeze-up, depending on grazing or forage harvest frequency and soil moistureconditions. Winter spreading is a legal option in some regions of Canada but should be avoided ifpossible and, if necessary, only done with extreme caution to prevent manure being transferred tosurface water courses. Specific regions may also regulate manure application timing. Consult localregulations for details on permitted application timing.
In-crop manure applications are generally possible in all regions of Canada; however, fall applicationsare common in western Canada due to a relatively short growing season. Tight time lines reduce theopportunity for spring application while post-harvest soil conditions are generally suitable for supportingapplication equipment traffic. In eastern Canada, manure application during the spring pre-plant andsummer in-crop periods is recommended where possible due to the predominance of row crop andfall-seeded cereal production.
If possible, application timing should correspond to periods of rapid uptake of nutrients by developingcrops or to times of minimal soil microbial activity. Applying manure when a crop is actively usingnutrients will reduce the chance of environmental contamination. Applying manure when the soil iscold will minimize soil microbial action on the manure and minimize the transformation of organic andammonium-nitrogen to nitrate-nitrogen, therefore reducing potential loss of manure nitrogen to leachingand to the production of nitrous oxide. Nitrous oxide has been shown to be a contributor to theatmospheric greenhouse effect or “global warming”. When applying manure to growing crops, careshould be taken to avoid contact between manure and the plant surface for crops susceptible toammonia burning. Drop tube, Aerway®, or low-disturbance coulter injection should be considered inthis application. Research in Manitoba has shown positive winter wheat responses to spring and in-crop applications of liquid hog manure (PAMI, 2004).
In-crop manure application to spring wheat using anAerway applicator and drag line system.
Cover crops can temporarily tie up manure nutrientsif manure must be applied in the fall. A cover cropcan be a nutrient management option if manurecannot be applied in the spring or in-crop. Cover cropscan be plowed in or desiccated prior to spring plantingoperations, contributing organic carbon and nitrogenback into the soil system.
Inter-row applications to established row-crops, suchas corn, are possible, as are applications to standingsmall grain crops, with negligible crop damage ifproper equipment and practices are used. Care mustbe taken when applying manure any time throughoutthe year to avoid soil compaction resulting fromequipment traffic on moist soils. This will be especiallyimportant for spring pre-plant and in-cropapplications. Drag line systems tend to reduce thepotential for soil compaction compared to tankersystems.
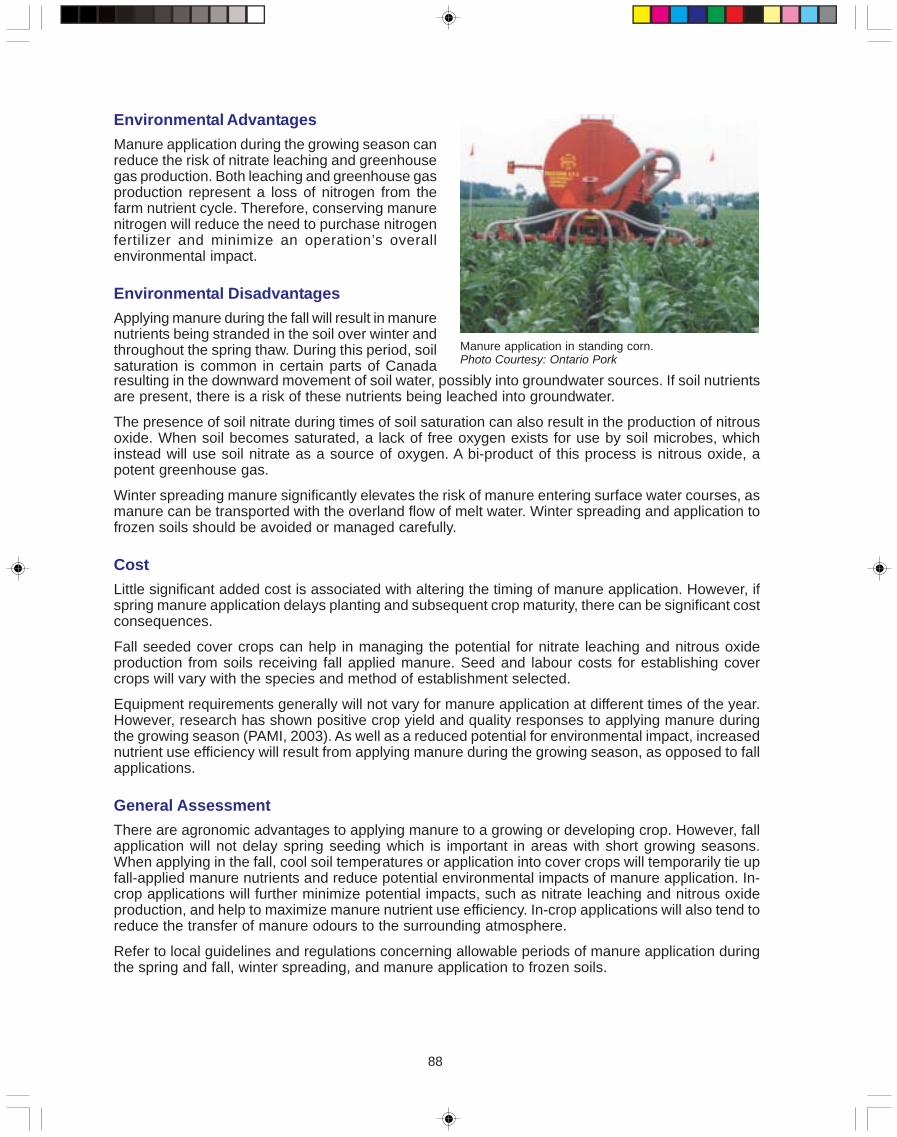
88
Environmental AdvantagesManure application during the growing season canreduce the risk of nitrate leaching and greenhousegas production. Both leaching and greenhouse gasproduction represent a loss of nitrogen from thefarm nutrient cycle. Therefore, conserving manurenitrogen will reduce the need to purchase nitrogenfertilizer and minimize an operation’s overallenvironmental impact.
Environmental DisadvantagesApplying manure during the fall will result in manurenutrients being stranded in the soil over winter andthroughout the spring thaw. During this period, soilsaturation is common in certain parts of Canada
Manure application in standing corn.Photo Courtesy: Ontario Pork
resulting in the downward movement of soil water, possibly into groundwater sources. If soil nutrientsare present, there is a risk of these nutrients being leached into groundwater.
The presence of soil nitrate during times of soil saturation can also result in the production of nitrousoxide. When soil becomes saturated, a lack of free oxygen exists for use by soil microbes, whichinstead will use soil nitrate as a source of oxygen. A bi-product of this process is nitrous oxide, apotent greenhouse gas.
Winter spreading manure significantly elevates the risk of manure entering surface water courses, asmanure can be transported with the overland flow of melt water. Winter spreading and application tofrozen soils should be avoided or managed carefully.
CostLittle significant added cost is associated with altering the timing of manure application. However, ifspring manure application delays planting and subsequent crop maturity, there can be significant costconsequences.
Fall seeded cover crops can help in managing the potential for nitrate leaching and nitrous oxideproduction from soils receiving fall applied manure. Seed and labour costs for establishing covercrops will vary with the species and method of establishment selected.
Equipment requirements generally will not vary for manure application at different times of the year.However, research has shown positive crop yield and quality responses to applying manure duringthe growing season (PAMI, 2003). As well as a reduced potential for environmental impact, increasednutrient use efficiency will result from applying manure during the growing season, as opposed to fallapplications.
General AssessmentThere are agronomic advantages to applying manure to a growing or developing crop. However, fallapplication will not delay spring seeding which is important in areas with short growing seasons.When applying in the fall, cool soil temperatures or application into cover crops will temporarily tie upfall-applied manure nutrients and reduce potential environmental impacts of manure application. In-crop applications will further minimize potential impacts, such as nitrate leaching and nitrous oxideproduction, and help to maximize manure nutrient use efficiency. In-crop applications will also tend toreduce the transfer of manure odours to the surrounding atmosphere.
Refer to local guidelines and regulations concerning allowable periods of manure application duringthe spring and fall, winter spreading, and manure application to frozen soils.
89
Complementary TechnologiesNew developments in machinery, such as precision automated steering, may decrease the crop damagewhen doing in-crop manure application into crops with narrow row spacing.
Literature CitedGordon, R., T. Hartz, and V. Rodd. 1996. The development of a weather based manure spreading index. Final Report.
Canada/Nova Scotia Component of the Green Plan.
Lorimor, J. 2001. Manure treatment for control of odor and odorous gases. Iowa Manure Matters: odour and Nutrient Man-agement, Summer 2001. Iowa State University, Extension.
Prairie Agricultural Machinery Institute (PAMI). 2003. Post emergent injection of manure on wheat or barley. ResearchReport, Progress Report.
Prairie Agricultural Machinery Institute. 2004. Demonstration of in-crop manure application using low disturbance injectionopeners in winter wheat. Progress report.
Schmitt, M. and G. Rehm. 1998. Fertilizing cropland with swine manure. University of Minnesota Extension Service, Depart-ment of Soil, Water, and Climate. F0-05879-G0
Warnemuende, E., R. Kanwar, J. Baker, S. Mickelson, J. Lorimor, and S. Melvin. 1999. The effect of swine manure applica-tion to surface and groundwater quality. ASAE Paper #MC99-118.
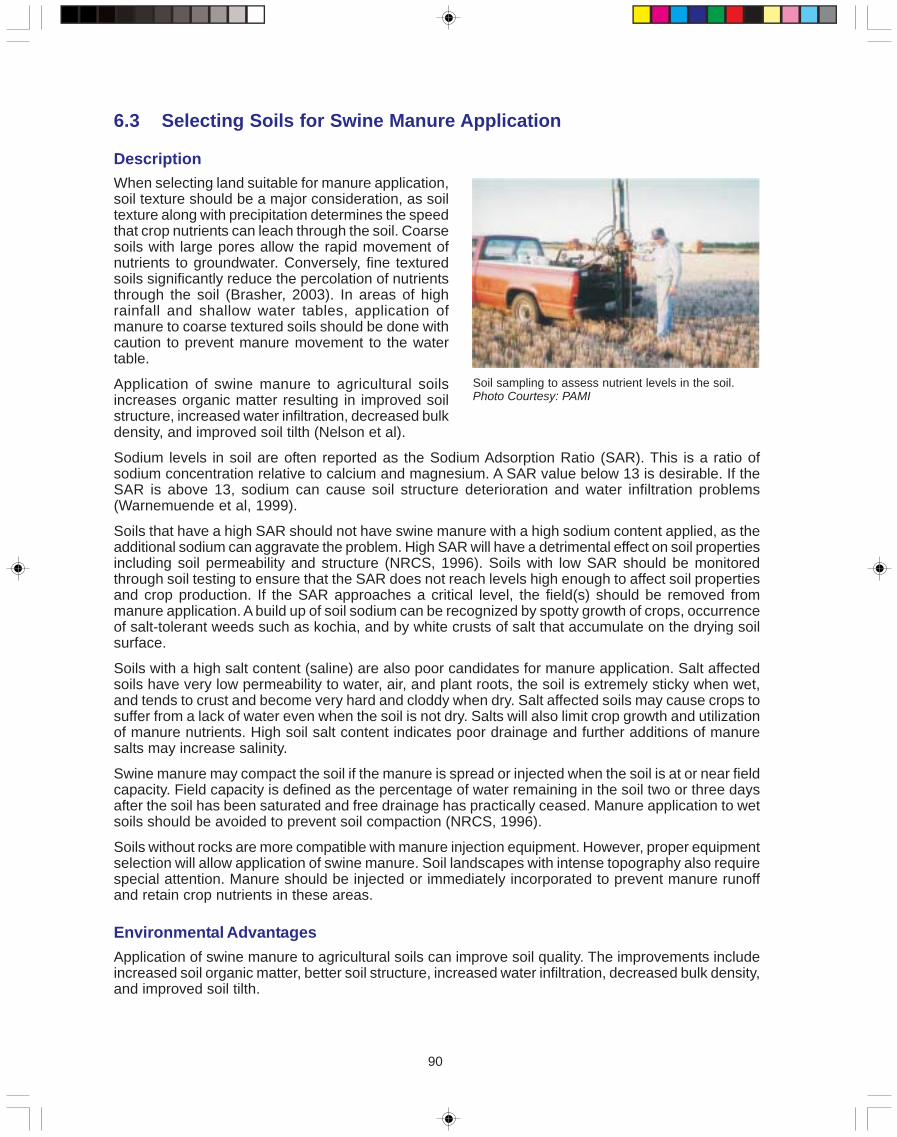
90
6.3 Selecting Soils for Swine Manure Application
DescriptionWhen selecting land suitable for manure application,soil texture should be a major consideration, as soiltexture along with precipitation determines the speedthat crop nutrients can leach through the soil. Coarsesoils with large pores allow the rapid movement ofnutrients to groundwater. Conversely, fine texturedsoils significantly reduce the percolation of nutrientsthrough the soil (Brasher, 2003). In areas of highrainfall and shallow water tables, application ofmanure to coarse textured soils should be done withcaution to prevent manure movement to the watertable.
Application of swine manure to agricultural soilsincreases organic matter resulting in improved soilstructure, increased water infiltration, decreased bulk
Soil sampling to assess nutrient levels in the soil.Photo Courtesy: PAMI
density, and improved soil tilth (Nelson et al).
Sodium levels in soil are often reported as the Sodium Adsorption Ratio (SAR). This is a ratio ofsodium concentration relative to calcium and magnesium. A SAR value below 13 is desirable. If theSAR is above 13, sodium can cause soil structure deterioration and water infiltration problems(Warnemuende et al, 1999).
Soils that have a high SAR should not have swine manure with a high sodium content applied, as theadditional sodium can aggravate the problem. High SAR will have a detrimental effect on soil propertiesincluding soil permeability and structure (NRCS, 1996). Soils with low SAR should be monitoredthrough soil testing to ensure that the SAR does not reach levels high enough to affect soil propertiesand crop production. If the SAR approaches a critical level, the field(s) should be removed frommanure application. A build up of soil sodium can be recognized by spotty growth of crops, occurrenceof salt-tolerant weeds such as kochia, and by white crusts of salt that accumulate on the drying soilsurface.
Soils with a high salt content (saline) are also poor candidates for manure application. Salt affectedsoils have very low permeability to water, air, and plant roots, the soil is extremely sticky when wet,and tends to crust and become very hard and cloddy when dry. Salt affected soils may cause crops tosuffer from a lack of water even when the soil is not dry. Salts will also limit crop growth and utilizationof manure nutrients. High soil salt content indicates poor drainage and further additions of manuresalts may increase salinity.
Swine manure may compact the soil if the manure is spread or injected when the soil is at or near fieldcapacity. Field capacity is defined as the percentage of water remaining in the soil two or three daysafter the soil has been saturated and free drainage has practically ceased. Manure application to wetsoils should be avoided to prevent soil compaction (NRCS, 1996).
Soils without rocks are more compatible with manure injection equipment. However, proper equipmentselection will allow application of swine manure. Soil landscapes with intense topography also requirespecial attention. Manure should be injected or immediately incorporated to prevent manure runoffand retain crop nutrients in these areas.
Environmental AdvantagesApplication of swine manure to agricultural soils can improve soil quality. The improvements includeincreased soil organic matter, better soil structure, increased water infiltration, decreased bulk density,and improved soil tilth.
91
Environmental DisadvantagesExcessive application of swine manure to coarse textured soils with high water tables could result inmovement of manure nutrients to the water table. Manure with high sodium content added to soilswith high SAR could have negative effects on soil structure. In poorly drained soils, salts contained inmanure may aggravate a salinity problem.
CostsAnalysis of land prior to siting a barn is important so that manure can be applied to the land in closeproximity. Poor barn siting that results in greater manure transport distances can be very costly.
General AssessmentIt is good practice to determine local soil characteristics when making a decision about the location ofa barn site. In high rainfall areas and regions with high water tables, avoid coarse textured soils. Landthat has received or will receive repeated application of manure should be soil tested periodically toensure that SAR and soil salinity is maintained within acceptable levels.
Complementary TechnologiesNew feed manipulation strategies may reduce the sodium and salts in manure, allowing more flexibilityregarding soil compatibility.
Literature CitedBrasher, P. 2003. Manure treatment yields twin benefits. The Des Moines Register, May 26.
Natural Resources Conservation Service (NRCS). 1996. Role of soils in waste management. National Engineering Hand-book, Part 651, Agricultural Waste Management Field Handbook, Chapter 5, p. 1-19.
Nelson, J., L. Whittington, M. Olson, J. Patience, S. LeMay, C. Lague, J. Schoenau, S. Krychuk, L. Chenard, and D. Farrer.Impact of land application of swine manure on soil, water and human health. Factsheet. Prairie Swine Centre.
Warnemuende, E., R. Kanwar, J. Baker, S. Mickelson, J. Lorimor, and S. Melvin. 1999. The effect of swine manure applica-tion to surface and groundwater quality. ASAE Paper #MC99-118.
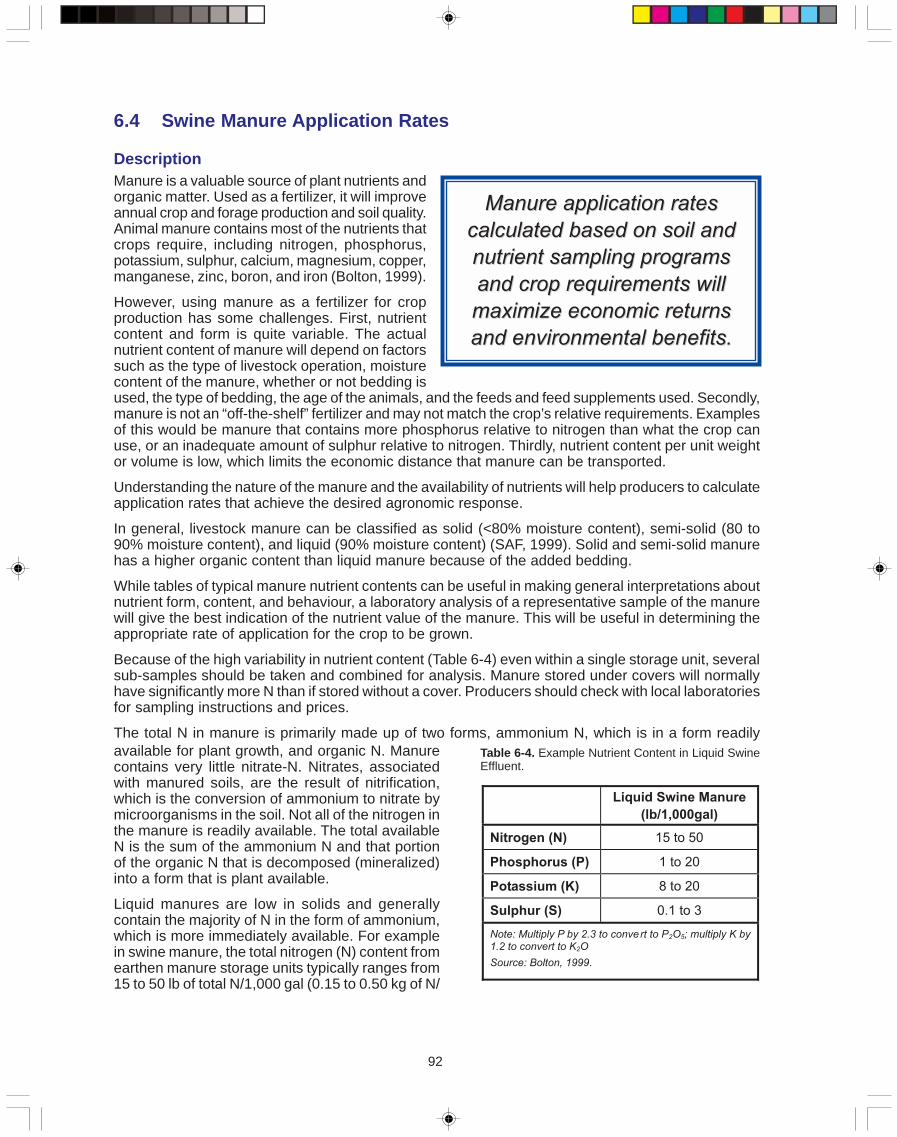
92
6.4 Swine Manure Application Rates
Description
MMaannuurree aapppplliiccaattiioonn rraatteess
ccaallccuullaatteedd bbaasseedd oonn ssooiill aanndd
nnuuttrriieenntt ssaammpplliinngg pprrooggrraammss
aanndd ccrroopp rreeqquuiirreemmeennttss wwiillll
mmaaxxiimmiizzee eeccoonnoommiicc rreettuurrnnss
aanndd eennvviirroonnmmeennttaall bbeenneeffiittss..
Manure is a valuable source of plant nutrients andorganic matter. Used as a fertilizer, it will improveannual crop and forage production and soil quality.Animal manure contains most of the nutrients thatcrops require, including nitrogen, phosphorus,potassium, sulphur, calcium, magnesium, copper,manganese, zinc, boron, and iron (Bolton, 1999).
However, using manure as a fertilizer for cropproduction has some challenges. First, nutrientcontent and form is quite variable. The actualnutrient content of manure will depend on factorssuch as the type of livestock operation, moisturecontent of the manure, whether or not bedding is
Liquid Swine Manure
(lb/1,000gal)
Nitrogen (N) 15 to 50
Phosphorus (P) 1 to 20
Potassium (K) 8 to 20
Sulphur (S) 0.1 to 3
Note: Multiply P by 2.3 to convert to P2O5; multiply K by1.2 to convert to K2O
Source: Bolton, 1999.
Table 6-4. Example Nutrient Content in Liquid SwineEffluent.
used, the type of bedding, the age of the animals, and the feeds and feed supplements used. Secondly,manure is not an “off-the-shelf” fertilizer and may not match the crop’s relative requirements. Examplesof this would be manure that contains more phosphorus relative to nitrogen than what the crop canuse, or an inadequate amount of sulphur relative to nitrogen. Thirdly, nutrient content per unit weightor volume is low, which limits the economic distance that manure can be transported.
Understanding the nature of the manure and the availability of nutrients will help producers to calculateapplication rates that achieve the desired agronomic response.
In general, livestock manure can be classified as solid (<80% moisture content), semi-solid (80 to90% moisture content), and liquid (90% moisture content) (SAF, 1999). Solid and semi-solid manurehas a higher organic content than liquid manure because of the added bedding.
While tables of typical manure nutrient contents can be useful in making general interpretations aboutnutrient form, content, and behaviour, a laboratory analysis of a representative sample of the manurewill give the best indication of the nutrient value of the manure. This will be useful in determining theappropriate rate of application for the crop to be grown.
Because of the high variability in nutrient content (Table 6-4) even within a single storage unit, severalsub-samples should be taken and combined for analysis. Manure stored under covers will normallyhave significantly more N than if stored without a cover. Producers should check with local laboratoriesfor sampling instructions and prices.
The total N in manure is primarily made up of two forms, ammonium N, which is in a form readilyavailable for plant growth, and organic N. Manurecontains very little nitrate-N. Nitrates, associatedwith manured soils, are the result of nitrification,which is the conversion of ammonium to nitrate bymicroorganisms in the soil. Not all of the nitrogen inthe manure is readily available. The total availableN is the sum of the ammonium N and that portionof the organic N that is decomposed (mineralized)into a form that is plant available.
Liquid manures are low in solids and generallycontain the majority of N in the form of ammonium,which is more immediately available. For examplein swine manure, the total nitrogen (N) content fromearthen manure storage units typically ranges from15 to 50 lb of total N/1,000 gal (0.15 to 0.50 kg of N/
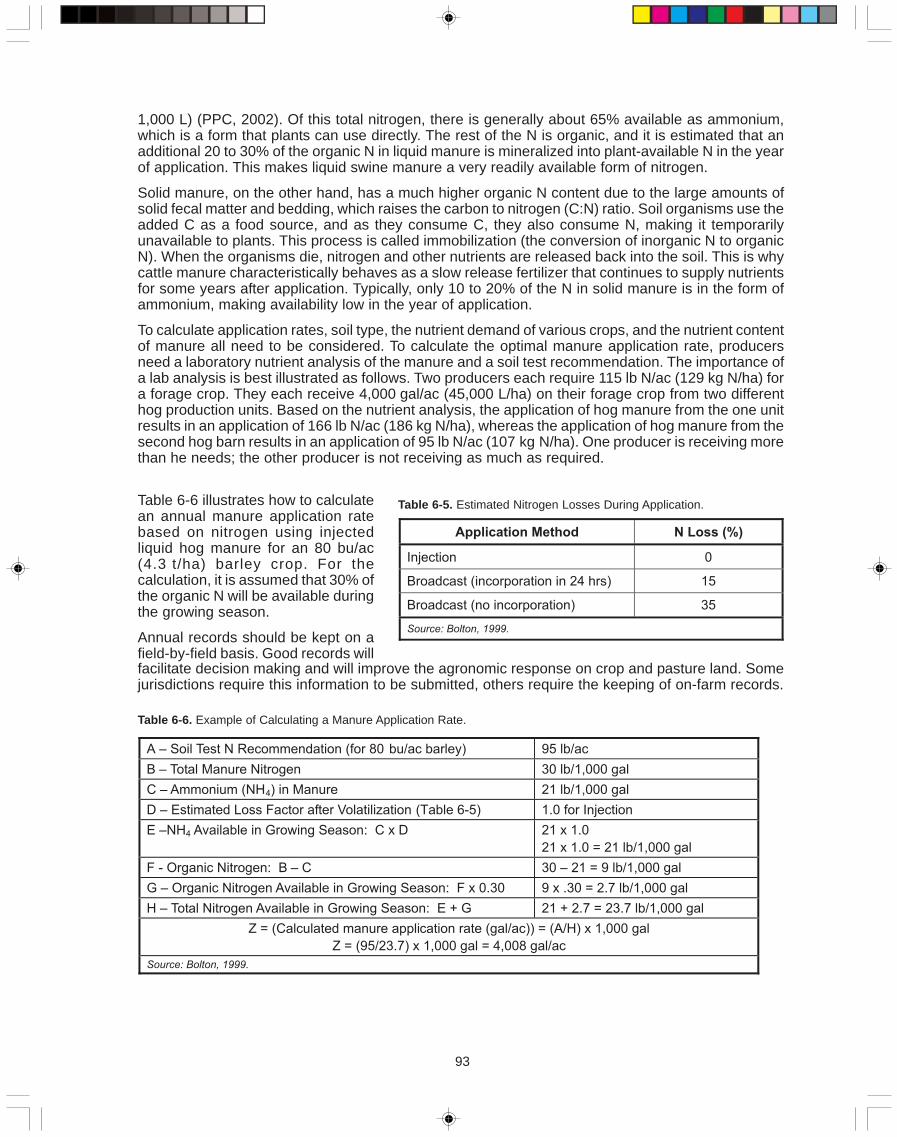
93
1,000 L) (PPC, 2002). Of this total nitrogen, there is generally about 65% available as ammonium,which is a form that plants can use directly. The rest of the N is organic, and it is estimated that anadditional 20 to 30% of the organic N in liquid manure is mineralized into plant-available N in the yearof application. This makes liquid swine manure a very readily available form of nitrogen.
Solid manure, on the other hand, has a much higher organic N content due to the large amounts ofsolid fecal matter and bedding, which raises the carbon to nitrogen (C:N) ratio. Soil organisms use theadded C as a food source, and as they consume C, they also consume N, making it temporarilyunavailable to plants. This process is called immobilization (the conversion of inorganic N to organicN). When the organisms die, nitrogen and other nutrients are released back into the soil. This is whycattle manure characteristically behaves as a slow release fertilizer that continues to supply nutrientsfor some years after application. Typically, only 10 to 20% of the N in solid manure is in the form ofammonium, making availability low in the year of application.
To calculate application rates, soil type, the nutrient demand of various crops, and the nutrient contentof manure all need to be considered. To calculate the optimal manure application rate, producersneed a laboratory nutrient analysis of the manure and a soil test recommendation. The importance ofa lab analysis is best illustrated as follows. Two producers each require 115 lb N/ac (129 kg N/ha) fora forage crop. They each receive 4,000 gal/ac (45,000 L/ha) on their forage crop from two differenthog production units. Based on the nutrient analysis, the application of hog manure from the one unitresults in an application of 166 lb N/ac (186 kg N/ha), whereas the application of hog manure from thesecond hog barn results in an application of 95 lb N/ac (107 kg N/ha). One producer is receiving morethan he needs; the other producer is not receiving as much as required.
Application Method N Loss (%)
Injection 0
Broadcast (incorporation in 24 hrs) 15
Broadcast (no incorporation) 35
Source: Bolton, 1999.
Table 6-5. Estimated Nitrogen Losses During Application.Table 6-6 illustrates how to calculatean annual manure application ratebased on nitrogen using injectedliquid hog manure for an 80 bu/ac(4.3 t/ha) barley crop. For thecalculation, it is assumed that 30% ofthe organic N will be available duringthe growing season.
Annual records should be kept on afield-by-field basis. Good records willfacilitate decision making and will improve the agronomic response on crop and pasture land. Somejurisdictions require this information to be submitted, others require the keeping of on-farm records.
Table 6-6. Example of Calculating a Manure Application Rate.
A – Soil Test N Recommendation (for 80 bu/ac barley) 95 lb/ac
B – Total Manure Nitrogen 30 lb/1,000 gal
C – Ammonium (NH4) in Manure 21 lb/1,000 gal
D – Estimated Loss Factor after Volatilization (Table 6-5) 1.0 for Injection
E –NH4 Available in Growing Season: C x D 21 x 1.0
21 x 1.0 = 21 lb/1,000 gal
F - Organic Nitrogen: B – C 30 – 21 = 9 lb/1,000 gal
G – Organic Nitrogen Available in Growing Season: F x 0.30 9 x .30 = 2.7 lb/1,000 gal
H – Total Nitrogen Available in Growing Season: E + G 21 + 2.7 = 23.7 lb/1,000 gal
Z = (Calculated manure application rate (gal/ac)) = (A/H) x 1,000 gal
Z = (95/23.7) x 1,000 gal = 4,008 gal/ac
Source: Bolton, 1999.
94
Environmental AdvantagesUtilizing manure for crop and forage production allows the recycling of nutrients and can effectivelyreplace or reduce the use of commercial fertilizers. Applying manure correctly increase microbialactivity, protects water resources, and increases the water holding capacity of soils. Manure alsoincreases organic matter content, which improves soil structure, increases soil cation exchange capacity(the ability to hold nutrients), increases water infiltration, and reduces wind and water erosion (Schoenau,1997).
Environmental DisadvantagesOver-application of manures (e.g. repeated application at rates which greatly exceed the crop nutrientremoval) and improper application (e.g. surface placement without incorporation) increases the riskof manure nutrient losses to the environment and deterioration of environmental quality. Concernsinclude transport of nutrients to groundwater and surface water bodies, escape into the atmosphereof gases such as ammonia and nitrous oxide, and accumulation of manure salts under conditions ofpoor drainage (PPC, 2002).
CostManure is often promoted as a valuable source of nutrients and a soil conditioner with the ability toreplace, in whole or in part, commercial fertilizers. The value of manure as a fertilizer can be assessedin different ways.
One method is to give the nutrient content in the manure a monetary value based on the commercialfertilizer nutrients. For example, if a commercial fertilizer such as 46-0-0 costs $363/ton ($400/t). Thefertilizer contains 46% nitrogen (N). The cost of nitrogen is therefore $363/920 lb ($400/460 kg) or$0.39/lb ($0.87/kg) of N. Based on typical variability of N in manure, a 500 sow farrow-to-finish barnwould annually produce manure containing N valued at between $14,000 to $47,000.
The value of other nutrients in manure can also be calculated this way provided that they are arequired nutrient. Note that the economic value of potassium (K2O) would be zero when soils do notneed added potassium. In addition, many fields, particularly those that have a long history of manureapplication, may no longer require phosphorus. Manure also adds benefits to the soil quality such asimproved soil structure, and it is difficult to determine an economic value for these benefits. It shouldbe stressed that this approach to calculating an economic value for manure is not to be confused withmarket values. It is just a means of comparing manure to commercial fertilizer.
For farmers receiving manure from a livestock operation, manure can prove to be a very low costinput. Although manure is valued differently across the country, there are a number of places wheremanure is sold to surrounding farmers. In the prairies, the cost ranges from $15 to $25/ac ($37 to$63/ha) for approximately 100 to 150 lb/ac (114 to 171 kg/ha) of actual N applied (Bolton, 2004).Those farmers receiving manure can estimate their actual return by considering the value of the cropyield increase. The net yield increase minus the application costs is the actual return. For example, ifyou fertilize your land with $15/ac ($37/ha) of manure and get a yield increase of 20 bu/ac (1.4 t/ha),which is sold at $4/bu ($147/t), the net gain is $65/ac ($161/ha).
General AssessmentManure is a valuable source of plant nutrients and organic matter and, when used as a fertilizer, willimprove annual crop and forage production and soil quality. Application rates calculated based on soiland nutrient sampling programs and crop requirements will maximize economic returns andenvironmental benefits.
95
Complementary TechnologiesSoil and manure sample analysis services are complementary technologies to help optimize economicand environmental benefits of swine manure application.
Manure storage covers are also a complementary technology as they have been shown to retaintwice the nitrogen nutrients in the manure compared to stored manure without a cover.
Literature CitedBolton, K. 1999. Managing manure as a fertilizer for prairie agriculture. Proceedings of a Tri-Provincial Conference on
Manure Management: p. 148-157. June 22-25, Saskatoon, Canada.
Bolton, K. 2004. Personal Communication. Provincial Manure Management Specialist. Saskatchewan Agriculture, Foodand Rural Revitalization.
Hilborn, D. 2001. Land application of liquid manure in an environmentally responsible manner. Ontario Ministry of Agricul-ture and Food. Factsheet, Agdex #538/743, Order #92-164.
Hoff, J.D. D.W. Nelson, and A.L. Sutton. 1981. Ammonia volitilization from liquid swine manure applied to cropland. Journalof Environmental Quality, 10(1): 90-95..
King, T.N. 2002. Liquid swine manure application to forage soils: effect on soil carbon and economic returns. University ofSaskatchewan, Department of Soil Science. Soil Science 992.6 Project Report.
The Prairie Province’s Committee (PPC) on Livestock Development and Manure Management. 2002. Tri-provincial manureapplication and use guidelines: Saskatchewan. Saskatchewan Agriculture, Food and Rural Revitalization, Alberta Agri-culture, Food and Rural Development, and Manitoba Agriculture and Food.
Saskatchewan Agriculture and Food (SAF). 1999. Nutrient values of manure. FARMFACTS.
Schoenau, J.J. 1997. Soil fertility benefits from swine manure addition. Saskatchewan Pork Industry Symposium, Novem-ber 13-14.
Schoenau, J.J., P. Mooleki, and P. Qian. 2001. Maximizing the economic and environmental benefit of land application ofanimal manure, a four year study in east-central Saskatchewan. Department of Soil Science, University of Saskatchewan.Final Report. AFIF Project No 96000131.
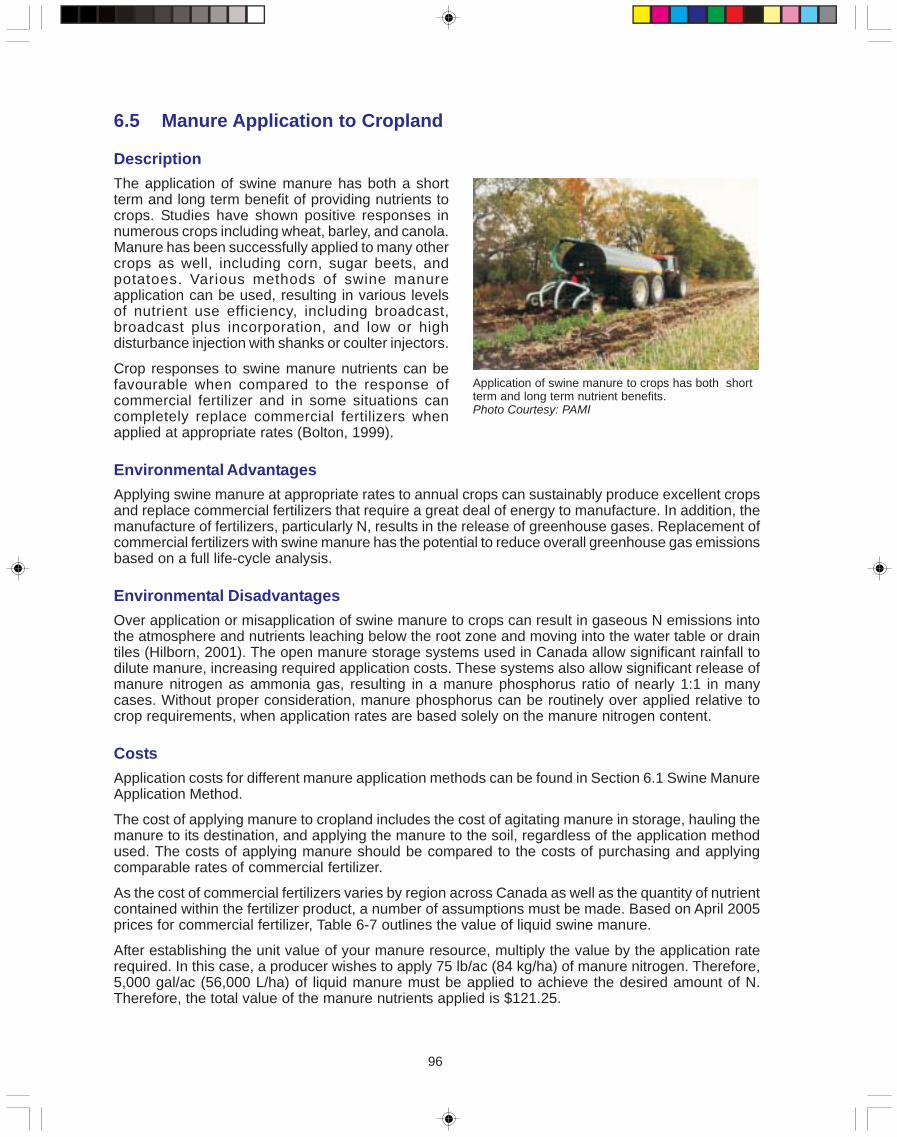
96
6.5 Manure Application to Cropland
DescriptionThe application of swine manure has both a shortterm and long term benefit of providing nutrients tocrops. Studies have shown positive responses innumerous crops including wheat, barley, and canola.Manure has been successfully applied to many othercrops as well, including corn, sugar beets, andpotatoes. Various methods of swine manureapplication can be used, resulting in various levelsof nutrient use efficiency, including broadcast,broadcast plus incorporation, and low or highdisturbance injection with shanks or coulter injectors.
Crop responses to swine manure nutrients can befavourable when compared to the response ofcommercial fertilizer and in some situations cancompletely replace commercial fertilizers whenapplied at appropriate rates (Bolton, 1999).
Application of swine manure to crops has both shortterm and long term nutrient benefits.Photo Courtesy: PAMI
Environmental AdvantagesApplying swine manure at appropriate rates to annual crops can sustainably produce excellent cropsand replace commercial fertilizers that require a great deal of energy to manufacture. In addition, themanufacture of fertilizers, particularly N, results in the release of greenhouse gases. Replacement ofcommercial fertilizers with swine manure has the potential to reduce overall greenhouse gas emissionsbased on a full life-cycle analysis.
Environmental DisadvantagesOver application or misapplication of swine manure to crops can result in gaseous N emissions intothe atmosphere and nutrients leaching below the root zone and moving into the water table or draintiles (Hilborn, 2001). The open manure storage systems used in Canada allow significant rainfall todilute manure, increasing required application costs. These systems also allow significant release ofmanure nitrogen as ammonia gas, resulting in a manure phosphorus ratio of nearly 1:1 in manycases. Without proper consideration, manure phosphorus can be routinely over applied relative tocrop requirements, when application rates are based solely on the manure nitrogen content.
CostsApplication costs for different manure application methods can be found in Section 6.1 Swine ManureApplication Method.
The cost of applying manure to cropland includes the cost of agitating manure in storage, hauling themanure to its destination, and applying the manure to the soil, regardless of the application methodused. The costs of applying manure should be compared to the costs of purchasing and applyingcomparable rates of commercial fertilizer.
As the cost of commercial fertilizers varies by region across Canada as well as the quantity of nutrientcontained within the fertilizer product, a number of assumptions must be made. Based on April 2005prices for commercial fertilizer, Table 6-7 outlines the value of liquid swine manure.
After establishing the unit value of your manure resource, multiply the value by the application raterequired. In this case, a producer wishes to apply 75 lb/ac (84 kg/ha) of manure nitrogen. Therefore,5,000 gal/ac (56,000 L/ha) of liquid manure must be applied to achieve the desired amount of N.Therefore, the total value of the manure nutrients applied is $121.25.
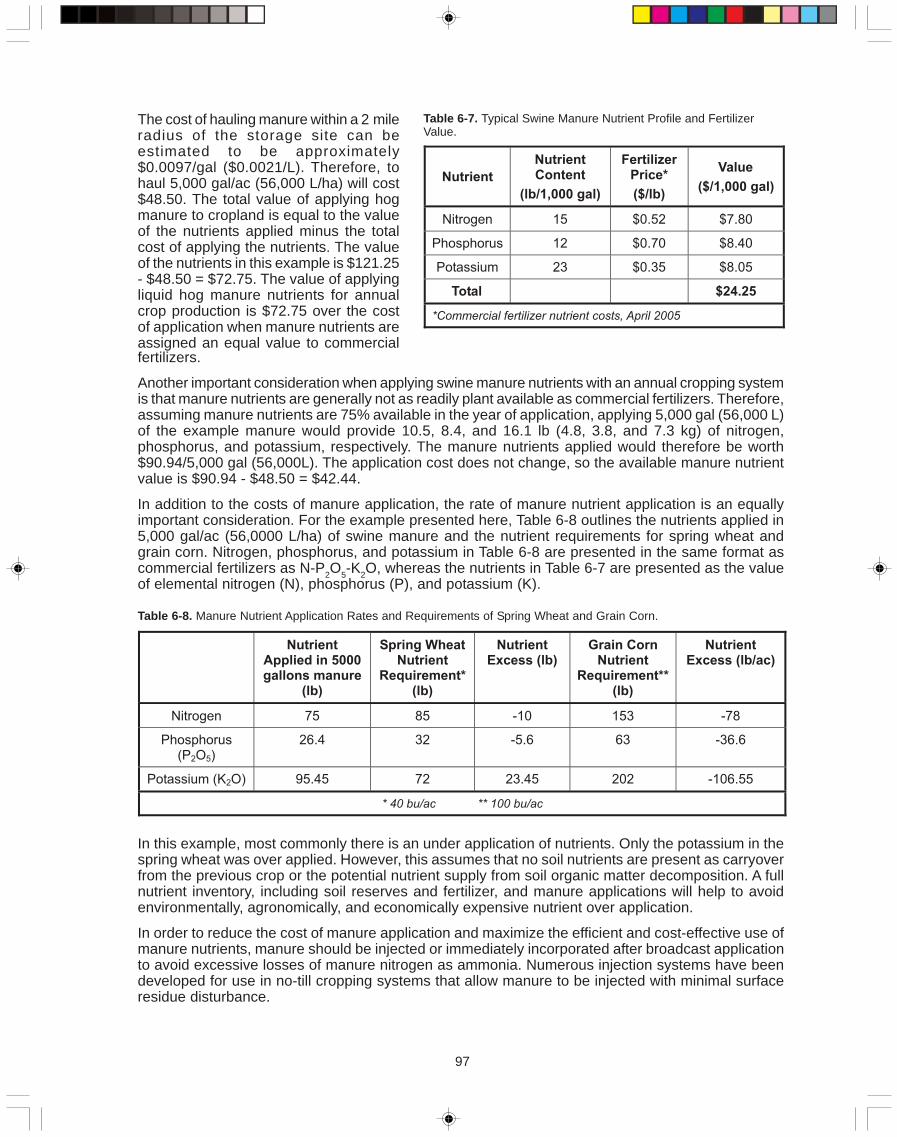
97
The cost of hauling manure within a 2 mileradius of the storage site can beestimated to be approximately$0.0097/gal ($0.0021/L). Therefore, tohaul 5,000 gal/ac (56,000 L/ha) will cost$48.50. The total value of applying hogmanure to cropland is equal to the valueof the nutrients applied minus the totalcost of applying the nutrients. The valueof the nutrients in this example is $121.25- $48.50 = $72.75. The value of applyingliquid hog manure nutrients for annualcrop production is $72.75 over the costof application when manure nutrients areassigned an equal value to commercial
Nutrient
NutrientContent
(lb/1,000 gal)
FertilizerPrice*
($/lb)
Value
($/1,000 gal)
Nitrogen 15 $0.52 $7.80
Phosphorus 12 $0.70 $8.40
Potassium 23 $0.35 $8.05
Total $24.25
*Commercial fertilizer nutrient costs, April 2005
Table 6-7. Typical Swine Manure Nutrient Profile and FertilizerValue.
fertilizers.
Another important consideration when applying swine manure nutrients with an annual cropping systemis that manure nutrients are generally not as readily plant available as commercial fertilizers. Therefore,assuming manure nutrients are 75% available in the year of application, applying 5,000 gal (56,000 L)of the example manure would provide 10.5, 8.4, and 16.1 lb (4.8, 3.8, and 7.3 kg) of nitrogen,phosphorus, and potassium, respectively. The manure nutrients applied would therefore be worth$90.94/5,000 gal (56,000L). The application cost does not change, so the available manure nutrientvalue is $90.94 - $48.50 = $42.44.
In addition to the costs of manure application, the rate of manure nutrient application is an equallyimportant consideration. For the example presented here, Table 6-8 outlines the nutrients applied in5,000 gal/ac (56,0000 L/ha) of swine manure and the nutrient requirements for spring wheat andgrain corn. Nitrogen, phosphorus, and potassium in Table 6-8 are presented in the same format ascommercial fertilizers as N-P2O5-K2O, whereas the nutrients in Table 6-7 are presented as the valueof elemental nitrogen (N), phosphorus (P), and potassium (K).
NutrientApplied in 5000gallons manure
(lb)
Spring WheatNutrient
Requirement*(lb)
NutrientExcess (lb)
Grain CornNutrient
Requirement**(lb)
NutrientExcess (lb/ac)
Nitrogen 75 85 -10 153 -78
Phosphorus(P2O5)
26.4 32 -5.6 63 -36.6
Potassium (K2O) 95.45 72 23.45 202 -106.55
* 40 bu/ac ** 100 bu/ac
Table 6-8. Manure Nutrient Application Rates and Requirements of Spring Wheat and Grain Corn.
In this example, most commonly there is an under application of nutrients. Only the potassium in thespring wheat was over applied. However, this assumes that no soil nutrients are present as carryoverfrom the previous crop or the potential nutrient supply from soil organic matter decomposition. A fullnutrient inventory, including soil reserves and fertilizer, and manure applications will help to avoidenvironmentally, agronomically, and economically expensive nutrient over application.
In order to reduce the cost of manure application and maximize the efficient and cost-effective use ofmanure nutrients, manure should be injected or immediately incorporated after broadcast applicationto avoid excessive losses of manure nitrogen as ammonia. Numerous injection systems have beendeveloped for use in no-till cropping systems that allow manure to be injected with minimal surfaceresidue disturbance.
98
Effective use of barn wash water and regular management and maintenance of barn watering systemswill avoid excessive quantities of manure being produced in the barn and result in reduced manurehauling and application costs.
General AssessmentAt one time, liquid swine manure was considered a waste product to be disposed. With increasingfertilizer prices, environmental regulations, new research, and improved application equipment,producers are realizing that liquid swine manure is an excellent source of annual crop nutrients.
The numbers presented here represent one example of potential manure nutrient value and haulingcosts, which are subject to change from year to year and throughout different regions of Canada.Each manure producer is encouraged to establish and maintain a routine manure and soil samplingprotocol. This will allow a producer to make efficient use of manure nutrients, calculate the value andcosts of applying manure nutrients on an annual basis, and avoid potential soil and water degradationdue to the over application of manure nutrients.
Complimentary TechnologiesSoil and nutrient sampling programs along with database record keeping are complementarytechnologies. Application rates can then be calculated based on crop requirements. Annual recordsshould be kept on a field-by-field basis. Good records will facilitate decision making and will improvethe agronomic response on crop and pasture land.
Manure injection equipment that places manure in the soil instead of broadcasting on the surface willsignificantly reduce the amount of ammonia lost to volatilization as well as odour production duringmanure application. Manure tankers equipped with narrow profile tires and narrow row-crop injectionunits are capable of applying liquid manure to row crops during the growing season. Applying manureduring crop development provides nutrients to growing crops precisely when they are needed,maximizing the efficient use of the applied nutrients.
Manure storage cover systems will help to conserve manure nitrogen from being lost as ammoniathroughout the storage period. An increase in manure nitrogen content will add significant value to afarm’s manure resources. Conserving nitrogen will also help to balance the manure nitrogen tophosphorus ratio to more closely resemble crop nutrient requirements. Therefore, cover systems canhelp reduce the potential for over application of manure phosphorus to cropland when manureapplication rates are based on manure nitrogen content.
Literature CitedBolton, K. 1999. Managing manure as a fertilizer for prairie agriculture. Proceedings of a Tri-Provincial Conference on
Manure Management. pp 148-157. June 22-25, Saskatoon, SK.
Halter, S. 2003. Economics of post emergent swine manure application. Draft Report prepared for The Prairie AgriculturalMachinery Institute (unpublished).
Hilborn, D. 2001. Land application of liquid manure in an environmentally responsible manner. Ontario Ministry of Agricul-ture and Food. Factsheet, Agdex #538/743, Order #92-164.
King, T.N. 2002. Liquid swine manure application to forage soils: effect on soil carbon and economic returns. University ofSaskatchewan, Department of Soil Science. Soil Science 992.6 Project Report.
Prairie Agricultural Machinery Institute (PAMI). 2003. Post emergent injection of manure on wheat or barley. ResearchReport, Progress Report.
Saskatchewan Agriculture and Food. 1999. Nutrient values of manure. FARMFACTS.
Saskatchewan Agriculture and Food. 2002. Baled forage prices. Feed Grain and Forage Listing Service.
Schoenau, J.J., P. Mooleki, and P. Qian. 2001. Maximizing the economic and environmental benefit of land application ofanimal manure, a four year study in east-central Saskatchewan. Department of Soil Science, University of Saskatchewan.Final Report. AFIF Project No 96000131.
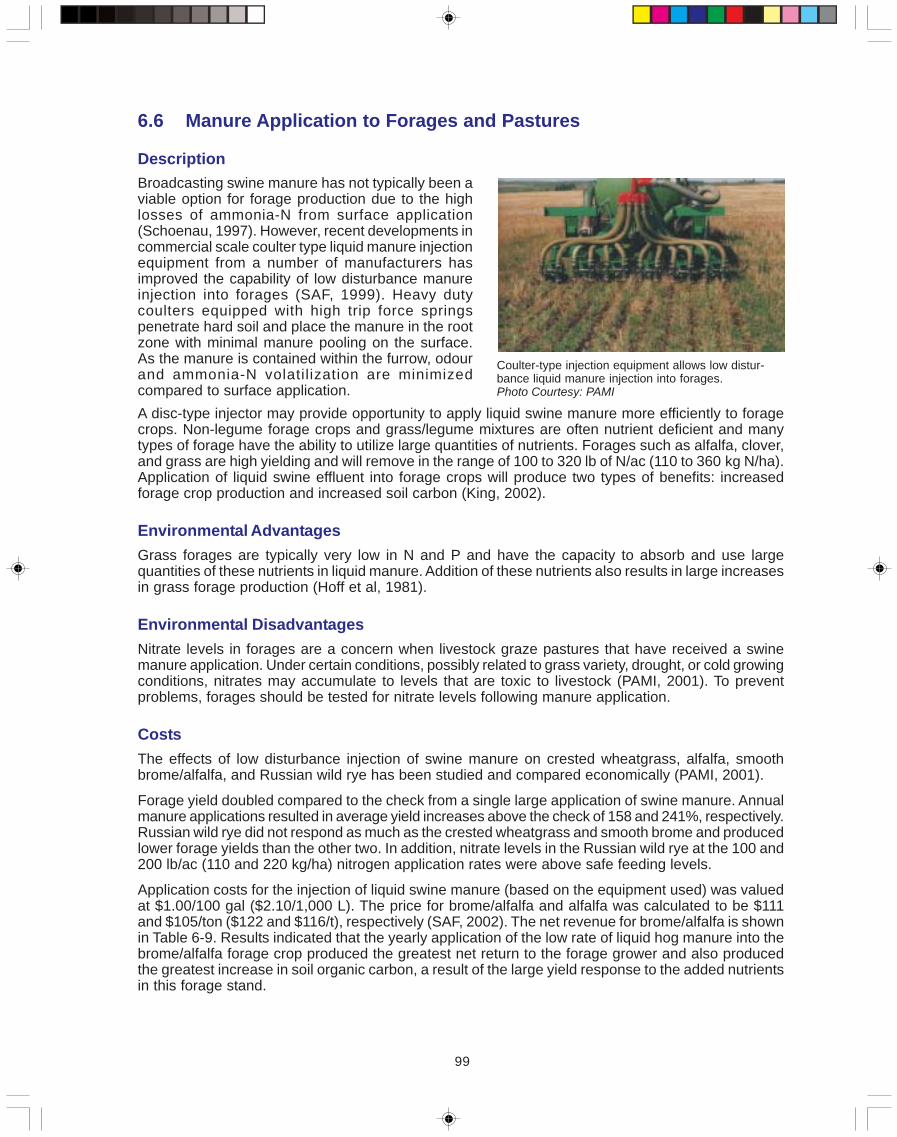
99
6.6 Manure Application to Forages and Pastures
DescriptionBroadcasting swine manure has not typically been aviable option for forage production due to the highlosses of ammonia-N from surface application(Schoenau, 1997). However, recent developments incommercial scale coulter type liquid manure injectionequipment from a number of manufacturers hasimproved the capability of low disturbance manureinjection into forages (SAF, 1999). Heavy dutycoulters equipped with high trip force springspenetrate hard soil and place the manure in the rootzone with minimal manure pooling on the surface.As the manure is contained within the furrow, odourand ammonia-N volatilization are minimizedcompared to surface application.
Coulter-type injection equipment allows low distur-bance liquid manure injection into forages.Photo Courtesy: PAMI
A disc-type injector may provide opportunity to apply liquid swine manure more efficiently to foragecrops. Non-legume forage crops and grass/legume mixtures are often nutrient deficient and manytypes of forage have the ability to utilize large quantities of nutrients. Forages such as alfalfa, clover,and grass are high yielding and will remove in the range of 100 to 320 lb of N/ac (110 to 360 kg N/ha).Application of liquid swine effluent into forage crops will produce two types of benefits: increasedforage crop production and increased soil carbon (King, 2002).
Environmental AdvantagesGrass forages are typically very low in N and P and have the capacity to absorb and use largequantities of these nutrients in liquid manure. Addition of these nutrients also results in large increasesin grass forage production (Hoff et al, 1981).
Environmental DisadvantagesNitrate levels in forages are a concern when livestock graze pastures that have received a swinemanure application. Under certain conditions, possibly related to grass variety, drought, or cold growingconditions, nitrates may accumulate to levels that are toxic to livestock (PAMI, 2001). To preventproblems, forages should be tested for nitrate levels following manure application.
CostsThe effects of low disturbance injection of swine manure on crested wheatgrass, alfalfa, smoothbrome/alfalfa, and Russian wild rye has been studied and compared economically (PAMI, 2001).
Forage yield doubled compared to the check from a single large application of swine manure. Annualmanure applications resulted in average yield increases above the check of 158 and 241%, respectively.Russian wild rye did not respond as much as the crested wheatgrass and smooth brome and producedlower forage yields than the other two. In addition, nitrate levels in the Russian wild rye at the 100 and200 lb/ac (110 and 220 kg/ha) nitrogen application rates were above safe feeding levels.
Application costs for the injection of liquid swine manure (based on the equipment used) was valuedat $1.00/100 gal ($2.10/1,000 L). The price for brome/alfalfa and alfalfa was calculated to be $111and $105/ton ($122 and $116/t), respectively (SAF, 2002). The net revenue for brome/alfalfa is shownin Table 6-9. Results indicated that the yearly application of the low rate of liquid hog manure into thebrome/alfalfa forage crop produced the greatest net return to the forage grower and also producedthe greatest increase in soil organic carbon, a result of the large yield response to the added nutrientsin this forage stand.
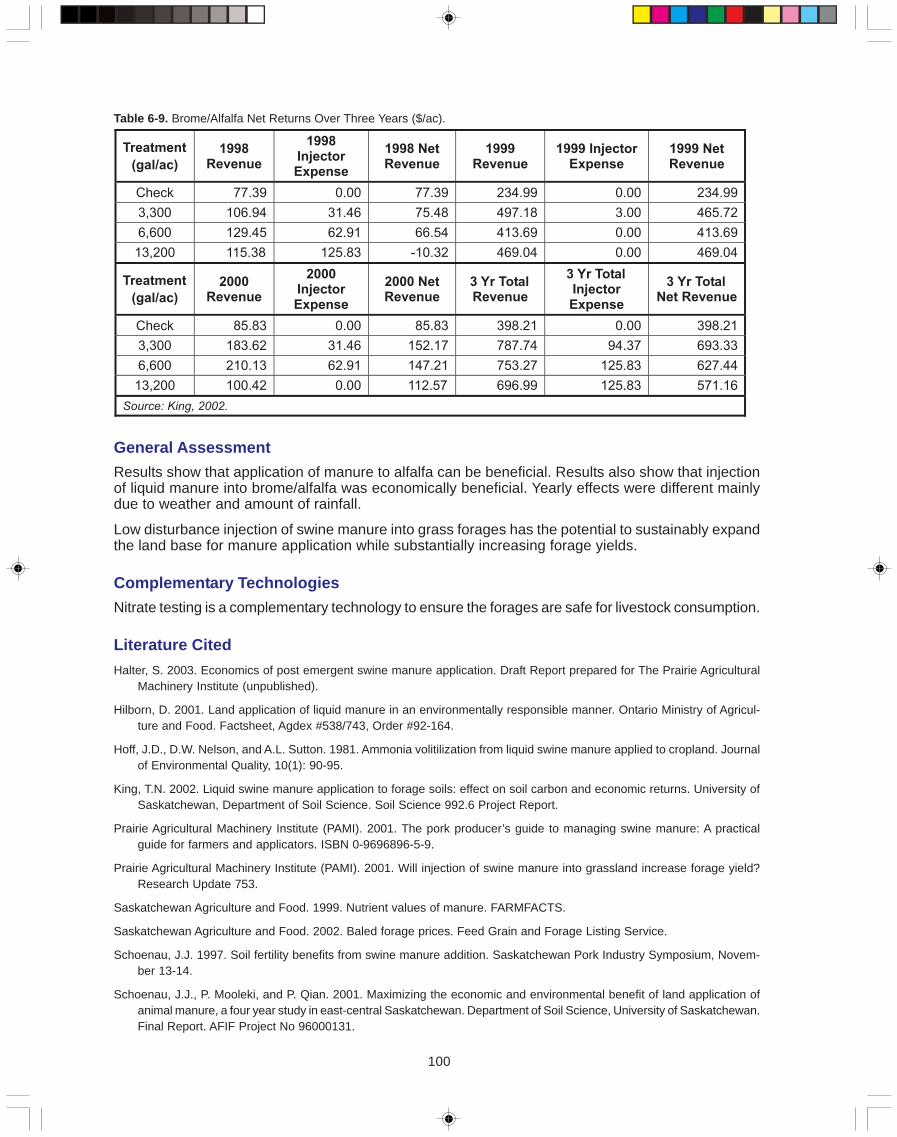
100
General AssessmentResults show that application of manure to alfalfa can be beneficial. Results also show that injectionof liquid manure into brome/alfalfa was economically beneficial. Yearly effects were different mainlydue to weather and amount of rainfall.
Low disturbance injection of swine manure into grass forages has the potential to sustainably expandthe land base for manure application while substantially increasing forage yields.
Complementary TechnologiesNitrate testing is a complementary technology to ensure the forages are safe for livestock consumption.
Literature CitedHalter, S. 2003. Economics of post emergent swine manure application. Draft Report prepared for The Prairie Agricultural
Machinery Institute (unpublished).
Hilborn, D. 2001. Land application of liquid manure in an environmentally responsible manner. Ontario Ministry of Agricul-ture and Food. Factsheet, Agdex #538/743, Order #92-164.
Hoff, J.D., D.W. Nelson, and A.L. Sutton. 1981. Ammonia volitilization from liquid swine manure applied to cropland. Journalof Environmental Quality, 10(1): 90-95.
King, T.N. 2002. Liquid swine manure application to forage soils: effect on soil carbon and economic returns. University ofSaskatchewan, Department of Soil Science. Soil Science 992.6 Project Report.
Prairie Agricultural Machinery Institute (PAMI). 2001. The pork producer’s guide to managing swine manure: A practicalguide for farmers and applicators. ISBN 0-9696896-5-9.
Prairie Agricultural Machinery Institute (PAMI). 2001. Will injection of swine manure into grassland increase forage yield?Research Update 753.
Saskatchewan Agriculture and Food. 1999. Nutrient values of manure. FARMFACTS.
Saskatchewan Agriculture and Food. 2002. Baled forage prices. Feed Grain and Forage Listing Service.
Schoenau, J.J. 1997. Soil fertility benefits from swine manure addition. Saskatchewan Pork Industry Symposium, Novem-ber 13-14.
Schoenau, J.J., P. Mooleki, and P. Qian. 2001. Maximizing the economic and environmental benefit of land application ofanimal manure, a four year study in east-central Saskatchewan. Department of Soil Science, University of Saskatchewan.Final Report. AFIF Project No 96000131.
Table 6-9. Brome/Alfalfa Net Returns Over Three Years ($/ac).
Treatment
(gal/ac)
1998Revenue
1998InjectorExpense
1998 NetRevenue
1999Revenue
1999 InjectorExpense
1999 NetRevenue
Check 77.39 0.00 77.39 234.99 0.00 234.99
3,300 106.94 31.46 75.48 497.18 3.00 465.72
6,600 129.45 62.91 66.54 413.69 0.00 413.69
13,200 115.38 125.83 -10.32 469.04 0.00 469.04
Treatment
(gal/ac)
2000Revenue
2000InjectorExpense
2000 NetRevenue
3 Yr TotalRevenue
3 Yr TotalInjectorExpense
3 Yr TotalNet Revenue
Check 85.83 0.00 85.83 398.21 0.00 398.21
3,300 183.62 31.46 152.17 787.74 94.37 693.33
6,600 210.13 62.91 147.21 753.27 125.83 627.44
13,200 100.42 0.00 112.57 696.99 125.83 571.16
Source: King, 2002.
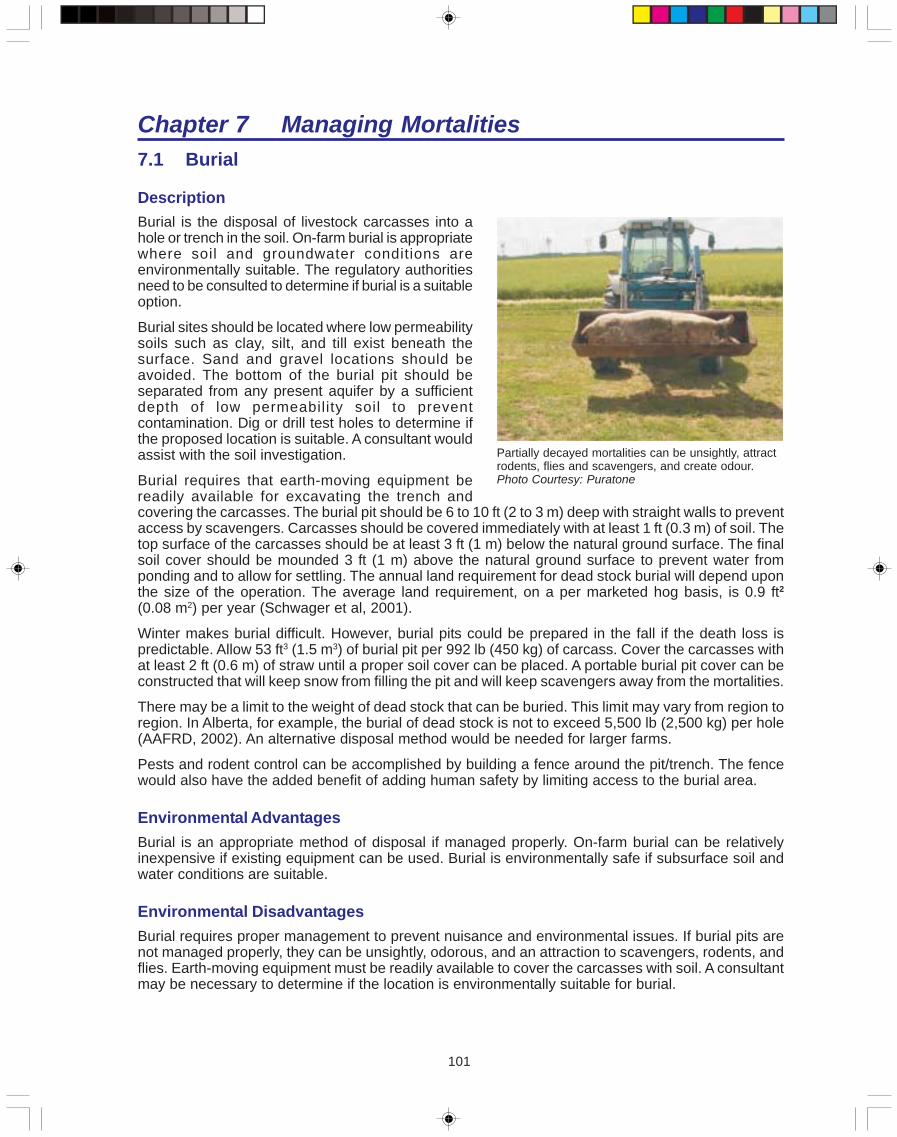
101
Chapter 7 Managing Mortalities7.1 Burial
DescriptionBurial is the disposal of livestock carcasses into ahole or trench in the soil. On-farm burial is appropriatewhere soil and groundwater conditions areenvironmentally suitable. The regulatory authoritiesneed to be consulted to determine if burial is a suitableoption.
Burial sites should be located where low permeabilitysoils such as clay, silt, and till exist beneath thesurface. Sand and gravel locations should beavoided. The bottom of the burial pit should beseparated from any present aquifer by a sufficientdepth of low permeability soil to preventcontamination. Dig or drill test holes to determine ifthe proposed location is suitable. A consultant wouldassist with the soil investigation.
Burial requires that earth-moving equipment bereadily available for excavating the trench and
Partially decayed mortalities can be unsightly, attractrodents, flies and scavengers, and create odour.Photo Courtesy: Puratone
covering the carcasses. The burial pit should be 6 to 10 ft (2 to 3 m) deep with straight walls to preventaccess by scavengers. Carcasses should be covered immediately with at least 1 ft (0.3 m) of soil. Thetop surface of the carcasses should be at least 3 ft (1 m) below the natural ground surface. The finalsoil cover should be mounded 3 ft (1 m) above the natural ground surface to prevent water fromponding and to allow for settling. The annual land requirement for dead stock burial will depend uponthe size of the operation. The average land requirement, on a per marketed hog basis, is 0.9 ft2
(0.08 m2) per year (Schwager et al, 2001).
Winter makes burial difficult. However, burial pits could be prepared in the fall if the death loss ispredictable. Allow 53 ft3 (1.5 m3) of burial pit per 992 lb (450 kg) of carcass. Cover the carcasses withat least 2 ft (0.6 m) of straw until a proper soil cover can be placed. A portable burial pit cover can beconstructed that will keep snow from filling the pit and will keep scavengers away from the mortalities.
There may be a limit to the weight of dead stock that can be buried. This limit may vary from region toregion. In Alberta, for example, the burial of dead stock is not to exceed 5,500 lb (2,500 kg) per hole(AAFRD, 2002). An alternative disposal method would be needed for larger farms.
Pests and rodent control can be accomplished by building a fence around the pit/trench. The fencewould also have the added benefit of adding human safety by limiting access to the burial area.
Environmental AdvantagesBurial is an appropriate method of disposal if managed properly. On-farm burial can be relativelyinexpensive if existing equipment can be used. Burial is environmentally safe if subsurface soil andwater conditions are suitable.
Environmental DisadvantagesBurial requires proper management to prevent nuisance and environmental issues. If burial pits arenot managed properly, they can be unsightly, odorous, and an attraction to scavengers, rodents, andflies. Earth-moving equipment must be readily available to cover the carcasses with soil. A consultantmay be necessary to determine if the location is environmentally suitable for burial.
102
CostsCertain equipment for digging a pit/trench and loading it with dead stock is likely already available onthe farm. This equipment could be a front-end loader or skid loader and a backhoe. An 80 hp (60 kW)tractor would cost about $43,000 (AAFRD, 2002), while a skid loader capable of moving 1,500 lb(680 kg) would cost $28,000. A backhoe attachment for an 80 hp (60 kW) tractor required for diggingthe burial trench/pit costs about $10,000, depending upon the size.
Assuming annual use of the tractor and front-end loader attachment of 600 hours, a tractor life of13 years, and a loader life of 5 years, the annual costs associated with the equipment used to movemortalities to the pit/trench and to cover the dead stock are $11,830/year for a front-end loaderattachment and an 80 hp (60 kW) tractor. For the backhoe attachment, the annual costs are about$1,400. The costs reflect the total use of the tractor for mortality management and burial, so they willbe less if the equipment is used for other tasks.
The labour associated with burial of mortalities can range from 0.001 to 0.53 hours/marketed hog(Schwager et al, 2001) and will depend on the size of the operation. For example, in a 300 sow farrowto finish system, if 70 minutes/day are required for loading dead stock plus 85 minutes/day for coveringmortalities, then the labour works out to 0.180 hours/marketed hog in a 2.26 turn operation (Henry etal, 2001). At a labour rate of $12, the annual labour cost is $0.01 to $6.36/marketed hog.
Depending upon the size of the operation, annual savings may occur by contracting a backhoe to digthe pit/trench, thus eliminating the costs associated with owning and operating the backhoe attachmentfor the tractor.
The cost of fencing to enclose the pit/trench can range from $9 to 15/ft ($30 to $50/m) plus labour forinstallation.
General AssessmentOn-farm burial is appropriate where soil and groundwater conditions provide environmental protection.Burial requires proper management to prevent nuisance issues. Check with local authorities for anyapplicable bylaws associated with dead stock disposal methods.
Complementary TechnologiesRendering, composting, and incineration are complementary technologies. In addition, aquifer mappingwould be helpful to determine the suitability and location for burial.
Literature CitedAlberta Agriculture, Food and Rural Development (AAFRD). 2002. Livestock mortality burial techniques. Agricultural Engi-
neering Branch, Livestock. Agdex #400/29-2.
Alberta Agriculture, Food and Rural Development (AAFRD). 2002. Livestock mortality management (disposal). AgriculturalEngineering Branch, Livestock. Agdex #400/29-1.
Baas, T., T. Glanville, and M. Schwager. 2001. A closer look at mortality management. Iowa Pork Production. Iowa PorkProducers Association.
Henry, C., R. Willis, and L. Bitney. 2001. Disposal methods of livestock mortality. University of Nebraska Lincoln, Coopera-tive Extension, Institute of Agriculture and Natural Resources. NebGuide, G01-1421-A.
Manitoba Agriculture, Food and Rural Initiatives. 2003. 2003 Farm Machinery Rental and Custom Rate Guide.
Saskatchewan Agriculture, Food and Rural Revitalization. 2004. Managing livestock mortalities. FARMFACTS.
Schwager, M., T.J. Baas, T. Glanville, J. Lorimor, and J. Lawrence. 2001. Mortality disposal analysis. Iowa Pork IndustryCenter, Iowa State University Extension, ISU Swine Research Report 2001, ASL-R1788.
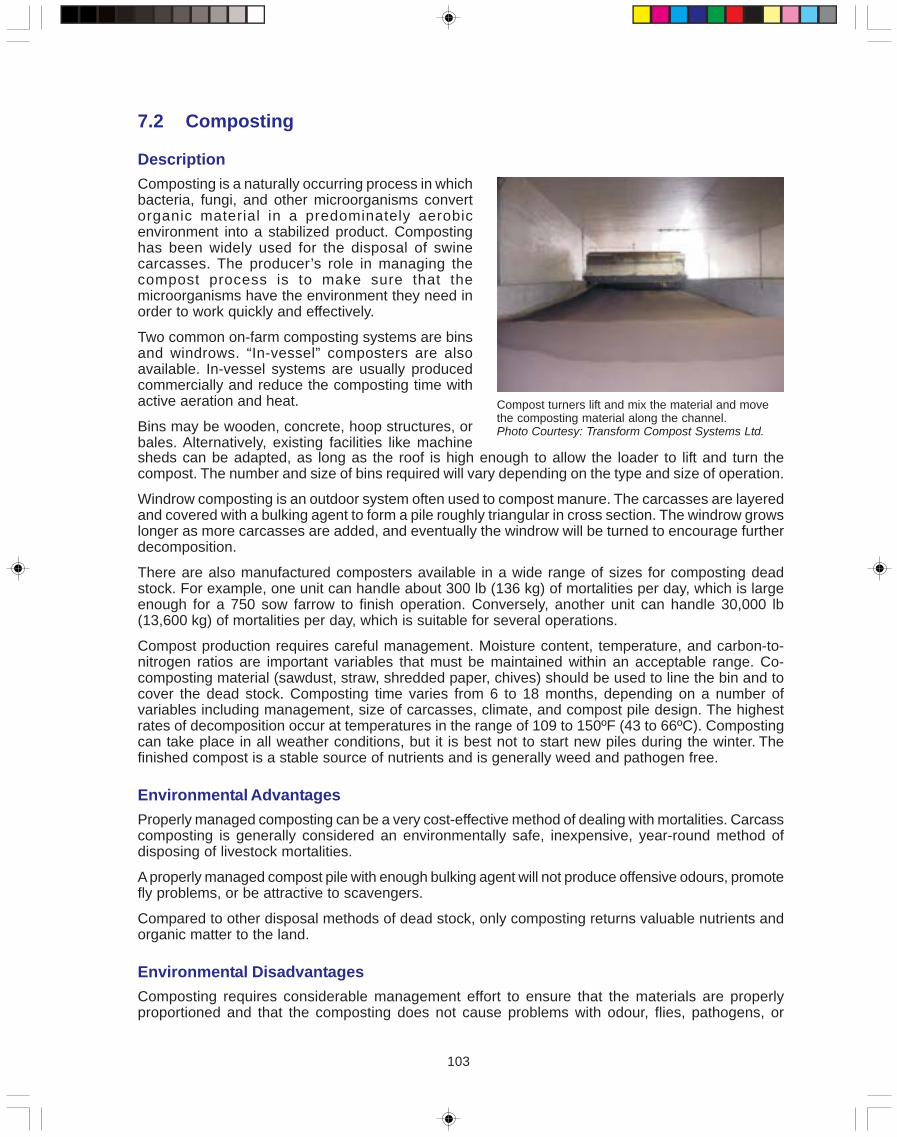
103
7.2 Composting
DescriptionComposting is a naturally occurring process in whichbacteria, fungi, and other microorganisms convertorganic material in a predominately aerobicenvironment into a stabilized product. Compostinghas been widely used for the disposal of swinecarcasses. The producer’s role in managing thecompost process is to make sure that themicroorganisms have the environment they need inorder to work quickly and effectively.
Two common on-farm composting systems are binsand windrows. “In-vessel” composters are alsoavailable. In-vessel systems are usually producedcommercially and reduce the composting time withactive aeration and heat.
Bins may be wooden, concrete, hoop structures, orbales. Alternatively, existing facilities like machine
Compost turners lift and mix the material and movethe composting material along the channel.Photo Courtesy: Transform Compost Systems Ltd.
sheds can be adapted, as long as the roof is high enough to allow the loader to lift and turn thecompost. The number and size of bins required will vary depending on the type and size of operation.
Windrow composting is an outdoor system often used to compost manure. The carcasses are layeredand covered with a bulking agent to form a pile roughly triangular in cross section. The windrow growslonger as more carcasses are added, and eventually the windrow will be turned to encourage furtherdecomposition.
There are also manufactured composters available in a wide range of sizes for composting deadstock. For example, one unit can handle about 300 lb (136 kg) of mortalities per day, which is largeenough for a 750 sow farrow to finish operation. Conversely, another unit can handle 30,000 lb(13,600 kg) of mortalities per day, which is suitable for several operations.
Compost production requires careful management. Moisture content, temperature, and carbon-to-nitrogen ratios are important variables that must be maintained within an acceptable range. Co-composting material (sawdust, straw, shredded paper, chives) should be used to line the bin and tocover the dead stock. Composting time varies from 6 to 18 months, depending on a number ofvariables including management, size of carcasses, climate, and compost pile design. The highestrates of decomposition occur at temperatures in the range of 109 to 150ºF (43 to 66ºC). Compostingcan take place in all weather conditions, but it is best not to start new piles during the winter. Thefinished compost is a stable source of nutrients and is generally weed and pathogen free.
Environmental AdvantagesProperly managed composting can be a very cost-effective method of dealing with mortalities. Carcasscomposting is generally considered an environmentally safe, inexpensive, year-round method ofdisposing of livestock mortalities.
A properly managed compost pile with enough bulking agent will not produce offensive odours, promotefly problems, or be attractive to scavengers.
Compared to other disposal methods of dead stock, only composting returns valuable nutrients andorganic matter to the land.
Environmental DisadvantagesComposting requires considerable management effort to ensure that the materials are properlyproportioned and that the composting does not cause problems with odour, flies, pathogens, or
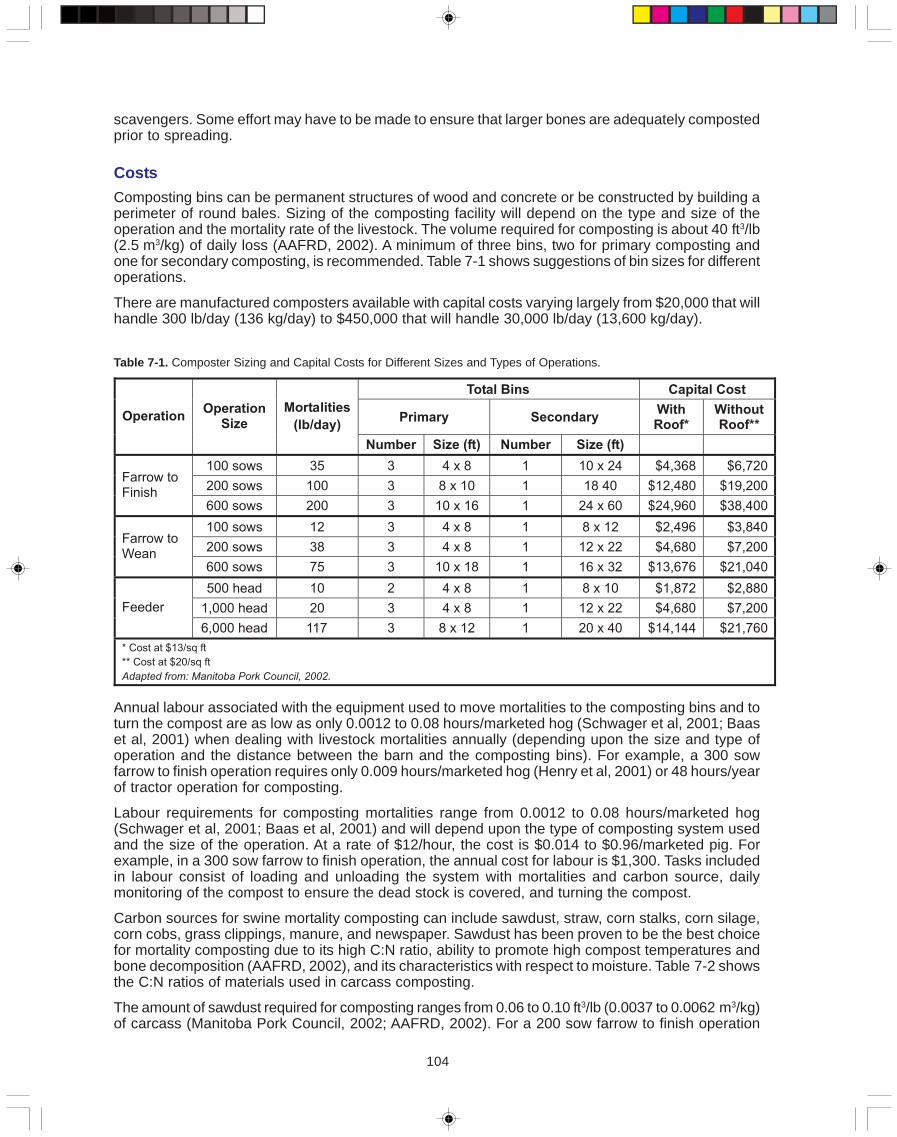
104
scavengers. Some effort may have to be made to ensure that larger bones are adequately compostedprior to spreading.
CostsComposting bins can be permanent structures of wood and concrete or be constructed by building aperimeter of round bales. Sizing of the composting facility will depend on the type and size of theoperation and the mortality rate of the livestock. The volume required for composting is about 40 ft3/lb(2.5 m3/kg) of daily loss (AAFRD, 2002). A minimum of three bins, two for primary composting andone for secondary composting, is recommended. Table 7-1 shows suggestions of bin sizes for differentoperations.
There are manufactured composters available with capital costs varying largely from $20,000 that willhandle 300 lb/day (136 kg/day) to $450,000 that will handle 30,000 lb/day (13,600 kg/day).
Table 7-1. Composter Sizing and Capital Costs for Different Sizes and Types of Operations.
Annual labour associated with the equipment used to move mortalities to the composting bins and toturn the compost are as low as only 0.0012 to 0.08 hours/marketed hog (Schwager et al, 2001; Baaset al, 2001) when dealing with livestock mortalities annually (depending upon the size and type ofoperation and the distance between the barn and the composting bins). For example, a 300 sowfarrow to finish operation requires only 0.009 hours/marketed hog (Henry et al, 2001) or 48 hours/yearof tractor operation for composting.
Labour requirements for composting mortalities range from 0.0012 to 0.08 hours/marketed hog(Schwager et al, 2001; Baas et al, 2001) and will depend upon the type of composting system usedand the size of the operation. At a rate of $12/hour, the cost is $0.014 to $0.96/marketed pig. Forexample, in a 300 sow farrow to finish operation, the annual cost for labour is $1,300. Tasks includedin labour consist of loading and unloading the system with mortalities and carbon source, dailymonitoring of the compost to ensure the dead stock is covered, and turning the compost.
Carbon sources for swine mortality composting can include sawdust, straw, corn stalks, corn silage,corn cobs, grass clippings, manure, and newspaper. Sawdust has been proven to be the best choicefor mortality composting due to its high C:N ratio, ability to promote high compost temperatures andbone decomposition (AAFRD, 2002), and its characteristics with respect to moisture. Table 7-2 showsthe C:N ratios of materials used in carcass composting.
The amount of sawdust required for composting ranges from 0.06 to 0.10 ft3/lb (0.0037 to 0.0062 m3/kg)of carcass (Manitoba Pork Council, 2002; AAFRD, 2002). For a 200 sow farrow to finish operation
Total Bins Capital Cost
Primary SecondaryWithRoof*
WithoutRoof**
OperationOperation
Size
Mortalities
(lb/day)
Number Size (ft) Number Size (ft)
100 sows 35 3 4 x 8 1 10 x 24 $4,368 $6,720
200 sows 100 3 8 x 10 1 18 40 $12,480 $19,200Farrow toFinish
600 sows 200 3 10 x 16 1 24 x 60 $24,960 $38,400
100 sows 12 3 4 x 8 1 8 x 12 $2,496 $3,840
200 sows 38 3 4 x 8 1 12 x 22 $4,680 $7,200Farrow toWean
600 sows 75 3 10 x 18 1 16 x 32 $13,676 $21,040
500 head 10 2 4 x 8 1 8 x 10 $1,872 $2,880
1,000 head 20 3 4 x 8 1 12 x 22 $4,680 $7,200Feeder
6,000 head 117 3 8 x 12 1 20 x 40 $14,144 $21,760
* Cost at $13/sq ft
** Cost at $20/sq ft
Adapted from: Manitoba Pork Council, 2002.
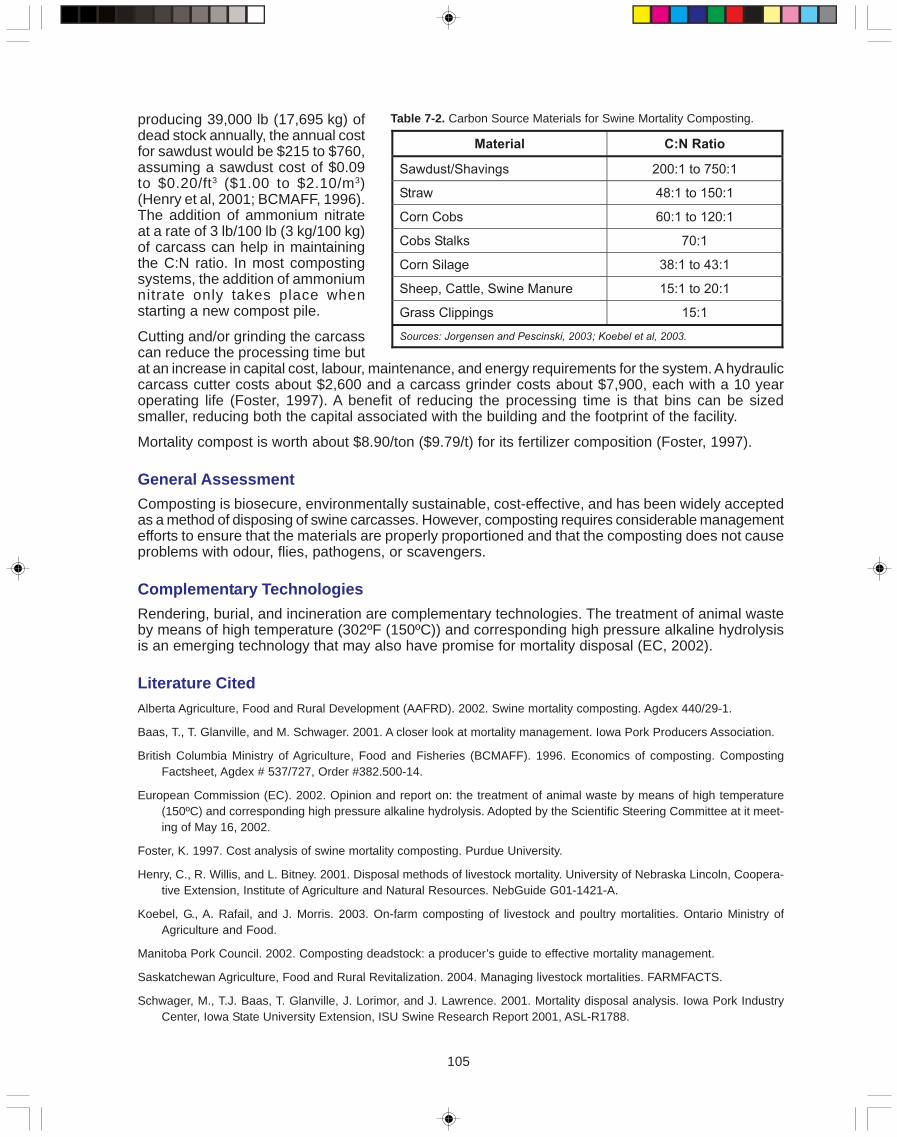
105
producing 39,000 lb (17,695 kg) ofdead stock annually, the annual costfor sawdust would be $215 to $760,assuming a sawdust cost of $0.09to $0.20/ft3 ($1.00 to $2.10/m3)(Henry et al, 2001; BCMAFF, 1996).The addition of ammonium nitrateat a rate of 3 lb/100 lb (3 kg/100 kg)of carcass can help in maintainingthe C:N ratio. In most compostingsystems, the addition of ammoniumnitrate only takes place whenstarting a new compost pile.
Cutting and/or grinding the carcasscan reduce the processing time but
Material C:N Ratio
Sawdust/Shavings 200:1 to 750:1
Straw 48:1 to 150:1
Corn Cobs 60:1 to 120:1
Cobs Stalks 70:1
Corn Silage 38:1 to 43:1
Sheep, Cattle, Swine Manure 15:1 to 20:1
Grass Clippings 15:1
Sources: Jorgensen and Pescinski, 2003; Koebel et al, 2003.
Table 7-2. Carbon Source Materials for Swine Mortality Composting.
at an increase in capital cost, labour, maintenance, and energy requirements for the system. A hydrauliccarcass cutter costs about $2,600 and a carcass grinder costs about $7,900, each with a 10 yearoperating life (Foster, 1997). A benefit of reducing the processing time is that bins can be sizedsmaller, reducing both the capital associated with the building and the footprint of the facility.
Mortality compost is worth about $8.90/ton ($9.79/t) for its fertilizer composition (Foster, 1997).
General AssessmentComposting is biosecure, environmentally sustainable, cost-effective, and has been widely acceptedas a method of disposing of swine carcasses. However, composting requires considerable managementefforts to ensure that the materials are properly proportioned and that the composting does not causeproblems with odour, flies, pathogens, or scavengers.
Complementary TechnologiesRendering, burial, and incineration are complementary technologies. The treatment of animal wasteby means of high temperature (302ºF (150ºC)) and corresponding high pressure alkaline hydrolysisis an emerging technology that may also have promise for mortality disposal (EC, 2002).
Literature CitedAlberta Agriculture, Food and Rural Development (AAFRD). 2002. Swine mortality composting. Agdex 440/29-1.
Baas, T., T. Glanville, and M. Schwager. 2001. A closer look at mortality management. Iowa Pork Producers Association.
British Columbia Ministry of Agriculture, Food and Fisheries (BCMAFF). 1996. Economics of composting. CompostingFactsheet, Agdex # 537/727, Order #382.500-14.
European Commission (EC). 2002. Opinion and report on: the treatment of animal waste by means of high temperature(150ºC) and corresponding high pressure alkaline hydrolysis. Adopted by the Scientific Steering Committee at it meet-ing of May 16, 2002.
Foster, K. 1997. Cost analysis of swine mortality composting. Purdue University.
Henry, C., R. Willis, and L. Bitney. 2001. Disposal methods of livestock mortality. University of Nebraska Lincoln, Coopera-tive Extension, Institute of Agriculture and Natural Resources. NebGuide G01-1421-A.
Koebel, G., A. Rafail, and J. Morris. 2003. On-farm composting of livestock and poultry mortalities. Ontario Ministry ofAgriculture and Food.
Manitoba Pork Council. 2002. Composting deadstock: a producer’s guide to effective mortality management.
Saskatchewan Agriculture, Food and Rural Revitalization. 2004. Managing livestock mortalities. FARMFACTS.
Schwager, M., T.J. Baas, T. Glanville, J. Lorimor, and J. Lawrence. 2001. Mortality disposal analysis. Iowa Pork IndustryCenter, Iowa State University Extension, ISU Swine Research Report 2001, ASL-R1788.
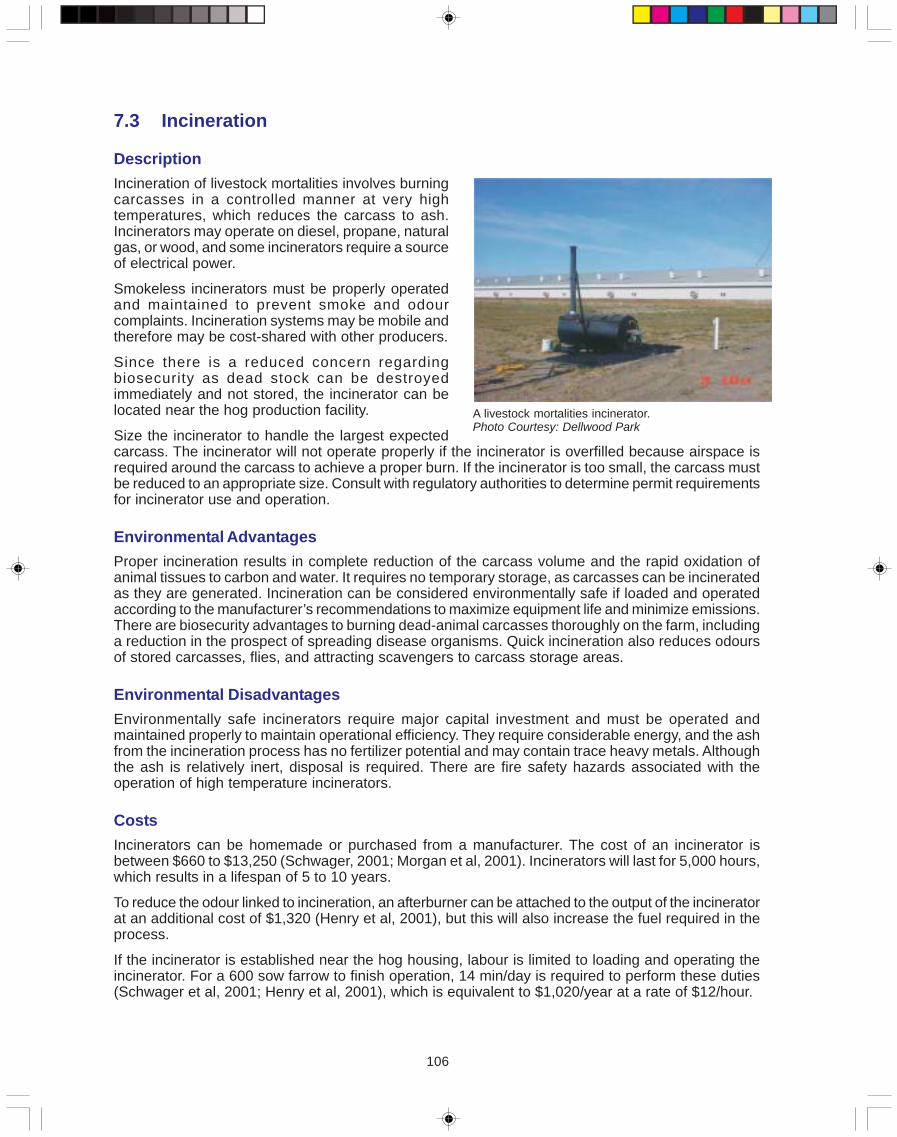
106
7.3 Incineration
DescriptionIncineration of livestock mortalities involves burningcarcasses in a controlled manner at very hightemperatures, which reduces the carcass to ash.Incinerators may operate on diesel, propane, naturalgas, or wood, and some incinerators require a sourceof electrical power.
Smokeless incinerators must be properly operatedand maintained to prevent smoke and odourcomplaints. Incineration systems may be mobile andtherefore may be cost-shared with other producers.
Since there is a reduced concern regardingbiosecurity as dead stock can be destroyedimmediately and not stored, the incinerator can belocated near the hog production facility.
Size the incinerator to handle the largest expectedA livestock mortalities incinerator.Photo Courtesy: Dellwood Park
carcass. The incinerator will not operate properly if the incinerator is overfilled because airspace isrequired around the carcass to achieve a proper burn. If the incinerator is too small, the carcass mustbe reduced to an appropriate size. Consult with regulatory authorities to determine permit requirementsfor incinerator use and operation.
Environmental AdvantagesProper incineration results in complete reduction of the carcass volume and the rapid oxidation ofanimal tissues to carbon and water. It requires no temporary storage, as carcasses can be incineratedas they are generated. Incineration can be considered environmentally safe if loaded and operatedaccording to the manufacturer’s recommendations to maximize equipment life and minimize emissions.There are biosecurity advantages to burning dead-animal carcasses thoroughly on the farm, includinga reduction in the prospect of spreading disease organisms. Quick incineration also reduces odoursof stored carcasses, flies, and attracting scavengers to carcass storage areas.
Environmental DisadvantagesEnvironmentally safe incinerators require major capital investment and must be operated andmaintained properly to maintain operational efficiency. They require considerable energy, and the ashfrom the incineration process has no fertilizer potential and may contain trace heavy metals. Althoughthe ash is relatively inert, disposal is required. There are fire safety hazards associated with theoperation of high temperature incinerators.
CostsIncinerators can be homemade or purchased from a manufacturer. The cost of an incinerator isbetween $660 to $13,250 (Schwager, 2001; Morgan et al, 2001). Incinerators will last for 5,000 hours,which results in a lifespan of 5 to 10 years.
To reduce the odour linked to incineration, an afterburner can be attached to the output of the incineratorat an additional cost of $1,320 (Henry et al, 2001), but this will also increase the fuel required in theprocess.
If the incinerator is established near the hog housing, labour is limited to loading and operating theincinerator. For a 600 sow farrow to finish operation, 14 min/day is required to perform these duties(Schwager et al, 2001; Henry et al, 2001), which is equivalent to $1,020/year at a rate of $12/hour.
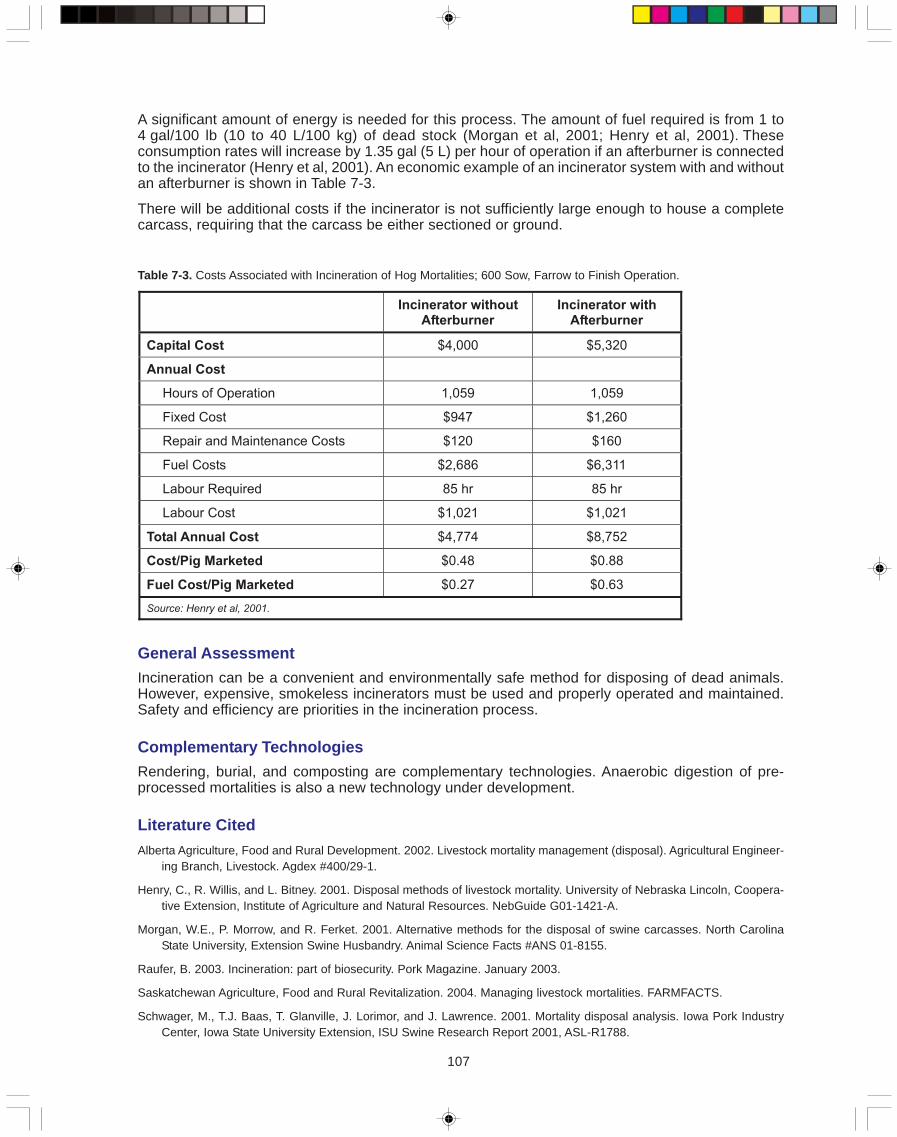
107
A significant amount of energy is needed for this process. The amount of fuel required is from 1 to4 gal/100 lb (10 to 40 L/100 kg) of dead stock (Morgan et al, 2001; Henry et al, 2001). Theseconsumption rates will increase by 1.35 gal (5 L) per hour of operation if an afterburner is connectedto the incinerator (Henry et al, 2001). An economic example of an incinerator system with and withoutan afterburner is shown in Table 7-3.
There will be additional costs if the incinerator is not sufficiently large enough to house a completecarcass, requiring that the carcass be either sectioned or ground.
Incinerator withoutAfterburner
Incinerator withAfterburner
Capital Cost $4,000 $5,320
Annual Cost
Hours of Operation 1,059 1,059
Fixed Cost $947 $1,260
Repair and Maintenance Costs $120 $160
Fuel Costs $2,686 $6,311
Labour Required 85 hr 85 hr
Labour Cost $1,021 $1,021
Total Annual Cost $4,774 $8,752
Cost/Pig Marketed $0.48 $0.88
Fuel Cost/Pig Marketed $0.27 $0.63
Source: Henry et al, 2001.
Table 7-3. Costs Associated with Incineration of Hog Mortalities; 600 Sow, Farrow to Finish Operation.
General AssessmentIncineration can be a convenient and environmentally safe method for disposing of dead animals.However, expensive, smokeless incinerators must be used and properly operated and maintained.Safety and efficiency are priorities in the incineration process.
Complementary TechnologiesRendering, burial, and composting are complementary technologies. Anaerobic digestion of pre-processed mortalities is also a new technology under development.
Literature CitedAlberta Agriculture, Food and Rural Development. 2002. Livestock mortality management (disposal). Agricultural Engineer-
ing Branch, Livestock. Agdex #400/29-1.
Henry, C., R. Willis, and L. Bitney. 2001. Disposal methods of livestock mortality. University of Nebraska Lincoln, Coopera-tive Extension, Institute of Agriculture and Natural Resources. NebGuide G01-1421-A.
Morgan, W.E., P. Morrow, and R. Ferket. 2001. Alternative methods for the disposal of swine carcasses. North CarolinaState University, Extension Swine Husbandry. Animal Science Facts #ANS 01-8155.
Raufer, B. 2003. Incineration: part of biosecurity. Pork Magazine. January 2003.
Saskatchewan Agriculture, Food and Rural Revitalization. 2004. Managing livestock mortalities. FARMFACTS.
Schwager, M., T.J. Baas, T. Glanville, J. Lorimor, and J. Lawrence. 2001. Mortality disposal analysis. Iowa Pork IndustryCenter, Iowa State University Extension, ISU Swine Research Report 2001, ASL-R1788.
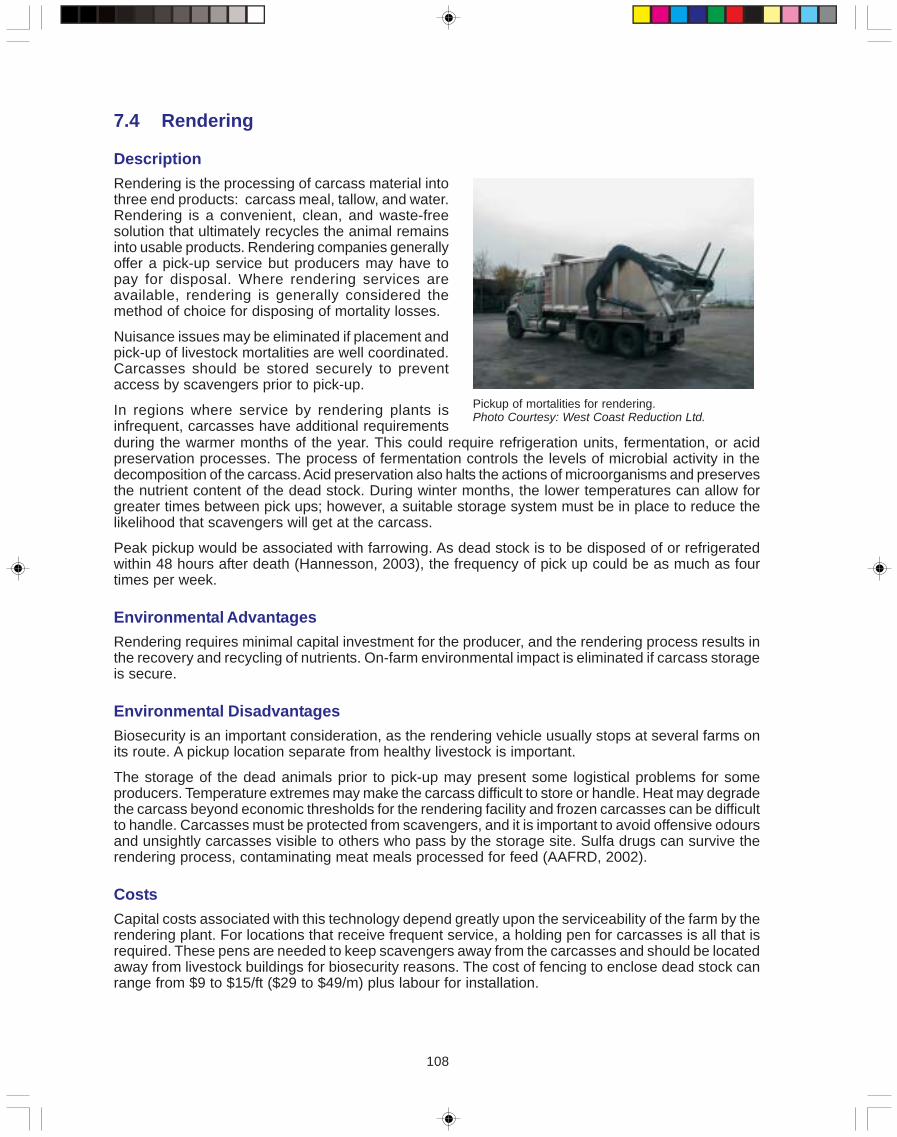
108
7.4 Rendering
DescriptionRendering is the processing of carcass material intothree end products: carcass meal, tallow, and water.Rendering is a convenient, clean, and waste-freesolution that ultimately recycles the animal remainsinto usable products. Rendering companies generallyoffer a pick-up service but producers may have topay for disposal. Where rendering services areavailable, rendering is generally considered themethod of choice for disposing of mortality losses.
Nuisance issues may be eliminated if placement andpick-up of livestock mortalities are well coordinated.Carcasses should be stored securely to preventaccess by scavengers prior to pick-up.
In regions where service by rendering plants isinfrequent, carcasses have additional requirements
Pickup of mortalities for rendering.Photo Courtesy: West Coast Reduction Ltd.
during the warmer months of the year. This could require refrigeration units, fermentation, or acidpreservation processes. The process of fermentation controls the levels of microbial activity in thedecomposition of the carcass. Acid preservation also halts the actions of microorganisms and preservesthe nutrient content of the dead stock. During winter months, the lower temperatures can allow forgreater times between pick ups; however, a suitable storage system must be in place to reduce thelikelihood that scavengers will get at the carcass.
Peak pickup would be associated with farrowing. As dead stock is to be disposed of or refrigeratedwithin 48 hours after death (Hannesson, 2003), the frequency of pick up could be as much as fourtimes per week.
Environmental AdvantagesRendering requires minimal capital investment for the producer, and the rendering process results inthe recovery and recycling of nutrients. On-farm environmental impact is eliminated if carcass storageis secure.
Environmental DisadvantagesBiosecurity is an important consideration, as the rendering vehicle usually stops at several farms onits route. A pickup location separate from healthy livestock is important.
The storage of the dead animals prior to pick-up may present some logistical problems for someproducers. Temperature extremes may make the carcass difficult to store or handle. Heat may degradethe carcass beyond economic thresholds for the rendering facility and frozen carcasses can be difficultto handle. Carcasses must be protected from scavengers, and it is important to avoid offensive odoursand unsightly carcasses visible to others who pass by the storage site. Sulfa drugs can survive therendering process, contaminating meat meals processed for feed (AAFRD, 2002).
CostsCapital costs associated with this technology depend greatly upon the serviceability of the farm by therendering plant. For locations that receive frequent service, a holding pen for carcasses is all that isrequired. These pens are needed to keep scavengers away from the carcasses and should be locatedaway from livestock buildings for biosecurity reasons. The cost of fencing to enclose dead stock canrange from $9 to $15/ft ($29 to $49/m) plus labour for installation.
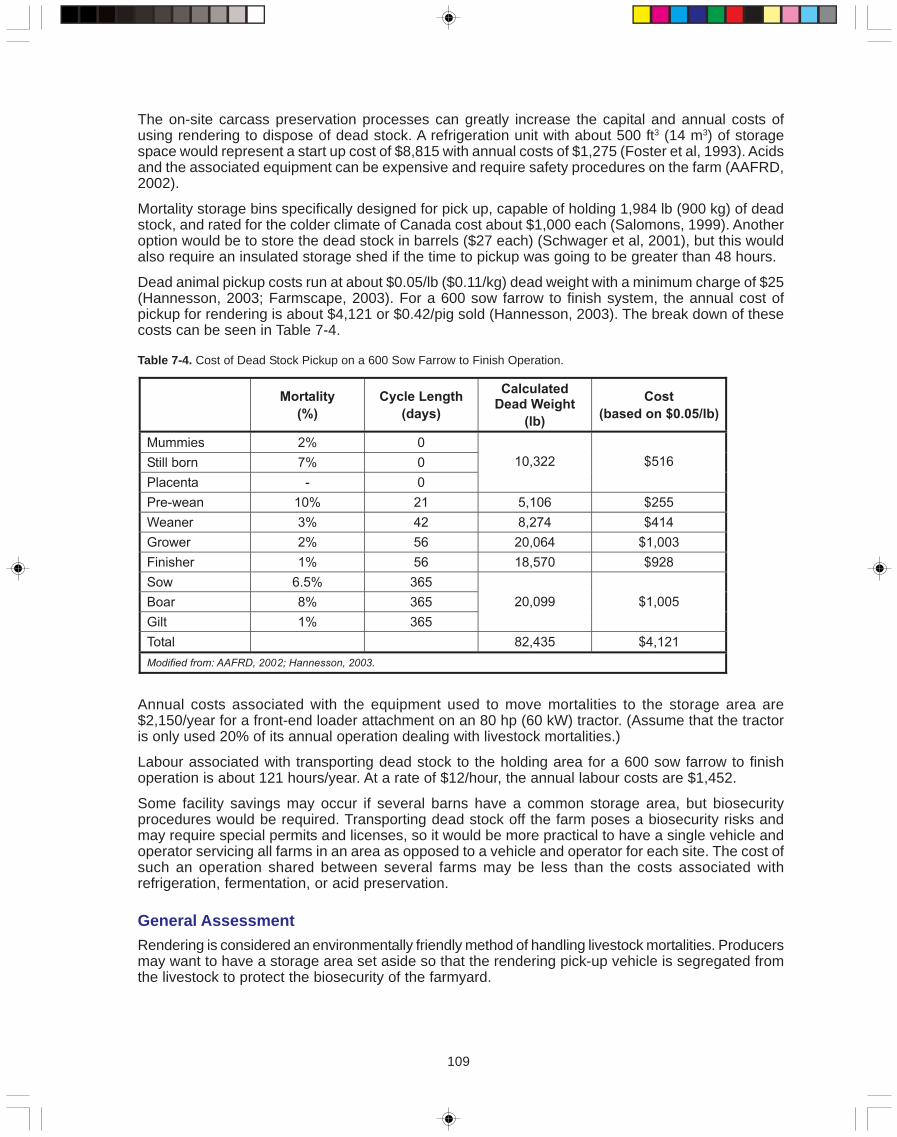
109
The on-site carcass preservation processes can greatly increase the capital and annual costs ofusing rendering to dispose of dead stock. A refrigeration unit with about 500 ft3 (14 m3) of storagespace would represent a start up cost of $8,815 with annual costs of $1,275 (Foster et al, 1993). Acidsand the associated equipment can be expensive and require safety procedures on the farm (AAFRD,2002).
Mortality storage bins specifically designed for pick up, capable of holding 1,984 lb (900 kg) of deadstock, and rated for the colder climate of Canada cost about $1,000 each (Salomons, 1999). Anotheroption would be to store the dead stock in barrels ($27 each) (Schwager et al, 2001), but this wouldalso require an insulated storage shed if the time to pickup was going to be greater than 48 hours.
Dead animal pickup costs run at about $0.05/lb ($0.11/kg) dead weight with a minimum charge of $25(Hannesson, 2003; Farmscape, 2003). For a 600 sow farrow to finish system, the annual cost ofpickup for rendering is about $4,121 or $0.42/pig sold (Hannesson, 2003). The break down of thesecosts can be seen in Table 7-4.
Mortality
(%)
Cycle Length
(days)
CalculatedDead Weight
(lb)
Cost
(based on $0.05/lb)
Mummies 2% 0
Still born 7% 0
Placenta - 0
10,322 $516
Pre-wean 10% 21 5,106 $255
Weaner 3% 42 8,274 $414
Grower 2% 56 20,064 $1,003
Finisher 1% 56 18,570 $928
Sow 6.5% 365
Boar 8% 365
Gilt 1% 365
20,099 $1,005
Total 82,435 $4,121
Modified from: AAFRD, 2002; Hannesson, 2003.
Table 7-4. Cost of Dead Stock Pickup on a 600 Sow Farrow to Finish Operation.
Annual costs associated with the equipment used to move mortalities to the storage area are$2,150/year for a front-end loader attachment on an 80 hp (60 kW) tractor. (Assume that the tractoris only used 20% of its annual operation dealing with livestock mortalities.)
Labour associated with transporting dead stock to the holding area for a 600 sow farrow to finishoperation is about 121 hours/year. At a rate of $12/hour, the annual labour costs are $1,452.
Some facility savings may occur if several barns have a common storage area, but biosecurityprocedures would be required. Transporting dead stock off the farm poses a biosecurity risks andmay require special permits and licenses, so it would be more practical to have a single vehicle andoperator servicing all farms in an area as opposed to a vehicle and operator for each site. The cost ofsuch an operation shared between several farms may be less than the costs associated withrefrigeration, fermentation, or acid preservation.
General AssessmentRendering is considered an environmentally friendly method of handling livestock mortalities. Producersmay want to have a storage area set aside so that the rendering pick-up vehicle is segregated fromthe livestock to protect the biosecurity of the farmyard.
110
Complementary TechnologiesComposting, burial, and incineration are complementary technologies.
Literature CitedAlberta Agriculture, Food, and Rural Development (AAFRD). 2002. Livestock mortality management (disposal). Agricultural
Engineering Branch, Livestock. Agdex #400/29-1.
Farmscape. 2003. Rendering costs prompt producers to consider other options. Episode 1352, September 29, 2003.
Foster, K.A., J.C. Klotz, L.K. Clark, D.D. Jones, and A.L. Sutton. 1993. Estimated costs of alternative dead hog disposalmethods. Purdue University.
Government of Manitoba. 1998. Livestock manure and mortalities, management regulation. The Environment Act Regula-tion. 42/98.
Hannesson, J. 2003. Rendering and the hog industry: the cost of dead animal disposal. Alberta Agriculture, Food and RuralDevelopment. Bacon Bits, September 2003.
National Agricultural Biosecurity Center Consortium. 2004. Carcass disposal: a comprehensive review. Report for the USDAAnimal and Plant Health Inspection Service (APHIS). Cooperative Agreement #01-1001-0355-CA.
Salomons, M. 1999. Disposing of dead pigs. Alberta Agriculture, Food and Rural Development. Bacon Bits, September2003.
Saskatchewan Agriculture, Food and Rural Revitalization. 2004. Managing livestock mortalities. FARMFACTS.
Schwager, M., T.J. Baas, T. Glanville, J. Lorimor, and J. Lawrence. 2001. Mortality disposal analysis. Iowa Pork IndustryCenter, Iowa State University Extension, ISU Swine Research Report 2001, ASL-R1788.

Notes

ISBN #0-9696896-8-3July 2005
Printed in Canada