the 1989 report of the north american pediatric renal transplant cooperative study
TRANSCRIPT
Pediatr Nephrol (1990) 4:542-553 �9 IPNA 1990 Pediatric
Nephrology
Occasional survey
The 1989 report of the North American Pediatric Renal Transplant Cooperative Study*
This report is prepared under the auspices of the scientific advisory committee of the North American Pediatric Renal Transplant Cooperative Study
Steven R. Alexander, Gerald S. Arbus, Khalid M. H. Butt, Susan Conley, Richard N. Fine, Ira Greifer, Alan B. Gruskin, William E. Harmon, Paul T. McEnery, Thomas E. Nevins, Nadia Nogueira, Oscar Salvatierra Jr, and Amir Tejani
Abstract. This report of the North American Pediatric Transplant Cooperative Study summarizes data con- tributed by 57 participating centers on 754 children with 761 transplants from 1 January 1989 to 16 February 1989. Data collection was initiated in October 1987 and follow- up of all patients is ongoing. Transplant frequency in- creased with age; 24% of the patients were less than 5 years, with 7% being under 2 years. Common frequent diagnoses were: aplastic/dysplastic kidneys (18%), ob- structive uropathy (16%), and focal segmental glomerulo- sclerosis (12%). Preemptive transplant, i.e., transplanta- tion without prior maintenance dialysis, was performed in 21% of the patients. Dialytic modalities pretransplant were peritoneal dialysis in 42% and hemodialysis in 25%. Bilat- eral nephrectomy was reported in 29%. Live-donor sources accounted for 42% of the transplants. Among cadaveric donors, 41% of the donors were under 11 years old. During the first post-transplant month, maintenance therapy was used similarly for live-donor and cadaver source trans- plants, with prednisone, cyclosporine, and azathioprine used in 93%, 83%, and 81%, respectively. Triple therapy with prednisone, cyclosporine, and azathioprine was used in 78%. 75%, and 75% of functioning cadaver source transplants at 6 months, 12 months, and 18 months as opposed to 60%, 63 %, and 54% for live-donor procedures. with single-drug therapy being uncommon. Rehospitaliza- tion during months 1-5 occurred in 62% of the patients, with treatment of rejection and infection being the main causes. Additionally, 9% were hospitalized for hyperten- sion. During months 6 -12 and 12-17, 30% and 28% of the patients with functioning grafts were rehospitalized. Times to first rejection differed significantly for cadaver and live-donor transplants. The median time to the first rejection was 36 days for cadaver transplants and 156 days for live-donor transplants. Overall, 57% of treated rejec-
* A list of all participating centers and the names of the investigators is printed on pages 552-553
Offprint requests to: A. Tejani, Director. The Clinical Coordinating Center. 450 Clarkson Avenue, Box 49. Brooklyn, NY 11203. USA
tions were completely reversible although the complete reversal rate decreased to 37% for four or more rejections. One hundred and fifty-two graft failures had occurred at the time of writing, with a 1-year graft survival estimate of 0.88 for live-donor and 0.71 for cadaver source transplants. In addition to donor source, recipient age is a significant prognostic factor for graft survival. Among cadaver donors, decreasing donor age is associated with a decreas- ing probability of graft survival. Thirty-five deaths have occurred; 16 attributed to infection and 19 to other causes. The current 1-year survival estimate is 0.94. There have been 9 malignancies.
Key words: Renal transplants - Live donors - Cadaveric donors - Maintenance therapy - Rehospitalization - Rejection
Introduction
The North American Pediatric Renal Transplantation Co- operative Study (NAPRTCS) is a research effort organized in 1987. The organizational structure of the NAPRTCS consists of: (1) the Clinical Coordinating Center (Dr. Te- jani) located at the State University of New York Health Science Center at Brooklyn, (2) the Data Coordinating Center (EMMES Corporation, Drs. Novak and Stablein) located in Maryland, (3) a Scientific Advisory Committee of 13 members which has a geographic distribution across the United States and Canada, and (4) the participating clinic centers. (A listing of the centers appears at the end.) The objective of this group is to obtaiaa the voluntary par- ticipation of all renal transplant centers in the United States and Canada in which multiple pediatric patients (>4) re- ceive renal allografts annually. In so doing, we hope to register and follow greater than 80% of the children receiv- ing renal allografts in the United States and Canada. For the purpose of this study, children are defined as patients
30
38
30
20
10
40 36
i
54
45
50
j I 40
I 32
I []
! I [ I I I I [ I I t 1 I
JAN FEB MAR APR MAY JUN JUL AUG SEP OCT NOV DEC
MONTH
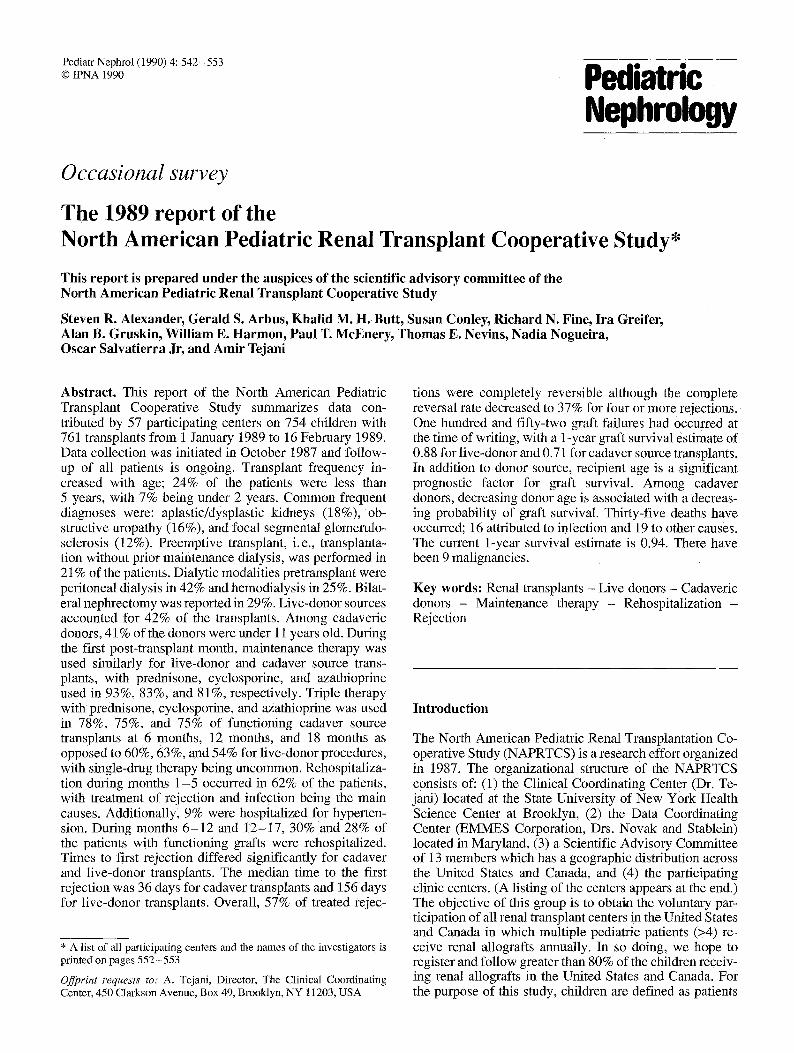
Fig. 1. Distribution of 1987 pediatric transplants in relation to month and donor source. N, Live donor; I , cadaver
who have not yet attained their 18th birthday at the time of the index transplant. As a scientific objective, we hope to gain information about current practice and trends in im- munosuppressive therapy for children receiving renal transplants in North America. Data submission for the study is organized so as to enable an analysis of patient and/or graft survival, morbidity, and relationships that these endpoints have to such variables as graft source, immunosuppressive treatment, and selected recipient characteristics such as age, sex, primary renal disease, an- tigen matches, and prior therapy. As we plan to longitudi- nally follow all patients registered into the program, we anticipate with continued follow-up to be able to analyze growth and its relationship to patient characteristics and therapies. As the study matures, it is our intent to design special studies to focus on questions pertaining to such topics as quality of life, rehabilitation, physical and mental development, or other questions for particular patient sub- groups. In this manner, the study will serve as a resource to investigators whose research activities are consistent with the goals and objectives of the program.
The study began in 1987 with organizational efforts and pilot testing of data collection instruments at the Ad- visory Committee institutions as well as at selected volun- teer centers. In October 1987, fullscale data collection was initiated, and participating centers were requested to regis- ter all pediatric patients receiving transplants on or after 1 January 1987. This report includes information received at the Data Coordinating Center up to and including 16 February 1989. We are particularly pleased and grateful for the enthusiastic response of the volunteer clinical centers without which this project could not be successful.
A total of 754 patients from 57 centers were registered; this represents 338 patients and 12 more centers than in the initial report. A total of 29 cases were registered without
543
submission of follow-up information; thus follow-up infor- mation was available for 725 patients. Transplant forms were submitted for 761 procedures, 725 index transplants and 36 which were the second transplants in the same patient since the start of the study on 1 January 1987. A total of 1,017 monthly status forms were received, while an additional 240 forms which were due by 1 January 1989 had not been received by the time of the closure of the data files. This report summarizes the experience of both patients and transplants. In general, descriptive informa- tion focuses on the transplant as the unit of observation. Variables pertinent to the patient (i. e., sex, diagnosis, etc.) use the patient number as the denominator. Formal analysis of failure times - survival, graft, and rejection-free inter- vals - includes only the first transplant during the study for each patient.
Patient characteristics
Figure 1 shows the distribution of transplants, by month, for the 415 reported transplants from 1987. The transplants were not uniformly distributed throughout the months as an excess of transplants were performed in July and August. We recorded 190, 225,204, and 137 transplants in each 6-month period starting 1 January 1987; thus we expected to collect about 70 more transplants in 1988. In 1986, the Health Care Financing Administration (HCFA) recorded 518 renal transplants in patients prior to their 18th birthday (P. Eggers, personal communication). The short- fall of patients registered in this study appears to be con- centrated in the oldest age groups; the HCFA registry had 39% of its pediatric patients in the 15- to 17-year age group while only 27% of transplants in this study are in the same age range. A significant number of these older children are probably cared for by internists and were thus difficult to enroll in this study.
Recipient history is described in Table 1. A significant excess (60%) of the transplant patients were male. The most common primary renal diagnosis was aplastic/hypo- plastic/dysplastic kidneys (18%) followed closely by ob- structive uropathy (16%). Among glomernlar lesions, focal segmental sclerosis (12%) was the most common reason for transplantation. Systemic diseases such as lupus nephri- tis and hemolytic uremic syndrome each accounted for less than 5% of the cases. Interestingly no child received a transplant for either diabetic nephropathy, or sickle cell nephropathy.
Eighteen percent of the patients had received a trans- plant prior to entry into the study, while 4 patients had received three prior transplants. For those with prior trans- plants, a median of 42 months had elapsed since their first transplant. In 21% of the patients, preemptive transplanta- tion was performed without prior maintenance dialysis. For those with prior maintenance dialysis, the median time of initiation was 14 months (mean 22) prior to the index transplant. Twenty-four percent of patients were not on dialysis, 28% were only on hemodialysis, and 42% were exclusively on peritoneal dialysis immediately prior to the index transplant. Patients who were on dialysis immediate-
544
Table 1. Recipient characteristics
n %
Table 2. Age at transplantation
n %
Sex Male 437 60.4 Female 286 39.6
Race White 508 70.1 Black 95 13.1 Hispanic 77 10.6 Other 45 6.2
Diagnosis Aplastic/hypoplastic/dysplastickidneys 131 18.1 Obstructive uropathy 116 16.0 Focal segmental glomerulosclerosis 87 12.0 Systemic immunologic disease 34 4.7 Reflux nephropathy 30 4.1 Hemolytic uremic syndrome 28 3.9 Congenital nephrotic syndrome 28 3.9 Chronic glomerulonephritis 27 3.7 Syndrome of agenesis of abdominal musculature 26 3.6 Familial nephritis 22 3.0 Pyelonephritis/interstitial nephritis 21 2.9 Medullary cystic disease/
juvenile nephronophthisis 21 2.9 Cystinosis 19 2.6 Renal infarct 16 2.2 Idiopathic crescentic glomerulonephritis 14 1.9 Membranoproliferative glomerulonephritis type I 14 1.9 Polycysfic kidney disease 13 1.8 Membranoproliferative glomerulonephritis type II 10 1.4 Oxalosis 7 1.0 Wilms, tumor 5 0.7 Drash syndrome 4 0.6 Membranous nephropathy 3 0.4 Diabetic glomerulonephritis 0 0 Sickle cell nephropathy 0 0 Other 25 3.5 Unknown 24 3.3 Biopsy or nephrectomy confirmation of diagnosis
No 272 37.6 Yes 358 49.5 Unknown 94 13.0
Number of transplants prior to study 0 593 81.9 1 107 14.5 2 20 2.8 3 4 0.6
Maintenance dialysis Never performed 151 20.8 Performed 574 79.2
Maintenance dialysis immediately prior to index transplant
No 173 23.9 Yes - hemodialysis 201 27.8 Yes - peritoneal dialysis 307 42.4 Yes - both 43 5.9
Splenectomy - yes 15 2.1 All native renal tissue removed 210 29.0
ly prior to the index transplant were main ta ined by this therapy for a median of 16 months.
Splenectomy had been performed in only 15 patients while all nat ive renal tissue had b e e n removed in 29% of the patients. Sixty-three percent of the patients with a prior transplant had had their prior grafts removed.
Age at transplantation (years) 0 14 1.8 1 37 4.9 2 39 5.1 3 37 4.9 4 25 3.3 5 29 3.8 6 31 4.1 7 41 5.4 8 25 3.3 9 38 5.0 10 47 6.2 11 48 6.3 12 44 5.8 13 44 5.8 14 54 7.1 15 64 8.4 16 72 9.5 >_17 72 9.5
Age groupings 0-1 51 6.7 2-5 130 17.1 6-12 274 36.0 13-18 306 40.2
Table 3. Age at index transplant in relation to patient's sex, race and diagnosis (%)
Age (years)
0-1 2-5 6-12 13-17 (n=47) (n=120) (n=261) (n=297) % % % %
Sex Male 70 73 63 52 Female 30 28 37 48
Race White 81 73 70 67 Black 11 10 11 17 Hispanic 4 13 12 9 Other 4 4 7 7
Diagnosis Aplastic/hypoplastic/ dysplastic kidneys 34 23 22 10 Obstructive uropathy 21 23 16 12 Focal segmental 0 9 15 12 glomerulosclerosis
Other 45 45 47 66
Table 2 details the recipient ' s ages at each transplanta- t ion procedure. For this report, we have also grouped ages 0 - 1 , 2 - 5 , 6 - 1 2 , and 1 3 - 1 7 years. In Table 3, pat ients ' sex and diagnoses are classified by age. The sex distribu- t ion was most unbalanced in the youngest age groups, where 70% and 73% of the 0- to 1- and 2- to 5-year-old patients, respectively were male; the sex ratio was nearly even in the oldest age group. The importance of aplastic/hypoplastic/dysplastic kidneys and obstructive uropathy diagnoses also decreased with age. Forty-four percent of male patients fell into these two diagnostic cate,
545
Table 4. Sex, race and biopsy distributions in relation to primary renal diagnosis
Diagnosis n Male White Not biopsied
(%) (%) (%)
Aplastic/hypoplastic/dysplastickidneys 131 69 76 60 Obstructive uropathy 116 88 78 59 Focal segmental glomerulosclerosis 87 61 61 4 Systemic immunologic disease 34 24 50 12 Reflux nephropathy 30 33 67 60 Hemolytic uremic syndrome 28 57 82 43 Congenital nephrotic syndrome 28 57 71 4 Chronic glomemlonephritis 27 41 44 33 Syndrome of agenesis of
abdominal musculature 26 100 65 58 Familial nephritis 22 73 68 5 Pyelonephritis/interstitial nephritis 21 38 67 33 Medullary cystic disease/juvenile
nephronophthisis 21 50 81 38 Cystinosis 19 74 89 47 Renal infarct 16 38 81 50 Idiopathic crescentic
glomerulonephritis 14 29 71 0 Membranoproliferative
glomerulonephritis type I 14 64 71 7 Polycystic kidney disease 13 38 85 54 Membranoproliferative
glomenflonephritis type II 10 30 70 10 Oxalosis 7 71 71 14 Wilms' tumor 5 20 80 0 Drash syndrome 4 25 50 0 Membranous nephropathy 3 100 67 0 Other 25 52 68 28 Unknown 24 33 42 58
Table 5. Donor information
Information n %
Donor SOurce Live parent 281 Live sibling 22 Live other related 12 Live unrelated 4 Cadaver 441
Donor age (years)
0-1 2-10 11-20 21-30 31 - 40 41-50 >50
If cadaver source n Method of allograft perfusion
(n = 441) Machine 76 Iced electrolyte 330 Mixed 18 Unknown 17
Live donor n %
0 0 0 0
16 5.0 80 25.9
141 44.5 68 21.5 12 3.8
37.0 2.9 1.6 0.5
58.0
%
17.2 74.8
4.1 3.9
Cadaver n % 22 5.1
156 36.2 95 22.0 62 14.4 52 12.1 27 6.3 17 3.9
Table 6. HLA mismatches (%)
No. of mismatches
Donor source
Living related (n = 315)
Other a (n = 445)
gories, as opposed to only 19% of the females . The sex dispar i ty d i sappeared for other d iagnoses and only 52% of the pat ients were male in the remain ing diagnost ic groups.
Table 4 shows for each p r imary d iagnosis the propor- t ion o f pat ients who were male, the propor t ion who were white, and the propor t ion k n o w n not to have had the diag- nosis conf i rmed by b iopsy or nephrec tomy. Sixty percent of pat ients with ap las t ic /hypoplas t ic /dysplas t ic k idneys were not d iagnosed on this basis; s imi lar ly 59% of patients with obst ruct ive uropa thy and 60% of patients with ref lux nephropa thy did not have a b iopsy or nephrec tomy. Com- parable rates for focal segmenta l g lomerulosc leros is , hemoly t i c u remic syndrome, and sys temic immuno log ic disease were 3%, 43%, and 12%, respect ively .
Wi th more data, the p reempt ive t ransplant rate was observed to be s imilar across the age groups with rates of 21%, 19%, 25%, and 18% in the 0 - 1 , 2 - 5 , 6 - 1 2 , and 1 3 - 1 7 age groups, respect ively .
D o n o r history and antigen matches
As shown in Table 5, 58% of the t ransplants were f rom a cadaver source, 37% of the al lografts came from pat ien ts ' parents, whi le the remain ing 5% came f rom other l ive donors. Twen ty - two s ibl ing t ransplants were per formed, and 16 l ive-donor grafts were f rom donors under the age of
I-ILA-A 0 18.4 8.5 1 80.0 45.4 2 1.6 46.0
HLA-B 0 14.6 6.1 1 82.5 38.4 2 2.9 55.5
HLA-DR 0 14.9 11.0 1 72.7 44.3 2 12.4 44.7
HLA-B HLA-DR 0 5.7 2.7 1 16.5 6.3 2 61.9 23.8 3 13.0 40.4 4 0.3 27.6
a Includes cadaver (n = 441) and living unrelated (n = 4)
20 years. Three l ive donors were under 18 years o f age. Two of these were ident ical twins, the younger twins be ing 13 years old. Twen ty - two (5%) cadaver ic grafts came from donors ei ther 0 or 1 year o ld and a total of 41% of cadaver donors were 10 years of age or younger . The oldest cadaver donor was 64 years and the o ldes t l ive donor was 57 years. Of the cadaver al lografts , 3 out of 4 were main ta ined with an iced e lect rolyte per fus ion whi le 17% were main ta ined by machine perfusion. F i f ty-n ine percent of the cadaver grafts had cold t imes of less than 24-h durat ion with 2 (0.5%) exceeding 48 h. The m a x i m u m cold t ime was 56 h.
546
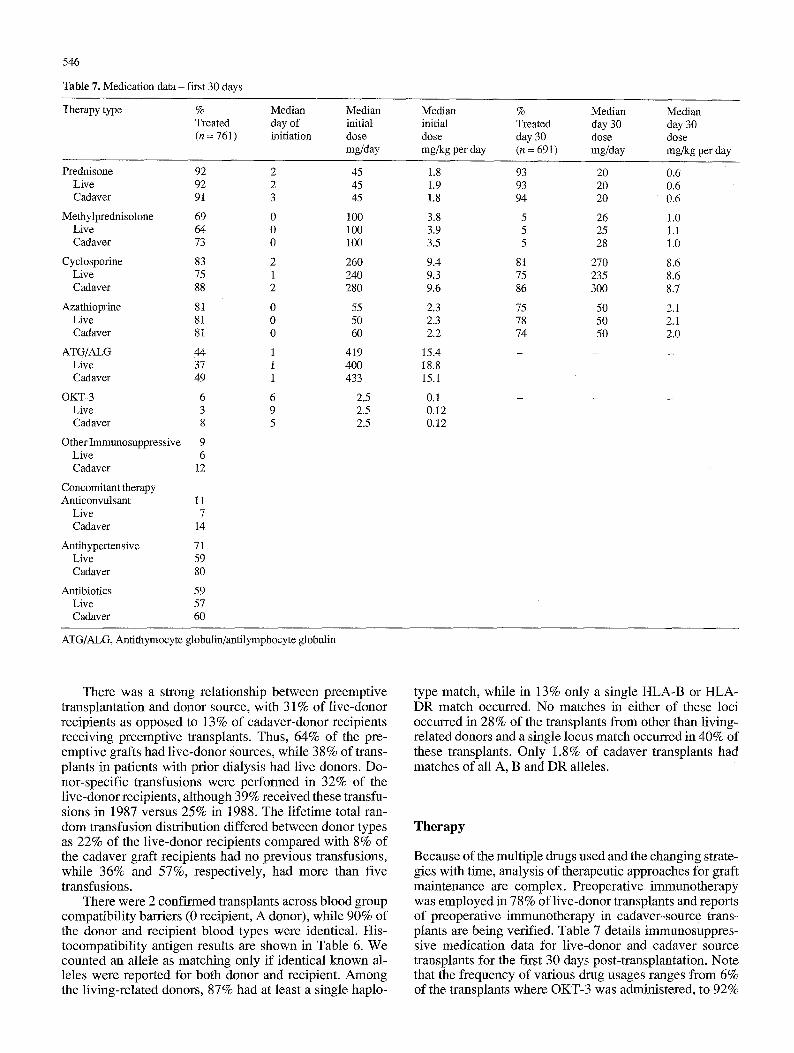
Table 7. Medication data - first 30 days
Therapy type % Median Median Median % Median Median Treated day of initial initial Treated day 30 day 30 (n = 7 6 1 ) initiation dose dose day 30 dose dose
mg/day mg/kg per day (n = 691) mg/day mg/kg per day
Prednisone 92 Live 92 Cadaver 91
Methylprednisolone 69 Live 64 Cadaver 73
Cyclosporine 83 Live 75 Cadaver 88
Azathioprine 81 Live 81 Cadaver 81
ATG/ALG 44 Live 37 Cadaver 49
OKT-3 6 Live 3 Cadaver 8
Other Immunosuppressive 9 Live 6 Cadaver 12
Concomitant therapy Anticonvulsant 11
Live 7 Cadaver 14
Antihypertensive 71 Live 59 Cadaver 80
Antibiotics 59 Live 57 Cadaver 60
2 45 1.8 93 2 45 1.9 93 3 45 1.8 94
0 100 3.8 5 0 100 3.9 5 0 100 3.5 5
2 260 9.4 81 1 240 9.3 75 2 280 9.6 86
0 55 2.3 75 0 50 2.3 78 0 60 2.2 74
1 419 15.4 - 1 400 18.8 1 433 15.1
6 2.5 0.1 - 9 2.5 0.12 5 2.5 0.12
20 0.6 20 0,6 20 0.6
26 1.0 25 1.1 28 1.0
270 8.6 235 8.6 300 8.7
50 2.1 50 2.1 50 2.0
ATG/ALG, Antithymocyte globulin/antilymphocyte globulin
There was a strong relationship between preemptive transplantation and donor source, with 31% of live-donor recipients as opposed to 13% of cadaver-donor recipients receiving preemptive transplants. Thus, 64% of the pre- emptive grafts had live-donor Sources, while 38% of trans- plants in patients with prior dialysis had live donors. Do- nor-specific transfusions were performed in 32% of the live-donor recipients, although 39% received these transfu- sions in 1987 versus 25% in 1988. The lifetime total ran- dom transfusion distribution differed between donor types as 22% of the live-donor recipients compared with 8% of the cadaver graft recipients had no previous transfusions, while 36% and 57%, respectively, had more than five transfusions.
There were 2 confirmed transplants across blood group compatibility barriers (0 recipient, A donor), while 90% of the donor and recipient blood types were identical. His- tocompatibility antigen results are shown in Table 6. We counted an allele as matching only if identical known al- leles were reported for both donor and recipient. Among the living-related donors, 87% had at least a single haplo-
type match, while in 13% only a single HLA-B or HLA- DR match occurred. No matches in either of these loci occurred in 28% of the transplants from other than living- related donors and a single locus match occurred in 40% of these transplants. Only 1.8% of cadaver transplants had matches of all A, B and DR alleles.
Therapy
Because of the multiple drugs used and the changing strate- gies with time, analysis of therapeutic approaches for graft maintenance are complex. Preoperative immunotherapy was employed in 78% of live-donor transplants and reports of preoperative immunotherapy in cadaver-source trans- plants are being verified. Table 7 details immunosuppres- sive medication data for live-donor and cadaver source transplants for the first 30 days post-transplantation. Note that the frequency of various drug usages ranges from 6% of the transplants where OKT-3 was administered, to 92%
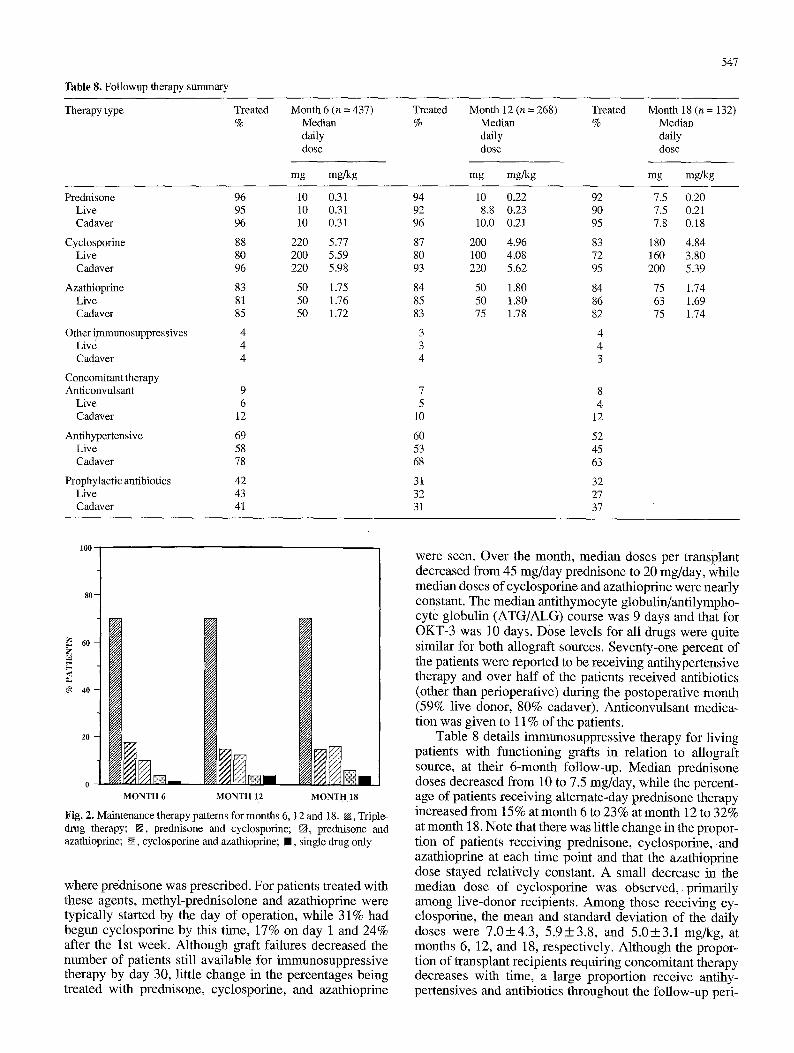
Table 8. Followup therapy summary
547
Therapy type Treated %
Month 6 (n = 437) Median daily dose
mg mgNg
Treated Month 12 (n = 268) Treated Month 18 (n = 132) % Median % Median
daily daily dose dose
mg mgNg mg mgNg
Prednisone Live Cadaver
Cyclosporine Live Cadaver
Azathioprine Live Cadaver
Other i~nmunosuppressives Live Cadaver
Concomitant therapy Anticonvulsant
Live Cadaver
Antihypertensive Live Cadaver
Prophylactic antibiotics Live Cadaver
96 95 96
88 80 96
83 81 85
4 4 4
9 6
12
69 58 78
42 43 41
10 0.31 10 0.31 10 0.31
220 5.77 200 5.59 220 5.98
50 1.75 50 1.76 50 1.72
94 10 0.22 92 7.5 0.20 92 8.8 0.23 90 7.5 0.21 96 10.0 0.21 95 7.8 0.18
87 200 4.96 83 180 4.84 80 100 4.08 72 160 3.80 93 220 5.62 95 200 5.39
84 50 1.80 84 75 1.74 85 50 1.80 86 63 1.69 83 75 1.78 82 75 1.74
3 4 3 4 4 3
7 8 5 4
10 12
60 52 53 45 68 63
31 32 32 27 31 37
loo
6 0 - Z
4 0 -
MONTH 6 MONTH 12 MONTH lS
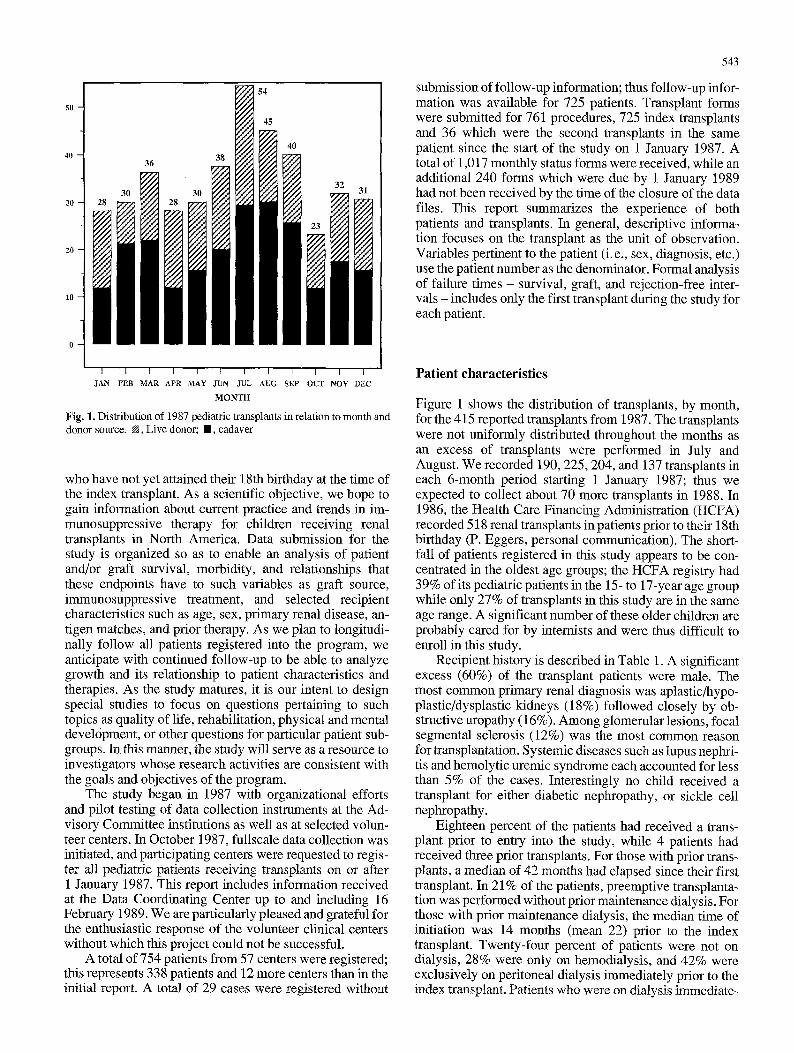
Fig. 2. Maintenance therapy patterns for months 6, 12 and 18. N, Triple- drug therapy; N, prednisone and cyclosporine; N., prednisone and azathioprine; N, cyclosporine and azathioprine; I , single drug only
where prednisone was prescribed. For patients treated with these agents, methyl-prednisolone and azathioprine were typically started by the day of operation, while 31% had begun cyclosporine by this time, 17% on day 1 and 24% after the 1st week. Although graft failures decreased the number of patients still available for immunosuppressive therapy by day 30, little change in the percentages being treated with prednisone, cyclosporine, and azathioprine
were seen. Over the month, median doses per transplant decreased from 45 mg/day prednisone to 20 mg/day, while median doses of cyclosporine and azathioprine were nearly constant. The median antithymocyte globulin/antilympho- cyte globulin (ATG/ALG) course was 9 days and that for OKT-3 was 10 days. Dose levels for all drugs were quite similar for both allograft sources. Seventy-one percent of the patients were reported to be receiving antihypertensive therapy and over half of the patients received antibiotics (other than perioperative) during the postoperative month (59% live donor, 80% cadaver). Anticonvulsant medica- tion was given to 11% of the patients.
Table 8 details immunosuppressive therapy for living patients with functioning grafts in relation to allograft source, at their 6-month follow-up. Median prednisone doses decreased from 10 to 7.5 mg/day, while the percent- age of patients receiving alternate-day prednisone therapy increased from 15% at month 6 to 23% at month 12 to 32% at month 18. Note that there was little change in the propor- tion of patients receiving prednisone, cyclosporine, and azathioprine at each time point and that the azathioprine dose stayed relatively constant. A small decrease in the median dose of cyclosporine was observed , primarily among live-donor recipients. Among those receiving cy- closporine, the mean and standard deviation of the daily doses were 7 .0+4.3 , 5 .9+3.8 , and 5 .0+3.1 mg/kg, at months 6, 12, and 18, respectively, Although the propor- tion of transplant recipients requiring concomitant therapy decreases with time, a large proportion receive antihy- pertensives and antibiotics throughout the follow-up peri-
548
100
80
, o o . . . o o , o ~
~ 1 7 6 1 7 6 1 7 6 1 7 6 1 7 6 ~ ' ' ' *~ ~ 1 7 6
~ 6 0 . " �9 ~ / . I t - -
. ~ 1 7 6 : , . , . , ---~---""
2 0
0 I ' I ' I I ~ I 0 1 0 0 2 0 0 3 0 0 4 0 0 5 0 0
DAYS
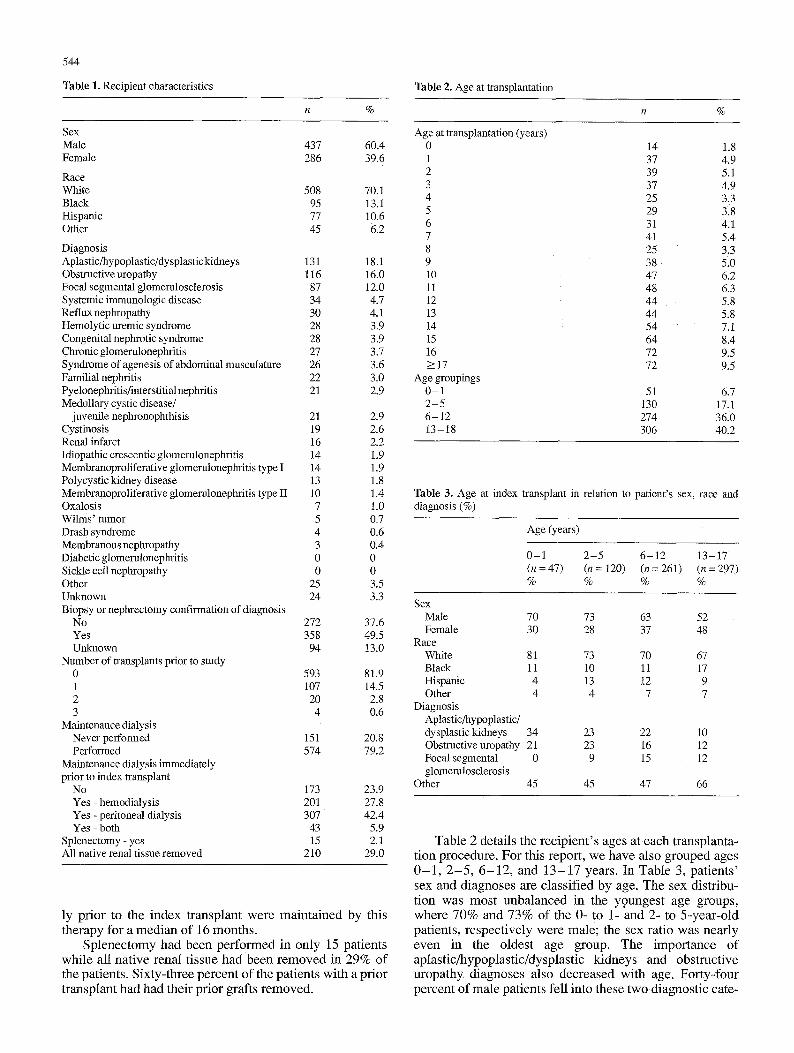
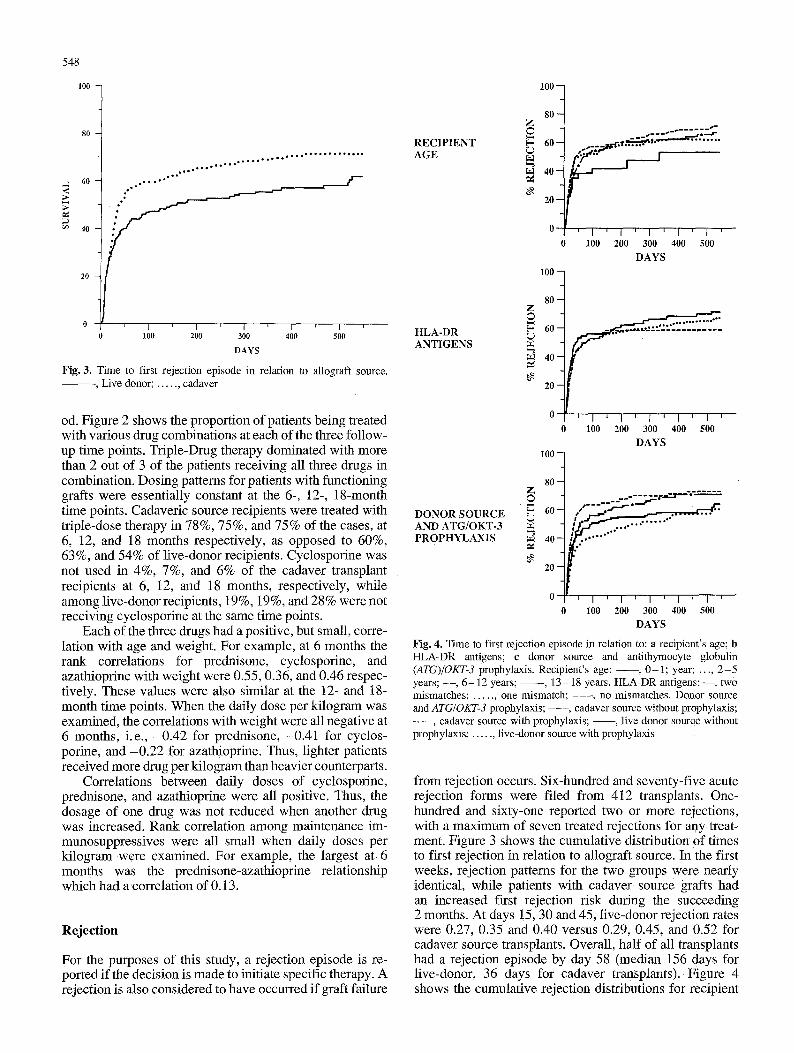
Fig. 3. T ime to first re jec t ion ep isode in re la t ion to a l lograf t source. , L ive donor; . . . . . . cadaver
od. Figure 2 shows the proportion of patients being treated with various drug combinations at each of the three follow- up time points. Triple-Drug therapy dominated with more than 2 out of 3 of the patients receiving all three drugs in combination. Dosing patterns for patients with functioning grafts were essentially constant at the 6-, 12-, 18-month time points. Cadaveric source recipients were treated with triple-dose therapy in 78%, 75%, and 75% of the cases, at 6, 12, and 18 months respectively, as opposed to 60%, 63%, and 54% of live-donor recipients. Cyclosporine was not used in 4%, 7%, and 6% of the cadaver transplant recipients at 6, 12, and 18 months, respectively, while among live-donor recipients, 19%, 19%, and 28% were not receiving cyclosporine at the same time points.
Each of the three drugs had a positive, but small, corre- lation with age and weight. For example, at 6 months the rank correlations for prednisone, cyclosporine, and azathioprine with weight were 0.55, 0.36, and 0.46 respec- tively. These values were also similar at the 12- and 18- month time points. When the daily dose per kilogram was examined, the correlations with weight were all negative at 6 months, i.e., -0.42 for prednisone, -0.41 for cyclos- porine, and -0.22 for azathioprine. Thus, lighter patients received more drug per kilogram than heavier counterparts.
Correlations between daily doses of cyclosporine, prednisone, and azathioprine were all positive. Thus, the dosage of one drug was not reduced when another drug was increased. Rank correlation among maintenance im- munosuppressives were all small when daily doses per kilogram were examined. For example, the largest at 6 months was the prednisone-azathioprine relationship which had a correlation of 0.13.
Reject ion
For the purposes of this study, a rejection episode is re- ported if the decision is made to initiate specific therapy. A rejection is also considered to have occurred if graft failure
1 0 0 -
R E C I P I E N T A G E
80 Z �9
6 0
4 0 -
~9. 2 0 -
1 0 0
0
0
[•j "bt~ ..! I
I ' I ' I ' I ' I ' 1 0 0 200 300 400 .500
D A Y S
H L A - D R A N T I G E N S
D O N O R S O U R C E A N D A T G / O K T - 3 P R O P H Y L A X I S
80 Z
F- 60
40
20
1 0 0
8 0 -
6 0 -
4 0 -
2 0 -
I ~ I ' 1 J I ' I
1 0 0 200 300 400 500
D A Y S
. . . . . . . . . . . . . .
0 I ] [ I ' I ' I ' 1 ' I ' 0 100 200 300 400 500
D A Y S
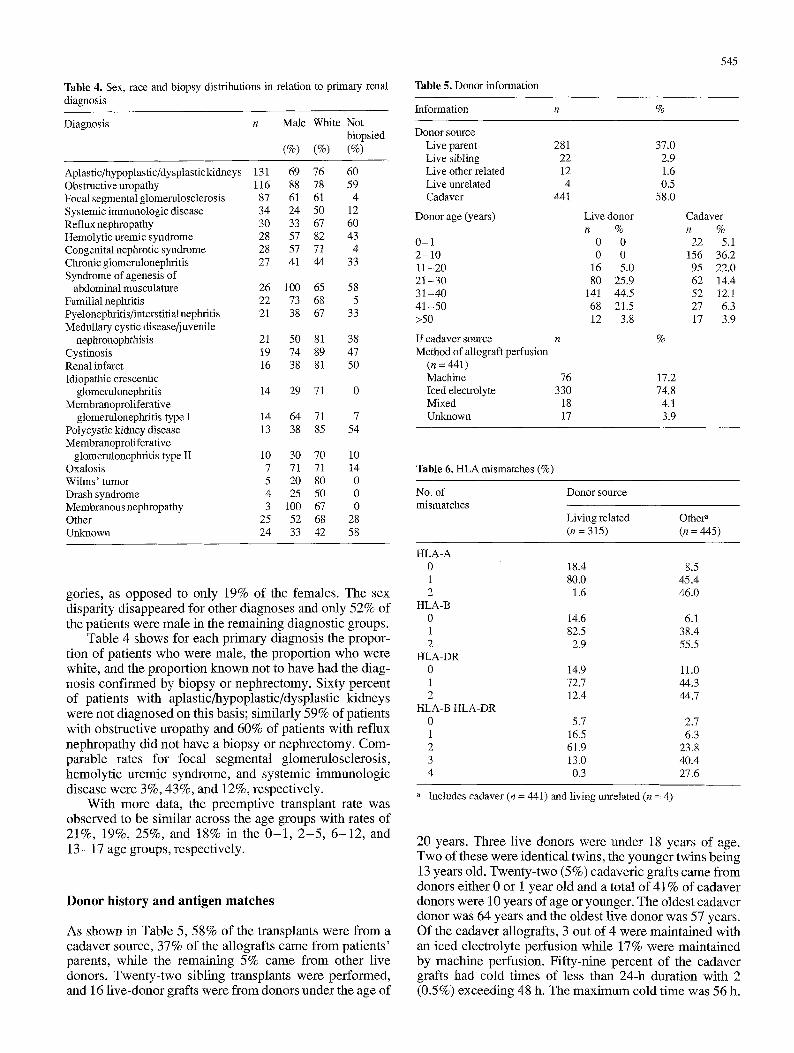
Fig. 4. T ime to first re ject ion episode in re la t ion to: a rec ip ient ' s age; b H L A - D R ant igens; c donor source and an t i thymocyte g lobul in (ATG)/OKT-3 prophylaxis . Rec ip ien t ' s a g e : - - , 0 - 1 ; year; . . . . 2 - 5 years; - - , 6 - 1 2 years; - - - - , 1 3 - 18 years. H L A - D R ant igens: - - , two mismatches ; . . . . . , one mismatch ; . . . . , no mismatches . D o n o r source and ATG/OKT-3 prophylaxis ; - - - , cadaver source wi thout prophylaxis ; - - - , cadaver source wi th prophylaxis ; - - , l ive donor source wi thout prophylaxis ; . . . . . . l ive -donor source wi th p rophy lax i s
from rejection occurs. Six-hundred and seventy-five acute rejection forms were filed from 412 transplants. One- hundred and sixty-one reported two or more rejections, with a maximum of seven treated rejections for any treat- ment. Figure 3 shows the cumulative distribution of times to first rejection in relation to allograft source. In the first weeks, rejection patterns for the two groups were nearly identical, while patients with cadaver source grafts had an increased first rejection risk during the succeeding 2 months. At days !5, 30 and 45, live-donor rejection rates were 0.27, 0.35 and 0.40 versus 0.29, 0.45, and 0.52 for cadaver source transplants. Overall, half of all transplants had a rejection episode by day 58 (median 156 days for live-donor, 36 days for cadaver transplants). Figure 4 shows the cumulative rejection distributions for recipient
549
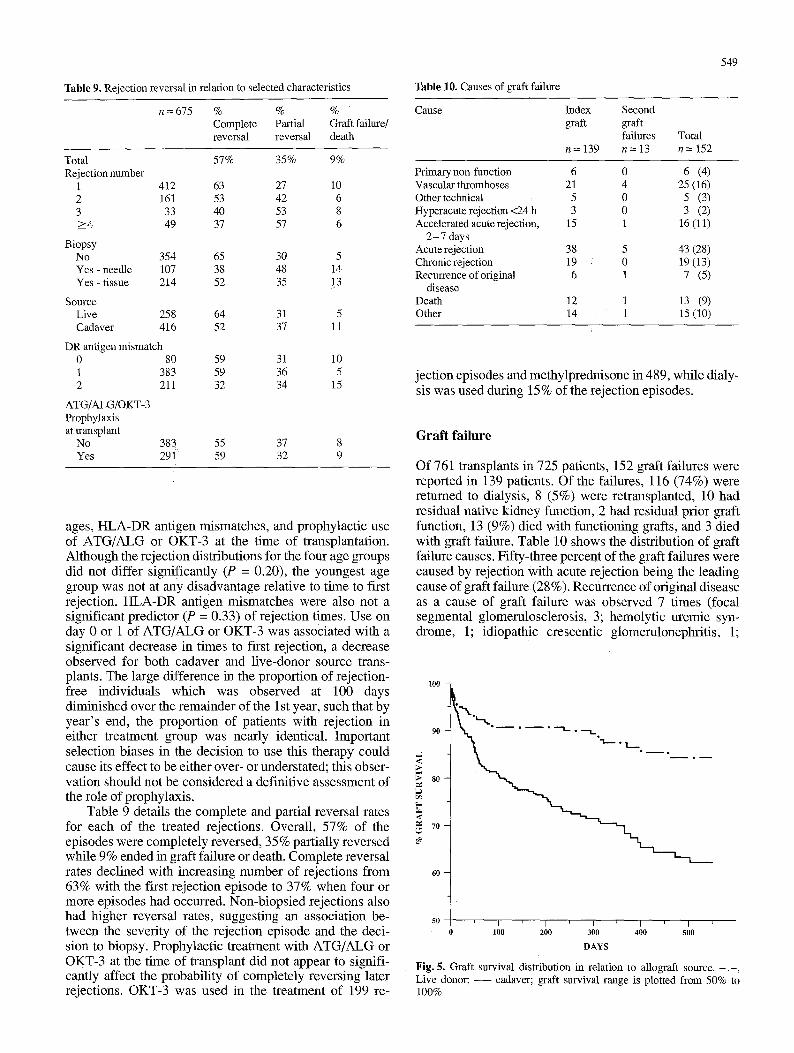
T a b l e 9, Rejection reversal in relation to selected characteristics
n = 675 % % % -
Complete Partial Graft failure/ reversal reversal death
Total 57% 35% 9% Rejection number
1 412 63 27 10 2 161 53 42 6 3 33 40 53 8 -->4 49 37 57 6
Biopsy No 354 65 30 5 Yes - needle 107 38 48 14 Yes - tissue 214 52 35 1.3
Source Live 258 64 31 5 Cadaver 416 52 37 11
DR antigen mismatch 0 80 59 31 10 1 383 59 36 5 2 211 32 34 15
ATG/ALG/OKT-3 Prophylaxis at transplant
No 383 55 37 8 Yes 291 59 32 9
ages, HLA-DR antigen mismatches, and prophylactic use of ATG/ALG or OKT-3 at the time of transplantation. Although the rejection distributions for the four age groups did not differ significantly (P = 0.20), the youngest age group was not at any disadvantage relative to time to first rejection. HLA-DR antigen mismatches were also not a significant predictor (P = 0.33) of rejection times. Use on day 0 or 1 of ATG/ALG or OKT-3 was associated with a significant decrease in times to first rejection, a decrease observed for both cadaver and live-donor source trans- plants. The large difference in the proportion of rejection- free individuals which was observed at 100 days diminished over the remainder of the 1 st year, such that by year's end, the proportion of patients with rejection in either treatment group was nearly identical. Important selection biases in the decision to use this therapy could cause its effect to be either over- or understated; this obser- vation should not be considered a definitive assessment of the role of prophylaxis.
Table 9 details the complete and partial reversal rates for each of the treated rejections. Overall, 57% of the episodes were completely reversed, 35% partially reversed while 9% ended in graft failure or death. Complete reversal rates declined with increasing number of rejections from 63% with the first rejection episode to 37% when four or more episodes had occurred. Non-biopsied rejections also had higher reversal rates, suggesting an association be- tween the severity of the rejection episode and the deci- sion to biopsy. Prophylactic treatment with ATG/ALG or OKT-3 at the time of transplant did not appear to signifi- cantly affect the probability of completely reversing later rejections. OKT-3 was used in the treatment of 199 re-
Table 10. Causes of graft failure
Cause Index Second graft graft
failures Total n = 139 n = 13 n = 152
Primary non-function 6 Vascular thromboses 21 Other technical 5 Hyperacute rejection <24 h 3 Accelerated acute rejection, 15
2 - 7 days Acute rejection 38 Chronic rejection 19 Recurrence of original 6
disease Death 12 Other 14
0 6 (4) 4 25 (16) 0 5 (3) 0 3 (2) 1 16(11)
5 43 (28) 0 19(13) 1 7 (5)
1 13 (9) 1 1 5 ( 1 0 )
jection episodes and methylprednisone in 489, while dialy- sis was used during 15% of the rejection episodes.
G r a f t f a i l u r e
Of 761 transplants in 725 patients, 152 graft failures were reported in 139 patients. Of the failures, 116 (74%) were returned to dialysis, 8 (5%) were retransplanted, 10 had residual native kidney function, 2 had residual prior graft function, 13 (9%) died with functioning grafts, and 3 died with graft failure. Table 10 shows the distribution of graft failure causes. Fifty-three percent of the graft failures were caused by rejection with acute rejection being the leading cause of graft failure (28%). Recurrence of original disease as a cause of graft failure was observed 7 times (focal segmental glomerulosclerosis, 3; hemolytic uremic syn- drome, 1; idiopathic crescentic glomerulonephritis, 1;
100
90
-<
so
.< 7o
60
50
B ~ O I
I I ' I I ~ I 0 100 200 300 400 500
DAYS
Fig. 5. Graft survival distribution in relation to allograft source. . , Live donor; - - cadaver; graft survival range is plotted from 50% to 100%
550
CADAVER S O U R C E
LIVE D O N O R
100 -
9O
,,Z *r
~, 8o g
< 70
60
SO
100
9O
> 8O g
70
60
50
�9 i _ .
. . . . . . , : ]. ,
I 100 200 300 400 500
DAYS
- . . _ ; : ; . . . . . . . . . . . . . . . .
100 200 300 400 500
DAYS
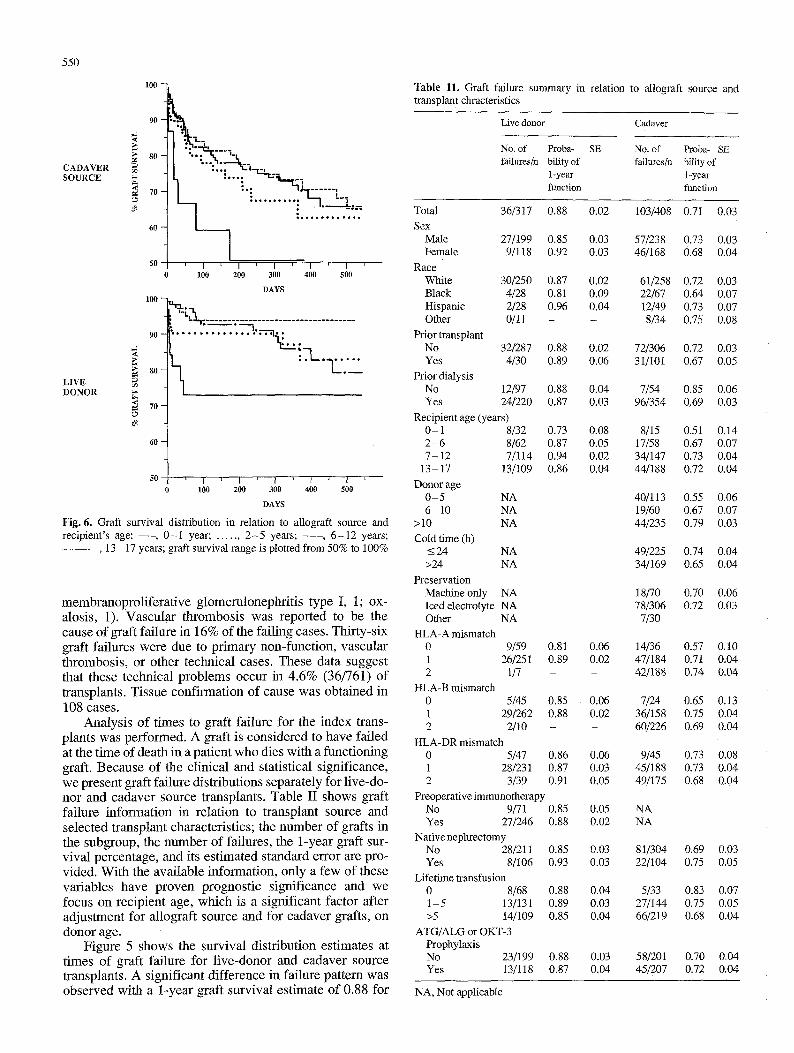
Fig. 6. Graft survival distribution in relation to allograft source and recipient's age: - - , 0-1 year; . . . . . , 2 -5 years; . . . . , 6-12 years; - - - - - - , 13 - 17 years; graft survival range is plotted from 50% to 100%
membranopro l i f e ra t ive g lomeru lonephr i t i s type I, 1; ox- alosis , 1). Vascu la r th rombos is was repor ted to be the cause o f graf t fai lure in 16% of the fa i l ing cases. Thi r ty-s ix graft fai lures were due to p r imary non-funct ion, vascu la r thrombosis , or other technica l cases. These data suggest that these technica l p rob lems occur in 4 .6% (36/761) o f transplants. Tissue conf i rmat ion of cause was ob ta ined in 108 cases.
Ana lys i s o f t imes to graf t fai lure for the index trans- plants was per formed. A graft is cons idered to have fa i led at the t ime o f death in a pat ient who dies wi th a funct ioning graft. Because of the c l in ica l and stat is t ical s ignif icance, we present graft fai lure dis t r ibut ions separa te ly for l ive-do- nor and cadaver source transplants . Table II shows graft fai lure in format ion in re la t ion to t ransplant source and se lec ted t ransplant character is t ics ; the number of grafts in the subgroup, the number o f fai lures, the 1-year graft sur- v iva l percentage , and its es t imated s tandard error are pro- vided. Wi th the avai lab le informat ion, only a few of these var iables have p roven prognos t ic s igni f icance and we focus on rec ip ient age, which is a s ignif icant fac tor after ad jus tment for a l lograf t source and for cadaver grafts, on donor age.
F igure 5 shows the surv iva l d is t r ibut ion es t imates at t imes of graft fai lure for l ive -donor and cadaver source transplants . A s ignif icant d i f ference in fai lure pat tern was observed with a 1-year graf t survival es t imate o f 0.88 for
Table 11. Graft failure summary in relation to allograft source and transplant chracteristics
Live donor Cadaver
No. of Proba- SE No. of Proba- SE failures/n bility of failures/n bility of
1-year 1-year function function
Total 36/317 0.88 0.02 103/408 0 .71 0.03 Sex
Male 27/199 0.85 0 .03 57/238 0.73 0.03 Female 9/118 0.92 0.03 46/168 0.68 0.04
Race White 30/250 0.87 0.02 61/258 0.72 0.03 Black 4/28 0.81 0.09 22/67 0.64 0.07 Hispanic 2/28 0.96 0.04 12/49 0.73 0.07 Other 0/11 - - 8/34 0.75 0.08
Prior transplant No 32/287 0.88 0.02 72/306 0.72 0.03 Yes 4/30 0.89 0.06 31/101 0.67 0.05
Plior dialysis No 12/97 0.88 0.04 7/54 0.85 0.06 Yes 24/220 0.87 0.03 96/354 0.69 0.03
Recipient age (years) 0-1 8/32 2 - 6 8/62 7-12 7/114
13-17 13/109 Donor age
0 -5 NA 6 - i0 NA
>10 NA Cold time (h)
_<24 NA >24 NA
Preservation Machine only NA Iced electrolyte NA Other NA
HLA-A mismatch 0 9/59 1 26/251 2 1/7
HLA-B mismatch 0 5/45 1 29/262 2 2/10
0.73 0.87 0.94 0.86
0.08 0.05 0.02 0.04
0.81 0.89
0.85 0.88
HLA-DR mismatch 0 5/47 0.86 0.06 I 28/231 0.87 0.03 2 3/39 0.91 0.05
Preoperative immunotherapy No 9/71 0.85 0.05 Yes 27/246 0.88 0.02
Native nephrectomy No 28/211 0.85 0.03 Yes 8/106 0.93 0.03
Lifetime transfusion 0 8/68 0.88 0.04 1-5 13/131 0.89 0.03 >5 14/109 0.85 0.04
ATG/ALG or OKT-3 Prophylaxis No 23/199 0.88 0.03 Yes 13/118 0.87 0.04
0.06 0.02
0.06 0.02
8/15 17/58 34/147 44/188
40/113 1 9 / 6 0 44/235
49/225 34/169
18/70 78/306
7/30
14/36 47/184 42/188
7/24 36/158 60/226
9/45 45/188 49/175
NA NA
81/304 22/104
5/33 27/144 66/219
58/201 45/207
0.51 0.67 0.73 0.72
0.55 0.67 0.79
0.74 0.65
0.70 0.72
0.57 0.71 0.74
0.65 0.75 0.69
0.73 0.73 0.68
0.69 0.75
0.83 0.75 0.68
O.70 0.72
0.14 0.07 0.04 0.04
0.06 0.07 0.03
0.04 0.04
0.06 0.03
0.10 0.04 0.04
0.13 0.04 0.04
0.08 0.04 0.04
0.03 0.05
0.07 0.05 0.04
0,04 0.04
NA, Not applicable
100
90
,.a .<
;~ 80
[., r~ <
70
60
i
�9 I-I[
. . . i .
] [ ' ' i l l . % ' . . . . . . . L_.
�9 i ~ � 9 1 4 9 1 4 9 i . . -
": - '7 : .. .: "]
�9 - i . . . . . : ' = " 3
----] . . . . . . :
I L] , ) , , , e ,
! I ' I I ' I '
1 0 0 2 0 0 4 0 0 500 I
3 0 0
DAYS
50
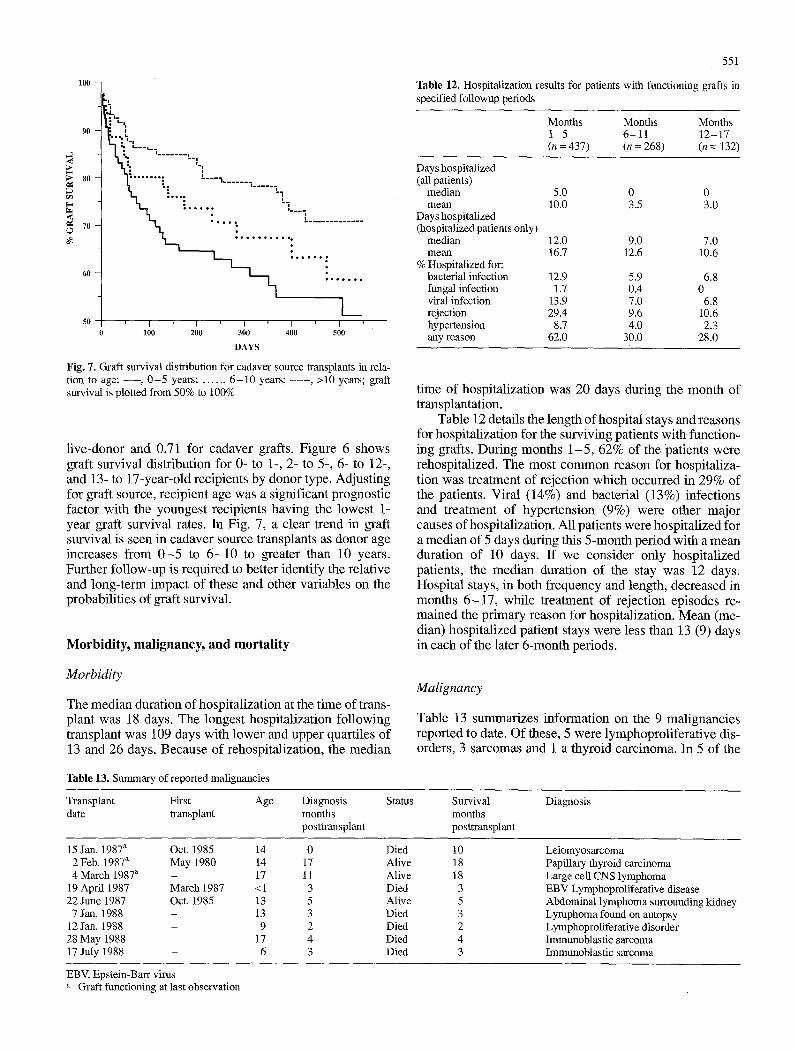
Fig. 7. Graft survival distribution for cadaver source transplants in rela- tion to age: - - , 0 - 5 years; . . . . . , 6 - 1 0 years; . . . . , >10 years; graft survival is plotted from 50% to 100%
live-donor and 0.71 for cadaver grafts. Figure 6 shows graft survival distribution for 0- to 1-, 2- to 5-, 6- to 12-, and 13- to 17-year-old recipients by donor type. Adjusting for graft source, recipient age was a significant prognostic factor with the youngest recipients having the lowest 1- year graft survival rates. In Fig. 7, a clear trend in graft survival is seen in cadaver source transplants as donor age increases from 0 - 5 to 6 - 1 0 to greater than 10 years. Further follow-up is required to better identify the relative and long-term impact of these and other variables on the probabilities of graft survival.
Morbidity, malignancy, and mortality
551
Table 12. Hospitalization results for patients with functioning grafts in specified followup periods
Months Months Months I - 5 6 - 1 1 12-17 (n = 437) (n = 268) (n = 132)
Days hospitalized (all patients)
median 5.0 0 0 mean 10.0 3.5 3.0
Days hospitalized (hospitalized patients only)
median 12.0 9.0 7.0 mean 16.7 12.6 10.6
% Hospitalized for: bacterial infection 12.9 5.9 6.8 fungal infection 1.7 0.4 0 viral infection 13.9 7.0 6.8 rejection 29.4 9.6 10.6 hypertension 8.7 4.0 2.3 any reason 62.0 30.0 28,0
time of hospitalization was 20 days during the month of transplantation.
Table 12 details the length of hospital stays and reasons for hospitalization for the surviving patients with function- ing grafts. During months 1-5 , 62% of the 'patients were rehospitalized. The most common reason for hospitaliza- tion was treatment of rejection which occurred in 29% of the patients. Viral (14%) and bacterial (13%) infections and treatment of hypertension (9%) were other major causes of hospitalization. All patients were hospitalized for a median of 5 days during this 5-month period with a mean duration of 10 days. If we consider only hospitalized patients, the median duration of the stay was 12 days. Hospital stays, in both frequency and length, decreased in months 6 -17 , while treatment of rejection episodes re- mained the primary reason for hospitalization. Mean (me- dian) hospitalized patient stays were less than 13 (9) days in each of the later 6-month periods.
Morbidity
The median duration of hospitalization at the time of trans- plant was 18 days. The longest hospitalization following transplant was 109 days with lower and upper quartiles of 13 and 26 days. Because of rehospitalization, the median
Malignancy
Table 13 summarizes information on the 9 malignancies reported to date. Of these, 5 were lymphoproliferative dis- orders, 3 sarcomas and 1 a thyroid carcinoma. In 5 of the
Table 13. Summary of reported malignancies
Transplant First Age Diagnosis date transplant months
posttransplant
Status Survival months posttransplant
Diagnosis
15 Jan. 1987 a Oct. 1985 14 0 2 Feb. 1987 a May 1980 14 17 4 March 1987 a - 17 11
19 April 1987 March 1987 <1 3 22 June 1987 Oct. 1985 13 5
7 Jan. 1988 - 13 3 12 Jan, 1988 - 9 2 28 May 1988 - 17 4 17 July 1988 - 6 3
Died Alive Alive Died Alive Died Died Died Died
10 18 18
3 5 3 2 4 3
Leiomyosarcoma Papillary thyroid carcinoma Large cell CNS lymphoma EBV Lymphoproliferative disease Abdominal lymphoma surrounding kidney Lymphoma found on autopsy Lymphoproliferative disorder Immunoblastic sarcoma Immunoblastic sarcoma
EBV, Epstein-Barr virus a Graft functioning at last observation
552
lO0
~ , , % . . . . . . , o . i
�9 . . � 9 1 4 9 1 4 9 * * . . � 9 1 4 9 1 7 6 1 7 6 1 7 6 1 7 6
50 t I I J [ I ~ I J 0 100 200 300 400 500
D A Y S
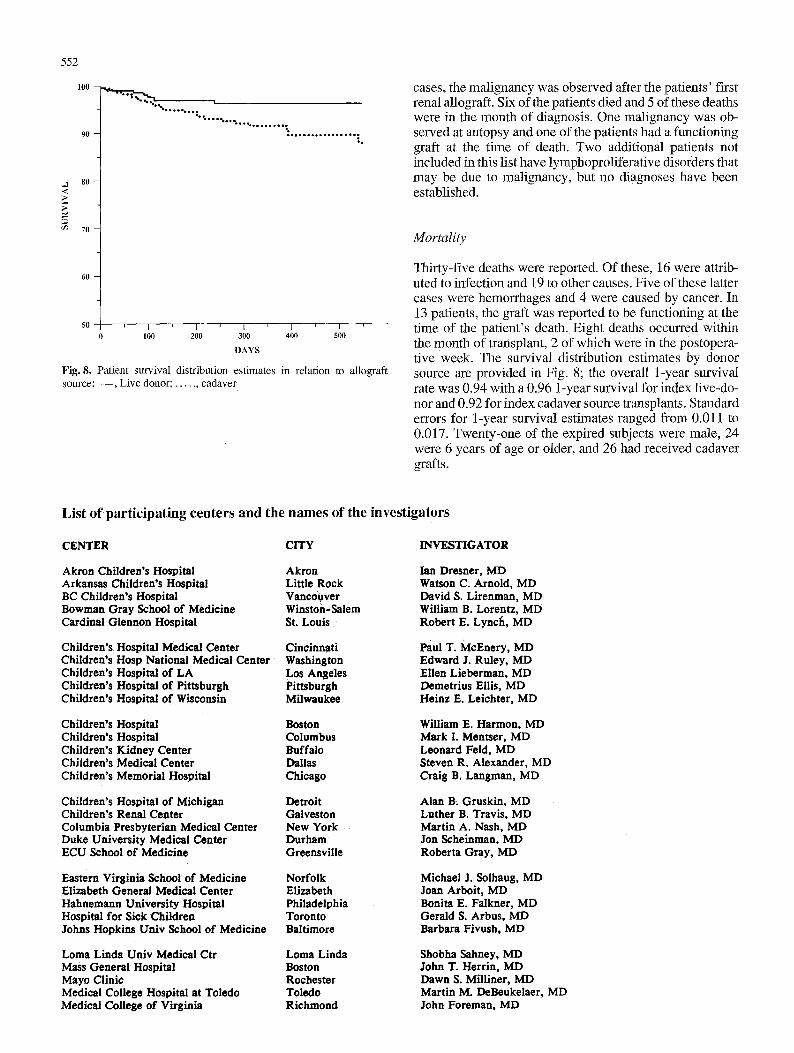
Fig. 8. Patient survival distribution estimates in relation to allograft source: - - , Live donor; . . . . . , cadaver
cases, the malignancy was observed after the patients' first renal allograft. Six of the patients died and 5 of these deaths were in the month of diagnosis. One malignancy was ob- served at autopsy and one of the patients had a functioning graft at the time of death. Two additional patients not included in this list have lymphoproliferative disorders that may be due to malignancy, but no diagnoses have been established.
Mortality
Thirty-five deaths were reported. Of these, 16 were attrib- uted to infection and 19 to other causes. Five of these latter cases were hemorrhages and 4 were caused by cancer. In 13 patients, the graft was reported to be functioning at the time of the patient's death. Eight deaths occurred within the month of transplant, 2 of which were in the postopera- tive week. The survival distribution estimates by donor source are provided in Fig. 8; the overall 1-year survival rate was 0.94 with a 0.96 1-year survival for index live-do- nor and 0.92 for index cadaver source transplants. Standard errors for 1-year survival estimates ranged from 0.011 to 0.017. Twenty-one of the expired subjects were male, 24 were 6 years of age or older, and 26 had received cadaver grafts.
List of participating centers and the names of the investigators
CENTER CITY INVESTIGATOR
Akron Children's Hospital Arkansas Children's Hospital BC Children's Hospital Bowman Gray School of Medicine Cardinal Glennon Hospital
Children's Hospital Medical Center Children's Hosp National Medical Center Children's Hospital of LA Children's Hospital of Pittsburgh Children's Hospital of Wisconsin
Akron Little Rock Vancouver Winston-Salem St. Louis
Cincinnati Washington Los Angeles Pittsburgh Milwaukee
Ian Dresner, MD Watson C. Arnold, MD David S. Lirenman, MD William B. Lorentz, MD Robert E. Lynch, MD
Paul T. McEnery, MD Edward J. Ruley, MD Ellen Lieberman, MD Demetrius Ellis, MD Heinz E. Leichter, MD
Children's Hospital Children's HosPital Children's Kidney Center Children's Medical Center Children's Memorial Hospital
Boston Columbus Buffalo Dallas Chicago
William E. Harmon, MD Mark I. Mentser, MD Leonard Feld, MD Steven R. Alexander, MD Craig B. Langman, MD
Children's Hospital of Michigan Children's Renal Center Columbia Presbyterian Medical Center Duke University Medical Center ECU School of Medicine
Detroit Galveston New York Durham Greensville
Alan B: Gruskln, MD Luther B. Travis, MD Martin A. Nash, MD Jon Scheinman, MD Roberta Gray, MD
Eastern Virginia School of Medicine Elizabeth General Medical Center Hahnemann University Hospital Hospital for Sick Children Johns Hopkins Univ School of Medicine
Norfolk Elizabeth Philadelphia Toronto Baltimore
Michael J. Solhaug, MD Joan Arboit, MD Bonita E. Falkner, MD Gerald S. Arbus, MD Barbara Fivush, MD
Loma Linda Univ Medical Ctr Mass General Hospital Mayo Clinic Medical College Hospital at Toledo Medical College of Virginia
Loma Linda Boston Rochester Toledo Richmond
Shobha Sahney, MD John T. Herrin, MD Dawn S. Milliner, MD Martin M. DeBeukelaer, MD John Foreman, MD
CENTER
Mount Sinai Medical Center New York Hospital Oklahoma Children's Memorial Hospital Oregon Health Sciences University Phoenix Children Hospital
SUNY Health Science Center at Brooklyn Seattle Children's Medical Center St. Christopher's Hospital for Children St. Francis Renal Institute St. Louis Children's Hospital
The Children's Mercy Hospital Tulane Medical Center U of MO Columbia School of Medicine U of Neb/Bishop Clarkson Hospital U of Tenn/Le Bonheur Children's
U of Miami/Children's Hospital Center Univ of Texas HSC at Houston Univ of Texas HSC at San Antonio Univ of CO Health Science Center University of CA at Los Angeles
University of CA at San Diego University of CA at San Francisco University Hospital, University of Alabama Medical Center University of Iowa Hospitals
University of Kentucky University of Michigan University of Minnesota Hospital University of Virginia University of Wisconsin Hospital
Weiler/Einstein Hospital Wyler Children's Hospital
CITY
New York New York Oklahoma City Portland Phoenix
Brooklyn Seattle Philadelphia Honolulu St. Louis
Kansas City New Orleans Columbia Omaha Memphis
Miami Houston San Antonio Denver Los Angeles
San Diego San Francisco London Birmingham Iowa City
Lexington Ann Arbor Minneapolis Charlottesville Madison
Bronx Chicago
INVESTIGATOR
Kenneth Lieberman, MD Valerie Johnson, MD, PhD James Wenzl, MD Mike Leone, MD Mel Cohen, MD
Amir Tejani, MD Sandra Watkins, MD H. Jorge Baluarte, MD James E. Musgrave, MD Barbara R. Cole, MD
Bradley A. Warady, MD Frank G. Boineau, MD Ted D. Groshong, MD Mark T. Houser, MD F. Bruder Stapleton, MD
Jose Strauss, MD Susan B. Conley, MD Sudesh P. Makker, MD Gary M. Lum, MD Richard N. Fine, MD
Stanley A. Mendoza, MD Donald E. Potter, MD David J. Hollomby, MD Edward Kohaut, MD Jean Robillard, MD
Randall Jenkins, MD Aileen Sedman, MD Thomas E. Nevins, MD Robert L. Chevalier, MD Aaron Friedman, MD
Ira Greifer, MD Andrew Aronson, MD
553