temperature and density of the tyrrhenian lithosphere and slab and new interpretation of gravity...
TRANSCRIPT

www.elsevier.com/locate/tecto
Tectonophysics 412
Temperature and density of the Tyrrhenian lithosphere and slab and
new interpretation of gravity field in the Tyrrhenian Basin
F. Cella a, S. de Lorenzo b, M. Fedi c, M. Loddo b, F. Mongelli b, A. Rapolla c, G. Zito b,*
a Department of Earth Sciences—University of Calabria, Italyb Department of Geology and Geophysics—University of Bari, Italy
c Department of Earth Sciences—University bFederico IIQ of Naples, Italy
Received 16 July 2003; accepted 16 August 2005
Abstract
The gravity anomaly field of the Tyrrhenian basin and surrounding regions reflects the complex series of geodynamic events
active in this area since the Oligocene–Miocene. They can resume in lithospheric thinning and asthenospheric rising beneath the
Tyrrhenian Basin, coexisting with the roll-back subduction of the African plate margin westward sinking beneath the Calabrian
Arc. The geographic closeness between these processes implies an intense perturbation of the mantle thermal regime and an
interference at regional scale between the related gravity effects.
A model of the litho-asthenospheric structure of this region is suggested, showing a reasonable agreement with both the
evidences in terms of regional gravity anomaly pattern and the results concerning thermal state and petro-physical features of the
mantle. The first phase of this study consisted of the computation of the isotherms in the crust–mantle system beneath the
Tyrrhenian Basin and, afterwards, of the density distribution within the partially melted upwelling asthenosphere. The second phase
consisted of a temperature/density modelling of the slab subducting beneath the Calabrian Arc. Finally, a 21 / 2 interpretation of
gravity data was carried out by including as constraints the results previously obtained. Thus, the final result depicts a model
matching both gravity, thermal and petrographic data. They provide (a) a better definition of the thermal regime of the passive
mantle rise beneath the Tyrrhenian basin by means of the estimation of the moderate asthenospheric heating and (b) a model of
lithospheric slab subducting with rates that could be smaller than generally suggested in previous works.
D 2005 Elsevier B.V. All rights reserved.
Keywords: Tyrrhenian Basin; Central Mediterranean; Subduction; Lithosphere; Asthenosphere; Heat flow; Gravity anomalies; Thermal model;
Density model
1. Introduction: the Tyrrhenian Sea–Calabrian Arc
system: geophysical setting
The Tyrrhenian basin (Fig. 1) is a deep, asymmetric,
depression representing one of the major structural ele-
ments of the central Mediterranean. Its Northern part,
mostly composed of continental crust, has been inter-
0040-1951/$ - see front matter D 2005 Elsevier B.V. All rights reserved.
doi:10.1016/j.tecto.2005.08.025
* Corresponding author.
E-mail address: [email protected] (G. Zito).
preted as the western sector of an accretionary prism
related to the westwards subduction below Corsica since
the early Oligocene (Abbate et al., 1994). Along the
western margin the continental basement results thinned
by rotational normal faulting (Kastens et al., 1988).
The southern margin of the Tyrrhenian Basin shows
a very composite volcanic activity whose products have
large petrological differences, from the oldest terms
(31–13 My) up to the Aeolian arc (active since 1 My
ago) and the Lazio–Campania volcanic districts.
(2006) 27–47

Fig. 1. Regional Sketch map of the main geological and structural features in the Central Mediterranean.
F. Cella et al. / Tectonophysics 412 (2006) 27–4728
Within the central abyssal plain, a strongly stretched
ancient continental crust underwent MORB magmatism
(DSDP 373; ODP 650-651-655) and alkali-basaltic
volcanic activity (Kastens et al., 1988). The Tyrrhenian
Basin is described as an extensional Neogene–Quater-
nary back-arc basin formed by counterclockwise rota-
tion of the Corsica–Sardinia and Adriatic microplates
(Alvarez, 1972; Cherchi and Montadert, 1982; Rehault
and Bethoux, 1984). The opening process migrated
southeastward and was triggered by the passive west-
ward dipping subduction (Malinverno and Ryan, 1986;
Royden et al., 1987; Kastens et al., 1988) of Triassic
oceanic lithosphere whose relicts should be present
in the Ionian abyssal plain. Such a model agrees
with the subduction-related processes like the Apen-
ninic thrust-fold belt (Doglioni, 1991) and the shal-
lower Moho inferred from seismic data (Steinmetz et
al., 1983; Recq et al., 1984; Duschenes et al., 1986;
Nicolich, 1989; Scarascia et al., 1994), from high
heat flow (Della Vedova et al., 1984; Hutchison et
al., 1985; Wang et al., 1989; Mongelli et al., 1991;
Cataldi et al., 1995, Pasquale et al., 1999) and from
the regional gravity field (Morelli, 1970; Corrado and
Rapolla, 1981). Further quantitative elements support-
ing both the strong lithospheric thinning and a pas-
sive mantle rise beneath the Tyrrhenian basin came
from the density model computed by Cella et al.
(1998) not only by merely fitting the regional gravity
field but basing also on constraints derived from
geothermal information. They were directly inferred
from a few available data (i.e. the potential temper-
ature, the h factor and the pre-stretched lithospheric
thickness) by means of the petrophysical model pro-
vided by McKenzie and Bickle (1988).
The hypothesis of the eastward migration of the
rifting process has been recently supported by geo-
physical investigations (Pasquale et al., 1999; Zito et
al., 2003) depicting the present heat flow in the
southern Tyrrhenian Sea as a transient thermal
wave migrating in time and space. Therefore, the
eastward jumping of the spreading centers could be
really explained as consequence of the break-up of
the earlier Alpine orogen and of the roll-back of the
slab that developed eastward (Spadini et al., 1995;
Gueguen et al., 1997; Doglioni et al., 1998, 1999).
Stretched continental block were dispersed by litho-
spheric boudinage within areas where the mantle
melt rises at very shallow depths and solidifies by

F. Cella et al. / Tectonophysics 412 (2006) 27–47 29
loss of latent heat of fusion (Zito et al., 2003). In the
Tyrrhenian case, the opening occurred by two rapid
and separate episodes, which moved from west to
east generating the Vavilov and Marsili subbasins
(Zito et al., 2003).
The southeastward migration of both the Tyrrhenian
spreading centre and the Ionian arc since the Neogene,
is related to the earlier arrival at the subduction hinge of
thicker and less dense continental lithosphere repre-
sented by Apulian plate, at first along Central Apen-
nines, whereas, along the Calabrian Arc, thinner and
denser oceanic lithosphere still forms the slab at depth
(Doglioni, 1991).
The existence of a Benioff zone beneath the South-
ern Apennine and the Calabrian Arc (Caputo et al.,
1970; Patacca et al., 1990; Spakman et al., 1993) was
confirmed by the presence of several seismicity clusters
up to a depth of 500 km (Gasparini, 1982; Finetti and
Del Ben, 1986; Anderson and Jackson, 1987; Giardini
and Velona, 1991; Selvaggi and Chiarabba, 1995).
Clashing opinions still exist about the Tyrrhenian
subduction, for example, whether the roll back regres-
sive movement is the cause or the effect of back-arc
extension, or its timing, variously aged between 30
and 80 My (Boccaletti et al., 1971; Decourt et al.,
1986; Doglioni et al. 1998; Faccenna et al., 2001).
Similarly, the rate of subduction underneath the
Calabrian Arc is largely debated, ranging from 2 up
to 6 cm y�1 (Patacca et al., 1990; Pasquale et al.,
1999; Faccenna et al., 2001; Doglioni et al., 1999;
Valera et al., 2003). The other question that is of
concern is if the dipping angle has always been
high (65~808) as a consequence of the global, east-
ward oriented, asthenospheric flow with respect to the
lithosphere (Doglioni, 1991; Pasquale et al., 1999), or
of its gradual increase (Faccenna et al., 2001).
In the present research the distribution of densities
within the Tyrrhenian shallow mantle resulting from
Cella et al. (1998) has been updated. Computations
have been now based not only on a single geotherm
roughly representative of the thermal state of the whole
basin, but on a much more complete data set that
allowed Zito et al. (2003) to draw different thermal
gradients for each sector of the basin. The density
distribution within the subducting slab was finally
estimated, taking into account the advection of heat
in the sinking slab and the heating both by conduc-
tion from the hotter asthenosphere and by compres-
sion of the lithospheric slab. The resulting data allow
to suggest a regional model depicting the structure
of the lithosphere–asthenosphere system in the whole
region.
2. Geophysical data
2.1. Description of the gravity anomaly pattern
This study is based on several gravity data sets:
– The Bouguer gravity map of the Tyrrhenian Sea
(Morelli, 1970);
– The Bouguer gravity map of the Strait of Sicily and
of the Ionian Sea (Morelli et al., 1975);
– The Bouguer Gravity Anomaly Map of the Mediter-
ranean Region, (1 :1,000,000), issued (1989) by the
Intergovernmental Oceanographic Commission
(IOC-UNESCO), as an overprint of the International
Bathymetric Chart of the Mediterranean (IBCM).
All data sets are based upon the 1967 normal gravity
formula and on terrain corrections made by assigning a
Bouguer density of 2.67 g/cm3.
The anomaly field was sampled over a broad area
(36–468 N; 7–198 E) to provide a step grid (5’)
coherent with the regional feature of the study
(Fig. 2). The problem due to the integration of the
gravity modelling with data from the local geoid,
was tackled. Therefore, the indirect effect caused
by differences between the reference ellipsoid and
the geoid was computed in terms of gravity along
the profile. The model provided by the GEOMED
Project over the Central Mediterranean area was
adopted as reference. The resulting effect shows a
maximum amplitude having the same order of the
average magnitude of the differences between ob-
served and computed profile. Therefore it should be
further reduced by means of low-pass filtering and
can be neglected without significant consequences
because the gravity data profile has been low pass
filtered before the interpretation. The gravity field of
the central Mediterranean shows a significant corre-
lation with respect to the main regional morpho-
structural components in the area. In fact, long wave-
length, high amplitude, Bouguer positive anomalies
are located within the main marine basins (Jonian
basin: +310 mGal; Tyrrhenian basin: +250 mGal;
Ligurian–Provencal basin: +210 mGal). An exception
is the Adriatic basin that represents foreland conti-
nental African domain mostly undeformed and shows
a rather flat regional gravity field. Patterns of region-
al negative Bouguer anomalies are detectable in cor-
respondence of continental areas, e.g. the Alpine and
Calabrian orogenic wedges, the Apennine thrust/fold
belt system and the Corsica–Sardinia microplate.
These correlations, together with the high amplitude

Fig. 2. Bouguer gravity anomaly map of the Central Mediterranean. Reference system IGSN-71; Bouguer density=2.67 g/cm3; 1967; normal
gravity formula; equidistance=10 mGal.; step grid (5V); The solid line shows the location of the interpreted gravity profile.
F. Cella et al. / Tectonophysics 412 (2006) 27–4730
of the anomalies are clearly due to deep sources, i.e.
the thickening of the less dense continental litho-
sphere in the mentioned areas: as often observed in
similar cases, the axial gravity placed low on the
southern and central Italy is roughly coincident with
the external front of the accretionary prism along
both the Apennine and Calabrian Arcs.
With regard to the isostatic set-up of the Calabrian
Arc, the effect of the crustal roots beneath Calabria was
computed by assuming the Airy hypothesis and by
assigning a density contrast of 0.5 g/cm3 between mantle
and crust, a maximum topographic height of about 1000
m a.s.l. (in correspondence of the Calabrian Arc) and,
finally, an original crust 30 km thick.
The resulting thickness of the compensating root
beneath the chain is about 5 km. It implies a high
amplitude negative isostatic anomaly and, therefore, a
significant tendency to a continental uprising. Several
geological evidences and neotectonic studies (Cucci
and Cinti, 1999) confirm a quite strong topographic
uplift, at least during the quaternary. However, the
continental crust is characterized by a compensation
depth of about 30 km and by a lateral section less
wide than 300 km. This means that the structure
would not be wide enough with respect to the com-
pensation depth in order that isostatic adjustments are
possible.
In this case, an alternative mechanism to explain the
continental uplift has been suggested by Gvirtzman and
Nur (1999) that analyzed the topography across sub-
duction zones, considering the separate contributions of
the crust and the mantle lithosphere to the continental
elevation observed at the surface. They demonstrated
that when a slab retreats quickly, as in the Calabrian
case, the asthenospheric material flows farther into the
plate contact, leading to the loss of suction and plate
decoupling. As a result, the heavy slab sinks and the
asthenospheric wedge releases overriding the plate
from the drag of the slab directly underlying the
crust. Consequently the overriding plate rebounds,
floating higher than normal. In other words, this
means a continental uplift caused neither by classic
isostatic adjustment nor by tectonic stress but by
other factors related to the dynamic regime of the
subduction process.
2.2. Regional heat flow and temperature of the thinned
lithosphere and upwelling asthenosphere
Fig. 3 shows the heat flow map of the Tyrrhenian
Sea and surrounding areas compiled by Zito et al.
(2003). The most conspicuous feature of the map is
the high heat flow (rough average 120–130 mW m�2)
all over the abyssal plain of the Southern Tyrrhenian
Sea. Heat flow decreases towards the continental mar-
gins of Corsica–Sardinia block. The lowest values are
located offshore Sicily. Two strong local maxima of 143
and 245 mWm�2 located over two major sub basin of

Fig. 3. Heat flow map of the Tyrrhenian Sea and surrounding areas. Contour intervals, 10 mW m�2. After Zito et al., 2003.
F. Cella et al. / Tectonophysics 412 (2006) 27–47 31
the southern Tyrrhenian sea (Fig. 4), i.e. the Vavilov
basin and the Marsili basin (Malinverno, 1981; Spadini
et al., 1995).Wang et al. (1989) demonstrated that heat
flow is not symmetrically distributed about the centre of
this young oceanic Tyrrhenian basin. Hutchison et al.
(1985) interpreted the regional heat flow value by the
simple stretching model of McKenzie (1978). Hutch-
ison et al. (1985) interpreted the observed maximum
value at that time of 151F10 mWm�2 in the southern
Tyrrhenian by the oceanic plate model of Parsons and
Sclater (1977). In all these papers the stretching is
considered as a unique or continuous event. Recently,
new ideas have been elaborated about the stretching of
the Tyrrhenian basin (Zito et al., 2003).
Fig. 4. Smoothed heat flow map of a large strip between Sardinia and Cala
Dashed areas refers to Magnaghi–Vavilov (M–V) and Marsili (M) basins, r
As mentioned in the previous section, the rifting
of the Tyrrhenian sea started in the Upper Oligocene
in the Ligurian–Provencal basin to the west of the
Corsica–Sardinia, floored by oceanic crust 19–15 Ma
ago (Gueguen et al., 1997). Then the rifting jumped
east to the Corsica and Sardinia, proceeding by steps
and generating in the southern Tyrrhenian two major
basins, i.e. Vavilov basin (7–3.5 Ma) and the Marsili
basin (1.7–1.2 Ma). Basalts at the Mt. Vavilov are
OIB-MORB type with an age of 4.1 Ma (Sartori,
1989), while the basalts of Mt. Marsili are also calc-
alkaline (Beccaluva et al., 1990), and the upper lying
sediments have an age of 1.8 Ma (Kastens et al.,
1988) indicating a very young basaltic crust.
brian according to Zito et al. (2003). Contour interval, 20 mW m�2.
espectively.

F. Cella et al. / Tectonophysics 412 (2006) 27–4732
Zito et al. (2003) modeled these events supposing
that in each basin stretching occurred at different times
according to the McKenzie model and that further
stretching caused the laceration of the thinned litho-
sphere favoring the passive rising to the surface of an
asthenospheric body. They assumed that before the
extension the lithosphere had the same structure as
the present Alpine Chain: a lithosphere 130 km (Cal-
cagnile and Panza, 1981) and a crust 45–50 km thick
(Locardi and Nicolich, 1988 modified by Morelli,
1995). Since the actual thickness of the Tyrrhenian
lithosphere is 30 km (Calcagnile and Panza, 1981), in
the westernmost sector, and 20 km (Pontevivo and
Panza, 2002) in the easternmost sector, Zito et al.
(2003) deduced a value b =6.3 for the older basin and
b =7.0 for the younger one. They calculated the con-
tribution of the rock radioactivity to deep temperatures,
as well. Moreover, Zito et al. (2003) studied the cooling
of the asthenospheric bodies considering the heat liber-
ated by the solidification (Stefan problem) and deduced
the thickness of the new lithosphere.
Fig. 5 shows the geotherms calculated by this model
along a profile crossing the southern Tyrrhenian Sea,
passing over the Vavilov and Marsili basins.
3. Density distribution in the thinned lithosphere
and upwelling asthenosphere
Several studies (Cella and Rapolla, 1997; Cella et
al., 1998) pointed out that the thermal state of the
upwelling asthenosphere strongly influences the distri-
bution of density within the uprising mantle, causing
significant gravity changes. Consequently, a reasonable
knowledge of the temperature distribution within the
mantle is crucial for a structural modelling by means of
gravity data interpretation.
It is well known that the upward migration of the
LAB (lithosphere–asthenosphere boundary) can be pri-
marily caused by an active process, i.e. the presence of
a bhot plumeQ having a thermal origin in the lower
mantle (Spohn and Shubert, 1982; Courtney and
White, 1986). Alternatively, mantle rising and progres-
sive lithospheric thinning are a passive process due to
an extensional regime driven, for example, by external
forces triggered by the roll-back of sinking slabs (For-
syth and Uyeda, 1975; Angelier and Le Pichon, 1979)
and intensified by the convective removal of the lower
lithosphere by a delamination process (Schott and
Schmeling, 1998) or by sublithospheric dragging and
erosion (Mongelli and Zito, 2000).
When the mantle rises and the isotherms upward
migrate, the temperature increases reaching the mantle
solidus by adiabatic decompression and partial melting
occurs. The amount of melt fraction and its composi-
tion primarily depend on some factors: (a) the potential
temperature (Tp), i.e. the temperature that a fluid mass
would have if it were compressed or expanded at a
constant reference pressure. With increasing values
of Tp the transition from absence (passive upwelling)
to presence (active rising) of thermal anomalies occurs;
(b) the stretching factor h (McKenzie, 1978), i.e. the
ratio of the final to initial surface area involved in
the rifting process. With increasing values of h the
transition from bcontinentalQ to boceanicQ rifting
occurs; (c) lithospheric thickness prior to the thinning
process starts; increasing values reduce the partial
melting process.
On the other hand, also the changes in density within
the uprising asthenosphere are controlled by several
elements: (a) distribution of temperature within the
upwelling mantle, (b) changes in amount of partial
melting; (c) changes in melt composition; (d) changes
in composition of the mantle rocks after the magma
segregation; (e) dependence of density of the liquid and
solid fractions on pressure and temperature.
The first step was the computation of new geotherms
in the uppermost mantle. Significant improvements
resulted with respect to previous works (Cella and
Rapolla, 1997; Cella et al., 1998). The second step
was the computation, based on the model of McKenzie
and Bickle (1988), of the amount of melt fraction and of
its chemical composition as function of the geotherms
and of the degree of lithospheric stretching. The MORB
pyrolite with Fo90 (MPY90) composition (Fallon and
Green, 1987) was chosen as representative of a typical
upper mantle source.
Very small amounts of liquid fraction remain in the
residual mantle rock after melt segregation and migra-
tion (McKenzie, 1984); therefore the melt composition
allows to infer the chemical composition of the residual
mantle. The third step was the computation of the
modal norm of the residual mantle rock by treating
the problem in terms of solution of component trans-
formations, in which both the global chemical compo-
sition of the rock and the composition of any phase
component of the rock are known, whereas the amount
of any phase component must be determined (Spear et
al., 1982; Sebastian, 1989; Cella and Rapolla, 1997).
The problem was solved basing on the bminimum
lengthQ solution for undetermined linear problems
(Menke, 1984; Cella and Rapolla, 1997). Three differ-
ent input data sets were used depending on the mantle
composition depth for which the computation was done
(depthN70 kmYgarnet peridotite; 30 kmbdepthb70

Fig. 5. Lithospheric thickness along the strip of Fig. 4 and geotherms characterizing each sector.
F.Cella
etal./Tecto
nophysics
412(2006)27–47
33

F. Cella et al. / Tectonophysics 412 (2006) 27–4734
kmYspinel peridotite; depthb30 kmYplagioclase pe-
ridotite) (Green, 1991).
In the last step, the density distribution in the
upwelling asthenosphere was finally computed as a
function of temperature, pressure and normative
composition, by exploiting the model by Niu and
Batiza (1991a,b,c). Basing on a quantitative relation
between the mantle potential temperature and the
vertical displacement of the earth surface (McKenzie
and Bickle, 1988; White and McKenzie, 1988), the
Tyrrhenian bathial plain, located at a depth of
3000–4000 m, necessarily implies at the LAB a
temperature not higher than some tens exceeding
the normal. Such a hypothesis was reasonable
since previous studies (Keen, 1985) verified that
the active mantle upwelling, implying high thermal
anomalies, can laterally extend only in areas much
larger than the Tyrrhenian Basin. Further confirma-
tions came which have been provided a gravity
approach (Cella et al., 1998) and by detailed stud-
ies on the heat flux within the Tyrrhenian area
(Pasquale et al., 2003; Zito et al., 2003) confirming
a potential temperature of 1320–1330 8C. Therefore,the computations were carried out by setting input
data for a passive mantle rising model (Tp= 1330
8C). In addition, a value b =6.3–7 was chosen
following Zito et al. (2003) that, in agreement
with Hutchison et al. (1985) and basing on the
heat flow anomalies, predicted a significant degree
Fig. 6. Vertical density profile of the residual mantle rocks within the as
140–40 km.
of thinning (N6), able to cause lithospheric lacera-
tion. As far as the pre-rift lithosphere thickness is
concerned, a value of 115–130 km was chosen in
agreement with previous studies (Pasquale et al.,
2003; Zito et al., 2003). In correspondence of the
two main positive Tyrrhenian heat flow anomalies,
the thermal model predicts an asthenosphere rising
nearly up to the base of the stretched crust. Here,
material mainly consists of basalt dykes derived
from asthenospheric partial fusion and upward
melt migration.
The vertical density distribution was computed
for each of the geotherms computed along the
transect. Melting degree results to upward increase
reaching 20–25%. The density gradients computed
for most profiles are rather similar for depths rang-
ing from 140 and 50 km. (Fig. 6). For depths
lower than 50 km, the density gradients can be
grouped in two main vertical profiles. The first
one concerns the areas marked by the two positive
heat flow anomalies within the abyssal plain and
exhibits at shallow depth the lowest density values
(Fig. 7a). The second one interests the most part of
the basin and a slightly less intense thermal gradi-
ent with lower melting degree and denser residual
mantle rocks (Fig. 7b).
The computed mantle densities change within
rather broad ranges, from 3.35 g/cm3 (depth6100
km) to 3.12 g/cm3 (depth610 km) to 3.06 g/cm3
thenosphere upwelling beneath the Tyrrhenian Basin; depth range:

Fig. 7. Vertical density profile of the residual mantle rocks within the asthenosphere upwelling beneath the Tyrrhenian Basin; depthsb40 km.
Differences between (a) and (b): see the text.
F. Cella et al. / Tectonophysics 412 (2006) 27–47 35
(within the two small areas with the highest heat
flow). Results confirm that each of the physical
parameters considered has a specific control on the
mantle density. Finally, density values provided by
these computations were used to constrain the inter-
pretation of the gravity data.

ig. 8. Reference system of a subducting slab beneath the Tyrrhenian
ea.
F. Cella et al. / Tectonophysics 412 (2006) 27–4736
4. Temperature and density distribution in the
sinking slab
The great closeness between the mantle uprise be-
neath the Tyrrhenian spreading axis, and the westward
subduction of the African margin beneath the European
plate, clearly means the existence of a contribution of
the sinking slab to the gravity anomaly field of the
Tyrrhenian basin. This contribution has to be computed
and taken into account when gravity data are inter-
preted.
The Adriatic microplate subduction started in the
late Oligocene–Early Miocene. At present, subduction
of the Southern Adriatic sector of the plate is demon-
strated by the existence of a well defined Benioff plane
under the Tyrrhenian sea. Many authors (Gasparini,
1982; Anderson and Jackson, 1987; Guerra et al.,
1991; Giardini and Velona, 1991; Amato et al., 1993;
Selvaggi and Chiarabba, 1995; Cimini, 1999; Selvaggi,
2001; Chiozzi et al., 2002) have defined the geometry
of the subducted slab by different seismological meth-
ods. Selvaggi and Chiarabba (1995) have defined a
continuous slab having a slope down to 50 km of
depth, then a rapid increase at the hinge, where the
slope reaches 708 that maintains constant down to 500
km. The thickness of the slab is about 80 km. By
assuming a subduction age of 20 Ma, we deduce an
average subduction rate of 2.5 cm/a. Temperature with-
in the cold slab depends mainly on:
(i) heating by conduction from the hotter astheno-
sphere;
(ii) advection of heat in the moving slab;
(iii) heating by compression of the asthenosphere.
For (i) point, according to Devaux et al. (1997), we
assume that the surrounding close mantle moves down-
ward with the slab and heats adiabatically, as in the
whole mantle; for (iii) point we retain that in steady
state conditions the horizontal movement of the slab
within a thermal fluid mantle horizontally stratified
does not perturb the temperature in the slab.
Two other phenomena connected with the subduc-
tion are the corner flow and the slab retrait.
Minear and Toksoz (1970), McKenzie (1969, 1984),
Devaux et al. (1997) have studied the problem by
considering the factors (i) and (ii) by analytical or
numerical methods. In this paper we studied all the
effects by analytical methods.
Fig. 8 shows the reference system of our model and
the slab, having a slope a with respect to the Earth
surface.
F
S
The adiabatic gradient in the mantle (see e.g.
Turcotte and Subert, 1982) is
dT
dz
� �s
¼ avgTCp
ð1Þ
where T is the absolute temperature, av the coeffi-
cient of thermal expansion at constant volume, which
is 3*10�5 K�1 for the upper mantle where the
thermal gradient is about 0.5 K/km and about
2*10�5 K�1 for the deeper mantle where the gradi-
ent is about 0.3 K km�1 (Fowler, 1992; Devaux et
al., 1997); here we assume an average value of
2.5 d 10�5 K�1. Cp (1 kJ kg�1 K�1) is the specific
heat at constant pressure, g (10 m/s2) the gravity
acceleration, z the vertical axis with respect to the
Earth surface. From Eq. (1) we obtain by integration:
T ¼ T0exp kzð Þ ð2Þ
where T0=1660 K is the temperature at the base of
the lithosphere,
k ¼ avgCp
: ð3Þ
Temperatures over the lower and upper surfaces of
the slab are respectively:
T x; y ¼ 0ð Þ ¼ T0exp kxsinað Þ
T x; y ¼ hð Þ ¼ T0exp kxsina � khcosað Þ ð4Þ
where h is the slab thickness and a the dipping angle.

Fig. 10. Predicted temperature (in K) within a subducted slab at rest
F. Cella et al. / Tectonophysics 412 (2006) 27–47 37
We assume:
T x ¼ 0; yð Þ ¼ T0 � 273ð Þ 1� y
h
� �þ 273 0bybh ð5Þ
over OB.
The energy balance equation within a two dimen-
sional subducting slab in steady state is:
kB2T
Bx2þ B
2T
By2
�� qCpv
BT
Bxþ qgvavsTsina ¼ 0
�ð6Þ
where k is the thermal conductivity (Wm�1 8K�1) v the
subduction rate; the first term refers to the conduction,
the second term to the advection and the third term to
the compression. The solution to Eq. (6) with the above
boundary conditions is shown in Appendix.
Fig. 9 shows the temperature distribution within the
slab, assuming h =80 km, k =3.0 Wm�1 K�1, q =3300
kg m�3. avs =2 d 10�5 K�1 (because the slab is cooler
than the mantle) v =2.5 cm/a, a =708.We can see that isotherms are dragged downward
by the motion of the subducting slab. The inner
section of the slab is cooler than the outer sectors,
indicating that the advection is dominant, even
Fig. 9. Temperature within the subducting slab (in K).
.
though it is reduced by the heat generated by
compression.
By putting v=0 in Eq. (6) we obtain:
B2T
Bx2þ B
2T
By2
�¼ 0:
�ð7Þ
The solution to this equation with the same bound-
ary conditions (Eq. (4)) is easily obtained by putting
v =0 in the solution to Eq. (6). This gives the tempera-
tures of the slab at rest. Fig. 10 shows the calculated
isotherms.
The upper part of the slab is cold depending on the
surface conditions. In the inner part the temperature is
equal to that of the mantle.
By subtracting the solution to Eq. (6) from the
solution to Eq. (7) we obtain the temperature difference
(negative) between the slab and the mantle. Fig. 11
shows the resulting isotherms.
We see that the slab is colder than the mantle. High-
est negative anomalies are almost superficial and inter-
nal. They are also asymmetrical.
From the distribution of DT within the slab, by using
the equation:
q Tð Þ ¼ q0 1� avDTð Þ
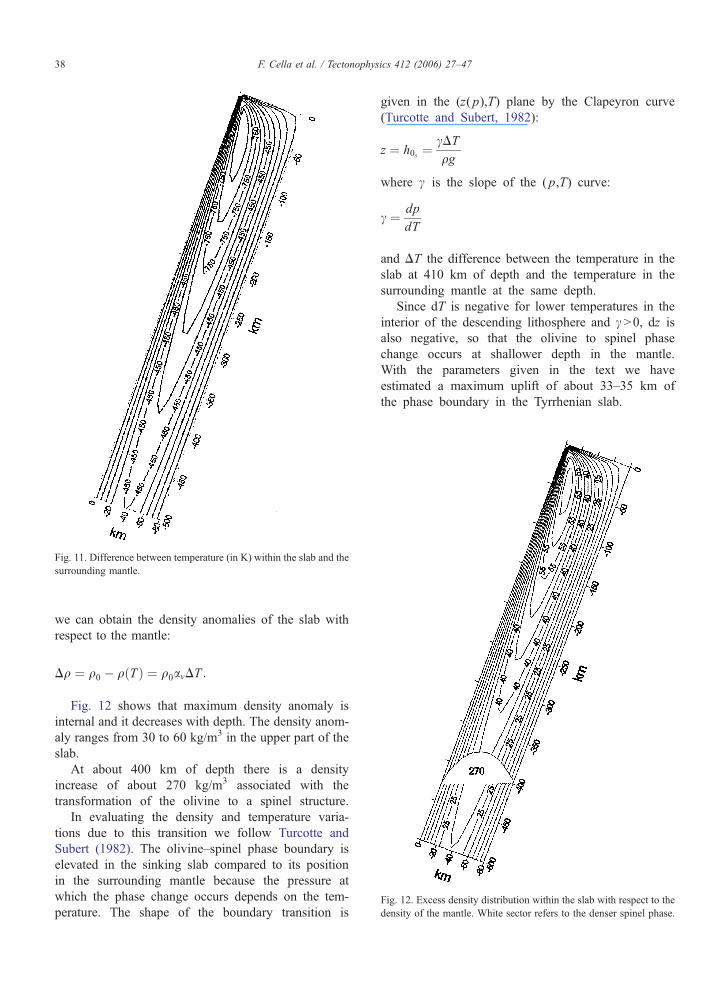
Fig. 12. Excess density distribution within the slab with respect to the
density of the mantle. White sector refers to the denser spinel phase.
Fig. 11. Difference between temperature (in K) within the slab and the
surrounding mantle.
F. Cella et al. / Tectonophysics 412 (2006) 27–4738
we can obtain the density anomalies of the slab with
respect to the mantle:
Dq ¼ q0 � q Tð Þ ¼ q0avDT :
Fig. 12 shows that maximum density anomaly is
internal and it decreases with depth. The density anom-
aly ranges from 30 to 60 kg/m3 in the upper part of the
slab.
At about 400 km of depth there is a density
increase of about 270 kg/m3 associated with the
transformation of the olivine to a spinel structure.
In evaluating the density and temperature varia-
tions due to this transition we follow Turcotte and
Subert (1982). The olivine–spinel phase boundary is
elevated in the sinking slab compared to its position
in the surrounding mantle because the pressure at
which the phase change occurs depends on the tem-
perature. The shape of the boundary transition is
given in the (z( p),T) plane by the Clapeyron curve
(Turcotte and Subert, 1982):
z ¼ h0s ¼cDTqg
where c is the slope of the ( p,T) curve:
c ¼ dp
dT
and DT the difference between the temperature in the
slab at 410 km of depth and the temperature in the
surrounding mantle at the same depth.
Since dT is negative for lower temperatures in the
interior of the descending lithosphere and cN0, dz is
also negative, so that the olivine to spinel phase
change occurs at shallower depth in the mantle.
With the parameters given in the text we have
estimated a maximum uplift of about 33–35 km of
the phase boundary in the Tyrrhenian slab.

F. Cella et al. / Tectonophysics 412 (2006) 27–47 39
5. Gravity modelling: data discussion and
interpretation
Because of the aim of the study, essentially limited
to deep and large scale structures, the data interpretation
concerned only the regional component of the gravity
profile.
Several studies indicate that gravity anomalies due
to Moho geometry have at least a wavelength of some
hundreds of kilometers (Pinna and Rapolla, 1979; Cella
et al., 1995). Nevertheless, the presence of strong var-
iations of the Moho depth along small distances (with
depths from 30 km up to 10 km in the Tyrrhenian
Basin) suggested the choice of a smaller cut-off wave-
length (100 km) (Fig. 13).
Data were prior tapered with a maximum entropy
predictor algorithm to prevent distortions from bound-
ary effects. Long wavelength components were selected
by means of a frequency domain filter provided with a
Hamming–Tukey window.
Therefore, the gravity effect due to density disconti-
nuities within the shallow crust (including the effect
due to the unavoidable choice of a unique density value
for the terrain correction, even if in the presence of
lateral variations within the masses beneath the topog-
raphy) was completely removed from the interpreted
profile. The sole intra-crustal feature generating a long
period gravity signal is the lateral transition between
boceanicQ and continental crust and, therefore, it was
Fig. 13. Regional Bouguer anomaly field of the Tyrrhenian Basin.
modelled basing on seismic data (Duschenes et al.,
1986).
The regional gravity anomaly field was interpreted
along a profile WNW–ESE oriented for a length of
about 850 km. The profile covers the whole Tyrrhenian
Basin, crossing the Sardinia plate and the Calabrian
Arc, respectively, toward NW and SE.
Data were interpreted adopting a technique that
resolves the 2.5 D inverse problem of determining the
density contrast function and the source top and bottom
functions from the measured data sets by using the
spectral expansion linear inverse problem (e.g. Fedi,
1989). Because of the non-linearity of the problem,
linearization is assumed and the Frechet derivatives of
the data functionals with respect to the density and to
the source top and bottom depths are calculated. The
algorithm is very efficient and only a few iterations are
required to reach a good convergence error.
Several reliable information were introduced in the
modeling as constraints. Reasonable half-strike values
was set for every body source as in Table 1, taking into
account the presumable extension of main structures
crossed along the direction normal with respect to the
profile.
The thickness of the lithosphere in the continental
regions surrounding the Tyrrhenian Basin (Sardinia and
Calabria) were partially constrained with data from
several authors (Knopoff and Panza, 1978; Panza et
al., 1980; Calcagnile and Panza, 1981; Suhadolc and
Low-pass filter; cut-off wavelength=100 km; step grid=5V.

Table 1
Half strike values chosen for 2.5 inversion along the given profile
Continental
crust
Oceanic
crust
Lithospheric
mantle
Upwelling
asthenosphere
150 km 150 km 350 km From 350 km to
80 km (upward)
F. Cella et al. / Tectonophysics 412 (2006) 27–4740
Panza, 1989) and based on the dispersion of the Ray-
leigh-waves. An average value of density typical of the
continental lithotypes (2.85 g/cm3), was assigned bas-
ing on many previous works as described in Cella et al.
(1995). The model does not consider the hypothesis of
asthenospheric material directly underlying the crust
beneath the Calabrian Arc (Gvirtzman and Nur, 1999)
since there are no evidences of somewhat related mag-
matism that should be expected at crustal depths by
adiabatic decompression of asthenospheric material.
Data from seismic investigations (Finetti and Mor-
elli, 1972; Steinmetz et al., 1983; Recq et al., 1984;
Duschenes et al., 1986; Nicolich, 1989; Scarascia et al.,
1994) and from heat flow studies (Della Vedova et al.,
1984) indicate, for the central area of the Tyrrhenian
depression, a crustal thickness of about 8–10 km. These
information were used to constrain the Moho depth
along the profile. Data reported by Duschenes et al.
Fig. 14. 2D regional gravity profile showing the long wavelength contribution
eastern part of the Tyrrhenian Basin.
(1986), concerning the geographic extent of the
boceanicQ crust (~300 km along the profile), were
adopted in our case.
However, the transition from continental to
boceanicQ crust in the Tyrrhenian Basin is a still
debated argument because in the Tyrrhenian central
area some authors (Thisseau et al., 1986) individuate
only extremely stretched and fragmented continental
crust, diffusely intruded by oceanic material and still
representing a noticeable portion of the whole crustal
volume. Thus, it is reasonable to attribute to this
crustal segment features intermediate between conti-
nental and oceanic crust. Therefore a density of 2.85
g/cm3 was assigned to the crustal rocks surrounding
the two central sectors of the Vavilov and Marsili
Basins, in correspondence of the two main positive
heat flow anomalies. Here the crustal thinning
reaches the higher values and a prevailing presence
of basalt dykes is instead probable. Consequently, a
slightly higher density (2.9 g/cm3) has been chosen
for these areas.
Other two significant sets of information were
adopted to reduce the ambiguity of the gravity inter-
pretation. With the first one, the model was constrained
by introducing the information (see Section III) repre-
sented by the vertical distribution of density within the
of a finite element model reproducing the subducting slab beneath the

Fig. 15. Regional gravity model of the litho–asthenospheric structure along the interpreted profile; the dashed line indicates the moho depth beneath the Calabrian Arc as predicted by Scarascia et al.
(1994).
F.Cella
etal./Tecto
nophysics
412(2006)27–47
41

F. Cella et al. / Tectonophysics 412 (2006) 27–4742
rising mantle as computed by petro-physical criteria
from laboratory evidences. Variations were discretized
by modeling the upwelling asthenosphere as a set of
layers 10 km thick and by assigning to each layer the
value computed for its intermediate depth. Averaged
densities of 3.4, 3.37, and 3.28 g/cm3 were assigned,
respectively, to the garnet (more than 110 km of depth),
spinel (depths from 75 to 35 km), and plagioclase
peridotite (less than 35 km of depth). Densities gradu-
ally ranging from 3.35 g/cm3 (at a depth of 100 km) to
3.06 g/cm3 (at a depth of 15 km) were assigned to the
rising mantle.
The second constraint was imposed to the interpreta-
tion by assigning the density values previously comput-
ed (see Section IV) to the finite element model
reproducing the slab sinking beneath the Tyrrhenian
Basin (Fig. 14). The range of densities predicted
within the slab model is very broad (up to 0.29 g/
cm3) and represents a mass excess within the upper
mantle, thus generating a significant long wavelength
positive anomaly with the maximum (about 35 mGal
of amplitude) located beneath the eastern part of the
Tyrrhenian Basin, between the Marsili Seamount and
the coast of Calabria (Fig. 14). The gravity contri-
bution of the finite element model reproducing the
subducting slab was subtracted from the measured
gravity profile. Afterwards, the resulting profile was
interpreted as in Fig. 15.
6. Conclusions
The structural model resulting from the interpretation
of gravity data along the chosen profile (Fig. 15) pro-
vides an image of the main litho-asthenospheric sources
by introducing both constraints from other geophysical
evidences and from results of petro-physical computa-
tions based on heat flow studies and on experimental
data concerning the physical properties of the uppermost
mantle. However, the gravity modelling here presented
introduces new significant constraining elements with
respect to previous studies (Cella et al., 1998).
Firstly, the computation of the density distribution
within the Tyrrhenian asthenosphere has been based on
new geotherms predicted by a re-interpretation of the
heat flow anomalies in this area.
Second, the interpretation of the gravity profile
accounts also for the gravity contribution of the litho-
spheric slab subducting within the upper mantle be-
neath the Tyrrhenian Basin. To do this, the
temperature distribution within the sinking plate was
modelled not only basing, as already done for previous
models, on (a) the heating by conduction from the
hotter asthenosphere and (b) the advection of heat in
the moving slab, but also (c) accounting for the heating
by compression of the asthenosphere.
The satisfactory agreement between measured and
computed gravity data depicts a structural and geody-
namic outline at regional scale with several interesting
elements.
The crustal thickness beneath the Sardinia micro-
plate reaches about 30 km in correspondence of the
areas of highest topography. As previously evidenced
(Cella et al., 1998), the lithospheric roots of the
Sardinia plate with greater thickness (about 85 km)
appears instead to be shifted to the east. This could
reinforce the hypothesis of an underlying eastward
migrating asthenosphere (Doglioni et al., 1998).
Moho gradually rises toward the Tyrrhenian Basin,
reaching shallower depths (625 km) beneath the Tyr-
rhenian coast of Sardinia, westward, and of Calabria,
eastward, up to a minimum depth (9–10 km) beneath
the Tyrrhenian bathial plain.
Toward the central sector of the Tyrrhenian Basin,
the LAB abruptly rises up to depths of about 12 km
beneath the central bathial plain, confirming an in-
tense stretching of the continental lithosphere (b66)
and a strong modification of its structure. Here, in
fact, the lithospheric boudinage occurring by means
of a jumping process of the spreading centers
appears discontinuous both in space and time and
clearly indicates an eastward migrating mantle up-
welling. The latter is caused not only by the exten-
sional regime due to external driving forces, induced
by the slab pull (Forsyth and Uyeda, 1975; Angelier
and Le Pichon, 1979), but also appears reinforced by
the mantle flow triggered by the eastward rollback of
the westward subducting slab (McKenzie, 1969; Tur-
cotte and Subert, 1982; Marotta and Mongelli, 1998)
and by the advection of the asthenosphere beneath
the LID toward the subduction zone (Toksoz and
Hsui, 1978). The computations confirm that the man-
tle potential temperature exceed only a few tens of
degrees Centigrade (8C) (Tp61330 8C) with respect
to the normal conditions. However, a large amount
(up to 20%) of mantle rocks melts and migrates
upward, partly at the earth surface, as basaltic mag-
mas, and partly as underplating igneous basic rocks
at the base of the thinned crust. Its original structure
is therefore reduced to isolated crystalline relicts
sparse within small boceanQ like spreading centres
in correspondence of the Tyrrhenian bathial plain.
Eastward, the gravity model depicts a crustal struc-
ture of the Calabrian accretionary wedge rather differ-
ent with respect to those suggested in the last years

F. Cella et al. / Tectonophysics 412 (2006) 27–47 43
(Scarascia et al., 1994). In fact, instead of an abrupt
increase in thickness delineating a crustal decoupling,
the Moho seems to gently deepens up to a reach of 35
km beneath the Ionian side of the Calabria arc. Be-
neath the western side of the chain, in correspondence
of the subduction hinge the lithosphere thickens up to
85 km. Here, the interpretation of the gravity data
accounts also for the gravity effect due to the plate
sinking beneath the Calabrian Arc. It consists of a very
long wavelength positive anomaly with an amplitude
of about 35 mGal. This contribution has been comput-
ed starting from a density model that hypothesizes an
80 km thick plate subducting with an angle of about
708, with subduction rates of 2–3 cm y�1, that is a
value smaller than suggested by other studies.
Acknowledgements
C. Doglioni is thanked for frequent discussions and
constructive comments concerning the argument dis-
cussed here.
Appendix A
A.1. Solution of heat Eq. (6)
By putting:
d ¼ qgvavssinak
b ¼ qCpv
k: ðA7Þ
Eq. (6) becomes:
B2T
Bx2þ B
2T
By2
�� b
BT
Bxþ dT ¼ 0:
�ðA8Þ
If we consider the following non-dimensional
variables:
T V ¼ T=T0 ðA9aÞx V ¼ x=h ðA9bÞy V ¼ y=h ðA9cÞ
8<:
Eq. (A8) can be written as:
B2T V
BxV2þ B
2T V
ByV2
�� bV BT
V
BxVþ dVT V ¼ 0
�ðA10Þ
where:
dV ¼ dh2 bV ¼ hb ðA11Þ
The boundary conditions (4) and (5) in the non-
dimensional variables can be written as follows:
T V x V; y V ¼ 0ð Þ ¼ exp khx Vsinað Þ ðA12aÞT x V; y V ¼ 1ð Þ ¼ expkh x Vsina � cosað Þ ðA12bÞT x V ¼ 0; y Vð Þ¼ 1� 273
T0
� �1� y Vð Þ þ 273
T00by Vb1:
8><>:
ðA12cÞ
The solution to Eq. (A10) is given by the sum:
T V ¼ T Vg þ T VP ðA13Þ
where TVg is the general integral of Eq. (A10) and TVP isa particular solution to the same equation.
A.2. The particular solution
Let us first search a particular solution TVP. Assume
that:
T Vp x V; y Vð Þ ¼ f x Vð Þg y Vð Þ: ðA14Þ
By substituting Eq. (A14) in Eq. (A10) we obtain:
f Wf� bV f V
f¼ c ðA15aÞ
� gWgþ dV
h i¼ c ðA15bÞ
8<:where c is a constant. If we assume:
f x Vð Þ ¼ exp khx Vsinað Þ ðA16Þ
by substituting Eq. (A16) in Eq. (A15a) the constant is
found to be:
c ¼ k2h2sin2a � bVkhsina: ðA17Þ
Moreover, by using Eq. (A14), the two boundary
conditions Eqs. (A12a,b) are satisfied only if:
gð0Þ ¼ 1 ðA18Þ
and:
g y V ¼ 1ð Þ ¼ exp � khcosað Þ ðA19Þ
So, the solution to Eq. (A15b) must satisfy the
boundary conditions (A18) and (A19).
If we assume:
w2 ¼ c þ dV ðA20Þ
the Eq. (A15b) becomes:
gW
g¼ � w2: ðA21Þ

F. Cella et al. / Tectonophysics 412 (2006) 27–4744
Three different solutions could give according to the
sign of w2. In our case, by assuming: h =80 km, k =3Wm�1 K�1, q =3300 kg/m3, avs =2�10�5 K�1,
v =2.5 cm/a, a =708, w2N0. In this case, the solution
to Eq. (A21) is given by:
g y Vð Þ ¼ Acos wy Vð Þ þ Bsin wy Vð Þ: ðA22Þ
From the conditions (A18) and (A19) it follows that:
A ¼ 1 ðA23Þ
and:
B ¼ exp � khcosað Þ � coswsinw
: ðA24Þ
By substituting Eqs. (A23) and (A24) in Eq. (A22),
it follows that:
g y Vð Þ ¼ cos wy Vð Þ
þ exp � khcosað Þ � coswsinw
� �sin wy VÞ: ðA25Þð
By taking into account Eqs. (A14), (A16), and
(A25), the particular solution to the heat equation, for
the case w2N0, is given by:
T Vp x V; y Vð Þ ¼ exp khx Vsinað Þ
� cos wy Vð Þþ exp � khcosað Þ�coswsinw
� ��
� sin wy Vð Þ�: ðA26Þ
A.3. The general solution
The general integral to Eq. (A10) can be written as:
T Vg x V; y Vð Þ ¼
Xln¼1
Tn
¼Xln¼1
Ansin npy Vð Þexp anx Vð Þ ðA27Þ
with the coefficients an to be determined. The sinusoi-
dal dependence on yV assures that the series Eq. (A27)
assumes nil values on both yV=0 and yV=1. This
implies that the two boundary conditions (A12a,b) are
satisfied by the solution (A13). In Eq. (A27) the series
coefficients An must be determined by imposing the
boundary condition (A12c), as we show in the next
sections.
In order to determine the an coefficients we substi-
tute Eq. (A27) in Eq. (A10). It follows that:
Ana2nsin npy Vð Þexp anx Vð Þ
� npð Þ2Ansin npy Vð Þexp anx Vð Þ
� b VAnanexp anx Vð Þsin npy Vð Þ
þ dVAnsin npy Vð Þexp anx Vð Þ
¼ 0: ðA28ÞEq. (A28) is equivalent to:
a2n � bVan � npð Þ2 þ dV ¼ 0: ðA29ÞThe only physically acceptable solution to Eq. (A29)
is:
an ¼bV2
�
ffiffiffiffiffiffiffiffiffiffiffiffiffiffiffiffiffiffiffiffiffiffiffiffiffiffiffiffiffiffiffiffibV2
4� dVþ n2p2
s: ðA30Þ
A.4. The complete solution
By summing Eqs. (A26) and (A27) the complete
solution to Eq. (A10), is given by:
T V ¼ TgVþ T VP ¼ exp khx Vsinað Þ
� cos wy Vð Þ þ exp � khcosað Þ � coswsinw
� ��
� sin wy Vð Þ�þXln¼1
Ansin npy Vð Þexp anx Vð Þ: ðA31Þ
The An coefficients can be determined by imposing
the boundary condition (A12c), from which it follows
that:
Xln¼1
Ansin npy Vð Þ ¼ 1� 273
T0
� �1� y Vð Þ
þ 273
T0��cos wy Vð Þ
þ exp � khcosað Þ � coswsinw
� �
� sin wy Vð Þ�
ðA32Þ
or:
An ¼ 2
Z10
1� 273
T0
� �1� y Vð Þ þ 273
T0
�
� cos wy Vð Þ þ exp � khcosað Þ � coswsinw
� ��
� sin wy Vð Þ��
sinnpy Vy V: ðA33Þ

F. Cella et al. / Tectonophysics 412 (2006) 27–47 45
The integrals in Eq. (A33) can be easily computed.
The result is:
An ¼2
np
�1� 273
T0�1ð Þngþ 1
w þ npcos wþnpð Þ�1ð Þ
�
� 1
w � npcos w � npð Þ � 1ð Þ
�þ
� exp � khcosað Þ � coswsinw
� 1
w�npsin w�npð Þ� 1
w þ npsin wþnpð Þ
� �ðA34Þ
References
Abbate, E., Bortolotti, V., Passerini, P., Principe, G., Treves, B., 1994.
Oceanization processes and sedimentary evolution of the Northern
Apennine ophiolitic suite: a discussion. Mem. Soc. Geol. Ital. 48,
117–136.
Alvarez, W., 1972. Rotation of the Corsica–Sardinia microplate.
Nature 235, 103–105.
Amato, A., Cimini, G.B., Alessandrini, B., 1991. Struttura del sistema
litosfera-astenosfera nell’Appennino settentrionale da dati di tomo-
grafia sismica. Studi Geolog. Camerti, Vol. Spec. 1991/1, 83–90.
Amato, A., Alessandrini, B., Cimini, G., Frepoli, A., Selvaggi, G.,
1993. Active and remnant subducted slabs beneath Italy: evi-
dence from seismic tomography and seismicity. Ann. Geofis. 26,
201/214.
Anderson, H., Jackson, J., 1987. The deep seismicity of the Tyrrhe-
nian Sea. Geophys. J. R. Astron. Soc. 91, 613–637.
Angelier, J., Le Pichon, X., 1979. The Hellenic Arc and Trench
system: a key to the tectonic evolution of the eastern Mediterra-
nean. Tectonophysics 60, 1–40.
Beccaluva, L., Bonati, E., Dupuy, C., et al., 1990. Geochemistry and
mineralogy of volcanic rocks from the ODP sites 650, 651, 655
and 654 in the Tyrrhenian sea. Proceeding of the ODP. Scientific
Results, vol. 107, pp. 49–74.
Boccaletti, M., Elter, P., Guazzone, G., 1971. Plate tectonics model
for development of the western Alps and northern Apennines.
Nature 234, 108–111.
Calcagnile, G., Panza, G.F., 1981. The main characteristics of the
lithosphere asthenosphere system in Italy and surrounding
regions. Pageoph 119, 865–879.
Caputo, M., Panza, G.F., Postpischel, D., 1970. Deep structure in the
Mediterranean basins. J. Geophys. Res. 75, 4919–4923.
Cataldi, R., Mongelli, F., Squarci, P., Taffi, L., Zito, G., Calore, C.,
1995. Geothermal ranking of Italian territory. Geothermics, No. 1,
pp. 115, 129.
Cella, F., Rapolla, A., 1997. Density changes in upwelling mantle.
Phys. Earth Planet. Inter. 103 (1-2), 63–84.
Cella, F., Dorre, A.S., Rapolla, A., 1995. Moho and lithosphere–
asthenosphere boundary in East Africa from regional gravity
data. Boll. Geofis. Teor. Appl. XXXVII (148), 277–301.
Cella, F., Fedi, F., Florio, G., Rapolla, A., 1998. Optimal gravity
modelling of the litho–asthenosphere system in Central Mediter-
ranean. Tectnophysics 287 (1-4), 117–138.
Cherchi, A., Montadert, L., 1982. Oligo-miocene rift of Sardinia and
the early history of the west mediterranean basin. Nature 298,
736–739.
Chiozzi, P., Pasquale, V., Verdoya, M., 2002. Thermal constrains to
the geodynamic processes in the Southern Tyrrhenian. Atti 21
Conv. Gruppo Nazionale Geofisica Terra Solida. GNGTS-CNR,
Roma, pp. 1–8.
Cimini, G.B., 1999. P-wave deep velocity structure of the Southern
Tyrrhenian Subduction Zone from nonlinear traveltime tomogra-
phy. Geophys. Res. Lett. 26, 3709–3712.
Corrado, G., Rapolla, A., 1981. The gravity field of Italy: analysis
of its spectral composition and delineation of a tridimensional
crustal model for central-southern Italy. Boll. Geofis. Teor. Appl.
23, 17–29.
Courtney, R.C., White, R.S., 1986. Anomalous heat flow and geoid
across the Cape Verde rise: evidence of dynamic support from a
thermal plume in the mantle. Geophys. J. R. Astron. Soc. 87,
815–868.
Cucci, L., Cinti, F., 1999. Regional uplift and local tectonic deforma-
tion recorded by the Quaternary marine terraces in the Ionian coast
of northern Calabria (southern Italy). Tectonophysics 292, 67–83.
Decourt, J., Zonenshain, L.P., Ricou, L.E., et al., 1986. Geological
evolution of the Tethis belt from the Atlantic to the Pameirs since
the Lias. Tectonophysics 123, 241–315.
Della Vedova, B., Pellis, G., Foucher, J.P., Rehault, J.-P., 1984. Geo-
thermal structure of the Tyrrhenian Sea. Mar. Geol. 55, 271–289.
Devaux, J.P., Schubert, G., Anderson, C., 1997. Formation of a
metastable olivine wedge in a descending slab. J. Geophys. Res.
102, 24627–24637.
Doglioni, C., 1991. A proposal of kinematic modelling for W-dipping
subductions—possible applications to the Tyrrhenian–Appennines
system. Terra Nova 3, 423–434.
Doglioni, C., Mongelli, F., Pialli, G.P., 1998. Boudinage of the
Alpine belt in the Apenninic back-arc. Mem. Soc. Geol. Ital. 52,
447–468.
Doglioni, C., Gueguen, E., Harabaglia, P., Mongelli, F., 1999. On the
origin of west-directed subduction zones and application to the
western Mediterranean. In: Durand, B., Jolivet, L., Horvath, F.,
Seranne, M. (Eds.), The Mediterranean basins: tertiary extension
within the Alpine orogen, Geological Soc., London, special pub-
lications 156, pp. 541–561.
Duschenes, J., Louden, K.E., Sinha, M.C., 1986. A seismic refraction
experiment in the Tyrrenhian Sea. Geophys. J. R. Astron. Soc. 85,
139–160.
Faccenna, C., Thorsten, W. Becker, Lucente, F.P., Jolivet, L., Rossetti,
F., 2001. History of subduction and back arc extension in the
Central Mediterranean. Geophys. J. Int. 145 (3), 809.
Fallon, T.J., Green, D.H., 1987. Anhydrous partial melting of
MORB pyrolite and other peridotite compositions at 10 kbar:
implications for the origin of MORB glasses. Mineral. Petrol.
37, 181–219.
Fedi, M., 1989. Spectral expansion inversion of gravity data for 2.5 D
structures. Boll. Geofis. Teor. Appl. XXXI (121), 25–39.
Finetti, M., Del Ben, A., 1986. Geophysical study of the Tyrrhenian
opening. Boll. Geofis. Teor. Appl. 28, 75–156.
Finetti, I., Morelli, C., 1972. Wide scale digital seismic exploration
of the Mediterranean Sea. Boll. Geofis. Teor. Appl. XIV (56),
291–342.
Forsyth, D., Uyeda, S., 1975. On the relative importance of the
driving forces of plate motions. Geophys. J. R. Astron. Soc. 43,
163–200.
Fowler, C.M.R., 1992. The Solid Earth. Cambridge University Press.
472 pp.
Gasparini, P., 1982. Seismo-tectonics of the Calabrian Arcs. Tectono-
physics 84, 267–286.

F. Cella et al. / Tectonophysics 412 (2006) 27–4746
Giardini, D., Velona, M., 1991. The deep seismicity in the Tyrrhenian
Sea. Terra Nova 3, 57–64.
Green, D.H., 1991. The Earth’s lithosphere and asthenosphere—con-
cepts and constraints derived from petrology and high pressure
experiments. Geol. Soc.Aust. Spec. Publ. 17, 1–22.
Gueguen, E., Doglioni, C., Fernandez, M., 1997. Lithosphere boudi-
nage in the western Mediterranean back-arc basins. Terra Nova 9
(4), 184–187.
Guerra, I., Curra, F., Moretti, A., 1991. Sull’attendibilita della loca-
lizzazione dei microterremoti intermedi e profondi nel Tirreno
Sud-orientale. Atti 10 Comv. Nazionale Geofisica Terra Solida.
GNGTS-CNR, Roma, pp. 95–106.
Gvirtzman, Z., Nur, A., 1999. Plate detachment, asthenosphere upwell-
ing, and topography across subduction zones. Geology, 563–566
(June).
Hutchison, I., Von Herzen, R.P., Louden, K.E., Sclater, J.G., Jemsek,
J., 1985. Heat flow in the Balearic and Tyrrhenian basins, Western
Mediterranean. J. Geophys. Res. 90, 685–702.
Kastens, K., Mascle, J., Auroux, C., Bonatti, E., Broglia, C., Chan-
nell, J., Curzi, P., Emeis, K.C., Glacon, G., Asegawa, S., Hieke,
W., Mascle, G., McCoy, F., McKenzie, J., Mendelson, J., Muller,
C., Rehault, J.P., Robertson, A., Sartori, R., Sprovieri, R., Torii,
M., 1988. ODP Leg 107 in the Tyrrhenian Sea: insights into
passive margin and back-arc basin evolution. Geol. Soc. Amer.
Bull. 100, 1140–1156.
Keen, C.E., 1985. The dynamics of rifting deformation of the litho-
sphere by active and passive driving forces. Geophys. J. R.
Astron. Soc. 80, 95–120.
Knopoff, L., Panza, G.F., 1978. Resolution of upper mantle struc-
ture using higher modes of Rayleigh waves. Ann. Geophys. 30,
491–505.
Locardi, E., Nicolich, R., 1988. Geodinamica del Tirreno e dell’
Appennino centro-meridionale: la nuova Moho. Mem. Soc.
Geol. It. 41, 121–140.
Malinverno, A., 1981. Quantitative estimates of age and Messinian
paleobathymetry of the Tyrrhenian Sea after seismic reflection,
heat flow and geophysical models. Boll. Geofis. Teor. Appl. 23,
159–171.
Malinverno, A., Ryan, W.B.F., 1986. Extension in Tyrrhenian Sea
and shortening in the Appennines as a result of arc migration
driven by sinking of the lithosphere. Tectonics 5 (2), 227–245.
Marotta, A., Mongelli, F., 1998. Flexure of subducted slabs. Geophys.
J. Int. 132, 701–711.
McKenzie, D., 1969. Speculation on the consequences and causes of
plate motion. Geophys. J. R. Astron. Soc. 18, 1–32.
McKenzie, D., 1978. Some remarks on the development of sedimen-
tary basins. Earth Planet. Sci. Lett. 40, 25.
McKenzie, D., 1984. The generation and compaction of partially
molten rock. J. Petrol. 25, 713–765.
McKenzie, D., Bickle, M.J., 1988. The volume and composition of
melt generated by extension of the lithosphere. J. Petrol. 29,
625–679 (Part. 3).
Menke, W., 1984. Geophysical data analysis: discrete inverse theory.
Academic Press, New York. 260 pp.
Minear, J.W., Toksoz, N.M., 1970. Thermal regime of downgoing
slab and global tectonics. J. Geophys. Res. 75, 1397–1419.
Mongelli, F., Zito, G., 2000. The thermal field in a basin after a
sudden passive pure shear lithospheric extension and sublitho-
spheric mechanical erosion: the case of the Tuscan basin (Italy).
Geophys. J. Int. 142, 142–150.
Mongelli, F., Zito, G., Della Vedova, B., Pellis, G., Squarci, P., Taffi,
L., 1991. Geothermal regime of Italy and surrounding seas.
Exploration of the Deep Continental Crust. Springer-Verlag, Ber-
lin, pp. 381–394.
Morelli, C., 1970. Physiography, gravity and magnetism of the Tyr-
rhenian Sea. Boll Geofis. Teor. Appl. XII (48), 275–311.
Morelli, C., 1995. Ulteriori vincoli, geofisici, petrografici e geodetici
alla geodinamica del Mediterraneo centrale. Atti XIII, Conv. Naz.
del GNGTS 1, pp. 27–43.
Morelli, C., Pisani, M., Gantar, C., 1975. Geophysical anomalies and
tectonics in the Strait of Sicily and of the Ionian Sea. Boll. Geofis.
Teor. Appl. XVII (67), 211–249.
Nicolich, R., 1989. Crustal structures from seismic studies in the
frame of the European Geotraverse (Southern segment) and
CROP projects. Proceedings of: bThe lithosphere in ItalyQ. Acc.Naz. dei Lincei, vol. 80, pp. 41–61.
Niu, Y., Batiza, R., 1991a. DENSCAL: a program for calculating
densities of silicate melts and mantle minerals as a function of
pressure, temperature, and composition in melting range. Comput.
Geosci. 17 (5), 679–687.
Niu, Y., Batiza, R., 1991b. In situ densities of silicate melts and
mantle minerals as a function of temperature, pressure and com-
positions. J. Geol. 99, 767–775.
Niu, Y., Batiza, R., 1991c. An empirical method for calculating melt
compositions produced beneath mid-ocean ridges: applications for
axis and off axis (seamounts) melting. J. Geophys. Res. 96 (B13),
21753–21777.
Panza, G.F., Mueller, St., Calcagnile, G., 1980. The gross features of
the lithosphere–asthenosphere system in Europe from seismic
surface waves and body waves. Pageoph 118, 1209–1213.
Parsons, B., Sclater, J.G., 1977. An analysis of the variation of ocean
flor bathymetry and heat flow with age. J. Geophys. Res. 82,
803–827.
Pasquale, V., Verdoya, M., Chiozzi, P., 1999. Thermal state and deep
earthquakes in the Southern Tyrrhenian. Tectonophysics 306,
435–488.
Pasquale, V., Verdoya, M., Chiozzi, P., 2003. Heat-flux budget in the
southeastern continental margin of the Tyrrhenian basin. Phys.
Chem. Earth 28, 407–428.
Patacca, E., Sartori, R., Scandone, P., 1990. Tyrrhenian basin and
Appenninic Arcs: kinematic relations since Late Tortonian times.
Mem. Soc. Geol. Ital. 45, 453–462.
Pinna, E., Rapolla, A., 1979. Strutture crostali nell’Italia Meridionale
da dati gravimetrici. Pubbl. n.235, Progetto Finalizzato Geodina-
mica, CNR.
Pontevivo, A., Panza, G.F., 2002. Group velocity tomography and
regionalization in Italy and bordering areas. Phys. Earth Planet.
Inter. 134, 1–15.
Recq, M., Rehault, J.P., Steinmetz, L., Fabbri, A., 1984. Amin-
cissement de la croute et accretion au centre du Bassin
Tyrrehenien d’apres la sismique refraction. Mar. Geol. 55,
411–428.
Rehault, J.P., Bethoux, N., 1984. Earthquake relocation in the Ligur-
ian Sea (Western Mediterranean): geological interpretation. Mar.
Geol. 55, 429–445.
Royden, L., Patacca, E., Scandone, P., 1987. Segmentation and
configuration of subducted lithosphere in Italy: an important
control on thrust-belt and foredip basin evolution. Geology 15,
714–717.
Sartori, R., 1989. Evoluzione neogenico-recente del bacino tirrenico e
i suoi rapporti con la geologia delle aree circostanti. Gior. Geol. 3
(51/2), 1–39.
Scarascia, S., Lozej, A., Cassinis, R., 1994. Crustal structures of the
Ligurian, Tyrrhenian and Ionian Seas and adjacent onshore areas

F. Cella et al. / Tectonophysics 412 (2006) 27–47 47
interpreted from wide-angle seismic profiles. Boll. Geofis. Teor.
Appl. XXXVI (141-144), 5–19.
Schott, J., Schmeling, H., 1998. Delamination and detachment of a
lithospheric root. Tectonophysics 296, 225–247.
Sebastian, A., 1989. NORMOD: a program for modal norm calcula-
tion and evaluation of other component transformations. Comput.
Geosci. 15 (8), 1241–1248.
Selvaggi, G., 2001. Strain pattern of the southern Tyrrhenian slab
from moment tensor and deep earthquakes: implications on the
down-deep velocity. Ann. Geofis. 44 (1), 155–165.
Selvaggi, G., Chiarabba, C., 1995. Seismicity and P-wave velocity
image of the Southern Tyrrhenian subduction zone. Geophys. J.
Int. 121, 818–826.
Spadini, G., Cloetingh, S., Bertotti, G., 1995. Thermo-mechanical
modeling of the Tyrrhenian Sea: lithospheric necking and kine-
matics of rifting. Tectonics 14, 629–644.
Spakman, W., Van der Lee, S., Van der Hilst, R., 1993. Travel-time
tomography of the European–Mediterranean mantle down to 1400
km. Phys. Earth Planet. Inter. 79, 3–74.
Spear, F.S., Rumble III, D., Ferry, J.M., 1982. Linear algebraic manip-
ulation of n-dimensional composition space. In: Ferry, J.M. (Ed.),
Reviews in Mineralogy: Min. Soc. America, vol. 10, pp. 1–31.
chapt. 1.
Spohn, T., Shubert, G., 1982. Convective thinning of the lithosphere:
a mechanism for the initiation of continental rifting. J. Geophys.
Res. 87, 4669–4681.
Steinmetz, L., Ferrucci, F., Hirn, A., Morelli, C., Nicolich, R., 1983.
A 550 km long Moho traverse in the Tyrrhenian Dea from O.B.S.
recorded Pn waves. Geophys. Res. Lett. 10, 428–431.
Suhadolc, P., Panza, G.F., 1989. Physical properties of the litho-
sphere–asthenosphere system in Europe from geophysical data.
Proceedings of: bThe lithosphere in ItalyQ. Acc. Naz. dei Lincei,vol. 80, pp. 15–40.
Thisseau, C., Rehault, J.P., Foucher, J.P., 1986. Modeles thermiques et
hypotheses sur la nature de la croute au centre de la Mer Tyr-
rhenienne. Mem. Soc. Geol. Ital. 36, 109–122.
Toksoz, M.N., Hsui, A.T., 1978. Numerical studies of back-arc con-
vection and the formation of marginal basins. Tectonophysics 50,
177–196.
Turcotte, D.L., Subert, G., 1982. Geodynamics. Application of Con-
tinuum Physics to Geological Problems. John Wiley, New York.
Valera, J.L., Carminati, E., Negredo, A.M., Doglioni, C., 2003.
Subcrustal seismicity in italy: control of rheology and phase
changes. Geophys. Res. Abstr., 5.
Wang, C.Y., Awang, W.T., Yaolin, S., 1989. Thermal evolution of a rift
basin: the Tyrrhenian Sea. J. Geophys. Res. 94 (B4), 3991–4006.
White, R., McKenzie, D., 1988. Magmatism at rift zones: the gener-
ation of volcanic continental margins and flood basalts. J. Geo-
phys. Res. 94 (B6), 7685–7729.
Zito, G., Mongelli, F., de Lorenzo, S., Doglioni, C., 2003. Geodyna-
mical interpretation of the heat flow in the Tyrrhenian Sea. Terra
Nova 15, 425–432.