teleost vision: seeing while growing
TRANSCRIPT
THE JOURNAL OF EXPERIMENTAL ZOOLOGY SUPPLEMENT 5167-180 (1991)
Teleost Vision: Seeing While Growing RUSSELL D. FERNALD Institute of Neuroscience, University of Oregon, Eugene, Oregon 97403
ABSTRACT Teleost fish eyes grow throughout life without compromising visual performance of the animal. This is made possible by a set of novel adaptations in the growth and development of the eye. Increased retinal area is achieved both by stretching the existing retina and by genera- tion of new tissue a t the retinal germinal zone at the margin of the eye. Rods are added in a fundamentally different fashion than are all other retinal cell types: they appear last as new retina is produced a t the margin and they are inserted throughout the functional retina as it stretches. In this way, the animal maintains a constant rod density to preserve vision in low light level. Because the larger eye produces a larger image, visual acuity improves slightly as the animal grows. Adaptations responsible for regulation of retinal growth are analyzed and discussed.
In animal species in which vision is important, eyes have evolved specialized adaptations permit- ting vision under a wide variety of circumstances. Since the resulting evolutionary modifications can be found at all levels of organization, they have challenged human curiosity since earliest times. The external selective pressures responsi- ble for specialized adaptations arise primarily from two sources: the properties of light itself and its natural variation. The physical laws that gov- ern light determine how images can be captured, focused, and formed into images. That is, the physics of light sets fundamental limits on the optical features of eyes. The natural daily and yearly variation of light intensity, in turn, defines the usefulness of vision. For example, every day the light intensity of the sun typically changes by 6-7 orders of magnitude and yet this extreme range goes largely undetected by our visual sys- tem. Adaptive modifications at all levels in the eye, from its structure to the genetic control of biochemical processes responsible for phototrans- duction, ensure good vision, despite this intensity difference.
Seeing underwater brings a special set of chal- lenges, and those have been met by elasmo- branchs and teleosts alike. There are >25,000 species of fishes and nearly 20,000 of these are the ray-finned bony fish or teleosts. This large number of species reflects enormous success in adapting to nearly every kind of watery habitat imaginable. They thrive in very cold water ( - 17°C) by using antifreeze in their blood, in very hot water (38"C), in low pressures at the water's surface, and at enormous pressures at 9,000 m
depth, and in currents as different as stagnant swamps and raging torrents. This diversity of habitats has resulted in a spectacular range of adaptations in teleost vision, particularly in those species where seeing is the most important sense (reviewed in Fernald, '89b). In one highly visual teleost species, Haplochromis burtoni, we have been able to analyze the role of vision in the ani- mal's behavior and trace some of these adapta- tions to their embryological origins or molecular expression.
VISUALLY GUIDED TELEOST BEHAVIOR Among the teleosts, cichlid fish species have
been particularly well studied because they have been attractive to aquarists who were happy to find brightly colored freshwater fish that re- mained vigorous and active in aquaria. Etholo- gists described the coloration and behavioral pat- terns in numerous species available for purchase in Europe (e.g., Baerends and Baerends van der Roon, 'SO) long after two major expeditions (Re- gan, '20; Poll, '56) had made it clear that the Afri- can rift lakes, home of the cichlids, rivaled the Galapagos Islands as a natural laboratory for evo- lution. For example, in Lake Tanganyika, there are 133 endemic cichlid species, and in Lake Ma- lawi, 200 endemic species (Greenwood, '81). In ad- dition to their unusual behavioral patterns, cich- lids have also been studied because of their variety of specialized behavioral adaptations (e.g., Fryer and Iles, '72), and some unique mor- phological traits (e.g., Liem and Osse, '75).
Haplochromis burtoni is brightly colored and
0 1991 WILEY-LISS, INC.
168 R.D. FERNALD
oDercular spot
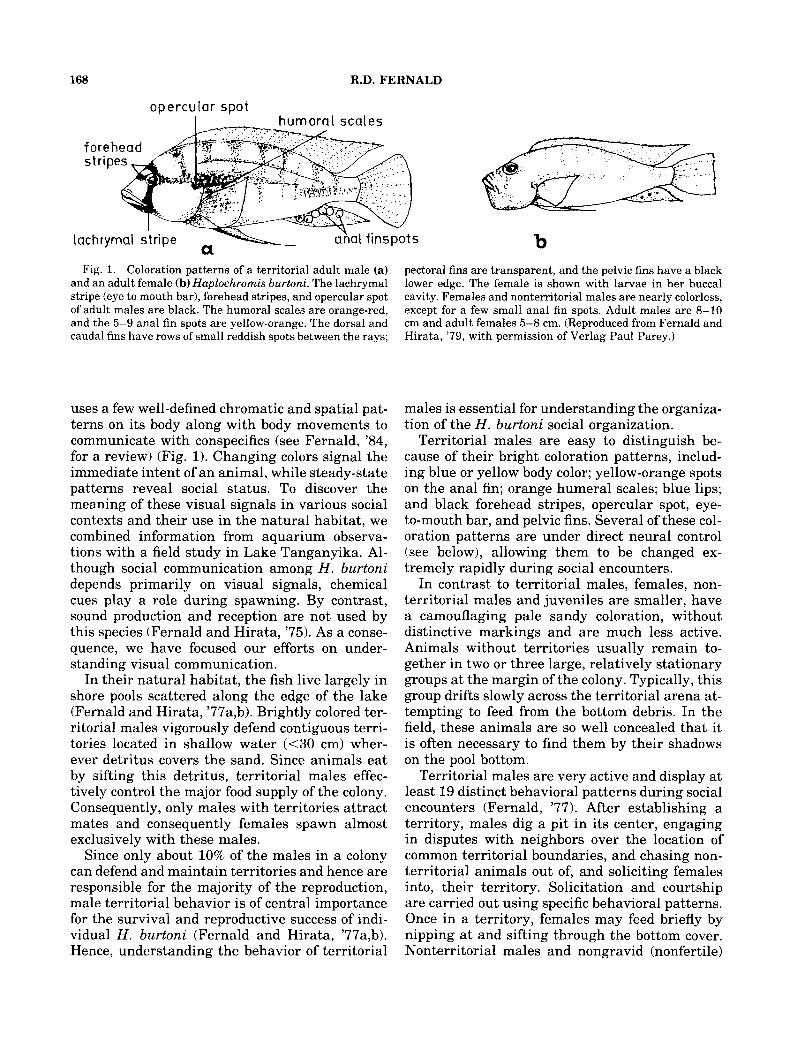
b Fig. 1. Coloration patterns of a territorial adult male (a)
and an adult female (b) Haplochromis burtoni. The lachrymal stripe (eye to mouth bar), forehead stripes, and opercular spot of adult males are black. The humoral scales are orange-red, and the 5-9 anal fin spots are yellow-orange. The dorsal and caudal fins have rows of small reddish spots between the rays;
uses a few well-defined chromatic and spatial pat- terns on its body along with body movements to communicate with conspecifics (see Fernald, '84, for a review) (Fig. 1). Changing colors signal the immediate intent of an animal, while steady-state patterns reveal social status. To discover the meaning of these visual signals in various social contexts and their use in the natural habitat, we combined information from aquarium observa- tions with a field study in Lake Tanganyika. Al- though social communication among H. burtoni depends primarily on visual signals, chemical cues play a role during spawning. By contrast, sound production and reception are not used by this species (Fernald and Hirata, '75). As a conse- quence, we have focused our efforts on under- standing visual communication.
In their natural habitat, the fish live largely in shore pools scattered along the edge of the lake (Fernald and Hirata, '77a,b). Brightly colored ter- ritorial males vigorously defend contiguous terri- tories located in shallow water (<30 cm) wher- ever detritus covers the sand. Since animals eat by sifting this detritus, territorial males effec- tively control the major food supply of the colony. Consequently, only males with territories attract mates and consequently females spawn almost exclusively with these males.
Since only about 10% of the males in a colony can defend and maintain territories and hence are responsible for the majority of the reproduction, male territorial behavior is of central importance for the survival and reproductive success of indi- vidual H. burtoni (Fernald and Hirata, '77a,b). Hence, understanding the behavior of territorial
pectoral fins are transparent, and the pelvic fins have a black lower edge. The female is shown with larvae in her buccal cavity. Females and nonterritorial males are nearly colorless, except for a few small anal fin spots. Adult males are 8-10 cm and adult females 5-8 cm. (Reproduced from Fernald and Hirata, '79, with permission of Verlag Paul Parey.)
males is essential for understanding the organiza- tion of the H . burtoni social organization.
Territorial males are easy to distinguish be- cause of their bright coloration patterns, includ- ing blue or yellow body color; yellow-orange spots on the anal fin; orange humeral scales; blue lips; and black forehead stripes, opercular spot, eye- to-mouth bar, and pelvic fins. Several of these col- oration patterns are under direct neural control (see below), allowing them to be changed ex- tremely rapidly during social encounters.
In contrast to territorial males, females, non- territorial males and juveniles are smaller, have a camouflaging pale sandy coloration, without distinctive markings and are much less active. Animals without territories usually remain to- gether in two or three large, relatively stationary groups at the margin of the colony. Typically, this group drifts slowly across the territorial arena at- tempting to feed from the bottom debris. In the field, these animals are so well concealed that it is often necessary to find them by their shadows on the pool bottom.
Territorial males are very active and display at least 19 distinct behavioral patterns during social encounters (Fernald, '77). After establishing a territory, males dig a pit in its center, engaging in disputes with neighbors over the location of common territorial boundaries, and chasing non- territorial animals out of, and soliciting females into, their territory. Solicitation and courtship are carried out using specific behavioral patterns. Once in a territory, females may feed briefly by nipping at and sifting through the bottom cover. Nonterritorial males and nongravid (nonfertile)
SEEING WHILE GROWING 169
females often mimic this typically female behav- ior and are allowed to eat before the territorial male detects the deception and chases off the fe- male "impersonator."
If the male locates a responsive, gravid female, he leads her into his pit and continues to use elab- orate courtship movements, including moving to the front of the female and quivering his body with spread anal fin in her view. As the pair goes down into the pit, out of direct view of the terri- tory, other animals exploit the opportunity to feed vigorously within the territory. Typically, the male must repeatedly interrupt his courtship be- havior and chase off intruders, being forced to de- cide between continued spawning and territorial defense on a moment-to-moment basis. The fe- male lays her eggs on the substrate within the pit, collecting them in her mouth almost immedi- ately. She broods the eggs in her mouth well away from the territorial arena for 10-14 days, when they become free-swimming fry.
Taken together, observations of the behavioral patterns of H . burtoni reveal that visual signals are of central importance for its behavioral deci- sions. Field observations in Lake Tanganyika, Burundi, East Africa (Fernald and Hirata, '77a,b) confimed the aquarium observations of behavior. In addition, measurements of the optical proper- ties of water in which the animals live and breed (Fernald and Hirata, '77a) revealed that the chro- matic patterns used for communication closely match the wavelengths of light maximally trans- mitted by the water in the pool. This supports the idea that visual signaling has been an important selective force during the evolution of this species.
The impression that vision is important is amply confirmed by laboratory experiments in which variously colored models are presented to the animals and the responses measured. From a variety of such experiments, it is clear that the black eye bar (see Fig. 1) serves as the most im- portant visual signal, indicating territoriality and generally aggressive intent (Leong, '69; Hei- ligenberg and Kramer, '72; Heiligenberg et al., '72; Fernald, '77). In fact, the animals can recog- nize this signal without having had any prior ex- posure to it (Fernald, '80), meaning that its recog- nition is genetically encoded.
The importance of this particular signal is fur- ther reflected in a variety of specialized physiolog- ical adaptations that serve to make it more visi- ble. The deep black color of the eyebar is produced by a pigment unit in the dermis layer of the skin that is unique to the eyebar tissue (Muske and
Fernald, '83). Each pigment unit consists of mela- nophore cells, which produce the darkening by the migration of pigment overlying an iridiphore cell whose reflecting properties enhance the effect of the melanophore pigment. Although most males have a vestige of the eyebar, only territo- rial males display the very visible deep black sig- nal. This is because only during the acquisition of a territory through successful territorial en- counters do males show aggregation of increased amounts of pigment in the eyebar. Also, only during this territorial acquisition do the rnelanophore-iridiphore pairings, necessary to achieve the highly visible eyebar, appear (Muske and Fernald, '83, '87a). The eyebar can be dark- ened by a territorial male in a fraction of a second, because it is controlled by a unique set of fibers of the sympathetic nervous system. These fibers make adrenergic synapses in the eyebar tissue, and the sensitivity of these synapses also changes after a male acquires a territory (Muske and Fer- nald, '87b). In addition to these well-defined color- ation patterns, specific body and eye movements also provide important information to conspecifics (Fernald, '75, '85b).
As is true for many such signals between ani- mals, the meaning of each signal depends both on the physical location and relative status of sender and receiver. For example, the black eyebar sig- nals territorial ownership and nonterritorial males flee when seeing it, whereas a territorial male will attack an animal displaying the same signal, interpreting it as a territorial challenge. H . burtoni move and interact vigorously, making decisions rapidly. They need accurate visual in- formation at all times, and all our behavioral ob- servations suggest that they rely primarily on vi- sual signals. The adaptations within the visual system that permit such rapid collection and pro- cessing of visual information are interesting and impressive in their own right.
RETINAL STRUCTURE AND FUNCTIONAL ORGANIZATION
Teleosts have a basic retinal structure charac- teristic of all vertebrates: gelatinous, thin and transparent, compromised of well-defined alter- nating layers of cell bodies and neuropil. There are three different kinds of photoreceptors in the retina of H . burtoni: single cones, twin cones, and rods. As in other cold-blooded vertebrates, the photoreceptors move along the axis of impinging light rays, so that the cones are in the focal plane during the daytime and rods are in the position at
170 R.D. FERNALD
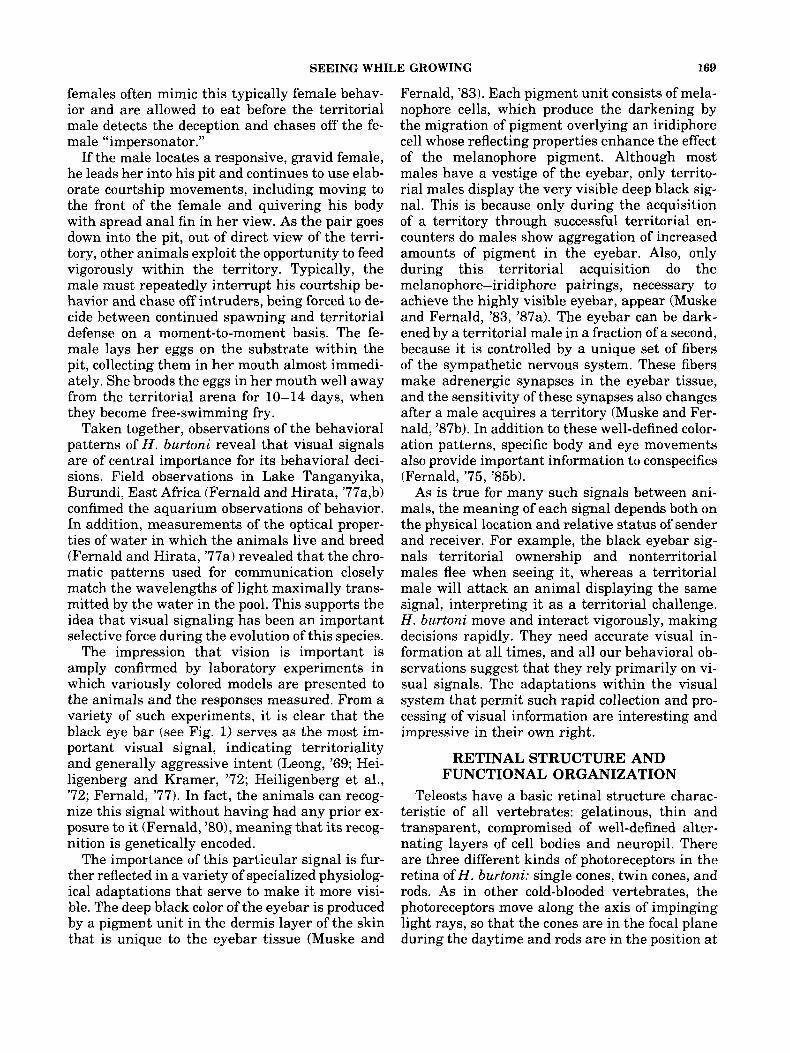
Fig. 2. Tangential 3-pm section stained with toluidine blue through the retina of a mature male H. burtonz. Plane of section slightly oblique through the inner segments of the cone photoreceptors. (Reproduced from Fernald and Liebman, '80, with permission of Pergamon Press.)
night. These retinomotor movements effectively provide an all-cone retina during the day and an all-rod retina at night. One consequence of this is higher acuity (-18%) in the daytime than is possible if all the photoreceptors were present at once (Fernald, '88). When seen in cross section during the day, the cone photoreceptors are ar- ranged in a highly ordered array (Fig. 2). Each single cone is centered in a square composed of four twin cones. By contrast, the rod photorecep- tors do not have an orderly arrangement.
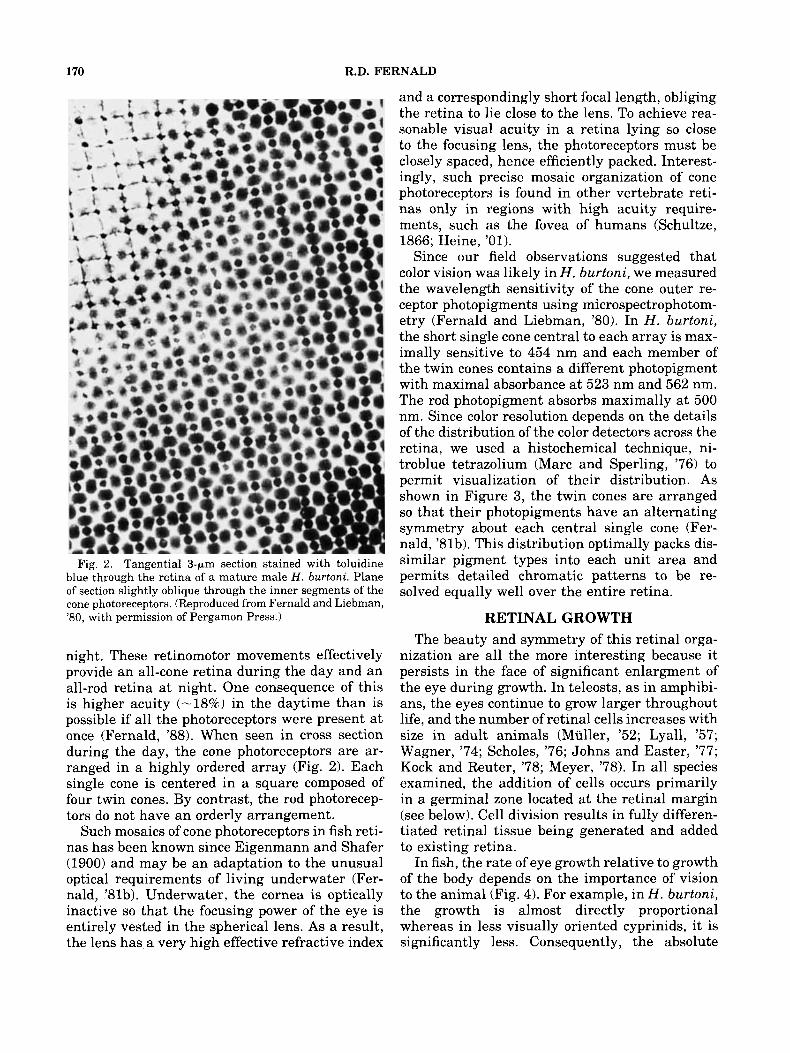
Such mosaics of cone photoreceptors in fish reti- nas has been known since Eigenmann and Shafer (1900) and may be an adaptation to the unusual optical requirements of living underwater (Fer- nald, '81b). Underwater, the cornea is optically inactive so that the focusing power of the eye is entirely vested in the spherical lens. As a result, the lens has a very high effective refractive index
and a correspondingly short focal length, obliging the retina to lie close to the lens. To achieve rea- sonable visual acuity in a retina lying so close to the focusing lens, the photoreceptors must be closely spaced, hence efficiently packed. Interest- ingly, such precise mosaic organization of cone photoreceptors is found in other vertebrate reti- nas only in regions with high acuity require- ments, such as the fovea of humans (Schultze, 1866; Heine, '01).
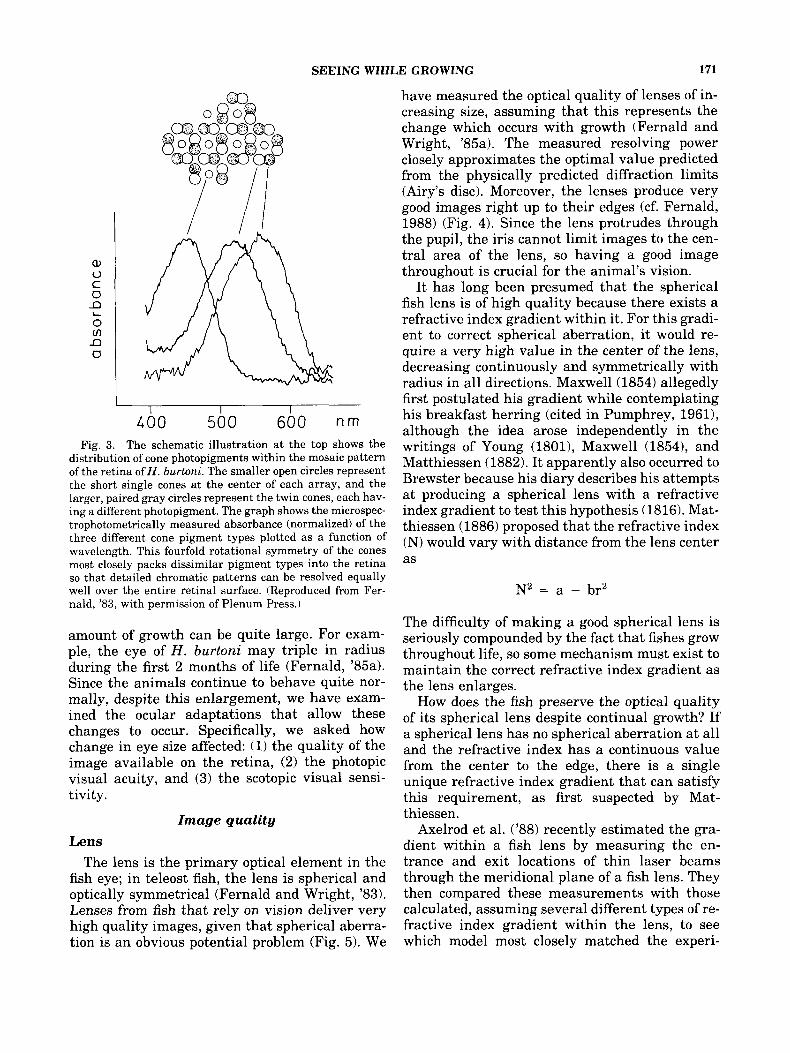
Since our field observations suggested that color vision was likely in H. burtoni, we measured the wavelength sensitivity of the cone outer re- ceptor photopigments using microspectrophotom- etry (Fernald and Liebman, '80). In H . burtoni, the short single cone central to each array is max- imally sensitive to 454 nm and each member of the twin cones contains a different photopigment with maximal absorbance at 523 nm and 562 nm. The rod photopigment absorbs maximally at 500 nm. Since color resolution depends on the details of the distribution of the color detectors across the retina, we used a histochemical technique, ni- troblue tetrazolium (Marc and Sperling, '76) to permit visualization of their distribution. As shown in Figure 3, the twin cones are arranged so that their photopigments have an alternating symmetry about each central single cone (Fer- nald, '81b). This distribution optimally packs dis- similar pigment types into each unit area and permits detailed chromatic patterns to be re- solved equally well over the entire retina.
RETINAL GROWTH The beauty and symmetry of this retinal orga-
nization are all the more interesting because it persists in the face of significant enlargment of the eye during growth. In teleosts, as in amphibi- ans, the eyes continue to grow larger throughout life, and the number of retinal cells increases with size in adult animals (Muller, '52; Lyall, '57; Wagner, '74; Scholes, '76; Johns and Easter, '77; Kock and Reuter, '78; Meyer, '78). In all species examined, the addition of cells occurs primarily in a germinal zone located at the retinal margin (see below). Cell division results in fully differen- tiated retinal tissue being generated and added to existing retina.
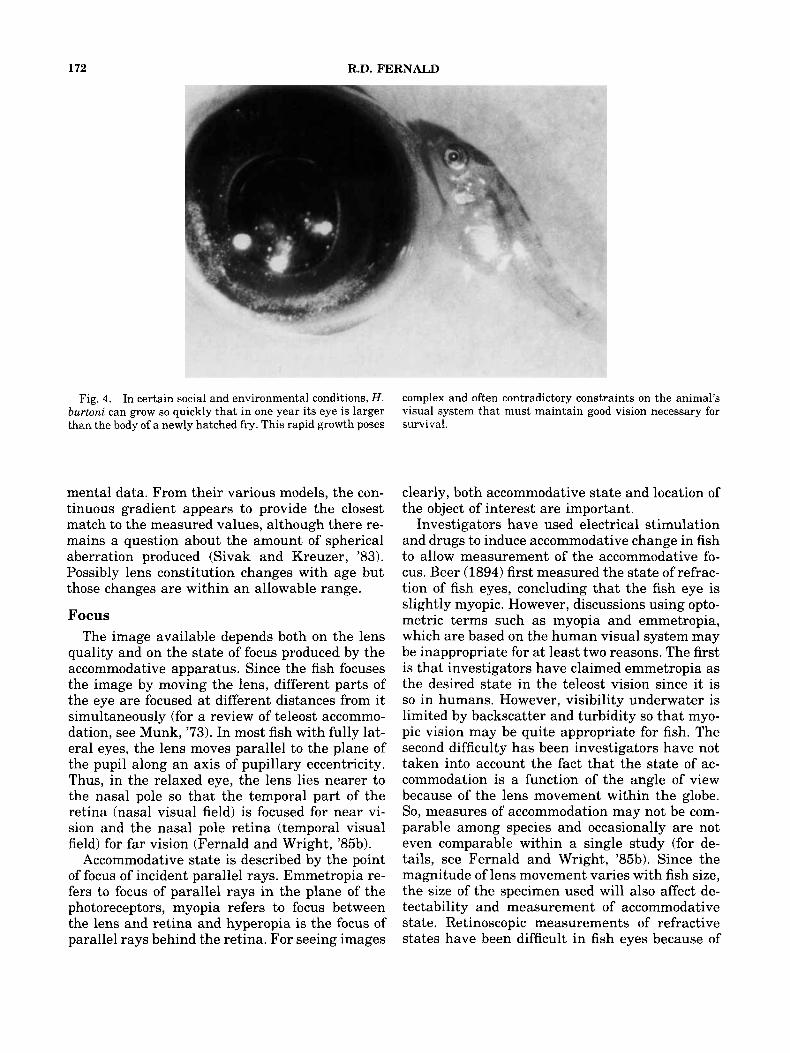
In fish, the rate of eye growth relative to growth of the body depends on the importance of vision to the animal (Fig. 4). For example, in H . burtoni, the growth is almost directly proportional whereas in less visually oriented cyprinids, it is significantly less. Consequently, the absolute
SEEING WHILE GROWING 171
460 560 660 n m Fig. 3. The schematic illustration at the top shows the
distribution of cone photopigments within the mosaic pattern of the retina of H . burtoni. The smaller open circles represent the short single cones at the center of each array, and the larger, paired gray circles represent the twin cones, each hav- ing a different photopigment. The graph shows the microspec- trophotometrically measured absorbance (normalized) of the three different cone pigment types plotted as a function of wavelength. This fourfold rotational symmetry of the cones most closely packs dissimilar pigment types into the retina so that detailed chromatic patterns can be resolved equally well over the entire retinal surface. (Reproduced from Fer- nald, '83, with permission of Plenum Press.)
amount of growth can be quite large. For exam- ple, the eye of H . burtoni may triple in radius during the first 2 months of life (Fernald, %a). Since the animals continue to behave quite nor- mally, despite this enlargement, we have exam- ined the ocular adaptations that allow these changes to occur. Specifically, we asked how change in eye size affected: (1) the quality of the image available on the retina, (2) the photopic visual acuity, and (3) the scotopic visual sensi- tivity.
Image quality Lens
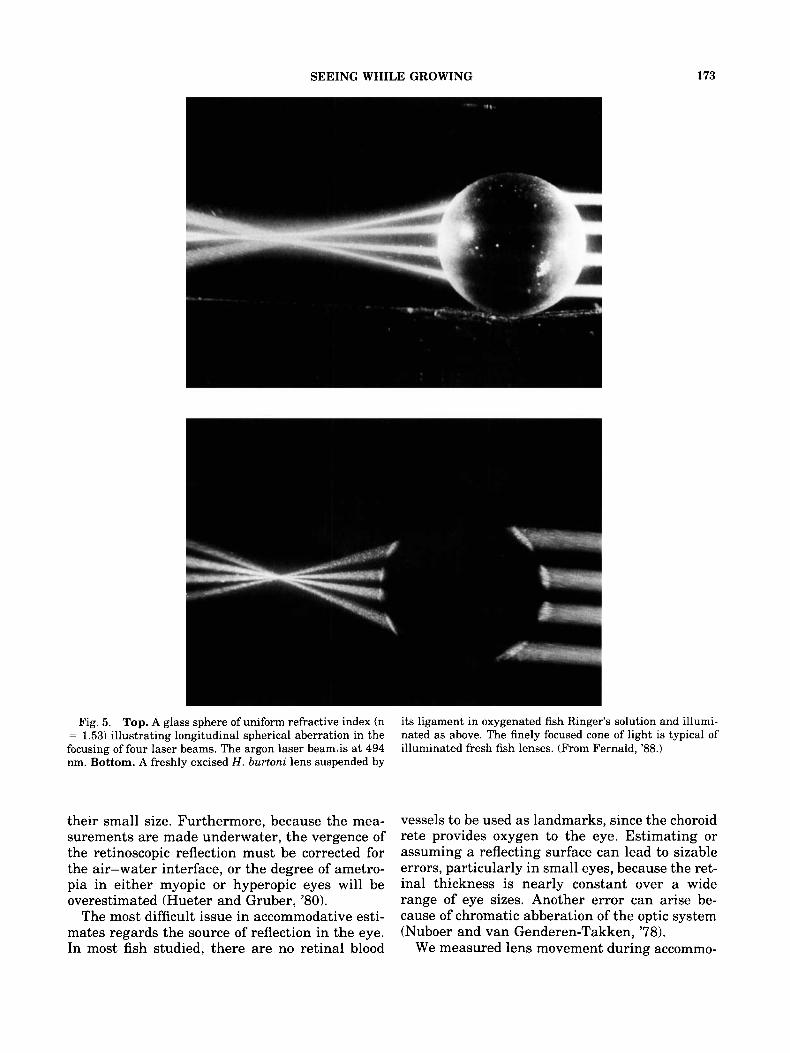
The lens is the primary optical element in the fish eye; in teleost fish, the lens is spherical and optically symmetrical (Fernald and Wright, '83). Lenses from fish that rely on vision deliver very high quality images, given that spherical aberra- tion is an obvious potential problem (Fig. 5). We
have measured the optical quality of lenses of in- creasing size, assuming that this represents the change which occurs with growth (Fernald and Wright, '85a). The measured resolving power closely approximates the optimal value predicted from the physically predicted diffraction limits (Airy's disc). Moreover, the lenses produce very good images right up to their edges (cf. Fernald, 1988) (Fig. 4). Since the lens protrudes through the pupil, the iris cannot limit images to the cen- tral area of the lens, so having a good image throughout is crucial for the animal's vision.
It has long been presumed that the spherical fish lens is of high quality because there exists a refractive index gradient within it. For this gradi- ent to correct spherical aberration, it would re- quire a very high value in the center of the lens, decreasing continuously and symmetrically with radius in all directions. Maxwell (1854) allegedly first postulated his gradient while contemplating his breakfast herring (cited in Pumphrey, 19611, although the idea arose independently in the writings of Young (1801), Maxwell (1854), and Matthiessen (1882). It apparently also occurred to Brewster because his diary describes his attempts at producing a spherical lens with a refractive index gradient to test this hypothesis (1816). Mat- thiessen (1886) proposed that the refractive index (N) would vary with distance from the lens center as
N2 = a - br2
The difficulty of making a good spherical lens is seriously compounded by the fact that fishes grow throughout life, so some mechanism must exist to maintain the correct refractive index gradient as the lens enlarges.
How does the fish preserve the optical quality of its spherical lens despite continual growth? If a spherical lens has no spherical aberration at all and the refractive index has a continuous value from the center to the edge, there is a single unique refractive index gradient that can satisfy this requirement, as first suspected by Mat- thiessen.
Axelrod et al. ('88) recently estimated the gra- dient within a fish lens by measuring the en- trance and exit locations of thin laser beams through the meridional plane of a fish lens. They then compared these measurements with those calculated, assuming several different types of re- fractive index gradient within the lens, to see which model most closely matched the experi-
172 R.D. FERNALD
Fig. 4. In certain social and environmental conditions, H . burtoni can grow so quickly that in one year its eye is larger than the body of a newly hatched fry. This rapid growth poses
complex and often contradictory constraints on the animal's visual system that must maintain good vision necessary for survival.
mental data. From their various models, the con- tinuous gradient appears to provide the closest match to the measured values, although there re- mains a question about the amount of spherical aberration produced (Sivak and Kreuzer, '83). Possibly lens constitution changes with age but those changes are within an allowable range.
Focus The image available depends both on the lens
quality and on the state of focus produced by the accommodative apparatus. Since the fish focuses the image by moving the lens, different parts of the eye are focused at different distances from it simultaneously (for a review of teleost accommo- dation, see Munk, '73). In most fish with fully lat- eral eyes, the lens moves parallel to the plane of the pupil along an axis of pupillary eccentricity. Thus, in the relaxed eye, the lens lies nearer to the nasal pole so that the temporal part of the retina (nasal visual field) is focused for near vi- sion and the nasal pole retina (temporal visual field) for far vision (Fernald and Wright, '85b).
Accommodative state is described by the point of focus of incident parallel rays. Emmetropia re- fers to focus of parallel rays in the plane of the photoreceptors, myopia refers to focus between the lens and retina and hyperopia is the focus of parallel rays behind the retina. For seeing images
clearly, both accommodative state and location of the object of interest are important.
Investigators have used electrical stimulation and drugs to induce accommodative change in fish to allow measurement of the accommodative fo- cus. Beer (1894) first measured the state of refrac- tion of fish eyes, concluding that the fish eye is slightly myopic. However, discussions using opto- metric terms such as myopia and emmetropia, which are based on the human visual system may be inappropriate for at least two reasons. The first is that investigators have claimed emmetropia as the desired state in the teleost vision since it is so in humans. However, visibility underwater is limited by backscatter and turbidity so that myo- pic vision may be quite appropriate for fish. The second difficulty has been investigators have not taken into account the fact that the state of ac- commodation is a function of the angle of view because of the lens movement within the globe. So, measures of accommodation may not be com- parable among species and occasionally are not even comparable within a single study (for de- tails, see Fernald and Wright, '85b). Since the magnitude of lens movement varies with fish size, the size of the specimen used will also affect de- tectability and measurement of accommodative state. Retinoscopic measurements of refractive states have been difficult in fish eyes because of
SEEING WHILE GROWING 173
Fig. 5. Top. A glass sphere of uniform refractive index (n = 1.53) illustrating longitudinal spherical aberration in the focusing of four laser beams. The argon laser beam,is at 494 nm. Bottom. A freshly excised H. burtoni lens suspended by
its ligament in oxygenated fish Ringer's solution and illumi- nated as above. The finely focused cone of light is typical of illuminated fresh fish lenses. (From Fernald, '88.)
their small size. Furthermore, because the mea- surements are made underwater, the vergence of the retinoscopic reflection must be corrected for the air-water interface, or the degree of ametro- pia in either myopic or hyperopic eyes will be overestimated (Hueter and Gruber, '80).
The most difficult issue in accommodative esti- mates regards the source of reflection in the eye. In most fish studied, there are no retinal blood
vessels to be used as landmarks, since the choroid rete provides oxygen to the eye. Estimating or assuming a reflecting surface can lead to sizable errors, particularly in small eyes, because the ret- inal thickness is nearly constant over a wide range of eye sizes. Another error can arise be- cause of chromatic abberation of the optic system (Nuboer and van Genderen-Takken, '78).
We measured lens movement during accommo-
174 R.D. FERNALD
dation and the corresponding refractive state in a variety of sizes of eyes in H . burtoni, using two different methods (Fernald and Wright, '85b). The magnitude of lens movement responsible for ac- commodation increases with eye size but with in- creasing lens diameter, and power of the lens de- creases. So, the net effect is nearly neutralized. That is, as the animal gets larger, its accommoda- tive mechanism is appropriately scaled to body size. The slight loss of accommodative amplitude with growth (Fernald and Wright, '85b) means that the distance to the nearest focal point in- creases from -2 cm to 4.5 cm as the animal grows. Since the total length of the fish is increasing, this visual near point maintains its same position relative to the body and hence the eyes. We have calculated accommodative amplitude as a func- tion of retinal location in two different sizes of fish. By making this comparison, two important points are clear. First, larger animals have a smaller total dynamic range of accommodative power corresponding to the higher power of their lens. Second, active accommodation can only be effective for images falling onto either the nasal or temporal poles of the retina in this fish. This is because the axis of accommodation is in the nasal-temporal plane and lens movement is very nearly parallel to the plane of the pupil. So, for most fish it will be true that the state of focus on the dorsal and ventral retinas will be a compro- mise achieved during active accommodation by lens movement in the nasal-temporal plane. Our various methods for measuring refractive state lead us to propose that fish are typically emme- tropic to slightly myopic, which agrees with the results of recordings from the optic tectum and is appropriate for fish.
Retinal function during growth Fish retinas differ fundamentally from those of
other vertebrates because they continue to grow throughout the life of the animal, both by adding new neurons and by stretching existing retinal tissue. In most vertebrates, postnatal eye growth is due solely to the stretching of existing neural tissue, though in some species of birds and mam- mals, there is also some retinal cell addition in a period immediately after birth. Amphibians add retinal neurons past metamorphosis, but exactly how long this continues is unknown. In fish, the rate of eye growth relative to body growth de- pends on the importance of vision to the animal, and in some species, the individual growth rate may be under social control (Fraley and Fernald,
'82). The proportion of retinal area that increases owing to cell addition, as compared with that due to retinal stretching, varies greatly among spe- cies. In all species examined, cells are added from a germinal zone located all around the retinal margin as originally described (Muller, 1952).
Photopic visual acuity during growth Photopic visual acuity depends on the solid
angle viewed by the eye, on the cone photorecep- tor spacing across the retina, and on the conver- gence of the cones onto higher-order processing cells (ganglion), since in fish with retinomotor movements, only the cones participate in photo- transduction under photopic conditions. Since the solid angle viewed by the eye is independent of eye size, the same volume of space projects onto a larger retinal surface as the eye grows. So, to maintain visual acuity, the density of cone photo- receptors per degree of visual angle must remain the same, as must the ratio of cones to higher- order cells. In fact, because new cones are added throughout life, the cone density per visual angle increases slightly with eye size, and with that in- crease the best theoretically achievable acuity in- creases as well. For example, as H . burtoni grows from eight weeks to four months and its eye in- creases in size from a radius of 0.85-2.4 mm, the cone density increases from 6.9 coneddegree to 14.8 coneddegree (Fernald, '85a). Because the cell addition accounts for only 40% of the increase in retinal area (Fernald, ,831, the cone density per unit area decreases, while the cone density per visual angle increases (see Fernald, '85a, for de- tails). Behavioral studies of the sunfish have con- firmed that visual acuity improves with fish size (Hairston et al., '82).
Scotopic visual sensitivity during growth Scotopic visual sensitivity depends on capture
of photons by rod photoreceptors, since cones are moved out of the plane of focus in low light by retinomotor movements. The behaviorally mea- sured scotopic visual threshold is constant over a wider ange of eye sizes (Allen and Fernald, '85; Powers and Bassi, ,811, meaning that the fish can detect very low levels of light energy despite its enlarging eye. As Muller (1952) first showed, the number of rods per unit area remains constant as the fish grows. Since the number of ganglion cells per visual angle, like the cones, increases slightly with growth, the solid angle of visual space per ganglion cell is slightly smaller in larger animals. Clearly these ganglion cells receive their input
SEEING WHILE GROWING
from an increasingly large number of rod photore- ceptors (Kock and Stell, '85) but how they pre- serve their response properties during growth is unknown.
When first describing the preservation of rod density, Miiller ('52) also noted that mitotic fig- ures associated with cell division exist only at the retinal margin. He suggested, therefore, that rod photoreceptor density was maintained by migra- tion of rods from the marginal zone into the ret- ina. Since the rod photoreceptor has a long outer segment (-50 km) connected by an ellipsoid to a cell body, lateral migration would appear to cause disruption, particularly because the number of rods and the distances involved are large (re- viewed in Fernald, '89a). Despite early claims that this was so (Johns, '76, ,771, our results (Fer- nald and Johns, '80; Johns and Fernald, '81) re- vealed instead a novel means of rod production.
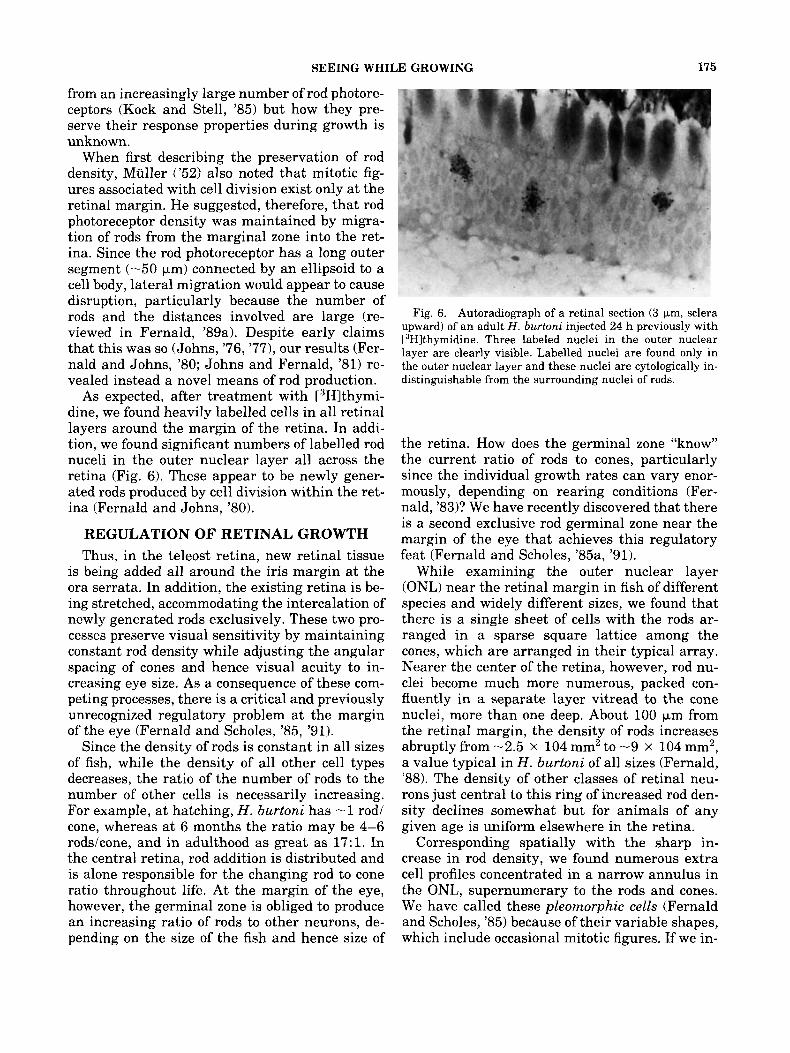
As expected, after treatment with [3Hlthymi- dine, we found heavily labelled cells in all retinal layers around the margin of the retina. In addi- tion, we found significant numbers of labelled rod nuceli in the outer nuclear layer all across the retina (Fig. 6). These appear to be newly gener- ated rods produced by cell division within the ret- ina (Fernald and Johns, '80).
REGULATION OF RETINAL GROWTH Thus, in the teleost retina, new retinal tissue
is being added all around the iris margin at the ora serrata. In addition, the existing retina is be- ing stretched, accommodating the intercalation of newly generated rods exclusively. These two pro- cesses preserve visual sensitivity by maintaining constant rod density while adjusting the angular spacing of cones and hence visual acuity to in- creasing eye size. As a consequence of these com- peting processes, there is a critical and previously unrecognized regulatory problem at the margin of the eye (Fernald and Scholes, '85, '91).
Since the density of rods is constant in all sizes of fish, while the density of all other cell types decreases, the ratio of the number of rods to the number of other cells is necessarily increasing. For example, at hatching, H. burtoni has -1 rod/ cone, whereas at 6 months the ratio may be 4-6 rods/cone, and in adulthood as great as 17:l . In the central retina, rod addition is distributed and is alone responsible for the changing rod to cone ratio throughout life. At the margin of the eye, however, the germinal zone is obliged to produce an increasing ratio of rods to other neurons, de- pending on the size of the fish and hence size of
175
Fig. 6. Autoradiograph of a retinal section (3 pm, sclera upward) of an adult H . burtoni injected 24 h previously with L3H]thymidine. Three labeled nuclei in the outer nuclear layer are clearly visible. Labelled nuclei are found only in the outer nuclear layer and these nuclei are cytologically in- distinguishable from the surrounding nuclei of rods.
the retina. How does the germinal zone "know" the current ratio of rods to cones, particularly since the individual growth rates can vary enor- mously, depending on rearing conditions (Fer- nald, '83)? We have recently discovered that there is a second exclusive rod germinal zone near the margin of the eye that achieves this regulatory feat (Fernald and Scholes, '85a, '91).
While examining the outer nuclear layer (ONL) near the retinal margin in fish of different species and widely different sizes, we found that there is a single sheet of cells with the rods ar- ranged in a sparse square lattice among the cones, which are arranged in their typical array. Nearer the center of the retina, however, rod nu- clei become much more numerous, packed con- fluently in a separate layer vitread to the cone nuclei, more than one deep. About 100 km from the retinal margin, the density of rods increases abruptly from -2.5 x 104 mm2 to -9 x 104 mm2, a value typical in H. burtoni of all sizes (Fernald, '88). The density of other classes of retinal neu- rons just central to this ring of increased rod den- sity declines somewhat but for animals of any given age is uniform elsewhere in the retina.
Corresponding spatially with the sharp in- crease in rod density, we found numerous extra cell profiles concentrated in a narrow annulus in the ONL, supernumerary to the rods and cones. We have called these pleomorphic cells (Fernald and Scholes, '85) because of their variable shapes, which include occasional mitotic figures. If we in-
176
A d u l t r e t i n a
R.D. FERNALD
8 - Cone p a i r s a n d s ing le cone
Rods
Rod p r e c u r s o r s
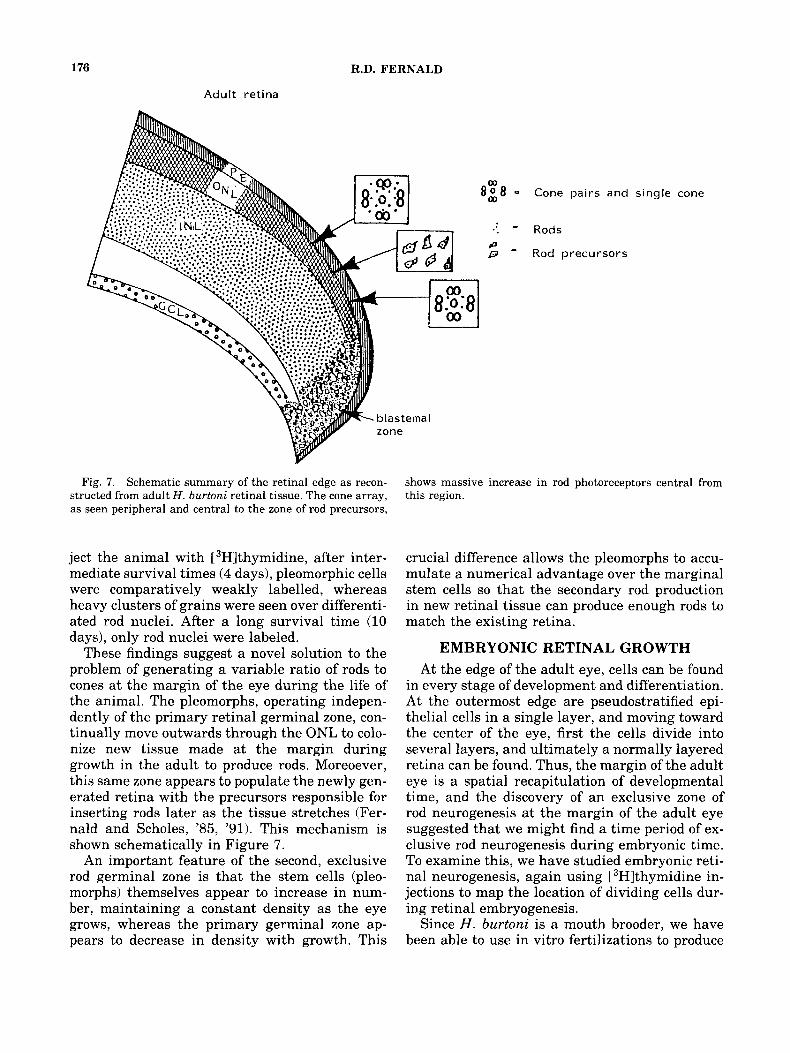
Fig. 7. Schematic summary of the retinal edge as recon- structed from adult H . burtoni retinal tissue. The cone array, as seen peripheral and central to the zone of rod precursors,
shows massive increase in rod photoreceptors central from this region.
ject the animal with [3H]thymidine, after inter- crucial difference allows the pleomorphs to accu- mediate survival times (4 days), pleomorphic cells mulate a numerical advantage over the marginal were comparatively weakly labelled, whereas stem cells so that the secondary rod production heavy clusters of grains were seen over differenti- in new retinal tissue can produce enough rods to ated rod nuclei. After a long survival time (10 match the existing retina. days), only rod nuclei were labeled.
These findings suggest a novel solution to the problem of generating a variable ratio of rods to cones at the margin of the eye during the life of the animal. The pleomorphs, operating indepen- dently of the primary retinal germinal zone, con- tinually move outwards through the ONL to colo- nize new tissue made at the margin during growth in the adult to produce rods. Moreoever, this same zone appears to populate the newly gen- erated retina with the precursors responsible for inserting rods later as the tissue stretches (Fer- nald and Scholes, '85, '91). This mechanism is shown schematically in Figure 7.
An important feature of the second, exclusive rod germinal zone is that the stem cells (pleo- morphs) themselves appear to increase in num- ber, maintaining a constant density as the eye grows, whereas the primary germinal zone ap- pears to decrease in density with growth. This
-
EMBRYONIC RETINAL GROWTH At the edge of the adult eye, cells can be found
in every stage of development and differentiation. At the outermost edge are pseudostratified epi- thelial cells in a single layer, and moving toward the center of the eye, first the cells divide into several layers, and ultimately a normally layered retina can be found. Thus, the margin of the adult eye is a spatial recapitulation of developmental time, and the discovery of an exclusive zone of rod neurogenesis at the margin of the adult eye suggested that we might find a time period of ex- clusive rod neurogenesis during embryonic time. To examine this, we have studied embryonic reti- nal neurogenesis, again using F3H]thymidine in- jections to map the location of dividing cells dur- ing retinal embryogenesis.
Since H. burtoni is a mouth brooder, we have been able to use in vitro fertilizations to produce
T N
SEEING WHILE GROWING
Day 7 2hr
D
177
Day 4 2hr
D
N
V
Day 14 2hr
D
Days 5 0.5hr
D
N T N
T
T
V
V
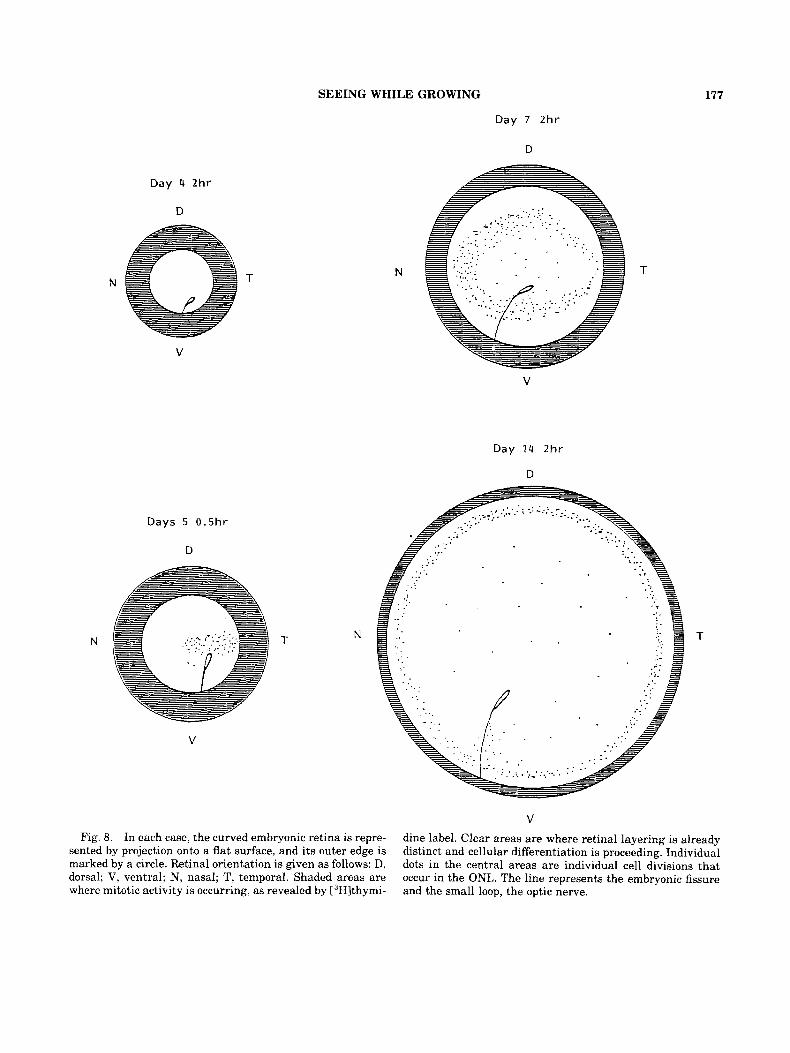
Fig. 8. In each case, the curved embryonic retina is repre- sented by projection onto a flat surface, and its outer edge is marked by a circle. Retinal orientation is given as follows: D, dorsal; V, ventral; N, nasal; T, temporal. Shaded areas are where mitotic activity is occurring, as revealed by L3H1thymi-
dine label. Clear areas are where retinal layering is already distinct and cellular differentiation is proceeding. Individual dots in the central areas are individual cell divisions that occur in the ONL. The line represents the embryonic fissure and the small loop, the optic nerve.
178 R.D. FERNALD
animals of known age, and have analyzed the ret- inal tissue autoradiographically after survival times ranging frrom 1.5 h to 10 days. When the distribution of labelled cells is mapped using the Lambert azimuthal projection (preserving area when projecting a hemisphere onto a plane), an interesting pattern emerges (Fig. 8).
By the fourth day of development, approxi- mately one-half of the eyecup contains dividing cells, and the remainder differentiated, layered retina. By the fifth day after fertilization, the ra- tio of dividing to differentiated cells has decreased and a significant amount of cell division appears in the vicinity of the temporal pole of the retina, near the site of the first cell divisions in retinal tissue. By day 7, this second phase of cell divisions covers much more of the differentiated retinal tis- sue and has begun to take the shape of a ring. By day 14, the distribution of the late labelled cells is a ring close to the margin of the eye.
To identify the progeny of these labeled cells, we examined the retina with electron microscopy and we looked at labeled progeny in animals which survived for long periods of time. For elec- tron microscopy, we re-embedded outer nuclear layer tissue from the central retina, from the cen- ter of the mitotically active zone and from the peripheral retina and sectioned it for electron mi- croscopy. We found that central tissue had differ- entiated rod and cone photoreceptors. The mar- ginal tissue had an undifferentiated population of cells. In the midst of the area with cell divisions, we found differentiated cone photoreceptors with incompletely assembled outer segments and no evidence of rods. In tissue from animals that sur- vived a longer time, we found only rod nuclei la- beled in the central retina.
This late phase of rod addition in the embryonic tissue appears to be the origin of the second ger- minal zone described above (Fernald and Scholes, '85, '91). The late addition of rods to the embry- onic retina, by means of the spreading wave of cell division, mimics the corresponding addition of rods to the retinal edge in adults. Thus the adult retinal edge provides an exact map of devel- opmental time and is a spatial recapitulation of embryonic time.
SUMMARY Analysis of vision in H . burtoni has led to a
number of unexpected insights into adaptations that underlie its visual specialization. At every level of analysis, structural, functional, or devel- opmental modifications have resulted from selec-
tive forces over evolutionary time. In many cases, the discoveries in fishes have led to similar dis- coveries in other species confirming the common ancestry of vertebrate eyes in fishes.
In this species, we have now begun looking at the level of molecular control of photoreceptor outer segment development and renewal pro- cesses (Fernald et al. ,'87; Korenbrot and Fernald, '89) and our results suggest that at this level as well, fish will offer insights into molecular control mechanisms common throughout vertebrate phy- logeny.
ACKNOWLEDGMENTS This work was supported by the grant EY
05051 from the National Institutes of Health and by the Medical Research Foundation of Oregon. I would like to thank Drs. J. Scholes, J. Presson, L. Muske, S. Wright, and Ms. L. Shelton for scien- tific help.
LITERATURE CITED Allen, E.E., and R.D. Fernald (1985) Scotopic visual threshold
in the African cichlid fish, Haplochromis burtoni. J. Comp. Physiol., 157:247-253.
Axelrod, D., D. Lerner, and P.J. Sands (1988) Refractive in- dex within the lens of a goldifsh eye determined from the paths of thin laser beams. Vision Res., 28:57-65.
Baerends, G., and J.M. Baerends-Van Roon (1950) An intro- duction to the ethology of Cichlid fishes. Behaviour Suppl.
Beer, T. (1894) Die Accommodation des Fischauges. Pfluegers Arch. Ges. Physiol. Menschen Tiere, 58523-650.
Brewster, D. (1816) On the structure of the crystalline lens in fishes and quadrupeds, as ascertained by its action on polarized light. Philos. Trans. R. SOC. Lond., 311-317.
Eigenmann, C.H., and G.D. Shafer. (1900) The mosaic of sin- gle and twin cones in the retina of fishes. Am. Nat.,
Fernald, R.D. (1975) Fast body turns in a cichlid fish. Nature (Lond.), 258:228-229.
Fernald, R.D. (1977) Quantitative behavioral observations of Haplochromis burtoni under semi-natural conditions. Ani- mal Behav., 25:643-653.
Fernald, R.D. (1980) Responses of male Haplochromis burtoni reared in isolation to models of conspecifics. Z. Tierpsychol.,
Fernald, R.D. (1981b) Chromatic organization of the cichlid fish retina. Vision Res., 20:1749-1753.
Fernald, R.D. (1983) Pattern recognition in fish. In: Advances in Vertebrate Neuroethology. J.-P. Ewert, R.R. Capranica, and D.J. Ingle, eds. Plenum Press, New York, pp. 569-580.
Fernald, R.D. (1984) Vision and behavior in an African cich- lid fish. Am. Sci., 72(1):58-65.
Fernald, R.D. (1985a) Growth of the teleost eye: Novel solu- tions to complex constraints. Environ. Biol. Fish., 13:
Fernald, R.D. (1985b) Eye movements in the African cichlid fish, Haplochromis burtoni. Comp. Physiol., 156:119-208.
Fernald, R.D. (1988) Aquatic adaptations in fish eyes. In: Sen-
I: 1-243.
34:109-18.
54:85-93.
113-123.
SEEING WHILE GROWING 179
sory Biology of Aquatic Animals. J . Atema, R.R. Fay, A.N. Popper, and W.N. Tavolga, eds. Springer-Verlag, New York, pp. 435-466.
Fernald, R.D. (1989a) Retinal rod neurogenesis. In: Develop- ment of the Vertebrate Retina. B. Finlay and D.R. Senge- laub, eds. Plenum Press, New York, pp. 31-42.
Fernald, R.D. (1989b) Fish vision. In: Development of the Vertebrate Retina. B. Finlay and D.R. Sengelaub, eds. Ple- num Press, New York, pp. 247-266.
Fernald, R.D., and N. Hirata (1975) Non-intentional sound production in a cichlid fish (Haplochromis burtoni, Gun- ther). Experientia, 31 :299-300.
Fernald, R.D., and N. Hirata (1977a) Field study of Huplo- chromis burtoni: Habitats and co-habitants. Environ. Biol. Fish., 2:299-308.
Fernald, R.D., and N. Hirata (1977b) Field study of Haplo- chromis burtoni: Quantitative behavioral observations. Anim. Behav., 25:964-975.
Fernald, R.D., and N. Hirata (1979) The ontogeny of social behavior and body coloration in the African cichlid fish, Haplochromis burtoni. Z. Tierpsychol., 50:180-187.
Fernald, R.D., and P. Johns (1980) Retinal structure and growth in the Cichlid fish, Invest. Ophthalmol. Visual Sci., 69.
Fernald, R.D., and P.A. Liebman (1980) Visual receptor pig- ments in the African cichlid fish Haplochromis burtoni. Vis. Res., 20:857-864.
Fernald, R.D., R. McDonald, and J. Korenbrot (1987) Light- dark cycle of opsin mRNA production in toads and fish. Invest. Ophthalmol. Visual Sci. Suppl. 28f3):184.
Fernald, R.D., and J. Scholes (1985) A zone exclusive rod neurogenesis in the teleost retina, SOC. Neurosci. Abs., 11 :1063.
Fernald, R.D., and J. Scholes (1991) Retinal neurogenesis in teleosts: A second germinal zone. (in press).
Fernald, R.D., and S.E. Wright (1983) Maintenance of optical quality during crystalline lens growth, Nature (Lond.),
Fernald, R.D., and S.E. Wright (1985a) Growth of the visual system of the African cichlid fish, H . burtoni: Optics. Vision Res., 25:155-161.
Fernald, R.D., and S.E. Wright (198513) Growth of the visual system of the African cichlid fish, H. burtoni: Accommoda- tion. Vision Res., 25:163-170.
Fraley, N.B., and R.D. Fernald (1982) Social control of devel- opment rate in the African cichlid fish, Haplochromis bur- toni. Z. Tierpsychol., 60~66-82.
Fryer, G., and T.D. Iles (1972) The Cichlid Fishes of the Great Lakes of Africa. Oliver and Boyd, Edinburgh.
Greenwood, P.H. (1981) Species flocks and explosive evolu- tion. In: Chance, Change and Challenge-The Evolving Biosphere. P.H. Greenwood, and P.L. Forey, eds. Cambridge University Press and the British Museum, London, pp.
Hairston, N.G., K.T. Li, and S.S. Easter (1982) Fish vision and the detection of planktonic prey. Science, 218:1240- 1242.
Heiligenberg, W., and U. Kramer (1972) Aggressiveness as a function of external stimulation. J . Comp. Physiol., 77:332-340.
Heiligenberg, W., U. Kramer and V. Schultz (1972) The angu- lar orientation of the black eye-bar in Haplochromis burtoni (Cichlidae, Pisces) and its relevance to aggressivity. Z. Vergl. Physiol., 76: 168- 176.
Heine, C. (1901) Demonstration des Zapfenmosaiks der
301 :618-620.
61-74.
Menschlichen Fovea. Dtsch. Ophthalmol. Ges. Ber. Ver., 29.265-266.
Hueter, R.E., and S.H. Gruber (1980) Retinoscopy of aquatic eyes. Vision Res., 20:197-200.
Johns, P.R. (1976) Synaptic connections must change in the adult goldfish retina. Neurosci. Abs., 6r826.
Johns, P.R. (1977) Growth of the adult goldfish eye. 111. Source of the new retinal cells. J . Comp. Neurol., 176: 343-357.
Johns, P.R., and S.S. Easter (1977) Growth of the adult gold- fish eye. 11. Increase in retinal cell number, J . Comp. Neu- rol., 176:331-341.
Johns, P.R., and R.D. Fernald (1981) Genesis of rods in teleost fish retina. Nature (Lond.), 293:141-142.
Kock, J.-H., and T. Reuter (1978) Retinal ganglion cells in the crucia carp (Carassius carassius) I. Size and number of somata in eyes of different sizes. J. Comp. Neurol. 179:
Kock, J.-H., and W.K. Stell (1985) Formation of new rod pho- toreceptor synapses onto differentiated bipolar cells in gold- fish retina. Anat. Rec., 211:69-74.
Korenbrot, J.I., and R.D. Fernald (1989) Circadian rhythm and light regulate opsin mRNA in rod photoreceptors. Na- ture (Lond.), 337:454-457.
Leong, C.Y. (1969) Quantitative effect of releasers in the at- tack readiness of the fish Haplochromis burtoni. Vergl. Physiol., 65:29-50.
Liem, K.F., and J.W.M. Osse. (1975) Biological versatility, evolution and food resources, exploitation in African cichlid fishes. Am. Zool., 15:427-454.
Lyall, A.H. (1957) The growth of the trout retina. Quant. J. Micros. Sci., 98:lOl-110.
Marc, R.E., and H.G. Sperling (1976) Color receptor identities of goldfish cones. Science, 191:487-489.
Matthiessen, L. (1882) Ueber die Beziehungen, Welche Zwischen dem Brechungsindex des Kernzentrums der Krystallinse und den Dimensionen des Auges Bestehen. Pflugers Arch. Ges. Physiol., 27:510-523.
Maxwell, J.C. (1854) Some solutions of problems, Camb. Dubl. Math. J., 8:188-195.
Meyer, R.L. (1978) Evidence from thymidine labelling for continuing growth of retina and tectum in juvenile goldfish. Exp. Neurol., 59:99-111.
Muller, H. (1952) Bau and Wachstum der Netzhaut des Guppy (Lebistes reticulatus). Zool. Jahrb., 63:275-324.
Munk, 0. (1973) Early notions of dynamic accommodatory devices in teleosts. Vidensk. Meddr Dansk Naturh. Foren.,
Muske, L.E., and R.D. Fernald (1983) Differential sensitivity of adrenergic melanophore receptors in two color morphs of cichlid Haplochromis burtoni. Neurosci. Abs., 9:1120.
Muske, L., and R.D. Fernald (1987a) Control of a teleost so- cial signal: Neural basis for differential expression of a color pattern. J. Comp. Physiol., 160:89-97.
Muske, L., and R.D. Fernald (1987b) Control of a teleost so- cial signal: Anatomical and physiological specializations of chromatophores. J . Comp. Physiol., 160:99-107.
Nuboer, J.F.W., and H. van Genderen-Takken (1978) The ar- tifact of retinoscopy. Vision Res., 18:1091-1096.
Poll, M (1956) Poissons Cichlidae, Result. Sci. Explor. Hy- drobiol. Lake Tanganyika (1946-471, 3(5b):1-619.
Powers, M.K., and C.J. Bassi (1981) Absolute visual thresh- old is determined by the proportion of stimulated rods in the growing goldfish retina. Neurosci. Abs., 7:541.
Pumphrey, R.J. (1961) Concerning vision. In The Cell and
535-548.
136:7-28.

180 R.D. FERNALD
Organism. J.A. Ramsey, ed. Cambridge University Press, New York, pp. 193-208.
Regan, C.T. (1920) The classification of the fishes of the fam- ily Cichlidae. I. The Tanganyika genera. Annu. Mag. Nat. Hist. 5:33-53.
Sandy, J.M., and J.H.S. Blaxter (1980) A study of retinal development in larval herring and sole. J . Mar. Biol. Assoc. UK, 60.59-71.
Scholes, J.H. (1976) Neuronal connections and cellular ar- rangement in the fish retina. In: Neural Principles in Vi- sion. F. Zettler, and R. Weiler, eds. Springer-Verlag, New York, pp. 63-93.
Schultze, M. (1866) Zur Anatomie und Physiologie der Ret- ina. Arch. Micrask. Anat. Entwichlungsmech., 2:165-174.
Sivak, J.G., and R.O. Kreuzer (1983) Spherical aberration of the crystalline lens. Vision Res., 2359-70.
Wagner, H.J. (1974) Development of the retina of Nunnacaru anomala, with reference to regional variations in differenti- ation, Z. Morphol. Tiere., 79:113-131.
Young, T. (1801) On the mechanism of the eye. Philos. Trans., 92:23-88.