targeted investments in modernization and gains in productivity: evidence from firms in the global...
TRANSCRIPT
IE
VS
a
AA
JDLLM
KIIPO
1
eeaibmaaotfilc
Au
0d
Research Policy 38 (2009) 536–547
Contents lists available at ScienceDirect
Research Policy
journa l homepage: www.e lsev ier .com/ locate / respol
nvestments in modernization, innovation and gains in productivity:vidence from firms in the global paper industry
ivek Ghosal ∗, Usha Nair-Reichertchool of Economics, Georgia Institute of Technology, Atlanta, GA 30332, USA
r t i c l e i n f o
rticle history:vailable online 22 November 2008
EL classification:20206010
eywords:nvestment
a b s t r a c t
This paper examines the impact of investments in modernization and innovation on productivity in asample of firms in the global pulp and paper industry. This industry has traditionally accounted for sig-nificant amounts of employment and capital investment in North America and Europe. In contrast tomuch of the existing literature which focuses on the impact of R&D and patents on firms’ performanceand productivity, we examine data on actual investment transactions in four main areas: (i) mechanical,(ii) chemicals, (iii) monitoring devices and (iv) information technology. We find that firms that imple-mented a greater number of investment transactions in modernization achieved higher productivity, andthese estimated quantitative effects are greater than the impact of standard innovation variables such aspatents and R&D. Investment transactions in the information technology and digital monitoring devices
nnovationroductivityrganizational behavior
imparted a particularly noticeable boost to productivity. These results are obtained after controlling forother firm-specific variables such as capital intensity or mergers and acquisitions. Thus, firms’ decisionsto undertake investments in modernization and incremental innovations appear to be critical for achiev-ing gains in productivity, compounding to form meaningful differences in performance, productivity andcompetitive position across firms in the longer run. For some of the traditional industries like pulp and
eem tains
dmttIa0Tcflminnovations that arise from learning-by-doing and possibly merg-ers and acquisitions.
The global pulp and paper industry has undergone significant
paper, R&D and patents sfirms go about achieving g
. Introduction
Improving productivity is at the core of a firm’s business strat-gy. Higher productivity is likely to improve profitability andnhance a firm’s competitive position relative to its rivals. Therere alternative strategies a firm can pursue to improve its productiv-ty. These include: (1) pursuing a path of pure innovation capturedy variables such as R&D expenditures and patents granted; (2)aking decisions to invest in physical capital that modernizes
nd upgrades production capabilities; (3) engaging in mergers andcquisitions to reap economies of scale and scope and generatether synergies; and (4) make changes to its organizational struc-ure, better management and improve its supply-chains. While arm can potentially pursue all of these strategies, which one is
ikely to be more successful, or viable, depends in part on market
onditions and the industry the firm operates in.Our focus in this paper is on the global pulp and paper industry.defining characteristic of this industry is that the basic technologysed for producing paper is quite old and well known. While recent
∗ Corresponding author.E-mail address: [email protected] (V. Ghosal).
c
i
Ra
048-7333/$ – see front matter © 2008 Elsevier B.V. All rights reserved.oi:10.1016/j.respol.2008.10.010
o be particularly poor indicators of innovation and, more generally, howin productivity.
© 2008 Elsevier B.V. All rights reserved.
ecades have seen changes in the sophistication of equipment andachines and the incorporation of digital devices and information
echnology, this is not an industry where a firm can typically expecto make a breakthrough innovation to distance itself from its rivals.1
n our sample of pulp and paper firms from North America, Europend other regions, the ‘typical’ firm has an R&D intensity of about.5% and the number of patents granted is low at about 2 per year.hese numbers are underwhelming; R&D and patents, at least asonventionally measured, seem unlikely to be the major avenuesor productivity gains. In this sense, firms in this industry are moreikely to be able to achieve gains in productivity via strategies of
odernization and upgrading of production processes, incremental
hanges since the late 1980s.2 The global economic downturn in
1 See Ghosal and Nair-Reichert (2007) for details about the nature of technologiesn the pulp and paper industry.
2 See Ince (1999), Douglas (2001), Engel (1997), Ghosal (2003), Ghosal and Nair-eichert (2007), Kates (2001), and Suhonen (2001). Ohanian (1993, 1994) presentshistorical perspective of some of the changes in this industry.
esearc
tpilmlgeiami
iMtspaftsov
oa
•
••
gdum
ufidbdpagtdfm
t
pcs
db(
fi(
wsi
tpicfitot
2
prmwt
1isbc
sca
2
3
V. Ghosal, U. Nair-Reichert / R
he late 1980s and early 1990s produced downward pressure onrices of paper products and sharp compression in firms’ prof-
tability. Firms were saddled with significant overcapacity due toow demand. Changing environmental standards forced firms in
any countries to make new and costly investments to reduce pol-ution in order to meet the new regulatory standards. More openlobal markets and reduced ocean-freight rates allowed firms tonter new markets and compete. The overall effect was that firmsn the pulp and paper industry faced a new economic environmentnd increased competitive pressure. To survive in this new environ-ent, they had to carefully think through their business strategies
n order to stay competitive and improve their bottom line.As we examine the behavior of the firms in the pulp and paper
ndustry, we find that many engaged in a significant number of&As, presumably with the objective of consolidating their posi-
ion in the market, potentially reaping economies of scale andcope, and weeding out competitors as evidenced by post-mergerlant closures.3 To improve their competitive position, many firmslso engaged in investments that modernized their productionacilities, improved innovation outcomes, implemented changes inhe supply-chain and their organizational structure.4 In a broadense, the firms appear to have adopted a two-pronged strategyf improving efficiency via modernization and incremental inno-ations, and engaging in M&As.
The objective of this paper is to examine in detail the outcomesf some of these strategies. Some of the questions we seek to answerre:
Did the strategies to modernize and update production processesimprove the performance and productivity of the firms?Did M&As improve productivity?Which strategy worked better?
This paper contributes to our understanding of business strate-ies pursued by firms in the global pulp and paper industry byeveloping a framework within which we conceptualize the eval-ation of productivity gains and compile an extensive dataset fromyriad sources to quantify the impacts.
Our main findings are that investments in modernization andpgrading of the production processes pay off in terms of higherrm-level productivity. The estimated quantitative impact on pro-uctivity of these investments is greater than the gains obtainedy pursuing a path of more innovation as measured by R&D expen-itures and patents.5 M&As appear to have little or no effect onroductivity. In general, the gains in productivity via modernizationnd upgrading investments are not large. While the year-to-yearains are somewhat modest, the important point to note is thathese modest gains can compound over time to form meaningfulifferences across firms. Therefore, managers of firms need to stay
ocused and emphasize the incremental gains in productivity toaintain or enhance their competitive position in the longer run.While the issues we discuss and our framework and data are for
he firms in the pulp and paper industry, the conceptual framework
3 See Kates (2001) for plant closures. Pesendorfer (2003) examines M&As in the USulp and paper and evaluates the effects on firms’ investment decisions, costs, andonsumers. Among his findings is that the merged firms are likely to scrap capacityubsequent to an acquisition.
4 See Bjorkman et al. (1997), Ghosal (2003) and Nilsson et al. (1996) for someetails about the pulp and paper firms. The role of various types of innovations haveeen formally discussed by Audretsch (1995), Gort and Klepper (1982) and Winter1984).
5 For various facets of the standard literature on R&D and patents and empiricalndings, see Audretsch (1995), Cohen and Levin (1989), Griliches (1984), Sutton1997) and Winter (1984).
4
5
h Policy 38 (2009) 536–547 537
e outline is general enough to be applied to examining businesstrategies related to productivity and innovation at the firm leveln almost any industry.
The paper is organized as follows. Section 2 provides informa-ion about the industry. In Section 3 we discuss the productionrocess and technologies, outline our categorization of investments
n the key areas and provide details about the extensive dataset weompiled. Sections 4 and 5 describe the framework for examiningrm-level differences in productivity and the firm-level data fromhe Compustat and Thompson’s Financial databases. The results ofur regression analysis are presented in Sections 6 and 7. Implica-ions and concluding remarks appear in Section 9.
. Industry basics
We begin by providing a brief outline of the industry and theroduction processes. Paper is manufactured from wood, a natu-al and renewable raw material. Pulp – the basic ingredient for theanufacture of paper and board – is produced from fresh wood,oodchips from sawmills, recovered paper, sometimes from tex-
iles, agricultural by-products and industrial crops.The use of recycled fiber has been growing steadily since the
980s. Between 40% and 50% of all paper used in North Americas recovered for recycling and reuse. The recycling rate is higher ineveral European countries. (The recycling rate is calculated on theasis of recovered paper used in recycling compared to total paperonsumption.)
The process of making paper has not fundamentally changedince its discovery, but modern papermaking has evolved into aomplex industry. The important steps in the production processre:
1. Forestry: Trees used for paper-making are usually grown and har-vested like a crop. To meet future demand, forest products firmsand private landowners plant millions of new seedlings everyyear.
. Debarking, chipping and/or recycling: To begin the process, logsare first passed through a debarker, where the bark is removed.Next, the debarked logs are passed through chippers where thewood is cut into 1-in. pieces. The wood chips are then pressure-cooked in a digester with a mixture of water and chemicals. Usedpaper is an important source of paper fiber. The recycled paperis shredded and mixed with water.
. Pulp preparation: The pulp is washed, refined, cleaned and some-times bleached, then turned to slush in the beater. Color dyes,coatings and other additives are mixed in, and the pulp slushis pumped onto a moving wire screen. Computerized sensorsand state-of-the-art control equipment monitor each stage ofthe process.
. Paper formation: As the pulp travels down the screen, water isdrained away and recycled. The resulting crude paper sheet, orweb, is squeezed between large rollers to remove most of theremaining water and ensure smoothness and uniform thickness.The semi-dry web is then run through heated dryer rollers toremove the remaining water.
. Paper finishing: The finished paper is wound into large rolls,
which can be 30 ft or more in width and weigh close to 25 tons.A slitter cuts the paper into smaller rolls and the paper is readyfor use. Papermaking is a highly capital-intensive industry and,in many firms, there may be over $100,000 in equipment foreach employee. The largest paper-making machines can be over32 ft wide, 550 ft long and produce over 1000 miles of paper aday.
538 V. Ghosal, U. Nair-Reichert / Research Policy 38 (2009) 536–547
Table 1Production process.
Process number Process description
1 Debarking2 Chipping3 Pulping (pressure-cooking)4 Washing5 Refining6 Cleaning7 Bleaching8 Dying9 Coating
10 Pumping11 Draining water12 Squeezing (removing water)
3d
aIati
tc(onfwl
adttciii
t(ptfiode
3
poscsds
Table 2Investment categories.
Category Comments
Mechanical Transactions in this category include majormachine rebuilds and a variety of otherinvestments, upgrades and modernization ofphysical equipment related to the processesdescribed in Table 1. The recorded transactions inthis category include a wide range such as presssection rebuilds, installation of fiberflow drumpulper, coating systems, new recovery boiler, paperwinders, screening systems to remove plastics andcontaminants, replacement of chip-and-saw headswith turnknife chipping heads, covers forsupercalender, gravity strainers and showers,steam systems with blow-thru controls on papermachine dryer sections, pre-evaporation systemsto capture blow steam from mill pulping process,chip thickness screening equipment, sludgedewatering equipment, among many others
Chemical Includes transactions related to dyes, pigments,water treatment chemicals, among others. Someexamples include high-yield polysulfide pulpingprocesses and precipitated calcium carbonate forcoating and filling. Chemicals are an importantcomponent of the process categories 3–9 in Table 1
Monitoring devices Included in this category are transactions relatedto digital cameras and a variety of other devicesdesigned to monitor the production line. Examplesinclude devices that monitor fluid leaks in theproduction line, paper jams, paper quality, paperreflection, paper-coat weight, curl and moisture onthe coater, digital break recording systems,devronizer systems and on-line measurement ofkappa and dissolved lignin
Information technology Transactions in this group included purchase andinstallation of new software and integrationinvestments with digital devices and other aspectsof production. Examples include integrated qualitycontrol systems to provide regulatory control forpaper machines, order fulfillment systems, woodprocurement systems, transportation managementand plant wide information systems
Other Miscellaneous transactions not covered in theabove categories. Examples include constructionservices for environmental improvements,contracts to manage wastewater treatment facility,injury prevention initiatives and initiatives toreduce water consumption
FTr
wt
oabatdisa(T
13 Drying14 Calendaring15 Slitting
. Production process and investments: categorization andata
To develop our framework for analysis, we gathered informationbout the production process from various industry publications.n addition, both of us had visited pulp and paper mills in the USnd Northern Europe to get a first-hand look at the processes. Usinghis information, we classified the overall process into 15 key stagestemized in Table 1.
Next, as we looked through the important areas of operations ofhe pulp and paper firms, we created 4 broad categories in which weould observe important changes. These relate to (1) mechanical,2) chemical, (3) monitoring devices and (4) information technol-gy. We also created a fifth category of ‘other’ for those areas that doot fit into the four main categories noted above. Since each of the
our main categories involves distinct processes and technologies,e classify them as ‘investment categories’. The five categories are
isted in column 1 of Table 2.Our insight is that by tracking firms’ investments in equipment
nd machinery, chemicals and chemical processes, monitoringevices and information technology, we obtain a broad sketch ofhe transactions the firms engage in. The main premise is thathese investments allow firms to improve their productivity andompetitive position relative to their rivals. The more active a firms in making these improvements and upgrades, the more likelyt is that the firm will improve its performance and productiv-ty.
Our next task was to gather information and gain insights intohe transactions in each of the four key investment categoriesnoted in Table 2) for the major firms in the global pulp andaper industry, and then provide a comparison of how the effortso modernize and improve efficiency varied across the differentrms. Unfortunately, due to confidentiality restrictions and lackf reliable and consistent firm-level data available in the publicomain, this proved to be a far more difficult task than we hadxpected.
.1. Compiling the data
We examined information from a large number of pulp andaper industry resources. The publication Pulp and Paper was thenly source that provided some semblance of a consistent data
ource. For each of the investment categories noted in Table 2, weollected information from Pulp and Paper’s “Orders and Deliveries”ection over the time-period 1996–2003. The time-period for ourata collection was restricted by the following: (1) at the time wetarted collecting the data, 2003 was the most recent year for whichuti
w
or some of our analysis we will combine ‘Monitoring Devices’ and ‘Informationechnology’ into one category labeled ‘Digital’ as several of the transactions weecorded contained elements of both.
e could obtain complete data; and (2) the years before 1996 con-ained relatively sketchy data.
Included in the orders and deliveries information were namesf buyers and suppliers, and some specifics of the transactions suchs purchase of a new pulping or debarking unit, purchase or refur-ishing of the paper mill, coating systems, calendaring machine,mong many others. Table 2 (column 2) provides information onhe range of transactions obtained. In terms of having a completeataset, we have information on a total of 25 firms (buyers), includ-
ng most of the major global firms. The supplier side – that is,uppliers of equipment, machinery, chemicals, monitoring devicesnd information technology – contains names of over 20 firmsglobally). We then developed a system of classification outlined inables 1 and 2, obtaining information on firm-specific transactionsnder each of the 15 different processes noted in Table 1, and fur-
her classifying them by the five investment categories describedn Table 2.After the data were put in machine-readable form, we thenent through a painstaking process of examining each transaction,
V. Ghosal, U. Nair-Reichert / Research Policy 38 (2009) 536–547 539
Table 3Investment categories, data summary, 1995–2003.
Firm ID Mechanical Chemical Monitoring devices Information technology Other Total
1 9 0 3 5 0 172 16 1 1 2 0 203 2 0 1 1 0 44 11 0 2 3 0 165 5 1 1 1 0 86 44 1 5 10 3 637 16 1 3 5 0 258 8 1 3 3 0 159 10 0 2 4 0 1610 13 1 2 5 3 2411 3 0 0 1 1 512 22 0 3 4 0 2913 4 1 1 1 0 714 33 0 3 5 2 4315 17 0 1 2 1 2116 31 0 3 8 0 4217 4 0 3 5 0 1218 26 0 6 13 2 4719 31 0 2 5 1 39
Mean 16.05 0.37 2.36 4.37 0.68 23.84S.D. 12.05 0.49 1.46 3.18 1.06 16.1925th percentile 6.50 0.00 1.00 2.00 0.00 13.5050th percentile 13.00 0.00 2.00 4.00 0.00 20.007
N for ou
osaTt4a
3
stirv
ddfiiaw8ga
tto
aaotiba
3
otpo
soaromt
manttpi
iicimotps
5th percentile 24.00 1.00 3.00
ote: The table presents summary statistics for our final set of 19 firms that we use
btaining additional information on many of them from secondaryources such as the firms’ websites, industry reports, among others,nd then arranged them into the classification scheme outlined inables 1 and 2. Across all the processes and categories under ourwo-tier (Tables 1 and 2) classification system, we have a total of62 buyer–seller transactions for the period 1996–2003 for 25 USnd foreign firms.
.2. Pros and cons of “Orders and Deliveries” investments data
As we noted above, the Pulp and Paper publication is the onlyource we could find that reported such buyer–supplier transac-ions on a consistent basis. The Pulp and Paper publication compilednformation on the buyer–seller transactions as part of their ownesearch as well as transactions reported to them by the firms on aoluntary basis.
There are two important shortcomings of the data. First, theata are not comprehensive in the sense that they do not containata and information on all the transactions undertaken by a givenrm over the 1996–2003 period. This deficiency is clearly a lim-
tation, but there was no other source we could find that wouldllow us to obtain a complete set of transactions. Further, thereere some firms for which we recorded 0 or 1 transactions for the-year period. Following a series of unsuccessful attempts to fill thisap, we decided to drop these firms from our sample, resulting infinal set of 19 US and foreign firms.
The second shortcoming is that while we were able to observehe transactions, we were not able to assess how large or smallhey were in monetary terms. We return to this specific issue inur concluding remarks.
On the positive side, the information on the buyer–seller trans-ctions for the categories listed in Tables 1 and 2 are high qualitynd informative. In summary, while the incompleteness and lack
f monetary values are shortcomings, we feel that the richness ofhe available data offered a unique opportunity to conduct researchnto the firms’ efforts to modernize the production processes andusiness operations in order to improve their production efficiencynd competitive position.tsi
T
5.00 1.00 34.00
r regression analysis. The numbers represent the totals over the sample period.
.3. Investment categories: data characteristics
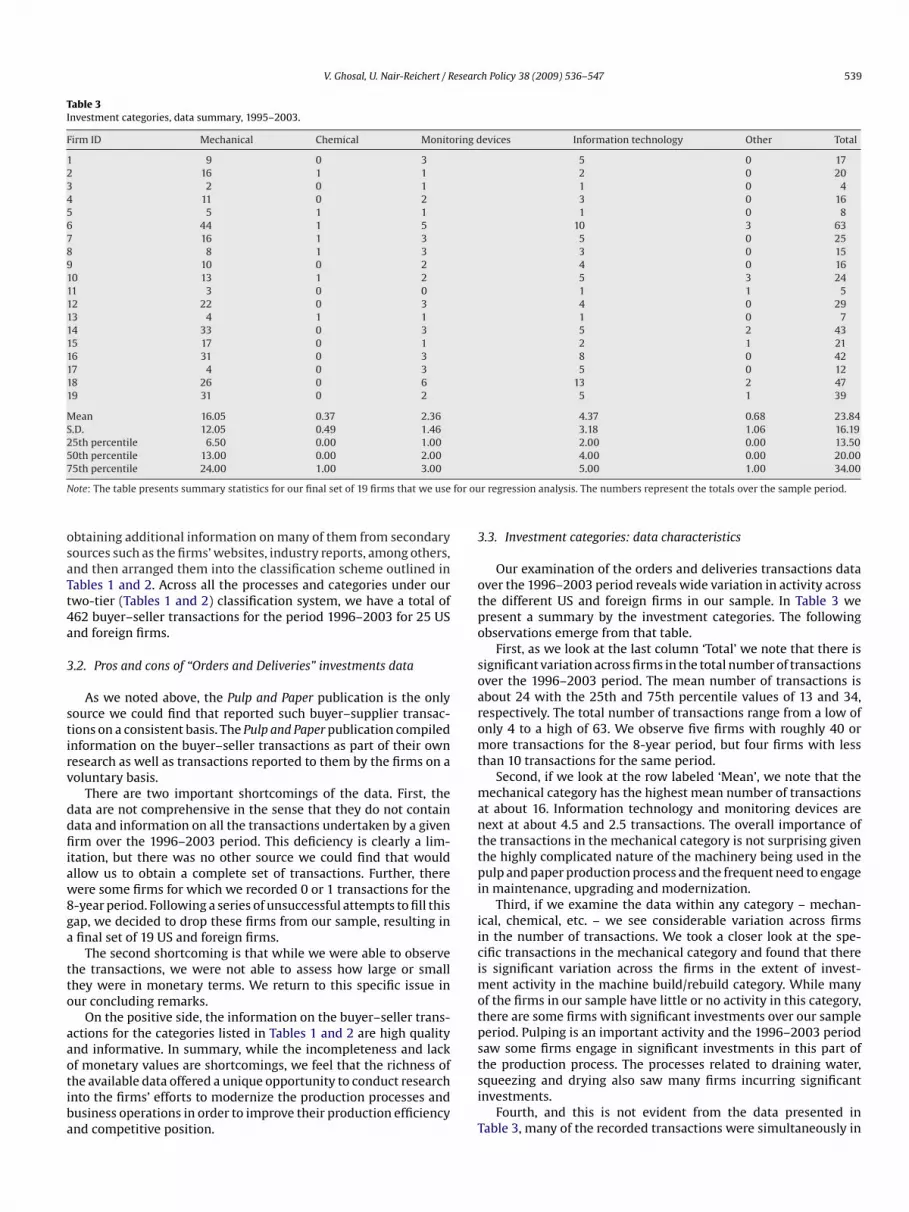
Our examination of the orders and deliveries transactions dataver the 1996–2003 period reveals wide variation in activity acrosshe different US and foreign firms in our sample. In Table 3 weresent a summary by the investment categories. The followingbservations emerge from that table.
First, as we look at the last column ‘Total’ we note that there isignificant variation across firms in the total number of transactionsver the 1996–2003 period. The mean number of transactions isbout 24 with the 25th and 75th percentile values of 13 and 34,espectively. The total number of transactions range from a low ofnly 4 to a high of 63. We observe five firms with roughly 40 orore transactions for the 8-year period, but four firms with less
han 10 transactions for the same period.Second, if we look at the row labeled ‘Mean’, we note that the
echanical category has the highest mean number of transactionst about 16. Information technology and monitoring devices areext at about 4.5 and 2.5 transactions. The overall importance ofhe transactions in the mechanical category is not surprising givenhe highly complicated nature of the machinery being used in theulp and paper production process and the frequent need to engage
n maintenance, upgrading and modernization.Third, if we examine the data within any category – mechan-
cal, chemical, etc. – we see considerable variation across firmsn the number of transactions. We took a closer look at the spe-ific transactions in the mechanical category and found that theres significant variation across the firms in the extent of invest-
ent activity in the machine build/rebuild category. While manyf the firms in our sample have little or no activity in this category,here are some firms with significant investments over our sampleeriod. Pulping is an important activity and the 1996–2003 periodaw some firms engage in significant investments in this part of
he production process. The processes related to draining water,queezing and drying also saw many firms incurring significantnvestments.Fourth, and this is not evident from the data presented inable 3, many of the recorded transactions were simultaneously in
540 V. Ghosal, U. Nair-Reichert / Research Policy 38 (2009) 536–547
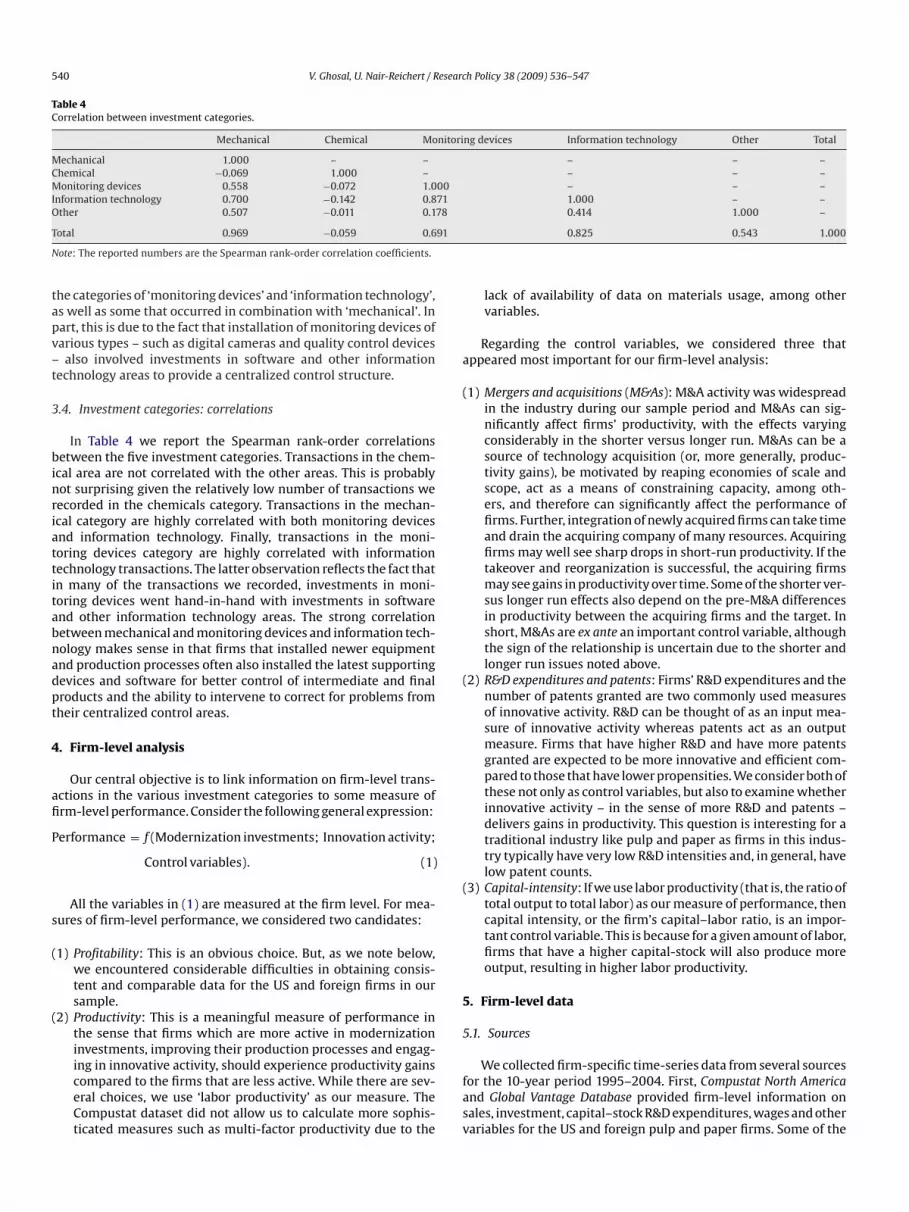
Table 4Correlation between investment categories.
Mechanical Chemical Monitoring devices Information technology Other Total
Mechanical 1.000 – – – – –Chemical −0.069 1.000 – – – –Monitoring devices 0.558 −0.072 1.000 – – –Information technology 0.700 −0.142 0.871 1.000 – –Other 0.507 −0.011 0.178 0.414 1.000 –
T 91
N
tapv–t
3
binriattitabnadpt
4
afi
P
s
(
(
a
(
(
(
5
5
otal 0.969 −0.059 0.6
ote: The reported numbers are the Spearman rank-order correlation coefficients.
he categories of ‘monitoring devices’ and ‘information technology’,s well as some that occurred in combination with ‘mechanical’. Inart, this is due to the fact that installation of monitoring devices ofarious types – such as digital cameras and quality control devicesalso involved investments in software and other information
echnology areas to provide a centralized control structure.
.4. Investment categories: correlations
In Table 4 we report the Spearman rank-order correlationsetween the five investment categories. Transactions in the chem-
cal area are not correlated with the other areas. This is probablyot surprising given the relatively low number of transactions weecorded in the chemicals category. Transactions in the mechan-cal category are highly correlated with both monitoring devicesnd information technology. Finally, transactions in the moni-oring devices category are highly correlated with informationechnology transactions. The latter observation reflects the fact thatn many of the transactions we recorded, investments in moni-oring devices went hand-in-hand with investments in softwarend other information technology areas. The strong correlationetween mechanical and monitoring devices and information tech-ology makes sense in that firms that installed newer equipmentnd production processes often also installed the latest supportingevices and software for better control of intermediate and finalroducts and the ability to intervene to correct for problems fromheir centralized control areas.
. Firm-level analysis
Our central objective is to link information on firm-level trans-ctions in the various investment categories to some measure ofrm-level performance. Consider the following general expression:
erformance = f (Modernization investments; Innovation activity;
Control variables). (1)
All the variables in (1) are measured at the firm level. For mea-ures of firm-level performance, we considered two candidates:
1) Profitability: This is an obvious choice. But, as we note below,we encountered considerable difficulties in obtaining consis-tent and comparable data for the US and foreign firms in oursample.
2) Productivity: This is a meaningful measure of performance inthe sense that firms which are more active in modernizationinvestments, improving their production processes and engag-
ing in innovative activity, should experience productivity gainscompared to the firms that are less active. While there are sev-eral choices, we use ‘labor productivity’ as our measure. TheCompustat dataset did not allow us to calculate more sophis-ticated measures such as multi-factor productivity due to thefasv
0.825 0.543 1.000
lack of availability of data on materials usage, among othervariables.
Regarding the control variables, we considered three thatppeared most important for our firm-level analysis:
1) Mergers and acquisitions (M&As): M&A activity was widespreadin the industry during our sample period and M&As can sig-nificantly affect firms’ productivity, with the effects varyingconsiderably in the shorter versus longer run. M&As can be asource of technology acquisition (or, more generally, produc-tivity gains), be motivated by reaping economies of scale andscope, act as a means of constraining capacity, among oth-ers, and therefore can significantly affect the performance offirms. Further, integration of newly acquired firms can take timeand drain the acquiring company of many resources. Acquiringfirms may well see sharp drops in short-run productivity. If thetakeover and reorganization is successful, the acquiring firmsmay see gains in productivity over time. Some of the shorter ver-sus longer run effects also depend on the pre-M&A differencesin productivity between the acquiring firms and the target. Inshort, M&As are ex ante an important control variable, althoughthe sign of the relationship is uncertain due to the shorter andlonger run issues noted above.
2) R&D expenditures and patents: Firms’ R&D expenditures and thenumber of patents granted are two commonly used measuresof innovative activity. R&D can be thought of as an input mea-sure of innovative activity whereas patents act as an outputmeasure. Firms that have higher R&D and have more patentsgranted are expected to be more innovative and efficient com-pared to those that have lower propensities. We consider both ofthese not only as control variables, but also to examine whetherinnovative activity – in the sense of more R&D and patents –delivers gains in productivity. This question is interesting for atraditional industry like pulp and paper as firms in this indus-try typically have very low R&D intensities and, in general, havelow patent counts.
3) Capital-intensity: If we use labor productivity (that is, the ratio oftotal output to total labor) as our measure of performance, thencapital intensity, or the firm’s capital–labor ratio, is an impor-tant control variable. This is because for a given amount of labor,firms that have a higher capital-stock will also produce moreoutput, resulting in higher labor productivity.
. Firm-level data
.1. Sources
We collected firm-specific time-series data from several sourcesor the 10-year period 1995–2004. First, Compustat North Americand Global Vantage Database provided firm-level information onales, investment, capital–stock R&D expenditures, wages and otherariables for the US and foreign pulp and paper firms. Some of the
esearch Policy 38 (2009) 536–547 541
dpafittttasridlfidwWmdicwdm
Oetp
oi
MtodeaTsctd
uod
5
dfirpace
i
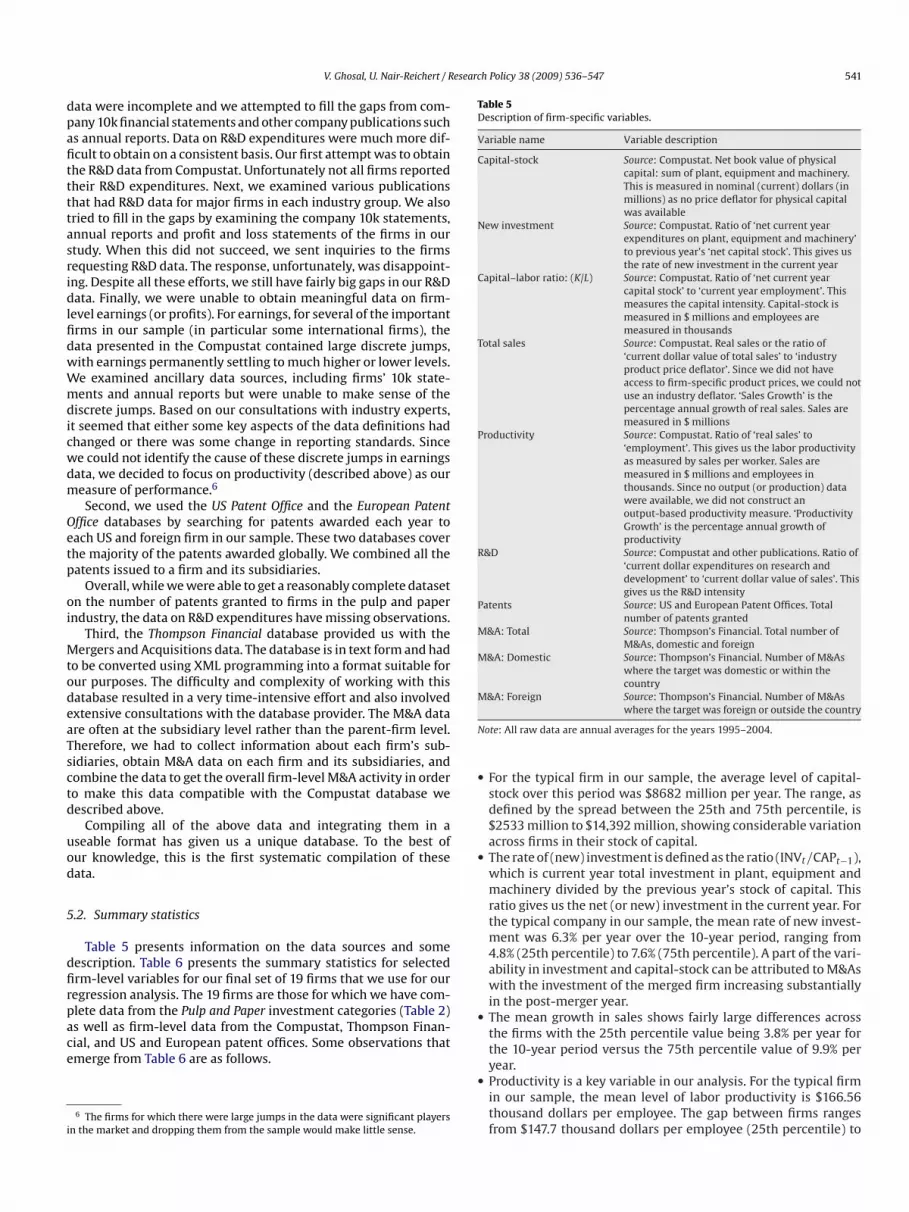
Table 5Description of firm-specific variables.
Variable name Variable description
Capital-stock Source: Compustat. Net book value of physicalcapital: sum of plant, equipment and machinery.This is measured in nominal (current) dollars (inmillions) as no price deflator for physical capitalwas available
New investment Source: Compustat. Ratio of ‘net current yearexpenditures on plant, equipment and machinery’to previous year’s ‘net capital stock’. This gives usthe rate of new investment in the current year
Capital–labor ratio: (K/L) Source: Compustat. Ratio of ‘net current yearcapital stock’ to ‘current year employment’. Thismeasures the capital intensity. Capital-stock ismeasured in $ millions and employees aremeasured in thousands
Total sales Source: Compustat. Real sales or the ratio of‘current dollar value of total sales’ to ‘industryproduct price deflator’. Since we did not haveaccess to firm-specific product prices, we could notuse an industry deflator. ‘Sales Growth’ is thepercentage annual growth of real sales. Sales aremeasured in $ millions
Productivity Source: Compustat. Ratio of ‘real sales’ to‘employment’. This gives us the labor productivityas measured by sales per worker. Sales aremeasured in $ millions and employees inthousands. Since no output (or production) datawere available, we did not construct anoutput-based productivity measure. ‘ProductivityGrowth’ is the percentage annual growth ofproductivity
R&D Source: Compustat and other publications. Ratio of‘current dollar expenditures on research anddevelopment’ to ‘current dollar value of sales’. Thisgives us the R&D intensity
Patents Source: US and European Patent Offices. Totalnumber of patents granted
M&A: Total Source: Thompson’s Financial. Total number ofM&As, domestic and foreign
M&A: Domestic Source: Thompson’s Financial. Number of M&Aswhere the target was domestic or within thecountry
M&A: Foreign Source: Thompson’s Financial. Number of M&As
N
•
•
V. Ghosal, U. Nair-Reichert / R
ata were incomplete and we attempted to fill the gaps from com-any 10k financial statements and other company publications suchs annual reports. Data on R&D expenditures were much more dif-cult to obtain on a consistent basis. Our first attempt was to obtainhe R&D data from Compustat. Unfortunately not all firms reportedheir R&D expenditures. Next, we examined various publicationshat had R&D data for major firms in each industry group. We alsoried to fill in the gaps by examining the company 10k statements,nnual reports and profit and loss statements of the firms in ourtudy. When this did not succeed, we sent inquiries to the firmsequesting R&D data. The response, unfortunately, was disappoint-ng. Despite all these efforts, we still have fairly big gaps in our R&Data. Finally, we were unable to obtain meaningful data on firm-
evel earnings (or profits). For earnings, for several of the importantrms in our sample (in particular some international firms), theata presented in the Compustat contained large discrete jumps,ith earnings permanently settling to much higher or lower levels.e examined ancillary data sources, including firms’ 10k state-ents and annual reports but were unable to make sense of the
iscrete jumps. Based on our consultations with industry experts,t seemed that either some key aspects of the data definitions hadhanged or there was some change in reporting standards. Sincee could not identify the cause of these discrete jumps in earningsata, we decided to focus on productivity (described above) as oureasure of performance.6
Second, we used the US Patent Office and the European Patentffice databases by searching for patents awarded each year toach US and foreign firm in our sample. These two databases coverhe majority of the patents awarded globally. We combined all theatents issued to a firm and its subsidiaries.
Overall, while we were able to get a reasonably complete datasetn the number of patents granted to firms in the pulp and paperndustry, the data on R&D expenditures have missing observations.
Third, the Thompson Financial database provided us with theergers and Acquisitions data. The database is in text form and had
o be converted using XML programming into a format suitable forur purposes. The difficulty and complexity of working with thisatabase resulted in a very time-intensive effort and also involvedxtensive consultations with the database provider. The M&A datare often at the subsidiary level rather than the parent-firm level.herefore, we had to collect information about each firm’s sub-idiaries, obtain M&A data on each firm and its subsidiaries, andombine the data to get the overall firm-level M&A activity in ordero make this data compatible with the Compustat database weescribed above.
Compiling all of the above data and integrating them in aseable format has given us a unique database. To the best ofur knowledge, this is the first systematic compilation of theseata.
.2. Summary statistics
Table 5 presents information on the data sources and someescription. Table 6 presents the summary statistics for selectedrm-level variables for our final set of 19 firms that we use for ouregression analysis. The 19 firms are those for which we have com-
lete data from the Pulp and Paper investment categories (Table 2)s well as firm-level data from the Compustat, Thompson Finan-ial, and US and European patent offices. Some observations thatmerge from Table 6 are as follows.6 The firms for which there were large jumps in the data were significant playersn the market and dropping them from the sample would make little sense.
•
•
where the target was foreign or outside the country
ote: All raw data are annual averages for the years 1995–2004.
For the typical firm in our sample, the average level of capital-stock over this period was $8682 million per year. The range, asdefined by the spread between the 25th and 75th percentile, is$2533 million to $14,392 million, showing considerable variationacross firms in their stock of capital.The rate of (new) investment is defined as the ratio (INVt/CAPt−1),which is current year total investment in plant, equipment andmachinery divided by the previous year’s stock of capital. Thisratio gives us the net (or new) investment in the current year. Forthe typical company in our sample, the mean rate of new invest-ment was 6.3% per year over the 10-year period, ranging from4.8% (25th percentile) to 7.6% (75th percentile). A part of the vari-ability in investment and capital-stock can be attributed to M&Aswith the investment of the merged firm increasing substantiallyin the post-merger year.The mean growth in sales shows fairly large differences acrossthe firms with the 25th percentile value being 3.8% per year forthe 10-year period versus the 75th percentile value of 9.9% peryear.
Productivity is a key variable in our analysis. For the typical firmin our sample, the mean level of labor productivity is $166.56thousand dollars per employee. The gap between firms rangesfrom $147.7 thousand dollars per employee (25th percentile) to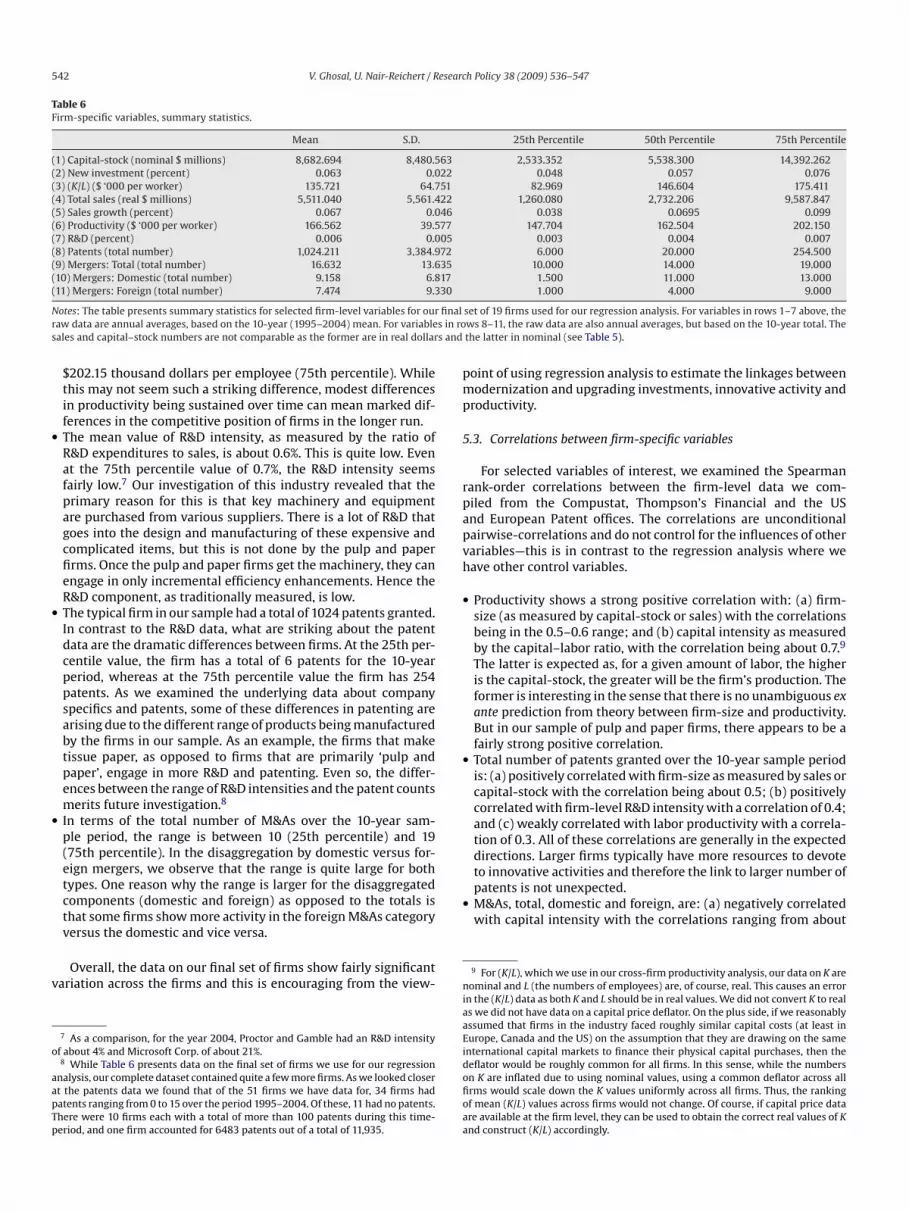
542 V. Ghosal, U. Nair-Reichert / Research Policy 38 (2009) 536–547
Table 6Firm-specific variables, summary statistics.
Mean S.D. 25th Percentile 50th Percentile 75th Percentile
(1) Capital-stock (nominal $ millions) 8,682.694 8,480.563 2,533.352 5,538.300 14,392.262(2) New investment (percent) 0.063 0.022 0.048 0.057 0.076(3) (K/L) ($ ‘000 per worker) 135.721 64.751 82.969 146.604 175.411(4) Total sales (real $ millions) 5,511.040 5,561.422 1,260.080 2,732.206 9,587.847(5) Sales growth (percent) 0.067 0.046 0.038 0.0695 0.099(6) Productivity ($ ‘000 per worker) 166.562 39.577 147.704 162.504 202.150(7) R&D (percent) 0.006 0.005 0.003 0.004 0.007(8) Patents (total number) 1,024.211 3,384.972 6.000 20.000 254.500(9) Mergers: Total (total number) 16.632 13.635 10.000 14.000 19.000(10) Mergers: Domestic (total number) 9.158 6.817 1.500 11.000 13.000(11) Mergers: Foreign (total number) 7.474 9.330 1.000 4.000 9.000
N finalr s in ros s and
•
•
•
v
o
aapTp
pmp
5
rpapvh
•
•
to innovative activities and therefore the link to larger number ofpatents is not unexpected.
• M&As, total, domestic and foreign, are: (a) negatively correlatedwith capital intensity with the correlations ranging from about
otes: The table presents summary statistics for selected firm-level variables for ouraw data are annual averages, based on the 10-year (1995–2004) mean. For variableales and capital–stock numbers are not comparable as the former are in real dollar
$202.15 thousand dollars per employee (75th percentile). Whilethis may not seem such a striking difference, modest differencesin productivity being sustained over time can mean marked dif-ferences in the competitive position of firms in the longer run.The mean value of R&D intensity, as measured by the ratio ofR&D expenditures to sales, is about 0.6%. This is quite low. Evenat the 75th percentile value of 0.7%, the R&D intensity seemsfairly low.7 Our investigation of this industry revealed that theprimary reason for this is that key machinery and equipmentare purchased from various suppliers. There is a lot of R&D thatgoes into the design and manufacturing of these expensive andcomplicated items, but this is not done by the pulp and paperfirms. Once the pulp and paper firms get the machinery, they canengage in only incremental efficiency enhancements. Hence theR&D component, as traditionally measured, is low.The typical firm in our sample had a total of 1024 patents granted.In contrast to the R&D data, what are striking about the patentdata are the dramatic differences between firms. At the 25th per-centile value, the firm has a total of 6 patents for the 10-yearperiod, whereas at the 75th percentile value the firm has 254patents. As we examined the underlying data about companyspecifics and patents, some of these differences in patenting arearising due to the different range of products being manufacturedby the firms in our sample. As an example, the firms that maketissue paper, as opposed to firms that are primarily ‘pulp andpaper’, engage in more R&D and patenting. Even so, the differ-ences between the range of R&D intensities and the patent countsmerits future investigation.8
In terms of the total number of M&As over the 10-year sam-ple period, the range is between 10 (25th percentile) and 19(75th percentile). In the disaggregation by domestic versus for-eign mergers, we observe that the range is quite large for bothtypes. One reason why the range is larger for the disaggregatedcomponents (domestic and foreign) as opposed to the totals isthat some firms show more activity in the foreign M&As category
versus the domestic and vice versa.Overall, the data on our final set of firms show fairly significantariation across the firms and this is encouraging from the view-
7 As a comparison, for the year 2004, Proctor and Gamble had an R&D intensityf about 4% and Microsoft Corp. of about 21%.8 While Table 6 presents data on the final set of firms we use for our regression
nalysis, our complete dataset contained quite a few more firms. As we looked closert the patents data we found that of the 51 firms we have data for, 34 firms hadatents ranging from 0 to 15 over the period 1995–2004. Of these, 11 had no patents.here were 10 firms each with a total of more than 100 patents during this time-eriod, and one firm accounted for 6483 patents out of a total of 11,935.
niaaEidofioaa
set of 19 firms used for our regression analysis. For variables in rows 1–7 above, thews 8–11, the raw data are also annual averages, but based on the 10-year total. Thethe latter in nominal (see Table 5).
oint of using regression analysis to estimate the linkages betweenodernization and upgrading investments, innovative activity and
roductivity.
.3. Correlations between firm-specific variables
For selected variables of interest, we examined the Spearmanank-order correlations between the firm-level data we com-iled from the Compustat, Thompson’s Financial and the USnd European Patent offices. The correlations are unconditionalairwise-correlations and do not control for the influences of otherariables—this is in contrast to the regression analysis where weave other control variables.
Productivity shows a strong positive correlation with: (a) firm-size (as measured by capital-stock or sales) with the correlationsbeing in the 0.5–0.6 range; and (b) capital intensity as measuredby the capital–labor ratio, with the correlation being about 0.7.9
The latter is expected as, for a given amount of labor, the higheris the capital-stock, the greater will be the firm’s production. Theformer is interesting in the sense that there is no unambiguous exante prediction from theory between firm-size and productivity.But in our sample of pulp and paper firms, there appears to be afairly strong positive correlation.Total number of patents granted over the 10-year sample periodis: (a) positively correlated with firm-size as measured by sales orcapital-stock with the correlation being about 0.5; (b) positivelycorrelated with firm-level R&D intensity with a correlation of 0.4;and (c) weakly correlated with labor productivity with a correla-tion of 0.3. All of these correlations are generally in the expecteddirections. Larger firms typically have more resources to devote
9 For (K/L), which we use in our cross-firm productivity analysis, our data on K areominal and L (the numbers of employees) are, of course, real. This causes an error
n the (K/L) data as both K and L should be in real values. We did not convert K to reals we did not have data on a capital price deflator. On the plus side, if we reasonablyssumed that firms in the industry faced roughly similar capital costs (at least inurope, Canada and the US) on the assumption that they are drawing on the samenternational capital markets to finance their physical capital purchases, then theeflator would be roughly common for all firms. In this sense, while the numbersn K are inflated due to using nominal values, using a common deflator across allrms would scale down the K values uniformly across all firms. Thus, the rankingf mean (K/L) values across firms would not change. Of course, if capital price datare available at the firm level, they can be used to obtain the correct real values of Knd construct (K/L) accordingly.
V. Ghosal, U. Nair-Reichert / Research Policy 38 (2009) 536–547 543
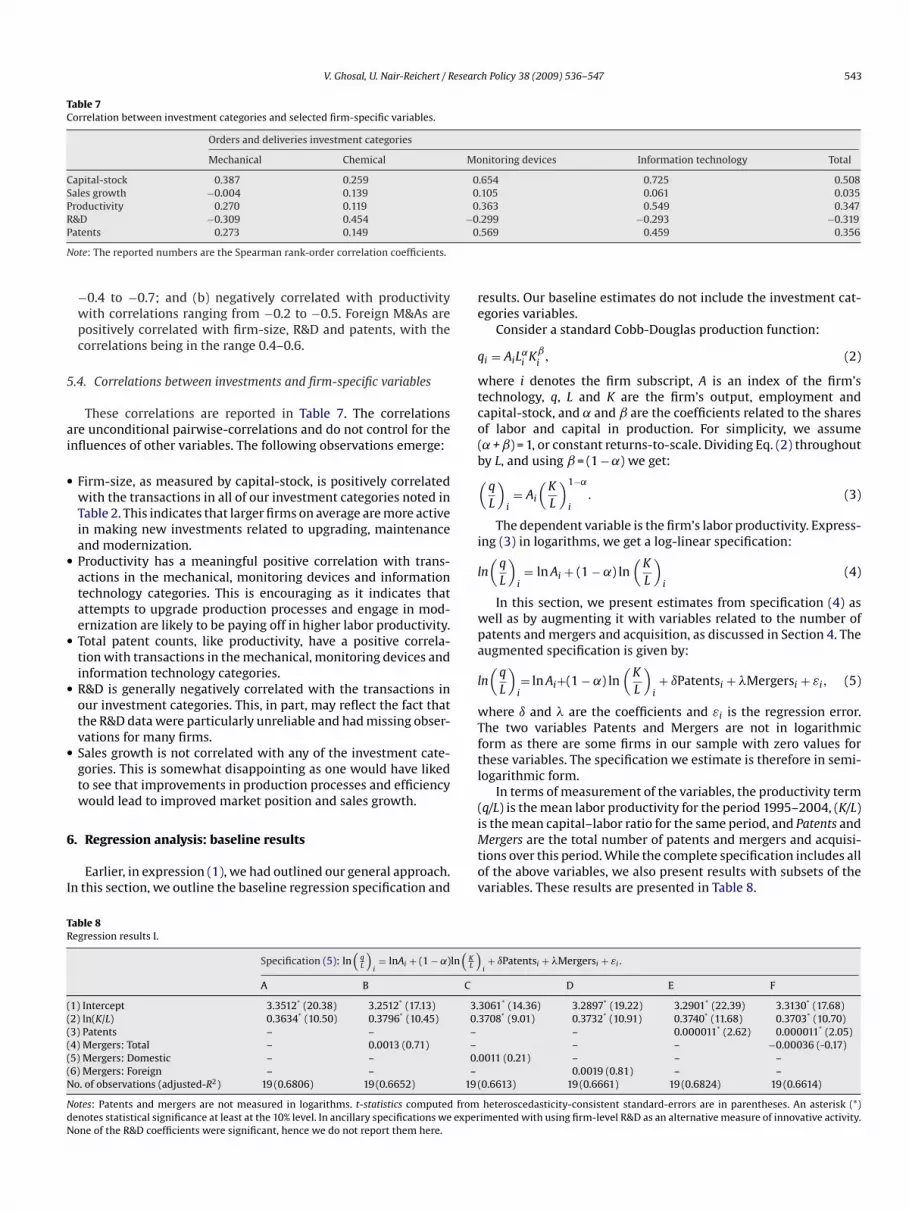
Table 7Correlation between investment categories and selected firm-specific variables.
Orders and deliveries investment categories
Mechanical Chemical Monitoring devices Information technology Total
Capital-stock 0.387 0.259 0.654 0.725 0.508Sales growth −0.004 0.139 0.105 0.061 0.035Productivity 0.270 0.119 0.363 0.549 0.347R −0P 0
N
5
ai
•
•
•
•
•
6
I
re
q
wtco(b(
i
l
wpa
l
wTftl
(
TR
((((((N
NdN
&D −0.309 0.454atents 0.273 0.149
ote: The reported numbers are the Spearman rank-order correlation coefficients.
−0.4 to −0.7; and (b) negatively correlated with productivitywith correlations ranging from −0.2 to −0.5. Foreign M&As arepositively correlated with firm-size, R&D and patents, with thecorrelations being in the range 0.4–0.6.
.4. Correlations between investments and firm-specific variables
These correlations are reported in Table 7. The correlationsre unconditional pairwise-correlations and do not control for thenfluences of other variables. The following observations emerge:
Firm-size, as measured by capital-stock, is positively correlatedwith the transactions in all of our investment categories noted inTable 2. This indicates that larger firms on average are more activein making new investments related to upgrading, maintenanceand modernization.Productivity has a meaningful positive correlation with trans-actions in the mechanical, monitoring devices and informationtechnology categories. This is encouraging as it indicates thatattempts to upgrade production processes and engage in mod-ernization are likely to be paying off in higher labor productivity.Total patent counts, like productivity, have a positive correla-tion with transactions in the mechanical, monitoring devices andinformation technology categories.R&D is generally negatively correlated with the transactions inour investment categories. This, in part, may reflect the fact thatthe R&D data were particularly unreliable and had missing obser-vations for many firms.Sales growth is not correlated with any of the investment cate-gories. This is somewhat disappointing as one would have likedto see that improvements in production processes and efficiencywould lead to improved market position and sales growth.
. Regression analysis: baseline results
Earlier, in expression (1), we had outlined our general approach.n this section, we outline the baseline regression specification and
iMtov
able 8egression results I.
Specification (5): ln(
qL
)i= lnAi + (1 − ˛)ln
(KL
)
A B C
1) Intercept 3.3512* (20.38) 3.2512* (17.13) 3.2) ln(K/L) 0.3634* (10.50) 0.3796* (10.45) 0.3) Patents – – –4) Mergers: Total – 0.0013 (0.71) –5) Mergers: Domestic – – 0.6) Mergers: Foreign – – –o. of observations (adjusted-R2) 19 (0.6806) 19 (0.6652) 19 (
otes: Patents and mergers are not measured in logarithms. t-statistics computed fromenotes statistical significance at least at the 10% level. In ancillary specifications we experone of the R&D coefficients were significant, hence we do not report them here.
.299 −0.293 −0.319
.569 0.459 0.356
esults. Our baseline estimates do not include the investment cat-gories variables.
Consider a standard Cobb-Douglas production function:
i = AiL˛i Kˇ
i, (2)
here i denotes the firm subscript, A is an index of the firm’sechnology, q, L and K are the firm’s output, employment andapital-stock, and ˛ and ˇ are the coefficients related to the sharesf labor and capital in production. For simplicity, we assume˛ + ˇ) = 1, or constant returns-to-scale. Dividing Eq. (2) throughouty L, and using ˇ = (1 − ˛) we get:
q
L
)i= Ai
(K
L
)1−˛
i. (3)
The dependent variable is the firm’s labor productivity. Express-ng (3) in logarithms, we get a log-linear specification:
n(
q
L
)i= ln Ai + (1 − ˛) ln
(K
L
)i
(4)
In this section, we present estimates from specification (4) asell as by augmenting it with variables related to the number ofatents and mergers and acquisition, as discussed in Section 4. Theugmented specification is given by:
n(
q
L
)i= ln Ai+(1 − ˛) ln
(K
L
)i+ ıPatentsi + �Mergersi + εi, (5)
here ı and � are the coefficients and εi is the regression error.he two variables Patents and Mergers are not in logarithmicorm as there are some firms in our sample with zero values forhese variables. The specification we estimate is therefore in semi-ogarithmic form.
In terms of measurement of the variables, the productivity termq/L) is the mean labor productivity for the period 1995–2004, (K/L)
s the mean capital–labor ratio for the same period, and Patents andergers are the total number of patents and mergers and acquisi-ions over this period. While the complete specification includes allf the above variables, we also present results with subsets of theariables. These results are presented in Table 8.
i+ ıPatentsi + �Mergersi + εi.
D E F
3061* (14.36) 3.2897* (19.22) 3.2901* (22.39) 3.3130* (17.68)3708* (9.01) 0.3732* (10.91) 0.3740* (11.68) 0.3703* (10.70)
– 0.000011* (2.62) 0.000011* (2.05)– – −0.00036 (-0.17)
0011 (0.21) – – –0.0019 (0.81) – –
0.6613) 19 (0.6661) 19 (0.6824) 19 (0.6614)
heteroscedasticity-consistent standard-errors are in parentheses. An asterisk (*)imented with using firm-level R&D as an alternative measure of innovative activity.
5 esearch Policy 38 (2009) 536–547
•
•
•
•
tsbtf
7c
itoT
l
wtcpomnTgt
pnh
•
•
d
Spec
ifica
tion
(6):
ln( q L
) i=
lnA
i+
(1−
˛)l
n( K L
) i+
ıPat
ents
i+
�M
erge
rsi+
�(T
arge
ted
Inve
stm
ents
) i+
�i.
Incl
ud
eco
ntr
olfo
rm
erge
rsEx
clu
de
con
trol
for
mer
gers
AB
CD
EF
GH
3.35
57*
(15.
28)
3.32
35*
(15.
53)
3.39
32*
(15.
02)
3.34
42*
(16.
78)
3.21
05*
(22.
54)
3.18
85*
(22.
97)
3.31
48*
(20.
78)
3.30
38*
(21.
94)
0.33
94*
(8.0
1)0.
3507
*(8
.33)
0.32
79*
(7.1
7)0.
3614
*(8
.79)
0.36
42*
(11.
48)
0.37
35*
(11.
93)
0.34
08*
(9.4
9)0.
3680
*(1
0.05
)0.
00
001
6*(3
.18)
0.0
00
017*
(2.9
0)0.
00
001
1*(2
.78)
0.0
00
009
(1.4
5)0.
00
001
1*(4
.25)
0.0
00
012*
(3.9
4)0.
00
00
08*
(3.6
8)0.
00
00
08(1
.43)
−0.0
024
(−1.
03)
−0.0
022
(−0.
90)
−0.0
012
(−0.
65)
−0.0
006
(0.3
3)–
––
–0.
005
6*(3
.98)
––
–0.
005
3*(3
.28)
––
––
0.0
067*
(2.8
2)–
––
0.0
064*
(2.4
4)–
––
–0.
0204
*(4
.09)
––
–0.
0202
*(4
.12)
––
––
0.04
92(0
.65)
––
–0.
0476
(0.6
3)d
-R2)
19(0
.796
1)19
(0.7
657)
19(0
.807
2)19
(0.6
476)
19(0
.799
6)19
(0.7
724)
19(0
.817
2)19
(0.6
704)
inve
stm
ents
are
not
mea
sure
din
loga
rith
ms.
TI’s
rep
rese
nt
the
‘tar
gete
din
vest
men
t’va
riab
les.
The
‘TI:
Dig
ital
’cat
egor
yin
row
5is
the
sum
ofth
e‘M
onit
orin
gD
evic
es’a
nd
‘Info
rmat
ion
Tech
nol
ogy’
ty-c
onsi
sten
tsta
nd
ard
-err
ors
are
inp
aren
thes
es.A
nas
teri
sk(*
)den
otes
stat
isti
cals
ign
ifica
nce
atle
asta
tth
e10
%le
vel.
Sin
ceou
rfi
nd
ings
onR
&D
wer
eth
esa
me
asn
oted
inTa
ble
8,w
ed
on
otre
por
t
44 V. Ghosal, U. Nair-Reichert / R
The key observations that emerge are:
As expected, a firm with higher capital–labor ratio has higherlabor productivity, with the estimated coefficients being highlystatistically significant in all the specifications.Firms with a larger number of patents show greater labor pro-ductivity, as expected. The estimated coefficients are highlysignificant.The number of M&As a firm engaged in appears not to beimportant in explaining differences in labor productivity acrossfirms. We included this control variable because firms that aremore active in M&As may face uncertain shorter and longer runoutcomes due to the uncertainties of integrating the new acqui-sitions. Our data do not reveal a significant relationship in eitherdirection.The regression adjusted-R2s are between 0.66 and 0.68, imply-ing that about two-thirds of the (logarithm of) labor productivitydifferences across firms are explained by the variables includedin the estimated specification.
In an ancillary regression we included R&D intensity as a con-rol variable. To include R&D, we had to drop a few firms from ourample of 19 firms due to the lack of R&D data. R&D turned out toe insignificant in all the estimated specifications. This is likely dueo the data problems we noted earlier. Given this result, we do notocus on R&D in our subsequent analysis.
. Regression analysis: incorporating the investmentategories
In this section, we augment the baseline specification (5) tonclude our investment categories variables. The central objective iso examine the linkages between the firms’ transactions in the vari-us investments and performance, which in our case is productivity.he augmented regression takes the form:
n(
q
L
)i= ln Ai + (1 − ˛) ln
(K
L
)i+ ıPatentsi + �Mergersi
+ �Investmentsi + �i, (6)
here �i is the regression error term and Investments referso mechanical, monitoring devices, information technology andhemical classifications described in Table 2. As with the data onatents and mergers, there are some firms that have observationsf zero for some of the investment categories. Therefore, invest-ents are not entered in logarithmic form. We first use the total
umber of transactions across all categories to get a broad picture.hen we re-estimate (6) by using the individual investment cate-ories to provide a comparison of the effects of the transactions inhe different categories.
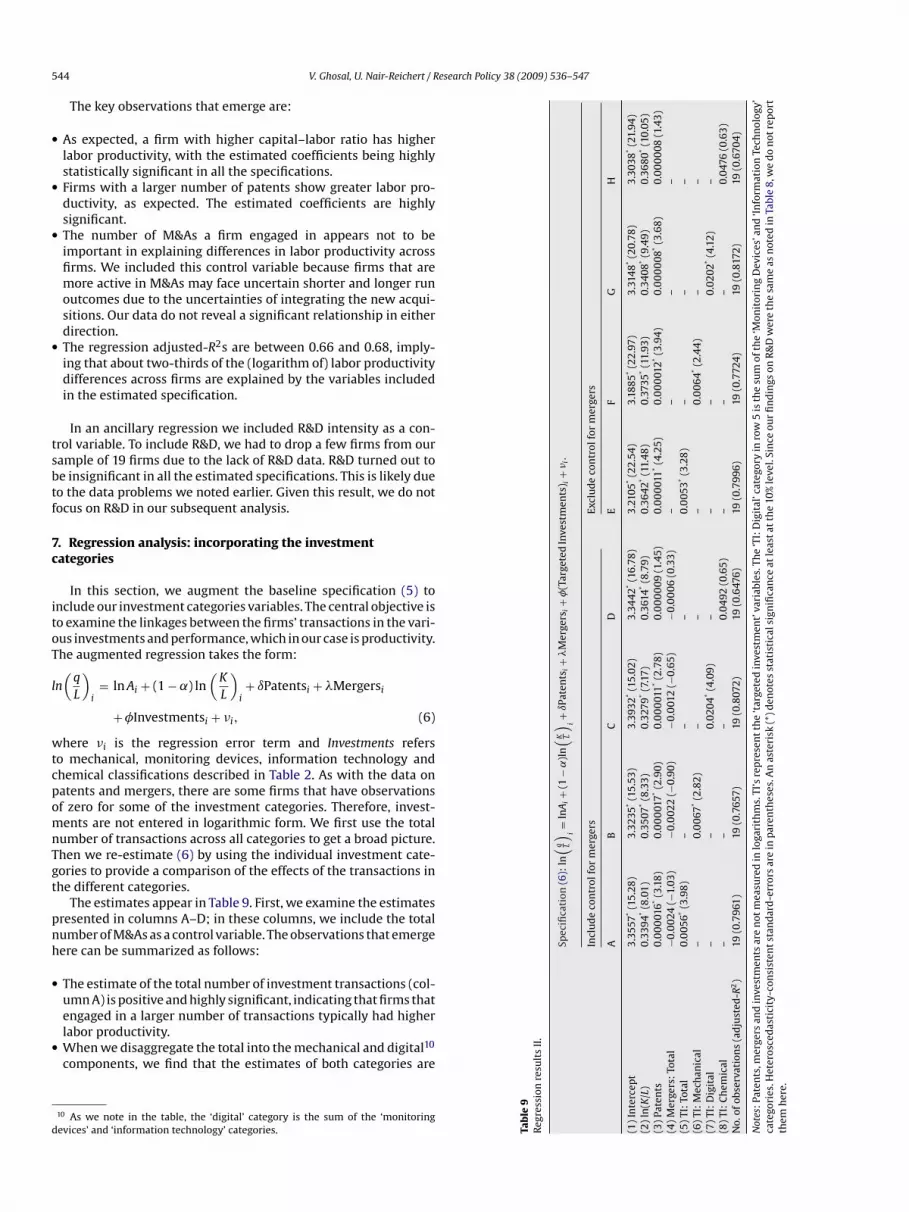
The estimates appear in Table 9. First, we examine the estimatesresented in columns A–D; in these columns, we include the totalumber of M&As as a control variable. The observations that emergeere can be summarized as follows:
The estimate of the total number of investment transactions (col-umn A) is positive and highly significant, indicating that firms that
engaged in a larger number of transactions typically had higherlabor productivity.When we disaggregate the total into the mechanical and digital10components, we find that the estimates of both categories are
10 As we note in the table, the ‘digital’ category is the sum of the ‘monitoringevices’ and ‘information technology’ categories. Ta
ble
9R
egre
ssio
nre
sult
sII
.
(1)
Inte
rcep
t(2
)ln
(K/L
)(3
)Pa
ten
ts(4
)M
erge
rs:
Tota
l(5
)TI
:To
tal
(6)
TI:
Mec
han
ical
(7)
TI:
Dig
ital
(8)
TI:
Ch
emic
alN
o.of
obse
rvat
ion
s(a
dju
ste
Not
es:P
aten
ts,m
erge
rsan
dca
tego
ries
.Het
eros
ced
asti
cith
emh
ere.
V. Ghosal, U. Nair-Reichert / Research Policy 38 (2009) 536–547 545
Table 10Implied quantitative effects based on the estimated coefficients in Table 9.
A B C D
(1) (K/L) 26.97* (8.01) 27.86* (8.33) 26.94* (7.17) 29.64* (8.79)(2) Patents 9.01** (3.08) 9.58* (2.90) 6.20* (2.78) 5.07 (1.45)(3) Mergers: Total −5.45 (−1.03) −4.99 (−0.90) −2.72 (−0.65) −1.36 (0.33)(4) TI: Total 15.10* (3.98) – – –(5) TI: Mechanical – 13.45* (2.82) – –(6) TI: Digital – – 15.52* (4.09) –(7) TI: Chemical – – – 4.01 (0.65)No. of observations (adjusted-R2) 19 (0.7961) 19 (0.7657) 19 (0.8072) 19 (0.6476)
Notes: The implied quantitative effects are computed from the coefficient estimates presented in Table 9 (columns A–D) and the summary statistics presented in Tables 3 and 6.For each of the explanatory variables, the starting points are the means of the dependent variable and the explanatory variable. Then we consider a one-standard-deviationchange in that explanatory variable (e.g. patents) and compute the resulting change in the dependent variable (q/L). The t-statistics, significance levels and adjusted-R2 aret st at tq
•
•
•
eaepbtp
7
aatfc
l
D
ia
mcettT(
niaosbariaif2
pTco
ptaea
8
and paper industry. Based on observation-based insights from visitsto pulp and paper mills, Ghosal (2003) noted that various kinds of‘incremental’ innovations, modernization investments, among oth-
he same as in Table 9. An asterisk (*) denotes that the estimate is significant at leauantitative effects of the explanatory variables.
highly significant, indicating that these transactions individuallyplayed an important role in enhancing productivity. The pointestimate of the digital transactions is greater than the mechani-cal category, but, as we evaluate later, the estimated quantitativeeffect of the digital category is only slightly larger than themechanical.The estimate of the chemicals category, while positive, is statisti-cally insignificant. This is probably not too surprising given thatwe do not observe many transactions in the chemicals categoryfor our sample of firms.If we compare column F in Table 8 with column A in Table 9,the latter has an adjusted-R2 that is 0.135 greater. Thus, addingjust one variable – the total number of investment transactions –increases the (degrees-of-freedom adjusted) explanatory powerby 13.5%.Given our small sample, we have some concerns about thedegrees of freedom. Since the M&A effects were statisticallyinsignificant, we re-estimated specification (6) by excludingthe M&A control variable. These estimates are presented incolumns E and H of Table 9. Our broad inferences remainintact.
To summarize, the investment transactions aimed at mod-rnization and upgrading of the production processes and otherspects of firm operations do seem to be an important factorxplaining productivity differences across firms in the pulp andaper industry. In particular, firms that engaged in a larger num-er of transactions in the monitoring devices and informationechnology areas seem to have experienced a noticeable boost inroductivity.
.1. Assessing the quantitative impacts
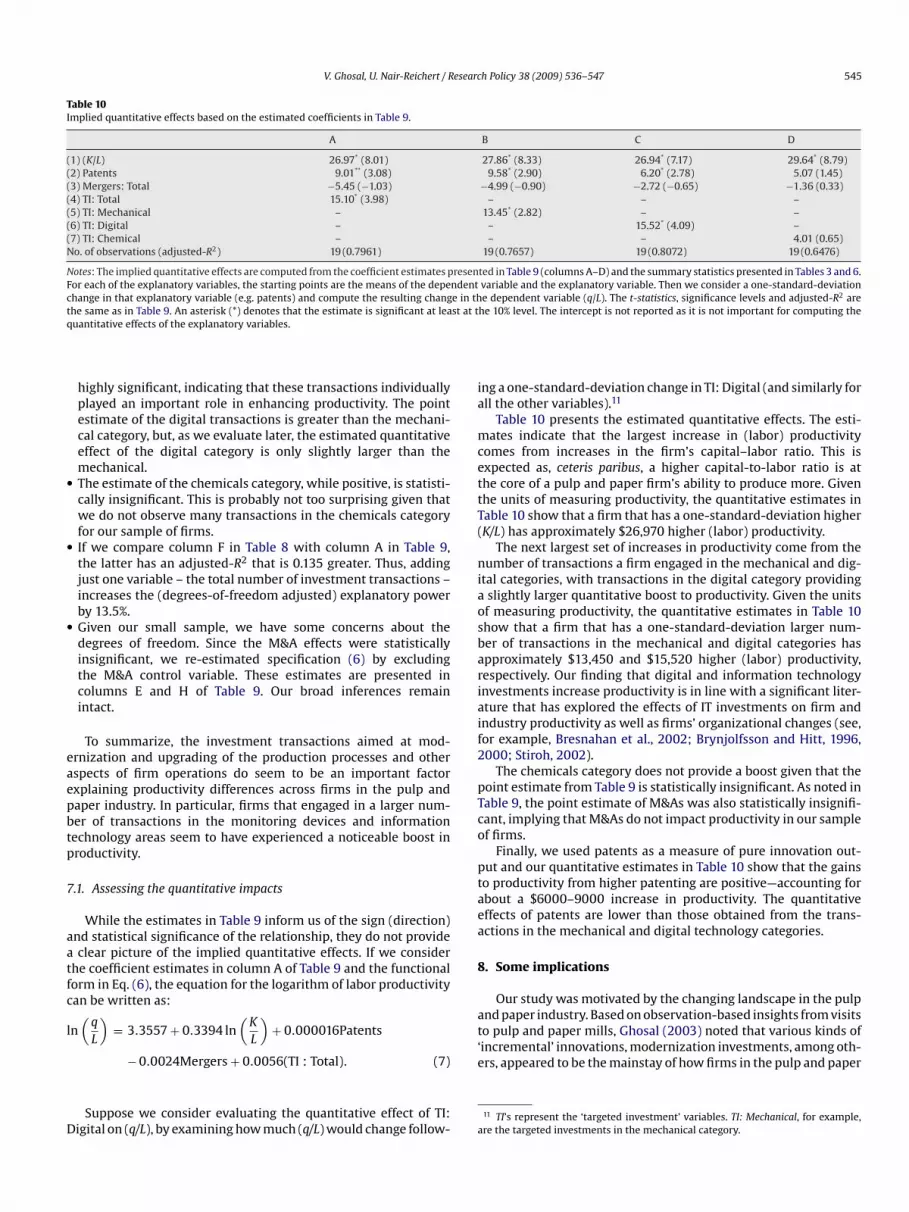
While the estimates in Table 9 inform us of the sign (direction)nd statistical significance of the relationship, they do not provideclear picture of the implied quantitative effects. If we consider
he coefficient estimates in column A of Table 9 and the functionalorm in Eq. (6), the equation for the logarithm of labor productivityan be written as:
n(
q
L
)= 3.3557 + 0.3394 ln
(K
L
)+ 0.000016Patents
− 0.0024Mergers + 0.0056(TI : Total). (7)
Suppose we consider evaluating the quantitative effect of TI:igital on (q/L), by examining how much (q/L) would change follow-
e
a
he 10% level. The intercept is not reported as it is not important for computing the
ng a one-standard-deviation change in TI: Digital (and similarly forll the other variables).11
Table 10 presents the estimated quantitative effects. The esti-ates indicate that the largest increase in (labor) productivity
omes from increases in the firm’s capital–labor ratio. This isxpected as, ceteris paribus, a higher capital-to-labor ratio is athe core of a pulp and paper firm’s ability to produce more. Givenhe units of measuring productivity, the quantitative estimates inable 10 show that a firm that has a one-standard-deviation higherK/L) has approximately $26,970 higher (labor) productivity.
The next largest set of increases in productivity come from theumber of transactions a firm engaged in the mechanical and dig-
tal categories, with transactions in the digital category providingslightly larger quantitative boost to productivity. Given the unitsf measuring productivity, the quantitative estimates in Table 10how that a firm that has a one-standard-deviation larger num-er of transactions in the mechanical and digital categories haspproximately $13,450 and $15,520 higher (labor) productivity,espectively. Our finding that digital and information technologynvestments increase productivity is in line with a significant liter-ture that has explored the effects of IT investments on firm andndustry productivity as well as firms’ organizational changes (see,or example, Bresnahan et al., 2002; Brynjolfsson and Hitt, 1996,000; Stiroh, 2002).
The chemicals category does not provide a boost given that theoint estimate from Table 9 is statistically insignificant. As noted inable 9, the point estimate of M&As was also statistically insignifi-ant, implying that M&As do not impact productivity in our samplef firms.
Finally, we used patents as a measure of pure innovation out-ut and our quantitative estimates in Table 10 show that the gainso productivity from higher patenting are positive—accounting forbout a $6000–9000 increase in productivity. The quantitativeffects of patents are lower than those obtained from the trans-ctions in the mechanical and digital technology categories.
. Some implications
Our study was motivated by the changing landscape in the pulp
rs, appeared to be the mainstay of how firms in the pulp and paper
11 TI’s represent the ‘targeted investment’ variables. TI: Mechanical, for example,re the targeted investments in the mechanical category.
5 esearc
iatmttatms
figtevmgfmfiitmtca
9
lfieetputltOuibRviwwa
Tati
cpao
m
fcartawIuadbiirTsnrm
atitfirie–pietew
ntisail
A
PIVStia
46 V. Ghosal, U. Nair-Reichert / R
ndustry viewed themselves as staying competitive in the short runs well as gaining on their competitors in the longer run.12 Break-hrough innovations that characterize some industries are not the
ost important factors that drive the changing competitive posi-ion and performance of firms in this industry. In contrast, firmshat succeed in implementing even small gains in productivity onyear-to-year basis via investments in upgrading and moderniza-
ion, as well as making changes to the supply-chain, would in theedium-to-longer run gain relative to those firms who were not
uccessful at implementing such strategies.The results in this paper, linking productivity differences across
rms to modernization investments and upgrading in various cate-ories, as well as examining the link to patents, appear to reinforcehis message strongly. Patents, for example, help explain differ-nces in productivity across firms, but the quantitative effect is notery large. In contrast, the estimated impact of investments in theechanical, monitoring devices and information technology cate-
ories on productivity is positive and larger than those observedor patents. Based on our results, R&D expenditures do not make a
eaningful contribution to productivity. The clear message is thatrms need to stay focused and actively implement modernization
nvestments in all stages of the production process to ensure thathey achieve gains in productivity. Further, while these investments
ay only produce relatively small gains in productivity on a year-o-year basis, it is important to recognize that these small gainsan compound over time to form larger differences in productivitycross firms in the longer run.
. Concluding remarks
The primary contributions of this paper can be viewed as fol-ows. First, we develop a framework within which we conceptualizerms’ operations and strategies to boost productivity. We did notmphasize much of the standard literature that focuses on R&Dxpenditures and patent counts to gauge firms’ innovation activi-ies and link these to the measures of performance. While R&D andatents are useful measures in many industries, in general they arenlikely to be good measures for firms in the pulp and paper indus-ry. This is because firms in this industry typically have a ratherow R&D intensity, as measured by the ratio of R&D expenditureso sales, and most firms do not hold a large number of patents.ur prior assumption, therefore, was that R&D and patents werenlikely to be the key channels. Our empirical results confirm this
nsight. We found that patents had a relatively small positive contri-ution towards firm-level productivity and our experiments with&D revealed that it was not a factor in boosting productivity. Ourisits to various pulp and paper mills convinced us that examiningnvestments made by firms related to modernization and upgrading
ould be more useful in gaining insights. In short, the frameworke adopted was more expansive, allowing alternative channels to
ffect firm-level productivity.Second, we compiled an extensive dataset from diverse sources.
hese were described in detail in Sections 3 and 5. As far as we areware, there is no other study of firms in this industry which has putogether such a diverse amount of data and information to analyzessues related to investments, innovation, M&As and productivity.
In combination, we feel that our framework and the data we have
ollected can serve as a useful starting point for future research onroductivity and performance issues not only for firms in the pulpnd paper industry, but also provide a useful model for research forther industries.12 Norberg-Bohm and Rossi (1998) present insights on specific aspects of incre-ental innovations in this industry.
R
AB
B
h Policy 38 (2009) 536–547
We noted several shortcomings of our data. Our hope is thatuture research can fill the gaps in the data and provide a moreomprehensive picture. There are three areas in particular wheredditional data and insights would add value to this line ofesearch. The first relates to quantifying the monetary value ofhe investments in the mechanical, chemicals, monitoring devicesnd information technology categories. Despite our best efforts, weere unable to put together a reasonable dataset in this dimension.
f one is able to attach monetary values, then one could provideseful insights on prioritizing the different areas of investmentsnd modernization. The second relates to obtaining a consistentatabase for firm-level profits. Profits are a key measure of a firm’sottom line and would serve as an important complement to exam-
ning productivity differentials across firms. For the reasons notedn Section 5.1, we were unable to compile consistent and compa-able data on US and foreign firms in the pulp and paper industry.hird, despite our best efforts, we were unable to put together aample with a larger number of firms. This was due to the diverseature of the data we had to compile and the myriad sources. Futureesearch, by compiling information on a larger number of firms,ay provide additional insights.Apart from the path we pursued in this paper, there are three
reas of research that can yield valuable insights. First would beo examine the organizational and management changes the firmsn the pulp and paper industry made in response to the competi-ive challenges (Ghosal, 2003, 2008). Second, our discussions withrms’ production managers, other executives and industry analystsevealed that while R&D as traditionally measured is low, the typ-cal worker in a pulp and paper firm can be quite technical – forxample, many of them are mechanical and chemical engineersand these employees contribute to learning-by-doing gains in
roductivity, pointing out areas that need upgrading and modern-zation and various forms of incremental innovation. While thesemployees are hired to do routine work for the firm, they also con-ribute as ‘R&D workers’ at the margin. Unfortunately, our initialfforts to put a number on this dimension proved unsuccessful ande hope to pursue this in our ongoing research.
Third, our paper focused on process change in the industry,eglecting areas of product innovation related to, for example, bet-er quality of paper and newer varieties. Some aspects of productnnovation are undoubtedly related to process changes. An exten-ion of the current work where the interlinkages between productnd process innovation are examined would yield useful insightsnto decision-making and business strategy in a traditional industryike pulp and paper.
cknowledgments
This study was funded by a 2004–2006 grant from the Center foraper Business and Industry Studies, an Alfred P. Sloan Foundationndustry Research Center. The grant was to examine “The Role andalue of Innovation in the Pulp and Paper Industry” and is part of theloan Foundation’s initiatives to gain an understanding of innova-ion, productivity and competition issues in important traditionalndustries. The authors thank participants at several workshops andnonymous referees for helpful suggestions.
eferences
udretsch, D., 1995. Innovation and Industry Evolution. MIT Press, Cambridge, MA.
jorkman, A., Paun, D., Jacobs-Young, C., 1997. Financial performance, capital expen-ditures, and international activities of the North American pulp and paperindustry at mid-decade. The TAPPI Journal 80 (10), 71–84.
resnahan, T.F., Brynjolfsson, E., Hitt, L.M., 2002. Information technology, workplaceorganization, and the demand for skilled labor: firm-level evidence. QuarterlyJournal of Economics 117 (1), 339–376.
esearc
B
B
C
D
E
G
G
G
G
G
I
K
N
N
O
O
P
P
V. Ghosal, U. Nair-Reichert / R
rynjolfsson, E., Hitt, L., 1996. Paradox lost?: firm-level evidence on the returns toinformation systems spending. Management Science 42 (4), 541–558.
rynjolfsson, E., Hitt, L., 2000. Beyond computation: information technology, orga-nizational transformation and business performance. Journal of EconomicPerspectives 14 (4), 23–48.
ohen, W., Levin, R., 1989. Empirical studies of innovation and market structure. In:Schmalensee, R., Willig, R. (Eds.), Handbook of Industrial Organization. North-Holland, Amsterdam.
ouglas, C., March 2001. Pulp friction. In: Fedgazette. Federal Reserve Bank of Min-neapolis.
ngel, C., 1997. Taking note of the paper industry. Monthly Labor Review 120 (9),32–40.
hosal, V., 2003. Is there a productivity gap between US and European pulp andpaper producers? Research Report. Center for Paper Business and Industry Stud-ies, pp. 1–24.
hosal, V., 2008. Business strategy and firm reorganization under changing marketconditions. Working paper. Georgia Institute of Technology.
hosal, V., Nair-Reichert, U., 2007. Innovation and productivity growth in the pulp
and paper industry: firm-level empirical evidence. Research Report. Center forPaper Business and Industry Studies, pp. 1–52.ort, M., Klepper, S., 1982. Time paths in the diffusion of product innovations. Eco-nomic Journal 92, 630–653.
riliches, Z. (Ed.), 1984. R&D, Patents and Productivity. University of Chicago Press,Chicago.
S
SSW
h Policy 38 (2009) 536–547 547
nce, P.J., 1999. Global cycle changes the rules for U.S. pulp and paper. AmericanPapermaker 81 (12), 37–42.
ates, W., July 2001. Hurting Paper Industry Watches Mills Close, Jobs Disappear.Associated Press.
ilsson, L.J., Larson, E.D., Gilbreath, K., Gupta, A., 1996. Energy efficiency and thepaper and pulp industry. Report No. IE962. American Council for an EnergyEfficient Economy.
orberg-Bohm, V., Rossi, M., 1998. The power of incrementalism: environmentalregulation and technological change in pulp and paper bleaching in the US.Technology Analysis and Strategic Management 10, 225–245.
hanian, N.K., 1993. The American pulp and paper industry, 1900–1940: mill sur-vival, firm structure, and industry relocation. In: Contributions in Economics andEconomic History, No. 140. Greenwood Press, Westport CT and London.
hanian, N.K., 1994. Vertical integration in the US pulp and paper industry,1900–1940. Review of Economics and Statistics 76 (1), 202–207.
esendorfer, M., 2003. Horizontal mergers in the paper industry. RAND Journal ofEconomics 34 (3), 495–515.
ulp and Paper: North American Factbook. Paperloop Publications, 1996–2003.
tiroh, K., 2002. Information technology and the U.S. productivity revival: what dothe industry data say? American Economic Review 92 (5), 1559–1576.uhonen, T., January 2001. Last of the big spenders? Pulp and Paper International.utton, J., 1997. Technology and Market Structure. MIT Press, Cambridge, MA.inter, S., 1984. Schumpeterian competition in alternative technological regimes.
Journal of Economic Behavior and Organization 5 (3), 287–320.