t2 user handbook v3.0- data warehouse (dwh)
TRANSCRIPT
User Handbook
Author 4CB
Version V3.0
Date 14 June 2022
All rights reserved.
Data Warehouse
All rights reserved. Page 2 of 478
Table of contents
List of Figures ............................................................................................................................................8
List of Tables .......................................................................................................................................... 22
1 Introduction .......................................................................................................................................... 26
1.1 Purpose of the document ................................................................................................................ 26
1.1.1 UHB Methodology ...................................................................................................................... 26
1.1.2 UHB Structure ............................................................................................................................ 27
1.2 Set-up and Login ............................................................................................................................. 28
1.2.1 GUI Access................................................................................................................................. 28
1.2.2 Technical Requirements ............................................................................................................. 28
2 Introduction to the Data Warehouse ................................................................................................. 30
2.1 Overview .......................................................................................................................................... 30
2.2 Process of the Data Warehouse ..................................................................................................... 31
3 First steps & basics ............................................................................................................................. 32
3.1 Access to the DWH ......................................................................................................................... 32
3.2 Navigating in the DWH GUI – Global application bar...................................................................... 33
3.2.1 Open menu ................................................................................................................................. 33
3.2.2 Data Warehouse icon ................................................................................................................. 33
3.2.3 View switcher ............................................................................................................................. 33
3.2.4 Search content ........................................................................................................................... 34
3.2.5 Notification .................................................................................................................................. 36
3.2.5.1 Subscribing to reports .......................................................................................................... 37
3.2.6 Personal menu ........................................................................................................................... 37
3.2.6.1 Profile and settings ............................................................................................................... 38
3.2.6.2 Logging ................................................................................................................................. 42
3.2.6.2.1 Profile and Settings - Settings ........................................................................................ 44
3.2.6.3 My schedules and subscriptions .......................................................................................... 46
3.2.6.4 Log out ................................................................................................................................. 57
3.3 Navigating in the DWH GUI – menu................................................................................................ 57
3.3.1 Data Warehouse logo ................................................................................................................. 58
3.3.2 Open Home ................................................................................................................................ 58
3.3.3 Search function .......................................................................................................................... 59
3.3.3.1 Narrow your search with filters ............................................................................................. 59
3.3.3.2 Save search results .............................................................................................................. 59
3.3.4 System information ..................................................................................................................... 60
3.3.5 Recent ........................................................................................................................................ 61
3.3.6 New ............................................................................................................................................ 62
3.4 Personal Folders ............................................................................................................................. 63
3.4.1 Team content ............................................................................................................................. 63
All rights reserved. Page 3 of 478
3.4.2 My content .................................................................................................................................. 66
3.4.3 Add a new folder ........................................................................................................................ 67
3.4.4 Sort the content .......................................................................................................................... 68
3.4.5 Filter the content ......................................................................................................................... 69
4 Working with reports ........................................................................................................................... 71
4.1 Copy, save and export .................................................................................................................... 71
4.1.1 Copy a report .............................................................................................................................. 71
4.1.2 Creating a report view ................................................................................................................ 73
4.1.3 Saving a report output ................................................................................................................ 78
4.1.4 Exporting a report to a local folder ............................................................................................. 80
4.2 Running reports ............................................................................................................................... 83
4.2.1 Run a report step-by-step........................................................................................................... 83
4.2.1.1 Choose different formats ...................................................................................................... 85
4.2.1.2 Run in background ............................................................................................................... 89
4.2.2 Delivery....................................................................................................................................... 92
4.2.2.1 Delivery - Save report (U2A) ................................................................................................ 92
4.2.2.2 Delivery - Save the report for an external file (A2A) ............................................................ 95
4.3 Scheduling reports ........................................................................................................................ 102
4.3.1 Precondition ............................................................................................................................. 103
4.3.2 Scheduling the report for a specific time .................................................................................. 103
4.3.3 Scheduling the report for a specific DWH event ...................................................................... 114
4.3.4 Check the schedule of your report ........................................................................................... 120
5 Predefined reports ............................................................................................................................. 122
5.1 Ancillary systems reports (ANS) .................................................................................................... 122
5.1.1 ANS01 – Overview of AS transfer orders ................................................................................. 122
5.1.2 ANS02 – Daily average of AS transfers ................................................................................... 124
5.2 Business day reports (BDY) .......................................................................................................... 127
5.2.1 BDY01 - Business Day event/delay information on settlement opening time .......................... 127
5.3 Billing reports (BIL) ........................................................................................................................ 131
5.3.1 BIL01 - Consumption data........................................................................................................ 131
5.3.2 BIL02 - Monitoring the invoice activity ...................................................................................... 138
5.3.3 BIL03 - Audit of critical billing data ........................................................................................... 144
5.3.4 BIL04 - Detailed consumption .................................................................................................. 149
5.3.5 BIL05 - Detailed participation ................................................................................................... 155
5.4 Contingency reports (CON) ........................................................................................................... 158
5.4.1 CON01 – Cash transfers settled during contingency processing and final contingency account
balances ............................................................................................................................................ 158
5.4.2 CON02 – Contingency processing – end of procedure account balances per CB .................. 163
5.5 Data extraction reports (DEX) ....................................................................................................... 165
5.5.1 DEX01 - Monitoring data extraction request(s) ........................................................................ 165
5.5.2 DEX02 - Data extraction request ............................................................................................. 167
All rights reserved. Page 4 of 478
5.6 Intraday credit reports (IDC) .......................................................................................................... 174
5.6.1 IDC01 - Daily Intraday credit (IDC) community indicators ....................................................... 174
5.6.2 IDC02 – Credit line/IDC daily reporting .................................................................................... 178
5.6.3 IDC03 – Credit line/IDC averages and maxima (account level)............................................... 182
5.6.4 IDC04 – Credit line/IDC averages and maxima (community level) .......................................... 186
5.6.5 IDC05 – Maximum of credit line used ...................................................................................... 189
5.6.6 IDC06 – Credit line and IDC use at system level ..................................................................... 193
5.7 Invoice Data (INV) ......................................................................................................................... 197
5.7.1 INV01 - Reporting revenues ..................................................................................................... 197
5.8 Minimum reserve reports (MIR) ..................................................................................................... 201
5.8.1 MIR01 – Minimum reserve information .................................................................................... 201
5.8.2 MIR02 – Minimum reserve requirements per country .............................................................. 207
5.9 Participation reports (PAR) ............................................................................................................ 209
5.9.1 PAR01 – Critical participants.................................................................................................... 209
5.9.2 PAR02 – List of active Direct and Indirect Participants according to RTGS Directory ............ 212
5.9.3 PAR03 – Parties subject and not subject to minimum reserve ................................................ 216
5.9.4 PAR04 – List of ancillary systems ............................................................................................ 220
5.9.5 PAR05 – List of DCA cross-border links .................................................................................. 223
5.9.6 PAR06 – Number of participants per CB ................................................................................. 227
5.10 Standing facilities reports (STF) .................................................................................................. 230
5.10.1 STF01 – Standing facility information .................................................................................... 230
5.11 Statement reports (STA) ............................................................................................................. 235
5.11.1 STA01 – Statement of account (single account) .................................................................... 235
5.11.2 STA02 – Statement of account (co-managed accounts) ....................................................... 241
5.12 Transaction reports (TRN) ........................................................................................................... 245
5.12.1 TRN01 - Cash transfer (order) search and details ................................................................. 245
5.12.2 TRN02 - Monthly overview of domestic and cross-border payments .................................... 256
5.12.3 TRN03 - Monthly peak day and peak hour in terms of volume and value of cash transfer
orders 260
5.12.4 TRN04 - Cash transfers per time band and per CB ............................................................... 264
5.12.5 TRN05 – Monthly overview of cash transfer orders per party ................................................ 268
5.12.6 TRN06 – Monthly share of Indirect Participant, addressable BIC and multi-addressee
payments as part of total Direct Participant’s activity ........................................................................ 275
5.12.7 TRN07 – Cash transfers between two accounts of different parties ...................................... 279
5.12.8 TRN08 – Business activity of a party/parties ......................................................................... 285
5.12.9 TRN09 – RTGS Account Holder activity ................................................................................ 290
5.12.10 TRN10 – Monthly value and volume of cash transfers in CLM/RTGS (according to T2
statistical framework) ......................................................................................................................... 294
5.12.11 TRN11 – Monthly value and volume of cash transfers between system entities ................. 298
6 Understanding user rights and access rights (advanced users) ................................................. 304
6.1 Functional security ........................................................................................................................ 304
All rights reserved. Page 5 of 478
6.2 Data security .................................................................................................................................. 307
7 Creating reports (just advanced users) .......................................................................................... 308
7.1 The user interface ......................................................................................................................... 309
7.1.1 On-demand toolbar .................................................................................................................. 316
7.1.2 Sources tab .............................................................................................................................. 320
7.1.3 Data items tab .......................................................................................................................... 321
7.1.4 Toolbox bar .............................................................................................................................. 322
7.1.5 Report overview pane .............................................................................................................. 324
7.1.6 Pages pane .............................................................................................................................. 325
7.1.7 Queries pane ............................................................................................................................ 326
7.1.8 Classes pane ............................................................................................................................ 326
7.1.9 Variables pane ......................................................................................................................... 327
7.1.10 Filters pane ............................................................................................................................. 327
7.1.11 Properties pane ...................................................................................................................... 328
7.2 Report Layout, queries and objects............................................................................................... 332
7.2.1 Layout ....................................................................................................................................... 332
7.2.1.1 The Function of the page structure view ............................................................................ 333
7.2.1.2 Pages ................................................................................................................................. 336
7.2.1.3 Guided Report Layout ........................................................................................................ 338
7.2.1.4 Specify the font for a report ................................................................................................ 339
7.2.2 Queries ..................................................................................................................................... 341
7.2.3 Report objects .......................................................................................................................... 341
7.2.3.1 Mostly Used Objects .......................................................................................................... 344
7.2.3.2 Copy object formatting ....................................................................................................... 347
7.2.3.3 Add borders to a formatting object ..................................................................................... 347
7.3 Relational and Dimensional Reporting .......................................................................................... 349
7.3.1 How to choose a reporting style ............................................................................................... 349
7.3.2 Relational reporting style .......................................................................................................... 349
7.3.3 Dimensional reporting style ...................................................................................................... 350
7.3.4 Insert a Query Calculation ........................................................................................................ 350
7.3.4.1 Functions for data items ..................................................................................................... 354
7.3.5 Guidelines for each reporting style ........................................................................................... 371
7.4 Create a report .............................................................................................................................. 374
7.4.1 Templates and themes ............................................................................................................. 374
7.4.2 Adding data .............................................................................................................................. 375
7.4.3 Insert a single data item ........................................................................................................... 378
7.4.4 Validate a report ....................................................................................................................... 379
7.5 Options in Reporting ...................................................................................................................... 382
7.5.1 View Options ............................................................................................................................ 382
7.5.2 Edit Options .............................................................................................................................. 384
7.5.3 Report Options ......................................................................................................................... 386
All rights reserved. Page 6 of 478
7.5.4 Advanced Options .................................................................................................................... 388
7.6 Working with lists ........................................................................................................................... 389
7.6.1 Set list properties ...................................................................................................................... 389
7.6.2 Hide column in reports ............................................................................................................. 391
7.6.3 Create a scrollable list .............................................................................................................. 392
7.6.4 Using Repeaters ....................................................................................................................... 393
7.6.5 Change a list into a crosstab .................................................................................................... 394
7.7 Working with crosstabs ................................................................................................................. 395
7.7.1 Crosstab nodes and Crosstab nodes members ....................................................................... 396
7.7.2 Set Crosstabs properties .......................................................................................................... 397
7.7.3 Create a Single-Edge crosstab ................................................................................................ 401
7.7.4 Create a nested Crosstab ........................................................................................................ 401
7.7.5 Creating headers automatically for sets in crosstabs .............................................................. 403
7.7.6 Showing Crosstab values as percentages ............................................................................... 403
7.7.7 Specify the Default Measure .................................................................................................... 405
7.7.8 Indent data ............................................................................................................................... 405
7.8 Working with Visualisations ........................................................................................................... 406
7.8.1 Comparing measures in a visualization ................................................................................... 408
7.8.2 Adding a baseline to a visualization ......................................................................................... 409
7.8.3 Change visualization from one type to another ........................................................................ 412
7.9 Charts ............................................................................................................................................ 413
7.9.1 Change Chart from one type to another ................................................................................... 413
7.9.2 Customizing chart properties.................................................................................................... 414
7.9.3 Adding a note to a chart ........................................................................................................... 425
7.9.4 Adding a baseline to a chart ..................................................................................................... 427
7.9.5 Adding a marker to a chart ....................................................................................................... 429
7.9.6 Creating a drill-down Chart....................................................................................................... 431
7.10 Adding prompts to filter data ....................................................................................................... 431
7.10.1 Build your own Prompt and Prompt page .............................................................................. 432
7.10.2 Create a Prompt Directly in a Report Page ............................................................................ 440
7.10.3 Control the data that appears in a tree prompt ...................................................................... 443
7.10.4 Modifying prompts .................................................................................................................. 445
7.10.4.1 Choose a drop-down list, a list box, or a radio button group: .......................................... 445
7.10.4.2 Prompt requires user input ............................................................................................... 447
7.10.4.3 Selecting multiple values in a prompt .............................................................................. 448
7.10.4.4 Show or Hide Prompt Status ............................................................................................ 452
7.10.4.5 Specify a Default Selection for a Prompt ......................................................................... 452
7.10.4.6 Customize Prompt Text .................................................................................................... 453
7.10.4.7 Add prompt buttons .......................................................................................................... 455
7.10.4.8 Create a Cascading Prompt ............................................................................................. 457
8 Additional information ...................................................................................................................... 460

All rights reserved. Page 7 of 478
8.1 DWH data objects ......................................................................................................................... 460
8.2 CLM/RTGS inbound XML messages available in the DWH ......................................................... 478
List of Figures
All rights reserved. Page 8 of 478
List of Figures
Figure 1 - DWH high level overview ................................................................................................................ 31
Figure 2 - Welcome page ................................................................................................................................ 32
Figure 3 - Welcome page - navigation view .................................................................................................... 33
Figure 4 - Welcome page - navigation view - items ........................................................................................ 34
Figure 5 - Welcome page – navigation view – items – report view selection .................................................. 34
Figure 6 - Welcome page – Search content .................................................................................................... 34
Figure 7 - Welcome page – Search content - Save search ............................................................................. 35
Figure 8 - Welcome page – Search content - initiate actions .......................................................................... 35
Figure 9 - Welcome page – Search content - Action menu ............................................................................. 35
Figure 10 - Welcome page - Notification ......................................................................................................... 36
Figure 11 - More options – Notify me .............................................................................................................. 36
Figure 12 - Welcome page - Notification – subscribe ...................................................................................... 37
Figure 13 - Welcome screen – Personal menu (1) .......................................................................................... 38
Figure 14 - Welcome screen – Personal menu (2) .......................................................................................... 38
Figure 15 - Welcome screen – Personal menu – Profile and settings – Profile .............................................. 39
Figure 16 - Welcome screen – Personal menu – Profile and settings – Personal – Groups and roles .......... 40
Figure 17 - Welcome screen – Personal menu – Profile and settings – Personal – Groups and roles .......... 40
Figure 18 - Welcome screen – Personal menu – Profile and settings – Profile – My capabilities (1) ............. 41
Figure 19 - Welcome screen – Personal menu – Profile and settings – Profile – My capabilities (2) ............. 42
Figure 20 - Welcome screen – Personal menu – Profile and settings - Logging ............................................ 43
Figure 21 - Welcome screen – Personal menu – Profile and settings – logging ............................................. 43
Figure 22 - Welcome screen – Personal menu – Profile and settings - logging level ..................................... 44
Figure 23 - Welcome screen – Personal menu – Profile and settings – Settings ........................................... 45
Figure 24 - Welcome screen – Personal menu – My schedules and subscriptions ........................................ 47
Figure 25 - Welcome screen – Personal menu – My schedules and subscriptions - Filter ............................ 47
Figure 26 - Welcome screen – Personal menu – My schedules and subscriptions – Upcoming schedules .. 48
Figure 27 - Welcome screen – Personal menu – My schedules and subscriptions – Past schedules ........... 48
Figure 28 - Welcome screen – Personal menu – My schedules and subscriptions ........................................ 49
Figure 29 - Welcome screen – Personal menu – My schedules and subscriptions – Modify ......................... 50
Figure 30 - Welcome screen – Personal menu – My schedules and subscriptions – View versions ............. 50
Figure 31 - Welcome screen – Personal menu – My schedules and subscriptions – Disable schedule ........ 50
Figure 32 - Welcome screen – Personal menu – My schedules and subscriptions – Remove schedule ....... 51
List of Figures
All rights reserved. Page 9 of 478
Figure 33 - Welcome screen – Personal menu – My schedules and subscriptions – Filter (2) ...................... 51
Figure 34 - Welcome screen – Personal menu – My schedules and subscriptions – Filter (2) - Further options
......................................................................................................................................................................... 51
Figure 35 - Welcome screen – Personal menu – My schedules and subscriptions - Subscription type ......... 52
Figure 36 - Welcome screen – Personal menu – My schedules and subscriptions – Status disabled ........... 52
Figure 37 - Welcome screen – Personal menu – My schedules and subscriptions – Schedules Priority ...... 53
Figure 38 - Welcome screen – Personal menu – My schedules and subscriptions – Advanced .................... 54
Figure 39 - Welcome screen – Personal menu – My schedules and subscriptions – Advanced - All - Type of
schedule .......................................................................................................................................................... 55
Figure 40 - Welcome screen – Personal menu – My schedules and subscriptions – Advanced - All - Type of
schedule – Report ............................................................................................................................................ 56
Figure 41 - Welcome screen – Personal menu – My schedules and subscriptions – Advanced - All - Type of
schedule - Report ............................................................................................................................................ 56
Figure 42 - Personal menu - Log out ............................................................................................................... 57
Figure 43 - Welcome page - menu .................................................................................................................. 58
Figure 44 - Welcome page - Home ................................................................................................................. 58
Figure 45 - Welcome page - Search ................................................................................................................ 59
Figure 46 - Welcome page - filter options ........................................................................................................ 59
Figure 47 - Welcome page - Search - Save icon ............................................................................................ 59
Figure 48 - Welcome page – remove search .................................................................................................. 60
Figure 49 - Welcome page - Search - Saved searches .................................................................................. 60
Figure 50 - Welcome page - System information link ...................................................................................... 60
Figure 51 - Welcome page – System information menu ................................................................................. 61
Figure 52 - Welcome page – Recently viewed ................................................................................................ 62
Figure 53 - Welcome page - New .................................................................................................................... 63
Figure 54 - Welcome page - Team content ..................................................................................................... 64
Figure 55 - Welcome page- Team content - folder structure........................................................................... 64
Figure 56 - Welcome page - Team content - folder structure (CB user) ......................................................... 65
Figure 57 - Welcome page - Team content - Data Packages ......................................................................... 65
Figure 58 - Welcome page - Team content - Predefined reports .................................................................... 66
Figure 59 - Welcome page - Team content - Predefined Reports - ANS - Ancillary System Reports ............ 66
Figure 60 - Welcome page – My content ......................................................................................................... 67
Figure 61 - Welcome page – My content – Add folder .................................................................................... 67
Figure 62 - Welcome page – My content – New Folder (1) ............................................................................. 67
List of Figures
All rights reserved. Page 10 of 478
Figure 63 - Welcome page – My content– New Folder (2) .............................................................................. 68
Figure 64 - Welcome page – My content – sort in ascending order ................................................................ 68
Figure 65 - Welcome page – My content – sort in descending order .............................................................. 69
Figure 66 - Welcome page – Team content – Predefined Reports – filter options ......................................... 69
Figure 67 - Welcome page – My content – filter options – filter by folders ..................................................... 70
Figure 68 - Team content - Predefined Reports - STF - Standing Facilities Reports...................................... 71
Figure 69 - Team content - Predefined Reports - STF - Standing Facilities Reports – STF01 – Standing
Facility information- Copy ................................................................................................................................ 72
Figure 70 - Team content - Predefined Reports - STF - Standing Facilities Reports – STF0 – Standing
Facility information - Copy to ........................................................................................................................... 72
Figure 71 - Team content – CB Shared folders ............................................................................................... 73
Figure 72 - My content - copied report ............................................................................................................ 73
Figure 73 - Team content - Predefined Reports - STF - Standing Facilities Reports...................................... 74
Figure 74 - Team content - Predefined Reports - STF - Standing Facilities Reports – STF01 – Standing
Facility information - Create report view .......................................................................................................... 74
Figure 75 - My content - report view ................................................................................................................ 75
Figure 76 - My content - report view - Properties ............................................................................................ 76
Figure 77 - My content - report view - Properties - Source report ................................................................... 77
Figure 78 - My content - report view - Properties - Source report deleted ...................................................... 78
Figure 79 - My content - report view - View versions ...................................................................................... 79
Figure 80 - My content - report view - View versions - Versions ..................................................................... 79
Figure 81 - My content - report view - View versions - Version - report output ............................................... 80
Figure 82 - Welcome page - My content - Properties ...................................................................................... 81
Figure 83 - Welcome page - My content – Run as XML ................................................................................. 82
Figure 84 - Save Report .................................................................................................................................. 83
Figure 85 - Team content – Predefined Reports – STF – Standing Facilities Reports ................................... 84
Figure 86 - Team content – Predefined reports – STF – Standing Facilities Reports .................................... 84
Figure 87 - Standing Facilities Reports – STF01 Standing Facility information – prompt page ...................... 85
Figure 88 - Team content – Predefined Reports – STF – Standing Facilities Reports ................................... 86
Figure 89 - Team content – Predefined Reports – STF – Standing Facilities Reports – STF01 Standing
Facility information – Run as (1) ...................................................................................................................... 86
Figure 90 - Team content – Predefined Reports – STF – Standing Facilities Reports – STF01 Standing
Facility information – Run as (2) ...................................................................................................................... 87
Figure 91 - Standing Facilities Reports – STF01 Standing Facility information - prompt page ...................... 88
List of Figures
All rights reserved. Page 11 of 478
Figure 92 - Standing Facilities Reports – STF01 Standing Facility information – report ................................ 89
Figure 93 - Team content – Predefined Reports – STF – Standing Facilities Reports – STF01 Standing
Facility information – Run as ........................................................................................................................... 89
Figure 94 - Team content – Predefined Reports – STF – Standing Facilities Reports – STF01 Standing
Facility information – Run as – Run in background ......................................................................................... 90
Figure 95 - Run as – Run in background – Advanced .................................................................................... 91
Figure 96 - Run as – Run in background - Advanced ..................................................................................... 92
Figure 97 - Run as – Run in background – Advanced – Execution time – Later ............................................ 92
Figure 98 - Team content – Predefined Reports – STF – Standing Facilities Reports ................................... 93
Figure 99 - Team content – Predefined Reports – STF – Standing Facilities Reports – Run as .................... 93
Figure 100 - Team content – Predefined Reports – STF – Standing Facilities Reports – Run as – Run in
background ...................................................................................................................................................... 94
Figure 101 - Team content – Predefined Reports – STF – Standing Facilities Reports – Run as – Run in
background – Advanced .................................................................................................................................. 94
Figure 102 - Team content – Predefined Reports – STF – Standing Facilities Reports – Run as – Run in
background – Advanced – Save report as an external file .............................................................................. 95
Figure 103 - Team content - Predefined Reports - Standing Facilities Reports - STF01 Standing Facility
information ....................................................................................................................................................... 95
Figure 104 - STF01 Standing Facility information - More options ................................................................... 96
Figure 105 - STF01 Standing Facility information - Copy ............................................................................... 96
Figure 106 - STF01 Standing Facility information – Copy to My content ........................................................ 97
Figure 107 - My content - STF01 Standing Facility information - Run as ....................................................... 97
Figure 108 - My content - STF01 Standing Facility information - Run as – Run in background ..................... 98
Figure 109 - My content - STF01 Standing Facility information - Run as – Choose the format ...................... 98
Figure 110 - My content - STF01 Standing Facility information - Run as – Advanced – Now or Later........... 99
Figure 111 - My content - STF01 Standing Facility information - Run in background - Advanced Delivery ... 99
Figure 112 - My content - STF01 Standing Facility information - Run in background - Advanced Delivery -
Save report as an external file ....................................................................................................................... 100
Figure 113 - My content - STF01 Standing Facility information - Run in background - Advanced Delivery –
Run the report ................................................................................................................................................ 101
Figure 114 - My content - STF01 Standing Facility information - Run in background - Advanced Delivery –
Enter search criteria ....................................................................................................................................... 102
Figure 115 - My content - report view - Properties ........................................................................................ 103
Figure 116 - My content - report view - Properties – General - description of your report ............................ 104
Figure 117 - Welcome page - My content - report view - Properties - Schedule .......................................... 104
List of Figures
All rights reserved. Page 12 of 478
Figure 118 - Welcome page - My content - report view - Properties - create schedule (1) .......................... 105
Figure 119 - Welcome page - My content - report view - Properties - create schedule (2) .......................... 106
Figure 120 - Welcome page - My content - Report view - Properties - Create schedule – Current values .. 107
Figure 121 - Welcome page - My content - Report view - Properties - Create schedule – Enter values ..... 107
Figure 122 - Welcome page - My content - Report view - Properties - Create schedule – Languages ........ 108
Figure 123 - Welcome page - My content - Report view - Properties - Create schedule - PDF ................... 109
Figure 124 - Welcome page - My content - report view - Properties - create schedule (3) .......................... 110
Figure 125 - Welcome page - My content - Properties - Set values ............................................................. 111
Figure 126 - Welcome page - My content - Properties - Prompts - Set values ............................................. 112
Figure 127 - Welcome page - My content - Properties -– Schedule ............................................................. 113
Figure 128 - Welcome page - My content - Properties – Schedule .............................................................. 114
Figure 129 - My content - report view – Properties ....................................................................................... 115
Figure 130 - My content - report view - Properties – General - description of your report ............................ 115
Figure 131 - Welcome page - My content - report view - Properties – Schedule.......................................... 116
Figure 132 - Welcome page - My content - report view - Properties - create schedule (1) .......................... 116
Figure 133 - Welcome page - My content - report view - Properties - create schedule (2) .......................... 117
Figure 134 - Welcome page - My content - report view - Properties - create schedule (3) .......................... 118
Figure 135 - Welcome page - My content - Properties - Set values ............................................................. 119
Figure 136 - Welcome page - My content - Properties - Prompts - Set values ............................................. 120
Figure 137 - Welcome page - My content - Properties - Schedule ............................................................... 120
Figure 138 - Welcome page - Personal menu ............................................................................................... 121
Figure 139 - Welcome page - Personal menu - My schedules and subscriptions ........................................ 121
Figure 140 - Welcome page - Personal menu - My schedules and subscriptions - Schedule ...................... 121
Figure 141 - ANS01 prompt ........................................................................................................................... 122
Figure 142 - ANS01 output ............................................................................................................................ 123
Figure 143 - ANS02 Prompt .......................................................................................................................... 125
Figure 144 - ANS02 output ............................................................................................................................ 126
Figure 145 - BDY01 prompt ........................................................................................................................... 128
Figure 146 - BDY01 Output (1) ...................................................................................................................... 129
Figure 147 - BDY01 Output (2) ...................................................................................................................... 130
Figure 148 - BIL01 prompt ............................................................................................................................. 132
Figure 149 - BIL01 Output (“Per service”)(1) ................................................................................................. 133
Figure 150 - BIL01 Output (“Per service”)(2) ................................................................................................. 134
List of Figures
All rights reserved. Page 13 of 478
Figure 151 - BIL01 Output (“System entity wide sums per service”)(1) ........................................................ 134
Figure 152 - BIL01 Output (“System entity wide sums per service”)(2) ........................................................ 135
Figure 153 - BIL02 prompt ............................................................................................................................. 139
Figure 154 - BIL02 Output (“Monitor the invoicing activity by party”) ............................................................ 140
Figure 155 - BIL02 Output (“Monitor the invoicing activity by service”) ......................................................... 140
Figure 156 - BIL02 Output (“Monitor the invoicing activity by billing period”) ................................................ 141
Figure 157 - BIL02 Output (“Monitor the invoicing activity by fee type”) ....................................................... 141
Figure 158 - BIL03 prompt ............................................................................................................................. 144
Figure 159 - BIL03 output (1) (“Invoice configuration”) ................................................................................. 145
Figure 160 - BIL03 output (2) (“Fee schedule”) ............................................................................................. 146
Figure 161 - BIL03 output (3) (“Fee band”) ................................................................................................... 146
Figure 162 - BIL03 output (4) (“VAT”) ............................................................................................................ 147
Figure 163 - BIL03 output (5) (“Service”) ....................................................................................................... 147
Figure 164 - BIL04 prompt (1) ....................................................................................................................... 150
Figure 165 - BIL04 prompt (2) ....................................................................................................................... 151
Figure 166 - BIL04 Output ............................................................................................................................. 152
Figure 167 - BIL05 prompt ............................................................................................................................. 155
Figure 168 - BIL05 Output ............................................................................................................................. 157
Figure 169 - CON1 prompt ............................................................................................................................ 159
Figure 170 - CON01 output (1) (“Synthesis of contingency accounts settlements during the contingency
procedure and final balances”) ...................................................................................................................... 160
Figure 171 - CON01 output (2) (“Details on contingency cash transfers settled”) ........................................ 160
Figure 172 - CON02 prompt .......................................................................................................................... 163
Figure 173 - CON02 output (2) ...................................................................................................................... 164
Figure 174 - DEX01 prompt ........................................................................................................................... 166
Figure 175 - DEX01 output ............................................................................................................................ 167
Figure 176 - DEX02 prompt ........................................................................................................................... 168
Figure 177 - IDC01 prompt ............................................................................................................................ 175
Figure 178 - IDC01 Output (1) ....................................................................................................................... 176
Figure 179 - IDC01 Output (2) ....................................................................................................................... 176
Figure 180 - IDC02 prompt ............................................................................................................................ 179
Figure 181 - IDC02 output (1) ........................................................................................................................ 180
Figure 182 - IDC02 output (2) ........................................................................................................................ 180
List of Figures
All rights reserved. Page 14 of 478
Figure 183 - IDC02 output (3) ........................................................................................................................ 181
Figure 184 - IDC03 prompt ............................................................................................................................ 183
Figure 185 - IDC03 output (1) ........................................................................................................................ 184
Figure 186 - IDC03 output (2) ........................................................................................................................ 185
Figure 187 - IDC04 prompt ............................................................................................................................ 187
Figure 188 - IDC04 output (1) ........................................................................................................................ 188
Figure 189 - IDC04 output (2) ........................................................................................................................ 188
Figure 190 - IDC05 prompt (1) – For a specific party BIC ............................................................................. 190
Figure 191 - IDC05 prompt (2) – For all parties............................................................................................. 190
Figure 192 - IDC05 output (1) - A party was selected ................................................................................... 191
Figure 193 - IDC05 output (2) - A party was not selected covering one day only ......................................... 192
Figure 194 - IDC06 prompt ............................................................................................................................ 194
Figure 195 - IDC06 output (1) ........................................................................................................................ 195
Figure 196 - IDC06 output (2) ........................................................................................................................ 196
Figure 197 - INV01 prompt ............................................................................................................................ 197
Figure 198 - INV01 Output............................................................................................................................. 199
Figure 199 - MIR01 prompt............................................................................................................................ 202
Figure 200 - MIR01 output (1) ....................................................................................................................... 203
Figure 201 - MIR01 output (2) ....................................................................................................................... 203
Figure 202 - MIR01 – Output (List of interest and penalty rates) .................................................................. 204
Figure 203 - MIR02 prompt............................................................................................................................ 208
Figure 204 - MIR02 output ............................................................................................................................. 209
Figure 205 - PAR01 prompt ........................................................................................................................... 210
Figure 206 - PAR01 output (1) ...................................................................................................................... 211
Figure 207 - PAR02 prompt ........................................................................................................................... 213
Figure 208 - PAR02 output (1) ...................................................................................................................... 214
Figure 209 - PAR02 output (2) ...................................................................................................................... 214
Figure 210 - PAR02 output (3) ...................................................................................................................... 215
Figure 211 - PAR03 prompt ........................................................................................................................... 217
Figure 212 - PAR03 output (1) ...................................................................................................................... 218
Figure 213 - PAR03 output (2) ...................................................................................................................... 218
Figure 214 - PAR04 prompt ........................................................................................................................... 220
Figure 215 - PAR04 output (1) ...................................................................................................................... 221
List of Figures
All rights reserved. Page 15 of 478
Figure 216 - PAR04 output (2) ...................................................................................................................... 222
Figure 217 - PAR05 prompt ........................................................................................................................... 224
Figure 218 - PAR05 output (1) – DCA view................................................................................................... 225
Figure 219 - PAR05 output (2) – Linked account view .................................................................................. 226
Figure 220 - PAR06 prompt ........................................................................................................................... 228
Figure 221 - PAR06 output ............................................................................................................................ 229
Figure 222 - STF01 prompt ........................................................................................................................... 231
Figure 223 - STF01 output (1) ....................................................................................................................... 232
Figure 224 - STF01 output (2) ....................................................................................................................... 232
Figure 225 - STF01 output (3) ....................................................................................................................... 233
Figure 226 - STA01 prompt (1) ...................................................................................................................... 236
Figure 227 - STA01 prompt (2) ...................................................................................................................... 237
Figure 228 - STA01 output (1) ....................................................................................................................... 238
Figure 229 - STA01 output (2) ....................................................................................................................... 239
Figure 230 - STA02 prompt ........................................................................................................................... 242
Figure 231 - STA02 output (1) ....................................................................................................................... 243
Figure 232 - STA02 output (2) ....................................................................................................................... 244
Figure 233 - TRN01 prompt (1) – by transaction reference .......................................................................... 246
Figure 234 - TRN01 prompt (2) - by business characteristics ....................................................................... 247
Figure 235 - TRN01 output (1) – by transaction reference ............................................................................ 250
Figure 236 - TRN01 output (2) – details ........................................................................................................ 250
Figure 237 - TRN01 output (3) - by business characteristics ........................................................................ 251
Figure 238 - TRN01 output (4) – details ........................................................................................................ 251
Figure 239 - TRN01 output (5) - details ......................................................................................................... 252
Figure 240 - TRN02 prompt ........................................................................................................................... 257
Figure 241 - TRN02 output (1) ...................................................................................................................... 258
Figure 242 - TRN02 output (2) ...................................................................................................................... 258
Figure 243 - TRN03 prompt ........................................................................................................................... 260
Figure 244 - TRN03 output ............................................................................................................................ 262
Figure 245 - TRN04 prompt ........................................................................................................................... 265
Figure 246 - TRN04 output (1) ...................................................................................................................... 266
Figure 247 - TRN04 output (2) ...................................................................................................................... 266
Figure 248 - TRN04 output (3) ...................................................................................................................... 267
List of Figures
All rights reserved. Page 16 of 478
Figure 249 - TRN04 output (4) ...................................................................................................................... 267
Figure 250 - TRN05 prompt ........................................................................................................................... 269
Figure 251 - TRN05 output (1) ...................................................................................................................... 270
Figure 252 - TRN05 output (2) ...................................................................................................................... 271
Figure 253 - TRN05 output (3) ...................................................................................................................... 271
Figure 254 - TRN05 output (4) ...................................................................................................................... 272
Figure 255 - TRN05 output (5) ...................................................................................................................... 272
Figure 256 - TRN05 output (6) ...................................................................................................................... 273
Figure 257 - TRN05 output (7) ...................................................................................................................... 273
Figure 258 - TRN05 output (8) ...................................................................................................................... 274
Figure 259 - TRN06 prompt ........................................................................................................................... 276
Figure 260 - TRN06 output (1) ...................................................................................................................... 277
Figure 261 - TRN06 output (2) ...................................................................................................................... 278
Figure 262 - TRN07 prompt ........................................................................................................................... 280
Figure 263 - TRN07 output (1) ...................................................................................................................... 281
Figure 264 - TRN07 output (2) ...................................................................................................................... 282
Figure 265 - TRN07 output (3) ...................................................................................................................... 282
Figure 266 - TRN08 prompt ........................................................................................................................... 286
Figure 267 - TRN08 output (1) ...................................................................................................................... 287
Figure 268 - TRN08 output (2) ...................................................................................................................... 288
Figure 269 - TRN08 output (3) ...................................................................................................................... 288
Figure 270 - TRN08 output (4) ...................................................................................................................... 289
Figure 271 - TRN09 prompt ........................................................................................................................... 290
Figure 272 - TRN09 output (1) – RTGS Account Holder activity View .......................................................... 291
Figure 273 - TRN09 output (2) – Party Market Share View .......................................................................... 292
Figure 274 - TRN10 prompt ........................................................................................................................... 295
Figure 275 - TRN10 output (1) ...................................................................................................................... 296
Figure 276 - TRN10 output (2) ...................................................................................................................... 297
Figure 277 - TRN11 prompt ........................................................................................................................... 298
Figure 278 - TRN11 output (1) ...................................................................................................................... 300
Figure 279 - TRN11 output (2) ...................................................................................................................... 300
Figure 280 - TRN11 output (3) ...................................................................................................................... 301
Figure 281 - TRN11 output (4) ...................................................................................................................... 301
List of Figures
All rights reserved. Page 17 of 478
Figure 282 - Groups and roles and capabilities ............................................................................................. 304
Figure 283 - Functional security - Central Bank user .................................................................................... 306
Figure 284 - Functional security - Payment bank user .................................................................................. 306
Figure 285 - Functional security - Ancillary System user .............................................................................. 307
Figure 286 - Creating reports - Welcome page – Open menu - New - Report .............................................. 308
Figure 287 - Creating reports - Predefined Reports - Edit report .................................................................. 309
Figure 288 - The user interface- Creating a report ........................................................................................ 309
Figure 289 - The user interface - Page Preview ............................................................................................ 314
Figure 290 - The user interface - Page design view ...................................................................................... 314
Figure 291 - The user interface - Page structure preview ............................................................................. 315
Figure 292 - The user interface - Page structure view .................................................................................. 315
Figure 293 - On-demand toolbar - Pin and Unpin ......................................................................................... 316
Figure 294 - On-demand toolbar - More icon ................................................................................................ 317
Figure 295 - On-demand toolbar - More icon - Options ................................................................................ 318
Figure 296 - On-demand toolbar - Select ancestor ....................................................................................... 320
Figure 297 - Sources tab - Sources items ..................................................................................................... 321
Figure 298 - Toolbox bar ............................................................................................................................... 322
Figure 299 - Toolbox bar - Properties Pane .................................................................................................. 323
Figure 300 - Report overview pane ............................................................................................................... 324
Figure 301 - Report overview pane - Validate report .................................................................................... 325
Figure 302 - Pages pane ............................................................................................................................... 325
Figure 303 - Queries pane ............................................................................................................................. 326
Figure 304 - Classes pane............................................................................................................................. 327
Figure 305 - Variables pane .......................................................................................................................... 327
Figure 306 - Properties pane - Report level .................................................................................................. 329
Figure 307 - Properties pane - Report level – Burst options (2) .................................................................... 330
Figure 308 - The user interface - Report Layout, queries and objects - Layout - Page structure ................. 334
Figure 309 - The Function of the page structure view ................................................................................... 335
Figure 310 - Report Layout, queries and objects - Pages ............................................................................. 336
Figure 311 - Report Layout, queries and objects - Pages - First page ......................................................... 337
Figure 312 - Report Layout, queries and objects - Pages - Second page .................................................... 337
Figure 313 - Report Layout, queries and objects - Pages - Chart and first rows of the table on the first page
....................................................................................................................................................................... 338
List of Figures
All rights reserved. Page 18 of 478
Figure 314 - Guided Report Layout - More icon - Options - Report .............................................................. 339
Figure 315 - Specify the font for a report - Font icon - Foreground Color ..................................................... 340
Figure 316 - Queries - Query example of Eurosystem2 template ................................................................. 341
Figure 317 - Report objects - Insert map and list in a cell of table ................................................................ 342
Figure 318 - Report objects - Find - Find objects in the query ...................................................................... 343
Figure 319 - Report objects - Mostly Used Objects - Data container - List ................................................... 345
Figure 320 - Report objects - Mostly Used Objects - Textual........................................................................ 346
Figure 321 - Report objects - Mostly Used Objects - Layout......................................................................... 346
Figure 322 - Report objects - Add borders to a formatting object ................................................................. 348
Figure 323 - Relational reporting style - Dimensional data ........................................................................... 350
Figure 324 - Dimensional reporting style - Dimensional data (2) .................................................................. 350
Figure 325 - Insert a Query Calculation ......................................................................................................... 351
Figure 326 - Insert a Query Calculation - Specify Query Calculation ............................................................ 352
Figure 327 - Insert a Query Calculation - Specify Query Calculation - Data items ....................................... 353
Figure 328 - Insert a Query Calculation - Operators ..................................................................................... 354
Figure 329 - Insert a Query Calculation - Operators - Function tab .............................................................. 355
Figure 330 - Insert a Query Calculation - Searching the string ..................................................................... 356
Figure 331 - Insert a Query Calculation - Searching the string - Results ...................................................... 356
Figure 332 - Insert a Query Calculation - Searching the string (2) ................................................................ 357
Figure 333 - Insert a Query Calculation - Searching the string - Results (2) ................................................ 357
Figure 334 - Insert a Query Calculation - Data item expression - Tips tab – Information ............................. 358
Figure 335 - Insert a Query Calculation - Operators ..................................................................................... 359
Figure 336 - Insert a Query Calculation - Searching the string - Different context than the “like” function ... 360
Figure 337 - Insert a Query Calculation - Searching the string - Different context than the “like” function -
Results ........................................................................................................................................................... 360
Figure 338 - Insert a Query Calculation - Data item expression - Tips tab - Information - Literal ................. 361
Figure 339 - Insert a Query Calculation - Data item expression - Tips tab - Information - Literal (2) ........... 361
Figure 340 - Insert a Query Calculation - Summarize Functions .................................................................. 362
Figure 341 - Insert a Query Calculation - Member Summaries ..................................................................... 363
Figure 342 - Insert a Query Calculation - Constants ..................................................................................... 364
Figure 343 - Insert a Query Calculation - Constructs .................................................................................... 365
Figure 344 - Insert a Query Calculation - Business Date/Time Functions .................................................... 366
Figure 345 - Insert a Query Calculation - Period Predicates ......................................................................... 367
List of Figures
All rights reserved. Page 19 of 478
Figure 346 - Insert a Query Calculation - Block Functions ............................................................................ 367
Figure 347 - Insert a Query Calculation - Common Functions ...................................................................... 369
Figure 348 - Insert a Query Calculation - Dimensional Functions ................................................................. 371
Figure 349 - Templates and themes - Templates ......................................................................................... 375
Figure 350 - Templates and themes - Themes ............................................................................................. 375
Figure 351 - Adding data - Add a source - Right click item - Set default package ........................................ 376
Figure 352 - Adding data - Add a source - Right click item - Delete package ............................................... 377
Figure 353 - Adding data - Add a source - Right click item - Replace package ............................................ 378
Figure 354 - Insert a single data item - Data container - Singleton ............................................................... 379
Figure 355 - Validate a report - Validate options ........................................................................................... 381
Figure 356 - Set list properties ...................................................................................................................... 390
Figure 357 - Hide column in reports -List column properties - Conditional - Set Render to No .................... 392
Figure 358 - Create a scrollable list ............................................................................................................... 392
Figure 359 - Create a scrollable list - Properties - General - Scrollable area height ..................................... 393
Figure 360 - Using Repeaters - Data container - Repeater/Repeater table .................................................. 393
Figure 361 - Using Repeaters - List with all Number of Transactions in a single row ................................... 394
Figure 362 - Using Repeaters - Properties - General - Across and Down .................................................... 394
Figure 363 - Change a list into a crosstab - More icon - Pivot List to Crosstab ............................................ 395
Figure 364 - Working with crosstabs - Data container - Crosstab ................................................................. 395
Figure 365 - Crosstab nodes and Crosstab nodes members........................................................................ 396
Figure 366 - Crosstab nodes and Crosstab nodes members (2) .................................................................. 397
Figure 367 - Set Crosstabs properties ........................................................................................................... 399
Figure 368 - Create a Single-Edge crosstab ................................................................................................. 401
Figure 369 - Create a nested Crosstab ......................................................................................................... 402
Figure 370 - Creating headers automatically for sets in crosstabs ............................................................... 403
Figure 371 - Specify the Default measure ..................................................................................................... 405
Figure 372 - Indent data - Properties pane - General - Level indentation ..................................................... 406
Figure 373 - Working with Visualisations - Data container - Visualization .................................................... 407
Figure 374 - Working with Visualisations - Visualization gallery ................................................................... 407
Figure 375 - Adding a baseline to a visualization .......................................................................................... 410
Figure 376 - Adding a baseline to a visualization - Baselines ....................................................................... 411
Figure 377 - Adding a baseline to a visualization - Baseline at 1.300.000 .................................................... 411
Figure 378 - Adding a baseline to a visualization - Baseline properties ........................................................ 412
List of Figures
All rights reserved. Page 20 of 478
Figure 379 - Adding a baseline to a visualization - Baselines box ................................................................ 412
Figure 380 - Charts - Visualization gallery..................................................................................................... 413
Figure 381 - Adding a note to a chart ............................................................................................................ 425
Figure 382 - Adding a note to a chart - Position the node / Expression ........................................................ 426
Figure 383 - Adding a note to a chart - Report expression ........................................................................... 427
Figure 384 - Adding a baseline to a chart ...................................................................................................... 428
Figure 385 - Adding a marker to a chart ........................................................................................................ 430
Figure 386 - Build your own Prompt and Prompt page ................................................................................. 433
Figure 387 - Build your own Prompt and Prompt page - Prompting ............................................................. 434
Figure 388 - Build your own Prompt and Prompt page - Prompt Wizard dialog box..................................... 436
Figure 389 - Build your own Prompt and Prompt page - Prompt Wizard dialog box - Make the filter optional
....................................................................................................................................................................... 437
Figure 390 - Build your own Prompt and Prompt page - Prompt Wizard - Tree prompt ............................... 438
Figure 391 - Build your own Prompt and Prompt page - Prompt Wizard - Tree prompt - Apply filter ........... 439
Figure 392 - Build your own Prompt and Prompt page - Prompt Wizard - Tree prompt - Create new query 439
Figure 393 - Create a Prompt Directly in a Report Page ............................................................................... 441
Figure 394 - Create a Prompt Directly in a Report Page - Prompt Wizard - Date prompt ............................ 441
Figure 395 - Create a Prompt Directly in a Report Page - Prompt Wizard - Date prompt - Make the filter
optional .......................................................................................................................................................... 442
Figure 396 - Control the data that appears in a tree prompt - Prompt Wizard - Operator ............................ 444
Figure 397 - Modifying prompts - Properties - General - Select UI - List box ............................................... 446
Figure 398 - Modifying prompts - Properties - General - Select UI - List box ............................................... 446
Figure 399 - Modifying prompts - Filters - Usage box ................................................................................... 448
Figure 400 - Modifying prompts - Properties - General - Multi-select ........................................................... 449
Figure 401 - Modifying prompts - Filters - Edit filters ..................................................................................... 450
Figure 402 - Modifying prompts - Operator ................................................................................................... 450
Figure 403 - Modifying prompts - Detail filter expression .............................................................................. 451
Figure 404 - Modifying prompts - Select more than one value ..................................................................... 451
Figure 405 - Modifying prompts - Check box group - Select more than one value ....................................... 452
Figure 406 - Modifying prompts - Properties - General - Hide adornments .................................................. 452
Figure 407 - Modifying prompts - Properties - Default selections - Minimum value/ Maximum value .......... 453
Figure 408 - Modifying prompts - Properties - Prompt Text .......................................................................... 454
Figure 409 - Modifying prompts - Properties - Prompt Text - Header Text ................................................... 454
Figure 410 - Modifying prompts - Properties - Prompt Text - Header Text - Localized Text ........................ 455
List of Figures
All rights reserved. Page 21 of 478
Figure 411 - Modifying prompts - Add prompt buttons - Toolbox - Prompt button ........................................ 456
Figure 412 - Modifying prompts - Add prompt buttons - Prompt button properties - General - Type............ 457
Figure 413 - Modifying prompts - Value prompt - Properties - General - Cascade source ........................... 458
Figure 414 - Modifying prompts - Value prompt - Properties - General - Cascade source - Select Parameter
....................................................................................................................................................................... 458
List of Tables
All rights reserved. Page 22 of 478
List of Tables
Table 1 - ANS01 - Report description - Prompt screen ................................................................................. 123
Table 2 - ANS01 - Report description - Output screen .................................................................................. 124
Table 3 - ANS02 - Report description - Prompt screen ................................................................................. 126
Table 4 - ANS02 - Report description - Output screen .................................................................................. 127
Table 5 - BDY01 - Prompt description ........................................................................................................... 129
Table 6 - BDY01 - Output description ............................................................................................................ 131
Table 7 - BIL01 - Prompt description ............................................................................................................. 133
Table 8 - BIL01 - Output description .............................................................................................................. 138
Table 9 - BIL02 – Prompt description ............................................................................................................ 139
Table 10 - BIL02 - Output description ............................................................................................................ 143
Table 11 - BIL03 - Prompt description ........................................................................................................... 145
Table 12 - BIL03 - Output description ............................................................................................................ 148
Table 13 - BIL03 - Critical data fields ............................................................................................................ 149
Table 14 - BIL04 - Prompt description ........................................................................................................... 152
Table 15 - BIL04 - Output description ............................................................................................................ 155
Table 16 - BIL05 - Prompt description ........................................................................................................... 156
Table 17 - BIL05 - Output description ............................................................................................................ 158
Table 18 - CON01 - Prompt description ........................................................................................................ 159
Table 19 - CON01 - Output description ......................................................................................................... 162
Table 20 - CON02 - Prompt description ........................................................................................................ 164
Table 21 - CON02 - Output description ......................................................................................................... 165
Table 22 - DEX01 - Prompt description ......................................................................................................... 166
Table 23 - DEX01 - Output description .......................................................................................................... 167
Table 24 - DEX02 - Prompt description ......................................................................................................... 169
Table 25 - DEX02 - Output description .......................................................................................................... 174
Table 26 - IDC01 - Prompt description .......................................................................................................... 175
Table 27 - IDC01 - Output description ........................................................................................................... 178
Table 28 - IDC02 - Prompt description .......................................................................................................... 179
Table 29 - IDC02 - Output description ........................................................................................................... 182
Table 30 - IDC03 - Prompt description .......................................................................................................... 183
Table 31 - IDC03 - Output description ........................................................................................................... 186
Table 32 - IDC04 - Prompt description .......................................................................................................... 187
List of Tables
All rights reserved. Page 23 of 478
Table 33 - IDC04 - Output description ........................................................................................................... 189
Table 34 - IDC05 - Prompt description .......................................................................................................... 191
Table 35 - IDC05 - Output description ........................................................................................................... 193
Table 36 - IDC06 - Prompt description .......................................................................................................... 194
Table 37 - IDC06 - Output description ........................................................................................................... 196
Table 38 - INV01 - Prompt description .......................................................................................................... 198
Table 39 - INV01 - Output description ........................................................................................................... 201
Table 40 - MIR01 - Prompt description .......................................................................................................... 202
Table 41 - MIR01 - Output description - table minimum reserve information ................................................ 206
Table 42 - MIR01 - Output description - table list of interest and penalty rates ............................................ 207
Table 43 - MIR02 - Prompt description .......................................................................................................... 208
Table 44 - MIR02 - Output description .......................................................................................................... 209
Table 45 - PAR01 - Prompt description ......................................................................................................... 211
Table 46 - PAR01 - Output description .......................................................................................................... 212
Table 47 - PAR02 - Prompt description ......................................................................................................... 213
Table 48 - PAR02 - Output description .......................................................................................................... 216
Table 49 - PAR03 - Prompt description ......................................................................................................... 217
Table 50 - PAR03 - Output description - table parties subject to minimum reserve ..................................... 219
Table 51 - PAR03 - Output description - table parties not subject to minimum reserve ............................... 219
Table 52 - PAR04 - Prompt description ......................................................................................................... 221
Table 53 - PAR04 - Output description .......................................................................................................... 223
Table 54 - PAR05 - Prompt description ......................................................................................................... 225
Table 55 - PAR05 - Output description - Table DCA View ............................................................................ 226
Table 56 - PAR05 - Output description - Table linked account view ............................................................. 227
Table 57 - PAR06 - Prompt description ......................................................................................................... 228
Table 58 - PAR06 - Output description .......................................................................................................... 230
Table 59 - STF01 - Prompt description ......................................................................................................... 231
Table 60 - STF01 - Output description - Table use of marginal lending ....................................................... 234
Table 61 - STF01 - Output description - Table overnight deposit ................................................................. 235
Table 62 - STF01 - Output description - Bar chart for marginal lending and overnight deposit .................... 235
Table 63 - STA01 - Prompt description ......................................................................................................... 237
Table 64 - STA01 - Output description .......................................................................................................... 241
Table 65 - STA02 - Prompt description ......................................................................................................... 243
List of Tables
All rights reserved. Page 24 of 478
Table 66 - STA02 - Output description .......................................................................................................... 245
Table 67 - TRN01 - Prompt description ......................................................................................................... 249
Table 68 - TRN01 - Output description .......................................................................................................... 253
Table 69 - TRN01 - Report description - Details ........................................................................................... 256
Table 70 - TRN02 - Prompt description ......................................................................................................... 257
Table 71 - TRN02 - Output description .......................................................................................................... 259
Table 72 - TRN03 - Prompt description ......................................................................................................... 261
Table 73 - TRN03 - Output description .......................................................................................................... 264
Table 74 - TRN04 - Prompt description ......................................................................................................... 265
Table 75 - TRN04 - Output description .......................................................................................................... 268
Table 76 - TRN05 - Prompt description ......................................................................................................... 270
Table 77 - TRN05 - Output description .......................................................................................................... 275
Table 78 - TRN06 - Prompt description ......................................................................................................... 277
Table 79 - TRN06 - Output description .......................................................................................................... 279
Table 80 - TRN07 - Prompt description ......................................................................................................... 281
Table 81 - TRN07 - Output description .......................................................................................................... 285
Table 82 - TRN08 - Prompt description ......................................................................................................... 287
Table 83 - TRN08 - Output description .......................................................................................................... 289
Table 84 - TRN09 - Prompt description ......................................................................................................... 291
Table 85 - TRN09 - Output description - Table ............................................................................................. 294
Table 86 - TRN09 - Output description .......................................................................................................... 294
Table 87 - TRN10 - Prompt description ......................................................................................................... 296
Table 88 - TRN10 - Output description .......................................................................................................... 297
Table 89 - TRN11 - Prompt description ......................................................................................................... 299
Table 90 - TRN11 - Output description - Table overall volume ..................................................................... 303
Table 91 - TRN11 - Output description - Table overall value ........................................................................ 303
Table 92 - Functional security - User Groups and Roles .............................................................................. 305
Table 93 - The user interface - Report icons and functions .......................................................................... 313
Table 94 - Guidelines for each reporting style ............................................................................................... 374
Table 95 - Validate a report ........................................................................................................................... 380
Table 96 - View Options ................................................................................................................................ 383
Table 97 - Edit Options .................................................................................................................................. 385
Table 98 - Report Options ............................................................................................................................. 387
List of Tables
All rights reserved. Page 25 of 478
Table 99 - Advanced Options ........................................................................................................................ 389
Table 100 - Adding a baseline to a visualization ........................................................................................... 409
Table 101 - Customizing chart properties ...................................................................................................... 425
Table 102 - Adding a marker to a chart ......................................................................................................... 429
Table 103 - Adding prompts to filter data ...................................................................................................... 432
Table 104 - Build your own Prompt and Prompt page .................................................................................. 435
Table 105 - Control the data that appears in a tree prompt .......................................................................... 445
Table 106 - DWH objects............................................................................................................................... 477
Table 107 - List of CLM/RTGS inbound messages ....................................................................................... 478
Introduction
Purpose of the document
All rights reserved. Page 26 of 478
1 Introduction
1.1 Purpose of the document
The Data Warehouse (DWH) User Handbook, hereinafter referred to as UHB, aims to facilitate the use of the
Data Warehouse Graphical User Interface. It is addressed to all DWH users, regardless of the parties and
describes the full range of functionalities available in user-to-application (U2A) mode. The UHB provides
detailed reference information on all GUI functionalities and step-by-step descriptions. Thus the DWH UHB
provides helpful information on the use of the DWH GUI.
There is only one handbook for DWH addressing all actors: Central Banks (CB), Payment Banks (PB) and
Ancillary Systems (AS). Specific chapters for CB users with advanced user’s profile (see chapter Overview
[ 30]) are marked with the annex “for advanced user” in the title of the chapter. All other chapters are relevant
for each reader.
The UHB is part of the functional documentation and complements the DWH UDFS, which can be found on
the ECB’s website.
Updated versions of the UHB will be provided on a regular basis.
1.1.1 UHB Methodology
To ease orientation and help you to find your desired information quickly several symbols and methodological
elements are used throughout the DWH UHB.
Page
Every page of the UHB has a similar page layout. You can find the following elements:
l The header, which shows the chapter and the sub-chapter title,
l The text, which contains the main information, tables and screenshots
l The footer, which shows page number and the amount of pages of the document
Links
Links are illustrated throughout the UHB with a little triangle followed by a page number within squared
brackets. These links help you to jump to related sections by clicking on them or turning to the relevant page.
Example:
Introduction
Purpose of the document
All rights reserved. Page 27 of 478
Tables
Tables are used to present information in a clearly arranged format. They consist of a table head and a table
body. The body is divided into a left and a right column. The left column contains keywords, for example field
names, which are explained in the right column. Subsections within a table are preceded by a heading. The
order of the description follows the appearance on the screens from left to right and from top to bottom.
Action steps
Step-by-step descriptions are divided into single action steps. These steps are numbered sequentially.
Intermediate results are described where appropriate.
Screenshots
Screenshots are used to illustrate the corresponding text. Note that there might be minor deviations be-tween
the screenshot and your screen appearance, according to your access rights or a specific selection you have
made. In addition, some functions are mutually exclusive and cannot be represented in a single screenshot.
In these cases, the screenshot illustrates the more relevant use of the screen.
Values shown on a screenshot might also deviate from the default values indicated in the description. In these
cases, the description is valid rather than the screenshot.
1.1.2 UHB Structure
The UHB is divided in eight chapters:
Chapter 1
The chapter Introduction explains the aim, the content and the approach of both the UHB and the DWH GUI.
While the first section explains how to use the UHB, the second section focuses on technical requirements.
Chapter 2
The chapter Introduction to the Data Warehouse provides background information about the Data
Warehouse itself and also about the software tool used as GUI.
Chapter 3
The chapter First steps & basics provides the reader with basic elements and the structure of the DWH GUI.
Chapter 4
The chapter Working with reports explains the reader how to
l copy and save a report (see chapter Copy, save and export [ 71])
Introduction
Set-up and Login
All rights reserved. Page 28 of 478
l run a report (see chapter Running reports [ 83])
l schedule a report (see chapter Scheduling reports [ 102])
Chapter 5
The chapter Predefined reports provides the reader with information about all predefined reports.
Chapter 6
The chapter Understanding user rights and access rights is only applicable for advanced users and
explains on one hand the functional security and on the other hand the data security in DWH.
Chapter 7
The chapter Creating reports is only applicable for advanced users and provides information how to build a
user defined report from scratch and how to adapt a predefined report.
Chapter 8
The chapter DWH data objects lists all data objects available in the DWH GUI.
1.2 Set-up and Login
1.2.1 GUI Access
Users are directed to an initial page named ESMIG portal that ensures proper routing to the web applications
the user has been granted to enter. Refer to the Connectivity Guide specified in the ESMIG UDFS document,
current version available, for details on the communication network and services.
1.2.2 Technical Requirements
Before entering the GUI, make sure to implement all necessary preparations described below.
Such preparations may be subject to periodical review/update to comply with changing technical/regulatory
scenarios.
The following web-browsers are suggested:
l Mozilla Firefox 78.0 +
l Google Chrome 88.0 +
The required minimum screen resolution is 1366 x 768 pixel. Screen resolutions below this requirement are
not supported and can lead to a deviating appearance and functionality of the GUI.

Introduction
Set-up and Login
All rights reserved. Page 29 of 478
Even if the screen resolution fulfils the requirement defined above, it is important to note that scaling options
provided by the operating system and the browser (e.g. 125% or 150%) may cause a deviating appearance
and functionality of the GUI. If this is the case, the usage of scaling options is not supported.
Introduction to the Data Warehouse
Overview
All rights reserved. Page 30 of 478
2 Introduction to the Data Warehouse
2.1 Overview
The aim of the DWH is to store and compile information coming from T2 (Real-Time Gross Settlement (RTGS)
and Central Liquidity Management (CLM)), TARGET2- Securities (T2S) and common components i.e.
Common Reference Data Management (CRDM), Billing (BILL), Contingency Services (ECONS II) and
Business Day Management (BDM) in a homogenous manner at business level. As in T2 only data from the
current business day are available, based on a reliable and secure database, the DWH offers the possibility
of accessing the past data accumulated for further data analysis.
The DWH provides access to data in U2A mode and permits access to data within the databases. It gives a
business-oriented view of the collected data without any detailed technical database terminology. Therefore,
no knowledge about the database structure of T2 or T2S is required. It provides information through reports
as predefined reports (for all user profiles) and user defined reports (only applicable for CB users with
advanced user profile).
The DWH consolidates the content of the sources into a single database for reporting purposes and offers pre-
defined reports to the users of the following T2 parties:
l Central Banks (CB),
l Payment Banks (PB),
l Ancillary Systems (AS).
The precondition for a user to obtain access to the DWH is a setup in CRDM by the respective party. Access
to the DWH depends on the user's profile, which ensures that the user is allowed to perform the requested
action(s). There are two user profiles reflected as privileges in CRDM:
l Normal user profile: will be available for all party types.
l Advanced user profile: will be available for CB users only.
The data scope in the DWH follows the following rules:
l Users have access to their parties’ data based on the data scope according to the hierarchical model (for
details please refer to CRDM UDFS).
l For CBs: Each CB has access to granular data for all parties belonging to its system entity. Moreover,
each CB has access to aggregated data of all system entities.
The DWH uses Cognos as platform. It is an enterprise wide Business Intelligence (BI) solution, mostly used
for reporting. Cognos is a web-based solution. Both the development and the end user interface are displayed
on the web. It supports Relational Online Analytical Processing (ROLAP) and Multidimensional Online
Analytical Processing (MOLAP) data sources.
The DWH provides reports to users in different formats in user-to-application mode (U2A) or to other
applications in application-to-application mode (A2A). The user can run a report directly in the DWH GUI
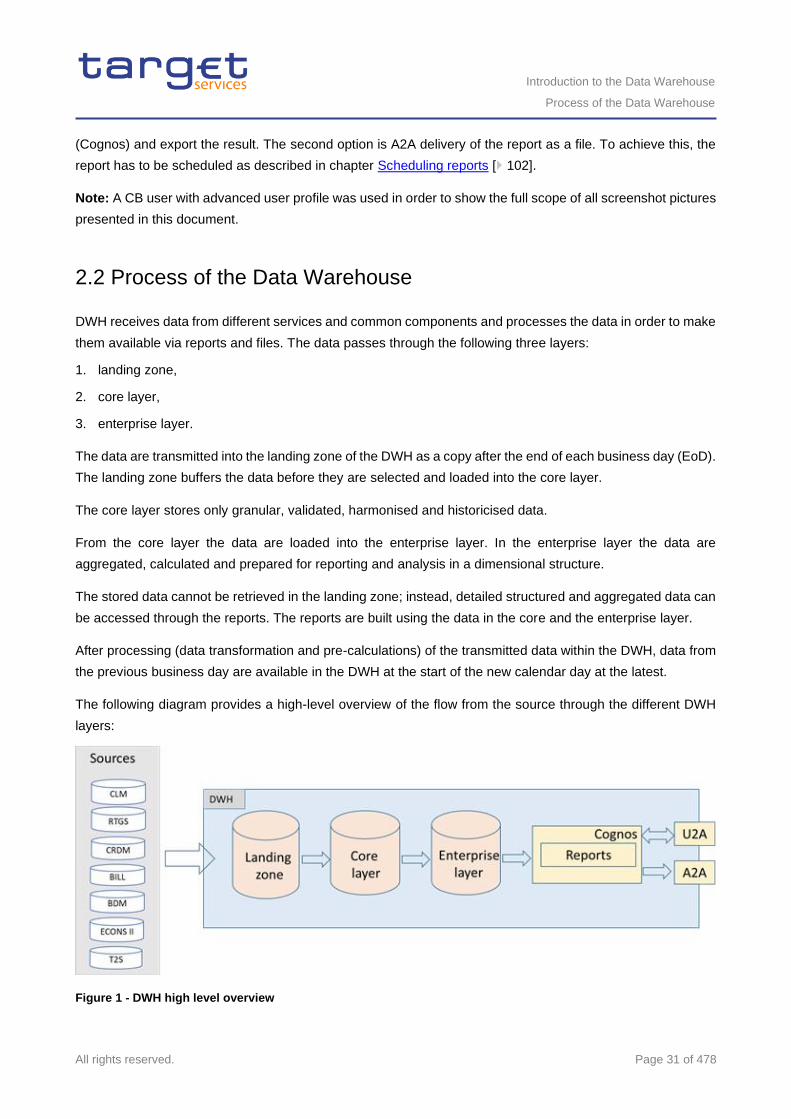
Introduction to the Data Warehouse
Process of the Data Warehouse
All rights reserved. Page 31 of 478
(Cognos) and export the result. The second option is A2A delivery of the report as a file. To achieve this, the
report has to be scheduled as described in chapter Scheduling reports [ 102].
Note: A CB user with advanced user profile was used in order to show the full scope of all screenshot pictures
presented in this document.
2.2 Process of the Data Warehouse
DWH receives data from different services and common components and processes the data in order to make
them available via reports and files. The data passes through the following three layers:
1. landing zone,
2. core layer,
3. enterprise layer.
The data are transmitted into the landing zone of the DWH as a copy after the end of each business day (EoD).
The landing zone buffers the data before they are selected and loaded into the core layer.
The core layer stores only granular, validated, harmonised and historicised data.
From the core layer the data are loaded into the enterprise layer. In the enterprise layer the data are
aggregated, calculated and prepared for reporting and analysis in a dimensional structure.
The stored data cannot be retrieved in the landing zone; instead, detailed structured and aggregated data can
be accessed through the reports. The reports are built using the data in the core and the enterprise layer.
After processing (data transformation and pre-calculations) of the transmitted data within the DWH, data from
the previous business day are available in the DWH at the start of the new calendar day at the latest.
The following diagram provides a high-level overview of the flow from the source through the different DWH
layers:
Figure 1 - DWH high level overview
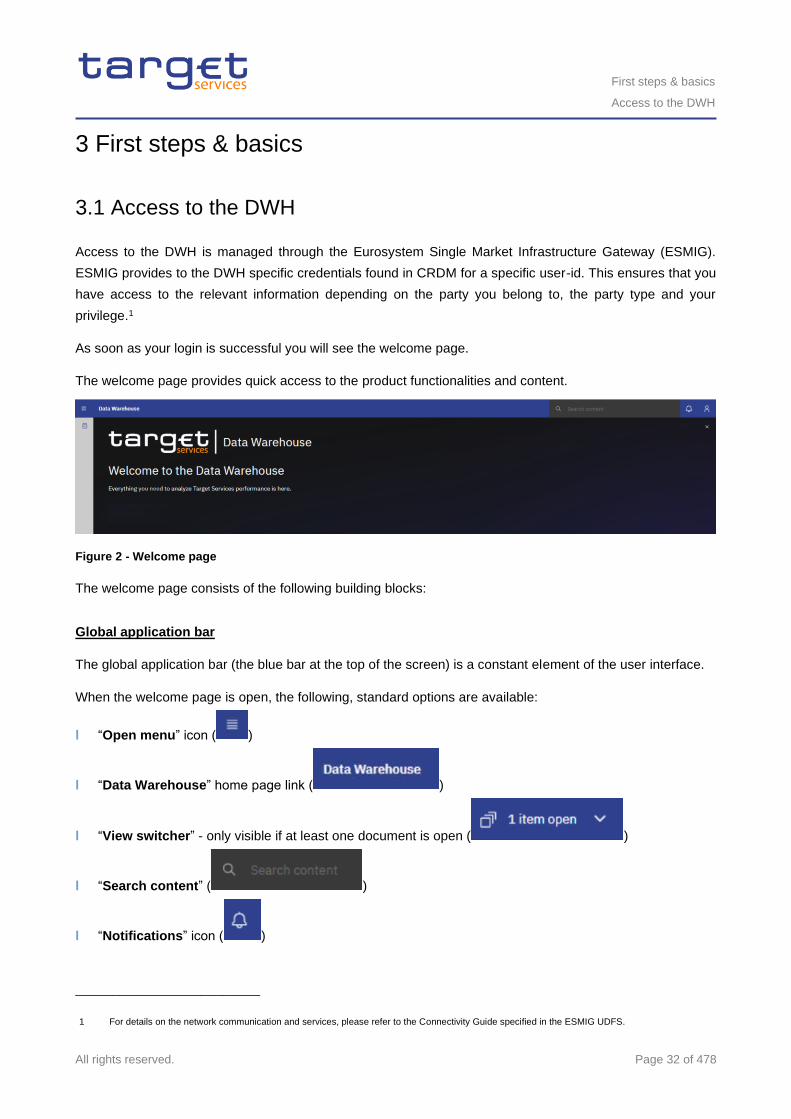
First steps & basics
Access to the DWH
All rights reserved. Page 32 of 478
3 First steps & basics
3.1 Access to the DWH
Access to the DWH is managed through the Eurosystem Single Market Infrastructure Gateway (ESMIG).
ESMIG provides to the DWH specific credentials found in CRDM for a specific user-id. This ensures that you
have access to the relevant information depending on the party you belong to, the party type and your
privilege.1
As soon as your login is successful you will see the welcome page.
The welcome page provides quick access to the product functionalities and content.
Figure 2 - Welcome page
The welcome page consists of the following building blocks:
Global application bar
The global application bar (the blue bar at the top of the screen) is a constant element of the user interface.
When the welcome page is open, the following, standard options are available:
l “Open menu” icon ( )
l “Data Warehouse” home page link ( )
l “View switcher” - only visible if at least one document is open ( )
l “Search content” ( )
l “Notifications” icon ( )
_________________________
1 For details on the network communication and services, please refer to the Connectivity Guide specified in the ESMIG UDFS.
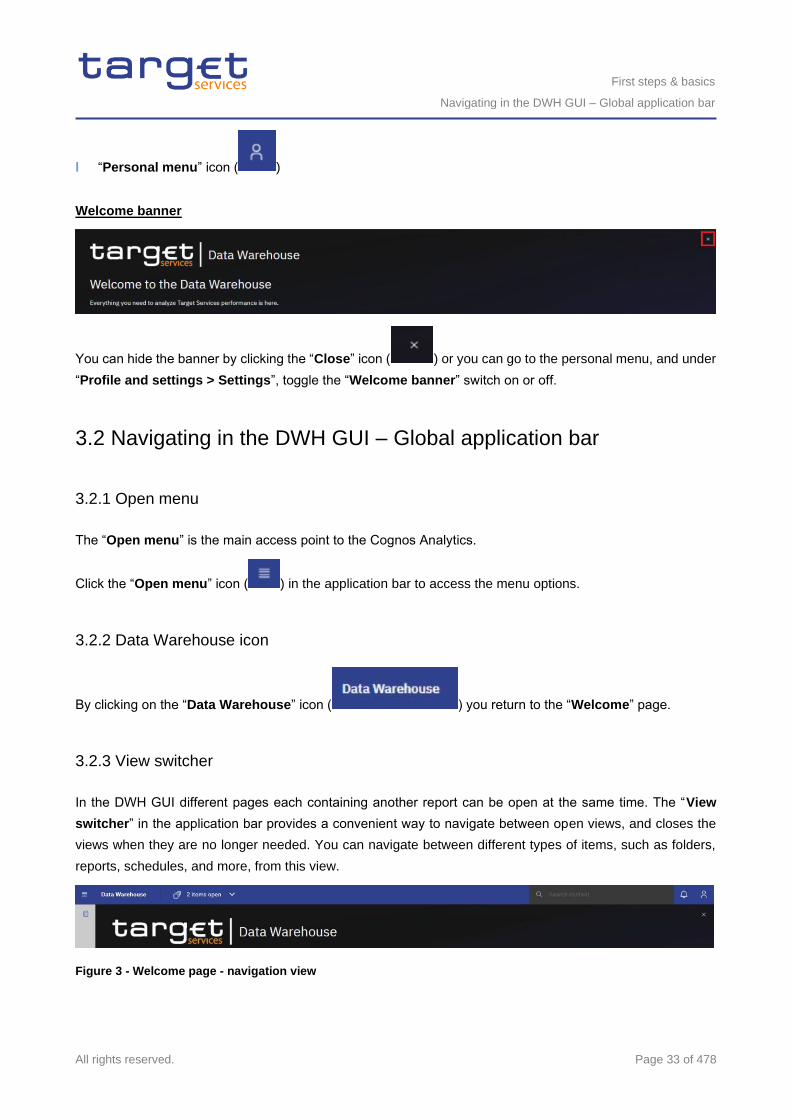
First steps & basics
Navigating in the DWH GUI – Global application bar
All rights reserved. Page 33 of 478
l “Personal menu” icon ( )
Welcome banner
You can hide the banner by clicking the “Close” icon ( ) or you can go to the personal menu, and under
“Profile and settings > Settings”, toggle the “Welcome banner” switch on or off.
3.2 Navigating in the DWH GUI – Global application bar
3.2.1 Open menu
The “Open menu” is the main access point to the Cognos Analytics.
Click the “Open menu” icon ( ) in the application bar to access the menu options.
3.2.2 Data Warehouse icon
By clicking on the “Data Warehouse” icon ( ) you return to the “Welcome” page.
3.2.3 View switcher
In the DWH GUI different pages each containing another report can be open at the same time. The “View
switcher” in the application bar provides a convenient way to navigate between open views, and closes the
views when they are no longer needed. You can navigate between different types of items, such as folders,
reports, schedules, and more, from this view.
Figure 3 - Welcome page - navigation view
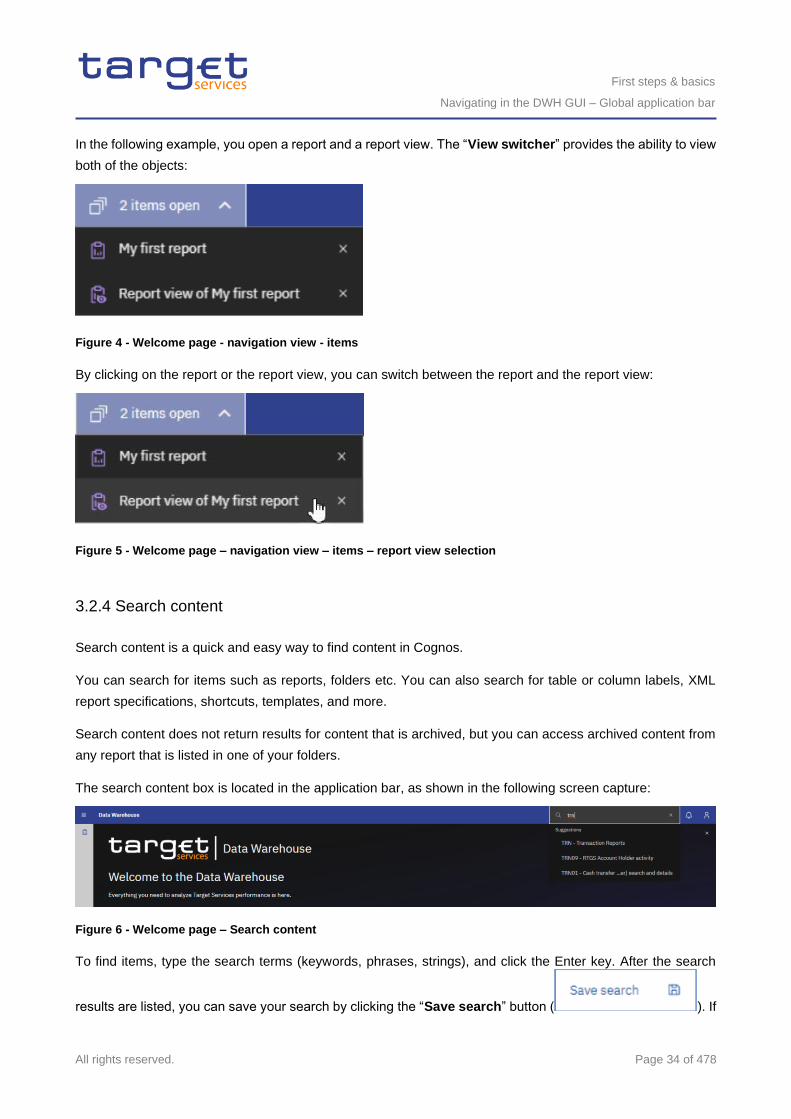
First steps & basics
Navigating in the DWH GUI – Global application bar
All rights reserved. Page 34 of 478
In the following example, you open a report and a report view. The “View switcher” provides the ability to view
both of the objects:
Figure 4 - Welcome page - navigation view - items
By clicking on the report or the report view, you can switch between the report and the report view:
Figure 5 - Welcome page – navigation view – items – report view selection
3.2.4 Search content
Search content is a quick and easy way to find content in Cognos.
You can search for items such as reports, folders etc. You can also search for table or column labels, XML
report specifications, shortcuts, templates, and more.
Search content does not return results for content that is archived, but you can access archived content from
any report that is listed in one of your folders.
The search content box is located in the application bar, as shown in the following screen capture:
Figure 6 - Welcome page – Search content
To find items, type the search terms (keywords, phrases, strings), and click the Enter key. After the search
results are listed, you can save your search by clicking the “Save search” button ( ). If
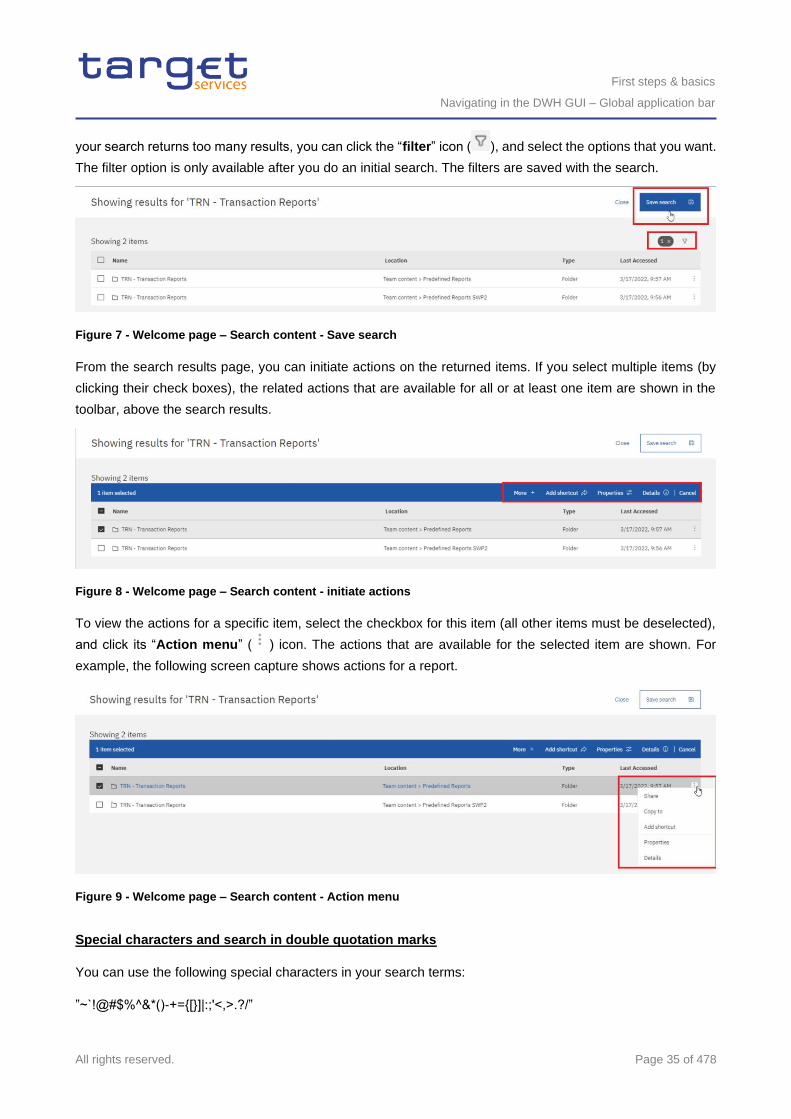
First steps & basics
Navigating in the DWH GUI – Global application bar
All rights reserved. Page 35 of 478
your search returns too many results, you can click the “filter” icon ( ), and select the options that you want.
The filter option is only available after you do an initial search. The filters are saved with the search.
Figure 7 - Welcome page – Search content - Save search
From the search results page, you can initiate actions on the returned items. If you select multiple items (by
clicking their check boxes), the related actions that are available for all or at least one item are shown in the
toolbar, above the search results.
Figure 8 - Welcome page – Search content - initiate actions
To view the actions for a specific item, select the checkbox for this item (all other items must be deselected),
and click its “Action menu” ( ) icon. The actions that are available for the selected item are shown. For
example, the following screen capture shows actions for a report.
Figure 9 - Welcome page – Search content - Action menu
Special characters and search in double quotation marks
You can use the following special characters in your search terms:
”~`!@#$%^&*()-+={[}]|:;'<,>.?/”
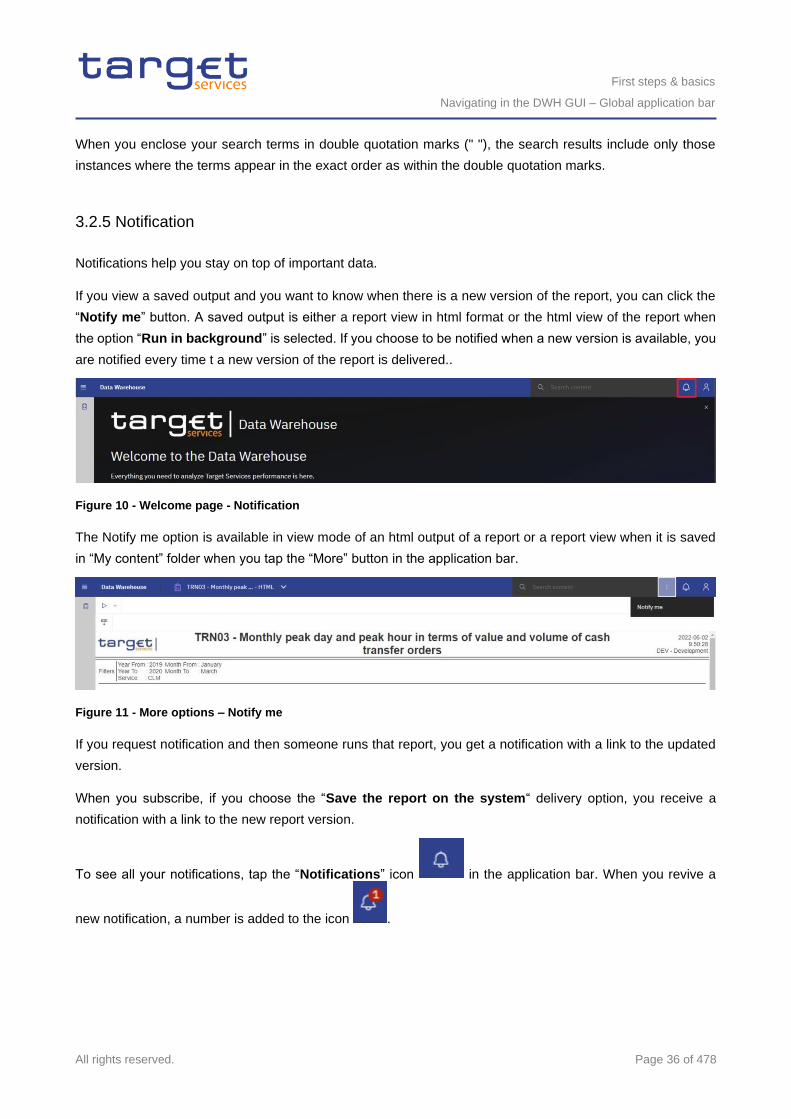
First steps & basics
Navigating in the DWH GUI – Global application bar
All rights reserved. Page 36 of 478
When you enclose your search terms in double quotation marks (" "), the search results include only those
instances where the terms appear in the exact order as within the double quotation marks.
3.2.5 Notification
Notifications help you stay on top of important data.
If you view a saved output and you want to know when there is a new version of the report, you can click the
“Notify me” button. A saved output is either a report view in html format or the html view of the report when
the option “Run in background” is selected. If you choose to be notified when a new version is available, you
are notified every time t a new version of the report is delivered..
Figure 10 - Welcome page - Notification
The Notify me option is available in view mode of an html output of a report or a report view when it is saved
in “My content” folder when you tap the “More” button in the application bar.
Figure 11 - More options – Notify me
If you request notification and then someone runs that report, you get a notification with a link to the updated
version.
When you subscribe, if you choose the “Save the report on the system“ delivery option, you receive a
notification with a link to the new report version.
To see all your notifications, tap the “Notifications” icon in the application bar. When you revive a
new notification, a number is added to the icon .
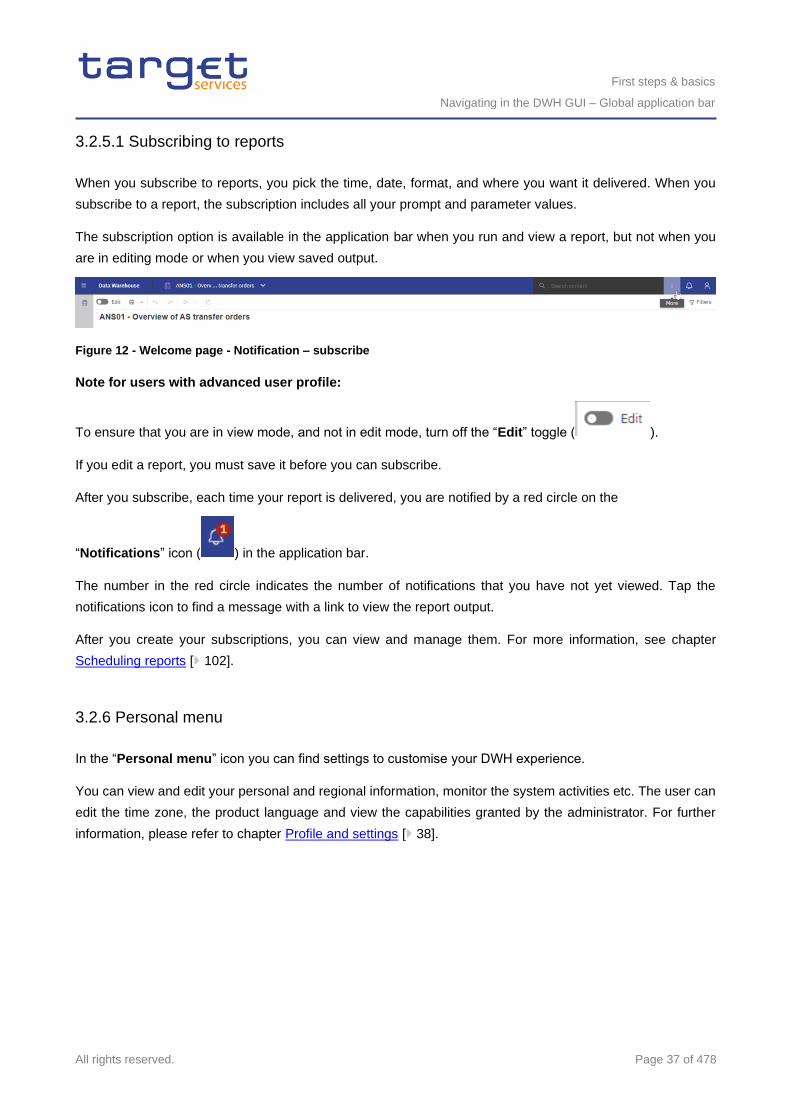
First steps & basics
Navigating in the DWH GUI – Global application bar
All rights reserved. Page 37 of 478
3.2.5.1 Subscribing to reports
When you subscribe to reports, you pick the time, date, format, and where you want it delivered. When you
subscribe to a report, the subscription includes all your prompt and parameter values.
The subscription option is available in the application bar when you run and view a report, but not when you
are in editing mode or when you view saved output.
Figure 12 - Welcome page - Notification – subscribe
Note for users with advanced user profile:
To ensure that you are in view mode, and not in edit mode, turn off the “Edit” toggle ( ).
If you edit a report, you must save it before you can subscribe.
After you subscribe, each time your report is delivered, you are notified by a red circle on the
“Notifications” icon ( ) in the application bar.
The number in the red circle indicates the number of notifications that you have not yet viewed. Tap the
notifications icon to find a message with a link to view the report output.
After you create your subscriptions, you can view and manage them. For more information, see chapter
Scheduling reports [ 102].
3.2.6 Personal menu
In the “Personal menu” icon you can find settings to customise your DWH experience.
You can view and edit your personal and regional information, monitor the system activities etc. The user can
edit the time zone, the product language and view the capabilities granted by the administrator. For further
information, please refer to chapter Profile and settings [ 38].
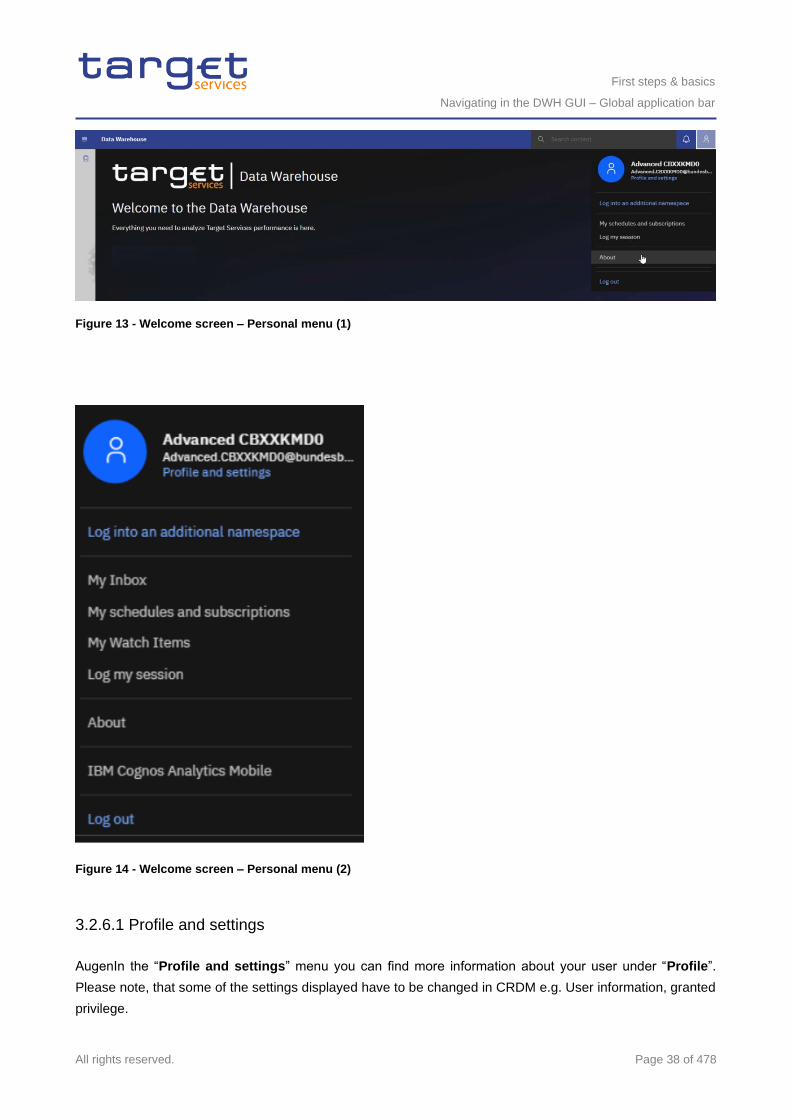
First steps & basics
Navigating in the DWH GUI – Global application bar
All rights reserved. Page 38 of 478
Figure 13 - Welcome screen – Personal menu (1)
Figure 14 - Welcome screen – Personal menu (2)
3.2.6.1 Profile and settings
AugenIn the “Profile and settings” menu you can find more information about your user under “Profile”.
Please note, that some of the settings displayed have to be changed in CRDM e.g. User information, granted
privilege.
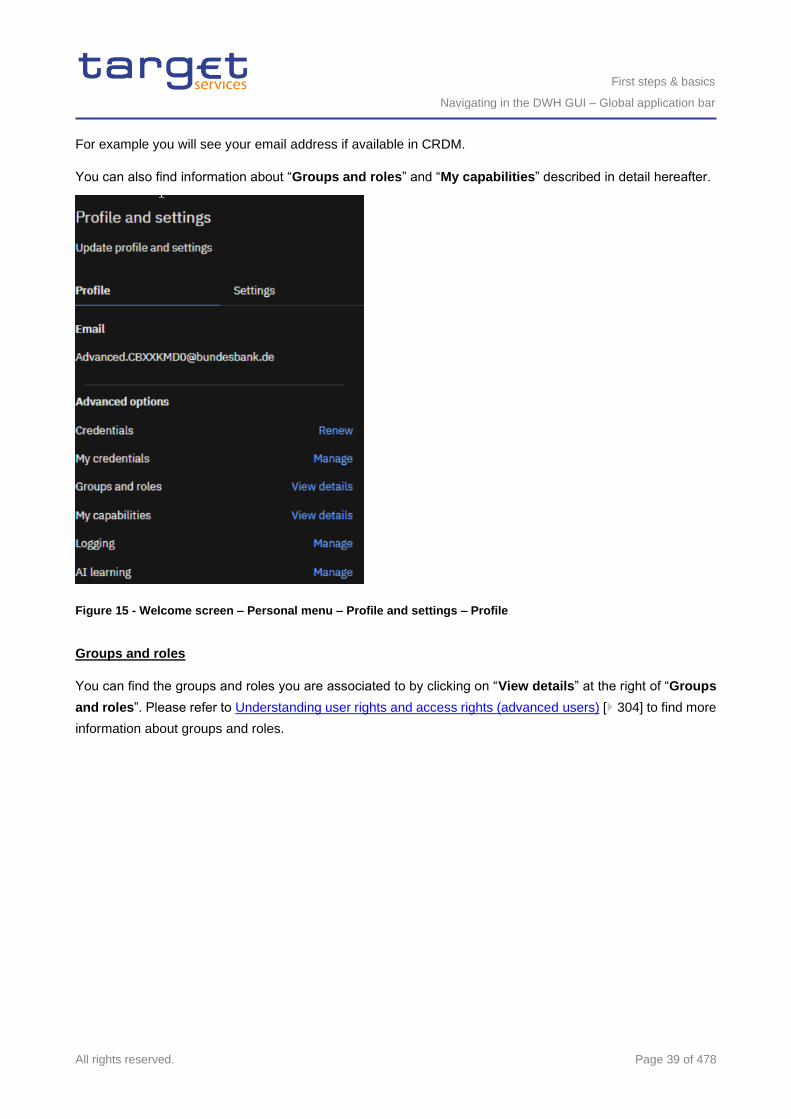
First steps & basics
Navigating in the DWH GUI – Global application bar
All rights reserved. Page 39 of 478
For example you will see your email address if available in CRDM.
You can also find information about “Groups and roles” and “My capabilities” described in detail hereafter.
Figure 15 - Welcome screen – Personal menu – Profile and settings – Profile
Groups and roles
You can find the groups and roles you are associated to by clicking on “View details” at the right of “Groups
and roles”. Please refer to Understanding user rights and access rights (advanced users) [ 304] to find more
information about groups and roles.
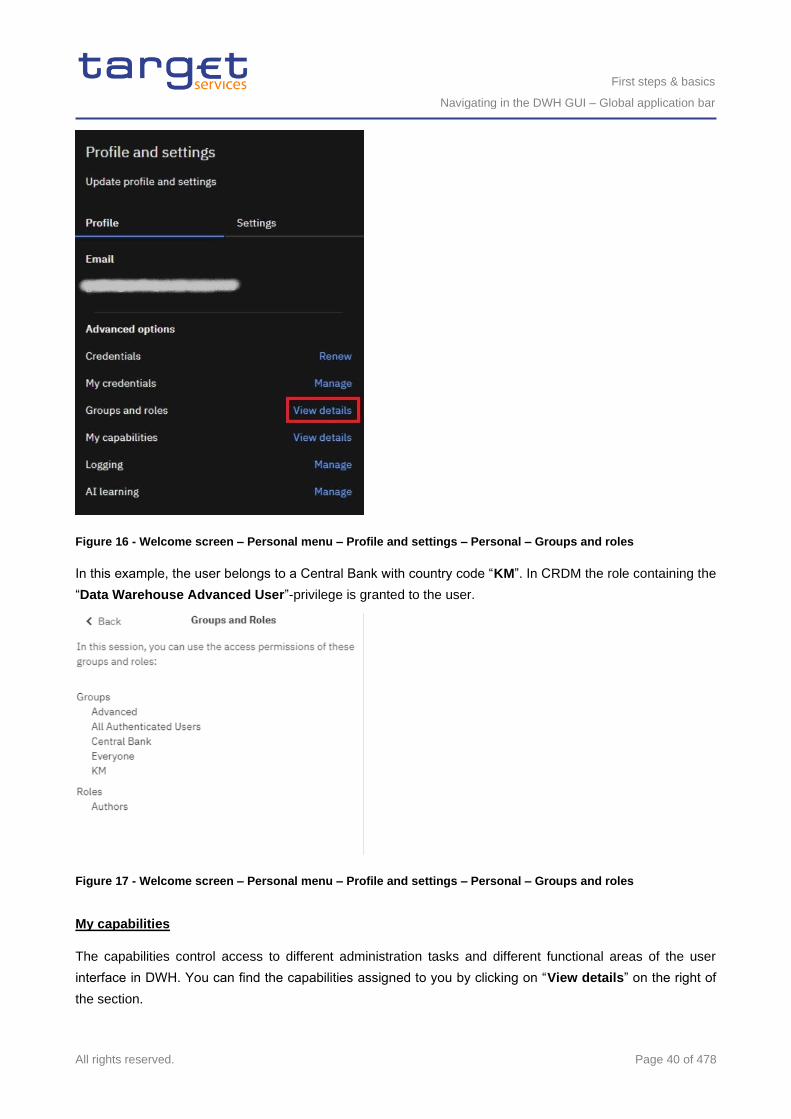
First steps & basics
Navigating in the DWH GUI – Global application bar
All rights reserved. Page 40 of 478
Figure 16 - Welcome screen – Personal menu – Profile and settings – Personal – Groups and roles
In this example, the user belongs to a Central Bank with country code “KM”. In CRDM the role containing the
“Data Warehouse Advanced User”-privilege is granted to the user.
Figure 17 - Welcome screen – Personal menu – Profile and settings – Personal – Groups and roles
My capabilities
The capabilities control access to different administration tasks and different functional areas of the user
interface in DWH. You can find the capabilities assigned to you by clicking on “View details” on the right of
the section.
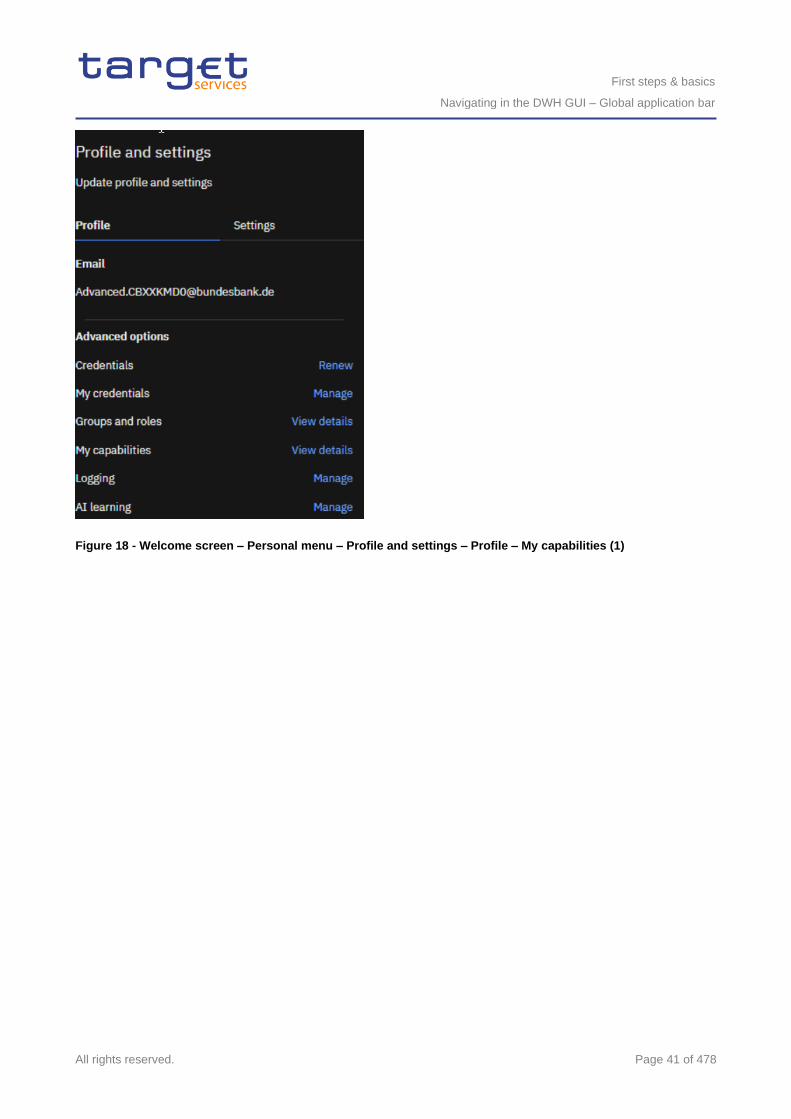
First steps & basics
Navigating in the DWH GUI – Global application bar
All rights reserved. Page 41 of 478
Figure 18 - Welcome screen – Personal menu – Profile and settings – Profile – My capabilities (1)
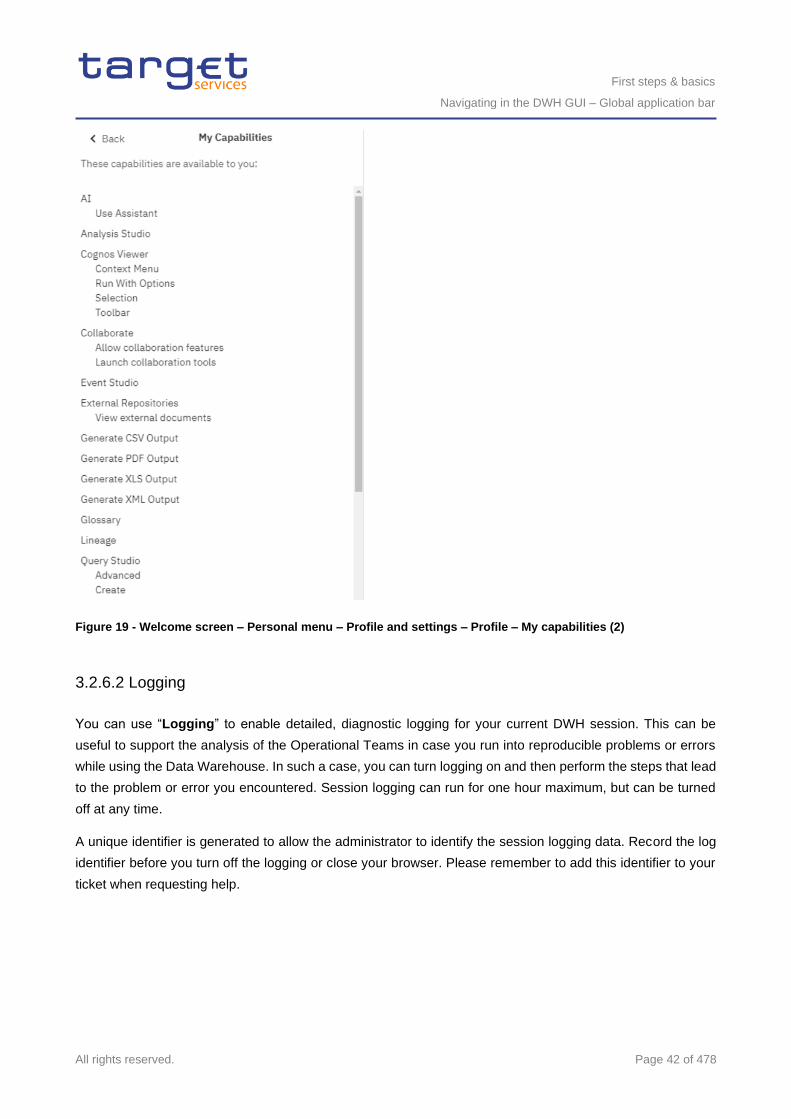
First steps & basics
Navigating in the DWH GUI – Global application bar
All rights reserved. Page 42 of 478
Figure 19 - Welcome screen – Personal menu – Profile and settings – Profile – My capabilities (2)
3.2.6.2 Logging
You can use “Logging” to enable detailed, diagnostic logging for your current DWH session. This can be
useful to support the analysis of the Operational Teams in case you run into reproducible problems or errors
while using the Data Warehouse. In such a case, you can turn logging on and then perform the steps that lead
to the problem or error you encountered. Session logging can run for one hour maximum, but can be turned
off at any time.
A unique identifier is generated to allow the administrator to identify the session logging data. Record the log
identifier before you turn off the logging or close your browser. Please remember to add this identifier to your
ticket when requesting help.
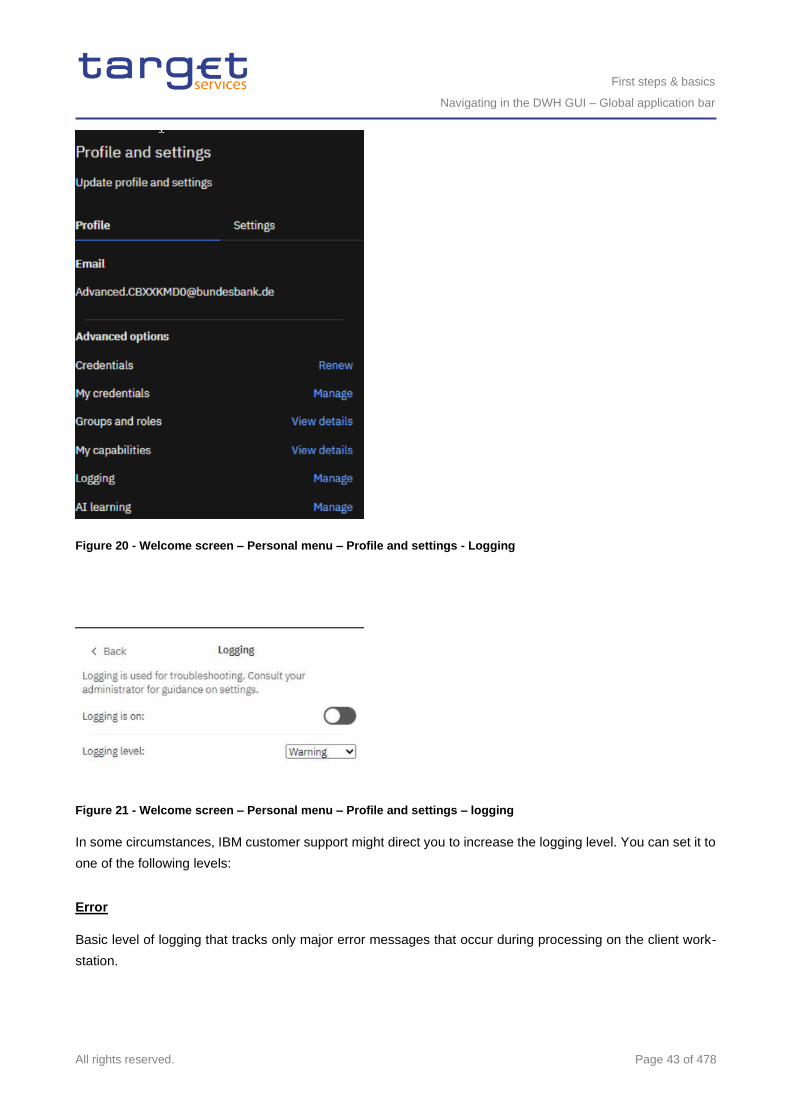
First steps & basics
Navigating in the DWH GUI – Global application bar
All rights reserved. Page 43 of 478
Figure 20 - Welcome screen – Personal menu – Profile and settings - Logging
Figure 21 - Welcome screen – Personal menu – Profile and settings – logging
In some circumstances, IBM customer support might direct you to increase the logging level. You can set it to
one of the following levels:
Error
Basic level of logging that tracks only major error messages that occur during processing on the client work-
station.
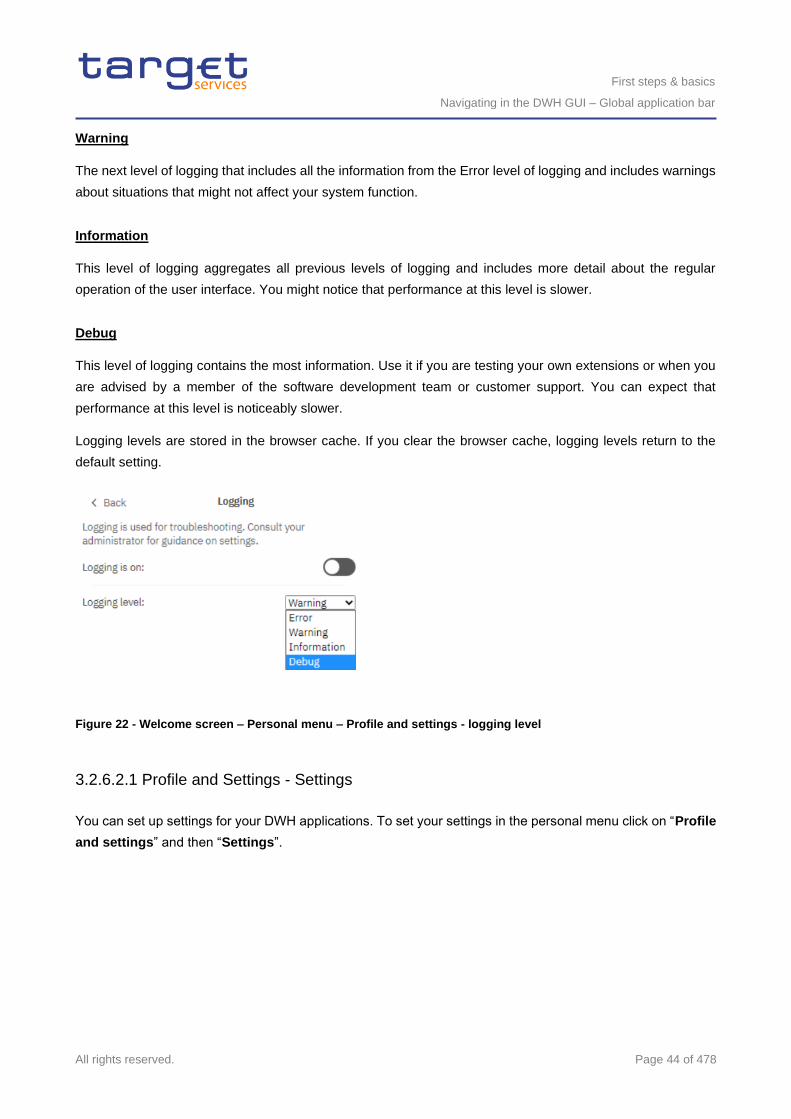
First steps & basics
Navigating in the DWH GUI – Global application bar
All rights reserved. Page 44 of 478
Warning
The next level of logging that includes all the information from the Error level of logging and includes warnings
about situations that might not affect your system function.
Information
This level of logging aggregates all previous levels of logging and includes more detail about the regular
operation of the user interface. You might notice that performance at this level is slower.
Debug
This level of logging contains the most information. Use it if you are testing your own extensions or when you
are advised by a member of the software development team or customer support. You can expect that
performance at this level is noticeably slower.
Logging levels are stored in the browser cache. If you clear the browser cache, logging levels return to the
default setting.
Figure 22 - Welcome screen – Personal menu – Profile and settings - logging level
3.2.6.2.1 Profile and Settings - Settings
You can set up settings for your DWH applications. To set your settings in the personal menu click on “Profile
and settings” and then “Settings”.
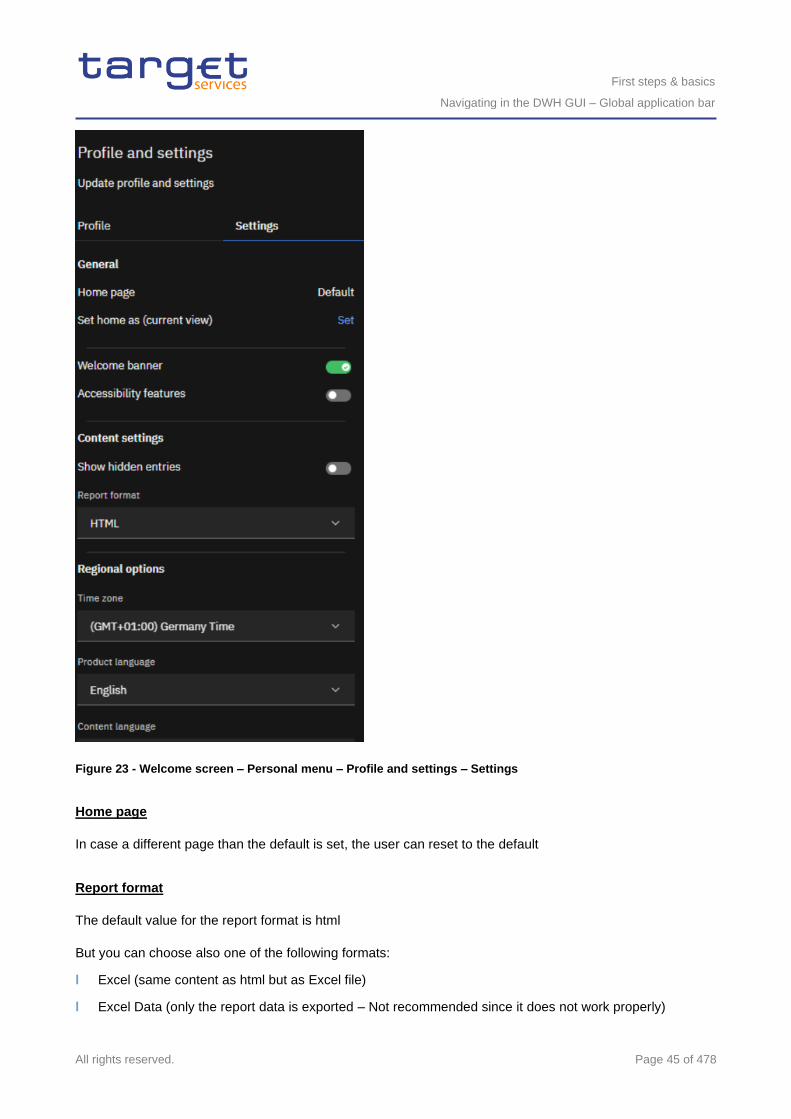
First steps & basics
Navigating in the DWH GUI – Global application bar
All rights reserved. Page 45 of 478
Figure 23 - Welcome screen – Personal menu – Profile and settings – Settings
Home page
In case a different page than the default is set, the user can reset to the default
Report format
The default value for the report format is html
But you can choose also one of the following formats:
l Excel (same content as html but as Excel file)
l Excel Data (only the report data is exported – Not recommended since it does not work properly)
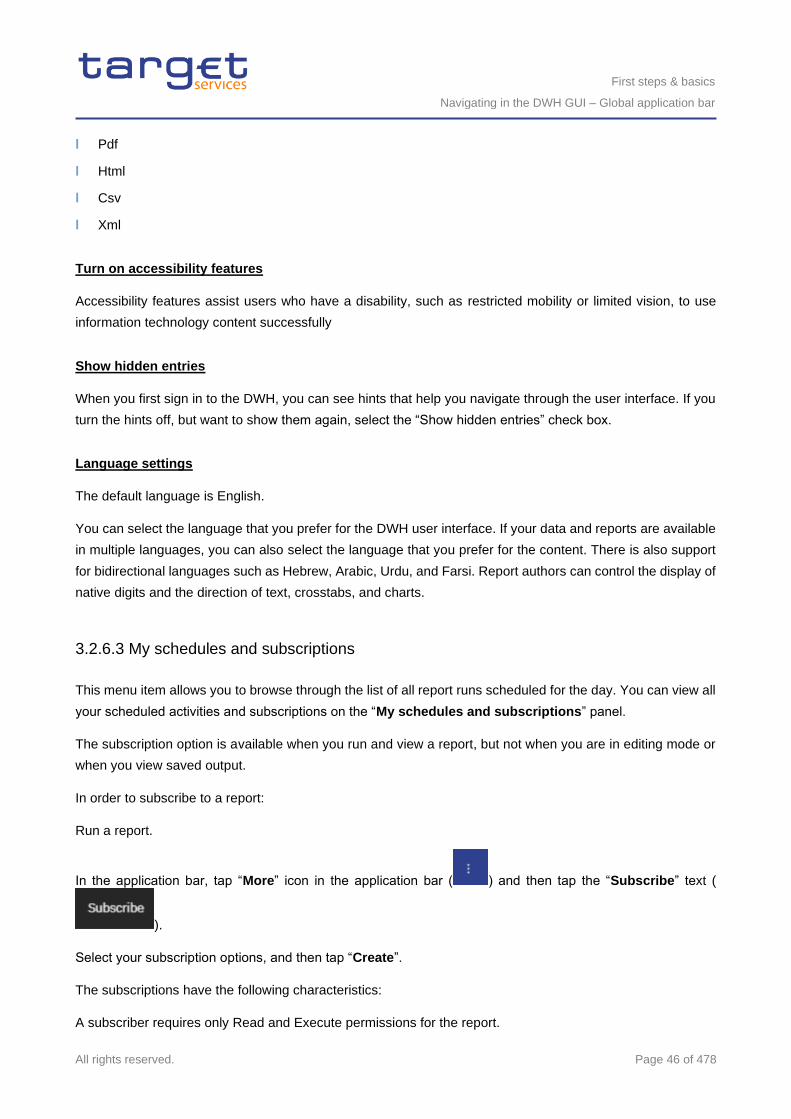
First steps & basics
Navigating in the DWH GUI – Global application bar
All rights reserved. Page 46 of 478
l Pdf
l Html
l Csv
l Xml
Turn on accessibility features
Accessibility features assist users who have a disability, such as restricted mobility or limited vision, to use
information technology content successfully
Show hidden entries
When you first sign in to the DWH, you can see hints that help you navigate through the user interface. If you
turn the hints off, but want to show them again, select the “Show hidden entries” check box.
Language settings
The default language is English.
You can select the language that you prefer for the DWH user interface. If your data and reports are available
in multiple languages, you can also select the language that you prefer for the content. There is also support
for bidirectional languages such as Hebrew, Arabic, Urdu, and Farsi. Report authors can control the display of
native digits and the direction of text, crosstabs, and charts.
3.2.6.3 My schedules and subscriptions
This menu item allows you to browse through the list of all report runs scheduled for the day. You can view all
your scheduled activities and subscriptions on the “My schedules and subscriptions” panel.
The subscription option is available when you run and view a report, but not when you are in editing mode or
when you view saved output.
In order to subscribe to a report:
Run a report.
In the application bar, tap “More” icon in the application bar ( ) and then tap the “Subscribe” text (
).
Select your subscription options, and then tap “Create”.
The subscriptions have the following characteristics:
A subscriber requires only Read and Execute permissions for the report.
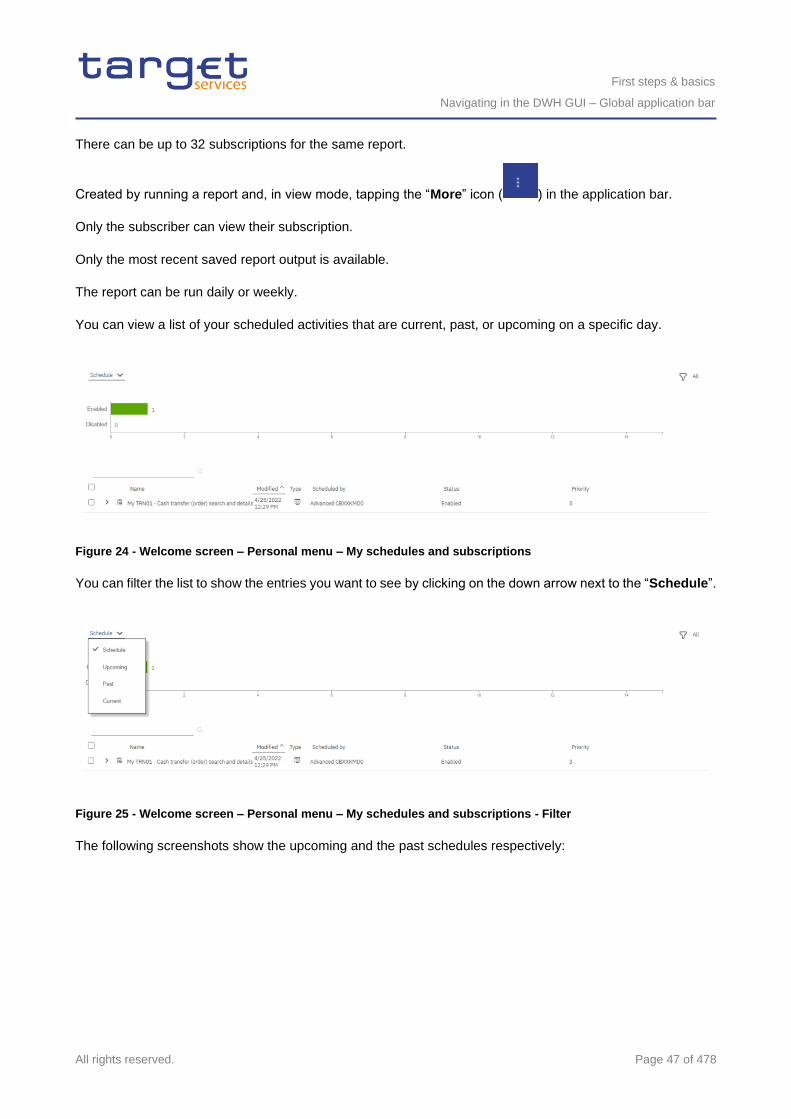
First steps & basics
Navigating in the DWH GUI – Global application bar
All rights reserved. Page 47 of 478
There can be up to 32 subscriptions for the same report.
Created by running a report and, in view mode, tapping the “More” icon ( ) in the application bar.
Only the subscriber can view their subscription.
Only the most recent saved report output is available.
The report can be run daily or weekly.
You can view a list of your scheduled activities that are current, past, or upcoming on a specific day.
Figure 24 - Welcome screen – Personal menu – My schedules and subscriptions
You can filter the list to show the entries you want to see by clicking on the down arrow next to the “Schedule”.
Figure 25 - Welcome screen – Personal menu – My schedules and subscriptions - Filter
The following screenshots show the upcoming and the past schedules respectively:
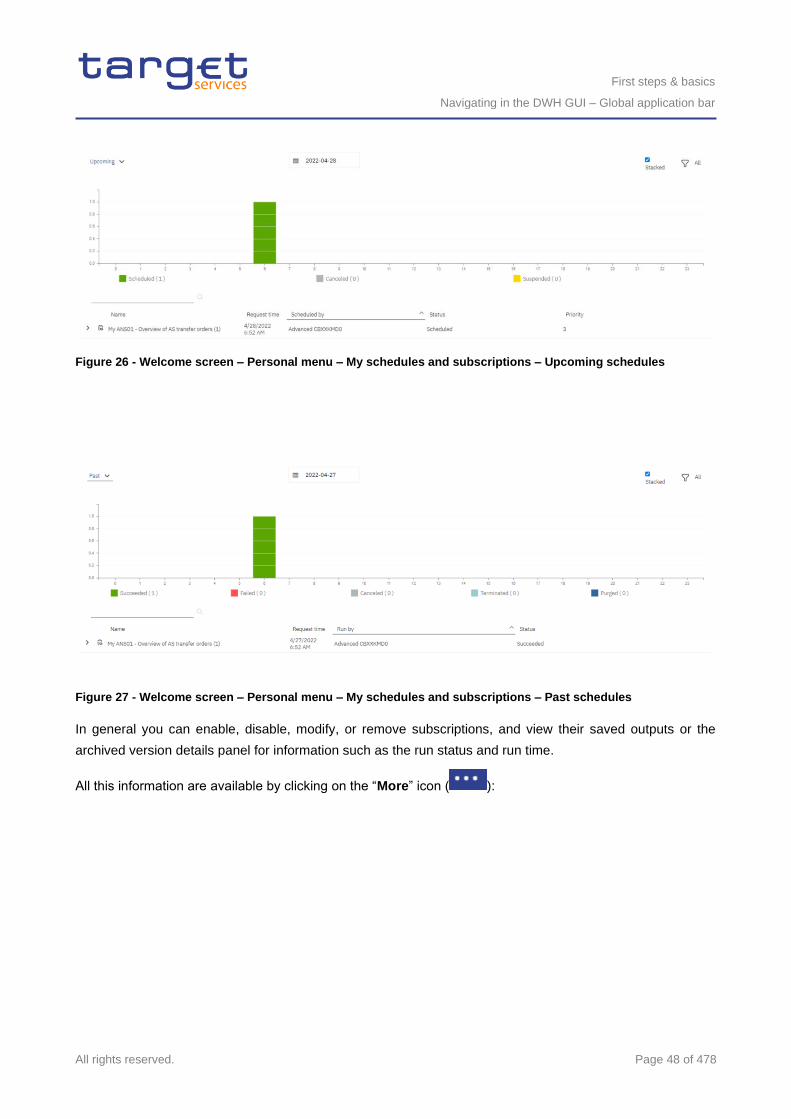
First steps & basics
Navigating in the DWH GUI – Global application bar
All rights reserved. Page 48 of 478
Figure 26 - Welcome screen – Personal menu – My schedules and subscriptions – Upcoming schedules
Figure 27 - Welcome screen – Personal menu – My schedules and subscriptions – Past schedules
In general you can enable, disable, modify, or remove subscriptions, and view their saved outputs or the
archived version details panel for information such as the run status and run time.
All this information are available by clicking on the “More” icon ( ):
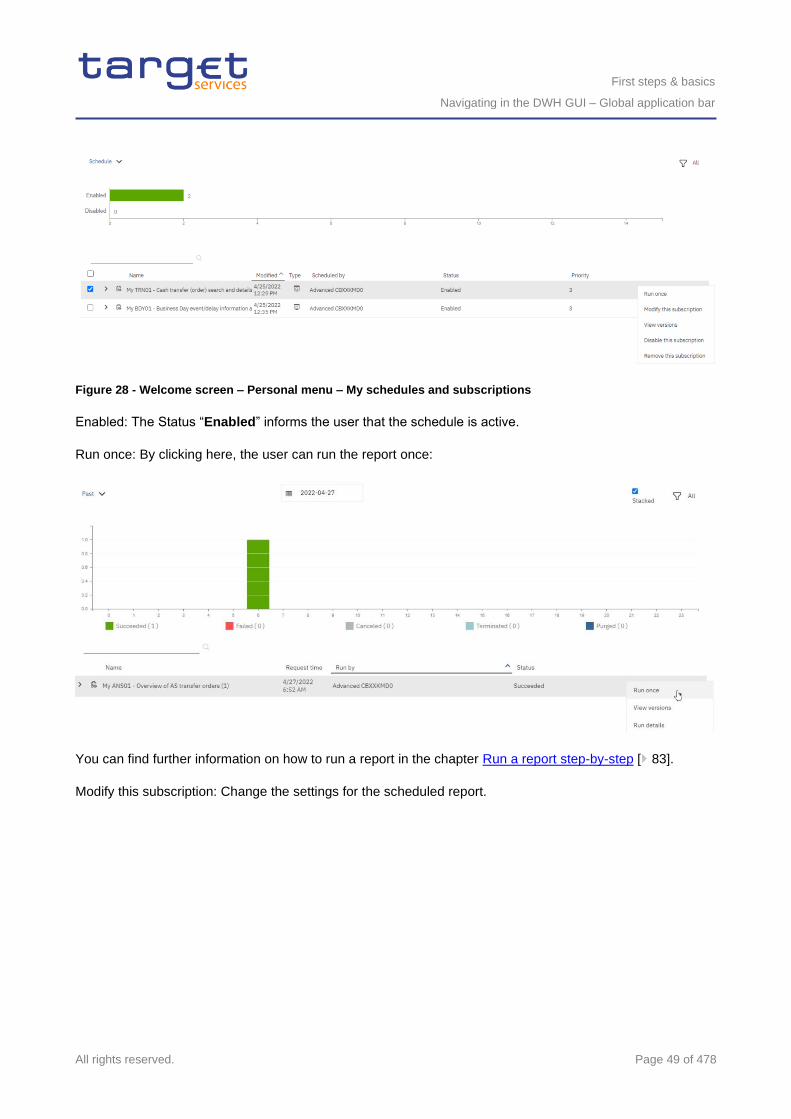
First steps & basics
Navigating in the DWH GUI – Global application bar
All rights reserved. Page 49 of 478
Figure 28 - Welcome screen – Personal menu – My schedules and subscriptions
Enabled: The Status “Enabled” informs the user that the schedule is active.
Run once: By clicking here, the user can run the report once:
You can find further information on how to run a report in the chapter Run a report step-by-step [ 83].
Modify this subscription: Change the settings for the scheduled report.
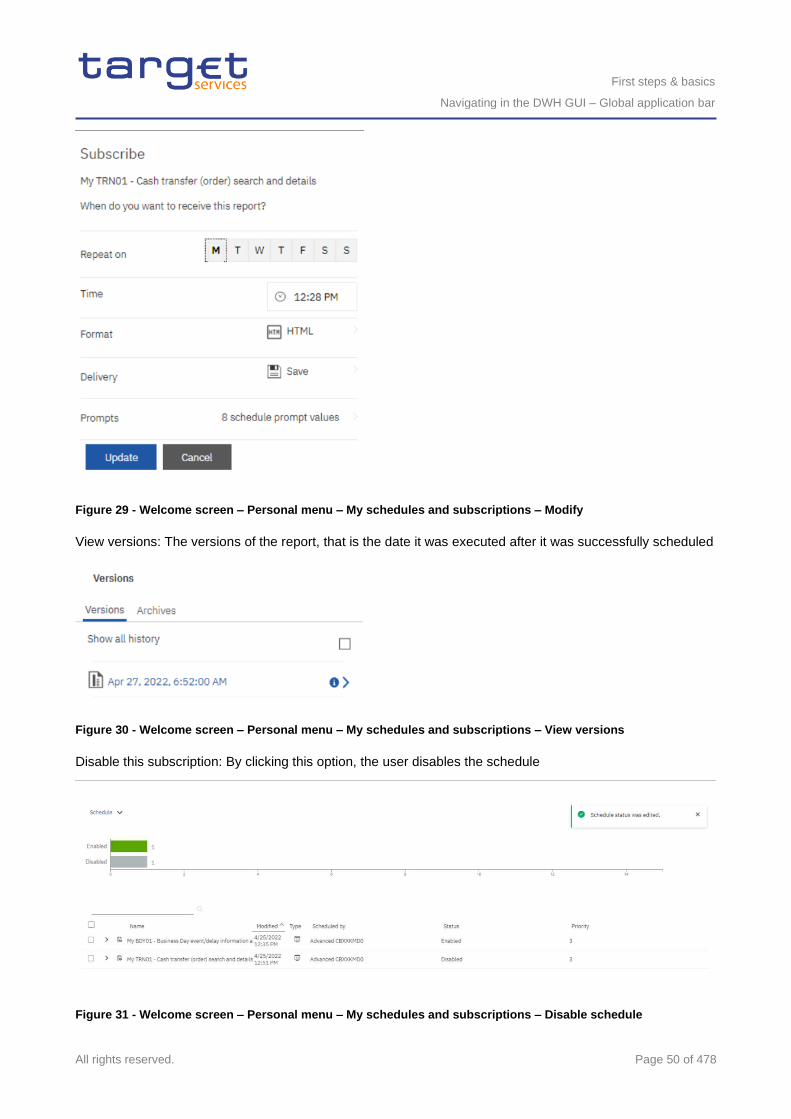
First steps & basics
Navigating in the DWH GUI – Global application bar
All rights reserved. Page 50 of 478
Figure 29 - Welcome screen – Personal menu – My schedules and subscriptions – Modify
View versions: The versions of the report, that is the date it was executed after it was successfully scheduled
Figure 30 - Welcome screen – Personal menu – My schedules and subscriptions – View versions
Disable this subscription: By clicking this option, the user disables the schedule
Figure 31 - Welcome screen – Personal menu – My schedules and subscriptions – Disable schedule
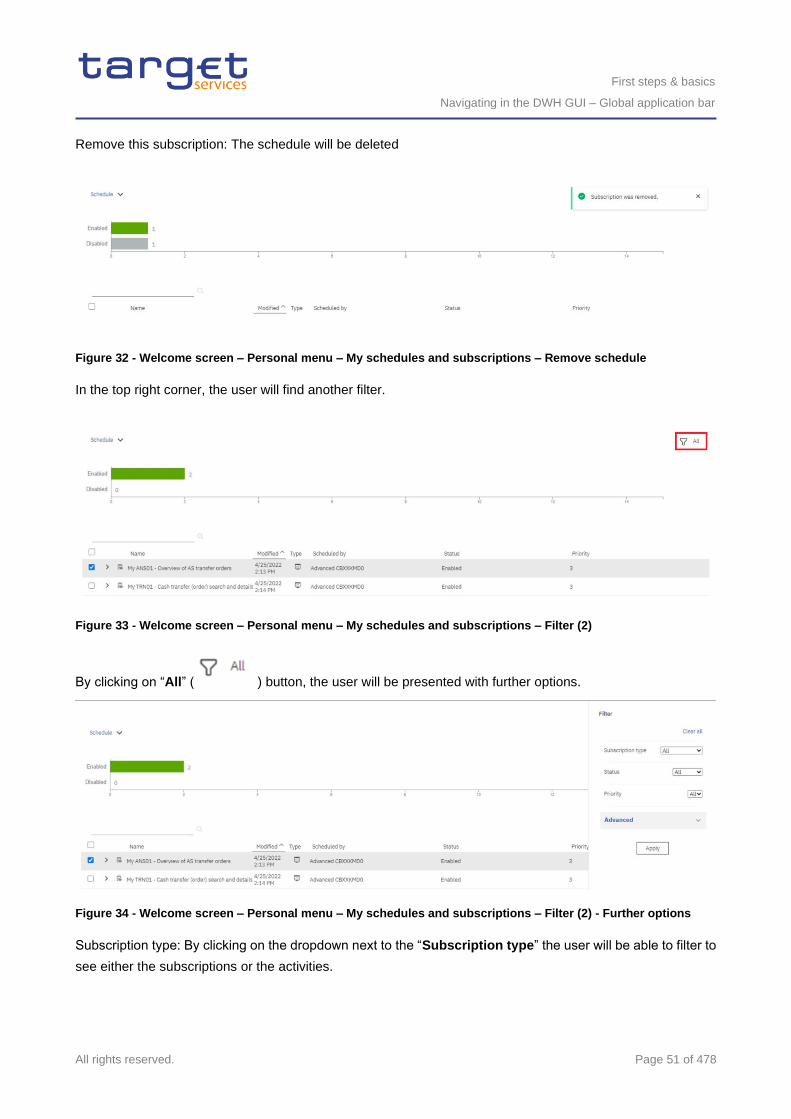
First steps & basics
Navigating in the DWH GUI – Global application bar
All rights reserved. Page 51 of 478
Remove this subscription: The schedule will be deleted
Figure 32 - Welcome screen – Personal menu – My schedules and subscriptions – Remove schedule
In the top right corner, the user will find another filter.
Figure 33 - Welcome screen – Personal menu – My schedules and subscriptions – Filter (2)
By clicking on “All” ( ) button, the user will be presented with further options.
Figure 34 - Welcome screen – Personal menu – My schedules and subscriptions – Filter (2) - Further options
Subscription type: By clicking on the dropdown next to the “Subscription type” the user will be able to filter to
see either the subscriptions or the activities.
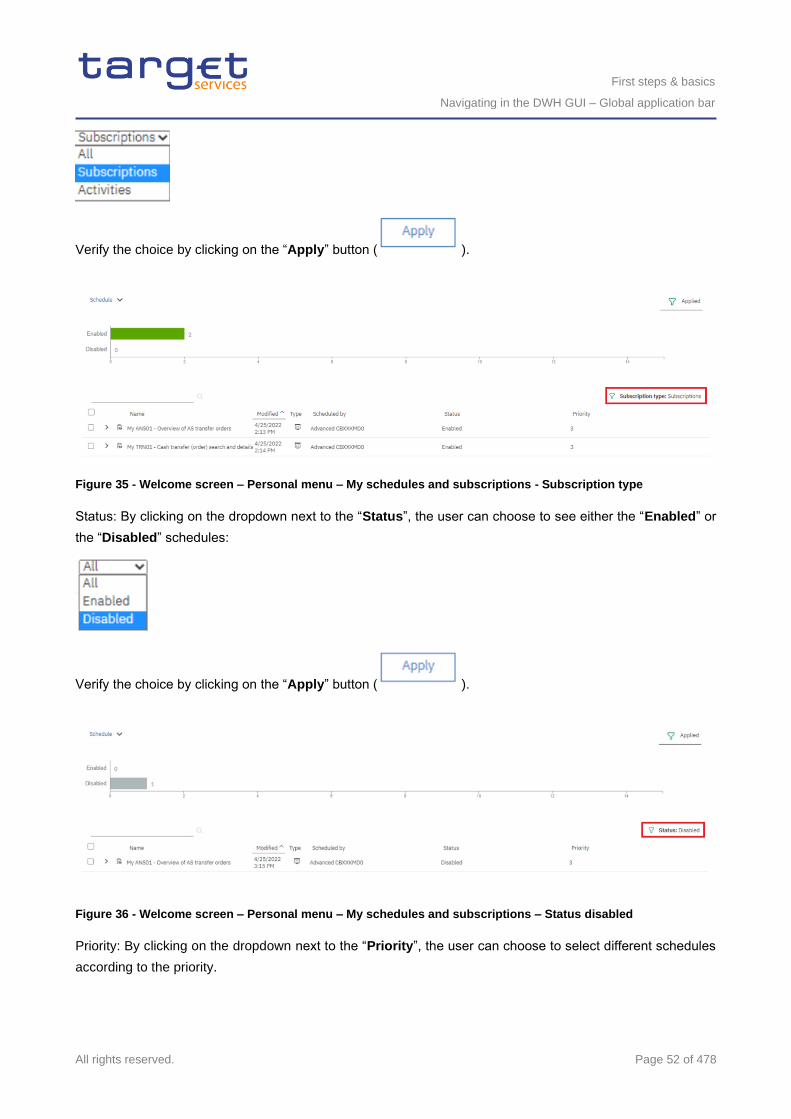
First steps & basics
Navigating in the DWH GUI – Global application bar
All rights reserved. Page 52 of 478
Verify the choice by clicking on the “Apply” button ( ).
Figure 35 - Welcome screen – Personal menu – My schedules and subscriptions - Subscription type
Status: By clicking on the dropdown next to the “Status”, the user can choose to see either the “Enabled” or
the “Disabled” schedules:
Verify the choice by clicking on the “Apply” button ( ).
Figure 36 - Welcome screen – Personal menu – My schedules and subscriptions – Status disabled
Priority: By clicking on the dropdown next to the “Priority”, the user can choose to select different schedules
according to the priority.
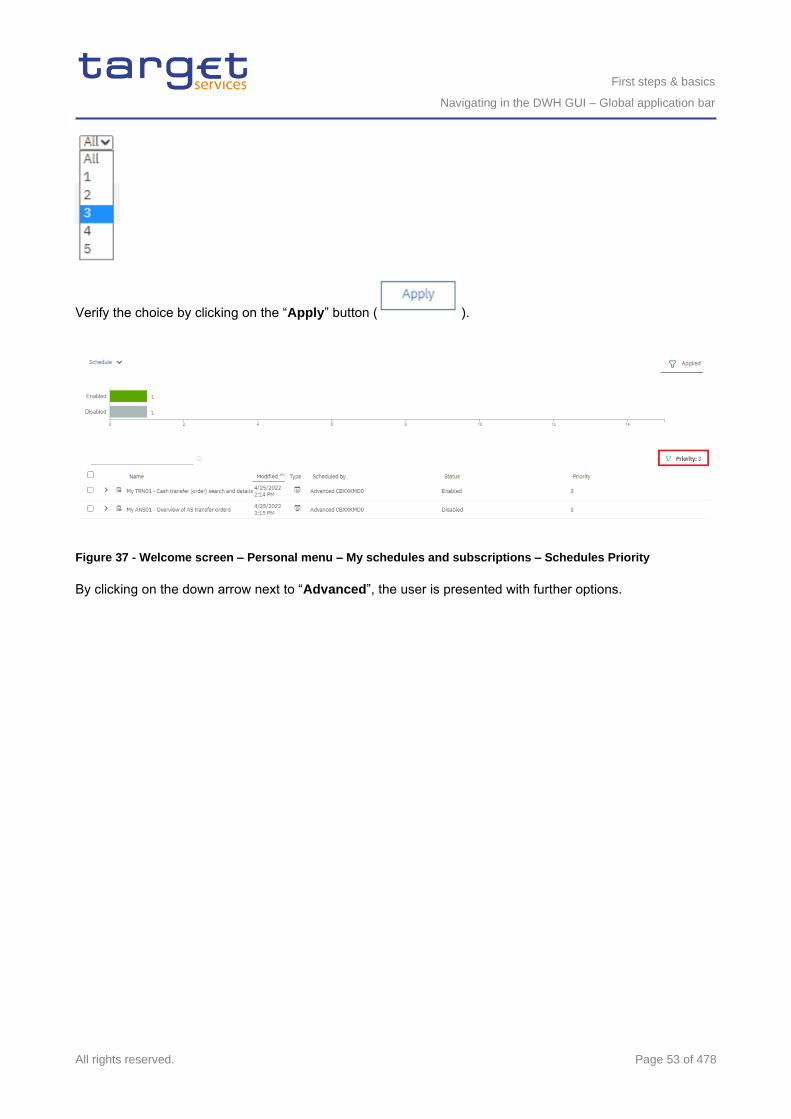
First steps & basics
Navigating in the DWH GUI – Global application bar
All rights reserved. Page 53 of 478
Verify the choice by clicking on the “Apply” button ( ).
Figure 37 - Welcome screen – Personal menu – My schedules and subscriptions – Schedules Priority
By clicking on the down arrow next to “Advanced”, the user is presented with further options.
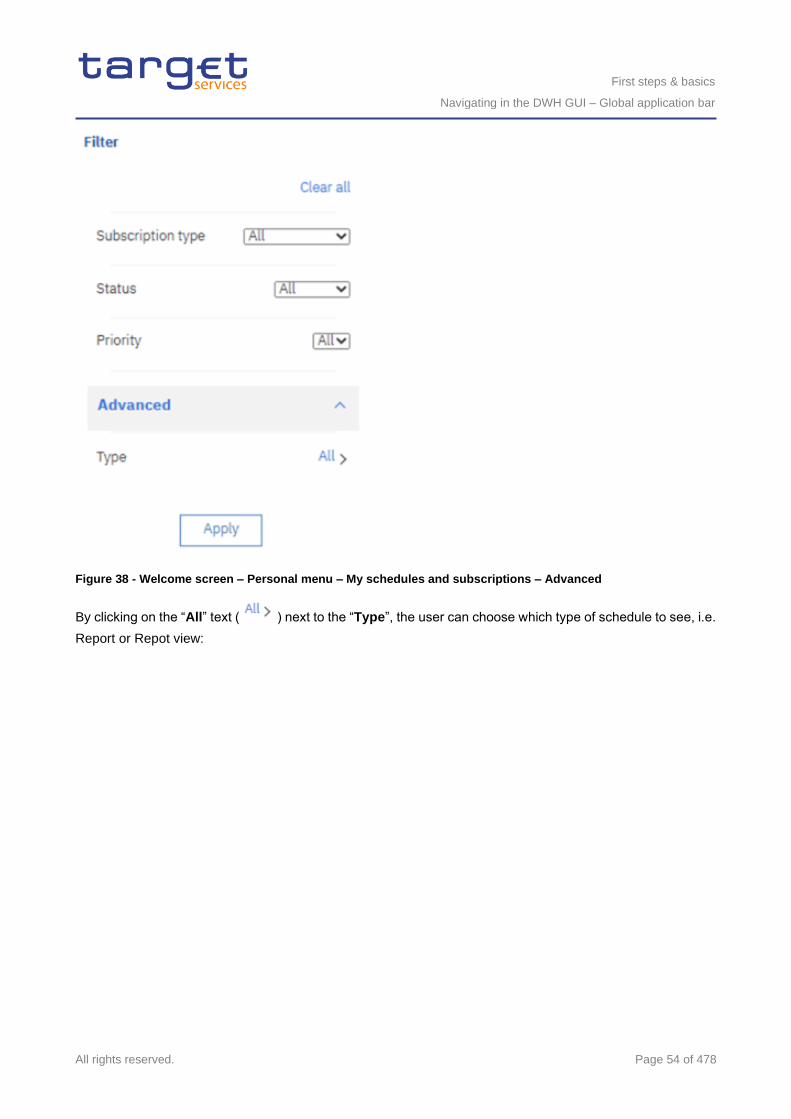
First steps & basics
Navigating in the DWH GUI – Global application bar
All rights reserved. Page 54 of 478
Figure 38 - Welcome screen – Personal menu – My schedules and subscriptions – Advanced
By clicking on the “All” text ( ) next to the “Type”, the user can choose which type of schedule to see, i.e.
Report or Repot view:
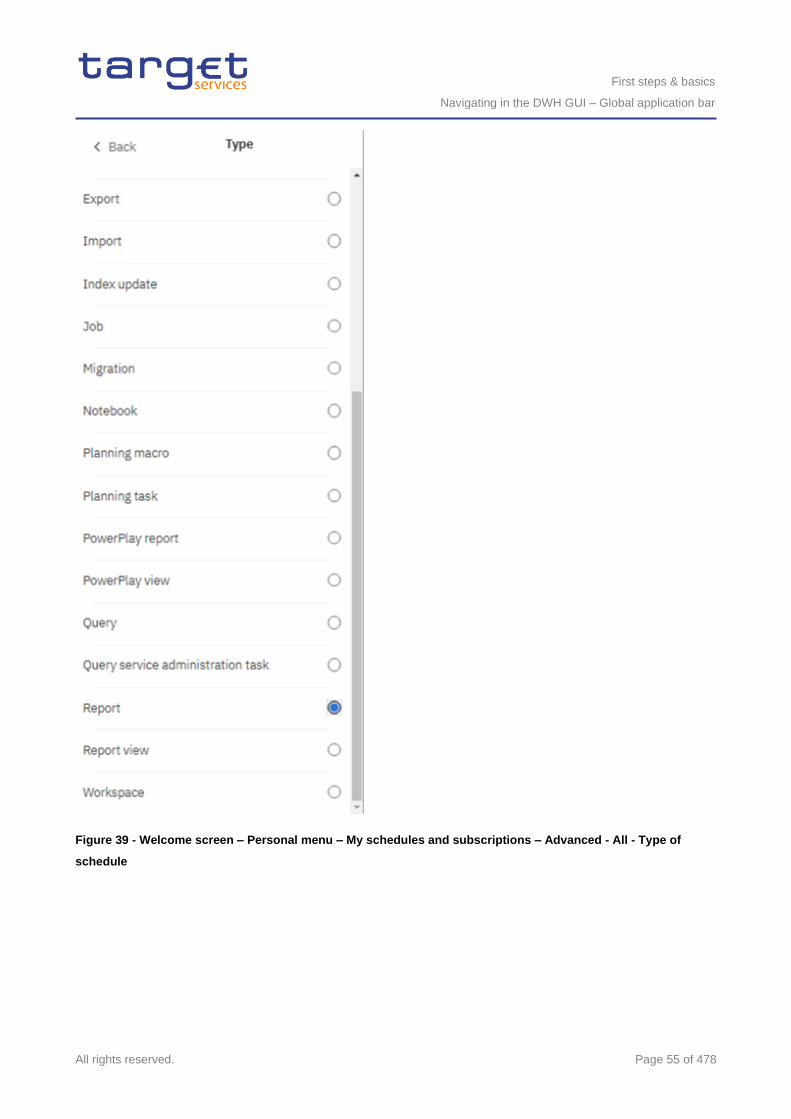
First steps & basics
Navigating in the DWH GUI – Global application bar
All rights reserved. Page 55 of 478
Figure 39 - Welcome screen – Personal menu – My schedules and subscriptions – Advanced - All - Type of
schedule
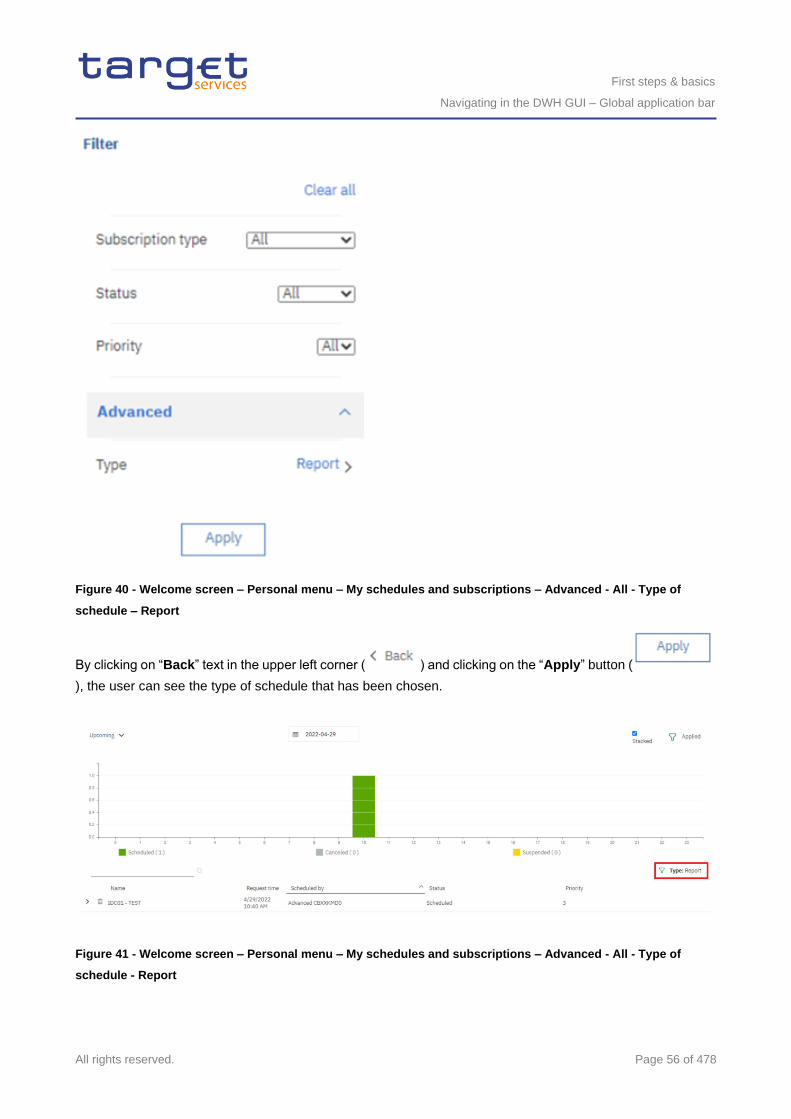
First steps & basics
Navigating in the DWH GUI – Global application bar
All rights reserved. Page 56 of 478
Figure 40 - Welcome screen – Personal menu – My schedules and subscriptions – Advanced - All - Type of
schedule – Report
By clicking on “Back” text in the upper left corner ( ) and clicking on the “Apply” button (
), the user can see the type of schedule that has been chosen.
Figure 41 - Welcome screen – Personal menu – My schedules and subscriptions – Advanced - All - Type of
schedule - Report
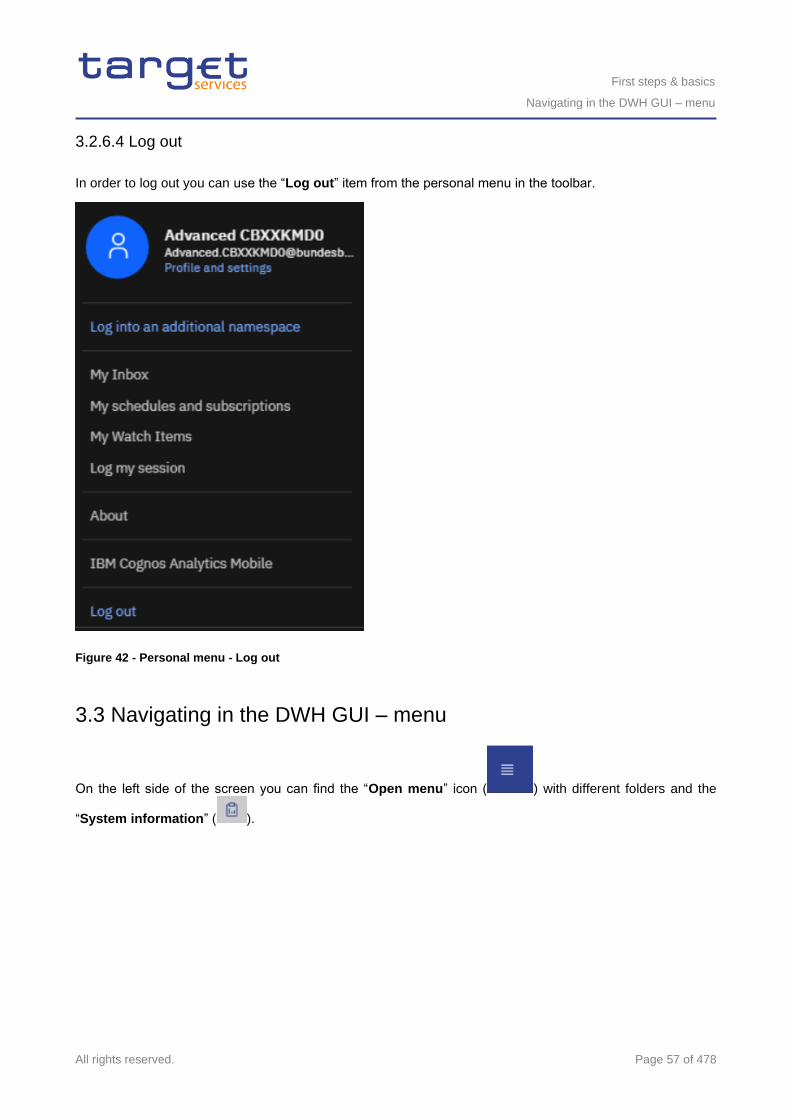
First steps & basics
Navigating in the DWH GUI – menu
All rights reserved. Page 57 of 478
3.2.6.4 Log out
In order to log out you can use the “Log out” item from the personal menu in the toolbar.
Figure 42 - Personal menu - Log out
3.3 Navigating in the DWH GUI – menu
On the left side of the screen you can find the “Open menu” icon ( ) with different folders and the
“System information” ( ).
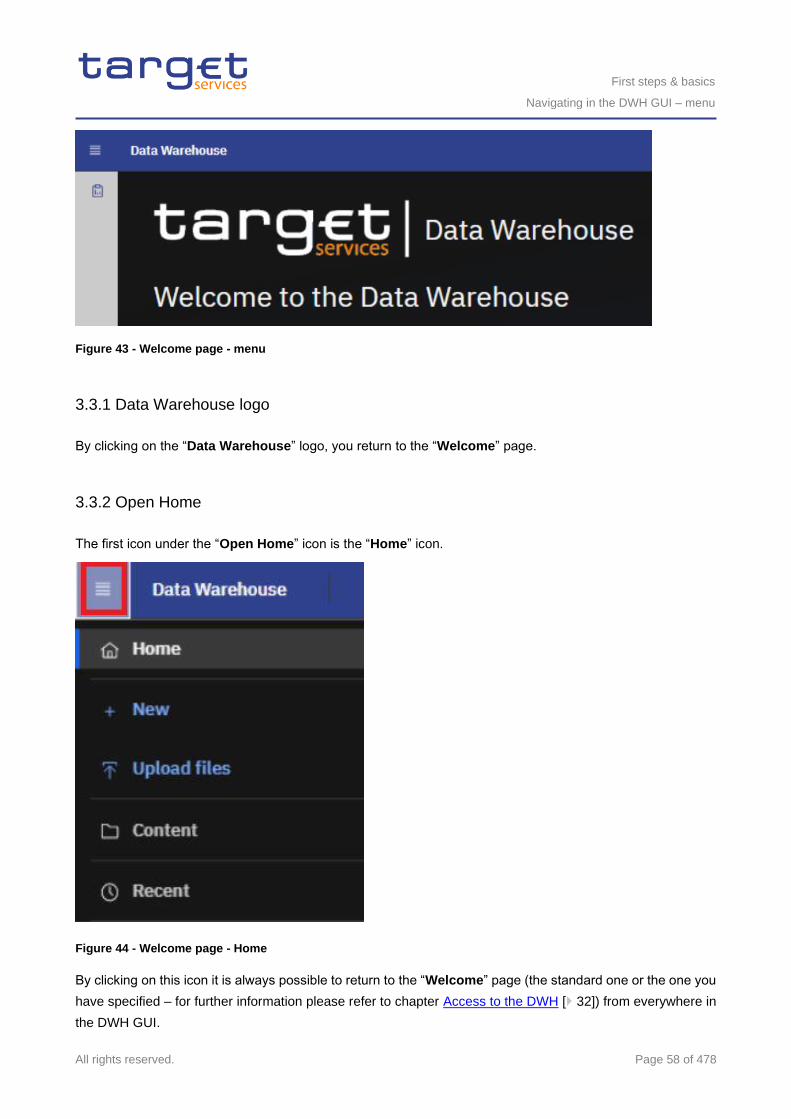
First steps & basics
Navigating in the DWH GUI – menu
All rights reserved. Page 58 of 478
Figure 43 - Welcome page - menu
3.3.1 Data Warehouse logo
By clicking on the “Data Warehouse” logo, you return to the “Welcome” page.
3.3.2 Open Home
The first icon under the “Open Home” icon is the “Home” icon.
Figure 44 - Welcome page - Home
By clicking on this icon it is always possible to return to the “Welcome” page (the standard one or the one you
have specified – for further information please refer to chapter Access to the DWH [ 32]) from everywhere in
the DWH GUI.
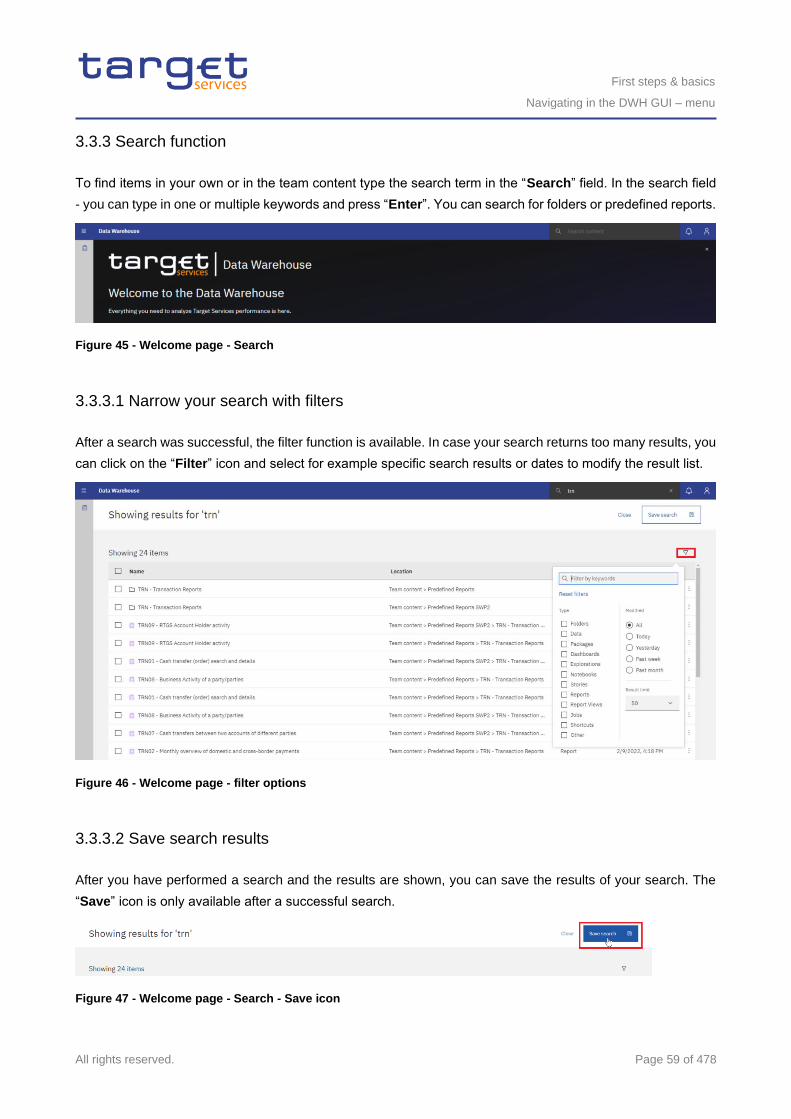
First steps & basics
Navigating in the DWH GUI – menu
All rights reserved. Page 59 of 478
3.3.3 Search function
To find items in your own or in the team content type the search term in the “Search” field. In the search field
- you can type in one or multiple keywords and press “Enter”. You can search for folders or predefined reports.
Figure 45 - Welcome page - Search
3.3.3.1 Narrow your search with filters
After a search was successful, the filter function is available. In case your search returns too many results, you
can click on the “Filter” icon and select for example specific search results or dates to modify the result list.
Figure 46 - Welcome page - filter options
3.3.3.2 Save search results
After you have performed a search and the results are shown, you can save the results of your search. The
“Save” icon is only available after a successful search.
Figure 47 - Welcome page - Search - Save icon
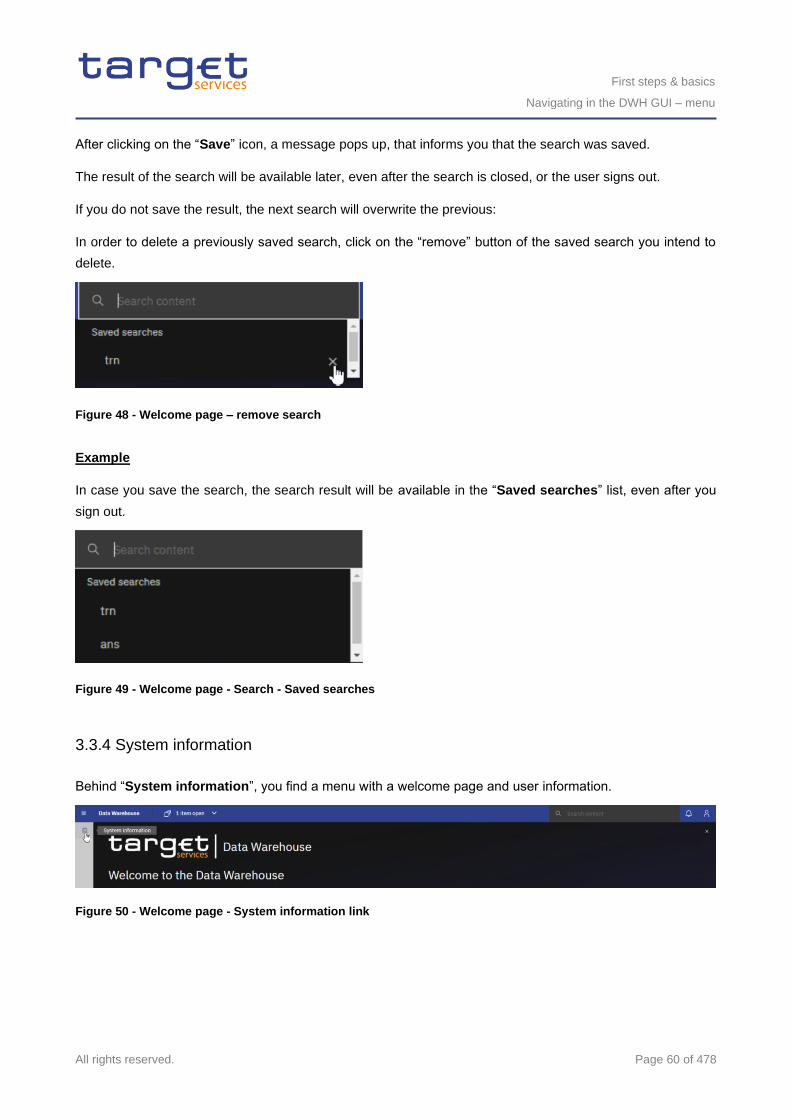
First steps & basics
Navigating in the DWH GUI – menu
All rights reserved. Page 60 of 478
After clicking on the “Save” icon, a message pops up, that informs you that the search was saved.
The result of the search will be available later, even after the search is closed, or the user signs out.
If you do not save the result, the next search will overwrite the previous:
In order to delete a previously saved search, click on the “remove” button of the saved search you intend to
delete.
Figure 48 - Welcome page – remove search
Example
In case you save the search, the search result will be available in the “Saved searches” list, even after you
sign out.
Figure 49 - Welcome page - Search - Saved searches
3.3.4 System information
Behind “System information”, you find a menu with a welcome page and user information.
Figure 50 - Welcome page - System information link
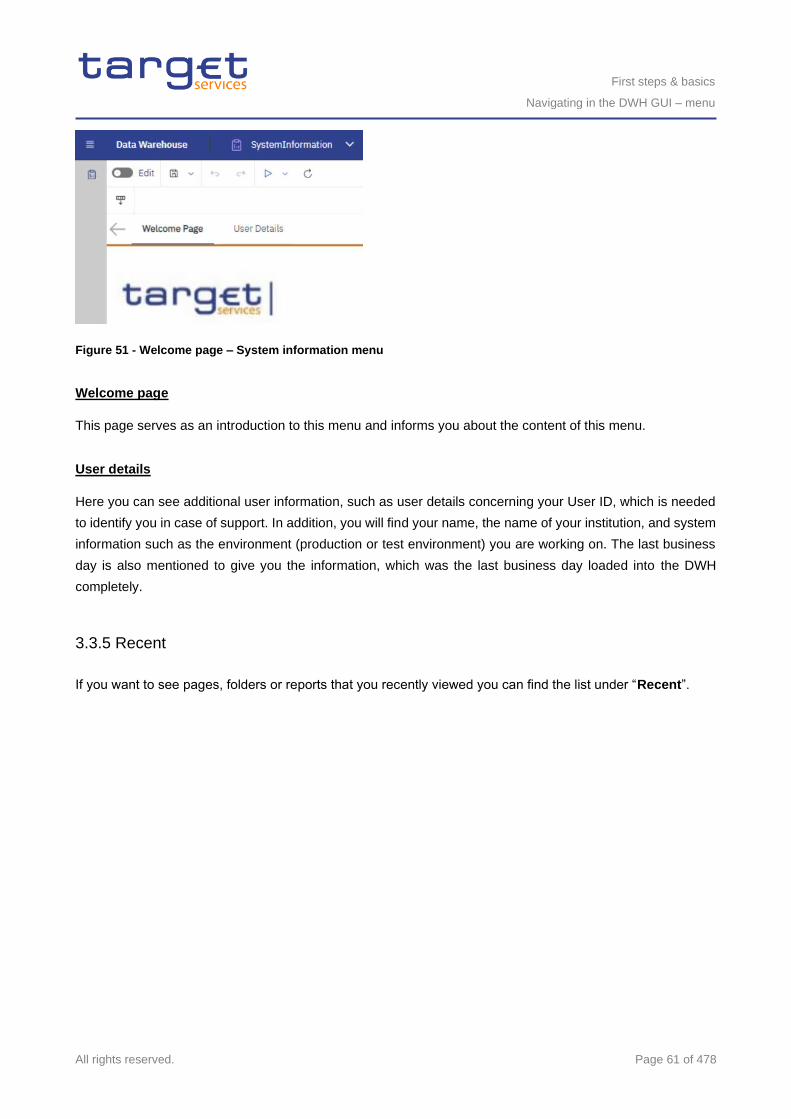
First steps & basics
Navigating in the DWH GUI – menu
All rights reserved. Page 61 of 478
Figure 51 - Welcome page – System information menu
Welcome page
This page serves as an introduction to this menu and informs you about the content of this menu.
User details
Here you can see additional user information, such as user details concerning your User ID, which is needed
to identify you in case of support. In addition, you will find your name, the name of your institution, and system
information such as the environment (production or test environment) you are working on. The last business
day is also mentioned to give you the information, which was the last business day loaded into the DWH
completely.
3.3.5 Recent
If you want to see pages, folders or reports that you recently viewed you can find the list under “Recent”.
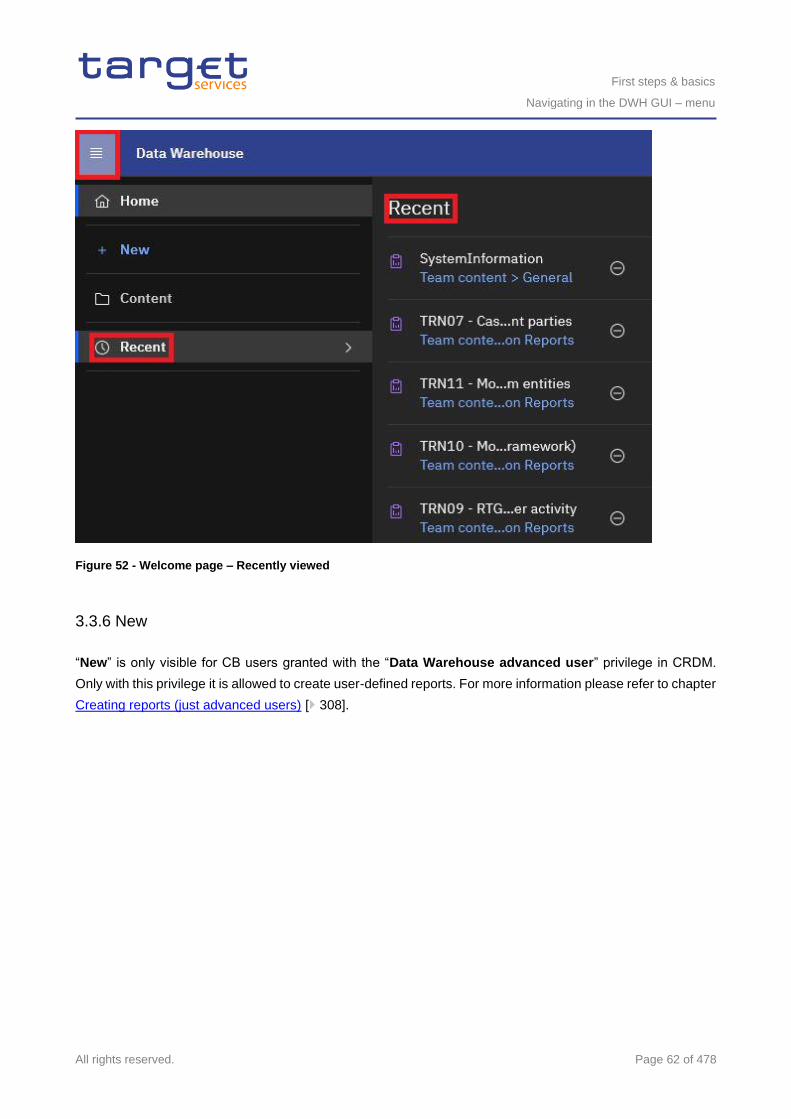
First steps & basics
Navigating in the DWH GUI – menu
All rights reserved. Page 62 of 478
Figure 52 - Welcome page – Recently viewed
3.3.6 New
“New” is only visible for CB users granted with the “Data Warehouse advanced user” privilege in CRDM.
Only with this privilege it is allowed to create user-defined reports. For more information please refer to chapter
Creating reports (just advanced users) [ 308].
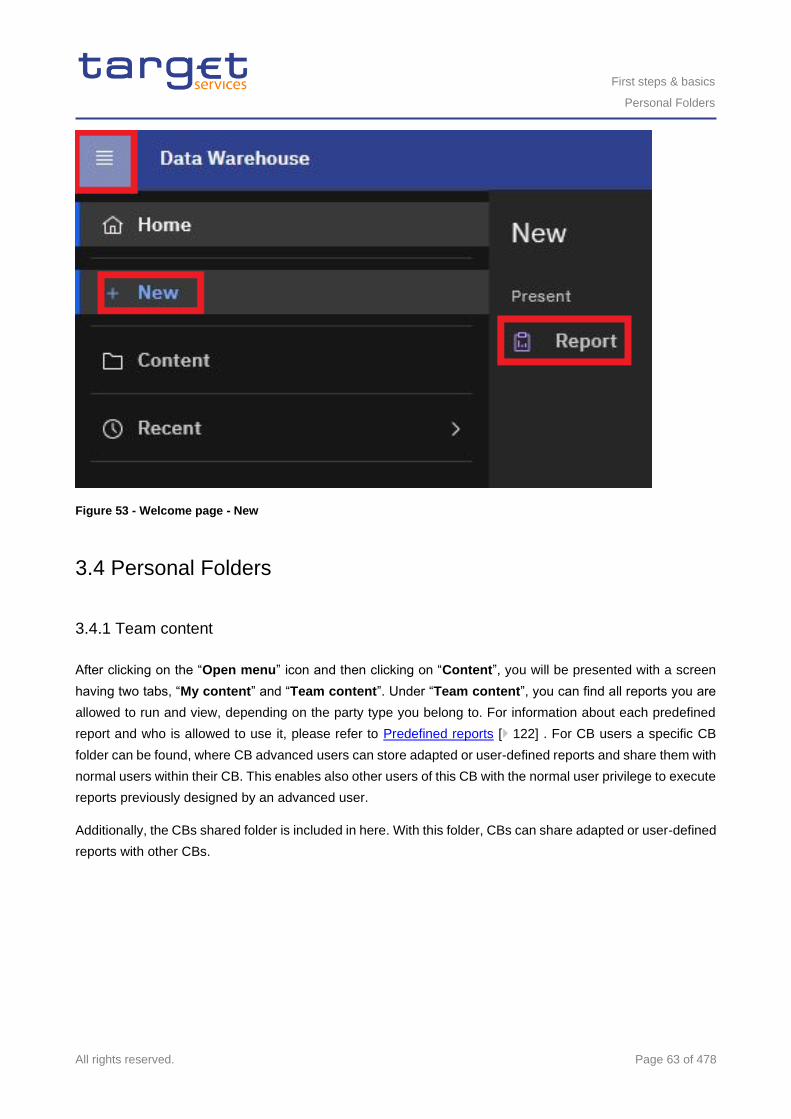
First steps & basics
Personal Folders
All rights reserved. Page 63 of 478
Figure 53 - Welcome page - New
3.4 Personal Folders
3.4.1 Team content
After clicking on the “Open menu” icon and then clicking on “Content”, you will be presented with a screen
having two tabs, “My content” and “Team content”. Under “Team content”, you can find all reports you are
allowed to run and view, depending on the party type you belong to. For information about each predefined
report and who is allowed to use it, please refer to Predefined reports [ 122] . For CB users a specific CB
folder can be found, where CB advanced users can store adapted or user-defined reports and share them with
normal users within their CB. This enables also other users of this CB with the normal user privilege to execute
reports previously designed by an advanced user.
Additionally, the CBs shared folder is included in here. With this folder, CBs can share adapted or user-defined
reports with other CBs.
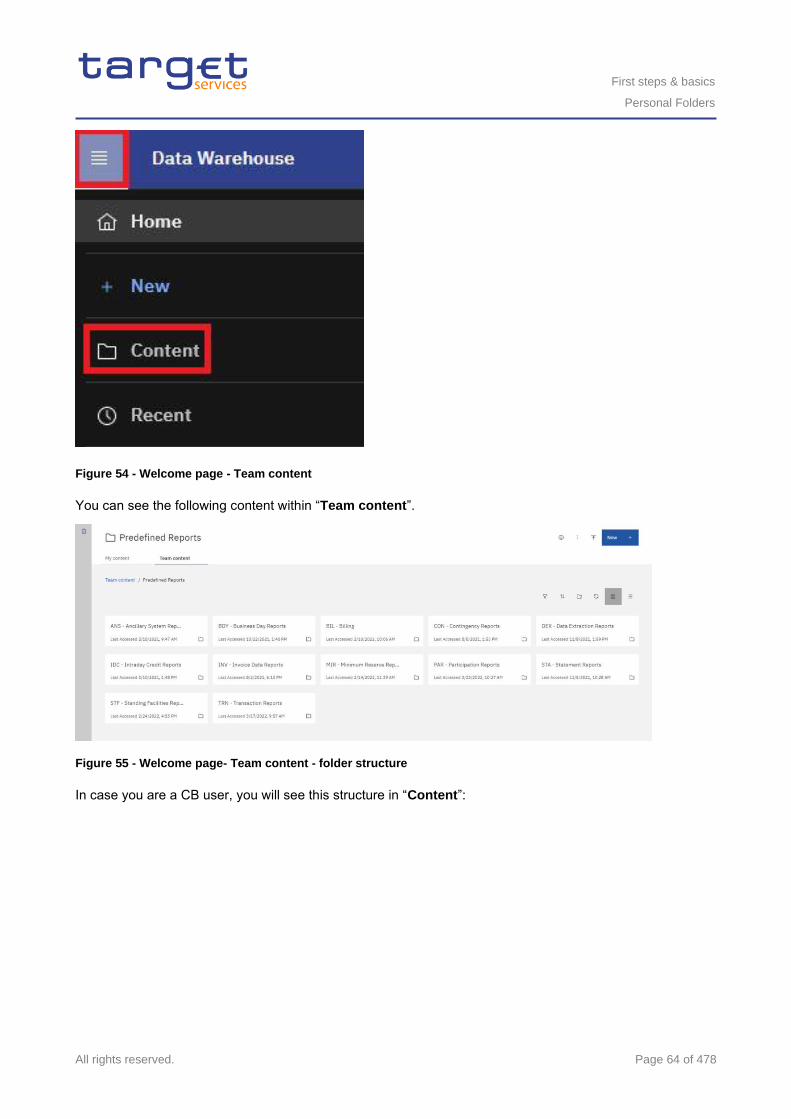
First steps & basics
Personal Folders
All rights reserved. Page 64 of 478
Figure 54 - Welcome page - Team content
You can see the following content within “Team content”.
Figure 55 - Welcome page- Team content - folder structure
In case you are a CB user, you will see this structure in “Content”:
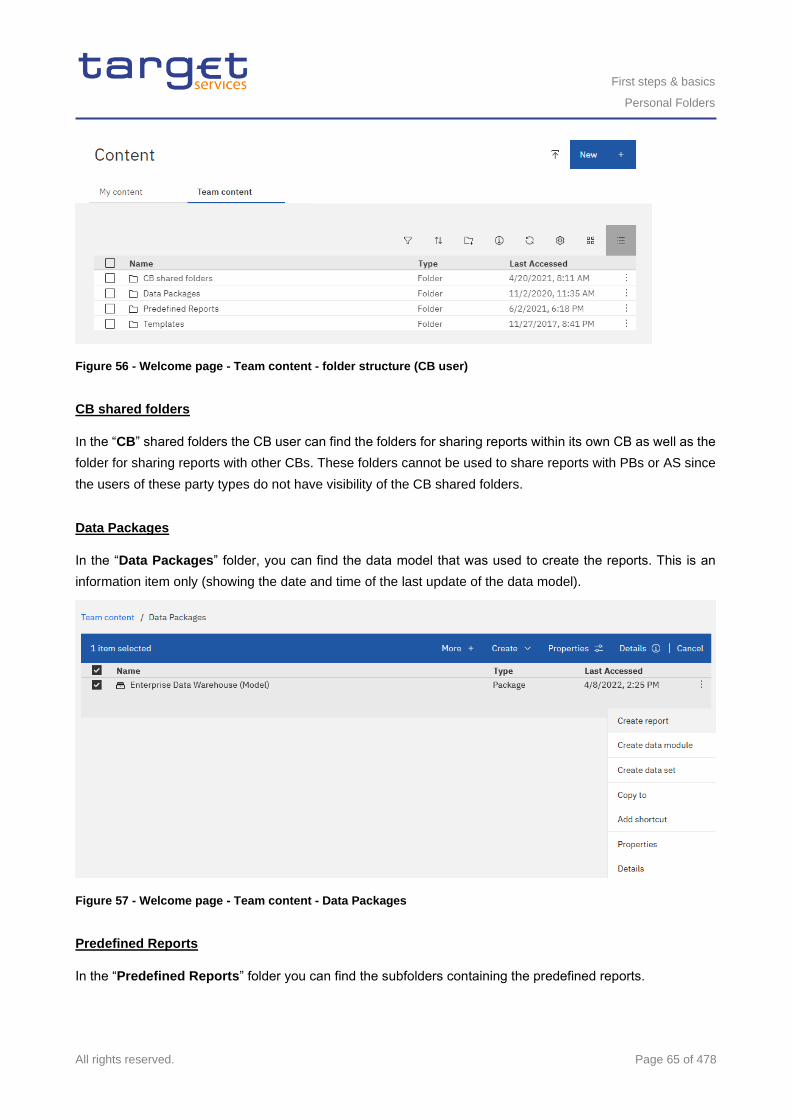
First steps & basics
Personal Folders
All rights reserved. Page 65 of 478
Figure 56 - Welcome page - Team content - folder structure (CB user)
CB shared folders
In the “CB” shared folders the CB user can find the folders for sharing reports within its own CB as well as the
folder for sharing reports with other CBs. These folders cannot be used to share reports with PBs or AS since
the users of these party types do not have visibility of the CB shared folders.
Data Packages
In the “Data Packages” folder, you can find the data model that was used to create the reports. This is an
information item only (showing the date and time of the last update of the data model).
Figure 57 - Welcome page - Team content - Data Packages
Predefined Reports
In the “Predefined Reports” folder you can find the subfolders containing the predefined reports.
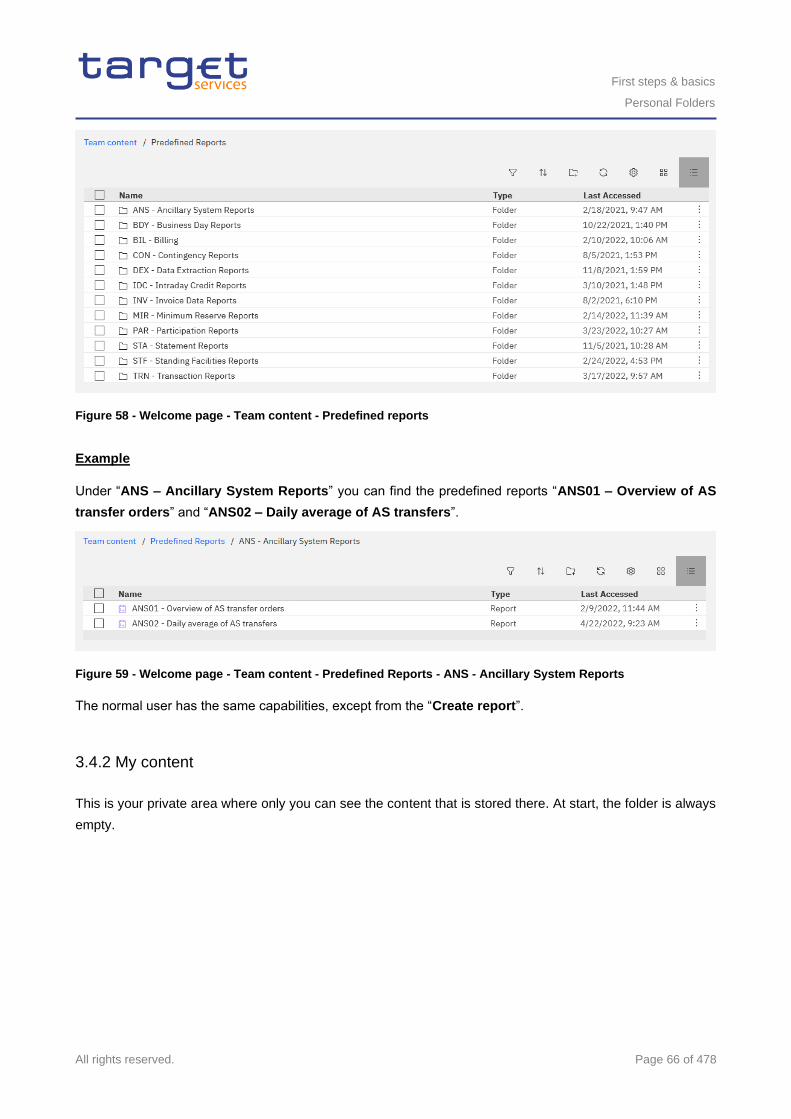
First steps & basics
Personal Folders
All rights reserved. Page 66 of 478
Figure 58 - Welcome page - Team content - Predefined reports
Example
Under “ANS – Ancillary System Reports” you can find the predefined reports “ANS01 – Overview of AS
transfer orders” and “ANS02 – Daily average of AS transfers”.
Figure 59 - Welcome page - Team content - Predefined Reports - ANS - Ancillary System Reports
The normal user has the same capabilities, except from the “Create report”.
3.4.2 My content
This is your private area where only you can see the content that is stored there. At start, the folder is always
empty.
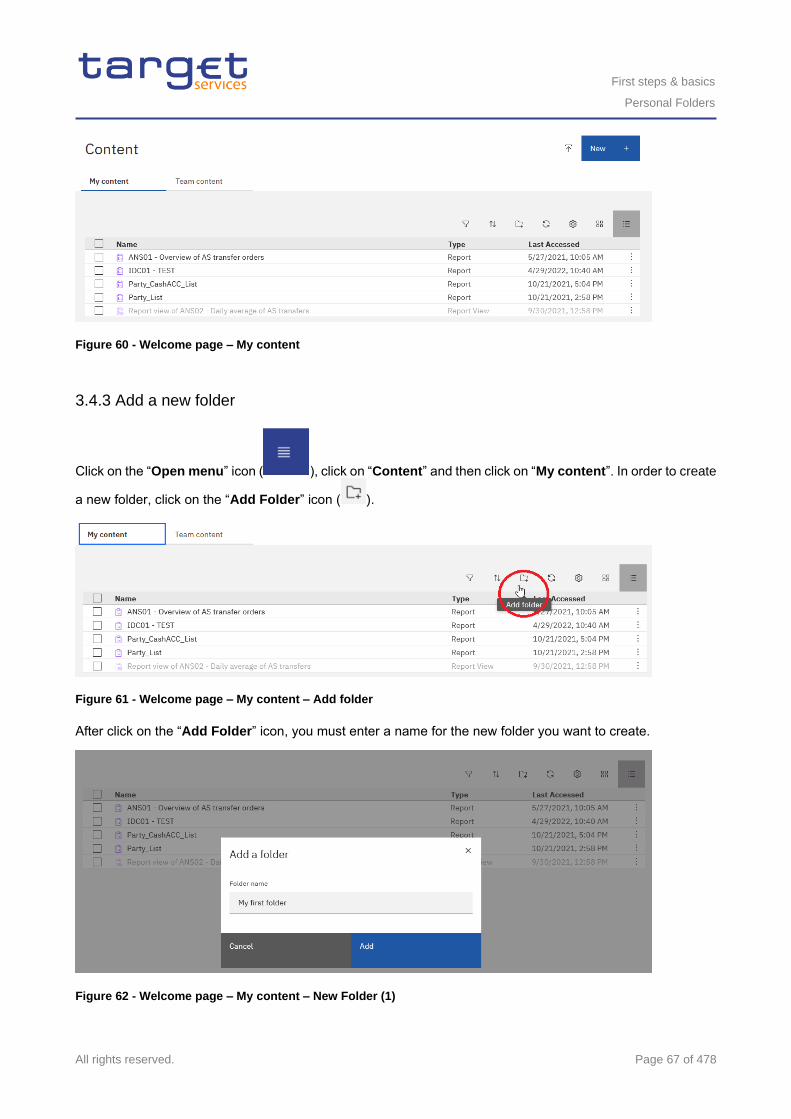
First steps & basics
Personal Folders
All rights reserved. Page 67 of 478
Figure 60 - Welcome page – My content
3.4.3 Add a new folder
Click on the “Open menu” icon ( ), click on “Content” and then click on “My content”. In order to create
a new folder, click on the “Add Folder” icon ( ).
Figure 61 - Welcome page – My content – Add folder
After click on the “Add Folder” icon, you must enter a name for the new folder you want to create.
Figure 62 - Welcome page – My content – New Folder (1)
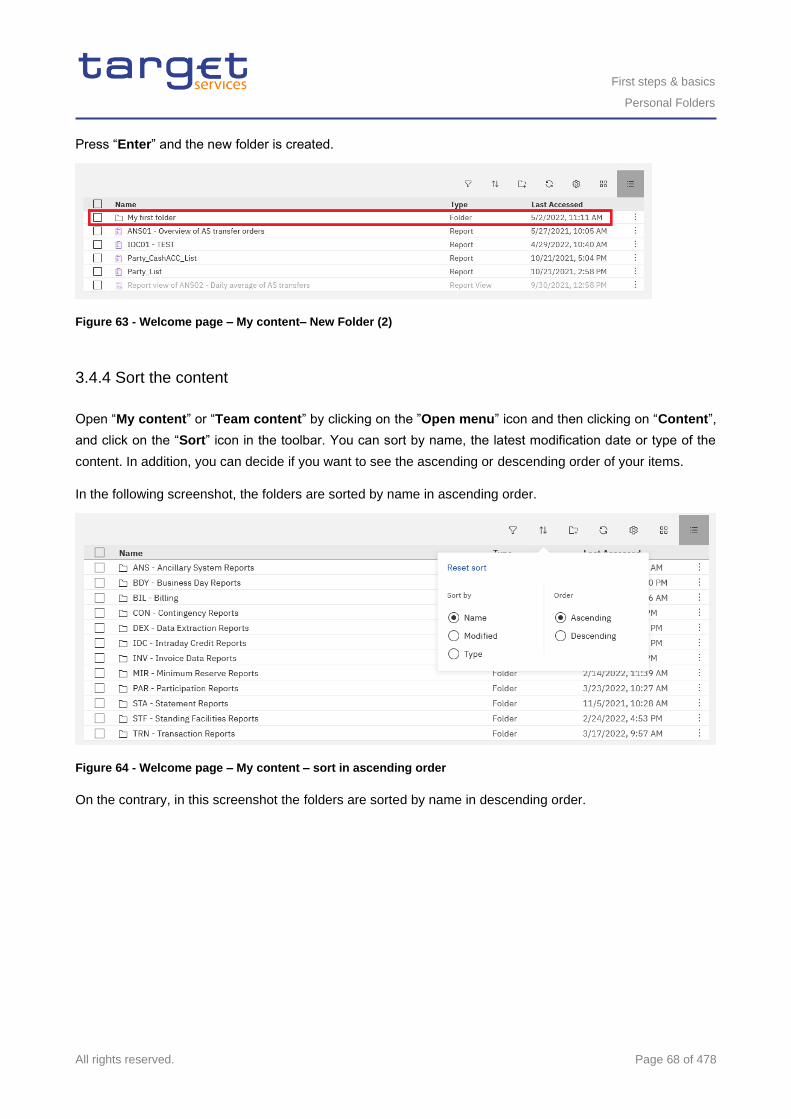
First steps & basics
Personal Folders
All rights reserved. Page 68 of 478
Press “Enter” and the new folder is created.
Figure 63 - Welcome page – My content– New Folder (2)
3.4.4 Sort the content
Open “My content” or “Team content” by clicking on the ”Open menu” icon and then clicking on “Content”,
and click on the “Sort” icon in the toolbar. You can sort by name, the latest modification date or type of the
content. In addition, you can decide if you want to see the ascending or descending order of your items.
In the following screenshot, the folders are sorted by name in ascending order.
Figure 64 - Welcome page – My content – sort in ascending order
On the contrary, in this screenshot the folders are sorted by name in descending order.
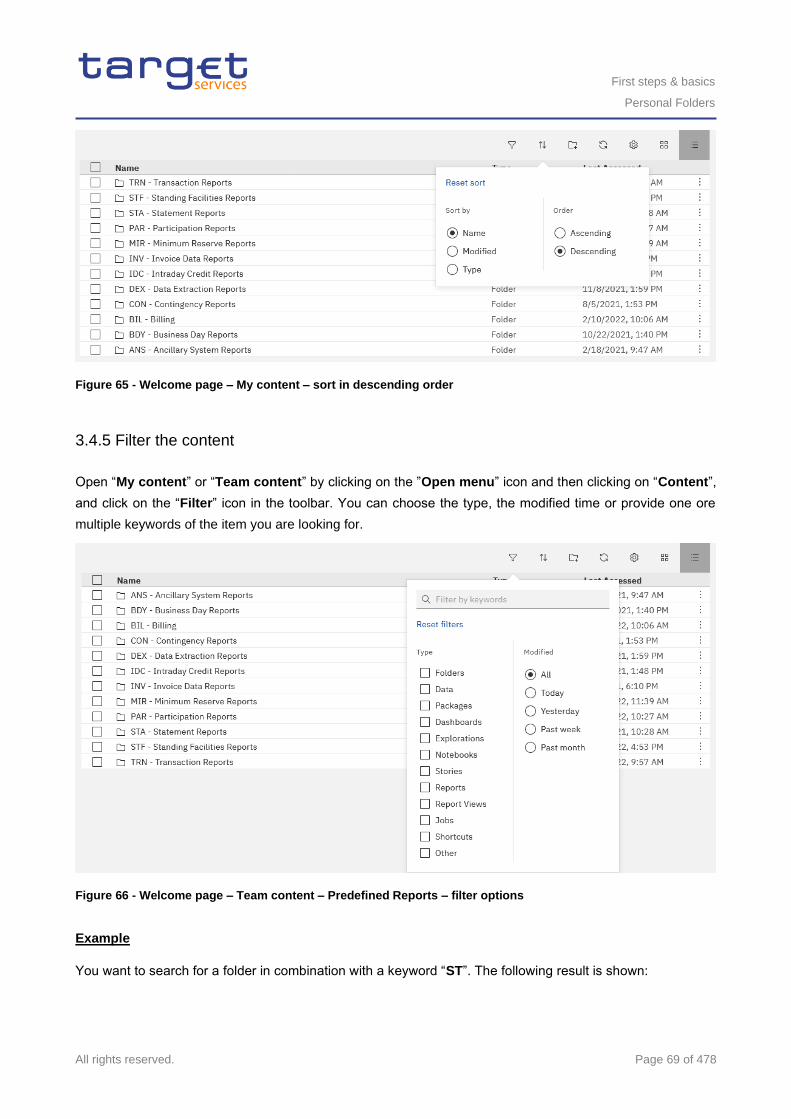
First steps & basics
Personal Folders
All rights reserved. Page 69 of 478
Figure 65 - Welcome page – My content – sort in descending order
3.4.5 Filter the content
Open “My content” or “Team content” by clicking on the ”Open menu” icon and then clicking on “Content”,
and click on the “Filter” icon in the toolbar. You can choose the type, the modified time or provide one ore
multiple keywords of the item you are looking for.
Figure 66 - Welcome page – Team content – Predefined Reports – filter options
Example
You want to search for a folder in combination with a keyword “ST”. The following result is shown:
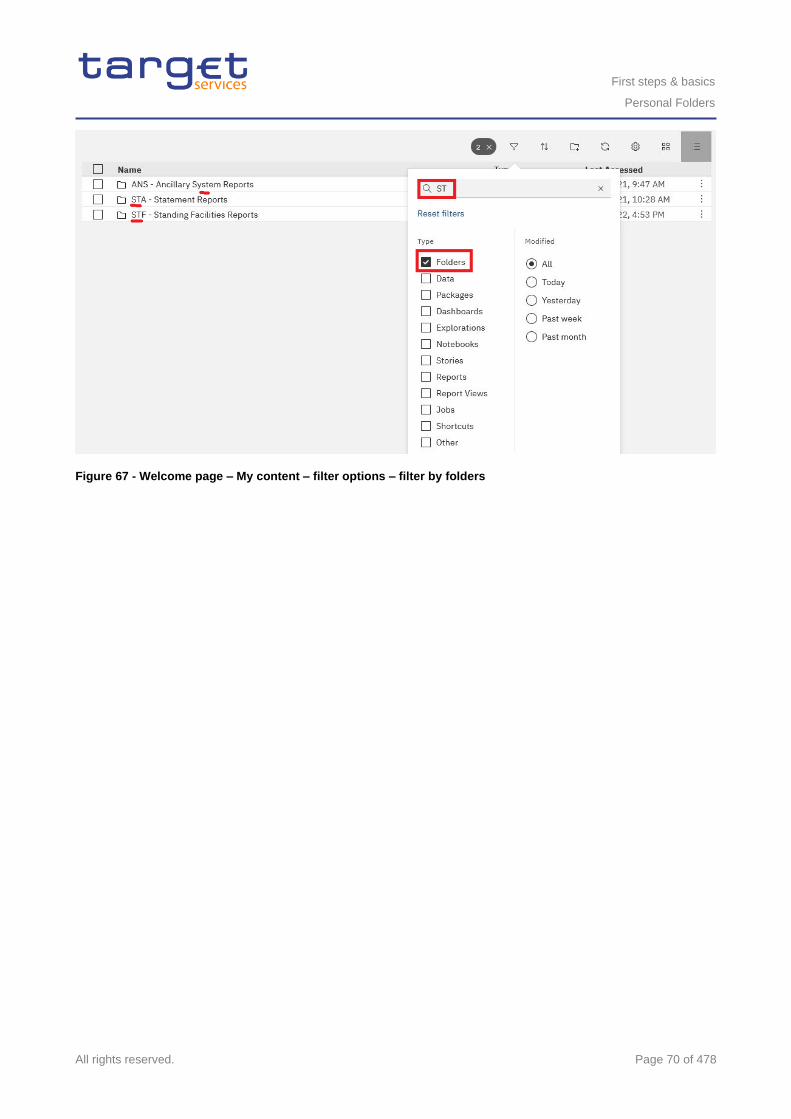
First steps & basics
Personal Folders
All rights reserved. Page 70 of 478
Figure 67 - Welcome page – My content – filter options – filter by folders
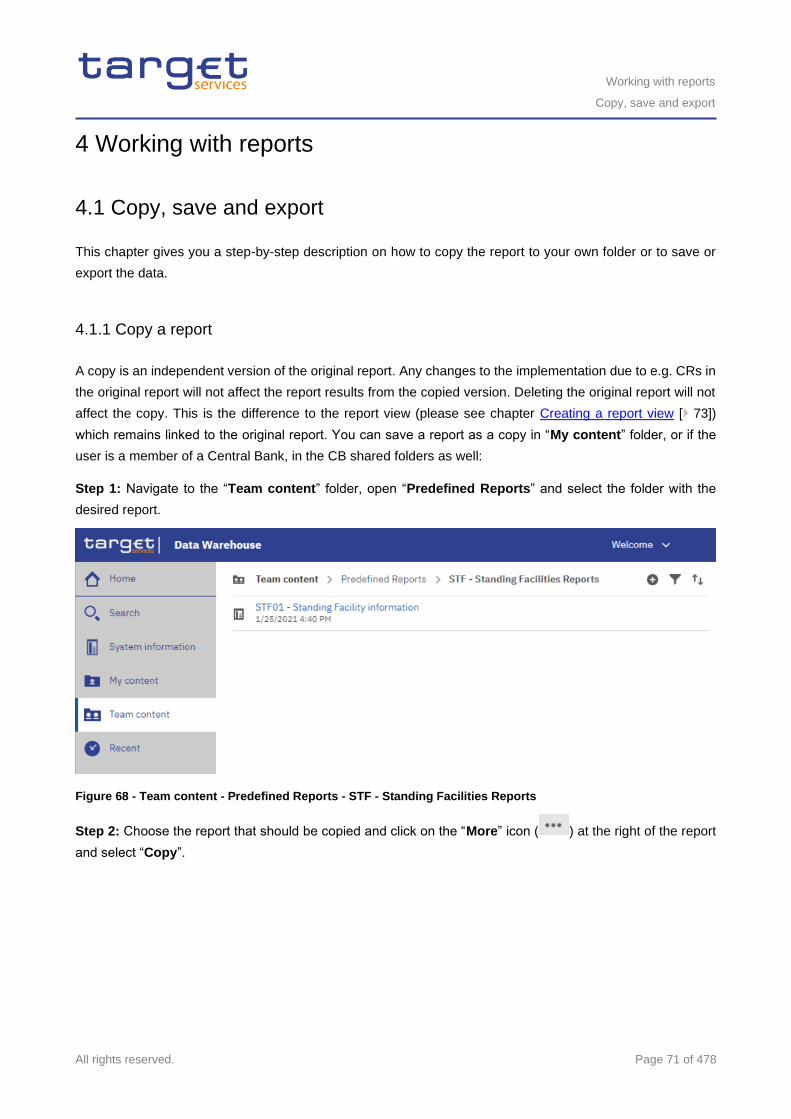
Working with reports
Copy, save and export
All rights reserved. Page 71 of 478
4 Working with reports
4.1 Copy, save and export
This chapter gives you a step-by-step description on how to copy the report to your own folder or to save or
export the data.
4.1.1 Copy a report
A copy is an independent version of the original report. Any changes to the implementation due to e.g. CRs in
the original report will not affect the report results from the copied version. Deleting the original report will not
affect the copy. This is the difference to the report view (please see chapter Creating a report view [ 73])
which remains linked to the original report. You can save a report as a copy in “My content” folder, or if the
user is a member of a Central Bank, in the CB shared folders as well:
Step 1: Navigate to the “Team content” folder, open “Predefined Reports” and select the folder with the
desired report.
Figure 68 - Team content - Predefined Reports - STF - Standing Facilities Reports
Step 2: Choose the report that should be copied and click on the “More” icon ( ) at the right of the report
and select “Copy”.
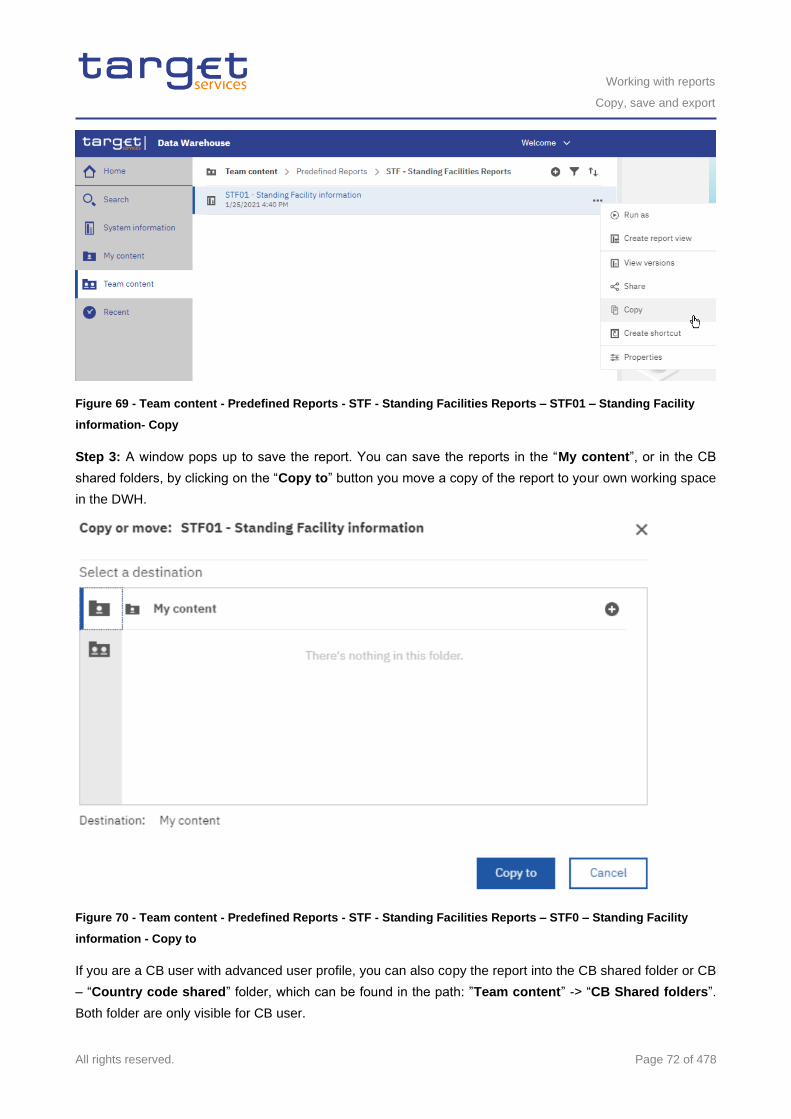
Working with reports
Copy, save and export
All rights reserved. Page 72 of 478
Figure 69 - Team content - Predefined Reports - STF - Standing Facilities Reports – STF01 – Standing Facility
information- Copy
Step 3: A window pops up to save the report. You can save the reports in the “My content”, or in the CB
shared folders, by clicking on the “Copy to” button you move a copy of the report to your own working space
in the DWH.
Figure 70 - Team content - Predefined Reports - STF - Standing Facilities Reports – STF0 – Standing Facility
information - Copy to
If you are a CB user with advanced user profile, you can also copy the report into the CB shared folder or CB
– “Country code shared” folder, which can be found in the path: ”Team content” -> “CB Shared folders”.
Both folder are only visible for CB user.
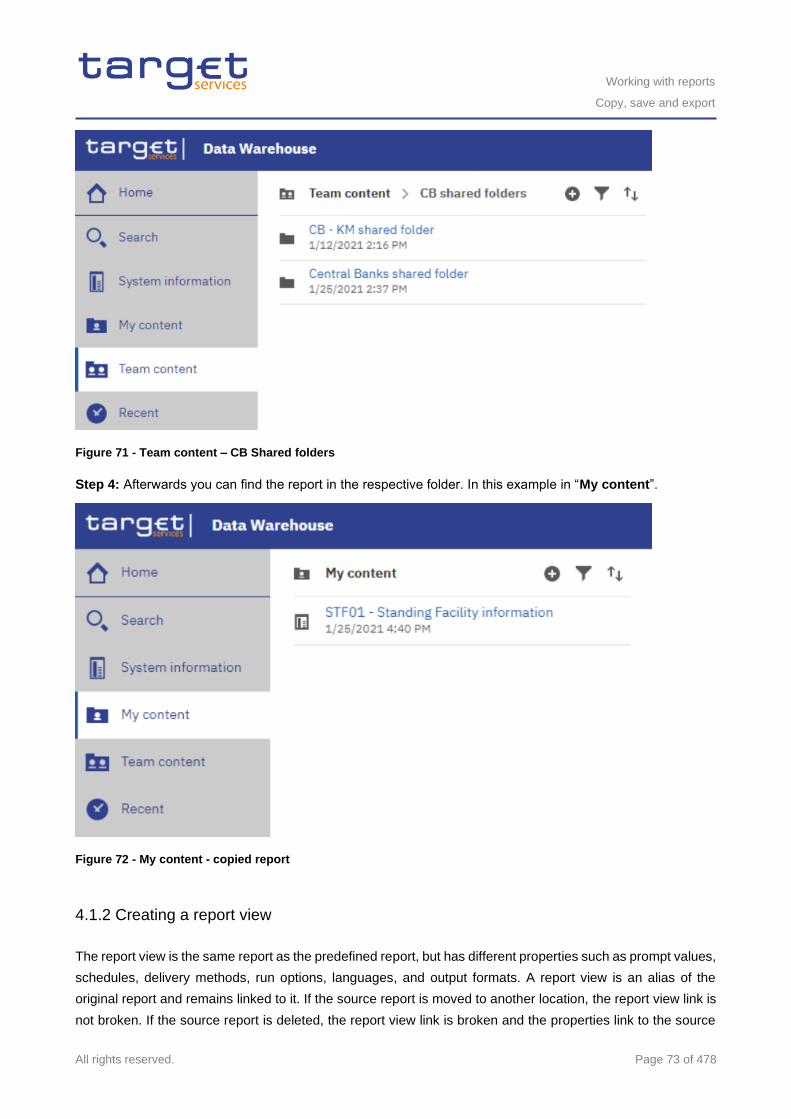
Working with reports
Copy, save and export
All rights reserved. Page 73 of 478
Figure 71 - Team content – CB Shared folders
Step 4: Afterwards you can find the report in the respective folder. In this example in “My content”.
Figure 72 - My content - copied report
4.1.2 Creating a report view
The report view is the same report as the predefined report, but has different properties such as prompt values,
schedules, delivery methods, run options, languages, and output formats. A report view is an alias of the
original report and remains linked to it. If the source report is moved to another location, the report view link is
not broken. If the source report is deleted, the report view link is broken and the properties link to the source
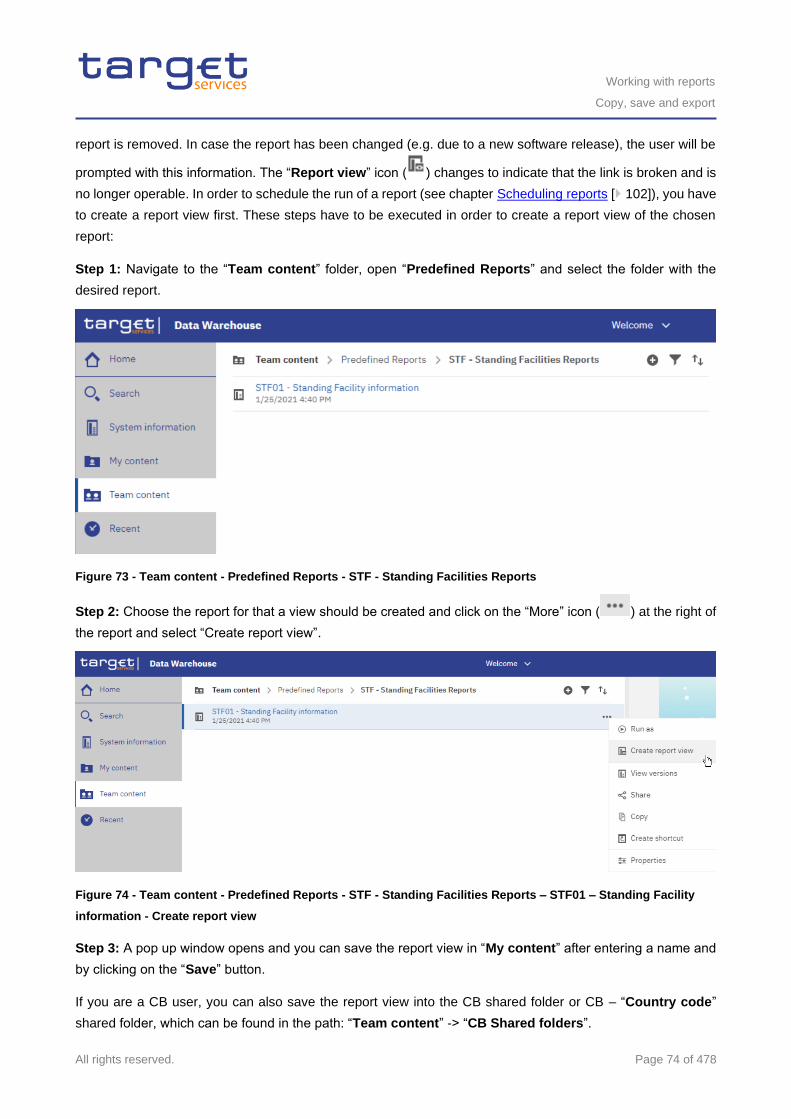
Working with reports
Copy, save and export
All rights reserved. Page 74 of 478
report is removed. In case the report has been changed (e.g. due to a new software release), the user will be
prompted with this information. The “Report view” icon ( ) changes to indicate that the link is broken and is
no longer operable. In order to schedule the run of a report (see chapter Scheduling reports [ 102]), you have
to create a report view first. These steps have to be executed in order to create a report view of the chosen
report:
Step 1: Navigate to the “Team content” folder, open “Predefined Reports” and select the folder with the
desired report.
Figure 73 - Team content - Predefined Reports - STF - Standing Facilities Reports
Step 2: Choose the report for that a view should be created and click on the “More” icon ( ) at the right of
the report and select “Create report view”.
Figure 74 - Team content - Predefined Reports - STF - Standing Facilities Reports – STF01 – Standing Facility
information - Create report view
Step 3: A pop up window opens and you can save the report view in “My content” after entering a name and
by clicking on the “Save” button.
If you are a CB user, you can also save the report view into the CB shared folder or CB – “Country code”
shared folder, which can be found in the path: “Team content” -> “CB Shared folders”.
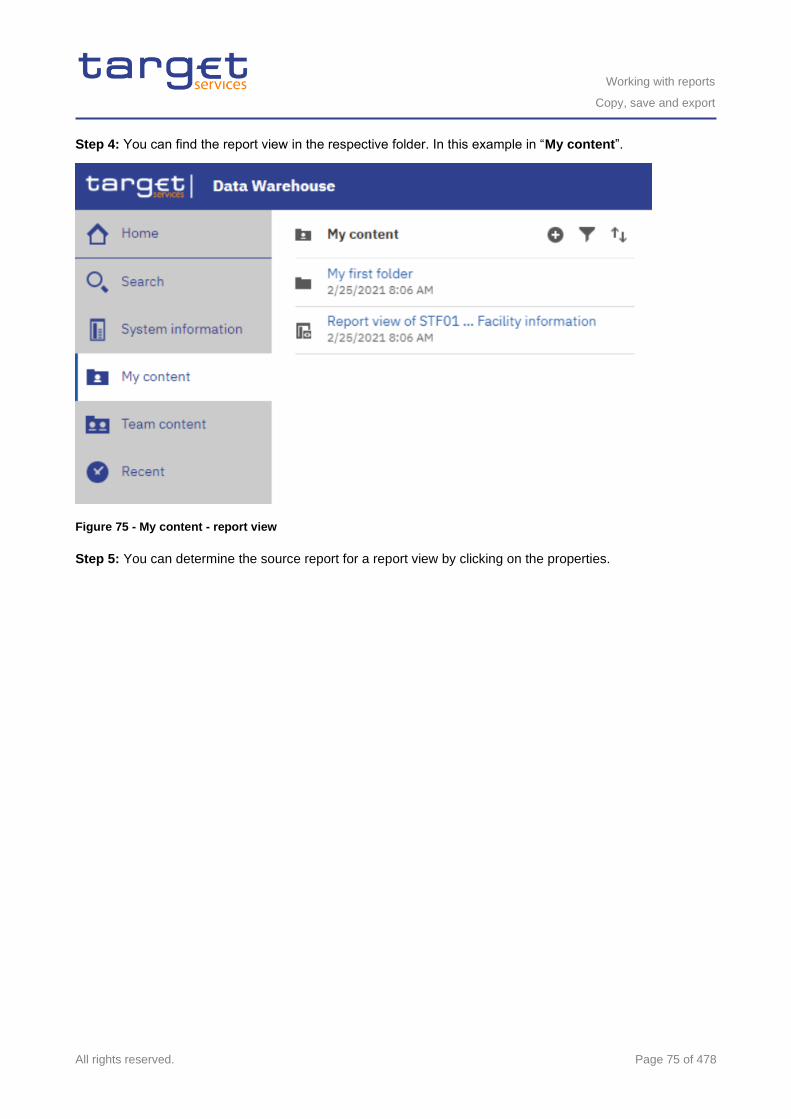
Working with reports
Copy, save and export
All rights reserved. Page 75 of 478
Step 4: You can find the report view in the respective folder. In this example in “My content”.
Figure 75 - My content - report view
Step 5: You can determine the source report for a report view by clicking on the properties.
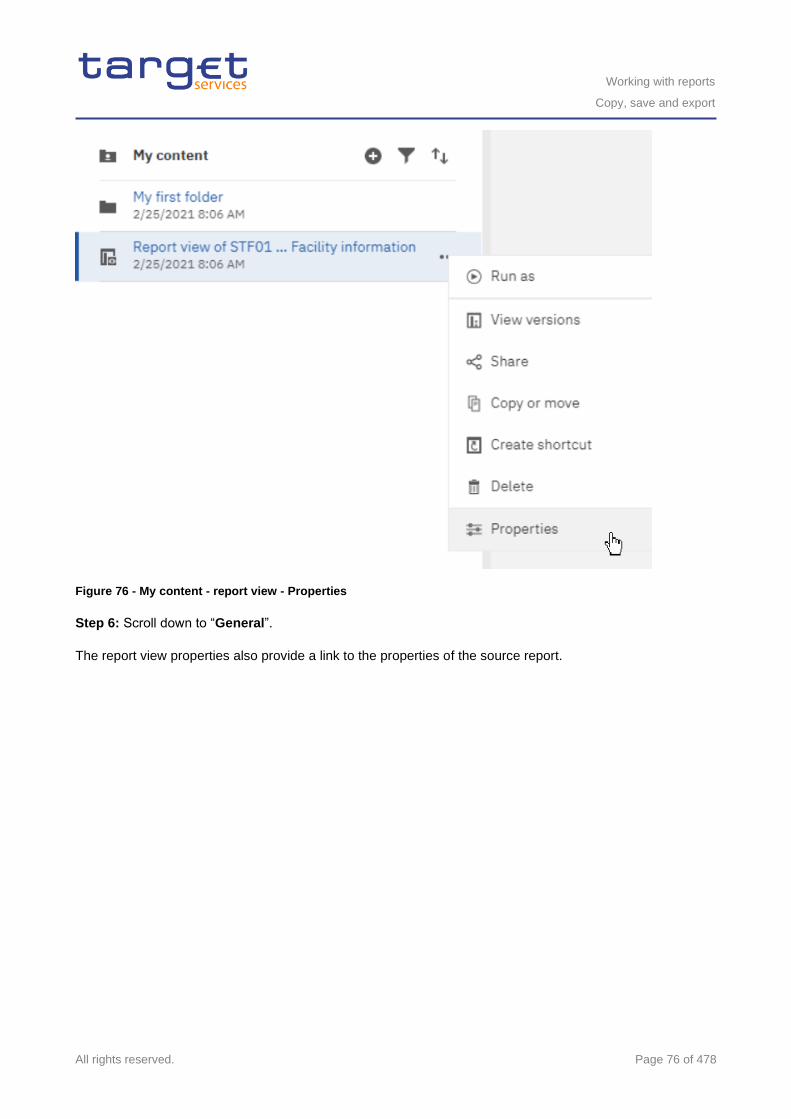
Working with reports
Copy, save and export
All rights reserved. Page 76 of 478
Figure 76 - My content - report view - Properties
Step 6: Scroll down to “General”.
The report view properties also provide a link to the properties of the source report.
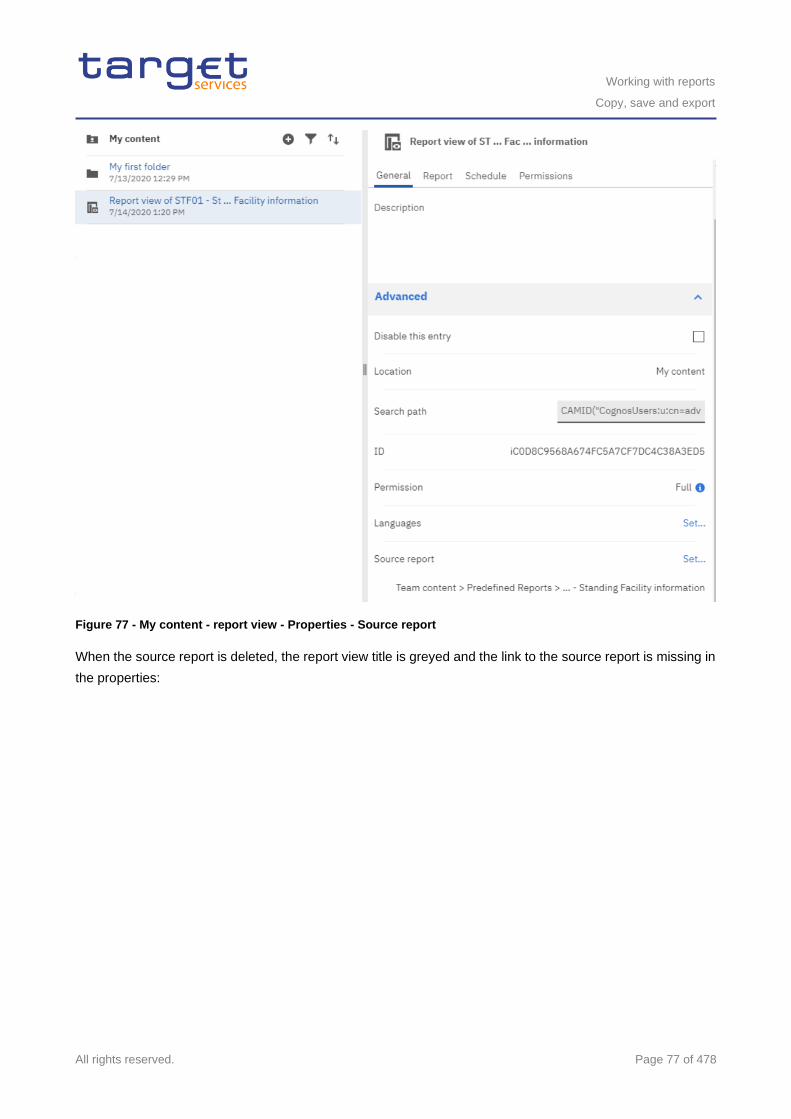
Working with reports
Copy, save and export
All rights reserved. Page 77 of 478
Figure 77 - My content - report view - Properties - Source report
When the source report is deleted, the report view title is greyed and the link to the source report is missing in
the properties:
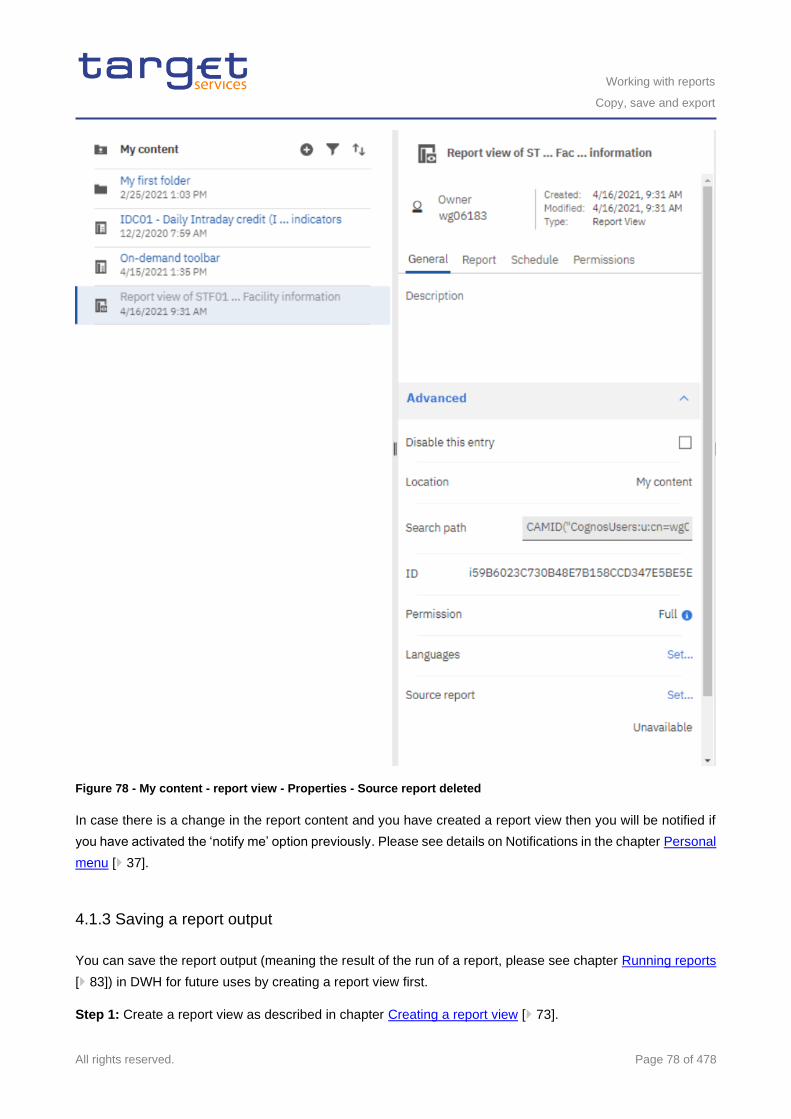
Working with reports
Copy, save and export
All rights reserved. Page 78 of 478
Figure 78 - My content - report view - Properties - Source report deleted
In case there is a change in the report content and you have created a report view then you will be notified if
you have activated the ‘notify me’ option previously. Please see details on Notifications in the chapter Personal
menu [ 37].
4.1.3 Saving a report output
You can save the report output (meaning the result of the run of a report, please see chapter Running reports
[ 83]) in DWH for future uses by creating a report view first.
Step 1: Create a report view as described in chapter Creating a report view [ 73].
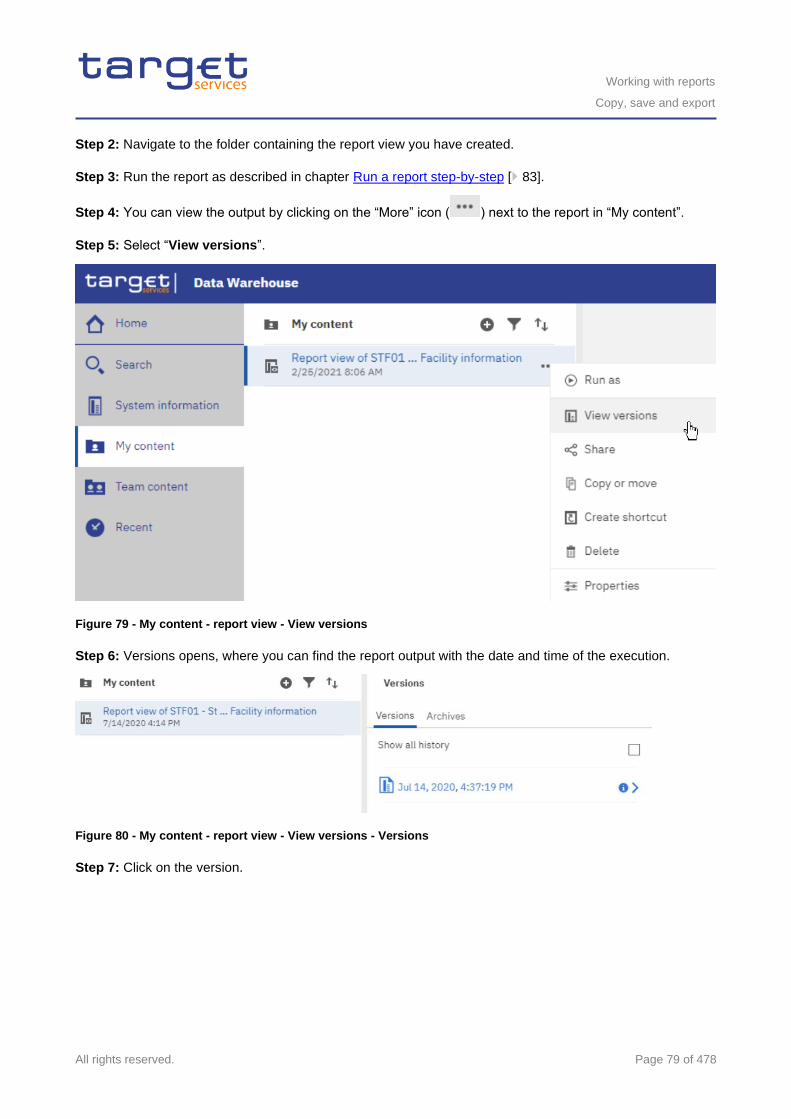
Working with reports
Copy, save and export
All rights reserved. Page 79 of 478
Step 2: Navigate to the folder containing the report view you have created.
Step 3: Run the report as described in chapter Run a report step-by-step [ 83].
Step 4: You can view the output by clicking on the “More” icon ( ) next to the report in “My content”.
Step 5: Select “View versions”.
Figure 79 - My content - report view - View versions
Step 6: Versions opens, where you can find the report output with the date and time of the execution.
Figure 80 - My content - report view - View versions - Versions
Step 7: Click on the version.
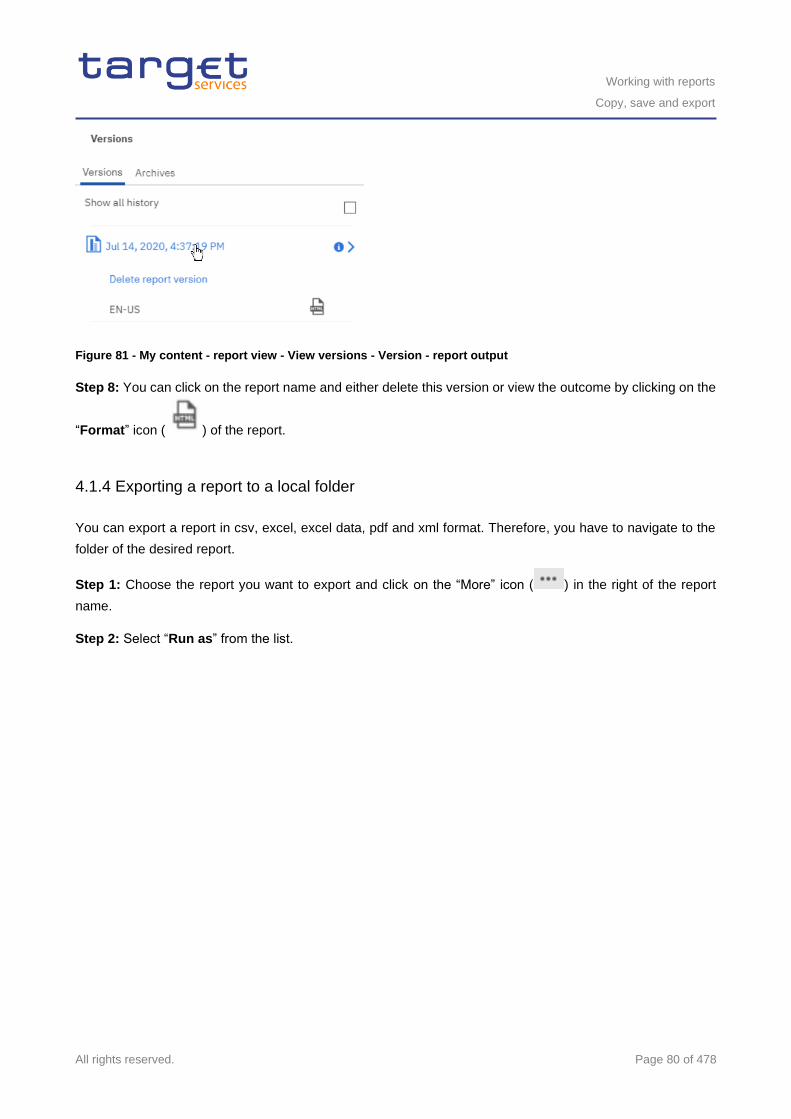
Working with reports
Copy, save and export
All rights reserved. Page 80 of 478
Figure 81 - My content - report view - View versions - Version - report output
Step 8: You can click on the report name and either delete this version or view the outcome by clicking on the
“Format” icon ( ) of the report.
4.1.4 Exporting a report to a local folder
You can export a report in csv, excel, excel data, pdf and xml format. Therefore, you have to navigate to the
folder of the desired report.
Step 1: Choose the report you want to export and click on the “More” icon ( ) in the right of the report
name.
Step 2: Select “Run as” from the list.
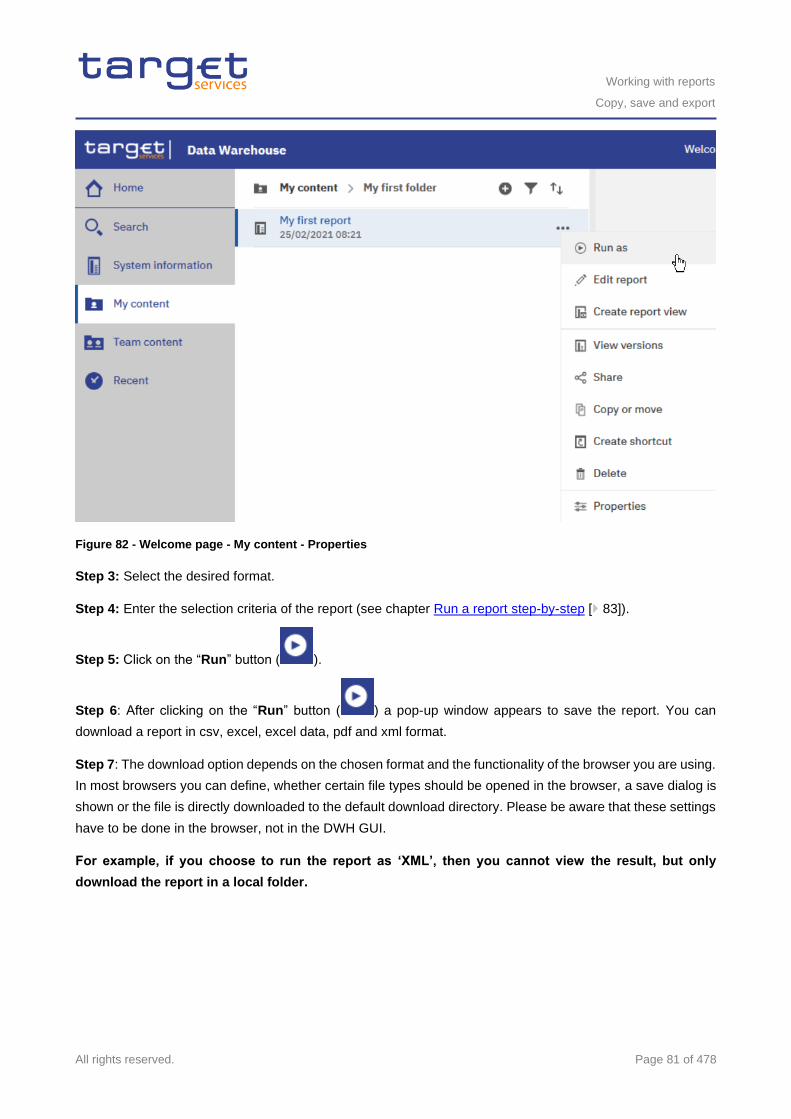
Working with reports
Copy, save and export
All rights reserved. Page 81 of 478
Figure 82 - Welcome page - My content - Properties
Step 3: Select the desired format.
Step 4: Enter the selection criteria of the report (see chapter Run a report step-by-step [ 83]).
Step 5: Click on the “Run” button ( ).
Step 6: After clicking on the “Run” button ( ) a pop-up window appears to save the report. You can
download a report in csv, excel, excel data, pdf and xml format.
Step 7: The download option depends on the chosen format and the functionality of the browser you are using.
In most browsers you can define, whether certain file types should be opened in the browser, a save dialog is
shown or the file is directly downloaded to the default download directory. Please be aware that these settings
have to be done in the browser, not in the DWH GUI.
For example, if you choose to run the report as ‘XML’, then you cannot view the result, but only
download the report in a local folder.
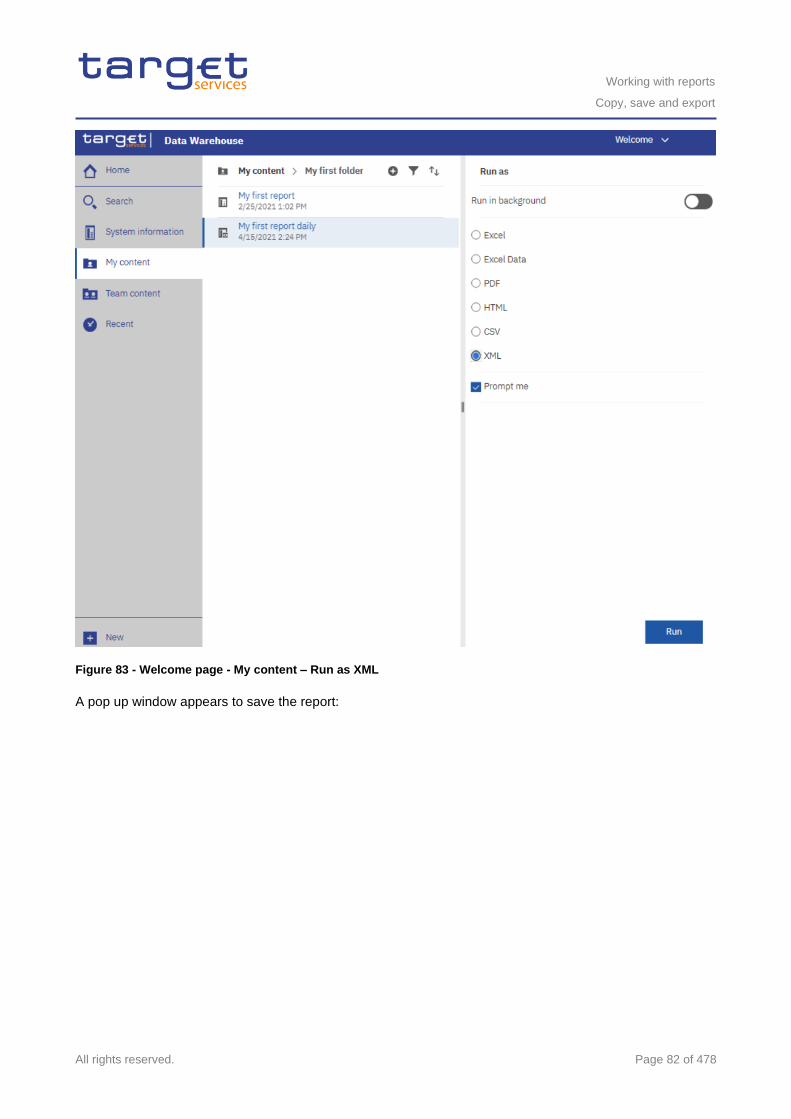
Working with reports
Copy, save and export
All rights reserved. Page 82 of 478
Figure 83 - Welcome page - My content – Run as XML
A pop up window appears to save the report:
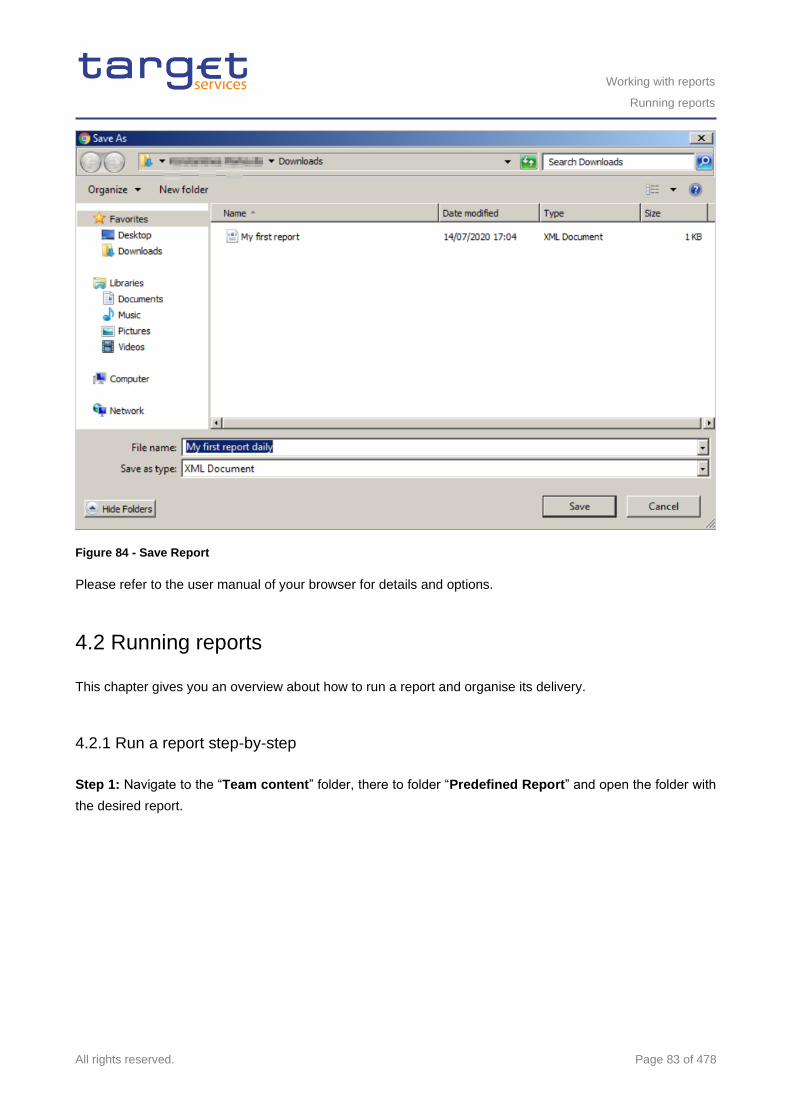
Working with reports
Running reports
All rights reserved. Page 83 of 478
Figure 84 - Save Report
Please refer to the user manual of your browser for details and options.
4.2 Running reports
This chapter gives you an overview about how to run a report and organise its delivery.
4.2.1 Run a report step-by-step
Step 1: Navigate to the “Team content” folder, there to folder “Predefined Report” and open the folder with
the desired report.
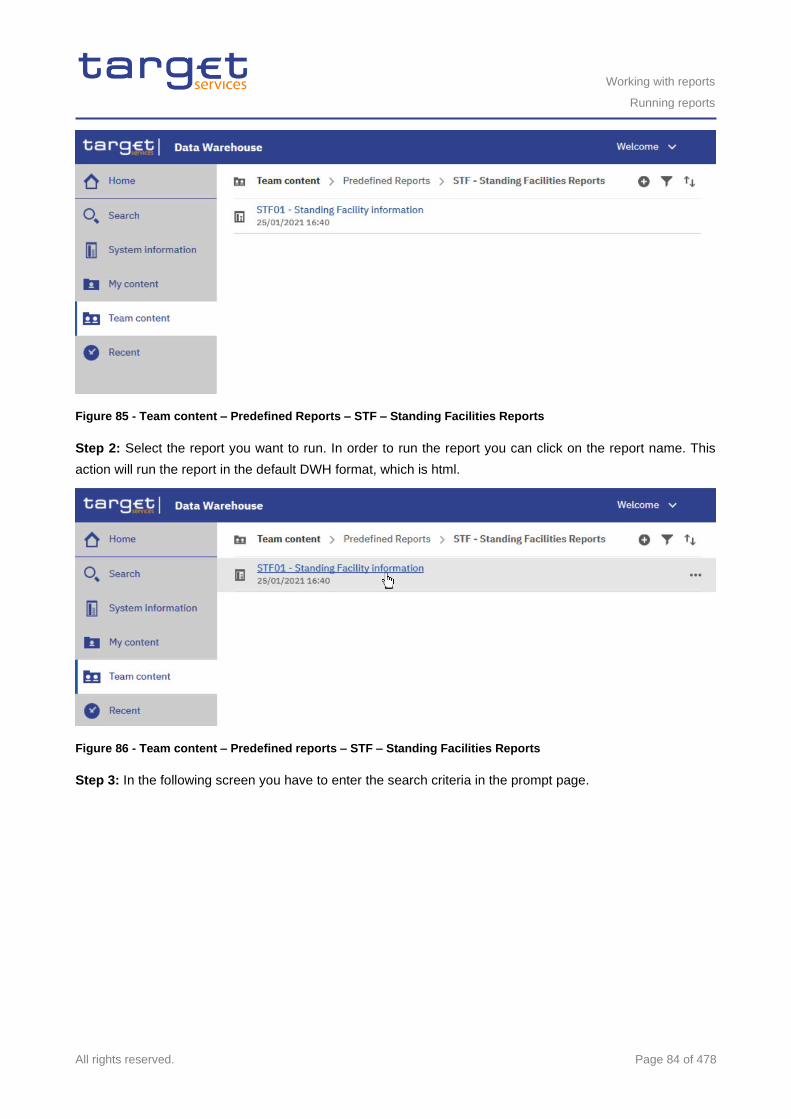
Working with reports
Running reports
All rights reserved. Page 84 of 478
Figure 85 - Team content – Predefined Reports – STF – Standing Facilities Reports
Step 2: Select the report you want to run. In order to run the report you can click on the report name. This
action will run the report in the default DWH format, which is html.
Figure 86 - Team content – Predefined reports – STF – Standing Facilities Reports
Step 3: In the following screen you have to enter the search criteria in the prompt page.
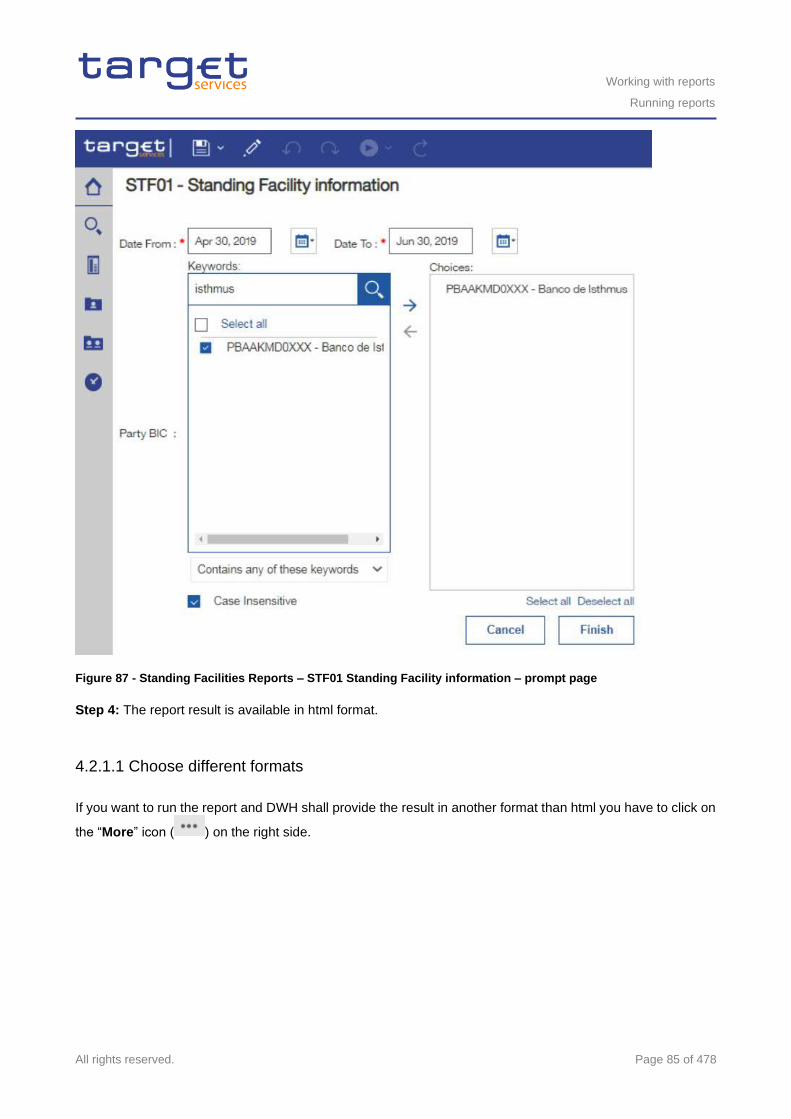
Working with reports
Running reports
All rights reserved. Page 85 of 478
Figure 87 - Standing Facilities Reports – STF01 Standing Facility information – prompt page
Step 4: The report result is available in html format.
4.2.1.1 Choose different formats
If you want to run the report and DWH shall provide the result in another format than html you have to click on
the “More” icon ( ) on the right side.
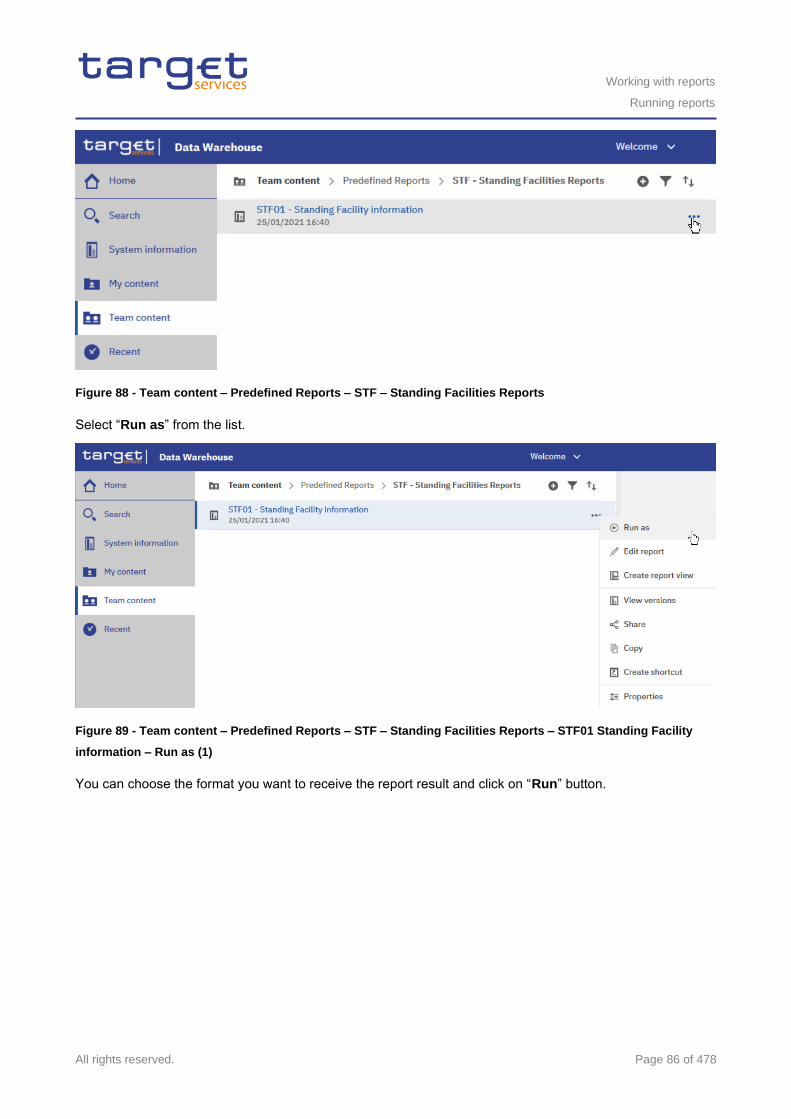
Working with reports
Running reports
All rights reserved. Page 86 of 478
Figure 88 - Team content – Predefined Reports – STF – Standing Facilities Reports
Select “Run as” from the list.
Figure 89 - Team content – Predefined Reports – STF – Standing Facilities Reports – STF01 Standing Facility
information – Run as (1)
You can choose the format you want to receive the report result and click on “Run” button.
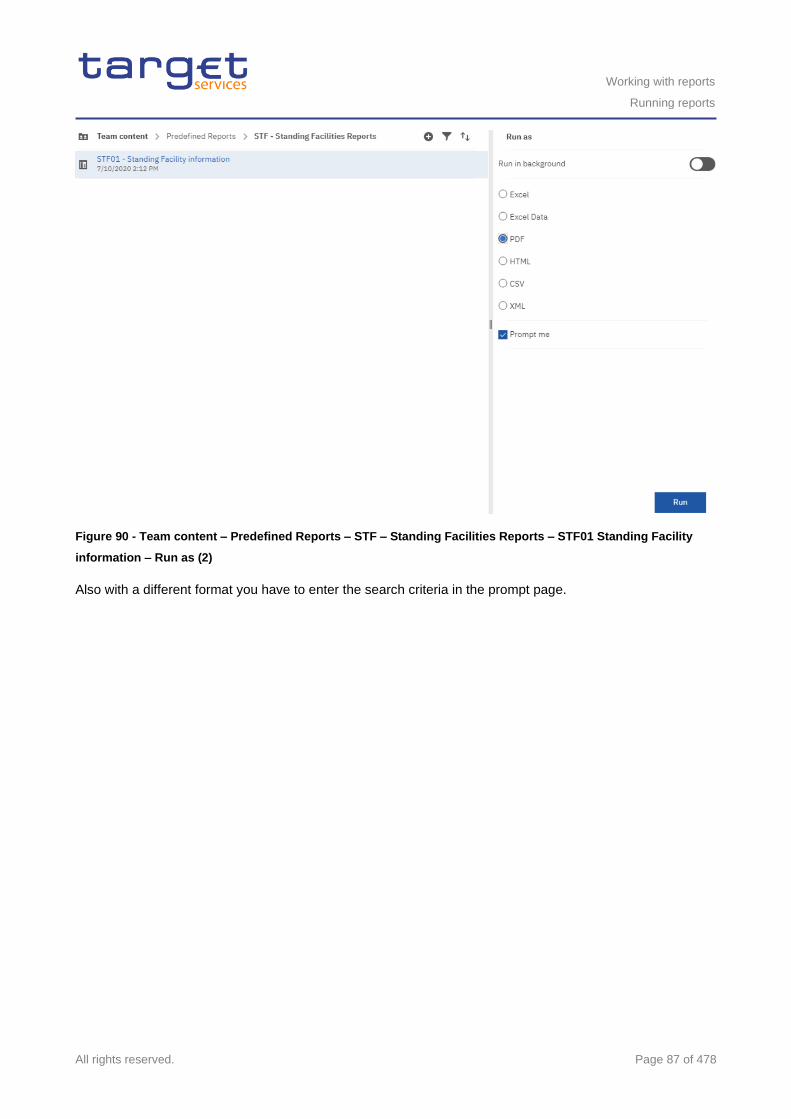
Working with reports
Running reports
All rights reserved. Page 87 of 478
Figure 90 - Team content – Predefined Reports – STF – Standing Facilities Reports – STF01 Standing Facility
information – Run as (2)
Also with a different format you have to enter the search criteria in the prompt page.
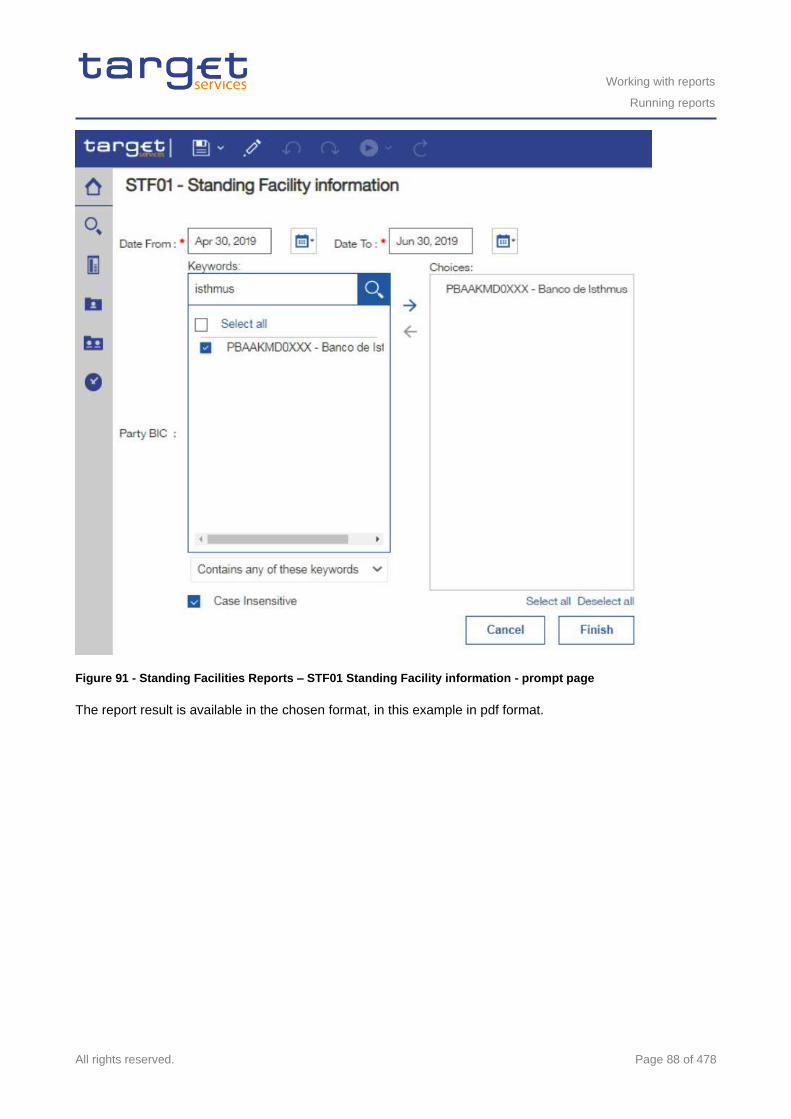
Working with reports
Running reports
All rights reserved. Page 88 of 478
Figure 91 - Standing Facilities Reports – STF01 Standing Facility information - prompt page
The report result is available in the chosen format, in this example in pdf format.
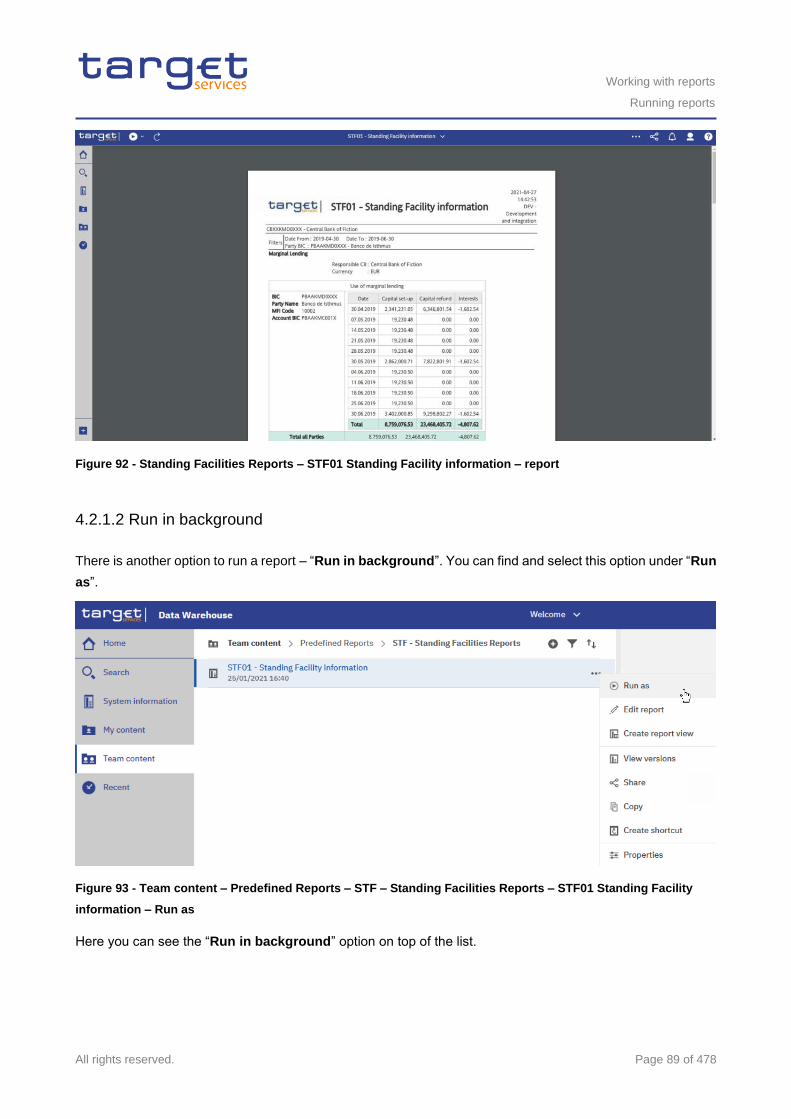
Working with reports
Running reports
All rights reserved. Page 89 of 478
Figure 92 - Standing Facilities Reports – STF01 Standing Facility information – report
4.2.1.2 Run in background
There is another option to run a report – “Run in background”. You can find and select this option under “Run
as”.
Figure 93 - Team content – Predefined Reports – STF – Standing Facilities Reports – STF01 Standing Facility
information – Run as
Here you can see the “Run in background” option on top of the list.
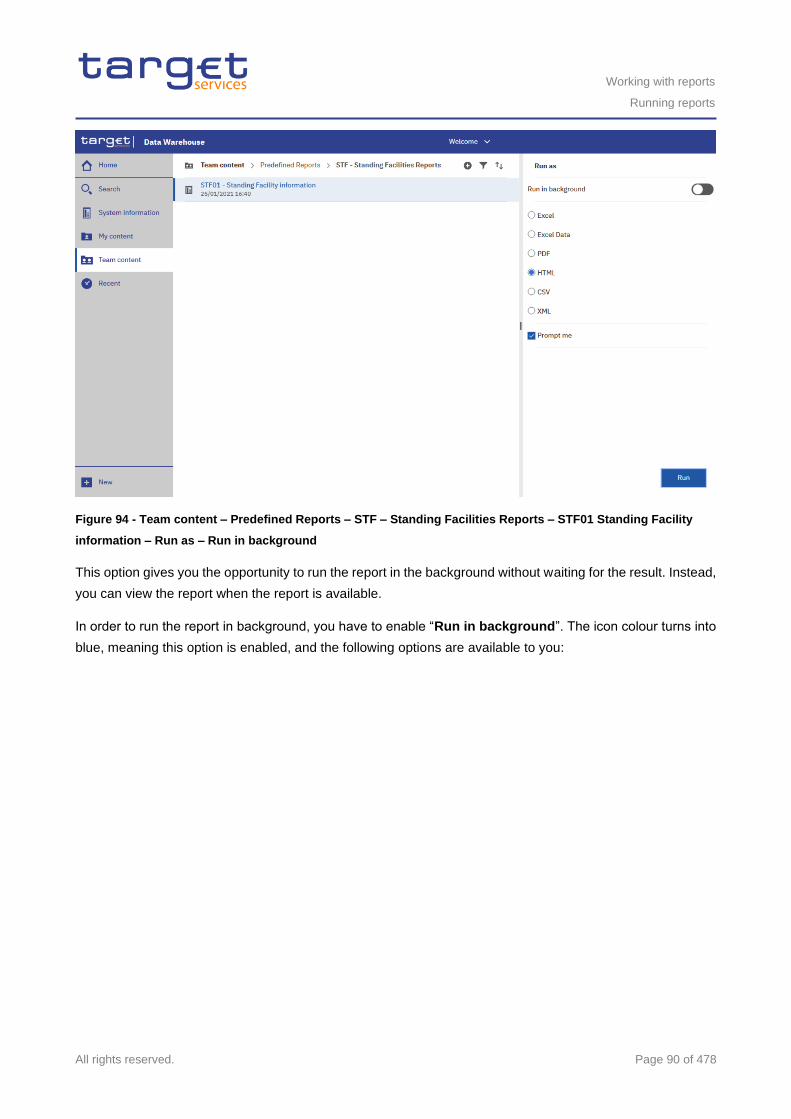
Working with reports
Running reports
All rights reserved. Page 90 of 478
Figure 94 - Team content – Predefined Reports – STF – Standing Facilities Reports – STF01 Standing Facility
information – Run as – Run in background
This option gives you the opportunity to run the report in the background without waiting for the result. Instead,
you can view the report when the report is available.
In order to run the report in background, you have to enable “Run in background”. The icon colour turns into
blue, meaning this option is enabled, and the following options are available to you:
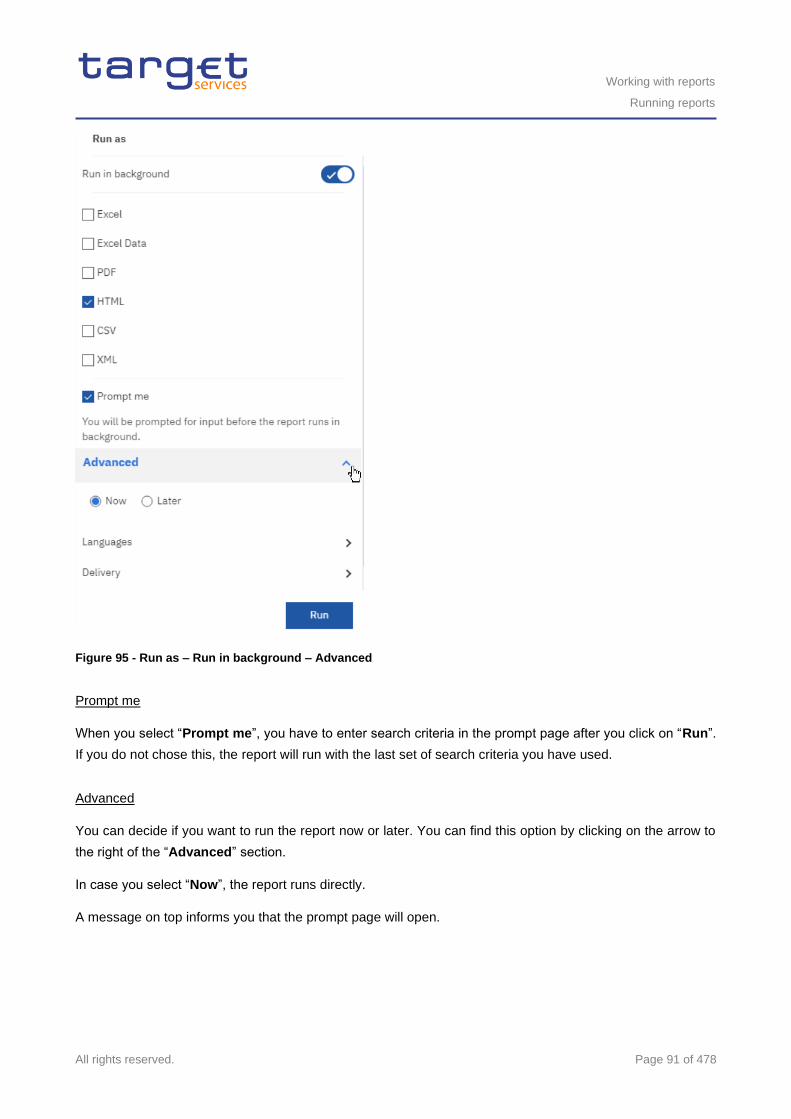
Working with reports
Running reports
All rights reserved. Page 91 of 478
Figure 95 - Run as – Run in background – Advanced
Prompt me
When you select “Prompt me”, you have to enter search criteria in the prompt page after you click on “Run”.
If you do not chose this, the report will run with the last set of search criteria you have used.
Advanced
You can decide if you want to run the report now or later. You can find this option by clicking on the arrow to
the right of the “Advanced” section.
In case you select “Now”, the report runs directly.
A message on top informs you that the prompt page will open.
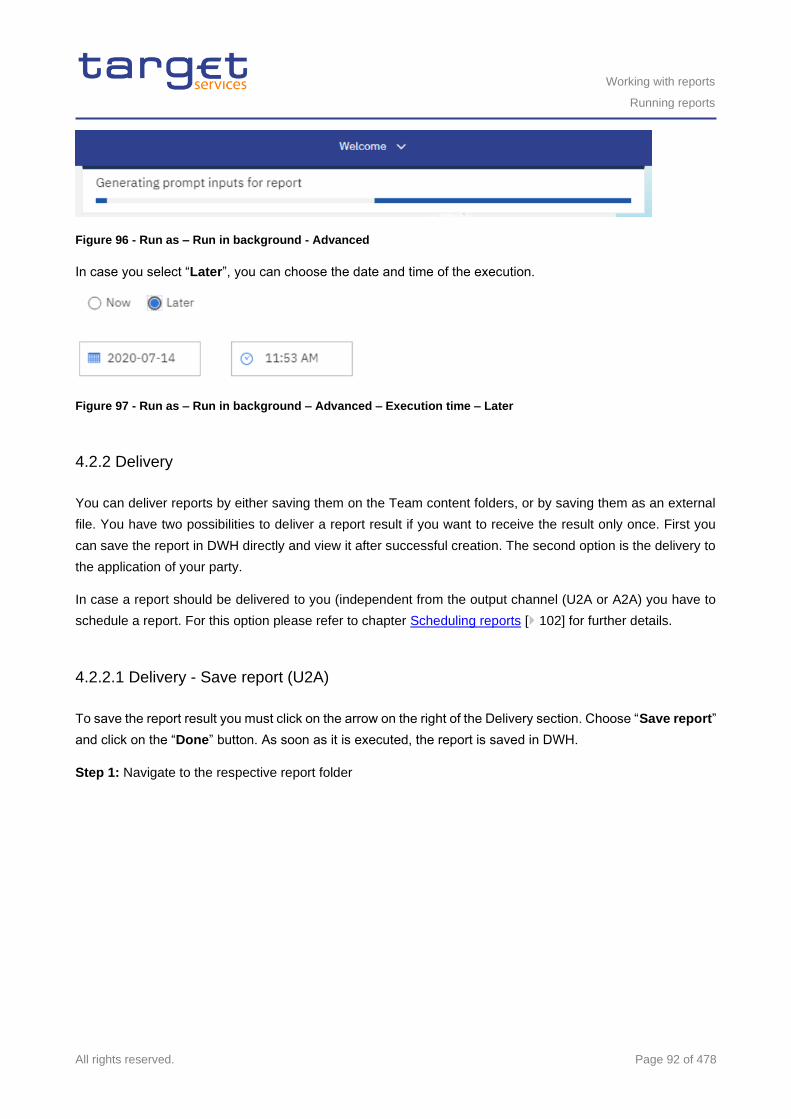
Working with reports
Running reports
All rights reserved. Page 92 of 478
Figure 96 - Run as – Run in background - Advanced
In case you select “Later”, you can choose the date and time of the execution.
Figure 97 - Run as – Run in background – Advanced – Execution time – Later
4.2.2 Delivery
You can deliver reports by either saving them on the Team content folders, or by saving them as an external
file. You have two possibilities to deliver a report result if you want to receive the result only once. First you
can save the report in DWH directly and view it after successful creation. The second option is the delivery to
the application of your party.
In case a report should be delivered to you (independent from the output channel (U2A or A2A) you have to
schedule a report. For this option please refer to chapter Scheduling reports [ 102] for further details.
4.2.2.1 Delivery - Save report (U2A)
To save the report result you must click on the arrow on the right of the Delivery section. Choose “Save report”
and click on the “Done” button. As soon as it is executed, the report is saved in DWH.
Step 1: Navigate to the respective report folder
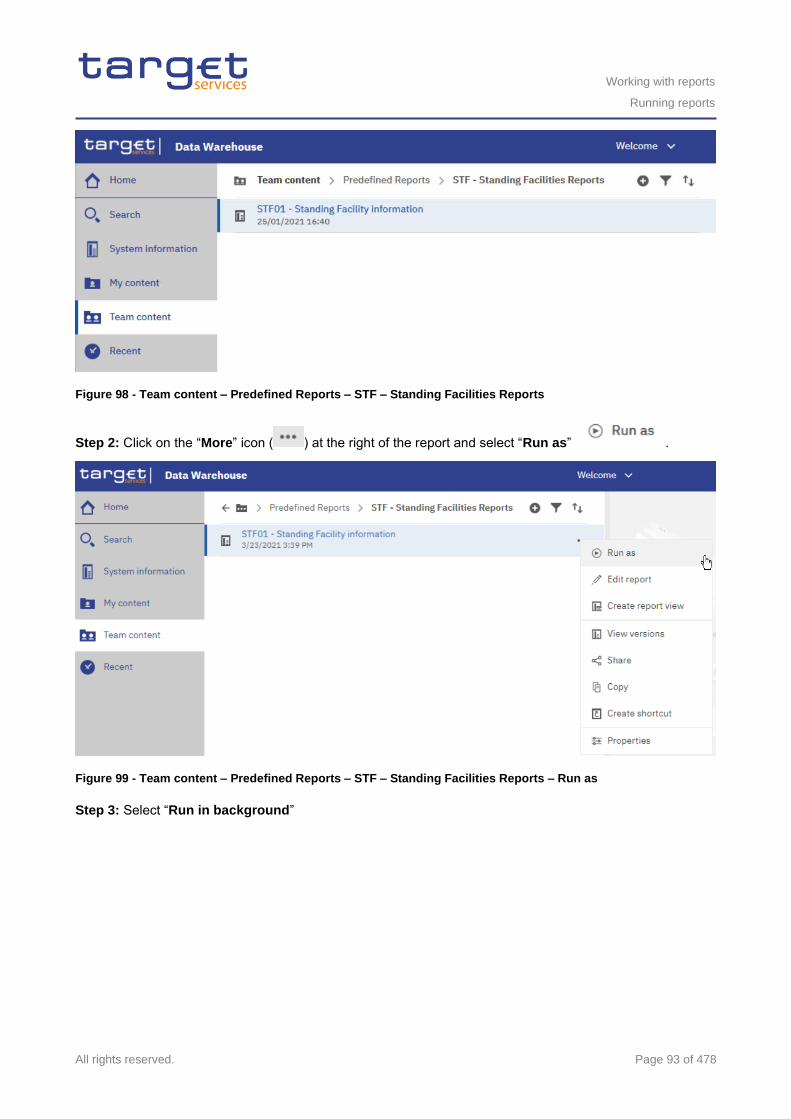
Working with reports
Running reports
All rights reserved. Page 93 of 478
Figure 98 - Team content – Predefined Reports – STF – Standing Facilities Reports
Step 2: Click on the “More” icon ( ) at the right of the report and select “Run as” .
Figure 99 - Team content – Predefined Reports – STF – Standing Facilities Reports – Run as
Step 3: Select “Run in background”
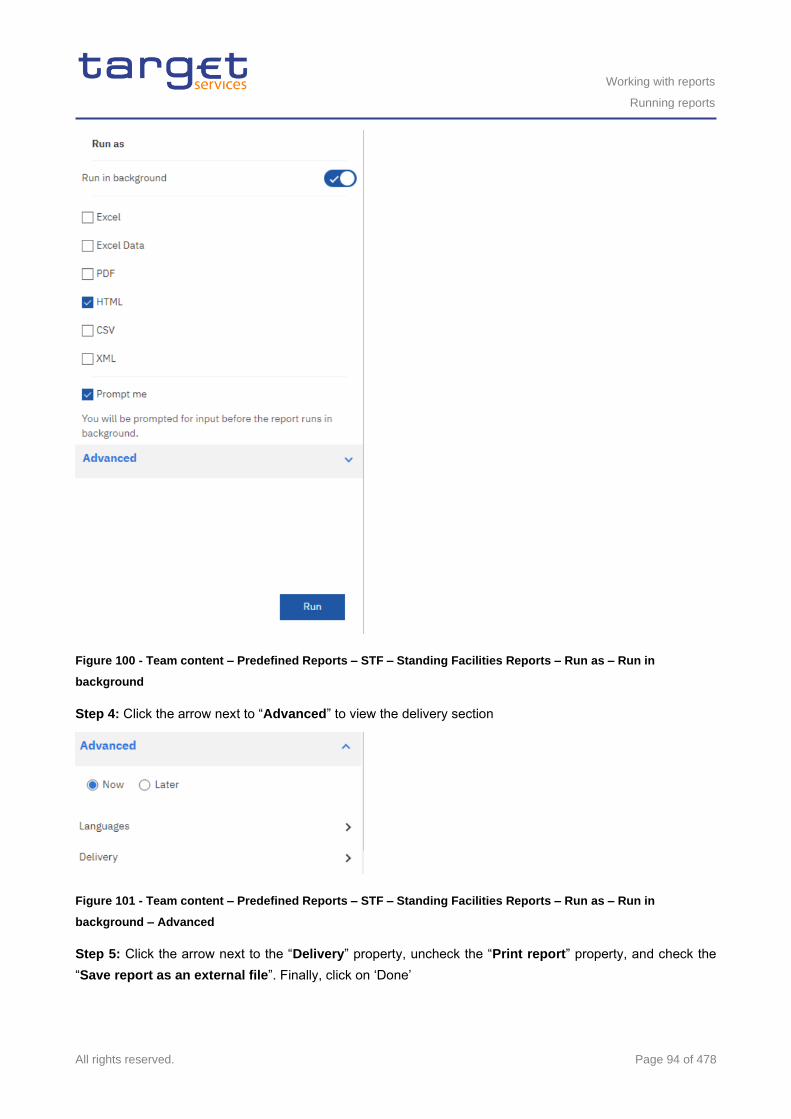
Working with reports
Running reports
All rights reserved. Page 94 of 478
Figure 100 - Team content – Predefined Reports – STF – Standing Facilities Reports – Run as – Run in
background
Step 4: Click the arrow next to “Advanced” to view the delivery section
Figure 101 - Team content – Predefined Reports – STF – Standing Facilities Reports – Run as – Run in
background – Advanced
Step 5: Click the arrow next to the “Delivery” property, uncheck the “Print report” property, and check the
“Save report as an external file”. Finally, click on ‘Done’
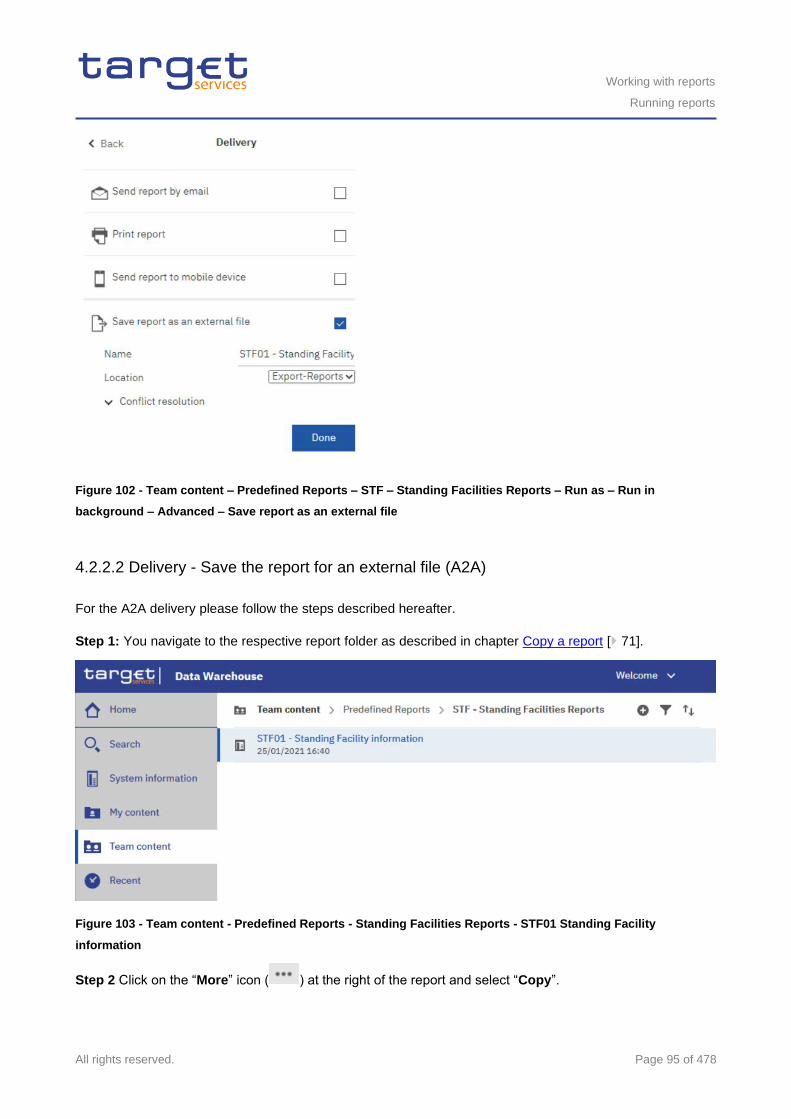
Working with reports
Running reports
All rights reserved. Page 95 of 478
Figure 102 - Team content – Predefined Reports – STF – Standing Facilities Reports – Run as – Run in
background – Advanced – Save report as an external file
4.2.2.2 Delivery - Save the report for an external file (A2A)
For the A2A delivery please follow the steps described hereafter.
Step 1: You navigate to the respective report folder as described in chapter Copy a report [ 71].
Figure 103 - Team content - Predefined Reports - Standing Facilities Reports - STF01 Standing Facility
information
Step 2 Click on the “More” icon ( ) at the right of the report and select “Copy”.
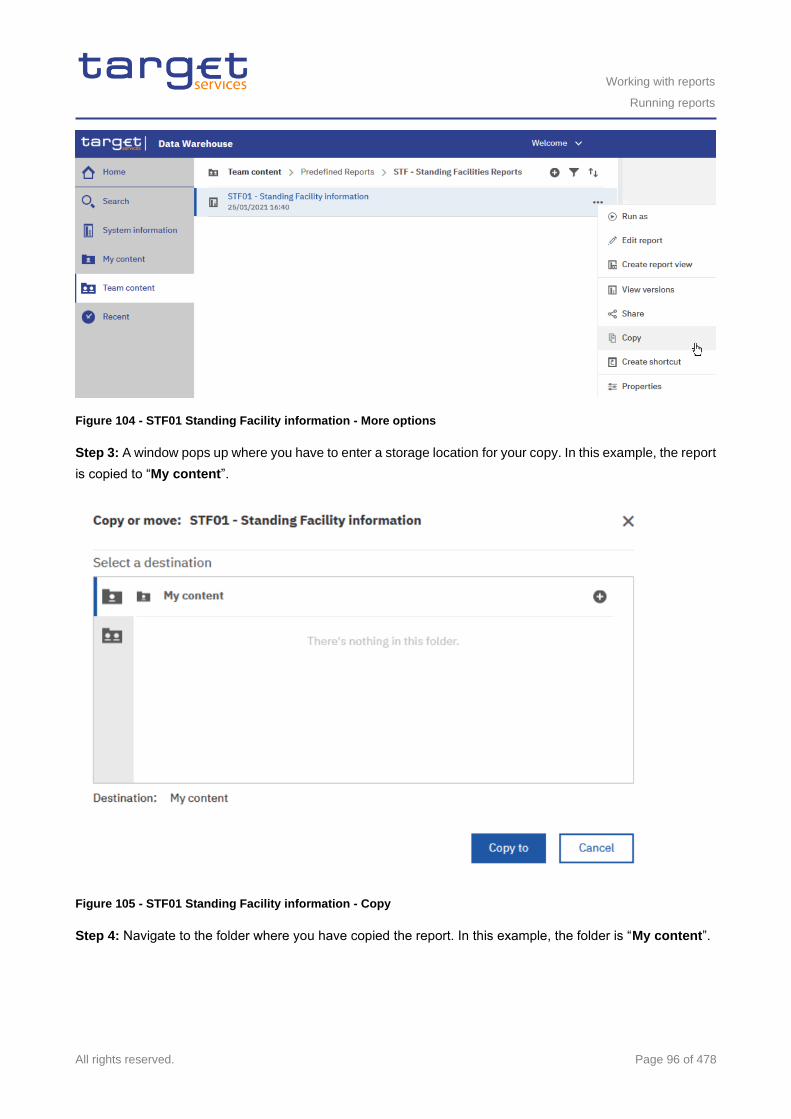
Working with reports
Running reports
All rights reserved. Page 96 of 478
Figure 104 - STF01 Standing Facility information - More options
Step 3: A window pops up where you have to enter a storage location for your copy. In this example, the report
is copied to “My content”.
Figure 105 - STF01 Standing Facility information - Copy
Step 4: Navigate to the folder where you have copied the report. In this example, the folder is “My content”.
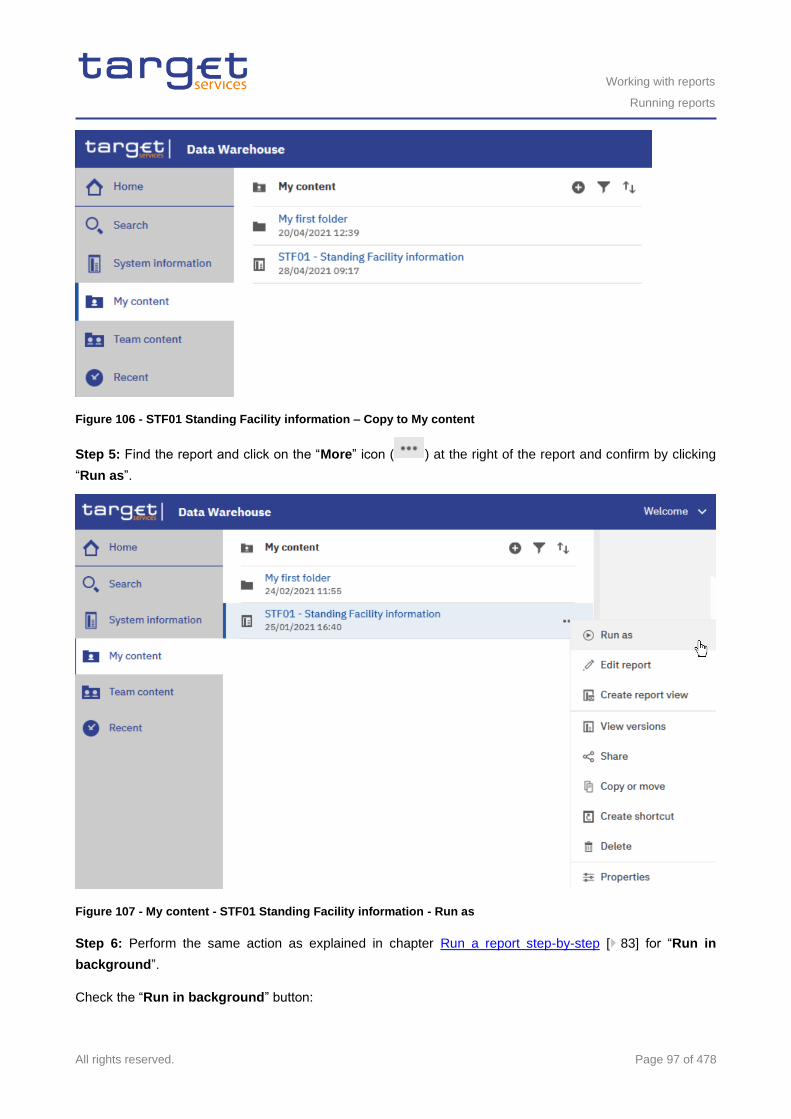
Working with reports
Running reports
All rights reserved. Page 97 of 478
Figure 106 - STF01 Standing Facility information – Copy to My content
Step 5: Find the report and click on the “More” icon ( ) at the right of the report and confirm by clicking
“Run as”.
Figure 107 - My content - STF01 Standing Facility information - Run as
Step 6: Perform the same action as explained in chapter Run a report step-by-step [ 83] for “Run in
background”.
Check the “Run in background” button:
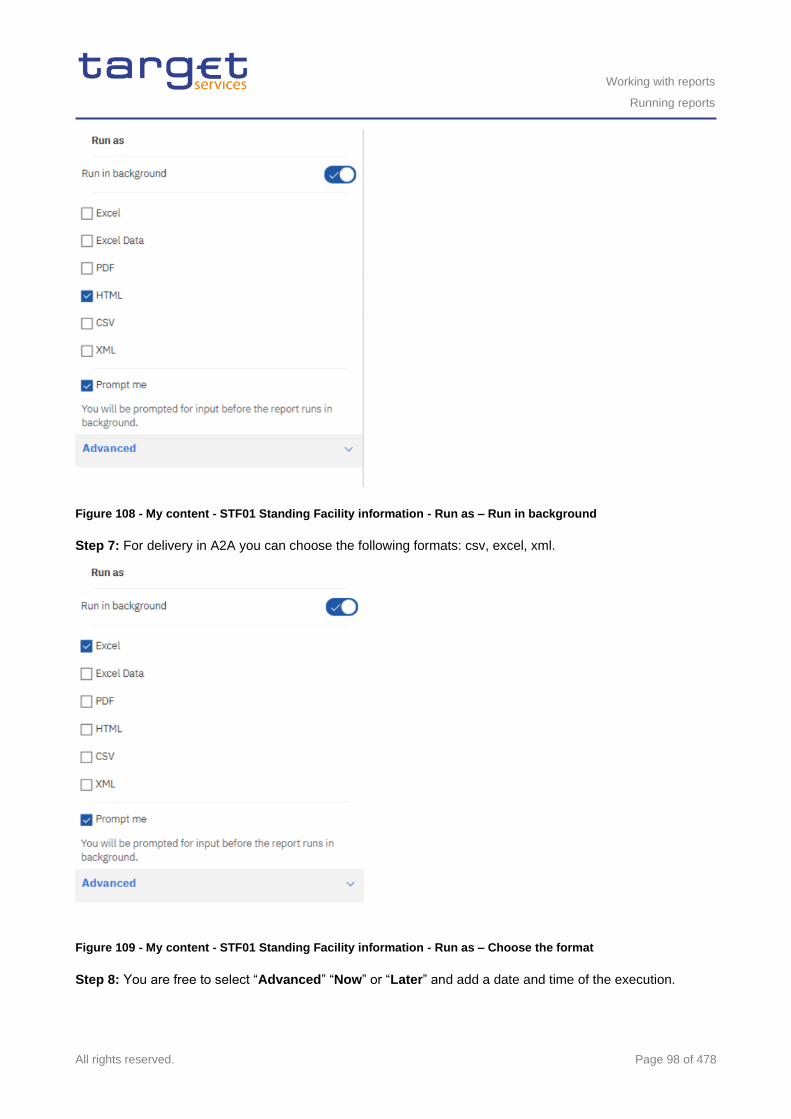
Working with reports
Running reports
All rights reserved. Page 98 of 478
Figure 108 - My content - STF01 Standing Facility information - Run as – Run in background
Step 7: For delivery in A2A you can choose the following formats: csv, excel, xml.
Figure 109 - My content - STF01 Standing Facility information - Run as – Choose the format
Step 8: You are free to select “Advanced” “Now” or “Later” and add a date and time of the execution.
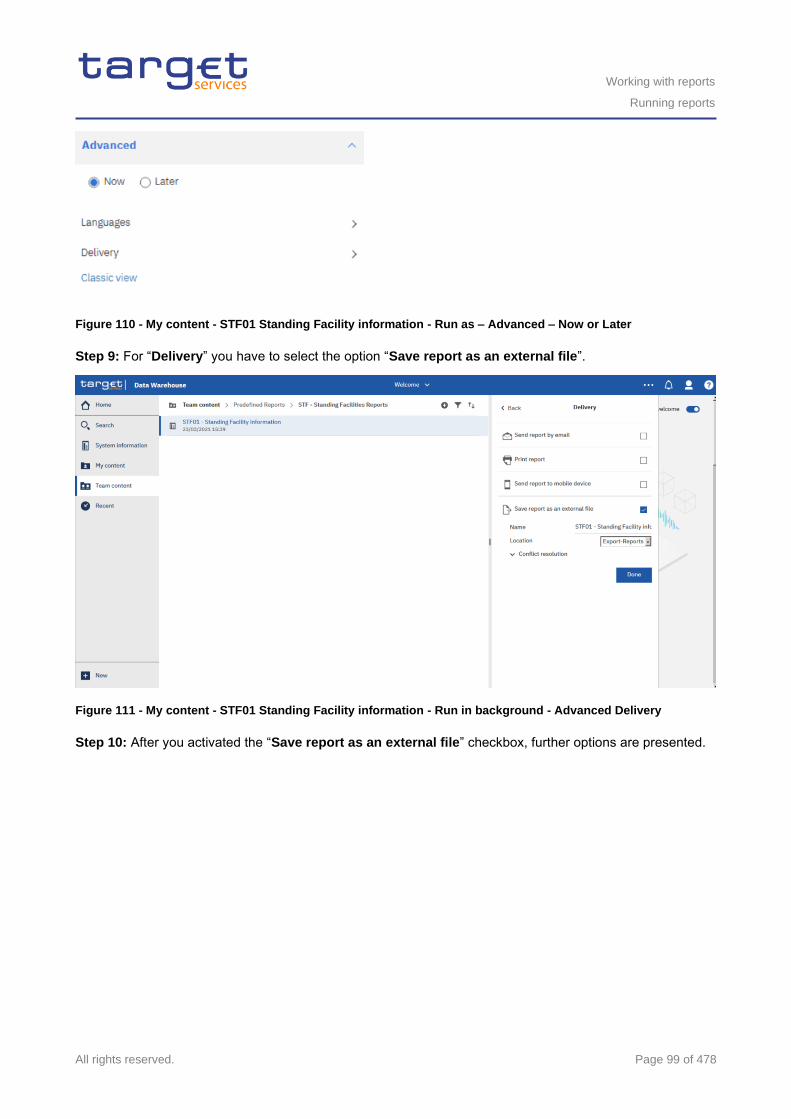
Working with reports
Running reports
All rights reserved. Page 99 of 478
Figure 110 - My content - STF01 Standing Facility information - Run as – Advanced – Now or Later
Step 9: For “Delivery” you have to select the option “Save report as an external file”.
Figure 111 - My content - STF01 Standing Facility information - Run in background - Advanced Delivery
Step 10: After you activated the “Save report as an external file” checkbox, further options are presented.
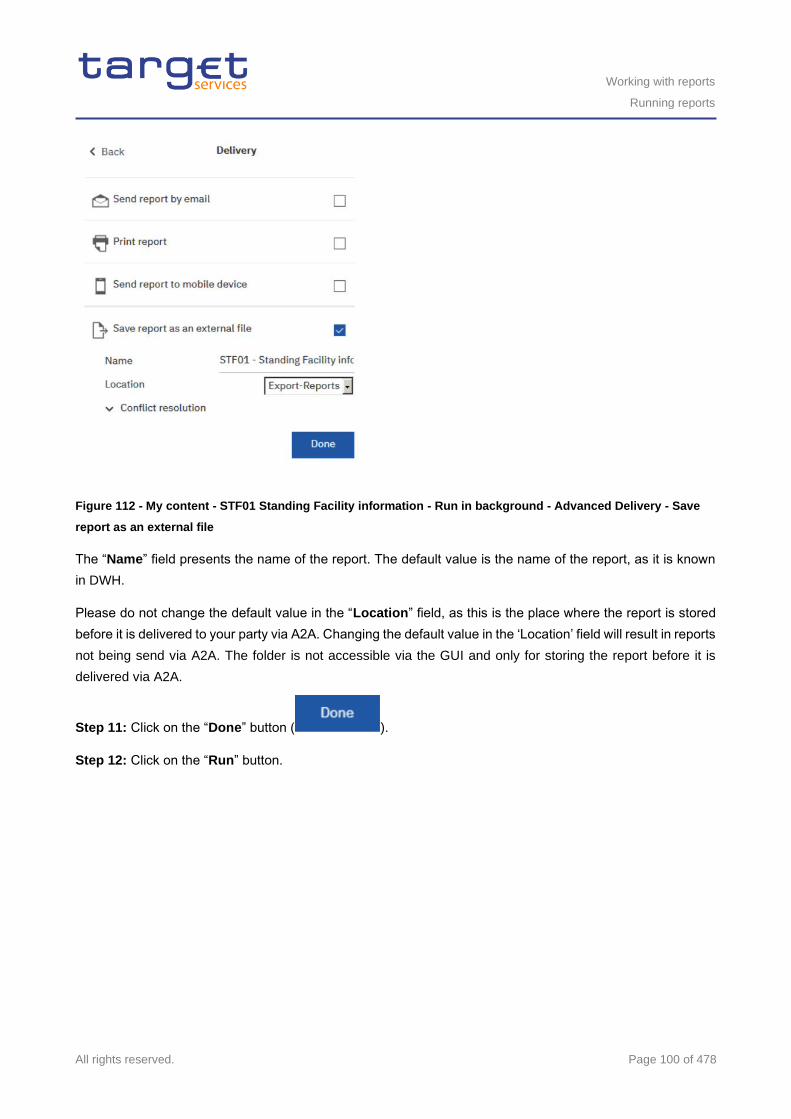
Working with reports
Running reports
All rights reserved. Page 100 of 478
Figure 112 - My content - STF01 Standing Facility information - Run in background - Advanced Delivery - Save
report as an external file
The “Name” field presents the name of the report. The default value is the name of the report, as it is known
in DWH.
Please do not change the default value in the “Location” field, as this is the place where the report is stored
before it is delivered to your party via A2A. Changing the default value in the ‘Location’ field will result in reports
not being send via A2A. The folder is not accessible via the GUI and only for storing the report before it is
delivered via A2A.
Step 11: Click on the “Done” button ( ).
Step 12: Click on the “Run” button.
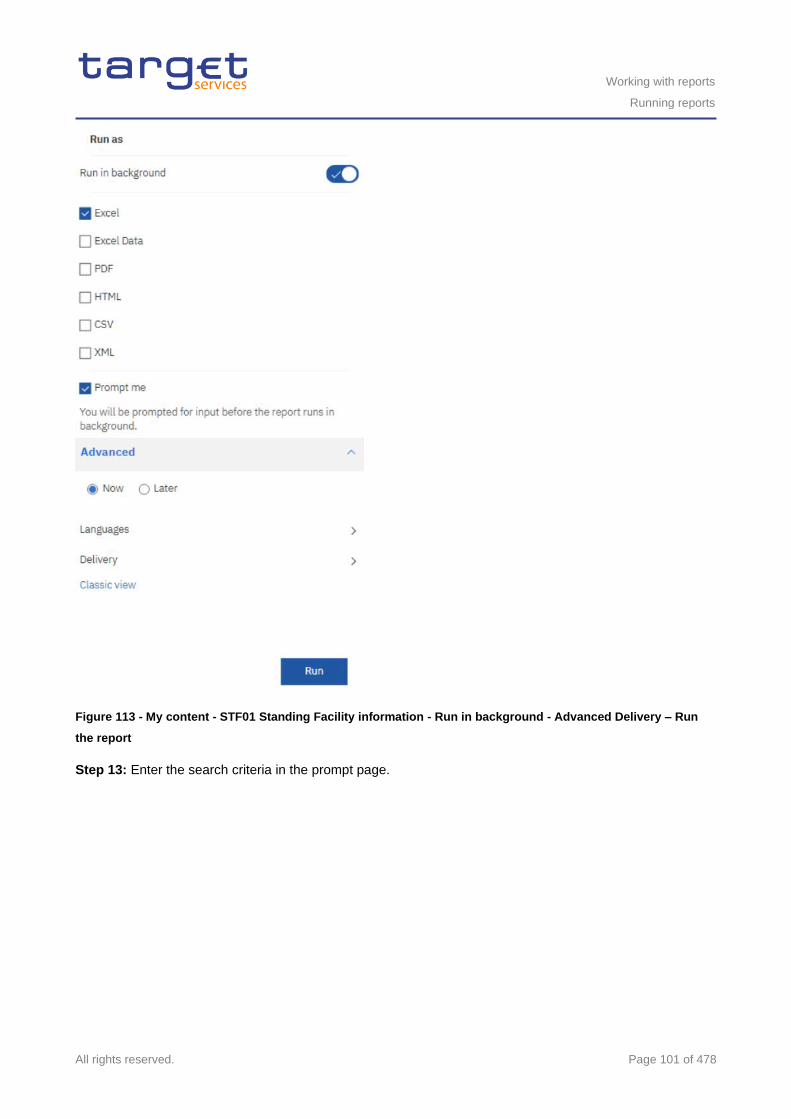
Working with reports
Running reports
All rights reserved. Page 101 of 478
Figure 113 - My content - STF01 Standing Facility information - Run in background - Advanced Delivery – Run
the report
Step 13: Enter the search criteria in the prompt page.
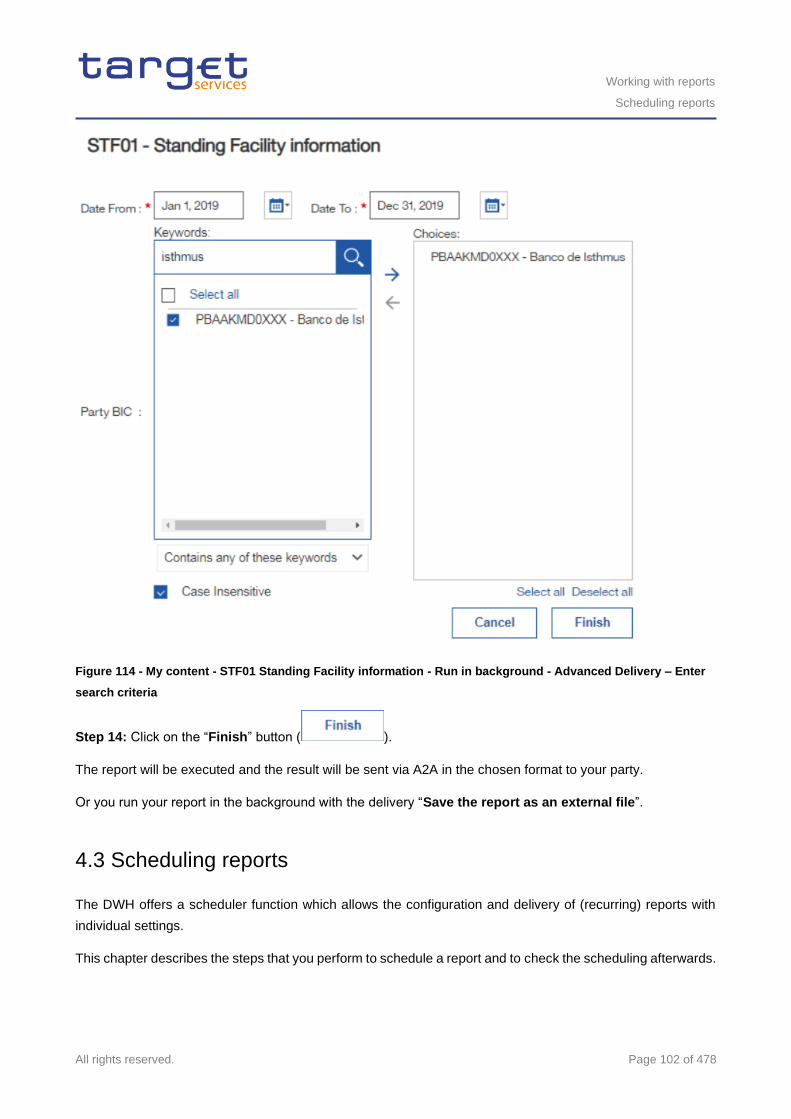
Working with reports
Scheduling reports
All rights reserved. Page 102 of 478
Figure 114 - My content - STF01 Standing Facility information - Run in background - Advanced Delivery – Enter
search criteria
Step 14: Click on the “Finish” button ( ).
The report will be executed and the result will be sent via A2A in the chosen format to your party.
Or you run your report in the background with the delivery “Save the report as an external file”.
4.3 Scheduling reports
The DWH offers a scheduler function which allows the configuration and delivery of (recurring) reports with
individual settings.
This chapter describes the steps that you perform to schedule a report and to check the scheduling afterwards.
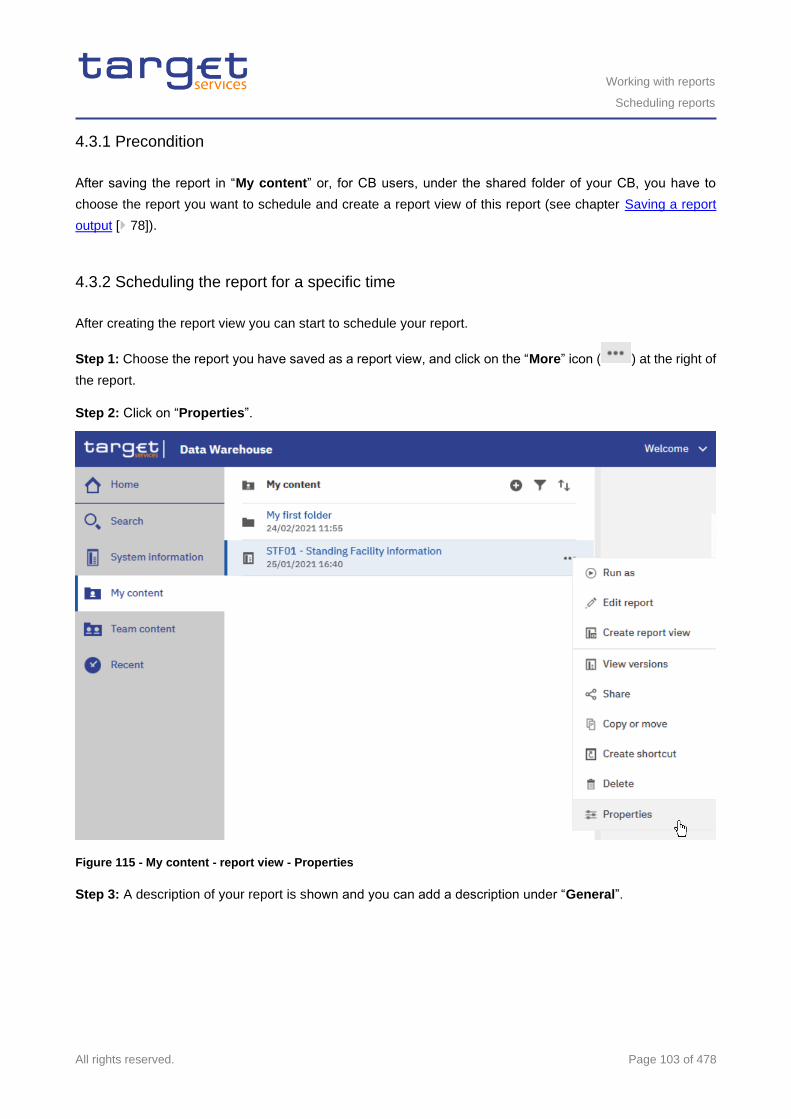
Working with reports
Scheduling reports
All rights reserved. Page 103 of 478
4.3.1 Precondition
After saving the report in “My content” or, for CB users, under the shared folder of your CB, you have to
choose the report you want to schedule and create a report view of this report (see chapter Saving a report
output [ 78]).
4.3.2 Scheduling the report for a specific time
After creating the report view you can start to schedule your report.
Step 1: Choose the report you have saved as a report view, and click on the “More” icon ( ) at the right of
the report.
Step 2: Click on “Properties”.
Figure 115 - My content - report view - Properties
Step 3: A description of your report is shown and you can add a description under “General”.
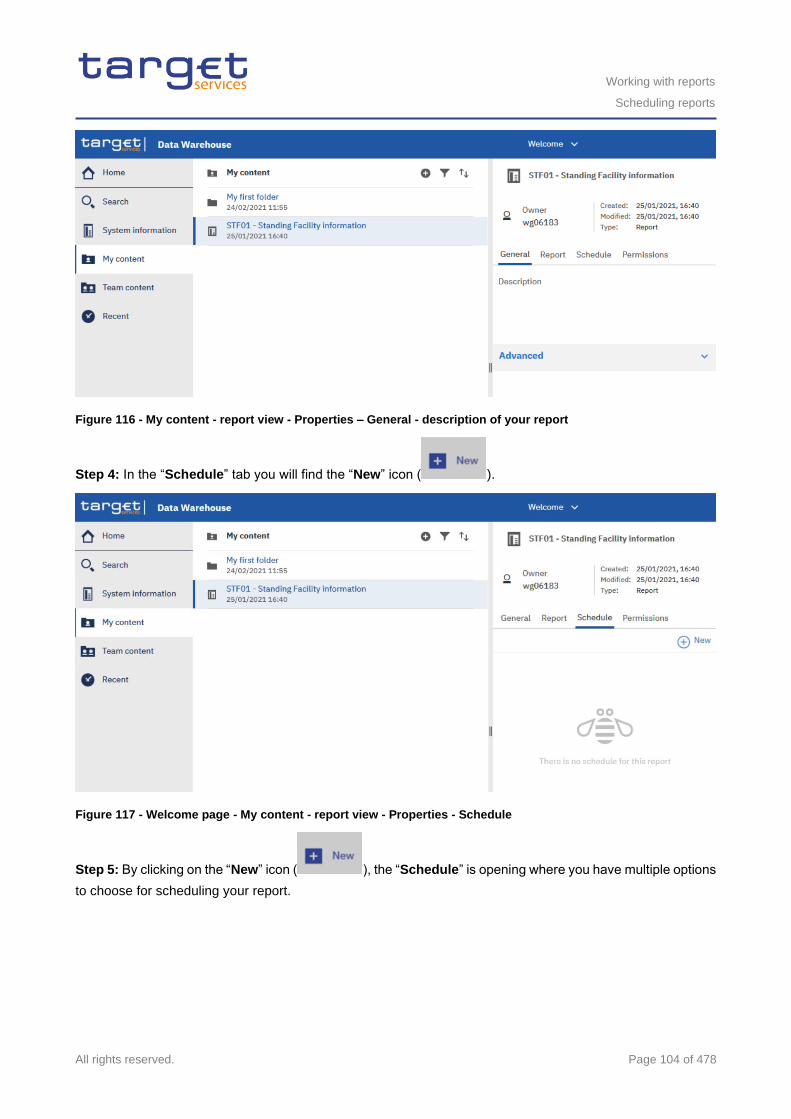
Working with reports
Scheduling reports
All rights reserved. Page 104 of 478
Figure 116 - My content - report view - Properties – General - description of your report
Step 4: In the “Schedule” tab you will find the “New” icon ( ).
Figure 117 - Welcome page - My content - report view - Properties - Schedule
Step 5: By clicking on the “New” icon ( ), the “Schedule” is opening where you have multiple options
to choose for scheduling your report.
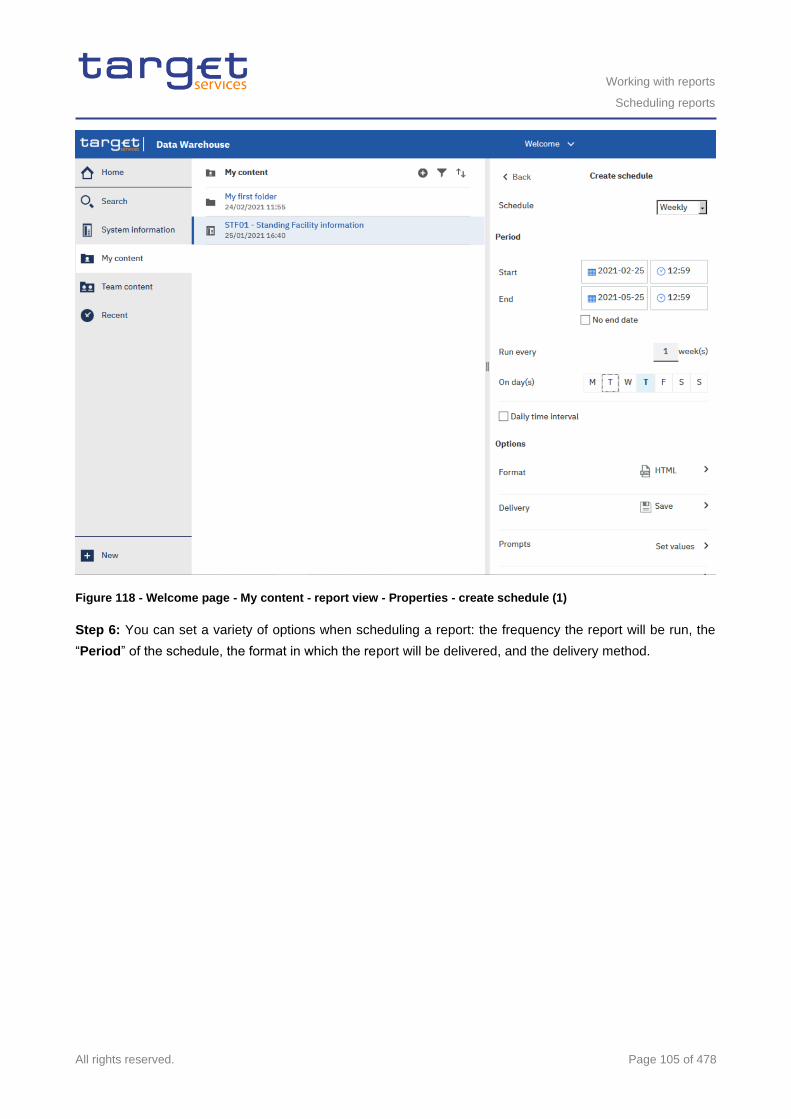
Working with reports
Scheduling reports
All rights reserved. Page 105 of 478
Figure 118 - Welcome page - My content - report view - Properties - create schedule (1)
Step 6: You can set a variety of options when scheduling a report: the frequency the report will be run, the
“Period” of the schedule, the format in which the report will be delivered, and the delivery method.
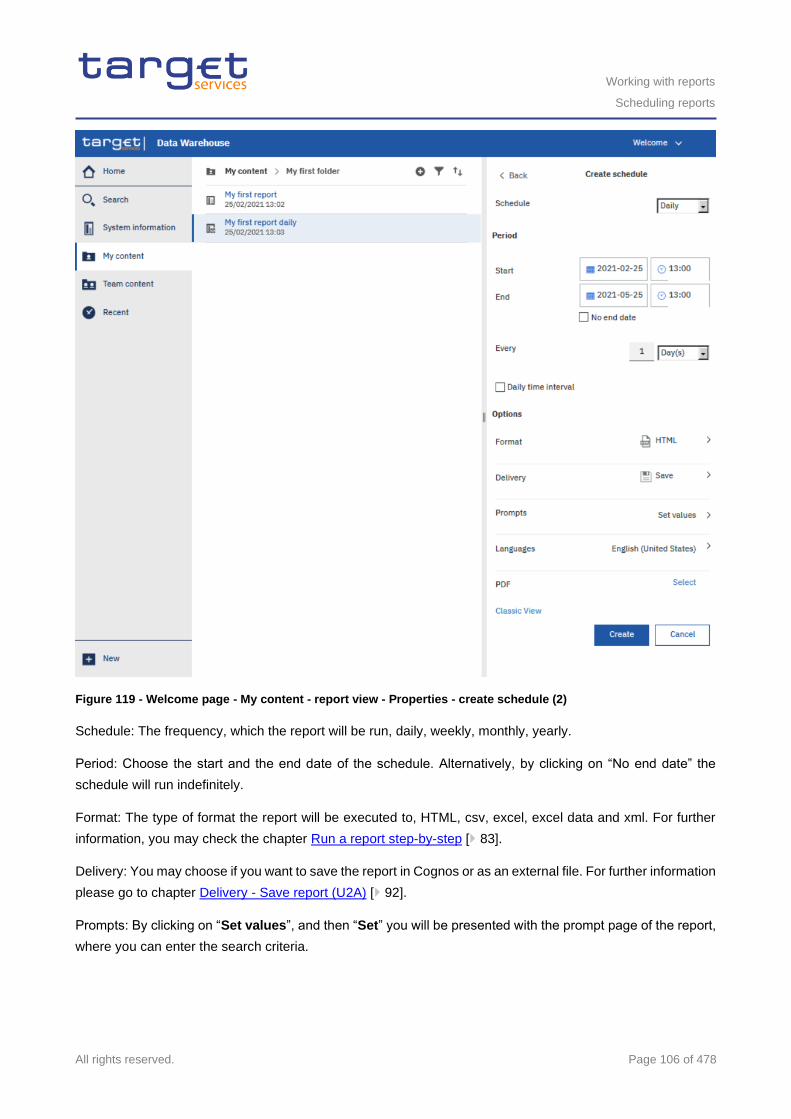
Working with reports
Scheduling reports
All rights reserved. Page 106 of 478
Figure 119 - Welcome page - My content - report view - Properties - create schedule (2)
Schedule: The frequency, which the report will be run, daily, weekly, monthly, yearly.
Period: Choose the start and the end date of the schedule. Alternatively, by clicking on “No end date” the
schedule will run indefinitely.
Format: The type of format the report will be executed to, HTML, csv, excel, excel data and xml. For further
information, you may check the chapter Run a report step-by-step [ 83].
Delivery: You may choose if you want to save the report in Cognos or as an external file. For further information
please go to chapter Delivery - Save report (U2A) [ 92].
Prompts: By clicking on “Set values”, and then “Set” you will be presented with the prompt page of the report,
where you can enter the search criteria.
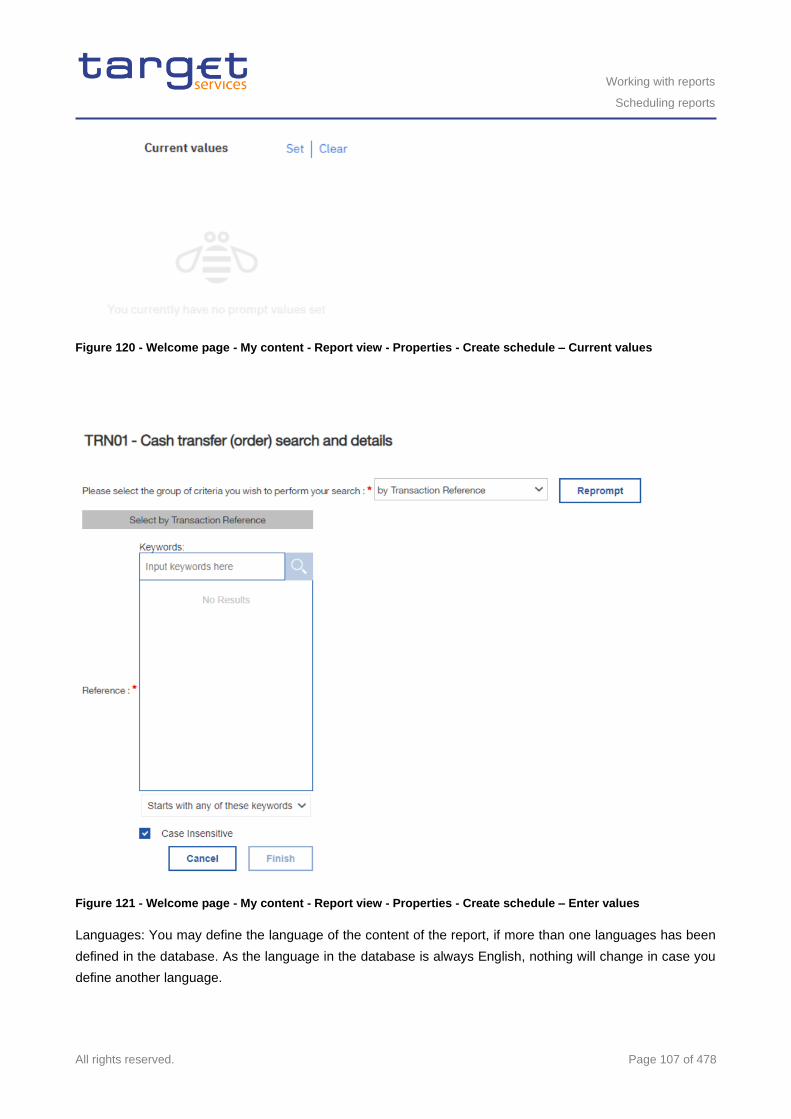
Working with reports
Scheduling reports
All rights reserved. Page 107 of 478
Figure 120 - Welcome page - My content - Report view - Properties - Create schedule – Current values
Figure 121 - Welcome page - My content - Report view - Properties - Create schedule – Enter values
Languages: You may define the language of the content of the report, if more than one languages has been
defined in the database. As the language in the database is always English, nothing will change in case you
define another language.
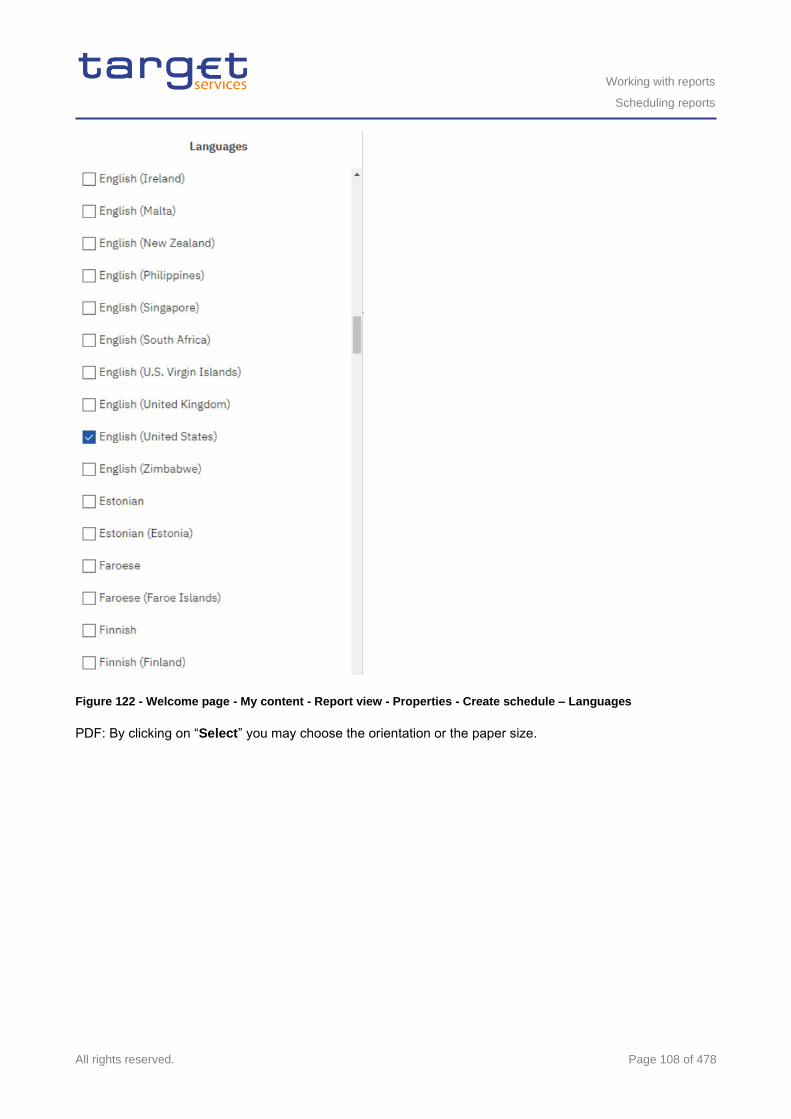
Working with reports
Scheduling reports
All rights reserved. Page 108 of 478
Figure 122 - Welcome page - My content - Report view - Properties - Create schedule – Languages
PDF: By clicking on “Select” you may choose the orientation or the paper size.
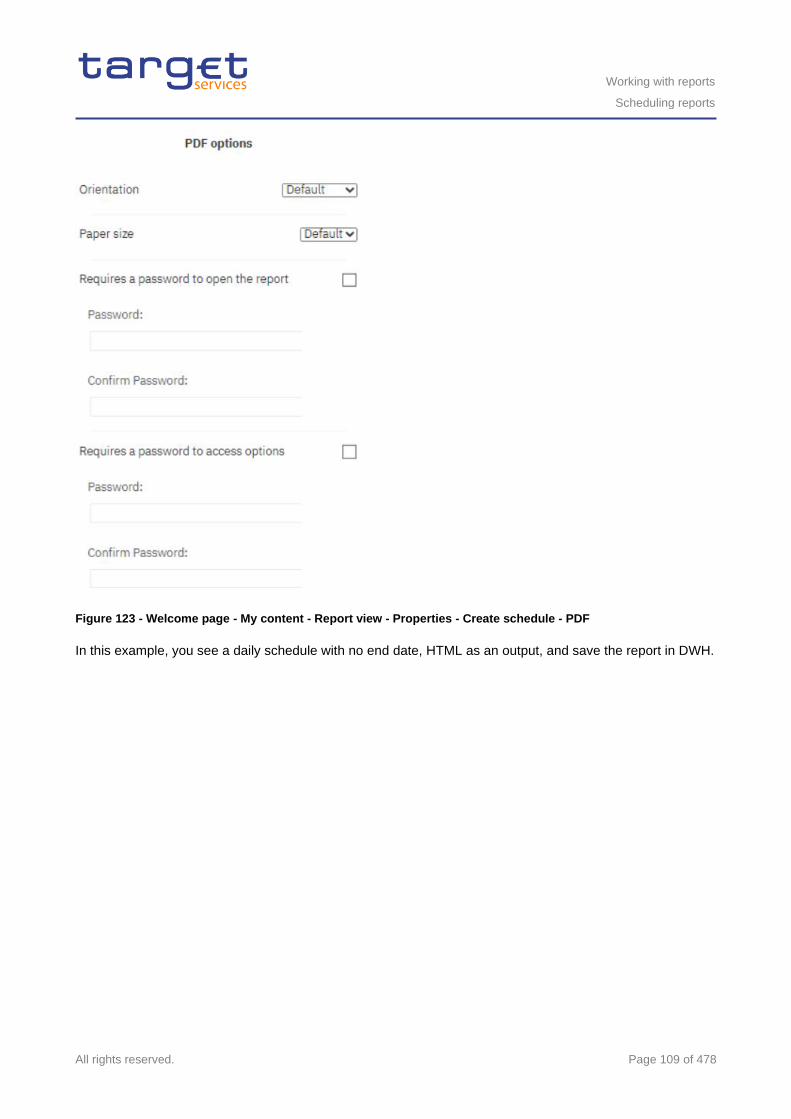
Working with reports
Scheduling reports
All rights reserved. Page 109 of 478
Figure 123 - Welcome page - My content - Report view - Properties - Create schedule - PDF
In this example, you see a daily schedule with no end date, HTML as an output, and save the report in DWH.
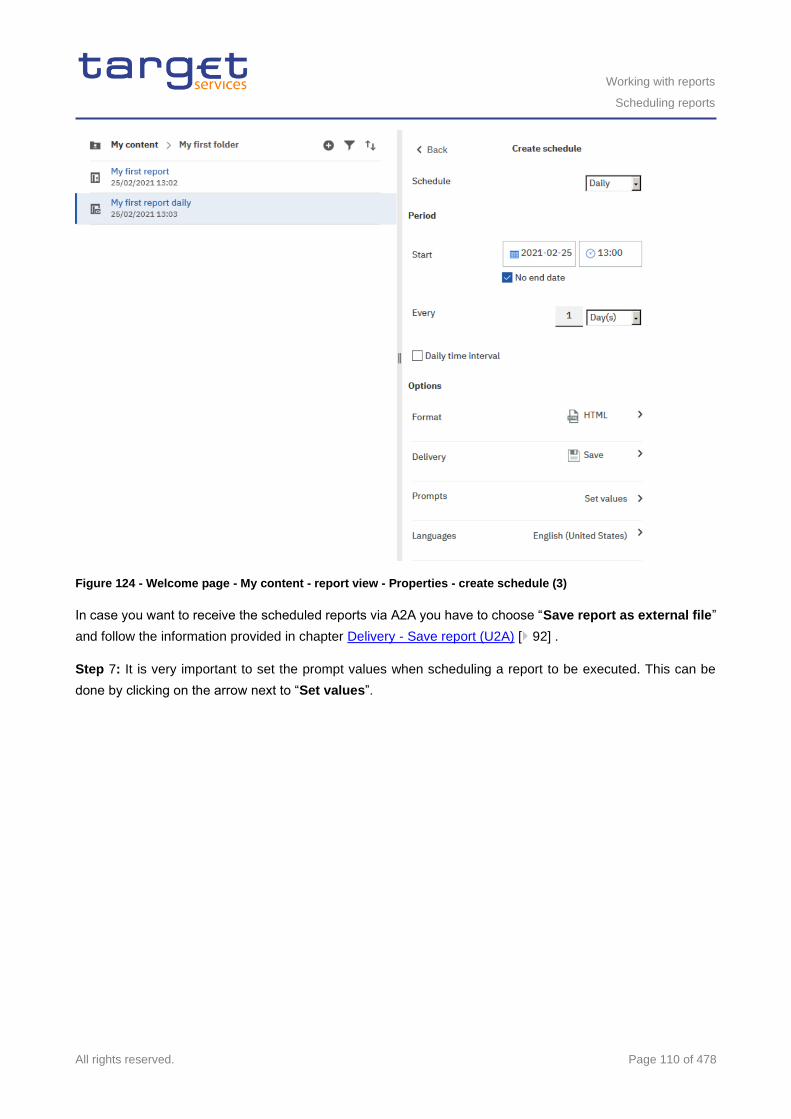
Working with reports
Scheduling reports
All rights reserved. Page 110 of 478
Figure 124 - Welcome page - My content - report view - Properties - create schedule (3)
In case you want to receive the scheduled reports via A2A you have to choose “Save report as external file”
and follow the information provided in chapter Delivery - Save report (U2A) [ 92] .
Step 7: It is very important to set the prompt values when scheduling a report to be executed. This can be
done by clicking on the arrow next to “Set values”.
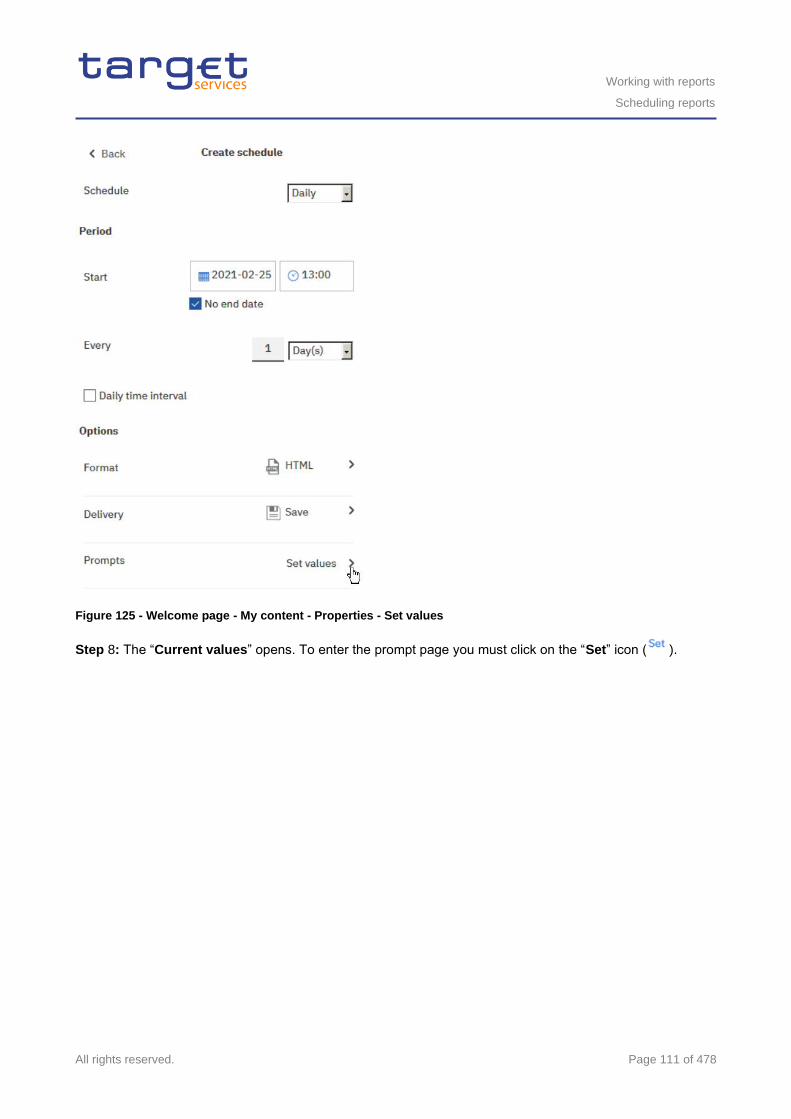
Working with reports
Scheduling reports
All rights reserved. Page 111 of 478
Figure 125 - Welcome page - My content - Properties - Set values
Step 8: The “Current values” opens. To enter the prompt page you must click on the “Set” icon ( ).
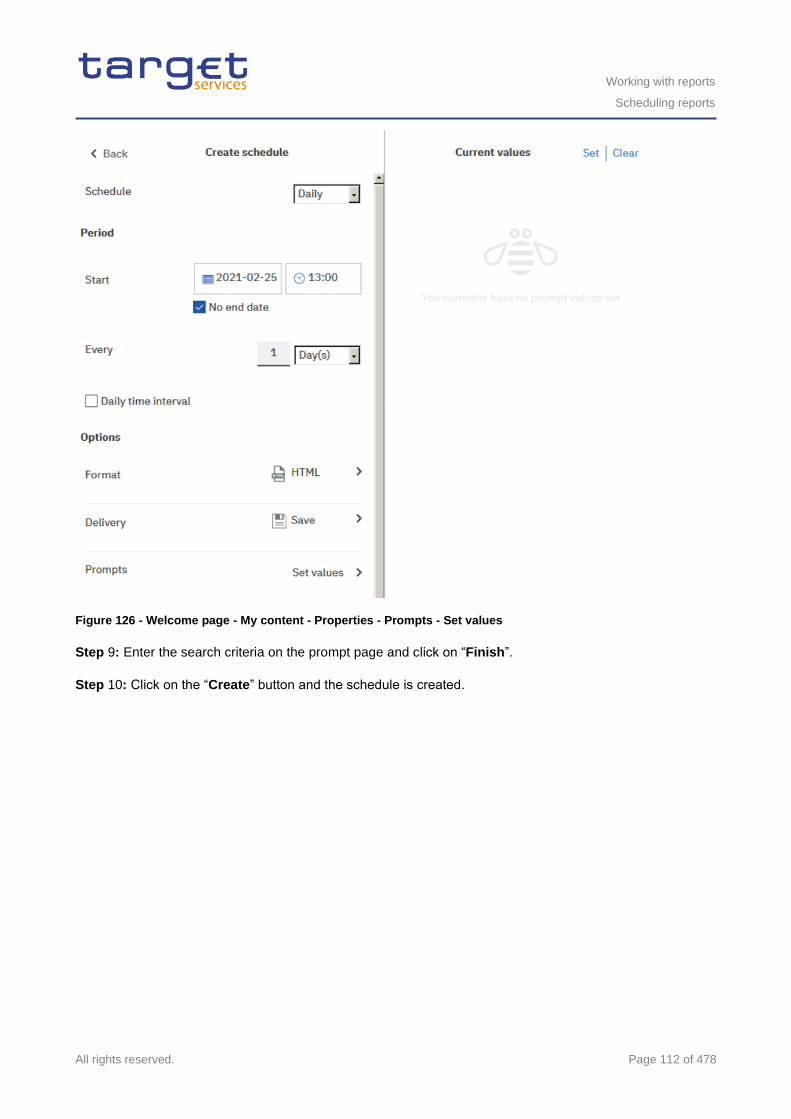
Working with reports
Scheduling reports
All rights reserved. Page 112 of 478
Figure 126 - Welcome page - My content - Properties - Prompts - Set values
Step 9: Enter the search criteria on the prompt page and click on “Finish”.
Step 10: Click on the “Create” button and the schedule is created.
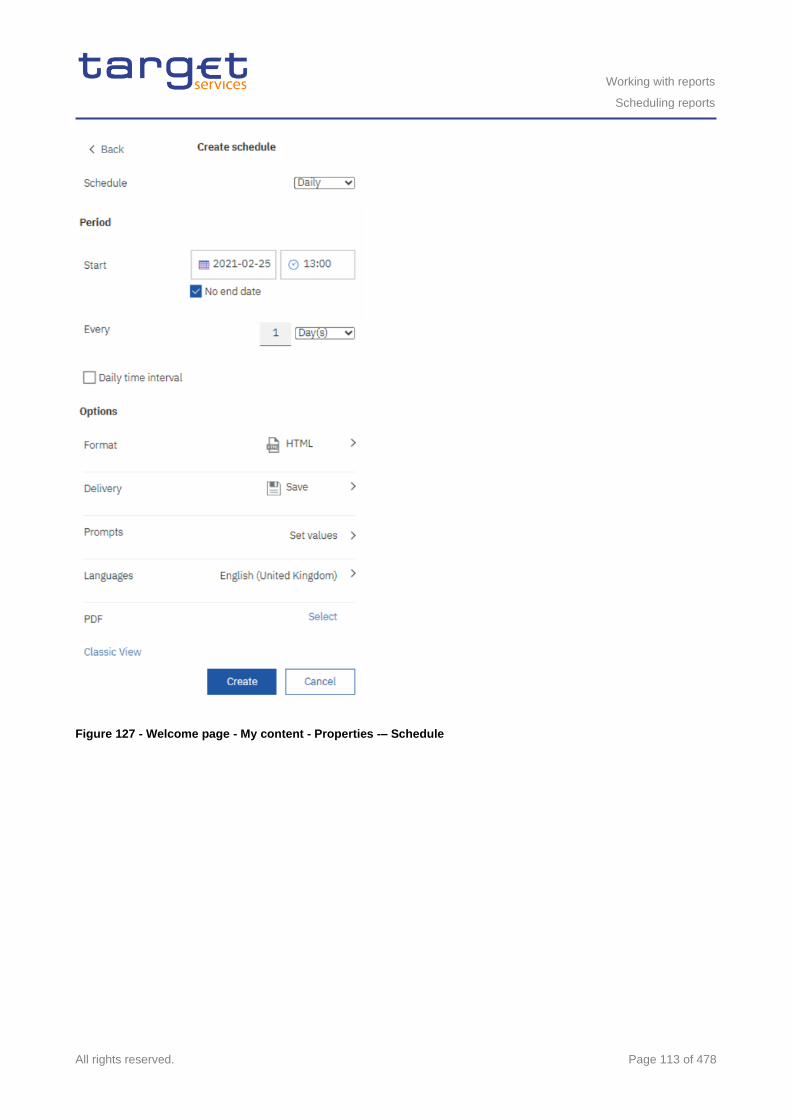
Working with reports
Scheduling reports
All rights reserved. Page 113 of 478
Figure 127 - Welcome page - My content - Properties -– Schedule
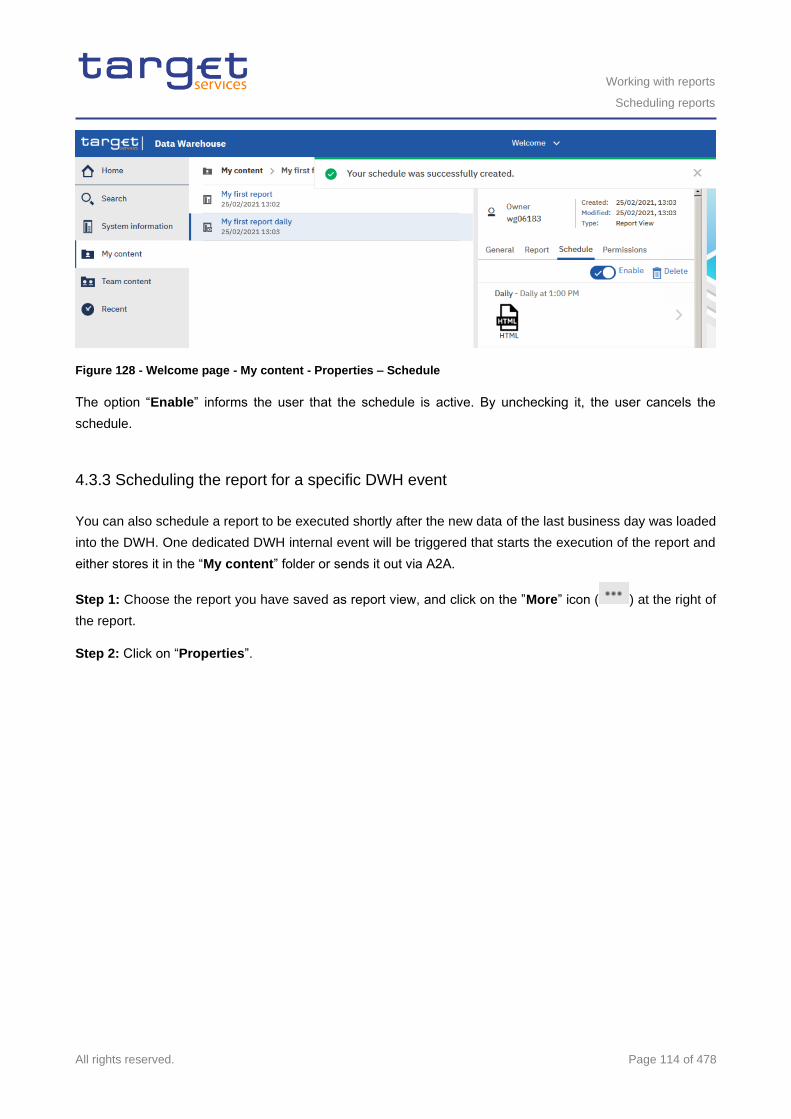
Working with reports
Scheduling reports
All rights reserved. Page 114 of 478
Figure 128 - Welcome page - My content - Properties – Schedule
The option “Enable” informs the user that the schedule is active. By unchecking it, the user cancels the
schedule.
4.3.3 Scheduling the report for a specific DWH event
You can also schedule a report to be executed shortly after the new data of the last business day was loaded
into the DWH. One dedicated DWH internal event will be triggered that starts the execution of the report and
either stores it in the “My content” folder or sends it out via A2A.
Step 1: Choose the report you have saved as report view, and click on the ”More” icon ( ) at the right of
the report.
Step 2: Click on “Properties”.
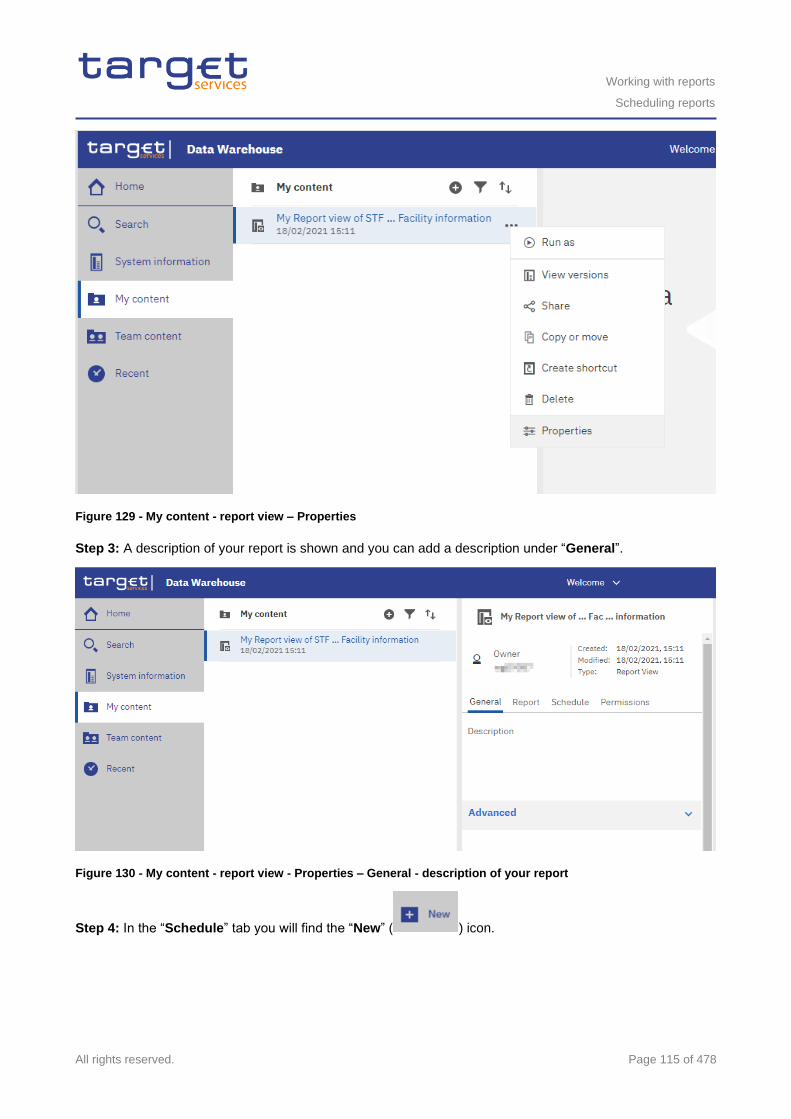
Working with reports
Scheduling reports
All rights reserved. Page 115 of 478
Figure 129 - My content - report view – Properties
Step 3: A description of your report is shown and you can add a description under “General”.
Figure 130 - My content - report view - Properties – General - description of your report
Step 4: In the “Schedule” tab you will find the “New” ( ) icon.
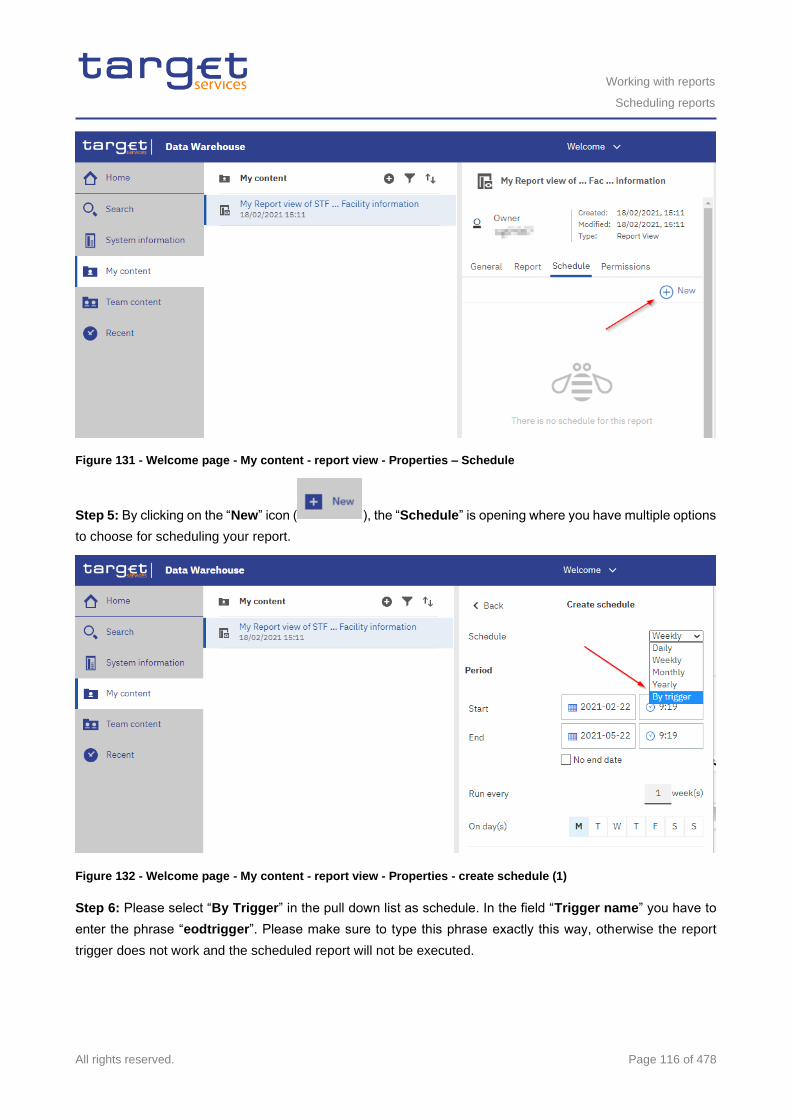
Working with reports
Scheduling reports
All rights reserved. Page 116 of 478
Figure 131 - Welcome page - My content - report view - Properties – Schedule
Step 5: By clicking on the “New” icon ( ), the “Schedule” is opening where you have multiple options
to choose for scheduling your report.
Figure 132 - Welcome page - My content - report view - Properties - create schedule (1)
Step 6: Please select “By Trigger” in the pull down list as schedule. In the field “Trigger name” you have to
enter the phrase “eodtrigger”. Please make sure to type this phrase exactly this way, otherwise the report
trigger does not work and the scheduled report will not be executed.
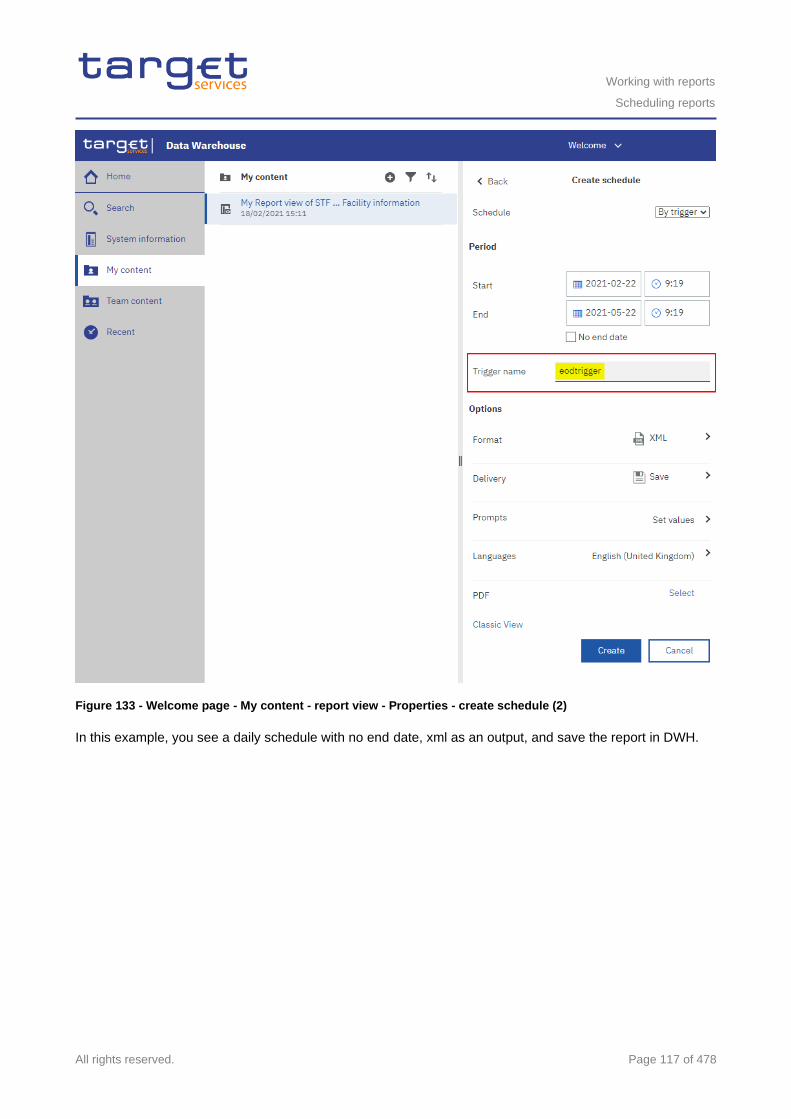
Working with reports
Scheduling reports
All rights reserved. Page 117 of 478
Figure 133 - Welcome page - My content - report view - Properties - create schedule (2)
In this example, you see a daily schedule with no end date, xml as an output, and save the report in DWH.
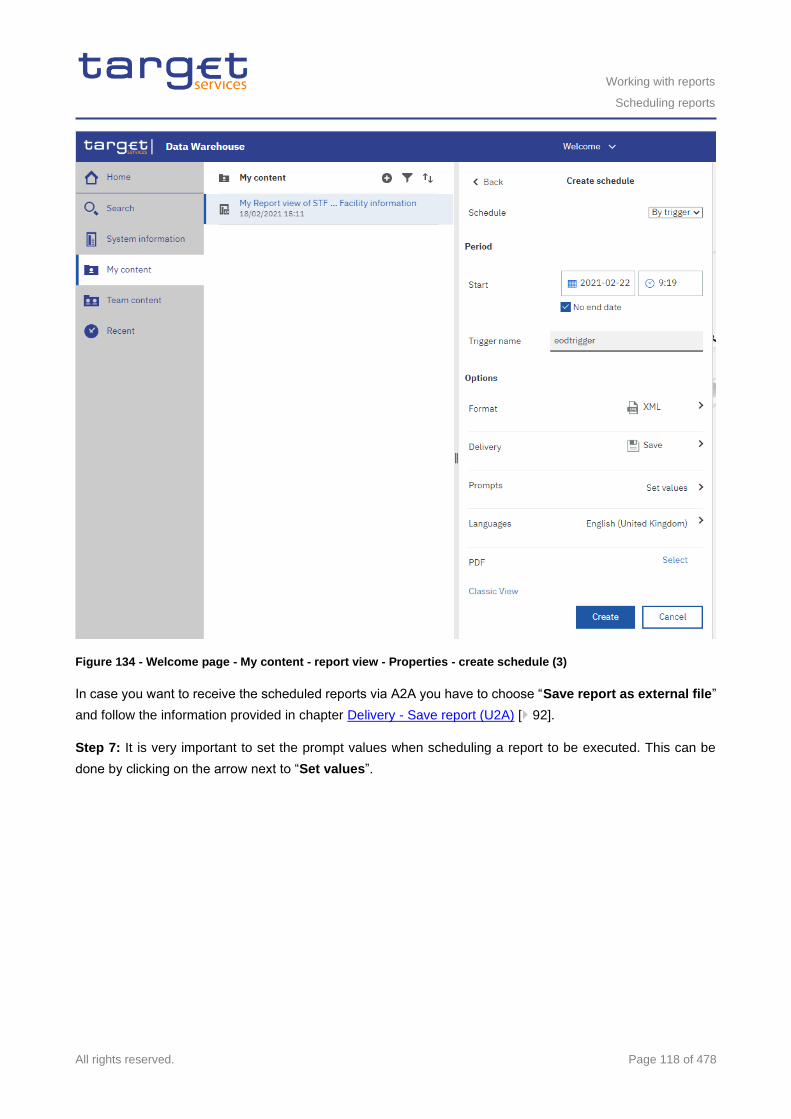
Working with reports
Scheduling reports
All rights reserved. Page 118 of 478
Figure 134 - Welcome page - My content - report view - Properties - create schedule (3)
In case you want to receive the scheduled reports via A2A you have to choose “Save report as external file”
and follow the information provided in chapter Delivery - Save report (U2A) [ 92].
Step 7: It is very important to set the prompt values when scheduling a report to be executed. This can be
done by clicking on the arrow next to “Set values”.
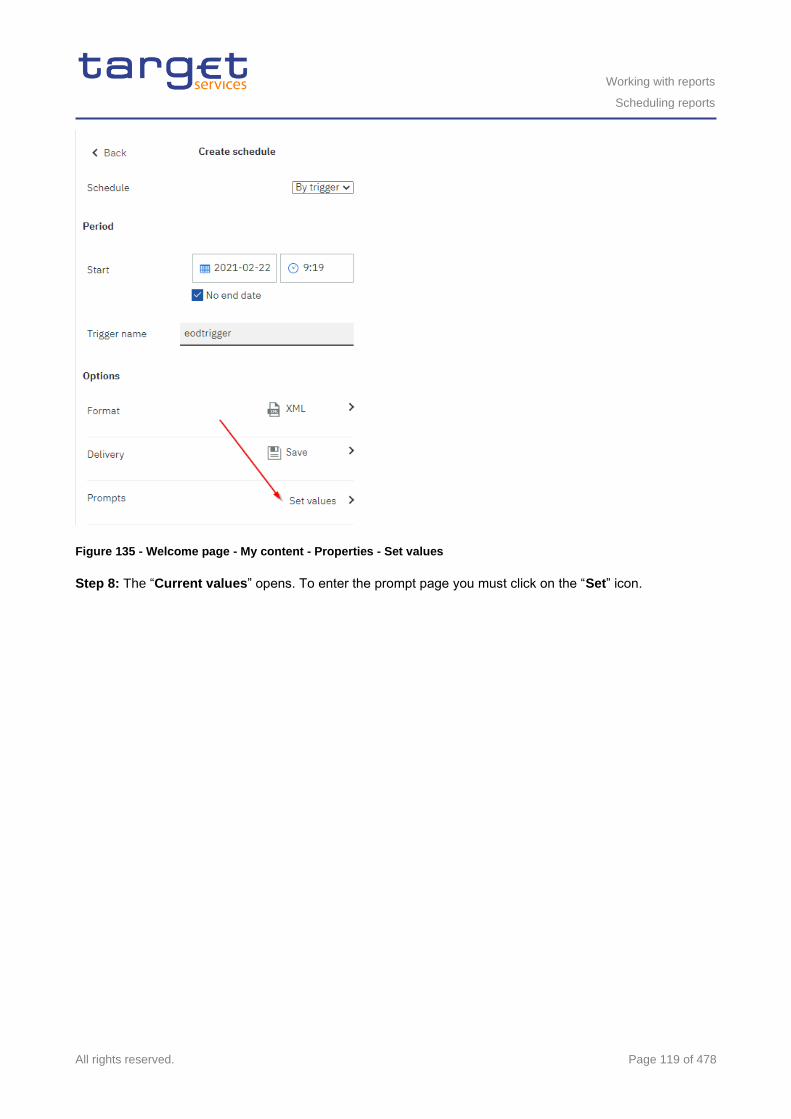
Working with reports
Scheduling reports
All rights reserved. Page 119 of 478
Figure 135 - Welcome page - My content - Properties - Set values
Step 8: The “Current values” opens. To enter the prompt page you must click on the “Set” icon.
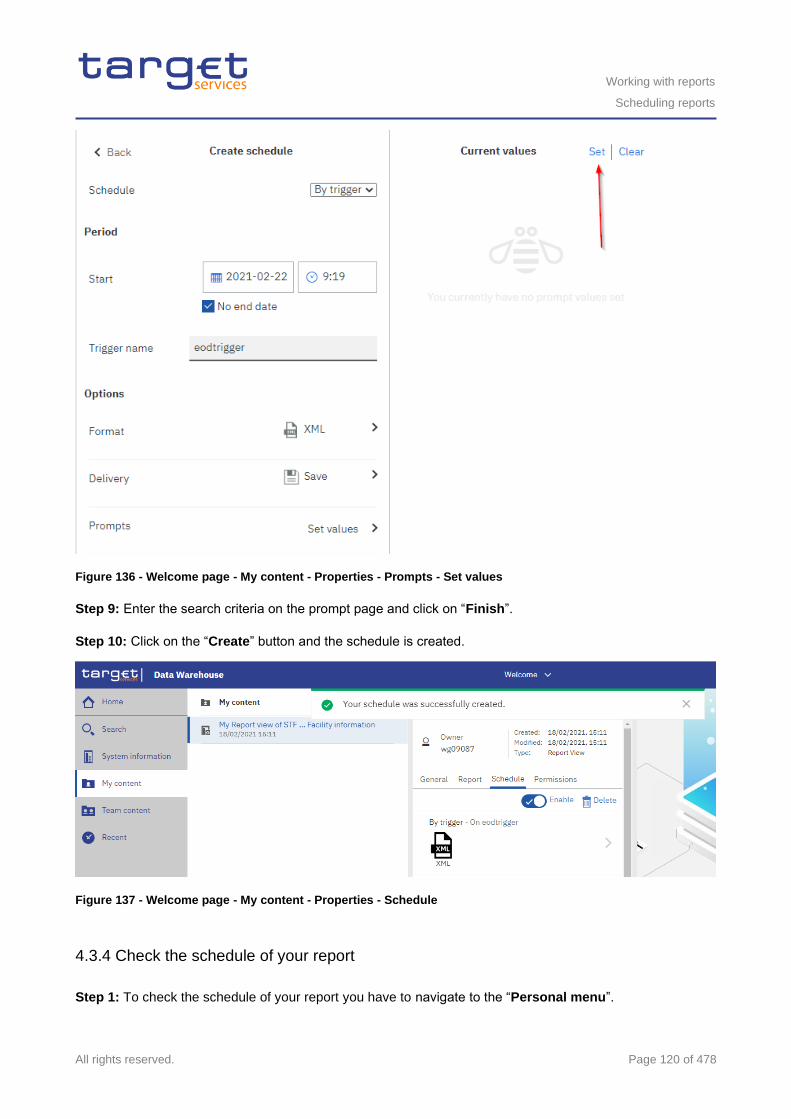
Working with reports
Scheduling reports
All rights reserved. Page 120 of 478
Figure 136 - Welcome page - My content - Properties - Prompts - Set values
Step 9: Enter the search criteria on the prompt page and click on “Finish”.
Step 10: Click on the “Create” button and the schedule is created.
Figure 137 - Welcome page - My content - Properties - Schedule
4.3.4 Check the schedule of your report
Step 1: To check the schedule of your report you have to navigate to the “Personal menu”.
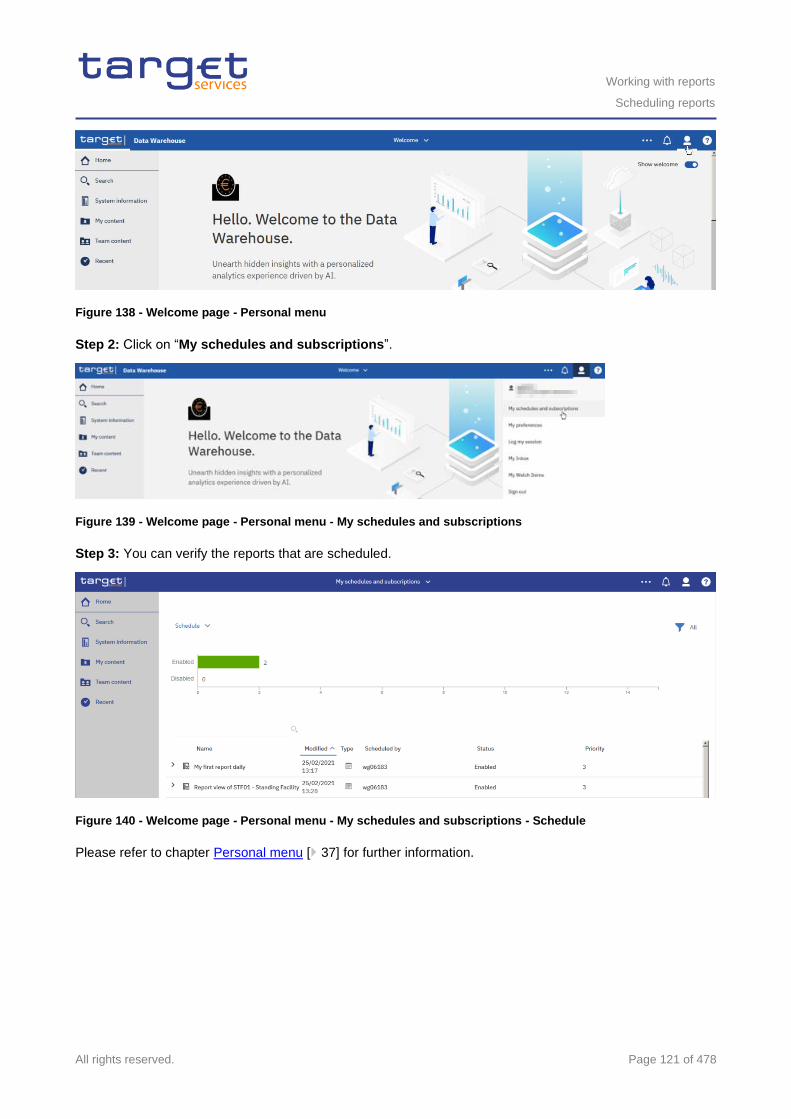
Working with reports
Scheduling reports
All rights reserved. Page 121 of 478
Figure 138 - Welcome page - Personal menu
Step 2: Click on “My schedules and subscriptions”.
Figure 139 - Welcome page - Personal menu - My schedules and subscriptions
Step 3: You can verify the reports that are scheduled.
Figure 140 - Welcome page - Personal menu - My schedules and subscriptions - Schedule
Please refer to chapter Personal menu [ 37] for further information.
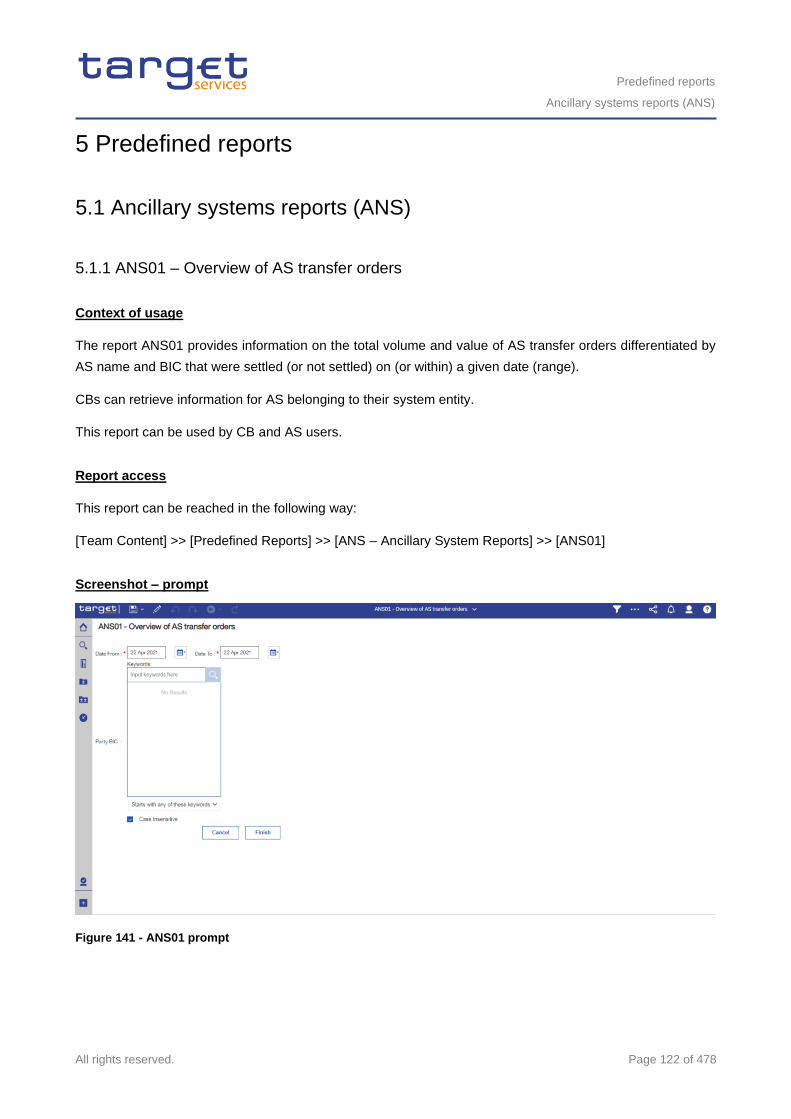
Predefined reports
Ancillary systems reports (ANS)
All rights reserved. Page 122 of 478
5 Predefined reports
5.1 Ancillary systems reports (ANS)
5.1.1 ANS01 – Overview of AS transfer orders
Context of usage
The report ANS01 provides information on the total volume and value of AS transfer orders differentiated by
AS name and BIC that were settled (or not settled) on (or within) a given date (range).
CBs can retrieve information for AS belonging to their system entity.
This report can be used by CB and AS users.
Report access
This report can be reached in the following way:
[Team Content] >> [Predefined Reports] >> [ANS – Ancillary System Reports] >> [ANS01]
Screenshot – prompt
Figure 141 - ANS01 prompt
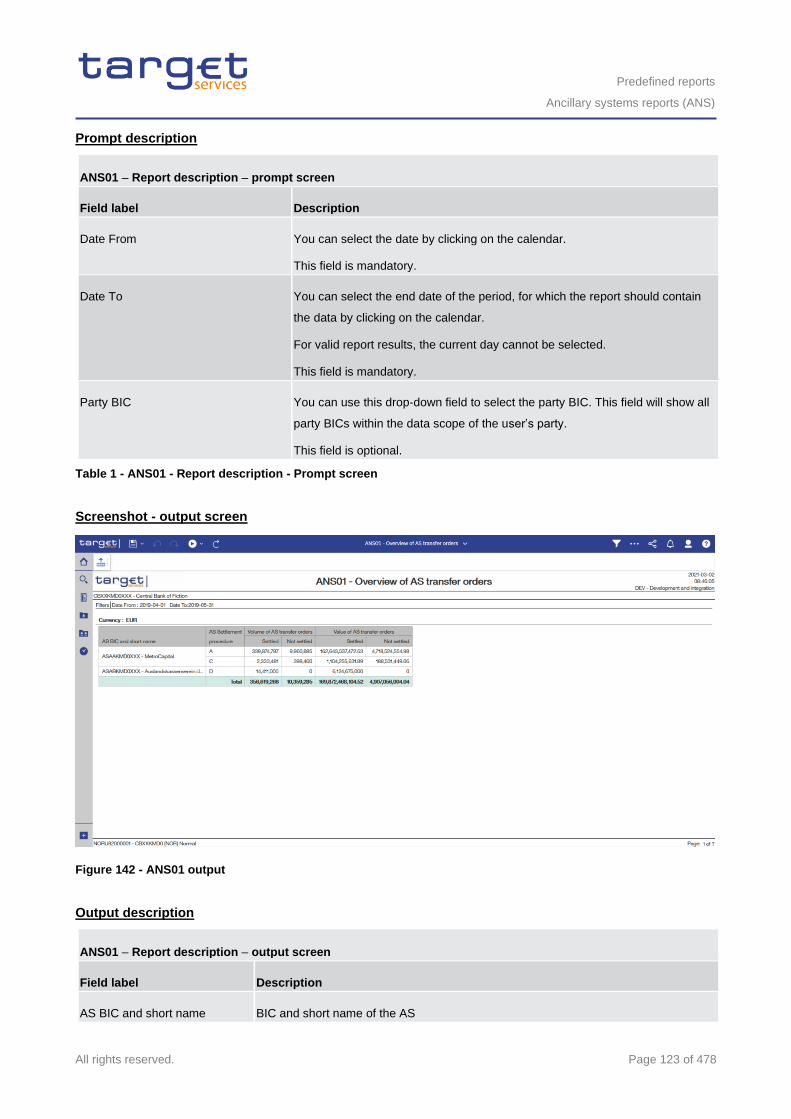
Predefined reports
Ancillary systems reports (ANS)
All rights reserved. Page 123 of 478
Prompt description
ANS01 – Report description – prompt screen
Field label Description
Date From You can select the date by clicking on the calendar.
This field is mandatory.
Date To You can select the end date of the period, for which the report should contain
the data by clicking on the calendar.
For valid report results, the current day cannot be selected.
This field is mandatory.
Party BIC You can use this drop-down field to select the party BIC. This field will show all
party BICs within the data scope of the user’s party.
This field is optional.
Table 1 - ANS01 - Report description - Prompt screen
Screenshot - output screen
Figure 142 - ANS01 output
Output description
ANS01 – Report description – output screen
Field label Description
AS BIC and short name BIC and short name of the AS
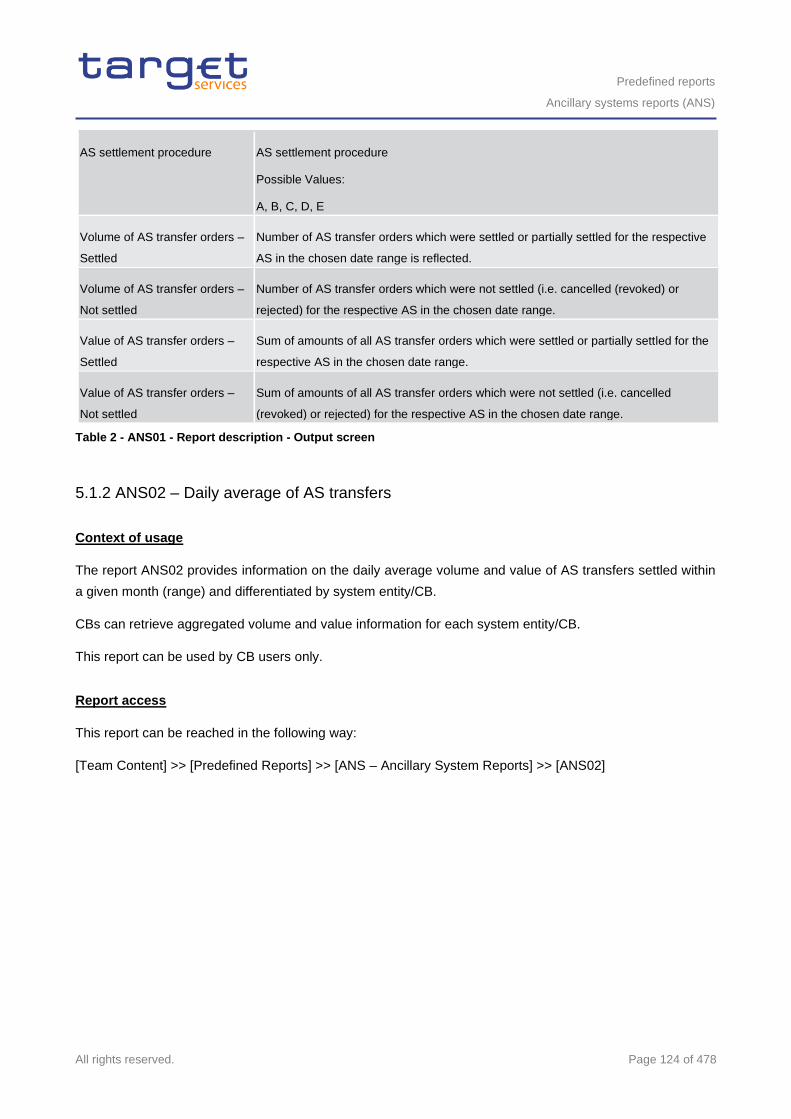
Predefined reports
Ancillary systems reports (ANS)
All rights reserved. Page 124 of 478
AS settlement procedure AS settlement procedure
Possible Values:
A, B, C, D, E
Volume of AS transfer orders –
Settled
Number of AS transfer orders which were settled or partially settled for the respective
AS in the chosen date range is reflected.
Volume of AS transfer orders –
Not settled
Number of AS transfer orders which were not settled (i.e. cancelled (revoked) or
rejected) for the respective AS in the chosen date range.
Value of AS transfer orders –
Settled
Sum of amounts of all AS transfer orders which were settled or partially settled for the
respective AS in the chosen date range.
Value of AS transfer orders –
Not settled
Sum of amounts of all AS transfer orders which were not settled (i.e. cancelled
(revoked) or rejected) for the respective AS in the chosen date range.
Table 2 - ANS01 - Report description - Output screen
5.1.2 ANS02 – Daily average of AS transfers
Context of usage
The report ANS02 provides information on the daily average volume and value of AS transfers settled within
a given month (range) and differentiated by system entity/CB.
CBs can retrieve aggregated volume and value information for each system entity/CB.
This report can be used by CB users only.
Report access
This report can be reached in the following way:
[Team Content] >> [Predefined Reports] >> [ANS – Ancillary System Reports] >> [ANS02]
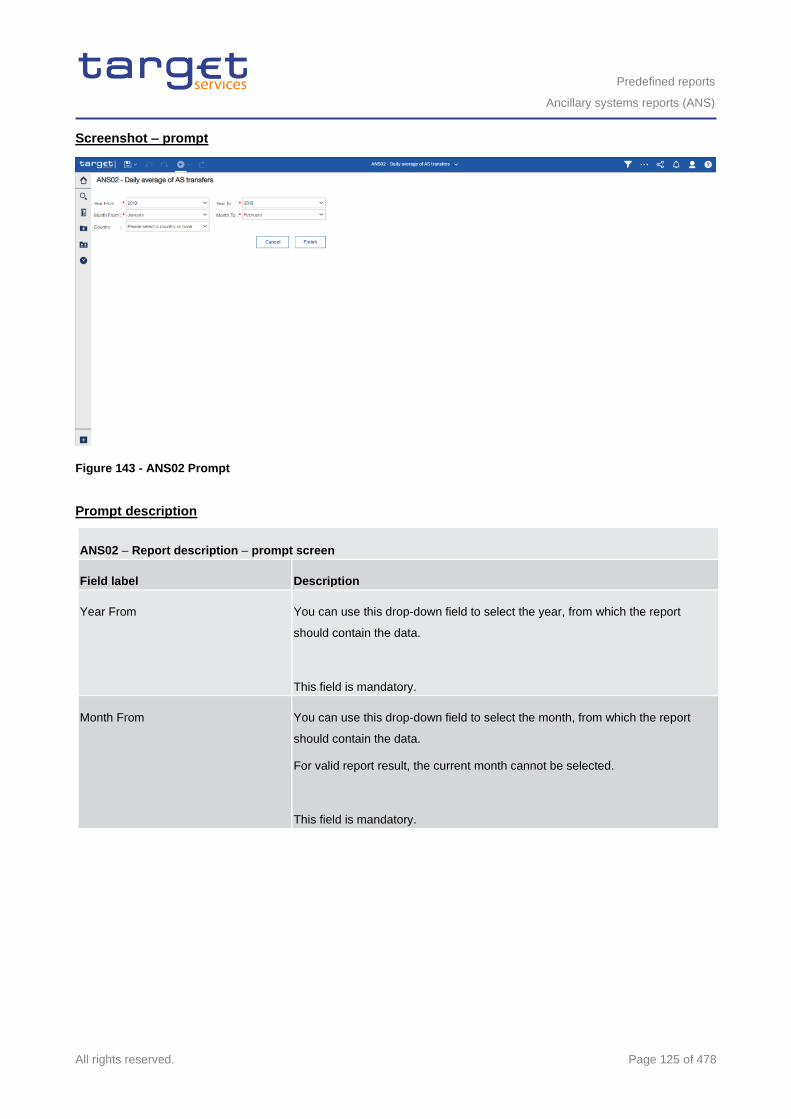
Predefined reports
Ancillary systems reports (ANS)
All rights reserved. Page 125 of 478
Screenshot – prompt
Figure 143 - ANS02 Prompt
Prompt description
ANS02 – Report description – prompt screen
Field label Description
Year From
You can use this drop-down field to select the year, from which the report
should contain the data.
This field is mandatory.
Month From You can use this drop-down field to select the month, from which the report
should contain the data.
For valid report result, the current month cannot be selected.
This field is mandatory.
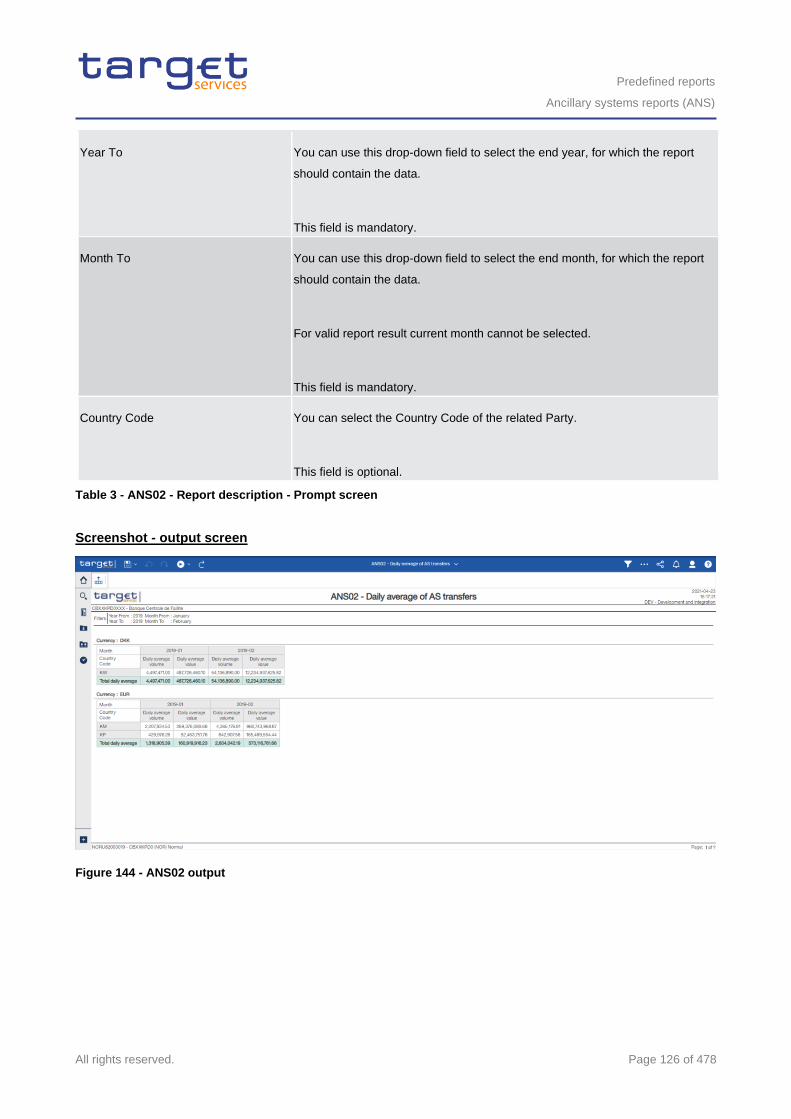
Predefined reports
Ancillary systems reports (ANS)
All rights reserved. Page 126 of 478
Year To You can use this drop-down field to select the end year, for which the report
should contain the data.
This field is mandatory.
Month To You can use this drop-down field to select the end month, for which the report
should contain the data.
For valid report result current month cannot be selected.
This field is mandatory.
Country Code You can select the Country Code of the related Party.
This field is optional.
Table 3 - ANS02 - Report description - Prompt screen
Screenshot - output screen
Figure 144 - ANS02 output
Predefined reports
Business day reports (BDY)
All rights reserved. Page 127 of 478
Output description
ANS02 – Report description – output screen
The output table will be repeated for each currency and for every selected month in the search prompt. It is sorted by
country code.
Field label Description
Month Month and Year
AS transfer orders which were settled or partially settled within the scope of the
respective CB during this month are reflected.
Country Code Country Code for all available CBs or for the one selected in the search prompt.
Daily average volume Daily average AS transfer volume for this CB in this month.
Daily average value Daily average AS transfer value for this CB in this month.
Total daily average volume The total daily average for a month as sum of daily averages for all CBs divided by the
number of CBs.
Total daily average value The total daily average for a month as sum of daily averages for all CBs divided by the
number of CBs.
Table 4 - ANS02 - Report description - Output screen
5.2 Business day reports (BDY)
5.2.1 BDY01 - Business Day event/delay information on settlement opening time
Context of usage
This report provides information on the daily timing of business day events and on delays in periods of the
business Day for CLM or RTGS.
For each time-based event of a respective business day the report provides information as regards the planned
time, the revised time and the effective time. For events that are not time-based the report will only provide an
effective time. In case of currency-specific events the event times are provided separate per currency.
Based on the timing of the business Day events, the report calculates the daily opening time for settlement as
well as the total number and the duration of delays in CLM or RTGS.
The report is available for a given date (range).
This report can be used by CB, PB and AS users.
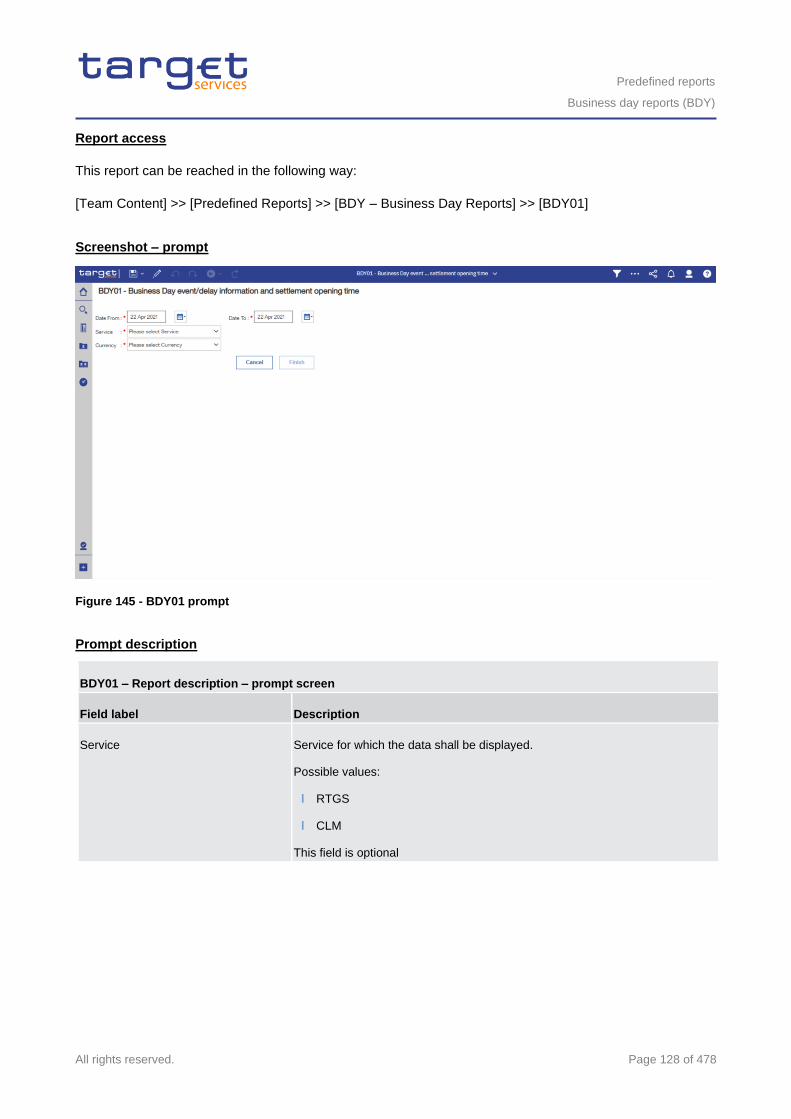
Predefined reports
Business day reports (BDY)
All rights reserved. Page 128 of 478
Report access
This report can be reached in the following way:
[Team Content] >> [Predefined Reports] >> [BDY – Business Day Reports] >> [BDY01]
Screenshot – prompt
Figure 145 - BDY01 prompt
Prompt description
BDY01 – Report description – prompt screen
Field label Description
Service Service for which the data shall be displayed.
Possible values:
l RTGS
l CLM
This field is optional
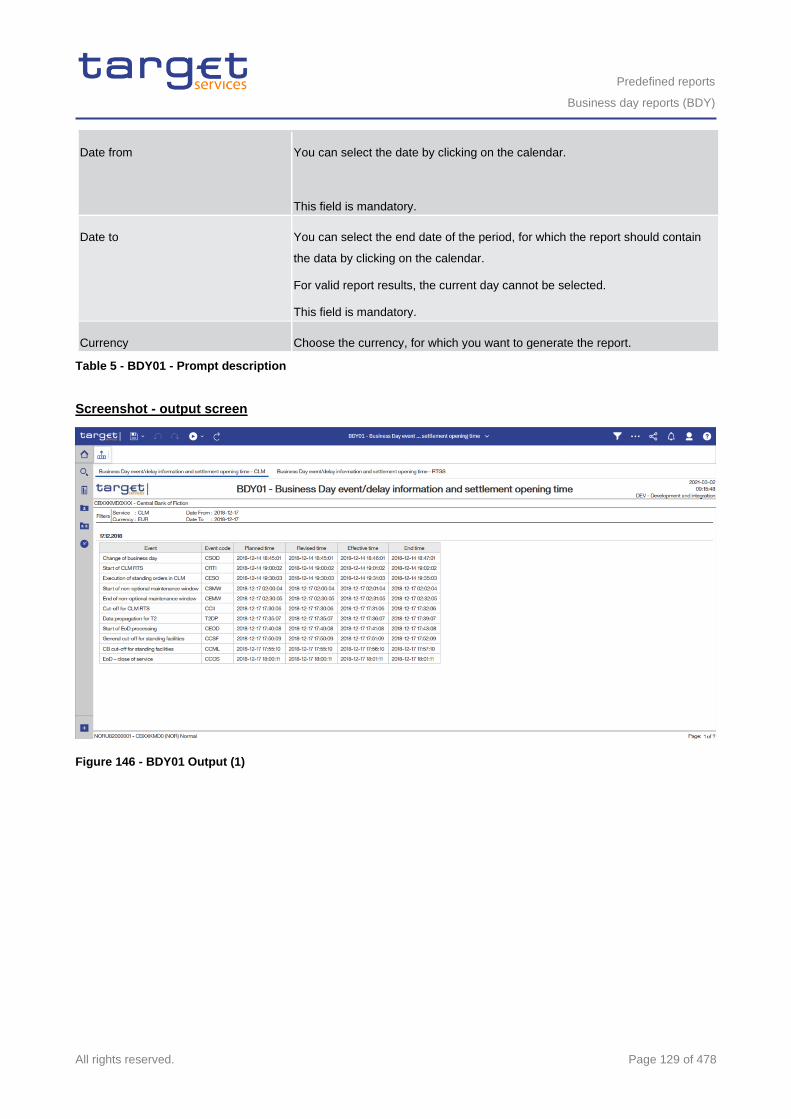
Predefined reports
Business day reports (BDY)
All rights reserved. Page 129 of 478
Date from You can select the date by clicking on the calendar.
This field is mandatory.
Date to You can select the end date of the period, for which the report should contain
the data by clicking on the calendar.
For valid report results, the current day cannot be selected.
This field is mandatory.
Currency Choose the currency, for which you want to generate the report.
Table 5 - BDY01 - Prompt description
Screenshot - output screen
Figure 146 - BDY01 Output (1)
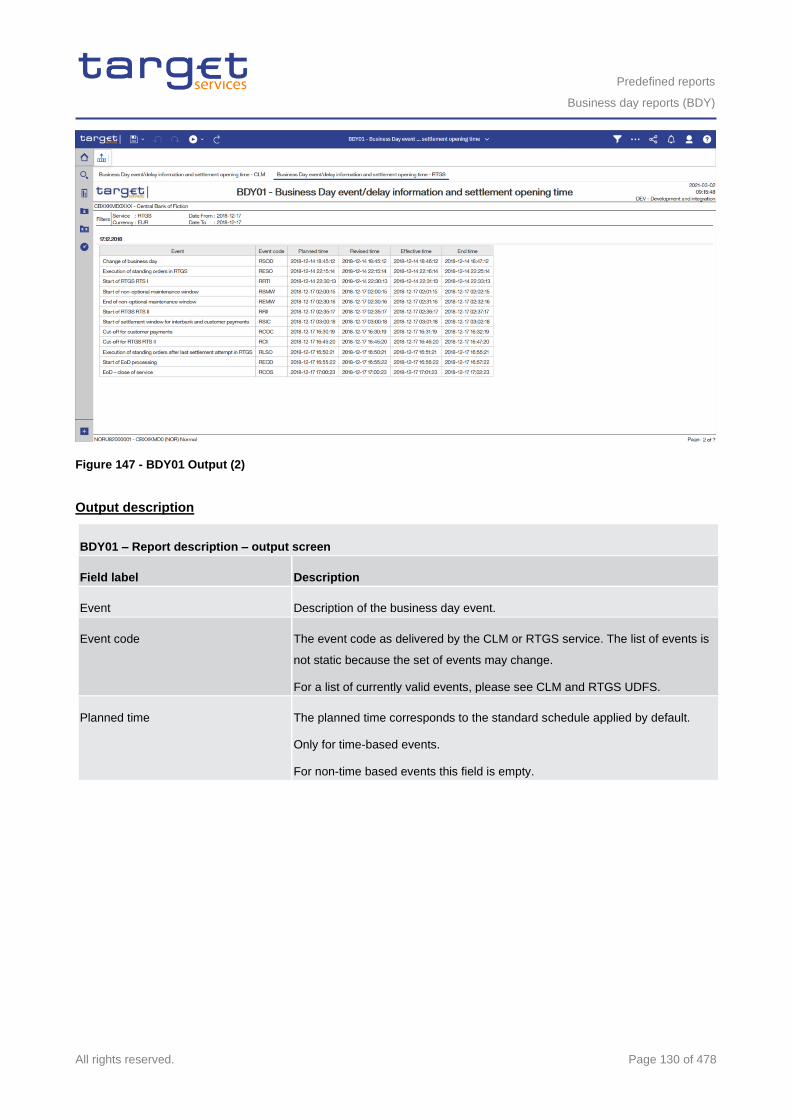
Predefined reports
Business day reports (BDY)
All rights reserved. Page 130 of 478
Figure 147 - BDY01 Output (2)
Output description
BDY01 – Report description – output screen
Field label Description
Event Description of the business day event.
Event code The event code as delivered by the CLM or RTGS service. The list of events is
not static because the set of events may change.
For a list of currently valid events, please see CLM and RTGS UDFS.
Planned time The planned time corresponds to the standard schedule applied by default.
Only for time-based events.
For non-time based events this field is empty.
Predefined reports
Billing reports (BIL)
All rights reserved. Page 131 of 478
Revised time The revised time is the foreseen time for the current business day, which
usually coincides with the planned time except when a delay has occurred.
Only for time-based events.
For non-time based events this field is empty.
Effective time The effective time is the time of the actual occurrence of the event during the
current business day. It is the time, when the BDM (Business Day
Management) sent the trigger to CLM or RTGS.
End time The end time is the time, when CLM or RTGS informed the BDM, that the
processes for this event have been finished.
Table 6 - BDY01 - Output description
5.3 Billing reports (BIL)
5.3.1 BIL01 - Consumption data
Context of usage
This report provides aggregated information on consumption data for a selected period per service and
charged party at the level of service item. It provides a monthly view on the quantity per service item and
the share (in %) compared to the whole system entity’s quantity. CBs can retrieve information on the
aggregated consumption data of those parties belonging to their system entity.
Additionally, the report provides the sums over all parties per service item and service for the system entity.
This report can be used by CB users only.
Report access
This report can be reached in the following way:
[Team Content] >> [Predefined Reports] >> [BIL – Billing Reports] >> [BIL01]
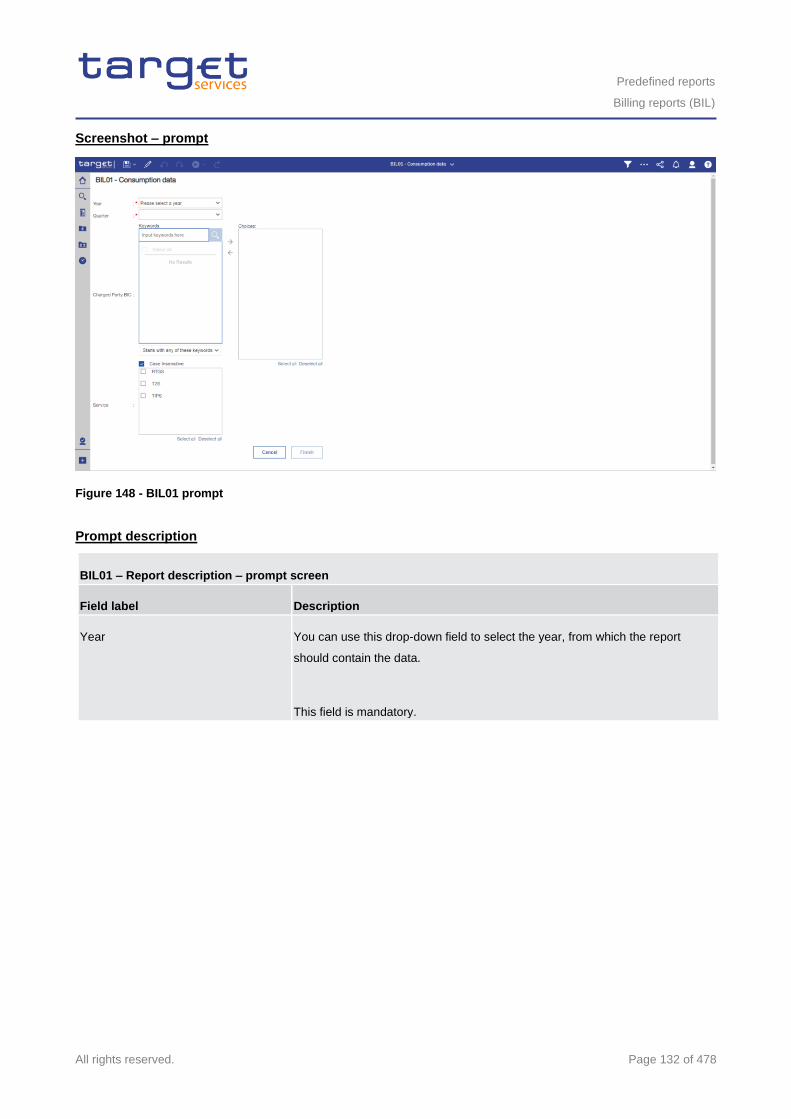
Predefined reports
Billing reports (BIL)
All rights reserved. Page 132 of 478
Screenshot – prompt
Figure 148 - BIL01 prompt
Prompt description
BIL01 – Report description – prompt screen
Field label Description
Year You can use this drop-down field to select the year, from which the report
should contain the data.
This field is mandatory.
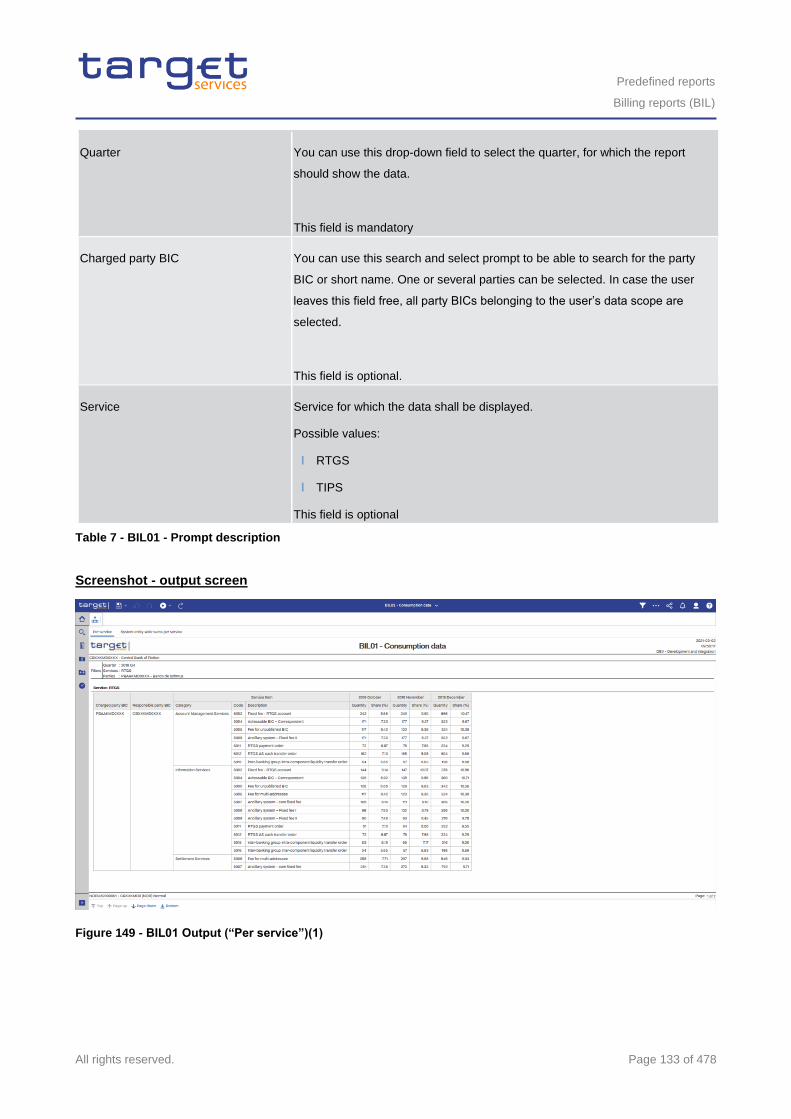
Predefined reports
Billing reports (BIL)
All rights reserved. Page 133 of 478
Quarter You can use this drop-down field to select the quarter, for which the report
should show the data.
This field is mandatory
Charged party BIC You can use this search and select prompt to be able to search for the party
BIC or short name. One or several parties can be selected. In case the user
leaves this field free, all party BICs belonging to the user’s data scope are
selected.
This field is optional.
Service Service for which the data shall be displayed.
Possible values:
l RTGS
l TIPS
This field is optional
Table 7 - BIL01 - Prompt description
Screenshot - output screen
Figure 149 - BIL01 Output (“Per service”)(1)
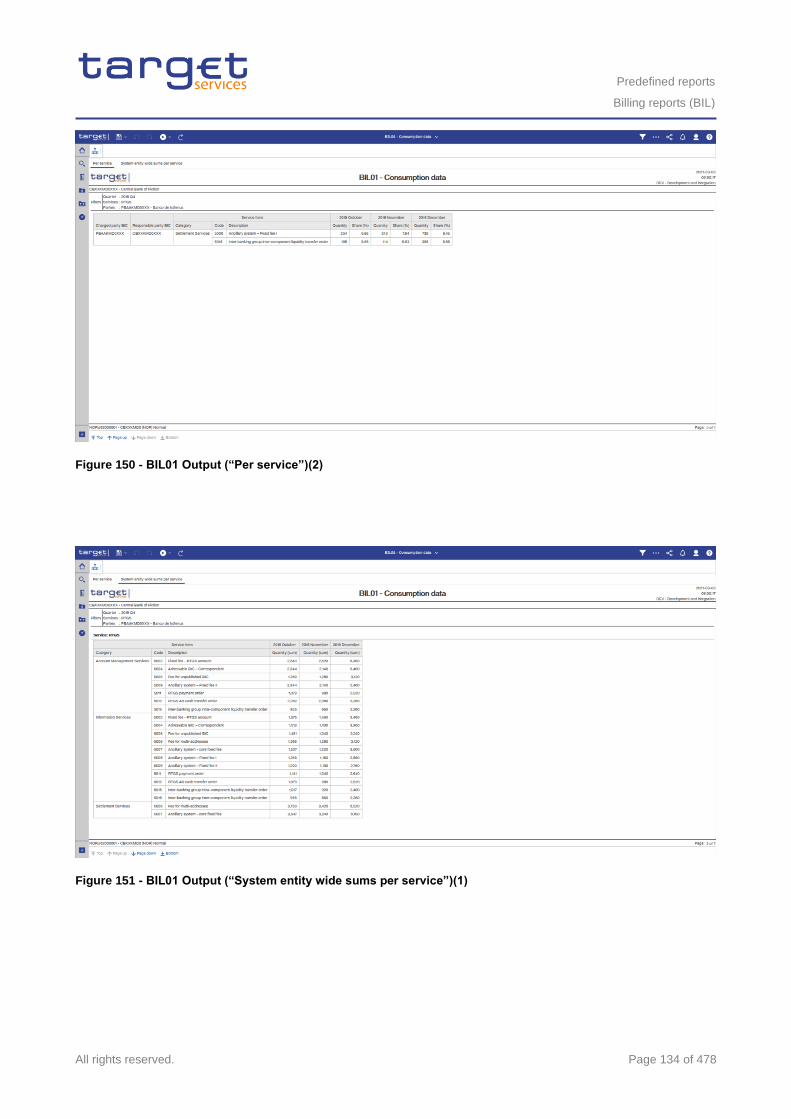
Predefined reports
Billing reports (BIL)
All rights reserved. Page 134 of 478
Figure 150 - BIL01 Output (“Per service”)(2)
Figure 151 - BIL01 Output (“System entity wide sums per service”)(1)
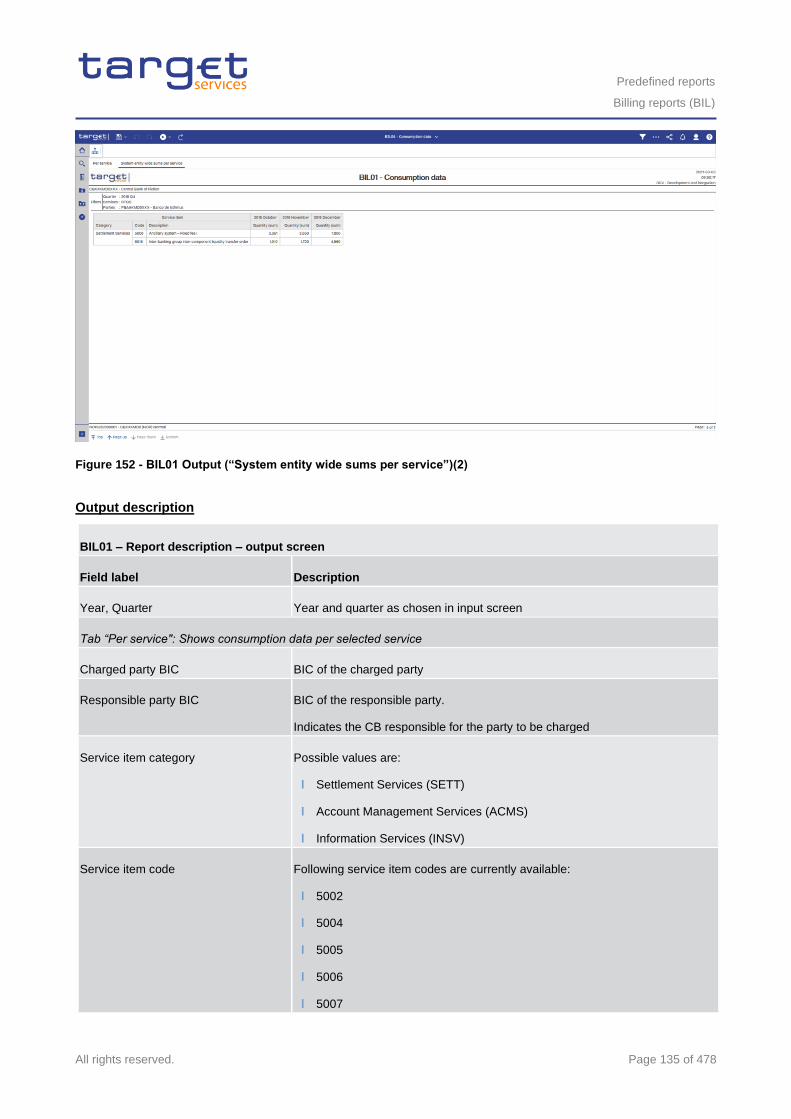
Predefined reports
Billing reports (BIL)
All rights reserved. Page 135 of 478
Figure 152 - BIL01 Output (“System entity wide sums per service”)(2)
Output description
BIL01 – Report description – output screen
Field label Description
Year, Quarter Year and quarter as chosen in input screen
Tab “Per service": Shows consumption data per selected service
Charged party BIC BIC of the charged party
Responsible party BIC BIC of the responsible party.
Indicates the CB responsible for the party to be charged
Service item category Possible values are:
l Settlement Services (SETT)
l Account Management Services (ACMS)
l Information Services (INSV)
Service item code Following service item codes are currently available:
l 5002
l 5004
l 5005
l 5006
l 5007
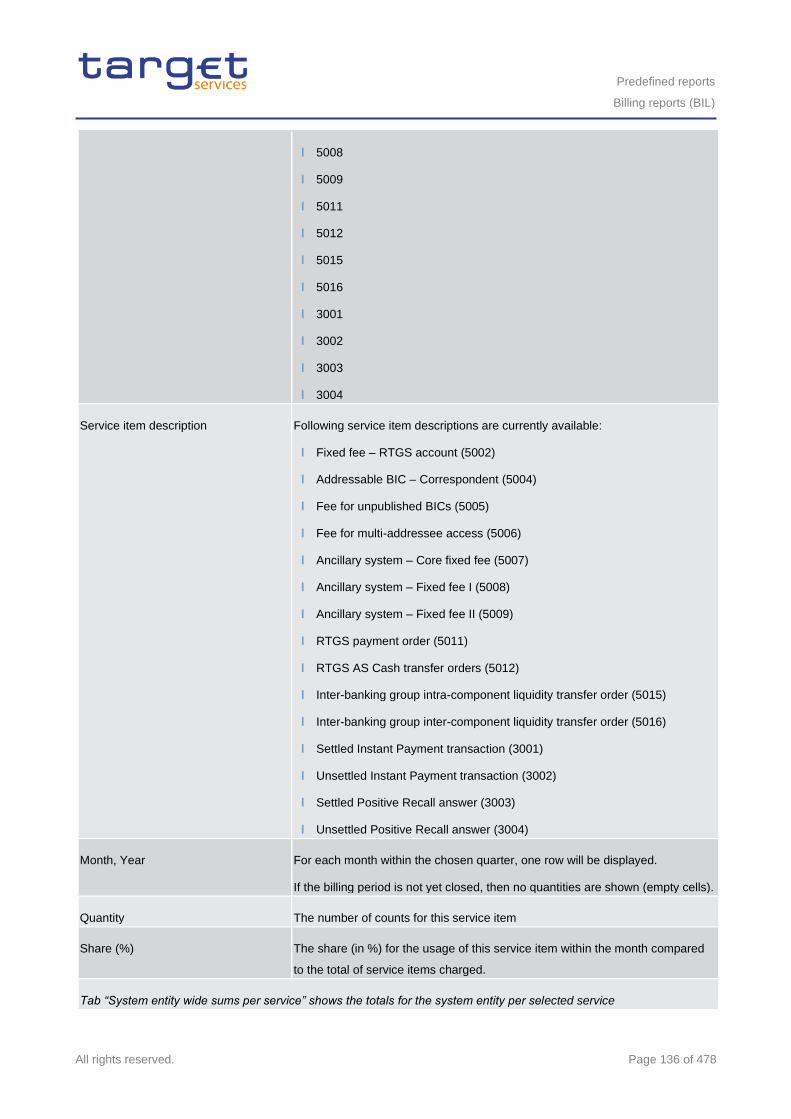
Predefined reports
Billing reports (BIL)
All rights reserved. Page 136 of 478
l 5008
l 5009
l 5011
l 5012
l 5015
l 5016
l 3001
l 3002
l 3003
l 3004
Service item description Following service item descriptions are currently available:
l Fixed fee – RTGS account (5002)
l Addressable BIC – Correspondent (5004)
l Fee for unpublished BICs (5005)
l Fee for multi-addressee access (5006)
l Ancillary system – Core fixed fee (5007)
l Ancillary system – Fixed fee I (5008)
l Ancillary system – Fixed fee II (5009)
l RTGS payment order (5011)
l RTGS AS Cash transfer orders (5012)
l Inter-banking group intra-component liquidity transfer order (5015)
l Inter-banking group inter-component liquidity transfer order (5016)
l Settled Instant Payment transaction (3001)
l Unsettled Instant Payment transaction (3002)
l Settled Positive Recall answer (3003)
l Unsettled Positive Recall answer (3004)
Month, Year For each month within the chosen quarter, one row will be displayed.
If the billing period is not yet closed, then no quantities are shown (empty cells).
Quantity The number of counts for this service item
Share (%) The share (in %) for the usage of this service item within the month compared
to the total of service items charged.
Tab “System entity wide sums per service” shows the totals for the system entity per selected service
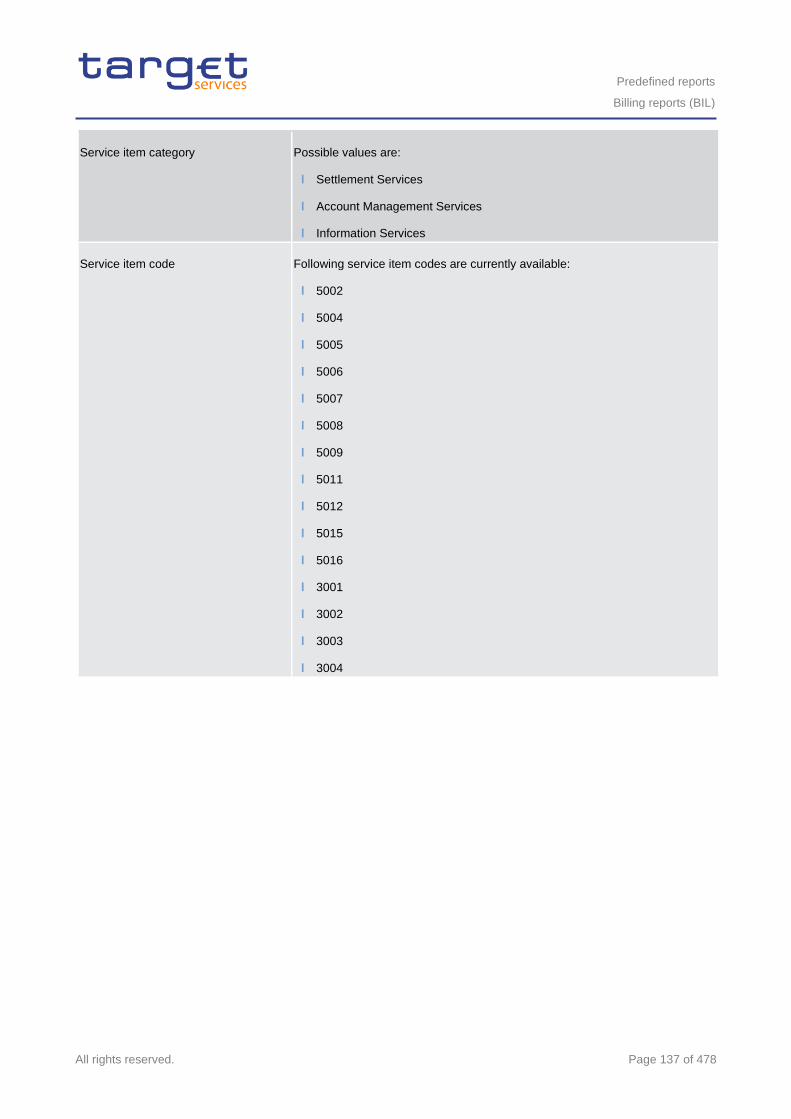
Predefined reports
Billing reports (BIL)
All rights reserved. Page 137 of 478
Service item category Possible values are:
l Settlement Services
l Account Management Services
l Information Services
Service item code Following service item codes are currently available:
l 5002
l 5004
l 5005
l 5006
l 5007
l 5008
l 5009
l 5011
l 5012
l 5015
l 5016
l 3001
l 3002
l 3003
l 3004
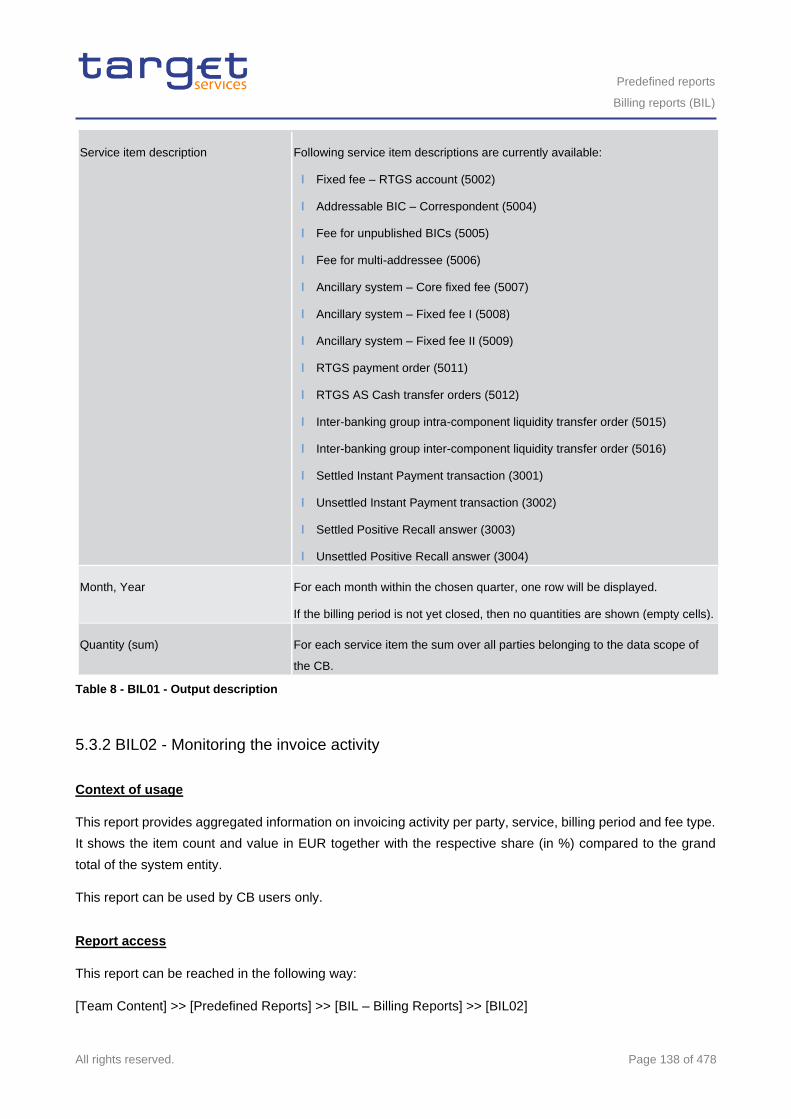
Predefined reports
Billing reports (BIL)
All rights reserved. Page 138 of 478
Service item description Following service item descriptions are currently available:
l Fixed fee – RTGS account (5002)
l Addressable BIC – Correspondent (5004)
l Fee for unpublished BICs (5005)
l Fee for multi-addressee (5006)
l Ancillary system – Core fixed fee (5007)
l Ancillary system – Fixed fee I (5008)
l Ancillary system – Fixed fee II (5009)
l RTGS payment order (5011)
l RTGS AS Cash transfer orders (5012)
l Inter-banking group intra-component liquidity transfer order (5015)
l Inter-banking group inter-component liquidity transfer order (5016)
l Settled Instant Payment transaction (3001)
l Unsettled Instant Payment transaction (3002)
l Settled Positive Recall answer (3003)
l Unsettled Positive Recall answer (3004)
Month, Year For each month within the chosen quarter, one row will be displayed.
If the billing period is not yet closed, then no quantities are shown (empty cells).
Quantity (sum) For each service item the sum over all parties belonging to the data scope of
the CB.
Table 8 - BIL01 - Output description
5.3.2 BIL02 - Monitoring the invoice activity
Context of usage
This report provides aggregated information on invoicing activity per party, service, billing period and fee type.
It shows the item count and value in EUR together with the respective share (in %) compared to the grand
total of the system entity.
This report can be used by CB users only.
Report access
This report can be reached in the following way:
[Team Content] >> [Predefined Reports] >> [BIL – Billing Reports] >> [BIL02]
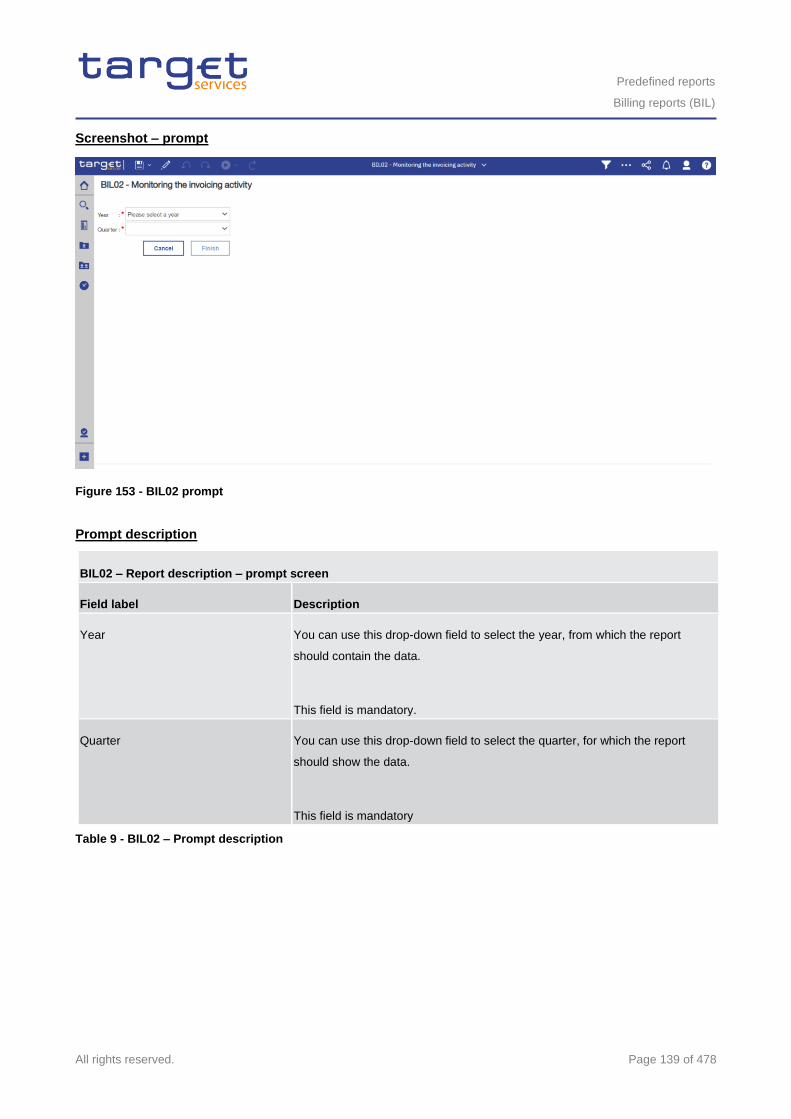
Predefined reports
Billing reports (BIL)
All rights reserved. Page 139 of 478
Screenshot – prompt
Figure 153 - BIL02 prompt
Prompt description
BIL02 – Report description – prompt screen
Field label Description
Year You can use this drop-down field to select the year, from which the report
should contain the data.
This field is mandatory.
Quarter You can use this drop-down field to select the quarter, for which the report
should show the data.
This field is mandatory
Table 9 - BIL02 – Prompt description
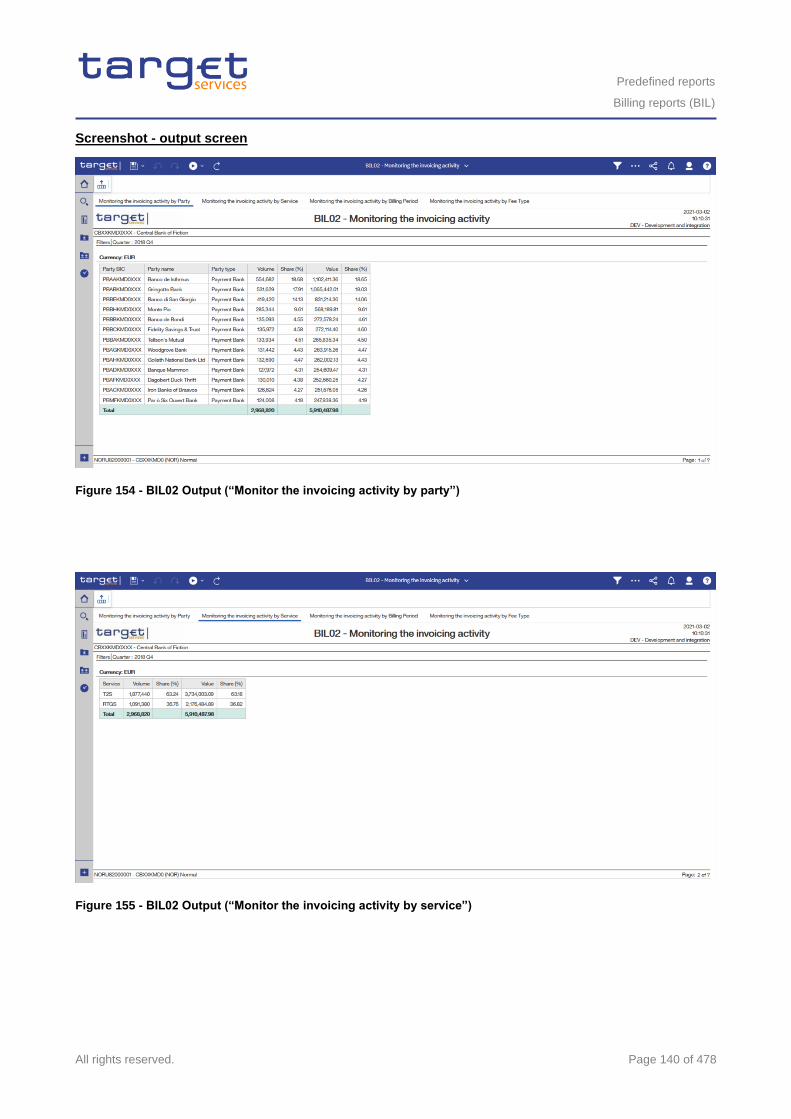
Predefined reports
Billing reports (BIL)
All rights reserved. Page 140 of 478
Screenshot - output screen
Figure 154 - BIL02 Output (“Monitor the invoicing activity by party”)
Figure 155 - BIL02 Output (“Monitor the invoicing activity by service”)
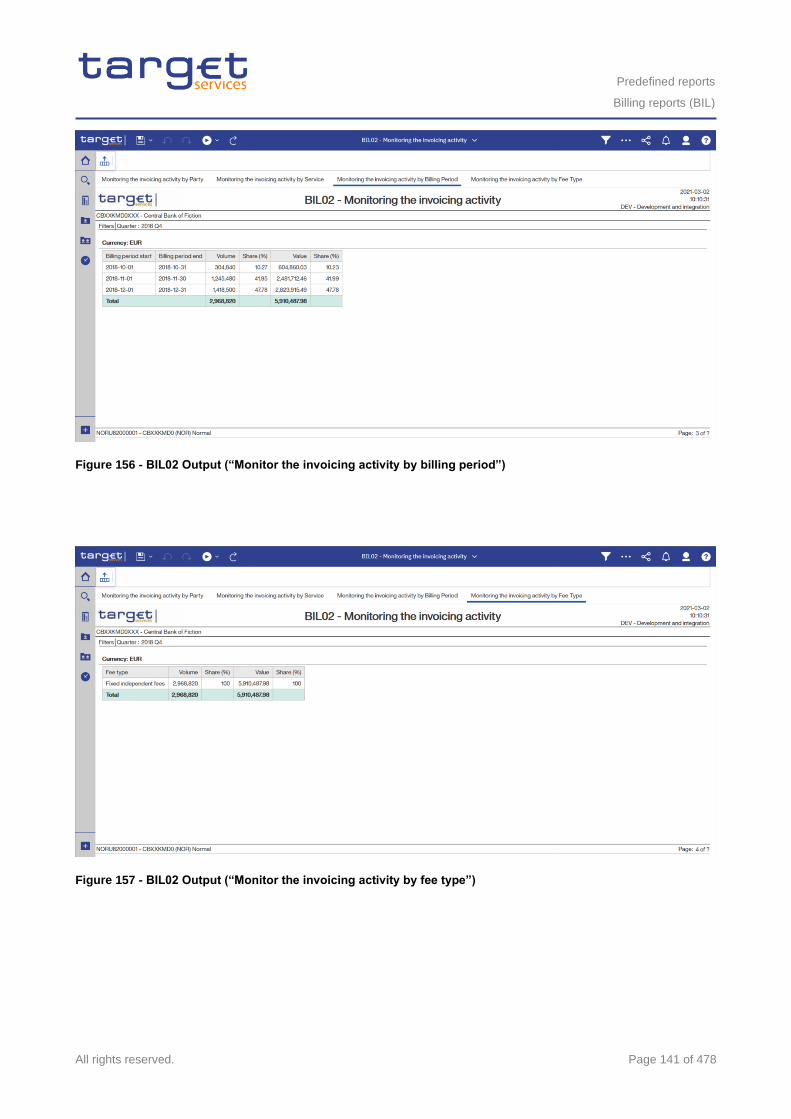
Predefined reports
Billing reports (BIL)
All rights reserved. Page 141 of 478
Figure 156 - BIL02 Output (“Monitor the invoicing activity by billing period”)
Figure 157 - BIL02 Output (“Monitor the invoicing activity by fee type”)
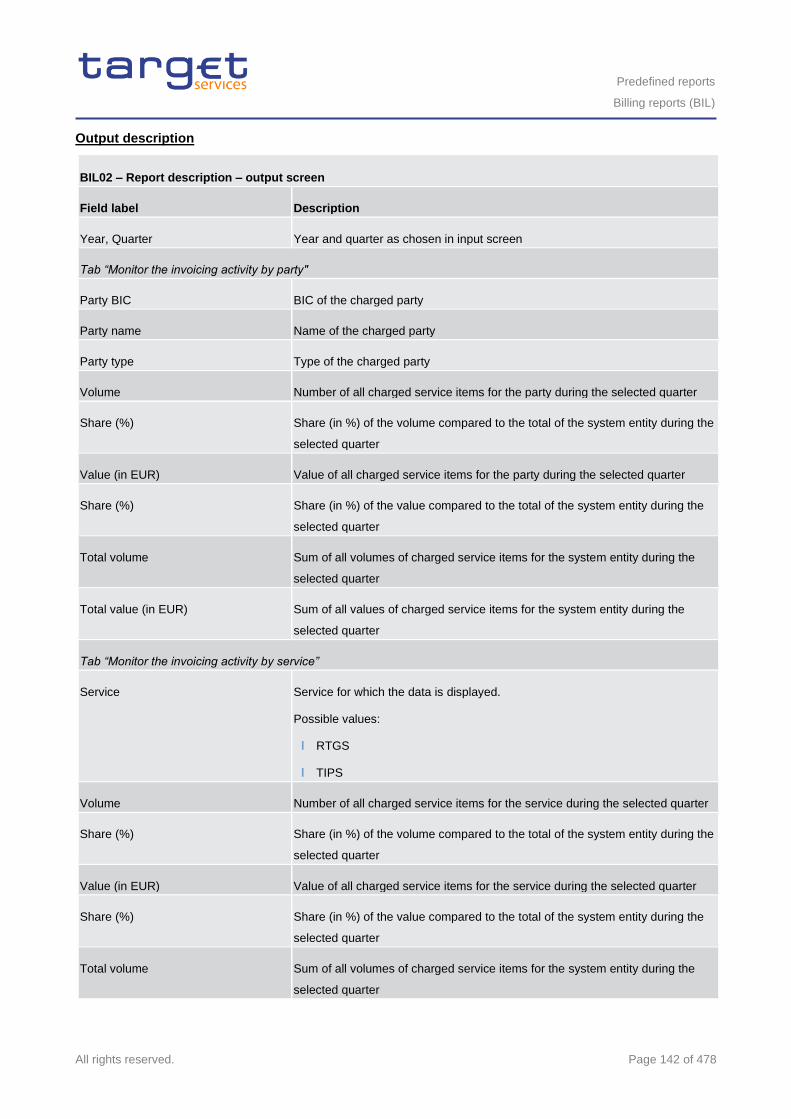
Predefined reports
Billing reports (BIL)
All rights reserved. Page 142 of 478
Output description
BIL02 – Report description – output screen
Field label Description
Year, Quarter Year and quarter as chosen in input screen
Tab “Monitor the invoicing activity by party"
Party BIC BIC of the charged party
Party name Name of the charged party
Party type Type of the charged party
Volume Number of all charged service items for the party during the selected quarter
Share (%) Share (in %) of the volume compared to the total of the system entity during the
selected quarter
Value (in EUR) Value of all charged service items for the party during the selected quarter
Share (%) Share (in %) of the value compared to the total of the system entity during the
selected quarter
Total volume Sum of all volumes of charged service items for the system entity during the
selected quarter
Total value (in EUR) Sum of all values of charged service items for the system entity during the
selected quarter
Tab “Monitor the invoicing activity by service”
Service Service for which the data is displayed.
Possible values:
l RTGS
l TIPS
Volume Number of all charged service items for the service during the selected quarter
Share (%) Share (in %) of the volume compared to the total of the system entity during the
selected quarter
Value (in EUR) Value of all charged service items for the service during the selected quarter
Share (%) Share (in %) of the value compared to the total of the system entity during the
selected quarter
Total volume Sum of all volumes of charged service items for the system entity during the
selected quarter
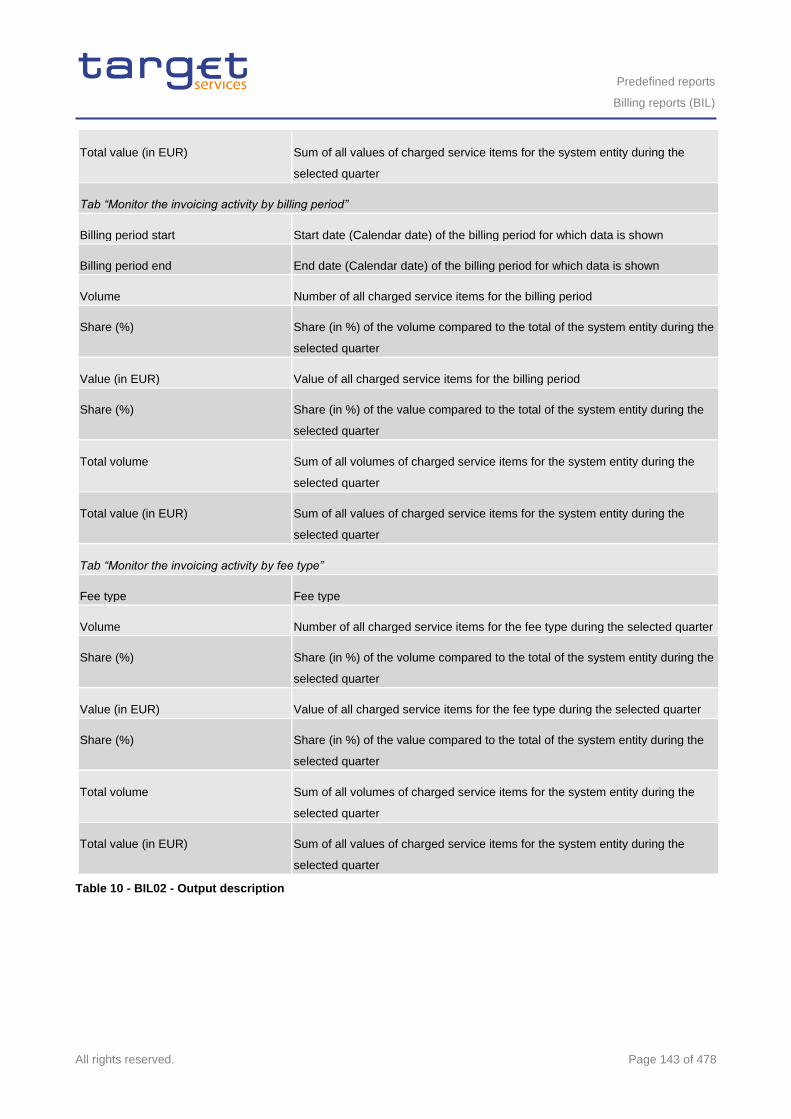
Predefined reports
Billing reports (BIL)
All rights reserved. Page 143 of 478
Total value (in EUR) Sum of all values of charged service items for the system entity during the
selected quarter
Tab “Monitor the invoicing activity by billing period”
Billing period start Start date (Calendar date) of the billing period for which data is shown
Billing period end End date (Calendar date) of the billing period for which data is shown
Volume Number of all charged service items for the billing period
Share (%) Share (in %) of the volume compared to the total of the system entity during the
selected quarter
Value (in EUR) Value of all charged service items for the billing period
Share (%) Share (in %) of the value compared to the total of the system entity during the
selected quarter
Total volume Sum of all volumes of charged service items for the system entity during the
selected quarter
Total value (in EUR) Sum of all values of charged service items for the system entity during the
selected quarter
Tab “Monitor the invoicing activity by fee type”
Fee type Fee type
Volume Number of all charged service items for the fee type during the selected quarter
Share (%) Share (in %) of the volume compared to the total of the system entity during the
selected quarter
Value (in EUR) Value of all charged service items for the fee type during the selected quarter
Share (%) Share (in %) of the value compared to the total of the system entity during the
selected quarter
Total volume Sum of all volumes of charged service items for the system entity during the
selected quarter
Total value (in EUR) Sum of all values of charged service items for the system entity during the
selected quarter
Table 10 - BIL02 - Output description
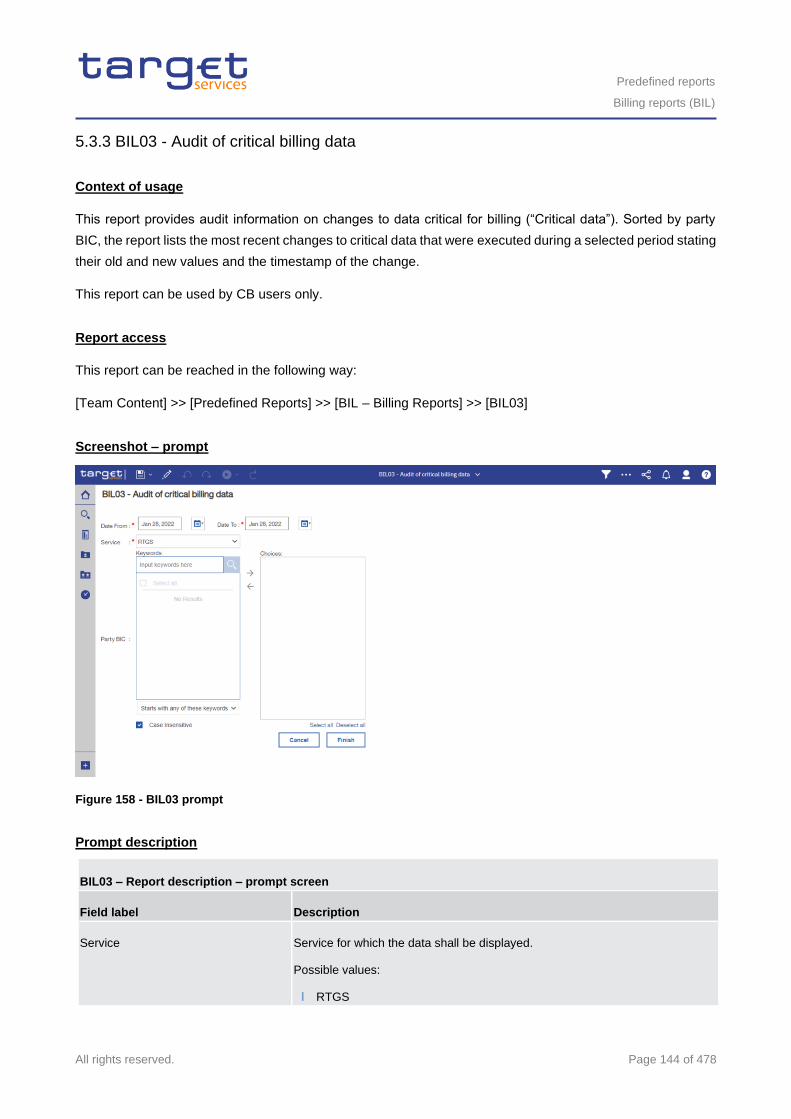
Predefined reports
Billing reports (BIL)
All rights reserved. Page 144 of 478
5.3.3 BIL03 - Audit of critical billing data
Context of usage
This report provides audit information on changes to data critical for billing (“Critical data”). Sorted by party
BIC, the report lists the most recent changes to critical data that were executed during a selected period stating
their old and new values and the timestamp of the change.
This report can be used by CB users only.
Report access
This report can be reached in the following way:
[Team Content] >> [Predefined Reports] >> [BIL – Billing Reports] >> [BIL03]
Screenshot – prompt
Figure 158 - BIL03 prompt
Prompt description
BIL03 – Report description – prompt screen
Field label Description
Service Service for which the data shall be displayed.
Possible values:
l RTGS
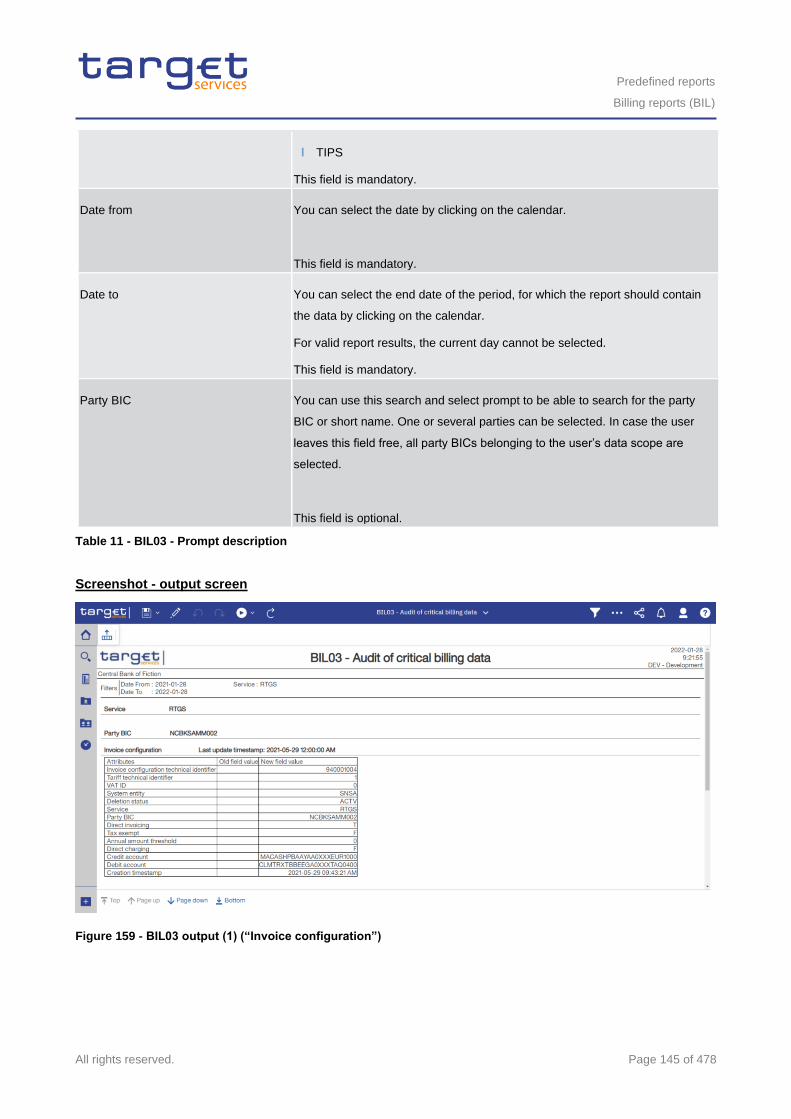
Predefined reports
Billing reports (BIL)
All rights reserved. Page 145 of 478
l TIPS
This field is mandatory.
Date from You can select the date by clicking on the calendar.
This field is mandatory.
Date to You can select the end date of the period, for which the report should contain
the data by clicking on the calendar.
For valid report results, the current day cannot be selected.
This field is mandatory.
Party BIC You can use this search and select prompt to be able to search for the party
BIC or short name. One or several parties can be selected. In case the user
leaves this field free, all party BICs belonging to the user’s data scope are
selected.
This field is optional.
Table 11 - BIL03 - Prompt description
Screenshot - output screen
Figure 159 - BIL03 output (1) (“Invoice configuration”)
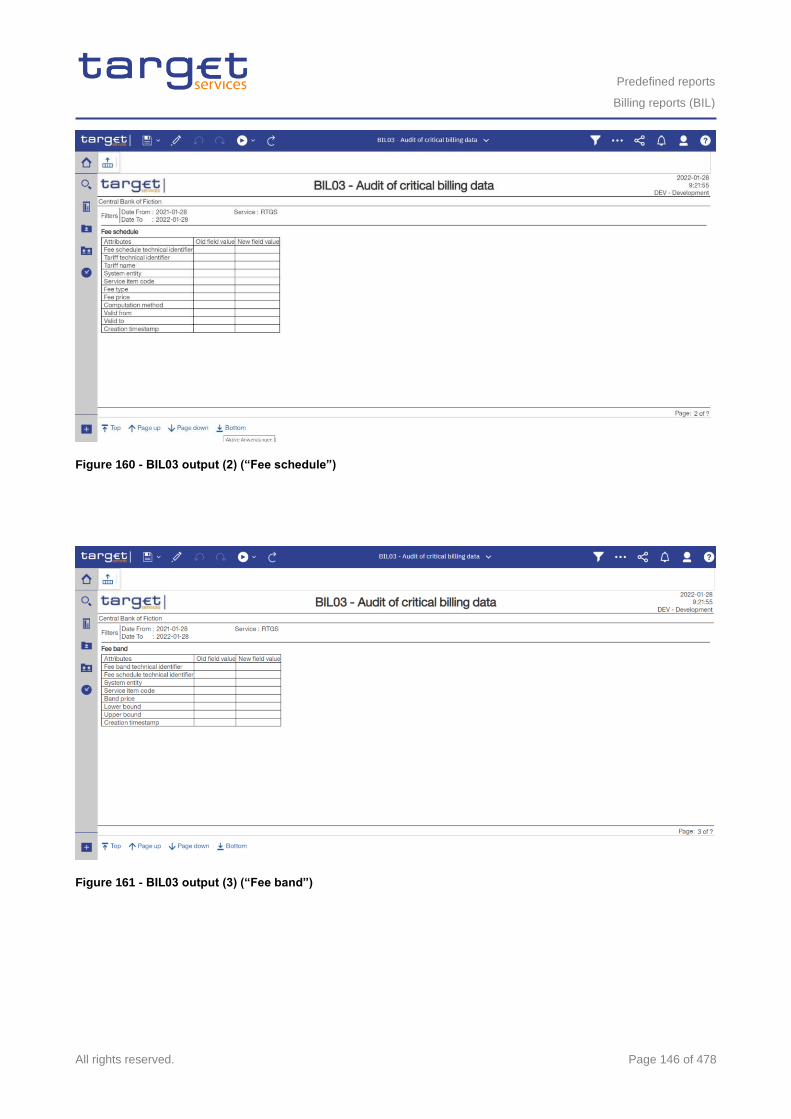
Predefined reports
Billing reports (BIL)
All rights reserved. Page 146 of 478
Figure 160 - BIL03 output (2) (“Fee schedule”)
Figure 161 - BIL03 output (3) (“Fee band”)

Predefined reports
Billing reports (BIL)
All rights reserved. Page 147 of 478
Figure 162 - BIL03 output (4) (“VAT”)
Figure 163 - BIL03 output (5) (“Service”)
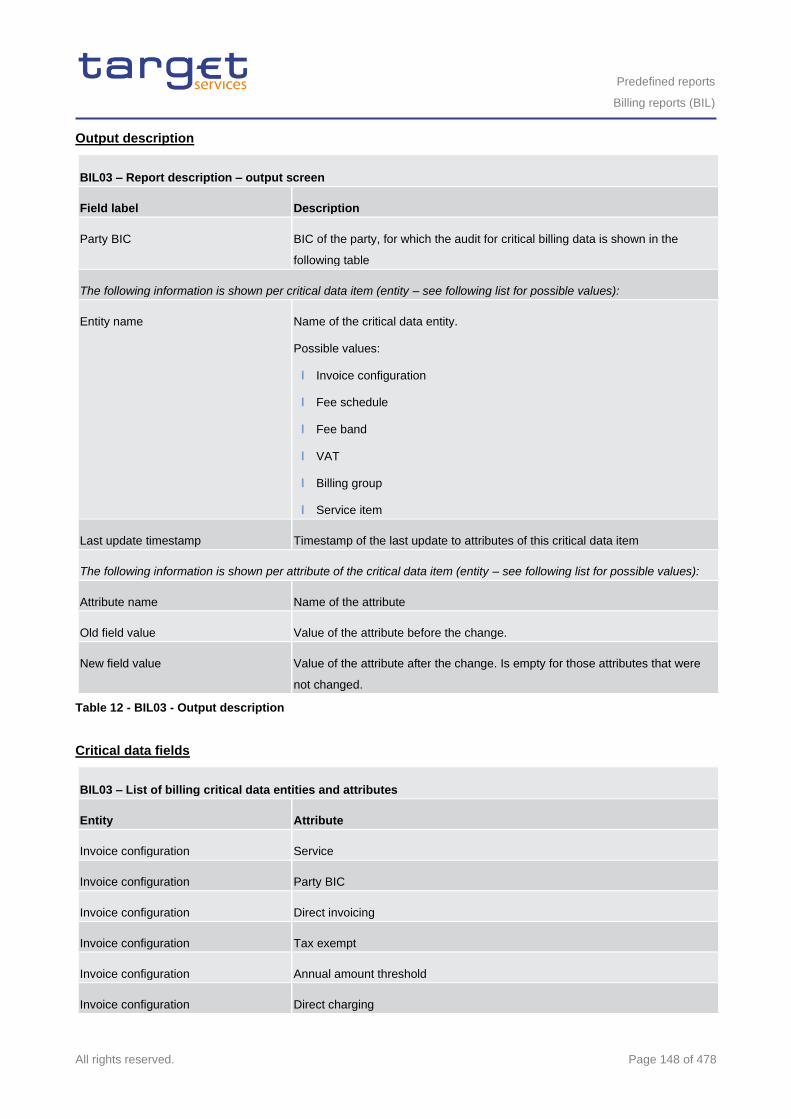
Predefined reports
Billing reports (BIL)
All rights reserved. Page 148 of 478
Output description
BIL03 – Report description – output screen
Field label Description
Party BIC BIC of the party, for which the audit for critical billing data is shown in the
following table
The following information is shown per critical data item (entity – see following list for possible values):
Entity name Name of the critical data entity.
Possible values:
l Invoice configuration
l Fee schedule
l Fee band
l VAT
l Billing group
l Service item
Last update timestamp Timestamp of the last update to attributes of this critical data item
The following information is shown per attribute of the critical data item (entity – see following list for possible values):
Attribute name Name of the attribute
Old field value Value of the attribute before the change.
New field value Value of the attribute after the change. Is empty for those attributes that were
not changed.
Table 12 - BIL03 - Output description
Critical data fields
BIL03 – List of billing critical data entities and attributes
Entity Attribute
Invoice configuration Service
Invoice configuration Party BIC
Invoice configuration Direct invoicing
Invoice configuration Tax exempt
Invoice configuration Annual amount threshold
Invoice configuration Direct charging
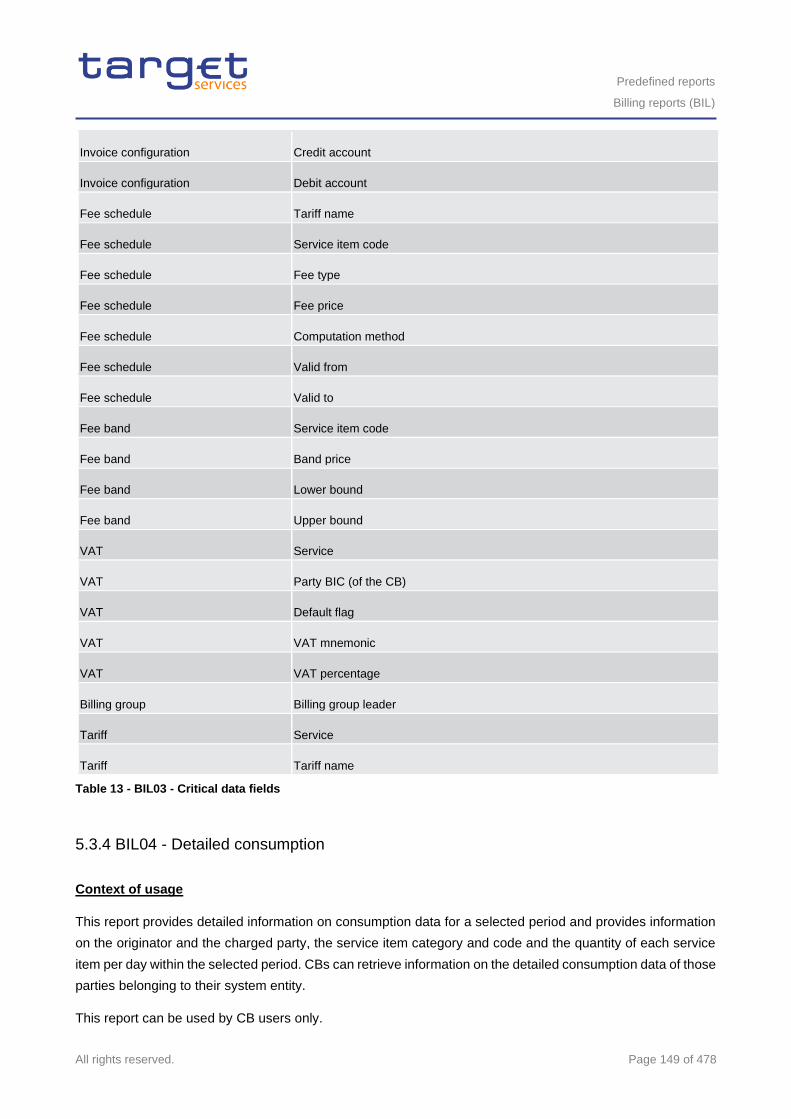
Predefined reports
Billing reports (BIL)
All rights reserved. Page 149 of 478
Invoice configuration Credit account
Invoice configuration Debit account
Fee schedule Tariff name
Fee schedule Service item code
Fee schedule Fee type
Fee schedule Fee price
Fee schedule Computation method
Fee schedule Valid from
Fee schedule Valid to
Fee band Service item code
Fee band Band price
Fee band Lower bound
Fee band Upper bound
VAT Service
VAT Party BIC (of the CB)
VAT Default flag
VAT VAT mnemonic
VAT VAT percentage
Billing group Billing group leader
Tariff Service
Tariff Tariff name
Table 13 - BIL03 - Critical data fields
5.3.4 BIL04 - Detailed consumption
Context of usage
This report provides detailed information on consumption data for a selected period and provides information
on the originator and the charged party, the service item category and code and the quantity of each service
item per day within the selected period. CBs can retrieve information on the detailed consumption data of those
parties belonging to their system entity.
This report can be used by CB users only.
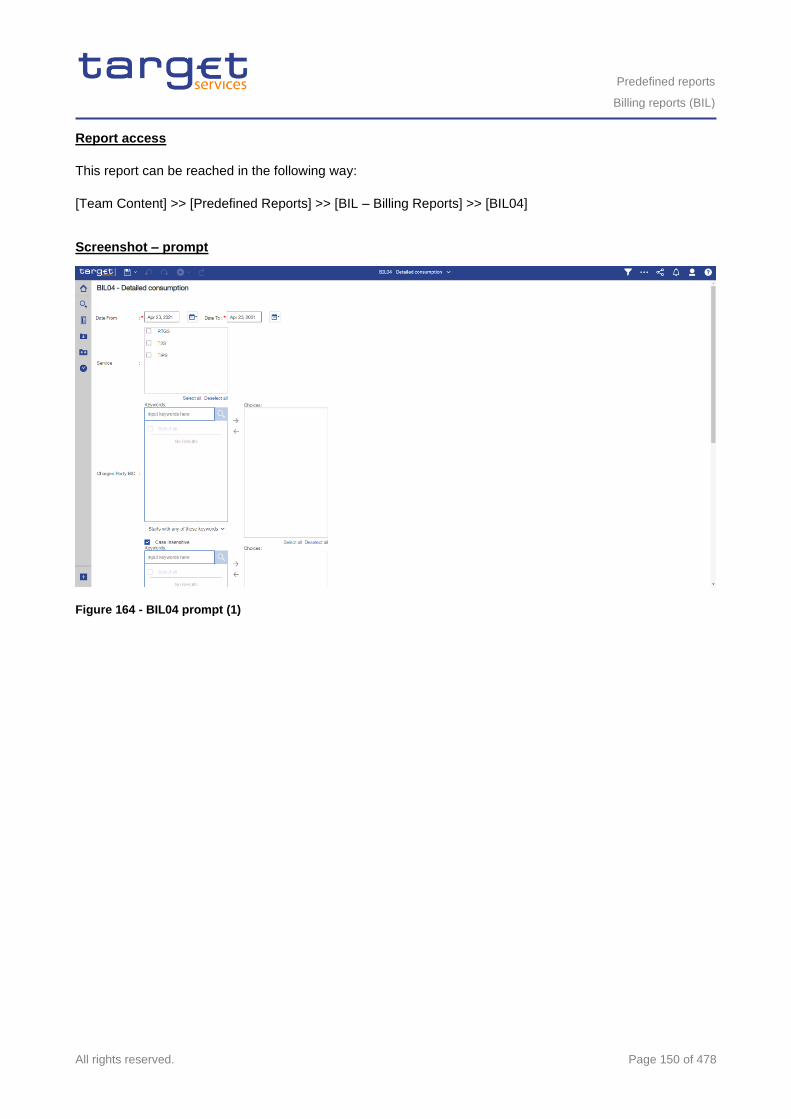
Predefined reports
Billing reports (BIL)
All rights reserved. Page 150 of 478
Report access
This report can be reached in the following way:
[Team Content] >> [Predefined Reports] >> [BIL – Billing Reports] >> [BIL04]
Screenshot – prompt
Figure 164 - BIL04 prompt (1)
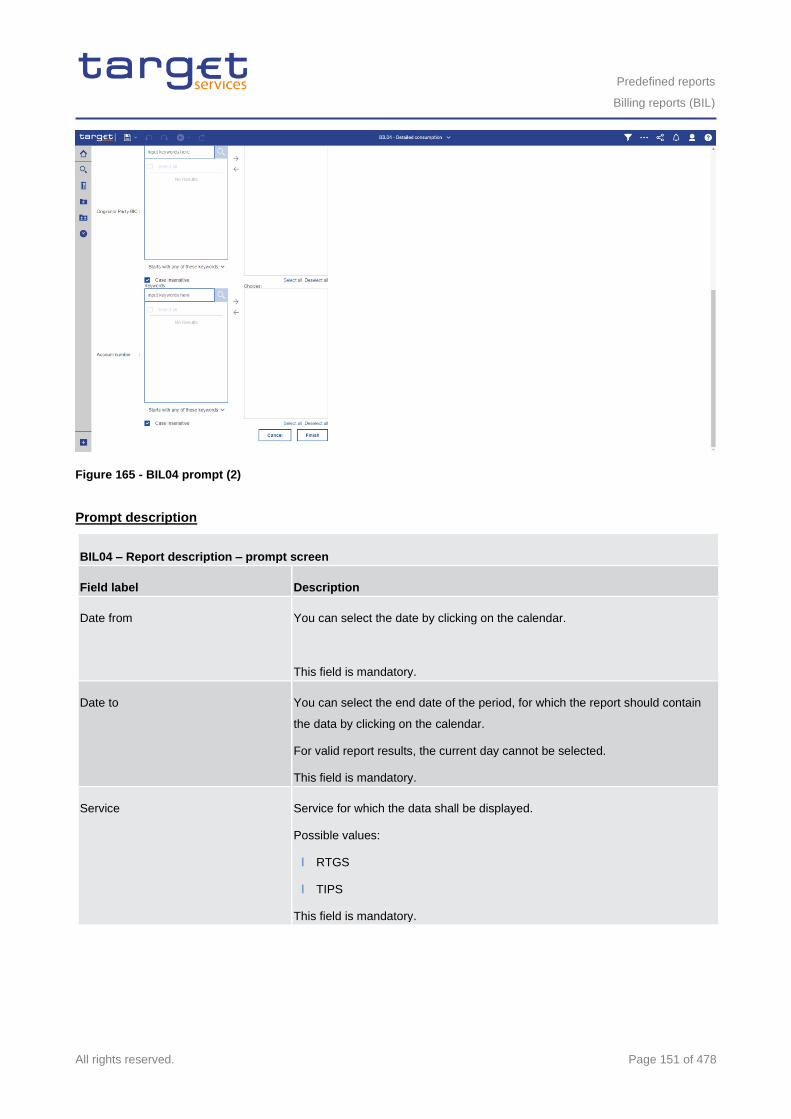
Predefined reports
Billing reports (BIL)
All rights reserved. Page 151 of 478
Figure 165 - BIL04 prompt (2)
Prompt description
BIL04 – Report description – prompt screen
Field label Description
Date from You can select the date by clicking on the calendar.
This field is mandatory.
Date to You can select the end date of the period, for which the report should contain
the data by clicking on the calendar.
For valid report results, the current day cannot be selected.
This field is mandatory.
Service Service for which the data shall be displayed.
Possible values:
l RTGS
l TIPS
This field is mandatory.
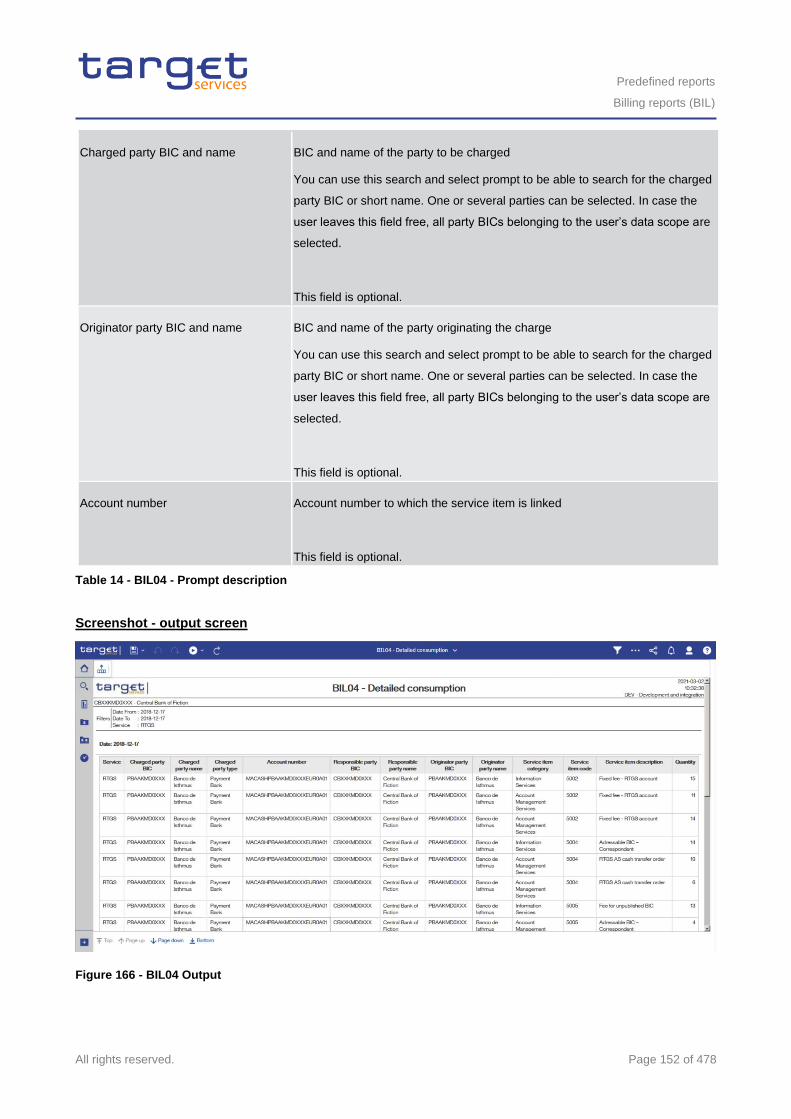
Predefined reports
Billing reports (BIL)
All rights reserved. Page 152 of 478
Charged party BIC and name BIC and name of the party to be charged
You can use this search and select prompt to be able to search for the charged
party BIC or short name. One or several parties can be selected. In case the
user leaves this field free, all party BICs belonging to the user’s data scope are
selected.
This field is optional.
Originator party BIC and name BIC and name of the party originating the charge
You can use this search and select prompt to be able to search for the charged
party BIC or short name. One or several parties can be selected. In case the
user leaves this field free, all party BICs belonging to the user’s data scope are
selected.
This field is optional.
Account number Account number to which the service item is linked
This field is optional.
Table 14 - BIL04 - Prompt description
Screenshot - output screen
Figure 166 - BIL04 Output
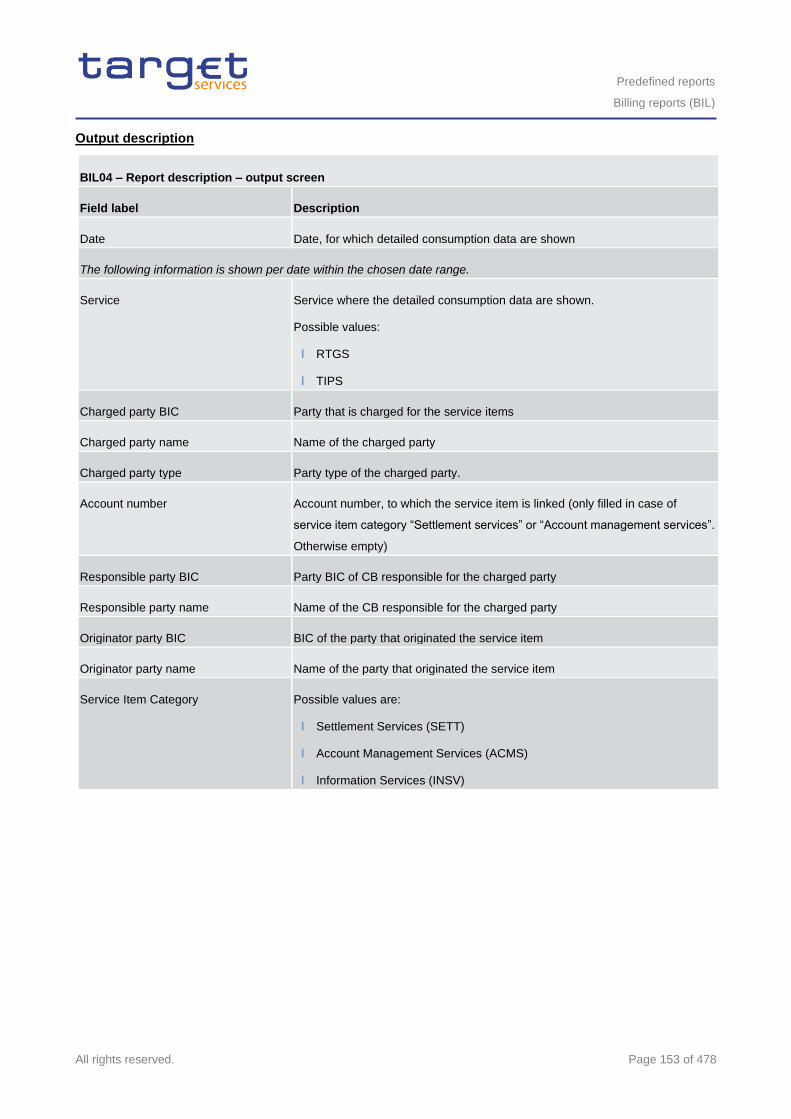
Predefined reports
Billing reports (BIL)
All rights reserved. Page 153 of 478
Output description
BIL04 – Report description – output screen
Field label Description
Date Date, for which detailed consumption data are shown
The following information is shown per date within the chosen date range.
Service Service where the detailed consumption data are shown.
Possible values:
l RTGS
l TIPS
Charged party BIC Party that is charged for the service items
Charged party name Name of the charged party
Charged party type Party type of the charged party.
Account number Account number, to which the service item is linked (only filled in case of
service item category “Settlement services” or “Account management services”.
Otherwise empty)
Responsible party BIC Party BIC of CB responsible for the charged party
Responsible party name Name of the CB responsible for the charged party
Originator party BIC BIC of the party that originated the service item
Originator party name Name of the party that originated the service item
Service Item Category Possible values are:
l Settlement Services (SETT)
l Account Management Services (ACMS)
l Information Services (INSV)
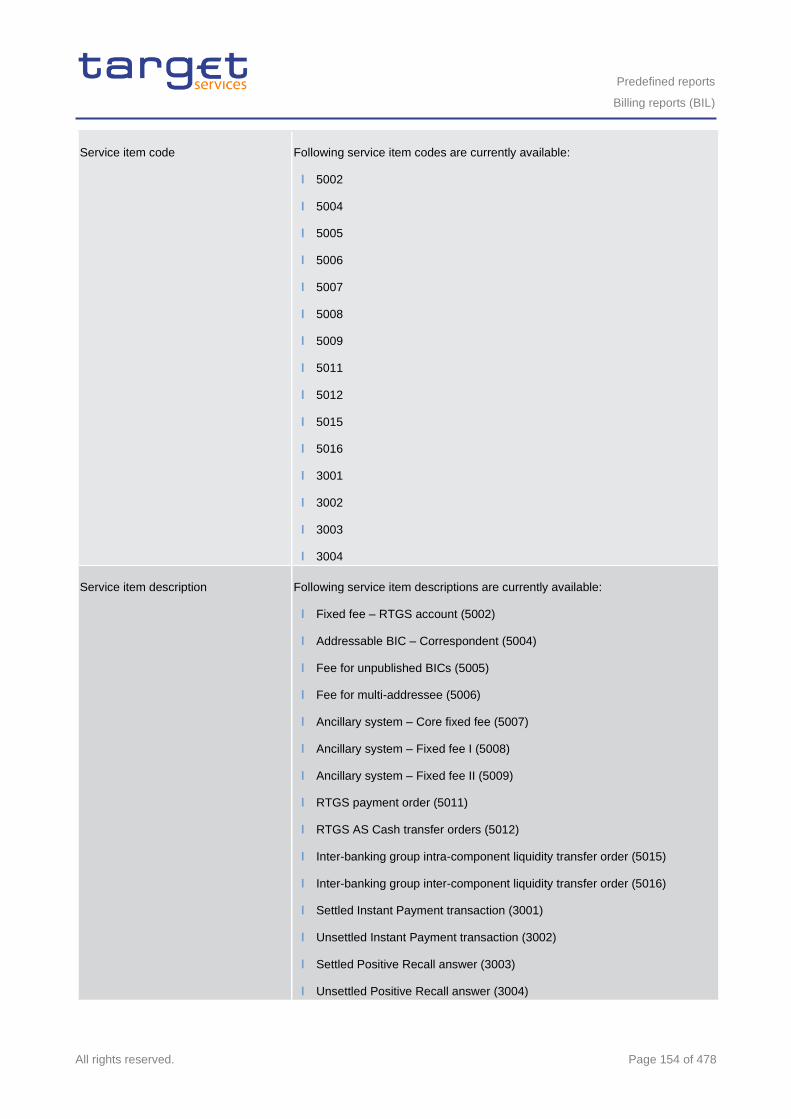
Predefined reports
Billing reports (BIL)
All rights reserved. Page 154 of 478
Service item code Following service item codes are currently available:
l 5002
l 5004
l 5005
l 5006
l 5007
l 5008
l 5009
l 5011
l 5012
l 5015
l 5016
l 3001
l 3002
l 3003
l 3004
Service item description Following service item descriptions are currently available:
l Fixed fee – RTGS account (5002)
l Addressable BIC – Correspondent (5004)
l Fee for unpublished BICs (5005)
l Fee for multi-addressee (5006)
l Ancillary system – Core fixed fee (5007)
l Ancillary system – Fixed fee I (5008)
l Ancillary system – Fixed fee II (5009)
l RTGS payment order (5011)
l RTGS AS Cash transfer orders (5012)
l Inter-banking group intra-component liquidity transfer order (5015)
l Inter-banking group inter-component liquidity transfer order (5016)
l Settled Instant Payment transaction (3001)
l Unsettled Instant Payment transaction (3002)
l Settled Positive Recall answer (3003)
l Unsettled Positive Recall answer (3004)
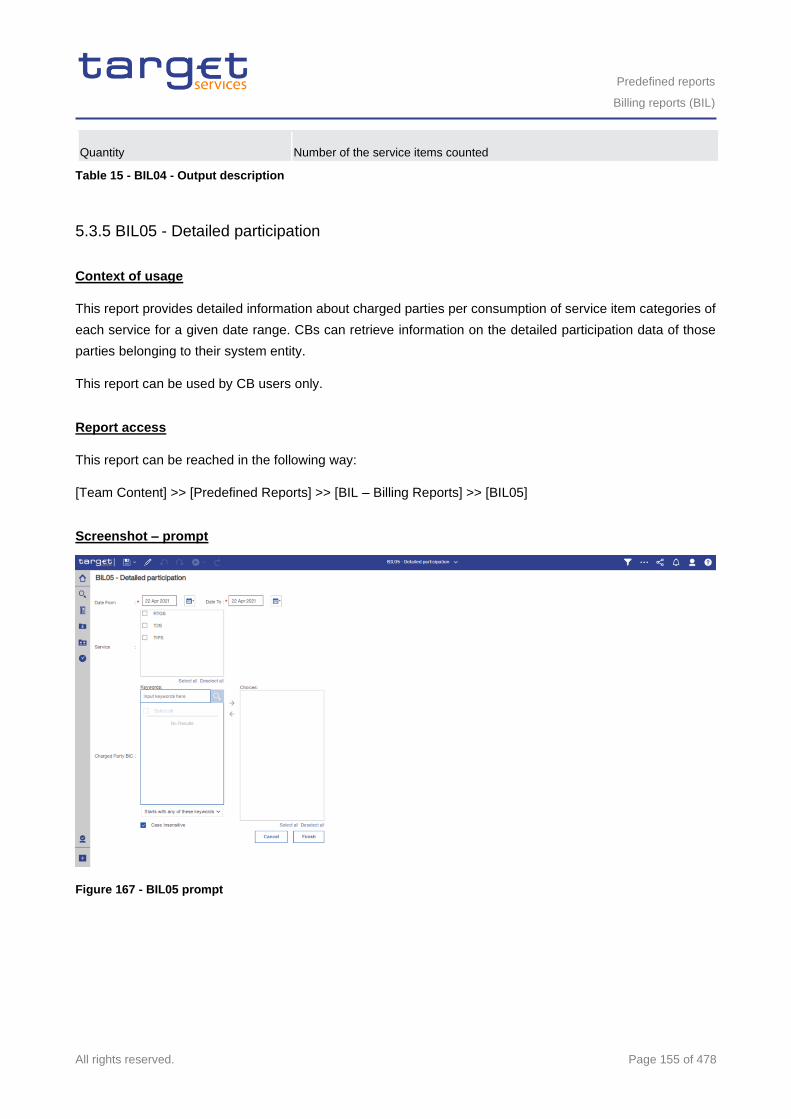
Predefined reports
Billing reports (BIL)
All rights reserved. Page 155 of 478
Quantity Number of the service items counted
Table 15 - BIL04 - Output description
5.3.5 BIL05 - Detailed participation
Context of usage
This report provides detailed information about charged parties per consumption of service item categories of
each service for a given date range. CBs can retrieve information on the detailed participation data of those
parties belonging to their system entity.
This report can be used by CB users only.
Report access
This report can be reached in the following way:
[Team Content] >> [Predefined Reports] >> [BIL – Billing Reports] >> [BIL05]
Screenshot – prompt
Figure 167 - BIL05 prompt
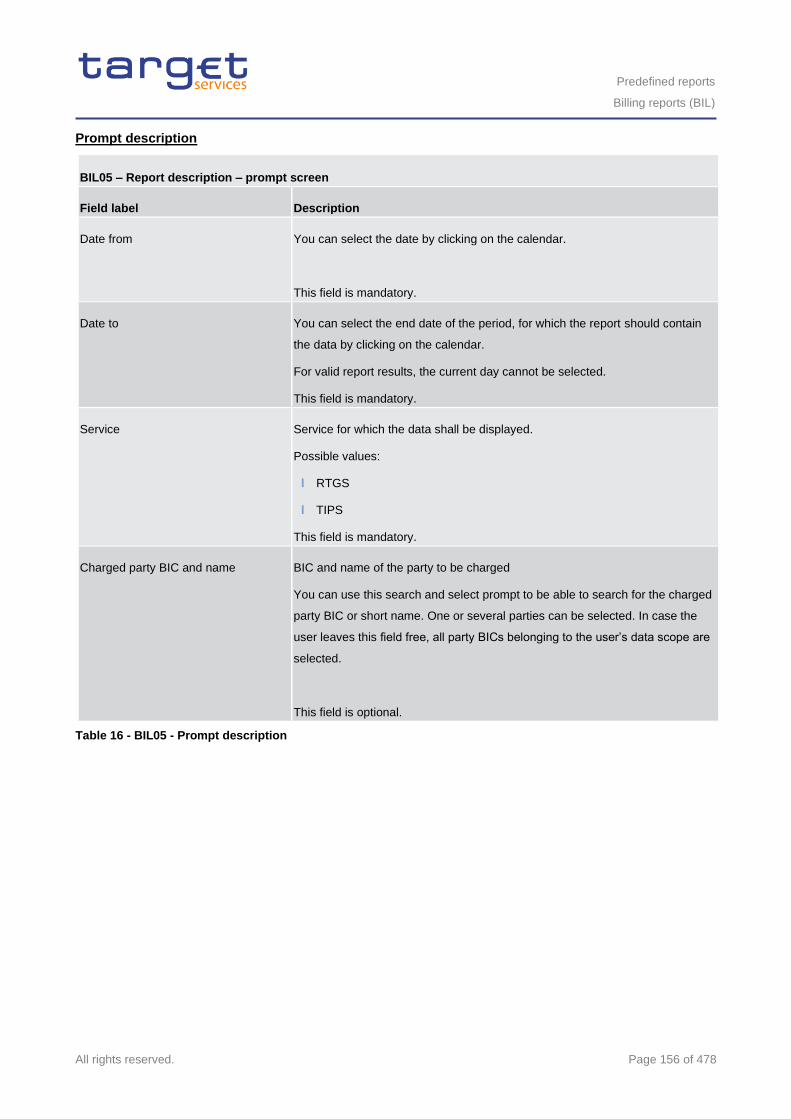
Predefined reports
Billing reports (BIL)
All rights reserved. Page 156 of 478
Prompt description
BIL05 – Report description – prompt screen
Field label Description
Date from You can select the date by clicking on the calendar.
This field is mandatory.
Date to You can select the end date of the period, for which the report should contain
the data by clicking on the calendar.
For valid report results, the current day cannot be selected.
This field is mandatory.
Service Service for which the data shall be displayed.
Possible values:
l RTGS
l TIPS
This field is mandatory.
Charged party BIC and name BIC and name of the party to be charged
You can use this search and select prompt to be able to search for the charged
party BIC or short name. One or several parties can be selected. In case the
user leaves this field free, all party BICs belonging to the user’s data scope are
selected.
This field is optional.
Table 16 - BIL05 - Prompt description
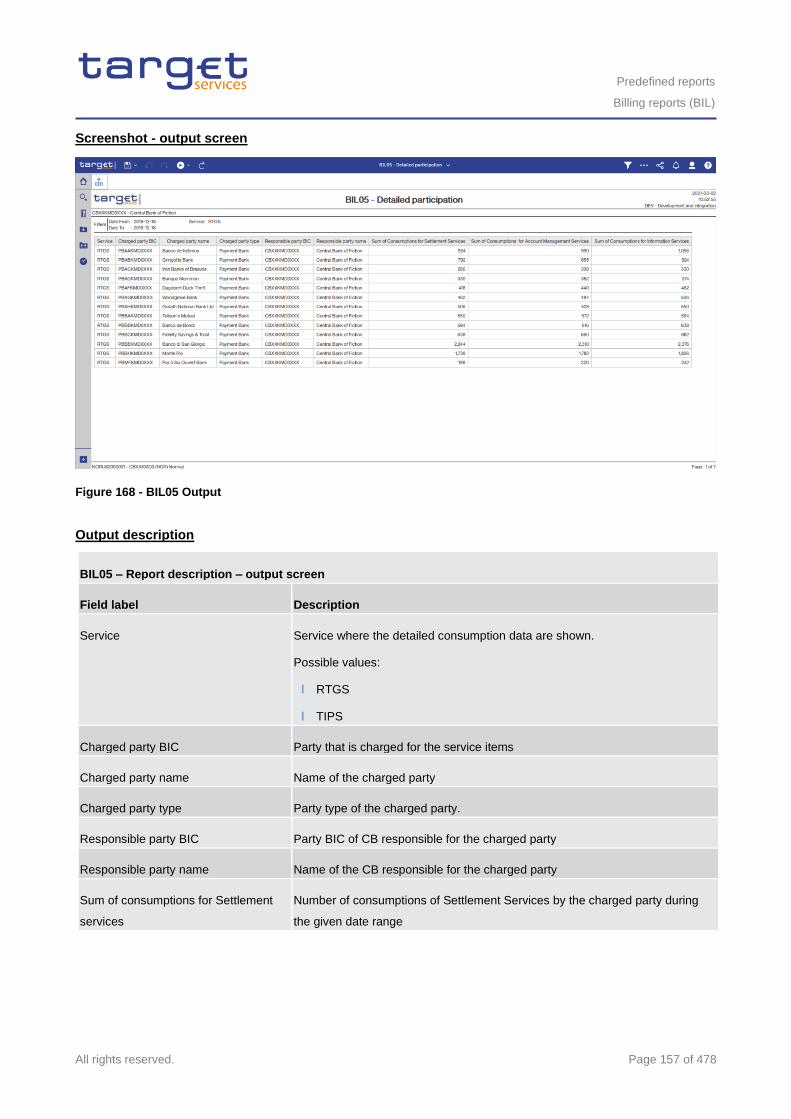
Predefined reports
Billing reports (BIL)
All rights reserved. Page 157 of 478
Screenshot - output screen
Figure 168 - BIL05 Output
Output description
BIL05 – Report description – output screen
Field label Description
Service Service where the detailed consumption data are shown.
Possible values:
l RTGS
l TIPS
Charged party BIC Party that is charged for the service items
Charged party name Name of the charged party
Charged party type Party type of the charged party.
Responsible party BIC Party BIC of CB responsible for the charged party
Responsible party name Name of the CB responsible for the charged party
Sum of consumptions for Settlement
services
Number of consumptions of Settlement Services by the charged party during
the given date range
Predefined reports
Contingency reports (CON)
All rights reserved. Page 158 of 478
Sum of consumptions for Account
management services
Number of consumptions of Account management services by the charged
party during the given date range
Sum of consumptions for Information
services
Number of consumptions of Information services by the charged party during
the given date range
Quantity Number of the service items counted
Table 17 - BIL05 - Output description
5.4 Contingency reports (CON)
5.4.1 CON01 – Cash transfers settled during contingency processing and final contingency
account balances
Context of usage
This report provides information on the cash transfers settled on accounts in the Contingency Services during
a contingency procedure. For each party/contingency account (with at least one cash transfer within a
contingency processing) all cash transfers within the contingency processing as well as the final account
balance on the contingency account at the time of the closure of the contingency processing are provided.
For each cash transfer the report provides the account number in the Contingency Services, the account
number of the cash transfer counterparty in the Contingency Services, the settlement timestamp and the credit
or debit amount. Cash transfers on the same account are sorted in chronological order of their settlement
timestamp.
In case that several contingency processing sessions occurred within the same business day, the sessions
are reported separate.
CBs can retrieve information for parties belonging to their system entity.
This report can be used by CB users only.
Report access
This report can be reached in the following way:
[Team Content] >> [Predefined Reports] >> [CON – Contingency Reports] >> [CON01]
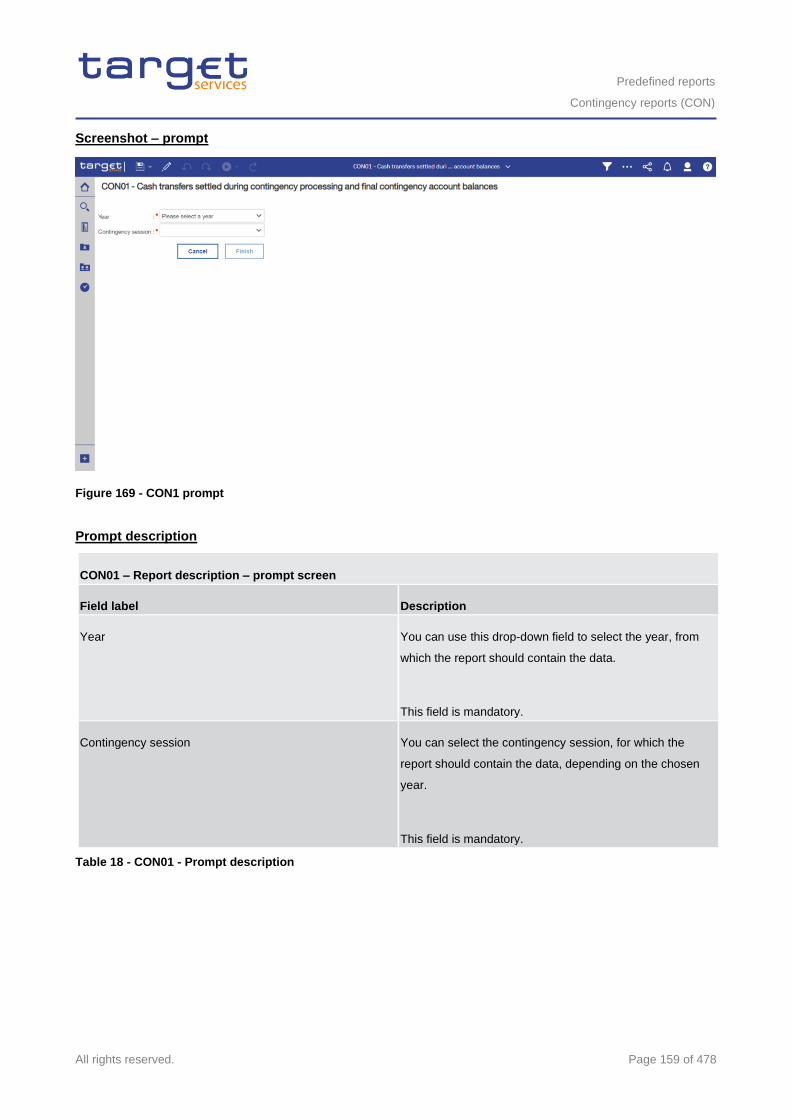
Predefined reports
Contingency reports (CON)
All rights reserved. Page 159 of 478
Screenshot – prompt
Figure 169 - CON1 prompt
Prompt description
CON01 – Report description – prompt screen
Field label Description
Year You can use this drop-down field to select the year, from
which the report should contain the data.
This field is mandatory.
Contingency session You can select the contingency session, for which the
report should contain the data, depending on the chosen
year.
This field is mandatory.
Table 18 - CON01 - Prompt description
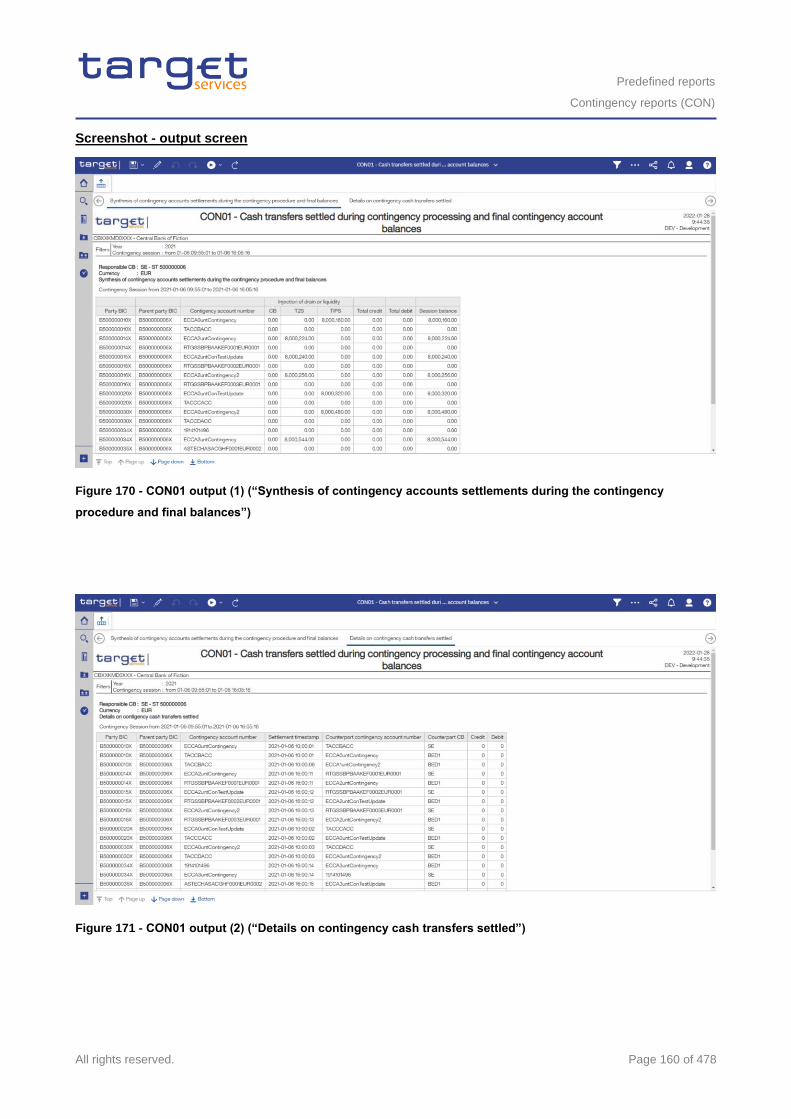
Predefined reports
Contingency reports (CON)
All rights reserved. Page 160 of 478
Screenshot - output screen
Figure 170 - CON01 output (1) (“Synthesis of contingency accounts settlements during the contingency
procedure and final balances”)
Figure 171 - CON01 output (2) (“Details on contingency cash transfers settled”)
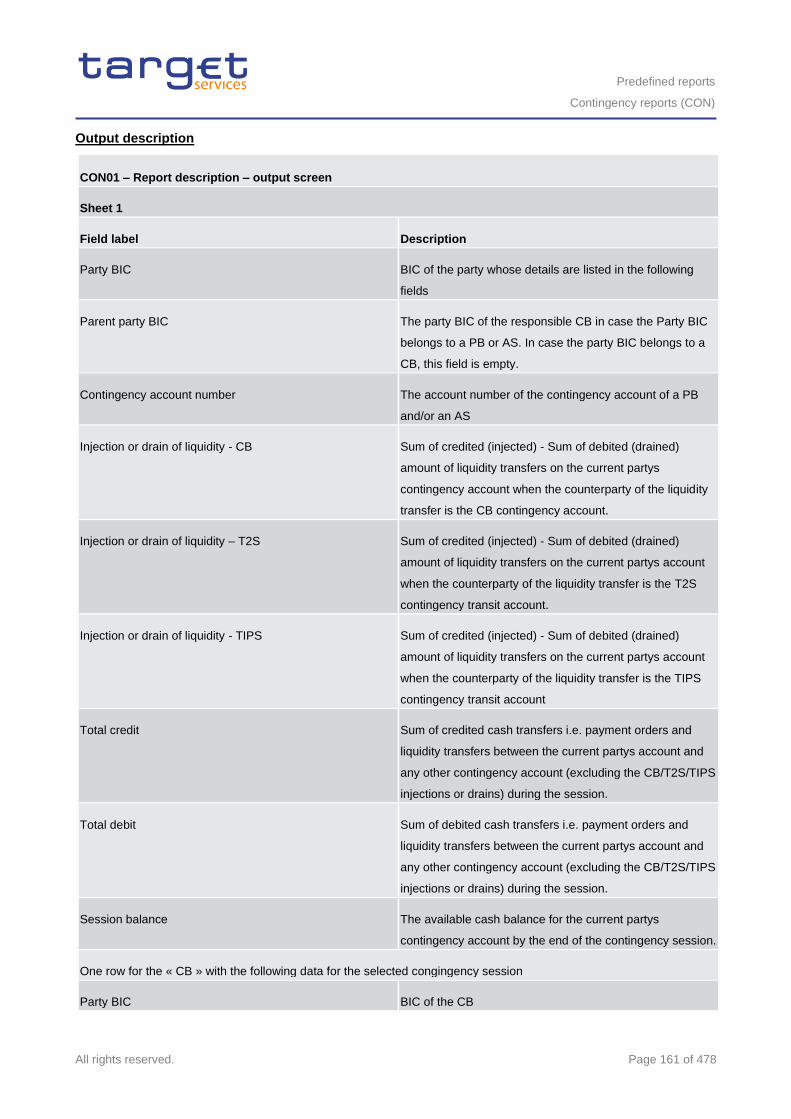
Predefined reports
Contingency reports (CON)
All rights reserved. Page 161 of 478
Output description
CON01 – Report description – output screen
Sheet 1
Field label Description
Party BIC BIC of the party whose details are listed in the following
fields
Parent party BIC The party BIC of the responsible CB in case the Party BIC
belongs to a PB or AS. In case the party BIC belongs to a
CB, this field is empty.
Contingency account number The account number of the contingency account of a PB
and/or an AS
Injection or drain of liquidity - CB Sum of credited (injected) - Sum of debited (drained)
amount of liquidity transfers on the current partys
contingency account when the counterparty of the liquidity
transfer is the CB contingency account.
Injection or drain of liquidity – T2S Sum of credited (injected) - Sum of debited (drained)
amount of liquidity transfers on the current partys account
when the counterparty of the liquidity transfer is the T2S
contingency transit account.
Injection or drain of liquidity - TIPS Sum of credited (injected) - Sum of debited (drained)
amount of liquidity transfers on the current partys account
when the counterparty of the liquidity transfer is the TIPS
contingency transit account
Total credit Sum of credited cash transfers i.e. payment orders and
liquidity transfers between the current partys account and
any other contingency account (excluding the CB/T2S/TIPS
injections or drains) during the session.
Total debit Sum of debited cash transfers i.e. payment orders and
liquidity transfers between the current partys account and
any other contingency account (excluding the CB/T2S/TIPS
injections or drains) during the session.
Session balance The available cash balance for the current partys
contingency account by the end of the contingency session.
One row for the « CB » with the following data for the selected congingency session
Party BIC BIC of the CB
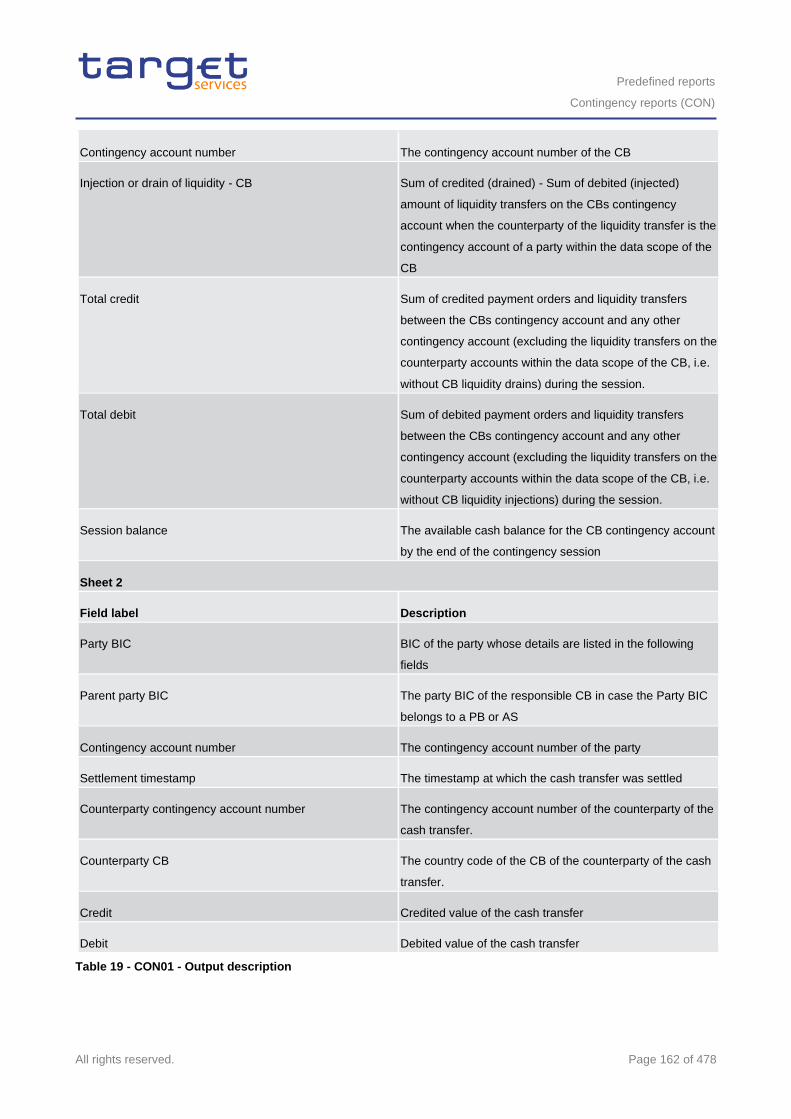
Predefined reports
Contingency reports (CON)
All rights reserved. Page 162 of 478
Contingency account number The contingency account number of the CB
Injection or drain of liquidity - CB Sum of credited (drained) - Sum of debited (injected)
amount of liquidity transfers on the CBs contingency
account when the counterparty of the liquidity transfer is the
contingency account of a party within the data scope of the
CB
Total credit Sum of credited payment orders and liquidity transfers
between the CBs contingency account and any other
contingency account (excluding the liquidity transfers on the
counterparty accounts within the data scope of the CB, i.e.
without CB liquidity drains) during the session.
Total debit Sum of debited payment orders and liquidity transfers
between the CBs contingency account and any other
contingency account (excluding the liquidity transfers on the
counterparty accounts within the data scope of the CB, i.e.
without CB liquidity injections) during the session.
Session balance The available cash balance for the CB contingency account
by the end of the contingency session
Sheet 2
Field label Description
Party BIC BIC of the party whose details are listed in the following
fields
Parent party BIC The party BIC of the responsible CB in case the Party BIC
belongs to a PB or AS
Contingency account number The contingency account number of the party
Settlement timestamp The timestamp at which the cash transfer was settled
Counterparty contingency account number The contingency account number of the counterparty of the
cash transfer.
Counterparty CB The country code of the CB of the counterparty of the cash
transfer.
Credit Credited value of the cash transfer
Debit Debited value of the cash transfer
Table 19 - CON01 - Output description
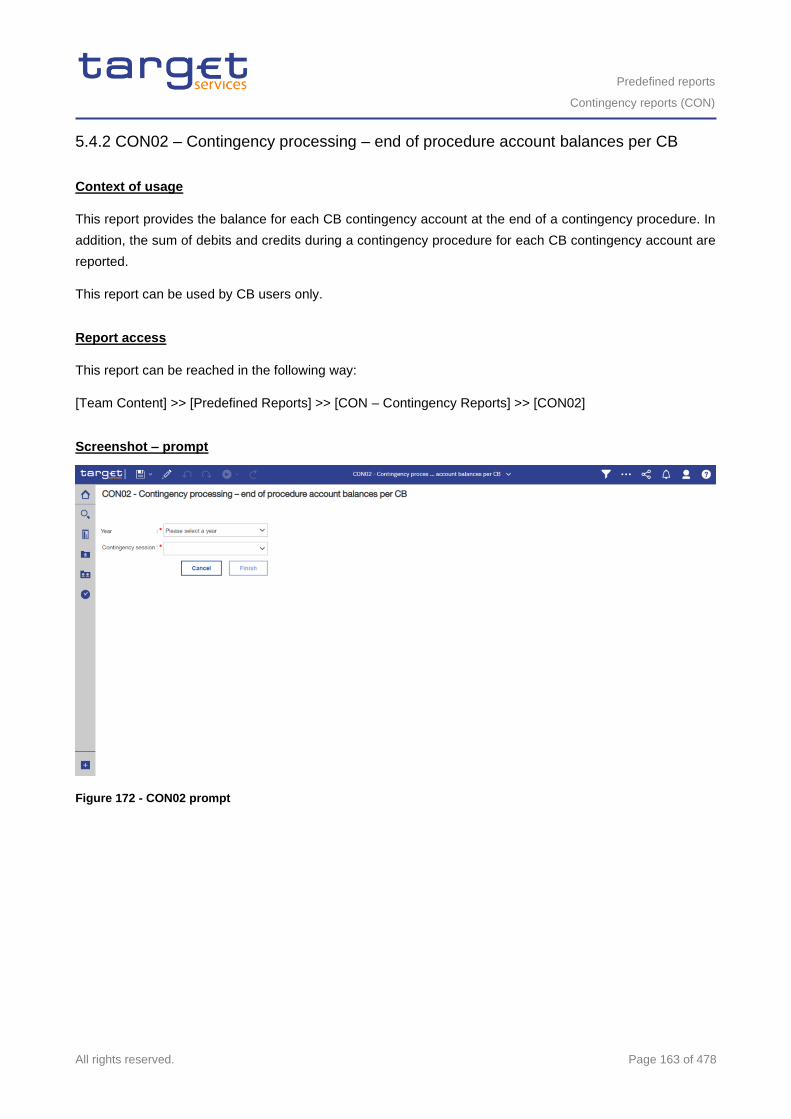
Predefined reports
Contingency reports (CON)
All rights reserved. Page 163 of 478
5.4.2 CON02 – Contingency processing – end of procedure account balances per CB
Context of usage
This report provides the balance for each CB contingency account at the end of a contingency procedure. In
addition, the sum of debits and credits during a contingency procedure for each CB contingency account are
reported.
This report can be used by CB users only.
Report access
This report can be reached in the following way:
[Team Content] >> [Predefined Reports] >> [CON – Contingency Reports] >> [CON02]
Screenshot – prompt
Figure 172 - CON02 prompt
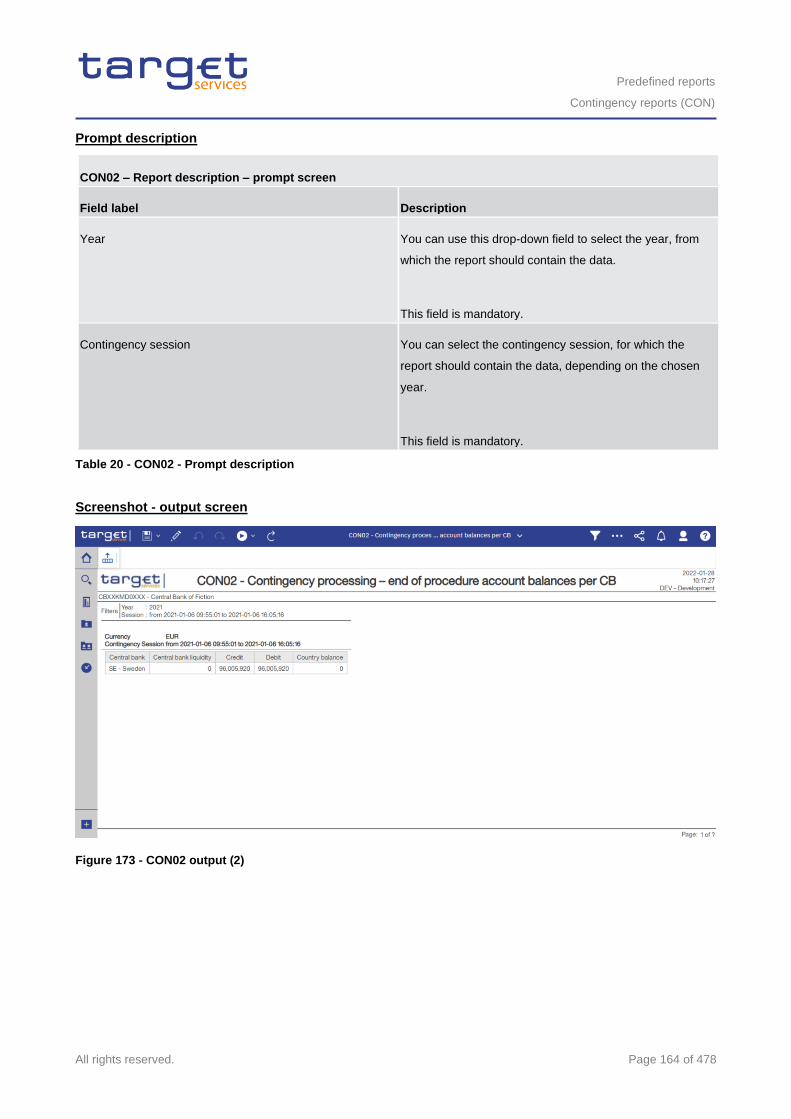
Predefined reports
Contingency reports (CON)
All rights reserved. Page 164 of 478
Prompt description
CON02 – Report description – prompt screen
Field label Description
Year You can use this drop-down field to select the year, from
which the report should contain the data.
This field is mandatory.
Contingency session You can select the contingency session, for which the
report should contain the data, depending on the chosen
year.
This field is mandatory.
Table 20 - CON02 - Prompt description
Screenshot - output screen
Figure 173 - CON02 output (2)
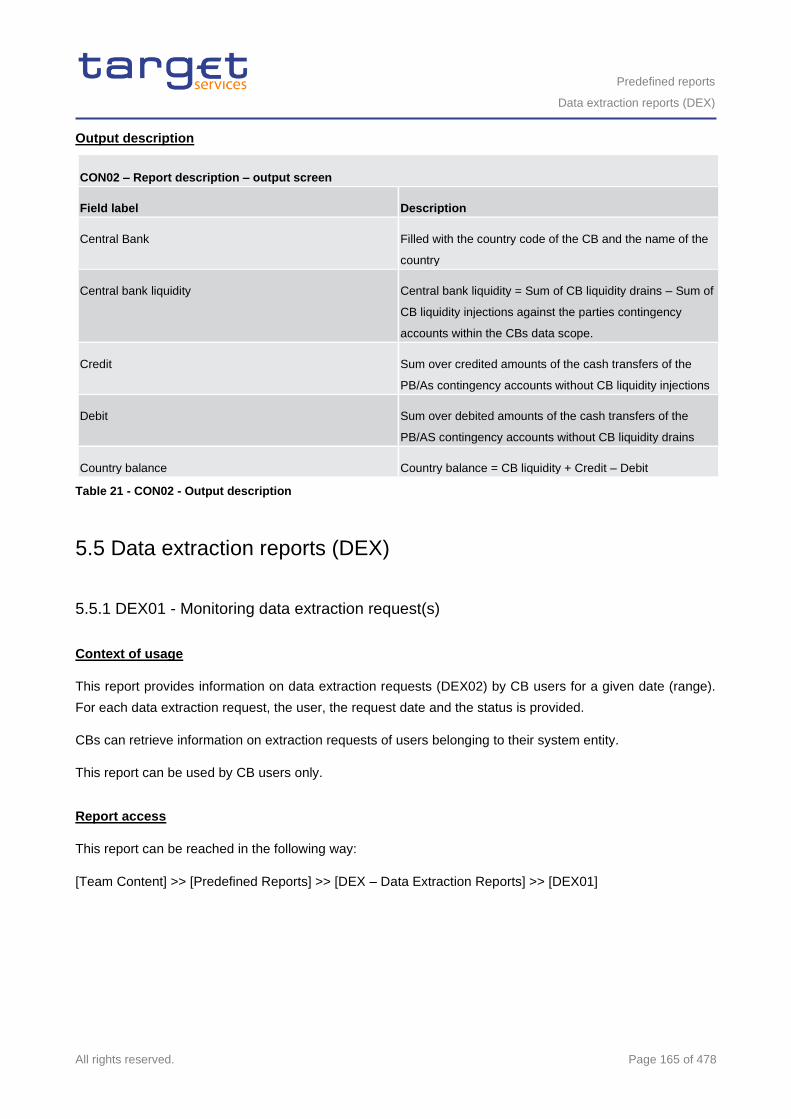
Predefined reports
Data extraction reports (DEX)
All rights reserved. Page 165 of 478
Output description
CON02 – Report description – output screen
Field label Description
Central Bank Filled with the country code of the CB and the name of the
country
Central bank liquidity Central bank liquidity = Sum of CB liquidity drains – Sum of
CB liquidity injections against the parties contingency
accounts within the CBs data scope.
Credit Sum over credited amounts of the cash transfers of the
PB/As contingency accounts without CB liquidity injections
Debit Sum over debited amounts of the cash transfers of the
PB/AS contingency accounts without CB liquidity drains
Country balance Country balance = CB liquidity + Credit – Debit
Table 21 - CON02 - Output description
5.5 Data extraction reports (DEX)
5.5.1 DEX01 - Monitoring data extraction request(s)
Context of usage
This report provides information on data extraction requests (DEX02) by CB users for a given date (range).
For each data extraction request, the user, the request date and the status is provided.
CBs can retrieve information on extraction requests of users belonging to their system entity.
This report can be used by CB users only.
Report access
This report can be reached in the following way:
[Team Content] >> [Predefined Reports] >> [DEX – Data Extraction Reports] >> [DEX01]
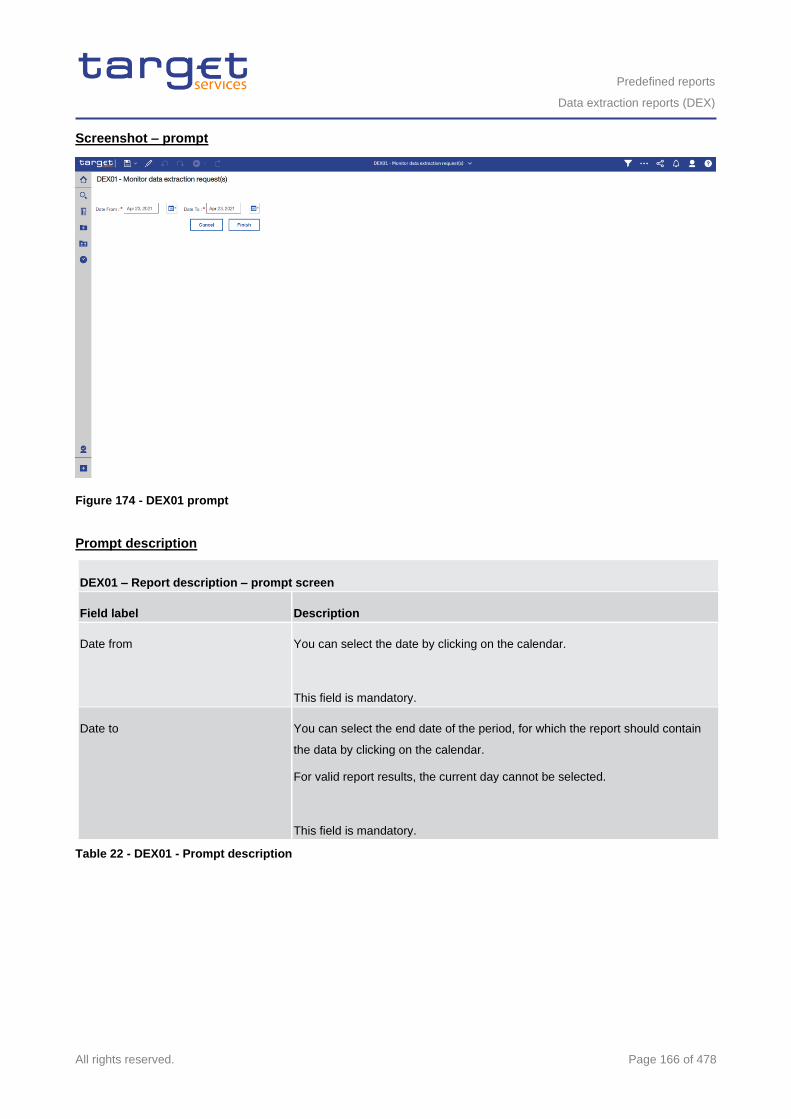
Predefined reports
Data extraction reports (DEX)
All rights reserved. Page 166 of 478
Screenshot – prompt
Figure 174 - DEX01 prompt
Prompt description
DEX01 – Report description – prompt screen
Field label Description
Date from You can select the date by clicking on the calendar.
This field is mandatory.
Date to You can select the end date of the period, for which the report should contain
the data by clicking on the calendar.
For valid report results, the current day cannot be selected.
This field is mandatory.
Table 22 - DEX01 - Prompt description
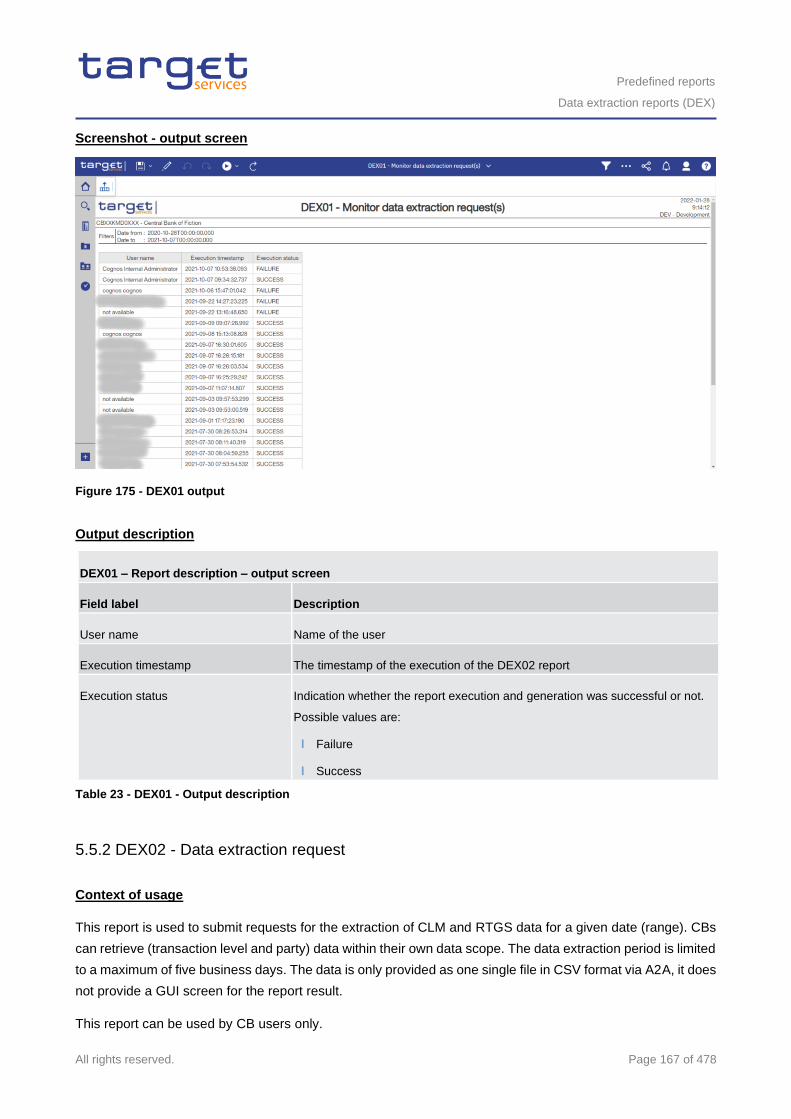
Predefined reports
Data extraction reports (DEX)
All rights reserved. Page 167 of 478
Screenshot - output screen
Figure 175 - DEX01 output
Output description
DEX01 – Report description – output screen
Field label Description
User name Name of the user
Execution timestamp The timestamp of the execution of the DEX02 report
Execution status Indication whether the report execution and generation was successful or not.
Possible values are:
l Failure
l Success
Table 23 - DEX01 - Output description
5.5.2 DEX02 - Data extraction request
Context of usage
This report is used to submit requests for the extraction of CLM and RTGS data for a given date (range). CBs
can retrieve (transaction level and party) data within their own data scope. The data extraction period is limited
to a maximum of five business days. The data is only provided as one single file in CSV format via A2A, it does
not provide a GUI screen for the report result.
This report can be used by CB users only.
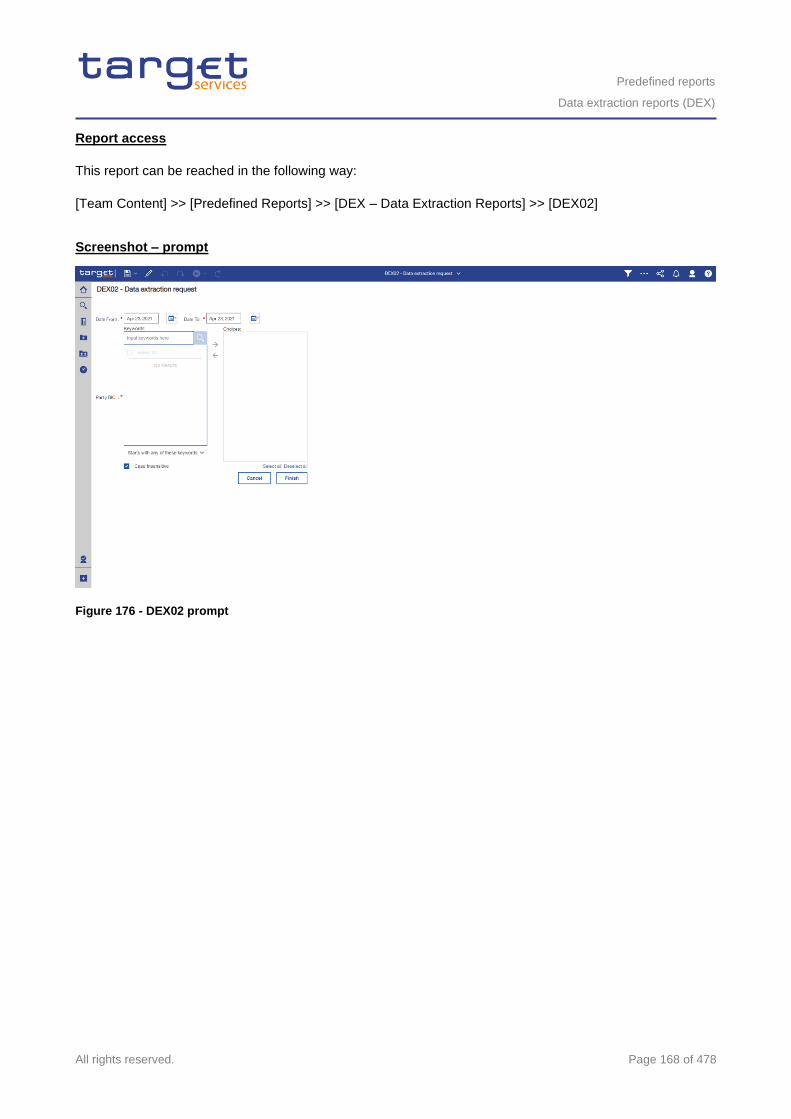
Predefined reports
Data extraction reports (DEX)
All rights reserved. Page 168 of 478
Report access
This report can be reached in the following way:
[Team Content] >> [Predefined Reports] >> [DEX – Data Extraction Reports] >> [DEX02]
Screenshot – prompt
Figure 176 - DEX02 prompt
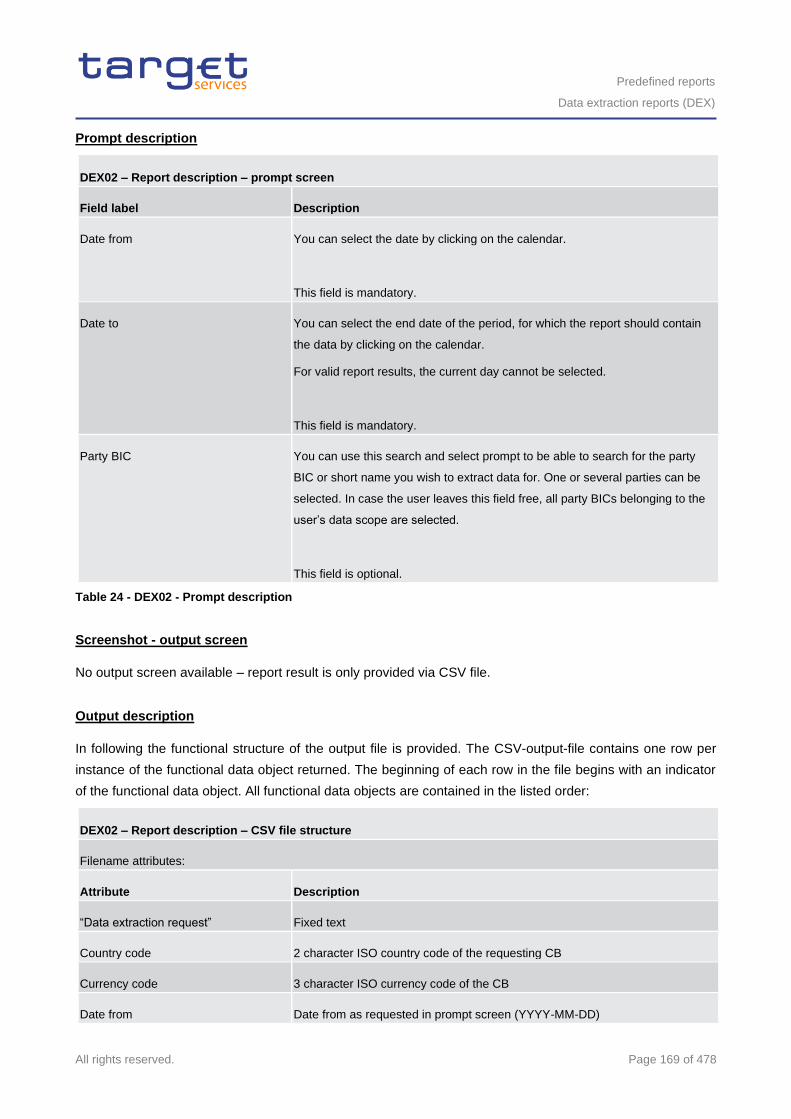
Predefined reports
Data extraction reports (DEX)
All rights reserved. Page 169 of 478
Prompt description
DEX02 – Report description – prompt screen
Field label Description
Date from You can select the date by clicking on the calendar.
This field is mandatory.
Date to You can select the end date of the period, for which the report should contain
the data by clicking on the calendar.
For valid report results, the current day cannot be selected.
This field is mandatory.
Party BIC You can use this search and select prompt to be able to search for the party
BIC or short name you wish to extract data for. One or several parties can be
selected. In case the user leaves this field free, all party BICs belonging to the
user’s data scope are selected.
This field is optional.
Table 24 - DEX02 - Prompt description
Screenshot - output screen
No output screen available – report result is only provided via CSV file.
Output description
In following the functional structure of the output file is provided. The CSV-output-file contains one row per
instance of the functional data object returned. The beginning of each row in the file begins with an indicator
of the functional data object. All functional data objects are contained in the listed order:
DEX02 – Report description – CSV file structure
Filename attributes:
Attribute Description
“Data extraction request” Fixed text
Country code 2 character ISO country code of the requesting CB
Currency code 3 character ISO currency code of the CB
Date from Date from as requested in prompt screen (YYYY-MM-DD)
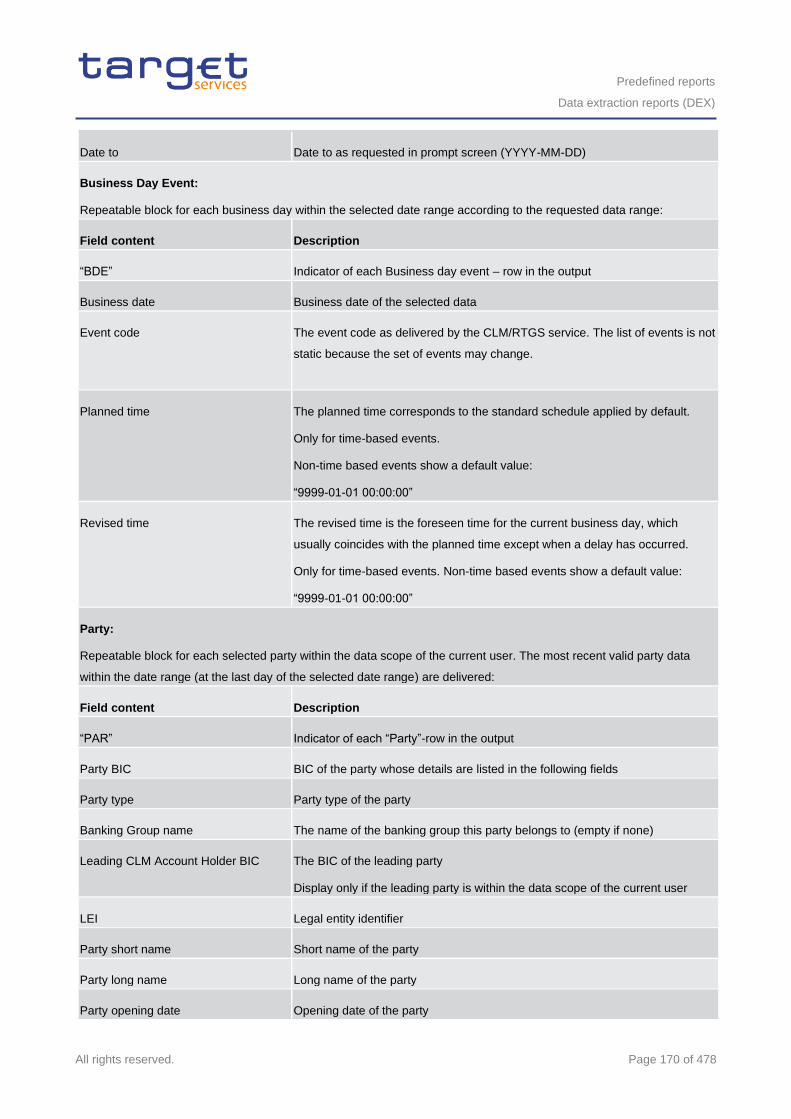
Predefined reports
Data extraction reports (DEX)
All rights reserved. Page 170 of 478
Date to Date to as requested in prompt screen (YYYY-MM-DD)
Business Day Event:
Repeatable block for each business day within the selected date range according to the requested data range:
Field content Description
“BDE” Indicator of each Business day event – row in the output
Business date Business date of the selected data
Event code The event code as delivered by the CLM/RTGS service. The list of events is not
static because the set of events may change.
Planned time The planned time corresponds to the standard schedule applied by default.
Only for time-based events.
Non-time based events show a default value:
“9999-01-01 00:00:00”
Revised time The revised time is the foreseen time for the current business day, which
usually coincides with the planned time except when a delay has occurred.
Only for time-based events. Non-time based events show a default value:
“9999-01-01 00:00:00”
Party:
Repeatable block for each selected party within the data scope of the current user. The most recent valid party data
within the date range (at the last day of the selected date range) are delivered:
Field content Description
“PAR” Indicator of each “Party”-row in the output
Party BIC BIC of the party whose details are listed in the following fields
Party type Party type of the party
Banking Group name The name of the banking group this party belongs to (empty if none)
Leading CLM Account Holder BIC The BIC of the leading party
Display only if the leading party is within the data scope of the current user
LEI Legal entity identifier
Party short name Short name of the party
Party long name Long name of the party
Party opening date Opening date of the party
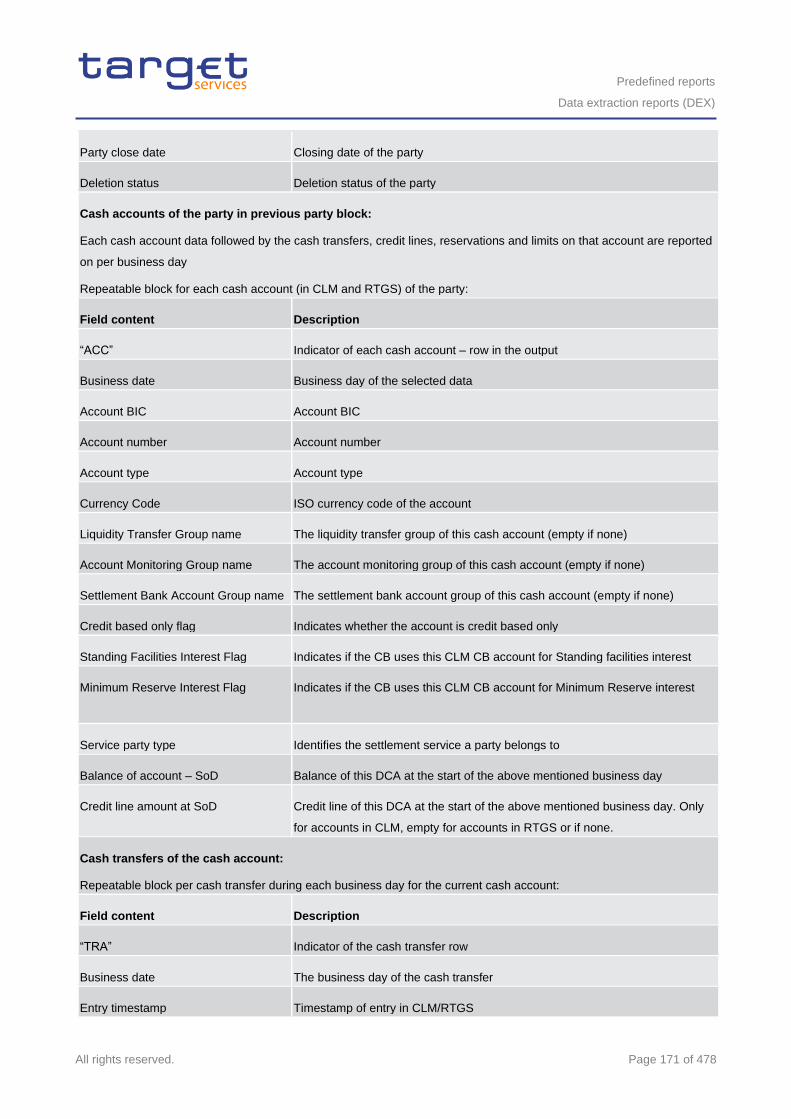
Predefined reports
Data extraction reports (DEX)
All rights reserved. Page 171 of 478
Party close date Closing date of the party
Deletion status Deletion status of the party
Cash accounts of the party in previous party block:
Each cash account data followed by the cash transfers, credit lines, reservations and limits on that account are reported
on per business day
Repeatable block for each cash account (in CLM and RTGS) of the party:
Field content Description
“ACC” Indicator of each cash account – row in the output
Business date Business day of the selected data
Account BIC Account BIC
Account number Account number
Account type Account type
Currency Code ISO currency code of the account
Liquidity Transfer Group name The liquidity transfer group of this cash account (empty if none)
Account Monitoring Group name The account monitoring group of this cash account (empty if none)
Settlement Bank Account Group name The settlement bank account group of this cash account (empty if none)
Credit based only flag Indicates whether the account is credit based only
Standing Facilities Interest Flag Indicates if the CB uses this CLM CB account for Standing facilities interest
Minimum Reserve Interest Flag Indicates if the CB uses this CLM CB account for Minimum Reserve interest
Service party type Identifies the settlement service a party belongs to
Balance of account – SoD Balance of this DCA at the start of the above mentioned business day
Credit line amount at SoD Credit line of this DCA at the start of the above mentioned business day. Only
for accounts in CLM, empty for accounts in RTGS or if none.
Cash transfers of the cash account:
Repeatable block per cash transfer during each business day for the current cash account:
Field content Description
“TRA” Indicator of the cash transfer row
Business date The business day of the cash transfer
Entry timestamp Timestamp of entry in CLM/RTGS
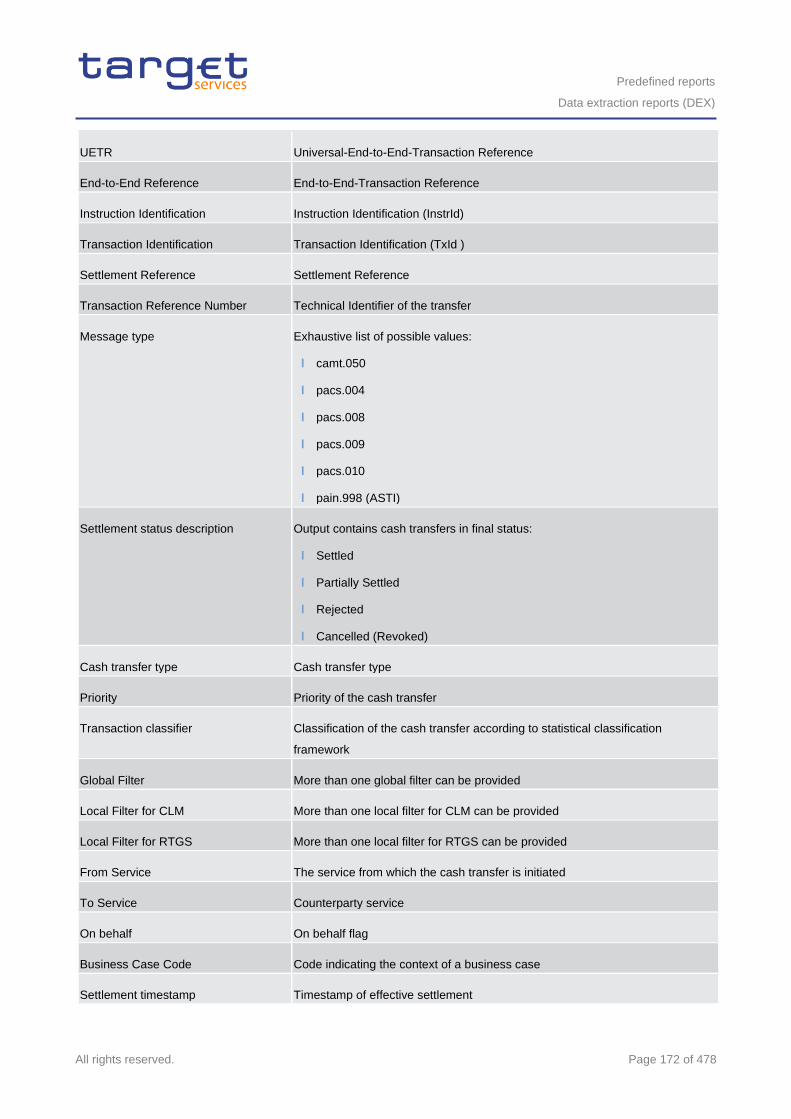
Predefined reports
Data extraction reports (DEX)
All rights reserved. Page 172 of 478
UETR Universal-End-to-End-Transaction Reference
End-to-End Reference End-to-End-Transaction Reference
Instruction Identification Instruction Identification (InstrId)
Transaction Identification Transaction Identification (TxId )
Settlement Reference Settlement Reference
Transaction Reference Number Technical Identifier of the transfer
Message type Exhaustive list of possible values:
l camt.050
l pacs.004
l pacs.008
l pacs.009
l pacs.010
l pain.998 (ASTI)
Settlement status description Output contains cash transfers in final status:
l Settled
l Partially Settled
l Rejected
l Cancelled (Revoked)
Cash transfer type Cash transfer type
Priority Priority of the cash transfer
Transaction classifier Classification of the cash transfer according to statistical classification
framework
Global Filter More than one global filter can be provided
Local Filter for CLM More than one local filter for CLM can be provided
Local Filter for RTGS More than one local filter for RTGS can be provided
From Service The service from which the cash transfer is initiated
To Service Counterparty service
On behalf On behalf flag
Business Case Code Code indicating the context of a business case
Settlement timestamp Timestamp of effective settlement
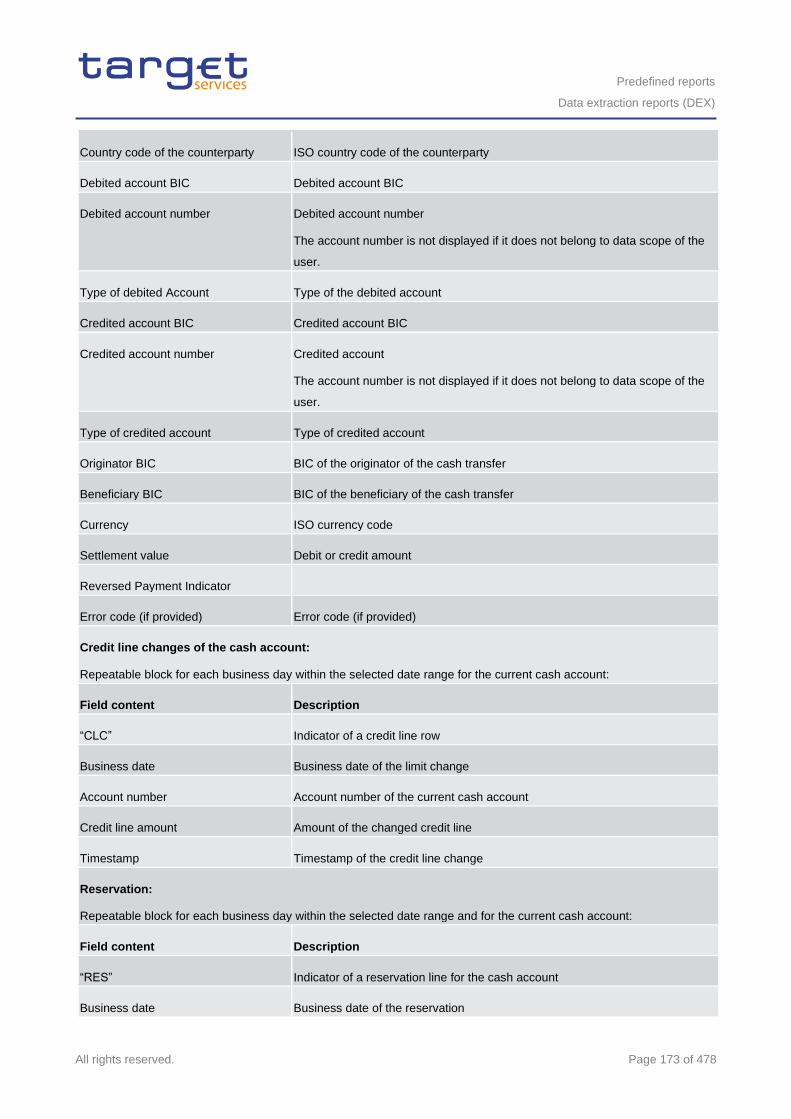
Predefined reports
Data extraction reports (DEX)
All rights reserved. Page 173 of 478
Country code of the counterparty ISO country code of the counterparty
Debited account BIC Debited account BIC
Debited account number Debited account number
The account number is not displayed if it does not belong to data scope of the
user.
Type of debited Account Type of the debited account
Credited account BIC Credited account BIC
Credited account number Credited account
The account number is not displayed if it does not belong to data scope of the
user.
Type of credited account Type of credited account
Originator BIC BIC of the originator of the cash transfer
Beneficiary BIC BIC of the beneficiary of the cash transfer
Currency ISO currency code
Settlement value Debit or credit amount
Reversed Payment Indicator
Error code (if provided) Error code (if provided)
Credit line changes of the cash account:
Repeatable block for each business day within the selected date range for the current cash account:
Field content Description
“CLC” Indicator of a credit line row
Business date Business date of the limit change
Account number Account number of the current cash account
Credit line amount Amount of the changed credit line
Timestamp Timestamp of the credit line change
Reservation:
Repeatable block for each business day within the selected date range and for the current cash account:
Field content Description
“RES” Indicator of a reservation line for the cash account
Business date Business date of the reservation
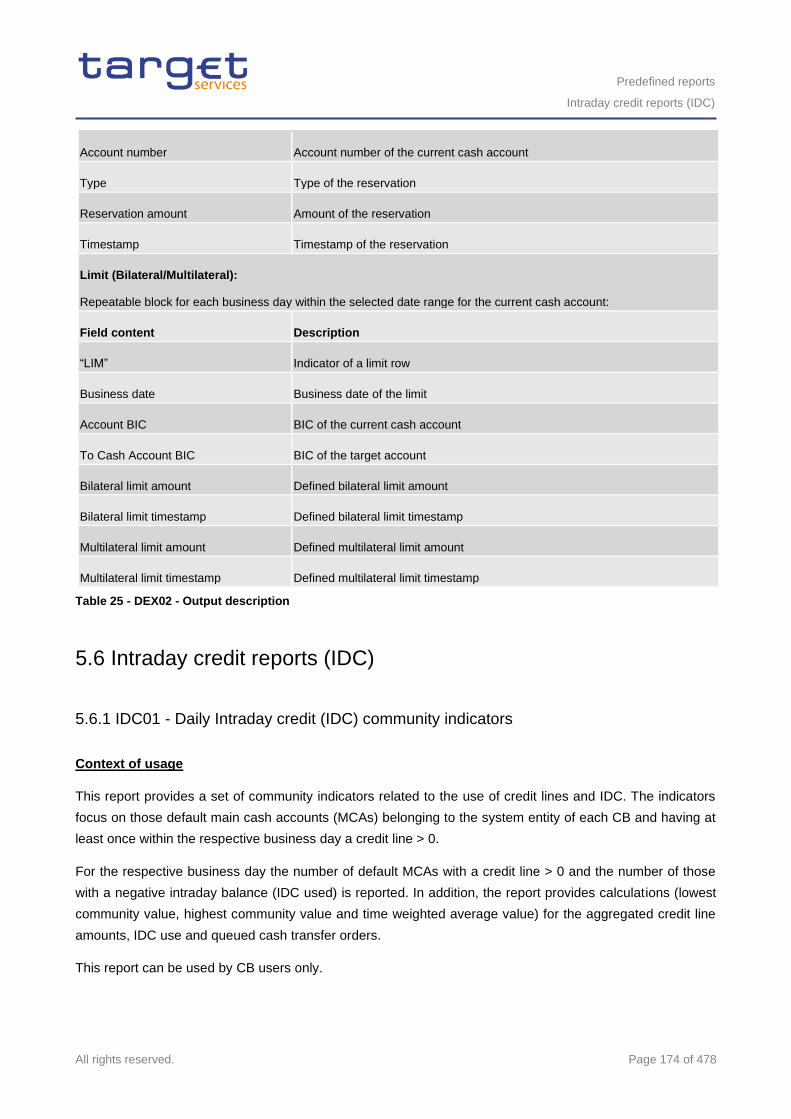
Predefined reports
Intraday credit reports (IDC)
All rights reserved. Page 174 of 478
Account number Account number of the current cash account
Type Type of the reservation
Reservation amount Amount of the reservation
Timestamp Timestamp of the reservation
Limit (Bilateral/Multilateral):
Repeatable block for each business day within the selected date range for the current cash account:
Field content Description
“LIM” Indicator of a limit row
Business date Business date of the limit
Account BIC BIC of the current cash account
To Cash Account BIC BIC of the target account
Bilateral limit amount Defined bilateral limit amount
Bilateral limit timestamp Defined bilateral limit timestamp
Multilateral limit amount Defined multilateral limit amount
Multilateral limit timestamp Defined multilateral limit timestamp
Table 25 - DEX02 - Output description
5.6 Intraday credit reports (IDC)
5.6.1 IDC01 - Daily Intraday credit (IDC) community indicators
Context of usage
This report provides a set of community indicators related to the use of credit lines and IDC. The indicators
focus on those default main cash accounts (MCAs) belonging to the system entity of each CB and having at
least once within the respective business day a credit line > 0.
For the respective business day the number of default MCAs with a credit line > 0 and the number of those
with a negative intraday balance (IDC used) is reported. In addition, the report provides calculations (lowest
community value, highest community value and time weighted average value) for the aggregated credit line
amounts, IDC use and queued cash transfer orders.
This report can be used by CB users only.
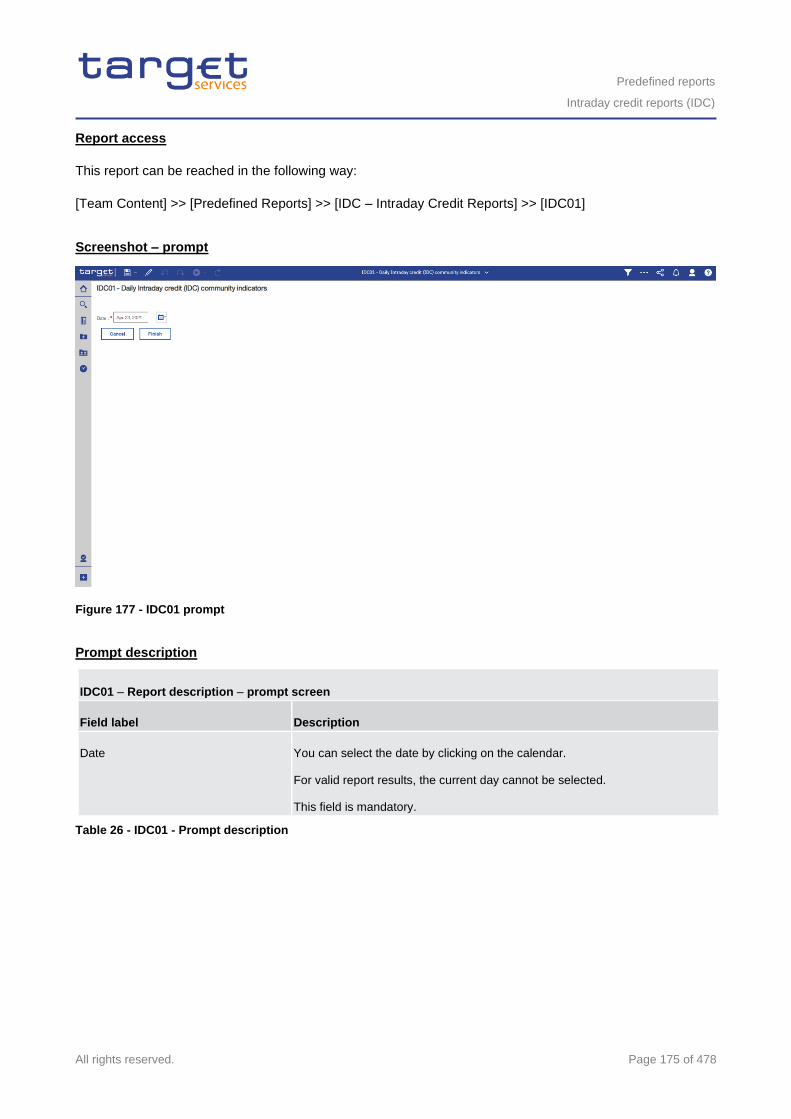
Predefined reports
Intraday credit reports (IDC)
All rights reserved. Page 175 of 478
Report access
This report can be reached in the following way:
[Team Content] >> [Predefined Reports] >> [IDC – Intraday Credit Reports] >> [IDC01]
Screenshot – prompt
Figure 177 - IDC01 prompt
Prompt description
IDC01 – Report description – prompt screen
Field label Description
Date You can select the date by clicking on the calendar.
For valid report results, the current day cannot be selected.
This field is mandatory.
Table 26 - IDC01 - Prompt description
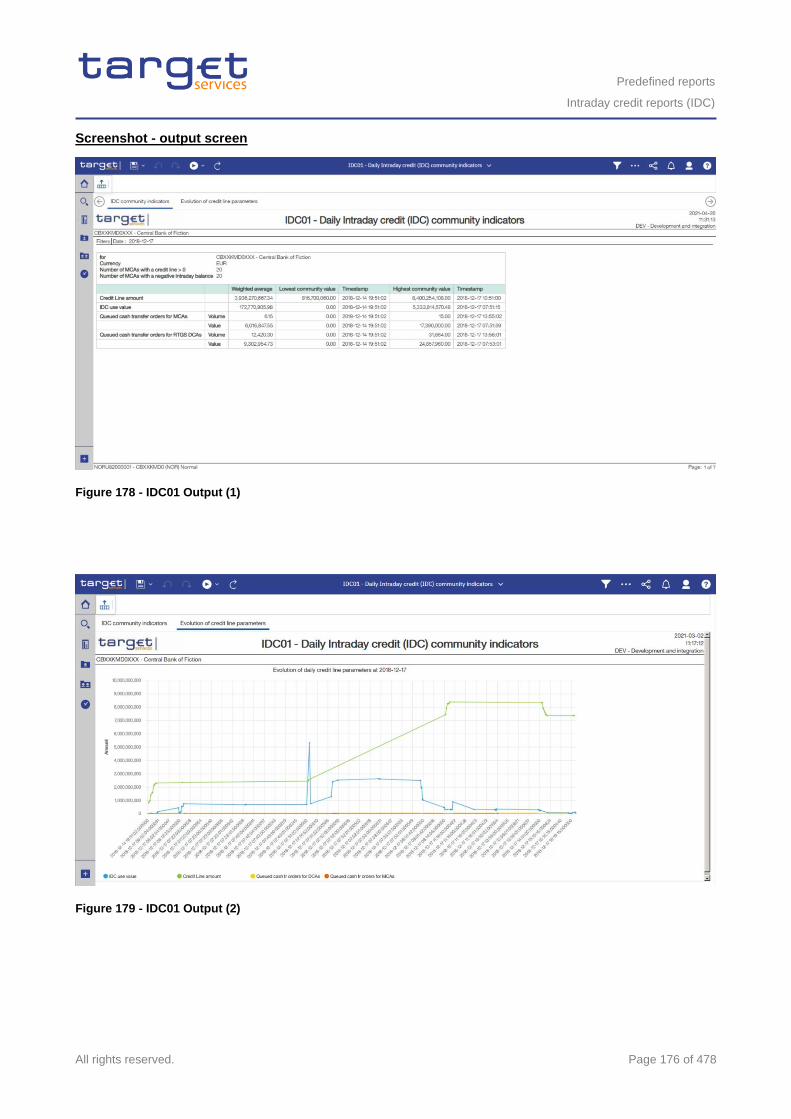
Predefined reports
Intraday credit reports (IDC)
All rights reserved. Page 176 of 478
Screenshot - output screen
Figure 178 - IDC01 Output (1)
Figure 179 - IDC01 Output (2)
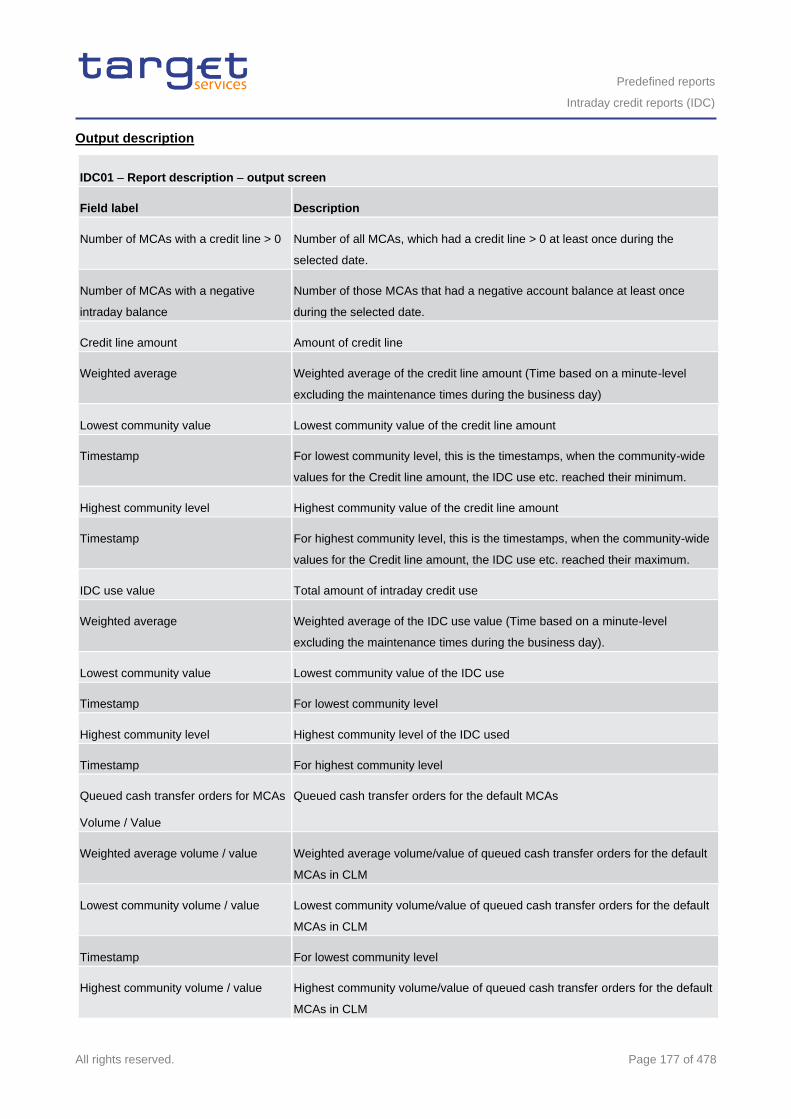
Predefined reports
Intraday credit reports (IDC)
All rights reserved. Page 177 of 478
Output description
IDC01 – Report description – output screen
Field label Description
Number of MCAs with a credit line > 0 Number of all MCAs, which had a credit line > 0 at least once during the
selected date.
Number of MCAs with a negative
intraday balance
Number of those MCAs that had a negative account balance at least once
during the selected date.
Credit line amount Amount of credit line
Weighted average Weighted average of the credit line amount (Time based on a minute-level
excluding the maintenance times during the business day)
Lowest community value Lowest community value of the credit line amount
Timestamp For lowest community level, this is the timestamps, when the community-wide
values for the Credit line amount, the IDC use etc. reached their minimum.
Highest community level Highest community value of the credit line amount
Timestamp For highest community level, this is the timestamps, when the community-wide
values for the Credit line amount, the IDC use etc. reached their maximum.
IDC use value Total amount of intraday credit use
Weighted average Weighted average of the IDC use value (Time based on a minute-level
excluding the maintenance times during the business day).
Lowest community value Lowest community value of the IDC use
Timestamp For lowest community level
Highest community level Highest community level of the IDC used
Timestamp For highest community level
Queued cash transfer orders for MCAs
Volume / Value
Queued cash transfer orders for the default MCAs
Weighted average volume / value Weighted average volume/value of queued cash transfer orders for the default
MCAs in CLM
Lowest community volume / value Lowest community volume/value of queued cash transfer orders for the default
MCAs in CLM
Timestamp For lowest community level
Highest community volume / value Highest community volume/value of queued cash transfer orders for the default
MCAs in CLM
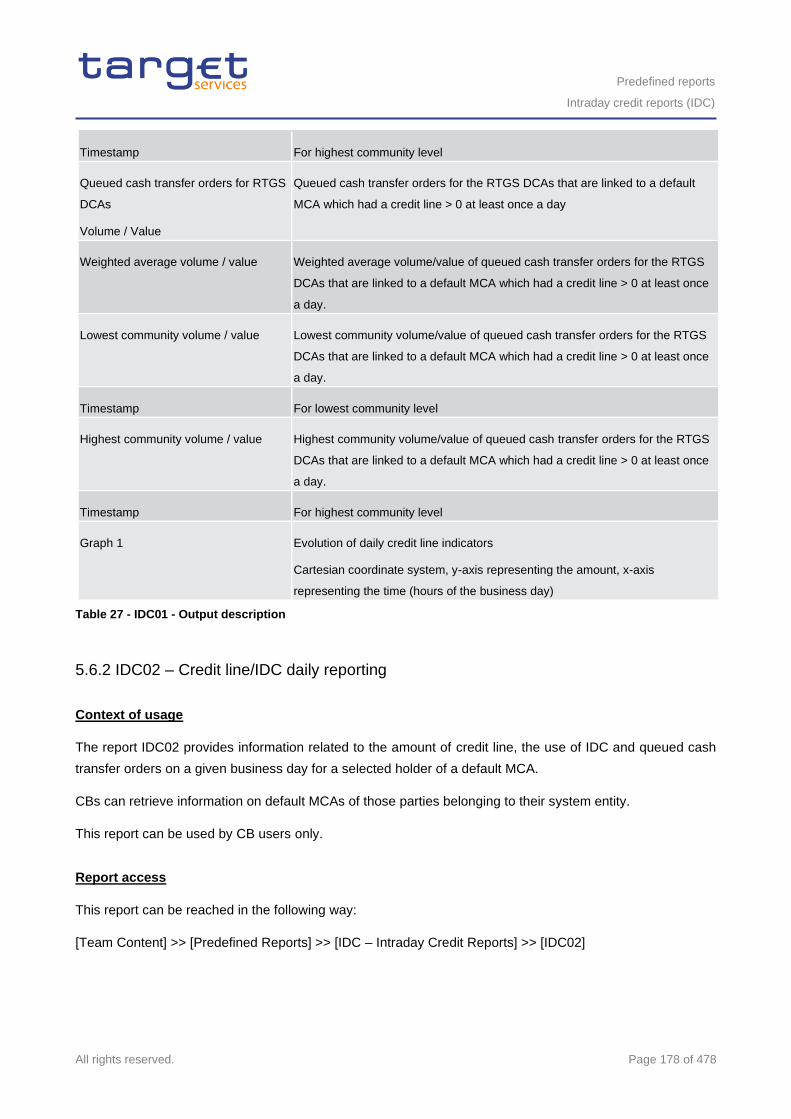
Predefined reports
Intraday credit reports (IDC)
All rights reserved. Page 178 of 478
Timestamp For highest community level
Queued cash transfer orders for RTGS
DCAs
Volume / Value
Queued cash transfer orders for the RTGS DCAs that are linked to a default
MCA which had a credit line > 0 at least once a day
Weighted average volume / value Weighted average volume/value of queued cash transfer orders for the RTGS
DCAs that are linked to a default MCA which had a credit line > 0 at least once
a day.
Lowest community volume / value Lowest community volume/value of queued cash transfer orders for the RTGS
DCAs that are linked to a default MCA which had a credit line > 0 at least once
a day.
Timestamp For lowest community level
Highest community volume / value Highest community volume/value of queued cash transfer orders for the RTGS
DCAs that are linked to a default MCA which had a credit line > 0 at least once
a day.
Timestamp For highest community level
Graph 1 Evolution of daily credit line indicators
Cartesian coordinate system, y-axis representing the amount, x-axis
representing the time (hours of the business day)
Table 27 - IDC01 - Output description
5.6.2 IDC02 – Credit line/IDC daily reporting
Context of usage
The report IDC02 provides information related to the amount of credit line, the use of IDC and queued cash
transfer orders on a given business day for a selected holder of a default MCA.
CBs can retrieve information on default MCAs of those parties belonging to their system entity.
This report can be used by CB users only.
Report access
This report can be reached in the following way:
[Team Content] >> [Predefined Reports] >> [IDC – Intraday Credit Reports] >> [IDC02]
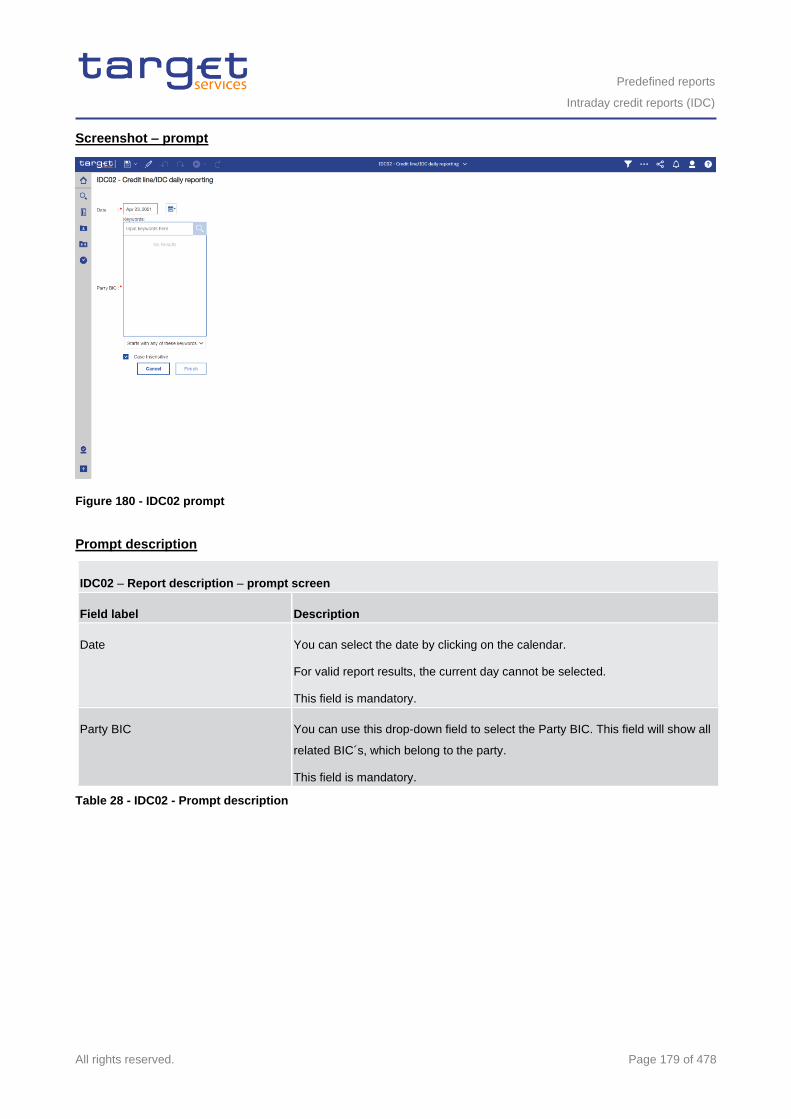
Predefined reports
Intraday credit reports (IDC)
All rights reserved. Page 179 of 478
Screenshot – prompt
Figure 180 - IDC02 prompt
Prompt description
IDC02 – Report description – prompt screen
Field label Description
Date You can select the date by clicking on the calendar.
For valid report results, the current day cannot be selected.
This field is mandatory.
Party BIC You can use this drop-down field to select the Party BIC. This field will show all
related BIC´s, which belong to the party.
This field is mandatory.
Table 28 - IDC02 - Prompt description
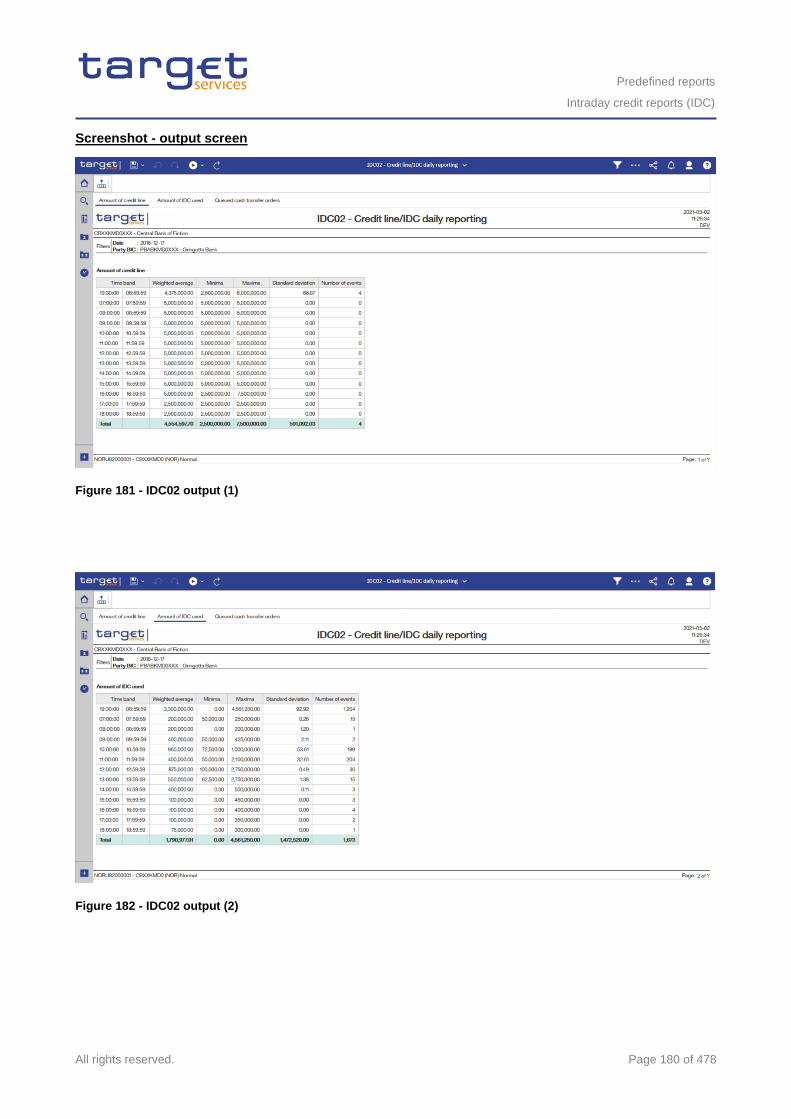
Predefined reports
Intraday credit reports (IDC)
All rights reserved. Page 180 of 478
Screenshot - output screen
Figure 181 - IDC02 output (1)
Figure 182 - IDC02 output (2)
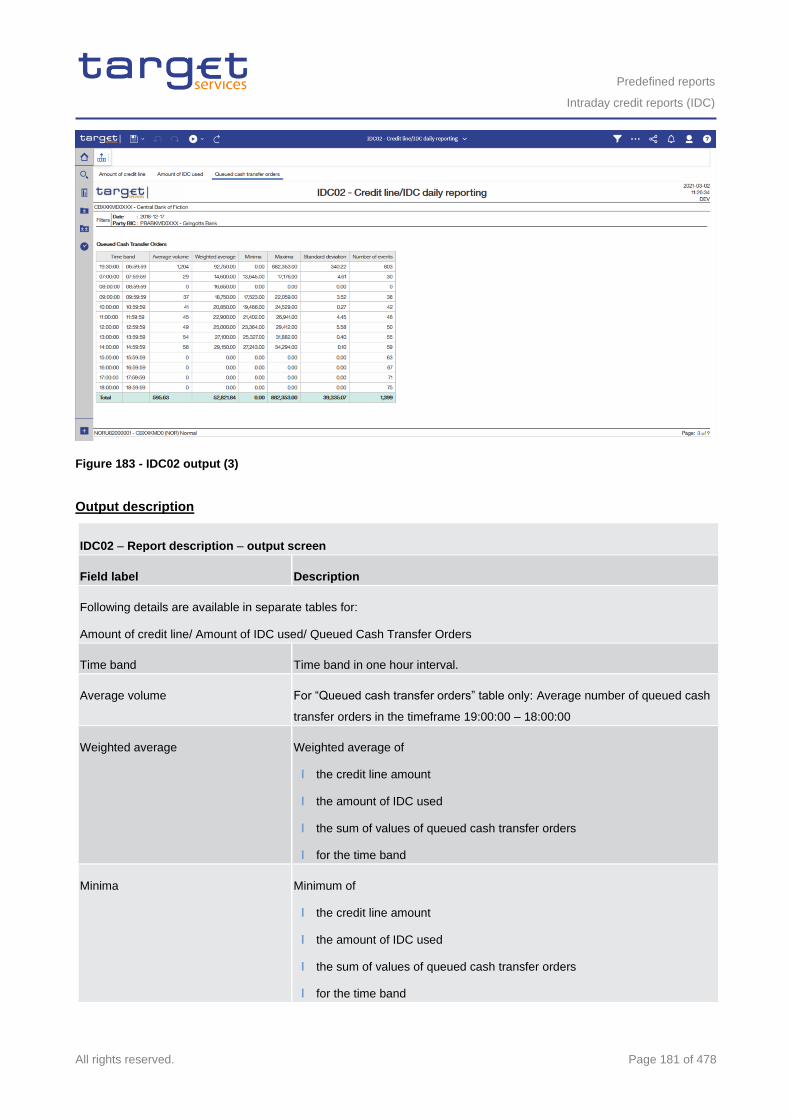
Predefined reports
Intraday credit reports (IDC)
All rights reserved. Page 181 of 478
Figure 183 - IDC02 output (3)
Output description
IDC02 – Report description – output screen
Field label Description
Following details are available in separate tables for:
Amount of credit line/ Amount of IDC used/ Queued Cash Transfer Orders
Time band Time band in one hour interval.
Average volume For “Queued cash transfer orders” table only: Average number of queued cash
transfer orders in the timeframe 19:00:00 – 18:00:00
Weighted average Weighted average of
l the credit line amount
l the amount of IDC used
l the sum of values of queued cash transfer orders
l for the time band
Minima Minimum of
l the credit line amount
l the amount of IDC used
l the sum of values of queued cash transfer orders
l for the time band
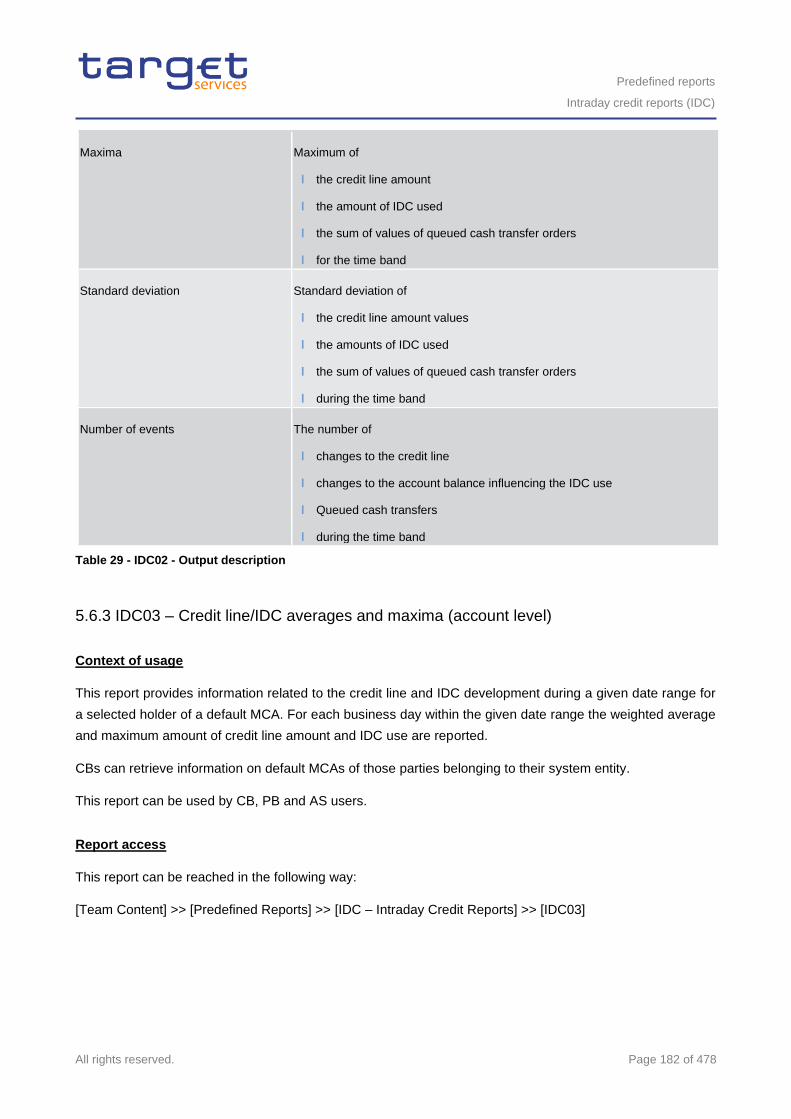
Predefined reports
Intraday credit reports (IDC)
All rights reserved. Page 182 of 478
Maxima Maximum of
l the credit line amount
l the amount of IDC used
l the sum of values of queued cash transfer orders
l for the time band
Standard deviation Standard deviation of
l the credit line amount values
l the amounts of IDC used
l the sum of values of queued cash transfer orders
l during the time band
Number of events The number of
l changes to the credit line
l changes to the account balance influencing the IDC use
l Queued cash transfers
l during the time band
Table 29 - IDC02 - Output description
5.6.3 IDC03 – Credit line/IDC averages and maxima (account level)
Context of usage
This report provides information related to the credit line and IDC development during a given date range for
a selected holder of a default MCA. For each business day within the given date range the weighted average
and maximum amount of credit line amount and IDC use are reported.
CBs can retrieve information on default MCAs of those parties belonging to their system entity.
This report can be used by CB, PB and AS users.
Report access
This report can be reached in the following way:
[Team Content] >> [Predefined Reports] >> [IDC – Intraday Credit Reports] >> [IDC03]
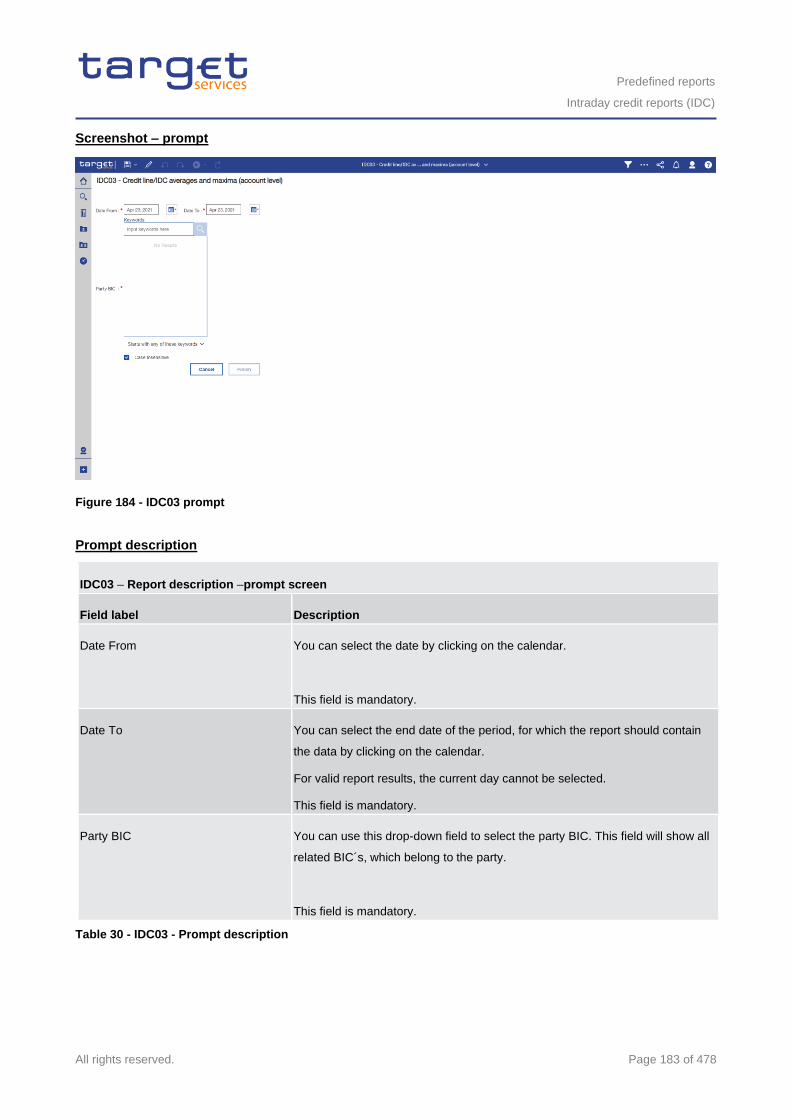
Predefined reports
Intraday credit reports (IDC)
All rights reserved. Page 183 of 478
Screenshot – prompt
Figure 184 - IDC03 prompt
Prompt description
IDC03 – Report description –prompt screen
Field label Description
Date From You can select the date by clicking on the calendar.
This field is mandatory.
Date To You can select the end date of the period, for which the report should contain
the data by clicking on the calendar.
For valid report results, the current day cannot be selected.
This field is mandatory.
Party BIC You can use this drop-down field to select the party BIC. This field will show all
related BIC´s, which belong to the party.
This field is mandatory.
Table 30 - IDC03 - Prompt description
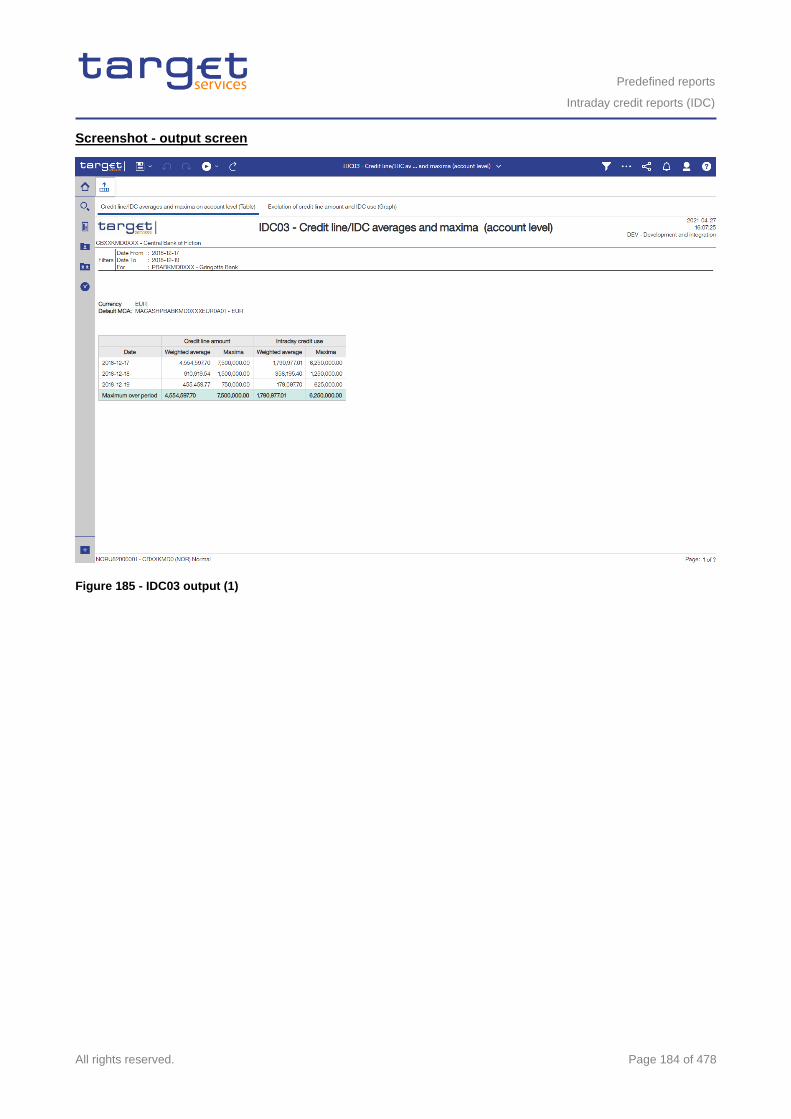
Predefined reports
Intraday credit reports (IDC)
All rights reserved. Page 184 of 478
Screenshot - output screen
Figure 185 - IDC03 output (1)
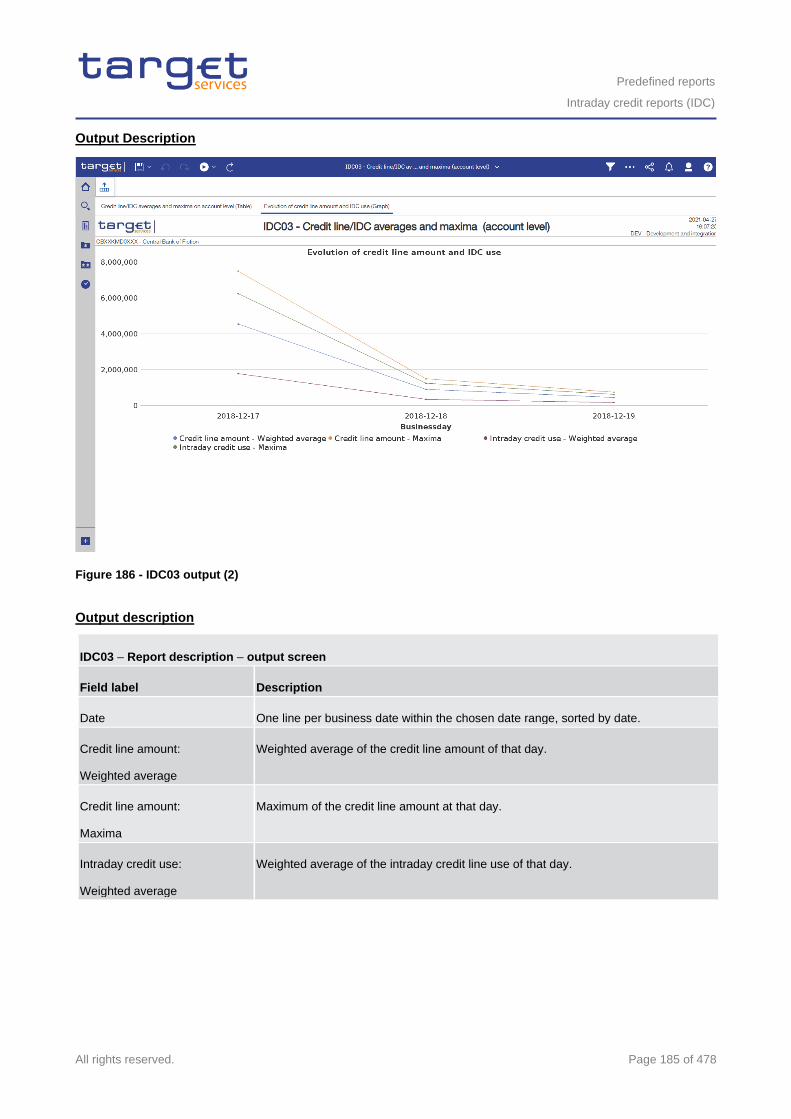
Predefined reports
Intraday credit reports (IDC)
All rights reserved. Page 185 of 478
Output Description
Figure 186 - IDC03 output (2)
Output description
IDC03 – Report description – output screen
Field label Description
Date One line per business date within the chosen date range, sorted by date.
Credit line amount:
Weighted average
Weighted average of the credit line amount of that day.
Credit line amount:
Maxima
Maximum of the credit line amount at that day.
Intraday credit use:
Weighted average
Weighted average of the intraday credit line use of that day.
Predefined reports
Intraday credit reports (IDC)
All rights reserved. Page 186 of 478
Intraday credit use:
Maxima
Maximum of the intraday credit line use at that day.
Maximum over period Highest amount of the respective column.
Graph 1 Evolution of credit line amount and IDC use
Cartesian coordinate system, y-axis representing the amount, x-axis representing the
date.
Show four lines in different colours representing the values in the table on previous
page.
Table 31 - IDC03 - Output description
5.6.4 IDC04 – Credit line/IDC averages and maxima (community level)
Context of usage
This report provides aggregated information related to the credit line and IDC development during a given date
range at community level. For each business day within the given date range the weighted average and
maximum amount of credit line amount and IDC use (aggregated Figures at community level) are reported.
CBs can retrieve aggregated information on parties belonging to their system entity.
This report can be used by CB users only.
Report access
This report can be reached in the following way:
[Team Content] >> [Predefined Reports] >> [IDC – Intraday Credit Reports] >> [IDC04]
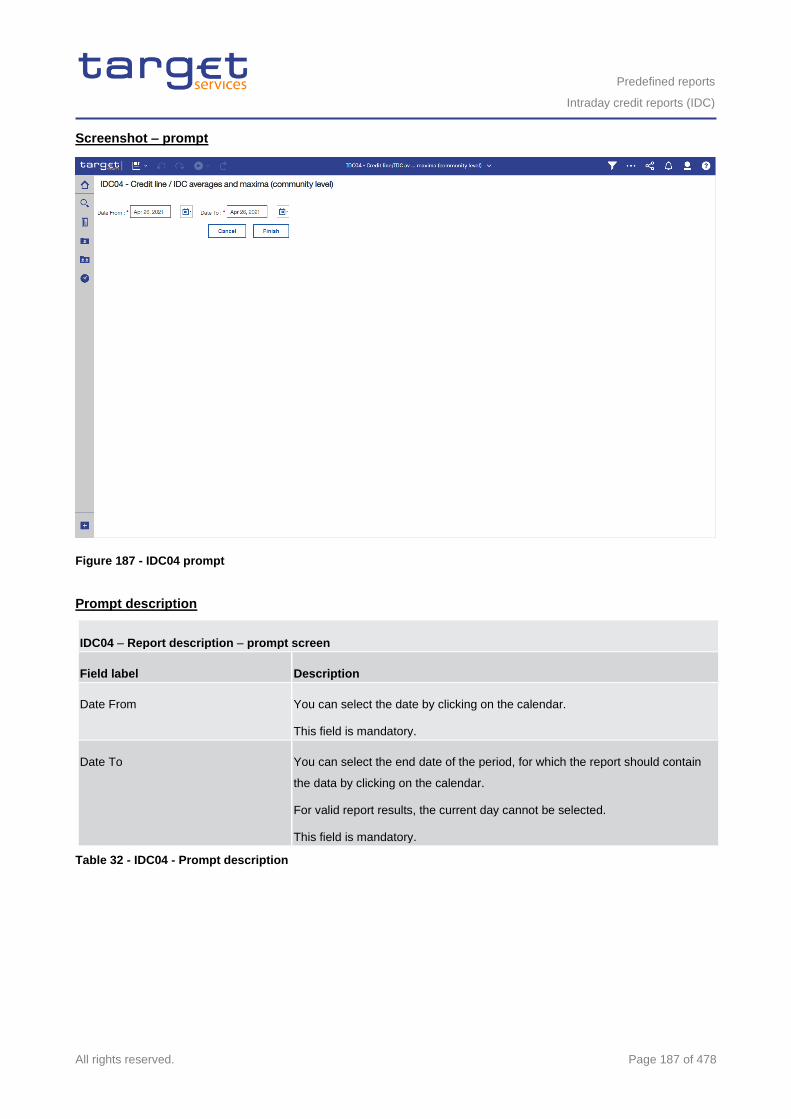
Predefined reports
Intraday credit reports (IDC)
All rights reserved. Page 187 of 478
Screenshot – prompt
Figure 187 - IDC04 prompt
Prompt description
IDC04 – Report description – prompt screen
Field label Description
Date From You can select the date by clicking on the calendar.
This field is mandatory.
Date To You can select the end date of the period, for which the report should contain
the data by clicking on the calendar.
For valid report results, the current day cannot be selected.
This field is mandatory.
Table 32 - IDC04 - Prompt description
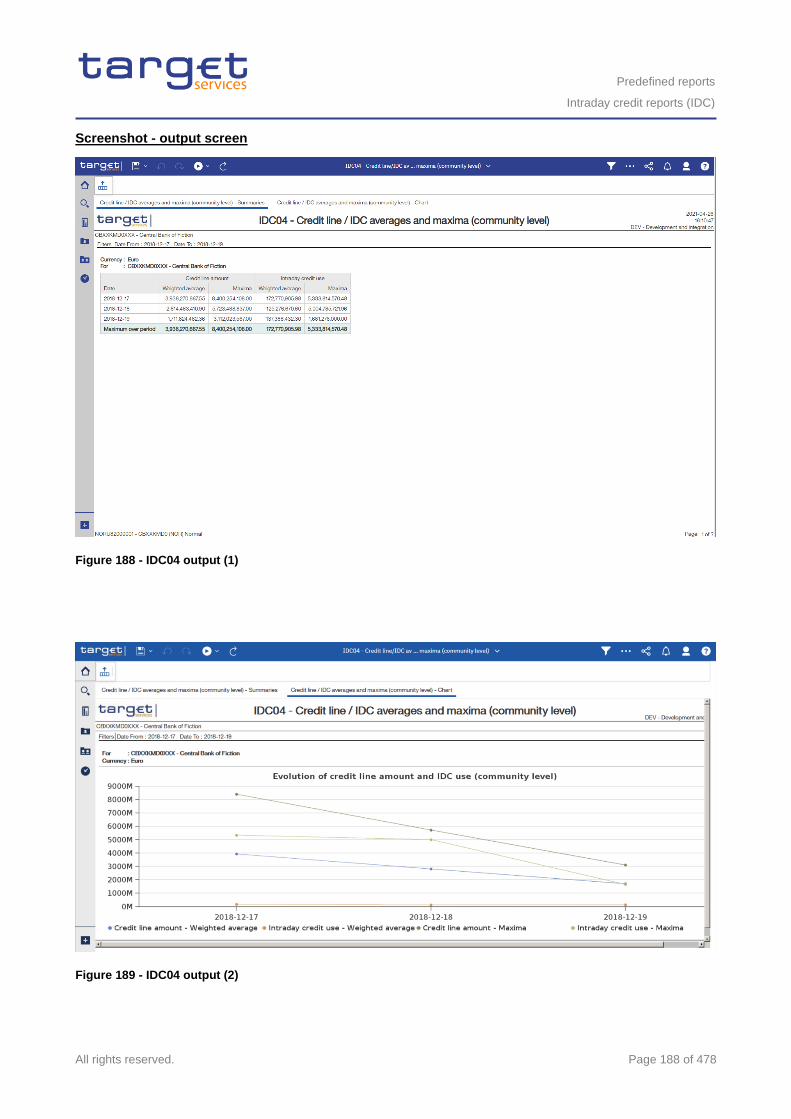
Predefined reports
Intraday credit reports (IDC)
All rights reserved. Page 188 of 478
Screenshot - output screen
Figure 188 - IDC04 output (1)
Figure 189 - IDC04 output (2)
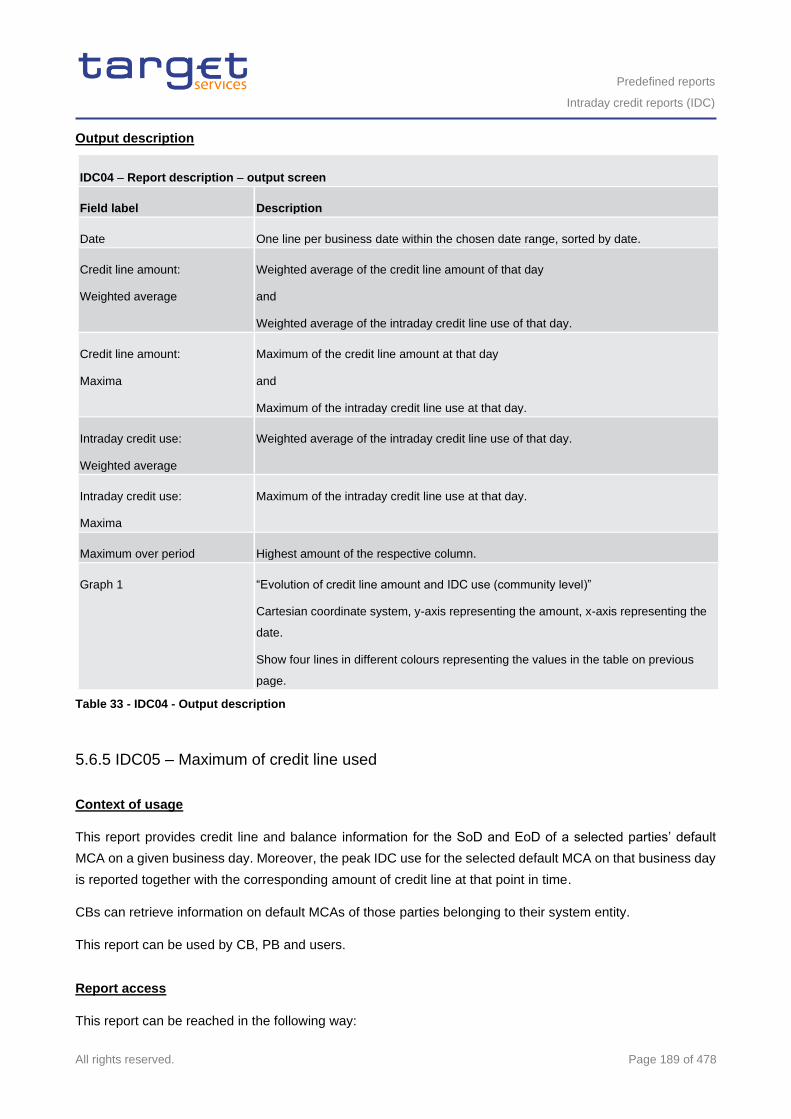
Predefined reports
Intraday credit reports (IDC)
All rights reserved. Page 189 of 478
Output description
IDC04 – Report description – output screen
Field label Description
Date One line per business date within the chosen date range, sorted by date.
Credit line amount:
Weighted average
Weighted average of the credit line amount of that day
and
Weighted average of the intraday credit line use of that day.
Credit line amount:
Maxima
Maximum of the credit line amount at that day
and
Maximum of the intraday credit line use at that day.
Intraday credit use:
Weighted average
Weighted average of the intraday credit line use of that day.
Intraday credit use:
Maxima
Maximum of the intraday credit line use at that day.
Maximum over period Highest amount of the respective column.
Graph 1 “Evolution of credit line amount and IDC use (community level)”
Cartesian coordinate system, y-axis representing the amount, x-axis representing the
date.
Show four lines in different colours representing the values in the table on previous
page.
Table 33 - IDC04 - Output description
5.6.5 IDC05 – Maximum of credit line used
Context of usage
This report provides credit line and balance information for the SoD and EoD of a selected parties’ default
MCA on a given business day. Moreover, the peak IDC use for the selected default MCA on that business day
is reported together with the corresponding amount of credit line at that point in time.
CBs can retrieve information on default MCAs of those parties belonging to their system entity.
This report can be used by CB, PB and users.
Report access
This report can be reached in the following way:
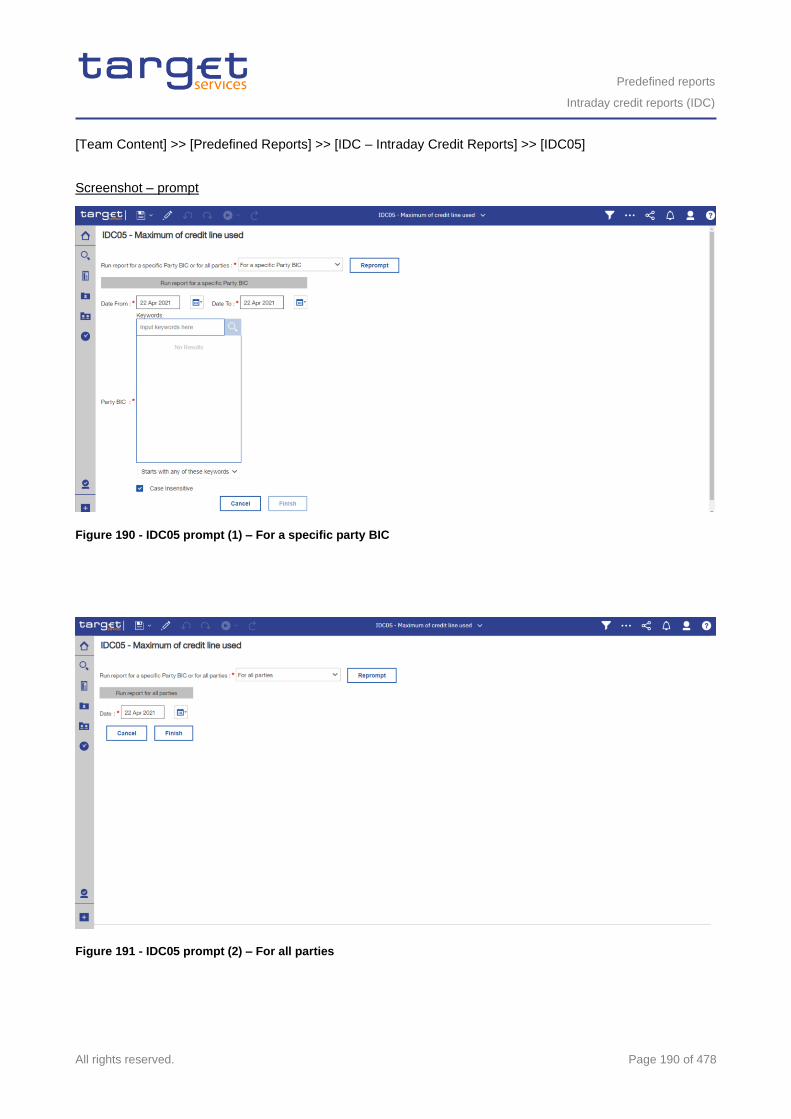
Predefined reports
Intraday credit reports (IDC)
All rights reserved. Page 190 of 478
[Team Content] >> [Predefined Reports] >> [IDC – Intraday Credit Reports] >> [IDC05]
Screenshot – prompt
Figure 190 - IDC05 prompt (1) – For a specific party BIC
Figure 191 - IDC05 prompt (2) – For all parties
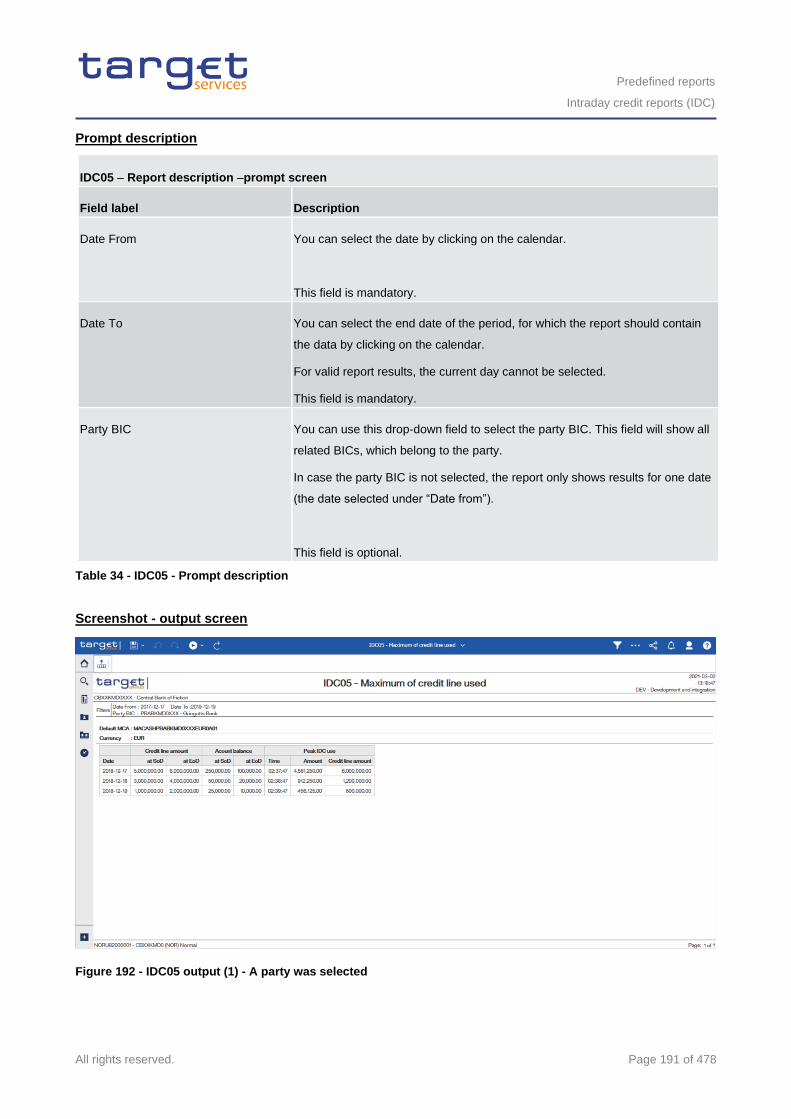
Predefined reports
Intraday credit reports (IDC)
All rights reserved. Page 191 of 478
Prompt description
IDC05 – Report description –prompt screen
Field label Description
Date From You can select the date by clicking on the calendar.
This field is mandatory.
Date To You can select the end date of the period, for which the report should contain
the data by clicking on the calendar.
For valid report results, the current day cannot be selected.
This field is mandatory.
Party BIC You can use this drop-down field to select the party BIC. This field will show all
related BICs, which belong to the party.
In case the party BIC is not selected, the report only shows results for one date
(the date selected under “Date from”).
This field is optional.
Table 34 - IDC05 - Prompt description
Screenshot - output screen
Figure 192 - IDC05 output (1) - A party was selected
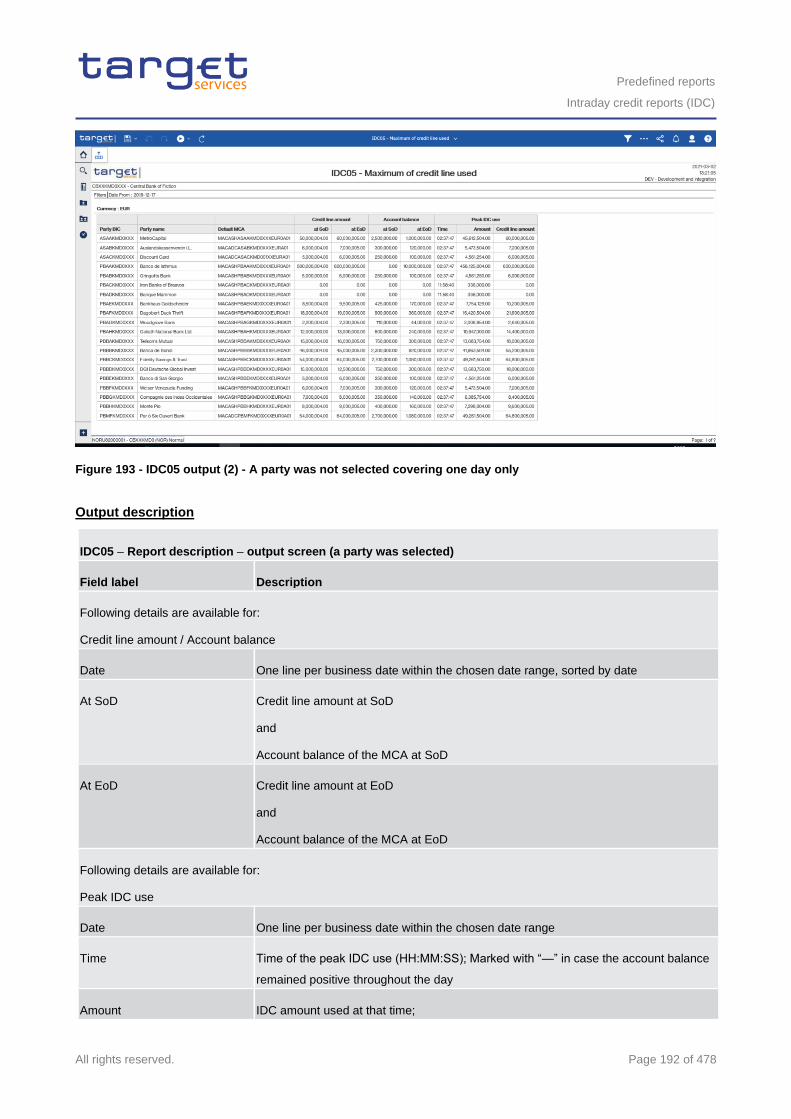
Predefined reports
Intraday credit reports (IDC)
All rights reserved. Page 192 of 478
Figure 193 - IDC05 output (2) - A party was not selected covering one day only
Output description
IDC05 – Report description – output screen (a party was selected)
Field label Description
Following details are available for:
Credit line amount / Account balance
Date One line per business date within the chosen date range, sorted by date
At SoD Credit line amount at SoD
and
Account balance of the MCA at SoD
At EoD Credit line amount at EoD
and
Account balance of the MCA at EoD
Following details are available for:
Peak IDC use
Date One line per business date within the chosen date range
Time Time of the peak IDC use (HH:MM:SS); Marked with “—” in case the account balance
remained positive throughout the day
Amount IDC amount used at that time;
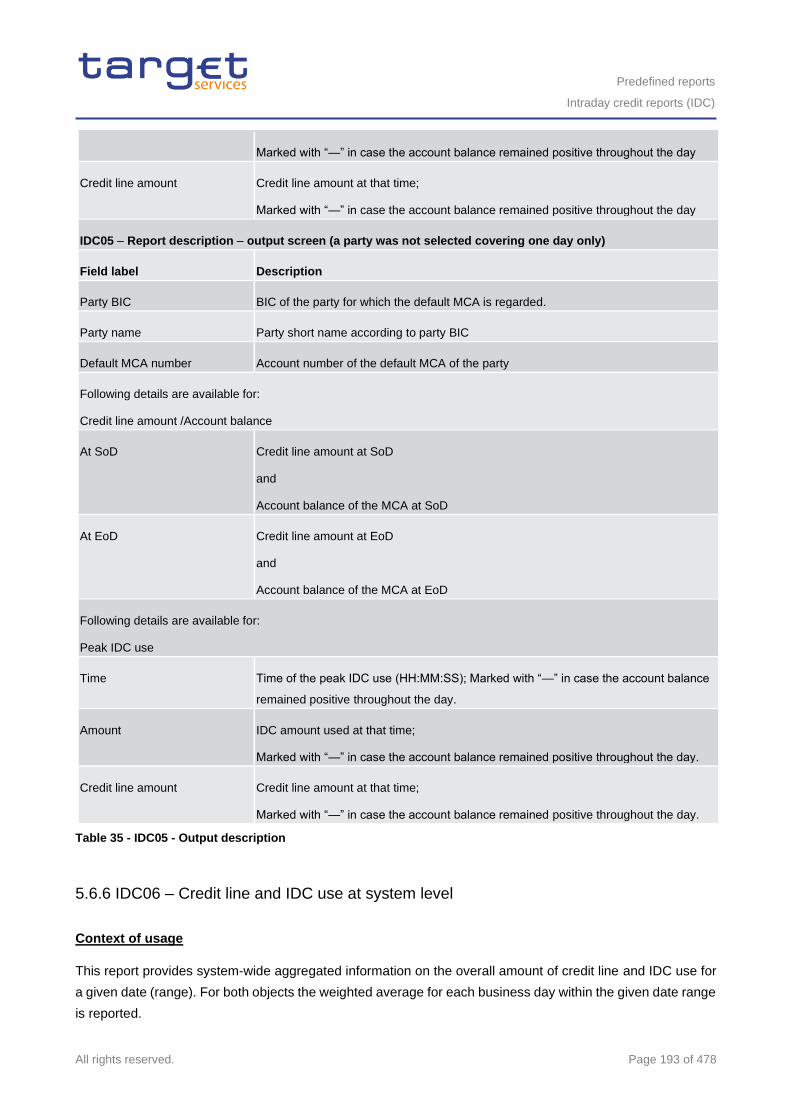
Predefined reports
Intraday credit reports (IDC)
All rights reserved. Page 193 of 478
Marked with “—” in case the account balance remained positive throughout the day
Credit line amount Credit line amount at that time;
Marked with “—” in case the account balance remained positive throughout the day
IDC05 – Report description – output screen (a party was not selected covering one day only)
Field label Description
Party BIC BIC of the party for which the default MCA is regarded.
Party name Party short name according to party BIC
Default MCA number Account number of the default MCA of the party
Following details are available for:
Credit line amount /Account balance
At SoD Credit line amount at SoD
and
Account balance of the MCA at SoD
At EoD Credit line amount at EoD
and
Account balance of the MCA at EoD
Following details are available for:
Peak IDC use
Time Time of the peak IDC use (HH:MM:SS); Marked with “—” in case the account balance
remained positive throughout the day.
Amount IDC amount used at that time;
Marked with “—” in case the account balance remained positive throughout the day.
Credit line amount Credit line amount at that time;
Marked with “—” in case the account balance remained positive throughout the day.
Table 35 - IDC05 - Output description
5.6.6 IDC06 – Credit line and IDC use at system level
Context of usage
This report provides system-wide aggregated information on the overall amount of credit line and IDC use for
a given date (range). For both objects the weighted average for each business day within the given date range
is reported.
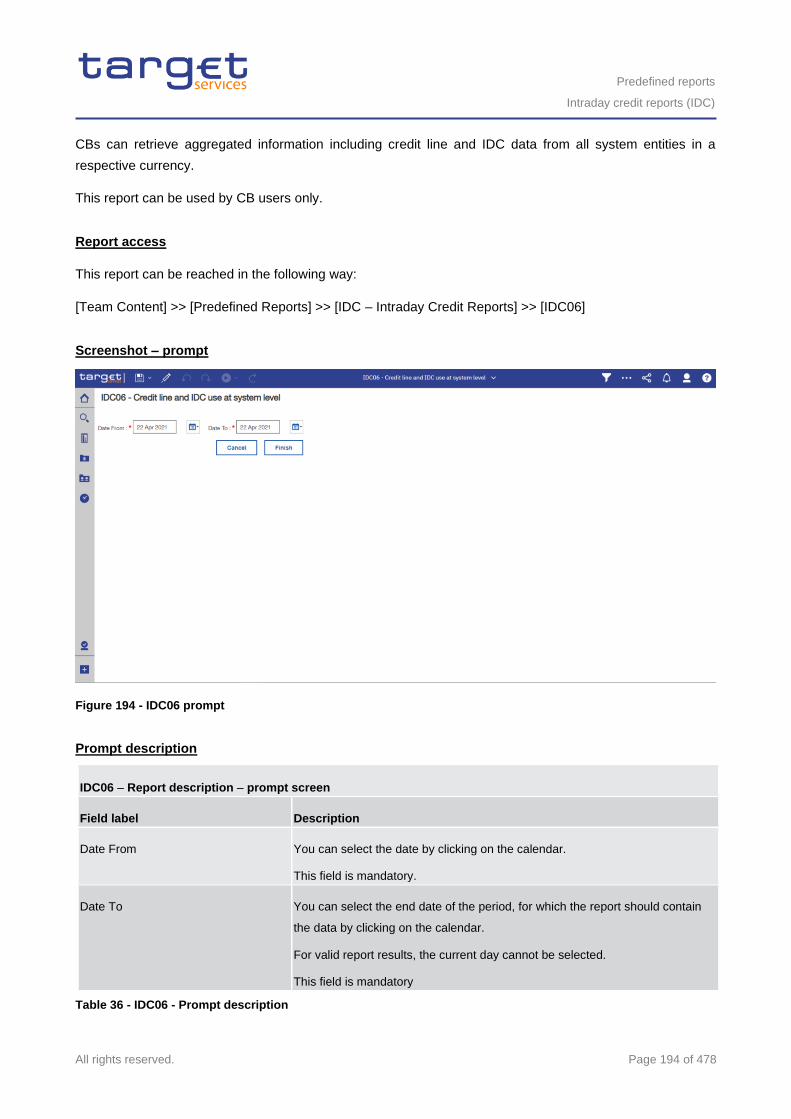
Predefined reports
Intraday credit reports (IDC)
All rights reserved. Page 194 of 478
CBs can retrieve aggregated information including credit line and IDC data from all system entities in a
respective currency.
This report can be used by CB users only.
Report access
This report can be reached in the following way:
[Team Content] >> [Predefined Reports] >> [IDC – Intraday Credit Reports] >> [IDC06]
Screenshot – prompt
Figure 194 - IDC06 prompt
Prompt description
IDC06 – Report description – prompt screen
Field label Description
Date From You can select the date by clicking on the calendar.
This field is mandatory.
Date To You can select the end date of the period, for which the report should contain
the data by clicking on the calendar.
For valid report results, the current day cannot be selected.
This field is mandatory
Table 36 - IDC06 - Prompt description
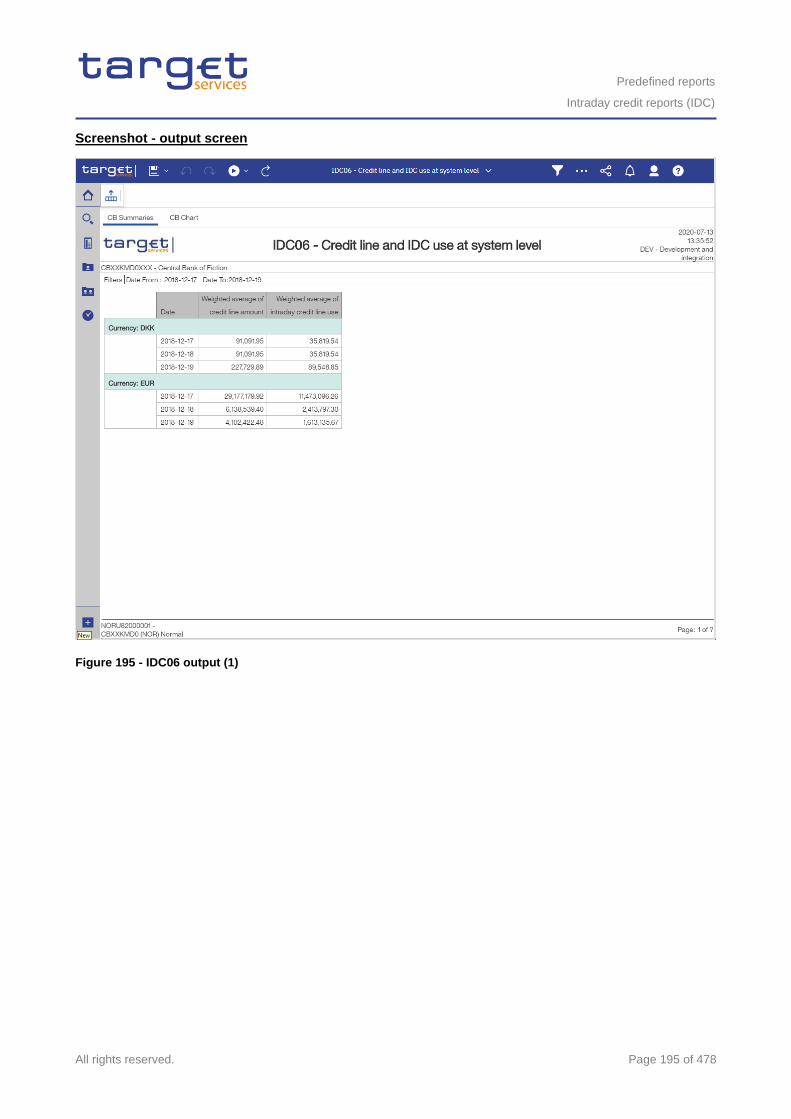
Predefined reports
Intraday credit reports (IDC)
All rights reserved. Page 195 of 478
Screenshot - output screen
Figure 195 - IDC06 output (1)
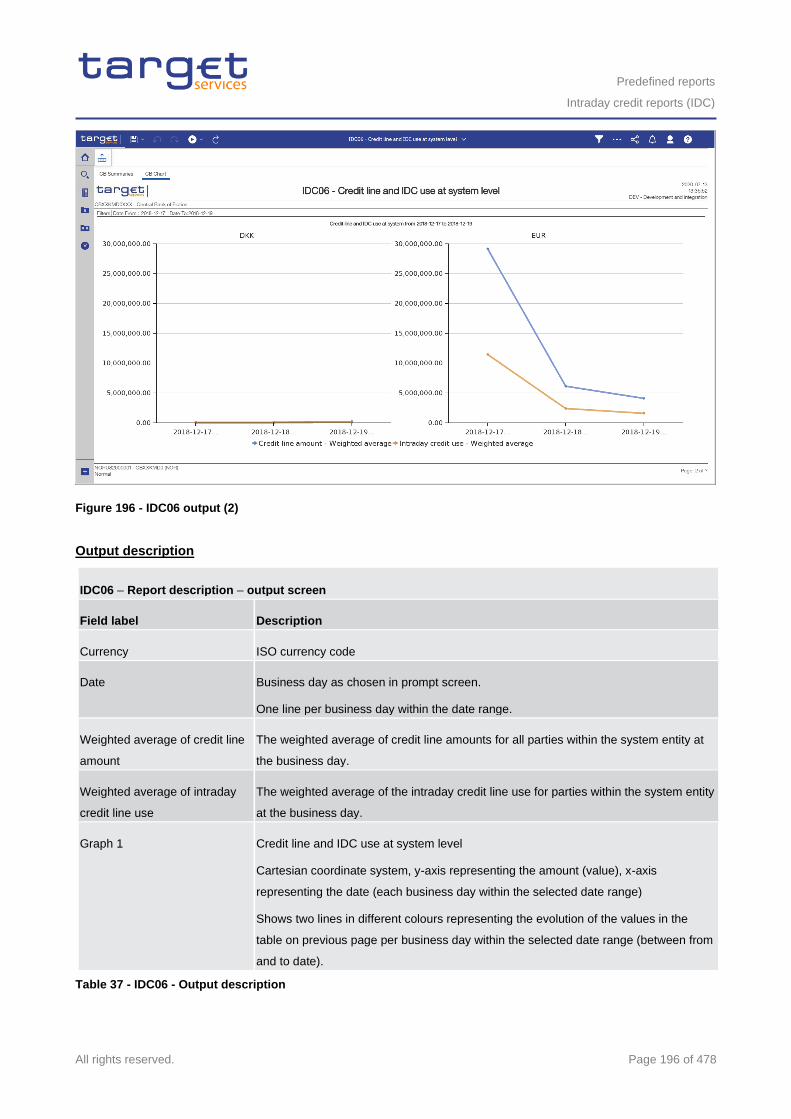
Predefined reports
Intraday credit reports (IDC)
All rights reserved. Page 196 of 478
Figure 196 - IDC06 output (2)
Output description
IDC06 – Report description – output screen
Field label Description
Currency ISO currency code
Date Business day as chosen in prompt screen.
One line per business day within the date range.
Weighted average of credit line
amount
The weighted average of credit line amounts for all parties within the system entity at
the business day.
Weighted average of intraday
credit line use
The weighted average of the intraday credit line use for parties within the system entity
at the business day.
Graph 1 Credit line and IDC use at system level
Cartesian coordinate system, y-axis representing the amount (value), x-axis
representing the date (each business day within the selected date range)
Shows two lines in different colours representing the evolution of the values in the
table on previous page per business day within the selected date range (between from
and to date).
Table 37 - IDC06 - Output description
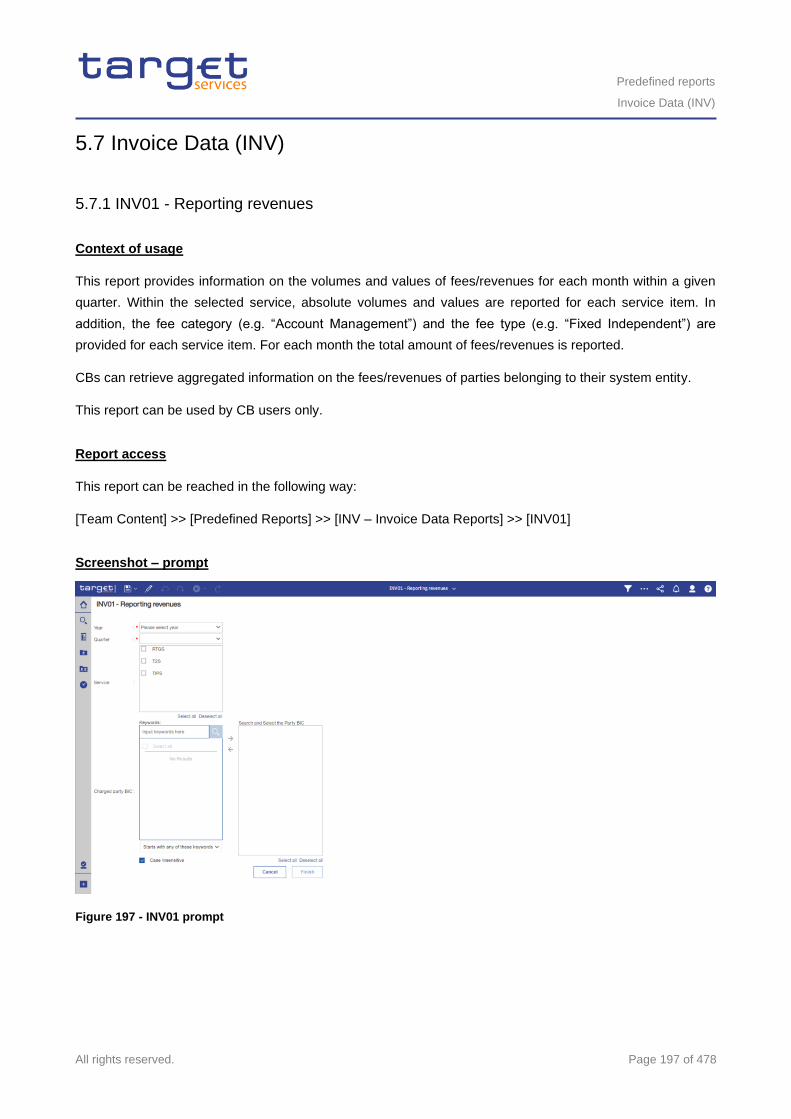
Predefined reports
Invoice Data (INV)
All rights reserved. Page 197 of 478
5.7 Invoice Data (INV)
5.7.1 INV01 - Reporting revenues
Context of usage
This report provides information on the volumes and values of fees/revenues for each month within a given
quarter. Within the selected service, absolute volumes and values are reported for each service item. In
addition, the fee category (e.g. “Account Management”) and the fee type (e.g. “Fixed Independent”) are
provided for each service item. For each month the total amount of fees/revenues is reported.
CBs can retrieve aggregated information on the fees/revenues of parties belonging to their system entity.
This report can be used by CB users only.
Report access
This report can be reached in the following way:
[Team Content] >> [Predefined Reports] >> [INV – Invoice Data Reports] >> [INV01]
Screenshot – prompt
Figure 197 - INV01 prompt
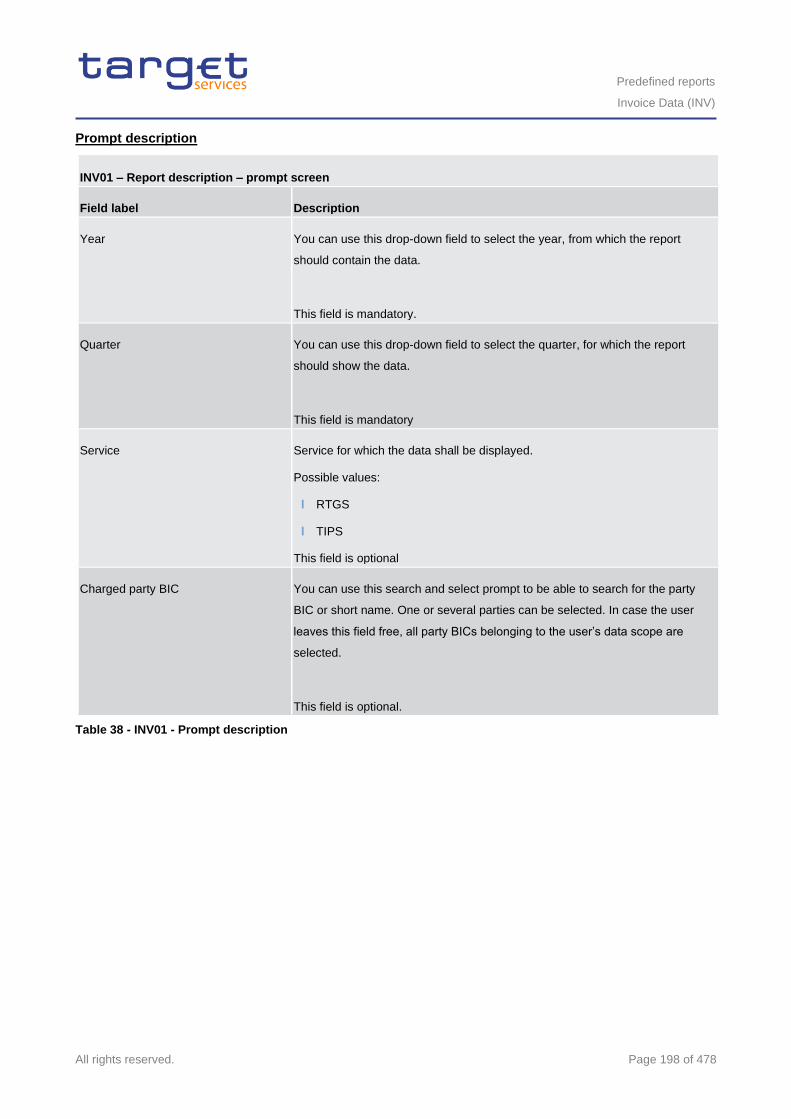
Predefined reports
Invoice Data (INV)
All rights reserved. Page 198 of 478
Prompt description
INV01 – Report description – prompt screen
Field label Description
Year You can use this drop-down field to select the year, from which the report
should contain the data.
This field is mandatory.
Quarter You can use this drop-down field to select the quarter, for which the report
should show the data.
This field is mandatory
Service Service for which the data shall be displayed.
Possible values:
l RTGS
l TIPS
This field is optional
Charged party BIC You can use this search and select prompt to be able to search for the party
BIC or short name. One or several parties can be selected. In case the user
leaves this field free, all party BICs belonging to the user’s data scope are
selected.
This field is optional.
Table 38 - INV01 - Prompt description
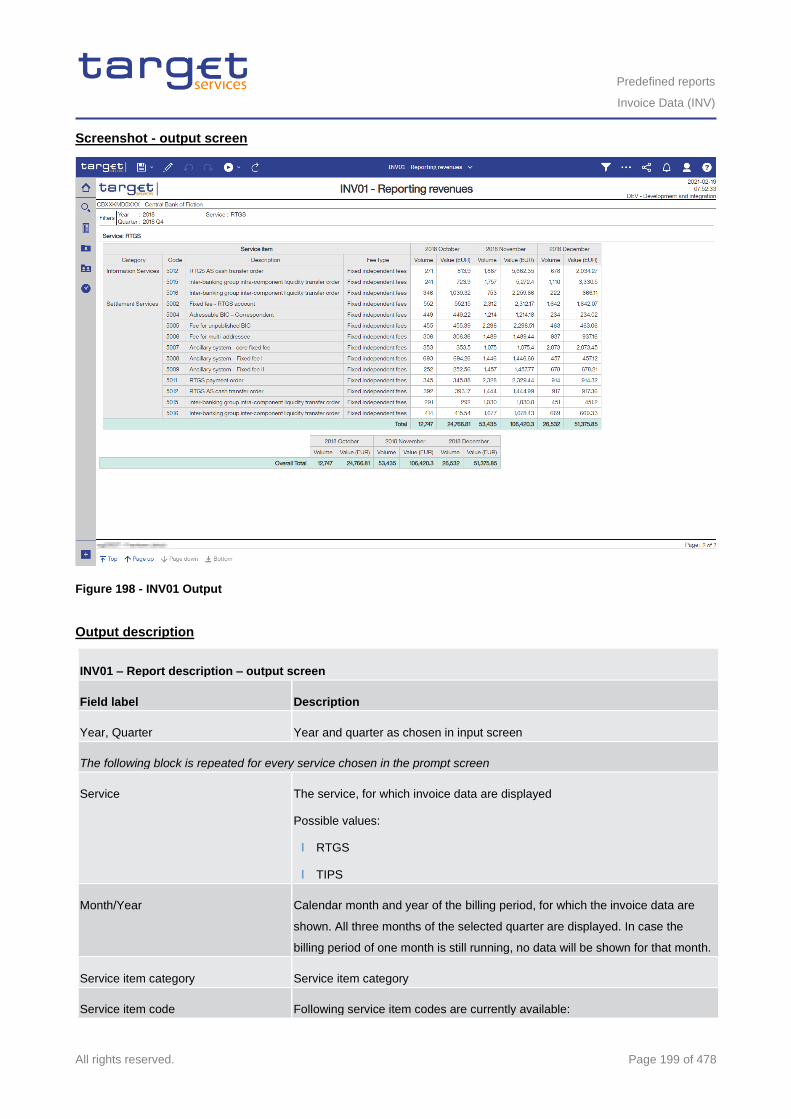
Predefined reports
Invoice Data (INV)
All rights reserved. Page 199 of 478
Screenshot - output screen
Figure 198 - INV01 Output
Output description
INV01 – Report description – output screen
Field label Description
Year, Quarter Year and quarter as chosen in input screen
The following block is repeated for every service chosen in the prompt screen
Service The service, for which invoice data are displayed
Possible values:
l RTGS
l TIPS
Month/Year Calendar month and year of the billing period, for which the invoice data are
shown. All three months of the selected quarter are displayed. In case the
billing period of one month is still running, no data will be shown for that month.
Service item category Service item category
Service item code Following service item codes are currently available:
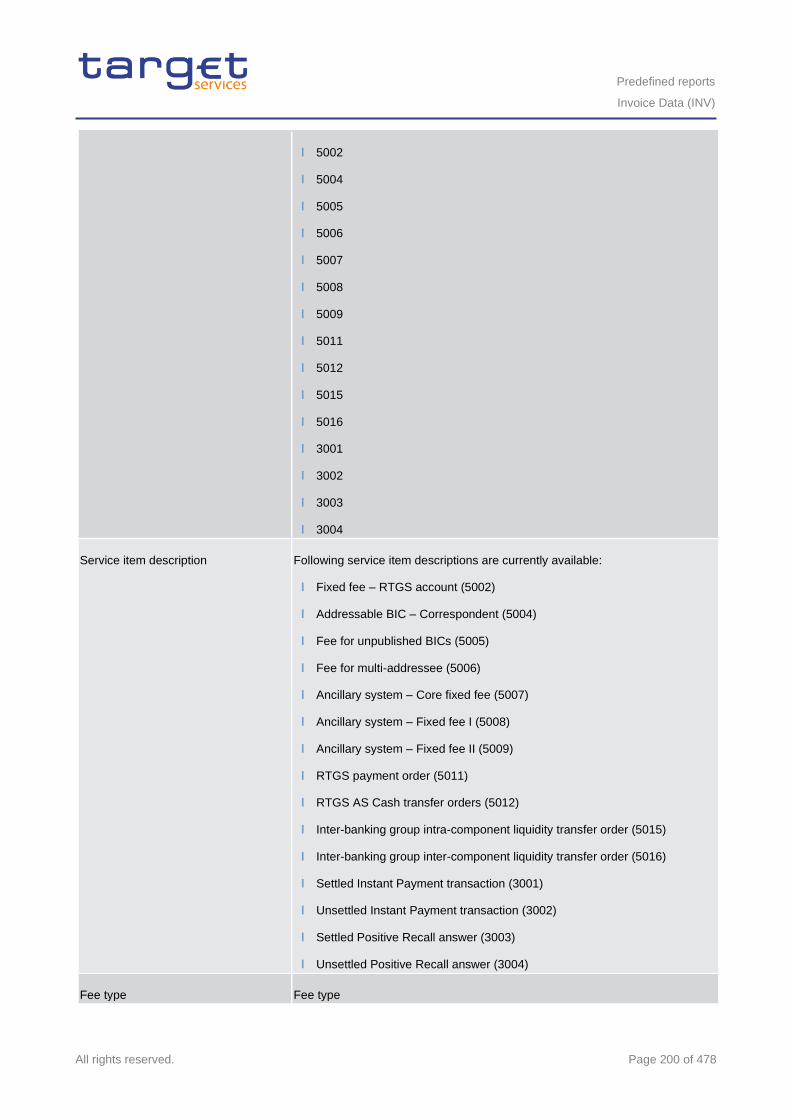
Predefined reports
Invoice Data (INV)
All rights reserved. Page 200 of 478
l 5002
l 5004
l 5005
l 5006
l 5007
l 5008
l 5009
l 5011
l 5012
l 5015
l 5016
l 3001
l 3002
l 3003
l 3004
Service item description Following service item descriptions are currently available:
l Fixed fee – RTGS account (5002)
l Addressable BIC – Correspondent (5004)
l Fee for unpublished BICs (5005)
l Fee for multi-addressee (5006)
l Ancillary system – Core fixed fee (5007)
l Ancillary system – Fixed fee I (5008)
l Ancillary system – Fixed fee II (5009)
l RTGS payment order (5011)
l RTGS AS Cash transfer orders (5012)
l Inter-banking group intra-component liquidity transfer order (5015)
l Inter-banking group inter-component liquidity transfer order (5016)
l Settled Instant Payment transaction (3001)
l Unsettled Instant Payment transaction (3002)
l Settled Positive Recall answer (3003)
l Unsettled Positive Recall answer (3004)
Fee type Fee type
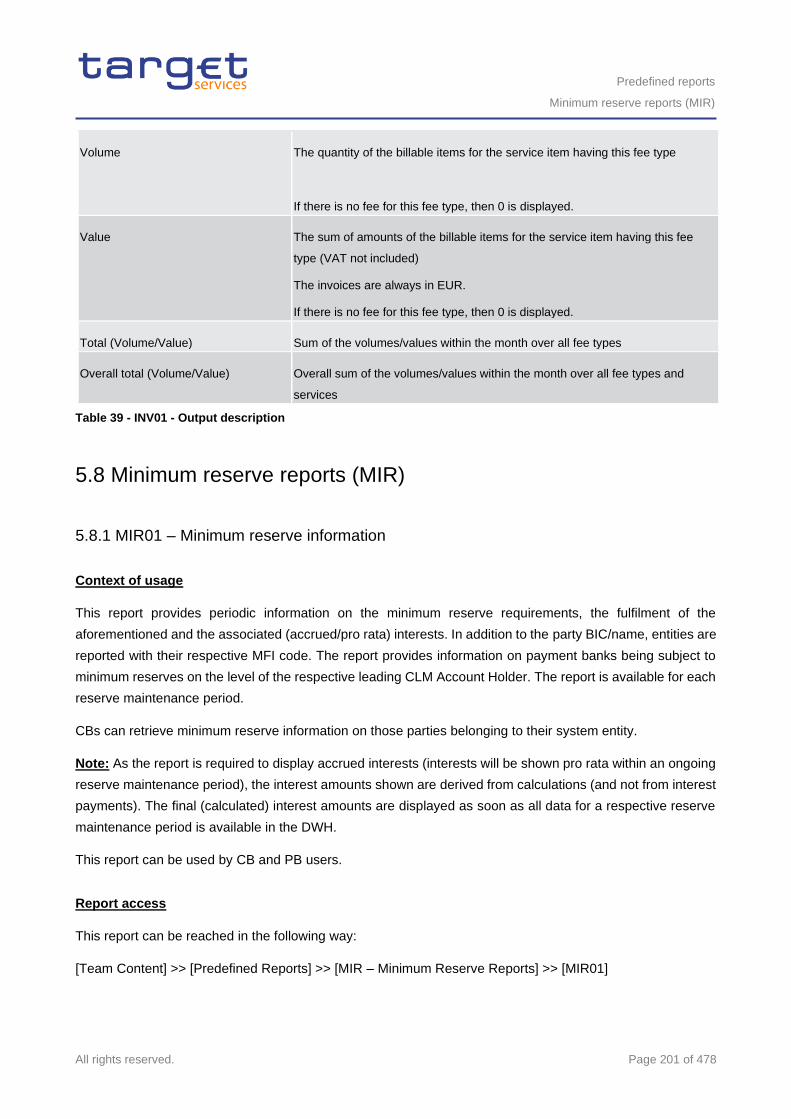
Predefined reports
Minimum reserve reports (MIR)
All rights reserved. Page 201 of 478
Volume The quantity of the billable items for the service item having this fee type
If there is no fee for this fee type, then 0 is displayed.
Value The sum of amounts of the billable items for the service item having this fee
type (VAT not included)
The invoices are always in EUR.
If there is no fee for this fee type, then 0 is displayed.
Total (Volume/Value) Sum of the volumes/values within the month over all fee types
Overall total (Volume/Value) Overall sum of the volumes/values within the month over all fee types and
services
Table 39 - INV01 - Output description
5.8 Minimum reserve reports (MIR)
5.8.1 MIR01 – Minimum reserve information
Context of usage
This report provides periodic information on the minimum reserve requirements, the fulfilment of the
aforementioned and the associated (accrued/pro rata) interests. In addition to the party BIC/name, entities are
reported with their respective MFI code. The report provides information on payment banks being subject to
minimum reserves on the level of the respective leading CLM Account Holder. The report is available for each
reserve maintenance period.
CBs can retrieve minimum reserve information on those parties belonging to their system entity.
Note: As the report is required to display accrued interests (interests will be shown pro rata within an ongoing
reserve maintenance period), the interest amounts shown are derived from calculations (and not from interest
payments). The final (calculated) interest amounts are displayed as soon as all data for a respective reserve
maintenance period is available in the DWH.
This report can be used by CB and PB users.
Report access
This report can be reached in the following way:
[Team Content] >> [Predefined Reports] >> [MIR – Minimum Reserve Reports] >> [MIR01]
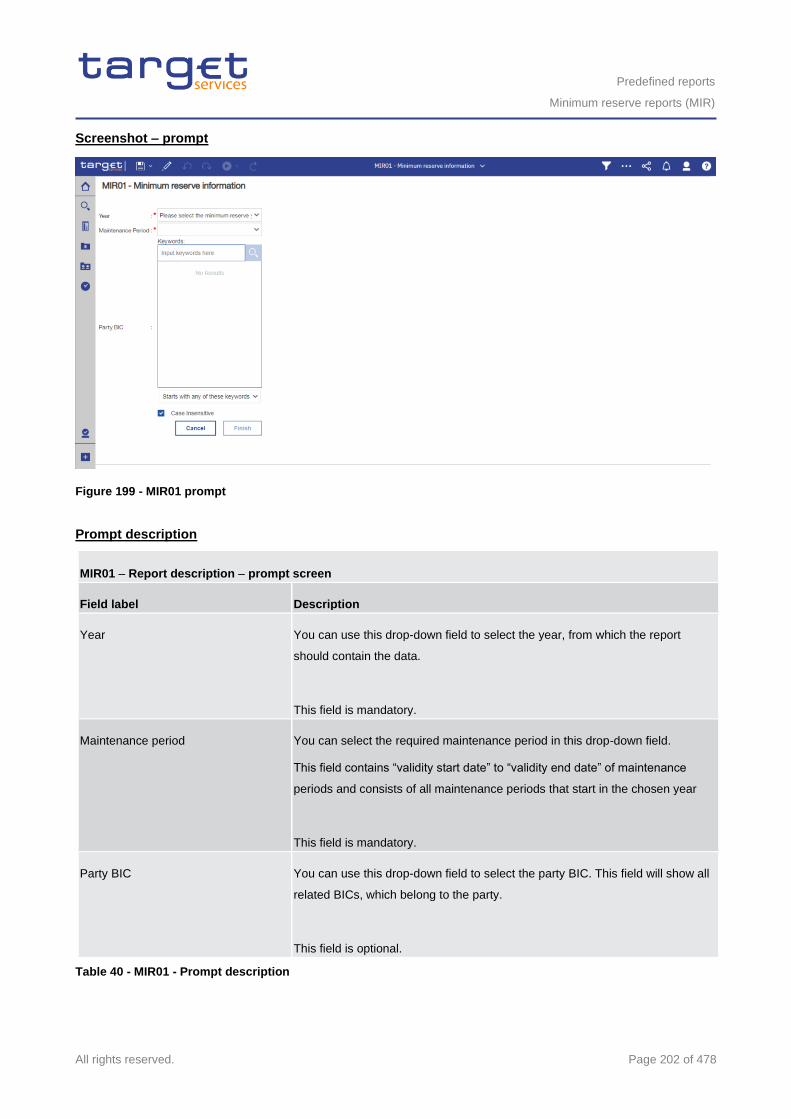
Predefined reports
Minimum reserve reports (MIR)
All rights reserved. Page 202 of 478
Screenshot – prompt
Figure 199 - MIR01 prompt
Prompt description
MIR01 – Report description – prompt screen
Field label Description
Year You can use this drop-down field to select the year, from which the report
should contain the data.
This field is mandatory.
Maintenance period You can select the required maintenance period in this drop-down field.
This field contains “validity start date” to “validity end date” of maintenance
periods and consists of all maintenance periods that start in the chosen year
This field is mandatory.
Party BIC You can use this drop-down field to select the party BIC. This field will show all
related BICs, which belong to the party.
This field is optional.
Table 40 - MIR01 - Prompt description
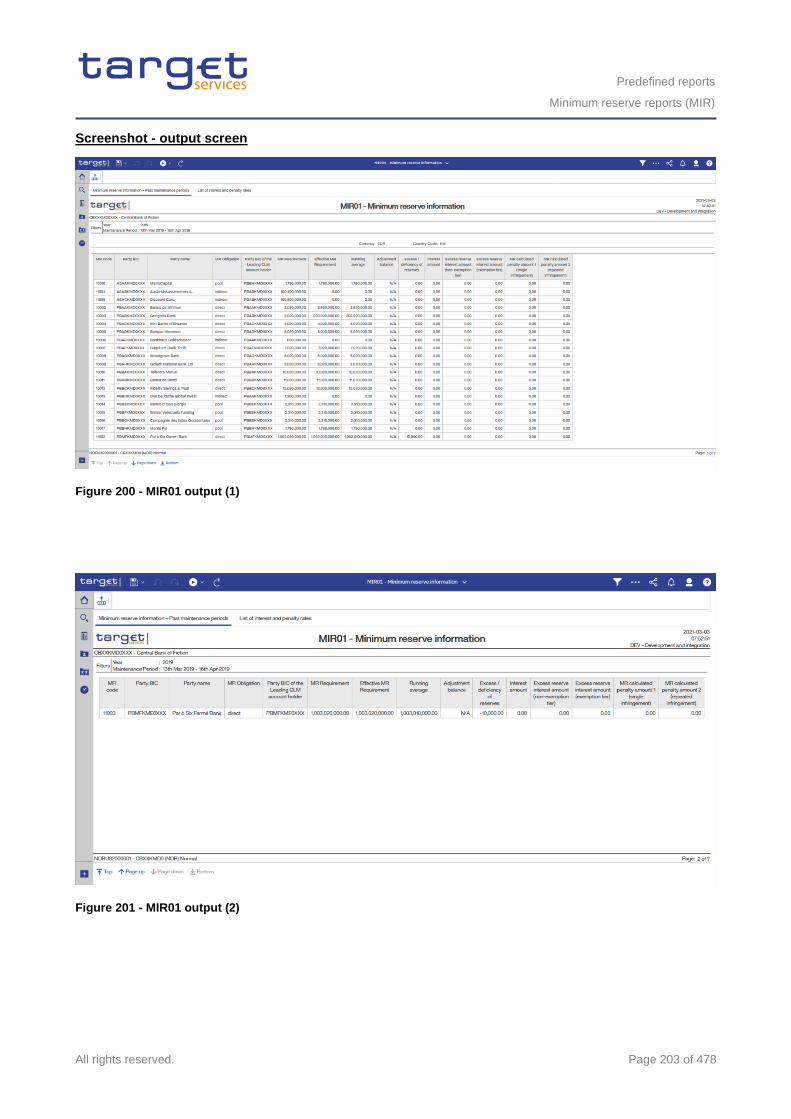
Predefined reports
Minimum reserve reports (MIR)
All rights reserved. Page 203 of 478
Screenshot - output screen
Figure 200 - MIR01 output (1)
Figure 201 - MIR01 output (2)
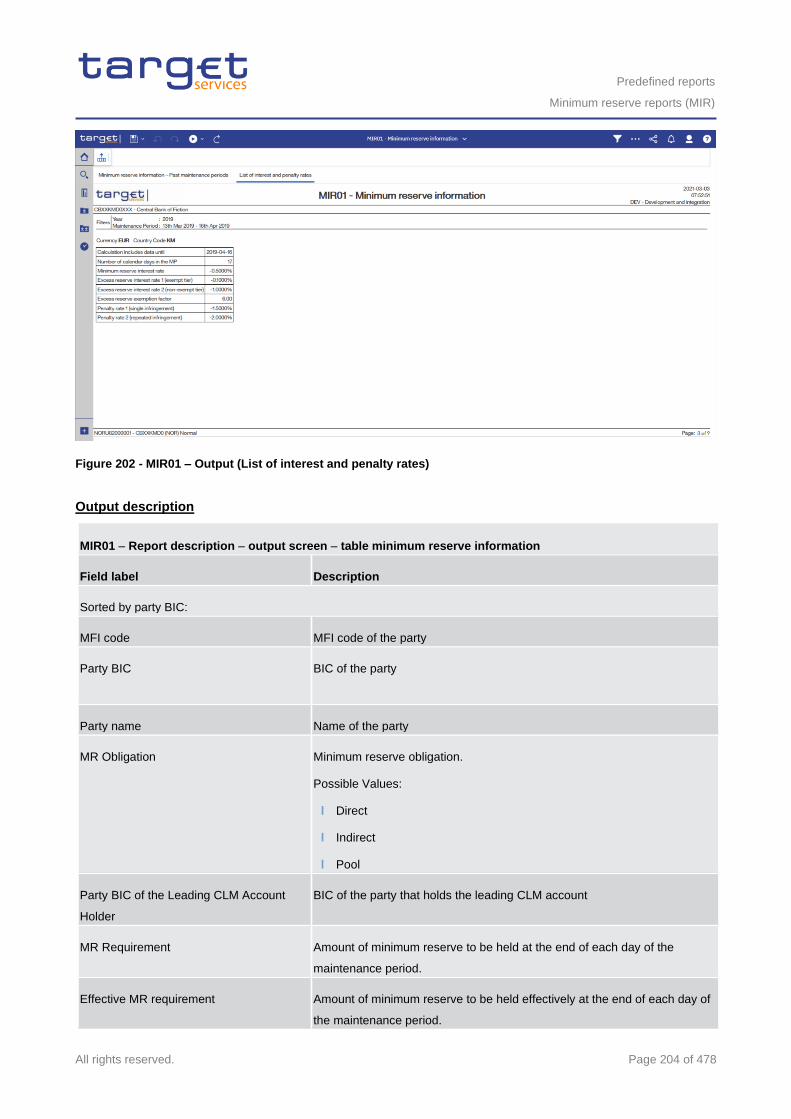
Predefined reports
Minimum reserve reports (MIR)
All rights reserved. Page 204 of 478
Figure 202 - MIR01 – Output (List of interest and penalty rates)
Output description
MIR01 – Report description – output screen – table minimum reserve information
Field label Description
Sorted by party BIC:
MFI code MFI code of the party
Party BIC BIC of the party
Party name Name of the party
MR Obligation Minimum reserve obligation.
Possible Values:
l Direct
l Indirect
l Pool
Party BIC of the Leading CLM Account
Holder
BIC of the party that holds the leading CLM account
MR Requirement Amount of minimum reserve to be held at the end of each day of the
maintenance period.
Effective MR requirement Amount of minimum reserve to be held effectively at the end of each day of
the maintenance period.
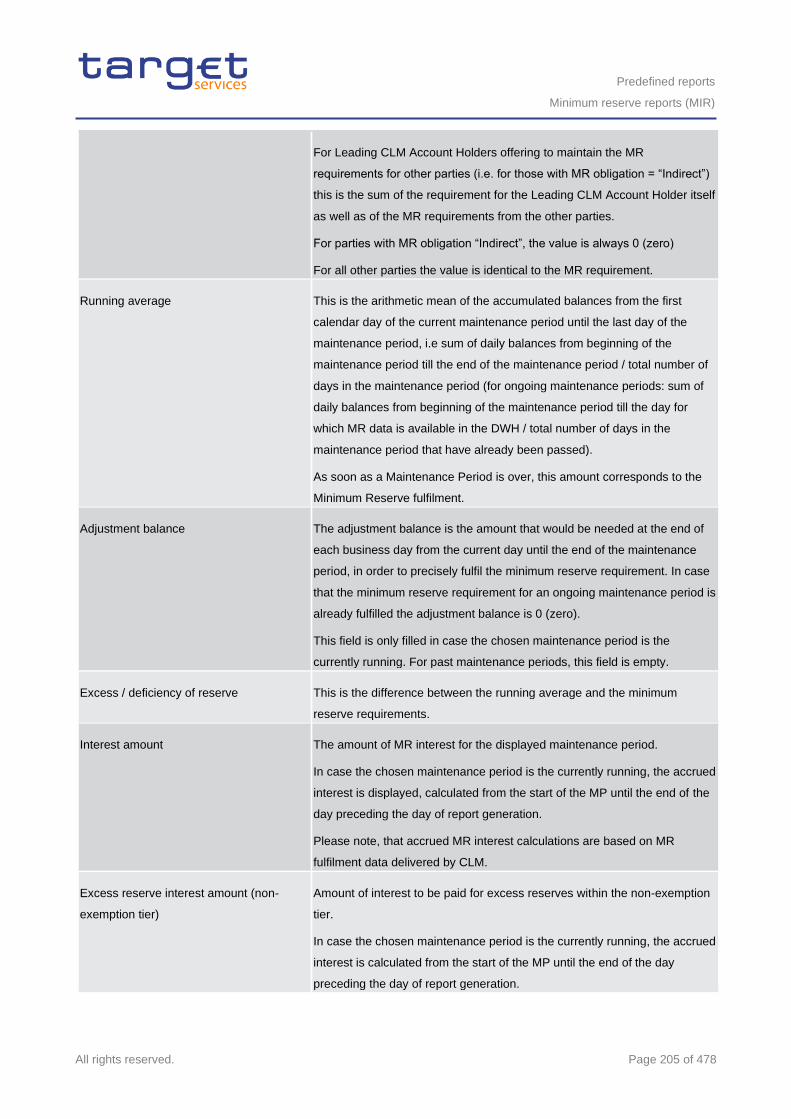
Predefined reports
Minimum reserve reports (MIR)
All rights reserved. Page 205 of 478
For Leading CLM Account Holders offering to maintain the MR
requirements for other parties (i.e. for those with MR obligation = “Indirect”)
this is the sum of the requirement for the Leading CLM Account Holder itself
as well as of the MR requirements from the other parties.
For parties with MR obligation “Indirect”, the value is always 0 (zero)
For all other parties the value is identical to the MR requirement.
Running average This is the arithmetic mean of the accumulated balances from the first
calendar day of the current maintenance period until the last day of the
maintenance period, i.e sum of daily balances from beginning of the
maintenance period till the end of the maintenance period / total number of
days in the maintenance period (for ongoing maintenance periods: sum of
daily balances from beginning of the maintenance period till the day for
which MR data is available in the DWH / total number of days in the
maintenance period that have already been passed).
As soon as a Maintenance Period is over, this amount corresponds to the
Minimum Reserve fulfilment.
Adjustment balance The adjustment balance is the amount that would be needed at the end of
each business day from the current day until the end of the maintenance
period, in order to precisely fulfil the minimum reserve requirement. In case
that the minimum reserve requirement for an ongoing maintenance period is
already fulfilled the adjustment balance is 0 (zero).
This field is only filled in case the chosen maintenance period is the
currently running. For past maintenance periods, this field is empty.
Excess / deficiency of reserve This is the difference between the running average and the minimum
reserve requirements.
Interest amount The amount of MR interest for the displayed maintenance period.
In case the chosen maintenance period is the currently running, the accrued
interest is displayed, calculated from the start of the MP until the end of the
day preceding the day of report generation.
Please note, that accrued MR interest calculations are based on MR
fulfilment data delivered by CLM.
Excess reserve interest amount (non-
exemption tier)
Amount of interest to be paid for excess reserves within the non-exemption
tier.
In case the chosen maintenance period is the currently running, the accrued
interest is calculated from the start of the MP until the end of the day
preceding the day of report generation.
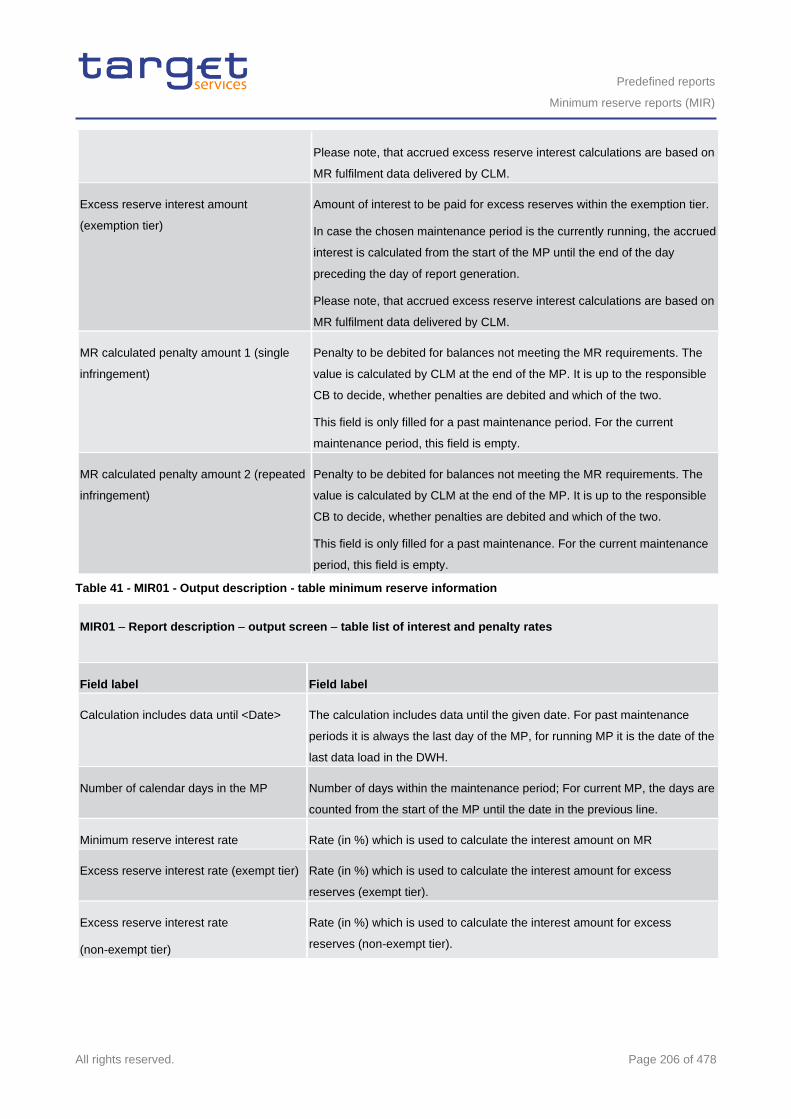
Predefined reports
Minimum reserve reports (MIR)
All rights reserved. Page 206 of 478
Please note, that accrued excess reserve interest calculations are based on
MR fulfilment data delivered by CLM.
Excess reserve interest amount
(exemption tier)
Amount of interest to be paid for excess reserves within the exemption tier.
In case the chosen maintenance period is the currently running, the accrued
interest is calculated from the start of the MP until the end of the day
preceding the day of report generation.
Please note, that accrued excess reserve interest calculations are based on
MR fulfilment data delivered by CLM.
MR calculated penalty amount 1 (single
infringement)
Penalty to be debited for balances not meeting the MR requirements. The
value is calculated by CLM at the end of the MP. It is up to the responsible
CB to decide, whether penalties are debited and which of the two.
This field is only filled for a past maintenance period. For the current
maintenance period, this field is empty.
MR calculated penalty amount 2 (repeated
infringement)
Penalty to be debited for balances not meeting the MR requirements. The
value is calculated by CLM at the end of the MP. It is up to the responsible
CB to decide, whether penalties are debited and which of the two.
This field is only filled for a past maintenance. For the current maintenance
period, this field is empty.
Table 41 - MIR01 - Output description - table minimum reserve information
MIR01 – Report description – output screen – table list of interest and penalty rates
Field label Field label
Calculation includes data until <Date> The calculation includes data until the given date. For past maintenance
periods it is always the last day of the MP, for running MP it is the date of the
last data load in the DWH.
Number of calendar days in the MP Number of days within the maintenance period; For current MP, the days are
counted from the start of the MP until the date in the previous line.
Minimum reserve interest rate Rate (in %) which is used to calculate the interest amount on MR
Excess reserve interest rate (exempt tier) Rate (in %) which is used to calculate the interest amount for excess
reserves (exempt tier).
Excess reserve interest rate
(non-exempt tier)
Rate (in %) which is used to calculate the interest amount for excess
reserves (non-exempt tier).
Predefined reports
Minimum reserve reports (MIR)
All rights reserved. Page 207 of 478
Excess reserve exemption factor Factor for the calculation of the excess reserve exemption amount
Penalty rate 1 (single infringement) Rate (in %) which is used to calculate the interest amount on MR balances
which did not meet the MR requirement (for a single infringement).
Penalty rate 2 (repeated infringement) Rate (in %) which is used to calculate the interest amount on MR balances
which did not meet the MR requirement (for a repeated infringement)
Table 42 - MIR01 - Output description - table list of interest and penalty rates
5.8.2 MIR02 – Minimum reserve requirements per country
Context of usage
This report provides information on the aggregated amount of minimum reserve requirements for a given
reserve maintenance period and the five preceding reserve maintenance periods. For each reserve
maintenance period the aggregated amount of minimum reserve requirements at country level is reported.
CBs can retrieve aggregated minimum reserve information of parties belonging to their system entity.
This report can be used by CB users only.
Report access
This report can be reached in the following way:
[Team Content] >> [Predefined Reports] >> [MIR – Minimum Reserve Reports] >> [MIR02]
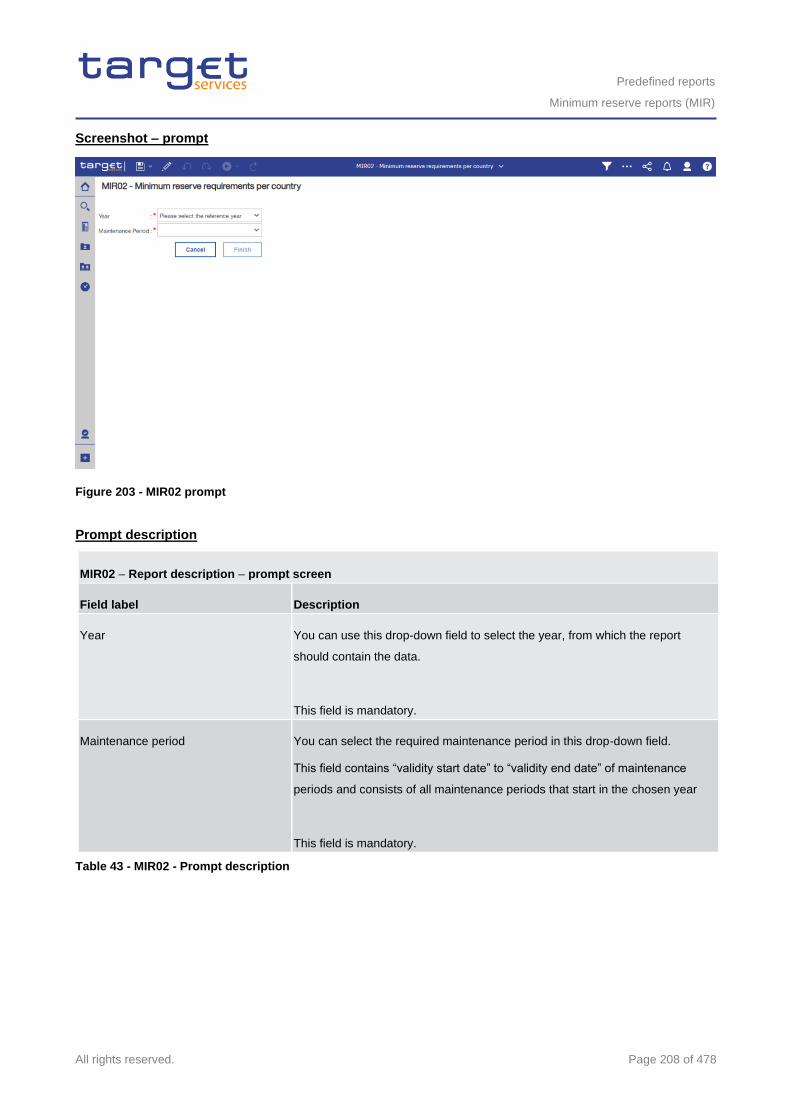
Predefined reports
Minimum reserve reports (MIR)
All rights reserved. Page 208 of 478
Screenshot – prompt
Figure 203 - MIR02 prompt
Prompt description
MIR02 – Report description – prompt screen
Field label Description
Year You can use this drop-down field to select the year, from which the report
should contain the data.
This field is mandatory.
Maintenance period You can select the required maintenance period in this drop-down field.
This field contains “validity start date” to “validity end date” of maintenance
periods and consists of all maintenance periods that start in the chosen year
This field is mandatory.
Table 43 - MIR02 - Prompt description
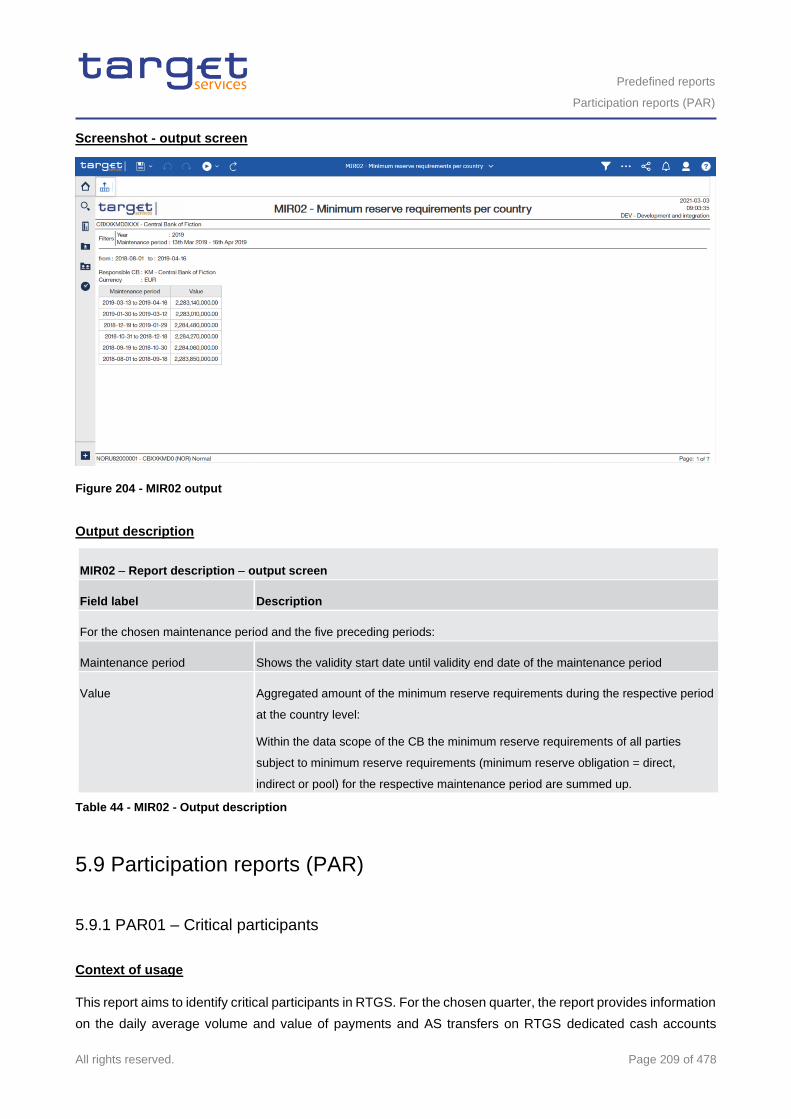
Predefined reports
Participation reports (PAR)
All rights reserved. Page 209 of 478
Screenshot - output screen
Figure 204 - MIR02 output
Output description
MIR02 – Report description – output screen
Field label Description
For the chosen maintenance period and the five preceding periods:
Maintenance period Shows the validity start date until validity end date of the maintenance period
Value Aggregated amount of the minimum reserve requirements during the respective period
at the country level:
Within the data scope of the CB the minimum reserve requirements of all parties
subject to minimum reserve requirements (minimum reserve obligation = direct,
indirect or pool) for the respective maintenance period are summed up.
Table 44 - MIR02 - Output description
5.9 Participation reports (PAR)
5.9.1 PAR01 – Critical participants
Context of usage
This report aims to identify critical participants in RTGS. For the chosen quarter, the report provides information
on the daily average volume and value of payments and AS transfers on RTGS dedicated cash accounts
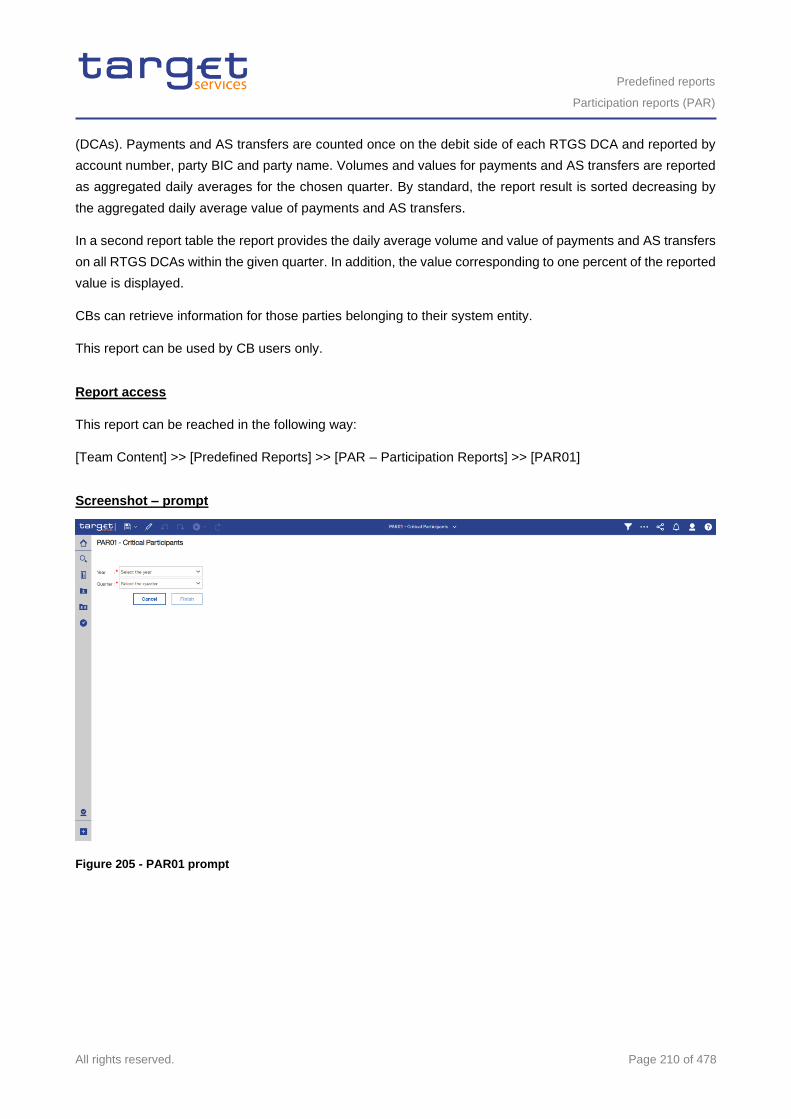
Predefined reports
Participation reports (PAR)
All rights reserved. Page 210 of 478
(DCAs). Payments and AS transfers are counted once on the debit side of each RTGS DCA and reported by
account number, party BIC and party name. Volumes and values for payments and AS transfers are reported
as aggregated daily averages for the chosen quarter. By standard, the report result is sorted decreasing by
the aggregated daily average value of payments and AS transfers.
In a second report table the report provides the daily average volume and value of payments and AS transfers
on all RTGS DCAs within the given quarter. In addition, the value corresponding to one percent of the reported
value is displayed.
CBs can retrieve information for those parties belonging to their system entity.
This report can be used by CB users only.
Report access
This report can be reached in the following way:
[Team Content] >> [Predefined Reports] >> [PAR – Participation Reports] >> [PAR01]
Screenshot – prompt
Figure 205 - PAR01 prompt
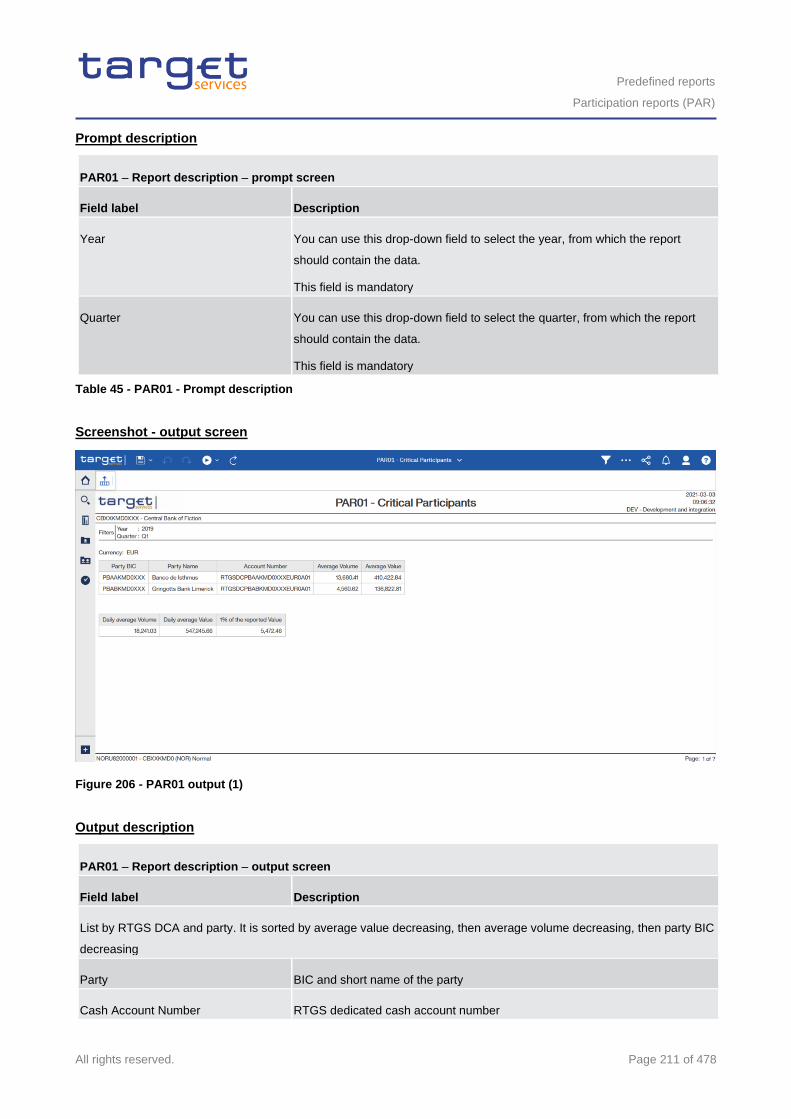
Predefined reports
Participation reports (PAR)
All rights reserved. Page 211 of 478
Prompt description
PAR01 – Report description – prompt screen
Field label Description
Year You can use this drop-down field to select the year, from which the report
should contain the data.
This field is mandatory
Quarter You can use this drop-down field to select the quarter, from which the report
should contain the data.
This field is mandatory
Table 45 - PAR01 - Prompt description
Screenshot - output screen
Figure 206 - PAR01 output (1)
Output description
PAR01 – Report description – output screen
Field label Description
List by RTGS DCA and party. It is sorted by average value decreasing, then average volume decreasing, then party BIC
decreasing
Party BIC and short name of the party
Cash Account Number RTGS dedicated cash account number
Predefined reports
Participation reports (PAR)
All rights reserved. Page 212 of 478
Daily Average Volume Average volume of the debit side of payments and AS transfers on the specified
RTGS DCA.
Daily Average Value Average value of the debit side of payments and AS transfers on the specified
RTGS DCA.
Overall
Daily average Volume Daily average volume for all RTGS DCAs in the first list.
Daily average Value Daily average value for all RTGS DCAs in the first list.
1 % of the reported Value 1 % of the daily average value for all RTGS DCAs in the first list.
Table 46 - PAR01 - Output description
5.9.2 PAR02 – List of active Direct and Indirect Participants according to RTGS Directory
Context of usage
This report provides information on those entities being a Direct or an Indirect Participant (Participation Type
= 01 – Direct or 02 – Indirect) according to the RTGS Directory on a given date.
For each Direct and Indirect Participant the following information from the RTGS Directory are provided: BIC,
Institution Name, Valid from, National Sorting Code, Participation Type. In addition, the overall number of Direct
and Indirect Participants is reported.
In case of Indirect Participation, the report provides the country code (ISO 3166 Alpha-2) from the BIC of the
corresponding Direct Participant.
The report is provided in several sorting options, including an option where the Indirect Participants are
reported under their corresponding Direct Participant/addressee.
Note: Independent from the Participation Type, unpublished BICs are not considered for the purpose of this
report:
This report can be used by CB, PB and AS users.
Report access
This report can be reached in the following way:
[Team Content] >> [Predefined Reports] >> [PAR – Participation Reports] >> [PAR02]
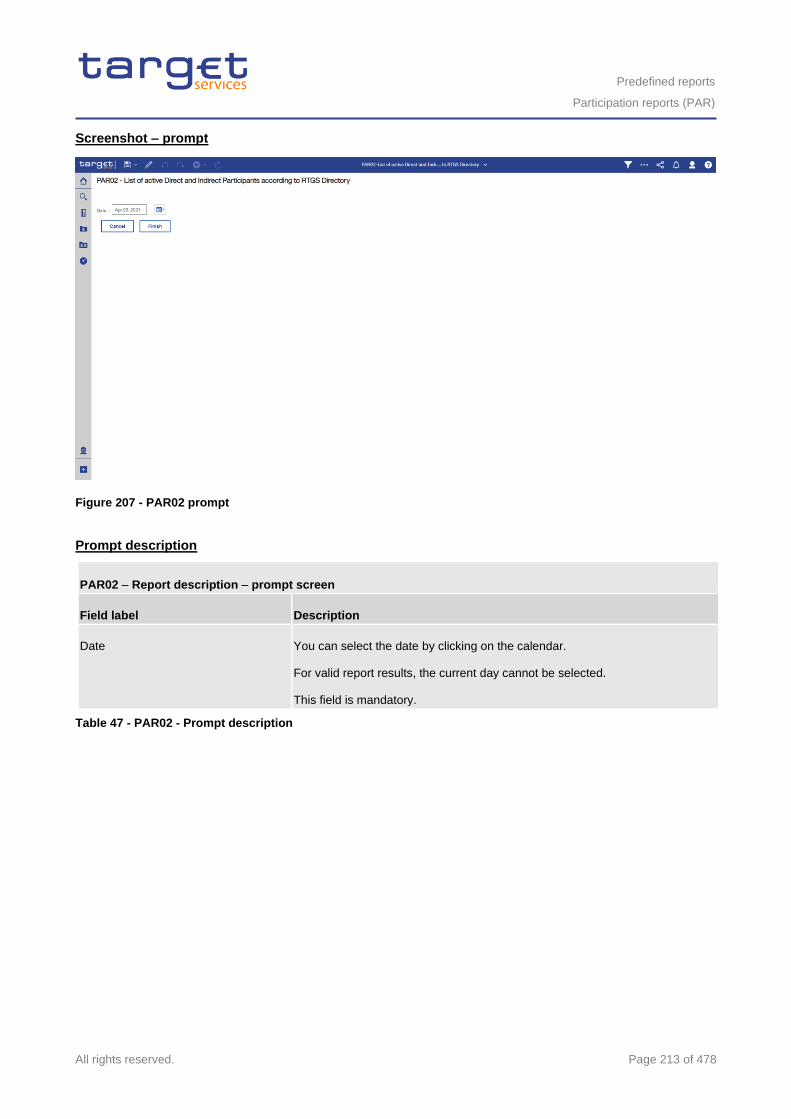
Predefined reports
Participation reports (PAR)
All rights reserved. Page 213 of 478
Screenshot – prompt
Figure 207 - PAR02 prompt
Prompt description
PAR02 – Report description – prompt screen
Field label Description
Date You can select the date by clicking on the calendar.
For valid report results, the current day cannot be selected.
This field is mandatory.
Table 47 - PAR02 - Prompt description
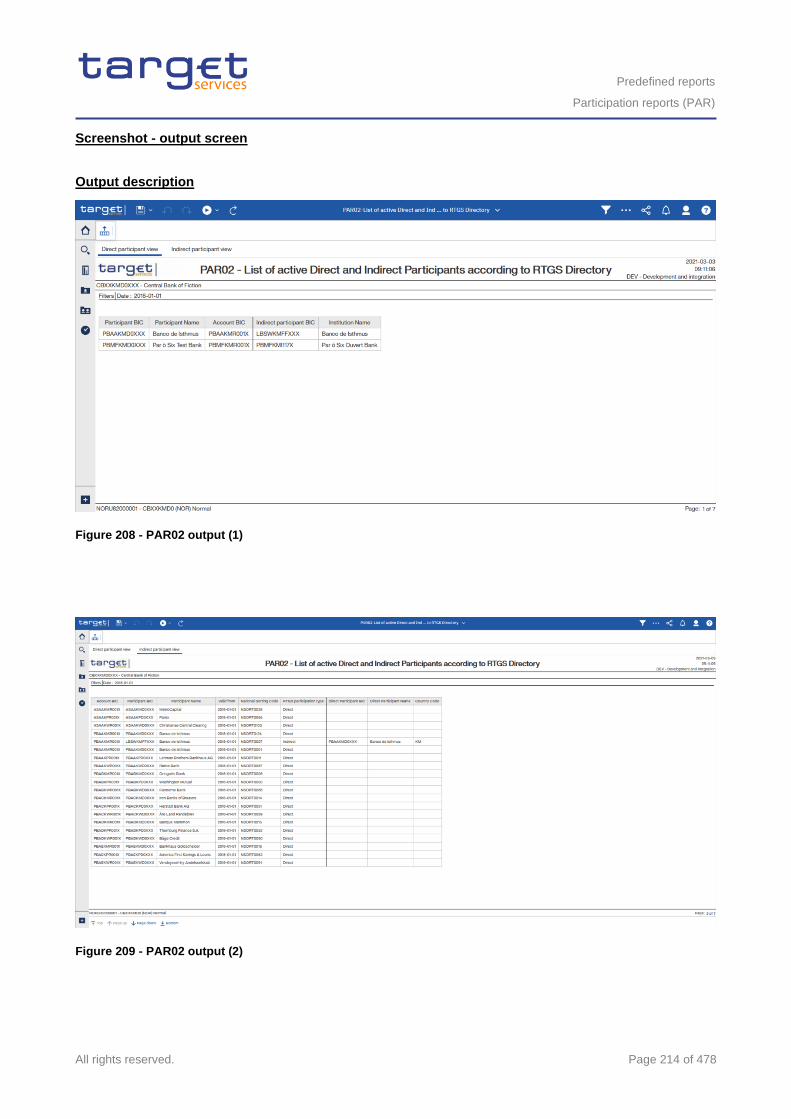
Predefined reports
Participation reports (PAR)
All rights reserved. Page 214 of 478
Screenshot - output screen
Output description
Figure 208 - PAR02 output (1)
Figure 209 - PAR02 output (2)
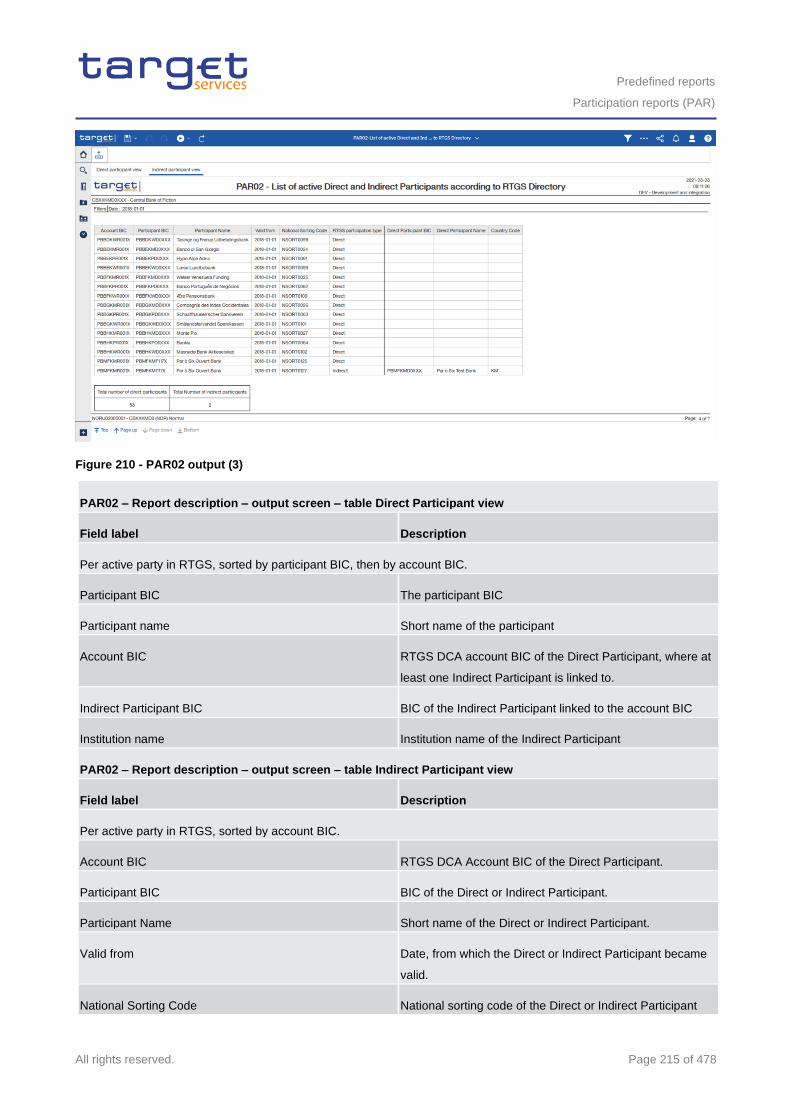
Predefined reports
Participation reports (PAR)
All rights reserved. Page 215 of 478
Figure 210 - PAR02 output (3)
PAR02 – Report description – output screen – table Direct Participant view
Field label Description
Per active party in RTGS, sorted by participant BIC, then by account BIC.
Participant BIC The participant BIC
Participant name Short name of the participant
Account BIC RTGS DCA account BIC of the Direct Participant, where at
least one Indirect Participant is linked to.
Indirect Participant BIC BIC of the Indirect Participant linked to the account BIC
Institution name Institution name of the Indirect Participant
PAR02 – Report description – output screen – table Indirect Participant view
Field label Description
Per active party in RTGS, sorted by account BIC.
Account BIC RTGS DCA Account BIC of the Direct Participant.
Participant BIC BIC of the Direct or Indirect Participant.
Participant Name Short name of the Direct or Indirect Participant.
Valid from Date, from which the Direct or Indirect Participant became
valid.
National Sorting Code National sorting code of the Direct or Indirect Participant
Predefined reports
Participation reports (PAR)
All rights reserved. Page 216 of 478
RTGS participation type RTGS participation type.
Possible values:
l Direct
l Indirect
Direct Participant BIC The Participant BIC of the related participant.
Direct Participant Name The Direct Participant Name of the related participant.
Country code The Country code of the related participant.
Total number of Direct Participants Only displayed for participation type = direct
Total number of Indirect Participant Only displayed for participation type = indirect
Table 48 - PAR02 - Output description
5.9.3 PAR03 – Parties subject and not subject to minimum reserve
Context of usage
This report provides information on whether or not parties are subject to minimum reserves according to the
CLM configuration reference data attribute Minimum Reserve Obligation on a given date.
Separate lists are provided for parties holding their minimum reserves direct, indirect, in a pool of accounts
(pool) and those not being subject to minimum reserves.
Each party is reported with its respective MFI code in addition to its party BIC and name.
For parties holding their minimum reserves indirect, BIC and name of the party maintaining reserves for this
party are reported.
CBs can retrieve data of those parties belonging to their system entity.
This report can be used by CB users.
Report access
This report can be reached in the following way:
[Team Content] >> [Predefined Reports] >> [PAR – Participation Reports] >> [PAR03]
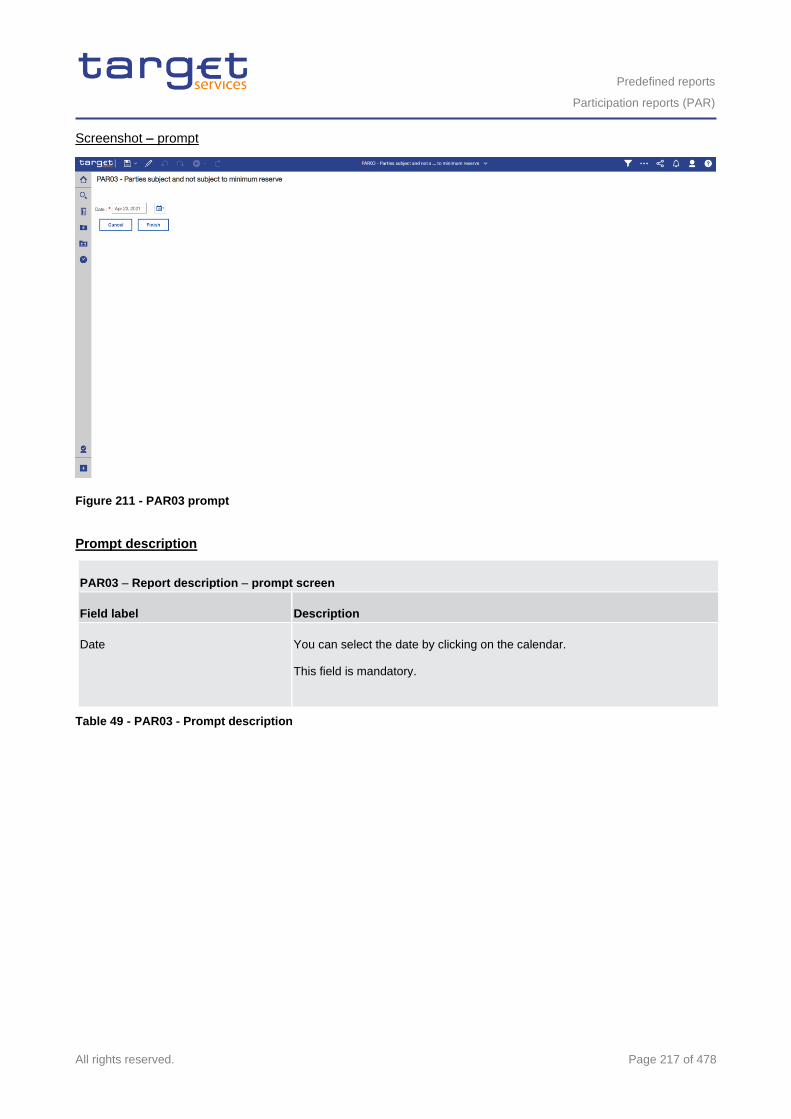
Predefined reports
Participation reports (PAR)
All rights reserved. Page 217 of 478
Screenshot – prompt
Figure 211 - PAR03 prompt
Prompt description
PAR03 – Report description – prompt screen
Field label Description
Date You can select the date by clicking on the calendar.
This field is mandatory.
Table 49 - PAR03 - Prompt description
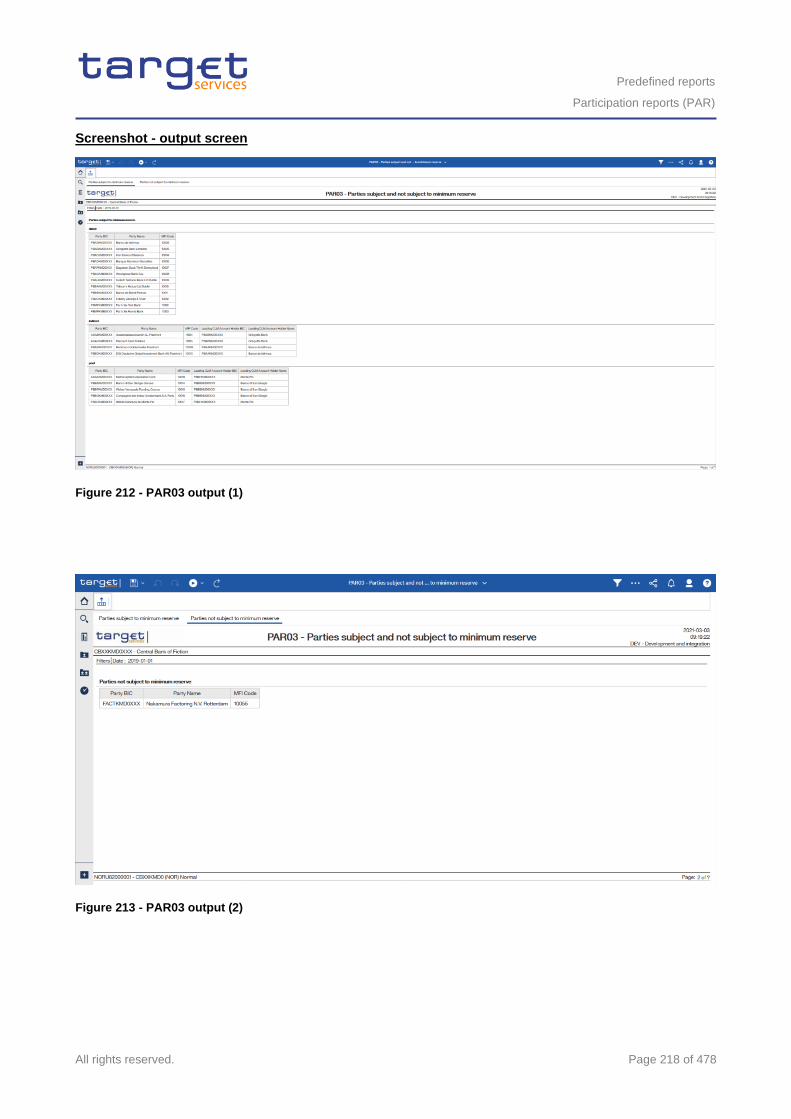
Predefined reports
Participation reports (PAR)
All rights reserved. Page 218 of 478
Screenshot - output screen
Figure 212 - PAR03 output (1)
Figure 213 - PAR03 output (2)
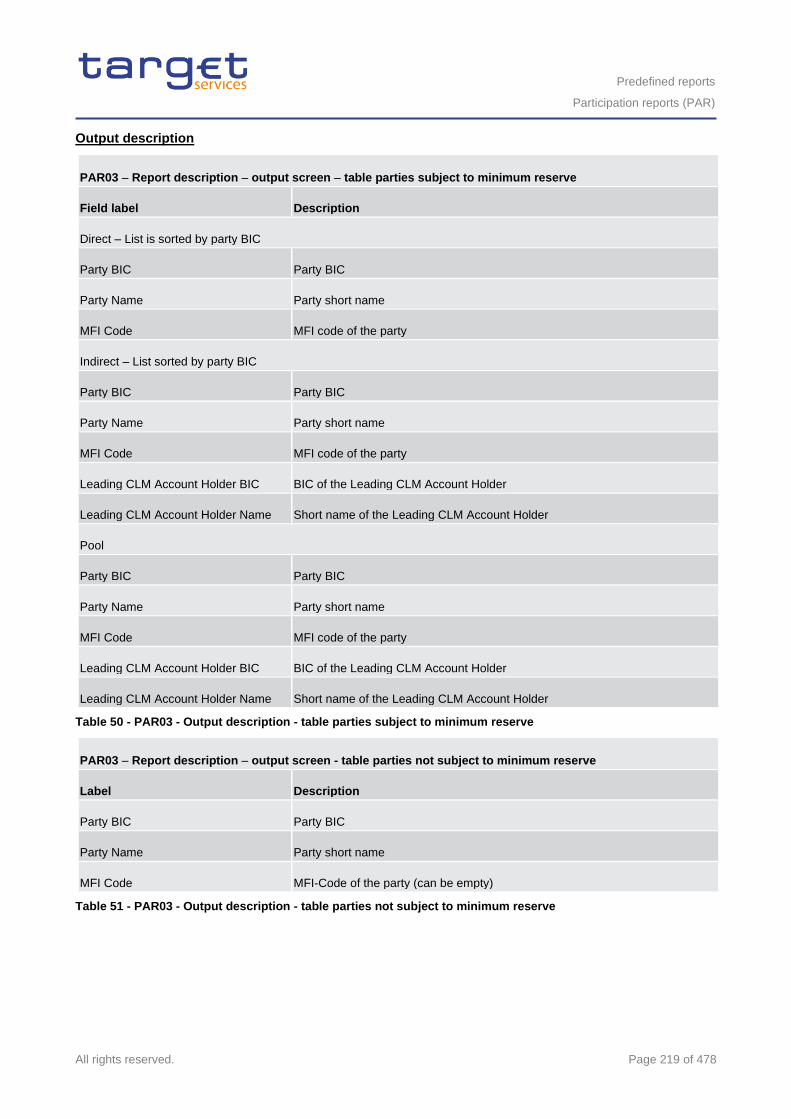
Predefined reports
Participation reports (PAR)
All rights reserved. Page 219 of 478
Output description
PAR03 – Report description – output screen – table parties subject to minimum reserve
Field label Description
Direct – List is sorted by party BIC
Party BIC Party BIC
Party Name Party short name
MFI Code MFI code of the party
Indirect – List sorted by party BIC
Party BIC Party BIC
Party Name Party short name
MFI Code MFI code of the party
Leading CLM Account Holder BIC BIC of the Leading CLM Account Holder
Leading CLM Account Holder Name Short name of the Leading CLM Account Holder
Pool
Party BIC Party BIC
Party Name Party short name
MFI Code MFI code of the party
Leading CLM Account Holder BIC BIC of the Leading CLM Account Holder
Leading CLM Account Holder Name Short name of the Leading CLM Account Holder
Table 50 - PAR03 - Output description - table parties subject to minimum reserve
PAR03 – Report description – output screen - table parties not subject to minimum reserve
Label Description
Party BIC Party BIC
Party Name Party short name
MFI Code MFI-Code of the party (can be empty)
Table 51 - PAR03 - Output description - table parties not subject to minimum reserve
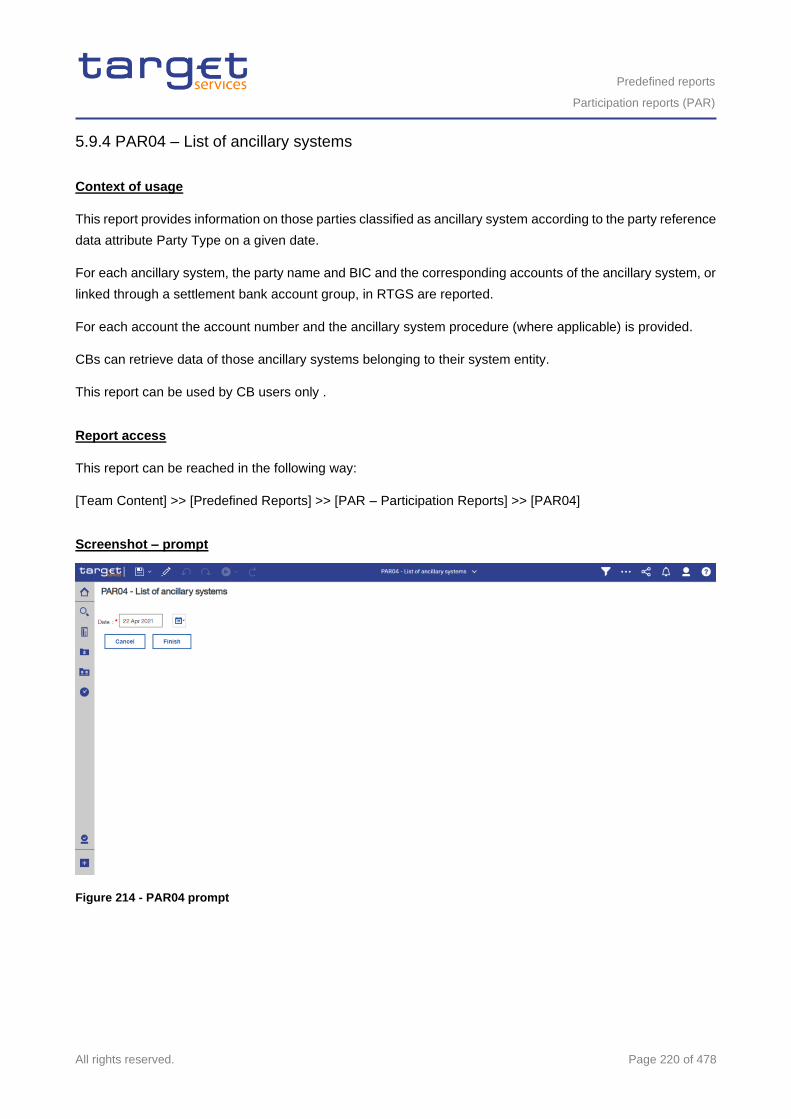
Predefined reports
Participation reports (PAR)
All rights reserved. Page 220 of 478
5.9.4 PAR04 – List of ancillary systems
Context of usage
This report provides information on those parties classified as ancillary system according to the party reference
data attribute Party Type on a given date.
For each ancillary system, the party name and BIC and the corresponding accounts of the ancillary system, or
linked through a settlement bank account group, in RTGS are reported.
For each account the account number and the ancillary system procedure (where applicable) is provided.
CBs can retrieve data of those ancillary systems belonging to their system entity.
This report can be used by CB users only .
Report access
This report can be reached in the following way:
[Team Content] >> [Predefined Reports] >> [PAR – Participation Reports] >> [PAR04]
Screenshot – prompt
Figure 214 - PAR04 prompt
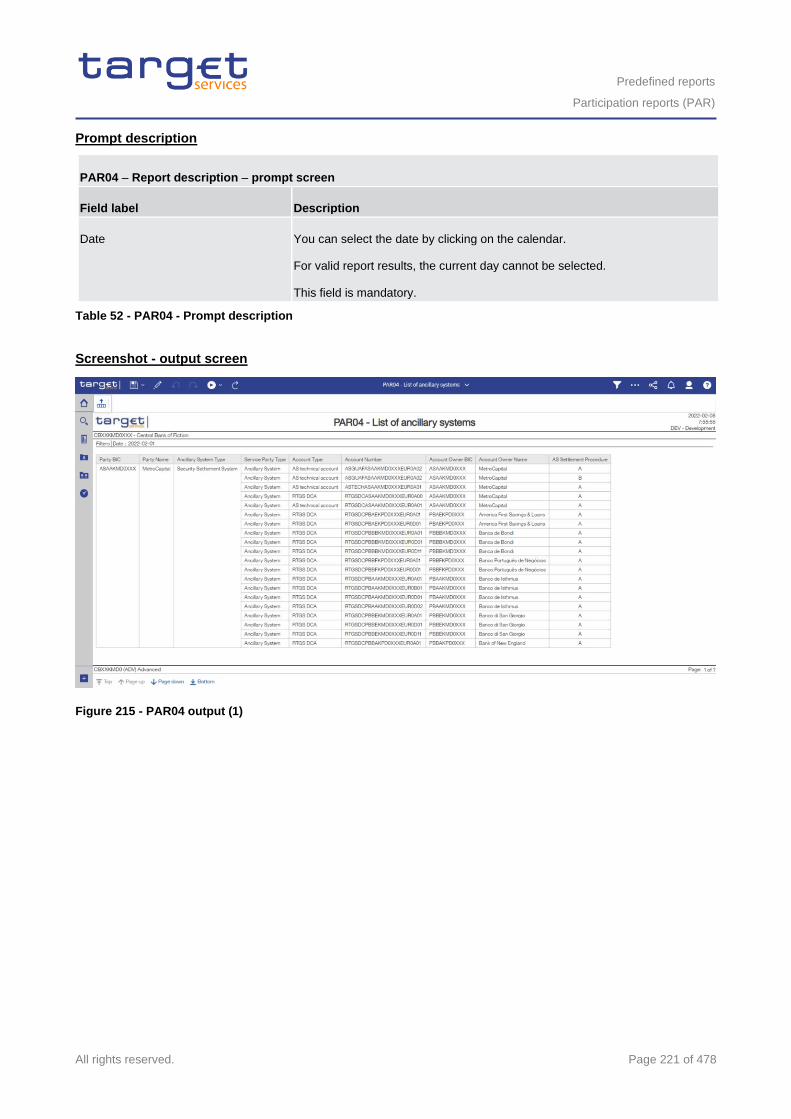
Predefined reports
Participation reports (PAR)
All rights reserved. Page 221 of 478
Prompt description
PAR04 – Report description – prompt screen
Field label Description
Date You can select the date by clicking on the calendar.
For valid report results, the current day cannot be selected.
This field is mandatory.
Table 52 - PAR04 - Prompt description
Screenshot - output screen
Figure 215 - PAR04 output (1)
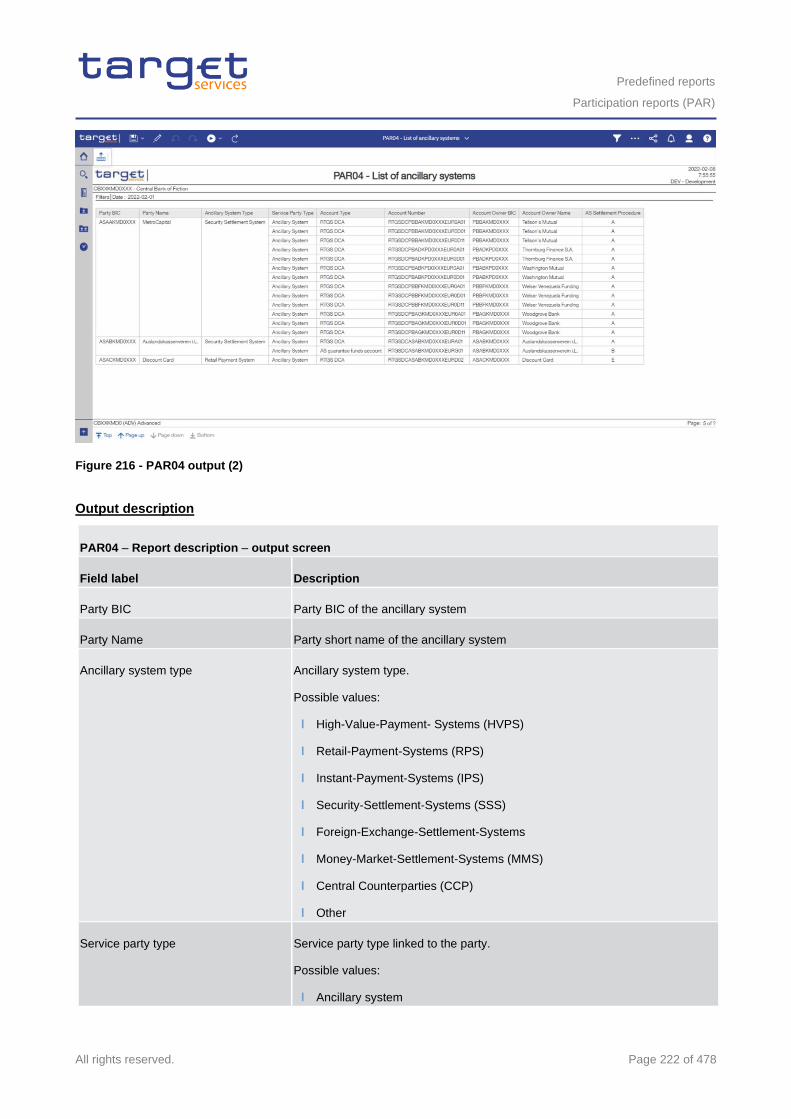
Predefined reports
Participation reports (PAR)
All rights reserved. Page 222 of 478
Figure 216 - PAR04 output (2)
Output description
PAR04 – Report description – output screen
Field label Description
Party BIC Party BIC of the ancillary system
Party Name Party short name of the ancillary system
Ancillary system type Ancillary system type.
Possible values:
l High-Value-Payment- Systems (HVPS)
l Retail-Payment-Systems (RPS)
l Instant-Payment-Systems (IPS)
l Security-Settlement-Systems (SSS)
l Foreign-Exchange-Settlement-Systems
l Money-Market-Settlement-Systems (MMS)
l Central Counterparties (CCP)
l Other
Service party type Service party type linked to the party.
Possible values:
l Ancillary system
Predefined reports
Participation reports (PAR)
All rights reserved. Page 223 of 478
l RTGS Account holder
Account type Account type.
Possible values:
l RTGS CB account
l RTGS DCA
l RTGS sub-account
l AS guarantee funds account
l AS technical account
Account number Account number, where the party (AS) is owner as well as those, that are linked
to this party (AS) via its Settlement Bank Account Group.
Account owner BIC BIC of the party owning the account. This can either be the AS itself or (in case
the account is linked to the AS via the Settlement Bank Account Group) the AS
settlement bank
Account owner name Name of the party owning the account
AS settlement procedure Optional criteria;
Possible Values:
A, B, C, D, E
If not applicable, field is filled with “—“
Table 53 - PAR04 - Output description
5.9.5 PAR05 – List of DCA cross-border links
Context of usage
This report provides information on those DCAs and their linked MCA when they are held in books of different
CBs within a given month.
For each cross border link, the account number and the party BIC and name of the DCA and the linked account
are reported. In addition, the country code of the CB being responsible for the respective account (DCA and
the linked account) is displayed.
The report is provided in two different views (DCA and linked account view).
CBs can retrieve information on those cross border links where either the party owning the DCA and/or the
party owning the linked account of a cross border link belongs to their system entity.
This report can be used by CB users only.
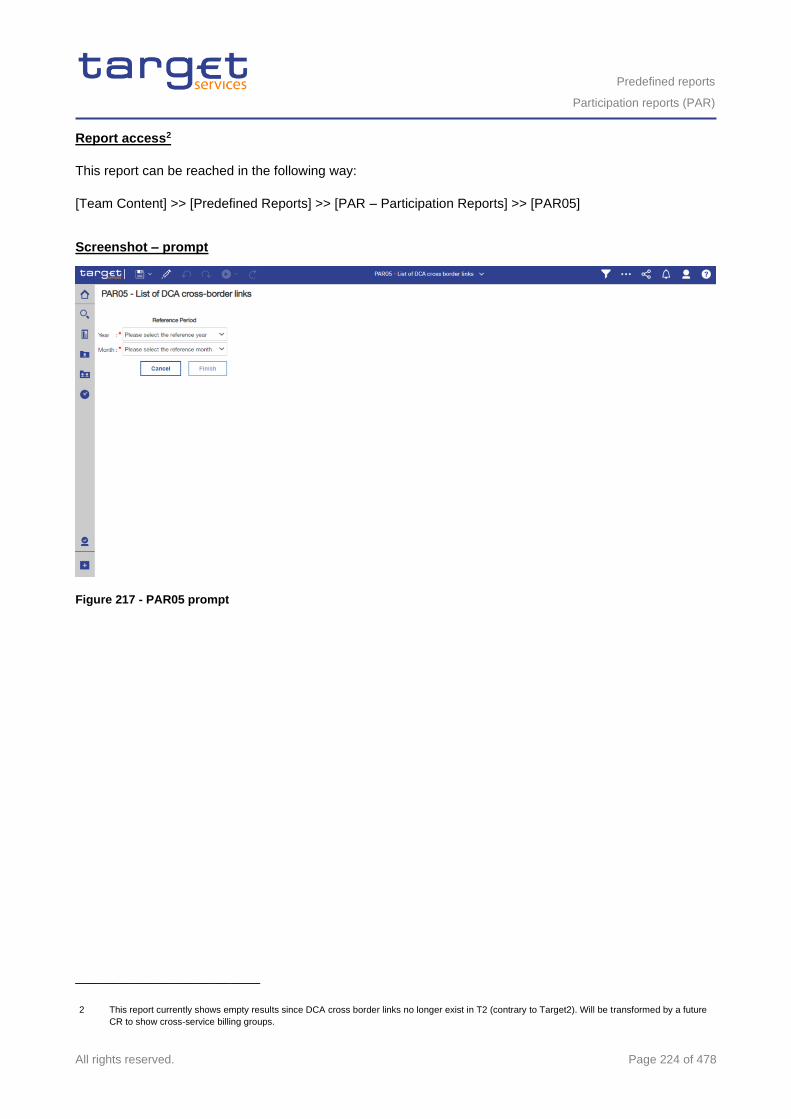
Predefined reports
Participation reports (PAR)
All rights reserved. Page 224 of 478
Report access2
This report can be reached in the following way:
[Team Content] >> [Predefined Reports] >> [PAR – Participation Reports] >> [PAR05]
Screenshot – prompt
Figure 217 - PAR05 prompt
_________________________
2 This report currently shows empty results since DCA cross border links no longer exist in T2 (contrary to Target2). Will be transformed by a future
CR to show cross-service billing groups.
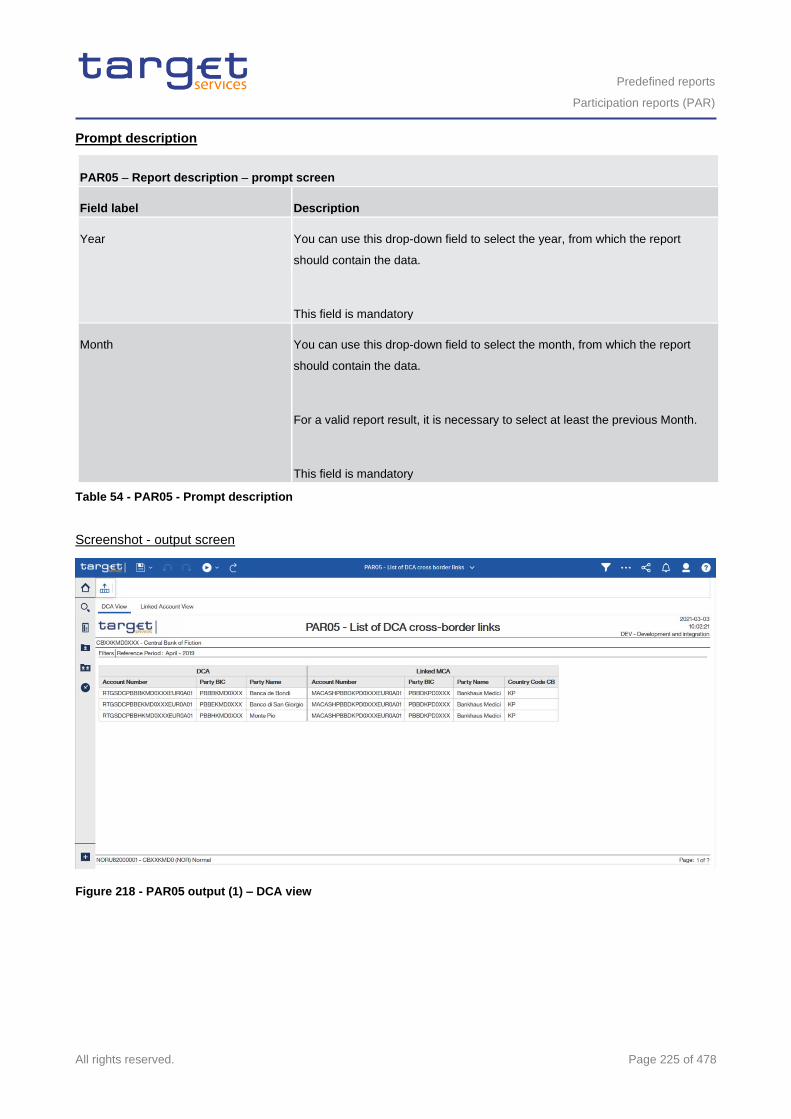
Predefined reports
Participation reports (PAR)
All rights reserved. Page 225 of 478
Prompt description
PAR05 – Report description – prompt screen
Field label Description
Year You can use this drop-down field to select the year, from which the report
should contain the data.
This field is mandatory
Month You can use this drop-down field to select the month, from which the report
should contain the data.
For a valid report result, it is necessary to select at least the previous Month.
This field is mandatory
Table 54 - PAR05 - Prompt description
Screenshot - output screen
Figure 218 - PAR05 output (1) – DCA view
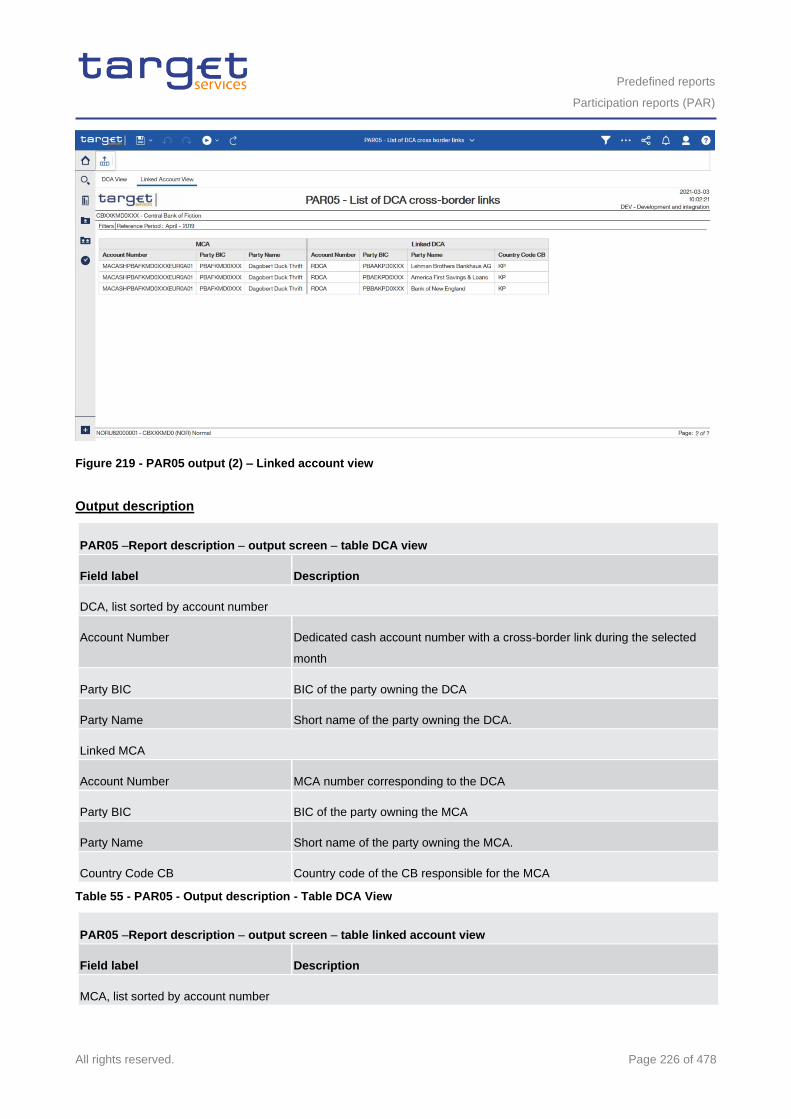
Predefined reports
Participation reports (PAR)
All rights reserved. Page 226 of 478
Figure 219 - PAR05 output (2) – Linked account view
Output description
PAR05 –Report description – output screen – table DCA view
Field label Description
DCA, list sorted by account number
Account Number Dedicated cash account number with a cross-border link during the selected
month
Party BIC BIC of the party owning the DCA
Party Name Short name of the party owning the DCA.
Linked MCA
Account Number MCA number corresponding to the DCA
Party BIC BIC of the party owning the MCA
Party Name Short name of the party owning the MCA.
Country Code CB Country code of the CB responsible for the MCA
Table 55 - PAR05 - Output description - Table DCA View
PAR05 –Report description – output screen – table linked account view
Field label Description
MCA, list sorted by account number
Predefined reports
Participation reports (PAR)
All rights reserved. Page 227 of 478
Account Number MCA number
Party BIC BIC of the party owning the MCA
Party Name Short name of the party owning the MCA
Linked DCA
Account Number Dedicated cash account number corresponding to the MCA
Party BIC BIC of the party owning the DCA
Party Name Short name of the party owning the DCA.
Country Code CB Country code of the CB responsible for the MCA corresponding to the DCA
Table 56 - PAR05 - Output description - Table linked account view
5.9.6 PAR06 – Number of participants per CB
Context of usage
This report provides information on the number of participants per participation type according to RTGS
Directory on a given date.
For each participation type in RTGS Directory, the number (total and per CB) of participants on the given date
is reported. In addition, the number of unpublished RTGS DCAs belonging to payment banks and the number
of Direct Participants (payment banks) having a different BIC8 is provided in the same manner.
CBs can retrieve aggregated numbers (overall and per CB) for all CBs/system entities.
This report can be used by CB users only.
Report access
This report can be reached in the following way:
[Team Content] >> [Predefined Reports] >> [PAR – Participation Reports] >> [PAR06]
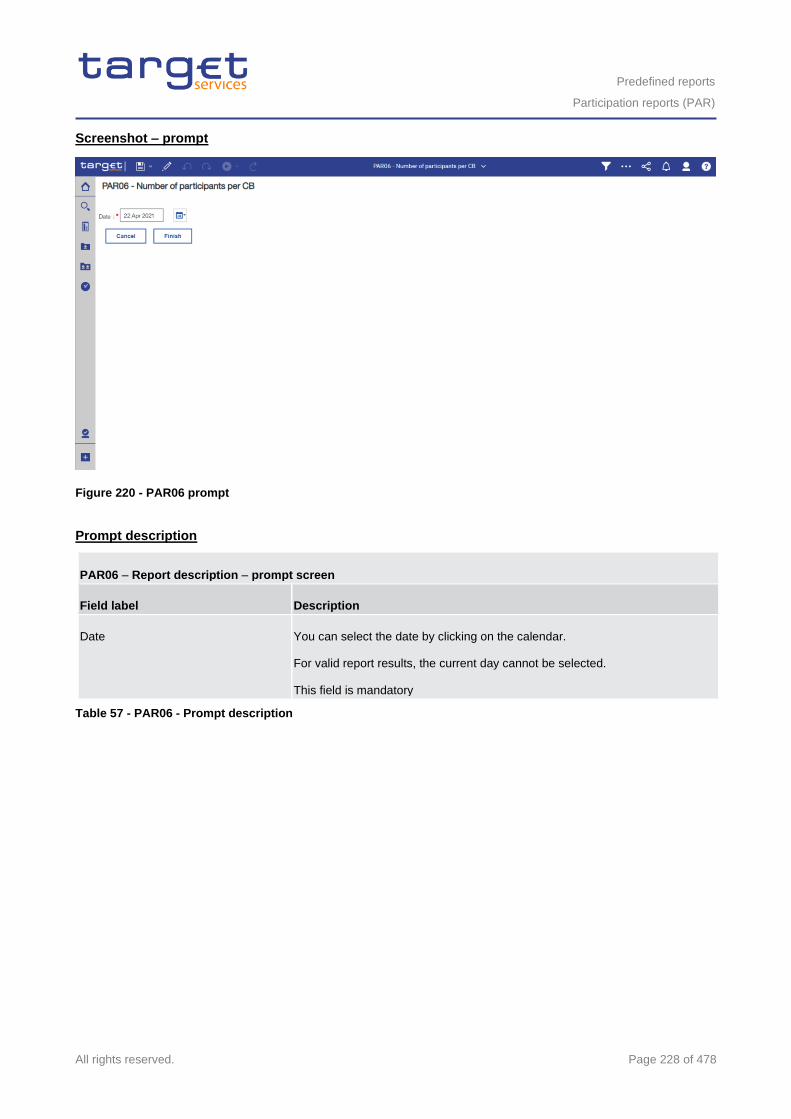
Predefined reports
Participation reports (PAR)
All rights reserved. Page 228 of 478
Screenshot – prompt
Figure 220 - PAR06 prompt
Prompt description
PAR06 – Report description – prompt screen
Field label Description
Date You can select the date by clicking on the calendar.
For valid report results, the current day cannot be selected.
This field is mandatory
Table 57 - PAR06 - Prompt description
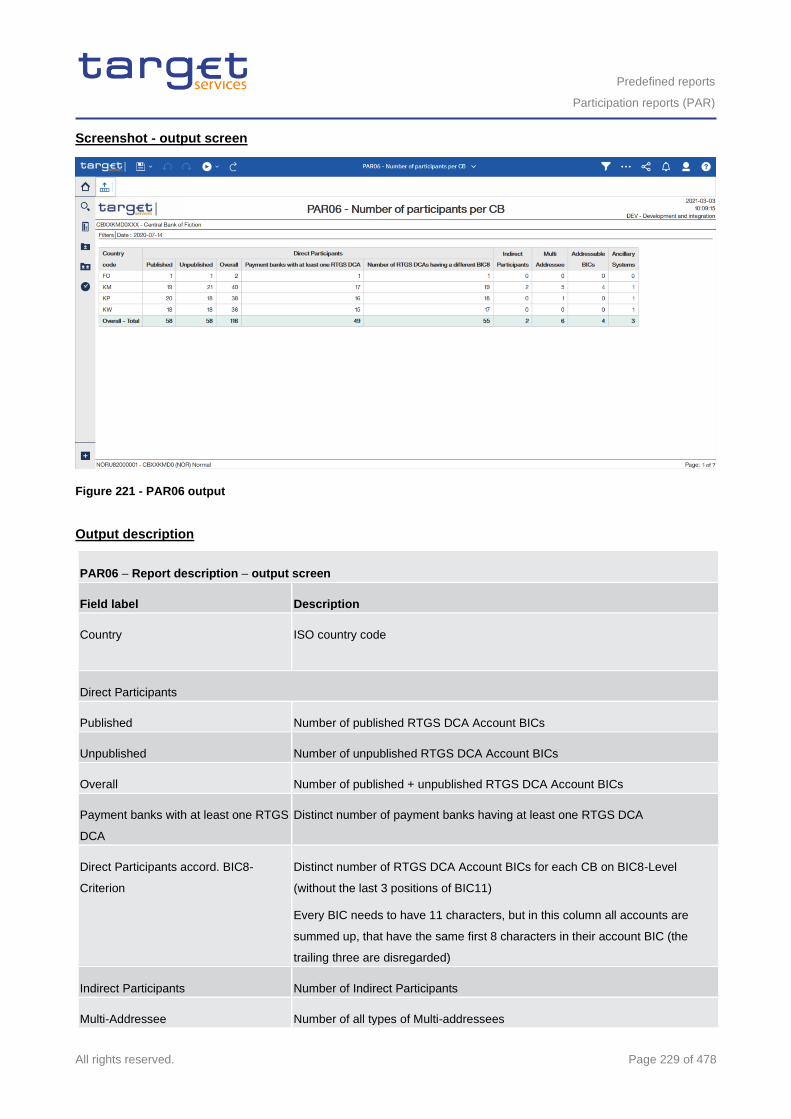
Predefined reports
Participation reports (PAR)
All rights reserved. Page 229 of 478
Screenshot - output screen
Figure 221 - PAR06 output
Output description
PAR06 – Report description – output screen
Field label Description
Country ISO country code
Direct Participants
Published Number of published RTGS DCA Account BICs
Unpublished Number of unpublished RTGS DCA Account BICs
Overall Number of published + unpublished RTGS DCA Account BICs
Payment banks with at least one RTGS
DCA
Distinct number of payment banks having at least one RTGS DCA
Direct Participants accord. BIC8-
Criterion
Distinct number of RTGS DCA Account BICs for each CB on BIC8-Level
(without the last 3 positions of BIC11)
Every BIC needs to have 11 characters, but in this column all accounts are
summed up, that have the same first 8 characters in their account BIC (the
trailing three are disregarded)
Indirect Participants Number of Indirect Participants
Multi-Addressee Number of all types of Multi-addressees
Predefined reports
Standing facilities reports (STF)
All rights reserved. Page 230 of 478
Addressable BICs Number of all types of Addressable BICs
Ancillary Systems Number of parties with party type = ancillary system
Overall - Total Sums for each of the columns
Table 58 - PAR06 - Output description
5.10 Standing facilities reports (STF)
5.10.1 STF01 – Standing facility information
Context of usage
This report provides daily information on the use of standing facilities within a given data range. In addition to
the party BIC/name, entities are reported with their respective MFI code. The report provides information on
payment banks with access to monetary policy operations and is split in two parts: Marginal lending and
overnight deposit.
For each facility and day the set-up amount, the refund amount and the interest amount is reported. For the
marginal lending facility, the reported amounts include both, the use of marginal lending on request and the
use of automated marginal lending.
CBs can retrieve information on the use of standing facilities of those parties belonging to their system entity.
Note: After the launch of Eurosystem Collateral Management System (ECMS) this report will only provide
information on the use of the overnight deposit facility as major parts of the marginal lending facility will be no
more handled by CLM, but by ECMS. Further information can be found in CLM UDFS chapters “Marginal
lending on request” and “Automated marginal lending”.
This report can be used by CB and PB users.
Report access
This report can be reached in the following way:
[Team Content] >> [Predefined Reports] >> [STF – Standing Facilities Reports] >> [STF01]
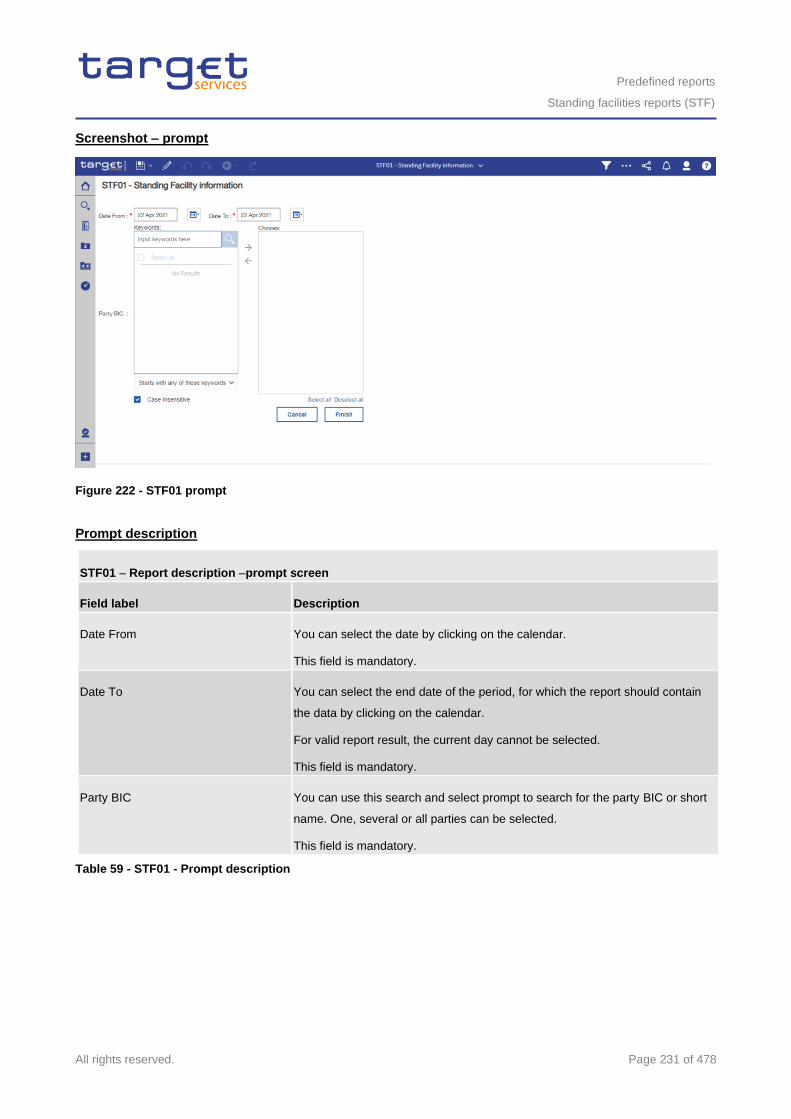
Predefined reports
Standing facilities reports (STF)
All rights reserved. Page 231 of 478
Screenshot – prompt
Figure 222 - STF01 prompt
Prompt description
STF01 – Report description –prompt screen
Field label Description
Date From You can select the date by clicking on the calendar.
This field is mandatory.
Date To You can select the end date of the period, for which the report should contain
the data by clicking on the calendar.
For valid report result, the current day cannot be selected.
This field is mandatory.
Party BIC You can use this search and select prompt to search for the party BIC or short
name. One, several or all parties can be selected.
This field is mandatory.
Table 59 - STF01 - Prompt description
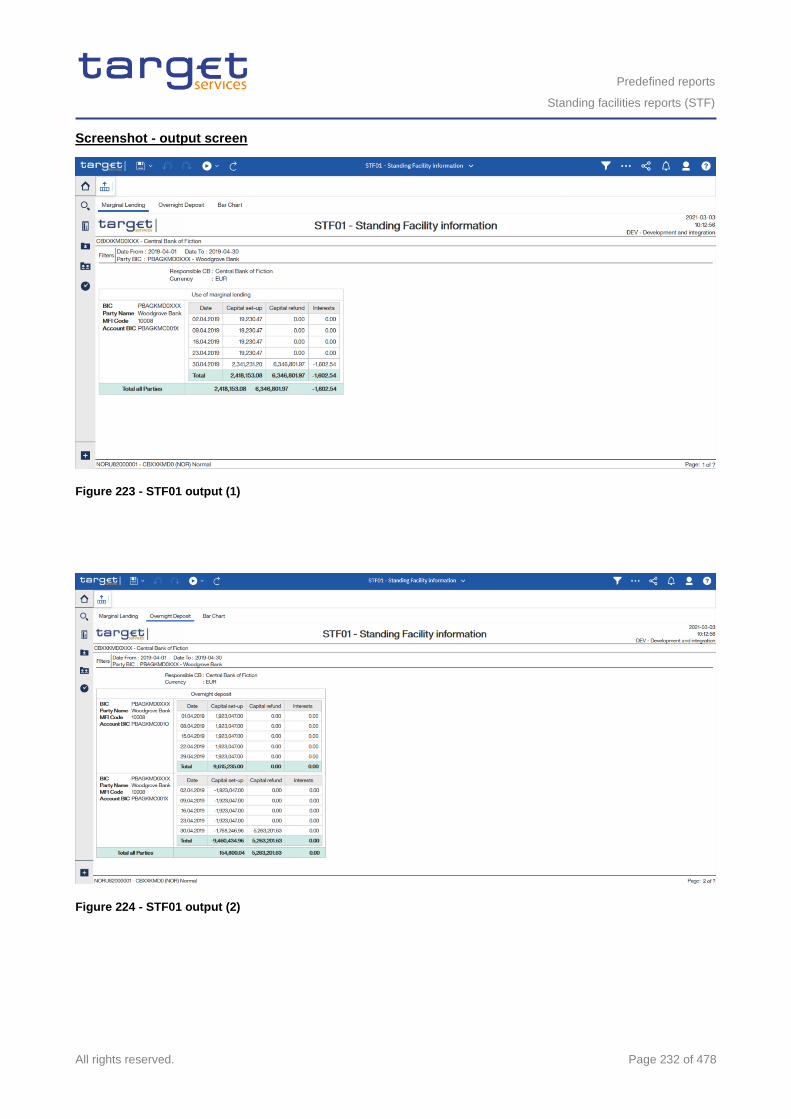
Predefined reports
Standing facilities reports (STF)
All rights reserved. Page 232 of 478
Screenshot - output screen
Figure 223 - STF01 output (1)
Figure 224 - STF01 output (2)
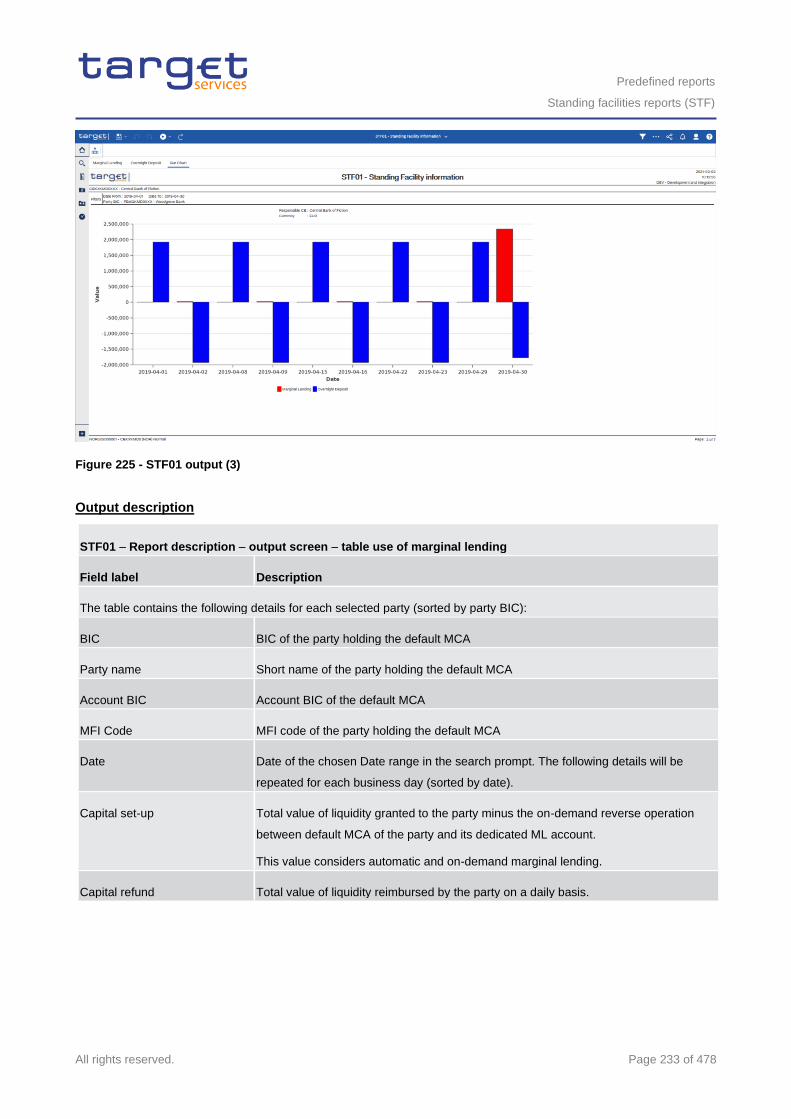
Predefined reports
Standing facilities reports (STF)
All rights reserved. Page 233 of 478
Figure 225 - STF01 output (3)
Output description
STF01 – Report description – output screen – table use of marginal lending
Field label Description
The table contains the following details for each selected party (sorted by party BIC):
BIC BIC of the party holding the default MCA
Party name Short name of the party holding the default MCA
Account BIC Account BIC of the default MCA
MFI Code MFI code of the party holding the default MCA
Date Date of the chosen Date range in the search prompt. The following details will be
repeated for each business day (sorted by date).
Capital set-up Total value of liquidity granted to the party minus the on-demand reverse operation
between default MCA of the party and its dedicated ML account.
This value considers automatic and on-demand marginal lending.
Capital refund Total value of liquidity reimbursed by the party on a daily basis.
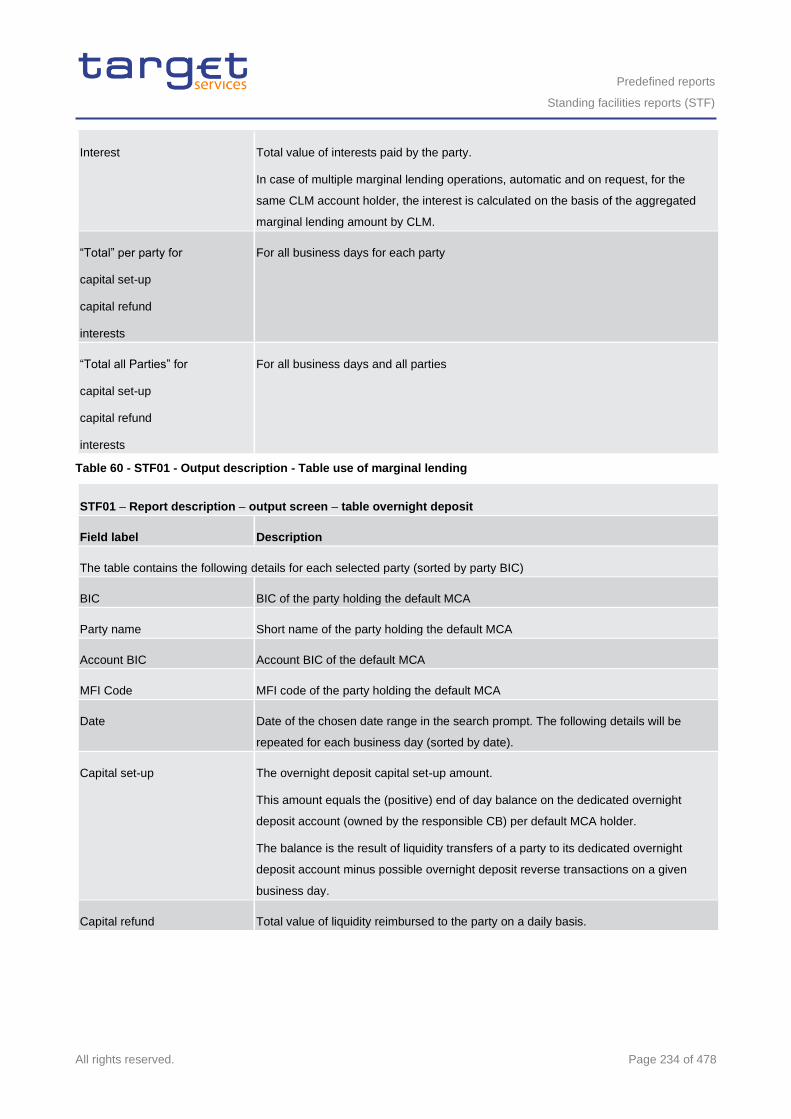
Predefined reports
Standing facilities reports (STF)
All rights reserved. Page 234 of 478
Interest Total value of interests paid by the party.
In case of multiple marginal lending operations, automatic and on request, for the
same CLM account holder, the interest is calculated on the basis of the aggregated
marginal lending amount by CLM.
“Total” per party for
capital set-up
capital refund
interests
For all business days for each party
“Total all Parties” for
capital set-up
capital refund
interests
For all business days and all parties
Table 60 - STF01 - Output description - Table use of marginal lending
STF01 – Report description – output screen – table overnight deposit
Field label Description
The table contains the following details for each selected party (sorted by party BIC)
BIC BIC of the party holding the default MCA
Party name Short name of the party holding the default MCA
Account BIC Account BIC of the default MCA
MFI Code MFI code of the party holding the default MCA
Date Date of the chosen date range in the search prompt. The following details will be
repeated for each business day (sorted by date).
Capital set-up The overnight deposit capital set-up amount.
This amount equals the (positive) end of day balance on the dedicated overnight
deposit account (owned by the responsible CB) per default MCA holder.
The balance is the result of liquidity transfers of a party to its dedicated overnight
deposit account minus possible overnight deposit reverse transactions on a given
business day.
Capital refund Total value of liquidity reimbursed to the party on a daily basis.
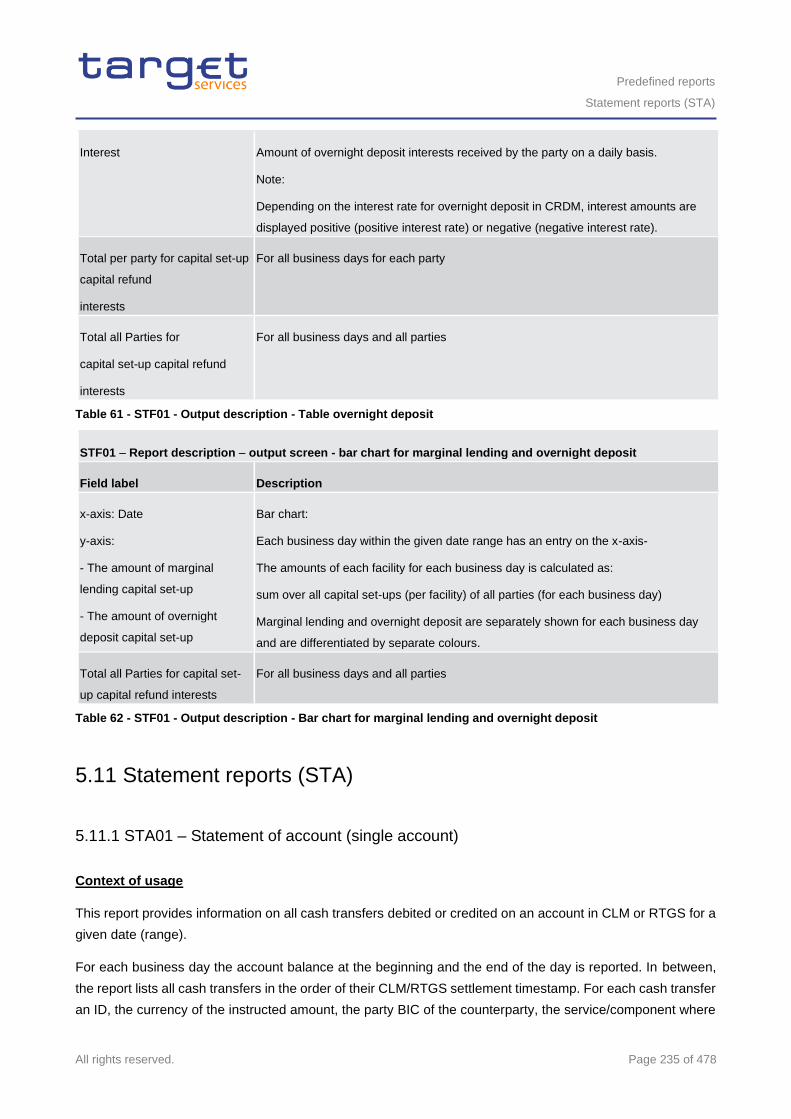
Predefined reports
Statement reports (STA)
All rights reserved. Page 235 of 478
Interest Amount of overnight deposit interests received by the party on a daily basis.
Note:
Depending on the interest rate for overnight deposit in CRDM, interest amounts are
displayed positive (positive interest rate) or negative (negative interest rate).
Total per party for capital set-up
capital refund
interests
For all business days for each party
Total all Parties for
capital set-up capital refund
interests
For all business days and all parties
Table 61 - STF01 - Output description - Table overnight deposit
STF01 – Report description – output screen - bar chart for marginal lending and overnight deposit
Field label Description
x-axis: Date
y-axis:
- The amount of marginal
lending capital set-up
- The amount of overnight
deposit capital set-up
Bar chart:
Each business day within the given date range has an entry on the x-axis-
The amounts of each facility for each business day is calculated as:
sum over all capital set-ups (per facility) of all parties (for each business day)
Marginal lending and overnight deposit are separately shown for each business day
and are differentiated by separate colours.
Total all Parties for capital set-
up capital refund interests
For all business days and all parties
Table 62 - STF01 - Output description - Bar chart for marginal lending and overnight deposit
5.11 Statement reports (STA)
5.11.1 STA01 – Statement of account (single account)
Context of usage
This report provides information on all cash transfers debited or credited on an account in CLM or RTGS for a
given date (range).
For each business day the account balance at the beginning and the end of the day is reported. In between,
the report lists all cash transfers in the order of their CLM/RTGS settlement timestamp. For each cash transfer
an ID, the currency of the instructed amount, the party BIC of the counterparty, the service/component where
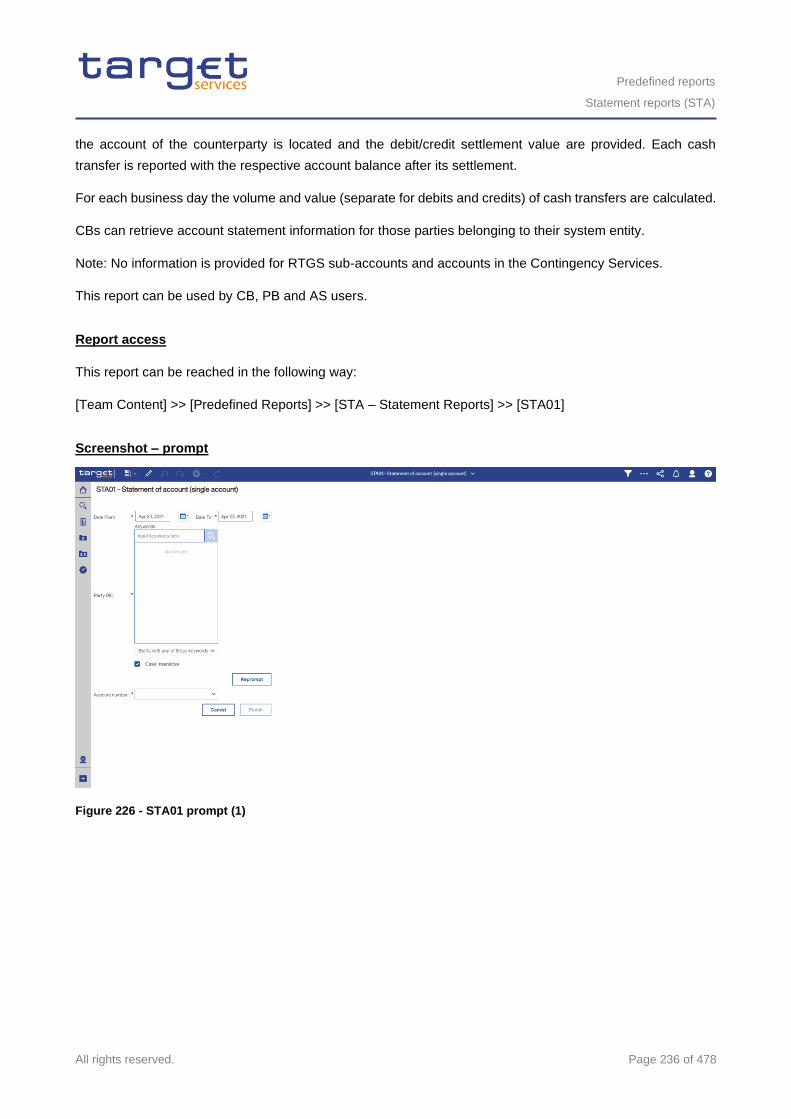
Predefined reports
Statement reports (STA)
All rights reserved. Page 236 of 478
the account of the counterparty is located and the debit/credit settlement value are provided. Each cash
transfer is reported with the respective account balance after its settlement.
For each business day the volume and value (separate for debits and credits) of cash transfers are calculated.
CBs can retrieve account statement information for those parties belonging to their system entity.
Note: No information is provided for RTGS sub-accounts and accounts in the Contingency Services.
This report can be used by CB, PB and AS users.
Report access
This report can be reached in the following way:
[Team Content] >> [Predefined Reports] >> [STA – Statement Reports] >> [STA01]
Screenshot – prompt
Figure 226 - STA01 prompt (1)
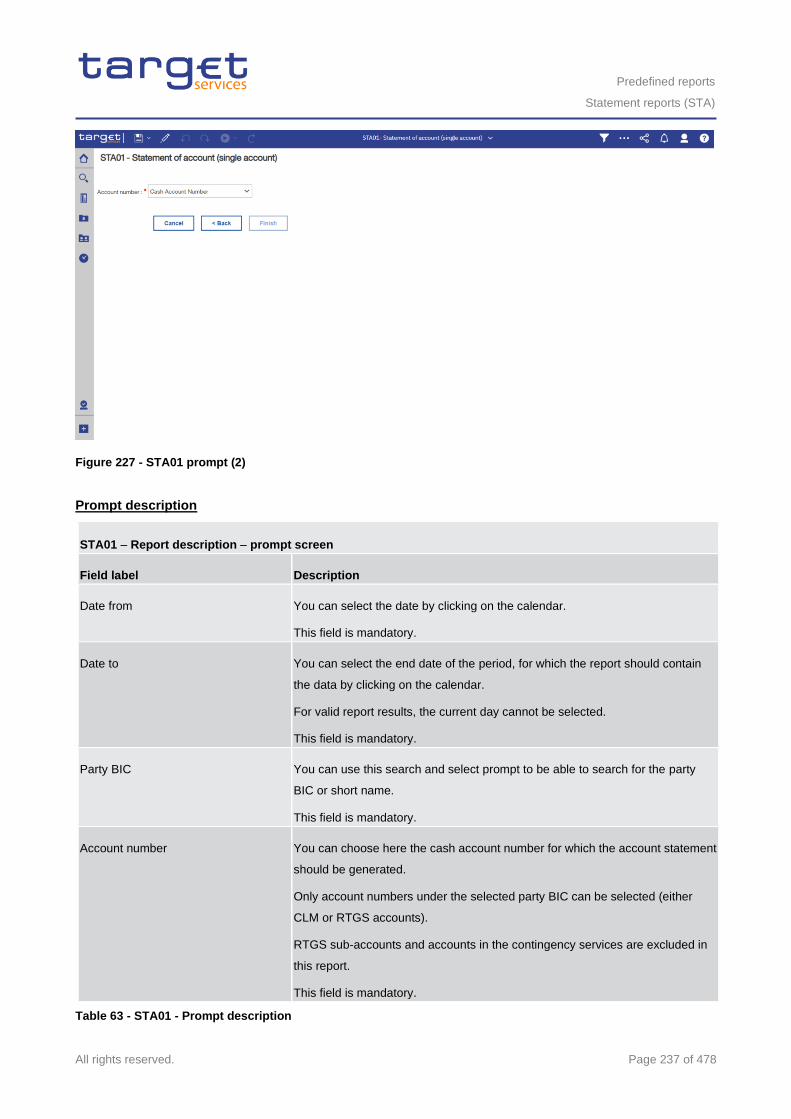
Predefined reports
Statement reports (STA)
All rights reserved. Page 237 of 478
Figure 227 - STA01 prompt (2)
Prompt description
STA01 – Report description – prompt screen
Field label Description
Date from You can select the date by clicking on the calendar.
This field is mandatory.
Date to You can select the end date of the period, for which the report should contain
the data by clicking on the calendar.
For valid report results, the current day cannot be selected.
This field is mandatory.
Party BIC You can use this search and select prompt to be able to search for the party
BIC or short name.
This field is mandatory.
Account number You can choose here the cash account number for which the account statement
should be generated.
Only account numbers under the selected party BIC can be selected (either
CLM or RTGS accounts).
RTGS sub-accounts and accounts in the contingency services are excluded in
this report.
This field is mandatory.
Table 63 - STA01 - Prompt description
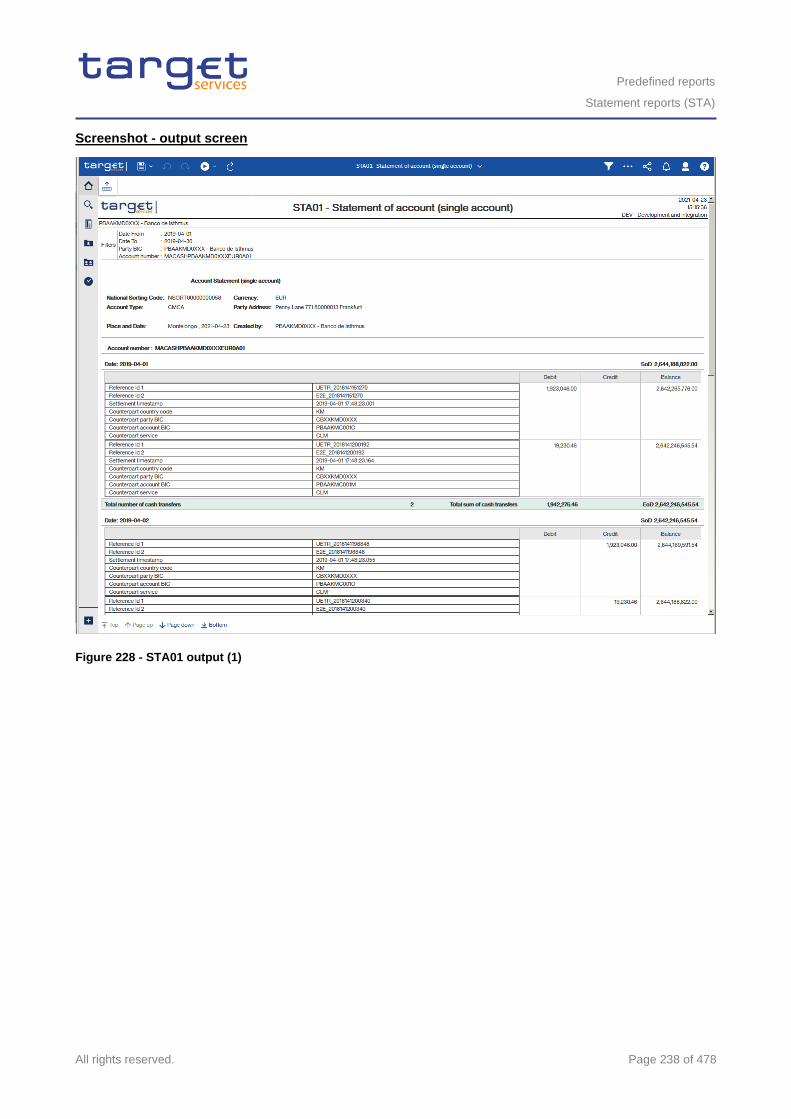
Predefined reports
Statement reports (STA)
All rights reserved. Page 238 of 478
Screenshot - output screen
Figure 228 - STA01 output (1)
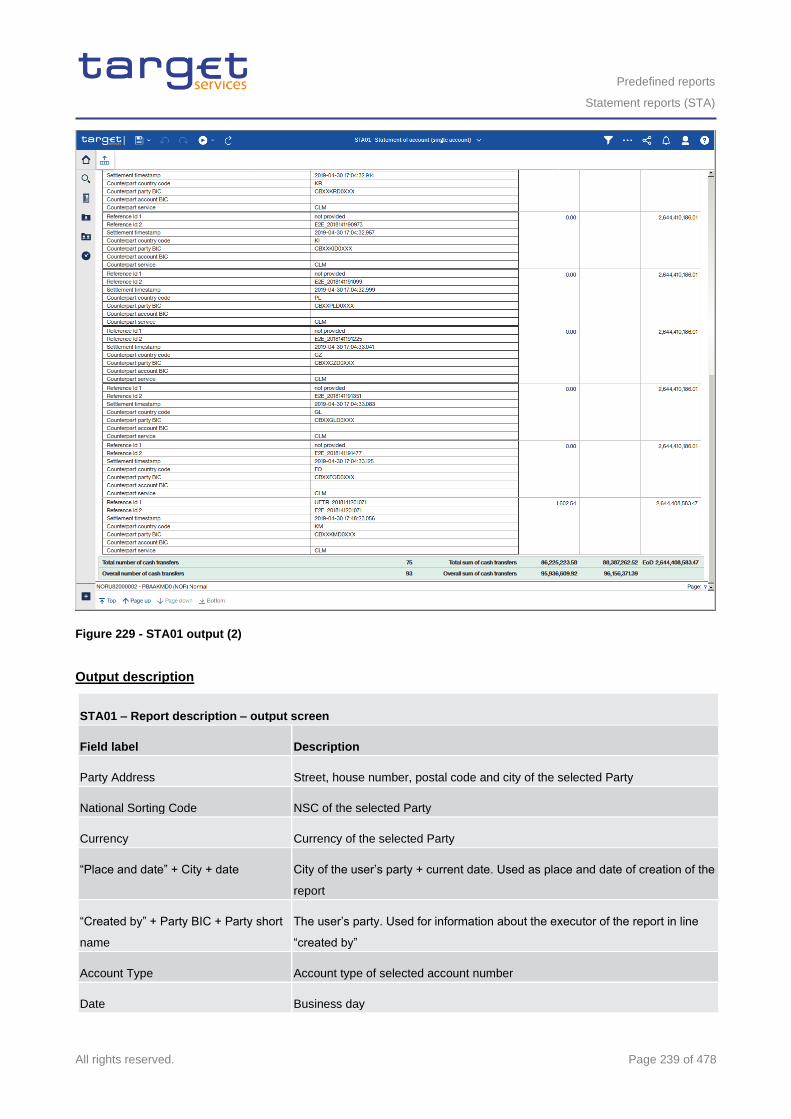
Predefined reports
Statement reports (STA)
All rights reserved. Page 239 of 478
Figure 229 - STA01 output (2)
Output description
STA01 – Report description – output screen
Field label Description
Party Address Street, house number, postal code and city of the selected Party
National Sorting Code NSC of the selected Party
Currency Currency of the selected Party
“Place and date” + City + date City of the user’s party + current date. Used as place and date of creation of the
report
“Created by” + Party BIC + Party short
name
The user’s party. Used for information about the executor of the report in line
“created by”
Account Type Account type of selected account number
Date Business day
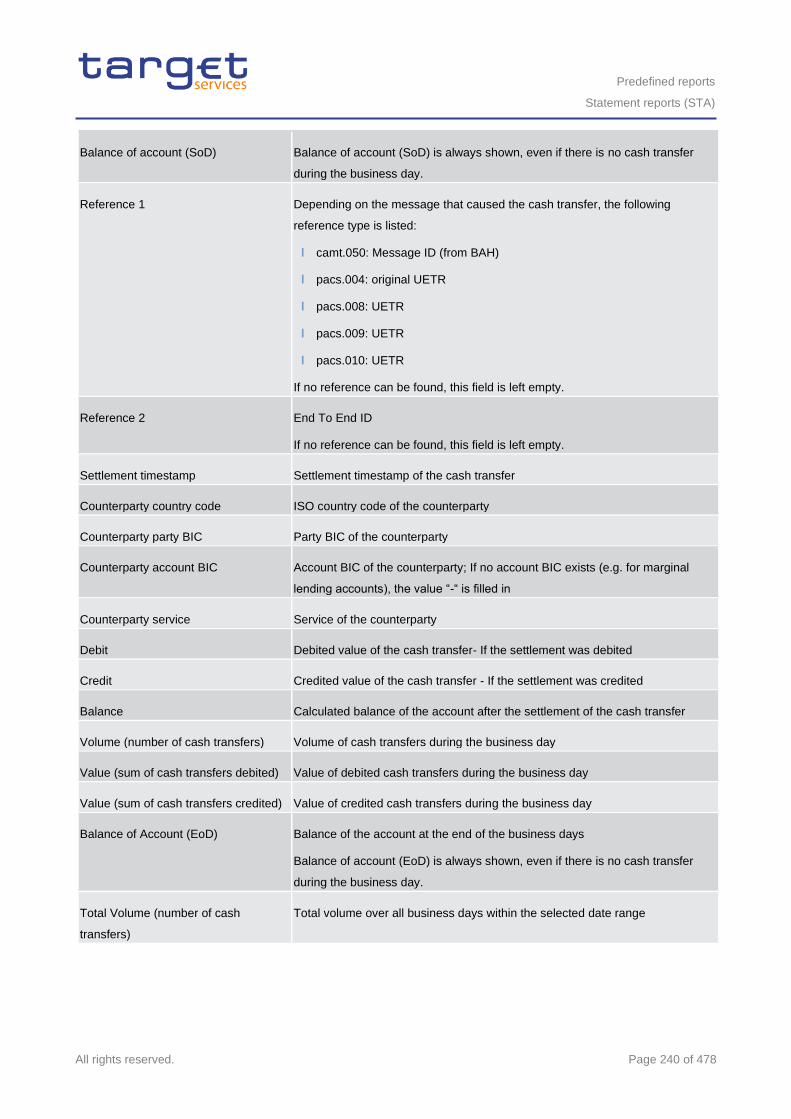
Predefined reports
Statement reports (STA)
All rights reserved. Page 240 of 478
Balance of account (SoD) Balance of account (SoD) is always shown, even if there is no cash transfer
during the business day.
Reference 1
Depending on the message that caused the cash transfer, the following
reference type is listed:
l camt.050: Message ID (from BAH)
l pacs.004: original UETR
l pacs.008: UETR
l pacs.009: UETR
l pacs.010: UETR
If no reference can be found, this field is left empty.
Reference 2 End To End ID
If no reference can be found, this field is left empty.
Settlement timestamp Settlement timestamp of the cash transfer
Counterparty country code ISO country code of the counterparty
Counterparty party BIC Party BIC of the counterparty
Counterparty account BIC Account BIC of the counterparty; If no account BIC exists (e.g. for marginal
lending accounts), the value “-“ is filled in
Counterparty service Service of the counterparty
Debit Debited value of the cash transfer- If the settlement was debited
Credit Credited value of the cash transfer - If the settlement was credited
Balance Calculated balance of the account after the settlement of the cash transfer
Volume (number of cash transfers) Volume of cash transfers during the business day
Value (sum of cash transfers debited) Value of debited cash transfers during the business day
Value (sum of cash transfers credited) Value of credited cash transfers during the business day
Balance of Account (EoD) Balance of the account at the end of the business days
Balance of account (EoD) is always shown, even if there is no cash transfer
during the business day.
Total Volume (number of cash
transfers)
Total volume over all business days within the selected date range
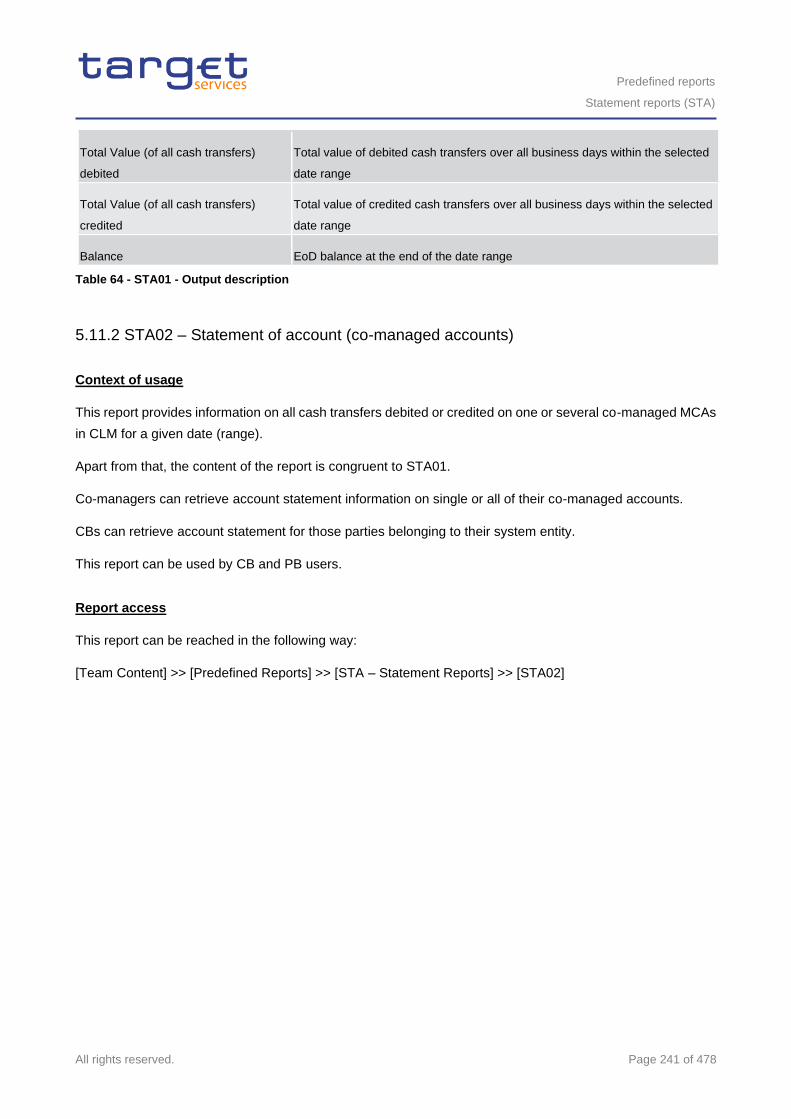
Predefined reports
Statement reports (STA)
All rights reserved. Page 241 of 478
Total Value (of all cash transfers)
debited
Total value of debited cash transfers over all business days within the selected
date range
Total Value (of all cash transfers)
credited
Total value of credited cash transfers over all business days within the selected
date range
Balance EoD balance at the end of the date range
Table 64 - STA01 - Output description
5.11.2 STA02 – Statement of account (co-managed accounts)
Context of usage
This report provides information on all cash transfers debited or credited on one or several co-managed MCAs
in CLM for a given date (range).
Apart from that, the content of the report is congruent to STA01.
Co-managers can retrieve account statement information on single or all of their co-managed accounts.
CBs can retrieve account statement for those parties belonging to their system entity.
This report can be used by CB and PB users.
Report access
This report can be reached in the following way:
[Team Content] >> [Predefined Reports] >> [STA – Statement Reports] >> [STA02]
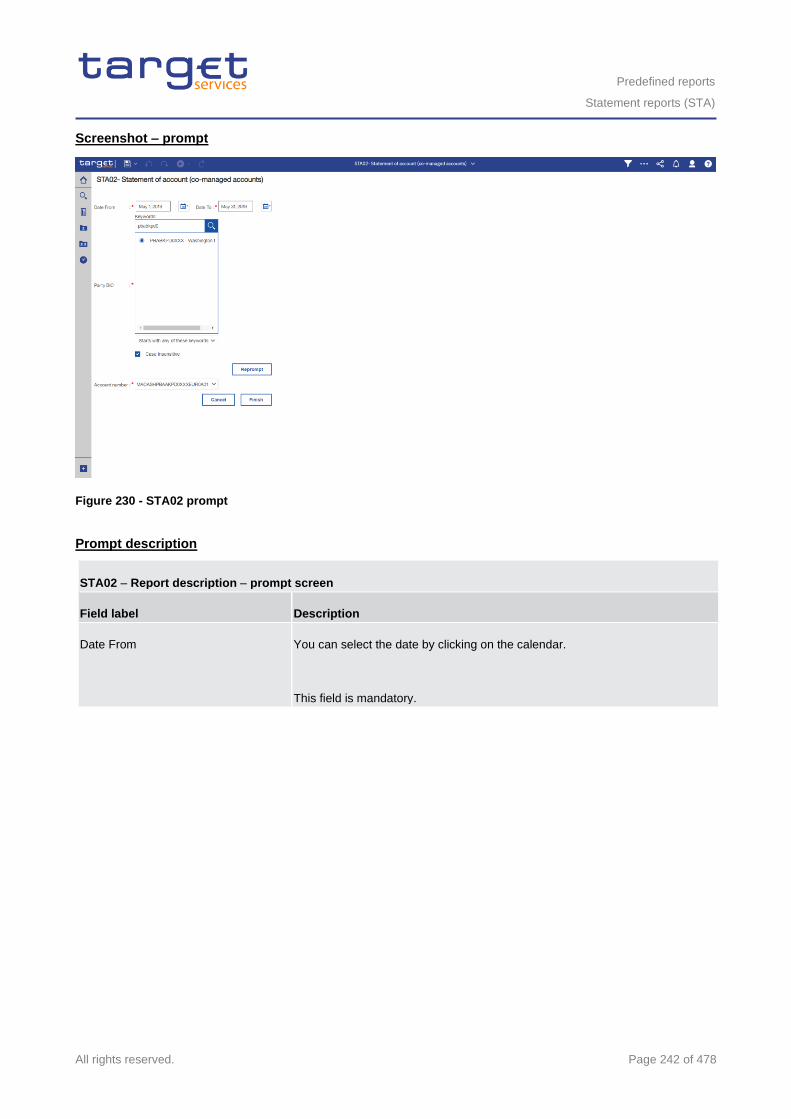
Predefined reports
Statement reports (STA)
All rights reserved. Page 242 of 478
Screenshot – prompt
Figure 230 - STA02 prompt
Prompt description
STA02 – Report description – prompt screen
Field label Description
Date From You can select the date by clicking on the calendar.
This field is mandatory.
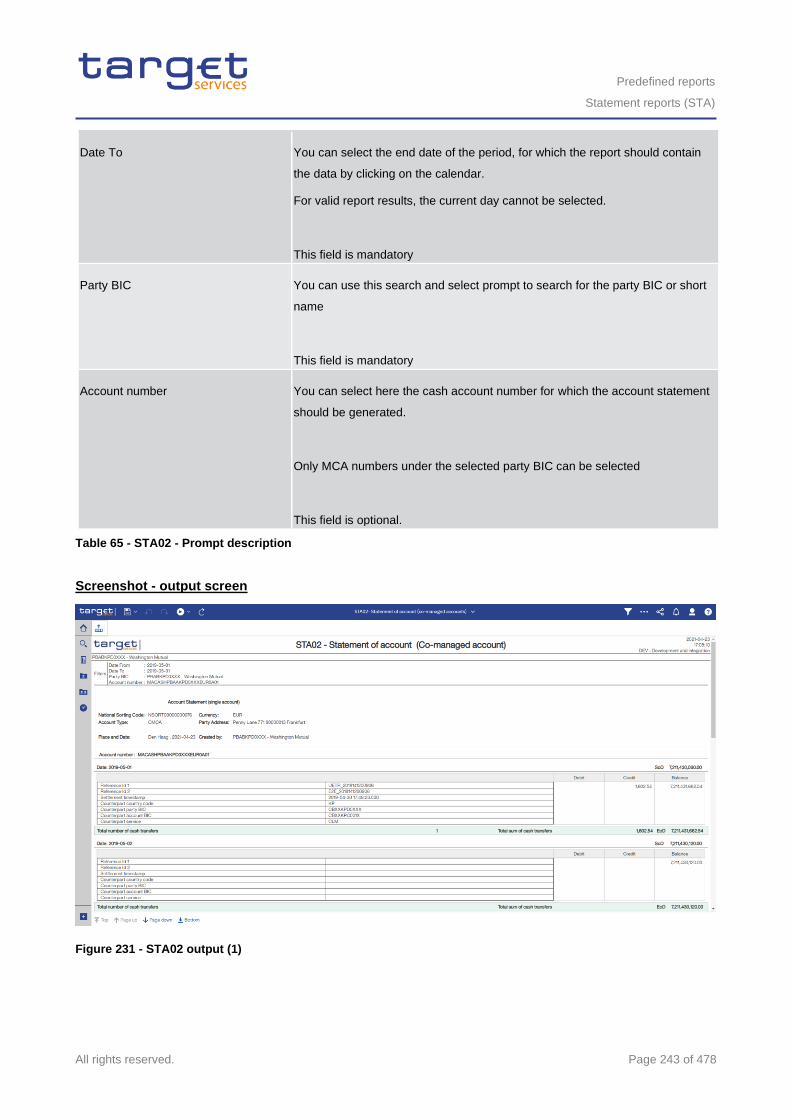
Predefined reports
Statement reports (STA)
All rights reserved. Page 243 of 478
Date To You can select the end date of the period, for which the report should contain
the data by clicking on the calendar.
For valid report results, the current day cannot be selected.
This field is mandatory
Party BIC You can use this search and select prompt to search for the party BIC or short
name
This field is mandatory
Account number You can select here the cash account number for which the account statement
should be generated.
Only MCA numbers under the selected party BIC can be selected
This field is optional.
Table 65 - STA02 - Prompt description
Screenshot - output screen
Figure 231 - STA02 output (1)
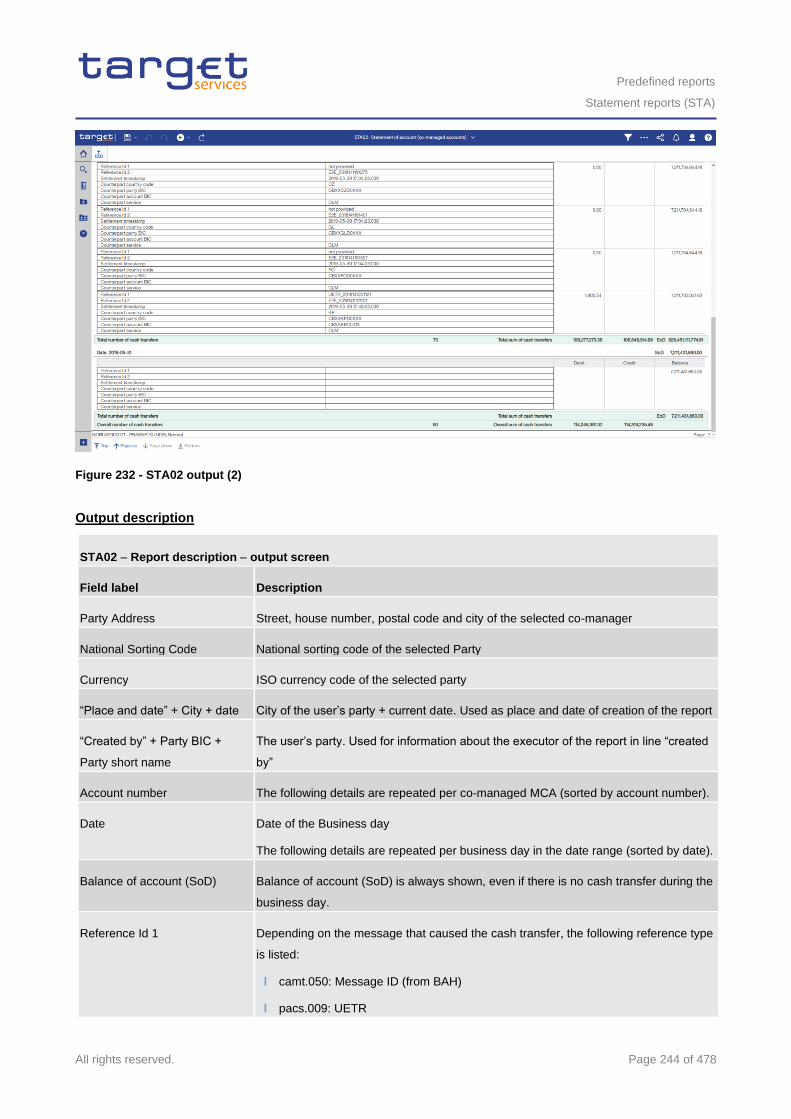
Predefined reports
Statement reports (STA)
All rights reserved. Page 244 of 478
Figure 232 - STA02 output (2)
Output description
STA02 – Report description – output screen
Field label Description
Party Address Street, house number, postal code and city of the selected co-manager
National Sorting Code National sorting code of the selected Party
Currency ISO currency code of the selected party
“Place and date” + City + date City of the user’s party + current date. Used as place and date of creation of the report
“Created by” + Party BIC +
Party short name
The user’s party. Used for information about the executor of the report in line “created
by”
Account number The following details are repeated per co-managed MCA (sorted by account number).
Date Date of the Business day
The following details are repeated per business day in the date range (sorted by date).
Balance of account (SoD) Balance of account (SoD) is always shown, even if there is no cash transfer during the
business day.
Reference Id 1
Depending on the message that caused the cash transfer, the following reference type
is listed:
l camt.050: Message ID (from BAH)
l pacs.009: UETR
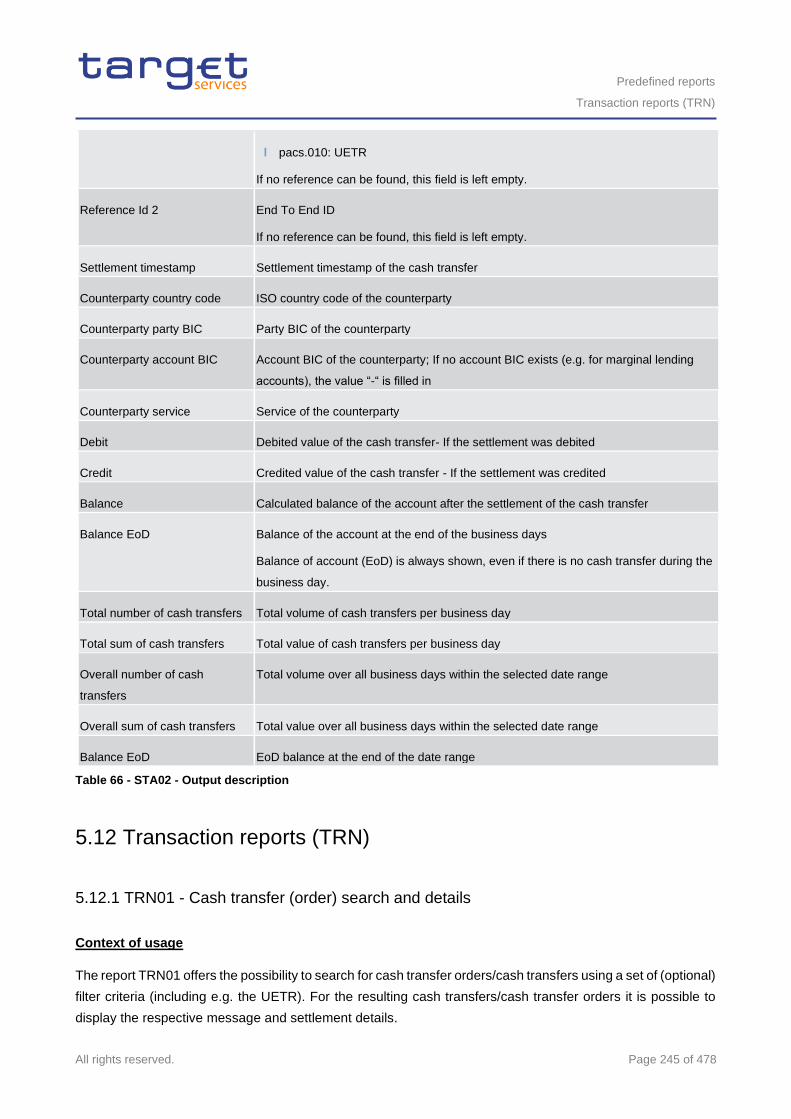
Predefined reports
Transaction reports (TRN)
All rights reserved. Page 245 of 478
l pacs.010: UETR
If no reference can be found, this field is left empty.
Reference Id 2 End To End ID
If no reference can be found, this field is left empty.
Settlement timestamp Settlement timestamp of the cash transfer
Counterparty country code ISO country code of the counterparty
Counterparty party BIC Party BIC of the counterparty
Counterparty account BIC Account BIC of the counterparty; If no account BIC exists (e.g. for marginal lending
accounts), the value “-“ is filled in
Counterparty service Service of the counterparty
Debit Debited value of the cash transfer- If the settlement was debited
Credit Credited value of the cash transfer - If the settlement was credited
Balance Calculated balance of the account after the settlement of the cash transfer
Balance EoD Balance of the account at the end of the business days
Balance of account (EoD) is always shown, even if there is no cash transfer during the
business day.
Total number of cash transfers Total volume of cash transfers per business day
Total sum of cash transfers Total value of cash transfers per business day
Overall number of cash
transfers
Total volume over all business days within the selected date range
Overall sum of cash transfers Total value over all business days within the selected date range
Balance EoD EoD balance at the end of the date range
Table 66 - STA02 - Output description
5.12 Transaction reports (TRN)
5.12.1 TRN01 - Cash transfer (order) search and details
Context of usage
The report TRN01 offers the possibility to search for cash transfer orders/cash transfers using a set of (optional)
filter criteria (including e.g. the UETR). For the resulting cash transfers/cash transfer orders it is possible to
display the respective message and settlement details.
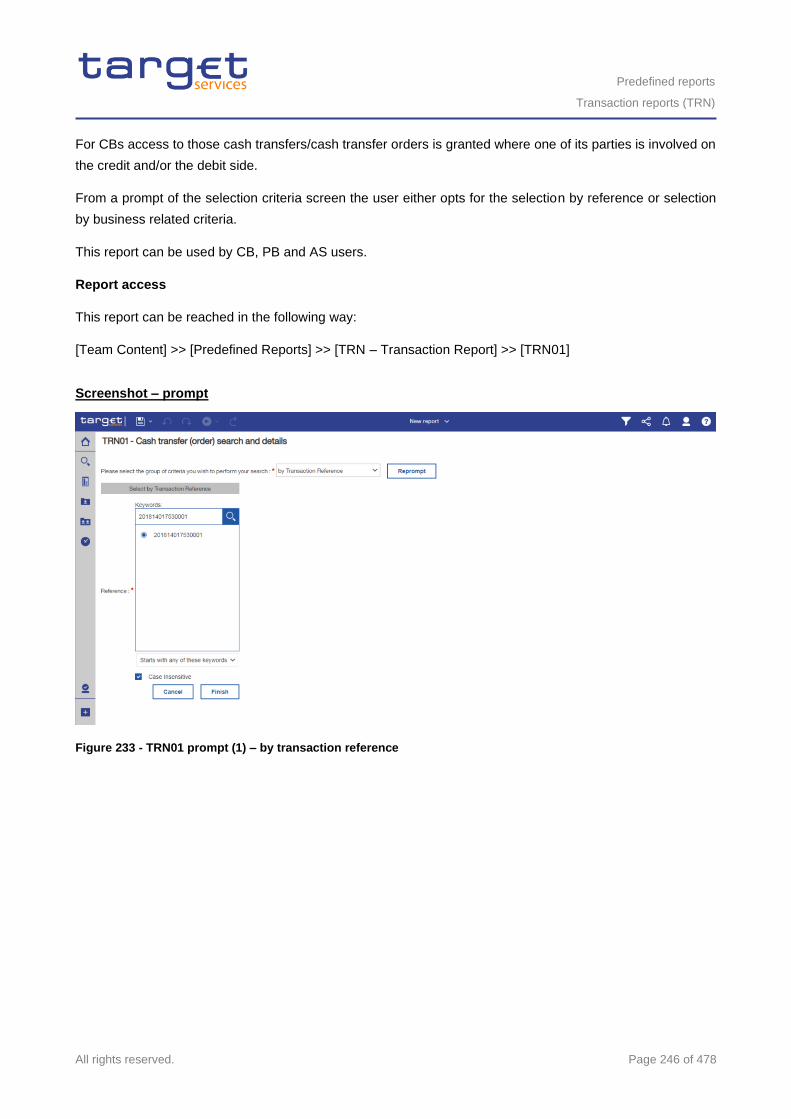
Predefined reports
Transaction reports (TRN)
All rights reserved. Page 246 of 478
For CBs access to those cash transfers/cash transfer orders is granted where one of its parties is involved on
the credit and/or the debit side.
From a prompt of the selection criteria screen the user either opts for the selection by reference or selection
by business related criteria.
This report can be used by CB, PB and AS users.
Report access
This report can be reached in the following way:
[Team Content] >> [Predefined Reports] >> [TRN – Transaction Report] >> [TRN01]
Screenshot – prompt
Figure 233 - TRN01 prompt (1) – by transaction reference
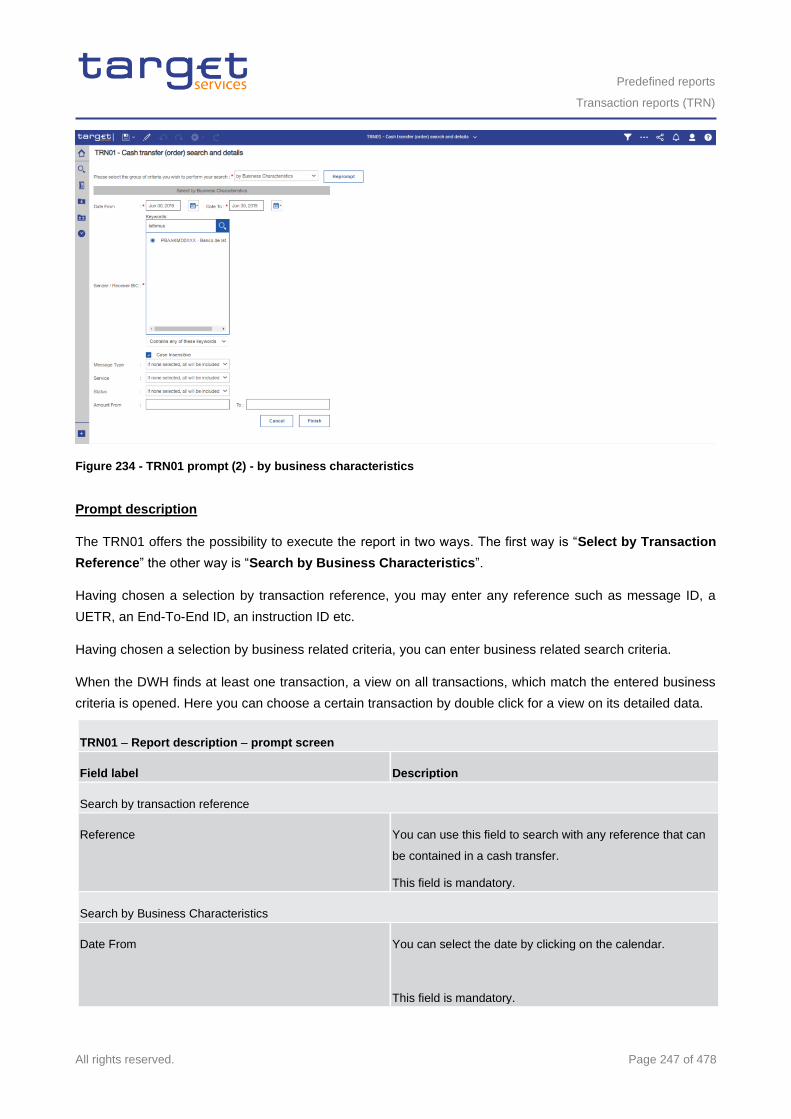
Predefined reports
Transaction reports (TRN)
All rights reserved. Page 247 of 478
Figure 234 - TRN01 prompt (2) - by business characteristics
Prompt description
The TRN01 offers the possibility to execute the report in two ways. The first way is “Select by Transaction
Reference” the other way is “Search by Business Characteristics”.
Having chosen a selection by transaction reference, you may enter any reference such as message ID, a
UETR, an End-To-End ID, an instruction ID etc.
Having chosen a selection by business related criteria, you can enter business related search criteria.
When the DWH finds at least one transaction, a view on all transactions, which match the entered business
criteria is opened. Here you can choose a certain transaction by double click for a view on its detailed data.
TRN01 – Report description – prompt screen
Field label Description
Search by transaction reference
Reference You can use this field to search with any reference that can
be contained in a cash transfer.
This field is mandatory.
Search by Business Characteristics
Date From You can select the date by clicking on the calendar.
This field is mandatory.
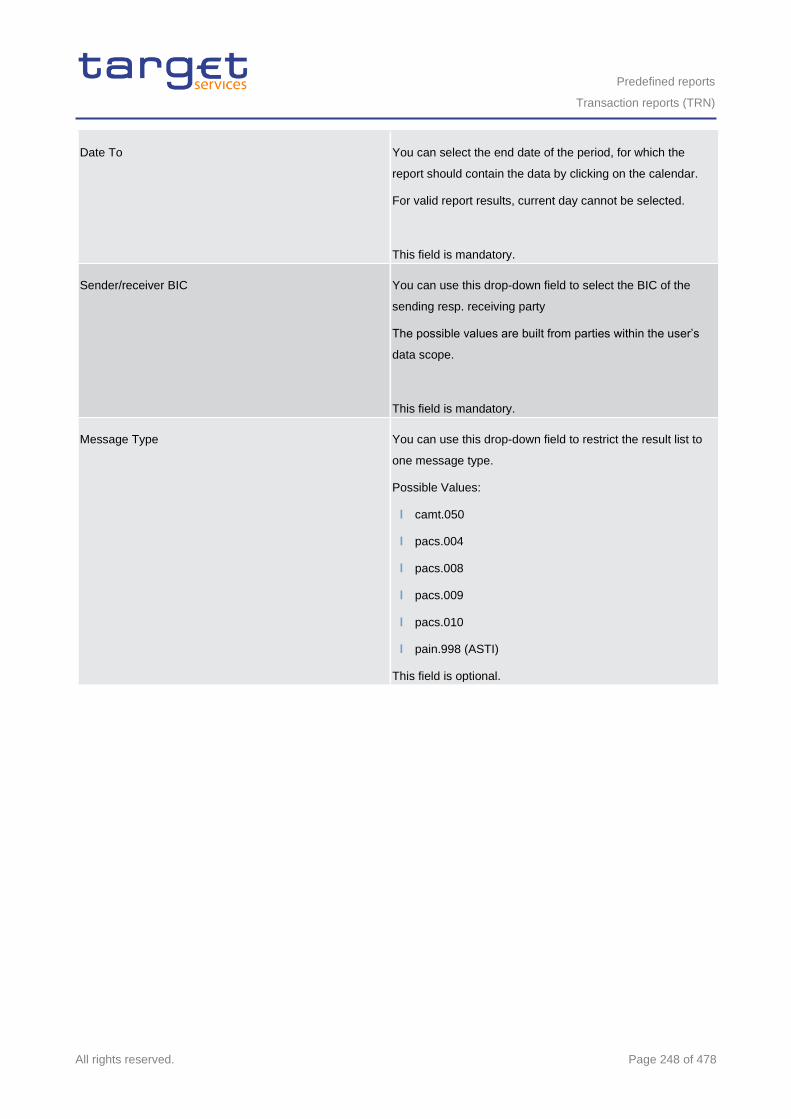
Predefined reports
Transaction reports (TRN)
All rights reserved. Page 248 of 478
Date To You can select the end date of the period, for which the
report should contain the data by clicking on the calendar.
For valid report results, current day cannot be selected.
This field is mandatory.
Sender/receiver BIC You can use this drop-down field to select the BIC of the
sending resp. receiving party
The possible values are built from parties within the user’s
data scope.
This field is mandatory.
Message Type You can use this drop-down field to restrict the result list to
one message type.
Possible Values:
l camt.050
l pacs.004
l pacs.008
l pacs.009
l pacs.010
l pain.998 (ASTI)
This field is optional.
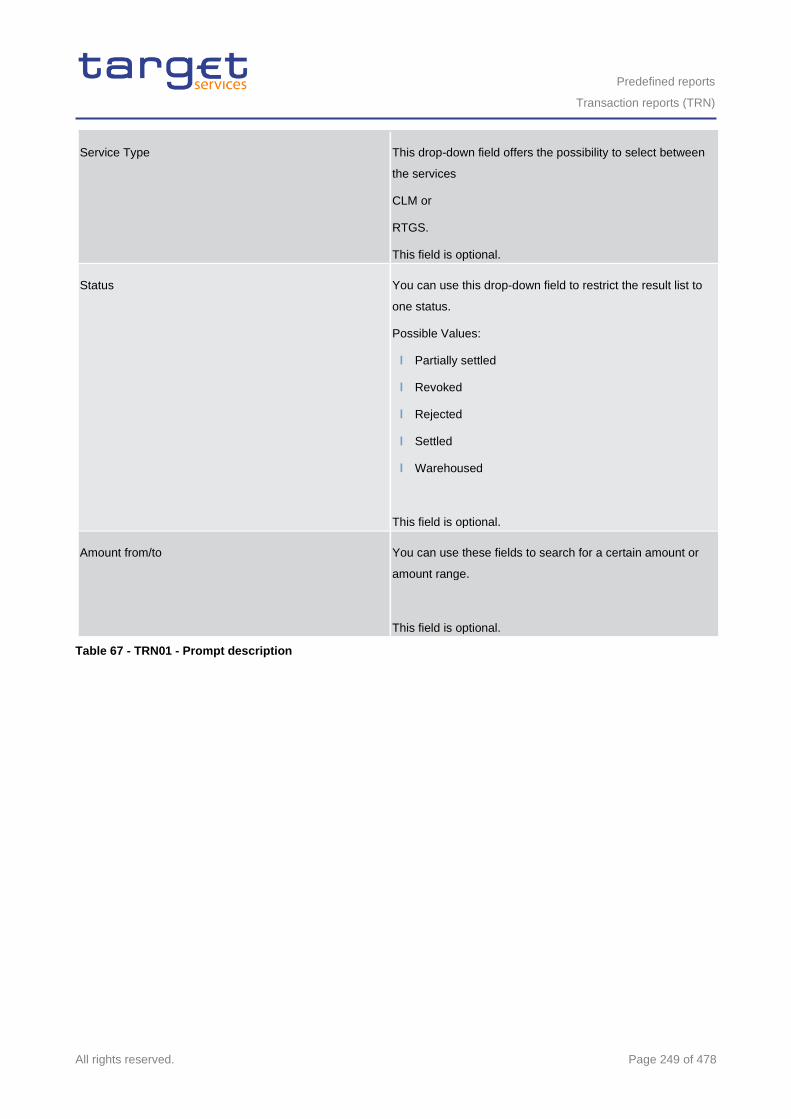
Predefined reports
Transaction reports (TRN)
All rights reserved. Page 249 of 478
Service Type This drop-down field offers the possibility to select between
the services
CLM or
RTGS.
This field is optional.
Status You can use this drop-down field to restrict the result list to
one status.
Possible Values:
l Partially settled
l Revoked
l Rejected
l Settled
l Warehoused
This field is optional.
Amount from/to You can use these fields to search for a certain amount or
amount range.
This field is optional.
Table 67 - TRN01 - Prompt description
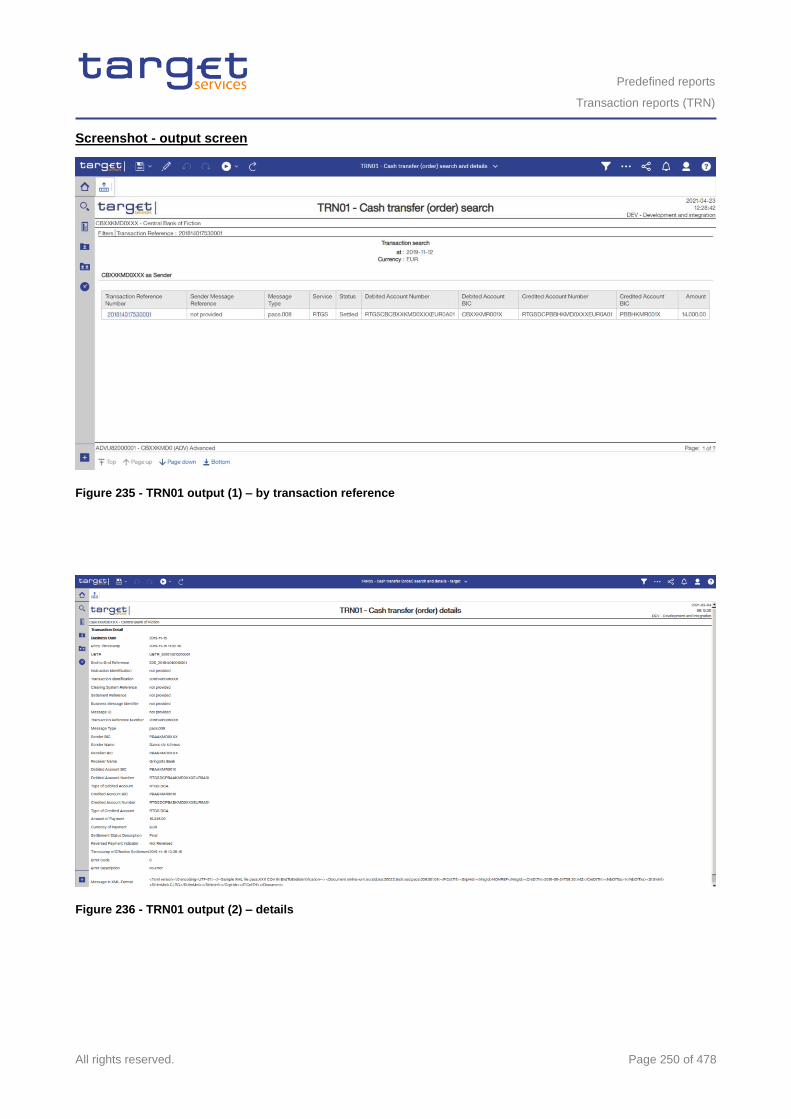
Predefined reports
Transaction reports (TRN)
All rights reserved. Page 250 of 478
Screenshot - output screen
Figure 235 - TRN01 output (1) – by transaction reference
Figure 236 - TRN01 output (2) – details
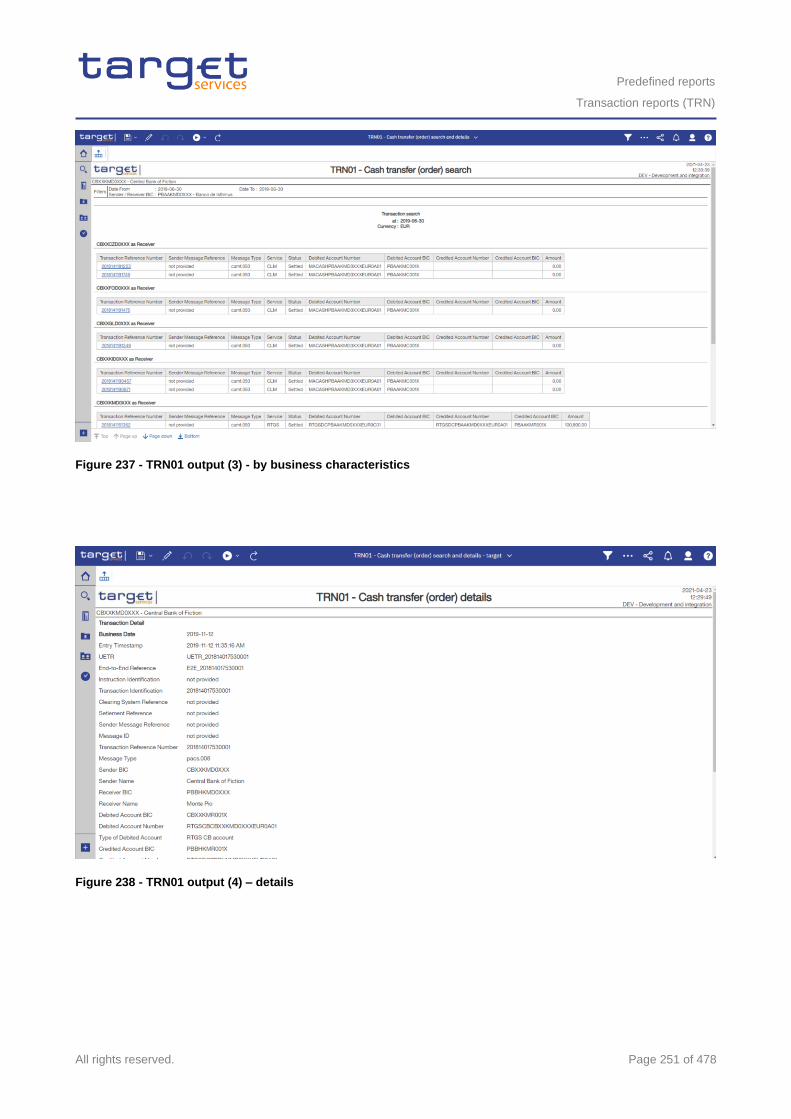
Predefined reports
Transaction reports (TRN)
All rights reserved. Page 251 of 478
Figure 237 - TRN01 output (3) - by business characteristics
Figure 238 - TRN01 output (4) – details
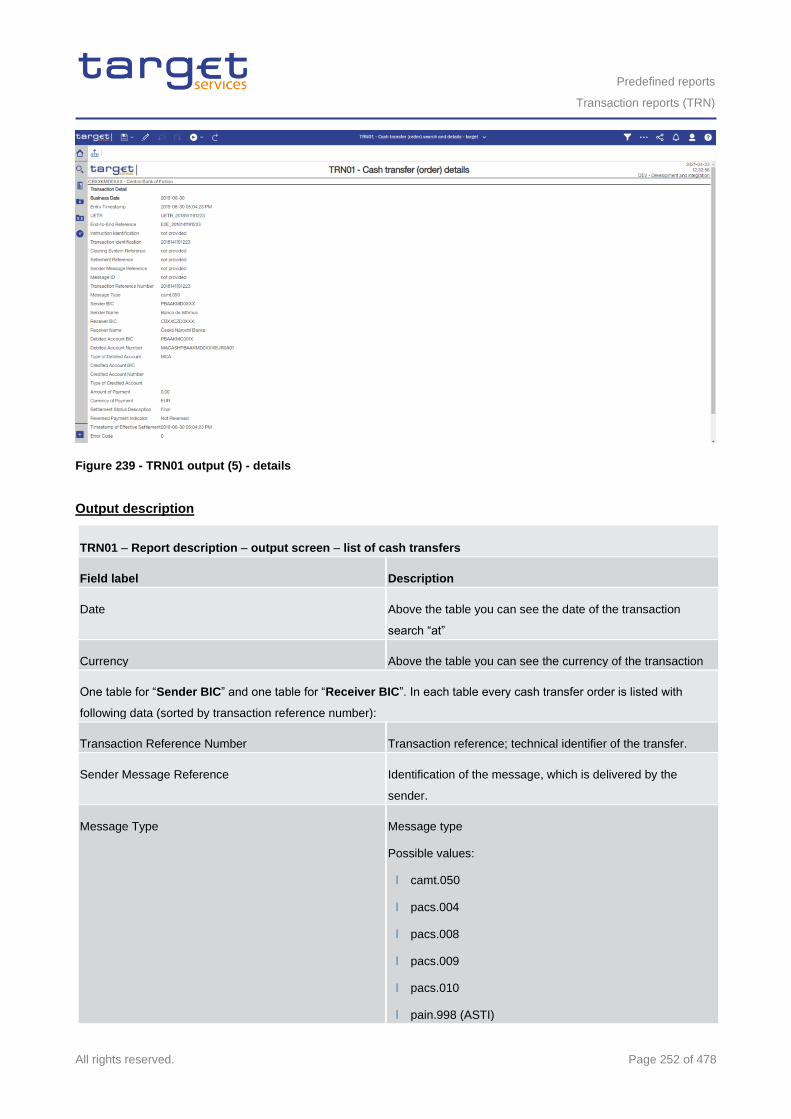
Predefined reports
Transaction reports (TRN)
All rights reserved. Page 252 of 478
Figure 239 - TRN01 output (5) - details
Output description
TRN01 – Report description – output screen – list of cash transfers
Field label Description
Date Above the table you can see the date of the transaction
search “at”
Currency Above the table you can see the currency of the transaction
One table for “Sender BIC” and one table for “Receiver BIC”. In each table every cash transfer order is listed with
following data (sorted by transaction reference number):
Transaction Reference Number Transaction reference; technical identifier of the transfer.
Sender Message Reference Identification of the message, which is delivered by the
sender.
Message Type Message type
Possible values:
l camt.050
l pacs.004
l pacs.008
l pacs.009
l pacs.010
l pain.998 (ASTI)
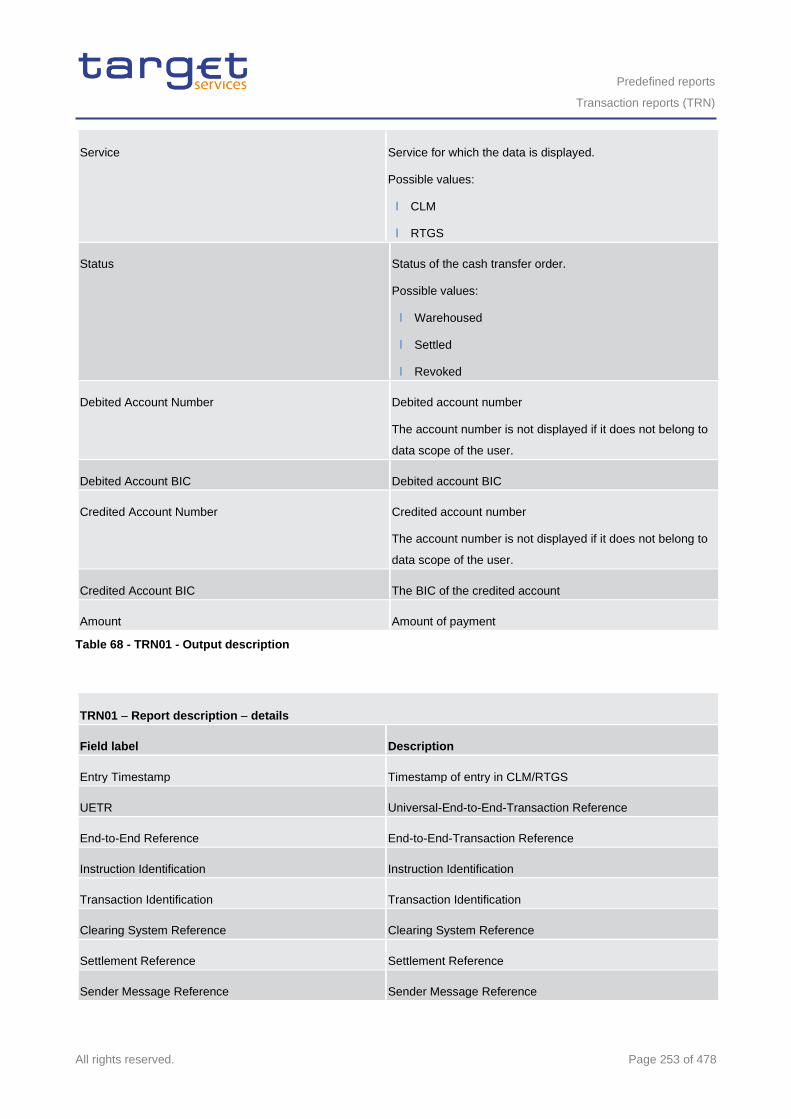
Predefined reports
Transaction reports (TRN)
All rights reserved. Page 253 of 478
Service Service for which the data is displayed.
Possible values:
l CLM
l RTGS
Status Status of the cash transfer order.
Possible values:
l Warehoused
l Settled
l Revoked
Debited Account Number Debited account number
The account number is not displayed if it does not belong to
data scope of the user.
Debited Account BIC Debited account BIC
Credited Account Number Credited account number
The account number is not displayed if it does not belong to
data scope of the user.
Credited Account BIC The BIC of the credited account
Amount Amount of payment
Table 68 - TRN01 - Output description
TRN01 – Report description – details
Field label Description
Entry Timestamp Timestamp of entry in CLM/RTGS
UETR Universal-End-to-End-Transaction Reference
End-to-End Reference End-to-End-Transaction Reference
Instruction Identification Instruction Identification
Transaction Identification Transaction Identification
Clearing System Reference Clearing System Reference
Settlement Reference Settlement Reference
Sender Message Reference Sender Message Reference
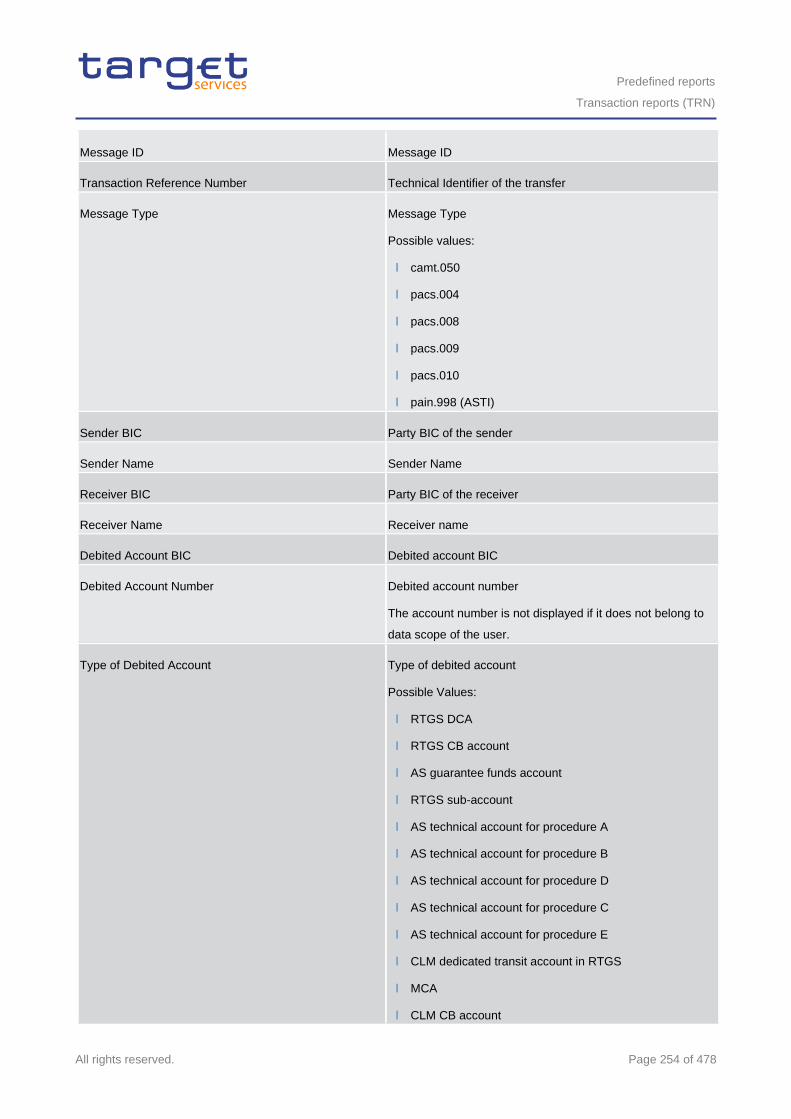
Predefined reports
Transaction reports (TRN)
All rights reserved. Page 254 of 478
Message ID Message ID
Transaction Reference Number Technical Identifier of the transfer
Message Type Message Type
Possible values:
l camt.050
l pacs.004
l pacs.008
l pacs.009
l pacs.010
l pain.998 (ASTI)
Sender BIC Party BIC of the sender
Sender Name Sender Name
Receiver BIC Party BIC of the receiver
Receiver Name Receiver name
Debited Account BIC Debited account BIC
Debited Account Number Debited account number
The account number is not displayed if it does not belong to
data scope of the user.
Type of Debited Account Type of debited account
Possible Values:
l RTGS DCA
l RTGS CB account
l AS guarantee funds account
l RTGS sub-account
l AS technical account for procedure A
l AS technical account for procedure B
l AS technical account for procedure D
l AS technical account for procedure C
l AS technical account for procedure E
l CLM dedicated transit account in RTGS
l MCA
l CLM CB account
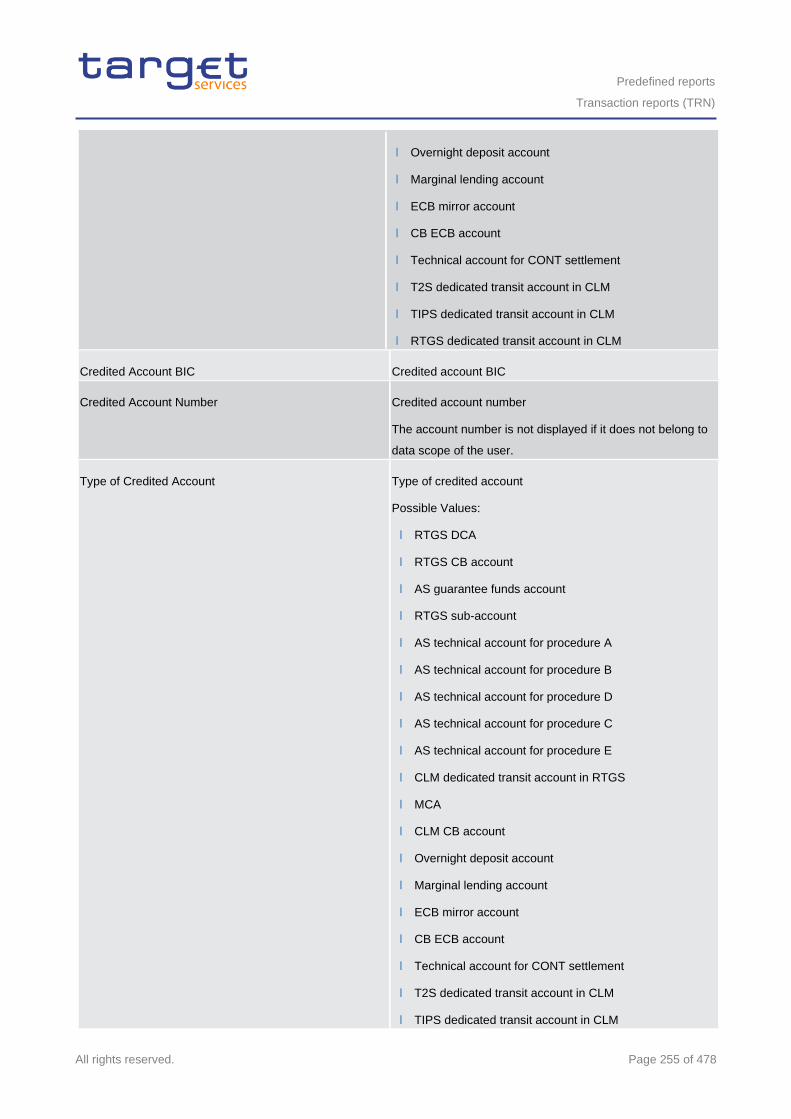
Predefined reports
Transaction reports (TRN)
All rights reserved. Page 255 of 478
l Overnight deposit account
l Marginal lending account
l ECB mirror account
l CB ECB account
l Technical account for CONT settlement
l T2S dedicated transit account in CLM
l TIPS dedicated transit account in CLM
l RTGS dedicated transit account in CLM
Credited Account BIC Credited account BIC
Credited Account Number Credited account number
The account number is not displayed if it does not belong to
data scope of the user.
Type of Credited Account Type of credited account
Possible Values:
l RTGS DCA
l RTGS CB account
l AS guarantee funds account
l RTGS sub-account
l AS technical account for procedure A
l AS technical account for procedure B
l AS technical account for procedure D
l AS technical account for procedure C
l AS technical account for procedure E
l CLM dedicated transit account in RTGS
l MCA
l CLM CB account
l Overnight deposit account
l Marginal lending account
l ECB mirror account
l CB ECB account
l Technical account for CONT settlement
l T2S dedicated transit account in CLM
l TIPS dedicated transit account in CLM
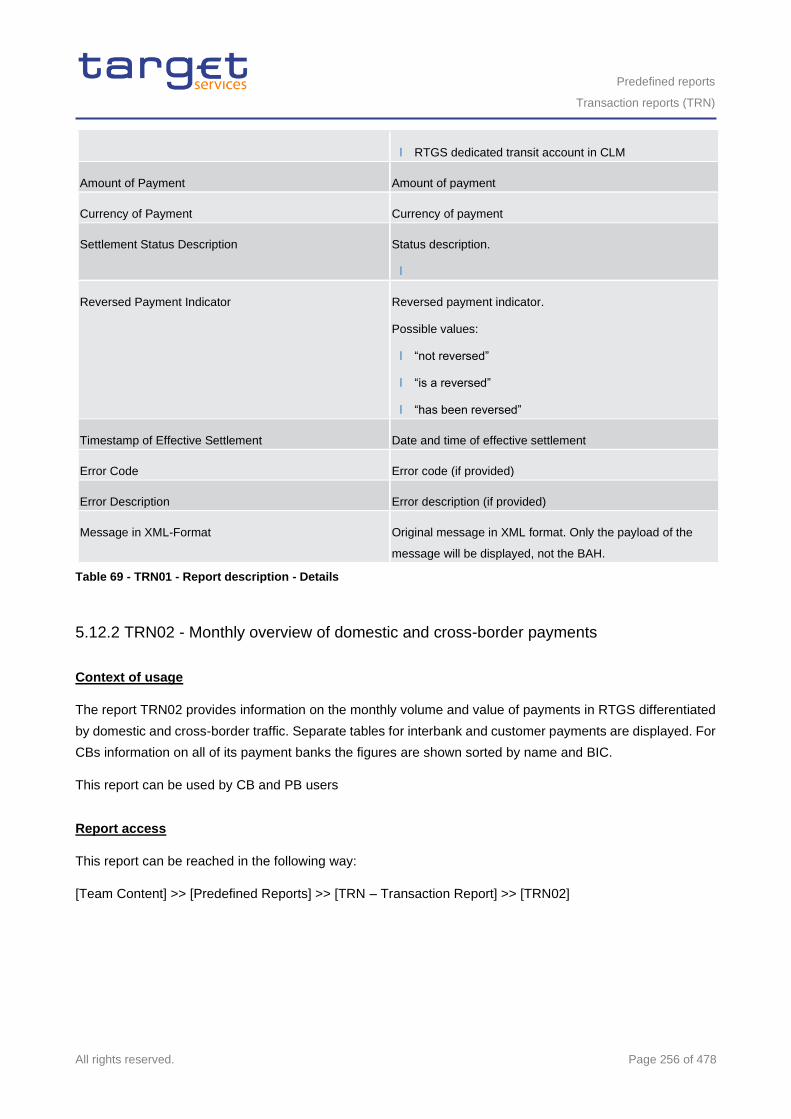
Predefined reports
Transaction reports (TRN)
All rights reserved. Page 256 of 478
l RTGS dedicated transit account in CLM
Amount of Payment Amount of payment
Currency of Payment Currency of payment
Settlement Status Description Status description.
l
Reversed Payment Indicator Reversed payment indicator.
Possible values:
l “not reversed”
l “is a reversed”
l “has been reversed”
Timestamp of Effective Settlement Date and time of effective settlement
Error Code Error code (if provided)
Error Description Error description (if provided)
Message in XML-Format Original message in XML format. Only the payload of the
message will be displayed, not the BAH.
Table 69 - TRN01 - Report description - Details
5.12.2 TRN02 - Monthly overview of domestic and cross-border payments
Context of usage
The report TRN02 provides information on the monthly volume and value of payments in RTGS differentiated
by domestic and cross-border traffic. Separate tables for interbank and customer payments are displayed. For
CBs information on all of its payment banks the figures are shown sorted by name and BIC.
This report can be used by CB and PB users
Report access
This report can be reached in the following way:
[Team Content] >> [Predefined Reports] >> [TRN – Transaction Report] >> [TRN02]
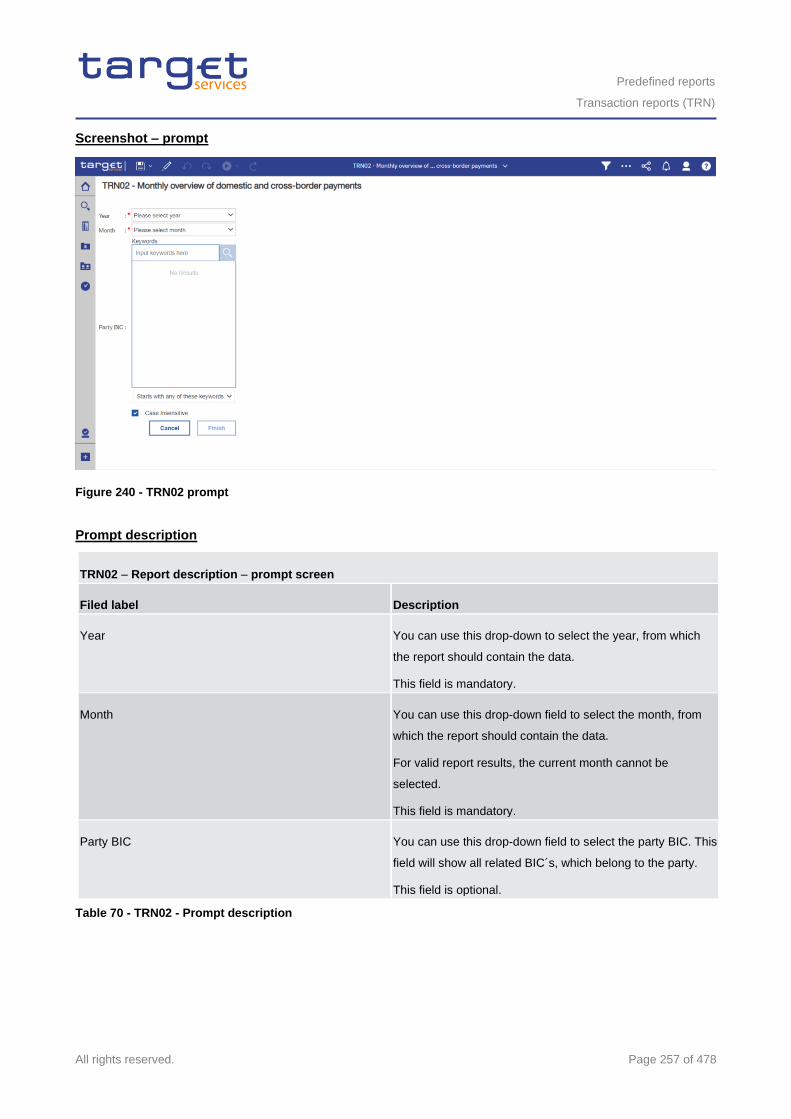
Predefined reports
Transaction reports (TRN)
All rights reserved. Page 257 of 478
Screenshot – prompt
Figure 240 - TRN02 prompt
Prompt description
TRN02 – Report description – prompt screen
Filed label Description
Year You can use this drop-down to select the year, from which
the report should contain the data.
This field is mandatory.
Month You can use this drop-down field to select the month, from
which the report should contain the data.
For valid report results, the current month cannot be
selected.
This field is mandatory.
Party BIC You can use this drop-down field to select the party BIC. This
field will show all related BIC´s, which belong to the party.
This field is optional.
Table 70 - TRN02 - Prompt description
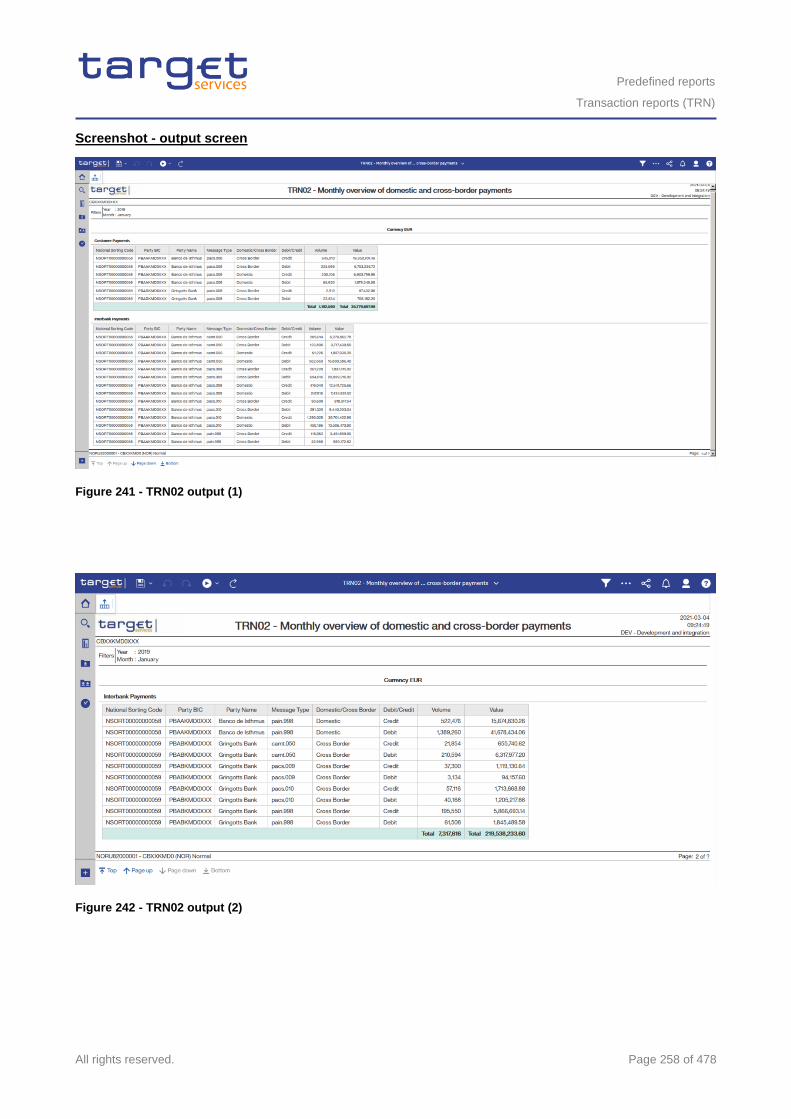
Predefined reports
Transaction reports (TRN)
All rights reserved. Page 258 of 478
Screenshot - output screen
Figure 241 - TRN02 output (1)
Figure 242 - TRN02 output (2)
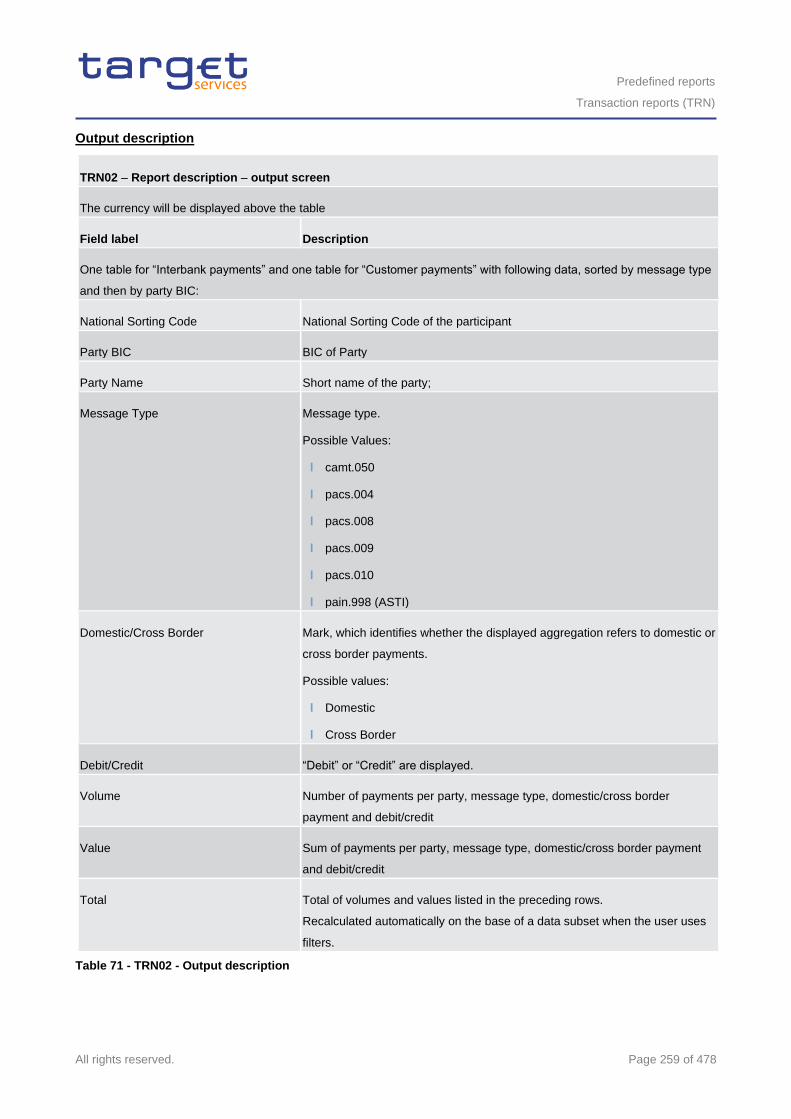
Predefined reports
Transaction reports (TRN)
All rights reserved. Page 259 of 478
Output description
TRN02 – Report description – output screen
The currency will be displayed above the table
Field label Description
One table for “Interbank payments” and one table for “Customer payments” with following data, sorted by message type
and then by party BIC:
National Sorting Code National Sorting Code of the participant
Party BIC BIC of Party
Party Name Short name of the party;
Message Type Message type.
Possible Values:
l camt.050
l pacs.004
l pacs.008
l pacs.009
l pacs.010
l pain.998 (ASTI)
Domestic/Cross Border Mark, which identifies whether the displayed aggregation refers to domestic or
cross border payments.
Possible values:
l Domestic
l Cross Border
Debit/Credit “Debit” or “Credit” are displayed.
Volume Number of payments per party, message type, domestic/cross border
payment and debit/credit
Value Sum of payments per party, message type, domestic/cross border payment
and debit/credit
Total Total of volumes and values listed in the preceding rows.
Recalculated automatically on the base of a data subset when the user uses
filters.
Table 71 - TRN02 - Output description
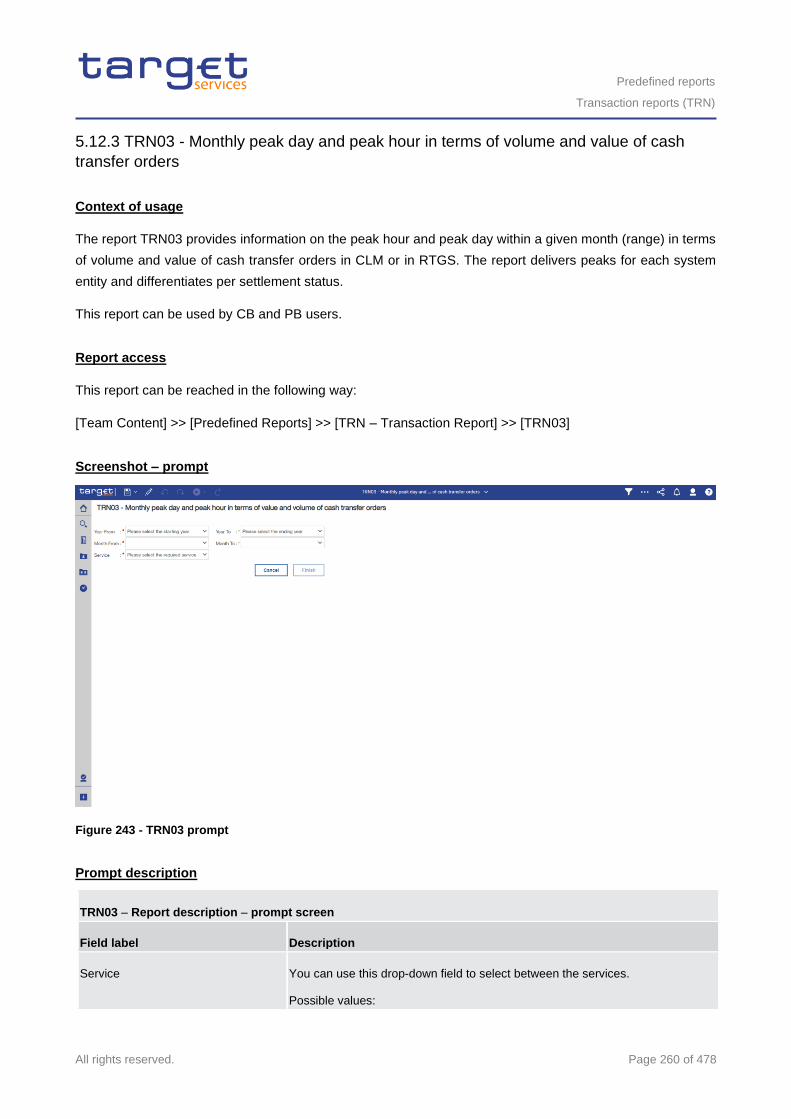
Predefined reports
Transaction reports (TRN)
All rights reserved. Page 260 of 478
5.12.3 TRN03 - Monthly peak day and peak hour in terms of volume and value of cash
transfer orders
Context of usage
The report TRN03 provides information on the peak hour and peak day within a given month (range) in terms
of volume and value of cash transfer orders in CLM or in RTGS. The report delivers peaks for each system
entity and differentiates per settlement status.
This report can be used by CB and PB users.
Report access
This report can be reached in the following way:
[Team Content] >> [Predefined Reports] >> [TRN – Transaction Report] >> [TRN03]
Screenshot – prompt
Figure 243 - TRN03 prompt
Prompt description
TRN03 – Report description – prompt screen
Field label Description
Service You can use this drop-down field to select between the services.
Possible values:
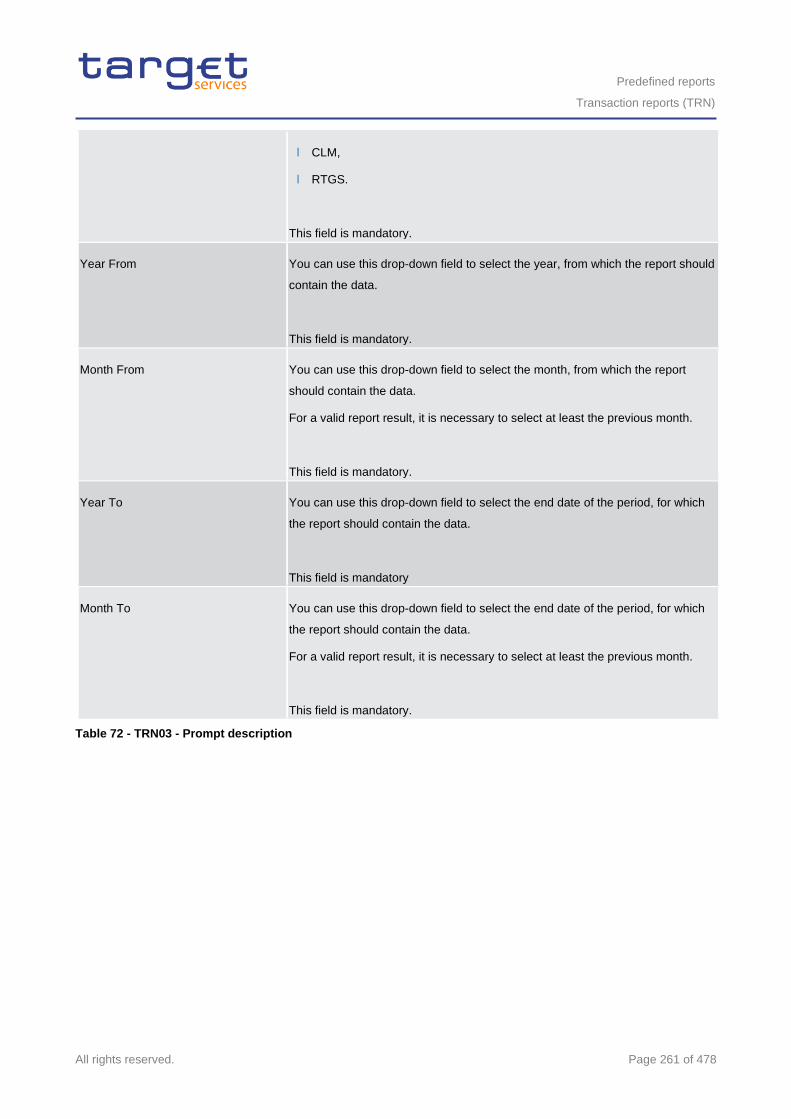
Predefined reports
Transaction reports (TRN)
All rights reserved. Page 261 of 478
l CLM,
l RTGS.
This field is mandatory.
Year From
You can use this drop-down field to select the year, from which the report should
contain the data.
This field is mandatory.
Month From You can use this drop-down field to select the month, from which the report
should contain the data.
For a valid report result, it is necessary to select at least the previous month.
This field is mandatory.
Year To You can use this drop-down field to select the end date of the period, for which
the report should contain the data.
This field is mandatory
Month To You can use this drop-down field to select the end date of the period, for which
the report should contain the data.
For a valid report result, it is necessary to select at least the previous month.
This field is mandatory.
Table 72 - TRN03 - Prompt description
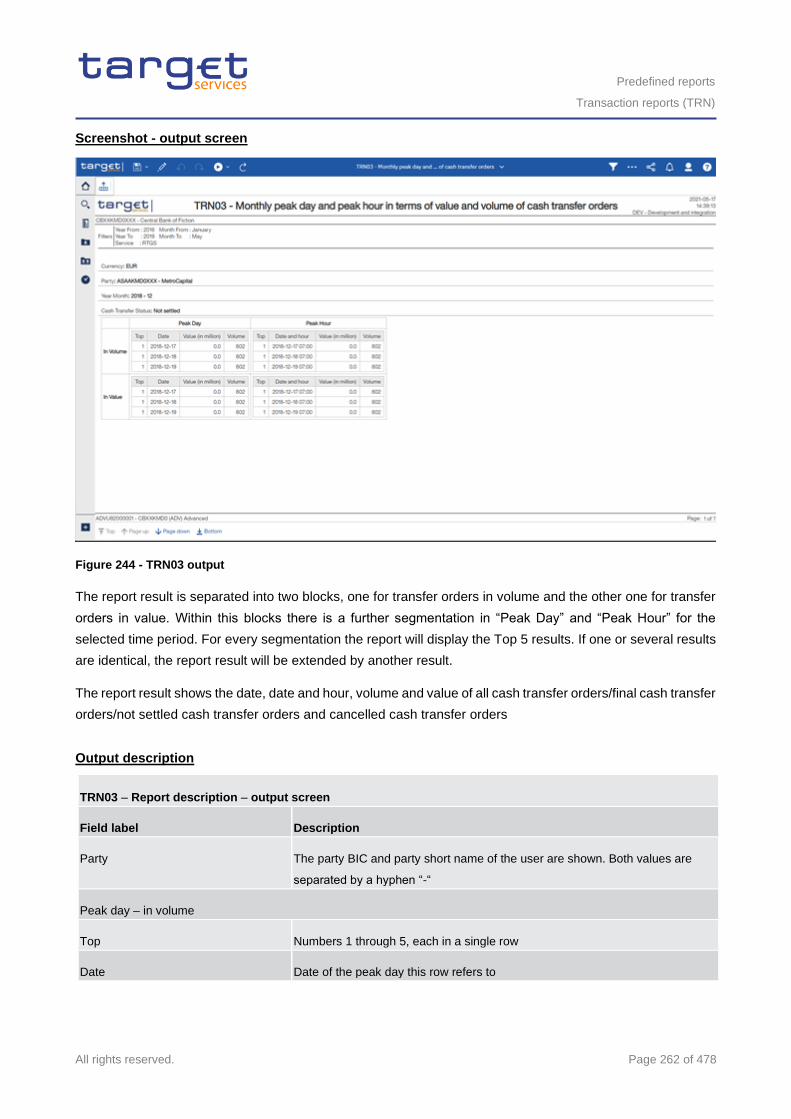
Predefined reports
Transaction reports (TRN)
All rights reserved. Page 262 of 478
Screenshot - output screen
Figure 244 - TRN03 output
The report result is separated into two blocks, one for transfer orders in volume and the other one for transfer
orders in value. Within this blocks there is a further segmentation in “Peak Day” and “Peak Hour” for the
selected time period. For every segmentation the report will display the Top 5 results. If one or several results
are identical, the report result will be extended by another result.
The report result shows the date, date and hour, volume and value of all cash transfer orders/final cash transfer
orders/not settled cash transfer orders and cancelled cash transfer orders
Output description
TRN03 – Report description – output screen
Field label Description
Party The party BIC and party short name of the user are shown. Both values are
separated by a hyphen “-“
Peak day – in volume
Top Numbers 1 through 5, each in a single row
Date Date of the peak day this row refers to
Predefined reports
Transaction reports (TRN)
All rights reserved. Page 263 of 478
Value (in million) Sum of the value of all cash transfer orders/all final cash transfer orders/all not
settled cash transfer orders this row refers to million of the given currency
commercially rounded.
Volume Number of all cash transfer orders/all final cash transfer orders/all not settled
cash transfer orders this row refers to.
Peak day – in value
Top Numbers 1 through 5, each in a single row
Date Date of the peak day this row refers to
Value (in million) Sum of the value of all cash transfer orders/all final cash transfer orders/all not
settled cash transfer orders this row refers to million of the given currency,
commercially rounded.
Volume Number of all cash transfer orders/all final cash transfer orders/all not settled
cash transfer orders this row refers to.
Peak hour – in volume
Top Numbers 1 through 5, each in a single row
Hour Date and hour (as range) this row refers to:
yyyy-mm-dd
hh.mm – hh.mm
(from 00:00 – 00:59 till 23:00 – 23:59)
Value (in million) Sum of the value of all cash transfer orders/all final cash transfer orders/all not
settled cash transfer orders this row refers to million in the given currency,
commercially rounded.
Volume Number of all cash transfer orders/all final cash transfer orders/all not settled
cash transfer orders this row refers to
Peak hour – in value
Top Numbers 1 through 5, each in a single row
Predefined reports
Transaction reports (TRN)
All rights reserved. Page 264 of 478
Date and Hour Date and hour (as range) this row refers to:
yyyy-mm-dd
hh:mm – hh:mm
(from 00:00 – 00:59 till 23:00 – 23:59)
Value (in million) Sum of the value of all cash transfer orders/all final cash transfer orders/all not
settled cash transfer orders this row refers to in million in the given currency,
commercially rounded.
Volume Number of all cash transfer orders/all final cash transfer orders/all not settled
cash transfer orders this row refers to.
Table 73 - TRN03 - Output description
5.12.4 TRN04 - Cash transfers per time band and per CB
Context of usage
The report TRN04 provides information on the total volume and value of cash transfers per time band of 15
minutes on a chosen business day. Cash transfers in CLM and RTGS are reported in separate report Tables.
Volume and value Figures are reported separate for domestic (only debits) and cross-border (differentiated by
debits and credits) cash transfers. In addition, cumulated volume and value Figures are displayed.
CBs can retrieve information on cash transfers of parties belonging to their system entity.
This report can be used by CB users only.
Report access
This report can be reached in the following way:
[Team Content] >> [Predefined Reports] >> [TRN – Transaction Report] >> [TRN04]
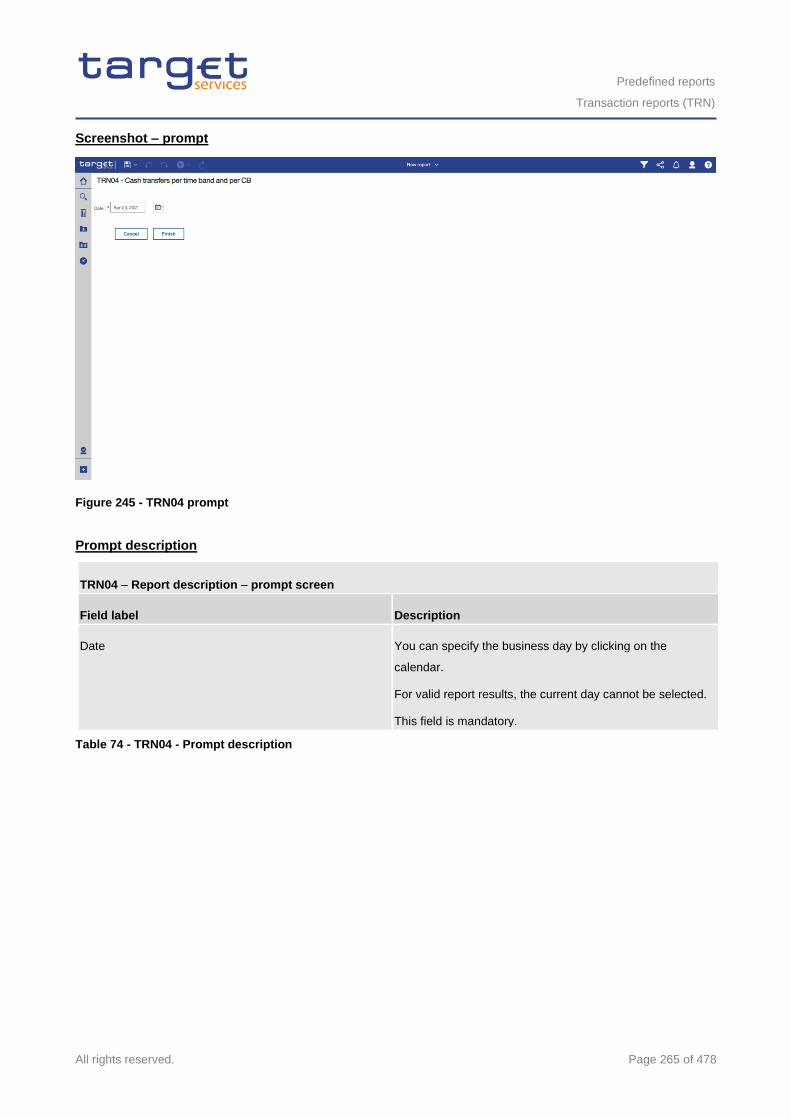
Predefined reports
Transaction reports (TRN)
All rights reserved. Page 265 of 478
Screenshot – prompt
Figure 245 - TRN04 prompt
Prompt description
TRN04 – Report description – prompt screen
Field label Description
Date
You can specify the business day by clicking on the
calendar.
For valid report results, the current day cannot be selected.
This field is mandatory.
Table 74 - TRN04 - Prompt description
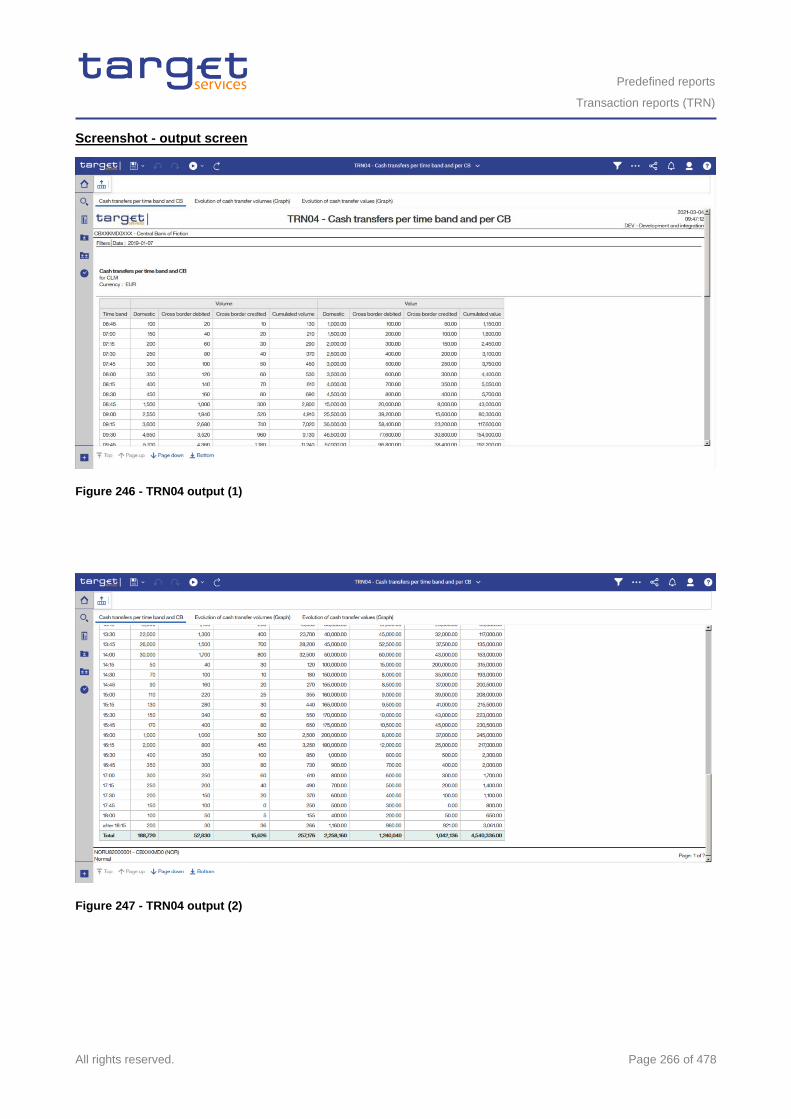
Predefined reports
Transaction reports (TRN)
All rights reserved. Page 266 of 478
Screenshot - output screen
Figure 246 - TRN04 output (1)
Figure 247 - TRN04 output (2)
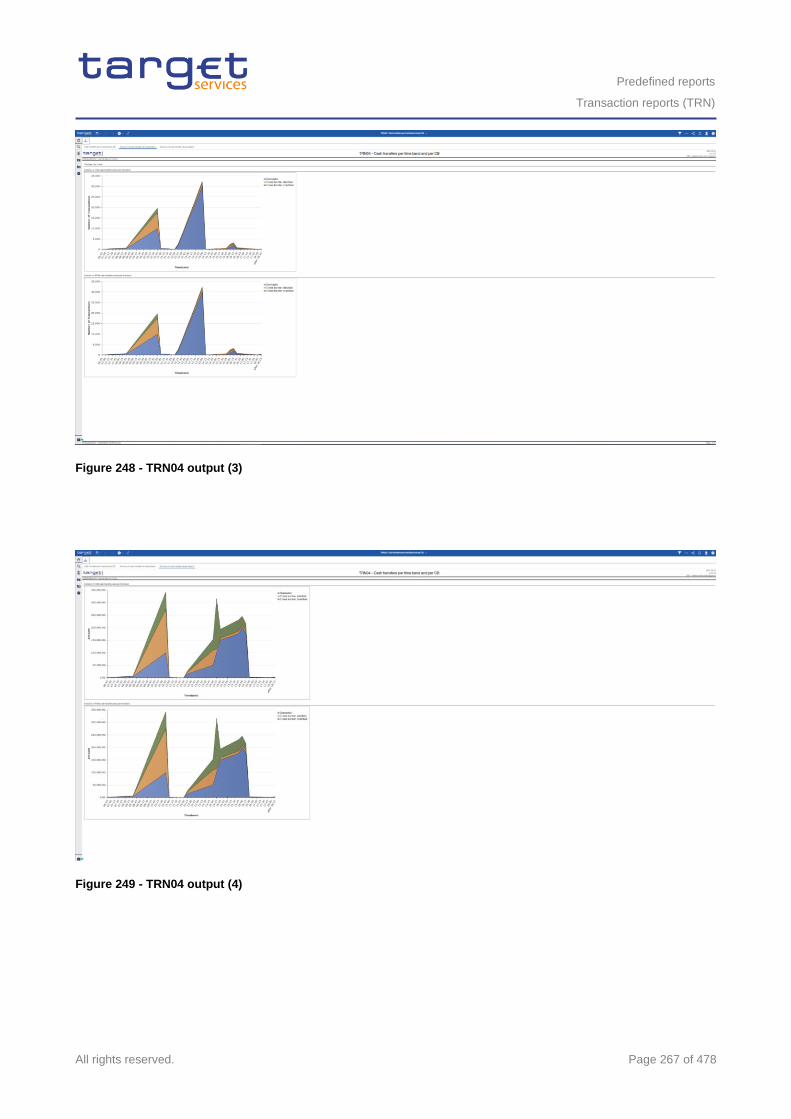
Predefined reports
Transaction reports (TRN)
All rights reserved. Page 267 of 478
Figure 248 - TRN04 output (3)
Figure 249 - TRN04 output (4)
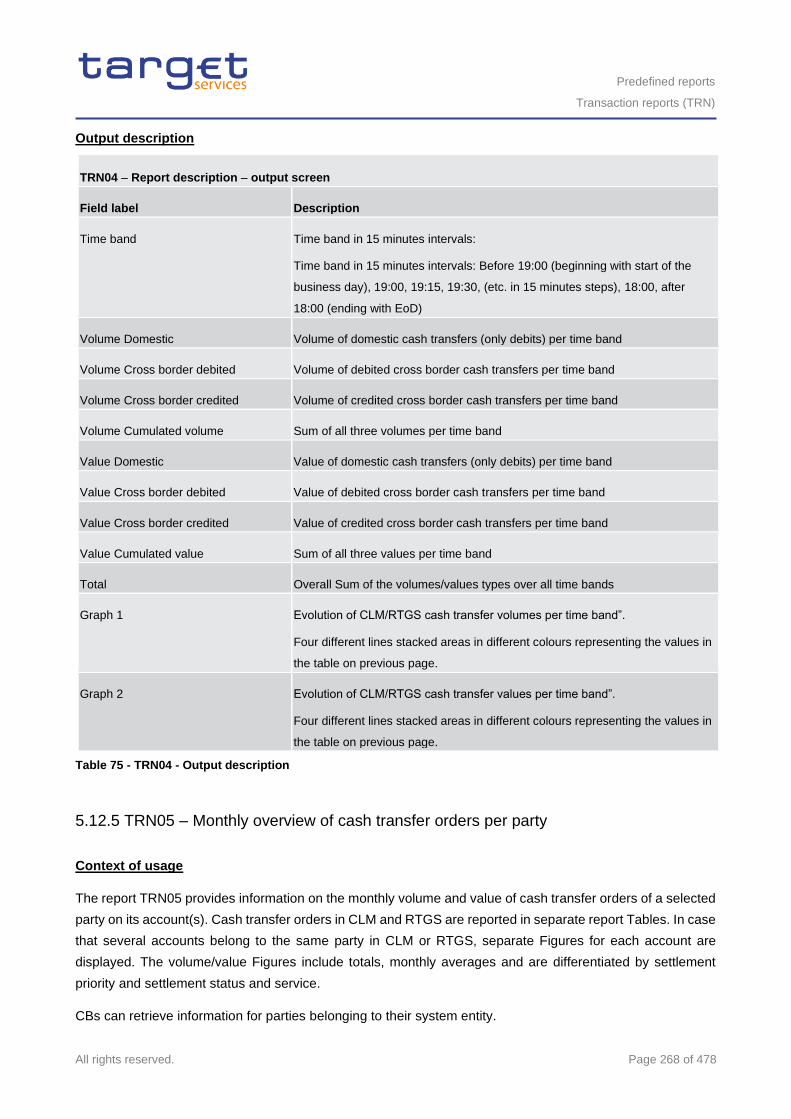
Predefined reports
Transaction reports (TRN)
All rights reserved. Page 268 of 478
Output description
TRN04 – Report description – output screen
Field label Description
Time band Time band in 15 minutes intervals:
Time band in 15 minutes intervals: Before 19:00 (beginning with start of the
business day), 19:00, 19:15, 19:30, (etc. in 15 minutes steps), 18:00, after
18:00 (ending with EoD)
Volume Domestic Volume of domestic cash transfers (only debits) per time band
Volume Cross border debited Volume of debited cross border cash transfers per time band
Volume Cross border credited Volume of credited cross border cash transfers per time band
Volume Cumulated volume Sum of all three volumes per time band
Value Domestic Value of domestic cash transfers (only debits) per time band
Value Cross border debited Value of debited cross border cash transfers per time band
Value Cross border credited Value of credited cross border cash transfers per time band
Value Cumulated value Sum of all three values per time band
Total Overall Sum of the volumes/values types over all time bands
Graph 1 Evolution of CLM/RTGS cash transfer volumes per time band”.
Four different lines stacked areas in different colours representing the values in
the table on previous page.
Graph 2 Evolution of CLM/RTGS cash transfer values per time band”.
Four different lines stacked areas in different colours representing the values in
the table on previous page.
Table 75 - TRN04 - Output description
5.12.5 TRN05 – Monthly overview of cash transfer orders per party
Context of usage
The report TRN05 provides information on the monthly volume and value of cash transfer orders of a selected
party on its account(s). Cash transfer orders in CLM and RTGS are reported in separate report Tables. In case
that several accounts belong to the same party in CLM or RTGS, separate Figures for each account are
displayed. The volume/value Figures include totals, monthly averages and are differentiated by settlement
priority and settlement status and service.
CBs can retrieve information for parties belonging to their system entity.
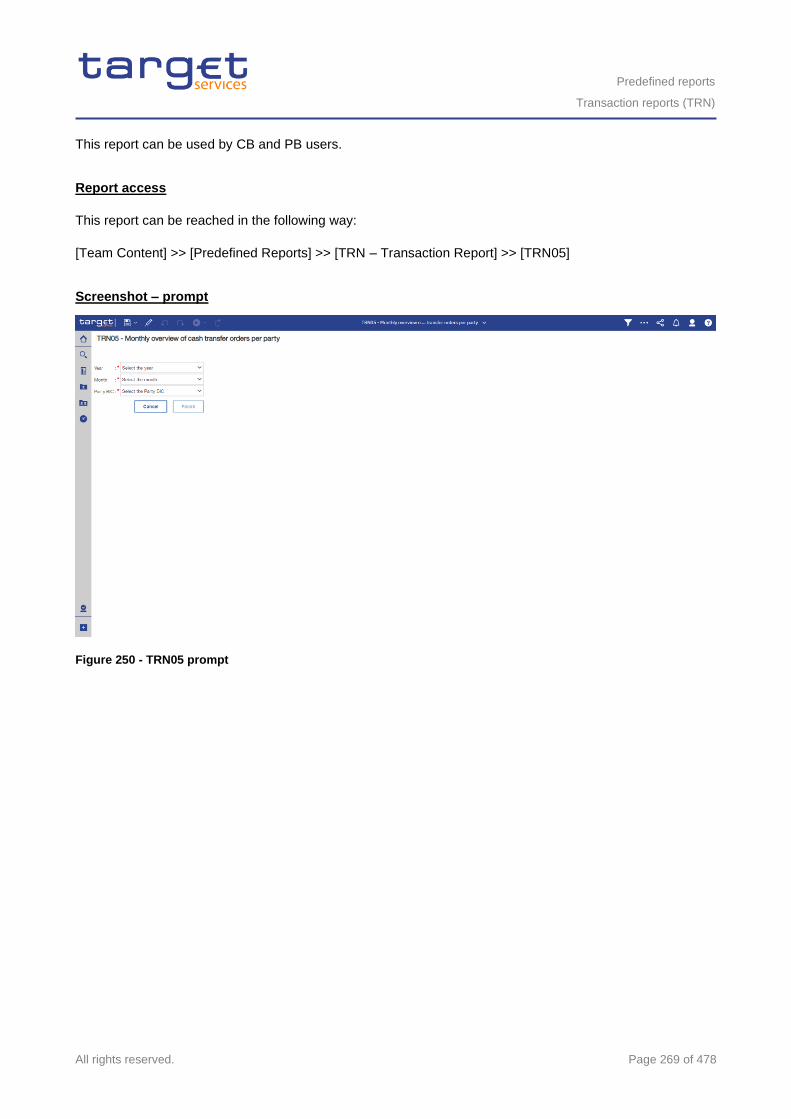
Predefined reports
Transaction reports (TRN)
All rights reserved. Page 269 of 478
This report can be used by CB and PB users.
Report access
This report can be reached in the following way:
[Team Content] >> [Predefined Reports] >> [TRN – Transaction Report] >> [TRN05]
Screenshot – prompt
Figure 250 - TRN05 prompt
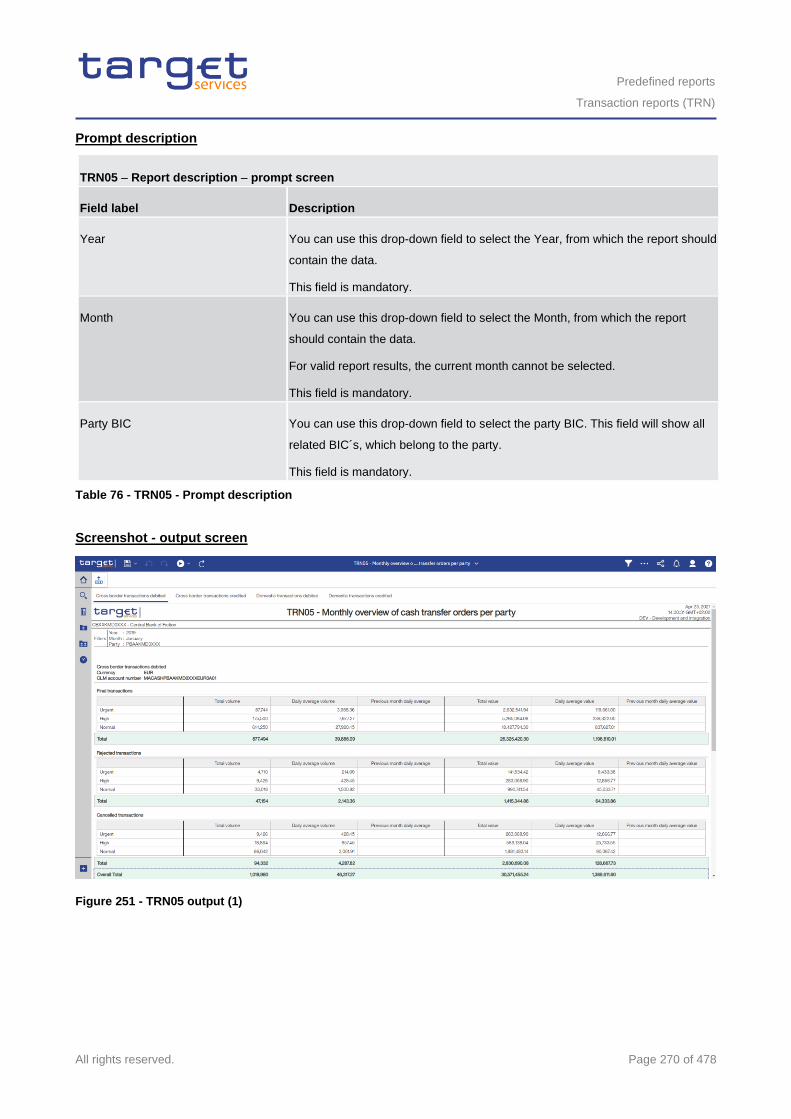
Predefined reports
Transaction reports (TRN)
All rights reserved. Page 270 of 478
Prompt description
TRN05 – Report description – prompt screen
Field label Description
Year You can use this drop-down field to select the Year, from which the report should
contain the data.
This field is mandatory.
Month You can use this drop-down field to select the Month, from which the report
should contain the data.
For valid report results, the current month cannot be selected.
This field is mandatory.
Party BIC You can use this drop-down field to select the party BIC. This field will show all
related BIC´s, which belong to the party.
This field is mandatory.
Table 76 - TRN05 - Prompt description
Screenshot - output screen
Figure 251 - TRN05 output (1)
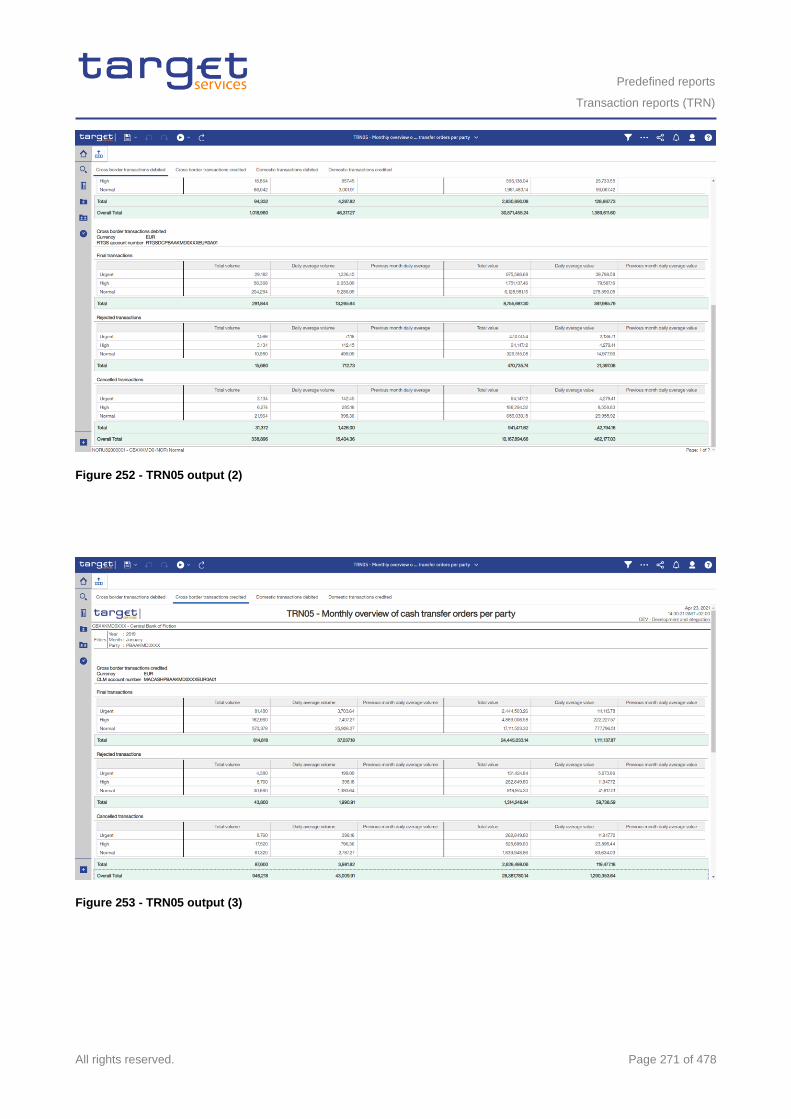
Predefined reports
Transaction reports (TRN)
All rights reserved. Page 271 of 478
Figure 252 - TRN05 output (2)
Figure 253 - TRN05 output (3)
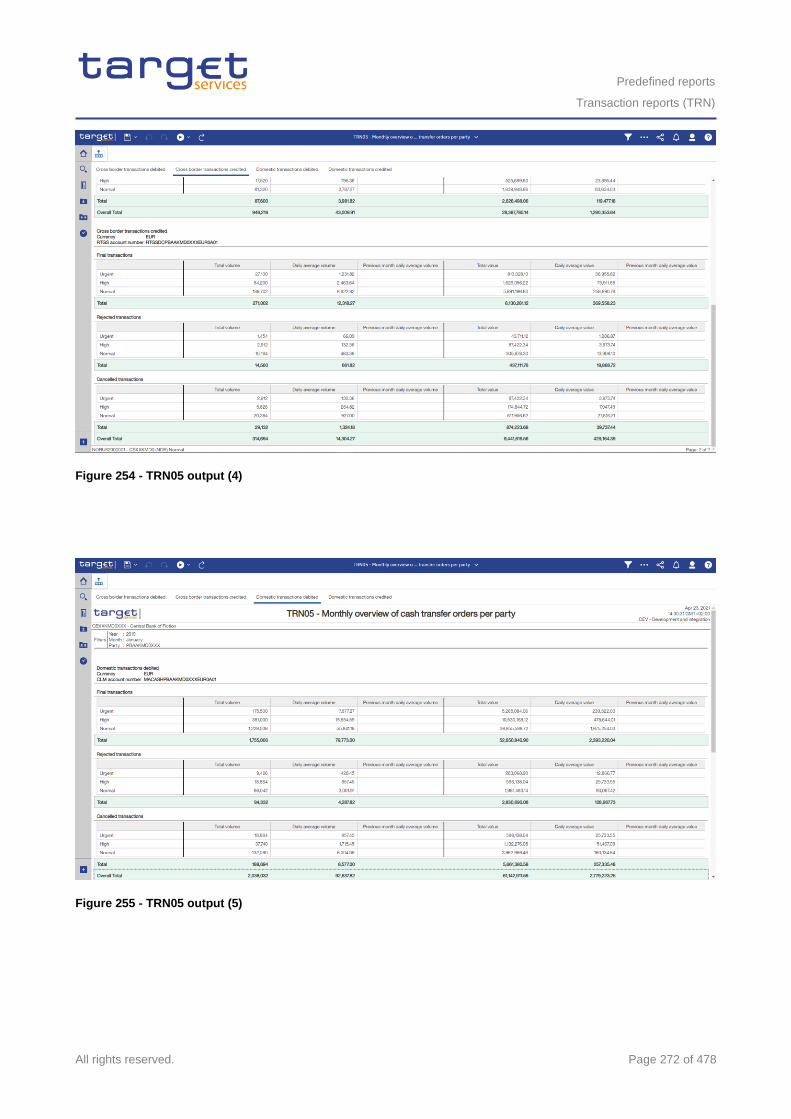
Predefined reports
Transaction reports (TRN)
All rights reserved. Page 272 of 478
Figure 254 - TRN05 output (4)
Figure 255 - TRN05 output (5)

Predefined reports
Transaction reports (TRN)
All rights reserved. Page 273 of 478
Figure 256 - TRN05 output (6)
Figure 257 - TRN05 output (7)
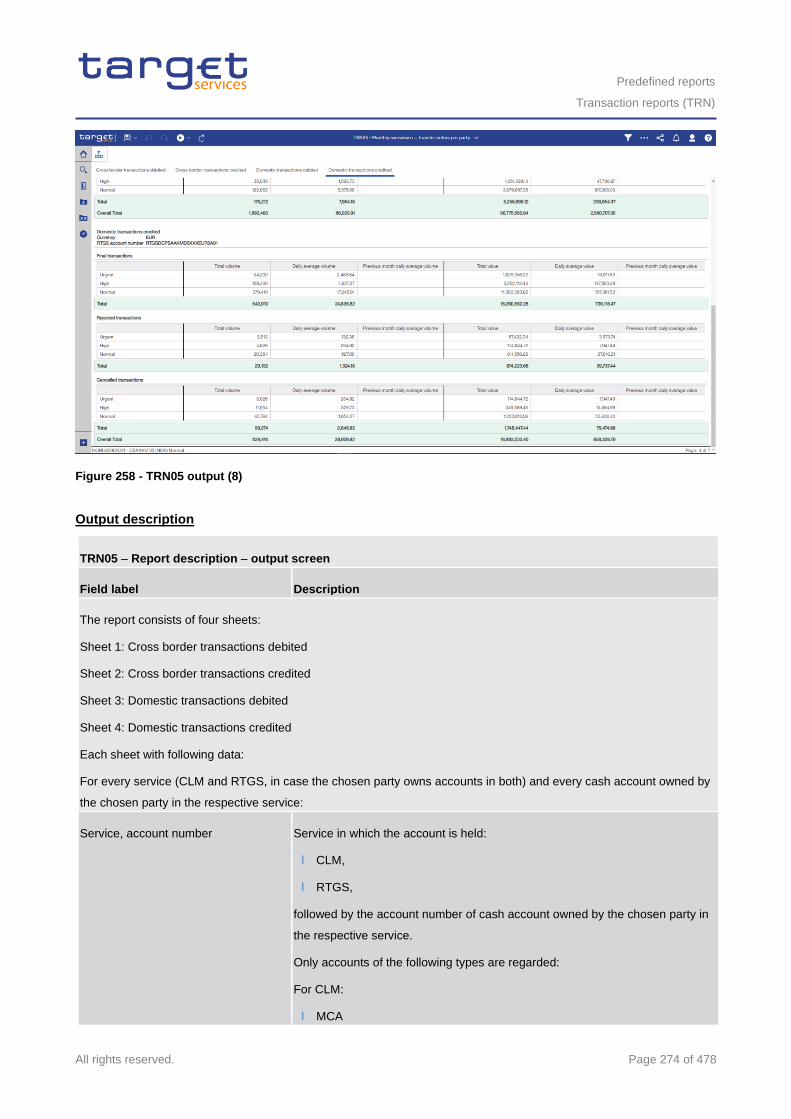
Predefined reports
Transaction reports (TRN)
All rights reserved. Page 274 of 478
Figure 258 - TRN05 output (8)
Output description
TRN05 – Report description – output screen
Field label Description
The report consists of four sheets:
Sheet 1: Cross border transactions debited
Sheet 2: Cross border transactions credited
Sheet 3: Domestic transactions debited
Sheet 4: Domestic transactions credited
Each sheet with following data:
For every service (CLM and RTGS, in case the chosen party owns accounts in both) and every cash account owned by
the chosen party in the respective service:
Service, account number Service in which the account is held:
l CLM,
l RTGS,
followed by the account number of cash account owned by the chosen party in
the respective service.
Only accounts of the following types are regarded:
For CLM:
l MCA
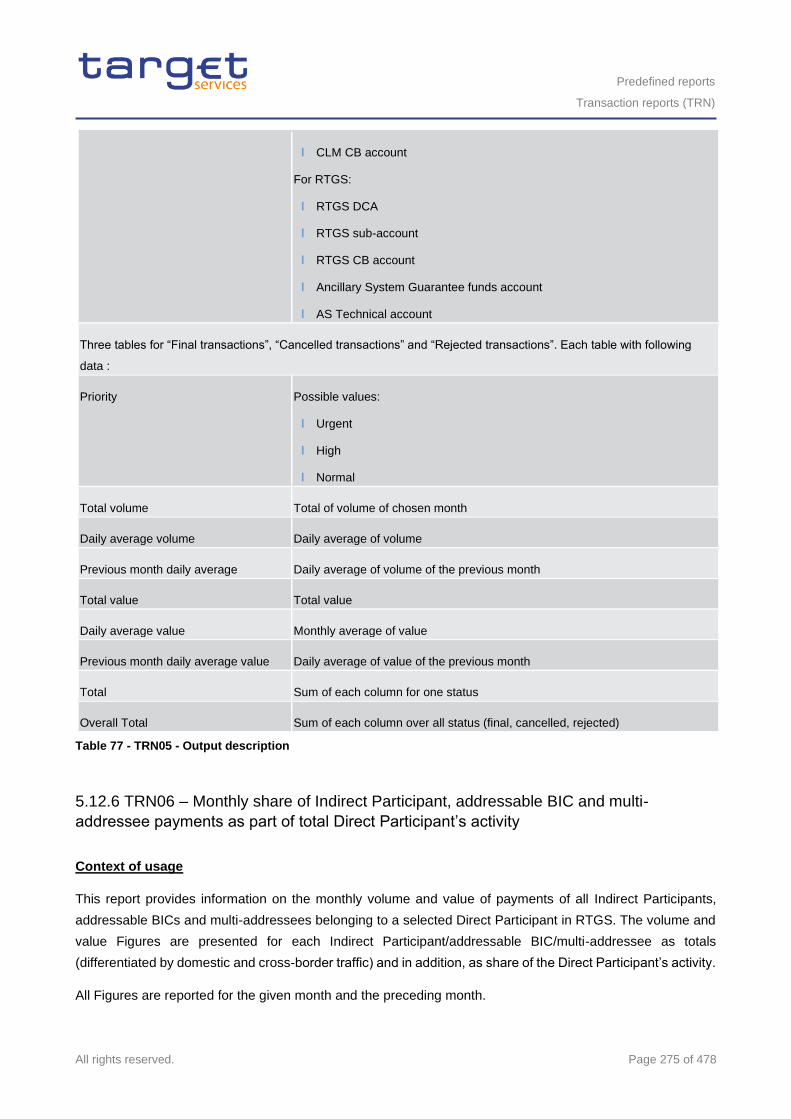
Predefined reports
Transaction reports (TRN)
All rights reserved. Page 275 of 478
l CLM CB account
For RTGS:
l RTGS DCA
l RTGS sub-account
l RTGS CB account
l Ancillary System Guarantee funds account
l AS Technical account
Three tables for “Final transactions”, “Cancelled transactions” and “Rejected transactions”. Each table with following
data :
Priority Possible values:
l Urgent
l High
l Normal
Total volume Total of volume of chosen month
Daily average volume Daily average of volume
Previous month daily average Daily average of volume of the previous month
Total value Total value
Daily average value Monthly average of value
Previous month daily average value Daily average of value of the previous month
Total Sum of each column for one status
Overall Total Sum of each column over all status (final, cancelled, rejected)
Table 77 - TRN05 - Output description
5.12.6 TRN06 – Monthly share of Indirect Participant, addressable BIC and multi-
addressee payments as part of total Direct Participant’s activity
Context of usage
This report provides information on the monthly volume and value of payments of all Indirect Participants,
addressable BICs and multi-addressees belonging to a selected Direct Participant in RTGS. The volume and
value Figures are presented for each Indirect Participant/addressable BIC/multi-addressee as totals
(differentiated by domestic and cross-border traffic) and in addition, as share of the Direct Participant’s activity.
All Figures are reported for the given month and the preceding month.
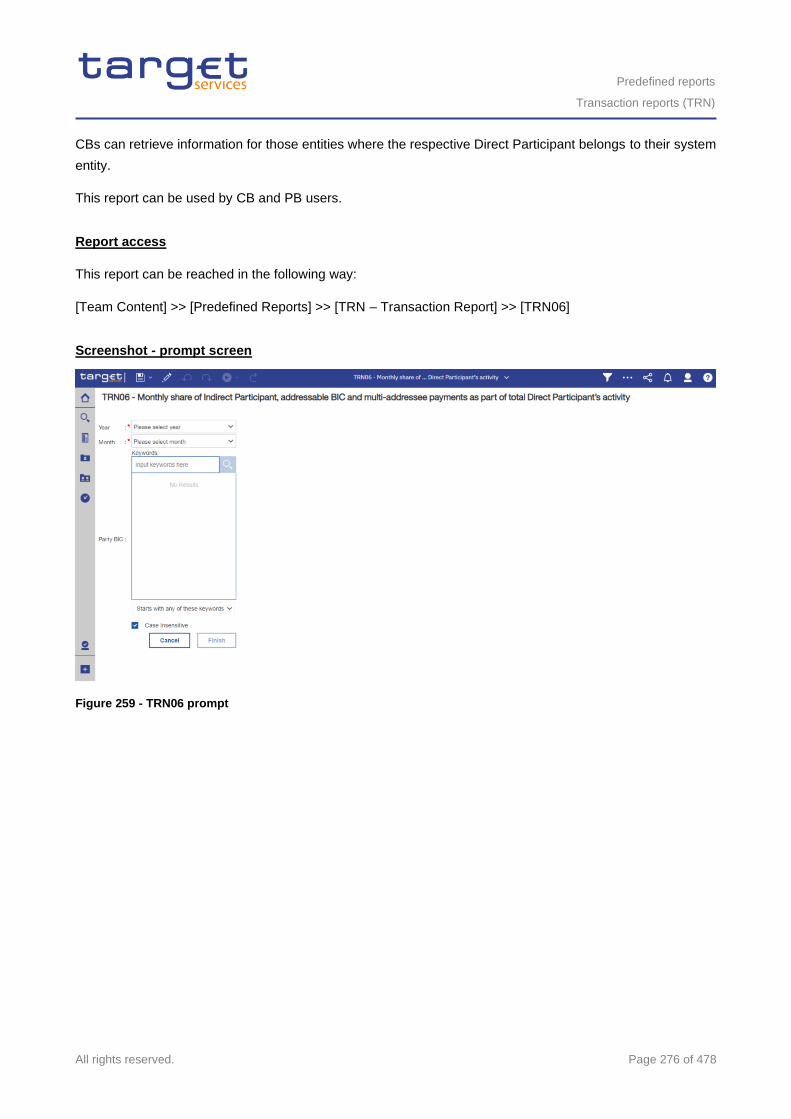
Predefined reports
Transaction reports (TRN)
All rights reserved. Page 276 of 478
CBs can retrieve information for those entities where the respective Direct Participant belongs to their system
entity.
This report can be used by CB and PB users.
Report access
This report can be reached in the following way:
[Team Content] >> [Predefined Reports] >> [TRN – Transaction Report] >> [TRN06]
Screenshot - prompt screen
Figure 259 - TRN06 prompt
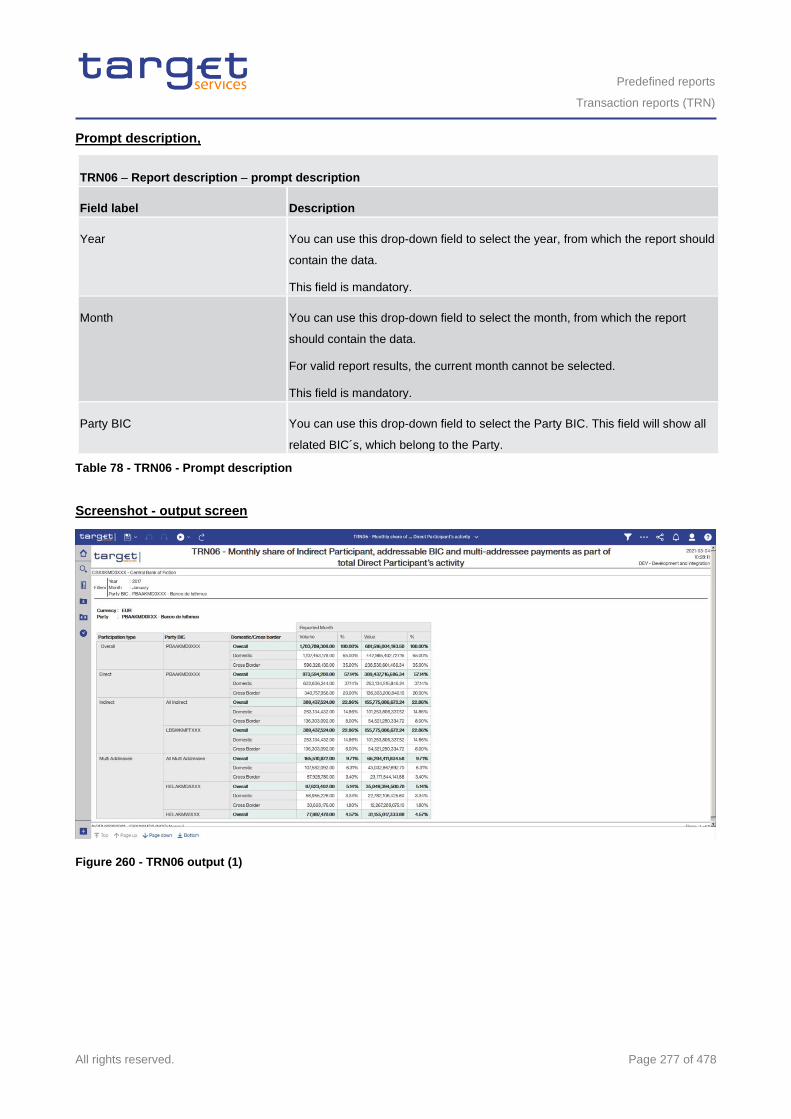
Predefined reports
Transaction reports (TRN)
All rights reserved. Page 277 of 478
Prompt description,
TRN06 – Report description – prompt description
Field label Description
Year You can use this drop-down field to select the year, from which the report should
contain the data.
This field is mandatory.
Month You can use this drop-down field to select the month, from which the report
should contain the data.
For valid report results, the current month cannot be selected.
This field is mandatory.
Party BIC You can use this drop-down field to select the Party BIC. This field will show all
related BIC´s, which belong to the Party.
Table 78 - TRN06 - Prompt description
Screenshot - output screen
Figure 260 - TRN06 output (1)
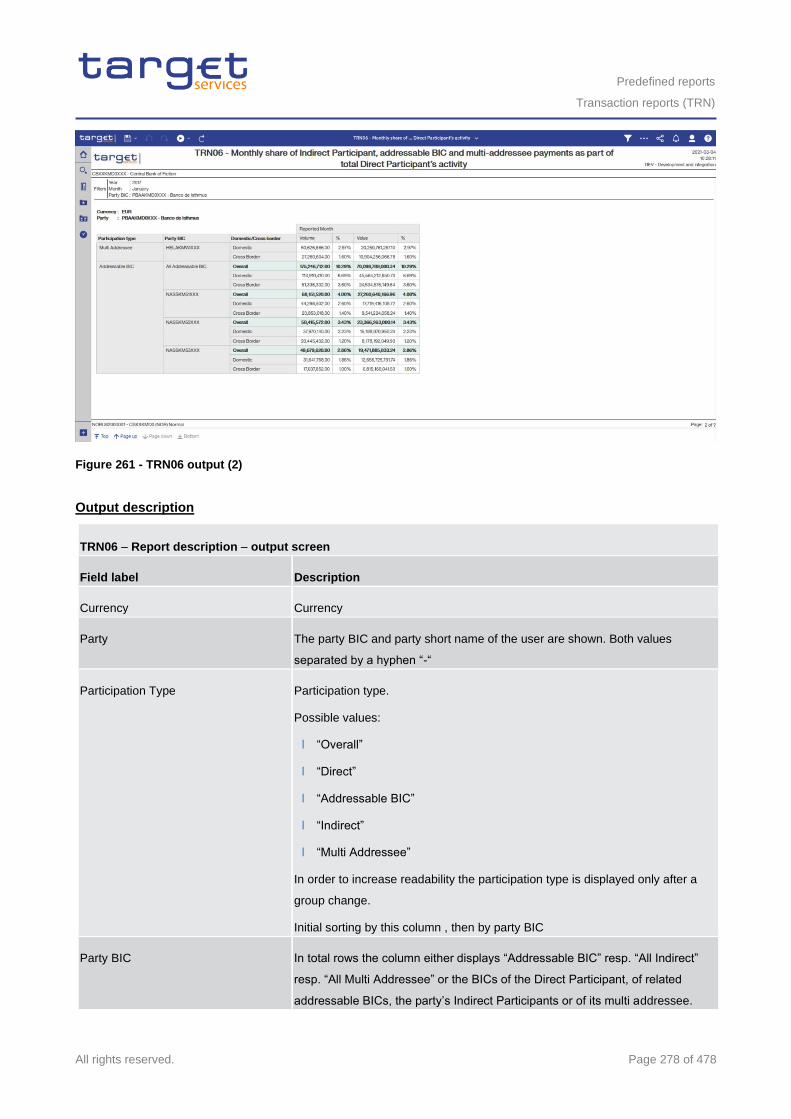
Predefined reports
Transaction reports (TRN)
All rights reserved. Page 278 of 478
Figure 261 - TRN06 output (2)
Output description
TRN06 – Report description – output screen
Field label Description
Currency Currency
Party The party BIC and party short name of the user are shown. Both values
separated by a hyphen “-“
Participation Type Participation type.
Possible values:
l “Overall”
l “Direct”
l “Addressable BIC”
l “Indirect”
l “Multi Addressee”
In order to increase readability the participation type is displayed only after a
group change.
Initial sorting by this column , then by party BIC
Party BIC In total rows the column either displays “Addressable BIC” resp. “All Indirect”
resp. “All Multi Addressee” or the BICs of the Direct Participant, of related
addressable BICs, the party’s Indirect Participants or of its multi addressee.
Predefined reports
Transaction reports (TRN)
All rights reserved. Page 279 of 478
In order to increase readability the party BIC/Total is displayed only after a
group change.
Initial sorting by participation type , then by this column
Overall/Domestic/Cross Border Mark which identifies whether the displayed aggregation refers to a total per
BIC or domestic or cross border cash transfer orders.
Possible values:
l Overall
l Domestic
l Cross Border
Previous Month
Volume Number of cash transfer orders
% Percentage value of the displayed volume for the combination of participation
type, party BIC total and debit/credit;
Up to 2 decimals are displayed
Value Sum of amount. The base for the calculation are debited amounts only.
% Percentage of the displayed volume for the combination of participation type,
party BIC total and debit/credit
Up to 2 decimals are displayed.
Reported Month
% Percentage value of the displayed volume for the combination of participation
type, party BIC total and debit/credit;
Up to 2 decimals are displayed.
Value Sum of amount. The base for the calculation are debited amounts only.
% Percentage of the displayed volume for the combination of participation type,
party BIC total and debit/credit
Up to 2 decimals are displayed.
Table 79 - TRN06 - Output description
5.12.7 TRN07 – Cash transfers between two accounts of different parties
Context of usage
TRN07 lists all cash transfers between two accounts in CLM or RTGS for a given date (range). For each cash
transfer the settlement time stamp, the message type, the CLM/RTGS booking reference, the transaction
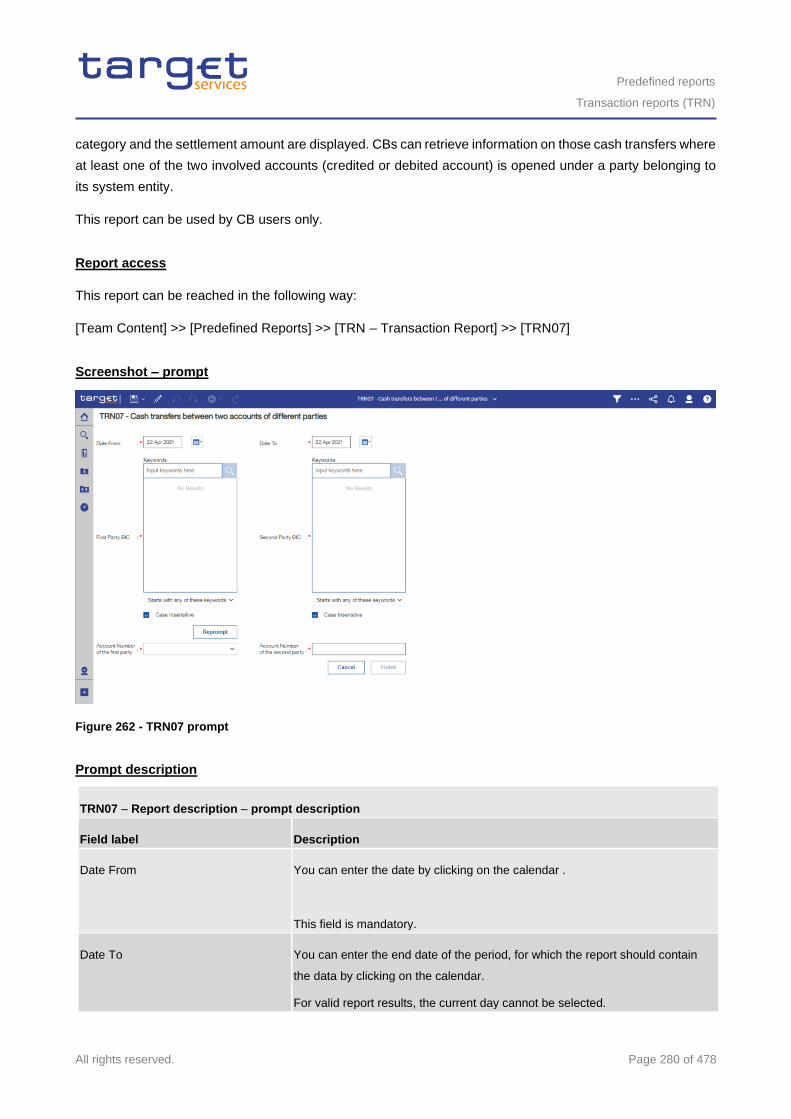
Predefined reports
Transaction reports (TRN)
All rights reserved. Page 280 of 478
category and the settlement amount are displayed. CBs can retrieve information on those cash transfers where
at least one of the two involved accounts (credited or debited account) is opened under a party belonging to
its system entity.
This report can be used by CB users only.
Report access
This report can be reached in the following way:
[Team Content] >> [Predefined Reports] >> [TRN – Transaction Report] >> [TRN07]
Screenshot – prompt
Figure 262 - TRN07 prompt
Prompt description
TRN07 – Report description – prompt description
Field label Description
Date From You can enter the date by clicking on the calendar .
This field is mandatory.
Date To You can enter the end date of the period, for which the report should contain
the data by clicking on the calendar.
For valid report results, the current day cannot be selected.
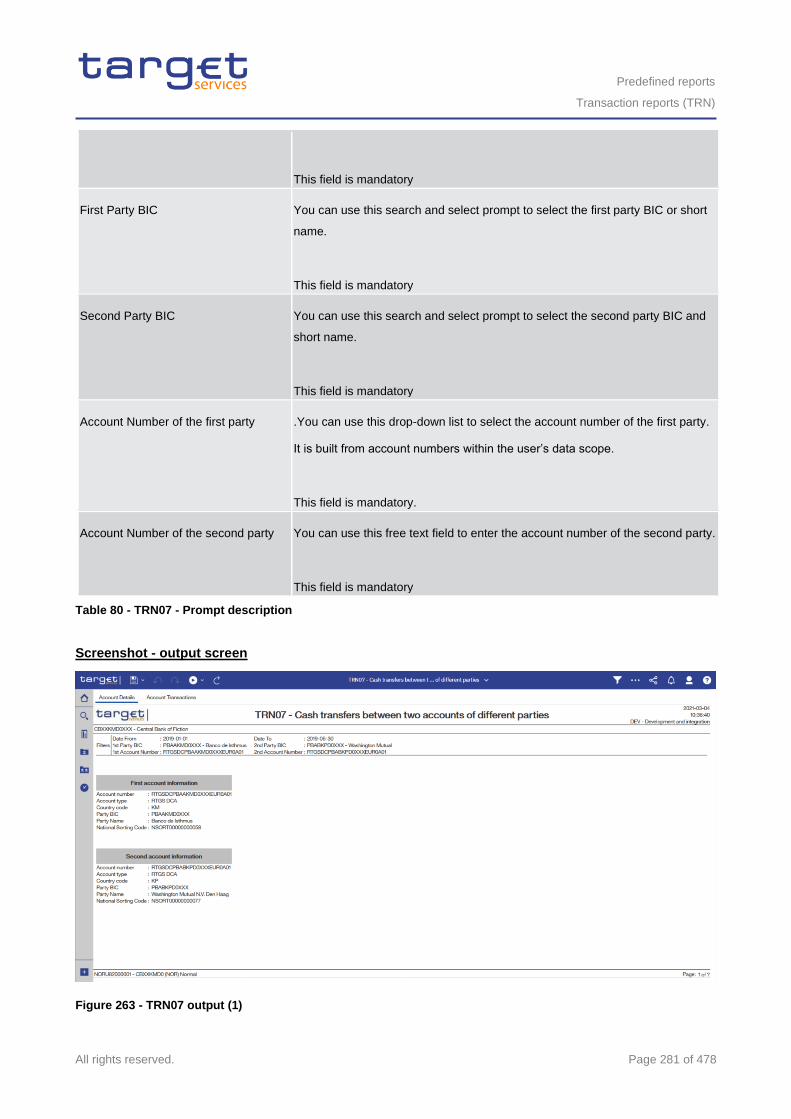
Predefined reports
Transaction reports (TRN)
All rights reserved. Page 281 of 478
This field is mandatory
First Party BIC You can use this search and select prompt to select the first party BIC or short
name.
This field is mandatory
Second Party BIC You can use this search and select prompt to select the second party BIC and
short name.
This field is mandatory
Account Number of the first party .You can use this drop-down list to select the account number of the first party.
It is built from account numbers within the user’s data scope.
This field is mandatory.
Account Number of the second party You can use this free text field to enter the account number of the second party.
This field is mandatory
Table 80 - TRN07 - Prompt description
Screenshot - output screen
Figure 263 - TRN07 output (1)
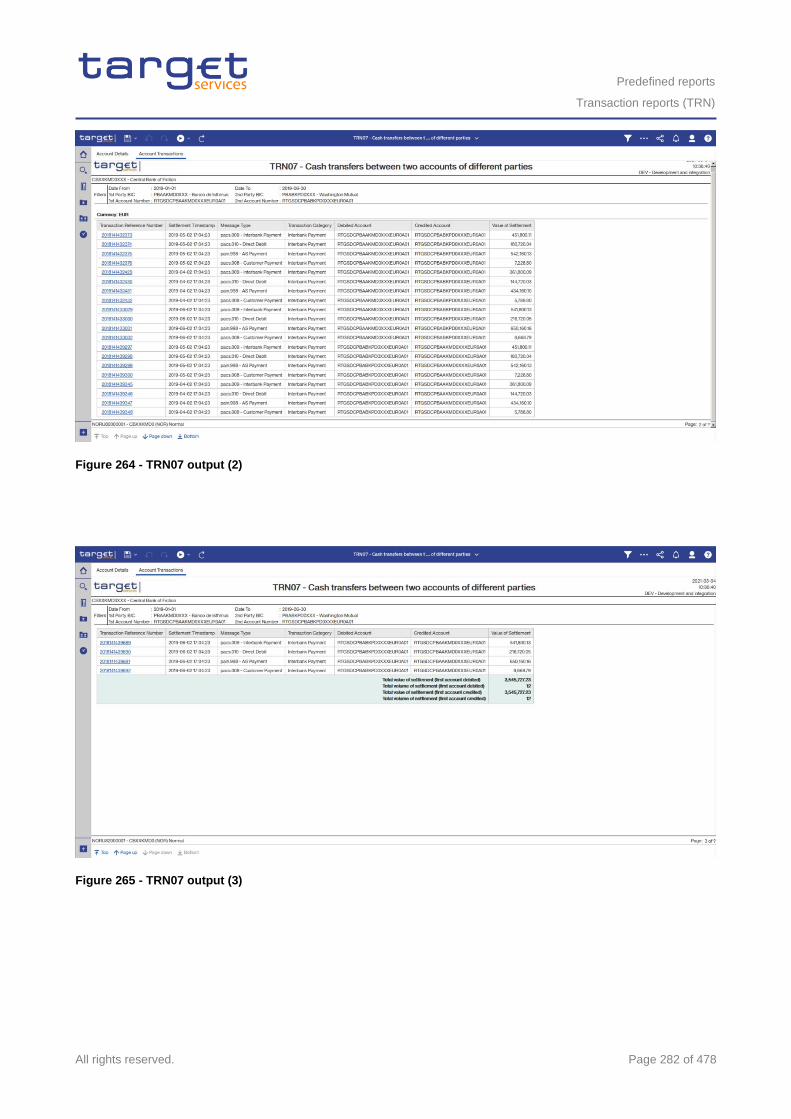
Predefined reports
Transaction reports (TRN)
All rights reserved. Page 282 of 478
Figure 264 - TRN07 output (2)
Figure 265 - TRN07 output (3)
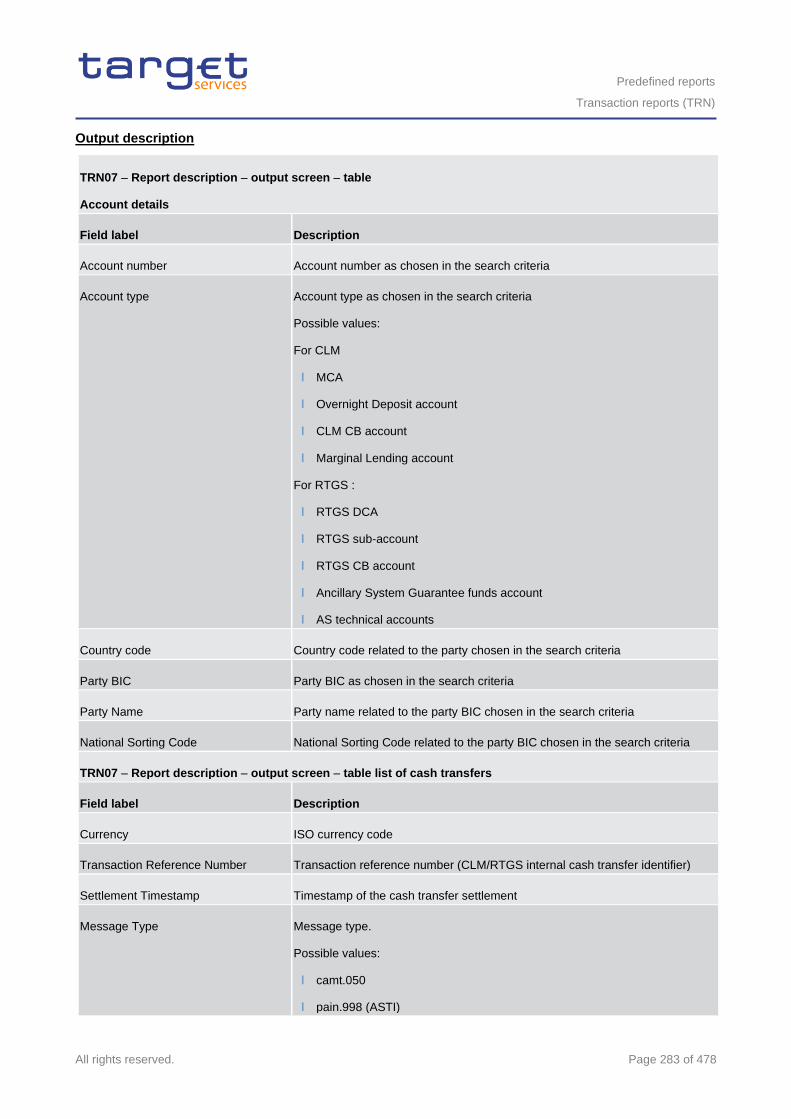
Predefined reports
Transaction reports (TRN)
All rights reserved. Page 283 of 478
Output description
TRN07 – Report description – output screen – table
Account details
Field label Description
Account number Account number as chosen in the search criteria
Account type Account type as chosen in the search criteria
Possible values:
For CLM
l MCA
l Overnight Deposit account
l CLM CB account
l Marginal Lending account
For RTGS :
l RTGS DCA
l RTGS sub-account
l RTGS CB account
l Ancillary System Guarantee funds account
l AS technical accounts
Country code Country code related to the party chosen in the search criteria
Party BIC Party BIC as chosen in the search criteria
Party Name Party name related to the party BIC chosen in the search criteria
National Sorting Code National Sorting Code related to the party BIC chosen in the search criteria
TRN07 – Report description – output screen – table list of cash transfers
Field label Description
Currency ISO currency code
Transaction Reference Number Transaction reference number (CLM/RTGS internal cash transfer identifier)
Settlement Timestamp Timestamp of the cash transfer settlement
Message Type Message type.
Possible values:
l camt.050
l pain.998 (ASTI)
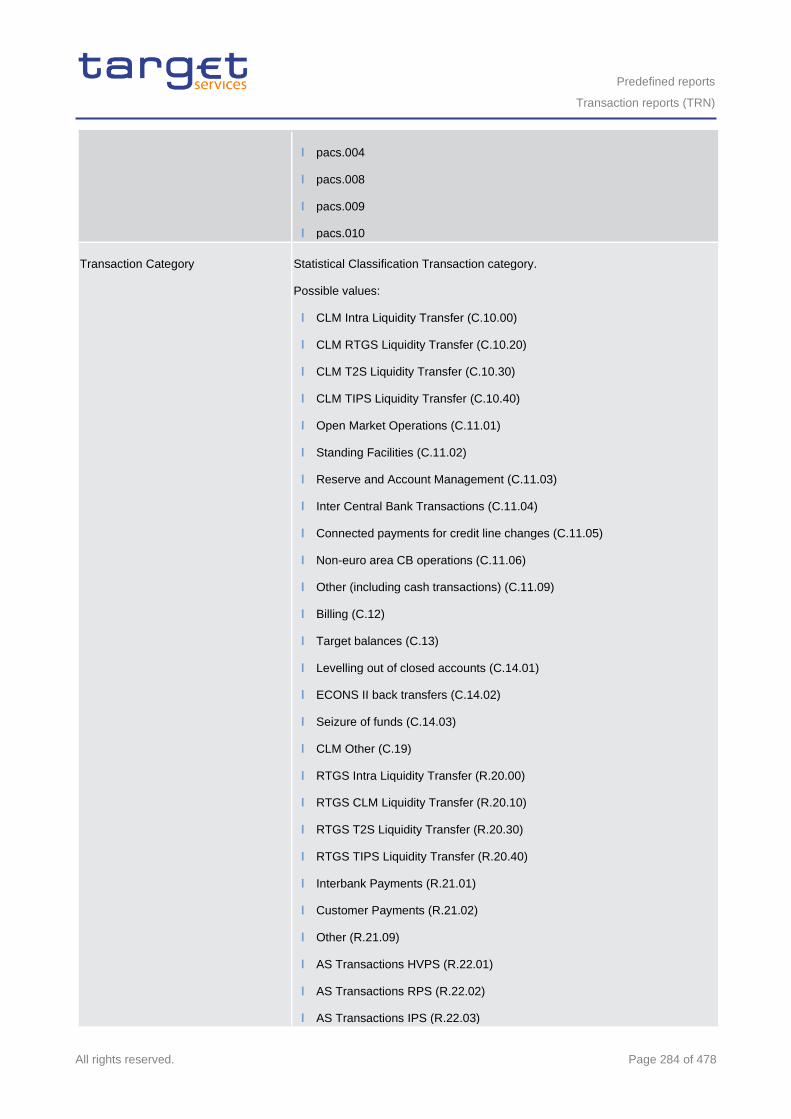
Predefined reports
Transaction reports (TRN)
All rights reserved. Page 284 of 478
l pacs.004
l pacs.008
l pacs.009
l pacs.010
Transaction Category Statistical Classification Transaction category.
Possible values:
l CLM Intra Liquidity Transfer (C.10.00)
l CLM RTGS Liquidity Transfer (C.10.20)
l CLM T2S Liquidity Transfer (C.10.30)
l CLM TIPS Liquidity Transfer (C.10.40)
l Open Market Operations (C.11.01)
l Standing Facilities (C.11.02)
l Reserve and Account Management (C.11.03)
l Inter Central Bank Transactions (C.11.04)
l Connected payments for credit line changes (C.11.05)
l Non-euro area CB operations (C.11.06)
l Other (including cash transactions) (C.11.09)
l Billing (C.12)
l Target balances (C.13)
l Levelling out of closed accounts (C.14.01)
l ECONS II back transfers (C.14.02)
l Seizure of funds (C.14.03)
l CLM Other (C.19)
l RTGS Intra Liquidity Transfer (R.20.00)
l RTGS CLM Liquidity Transfer (R.20.10)
l RTGS T2S Liquidity Transfer (R.20.30)
l RTGS TIPS Liquidity Transfer (R.20.40)
l Interbank Payments (R.21.01)
l Customer Payments (R.21.02)
l Other (R.21.09)
l AS Transactions HVPS (R.22.01)
l AS Transactions RPS (R.22.02)
l AS Transactions IPS (R.22.03)
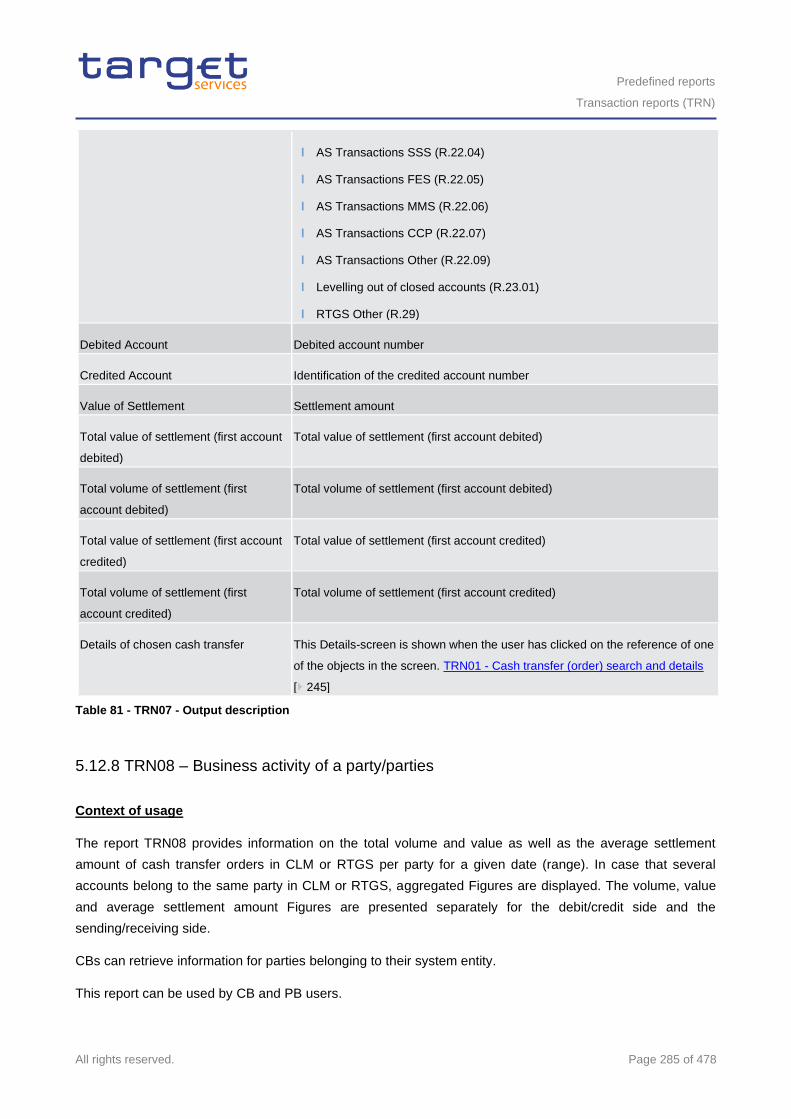
Predefined reports
Transaction reports (TRN)
All rights reserved. Page 285 of 478
l AS Transactions SSS (R.22.04)
l AS Transactions FES (R.22.05)
l AS Transactions MMS (R.22.06)
l AS Transactions CCP (R.22.07)
l AS Transactions Other (R.22.09)
l Levelling out of closed accounts (R.23.01)
l RTGS Other (R.29)
Debited Account Debited account number
Credited Account Identification of the credited account number
Value of Settlement Settlement amount
Total value of settlement (first account
debited)
Total value of settlement (first account debited)
Total volume of settlement (first
account debited)
Total volume of settlement (first account debited)
Total value of settlement (first account
credited)
Total value of settlement (first account credited)
Total volume of settlement (first
account credited)
Total volume of settlement (first account credited)
Details of chosen cash transfer This Details-screen is shown when the user has clicked on the reference of one
of the objects in the screen. TRN01 - Cash transfer (order) search and details
[ 245]
Table 81 - TRN07 - Output description
5.12.8 TRN08 – Business activity of a party/parties
Context of usage
The report TRN08 provides information on the total volume and value as well as the average settlement
amount of cash transfer orders in CLM or RTGS per party for a given date (range). In case that several
accounts belong to the same party in CLM or RTGS, aggregated Figures are displayed. The volume, value
and average settlement amount Figures are presented separately for the debit/credit side and the
sending/receiving side.
CBs can retrieve information for parties belonging to their system entity.
This report can be used by CB and PB users.
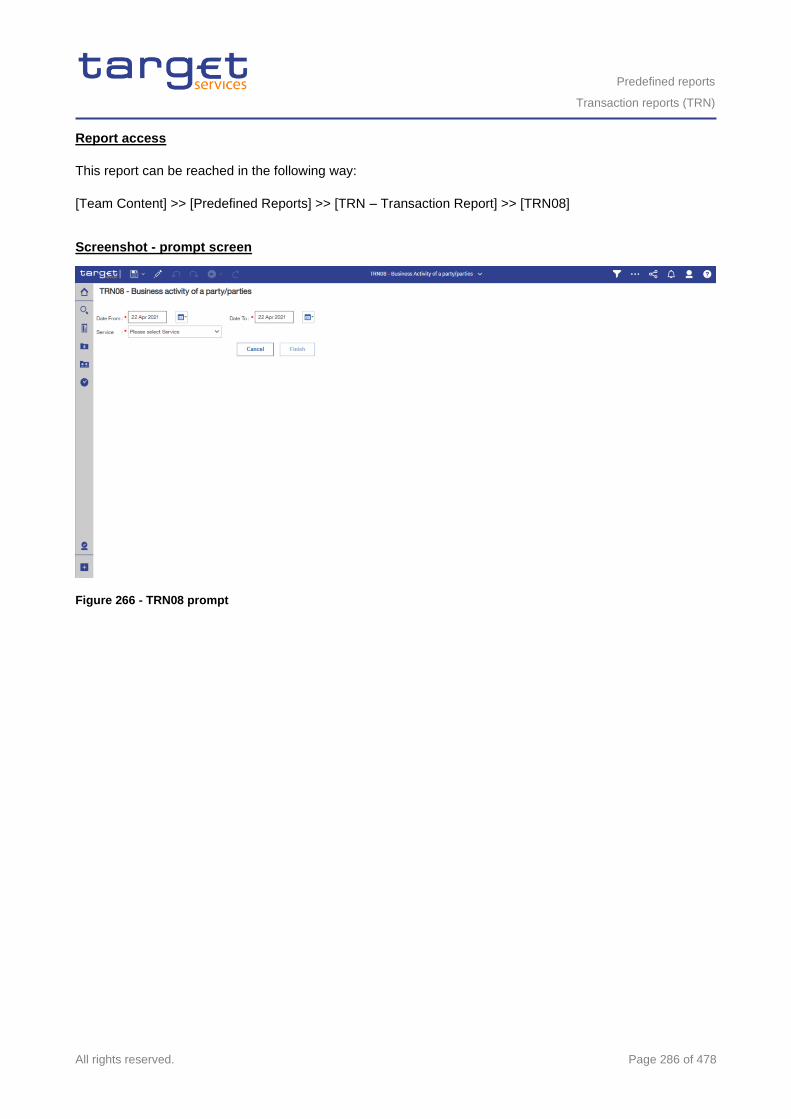
Predefined reports
Transaction reports (TRN)
All rights reserved. Page 286 of 478
Report access
This report can be reached in the following way:
[Team Content] >> [Predefined Reports] >> [TRN – Transaction Report] >> [TRN08]
Screenshot - prompt screen
Figure 266 - TRN08 prompt
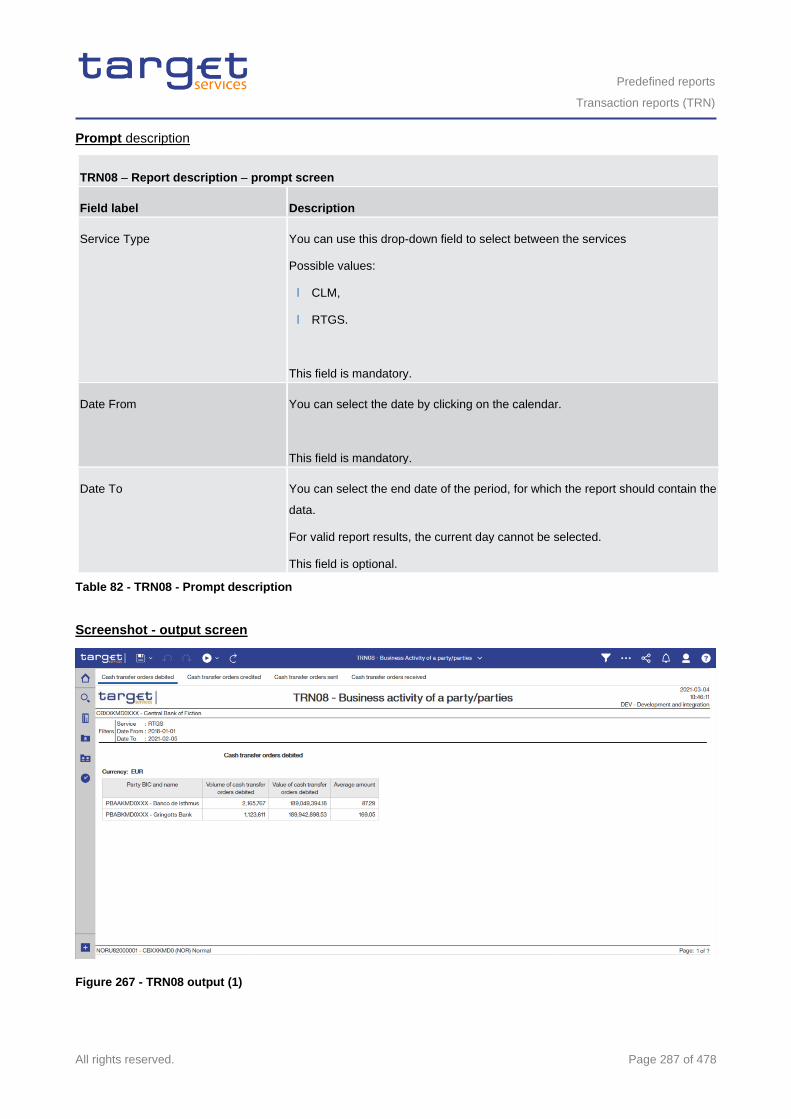
Predefined reports
Transaction reports (TRN)
All rights reserved. Page 287 of 478
Prompt description
TRN08 – Report description – prompt screen
Field label Description
Service Type You can use this drop-down field to select between the services
Possible values:
l CLM,
l RTGS.
This field is mandatory.
Date From You can select the date by clicking on the calendar.
This field is mandatory.
Date To You can select the end date of the period, for which the report should contain the
data.
For valid report results, the current day cannot be selected.
This field is optional.
Table 82 - TRN08 - Prompt description
Screenshot - output screen
Figure 267 - TRN08 output (1)
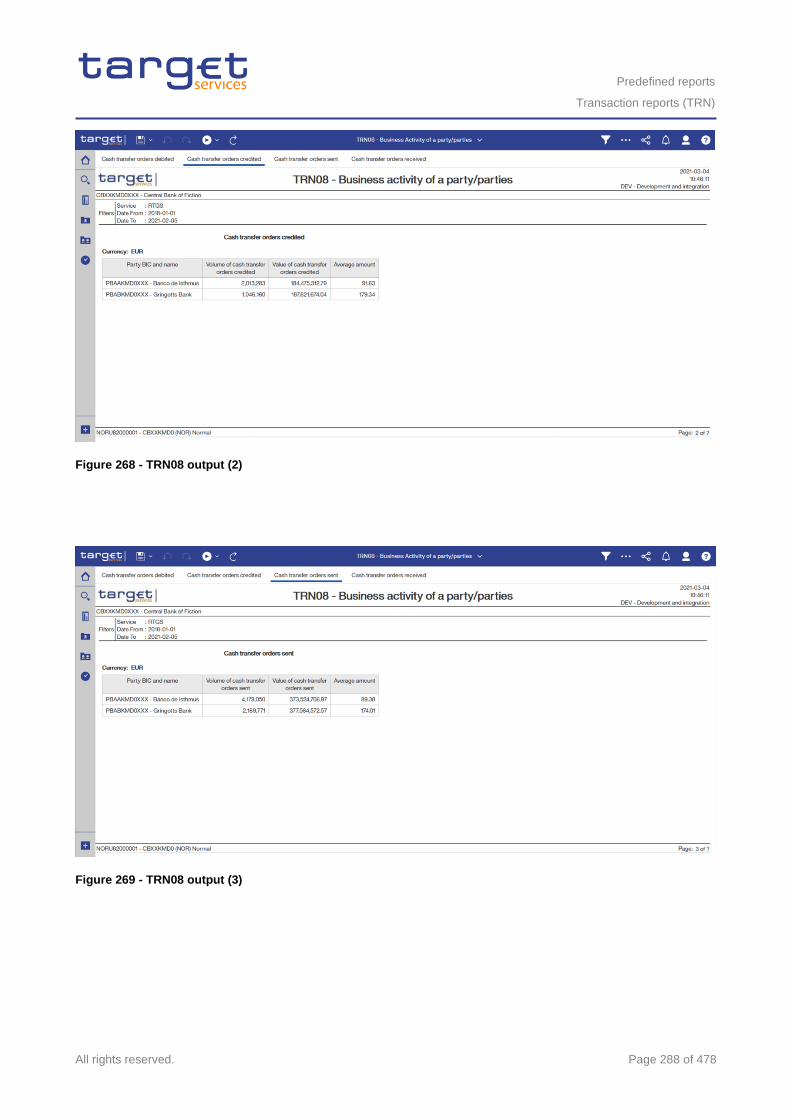
Predefined reports
Transaction reports (TRN)
All rights reserved. Page 288 of 478
Figure 268 - TRN08 output (2)
Figure 269 - TRN08 output (3)
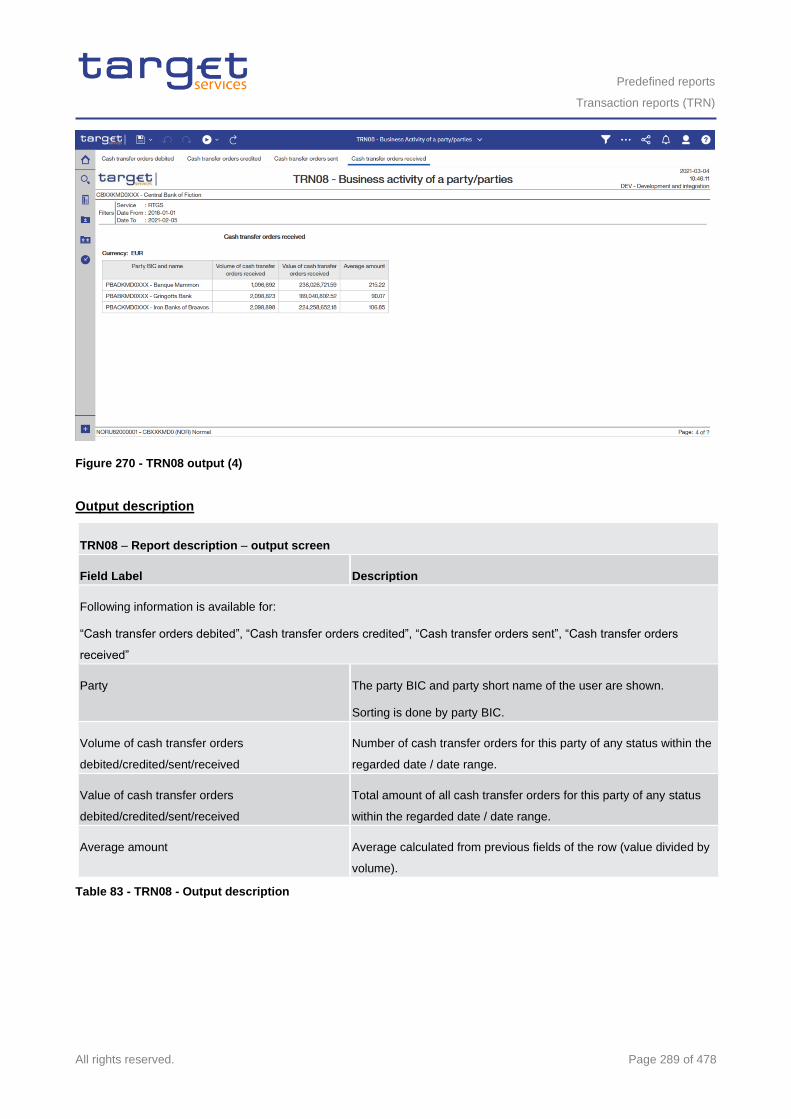
Predefined reports
Transaction reports (TRN)
All rights reserved. Page 289 of 478
Figure 270 - TRN08 output (4)
Output description
TRN08 – Report description – output screen
Field Label Description
Following information is available for:
“Cash transfer orders debited”, “Cash transfer orders credited”, “Cash transfer orders sent”, “Cash transfer orders
received”
Party The party BIC and party short name of the user are shown.
Sorting is done by party BIC.
Volume of cash transfer orders
debited/credited/sent/received
Number of cash transfer orders for this party of any status within the
regarded date / date range.
Value of cash transfer orders
debited/credited/sent/received
Total amount of all cash transfer orders for this party of any status
within the regarded date / date range.
Average amount Average calculated from previous fields of the row (value divided by
volume).
Table 83 - TRN08 - Output description
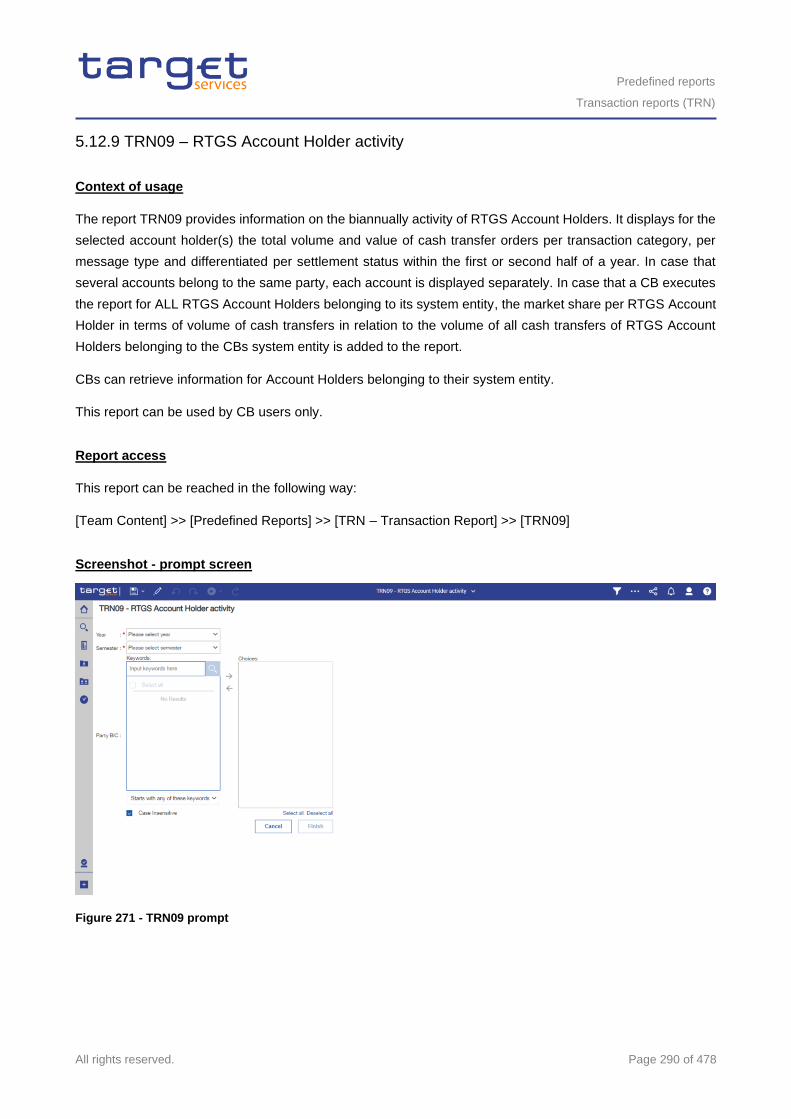
Predefined reports
Transaction reports (TRN)
All rights reserved. Page 290 of 478
5.12.9 TRN09 – RTGS Account Holder activity
Context of usage
The report TRN09 provides information on the biannually activity of RTGS Account Holders. It displays for the
selected account holder(s) the total volume and value of cash transfer orders per transaction category, per
message type and differentiated per settlement status within the first or second half of a year. In case that
several accounts belong to the same party, each account is displayed separately. In case that a CB executes
the report for ALL RTGS Account Holders belonging to its system entity, the market share per RTGS Account
Holder in terms of volume of cash transfers in relation to the volume of all cash transfers of RTGS Account
Holders belonging to the CBs system entity is added to the report.
CBs can retrieve information for Account Holders belonging to their system entity.
This report can be used by CB users only.
Report access
This report can be reached in the following way:
[Team Content] >> [Predefined Reports] >> [TRN – Transaction Report] >> [TRN09]
Screenshot - prompt screen
Figure 271 - TRN09 prompt
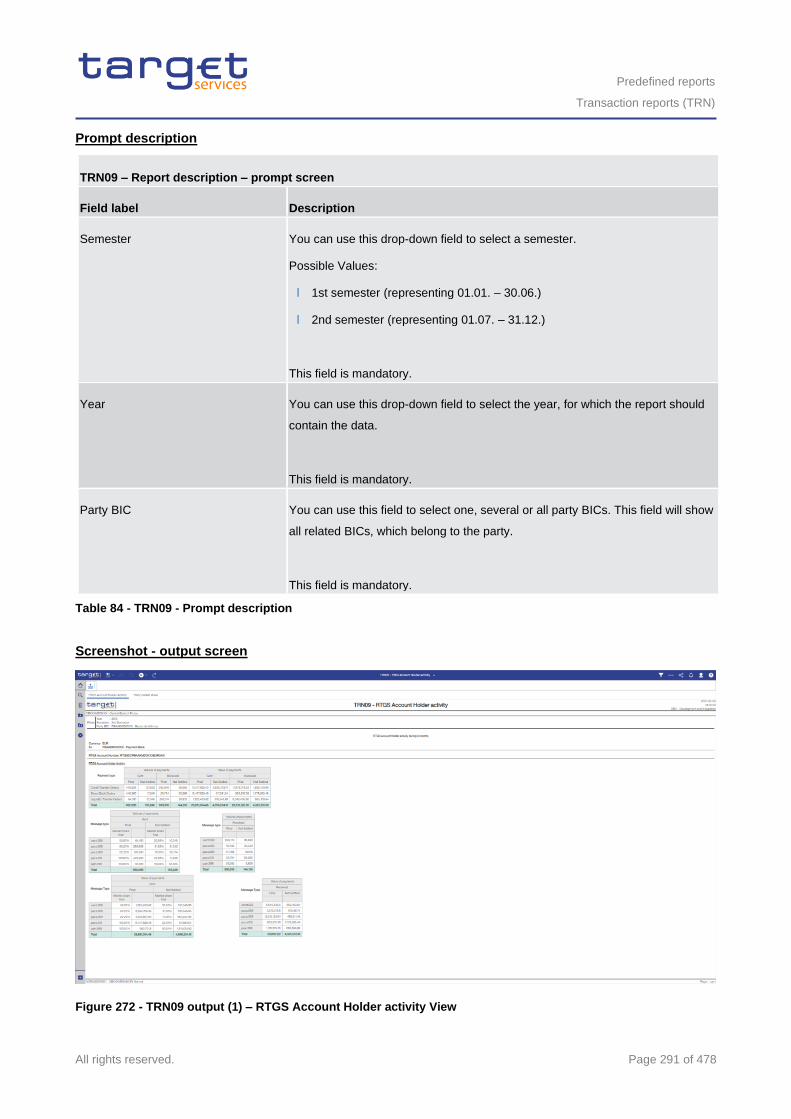
Predefined reports
Transaction reports (TRN)
All rights reserved. Page 291 of 478
Prompt description
TRN09 – Report description – prompt screen
Field label Description
Semester You can use this drop-down field to select a semester.
Possible Values:
l 1st semester (representing 01.01. – 30.06.)
l 2nd semester (representing 01.07. – 31.12.)
This field is mandatory.
Year You can use this drop-down field to select the year, for which the report should
contain the data.
This field is mandatory.
Party BIC You can use this field to select one, several or all party BICs. This field will show
all related BICs, which belong to the party.
This field is mandatory.
Table 84 - TRN09 - Prompt description
Screenshot - output screen
Figure 272 - TRN09 output (1) – RTGS Account Holder activity View
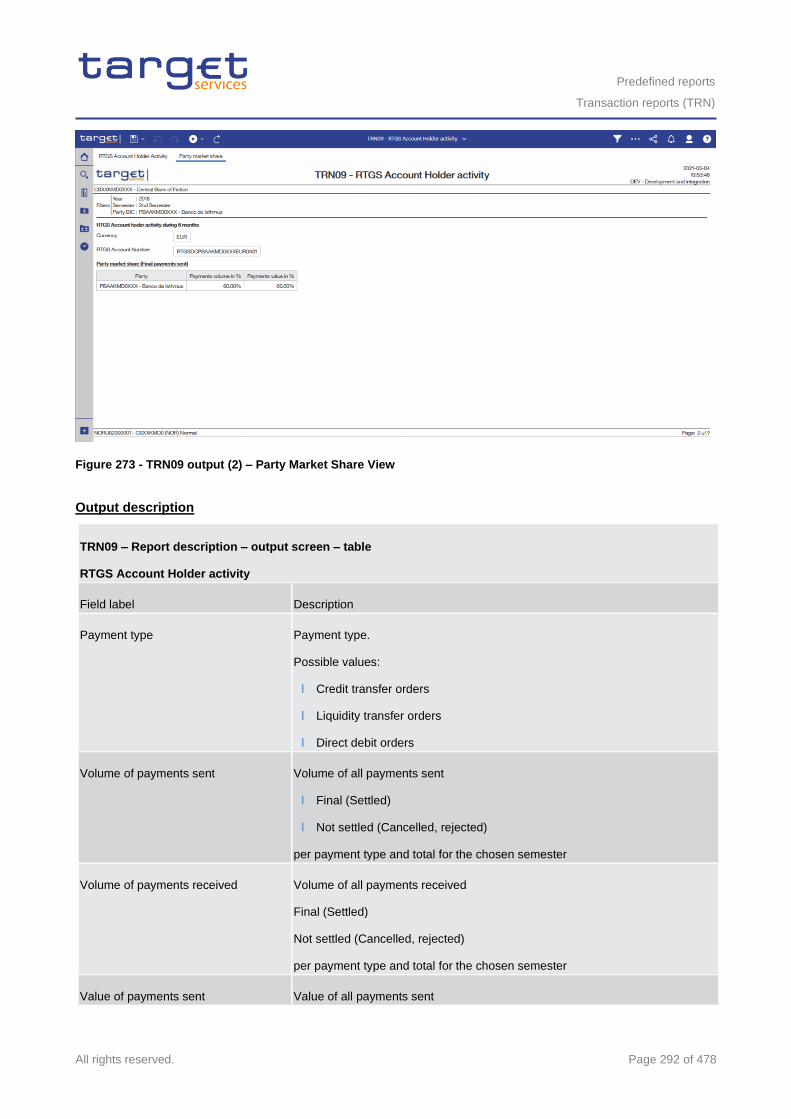
Predefined reports
Transaction reports (TRN)
All rights reserved. Page 292 of 478
Figure 273 - TRN09 output (2) – Party Market Share View
Output description
TRN09 – Report description – output screen – table
RTGS Account Holder activity
Field label Description
Payment type Payment type.
Possible values:
l Credit transfer orders
l Liquidity transfer orders
l Direct debit orders
Volume of payments sent Volume of all payments sent
l Final (Settled)
l Not settled (Cancelled, rejected)
per payment type and total for the chosen semester
Volume of payments received Volume of all payments received
Final (Settled)
Not settled (Cancelled, rejected)
per payment type and total for the chosen semester
Value of payments sent Value of all payments sent
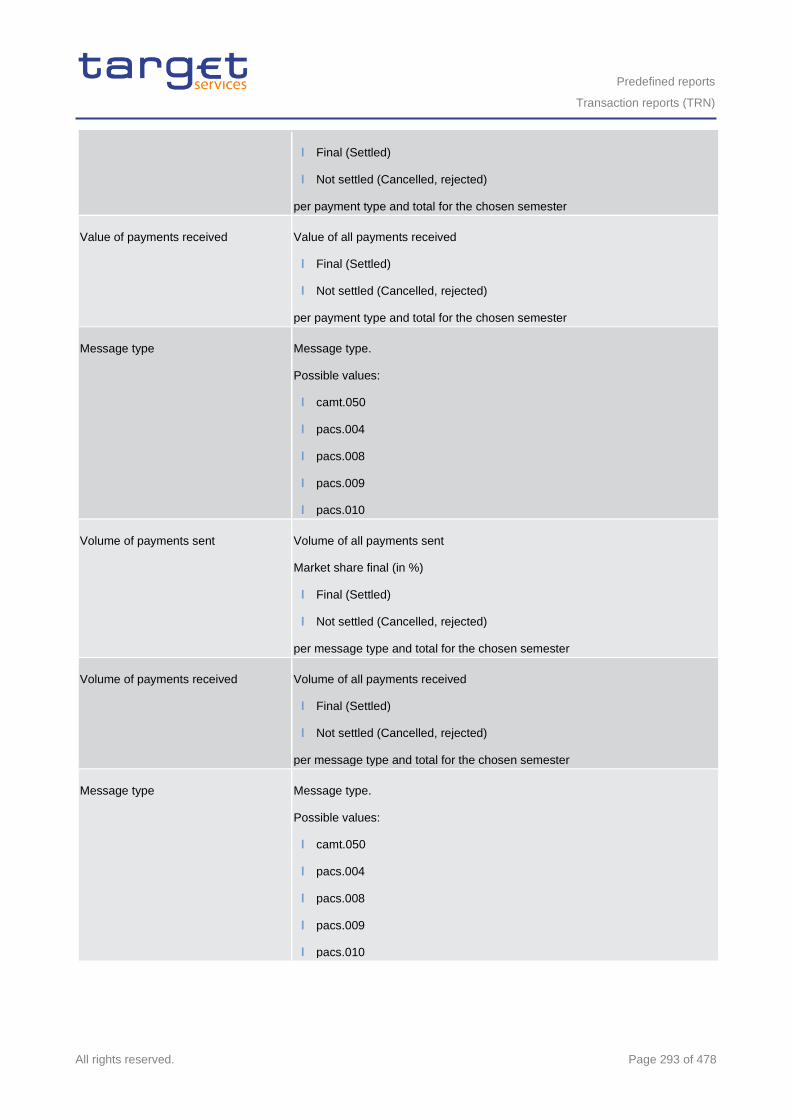
Predefined reports
Transaction reports (TRN)
All rights reserved. Page 293 of 478
l Final (Settled)
l Not settled (Cancelled, rejected)
per payment type and total for the chosen semester
Value of payments received Value of all payments received
l Final (Settled)
l Not settled (Cancelled, rejected)
per payment type and total for the chosen semester
Message type Message type.
Possible values:
l camt.050
l pacs.004
l pacs.008
l pacs.009
l pacs.010
Volume of payments sent Volume of all payments sent
Market share final (in %)
l Final (Settled)
l Not settled (Cancelled, rejected)
per message type and total for the chosen semester
Volume of payments received Volume of all payments received
l Final (Settled)
l Not settled (Cancelled, rejected)
per message type and total for the chosen semester
Message type Message type.
Possible values:
l camt.050
l pacs.004
l pacs.008
l pacs.009
l pacs.010
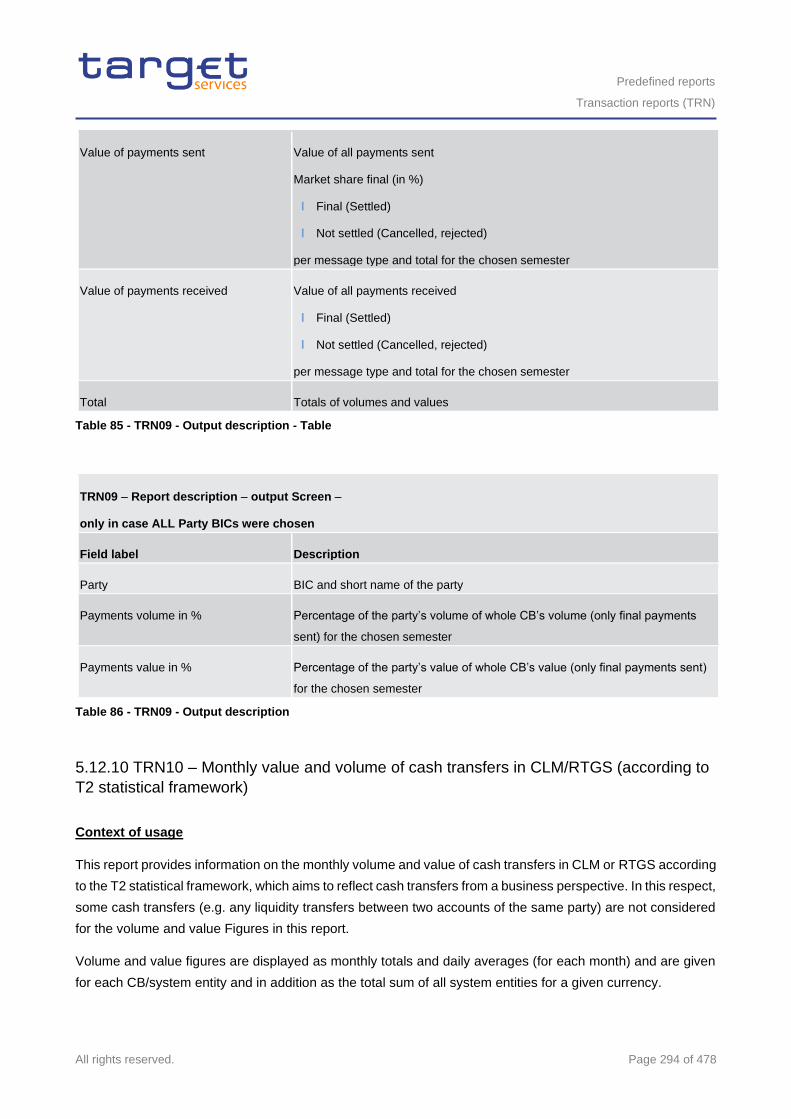
Predefined reports
Transaction reports (TRN)
All rights reserved. Page 294 of 478
Value of payments sent Value of all payments sent
Market share final (in %)
l Final (Settled)
l Not settled (Cancelled, rejected)
per message type and total for the chosen semester
Value of payments received Value of all payments received
l Final (Settled)
l Not settled (Cancelled, rejected)
per message type and total for the chosen semester
Total Totals of volumes and values
Table 85 - TRN09 - Output description - Table
TRN09 – Report description – output Screen –
only in case ALL Party BICs were chosen
Field label Description
Party BIC and short name of the party
Payments volume in % Percentage of the party’s volume of whole CB’s volume (only final payments
sent) for the chosen semester
Payments value in % Percentage of the party’s value of whole CB’s value (only final payments sent)
for the chosen semester
Table 86 - TRN09 - Output description
5.12.10 TRN10 – Monthly value and volume of cash transfers in CLM/RTGS (according to
T2 statistical framework)
Context of usage
This report provides information on the monthly volume and value of cash transfers in CLM or RTGS according
to the T2 statistical framework, which aims to reflect cash transfers from a business perspective. In this respect,
some cash transfers (e.g. any liquidity transfers between two accounts of the same party) are not considered
for the volume and value Figures in this report.
Volume and value figures are displayed as monthly totals and daily averages (for each month) and are given
for each CB/system entity and in addition as the total sum of all system entities for a given currency.
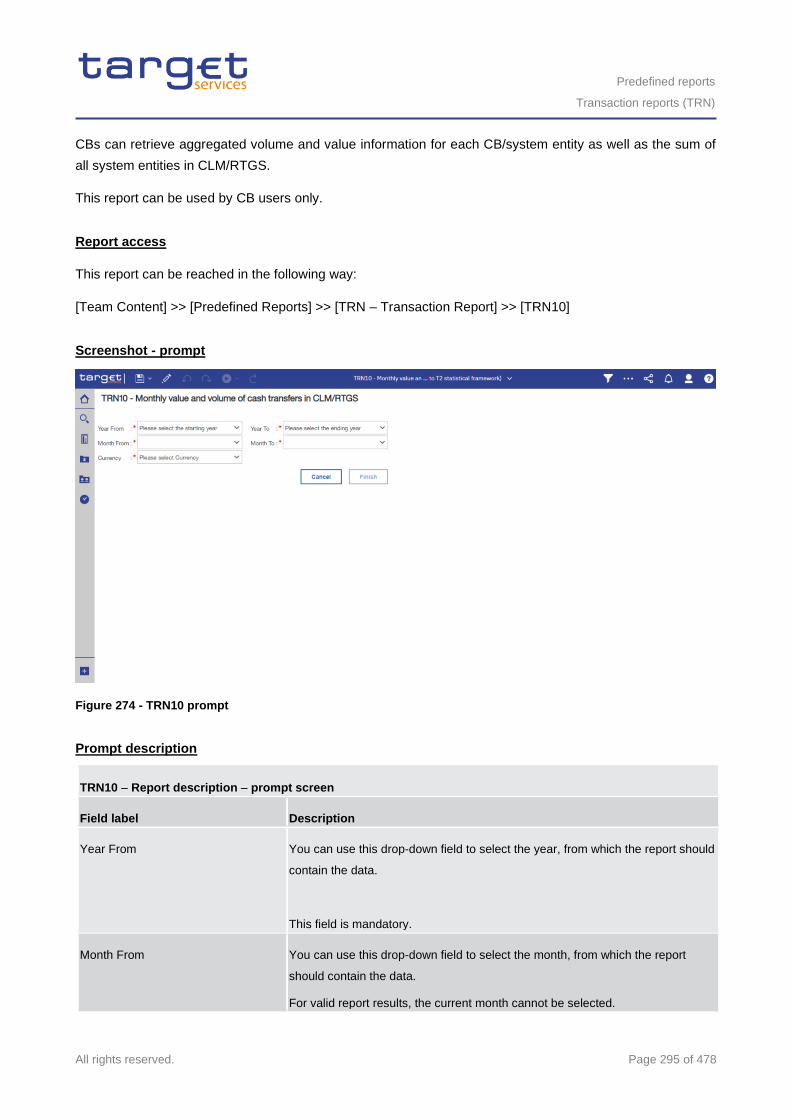
Predefined reports
Transaction reports (TRN)
All rights reserved. Page 295 of 478
CBs can retrieve aggregated volume and value information for each CB/system entity as well as the sum of
all system entities in CLM/RTGS.
This report can be used by CB users only.
Report access
This report can be reached in the following way:
[Team Content] >> [Predefined Reports] >> [TRN – Transaction Report] >> [TRN10]
Screenshot - prompt
Figure 274 - TRN10 prompt
Prompt description
TRN10 – Report description – prompt screen
Field label Description
Year From
You can use this drop-down field to select the year, from which the report should
contain the data.
This field is mandatory.
Month From You can use this drop-down field to select the month, from which the report
should contain the data.
For valid report results, the current month cannot be selected.
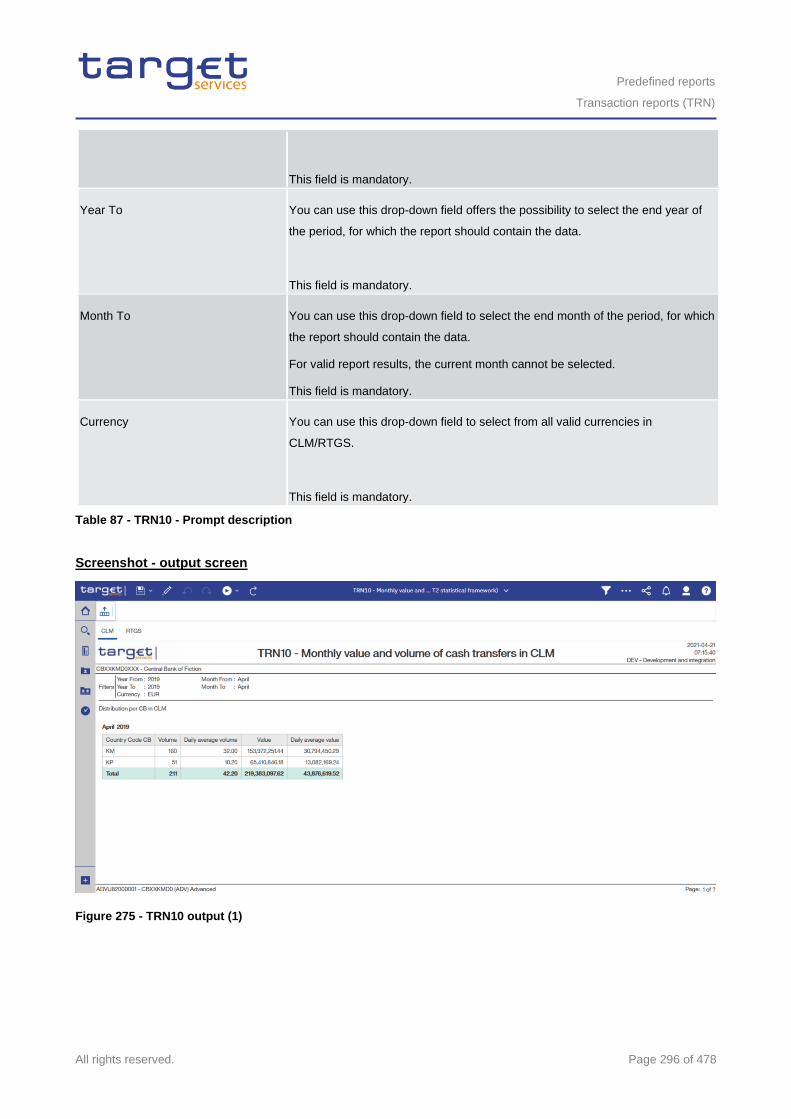
Predefined reports
Transaction reports (TRN)
All rights reserved. Page 296 of 478
This field is mandatory.
Year To You can use this drop-down field offers the possibility to select the end year of
the period, for which the report should contain the data.
This field is mandatory.
Month To You can use this drop-down field to select the end month of the period, for which
the report should contain the data.
For valid report results, the current month cannot be selected.
This field is mandatory.
Currency You can use this drop-down field to select from all valid currencies in
CLM/RTGS.
This field is mandatory.
Table 87 - TRN10 - Prompt description
Screenshot - output screen
Figure 275 - TRN10 output (1)
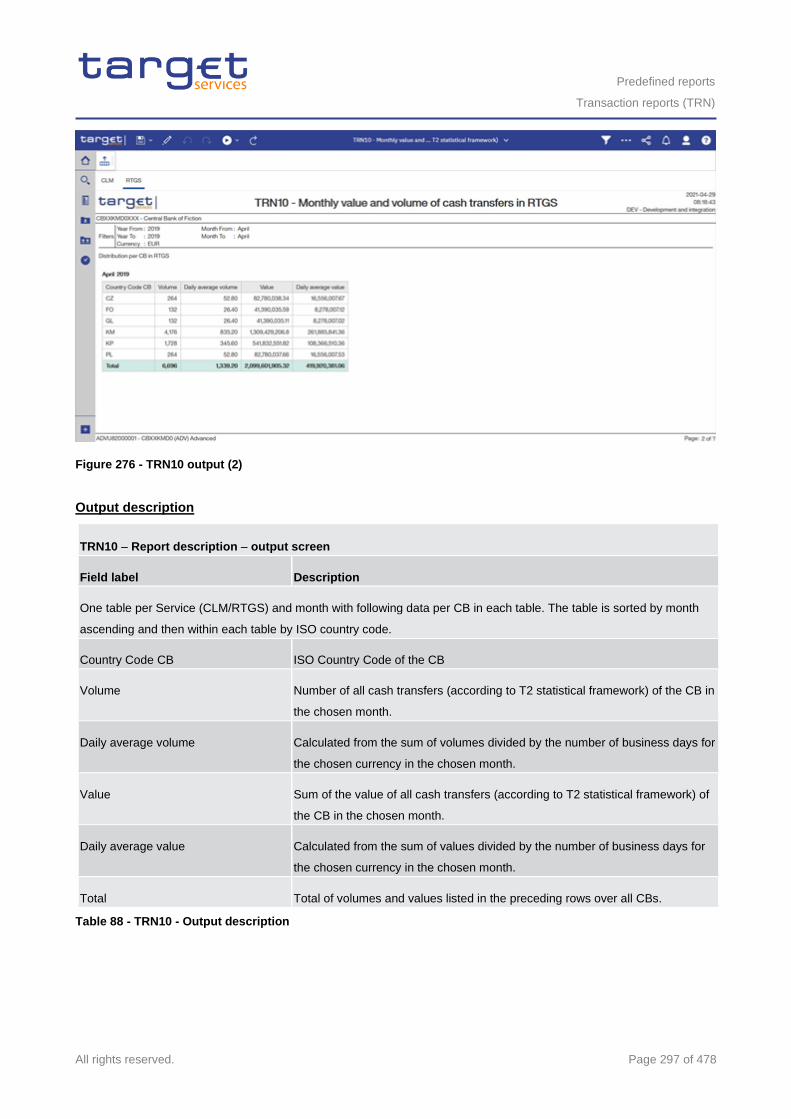
Predefined reports
Transaction reports (TRN)
All rights reserved. Page 297 of 478
Figure 276 - TRN10 output (2)
Output description
TRN10 – Report description – output screen
Field label Description
One table per Service (CLM/RTGS) and month with following data per CB in each table. The table is sorted by month
ascending and then within each table by ISO country code.
Country Code CB ISO Country Code of the CB
Volume Number of all cash transfers (according to T2 statistical framework) of the CB in
the chosen month.
Daily average volume Calculated from the sum of volumes divided by the number of business days for
the chosen currency in the chosen month.
Value Sum of the value of all cash transfers (according to T2 statistical framework) of
the CB in the chosen month.
Daily average value Calculated from the sum of values divided by the number of business days for
the chosen currency in the chosen month.
Total Total of volumes and values listed in the preceding rows over all CBs.
Table 88 - TRN10 - Output description
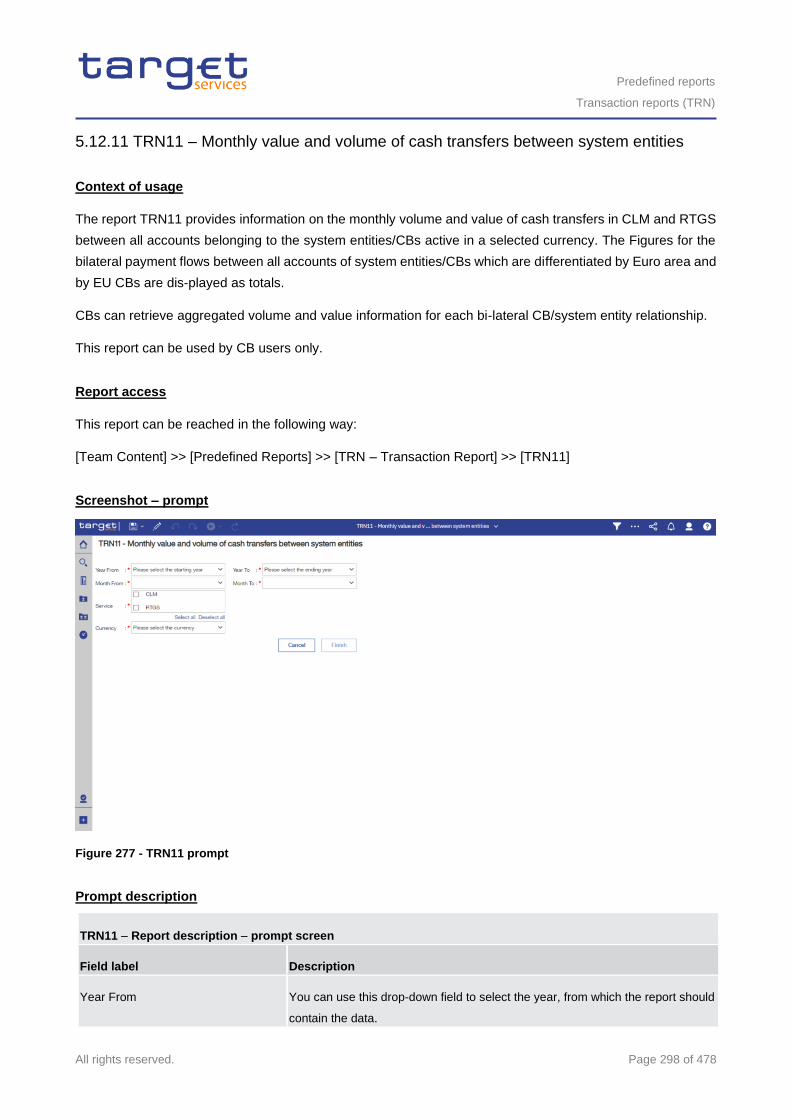
Predefined reports
Transaction reports (TRN)
All rights reserved. Page 298 of 478
5.12.11 TRN11 – Monthly value and volume of cash transfers between system entities
Context of usage
The report TRN11 provides information on the monthly volume and value of cash transfers in CLM and RTGS
between all accounts belonging to the system entities/CBs active in a selected currency. The Figures for the
bilateral payment flows between all accounts of system entities/CBs which are differentiated by Euro area and
by EU CBs are dis-played as totals.
CBs can retrieve aggregated volume and value information for each bi-lateral CB/system entity relationship.
This report can be used by CB users only.
Report access
This report can be reached in the following way:
[Team Content] >> [Predefined Reports] >> [TRN – Transaction Report] >> [TRN11]
Screenshot – prompt
Figure 277 - TRN11 prompt
Prompt description
TRN11 – Report description – prompt screen
Field label Description
Year From You can use this drop-down field to select the year, from which the report should
contain the data.
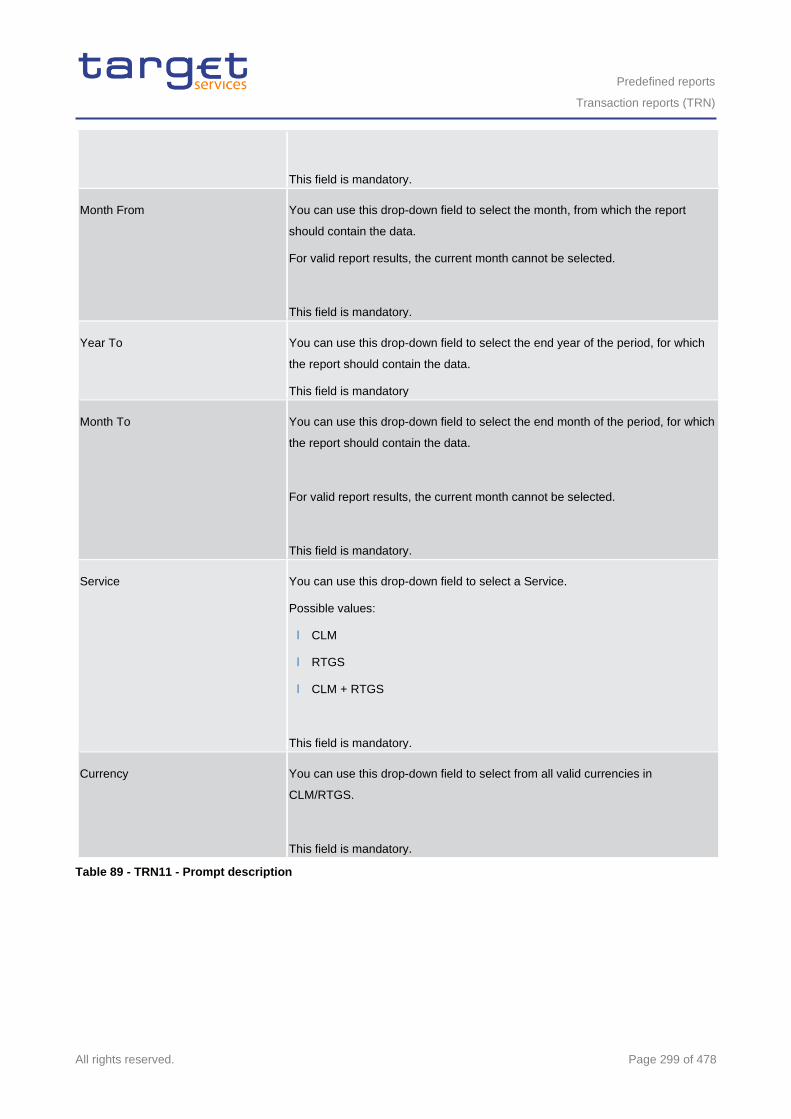
Predefined reports
Transaction reports (TRN)
All rights reserved. Page 299 of 478
This field is mandatory.
Month From You can use this drop-down field to select the month, from which the report
should contain the data.
For valid report results, the current month cannot be selected.
This field is mandatory.
Year To You can use this drop-down field to select the end year of the period, for which
the report should contain the data.
This field is mandatory
Month To You can use this drop-down field to select the end month of the period, for which
the report should contain the data.
For valid report results, the current month cannot be selected.
This field is mandatory.
Service You can use this drop-down field to select a Service.
Possible values:
l CLM
l RTGS
l CLM + RTGS
This field is mandatory.
Currency You can use this drop-down field to select from all valid currencies in
CLM/RTGS.
This field is mandatory.
Table 89 - TRN11 - Prompt description
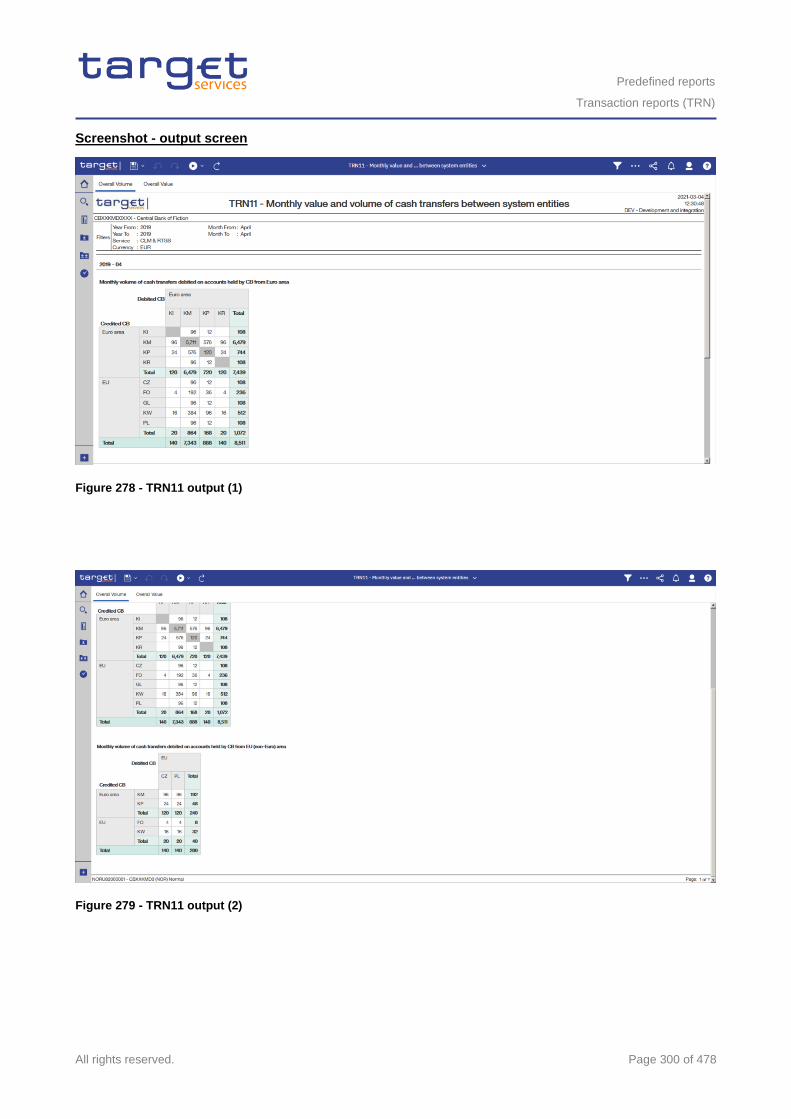
Predefined reports
Transaction reports (TRN)
All rights reserved. Page 300 of 478
Screenshot - output screen
Figure 278 - TRN11 output (1)
Figure 279 - TRN11 output (2)
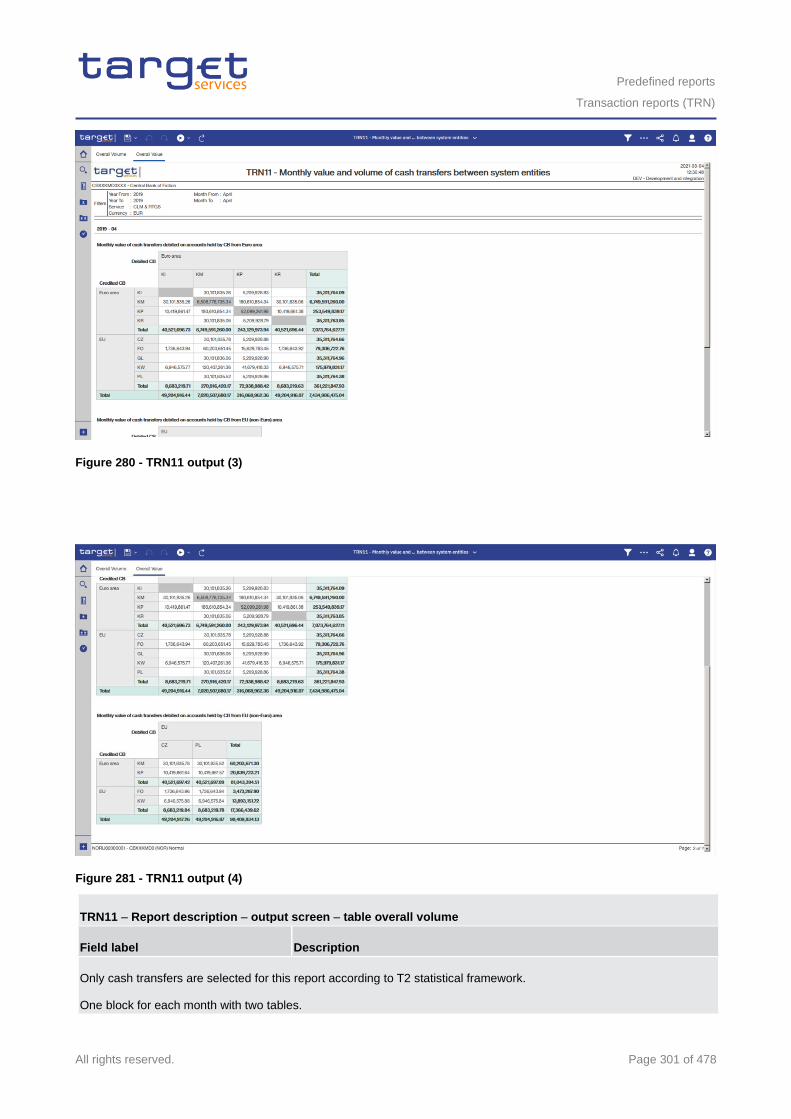
Predefined reports
Transaction reports (TRN)
All rights reserved. Page 301 of 478
Figure 280 - TRN11 output (3)
Figure 281 - TRN11 output (4)
TRN11 – Report description – output screen – table overall volume
Field label Description
Only cash transfers are selected for this report according to T2 statistical framework.
One block for each month with two tables.
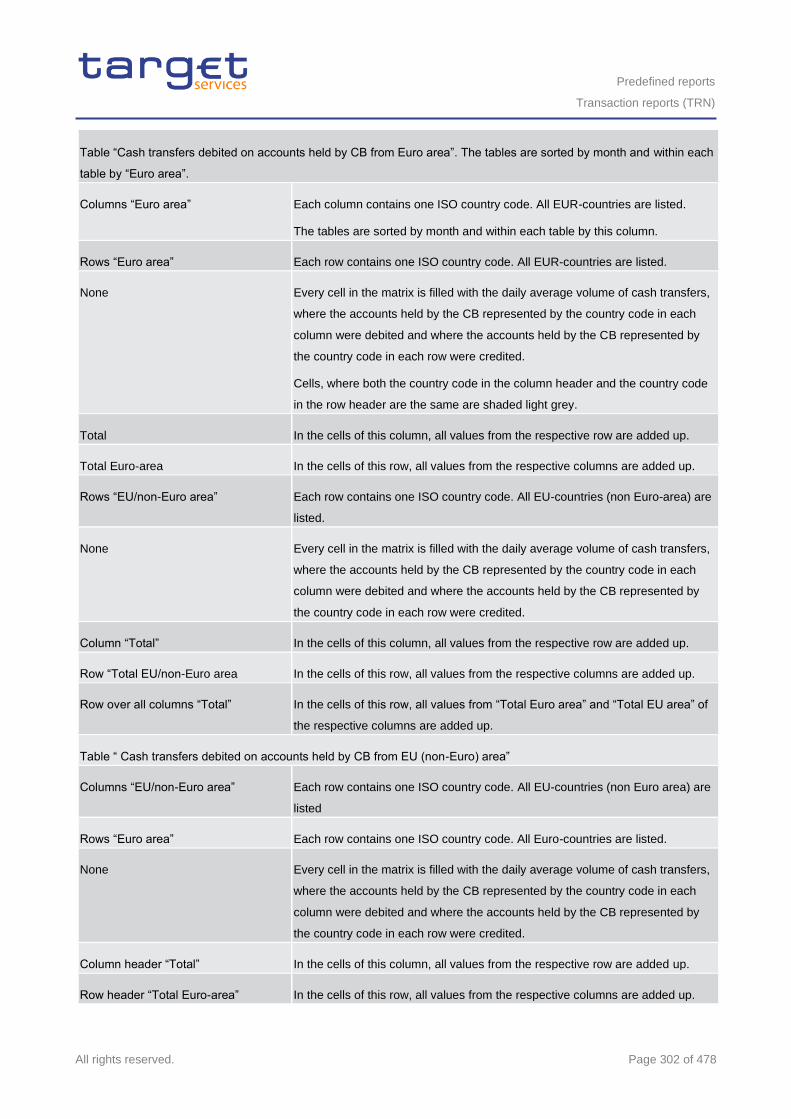
Predefined reports
Transaction reports (TRN)
All rights reserved. Page 302 of 478
Table “Cash transfers debited on accounts held by CB from Euro area”. The tables are sorted by month and within each
table by “Euro area”.
Columns “Euro area” Each column contains one ISO country code. All EUR-countries are listed.
The tables are sorted by month and within each table by this column.
Rows “Euro area” Each row contains one ISO country code. All EUR-countries are listed.
None Every cell in the matrix is filled with the daily average volume of cash transfers,
where the accounts held by the CB represented by the country code in each
column were debited and where the accounts held by the CB represented by
the country code in each row were credited.
Cells, where both the country code in the column header and the country code
in the row header are the same are shaded light grey.
Total In the cells of this column, all values from the respective row are added up.
Total Euro-area In the cells of this row, all values from the respective columns are added up.
Rows “EU/non-Euro area” Each row contains one ISO country code. All EU-countries (non Euro-area) are
listed.
None Every cell in the matrix is filled with the daily average volume of cash transfers,
where the accounts held by the CB represented by the country code in each
column were debited and where the accounts held by the CB represented by
the country code in each row were credited.
Column “Total” In the cells of this column, all values from the respective row are added up.
Row “Total EU/non-Euro area In the cells of this row, all values from the respective columns are added up.
Row over all columns “Total” In the cells of this row, all values from “Total Euro area” and “Total EU area” of
the respective columns are added up.
Table “ Cash transfers debited on accounts held by CB from EU (non-Euro) area”
Columns “EU/non-Euro area” Each row contains one ISO country code. All EU-countries (non Euro area) are
listed
Rows “Euro area” Each row contains one ISO country code. All Euro-countries are listed.
None Every cell in the matrix is filled with the daily average volume of cash transfers,
where the accounts held by the CB represented by the country code in each
column were debited and where the accounts held by the CB represented by
the country code in each row were credited.
Column header “Total” In the cells of this column, all values from the respective row are added up.
Row header “Total Euro-area” In the cells of this row, all values from the respective columns are added up.
Predefined reports
Transaction reports (TRN)
All rights reserved. Page 303 of 478
Rows “EU/non-Euro area” Each row contains one ISO country code. All EU-countries (non Euro-area) are
listed.
None Every cell in the matrix is filled with the daily average volume of cash transfers,
where the accounts held by the CB represented by the country code in each
column were debited and where the accounts held by the CB represented by
the country code in each row were credited.
Cells, where both the country code in the column header and the country code
in the row header are the same are shaded light grey.
Column “Total” In the cells of this column, all values from the respective row are added up.
Row “Total EU area” In the cells of this row, all values from the respective columns are added up.
Row over all columns “Total” In the cells of this row, all values from “Total Euro area” and “Total EU area” of
the respective columns are added up.
Table 90 - TRN11 - Output description - Table overall volume
TRN11 – Report description – output screen – table overall value
This table has the same structure as the previous table (Overall Volume) with the difference that here the daily average
values are displayed.
Table 91 - TRN11 - Output description - Table overall value
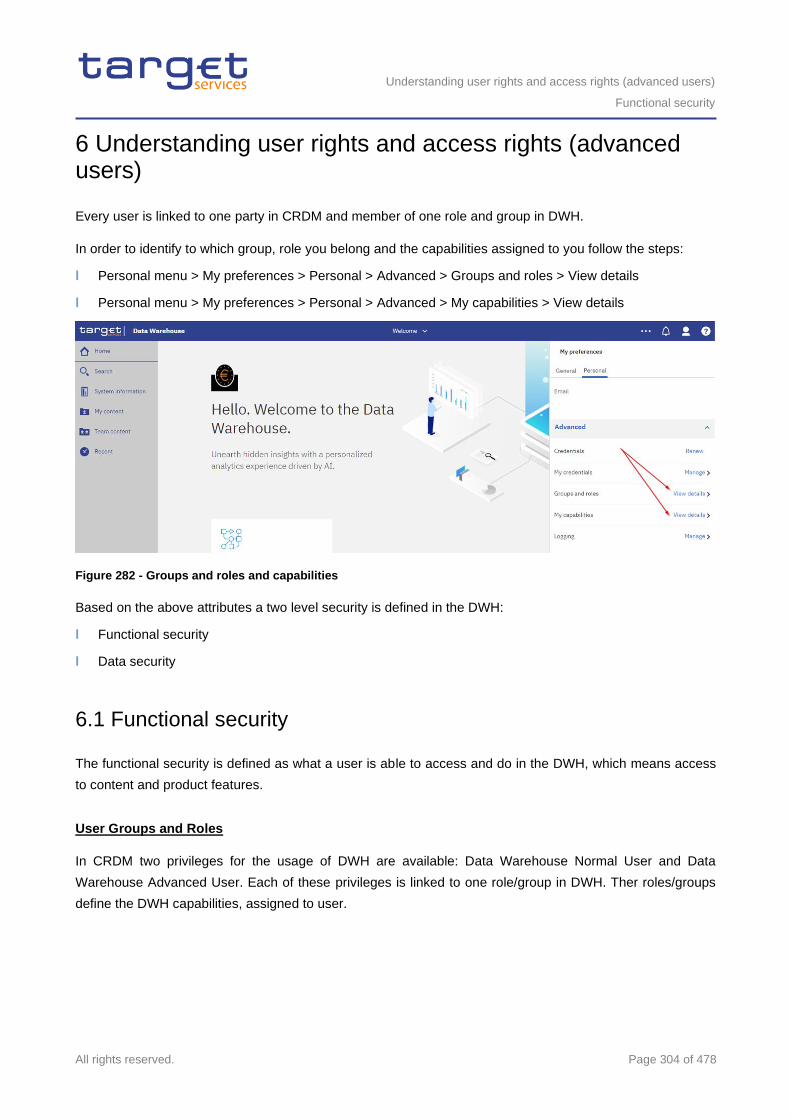
Understanding user rights and access rights (advanced users)
Functional security
All rights reserved. Page 304 of 478
6 Understanding user rights and access rights (advanced users)
Every user is linked to one party in CRDM and member of one role and group in DWH.
In order to identify to which group, role you belong and the capabilities assigned to you follow the steps:
l Personal menu > My preferences > Personal > Advanced > Groups and roles > View details
l Personal menu > My preferences > Personal > Advanced > My capabilities > View details
Figure 282 - Groups and roles and capabilities
Based on the above attributes a two level security is defined in the DWH:
l Functional security
l Data security
6.1 Functional security
The functional security is defined as what a user is able to access and do in the DWH, which means access
to content and product features.
User Groups and Roles
In CRDM two privileges for the usage of DWH are available: Data Warehouse Normal User and Data
Warehouse Advanced User. Each of these privileges is linked to one role/group in DWH. Ther roles/groups
define the DWH capabilities, assigned to user.
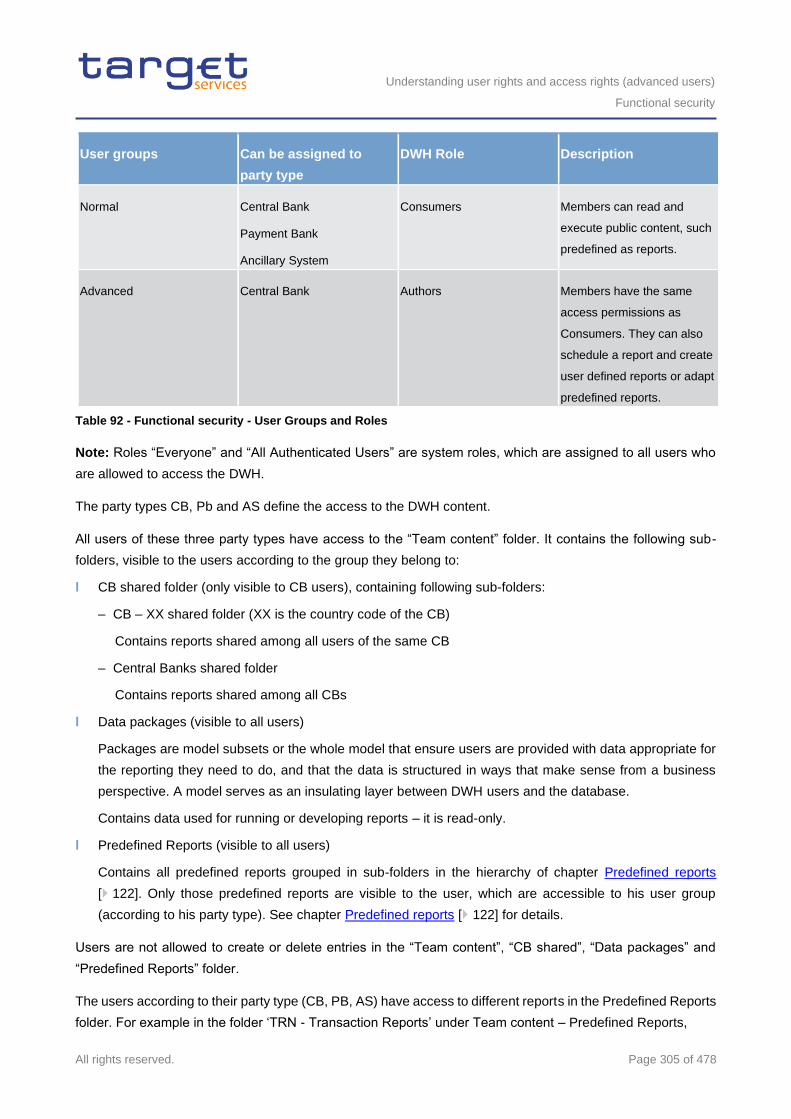
Understanding user rights and access rights (advanced users)
Functional security
All rights reserved. Page 305 of 478
User groups Can be assigned to
party type
DWH Role Description
Normal Central Bank
Payment Bank
Ancillary System
Consumers Members can read and
execute public content, such
predefined as reports.
Advanced Central Bank Authors Members have the same
access permissions as
Consumers. They can also
schedule a report and create
user defined reports or adapt
predefined reports.
Table 92 - Functional security - User Groups and Roles
Note: Roles “Everyone” and “All Authenticated Users” are system roles, which are assigned to all users who
are allowed to access the DWH.
The party types CB, Pb and AS define the access to the DWH content.
All users of these three party types have access to the “Team content” folder. It contains the following sub-
folders, visible to the users according to the group they belong to:
l CB shared folder (only visible to CB users), containing following sub-folders:
– CB – XX shared folder (XX is the country code of the CB)
Contains reports shared among all users of the same CB
– Central Banks shared folder
Contains reports shared among all CBs
l Data packages (visible to all users)
Packages are model subsets or the whole model that ensure users are provided with data appropriate for
the reporting they need to do, and that the data is structured in ways that make sense from a business
perspective. A model serves as an insulating layer between DWH users and the database.
Contains data used for running or developing reports – it is read-only.
l Predefined Reports (visible to all users)
Contains all predefined reports grouped in sub-folders in the hierarchy of chapter Predefined reports
[ 122]. Only those predefined reports are visible to the user, which are accessible to his user group
(according to his party type). See chapter Predefined reports [ 122] for details.
Users are not allowed to create or delete entries in the “Team content”, “CB shared”, “Data packages” and
“Predefined Reports” folder.
The users according to their party type (CB, PB, AS) have access to different reports in the Predefined Reports
folder. For example in the folder ‘TRN - Transaction Reports’ under Team content – Predefined Reports,
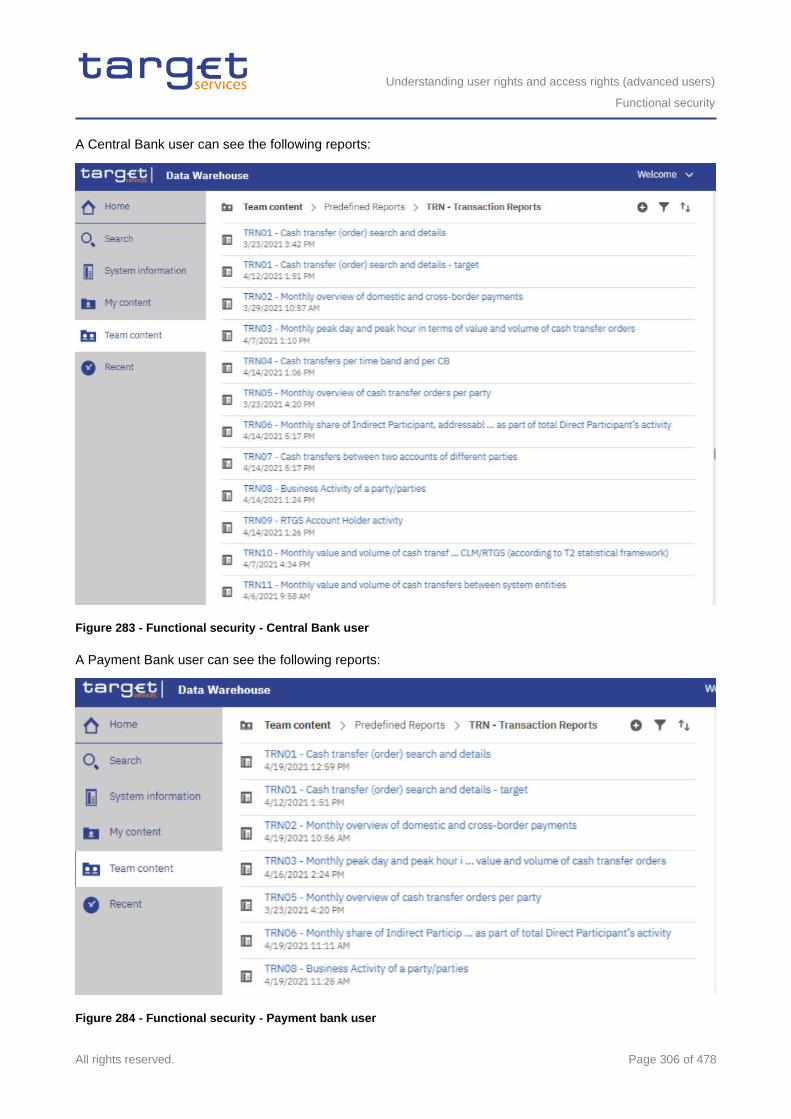
Understanding user rights and access rights (advanced users)
Functional security
All rights reserved. Page 306 of 478
A Central Bank user can see the following reports:
Figure 283 - Functional security - Central Bank user
A Payment Bank user can see the following reports:
Figure 284 - Functional security - Payment bank user
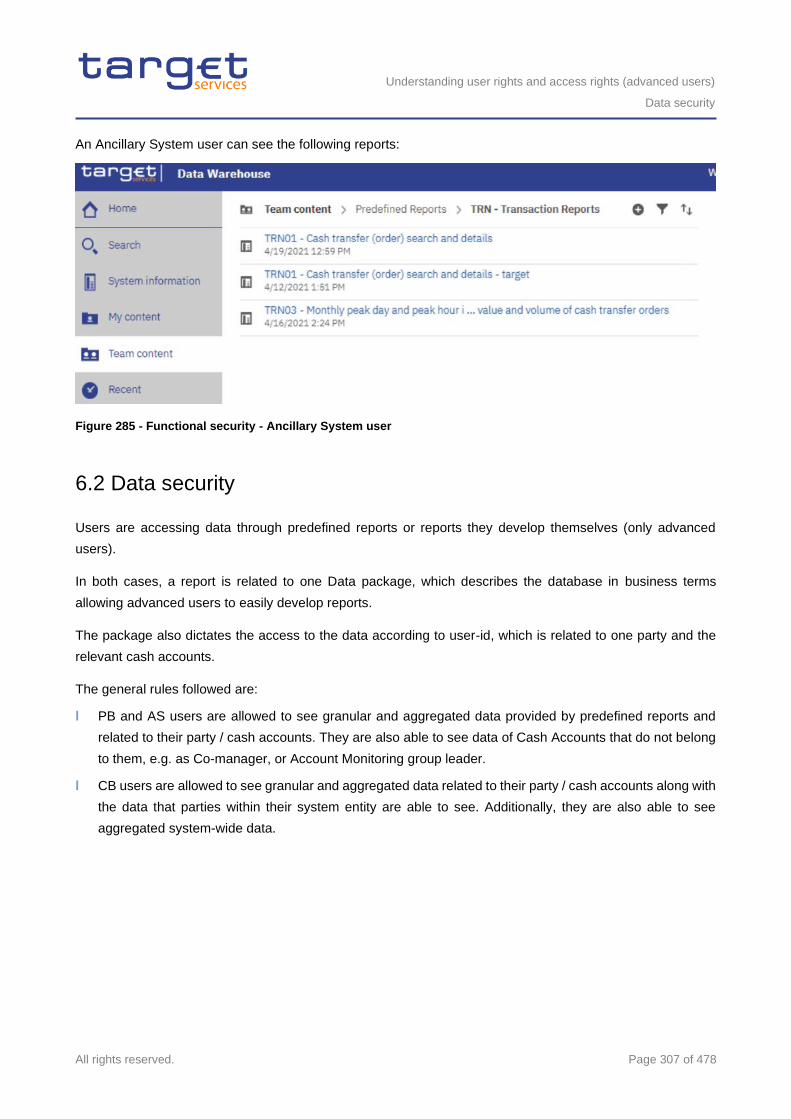
Understanding user rights and access rights (advanced users)
Data security
All rights reserved. Page 307 of 478
An Ancillary System user can see the following reports:
Figure 285 - Functional security - Ancillary System user
6.2 Data security
Users are accessing data through predefined reports or reports they develop themselves (only advanced
users).
In both cases, a report is related to one Data package, which describes the database in business terms
allowing advanced users to easily develop reports.
The package also dictates the access to the data according to user-id, which is related to one party and the
relevant cash accounts.
The general rules followed are:
l PB and AS users are allowed to see granular and aggregated data provided by predefined reports and
related to their party / cash accounts. They are also able to see data of Cash Accounts that do not belong
to them, e.g. as Co-manager, or Account Monitoring group leader.
l CB users are allowed to see granular and aggregated data related to their party / cash accounts along with
the data that parties within their system entity are able to see. Additionally, they are also able to see
aggregated system-wide data.
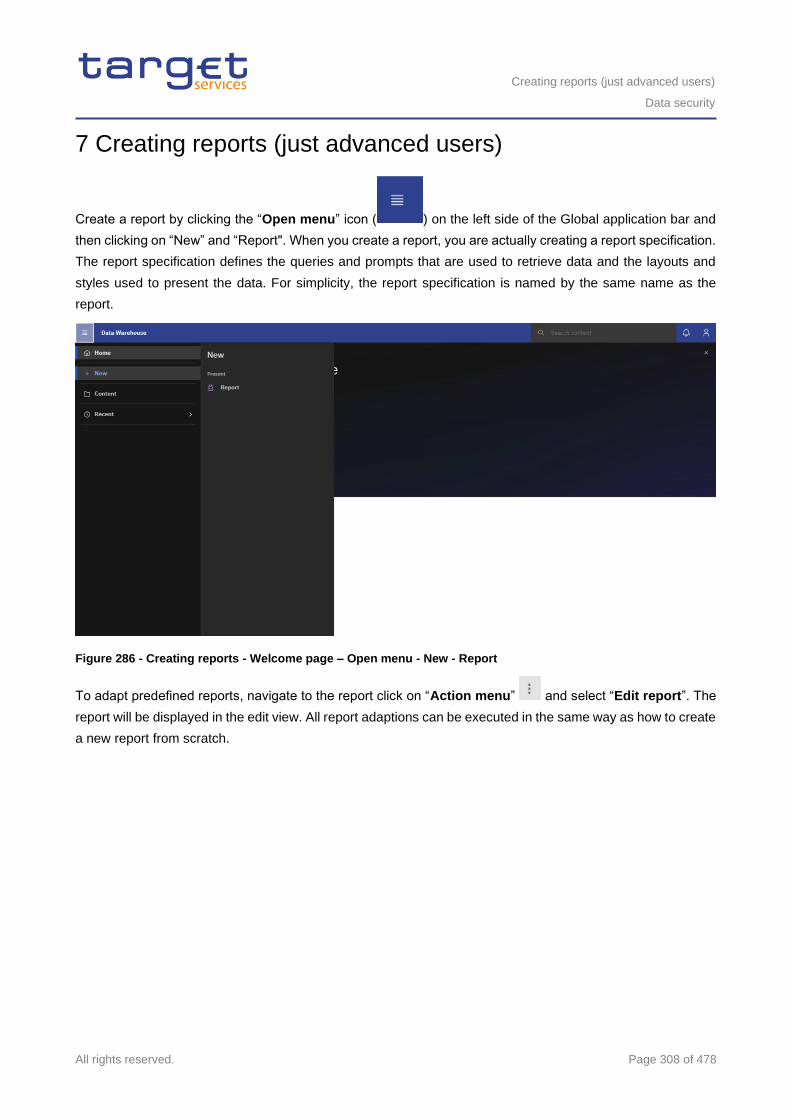
Creating reports (just advanced users)
Data security
All rights reserved. Page 308 of 478
7 Creating reports (just advanced users)
Create a report by clicking the “Open menu” icon ( ) on the left side of the Global application bar and
then clicking on “New” and “Report". When you create a report, you are actually creating a report specification.
The report specification defines the queries and prompts that are used to retrieve data and the layouts and
styles used to present the data. For simplicity, the report specification is named by the same name as the
report.
Figure 286 - Creating reports - Welcome page – Open menu - New - Report
To adapt predefined reports, navigate to the report click on “Action menu” and select “Edit report”. The
report will be displayed in the edit view. All report adaptions can be executed in the same way as how to create
a new report from scratch.
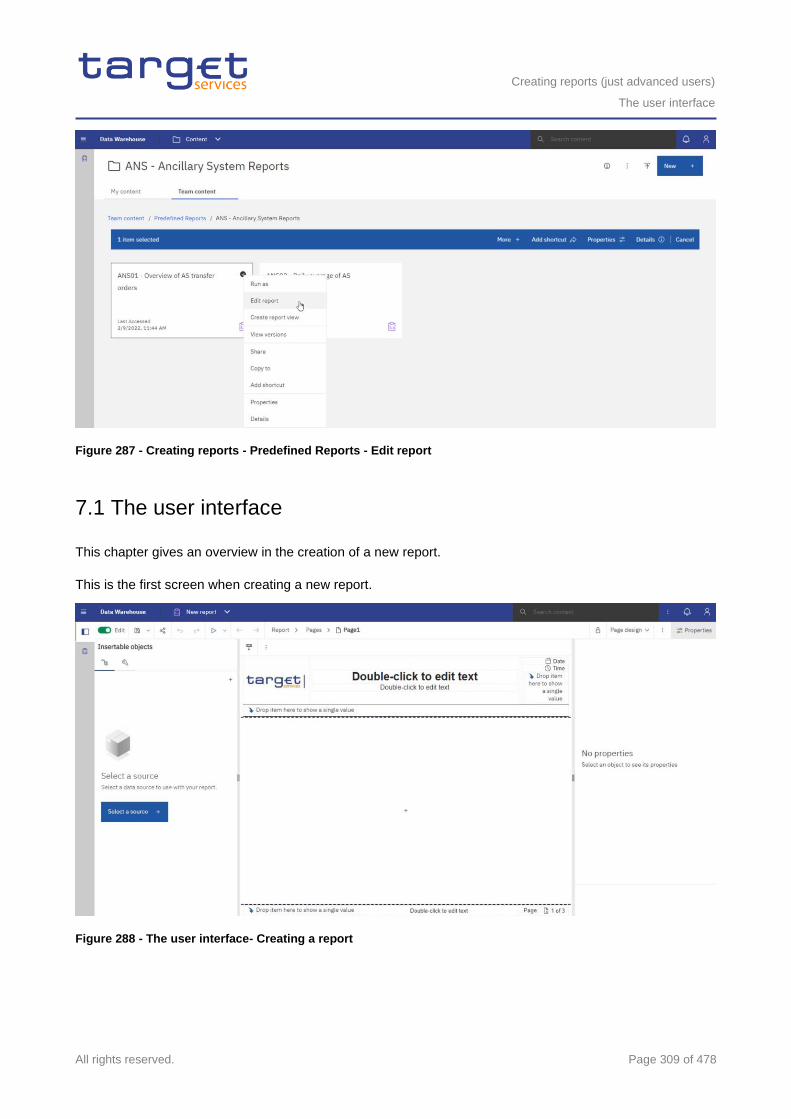
Creating reports (just advanced users)
The user interface
All rights reserved. Page 309 of 478
Figure 287 - Creating reports - Predefined Reports - Edit report
7.1 The user interface
This chapter gives an overview in the creation of a new report.
This is the first screen when creating a new report.
Figure 288 - The user interface- Creating a report
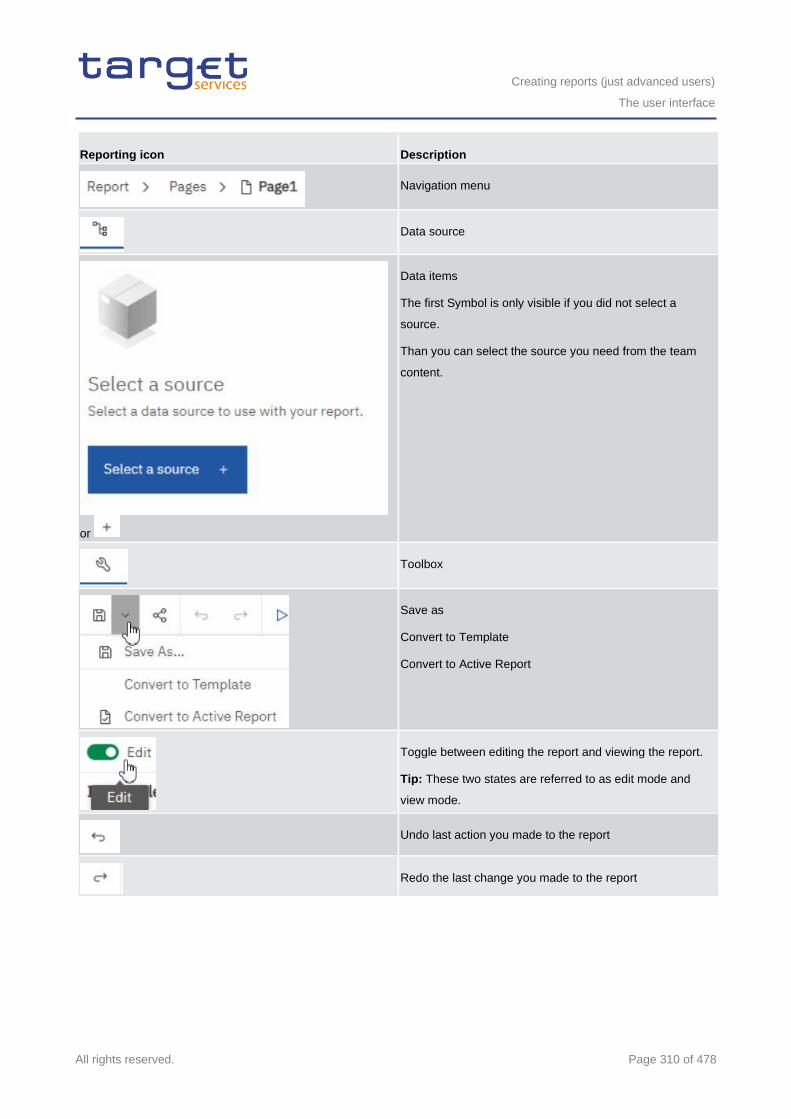
Creating reports (just advanced users)
The user interface
All rights reserved. Page 310 of 478
Reporting icon Description
Navigation menu
Data source
or
Data items
The first Symbol is only visible if you did not select a
source.
Than you can select the source you need from the team
content.
Toolbox
Save as
Convert to Template
Convert to Active Report
Toggle between editing the report and viewing the report.
Tip: These two states are referred to as edit mode and
view mode.
Undo last action you made to the report
Redo the last change you made to the report
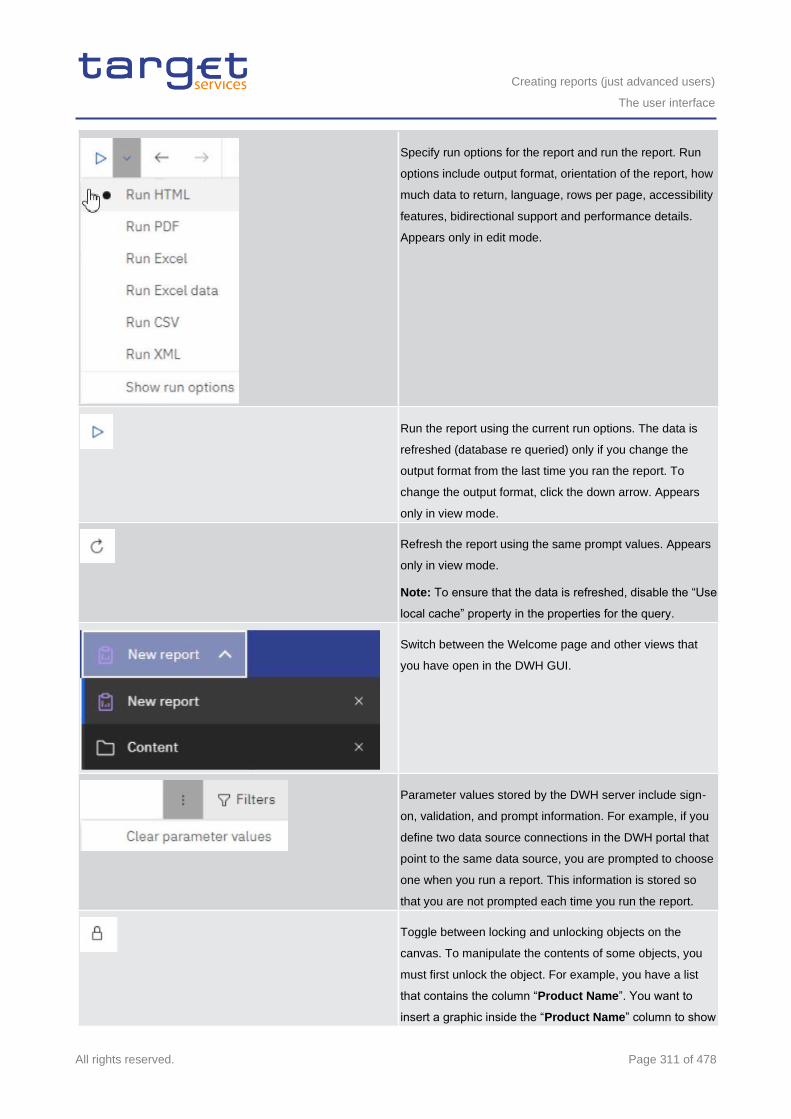
Creating reports (just advanced users)
The user interface
All rights reserved. Page 311 of 478
Specify run options for the report and run the report. Run
options include output format, orientation of the report, how
much data to return, language, rows per page, accessibility
features, bidirectional support and performance details.
Appears only in edit mode.
Run the report using the current run options. The data is
refreshed (database re queried) only if you change the
output format from the last time you ran the report. To
change the output format, click the down arrow. Appears
only in view mode.
Refresh the report using the same prompt values. Appears
only in view mode.
Note: To ensure that the data is refreshed, disable the “Use
local cache” property in the properties for the query.
Switch between the Welcome page and other views that
you have open in the DWH GUI.
Parameter values stored by the DWH server include sign-
on, validation, and prompt information. For example, if you
define two data source connections in the DWH portal that
point to the same data source, you are prompted to choose
one when you run a report. This information is stored so
that you are not prompted each time you run the report.
Toggle between locking and unlocking objects on the
canvas. To manipulate the contents of some objects, you
must first unlock the object. For example, you have a list
that contains the column “Product Name”. You want to
insert a graphic inside the “Product Name” column to show
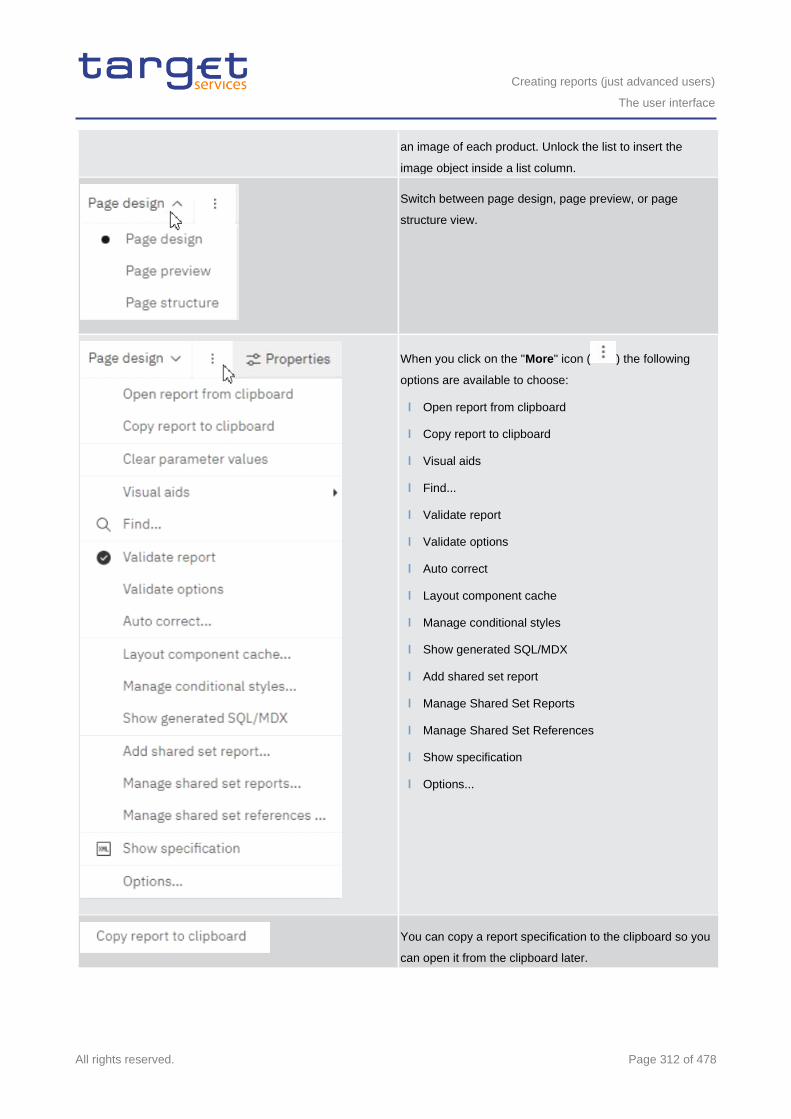
Creating reports (just advanced users)
The user interface
All rights reserved. Page 312 of 478
an image of each product. Unlock the list to insert the
image object inside a list column.
Switch between page design, page preview, or page
structure view.
When you click on the "More" icon ( ) the following
options are available to choose:
l Open report from clipboard
l Copy report to clipboard
l Visual aids
l Find...
l Validate report
l Validate options
l Auto correct
l Layout component cache
l Manage conditional styles
l Show generated SQL/MDX
l Add shared set report
l Manage Shared Set Reports
l Manage Shared Set References
l Show specification
l Options...
You can copy a report specification to the clipboard so you
can open it from the clipboard later.
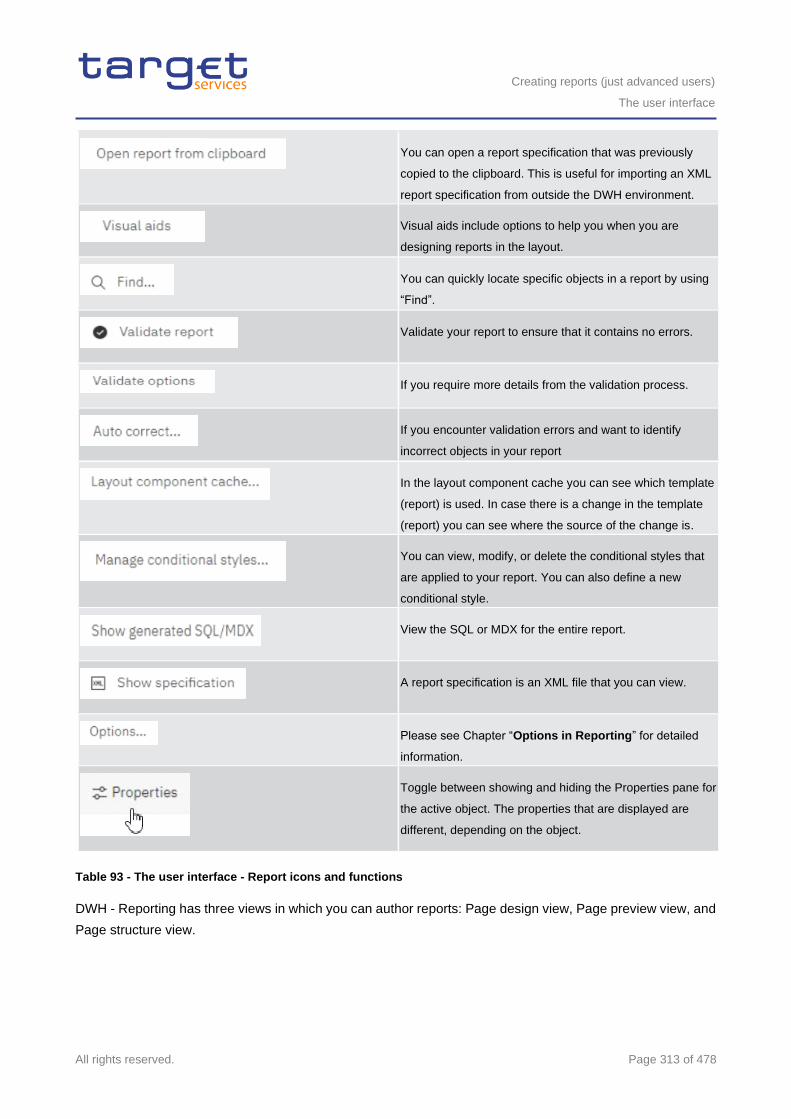
Creating reports (just advanced users)
The user interface
All rights reserved. Page 313 of 478
You can open a report specification that was previously
copied to the clipboard. This is useful for importing an XML
report specification from outside the DWH environment.
Visual aids include options to help you when you are
designing reports in the layout.
You can quickly locate specific objects in a report by using
“Find”.
Validate your report to ensure that it contains no errors.
If you require more details from the validation process.
If you encounter validation errors and want to identify
incorrect objects in your report
In the layout component cache you can see which template
(report) is used. In case there is a change in the template
(report) you can see where the source of the change is.
You can view, modify, or delete the conditional styles that
are applied to your report. You can also define a new
conditional style.
View the SQL or MDX for the entire report.
A report specification is an XML file that you can view.
Please see Chapter “Options in Reporting” for detailed
information.
Toggle between showing and hiding the Properties pane for
the active object. The properties that are displayed are
different, depending on the object.
Table 93 - The user interface - Report icons and functions
DWH - Reporting has three views in which you can author reports: Page design view, Page preview view, and
Page structure view.
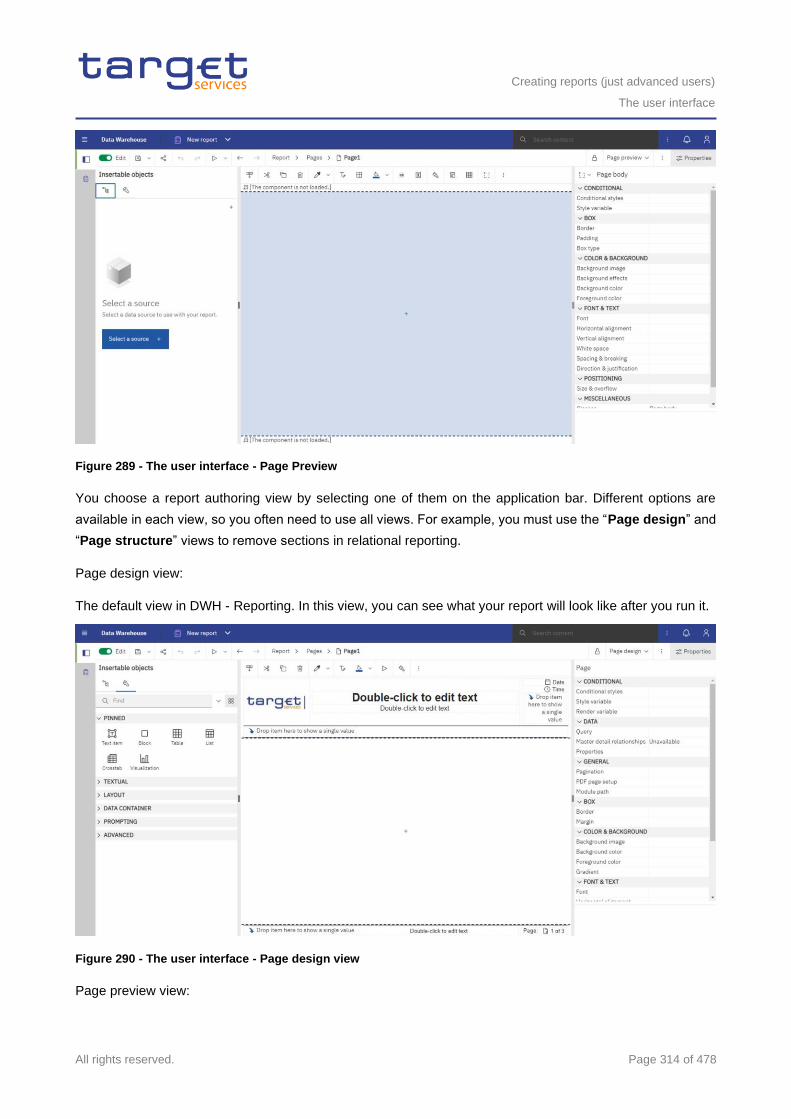
Creating reports (just advanced users)
The user interface
All rights reserved. Page 314 of 478
Figure 289 - The user interface - Page Preview
You choose a report authoring view by selecting one of them on the application bar. Different options are
available in each view, so you often need to use all views. For example, you must use the “Page design” and
“Page structure” views to remove sections in relational reporting.
Page design view:
The default view in DWH - Reporting. In this view, you can see what your report will look like after you run it.
Figure 290 - The user interface - Page design view
Page preview view:
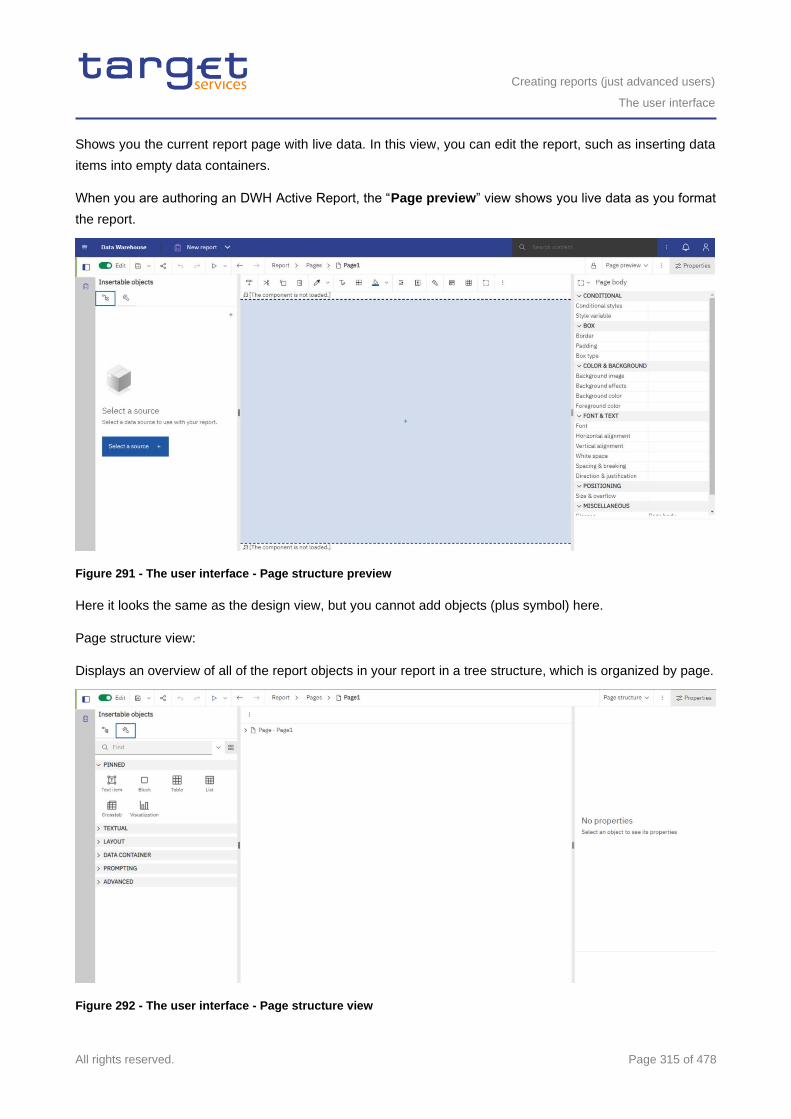
Creating reports (just advanced users)
The user interface
All rights reserved. Page 315 of 478
Shows you the current report page with live data. In this view, you can edit the report, such as inserting data
items into empty data containers.
When you are authoring an DWH Active Report, the “Page preview” view shows you live data as you format
the report.
Figure 291 - The user interface - Page structure preview
Here it looks the same as the design view, but you cannot add objects (plus symbol) here.
Page structure view:
Displays an overview of all of the report objects in your report in a tree structure, which is organized by page.
Figure 292 - The user interface - Page structure view
Creating reports (just advanced users)
The user interface
All rights reserved. Page 316 of 478
Create a report [ 374] details the process of report creation further by providing a step-by-step guidance.
7.1.1 On-demand toolbar
The on-demand toolbar (formerly known as the report object toolbar) contains the actions you can perform on
an object.
You can disable the on-demand toolbar.
The following list shows the actions that are available from the on-demand toolbar. The actions that appear
depend on the type of object that is active on the canvas:
Pin and Unpin
Figure 293 - On-demand toolbar - Pin and Unpin
When the on-demand toolbar is pinned, it stays at the upper left corner of the canvas, regardless of which
object is active.
When it is unpinned, it floats near the object that is active.
You can also control the display of the on-demand toolbar by setting the “Show on demand toolbar on right-
click” option
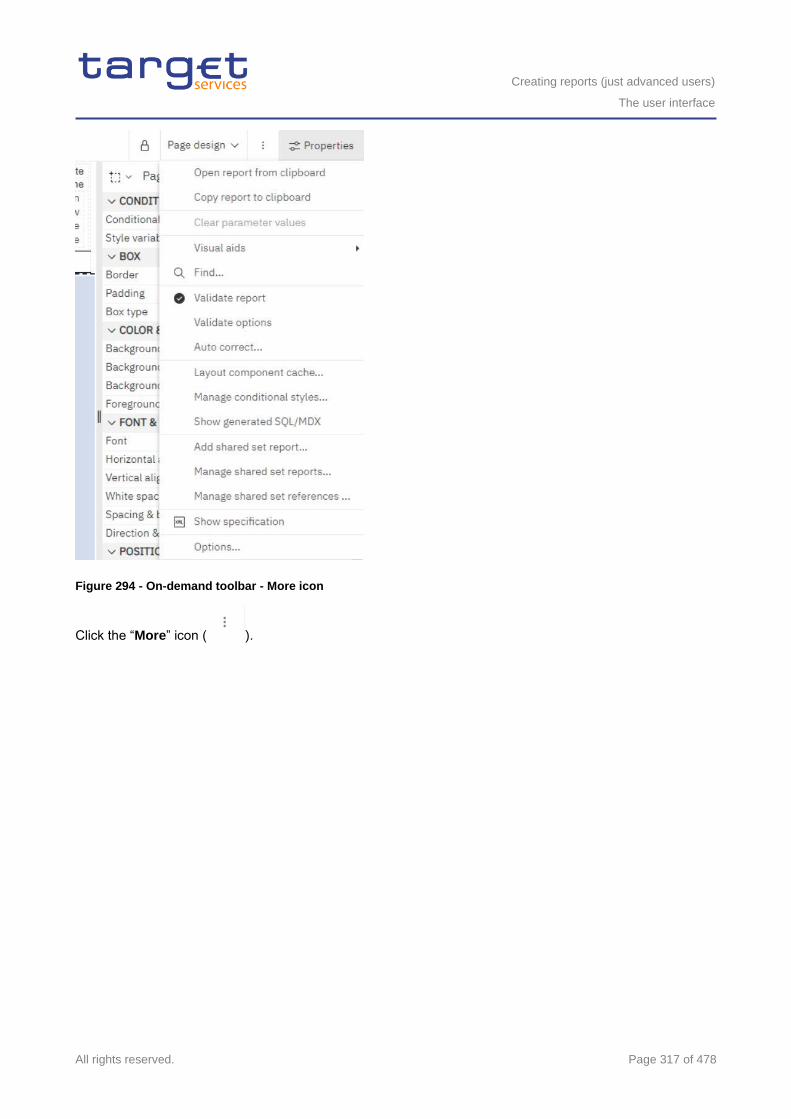
Creating reports (just advanced users)
The user interface
All rights reserved. Page 317 of 478
Figure 294 - On-demand toolbar - More icon
Click the “More” icon ( ).
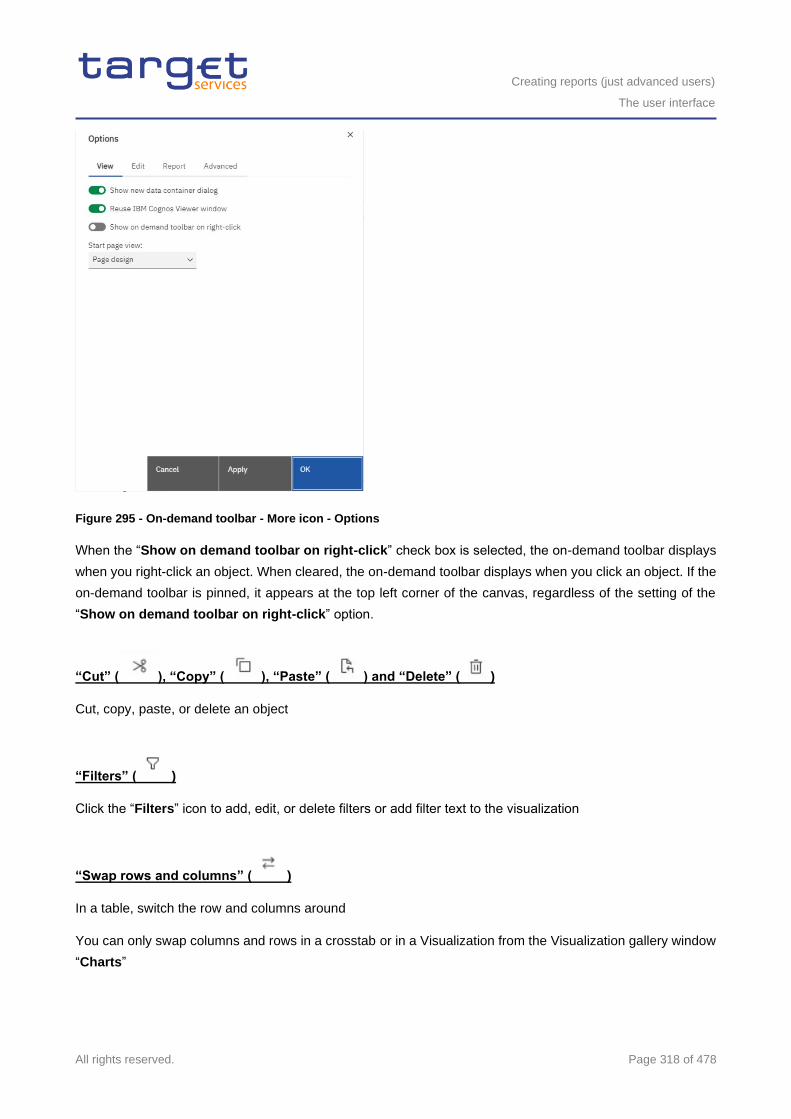
Creating reports (just advanced users)
The user interface
All rights reserved. Page 318 of 478
Figure 295 - On-demand toolbar - More icon - Options
When the “Show on demand toolbar on right-click” check box is selected, the on-demand toolbar displays
when you right-click an object. When cleared, the on-demand toolbar displays when you click an object. If the
on-demand toolbar is pinned, it appears at the top left corner of the canvas, regardless of the setting of the
“Show on demand toolbar on right-click” option.
“Cut” ( ), “Copy” ( ), “Paste” ( ) and “Delete” ( )
Cut, copy, paste, or delete an object
“Filters” ( )
Click the “Filters” icon to add, edit, or delete filters or add filter text to the visualization
“Swap rows and columns” ( )
In a table, switch the row and columns around
You can only swap columns and rows in a crosstab or in a Visualization from the Visualization gallery window
“Charts”
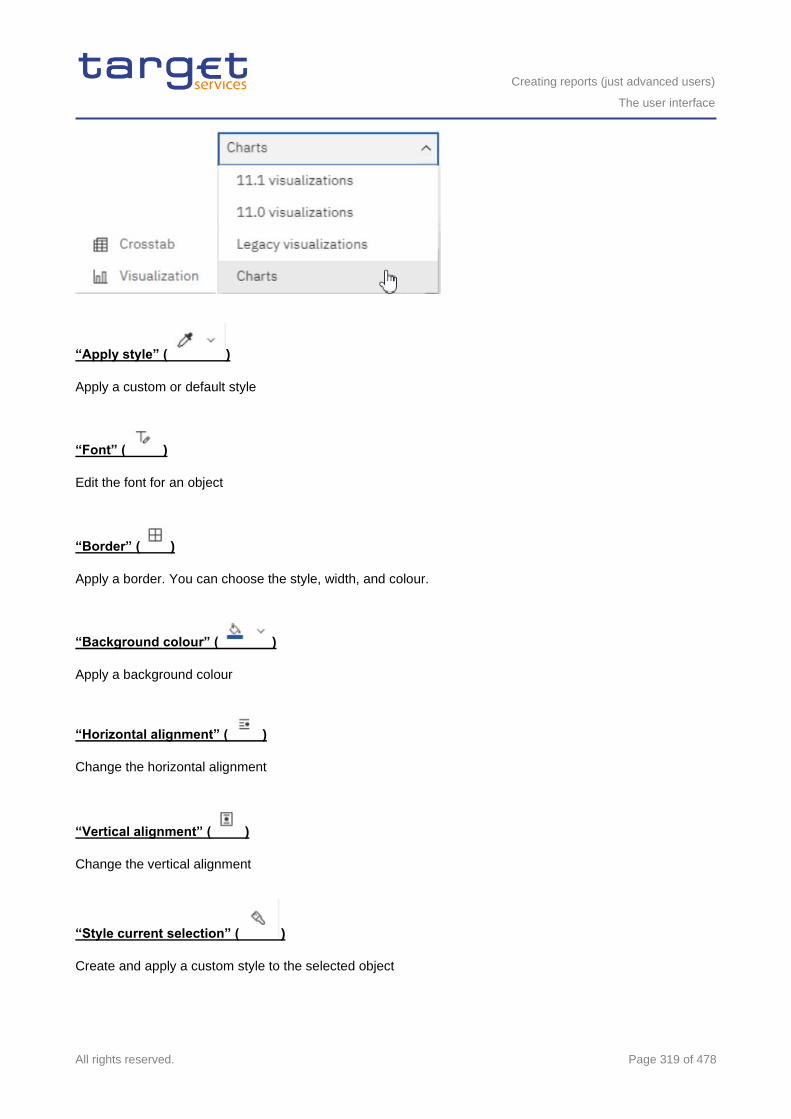
Creating reports (just advanced users)
The user interface
All rights reserved. Page 319 of 478
“Apply style” ( )
Apply a custom or default style
“Font” ( )
Edit the font for an object
“Border” ( )
Apply a border. You can choose the style, width, and colour.
“Background colour” ( )
Apply a background colour
“Horizontal alignment” ( )
Change the horizontal alignment
“Vertical alignment” ( )
Change the vertical alignment
“Style current selection” ( )
Create and apply a custom style to the selected object
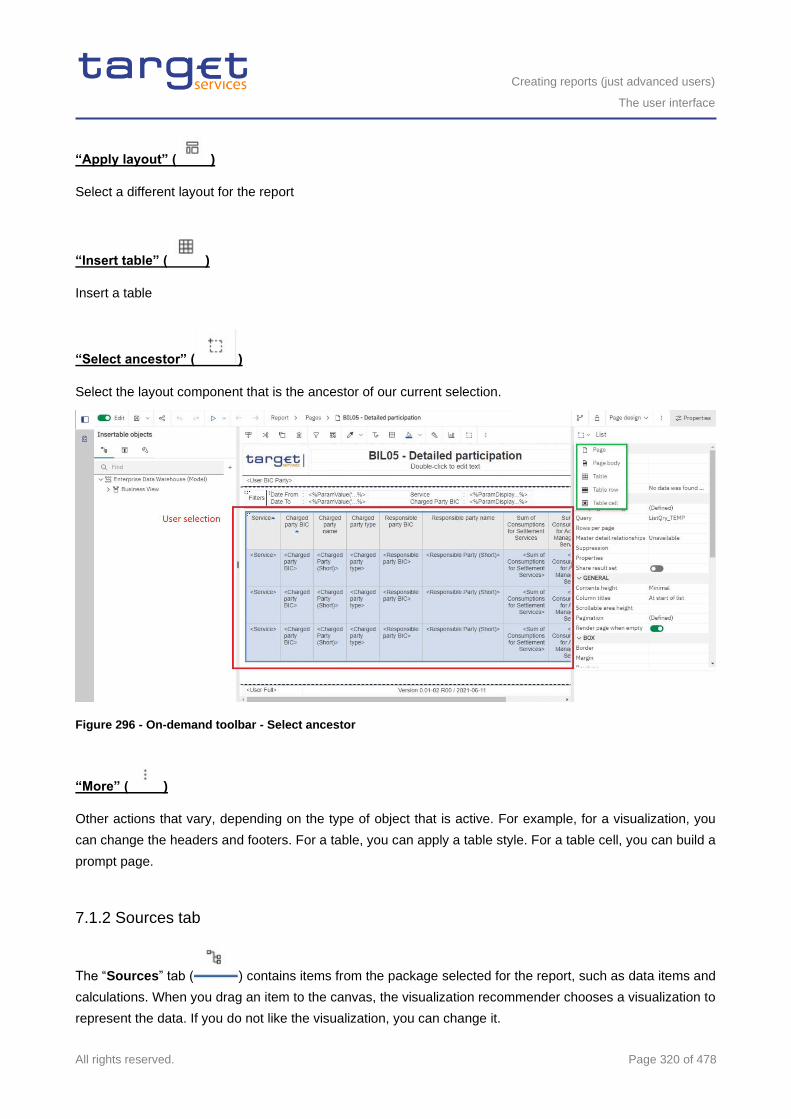
Creating reports (just advanced users)
The user interface
All rights reserved. Page 320 of 478
“Apply layout” ( )
Select a different layout for the report
“Insert table” ( )
Insert a table
“Select ancestor” ( )
Select the layout component that is the ancestor of our current selection.
Figure 296 - On-demand toolbar - Select ancestor
“More” ( )
Other actions that vary, depending on the type of object that is active. For example, for a visualization, you
can change the headers and footers. For a table, you can apply a table style. For a table cell, you can build a
prompt page.
7.1.2 Sources tab
The “Sources” tab ( ) contains items from the package selected for the report, such as data items and
calculations. When you drag an item to the canvas, the visualization recommender chooses a visualization to
represent the data. If you do not like the visualization, you can change it.
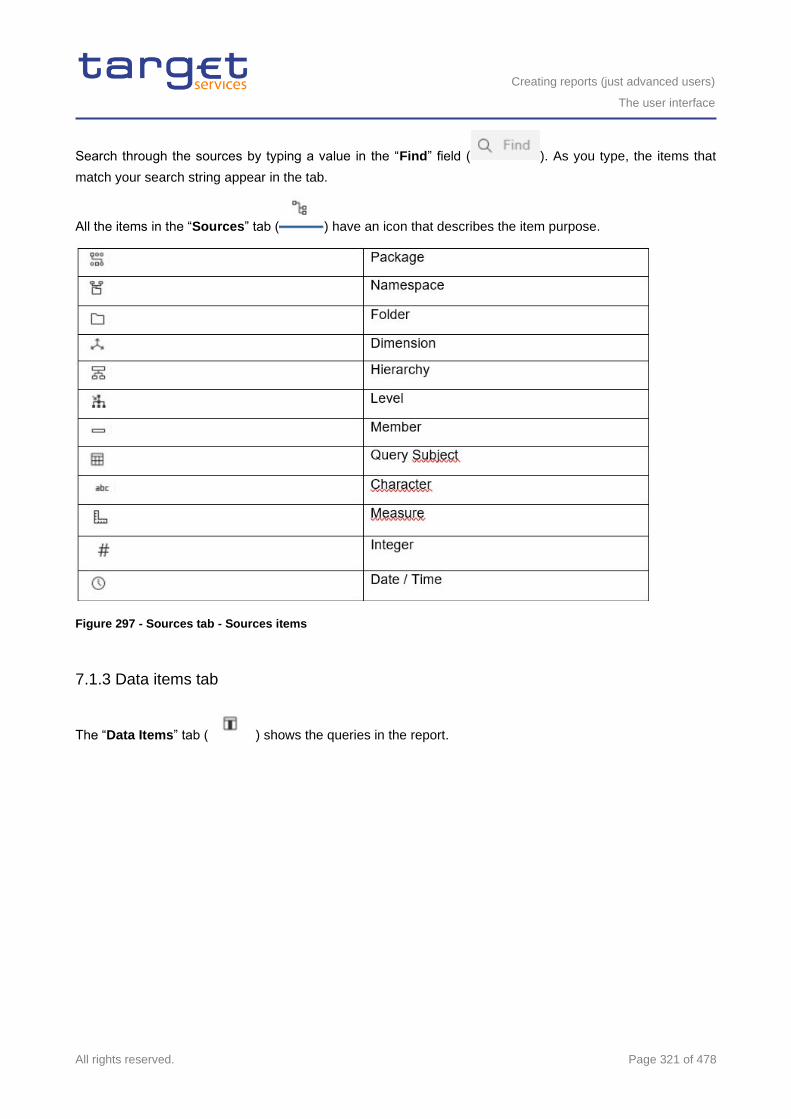
Creating reports (just advanced users)
The user interface
All rights reserved. Page 321 of 478
Search through the sources by typing a value in the “Find” field ( ). As you type, the items that
match your search string appear in the tab.
All the items in the “Sources” tab ( ) have an icon that describes the item purpose.
Figure 297 - Sources tab - Sources items
7.1.3 Data items tab
The “Data Items” tab ( ) shows the queries in the report.
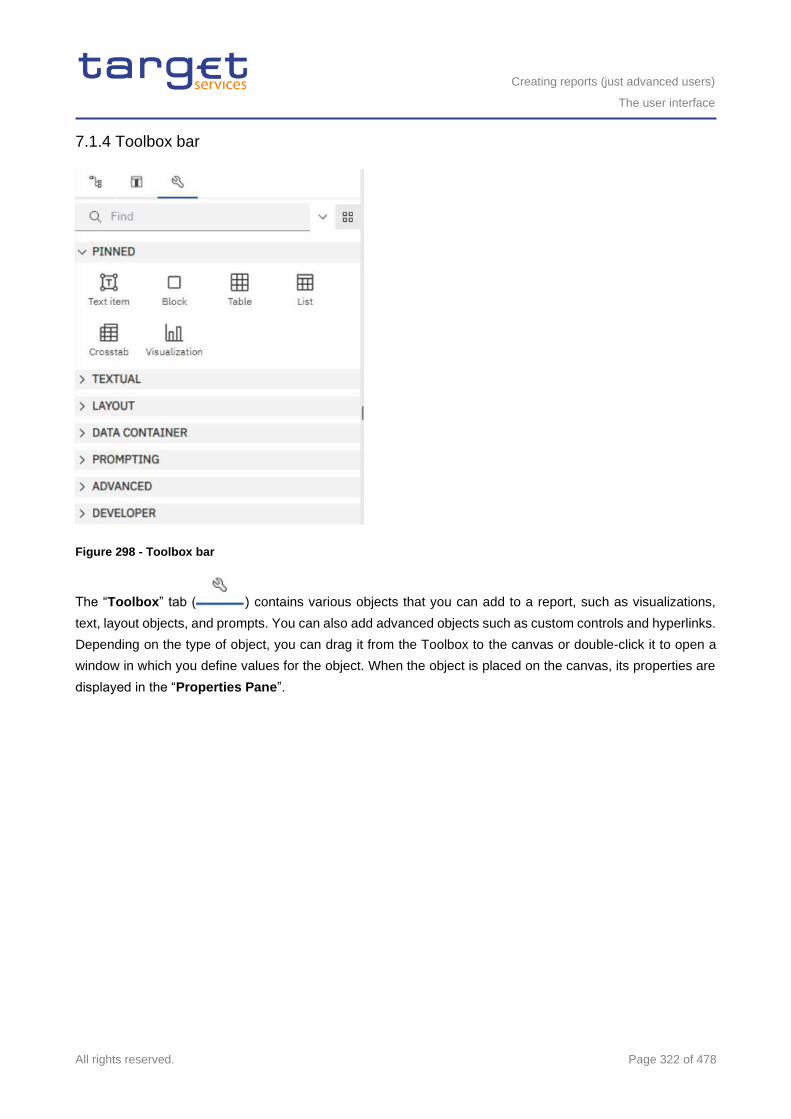
Creating reports (just advanced users)
The user interface
All rights reserved. Page 322 of 478
7.1.4 Toolbox bar
Figure 298 - Toolbox bar
The “Toolbox” tab ( ) contains various objects that you can add to a report, such as visualizations,
text, layout objects, and prompts. You can also add advanced objects such as custom controls and hyperlinks.
Depending on the type of object, you can drag it from the Toolbox to the canvas or double-click it to open a
window in which you define values for the object. When the object is placed on the canvas, its properties are
displayed in the “Properties Pane”.
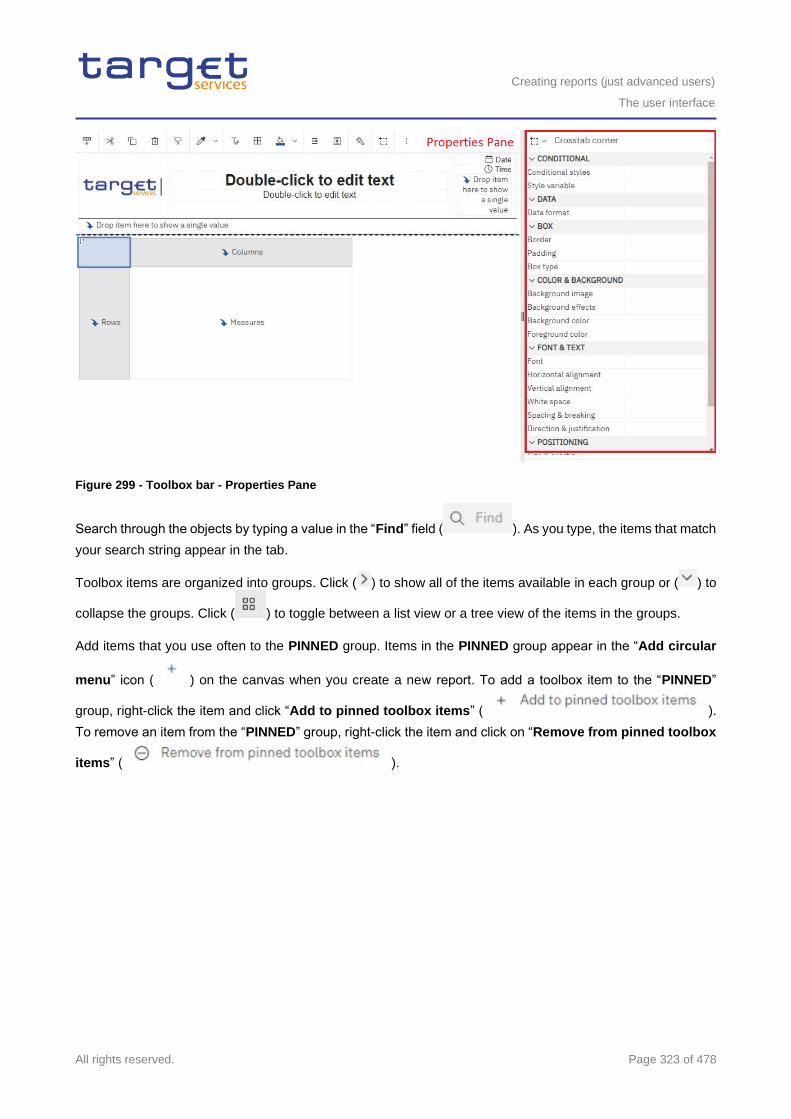
Creating reports (just advanced users)
The user interface
All rights reserved. Page 323 of 478
Figure 299 - Toolbox bar - Properties Pane
Search through the objects by typing a value in the “Find” field ( ). As you type, the items that match
your search string appear in the tab.
Toolbox items are organized into groups. Click ( ) to show all of the items available in each group or ( ) to
collapse the groups. Click ( ) to toggle between a list view or a tree view of the items in the groups.
Add items that you use often to the PINNED group. Items in the PINNED group appear in the “Add circular
menu” icon ( ) on the canvas when you create a new report. To add a toolbox item to the “PINNED”
group, right-click the item and click “Add to pinned toolbox items” ( ).
To remove an item from the “PINNED” group, right-click the item and click on “Remove from pinned toolbox
items” ( ).
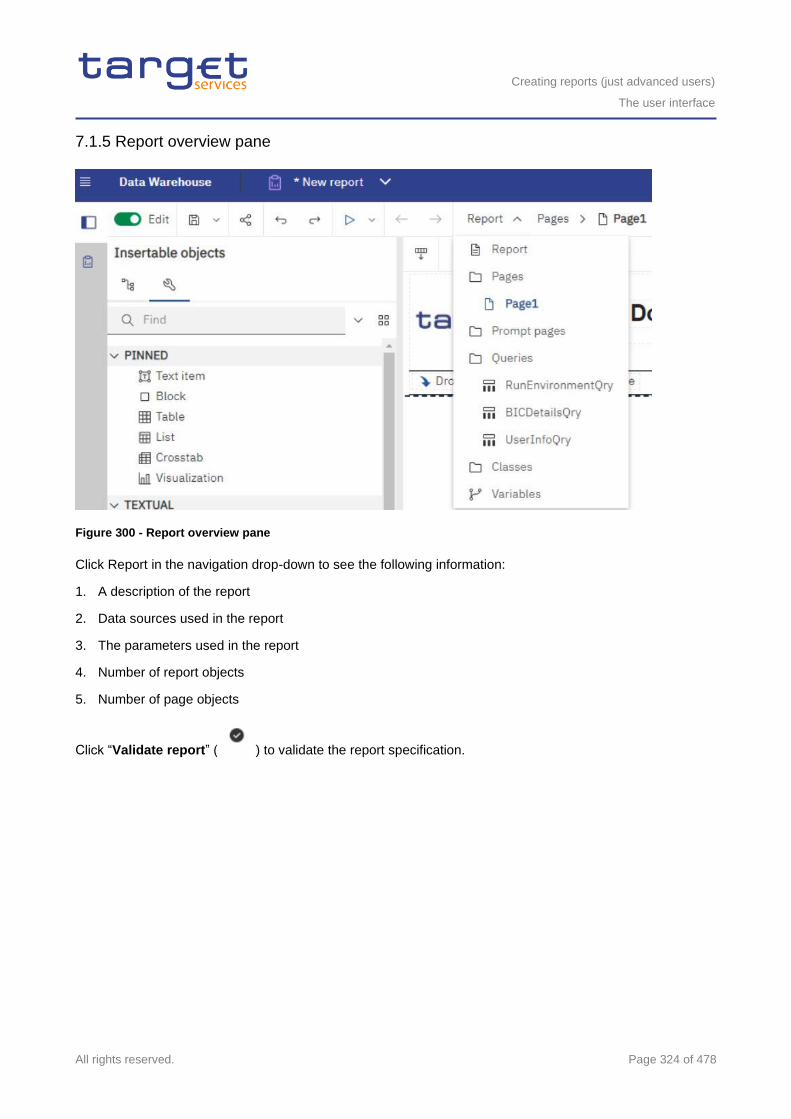
Creating reports (just advanced users)
The user interface
All rights reserved. Page 324 of 478
7.1.5 Report overview pane
Figure 300 - Report overview pane
Click Report in the navigation drop-down to see the following information:
1. A description of the report
2. Data sources used in the report
3. The parameters used in the report
4. Number of report objects
5. Number of page objects
Click “Validate report” ( ) to validate the report specification.
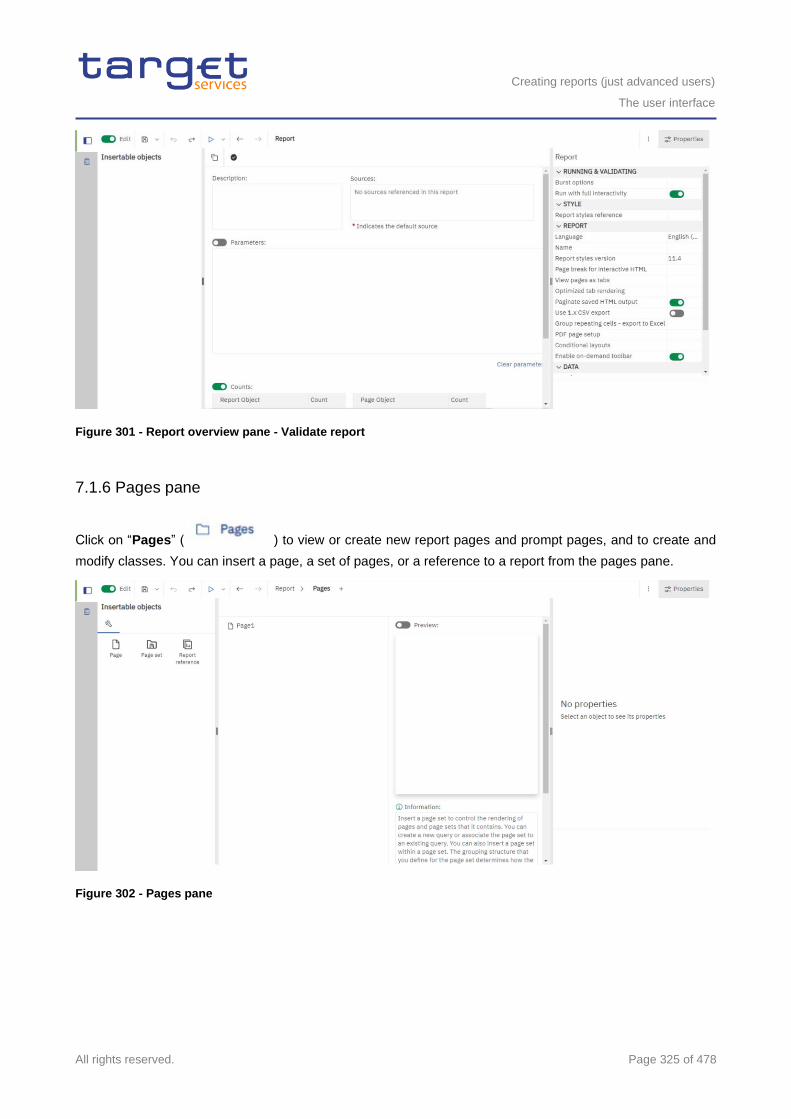
Creating reports (just advanced users)
The user interface
All rights reserved. Page 325 of 478
Figure 301 - Report overview pane - Validate report
7.1.6 Pages pane
Click on “Pages” ( ) to view or create new report pages and prompt pages, and to create and
modify classes. You can insert a page, a set of pages, or a reference to a report from the pages pane.
Figure 302 - Pages pane
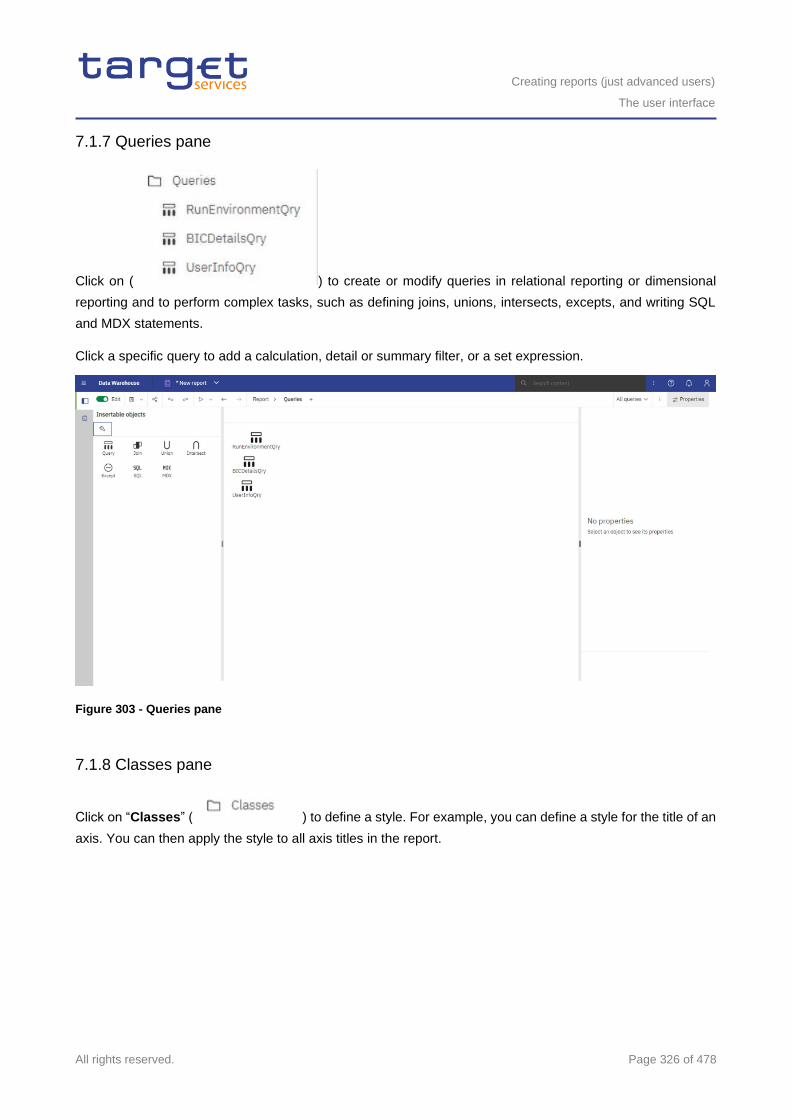
Creating reports (just advanced users)
The user interface
All rights reserved. Page 326 of 478
7.1.7 Queries pane
Click on ( ) to create or modify queries in relational reporting or dimensional
reporting and to perform complex tasks, such as defining joins, unions, intersects, excepts, and writing SQL
and MDX statements.
Click a specific query to add a calculation, detail or summary filter, or a set expression.
Figure 303 - Queries pane
7.1.8 Classes pane
Click on “Classes” ( ) to define a style. For example, you can define a style for the title of an
axis. You can then apply the style to all axis titles in the report.
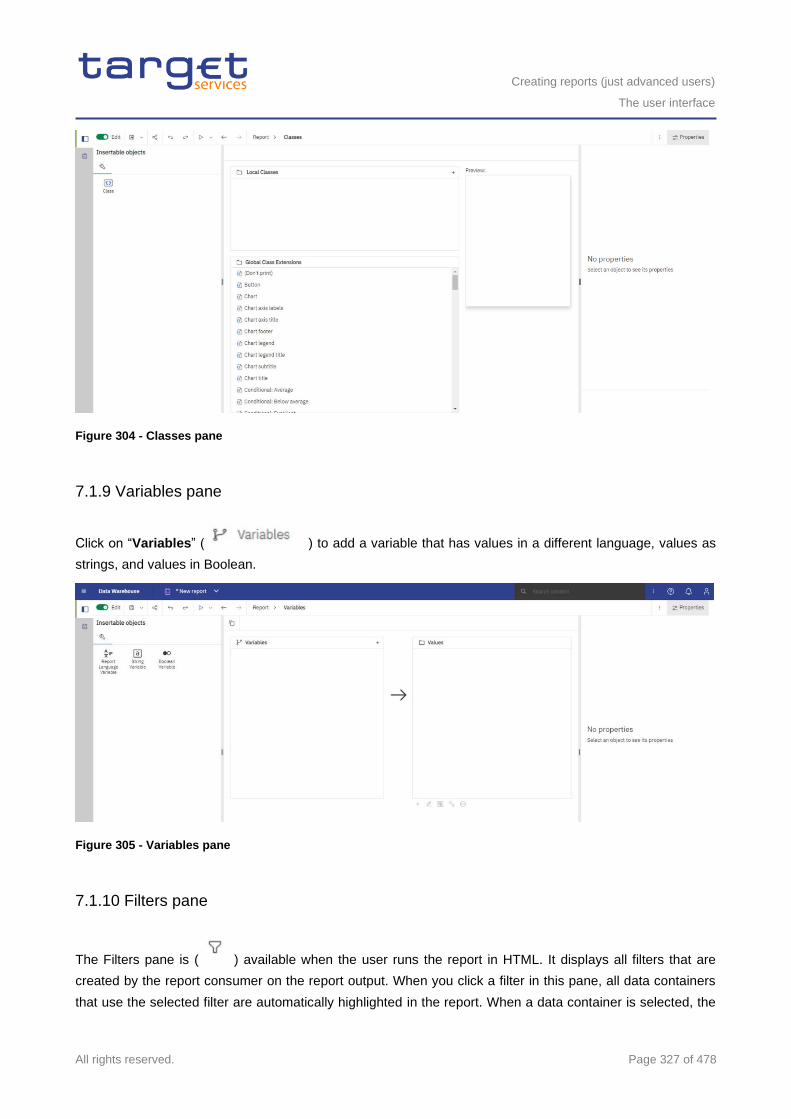
Creating reports (just advanced users)
The user interface
All rights reserved. Page 327 of 478
Figure 304 - Classes pane
7.1.9 Variables pane
Click on “Variables” ( ) to add a variable that has values in a different language, values as
strings, and values in Boolean.
Figure 305 - Variables pane
7.1.10 Filters pane
The Filters pane is ( ) available when the user runs the report in HTML. It displays all filters that are
created by the report consumer on the report output. When you click a filter in this pane, all data containers
that use the selected filter are automatically highlighted in the report. When a data container is selected, the
Creating reports (just advanced users)
The user interface
All rights reserved. Page 328 of 478
filter pane is updated instantly to display only filters that are applied to the selected data container. You can
edit or delete the filter directly in the pane.
You can resize the filter pane, and pin or unpin the pane depending on the screen resolution. Report authors
can also make an authored filter visible to report consumers so that they can interact with it in this pane.
The pane cannot be used to create or view low-level filter expressions that are manually created in the
expression editor. By default, interactive filtering is disabled for filters that were created in earlier versions of
the DWH software.
This feature is not available for active reports.
7.1.11 Properties pane
The properties pane lists the properties that you can set for an object in a report or for the entire report. The
properties that are displayed vary depending on the type of object. When you specify a value for a property,
press “Enter”, click another property, or save the report to ensure that the value is saved. Click on (
) to show or hide the properties pane.
At the “Report” level, you can set the following properties:
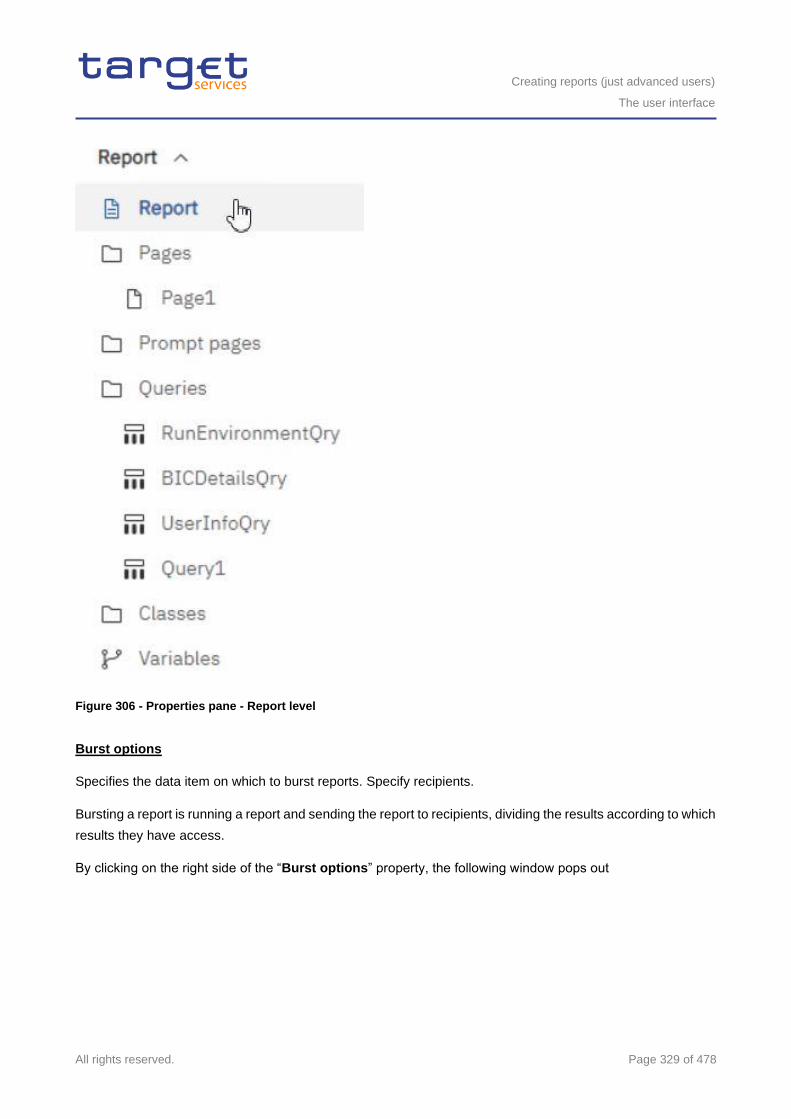
Creating reports (just advanced users)
The user interface
All rights reserved. Page 329 of 478
Figure 306 - Properties pane - Report level
Burst options
Specifies the data item on which to burst reports. Specify recipients.
Bursting a report is running a report and sending the report to recipients, dividing the results according to which
results they have access.
By clicking on the right side of the “Burst options” property, the following window pops out
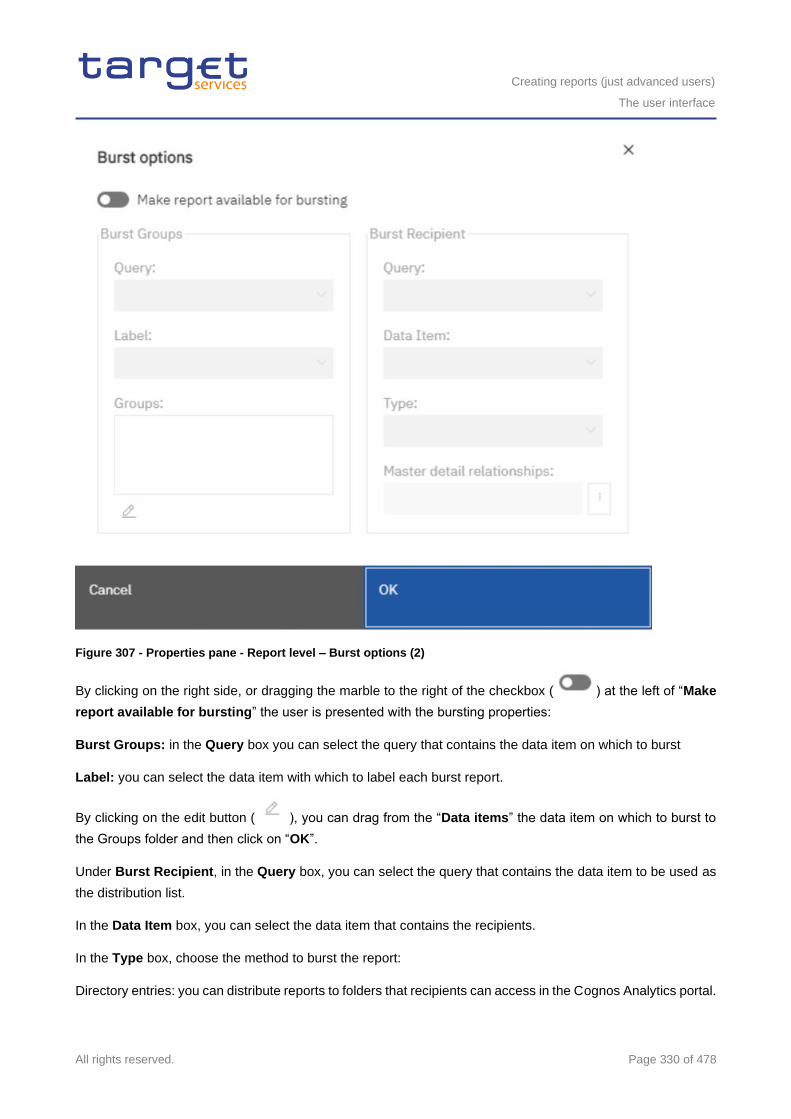
Creating reports (just advanced users)
The user interface
All rights reserved. Page 330 of 478
Figure 307 - Properties pane - Report level – Burst options (2)
By clicking on the right side, or dragging the marble to the right of the checkbox ( ) at the left of “Make
report available for bursting” the user is presented with the bursting properties:
Burst Groups: in the Query box you can select the query that contains the data item on which to burst
Label: you can select the data item with which to label each burst report.
By clicking on the edit button ( ), you can drag from the “Data items” the data item on which to burst to
the Groups folder and then click on “OK”.
Under Burst Recipient, in the Query box, you can select the query that contains the data item to be used as
the distribution list.
In the Data Item box, you can select the data item that contains the recipients.
In the Type box, choose the method to burst the report:
Directory entries: you can distribute reports to folders that recipients can access in the Cognos Analytics portal.
Creating reports (just advanced users)
The user interface
All rights reserved. Page 331 of 478
Run with full interactivity
Enable users to change the report
By default, reports that are created are set to run with full interactivity
Style
Apply local and global styles from another report
Language
Specifies the language package
Name
Name of the report, specified when you save it
Report styles
Specifies the product classes used to format objects. You can select between1.x, 8.x, 10.x, 11.x, 11.4 and
11.5.
Page break for interactive HTML
For reports with multiple data containers, specifies whether to render the default number of rows of each data
container on each page.
View pages as tabs
In HTML output, specifies whether to show each report page in its own tab, and the location where the tabs
appear in the browser.
Paginate saved HTML output
Specifies whether to create multiple pages or one scrollable page.
Use 1.x CSV export
Not applicable.
Group repeating cells - export to Excel
When you produce reports in Excel format, you can choose to group repeating cells into a single merged cell.
Creating reports (just advanced users)
Report Layout, queries and objects
All rights reserved. Page 332 of 478
PDF page setup
Sets PDF page options
Conditional layouts
Add layouts to a report based on conditions
Data formats
Specifies the default data format properties for each type of data
Package-based drill-through source
Enable or disable the report to be used as the source during a package drill-through. This property can also
be set in the drill through definitions property.
Dynamic filtering
When the report is a drill-through target, specifies whether to apply more filtering when names from the context
in the source report match names of items in the target report. This property can also be set in the drill through
definitions property.
For other types of objects, like containers, you can set conditional styles, queries, pagination, margins, colour
and background, font and text, and many other properties.
7.2 Report Layout, queries and objects
All reports have two components: a layout component that defines the report appearance and a query
component that defines report data. Understanding these components will help you design effective reports.
7.2.1 Layout
A layout is a set of pages that defines the appearance and formatting of a report. When you design the layout
of a report, you:
l present the data in a meaningful way by using lists, crosstabs, charts, and maps
l add formatting, such as borders, colour, images, and page numbers
l specify how the data flows from one page to the next
When you create a report, consider the following structural elements:
l Define the page structure.
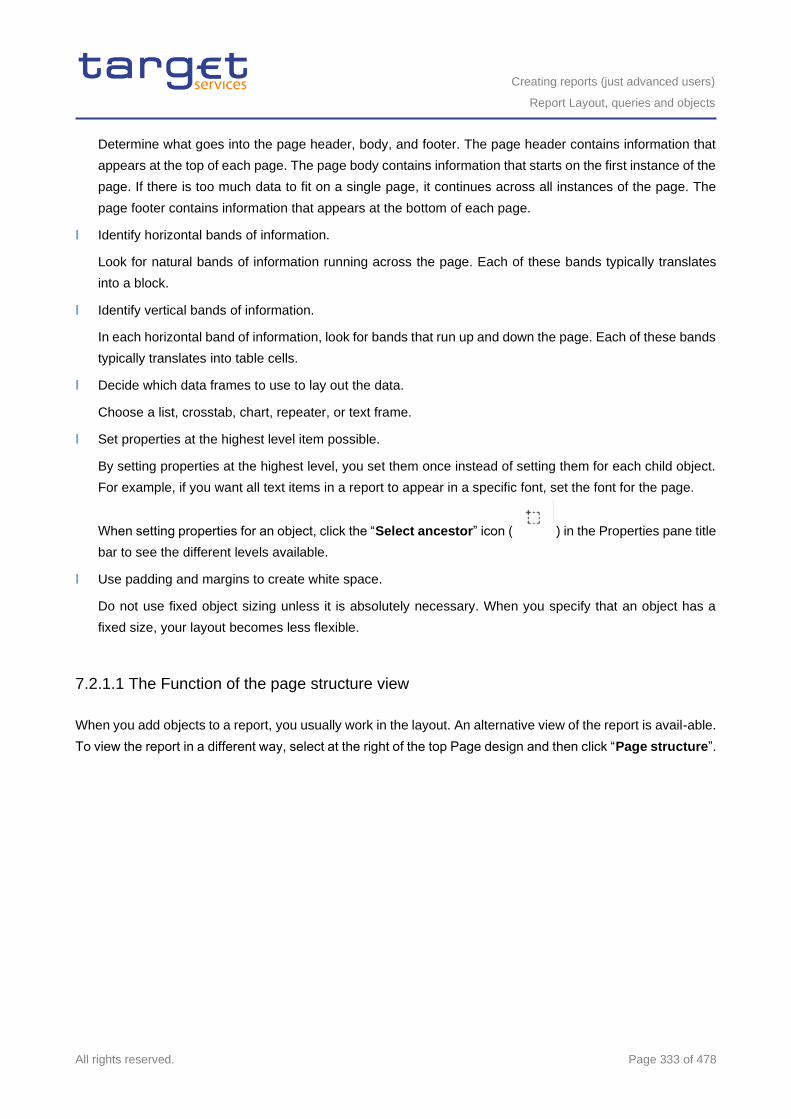
Creating reports (just advanced users)
Report Layout, queries and objects
All rights reserved. Page 333 of 478
Determine what goes into the page header, body, and footer. The page header contains information that
appears at the top of each page. The page body contains information that starts on the first instance of the
page. If there is too much data to fit on a single page, it continues across all instances of the page. The
page footer contains information that appears at the bottom of each page.
l Identify horizontal bands of information.
Look for natural bands of information running across the page. Each of these bands typically translates
into a block.
l Identify vertical bands of information.
In each horizontal band of information, look for bands that run up and down the page. Each of these bands
typically translates into table cells.
l Decide which data frames to use to lay out the data.
Choose a list, crosstab, chart, repeater, or text frame.
l Set properties at the highest level item possible.
By setting properties at the highest level, you set them once instead of setting them for each child object.
For example, if you want all text items in a report to appear in a specific font, set the font for the page.
When setting properties for an object, click the “Select ancestor” icon ( ) in the Properties pane title
bar to see the different levels available.
l Use padding and margins to create white space.
Do not use fixed object sizing unless it is absolutely necessary. When you specify that an object has a
fixed size, your layout becomes less flexible.
7.2.1.1 The Function of the page structure view
When you add objects to a report, you usually work in the layout. An alternative view of the report is avail-able.
To view the report in a different way, select at the right of the top Page design and then click “Page structure”.
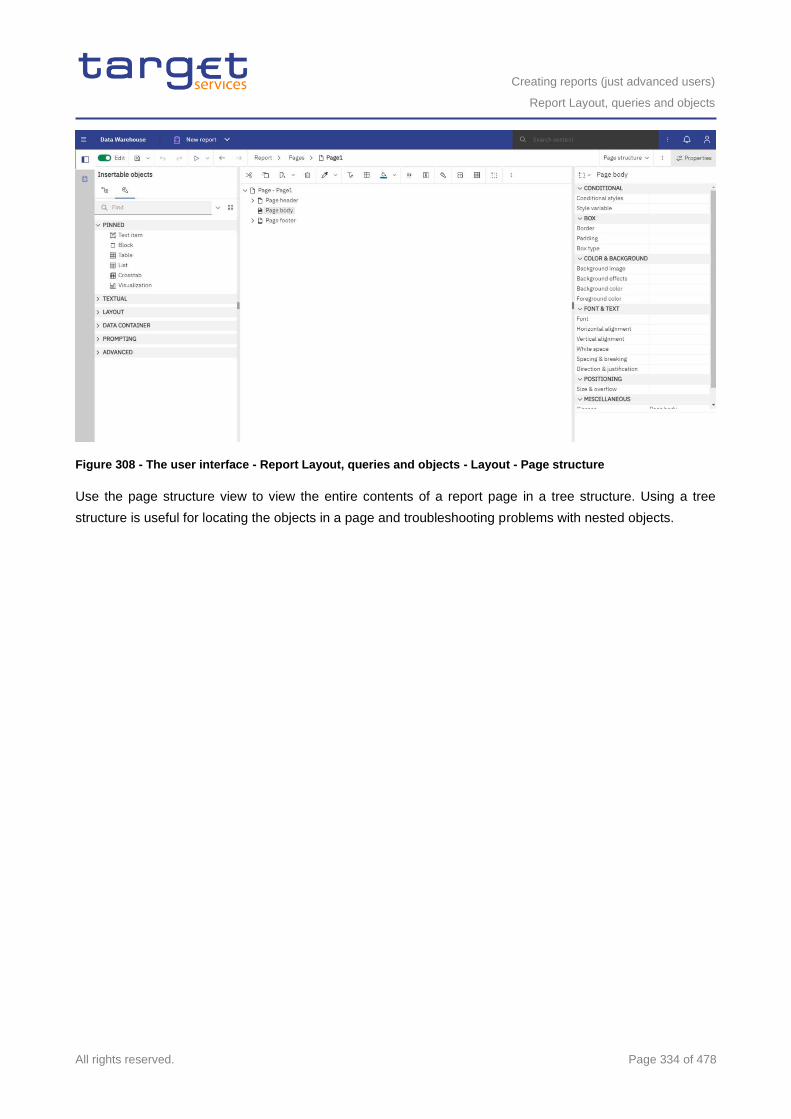
Creating reports (just advanced users)
Report Layout, queries and objects
All rights reserved. Page 334 of 478
Figure 308 - The user interface - Report Layout, queries and objects - Layout - Page structure
Use the page structure view to view the entire contents of a report page in a tree structure. Using a tree
structure is useful for locating the objects in a page and troubleshooting problems with nested objects.
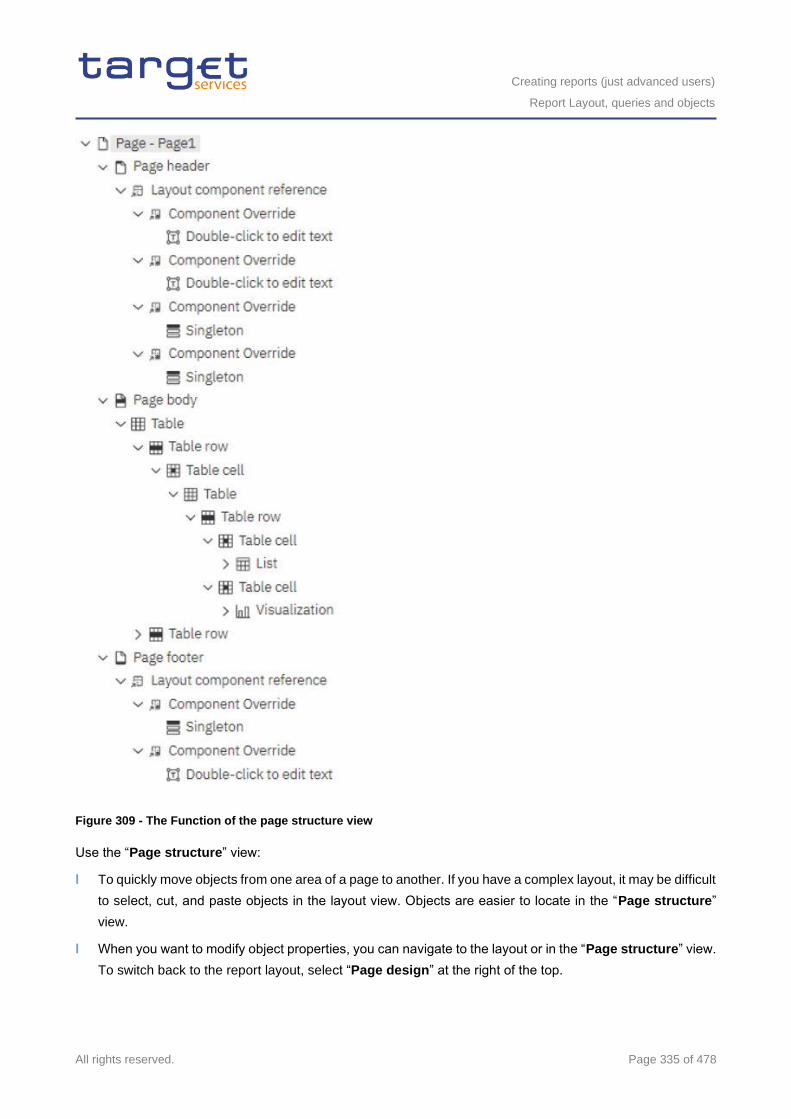
Creating reports (just advanced users)
Report Layout, queries and objects
All rights reserved. Page 335 of 478
Figure 309 - The Function of the page structure view
Use the “Page structure” view:
l To quickly move objects from one area of a page to another. If you have a complex layout, it may be difficult
to select, cut, and paste objects in the layout view. Objects are easier to locate in the “Page structure”
view.
l When you want to modify object properties, you can navigate to the layout or in the “Page structure” view.
To switch back to the report layout, select “Page design” at the right of the top.
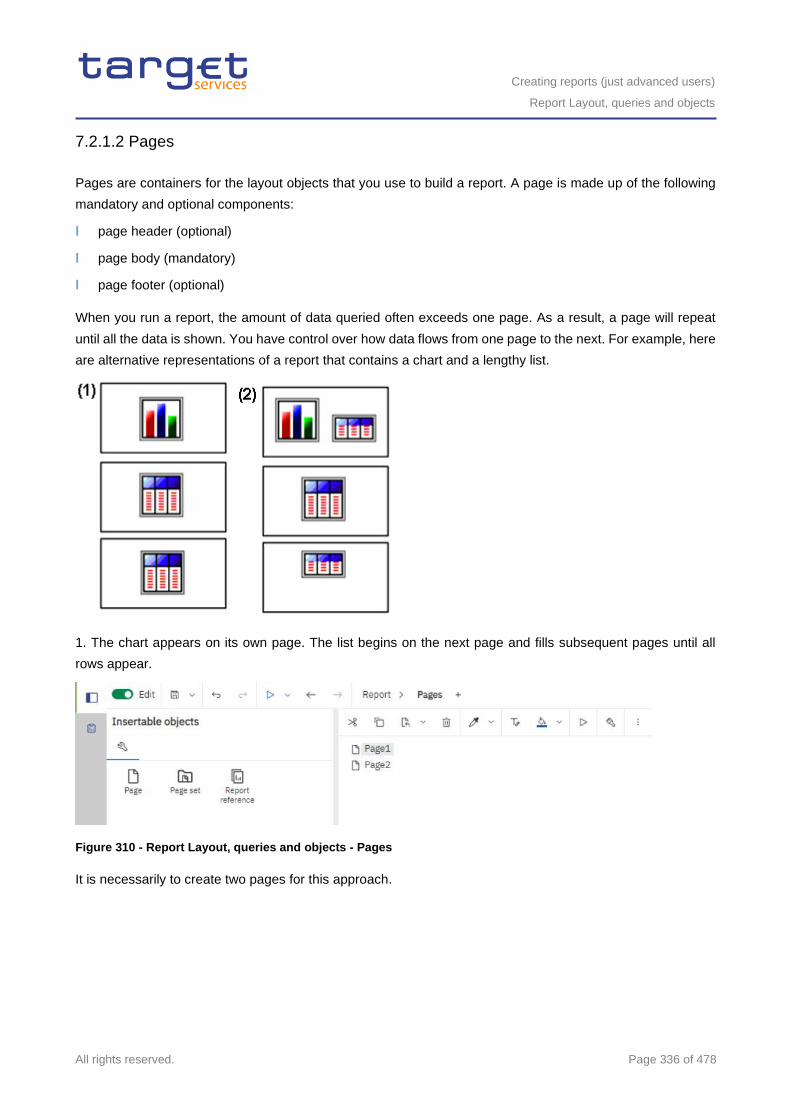
Creating reports (just advanced users)
Report Layout, queries and objects
All rights reserved. Page 336 of 478
7.2.1.2 Pages
Pages are containers for the layout objects that you use to build a report. A page is made up of the following
mandatory and optional components:
l page header (optional)
l page body (mandatory)
l page footer (optional)
When you run a report, the amount of data queried often exceeds one page. As a result, a page will repeat
until all the data is shown. You have control over how data flows from one page to the next. For example, here
are alternative representations of a report that contains a chart and a lengthy list.
1. The chart appears on its own page. The list begins on the next page and fills subsequent pages until all
rows appear.
Figure 310 - Report Layout, queries and objects - Pages
It is necessarily to create two pages for this approach.
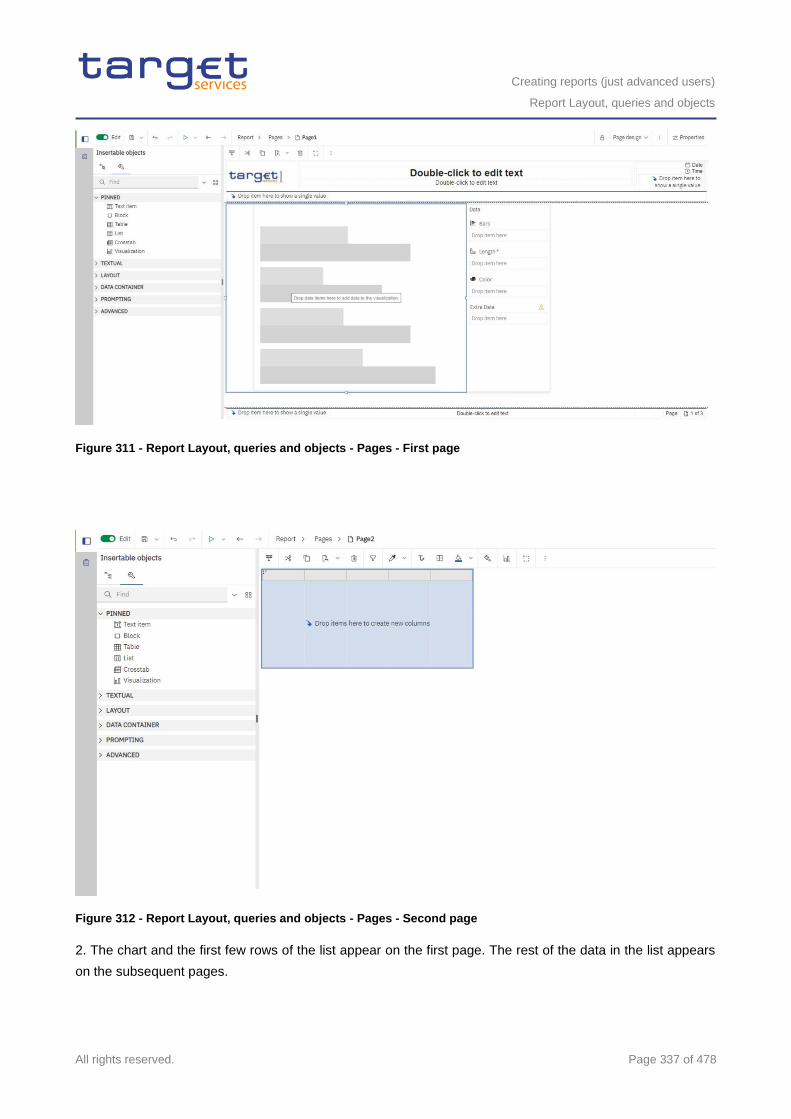
Creating reports (just advanced users)
Report Layout, queries and objects
All rights reserved. Page 337 of 478
Figure 311 - Report Layout, queries and objects - Pages - First page
Figure 312 - Report Layout, queries and objects - Pages - Second page
2. The chart and the first few rows of the list appear on the first page. The rest of the data in the list appears
on the subsequent pages.
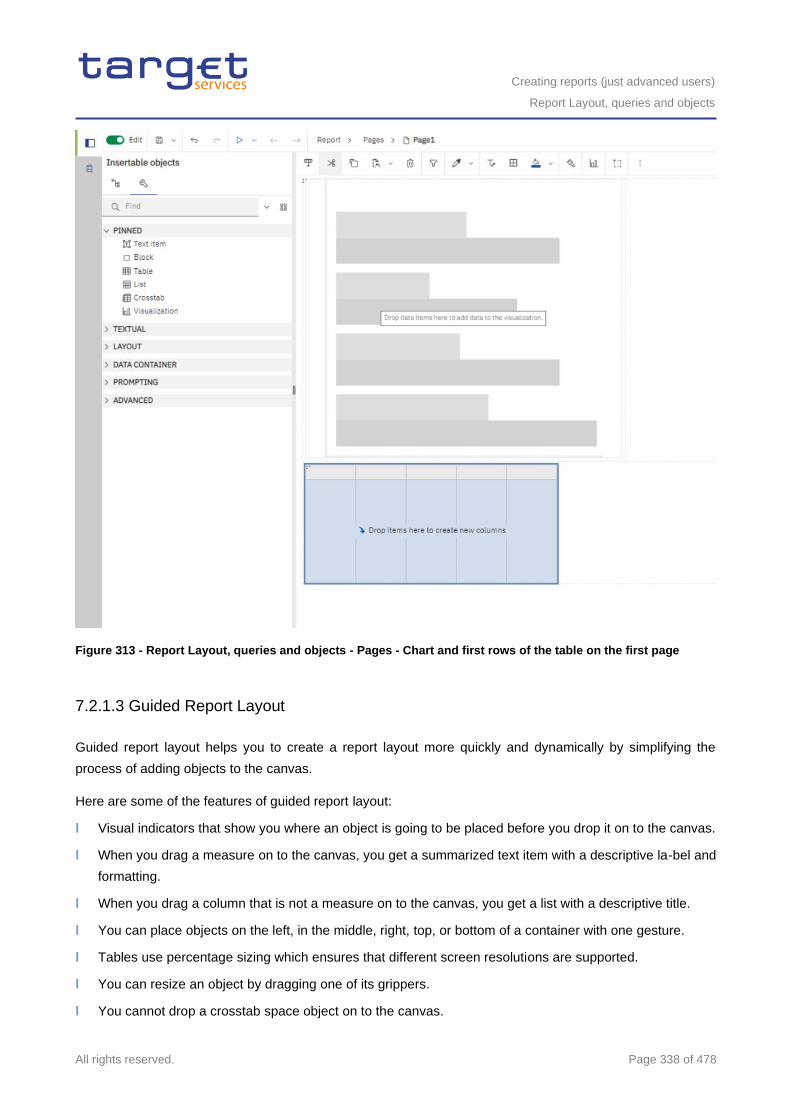
Creating reports (just advanced users)
Report Layout, queries and objects
All rights reserved. Page 338 of 478
Figure 313 - Report Layout, queries and objects - Pages - Chart and first rows of the table on the first page
7.2.1.3 Guided Report Layout
Guided report layout helps you to create a report layout more quickly and dynamically by simplifying the
process of adding objects to the canvas.
Here are some of the features of guided report layout:
l Visual indicators that show you where an object is going to be placed before you drop it on to the canvas.
l When you drag a measure on to the canvas, you get a summarized text item with a descriptive la-bel and
formatting.
l When you drag a column that is not a measure on to the canvas, you get a list with a descriptive title.
l You can place objects on the left, in the middle, right, top, or bottom of a container with one gesture.
l Tables use percentage sizing which ensures that different screen resolutions are supported.
l You can resize an object by dragging one of its grippers.
l You cannot drop a crosstab space object on to the canvas.
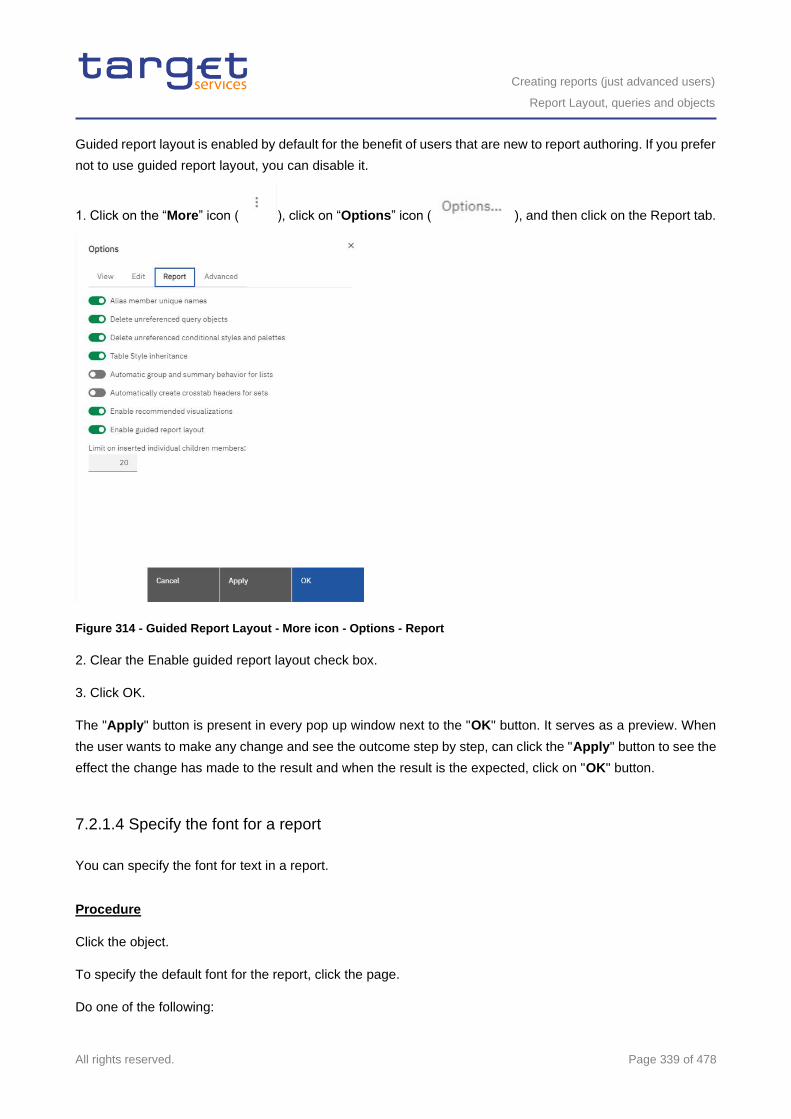
Creating reports (just advanced users)
Report Layout, queries and objects
All rights reserved. Page 339 of 478
Guided report layout is enabled by default for the benefit of users that are new to report authoring. If you prefer
not to use guided report layout, you can disable it.
1. Click on the “More” icon ( ), click on “Options” icon ( ), and then click on the Report tab.
Figure 314 - Guided Report Layout - More icon - Options - Report
2. Clear the Enable guided report layout check box.
3. Click OK.
The "Apply" button is present in every pop up window next to the "OK" button. It serves as a preview. When
the user wants to make any change and see the outcome step by step, can click the "Apply" button to see the
effect the change has made to the result and when the result is the expected, click on "OK" button.
7.2.1.4 Specify the font for a report
You can specify the font for text in a report.
Procedure
Click the object.
To specify the default font for the report, click the page.
Do one of the following:
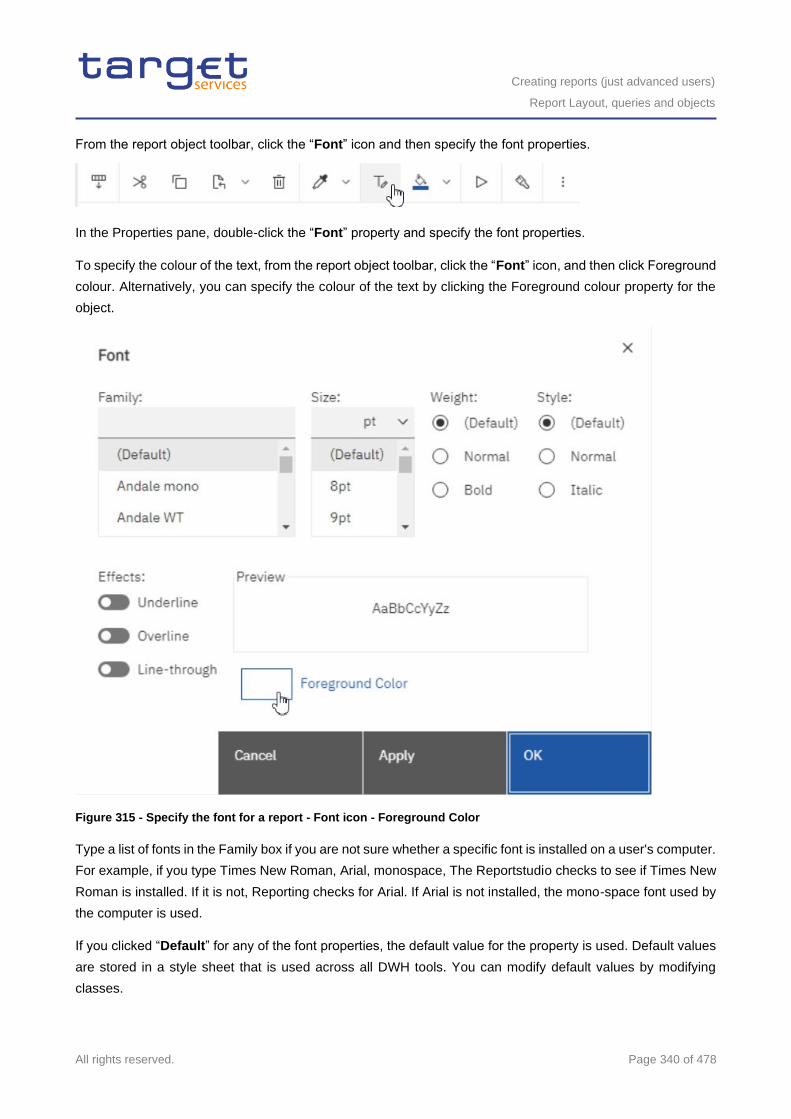
Creating reports (just advanced users)
Report Layout, queries and objects
All rights reserved. Page 340 of 478
From the report object toolbar, click the “Font” icon and then specify the font properties.
In the Properties pane, double-click the “Font” property and specify the font properties.
To specify the colour of the text, from the report object toolbar, click the “Font” icon, and then click Foreground
colour. Alternatively, you can specify the colour of the text by clicking the Foreground colour property for the
object.
Figure 315 - Specify the font for a report - Font icon - Foreground Color
Type a list of fonts in the Family box if you are not sure whether a specific font is installed on a user's computer.
For example, if you type Times New Roman, Arial, monospace, The Reportstudio checks to see if Times New
Roman is installed. If it is not, Reporting checks for Arial. If Arial is not installed, the mono-space font used by
the computer is used.
If you clicked “Default” for any of the font properties, the default value for the property is used. Default values
are stored in a style sheet that is used across all DWH tools. You can modify default values by modifying
classes.
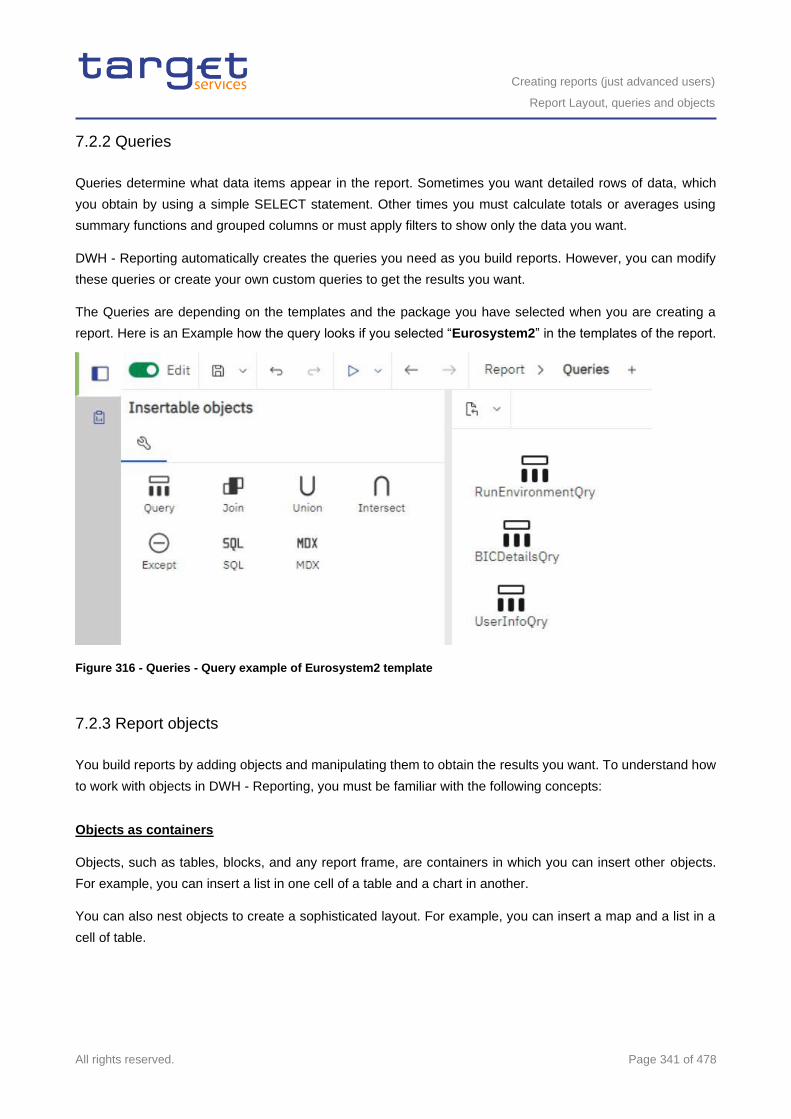
Creating reports (just advanced users)
Report Layout, queries and objects
All rights reserved. Page 341 of 478
7.2.2 Queries
Queries determine what data items appear in the report. Sometimes you want detailed rows of data, which
you obtain by using a simple SELECT statement. Other times you must calculate totals or averages using
summary functions and grouped columns or must apply filters to show only the data you want.
DWH - Reporting automatically creates the queries you need as you build reports. However, you can modify
these queries or create your own custom queries to get the results you want.
The Queries are depending on the templates and the package you have selected when you are creating a
report. Here is an Example how the query looks if you selected “Eurosystem2” in the templates of the report.
Figure 316 - Queries - Query example of Eurosystem2 template
7.2.3 Report objects
You build reports by adding objects and manipulating them to obtain the results you want. To understand how
to work with objects in DWH - Reporting, you must be familiar with the following concepts:
Objects as containers
Objects, such as tables, blocks, and any report frame, are containers in which you can insert other objects.
For example, you can insert a list in one cell of a table and a chart in another.
You can also nest objects to create a sophisticated layout. For example, you can insert a map and a list in a
cell of table.
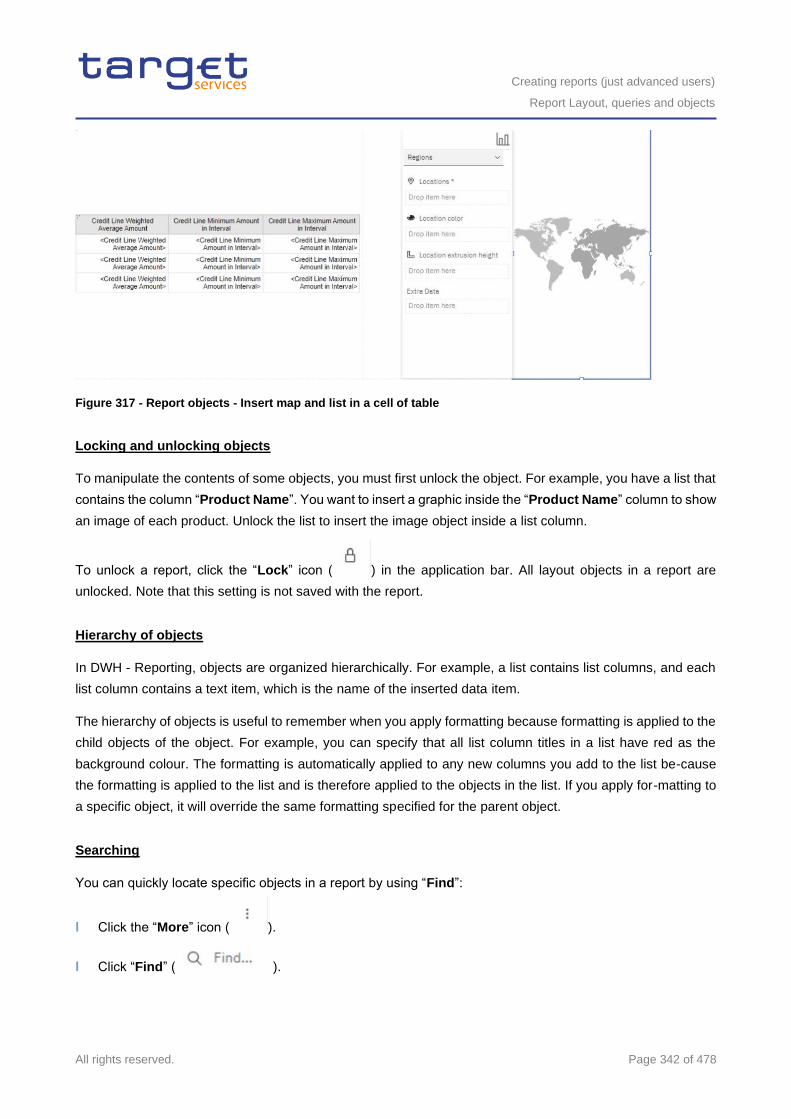
Creating reports (just advanced users)
Report Layout, queries and objects
All rights reserved. Page 342 of 478
Figure 317 - Report objects - Insert map and list in a cell of table
Locking and unlocking objects
To manipulate the contents of some objects, you must first unlock the object. For example, you have a list that
contains the column “Product Name”. You want to insert a graphic inside the “Product Name” column to show
an image of each product. Unlock the list to insert the image object inside a list column.
To unlock a report, click the “Lock” icon ( ) in the application bar. All layout objects in a report are
unlocked. Note that this setting is not saved with the report.
Hierarchy of objects
In DWH - Reporting, objects are organized hierarchically. For example, a list contains list columns, and each
list column contains a text item, which is the name of the inserted data item.
The hierarchy of objects is useful to remember when you apply formatting because formatting is applied to the
child objects of the object. For example, you can specify that all list column titles in a list have red as the
background colour. The formatting is automatically applied to any new columns you add to the list be-cause
the formatting is applied to the list and is therefore applied to the objects in the list. If you apply for-matting to
a specific object, it will override the same formatting specified for the parent object.
Searching
You can quickly locate specific objects in a report by using “Find”:
l Click the “More” icon ( ).
l Click “Find” ( ).
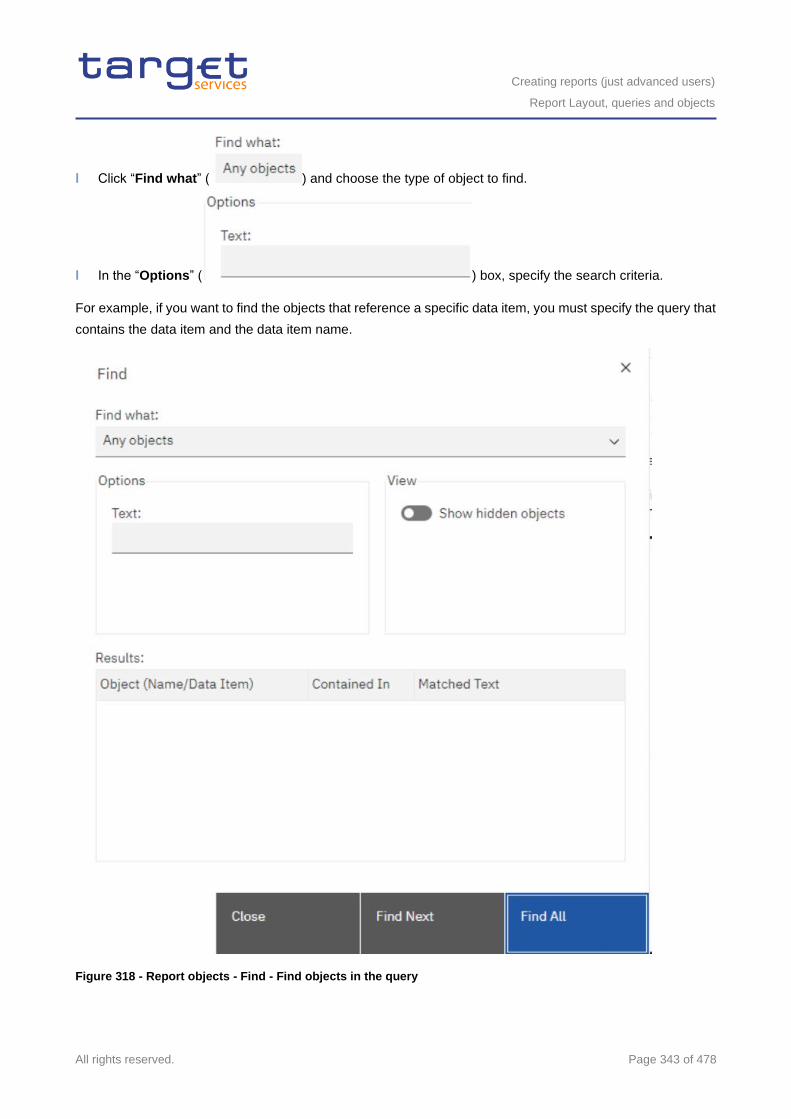
Creating reports (just advanced users)
Report Layout, queries and objects
All rights reserved. Page 343 of 478
l Click “Find what” ( ) and choose the type of object to find.
l In the “Options” ( ) box, specify the search criteria.
For example, if you want to find the objects that reference a specific data item, you must specify the query that
contains the data item and the data item name.
Figure 318 - Report objects - Find - Find objects in the query
Creating reports (just advanced users)
Report Layout, queries and objects
All rights reserved. Page 344 of 478
l To search for objects that are hidden in the report, in the “View” box ( ),
select the Show hidden objects check box.
l Click “Find All” ( ) or “Find Next” ( ).
All objects that meet the search criteria are listed under “Results”( ). The first object that meets the
search criteria is highlighted in the list. Continue clicking “Find Next”( ) to show all
other objects that meet the search criteria.
In some cases, such as searching for a data item that is used to define a conditional style, the Report Studio
cannot directly select the object in the report. Instead, Reporting selects the object that uses the object for
which you are searching.
7.2.3.1 Mostly Used Objects
You add layout objects to a page when you create a report. Below are objects that you will use often when
building reports in DWH - Reporting:
l List
Add a list to show data in rows and columns.
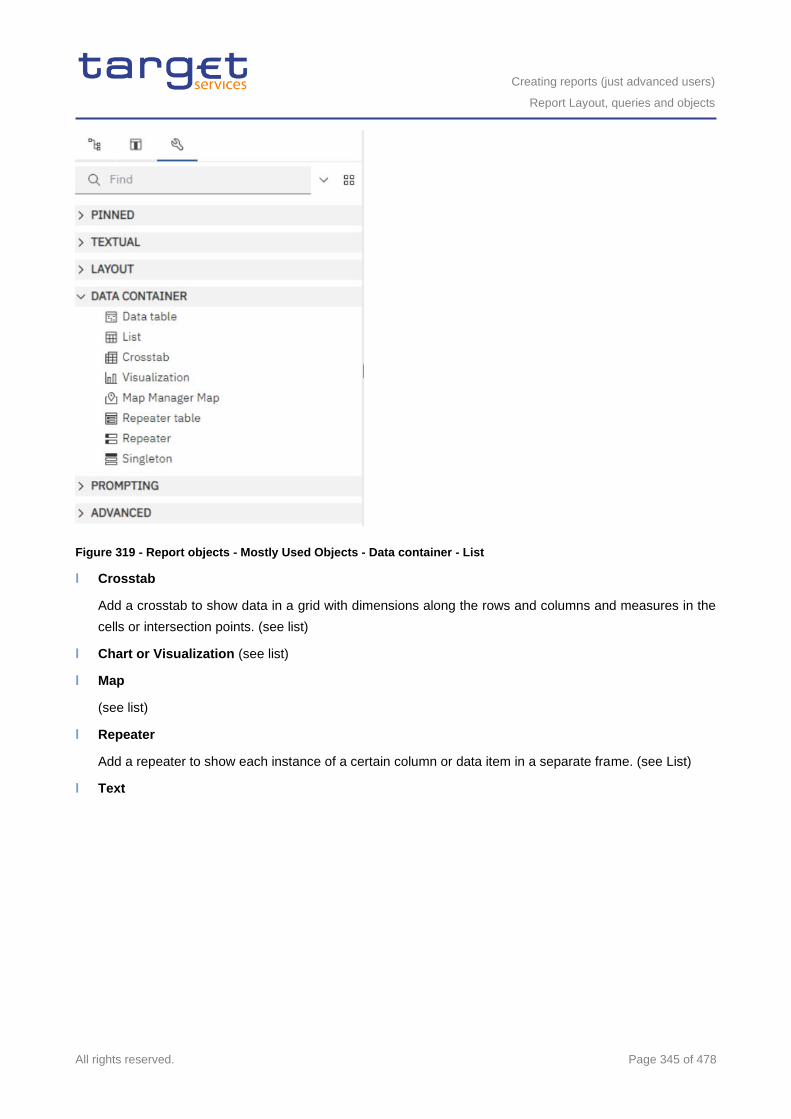
Creating reports (just advanced users)
Report Layout, queries and objects
All rights reserved. Page 345 of 478
Figure 319 - Report objects - Mostly Used Objects - Data container - List
l Crosstab
Add a crosstab to show data in a grid with dimensions along the rows and columns and measures in the
cells or intersection points. (see list)
l Chart or Visualization (see list)
l Map
(see list)
l Repeater
Add a repeater to show each instance of a certain column or data item in a separate frame. (see List)
l Text
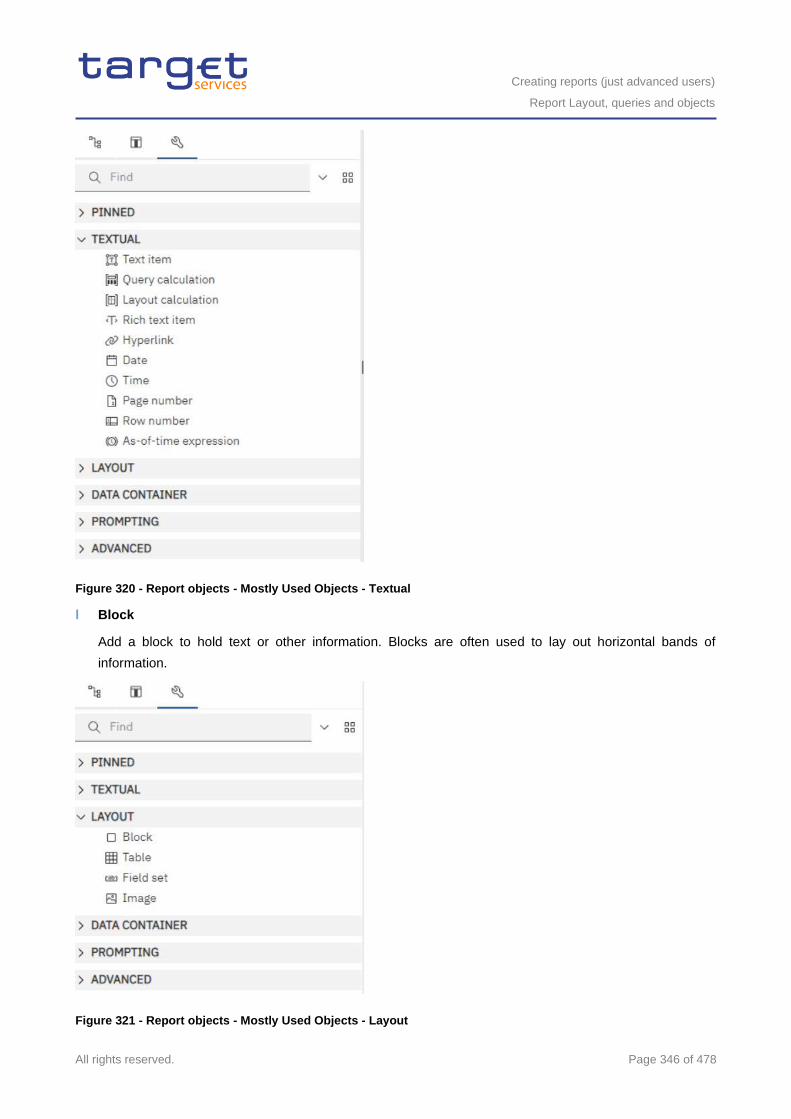
Creating reports (just advanced users)
Report Layout, queries and objects
All rights reserved. Page 346 of 478
Figure 320 - Report objects - Mostly Used Objects - Textual
l Block
Add a block to hold text or other information. Blocks are often used to lay out horizontal bands of
information.
Figure 321 - Report objects - Mostly Used Objects - Layout
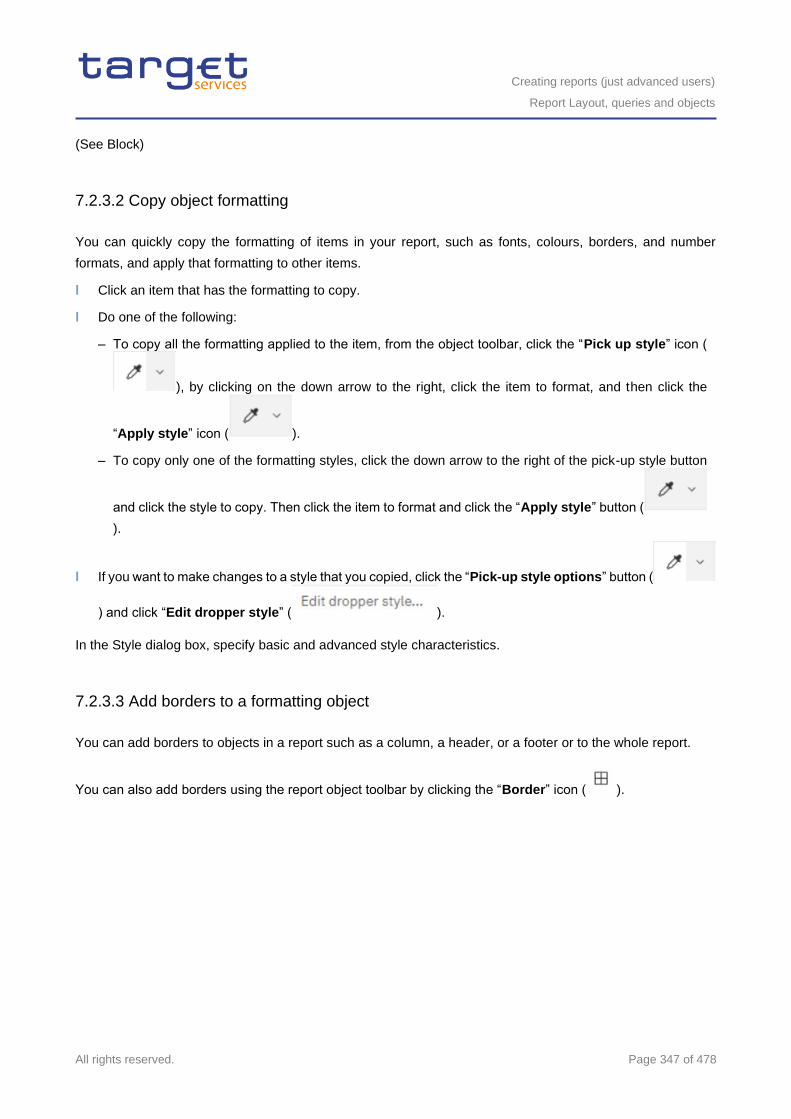
Creating reports (just advanced users)
Report Layout, queries and objects
All rights reserved. Page 347 of 478
(See Block)
7.2.3.2 Copy object formatting
You can quickly copy the formatting of items in your report, such as fonts, colours, borders, and number
formats, and apply that formatting to other items.
l Click an item that has the formatting to copy.
l Do one of the following:
– To copy all the formatting applied to the item, from the object toolbar, click the “Pick up style” icon (
), by clicking on the down arrow to the right, click the item to format, and then click the
“Apply style” icon ( ).
– To copy only one of the formatting styles, click the down arrow to the right of the pick-up style button
and click the style to copy. Then click the item to format and click the “Apply style” button (
).
l If you want to make changes to a style that you copied, click the “Pick-up style options” button (
) and click “Edit dropper style” ( ).
In the Style dialog box, specify basic and advanced style characteristics.
7.2.3.3 Add borders to a formatting object
You can add borders to objects in a report such as a column, a header, or a footer or to the whole report.
You can also add borders using the report object toolbar by clicking the “Border” icon ( ).
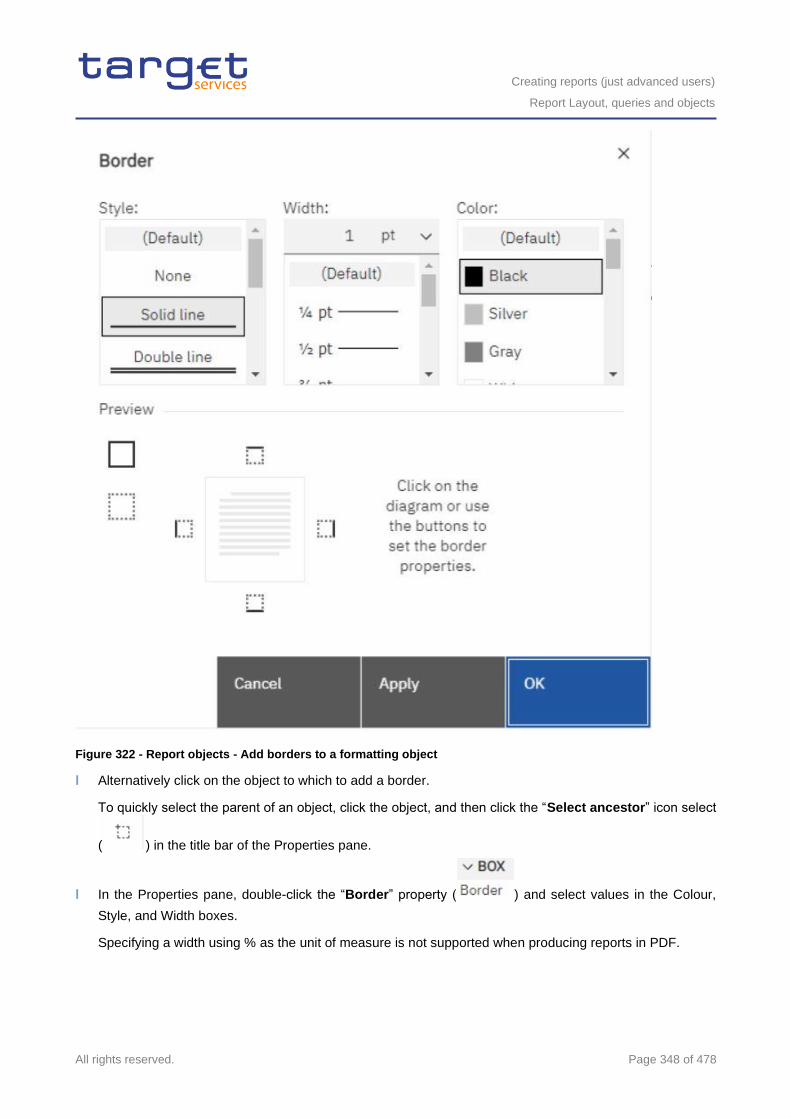
Creating reports (just advanced users)
Report Layout, queries and objects
All rights reserved. Page 348 of 478
Figure 322 - Report objects - Add borders to a formatting object
l Alternatively click on the object to which to add a border.
To quickly select the parent of an object, click the object, and then click the “Select ancestor” icon select
( ) in the title bar of the Properties pane.
l In the Properties pane, double-click the “Border” property ( ) and select values in the Colour,
Style, and Width boxes.
Specifying a width using % as the unit of measure is not supported when producing reports in PDF.
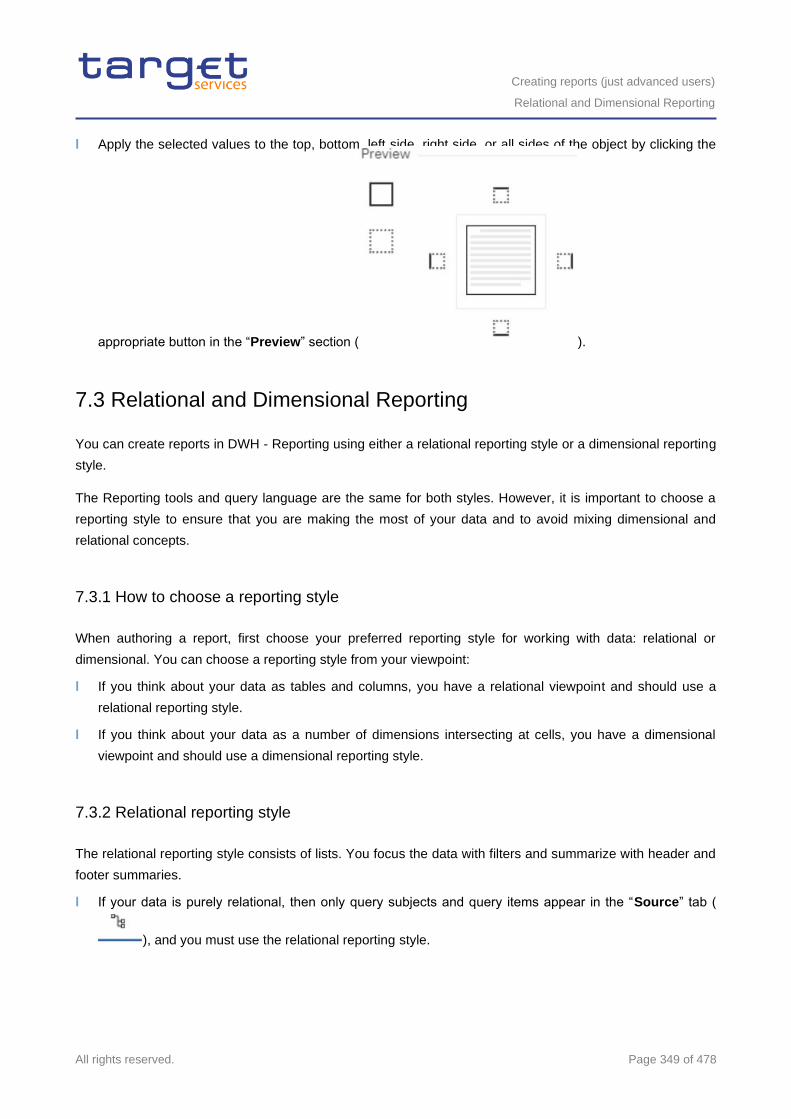
Creating reports (just advanced users)
Relational and Dimensional Reporting
All rights reserved. Page 349 of 478
l Apply the selected values to the top, bottom, left side, right side, or all sides of the object by clicking the
appropriate button in the “Preview” section ( ).
7.3 Relational and Dimensional Reporting
You can create reports in DWH - Reporting using either a relational reporting style or a dimensional reporting
style.
The Reporting tools and query language are the same for both styles. However, it is important to choose a
reporting style to ensure that you are making the most of your data and to avoid mixing dimensional and
relational concepts.
7.3.1 How to choose a reporting style
When authoring a report, first choose your preferred reporting style for working with data: relational or
dimensional. You can choose a reporting style from your viewpoint:
l If you think about your data as tables and columns, you have a relational viewpoint and should use a
relational reporting style.
l If you think about your data as a number of dimensions intersecting at cells, you have a dimensional
viewpoint and should use a dimensional reporting style.
7.3.2 Relational reporting style
The relational reporting style consists of lists. You focus the data with filters and summarize with header and
footer summaries.
l If your data is purely relational, then only query subjects and query items appear in the “Source” tab (
), and you must use the relational reporting style.
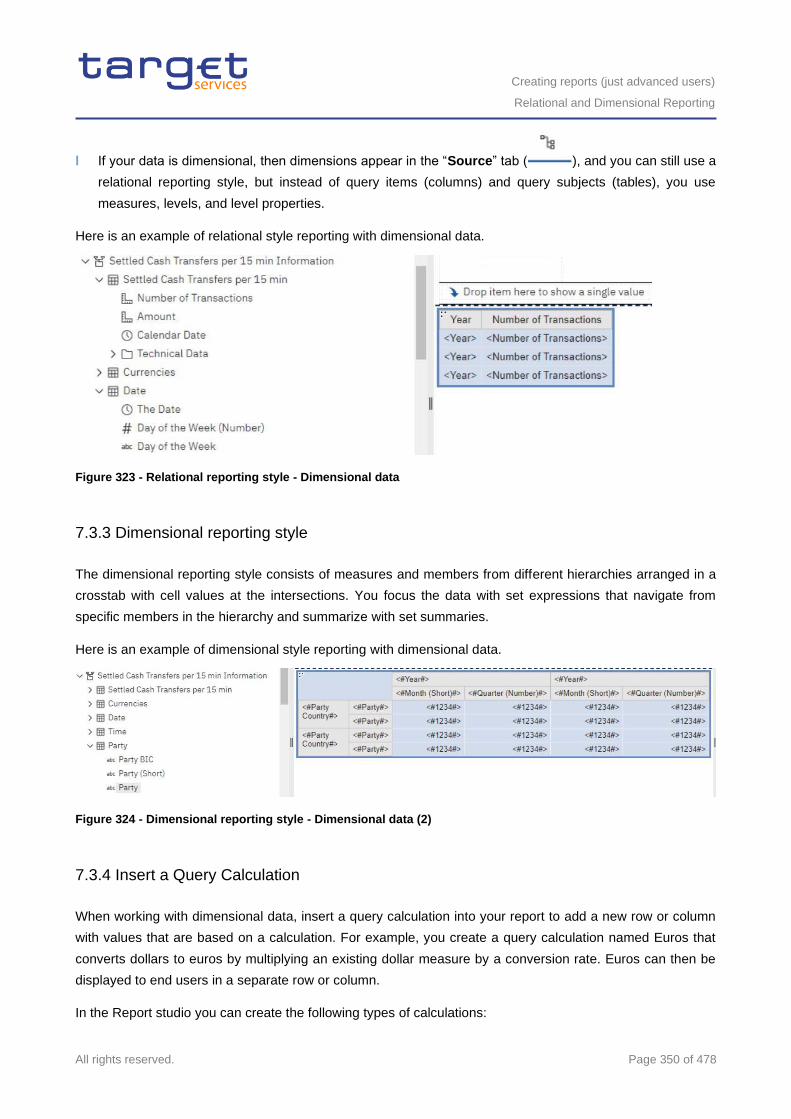
Creating reports (just advanced users)
Relational and Dimensional Reporting
All rights reserved. Page 350 of 478
l If your data is dimensional, then dimensions appear in the “Source” tab ( ), and you can still use a
relational reporting style, but instead of query items (columns) and query subjects (tables), you use
measures, levels, and level properties.
Here is an example of relational style reporting with dimensional data.
Figure 323 - Relational reporting style - Dimensional data
7.3.3 Dimensional reporting style
The dimensional reporting style consists of measures and members from different hierarchies arranged in a
crosstab with cell values at the intersections. You focus the data with set expressions that navigate from
specific members in the hierarchy and summarize with set summaries.
Here is an example of dimensional style reporting with dimensional data.
Figure 324 - Dimensional reporting style - Dimensional data (2)
7.3.4 Insert a Query Calculation
When working with dimensional data, insert a query calculation into your report to add a new row or column
with values that are based on a calculation. For example, you create a query calculation named Euros that
converts dollars to euros by multiplying an existing dollar measure by a conversion rate. Euros can then be
displayed to end users in a separate row or column.
In the Report studio you can create the following types of calculations:
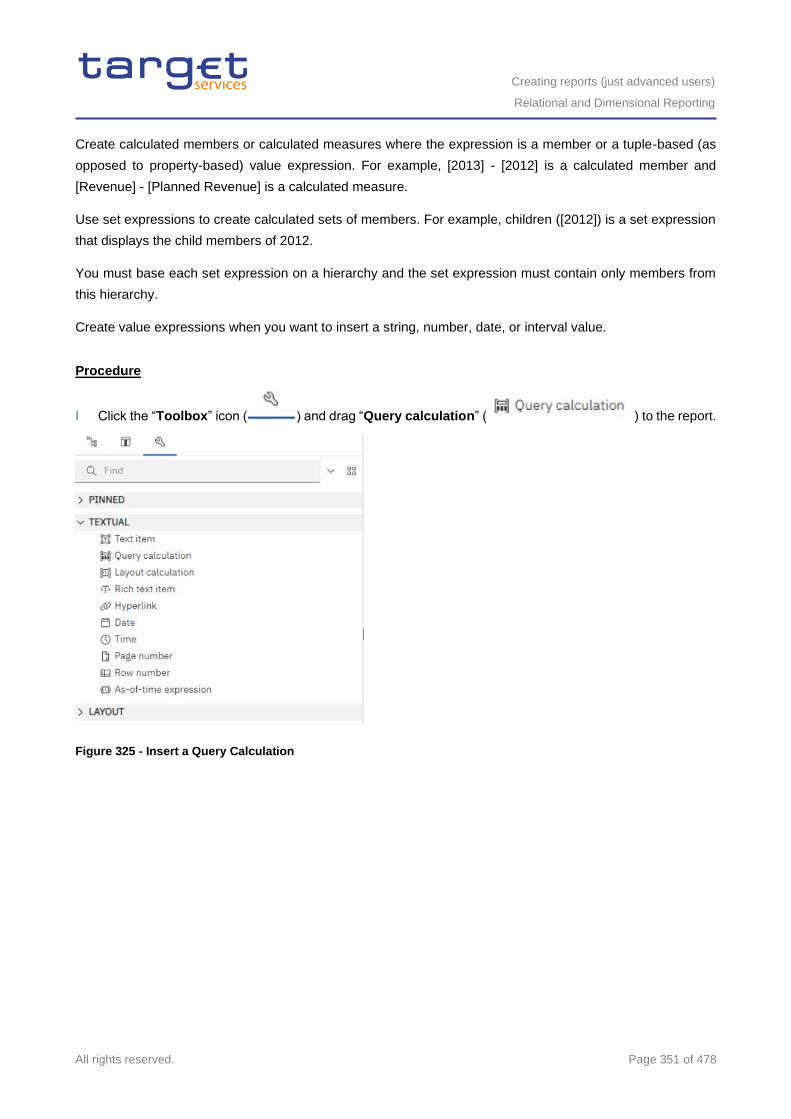
Creating reports (just advanced users)
Relational and Dimensional Reporting
All rights reserved. Page 351 of 478
Create calculated members or calculated measures where the expression is a member or a tuple-based (as
opposed to property-based) value expression. For example, [2013] - [2012] is a calculated member and
[Revenue] - [Planned Revenue] is a calculated measure.
Use set expressions to create calculated sets of members. For example, children ([2012]) is a set expression
that displays the child members of 2012.
You must base each set expression on a hierarchy and the set expression must contain only members from
this hierarchy.
Create value expressions when you want to insert a string, number, date, or interval value.
Procedure
l Click the “Toolbox” icon ( ) and drag “Query calculation” ( ) to the report.
Figure 325 - Insert a Query Calculation
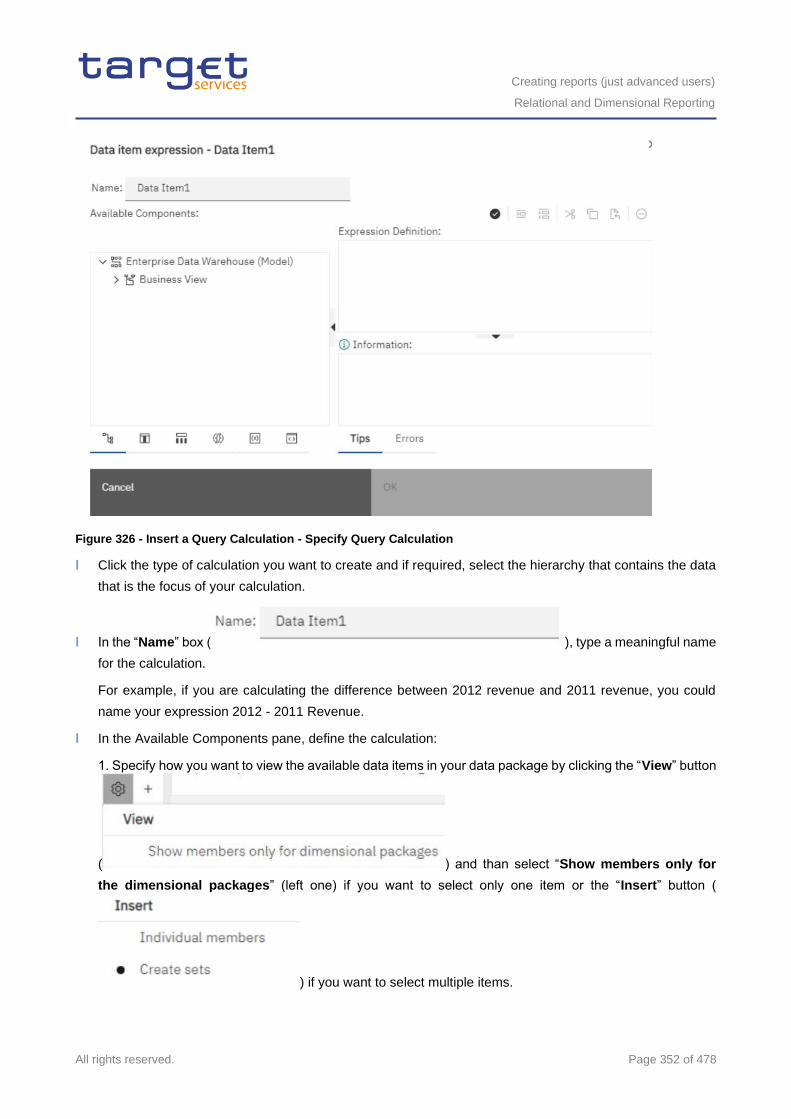
Creating reports (just advanced users)
Relational and Dimensional Reporting
All rights reserved. Page 352 of 478
Figure 326 - Insert a Query Calculation - Specify Query Calculation
l Click the type of calculation you want to create and if required, select the hierarchy that contains the data
that is the focus of your calculation.
l In the “Name” box ( ), type a meaningful name
for the calculation.
For example, if you are calculating the difference between 2012 revenue and 2011 revenue, you could
name your expression 2012 - 2011 Revenue.
l In the Available Components pane, define the calculation:
1. Specify how you want to view the available data items in your data package by clicking the “View” button
( ) and than select “Show members only for
the dimensional packages” (left one) if you want to select only one item or the “Insert” button (
) if you want to select multiple items.
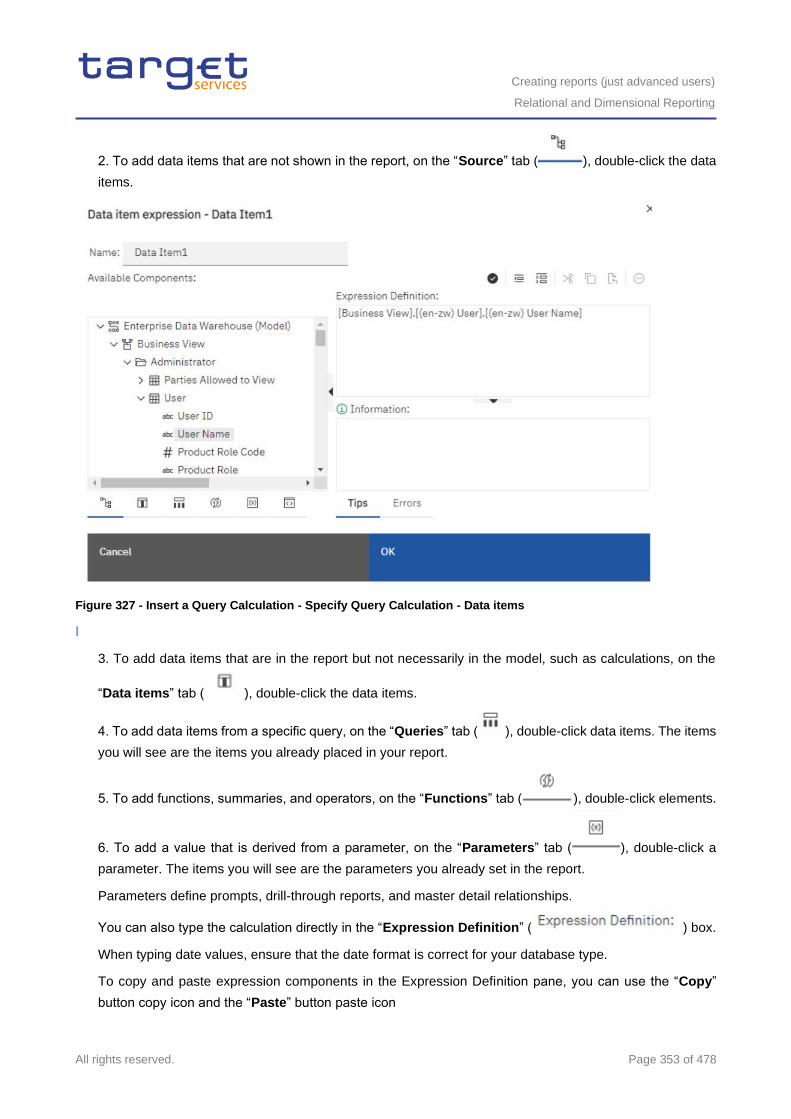
Creating reports (just advanced users)
Relational and Dimensional Reporting
All rights reserved. Page 353 of 478
2. To add data items that are not shown in the report, on the “Source” tab ( ), double-click the data
items.
Figure 327 - Insert a Query Calculation - Specify Query Calculation - Data items
l
3. To add data items that are in the report but not necessarily in the model, such as calculations, on the
“Data items” tab ( ), double-click the data items.
4. To add data items from a specific query, on the “Queries” tab ( ), double-click data items. The items
you will see are the items you already placed in your report.
5. To add functions, summaries, and operators, on the “Functions” tab ( ), double-click elements.
6. To add a value that is derived from a parameter, on the “Parameters” tab ( ), double-click a
parameter. The items you will see are the parameters you already set in the report.
Parameters define prompts, drill-through reports, and master detail relationships.
You can also type the calculation directly in the “Expression Definition” ( ) box.
When typing date values, ensure that the date format is correct for your database type.
To copy and paste expression components in the Expression Definition pane, you can use the “Copy”
button copy icon and the “Paste” button paste icon
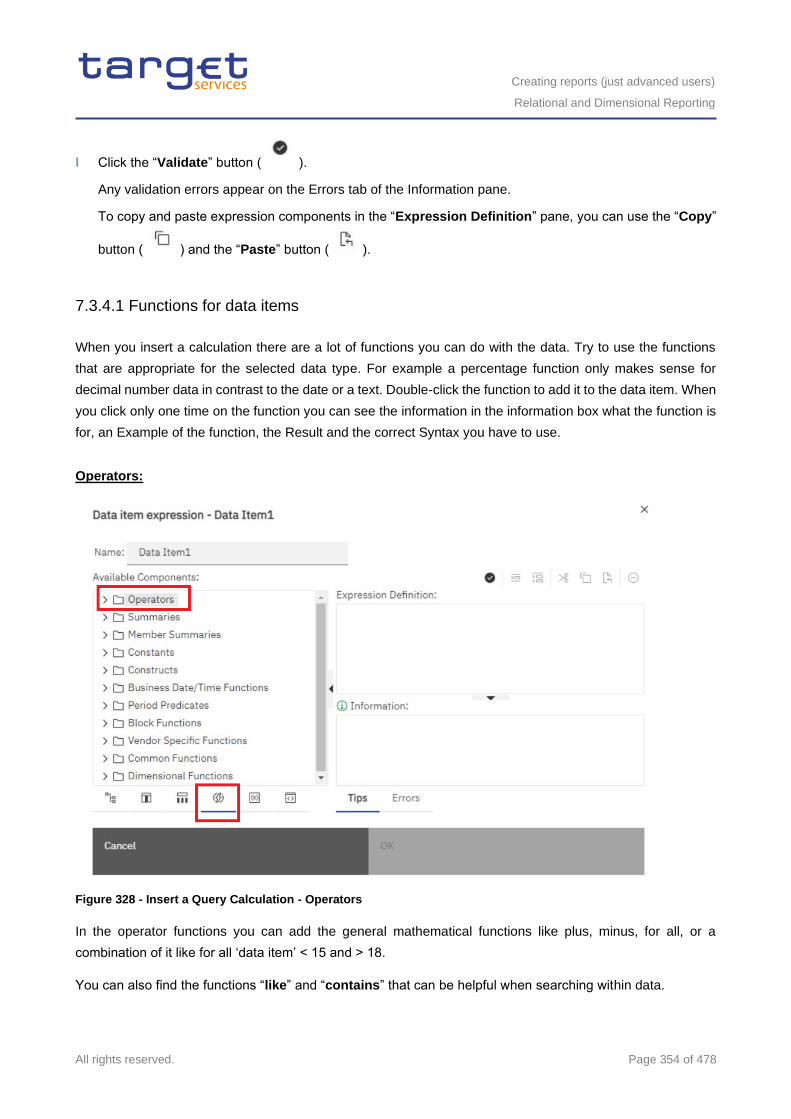
Creating reports (just advanced users)
Relational and Dimensional Reporting
All rights reserved. Page 354 of 478
l Click the “Validate” button ( ).
Any validation errors appear on the Errors tab of the Information pane.
To copy and paste expression components in the “Expression Definition” pane, you can use the “Copy”
button ( ) and the “Paste” button ( ).
7.3.4.1 Functions for data items
When you insert a calculation there are a lot of functions you can do with the data. Try to use the functions
that are appropriate for the selected data type. For example a percentage function only makes sense for
decimal number data in contrast to the date or a text. Double-click the function to add it to the data item. When
you click only one time on the function you can see the information in the information box what the function is
for, an Example of the function, the Result and the correct Syntax you have to use.
Operators:
Figure 328 - Insert a Query Calculation - Operators
In the operator functions you can add the general mathematical functions like plus, minus, for all, or a
combination of it like for all ‘data item’ < 15 and > 18.
You can also find the functions “like” and “contains” that can be helpful when searching within data.
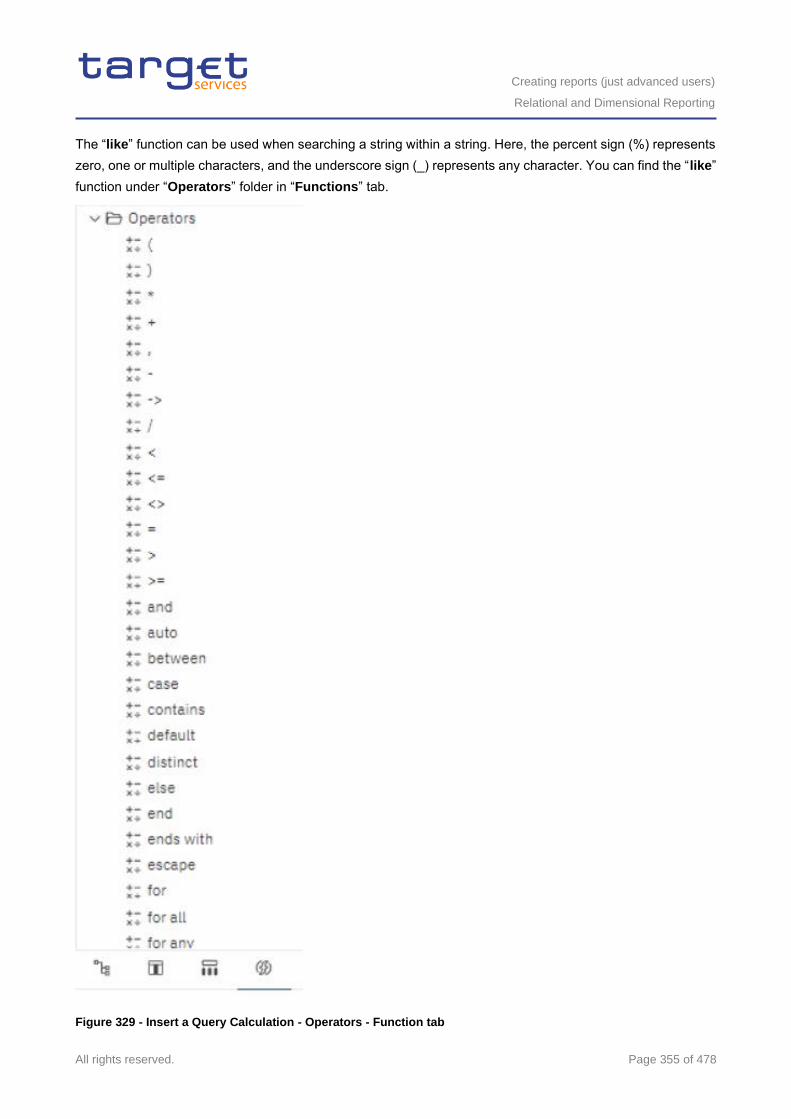
Creating reports (just advanced users)
Relational and Dimensional Reporting
All rights reserved. Page 355 of 478
The “like” function can be used when searching a string within a string. Here, the percent sign (%) represents
zero, one or multiple characters, and the underscore sign (_) represents any character. You can find the “like”
function under “Operators” folder in “Functions” tab.
Figure 329 - Insert a Query Calculation - Operators - Function tab
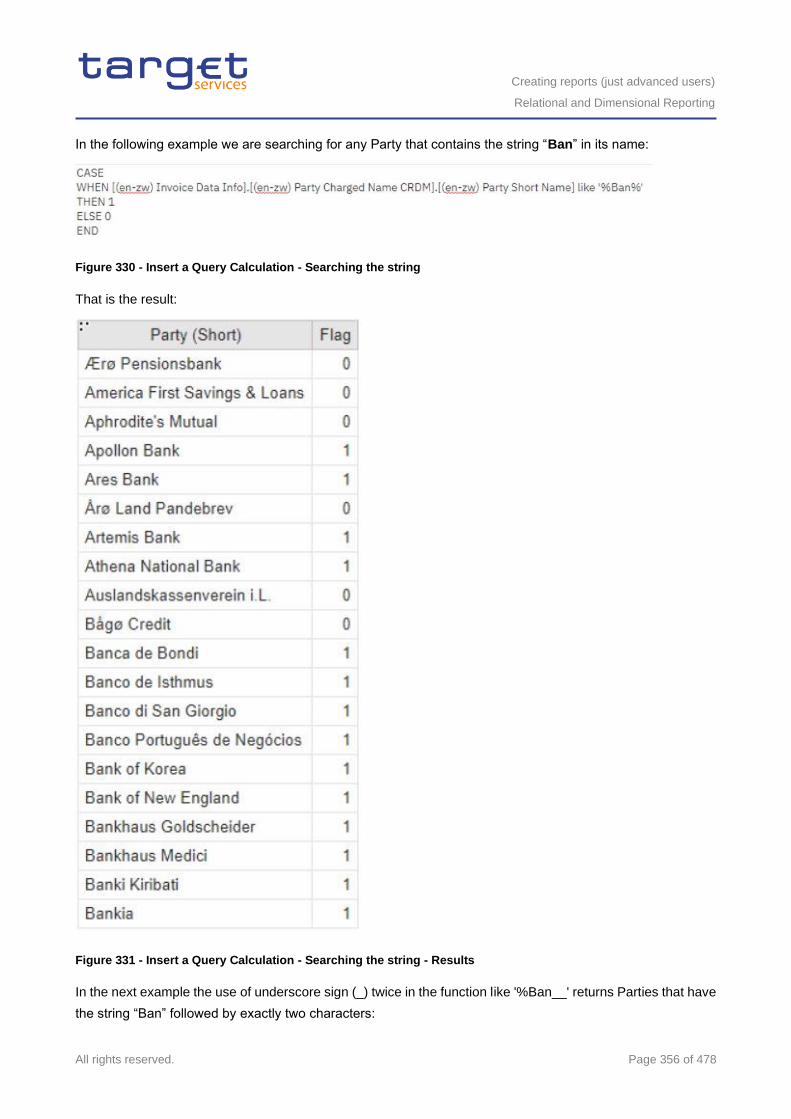
Creating reports (just advanced users)
Relational and Dimensional Reporting
All rights reserved. Page 356 of 478
In the following example we are searching for any Party that contains the string “Ban” in its name:
Figure 330 - Insert a Query Calculation - Searching the string
That is the result:
Figure 331 - Insert a Query Calculation - Searching the string - Results
In the next example the use of underscore sign (_) twice in the function like '%Ban__' returns Parties that have
the string “Ban” followed by exactly two characters:
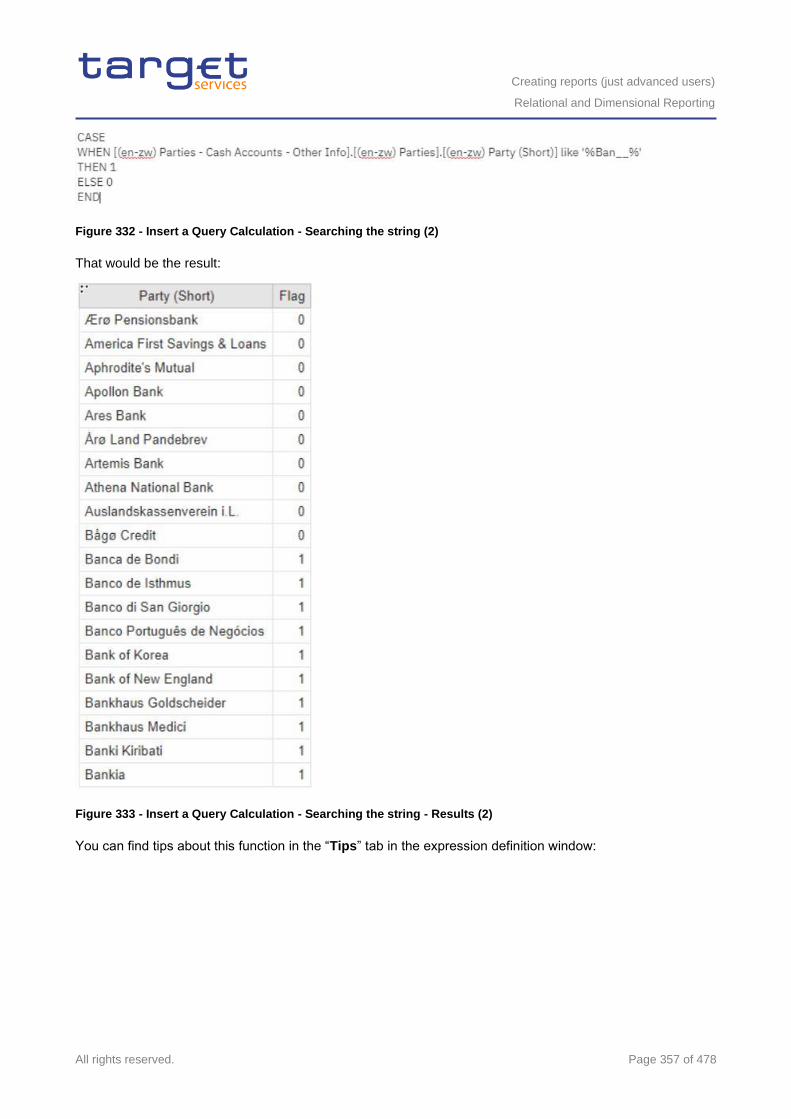
Creating reports (just advanced users)
Relational and Dimensional Reporting
All rights reserved. Page 357 of 478
Figure 332 - Insert a Query Calculation - Searching the string (2)
That would be the result:
Figure 333 - Insert a Query Calculation - Searching the string - Results (2)
You can find tips about this function in the “Tips” tab in the expression definition window:
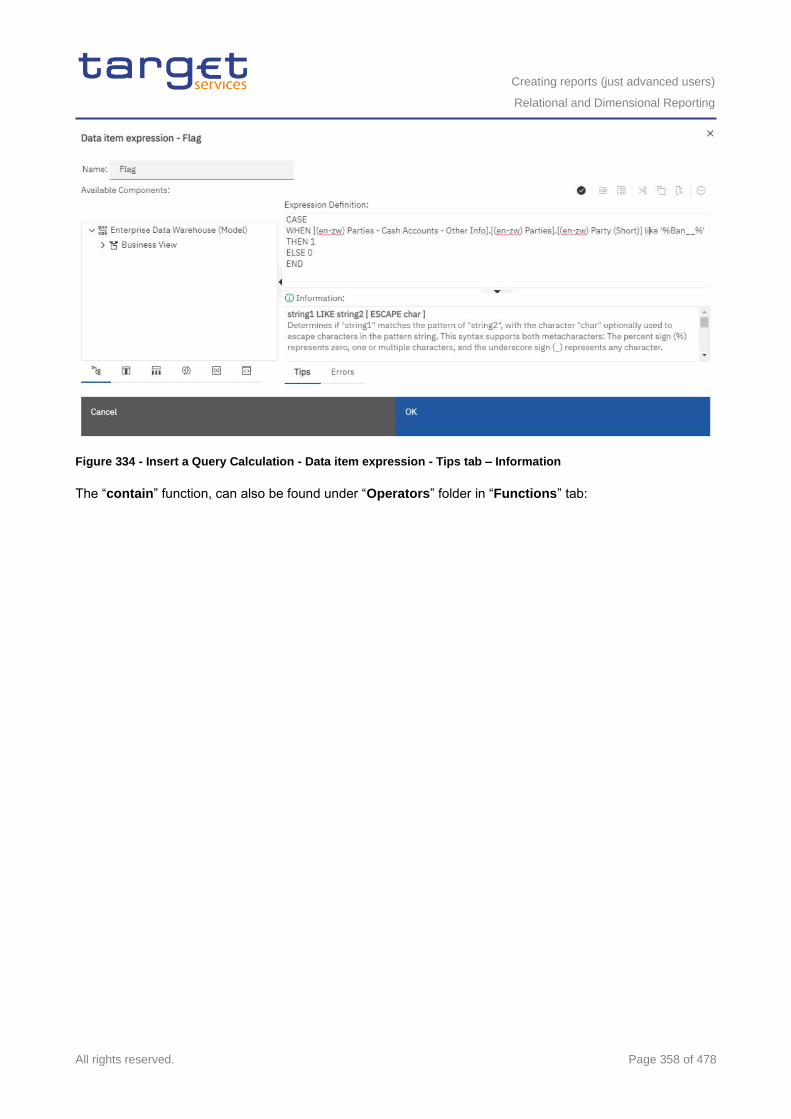
Creating reports (just advanced users)
Relational and Dimensional Reporting
All rights reserved. Page 358 of 478
Figure 334 - Insert a Query Calculation - Data item expression - Tips tab – Information
The “contain” function, can also be found under “Operators” folder in “Functions” tab:
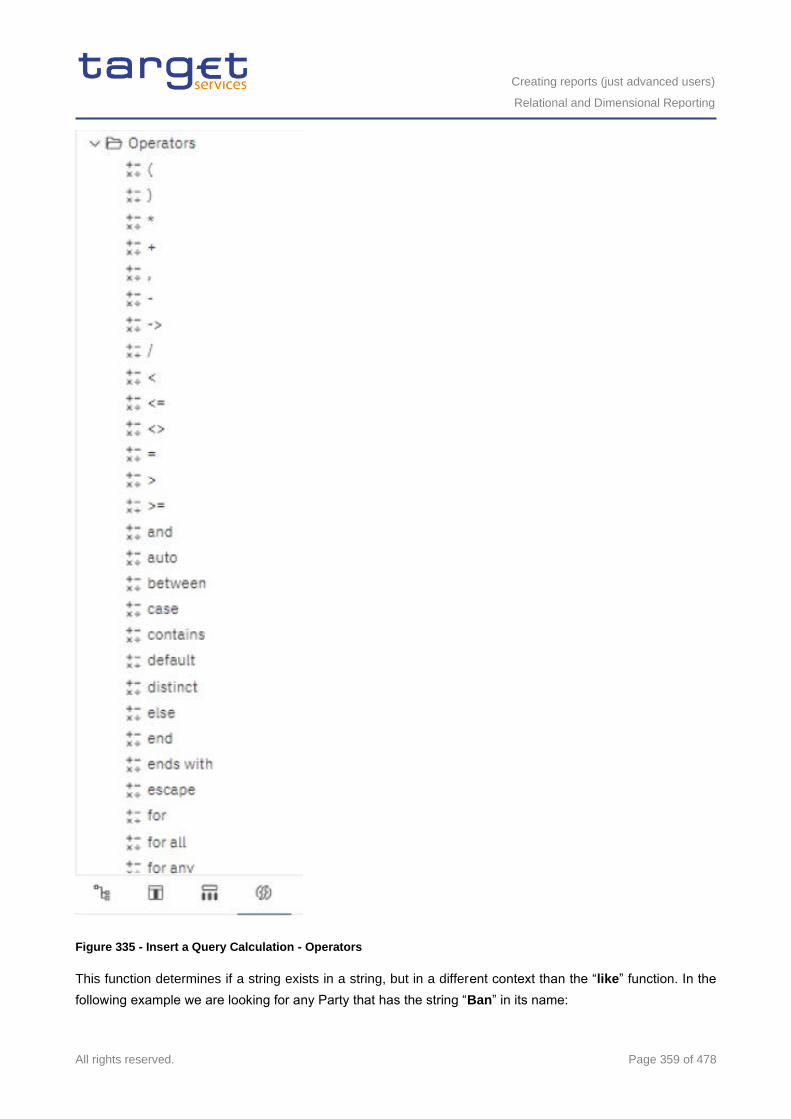
Creating reports (just advanced users)
Relational and Dimensional Reporting
All rights reserved. Page 359 of 478
Figure 335 - Insert a Query Calculation - Operators
This function determines if a string exists in a string, but in a different context than the “like” function. In the
following example we are looking for any Party that has the string “Ban” in its name:
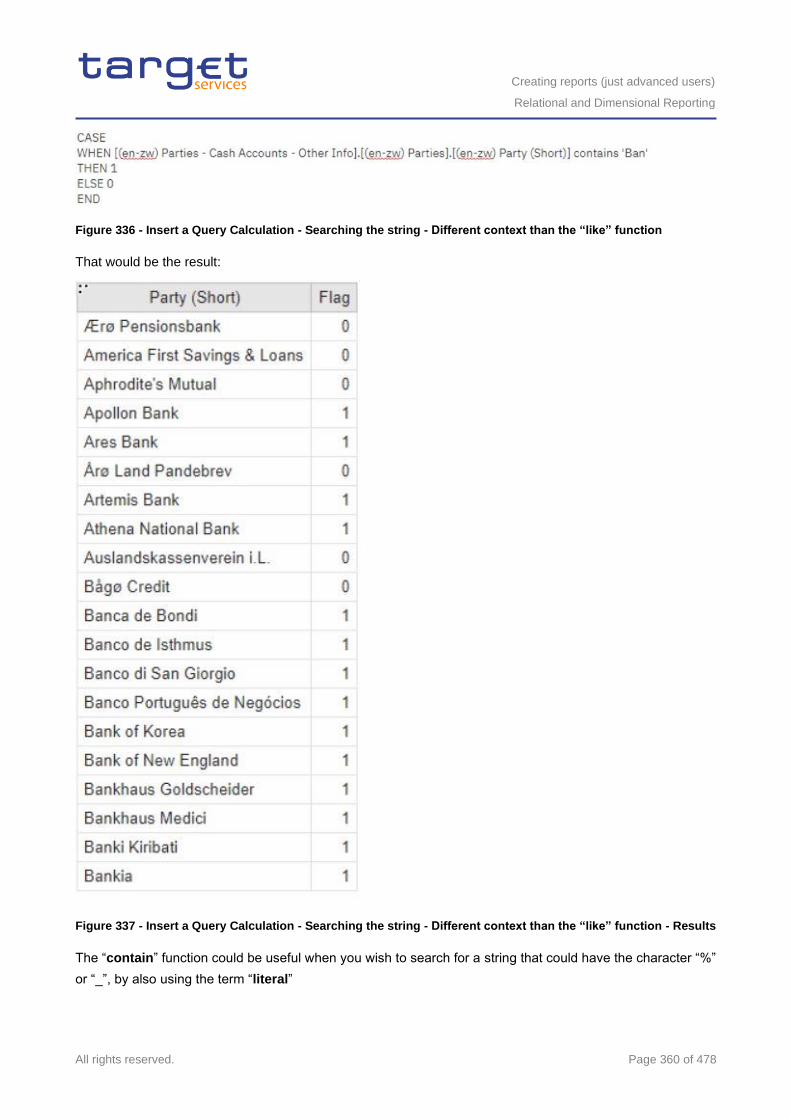
Creating reports (just advanced users)
Relational and Dimensional Reporting
All rights reserved. Page 360 of 478
Figure 336 - Insert a Query Calculation - Searching the string - Different context than the “like” function
That would be the result:
Figure 337 - Insert a Query Calculation - Searching the string - Different context than the “like” function - Results
The “contain” function could be useful when you wish to search for a string that could have the character “%”
or “_”, by also using the term “literal”
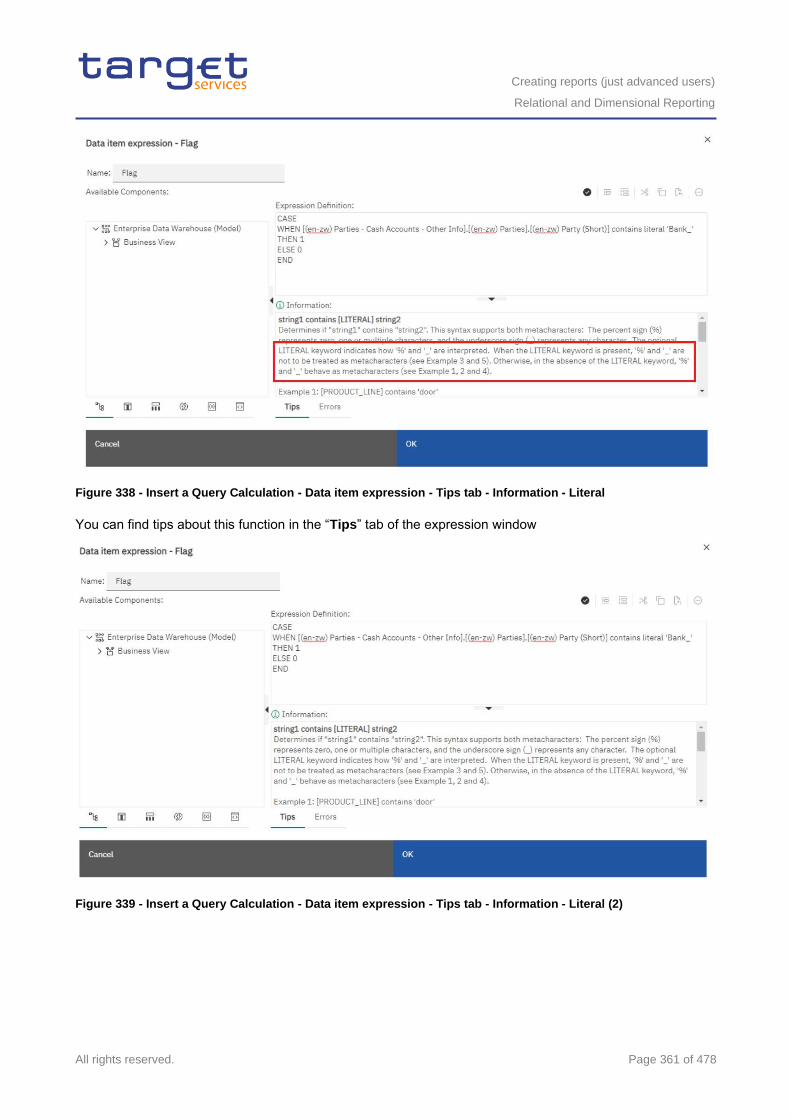
Creating reports (just advanced users)
Relational and Dimensional Reporting
All rights reserved. Page 361 of 478
Figure 338 - Insert a Query Calculation - Data item expression - Tips tab - Information - Literal
You can find tips about this function in the “Tips” tab of the expression window
Figure 339 - Insert a Query Calculation - Data item expression - Tips tab - Information - Literal (2)
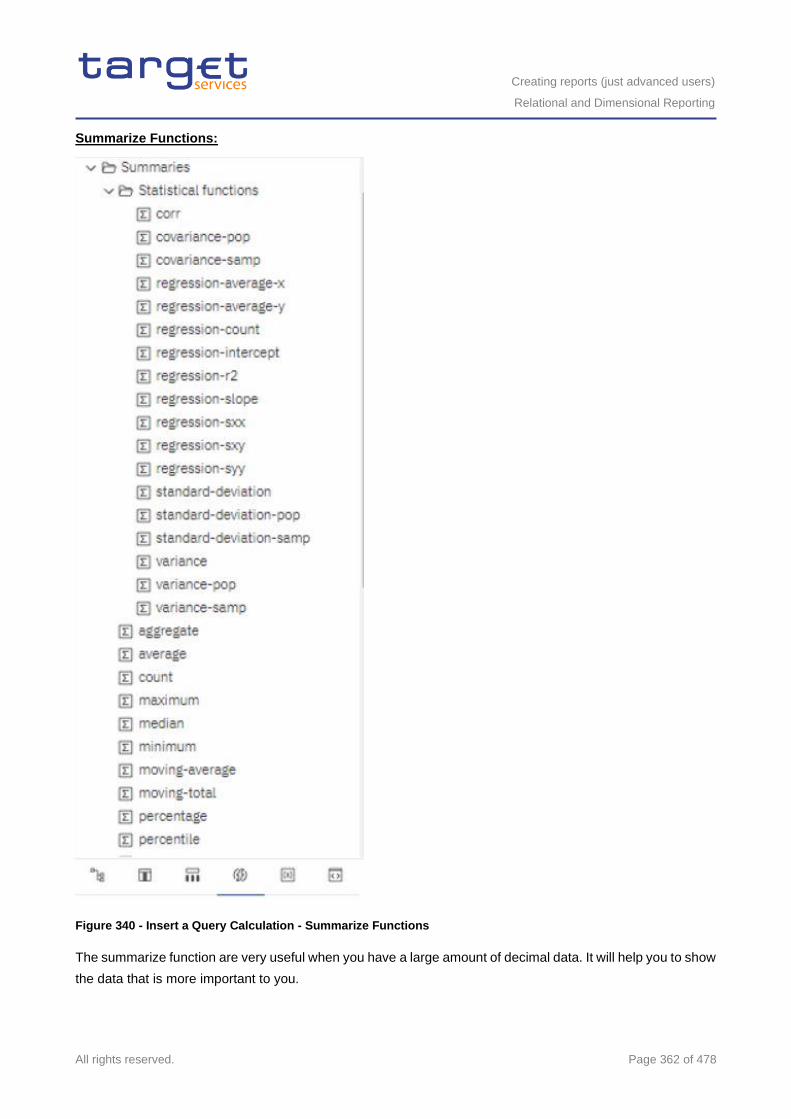
Creating reports (just advanced users)
Relational and Dimensional Reporting
All rights reserved. Page 362 of 478
Summarize Functions:
Figure 340 - Insert a Query Calculation - Summarize Functions
The summarize function are very useful when you have a large amount of decimal data. It will help you to show
the data that is more important to you.
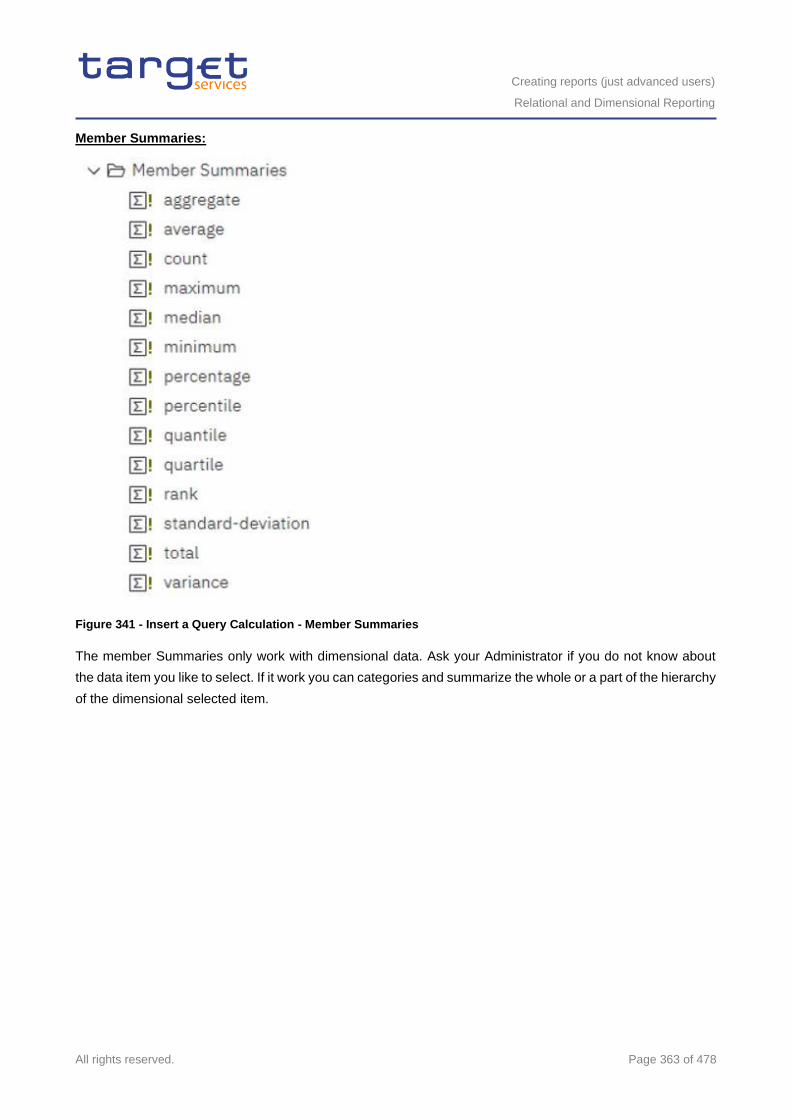
Creating reports (just advanced users)
Relational and Dimensional Reporting
All rights reserved. Page 363 of 478
Member Summaries:
Figure 341 - Insert a Query Calculation - Member Summaries
The member Summaries only work with dimensional data. Ask your Administrator if you do not know about
the data item you like to select. If it work you can categories and summarize the whole or a part of the hierarchy
of the dimensional selected item.
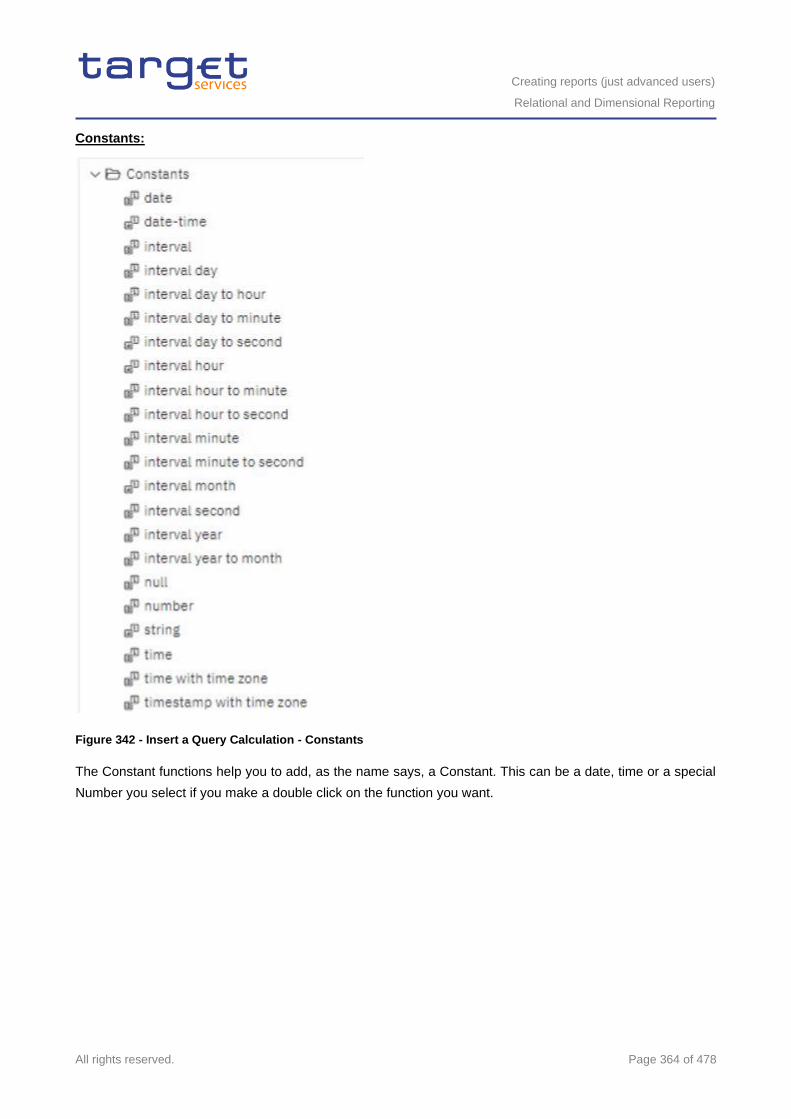
Creating reports (just advanced users)
Relational and Dimensional Reporting
All rights reserved. Page 364 of 478
Constants:
Figure 342 - Insert a Query Calculation - Constants
The Constant functions help you to add, as the name says, a Constant. This can be a date, time or a special
Number you select if you make a double click on the function you want.
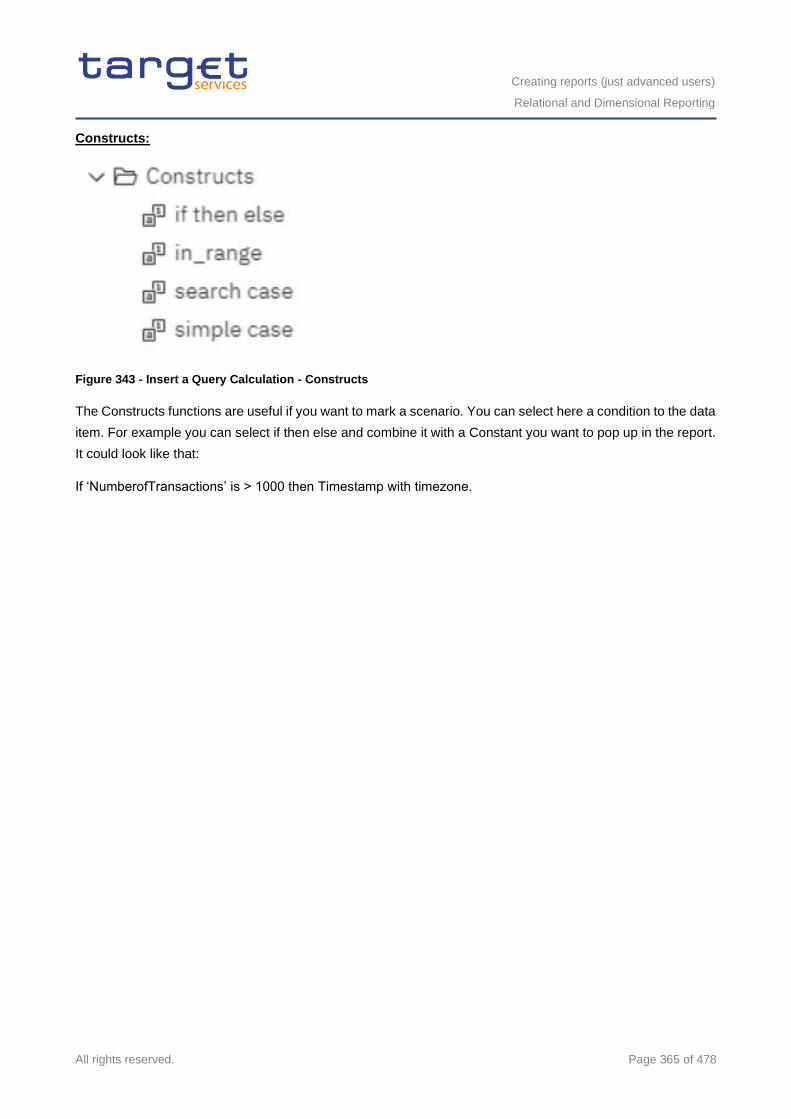
Creating reports (just advanced users)
Relational and Dimensional Reporting
All rights reserved. Page 365 of 478
Constructs:
Figure 343 - Insert a Query Calculation - Constructs
The Constructs functions are useful if you want to mark a scenario. You can select here a condition to the data
item. For example you can select if then else and combine it with a Constant you want to pop up in the report.
It could look like that:
If ‘NumberofTransactions’ is > 1000 then Timestamp with timezone.
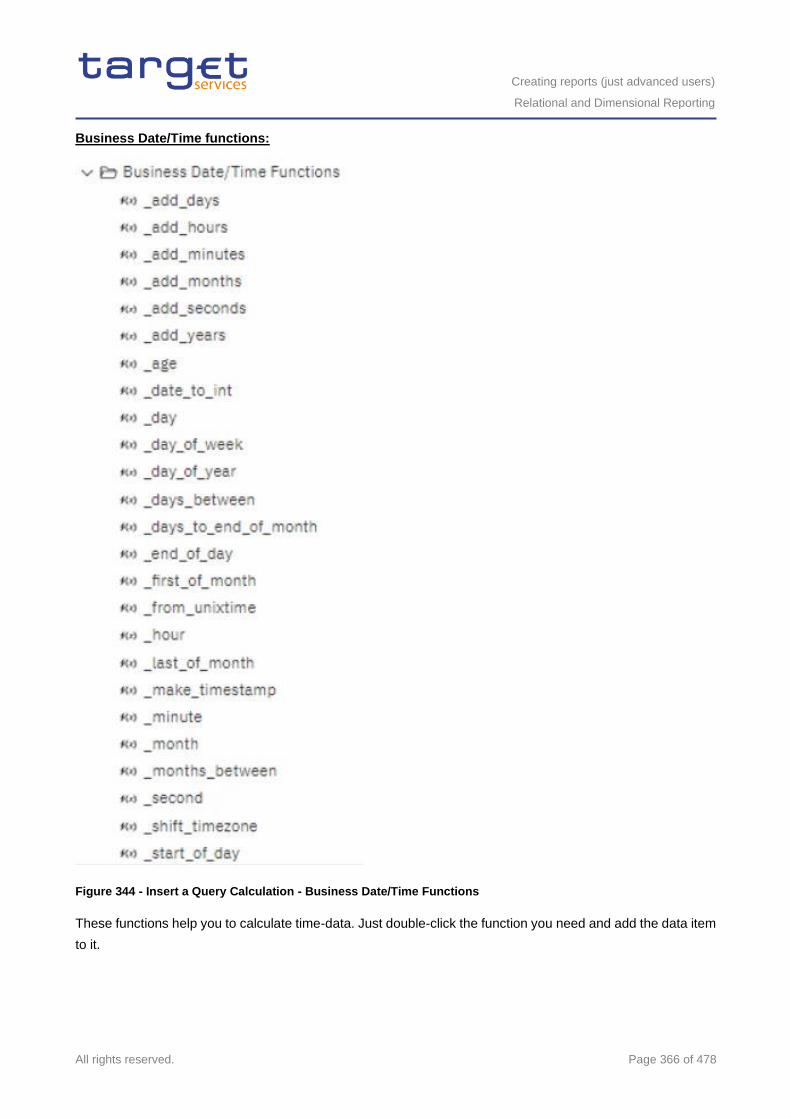
Creating reports (just advanced users)
Relational and Dimensional Reporting
All rights reserved. Page 366 of 478
Business Date/Time functions:
Figure 344 - Insert a Query Calculation - Business Date/Time Functions
These functions help you to calculate time-data. Just double-click the function you need and add the data item
to it.
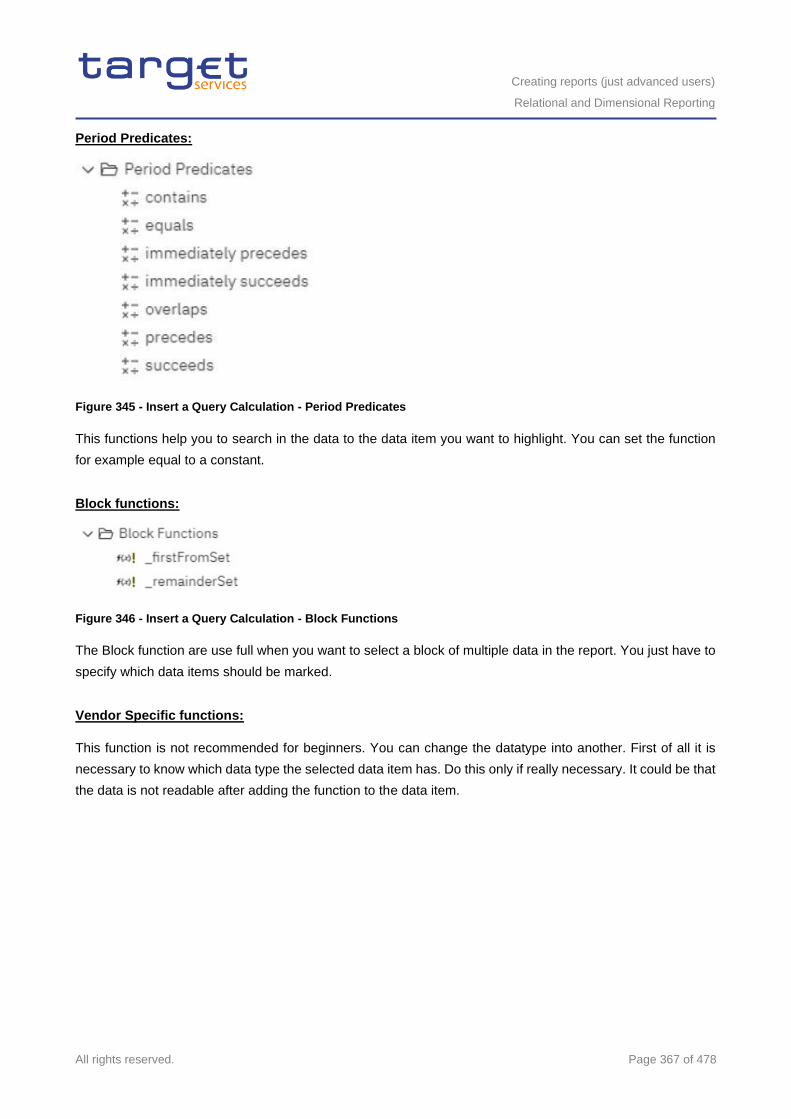
Creating reports (just advanced users)
Relational and Dimensional Reporting
All rights reserved. Page 367 of 478
Period Predicates:
Figure 345 - Insert a Query Calculation - Period Predicates
This functions help you to search in the data to the data item you want to highlight. You can set the function
for example equal to a constant.
Block functions:
Figure 346 - Insert a Query Calculation - Block Functions
The Block function are use full when you want to select a block of multiple data in the report. You just have to
specify which data items should be marked.
Vendor Specific functions:
This function is not recommended for beginners. You can change the datatype into another. First of all it is
necessary to know which data type the selected data item has. Do this only if really necessary. It could be that
the data is not readable after adding the function to the data item.
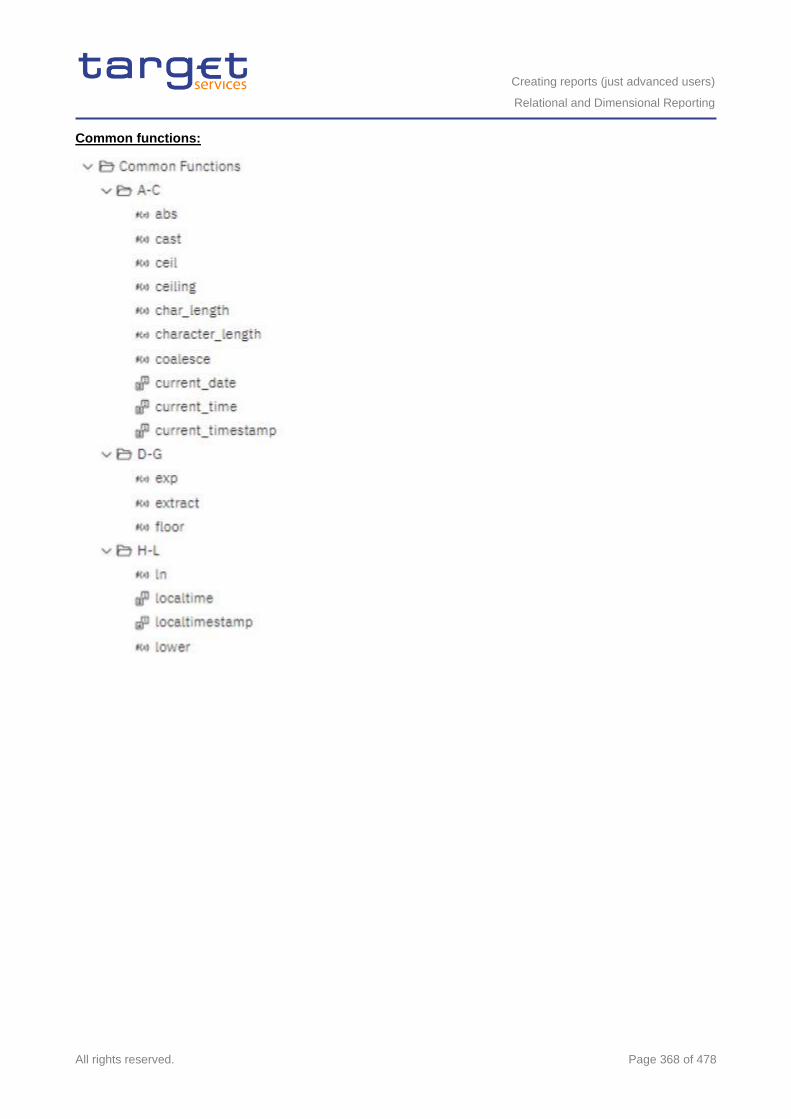
Creating reports (just advanced users)
Relational and Dimensional Reporting
All rights reserved. Page 368 of 478
Common functions:
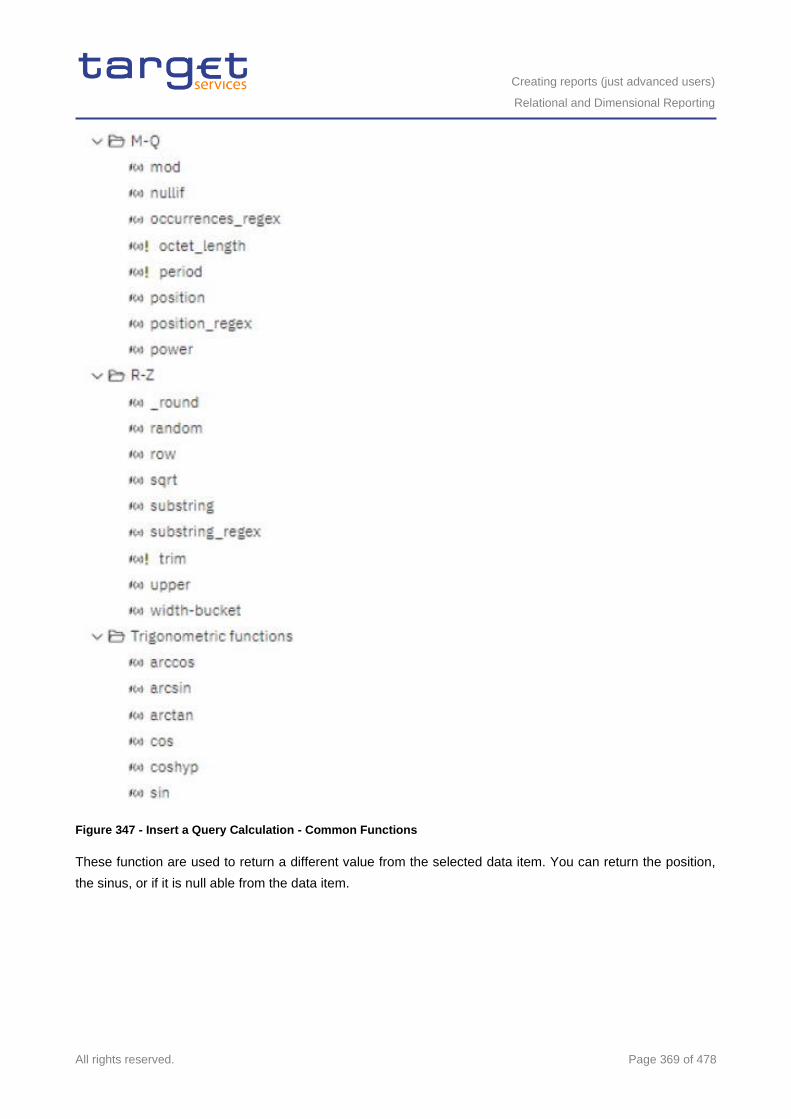
Creating reports (just advanced users)
Relational and Dimensional Reporting
All rights reserved. Page 369 of 478
Figure 347 - Insert a Query Calculation - Common Functions
These function are used to return a different value from the selected data item. You can return the position,
the sinus, or if it is null able from the data item.
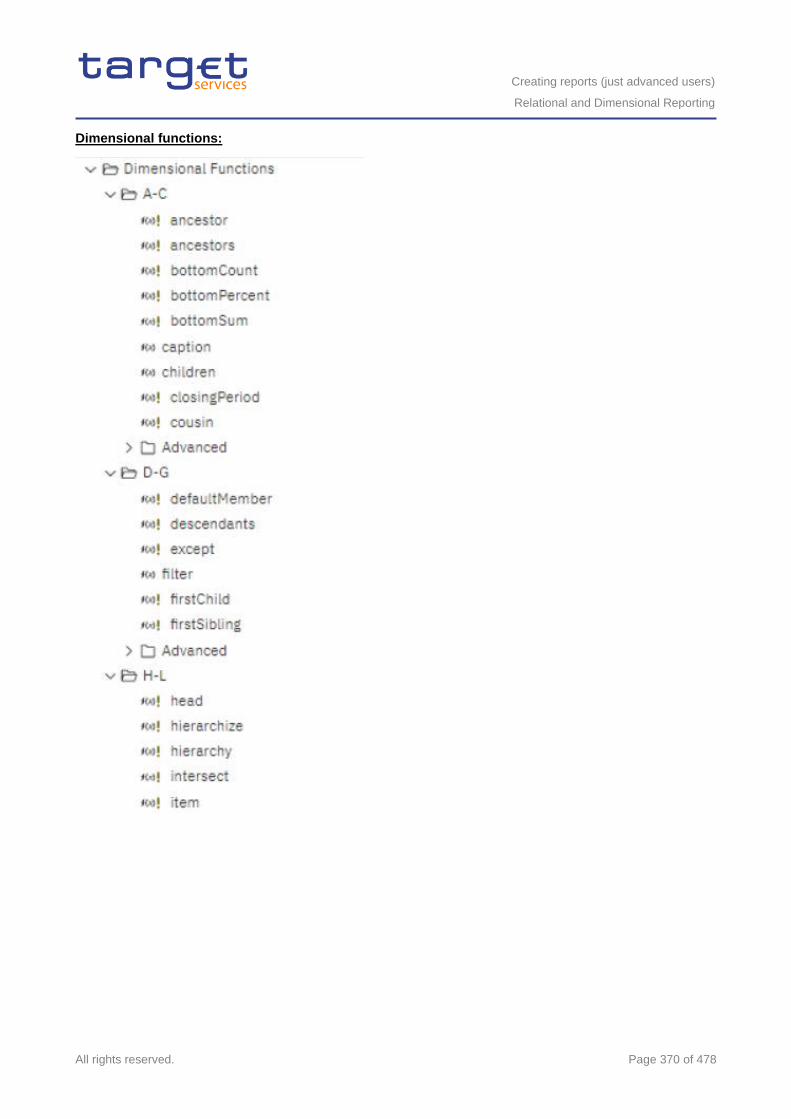
Creating reports (just advanced users)
Relational and Dimensional Reporting
All rights reserved. Page 370 of 478
Dimensional functions:
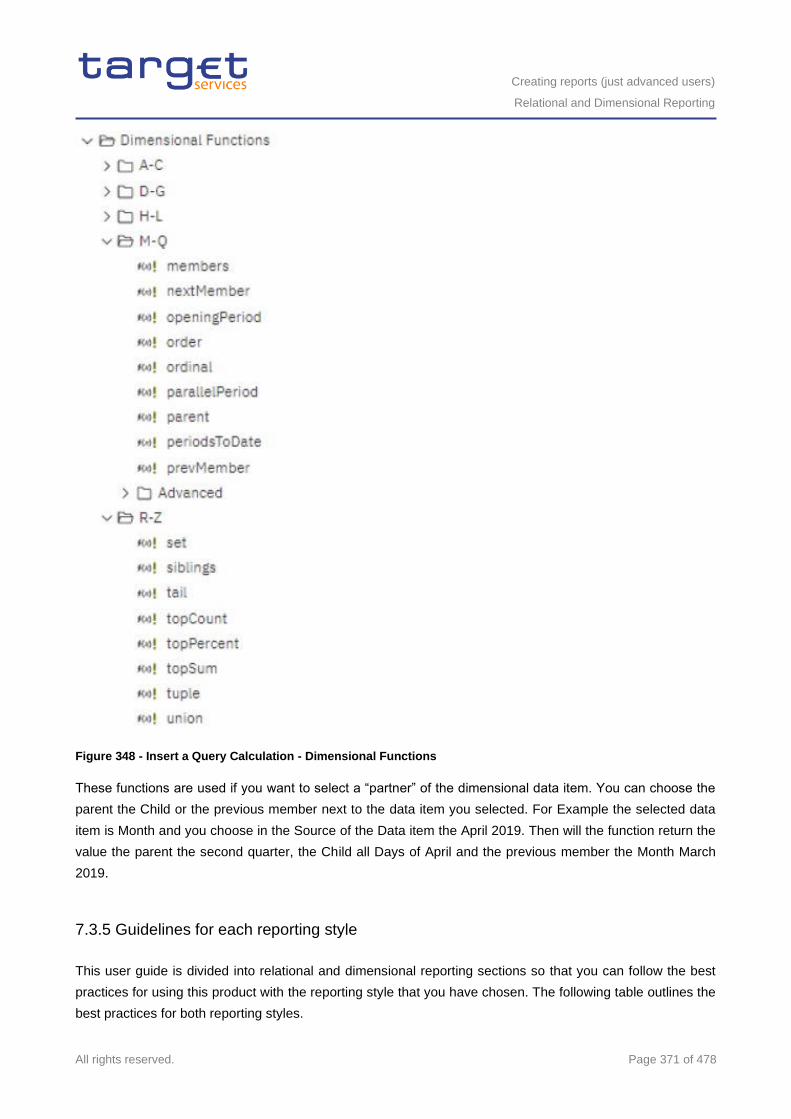
Creating reports (just advanced users)
Relational and Dimensional Reporting
All rights reserved. Page 371 of 478
Figure 348 - Insert a Query Calculation - Dimensional Functions
These functions are used if you want to select a “partner” of the dimensional data item. You can choose the
parent the Child or the previous member next to the data item you selected. For Example the selected data
item is Month and you choose in the Source of the Data item the April 2019. Then will the function return the
value the parent the second quarter, the Child all Days of April and the previous member the Month March
2019.
7.3.5 Guidelines for each reporting style
This user guide is divided into relational and dimensional reporting sections so that you can follow the best
practices for using this product with the reporting style that you have chosen. The following table outlines the
best practices for both reporting styles.
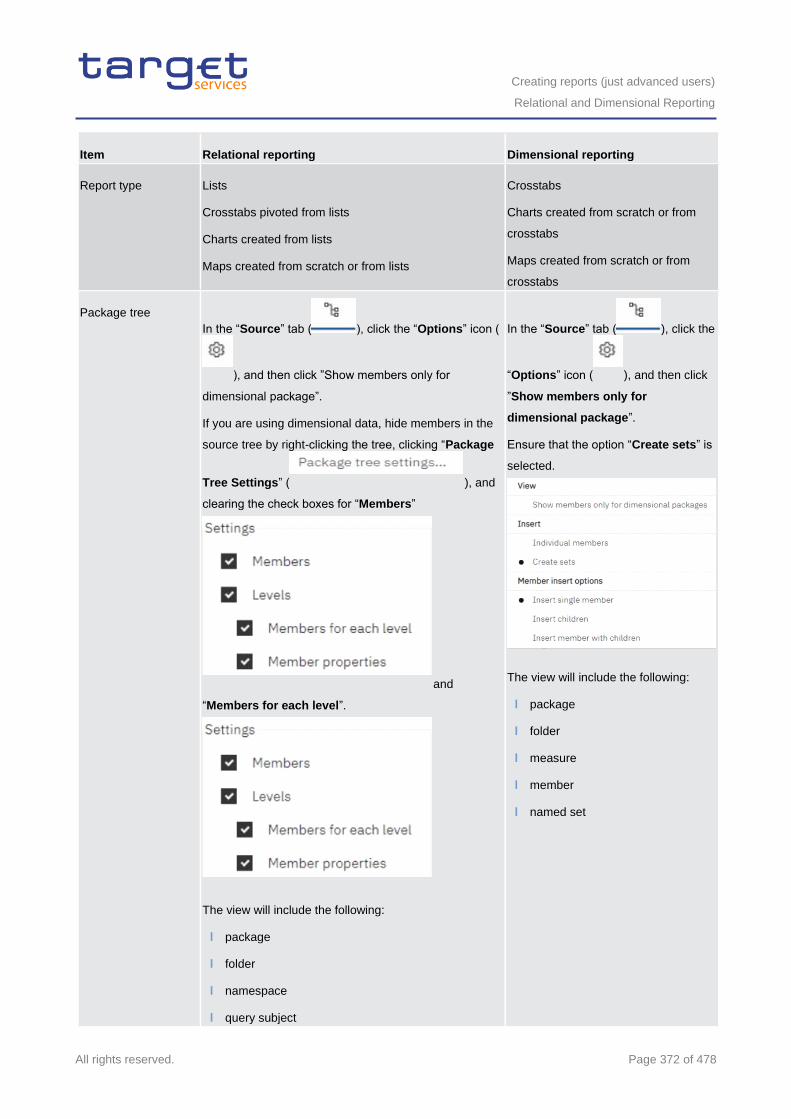
Creating reports (just advanced users)
Relational and Dimensional Reporting
All rights reserved. Page 372 of 478
Item Relational reporting Dimensional reporting
Report type Lists
Crosstabs pivoted from lists
Charts created from lists
Maps created from scratch or from lists
Crosstabs
Charts created from scratch or from
crosstabs
Maps created from scratch or from
crosstabs
Package tree
In the “Source” tab ( ), click the “Options” icon (
), and then click ”Show members only for
dimensional package”.
If you are using dimensional data, hide members in the
source tree by right-clicking the tree, clicking “Package
Tree Settings” ( ), and
clearing the check boxes for “Members”
and
“Members for each level”.
The view will include the following:
l package
l folder
l namespace
l query subject
In the “Source” tab ( ), click the
“Options” icon ( ), and then click
”Show members only for
dimensional package”.
Ensure that the option “Create sets” is
selected.
The view will include the following:
l package
l folder
l measure
l member
l named set
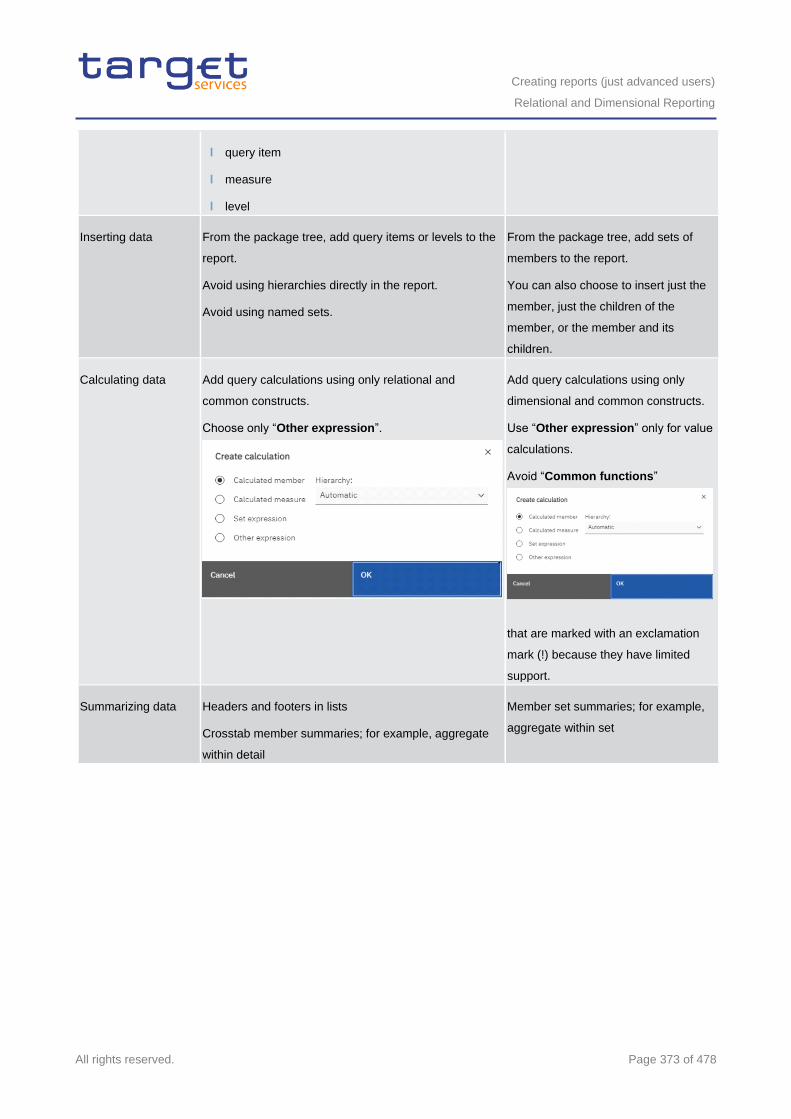
Creating reports (just advanced users)
Relational and Dimensional Reporting
All rights reserved. Page 373 of 478
l query item
l measure
l level
Inserting data From the package tree, add query items or levels to the
report.
Avoid using hierarchies directly in the report.
Avoid using named sets.
From the package tree, add sets of
members to the report.
You can also choose to insert just the
member, just the children of the
member, or the member and its
children.
Calculating data Add query calculations using only relational and
common constructs.
Choose only “Other expression”.
Add query calculations using only
dimensional and common constructs.
Use “Other expression” only for value
calculations.
Avoid “Common functions”
that are marked with an exclamation
mark (!) because they have limited
support.
Summarizing data Headers and footers in lists
Crosstab member summaries; for example, aggregate
within detail
Member set summaries; for example,
aggregate within set

Creating reports (just advanced users)
Create a report
All rights reserved. Page 374 of 478
Focusing data Add detail or summary filters to view only the data you
want to see. For example, add the “Quarter” query item
to a list and filter by Q3.
Add only the relevant members to an
edge of the crosstab or to the context
filter. For example, only add the Q3
member to your report.
Use a set expression such as
“Topcount” or “Filter”.
Drilling Drilling through by value Drilling through by member
Drilling up and down
Page and section
breaks
Simple page breaks
Page sets
Sections
Master detail relationships using parameterized filters
Simple page breaks
Page sets
Page layers
Master detail relationships using
parameterized edge or slicer
expressions
Table 94 - Guidelines for each reporting style
7.4 Create a report
Create a report by clicking the “Open menu” icon ( ) and then clicking on “New” icon (
) and “Report” icon (
) in the DWH portal on the left side.
7.4.1 Templates and themes
The DWH includes several basic report templates and colour themes that you can choose from when you
create a new report.
The templates and themes are stored in the Templates.zip deployment file. If you do not see the list of
templates and themes when you create a new report, ask your administrator to import the deployment file into
the DWH Administration. After the deployment file is imported, the templates appear in the Templates folder
in Team content.
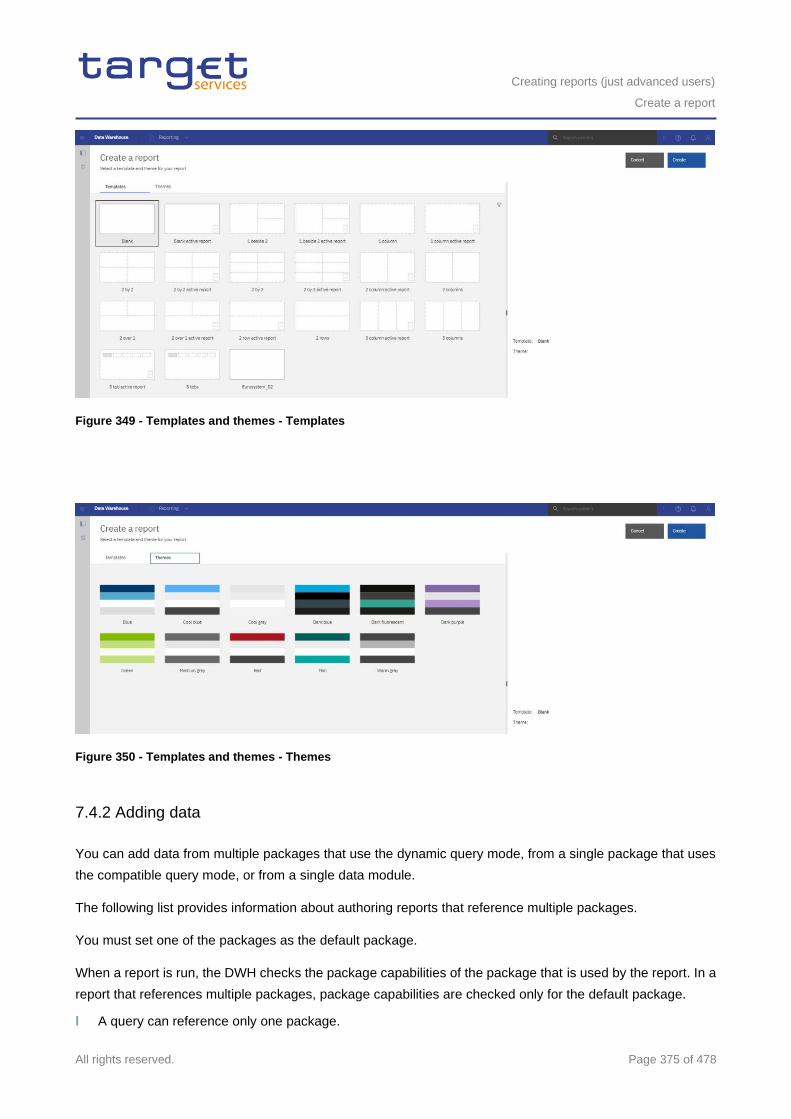
Creating reports (just advanced users)
Create a report
All rights reserved. Page 375 of 478
Figure 349 - Templates and themes - Templates
Figure 350 - Templates and themes - Themes
7.4.2 Adding data
You can add data from multiple packages that use the dynamic query mode, from a single package that uses
the compatible query mode, or from a single data module.
The following list provides information about authoring reports that reference multiple packages.
You must set one of the packages as the default package.
When a report is run, the DWH checks the package capabilities of the package that is used by the report. In a
report that references multiple packages, package capabilities are checked only for the default package.
l A query can reference only one package.
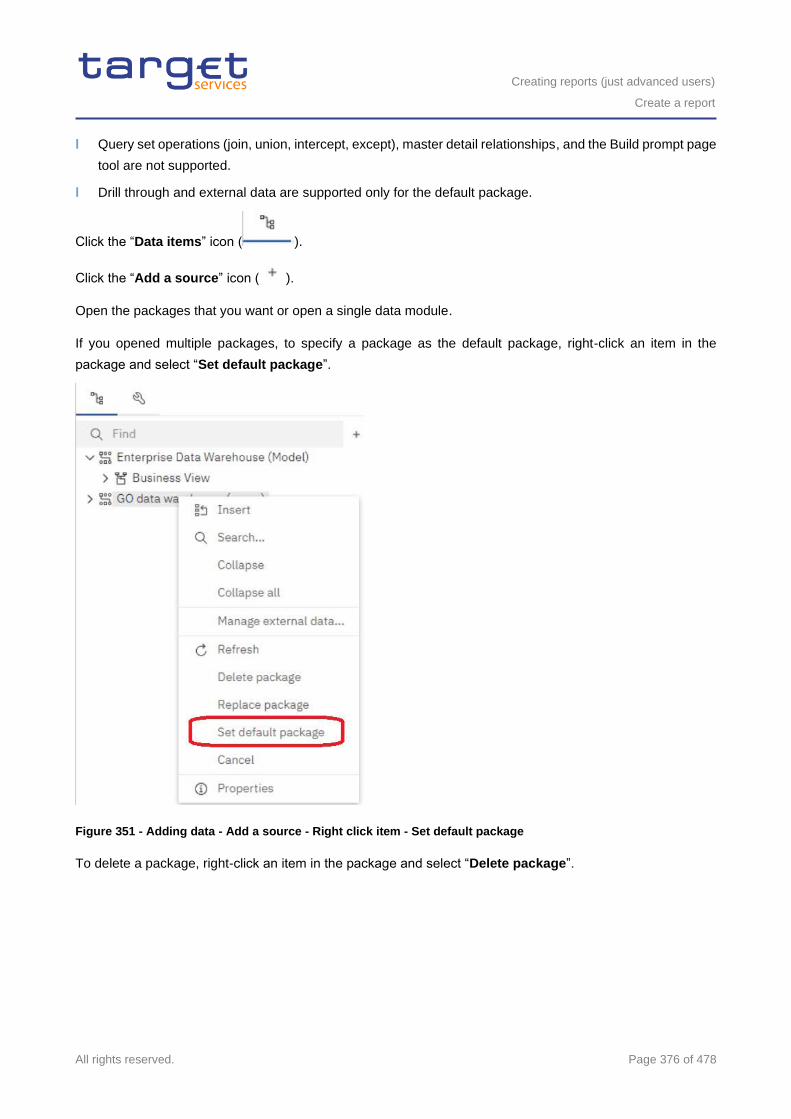
Creating reports (just advanced users)
Create a report
All rights reserved. Page 376 of 478
l Query set operations (join, union, intercept, except), master detail relationships, and the Build prompt page
tool are not supported.
l Drill through and external data are supported only for the default package.
Click the “Data items” icon ( ).
Click the “Add a source” icon ( ).
Open the packages that you want or open a single data module.
If you opened multiple packages, to specify a package as the default package, right-click an item in the
package and select “Set default package”.
Figure 351 - Adding data - Add a source - Right click item - Set default package
To delete a package, right-click an item in the package and select “Delete package”.
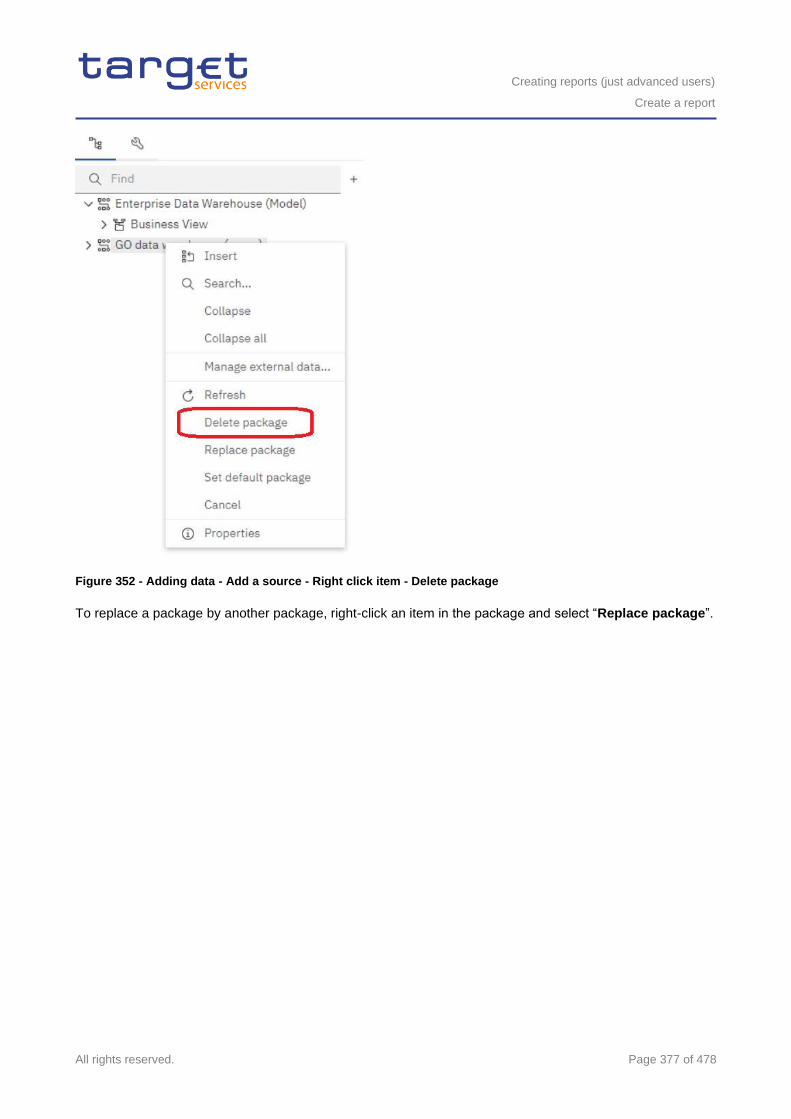
Creating reports (just advanced users)
Create a report
All rights reserved. Page 377 of 478
Figure 352 - Adding data - Add a source - Right click item - Delete package
To replace a package by another package, right-click an item in the package and select “Replace package”.
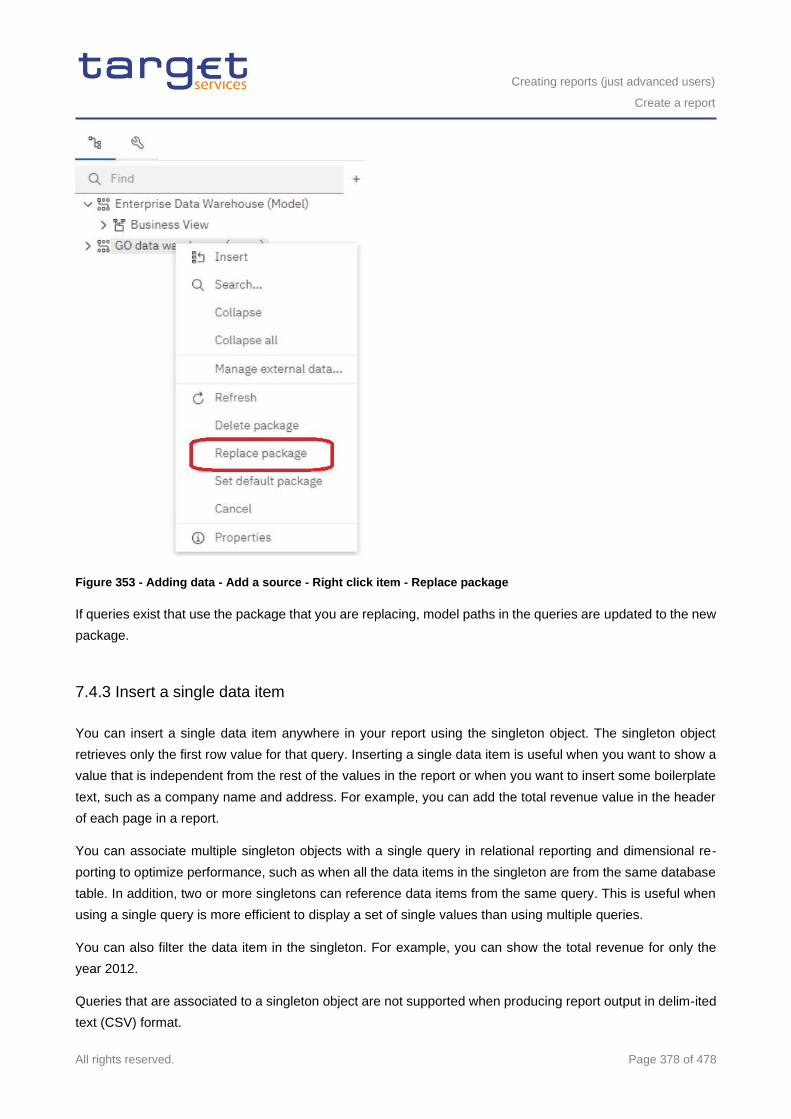
Creating reports (just advanced users)
Create a report
All rights reserved. Page 378 of 478
Figure 353 - Adding data - Add a source - Right click item - Replace package
If queries exist that use the package that you are replacing, model paths in the queries are updated to the new
package.
7.4.3 Insert a single data item
You can insert a single data item anywhere in your report using the singleton object. The singleton object
retrieves only the first row value for that query. Inserting a single data item is useful when you want to show a
value that is independent from the rest of the values in the report or when you want to insert some boilerplate
text, such as a company name and address. For example, you can add the total revenue value in the header
of each page in a report.
You can associate multiple singleton objects with a single query in relational reporting and dimensional re-
porting to optimize performance, such as when all the data items in the singleton are from the same database
table. In addition, two or more singletons can reference data items from the same query. This is useful when
using a single query is more efficient to display a set of single values than using multiple queries.
You can also filter the data item in the singleton. For example, you can show the total revenue for only the
year 2012.
Queries that are associated to a singleton object are not supported when producing report output in delim-ited
text (CSV) format.
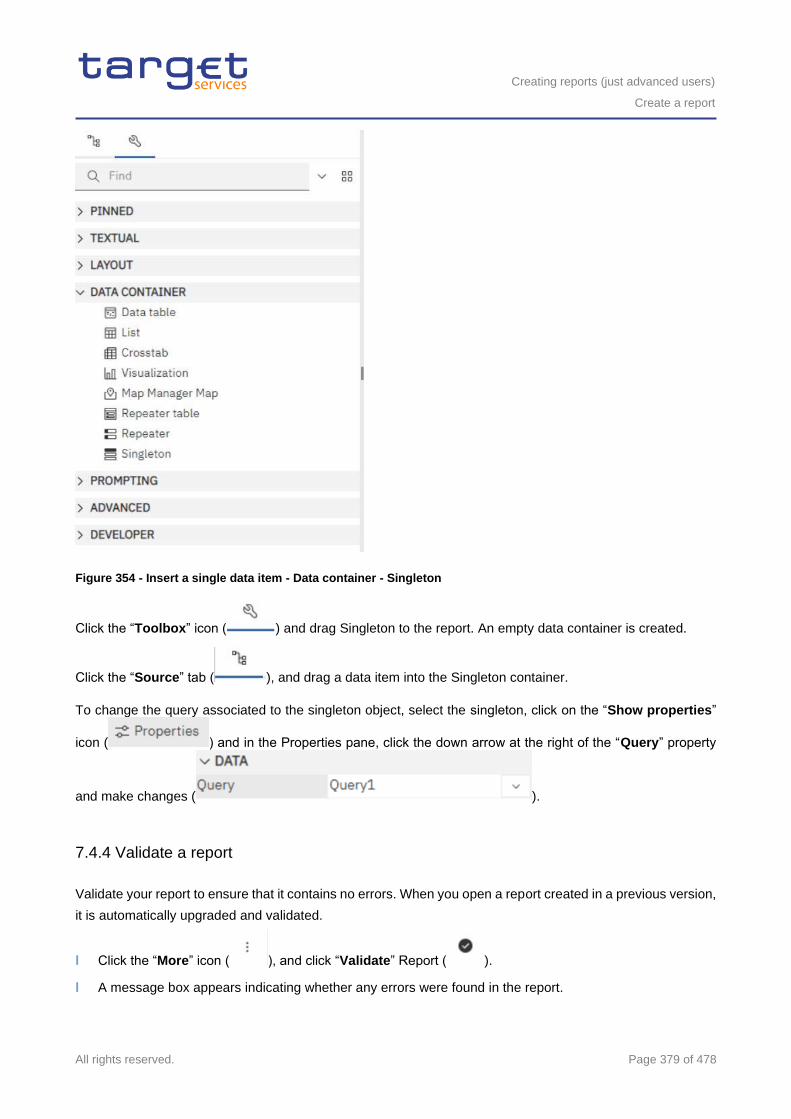
Creating reports (just advanced users)
Create a report
All rights reserved. Page 379 of 478
Figure 354 - Insert a single data item - Data container - Singleton
Click the “Toolbox” icon ( ) and drag Singleton to the report. An empty data container is created.
Click the “Source” tab ( ), and drag a data item into the Singleton container.
To change the query associated to the singleton object, select the singleton, click on the “Show properties”
icon ( ) and in the Properties pane, click the down arrow at the right of the “Query” property
and make changes ( ).
7.4.4 Validate a report
Validate your report to ensure that it contains no errors. When you open a report created in a previous version,
it is automatically upgraded and validated.
l Click the “More” icon ( ), and click “Validate” Report ( ).
l A message box appears indicating whether any errors were found in the report.
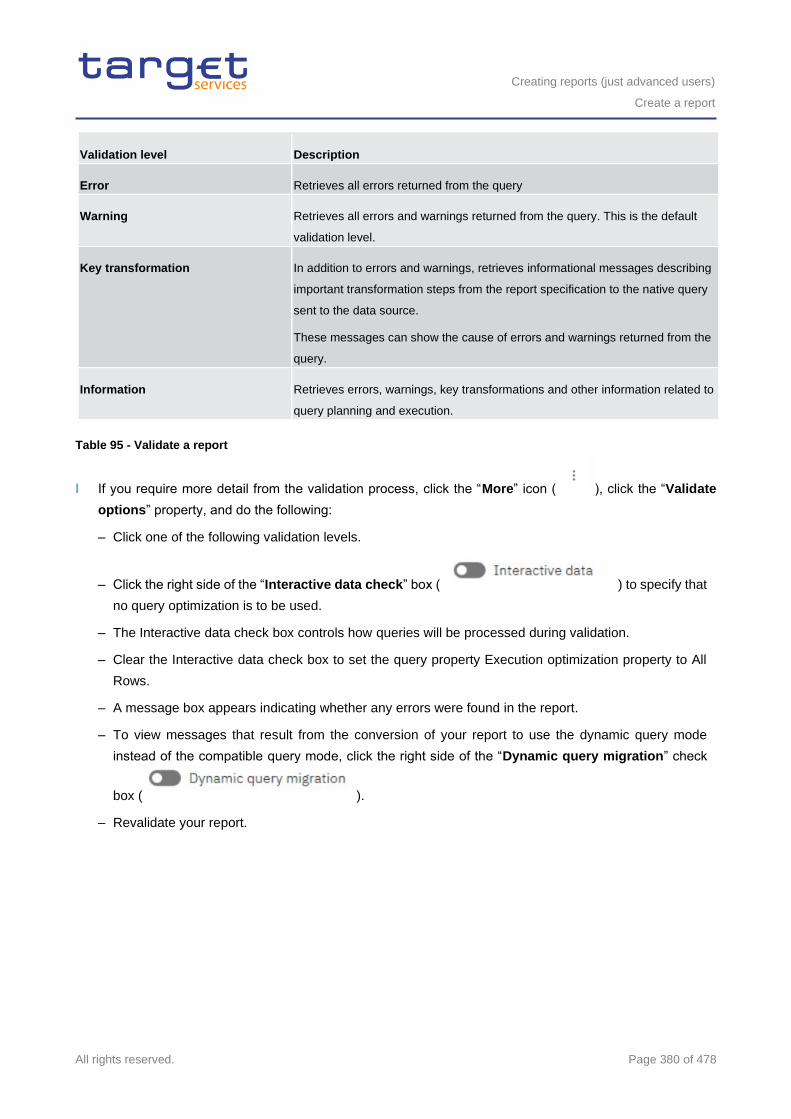
Creating reports (just advanced users)
Create a report
All rights reserved. Page 380 of 478
Validation level Description
Error Retrieves all errors returned from the query
Warning Retrieves all errors and warnings returned from the query. This is the default
validation level.
Key transformation In addition to errors and warnings, retrieves informational messages describing
important transformation steps from the report specification to the native query
sent to the data source.
These messages can show the cause of errors and warnings returned from the
query.
Information Retrieves errors, warnings, key transformations and other information related to
query planning and execution.
Table 95 - Validate a report
l If you require more detail from the validation process, click the “More” icon ( ), click the “Validate
options” property, and do the following:
– Click one of the following validation levels.
– Click the right side of the “Interactive data check” box ( ) to specify that
no query optimization is to be used.
– The Interactive data check box controls how queries will be processed during validation.
– Clear the Interactive data check box to set the query property Execution optimization property to All
Rows.
– A message box appears indicating whether any errors were found in the report.
– To view messages that result from the conversion of your report to use the dynamic query mode
instead of the compatible query mode, click the right side of the “Dynamic query migration” check
box ( ).
– Revalidate your report.
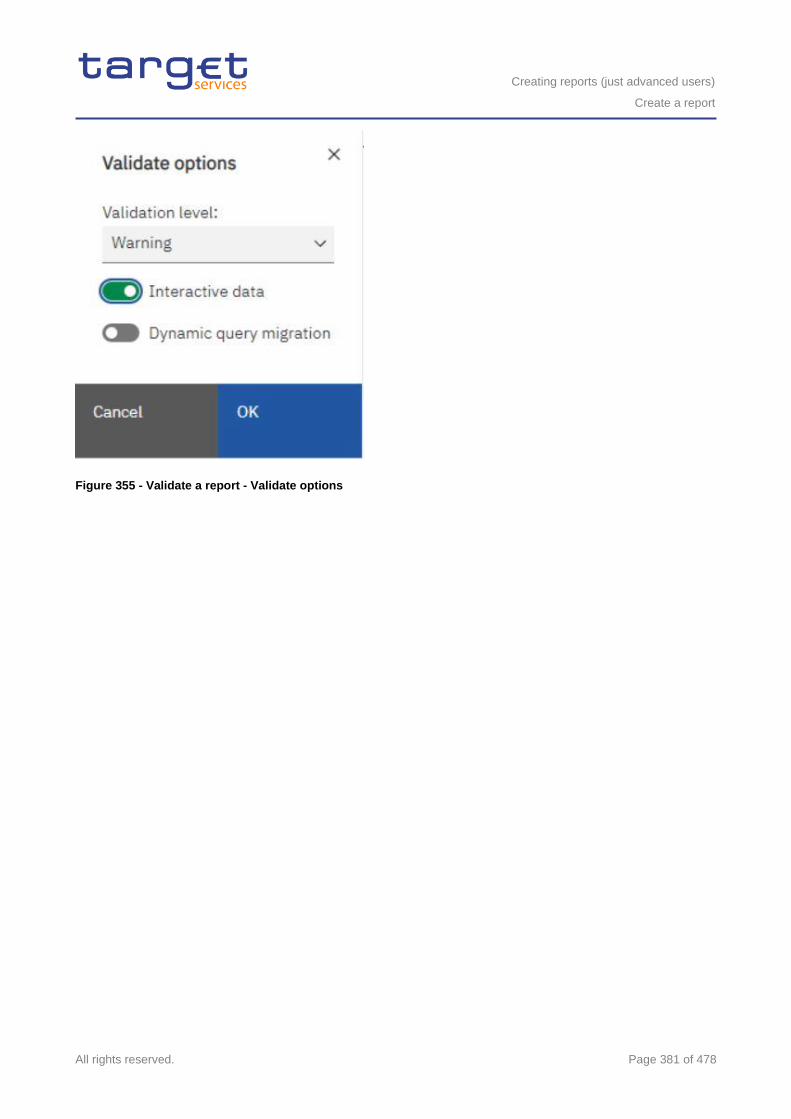
Creating reports (just advanced users)
Create a report
All rights reserved. Page 381 of 478
Figure 355 - Validate a report - Validate options
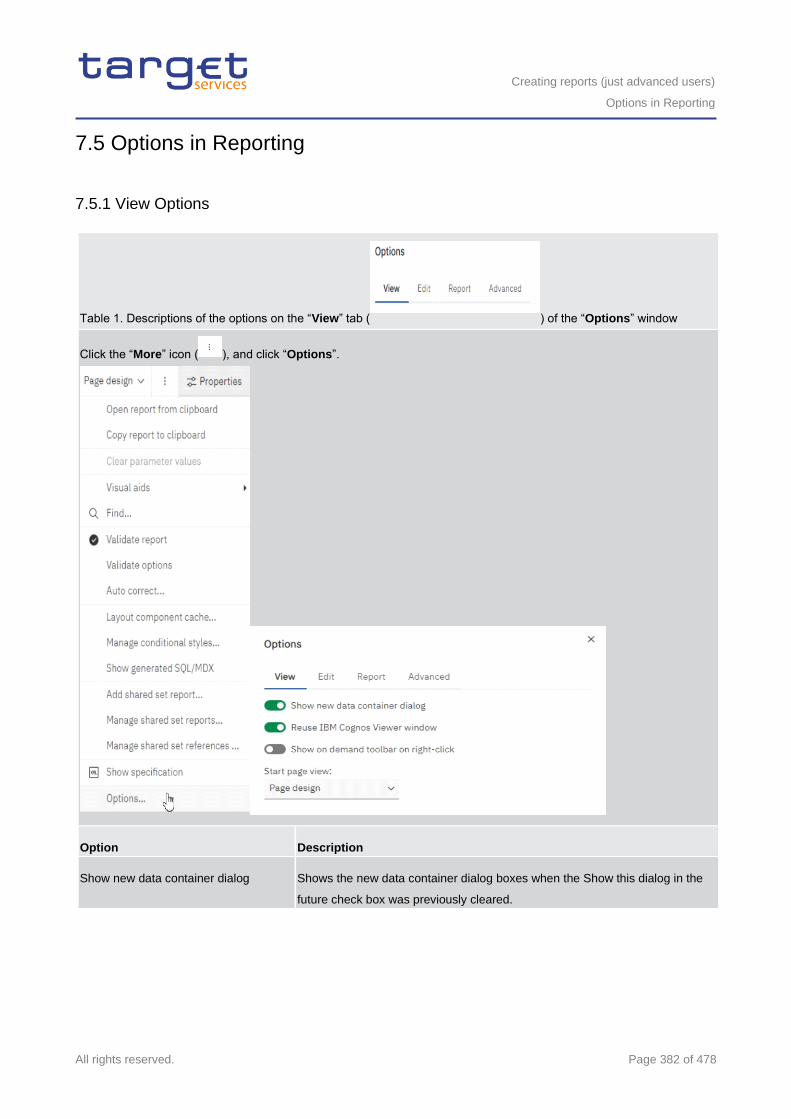
Creating reports (just advanced users)
Options in Reporting
All rights reserved. Page 382 of 478
7.5 Options in Reporting
7.5.1 View Options
Table 1. Descriptions of the options on the “View” tab ( ) of the “Options” window
Click the “More” icon ( ), and click “Options”.
Option Description
Show new data container dialog Shows the new data container dialog boxes when the Show this dialog in the
future check box was previously cleared.
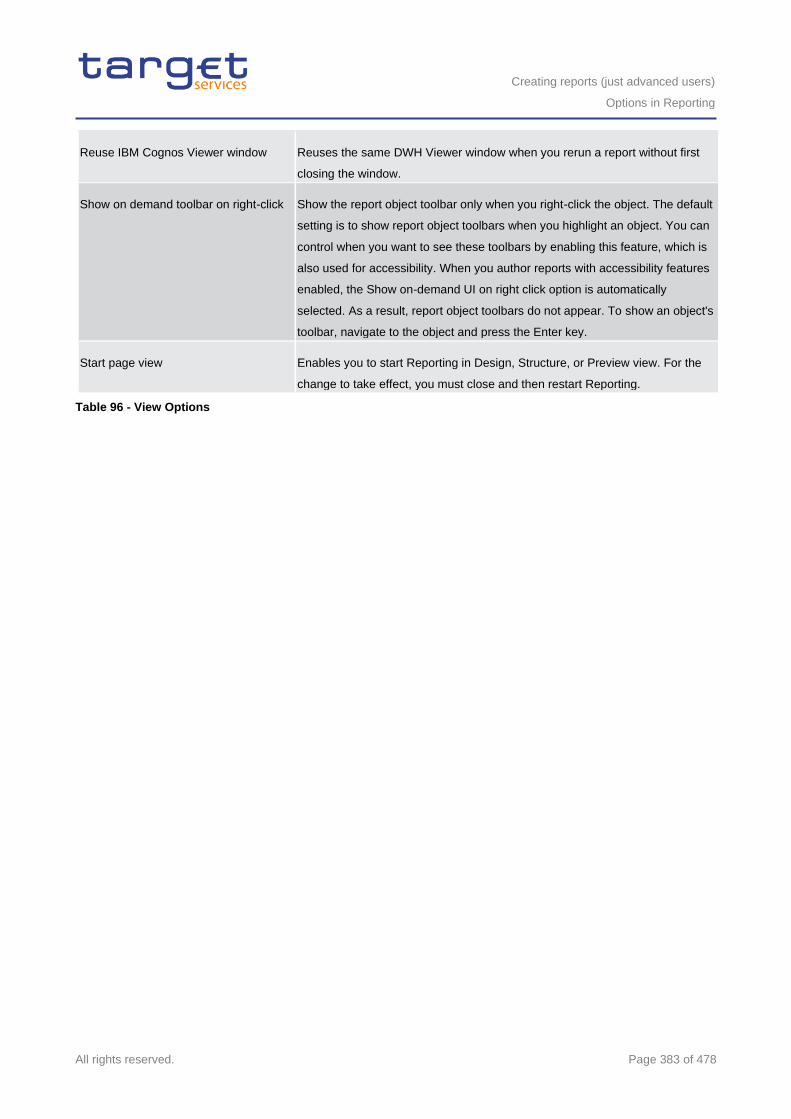
Creating reports (just advanced users)
Options in Reporting
All rights reserved. Page 383 of 478
Reuse IBM Cognos Viewer window Reuses the same DWH Viewer window when you rerun a report without first
closing the window.
Show on demand toolbar on right-click Show the report object toolbar only when you right-click the object. The default
setting is to show report object toolbars when you highlight an object. You can
control when you want to see these toolbars by enabling this feature, which is
also used for accessibility. When you author reports with accessibility features
enabled, the Show on-demand UI on right click option is automatically
selected. As a result, report object toolbars do not appear. To show an object's
toolbar, navigate to the object and press the Enter key.
Start page view Enables you to start Reporting in Design, Structure, or Preview view. For the
change to take effect, you must close and then restart Reporting.
Table 96 - View Options
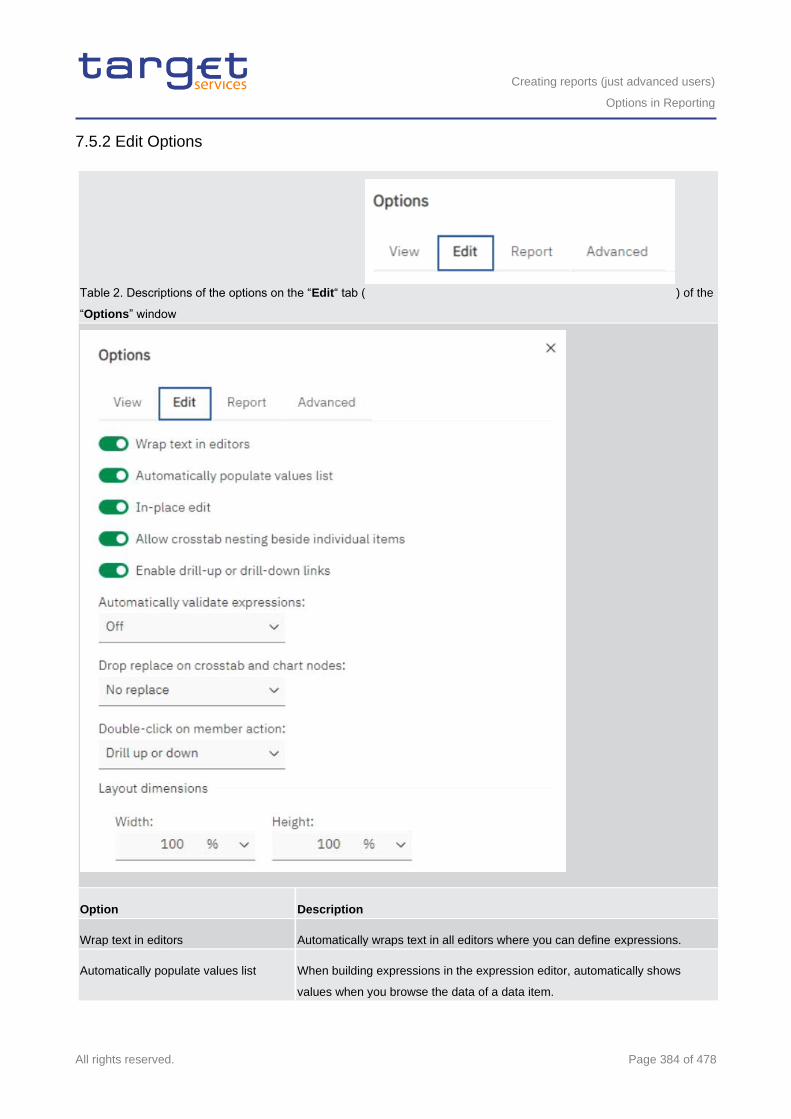
Creating reports (just advanced users)
Options in Reporting
All rights reserved. Page 384 of 478
7.5.2 Edit Options
Table 2. Descriptions of the options on the “Edit“ tab ( ) of the
“Options” window
Option Description
Wrap text in editors Automatically wraps text in all editors where you can define expressions.
Automatically populate values list When building expressions in the expression editor, automatically shows
values when you browse the data of a data item.
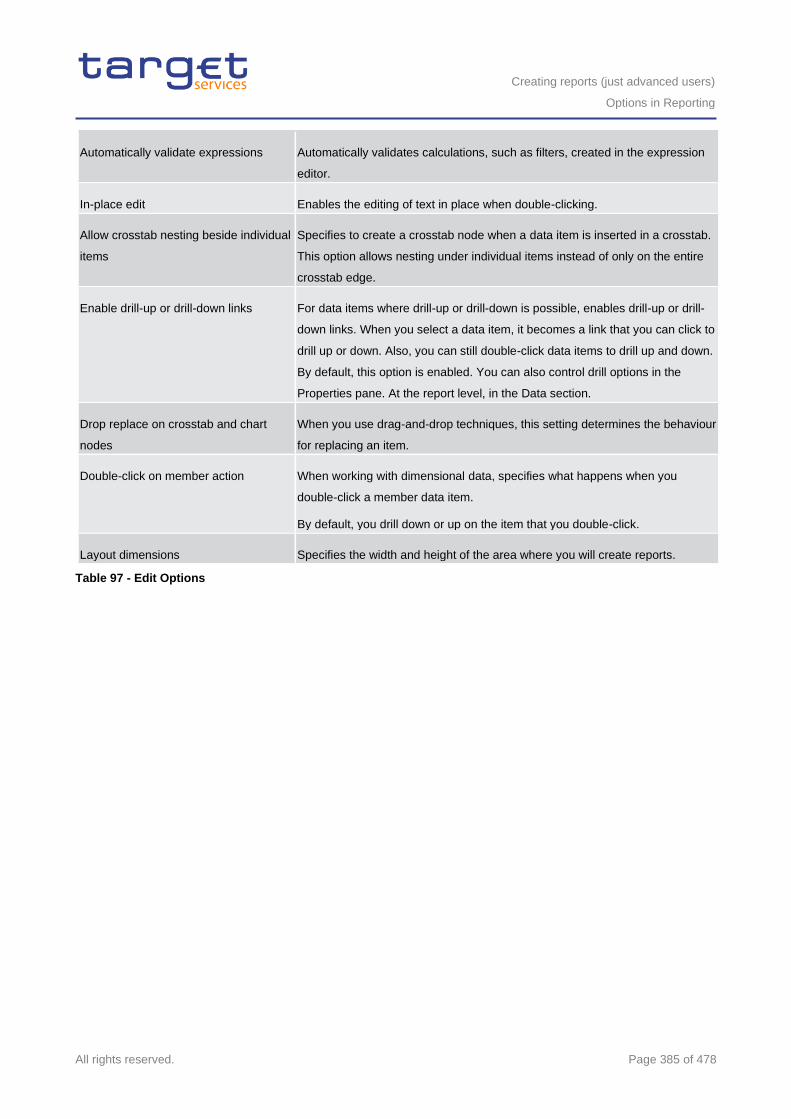
Creating reports (just advanced users)
Options in Reporting
All rights reserved. Page 385 of 478
Automatically validate expressions Automatically validates calculations, such as filters, created in the expression
editor.
In-place edit Enables the editing of text in place when double-clicking.
Allow crosstab nesting beside individual
items
Specifies to create a crosstab node when a data item is inserted in a crosstab.
This option allows nesting under individual items instead of only on the entire
crosstab edge.
Enable drill-up or drill-down links For data items where drill-up or drill-down is possible, enables drill-up or drill-
down links. When you select a data item, it becomes a link that you can click to
drill up or down. Also, you can still double-click data items to drill up and down.
By default, this option is enabled. You can also control drill options in the
Properties pane. At the report level, in the Data section.
Drop replace on crosstab and chart
nodes
When you use drag-and-drop techniques, this setting determines the behaviour
for replacing an item.
Double-click on member action When working with dimensional data, specifies what happens when you
double-click a member data item.
By default, you drill down or up on the item that you double-click.
Layout dimensions Specifies the width and height of the area where you will create reports.
Table 97 - Edit Options
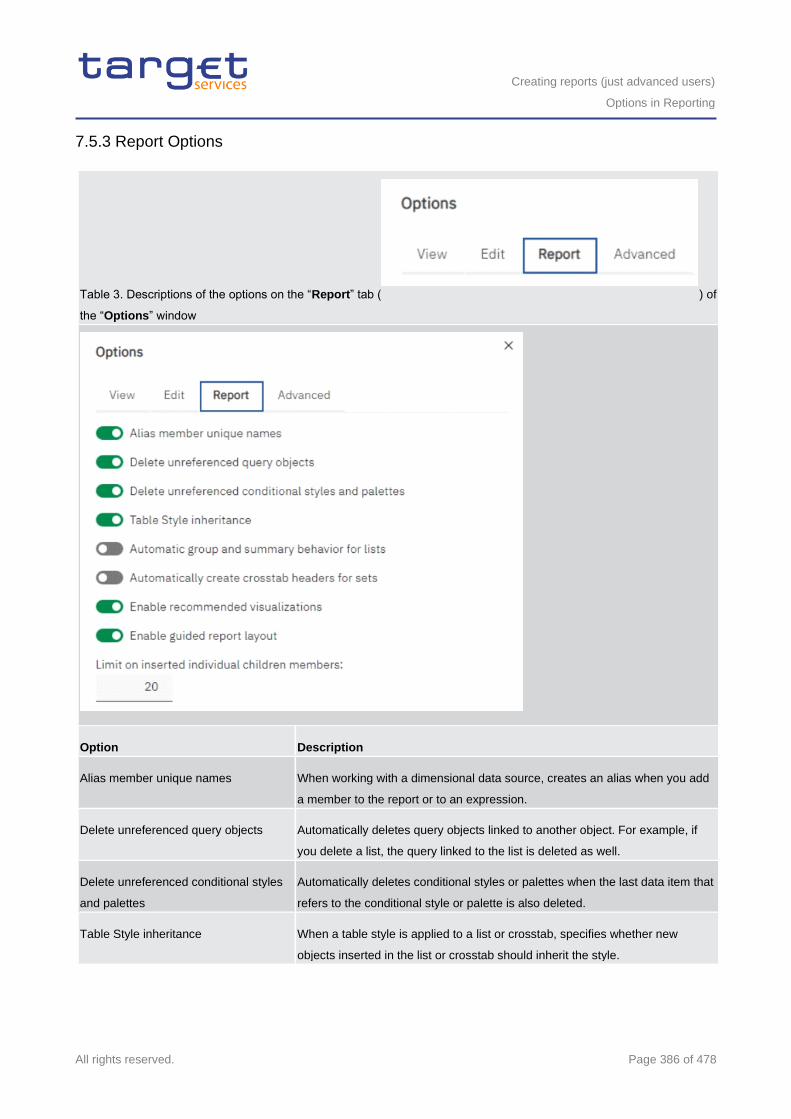
Creating reports (just advanced users)
Options in Reporting
All rights reserved. Page 386 of 478
7.5.3 Report Options
Table 3. Descriptions of the options on the “Report” tab ( ) of
the “Options” window
Option Description
Alias member unique names When working with a dimensional data source, creates an alias when you add
a member to the report or to an expression.
Delete unreferenced query objects Automatically deletes query objects linked to another object. For example, if
you delete a list, the query linked to the list is deleted as well.
Delete unreferenced conditional styles
and palettes
Automatically deletes conditional styles or palettes when the last data item that
refers to the conditional style or palette is also deleted.
Table Style inheritance When a table style is applied to a list or crosstab, specifies whether new
objects inserted in the list or crosstab should inherit the style.
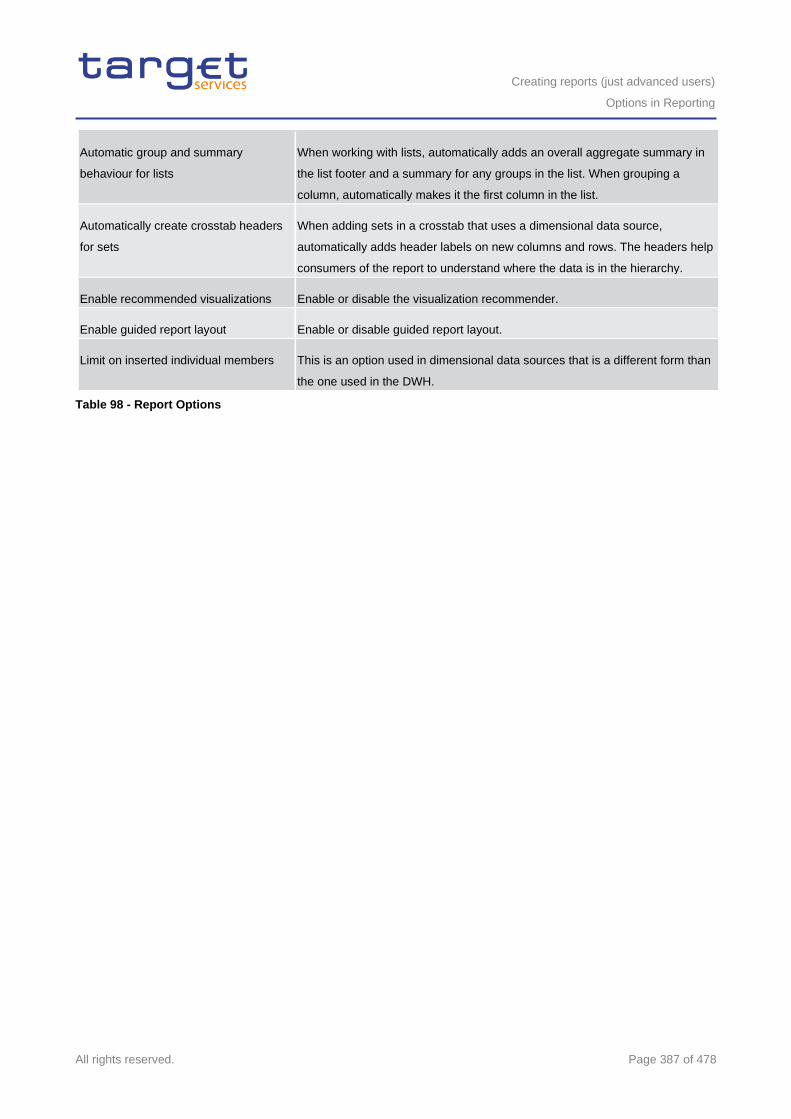
Creating reports (just advanced users)
Options in Reporting
All rights reserved. Page 387 of 478
Automatic group and summary
behaviour for lists
When working with lists, automatically adds an overall aggregate summary in
the list footer and a summary for any groups in the list. When grouping a
column, automatically makes it the first column in the list.
Automatically create crosstab headers
for sets
When adding sets in a crosstab that uses a dimensional data source,
automatically adds header labels on new columns and rows. The headers help
consumers of the report to understand where the data is in the hierarchy.
Enable recommended visualizations Enable or disable the visualization recommender.
Enable guided report layout Enable or disable guided report layout.
Limit on inserted individual members This is an option used in dimensional data sources that is a different form than
the one used in the DWH.
Table 98 - Report Options
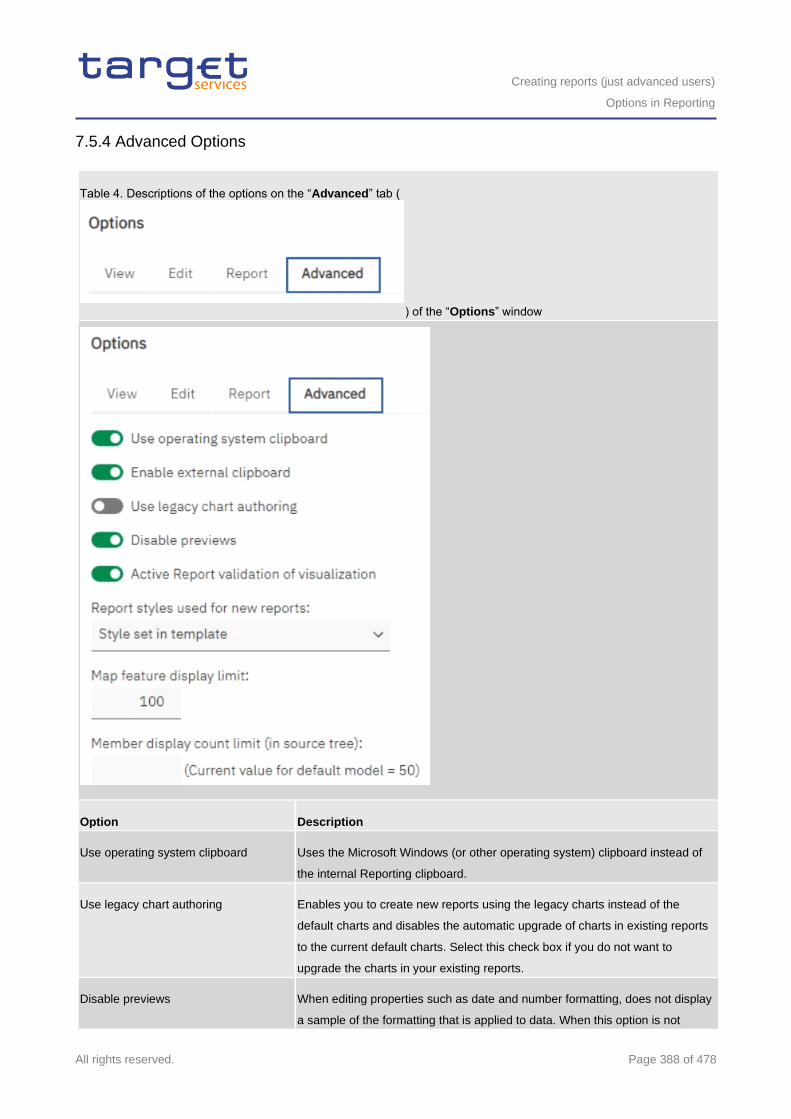
Creating reports (just advanced users)
Options in Reporting
All rights reserved. Page 388 of 478
7.5.4 Advanced Options
Table 4. Descriptions of the options on the “Advanced” tab (
) of the “Options” window
Option Description
Use operating system clipboard Uses the Microsoft Windows (or other operating system) clipboard instead of
the internal Reporting clipboard.
Use legacy chart authoring Enables you to create new reports using the legacy charts instead of the
default charts and disables the automatic upgrade of charts in existing reports
to the current default charts. Select this check box if you do not want to
upgrade the charts in your existing reports.
Disable previews When editing properties such as date and number formatting, does not display
a sample of the formatting that is applied to data. When this option is not
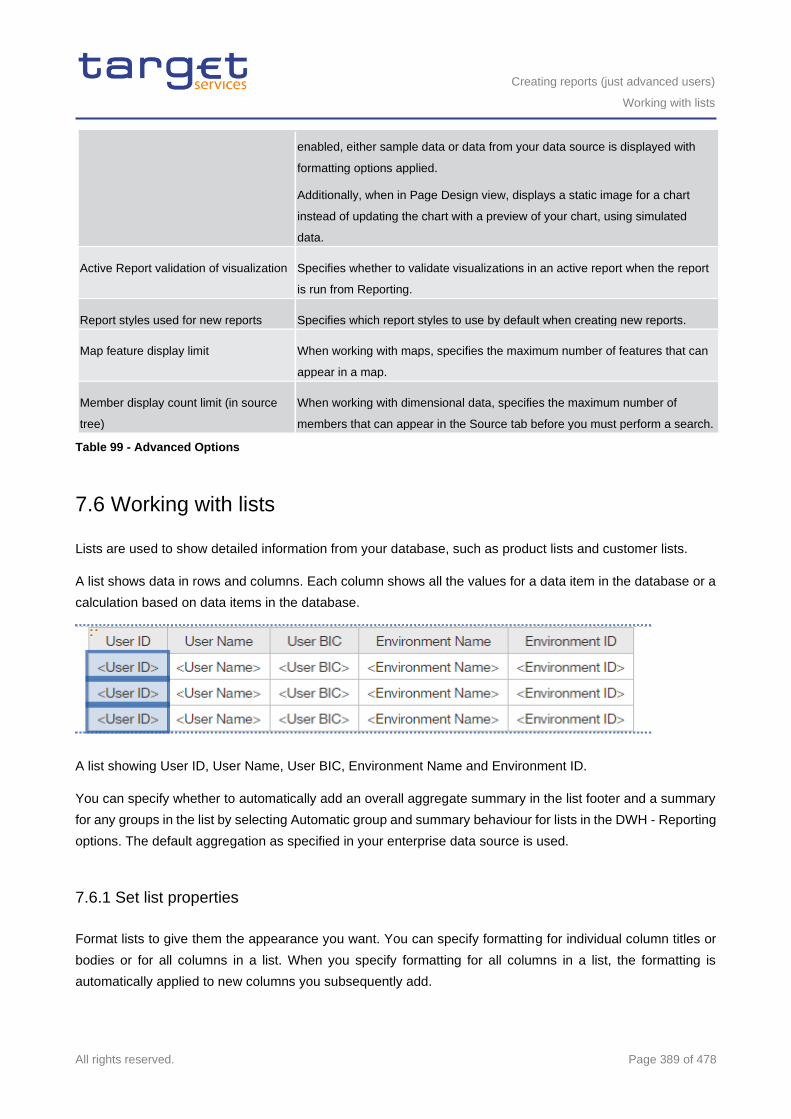
Creating reports (just advanced users)
Working with lists
All rights reserved. Page 389 of 478
enabled, either sample data or data from your data source is displayed with
formatting options applied.
Additionally, when in Page Design view, displays a static image for a chart
instead of updating the chart with a preview of your chart, using simulated
data.
Active Report validation of visualization Specifies whether to validate visualizations in an active report when the report
is run from Reporting.
Report styles used for new reports Specifies which report styles to use by default when creating new reports.
Map feature display limit When working with maps, specifies the maximum number of features that can
appear in a map.
Member display count limit (in source
tree)
When working with dimensional data, specifies the maximum number of
members that can appear in the Source tab before you must perform a search.
Table 99 - Advanced Options
7.6 Working with lists
Lists are used to show detailed information from your database, such as product lists and customer lists.
A list shows data in rows and columns. Each column shows all the values for a data item in the database or a
calculation based on data items in the database.
A list showing User ID, User Name, User BIC, Environment Name and Environment ID.
You can specify whether to automatically add an overall aggregate summary in the list footer and a summary
for any groups in the list by selecting Automatic group and summary behaviour for lists in the DWH - Reporting
options. The default aggregation as specified in your enterprise data source is used.
7.6.1 Set list properties
Format lists to give them the appearance you want. You can specify formatting for individual column titles or
bodies or for all columns in a list. When you specify formatting for all columns in a list, the formatting is
automatically applied to new columns you subsequently add.
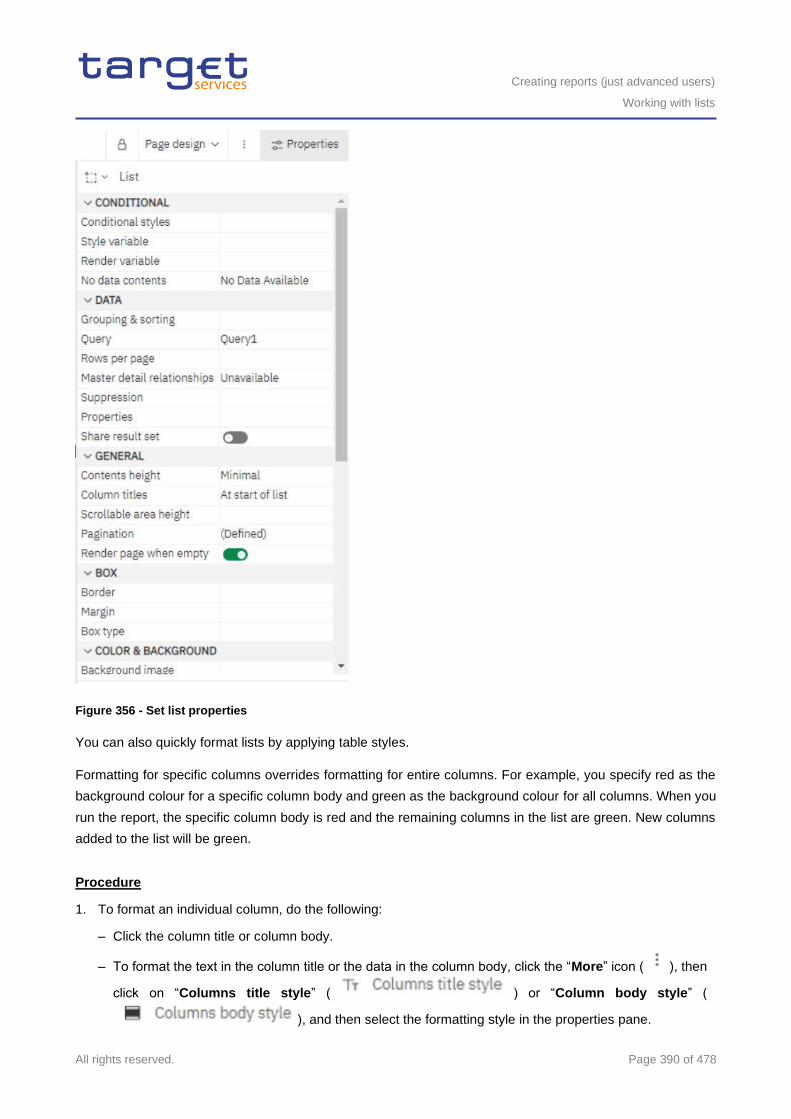
Creating reports (just advanced users)
Working with lists
All rights reserved. Page 390 of 478
Figure 356 - Set list properties
You can also quickly format lists by applying table styles.
Formatting for specific columns overrides formatting for entire columns. For example, you specify red as the
background colour for a specific column body and green as the background colour for all columns. When you
run the report, the specific column body is red and the remaining columns in the list are green. New columns
added to the list will be green.
Procedure
1. To format an individual column, do the following:
– Click the column title or column body.
– To format the text in the column title or the data in the column body, click the “More” icon ( ), then
click on “Columns title style” ( ) or “Column body style” (
), and then select the formatting style in the properties pane.
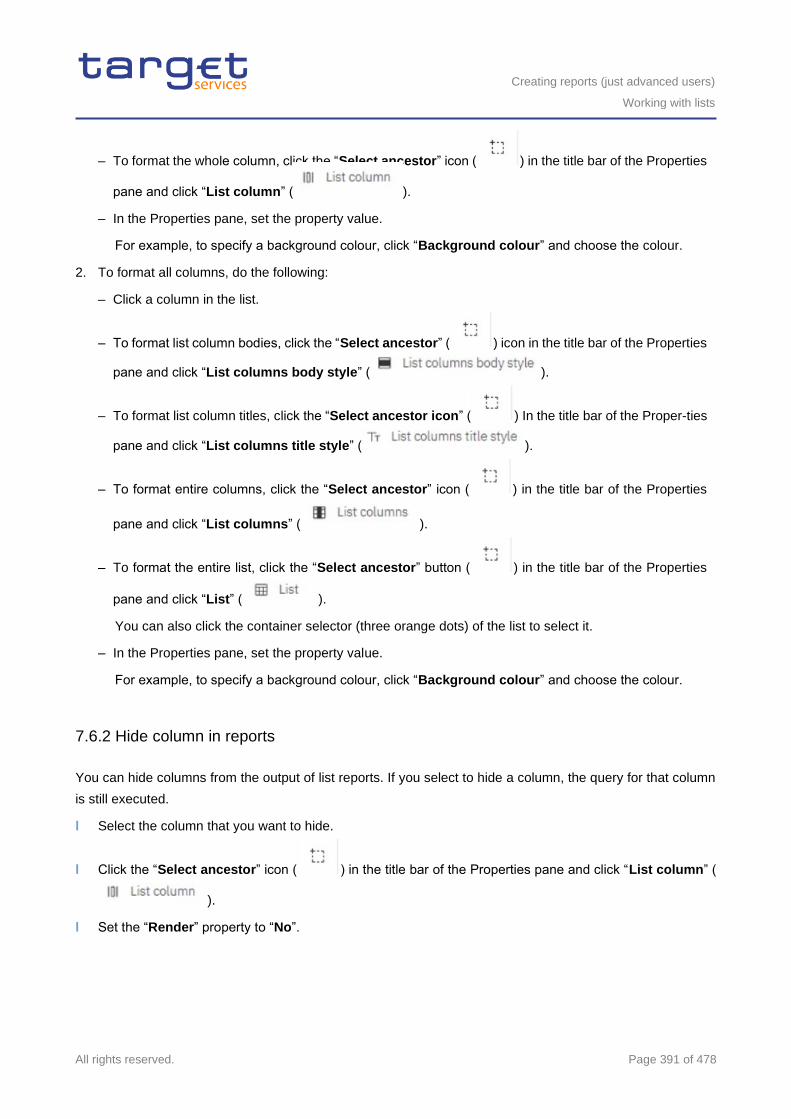
Creating reports (just advanced users)
Working with lists
All rights reserved. Page 391 of 478
– To format the whole column, click the “Select ancestor” icon ( ) in the title bar of the Properties
pane and click “List column” ( ).
– In the Properties pane, set the property value.
For example, to specify a background colour, click “Background colour” and choose the colour.
2. To format all columns, do the following:
– Click a column in the list.
– To format list column bodies, click the “Select ancestor” ( ) icon in the title bar of the Properties
pane and click “List columns body style” ( ).
– To format list column titles, click the “Select ancestor icon” ( ) In the title bar of the Proper-ties
pane and click “List columns title style” ( ).
– To format entire columns, click the “Select ancestor” icon ( ) in the title bar of the Properties
pane and click “List columns” ( ).
– To format the entire list, click the “Select ancestor” button ( ) in the title bar of the Properties
pane and click “List” ( ).
You can also click the container selector (three orange dots) of the list to select it.
– In the Properties pane, set the property value.
For example, to specify a background colour, click “Background colour” and choose the colour.
7.6.2 Hide column in reports
You can hide columns from the output of list reports. If you select to hide a column, the query for that column
is still executed.
l Select the column that you want to hide.
l Click the “Select ancestor” icon ( ) in the title bar of the Properties pane and click “List column” (
).
l Set the “Render” property to “No”.
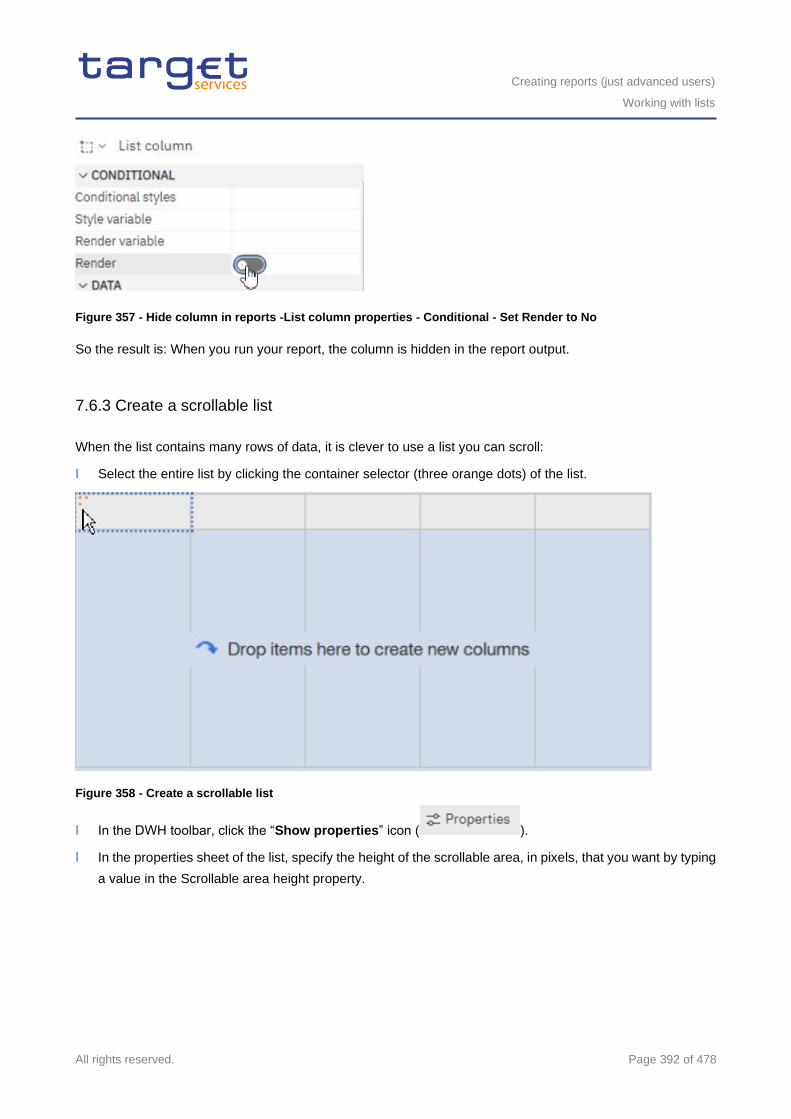
Creating reports (just advanced users)
Working with lists
All rights reserved. Page 392 of 478
Figure 357 - Hide column in reports -List column properties - Conditional - Set Render to No
So the result is: When you run your report, the column is hidden in the report output.
7.6.3 Create a scrollable list
When the list contains many rows of data, it is clever to use a list you can scroll:
l Select the entire list by clicking the container selector (three orange dots) of the list.
Figure 358 - Create a scrollable list
l In the DWH toolbar, click the “Show properties” icon ( ).
l In the properties sheet of the list, specify the height of the scrollable area, in pixels, that you want by typing
a value in the Scrollable area height property.
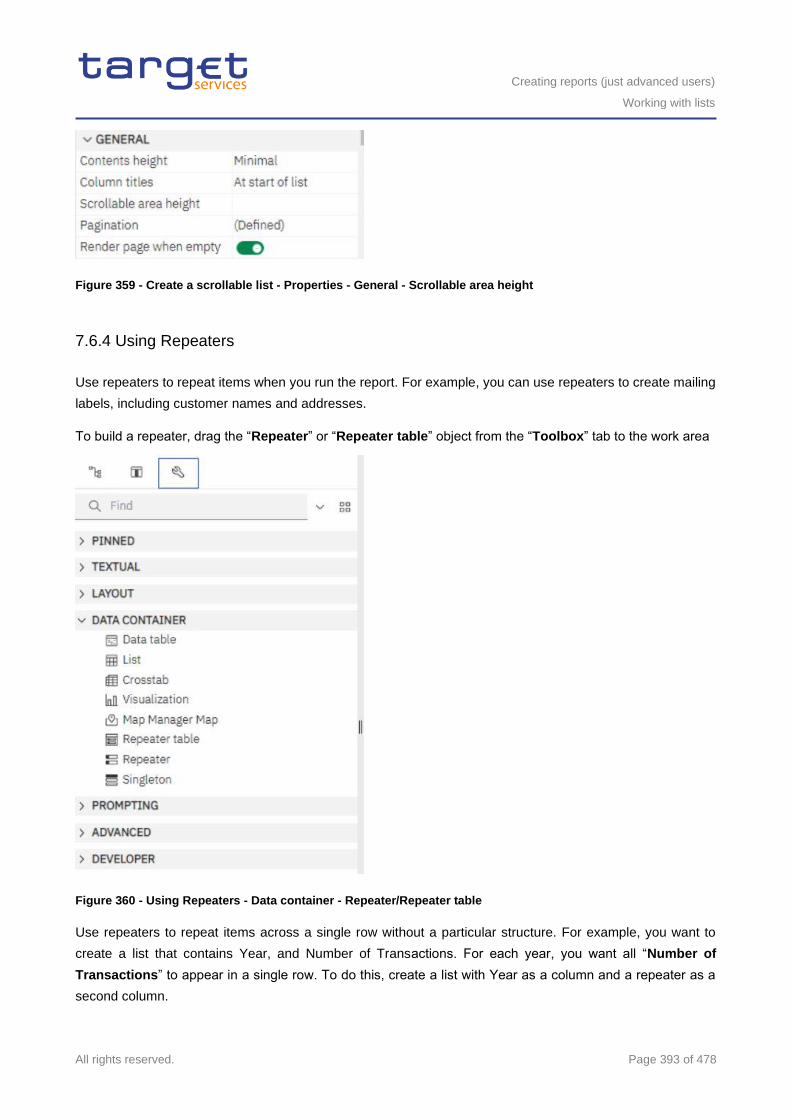
Creating reports (just advanced users)
Working with lists
All rights reserved. Page 393 of 478
Figure 359 - Create a scrollable list - Properties - General - Scrollable area height
7.6.4 Using Repeaters
Use repeaters to repeat items when you run the report. For example, you can use repeaters to create mailing
labels, including customer names and addresses.
To build a repeater, drag the “Repeater” or “Repeater table” object from the “Toolbox” tab to the work area
Figure 360 - Using Repeaters - Data container - Repeater/Repeater table
Use repeaters to repeat items across a single row without a particular structure. For example, you want to
create a list that contains Year, and Number of Transactions. For each year, you want all “Number of
Transactions” to appear in a single row. To do this, create a list with Year as a column and a repeater as a
second column.
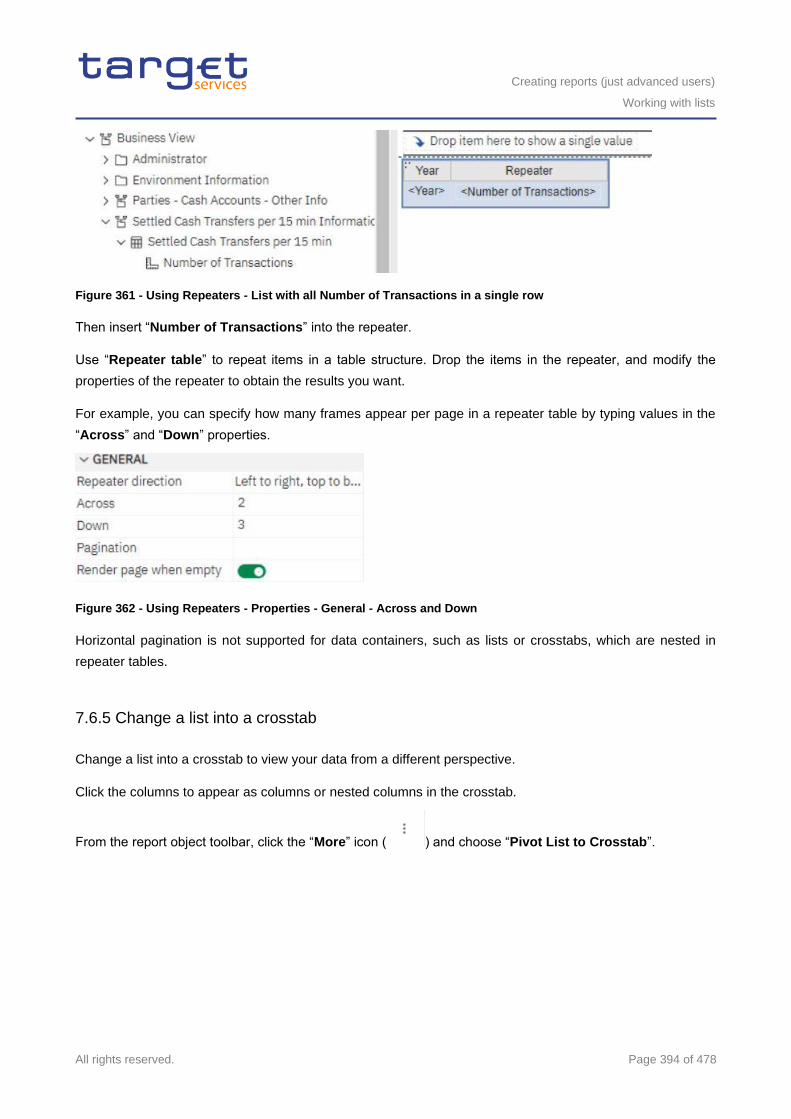
Creating reports (just advanced users)
Working with lists
All rights reserved. Page 394 of 478
Figure 361 - Using Repeaters - List with all Number of Transactions in a single row
Then insert “Number of Transactions” into the repeater.
Use “Repeater table” to repeat items in a table structure. Drop the items in the repeater, and modify the
properties of the repeater to obtain the results you want.
For example, you can specify how many frames appear per page in a repeater table by typing values in the
“Across” and “Down” properties.
Figure 362 - Using Repeaters - Properties - General - Across and Down
Horizontal pagination is not supported for data containers, such as lists or crosstabs, which are nested in
repeater tables.
7.6.5 Change a list into a crosstab
Change a list into a crosstab to view your data from a different perspective.
Click the columns to appear as columns or nested columns in the crosstab.
From the report object toolbar, click the “More” icon ( ) and choose “Pivot List to Crosstab”.
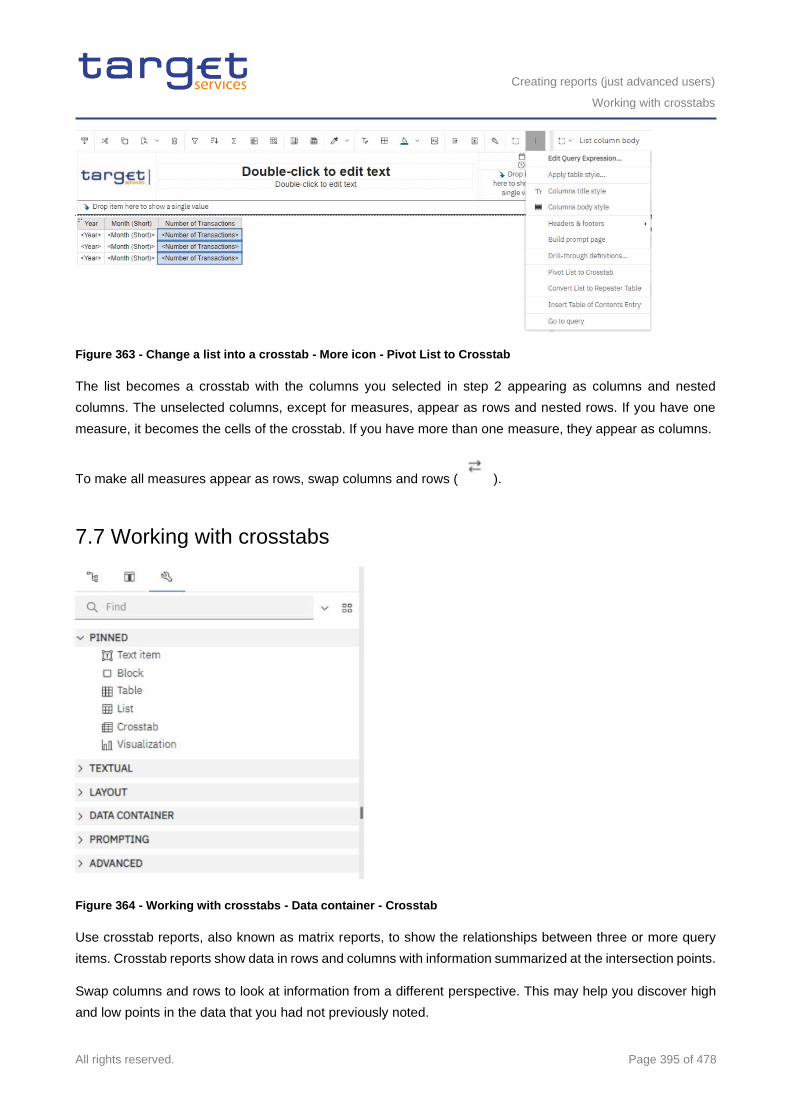
Creating reports (just advanced users)
Working with crosstabs
All rights reserved. Page 395 of 478
Figure 363 - Change a list into a crosstab - More icon - Pivot List to Crosstab
The list becomes a crosstab with the columns you selected in step 2 appearing as columns and nested
columns. The unselected columns, except for measures, appear as rows and nested rows. If you have one
measure, it becomes the cells of the crosstab. If you have more than one measure, they appear as columns.
To make all measures appear as rows, swap columns and rows ( ).
7.7 Working with crosstabs
Figure 364 - Working with crosstabs - Data container - Crosstab
Use crosstab reports, also known as matrix reports, to show the relationships between three or more query
items. Crosstab reports show data in rows and columns with information summarized at the intersection points.
Swap columns and rows to look at information from a different perspective. This may help you discover high
and low points in the data that you had not previously noted.
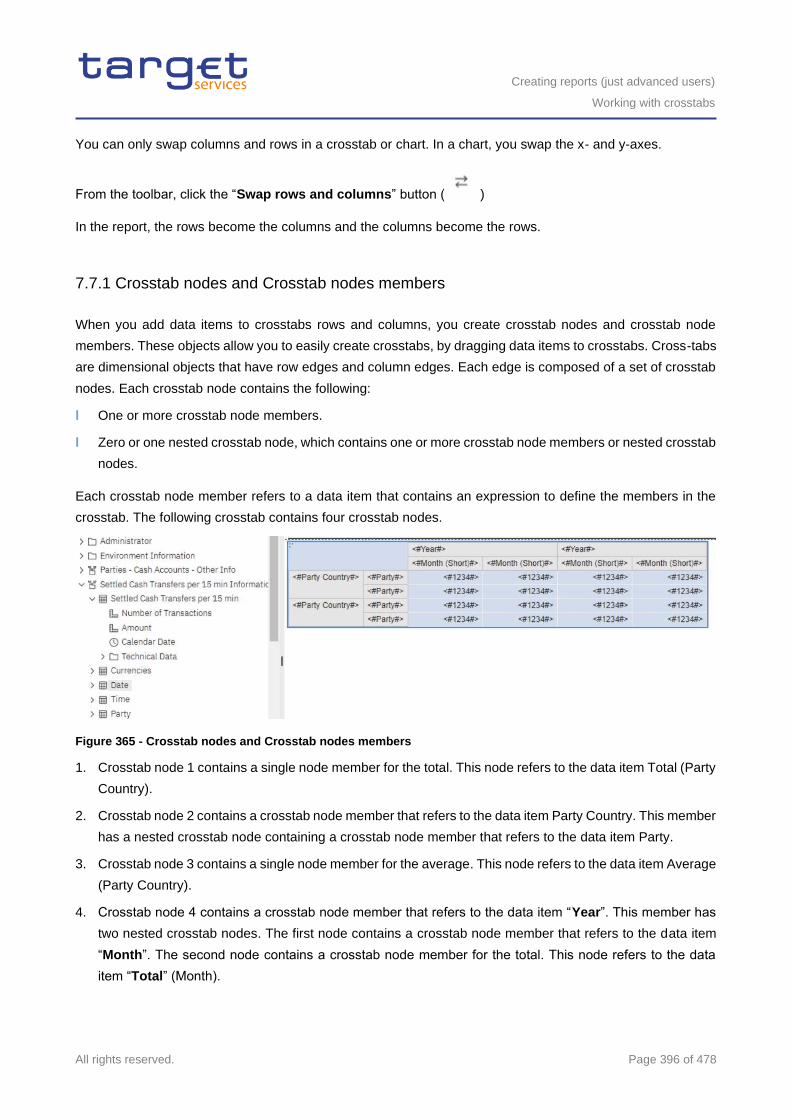
Creating reports (just advanced users)
Working with crosstabs
All rights reserved. Page 396 of 478
You can only swap columns and rows in a crosstab or chart. In a chart, you swap the x- and y-axes.
From the toolbar, click the “Swap rows and columns” button ( )
In the report, the rows become the columns and the columns become the rows.
7.7.1 Crosstab nodes and Crosstab nodes members
When you add data items to crosstabs rows and columns, you create crosstab nodes and crosstab node
members. These objects allow you to easily create crosstabs, by dragging data items to crosstabs. Cross-tabs
are dimensional objects that have row edges and column edges. Each edge is composed of a set of crosstab
nodes. Each crosstab node contains the following:
l One or more crosstab node members.
l Zero or one nested crosstab node, which contains one or more crosstab node members or nested crosstab
nodes.
Each crosstab node member refers to a data item that contains an expression to define the members in the
crosstab. The following crosstab contains four crosstab nodes.
Figure 365 - Crosstab nodes and Crosstab nodes members
1. Crosstab node 1 contains a single node member for the total. This node refers to the data item Total (Party
Country).
2. Crosstab node 2 contains a crosstab node member that refers to the data item Party Country. This member
has a nested crosstab node containing a crosstab node member that refers to the data item Party.
3. Crosstab node 3 contains a single node member for the average. This node refers to the data item Average
(Party Country).
4. Crosstab node 4 contains a crosstab node member that refers to the data item “Year”. This member has
two nested crosstab nodes. The first node contains a crosstab node member that refers to the data item
“Month”. The second node contains a crosstab node member for the total. This node refers to the data
item “Total” (Month).
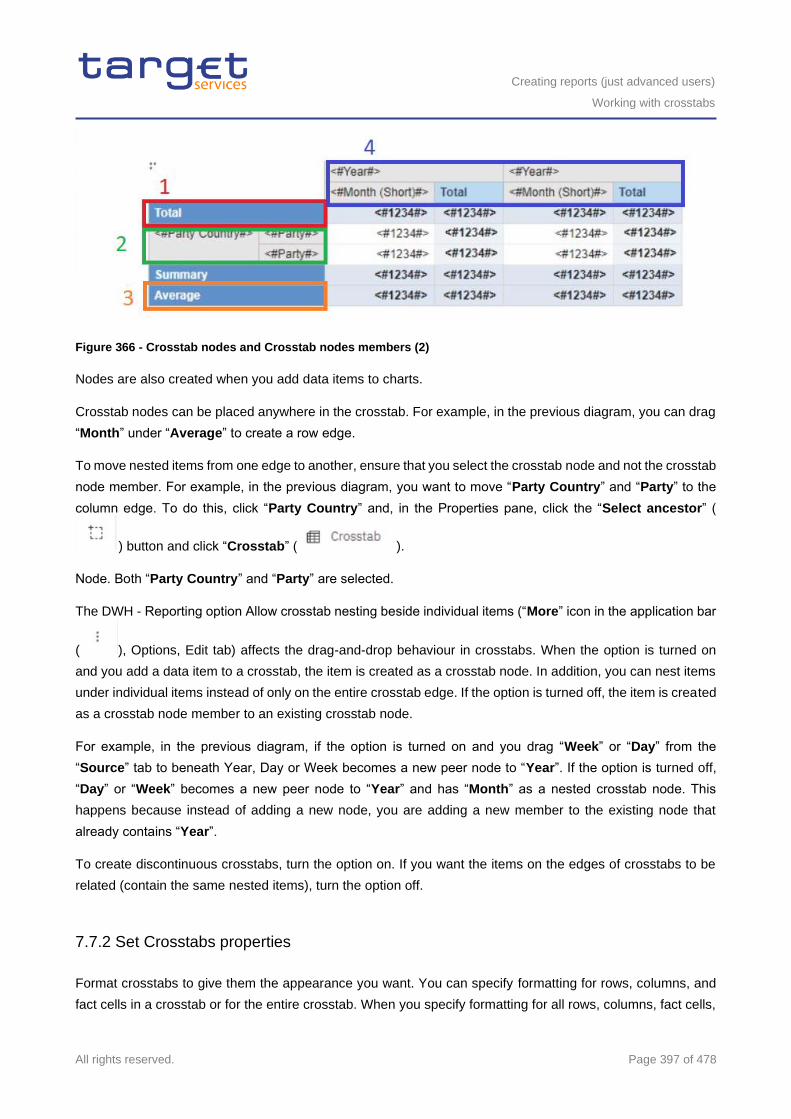
Creating reports (just advanced users)
Working with crosstabs
All rights reserved. Page 397 of 478
Figure 366 - Crosstab nodes and Crosstab nodes members (2)
Nodes are also created when you add data items to charts.
Crosstab nodes can be placed anywhere in the crosstab. For example, in the previous diagram, you can drag
“Month” under “Average” to create a row edge.
To move nested items from one edge to another, ensure that you select the crosstab node and not the crosstab
node member. For example, in the previous diagram, you want to move “Party Country” and “Party” to the
column edge. To do this, click “Party Country” and, in the Properties pane, click the “Select ancestor” (
) button and click “Crosstab” ( ).
Node. Both “Party Country” and “Party” are selected.
The DWH - Reporting option Allow crosstab nesting beside individual items (“More” icon in the application bar
( ), Options, Edit tab) affects the drag-and-drop behaviour in crosstabs. When the option is turned on
and you add a data item to a crosstab, the item is created as a crosstab node. In addition, you can nest items
under individual items instead of only on the entire crosstab edge. If the option is turned off, the item is created
as a crosstab node member to an existing crosstab node.
For example, in the previous diagram, if the option is turned on and you drag “Week” or “Day” from the
“Source” tab to beneath Year, Day or Week becomes a new peer node to “Year”. If the option is turned off,
“Day” or “Week” becomes a new peer node to “Year” and has “Month” as a nested crosstab node. This
happens because instead of adding a new node, you are adding a new member to the existing node that
already contains “Year”.
To create discontinuous crosstabs, turn the option on. If you want the items on the edges of crosstabs to be
related (contain the same nested items), turn the option off.
7.7.2 Set Crosstabs properties
Format crosstabs to give them the appearance you want. You can specify formatting for rows, columns, and
fact cells in a crosstab or for the entire crosstab. When you specify formatting for all rows, columns, fact cells,
Creating reports (just advanced users)
Working with crosstabs
All rights reserved. Page 398 of 478
or the crosstab, the formatting is automatically applied to any new items you add. If you apply the same styles,
such as font colour, to crosstab rows, columns, and crosstab intersections, the styles are applied in the
following order:
l Crosstab fact cells
l fact cells in the outermost rows
l fact cells in the innermost rows
l fact cells in the outermost columns
l fact cells in the innermost columns
l crosstab intersections
The style applied to the last object in the list overrides styles applied to previous objects. In addition, class
styles are applied before styles that you apply manually.
You can also quickly format crosstabs by applying table styles and add white space to a crosstab by inserting
crosstab space objects.
In cases where fact cell formatting applied to rows conflicts with fact cell formatting applied to columns, you
can set the ”Fact cells precedence” property in the Properties pane to determine whether the row formatting
or the column formatting precedence has. To set this property, click anywhere in the crosstab, click the “Select
ancestor” icon ( ) in the title bar of the Properties pane, and click “Crosstab”.
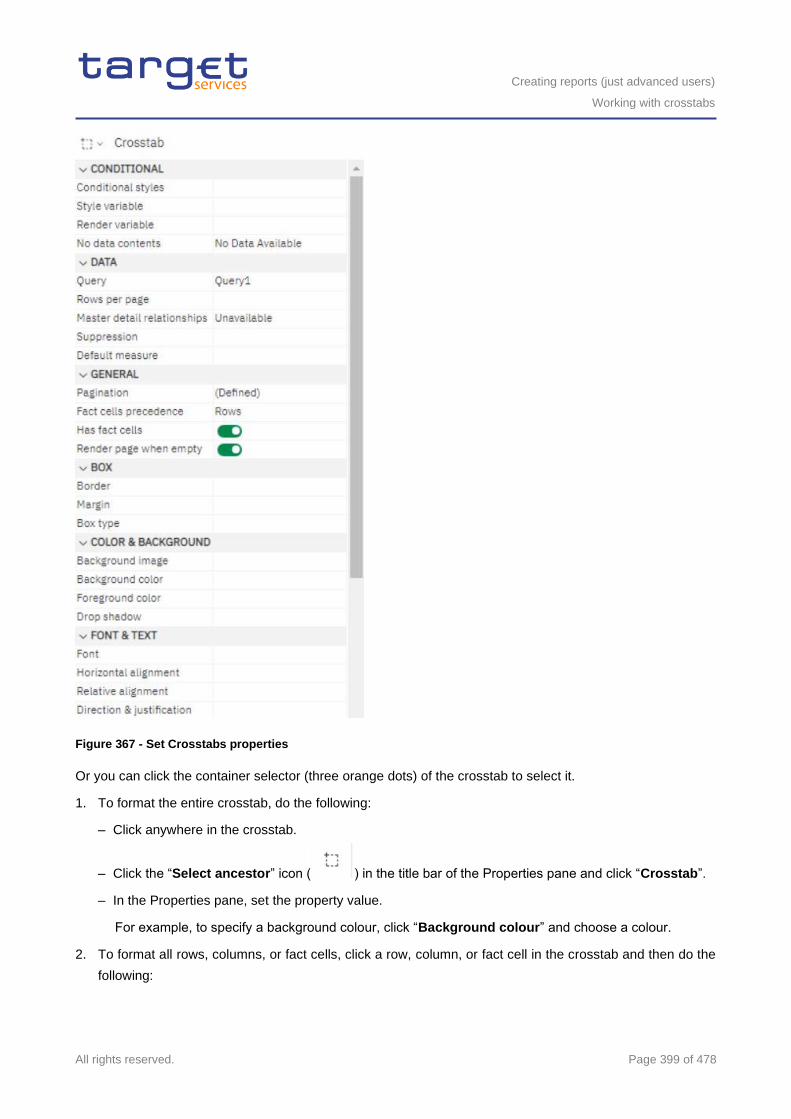
Creating reports (just advanced users)
Working with crosstabs
All rights reserved. Page 399 of 478
Figure 367 - Set Crosstabs properties
Or you can click the container selector (three orange dots) of the crosstab to select it.
1. To format the entire crosstab, do the following:
– Click anywhere in the crosstab.
– Click the “Select ancestor” icon ( ) in the title bar of the Properties pane and click “Crosstab”.
– In the Properties pane, set the property value.
For example, to specify a background colour, click “Background colour” and choose a colour.
2. To format all rows, columns, or fact cells, click a row, column, or fact cell in the crosstab and then do the
following:
Creating reports (just advanced users)
Working with crosstabs
All rights reserved. Page 400 of 478
– If you clicked a row, click the “Select ancestor” icon ( ) in the title bar of the Properties pane
and click “Crosstab rows”.
– If you clicked a column, click the “Select ancestor” icon ( ) in the title bar of the Properties pane
and click Crosstab Columns.
– If you clicked a fact cell, click the “Select ancestor” button ( ) in the title bar of the Properties
pane and click “Crosstab fact cells”.
– In the Properties pane, set the property value.
For example, to specify a background colour, click “Background colour” and choose the colour.
You can also right-click the row or column and click “Select fact cells”.
3. To format all crosstab cells for a specific row or column, do the following:
– Click the row or column.
– Click the “Select ancestor” icon ( ) in the title bar of the Properties pane and click “Crosstab
member fact cells”.
You can also right-click the row or column and click “Select member fact cells”.
– In the Properties pane, set the property value.
For example, to specify a background colour, click “Background colour” and choose the colour.
4. To format all row or column titles, do the following:
– Click a row or column title.
– Click the “Select ancestor” icon ( ) in the title bar of the Properties pane and click “Crosstab
rows” or “Crosstab columns”.
– In the Properties pane, set the property value.
For example, to specify a background colour, click “Background colour” and choose the colour.
5. To format an individual row, column, or intersection, do the following:
– Click the row, column, or intersection.
To format the data in a row, column, or intersection, click the “Lock page objects” ( ) icon to
unlock then click the text item to format.
– In the Properties pane, set the property value.
For example, to specify a background colour, click “Background colour” and choose the colour.
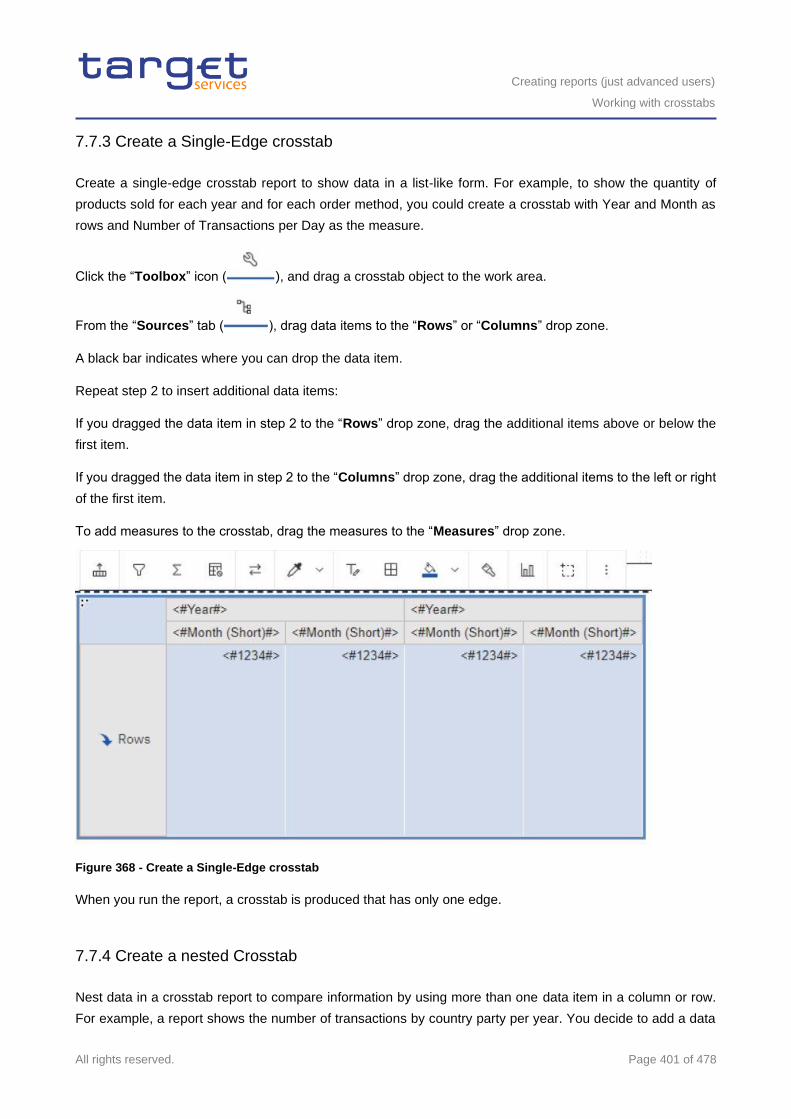
Creating reports (just advanced users)
Working with crosstabs
All rights reserved. Page 401 of 478
7.7.3 Create a Single-Edge crosstab
Create a single-edge crosstab report to show data in a list-like form. For example, to show the quantity of
products sold for each year and for each order method, you could create a crosstab with Year and Month as
rows and Number of Transactions per Day as the measure.
Click the “Toolbox” icon ( ), and drag a crosstab object to the work area.
From the “Sources” tab ( ), drag data items to the “Rows” or “Columns” drop zone.
A black bar indicates where you can drop the data item.
Repeat step 2 to insert additional data items:
If you dragged the data item in step 2 to the “Rows” drop zone, drag the additional items above or below the
first item.
If you dragged the data item in step 2 to the “Columns” drop zone, drag the additional items to the left or right
of the first item.
To add measures to the crosstab, drag the measures to the “Measures” drop zone.
Figure 368 - Create a Single-Edge crosstab
When you run the report, a crosstab is produced that has only one edge.
7.7.4 Create a nested Crosstab
Nest data in a crosstab report to compare information by using more than one data item in a column or row.
For example, a report shows the number of transactions by country party per year. You decide to add a data
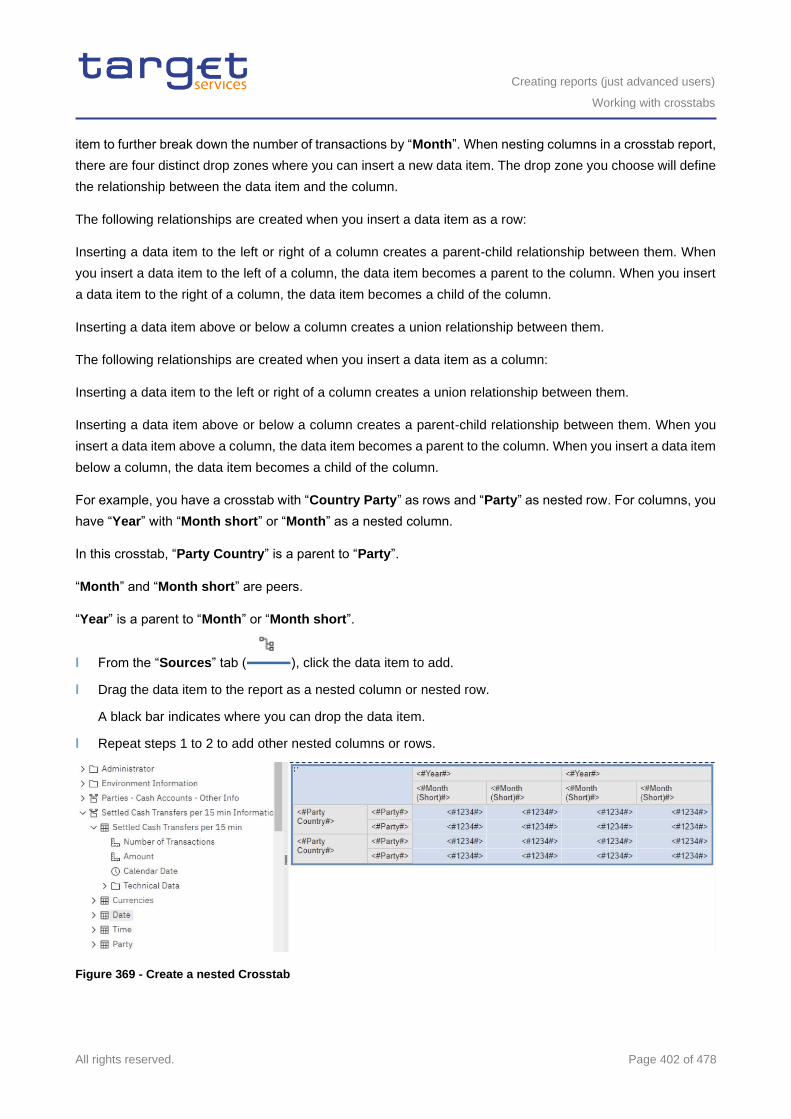
Creating reports (just advanced users)
Working with crosstabs
All rights reserved. Page 402 of 478
item to further break down the number of transactions by “Month”. When nesting columns in a crosstab report,
there are four distinct drop zones where you can insert a new data item. The drop zone you choose will define
the relationship between the data item and the column.
The following relationships are created when you insert a data item as a row:
Inserting a data item to the left or right of a column creates a parent-child relationship between them. When
you insert a data item to the left of a column, the data item becomes a parent to the column. When you insert
a data item to the right of a column, the data item becomes a child of the column.
Inserting a data item above or below a column creates a union relationship between them.
The following relationships are created when you insert a data item as a column:
Inserting a data item to the left or right of a column creates a union relationship between them.
Inserting a data item above or below a column creates a parent-child relationship between them. When you
insert a data item above a column, the data item becomes a parent to the column. When you insert a data item
below a column, the data item becomes a child of the column.
For example, you have a crosstab with “Country Party” as rows and “Party” as nested row. For columns, you
have “Year” with “Month short” or “Month” as a nested column.
In this crosstab, “Party Country” is a parent to “Party”.
“Month” and “Month short” are peers.
“Year” is a parent to “Month” or “Month short”.
l From the “Sources” tab ( ), click the data item to add.
l Drag the data item to the report as a nested column or nested row.
A black bar indicates where you can drop the data item.
l Repeat steps 1 to 2 to add other nested columns or rows.
Figure 369 - Create a nested Crosstab
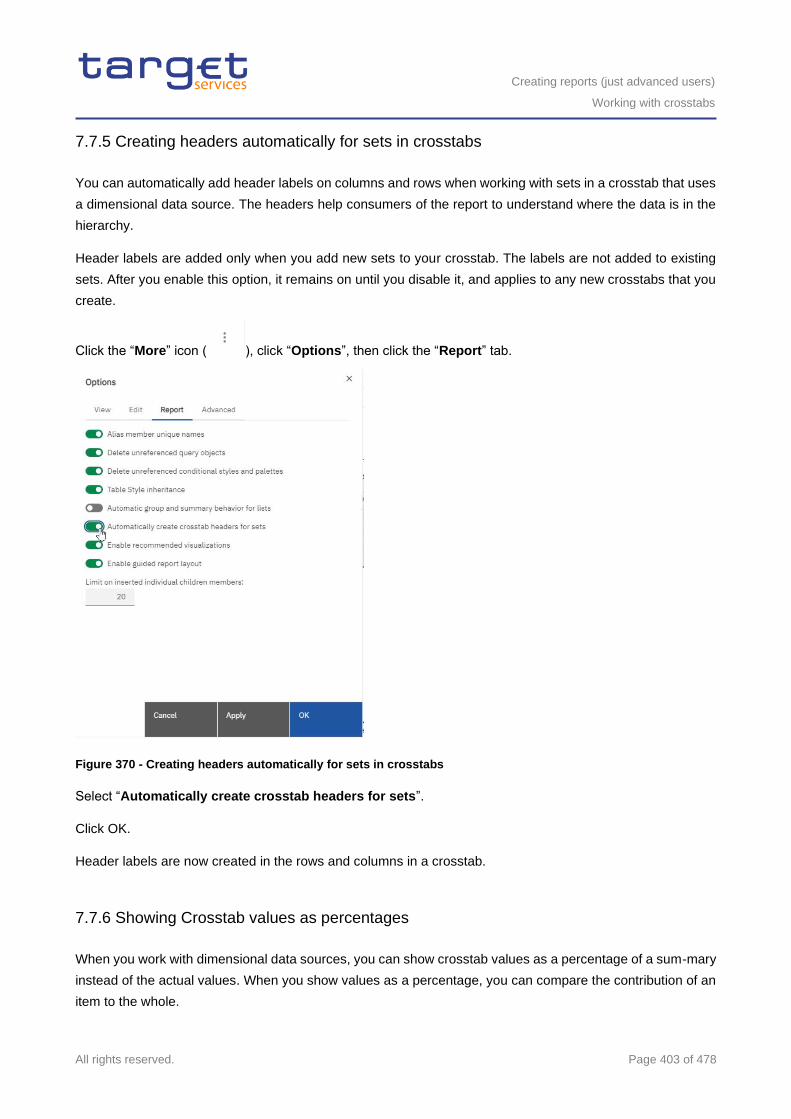
Creating reports (just advanced users)
Working with crosstabs
All rights reserved. Page 403 of 478
7.7.5 Creating headers automatically for sets in crosstabs
You can automatically add header labels on columns and rows when working with sets in a crosstab that uses
a dimensional data source. The headers help consumers of the report to understand where the data is in the
hierarchy.
Header labels are added only when you add new sets to your crosstab. The labels are not added to existing
sets. After you enable this option, it remains on until you disable it, and applies to any new crosstabs that you
create.
Click the “More” icon ( ), click “Options”, then click the “Report” tab.
Figure 370 - Creating headers automatically for sets in crosstabs
Select “Automatically create crosstab headers for sets”.
Click OK.
Header labels are now created in the rows and columns in a crosstab.
7.7.6 Showing Crosstab values as percentages
When you work with dimensional data sources, you can show crosstab values as a percentage of a sum-mary
instead of the actual values. When you show values as a percentage, you can compare the contribution of an
item to the whole.
Creating reports (just advanced users)
Working with crosstabs
All rights reserved. Page 404 of 478
You can show crosstab values as a percentage of a summary on the rows, the columns, or the rows and
columns.
By default, the summary type that is used to calculate the percentages is Automatic summary. When you show
values as a percentage, a percentage measure data item is created.
You can also create a custom percentage calculation. For example, you can show values as a percentage of
an intersection (tuple). Or you can show values as a percentage of a different summary type, such as
“Maximum”.
When you show values as a percentage, the fact cells are formatted with the percent data format. When you
show the actual values, the fact cells are formatted with the number format. If you modify the data for-mat of
the actual values, the change is lost when you switch between showing the actual values and percentage
values.
You can show values as a percentage only in crosstabs. If you insert a chart, you cannot fill the chart with data
from a crosstab that shows values as a percentage. If you create a chart from a crosstab that shows values
as percentages, an empty chart is created in the report.
l Select the measure for which you want to show values as a percentage.
If there is only one measure in the crosstab, click the crosstab corner.
l From the report object toolbar, click the “More” icon ( ), click “Show value as”, and click the
percentage values that you want to show.
l If you click Custom, provide the information that is required to calculate the percentage values.
– To change the default name of the percentage data item that you are creating, type the new name in
the Name field.
– In the Percentage based on box, choose to build the percentage data item based on a summary of
sets in the crosstab or based on an intersection (tuple).
– If you choose to build the percentage data item based on a summary of sets, in the Choose sets box,
click the sets that you want to use. Then, click “Summary type” and select the summary that you want
to use to calculate the percentage values.
If there is more than one data item on the crosstab edge that you chose for the sets, select which data
item that you want to use.
– If you choose to build the percentage data item based on an intersection (tuple), click the ellipsis and
select the items that you want to use to create the intersection.
– Click “OK”.
l To edit a measure percentage data item, follow these steps.
– Select the measure.
– From the report object toolbar, click the “More” icon ( ), click “Show value as” > Edit.
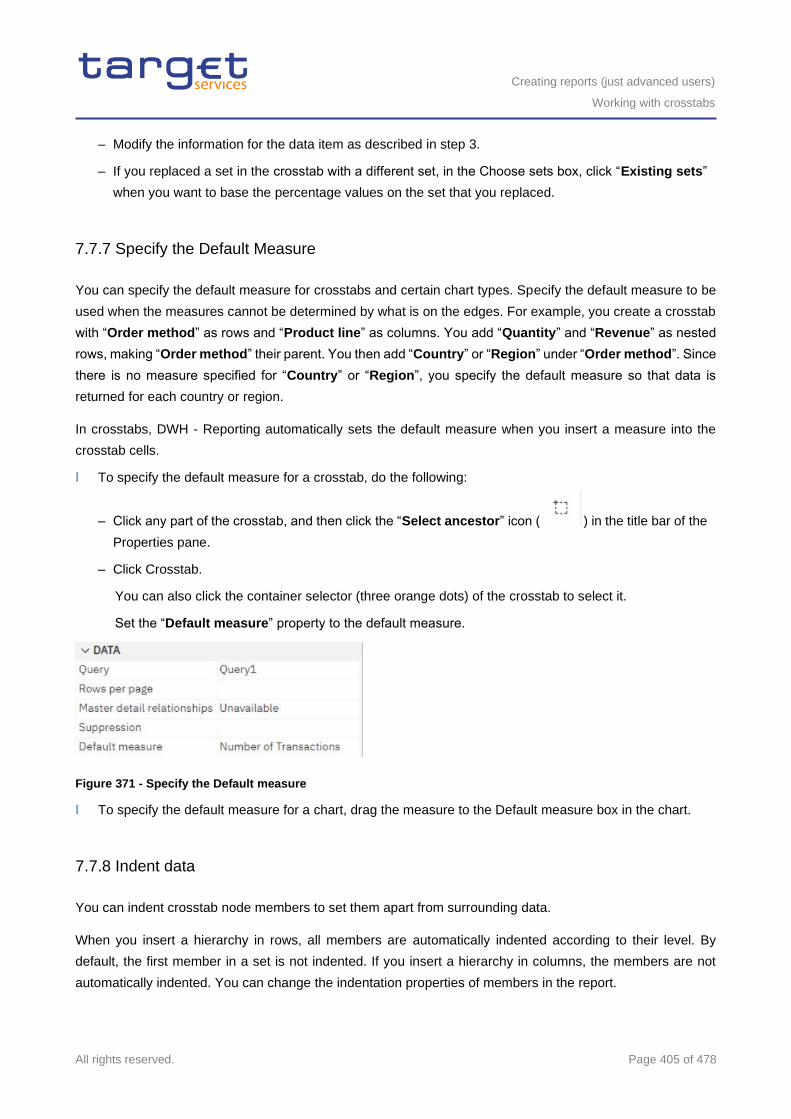
Creating reports (just advanced users)
Working with crosstabs
All rights reserved. Page 405 of 478
– Modify the information for the data item as described in step 3.
– If you replaced a set in the crosstab with a different set, in the Choose sets box, click “Existing sets”
when you want to base the percentage values on the set that you replaced.
7.7.7 Specify the Default Measure
You can specify the default measure for crosstabs and certain chart types. Specify the default measure to be
used when the measures cannot be determined by what is on the edges. For example, you create a crosstab
with “Order method” as rows and “Product line” as columns. You add “Quantity” and “Revenue” as nested
rows, making “Order method” their parent. You then add “Country” or “Region” under “Order method”. Since
there is no measure specified for “Country” or “Region”, you specify the default measure so that data is
returned for each country or region.
In crosstabs, DWH - Reporting automatically sets the default measure when you insert a measure into the
crosstab cells.
l To specify the default measure for a crosstab, do the following:
– Click any part of the crosstab, and then click the “Select ancestor” icon ( ) in the title bar of the
Properties pane.
– Click Crosstab.
You can also click the container selector (three orange dots) of the crosstab to select it.
Set the “Default measure” property to the default measure.
Figure 371 - Specify the Default measure
l To specify the default measure for a chart, drag the measure to the Default measure box in the chart.
7.7.8 Indent data
You can indent crosstab node members to set them apart from surrounding data.
When you insert a hierarchy in rows, all members are automatically indented according to their level. By
default, the first member in a set is not indented. If you insert a hierarchy in columns, the members are not
automatically indented. You can change the indentation properties of members in the report.
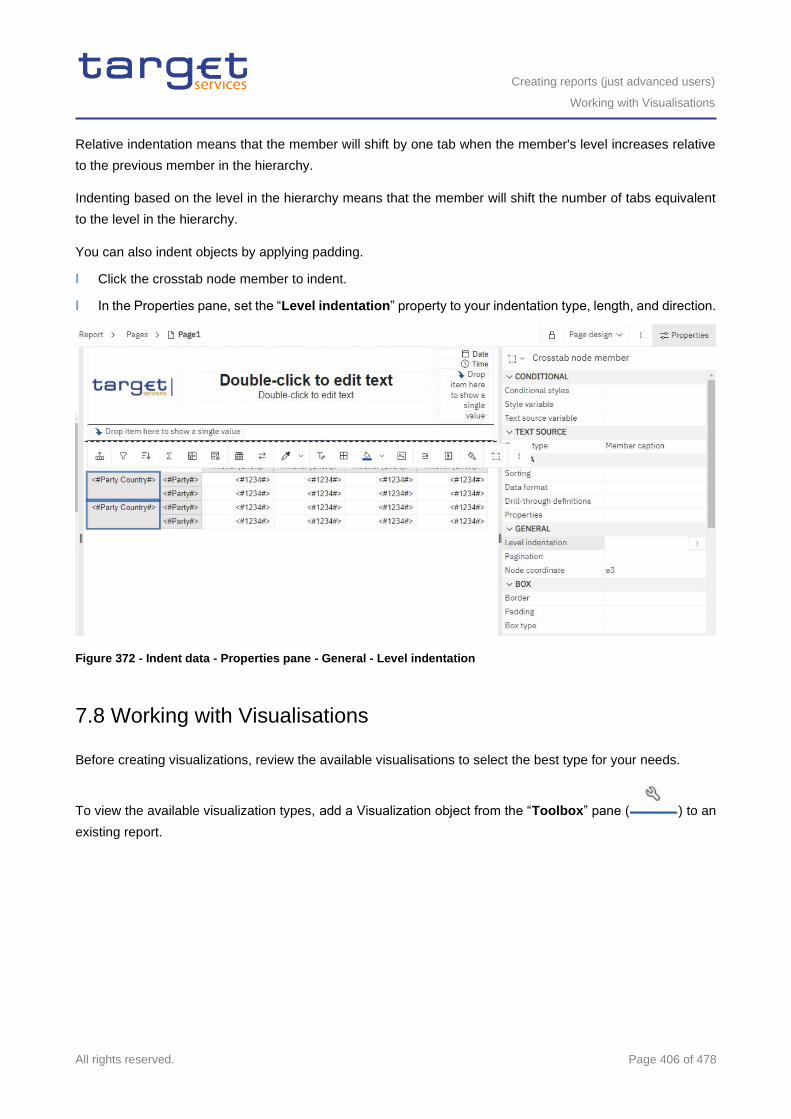
Creating reports (just advanced users)
Working with Visualisations
All rights reserved. Page 406 of 478
Relative indentation means that the member will shift by one tab when the member's level increases relative
to the previous member in the hierarchy.
Indenting based on the level in the hierarchy means that the member will shift the number of tabs equivalent
to the level in the hierarchy.
You can also indent objects by applying padding.
l Click the crosstab node member to indent.
l In the Properties pane, set the “Level indentation” property to your indentation type, length, and direction.
Figure 372 - Indent data - Properties pane - General - Level indentation
7.8 Working with Visualisations
Before creating visualizations, review the available visualisations to select the best type for your needs.
To view the available visualization types, add a Visualization object from the “Toolbox” pane ( ) to an
existing report.
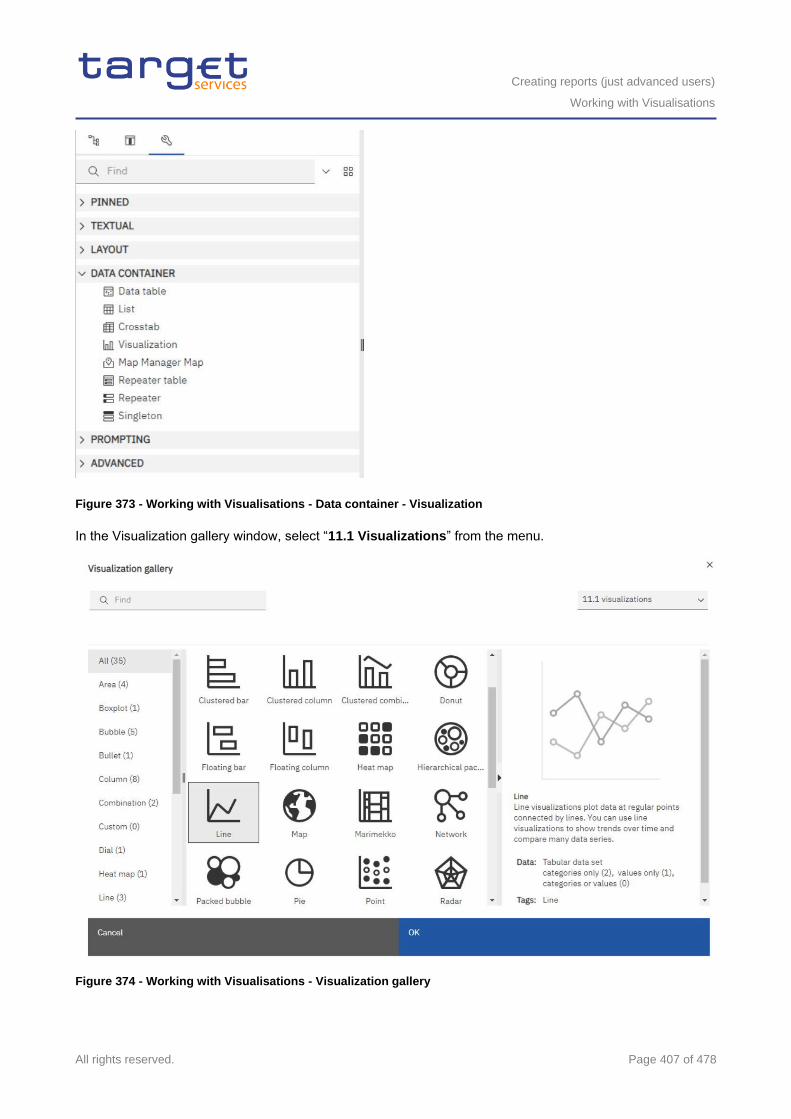
Creating reports (just advanced users)
Working with Visualisations
All rights reserved. Page 407 of 478
Figure 373 - Working with Visualisations - Data container - Visualization
In the Visualization gallery window, select “11.1 Visualizations” from the menu.
Figure 374 - Working with Visualisations - Visualization gallery
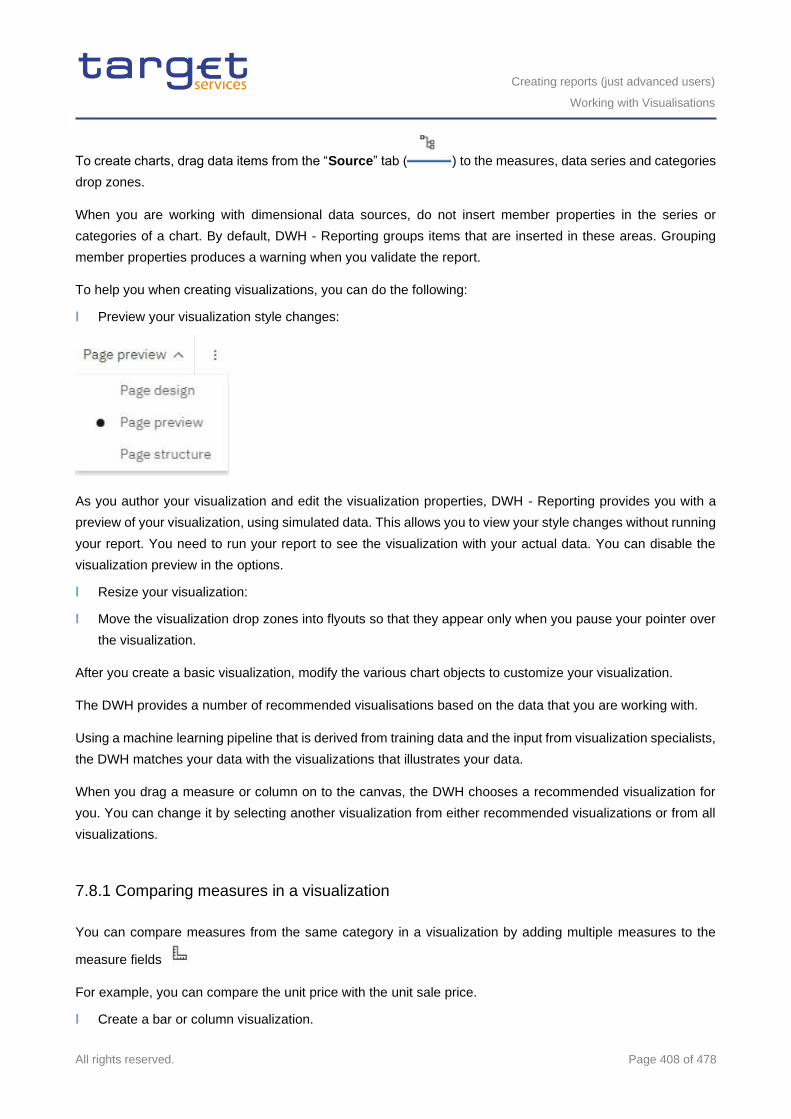
Creating reports (just advanced users)
Working with Visualisations
All rights reserved. Page 408 of 478
To create charts, drag data items from the “Source” tab ( ) to the measures, data series and categories
drop zones.
When you are working with dimensional data sources, do not insert member properties in the series or
categories of a chart. By default, DWH - Reporting groups items that are inserted in these areas. Grouping
member properties produces a warning when you validate the report.
To help you when creating visualizations, you can do the following:
l Preview your visualization style changes:
As you author your visualization and edit the visualization properties, DWH - Reporting provides you with a
preview of your visualization, using simulated data. This allows you to view your style changes without running
your report. You need to run your report to see the visualization with your actual data. You can disable the
visualization preview in the options.
l Resize your visualization:
l Move the visualization drop zones into flyouts so that they appear only when you pause your pointer over
the visualization.
After you create a basic visualization, modify the various chart objects to customize your visualization.
The DWH provides a number of recommended visualisations based on the data that you are working with.
Using a machine learning pipeline that is derived from training data and the input from visualization specialists,
the DWH matches your data with the visualizations that illustrates your data.
When you drag a measure or column on to the canvas, the DWH chooses a recommended visualization for
you. You can change it by selecting another visualization from either recommended visualizations or from all
visualizations.
7.8.1 Comparing measures in a visualization
You can compare measures from the same category in a visualization by adding multiple measures to the
measure fields
For example, you can compare the unit price with the unit sale price.
l Create a bar or column visualization.
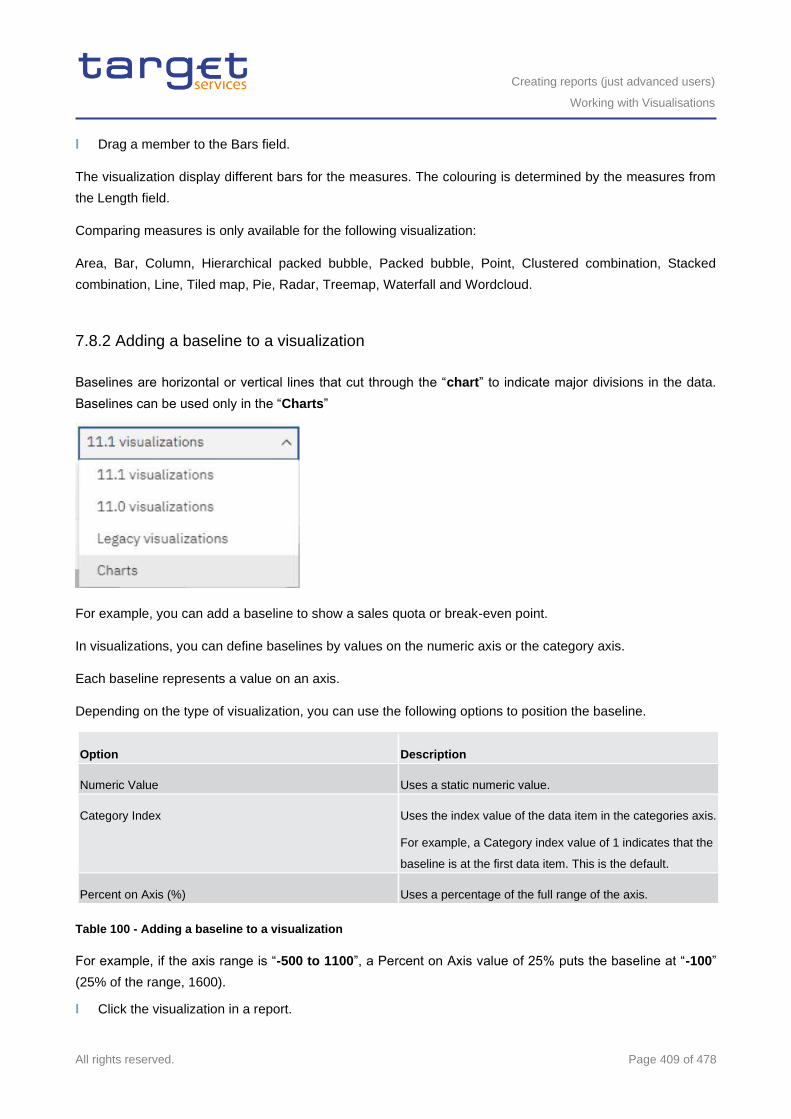
Creating reports (just advanced users)
Working with Visualisations
All rights reserved. Page 409 of 478
l Drag a member to the Bars field.
The visualization display different bars for the measures. The colouring is determined by the measures from
the Length field.
Comparing measures is only available for the following visualization:
Area, Bar, Column, Hierarchical packed bubble, Packed bubble, Point, Clustered combination, Stacked
combination, Line, Tiled map, Pie, Radar, Treemap, Waterfall and Wordcloud.
7.8.2 Adding a baseline to a visualization
Baselines are horizontal or vertical lines that cut through the “chart” to indicate major divisions in the data.
Baselines can be used only in the “Charts”
For example, you can add a baseline to show a sales quota or break-even point.
In visualizations, you can define baselines by values on the numeric axis or the category axis.
Each baseline represents a value on an axis.
Depending on the type of visualization, you can use the following options to position the baseline.
Option Description
Numeric Value Uses a static numeric value.
Category Index Uses the index value of the data item in the categories axis.
For example, a Category index value of 1 indicates that the
baseline is at the first data item. This is the default.
Percent on Axis (%) Uses a percentage of the full range of the axis.
Table 100 - Adding a baseline to a visualization
For example, if the axis range is “-500 to 1100”, a Percent on Axis value of 25% puts the baseline at “-100”
(25% of the range, 1600).
l Click the visualization in a report.
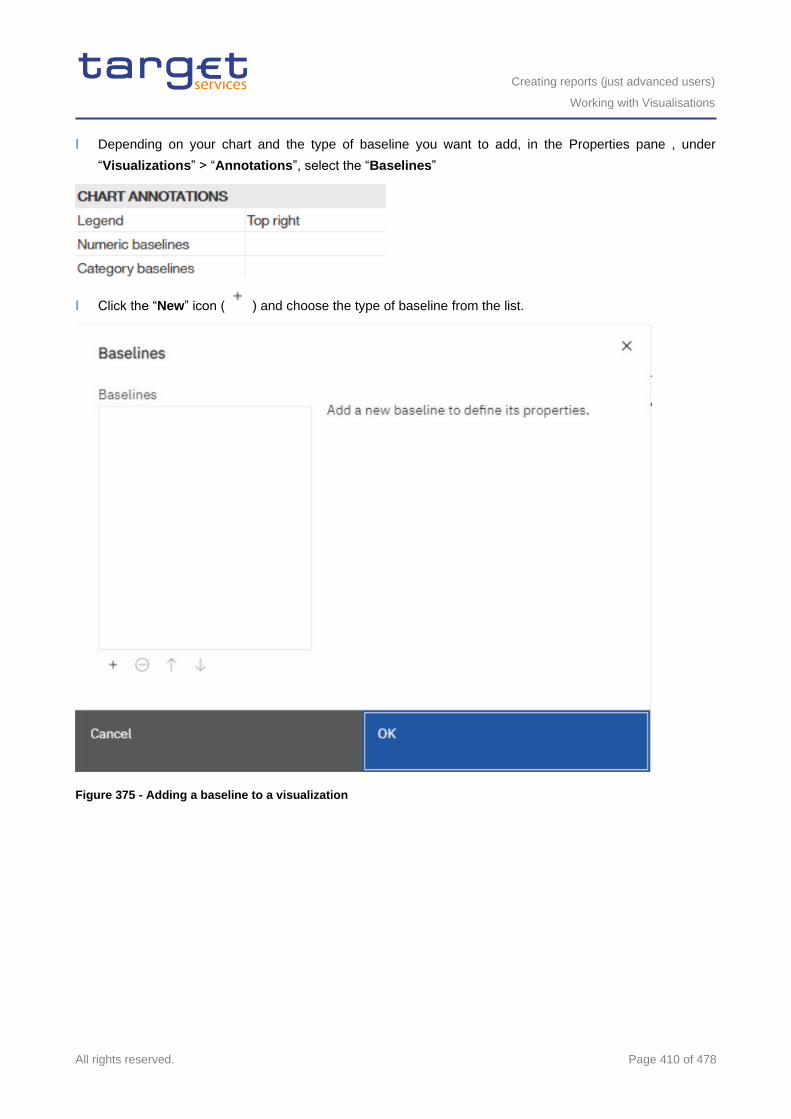
Creating reports (just advanced users)
Working with Visualisations
All rights reserved. Page 410 of 478
l Depending on your chart and the type of baseline you want to add, in the Properties pane , under
“Visualizations” > “Annotations”, select the “Baselines”
l Click the “New” icon ( ) and choose the type of baseline from the list.
Figure 375 - Adding a baseline to a visualization
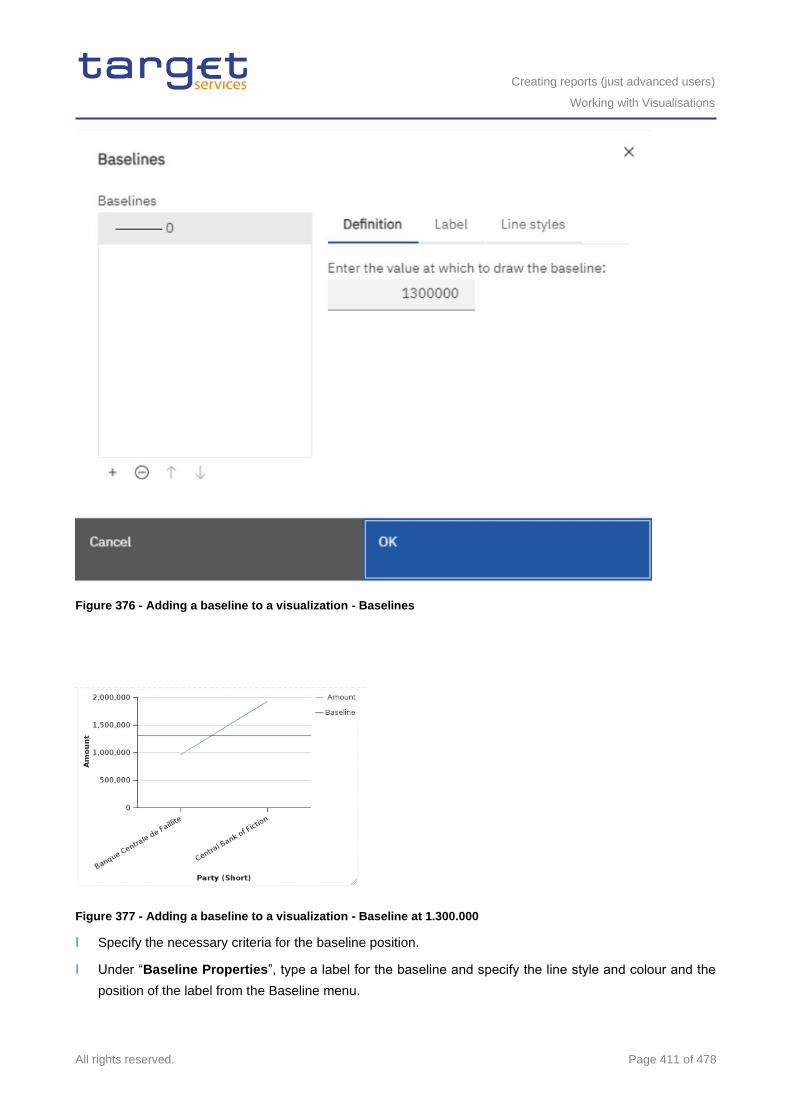
Creating reports (just advanced users)
Working with Visualisations
All rights reserved. Page 411 of 478
Figure 376 - Adding a baseline to a visualization - Baselines
Figure 377 - Adding a baseline to a visualization - Baseline at 1.300.000
l Specify the necessary criteria for the baseline position.
l Under “Baseline Properties”, type a label for the baseline and specify the line style and colour and the
position of the label from the Baseline menu.
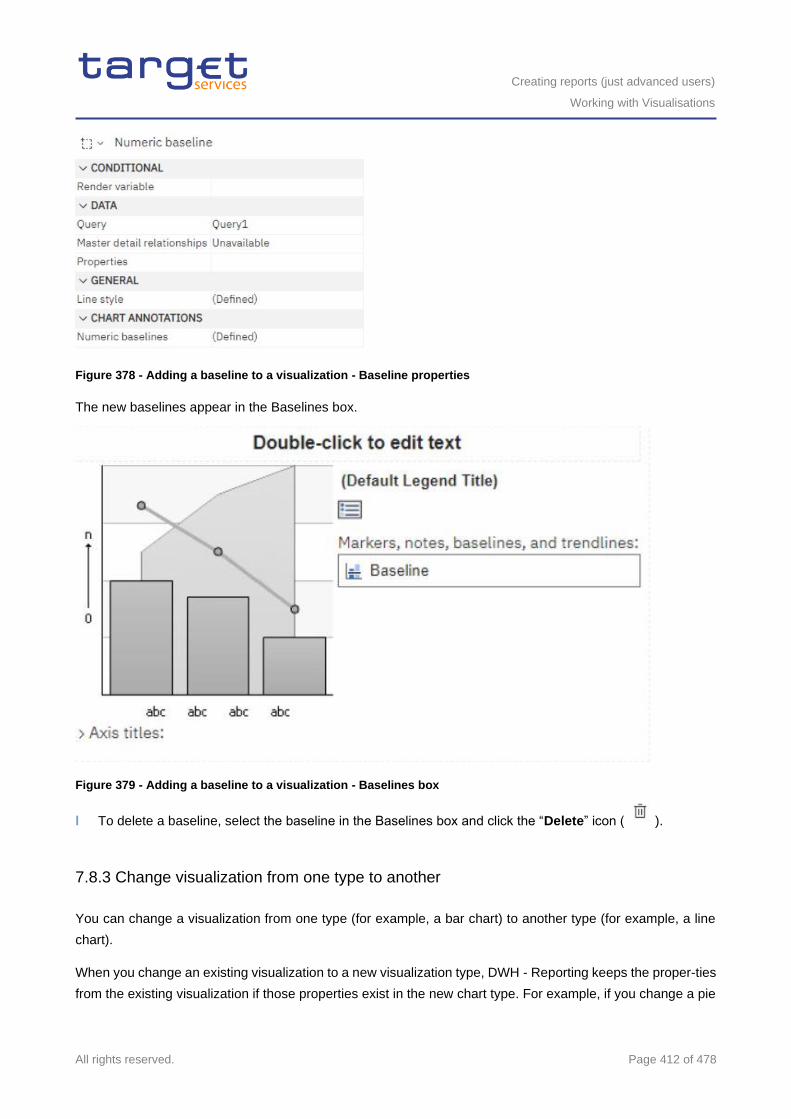
Creating reports (just advanced users)
Working with Visualisations
All rights reserved. Page 412 of 478
Figure 378 - Adding a baseline to a visualization - Baseline properties
The new baselines appear in the Baselines box.
Figure 379 - Adding a baseline to a visualization - Baselines box
l To delete a baseline, select the baseline in the Baselines box and click the “Delete” icon ( ).
7.8.3 Change visualization from one type to another
You can change a visualization from one type (for example, a bar chart) to another type (for example, a line
chart).
When you change an existing visualization to a new visualization type, DWH - Reporting keeps the proper-ties
from the existing visualization if those properties exist in the new chart type. For example, if you change a pie
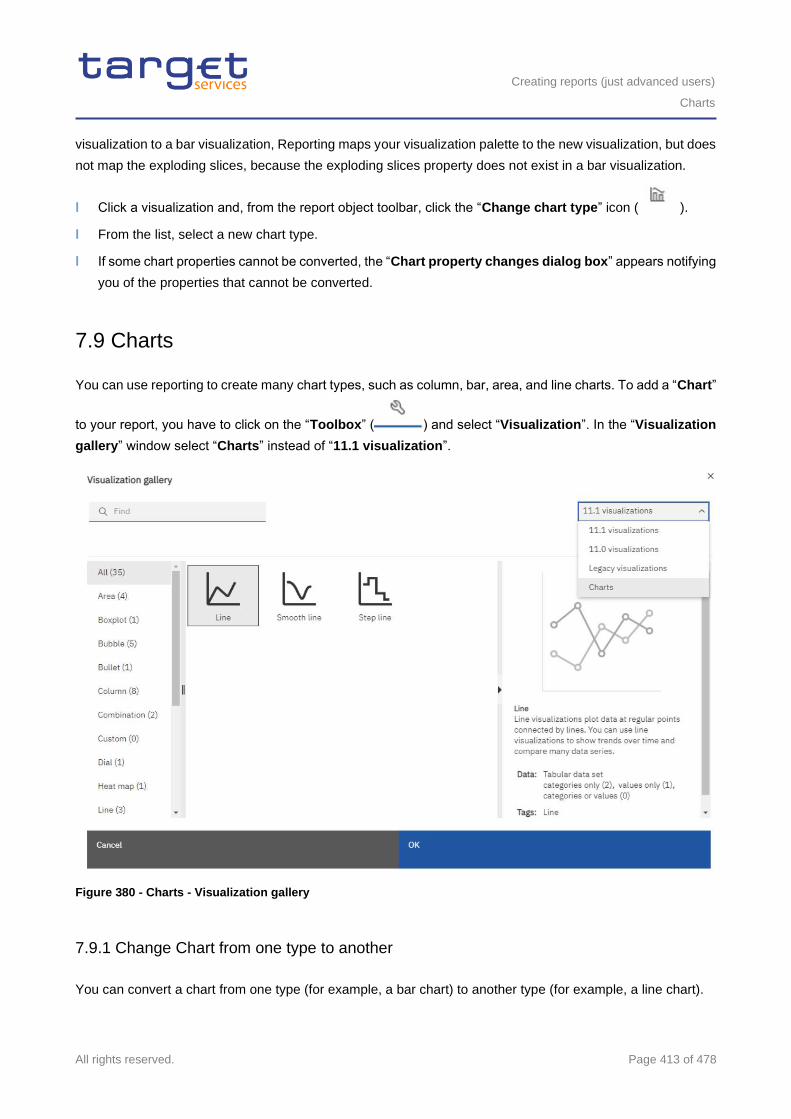
Creating reports (just advanced users)
Charts
All rights reserved. Page 413 of 478
visualization to a bar visualization, Reporting maps your visualization palette to the new visualization, but does
not map the exploding slices, because the exploding slices property does not exist in a bar visualization.
l Click a visualization and, from the report object toolbar, click the “Change chart type” icon ( ).
l From the list, select a new chart type.
l If some chart properties cannot be converted, the “Chart property changes dialog box” appears notifying
you of the properties that cannot be converted.
7.9 Charts
You can use reporting to create many chart types, such as column, bar, area, and line charts. To add a “Chart”
to your report, you have to click on the “Toolbox” ( ) and select “Visualization”. In the “Visualization
gallery” window select “Charts” instead of “11.1 visualization”.
Figure 380 - Charts - Visualization gallery
7.9.1 Change Chart from one type to another
You can convert a chart from one type (for example, a bar chart) to another type (for example, a line chart).
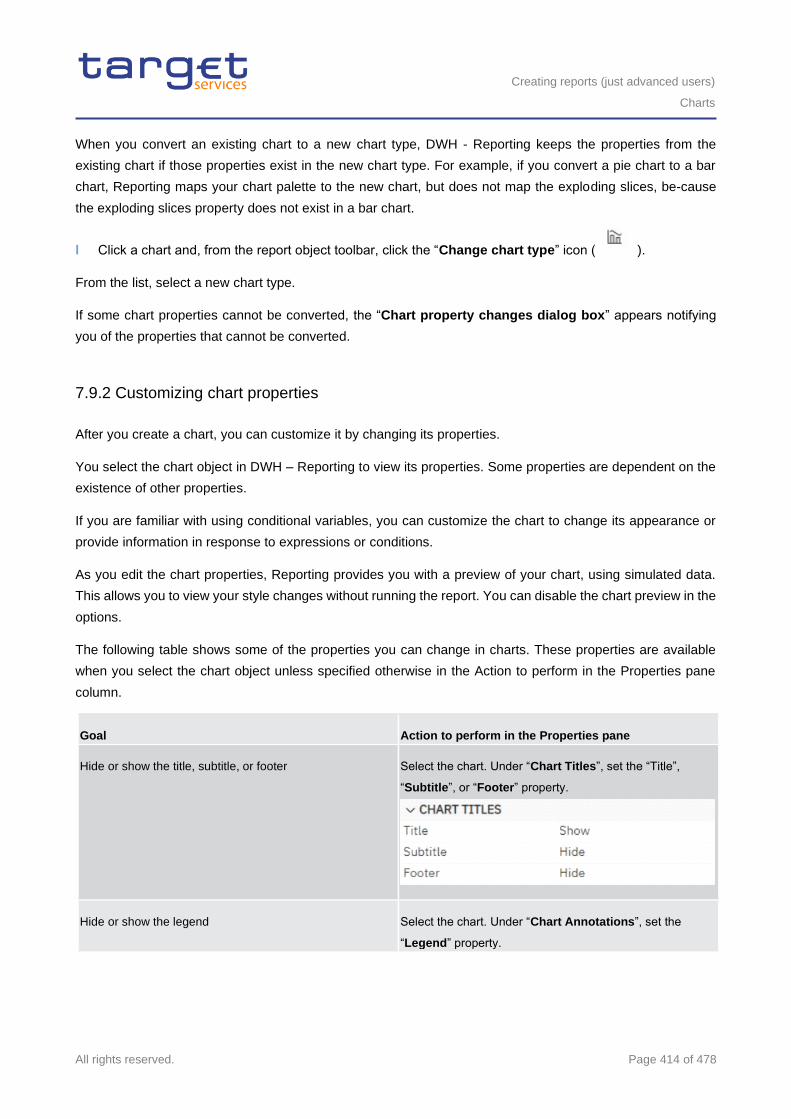
Creating reports (just advanced users)
Charts
All rights reserved. Page 414 of 478
When you convert an existing chart to a new chart type, DWH - Reporting keeps the properties from the
existing chart if those properties exist in the new chart type. For example, if you convert a pie chart to a bar
chart, Reporting maps your chart palette to the new chart, but does not map the exploding slices, be-cause
the exploding slices property does not exist in a bar chart.
l Click a chart and, from the report object toolbar, click the “Change chart type” icon ( ).
From the list, select a new chart type.
If some chart properties cannot be converted, the “Chart property changes dialog box” appears notifying
you of the properties that cannot be converted.
7.9.2 Customizing chart properties
After you create a chart, you can customize it by changing its properties.
You select the chart object in DWH – Reporting to view its properties. Some properties are dependent on the
existence of other properties.
If you are familiar with using conditional variables, you can customize the chart to change its appearance or
provide information in response to expressions or conditions.
As you edit the chart properties, Reporting provides you with a preview of your chart, using simulated data.
This allows you to view your style changes without running the report. You can disable the chart preview in the
options.
The following table shows some of the properties you can change in charts. These properties are available
when you select the chart object unless specified otherwise in the Action to perform in the Properties pane
column.
Goal Action to perform in the Properties pane
Hide or show the title, subtitle, or footer Select the chart. Under “Chart Titles”, set the “Title”,
“Subtitle”, or “Footer” property.
Hide or show the legend Select the chart. Under “Chart Annotations”, set the
“Legend” property.
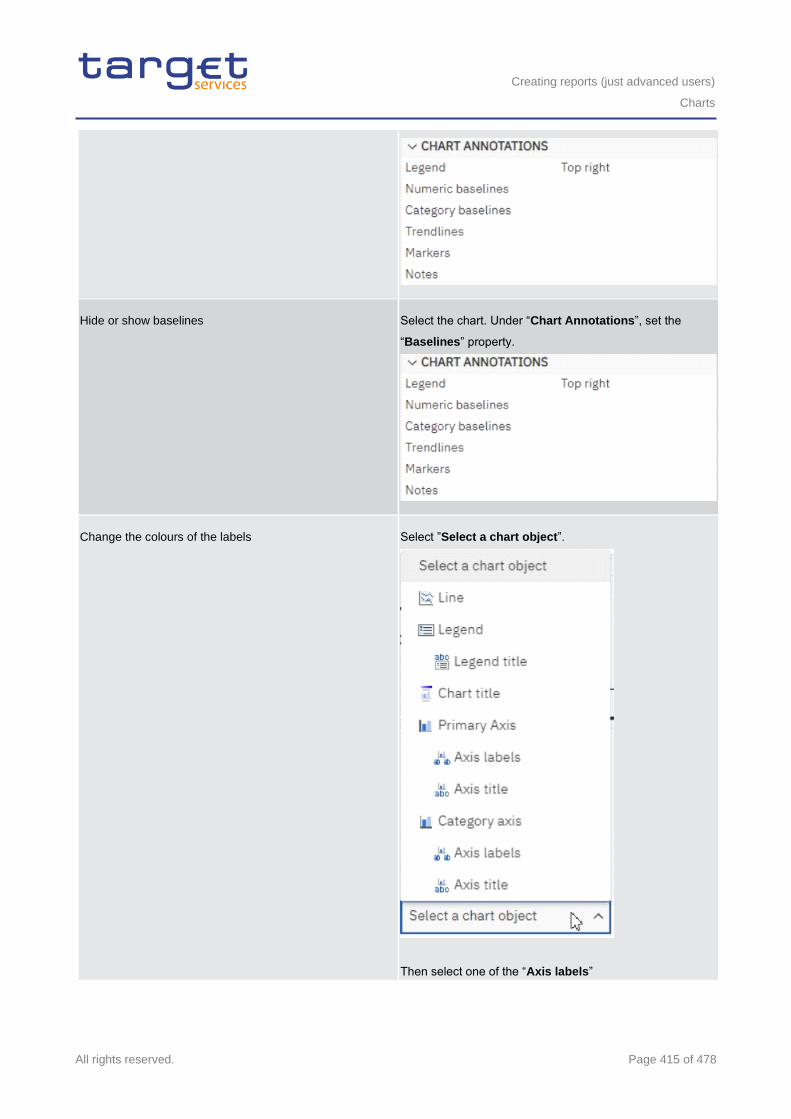
Creating reports (just advanced users)
Charts
All rights reserved. Page 415 of 478
Hide or show baselines Select the chart. Under “Chart Annotations”, set the
“Baselines” property.
Change the colours of the labels Select ”Select a chart object”.
Then select one of the “Axis labels”
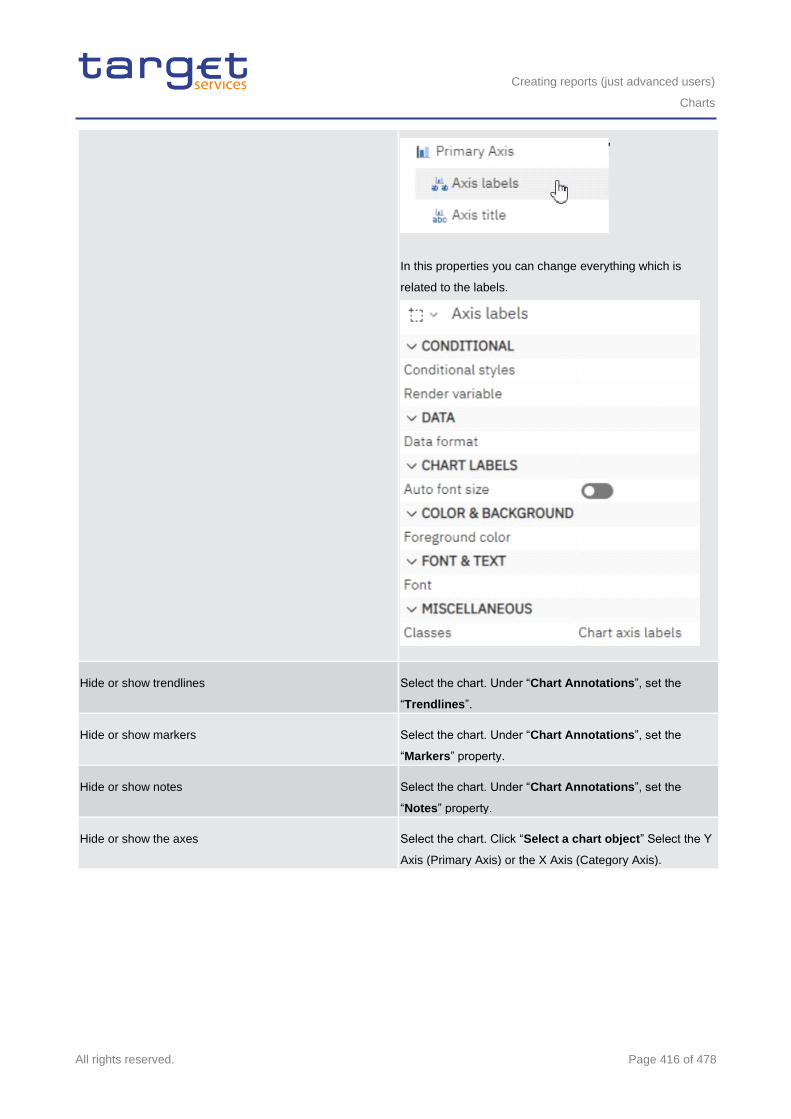
Creating reports (just advanced users)
Charts
All rights reserved. Page 416 of 478
In this properties you can change everything which is
related to the labels.
Hide or show trendlines Select the chart. Under “Chart Annotations”, set the
“Trendlines”.
Hide or show markers Select the chart. Under “Chart Annotations”, set the
“Markers” property.
Hide or show notes Select the chart. Under “Chart Annotations”, set the
“Notes” property.
Hide or show the axes Select the chart. Click “Select a chart object” Select the Y
Axis (Primary Axis) or the X Axis (Category Axis).
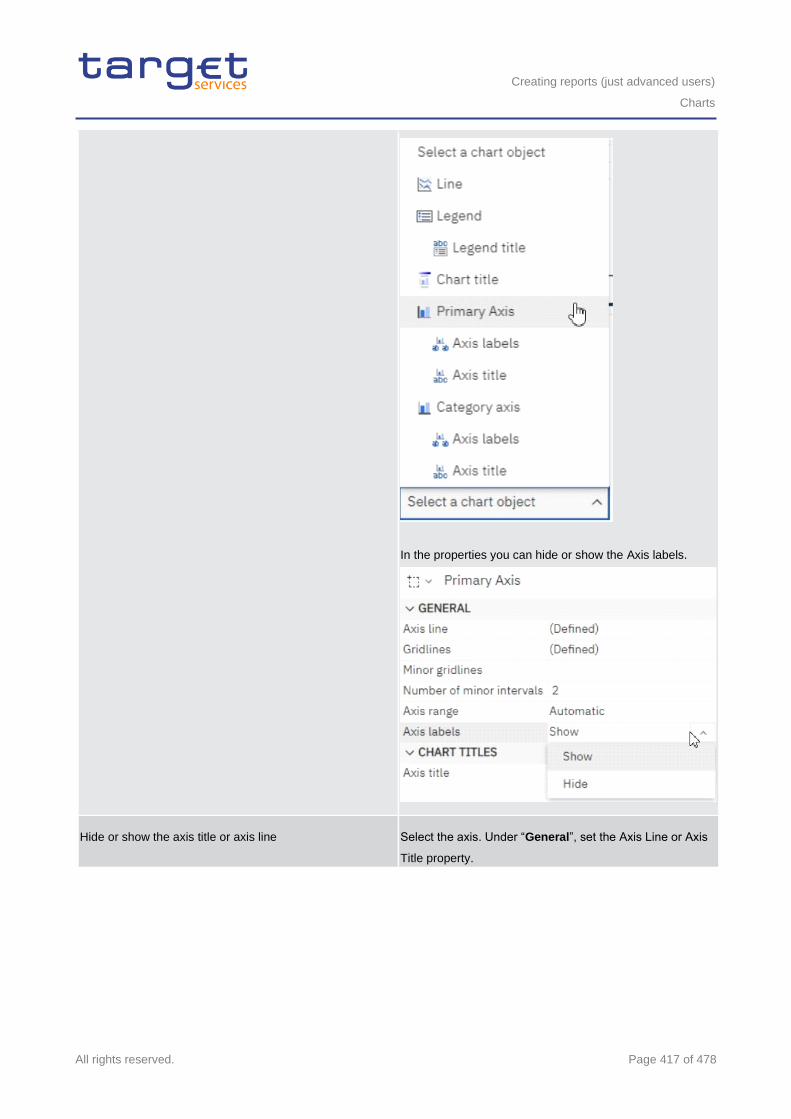
Creating reports (just advanced users)
Charts
All rights reserved. Page 417 of 478
In the properties you can hide or show the Axis labels.
Hide or show the axis title or axis line Select the axis. Under “General”, set the Axis Line or Axis
Title property.
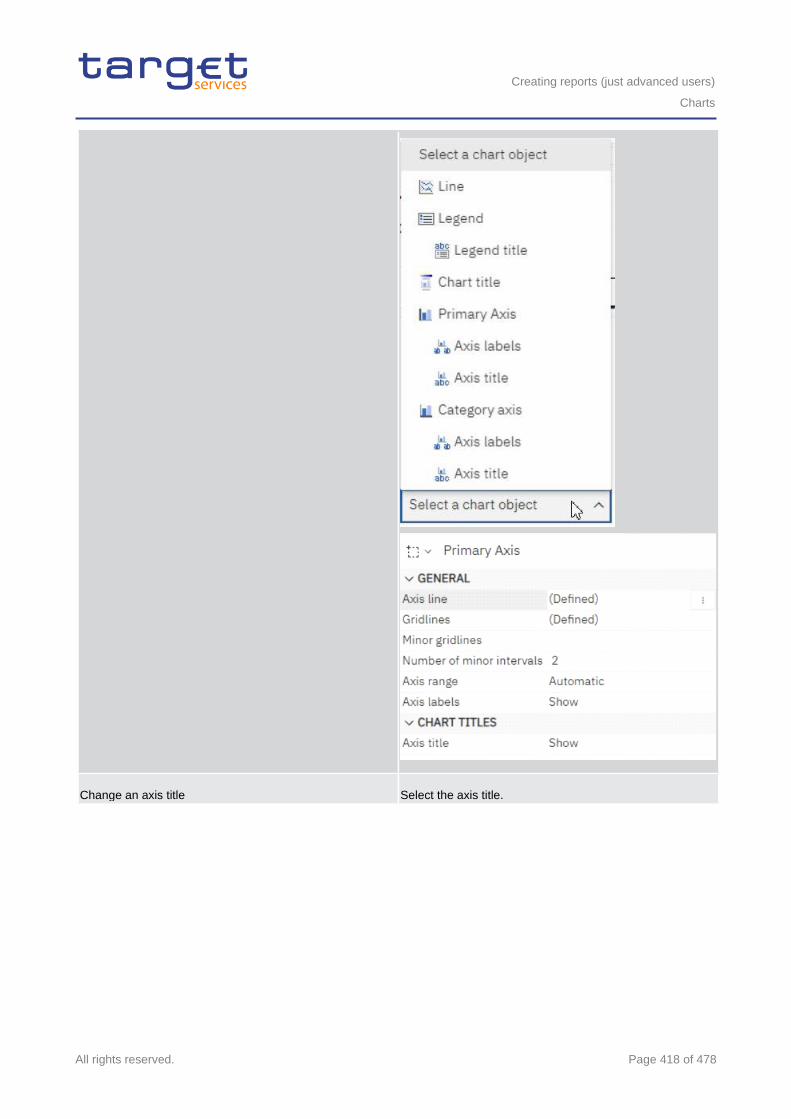
Creating reports (just advanced users)
Charts
All rights reserved. Page 418 of 478
Change an axis title Select the axis title.
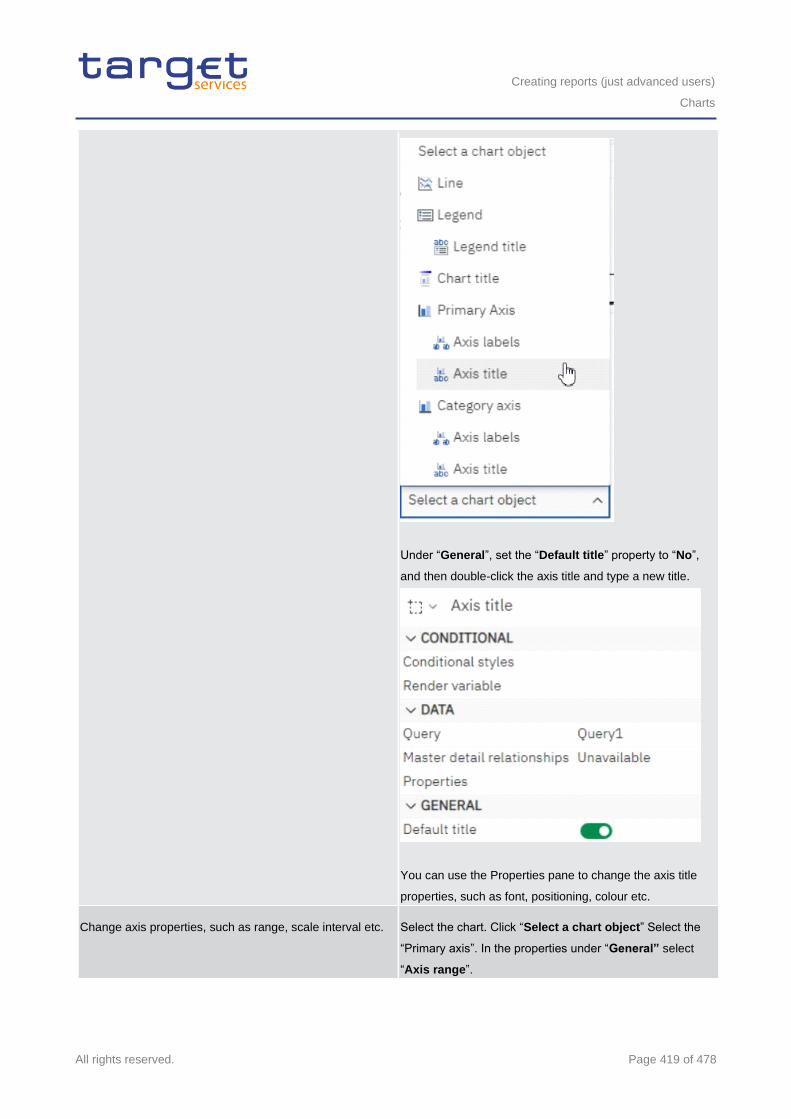
Creating reports (just advanced users)
Charts
All rights reserved. Page 419 of 478
Under “General”, set the “Default title” property to “No”,
and then double-click the axis title and type a new title.
You can use the Properties pane to change the axis title
properties, such as font, positioning, colour etc.
Change axis properties, such as range, scale interval etc. Select the chart. Click “Select a chart object” Select the
“Primary axis”. In the properties under “General” select
“Axis range”.
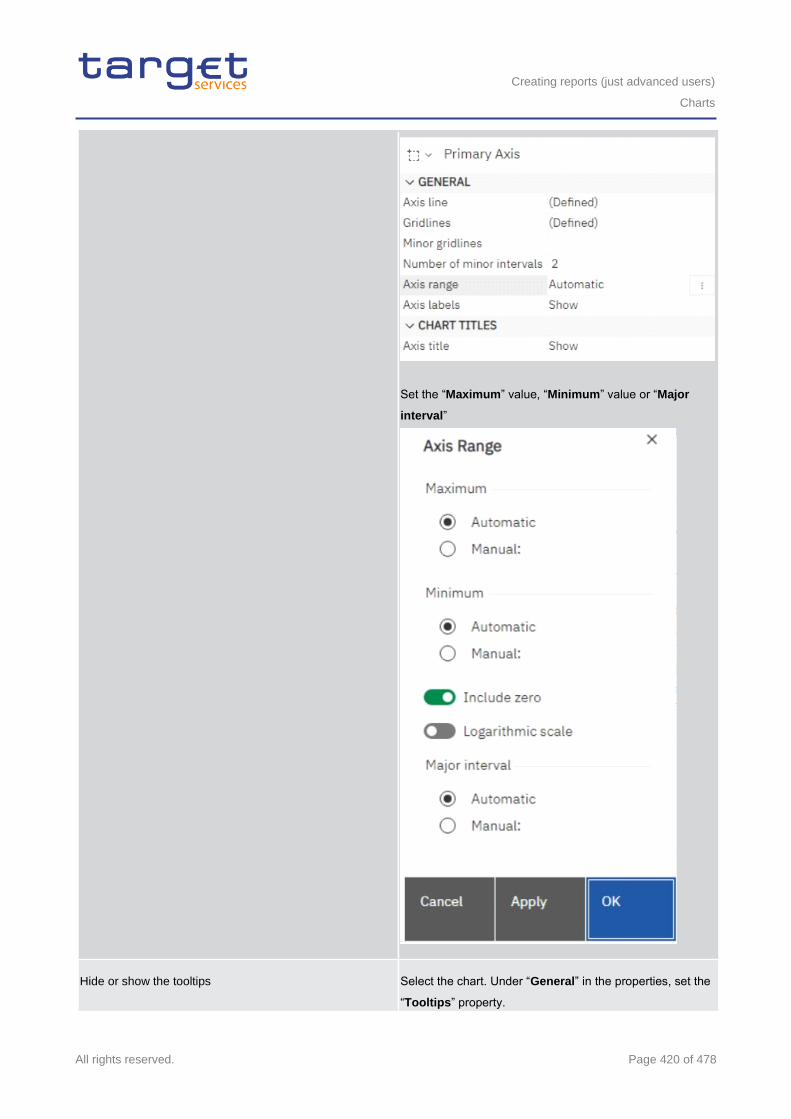
Creating reports (just advanced users)
Charts
All rights reserved. Page 420 of 478
Set the “Maximum” value, “Minimum” value or “Major
interval”
Hide or show the tooltips Select the chart. Under “General” in the properties, set the
“Tooltips” property.
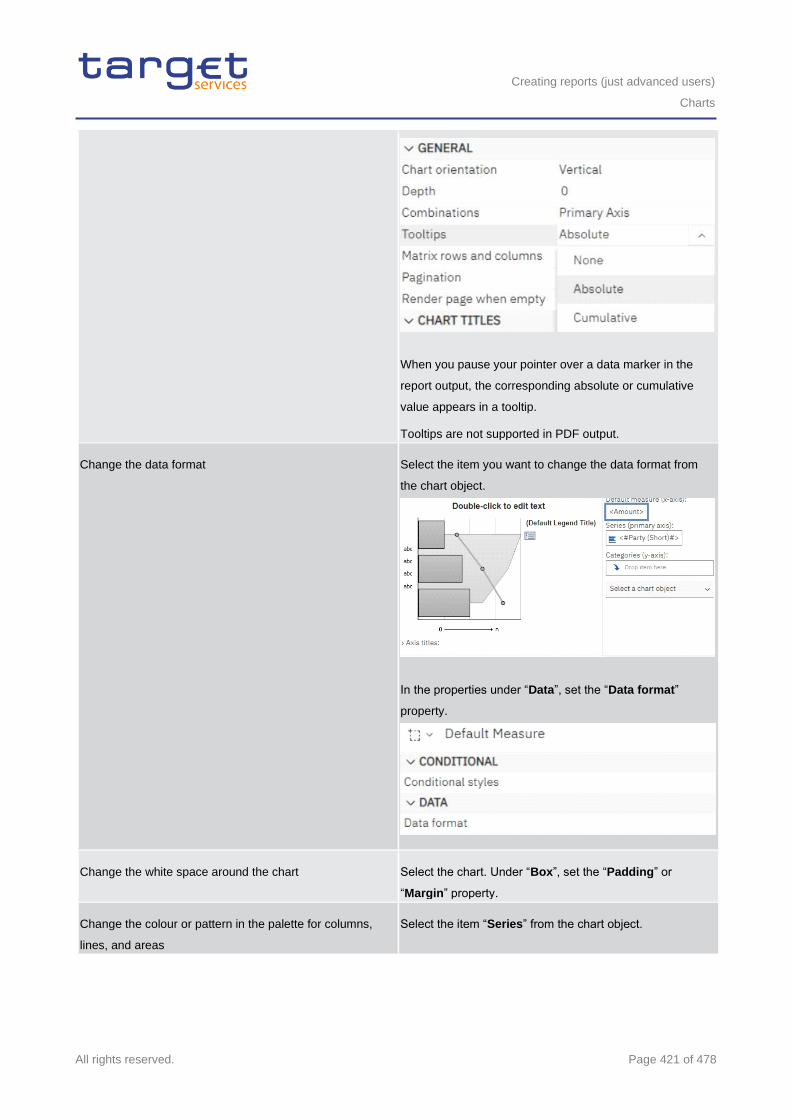
Creating reports (just advanced users)
Charts
All rights reserved. Page 421 of 478
When you pause your pointer over a data marker in the
report output, the corresponding absolute or cumulative
value appears in a tooltip.
Tooltips are not supported in PDF output.
Change the data format Select the item you want to change the data format from
the chart object.
In the properties under “Data”, set the “Data format”
property.
Change the white space around the chart Select the chart. Under “Box”, set the “Padding” or
“Margin” property.
Change the colour or pattern in the palette for columns,
lines, and areas
Select the item “Series” from the chart object.
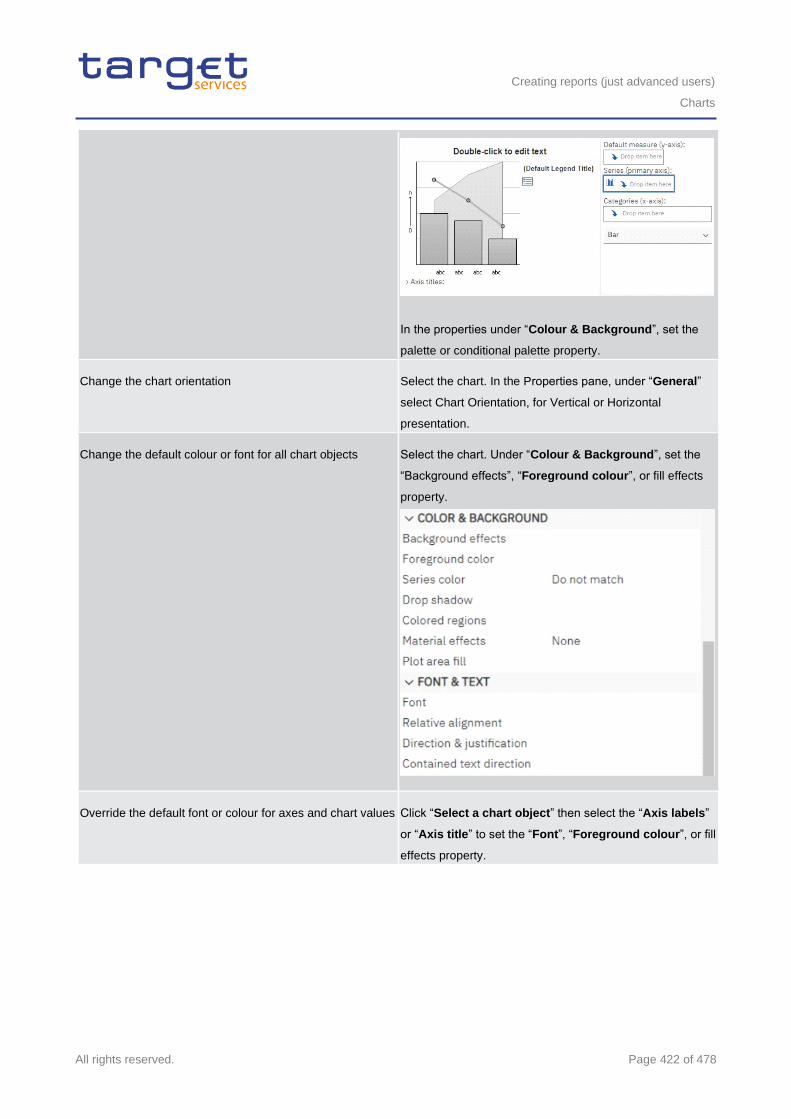
Creating reports (just advanced users)
Charts
All rights reserved. Page 422 of 478
In the properties under “Colour & Background”, set the
palette or conditional palette property.
Change the chart orientation Select the chart. In the Properties pane, under “General”
select Chart Orientation, for Vertical or Horizontal
presentation.
Change the default colour or font for all chart objects Select the chart. Under “Colour & Background”, set the
“Background effects”, “Foreground colour”, or fill effects
property.
Override the default font or colour for axes and chart values Click “Select a chart object” then select the “Axis labels”
or “Axis title” to set the “Font”, “Foreground colour”, or fill
effects property.
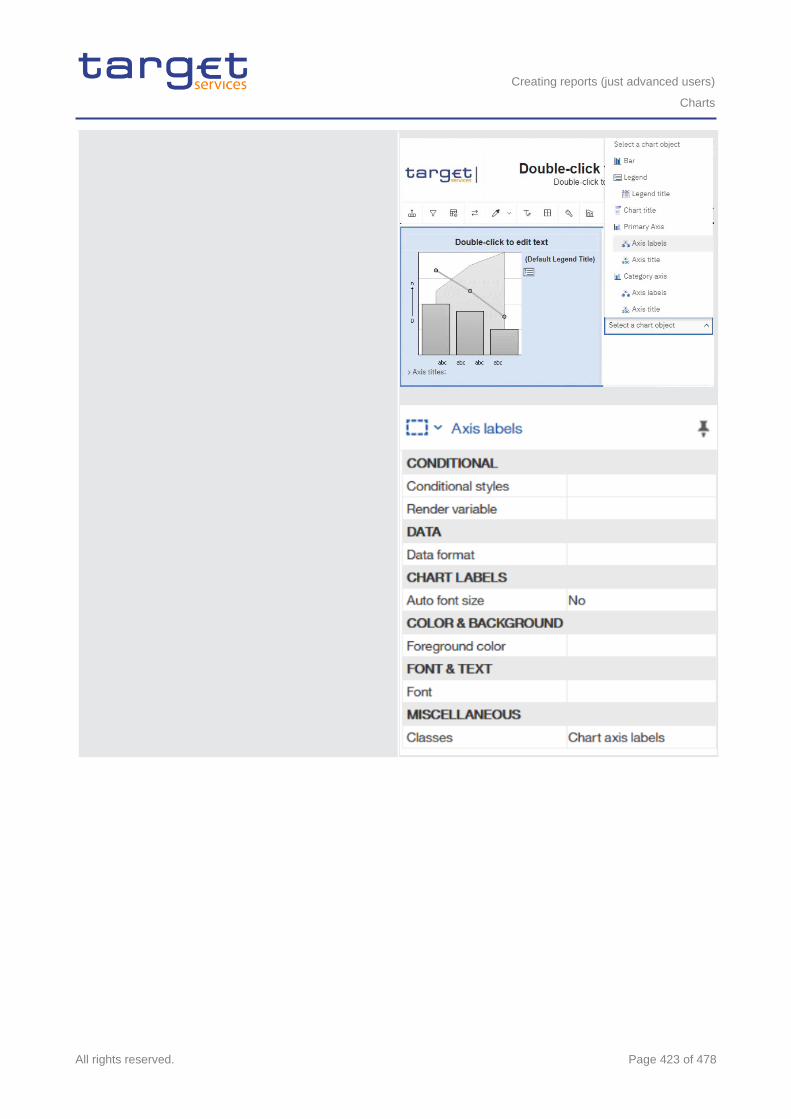
Creating reports (just advanced users)
Charts
All rights reserved. Page 423 of 478
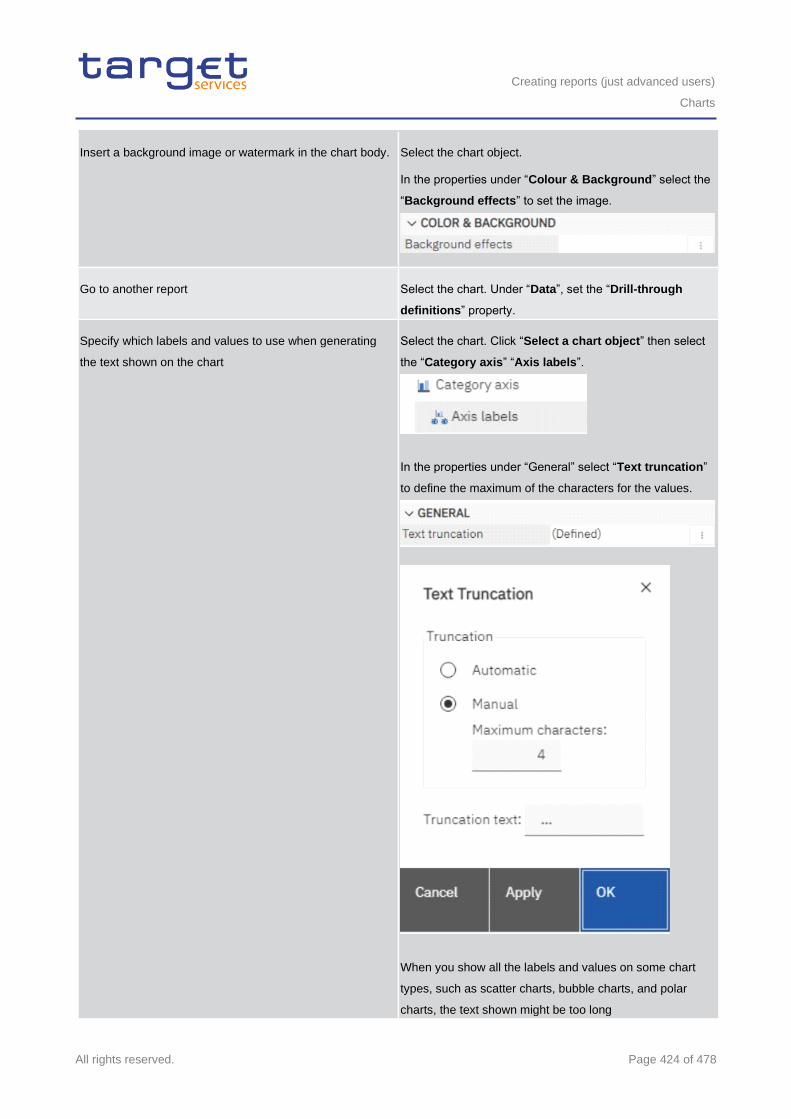
Creating reports (just advanced users)
Charts
All rights reserved. Page 424 of 478
Insert a background image or watermark in the chart body. Select the chart object.
In the properties under “Colour & Background” select the
“Background effects” to set the image.
Go to another report Select the chart. Under “Data”, set the “Drill-through
definitions” property.
Specify which labels and values to use when generating
the text shown on the chart
Select the chart. Click “Select a chart object” then select
the “Category axis” “Axis labels”.
In the properties under “General” select “Text truncation”
to define the maximum of the characters for the values.
When you show all the labels and values on some chart
types, such as scatter charts, bubble charts, and polar
charts, the text shown might be too long
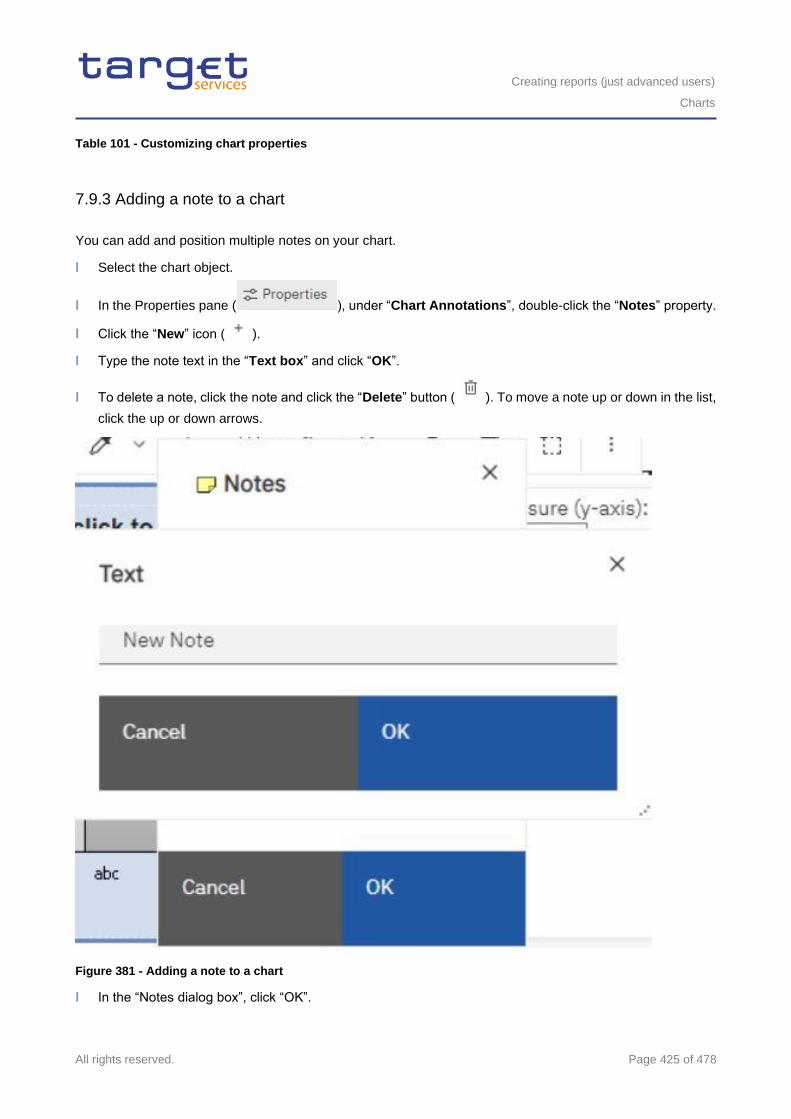
Creating reports (just advanced users)
Charts
All rights reserved. Page 425 of 478
Table 101 - Customizing chart properties
7.9.3 Adding a note to a chart
You can add and position multiple notes on your chart.
l Select the chart object.
l In the Properties pane ( ), under “Chart Annotations”, double-click the “Notes” property.
l Click the “New” icon ( ).
l Type the note text in the “Text box” and click “OK”.
l To delete a note, click the note and click the “Delete” button ( ). To move a note up or down in the list,
click the up or down arrows.
Figure 381 - Adding a note to a chart
l In the “Notes dialog box”, click “OK”.
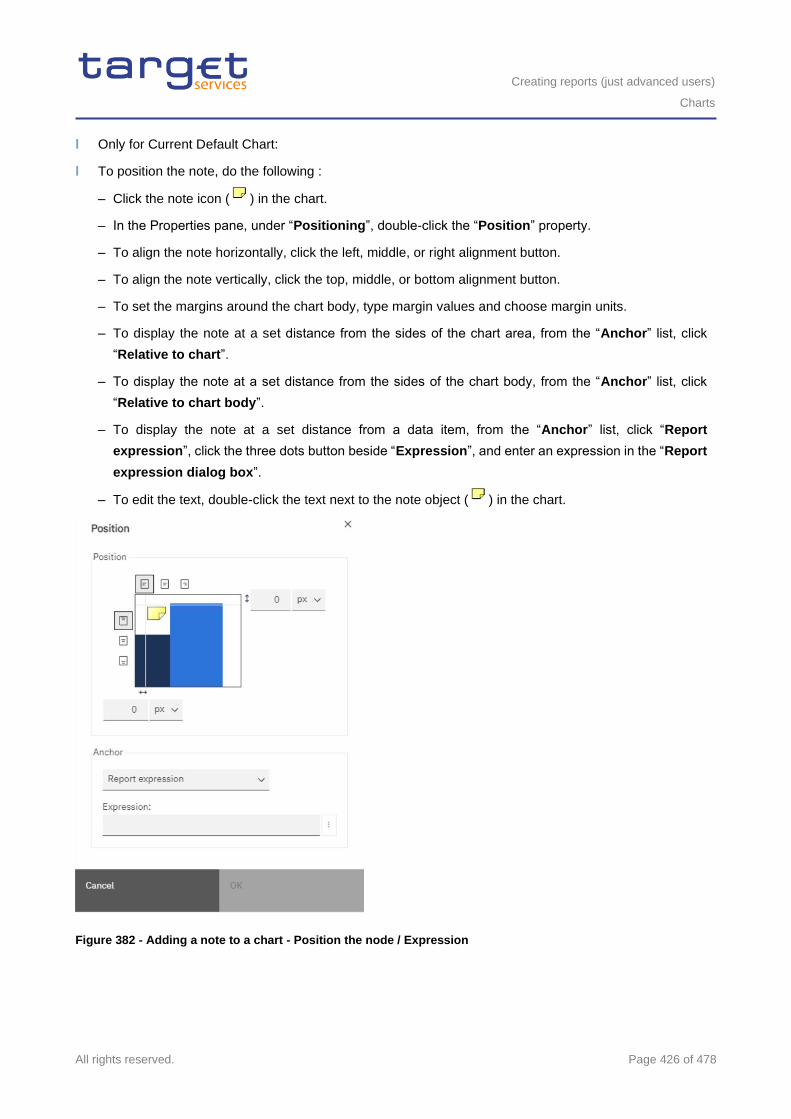
Creating reports (just advanced users)
Charts
All rights reserved. Page 426 of 478
l Only for Current Default Chart:
l To position the note, do the following :
– Click the note icon ( ) in the chart.
– In the Properties pane, under “Positioning”, double-click the “Position” property.
– To align the note horizontally, click the left, middle, or right alignment button.
– To align the note vertically, click the top, middle, or bottom alignment button.
– To set the margins around the chart body, type margin values and choose margin units.
– To display the note at a set distance from the sides of the chart area, from the “Anchor” list, click
“Relative to chart”.
– To display the note at a set distance from the sides of the chart body, from the “Anchor” list, click
“Relative to chart body”.
– To display the note at a set distance from a data item, from the “Anchor” list, click “Report
expression”, click the three dots button beside “Expression”, and enter an expression in the “Report
expression dialog box”.
– To edit the text, double-click the text next to the note object ( ) in the chart.
Figure 382 - Adding a note to a chart - Position the node / Expression
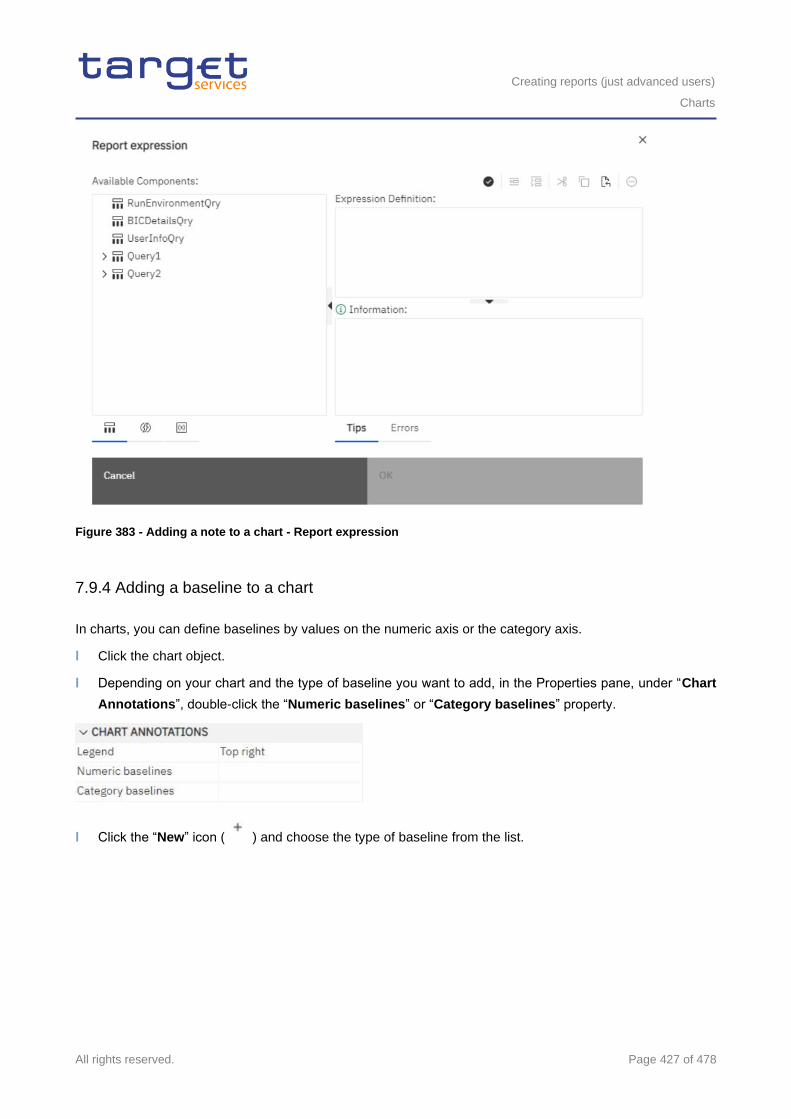
Creating reports (just advanced users)
Charts
All rights reserved. Page 427 of 478
Figure 383 - Adding a note to a chart - Report expression
7.9.4 Adding a baseline to a chart
In charts, you can define baselines by values on the numeric axis or the category axis.
l Click the chart object.
l Depending on your chart and the type of baseline you want to add, in the Properties pane, under “Chart
Annotations”, double-click the “Numeric baselines” or “Category baselines” property.
l Click the “New” icon ( ) and choose the type of baseline from the list.
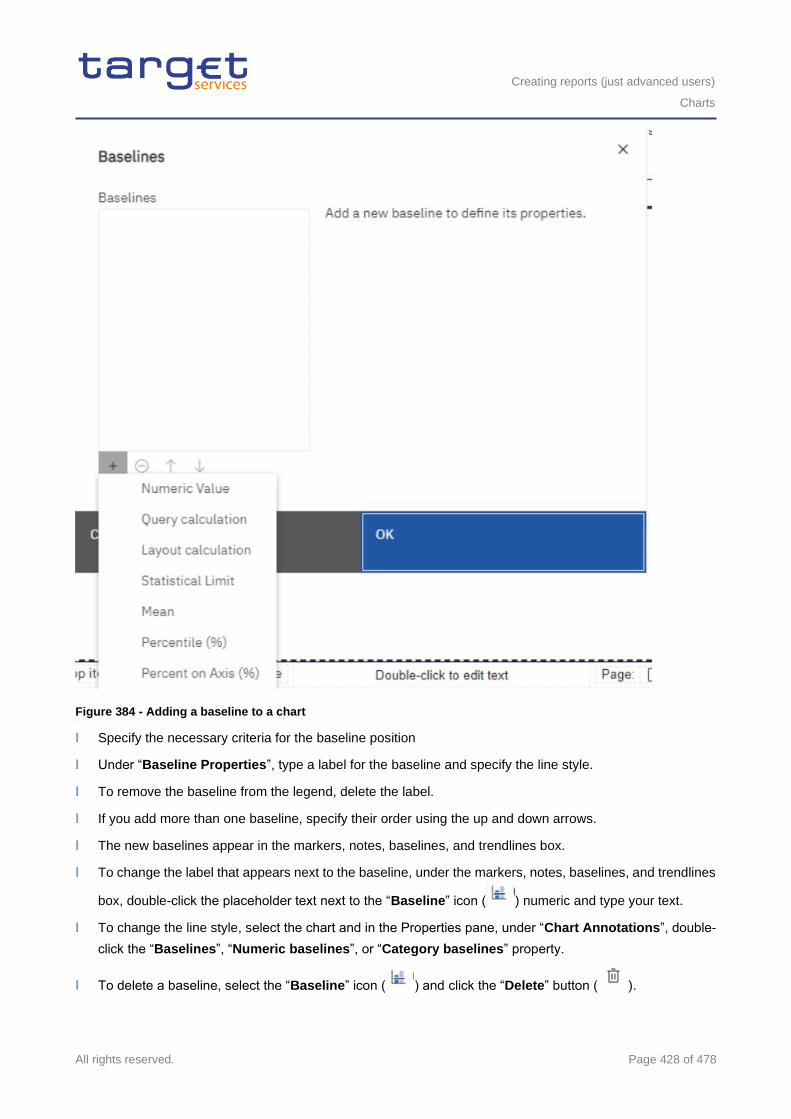
Creating reports (just advanced users)
Charts
All rights reserved. Page 428 of 478
Figure 384 - Adding a baseline to a chart
l Specify the necessary criteria for the baseline position
l Under “Baseline Properties”, type a label for the baseline and specify the line style.
l To remove the baseline from the legend, delete the label.
l If you add more than one baseline, specify their order using the up and down arrows.
l The new baselines appear in the markers, notes, baselines, and trendlines box.
l To change the label that appears next to the baseline, under the markers, notes, baselines, and trendlines
box, double-click the placeholder text next to the “Baseline” icon ( ) numeric and type your text.
l To change the line style, select the chart and in the Properties pane, under “Chart Annotations”, double-
click the “Baselines”, “Numeric baselines”, or “Category baselines” property.
l To delete a baseline, select the “Baseline” icon ( ) and click the “Delete” button ( ).
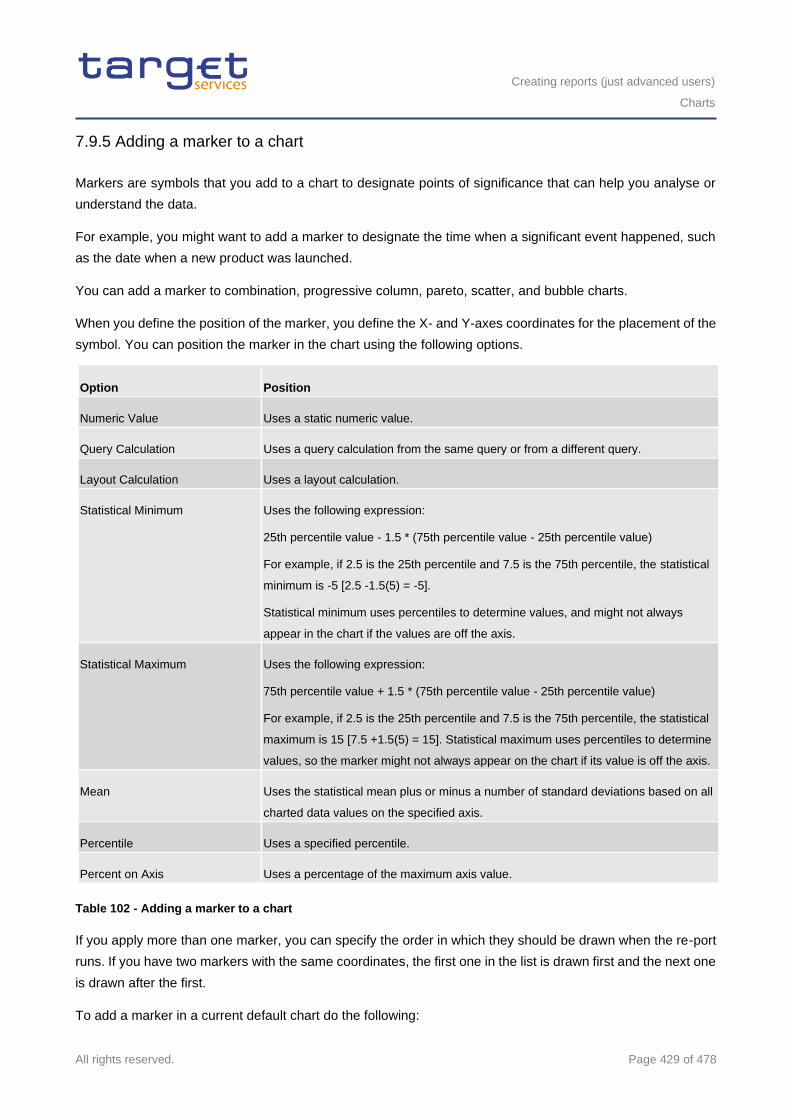
Creating reports (just advanced users)
Charts
All rights reserved. Page 429 of 478
7.9.5 Adding a marker to a chart
Markers are symbols that you add to a chart to designate points of significance that can help you analyse or
understand the data.
For example, you might want to add a marker to designate the time when a significant event happened, such
as the date when a new product was launched.
You can add a marker to combination, progressive column, pareto, scatter, and bubble charts.
When you define the position of the marker, you define the X- and Y-axes coordinates for the placement of the
symbol. You can position the marker in the chart using the following options.
Option Position
Numeric Value Uses a static numeric value.
Query Calculation Uses a query calculation from the same query or from a different query.
Layout Calculation Uses a layout calculation.
Statistical Minimum Uses the following expression:
25th percentile value - 1.5 * (75th percentile value - 25th percentile value)
For example, if 2.5 is the 25th percentile and 7.5 is the 75th percentile, the statistical
minimum is -5 [2.5 -1.5(5) = -5].
Statistical minimum uses percentiles to determine values, and might not always
appear in the chart if the values are off the axis.
Statistical Maximum Uses the following expression:
75th percentile value + 1.5 * (75th percentile value - 25th percentile value)
For example, if 2.5 is the 25th percentile and 7.5 is the 75th percentile, the statistical
maximum is 15 [7.5 +1.5(5) = 15]. Statistical maximum uses percentiles to determine
values, so the marker might not always appear on the chart if its value is off the axis.
Mean Uses the statistical mean plus or minus a number of standard deviations based on all
charted data values on the specified axis.
Percentile Uses a specified percentile.
Percent on Axis Uses a percentage of the maximum axis value.
Table 102 - Adding a marker to a chart
If you apply more than one marker, you can specify the order in which they should be drawn when the re-port
runs. If you have two markers with the same coordinates, the first one in the list is drawn first and the next one
is drawn after the first.
To add a marker in a current default chart do the following:
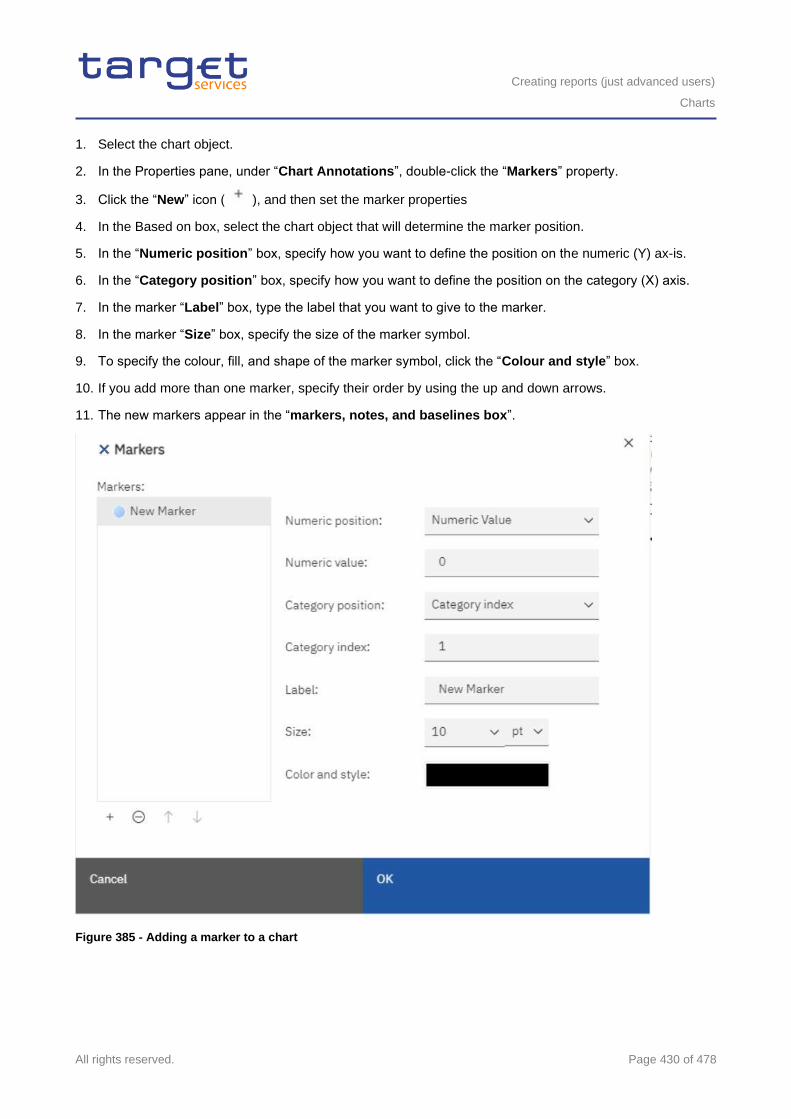
Creating reports (just advanced users)
Charts
All rights reserved. Page 430 of 478
1. Select the chart object.
2. In the Properties pane, under “Chart Annotations”, double-click the “Markers” property.
3. Click the “New” icon ( ), and then set the marker properties
4. In the Based on box, select the chart object that will determine the marker position.
5. In the “Numeric position” box, specify how you want to define the position on the numeric (Y) ax-is.
6. In the “Category position” box, specify how you want to define the position on the category (X) axis.
7. In the marker “Label” box, type the label that you want to give to the marker.
8. In the marker “Size” box, specify the size of the marker symbol.
9. To specify the colour, fill, and shape of the marker symbol, click the “Colour and style” box.
10. If you add more than one marker, specify their order by using the up and down arrows.
11. The new markers appear in the “markers, notes, and baselines box”.
Figure 385 - Adding a marker to a chart
Creating reports (just advanced users)
Adding prompts to filter data
All rights reserved. Page 431 of 478
7.9.6 Creating a drill-down Chart
If you use a dimensionally-modelled data source, you can create a chart that allows you to drill down to low-
er-level data or drill up to higher-level data.
Drilling up and down allows you to view more general or more detailed information on your data within a
predefined dimensional hierarchy.
This is an example of a dimensional hierarchy:
All Years - Year - Quarter - Month
Before you begin, ensure that you are using a dimensionally-modelled data source.
l Open a chart that uses a dimensionally-modelled data source.
l Click the “Show properties” icon ( ), click the “More” icon ( ), click “ Options” (
), and then, in the “ Edit” section, click on “Enable drill-up or drill-down links”.
By default, the system determines which items can be drilled on based on the dimensional structure.
The chart generates links for any item that can be drilled down on.
You can drill down or drill up by right-clicking and choosing the action from the context menu. The menu items
are unavailable if an item cannot be drilled up or down on.
7.10 Adding prompts to filter data
You can add prompts to a report to add interactivity for users. Prompts act as questions that help users to
customize the information in a report to suit their own needs. For example, you create a prompt so that users
can select a product type. Only products belonging to the selected product type are retrieved and shown in the
report.
Prompts are composed of three interrelated components: parameters, prompt controls, and parameter values.
Parameters are based on parameterized filters and form the questions to ask users. Prompt controls provide
the user interface in which the questions are asked. Parameter values provide the answers to the questions.
The Reportstudio provides several ways to create prompts.
l build your own prompt and prompt page
l create a parameter to produce a prompt
l insert prompts directly into the report page
In dimensional reporting, you can also define prompts using context filters.
Creating reports (just advanced users)
Adding prompts to filter data
All rights reserved. Page 432 of 478
If you include reports from different packages in an interactive dashboard that uses global filters, ensure that
you use the same parameter name for the prompt in all the reports. You can also use context filters, also
known as slicer filters, to focus the data in your report.
Syntax of Prompt Expressions
Prompt expressions use the following syntax, where p represents the parameter name.
You can also use these expressions to create parameterized data items that you can then use in master detail
relationships.
The type of expression you use depends on whether you have chosen relational or dimensional reporting style.
For more information about reporting styles, see Relational and dimensional reporting styles.
Relational: Detail Filter Expressions Dimensional: Context (Slicer) or Edge Expressions
[data item] = ?p?
for single-select prompts and master detail relationships
[level or hierarchy]->?p?
For single-select member prompts and master detail
relationships
[data item] in ?p?
for multi-select prompts
set([level or hierarchy]->?p?)
For multi-select member prompts
filter ([set], [property expression] = ?p? )
For single-select value prompts and master detail
relationships
A property expression is an expression that is assigned to a
property to enable dynamic update of the property when
the report runs.
filter ([set], [property expression] IN ?p? )
For multi-select value prompts
A property expression is an expression that is assigned to a
property to enable dynamic update of the property when
the report runs.
Table 103 - Adding prompts to filter data
7.10.1 Build your own Prompt and Prompt page
Create your own prompt and prompt page to control how they appear in a report.
Procedure
l In the navigation menu, click “Report” and then click “Prompt pages”.
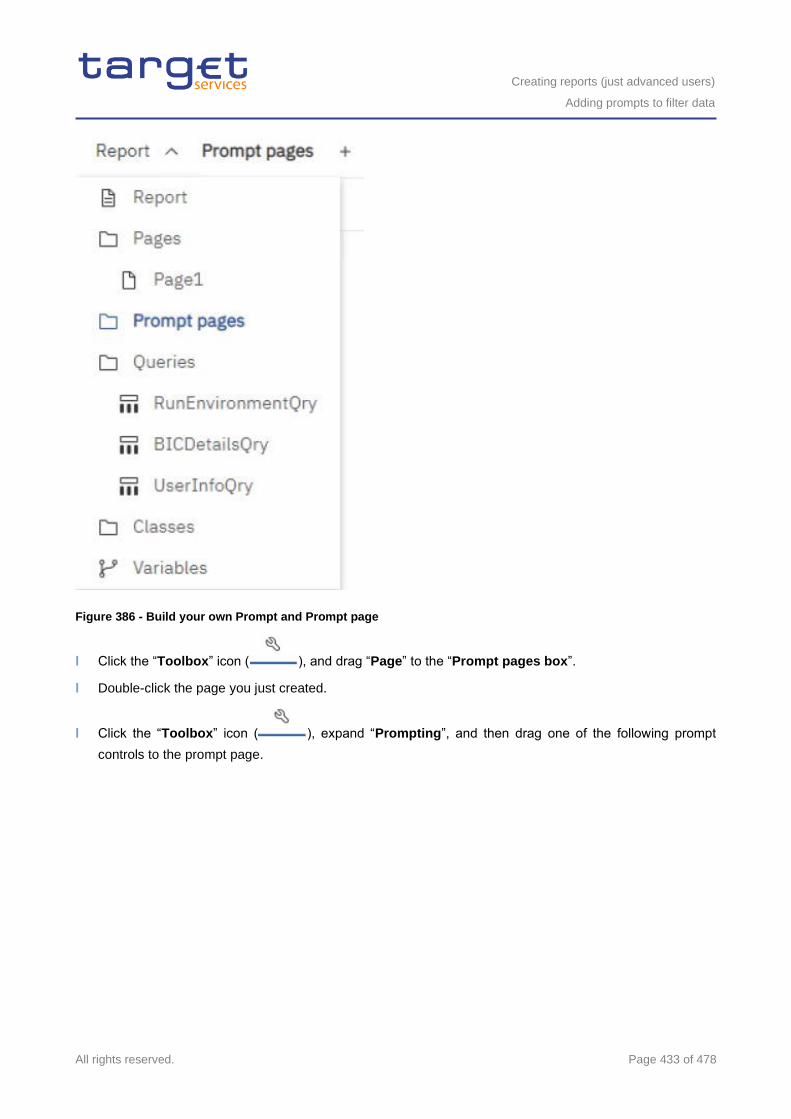
Creating reports (just advanced users)
Adding prompts to filter data
All rights reserved. Page 433 of 478
Figure 386 - Build your own Prompt and Prompt page
l Click the “Toolbox” icon ( ), and drag “Page” to the “Prompt pages box”.
l Double-click the page you just created.
l Click the “Toolbox” icon ( ), expand “Prompting”, and then drag one of the following prompt
controls to the prompt page.
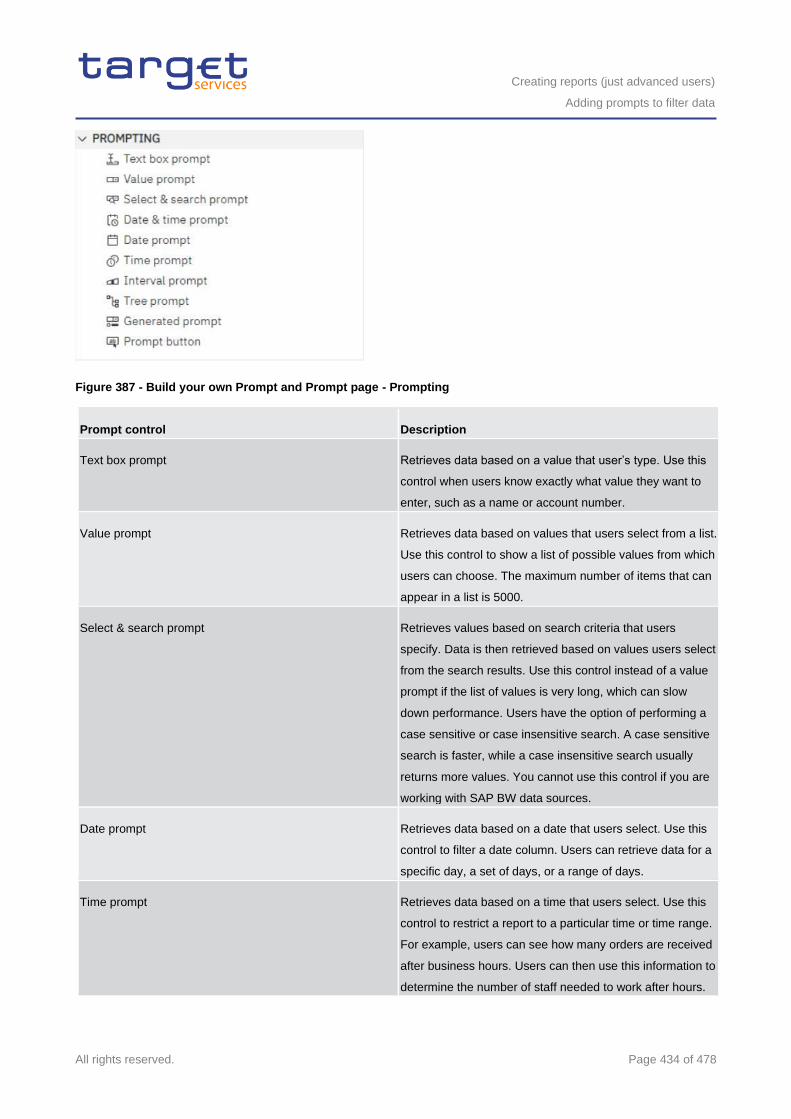
Creating reports (just advanced users)
Adding prompts to filter data
All rights reserved. Page 434 of 478
Figure 387 - Build your own Prompt and Prompt page - Prompting
Prompt control Description
Text box prompt Retrieves data based on a value that user’s type. Use this
control when users know exactly what value they want to
enter, such as a name or account number.
Value prompt Retrieves data based on values that users select from a list.
Use this control to show a list of possible values from which
users can choose. The maximum number of items that can
appear in a list is 5000.
Select & search prompt Retrieves values based on search criteria that users
specify. Data is then retrieved based on values users select
from the search results. Use this control instead of a value
prompt if the list of values is very long, which can slow
down performance. Users have the option of performing a
case sensitive or case insensitive search. A case sensitive
search is faster, while a case insensitive search usually
returns more values. You cannot use this control if you are
working with SAP BW data sources.
Date prompt Retrieves data based on a date that users select. Use this
control to filter a date column. Users can retrieve data for a
specific day, a set of days, or a range of days.
Time prompt Retrieves data based on a time that users select. Use this
control to restrict a report to a particular time or time range.
For example, users can see how many orders are received
after business hours. Users can then use this information to
determine the number of staff needed to work after hours.
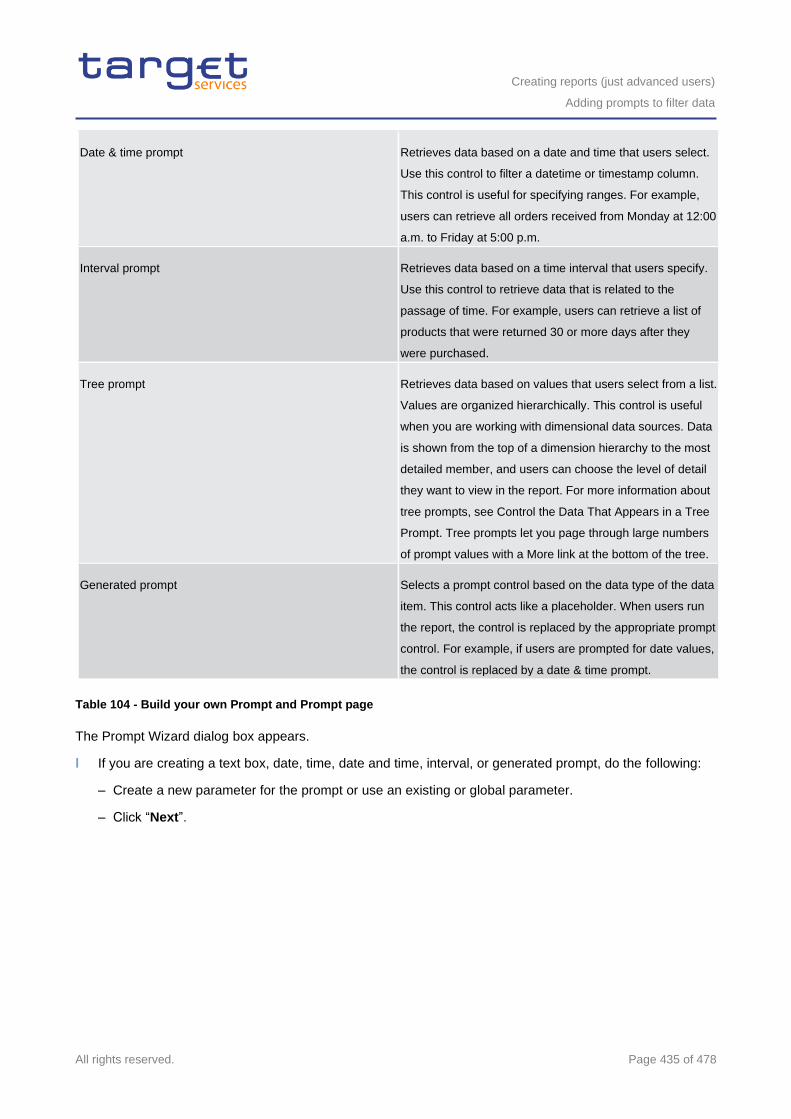
Creating reports (just advanced users)
Adding prompts to filter data
All rights reserved. Page 435 of 478
Date & time prompt Retrieves data based on a date and time that users select.
Use this control to filter a datetime or timestamp column.
This control is useful for specifying ranges. For example,
users can retrieve all orders received from Monday at 12:00
a.m. to Friday at 5:00 p.m.
Interval prompt Retrieves data based on a time interval that users specify.
Use this control to retrieve data that is related to the
passage of time. For example, users can retrieve a list of
products that were returned 30 or more days after they
were purchased.
Tree prompt Retrieves data based on values that users select from a list.
Values are organized hierarchically. This control is useful
when you are working with dimensional data sources. Data
is shown from the top of a dimension hierarchy to the most
detailed member, and users can choose the level of detail
they want to view in the report. For more information about
tree prompts, see Control the Data That Appears in a Tree
Prompt. Tree prompts let you page through large numbers
of prompt values with a More link at the bottom of the tree.
Generated prompt Selects a prompt control based on the data type of the data
item. This control acts like a placeholder. When users run
the report, the control is replaced by the appropriate prompt
control. For example, if users are prompted for date values,
the control is replaced by a date & time prompt.
Table 104 - Build your own Prompt and Prompt page
The Prompt Wizard dialog box appears.
l If you are creating a text box, date, time, date and time, interval, or generated prompt, do the following:
– Create a new parameter for the prompt or use an existing or global parameter.
– Click “Next”.
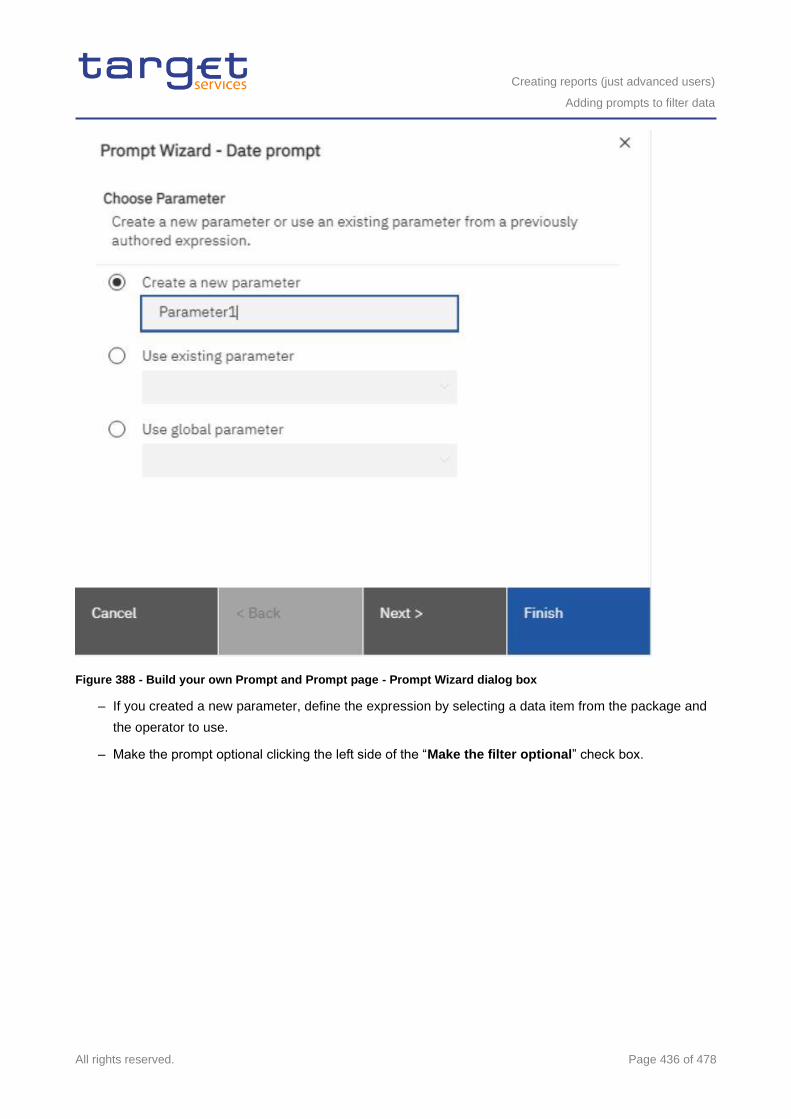
Creating reports (just advanced users)
Adding prompts to filter data
All rights reserved. Page 436 of 478
Figure 388 - Build your own Prompt and Prompt page - Prompt Wizard dialog box
– If you created a new parameter, define the expression by selecting a data item from the package and
the operator to use.
– Make the prompt optional clicking the left side of the “Make the filter optional” check box.
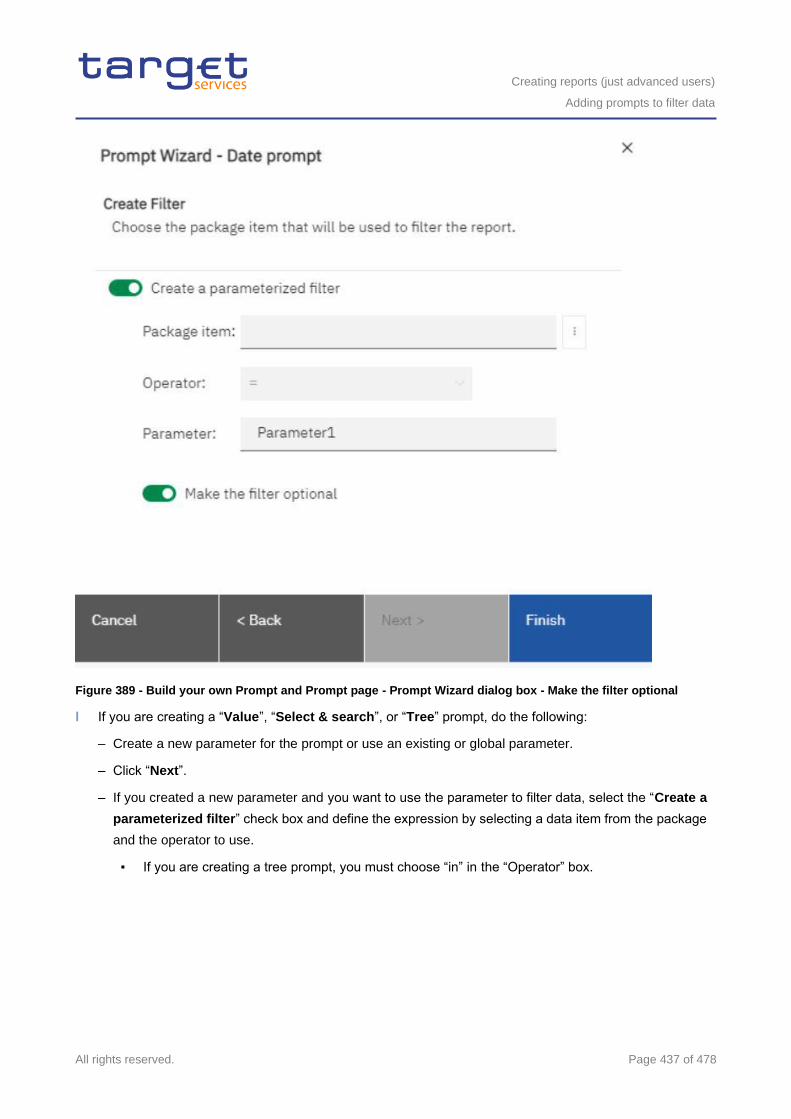
Creating reports (just advanced users)
Adding prompts to filter data
All rights reserved. Page 437 of 478
Figure 389 - Build your own Prompt and Prompt page - Prompt Wizard dialog box - Make the filter optional
l If you are creating a “Value”, “Select & search”, or “Tree” prompt, do the following:
– Create a new parameter for the prompt or use an existing or global parameter.
– Click “Next”.
– If you created a new parameter and you want to use the parameter to filter data, select the “Create a
parameterized filter” check box and define the expression by selecting a data item from the package
and the operator to use.
▪ If you are creating a tree prompt, you must choose “in” in the “Operator” box.
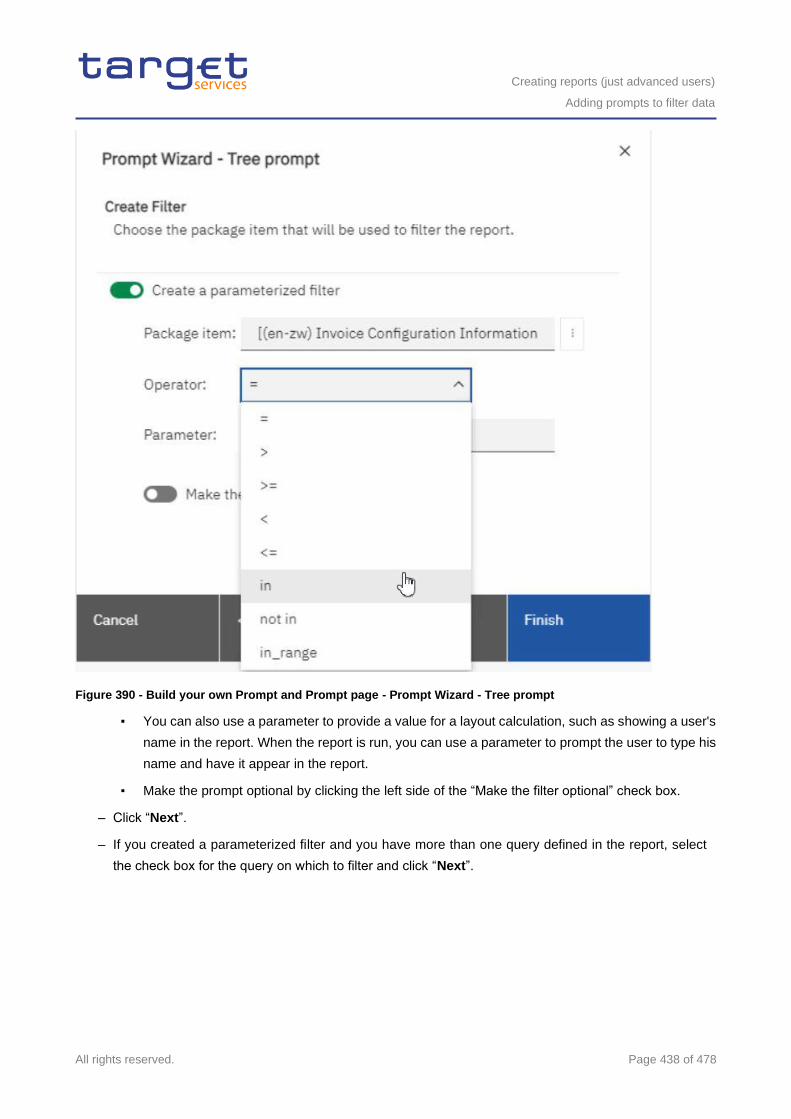
Creating reports (just advanced users)
Adding prompts to filter data
All rights reserved. Page 438 of 478
Figure 390 - Build your own Prompt and Prompt page - Prompt Wizard - Tree prompt
▪ You can also use a parameter to provide a value for a layout calculation, such as showing a user's
name in the report. When the report is run, you can use a parameter to prompt the user to type his
name and have it appear in the report.
▪ Make the prompt optional by clicking the left side of the “Make the filter optional” check box.
– Click “Next”.
– If you created a parameterized filter and you have more than one query defined in the report, select
the check box for the query on which to filter and click “Next”.
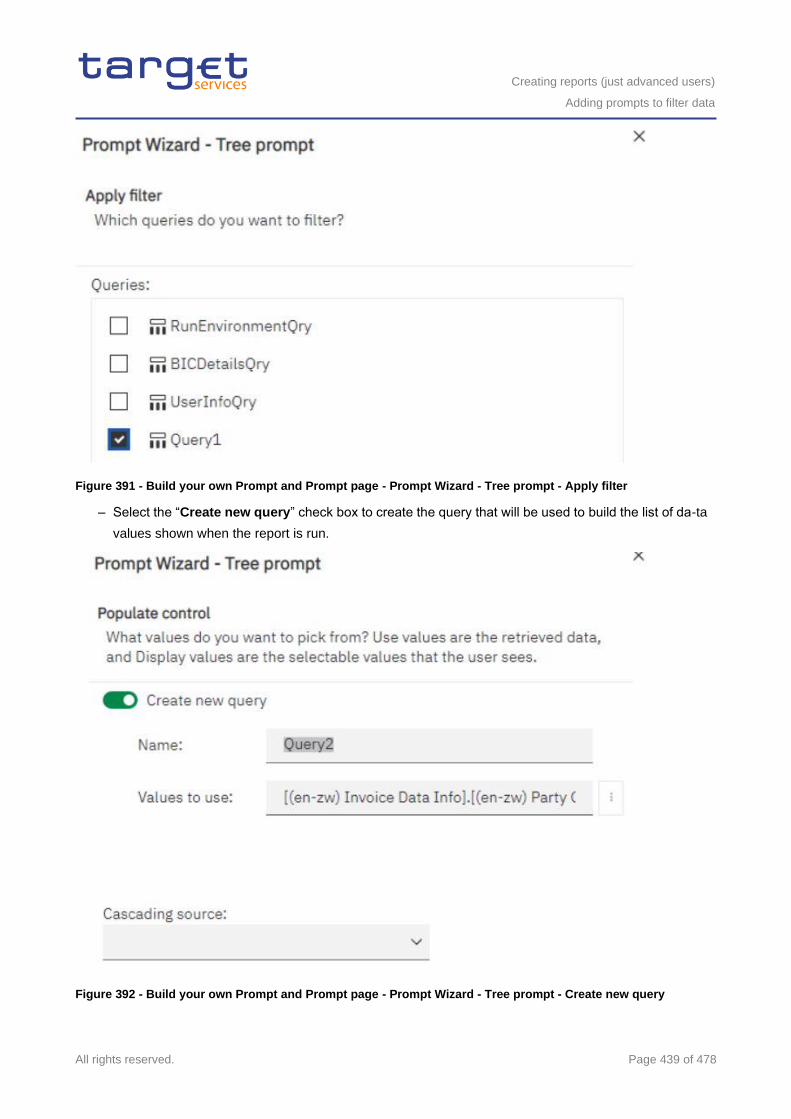
Creating reports (just advanced users)
Adding prompts to filter data
All rights reserved. Page 439 of 478
Figure 391 - Build your own Prompt and Prompt page - Prompt Wizard - Tree prompt - Apply filter
– Select the “Create new query” check box to create the query that will be used to build the list of da-ta
values shown when the report is run.
Figure 392 - Build your own Prompt and Prompt page - Prompt Wizard - Tree prompt - Create new query
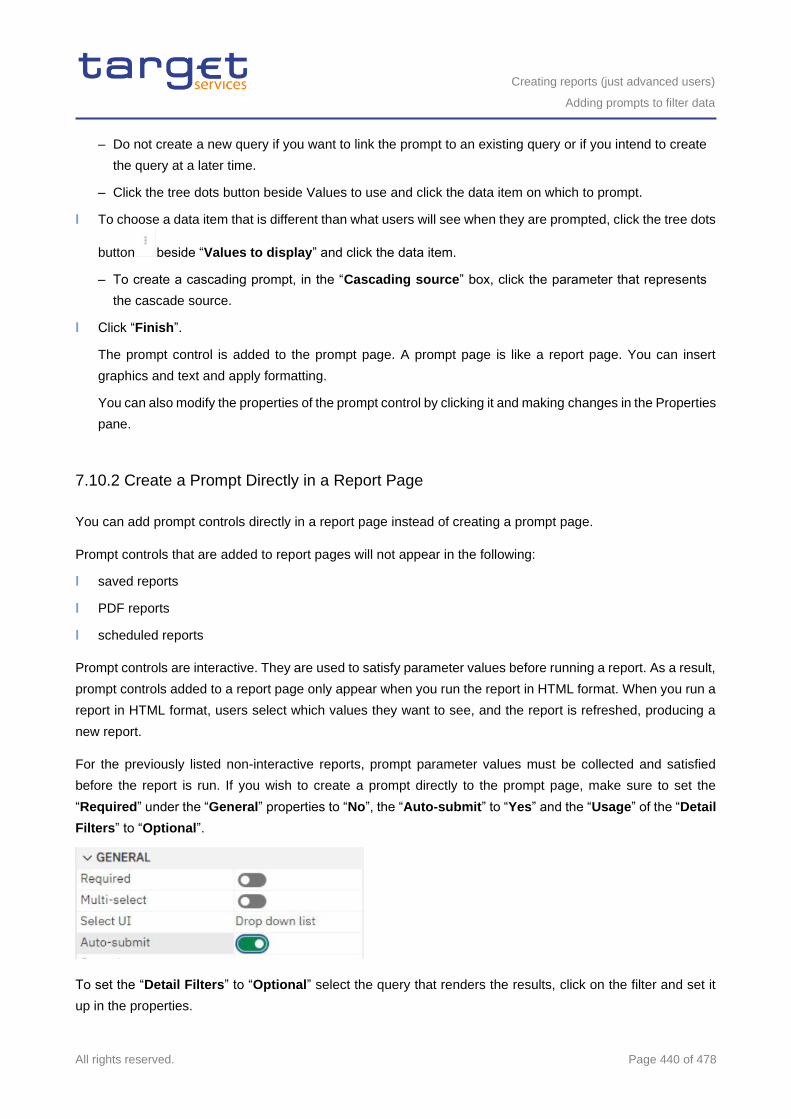
Creating reports (just advanced users)
Adding prompts to filter data
All rights reserved. Page 440 of 478
– Do not create a new query if you want to link the prompt to an existing query or if you intend to create
the query at a later time.
– Click the tree dots button beside Values to use and click the data item on which to prompt.
l To choose a data item that is different than what users will see when they are prompted, click the tree dots
button beside “Values to display” and click the data item.
– To create a cascading prompt, in the “Cascading source” box, click the parameter that represents
the cascade source.
l Click “Finish”.
The prompt control is added to the prompt page. A prompt page is like a report page. You can insert
graphics and text and apply formatting.
You can also modify the properties of the prompt control by clicking it and making changes in the Properties
pane.
7.10.2 Create a Prompt Directly in a Report Page
You can add prompt controls directly in a report page instead of creating a prompt page.
Prompt controls that are added to report pages will not appear in the following:
l saved reports
l PDF reports
l scheduled reports
Prompt controls are interactive. They are used to satisfy parameter values before running a report. As a result,
prompt controls added to a report page only appear when you run the report in HTML format. When you run a
report in HTML format, users select which values they want to see, and the report is refreshed, producing a
new report.
For the previously listed non-interactive reports, prompt parameter values must be collected and satisfied
before the report is run. If you wish to create a prompt directly to the prompt page, make sure to set the
“Required” under the “General” properties to “No”, the “Auto-submit” to “Yes” and the “Usage” of the “Detail
Filters” to “Optional”.
To set the “Detail Filters” to “Optional” select the query that renders the results, click on the filter and set it
up in the properties.
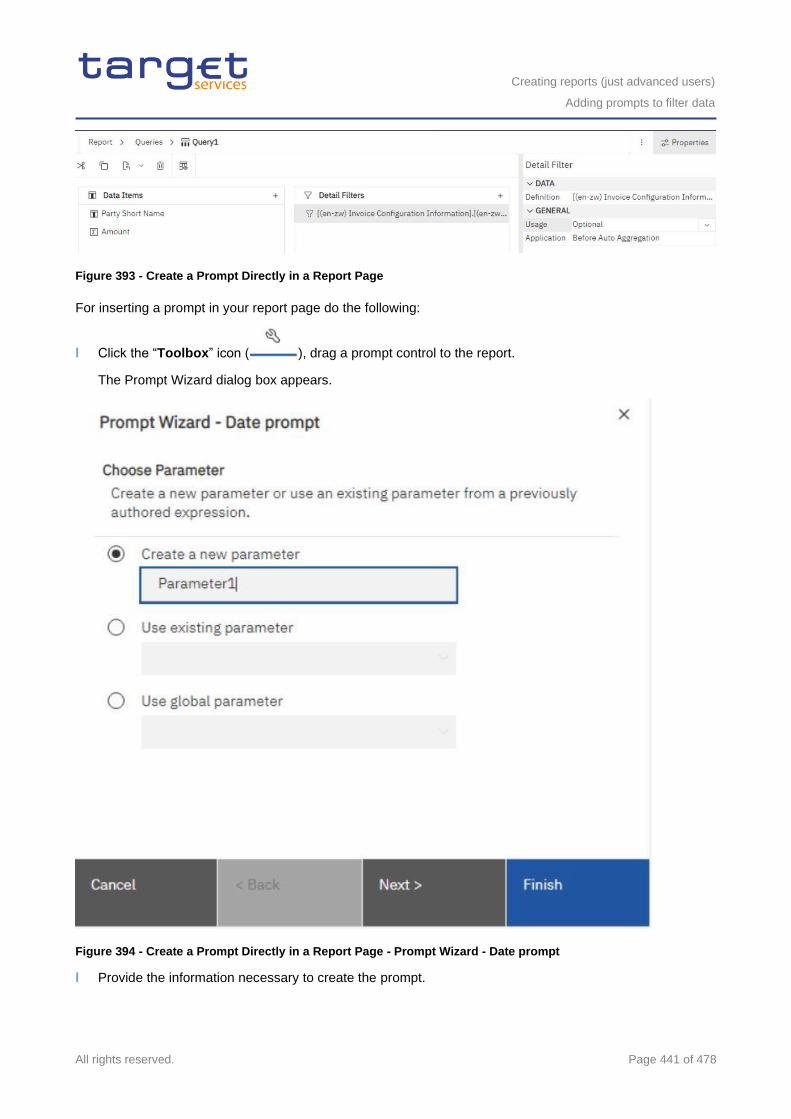
Creating reports (just advanced users)
Adding prompts to filter data
All rights reserved. Page 441 of 478
Figure 393 - Create a Prompt Directly in a Report Page
For inserting a prompt in your report page do the following:
l Click the “Toolbox” icon ( ), drag a prompt control to the report.
The Prompt Wizard dialog box appears.
Figure 394 - Create a Prompt Directly in a Report Page - Prompt Wizard - Date prompt
l Provide the information necessary to create the prompt.
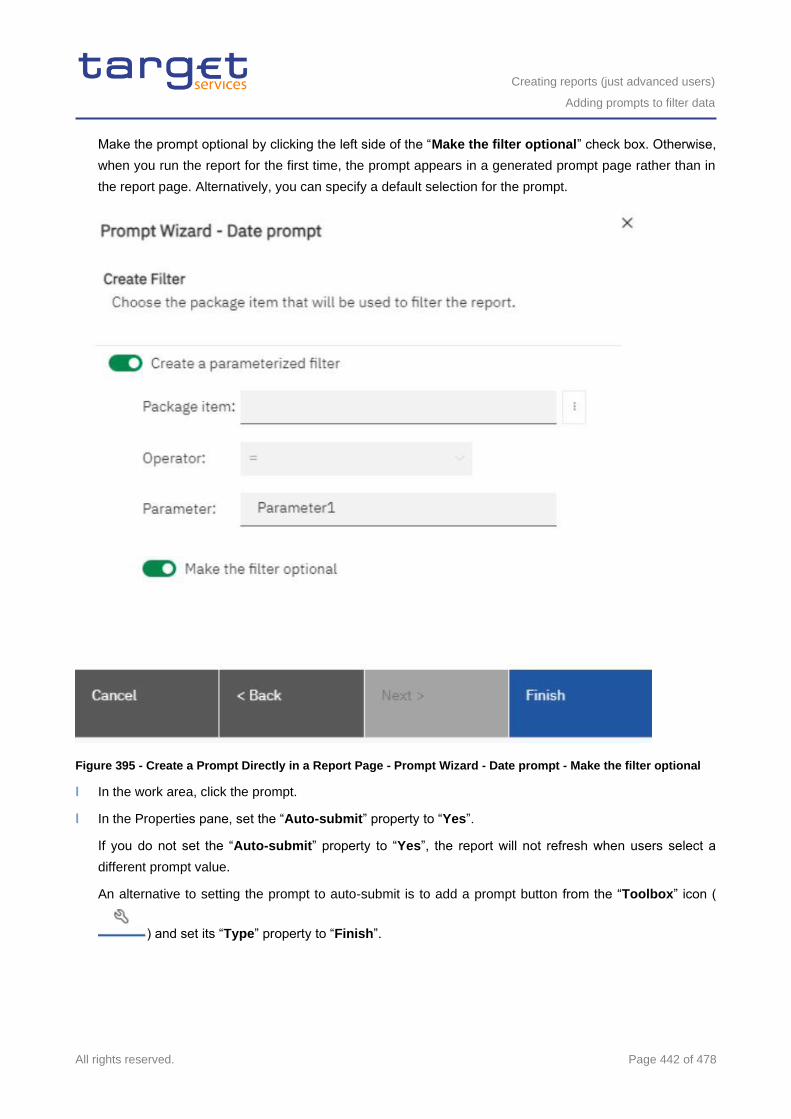
Creating reports (just advanced users)
Adding prompts to filter data
All rights reserved. Page 442 of 478
Make the prompt optional by clicking the left side of the “Make the filter optional” check box. Otherwise,
when you run the report for the first time, the prompt appears in a generated prompt page rather than in
the report page. Alternatively, you can specify a default selection for the prompt.
Figure 395 - Create a Prompt Directly in a Report Page - Prompt Wizard - Date prompt - Make the filter optional
l In the work area, click the prompt.
l In the Properties pane, set the “Auto-submit” property to “Yes”.
If you do not set the “Auto-submit” property to “Yes”, the report will not refresh when users select a
different prompt value.
An alternative to setting the prompt to auto-submit is to add a prompt button from the “Toolbox” icon (
) and set its “Type” property to “Finish”.
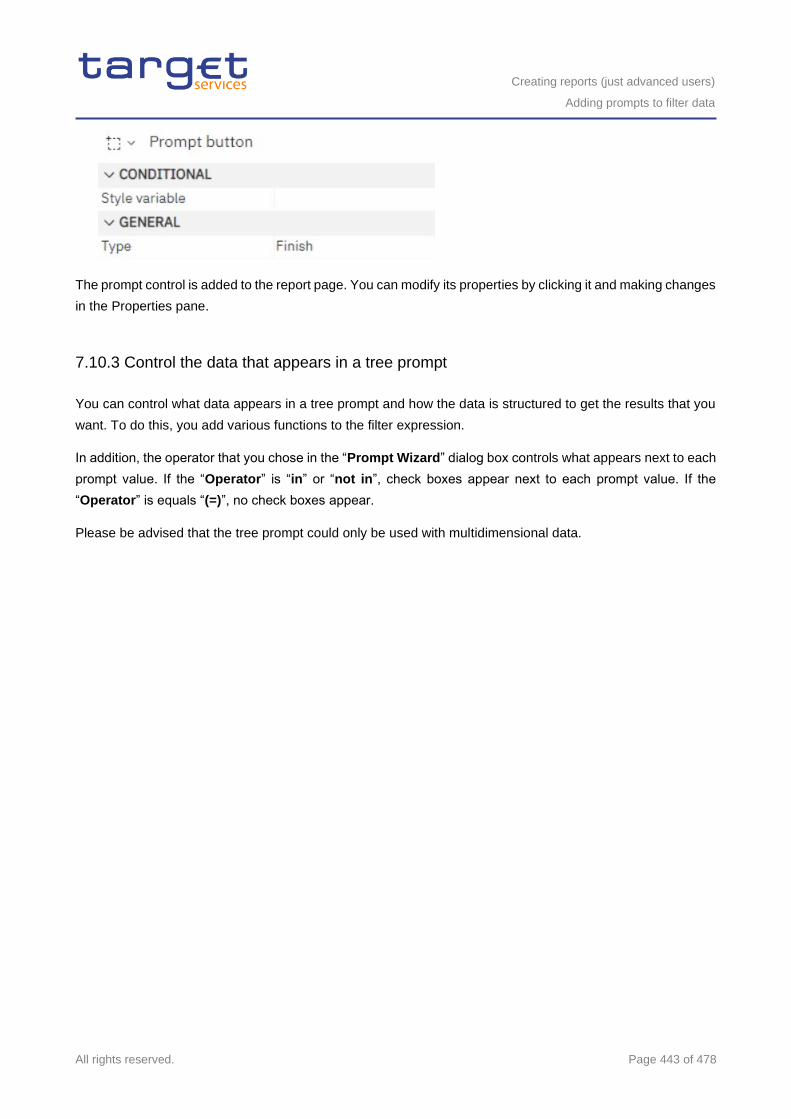
Creating reports (just advanced users)
Adding prompts to filter data
All rights reserved. Page 443 of 478
The prompt control is added to the report page. You can modify its properties by clicking it and making changes
in the Properties pane.
7.10.3 Control the data that appears in a tree prompt
You can control what data appears in a tree prompt and how the data is structured to get the results that you
want. To do this, you add various functions to the filter expression.
In addition, the operator that you chose in the “Prompt Wizard” dialog box controls what appears next to each
prompt value. If the “Operator” is “in” or “not in”, check boxes appear next to each prompt value. If the
“Operator” is equals “(=)”, no check boxes appear.
Please be advised that the tree prompt could only be used with multidimensional data.
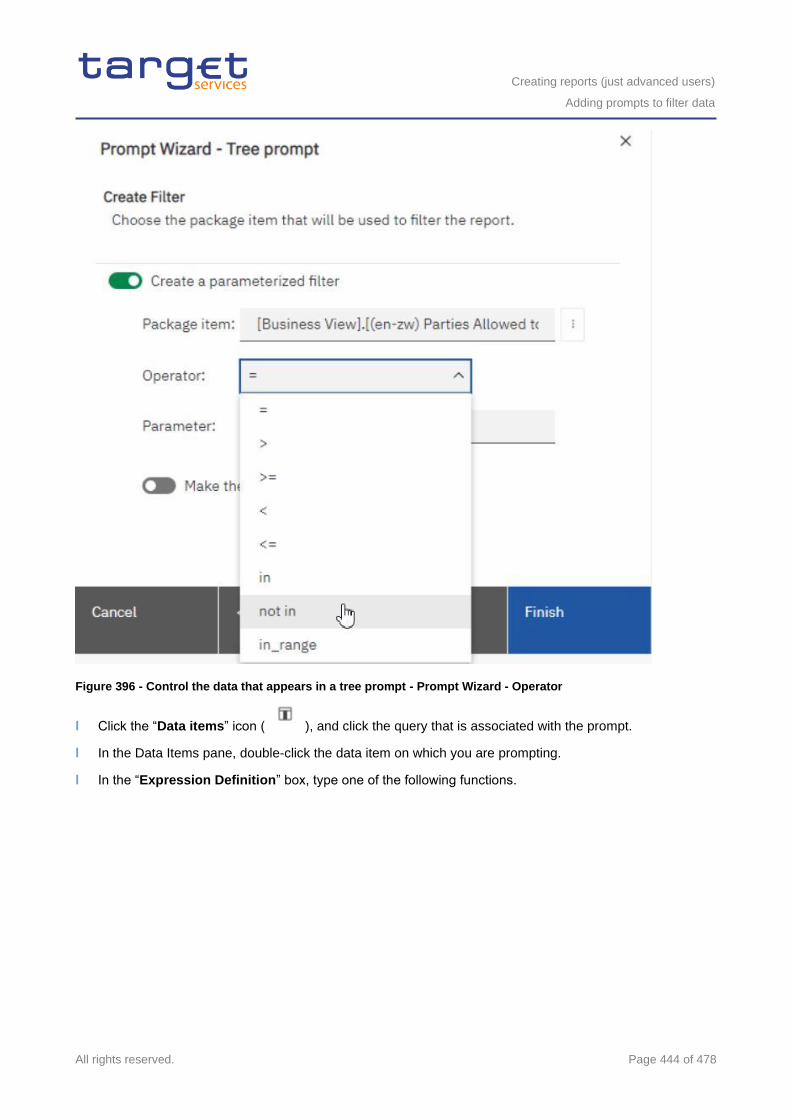
Creating reports (just advanced users)
Adding prompts to filter data
All rights reserved. Page 444 of 478
Figure 396 - Control the data that appears in a tree prompt - Prompt Wizard - Operator
l Click the “Data items” icon ( ), and click the query that is associated with the prompt.
l In the Data Items pane, double-click the data item on which you are prompting.
l In the “Expression Definition” box, type one of the following functions.
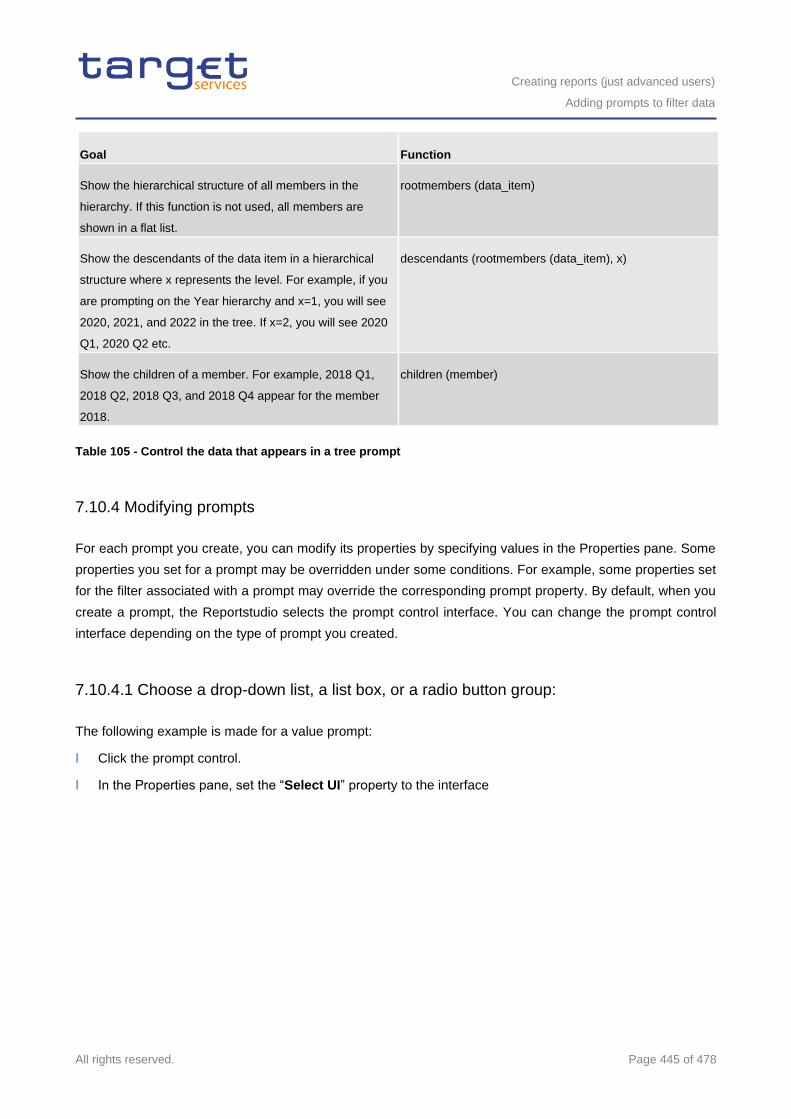
Creating reports (just advanced users)
Adding prompts to filter data
All rights reserved. Page 445 of 478
Goal Function
Show the hierarchical structure of all members in the
hierarchy. If this function is not used, all members are
shown in a flat list.
rootmembers (data_item)
Show the descendants of the data item in a hierarchical
structure where x represents the level. For example, if you
are prompting on the Year hierarchy and x=1, you will see
2020, 2021, and 2022 in the tree. If x=2, you will see 2020
Q1, 2020 Q2 etc.
descendants (rootmembers (data_item), x)
Show the children of a member. For example, 2018 Q1,
2018 Q2, 2018 Q3, and 2018 Q4 appear for the member
2018.
children (member)
Table 105 - Control the data that appears in a tree prompt
7.10.4 Modifying prompts
For each prompt you create, you can modify its properties by specifying values in the Properties pane. Some
properties you set for a prompt may be overridden under some conditions. For example, some properties set
for the filter associated with a prompt may override the corresponding prompt property. By default, when you
create a prompt, the Reportstudio selects the prompt control interface. You can change the prompt control
interface depending on the type of prompt you created.
7.10.4.1 Choose a drop-down list, a list box, or a radio button group:
The following example is made for a value prompt:
l Click the prompt control.
l In the Properties pane, set the “Select UI” property to the interface
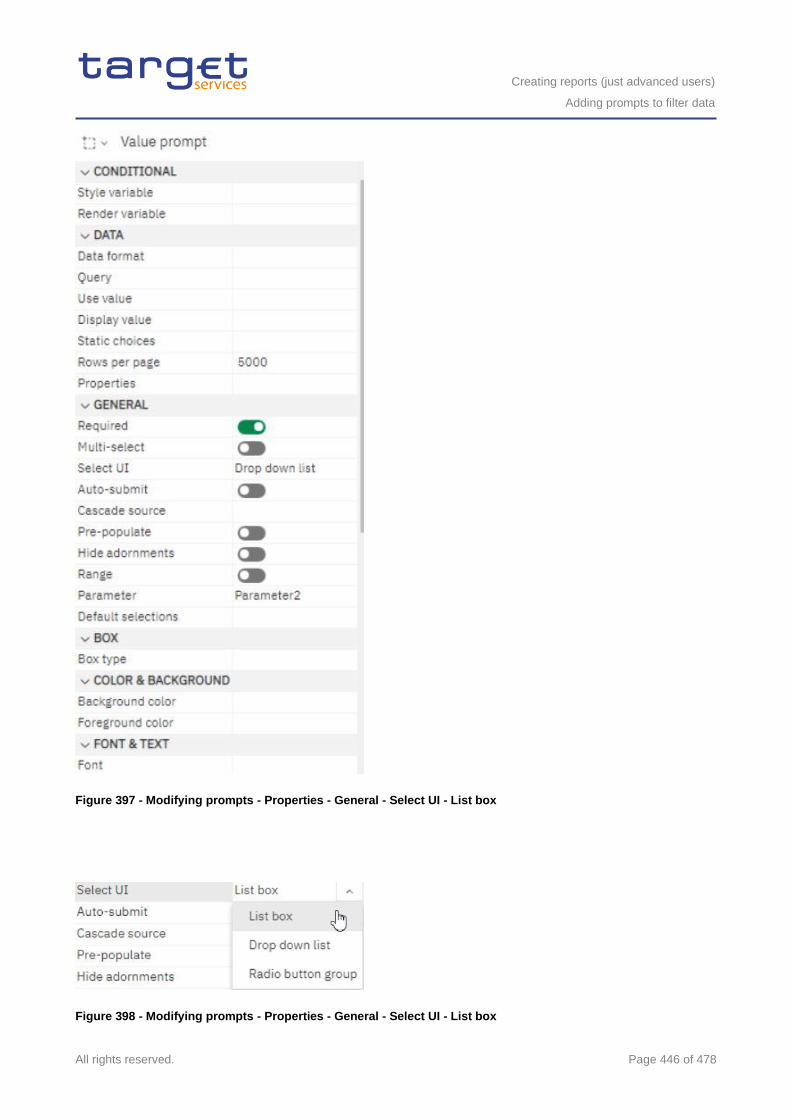
Creating reports (just advanced users)
Adding prompts to filter data
All rights reserved. Page 446 of 478
Figure 397 - Modifying prompts - Properties - General - Select UI - List box
Figure 398 - Modifying prompts - Properties - General - Select UI - List box
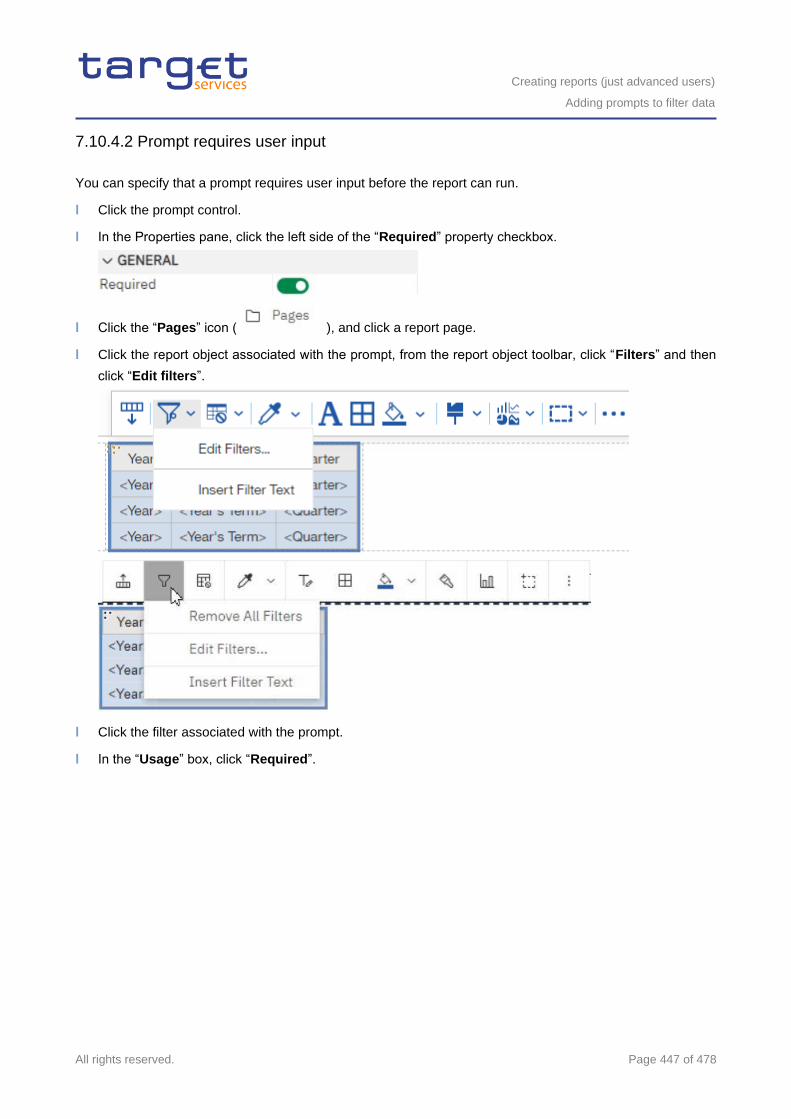
Creating reports (just advanced users)
Adding prompts to filter data
All rights reserved. Page 447 of 478
7.10.4.2 Prompt requires user input
You can specify that a prompt requires user input before the report can run.
l Click the prompt control.
l In the Properties pane, click the left side of the “Required” property checkbox.
l Click the “Pages” icon ( ), and click a report page.
l Click the report object associated with the prompt, from the report object toolbar, click “Filters” and then
click “Edit filters”.
l Click the filter associated with the prompt.
l In the “Usage” box, click “Required”.
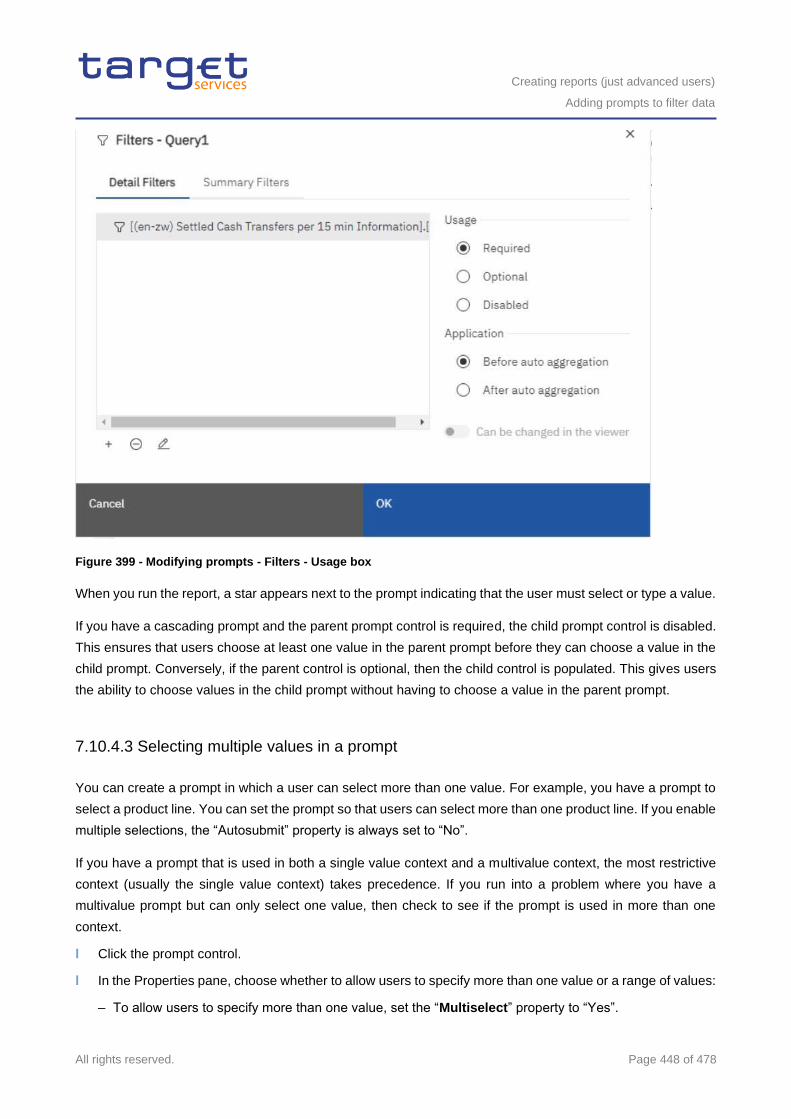
Creating reports (just advanced users)
Adding prompts to filter data
All rights reserved. Page 448 of 478
Figure 399 - Modifying prompts - Filters - Usage box
When you run the report, a star appears next to the prompt indicating that the user must select or type a value.
If you have a cascading prompt and the parent prompt control is required, the child prompt control is disabled.
This ensures that users choose at least one value in the parent prompt before they can choose a value in the
child prompt. Conversely, if the parent control is optional, then the child control is populated. This gives users
the ability to choose values in the child prompt without having to choose a value in the parent prompt.
7.10.4.3 Selecting multiple values in a prompt
You can create a prompt in which a user can select more than one value. For example, you have a prompt to
select a product line. You can set the prompt so that users can select more than one product line. If you enable
multiple selections, the “Autosubmit” property is always set to “No”.
If you have a prompt that is used in both a single value context and a multivalue context, the most restrictive
context (usually the single value context) takes precedence. If you run into a problem where you have a
multivalue prompt but can only select one value, then check to see if the prompt is used in more than one
context.
l Click the prompt control.
l In the Properties pane, choose whether to allow users to specify more than one value or a range of values:
– To allow users to specify more than one value, set the “Multiselect” property to “Yes”.
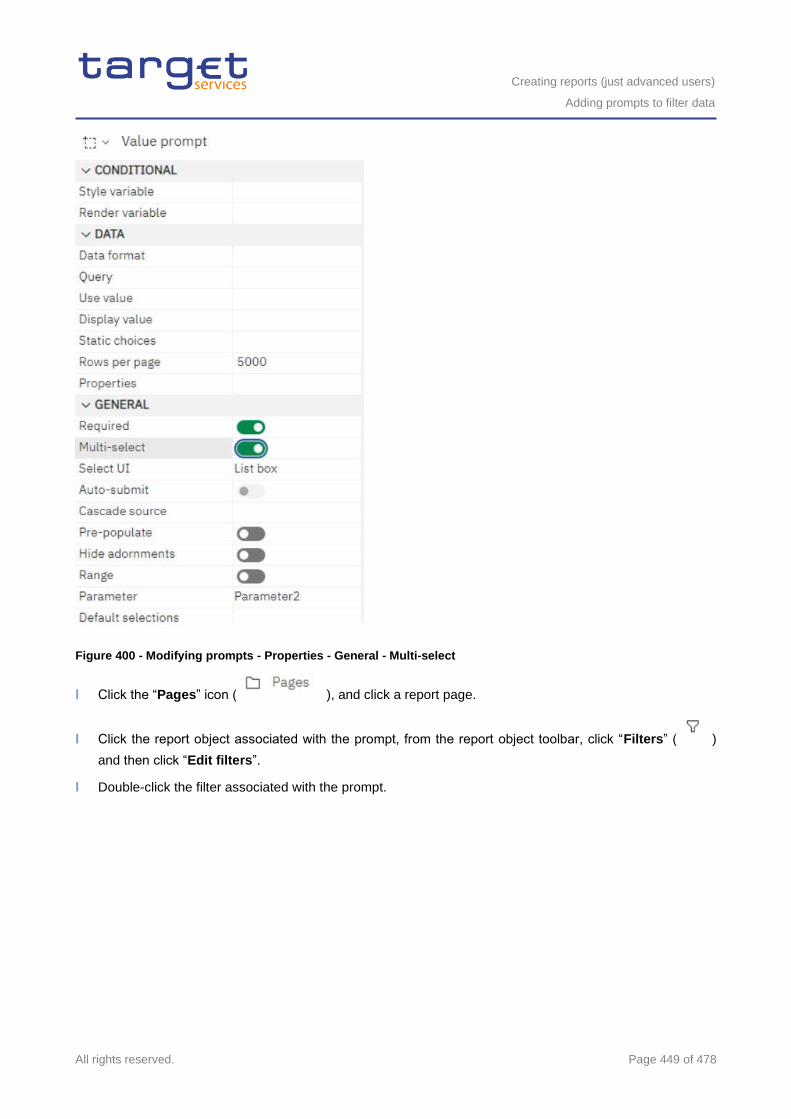
Creating reports (just advanced users)
Adding prompts to filter data
All rights reserved. Page 449 of 478
Figure 400 - Modifying prompts - Properties - General - Multi-select
l Click the “Pages” icon ( ), and click a report page.
l Click the report object associated with the prompt, from the report object toolbar, click “Filters” ( )
and then click “Edit filters”.
l Double-click the filter associated with the prompt.
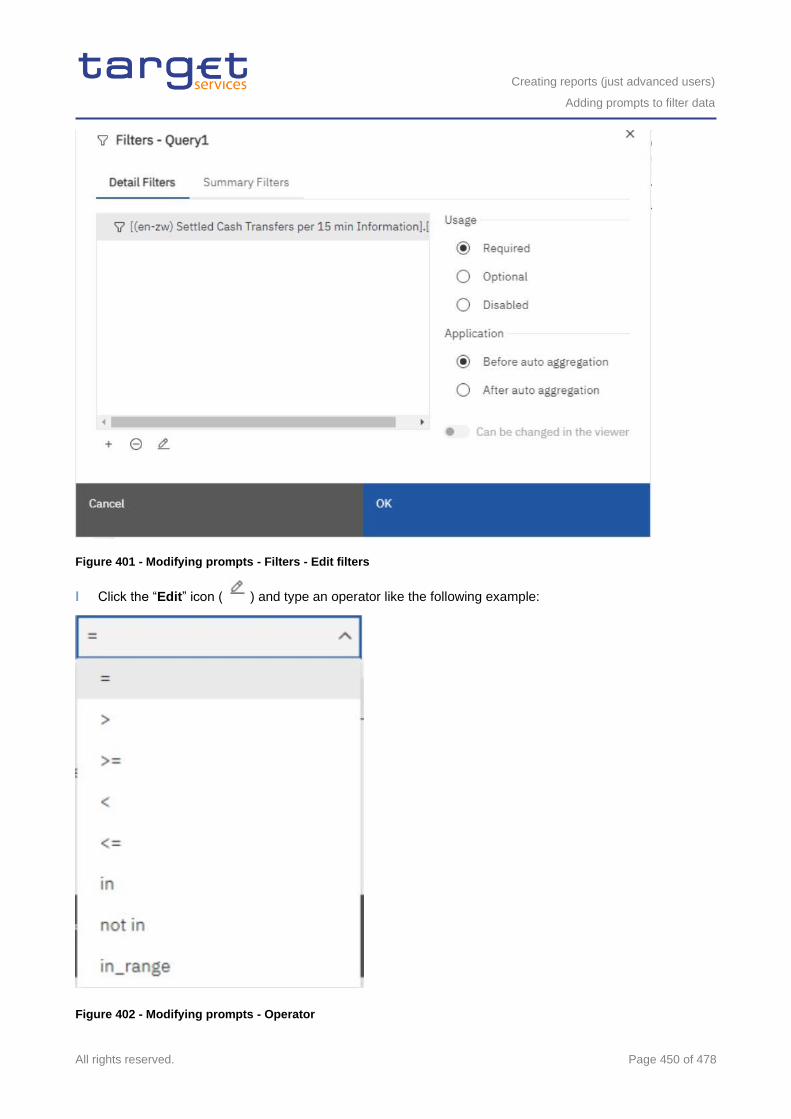
Creating reports (just advanced users)
Adding prompts to filter data
All rights reserved. Page 450 of 478
Figure 401 - Modifying prompts - Filters - Edit filters
l Click the “Edit” icon ( ) and type an operator like the following example:
Figure 402 - Modifying prompts - Operator
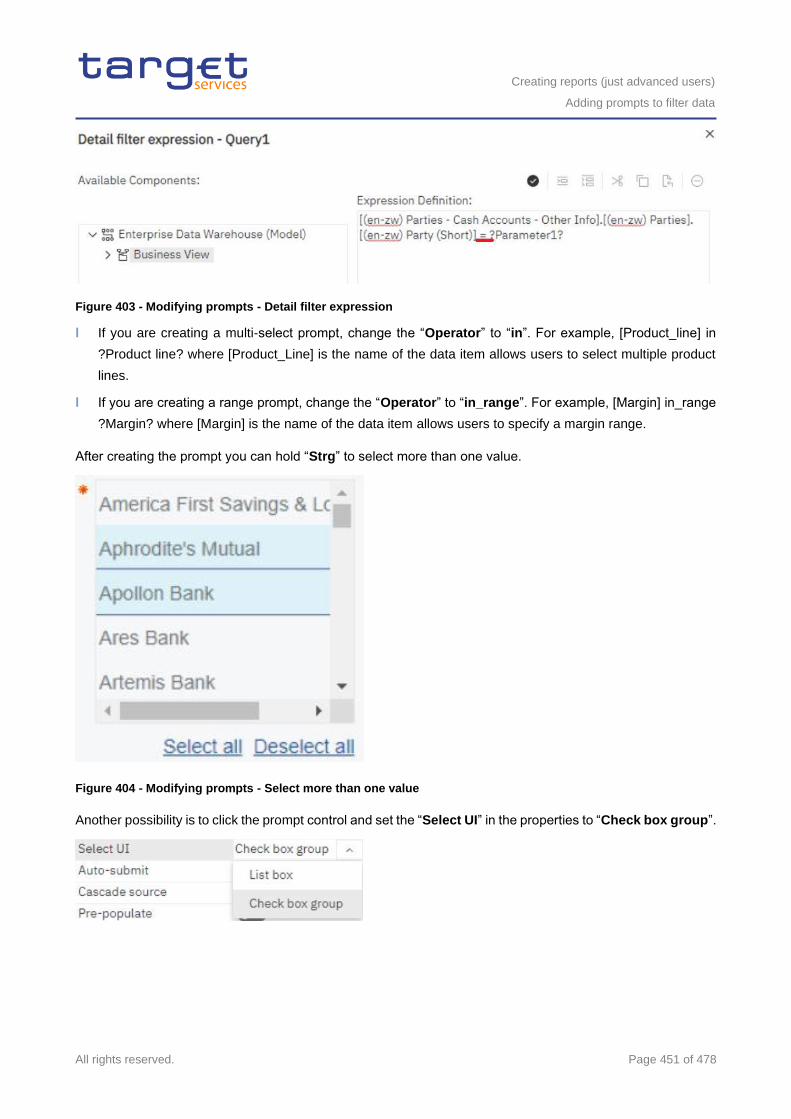
Creating reports (just advanced users)
Adding prompts to filter data
All rights reserved. Page 451 of 478
Figure 403 - Modifying prompts - Detail filter expression
l If you are creating a multi-select prompt, change the “Operator” to “in”. For example, [Product_line] in
?Product line? where [Product_Line] is the name of the data item allows users to select multiple product
lines.
l If you are creating a range prompt, change the “Operator” to “in_range”. For example, [Margin] in_range
?Margin? where [Margin] is the name of the data item allows users to specify a margin range.
After creating the prompt you can hold “Strg” to select more than one value.
Figure 404 - Modifying prompts - Select more than one value
Another possibility is to click the prompt control and set the “Select UI” in the properties to “Check box group”.
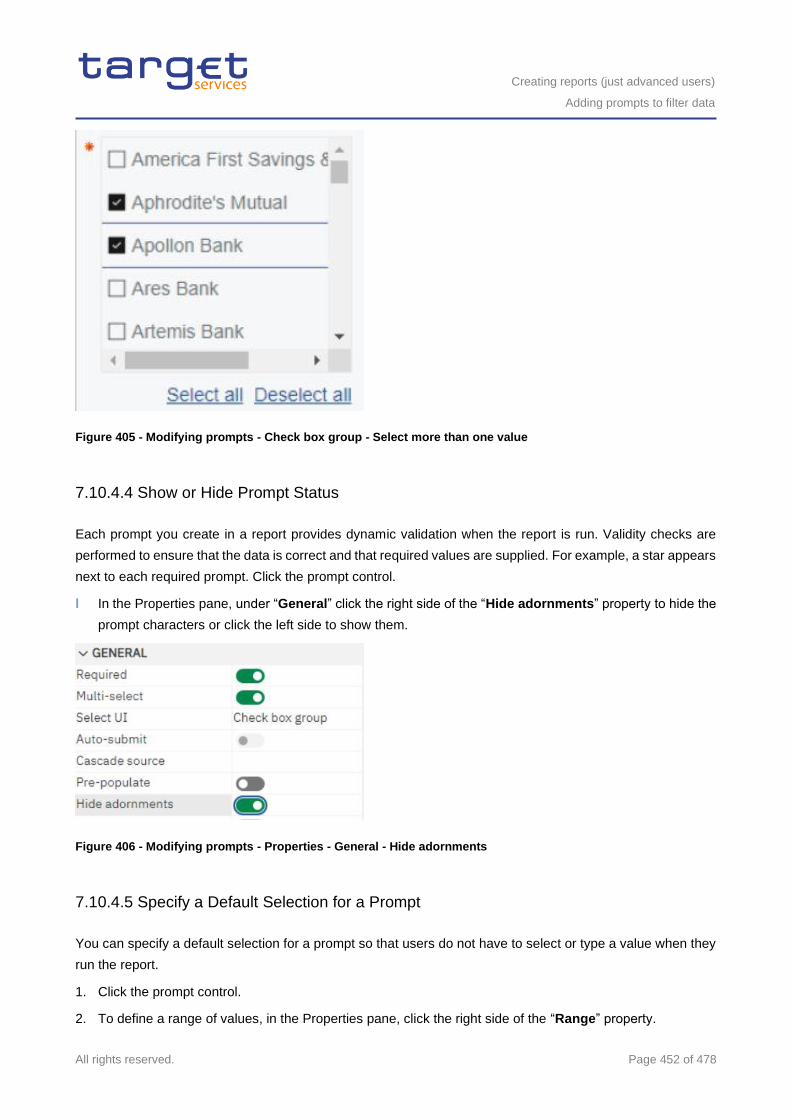
Creating reports (just advanced users)
Adding prompts to filter data
All rights reserved. Page 452 of 478
Figure 405 - Modifying prompts - Check box group - Select more than one value
7.10.4.4 Show or Hide Prompt Status
Each prompt you create in a report provides dynamic validation when the report is run. Validity checks are
performed to ensure that the data is correct and that required values are supplied. For example, a star appears
next to each required prompt. Click the prompt control.
l In the Properties pane, under “General” click the right side of the “Hide adornments” property to hide the
prompt characters or click the left side to show them.
Figure 406 - Modifying prompts - Properties - General - Hide adornments
7.10.4.5 Specify a Default Selection for a Prompt
You can specify a default selection for a prompt so that users do not have to select or type a value when they
run the report.
1. Click the prompt control.
2. To define a range of values, in the Properties pane, click the right side of the “Range” property.
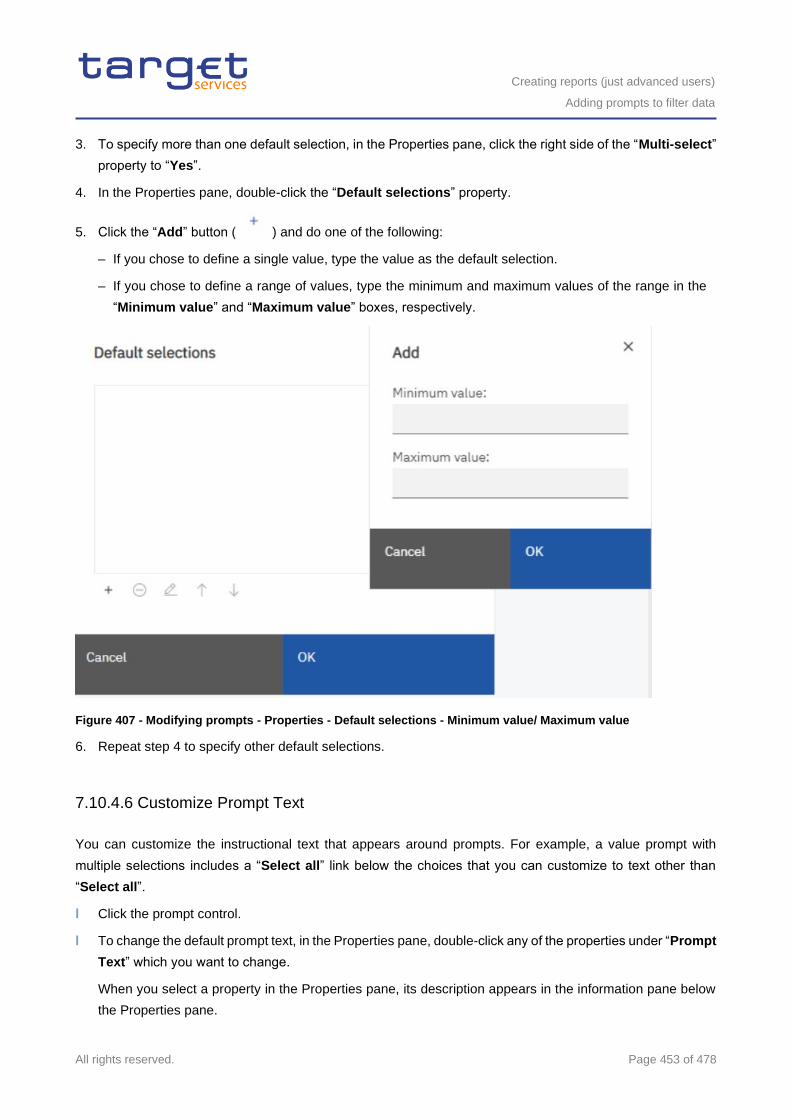
Creating reports (just advanced users)
Adding prompts to filter data
All rights reserved. Page 453 of 478
3. To specify more than one default selection, in the Properties pane, click the right side of the “Multi-select”
property to “Yes”.
4. In the Properties pane, double-click the “Default selections” property.
5. Click the “Add” button ( ) and do one of the following:
– If you chose to define a single value, type the value as the default selection.
– If you chose to define a range of values, type the minimum and maximum values of the range in the
“Minimum value” and “Maximum value” boxes, respectively.
Figure 407 - Modifying prompts - Properties - Default selections - Minimum value/ Maximum value
6. Repeat step 4 to specify other default selections.
7.10.4.6 Customize Prompt Text
You can customize the instructional text that appears around prompts. For example, a value prompt with
multiple selections includes a “Select all” link below the choices that you can customize to text other than
“Select all”.
l Click the prompt control.
l To change the default prompt text, in the Properties pane, double-click any of the properties under “Prompt
Text” which you want to change.
When you select a property in the Properties pane, its description appears in the information pane below
the Properties pane.
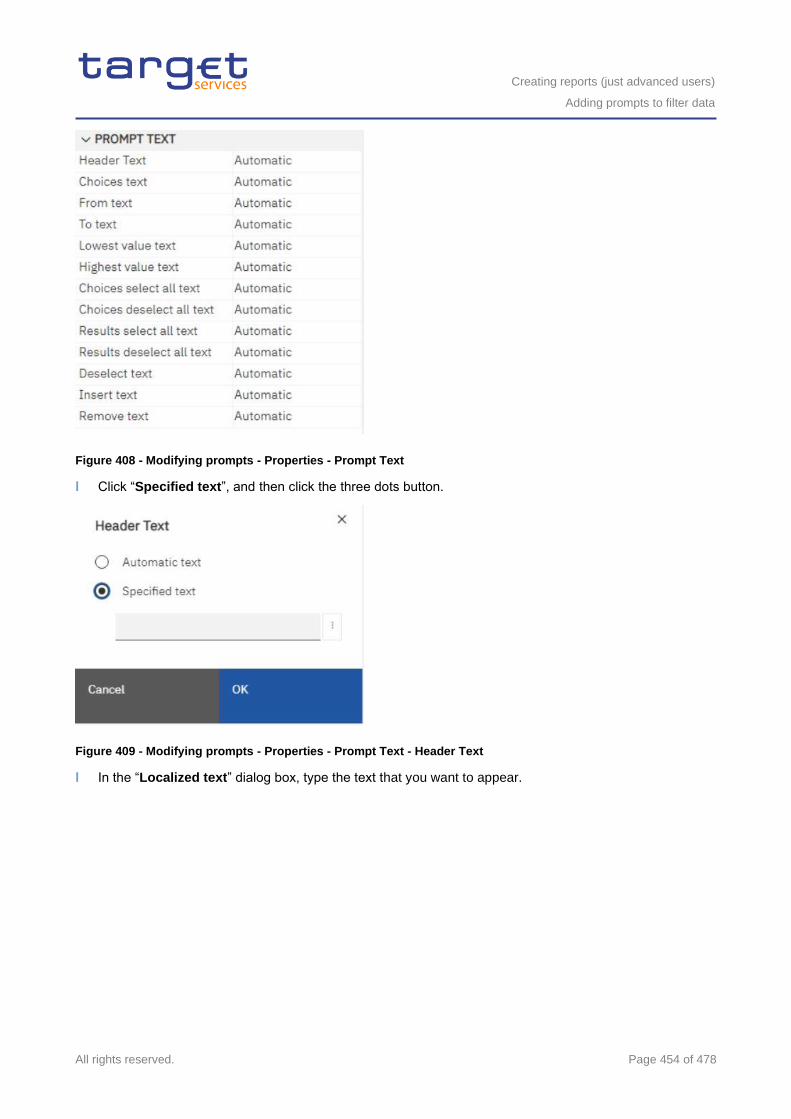
Creating reports (just advanced users)
Adding prompts to filter data
All rights reserved. Page 454 of 478
Figure 408 - Modifying prompts - Properties - Prompt Text
l Click “Specified text”, and then click the three dots button.
Figure 409 - Modifying prompts - Properties - Prompt Text - Header Text
l In the “Localized text” dialog box, type the text that you want to appear.
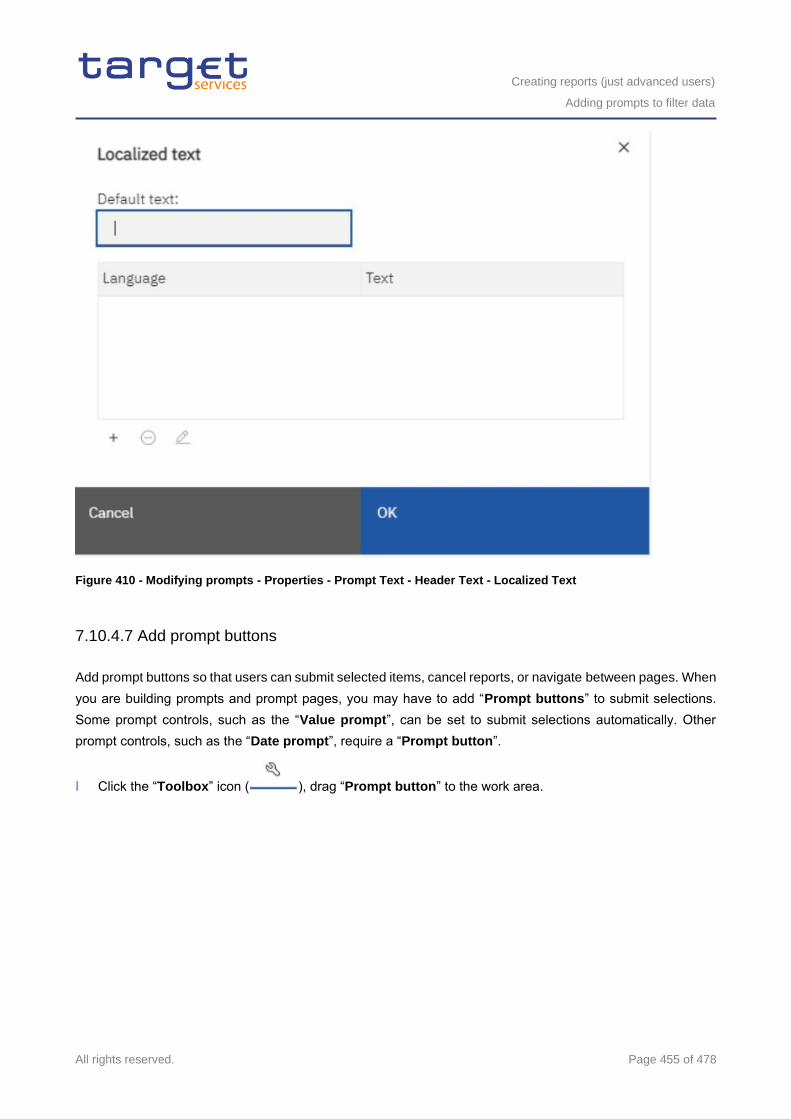
Creating reports (just advanced users)
Adding prompts to filter data
All rights reserved. Page 455 of 478
Figure 410 - Modifying prompts - Properties - Prompt Text - Header Text - Localized Text
7.10.4.7 Add prompt buttons
Add prompt buttons so that users can submit selected items, cancel reports, or navigate between pages. When
you are building prompts and prompt pages, you may have to add “Prompt buttons” to submit selections.
Some prompt controls, such as the “Value prompt”, can be set to submit selections automatically. Other
prompt controls, such as the “Date prompt”, require a “Prompt button”.
l Click the “Toolbox” icon ( ), drag “Prompt button” to the work area.
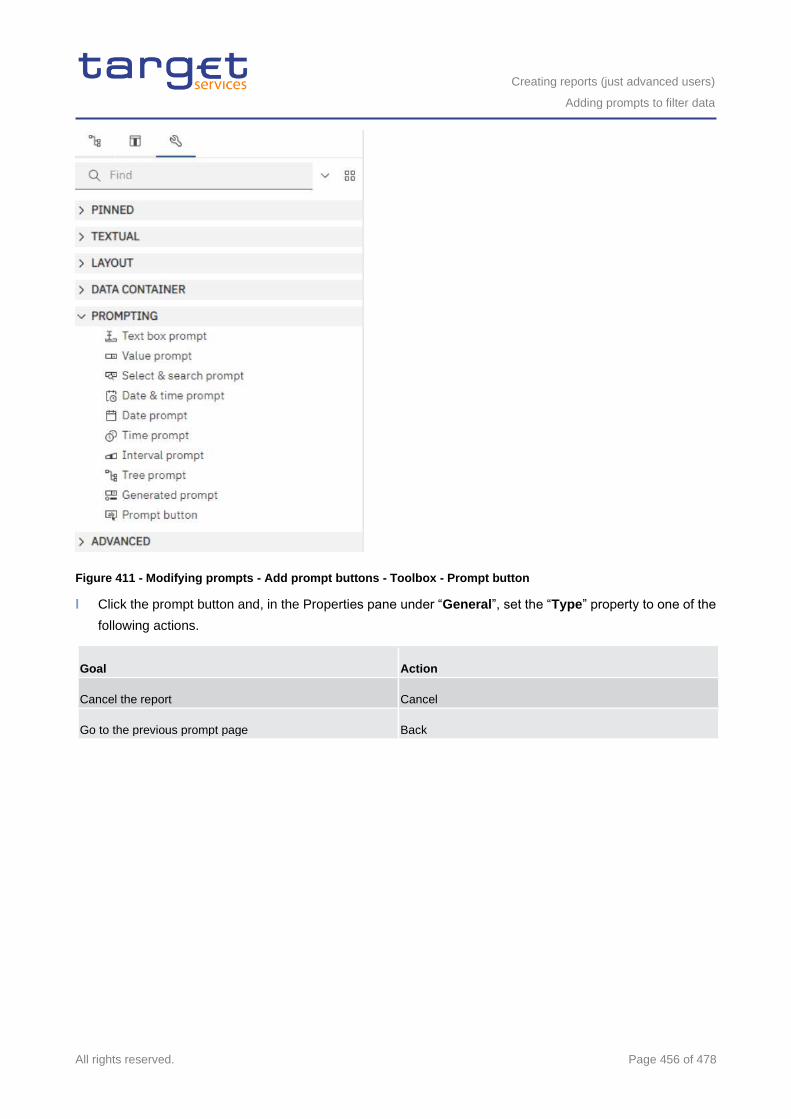
Creating reports (just advanced users)
Adding prompts to filter data
All rights reserved. Page 456 of 478
Figure 411 - Modifying prompts - Add prompt buttons - Toolbox - Prompt button
l Click the prompt button and, in the Properties pane under “General”, set the “Type” property to one of the
following actions.
Goal Action
Cancel the report Cancel
Go to the previous prompt page Back
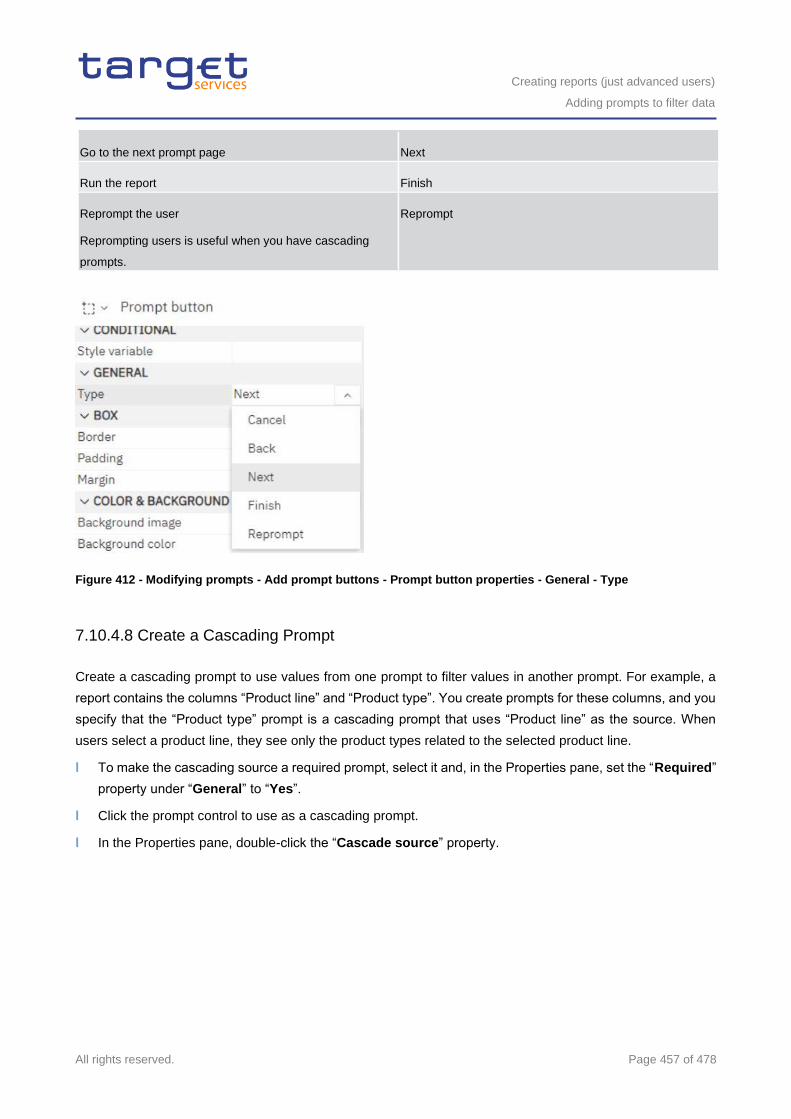
Creating reports (just advanced users)
Adding prompts to filter data
All rights reserved. Page 457 of 478
Go to the next prompt page Next
Run the report Finish
Reprompt the user
Reprompting users is useful when you have cascading
prompts.
Reprompt
Figure 412 - Modifying prompts - Add prompt buttons - Prompt button properties - General - Type
7.10.4.8 Create a Cascading Prompt
Create a cascading prompt to use values from one prompt to filter values in another prompt. For example, a
report contains the columns “Product line” and “Product type”. You create prompts for these columns, and you
specify that the “Product type” prompt is a cascading prompt that uses “Product line” as the source. When
users select a product line, they see only the product types related to the selected product line.
l To make the cascading source a required prompt, select it and, in the Properties pane, set the “Required”
property under “General” to “Yes”.
l Click the prompt control to use as a cascading prompt.
l In the Properties pane, double-click the “Cascade source” property.
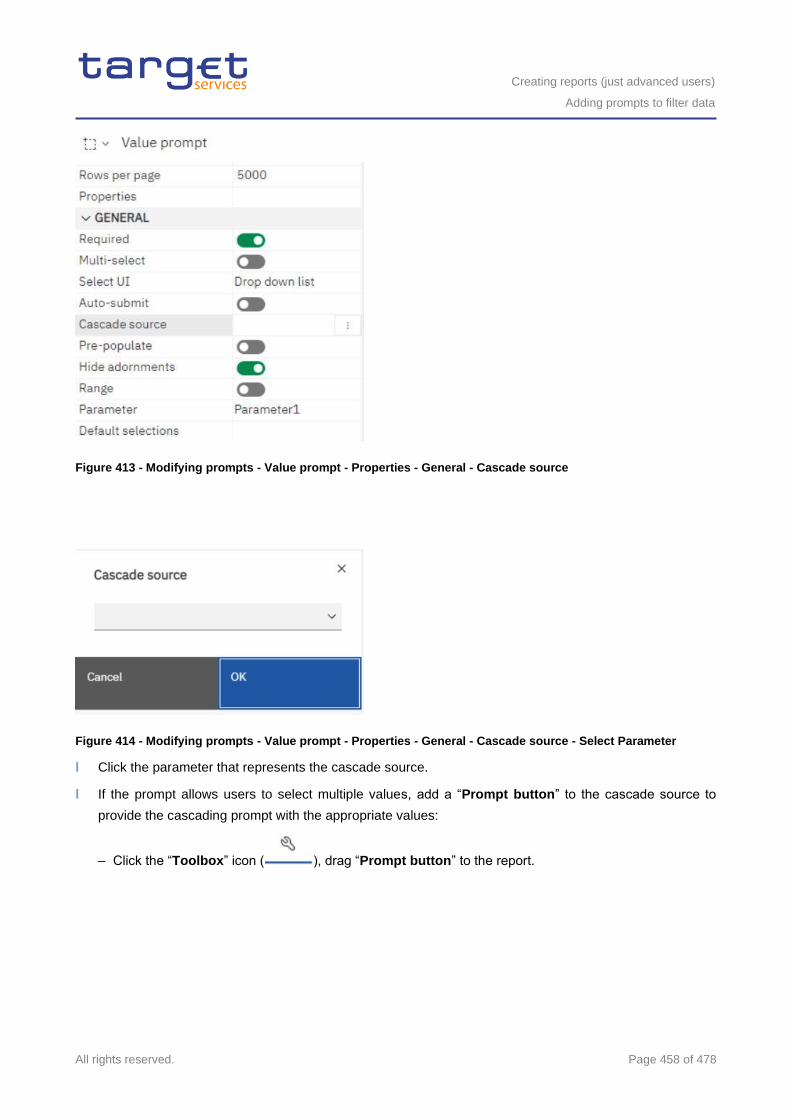
Creating reports (just advanced users)
Adding prompts to filter data
All rights reserved. Page 458 of 478
Figure 413 - Modifying prompts - Value prompt - Properties - General - Cascade source
Figure 414 - Modifying prompts - Value prompt - Properties - General - Cascade source - Select Parameter
l Click the parameter that represents the cascade source.
l If the prompt allows users to select multiple values, add a “Prompt button” to the cascade source to
provide the cascading prompt with the appropriate values:
– Click the “Toolbox” icon ( ), drag “Prompt button” to the report.
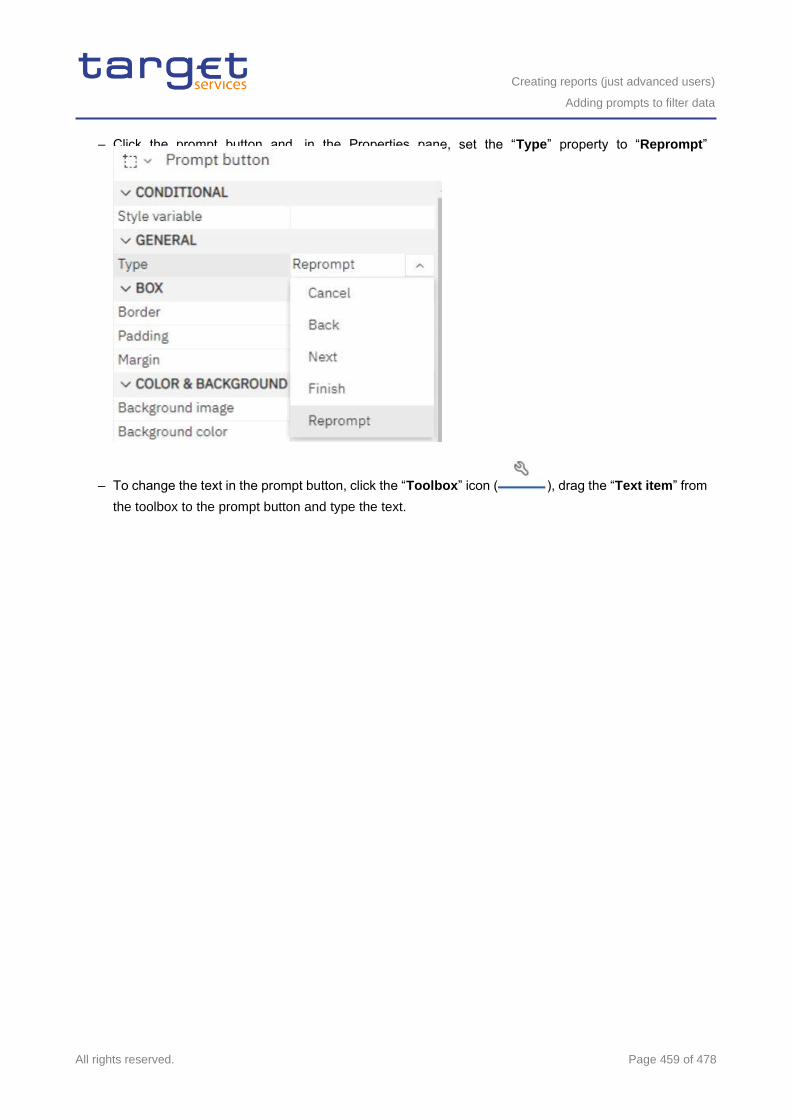
Creating reports (just advanced users)
Adding prompts to filter data
All rights reserved. Page 459 of 478
– Click the prompt button and, in the Properties pane, set the “Type” property to “Reprompt”
– To change the text in the prompt button, click the “Toolbox” icon ( ), drag the “Text item” from
the toolbox to the prompt button and type the text.
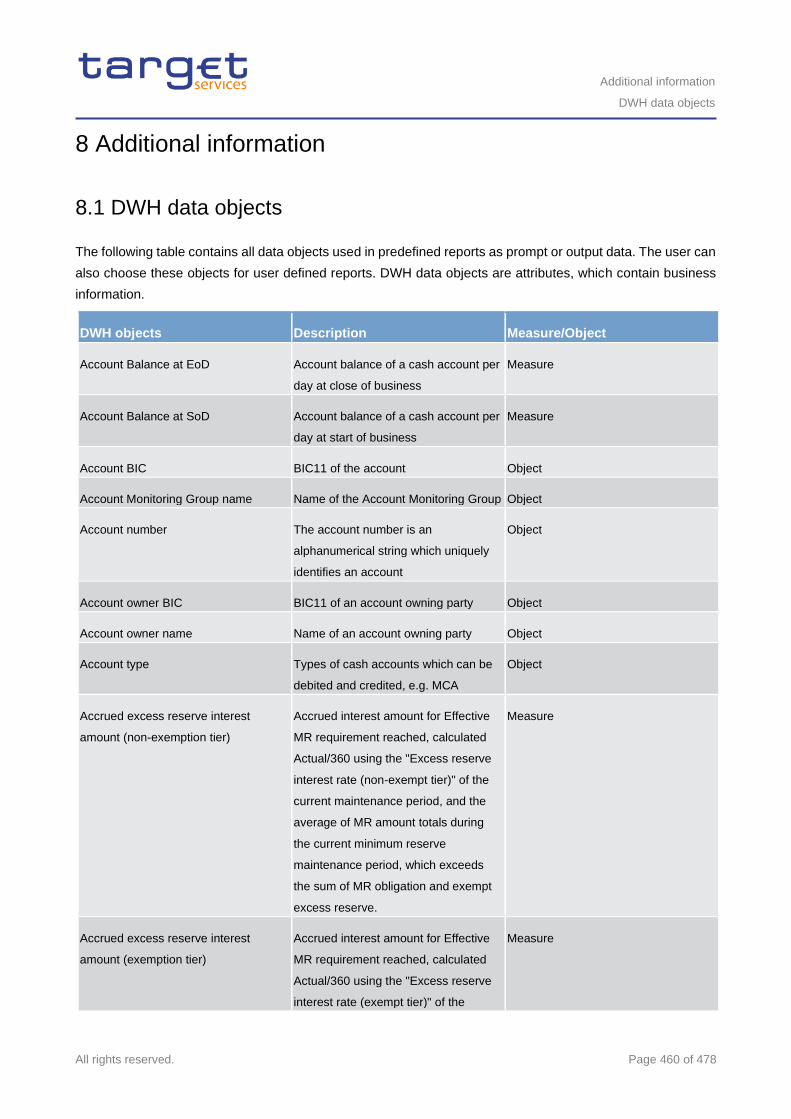
Additional information
DWH data objects
All rights reserved. Page 460 of 478
8 Additional information
8.1 DWH data objects
The following table contains all data objects used in predefined reports as prompt or output data. The user can
also choose these objects for user defined reports. DWH data objects are attributes, which contain business
information.
DWH objects Description Measure/Object
Account Balance at EoD Account balance of a cash account per
day at close of business
Measure
Account Balance at SoD Account balance of a cash account per
day at start of business
Measure
Account BIC BIC11 of the account Object
Account Monitoring Group name Name of the Account Monitoring Group Object
Account number The account number is an
alphanumerical string which uniquely
identifies an account
Object
Account owner BIC BIC11 of an account owning party Object
Account owner name Name of an account owning party Object
Account type Types of cash accounts which can be
debited and credited, e.g. MCA
Object
Accrued excess reserve interest
amount (non-exemption tier)
Accrued interest amount for Effective
MR requirement reached, calculated
Actual/360 using the "Excess reserve
interest rate (non-exempt tier)" of the
current maintenance period, and the
average of MR amount totals during
the current minimum reserve
maintenance period, which exceeds
the sum of MR obligation and exempt
excess reserve.
Measure
Accrued excess reserve interest
amount (exemption tier)
Accrued interest amount for Effective
MR requirement reached, calculated
Actual/360 using the "Excess reserve
interest rate (exempt tier)" of the
Measure
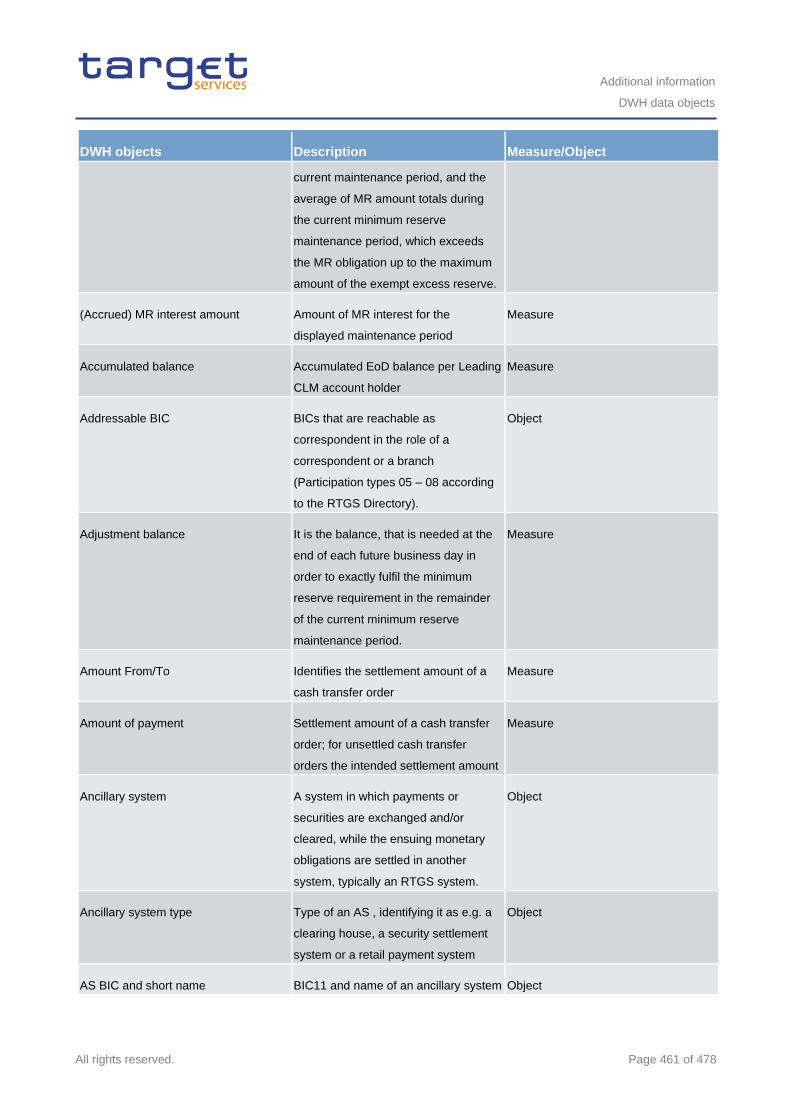
Additional information
DWH data objects
All rights reserved. Page 461 of 478
DWH objects Description Measure/Object
current maintenance period, and the
average of MR amount totals during
the current minimum reserve
maintenance period, which exceeds
the MR obligation up to the maximum
amount of the exempt excess reserve.
(Accrued) MR interest amount Amount of MR interest for the
displayed maintenance period
Measure
Accumulated balance Accumulated EoD balance per Leading
CLM account holder
Measure
Addressable BIC BICs that are reachable as
correspondent in the role of a
correspondent or a branch
(Participation types 05 – 08 according
to the RTGS Directory).
Object
Adjustment balance It is the balance, that is needed at the
end of each future business day in
order to exactly fulfil the minimum
reserve requirement in the remainder
of the current minimum reserve
maintenance period.
Measure
Amount From/To Identifies the settlement amount of a
cash transfer order
Measure
Amount of payment Settlement amount of a cash transfer
order; for unsettled cash transfer
orders the intended settlement amount
Measure
Ancillary system A system in which payments or
securities are exchanged and/or
cleared, while the ensuing monetary
obligations are settled in another
system, typically an RTGS system.
Object
Ancillary system type Type of an AS , identifying it as e.g. a
clearing house, a security settlement
system or a retail payment system
Object
AS BIC and short name BIC11 and name of an ancillary system Object
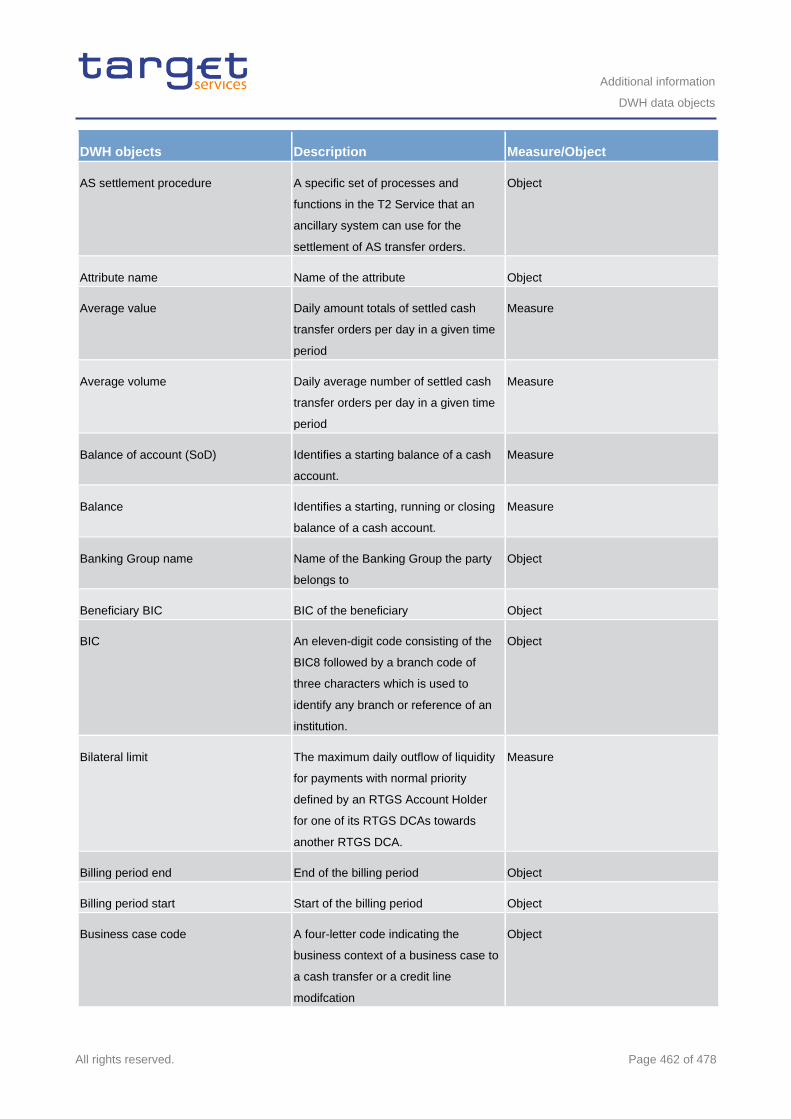
Additional information
DWH data objects
All rights reserved. Page 462 of 478
DWH objects Description Measure/Object
AS settlement procedure A specific set of processes and
functions in the T2 Service that an
ancillary system can use for the
settlement of AS transfer orders.
Object
Attribute name Name of the attribute Object
Average value Daily amount totals of settled cash
transfer orders per day in a given time
period
Measure
Average volume Daily average number of settled cash
transfer orders per day in a given time
period
Measure
Balance of account (SoD) Identifies a starting balance of a cash
account.
Measure
Balance Identifies a starting, running or closing
balance of a cash account.
Measure
Banking Group name Name of the Banking Group the party
belongs to
Object
Beneficiary BIC BIC of the beneficiary Object
BIC An eleven-digit code consisting of the
BIC8 followed by a branch code of
three characters which is used to
identify any branch or reference of an
institution.
Object
Bilateral limit The maximum daily outflow of liquidity
for payments with normal priority
defined by an RTGS Account Holder
for one of its RTGS DCAs towards
another RTGS DCA.
Measure
Billing period end End of the billing period Object
Billing period start Start of the billing period Object
Business case code A four-letter code indicating the
business context of a business case to
a cash transfer or a credit line
modifcation
Object
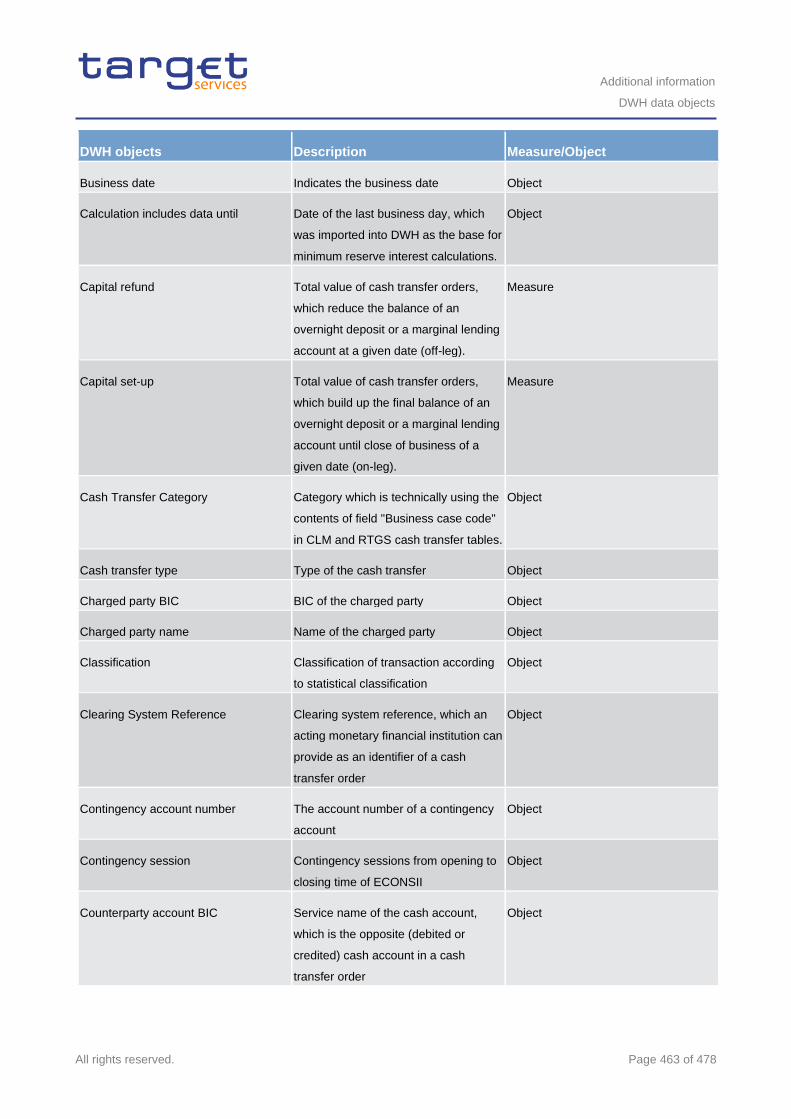
Additional information
DWH data objects
All rights reserved. Page 463 of 478
DWH objects Description Measure/Object
Business date Indicates the business date Object
Calculation includes data until Date of the last business day, which
was imported into DWH as the base for
minimum reserve interest calculations.
Object
Capital refund Total value of cash transfer orders,
which reduce the balance of an
overnight deposit or a marginal lending
account at a given date (off-leg).
Measure
Capital set-up Total value of cash transfer orders,
which build up the final balance of an
overnight deposit or a marginal lending
account until close of business of a
given date (on-leg).
Measure
Cash Transfer Category Category which is technically using the
contents of field "Business case code"
in CLM and RTGS cash transfer tables.
Object
Cash transfer type Type of the cash transfer Object
Charged party BIC BIC of the charged party Object
Charged party name Name of the charged party Object
Classification Classification of transaction according
to statistical classification
Object
Clearing System Reference Clearing system reference, which an
acting monetary financial institution can
provide as an identifier of a cash
transfer order
Object
Contingency account number The account number of a contingency
account
Object
Contingency session Contingency sessions from opening to
closing time of ECONSII
Object
Counterparty account BIC Service name of the cash account,
which is the opposite (debited or
credited) cash account in a cash
transfer order
Object
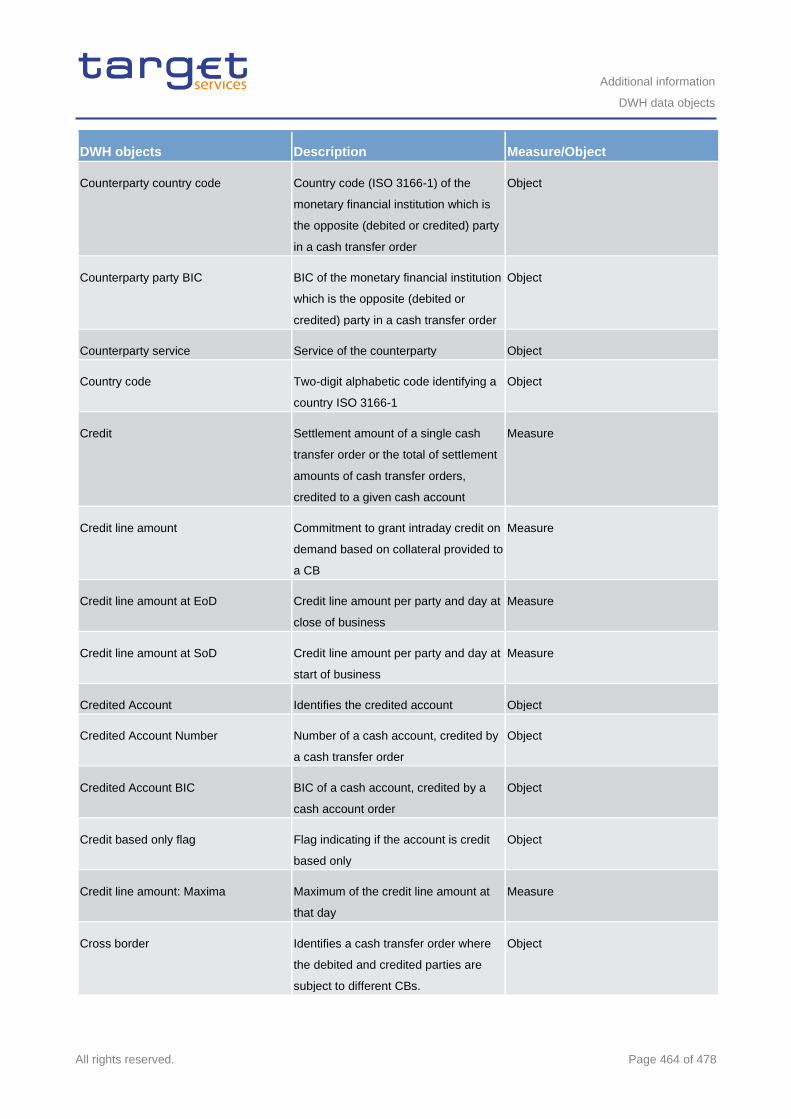
Additional information
DWH data objects
All rights reserved. Page 464 of 478
DWH objects Description Measure/Object
Counterparty country code Country code (ISO 3166-1) of the
monetary financial institution which is
the opposite (debited or credited) party
in a cash transfer order
Object
Counterparty party BIC BIC of the monetary financial institution
which is the opposite (debited or
credited) party in a cash transfer order
Object
Counterparty service Service of the counterparty Object
Country code Two-digit alphabetic code identifying a
country ISO 3166-1
Object
Credit Settlement amount of a single cash
transfer order or the total of settlement
amounts of cash transfer orders,
credited to a given cash account
Measure
Credit line amount Commitment to grant intraday credit on
demand based on collateral provided to
a CB
Measure
Credit line amount at EoD Credit line amount per party and day at
close of business
Measure
Credit line amount at SoD Credit line amount per party and day at
start of business
Measure
Credited Account Identifies the credited account Object
Credited Account Number Number of a cash account, credited by
a cash transfer order
Object
Credited Account BIC BIC of a cash account, credited by a
cash account order
Object
Credit based only flag Flag indicating if the account is credit
based only
Object
Credit line amount: Maxima Maximum of the credit line amount at
that day
Measure
Cross border Identifies a cash transfer order where
the debited and credited parties are
subject to different CBs.
Object
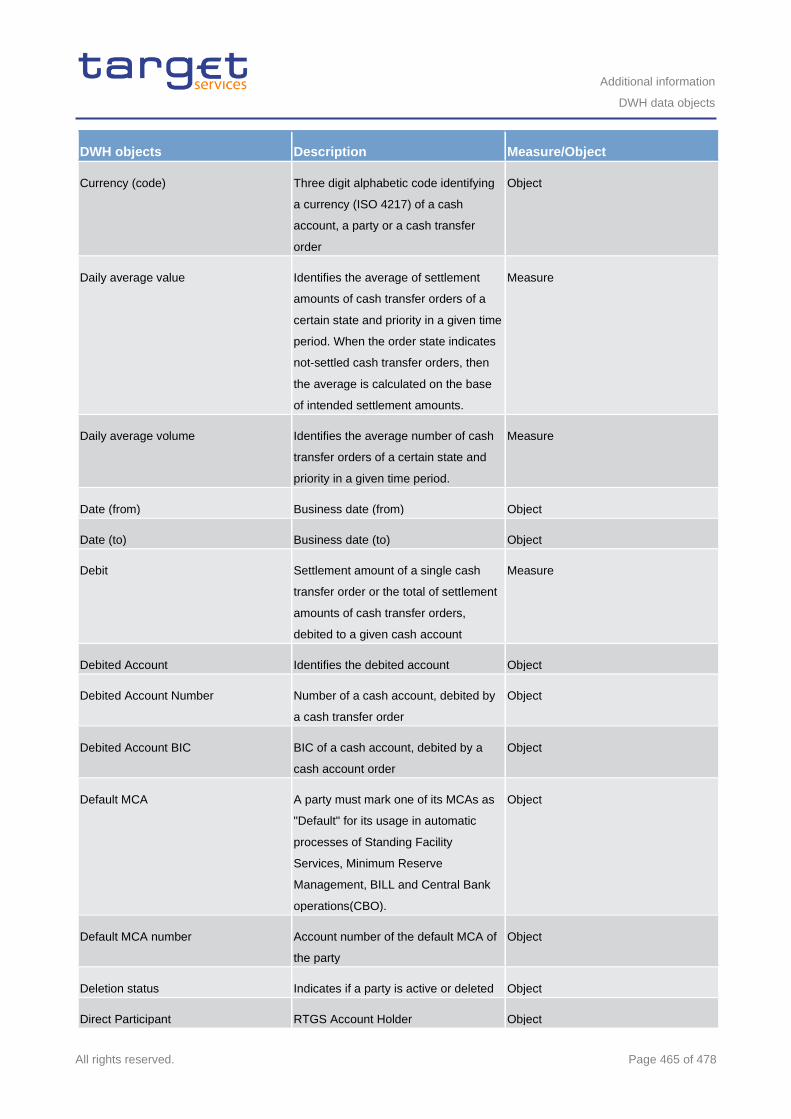
Additional information
DWH data objects
All rights reserved. Page 465 of 478
DWH objects Description Measure/Object
Currency (code) Three digit alphabetic code identifying
a currency (ISO 4217) of a cash
account, a party or a cash transfer
order
Object
Daily average value Identifies the average of settlement
amounts of cash transfer orders of a
certain state and priority in a given time
period. When the order state indicates
not-settled cash transfer orders, then
the average is calculated on the base
of intended settlement amounts.
Measure
Daily average volume Identifies the average number of cash
transfer orders of a certain state and
priority in a given time period.
Measure
Date (from) Business date (from) Object
Date (to) Business date (to) Object
Debit Settlement amount of a single cash
transfer order or the total of settlement
amounts of cash transfer orders,
debited to a given cash account
Measure
Debited Account Identifies the debited account Object
Debited Account Number Number of a cash account, debited by
a cash transfer order
Object
Debited Account BIC BIC of a cash account, debited by a
cash account order
Object
Default MCA A party must mark one of its MCAs as
"Default" for its usage in automatic
processes of Standing Facility
Services, Minimum Reserve
Management, BILL and Central Bank
operations(CBO).
Object
Default MCA number Account number of the default MCA of
the party
Object
Deletion status Indicates if a party is active or deleted Object
Direct Participant RTGS Account Holder Object
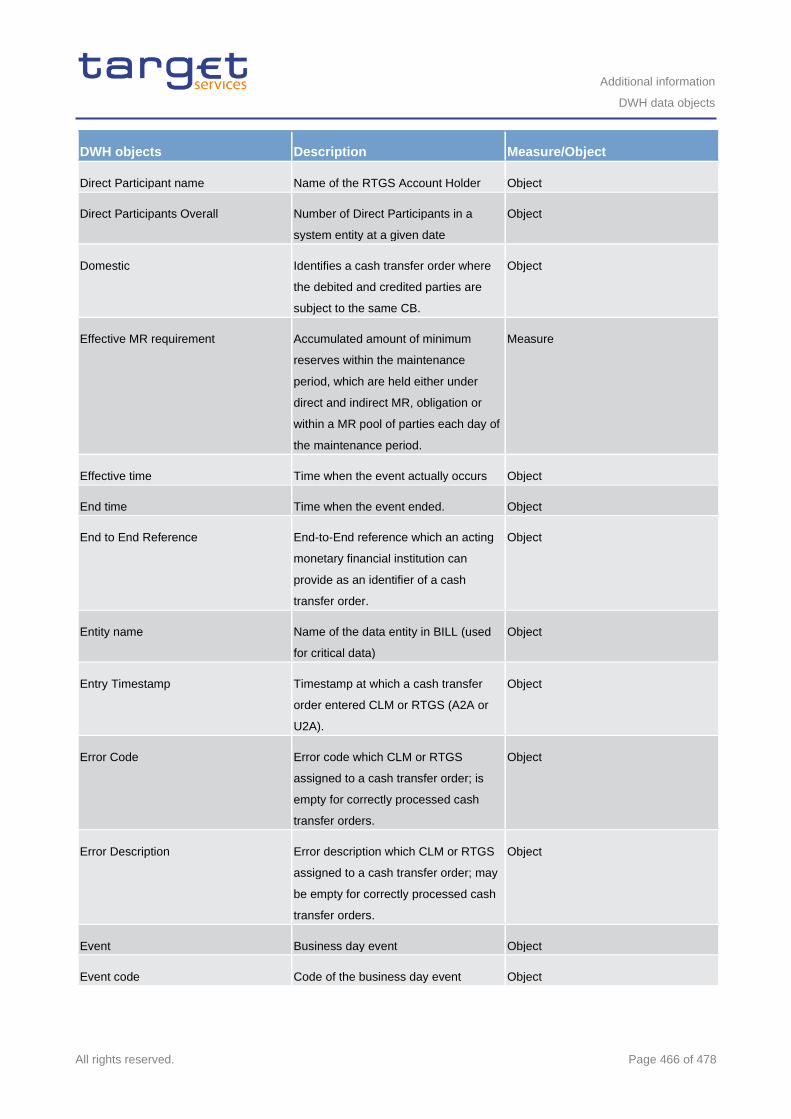
Additional information
DWH data objects
All rights reserved. Page 466 of 478
DWH objects Description Measure/Object
Direct Participant name Name of the RTGS Account Holder Object
Direct Participants Overall Number of Direct Participants in a
system entity at a given date
Object
Domestic Identifies a cash transfer order where
the debited and credited parties are
subject to the same CB.
Object
Effective MR requirement Accumulated amount of minimum
reserves within the maintenance
period, which are held either under
direct and indirect MR, obligation or
within a MR pool of parties each day of
the maintenance period.
Measure
Effective time Time when the event actually occurs Object
End time Time when the event ended. Object
End to End Reference End-to-End reference which an acting
monetary financial institution can
provide as an identifier of a cash
transfer order.
Object
Entity name Name of the data entity in BILL (used
for critical data)
Object
Entry Timestamp Timestamp at which a cash transfer
order entered CLM or RTGS (A2A or
U2A).
Object
Error Code Error code which CLM or RTGS
assigned to a cash transfer order; is
empty for correctly processed cash
transfer orders.
Object
Error Description Error description which CLM or RTGS
assigned to a cash transfer order; may
be empty for correctly processed cash
transfer orders.
Object
Event Business day event Object
Event code Code of the business day event Object
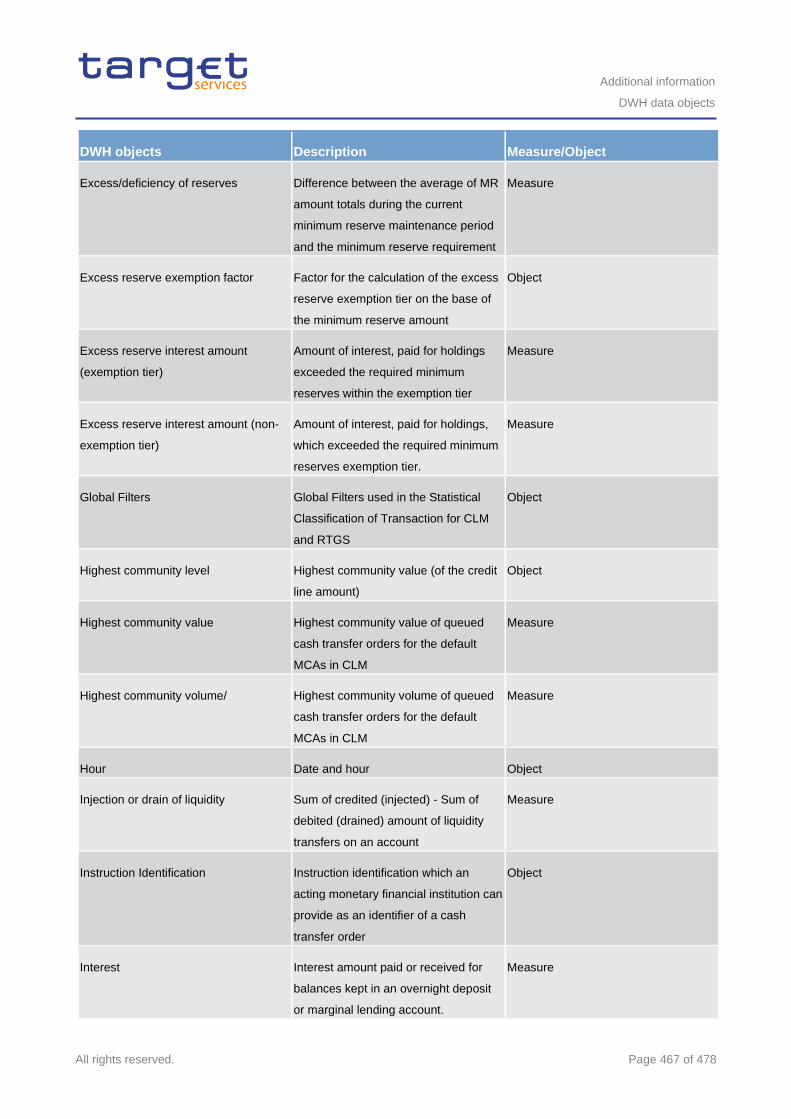
Additional information
DWH data objects
All rights reserved. Page 467 of 478
DWH objects Description Measure/Object
Excess/deficiency of reserves Difference between the average of MR
amount totals during the current
minimum reserve maintenance period
and the minimum reserve requirement
Measure
Excess reserve exemption factor Factor for the calculation of the excess
reserve exemption tier on the base of
the minimum reserve amount
Object
Excess reserve interest amount
(exemption tier)
Amount of interest, paid for holdings
exceeded the required minimum
reserves within the exemption tier
Measure
Excess reserve interest amount (non-
exemption tier)
Amount of interest, paid for holdings,
which exceeded the required minimum
reserves exemption tier.
Measure
Global Filters Global Filters used in the Statistical
Classification of Transaction for CLM
and RTGS
Object
Highest community level Highest community value (of the credit
line amount)
Object
Highest community value Highest community value of queued
cash transfer orders for the default
MCAs in CLM
Measure
Highest community volume/ Highest community volume of queued
cash transfer orders for the default
MCAs in CLM
Measure
Hour Date and hour Object
Injection or drain of liquidity Sum of credited (injected) - Sum of
debited (drained) amount of liquidity
transfers on an account
Measure
Instruction Identification Instruction identification which an
acting monetary financial institution can
provide as an identifier of a cash
transfer order
Object
Interest Interest amount paid or received for
balances kept in an overnight deposit
or marginal lending account.
Measure
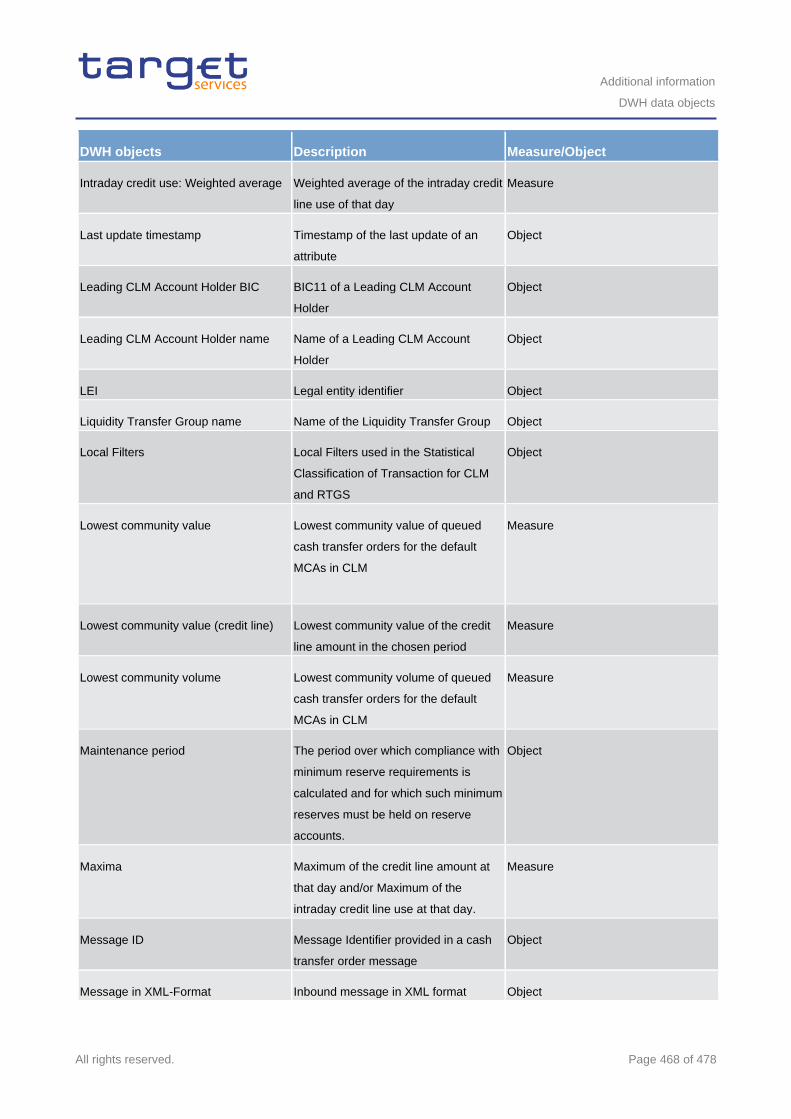
Additional information
DWH data objects
All rights reserved. Page 468 of 478
DWH objects Description Measure/Object
Intraday credit use: Weighted average Weighted average of the intraday credit
line use of that day
Measure
Last update timestamp Timestamp of the last update of an
attribute
Object
Leading CLM Account Holder BIC BIC11 of a Leading CLM Account
Holder
Object
Leading CLM Account Holder name Name of a Leading CLM Account
Holder
Object
LEI Legal entity identifier Object
Liquidity Transfer Group name Name of the Liquidity Transfer Group Object
Local Filters Local Filters used in the Statistical
Classification of Transaction for CLM
and RTGS
Object
Lowest community value Lowest community value of queued
cash transfer orders for the default
MCAs in CLM
Measure
Lowest community value (credit line) Lowest community value of the credit
line amount in the chosen period
Measure
Lowest community volume Lowest community volume of queued
cash transfer orders for the default
MCAs in CLM
Measure
Maintenance period The period over which compliance with
minimum reserve requirements is
calculated and for which such minimum
reserves must be held on reserve
accounts.
Object
Maxima Maximum of the credit line amount at
that day and/or Maximum of the
intraday credit line use at that day.
Measure
Message ID Message Identifier provided in a cash
transfer order message
Object
Message in XML-Format Inbound message in XML format Object
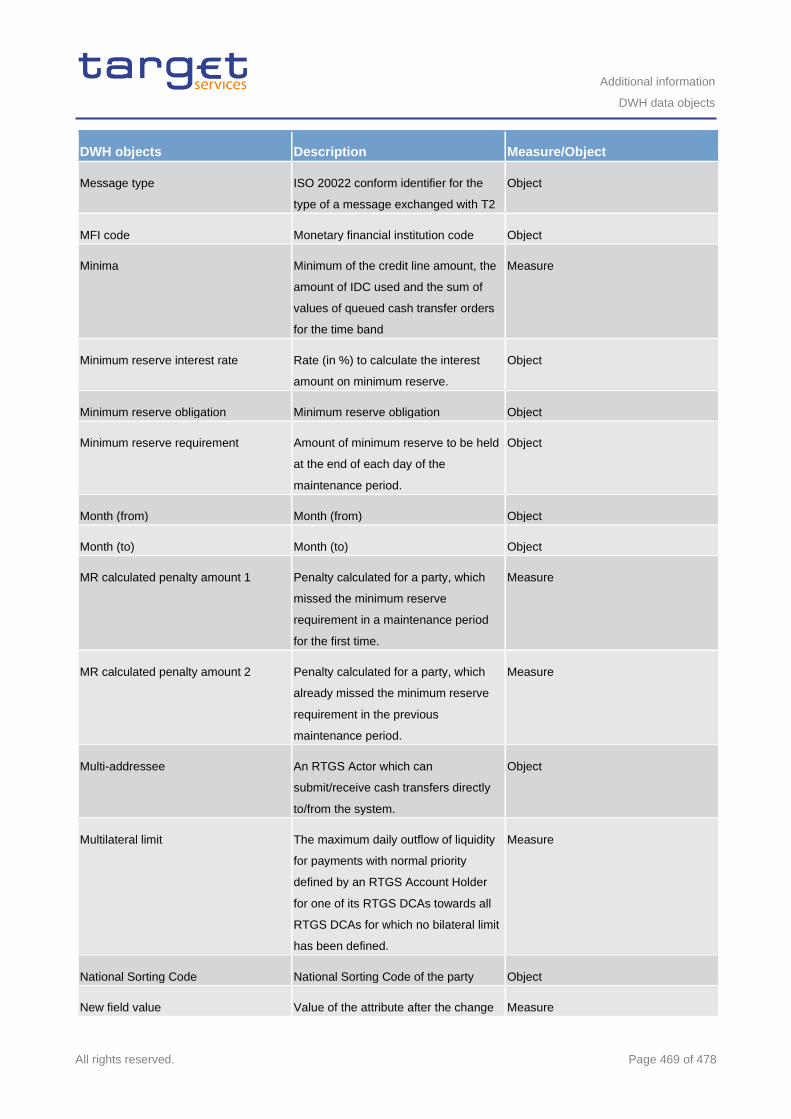
Additional information
DWH data objects
All rights reserved. Page 469 of 478
DWH objects Description Measure/Object
Message type ISO 20022 conform identifier for the
type of a message exchanged with T2
Object
MFI code Monetary financial institution code Object
Minima Minimum of the credit line amount, the
amount of IDC used and the sum of
values of queued cash transfer orders
for the time band
Measure
Minimum reserve interest rate Rate (in %) to calculate the interest
amount on minimum reserve.
Object
Minimum reserve obligation Minimum reserve obligation Object
Minimum reserve requirement Amount of minimum reserve to be held
at the end of each day of the
maintenance period.
Object
Month (from) Month (from) Object
Month (to) Month (to) Object
MR calculated penalty amount 1 Penalty calculated for a party, which
missed the minimum reserve
requirement in a maintenance period
for the first time.
Measure
MR calculated penalty amount 2 Penalty calculated for a party, which
already missed the minimum reserve
requirement in the previous
maintenance period.
Measure
Multi-addressee An RTGS Actor which can
submit/receive cash transfers directly
to/from the system.
Object
Multilateral limit The maximum daily outflow of liquidity
for payments with normal priority
defined by an RTGS Account Holder
for one of its RTGS DCAs towards all
RTGS DCAs for which no bilateral limit
has been defined.
Measure
National Sorting Code National Sorting Code of the party Object
New field value Value of the attribute after the change Measure
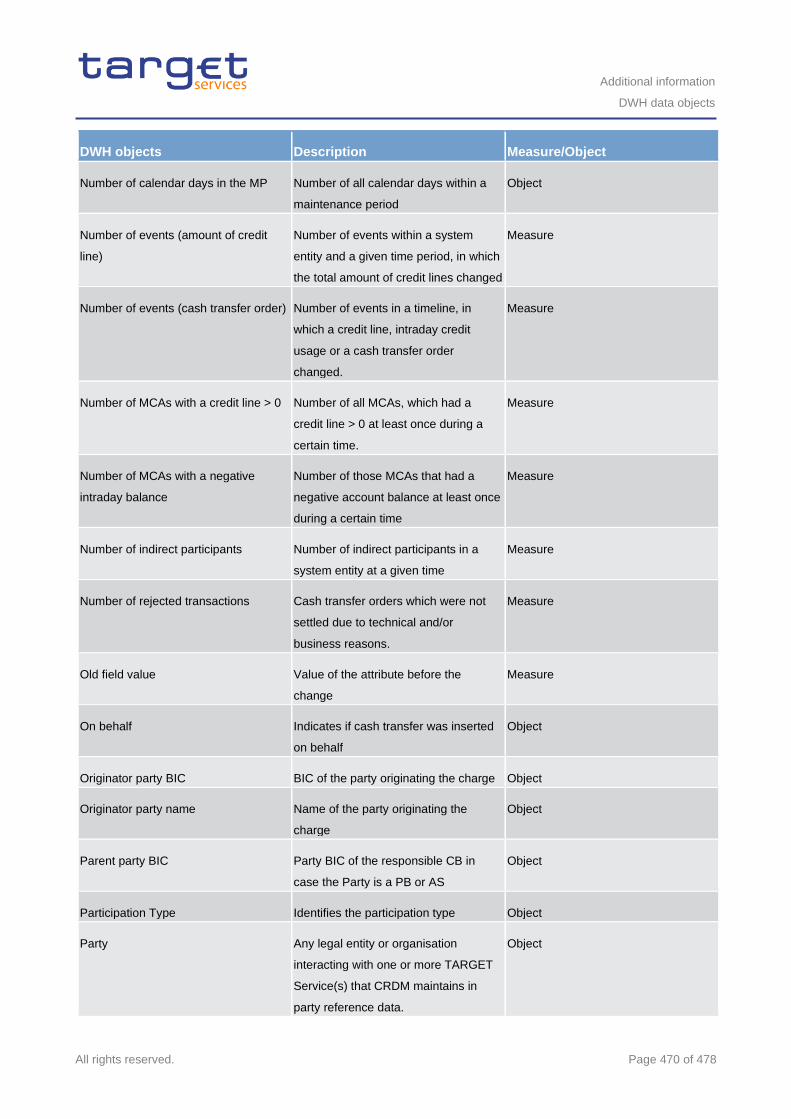
Additional information
DWH data objects
All rights reserved. Page 470 of 478
DWH objects Description Measure/Object
Number of calendar days in the MP Number of all calendar days within a
maintenance period
Object
Number of events (amount of credit
line)
Number of events within a system
entity and a given time period, in which
the total amount of credit lines changed
Measure
Number of events (cash transfer order) Number of events in a timeline, in
which a credit line, intraday credit
usage or a cash transfer order
changed.
Measure
Number of MCAs with a credit line > 0 Number of all MCAs, which had a
credit line > 0 at least once during a
certain time.
Measure
Number of MCAs with a negative
intraday balance
Number of those MCAs that had a
negative account balance at least once
during a certain time
Measure
Number of indirect participants Number of indirect participants in a
system entity at a given time
Measure
Number of rejected transactions Cash transfer orders which were not
settled due to technical and/or
business reasons.
Measure
Old field value Value of the attribute before the
change
Measure
On behalf Indicates if cash transfer was inserted
on behalf
Object
Originator party BIC BIC of the party originating the charge Object
Originator party name Name of the party originating the
charge
Object
Parent party BIC Party BIC of the responsible CB in
case the Party is a PB or AS
Object
Participation Type Identifies the participation type Object
Party Any legal entity or organisation
interacting with one or more TARGET
Service(s) that CRDM maintains in
party reference data.
Object
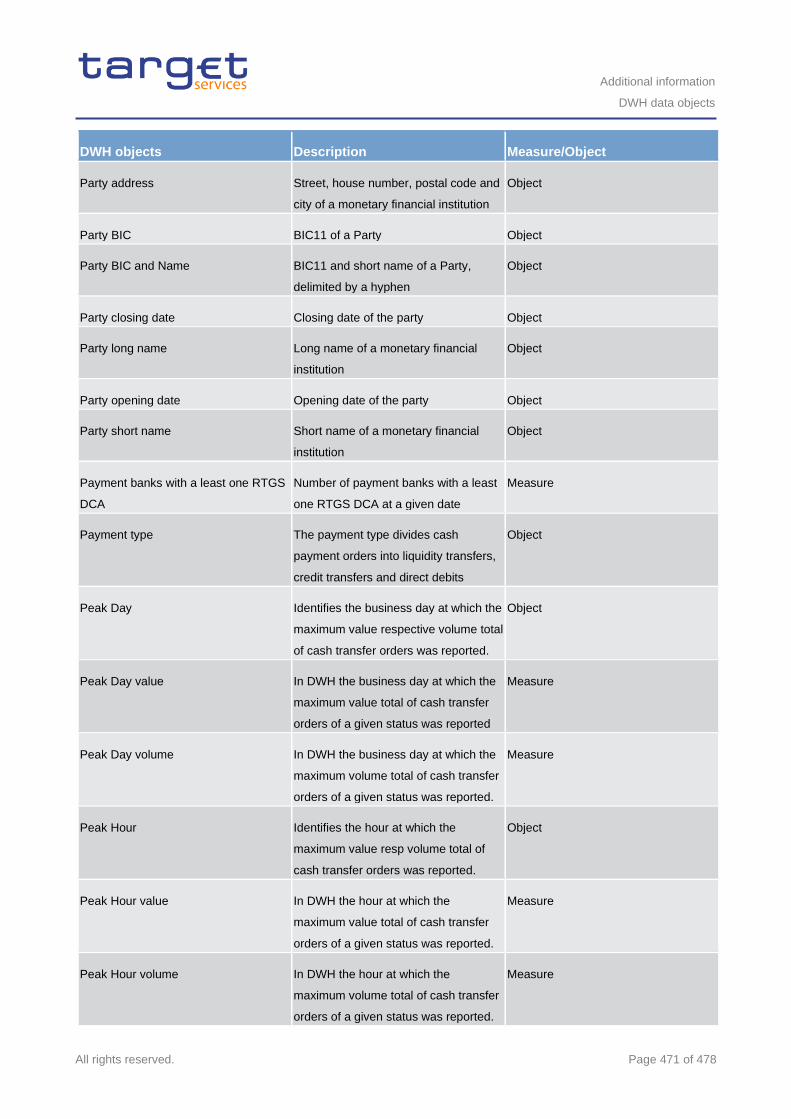
Additional information
DWH data objects
All rights reserved. Page 471 of 478
DWH objects Description Measure/Object
Party address Street, house number, postal code and
city of a monetary financial institution
Object
Party BIC BIC11 of a Party Object
Party BIC and Name BIC11 and short name of a Party,
delimited by a hyphen
Object
Party closing date Closing date of the party Object
Party long name Long name of a monetary financial
institution
Object
Party opening date Opening date of the party Object
Party short name Short name of a monetary financial
institution
Object
Payment banks with a least one RTGS
DCA
Number of payment banks with a least
one RTGS DCA at a given date
Measure
Payment type The payment type divides cash
payment orders into liquidity transfers,
credit transfers and direct debits
Object
Peak Day Identifies the business day at which the
maximum value respective volume total
of cash transfer orders was reported.
Object
Peak Day value In DWH the business day at which the
maximum value total of cash transfer
orders of a given status was reported
Measure
Peak Day volume In DWH the business day at which the
maximum volume total of cash transfer
orders of a given status was reported.
Measure
Peak Hour Identifies the hour at which the
maximum value resp volume total of
cash transfer orders was reported.
Object
Peak Hour value In DWH the hour at which the
maximum value total of cash transfer
orders of a given status was reported.
Measure
Peak Hour volume In DWH the hour at which the
maximum volume total of cash transfer
orders of a given status was reported.
Measure
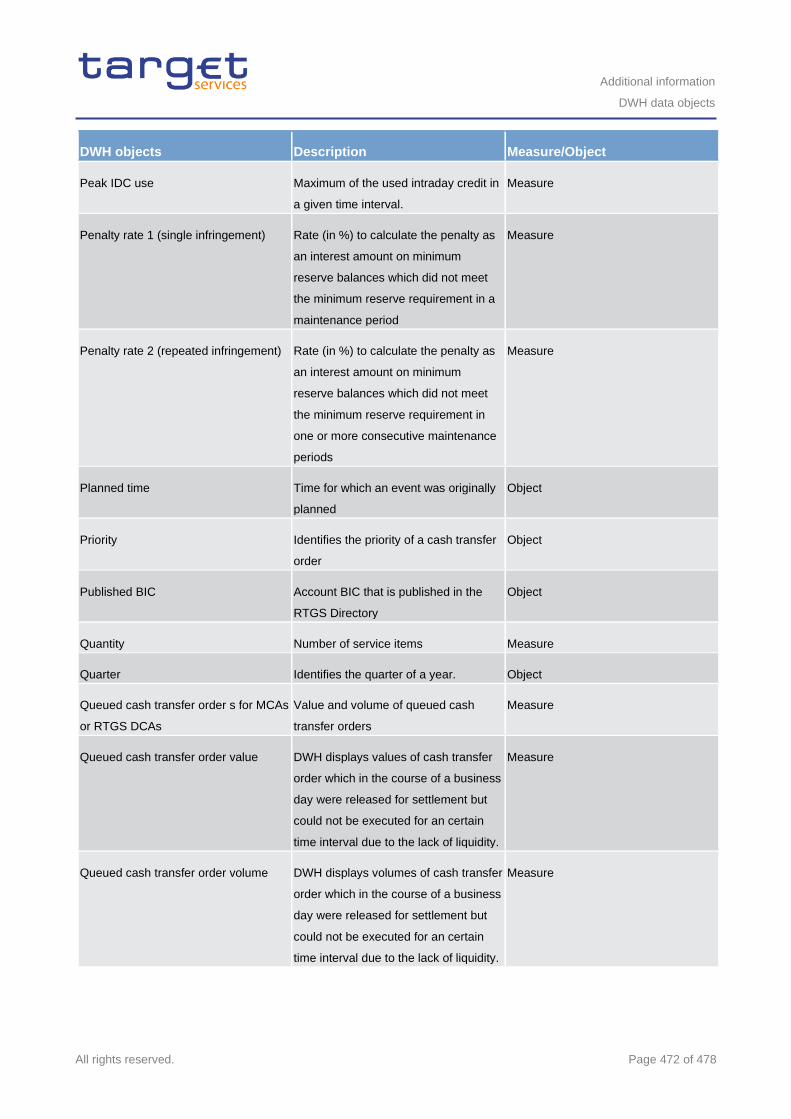
Additional information
DWH data objects
All rights reserved. Page 472 of 478
DWH objects Description Measure/Object
Peak IDC use Maximum of the used intraday credit in
a given time interval.
Measure
Penalty rate 1 (single infringement) Rate (in %) to calculate the penalty as
an interest amount on minimum
reserve balances which did not meet
the minimum reserve requirement in a
maintenance period
Measure
Penalty rate 2 (repeated infringement) Rate (in %) to calculate the penalty as
an interest amount on minimum
reserve balances which did not meet
the minimum reserve requirement in
one or more consecutive maintenance
periods
Measure
Planned time Time for which an event was originally
planned
Object
Priority Identifies the priority of a cash transfer
order
Object
Published BIC Account BIC that is published in the
RTGS Directory
Object
Quantity Number of service items Measure
Quarter Identifies the quarter of a year. Object
Queued cash transfer order s for MCAs
or RTGS DCAs
Value and volume of queued cash
transfer orders
Measure
Queued cash transfer order value DWH displays values of cash transfer
order which in the course of a business
day were released for settlement but
could not be executed for an certain
time interval due to the lack of liquidity.
Measure
Queued cash transfer order volume DWH displays volumes of cash transfer
order which in the course of a business
day were released for settlement but
could not be executed for an certain
time interval due to the lack of liquidity.
Measure
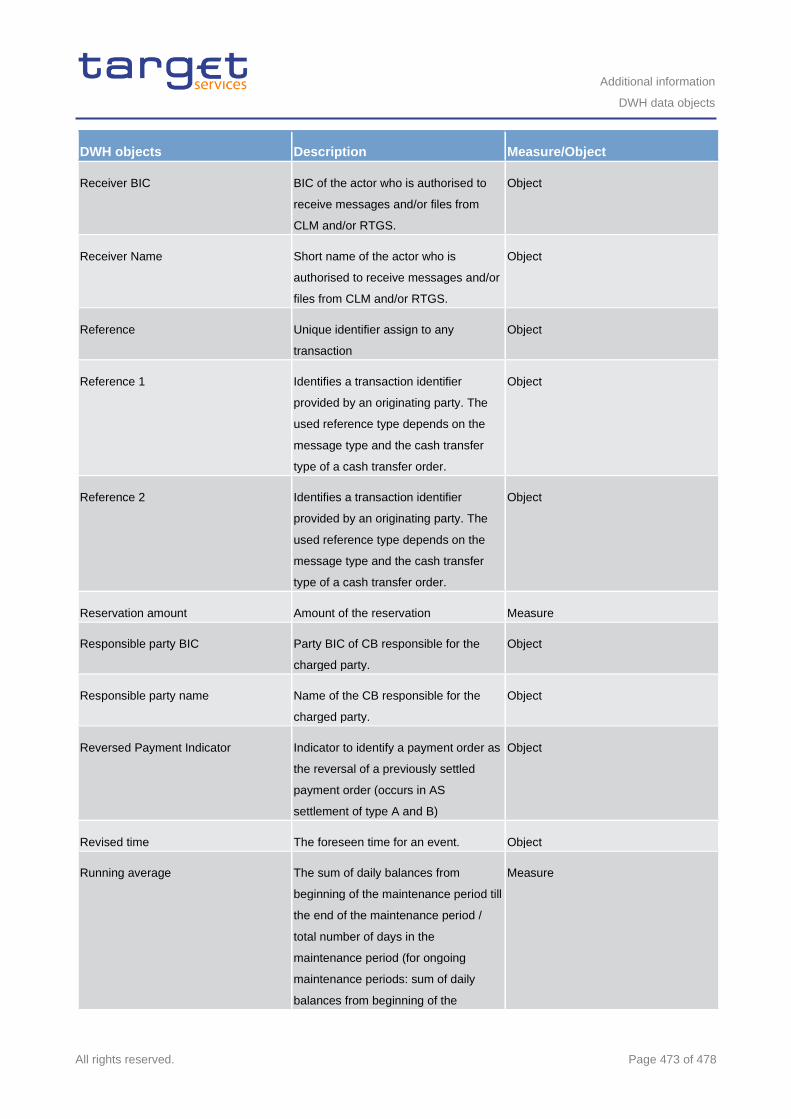
Additional information
DWH data objects
All rights reserved. Page 473 of 478
DWH objects Description Measure/Object
Receiver BIC BIC of the actor who is authorised to
receive messages and/or files from
CLM and/or RTGS.
Object
Receiver Name Short name of the actor who is
authorised to receive messages and/or
files from CLM and/or RTGS.
Object
Reference Unique identifier assign to any
transaction
Object
Reference 1 Identifies a transaction identifier
provided by an originating party. The
used reference type depends on the
message type and the cash transfer
type of a cash transfer order.
Object
Reference 2 Identifies a transaction identifier
provided by an originating party. The
used reference type depends on the
message type and the cash transfer
type of a cash transfer order.
Object
Reservation amount Amount of the reservation Measure
Responsible party BIC Party BIC of CB responsible for the
charged party.
Object
Responsible party name Name of the CB responsible for the
charged party.
Object
Reversed Payment Indicator Indicator to identify a payment order as
the reversal of a previously settled
payment order (occurs in AS
settlement of type A and B)
Object
Revised time The foreseen time for an event. Object
Running average The sum of daily balances from
beginning of the maintenance period till
the end of the maintenance period /
total number of days in the
maintenance period (for ongoing
maintenance periods: sum of daily
balances from beginning of the
Measure
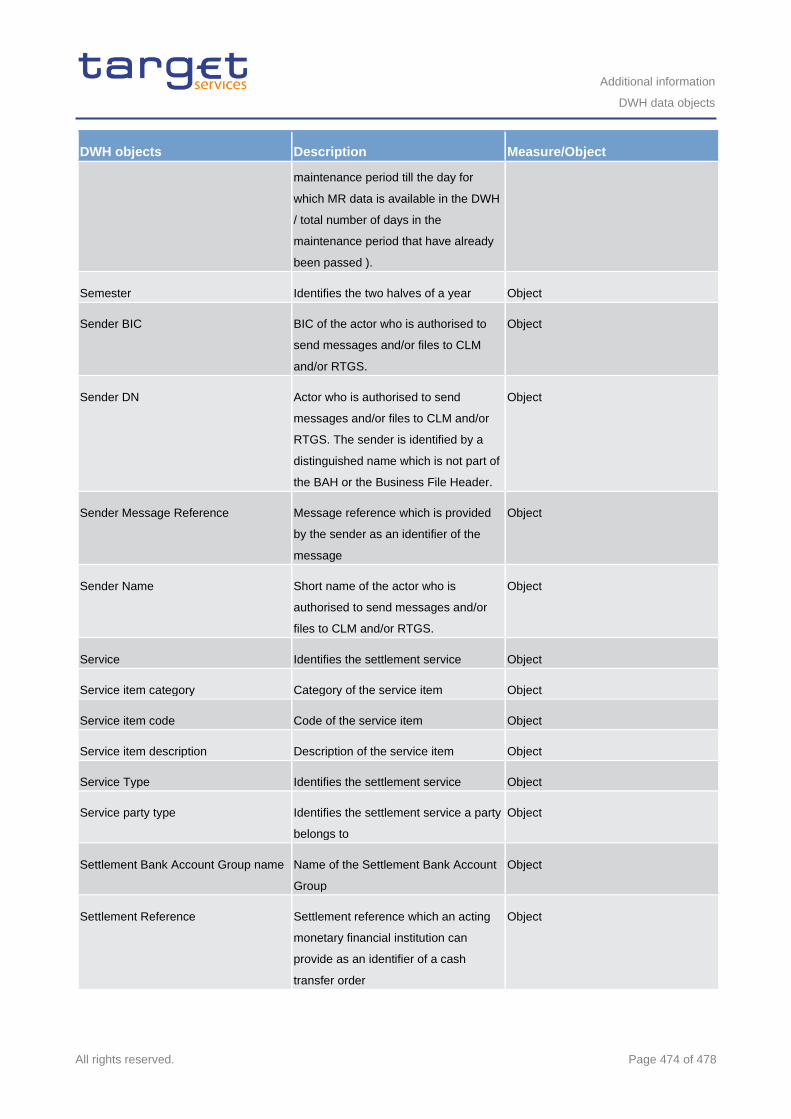
Additional information
DWH data objects
All rights reserved. Page 474 of 478
DWH objects Description Measure/Object
maintenance period till the day for
which MR data is available in the DWH
/ total number of days in the
maintenance period that have already
been passed ).
Semester Identifies the two halves of a year Object
Sender BIC BIC of the actor who is authorised to
send messages and/or files to CLM
and/or RTGS.
Object
Sender DN Actor who is authorised to send
messages and/or files to CLM and/or
RTGS. The sender is identified by a
distinguished name which is not part of
the BAH or the Business File Header.
Object
Sender Message Reference Message reference which is provided
by the sender as an identifier of the
message
Object
Sender Name Short name of the actor who is
authorised to send messages and/or
files to CLM and/or RTGS.
Object
Service Identifies the settlement service Object
Service item category Category of the service item Object
Service item code Code of the service item Object
Service item description Description of the service item Object
Service Type Identifies the settlement service Object
Service party type Identifies the settlement service a party
belongs to
Object
Settlement Bank Account Group name Name of the Settlement Bank Account
Group
Object
Settlement Reference Settlement reference which an acting
monetary financial institution can
provide as an identifier of a cash
transfer order
Object
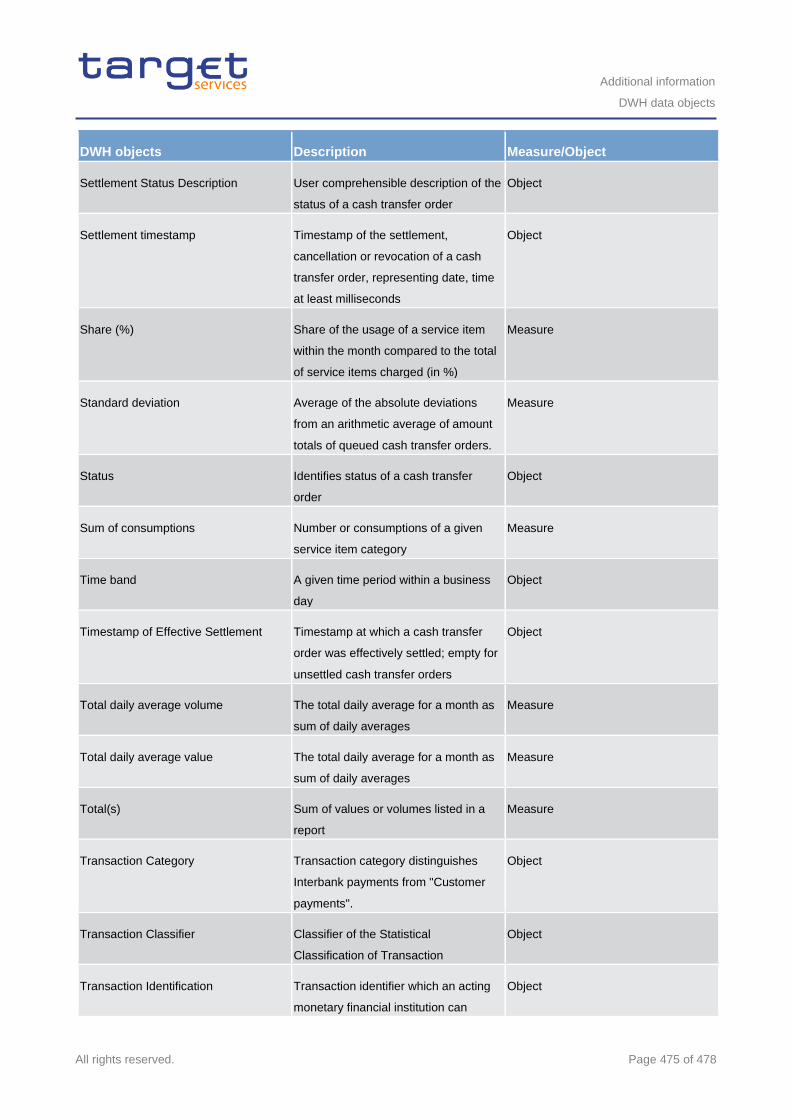
Additional information
DWH data objects
All rights reserved. Page 475 of 478
DWH objects Description Measure/Object
Settlement Status Description User comprehensible description of the
status of a cash transfer order
Object
Settlement timestamp Timestamp of the settlement,
cancellation or revocation of a cash
transfer order, representing date, time
at least milliseconds
Object
Share (%) Share of the usage of a service item
within the month compared to the total
of service items charged (in %)
Measure
Standard deviation Average of the absolute deviations
from an arithmetic average of amount
totals of queued cash transfer orders.
Measure
Status Identifies status of a cash transfer
order
Object
Sum of consumptions Number or consumptions of a given
service item category
Measure
Time band A given time period within a business
day
Object
Timestamp of Effective Settlement Timestamp at which a cash transfer
order was effectively settled; empty for
unsettled cash transfer orders
Object
Total daily average volume The total daily average for a month as
sum of daily averages
Measure
Total daily average value The total daily average for a month as
sum of daily averages
Measure
Total(s) Sum of values or volumes listed in a
report
Measure
Transaction Category Transaction category distinguishes
Interbank payments from "Customer
payments".
Object
Transaction Classifier Classifier of the Statistical
Classification of Transaction
Object
Transaction Identification Transaction identifier which an acting
monetary financial institution can
Object
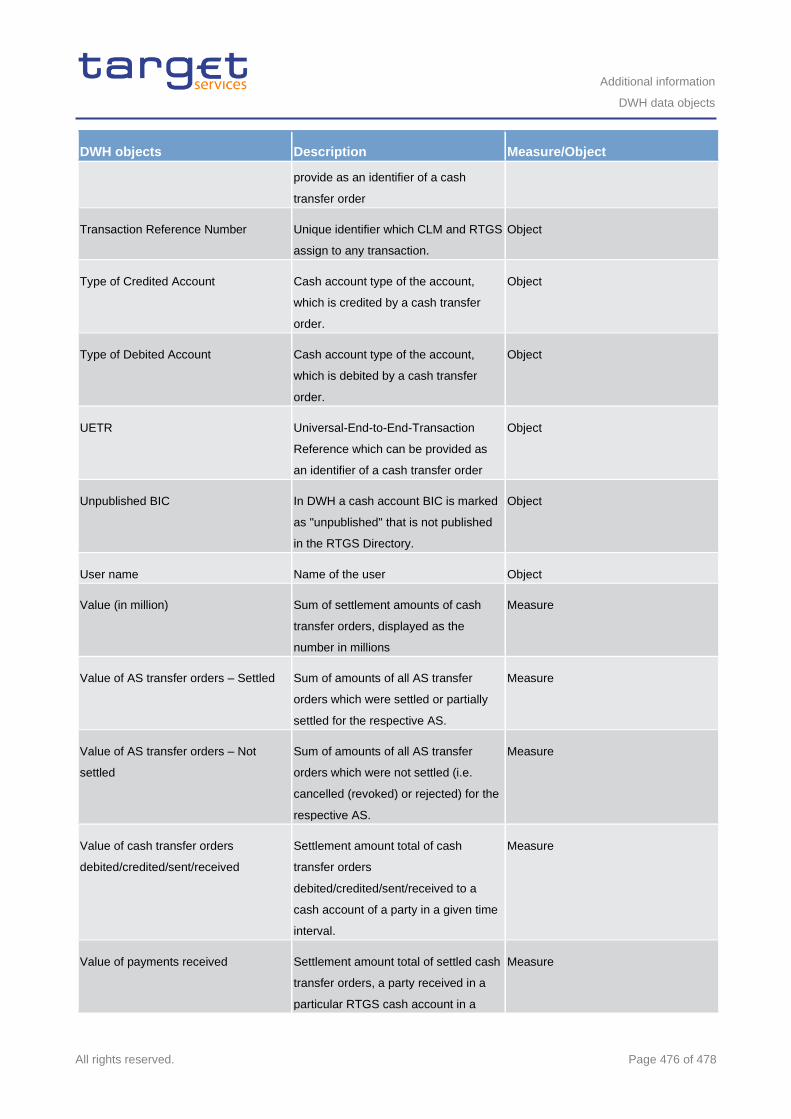
Additional information
DWH data objects
All rights reserved. Page 476 of 478
DWH objects Description Measure/Object
provide as an identifier of a cash
transfer order
Transaction Reference Number Unique identifier which CLM and RTGS
assign to any transaction.
Object
Type of Credited Account Cash account type of the account,
which is credited by a cash transfer
order.
Object
Type of Debited Account Cash account type of the account,
which is debited by a cash transfer
order.
Object
UETR Universal-End-to-End-Transaction
Reference which can be provided as
an identifier of a cash transfer order
Object
Unpublished BIC In DWH a cash account BIC is marked
as "unpublished" that is not published
in the RTGS Directory.
Object
User name Name of the user Object
Value (in million) Sum of settlement amounts of cash
transfer orders, displayed as the
number in millions
Measure
Value of AS transfer orders – Settled Sum of amounts of all AS transfer
orders which were settled or partially
settled for the respective AS.
Measure
Value of AS transfer orders – Not
settled
Sum of amounts of all AS transfer
orders which were not settled (i.e.
cancelled (revoked) or rejected) for the
respective AS.
Measure
Value of cash transfer orders
debited/credited/sent/received
Settlement amount total of cash
transfer orders
debited/credited/sent/received to a
cash account of a party in a given time
interval.
Measure
Value of payments received Settlement amount total of settled cash
transfer orders, a party received in a
particular RTGS cash account in a
Measure
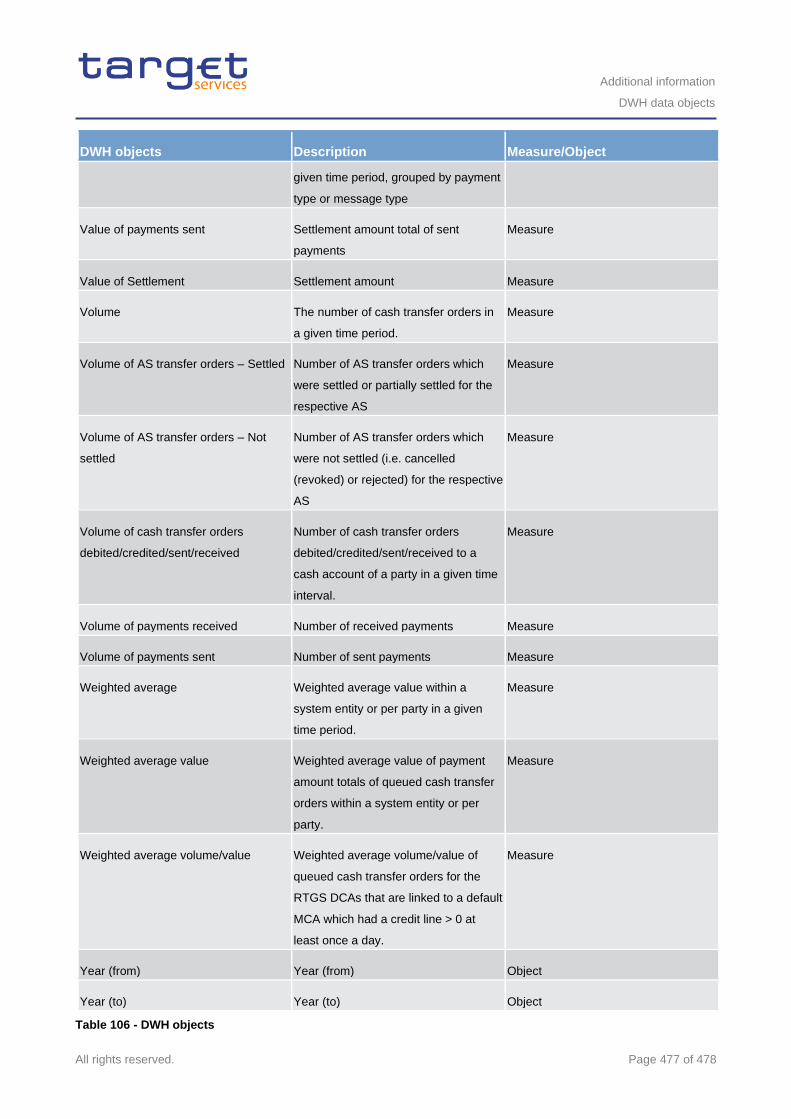
Additional information
DWH data objects
All rights reserved. Page 477 of 478
DWH objects Description Measure/Object
given time period, grouped by payment
type or message type
Value of payments sent Settlement amount total of sent
payments
Measure
Value of Settlement Settlement amount Measure
Volume The number of cash transfer orders in
a given time period.
Measure
Volume of AS transfer orders – Settled Number of AS transfer orders which
were settled or partially settled for the
respective AS
Measure
Volume of AS transfer orders – Not
settled
Number of AS transfer orders which
were not settled (i.e. cancelled
(revoked) or rejected) for the respective
AS
Measure
Volume of cash transfer orders
debited/credited/sent/received
Number of cash transfer orders
debited/credited/sent/received to a
cash account of a party in a given time
interval.
Measure
Volume of payments received Number of received payments Measure
Volume of payments sent Number of sent payments Measure
Weighted average Weighted average value within a
system entity or per party in a given
time period.
Measure
Weighted average value Weighted average value of payment
amount totals of queued cash transfer
orders within a system entity or per
party.
Measure
Weighted average volume/value Weighted average volume/value of
queued cash transfer orders for the
RTGS DCAs that are linked to a default
MCA which had a credit line > 0 at
least once a day.
Measure
Year (from) Year (from) Object
Year (to) Year (to) Object
Table 106 - DWH objects
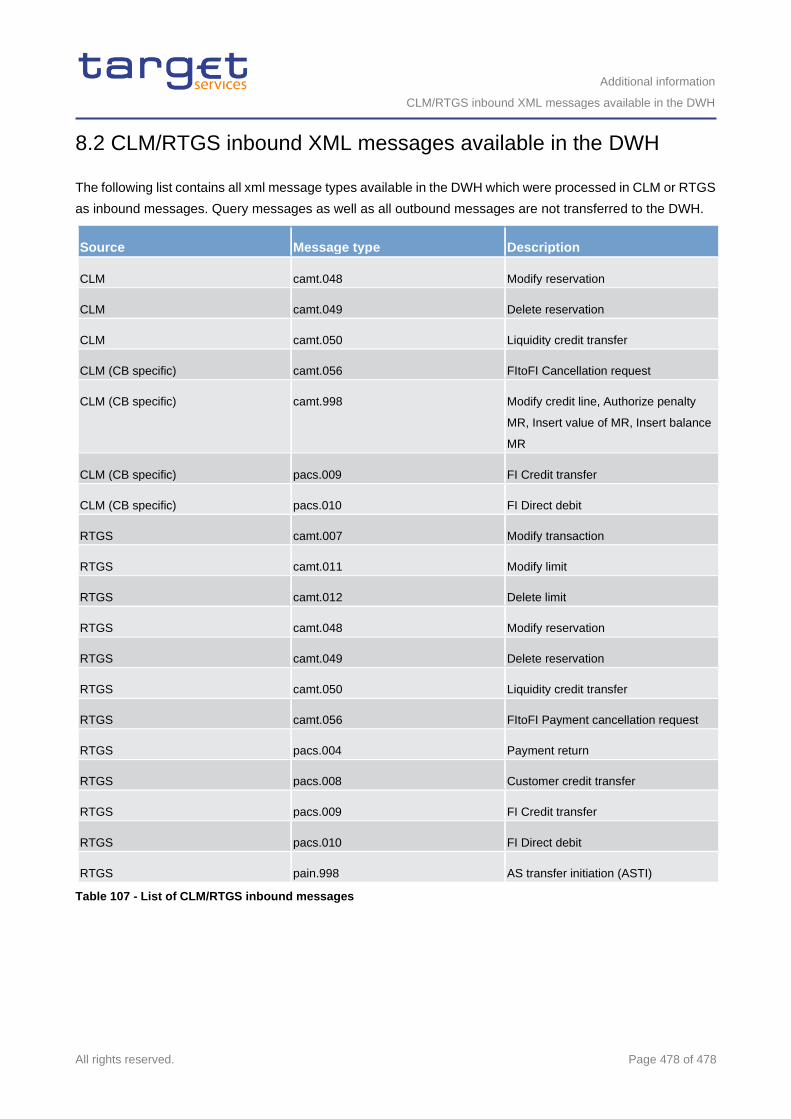
Additional information
CLM/RTGS inbound XML messages available in the DWH
All rights reserved. Page 478 of 478
8.2 CLM/RTGS inbound XML messages available in the DWH
The following list contains all xml message types available in the DWH which were processed in CLM or RTGS
as inbound messages. Query messages as well as all outbound messages are not transferred to the DWH.
Source Message type Description
CLM camt.048 Modify reservation
CLM camt.049 Delete reservation
CLM camt.050 Liquidity credit transfer
CLM (CB specific) camt.056 FItoFI Cancellation request
CLM (CB specific) camt.998 Modify credit line, Authorize penalty
MR, Insert value of MR, Insert balance
MR
CLM (CB specific) pacs.009 FI Credit transfer
CLM (CB specific) pacs.010 FI Direct debit
RTGS camt.007 Modify transaction
RTGS camt.011 Modify limit
RTGS camt.012 Delete limit
RTGS camt.048 Modify reservation
RTGS camt.049 Delete reservation
RTGS camt.050 Liquidity credit transfer
RTGS camt.056 FItoFI Payment cancellation request
RTGS pacs.004 Payment return
RTGS pacs.008 Customer credit transfer
RTGS pacs.009 FI Credit transfer
RTGS pacs.010 FI Direct debit
RTGS pain.998 AS transfer initiation (ASTI)
Table 107 - List of CLM/RTGS inbound messages