synthesis of multifunctional reactive dyes and their
TRANSCRIPT

Synthesis of Multifunctional Reactive Dyes and Their Application
onto Wool Fabric by Inkjet Printing
Saira Faisal
Submitted in accordance with the requirements for the degree of
Degree of Philosophy
The University of Leeds
Department of Colour Science
School of Chemistry
December 2013
- ii -
The candidate confirms that the work submitted is her own, except where work
which has formed part of jointly-authored publications has been included. The
contribution of the candidate and the other authors to this work has been explicitly
indicated below. The candidate confirms that appropriate credit has been given
within the thesis where reference has been made to the work of others.
The syntheses and applications of, triazine based dyes in magenta, yellow and
blue hue (Chapter 3,4,5) along with comparative study with commercial reactive
inks (Chapter 10) were presented in a conference as follows.
1. Saira FAISAL, Long LIN and Matthew CLARK. “Novel reactive colorants
and their application onto textile substrates by Inkjet printing”. In “12th
Congress of the International Colour Association”. 8th – 12
th July 2013,
Newcastle-upon Tyne, United Kingdom.
The syntheses and applications of, triazine based dyes in magenta, yellow and
blue hue (Chapter 3,4,5) were presented in a conference as follows.
2. Saira FAISAL, Long LIN and Matthew CLARK. “Novel reactive dyes and
their application onto textile substrates by Inkjet printing”. In “29th
International Conference on Digital Printing Technology”. September 29th –
October 3rd
2013, Seattle, United States of America.
I was responsible for 95% of the total contribution in above. The contributions
of the other Authors were 5% of the work, this being limited to the correction of the
draft paper and provision of relevant advice.
This copy has been supplied on the understanding that it is copyright material
and that no quotation from the thesis may be published without proper
acknowledgement.
The right of Saira Faisal to be identified as Author of this work has been asserted
by her in accordance with the Copyright, Designs and Patents Act 1988.
© 2013 The University of Leeds and Saira Faisal

- iii -
Dedicated to
My Grandmother (Late)
- iv -
Acknowledgements
I would like to express my sincere gratitude to Professor Long Lin for his
guidance, understanding, patience, and most importantly, excellent supervision
during my studies. I can only cherish with gratitude the invaluable suggestions and
timely discussions offered by him which made this piece of work possible. I would
also like to extend my gratitude to Dr. Matthew Clark who supervised the early
years of this project for his valuable guidance. His mentorship was paramount in
providing a well-rounded experience consistent my long-term career goals.
I would also like to thank Dr. Julie Fisher who has offered me unfailing advice
and support.
I am also grateful to Mr Algy Kazlauciunas, Mr Mohammad Asaf, Mr Martin
Huscroft and Mr. Ian Blakeley for providing excellent technical services for my
work.
I would like to thank NED University of Engineering and Technology, Karachi
Pakistan for financial support for this study.
I wish to express my deep sense of gratitude to my parents, in-laws, family and
friends who always stood firmly behind me in moments of despair and revived my
spirit and determination.
Finally, special thanks to my husband Faisal, who inspired me and provided
constant encouragement during the entire process. To my little girl, Warishah, who
missed out lots of Mummy time while I pursued my studies.

- v -
Abstract
Inkjet printing provides a favourable method for wool printing because of the
ability to produce economical short print runs and providing flexibility in print
design.
This work focused on the synthesis and characterisation of series of novel
multifunctional reactive dyes in magenta, blue and yellow hue based on
chlorotriazines and chloropyrimidine reactive groups and their modification by: (1)
replacing labile chlorine(s) by other labile sulfophenoxy group(s) and (2) replacing
the imino bridging group by an aliphatic amino group.
This study also focused on the formulation of a set of inks based on parent and
modified dyes in magenta, yellow and blue hue, their application onto wool via
inkjet printing, and evaluation of percent fixation along with their stability in ink
formulations and colour fastness properties. Moreover, the results were also
compared with commercially successful Jettex R Inks (DyStar).
The research has shown that reactive dyes based on chlorotriazines and
chloropyrimidine can be modified by the incorporation of sulfophenoxy group(s)
onto the reactive group of the dye.
The modified dyes, when inkjet printed onto the wool, were able to react with
the wool fibre and show excellent fixation results. The incorporation of more than
one reactive group on the dye chromophore has shown an increase in percent
fixation compared to dyes with only one reactive group. Moreover, modified inks
showed excellent colour fastness to light and wash.
Additionally, comparative analysis of modified dye-based inks and
commercially successful ‘Jettex R’ inks illustrates that the novel inks are superior in
terms of percent fixation and colour fastness properties.

- vi -
List of Abbreviations
CE Capillary Electrophoresis
CZE Capillary Zone Electrophoresis
MEKC Micellar Electrokinetic Capillary Chromatography
EOF Electroosmotic Flow
SDS Sodium dodecyl sulfate
TLC Thin layer chromatography
IR Infrared
FT-IR Fourier Transform-Infrared Spectroscopy
ATR Attenuated Total Reflectance
CMC Carboxymethyl cellulose
DMF N,N-dimethylformamide
NMMO N-methylmorpholine N-oxide
dpi dots per inch
cP Centipoise

- vii -
Table of Contents
Acknowledgements .............................................................................................. iv
Abstract ................................................................................................................. v
List of Abbreviations ........................................................................................... vi
Table of Contents ................................................................................................ vii
List of Figures .................................................................................................... xix
List of Schemes ..................................................................................................xxvi
List of Tables .................................................................................................. xxviii
Preface ................................................................................................................ xxx
1 Introduction .................................................................................................. 1
1.1 Reactive Dyes ....................................................................................... 1
1.1.1 History of Reactive Dye Development ..................................... 2
1.1.1.1 First Commercial Ranges of Reactive Dyes for
Cellulosic Fibres .............................................................. 3
1.1.1.2 First Commercial Ranges of Reactive Dyes for
Polyamide Fibres ............................................................. 3
1.1.2 Structure of Reactive Dyes ....................................................... 3
1.1.2.1 Chromophore ................................................................... 4
1.1.2.2 Solubilising Groups ......................................................... 4
1.1.2.3 Bridging Group ................................................................ 4
1.1.2.4 Reactive Group ................................................................ 4
1.1.2.4.1 Nucleophilic Aromatic Substitution ........................ 5
1.1.2.4.2 Michael Addition .................................................... 5
1.1.3 Reactive Groups for Wool ....................................................... 5
1.1.3.1 Triazine ........................................................................... 6
1.1.3.2 Diazine ............................................................................ 8
1.1.4 Multifunctional Reactive Dyes ................................................. 8
1.2 Wool ..................................................................................................... 9
1.2.1 Fibre Morphology .................................................................... 9
1.2.2 Composition of Wool ..............................................................12
1.2.3 Chemical Structure .................................................................12
1.2.4 Mechanism of Wool Coloration ..............................................14
- viii -
1.2.5 Dyes for Wool Coloration .......................................................15
1.3 Textile Printing.....................................................................................16
1.3.1 Development of Textile Printing .............................................16
1.3.2 Inkjet Printing .........................................................................17
1.3.3 Classification of Inkjet Printing Technology ...........................18
1.3.3.1 Continuous Inkjet ...........................................................18
1.3.3.2 Drop-on-Demand Inkjet ..................................................18
1.3.4 Applications of Inkjet for Textile Printing ...............................19
1.3.4.1 Early Developments........................................................19
1.3.5 Changes in the Textile Printing Market ...................................20
1.3.6 Mass Customisation ................................................................20
1.3.6.1 Change in the Business Model ........................................21
1.3.6.2 Quick Response and Just in Time Delivery .....................21
1.3.6.3 Economic Factors in Textile Printing ..............................21
1.3.6.4 Ecology ..........................................................................22
1.3.7 Improving Textile Printing Industry Through the Use of
Inkjet Technology ...................................................................22
1.3.7.1 Limitation of Inkjet Printing ...........................................25
1.3.8 Inks for Textile Inkjet Printing ................................................26
1.3.8.1 Dye Based Inks ...............................................................26
1.4 Inkjet Printing of Wool with Reactive Inks ...........................................27
1.4.1 Reactive Inks for Wool ...........................................................27
1.4.2 Pre-Treatment for Inkjet Printing of Wool...............................29
1.5 Aims of Research .................................................................................30
1.6 References ............................................................................................32
2 General Procedure and Instrumentation ...................................................39
2.1 Capillary Electrophoresis ......................................................................39
2.1.1 Principles of Capillary Electrophoresis (CE) ...........................39
2.1.1.1 Capillary Zone Electrophoresis (CZE) ............................40
2.1.1.2 Micellar Electrokinetic Chromatography (MEKC) ..........41
2.1.2 Analysis Parameters ................................................................42
2.2 Thin Layer Chromatography (TLC) ......................................................43
2.2.1 Analysis Parameters ................................................................45
2.3 Infrared (IR) Spectroscopy ...................................................................45

- ix -
2.3.1 Fourier Transform-Infrared Spectroscopy (FT-IR) ..................46
2.3.2 Attenuated Total Reflection (ATR) .........................................47
2.3.3 Analysis Parameters ................................................................48
2.4 Elemental Analysis ...............................................................................48
2.5 Inkjet Printing Procedure ......................................................................48
2.5.1 Fabric Pre-Treatment ..............................................................49
2.5.2 Ink Preparation .......................................................................49
2.5.2.1 Purification of Synthesised Dyes.....................................49
2.5.2.2 Ink Formulation ..............................................................50
2.5.2.2.1 Measurement of Surface Tension ...........................51
2.5.2.2.2 Measurement of Viscosity .....................................51
2.5.3 Application onto Wool Fabric .................................................52
2.5.4 Fixation of Prints ....................................................................52
2.5.5 Washing-off ............................................................................53
2.6 Stability of Dye based Inks ...................................................................53
2.7 Determination of Percent Fixation (Fibre-Dye Bond) ...........................53
2.7.1 Analysis Parameters ................................................................54
2.8 Colour Fastness Testing ........................................................................54
2.8.1 Light Fastness Testing ............................................................54
2.8.2 Wash Fastness Testing ............................................................55
2.9 Microwave-Irradiated Synthesis ...........................................................55
2.9.1 Principle of Microwave-Irradiated Synthesis ...........................57
2.9.1.1 Dipolar Polarisation ........................................................57
2.9.1.2 Conduction Mechanism ..................................................58
2.9.2 Advantages of Microwave-Irradiated Synthesis ......................58
2.9.3 Analysis Parameters ................................................................59
2.10 Miscellaneous Procedures.....................................................................59
2.10.1 Completion of Diazotization ...................................................59
2.10.2 Completion of Diazo-Coupling ...............................................59
2.10.3 Freeze Drying .........................................................................59
2.11 References ............................................................................................59

- x -
3 Synthesis, Modification, Characterisation of Magenta
Dichlorotriazine Dyes and Their Application onto Wool Fabric by
Inkjet Printing .............................................................................................65
3.1 Introduction ..........................................................................................65
3.2 Experimental ........................................................................................67
3.2.1 Materials .................................................................................67
3.2.2 Synthesis and Characterisation of Magenta 5-Amino-4-
Hydroxy-3-[(2-sulfophenyl)azo]-2,7-
Naphthalenedisulfonic Acid Dye (d1m) ...................................67
3.2.2.1 Synthesis of d1m..............................................................67
3.2.2.1.1 Diazotization .........................................................67
3.2.2.1.2 Coupling................................................................68
3.2.2.2 Characterisation of d1m ...................................................68
3.2.3 Synthesis and Characterisation of Magenta 5-[(4,6-
Dichloro-1,3,5-triazin-2-yl)amino]-4-Hydroxy-3-[(2-
Sulfophenyl)azo]-2,7-Naphthalenedisulfonic Acid Dye
(d2mt) ......................................................................................70
3.2.3.1 Synthesis of d2mt .............................................................70
3.2.3.2 Characterisation of d2mt ..................................................71
3.2.4 Synthesis and Characterisation of Modified Magenta 5-
[[4-Chloro-6-(4-sulfophenoxy)-1,3,5-triazin-2-yl]amino]-
4-Hydroxy-3-[(2-sulfophenyl)azo]-2,7-
Naphthalenedisulfonic Acid Dye (d3mtm) .................................74
3.2.4.1 Synthesis of d3mtm ...........................................................74
3.2.4.2 Characterisation of d3mtm ................................................75
3.2.5 Synthesis and Characterisation of Modified Magenta 5-
[[4,6-(4-Sulfophenoxy)-1,3,5-triazin-2-yl]amino]-4-
Hydroxy-3-[(2-sulfophenyl)azo]-2,7-
Naphthalenedisulfonic Acid Dye (d4mtd) .................................77
3.2.5.1 Synthesis of d4mtd............................................................77
3.2.5.2 Characterisation of d4mtd .................................................79
3.2.6 Application of Magenta Dyes (d2mt, d3mtm and d4mtd) onto
Wool Fabric by Inkjet Printing ................................................82
3.2.7 Characteristics of Inks (d2mt, d3mtm and d4mtd) .........................82
3.2.7.1 Surface Tension and Viscosity of Inks ............................82
3.2.7.2 Stability of Dye (d2mt, d3mtm and d4mtd) Based Inks .........82
- xi -
3.2.8 Evaluation of Percent Fixation of Magenta Dyes (d2mt,
d3mtm and d4mtd) by Different Fixation Methods ......................85
3.2.8.1 Method 1: Batching at Room Temperature ......................85
3.2.8.2 Method 2: Batching at 65 °C ...........................................86
3.2.8.3 Method 3: Steaming ........................................................87
3.2.9 Light Fastness .........................................................................88
3.2.10 Wash Fastness ........................................................................88
3.3 Conclusions ..........................................................................................89
3.4 References ............................................................................................90
4 Synthesis, Modification, Characterisation of Yellow Dichlorotriazine
Dyes and Their Application onto Wool Fabric by Inkjet Printing ............93
4.1 Experimental ........................................................................................93
4.1.1 Materials .................................................................................93
4.1.2 Synthesis and Characterisation of Yellow 7-[(4-Amino-2-
methylphenyl)azo]-1,3-Naphthalenedisulfonic Acid Dye
(d5y) ........................................................................................94
4.1.2.1 Synthesis of d5y ..............................................................94
4.1.2.1.1 Diazotization .........................................................94
4.1.2.1.2 Coupling................................................................94
4.1.2.2 Characterisation of d5y ....................................................95
4.1.3 Synthesis and Characterisation of Yellow 7-[(4,6-
Dichloro-1,3,5-triazin-2-yl)amino -2-methylphenyl]azo]-
1,3-Naphthalenedisulfonic Acid Dye (d6yt) .............................97
4.1.3.1 Synthesis of d6yt..............................................................97
4.1.3.2 Characterisation of d6yt ...................................................98
4.1.4 Synthesis and Characterisation of Modified Yellow 7-[(4-
Chloro-6-(4-sulfophenoxy)-1,3,5-triazin-2-yl)amino-2-
methylphenyl]azo]-1,3-Naphthalenedisulfonic Acid, Dye
(d7ytm) ................................................................................... 101
4.1.4.1 Synthesis of d7ytm .......................................................... 101
4.1.4.2 Characterisation of d7ytm ............................................... 101
4.1.5 Synthesis and Characterisation of Modified Yellow 7-
[(4,6-(4-Sulfophenoxy)-1,3,5-triazin-2-yl)amino-2-
methylphenyl]azo]-1,3-Naphthalenedisulfonic Acid Dye
(d8ytd) .................................................................................... 104
4.1.5.1 Synthesis of d8ytd .......................................................... 104
4.1.5.2 Characterisation of d8ytd ................................................ 105

- xii -
4.1.6 Application of Yellow Dyes (d6yt, d7ytm and d8ytd) onto
Wool Fabric by Inkjet Printing .............................................. 107
4.1.7 Characteristics of Formulated Inks (d6yt, d7ytm and d8ytd) ....... 108
4.1.7.1 Surface Tension and Viscosity of Inks .......................... 108
4.1.7.2 Stability of Dye (d6yt, d7ytm and d8ytd) Based Inks ......... 108
4.1.8 Evaluation of Percent Fixation of Yellow Dyes (d6yt, d7ytm
and d8ytd) by Different Fixation Methods .............................. 111
4.1.8.1 Method 1: Batching at Room Temperature .................... 111
4.1.8.2 Method 2: Batching at 65 °C ......................................... 112
4.1.8.3 Method 3: Steaming ...................................................... 113
4.1.9 Light Fastness ....................................................................... 114
4.1.10 Wash Fastness ...................................................................... 114
4.2 Conclusions ........................................................................................ 115
4.3 References .......................................................................................... 116
5 Synthesis, Modification, Characterisation of Blue Dichlorotriazine
Dyes and Their Application onto Wool Fabric by Inkjet Fabric ............ 118
5.1 Experimental ...................................................................................... 118
5.1.1 Materials ............................................................................... 118
5.1.2 Synthesis and Characterisation of Blue 1-Amino-4-[(3-
amino-4-sulfophenyl)amino)]-Anthraquinone-2-Sulfonic
Acid Dye (d9b) ...................................................................... 118
5.1.2.1 Synthesis of d9b ............................................................ 118
5.1.2.2 Characterisation of d9b .................................................. 119
5.1.3 Synthesis and Characterisation of Blue 1-Amino-4-[[3-
(4,6-dichloro)-1,3,5-triazin-2-yl]amino]-4-
(sulfophenyl)amino)]-Anthraquinone-2-Sulfonic Acid
Dye (d10bt) ........................................................................... 121
5.1.3.1 Synthesis of d10bt ......................................................... 121
5.1.3.2 Characterisation of d10bt ............................................... 122
5.1.4 Synthesis and Characterisation of Modified Blue 1-
Amino-4-[3-(4-chloro-6-(4-sulfophenoxy)-1,3,5-triazin-2-
yl]amino]-4-(sulfophenyl)amino)]-Anthraquinone-2-
Sulfonic Acid Dye (d11btm) ................................................... 124
5.1.4.1 Synthesis of d11btm ........................................................ 124
5.1.4.2 Characterisation of d11btm ............................................. 125

- xiii -
5.1.5 Synthesis and Characterisation of Modified Blue 1-
Amino-4-[3-(4,6-(4-sulfophenoxy)-1,3,5-triazin-2-
yl]amino]-4-(sulfophenyl)amino)]-Anthraquinone-2-
Sulfonic Acid Dye (d12btd) .................................................... 127
5.1.5.1 Synthesis of d12btd ........................................................ 127
5.1.5.2 Characterisation of d12btd .............................................. 128
5.1.6 Application of Blue Dyes (d10bt, d11btm and d12btd) onto
Wool Fabric by Inkjet Printing .............................................. 131
5.1.7 Characteristics of Formulated Inks (d10bt, d11btm and
d12btd) ................................................................................... 131
5.1.7.1 Surface Tension and Viscosity of Inks .......................... 131
5.1.7.2 Stability of Dye (d10bt, d11btm and d12btd) Based Inks ... 131
5.1.8 Evaluation of Percent Fixation of Blue Dyes (d10bt, d11btm
and d12btd) by Different Fixation Methods ............................ 134
5.1.8.1 Method 1: Batching at Room Temperature .................... 134
5.1.8.2 Method 2: Batching at 65 °C ......................................... 134
5.1.8.3 Method 3: Steaming ...................................................... 135
5.1.9 Light Fastness ....................................................................... 136
5.1.10 Wash Fastness ...................................................................... 137
5.2 Conclusions ........................................................................................ 137
5.3 References .......................................................................................... 138
6 Synthesis, Modification, Characterisation of Magenta
Trichloropyrimidine Dyes and Their Application onto Wool Fabric
by Inkjet Printing ...................................................................................... 140
6.1 Introduction ........................................................................................ 140
6.1.1 Synthesis Route 1 ................................................................. 141
6.1.2 Synthesis Route 2 ................................................................. 142
6.2 Experimental ...................................................................................... 143
6.2.1 Materials ............................................................................... 143
6.2.2 Conventional Heating Methods for the Synthesis of
Magenta 5-[(2,5,6-trichloro-4-pyrimidinyl)amino]-4-
Hydroxy-3-[(2-sulfophenyl)azo]-2,7-
Naphthalenedisulfonic Acid Dye (d13mp) .............................. 144
6.2.2.1 Conventional Heating Method (Route 1) ....................... 144
6.2.2.2 Conventional Heating Method (Route 2) ....................... 144

- xiv -
6.2.3 Investigation of Conventional Heating Method (Route 1)
for the Synthesis of Magenta Trichloropyrimidine Dye
(d13mp) .................................................................................. 144
6.2.3.1 Percent Conversion to d13mp Under Various
Temperature ................................................................. 144
6.2.3.2 Percent Conversion to d13mp Under Different Molar
Ratio ............................................................................. 147
6.2.4 Optimisation of Microwave-Irradiated Synthesis of Dye
d13mp .................................................................................... 149
6.2.5 Comparative Study of Conventional and Microwave-
Irradiated Synthesis of Dye d13mp ......................................... 153
6.2.6 Synthesis of Magenta 5-[(2,5,6-Trichloro-4-
pyrimidinyl)amino]-4-Hydroxy-3-[(2-sulfophenyl)azo]-
2,7-Naphthalenedisulfonic Acid Dye (d13mp) ........................ 155
6.2.6.1 Optimised Conventional Heating Method (Route 1) ...... 155
6.2.6.2 Optimised Microwave-Irradiated Method ..................... 156
6.2.6.3 Characterisation of Magenta 5-[(2,5,6-Trichloro-4-
pyrimidinyl)amino]-4-Hydroxy-3-[(2-
Sulfophenyl)azo]-2,7-Naphthalenedisulfonic Acid
Dye (d13mp) .................................................................. 157
6.2.7 Synthesis of Modified Magenta 5-[(2-(4-Sulfophenoxy)-
5,6-dichloro-4-pyrimidinyl)amino]-4-Hydroxy-3-[(2-
sulfophenyl)azo]-2,7-Naphthalenedisulfonic Acid Dye
(d14mpm) ................................................................................ 159
6.2.7.1 Conventional Heating Method ...................................... 159
6.2.7.2 Optimising Microwave-Irradiated Method .................... 161
6.2.8 Comparative Study of Conventional and Microwave-
Irradiated Synthesis of Dye d14mpm ....................................... 163
6.2.9 Synthesis of Modified Magenta 5-[(2-(4-Sulfophenoxy)-
5,6-dichloro-4-pyrimidinyl)amino]-4-Hydroxy-3-[(2-
sulfophenyl)azo]- 2,7-Naphthalenedisulfonic Acid Dye
(d14mpm) ................................................................................ 163
6.2.9.1 Characterisation of Modified Magenta 5-[(2-(4-
Sulfophenoxy)-5,6-dichloro-4-pyrimidinyl)amino]-
4-Hydroxy-3-[(2-sulfophenyl)azo]-2,7-
Naphthalenedisulfonic Acid Dye (d14mpm) .................... 164
6.2.10 Application of Magenta Dyes (d13mp and d14mpm) onto
Wool Fabric by Inkjet Printing .............................................. 167
6.2.11 Characteristics of Formulated Inks (d13mp and d14mpm) ......... 167
6.2.11.1 Surface Tension and Viscosity of Inks .......................... 167
- xv -
6.2.11.2 Stability of Dye (d13mp and d14mpm) Based Inks ............ 167
6.2.12 Evaluation of Percent Fixation of Magenta Pyrimidine
based Dyes (d13mp and d14mpm) by Various Fixation
Methods ................................................................................ 169
6.2.13 Light Fastness ....................................................................... 170
6.2.14 Wash Fastness ...................................................................... 170
6.3 Conclusions ........................................................................................ 171
6.4 References .......................................................................................... 171
7 Synthesis, Modification, Characterisation of Blue
Trichloropyrimidine Dyes and Their Application onto Wool Fabric
by Inkjet Printing ...................................................................................... 174
7.1 Experimental ...................................................................................... 174
7.1.1 Materials ............................................................................... 174
7.1.2 Conventional Heating Method for the Synthesis of Blue 1-
Amino-4-[3-[(2,5,6-trichloro-4-pyrimidinyl)amino]-4-
(Sulfophenyl)amino]-Anthraquinone-2-Sulfonic Acid Dye
(d15bp) .................................................................................. 174
7.1.2.1 Conventional Heating Method ...................................... 174
7.1.3 Investigation of Conventional Heating Method for the
Synthesis of Blue Trichloropyrimidine Dye (d15bp) .............. 175
7.1.3.1 Percent Conversion to d15bp Under Various
Temperature ................................................................. 175
7.1.3.2 Percent Conversion to d15bp Under Different Co-
Solvents ........................................................................ 177
7.1.4 Optimisation of Microwave-Irradiation Method for the
Synthesis of Blue Trichloropyrimidine Dye d15bp ................. 179
7.1.5 Comparative Study of Conventional and Microwave-
Irradiated Synthesis of Dye d15bp .......................................... 180
7.1.6 Synthesis of Blue 1-Amino-4-[3-[(2,5,6-Trichloro-4-
pyrimidinyl)amino]-4-(sulfophenyl)amino]-
Anthraquinone-2-Sulfonic Acid Dye (d15bp) ......................... 181
7.1.6.1 Optimised Conventional Heating Method ..................... 181
7.1.6.2 Optimised Microwave Irradiation Method .................... 182
7.1.6.3 Characterisation of Blue 1-Amino-4-[3-[(2,5,6-
Trichloro-4-pyrimidinyl)amino]-4-
(sulfophenyl)amino]-Anthraquinone-2-Sulfonic Acid
Dye (d15bp) ................................................................... 183

- xvi -
7.1.7 Synthesis of Modified Blue 1-Amino-4-[3-[[2-(4-
Sulfophenoxy)-5,6-trichloro-4-pyrimidinyl]amino]-4-
(sulfophenyl)amino]-Anthraquinone-2-Sulfonic Acid Dye
(d16bpm) ................................................................................ 185
7.1.7.1 Conventional Heating Method ...................................... 185
7.1.7.2 Optimisation of Microwave-Irradiation Method ............ 187
7.1.8 Comparative Results of Conventional and Microwave-
Assisted Synthesis of d16bpm ................................................. 188
7.1.9 Synthesis of Modified Blue 1-Amino-4-[3-[[2-(4-
sulfophenoxy)-5,6-trichloro-4-pyrimidinyl]amino]-4-
(sulfophenyl)amino]-Anthraquinone-2-Sulfonic Acid Dye
(d15bp) using Optimised Microwave-irradiation Method ....... 189
7.1.9.1 Characterisation of Modified Blue 1-Amino-4-[3-
[[2-(4-sulfophenoxy)-5,6-trichloro-4-
pyrimidinyl]amino]-4-(sulfophenyl)amino]-
Anthraquinone-2-Sulfonic Acid Dye (d16bpm) ............... 190
7.1.10 Application of Blue Dyes (d15bp and d16bpm) onto Wool
Fabric by Inkjet Printing ....................................................... 192
7.1.11 Characteristics of Formulated Inks (d15mp and d16bpm) .......... 192
7.1.11.1 Surface Tension and Viscosity of Inks .......................... 192
7.1.11.2 Stability of Dye (d15bp and d16bpm) Based Inks ............. 192
7.1.12 Evaluation of Percent Fixation of Blue Dyes (d15bp and
d16bpm) by Different Fixation Methods ................................. 194
7.1.13 Light Fastness ....................................................................... 195
7.1.14 Wash Fastness ...................................................................... 195
7.2 Conclusions ........................................................................................ 196
7.3 References .......................................................................................... 196
8 Synthesis, Modification and Characterisation of Yellow
Trichloropyrimidine Dyes for Inkjet Inks ................................................ 198
8.1 Experimental ...................................................................................... 198
8.1.1 Materials ............................................................................... 198
8.1.2 Synthesis of Yellow 7-[(2,5,6-Trichloro-4-
pyrimidinyl)amino]-2-[(methylphenyl)azo]-1,3-
Naphthalenedisulfonic Acid Dye (d17yp) ............................... 198
8.1.2.1 Conventional Heating Method ...................................... 198
8.1.2.2 Optimised Microwave-Irradiation Method .................... 199
8.1.2.2.1 Optimised Conditions for Synthesis of d17yp........ 199

- xvii -
8.1.3 Comparative Study of Conventional and Microwave-
Irradiated Synthesis of Dye d17yp .......................................... 200
8.1.4 Characterisation of Yellow 7-[(2,5,6-Trichloro-4-
pyrimidinyl) amino]-2-[(methylphenyl)azo]-1,3-
Naphthalenedisulfonic Acid Dye (d17yp) ............................... 201
8.1.5 Synthesis of Modified Yellow 7-[[2-(4-Sulfophenoxy)-
5,6-dichloro-4-pyrimidinyl]amino]-2-
[(methylphenyl)azo]-1,3-Naphthalenedisulfonic Acid Dye
(d18ypm)................................................................................. 203
8.1.5.1 Conventional Heating Method ...................................... 203
8.1.5.2 Optimisation of Microwave-Irradiation Method ............ 204
8.1.6 Comparative Results of Conventional and Microwave-
Irradiated Synthesis of d18ypm ............................................... 205
8.1.7 Characterisation of Modified Yellow 7-[[2-(4-
Sulfophenoxy)-5,6-dichloro-4-pyrimidinyl]amino]-2-
[(methylphenyl)azo]-1,3-Naphthalenedisulfonic Acid Dye
(d18ypm)................................................................................. 206
8.2 Conclusions ........................................................................................ 208
8.3 References .......................................................................................... 209
9 Synthesis, Modification and Characterisation of Magenta Bis-
Dichlorotriazine Dye for Inkjet Inks ........................................................ 210
9.1 Experimental ...................................................................................... 211
9.1.1 Materials ............................................................................... 211
9.1.2 Synthesis of Bis-Ethylenediamine Intermediate (d19di) ......... 211
9.1.2.1 Characterisation of Bis-Ethylenediamine
Intermediate (d19di) ...................................................... 212
9.1.3 Synthesis of Bis-Dichlorotriazine Dye (d20mbt) ..................... 214
9.1.3.1 Characterisation of Bis-Dichlorotriazine Dye
(d20mbt) ......................................................................... 215
9.1.4 Synthesis of Bis-(Monochlorotriazine/Sulfophenoxy) Dye
(d21bis) .................................................................................. 217
9.1.4.1 Characterisation of Bis-
(Monochlorotriazine/Sulfophenoxy) Dye (d21bis) .......... 218
9.2 Conclusions ........................................................................................ 220
9.3 References .......................................................................................... 221

- xviii -
10 Comparative Analysis of Synthesised Dyes-Based Inks and
Commercial Jettex R Reactive Inks for Wool Fabric .............................. 222
10.1 Introduction ........................................................................................ 222
10.2 Materials ............................................................................................ 222
10.3 Results and Discussion ....................................................................... 223
10.3.1 Characteristics of DyStar Inks ............................................... 223
10.3.1.1 Surface Tension and Viscosity of Inks .......................... 223
10.3.2 Comparative Study of Percent Fixation of Inks ..................... 224
10.3.3 Light Fastness ....................................................................... 225
10.3.4 Wash Fastness ...................................................................... 226
10.4 Conclusions ........................................................................................ 227
10.5 References .......................................................................................... 228
11 Conclusion and Future Work ................................................................... 229
11.1 Conclusion ......................................................................................... 229
11.2 Future Work ....................................................................................... 234
Appendix – A (List of Synthesised Dyes) .......................................................... 235
Appendix − B (Printed Samples) ....................................................................... 237
Appendix – C (Elemental Analysis) ................................................................... 244
Appendix – D (1H NMR) .................................................................................... 245
- xix -
List of Figures
Figure 1.1: Chemical structure of Supramino Orange R........................................... 2
Figure 1.2: General structure of a reactive dye ........................................................ 4
Figure 1.3: Nucleophilic aromatic substitution reaction ........................................... 5
Figure 1.4: Michael addition reaction ...................................................................... 5
Figure 1.5: Chemical structure of cyanuric chloride ................................................ 7
Figure 1.6: Chemical structure of 2,4,5,6-tetrachloropyrimidine .............................. 8
Figure 1.7: Schematic of the structure of a fine merino wool fibre ..........................10
Figure 1.8: Scanning electron micrograph of wool fibre showing overlapping
cuticle cells ...................................................................................................10
Figure 1.9: Ortho-cortex and para-cortex region in wool ........................................11
Figure 1.10: Schematic diagram showing cuticle and cortical cells surrounded
by cell membrane complex ............................................................................11
Figure 1.11: Typical amino acid structure ..............................................................12
Figure 1.12: General structure of wool keratin polypeptide ....................................13
Figure 1.13: Covalent bonds and non-covalent interactions in wool .......................13
Figure 1.14: Amphoteric behaviour of wool ...........................................................14
Figure 1.15: Diffusion of dye molecules into the cortex of a wool fibre ..................15
Figure 1.16: Schematic representation of inkjet technologies A) continuous
inkjet B) drop-on-demand inkjet ....................................................................19
Figure 1.17: Comparison of production routes of traditional and inkjet textile
printing .........................................................................................................25
Figure 1.18: General structure of new triazine based dyes for inkjet printing ..........31
Figure 1.19: General structure of new pyrimidine based dyes for inkjet
printing .........................................................................................................31
Figure 1.20: General formula for modified bis-dichlorotriazine dye for Inkjet
Printing .........................................................................................................32
Figure 2.1: Schematic diagram of a capillary electrophoresis (CE) system .............40
Figure 2.2: Diagrammatic representation of the CZE separation process ................41
Figure 2.3: Schematic illustration of the separation principle of MEKC .................42
Figure 2.4: A multiple reflection ATR system ........................................................47
Figure 2.5: Sequence of substrate preparation and inkjet printing ...........................49

- xx -
Figure 2.6: Inverted temperature gradients in microwave versus conventional
heating ..........................................................................................................57
Figure 2.7: Dipolar interaction – dipolar molecules in reaction mixture will try
to align with an oscillating electric field ........................................................57
Figure 2.8: Ionic conduction – charged particles in reaction mixture will
follow the applied electric field .....................................................................58
Figure 3.1: Electropherogram of magenta dye chromophore d1m. CZE
conditions: running buffer, 6mM potassium dihydrogen phosphate and
acetonitrile (10% v/v) pH 9.0; pressure injection 0.5 psi for 10 s; voltage
25 kV; detection at 542 nm. ...........................................................................69
Figure 3.2: FT-IR spectrum of magenta dye chromophore d1m ...............................70
Figure 3.3: Electropherograms showing reaction progress of synthesis of d2mt.
(a) Starting dye chromophore d1m; (b) d1m d2mt after 0.5 hour reaction
time; (c) Final product d2mt. CZE conditions: same as Figure 3.1. .................72
Figure 3.4: FT-IR spectrum of magenta dichlorotriazine dye d2mt ..........................73
Figure 3.5: Electropherograms showing reaction progress of synthesis of
d3mtm. (a) Starting dye d2mt; (b) d2mt d3mtm after 1 hour reaction time;
(c) Final product d3mtm. CZE conditions: same as Figure 3.1. ........................76
Figure 3.6: FT-IR spectrum of magenta mono-substituted modified dye d3mtm .......77
Figure 3.7: Electropherograms showing reaction progress of synthesis of d4mtd.
(a) Starting dye d2mt; (b) d2mt d3mtm d4mtd after 0.5 hour reaction
time; (c) d3mtm d4mtd after 4.5 hours reaction time; (d) Final product
d4mtd. CZE conditions: same as Figure 3.1. ....................................................80
Figure 3.8: FT-IR spectrum of magenta di-substituted dye d4mtd .............................81
Figure 3.9: Electropherograms showing d2mt based ink stability. (a) Fresh ink;
(b) Ink after one month storage at room temperature. ....................................83
Figure 3.10: Electropherograms showing d3mtm based ink stability. (a) Fresh
ink; (b) Ink after twelve months storage at room temperature. .......................84
Figure 3.11: Electropherograms showing d4mtd based ink stability. (a) Fresh
ink; (b) Ink after twelve months storage at room temperature. .......................84
Figure 3.12: Percent fixation of d2mt, d3mtm and d4mtd. Fixation conditions:
Batch at 65 °C for 30 to 180 minutes under moist conditions .........................86
Figure 3.13: Percent fixation of d2mt, d3mtm and d4mtd. Fixation conditions:
Steaming for 5, 10, 15, 20 and 25 minutes .....................................................87
Figure 4.1: Electropherogram of yellow dye chromophore d5y. MEKC
conditions: running buffer, 20 mM sodium tetraborate, 50 mM sodium
dodecyl sulphate (SDS), pH 9.3; pressure injection 0.5 psi for 10 s;
voltage 25 kV; detection at 420 nm ...............................................................96
- xxi -
Figure 4.2: FT-IR spectrum of yellow dye chromophore d5y ..................................96
Figure 4.3: Electropherograms showing reaction progress of synthesis of d6yt.
(a) Starting yellow dye chromophore d5y; (b) d5yd6yt after 1.5 hours
reaction; (c) Final product d6yt. MEKC conditions: same as Figure 4.1. .........99
Figure 4.4: FT-IR spectrum of yellow dichlorotriazine dye d6yt ............................ 100
Figure 4.5: Electropherograms showing reaction progress of synthesis of d7ytm.
(a) yellow dichlorotriazine dye d6yt; (b) d6yt d7ytm after 0.5 hour
reaction; (c) Final product d7ytm. MEKC conditions: same as Figure 4.1 ...... 102
Figure 4.6: FT-IR spectrum of mono-substituted yellow dye d7ytm........................ 103
Figure 4.7: Electropherograms showing reaction progress of synthesis of d8ytd.
(a) yellow dichlorotriazine dye d6yt; (b) d7ytmd8ytd after 3.5 hours
reaction; (c) Final product d8ytd. MEKC conditions: same as Figure 4.1 ...... 106
Figure 4.8: FT-IR spectrum of di-substituted yellow dye d8ytd .............................. 107
Figure 4.9: Electropherograms showing d6yt based ink stability. (a) Fresh ink;
(b) Ink after fifteen days storage at room temperature. ................................. 109
Figure 4.10: Electropherograms showing d7ytm based ink stability. (a) Fresh
ink; (b) Ink after six months storage at room temperature ............................ 110
Figure 4.11: Electropherograms showing d8ytd based ink stability. (a) Fresh
ink; (b) Ink after six months storage at room temperature ............................ 110
Figure 4.12: Percent fixation of d6yt, d7ytm and d8ytd. Fixation conditions:
Batch at 65 °C for 30 to 180 minutes under moist conditions ....................... 112
Figure 4.13: Percent fixation of d6yt, d7ytm and d8ytd. Fixation conditions:
Steaming for 5, 10, 15, 20 and 25 minutes ................................................... 113
Figure 5.1: Electropherogram of blue dye chromophore d9b. CZE conditions:
running buffer, 15mM ammonium acetate and acetonitrile (40% v/v) pH
9.3; pressure injection 0.5 psi for 10 s; voltage 25 kV; detection at 596
nm ............................................................................................................... 120
Figure 5.2: FT-IR spectrum of blue dye chromophore d9b .................................... 120
Figure 5.3: Electropherograms showing reaction progress of synthesis of d10bt.
(a) blue dye chromophore d9b; (b) d9b d10bt after 1.5 hours reaction
time; (c) Final product d10bt. CZE conditions: same as Figure 5.1 ............... 123
Figure 5.4: FT-IR spectrum of blue dichlorotriazine dye d10bt.............................. 124
Figure 5.5: Electropherograms showing reaction progress of synthesis of
d11btm. (a) blue dichlorotriazine dye d10bt; (b) d10bt d11btm after 1.5
hours reaction; (c) Final product d11btm. CZE conditions: same as Figure
5.1 ............................................................................................................... 126
Figure 5.6: FT-IR spectrum of blue mono-substituted dye d11btm ......................... 127

- xxii -
Figure 5.7: Electropherograms showing reaction progress of synthesis of
d12btd. (a) blue dichlorotriazine dye d10bt; (b) d11btm d12btd after 4
hours reaction; (c) Final product d12btd. CZE conditions: same as Figure
5.1 ............................................................................................................... 129
Figure 5.8: FT-IR spectrum of blue di-substituted dye d12btd ................................ 130
Figure 5.9: Electropherograms showing d10bt based ink stability. (a) Fresh ink;
(b) Ink after one month storage at room temperature. .................................. 132
Figure 5.10: Electropherograms showing d11btm based ink stability. (a) Fresh
ink; (b) Ink after one month storage at room temperature ............................ 133
Figure 5.11: Electropherograms showing d12btd based ink stability. (a) Fresh
ink; (b) Ink after one month storage at room temperature ............................ 133
Figure 5.12: Percent fixation of (d10bt, d11btm and d12btd). Fixation conditions:
Batch at 65 °C for 30 to 180 minutes under moist conditions ....................... 135
Figure 5.13: Percent fixation of (d10bt, d11btm and d12btd). Fixation conditions:
Steaming for 5, 10, 15, 20 and 25 minutes ................................................... 136
Figure 6.1: Electropherograms showing conversion of reactants to d13mp using
conventional heating method (route 1) at; (a) 50 °C; (b) 60 °C; (c) 70 °C;
(d) 85 °C; (e) 100 °C. CZE conditions: running buffer, 6mM potassium
dihydrogen phosphate and acetonitrile (10% v/v) pH 9.0; pressure
injection 0.5 psi for 10 s; voltage 25 kV; detection at 542 nm. ..................... 146
Figure 6.2: Electropherograms showing conversion of reactants to d13mp using
conventional heating method (route 1); (a) 1:1 molar ration; (b) 1:2
molar ratio. CZE conditions: same as Figure 6.1.......................................... 148
Figure 6.3: Electropherograms showing conversion of reactants to d13mp using
microwave irradiation at; (a) 50 °C; (b) 80 °C; (c) 110 °C; (d) 130 °C.
CZE conditions: same as Figure 6.1. ........................................................... 150
Figure 6.4: Electropherograms showing conversion of reactants to d13mp using
microwave-irradiated method (sodium phosphate buffer, pH 7.0); (a) 130
°C; (b) 100 °C. CZE conditions: same as Figure 6.1 .................................... 152
Figure 6.5: Comparison of reaction times, conversions and yields obtained by
conventional heating and microwave irradiation (d13mp) ............................. 154
Figure 6.6: Electropherograms showing reaction progress of synthesis of
d13mp. (a) magenta dye chromophore d1m; (b) d1m d13mp after 4 hours
reaction; (c) Final product d13mp. CZE conditions: same as Figure 6.1 ........ 158
Figure 6.7: FT-IR spectrum of magenta trichloropyrimidine dye d13mp ................ 159
Figure 6.8: Electropherograms showing reaction progress of synthesis of
d14mpm by conventional heating (a) magenta dye d13mp; (b) d13mp
d14mpm after 56 hours reaction time. CZE conditions: same as Figure 6.1 .... 161
- xxiii -
Figure 6.9: Effect of reactant concentration on rate of reaction (d14mpm) ............... 162
Figure 6.10: Comparison of reaction times, conversions and yields obtained by
conventional heating and microwave irradiation (d14mpm) ............................ 163
Figure 6.11: Electropherograms showing reaction progress of synthesis of
d14mpm. (a) magenta dye d13mp; (b) d13mp d14mpm after 2.5 hours
reaction time; (c) Final product d14mpm. CZE conditions: same as Figure
6.1 ............................................................................................................... 165
Figure 6.12: FT-IR spectrum of magenta mono-substituted dye d14mpm ................ 166
Figure 6.13: Electropherograms showing d13mp based ink stability. (a) Fresh
ink; (b) Ink after eight months storage at room temperature. ........................ 168
Figure 6.14: Electropherograms showing d14mpm based ink stability. (a) Fresh
ink; (b) Ink after eight months storage at room temperature. ........................ 168
Figure 6.15: Percent fixation of d13mp and d14mpm under various fixation
methods....................................................................................................... 169
Figure 7.1: Electropherograms showing conversion to d15bp using
conventional heating method at: (a) 50 °C; (b) 70 °C; (c) 80 °C; (d) 90
°C. CZE conditions: running buffer, 15 mM ammonium acetate and
acetonitrile (40% v/v) pH 9.3; pressure injection 0.5 psi for 10 s; voltage
25 kV; detection at 596 nm.......................................................................... 176
Figure 7.2: Electropherograms showing percent conversion to d15bp using
conventional heating method: (a) Water-acetone; (b) Water-ethanol.
CZE conditions: same as Figure 7.1. ........................................................... 178
Figure 7.3: Electropherograms showing percent conversion to d15bp using
microwave-irradiation method: (a) Water-acetone (Na2CO3) at 80 °C; (b)
Sodium phosphate buffer pH 7.0 at 85 °C; (c) Sodium phosphate buffer
pH 7.0 at 100 °C. CZE conditions: same as Figure 7.1. ................................ 179
Figure 7.4: Comparison of reaction times, conversions and yields obtained by
conventional heating and microwave heating............................................... 181
Figure 7.5: Electropherograms showing reaction progress of synthesis of
d15bp. (a) blue dye chromophore d9b; (b) d9b d15bp after 1.5 hours
reaction time; (c) final product d15bp. CZE conditions: same as Figure
7.1 ............................................................................................................... 184
Figure 7.6: FT-IR spectrum of blue trichloropyrimidine dye d15bp ....................... 185
Figure 7.7: Electropherograms showing reaction progress of synthesis of
d16bpm. (a) blue dye d15bp; (b) d15bp d16bpm after 72 hours reaction
time. CZE conditions: same as Figure 7.1 .................................................... 186
Figure 7.8: Comparison of reaction times, conversions and yields obtained by
conventional heating and microwave irradiation (d16bpm) ............................ 188

- xxiv -
Figure 7.9: Electropherograms showing reaction progress of synthesis of
d16mpm. (a) blue dye d16mpm; (b) d15mp d16mpm after 3.5 hours reaction
time; (c) Final product d16mpm. CZE conditions: same as Figure 7.1 ............ 190
Figure 7.10: FT-IR spectrum of blue mono-substituted dye d16bpm ....................... 191
Figure 7.11: Electropherograms showing d15bp based ink stability. (a) Fresh
ink; (b) Ink after three months storage at room temperature ......................... 193
Figure 7.12: Electropherograms showing d16bpm based ink stability. (a) Fresh
ink; (b) Ink after three months storage at room temperature ......................... 193
Figure 7.13: Percent fixation of d15bp and d16bpm under various fixation
methods....................................................................................................... 194
Figure 8.1: Comparison of reaction times and yields obtained by conventional
heating and microwave heating ................................................................... 201
Figure 8.2: Electropherograms showing reaction progress of synthesis of
d17yp. (a) yellow dye chromophore d5y; (b) d5y d17yp after 30 min
reaction time; (c) final product d17yp. MEKC conditions: running buffer,
20 mM sodium tetraborate, 50 mM sodium dodecyl sulphate (SDS), pH
9.3; pressure injection 0.5 psi for 10 s; voltage 25 kV; detection at 420
nm ............................................................................................................... 202
Figure 8.3: FT-IR spectrum of yellow trichloropyrimidine dye d17yp.................... 203
Figure 8.4: Comparison of reaction times and yields obtained by conventional
heating and microwave irradiation (d18ypm) ................................................. 205
Figure 8.5: Electropherograms showing reaction progress of synthesis of
d18ypm. (a) yellow dye d17yp; (b) d17yp d18ypm after 30 min reaction
time; (c) Final product d18mpm. MEKC conditions: same as Figure 8.2 ........ 207
Figure 8.6: FT-IR spectrum of yellow mono-substituted dye d18ypm ..................... 208
Figure 9.1: Electropherograms showing reaction progress of synthesis of d19di.
(a) Starting dye d2mt; (b) d2mt d19i after 0.5 hours reaction time; (c)
d19i d19di after 3 hours reaction time; (d) Final product d19di. CZE
conditions: running buffer, 6mM potassium dihydrogen phosphate and
acetonitrile (10% v/v) pH 9.0; pressure injection 0.5 psi for 10 s; voltage
25 kV; detection at 542 nm. ......................................................................... 213
Figure 9.2: FT-IR spectrum of bis-ethylenediamine intermediate d19di ................. 214
Figure 9.3: Electropherograms showing reaction progress of synthesis of
d20mbt. (a) Starting intermediate d19di; (b) d19di d20mbt after 1.5 hours
reaction time; (c) Final product d20mbt. CZE conditions: same as Figure
9.1 ............................................................................................................... 216
Figure 9.4: FT-IR spectrum of bis-dichlorotriazine dye d20mbt ............................. 217

- xxv -
Figure 9.5: Electropherograms showing reaction progress of synthesis of
d21bis. (a) Starting intermediate d20mbt; (b) d20mbt d21bis after 3 hours
reaction time; (c) Final product d21bis. CZE conditions: same as Figure
9.1 ............................................................................................................... 219
Figure 9.6: FT-IR spectrum of bis-sulfophenoxy dye (d21bis) ............................... 220
Figure 10.1: Comparision of percent fixation of magenta inks .............................. 224
Figure 10.2: Comparision of percent fixation of blue inks .................................... 224
Figure 10.3: Comparision of percent fixation of yellow inks ................................ 224
Figure 11.1: Optimal conditions for Microwave-irradiated synthesis of
trichloropyrimidine dyes ............................................................................. 232
Figure 11.2: Optimal conditions for Microwave-irradiated synthesis of
modified mono-substituted dyes .................................................................. 233

- xxvi -
List of Schemes
Scheme 1.1: Reduction of wool by sodium bisulfite ...............................................29
Scheme 3.1: Hydrolysis of dichlorotriazine dye .....................................................65
Scheme 3.2: Diazotisation of 2-aminobenzenesulfonic acid with nitrous acid
leads to diazonium salt ..................................................................................67
Scheme 3.3: Azo coupling of diazonium salt with H-acid to form magenta dye
chromophore d1m ..........................................................................................68
Scheme 3.4: Preparation of condensation product d2mt from magenta azo
chromophore and cyanuric chloride ...............................................................71
Scheme 3.5: Mono substitution of dye d2mt with 4HBSA to yield dye d3mtm ...........75
Scheme 3.6: Preparation of di-substituted dye d4mtd from magenta
dichlorotriazine dye d2mt and 4HBSA ............................................................78
Scheme 4.1: Diazotization of 7-amino-1,3-naphthalenedisulfonic acid with
nitrous acid to form diazonium salt ................................................................94
Scheme 4.2: Coupling of diazonium salt with m-toluidine to yield d5y ...................95
Scheme 4.3: Preparation of condensation product d6yt from yellow azo
chromophore and cyanuric chloride ...............................................................98
Scheme 4.4: Mono substitution of dye d6yt with 4HBSA to yield dye d7ytm .......... 101
Scheme 4.5: Preparation of di-substituted d8ytd from yellow dichlorotriazine
dye d6yt and 4HBSA .................................................................................... 105
Scheme 5.1: Synthesis of d9y by Ullmann coupling reaction................................. 119
Scheme 5.2: Preparation of condensation product d10bt from blue
anthraquinone chromophore and cyanuric chloride ...................................... 122
Scheme 5.3: Condensation of dye d10bt with 4HBSA to yield dye d11btm ............. 125
Scheme 5.4: Preparation of di substituted dye d12btd from blue dichlorotriazine
dye d10bt and 4HBSA .................................................................................. 128
Scheme 6.1: Condensation of 2,4,5,6-tetrachloropyrimidine with dye
chromophore [6]
........................................................................................... 141
Scheme 6.2: Substitution of 2,5,6-trichloropyrimidine dye ................................... 141
Scheme 6.3: Route 2 for the synthesis of trichloropyrimidine dyes [7] ................. 142
Scheme 6.4: Condensation of tetrachloropyrimidine with magenta dye
chromophore d1m to yield d13mp by conventional heating method ............... 155

- xxvii -
Scheme 6.5: Condensation of tetrachloropyrimidine with magenta dye
chromophore d1m to yield d13mp by microwave-irradiated method............... 156
Scheme 6.6: Mono substitution of dye d13mp with 4HBSA to yield dye d14mpm
by conventional heating ............................................................................... 160
Scheme 6.7: Mono substitution of dye d13mp with 4HBSA to yield dye d14mpm
with microwave irradiation .......................................................................... 164
Scheme 7.1: Condensation of 2,4,5,6-tetrachloropyrimidine with blue dye
chromophore d9b to yield d15bp by conventional heating method ................. 182
Scheme 7.2: Condensation of 2,4,5,6-tetrachloropyrimidine with blue dye
chromophore d9b to yield d15bp by microwave irradiation method ............... 183
Scheme 7.3: Mono substitution of dye d15bp with 4HBSA to yield dye d16bpm
by conventional heating ............................................................................... 186
Scheme 7.4: Mono substitution of dye d15bp with 4HBSA to yield dye d16bpm
by microwave irradiation ............................................................................. 189
Scheme 8.1: Condensation of 2,4,5,6-tetrachloropyrimidine with yellow dye
chromophore d5y to yield d17yp by conventional and microwave
irradiation method ....................................................................................... 200
Scheme 8.2: Mono substitution of dye d17yp with 4HBSA to yield dye d18ypm
by conventional and microwave irradiation ................................................. 205
Scheme 9.1: Condensation reaction of d2mt with ethylenediamine ........................ 212
Scheme 9.2: Condensation of cyanuric chloride with d19di (intermediate) to
yield d20mbt ................................................................................................. 215
Scheme 9.3: Synthesis of bis-sulfophenoxy dye d21bis.......................................... 218

- xxviii -
List of Tables
Table 1.1: Reactive groups in Reactive dyes for wool ............................................. 6
Table 1.2: Comparison between rotary screen printing and inkjet printing ..............24
Table 1.3: Selection of dyes for inkjet printing of textiles .......................................27
Table 2.1: CE buffer systems for reactive dyes .......................................................43
Table 2.2: TLC eluents for reactive dyes ................................................................45
Table 2.3: Pre-treatment padding recipe .................................................................49
Table 2.4: Solventnon-solvent mixtures used for the purification of dyes .............50
Table 2.5: Ink Recipe .............................................................................................51
Table 2.6: Batching temperatures for fixation .........................................................52
Table 2.7: Test conditions for wash fastness ...........................................................55
Table 3.1: Surface tension and viscosity of magenta inks .......................................82
Table 3.2: Percent Fixation of d2mt, d3mtm and d4mtd. Fixation conditions:
Batching at RT for 2 and 4 hours under moist conditions ...............................85
Table 3.3: Light fastness of magenta dyes (d2mt, d3mtm and d4mtd) compared to
target blue wool reference 6 ..........................................................................88
Table 3.4: Wash fastness of magenta dyes (d2mt, d3mtm and d4mtd) ..........................89
Table 4.1: Surface tension and viscosity of yellow inks ........................................ 108
Table 4.2: Percent fixation of d6yt, d7ytm and d8ytd. Fixation conditions:
Batching at 25 °C for 2 and 4 hours under moist conditions ......................... 111
Table 4.3: Light fastness of yellow dyes (d6yt, d7ytm and d8ytd) compared to
target blue wool reference 6 ........................................................................ 114
Table 4.4: Wash fastness of yellow dyes (d6yt, d7ytm and d8ytd) ............................. 115
Table 5.1: Surface tension and viscosity of blue Inks ........................................... 131
Table 5.2: Percent fixation of d10bt, d11btm and d12btd. Fixation conditions:
Batching at RT for 2 and 4 hours under moist conditions ............................. 134
Table 5.3: Light fastness of blue dyes (d10bt, d11btm and d12btd) compared to
target blue wool reference 6 ........................................................................ 137
Table 5.4: Wash fastness of blue dyes (d10bt, d11btm and d12btd) ........................... 137
Table 6.1: Summary of results with conventional heating (route 1) at various
temperatures ................................................................................................ 147
- xxix -
Table 6.2: Summary of results from conventional heating (route 1) at different
molar ratios ................................................................................................. 148
Table 6.3: Optimisation of reaction temperature for microwave-irradiated
condensation reaction .................................................................................. 151
Table 6.4: Modification of reaction conditions for microwave irradiated
condensation reaction .................................................................................. 153
Table 6.5: Optimisation of reaction conditions for microwave-irradiated
synthesis of d14mpm...................................................................................... 162
Table 6.6: Modification of reaction conditions for microwave irradiated
synthesis of d14mpm...................................................................................... 162
Table 6.7: Ink properties ...................................................................................... 167
Table 6.8: Light fastness of magenta dyes (d13mp and d14mpm) compared to
target blue wool reference 6 ........................................................................ 170
Table 6.9: Wash fastness of magenta dyes (d13mp and d14mpm) ............................. 170
Table 7.1: Summary of results with conventional heating at various
temperatures ................................................................................................ 177
Table 7.2: Summary of results from conventional heating using different co-
solvents ....................................................................................................... 178
Table 7.3: Optimisation of reaction conditions for microwave-irradiated
condensation reaction .................................................................................. 180
Table 7.4: Optimisation of reaction conditions for microwave-irradiated
condensation reaction .................................................................................. 187
Table 7.5: Ink measured properties ....................................................................... 192
Table 7.6: Light fastness of blue dyes (d15bp and d16bpm) compared to target
blue wool reference 6 .................................................................................. 195
Table 7.7: Wash fastness of blue dyes (d15bp and d16bpm) ..................................... 195
Table 10.1: Comparative results of surface tension and viscosity of Inks .............. 223
Table 10.2: Comparative results of light fastness of Inks ...................................... 226
Table 10.3: Comparative results of wash fastness of Inks ..................................... 227

- xxx -
Preface
The first two chapters of this thesis describe literature review and general
procedures and instrumentation used in this study, followed by seven chapters each
presenting synthesis, modification, charaterisation, application of parent and novel
modified dyes on wool via inkjet and evaluation of their properties. Moreover, the
last two chapters present the comparative analysis of inks and conclusions and future
work.
The first chapter gives a broad overview of reactive dyes, wool fibre and inkjet
printing, with the second chapter providing descriptions of analytical techniques
used in this study, the new microwave irradiation method adopted successfully for
the synthesis of difficultly synthesised pyrimidine based dyes followed by a
procedure of inkjet printing, as well as other tools and methodologies used.
Chapter three, four and five presents synthesis, modification, characterisation
and application of magenta, yellow and blue (hue) dyes based on chlorotriazine
chemistry respectively. It is shown that modification of chlorotriazine based dyes by
replacing one or both labile chlorine(s) by sulfophenoxy group(s) is advantageous
and significantly enhanced percent fixation along with stability of dyes in ink
formulations. Moreover, novel modified dyes exhibit excellent colour fastness
properties.
Chapter six, seven and eight presents a synthesis, modification, characterization
and application of chloropyrimidine based dyes in magenta, blue and yellow (hue)
by conventional and Microwave-irradiation method respectively. Taking advantage
of Microwave-irradiated method new, quick, efficient and high yielding procedure
for the synthesis of dyes is developed, which is superior to previously published
methods in all aspects, including conversion to products, yields and reaction times.
It is shown that modification of chloropyrimidine based dyes by replacing the
one labile chlorine by sulfophenoxy group is advantageous and marginally enhanced
percent fixation along with the stability of dyes in ink formulations. Moreover,
modified dyes exhibit excellent colour fastness properties. Due to time limitation
yellow inks were not evaluated to the full extent.

- xxxi -
Chapter nine presents a synthesis, modification and characterization of magenta
bis-(monochlorotriazine/sulfophenoxy) dye. However, due to time limitation these
inks were also not evaluated to the full extent.
Chapter ten presents the comparative analysis of commercially available and
successful Jettex R Inks with properties of synthesised dyes based inks.
Chapter eleven concludes the experimental results of this study, summaries the
finding of the current research and provides a suggestion of the future works.

- 1 -
1 Introduction
1.1 Reactive Dyes
Fibre-reactive dyes are coloured compounds that are capable of forming a
covalent bond between the reactive groups of the dye molecule and the fibre [1-4]
.
Consequently, in reacting, they become part of the fibre. Usually bonding occurs
between a carbon atom of the dye molecule and an oxygen, nitrogen or sulfur atom
of a hydroxy, amino or mercapto group respectively of the textile substrate [1]
. Due
to the strength of covalent bond, reactive dyes once applied to the textile substrate
resist removal and as a consequence show outstanding wash fastness properties [4, 5]
,
which ensure their wide application in textile colouration. In general, reactive dyes
are the only textile colorants designed to bond covalently with the substrate on
application. They are used for the dyeing and printing of cellulose and to a lesser
extent wool fibres. They are valued for their brilliance, variety of hue, their
flexibility in application and the all-round good fastness properties [6]
.
Most of the reactive dyes are water soluble, easily applied and because the
reactive group may be attached to almost any coloured molecular system, can be
used to produce both very bright and very dull shades of all colours. Because of their
distinctive advantages, the reactive dyes generally, have made a greater impact on
dyeing technology in the few years since their introduction than any other class of
dyes in so short time.
Reactive dyes are becoming progressively popular for dyeing and printing
wool fibres because of their wide shade range, ease of application and excellent
wash fastness properties. Improvement in the structure of reactive dyes such as type
and number of reactive groups led to an increased use of reactive dyes [7]
.
Commercial fibre-reactive dyes have been developed for both wool and
polyamide but, undoubtedly, the major success has been in the application to cotton
and cotton blends.

- 2 -
1.1.1 History of Reactive Dye Development
In 1931 IG Farben Industries patented [8, 9]
and marketed an acid dye [10, 11]
containing a chloroacetylamino side chain under the name Supramino Orange R
(Figure 1.1). At that time the very good wash-fastness properties of Supramino
Orange R were not put down to dye-fibre covalent bonding rather it was believed
that increased molecular mass through incorporating a chlorine atom in the side
chain was the reason for the enhanced fastness properties.
Figure 1.1: Chemical structure of Supramino Orange R
In 1937, a German patent published indicated that dyes could be firmly
attached to wool by covalent interactions [12]
.
Ciba [13]
described reactive dyes for wool containing -chloro propionylamino
groups and recognised the suitabilities of -chloro propionylamino dyes, which are
in most cases freely water-soluble and possess less affinity for the continuous dyeing
and printing of cellulosic fibres [14]
.
In a BASF patent containing -sulfonylpropionamide dyes, sulfonyl group is
described and claimed in anthraquinone, azo and phthalocyanine dyes.
From 1948 onwards, Heyna and Schuhmacher and Hoechst concentrated on
dyes containing either a vinylsulfone group or a vinylsulfone precursor that led to
the marketing of the Remalan dyes for wool in 1952. Patentees did not realise that
these were in fact reactive dyes [11]
. These dyes gave dyeings of high wash fastness
on wool, although the improved fastness was not publicly attributed to the formation
of a covalent bond between dye and fibre [12]
.
In 1954, Ciba introduced a range of bright reactive dyes for wool under the
name Cibalan with improved wash fastness properties which contained the
chloroacetamido group originally employed in Supramine Orange R. Once again,
there was no public statement of their ability to form covalent bonds with the
substrate during dyeing [12]
.

- 3 -
1.1.1.1 First Commercial Ranges of Reactive Dyes for Cellulosic Fibres
The first recognised range of reactive dyes was developed by Rattee and
Stephen and marketed by ICI in 1956 under the trade name Procion, for use on
cellulosic fibres [15]
.
Patenting new reactive dye systems then became intensive as other major dye
manufacturing companies rushed to get into this promising area. Hoechst revisited
their Remalan Fast wool dyes as mentioned earlier, and quickly devised application
conditions making the vinylsulfone dyes suitable for cellulose fibre coloration, thus
launching the very successful Remazol range of dyes in 1957 [11]
.
Geigy [16]
and Sandoz [17]
developed the less activated pyrimidine ring system
and launched 2,5,6-trichloropyrimidine dyes in 1959. Bayer devised the 2,3-
dichloroquinoxaline Levafix E dyes and marketed them in 1961.
In all the above, the major drive was to develop molecules to dye cellulose to
the widest possible shade gamut giving dyeings of good wash fastness; thus wool
where much of the reactive dye innovation started was temporarily side-lined.
1.1.1.2 First Commercial Ranges of Reactive Dyes for Polyamide Fibres
As discussed previously, wool featured highly in the early developments of
reactive dyes; in particular Supramino Orange R (IG Ferben), Cibalan Brilliant
(Ciba) and Remalan and Remalan Fast (Hoechst). However, probably as wool had
only a small share of the textile fibre market; it seemed that the marketing push for
selling these dyes as fibre reactive systems was somehow lacking [11]
. Generally it
can be said that only with the advent of truly machine-washable wool in the late
1960s was there sufficient stimulation of the market to encourage widespread use of
these dyes on wool [18]
.
1.1.2 Structure of Reactive Dyes
The characteristic structural features of reactive dyes are shown schematically
in Figure 1.2, and consist of;
1. Chromophore
2. One or more water-solubilising group
3. Bridging group
4. Reactive group

- 4 -
Figure 1.2: General structure of a reactive dye
1.1.2.1 Chromophore
The chromophore is a conjugated double bond system. It is the colour producing
part of any dye molecule. Reactive dyes may be prepared in principle from any of
the chemical classes of colorant by attaching a fibre reactive group to an appropriate
molecule [19]
. The only structural features necessary are a sufficiency of sulfonic
acid groups to ensure adequate water solubility and an amino group to which the
reactive group can be attached [20]
.
In practice, most of the reactive dyes belong to the azo chemical class, especially
in the yellow, orange and red shade area. Moreover, anthraquinones are used for the
preparation of blue reactive dyes [2, 20]
.
1.1.2.2 Solubilising Groups
Solubilising groups provide water solubility, substantivity, migration and ease
wash off after dyeing. All reactive dyes contain sodium sulfonate groups for
solubility, and dissolve in water to give coloured sulfonate anions and sodium
cations both of them are extremely attracted to water and become heavily hydrated.
Most reactive dyes have from one to four of these sulfonate groups [1]
.
1.1.2.3 Bridging Group
A bridging group is the group that links the reactive group to the chromophore.
The bridging group is necessary for ease of synthesis in order to attach reactive
groups to the chromophore. The connecting function of the bridging group can
influence the reactivity of the reactive group, degree of fixation, and stability of
reactive dyeing [2]
. The -NH- group is a typical bridging group especially for
heterocyclic reactive dyes.
1.1.2.4 Reactive Group
In theory, any group that is capable of reacting with sites in the fibre, e.g.
hydroxyl groups in cellulosic fibres, and amino and thiol groups in wool, is a

- 5 -
potential reactive group to be incorporated in a reactive dye [12]
. In practice there are
many restrictions on the type of reactive group employed, such as level of reactivity,
stability to hydrolysis, stability of the dye-fibre bond, and, not least, cost and ease of
manufacture.
The majority of reactive dyes can be distinguished into two catagories depending
upon their mode of reaction with fibres, i.e, nucleophilic aromatic substitution and
Micheal addition reaction. [12, 21]
.
1.1.2.4.1 Nucleophilic Aromatic Substitution [12]
Reactive dyes with triazine, pyrimidine, quinoxaline, chloroacetamido, and β-
sulfatoethylsulfamoyl groups (shown in Table 1.1) as the reactive groups react with
the fabric by nucleophilic aromatic substitution. The overall reaction can be
represented as Figure 1.3;
Figure 1.3: Nucleophilic aromatic substitution reaction
1.1.2.4.2 Michael Addition [12]
Reactive dyes with vinylsulfone, acrylamido and α-bromoacrylamido groups as
the reactive groups (shown in Table 1.1) function as activated Michael type
acceptors. With these types of dyes, covalent bond formation is by the 1,2-trans
addition of a nucleophile in the fibre across a polarised ethylenic bond. The overall
reactions can be represented as Figure 1.4;
Figure 1.4: Michael addition reaction
1.1.3 Reactive Groups for Wool
The introduction of reactive dyes was an outstanding achievement in the dye
chemistry in the later part of the 20th
Century. Comprehensive details of
developments in the field of reactive dyes are available in the literature [9, 12, 18, 22-26]
.
However, the main reactive groups suitable for wool are summarised in Table 1.1.
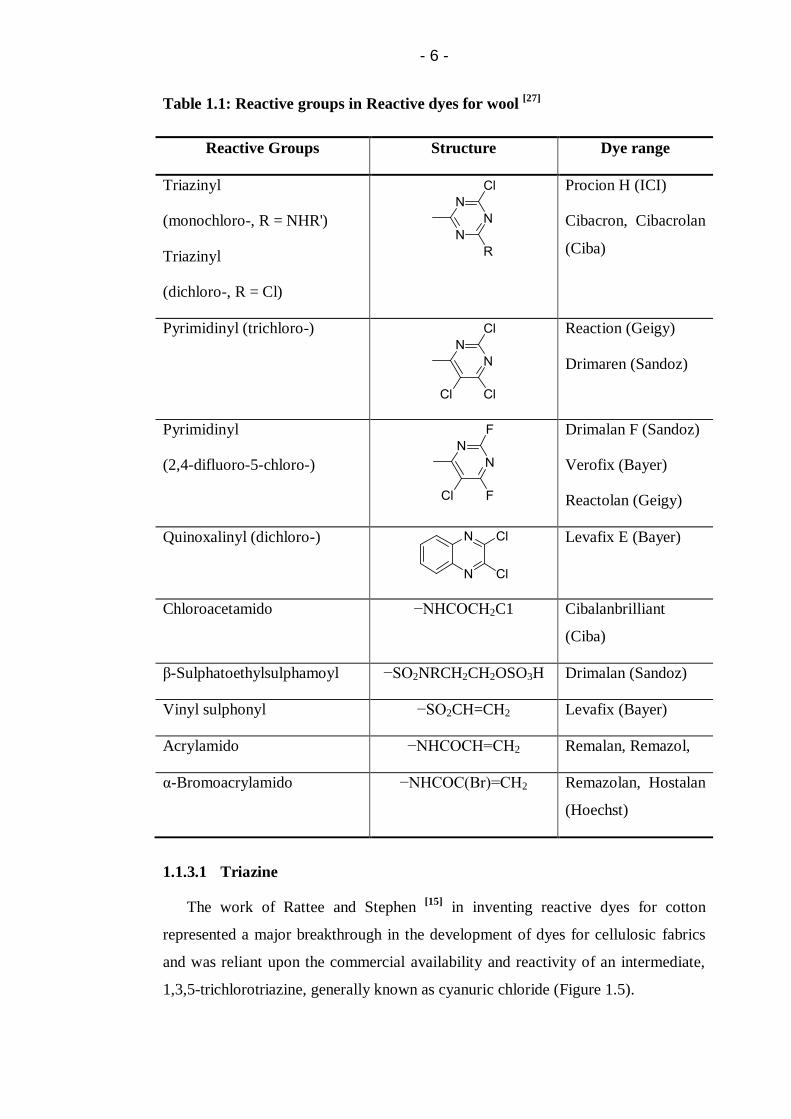
- 6 -
Table 1.1: Reactive groups in Reactive dyes for wool [27]
Reactive Groups Structure Dye range
Triazinyl
(monochloro-, R = NHR')
Triazinyl
(dichloro-, R = Cl)
Procion H (ICI)
Cibacron, Cibacrolan
(Ciba)
Pyrimidinyl (trichloro-)
Reaction (Geigy)
Drimaren (Sandoz)
Pyrimidinyl
(2,4-difluoro-5-chloro-)
Drimalan F (Sandoz)
Verofix (Bayer)
Reactolan (Geigy)
Quinoxalinyl (dichloro-)
Levafix E (Bayer)
Chloroacetamido −NHCOCH2C1 Cibalanbrilliant
(Ciba)
β-Sulphatoethylsulphamoyl −SO2NRCH2CH2OSO3H Drimalan (Sandoz)
Vinyl sulphonyl −SO2CH=CH2 Levafix (Bayer)
Acrylamido −NHCOCH=CH2 Remalan, Remazol,
α-Bromoacrylamido −NHCOC(Br)=CH2 Remazolan, Hostalan
(Hoechst)
1.1.3.1 Triazine
The work of Rattee and Stephen [15]
in inventing reactive dyes for cotton
represented a major breakthrough in the development of dyes for cellulosic fabrics
and was reliant upon the commercial availability and reactivity of an intermediate,
1,3,5-trichlorotriazine, generally known as cyanuric chloride (Figure 1.5).

- 7 -
Figure 1.5: Chemical structure of cyanuric chloride
Cyanuric chloride has been known since 1827 [25]
and has been widely used in
pesticides, rubber, explosives and medicinal industries [28]
. In cyanuric chloride a
partial positive charge resides on each alternating carbon atom, adjacent to two
electronegative nitrogen atoms and the presence of three highly electronegative
chlorine atoms directly attached to the carbon atoms also enhances the positive
charge density on the carbon atoms, and hence makes them more susceptible to
nucleophilic attack.
With the invention of the first successful reactive dyes for cellulose, Rattee and
Stephen [15]
demonstrated that dyes containing a dichlorotriazine group, under
alkaline conditions, could become attached to the cotton through covalent bond
formation.
The dichlorotriazine group was introduced into the dye molecule by reaction of
an amino containing dyebase with cyanuric chloride to give the reactive
dichlorotriazine dye.
The facile reaction of dyebase with cyanuric chloride generally takes place in
aqueous medium at around 0 – 5 °C. Replacement of an electronegative chlorine
atom by an electron donating amino substituent ensures that the reactivity of the
remaining chlorine atoms, towards the further nucleophilic attack, is less than that of
cyanuric chloride.
The unique behaviour of cyanuric chloride made possible the efficient
manufacture of both dichlorotriazine and monochlorotriazine.
The success of the dichlorotriazine system opened the door for researchers, who
immediately began extensive research in this field resulted in the subsequent
introduction of Procion H and Cibacron H dyes from ICI and Ciba respectively [29]
.
Inspection of the academic and patent literature indicates that much effort was
directed to the evaluation of other nucleophilic groups as potential fibre reactive
groups [25, 29-31]
.

- 8 -
1.1.3.2 Diazine
In addition to triazine, 1,3-diazine (pyrimidine) is technically the most important
heterocyclic system [25]
. In pyrimidines the lower reactivity, relative to triazines, is
due to the presence of one less ring nitrogen atom [2, 25]
. Depending on the bridging
group, substituents and leaving groups, pyrimidine permits wider range of variations
than triazine in regard to the application properties such as reactivity, ease of
washing-off and fastness properties [32]
.
The trichloropyrimidine group was introduced into the dye molecule by
condensation reaction of an amino based chromophore with 2,4,5,6-
tetrachloropyrimidine (shown in Figure 1.6). However, on account of their low
reactivity, chloropyrimidines react slowly with amines and are difficult to complete
and suffers poor yields [25]
.
Figure 1.6: Chemical structure of 2,4,5,6-tetrachloropyrimidine
The reactions (nucleophilic aromatic substitution) that cyanuric chloride and
2,4,5,6-tetrachloropyrimidine undergo, are of special importance in two ways:
1 Firstly, synthesis of the reactive dyes themselves along with any further
modification of ring;
2 Secondly, enabling covalent bond formation with fibre.
1.1.4 Multifunctional Reactive Dyes
The functionality of a reactive dye corresponds to the number of reactive groups
present in the molecule. The reactive groups may be similar or may differ in
chemical constitution. In order to maximise the level of dye fixation, ICI introduced
the Procion WE range of dyes, which contain two monochlorotriazine reactive
groups. Hydrolysis of one of the reactive groups leaves the other one intact, which is
still capable of reacting with fibre. These dyes thus fix to fibre more efficiently
resulting in less coloured effluent and greater economy.

- 9 -
Mixed or heterobifunctional reactive dyes i.e. dyes having two different reactive
groups are claimed to give major advantages (example wide temperature range of
application, better dye−fibre bond stability) as compared to monofunctional or homo
bifunctional reactive dyes. These types of dyes were designed exclusively in which
the two reactive groups are of substantially different reactivities. Only very few dyes
with functionalities greater than two have reached marketability and
commercialisation and most of these are tri-functional [25]
. Advantages of increasing
the number of independent reactive groups on a dye molecule are increased fixation
and lower amounts of unreacted and/or hydrolysed dye present in waste water [33]
.
Disadvantages include increased washing times of dyed substrates due to higher
affinity of the hydrolysed or unfixed dye for the fibre.
1.2 Wool
Wool is the most complex and versatile of all textile fibres. It can be used to
make products as diverse as cloth for billiard tables to the finest woven and knitted
fabrics. The insulating and moisture absorbing properties of the fibre make fine
wool products extremely comfortable to wear. The chemical composition of wool
enables it to be easily dyed in shades ranging from pastels to full, rich colours.
1.2.1 Fibre Morphology [34]
Wool is a staple fibre from the fleece of various breeds of sheep. It is a
multicellular, protein hair that tapers from the root to a point. Fibre lengths vary
from 4 to 40 cm and diameters from 17 to 40 µm. Wool fibres have complicated
structures. The main components are the scaly cuticle, the body of the fibre or
cortex, and the cell membrane complex (CMC). The latter surrounds the cells of
both the cuticle and cortex in a continuous phase. Coarse fibres may also have a
medulla or inner core. The schematic structure of fine wool and complex physical
structure of the cuticle cells are shown in Figure 1.7 and Figure 1.8.

- 10 -
Figure 1.7: Schematic of the structure of a fine merino wool fibre adapted from
reference [35]
Figure 1.8: Scanning electron micrograph of wool fibre showing overlapping
cuticle cells adapted from reference [35]
Microscopic examination shows the scales on the fibre surface that are
characteristic of most animal fibres. The overlapping scales point towards the fibre
tip. In a fine wool, they constitute about 10% of the fibre. The friction generated by
these scales hinders the movement of the wool fibre in the direction of the tip. This
is called the directional friction effect and is partly responsible for the felting and
shrinkage of wool articles on washing. The scales consist of several layers and are
covered with a hydrophobic outer layer called the epicuticle. It is part of the cell
membrane complex and covers all the fibre, except the tip where it has been worn
away by weathering.
The cortex is composed of spindle-shaped cells made up of fibrils of keratin, in a
matrix of high-sulfur proteins, and surrounded by the cell membrane complex. It
comprises about 90% of the wool fibre. In fine wools, the cortex appears as two
distinct regions rather like two half-cylinders stuck together along their axes.

- 11 -
These two regions, shown in Figure 1.9, are known as orthocortex and
paracortex. They spiral around each other along the fibre, following the crimp, the
orthocortex always being oriented towards the outside of the crimp wave. This
structure is similar to that in a bicomponent synthetic fibre. The crimp arises from
the unequal rates of hardening of the keratin that begins in the hair follicle, but
occurs at different levels on each side of the wool hair. These two cortical regions
differ in structure and reactivity. Basic dyes stain the more accessible orthocortex
cells but acid dyes show no preference for either cortex.
Figure 1.9: Ortho-cortex and para-cortex region in wool adapted from
reference [36]
The cell membrane complex, shown in Figure 1.10 consists mainly of protein
and lipid materials and surrounds all types of cells in a continuous network
throughout the fibre. It forms a region of poor mechanical strength compared to the
rest of the fibre and fractures first during fibre abrasion, leading to fibrillation into
the individual cortical cells or even into protein fibrils within the cells. The
membrane complex is weakened by extended dyeing at the boil in acidic solution.
Figure 1.10: Schematic diagram showing cuticle and cortical cells surrounded
by cell membrane complex adapted from reference [36]
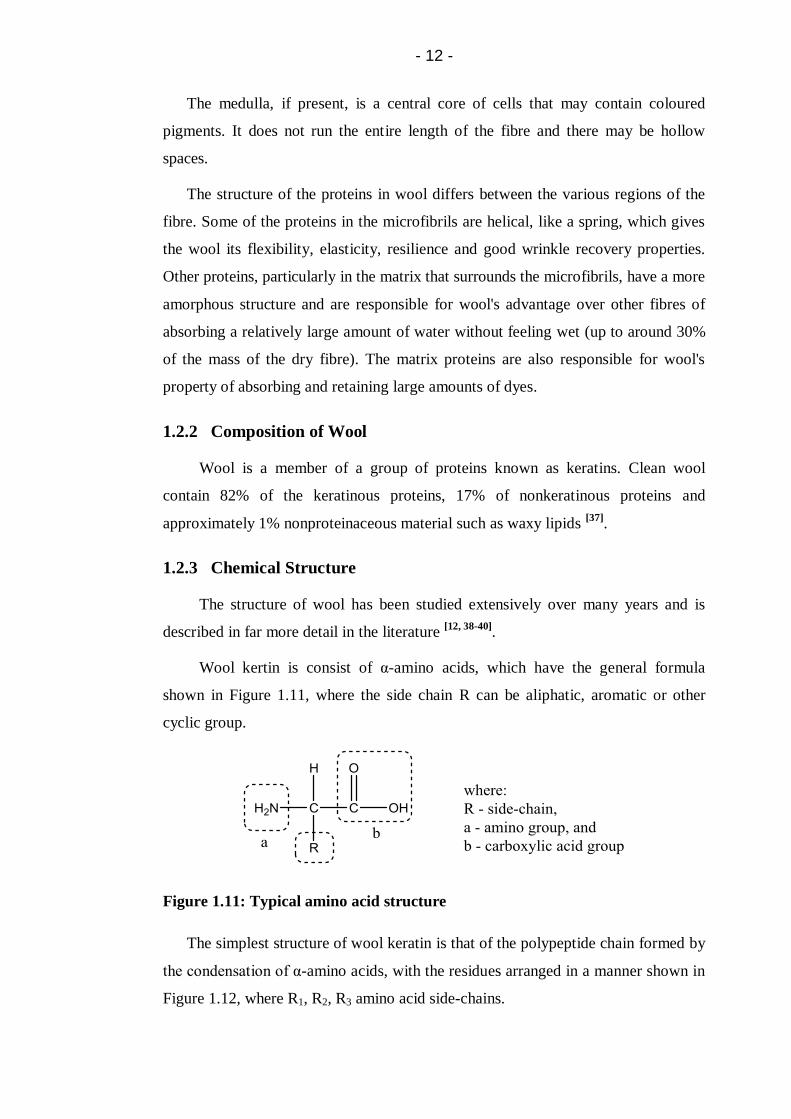
- 12 -
The medulla, if present, is a central core of cells that may contain coloured
pigments. It does not run the entire length of the fibre and there may be hollow
spaces.
The structure of the proteins in wool differs between the various regions of the
fibre. Some of the proteins in the microfibrils are helical, like a spring, which gives
the wool its flexibility, elasticity, resilience and good wrinkle recovery properties.
Other proteins, particularly in the matrix that surrounds the microfibrils, have a more
amorphous structure and are responsible for wool's advantage over other fibres of
absorbing a relatively large amount of water without feeling wet (up to around 30%
of the mass of the dry fibre). The matrix proteins are also responsible for wool's
property of absorbing and retaining large amounts of dyes.
1.2.2 Composition of Wool
Wool is a member of a group of proteins known as keratins. Clean wool
contain 82% of the keratinous proteins, 17% of nonkeratinous proteins and
approximately 1% nonproteinaceous material such as waxy lipids [37]
.
1.2.3 Chemical Structure
The structure of wool has been studied extensively over many years and is
described in far more detail in the literature [12, 38-40]
.
Wool kertin is consist of α-amino acids, which have the general formula
shown in Figure 1.11, where the side chain R can be aliphatic, aromatic or other
cyclic group.
Figure 1.11: Typical amino acid structure
The simplest structure of wool keratin is that of the polypeptide chain formed by
the condensation of α-amino acids, with the residues arranged in a manner shown in
Figure 1.12, where R1, R2, R3 amino acid side-chains.

- 13 -
Figure 1.12: General structure of wool keratin polypeptide
The side-chains of various amino acids vary in size and chemical nature. Hence,
they are grouped according to their chemical nature such as nonpolar hydrocarbons,
polar hydrocarbons, acidic, basic, and amino acids that contain sulfur.
The individual peptide chains in wool are held together by various types of
covalent bonds and noncovalent interactions, shown in Figure 1.13.
Figure 1.13: Covalent bonds and non-covalent interactions in wool adapted
from reference [35]
The most important covalent bonds are the sulfur containing disulfide bonds,
which are formed during fibre growth by a process called keratinisation. These make
keratin fibres insoluble in water and more stable to chemical and physical attack
than other types of proteins. Disulfide bonds are involved in the chemical reactions
that occur in the setting of fabrics during finishing. In this process, disulfide bonds
are rearranged to give wool fabrics smooth-drying properties so that ironing is not
required after laundering. Another type of covalent bond is the isopeptide bond,
formed between amino acids of lysine and the carboxyl groups of aspartic or
glutamic acid.
In addition to the covalent bonds, some other types of interactions also help to
stabilise the fibre under both wash and dry conditions. These arise from interactions
between the side-chains of the amino acids that constitute wool keratins. Thus,

- 14 -
hydrophobic interactions occur between hydrocarbon side groups; and ionic
interactions occur between groups that can exchange protons. These ionic
interactions or salt linkages between acidic (carboxyl) and basic (amino) side chains
are the most important of the non-covalent interactions.
The carboxyl and amino groups in wool are also important because they give
wool its amphoteric or pH buffering properties. This ability to absorb and desorb
both acids and alkalis, as shown in Figure 1.14. The ionic groups also control the
dyeing behaviour of the fibre, as a result of their interactions with negatively
charged dye molecules.
Figure 1.14: Amphoteric behaviour of wool [37]
1.2.4 Mechanism of Wool Coloration
A mechanism of wool coloration based on (1) transfer of a dye from the aqueous
solution to the fibre surface, (2) adsorption on the surface and (3) diffusion into the
fibre. Dyes enter the fibre at the junctions of the cuticle cells, shown in Figure 1.15.
Diffusion then occurs through the endocuticle, the CMC and intermacrofibrils. As
the dyeing cycle proceeds, dye progressively transfers from the nonkeratinous
regions into the sulphur-rich proteins of the matrix surrounding the microfibrils
within each cortical cell. Dyes also transfer from the endocuticle into the exocuticle,
particularly the A-layer.
At the end of the dyeing cycle if the dyes remains in the nonkeratinous region,
rapid diffusion out of the fibre occur, resulting in poor wash fastness properties.
Studies concluded that A-layer of the exocuticle is the barrier to the transcellular
diffusion across cuticle cells, in untreated wool, dyes find easier route into the fibre
interior by an intercellular pathway [37]
.
Reactive dyes may show a different equilibrium distribution between non
keratinous and keratinous regions of the fibre, because they can form covalent bonds
with proteins in the nonkeratinous regions early in the dyeing cycle. Therefore at
equilibrium reactive dyes may be present in the CMC and endocuticle to a greater
extent than the non-reactive dyes.

- 15 -
The effect of dye uptake is of even greater importance in printing than in dyeing.
The rate of diffusion of dyes in wool is a slow process and in printing this often
leads to uneven results, particularly, when the time required to achieve adequate
penetration, using steaming is excessive. Thus, wool fabric to be printed is normally
treated before printing to enable adequate penetration within a reasonable time under
mild steaming conditions.
Figure 1.15: Diffusion of dye molecules into the cortex of a wool fibre adapted
from reference [34]
1.2.5 Dyes for Wool Coloration
The dyes used on wool can be divided into the following groups: acid dyes,
chrome dyes, pre-metallised dyes and reactive dyes [35, 41]
. The conventional method
of producing fast dyeing on wool is to employ metallised dyes, which possess large
organic weighing groups. In this system, a high wash fastness is achieved by using
dyes with a very slow rate of diffusion through the wool fibre.
At present, reactive dyes offer the only viable alternative for products, where
very high wash fastness properties are required. Excellent wash fastness with
reactive dyes, does not depend upon a slow rate of diffusion of a dye through the
fibre, but upon the formation of a stable chemical bond between the dye and fibre.
Environmental requirements are also becoming more regulated and the dyer
must take care while selecting dyes for wool dyeings whilst ensuring that production
meets the environmental legislation relating to effluent, consumer protection and
disposal or recyclability [42]
.
- 16 -
1.3 Textile Printing
1.3.1 Development of Textile Printing
Textile printing involves the production of a predetermined coloured pattern
on a fabric, usually with a definite repeat. It can be described as a localised form of
dyeing, where colorant is applied to selected areas of the fabric to build up the
design [43]
.
Textile printing has a long history although the time and place of origin is not
easy to ascertain. The printed garment and carved wooden printing blocks made in
Coptic period (400 600 AD) have been excavated in Upper Egypt [44]
. Many block
printing goods are found in India and ancient China which can be dated back to the
13th century
[43].
By the 14th
century, wooden block printing was popular in some European
countries such as France, Italy and Germany. In block printing, a wooden block with
a raised pattern on the surface was dipped into the printing colorant and then pressed
face down on to fabric [43]
.
Portuguese traders discovered the potential for coloured cotton markets in
Europe. From that time on, the trading between Europe and India increased. This
increase in demand for prints initiated the development of printing. In 1752, Francis
Nixon adopted copper plate printing in Dublin. Copper plate printing can produce
much finer prints than block printing, but it did not replace block printing due to the
time and cost required for the preparation of copper plates [43]
.
In 1783, James Bell patented the method of engraved copper roller printing. In
1785, the first machine was invented for continual production with a high speed by
using the cylinder. This machine was capable of continuously printing six different
colours in sequence with the rollers pressed against the fabric. This invention
promoted the textile printing in the United Kingdom especially for high volume
production and maintained its position for a long time [43]
.
Screen printing was developed initially for lettering from a stencil printing. It
was developed in 1850 by Lyons and used silk gauze as a supporting stencil base.
The era of hand screen printing was from 1930 to 1954. Later, further development
led to semi-automatic and then fully automatic screen printing machines. These cut
production costs significantly.

- 17 -
In the mid-1950s, a screen printing method involving a cylindrical screen was
developed. Twenty or more colours can be printed at the same time. The process is
much quicker and more efficient than other screen printing methods. Since then
rotary screen printing has maintained a dominant share in the market due to high
productivity and good print quality.
During the 20th
century, Inkjet technologies have greatly affected many
industries including the textile printing market. With the launch of several inkjet
printers at International Textile Machinery Association (ITMA) in 2003 [45-47]
, this
printing method gain momentum and become a promising technique for textile
coloration [44, 48]
. Inkjet printing method has many advantages compared with the
traditional screen printing method. It enables mass customisation, which is one of
the main driving forces for the development of inkjet printing in the textile market
[49]. Although inkjet printing only has a small share of textile printing market
nowadays [50]
, it is expected that it will replace the dominant position of screen
printing in the future when the technical barriers are overcome.
1.3.2 Inkjet Printing
Inkjet printing is a non-contact printing technology in which fine ink droplets
are formed and then deposited on the substrate in a defined order to form an image.
The simple natural phenomenon of bubble formation when water is heated while
making tea led to discovery of this revolutionary technology [51]
. Though modern
inkjet printers were developed in 1979, the first research on the inkjet was carried
out by I’Abbe Nollet in France in 1749 [52]
. In 1878, Rayleigh [53]
explained the
breaking up of liquid stream into droplets and in 1930 this mechanism was used as
an inkjet for a recording device. In 1960s, Sweet of Stanford University developed
continuous inkjet technology and in 1967, Hertz from Lund Institute in Sweden
modified this technology which was licensed to Iris graphics and Stork [54]
. In 1972,
Zoltan, a pioneer of DOD (drop on demand) inkjet printing invented the principle of
piezoelectric DOD inkjet printing [55]
. Researchers at Canon discovered bubble jet
technology in 1979 [56]
. At nearly the same time, researchers at Hewlett Packard
(HP) invented the same technology and named it as Thermal Inkjet [57]
.

- 18 -
1.3.3 Classification of Inkjet Printing Technology
Although there are various inkjet printers available in the market, however,
industrial inkjet is broadly and most typically classified as either continuous (CIJ) or
drop-on-demand (DOD), with variants within each classification. [58-60]
. Both the
inkjet technologies differ in the method of drop generation and in the route to the
substrate. They have unique characteristics and place different requirements on the
inks that can be used.
1.3.3.1 Continuous Inkjet
The continuous inkjet technology shown in Figure 1.16, generates a constant
stream of small ink droplets, which are charged according to the image and
controlled electronically. The charged droplets are deflected by a subsequent electric
field, while the uncharged ones flow onto the substrate. This means that the imaging
signal for charging the droplets corresponds to a negative print image. Continuous
inkjet printing usually feeds only a small proportion of the stream of droplets to the
substrate. With continuous inkjet generally only a small part of the drop volume
covering the sheet in accordance with the print information is applied to the
substrate. The large part is fed back into the system.
1.3.3.2 Drop-on-Demand Inkjet
In Drop-on-Demand inkjet technology shown in Figure 1.16 , drops are ejected
only when needed to form the image. The most important drop-on-demand
technologies are thermal inkjet (TIJ) and piezoelectric inkjet printing (PIJ).
Thermal inkjet (also known as “bubble jet”) generates the drops by the heating
and localised vaporisation of the liquid in a jet chamber. With piezoelectric inkjet
the ink drop is formed and catapulted out of the nozzle by mechanically deforming
the jet chamber, an action resulting from an electronic signal and the piezoelectric
properties of the chamber wall. Due to the technical conditions, the possible droplet
frequencies are lower with thermal droplet generation than with piezoelectric
technology.

- 19 -
Figure 1.16: Schematic representation of inkjet technologies A) continuous
inkjet B) drop-on-demand inkjet adapted from references [60, 61]
1.3.4 Applications of Inkjet for Textile Printing
1.3.4.1 Early Developments
Carpet printing in 1970s was the first textile application of inkjet based on
DOD technology [52]
. In 1975, Milliken launched a digital carpet printer ‘Milliken
Millitron’ the continuous inkjet printers for carpet and upholstery fabrics. In the late
1970s, ‘ChromoJET’ (Zimmer, Austria) followed by ‘Titan MK IV’ (Godfrey Hirst,
Australia) were introduced [62]
. However, major developments in inkjet printers for
textiles began to emerge from 1980s.
In early 1980s, Seiren was the largest fabric printing company in Japan and
had used textile inkjet printers based on piezoelectric inkjet printing technology for
many years. The approach taken by Seiren was to use number of small inkjet
printers (0.1-0.5 yards/min) instead of using high output production machines. Their
‘Viscotecs’ printers have produced 10 million m2 of inkjet printed fabrics with a
value of approximately 105 million USD [51]
.
At the 1991 ITMA, Stork launched the earliest commercial inkjet printer
‘TruColor’ based on the continuous inkjet technology [63]
. The most interesting
development was the incorporation of high purity Procion P (monochlorotriazine,
ICI) reactive dyes into the ink formulations. This allowed the subsequent print to be
processed in the same manner (steaming and washing) as a conventional print
prepared by screen or roller printing [51, 63]
.
At the ITMA 1995, Stork and Scitex exhibited proofing printers and prototype
continuous textile printing machine. Both the proofing and fabric roll printing
machines were based on the continuous inkjet principle. The fabric roll printing
- 20 -
machine could print 1.56 metre wide fabric at 4.2 linear metres per hour. The
machine used eight-colours made of purified reactive dyes [60]
.
At the ITMA 1999, Stork displayed its full line of digital printers, including
‘Amethyst’ printer, a seven-colour continuous inkjet, used with reactive and acid
dyes for printing cellulose and protein fibres. This machine could print at a
maximum speed of 17.5 m2/h with a 254 dpi resolution
[52]. Stork has also displayed
two machines viz., ‘Amber’ and ‘Zircon’, theses machine were based on
piezoelectric inkjet printing technology [64]
. Also at the ITMA 1999, Encad
displayed its four-colour thermal inkjet printer with 300 dpi resolution and speed of
7.5 m2/h. Moreover, Mimaki has showed a printer with an Epson Seiko Piezo head
to achieve 720 dpi resolution and seven-colour capability. Perfecta Print AG used
Xaar piezo technology and developed a printer with four-colour capability and 200
dpi resolution. This printer can print at a speed of 100 m2/h but was limited to the
use of solvent based dye systems.
A number of improvements to existing devices as well as new technologies
and new approaches for textile inkjet printing were exhibited at the four yearly
ITMA, held in Birmingham in 2003, UK. Comprehensive detail of the developments
of inkjet printers is available in the literature [46]
. At this exhibition, many inkjet
printers with high resolution; high print speed and stable inks were exhibited; such
as ‘DReAM’ (Reggiani, Italy), ‘Monna Lisa’ (Robustelli, Italy), ‘Artistri-2020’
(Dupont, USA), ‘Mimaki Tx2-1600’ and ‘Tx3-600’ (Mimaki, Japan) [46]
.
Since ITMA 2003, further developments in inkjet printing had been made, the
printing speed was improved and also the printing width was increased. For the
DReAM, the productivity was improved from 160 m2/h in 2003 to 230 m
2/h in 2007
and the width was increased from 1.6 m in 2003 to 3.4 m in 2007 [65]
.
1.3.5 Changes in the Textile Printing Market
1.3.6 Mass Customisation
The textile printing market is subjected to fluctuations arising from seasonal
changes and rapidly altering fashion demands [66, 67]
. Consumers in today’s textile
market are increasingly obsessed with availability of wide range of choice and
flexibility to express their style. The traditional printing techniques are unable to
meet these demands due to high volume production requirements, labour costs and
- 21 -
longer lead times for new designs [68]
. Inkjet printing enables the textile businesses
to meet these mass customisation demands economically and efficiently.
1.3.6.1 Change in the Business Model
The traditional business model relies on generating profit through economies
of scales but it creates heaps of inventories especially at retailers’ end which need to
be pushed into the market through seasonal discounting and sales promotions. The
end consumer suffers the most because of limited choice [69]
. Moreover, retailers
competing in intensely competitive markets require minimum stocks with frequent
replenishments in order to curtail the stock holding costs [70]
. This calls for provision
of fresh and new designs to meet the market changing demands which cannot be
matched by the traditional time-inefficient printing processes.
1.3.6.2 Quick Response and Just in Time Delivery
Traditional printing processes are time-inefficient with high lead times (to
create a new design or pattern, prepare the screens and print several square metres of
sample fabric), setup costs and maintenance. The production sequence also follows
lengthy procedures of setting up the machine line for a particular design and changes
in design takes a long time resulting in huge machine downtimes. Production of
screens itself is a complex, costly and time consuming process. It involves
preparation, storage and replacement in case of damage, cleaning and drying of
screens after every production run. All this consumes over half the total production
time [67]
. Therefore any changes will lead to inefficiency of the process. Therefore
traditional printing is highly inefficient to support the quick response manufacturing
strategies and just in time delivery of customised and made to order to products.
1.3.6.3 Economic Factors in Textile Printing
Traditional printing is viable economically for some minimum production runs
under which the process is not cost-effective at all. A study in 1997 reported the
average run lengths to be 5300 metres in USA, 3200 metres in Asia and 750 metres
in Europe [66]
. With the average run length almost reduced to half in the following
eight years [71]
due to market demands, traditional printing has become highly cost-
ineffective and non-competitive.
- 22 -
Productivity is hindered by change-over, setting up and inspection times which
further affect the cost in a negative way. Kurt Salmon Associates in 1997 estimated
a 45 billion US Dollars loss by the textile industry per year attributed to long
manufacturing time cycles leading to high costs of inventory, overruns and stock-
outs [71]
.
Sampling is part and parcel of every production floor but it is disadvantageous
because it results in downtime of the process because of shorter runs and
changeovers. Therefore, there is a need for a process to rapidly produce samples
without affecting the main process. This is where inkjet printing can prove to be
extremely useful. Hence, textile companies need new quick response, mass
customised manufacturing technologies for sampling as well as for short to medium
production runs.
1.3.6.4 Ecology
Social pressures and legislative demands to efficiently utilise natural resources
of water and energy to minimise waste generation and disposal are becoming
stringent day by day. Therefore textile printers are looking for ways to cope up with
this challenge and indeed inkjet printing has the potential to provide them a relief
through its built-in ecological advantages.
1.3.7 Improving Textile Printing Industry Through the Use of Inkjet
Technology
Existing printing technologies are not sufficiently cost-effective and
competitive to meet the new requirements of global markets. For traditional printing
techniques, sample production time scale is 2 to 8 weeks and the bulk production
time scale is 3 to12 weeks. Moreover, they are labour intensive.
For short runs, traditional printing techniques are uneconomical due to high
downtime, high engraving and labour costs, lengthy set-up times for production like
colour matching, print paste preparation, sampling, design and registration.
Particularly design sampling and screen production are very lengthy and costly
processes [67]
.
Inkjet printing has the potential to meet the new market requirements.
Furthermore it has the capability to produce printed fabrics with significantly

- 23 -
reduced effluent outputs and with lower water and energy usage. This technology is
currently being explored and developed for commercial textile printing and has
begun to make the leap into the mainstream.
It has full potential to meet the market demands such as quick response and
mass customisation. It also offers unlimited design possibilities with respect to
repeat size and colour range. Inkjet printing of textiles offers a number of potential
benefits over traditional screen printing methods. It eliminates the set up cost
associated with screen preparation and can potentially enable cost effective short run
production. It allows visual effects such as tonal gradients and infinite pattern repeat
size which cannot be practically achieved by a screen printing technique. It is
recognised as the best available technique and is a simple and environmentally clean
technology. Other benefits include flexibility, reproducibility, creativity and
competitiveness. Comparison of traditional printing and Inkjet printing and their
production routes are shown in Table 1.2 and illustrated in Figure 1.17 respectively
[67].

- 24 -
Table 1.2: Comparison between rotary screen printing and inkjet printing [67]
Features Rotary Printing Inkjet Printing
Inks
Aqueous colour pastes in
large batches
Pre-formulated inks in small
containers supplied by the
machine manufacturer
Print speed Up to 30 − 70 m/min 1 − 4 m/min
Pre-treatment Nil Required
Resolution Usually 100 dpi with
maximum of 255 − 300 dpi
Up to 1440 is possible
Screens Screen cost for engraving,
washing and storage
No screens- no washing, no
storage
Effluent More Much less
Half tones Difficult Not a problem
Repeat
distance
Restrictions No restrictions
Registration Usually designs mis-register at
set-up
Instant registration
Strike-offs Strike-offs on proof may
differ from bulk
Strike-offs on bulk machine
Screen
contact
There is screen contact with
the fabric
No contact with the fabric

- 25 -
Figure 1.17: Comparison of production routes of traditional and inkjet textile
printing [67]
1.3.7.1 Limitation of Inkjet Printing
Apart from the above mentioned advantages, there are some disadvantages as
well such as slow speed, expensive inks, and extensive substrate pre-treatment and
also the limitation of incorporating components required for image definition,
achieving good dye fixation, colour yield and fastness properties.
Traditional Printing
Design Concept
Production of artwork
Traditional/ Inkjet
method
Approval
Engrave Design
Colour Matching
Print strike offs
Print Production
Approval
1 W
eek
6
– 8
Wee
ks
2 W
eek
s
Inkjet Printing
Design Concept
Production of artwork
Digital Files,
Manipulations
Approval
Print Production
Print strike offs NO
YES NO
YES
Ho
urs
1 W
eek
NO
YES
- 26 -
1.3.8 Inks for Textile Inkjet Printing
A traditional textile printer requires 8 to 12 basic colorants and up to 25
supplementary colorants to meet the wider colour space and fastness requirements.
Whereas, commercial inks for fabric inkjet printing are now available with up to 8 to
12 colorants including four process colours (C cyan, M magenta, Y yellow and K
black) to achieve the required colour gamut. The number of inks available
commercially, which can be used for inkjet textile printing is limited. Moreover,
each 1% adoption from traditional textile printing to inkjet printing creates a
potential for 1.3 million litres of reactive dye ink [52]
.
Therefore, improved ink formulations with required rheology and fixation
properties and processes for their fixation are needed to be developed for textile
applications.
Significant research activities have been seen over the past decade in the
development of inks for textile inkjet printing. The inks must meet following
stringent physical and chemical requirements:
1. extremely low salt content
2. high purity
3. non-corrosiveness
4. surface tension in the range of 25 – 60 dynes.cm-1
5. high light and water fastness
6. thermal and chemical stability
7. low viscosity
8. excellent storage stability
9. high solubility (Solubility of > 20% in water; low crystallisalion tendency) [48]
Depending upon the type of colorants used, inks for inkjet printing of textiles
can be broadly classified as dye based inks and pigment based inks.
1.3.8.1 Dye Based Inks
Inks based on reactive, acid and disperse dyes have been developed and are
now available commercially [52]
. Different textile substrates have different dye
suitability due to the difference in the mode of dye-fibre interaction. This is shown
in Table 1.3.

- 27 -
Table 1.3: Selection of dyes for inkjet printing of textiles [72, 73]
Dyes Fibre
Reactive Dyes Cotton, silk and wool
Disperse Dyes Polyester
Acid Dyes Silk, wool and nylon
1.4 Inkjet Printing of Wool with Reactive Inks
Printing of wool fabrics has always been a small-lot, high fashion activity; this
has meant that wool printing did not sit easily in print mills equipped with high
productivity rotary screen printing machines capable of printing speeds of 50 m/min.
However, even in the cotton fabric printing industry runs of 500 m are now common
and likely to become even smaller.
Given the demands for individual designs it could be that the age of mass
production printing to a particular colour-way and design is coming to an end; the
only way to meet this challenge is to develop inkjet printing processes for textiles.
Successful development of these inkjet systems will advantage wool and wool-blend
fabric printers with their traditional small run production.
Reactive printing by the all-in method is the normal approach for traditional
printing, but due to the specific purity requirements for inkjet printing, the
traditional printing chemicals are very difficult to directly incorporate into the ink
formulations [74]
. As a result the inkjet printing of wool has generally been carried
out by the two-phase method, the ink contains only purified dyes, the thickener and
auxiliary chemicals been applied to the fabric in a pre-treatment prior to inkjet
printing.
1.4.1 Reactive Inks for Wool
Reactive dyes do not form salt-like bonds to protein fibres; instead, covalent
bonds are formed in an acidic medium with −SH, =NH, and −NH2 groups from the
polypeptide. This results in products not only with good fastness properties as well
as very brilliant shades, thereby significantly enriching the market. The high demand
for goods that carry the Woolmark, together with the high serviceability associated
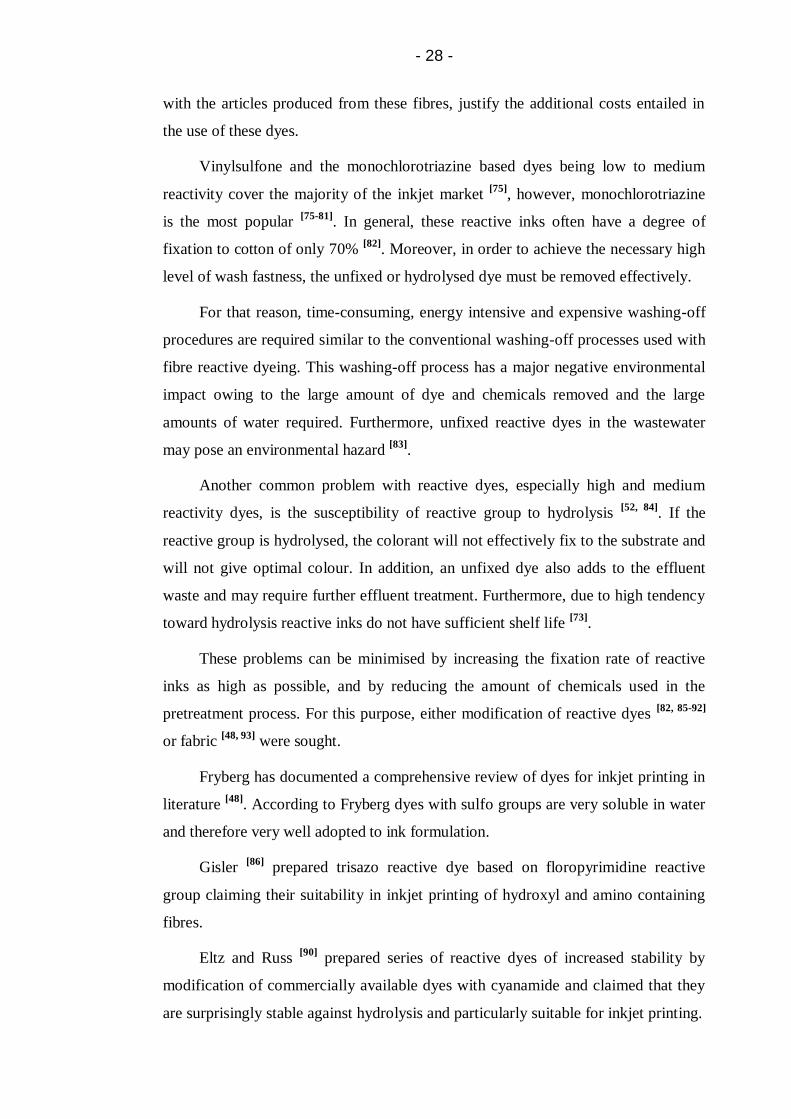
- 28 -
with the articles produced from these fibres, justify the additional costs entailed in
the use of these dyes.
Vinylsulfone and the monochlorotriazine based dyes being low to medium
reactivity cover the majority of the inkjet market [75]
, however, monochlorotriazine
is the most popular [75-81]
. In general, these reactive inks often have a degree of
fixation to cotton of only 70% [82]
. Moreover, in order to achieve the necessary high
level of wash fastness, the unfixed or hydrolysed dye must be removed effectively.
For that reason, time-consuming, energy intensive and expensive washing-off
procedures are required similar to the conventional washing-off processes used with
fibre reactive dyeing. This washing-off process has a major negative environmental
impact owing to the large amount of dye and chemicals removed and the large
amounts of water required. Furthermore, unfixed reactive dyes in the wastewater
may pose an environmental hazard [83]
.
Another common problem with reactive dyes, especially high and medium
reactivity dyes, is the susceptibility of reactive group to hydrolysis [52, 84]
. If the
reactive group is hydrolysed, the colorant will not effectively fix to the substrate and
will not give optimal colour. In addition, an unfixed dye also adds to the effluent
waste and may require further effluent treatment. Furthermore, due to high tendency
toward hydrolysis reactive inks do not have sufficient shelf life [73]
.
These problems can be minimised by increasing the fixation rate of reactive
inks as high as possible, and by reducing the amount of chemicals used in the
pretreatment process. For this purpose, either modification of reactive dyes [82, 85-92]
or fabric [48, 93]
were sought.
Fryberg has documented a comprehensive review of dyes for inkjet printing in
literature [48]
. According to Fryberg dyes with sulfo groups are very soluble in water
and therefore very well adopted to ink formulation.
Gisler [86]
prepared trisazo reactive dye based on floropyrimidine reactive
group claiming their suitability in inkjet printing of hydroxyl and amino containing
fibres.
Eltz and Russ [90]
prepared series of reactive dyes of increased stability by
modification of commercially available dyes with cyanamide and claimed that they
are surprisingly stable against hydrolysis and particularly suitable for inkjet printing.

- 29 -
Clark et al. [91]
prepared reactive dyes by modification of commercial
Drimarene K dyes with phenolsulfonic acid and claimed that the modified dye-based
inks show excellent solubility and stability during storage for up to one year.
More recently, Maheshwari [92]
prepared yellow reactive dye of increased
water solubility by modification of Reactive Yellow 160 with secondary amines
having sulfonate or carboxylate groups. It was claimed that this dye when used in
inkjet printing of cotton and wool exhibit good level of fixations and therefore
minimal washing-off required.
1.4.2 Pre-Treatment for Inkjet Printing of Wool
Wool fabrics are inkjet printed with reactive dyes by the two-phase method,
i.e. the fabric is pre-treated with a pre-treatment liquor and then printed. The pre-
treatment liquor is normally applied with the aid of a pad mangle. The fabric is then
dried before printing. The main constituents of the aqueous liquor are usually
thickener, urea, sodium bisulfite and wetting agent.
Thickeners are employed in printing to preserve the sharpness of edges and
outlines by countering the natural wicking effect of the substrate. In addition they
hold moisture to enable dyes and chemicals to dissolve and enter the fibres during
the steaming stage after printing and drying. They also modify the flow properties
(rheology) of the ink or print paste. The thickening agent should not react with either
the dye or other chemicals present because, if they do, an insoluble product usually
results. This does not wash-off and the fabric becomes stiff [58]
.
Incorporating sodium metabisulfite in the pre-treatment liquor increases the
rate of diffusion, improves the colour yield and appearance, and increases the rate of
fixation of reactive dyes on wool [94, 95]
. Bisulfite reacts with the cystine disulfide
residues in wool through a reversible reaction, the original disulfide bonds being
reformed on rinsing away of excess bisulfite. The cysteine thiol residue generated
(shown in Scheme 1.1) is extremely reactive towards reactive dyes [96]
.
Scheme 1.1: Reduction of wool by sodium bisulfite [37]

- 30 -
The effect of bisulfite on increasing the rate of reaction is not only due to the
formation of highly nucleophilic thiol groups but also due to increased fibre swelling
produced by aqueous urea-bisulfite solution [95, 97-99]
. The effect is more pronounced
in low to medium reactivity and high molecular weight reactive dyes. Moreover,
bisulfite deactivates the reactive dyes which react by Michael addition reaction [94]
.
Urea is essential in the pre-treatment print paste because during the steaming
process, particularly in the saturated steam right after inkjet printing, it is required
for swelling the fibres so that the dye can penetrate the fibres rapidly [100-102]
. Urea
also acts as a solvent for the reactive dye in the pre-treatment print paste by
absorbing moisture during the steaming process, thereby accelerating the migration
of dye from the thickener film into the wool fibre [103]
.
1.5 Aims of Research
In the latter part of the 20th century, new types of dyes for the traditional
applications to textiles continued to be developed and introduced commercially but
at a declining rate. At the same time, during this period, research effort in organic
colour chemistry has been made in new directions, continued by the opportunities
presented by the emergence of a range of novel application techniques, demanding
new types of colorants.
In recent years, Inkjet printing applications onto textiles have attracted
increasing interest at both academic and industrial levels. As commercial inkjet
reactive inks are usually based on dyes with low-to-moderate fixation properties
(generally monofunctional reactive dyes), so it is important to maximise dye fixation
and ink stability for technical, economic and environmental reasons.
The aim of the research was to design, syntheses and evaluate novel
multifunctional reactive dyes in magenta, yellow and blue hues for incorporation in
inkjet inks for wool, aimed at superior application properties (fixation), enhanced
stability (shelf life) and improved performance properties (colour fastness). The
following approaches were adopted:
Replacing one or both labile chlorine atom(s) of chlorotriazine by the
sulfophenoxy reactive group, which is/are displaceable by amino and thiol
groups of wool to form a covalent bond between the triazine nucleus and

- 31 -
wool; this approach will be discussed in Chapters 3, 4, and 5. The general
formula of these new dyes are shown in Figure 1.18.
Figure 1.18: General structure of new triazine based dyes for inkjet printing
Replacing one labile chlorine atom of chlorodiazine (pyrimidine) by
sulfophenoxy reactive group, which is displaceable by amino and thiol
groups of wool to form a covalent bond between the diazine nucleus and
wool. The study was aimed at highly soluble and stable new reactive dyes, of
general formula shown in Figure 1.19, for inkjet printing of wool. This
approach will be discussed in Chapters 6, 7, and 8.
Figure 1.19: General structure of new pyrimidine based dyes for inkjet printing
Preparing bis-dichlorotriazine dye in which the chlorotriazine is attached to
the triazine ring via a diamine linkage, and then replacing one labile chlorine
atom on the chlorotriazine by a sulfophenoxy reactive group, which is
displaceable by amino and thiol groups of wool to form a covalent bond
between the triazine nucleus and wool. The general formula of this type of

- 32 -
new dye is shown in Figure 1.20; this approach will be discussed in Chapter
9.
Figure 1.20: General formula for modified bis-dichlorotriazine dye for Inkjet
Printing
The new dyes were formulated into a set of inks, applied onto wool fabric
through inkjet printing, fixed using different methods and then evaluated in terms of
their stability, fixation and colour fastness.
The properties of the new sets of inks were compared to those of the
commercially successful ‘Jettex R’ range from DyStar (see Chapter 10).
1.6 References
1. Zollinger, H. Color Chemistry: Synthesis Properties, and Applications of
Organic Dyes and Pigments. Weinheim: Wiley-VCH, 2003.
2. Waring, D.R. and Hallas, G. eds. The Chemistry and Application of Dyes.
New York: Plenum Press, 1994.
3. Taylor, J.A., Pasha, K. and Phillips, D.A.S. The dyeing of cotton with hetero
bi-functional reactive dyes containing both a monochlorotriazinyl and a
chloroacetylamino reactive group. Dyes and Pigments, 2001, 51, pp.145-152.
4. Hadfield, H.R. and Lemin, D.R. The use of Reactive Dyes for dyeing Wool
and Wool Unions. Journal of the Textile Institute Transactions, 1960, 51,
pp.T1351-T1370.

- 33 -
5. Nkeonye, P.O. Reactive Dyes Containing Phosphonic and Carboxylic Acid
Reactive Groupings and Their Reactions with Cellulose. Journal of the
Society of Dyers and Colourists, 1986, 102, pp.384-391.
6. Lewis, D.M. The Chemistry of Reactive Dyes and Their Application
Processes. In: M. Clark, ed. Handbook of Textile and Industrial Dyeing.
Cambridge: Woodhead Publishing, 2011.
7. Renfrew, A.H.M. and Taylor, J.A. Cellulose reactive dyes: Recent
developments and trends. Review of Progress in Coloration and Related
Topics, 1990, 20, pp.1-9.
8. Patent GB341461 (1931)
9. Siegel, E. Reactive Groups. In: K. Venkataraman, ed. The chemistry of
synthetic dyes. New York: Academic Press, 1972.
10. Rattee, I.D. Historical Backgroud. In: I.C.I. Ltd., ed. Procion Dyestuffs in
Textile Printing. Leeds: Dyestuffs Divison, 1960.
11. Morris, K.F., Lewis, D.M. and Broadbent, P.J. Design and application of a
multifunctional reactive dye capable of high fixation efficiency on cellulose.
Coloration Technology, 2008, 124, pp.186-194.
12. Lewis, D.M. The Dyeing of Wool with Reactive Dyes. Journal of the Society
of Dyers and Colourists, 1982, 98, pp.165-175.
13. Patent DE1016230 (1957)
14. Patent BE560032 (1956)
15. Patent GB797946 (1956)
16. Patent BE578933 (1959)
17. Patent BE578742 (1959)
18. Lewis, D.M. Wool Dyeing. Review of Progress in Coloration and Related
Topics, 1977, 8, pp.10-23.
19. Christie, R.M. Colour chemistry. Cambridge: Royal Society of Chemistry,
2001.
20. Shore, J. ed. Colorants and auxiliaries : organic chemistry and application
properties. Bradford: Society of Dyers & Colourists, 1990.
21. Stamm, O.A. Mechanisms of Reaction of Reactive Dyes with Cellulosic and
other Fibres. Journal of the Society of Dyers and Colourists, 1964, 80,
pp.416-422.
- 34 -
22. Zollinger, H. Chemismus der Reaktivfarbstoffe. Angewandte Chemie, 1961,
73, pp.125-136.
23. Rattee, I.D. Reactive Dyes for Cellulose 1953–1983. Review of Progress in
Coloration and Related Topics, 1984, 14, pp.50-57.
24. Kleb, K., Siegel, E. and Sasse, K. New reactive dyes. Angewandte Chemie
International, 1964, 3, pp.408-416.
25. Beech, W.F. Fibre-Reactive Dyes London: Logos Press Ltd., 1970.
26. Taylor, J.A. Recent developments in reactive dyes. Review of Progress in
Coloration and Related Topics, 2000, 30, pp.93-108.
27. Medley, J. and Gardner, K. The Production of Fast Dyeings on Wool.
Review of Progress in Coloration and Related Topics, 1972, 3, pp.67-72.
28. Rapoport, L. S-Triazines and Derivatives. New York: An Interscience
Publishers, 1959.
29. Wegmann, J. Some Relations between the Chemical Constitution of
Cibacron Dyes and their Dyeing Characteristics. Journal of the Society of
Dyers and Colourists, 1960, 76, pp.205-209.
30. Patent GB10169008 (1963)
31. Patent GB937182 (1963)
32. Siegel, E. Reactive Dyes: Reactive Groups. In: K. Venkataraman, ed. The
chemistry of synthetic dyes. New York ; London: Academic Press, 1978.
33. Rattee, I.D. Reactive Dyes in the Coloration of Cellulosic Materials. Journal
of the Society of Dyers and Colourists, 1969, 85, pp.23-31.
34. Broadbent, A.D. Protein fibres. In: Basic principles of textile coloration.
Bradford: Society of Dyers and Colourists, 2001.
35. Christoe, J.R., Denning, R.J., Evans, D.J., Huson, M.G., Jones, L.N., Lamb,
P.R., Millington, K.R., Phillips, D.G., Pierlot, A.P., Rippon, J.A. and
Russell, I.M. Wool. In: Kirk-Othmer Encyclopedia of Chemical Technology.
New York: An Interscience Publication, 2000.
36. The Chemical & Physical Structure of Merino Wool [online]. 2006.
[Accessed June 12, 2010]. Available from:
http://www.csiro.au/files/files/p9ti.pdf.
37. Rippon, J.A. The Structure of Wool. In: D.M. Lewis, ed. Wool Dyeing.
Bradford: Society of Dyers and Colourists, 1992.

- 35 -
38. Leon, N.H. The chemical reactivity and modification of keratin fibres.
Textile Progress, 1975, 7, pp.1-70.
39. Hocker, H. Fibre morphology. In: W.S. Simpson and G.H. Crawshaw, eds.
Wool: science and technology. Cambridge: Woodhead Publishing, 2002.
40. Brady, P. Diffusion of dyes in natural fibres. Review of Progress in
Coloration and Related Topics, 1992, 22, pp.58-78.
41. Bird, C.L. The theory and practice of wool dyeing. Bradford: Society of
Dyers and Colourists, 1963.
42. Parton, K. Practical wool dyeing. In: W.S. Simpson and G.H. Crawshaw,
eds. Wool: science and technology. Cambridge: CRC Press, 2002.
43. Miles, L.W.C. Traditional methods. In: L.W.C. Miles, ed. Textile Printing.
Bradford: Society of Dyers and Colourists, 2003.
44. Dawson, T.L. and Hawkyard, C.J. A new millennium of textile printing.
Review of Progress in Coloration and Related Topics, 2000, 30, pp.7-20.
45. Moser, L.S. ITMA 2003 review: Textile printing. Journal of Textile and
Apparel Technology and Management, 2003, 3, pp.1-15.
46. Glover, B. The latest technology developments in inkjet printing from ITMA
2003. In: T.L. Dawson and B. Glover, eds. Textile Inkjet printing-A review of
ink jet printing of textiles, including ITMA 2003. Bradford: Society of Dyer
and Colourists Technical Monograph, 2004.
47. Tyler, D.J. Textile digital printing technologies. Textile Progress, 2005, 37,
pp.1-65.
48. Fryberg, M. Dyes for ink–jet printing. Review of Progress in Coloration and
Related Topics, 2005, 35, pp.1-30.
49. Fralix, M.T. From mass production to mass customization. Journal of Textile
and Apparel, Technology and Management, 2001, 1, pp.1-7.
50. Ujiie, H. Inkjet Textile Printing Status Report 2010. In: Digital Inkjet Textile
Hangzhou, China. 2010.
51. Gregory, P. Ink jet printing on textiles. In: T.L. Dawson and B. Glover, eds.
Textile Inkjet printing-A review of ink jet printing of textiles, including ITMA
2003. Bradford: Society of Dyer and Colourists Technical Monograph,
2004.
52. Ujiie, H. Digital printing of textiles. Cambridge: Woodhead Publishing Ltd.,
2006.

- 36 -
53. Rayleigh, L. and Strutt, J.W. On the instability of jets. Proc. London
Mathematical Society, 1879, pp.4-13.
54. Le, H.P. Progress and trends in ink-jet printing technology. Journal of
Imaging Science and Technology, 1998, 42, pp.49-62.
55. Patent US3683212 (1972)
56. Patent GB2007162 (1979)
57. Patent US4490728 (1984)
58. Freire, E.M. Ink jet printing technology (CIJ/DOD). In: H. Ujiie, ed. Digital
printing of Textiles. Cambridge: Woodhead Publishing Ltd, 2006.
59. Ahmed, A. Jet printing for textiles. Journal of the Society of Dyers and
Colourists, 1992, 108, pp.422-424.
60. Hudd, A. Inkjet Printing Technologies. In: S. Magdassi, ed. Chemistry of
Inkjet Inks. New Jersey: World Scientific Publishing Ltd., 2012.
61. Kipphan, H. ed. Handbook of Print Media Technologies and Production
Methods. New York: Springer, 2001.
62. Dawson, T.L. and Ellis, H. Will ink jets ever replace screens for textile
printing? Journal of the Society of Dyers and Colourists, 1994, 110, pp.331-
337.
63. Aston, S.O., Provost, J.R. and Masselink, H. Jet printing with reactive dyes.
Journal of the Society of Dyers and Colourists, 1993, 109, pp.147-152.
64. Moser, L.S. and Wilson, O.E. Trends in Preparation, Dyeing, and Printing.
Textile Progress, 2000, 30, pp.68-83.
65. Yang, K. Reactive dye ink-jet printing on wool fabrics. Ph.D. Thesis,
University of Leeds, 2008.
66. Gupta, S. Inkjet printing-A revolutionary ecofriendly technique for textile
printing. Indian Journal of Fibre & Textile Research, 2001, 26, pp.156-161.
67. Choi, P.S., Yuen, C.W.M., Ku, S.K.A. and Kwan, C.W. Ink-jet printing for
textiles. Textile Asia, 2003, 34, pp.21-24.
68. Weiser, J. The future of digital textile printing. International Textile Bulletin-
English Edition, 2001, 47, pp.71-73.
69. Ross, T. A primer in digital textile printing. [online], 2001, [Accessed
August 12th, 2013]Available from:
http://www.techexchange.com/thelibrary/DTP101.html.

- 37 -
70. Holme, I. Technology-Digital Ink Jet Printing of Textiles. Textiles magazine,
2004, 31, pp.11-16.
71. Gherzi, G. New prospects for transfer printing. Melliand International, 1997,
pp.36-37.
72. Hees, U., Freche, M., Kluge, M., Provost, J. and Weiser, J. Inkjet
interactions in inkjet printing- the role of pre-treatments. In: T.L. Dawson
and B. Glover, eds. Textile Inkjet printing-A review of ink jet printing of
textiles, including ITMA 2003. Bradford: Society of Dyer and Colourists
Technical Monograph, 2004.
73. Magdassi, S. Ink Requirements and Formulations Guidelines. In: S.
Magdassi, ed. Chemistry of Inkjet Inks. New Jersey: World Scientific
Publishing Ltd., 2012.
74. Yuen, C., Kan, C., Jiang, S., Ku, S., Choi, P. and Wong, K. Optimum
condition of ink-jet printing for wool fabric. Fibers and Polymers, 2010, 11,
pp.229-233.
75. Noguchi, H. and Shirota, k. Formulation of aqueous inkjet ink. In: H. Ujiie,
ed. Digital printing of textiles. Cambridge: Woodhead Publishing Ltd.,
2006.
76. Provost, J. Ink jet printing on textiles. Surface Coatings International, 1994,
77, pp.36-41.
77. Patent EP709519 (1996)
78. Patent JP09268482 (1997)
79. Patent CN102443314 (2012)
80. Patent WO2003006560 (2003)
81. Patent WO2001072907 (2001)
82. Fei Li, X. and Tincher, W.C. New colorant system for ink jet printing on
textiles. Textile chemist and colorist, 1999, 11, pp.37-42.
83. Kanik, M. and Hauser, P.J. Printing of cationised cotton with reactive dyes.
Coloration Technology, 2002, 118, pp.300-306.
84. Magdassi, S. ed. Chemistry of Inkjet Inks. New Jersey: World Scientific
Publication Ltd., 2012.
85. Lewis, D.M. The colouration of wool. In: M. Clark, ed. Handbook of Textile
and Industrial Dyeing. Cambridge: Woodhead Publishing, 2011.
86. Patent WO2003031520 (2003)

- 38 -
87. Patent CA2448867 (2003)
88. Patent WO2007045830 (2007)
89. Patent US20060107869 (2006)
90. Patent DE4417718 (1995)
91. Clark, M., Yang, K. and Lewis, D.M. Modified 2,4-difluoro-5-chloro-
pyrimidine dyes and their application in ink-jet printing on wool fabrics.
Coloration Technology, 2009, 125, pp.184-190.
92. Patent IN2009MU00138 (2010)
93. Hauser, P.J. and Kanik, M. Inkjet printing of cationized cotton with reactive
inks. In: H. Ujiie, ed. Digital printing of Textiles. Cambridge: Woodhead
Publishing Ltd, 2006.
94. Lewis, D.M. and Seltzer, I. Print-Batch (Cold)—A New Process for Wool.
Journal of the Society of Dyers and Colourists, 1972, 88, pp.327-329.
95. Lewis, D. The dyeing of wool with reactive dyes. Journal of the Society of
Dyers and Colourists, 1982, 98, pp.165-175.
96. Baumgarte, U. The reaction of acrylamide dyes with wool and amino acids.
Melliand Textilber, 1962, 43, pp.1297-1303.
97. Brady, P.R. The Effect of Urea on Wool Fibres. Journal of the Society of
Dyers and Colourists, 1976, 92, pp.56-58.
98. Lewis, D.M. and Seltzer, I. Pad-Batch Dyeing of Wool with Reactive Dyes.
Journal of the Society of Dyers and Colourists, 1968, 84, pp.501-507.
99. Lewis, D.M. and Rippon, J.A. eds. The Coloration of Wool and Other
Keratin Fibres. Bradford: Society of Dyer and Colourists, 2013.
100. Achwal, W.B. Textile chemical principles of digital textile printing (DTP).
Colourage, 2002, 49, pp.33-34.
101. Chen, W., Wang, G. and Bai, Y. Best for wool fabric printing—digital inkjet.
Text Asia, 2002, 33, pp.37-39.
102. Holme, I. Fibre physics and chemistry in relation to coloration. Review of
Progress in Coloration and Related Topics, 1976, 7, pp.1-22.
103. Choi, P., Yuen, C., Ku, S. and Kan, C. Digital ink-jet printing for chitosan-
treated cotton fabric. Fibers and Polymers, 2005, 6, pp.229-234.
- 39 -
2 General Procedure and Instrumentation
2.1 Capillary Electrophoresis
Capillary Electrophoresis (CE) is a relatively new technique which has gained
popularity over the last two decades due to its high efficiency, short analysis times,
wide application and low cost. It is particularly suited for the separation of a wide
variety of compounds including DNA, proteins, polynucleotides, amino acids,
vitamins, drugs, and dyestuffs [1, 2]
. It has been reported in literature that CE provide
superior separation efficiency than HPLC for the analysis of reactive dyes [2, 3]
.
In dye manufacturing impurities are often present; these include inorganic salts
as well as colourless and coloured organic compounds for instance, hydrolysis
products in the production of reactive dyes. Therefore, an effective method of
analysis to determine the levels of such impurities and purity of the final product is
highly desirable. Henceforth, in this study, capillary electrophoresis (CZE or
MEKC) was used to follow the synthesis reactions and to determine the purity of the
final product.
2.1.1 Principles of Capillary Electrophoresis (CE)
Capillary electrophoresis involves the separation of chemical compounds
based on the differential migration of charged species under the influence of an
applied electrical field. Typical small sample volumes are injected into the anodic
end of a narrow-bore capillary filled with buffer and are swept towards the cathode
by the electroosmotic flow (EOF). The EOF is caused by the application of an
electric field on the counter-ions (predominantly cations) accumulated on the
negatively charged silanol groups of the capillary wall which form an electrical
double layer [4]
. These cations are solvated and carry the bulk of the buffer solution
with them as they migrate toward the cathode [5]
. Under these conditions,
compounds are separated by their characteristic electrophoretic mobilities which are
dependent on the solute’s charge and size [4]
. A schematic of a simplified CE system
is presented in Figure 2.1.

- 40 -
Figure 2.1: Schematic diagram of a capillary electrophoresis (CE) system
adapted from reference [1]
Success of capillary electrophoresis is also partly due to various possible
separation modes which have vastly different operative and separation
characteristics which facilitate the analysis of distinctly different classes of chemical
compounds using the same instrument. The modes are: Capillary Zone
Electrophoresis (CZE), Micellar Electrokinetic Capillary Chromatography (MEKC),
Capillary Isoelectric Focusing (CIEF), Capillary Gel Electrophoresis (CGE) and
Isotachophoresis (ITP).
By utilising these various modes of capillary electrophoresis, this technique
clearly has potential to be a powerful and diverse analytical method for both the dye-
consuming and dye-manufacturing industries [6]
.
In this study, CZE (for magenta and blue dyes) and MEKC (for yellow dyes)
modes were used.
2.1.1.1 Capillary Zone Electrophoresis (CZE)
Capillary zone electrophoresis (CZE) is also known as free solution capillary
electrophoresis. CZE has been the most frequently used mode of CE due to its
simplicity and versatility and has a wide application range which includes the
analysis of peptides, amino acids, small molecules and dyes. The electrolyte for
CZE consists of a relatively simple buffer solution with a suitable known pH value
and separation takes place in an uncoated polyimide fused silica column with an
internal diameter usually in the range of 25 75 µm. The sample is introduced at the
anodic end of the capillary and upon the application of an applied potential, charged
analytes separate into spatially discrete zones based on their electrophoretic
mobilities. Neutral compounds are not capable of migrating in this environment and
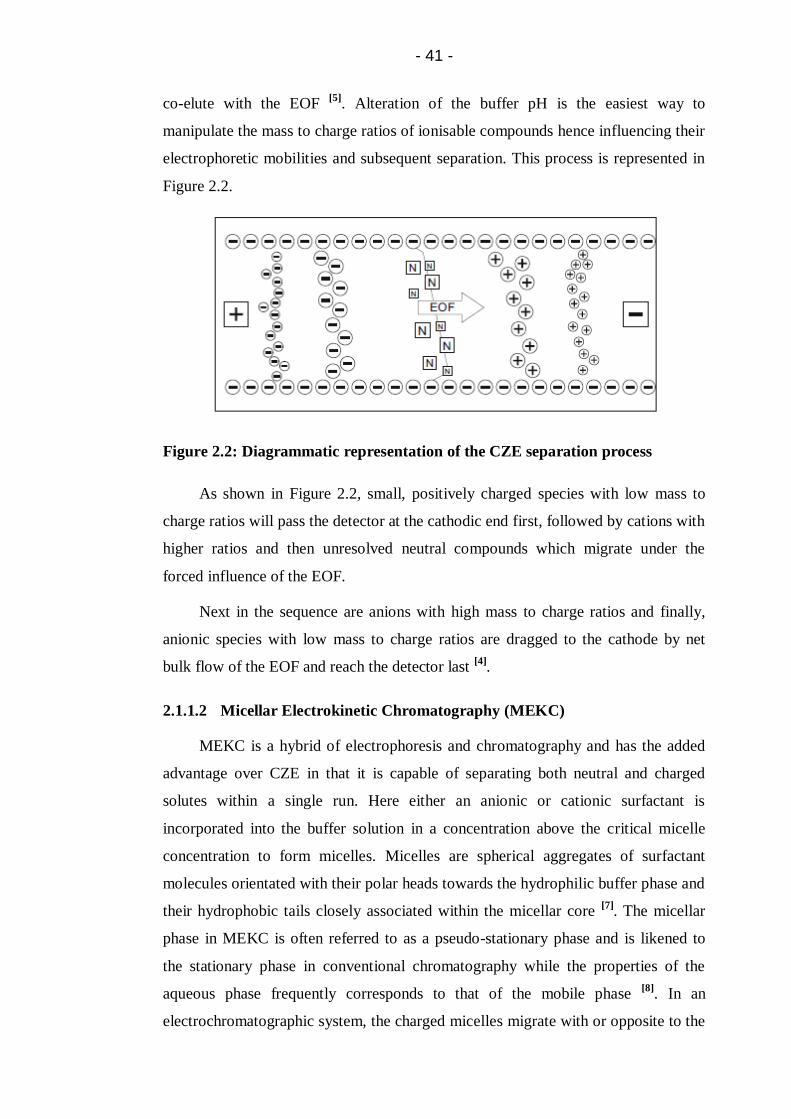
- 41 -
co-elute with the EOF [5]
. Alteration of the buffer pH is the easiest way to
manipulate the mass to charge ratios of ionisable compounds hence influencing their
electrophoretic mobilities and subsequent separation. This process is represented in
Figure 2.2.
Figure 2.2: Diagrammatic representation of the CZE separation process
As shown in Figure 2.2, small, positively charged species with low mass to
charge ratios will pass the detector at the cathodic end first, followed by cations with
higher ratios and then unresolved neutral compounds which migrate under the
forced influence of the EOF.
Next in the sequence are anions with high mass to charge ratios and finally,
anionic species with low mass to charge ratios are dragged to the cathode by net
bulk flow of the EOF and reach the detector last [4]
.
2.1.1.2 Micellar Electrokinetic Chromatography (MEKC)
MEKC is a hybrid of electrophoresis and chromatography and has the added
advantage over CZE in that it is capable of separating both neutral and charged
solutes within a single run. Here either an anionic or cationic surfactant is
incorporated into the buffer solution in a concentration above the critical micelle
concentration to form micelles. Micelles are spherical aggregates of surfactant
molecules orientated with their polar heads towards the hydrophilic buffer phase and
their hydrophobic tails closely associated within the micellar core [7]
. The micellar
phase in MEKC is often referred to as a pseudo-stationary phase and is likened to
the stationary phase in conventional chromatography while the properties of the
aqueous phase frequently corresponds to that of the mobile phase [8]
. In an
electrochromatographic system, the charged micelles migrate with or opposite to the
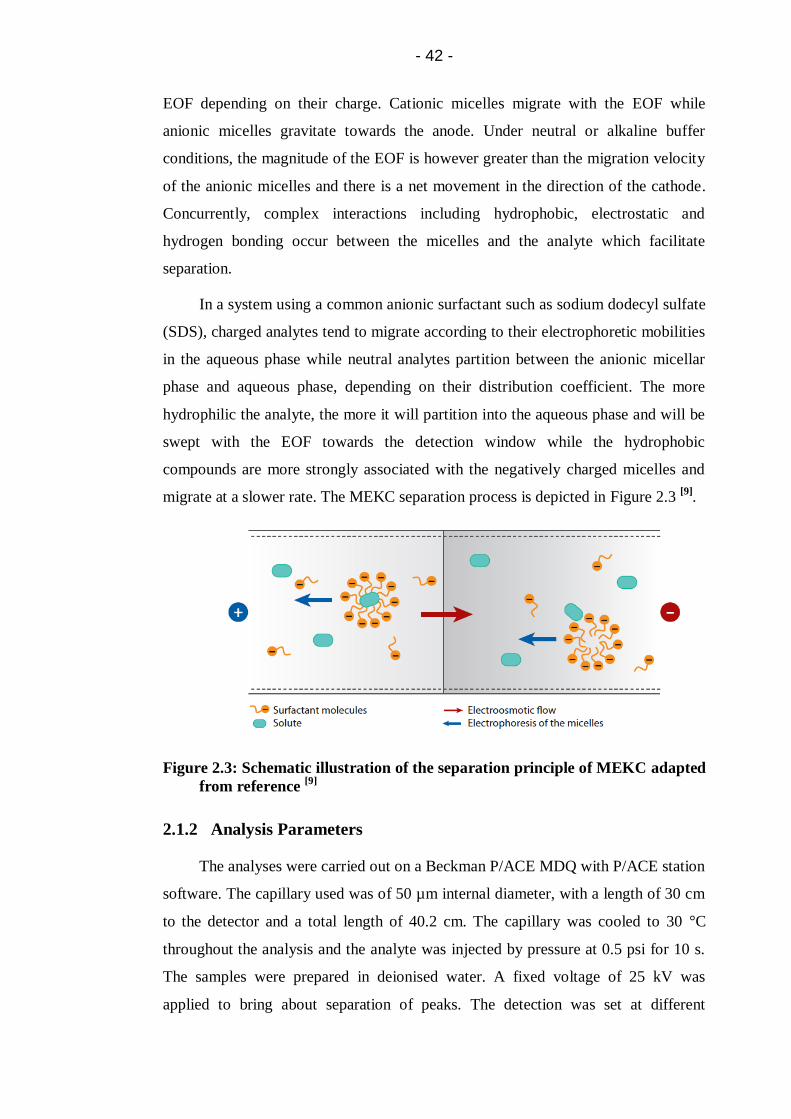
- 42 -
EOF depending on their charge. Cationic micelles migrate with the EOF while
anionic micelles gravitate towards the anode. Under neutral or alkaline buffer
conditions, the magnitude of the EOF is however greater than the migration velocity
of the anionic micelles and there is a net movement in the direction of the cathode.
Concurrently, complex interactions including hydrophobic, electrostatic and
hydrogen bonding occur between the micelles and the analyte which facilitate
separation.
In a system using a common anionic surfactant such as sodium dodecyl sulfate
(SDS), charged analytes tend to migrate according to their electrophoretic mobilities
in the aqueous phase while neutral analytes partition between the anionic micellar
phase and aqueous phase, depending on their distribution coefficient. The more
hydrophilic the analyte, the more it will partition into the aqueous phase and will be
swept with the EOF towards the detection window while the hydrophobic
compounds are more strongly associated with the negatively charged micelles and
migrate at a slower rate. The MEKC separation process is depicted in Figure 2.3 [9]
.
Figure 2.3: Schematic illustration of the separation principle of MEKC adapted
from reference [9]
2.1.2 Analysis Parameters
The analyses were carried out on a Beckman P/ACE MDQ with P/ACE station
software. The capillary used was of 50 µm internal diameter, with a length of 30 cm
to the detector and a total length of 40.2 cm. The capillary was cooled to 30 °C
throughout the analysis and the analyte was injected by pressure at 0.5 psi for 10 s.
The samples were prepared in deionised water. A fixed voltage of 25 kV was
applied to bring about separation of peaks. The detection was set at different

- 43 -
wavelengths in the visible spectrum, i.e. for Magenta at 542 nm, Yellow at 420 nm
and Blue at 596 nm.
In this study, three different buffer systems were employed which are
mentioned in Table 2.1. The buffers were replaced after every ten runs to minimise
solvent evaporation effects that might cause irreproducible electroosmotic flow and
migration times. The raw data were analysed and peaks were integrated using
OriginPro 9.0.0.
Table 2.1: CE buffer systems for reactive dyes
Colour Buffer System pH
Magenta 6 mM Potassium Dihydrogen Phosphate in
(acetonitrilewater; 10:90 v/v) [10]
9.0
Blue 15 mM Ammonium Acetate in
(acetonitrilewater; 40:60 v/v) [11]
9.3
Yellow 20 mM Sodium Tetraborate, 50 mM Sodium
Dodecyl Sulphate (SDS) [12]
9.3
2.2 Thin Layer Chromatography (TLC)
Chromatography is an analytical method that is widely used for the separation,
isolation, identification, and quantification of components in a mixture. Components
of the mixture are carried through the stationary phase by the flow of a mobile
phase. Separations are based on differences in migration rates among the sample
components [13]
.
Thin layer chromatography (TLC) was chosen over other chromatography
methods because it is a simple, quick and inexpensive procedure that can be used for
the analysis of mixtures.
TLC is a mode of liquid chromatography in which the sample is applied as a
small spot or streak to the origin of a thin sorbent layer such as silica gel, alumina,
or chemically bonded silica gel supported on a glass, plastic, or metal plate. This
layer consists of finely divided particles and constitutes the stationary phase. The
eluent or mobile phase is a solvent or a mixture of organic and/or aqueous solvents

- 44 -
in which the spotted plate is placed. The mobile phase moves through the stationary
phase by capillary action, sometimes assisted by gravity or pressure [13, 14]
.
The basic TLC procedure is carried out by placing a spot of sample solution
near one end of the stationary phase, a thin layer; the sample is then dried; and the
end of stationary phase is placed into a mobile phase, usually a mixture of pure
solvents, in a close chamber. The components of mixture migrate at different rates
during movement of the mobile phase through the stationary phase, which is termed
the development of the chromatogram. When the mobile phase has moved an
appropriate distance, the stationary phase is removed, the mobile phase is rapidly
dried, and if the compounds are not naturally coloured or fluorescent a visualisation
reagent is applied to detect the zones [13, 15]
, and their retention factors, Rf values, are
calculated by following formula:
In TLC, the compounds roughly follow the elution order based on their
polarity. Highly polar molecules interact fairly strongly with the polar SiOH groups
(silica plate) and will tend to adsorb onto the fine particles of the adsorbent while
weakly polar molecules are held less tightly. Weakly polar molecules generally tend
to move through the adsorbent more rapidly than the polar molecules.
The larger an Rf value of a compound, the larger the distance it travels on the
TLC plate. When comparing two different compounds run under identical
chromatography conditions, the compound with the larger Rf is less polar because it
interacts less strongly with the polar adsorbent on the TLC plate. Conversely, if you
know the structures of the compounds in a mixture, you can predict that a compound
of low polarity will have a larger Rf value than a polar compound run on the same
plate.
TLC separations take place in the open layer, with each component having the
same total migration time but different migration distances. Plates can be visualised,
depending on the chemical structure of the compounds at visible light, UV-254 nm
and 365 nm or by using spray reagents. The effectiveness of the separation depends
on the mixture to be separated, the choice of the mobile phase and the adsorption
layer [16]
.
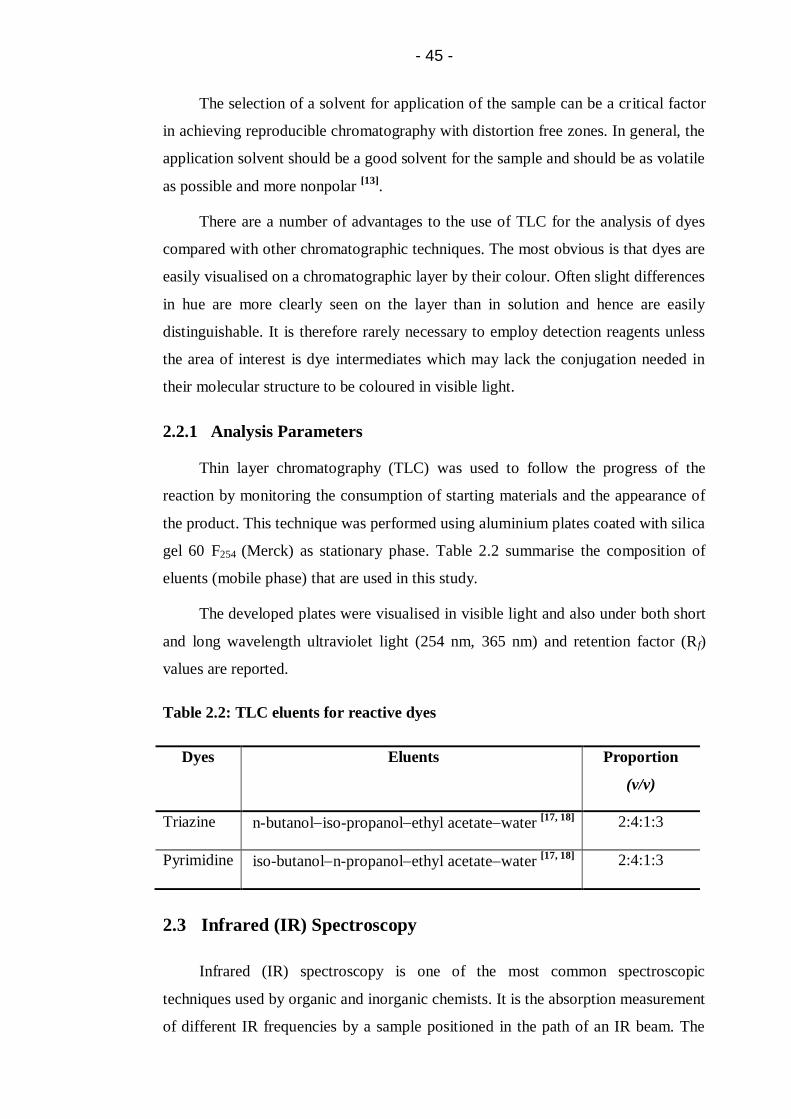
- 45 -
The selection of a solvent for application of the sample can be a critical factor
in achieving reproducible chromatography with distortion free zones. In general, the
application solvent should be a good solvent for the sample and should be as volatile
as possible and more nonpolar [13]
.
There are a number of advantages to the use of TLC for the analysis of dyes
compared with other chromatographic techniques. The most obvious is that dyes are
easily visualised on a chromatographic layer by their colour. Often slight differences
in hue are more clearly seen on the layer than in solution and hence are easily
distinguishable. It is therefore rarely necessary to employ detection reagents unless
the area of interest is dye intermediates which may lack the conjugation needed in
their molecular structure to be coloured in visible light.
2.2.1 Analysis Parameters
Thin layer chromatography (TLC) was used to follow the progress of the
reaction by monitoring the consumption of starting materials and the appearance of
the product. This technique was performed using aluminium plates coated with silica
gel 60 F254 (Merck) as stationary phase. Table 2.2 summarise the composition of
eluents (mobile phase) that are used in this study.
The developed plates were visualised in visible light and also under both short
and long wavelength ultraviolet light (254 nm, 365 nm) and retention factor (Rf)
values are reported.
Table 2.2: TLC eluents for reactive dyes
Dyes Eluents Proportion
(v/v)
Triazine n-butanoliso-propanolethyl acetatewater [17, 18]
2:4:1:3
Pyrimidine iso-butanoln-propanolethyl acetatewater [17, 18]
2:4:1:3
2.3 Infrared (IR) Spectroscopy
Infrared (IR) spectroscopy is one of the most common spectroscopic
techniques used by organic and inorganic chemists. It is the absorption measurement
of different IR frequencies by a sample positioned in the path of an IR beam. The

- 46 -
main goal of the IR spectroscopic analysis is to determine the chemical functional
groups in the sample. Different functional groups absorb characteristic frequencies
of IR radiation. Using various sampling accessories, IR spectrometers can accept a
wide range of sample types such as gases, liquids, and solids. Thus, IR spectroscopy
is an important and popular tool for structural elucidation and compound
identification.
Infrared spectroscopy involves the interaction of the molecule with
electromagnetic radiation. When an organic molecule is irradiated with infrared
energy, certain energies are absorbed by the molecule. The energies absorbed
correspond to the amount of energy needed to increase the amplitude of specific
molecular vibrations such as bond stretching and bending. Every functional group
has a characteristics set of infrared absorptions. By observing which frequencies of
infrared radiation are absorbed by a molecule and which are not, it is possible to
determine the functional group(s) a molecule contains [19]
.
In simple terms, IR spectra are obtained by detecting changes in transmittance
(or absorption) intensity as a function of frequency. Most commercial instruments
separate and measure IR radiation using dispersive spectrometers or Fourier
transform spectrometers. In this study samples were run on Fourier Transform-
Infrared Spectroscopy (FT-IR) with an Attenuated Total Reflection (ATR)
attachment.
2.3.1 Fourier Transform-Infrared Spectroscopy (FT-IR) [20]
Fourier Transform-Infrared Spectroscopy (FT-IR) is an analytical technique
used to identify organic (and in some cases inorganic) materials. This technique
measures the absorption of infrared radiation by the sample material versus
wavelength. The infrared absorption bands identify molecular components and
structures.
The FT-IR spectrometer uses an interferometer to modulate the wavelength
from a broadband infrared source. A detector measures the intensity of transmitted
or reflected light as a function of its wavelength. The signal obtained from the
detector is an interferogram, which must be analysed by a computer using Fourier
transforms to obtain a single-beam infrared spectrum.
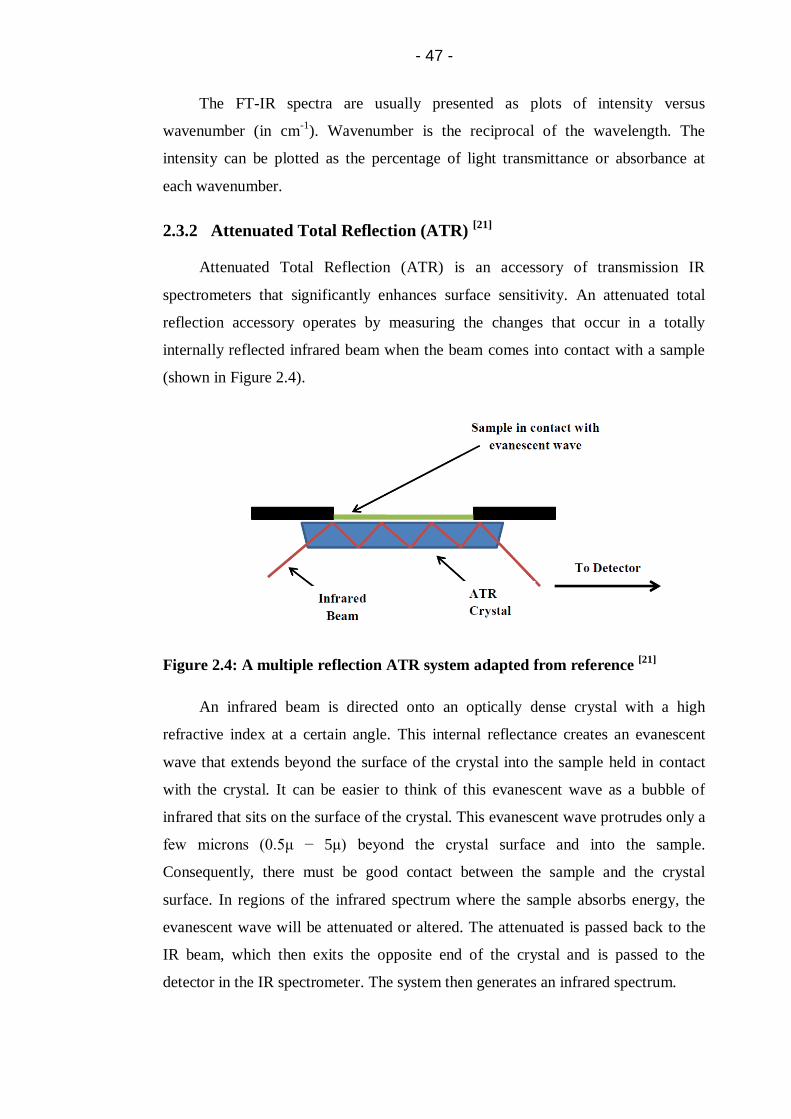
- 47 -
The FT-IR spectra are usually presented as plots of intensity versus
wavenumber (in cm-1
). Wavenumber is the reciprocal of the wavelength. The
intensity can be plotted as the percentage of light transmittance or absorbance at
each wavenumber.
2.3.2 Attenuated Total Reflection (ATR) [21]
Attenuated Total Reflection (ATR) is an accessory of transmission IR
spectrometers that significantly enhances surface sensitivity. An attenuated total
reflection accessory operates by measuring the changes that occur in a totally
internally reflected infrared beam when the beam comes into contact with a sample
(shown in Figure 2.4).
Figure 2.4: A multiple reflection ATR system adapted from reference [21]
An infrared beam is directed onto an optically dense crystal with a high
refractive index at a certain angle. This internal reflectance creates an evanescent
wave that extends beyond the surface of the crystal into the sample held in contact
with the crystal. It can be easier to think of this evanescent wave as a bubble of
infrared that sits on the surface of the crystal. This evanescent wave protrudes only a
few microns (0.5μ − 5μ) beyond the crystal surface and into the sample.
Consequently, there must be good contact between the sample and the crystal
surface. In regions of the infrared spectrum where the sample absorbs energy, the
evanescent wave will be attenuated or altered. The attenuated is passed back to the
IR beam, which then exits the opposite end of the crystal and is passed to the
detector in the IR spectrometer. The system then generates an infrared spectrum.
- 48 -
2.3.3 Analysis Parameters
In this study, infrared spectra were recorded on the Perkin Elmer Spectrum
One spectrophotometer (Perkin Elmer, UK) using the PE Diamond Golden Gate
sampling attachment for attenuated total reflection (ATR) measurement. Each
spectrum was acquired using the following settings: 4 cm-1
resolution, 100 scans per
spectrum and a scan speed of 0.5 cm/s. The software used was a Perkin Elmer
Spectrum 5.0.1 software. The raw data were analysed using OriginPro 9.0.0. The
vibrational frequencies are reported in wavenumbers (cm-1
).
2.4 Elemental Analysis
Elemental analyses of modified dyes for carbon, hydrogen and nitrogen were
performed using a FlashEA 1112 analyser from Thermo Scientific 1.
Elemental analysis of poly sulfonated dyes may give misleading results since
these dyes tend to crystallise with a varying number of water molecules in their
crystal structure [22]
. For triazine based dyes synthesised in this work, the dangers of
drying at elevated temperatures leading to dye hydrolysis, were considered to be
very significant; thus the presence of water of crystallisation was unavoidable and
CHN analysis results were adjusted accordingly.
Moreover, any further disagreement between the calculated and found values
could be attributed to the presence of traces of sodium chloride (used for
crystallisation of dyes), traces of solvents or sodium phosphate buffer (used for
stabilisation of dyes against hydrolysis during storage [23]
) even after purification of
crude dyes by solvent-non solvent method (see Section 2.5.2.1).
2.5 Inkjet Printing Procedure
Throughout this study, worsted 100% wool fabric, 1:1 twill, untreated, 200
g.m-2
(Woolmark Co., UK) and 100% cotton fabric, plain weave, bleached, non-
mercerised, 100 g.m-2
(Whaleys, UK) were used for inkjet printing.
1 Elemental analyses were performed by Mr. Ian Blakeley from School of
Chemistry.

- 49 -
The sequence of wool substrate preparation and inkjet printing is shown in
Figure 2.5.
Figure 2.5: Sequence of substrate preparation and inkjet printing
2.5.1 Fabric Pre-Treatment
Pretreatment of textile substrates in inkjet printing is required to optimise the
interaction between the low viscosity ink drops jetted from the print head and
capillaries in fibres, yarns and fabric structures [24]
.
Therefore, wool fabric was padded at 100% wet pick-up using a Werner
Mathis HVF padder with the pretreatment solution, mentioned in Table 2.3.
Following padding the fabric was dried at 70 °C using a Werner Mathis dryer.
Table 2.3: Pre-treatment padding recipe
Sodium bisulfite [25, 26]
20 g.dm-3
Carboxymethyl cellulose (CMC) [26]
20 g.dm-3
Urea [25, 26]
300 g.dm-3
Alcopol O 60 [26]
5 g.dm-3
Water X dm3
1 dm3
2.5.2 Ink Preparation
2.5.2.1 Purification of Synthesised Dyes
Typically, synthesised dyes contain inorganic impurities such as electrolytes
that prevent them from being used directly in the inkjet printing ink formulation.
Purification is therefore required to remove inorganic impurity that can be
detrimental to ink stability and ink performance in both print head and print quality.
Purification of parent and modified triazine based crude dyes and parent
pyrimidine dyes was done, in accordance with the method described as solvent−non-
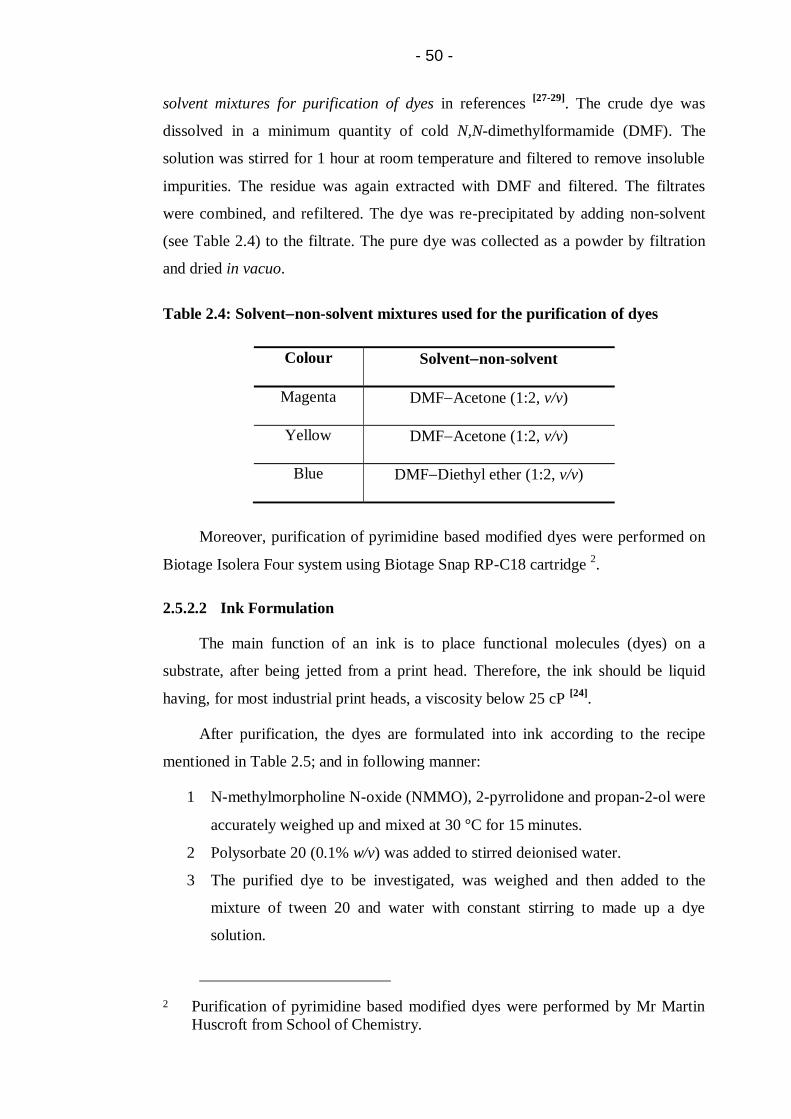
- 50 -
solvent mixtures for purification of dyes in references [27-29]
. The crude dye was
dissolved in a minimum quantity of cold N,N-dimethylformamide (DMF). The
solution was stirred for 1 hour at room temperature and filtered to remove insoluble
impurities. The residue was again extracted with DMF and filtered. The filtrates
were combined, and refiltered. The dye was re-precipitated by adding non-solvent
(see Table 2.4) to the filtrate. The pure dye was collected as a powder by filtration
and dried in vacuo.
Table 2.4: Solventnon-solvent mixtures used for the purification of dyes
Colour Solventnon-solvent
Magenta DMFAcetone (1:2, v/v)
Yellow DMFAcetone (1:2, v/v)
Blue DMFDiethyl ether (1:2, v/v)
Moreover, purification of pyrimidine based modified dyes were performed on
Biotage Isolera Four system using Biotage Snap RP-C18 cartridge 2.
2.5.2.2 Ink Formulation
The main function of an ink is to place functional molecules (dyes) on a
substrate, after being jetted from a print head. Therefore, the ink should be liquid
having, for most industrial print heads, a viscosity below 25 cP [24]
.
After purification, the dyes are formulated into ink according to the recipe
mentioned in Table 2.5; and in following manner:
1 N-methylmorpholine N-oxide (NMMO), 2-pyrrolidone and propan-2-ol were
accurately weighed up and mixed at 30 °C for 15 minutes.
2 Polysorbate 20 (0.1% w/v) was added to stirred deionised water.
3 The purified dye to be investigated, was weighed and then added to the
mixture of tween 20 and water with constant stirring to made up a dye
solution.
2 Purification of pyrimidine based modified dyes were performed by Mr Martin
Huscroft from School of Chemistry.
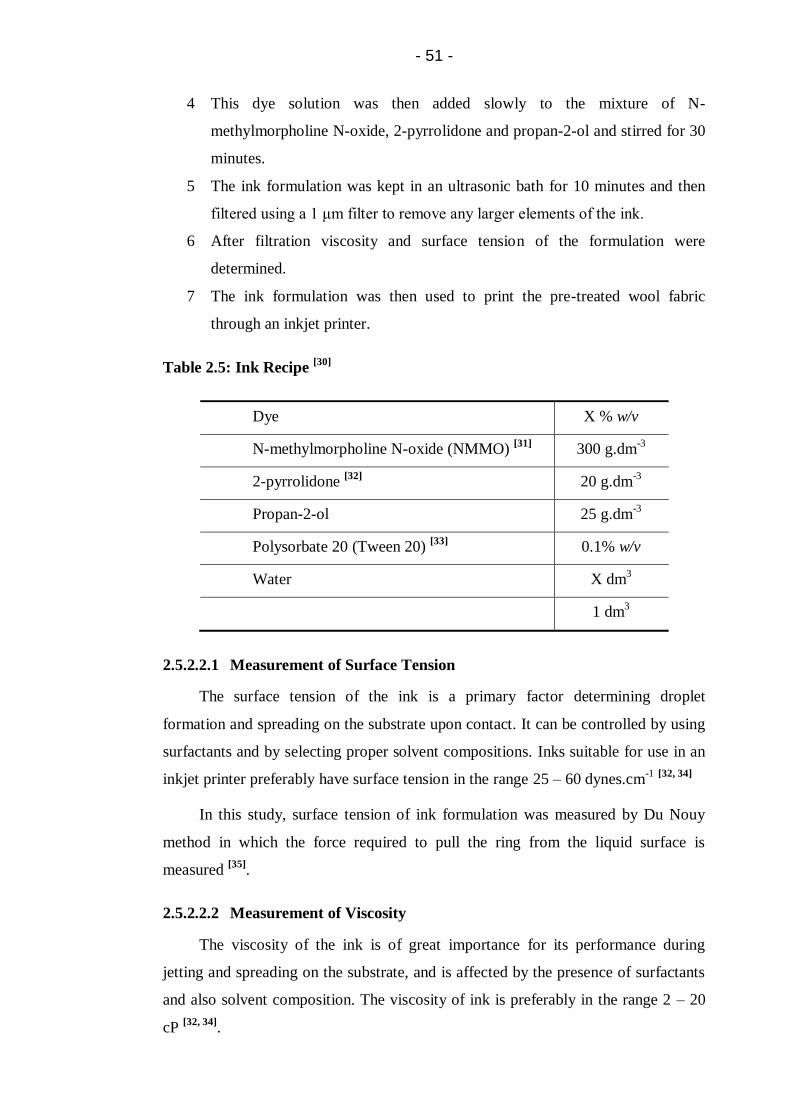
- 51 -
4 This dye solution was then added slowly to the mixture of N-
methylmorpholine N-oxide, 2-pyrrolidone and propan-2-ol and stirred for 30
minutes.
5 The ink formulation was kept in an ultrasonic bath for 10 minutes and then
filtered using a 1 μm filter to remove any larger elements of the ink.
6 After filtration viscosity and surface tension of the formulation were
determined.
7 The ink formulation was then used to print the pre-treated wool fabric
through an inkjet printer.
Table 2.5: Ink Recipe [30]
Dye X % w/v
N-methylmorpholine N-oxide (NMMO) [31]
300 g.dm-3
2-pyrrolidone [32]
20 g.dm-3
Propan-2-ol 25 g.dm-3
Polysorbate 20 (Tween 20) [33]
0.1% w/v
Water X dm3
1 dm3
2.5.2.2.1 Measurement of Surface Tension
The surface tension of the ink is a primary factor determining droplet
formation and spreading on the substrate upon contact. It can be controlled by using
surfactants and by selecting proper solvent compositions. Inks suitable for use in an
inkjet printer preferably have surface tension in the range 25 – 60 dynes.cm-1
[32, 34]
In this study, surface tension of ink formulation was measured by Du Nouy
method in which the force required to pull the ring from the liquid surface is
measured [35]
.
2.5.2.2.2 Measurement of Viscosity
The viscosity of the ink is of great importance for its performance during
jetting and spreading on the substrate, and is affected by the presence of surfactants
and also solvent composition. The viscosity of ink is preferably in the range 2 – 20
cP [32, 34]
.

- 52 -
In this study, viscosity of ink formulations was measured using a Brookfield
Viscometer.
2.5.3 Application onto Wool Fabric
Inkjet printing was carried out on Hewlett-Packard (HP) Deskjet 6940 thermal
drop on demand Colour Inkjet Printer with a single pass at a resolution of 600 dpi as
a solid rectangle print pattern using the formulated inks. For the purpose of passing
the fabric samples through the inkjet printer, they were glued to a sheet of A4
transparency by applying double sided tape to the fabric edges. Printed samples
were allowed to air dry for 5 minutes and then subjected to selected fixation
processes for the appropriate times. All the inks were applied twice through inkjet
printing.
2.5.4 Fixation of Prints
After printing, the dye is deposited on the fibre surface within a thickener film
in a highly aggregated form; therefore, an appropriate fixation step is necessary. In
this study, the dyes were fixed onto wool fabric through;
1. Method 1: Batching at room temperature for 2 and 4 hours under moist
conditions 3
2. Method 2: Batching at elevated temperature (see Table 2.6) for 30, 60,
90, 120, 150 and 180 minutes under moist conditions
3. Method 3: Saturated steam at 102 °C for 5, 10, 15, 20 and 25 minutes
Table 2.6: Batching temperatures for fixation
Reactive Group Temperature
Triazine 65 °C [36, 37]
Pyrimidine 90 °C [36, 37]
The moist conditions for batching were provided by interleaving the printed
wool fabric with a moist cotton fabric padded with distilled water at a wet pick-up of
80%. The moist cotton fabric was placed on the reverse side of the printed wool
3 Trichloropyrimidine based dyes (d13mp and d15bp) and their modifications
(d14mpm and d16bpm) were not fixed through batching at room temperature.

- 53 -
fabric. The fabrics were rolled onto a plastic cylinder and wrapped in clingfilm to
prevent moisture loss during batching.
2.5.5 Washing-off
Removal of hydrolysed and unreacted dye along with thickener and any
residue chemical from the goods is a vital step after printing [38]
. Washing-off
conditions must minimise staining of the unprinted ground [39]
. Therefore, an
alkaline washing solution containing sodium bicarbonate and Sandozin NIE in the
wash liquor were used.
The printed samples were washed according to the following three-step
washing procedure:
1. 5 minutes cold rinsing until no colour could be removed;
2. 10 minutes hot washing at 80 °C [39-41]
with the addition of 2 g.dm-3
Sandozin NIE and 5 g.dm-3
sodium bicarbonate;
3. 10 minutes rinsing with running tap water
After fixation and washing-off the printed samples were tested for light
fastness and wash fastness following the procedures detailed in section 2.8.1 and
2.8.2.
2.6 Stability of Dye based Inks
In order to assess the stability of the dyes in ink formulations, each ink was
allowed to stand at room temperature over a period of 1 to 12 months and the change
in percent area of dye from fresh ink to stored ink was recorded through CE (CZE or
MEKC).
Furthermore, for the ease of identification of dye peak in CE
electropherogram, stored ink sample was tested against fresh ink sample made on
that particular day. Therefore, the electropherograms presented in this research are
of samples tested for stability at the same time under same CE conditions.
2.7 Determination of Percent Fixation (Fibre-Dye Bond)
UV/Vis spectroscopy is frequently used in the measurement of percent fixation
of the dyes used in textile coloration [42-45]
.

- 54 -
2.7.1 Analysis Parameters
The percent fixation was determined using a Perkin Elmer Lambda 40
UV/Vis Spectrophotometer (UK) in order to calculate the dye concentration in the
various wash-off solutions.
After printing, the first sample was washed off immediately to obtain the total
amount of the dye printed on the fabric and the solution was diluted to 100 cm3; the
remaining samples were used for fixation (steaming and batching) followed by
washing to obtain the amount of the hydrolysed and unreacted dye after the fixation
process; the washing solutions were diluted to the same volume of 100 cm3
individually. The absorbance of the printed dye solution A0 and absorbance of the
wash-off solution Ai at the wavelength of maximum absorption λmax were used to
obtain the percent fixation (%F) according to Equation 2.2; and rounded to nearest
tenth.
……………. [2.2]
2.8 Colour Fastness Testing
2.8.1 Light Fastness Testing
Light fastness relates to the ability of a textile to retain its colour under the
influence of light. Light fastness test is carried out according to the BS EN ISO
105B02 (Method 3) [46]
by using Q-Sun 1000 Xenon test chamber with irradiance
of 0.65 W/m2 at a temperature of 45 °C.
The light fastness test is used to determine the resistance of the specimen to
artificial light which has a spectrum close to that of daylight (D65). The specimen of
printed fabric is exposed along with the appropriate dyed wool reference fabrics to
the light from the Xenon arc lamp. The fastness is assessed by comparing the fading
of specimen with that of the reference fabrics.
The test method ISO 105B02:2013 method 3 is suitable where the test
specimen is compared for conformity with a known performance specification. The
basic feature is the control of exposure by inspection of the target blue wool
reference. The method allows multiple test specimens to be tested using a reduced
number of blue wool references, typically the target blue wool reference together
with the two blue wool references immediately preceding the target blue wool

- 55 -
reference. This is to assist in quantifying a specimen which does not conform with
the required performance specification. For this method, opaque covers masking
approximately one-third and two-thirds of the test specimens and blue wool
references are required.
2.8.2 Wash Fastness Testing
Wash fastness test is carried out according to the BS EN ISO 105-C06:2010
(A1S) [47]
using Mathis WT laboratory machine.
A specimen of the wool substrate in contact with multi-fibre strip is laundered,
rinsed and dried. Specimens are laundered under appropriate conditions shown in
Table 2.7. The change in colour of the specimen and the staining of the adjacent
fabrics was assessed by comparison with the greyscale.
Table 2.7: Test conditions for wash fastness [47]
Test # Temperature Liquor
volume
Available
chlorine
Sodium
perborate
Time
(min)
No. of
Steel
balls
Adjust
pH to
A1S 40 C 150 ml None None 30 a
Not
adjusted
a: For delicate fabrics and articles of wool fibres, steel balls are not used in the test.
The washing liquor was prepared by dissolving 4g SDC ECE Phosphate
Reference Detergent B in 1 L deionised water. The adjacent multi-fibre strip
(100×40 mm) used in the testing contains the following fabrics: secondary cellulose
acetate, bleached un-mercerised cotton, Nylon 6.6, polyester, acrylic and wool.
2.9 Microwave-Irradiated Synthesis
Microwave irradiation has gained popularity in the past decade as a powerful
tool for rapid and efficient synthesis of a variety of compounds because of selective
absorption of microwave energy by polar molecules. The microwave irradiation is
quite successful in providing enhanced reaction rate and improved product yield in
chemical synthesis of a variety of carbon-heteroatom bonds [48, 49]
- 56 -
During recent years, microwaves have been extensively used for carrying out
chemical reactions and have become a useful non-conventional energy source for
performing organic synthesis. This is supported by a great number of publications in
recent years, related to the application of microwaves as a consequence of a great
availability of dedicated and reliable microwave instrumentation [50, 51]
.
As it is known, microwave irradiation is a fast route in organic synthesis.
However, the application of microwave irradiation for the synthesis of dyes is still
limited to functional dyes such as cyanine dyes [52-55]
. Furthermore, there is no report
on the synthesis of reactive dyes under microwave irradiation.
Traditionally, organic reactions are heated using an external heat source and
therefore heat is transferred by conductance. This is a relatively slow and inefficient
method for transmitting energy into the system because it relies on the thermal
conductivity of the various materials that must be penetrated, and results in the
temperature of the reaction vessel being higher than that of the reaction mixture. In
addition, a temperature gradient can develop within the sample and local
overheating can lead to product, reactants or reagent decomposition [51, 56, 57]
.
In contrast, microwave irradiation produces efficient internal heating by direct
coupling of microwave energy with the polar molecules of solvents, reagents or
catalysts presented in the reaction mixture. Since the vessels or vials are typically
made out of the microwave-transparent materials the radiation passes through the
walls of the vessel directly into the whole reaction mixture volume and an inverted
temperature gradient as compared to conventional thermal heating effects (see
Figure 2.7); which is directly responsible for the enhancements in reaction rates and
yields.

- 57 -
Figure 2.6: Inverted temperature gradients in microwave versus conventional
heating adapted from reference [57]
2.9.1 Principle of Microwave-Irradiated Synthesis [57]
Microwave-irradiated synthesis is primarily based on the efficient heating of
materials by microwave dielectric heating effects. Microwave dielectric heating is
dependent on the ability of a specific material to absorb microwave energy and
convert it to heat.
Microwave irradiation triggers heating by two main mechanisms: dipolar
polarisation and ionic conduction [49]
.
2.9.1.1 Dipolar Polarisation
Dipolar polarisation is a process by which heat is generated in polar molecules.
On exposure to an oscillating electromagnetic field of appropriate frequency, polar
molecules try to follow the field and align themselves in phase with the field.
However, owing to inter-molecular forces, polar molecules experience inertia and
are unable to follow the field. This results in the random motion of particles (Figure
2.7), and this random interaction generates heat.
Figure 2.7: Dipolar interaction – dipolar molecules in reaction mixture will try
to align with an oscillating electric field adapted from reference [49]
Microwave
Conventional

- 58 -
2.9.1.2 Conduction Mechanism
Due to the much stronger interaction of ions or even a single isolated ion with
an electric field, the conduction mechanisim leads to the heat generation. The ions
will move under the influence of an electric field (Figure 2.8), resulting in
expenditure of energy due to an increased collision rate, converting kinetic energy
into heat. The heat generated by both mechanisms adds up resulting in a higher final
temperature [51]
.
Figure 2.8: Ionic conduction – charged particles in reaction mixture will follow
the applied electric field adapted from reference [49]
The conductivity mechanism is a much stronger interaction than the dipolar
mechanism with regard to the heat generating capacity [49]
.
2.9.2 Advantages of Microwave-Irradiated Synthesis
Higher reaction temperatures can be obtained by combining rapid
microwave heating with sealed-vessel (autoclave) technology.
Significantly reduced reaction times, higher yields and cleaner reaction
profiles, allowing for more rapid reaction optimisation.
Solvents with low boiling points can be used under pressure and be
heated at temperatures considerably higher than their boiling point.
Microwave heating allows direct in-core heating of the reaction mixture,
which results in a faster and more even heating of the reaction mixture
(see Figure 2.6).
Easy on-line control of temperature and pressure profiles is possible,
which leads to more reproducible reaction conditions.
Microwave heating is more energy efficient than conventional heating
because of direct molecular heating and inverted temperature gradients,
see Figure 2.6.

- 59 -
2.9.3 Analysis Parameters
The microwave-irradiated syntheses were carried out in CEM Discover SP [58]
using 35 ml CEM reactor vessel.
2.10 Miscellaneous Procedures
2.10.1 Completion of Diazotization
The completion of diazotization was determined by checking for the presence
of excess nitrous acid using starch iodide paper [59]
. When all the aromatic amine has
reacted with sodium nitrite, then next portion (excess) of sodium nitrite added to the
solution under test, converted to nitrous acid that remain in the solution and can be
detected by the starch paper as an external indicator. This appearance of free nitrous
acid in solution indicates that diazotization reaction is complete and equivalence
point is attained.
2.10.2 Completion of Diazo-Coupling
In accordance with the method described in [59, 60]
, the endpoint of diazo-
coupling reaction was determined by placing a few drops of the reaction mixture on
a small heap of sodium chloride salt on filter paper. After 5 minutes, a drop of an
alkaline solution of J-acid and drop of leftover diazonium salt solution were placed
on both sides of the reaction mixture drop. Lines of colour appeared at the encounter
of the migrating reagents thus showing the presence of coupling agent as well as
diazonium salt. The coupling reaction was considered completed when a negative
test is obtained on both sides of the reaction drop.
2.10.3 Freeze Drying
Reaction mixtures were freeze dried in Thermo Heto powerDry LL1500 freeze
dryer [61]
.
2.11 References
1. Croft, S.N. and Hinks, D. Analysis of dyes by capillary electrophoresis.
Journal of the Society of Dyers and Colourists, 1992, 108, pp.546-551.
- 60 -
2. Croft, S.N. and Lewis, D.M. Analysis of reactive dyes and related
derivatives using high-performance capillary electrophoresis. Dyes and
Pigments, 1992, 18, pp.309-317.
3. Hansa, A., Pillay, V. and Buckley, C. Analysis of reactive dyes using high
performance capillary electrophoresis. Water Science and Technology, 1999,
39, pp.169-172.
4. Terabe, S. Micellar Electrokinetic Chromatography [online]. [Accessed
August 28,2012]. Available from:
http://pt7mdv.ceingebi.unam.mx/computo/pdfs/met/Electroforesis/Electrofor
esis/CE/MEKC/primer3.pdf.
5. Heiger, D.N. High performance capillary electrophoresis : an introduction
France: Hewlett Packard Co., 1992
6. Burkinshaw, S.M., Hinks, D. and Lewis, D.M. Capillary zone
electrophoresis in the analysis of dyes and other compounds employed in the
dye-manufacturing and dye-using industries. Journal of Chromatography A,
1993, 640, pp.413-417.
7. Suntornsuk, L. Capillary electrophoresis of phytochemical substances.
Journal of Pharmaceutical and Biomedical Analysis, 2002, 27, pp.679-698.
8. Kim, J.-B. and Terabe, S. On-line sample preconcentration techniques in
micellar electrokinetic chromatography. Journal of Pharmaceutical and
Biomedical Analysis, 2003, 30, pp.1625-1643.
9. Terabe, S. Capillary Separation: Micellar Electrokinetic Chromatography
[online]. 2009. [Accessed August 28, 2012]. Available from:
http://www.annualreviews.org/doi/pdf/10.1146/annurev.anchem.1.031207.11
3005.
10. Tapley, K.N. Capillary electrophoretic analysis of the reactions of
bifunctional reactive dyes under various conditions including a study of the
analysis of the traditionally difficult to analyse phthalocyanine dyes. Journal
of Chromatography A, 1995, 706, pp.555-562.
11. Stefan, A.R., Dockery, C.R., Nieuwland, A.A., Roberson, S.N., Baguley,
B.M., Hendrix, J.E. and Morgan, S.L. Forensic analysis of anthraquinone,
azo, and metal complex acid dyes from nylon fibers by micro-extraction and
capillary electrophoresis. Analytical and Bioanalytical Chemistry, 2009, 394,
pp.2077-2085.

- 61 -
12. Ojstršek, A., Doliška, A. and Fakin, D. Analysis of reactive dyestuffs and
their hydrolysis by capillary electrophoresis. Analytical Sciences, 2008, 24,
pp.1581-1587.
13. Fried, B. and Sherma, J. eds. Handbook of thin-layer chromatography. New
York Marcel Dekker, 1996.
14. Skoog, D.A., West, D.M. and Holler, F.J. Fundamentals of analytical
chemistry. New York: Saunders, 1988.
15. Fried, B. and Sherma, J. eds. Thin-Layer Chromatography. New York:
Marcel Dekker, 1999.
16. Fritz, J.S. and George, H.S. Quantitative analytical chemistry. Boston:
Allyn and Bacon, 1987.
17. Perkavac, J. and Perpar, M. Thin-layer chromatography of reactive dyes.
Fresenius' Zeitschrift für Analytische Chemie, 1964, 206, pp.356-9.
18. Perkavac, J. and Perpar, M. The analysis of reactive dyes by paper
chromatography. Kemija u Industriji, 1964, 13, pp.404-8.
19. McMurry, J. Organic Chemistry. 6 ed. London: Thomson Brooks/Cole,
2004.
20. Smith, B.C. Infrared spectral interpretation: a systematic approach.
Florida: CRC, 1999.
21. Perkin Elmer. FT-IR Spectroscopy: Attenuated Total Reflectance (ATR)
[online]. [Accessed July 12, 2012]. Available from:
http://shop.perkinelmer.com/content/technicalinfo/tch_ftiratr.pdf.
22. Lewis, D.M. and Smith, S.M. Substituted thiol derivatives of vinyl sulphone
dyes. Dyes and Pigments, 1995, 29, pp.275-294.
23. Patent GB838337 (1960)
24. Ujiie, H. Digital printing of textiles. Cambridge: Woodhead Publishing Ltd.,
2006.
25. Lewis, D.M. The Dyeing of Wool with Reactive Dyes. Journal of the Society
of Dyers and Colourists, 1982, 98, pp.165-175.
26. Clark, M., Yang, K. and Lewis, D.M. Modified 2,4-difluoro-5-chloro-
pyrimidine dyes and their application in inkjet printing on wool fabrics.
Coloration Technology, 2009, 125, pp.184-190.
27. Chavan, R.B. The Use of Solvent-Nonsolvent Mixtures for the Purification
of Anionic Dyes. Textile Research Journal, 1976, 46, pp.435-437.

- 62 -
28. Hall, D.M. and Perkins, W.S. Practical Methods for Purification of Anionic
Dyes as Their Sodium, Potassium and Lithium Salts. Textile Research
Journal, 1971, 41, pp.923-927.
29. Mehta, C.D. and Shah, K.H. Purification of Reactive dyes. Indian Journal of
Applied Chemistry, 1966, 29, pp.122-124.
30. Yang, K. Reactive dye ink-jet printing on wool fabrics. Ph.D. Thesis,
University of Leeds, 2008.
31. Patent WO2002031067 (2002)
32. Patent WO2007045830 (2007)
33. Patent EP1853431 (2006)
34. Magdassi, S. Ink Requirements and Formulations Guidelines. In: S.
Magdassi, ed. Chemistry of Inkjet Inks. New Jersey: World Scientific
Publishing Ltd., 2012.
35. Du Noüy, P.L. A new apparatus for measuring surface tension. The Journal
of general physiology, 1919, 1, p.521.
36. Beech, W.F. Fibre-Reactive Dyes London: Logos Press Ltd., 1970.
37. Patent US20040081761 (2004)
38. Broadbent, A.D. Basic principles of textile coloration. Bradford: Society of
Dyers and Colorists, 2001.
39. Broadbent, P.J. and Rigout, M.L. Wool Printing. The Coloration of Wool and
other Keratin Fibres, 2013, pp.393-430.
40. Bell, V. Recent developments in wool printing. Journal of the Society of
Dyers and Colourists, 1988, 104, pp.159-172.
41. Christoe, J.R., Denning, R.J., Evans, D.J., Huson, M.G., Jones, L.N., Lamb,
P.R., Millington, K.R., Phillips, D.G., Pierlot, A.P., Rippon, J.A. and
Russell, I.M. Wool. In: Kirk-Othmer Encyclopedia of Chemical Technology.
New York: An Interscience Publication, 2000.
42. Morris, K.F., Lewis, D.M. and Broadbent, P.J. Design and application of a
multifunctional reactive dye capable of high fixation efficiency on cellulose.
Coloration Technology, 2008, 124, pp.186-194.
43. Mousa, A. Synthesis and application of a polyfunctional bis
(monochlorotriazine/sulphatoethylsulphone) reactive dye. Dyes and
Pigments, 2007, 75, pp.747-752.
- 63 -
44. Li, Y., Zhang, S., Yang, J., Jiang, S. and Li, Q. Synthesis and application of
novel crosslinking polyamine dyes with good dyeing performance. Dyes and
Pigments, 2008, 76, pp.508-514.
45. Smith, B., Berger, R. and Freeman, H.S. High affinity, high efficiency fibre-
reactive dyes. Coloration Technology, 2006, 122, pp.187-193.
46. British Standards Institution. Colour fastness to artificial light: Xenon arc
fading lamp test, ISO 105-B02:2013.
47. British Standards Institution. Textiles - Tests for colour fastness - Part C06:
Colour fastness to domestic and commercial laundering, BS EN ISO 105-
C06:2010.
48. Ju, Y. and Varma, R.S. An efficient and simple aqueous N-heterocyclization
of aniline derivatives: microwave-assisted synthesis of N-aryl
azacycloalkanes. Organic Letters, 2005, 7, pp.2409-2411.
49. Lidström, P., Tierney, J., Wathey, B. and Westman, J. Microwave assisted
organic synthesis—a review. Tetrahedron, 2001, 57, pp.9225-9283.
50. Mingos, D. The applications of microwaves in chemical syntheses. Research
on Chemical Intermediates, 1994, 20, pp.85-91.
51. Surati, M.A., Jauhari, S. and Desai, K. A brief review: Microwave assisted
organic reaction. Archives of Applied Science Research, 2012, 4, pp.645-661.
52. Baqi, Y. and Müller, C.E. Rapid and Efficient Microwave-Assisted
Copper(0)-Catalyzed Ullmann Coupling Reaction: General Access to
Anilinoanthraquinone Derivatives. Organic Letters, 2007, 9, pp.1271-1274.
53. Baqi, Y. and Müller, C.E. Convergent Synthesis of the Potent P2Y Receptor
Antagonist MG 50-3-1 Based on a Regioselective Ullmann Coupling
Reaction. Molecules, 2012, 17, pp.2599-2615.
54. Shaabani, A. Synthesis of metallophthalocyanines under solvent-free
conditions using microwave irradiation. Journal of Chemical Research,
Synopses, 1998, 10, pp.672-673.
55. Lee, C.-C., Wang, J.-C. and Hu, A.T. Microwave-assisted synthesis of
photochromic spirooxazine dyes under solvent-free condition. Materials
Letters, 2004, 58, pp.535-538.
56. Tierney, J.P. and Lidström, P. eds. Microwave Assisted Organic Synthesis.
Oxford: Blackwell Publishing, 2005.

- 64 -
57. Kappe, C.O. and Dallinger, D. The impact of microwave synthesis on drug
discovery. Nature Reviews Drug Discovery, 2005, 5, pp.51-63.
58. CEM Corporation. The latest in microwave synthesis technology [online].
2010. [Accessed Januray 10, 2013]. Available from:
http://www.brs.be/pdf/DiscoverSPSynth_SinglePages.pdf.
59. Fierz-David, H.E. and Blangey, L. Fundamental processes of dye chemistry.
New York: An Interscience Publication, 1949.
60. De Groote, R.A.M.C. and Neuman, M.G. Spot test for azo dye formation: An
undergraduate laboratory experiment. Journal of Chemical Education, 1979,
56, p.625.
61. Thermo Electron Cooperation. Heto PowerDry® LL1500 Freeze Dryer
[online]. 2005. [Accessed March 01, 2013]. Available from:
http://www.thermo.com.cn/Resources/200802/productPDF_27025.pdf.
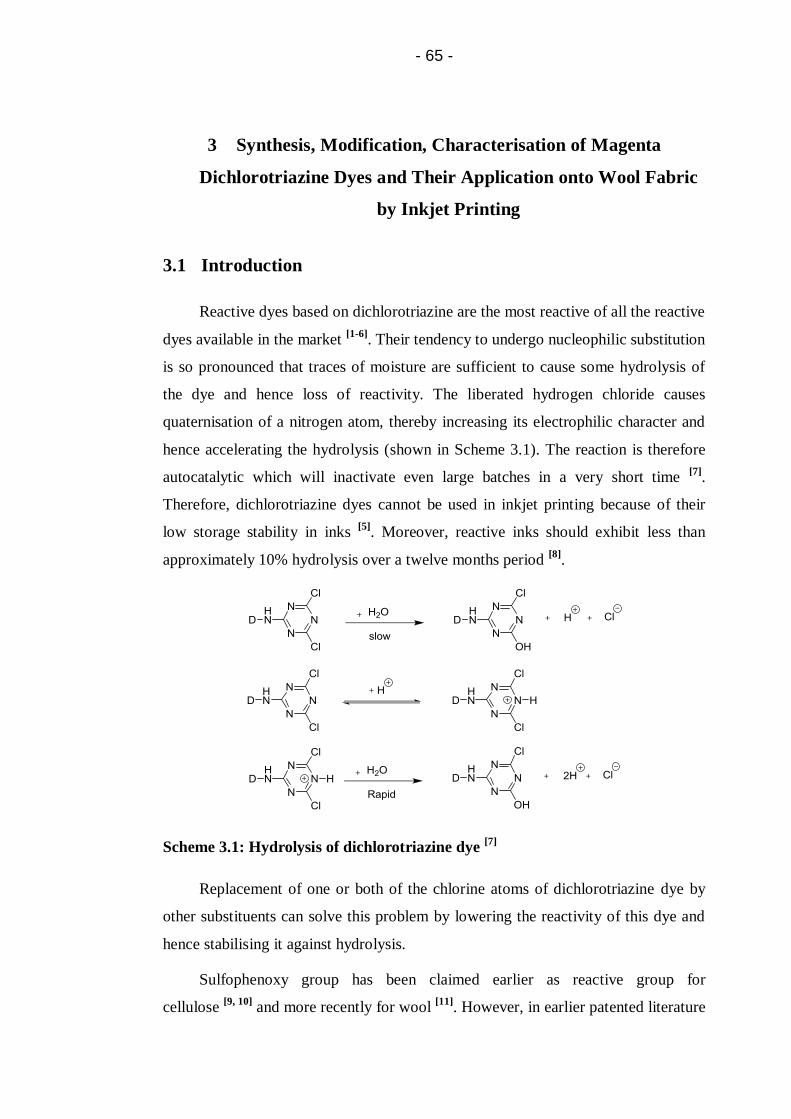
- 65 -
3 Synthesis, Modification, Characterisation of Magenta
Dichlorotriazine Dyes and Their Application onto Wool Fabric
by Inkjet Printing
3.1 Introduction
Reactive dyes based on dichlorotriazine are the most reactive of all the reactive
dyes available in the market [1-6]
. Their tendency to undergo nucleophilic substitution
is so pronounced that traces of moisture are sufficient to cause some hydrolysis of
the dye and hence loss of reactivity. The liberated hydrogen chloride causes
quaternisation of a nitrogen atom, thereby increasing its electrophilic character and
hence accelerating the hydrolysis (shown in Scheme 3.1). The reaction is therefore
autocatalytic which will inactivate even large batches in a very short time [7]
.
Therefore, dichlorotriazine dyes cannot be used in inkjet printing because of their
low storage stability in inks [5]
. Moreover, reactive inks should exhibit less than
approximately 10% hydrolysis over a twelve months period [8]
.
Scheme 3.1: Hydrolysis of dichlorotriazine dye [7]
Replacement of one or both of the chlorine atoms of dichlorotriazine dye by
other substituents can solve this problem by lowering the reactivity of this dye and
hence stabilising it against hydrolysis.
Sulfophenoxy group has been claimed earlier as reactive group for
cellulose [9, 10]
and more recently for wool [11]
. However, in earlier patented literature
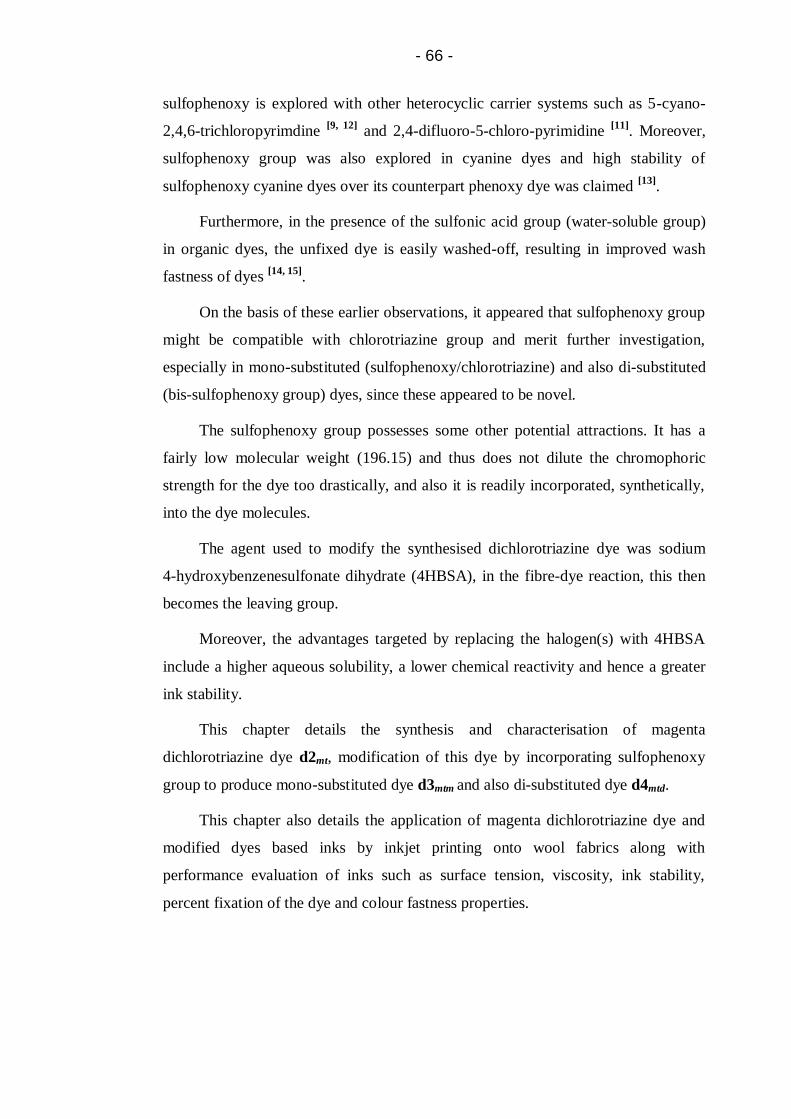
- 66 -
sulfophenoxy is explored with other heterocyclic carrier systems such as 5-cyano-
2,4,6-trichloropyrimdine [9, 12]
and 2,4-difluoro-5-chloro-pyrimidine [11]
. Moreover,
sulfophenoxy group was also explored in cyanine dyes and high stability of
sulfophenoxy cyanine dyes over its counterpart phenoxy dye was claimed [13]
.
Furthermore, in the presence of the sulfonic acid group (water-soluble group)
in organic dyes, the unfixed dye is easily washed-off, resulting in improved wash
fastness of dyes [14, 15]
.
On the basis of these earlier observations, it appeared that sulfophenoxy group
might be compatible with chlorotriazine group and merit further investigation,
especially in mono-substituted (sulfophenoxy/chlorotriazine) and also di-substituted
(bis-sulfophenoxy group) dyes, since these appeared to be novel.
The sulfophenoxy group possesses some other potential attractions. It has a
fairly low molecular weight (196.15) and thus does not dilute the chromophoric
strength for the dye too drastically, and also it is readily incorporated, synthetically,
into the dye molecules.
The agent used to modify the synthesised dichlorotriazine dye was sodium
4-hydroxybenzenesulfonate dihydrate (4HBSA), in the fibre-dye reaction, this then
becomes the leaving group.
Moreover, the advantages targeted by replacing the halogen(s) with 4HBSA
include a higher aqueous solubility, a lower chemical reactivity and hence a greater
ink stability.
This chapter details the synthesis and characterisation of magenta
dichlorotriazine dye d2mt, modification of this dye by incorporating sulfophenoxy
group to produce mono-substituted dye d3mtm and also di-substituted dye d4mtd.
This chapter also details the application of magenta dichlorotriazine dye and
modified dyes based inks by inkjet printing onto wool fabrics along with
performance evaluation of inks such as surface tension, viscosity, ink stability,
percent fixation of the dye and colour fastness properties.

- 67 -
3.2 Experimental
3.2.1 Materials
2-aminobenzenesulfonic acid (95%), sodium nitrite (98%), 4-amino-5-
hydroxy-2,7-naphthalenedisulfonic acid monosodium salt hydrate (85%), cyanuric
chloride (99%), sodium 4-hydroxybenzenesulfonate dihydrate (98%), sodium
metabisulfite, carboxymethyl cellulose, polysorbate 20 (Tween 20) and N-
methylmorpholine N-oxide (NMMO) were supplied by Sigma-Aldrich and used as
received. Urea (MP Biomedicals), Alcopol O 60 (Acros organics), 2-pyrrolidone
(Acros organics), 2-propanol (Fisher), Sandozin NIE (Clariant) were also purchased
and used as received.
3.2.2 Synthesis and Characterisation of Magenta 5-Amino-4-Hydroxy-3-
[(2-sulfophenyl)azo]-2,7-Naphthalenedisulfonic Acid Dye (d1m)
3.2.2.1 Synthesis of d1m
3.2.2.1.1 Diazotization
In accordance with the method described in reference [16]
, 2-
aminobenzenesulphonic acid (18.2 g, 0.1 mol, 95%) was dissolved in water (100
cm3) which was then adjusted to pH 7 by the addition of 2N sodium carbonate
solution followed by the addition of sodium nitrite (7.04 g, 0.1 mol, 98%), this
formed a solution. This solution was then added dropwise, with good stirring to a
mixture of concentrated hydrochloric acid (20 cm3, 0.25 mol, 36.6%), water (125
cm3) and ice (100 g) at 0 to 5 °C. The reaction mixture was stirred for further 30 min
at 0 to 5 °C and pH < 2, excess nitrous acid was removed by adding sulfamic acid
(confirmed by spotting a drop of reaction mixture on starch iodide paper). The
reaction is shown in Scheme 3.2.
Scheme 3.2: Diazotisation of 2-aminobenzenesulfonic acid with nitrous acid
leads to diazonium salt
- 68 -
3.2.2.1.2 Coupling
5-amino-4-naphthol-2,7-disulphonic acid (H-acid) (40.1 g, 0.1 mol, 85%) was
suspended in water (100 cm3), sodium hydroxide solution (10% w/v) was added to
raise the pH to 10, to allow the H-acid to dissolve. The temperature of the mixture
was kept at 0 to 5 °C and pH was maintained at 9.5 to 10.5 by the addition of
saturated sodium carbonate solution during the whole reaction period. The
diazonium salt (0.1 mol) was added dropwise and with good stirring into the H-acid
solution over 45 minutes, the reaction was continued for a further 1.5 hours (until
the pH was stabilised), and was monitored by CZE, analytical TLC and spot test.
Sodium chloride (8% w/v) was added in small portions to a stirred reaction mixture
to precipitate the dye which was subsequently collected by filtration, washed with
brine (10% w/v) and dried in vacuo.
The pure dye d1m (40.27 g, 0.08 mol, yield 80%) was collected as magenta
powder, after re-precipitation from DMF by acetone and dried in vacuo (Section
2.5.2.1). FT-IR analysis was conducted to confirm the presence of main functional
groups in dye d1m. The reaction is shown in Scheme 3.3.
Scheme 3.3: Azo coupling of diazonium salt with H-acid to form magenta dye
chromophore d1m
3.2.2.2 Characterisation of d1m
The CZE electropherogram of the synthesised magenta dye chromophore d1m
at obs. 542 nm is shown in Figure 3.1.
The synthesised d1m was detected at 6.90 min with percent area of 100%
indicating high purity of synthesised magenta dye chromophore.
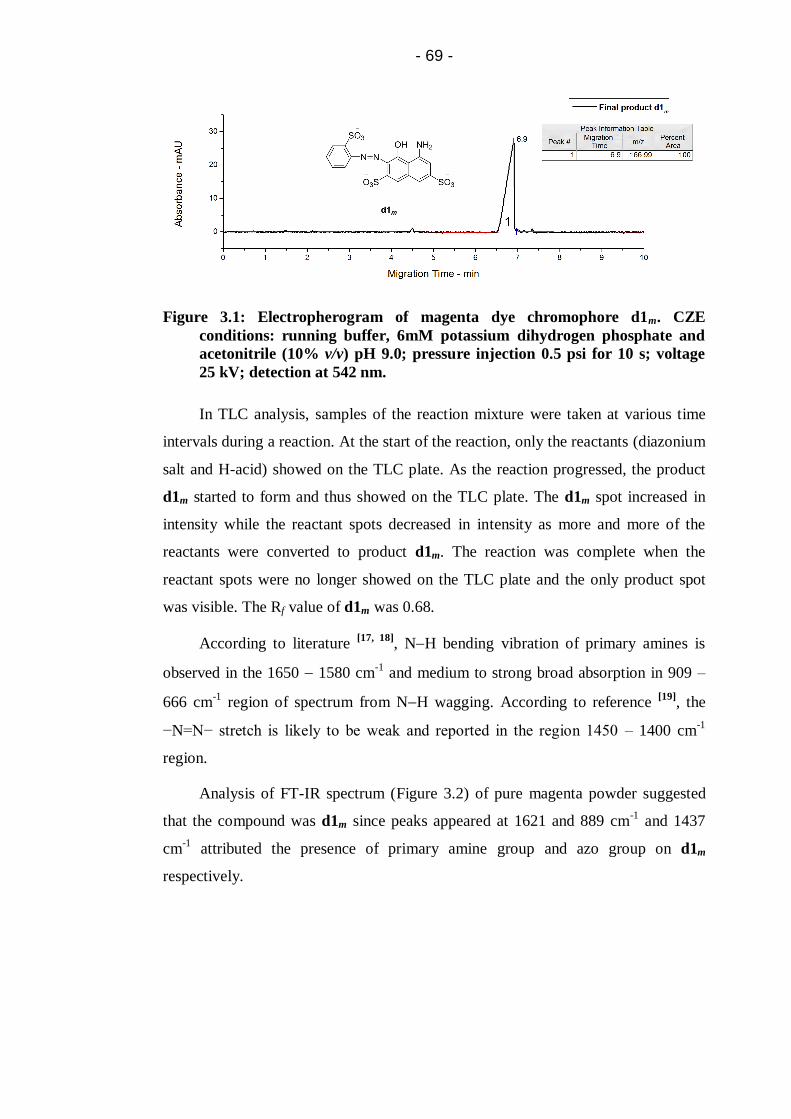
- 69 -
Figure 3.1: Electropherogram of magenta dye chromophore d1m. CZE
conditions: running buffer, 6mM potassium dihydrogen phosphate and
acetonitrile (10% v/v) pH 9.0; pressure injection 0.5 psi for 10 s; voltage
25 kV; detection at 542 nm.
In TLC analysis, samples of the reaction mixture were taken at various time
intervals during a reaction. At the start of the reaction, only the reactants (diazonium
salt and H-acid) showed on the TLC plate. As the reaction progressed, the product
d1m started to form and thus showed on the TLC plate. The d1m spot increased in
intensity while the reactant spots decreased in intensity as more and more of the
reactants were converted to product d1m. The reaction was complete when the
reactant spots were no longer showed on the TLC plate and the only product spot
was visible. The Rf value of d1m was 0.68.
According to literature [17, 18]
, NH bending vibration of primary amines is
observed in the 1650 1580 cm-1
and medium to strong broad absorption in 909 –
666 cm-1
region of spectrum from NH wagging. According to reference [19]
, the
−N=N− stretch is likely to be weak and reported in the region 1450 – 1400 cm-1
region.
Analysis of FT-IR spectrum (Figure 3.2) of pure magenta powder suggested
that the compound was d1m since peaks appeared at 1621 and 889 cm-1
and 1437
cm-1
attributed the presence of primary amine group and azo group on d1m
respectively.

- 70 -
Figure 3.2: FT-IR spectrum of magenta dye chromophore d1m
The detailed analysis of the spectrum (Figure 3.2) is as follows [17, 20-22]
; broad
intermolecular hydrogen bonded, OH stretch, 3404 cm-1
; overtone or
combinational bands, 2000 – 1667 cm-1
; NH bending, 1621 cm-1
; CC ring stretch,
1578, 1492 cm-1
; azo group stretch, 1437 cm-1
, CN stretch (primary amine), 1347
cm-1
; sulfonate, 1172 cm-1
; in-plane CH bend, 1040, 1020 cm-1
; broad, NH wag,
889 cm-1
; out of plane aromatic CH bend, 742 cm-1
.
3.2.3 Synthesis and Characterisation of Magenta 5-[(4,6-Dichloro-1,3,5-
triazin-2-yl)amino]-4-Hydroxy-3-[(2-Sulfophenyl)azo]-2,7-
Naphthalenedisulfonic Acid Dye (d2mt)
3.2.3.1 Synthesis of d2mt
In accordance with the method described in references [1, 23, 24]
, 5-amino-4-
hydroxy-3-[(2-sulfophenyl)azo]-2,7-naphthalenedisulfonic acid d1m (28.47 g, 0.05
mol) was dissolved in water (150 cm3) which was adjusted to pH 3.0 by the addition
of 2N hydrochloric acid solution at 0 to 5 °C. A solution of cyanuric chloride (9.22
g, 0.05 mol) in acetone (50 cm3) was added dropwise to the dye d1m solution over
30 minutes. The reaction mixture was stirred and the pH was maintained at 3.0 to
3.5 by the addition of 2N sodium carbonate solution, while the temperature was kept
at 0 to 5 °C. Once the addition of cyanuric chloride was complete, the reaction was
stirred for further 2 hours (until the pH was stabilised) and was monitored with CZE

- 71 -
and TLC. When the mono condensation reaction of cyanuric chloride had gone to
completion 2N sodium carbonate solution was added to raise the pH to 7.0 and
phosphate buffer (0.2 mol, 10% v/v) was added to buffer the pH to 6.4 [1, 25]
. Sodium
chloride (8% w/v) was added to precipitate the dye. The crude dye d2mt was
collected by filtration and the filter cake was washed with brine (2 100 cm3) and
dried in vacuo.
Purification of crude dye using solvent-nonsolvent technique (DMFAcetone,
1:2 v/v) afforded the pure dye d2mt (24.49 g, 3.75 mmol, yield 75%) as magenta
powder. FT-IR analysis was conducted to confirm the presence of main functional
groups in dye d2mt. The reaction is shown in Scheme 3.4.
Scheme 3.4: Preparation of condensation product d2mt from magenta azo
chromophore and cyanuric chloride
3.2.3.2 Characterisation of d2mt
Figure 3.3 shows the progression of the synthesis reactions of d2mt from
magenta starting material d1m in a fused silica capillary at pH 9.0. Both analytes
have a charge of −3 under these conditions. The EOF in this case is towards the
cathode, while the analytes are moved electrophoretically towards the anode. The
EOF contribution is larger than the electrophoretic mobility of analytes, so that the
net movement of analytes will be toward the cathode. The analyte with the highest
mass to charge ratio should elute first and the analyte with the lowest mass to charge
ratio should elute last.
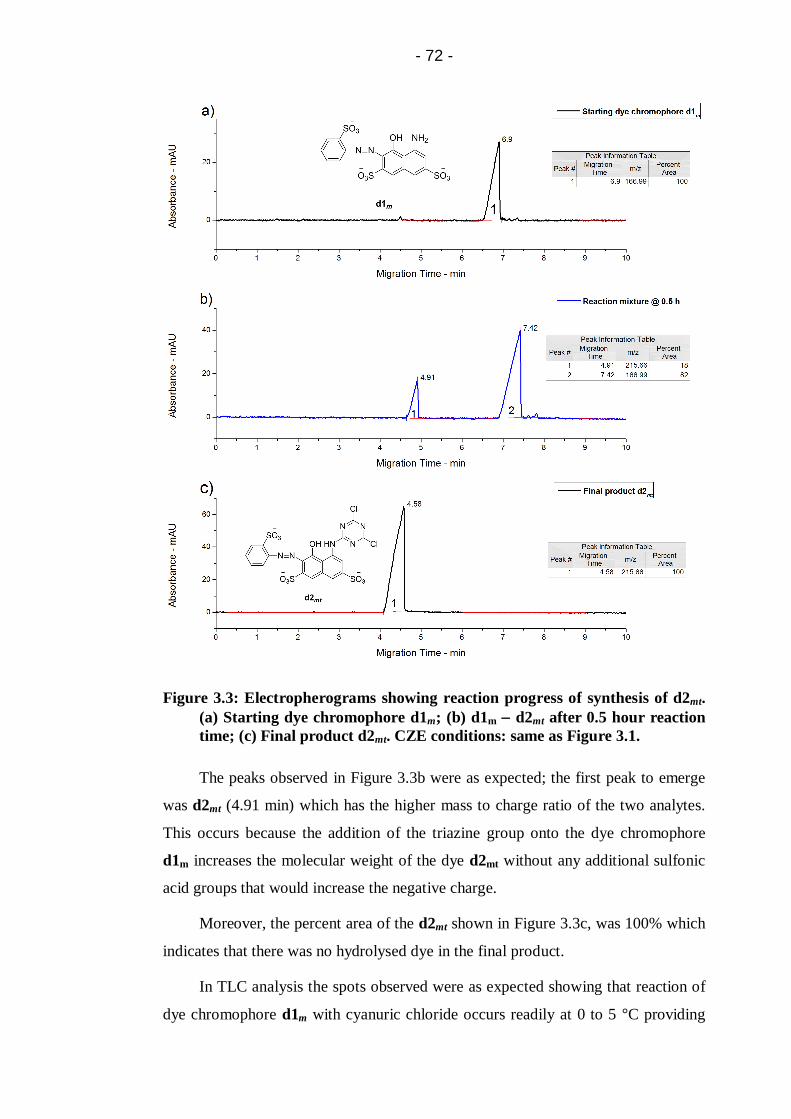
- 72 -
Figure 3.3: Electropherograms showing reaction progress of synthesis of d2mt.
(a) Starting dye chromophore d1m; (b) d1m d2mt after 0.5 hour reaction
time; (c) Final product d2mt. CZE conditions: same as Figure 3.1.
The peaks observed in Figure 3.3b were as expected; the first peak to emerge
was d2mt (4.91 min) which has the higher mass to charge ratio of the two analytes.
This occurs because the addition of the triazine group onto the dye chromophore
d1m increases the molecular weight of the dye d2mt without any additional sulfonic
acid groups that would increase the negative charge.
Moreover, the percent area of the d2mt shown in Figure 3.3c, was 100% which
indicates that there was no hydrolysed dye in the final product.
In TLC analysis the spots observed were as expected showing that reaction of
dye chromophore d1m with cyanuric chloride occurs readily at 0 to 5 °C providing
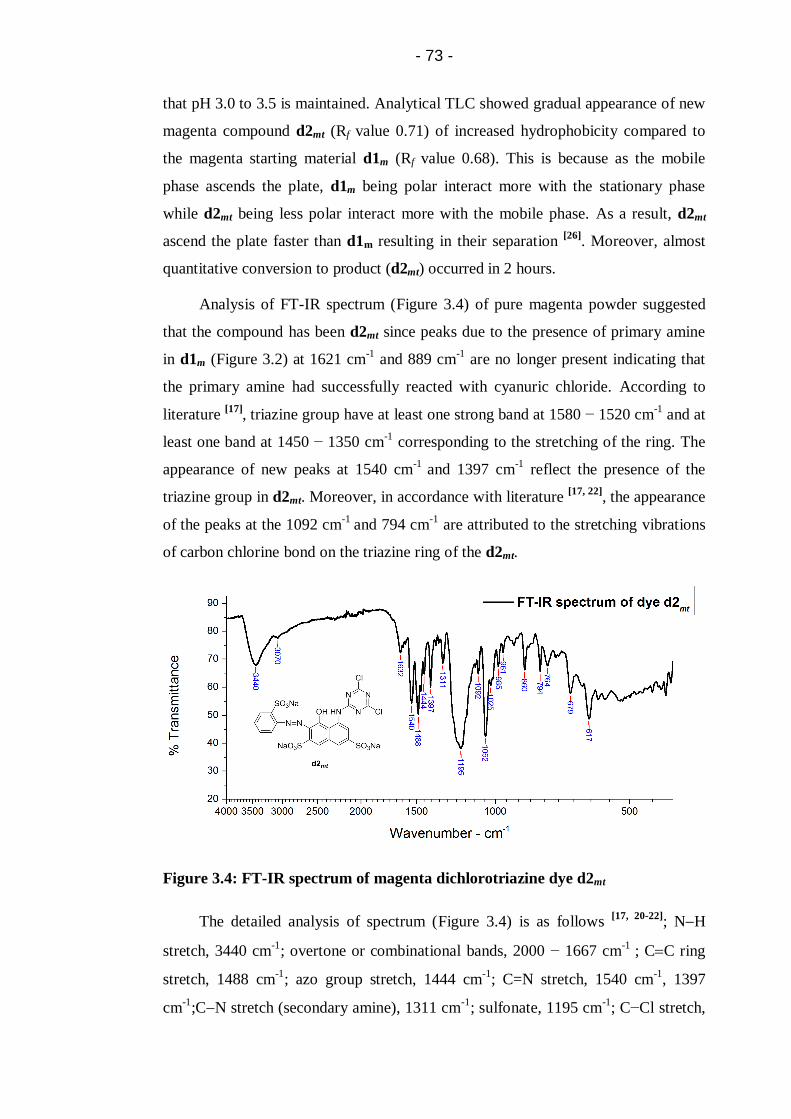
- 73 -
that pH 3.0 to 3.5 is maintained. Analytical TLC showed gradual appearance of new
magenta compound d2mt (Rf value 0.71) of increased hydrophobicity compared to
the magenta starting material d1m (Rf value 0.68). This is because as the mobile
phase ascends the plate, d1m being polar interact more with the stationary phase
while d2mt being less polar interact more with the mobile phase. As a result, d2mt
ascend the plate faster than d1m resulting in their separation [26]
. Moreover, almost
quantitative conversion to product (d2mt) occurred in 2 hours.
Analysis of FT-IR spectrum (Figure 3.4) of pure magenta powder suggested
that the compound has been d2mt since peaks due to the presence of primary amine
in d1m (Figure 3.2) at 1621 cm-1
and 889 cm-1
are no longer present indicating that
the primary amine had successfully reacted with cyanuric chloride. According to
literature [17]
, triazine group have at least one strong band at 1580 − 1520 cm-1
and at
least one band at 1450 − 1350 cm-1
corresponding to the stretching of the ring. The
appearance of new peaks at 1540 cm-1
and 1397 cm-1
reflect the presence of the
triazine group in d2mt. Moreover, in accordance with literature [17, 22]
, the appearance
of the peaks at the 1092 cm-1
and 794 cm-1
are attributed to the stretching vibrations
of carbon chlorine bond on the triazine ring of the d2mt.
Figure 3.4: FT-IR spectrum of magenta dichlorotriazine dye d2mt
The detailed analysis of spectrum (Figure 3.4) is as follows [17, 20-22]
; NH
stretch, 3440 cm-1
; overtone or combinational bands, 2000 − 1667 cm-1
; CC ring
stretch, 1488 cm-1
; azo group stretch, 1444 cm-1
; C=N stretch, 1540 cm-1
, 1397
cm-1
;CN stretch (secondary amine), 1311 cm-1
; sulfonate, 1195 cm-1
; C−Cl stretch,

- 74 -
1092 cm-1
, 794 cm-1
; in-plane CH bend, 1052, 1025 cm-1
; out of plane aromatic
CH bend, 764 cm-1
.
1H NMR (D2O, 500 MHz) 7.35 (1H, J = 10 Hz, t), 7.64 (1H, J = 10, t), 7.73
(1H, s), 7.82 (1H, J = 10 Hz, d), 7.88 (1H, s), 8.18 (1H, J = 10, d), 9.02 (1H, s)
3.2.4 Synthesis and Characterisation of Modified Magenta 5-[[4-Chloro-
6-(4-sulfophenoxy)-1,3,5-triazin-2-yl]amino]-4-Hydroxy-3-[(2-
sulfophenyl)azo]-2,7-Naphthalenedisulfonic Acid Dye (d3mtm)
3.2.4.1 Synthesis of d3mtm
Dye d2mt (6.51 g, 0.01 mol, 1 eq.) and sodium bicarbonate [27]
(1.23 g, 0.015
mol, 1.5 eq.) were dissolved in water (50 cm3) at 25 °C. A solution of sodium 4-
hydroxybenzenesulfonate dihydrate (4HBSA) (2.32 g, 0.01 mol, 1 eq.) in water (20
cm3) was added dropwise over 15 minutes to the d2mt solution; the pH was
maintained at 6.5 to 7.0 by the addition of saturated sodium carbonate solution.
Once the addition of 4HBSA solution was complete, the reaction mixture was stirred
for a further 5 hours (until the pH was stabilised) and was monitored with CZE and
TLC. Sodium chloride (10% w/v) was added to precipitate out the dye. The crude
dye d3mtm was collected by filtration and the filter cake was dried in vacuo.
Purification of crude dye d3mtm using solvent-nonsolvent technique
(DMFAcetone, 1:2 v/v) yielded pure dye d3mtm (5.45 g, 6.72 mmol, yield 67%) as
magenta powder. The dye d3mtm was characterised by FT-IR and elemental analysis
(CHN). The reaction is shown in Scheme 3.5.

- 75 -
Scheme 3.5: Mono substitution of dye d2mt with 4HBSA to yield dye d3mtm
3.2.4.2 Characterisation of d3mtm
The electropherograms from CZE analysis are shown in Figure 3.5 which
indicates the progression of the synthesis reaction from the starting dye d2mt to the
mono-substituted dye d3mtm (peak 2 in Figure 3.5b).
As shown in Figure 3.5b, the first peak to emerge was d2mt (4.57 min) which
had the higher mass to charge ratio of the two analytes. The next peak to emerge
was d3mtm (5.89 min). This occurs because the mono substitution of d2mt with
HBSA not only increases the molecular weight of modified dye d3mtm but also
increase a negative charge on it, therefore the migration time of the dye d3mtm
increases.
In addition, CZE analysis also shows that starting material d2mt was fully
converted to modified dye d3mtm in 5 hours.
Moreover, the percent area of the d3mtm shown in Figure 3.5c indicates the
purity of the final product.

- 76 -
Figure 3.5: Electropherograms showing reaction progress of synthesis of d3mtm.
(a) Starting dye d2mt; (b) d2mt d3mtm after 1 hour reaction time; (c) Final
product d3mtm. CZE conditions: same as Figure 3.1.
In analytical TLC analysis, the spots appeared as expected, indicating that the
primary condensation reaction of dye d2mt with HBSA taking place promptly at 25
°C provided that neutral pH was maintained. Analytical TLC showed the gradual
appearance of new more polar magenta compound d3mtm (Rf value 0.67) compared
to the magenta starting material d2mt (Rf value 0.71). Moreover, TLC showed that
the starting material d2mt was fully converted to the d3mtm in 5 hours.
In accordance with the literature [17, 22]
, the appearance of new peak at 1124
cm-1
in Figure 3.6 can be attributed to the stretching vibration of COC in the
structure between the triazine and 4HBSA. The small peaks at 1092 cm-1
and 808
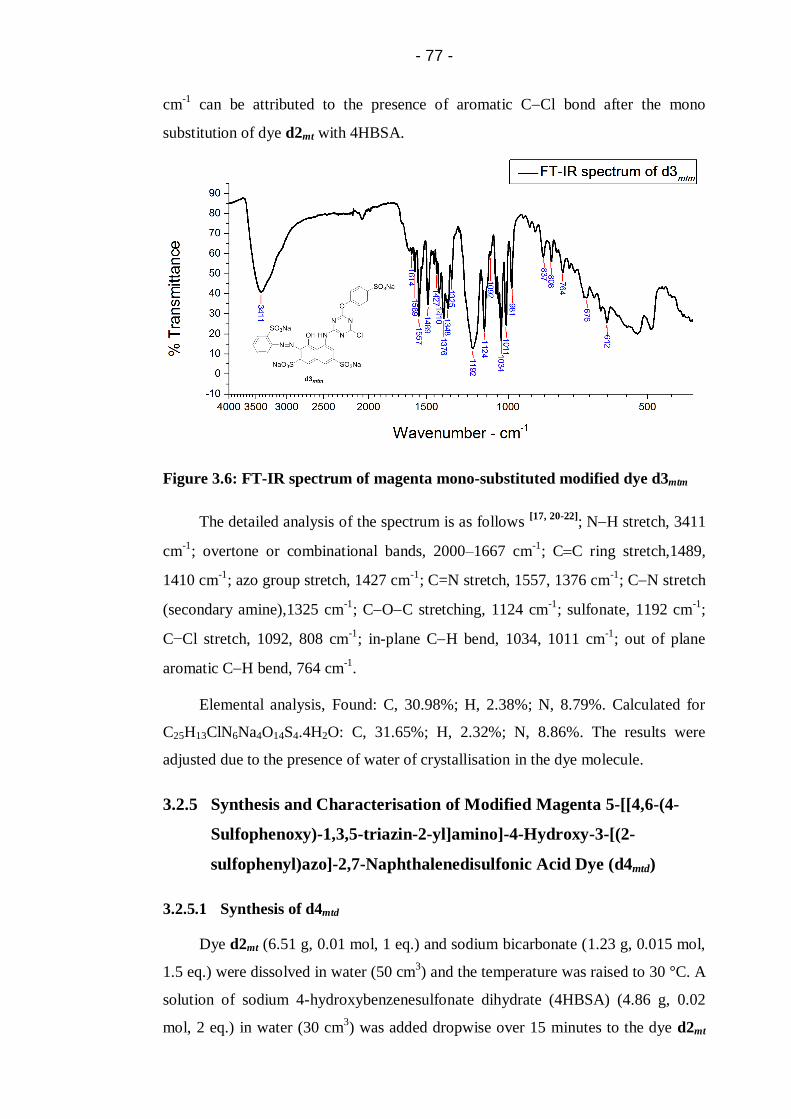
- 77 -
cm-1
can be attributed to the presence of aromatic CCl bond after the mono
substitution of dye d2mt with 4HBSA.
Figure 3.6: FT-IR spectrum of magenta mono-substituted modified dye d3mtm
The detailed analysis of the spectrum is as follows [17, 20-22]
; NH stretch, 3411
cm-1
; overtone or combinational bands, 2000–1667 cm-1
; CC ring stretch,1489,
1410 cm-1
; azo group stretch, 1427 cm-1
; C=N stretch, 1557, 1376 cm-1
; CN stretch
(secondary amine),1325 cm-1
; COC stretching, 1124 cm-1
; sulfonate, 1192 cm-1
;
C−Cl stretch, 1092, 808 cm-1
; in-plane CH bend, 1034, 1011 cm-1
; out of plane
aromatic CH bend, 764 cm-1
.
Elemental analysis, Found: C, 30.98%; H, 2.38%; N, 8.79%. Calculated for
C25H13ClN6Na4O14S4.4H2O: C, 31.65%; H, 2.32%; N, 8.86%. The results were
adjusted due to the presence of water of crystallisation in the dye molecule.
3.2.5 Synthesis and Characterisation of Modified Magenta 5-[[4,6-(4-
Sulfophenoxy)-1,3,5-triazin-2-yl]amino]-4-Hydroxy-3-[(2-
sulfophenyl)azo]-2,7-Naphthalenedisulfonic Acid Dye (d4mtd)
3.2.5.1 Synthesis of d4mtd
Dye d2mt (6.51 g, 0.01 mol, 1 eq.) and sodium bicarbonate (1.23 g, 0.015 mol,
1.5 eq.) were dissolved in water (50 cm3) and the temperature was raised to 30 °C. A
solution of sodium 4-hydroxybenzenesulfonate dihydrate (4HBSA) (4.86 g, 0.02
mol, 2 eq.) in water (30 cm3) was added dropwise over 15 minutes to the dye d2mt
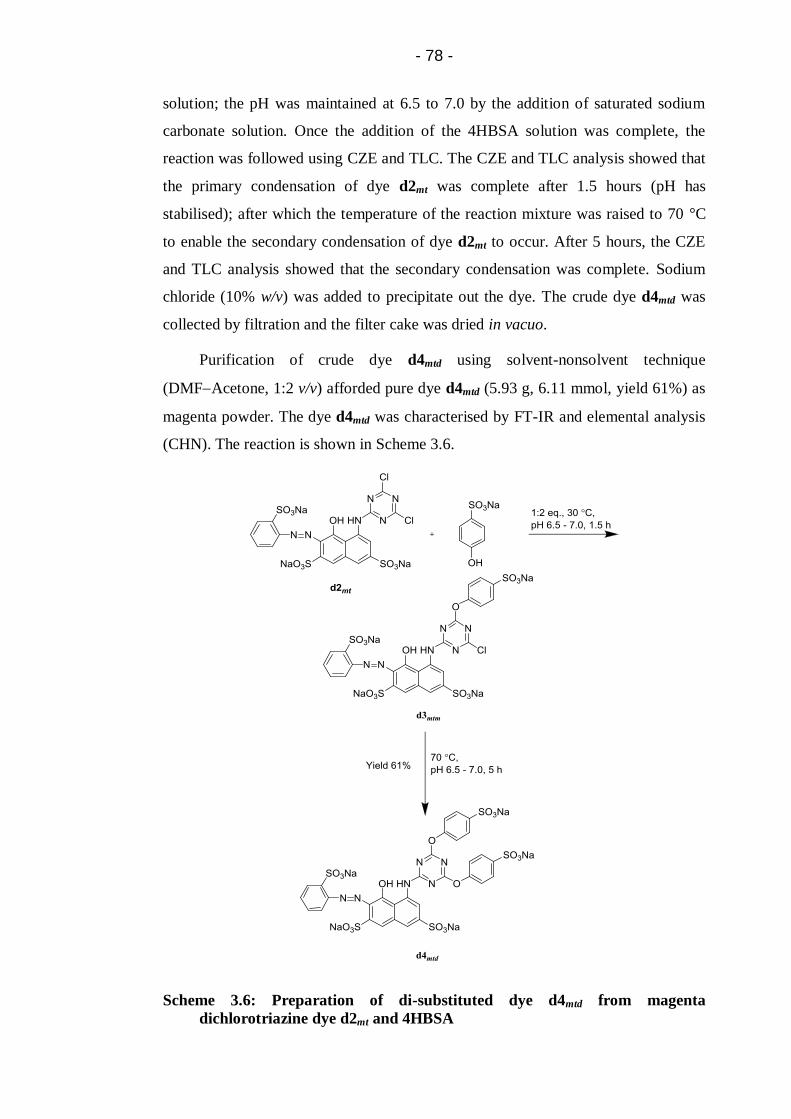
- 78 -
solution; the pH was maintained at 6.5 to 7.0 by the addition of saturated sodium
carbonate solution. Once the addition of the 4HBSA solution was complete, the
reaction was followed using CZE and TLC. The CZE and TLC analysis showed that
the primary condensation of dye d2mt was complete after 1.5 hours (pH has
stabilised); after which the temperature of the reaction mixture was raised to 70 °C
to enable the secondary condensation of dye d2mt to occur. After 5 hours, the CZE
and TLC analysis showed that the secondary condensation was complete. Sodium
chloride (10% w/v) was added to precipitate out the dye. The crude dye d4mtd was
collected by filtration and the filter cake was dried in vacuo.
Purification of crude dye d4mtd using solvent-nonsolvent technique
(DMFAcetone, 1:2 v/v) afforded pure dye d4mtd (5.93 g, 6.11 mmol, yield 61%) as
magenta powder. The dye d4mtd was characterised by FT-IR and elemental analysis
(CHN). The reaction is shown in Scheme 3.6.
Scheme 3.6: Preparation of di-substituted dye d4mtd from magenta
dichlorotriazine dye d2mt and 4HBSA
- 79 -
3.2.5.2 Characterisation of d4mtd
The CZE electropherograms at different reaction times during the modification
of dye d2mt with 4HBSA are shown in Figure 3.7.
Dye d2mt readily started to convert to the modified dye d3mtm (peak 2 in Figure
3.7b) after 0.5 hour; moreover, small amount of modified dye d4mtd (peak 3 in
Figure 3.7b) was also formed. After 4.5 hours of reaction at 25 °C, all of the dye
d2mt had been converted to the dye d3mtm or dye d4mtd (peak 1 and peak 2 in Figure
3.7c). When the reaction temperature was raised to 70 °C and allowed to continue
for a further 5 hours, the dye d3mtm had been fully converted to modified dye d4mtd
as shown in Figure 3.7d. The peaks were eluted in the order of decreasing mass to
charge ratio as expected.
Moreover, the percent area of the d4mtd shown in Figure 3.7 indicates the
purity of the final product.

- 80 -
Figure 3.7: Electropherograms showing reaction progress of synthesis of d4mtd.
(a) Starting dye d2mt; (b) d2mt d3mtm d4mtd after 0.5 hour reaction time;
(c) d3mtm d4mtd after 4.5 hours reaction time; (d) Final product d4mtd.
CZE conditions: same as Figure 3.1.
In analytical TLC analysis, the spots appeared as estimated, showing that the
primary condensation reaction of dye d2mt with 4HBSA occur readily at 30 °C

- 81 -
provided that neutral pH was maintained. Analytical TLC showed the gradual
appearance of new more polar magenta dye d3mtm (Rf value 0.67) compared to the
magenta starting material d2mt (Rf value 0.71). Once the mono-substitution was
completed, the di-substitution started and new more polar magenta dye d4mtd (Rf
value 0.60) appeared on TLC plate. TLC showed that mono-substituted dye d3mtm
was fully converted to the d4mtd in 5 hours.
In the FT-IR spectrum of the dye d4mtd, Figure 3.8, the appearance of new
peak at 1123 cm-1
can be attributed to the stretching vibration of COC in structure
between the triazine and the 4HBSA. The CCl peaks at 1092 cm-1
and 794 cm-1
(Figure 3.4) are no longer present indicating that dye d2mt has been successfully di-
substituted with 4HBSA to yield dye d4mtd.
Figure 3.8: FT-IR spectrum of magenta di-substituted dye d4mtd
The detailed analysis of spectrum (Figure 3.8) is as follows [17, 20-22]
; NH
stretch, 3431 cm-1
; aromatic CH stretch, 3077 cm-1
; overtone or combinational
bands, 2000–1667 cm-1
; CC ring stretch, 1488, 1405 cm-1
; azo group stretch, 1427
cm-1
; C=N stretch, 1557, 1376 cm-1
; CN stretch (secondary amine), 1323 cm-1
;
COC stretch, 1123,cm-1
; sulfonate, 1183 cm-1
; in-plane CH bend, 1034, 1008
cm-1
; out of plane aromatic CH bend, 763 cm-1
.
Elemental analysis, Found: C, 30.80%; H, 3.06%; N, 6.79%. Calculated for
C31H17N6Na5O18S5. 10H2O: C, 30.61%; H, 3.07%; N, 6.91%. It should be noted that
the results are adjusted due to the presence of water of crystallisation.

- 82 -
1H NMR (D2O, 500 MHz) 7.32 (2H, J = 10 Hz, t), 7.52 (2H,s), 7.62 (6H,
m), 7.82 (2H, J = 10 Hz, d), 8.15 (2H, J = 10 Hz, d), 9.20 (2H, s)
3.2.6 Application of Magenta Dyes (d2mt, d3mtm and d4mtd) onto Wool
Fabric by Inkjet Printing
The inks were prepared using 4% dye according to the procedure detailed in
section 2.5.2, and then viscosity and surface tension of inks were measured.
The resulting ink formulation was then introduced in the cartridge and printed
onto wool fabric using the HP 6940 Deskjet printer. Once printed, the printed wool
samples were fixed by three methods detailed in section 2.5.4, and evaluated for
percent fixation along with light fastness and wash fastness.
Moreover the inks were also evaluated for stability through CZE over twelve
months storage time at room temperature.
3.2.7 Characteristics of Inks (d2mt, d3mtm and d4mtd)
3.2.7.1 Surface Tension and Viscosity of Inks
In terms of inkjet printing, aqueous inks are required to have a surface tension
and viscosity of 25 – 60 dynes.cm-1
and 2 – 20 cP respectively [28, 29]
. It can be seen,
from Table 3.1, that parent dye d2mt and both the modified dyes (d3mtm and d4mtd)
based inks have a surface tension and viscosity within the operational range.
Table 3.1: Surface tension and viscosity of magenta inks
Ink formulation
Surface Tension
(dynes.cm-1
)
Viscosity
(cP)
d2mt based ink 43.5 10
d3mtm based ink 44.0 10
d4mtd based ink 45.0 8
3.2.7.2 Stability of Dye (d2mt, d3mtm and d4mtd) Based Inks
As discussed earlier, dichlorotriazine dyes are susceptible to hydrolysis even
with just traces of moisture. Moreover, reactive dyes can also react with

- 83 -
nucleophiles such as amino and hydroxyl groups present in ink during their storage.
From this mechanism there are several unfavourable courses of reaction by reactive
dyes during storage of inks. These reactions not only reduce the efficiency of
coloration of dye (percent fixation) but also results in dye wastage [29]
. Therefore,
stability of dichlorotriazine dye along with new modified dyes in inks were also
evaluated.
The results obtained from stability tests of magenta dyes are detailed in this
section. The results of any change in the percent area of the peaks of the dyes d2mt,
d3mtm and d4mtd within inks stored at room temperature for 12 months can be seen in
Figure 3.9, Figure 3.10 and Figure 3.11.
Figure 3.9: Electropherograms showing d2mt based ink stability. (a) Fresh ink;
(b) Ink after one month storage at room temperature.
The percent area of peaks on the CZE electropherogram is related to the
concentration of specific compounds in the ink samples. As shown in Figure 3.9a,
the effective component d2mt in the fresh ink was 100%, which reduced to 16%
(Figure 3.9b) after only one month storage, indicating that one or both of the labile
chlorine atom(s) of triazine group got hydrolysed during storage at room
temperature.

- 84 -
Figure 3.10: Electropherograms showing d3mtm based ink stability. (a) Fresh
ink; (b) Ink after twelve months storage at room temperature.
Figure 3.11: Electropherograms showing d4mtd based ink stability. (a) Fresh
ink; (b) Ink after twelve months storage at room temperature.
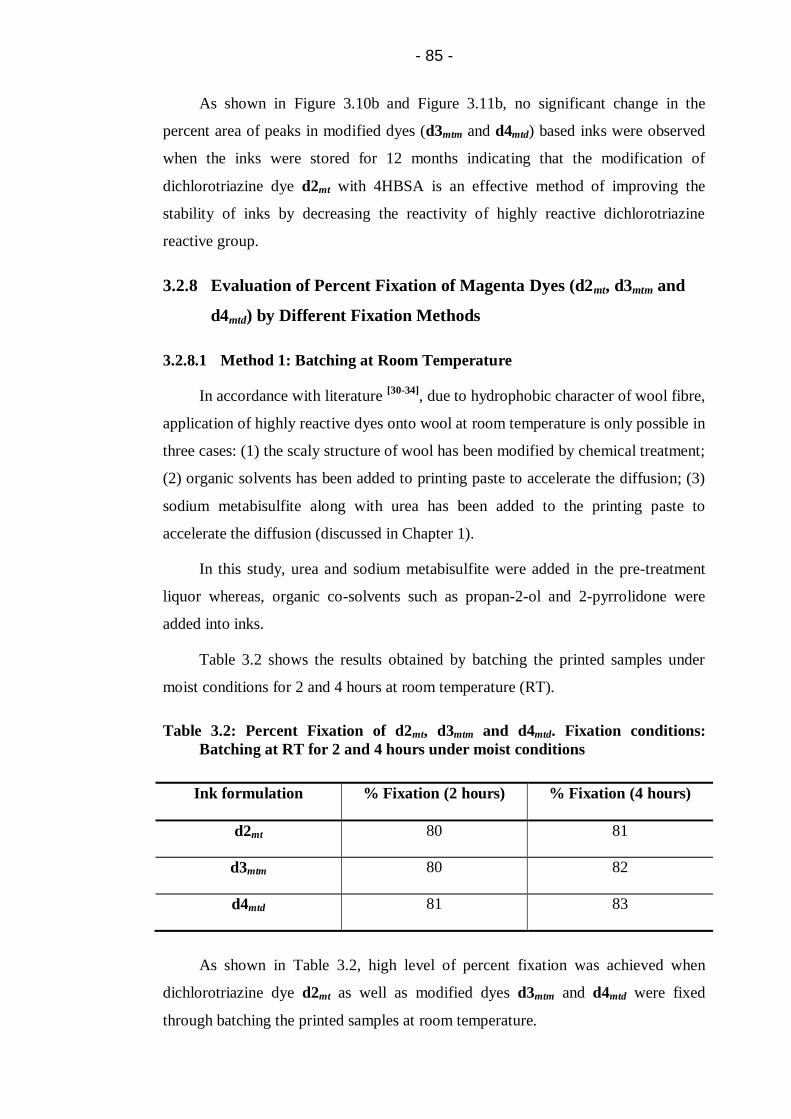
- 85 -
As shown in Figure 3.10b and Figure 3.11b, no significant change in the
percent area of peaks in modified dyes (d3mtm and d4mtd) based inks were observed
when the inks were stored for 12 months indicating that the modification of
dichlorotriazine dye d2mt with 4HBSA is an effective method of improving the
stability of inks by decreasing the reactivity of highly reactive dichlorotriazine
reactive group.
3.2.8 Evaluation of Percent Fixation of Magenta Dyes (d2mt, d3mtm and
d4mtd) by Different Fixation Methods
3.2.8.1 Method 1: Batching at Room Temperature
In accordance with literature [30-34]
, due to hydrophobic character of wool fibre,
application of highly reactive dyes onto wool at room temperature is only possible in
three cases: (1) the scaly structure of wool has been modified by chemical treatment;
(2) organic solvents has been added to printing paste to accelerate the diffusion; (3)
sodium metabisulfite along with urea has been added to the printing paste to
accelerate the diffusion (discussed in Chapter 1).
In this study, urea and sodium metabisulfite were added in the pre-treatment
liquor whereas, organic co-solvents such as propan-2-ol and 2-pyrrolidone were
added into inks.
Table 3.2 shows the results obtained by batching the printed samples under
moist conditions for 2 and 4 hours at room temperature (RT).
Table 3.2: Percent Fixation of d2mt, d3mtm and d4mtd. Fixation conditions:
Batching at RT for 2 and 4 hours under moist conditions
Ink formulation % Fixation (2 hours) % Fixation (4 hours)
d2mt 80 81
d3mtm 80 82
d4mtd 81 83
As shown in Table 3.2, high level of percent fixation was achieved when
dichlorotriazine dye d2mt as well as modified dyes d3mtm and d4mtd were fixed
through batching the printed samples at room temperature.
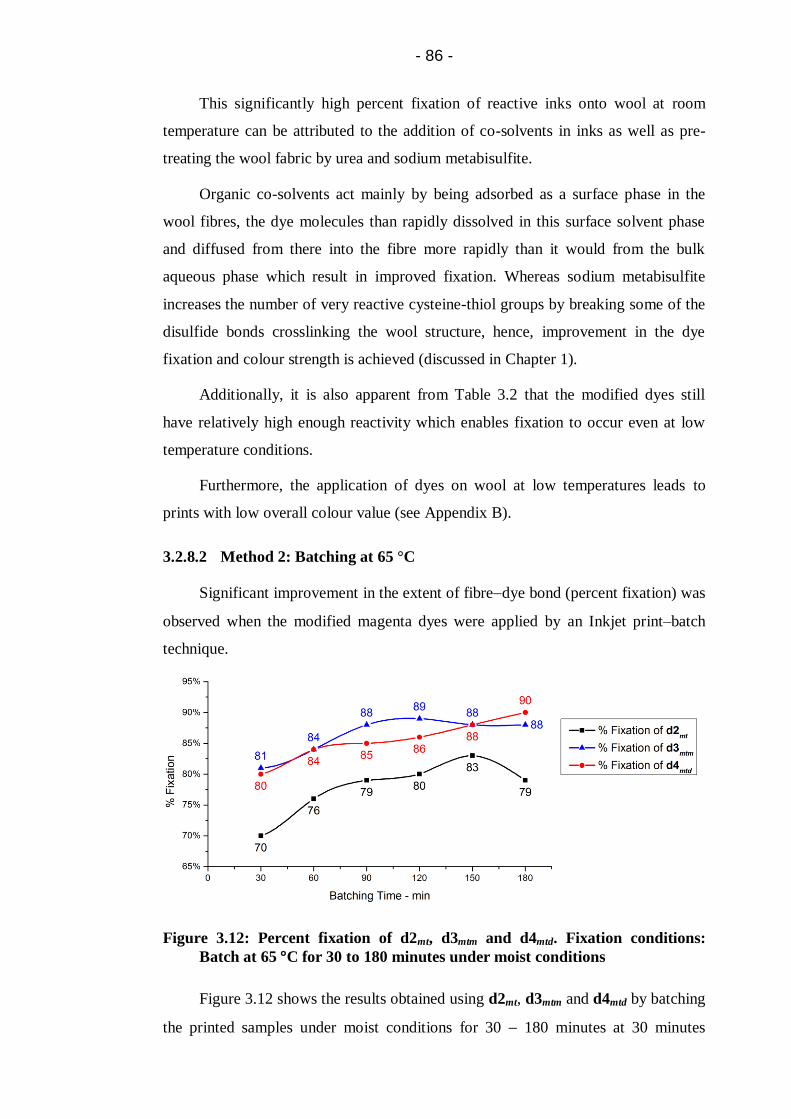
- 86 -
This significantly high percent fixation of reactive inks onto wool at room
temperature can be attributed to the addition of co-solvents in inks as well as pre-
treating the wool fabric by urea and sodium metabisulfite.
Organic co-solvents act mainly by being adsorbed as a surface phase in the
wool fibres, the dye molecules than rapidly dissolved in this surface solvent phase
and diffused from there into the fibre more rapidly than it would from the bulk
aqueous phase which result in improved fixation. Whereas sodium metabisulfite
increases the number of very reactive cysteine-thiol groups by breaking some of the
disulfide bonds crosslinking the wool structure, hence, improvement in the dye
fixation and colour strength is achieved (discussed in Chapter 1).
Additionally, it is also apparent from Table 3.2 that the modified dyes still
have relatively high enough reactivity which enables fixation to occur even at low
temperature conditions.
Furthermore, the application of dyes on wool at low temperatures leads to
prints with low overall colour value (see Appendix B).
3.2.8.2 Method 2: Batching at 65 °C
Significant improvement in the extent of fibredye bond (percent fixation) was
observed when the modified magenta dyes were applied by an Inkjet print–batch
technique.
Figure 3.12: Percent fixation of d2mt, d3mtm and d4mtd. Fixation conditions:
Batch at 65 °C for 30 to 180 minutes under moist conditions
Figure 3.12 shows the results obtained using d2mt, d3mtm and d4mtd by batching
the printed samples under moist conditions for 30 180 minutes at 30 minutes

- 87 -
interval. The highest level of percent fixation observed with ink based on magenta
dichlorotriazine dye was 83% in 150 minutes batching time, and for longer batching
times there was some evidence of the breakdown of fibre-dye bond. Whereas, for
modified dyes d3mtm and d4mtd based inks they are 89% in 120 minutes and 90% in
180 minutes respectively. This shows an increase of approximately 7% and 8%
improvement in the percent fixation of d3mtm and d4mtd onto wool respectively.
Moreover, di-substituted dye d4mtd exhibit highest fixation due to the presence
of more than one leaving group of same reactivity, which increases the chances of
this dye (d4mtd) to react with wool fibre, as every reactive group can cover another
area of the fibre with the same probability.
3.2.8.3 Method 3: Steaming
The profile shown in Figure 3.13 reflects the effect of steaming and steaming
time on the percent fixation of magenta dichlorotriazine (d2mt) and modified dyes
(d3mtm and d4mtd) printed on the wool fabric.
Figure 3.13: Percent fixation of d2mt, d3mtm and d4mtd. Fixation conditions:
Steaming for 5, 10, 15, 20 and 25 minutes
It can be seen from Figure 3.13 that, by steaming the samples at 102 °C,
modified dyes (d3mtm and d4mtd) exhibited percent fixation which was clearly
superior to that achieved with dichlorotriazine dye d2mt . It is generally agreed that
steam served as an effective source of both water and heat which allowed the wool
fibres to open up for the inks to penetrate rapidly [35, 36]
, thus enabling the reaction of
reactive group(s) with fibre to take place.
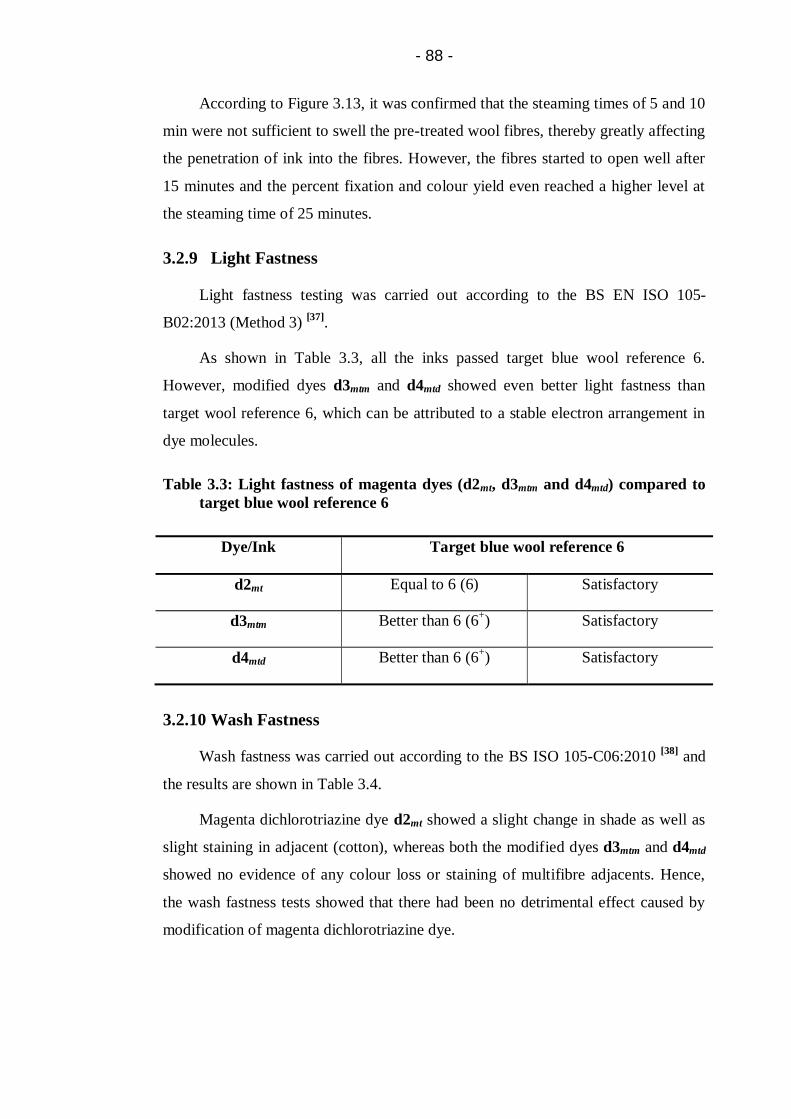
- 88 -
According to Figure 3.13, it was confirmed that the steaming times of 5 and 10
min were not sufficient to swell the pre-treated wool fibres, thereby greatly affecting
the penetration of ink into the fibres. However, the fibres started to open well after
15 minutes and the percent fixation and colour yield even reached a higher level at
the steaming time of 25 minutes.
3.2.9 Light Fastness
Light fastness testing was carried out according to the BS EN ISO 105-
B02:2013 (Method 3) [37]
.
As shown in Table 3.3, all the inks passed target blue wool reference 6.
However, modified dyes d3mtm and d4mtd showed even better light fastness than
target wool reference 6, which can be attributed to a stable electron arrangement in
dye molecules.
Table 3.3: Light fastness of magenta dyes (d2mt, d3mtm and d4mtd) compared to
target blue wool reference 6
Dye/Ink Target blue wool reference 6
d2mt Equal to 6 (6) Satisfactory
d3mtm Better than 6 (6+) Satisfactory
d4mtd Better than 6 (6+) Satisfactory
3.2.10 Wash Fastness
Wash fastness was carried out according to the BS ISO 105-C06:2010 [38]
and
the results are shown in Table 3.4.
Magenta dichlorotriazine dye d2mt showed a slight change in shade as well as
slight staining in adjacent (cotton), whereas both the modified dyes d3mtm and d4mtd
showed no evidence of any colour loss or staining of multifibre adjacents. Hence,
the wash fastness tests showed that there had been no detrimental effect caused by
modification of magenta dichlorotriazine dye.

- 89 -
Table 3.4: Wash fastness of magenta dyes (d2mt, d3mtm and d4mtd)
Dye/Ink Change in shade
Staining
CA C N P A W
d2mt 4-5 5 4-5 5 5 5 5
d3mtm 5 5 5 5 5 5 5
d4mtd 5 5 5 5 5 5 5
CA: Cellulose Acetate; C: Cotton; N: Nylon; P: Polyester; A: Acrylic; W: Wool
3.3 Conclusions
In this study, the specificity of the reactivity of chlorine atoms of cyanuric
chloride were explored in designing dyes for inkjet application of wool fabric with
the aim to lower the chemical reactivity of magenta dichlorotriazine dye, increased
solubility and increased stability.
Thus, one chlorine of cyanuric chloride was displaced by amino based
magenta dye chromophore at 0 to 5 °C (pH 3.0 to 3.5) to produce magenta
dichlorotriazine dye d2mt in pure form (without hydrolysed by-products).
The first modification of magenta dichlorotriazine dye was done by displacing
the second chlorine atom by the sulfophenoxy group at 25 °C (5 hours) to produce
mono-substituted dye d3mtm in pure form.
Second modification of magenta dichlorotriazine dye was done by displacing
the second chlorine atom by using two equivalent sulfophenoxy group at 30 °C (1.5
hours) to produce intermediate dye d3mtm and then the third chlorine atom as
displaced at 70 °C (5 hours) to produce di-substituted dye d4mtd in pure form.
The characteristic properties such as surface tension and viscosity of inks
formulated by incorporating the synthesised dyes were found to be in the operational
range.
As modified dyes are of low reactivity as such the inks can be stored for 12
months at room temperature without deterioration from hydrolysis of the reactive
group(s).
Significant improvement in the extent of covalent dye fixation was observed
when the modified magenta dyes were applied by both inkjet print–batch (elevated

- 90 -
temperature) and inkjet printsteaming methods. Moreover, when the inkjet
printbatch (room temperature) method was used, although modified dyes along
with dichlorotriazine dye gave high levels of fixation but there was no significant
improvement in the extent of percent fixation of modified dyes as compared to
dichlorotriazine dyes.
Furthermore, it is likewise evident from fixation results that reactive dyes with
more than one leaving group of same reactivity have intrinsically better chances to
react, since every reactive group can cover another area of the fibre with the same
probability. Hence, showed increased percent fixation and considerable reduced
washing-off.
Colour fastness properties of magenta dichlorotriazine dye-based ink was 0.5
grade lower when compared with the modified dyes-based inks for both the light
fastness as well as wash fastness.
3.4 References
1. Beech, W.F. Fibre-Reactive Dyes London: Logos Press Ltd., 1970.
2. Zollinger, H. Color Chemistry: Synthesis Properties, and Applications of
Organic Dyes and Pigments. Weinheim: Wiley-VCH, 2003.
3. Rattee, I.D. Historical Backgroud. In: I.C.I. Ltd., ed. Procion Dyestuffs in
Textile Printing. Leeds: Dyestuffs Divison, 1960.
4. Imperial Chemical Industries Ltd. Procion dyestuffs in textile printing.
London: The Division, 1960.
5. Hawkyard, C.J. Substrate preparation for inkjet printing. In: H. Ujiie, ed.
Digital printing of Textiles. Cambridge: Woodhead Publishing Ltd, 2006.
6. Lewis, D.M. The Dyeing of Wool with Reactive Dyes. Journal of the Society
of Dyers and Colourists, 1982, 98, pp.165-175.
7. Hildebrand, D. Application and Properties. In: K. Venkataraman, ed. The
chemistry of synthetic dyes. New York: Academic Press Ltd., 1978.
8. Patent US20040081761 (2004)
9. Patent FR1283172 (1961)
10. Patent CH464396 (1968)
- 91 -
11. Clark, M., Yang, K. and Lewis, D.M. Modified 2,4-difluoro-5-chloro-
pyrimidine dyes and their application in inkjet printing on wool fabrics.
Coloration Technology, 2009, 125, pp.184-190.
12. Venkataraman, K. ed. The chemistry of synthetic dyes. New York:
Academic Press Ltd., 1978.
13. Patent WO2002024815 (2002)
14. Mokhtari, J., Akbarzadeh, A., Phillips, D. and Taylor, J. Study of application
properties of novel trisazo hetero bi-functional reactive dyes based on j-acid
derivatives for cotton. Arabian Journal for Science and Engineering, 2009,
34, pp.63-71.
15. Zuwang, W. Recent developments of reactive dyes and reactive dyeing of
silk. Review of Progress in Coloration and Related Topics, 1998, 28, pp.32-
38.
16. Fierz-David, H.E. and Blangey, L. Fundamental processes of dye chemistry.
New York: An Interscience Publication, 1949.
17. Socrates, G. Infrared and Raman characteristic group frequencies : tables
and charts. Chichester: Wiley, 2001.
18. Lambert, J.B., Shurvell, H.E., Lightner, D.A. and Cooks, R.G. Organic
structural spectroscopy. New Jersey: Prentice Hall, 1998.
19. Miller, R.K. Infrared Spectroscopy. In: K. Venkataraman, ed. The Analytical
Chemistry of Synthetic Dyes. New York: Wiley & Sons, 1977.
20. Matlok, F., Gremlich, H.U., Bruker Analytische Meotechnik and Merck eds.
Merck FT-IR atlas : a collection of FT-IR spectra. Weinheim: Vch, 1988.
21. Keller, R.J. and Sigma-Aldrich Corporation. The Sigma library of FT-IR
spectra. Missouri: Sigma Chemical Company, 1986.
22. Silverstein, R.M., Webster, F.X. and Kiemle, D.J. Spectrometric
Identification of Organic Compounds. 7th ed. New York: John Wiley and
Sons, 2005.
23. Waring, D.R. and Hallas, G. eds. The Chemistry and Application of Dyes.
New York: Plenum Press, 1994.
24. Patent GB785222 (1957)
25. Patent GB838337 (1960)
- 92 -
26. University of Colorado at Boulder. Thin Layer Chromatography (TLC)
[online]. 2013. [Accessed December 10, 2011]. Available from:
http://orgchem.colorado.edu/Technique/Procedures/TLC/TLC.html.
27. Patent DE2045086A (1971)
28. Magdassi, S. Ink Requirements and Formulations Guidelines. In: S.
Magdassi, ed. Chemistry of Inkjet Inks. New Jersey: World Scientific
Publishing Ltd., 2012.
29. Ujiie, H. Digital printing of textiles. Cambridge: Woodhead Publishing Ltd.,
2006.
30. Beech, W.F. Reactive dyes for wool and synthetic fibres. In: Fibre-Reactive
Dyes London: Logos Press Ltd., 1970.
31. Bell, V. Recent developments in wool printing. Journal of the Society of
Dyers and Colourists, 1988, 104, pp.159-172.
32. Peters, L. and Stevens, C.B. The Effect of Solvents in Dyeing. Journal of the
Society of Dyers and Colourists, 1957, 73, pp.23-23.
33. Hadfield, H.R. and Lemin, D.R. The use of Reactive Dyes for dyeing Wool
and Wool Unions. Journal of the Textile Institute Transactions, 1960, 51,
pp.T1351-T1370.
34. Lewis, D.M. and Seltzer, I. Print‐Batch (Cold)—A New Process for Wool.
Journal of the Society of Dyers and Colourists, 1972, 88, pp.327-329.
35. Chapman, K. Printing 2002: A digital odyssey. AATCC Review, 2002, 2,
pp.12-15.
36. Yuen, C., Ku, S., Choi, P. and Kan, C. The effect of the pretreatment print
paste contents on colour yield of an ink-jet printed cotton fabric. Fibers and
Polymers, 2004, 5, pp.117-121.
37. British Standards Institution. Colour fastness to artificial light: Xenon arc
fading lamp test, ISO 105-B02:2013.
38. British Standards Institution. Textiles - Tests for colour fastness - Part C06:
Colour fastness to domestic and commercial laundering, BS EN ISO 105-
C06:2010.

- 93 -
4 Synthesis, Modification, Characterisation of Yellow
Dichlorotriazine Dyes and Their Application onto Wool Fabric
by Inkjet Printing
This chapter details the synthesis and characterisation of yellow
dichlorotriazine dye d6yt, modification of this dye by incorporating sulfophenoxy
group to produce mono-substituted dye d7ytm and also di-substituted dye d8ytd. CE
(MEKC) and TLC were used to monitor above course of reactions and the structural
changes were confirmed through FT-IR. Moreover, elemental analysis (CHN) of
new modified dyes were also done.
This chapter also details the application of yellow dichlorotriazine dye and
modified dyes based inks by inkjet printing on wool fabrics along with performance
evaluation of inks such as surface tension, viscosity, ink stability, percent fixation of
the dye and colour fastness properties.
4.1 Experimental
4.1.1 Materials
7-amino-1,3-naphthalenedisulfonic acid (88%), sodium nitrite (98%), m-
toluidine (99%), cyanuric chloride (99%), sodium 4-hydroxybenzenesulfonate
dihydrate (98%), sodium metabisulfite, carboxymethyl cellulose, polysorbate 20
(Tween 20) and N-methylmorpholine N-oxide (NMMO) were supplied by Sigma-
Aldrich and used as received. Urea (MP Biomedicals), Alcopol O 60 (Acros
organics), 2-pyrrolidone (Acros organics), 2-propanol (Fisher), Sandozin NIE
(Clariant) were also purchased and used as received.

- 94 -
4.1.2 Synthesis and Characterisation of Yellow 7-[(4-Amino-2-
methylphenyl)azo]-1,3-Naphthalenedisulfonic Acid Dye (d5y)
4.1.2.1 Synthesis of d5y
4.1.2.1.1 Diazotization
In accordance with the method described in references [1-4]
, 7-amino-1,3-
naphthalenedisulfonic acid (17.22 g, 0.05 mol, 88%) was suspended in water (100
cm3) and then treated with concentrated hydrochloric acid (10 cm
3, 0.125 mol,
36.6%) and cooled to 20 °C. The temperature was lowered to 0 to 5 °C by adding
ice, and diazotization was carried out by adding 1N sodium nitrite solution (3.52 g,
0.05 mol, 98%). The reaction mixture was stirred at 0 to 5 °C and pH < 2.
Diazotization was complete as soon as small amount withdrawn from a reaction
mixture did not give a yellow colour when treated with 2N sodium acetate solution.
Excess nitrous acid was removed by adding sulfamic acid (confirmed by spotting a
drop of reaction mixture on starch iodide paper). The reaction is shown in Scheme
4.1.
Scheme 4.1: Diazotization of 7-amino-1,3-naphthalenedisulfonic acid with
nitrous acid to form diazonium salt
4.1.2.1.2 Coupling
Meta-toluidine (5.40 g, 0.05 mol, 99%) was dissolved in concentrated
hydrochloric acid (5 cm3, strength 36.6%) and water (75 cm
3) and then added
dropwise with good stirring into the diazo solution (0.05 mol) at 0 to 5 °C over 45
minutes. The pH of the reaction mixture was then adjusted to pH 3.5 to 3.7 by the
addition of 2N sodium acetate solution and the reaction mixture was stirred for
further 4 hours at 0 to 5 °C; and was monitored by MEKC, analytical TLC and spot
test for completion. Sodium chloride (8% w/v) was added in small portions to a
stirred reaction mixture to precipitate the dye which was subsequently collected by
filtration, washed with brine (10% w/v) and dried in vacuo.
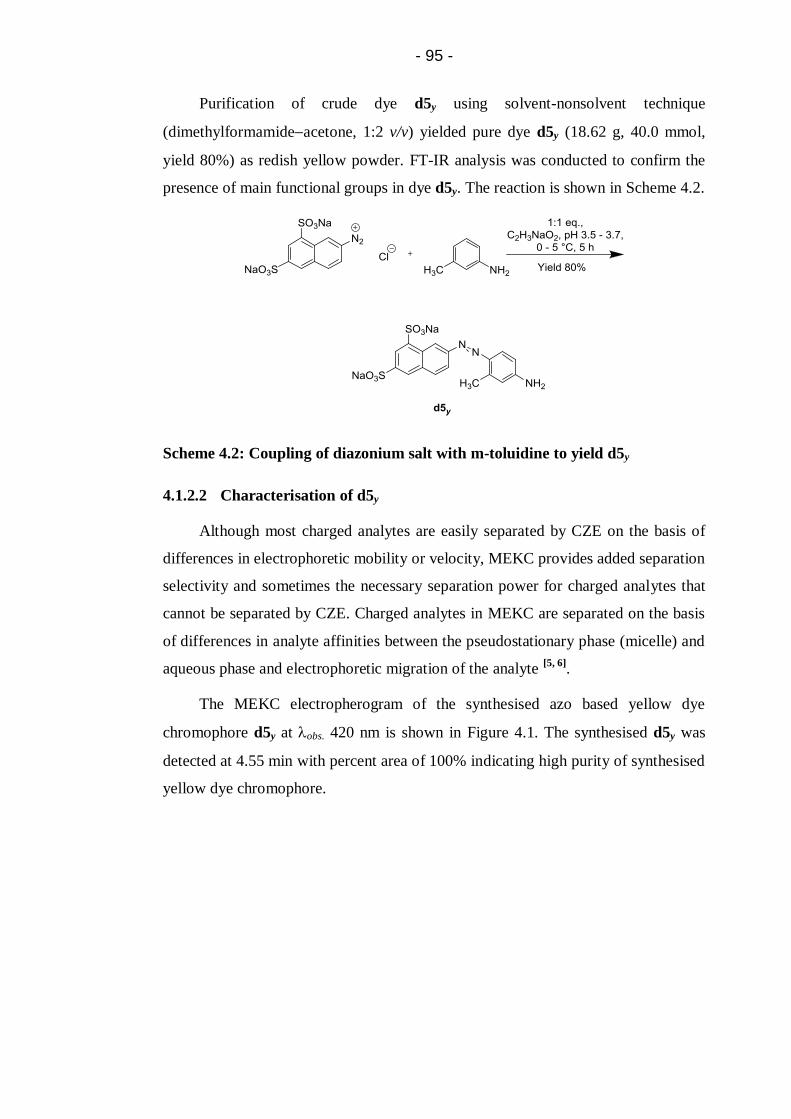
- 95 -
Purification of crude dye d5y using solvent-nonsolvent technique
(dimethylformamideacetone, 1:2 v/v) yielded pure dye d5y (18.62 g, 40.0 mmol,
yield 80%) as redish yellow powder. FT-IR analysis was conducted to confirm the
presence of main functional groups in dye d5y. The reaction is shown in Scheme 4.2.
Scheme 4.2: Coupling of diazonium salt with m-toluidine to yield d5y
4.1.2.2 Characterisation of d5y
Although most charged analytes are easily separated by CZE on the basis of
differences in electrophoretic mobility or velocity, MEKC provides added separation
selectivity and sometimes the necessary separation power for charged analytes that
cannot be separated by CZE. Charged analytes in MEKC are separated on the basis
of differences in analyte affinities between the pseudostationary phase (micelle) and
aqueous phase and electrophoretic migration of the analyte [5, 6]
.
The MEKC electropherogram of the synthesised azo based yellow dye
chromophore d5y at obs. 420 nm is shown in Figure 4.1. The synthesised d5y was
detected at 4.55 min with percent area of 100% indicating high purity of synthesised
yellow dye chromophore.

- 96 -
Figure 4.1: Electropherogram of yellow dye chromophore d5y. MEKC
conditions: running buffer, 20 mM sodium tetraborate, 50 mM sodium
dodecyl sulphate (SDS), pH 9.3; pressure injection 0.5 psi for 10 s; voltage
25 kV; detection at 420 nm
Only a single spot with Rf value of 0.63 was detected on a chromatogram in
n-butanol−iso-propanol−ethyl acetate−water (2:4:1:3 v/v).
According to literature [7, 8]
, primary amines display two absorption bands near
3400 3200 cm-1
, these bands represents the asymmetrical and symmetrical NH
stretching modes respectively. Also, strong to medium NH bending vibration of
primary amines is observed in the 16501580 cm-1
and medium to strong broad
absorption in 909 – 666 cm-1
region of spectrum from NH wagging.
Analysis of FT-IR spectrum (Figure 4.2) of pure redish yellow powder
suggested that the compound was d5y since peaks appeared at 3328, 3227cm-1
(stretching); 1588 cm-1
(bending) and 881 cm-1
(wagging) attributed the presence of
primary amine group on d5y.
Figure 4.2: FT-IR spectrum of yellow dye chromophore d5y

- 97 -
The detailed analysis of spectrum (Figure 4.2) is as follows [7-10]
; NH stretch,
primary amine, 3328 cm-1
and 3227 cm-1
; overtone or combinational bands, 2000–
1667 cm-1
; C=C stretch, 1651 cm-1
; NH bending, 1625 cm-1
;CC ring stretch,
1555, 1492; azo group stretch, 1414 cm-1
; CN stretch (primary amine), 1247 cm-1
;
sulfonate salts, 1176 cm-1
; in-plane CH bend, 1037 cm-1
; broad, NH wag, 881
cm-1
; out of plane aromatic CH bend, 809, 763 cm-1
; CH3 rock, 727 cm-1
.
1H NMR (D2O, 500 MHz) 2.30 (3H, s), 6.38 (1H, s), 6.41 (1H, J = 10 Hz,
d), 7.30 (1H, J = 10 Hz, d), 7.77 (1H, J = 10Hz, d), 7.91 (1H, J = 10, d), 8.22 (1H, s),
8.29 (1H, s), 8.68 (1H, s)
4.1.3 Synthesis and Characterisation of Yellow 7-[(4,6-Dichloro-1,3,5-
triazin-2-yl)amino -2-methylphenyl]azo]-1,3-
Naphthalenedisulfonic Acid Dye (d6yt)
4.1.3.1 Synthesis of d6yt
In accordance with the method described in references [11-14]
, a solution of
cyanuric chloride (9.22 g, 0.05 mol) in acetone (50 cm3) was poured into a stirred
mixture of water (125 cm3) and ice (125 cm
3) at a temperature below 5 °C. Dye
chromophore d5y (0.05 M, 23.37 g) was dissolved in water (250 cm3) and the pH
was adjusted to 7.0 by the addition of 2N sodium carbonate solution and then added
dropwise to the cyanuric chloride solution over 30 minutes. The pH of the reaction
mixture was maintained at pH 5.6 to 6.5 by the addition of 2N sodium carbonate
solution, while the temperature was kept at 0 to 5 °C.
Once the addition of the dye chromophore solution was complete, the reaction
was stirred for a further 2 hours and monitored by MEKC and analytical TLC. When
the reaction had gone to completion, the 2N sodium carbonate solution was added to
raise the pH to 7.0. Phosphate buffer (30 cm3, NaH2PO4 0.12 M, Na2HPO4 0.2 M,
pH 6.4) was added to buffer the reaction mixture. The dye was precipitated by the
addition of sodium chloride (10% w/v). The crude dye d6yt was collected by
filtration and the filter cake was washed with brine (2 50 cm3) and dried in vacuo.
Purification of crude dye using solventnonsolvent technique (DMFacetone,
1:2 v/v) yielded the pure dye d6yt (9.98 g, 14.6 mmol, yield 73%) as yellow powder.

- 98 -
FT-IR analysis was conducted to confirm the presence of main functional groups in
dye d6yt. The reaction is shown in Scheme 4.3.
Scheme 4.3: Preparation of condensation product d6yt from yellow azo
chromophore and cyanuric chloride
4.1.3.2 Characterisation of d6yt
It has previously been mentioned that the micelles used in MEKC are charged
on the surface, therefore an analyte with the opposite charge of the micelle will
strongly interact with the micelle through electrostatic forces and an analyte with the
same charge as the micelle will interact weakly, due to the electrostatic repulsion
[15]. When anionic micelle such as sodium dodecyl sulfate (SDS) is employed, the
general migration order will be exactly the opposite as in CZE: anions, neutral
analytes and cations. Anions will remain mostly in the bulk solution due to
electrostatic repulsions from the micelle; neutral molecules will be separated
exclusively due to their hydrophobicity; while cations will migrate last due to the
strong electrostatic attraction [16]
.
As anionic analytes spend more of their time in the bulk phase due to
electrostatic repulsions from the SDS micelle. Therefore, the greater the anionic
charge, the more rapid the elution [17]
.
As SDS micelle was used in this study for the separation of yellow
dichlorotriazine dye and modified dyes, therefore they will interact weakly due to
electrostatic repulsion, resulting in separation in the order of decreasing anionic
charge.
Figure 4.3 shows the reaction progression of synthesis of d6yt in a fused silica
capillary at pH 9.3. Both analytes have a charge of −2 under these conditions. As

- 99 -
shown in Figure 4.3b, water migrates quickly at the EOF velocity followed by d5y
(4.87 min) and then d6yt (5.49 min), this is because dye d6yt has an increased
molecular weight compared to dye d5y but no additional sulfonate groups that would
increase the solubility or hydrophilicity of the dye d6yt.
Moreover, the percent area of the d6yt shown in Figure 4.3c, was 100% which
indicates that there was no hydrolysed dye in the final product.
Figure 4.3: Electropherograms showing reaction progress of synthesis of d6yt.
(a) Starting yellow dye chromophore d5y; (b) d5yd6yt after 1.5 hours
reaction; (c) Final product d6yt. MEKC conditions: same as Figure 4.1.
Being weakly polar as compared to the yellow starting material d5y (Rf value
0.63) the new dichlorotriazine dye d6yt (Rf value 0.70) move through the adsorbent
more rapidly. Moreover, almost quantitative conversion to product occurred in 2
hours.
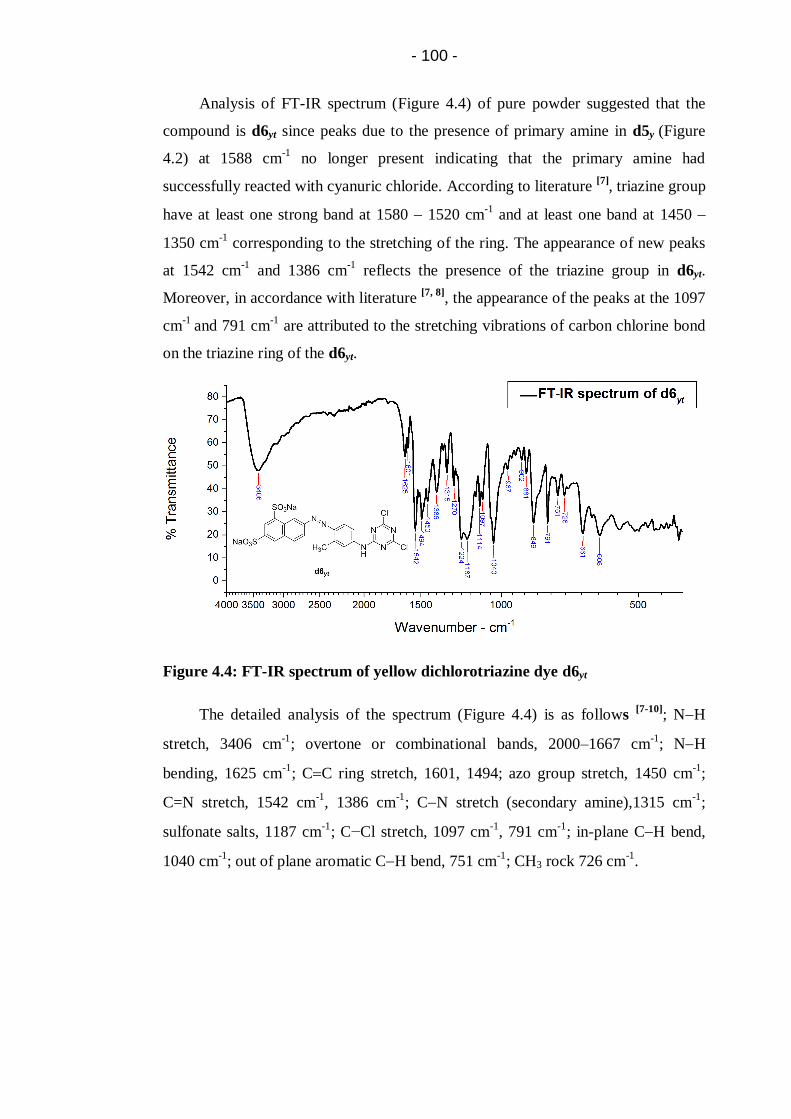
- 100 -
Analysis of FT-IR spectrum (Figure 4.4) of pure powder suggested that the
compound is d6yt since peaks due to the presence of primary amine in d5y (Figure
4.2) at 1588 cm-1
no longer present indicating that the primary amine had
successfully reacted with cyanuric chloride. According to literature [7]
, triazine group
have at least one strong band at 1580 1520 cm-1
and at least one band at 1450
1350 cm-1
corresponding to the stretching of the ring. The appearance of new peaks
at 1542 cm-1
and 1386 cm-1
reflects the presence of the triazine group in d6yt.
Moreover, in accordance with literature [7, 8]
, the appearance of the peaks at the 1097
cm-1
and 791 cm-1
are attributed to the stretching vibrations of carbon chlorine bond
on the triazine ring of the d6yt.
Figure 4.4: FT-IR spectrum of yellow dichlorotriazine dye d6yt
The detailed analysis of the spectrum (Figure 4.4) is as follows [7-10]
; NH
stretch, 3406 cm-1
; overtone or combinational bands, 2000–1667 cm-1
; NH
bending, 1625 cm-1
; CC ring stretch, 1601, 1494; azo group stretch, 1450 cm-1
;
C=N stretch, 1542 cm-1
, 1386 cm-1
; CN stretch (secondary amine),1315 cm-1
;
sulfonate salts, 1187 cm-1
; C−Cl stretch, 1097 cm-1
, 791 cm-1
; in-plane CH bend,
1040 cm-1
; out of plane aromatic CH bend, 751 cm-1
; CH3 rock 726 cm-1
.
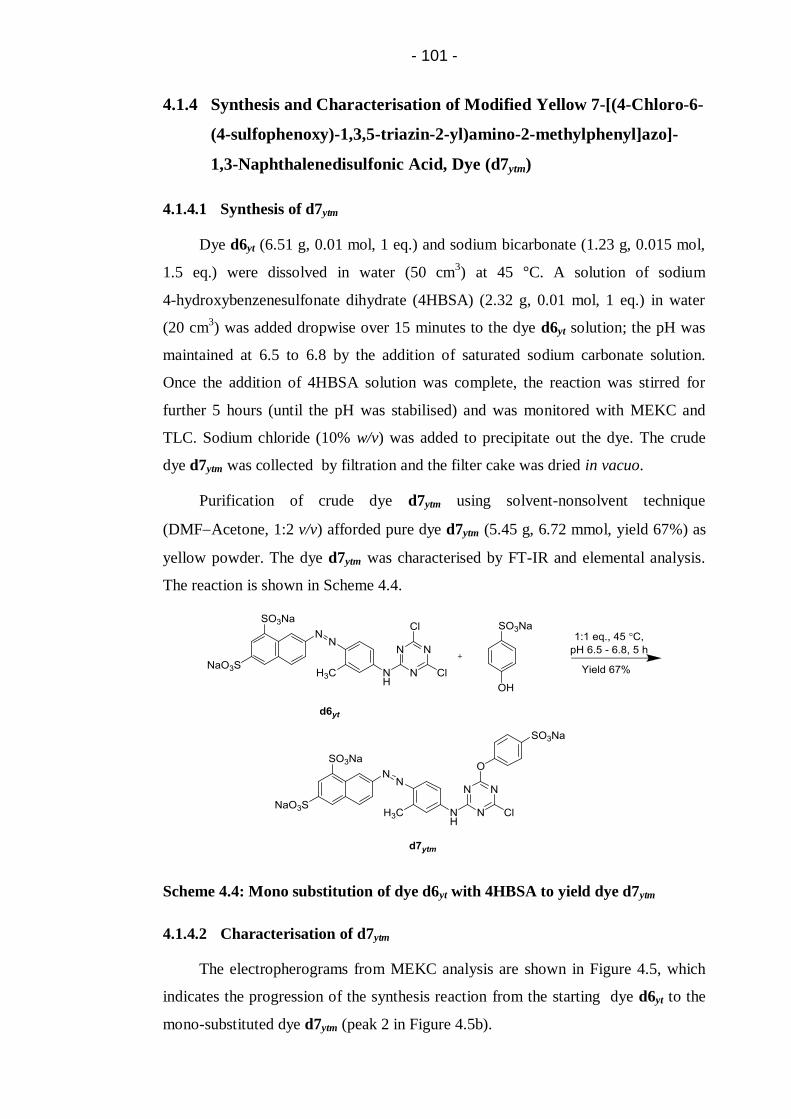
- 101 -
4.1.4 Synthesis and Characterisation of Modified Yellow 7-[(4-Chloro-6-
(4-sulfophenoxy)-1,3,5-triazin-2-yl)amino-2-methylphenyl]azo]-
1,3-Naphthalenedisulfonic Acid, Dye (d7ytm)
4.1.4.1 Synthesis of d7ytm
Dye d6yt (6.51 g, 0.01 mol, 1 eq.) and sodium bicarbonate (1.23 g, 0.015 mol,
1.5 eq.) were dissolved in water (50 cm3) at 45 °C. A solution of sodium
4-hydroxybenzenesulfonate dihydrate (4HBSA) (2.32 g, 0.01 mol, 1 eq.) in water
(20 cm3) was added dropwise over 15 minutes to the dye d6yt solution; the pH was
maintained at 6.5 to 6.8 by the addition of saturated sodium carbonate solution.
Once the addition of 4HBSA solution was complete, the reaction was stirred for
further 5 hours (until the pH was stabilised) and was monitored with MEKC and
TLC. Sodium chloride (10% w/v) was added to precipitate out the dye. The crude
dye d7ytm was collected by filtration and the filter cake was dried in vacuo.
Purification of crude dye d7ytm using solvent-nonsolvent technique
(DMFAcetone, 1:2 v/v) afforded pure dye d7ytm (5.45 g, 6.72 mmol, yield 67%) as
yellow powder. The dye d7ytm was characterised by FT-IR and elemental analysis.
The reaction is shown in Scheme 4.4.
Scheme 4.4: Mono substitution of dye d6yt with 4HBSA to yield dye d7ytm
4.1.4.2 Characterisation of d7ytm
The electropherograms from MEKC analysis are shown in Figure 4.5, which
indicates the progression of the synthesis reaction from the starting dye d6yt to the
mono-substituted dye d7ytm (peak 2 in Figure 4.5b).
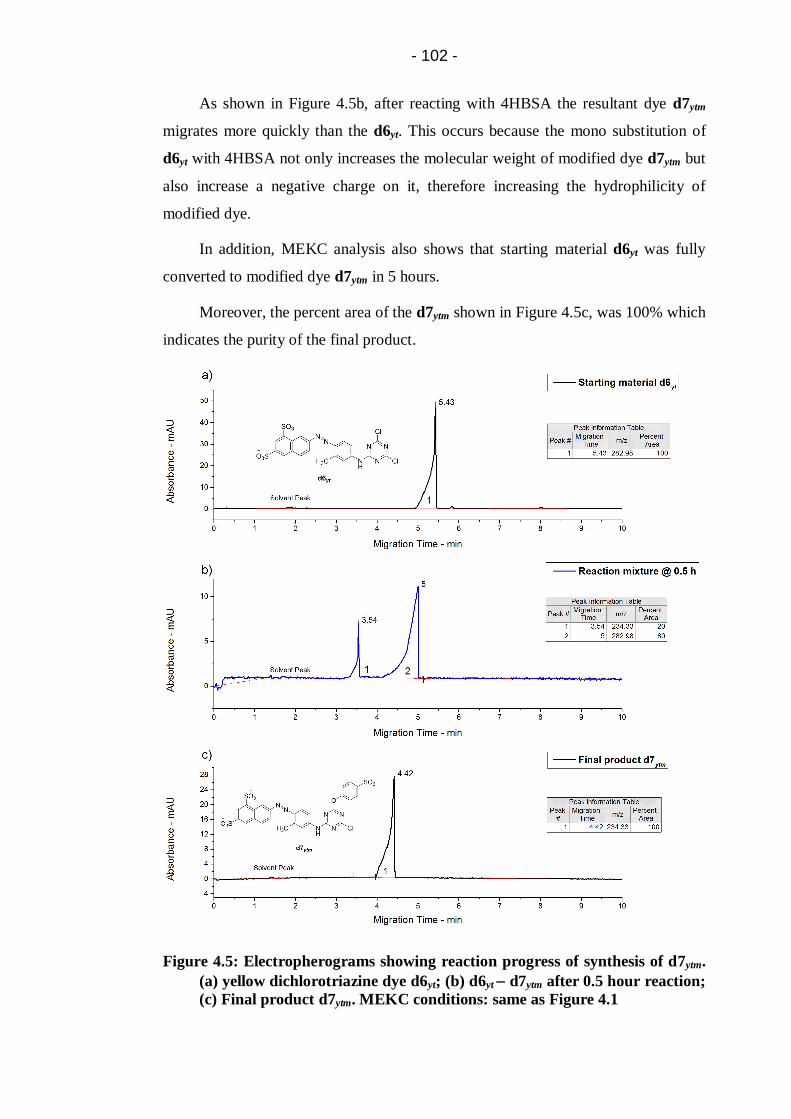
- 102 -
As shown in Figure 4.5b, after reacting with 4HBSA the resultant dye d7ytm
migrates more quickly than the d6yt. This occurs because the mono substitution of
d6yt with 4HBSA not only increases the molecular weight of modified dye d7ytm but
also increase a negative charge on it, therefore increasing the hydrophilicity of
modified dye.
In addition, MEKC analysis also shows that starting material d6yt was fully
converted to modified dye d7ytm in 5 hours.
Moreover, the percent area of the d7ytm shown in Figure 4.5c, was 100% which
indicates the purity of the final product.
Figure 4.5: Electropherograms showing reaction progress of synthesis of d7ytm.
(a) yellow dichlorotriazine dye d6yt; (b) d6yt d7ytm after 0.5 hour reaction;
(c) Final product d7ytm. MEKC conditions: same as Figure 4.1

- 103 -
Rf values were 0.70 and 0.67 for starting material (d6yt) and product (d7ytm)
respectively.
In FT-IR spectrum of the d7ytm, Figure 4.6, the new peak at 1120 cm-1
is
evident which can be attributed to the stretching vibration of C−O−C in its structure
between the triazine and the 4HBSA. The peak at 797 cm-1
can be attributed to the
presence of C−Cl after the mono-substitution of d6yt with 4HBSA.
Figure 4.6: FT-IR spectrum of mono-substituted yellow dye d7ytm
The detailed analysis of spectrum (Figure 4.6) is as follows [7-10]
; NH stretch,
3426 cm-1
; overtone or combinational bands, 2000–1667 cm-1
; CC ring stretch,
1594, 1495, 1404 cm-1
; azo group stretch, 1431 cm-1
; triazine stretch, 1547 cm-1
,
1359 cm-1
; CN stretch (secondary amine), 1295 cm-1
; sulfonate salts, 1176 cm-1
;
C−O−C stretch, 1120 cm-1
; in-plane CH bend, 1032, 1009 cm-1
; C−Cl stretch, 797
cm-1
; out of plane aromatic CH bend, 760 cm-1
.
Elemental analysis, Found: C, 35.58%; H, 3.10%; N, 8.87%. Calculated for
C26H16ClN6Na3O10S3.6H2O: C, 35.46%; H, 3.20%; N, 9.54%. The results were
adjusted due to the presence of water of crystallisation in the dye molecule. Further
disagreement could be attributed to the presence of traces of salt.

- 104 -
4.1.5 Synthesis and Characterisation of Modified Yellow 7-[(4,6-(4-
Sulfophenoxy)-1,3,5-triazin-2-yl)amino-2-methylphenyl]azo]-1,3-
Naphthalenedisulfonic Acid Dye (d8ytd)
4.1.5.1 Synthesis of d8ytd
Dye d6yt (6.51 g, 0.01 mol, 1 eq.) and sodium bicarbonate (1.23 g, 0.015 mol,
1.5 eq.) were dissolved in water (50 cm3) and temperature is raised to 45 °C. A
solution of sodium 4-hydroxybenzenesulfonate dihydrate (4HBSA) (4.86 g, 0.02
mol, 2 eq.) in water (30 cm3) was added dropwise over 15 minutes to the dye d6yt
solution; the pH was maintained at 6.5 to 6.8 by the addition of 2N sodium
carbonate solution. Once the addition of the 4HBSA solution was complete, the
reaction was followed using MEKC and TLC. The MEKC and TLC analysis
showed that the mono substitution of dye d6yt was complete after 1 h (pH had
stabilised); after that the temperature of the reaction mixture was raised to 80 °C to
enable the secondary di-substitution of dye d6yt to occur. After 4 hours, the MEKC
and TLC analysis showed that the di-substitution was also complete. Sodium
chloride (10% w/v) was added to precipitate out the dye. The crude dye d8ytd was
collected by filtration and the filter cake was dried in vacuo.
Purification of crude dye d8ytd using solvent-nonsolvent technique
(DMFAcetone, 1:2 v/v) yielded pure dye d8ytd (5.93 g, 6.11 mmol, yield 61%) as
yellow powder. The dye d8ytd was characterised by FT-IR and elemental analysis
(CHN). The reaction is shown in Scheme 4.5.
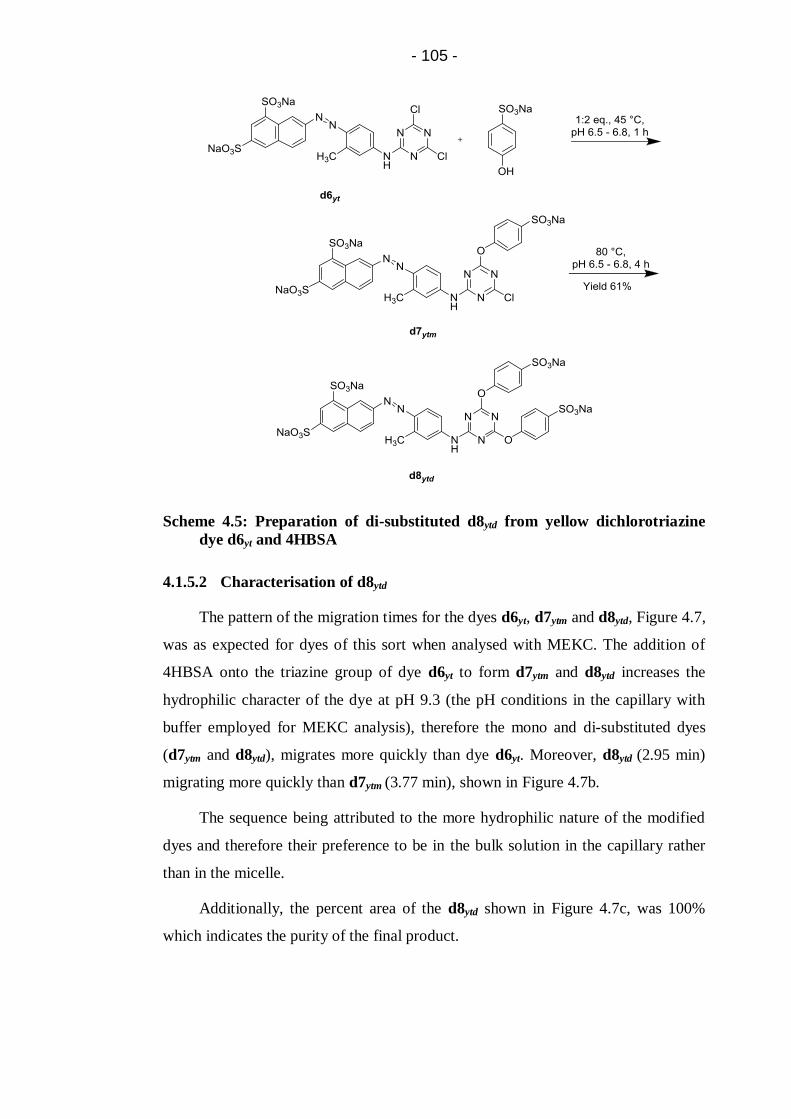
- 105 -
Scheme 4.5: Preparation of di-substituted d8ytd from yellow dichlorotriazine
dye d6yt and 4HBSA
4.1.5.2 Characterisation of d8ytd
The pattern of the migration times for the dyes d6yt, d7ytm and d8ytd, Figure 4.7,
was as expected for dyes of this sort when analysed with MEKC. The addition of
4HBSA onto the triazine group of dye d6yt to form d7ytm and d8ytd increases the
hydrophilic character of the dye at pH 9.3 (the pH conditions in the capillary with
buffer employed for MEKC analysis), therefore the mono and di-substituted dyes
(d7ytm and d8ytd), migrates more quickly than dye d6yt. Moreover, d8ytd (2.95 min)
migrating more quickly than d7ytm (3.77 min), shown in Figure 4.7b.
The sequence being attributed to the more hydrophilic nature of the modified
dyes and therefore their preference to be in the bulk solution in the capillary rather
than in the micelle.
Additionally, the percent area of the d8ytd shown in Figure 4.7c, was 100%
which indicates the purity of the final product.
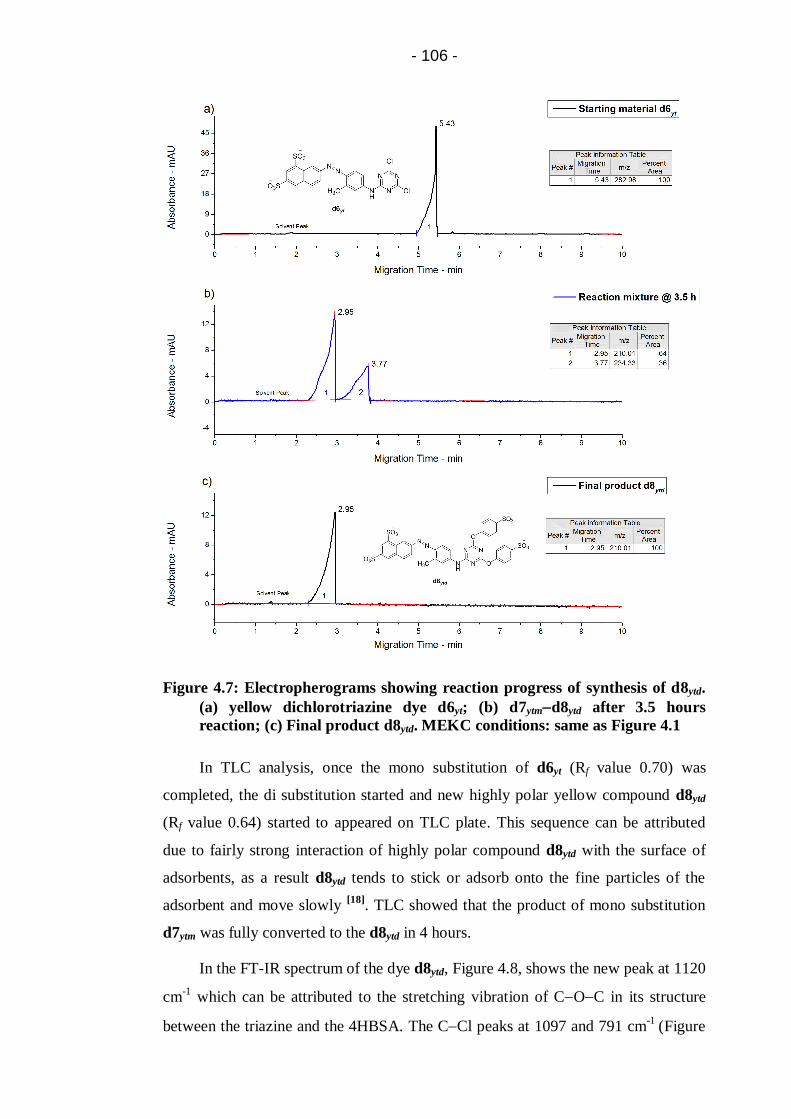
- 106 -
Figure 4.7: Electropherograms showing reaction progress of synthesis of d8ytd.
(a) yellow dichlorotriazine dye d6yt; (b) d7ytmd8ytd after 3.5 hours
reaction; (c) Final product d8ytd. MEKC conditions: same as Figure 4.1
In TLC analysis, once the mono substitution of d6yt (Rf value 0.70) was
completed, the di substitution started and new highly polar yellow compound d8ytd
(Rf value 0.64) started to appeared on TLC plate. This sequence can be attributed
due to fairly strong interaction of highly polar compound d8ytd with the surface of
adsorbents, as a result d8ytd tends to stick or adsorb onto the fine particles of the
adsorbent and move slowly [18]
. TLC showed that the product of mono substitution
d7ytm was fully converted to the d8ytd in 4 hours.
In the FT-IR spectrum of the dye d8ytd, Figure 4.8, shows the new peak at 1120
cm-1
which can be attributed to the stretching vibration of COC in its structure
between the triazine and the 4HBSA. The CCl peaks at 1097 and 791 cm-1
(Figure
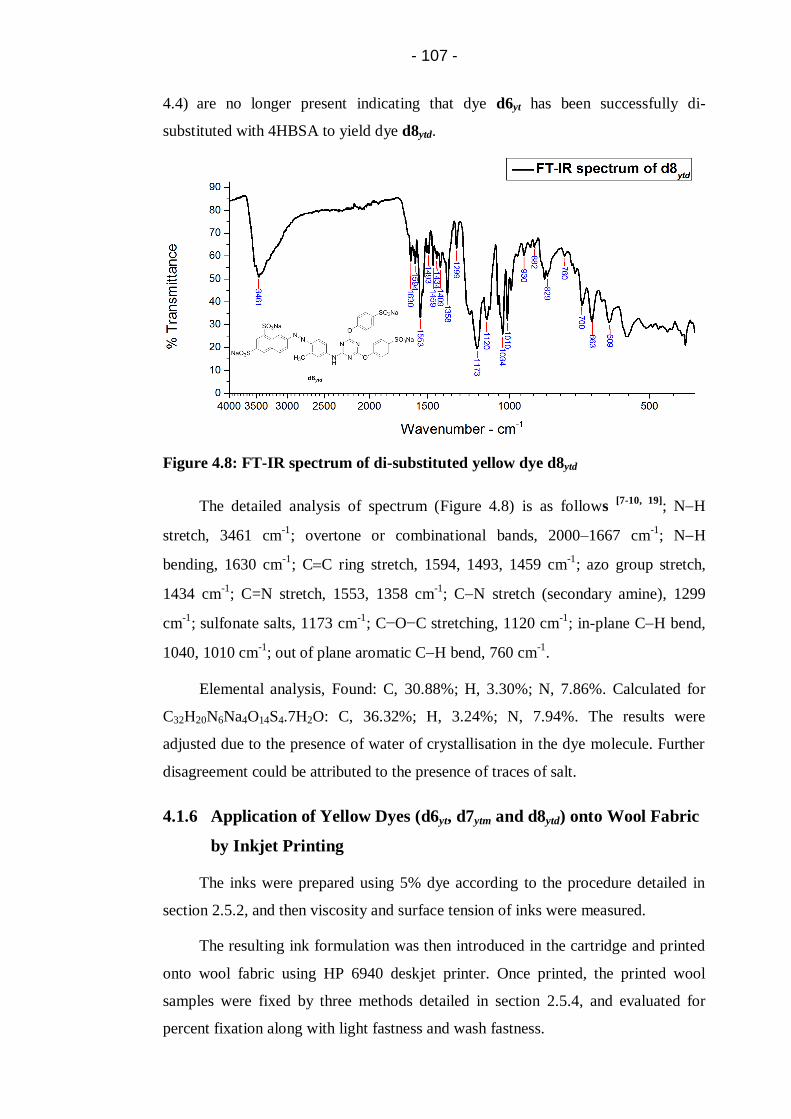
- 107 -
4.4)
are no longer present indicating that dye d6yt has been successfully di-
substituted with 4HBSA to yield dye d8ytd.
Figure 4.8: FT-IR spectrum of di-substituted yellow dye d8ytd
The detailed analysis of spectrum (Figure 4.8) is as follows [7-10, 19]
; NH
stretch, 3461 cm-1
; overtone or combinational bands, 2000–1667 cm-1
; NH
bending, 1630 cm-1
; CC ring stretch, 1594, 1493, 1459 cm-1
; azo group stretch,
1434 cm-1
; C=N stretch, 1553, 1358 cm-1
; CN stretch (secondary amine), 1299
cm-1
; sulfonate salts, 1173 cm-1
; C−O−C stretching, 1120 cm-1
; in-plane CH bend,
1040, 1010 cm-1
; out of plane aromatic CH bend, 760 cm-1
.
Elemental analysis, Found: C, 30.88%; H, 3.30%; N, 7.86%. Calculated for
C32H20N6Na4O14S4.7H2O: C, 36.32%; H, 3.24%; N, 7.94%. The results were
adjusted due to the presence of water of crystallisation in the dye molecule. Further
disagreement could be attributed to the presence of traces of salt.
4.1.6 Application of Yellow Dyes (d6yt, d7ytm and d8ytd) onto Wool Fabric
by Inkjet Printing
The inks were prepared using 5% dye according to the procedure detailed in
section 2.5.2, and then viscosity and surface tension of inks were measured.
The resulting ink formulation was then introduced in the cartridge and printed
onto wool fabric using HP 6940 deskjet printer. Once printed, the printed wool
samples were fixed by three methods detailed in section 2.5.4, and evaluated for
percent fixation along with light fastness and wash fastness.

- 108 -
Moreover the inks were also evaluated for stability through MEKC over six
months storage time at room temperatures.
4.1.7 Characteristics of Formulated Inks (d6yt, d7ytm and d8ytd)
4.1.7.1 Surface Tension and Viscosity of Inks
In terms of inkjet printing, aqueous inks are required to have a surface tension
and viscosity of 25 – 60 dynes.cm-1
and 2 – 20 cP respectively [20, 21]
. It can be seen,
from Table 4.1, that parent dye d6yt and both the modified dyes (d7ytm and d8ytd)
based inks had a surface tension and viscosity within the operational range.
Table 4.1: Surface tension and viscosity of yellow inks
Ink formulation Surface Tension
(dynes.cm-1
)
Viscosity
(cP)
d6yt based Ink 44.5 8
d7ytm based Ink 44.5 6
d8ytd based Ink 45.5 8
4.1.7.2 Stability of Dye (d6yt, d7ytm and d8ytd) Based Inks
As discussed earlier, dichlorotriazine dyes are susceptible to hydrolysis even in
traces of moisture. Therefore, stability of yellow dichlorotriazine dye along with
new modified dyes in inks were also evaluated.
The results of any change in percent area of the peaks of the dyes d6yt, d7ytm
and d8ytd within inks stored at room temperature for six months can be seen in
Figure 4.9, Figure 4.10 and Figure 4.11.

- 109 -
Figure 4.9: Electropherograms showing d6yt based ink stability. (a) Fresh ink;
(b) Ink after fifteen days storage at room temperature.
The percent area of peaks on the MEKC electropherogram is related to the
concentration of specific compounds within the samples. As shown in Figure 4.9a,
the effective component d6yt reduced to 5% (Figure 4.9b) after only fifteen days
storage, indicating that one or both of the labile chlorine atom(s) of triazine system
got hydrolysed or reacted with other components of inks during storage at room
temperature.
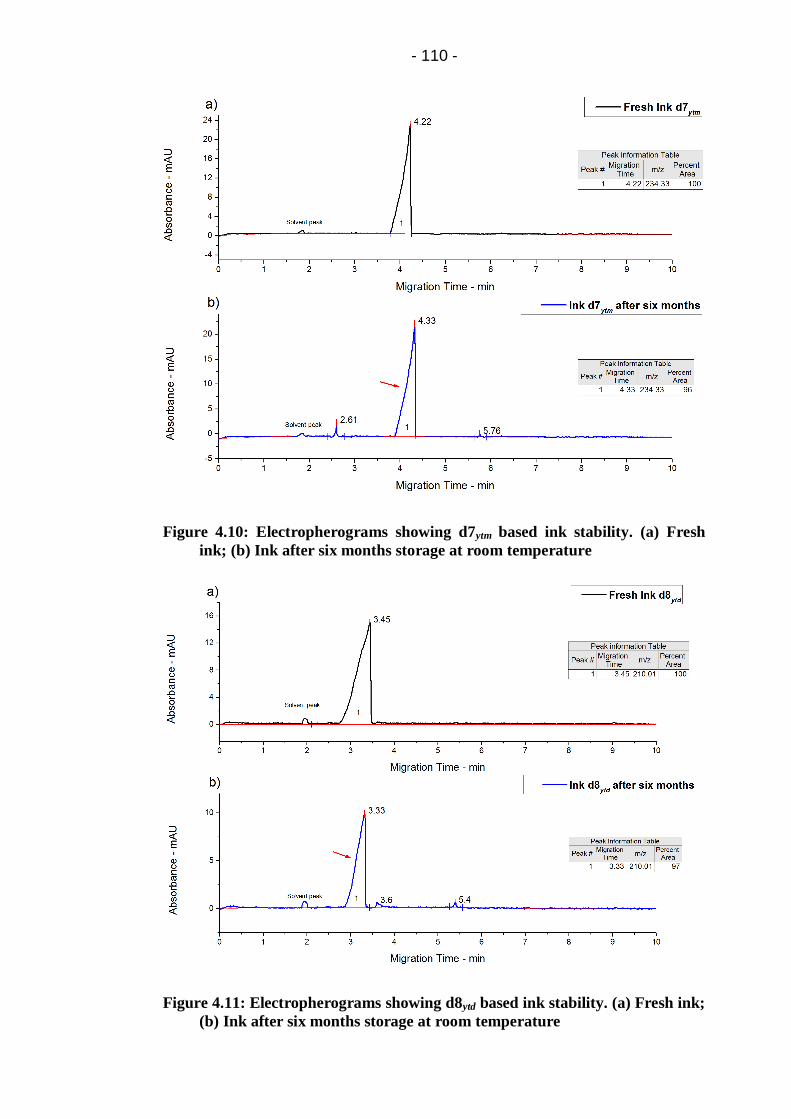
- 110 -
Figure 4.10: Electropherograms showing d7ytm based ink stability. (a) Fresh
ink; (b) Ink after six months storage at room temperature
Figure 4.11: Electropherograms showing d8ytd based ink stability. (a) Fresh ink;
(b) Ink after six months storage at room temperature
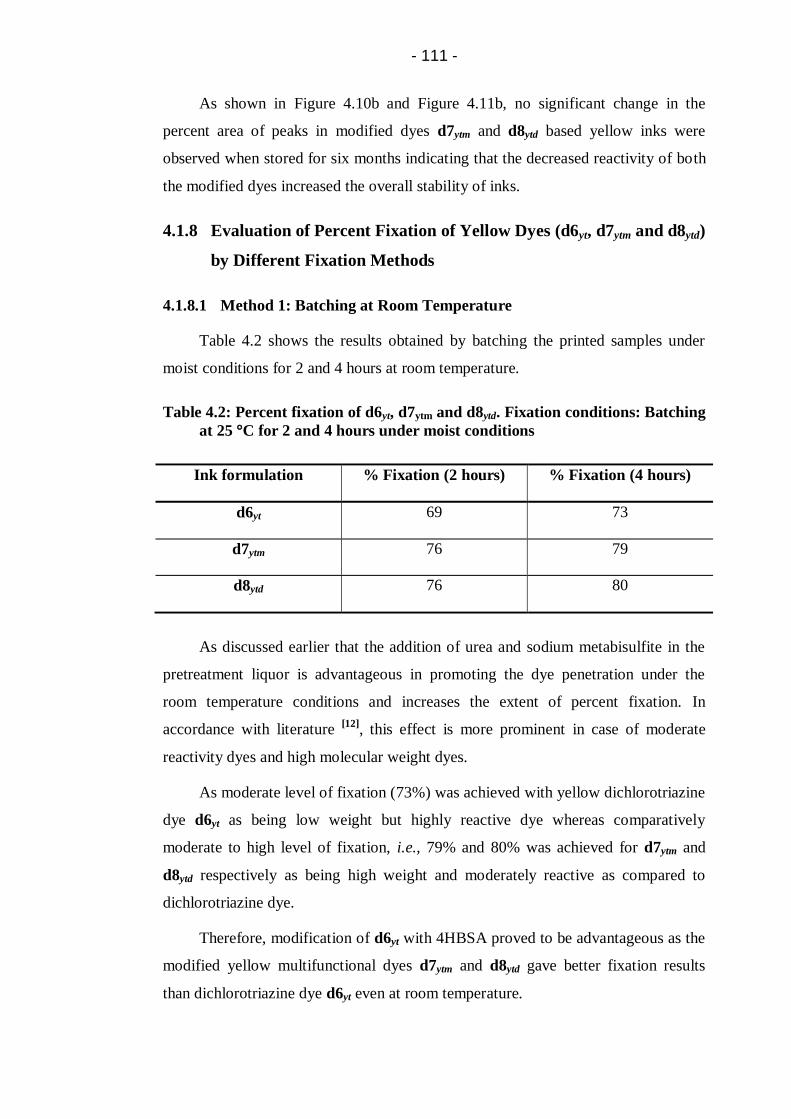
- 111 -
As shown in Figure 4.10b and Figure 4.11b, no significant change in the
percent area of peaks in modified dyes d7ytm and d8ytd based yellow inks were
observed when stored for six months indicating that the decreased reactivity of both
the modified dyes increased the overall stability of inks.
4.1.8 Evaluation of Percent Fixation of Yellow Dyes (d6yt, d7ytm and d8ytd)
by Different Fixation Methods
4.1.8.1 Method 1: Batching at Room Temperature
Table 4.2 shows the results obtained by batching the printed samples under
moist conditions for 2 and 4 hours at room temperature.
Table 4.2: Percent fixation of d6yt, d7ytm and d8ytd. Fixation conditions: Batching
at 25 °C for 2 and 4 hours under moist conditions
Ink formulation % Fixation (2 hours) % Fixation (4 hours)
d6yt 69 73
d7ytm 76 79
d8ytd 76 80
As discussed earlier that the addition of urea and sodium metabisulfite in the
pretreatment liquor is advantageous in promoting the dye penetration under the
room temperature conditions and increases the extent of percent fixation. In
accordance with literature [12]
, this effect is more prominent in case of moderate
reactivity dyes and high molecular weight dyes.
As moderate level of fixation (73%) was achieved with yellow dichlorotriazine
dye d6yt as being low weight but highly reactive dye whereas comparatively
moderate to high level of fixation, i.e., 79% and 80% was achieved for d7ytm and
d8ytd respectively as being high weight and moderately reactive as compared to
dichlorotriazine dye.
Therefore, modification of d6yt with 4HBSA proved to be advantageous as the
modified yellow multifunctional dyes d7ytm and d8ytd gave better fixation results
than dichlorotriazine dye d6yt even at room temperature.

- 112 -
4.1.8.2 Method 2: Batching at 65 °C
Significant improvement in the extent of dyefibre bond (percent fixation) was
observed when the modified yellow dyes were applied by a print (Inkjet)–batch
technique.
Figure 4.12: Percent fixation of d6yt, d7ytm and d8ytd. Fixation conditions: Batch
at 65 °C for 30 to 180 minutes under moist conditions
Figure 4.12 shows the results obtained using d6yt, d7ytm and d8ytd by batching
the printed samples under moist conditions for 30 180 minutes at 30 minutes
interval.
It is observed that yellow dichlorotriazine dye d6yt, being highly reactive dye
not only react with wool but also got hydrolysed under selected conditions of
fixation. Therefore, resulted in moderate fixation results of 65%.
Moreover, modified dyes d7ytm and d8ytd based inks show remarkable
improvement in percent fixation as d7ytm gave 83% in 180 minutes and d8ytd gave
85% in 120 minutes. This shows an increase of approximately 22% and 23%
improvement in the percent fixation of d7ytm and d8ytd onto wool respectively as
compared to yellow dichlorotriazine dye.
It is also evident from the Figure 4.12, that incorporating two sulfophenoxy
groups on dichlorotriazine dye gave better results. It could be due to the better
stability of sulfophenoxy group at the fixation temperature used.
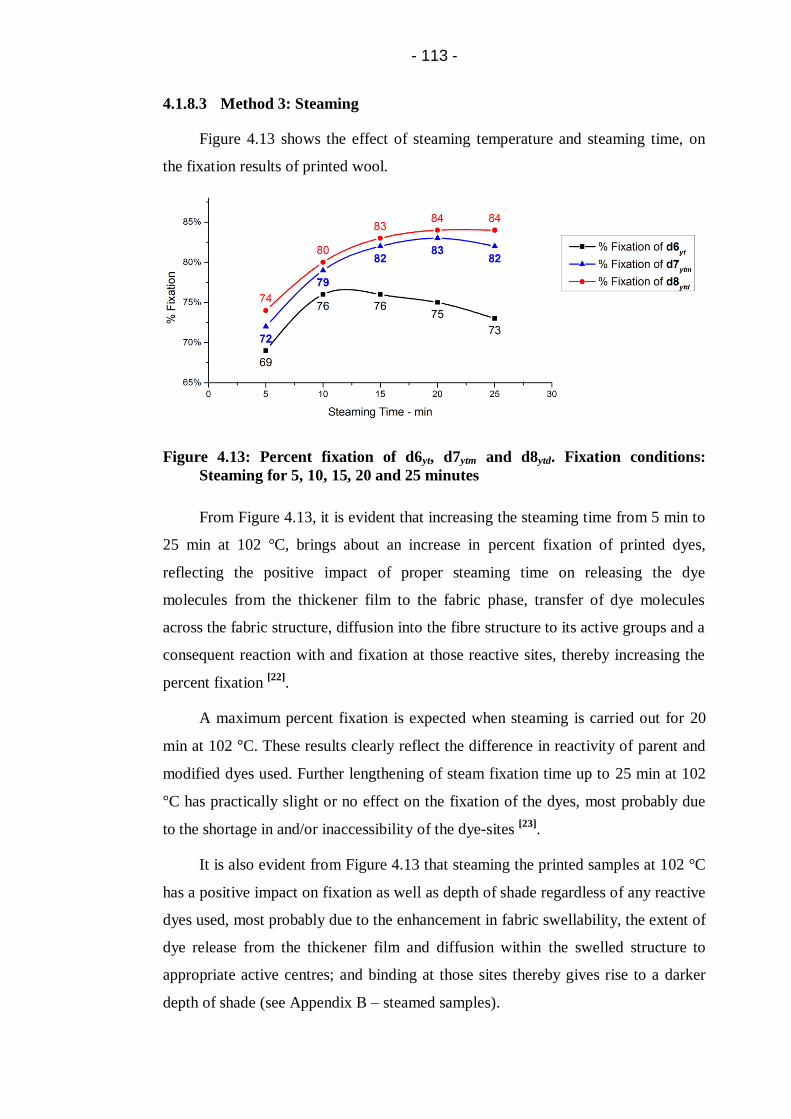
- 113 -
4.1.8.3 Method 3: Steaming
Figure 4.13 shows the effect of steaming temperature and steaming time, on
the fixation results of printed wool.
Figure 4.13: Percent fixation of d6yt, d7ytm and d8ytd. Fixation conditions:
Steaming for 5, 10, 15, 20 and 25 minutes
From Figure 4.13, it is evident that increasing the steaming time from 5 min to
25 min at 102 °C, brings about an increase in percent fixation of printed dyes,
reflecting the positive impact of proper steaming time on releasing the dye
molecules from the thickener film to the fabric phase, transfer of dye molecules
across the fabric structure, diffusion into the fibre structure to its active groups and a
consequent reaction with and fixation at those reactive sites, thereby increasing the
percent fixation [22]
.
A maximum percent fixation is expected when steaming is carried out for 20
min at 102 °C. These results clearly reflect the difference in reactivity of parent and
modified dyes used. Further lengthening of steam fixation time up to 25 min at 102
°C has practically slight or no effect on the fixation of the dyes, most probably due
to the shortage in and/or inaccessibility of the dye-sites [23]
.
It is also evident from Figure 4.13 that steaming the printed samples at 102 °C
has a positive impact on fixation as well as depth of shade regardless of any reactive
dyes used, most probably due to the enhancement in fabric swellability, the extent of
dye release from the thickener film and diffusion within the swelled structure to
appropriate active centres; and binding at those sites thereby gives rise to a darker
depth of shade (see Appendix B – steamed samples).
- 114 -
It can be concluded from Figure 4.13 that 10 min at 102 °C is an ideal time for
yellow dichlorotriazine dye d6yt fixation owing to its high reactivity, whereas 20 min
is an ideal time for modified dyes fixation owning to their lower reactivity that needs
longer time to achieve higher dye fixation.
4.1.9 Light Fastness
The light fastness of wool printed with printing paste using yellow dye d6yt
and modified dyes d7ytm and d8ytd were tested and evaluated according to BS EN
ISO 105-B02:2013 (Method 3) [24]
, and the results are shown in Table 4.3.
All the dyes passed target wool reference 6. However, modified dyes d3mtm
and d4mtd shows even better light fastness than target wool reference 6.
Table 4.3: Light fastness of yellow dyes (d6yt, d7ytm and d8ytd) compared to
target blue wool reference 6
Dye/Ink Target blue wool reference 6
d6yt Equal to 6 (6) Satisfactory
d7ytm Better than 6 (6+) Satisfactory
d8ytd Better than 6 (6+) Satisfactory
4.1.10 Wash Fastness
Wash fastness was carried out according to the BS ISO 105-C06:2010 [25] and
the results are shown in Table 4.4. Yellow dichlorotriazine dye d6yt showed a small
change in shade resulting in a grade 4-5; and also there was light staining on cotton
(adjacent fabrics) whereas both the modified dyes d7ytm and d8ytd showed no change
in colour or staining, hence, showed excellent wash fastness. This excellent wash
fastness is because of the strong covalent bonding between the dye and the wool
fibre.

- 115 -
Table 4.4: Wash fastness of yellow dyes (d6yt, d7ytm and d8ytd)
Dye/Ink Change in shade Staining
CA C N P A W
d6yt 4-5 5 4-5 5 5 5 5
d7ytm 5 5 5 5 5 5 5
d8ytd 5 5 5 5 5 5 5
CA: Cellulose Acetate; C: Cotton; N: Nylon; P: Polyester; A: Acrylic; W: Wool
4.2 Conclusions
With the aim of designing a series of yellow dyes for inkjet inks for wool with
lower chemical reactivity, increased solubility and increased stability, one chlorine
of cyanuric chloride was displaced by amino based yellow dye chromophore at 0 5
°C (pH 5.6 – 6.5) to produce yellow dichlorotriazine dye d6yt in pure form (without
hydrolysed by-products).
Modification of yellow dichlorotriazine was done by the same sequence as
done for magenta dyes, however, the parameters for modification were optimised.
The first modification of yellow dichlorotriazine dye was done by displacing
the second chlorine atom by the sulfophenoxy group at 45 °C (5 hours) to produce
mono-substituted dye d7ytm in pure form.
Second modification of yellow dichlorotriazine dye was done by displacing the
second chlorine atom by using two equivalent sulfophenoxy group at 45 °C (1
hours) to produce intermediate dye d4ytm and then the third chlorine atom as
displaced at 80 °C (4 hours) to produce homobifunctional dye d8ytd in pure form.
The characteristic properties such as surface tension and viscosity of inks
formulated by incorporating the synthesised dyes were found to be in operation
range.
The stability of modified dyes based inks increased significantly due to the
lower reactivity of the modified dyes, which make them ideally suited to inkjet
printing processes.
Significant improvement in the extent of covalent dye fixation was observed
when the modified yellow dyes were applied by all methods. However, noteworthy

- 116 -
enhancement observed when the samples were fixed through batch at 65 °C and
steaming at 102 °C.
With respect to the fastness properties, the yellow dichlorotriazine dye was 0.5
grade lower when compared with the modified dyes for light fastness test.
Moreover, modified dyes showed excellent wash fastness properties whereas
dichlorotriazine dye showed a small change in shade as well as staining on adjacent
fabrics (cotton).
4.3 References
1. David, H.E.F. and Blangey, L. Fundamental processes of dye chemistry.
New York: Interscience Publishers, 1949.
2. Cain, J.C. The chemistry of the diazo-compounds. London: Edward Arnold
Publishers Ltd., 1908.
3. Patent GB1165661 (1969)
4. Patent WO2007012828 (2007)
5. Terabe, S. Capillary Separation: Micellar Electrokinetic Chromatography.
Annual Review of Analytical Chemistry, 2009, 2, pp.99-120.
6. Quirino, J.P. and Terabe, S. Sample stacking of cationic and anionic analytes
in capillary electrophoresis. Journal of Chromatography A, 2000, 902,
pp.119-135.
7. Socrates, G. Infrared and Raman characteristic group frequencies : tables
and charts. Chichester: Wiley, 2001.
8. Silverstein, R.M., Webster, F.X. and Kiemle, D.J. Spectrometric
Identification of Organic Compounds. 7th ed. New York: John Wiley and
Sons, 2005.
9. Matlok, F., Gremlich, H.U., Bruker Analytische Meotechnik and Merck eds.
Merck FT-IR atlas : a collection of FT-IR spectra. Weinheim: Vch, 1988.
10. Keller, R.J. and Sigma-Aldrich Corporation. The Sigma library of FT-IR
spectra. Missouri: Sigma Chemical Company, 1986.
11. Beech, W.F. Fibre-Reactive Dyes London: Logos Press Ltd., 1970.
12. Waring, D.R. and Hallas, G. eds. The Chemistry and Application of Dyes.
New York: Plenum Press, 1994.
13. Patent WO2006103414 (2006)

- 117 -
14. Patent GB774925 (1957)
15. Li, S.F.Y. Capillary electrophoresis: principles, practice and applications.
Amsterdam: Elsevier Science Publishers, 1992.
16. Hancu, G., Simon, B., Rusu, A., Mircia, E. and Gyéresi, Á. Principles of
Micellar Electrokinetic Capillary Chromatography Applied in
Pharmaceutical Analysis. Advanced Pharmaceutical Bulletin, 2013, 9, pp.1-
8.
17. Coulter, B. Introduction to Capillary Electrophoresis [online]. [Accessed].
Available from:
https://www.google.co.uk/url?sa=t&rct=j&q=&esrc=s&source=web&cd=1&
cad=rja&ved=0CDsQFjAA&url=https%3A%2F%2Fwww.beckmancoulter.c
om%2Fwsrportal%2Fbibliography%3Fdocname%3D360643-
CEPrimer1.pdf&ei=6upWUp7ALcu10QWUioCABw&usg=AFQjCNEDEtG
GHzNUfJbcnwFbcKYb9FNdLw.
18. University of Colorado at Boulder. Thin Layer Chromatography (TLC)
[online]. 2013. [Accessed December 10, 2011]. Available from:
http://orgchem.colorado.edu/Technique/Procedures/TLC/TLC.html.
19. Miller, R.K. Infrared Spectroscopy. In: K. Venkataraman, ed. The Analytical
Chemistry of Synthetic Dyes. New York: Wiley & Sons, 1977.
20. Magdassi, S. Ink Requirements and Formulations Guidelines. In: S.
Magdassi, ed. Chemistry of Inkjet Inks. New Jersey: World Scientific
Publishing Ltd., 2012.
21. Ujiie, H. Digital printing of textiles. Cambridge: Woodhead Publishing Ltd.,
2006.
22. Kongliang, X. and Aiqin, H. Application of a reactive cationic dye to wool.
Journal of the Society of Dyers and Colourists, 1998, 114, pp.20-23.
23. Ibrahim, N., El Zairy, M., El-Gamal, A. and Tolba, S. Printing of nylon-6
fabric with anionic dyes in presence of thiourea/ammonium persulphate
redox system. Colourage, 2001, 48, pp.19-26.
24. British Standards Institution. Colour fastness to artificial light: Xenon arc
fading lamp test, ISO 105-B02:2013.
25. British Standards Institution. Textiles - Tests for colour fastness - Part C06:
Colour fastness to domestic and commercial laundering, BS EN ISO 105-
C06:2010.

- 118 -
5 Synthesis, Modification, Characterisation of Blue
Dichlorotriazine Dyes and Their Application onto Wool Fabric
by Inkjet Fabric
This chapter details the synthesis and characterisation of blue dichlorotriazine
dye d10bt from anthraquinone based chromophore, modification of this dye by
incorporating sulfophenoxy group to produce mono-substituted dye d11btm and also
di-substituted dye d12btd. CE (CZE) and TLC were used to monitor course of
reactions and the structural changes were confirmed through FT-IR.
This chapter also details the application of blue dichlorotriazine dye and
modified dyes based inks by inkjet printing on wool fabrics along with performance
evaluation of inks such as surface tension, viscosity, ink stability, percent fixation of
the dye and colour fastness properties.
5.1 Experimental
5.1.1 Materials
Bromaminic acid sodium salt, 2,4-diamino-benzenesulfonic acid, copper(I)
chloride, cyanuric chloride (99%), and sodium 4-hydroxybenzenesulfonate
dihydrate (98%), sodium metabisulfite, carboxymethyl cellulose, polysorbate 20
(Tween 20) and N-methylmorpholine N-oxide (NMMO) were purchased from
Sigma-Aldrich and used as received. Urea (MP Biomedicals), Alcopol O 60 (Acros
organics), 2-pyrrolidone (Acros organics), 2-propanol (Fisher), Sandozin NIE
(Clariant) were purchased and used as received. All other chemicals were of reagent
grade unless otherwise stated.
5.1.2 Synthesis and Characterisation of Blue 1-Amino-4-[(3-amino-4-
sulfophenyl)amino)]-Anthraquinone-2-Sulfonic Acid Dye (d9b)
5.1.2.1 Synthesis of d9b
In accordance with the method described in reference [1]
, bromaminic acid
(12.13 g, 0.03 mol, 1 eq.) dissolved in water (300 cm3) and stirred for 1 hour at 60
°C. 2,4-diamino-benzenesulfonic acid (7.15 g, 0.038 mol, 1.28 eq.), sodium
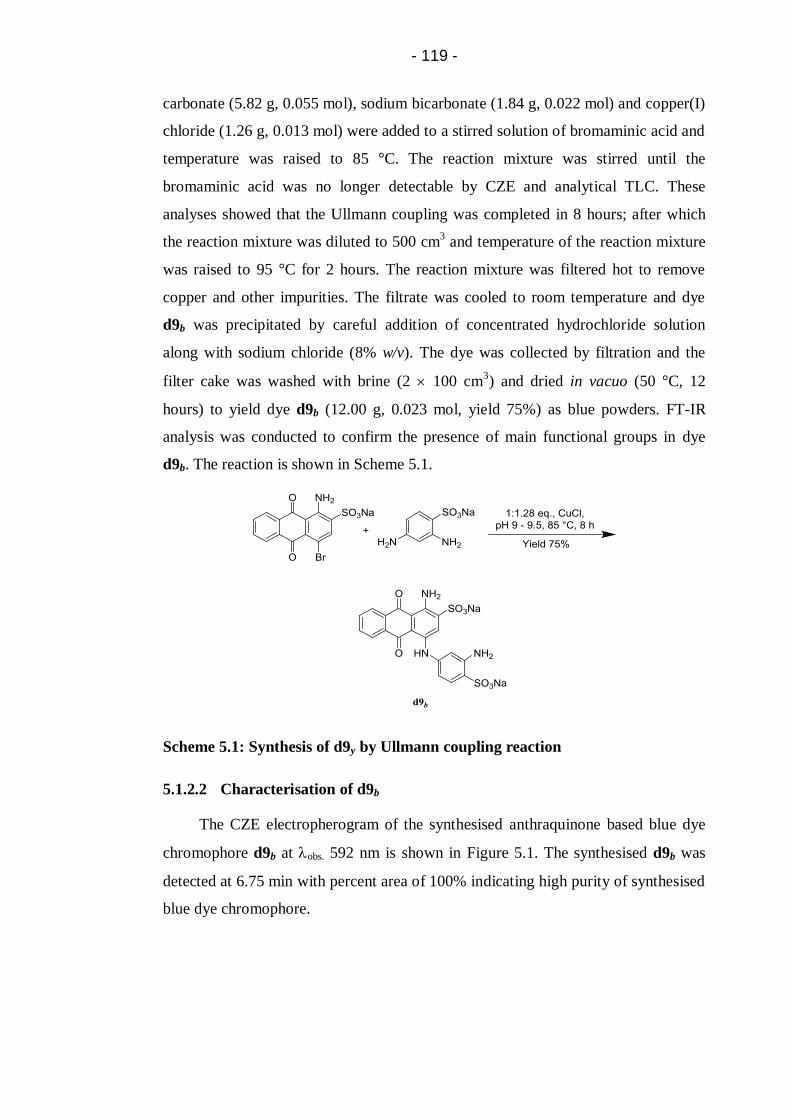
- 119 -
carbonate (5.82 g, 0.055 mol), sodium bicarbonate (1.84 g, 0.022 mol) and copper(I)
chloride (1.26 g, 0.013 mol) were added to a stirred solution of bromaminic acid and
temperature was raised to 85 °C. The reaction mixture was stirred until the
bromaminic acid was no longer detectable by CZE and analytical TLC. These
analyses showed that the Ullmann coupling was completed in 8 hours; after which
the reaction mixture was diluted to 500 cm3 and temperature of the reaction mixture
was raised to 95 °C for 2 hours. The reaction mixture was filtered hot to remove
copper and other impurities. The filtrate was cooled to room temperature and dye
d9b was precipitated by careful addition of concentrated hydrochloride solution
along with sodium chloride (8% w/v). The dye was collected by filtration and the
filter cake was washed with brine (2 100 cm3) and dried in vacuo (50 °C, 12
hours) to yield dye d9b (12.00 g, 0.023 mol, yield 75%) as blue powders. FT-IR
analysis was conducted to confirm the presence of main functional groups in dye
d9b. The reaction is shown in Scheme 5.1.
Scheme 5.1: Synthesis of d9y by Ullmann coupling reaction
5.1.2.2 Characterisation of d9b
The CZE electropherogram of the synthesised anthraquinone based blue dye
chromophore d9b at obs. 592 nm is shown in Figure 5.1. The synthesised d9b was
detected at 6.75 min with percent area of 100% indicating high purity of synthesised
blue dye chromophore.
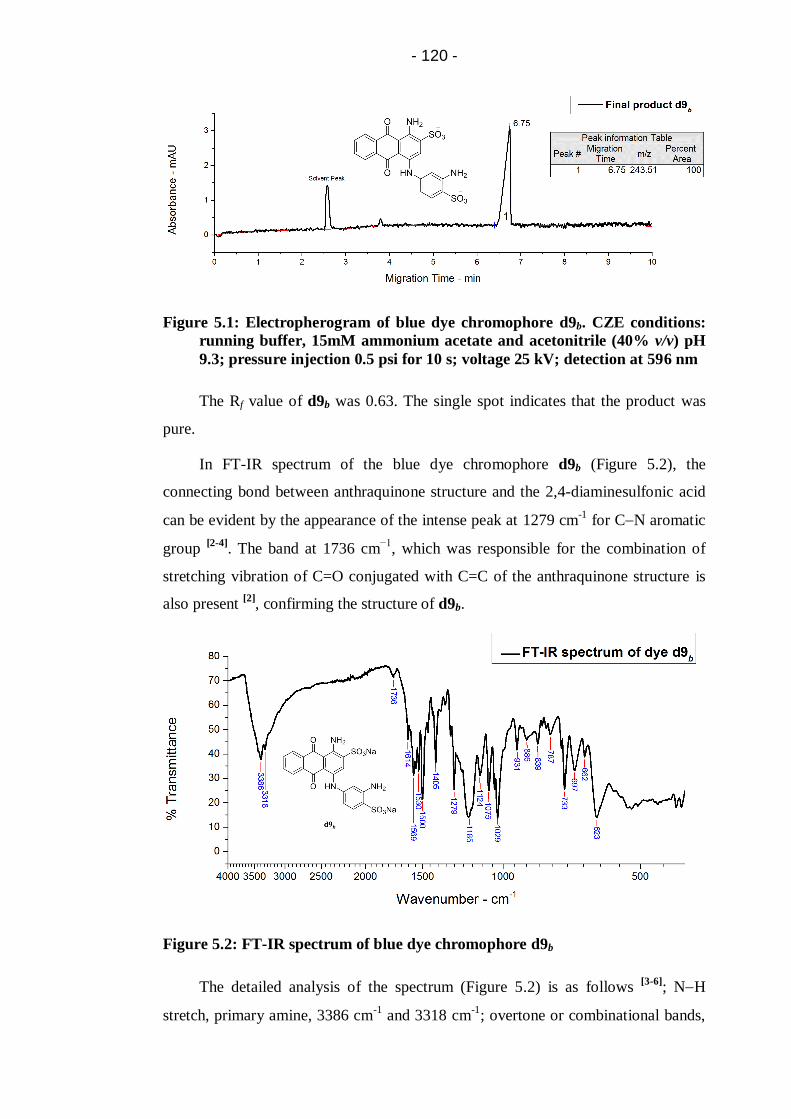
- 120 -
Figure 5.1: Electropherogram of blue dye chromophore d9b. CZE conditions:
running buffer, 15mM ammonium acetate and acetonitrile (40% v/v) pH
9.3; pressure injection 0.5 psi for 10 s; voltage 25 kV; detection at 596 nm
The Rf value of d9b was 0.63. The single spot indicates that the product was
pure.
In FT-IR spectrum of the blue dye chromophore d9b (Figure 5.2), the
connecting bond between anthraquinone structure and the 2,4-diaminesulfonic acid
can be evident by the appearance of the intense peak at 1279 cm-1
for CN aromatic
group [2-4]
. The band at 1736 cm−1
, which was responsible for the combination of
stretching vibration of C=O conjugated with C=C of the anthraquinone structure is
also present [2]
, confirming the structure of d9b.
Figure 5.2: FT-IR spectrum of blue dye chromophore d9b
The detailed analysis of the spectrum (Figure 5.2) is as follows [3-6]
; NH
stretch, primary amine, 3386 cm-1
and 3318 cm-1
; overtone or combinational bands,

- 121 -
2000–1700 cm-1
; C=O, 1736 cm-1
; NH bending, 1614 cm-1
;CC ring stretch, 1569,
1500, 1405 cm-1
; CN stretch, 1279 cm-1
; sulfonate, 1185 cm-1
; in-plane CH bend,
1020 cm-1
; broad, NH wag, 886 cm-1
; out of plane aromatic CH bend, 733 cm-1
;
out of plane ring C=C bend, 697 cm-1
.
5.1.3 Synthesis and Characterisation of Blue 1-Amino-4-[[3-(4,6-
dichloro)-1,3,5-triazin-2-yl]amino]-4-(sulfophenyl)amino)]-
Anthraquinone-2-Sulfonic Acid Dye (d10bt)
5.1.3.1 Synthesis of d10bt
In accordance with the method described in reference [7]
, a solution of cyanuric
chloride (3.63 g, 0.02 mol) in acetone (30 cm3) was added dropwise to a mixture of
icewater (50 cm3). The dye chromophore d9b (10.67 g, 0.02 mol) as dissolved in
water (150 cm3) which was then adjusted to pH 7.0 by the addition of 2N sodium
carbonate solution and then added to the stirred cyanuric chloride suspension at 0 to
5 °C, to form a reaction mixture.
Once the addition of dye chromophore d9b was complete, the reaction was
stirred for further 3 hours (until the pH had stabilised) and was monitored with CZE
and analytical TLC. When the reaction had gone to completion 2N sodium
carbonate solution was added to raise the pH to 7.0 and phosphate buffer (0.2 mol,
10% v/v) was added to buffer the pH to 6.4. Sodium chloride (10% w/v) was added
to precipitate the dye. The crude dye d10bt was collected by filtration and the filter
cake was washed with brine (2 100 cm3) and dried in vacuo.
Purification of crude dye using solventnonsolvent technique (1:2,
DMFdiethyl ether) afforded the pure dye d10bt (9.98 g, 14.6 mmol, yield 73%) as
blue powders. FT-IR analysis was conducted to confirm the presence of main
functional groups in dye d10bt. The reaction is shown in Scheme 5.2.
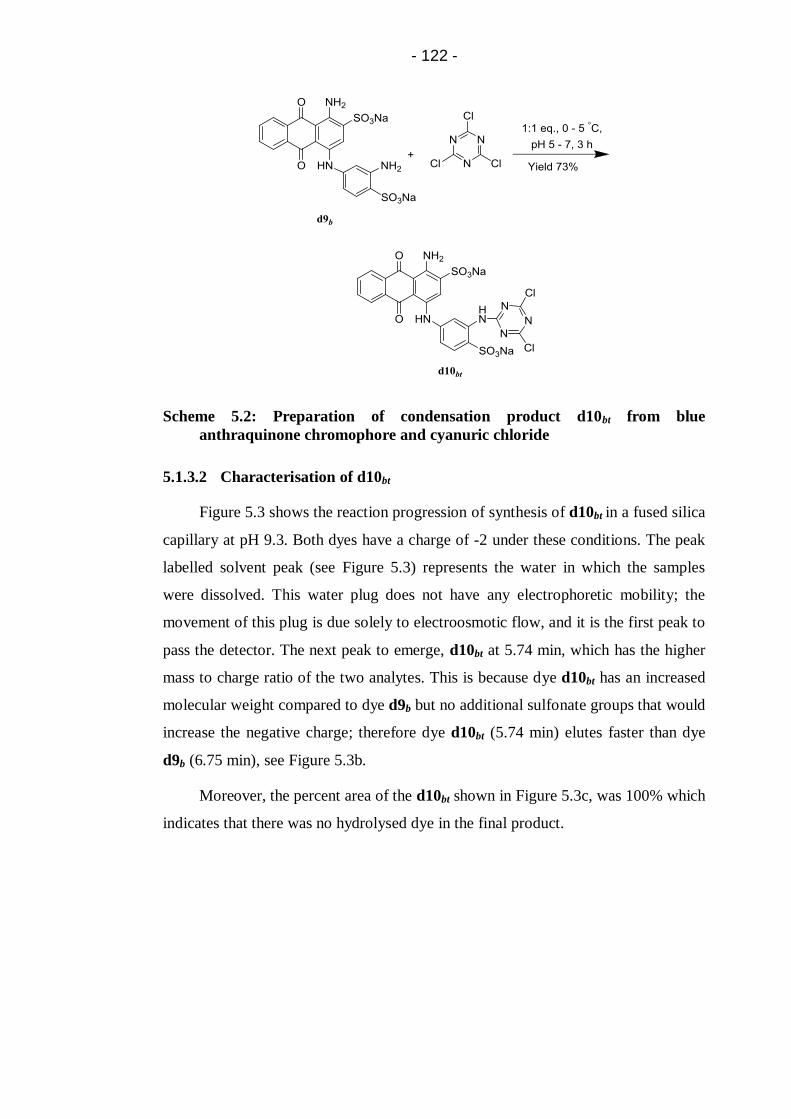
- 122 -
Scheme 5.2: Preparation of condensation product d10bt from blue
anthraquinone chromophore and cyanuric chloride
5.1.3.2 Characterisation of d10bt
Figure 5.3 shows the reaction progression of synthesis of d10bt in a fused silica
capillary at pH 9.3. Both dyes have a charge of -2 under these conditions. The peak
labelled solvent peak (see Figure 5.3) represents the water in which the samples
were dissolved. This water plug does not have any electrophoretic mobility; the
movement of this plug is due solely to electroosmotic flow, and it is the first peak to
pass the detector. The next peak to emerge, d10bt at 5.74 min, which has the higher
mass to charge ratio of the two analytes. This is because dye d10bt has an increased
molecular weight compared to dye d9b but no additional sulfonate groups that would
increase the negative charge; therefore dye d10bt (5.74 min) elutes faster than dye
d9b (6.75 min), see Figure 5.3b.
Moreover, the percent area of the d10bt shown in Figure 5.3c, was 100% which
indicates that there was no hydrolysed dye in the final product.

- 123 -
Figure 5.3: Electropherograms showing reaction progress of synthesis of d10bt.
(a) blue dye chromophore d9b; (b) d9b d10bt after 1.5 hours reaction
time; (c) Final product d10bt. CZE conditions: same as Figure 5.1
The Rf values of starting material and product were found to be 0.63 and 0.73
respectively. Moreover, almost quantitative conversion to product occurred in 3
hours.
In FT-IR spectrum of blue dichlorotriazine dye d10bt, the appearance of new
peaks at 1546 and 1404 cm-1
reflect the presence of the triazine ring in dye d10bt.
Also the presence of the peaks at the 1086 and 792 cm-1
are attributed to the CCl
stretching vibration on the triazine ring of the dye.
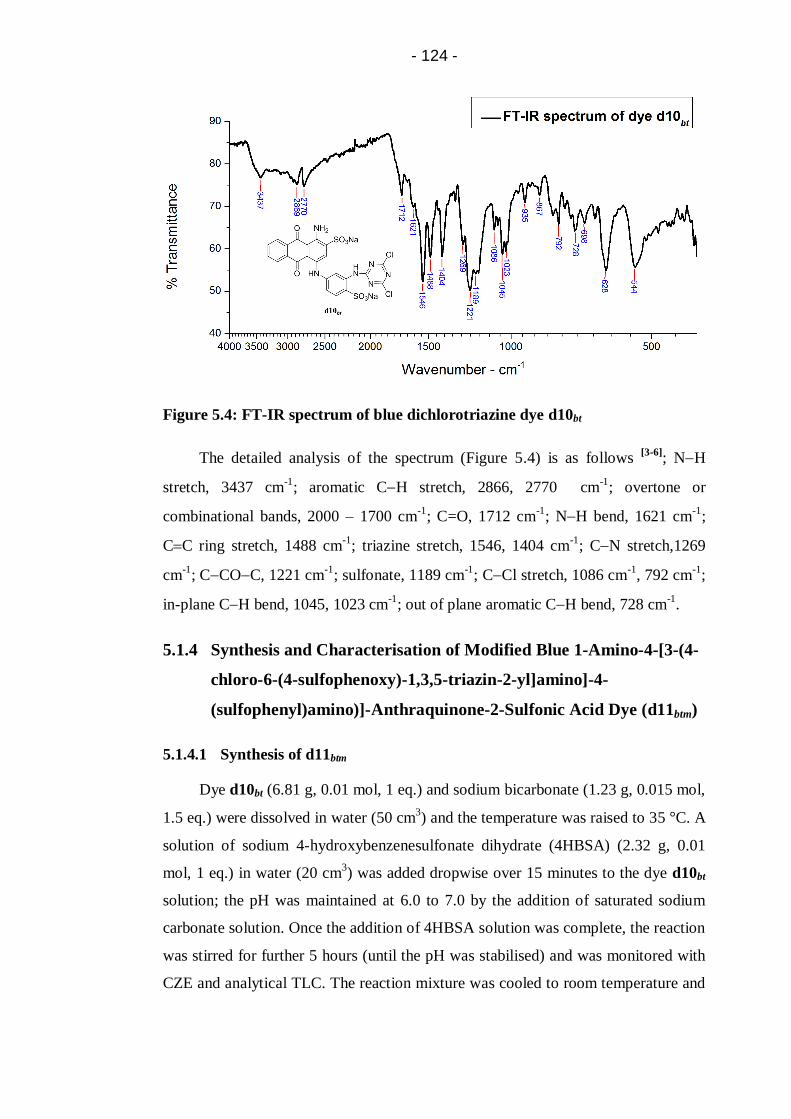
- 124 -
Figure 5.4: FT-IR spectrum of blue dichlorotriazine dye d10bt
The detailed analysis of the spectrum (Figure 5.4) is as follows [3-6]
; NH
stretch, 3437 cm-1
; aromatic CH stretch, 2866, 2770 cm-1
; overtone or
combinational bands, 2000 – 1700 cm-1
; C=O, 1712 cm-1
; NH bend, 1621 cm-1
;
CC ring stretch, 1488 cm-1
; triazine stretch, 1546, 1404 cm-1
; CN stretch,1269
cm-1
; CCOC, 1221 cm-1
; sulfonate, 1189 cm-1
; CCl stretch, 1086 cm-1
, 792 cm-1
;
in-plane CH bend, 1045, 1023 cm-1
; out of plane aromatic CH bend, 728 cm-1
.
5.1.4 Synthesis and Characterisation of Modified Blue 1-Amino-4-[3-(4-
chloro-6-(4-sulfophenoxy)-1,3,5-triazin-2-yl]amino]-4-
(sulfophenyl)amino)]-Anthraquinone-2-Sulfonic Acid Dye (d11btm)
5.1.4.1 Synthesis of d11btm
Dye d10bt (6.81 g, 0.01 mol, 1 eq.) and sodium bicarbonate (1.23 g, 0.015 mol,
1.5 eq.) were dissolved in water (50 cm3) and the temperature was raised to 35 °C. A
solution of sodium 4-hydroxybenzenesulfonate dihydrate (4HBSA) (2.32 g, 0.01
mol, 1 eq.) in water (20 cm3) was added dropwise over 15 minutes to the dye d10bt
solution; the pH was maintained at 6.0 to 7.0 by the addition of saturated sodium
carbonate solution. Once the addition of 4HBSA solution was complete, the reaction
was stirred for further 5 hours (until the pH was stabilised) and was monitored with
CZE and analytical TLC. The reaction mixture was cooled to room temperature and

- 125 -
sodium chloride (10% w/v) was added to precipitate out the dye. The crude dye
d11btm was collected by filtration and the filter cake was dried in vacuo.
Purification of crude dye d11btm using solventnonsolvent technique
(DMFdiethyl ether, 1:2 v/v) afforded pure dye d11btm (4.80 g, 5.7 mmol, yield
57%) as blue powders. FT-IR analysis was conducted to confirm the synthesis of the
dye. The reaction is shown in Scheme 5.3.
Scheme 5.3: Condensation of dye d10bt with 4HBSA to yield dye d11btm
5.1.4.2 Characterisation of d11btm
The electropherograms from CZE analyses are shown in Figure 5.5 which
indicates the progression of the synthesis reaction from the starting dye d10bt to the
mono-substituted dye d11btm (peak 3 in Figure 5.5b). After the modification, the
mass to charge ratio of the dye d11btm decreases compared to the parent dye d10bt,
therefore the migration time of the dye d11btm (6.65 min) increases as compared to
d10bt (5.69 min).
Furthermore, the percent area of modified dye d11btm was 100% which
indicates there was only one colour component in the synthesised dye (see Figure
5.5c).

- 126 -
Figure 5.5: Electropherograms showing reaction progress of synthesis of d11btm.
(a) blue dichlorotriazine dye d10bt; (b) d10bt d11btm after 1.5 hours
reaction; (c) Final product d11btm. CZE conditions: same as Figure 5.1
In analytical TLC analysis, the spots appeared as estimated, showing that the
primary condensation reaction of dye d10bt with 4HBSA take place readily at 35 °C
provided that neutral pH was maintained. Analytical TLC showed the gradual
appearance of new more polar blue compound d11btm (Rf value 0.69) compared to
the starting material d10bt (Rf value 0.73). Moreover, TLC showed that the starting
material d10bt was fully converted to the d11btm in 5 hours.
In FT-IR spectrum of the mono substituted dye d11btm, Figure 5.6, the new
peak at 1126 cm-1
is evident which can be attributed to the stretching vibration of
COC in its structure between the triazine and the 4HBSA. The peaks at 1077 and

- 127 -
803 cm-1
can be attributed to the presence of CCl after the mono substitution of dye
d10bt with 4HBSA.
Figure 5.6: FT-IR spectrum of blue mono-substituted dye d11btm
The detailed analysis of the spectrum (Figure 5.6) is as follows [3-6]
; NH
stretch, 3461 cm-1
; overtone or combinational bands, 2000–1700 cm-1
; C=O
stretching, 1745 cm-1
; NH bending, 1608 cm-1
; CC ring stretch,1593, 1492, 1440
cm-1
; triazine stretch, 1563, 1384 cm-1
; CN stretch ,1283 cm-1
; COC stretching,
1126 cm-1
; sulfonate, 1176 cm-1
; C−Cl stretch, 1077, 803 cm-1
; in-plane CH bend,
1031, 1010 cm-1
; out of plane aromatic CH bend, 733 cm-1
.
Elemental analysis, Found: C, 38.08%; H, 2.30%; N, 9.10%. Calculated for
C29H16ClN6Na3O12S3.5H2O: C, 37.42%; H, 2.82%; N, 9.03%. The results were
adjusted due to the presence of water of crystallisation in the dye molecule. Further
disagreement could be attributed to the presence of traces of salt.
5.1.5 Synthesis and Characterisation of Modified Blue 1-Amino-4-[3-
(4,6-(4-sulfophenoxy)-1,3,5-triazin-2-yl]amino]-4-
(sulfophenyl)amino)]-Anthraquinone-2-Sulfonic Acid Dye (d12btd)
5.1.5.1 Synthesis of d12btd
Dye d10bt (6.51 g, 0.01 mol, 1 eq.) and sodium bicarbonate (1.23 g, 0.015 mol,
1.5 eq.) were dissolved in water (50 cm3) and temperature was raised to 45 °C. A
solution of sodium 4-hydroxybenzenesulfonate dihydrate (4HBSA) (4.86 g, 0.02

- 128 -
mol, 2 eq.) in water (30 cm3) was added dropwise over 15 minutes to the dye d10bt
solution; the pH was maintained at 6.0 to 7.0 by the addition of saturated sodium
carbonate solution. Once the addition of the 4HBSA solution was complete, the
reaction was followed using CZE and analytical TLC. The CZE and TLC analysis
showed that the primary condensation of dye d10bt was complete after 2 hours (pH
has stabilised); after which the temperature of the reaction mixture was raised to
80 °C to enable the secondary condensation of dye d10bt to occur. After 4 hours, the
CZE and analytical TLC analysis showed that the secondary condensation was
complete. The reaction mixture was cooled to room temperature and sodium
chloride (10% w/v) was added to precipitate out the dye. The crude dye d12btd was
collected by filtration and the filter cake was dried in vacuo.
Purification of crude dye d12btd using solventnonsolvent technique
(DMFdiethyl ether, 1:2 v/v) afforded pure dye d12btd (5.5 g, 5.49 mmol, yield 55%)
as blue powders. The dye d12btd was characterised by FT-IR and elemental analysis.
The reaction is shown is Scheme 5.4.
Scheme 5.4: Preparation of di substituted dye d12btd from blue dichlorotriazine
dye d10bt and 4HBSA
5.1.5.2 Characterisation of d12btd
The CZE electropherograms at different reaction times during the modification
of dye d10bt with 4HBSA are shown in Figure 5.7. After 4 hours of reaction all of

- 129 -
the dye d10bt had been converted to the dye d11btm and dye d12btd, see Figure 5.7b.
When the reaction temperature was raised to 80 °C and allowed to continue for a
further 4 hours, all of the dye d11btm had been converted to dye d12btd as shown in
Figure 5.7c.
After the modification, the mass to charge ratio of the dye decreases compared
to the parent dye d10bt (5.52 min), therefore the migration time of the dye d12btd
(6.73 min) increases.
Additionally, the percent area of the d12btd shown in Figure 5.7 indicates the
purity of final product.
Figure 5.7: Electropherograms showing reaction progress of synthesis of d12btd.
(a) blue dichlorotriazine dye d10bt; (b) d11btm d12btd after 4 hours
reaction; (c) Final product d12btd. CZE conditions: same as Figure 5.1
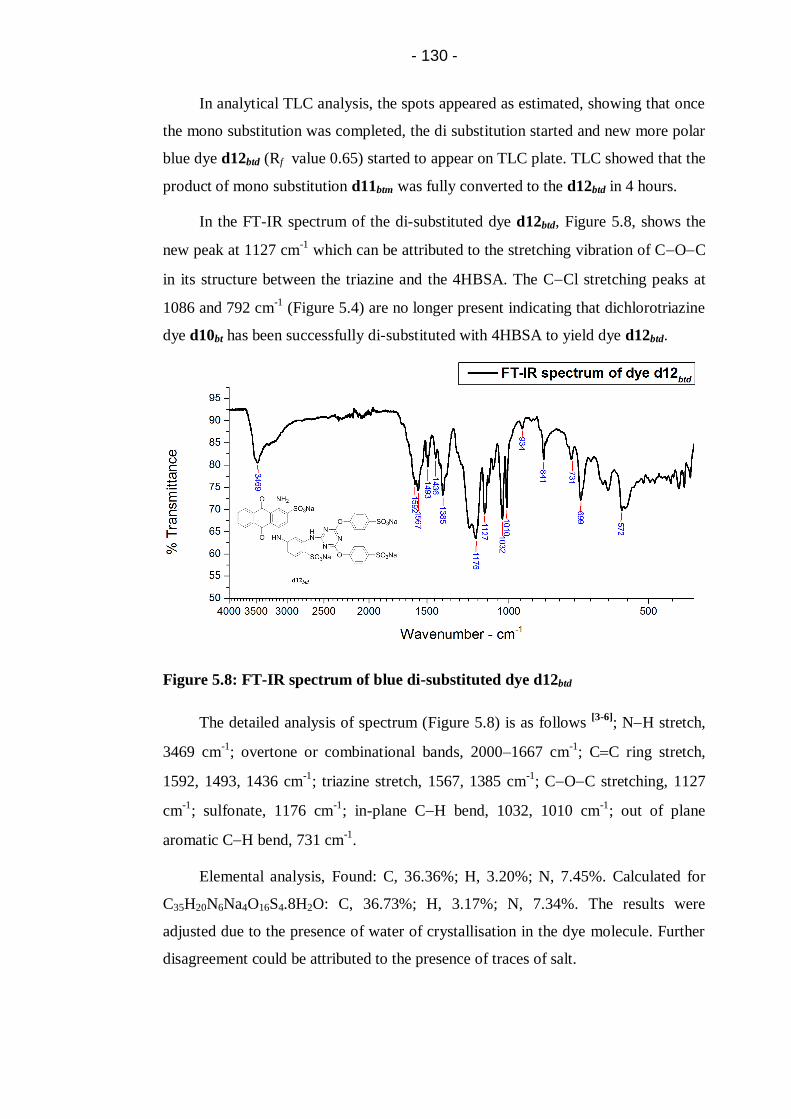
- 130 -
In analytical TLC analysis, the spots appeared as estimated, showing that once
the mono substitution was completed, the di substitution started and new more polar
blue dye d12btd (Rf value 0.65) started to appear on TLC plate. TLC showed that the
product of mono substitution d11btm was fully converted to the d12btd in 4 hours.
In the FT-IR spectrum of the di-substituted dye d12btd, Figure 5.8, shows the
new peak at 1127 cm-1
which can be attributed to the stretching vibration of COC
in its structure between the triazine and the 4HBSA. The CCl stretching peaks at
1086 and 792 cm-1
(Figure 5.4) are no longer present indicating that dichlorotriazine
dye d10bt has been successfully di-substituted with 4HBSA to yield dye d12btd.
Figure 5.8: FT-IR spectrum of blue di-substituted dye d12btd
The detailed analysis of spectrum (Figure 5.8) is as follows [3-6]
; NH stretch,
3469 cm-1
; overtone or combinational bands, 2000–1667 cm-1
; CC ring stretch,
1592, 1493, 1436 cm-1
; triazine stretch, 1567, 1385 cm-1
; COC stretching, 1127
cm-1
; sulfonate, 1176 cm-1
; in-plane CH bend, 1032, 1010 cm-1
; out of plane
aromatic CH bend, 731 cm-1
.
Elemental analysis, Found: C, 36.36%; H, 3.20%; N, 7.45%. Calculated for
C35H20N6Na4O16S4.8H2O: C, 36.73%; H, 3.17%; N, 7.34%. The results were
adjusted due to the presence of water of crystallisation in the dye molecule. Further
disagreement could be attributed to the presence of traces of salt.
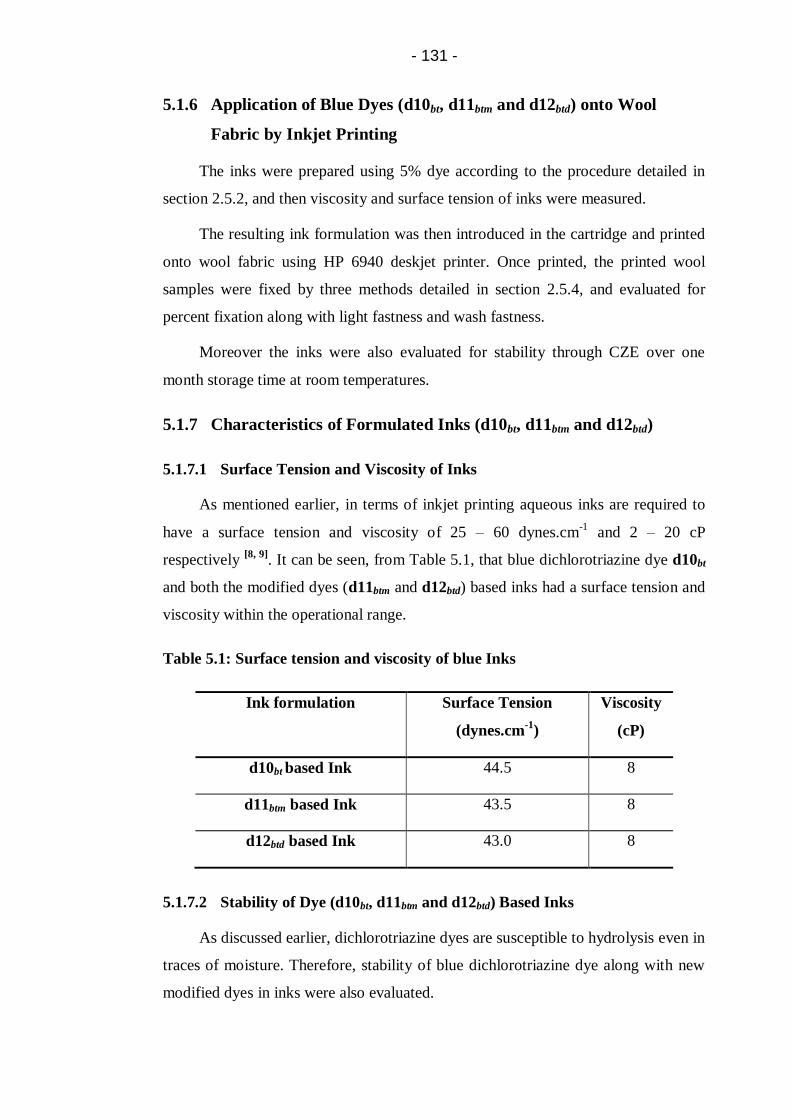
- 131 -
5.1.6 Application of Blue Dyes (d10bt, d11btm and d12btd) onto Wool
Fabric by Inkjet Printing
The inks were prepared using 5% dye according to the procedure detailed in
section 2.5.2, and then viscosity and surface tension of inks were measured.
The resulting ink formulation was then introduced in the cartridge and printed
onto wool fabric using HP 6940 deskjet printer. Once printed, the printed wool
samples were fixed by three methods detailed in section 2.5.4, and evaluated for
percent fixation along with light fastness and wash fastness.
Moreover the inks were also evaluated for stability through CZE over one
month storage time at room temperatures.
5.1.7 Characteristics of Formulated Inks (d10bt, d11btm and d12btd)
5.1.7.1 Surface Tension and Viscosity of Inks
As mentioned earlier, in terms of inkjet printing aqueous inks are required to
have a surface tension and viscosity of 25 – 60 dynes.cm-1
and 2 – 20 cP
respectively [8, 9]
. It can be seen, from Table 5.1, that blue dichlorotriazine dye d10bt
and both the modified dyes (d11btm and d12btd) based inks had a surface tension and
viscosity within the operational range.
Table 5.1: Surface tension and viscosity of blue Inks
Ink formulation Surface Tension
(dynes.cm-1
)
Viscosity
(cP)
d10bt based Ink 44.5 8
d11btm based Ink 43.5 8
d12btd based Ink 43.0 8
5.1.7.2 Stability of Dye (d10bt, d11btm and d12btd) Based Inks
As discussed earlier, dichlorotriazine dyes are susceptible to hydrolysis even in
traces of moisture. Therefore, stability of blue dichlorotriazine dye along with new
modified dyes in inks were also evaluated.

- 132 -
The results of any change in percent area of peaks of the dyes d10bt, d11btm
and d12btd within inks stored at room temperature for one month can be seen in
Figure 5.9, Figure 5.10 and Figure 5.11 respectively.
Figure 5.9: Electropherograms showing d10bt based ink stability. (a) Fresh ink;
(b) Ink after one month storage at room temperature.
From Figure 5.9, it can been seen that the reactive group of dye molecule
underwent hydrolysis under the storage conditions. The percent area of the effective
component d10bt of the ink was reduced from 100% to 15 % (Figure 5.9b) after one
month storage.
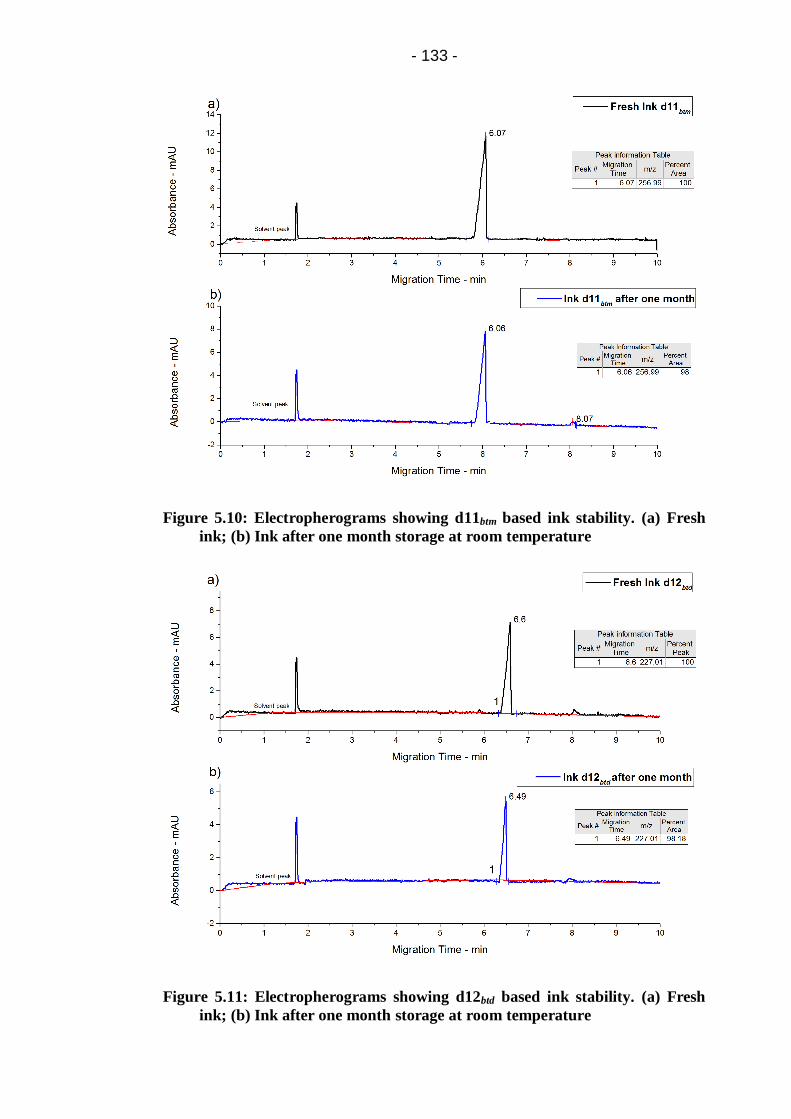
- 133 -
Figure 5.10: Electropherograms showing d11btm based ink stability. (a) Fresh
ink; (b) Ink after one month storage at room temperature
Figure 5.11: Electropherograms showing d12btd based ink stability. (a) Fresh
ink; (b) Ink after one month storage at room temperature
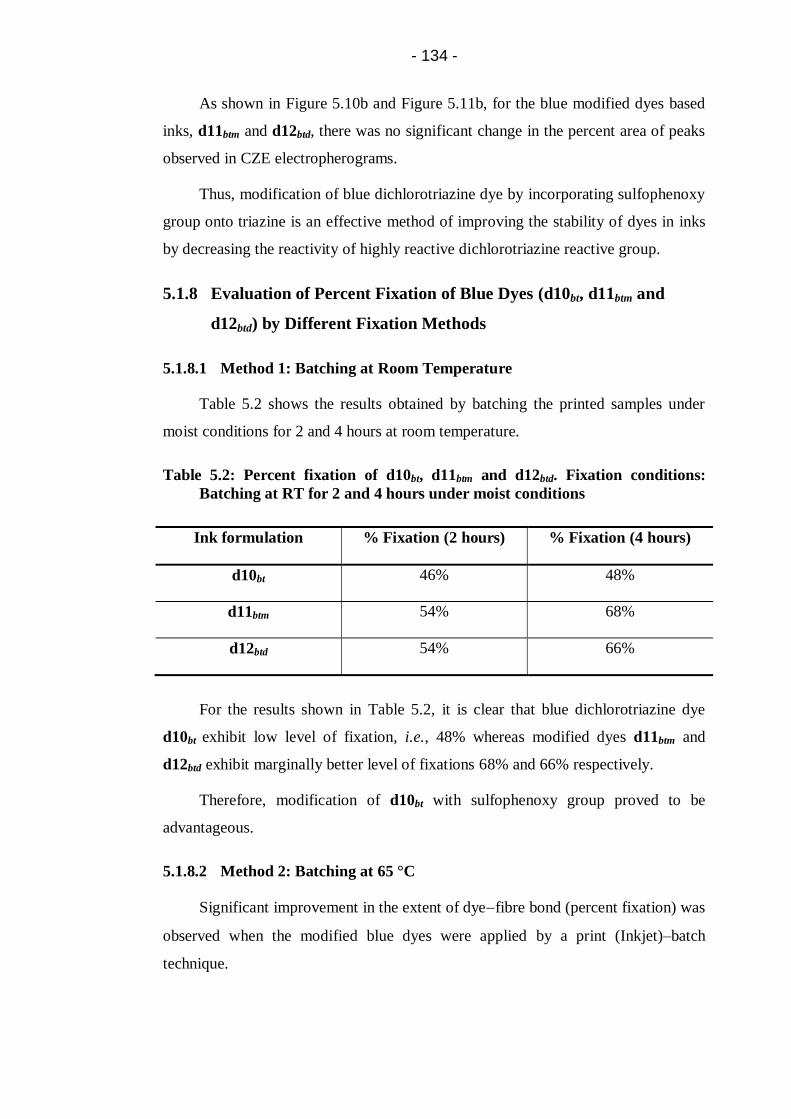
- 134 -
As shown in Figure 5.10b and Figure 5.11b, for the blue modified dyes based
inks, d11btm and d12btd, there was no significant change in the percent area of peaks
observed in CZE electropherograms.
Thus, modification of blue dichlorotriazine dye by incorporating sulfophenoxy
group onto triazine is an effective method of improving the stability of dyes in inks
by decreasing the reactivity of highly reactive dichlorotriazine reactive group.
5.1.8 Evaluation of Percent Fixation of Blue Dyes (d10bt, d11btm and
d12btd) by Different Fixation Methods
5.1.8.1 Method 1: Batching at Room Temperature
Table 5.2 shows the results obtained by batching the printed samples under
moist conditions for 2 and 4 hours at room temperature.
Table 5.2: Percent fixation of d10bt, d11btm and d12btd. Fixation conditions:
Batching at RT for 2 and 4 hours under moist conditions
Ink formulation % Fixation (2 hours) % Fixation (4 hours)
d10bt 46% 48%
d11btm 54% 68%
d12btd 54% 66%
For the results shown in Table 5.2, it is clear that blue dichlorotriazine dye
d10bt exhibit low level of fixation, i.e., 48% whereas modified dyes d11btm and
d12btd exhibit marginally better level of fixations 68% and 66% respectively.
Therefore, modification of d10bt with sulfophenoxy group proved to be
advantageous.
5.1.8.2 Method 2: Batching at 65 °C
Significant improvement in the extent of dyefibre bond (percent fixation) was
observed when the modified blue dyes were applied by a print (Inkjet)–batch
technique.

- 135 -
Figure 5.12: Percent fixation of (d10bt, d11btm and d12btd). Fixation conditions:
Batch at 65 °C for 30 to 180 minutes under moist conditions
Figure 5.12 shows the results obtained using d10bt, d11btm and d12btd by
batching the printed samples under moist conditions for 30 180 minutes at 30
minutes interval.
As shown in Figure 5.12, blue dichlorotriazine dye d10bt exhibit low to
moderate fixation, i.e. 59%. This could be because of its high reactivity and
susceptibility towards hydrolysis that one chlorine atom reacts with wool fibre and
the other hydrolysed readily under selected conditions.
Moreover, it is also evident from Figure 5.12 that blue modified dyes d11btm
and d12btd based inks show remarkable improvement in percent fixation. This could
be due to the alteration of leaving group(s) attached to triazine ring which effect the
reactivity of the resulting dye and because of the lower reactivity of these dyes they
give better fixation at higher temperatures.
It is also evident from Figure 5.10, that mono substituted dye d11btm gave
better results initially, however, later di-substituted dye d12btd levelled off the
results. It could be due to the better stability of the sulfophenoxy group at the
fixation temperature used.
5.1.8.3 Method 3: Steaming
Figure 5.13 shows the effect of steaming on the percent fixation of blue
dichlorotriazine and modified dyes printed on the wool fabric.
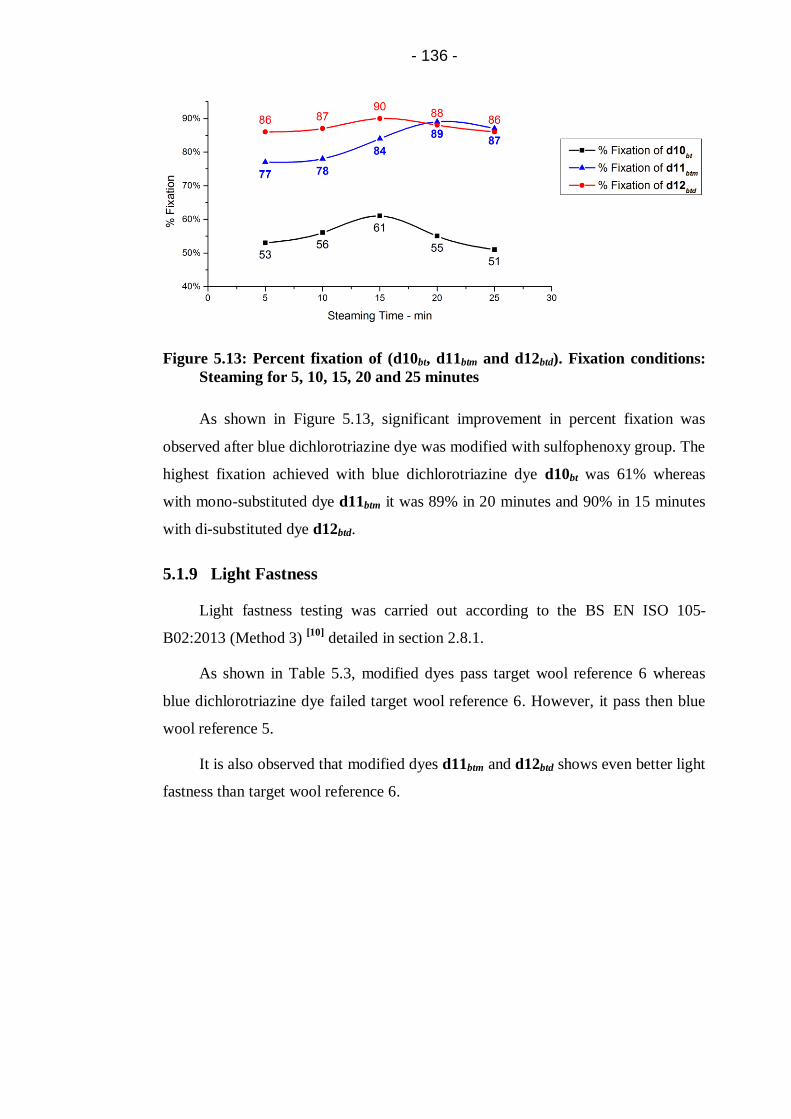
- 136 -
Figure 5.13: Percent fixation of (d10bt, d11btm and d12btd). Fixation conditions:
Steaming for 5, 10, 15, 20 and 25 minutes
As shown in Figure 5.13, significant improvement in percent fixation was
observed after blue dichlorotriazine dye was modified with sulfophenoxy group. The
highest fixation achieved with blue dichlorotriazine dye d10bt was 61% whereas
with mono-substituted dye d11btm it was 89% in 20 minutes and 90% in 15 minutes
with di-substituted dye d12btd.
5.1.9 Light Fastness
Light fastness testing was carried out according to the BS EN ISO 105-
B02:2013 (Method 3) [10]
detailed in section 2.8.1.
As shown in Table 5.3, modified dyes pass target wool reference 6 whereas
blue dichlorotriazine dye failed target wool reference 6. However, it pass then blue
wool reference 5.
It is also observed that modified dyes d11btm and d12btd shows even better light
fastness than target wool reference 6.

- 137 -
Table 5.3: Light fastness of blue dyes (d10bt, d11btm and d12btd) compared to
target blue wool reference 6
Dye/Ink Target blue wool reference 6
d10bt *Less than 6 Unsatisfactory
d11btm Better than 6 (6+) Satisfactory
d12btd Better than 6 (6+) Satisfactory
*: However, for textile applications light fastness of target wool reference 5 is also
satisfactory.
5.1.10 Wash Fastness
Wash fastness was carried out according to the BS ISO 105-C06:2010 [11]
and
the results are shown in Table 5.4. Blue dichlorotriazine dye d6yt showed a small
change in shade resulting in a grade 4-5; and also there was light staining on cotton
(adjacent fabrics) whereas both the modified dyes d7ytm and d8ytd showed no change
in colour or staining, hence, showed excellent wash fastness. This excellent wash
fastness is because of the strong covalent bonding between the dye and the wool
fibre and also due to the high stability of this bond under washing conditions.
Table 5.4: Wash fastness of blue dyes (d10bt, d11btm and d12btd)
Dye/Ink Change in shade
Staining
CA C N P A W
d10bt 4-5 5 4-5 5 5 5 5
d11btm 5 5 5 5 5 5 5
d12btd 5 5 5 5 5 5 5
CA: Cellulose Acetate; C: Cotton; N: Nylon; P: Polyester; A: Acrylic; W: Wool
5.2 Conclusions
With the aim of designing a series of blue dyes for inkjet inks for wool with
lower chemical reactivity, increased solubility and increased stability, one chlorine
of cyanuric chloride was displaced by anthraquinone based blue dye chromophore at
- 138 -
0 to 5 °C (pH 5.0 to 7.0) to produce blue dichlorotriazine dye d10bt in pure form
(without hydrolysed by-products).
Modification of blue dichlorotriazine was done by same sequence as done for
magenta and yellow dyes, however, the parameters for modification were optimised.
First modification of blue dichlorotriazine dye was done by displacing the
second chlorine atom by sulfophenoxy group at 35 °C (5 hours) to produce
heterobifunctional dye d11btm in pure form.
Second modification of blue dichlorotriazine dye was done by displacing the
second chlorine atom by using two equivalent sulfophenoxy group at 45 °C (2
hours) to produce intermediate dye d11btm and then the third chlorine atom as
displaced at 80 °C (4 hours) to produce homobifunctional dye d12btm in pure form.
The characteristic properties such as surface tension and viscosity of inks
formulated by incorporating the synthesised dyes were found to be in operational
range.
The stability of modified dyes based inks increased significantly due to the
lower reactivity of the modified dyes, which make them ideally suited to inkjet
printing processes.
Significant improvement in the extent of covalent dye fixation was observed
when the modified blue dyes were applied by inkjet printing and fixed through
batching and steaming.
With respect to colour fastness, the blue dichlorotriazine dye was 1.0 grade
lower when compared with the modified dye ink prints for light fastness test.
Moreover, modified dyes showed excellent wash fastness properties whereas
dichlorotriazine dye showed a small change in shade as well as staining on adjacent
fabrics (cotton).
5.3 References
1. Patent CN101575456 (2009)
2. Liu, J.L., Luo, H.J. and Wei, C.H. Degradation of anthraquinone dyes by
ozone. Transactions of Nonferrous Metals Society of China, 2007, 17,
pp.880-886.

- 139 -
3. Silverstein, R.M., Webster, F.X. and Kiemle, D.J. Spectrometric
Identification of Organic Compounds. 7th ed. New York: John Wiley and
Sons, 2005.
4. Socrates, G. Infrared and Raman characteristic group frequencies : tables
and charts. Chichester: Wiley, 2001.
5. Matlok, F., Gremlich, H.U., Bruker Analytische Meotechnik and Merck eds.
Merck FT-IR atlas : a collection of FT-IR spectra. Weinheim: Vch, 1988.
6. Keller, R.J. and Sigma-Aldrich Corporation. The Sigma library of FT-IR
spectra. Missouri: Sigma Chemical Company, 1986.
7. Beech, W.F. Fibre-Reactive Dyes London: Logos Press Ltd., 1970.
8. Magdassi, S. Ink Requirements and Formulations Guidelines. In: S.
Magdassi, ed. Chemistry of Inkjet Inks. New Jersey: World Scientific
Publishing Ltd., 2012.
9. Ujiie, H. Digital printing of textiles. Cambridge: Woodhead Publishing Ltd.,
2006.
10. British Standards Institution. Colour fastness to artificial light: Xenon arc
fading lamp test, ISO 105-B02:2013.
11. British Standards Institution. Textiles - Tests for colour fastness - Part C06:
Colour fastness to domestic and commercial laundering, BS EN ISO 105-
C06:2010.

- 140 -
6 Synthesis, Modification, Characterisation of Magenta
Trichloropyrimidine Dyes and Their Application onto Wool
Fabric by Inkjet Printing
6.1 Introduction
As discussed in Chapter 1, pyrimidine is technically the most important
heterocyclic carrier system in addition to triazine. Depending on the leaving groups,
substituents and bridging group, pyrimidine permits wider range of variations with
regard to the required properties in application (reactivity, ease of washing-off and
fastness properties) as compared to triazine [1]
. Pyrimidines bearing halogen
substituents at activated positions 2, 4, and 6 are the cornerstone to diverse
modifications of the pyrimidine ring. The polyhalogenated pyrimidine compounds
undergo regioselective and stepwise substitutions with common nucleophiles such
as amines [2]
. Thus, Geigy and Sandoz claimed almost simultaneously water-soluble
trichloropyrimidine dyes in 1959 and marketed them together under the trade names
Reactone (Geigy) and Drimaren (Sandoz). This technically important group of dyes
are slightly less reactive than monochlorotriazine dyes and also because of ease of
removal of unfixed dye and the high stability of the paste this group is well suited
for textile printing [3, 4]
.
It was at one time thought possible that the comparatively high solubility and
low substantivity of chloropyrimidine dyes might be associated with isomer
formation during condensation of polychloropyrimidines with amino chromophores;
however, Ackermann and Dussy [5]
found that in the condensation with the bridging
group of the dye chromophore, replacement of the chlorine atom in the 4-position
occurs exclusively (see Scheme 6.1). For this reason they are synthesised in this
study as compounds in which the amino group of the dye chromophore becomes
attached to the 4-position of the pyrimidine ring.

- 141 -
Scheme 6.1: Condensation of 2,4,5,6-tetrachloropyrimidine with dye
chromophore [6]
Ackermann and Dussy also found that any further substitution of 4-
aminotrichloropyrimidine produces 2 or 6 substituted pyrimidines (See Scheme 6.2)
[6].
Scheme 6.2: Substitution of 2,5,6-trichloropyrimidine dye [6]
Furthermore, on account of their low reactivity, chloropyrimidine react less
readily with amines than do the corresponding chlorotriazines, and this restricts the
methods available for preparing some dyes of pyrimidine series. Thus, the
substitution of tetrachloropyrimidine with the amino-containing chromophore is
much more difficult than the cyanuric chloride which is analogue in the triazine
series and generally requires vigorous reaction conditions such as high temperatures
and long reaction times (hours or days). Moreover, the reaction is difficult to bring
to completion and suffers from mostly poor yield [4]
.
According to the literature [5, 7-10]
, two synthesis routes were used for the
preparation of trichloropyrimidine dyes.
6.1.1 Synthesis Route 1
Ackermann and Dussy [5]
dissolve equimolar amount of reactants in a mixture
of equal volumes of water and acetone and added alkali to maintain the pH at 6.0 to
7.0 and the reaction mixture was subsequently heated to 50 °C. However, the
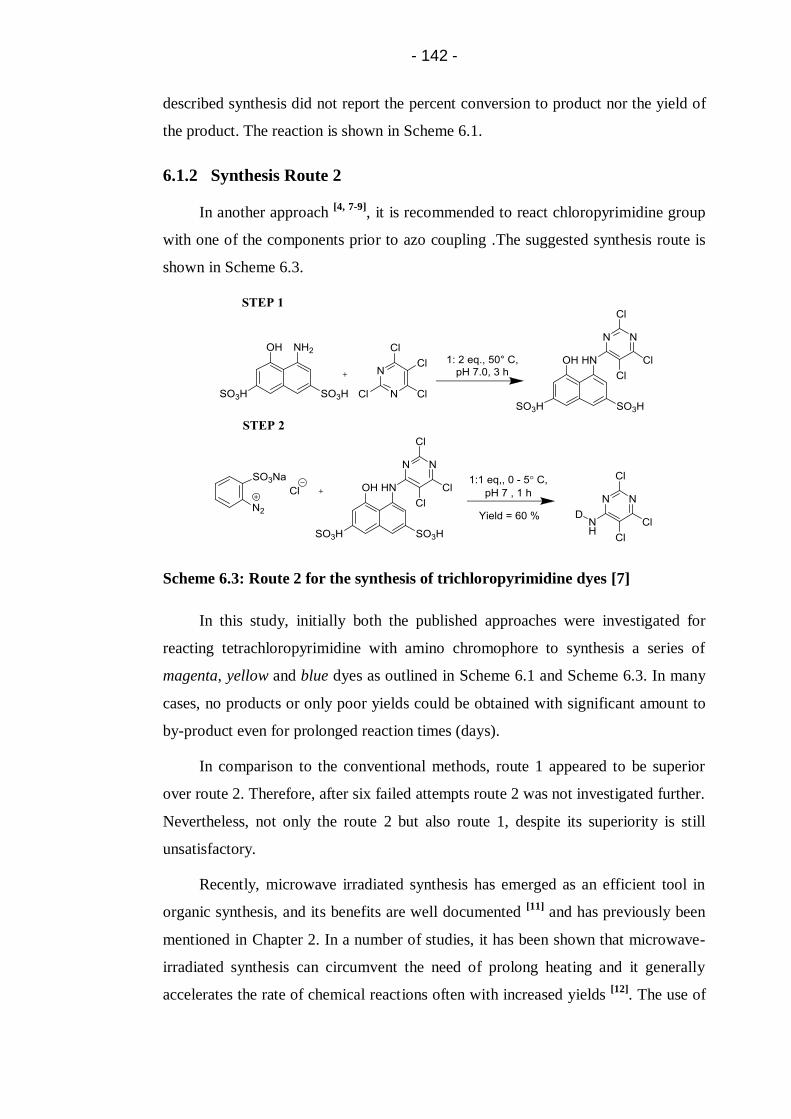
- 142 -
described synthesis did not report the percent conversion to product nor the yield of
the product. The reaction is shown in Scheme 6.1.
6.1.2 Synthesis Route 2
In another approach [4, 7-9]
, it is recommended to react chloropyrimidine group
with one of the components prior to azo coupling .The suggested synthesis route is
shown in Scheme 6.3.
Scheme 6.3: Route 2 for the synthesis of trichloropyrimidine dyes [7]
In this study, initially both the published approaches were investigated for
reacting tetrachloropyrimidine with amino chromophore to synthesis a series of
magenta, yellow and blue dyes as outlined in Scheme 6.1 and Scheme 6.3. In many
cases, no products or only poor yields could be obtained with significant amount to
by-product even for prolonged reaction times (days).
In comparison to the conventional methods, route 1 appeared to be superior
over route 2. Therefore, after six failed attempts route 2 was not investigated further.
Nevertheless, not only the route 2 but also route 1, despite its superiority is still
unsatisfactory.
Recently, microwave irradiated synthesis has emerged as an efficient tool in
organic synthesis, and its benefits are well documented [11]
and has previously been
mentioned in Chapter 2. In a number of studies, it has been shown that microwave-
irradiated synthesis can circumvent the need of prolong heating and it generally
accelerates the rate of chemical reactions often with increased yields [12]
. The use of

- 143 -
microwave irradiation for the formation of carbon-carbon, carbon-oxygen as well as
carbon-nitrogen has been successfully demonstrated [13]
.
Thus, in this study, it was expected that microwave irradiation could improve
the condensation reaction of 2,4,5,6-tetrachloropyrimidine with amino chromophore.
Moreover, substitution reaction of synthesised trichloropyrimidine dyes by 4HBSA
can also be done.
Therefore, microwave-irradiated synthesis, a novel strategy for the preparation
of the target dyes magenta trichloropyrimidine d13mp, blue trichloropyrimidine dye
d15bp yellow trichloropyrimidine dye d17yp was developed which resulted in high
yields of products along with high percent conversion and shorter reaction times.
After the successful syntheses of parent trichloropyrimidine dyes (magenta
d13mp, blue d15bp and yellow d17yp), modification of these dyes with sulfophenoxy
group was also investigated, initially, with conventional heating method. However,
these trials were completely failed in terms of achieving satisfactory yields of
products. Later, microwave-irradiated method was used which results in high yields
along with shorter reaction times.
This chapter details the synthesis, modification and characterisation of
magenta dyes based on the pyrimidine reactive group by the conventional heating
method as well as microwave irradiation and the results were evaluated.
Moreover, the synthesised magenta parent and specially modified reactive dye
were applied to wool fabric through inkjet printing in order to evaluate their percent
fixation, stability of inks along with colour fastness (light and wash) properties.
6.2 Experimental
6.2.1 Materials
Magenta dye chromophore d1m (100%); 2,4,5,6-tetrachloropyrimidine (97%),
sodium 4-hydroxybenzenesulfonate dihydrate (98%), sodium bisulfite,
carboxymethyl cellulose, polysorbate 20 (Tween 20) and N-methylmorpholine N-
oxide (NMMO) were purchased from Sigma-Aldrich and used as received. Urea
(MP Biomedicals), Alcopol O 60 (Acros organics), 2-pyrrolidone (Acros organics),
2-propanol (Fisher), Sandozin NIE (Clariant) were also purchased and used as
received.

- 144 -
6.2.2 Conventional Heating Methods for the Synthesis of Magenta 5-
[(2,5,6-trichloro-4-pyrimidinyl)amino]-4-Hydroxy-3-[(2-
sulfophenyl)azo]-2,7-Naphthalenedisulfonic Acid Dye (d13mp)
6.2.2.1 Conventional Heating Method (Route 1)
In accordance with the literature [5, 10]
, amino based dye chromophore d1m was
dissolved in water and adjusted to the pH 6.0 to 7.0 by the addition to 2N
hydrochloric acid at 35 °C. A solution of investigated molar ratio of 2,4,5,6-
tetrachloropyrimidine in acetone was added as thin stream to the dye chromophore
solution. The reaction mixture was refluxed to the investigated temperature and
percent conversion were monitored through CZE. The percent conversion can be
obtained from percent area of target dye on the CZE electropherogram.
The target magenta trichloropyrimidine dye was synthesised using a molar
ratio of 1:1 and 1:2 at a temperature range of 50, 60, 70, 85 and 100 °C.
6.2.2.2 Conventional Heating Method (Route 2)
In accordance with the literature [7]
, 5-amino-4-naphthol-2,7-disulphonic acid
(H-acid) (4 g, 0.011 mol, 1 eq.) was dissolved in water (50 cm3) and acetone (37.5
cm3) at 50 °C and the pH adjusted to 7 with 2N sodium hydroxide. 2,4,5,6-
tetrachloropyrimidine (5 g, 0.02 mol, 2 eq.) in acetone (12.5 cm3) was added
dropwise and the solution was stirred under reflux at 50 °C for three hours. The pH
was maintained between 6 and 8 by addition of 2N sodium hydroxide and the
reaction is monitored through CZE. The product was precipitated by pouring the
solution into acetone, and filtered.
However, after six unsuccessful attempts conventional heating method (route
2) was not attempted further.
6.2.3 Investigation of Conventional Heating Method (Route 1) for the
Synthesis of Magenta Trichloropyrimidine Dye (d13mp)
6.2.3.1 Percent Conversion to d13mp Under Various Temperature
The percent conversion of d1m to yield d13mp at temperatures 50, 60, 70, 85
and 100 °C were investigated provided that the reactants were used in equal molar
ratios (1:1) and pH of reaction mixture was maintained at 6.0 to 7.0 throughout with

- 145 -
2N sodium carbonate solution. The reactions were stirred until the pH had stabilised
(50 hours) and prolonged reaction times did not have any effect on percent
conversion to d13mp. The reactions were monitored through CZE.
The percent conversion to magenta dye d13mp achieved at different
temperatures are shown in Figure 6.1 and isolated yields are listed in Table 6.1.

- 146 -
Figure 6.1: Electropherograms showing conversion of reactants to d13mp using
conventional heating method (route 1) at; (a) 50 °C; (b) 60 °C; (c) 70 °C;
(d) 85 °C; (e) 100 °C. CZE conditions: running buffer, 6mM potassium
dihydrogen phosphate and acetonitrile (10% v/v) pH 9.0; pressure
injection 0.5 psi for 10 s; voltage 25 kV; detection at 542 nm.

- 147 -
When an initial reaction was performed under literature conditions [5]
(1:1 eq.,
Na2CO3, pH 6.0 to 7.0, wateracetone, 50 °C) to first establish the conversion to
product at a reaction time of 50 hours, poor conversion (5%) was seen (Figure 6.1a,
peak 1; Table 6.1, entry 1).
Table 6.1: Summary of results with conventional heating (route 1) at various
temperatures
Entry Parameters Time
(hours)
Conversion a(%)
Yield
(%)
1 1:1 eq., Na2CO3, pH 6.0 – 7.0,
wateracetone, 50 °C [5]
50 5 *
2 1:1 eq., Na2CO3, pH 6.0 – 7.0,
wateracetone, 60 °C
50 15 *
3 1:1 eq., Na2CO3, pH 6.0 – 7.0,
wateracetone, 70 °C [10]
50 24 6
4 1:1 eq., Na2CO3, pH 6.0 – 7.0,
wateracetone, 85 °C
50 41 13
5 1:1 eq., Na2CO3, pH 6.0 – 7.0,
wateracetone, 100 °C
50 38b 15c
a: Determined by CZE analysis; b: significant amount of by-product; c: isolated d13mp not pure; *: Dye d13mp was not isolated from the reaction mixture due to low percent
conversion
Adjustments of 10 – 15 °C per run provide a way to identify the optimal
reaction temperature of a conventional reaction. The percent conversion was seen to
increase as higher temperatures were screened as it accelerates the rate of reaction
(Figure 6.1 b, c, and d; Table 6.1, entries 2, 3 and 4) until significant amounts of an
by-product appeared in the CZE electropherogram of entry 5 (Figure 6.1e).
The reactions were carried out by conventional heating at a range of
temperatures, but the reactions generally proceeded sluggishly. Therefore, it is
concluded that by using conventional heating method (route 1) for the synthesis of
magenta trichloropyrimidine dye d13mp, the maximum percent conversion to the
product was 41% at 85 °C in 50 hours giving a poor yield of 13%.
6.2.3.2 Percent Conversion to d13mp Under Different Molar Ratio
The percent conversion of d1m to yield d13mp using 1:1 and 1:2 molar ratio at
85 °C were investigated provided that the pH of the reaction mixture was maintained
at 6.0 to 7.0 throughout with 2N sodium carbonate solution. The reactions were

- 148 -
stirred until the pH had stabilised and prolonged reaction times did not have any
effect on percent conversion to d13mp. The reactions were monitored through CZE.
The percent conversions achieved are shown in Figure 6.2 and isolated yields
are listed in Table 6.2.
Figure 6.2: Electropherograms showing conversion of reactants to d13mp using
conventional heating method (route 1); (a) 1:1 molar ration; (b) 1:2 molar
ratio. CZE conditions: same as Figure 6.1.
Table 6.2: Summary of results from conventional heating (route 1) at different
molar ratios
Entry Parameters Time
(hours)
Conversion a(%)
Yield
(%)
1 1:1 eq., Na2CO3, pH 6.0 – 7.0,
wateracetone, 85 °C
50 41 13
2 1:2 eq., Na2CO3, pH 6.0 – 7.0,
wateracetone, 85 °C
18 25 8b
a: Determined by CZE analysis; b: isolated d13mp not pure
As shown in Figure 6.2, when reactants are used in equal moles, percent
conversion of 41% was achieved at 85 °C in 50 hours. However, when the molar
ratio of 1:2 was used the rate of reaction accelerated, though after 18 hours of
reaction the product begins to hydrolyse (Figure 6.2b). Therefore, increasing the
- 149 -
molar ratio does not prove beneficial in the synthesis of d13mp under the reaction
conditions adopted.
The reaction conditions for the synthesis of d13mp using conventional heating
method (route 1) were investigated in detail and concluded that the current
conventional heating method for the synthesis of d13mp gave a poor yield of only
13%. Therefore, the documented conventional heating methods for the synthesis of
d13mp are unsatisfactory and insufficient.
6.2.4 Optimisation of Microwave-Irradiated Synthesis of Dye d13mp
For the optimisation of microwave-irradiated synthesis, the reaction should
initially run with the conditions used for conventional synthesis. However, if the
reaction is not successful, a change in temperature and reaction time is
recommended. Moreover, other conditions for example solvent and reagents can
also be varied when appropriate.
For this study, an initial reaction was performed under literature conditions
[1:1 eq., Na2CO3 (1 eq.), wateracetone, 50 °C; Table 6.3, entry 1] to first establish
the conversion to product at a typical microwave reaction conditions. Poor
conversion (9%) was seen at literature temperature (Table 6.3, entry 1; Figure 6.3a),
and no pressure increase was noted as the reaction proceeded.

- 150 -
Figure 6.3: Electropherograms showing conversion of reactants to d13mp using
microwave irradiation at; (a) 50 °C; (b) 80 °C; (c) 110 °C; (d) 130 °C. CZE
conditions: same as Figure 6.1.

- 151 -
Table 6.3: Optimisation of reaction temperature for microwave-irradiated
condensation reaction
Entry Solvent Alkali
Temperature
(°C)
Time
(hours)
Conversion
(%)
1 WaterAcetone Na2CO3 50 8 9
2 WaterAcetone Na2CO3 80 8 18
3 WaterAcetone Na2CO3 110 10 45a
4 WaterAcetone Na2CO3 130 10 43a
a: significant amount of hydrolysed dye (by-product)
Adjustments of 20 - 40 °C per run provide an efficient way to identify the
optimal reaction temperature of a microwave-irradiated reaction. The percent
conversion was seen to increase as higher temperatures were screened (entries 2, 3)
until significant amounts of hydrolysed by-product appeared in the CZE
electropherograms of entry 3 and 4 (Figure 6.3c and Figure 6.3d). However, it is
evident from Figure 6.3 and Table 6.3 that microwave irradiation is advantageous
for the synthesis of trichloropyrimidine dyes but needs further optimisation of
conditions to minimise side reactions, such as hydrolysis.
Since the hydrolysis of halogenated pyrimidines in water is fairly easy, there
are two competing reactions in the synthesis of trichloropyrimidine dyes; (1) the
condensation reaction with the amino group of dye chromophore and (2) the
formation of hydroxyl substituted pyrimidine by-product by nucleophilic
displacement of chlorine with water.
A thorough search of the patent literature yielded hints that during the course
of the reaction of chloropyrimidine and amino chromophore the reaction turn acidic
due to the formation of hydrogen chloride, therefore, use of buffer [14, 15]
(sodium
phosphate buffer) might be advantageous to control the pH of reaction mixture and
to avoid or minimise side reactions, i.e. hydrolysis of halogen.
Furthermore, Mueller and Baqi [16]
patented microwave irradiated synthesis of
anilinoanthraquinone derivatives in the presence of different mixtures of phosphate
buffer (neutral to basic) as a solvent system and they concluded that the reaction
went to completion with excellent yields.
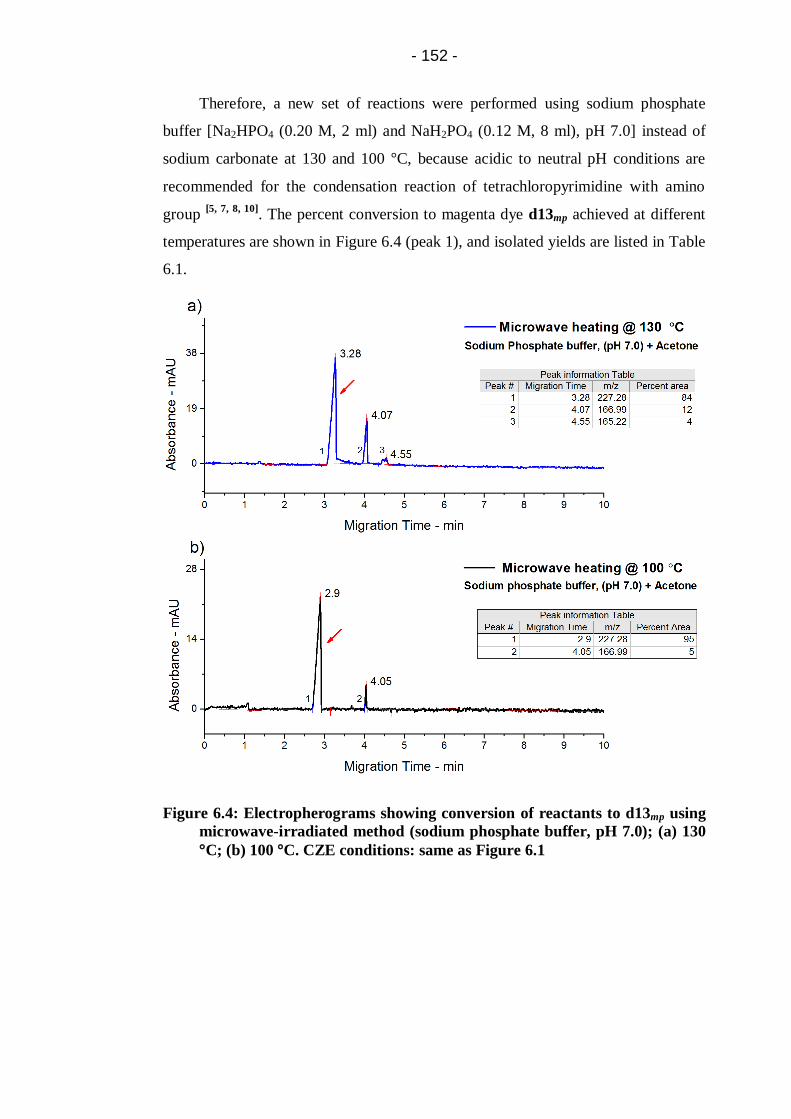
- 152 -
Therefore, a new set of reactions were performed using sodium phosphate
buffer [Na2HPO4 (0.20 M, 2 ml) and NaH2PO4 (0.12 M, 8 ml), pH 7.0] instead of
sodium carbonate at 130 and 100 °C, because acidic to neutral pH conditions are
recommended for the condensation reaction of tetrachloropyrimidine with amino
group [5, 7, 8, 10]
. The percent conversion to magenta dye d13mp achieved at different
temperatures are shown in Figure 6.4 (peak 1), and isolated yields are listed in Table
6.1.
Figure 6.4: Electropherograms showing conversion of reactants to d13mp using
microwave-irradiated method (sodium phosphate buffer, pH 7.0); (a) 130
°C; (b) 100 °C. CZE conditions: same as Figure 6.1

- 153 -
Table 6.4: Modification of reaction conditions for microwave irradiated
condensation reaction
Entry Solvent
(equal volumes)
Temperature
(°C)
Time
(hours)
Conversion
(%)
1 Sodium phosphate buffer pH (7.0)
Acetone
130 2 84a [63c]b
2 Sodium phosphate buffer pH (7.0)
Acetone
100 4 95 [83]b
a: hydrolysed dye (by-product); b: isolated yield; c: isolated d13mp not pure.
Although the conversion to d13mp was 84% at 130 °C in 2 hours, however,
only 63% yield of expected product was gained, which possibly suggested that
higher temperature might result in more by-products. Therefore, decreasing the
reaction temperature to 100 °C and increasing the time to 4 hours resulted in both a
significant increase in the initial rate of reaction and in the overall conversion of
95% with a pure 83% yield.
The microwave irradiation condensation of tetrachloropyrimidine with amino
chromophore worked very well with aqueous sodium phosphate buffer and acetone
at moderate temperature (100 °C), yielding the desired magenta trichloropyrimidine
dye d13mp in more than 80% yield. The desired dye d13mp was formed almost
exclusively, and only traces of d1m were detected with CZE (Figure 6.4b). The
product was isolated by salting-out with sodium chloride (10% v/v) at 55 °C.
6.2.5 Comparative Study of Conventional and Microwave-Irradiated
Synthesis of Dye d13mp
As shown in Figure 6.5, microwave-irradiated reaction was completed in only
4 hours with a dramatic increase in the rate of reaction and conversion of reactants
to d13mp in comparison to conventional heating which takes 50 hours until only 41%
conversion and resulted with a significant amount of hydrolysed by-product.
Moreover, dye d13mp of high purity was obtained in excellent yield of 83%
with microwave irradiated synthesis, whereas, a poor yield of 13% was achieved
with conventional heating method.

- 154 -
Figure 6.5: Comparison of reaction times, conversions and yields obtained by
conventional heating and microwave irradiation (d13mp)
This enhancement in the rate of reaction, conversion to product and high yield
is due to higher microwave temperatures as high microwave temperatures have led
to reaction times up to three orders of magnitude shorter than those for the same
preparations carried out conventionally [17]
.
This is because, with conventional heating, reactants are slowly activated by
external heat source which passes first through the walls of the vessel in order to
reach the solvent and reactants. This is a slow and inefficient method for transferring
energy into the reacting system. Whereas, in the microwave irradiation, microwaves
couple directly with the molecules of the entire reaction mixture, leading to a rapid
rise in temperature. Since the process is not limited by the thermal conductivity of
the vessel, the result is an instantaneous localised superheating of any substance that
will respond to either dipole rotation or ionic conduction.
Moreover, in conventional heating due to the developed temperature gradient
and localised overheating the product, reactants or reagent can be decomposed.
Therefore, in this study the novel, fast, efficient, and high-yielding procedure
for the synthesis of magenta trichloropyrimidine dye d13mp was developed, which is
superior to previously published methods in all aspects, including yields, reaction
time, and versatility.
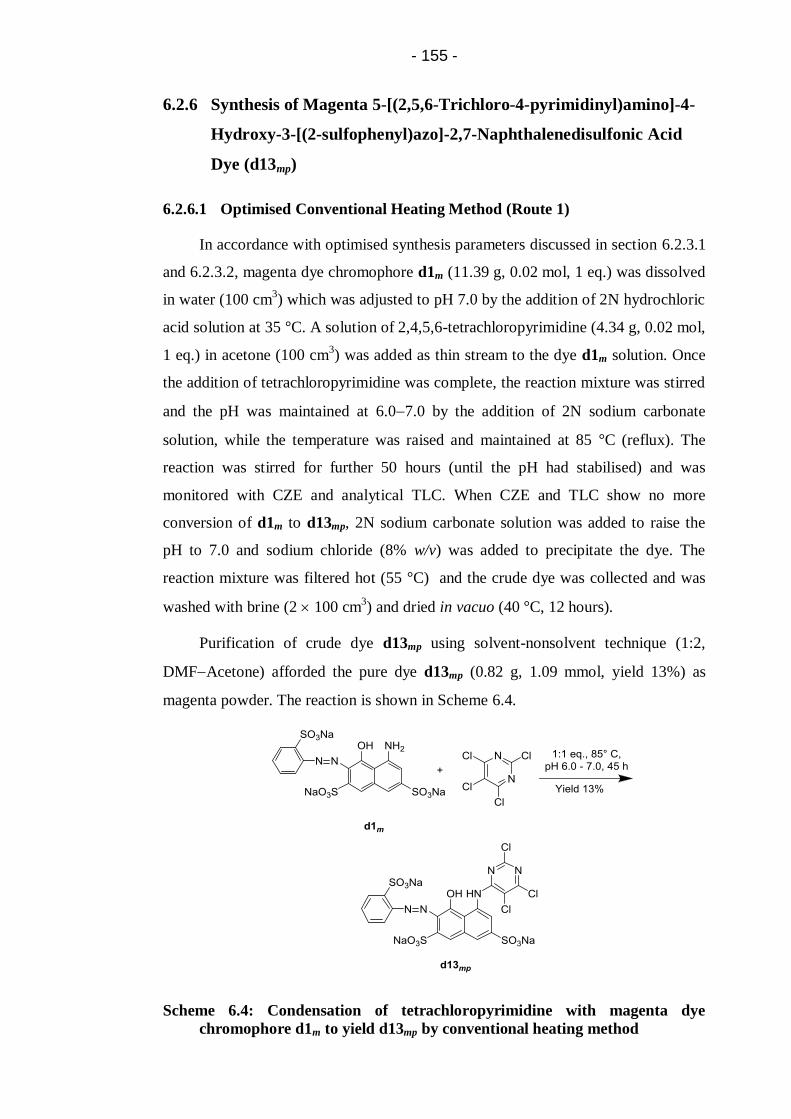
- 155 -
6.2.6 Synthesis of Magenta 5-[(2,5,6-Trichloro-4-pyrimidinyl)amino]-4-
Hydroxy-3-[(2-sulfophenyl)azo]-2,7-Naphthalenedisulfonic Acid
Dye (d13mp)
6.2.6.1 Optimised Conventional Heating Method (Route 1)
In accordance with optimised synthesis parameters discussed in section 6.2.3.1
and 6.2.3.2, magenta dye chromophore d1m (11.39 g, 0.02 mol, 1 eq.) was dissolved
in water (100 cm3) which was adjusted to pH 7.0 by the addition of 2N hydrochloric
acid solution at 35 °C. A solution of 2,4,5,6-tetrachloropyrimidine (4.34 g, 0.02 mol,
1 eq.) in acetone (100 cm3) was added as thin stream to the dye d1m solution. Once
the addition of tetrachloropyrimidine was complete, the reaction mixture was stirred
and the pH was maintained at 6.07.0 by the addition of 2N sodium carbonate
solution, while the temperature was raised and maintained at 85 °C (reflux). The
reaction was stirred for further 50 hours (until the pH had stabilised) and was
monitored with CZE and analytical TLC. When CZE and TLC show no more
conversion of d1m to d13mp, 2N sodium carbonate solution was added to raise the
pH to 7.0 and sodium chloride (8% w/v) was added to precipitate the dye. The
reaction mixture was filtered hot (55 °C) and the crude dye was collected and was
washed with brine (2 100 cm3) and dried in vacuo (40 °C, 12 hours).
Purification of crude dye d13mp using solvent-nonsolvent technique (1:2,
DMFAcetone) afforded the pure dye d13mp (0.82 g, 1.09 mmol, yield 13%) as
magenta powder. The reaction is shown in Scheme 6.4.
Scheme 6.4: Condensation of tetrachloropyrimidine with magenta dye
chromophore d1m to yield d13mp by conventional heating method

- 156 -
6.2.6.2 Optimised Microwave-Irradiated Method
Magenta dye chromophore d1m (0.569 g, 1 mmol, 1 eq.) and 2,4,5,6-
tetrachloropyrimidine (0.238 g, 1.1 mmol, 1.1 eq.) were added to each of the ten 35
ml microwave reaction vials equipped with a magnetic stirring bars followed by
addition of 10 ml of sodium phosphate buffer [Na2HPO4 (0.20 M, 2 ml) and
NaH2PO4 (0.12 M, 8 ml), pH 7.0] and 10 ml of acetone.
The mixtures were capped and irradiated in the microwave oven (200 W) for 4
hours at 100 °C. Then the reaction mixture were transferred from the vials to a
beaker and sodium chloride (8% w/v) was added to precipitate the dye. The reaction
mixture was filtered hot (55 °C) and the crude dye was collected and was washed
with brine (2 100 cm3) and dried in vacuo (40 °C, 12 hours).
Purification of crude dye d13mp using solvent-nonsolvent technique (1:2,
DMFAcetone) afforded the pure dye d13mp (5.91 g, 7.87 mmol, yield 83%) as
magenta powder.
FT-IR analysis was conducted to confirm the presence of main functional
groups in dye d13mp. The reaction is shown in Scheme 6.5.
Scheme 6.5: Condensation of tetrachloropyrimidine with magenta dye
chromophore d1m to yield d13mp by microwave-irradiated method
- 157 -
6.2.6.3 Characterisation of Magenta 5-[(2,5,6-Trichloro-4-
pyrimidinyl)amino]-4-Hydroxy-3-[(2-Sulfophenyl)azo]-2,7-
Naphthalenedisulfonic Acid Dye (d13mp)
The electropherograms (Figure 6.6) showing the progression of synthesis
reaction of d13mp with microwave irradiations. The peaks observed were as expected
(Figure 6.6b); the first peak to emerge was d13mp (2.9 min) which has the higher
mass to charge ratio of the two analytes. This occurs because the addition of the
pyrimidine group on to the dye chromophore d1m increases the molecular weight of
the dye d13mp without any additional sulfonic acid groups that would increase the
negative charge.
Moreover, the percent area of the d13mp shown in Figure 6.6c, was 100%
which indicates that there was no hydrolysed dye in the final product.

- 158 -
Figure 6.6: Electropherograms showing reaction progress of synthesis of d13mp.
(a) magenta dye chromophore d1m; (b) d1m d13mp after 4 hours reaction;
(c) Final product d13mp. CZE conditions: same as Figure 6.1
Analytical TLC show gradual appearance of new magenta less polar
compound d13mp (Rf value 0.65) compared to the magenta starting material d1m (Rf
value 0.62) Moreover, almost quantitative conversion occurred in 4 hours with
microwave irradiated synthesis.
Analysis of FT-IR spectrum (Figure 6.7) of pure magenta powder suggested
that the compound has been d13mp since peaks due to the presence of primary amine
in d1m (Figure 3.2, page 70) at 1621 cm-1
and 889 cm-1
are no longer present
indicating that the primary amine had successfully reacted with 2,4,5,6-
tetrachloropyrimidine. According to literature [18, 19]
, C=N have at least one strong
band at 1580-1520 cm-1
and at least one band at 1450-1350 cm-1
corresponding to
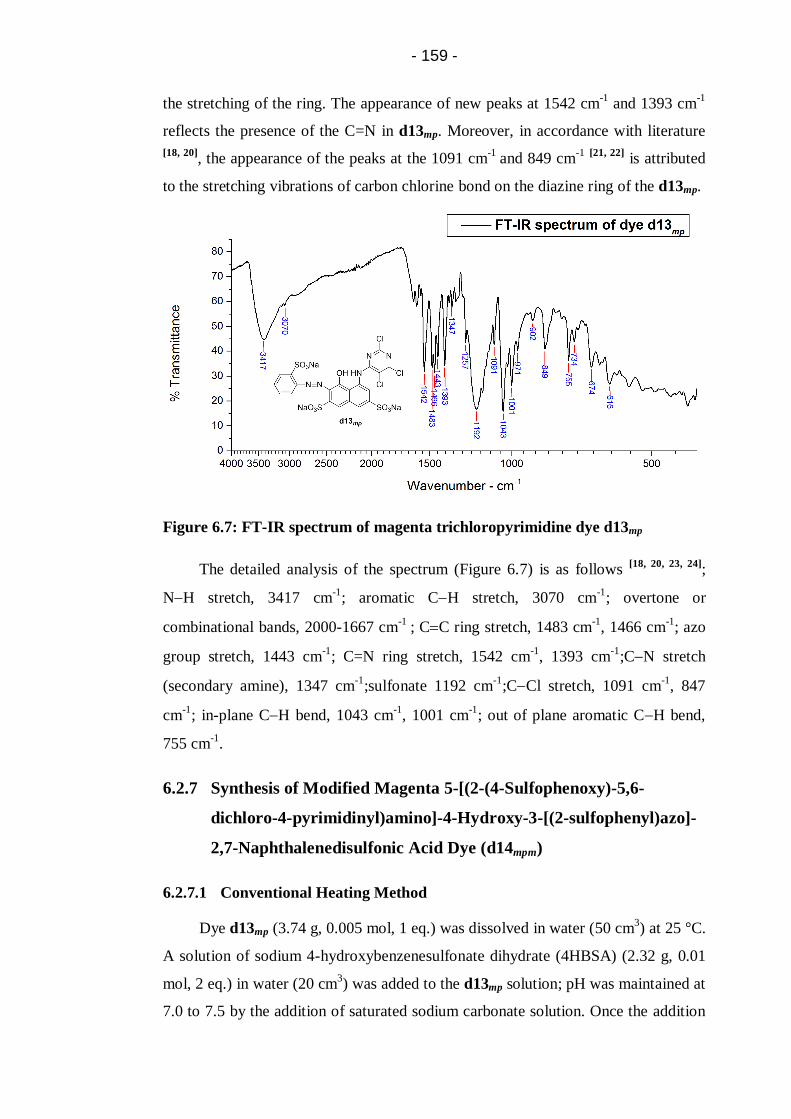
- 159 -
the stretching of the ring. The appearance of new peaks at 1542 cm-1
and 1393 cm-1
reflects the presence of the C=N in d13mp. Moreover, in accordance with literature
[18, 20], the appearance of the peaks at the 1091 cm
-1 and 849 cm
-1 [21, 22]
is attributed
to the stretching vibrations of carbon chlorine bond on the diazine ring of the d13mp.
Figure 6.7: FT-IR spectrum of magenta trichloropyrimidine dye d13mp
The detailed analysis of the spectrum (Figure 6.7) is as follows [18, 20, 23, 24]
;
NH stretch, 3417 cm-1
; aromatic CH stretch, 3070 cm-1
; overtone or
combinational bands, 2000-1667 cm-1
; CC ring stretch, 1483 cm-1
, 1466 cm-1
; azo
group stretch, 1443 cm-1
; C=N ring stretch, 1542 cm-1
, 1393 cm-1
;CN stretch
(secondary amine), 1347 cm-1
;sulfonate 1192 cm-1
;CCl stretch, 1091 cm-1
, 847
cm-1
; in-plane CH bend, 1043 cm-1
, 1001 cm-1
; out of plane aromatic CH bend,
755 cm-1
.
6.2.7 Synthesis of Modified Magenta 5-[(2-(4-Sulfophenoxy)-5,6-
dichloro-4-pyrimidinyl)amino]-4-Hydroxy-3-[(2-sulfophenyl)azo]-
2,7-Naphthalenedisulfonic Acid Dye (d14mpm)
6.2.7.1 Conventional Heating Method
Dye d13mp (3.74 g, 0.005 mol, 1 eq.) was dissolved in water (50 cm3) at 25 °C.
A solution of sodium 4-hydroxybenzenesulfonate dihydrate (4HBSA) (2.32 g, 0.01
mol, 2 eq.) in water (20 cm3) was added to the d13mp solution; pH was maintained at
7.0 to 7.5 by the addition of saturated sodium carbonate solution. Once the addition

- 160 -
of 4HBSA solution was complete, the reaction mixture was refluxed at 95 °C and
stirred until the pH had stabilised and was monitored with CZE and TLC. The
reaction is shown in Scheme 6.6 and the CZE electropherograms showing the
reaction progression is shown in Figure 6.8.
Scheme 6.6: Mono substitution of dye d13mp with 4HBSA to yield dye d14mpm by
conventional heating
The reaction mixture was freeze dried and then was subsequently submitted to
flash column chromatography using RP-18 silica gel and water as an eluent. The
polarity of the eluent was then gradually decreased by the addition of methanol in 5
- 95% gradient and was applied at a relatively slow flow rate (10 ml·min-1
). The
fractions containing magenta product d14mpm were collected. The pooled product-
containing fractions were evaporated under vacuum to remove the methanol, and the
remaining water was subsequently removed by freeze drying to yield the pure
d14mpm dye (95.2 mg, yield 8%) as a magenta powder.
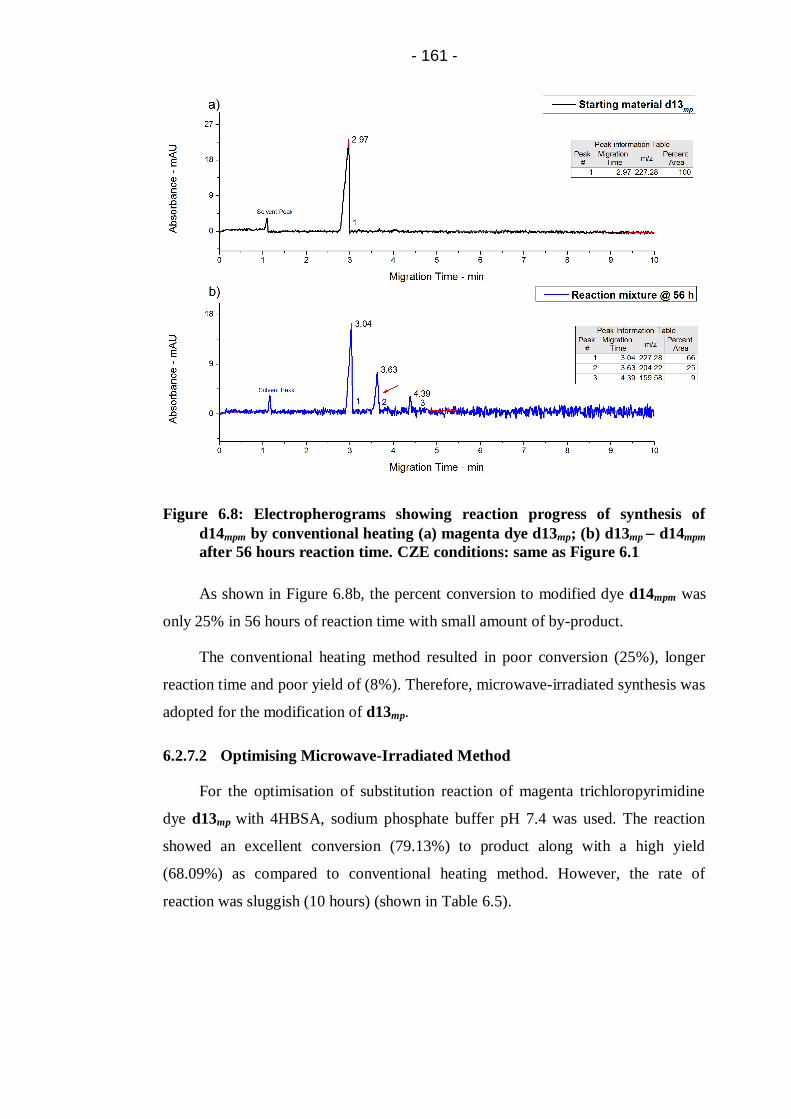
- 161 -
Figure 6.8: Electropherograms showing reaction progress of synthesis of
d14mpm by conventional heating (a) magenta dye d13mp; (b) d13mp d14mpm
after 56 hours reaction time. CZE conditions: same as Figure 6.1
As shown in Figure 6.8b, the percent conversion to modified dye d14mpm was
only 25% in 56 hours of reaction time with small amount of by-product.
The conventional heating method resulted in poor conversion (25%), longer
reaction time and poor yield of (8%). Therefore, microwave-irradiated synthesis was
adopted for the modification of d13mp.
6.2.7.2 Optimising Microwave-Irradiated Method
For the optimisation of substitution reaction of magenta trichloropyrimidine
dye d13mp with 4HBSA, sodium phosphate buffer pH 7.4 was used. The reaction
showed an excellent conversion (79.13%) to product along with a high yield
(68.09%) as compared to conventional heating method. However, the rate of
reaction was sluggish (10 hours) (shown in Table 6.5).

- 162 -
Table 6.5: Optimisation of reaction conditions for microwave-irradiated
synthesis of d14mpm
Solvent
Concentration
of reactants
Temperature
(°C)
Time
(hours)
Conversion
(%)
Yield
(%)
Sodium
phosphate buffer
pH (7.4)
0.02
(0.1 mM/5 ml)
100 10 79 68
Because for bimolecular reactions such as SNAr, rate of reaction is highly
dependent on the concentration of reactants, therefore, for improving the reaction
rate, concentration of reaction mixture was increased to 0.05.
Table 6.6: Modification of reaction conditions for microwave irradiated
synthesis of d14mpm
Solvent
Concentration
of reactants
Temperature
(°C)
Time
(hours)
Conversion
(%)
Yield
(%)
Sodium
phosphate buffer
pH (7.4)
0.05
(0.1 mM/2 ml)
100 2.5 89 70
As shown in Table 6.6 and Figure 6.9, the rate of reaction increased
dramatically by increasing the concentration of reactants in the reaction. This is
because as the concentration of reactants increased the reactant particles become
more crowded and there are more successful particle collisions and hence the rate of
reaction increases.
Figure 6.9: Effect of reactant concentration on rate of reaction (d14mpm)

- 163 -
6.2.8 Comparative Study of Conventional and Microwave-Irradiated
Synthesis of Dye d14mpm
A comparison between the results obtained under conventional heating and
microwave-irradiated synthesis for the reaction times, conversions and isolated
yields for the synthesis of d14mpm are shown in Figure 6.10.
Figure 6.10: Comparison of reaction times, conversions and yields obtained by
conventional heating and microwave irradiation (d14mpm)
As can be seen in Figure 6.10, microwave irradiation effectively reduced the
reaction time from 56 hours to a few hours (2.5 hours) with significant enhancement
in the conversion from only 25% to 89%.
Moreover, by using microwave irradiation, the modified mono-substituted dye
d14mpm was prepared in high yield (70%) and purity in contrast to low yield
obtained (8%) after 56 hours of conventional heating at 95 °C.
This is because, incorporation of sodium phosphate buffer not only maintain
the required pH of the reaction mixture, but also behave as ions that heats up rapidly
when exposed to microwave irradiation and hence enhances the rate of reaction.
Therefore, it is concluded that the microwave irradiated method is an efficient,
fast and easy method for the synthesis of d14mpm. In addition, the yield is also
increased.
6.2.9 Synthesis of Modified Magenta 5-[(2-(4-Sulfophenoxy)-5,6-
dichloro-4-pyrimidinyl)amino]-4-Hydroxy-3-[(2-sulfophenyl)azo]-
2,7-Naphthalenedisulfonic Acid Dye (d14mpm)
Magenta trichloropyrimidine dye d13mp (0.748 g, 1 mmol, 1 eq.) and 4HBSA
(0.464 g, 2 mmol, 2 eq.) were added to each of the five 35 ml microwave reaction
vials equipped with a magnetic stirring bars followed by the addition of 20 ml of
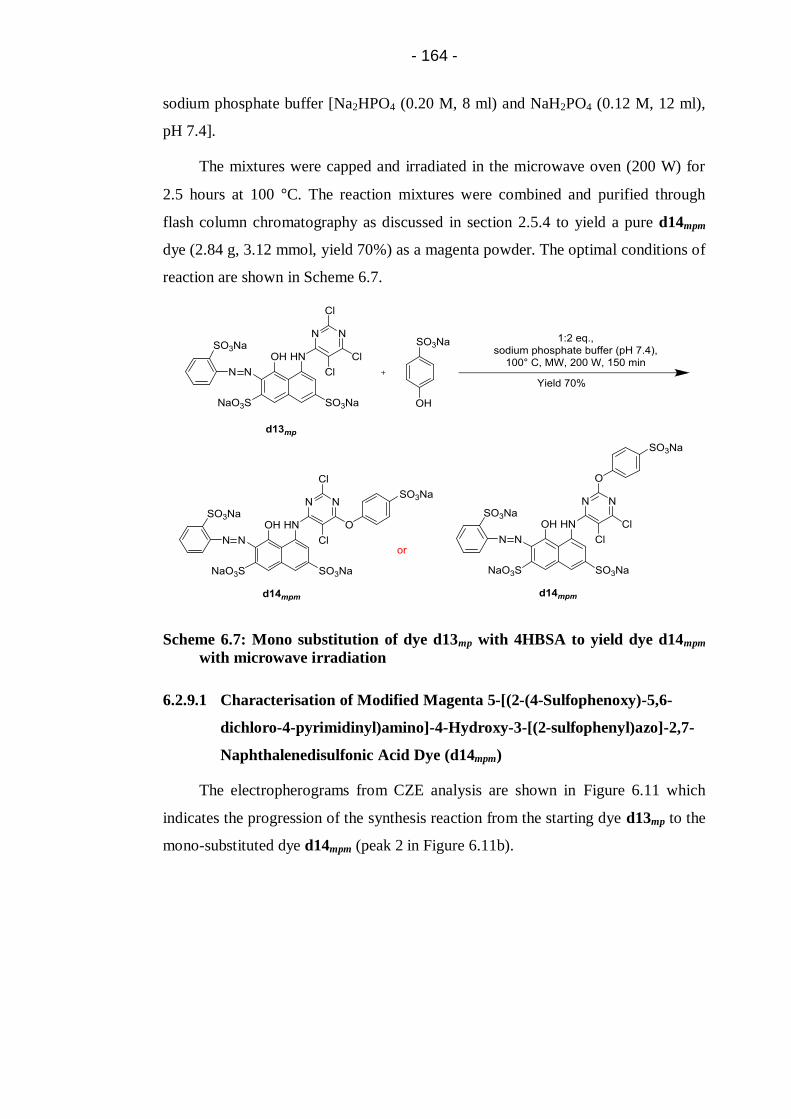
- 164 -
sodium phosphate buffer [Na2HPO4 (0.20 M, 8 ml) and NaH2PO4 (0.12 M, 12 ml),
pH 7.4].
The mixtures were capped and irradiated in the microwave oven (200 W) for
2.5 hours at 100 °C. The reaction mixtures were combined and purified through
flash column chromatography as discussed in section 2.5.4 to yield a pure d14mpm
dye (2.84 g, 3.12 mmol, yield 70%) as a magenta powder. The optimal conditions of
reaction are shown in Scheme 6.7.
Scheme 6.7: Mono substitution of dye d13mp with 4HBSA to yield dye d14mpm
with microwave irradiation
6.2.9.1 Characterisation of Modified Magenta 5-[(2-(4-Sulfophenoxy)-5,6-
dichloro-4-pyrimidinyl)amino]-4-Hydroxy-3-[(2-sulfophenyl)azo]-2,7-
Naphthalenedisulfonic Acid Dye (d14mpm)
The electropherograms from CZE analysis are shown in Figure 6.11 which
indicates the progression of the synthesis reaction from the starting dye d13mp to the
mono-substituted dye d14mpm (peak 2 in Figure 6.11b).

- 165 -
Figure 6.11: Electropherograms showing reaction progress of synthesis of
d14mpm. (a) magenta dye d13mp; (b) d13mp d14mpm after 2.5 hours reaction
time; (c) Final product d14mpm. CZE conditions: same as Figure 6.1
As shown in Figure 6.11, as the mono substitution of d13mp with 4HBSA
increases the molecular weight of modified dye d14mpm as well as increases a
negative charge on it. Hence the dye d13mpm with the highest mass to charge ratio
elute first (Figure 6.11b, peak 1) and the dye d14mpm with the second least mass to
charge ratio eluted second (Figure 6.11b, peak 2). Moreover, the last peak to emerge
in the Figure 6.11b could be the hydrolysed dye or di-substitution product as by-
product of reactions.
Furthermore, Figure 6.11c shows that the final product d14mpm was pure after
flash column chromatography.

- 166 -
The Rf values were found to be 0.65 and 0.62 for starting material (d1m) and
product (d13mp) respectively.
In accordance with the literature [18, 20]
, the appearance of new peaks at 1125
cm-1
in Figure 6.12 can be attributed to the stretching vibration of COC in
structure between the diazine and 4HBSA. The small peaks at 1091 cm-1
and 834
cm-1
can be attributed to the presence of aromatic CCl bond after the mono
substitution of dye d13mp with 4HBSA.
Figure 6.12: FT-IR spectrum of magenta mono-substituted dye d14mpm
The detailed analysis of spectrum (Figure 6.12) is as follows [18, 20, 23, 24]
; NH
stretch, 3406 cm-1
; overtone or combinational bands, 2000–1667 cm-1
; CC ring
stretch, 1484 cm-1
, azo group stretch, 1442 cm-1
; C=N ring stretch, 1555 cm-1
, 1389
cm-1
; CN stretch (secondary amine),1321 cm-1
; COC stretching, 1125 cm-1
;
sulfonate, 1183 cm-1
; CCl stretch, 1091 cm-1
, 834 cm-1
; in-plane CH bend, 1037
cm-1
, 1008 cm-1
; out of plane aromatic CH bend, 758 cm-1
.
Elemental analysis, Found: C, 33.18%; H, 1.59%; N, 7.27%. Calculated for
C26H13Cl2N5Na4O14S4. H2O: C, 33.65%; H, 1.63%; N, 7.51%. It should be noted that
the results are adjusted due to the presence of water of crystallisation.
- 167 -
6.2.10 Application of Magenta Dyes (d13mp and d14mpm) onto Wool Fabric
by Inkjet Printing
The inks were prepared using 4% dye according to the procedure detailed in
section 2.5.2, and then tested for viscosity and surface tension.
The resulting ink formulation was then introduced in the cartridge and printed
onto wool fabric using HP 6940 deskjet printer. Once printed, the printed wool
samples were fixed by two methods detailed in section 2.5.4, and evaluated for
percent fixation along with light fastness and wash fastness.
Moreover the inks were also evaluated for stability through CZE over eight
months storage time at room temperatures.
6.2.11 Characteristics of Formulated Inks (d13mp and d14mpm)
6.2.11.1 Surface Tension and Viscosity of Inks
It can be seen, from Table 6.7, that parent dye d13mp and the modified dye
d14mpm based inks had a surface tension and viscosity within the operational range.
Table 6.7: Ink properties
Ink formulation Surface Tension
(dynes.cm-1
)
Viscosity
(cP)
d13mp based Ink 49.0 12
d14mpm based Ink 46.5 10
6.2.11.2 Stability of Dye (d13mp and d14mpm) Based Inks
As discussed earlier, due to the low reactivity of trichloropyrimidine dyes, they
are not prone to hydrolysis. However, they can react with nucleophiles, such as
amino and hydroxyl present in ink during storage. Therefore, stability of
trichloropyrimidine dye d13mp along with new modified dye d14mpm in inks were
also evaluated.
The results of any change in percent area of the peaks of the dyes within inks
stored at room temperature for eight months can be seen in Figure 6.13 and Figure
6.14.

- 168 -
Figure 6.13: Electropherograms showing d13mp based ink stability. (a) Fresh
ink; (b) Ink after eight months storage at room temperature.
Figure 6.14: Electropherograms showing d14mpm based ink stability. (a) Fresh
ink; (b) Ink after eight months storage at room temperature.

- 169 -
As shown in Figure 6.13 and Figure 6.14, no significant change in the percent
area of peaks of both, i.e., magenta trichloropyrimidine dye d13mp and modified dye
d14mpm based ink were observed indicating that there had been no detrimental effect
caused by the modification of magenta trichloropyrimidine dye with 4HBSA.
6.2.12 Evaluation of Percent Fixation of Magenta Pyrimidine based Dyes
(d13mp and d14mpm) by Various Fixation Methods
The maximum percent fixations of magenta trichloropyrimidine dye d13mp and
magenta modified dye d14mpm for batching at 90 °C and steaming at 102 °C are
shown in Figure 6.15.
Figure 6.15: Percent fixation of d13mp and d14mpm under various fixation
methods
As shown in Figure 6.15, inkjet printing with magenta d13mp and d14mpm
based inks carried out using a pad–batch (90 °C) process showed exceptionally high
levels of dye fixations i.e. 94% and 92% respectively.
Moreover, Figure 6.15 also reflects the effect of steaming on the percent
fixation of magenta trichloropyrimidine and modified dye printed on the wool
fabric. The magenta mono-substituted dye d14mpm (91%) showed the highest
percent fixation followed by trichloropyrimidine dye d13mp (89%).
This could be due to bifunctional behavior of both dyes under the fixation
conditions used, as Ackermann and Dussy [5, 25, 26]
found evidence that dyes based on
tetrachloropyrimidine can exchange more than one chorine with fibre under drastic
reaction conditions. Also in case of steaming, mono substituted dye being less
reactive than the parent trichloropyrimidine dye allowed more controlled formation
of covalent bonds between the dye molecule and the wool fibre.

- 170 -
Moreover, it is noted the effect of addition of urea and sodium bisulfite in
pretreatment liquor is more pronounced in the inkjet printing of wool fabric with
low reactivity pyrimidine dyes as compared to analogous triazine based dyes .
6.2.13 Light Fastness
Light fastness testing was carried out according to the BS EN ISO 105-
B02:2013 (Method 3) [27]
.
The printed samples were tested against blue wool reference 6. As shown in
Table 6.8, both the dyes pass target wool reference 6.
Table 6.8: Light fastness of magenta dyes (d13mp and d14mpm) compared to
target blue wool reference 6
Dye/Ink Target blue wool reference 6
d13mp Better than 6 (6+) Satisfactory
d14mpm Better than 6 (6+) Satisfactory
6.2.14 Wash Fastness
Wash fastness was carried out according to the BS ISO 105-C06:2010 [28]
and
the results are shown in Table 6.9.
The tested fabric samples showed no evidence of any colour loss or staining of
multifibre adjacents. Hence, the wash fastness tests showed that there had been no
detrimental effect caused by modification of dye d13mp.
Table 6.9: Wash fastness of magenta dyes (d13mp and d14mpm)
Dye/Ink Change in shade Staining
CA C N P A W
d13mp 5 5 5 5 5 5 5
d14mpm 5 5 5 5 5 5 5
CA: Cellulose Acetate; C: Cotton; N: Nylon; P: Polyester; A: Acrylic; W: Wool

- 171 -
6.3 Conclusions
By using microwave irradiation both the dyes d13mp and d14mpm were
prepared in yields that were appreciable higher than conventional heating method
(Figure 6.5 and Figure 6.10).
Optimal reaction conditions time for the synthesis of d13mp and d14mpm were 4
hours and 2.5 hours at 200W of microwave irradiation power at 100 °C in the
presence of sodium phosphate buffer as energy transfer medium respectively.
The modification of magenta trichloropyrimidine dye d13mp with 4HBSA did
not have a detrimental effect on the stability of dye in the ink when stored for eight
months at room temperature.
When inkjet printed both the dyes exhibit excellent fixation properties.
Moreover, there is no significant difference in the percent fixation between parent
and modified dye although the reactivity of modified dye was lowered by the
incorporation of sulfophenoxy group.
Printed wool sample showed outstanding colour fastness to light and wash.
6.4 References
1. Siegel, E. Reactive Dyes: Reactive Groups. In: K. Venkataraman, ed. The
chemistry of synthetic dyes. New York ; London: Academic Press, 1978.
2. Brown, D.J. The pyrimidines. The Chemistry of heterocyclic compounds.
New York: Wiley and Sons, 1993.
3. Venkataraman, K. ed. The chemistry of synthetic dyes. New York:
Academic Press Ltd., 1978.
4. Beech, W.F. Fibre-Reactive Dyes London: Logos Press Ltd., 1970.
5. Ackermann, H. and Dussy, P. Cellulose-reactive chloropyrimidinyl dyes-
chemical reactivity and stabilizing ability. Melliand Textilber, 1961, 42,
pp.1167-72.
6. Stamm, O.A. Mechanisms of Reaction of Reactive Dyes with Cellulosic and
other Fibres. Journal of the Society of Dyers and Colourists, 1964, 80,
pp.416-422.
7. Rocha Gomes, J.I.N. Studies in the stability of bonds between fibre-reactive
dyes and cellulose. Ph.D. Thesis, University of Leeds, 1983.

- 172 -
8. Patent EP221013 (1987)
9. Patent US4766206 (1988)
10. Patent DE4231537A1 (1993)
11. Lidström, P., Tierney, J., Wathey, B. and Westman, J. Microwave assisted
organic synthesis—a review. Tetrahedron, 2001, 57, pp.9225-9283.
12. Galema, S.A. Microwave chemistry. Chemical Society Reviews, 1997, 26,
pp.233-238.
13. Baqi, Y. and Müller, C.E. Rapid and Efficient Microwave-Assisted
Copper(0)-Catalyzed Ullmann Coupling Reaction: General Access to
Anilinoanthraquinone Derivatives. Organic Letters, 2007, 9, pp.1271-1274.
14. Patent GB838337 (1960)
15. Patent BE578933 (1959)
16. Patent WO2008107211 (2008)
17. Tierney, J.P. and Lidström, P. eds. Microwave Assisted Organic Synthesis.
Oxford: Blackwell Publishing, 2005.
18. Socrates, G. Infrared and Raman characteristic group frequencies : tables
and charts. Chichester: Wiley, 2001.
19. Ito, M., Shimada, R., Kuraishi, T. and Mizushima, W. Vibrational Spectra of
Diazines. The Journal of Chemical Physics, 1956, 25, pp.597-598.
20. Silverstein, R.M., Webster, F.X. and Kiemle, D.J. Spectrometric
Identification of Organic Compounds. 7th ed. New York: John Wiley and
Sons, 2005.
21. Lewis, D.M. and Wang, J.C. The use of fourier transform infrared (FT-IR)
spectroscopy to study the state of heterobifunctional reactive dyes. Dyes and
Pigments, 1998, 39, pp.111-123.
22. Daimay, L.-V., Colthup, N.B., Fateley, W.G. and Grasselli, J.G. The
handbook of infrared and Raman characteristic frequencies of organic
molecules. London: Academic Press Ltd., 1991.
23. Matlok, F., Gremlich, H.U., Bruker Analytische Meotechnik and Merck eds.
Merck FT-IR atlas : a collection of FT-IR spectra. Weinheim: Vch, 1988.
24. Keller, R.J. and Sigma-Aldrich Corporation. The Sigma library of FT-IR
spectra. Missouri: Sigma Chemical Company, 1986.

- 173 -
25. Ackermann, H. and Dussy, P. Constitution and reactivity of
trichloropyrimidylamino derivatives. Helvetica Chimica Acta, 1962, 45,
pp.1683-98.
26. Hildebrand, D. Application and Properties. In: K. Venkataraman, ed. The
chemistry of synthetic dyes. New York: Academic Press Ltd., 1978.
27. British Standards Institution. Colour fastness to artificial light: Xenon arc
fading lamp test, ISO 105-B02:2013.
28. British Standards Institution. Textiles - Tests for colour fastness - Part C06:
Colour fastness to domestic and commercial laundering, BS EN ISO 105-
C06:2010.
- 174 -
7 Synthesis, Modification, Characterisation of Blue
Trichloropyrimidine Dyes and Their Application onto Wool
Fabric by Inkjet Printing
This chapter details the synthesis, modification and characterisation of blue
dyes based on pyrimidine reactive group by the conventional heating method as well
as microwave irradiation. The syntheses progression were monitored through CZE
and TLC and the structural changes was confirmed by FT-IR.
Moreover, the synthesised blue trichloropyrimidine dye d15bp and specially
modified dye d16bpm were applied to wool fabric through inkjet printing in order to
evaluate their percent fixation, stability of inks along with colour fastness (light and
wash) properties.
7.1 Experimental
7.1.1 Materials
Blue dye chromophore d9b (100%), 2,4,5,6-tetrachloropyrimidine (97%),
sodium 4-hydroxybenzenesulfonate dihydrate (98%), sodium metabisulfite,
carboxymethyl cellulose, polysorbate 20 (Tween 20) and N-methylmorpholine N-
oxide (NMO) were purchased from Sigma-Aldrich and used as received. Urea (MP
Biomedicals), Alcopol O 60 (Acros organics), 2-pyrrolidone (Acros organics), 2-
propanol (Fisher), Sandozin NIE (Clariant) were also purchased and used as
received.
7.1.2 Conventional Heating Method for the Synthesis of Blue 1-Amino-
4-[3-[(2,5,6-trichloro-4-pyrimidinyl)amino]-4-(Sulfophenyl)amino]-
Anthraquinone-2-Sulfonic Acid Dye (d15bp)
7.1.2.1 Conventional Heating Method
In accordance with the literature [1-3]
, amino based dye chromophore d9b (1
eq.) was dissolved in water and adjusted to the pH 6.0 to 7.0 by the addition to 2N
sodium carbonate solution at 35 °C. A solution of 2,4,5,6-tetrachloropyrimidine
(1.1eq.) in investigated solvent was added as thin stream to the dye chromophore

- 175 -
solution. The reaction mixture was refluxed to the investigated temperature and
percent conversion were monitored through CZE. The percent conversion can be
obtained from percent area of target dye on the CZE electropherogram.
The target blue trichloropyrimidine dye d15bp was synthesised using acetone
and ethanol as co-solvents at a temperature range of 50, 70, 80 and 90 °C.
7.1.3 Investigation of Conventional Heating Method for the Synthesis of
Blue Trichloropyrimidine Dye (d15bp)
7.1.3.1 Percent Conversion to d15bp Under Various Temperature
The percent conversion of d9b to yield d15bp at temperatures 50, 70, 80 and 90
°C were investigated provided that the reactants were used in 1:1.1 molar ratio and
pH of reaction mixture was maintained at 6.0 to 7.0 throughout with 2N sodium
carbonate solution. The reactions were stirred until the pH had stabilised and
prolonged reaction times do not increase conversion to d15bp. The reactions were
monitored through CZE.
The percent conversion to blue dye d15bp achieved at different temperatures
are shown in Figure 7.1 and isolated yields are listed in Table 7.1.
As shown in Figure 7.1a, using 1:1 eq. of reactants, Na2CO3 acid-binding agent
to maintain pH at 6.0 to 7.0 and wateracetone as solvent system at 50 °C, did not
lead to detectable conversion to d15bp even after 15 hours, however, by-products
were detectable in CZE electropherogram.

- 176 -
Figure 7.1: Electropherograms showing conversion to d15bp using conventional
heating method at: (a) 50 °C; (b) 70 °C; (c) 80 °C; (d) 90 °C. CZE
conditions: running buffer, 15 mM ammonium acetate and acetonitrile
(40% v/v) pH 9.3; pressure injection 0.5 psi for 10 s; voltage 25 kV;
detection at 596 nm

- 177 -
Table 7.1: Summary of results with conventional heating at various
temperatures
Entry Parameters Time
(hours)
Conversion a(%)
Yield c(%)
1 1:1.1 eq., Na2CO3, pH 6.0 – 7.0,
wateracetone, 50 °C
15 1.2 *
2 1:1.1 eq., Na2CO3, pH 6.0 – 7.0,
wateracetone, 70 °C
29 17 4.6
3 1:1.1 eq., Na2CO3, pH 6.0 – 7.0,
wateracetone, 80 °C
36 31 12
4 1:1.1 eq., Na2CO3, pH 6.0 – 7.0,
wateracetone, 90 °C
26 26b 10
a: Determined by CZE analysis; b: significant amount of by-product;
c: isolated product; *: Product
was not isolated from the reaction mixture due to low conversion
The reactions were carried out by conventional heating at a range of
temperatures, but the reactions generally proceeded sluggishly and resulted in more
by-products as shown in Figure 7.1. Therefore, it is concluded that by using
conventional heating method for the synthesis of blue trichloropyrimidine dye d15bp,
the reaction proceeded sluggishly, and an isolated yield of 12% of d15bp could be
obtained after a total reaction time of 36 hours at 80 °C.
7.1.3.2 Percent Conversion to d15bp Under Different Co-Solvents
In general terms, the choice of solvent can have a significant effect on the
performance of a reaction. Therefore, percent conversion of d9b to yield d15bp using
acetone and ethanol at 80 °C were investigated provided that pH of reaction mixture
was maintained at 6.0 to 7.0 throughout with 2N sodium carbonate solution. The
reactions were stirred until the pH had stabilised and prolonged reaction times did
not have any effect on percent conversion to d15bp. The reactions were monitored
through CZE.
The percent conversions achieved are shown in Figure 7.2 and isolated yields
are listed in Table 7.2.

- 178 -
Figure 7.2: Electropherograms showing percent conversion to d15bp using
conventional heating method: (a) Water-acetone; (b) Water-ethanol. CZE
conditions: same as Figure 7.1.
Table 7.2: Summary of results from conventional heating using different co-
solvents
Entry Parameters Time
(hours)
Conversion a(%)
Yield b(%)
1 1:1 eq., Na2CO3, pH 6.0 – 7.0,
wateracetone, 80 °C
36 31 12
2 1:2 eq., Na2CO3, pH 6.0 – 7.0,
waterethanol, 80 °C
9 3.1 *
a: Determined by CZE analysis;
b: isolated product; *: Product was not isolated from the
reaction mixture due to low conversion
As shown in Figure 7.2, the optimal co-solvent was found to be acetone
whereas ethanol was found to be less effective in improving any of the results
(conversion, reaction time and yield) in the synthesis of d15bp by conventional
heating method.
The effects of various experimental conditions (temperature and solvent) on
conversion, reaction times and yield were investigated and concluded that the
conventional heating method for the synthesis of blue trichloropyrimidine dye d15bp
is unsatisfactory and insufficient.
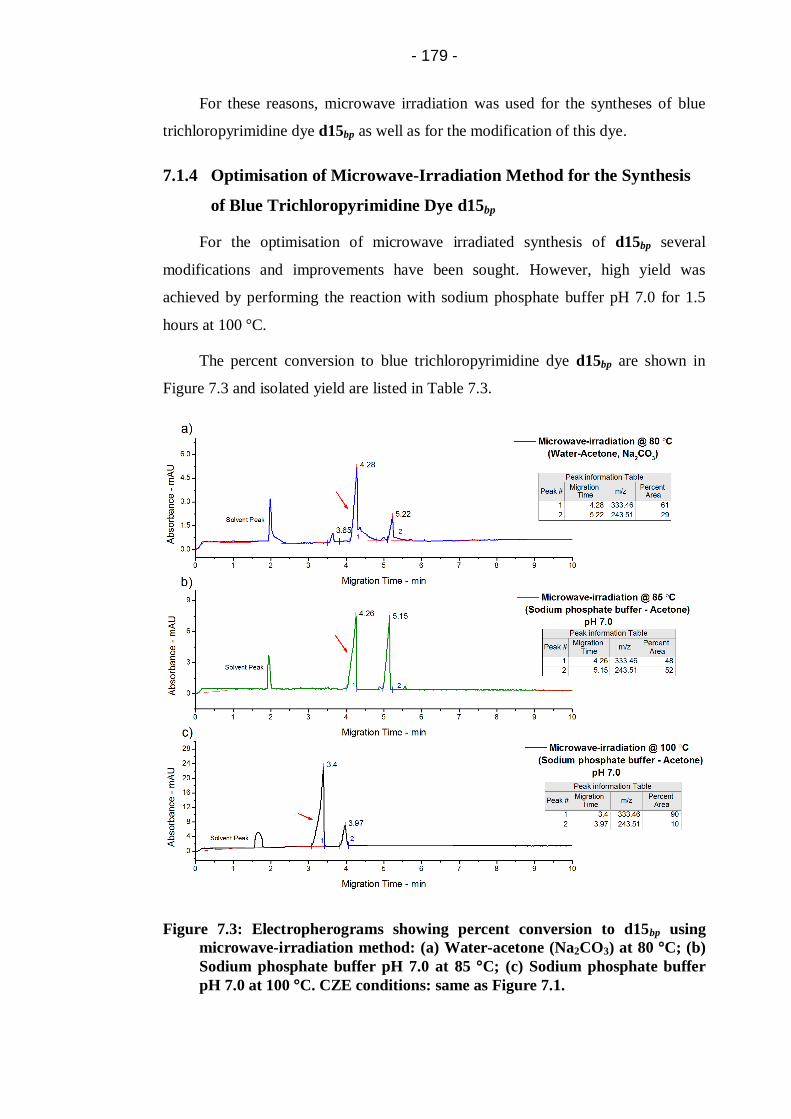
- 179 -
For these reasons, microwave irradiation was used for the syntheses of blue
trichloropyrimidine dye d15bp as well as for the modification of this dye.
7.1.4 Optimisation of Microwave-Irradiation Method for the Synthesis
of Blue Trichloropyrimidine Dye d15bp
For the optimisation of microwave irradiated synthesis of d15bp several
modifications and improvements have been sought. However, high yield was
achieved by performing the reaction with sodium phosphate buffer pH 7.0 for 1.5
hours at 100 °C.
The percent conversion to blue trichloropyrimidine dye d15bp are shown in
Figure 7.3 and isolated yield are listed in Table 7.3.
Figure 7.3: Electropherograms showing percent conversion to d15bp using
microwave-irradiation method: (a) Water-acetone (Na2CO3) at 80 °C; (b)
Sodium phosphate buffer pH 7.0 at 85 °C; (c) Sodium phosphate buffer
pH 7.0 at 100 °C. CZE conditions: same as Figure 7.1.

- 180 -
Table 7.3: Optimisation of reaction conditions for microwave-irradiated
condensation reaction
Entry Solvent
(equal volumes)
Temperature
(°C)
Time
(hours)
Conversion
(%)
1 Water Acetone 80 7.5 61
2 Sodium phosphate buffer pH (7.0)
Acetone
85 1.5 48
3 Sodium phosphate buffer pH (7.0)
Acetone
100 1.5 90
[80]b
4 Sodium phosphate buffer pH (7.0)
Acetone
120 0.5 a
a: decomposition of product occur ; b: isolated yield
Using water-acetone as energy transfer medium in the presence of Na2CO3
(1 eq.), 61% conversion of d9b to d15bp was achieved after 7.5 hours at 80 °C
(Figure 7.3a). However, substantial amount of by-product was also observed.
Therefore, sodium phosphate buffer pH 7.0 was used as energy transfer
medium, 48% conversion of d9b to d15bp was achieved after 1.5 hours at 85 °C.
Increasing the reaction temperature to 100 °C resulted in both a significant increase
in the initial rate of reaction and in the overall conversion (90%), although further
increments in the reaction temperature to 120 °C gave rise to much smaller changes
to either the rate or final conversion; discolouration of the reaction mixtures was
observed, indicating the start of undesirable decomposition.
7.1.5 Comparative Study of Conventional and Microwave-Irradiated
Synthesis of Dye d15bp
It can be seen in Figure 7.4, that the microwave irradiated reaction was
completed in 1.5 hours (90 min) with 90% conversion, which signifies the dramatic
acceleration of the condensation reaction of blue amino chromophore with 2,4,5,6-
tetrachloropyrimdine in comparison to conventional heating which took 36 hours
until only 31% conversion along with significant amount of hydrolysed by-products.
This approach represents a much more efficient method of the synthesis compared to
the traditional procedure discussed previously.

- 181 -
Figure 7.4: Comparison of reaction times, conversions and yields obtained by
conventional heating and microwave heating
A comparison of yields obtained by conventional and microwave irradiated
synthesis is shown in Figure 7.4. It was noted that time required for microwave
irradiated synthesis was less and yield was high (80%) against conventional
synthesis. The conventional synthesis of blue trichloropyrimidine dye d15bp requires
long reaction time at reflux temperature and obtain poor yield (12%).
From the above results, it could be concluded that the microwave irradiated
method is an efficient, fast, simple method for the synthesis of blue
trichloropyrimidine dye d15bp. In addition the yield is also increased. Hence it is a
viable and feasible method for the synthesis of dyes and intermediates.
7.1.6 Synthesis of Blue 1-Amino-4-[3-[(2,5,6-Trichloro-4-
pyrimidinyl)amino]-4-(sulfophenyl)amino]-Anthraquinone-2-
Sulfonic Acid Dye (d15bp)
7.1.6.1 Optimised Conventional Heating Method
In accordance with preparation method discussed in section 7.1.3, d9b (10.67
g, 0.02 mol) was dissolved in water (50 cm3) which was adjusted to pH 7.0 by the
addition of 2N sodium carbonate solution at 35 °C. A solution of 2,4,5,6-
tetrachloropyrimidine (4.36 g, 0.02 mol) in acetone (50 cm3) was added as thin
stream to the dye d9b solution. Once the addition of tetrachloropyrimidine was
complete, the reaction mixture was stirred and the pH was maintained at 6.0 to 7.0
by the addition of 2N sodium carbonate solution, while the temperature was raised
and maintained at 80 °C (reflux). The reaction was stirred for further 36 hours (until
the pH had stabilised) and was monitored with CZE and analytical TLC. When CZE
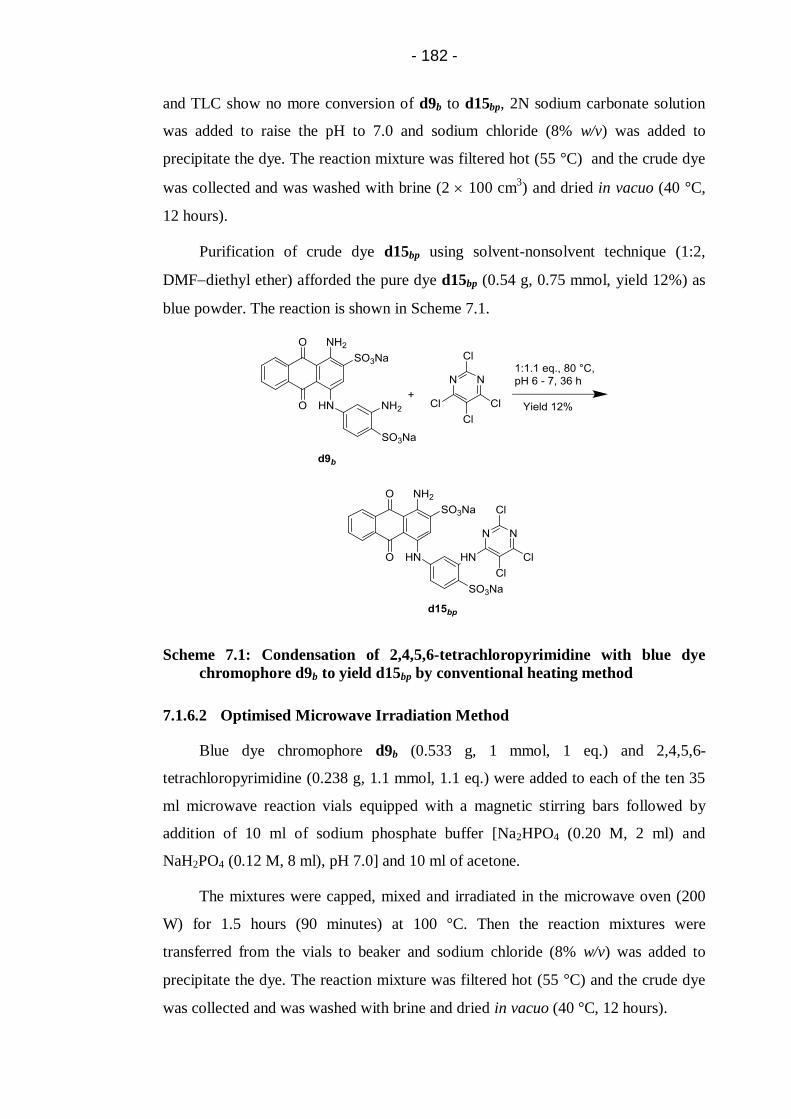
- 182 -
and TLC show no more conversion of d9b to d15bp, 2N sodium carbonate solution
was added to raise the pH to 7.0 and sodium chloride (8% w/v) was added to
precipitate the dye. The reaction mixture was filtered hot (55 °C) and the crude dye
was collected and was washed with brine (2 100 cm3) and dried in vacuo (40 °C,
12 hours).
Purification of crude dye d15bp using solvent-nonsolvent technique (1:2,
DMFdiethyl ether) afforded the pure dye d15bp (0.54 g, 0.75 mmol, yield 12%) as
blue powder. The reaction is shown in Scheme 7.1.
Scheme 7.1: Condensation of 2,4,5,6-tetrachloropyrimidine with blue dye
chromophore d9b to yield d15bp by conventional heating method
7.1.6.2 Optimised Microwave Irradiation Method
Blue dye chromophore d9b (0.533 g, 1 mmol, 1 eq.) and 2,4,5,6-
tetrachloropyrimidine (0.238 g, 1.1 mmol, 1.1 eq.) were added to each of the ten 35
ml microwave reaction vials equipped with a magnetic stirring bars followed by
addition of 10 ml of sodium phosphate buffer [Na2HPO4 (0.20 M, 2 ml) and
NaH2PO4 (0.12 M, 8 ml), pH 7.0] and 10 ml of acetone.
The mixtures were capped, mixed and irradiated in the microwave oven (200
W) for 1.5 hours (90 minutes) at 100 °C. Then the reaction mixtures were
transferred from the vials to beaker and sodium chloride (8% w/v) was added to
precipitate the dye. The reaction mixture was filtered hot (55 °C) and the crude dye
was collected and was washed with brine and dried in vacuo (40 °C, 12 hours).

- 183 -
Purification of crude dye d15bp using solvent-nonsolvent technique (1:2,
DMF diethyl ether) afforded the pure dye d15bp (5.14 g, 7.10 mmol, yield 80%) as
blue powder.
FT-IR analysis was conducted to confirm the presence of main functional
groups in dye d15bp. The reaction is shown in Scheme 7.2.
Scheme 7.2: Condensation of 2,4,5,6-tetrachloropyrimidine with blue dye
chromophore d9b to yield d15bp by microwave irradiation method
7.1.6.3 Characterisation of Blue 1-Amino-4-[3-[(2,5,6-Trichloro-4-
pyrimidinyl)amino]-4-(sulfophenyl)amino]-Anthraquinone-2-Sulfonic
Acid Dye (d15bp)
The peaks observed were as expected (Figure 7.5b); the first peak to emerge
was d15bp (3.39 min) which has the higher mass to charge ratio of the two analytes.
This occurs because the addition of the pyrimidine group onto the dye chromophore
d9b increases the molecular weight of the dye d15bp without any additional sulfonic
acid groups that would increase the negative charge.
Moreover, the percent area of the d15bp after isolation (Figure 7.5c) was 100%
which indicates that there was no hydrolysed dye in the final product.

- 184 -
Figure 7.5: Electropherograms showing reaction progress of synthesis of d15bp.
(a) blue dye chromophore d9b; (b) d9b d15bp after 1.5 hours reaction
time; (c) final product d15bp. CZE conditions: same as Figure 7.1
Rf values were found to be 0.63 and 0.76 for starting material and product
respectively.
In FT-IR spectrum of blue trichloropyrimidine dye d15bp, the appearance of
new peaks at 1531 cm-1
and 1416 cm-1
reflect the presence of the C=N group in dye
d15bp. Also the presence of the peaks at the 1093 cm-1
and 847 cm-1 [4, 5]
are
attributed to the CCl stretching vibration on the diazine ring of the dye.
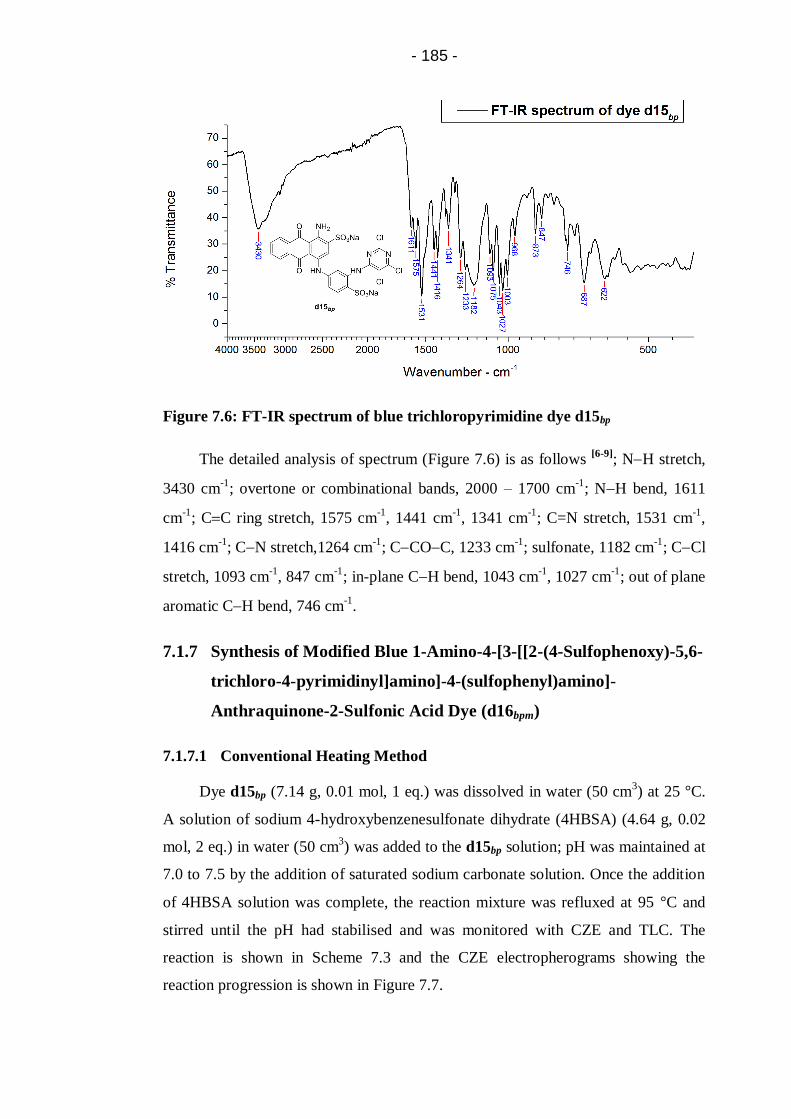
- 185 -
Figure 7.6: FT-IR spectrum of blue trichloropyrimidine dye d15bp
The detailed analysis of spectrum (Figure 7.6) is as follows [6-9]
; NH stretch,
3430 cm-1
; overtone or combinational bands, 2000 – 1700 cm-1
; NH bend, 1611
cm-1
; CC ring stretch, 1575 cm-1
, 1441 cm-1
, 1341 cm-1
; C=N stretch, 1531 cm-1
,
1416 cm-1
; CN stretch,1264 cm-1
; CCOC, 1233 cm-1
; sulfonate, 1182 cm-1
; CCl
stretch, 1093 cm-1
, 847 cm-1
; in-plane CH bend, 1043 cm-1
, 1027 cm-1
; out of plane
aromatic CH bend, 746 cm-1
.
7.1.7 Synthesis of Modified Blue 1-Amino-4-[3-[[2-(4-Sulfophenoxy)-5,6-
trichloro-4-pyrimidinyl]amino]-4-(sulfophenyl)amino]-
Anthraquinone-2-Sulfonic Acid Dye (d16bpm)
7.1.7.1 Conventional Heating Method
Dye d15bp (7.14 g, 0.01 mol, 1 eq.) was dissolved in water (50 cm3) at 25 °C.
A solution of sodium 4-hydroxybenzenesulfonate dihydrate (4HBSA) (4.64 g, 0.02
mol, 2 eq.) in water (50 cm3) was added to the d15bp solution; pH was maintained at
7.0 to 7.5 by the addition of saturated sodium carbonate solution. Once the addition
of 4HBSA solution was complete, the reaction mixture was refluxed at 95 °C and
stirred until the pH had stabilised and was monitored with CZE and TLC. The
reaction is shown in Scheme 7.3 and the CZE electropherograms showing the
reaction progression is shown in Figure 7.7.
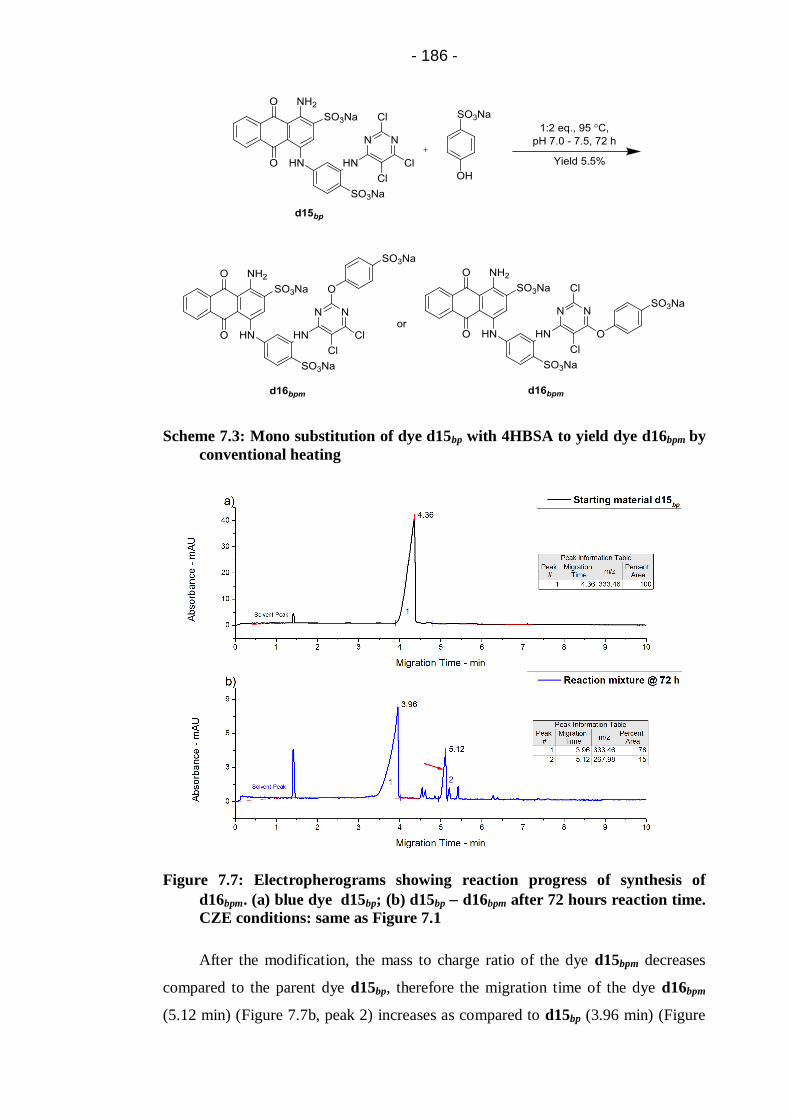
- 186 -
Scheme 7.3: Mono substitution of dye d15bp with 4HBSA to yield dye d16bpm by
conventional heating
Figure 7.7: Electropherograms showing reaction progress of synthesis of
d16bpm. (a) blue dye d15bp; (b) d15bp d16bpm after 72 hours reaction time.
CZE conditions: same as Figure 7.1
After the modification, the mass to charge ratio of the dye d15bpm decreases
compared to the parent dye d15bp, therefore the migration time of the dye d16bpm
(5.12 min) (Figure 7.7b, peak 2) increases as compared to d15bp (3.96 min) (Figure

- 187 -
7.7b, peak 1). Furthermore, the percent conversion to modified dye d16bpm was only
15% in 72 hours of reaction time with significant amount of by-products.
The reaction mixture was freeze dried and then was subsequently submitted to
flash column chromatography using RP-18 silica gel and water as an eluent. The
polarity of the eluent was then gradually decreased by the addition of methanol in 5
- 95% gradient and was applied at a relatively slow flow rate (10 ml·min-1
). The
fractions containing blue product d16bpm were collected. The pooled product-
containing fractions were evaporated under vacuum to remove the methanol, and the
remaining water was subsequently removed by freeze drying to yield the pure
d16bpm dye (71.2 mg, 0.08 mmol, yield 5.5%) as blue powder.
The conventional heating method resulted in poor conversion (14.71%), longer
reaction time and poor yield of 5.5%. Therefore, microwave irradiated synthesis was
adopted for the modification of d15bp.
7.1.7.2 Optimisation of Microwave-Irradiation Method
For the optimisation of microwave irradiated synthesis of d16bpm several
modifications and improvements have been sought. However, high yield (74%) was
achieved by performing the reaction with sodium phosphate buffer pH 7.4 for 3.5
hours at 100 °C. The percent conversion to modified dye d16bpm and isolated yields
are listed in Table 7.4.
Table 7.4: Optimisation of reaction conditions for microwave-irradiated
condensation reaction
Entry Solvent
Temperature
(°C)
Time
(hours)
Conversion
(%)
Yield
(%)
1 Water 130 1.5 ≥ 50a,b
43c
2 Water 100 6.5 ≥ 50a,b
38c
3 Sodium phosphate buffer
pH (7.4)
100 2.5 ≥70a -
4 Sodium phosphate buffer
pH (7.4)
100 3.5 94 74e
a: Determined by analytical TLC; b: significant amount of by-product (di-substituted dye) ; c:
product not pure; d: determined by CZE; e: isolated yield after flash column chromatography.

- 188 -
To optimise the reaction conditions, a mixture of reactants in water was
initially exposed to microwave irradiation at 130 °C for 1.5 hours. TLC analysis
indicated the reaction as uncompleted (conversion ≥50) with significant amount of
di-substituted dye.
Therefore, sodium phosphate buffer pH 7.4 (neutral to alkaline) [10]
was used
as energy transfer medium, ≥70% conversion of d15bp to d16bpm was observed after
2.5 hours at 100 °C. Increasing the reaction time to 3.5 hours resulted in significant
increase in the overall conversion (94%), although further increments in the reaction
time gave rise to much smaller changes to either the rate or final conversion.
7.1.8 Comparative Results of Conventional and Microwave-Assisted
Synthesis of d16bpm
A comparison between the results obtained under conventional heating and
microwave-irradiated synthesis for the reaction times, conversions and yield are
shown in Figure 7.8.
Figure 7.8: Comparison of reaction times, conversions and yields obtained by
conventional heating and microwave irradiation (d16bpm)
As can be seen in Figure 7.8, microwave heating effectively reduced the
reaction time from 72 hours to a few hours (3.5 hours) with significant enhancement
in the conversions percent from only 15% to 94%. By using microwave radiation for
heating, the modified mono-substituted dye d16bpm was prepared in yield (74%) that
was appreciably higher than the conventional method (5.5%) in high purity (see
Figure 7.9c).

- 189 -
7.1.9 Synthesis of Modified Blue 1-Amino-4-[3-[[2-(4-sulfophenoxy)-5,6-
trichloro-4-pyrimidinyl]amino]-4-(sulfophenyl)amino]-
Anthraquinone-2-Sulfonic Acid Dye (d15bp) using Optimised
Microwave-irradiation Method
Blue trichloropyrimidine dye d15bp (0.714 g, 0.1 mmol, 1 eq.) and sodium 4-
hydroxybenzenesulfonate dihydrate (4HBSA) (0.464 g, 0.2 mmol, 2 eq.) were added
to each of the five 35 ml microwave reaction vials equipped with magnetic stirring
bars followed by addition of 20 ml of sodium phosphate buffer [Na2HPO4 (0.20 M,
8 ml) and NaH2PO4 (0.12 M, 12 ml), pH 7.4].
The mixtures were capped and irradiated in the microwave oven (200 W) for
3.5 hours at 100 °C. The reaction mixtures were combined and purified through
flash column chromatography as discussed in section 2.5.4 to yield pure d16bpm dye
(3.03 g, 3.46 mmol, yield 74%) as blue powder. The optimal conditions of reaction
are shown in Scheme 7.4.
Scheme 7.4: Mono substitution of dye d15bp with 4HBSA to yield dye d16bpm by
microwave irradiation
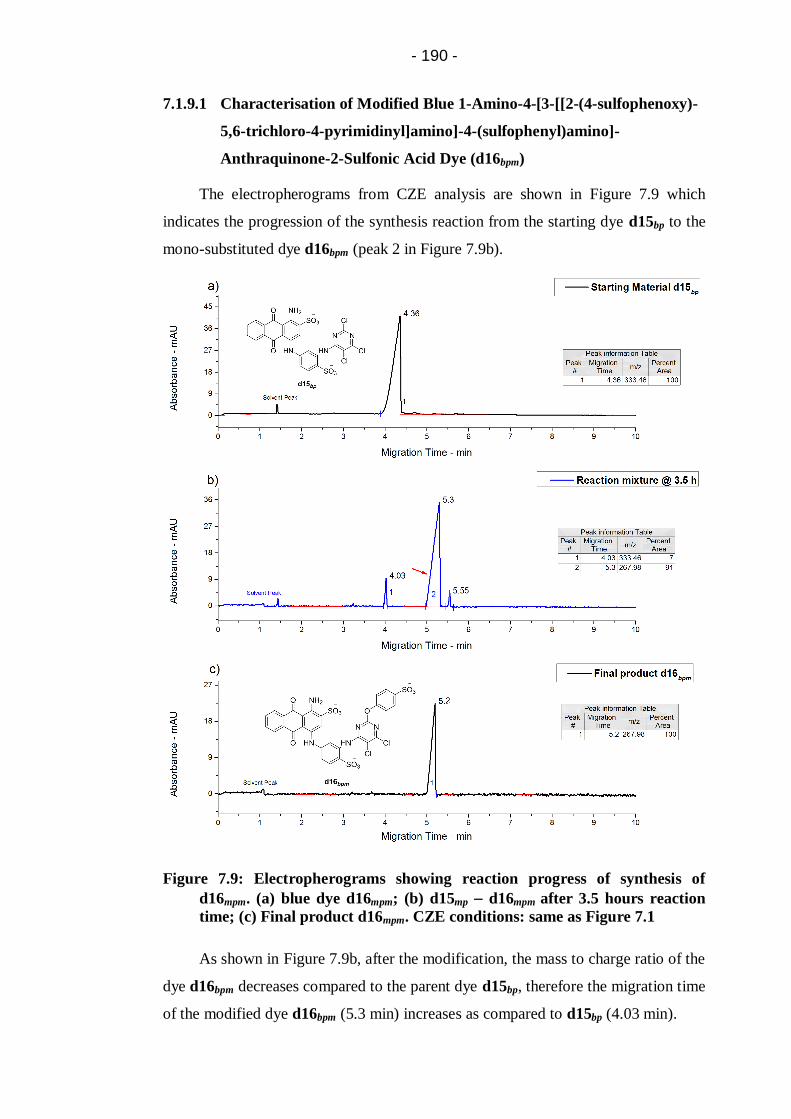
- 190 -
7.1.9.1 Characterisation of Modified Blue 1-Amino-4-[3-[[2-(4-sulfophenoxy)-
5,6-trichloro-4-pyrimidinyl]amino]-4-(sulfophenyl)amino]-
Anthraquinone-2-Sulfonic Acid Dye (d16bpm)
The electropherograms from CZE analysis are shown in Figure 7.9 which
indicates the progression of the synthesis reaction from the starting dye d15bp to the
mono-substituted dye d16bpm (peak 2 in Figure 7.9b).
Figure 7.9: Electropherograms showing reaction progress of synthesis of
d16mpm. (a) blue dye d16mpm; (b) d15mp d16mpm after 3.5 hours reaction
time; (c) Final product d16mpm. CZE conditions: same as Figure 7.1
As shown in Figure 7.9b, after the modification, the mass to charge ratio of the
dye d16bpm decreases compared to the parent dye d15bp, therefore the migration time
of the modified dye d16bpm (5.3 min) increases as compared to d15bp (4.03 min).

- 191 -
In analytical TLC analysis, the spots appeared as expected, and Rf values were
0.76 and 0.70 for the starting material d15bp and product d16bpm respectively.
In FT-IR spectrum of the mono-substituted dye d16bpm, Figure 7.10, the new
peak at 1123 cm-1
is evident which can be attributed to the stretching vibration of
COC in its structure between the diazine and the 4HBSA. The peaks at 1091 cm-1
and 828 cm-1
can be attributed to the presence of CCl after the mono substitution of
dye d15bp with 4HBSA.
Figure 7.10: FT-IR spectrum of blue mono-substituted dye d16bpm
The detailed analysis of the spectrum (Figure 7.10) is as follows [6-9]
; NH
stretch, 3423 cm-1
; overtone or combinational bands, 2000–1700 cm-1
; C=O
stretching, 1706 cm-1
; NH bending, 1615 cm-1
; CC ring stretch, 1590 cm-1
, 1491
cm-1
, 1435 cm-1
; C=N stretch, 1557 cm-1
, 1383 cm-1
; CN stretch ,1272 cm-1
;
COC stretching, 1123 cm-1
; sulfonate, 1186 cm-1
; CCl stretch, 1091 cm-1
, 828
cm-1
; in-plane CH bend, 1027 cm-1
, 1009 cm-1
; out of plane aromatic CH bend,
730 cm-1
.
Elemental analysis, Found: C, 39.88%; H, 1.99 %; N, 7.59%. Calculated for
C30H16Cl2N5Na3O12S3. H2O: C, 40.39%; H, 2.03%; N, 7.85%. It should be noted that
the results are adjusted due to the presence of water of crystallisation.

- 192 -
7.1.10 Application of Blue Dyes (d15bp and d16bpm) onto Wool Fabric by
Inkjet Printing
The inks were prepared using 4% dye according to the procedure detailed in
section 2.5.2, and then tested for viscosity and surface tension.
The resulting ink formulation was then introduced in the cartridge and printed
onto wool fabric using HP 6940 deskjet printer. Once printed, the printed wool
samples were fixed by two methods detailed in section 2.5.4, and evaluated for
percent fixation along with light fastness and wash fastness.
Moreover the inks were also evaluated for stability through CZE over three
months storage time at room temperatures.
7.1.11 Characteristics of Formulated Inks (d15mp and d16bpm)
7.1.11.1 Surface Tension and Viscosity of Inks
It can be seen, from Table 7.5, that parent dye d15bp and the modified dye
d15bpm based inks had a surface tension and viscosity within the operational range.
Table 7.5: Ink measured properties
Ink formulation Surface Tension
(dynes.cm-1
)
Viscosity
(cP)
d15bp 42.3 6
d16bpm 40.5 8
7.1.11.2 Stability of Dye (d15bp and d16bpm) Based Inks
Stability of blue trichloropyrimidine dye d15bp along with new modified dye
d16bpm in inks were also evaluated.
The results of any change in percent area of peaks of the dyes within inks
stored at room temperature for three month can be seen in Figure 7.11.

- 193 -
Figure 7.11: Electropherograms showing d15bp based ink stability. (a) Fresh
ink; (b) Ink after three months storage at room temperature
Figure 7.12: Electropherograms showing d16bpm based ink stability. (a) Fresh
ink; (b) Ink after three months storage at room temperature
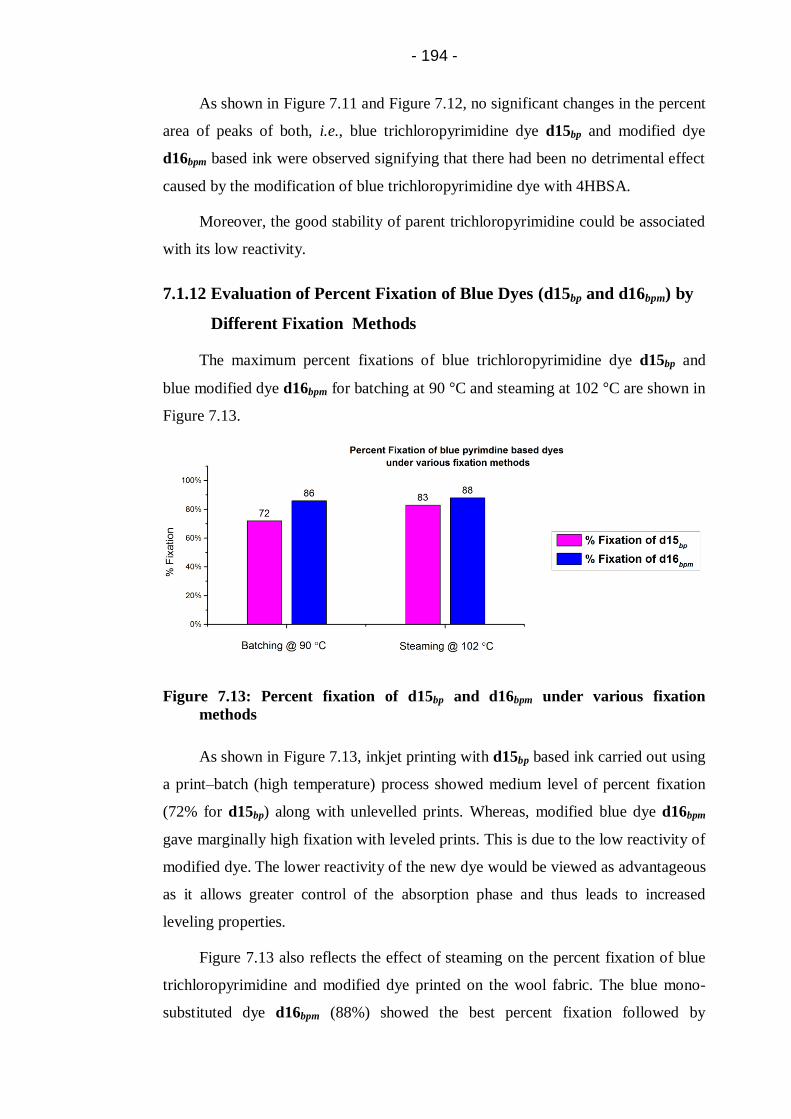
- 194 -
As shown in Figure 7.11 and Figure 7.12, no significant changes in the percent
area of peaks of both, i.e., blue trichloropyrimidine dye d15bp and modified dye
d16bpm based ink were observed signifying that there had been no detrimental effect
caused by the modification of blue trichloropyrimidine dye with 4HBSA.
Moreover, the good stability of parent trichloropyrimidine could be associated
with its low reactivity.
7.1.12 Evaluation of Percent Fixation of Blue Dyes (d15bp and d16bpm) by
Different Fixation Methods
The maximum percent fixations of blue trichloropyrimidine dye d15bp and
blue modified dye d16bpm for batching at 90 °C and steaming at 102 °C are shown in
Figure 7.13.
Figure 7.13: Percent fixation of d15bp and d16bpm under various fixation
methods
As shown in Figure 7.13, inkjet printing with d15bp based ink carried out using
a print–batch (high temperature) process showed medium level of percent fixation
(72% for d15bp) along with unlevelled prints. Whereas, modified blue dye d16bpm
gave marginally high fixation with leveled prints. This is due to the low reactivity of
modified dye. The lower reactivity of the new dye would be viewed as advantageous
as it allows greater control of the absorption phase and thus leads to increased
leveling properties.
Figure 7.13 also reflects the effect of steaming on the percent fixation of blue
trichloropyrimidine and modified dye printed on the wool fabric. The blue mono-
substituted dye d16bpm (88%) showed the best percent fixation followed by

- 195 -
trichloropyrimidine dye d15bp (83%). This is because mono-substituted dye being
less reactive than the parent trichloropyrimidine dye allowed more controlled
formation of covalent bonds between the dye molecule and the wool fibre.
7.1.13 Light Fastness
Light fastness testing was carried out according to the BS EN ISO 105-
B02:2013 (Method 3) [11]
.
The printed samples were tested against blue wool reference 6. As shown in
Table 7.6, both the dyes pass target wool reference 6. However, modified dye
d16bpm shows even better light fastness than target wool reference 6.
Table 7.6: Light fastness of blue dyes (d15bp and d16bpm) compared to target
blue wool reference 6
Dye/Ink Target blue wool reference 6
d15bp Equal to 6 (6) Satisfactory
d16bpm Better than 6 (6+) Satisfactory
7.1.14 Wash Fastness
Wash fastness was carried out according to the BS ISO 105-C06:2010 [12]
and
the results are shown in Table 7.7. The tested fabric sample printed with modified
blue dye d16bpm showed no evidence of any colour loss or staining of multifibre
adjacents. Hence, the wash fastness tests showed that there had been no detrimental
effect caused by modifying the dye. However, parent trichloropyrimidine dye show
slight change in shade (4-5) and slight staining on cotton.
Table 7.7: Wash fastness of blue dyes (d15bp and d16bpm)
Dye/Ink Change in shade
Staining
CA C N P A W
d15bp 4-5 5 4-5 5 5 5 5
d16bpm 5 5 5 5 5 5 5
CA: Cellulose Acetate; C: Cotton; N: Nylon; P: Polyester; A: Acrylic; W: Wool

- 196 -
7.2 Conclusions
With the help of microwave irradiation, the blue trichloropyrimidine dye d15bp
and modified dye d16bpm were prepared. By using the new method, the reaction time
was shortened, conversion to product was significantly increased with high yields of
dyes in pure form were achieved in comparison with conventional synthesis at
elevated temperatures.
By employing the microwave irradiation method difficultly synthesised d15bp
dye was successfully synthesised in pure 80% yield in 1.5 hours at 100 °C with 90%
conversion.
Moreover, the modification of d15bp was successfully done by using
microwave irradiation. at 100 °C, virtually quantitative conversion could be
achieved within 3.5 hours.
In addition, for these syntheses reactions performed under microwave
irradiation, sodium phosphate buffer was found to be the solvent of choice, provided
temperatures were kept below 110 °C. At higher reaction temperatures, significant
amount of hydrolysis would occur.
The modification of trichloropyrimidine dye with 4HBSA found to
advantageous in terms of increasing the solubility of dyes, increasing the percent
fixation and maintaining the high stability associated with pyrimidine group.
The performance properties were found to be excellent.
7.3 References
1. Patent GB1140998 (1969)
2. Patent GB1581019 (1980)
3. Patent DE2729497 (1979)
4. Lewis, D.M. and Wang, J.C. The use of fourier transform infrared (FT-IR)
spectroscopy to study the state of heterobifunctional reactive dyes. Dyes and
Pigments, 1998, 39, pp.111-123.
5. Daimay, L.-V., Colthup, N.B., Fateley, W.G. and Grasselli, J.G. The
handbook of infrared and Raman characteristic frequencies of organic
molecules. London: Academic Press Ltd., 1991.

- 197 -
6. Matlok, F., Gremlich, H.U., Bruker Analytische Meotechnik and Merck eds.
Merck FT-IR atlas : a collection of FT-IR spectra. Weinheim: Vch, 1988.
7. Keller, R.J. and Sigma-Aldrich Corporation. The Sigma library of FT-IR
spectra. Missouri: Sigma Chemical Company, 1986.
8. Socrates, G. Infrared and Raman characteristic group frequencies : tables
and charts. Chichester: Wiley, 2001.
9. Silverstein, R.M., Webster, F.X. and Kiemle, D.J. Spectrometric
Identification of Organic Compounds. 7th ed. New York: John Wiley and
Sons, 2005.
10. Clark, M., Yang, K. and Lewis, D.M. Modified 2,4-difluoro-5-chloro-
pyrimidine dyes and their application in inkjet printing on wool fabrics.
Coloration Technology, 2009, 125, pp.184-190.
11. British Standards Institution. Colour fastness to artificial light: Xenon arc
fading lamp test, ISO 105-B02:2013.
12. British Standards Institution. Textiles - Tests for colour fastness - Part C06:
Colour fastness to domestic and commercial laundering, BS EN ISO 105-
C06:2010.

- 198 -
8 Synthesis, Modification and Characterisation of Yellow
Trichloropyrimidine Dyes for Inkjet Inks
This chapter details the synthesis, modification and characterisation of yellow
dyes based on pyrimidine reactive group by the conventional heating method as well
as microwave irradiation. The syntheses progression were monitored through
MEKC and TLC and the structural changes were confirmed by FT-IR.
However, due to time limitation the inks were not evaluated to the full extent
as other inks were evaluated.
8.1 Experimental
8.1.1 Materials
Yellow dye chromophore d5y (100%), 2,4,5,6-tetrachloropyrimidine (97%),
sodium 4-hydroxybenzenesulfonate dihydrate (98%), sodium metabisulfite,
carboxymethyl cellulose, polysorbate 20 (Tween 20) and N-methylmorpholine N-
oxide (NMO) were purchased from Sigma-Aldrich and used as received. Urea (MP
Biomedicals), Alcopol O 60 (Acros organics), 2-pyrrolidone (Acros organics), 2-
propanol (Fisher), Sandozin NIE (Clariant) were also purchased and used as
received.
8.1.2 Synthesis of Yellow 7-[(2,5,6-Trichloro-4-pyrimidinyl)amino]-2-
[(methylphenyl)azo]-1,3-Naphthalenedisulfonic Acid Dye (d17yp)
8.1.2.1 Conventional Heating Method
Dye d5y (4.65 g, 0.01 mol) was dissolved in water (50 cm3) which was
adjusted to pH 7.0 by the addition of 2N sodium carbonate solution at 35 °C. A
solution of tetrachloropyrimidine (2.38 g, 0.011 mol) in acetone (50 cm3) was added
as thin stream to the dye d5y solution. Once the addition of tetrachloropyrimidine
was complete, the reaction mixture was stirred and the pH was maintained at 6.0
7.0 by the addition of 2N sodium carbonate solution. The reaction was stirred for
further 6 hours (until the pH had stabilised) and was monitored with MEKC and
analytical TLC. 2N sodium carbonate solution was added to raise the pH to 7.0 and

- 199 -
sodium chloride (8% w/v) was added to precipitate the dye. The reaction mixture
was filtered and the crude dye was collected and was washed with brine (2 100
cm3) and dried in vacuo (40 °C, 12 hours).
Purification of crude dye d17yp using solvent-nonsolvent technique (1:2,
DMFacetone) afforded the pure dye d17yp (3.86 g, 5.96 mmol, yield 59.7%) as
yellow powder. The reaction is shown in Scheme 8.1.
8.1.2.2 Optimised Microwave-Irradiation Method
For the optimisation of microwave irradiated synthesis of d17yp, initial
investigations were undertaken using optimised conditions (discussed in section
6.2.6.2 and 7.1.6.2). However, at high temperatures (80 and 100 °C) decomposition
and discoloration of the reaction mixture and the product was observed. Therefore,
mild conditions, i.e. sodium phosphate buffer [Na2HPO4 (0.20 M, 2 ml) and
NaH2PO4 (0.12 M, 8 ml), pH 7.0] at 55 °C, were used. Which resulted in high yield
84% in only 1.5 hours at 55 °C in contrast to 60% achieved from conventional
heating in 6 hours.
8.1.2.2.1 Optimised Conditions for Synthesis of d17yp
Yellow dye chromophore d5y (0.465 g, 1 mmol, 1 eq.) and 2,4,5,6-
tetrachloropyrimidine (0.238 g, 1.1 mmol, 1.1 eq.) were added to each of the ten 35
ml microwave reaction vials equipped with a magnetic stirring bars followed by
addition of 10 ml of sodium phosphate buffer [Na2HPO4 (0.20 M, 2 ml) and
NaH2PO4 (0.12 M, 8 ml), pH 7.0] and 10 ml of acetone.
The mixtures were capped, mixed and irradiated in the microwave oven (200
W) for 1.5 hours (90 minutes) at 55 °C. Then the reaction mixtures were transferred
from the vials to beaker and sodium chloride (8% w/v) was added to precipitate the
dye. The brine and dried in vacuo (40 °C, 12 hours).
Purification of crude dye d17yp using solvent-nonsolvent technique (1:2,
DMF acetone) afforded the pure dye d17yp (5.41 g, 8.36 mmol, yield 84%) as
yellow powder. FT-IR analysis was conducted to confirm the presence of main
functional groups in dye d17yp. The reaction is shown in Scheme 8.1.

- 200 -
Scheme 8.1: Condensation of 2,4,5,6-tetrachloropyrimidine with yellow dye
chromophore d5y to yield d17yp by conventional and microwave
irradiation method
8.1.3 Comparative Study of Conventional and Microwave-Irradiated
Synthesis of Dye d17yp
It can been seen in Figure 8.1a and b, a reaction that takes 6 hours with
conventional heating method, microwave irradiation of d5y with 2,4,5,6-
tetrachloropyrimidine in the presence of sodium phosphate buffer pH 7.0 gave d17yp
in 1.5 hours at 55 °C. In addition to the reduced reaction time, the yield of d17yp was
significantly better as well (conventional heating, 60% versus microwave heating,
84%).

- 201 -
Figure 8.1: Comparison of reaction times and yields obtained by conventional
heating and microwave heating
Therefore, it is concluded that the microwave irradiated method is an efficient,
fast, simple method for the synthesis of yellow trichloropyrimidine dye d17yp which
gave product of high purity in high yield.
8.1.4 Characterisation of Yellow 7-[(2,5,6-Trichloro-4-pyrimidinyl)
amino]-2-[(methylphenyl)azo]-1,3-Naphthalenedisulfonic Acid Dye
(d17yp)
As shown in Figure 8.2b, water migrates quickly at the EOF velocity followed
by d5y (5.2 min) and then d17yp (6.78 min), this is because dye d17yp has an
increased molecular weight compared to dye d5y but no additional sulfonate groups
that would increases the solubility of the dye d17yp.
Moreover, the percent area of the d17yp shown in Figure 8.2c, was 100%
which indicates that there was no hydrolysed dye in the final product.
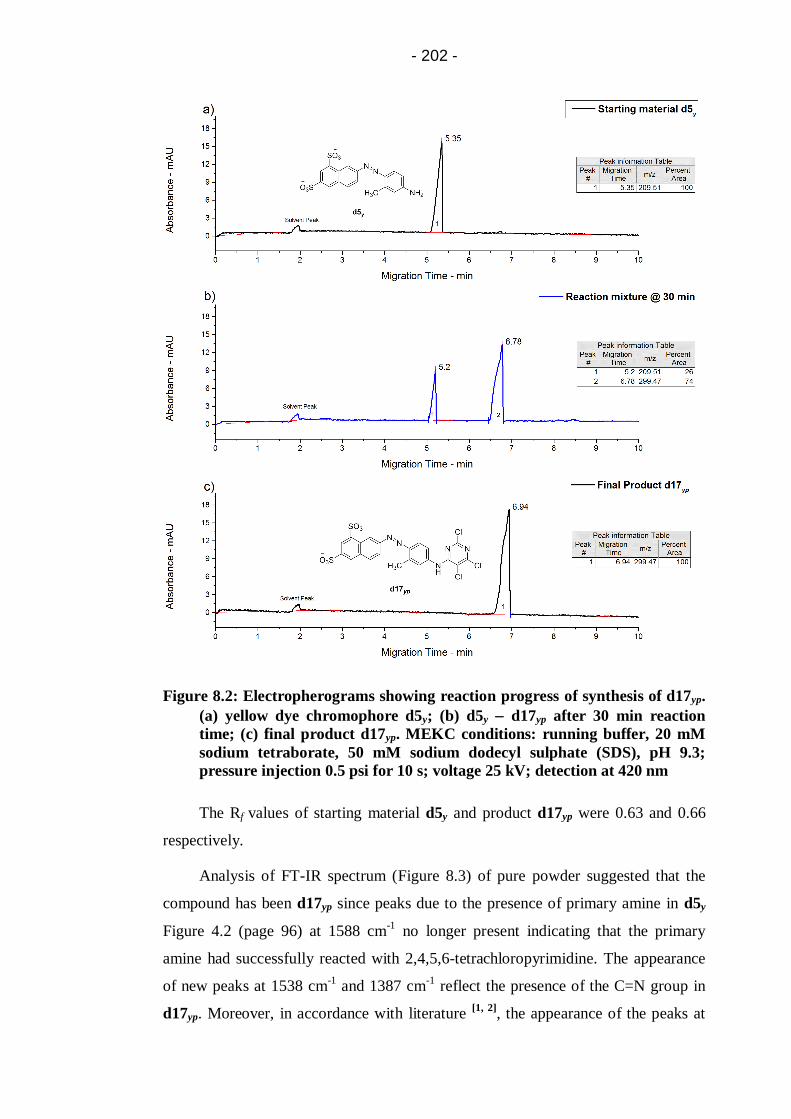
- 202 -
Figure 8.2: Electropherograms showing reaction progress of synthesis of d17yp.
(a) yellow dye chromophore d5y; (b) d5y d17yp after 30 min reaction
time; (c) final product d17yp. MEKC conditions: running buffer, 20 mM
sodium tetraborate, 50 mM sodium dodecyl sulphate (SDS), pH 9.3;
pressure injection 0.5 psi for 10 s; voltage 25 kV; detection at 420 nm
The Rf values of starting material d5y and product d17yp were 0.63 and 0.66
respectively.
Analysis of FT-IR spectrum (Figure 8.3) of pure powder suggested that the
compound has been d17yp since peaks due to the presence of primary amine in d5y
Figure 4.2 (page 96) at 1588 cm-1
no longer present indicating that the primary
amine had successfully reacted with 2,4,5,6-tetrachloropyrimidine. The appearance
of new peaks at 1538 cm-1
and 1387 cm-1
reflect the presence of the C=N group in
d17yp. Moreover, in accordance with literature [1, 2]
, the appearance of the peaks at
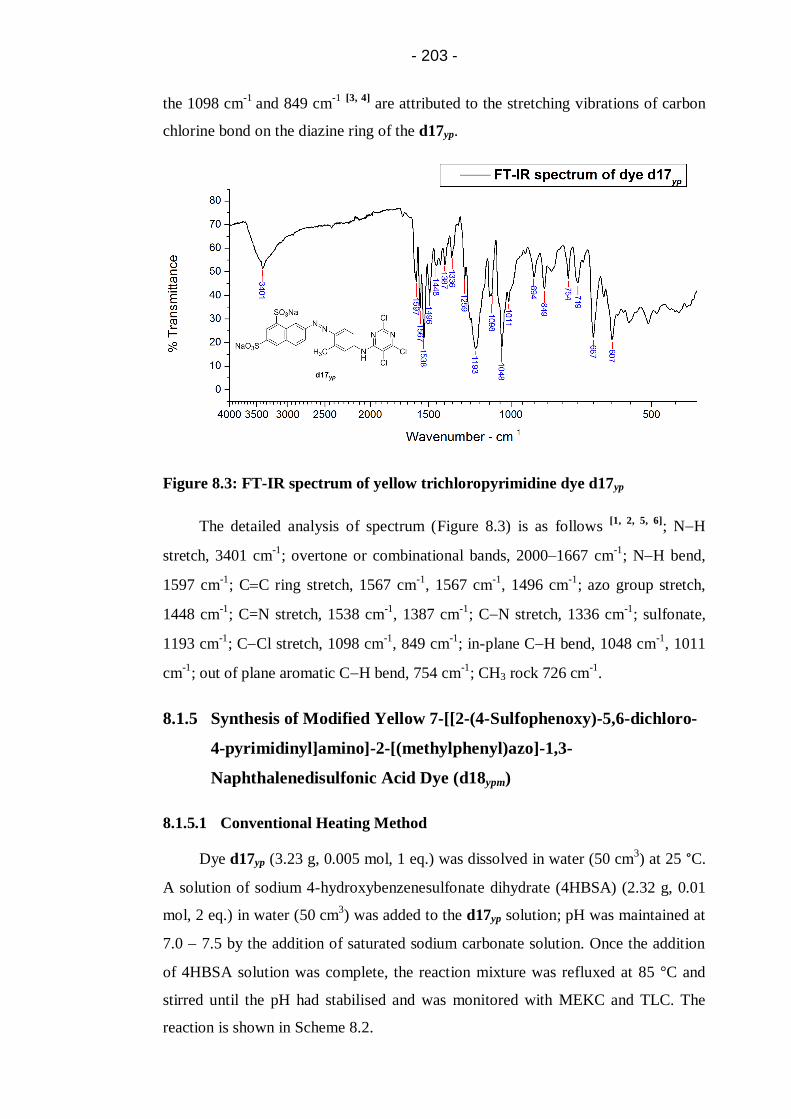
- 203 -
the 1098 cm-1
and 849 cm-1
[3, 4]
are attributed to the stretching vibrations of carbon
chlorine bond on the diazine ring of the d17yp.
Figure 8.3: FT-IR spectrum of yellow trichloropyrimidine dye d17yp
The detailed analysis of spectrum (Figure 8.3) is as follows [1, 2, 5, 6]
; NH
stretch, 3401 cm-1
; overtone or combinational bands, 2000–1667 cm-1
; NH bend,
1597 cm-1
; CC ring stretch, 1567 cm-1
, 1567 cm-1
, 1496 cm-1
; azo group stretch,
1448 cm-1
; C=N stretch, 1538 cm-1
, 1387 cm-1
; CN stretch, 1336 cm-1
; sulfonate,
1193 cm-1
; CCl stretch, 1098 cm-1
, 849 cm-1
; in-plane CH bend, 1048 cm-1
, 1011
cm-1
; out of plane aromatic CH bend, 754 cm-1
; CH3 rock 726 cm-1
.
8.1.5 Synthesis of Modified Yellow 7-[[2-(4-Sulfophenoxy)-5,6-dichloro-
4-pyrimidinyl]amino]-2-[(methylphenyl)azo]-1,3-
Naphthalenedisulfonic Acid Dye (d18ypm)
8.1.5.1 Conventional Heating Method
Dye d17yp (3.23 g, 0.005 mol, 1 eq.) was dissolved in water (50 cm3) at 25 °C.
A solution of sodium 4-hydroxybenzenesulfonate dihydrate (4HBSA) (2.32 g, 0.01
mol, 2 eq.) in water (50 cm3) was added to the d17yp solution; pH was maintained at
7.0 7.5 by the addition of saturated sodium carbonate solution. Once the addition
of 4HBSA solution was complete, the reaction mixture was refluxed at 85 °C and
stirred until the pH had stabilised and was monitored with MEKC and TLC. The
reaction is shown in Scheme 8.2.
- 204 -
The conventional heating method resulted in longer reaction time (12 hours)
and poor yield of 38%. Therefore, microwave irradiated synthesis was adopted for
the modification of d17yp.
8.1.5.2 Optimisation of Microwave-Irradiation Method
For the optimisation of microwave irradiated synthesis of d18ypm several
modifications and improvements have been sought. However, high yield (74%) was
achieved by performing the reaction with sodium phosphate buffer pH 7.4 for 1 hour
at 100 °C.
Yellow trichloropyrimidine dye d17yp (0.646 g, 0.1 mmol, 1 eq.) and sodium
4-hydroxybenzenesulfonate dihydrate (4HBSA) (0.464 g, 0.2 mmol, 2 eq.) were
added to each of the five 35 ml microwave reaction vials equipped with magnetic
stirring bars followed by addition of 20 ml of sodium phosphate buffer [Na2HPO4
(0.20 M, 8 ml) and NaH2PO4 (0.12 M, 12 ml), pH 7.4].
The mixtures were capped and irradiated in the microwave oven (200 W) for 1
hours at 100 °C. The reaction mixtures were combined and purified through flash
column chromatography to yield pure d18ypm dye (2.96 g, 3.67 mmol, yield 74%) as
yellow powder. The optimal conditions of reaction is shown in Scheme 8.2.

- 205 -
Scheme 8.2: Mono substitution of dye d17yp with 4HBSA to yield dye d18ypm by
conventional and microwave irradiation
8.1.6 Comparative Results of Conventional and Microwave-Irradiated
Synthesis of d18ypm
A comparison between the results obtained under conventional heating and
microwave-irradiated synthesis for the reaction times and yield are shown in Figure
8.4.
Figure 8.4: Comparison of reaction times and yields obtained by conventional
heating and microwave irradiation (d18ypm)
- 206 -
As can be seen in Figure 8.4, microwave heating effectively reduced the
reaction time from 12 hours to 1 hour. By using microwave radiation for heating, the
modified mono-substituted dye d18ypm was prepared in yield (74%) that was
appreciably higher than the conventional method (38%).
In conclusion, efficient, clean, fast and high yielded synthesis of modified dye
d18ypm have been achieved by microwave irradiation.
8.1.7 Characterisation of Modified Yellow 7-[[2-(4-Sulfophenoxy)-5,6-
dichloro-4-pyrimidinyl]amino]-2-[(methylphenyl)azo]-1,3-
Naphthalenedisulfonic Acid Dye (d18ypm)
The electropherograms from MEKC analysis are shown in Figure 8.5 which
indicates the progression of the synthesis reaction from the starting dye d17yp to the
mono-substituted dye d18ypm (peak 2 in Figure 8.5b).
As shown in Figure 8.5b, after reacting with 4HBSA the resultant dye d18ypm
migrates more quickly than the d17yp. This occurs because the mono substitution of
d17yp with 4HBSA not only increases the molecular weight of modified dye d18ypm
but also increase a negative charge on it, therefore increasing the hydrophilicity of
modified dye.
In addition, MEKC analysis also shows that starting material d17yp was fully
converted to modified dye d18ypm in 1 hour.
Moreover, the percent area of the d18ypm shown in Figure 8.5c, was 100%
which indicates the purity of final product.

- 207 -
Figure 8.5: Electropherograms showing reaction progress of synthesis of
d18ypm. (a) yellow dye d17yp; (b) d17yp d18ypm after 30 min reaction time;
(c) Final product d18mpm. MEKC conditions: same as Figure 8.2
In FT-IR spectrum of the mono-substituted dye d18ypm, Figure 8.6, the new
peak at 1124 cm-1
is evident which can be attributed to the stretching vibration of
COC in its structure between the diazine and the 4HBSA. The peak at 827 cm-1
can be attributed to the presence of CCl after the mono substitution of dye d17yp
with 4HBSA.

- 208 -
Figure 8.6: FT-IR spectrum of yellow mono-substituted dye d18ypm
The detailed analysis of spectrum (Figure 8.6) is as follows [1, 2, 5, 6]
; N−H
stretch, 3378 cm-1
; overtone or combinational bands, 2000–1667 cm-1
; NH
bending, 1610 cm-1
; CC ring stretch,1488 cm-1
; azo group stretch, 1449 cm-1
; C=N
stretch, 1558, 1375 cm-1
; CN stretch (secondary amine), 1294 cm-1
; COC
stretch, 1124 cm-1
; sulfonate, 1182 cm-1
; C−Cl stretch, 827 cm-1
; in-plane CH bend,
1038, 1008 cm-1
; out of plane aromatic CH bend, 759 cm-1
.
8.2 Conclusions
With the help of microwave irradiation, the yellow trichloropyrimidine dye
d17yp and modified dye d18ypm were prepared. By using the new method the reaction
time was shortened and high yields of dyes in pure form were achieved in
comparison with conventional synthesis at elevated temperatures.
By employing the microwave irradiation method dye d17yp was successfully
synthesised in adequate yield in 1.5 hours at 55 °C.
Moreover, the modification of d17yp was successfully done by using
microwave irradiation at 100 °C, quantitative conversion could be achieved with 1
hour.

- 209 -
8.3 References
1. Socrates, G. Infrared and Raman characteristic group frequencies : tables
and charts. Chichester: Wiley, 2001.
2. Silverstein, R.M., Webster, F.X. and Kiemle, D.J. Spectrometric
Identification of Organic Compounds. 7th ed. New York: John Wiley and
Sons, 2005.
3. Lewis, D.M. and Wang, J.C. The use of fourier transform infrared (FT-IR)
spectroscopy to study the state of heterobifunctional reactive dyes. Dyes and
Pigments, 1998, 39, pp.111-123.
4. Daimay, L.-V., Colthup, N.B., Fateley, W.G. and Grasselli, J.G. The
handbook of infrared and Raman characteristic frequencies of organic
molecules. London: Academic Press Ltd., 1991.
5. Keller, R.J. and Sigma-Aldrich Corporation. The Sigma library of FT-IR
spectra. Missouri: Sigma Chemical Company, 1986.
6. Matlok, F., Gremlich, H.U., Bruker Analytische Meotechnik and Merck eds.
Merck FT-IR atlas : a collection of FT-IR spectra. Weinheim: Vch, 1988.

- 210 -
9 Synthesis, Modification and Characterisation of Magenta Bis-
Dichlorotriazine Dye for Inkjet Inks
In 1980, ICI patented dyes which contained differing combinations of
chromophores and aliphatic or cycloaliphatic diamine linking groups [1]
. The most
notable of the dyes claimed, which relate to this study, were those in which a dye
containing a dichlorotriazine reactive group was disubstituted with diamines such as
ethylenediamine and then the terminal aliphatic amine groups further reacted with
cyanuric chloride. These dyes were claimed to have exceptionally high levels of
exhaustion and fixation when dyed on cellulosic fibres. The patent also claimed
dyeings of excellent fastness properties which were highly resistant to staining.
However, such claims were not substantiated by quantitative data.
More recently Morris et al [2]
, explored ethylenediamine as a bridging group
for dyeings on cotton and concluded that when compared with the parent
dichlorotriazine dye, the new dyes have high fixation efficiencies and the dye–fibre
bond stability is very good.
Therefore, in this study, a multifunctional reactive dye containing bis-
sulfophenoxy groups substituted to two dichlorotriazine groups linked through
aliphatic amino groups through a third triazine system to the magenta amino
chromophore residue has been prepared. The dye was synthesised stepwise from a
specially synthesised dichlorotriazine dye d2mt dye.
This chapter details the synthesis, modification and characterisation of
bis-dichlorotriazine dye. The syntheses progression were monitored through CZE
and the dye structural changes were confirmed through FT-IR.
However, when attempts were made to formulate these dyes into inks they
produce unsatisfactory results due to their low solubility. Further work was carried
out to improve the solubility of dyes in inks by the addition of 0.1% Tween 20
(surfactant). The addition of surfactant resolved the problem, however, due to time
limitation the inks were not evaluated to the full extent as other inks were evaluated.

- 211 -
9.1 Experimental
9.1.1 Materials
Magenta dichlorotriazine dye d2mt (100%), cyanuric chloride (99%),
ethylenediamine, sodium 4-hydroxybenzenesulfonate dihydrate (98%), sodium
bisulfite, carboxymethyl cellulose, Tween 20 and N-methylmorpholine N-oxide
(NMMO) were purchased from Sigma-Aldrich and used as received. Urea (MP
Biomedicals), alcopol O 60 (Acros organics), 2-pyrrolidone (Acros organics),
2-propanol (Fisher), sandozin NIE (Clariant) were also purchased and used as
received.
9.1.2 Synthesis of Bis-Ethylenediamine Intermediate (d19di)
In accordance with the method described in reference [2]
, ethylenediamine (0.2
mol, 12.01 g, 10 eq.) and sodium bicarbonate (1.5 eq.) were dissolved in water (100
cm3) which was adjusted to pH 7.0 by the addition of hydrochloric acid at 40 °C. A
solution of d2mt (0.02 mol, 14.34 g, 1 eq.) in water (50 cm3) was added dropwise to
the ethylenediamine solution over 30 minutes. The reaction mixture was stirred and
the pH was maintained at 6.5 to 7.0 by the addition of 2N sodium carbonate
solution, while the temperature was kept at 40 °C. Once the addition of dye d2mt
solution was complete, the reaction was followed using CZE. The CZE analysis
showed that the mono substitution reaction was complete after 1 hour, after which
the temperature of the reaction mixture was raised to 80 °C to enable the
di substitution to occur. After 4 hours, the CZE analysis showed that the second
substitution was complete. The precipitated bis-ethylenediamine intermediate d19di
(11.62 g, 0.015 mol, 76%) was collected by filtration, washed with ethanol (to
remove excess ethylenediamine) and dried in vacuo. FT-IR analysis was conducted
to confirm the presence of main functional groups in dye intermediate d19di. The
reaction is shown in Scheme 9.1.

- 212 -
Scheme 9.1: Condensation reaction of d2mt with ethylenediamine
9.1.2.1 Characterisation of Bis-Ethylenediamine Intermediate (d19di)
CZE electropherograms showing the reaction progression between d2mt and
ethylenediamine in fused silica capillary at pH 9.0 are shown in Figure 9.1. The
primary amino groups present on the intermediate might have decreased their
effective negative charge thereby allowing them to elute faster. Under these
conditions, d2mt have -3 effective charge whereas d19dii and d19di has -2 and -1
respectively.

- 213 -
Figure 9.1: Electropherograms showing reaction progress of synthesis of d19di.
(a) Starting dye d2mt; (b) d2mt d19i after 0.5 hours reaction time; (c) d19i
d19di after 3 hours reaction time; (d) Final product d19di. CZE
conditions: running buffer, 6mM potassium dihydrogen phosphate and
acetonitrile (10% v/v) pH 9.0; pressure injection 0.5 psi for 10 s; voltage
25 kV; detection at 542 nm.
It can be seen from the Figure 9.1c, that mono (2.04 min) and bis-substituted
(1.6 min) intermediates migrate more quickly than d2mt. Under the CZE conditions
used d19di being highest mass to charge ratio elute first.
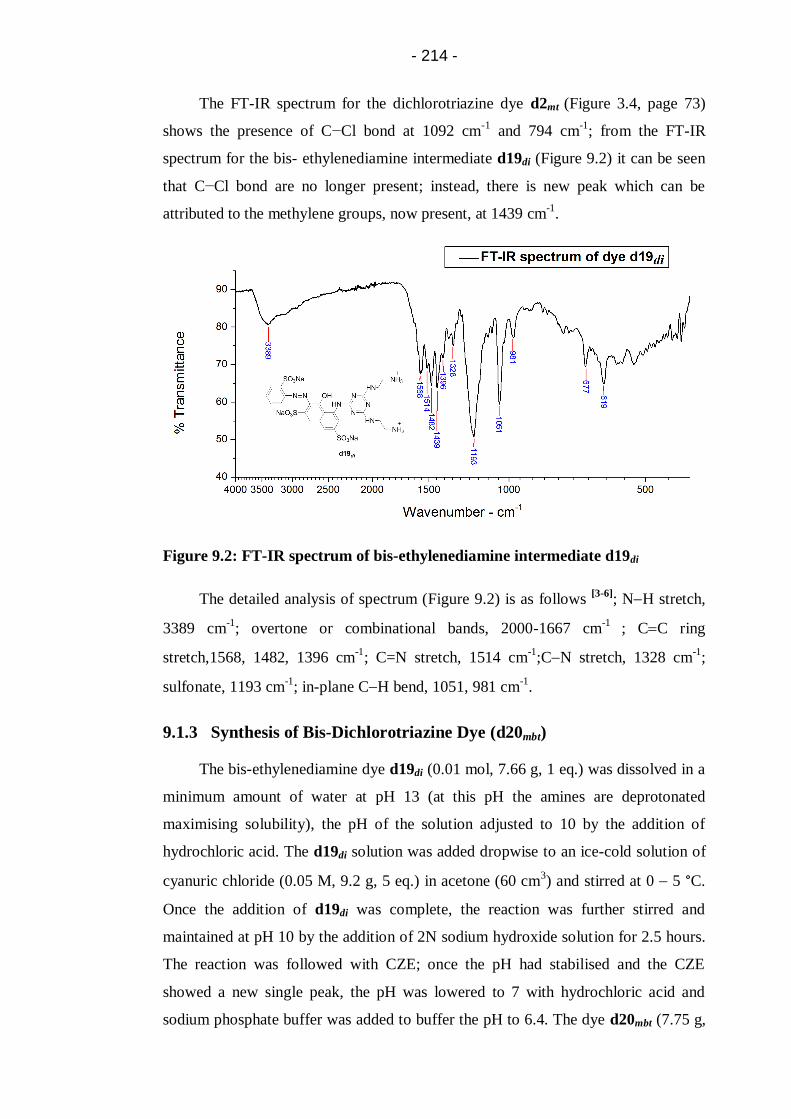
- 214 -
The FT-IR spectrum for the dichlorotriazine dye d2mt (Figure 3.4, page 73)
shows the presence of C−Cl bond at 1092 cm-1
and 794 cm-1
; from the FT-IR
spectrum for the bis- ethylenediamine intermediate d19di (Figure 9.2) it can be seen
that C−Cl bond are no longer present; instead, there is new peak which can be
attributed to the methylene groups, now present, at 1439 cm-1
.
Figure 9.2: FT-IR spectrum of bis-ethylenediamine intermediate d19di
The detailed analysis of spectrum (Figure 9.2) is as follows [3-6]
; NH stretch,
3389 cm-1
; overtone or combinational bands, 2000-1667 cm-1
; CC ring
stretch,1568, 1482, 1396 cm-1
; C=N stretch, 1514 cm-1
;CN stretch, 1328 cm-1
;
sulfonate, 1193 cm-1
; in-plane CH bend, 1051, 981 cm-1
.
9.1.3 Synthesis of Bis-Dichlorotriazine Dye (d20mbt)
The bis-ethylenediamine dye d19di (0.01 mol, 7.66 g, 1 eq.) was dissolved in a
minimum amount of water at pH 13 (at this pH the amines are deprotonated
maximising solubility), the pH of the solution adjusted to 10 by the addition of
hydrochloric acid. The d19di solution was added dropwise to an ice-cold solution of
cyanuric chloride (0.05 M, 9.2 g, 5 eq.) in acetone (60 cm3) and stirred at 0 5 °C.
Once the addition of d19di was complete, the reaction was further stirred and
maintained at pH 10 by the addition of 2N sodium hydroxide solution for 2.5 hours.
The reaction was followed with CZE; once the pH had stabilised and the CZE
showed a new single peak, the pH was lowered to 7 with hydrochloric acid and
sodium phosphate buffer was added to buffer the pH to 6.4. The dye d20mbt (7.75 g,

- 215 -
0.0073 mol, 73%) was precipitated by the addition of acetone, collected by filtration,
washed with acetone (to remove any excess cyanuric chloride) and dried in vacuo.
FT-IR analysis was conducted to confirm the presence of main functional groups in
dye d20mbt. The reaction is shown in Scheme 9.2.
Scheme 9.2: Condensation of cyanuric chloride with d19di (intermediate) to
yield d20mbt
9.1.3.1 Characterisation of Bis-Dichlorotriazine Dye (d20mbt)
CZE electropherograms showing the progression of synthesis reaction of
d20mbt are shown in Figure 9.3.

- 216 -
Figure 9.3: Electropherograms showing reaction progress of synthesis of d20mbt.
(a) Starting intermediate d19di; (b) d19di d20mbt after 1.5 hours reaction
time; (c) Final product d20mbt. CZE conditions: same as Figure 9.1
Most of the d19di was converted to the d20i (peak 2 in Figure 9.3b) after 1.5
hours of reaction although a small amount d20mbt (peak 3 in Figure 9.3b) was also
formed. After the reaction between cyanuric chloride and the bis-ethylenediamine
intermediate d19di, the resultant bis-dichlorotriazine dye d20mbt elutes later. This is
due to the smallest mass to charge ratio of d20mbt.
In FT-IR spectrum of bis-dichlorotriazine dye d20mbt (Figure 9.4), the
appearance of two new peaks at 1090 and 804 cm-1
signifies the presence of C−Cl
bond in new dye. Along with methylene groups at 1438 cm-1
, appearance of peaks at
1546 cm-1
and 1393 cm-1
reflect the presence of the triazine group in d20mbt. This
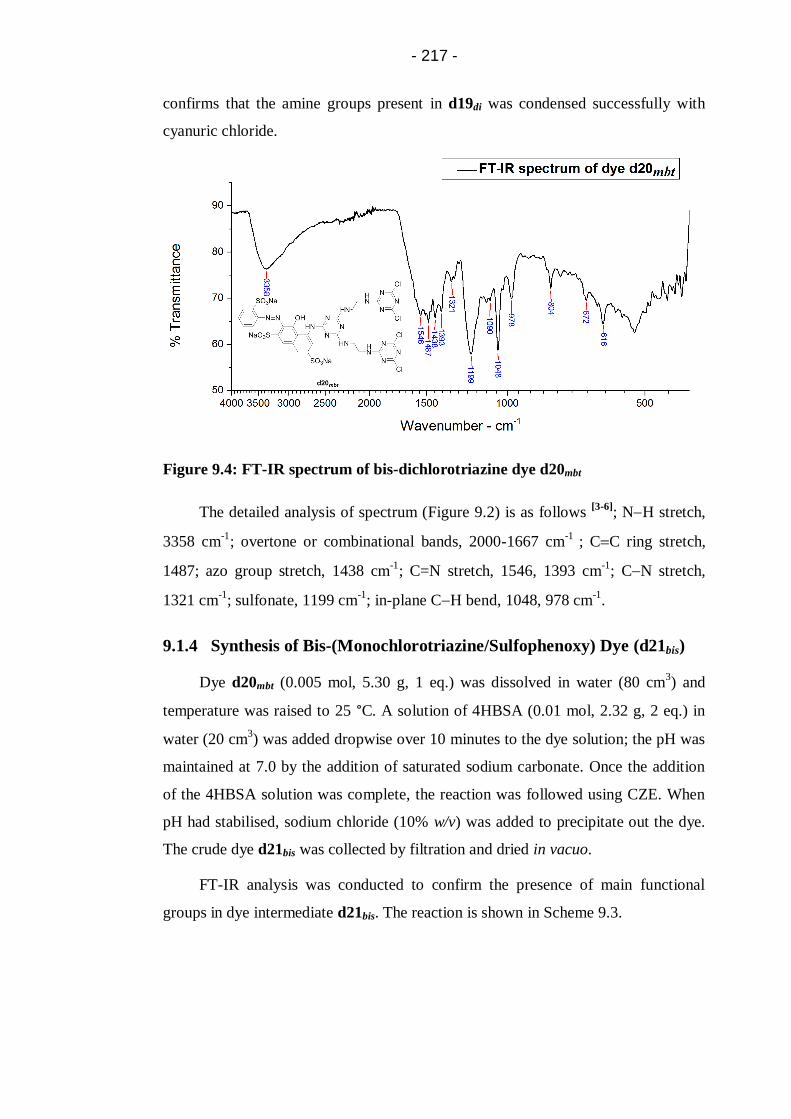
- 217 -
confirms that the amine groups present in d19di was condensed successfully with
cyanuric chloride.
Figure 9.4: FT-IR spectrum of bis-dichlorotriazine dye d20mbt
The detailed analysis of spectrum (Figure 9.2) is as follows [3-6]
; NH stretch,
3358 cm-1
; overtone or combinational bands, 2000-1667 cm-1
; CC ring stretch,
1487; azo group stretch, 1438 cm-1
; C=N stretch, 1546, 1393 cm-1
; CN stretch,
1321 cm-1
; sulfonate, 1199 cm-1
; in-plane CH bend, 1048, 978 cm-1
.
9.1.4 Synthesis of Bis-(Monochlorotriazine/Sulfophenoxy) Dye (d21bis)
Dye d20mbt (0.005 mol, 5.30 g, 1 eq.) was dissolved in water (80 cm3) and
temperature was raised to 25 °C. A solution of 4HBSA (0.01 mol, 2.32 g, 2 eq.) in
water (20 cm3) was added dropwise over 10 minutes to the dye solution; the pH was
maintained at 7.0 by the addition of saturated sodium carbonate. Once the addition
of the 4HBSA solution was complete, the reaction was followed using CZE. When
pH had stabilised, sodium chloride (10% w/v) was added to precipitate out the dye.
The crude dye d21bis was collected by filtration and dried in vacuo.
FT-IR analysis was conducted to confirm the presence of main functional
groups in dye intermediate d21bis. The reaction is shown in Scheme 9.3.

- 218 -
Scheme 9.3: Synthesis of bis-sulfophenoxy dye d21bis
9.1.4.1 Characterisation of Bis-(Monochlorotriazine/Sulfophenoxy) Dye
(d21bis)
CZE electropherograms showing the reaction progression between d20mbt and
4HBSA in fused silica capillary at pH 9.0 are shown in Figure 9.5. Under these
conditions d20mbt have -3 charge whereas d21bis have -5.

- 219 -
Figure 9.5: Electropherograms showing reaction progress of synthesis of d21bis.
(a) Starting intermediate d20mbt; (b) d20mbt d21bis after 3 hours reaction
time; (c) Final product d21bis. CZE conditions: same as Figure 9.1
After the modification, the mass to charge ratio of the d21bis decreases
compared to the bis-dichlorotriazine dye d20mbt, therefore the migration time of the
d21bis increases. Since an increase in molecular size decreases electrophoretic
mobility and increase in charge slows the migration towards the detector, therefore
analytes with higher mass to charge ratio elute first and the analytes with lower mass
to charge ratio elute last.
In FT-IR spectrum of the d21bis (Figure 9.6), the new peak at 1125 cm-1
is
evident which can be attributed to the stretching vibration of COC in its structure

- 220 -
between the triazine and the 4HBSA. The peak at 800 cm-1
can be attributed to the
presence of CCl after the modification of d20mbt with HBSA.
Figure 9.6: FT-IR spectrum of bis-sulfophenoxy dye (d21bis)
9.2 Conclusions
The synthesis of the dyes based on replacing the bridging group involved a 2-
step modification starting with the synthesis of dichlorotriazine reactive dye d2mt;
followed by bis-substitution of the triazine halogens usi 10 equivalent of
ethylenediamine to produce a bis-ethylenediamine intermediate d19di. Intermediate
d19di was subsequently reacted with cyanuric chloride to produce a bis-
dichlorotriazine d20mbt.
Modification of dye d20mbt with 4HBSA was done at 30 °C (pH 7.0) to yield
d21bis. The structural changes of the d20mbt was confirmed by FT-IR.
Furthermore, when these dyes (d20mbt and d21bis) were attempted to formulate
into inks they produce unsatisfactory inks due to their low solubility. Further work
was carried to improve the solubility of dyes in inks by the addition of 0.1% Tween
20 (surfactant). The addition of surfactant resolved the problem, however, due to
time limitation the inks were not evaluated to the full extent as other inks were
evaluated.

- 221 -
9.3 References
1. Patent GB2057479 (1980)
2. Morris, K.F., Lewis, D.M. and Broadbent, P.J. Design and application of a
multifunctional reactive dye capable of high fixation efficiency on cellulose.
Coloration Technology, 2008, 124, pp.186-194.
3. Matlok, F., Gremlich, H.U., Bruker Analytische Meotechnik and Merck eds.
Merck FT-IR atlas : a collection of FT-IR spectra. Weinheim: Vch, 1988.
4. Keller, R.J. and Sigma-Aldrich Corporation. The Sigma library of FT-IR
spectra. Missouri: Sigma Chemical Company, 1986.
5. Socrates, G. Infrared and Raman characteristic group frequencies : tables
and charts. Chichester: Wiley, 2001.
6. Silverstein, R.M., Webster, F.X. and Kiemle, D.J. Spectrometric
Identification of Organic Compounds. 7th ed. New York: John Wiley and
Sons, 2005.

- 222 -
10 Comparative Analysis of Synthesised Dyes-Based Inks and
Commercial Jettex R Reactive Inks for Wool Fabric
10.1 Introduction
DyStar is a leading supplier of innovative inks for digital textile printing. They
introduced Jettex R reactive inks for digital textile printing. The Jettex R range is
based on standard reactive dyes used for textile printing, covering the entire colour
space.
These inks are classed as outstanding inks for digital printing onto cellulosics,
silk and wool and are ideal for fashion fabrics for both women wear and menswear.
Particular advantages of Jettex R range of reactive inks are top colour fastness,
brilliancy and easy wash-off.
Jettex R inks were applied onto wool fabric according to the procedure
discussed in section 2.5.3 (page 52) and their performance in term of percent
fixation and colour fastness (light and wash) were compared with reactive inks
based on dyes that are synthesised in this study .
This chapter details the comparative analysis of synthesised parent and
modified dyes (triazine and pyrimidine) based inks and commercially successful
Jettex R reactive inks.
10.2 Materials
Inks based on triazine based modified dyes (magenta, d3mtm, d4mtd; yellow,
d7ytm, d8ytd; blue, d11btm, d12btd) and pyrimidine based modified dyes (magenta,
d14mpm; blue, d16bpm) were prepared. Samples of commercial Jettex R inks
(magenta, yellow and blue) were provided by DyStar and used as received.

- 223 -
10.3 Results and Discussion
10.3.1 Characteristics of DyStar Inks
10.3.1.1 Surface Tension and Viscosity of Inks
It can be seen, from Table 10.1, that Jettex R inks (magenta, blue and yellow)
had surface tension and viscosity within the operational range. However, all the
modified dye based inks have lower viscosity as compared to Jettex R inks. This
could be due to the use of different ink components; as choice of these components
have a significant effect on both, i.e., surface tension and viscosity.
Table 10.1: Comparative results of surface tension and viscosity of Inks
Ink formulation Surface Tension
(dynes.cm-1
)
Viscosity
(cP)
Dystar Magenta 44.5 28.7
Dystar Yellow 41.0 30.0
Dystar Blue 43.1 23.3
Triazine based modified dyes
Ink d3mtm 44.0 10
Ink d4mtd 45.0 8
Ink d7ytm 44.5 6
Ink d8ytd 45.5 8
Ink d11btm 43.5 8
Ink d12btd 43.0 8
Pyrimidine based modified dyes
Ink d14mpm 46.5 12
Ink d16bpm 40.5 8

- 224 -
10.3.2 Comparative Study of Percent Fixation of Inks
Figure 10.1 (magenta), Figure 10.2 (blue), and Figure 10.3 (yellow) illustrate
the superiority of the modified dye-based inks compared with the commercially
successful Jettex R inks when digitally printed onto wool fabric.
Figure 10.1: Comparision of percent fixation of magenta inks
Figure 10.2: Comparision of percent fixation of blue inks
Figure 10.3: Comparision of percent fixation of yellow inks

- 225 -
This is clearly indicated in Figure 10.1, Figure 10.2 and Figure 10.3 that both
the series, i.e. triazine and pyrimidine, of modified dyes in magenta, yellow and blue
hue exhibit high level of dye fixation when compared to Jettex R inks. It is
suggested that the enhanced dye fixation observed for these modified dyes are due to
lower reactivity and high solubility of these dyes. Moreover, modified dyes based
inks also showed higher stability in ink formulations.
10.3.3 Light Fastness
Light fastness testing was carried out according to the BS EN ISO 105-
B02:2013 (Method 3) [1]
.
The samples printed with Jettex R inks (magenta, blue and yellow) were tested
against blue wool reference 6 and the results are listed in Table 10.2.
All inks gave result ‘equal to’ target wool reference 6. Moreover, both the
series of modified dyes based Inks showed better light fastness then commercial
Jettex R Inks.
Therefore, modification of dichlorotriazine and trichloropyrimidine dyes in
magenta yellow blue hue with sulfophenoxy groups(s) gave a better range of inks
for digital printing of wool.
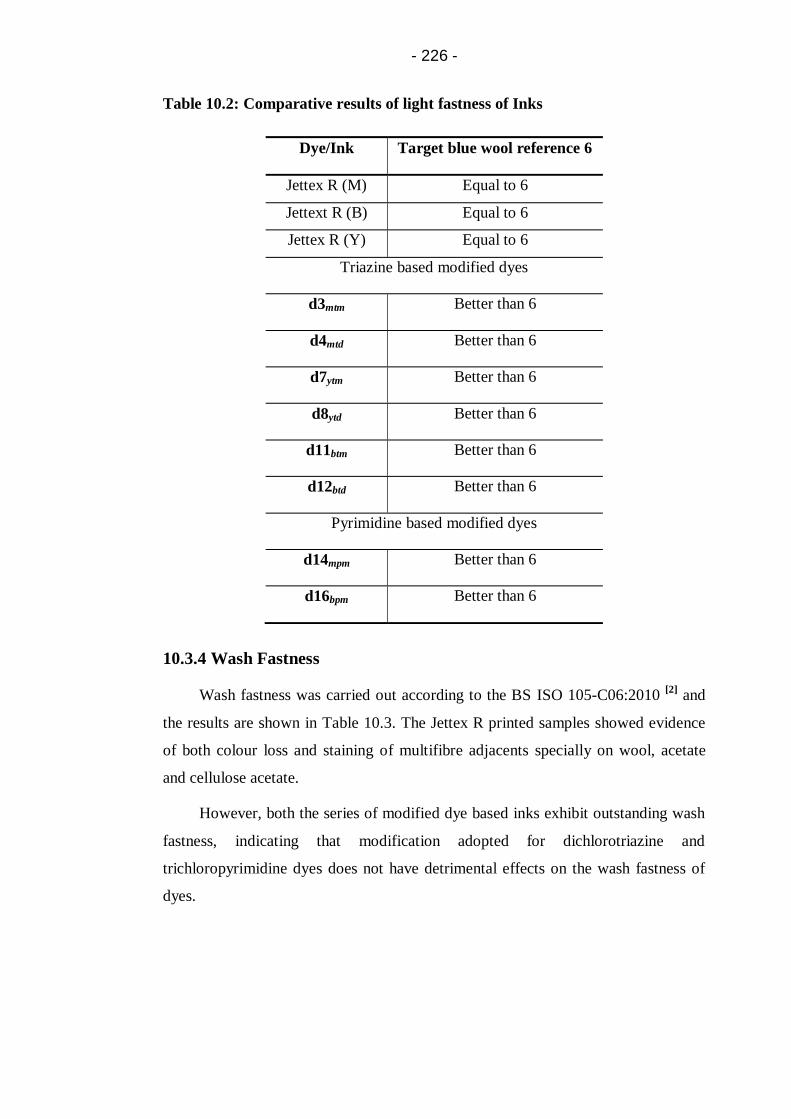
- 226 -
Table 10.2: Comparative results of light fastness of Inks
Dye/Ink Target blue wool reference 6
Jettex R (M) Equal to 6
Jettext R (B) Equal to 6
Jettex R (Y) Equal to 6
Triazine based modified dyes
d3mtm Better than 6
d4mtd Better than 6
d7ytm Better than 6
d8ytd Better than 6
d11btm Better than 6
d12btd Better than 6
Pyrimidine based modified dyes
d14mpm Better than 6
d16bpm Better than 6
10.3.4 Wash Fastness
Wash fastness was carried out according to the BS ISO 105-C06:2010 [2]
and
the results are shown in Table 10.3. The Jettex R printed samples showed evidence
of both colour loss and staining of multifibre adjacents specially on wool, acetate
and cellulose acetate.
However, both the series of modified dye based inks exhibit outstanding wash
fastness, indicating that modification adopted for dichlorotriazine and
trichloropyrimidine dyes does not have detrimental effects on the wash fastness of
dyes.
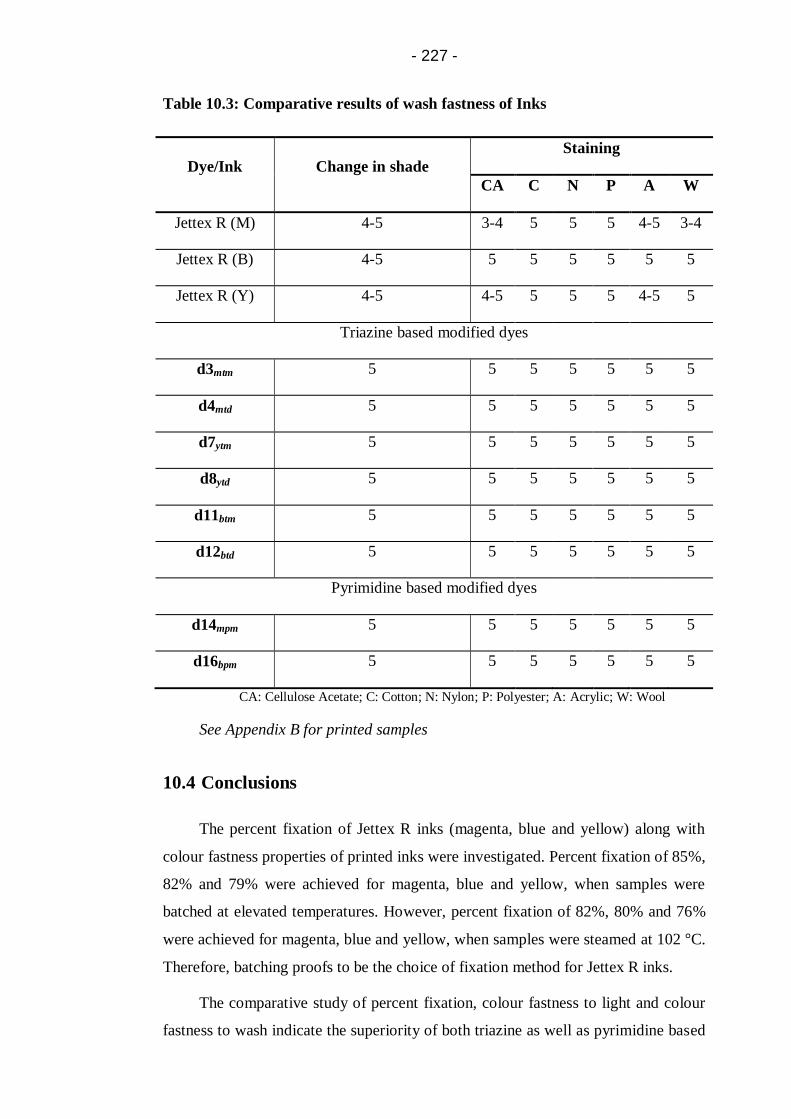
- 227 -
Table 10.3: Comparative results of wash fastness of Inks
Dye/Ink Change in shade
Staining
CA C N P A W
Jettex R (M) 4-5 3-4 5 5 5 4-5 3-4
Jettex R (B) 4-5 5 5 5 5 5 5
Jettex R (Y) 4-5 4-5 5 5 5 4-5 5
Triazine based modified dyes
d3mtm 5 5 5 5 5 5 5
d4mtd 5 5 5 5 5 5 5
d7ytm 5 5 5 5 5 5 5
d8ytd 5 5 5 5 5 5 5
d11btm 5 5 5 5 5 5 5
d12btd 5 5 5 5 5 5 5
Pyrimidine based modified dyes
d14mpm 5 5 5 5 5 5 5
d16bpm 5 5 5 5 5 5 5
CA: Cellulose Acetate; C: Cotton; N: Nylon; P: Polyester; A: Acrylic; W: Wool
See Appendix B for printed samples
10.4 Conclusions
The percent fixation of Jettex R inks (magenta, blue and yellow) along with
colour fastness properties of printed inks were investigated. Percent fixation of 85%,
82% and 79% were achieved for magenta, blue and yellow, when samples were
batched at elevated temperatures. However, percent fixation of 82%, 80% and 76%
were achieved for magenta, blue and yellow, when samples were steamed at 102 °C.
Therefore, batching proofs to be the choice of fixation method for Jettex R inks.
The comparative study of percent fixation, colour fastness to light and colour
fastness to wash indicate the superiority of both triazine as well as pyrimidine based
- 228 -
modified inks. The better results of modified dyes based inks are due to lower
reactivity and higher solubility.
10.5 References
1. British Standards Institution. Colour fastness to artificial light: Xenon arc
fading lamp test, ISO 105-B02:2013.
2. British Standards Institution. Textiles - Tests for colour fastness - Part C06:
Colour fastness to domestic and commercial laundering, BS EN ISO 105-
C06:2010.
- 229 -
11 Conclusion and Future Work
11.1 Conclusion
In recent years inkjet printing has become increasingly popular as a result of:
significant improvement in print speed of inkjet printers due to technical progress of
image processing by means of a computer, and print head manufacturing; and high
demands on market for digitalisation of print designs, as well as diversification and
lot reduction in printing. Therefore, development of an ink set which is capable of
providing printed fabrics having high quality and high fastness properties, and is
also superior in stability has been demanded.
Thus, the aims of this study were to improve fixation properties, performance
properties and the stability of existing reactive dyes when incorporated into inkjet
inks. The approach taken in this study was to modify existing reactive dyes
(dichlorotriazine and trichloropyrimidine) so that they can be utilised for the inkjet
printing of wool.
Thus, two series of multifunctional reactive dyes in magenta, blue and yellow
hue (which were suitable for application on wool) were synthesised from existing
reactive dyes (dichlorotriazine and trichloropyrimidine). The synthesised dyes were
formulated into a set of inks, applied onto wool fabrics through inkjet printing and
fixed using different methods. The inks were then evaluated in terms of their
stability, percent fixation and colour fastness and the results were compared with
their parent analogues based inks and commercial Jettex R inks.
Series I
For the synthesis and modification of dichlorotriazine dyes in magenta, yellow
and blue hue, the amino based chromophores were synthesised, followed by
condensation with cyanuric chloride in 0 to 5 °C.
First modification of prepared dichlorotriazine dyes (magenta, d2mt, yellow,
d6yt and blue, d10bt) was done by substitution of the second chlorine atom by
4HBSA at a temperature range of 25 to 45 °C at a pH range of 3.0 to 7.0 to produce
mono-substituted dyes (magenta, d3mtm; yellow, d7ytm; and blue, d11btm) in pure
form.

- 230 -
Second modification of dichlorotriazine dyes was done by substitution of the
second chlorine atom by using two equivalent 4HBSA at 30 °C to complete mono
substitution and then raising the temperature to 70 to 80 °C to produce di-substituted
dyes (magenta, d4mtd; yellow, d8ytd; and blue, d12btd) in pure form.
With respect to the formulation of synthesised parent and modified dyes into
inks, the modified dyes were easily formulated into inks due to their increased
solubility as compared to parent analogues. Moreover, the characteristic properties
such as viscosity and surface tension of the ink set based on parent and modified
dyes were found to be in operation range of 2 – 20 cP and 25 – 60 dynes.cm-1
.
The percent fixation (printing performance), under inkjet print−batch and
inkjet print−steam methods, of the three mono-substituted dyes and three di-
substituted dyes and their parent analogues were studied.
It has been shown in chapters 3, 4 and 5 that the mono-substituted dyes
(magenta, d3mtm; yellow, d7ytm; and blue, d11btm) and di-substituted dyes (magenta,
d4mtd; yellow, d8ytd; and blue, d12btd), synthesised from dichlorotriazine dyes
(magenta, d2mt, yellow, d6yt and blue, d10bt), showed significant improvement in
percent fixation over their analogue parent dyes (see Appendix B). This was due to
the incorporation of the sulfophenoxy reactive group, which reduced the reactivity
of modified dyes. This was in contrast to the analogue parent dyes, which are highly
reactive and are susceptible to hydrolysis during fixation, as well as storage.
Moreover, di-substituted dyes (magenta, d4mtd; yellow, d8ytd; and blue, d12btd)
have shown an increase in dye fixation compared to mono-substituted dyes
(magenta, d3mtm; yellow, d7ytm; and blue, d11btm). The is due to the incorporation of
more than one sulfophenoxy reactive group, which leads to the development of the
more stable reactive system compared to only one reactive group. Furthermore, the
incorporation of the sulfophenoxy reactive group into the dyes is advantageous in
two ways: (1) it increases dye solubility, and (2) it increases the stability of the
reactive group against hydrolysis. Therefore, the increased solubility and low
reactivity of chlorotriazine based modified dyes made them suitable for printing
applications.
Furthermore, the modified dyes (magenta, d3mtm and d4mtd; yellow, d7ytm and
d8ytd; and blue, d11btm and d12btd), can be suitably applied through inkjet print-batch
as well as inkjet-steam.
- 231 -
With respect to the stability of modified dyes (magenta, d3mtm and d4mtd;
yellow, d7ytm and d8ytd; and blue, d11btm and d12btd) in inks over a longer time, it
was found that the modified dye based inks can be stored at room temperature for 3
to 12 months without deteriorating. This is due to the decreased reactivity of
modified dyes, as compared to their parent analogues dichlorotriazine dyes.
With respect to the fastness properties of the subsequent prints with modified
dyes (magenta, d3mtm and d4mtd; yellow, d7ytm and d8ytd; and blue, d11btm and
d12btd), light fastness was found to be increased by 0.5-1.0 grade on target blue wool
reference 6, as well as improvements in their wash fastness when compared to their
parent analogues. This improvement in fastness properties can be attributed to
increased percent of fixation of reactive dyes that react covalently with the
functional groups in the fibre structure of wool.
Series II
For the synthesis of trichloropyrimidine dyes (magenta, d13mp; blue, d15bp;
and yellow, b17yp), the most widely employed strategy which involves the
condensation of 2,4,5,6-tetrachloropyrimidine with amino based dye chromophore
(azo or anthraquinone) in the presence of sodium carbonate as acid binding agent at
a temperature between 70 – 80 °C for several hours (15 – 50 hours) was employed.
However, even after several hours at high temperature the reaction did not reach
completion (discussed in chapters 5, 6, and 7) with a drawback of considerable
formation of hydrolysed by-products.
It was observed that the reaction typically requires harsh conditions e.g., high
temperatures and long reaction times, however, suffer from poor conversion and
hence poor yields.
It has been shown in chapters 6, 7 and 8 that microwave irradiation could
improve the condensation reactions by significantly enhancing the conversion to
product, increasing product yield and accelerating the reaction. The present study
thus discloses an improved method for the synthesis of trichloropyrimidine dyes
d13mp, d15bp and d17yp, wherein the method includes a microwave-irradiated
condensation reaction according to Figure 11.1 wherein D is an amino based dye
chromophore (azo or anthraquinone).

- 232 -
Figure 11.1: Optimal conditions for Microwave-irradiated synthesis of
trichloropyrimidine dyes
According to the new method, the reaction mixtures were subjected to
microwave irradiation, typically for only 1 – 4 hours at 100 °C applying 200 W.
Instead of sodium carbonate (as acid binding agent), sodium phosphate buffer
[Na2HPO4 (0.20 M) and NaH2PO4 (0.12 M), pH 7.0] was used.
The new method is characterised by dramatically increased yields (80 - 85%
isolated) especially of dyes poorly accessible without microwaves in reaction
duration of only about 1 − 4 hours.
The present study also discloses a method for the modification of
trichloropyrimidine dyes, wherein the method comprises the mono substitution of
trichloropyrimidine dye with 4HBSA in the presence of sodium phosphate buffer pH
7.4 at 100 °C.
According to the new method, the reaction mixtures were subjected to
microwave irradiation, typically for only 1 - 4 hours at 100 °C applying 200 W in
the presence of sodium phosphate buffer [Na2HPO4 (0.20 M) and NaH2PO4 (0.12
M), pH 7.4] shown in Figure 11.2. The mono-substituted dyes d14mpm, d16bpm and
d18ypm were formed almost exclusively, only small traces of by-products were
detected through CE and TLC. The microwave-irradiation method resulted in
dramatically increased yields (70 -75 % isolated).

- 233 -
Figure 11.2: Optimal conditions for Microwave-irradiated synthesis of
modified mono-substituted dyes
The percent fixation (printing performance), under inkjet print−batch and
inkjet print−steam methods, of the two mono-substituted dyes and their parent
analogues were studied.
As shown in chapter 6 the magenta parent trichloropyrimidine dye (d13mp) and
mono-substituted dye (d14mpm), equally displayed higher levels of fixation, i.e. 94%
and 90% respectively. This is thought to be due to the bifunctional behaviour of both
dyes under the fixation conditions used.
As shown in chapter 7 the blue parent trichloropyrimidine dye (d15bp), showed
poorer fixation (72%) and unlevelled prints compared to mono-substituted dye
(d16bpm) which displayed higher levels of fixation (88%) under inkjet print-batch
method. However, similar printing carried out under inkjet print-steam method
showed better fixation as well as levelled prints. This is thought to be due to perfect
steaming conditions used.
As has previously been discussed in chapter 6 that due to the low reactivity of
trichloropyrimidine dyes, they are highly resistant to hydrolysis. Therefore, with
respect to stability of modified dyes in inks, it was found that modification of
trichloropyrimidine dye with 4HBSA does not have any unfavourable effect on the
stability of dyes in inks when stored for prolonged time.
- 234 -
With respect to the fastness properties of the subsequent prints with parent
analogues and modified dyes, all the dyes exhibit excellent colour fastness to light
when tested against target blue wool reference 6, whereas, for wash fastness all the
dyes exhibit excellent wash fastness properties except blue trichloropyrimidine dye
d15bp, which show a slight staining on adjacents and change in shade (4-5).
Thus it can be concluded from the above discussions that synthesis of parent
trichloropyrimidine and modified dyes in high yields and shorter time through
microwave-irradiation, which can easily be up-scaled may find industrial application
for the preparation of dyes and will allow application of this highly promising and
potential class of reactive group in inkjet printing of textiles.
Moreover, on comparative analysis of properties of modified dyes with
commercially available Jettex R inks, it was found that the modified dyes based inks
are superior in every aspect such as fixation properties, stability and colour fastness.
Therefore, the concept of modification of reactive dyes based on chlorotriazine
and chloropyrimidine reactive groups by replacing the labile chlorine atom(s) by
sulfophenoxy group(s) to increase percent fixation has been demonstrated to be
viable and effective.
The superior application properties (fixation), enhanced stability (shelf life)
and improved performance properties (colour fastness) of modified magenta, yellow
and blue dyes, when compared with parent analogues and Jettex R inks were in
agreement with the concept.
11.2 Future Work
Based on the results and conclusions presented in this thesis, the following
aspects are suggested as being worthy of consideration for future work: (1)
application and evaluation of yellow trichloropyrimidine dye along with modified
dye; (2) application and evaluation of bis-dichlorotriazine dye along with bis-
(monochlorotriazine/sulfophenoxy) dye; (3) application of synthesised dyes based
inks onto other fibres and blends could be explored.
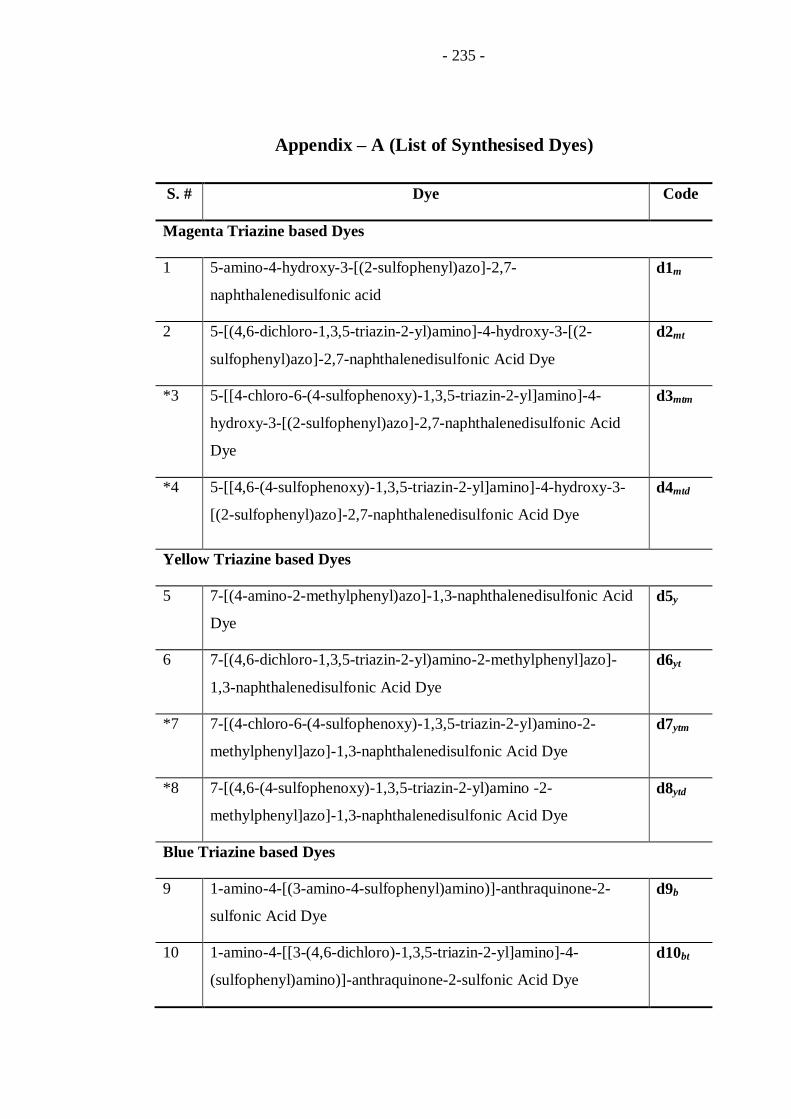
- 235 -
Appendix – A (List of Synthesised Dyes)
S. # Dye Code
Magenta Triazine based Dyes
1 5-amino-4-hydroxy-3-[(2-sulfophenyl)azo]-2,7-
naphthalenedisulfonic acid
d1m
2 5-[(4,6-dichloro-1,3,5-triazin-2-yl)amino]-4-hydroxy-3-[(2-
sulfophenyl)azo]-2,7-naphthalenedisulfonic Acid Dye
d2mt
*3 5-[[4-chloro-6-(4-sulfophenoxy)-1,3,5-triazin-2-yl]amino]-4-
hydroxy-3-[(2-sulfophenyl)azo]-2,7-naphthalenedisulfonic Acid
Dye
d3mtm
*4 5-[[4,6-(4-sulfophenoxy)-1,3,5-triazin-2-yl]amino]-4-hydroxy-3-
[(2-sulfophenyl)azo]-2,7-naphthalenedisulfonic Acid Dye
d4mtd
Yellow Triazine based Dyes
5 7-[(4-amino-2-methylphenyl)azo]-1,3-naphthalenedisulfonic Acid
Dye
d5y
6 7-[(4,6-dichloro-1,3,5-triazin-2-yl)amino-2-methylphenyl]azo]-
1,3-naphthalenedisulfonic Acid Dye
d6yt
*7 7-[(4-chloro-6-(4-sulfophenoxy)-1,3,5-triazin-2-yl)amino-2-
methylphenyl]azo]-1,3-naphthalenedisulfonic Acid Dye
d7ytm
*8 7-[(4,6-(4-sulfophenoxy)-1,3,5-triazin-2-yl)amino -2-
methylphenyl]azo]-1,3-naphthalenedisulfonic Acid Dye
d8ytd
Blue Triazine based Dyes
9 1-amino-4-[(3-amino-4-sulfophenyl)amino)]-anthraquinone-2-
sulfonic Acid Dye
d9b
10 1-amino-4-[[3-(4,6-dichloro)-1,3,5-triazin-2-yl]amino]-4-
(sulfophenyl)amino)]-anthraquinone-2-sulfonic Acid Dye
d10bt

- 236 -
S. # Dye Code
*11 1-amino-4-[3-(4-chloro-6-(4-sulfophenoxy)-1,3,5-triazin-2-
yl]amino]-4-(sulfophenyl)amino)]-anthraquinone-2-sulfonic Acid
Dye
d11mtm
*12 1-amino-4-[3-(4,6-(4-sulfophenoxy)-1,3,5-triazin-2-yl]amino]-4-
(sulfophenyl)amino)]-anthraquinone-2-sulfonic Acid Dye
d12btd
Magenta Diazine (pyrimidine) based dyes
13 5-[(2,5,6-trichloro-4-pyrimidinyl)amino]-4-hydroxy-3-[(2-
sulfophenyl)azo]-2,7-naphthalenedisulfonic acid
d13mp
*14 5-[(2-(4-sulfophenoxy)-5,6-dichloro-4-pyrimidinyl)amino]-4-
hydroxy-3-[(2-sulfophenyl)azo]-2,7-naphthalenedisulfonic Acid
Dye
d14mpm
Blue Diazine (pyrimidine) based Dyes
15 1-amino-4-[3-[(2,5,6-trichloro-4-pyrimidinyl)amino]-4-
(sulfophenyl)amino]-anthraquinone-2-sulfonic Acid Dye
d15bp
*16 1-amino-4-[3-[[2-(4-sulfophenoxy)-5,6-trichloro-4-
pyrimidinyl]amino]-4-(sulfophenyl)amino]-anthraquinone-2-
sulfonic Acid Dye
d16bpm
Yellow Diazine (pyrimidine) based Dyes
17 7-[(2,5,6-trichloro-4-pyrimidinyl)amino]-2-[(methylphenyl)azo]-
1,3-naphthalenedisulfonic Acid Dye
d17yp
*18 7-[[2-(4-sulfophenoxy)-5,6-dichloro-4-pyrimidinyl]amino]-2-
[(methylphenyl)azo]-1,3-naphthalenedisulfonic Acid Dye
d18ypm
Magenta Dyes based on ethylenediamine bridging group
19 bis-ethylenediamine intermediate d19di
20 bis-dichlorotriazine dye d20mbt
*21 bis-(monochlorotriazine/sulfophenoxy) dye d21bis
* : Modified Dyes
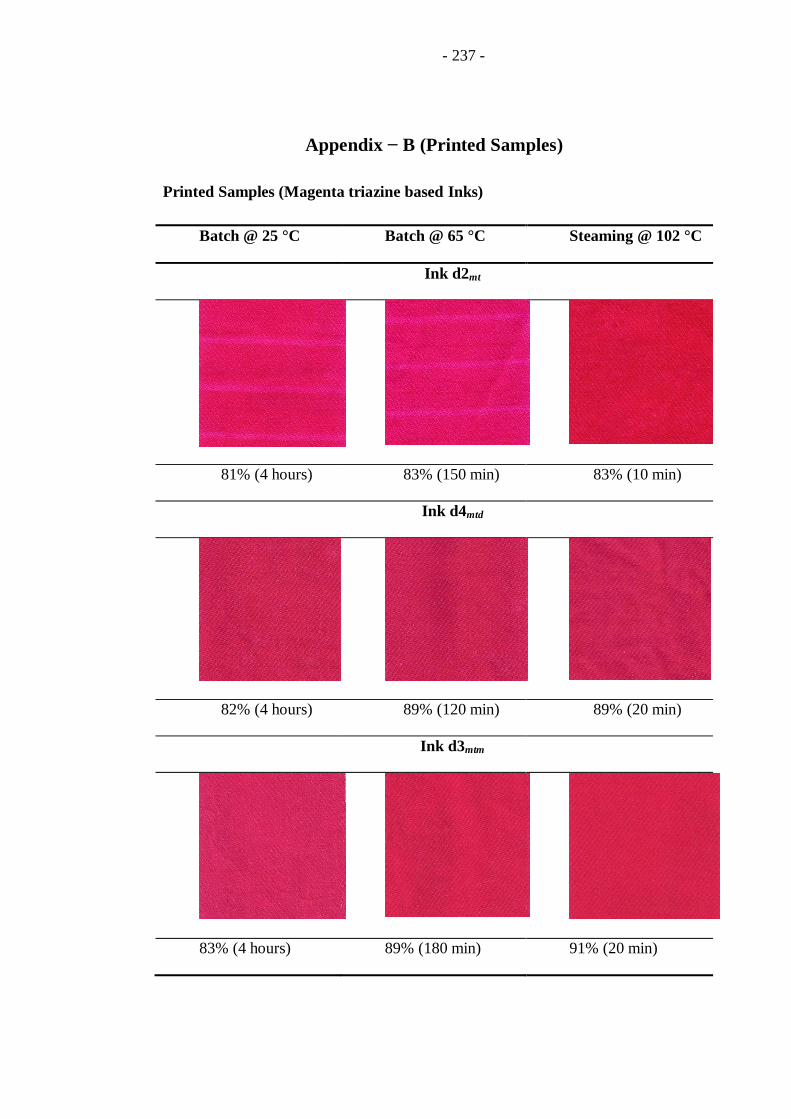
- 237 -
Appendix − B (Printed Samples)
Printed Samples (Magenta triazine based Inks)
Batch @ 25 °C Batch @ 65 °C Steaming @ 102 °C
Ink d2mt
81% (4 hours) 83% (150 min) 83% (10 min)
Ink d4mtd
82% (4 hours) 89% (120 min) 89% (20 min)
Ink d3mtm
83% (4 hours) 89% (180 min) 91% (20 min)
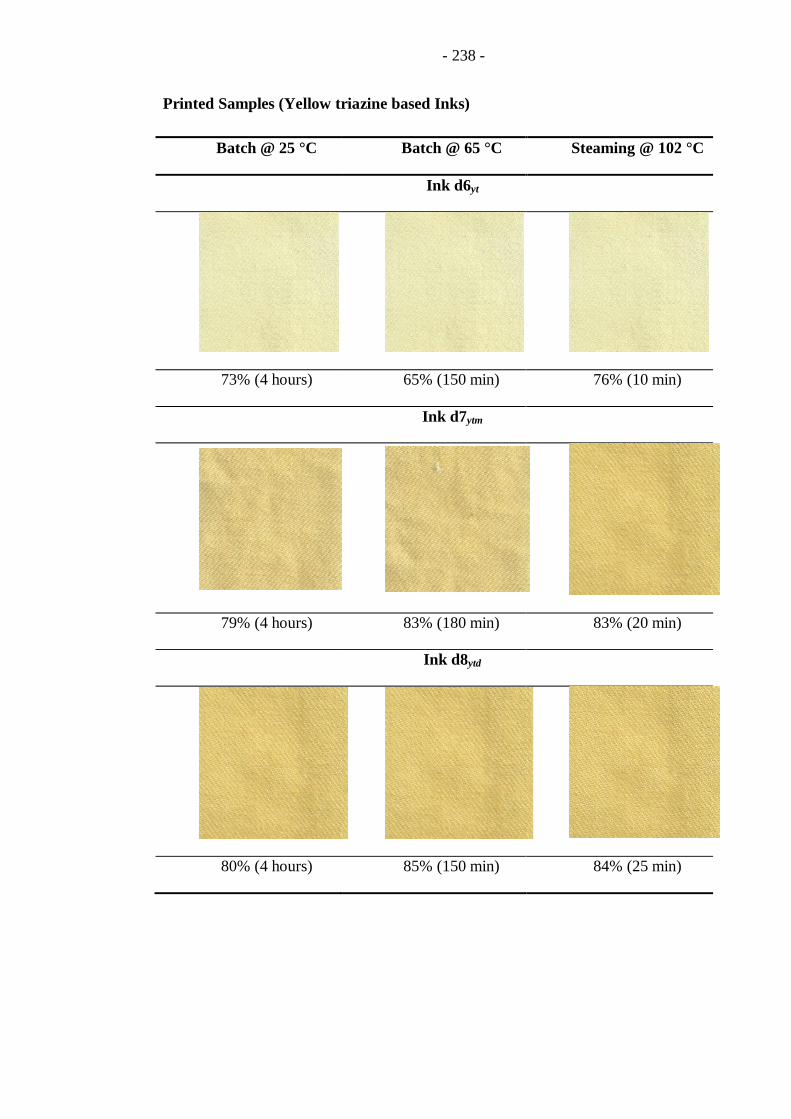
- 238 -
Printed Samples (Yellow triazine based Inks)
Batch @ 25 °C Batch @ 65 °C Steaming @ 102 °C
Ink d6yt
73% (4 hours) 65% (150 min) 76% (10 min)
Ink d7ytm
79% (4 hours) 83% (180 min) 83% (20 min)
Ink d8ytd
80% (4 hours) 85% (150 min) 84% (25 min)
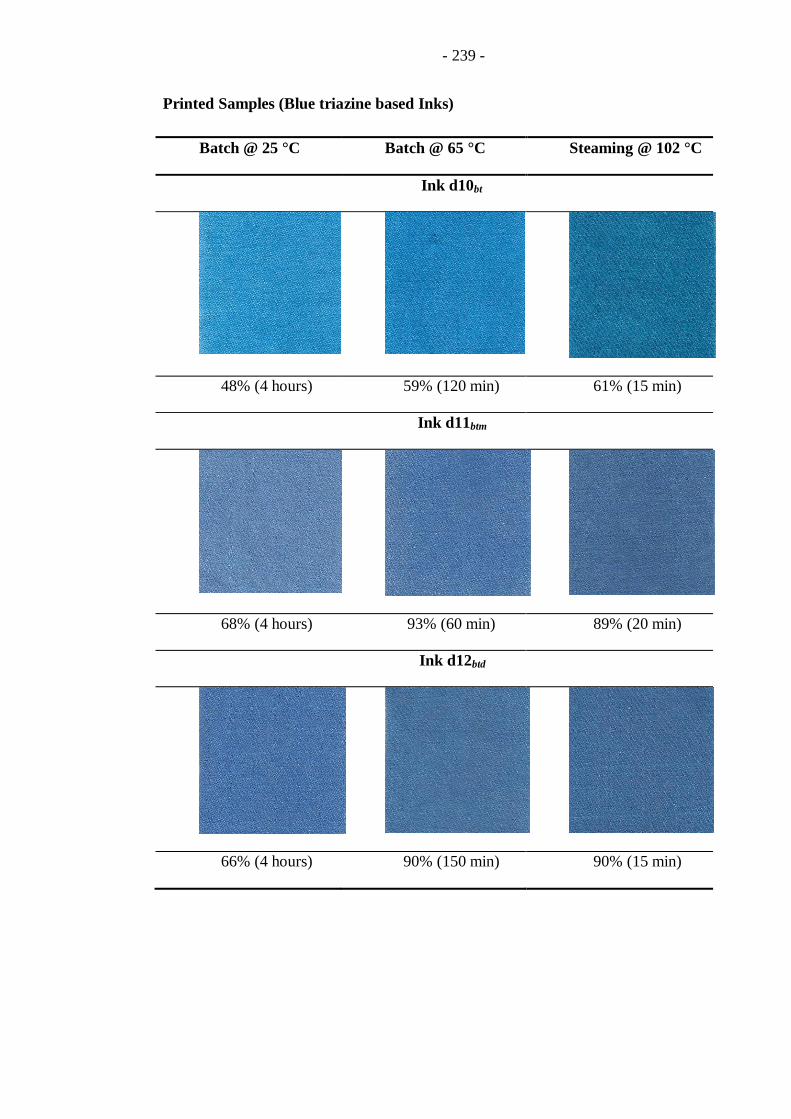
- 239 -
Printed Samples (Blue triazine based Inks)
Batch @ 25 °C Batch @ 65 °C Steaming @ 102 °C
Ink d10bt
48% (4 hours) 59% (120 min) 61% (15 min)
Ink d11btm
68% (4 hours) 93% (60 min) 89% (20 min)
Ink d12btd
66% (4 hours) 90% (150 min) 90% (15 min)

- 240 -
Printed Samples (Magenta pyrimidine based Inks)
Batch @ 90 °C Steaming @ 102 °C
Ink d13mp
94% 89%
Ink d14mpm
90% 91%

- 241 -
Printed Samples (Blue pyrimidine based Inks)
Batch @ 90 °C Steaming @ 102 °C
Ink d15bp
72% 84%
Ink d16bpm
86% 88%
Printed Samples (Jettex R Inks)
Jettex R (M) Jettex R (Y) Jettex R (C)
85% 79% 82%
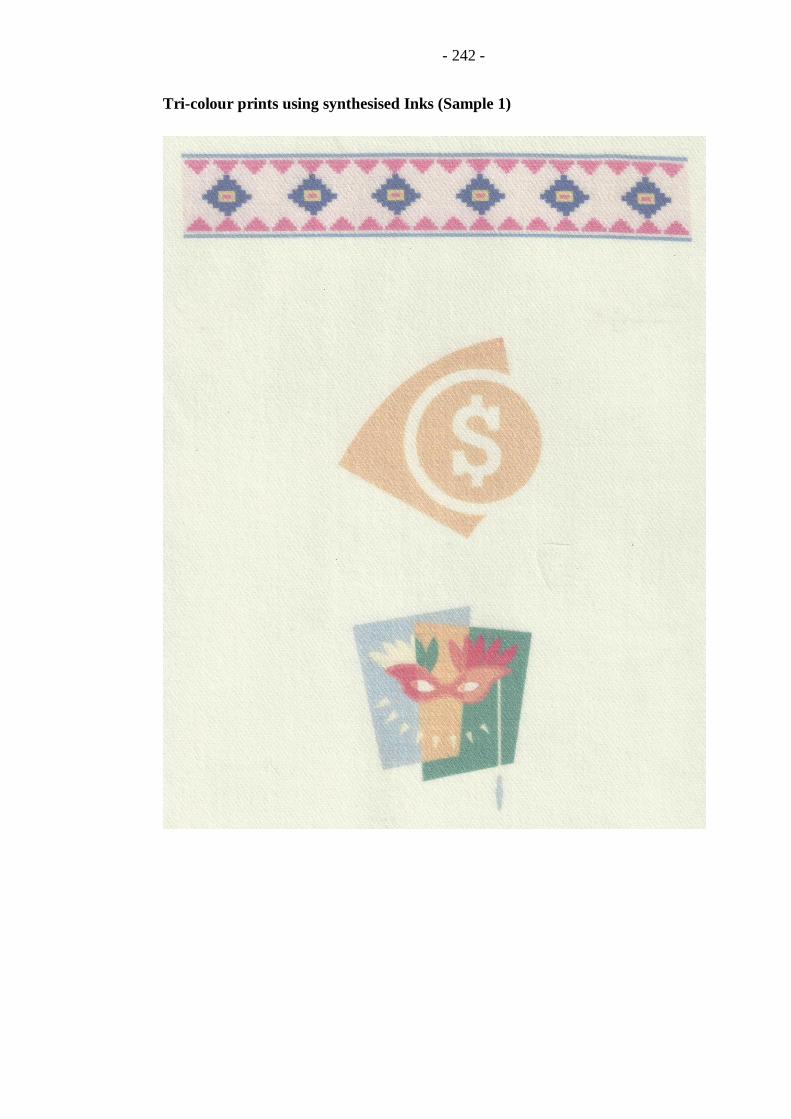
- 242 -
Tri-colour prints using synthesised Inks (Sample 1)
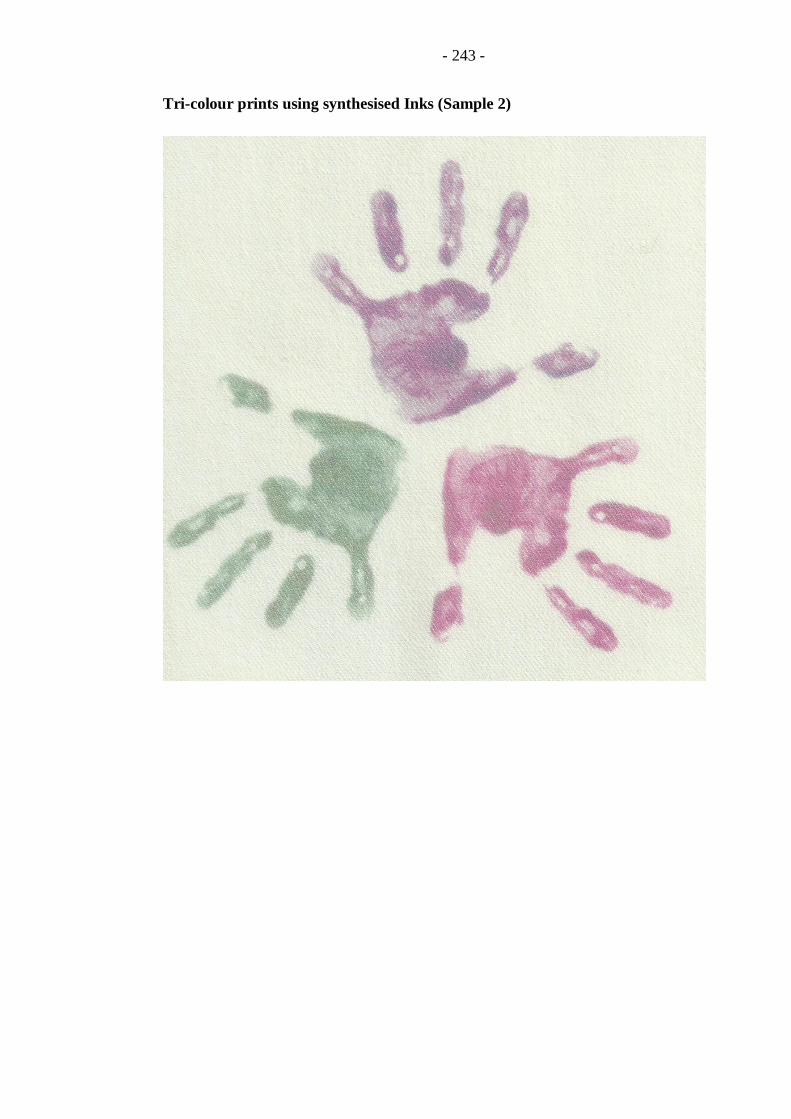
- 243 -
Tri-colour prints using synthesised Inks (Sample 2)
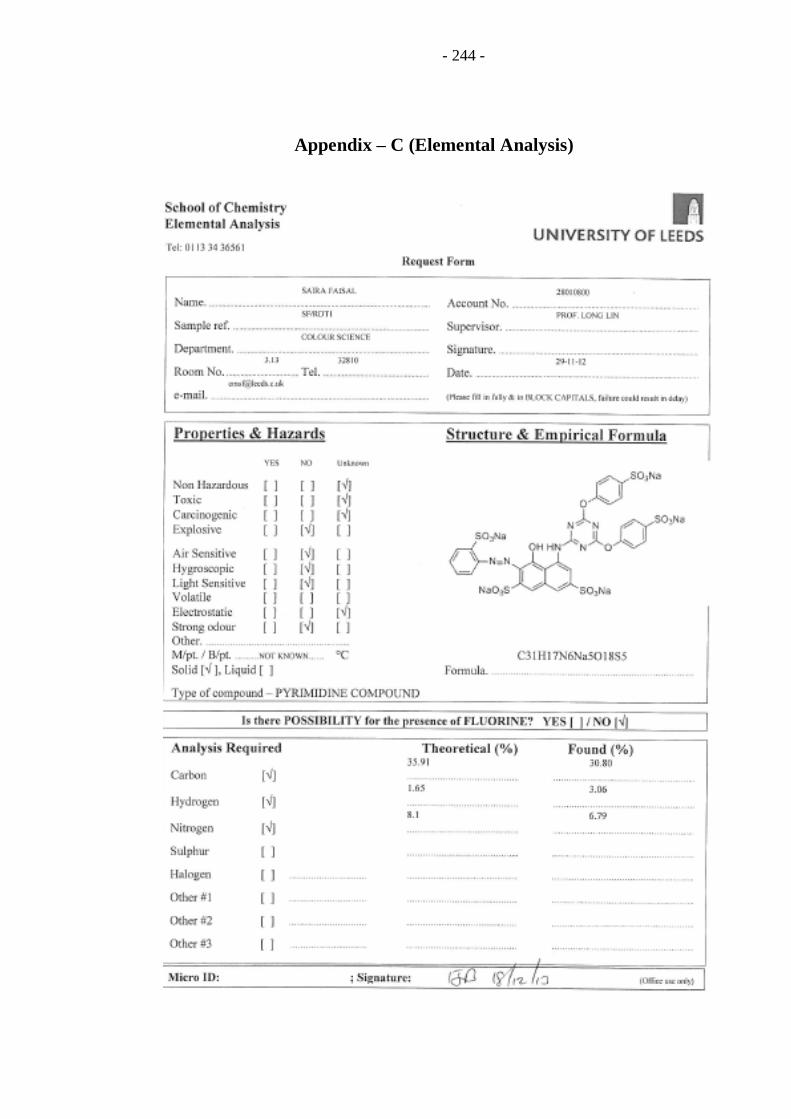
- 244 -
Appendix – C (Elemental Analysis)
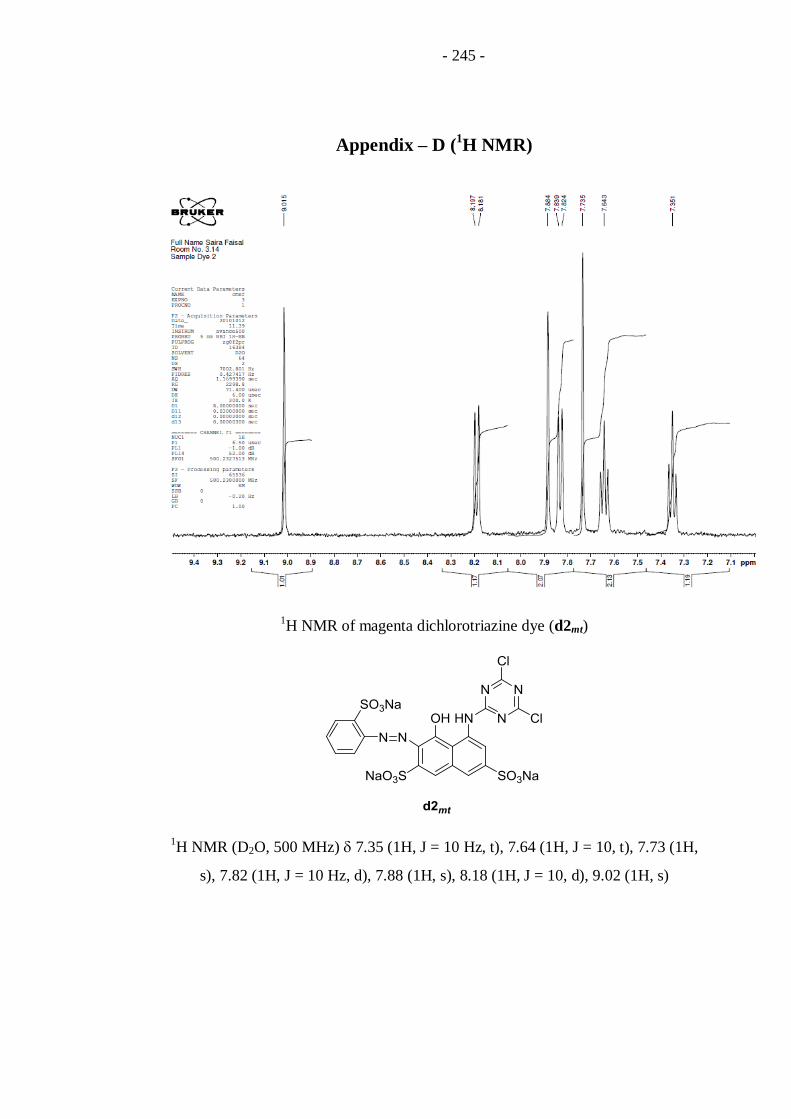
- 245 -
Appendix – D (1H NMR)
1H NMR of magenta dichlorotriazine dye (d2mt)
1H NMR (D2O, 500 MHz) 7.35 (1H, J = 10 Hz, t), 7.64 (1H, J = 10, t), 7.73 (1H,
s), 7.82 (1H, J = 10 Hz, d), 7.88 (1H, s), 8.18 (1H, J = 10, d), 9.02 (1H, s)
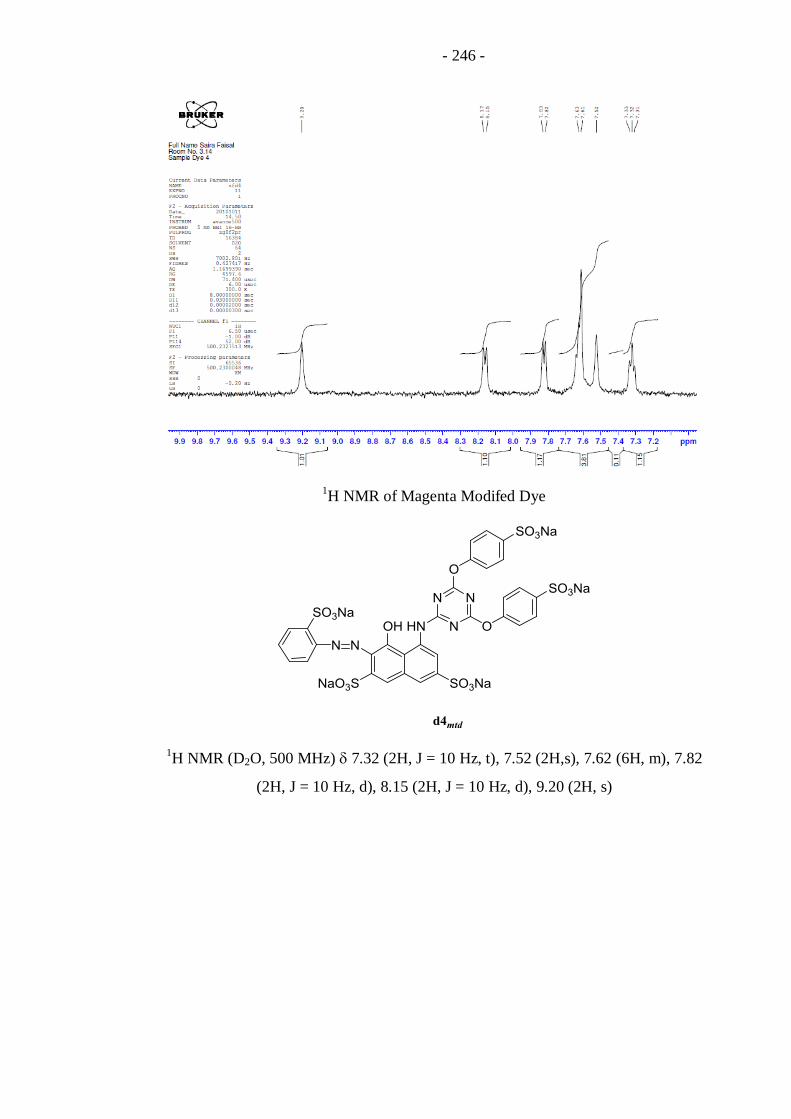
- 246 -
1H NMR of Magenta Modifed Dye
1H NMR (D2O, 500 MHz) 7.32 (2H, J = 10 Hz, t), 7.52 (2H,s), 7.62 (6H, m), 7.82
(2H, J = 10 Hz, d), 8.15 (2H, J = 10 Hz, d), 9.20 (2H, s)

- 247 -
1H NMR of yellow dye chromophore

- 248 -
1H NMR (D2O, 500 MHz) 2.30 (3H, s), 6.38 (1H, s), 6.41 (1H, J = 10 Hz, d), 7.30
(1H, J = 10 Hz, d), 7.77 (1H, J = 10Hz, d), 7.91 (1H, J = 10, d), 8.22 (1H, s), 8.29
(1H, s), 8.68 (1H, s)