food dyes health effects assessment oehha
TRANSCRIPT

kkSM
OFFICE OF ENVIRONMENTAL HEALTH HAZARD ASSESSMENT
Health Effects Assessment
Potential Neurobehavioral Effects of Synthetic Food Dyes in Children
April 2021
Children’s Environmental Health Center Office of Environmental Health Hazard Assessment California Environmental Protection Agency
List of Contributors Health Effects Assessment: Potential Neurobehavioral Effects of Synthetic Food
Dyes in Children
Children’s Environmental Health Center Office of Environmental Health Hazard Assessment
California Environmental Protection Agency
Contributors
Office of Environmental Health Hazard Assessment Marjannie Akintunde, PhD
Mari Golub, PhD Melanie Marty, PhD
Mark Miller, MD, MPH Nathalie Pham, PhD
Craig Steinmaus, MD, MPH
University of California, Berkeley Asa Bradman, PhD
Rosemary Castorina, PhD Mayela Gillan
Ruwan Thilakaratne., MPH Monice Wong
University of California, Davis Arlie Lehmkuhler
Alyson Mitchell, PhD
OEHHA Reviewer Vince Cogliano, PhD
Director Lauren Zeise, PhD
Potential Neurobehavioral Effects of Synthetic CalEPA OEHHA Food Dyes in Children April 2021
3
Peer Reviewers
Peter Spencer PhD, FANA, FRCPath Professor of Neurology and Occupational Health Sciences School of Medicine Oregon Health and Science University.
Emily S. Barrett, PhD Associate Professor of Biostatistics and Epidemiology School of Public Health and Environmental and Occupational Health Sciences Institute Rutgers University
Emanuela Taioli, MD, PhD Professor, Population Health Science and Policy, and Thoracic Surgery Director, Institute for Translational Epidemiology Mount Sinai

Potential Neurobehavioral Effects of Synthetic CalEPA OEHHA Food Dyes in Children April 2021
Preface The mission of the Office of Environmental Health Hazard Assessment (OEHHA) is to protect and enhance the health of Californians and our state’s environment through scientific evaluations that inform, support and guide regulatory and other actions.
In the State 2018-2019 budget, OEHHA received funding to review the scientific literature and conduct a risk assessment, as data allow, on the potential impacts of synthetic food dyes on children. These dyes are added to many foods, beverages, over-the-counter medications, and vitamins in the US, especially those intended for children.
Concern about synthetic food dyes has recently revolved around neurobehavioral impacts on children, in particular exacerbation of attentional problems, such as in children with attention-deficit/hyperactivity disorder (ADHD), and other behavioral outcomes. The US Food and Drug Administration (US FDA) initially approved the food dyes reviewed in this assessment between 1969 and 1987, when few studies of children were available. Since that time, clinical trials (including randomized double-blinded trials) using synthetic dyes have examined neurobehavioral outcomes in children, and laboratory studies of neurotoxic effects in developing animals have become available, and these are considered in this assessment. In 2011, the Food Advisory Committee of the US FDA reviewed the possible association between consumption of synthetic color additives in food and hyperactivity in children. US FDA concluded that most children have no adverse effects when consuming foods containing color additives, but some evidence suggests that certain children may be sensitive to them. Our review includes the human studies that US FDA reviewed and those published after their review, as well as the animal toxicology literature and studies of potential mechanisms of action.
This assessment reviews seven of the nine synthetic food dyes subject to batch certification by the US FDA 1. These are the most commonly consumed synthetic food dyes in the US. Batch-certification refers to a chemical analysis of each batch of dye sold to ensure that specific contaminants are below a legal limit.2 Color additives subject to batch certification are synthetic, derived from petroleum, and are listed on a product’s ingredient label.
1 These are FD&C Blue No. 1, Blue No. 2, Green No. 3, Red No. 3, Red No. 40, Yellow No. 5, and Yellow No. 6. The batch-certified dye Orange B is not included in this assessment because it is no longer manufactured in the US due to its contamination by the carcinogen 2-naphthylamine. Citrus Red No. 2 was not included because it is approved for use only for coloring the skins of oranges (from Florida). 2 https://www.fda.gov/industry/color-additive-inventories/summary-color-additives-use-united-states-foods-drugs-cosmetics-and-medical-devices#table1B
Potential Neurobehavioral Effects of Synthetic CalEPA OEHHA Food Dyes in Children April 2021
5
We conducted a systematic literature search that identified numerous clinical trials examining neurological effects of food dyes in children. Clinical trials are often considered a “gold standard” of epidemiologic study design, because investigators can control exposure and this can reduce biases and confounding exposures compared to other epidemiologic study designs. Accordingly, our epidemiologic review focuses on these clinical trials, and high confidence is warranted for conclusions from the results of these studies.
We also identified numerous laboratory studies of both mature and developing animals exposed to synthetic food dyes. These include studies of exposures during prenatal, infant, and juvenile development, examining neurobehavioral effects in the offspring manifest during development and later in adult animals. The availability of studies at different developmental stages allows a comprehensive review of adverse developmental effects, although it limits the ability to compare results across study designs, as exposures during different developmental stages may manifest differently later in life.
An innovative feature of this assessment is an evaluation of dyes tested in in-vitro high-throughput assay systems. We identified pertinent assays from three sources: assays with a neurologic-related gene target, neurologic markers based on pesticides that cause developmental neurotoxicity, and assays associated with oxidative stress or inflammation. These assays allowed us to explore the potential for synthetic food dyes to perturb mechanistic pathways leading to neurotoxicity.
We found six studies of food dye consumption published during the past 10 years. The most comprehensive study measured color additive levels in 600 foods in 52 categories and combined these levels with food consumption data from the 2007–2010 National Health and Nutrition Examination Survey (NHANES). OEHHA contracted with the University of California, Davis to measure recent levels in major sources of synthetic food dye exposure, plus food dye levels in over-the-counter medications and vitamins intended for children. OEHHA also contracted with the University of California, Berkeley to combine these food dye levels with 2015–2016 NHANES data and to compute exposure estimates for a finer set of age groupings. Our risk characterization compared these exposure estimates with US FDA Acceptable Daily Intakes (ADIs) derived during 1969–1987, and ADIs derived until 2010 by the Joint FAO/WHO Expert Committee on Food Additives. In keeping with OEHHA’s emphasis on analyses of disparate exposures in vulnerable populations, we also characterized risks by poverty level, race and ethnicity, and education of the mother.
An overarching feature of this assessment is the use of systematic review. We conducted systematic literature searches to ensure that pertinent, publicly available studies would be available for consideration. We updated the systematic searches twice to identify new studies as we developed the assessment. Next, we conducted systematic evaluations of study methods and quality to ensure an emphasis on studies of high quality to determine the conclusions. The systematic literature searches help

Potential Neurobehavioral Effects of Synthetic CalEPA OEHHA Food Dyes in Children April 2021
6
ensure that this assessment is comprehensive, and the systematic evaluations of study methods and quality provide transparency into how we viewed the available studies.
In this endeavor, we involved expert scientists and the general public. In October 2018, we issued a Request for Information that invited the public to submit information to us relating to possible exposures and neurologic and neurobehavioral impacts of synthetic food dyes. In September 2019, OEHHA convened a public symposium in Sacramento to discuss the potential neurobehavioral effects in children of synthetic food dyes.3 The public also had an opportunity to comment on the draft assessment, and independent external expert scientists peer-reviewed the draft assessment before it was revised and released as this final report. OEHHA is grateful to everyone who participated in these activities, as public contributions ensure that the final report is scientifically rigorous and addresses the needs and concerns of the public.
3 https://oehha.ca.gov/risk-assessment/general-info/2019-symposium-synthetic-food-dyes
Potential Neurobehavioral Effects of Synthetic CalEPA OEHHA Food Dyes in Children April 2021
TABLE OF CONTENTS
List of Contributors .......................................................................................................... 2
Preface ..................................................................................................................... 4
List of Abbreviations ...................................................................................................... 17
Executive Summary ...................................................................................................... 19
Components of the assessment ................................................................................. 19
Findings ..................................................................................................................... 20
Research needs and next steps ................................................................................. 22
Conclusion ................................................................................................................. 23
Chapter 1. Introduction ................................................................................................. 24
1.1 Purpose ................................................................................................................ 24
1.2 Overview of approach and organization of the document .................................... 27
1.3 Literature search strategy on neurological effects of synthetic food dyes ............ 28
Chapter 2. Epidemiologic Studies of Synthetic Food Dyes and Neurobehavioral Outcomes in Children ................................................................................. 34
2.1 Introduction .......................................................................................................... 34
2.2 Literature search and data abstraction ................................................................. 34
2.3 Assessment of individual studies ......................................................................... 35
2.4 Study quality ........................................................................................................ 36
2.5 Statistical analyses............................................................................................... 43
2.6 Results ................................................................................................................. 44
2.7 Discussion ............................................................................................................ 47
2.8 Conclusions ......................................................................................................... 51
Chapter 3. Animal Neurotoxicology .............................................................................. 76
3.1 Introduction .......................................................................................................... 76
3.2 Developmental neurobehavioral toxicology studies ............................................. 76
3.3 Adolescent/adult neurobehavioral toxicity studies ................................................ 97
3.4 Summary of mixture studies ............................................................................... 108
Chapter 4. Toxicocokinetics and Mechanistic Data .................................................... 136
4.1 Summary by dye: toxicokinetics and mechanisms ............................................. 136
4.2 Mechanistic studies with mixtures relevant to neurotoxicity ............................... 148

Potential Neurobehavioral Effects of Synthetic CalEPA OEHHA Food Dyes in Children April 2021
8
4.3 High-throughput screening assays ..................................................................... 150
Chapter 5. Hazard Identification ................................................................................. 164
5.1 Introduction ........................................................................................................ 164
5.2 Human studies ................................................................................................... 164
5.3 Animal neurotoxicity studies ............................................................................... 168
5.4 In vitro high-throughput assays .......................................................................... 174
5.5 Conclusion ......................................................................................................... 176
Chapter 6 Exposure Assessment ................................................................................ 178
6.1 Introduction ........................................................................................................ 178
6.2 Materials and methods ....................................................................................... 189
6.3 FD&C dye intake estimate (mg/person/day) ...................................................... 192
6.4 FD&C dye exposure estimate (mg/kg/day) ........................................................ 193
6.5 Top food contributors to children’s food dye exposure estimates....................... 216
6.6 Child total food dye consumption estimates from foods ..................................... 223
6.7 Socioeconomic differences in total food dye consumption in the US ................. 223
6.8 Exposures to FD&C food dyes from over-the-counter medications, prenatal
vitamins .............................................................................................................. 226
6.9 Children’s estimated exposures to FD&C food dyes from sampled foods and
beverages .......................................................................................................... 232
Chapter 7. Risk Characterization................................................................................ 246
7.1 Introduction ........................................................................................................ 246
7.2 US FDA and JECFA Acceptable Daily Intakes .................................................. 246
7.3 Comparison of US FDA ADI NOAELs to NOAELs in studies relevant to
neurobehavior .................................................................................................... 251
7.4 Comparison of estimated exposures to Acceptable Daily Intakes ...................... 258
7.5 Comparison of US FDA ADIs to NOAELs from studies useful for setting safe
levels protective of neurobehavioral effects in children ...................................... 270
7.6 Summary ............................................................................................................ 277
Chapter 8. Overall Summary and Conclusions .......................................................... 279
8.1 Summary of human studies ............................................................................... 279
8.2 Summary of animal toxicology ........................................................................... 280
Potential Neurobehavioral Effects of Synthetic CalEPA OEHHA Food Dyes in Children April 2021
9
8.3 Summary of hazard identification ....................................................................... 282
8.4 Summary of exposure assessment .................................................................... 283
8.5 Summary of risk characterization ....................................................................... 284
8.6 Research needs and future directions ................................................................ 285
8.7 Overall Conclusion ............................................................................................. 287
References ................................................................................................................. 288

Potential Neurobehavioral Effects of Synthetic CalEPA OEHHA Food Dyes in Children April 2021
10
TABLES
Table 1.1 US FDA batch-certified food colors addressed in this document .................. 26
Table 2.1 Clinical trials of synthetic food dyes and neurologic outcomes in children:
study details.................................................................................................. 52
Table 2.2 Excluded studies and reason for exclusion ................................................... 62
Table 2.3 Clinical trials of synthetic food dyes and neurobehavioral outcomes in
children: coding ............................................................................................ 64
Table 2.3b. Coding dictionary ........................................................................................ 67
Table 2.4 Clinical trials of synthetic food dyes and neurobehavioral outcomes in
children: summary of study characteristics ................................................... 70
Table 2.5 Clinical trials of synthetic food dyes and neurobehavioral outcomes in
children: summary of study results ............................................................... 73
Table 3.1a NOAELs and LOAELs from developmental studies with individual dyes .... 77
Table 3.1b NOAELs and LOAELs from adult studies with individual dyes ................... 78
Table 3.2 Comparison of dye doses in animal studies using the Nutrition
Foundation mixture ....................................................................................... 84
Table 3.3 Results of offspring activity testing by the Tokyo Metropolitan Institute of
Public Health. ............................................................................................... 87
Table 3.4 Results of the adult activity testing by the Tokyo Metropolitan Institute of
Public Health. ............................................................................................. 100
Table 3.5 Comparison of Nutrition Foundation mixture composition to current
estimates of dye exposure in children. ....................................................... 109
Table 3.6 Comparison of designs of animal studies using the Nutrition Foundation
dye mixture. ................................................................................................ 110
Table 3.7 Mixture doses used in Doguc prenatal exposure studies. .......................... 112
Table 3.8 Comparison of three studies with in utero exposure to dye mixture. .......... 112
Table 3.9 Individual dyes. Developmental and adolescent/adult studies................... 114
Table 3.10 Dye mixture. Developmental and adolescent/adult studies. .................... 129
Table 4.1 Summary of food dye activities in in vitro assays. ....................................... 156
Table 6.1 US FDA batch-certified food colors addressed in this document. ................ 178
Potential Neurobehavioral Effects of Synthetic CalEPA OEHHA Food Dyes in Children April 2021
11
Table 6.2 Review of FD&C synthetic food dye exposure assessment studies
performed in the US and Canada. .............................................................. 180
Table 6.3 Estimated food dye intake in mg/kg bw/day (Doell et al. 2016). ................. 184
Table 6.4 Estimated food dye exposures in µg/kg bw/day (Bastaki et al. 2017). ....... 187
Table 6.5 Food dye ADI’s established by US FDA and JECFA. ................................. 189
Table 6.6 Estimated FD&C Blue No. 1 intake (mg/kg/day) for pregnant women,
women of childbearing years (18-49 years), and children (<=18 years) ..... 209
Table 6.7 Estimated FD&C Blue No. 2 intake (mg/kg/day) for pregnant women,
women of childbearing years (18-49 years), and children (<=18 years). .... 210
Table 6.8 Estimated FD&C Green No. 3 intake (mg/kg/day) for pregnant women,
women of childbearing years (18-49 years), and children (<=18 years). .... 211
Table 6.9 Estimated FD&C Red No. 3 intake (mg/kg/day) for pregnant women,
women of childbearing years (18-49 years), and children (<=18 years). .... 212
Table 6.10 Estimated FD&C Red No. 40 intake (mg/kg/day) for pregnant women,
women of childbearing years (18-49 years), and children (<=18 years). .... 213
Table 6.11 Estimated FD&C Yellow No. 5 intake (mg/kg/day) for pregnant women,
women of childbearing years (18-49 years), and children (<=18 years). .... 214
Table 6.12 Estimated FD&C Yellow No. 6 intake (mg/kg/day) for pregnant women,
women of childbearing years (18-49 years), and children (<=18 years). .... 215
Table 6.13 Estimated total dye intake (mg/kg/day) among children 5 to 16 years
old (Typical-exposure scenario)a ................................................................ 223
Table 6.14 Total dye consumption by and association with poverty level in children
(0-18 yrs) and women of childbearing age ................................................. 224
Table 6.15 Dye consumption (mg/kg/day) by race and ethnicity, children (0-18)
and women of childbearing age (18-49 years)............................................ 225
Table 6.16 Dye consumption (mg/kg/day) by level of education, women of
childbearing age (18-49 years) ................................................................... 225
Table 6.17 Estimated FD&C Red No. 40 and Blue No. 1 exposures to children
from pain relievers/fever reducer syrups (2 to <11 years old) ..................... 227
Table 6.18 Estimated Red No. 40 and Blue No. 1 exposures to children from cold,
cough & allergy syrups ............................................................................... 228

Potential Neurobehavioral Effects of Synthetic CalEPA OEHHA Food Dyes in Children April 2021
12
Table 6.19 Estimated children’s, Red No. 40, Blue No. 1, Yellow No. 5 and Yellow
No. 6 exposures from children's gummie vitamins ..................................... 229
Table 6.20 Estimated pregnant women FD&C Blue No. 2, Red No. 40 and Yellow
No. 6 exposures from prenatal vitamin tablets (one per day) ..................... 230
Table 6.21 Estimated pregnant women FD&C Blue No. 1 and Red No. 40
exposures from prenatal vitamin softgel (one per day) ............................... 231
Table 6.22 Estimated FD&C Blue No. 1, Red No. 3, Red No. 40, Yellow No. 5,
and Yellow No. 6 exposure to children from single daily serving of
breakfast cereals ........................................................................................ 235
Table 6.23 Estimated FD&C Blue No. 1, Red No. 3, Red No. 40, Yellow No. 5,
and Yellow No. 6 exposure to children from single daily serving of fruit
flavored snacks ........................................................................................... 236
Table 6.24 Estimated FD&C Blue No. 1, Red No. 3, Red No. 40, Yellow No. 5,
and Yellow No. 6 exposure to children from single daily serving of
frozen desserts ........................................................................................... 237
Table 6.25 Estimated FD&C Blue No. 1, Red No. 3, Red No. 40, Yellow No. 5,
and Yellow No. 6 exposure to children from single daily servings of ice
cream cones ............................................................................................... 238
Table 6.26 Estimated FD&C Blue No. 1, Red No. 3, Red No. 40, Yellow No. 5,
and Yellow No. 6 exposure to children from single daily servings of
frostings and icings ..................................................................................... 239
Table 6.27 Estimated FD&C Blue No. 1, Red No. 3, Red No. 40, Yellow No. 5,
and Yellow No. 6 intakes to children from single daily servings of
decoration/chips for baking ......................................................................... 240
Table 6.28 Estimated FD&C Blue No. 1, Red No. 40 and Yellow No. 5 exposures
to children from one daily serving of juice drinks ........................................ 241
Table 6.29 Estimated FD&C Blue No. 1, Red No. 40, Yellow No. 5, and Yellow
No. 6 exposures to children from one daily serving of fruit flavored soft
drinks .......................................................................................................... 242
Table 6.30 Estimated Blue No. 1, Red No. 40, and Yellow No. 5 exposures to
children from one daily serving of water enhancers .................................... 243
Potential Neurobehavioral Effects of Synthetic CalEPA OEHHA Food Dyes in Children April 2021
13
Table 6.31 Estimated Blue No. 1, Red No. 40, Yellow No. 5, and Yellow No. 6
exposures to children from one daily serving of flavored fruit powder
drinks .......................................................................................................... 244
Table 7.1 ADIs in mg/kg/day from US FDA, and JECFA ............................................ 250
Table 7.2a Comparison of US FDA ADI and effective oral doses from
developmental studies with individual dyes ................................................ 253
Table 7.2b Comparison of US FDA ADI and effective oral dose from adult studies
with individual dyes ..................................................................................... 254
Table 7.3 Ratios of the FD&C Blue No. 1 intake compared with US FDA and
JECFA ADIs for pregnant women, women of childbearing years (18-49
years), and children (<=18 years) ............................................................... 261
Table 7.4 Ratios of the FD&C Blue No. 2 intake compared with US FDA and
JECFA ADIs for pregnant women, women of childbearing years (18-49
years), and children (<=18 years) ............................................................... 262
Table 7.5 Ratios of the FD&C Green No. 3 intake compared with US FDA and
JECFA ADIs for pregnant women, women of childbearing years (18-49
years), and children (<=18 years) ............................................................... 263
Table 7.6 Ratios of the FD&C Red No. 3 intake compared with US FDA and
JECFA ADIs for pregnant women, women of childbearing years (18-49
years), and children (<=18 years) ............................................................... 264
Table 7.7 Ratios of the FD&C Red No. 40 intake compared with US FDA and
JECFA ADIs for pregnant women, women of childbearing years (18-49
years), and children (<=18 years) ............................................................... 265
Table 7.8 Ratios of the FD&C Yellow No. 5 intake compared with US FDA and
JECFA ADIs for pregnant women, women of childbearing years (18-49
years), and children (<=18 years) ............................................................... 266
Table 7.9 Ratios of the FD&C Yellow No. 6 intake compared with US FDA and
JECFA ADIs for pregnant women, women of childbearing years (18-49
years), and children (<=18 years) ............................................................... 267
Table 7.10 Doses of Yellow No. 5 that elicited effects in children’s clinical trials ....... 276

Potential Neurobehavioral Effects of Synthetic CalEPA OEHHA Food Dyes in Children April 2021 FIGURES
Figure 1.1 Structures of the seven synthetic food dyes reviewed ................................. 27
Figure 2.1 Summary of associations by key variable found in clinical studies ............... 45
Figure 3.1 Number of developmental neurobehavioral toxicity studies by dye and
year .............................................................................................................. 79
Figure 3.2 Experimental designs of developmental neurotoxicity studies with food
dyes ............................................................................................................. 80
Figure 3.3 Changes in activity after a single gavage dose of Red No. 3 in rats not
previously exposed to Red No. 3. .............................................................. 104
Figure 3.4 Changes in activity after a single gavage dose of Red No. 3 in rats that
were previously exposed to Red No 3 for either 15 or 30 days. ................. 106
Figure 4.1 Food dye activity in ToxCast assay subset. ............................................... 153
Figure 4.2a ToxPi Slice Breakdown ............................................................................ 158
Figure 4.2b ToxPi ranking of food dyes. ...................................................................... 159
Figure 6.1a Single-day Blue No. 1 exposure estimates by demographic category
(Typical-exposure scenario) (left)............................................................... 194
Figure 6.1b Single-day Blue No. 1 exposure estimates by demographic category
(High-exposure scenario) (right) ................................................................ 194
Figure 6.1c Single-day Blue No. 1 exposure estimates by demographic category
(Typical-exposure scenario) (left)............................................................... 195
Figure 6.1d Two-Day Blue No. 1 exposure estimates by demographic category
(Typical-exposure scenario) (right) ............................................................ 195
Figure 6.2a Single-day Blue No. 2 exposure estimates by demographic category y
(Typical-exposure scenario) (left)............................................................... 196
Figure 6.2b Single-day Blue No. 2 exposure estimates by demographic category
(High-exposure scenario) (right) ................................................................ 196
Figure 6.2c Single-day Blue No. 2 exposure estimates by demographic category
(Typical-exposure scenario) (left)............................................................... 197
Figure 6.2d Two-Day Blue No. 2 exposure estimates by demographic category
(Typical-exposure scenario) (right) ............................................................ 197
Potential Neurobehavioral Effects of Synthetic CalEPA OEHHA Food Dyes in Children April 2021
15
Figure 6.3a Single-day Green No. 3 exposure estimates by demographic category
(Typical-exposure scenario) (left)............................................................... 198
Figure 6.3b Single-day Green No. 3 exposure estimates by demographic category
(High-exposure scenario) (right) ................................................................ 198
Figure 6.3c Single-day Green No. 3 exposure estimates by demographic category
(Typical-exposure scenario) (left)............................................................... 199
Figure 6.3d Two-day Green No. 3 exposure estimates by demographic category
(Typical-exposure scenario) (right) ............................................................ 199
Figure 6.4a Single-day Red No. 3 exposure estimates by demographic category
(Typical-exposure scenario (left) ................................................................ 200
Figure 6.4b Single-day Red No. 3 exposure estimates by demographic category
(High-exposure scenario (right).................................................................. 200
Figure 6.4c Single-day Red No. 3 exposure estimates by demographic category
(Typical-exposure scenario) (left)............................................................... 201
Figure 6.4d Two-day Red No. 3 exposure estimates by demographic category
(Typical-exposure scenario) (right) ............................................................ 201
Figure 6.5a Single-day Red No. 40 exposure estimates demographic category
(Typical-exposure scenario) (left)............................................................... 202
Figure 6.5b Single-day Red No. 40 exposure estimates demographic category
(High-exposure scenario) (right) ................................................................ 202
Figure 6.5c Single-day Red No. 40 exposure estimates by demographic category
(Typical-exposure scenario) (left)............................................................... 203
Figure 6.5d Two-Day Red No. 40 exposure estimates by demographic category
(Typical-exposure scenario) (right) ............................................................ 203
Figure 6.6a Single-day Yellow No. 5 exposure estimates by demographic
category (High-exposure scenario) (left) .................................................... 204
Figure 6.6b Single-day Yellow No. 5 exposure estimates by demographic
category (Typical-exposure scenario) (right) .............................................. 204
Figure 6.6c Single-day Yellow No. 5 exposure estimates by demographic
category (Typical-exposure scenario) (left) ................................................ 205

Potential Neurobehavioral Effects of Synthetic CalEPA OEHHA Food Dyes in Children April 2021
16
Figure 6.6d Two-day Yellow No. 5 exposure estimates by demographic category
(Typical-exposure scenario) (right) ............................................................ 205
Figure 6.7a Single-day Yellow No. 6 exposure estimates by demographic
category (Typical-exposure scenario) (left) ................................................ 206
Figure 6.7b Single-day Yellow No. 6 exposure estimates by demographic
category (High-exposure scenario) (right) .................................................. 206
Figure 6.7c Single-day Yellow No. 6 exposure estimates by demographic
category (Typical-exposure scenario) (left) ................................................ 207
Figure 6.7d Two-day Yellow No. 6 exposure estimates by demographic category
(Typical-exposure scenario) (right) ............................................................ 207
Figure 6.8 Top foods contributing to FD&C Blue No. 1 exposure estimates in
children ages 0-<16 years (Typical-exposure scenario) ............................ 216
Figure 6.9 Top foods contributing to FD&C Blue No. 2 exposure estimates in
children ages 0-<16 years (Typical-exposure scenario) ............................ 217
Figure 6.10 Top foods contributing to FD&C Green No. 3 exposure estimates in
children ages 0-<16 years (Typical-exposure scenario) ............................ 218
Figure 6.11 Top foods contributing to FD&C Red No. 3 exposure estimates in
children ages 0-<16 years (Typical-exposure scenario) ............................ 219
Figure 6.12 Top foods contributing to FD&C Red No. 40 exposure estimates in
children ages 0-<16 years (Typical-exposure scenario) ............................ 220
Figure 6.13 Top foods contributing to FD&C Yellow No. 5 exposure estimates in
children ages 0-<16 years (Typical-exposure scenario) ............................ 221
Figure 6.14 Top foods contributing to FD&C Yellow No. 6 exposure estimates in
children 0-<16 years (Typical-exposure scenario) ..................................... 222
Figure 7.1 US FDA review process ............................................................................ 247

Potential Neurobehavioral Effects of Synthetic CalEPA OEHHA Food Dyes in Children April 2021
17
List of Abbreviations AC50 – concentration at 50% activity in ToxCast database AChE – acetyl cholinesterase ADHD – Attention Deficit Hyperactivity Disorder ADI – Acceptable Daily Intake ADME – Absorption, Distribution, Metabolism, and Excretion of toxicants ANOVA – Analysis of Variance AOP – Adverse Outcome Pathway ATG – Attagene platform for HTS assays BBB - blood-brain barrier BrdU – bromodeoxyuridine BSK – Bioseek platform for HTS assays CDC – Centers for Disease Control CHDC - Chemical Hazard Data Commons CHE - cholinesterase CI – confidence interval CNS – central nervous system CTD - Comparative Toxicogenomics Database CYP – cytochrome P450 family of xenobiotic metabolizing enzymes d -- day DNT – developmental neurotoxicity EC50 – concentration at 50% effectiveness EFSA - European Food Safety Authority FDA – US Food and Drug Administration FDA ADI NOAEL – the NOAEL used by FDA to derive the current ADI FD&C – Food Drugs and Cosmetic Act F0, F1, F2 – F0 is the parental generation in a multigeneration study and F1, F2, and so on, are the subsequent generations GABA – gamma amino butyric acid GC - glucocorticoid GD – gestational day GI - gastrointestinal h – hour 5_HIAA – 5-hydroxyindole acetic acid metabolite of 5-HT
Potential Neurobehavioral Effects of Synthetic CalEPA OEHHA Food Dyes in Children April 2021
18
5-HT – 5-hydroxytryptamine HTS - high-throughput screening assays JECFA - Joint FAO/WHO Expert Committee on Food Additives LOAEL – Lowest-Observed-Adverse-Effect Level LOD – limit of detection MAO – monoamine oxidase MDA - malondialdehyde mg/day – mg of chemical consumed per day mg/kg/day – milligrams (of chemical) consumed per kilogram body weight per day MTT assays – cell viability assays using reduction of MTT or 3-(4,5-dimethylthiazol -2-yl)-2,5-diphenyltetrazolium bromide nAChR – acetylcholine receptor NMDR – n-methyl –D-aspartate (NMDA) form of the glutamate receptor NHANES – National Health and Nutrition Examination Survey NR2 – subunits of the NMDA receptor NIH - National Institutes of Health NOAEL – No-Observed-Adverse-Effect Level NT - neurotoxicity NVS – Novascreen platform for HTS assays 6-OHDA – 6-hydroxydopamine OP – organophosphate pesticides OTC – over the counter PND – post-natal day ROS – reactive oxygen species SOD – superoxide dismutase TBARS - thiobarbituric acid reactive substances TH – thyroid hormone ToxCast - US EPA’s Toxicity Forecaster database ToxPi - Toxicological Prioritization Index TPO - thyroid peroxidase US EPA – US Environmental Protection Agency US FDA – US Food and Drug Administration wk - week

Potential Neurobehavioral Effects of Synthetic CalEPA OEHHA Food Dyes in Children April 2021
19
Executive Summary CalEPA’s Office of Environmental Health Hazard Assessment (OEHHA) evaluated the scientific literature and conducted a risk assessment of the impact of synthetic food dyes on children, particularly on whether the dyes are associated with hyperactivity and other behavioral changes in children. This report presents the approach to and the results of that work.
Concerns about possible associations between synthetic food dyes and the exacerbation of symptoms of Attention Deficit/Hyperactivity Disorder (ADHD) in children prompted this review. The percentage of US children and adolescents diagnosed with ADHD has increased from an estimated 6.1% to 10.2% in the past 20 years (Xu et al. 2018). While inherited factors may put individual children at risk for ADHD, at least some of the risk in susceptible children is likely the result of these inherited factors interacting with exposures to substances in the environment, including foods (Swanson et al. 2007).
ADHD is characterized by symptoms of inattention, impulsivity and hyperactivity, and is considered to encompass a spectrum of neurobehavioral symptoms and severity. Widespread exposures that decrease attention and/or increase impulsivity and hyperactivity may increase the numbers of those who meet the criteria for the clinical diagnosis of ADHD, resulting in large costs for society. Symptoms of inattention and disorganization tend to predict problems with academic achievement and peer neglect while hyperactivity and impulsivity are predictive of aggression, peer rejection, and other difficulties.
OEHHA did not limit the review to the question of effects on children diagnosed with ADHD. Rather, OEHHA evaluated the literature to determine whether there might be any effects on behavior of the Food Drug and Cosmetics Act (FD&C) batch-certified synthetic food dyes in children in the general population with or without a diagnosis of ADHD. These neurobehavioral outcomes, many of which are components of the diagnosis of ADHD, were chosen since they are hazards in their own right.
Components of the assessment OEHHA conducted a multifaceted evaluation of the FD&C “batch-certified”4 synthetic food dyes, focusing on seven of the nine food dyes5 that have been approved by the US 4 FD&C batch-certified refers to the Food Drug and Cosmetic Act requirements for chemical analysis of each manufactured batch of food dye to ensure that specific contaminants are present below the legal limit. 5 FD&C Blue No. 1; FD&C Blue No. 2; FD&C Green No. 3; FD&C Red No. 3; FD&C Red No. 40; FD&C Yellow No. 5; and FD&C Yellow No. 6. The batch-certified dye Orange B is not included in this assessment because it is no longer manufactured in the US due to its contamination by the carcinogen 2-naphthylamine. Citrus Red No. 2 was not included because it is approved for use only for coloring the skins of oranges (from Florida).

Potential Neurobehavioral Effects of Synthetic CalEPA OEHHA Food Dyes in Children April 2021
20
Food and Drug Administration (US FDA) for general use in food in the US. These seven dyes contribute the greatest exposure to synthetic food dyes for the general US public. Specifically, OEHHA:
• Evaluated the literature on human studies relevant to whether consumption of synthetic food dyes affects behavior in children.
• Evaluated the literature relevant to neurobehavioral effects in laboratory animals following synthetic food dye exposure.
• Examined information relevant to how synthetic food dyes might exert neurobehavioral effects, including data obtained through high-throughput screening assays (laboratory tests that evaluate the effects of chemicals on cells or biological molecules) conducted by the US Environmental Protection Agency and its federal agency partners.
• Along with collaborators at the University of California’s Berkeley and Davis campuses, estimated exposures to each FD&C batch-certified synthetic food dye in general use in the US for children of varying age groups as well as for pregnant women and women of childbearing age.
• Conducted a risk characterization which presents a number of comparisons to gauge whether exposure to food dyes may present a risk of neurobehavioral impacts.
Acceptable Daily Intakes (ADIs) for synthetic food dyes were established by the US FDA between the 1960s and the1980s. OEHHA therefore also evaluated whether some newer studies would be useful for developing updated acceptable exposure levels that explicitly account for neurobehavioral effects of individual food dyes. OEHHA compared the results of those specific studies to the existing US FDA ADIs, as well as ADIs developed by the Joint FAO/WHO6 Expert Committee on Food Additives (JECFA).
Findings The body of evidence from human studies indicates that synthetic food dyes are associated with adverse neurobehavioral outcomes in children, and that children vary in their sensitivity to synthetic food dyes. The types of studies conducted in children that we focused on for this review are called “challenge studies” and are classified as clinical trials. The protocols generally involved placing the children on a dye-free diet for several weeks, followed by providing the children with a mixture of dyes (or in some studies only the dye tartrazine, i.e., FD&C Yellow No. 5) added to food or drink, and recording measures of behavior by a number of standardized methods. Behavioral measures were compared between days when the children were given synthetic food dyes against days they were not given the dyes. From these studies, it is clear that
66 Within the United Nations, the FAO is the Food and Agriculture Organization and the WHO is the World Health Organization

Potential Neurobehavioral Effects of Synthetic CalEPA OEHHA Food Dyes in Children April 2021
21
some children are likely to be more adversely affected by synthetic food dyes than others.
Clear associations were not seen in every study. However, after extensive analyses OEHHA was unable to identify any clear set of biases or other factors that invalidated the positive associations reported in the current epidemiological literature. Meta-analyses (combining results of multiple studies) indicate effects on children’s behavior from exposure to synthetic food dyes. Overall, our review of human studies suggests that synthetic food dyes are associated with adverse neurobehavioral effects, such as inattentiveness, hyperactivity and restlessness in sensitive children. The evidence supports a relationship between food dye exposure and adverse behavioral outcomes in children, both with and without pre-existing behavioral disorders.
Animal studies indicate effects of exposure to synthetic food dyes on activity, memory and learning, changes in neurotransmitter systems in the brain, and microscopic changes in brain structure. Developmental toxicology studies demonstrated effects on the activity of offspring when either Red No. 3, Red No. 40, Yellow No. 5, or Blue No. 1 was administered in utero, through lactation and into adulthood. While not all studies found effects, the reported effects cannot easily be dismissed. Studies of dye mixtures conducted on juvenile rats during several weeks of exposure demonstrated effects on their activity, which varied by study. Several more recent studies demonstrate long-term effects of in utero exposure on behavior, including effects involving activity in the animals as adults, at doses of the individual dyes found to have no effects in US FDA regulatory reviews. Some of these newer studies also evaluated changes in brain biomolecules related to behavioral performance, and long-term changes could be demonstrated after in utero dye exposure. Finally, studies of exposure to Red No. 3, Red No. 40, Yellow No. 5, and Yellow No. 6 in adult animals reported one or more of the following effects: altered brain chemistry, changes in activity, altered learning and memory, and microscopic alterations in brain structure. Notably, most studies of adult animal neurotoxicity conducted from 2001 to 2018 reported effects at levels much lower than those reported to cause general toxicological effects in studies used as the basis of the FDA ADIs.
Studies that examine how food dyes might exert effects on the body (including studies of the action of food dyes on cells and cellular components) provide evidence for a number of ways that adverse events might occur, including interaction of food dyes with neurotransmitter systems and other effects that could result in changes in the brain.
Thus, evidence from epidemiology, animal neurotoxicology, and mechanistic toxicology, taken together, provide support that FD&C batch-certified synthetic food dyes can impact neurobehavior in some children.
Overall, children’s estimated exposure to FD&C batch-certified synthetic food dyes (adjusted for body weight) from foods tended to be higher compared to those of adult women. Among the food dyes, the highest exposures from consuming foods were to

Potential Neurobehavioral Effects of Synthetic CalEPA OEHHA Food Dyes in Children April 2021
22
Red No. 40, followed by Yellow No. 5 and Yellow No. 6. The geometric mean (an estimate of the median) total dye exposure for children 5 to 18 years of age was 0.22 milligrams per kilogram of body weight per day (mg/kg/day). The most common food items associated with food dye exposure, which varies by dye, included juice drinks, fruit-flavored drinks (powders which get reconstituted), soft drinks, ice cream cones, breakfast cereals, and icings. In some age groupings, estimates of exposures to Red No. 3 from foods exceeded the US FDA and JECFA ADIs.
OEHHA also evaluated potential exposures to FD&C synthetic food dyes from several brands of over the counter (OTC) medications using laboratory measurements by UC Davis and dosing instructions from the label for children. None of the estimated exposures from the sampled OTC medications exceeded the US FDA or JECFA ADI. The highest estimated exposures for children 4 to 16 years old were for FD&C Red No. 40 from a brand of grape-flavored cough, cold and allergy syrup. The estimated FD&C Red No. 40 exposures from this brand ranged from 0.028 to 0.037 mg/kg/day for 1 dose/day to 0.17 to 0.22 mg/kg/day for the maximum recommended dose of 6 doses/day. Overall, children’s average food dye exposure estimates from gummy vitamins were relatively low as were exposures to pregnant women from prenatal vitamins.
The studies that form the basis of the US FDA and JECFA ADIs, with the exception of the JECFA ADI for Red No. 3, are 35 to almost 70 years old, and as such were not capable of detecting the types of neurobehavioral outcomes assessed in later studies, or for which there is concern in children consuming synthetic food dyes. The ADIs for dyes where recent data exist (Red No. 3, Red No. 40, Yellow No. 5, Yellow No. 6) would be much lower if they were based on the results of more recent animal and human studies that focus on neurobehavioral effects. Common exposures to some synthetic food dyes from foods would exceed ADIs if they were based on more recent studies focused on neurobehavioral effects.
Research needs and next steps Our thorough review of the literature on neurobehavioral effects of the FD&C batch-certified synthetic food dyes has established a good basis for determining the research needed to confidently establish safe exposure levels to protect children from neurobehavioral effects. This includes research to understand which children would be most susceptible, and to understand the mechanistic underpinnings of neurobehavioral responses to synthetic food dyes. Specific research is needed on
• genetic susceptibility, given the very limited information available • biomarkers of effect and exposure, • potential long term effects of repeated brief exposures on brain development and
function • differential exposure and effects by age, sex, race, ethnicity, or socioeconomic
status, and

Potential Neurobehavioral Effects of Synthetic CalEPA OEHHA Food Dyes in Children April 2021
23
• pharmacokinetics (absorption, distribution, metabolism, and excretion) of ingested food dyes (straights and lakes) in children and adult populations.
To adequately address these topics with well-conducted studies, which are generally resource-intensive, studies would best be funded or conducted by federal governmental institutions, for example, the National Institutes of Health.
On-going monitoring of synthetic dye content in food would enable an understanding of exposure trends.
This assessment was not performed as part of any OEHHA mandated program, and no formal action by OEHHA is planned after the release of the final report.
Conclusion The scientific literature indicates that synthetic food dyes can impact neurobehavior in some children. Data from multiple evidence streams, including epidemiology, animal neurotoxicology, and mechanistic studies, support this finding. Comparison of the recent animal studies and single-dye human studies on neurotoxicological outcomes with the older studies that serve as the basis for FDA ADIs indicates that current ADIs may not provide adequate protection from neurobehavioral impacts in children. For some of the dyes, these comparisons indicate that updated safe levels of exposure would be much lower.

Potential Neurobehavioral Effects of Synthetic CalEPA OEHHA Food Dyes in Children April 2021
24
Chapter 1. Introduction 1.1 Purpose In the State 2018-2019 budget, OEHHA received funding to review the scientific literature and conduct a risk assessment, as data allow, on the potential impacts of synthetic food dyes on children. These dyes are added to many foods, beverages, over-the-counter medications, and vitamins in the US, especially those intended for children.
We focused our review on the most commonly consumed synthetic food dyes, those that are batch-certified7 by the US Food and Drug Administration (US FDA).
US FDA has regulatory oversight of color additives used in foods, drugs, cosmetics, and medical devices. Certified color additives (referred to throughout this document as FD&C synthetic food dyes) are synthetic colorings that are used widely for intense, uniform color and because they blend easily to create a variety of hues. These FD&C synthetic food dyes are required to undergo certification every time a new batch is manufactured to avoid introducing specified contaminants into foods and drugs (FDA 2018). Currently, there are nine Food, Drug, and Cosmetic Act (FD&C) batch-certified color additives approved for general use in food in the United States: FD&C Blue No. 1; FD&C Blue No. 2; FD&C Green No. 3; FD&C Red No. 3; FD&C Red No. 40; FD&C Yellow No. 5; FD&C Yellow No. 6, Citrus Red No. 2, and Orange B. Citrus Red 2 is authorized only to color the peels of some Florida oranges not intended for processing (e.g., not used for marmalade) and is not included in this assessment since exposure to children would be minimal. Orange B is authorized for use in hot dog and sausage casings but has not been in use in the United States for many years and is not included in this assessment. The FD&C batch-certified synthetic food dyes that we reviewed are listed in Table 1.1 along with their common synonyms.
This assessment arose from the recurring concern that some studies in children have observed an effect of synthetic food dyes on behavior. In 1975, Benjamin Feingold, a pediatric allergist from California, hypothesized that food additives, including synthetic food coloring, may contribute to attentional problems in children. A number of studies were conducted in the late 1970s and early 1980s to try to assess this claim, including small clinical trials in children and some studies in animals. At the time, these early studies were largely unpersuasive. The publication of two larger modern randomized,
7 Batch-certification refers to chemical analysis of each manufactured batch of food dye to ensure that specific contaminants are present below the legal limit. The analyses are conducted by the Food and Drug Administration and the dyes cannot be sold until they are certified.

Potential Neurobehavioral Effects of Synthetic CalEPA OEHHA Food Dyes in Children April 2021
25
double-blinded, placebo-controlled clinical trials in the general population of children in the 2000s brought renewed attention to the issue and resulted in a 2011 US FDA review (FDA 2011). US FDA asked its Food Advisory Committee (FAC) to consider available relevant data on the possible association between consumption of synthetic color additives in food and hyperactivity in children, and to advise the US FDA as to what action, if any, is warranted to ensure consumer safety8.
Prior to the review of the FAC, US FDA had concluded: “For certain susceptible children with attention deficit/hyperactivity disorder and other problem behaviors, however, the data suggest that their condition may be exacerbated by exposure to a number of substances in food, including, but not limited to, synthetic color additives. Findings from relevant clinical trials indicate that the effects on their behavior appear to be due to a unique intolerance to these substances and not to any inherent neurotoxic properties.”
The overall charge of the FAC review focused on hyperactivity as measured in studies of children and did not emphasize other behavioral effects of the food dyes. As well, it appears the FAC was not presented with a detailed review of the animal toxicology literature or any of the mechanistic data from in vitro testing for their deliberations. The committee agreed with the earlier US FDA conclusion that a causal relationship between consumption of FD&C synthetic food dyes in food and hyperactivity or other adverse effects on behavior in children in the general population had not been established9.
The US FDA’s web page10 “Color Additives Questions and Answers for Consumers” contains this statement: “The FDA has reviewed and will continue to examine the effects of color additives on children’s behavior. The totality of scientific evidence indicates that most children have no adverse effects when consuming foods containing color additives, but some evidence suggests that certain children may be sensitive to them. The FDA will continue to evaluate emerging science to ensure the safety of color additives approved for use. Parents who wish to limit the amount of color additives in their children’s diet may check the food ingredient list on labels. Parents should also discuss any concerns with their family physician.”
8 FDA 2011a Food and Drug Administration. Food Advisory Committee. Transcript of meeting March 30, 2011; page 27 9 FDA 2011b. Food and Drug Administration Food Advisory Committee. Quick Minutes: Food Advisory Committee Meeting March 30-31, 2011. https://wayback.archive-it.org/org-1137/20170406211702/https://www.fda.gov/AdvisoryCommittees/CommitteesMeetingMaterials/FoodAdvisoryCommittee/ucm250901.htm Transcript of meeting March 31, 2011. 10 US FDA (2020) Color Additives Questions and Answers for Consumers (US FDA (2002) Color Additives Questions and Answers for Consumers, accessed April 23, 2020)
Potential Neurobehavioral Effects of Synthetic CalEPA OEHHA Food Dyes in Children April 2021
26
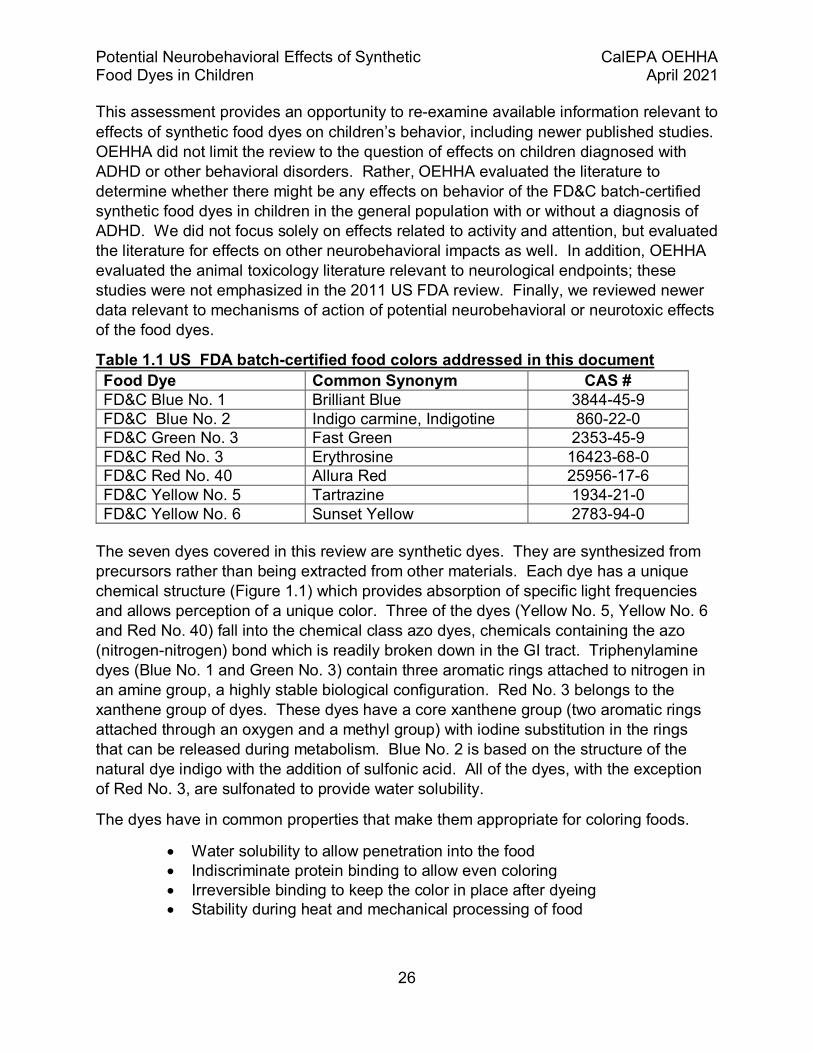
This assessment provides an opportunity to re-examine available information relevant to effects of synthetic food dyes on children’s behavior, including newer published studies. OEHHA did not limit the review to the question of effects on children diagnosed with ADHD or other behavioral disorders. Rather, OEHHA evaluated the literature to determine whether there might be any effects on behavior of the FD&C batch-certified synthetic food dyes in children in the general population with or without a diagnosis of ADHD. We did not focus solely on effects related to activity and attention, but evaluated the literature for effects on other neurobehavioral impacts as well. In addition, OEHHA evaluated the animal toxicology literature relevant to neurological endpoints; these studies were not emphasized in the 2011 US FDA review. Finally, we reviewed newer data relevant to mechanisms of action of potential neurobehavioral or neurotoxic effects of the food dyes.
Table 1.1 US FDA batch-certified food colors addressed in this document Food Dye Common Synonym CAS # FD&C Blue No. 1 Brilliant Blue 3844-45-9 FD&C Blue No. 2 Indigo carmine, Indigotine 860-22-0 FD&C Green No. 3 Fast Green 2353-45-9 FD&C Red No. 3 Erythrosine 16423-68-0 FD&C Red No. 40 Allura Red 25956-17-6 FD&C Yellow No. 5 Tartrazine 1934-21-0 FD&C Yellow No. 6 Sunset Yellow 2783-94-0
The seven dyes covered in this review are synthetic dyes. They are synthesized from precursors rather than being extracted from other materials. Each dye has a unique chemical structure (Figure 1.1) which provides absorption of specific light frequencies and allows perception of a unique color. Three of the dyes (Yellow No. 5, Yellow No. 6 and Red No. 40) fall into the chemical class azo dyes, chemicals containing the azo (nitrogen-nitrogen) bond which is readily broken down in the GI tract. Triphenylamine dyes (Blue No. 1 and Green No. 3) contain three aromatic rings attached to nitrogen in an amine group, a highly stable biological configuration. Red No. 3 belongs to the xanthene group of dyes. These dyes have a core xanthene group (two aromatic rings attached through an oxygen and a methyl group) with iodine substitution in the rings that can be released during metabolism. Blue No. 2 is based on the structure of the natural dye indigo with the addition of sulfonic acid. All of the dyes, with the exception of Red No. 3, are sulfonated to provide water solubility.
The dyes have in common properties that make them appropriate for coloring foods.
• Water solubility to allow penetration into the food • Indiscriminate protein binding to allow even coloring • Irreversible binding to keep the color in place after dyeing • Stability during heat and mechanical processing of food

Potential Neurobehavioral Effects of Synthetic CalEPA OEHHA Food Dyes in Children April 2021
27
However, aside for dyes within a chemical class, there is no chemical basis for assuming that all the dyes have a common biological action or similar toxicological profiles.
Figure 1.1 Structures of the seven synthetic food dyes reviewed
1.2 Overview of approach and organization of the document We evaluated the literature on human studies relevant to whether behavior is affected in children when they consumed food dyes. That review is described in Chapter 2. We also evaluated the animal toxicology literature relevant to neurobehavioral toxicity following synthetic food dye exposure. That review is described in Chapter 3. In Chapter 4, we describe available information on pharmacokinetics and mechanisms, and include our evaluation of the information obtained through high throughput screening assays developed by the US Environmental Protection Agency (US EPA) and partners and publicly available through US EPA’s Computational Toxicology Chemical Dashboard (https://comptox.epa.gov/dashboard). These assays are meant to evaluate whether cells can be perturbed in the presence of chemicals, in this case the FD&C batch-certified food dyes. We synthesize the various data streams and integrate them into a hazard identification, which is described in Chapter 5. OEHHA contracted with scientists at the University of California, Berkeley to conduct an exposure assessment focusing on children and women of child-bearing age. We also contracted with scientists at the University of California, Davis to conduct analytical work to provide additional data for the exposure assessment. The exposure estimate results are presented in Chapter 6.

Potential Neurobehavioral Effects of Synthetic CalEPA OEHHA Food Dyes in Children April 2021
28
Finally, we conducted a risk characterization in Chapter 7, where we present a number of comparisons to gauge whether exposure to food dyes may present a risk of neurobehavioral impacts. We compare No-Observed-Adverse-Effect Levels (NOAELs) from the results of the studies used as the basis of the US Food and Drug Administration Acceptable Daily Intakes (ADIs) and the Joint FAO/WHO Expert Committee on Food Additives (JECFA) ADIs to the NOAELs from studies we reviewed from the literature. We compare estimated exposures described in Chapter 6 to the existing ADIs, which are based on general toxicity and not behavioral effects. We also evaluate whether some newer studies would be useful to develop an ADI that explicitly accounts for neurobehavioral effects of individual food dyes and compare the results of those specific studies to the existing ADIs. Chapter 8 contains an overall summary and the conclusions of this report.
1.3 Literature search strategy on neurological effects of synthetic food dyes OEHHA conducted a thorough literature search to identify relevant studies. General searches of the literature on the neurological effects of FD&C synthetic food dyes were conducted to identify peer-reviewed open-source and proprietary journal articles, print and digital books, reports, and gray literature11 that potentially reported relevant toxicological and epidemiological information on the effects of synthetic food dyes. The literature search was last updated in October 2020. The literature review methods were designed to identify all literature relevant to the assessment of evidence on the neurological or neurobehavioral effects of the following FD&C synthetic food dyes: Erythrosine, Tartrazine, Sunset Yellow, Allura Red, Citrus Red No. 2, Fast Green, Indigo Carmine, Brilliant Blue, and Orange B/CI Acid Orange. Citrus Red No. 2 and Orange B/CI Acid Orange were included in the search since these chemicals are part of an overlapping literature that might contain information on the other FD&C synthetic food dyes.
1.3.1 Search process PubMed MeSH browser (PubMed MeSH brower) and PubChem (PubChem) were used to identify subject headings, other index terms and synonyms for the food dyes of interest and their metabolites, as well as for the concepts related to exposure, food, mechanisms of action, and neurological outcomes. Preliminary searches were run and results reviewed to identify additional terms.
11 Gray literature is defined as that which is produced by all levels of government, academia, business and industry in print and electronic formats, but which is not controlled by commercial publishers.

Potential Neurobehavioral Effects of Synthetic CalEPA OEHHA Food Dyes in Children April 2021
29
The concepts were combined in the following manner:
((food/dietary terms) AND (specific food dye terms)) OR ((specific food dye terms) AND (neurological outcome terms) OR (general exposure terms) OR (mechanisms of action terms)) The detailed search strategy executed in PubMed on November 26, 2018 appears at the end of this section. This search was run twice more to capture literature updates, on March 8, 2019 and April 22, 2019, and again in October 2020.
Additional databases and other data sources listed below were also searched. The search strategies were tailored according to the search features unique to each database and data source. In Embase, for example, Emtree was searched to identify subject headings to replace the MeSH terms used in PubMed.
Supplemental targeted searches were performed in PubMed and other resources as needed to expand retrieval on specific aspects of the subject. For example, a search for thyroid-related outcomes was performed in PubMed and Embase on April 19, 2019.
Relevant literature was also identified from citations in individual articles.
In addition, we searched NIH RePort to see if there were additional trials not published in the literature, but did not find any studies specific for artificial foods dyes.
Results of all searches were uploaded to Zotero. A total of 2,435 unique references were reviewed.
1.3.2 Data sources The following is a list of the major data sources that were searched to find information on synthetic food dyes.
Biomedical literature databases
• PubMed (National Library of Medicine) • Embase
• Scopus
Authoritative organizations and other databases
• European Food Safety Authority Journal
• European Food Safety Authority Scientific Output
• USDA Food Safety Information Office

Potential Neurobehavioral Effects of Synthetic CalEPA OEHHA Food Dyes in Children April 2021
30
• US FDA
• University of California, San Francisco (UCSF) Food Industry Documents Archive)
• Dyes and Pigments Journal

Potential Neurobehavioral Effects of Synthetic CalEPA OEHHA Food Dyes in Children April 2021
31
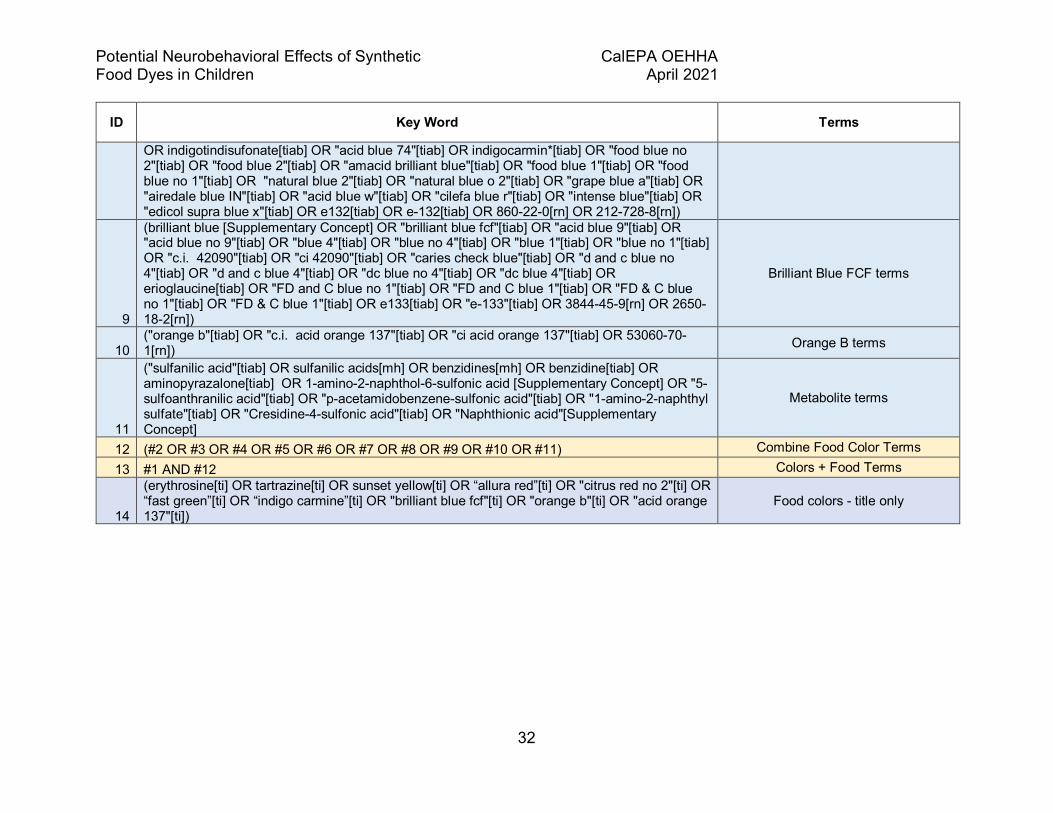
1.3.3. Search strategy The following illustrates the search strategy.
ID Key Word Terms
1 (food coloring agents[mh] OR food[mh] OR food[tiab] OR foods[tiab] OR foodstuff*[tiab] OR beverage*[tiab] OR pharmaceutical*[tiab] OR medication*[tiab] OR dietary exposure[mh])
Diet, Food & Generic food color terms
2
(Erythrosine[tiab] OR “Erythrosin”[tiab] OR “2',4',5',7'-Tetraiodofluorescein”[tiab] OR “2,4,5,7-Tetraiodofluorescein disodium salt”[tiab] OR “F D and C 3”[tiab] OR “Red No. 3”[tiab] OR “FDC Red 3”[tiab] OR “FD&C Red 3”[tiab] OR “1427 Red”[tiab] OR “1671 Red”[tiab] OR “9-(o-Carboxyphenyl)-6-hydroxy-2,4,5,7-tetraiodo-3H-xanthene-3-one disodium salt monohydrate”[tiab] OR “Aizen Food Red 3”[tiab] OR “C.I. 45430”[tiab] OR “C.I. 773”[tiab] OR “Acid Red 51”[tiab] OR “Food Red 14”[tiab] OR “Cerven kysela 51”[tiab] OR “Cerven potravinarska 14”[tiab] OR “Cilefa Pink B”[tiab] OR “E 127”[tiab] OR E127[tiab] OR “Food Color Red 3”[tiab] OR “Food Dye Red 3”[tiab] OR “Food Red 14”[tiab] OR “Food Red 3”[tiab] OR “Hexacert Red No. 3”[tiab] OR “LB-Rot 1”[tiab] OR “New Pink Bluish Geigy”[tiab] OR “Schultz No. 887”[tiab] OR “Tetraiodofluorescein sodium salt”[tiab] OR “Usacert Red No. 3”[tiab] OR 16423-68-0[rn])
Erythrosine terms
3 (Tartrazine[mh] OR tartrazine[tiab] OR "yellow no 5"[tiab] OR "yellow 5"[tiab] OR 12225-21-7[rn] OR 1934-21-0[rn] OR e102[tiab] OR "e-102"[tiab])
Tartrazine terms
4
("sunset yellow" OR "ci 15-985"[tiab] OR "yellow no 6"[tiab] "yellow 6"[tiab] OR gelborange[tiab] OR "yellow 3"[tiab] OR "l-orange 2"[tiab] OR "orange no 2"[tiab] OR "e 110"[tiab] OR e110[tiab] OR 2783-94-0[rn] OR 1325-37-7[rn] OR 220-491-7[rn] OR 215-393-6[rn])
Sunset Yellow terms
5
(Allura Red AC Dye [Supplementary Concept] OR "ci 16035"[tiab] OR "red 40"[tiab] OR "red no 40"[tiab] OR "r-40"[tiab] OR "curry red"[tiab] OR "food red 17"[tiab] OR "fancy red"[tiab] OR e129[tiab] OR "e-129"[tiab] OR "ccris 3493"[tiab] OR "hsdb 7260"[tiab] OR 25956-17-6[rn])
Allura Red terms
6
(citrus red No. 2 [Supplementary Concept] OR "citrus red 2"[tiab] OR "solvent red no 80"[tiab] OR "solvent red 80"[tiab] OR "C.I. 12156"[tiab] OR "CI 12156"[tiab] OR E121[tiab] OR "e-121"[tiab] OR 6358-53-8[rn] OR 228-778-9[rn])
Citrus Red terms
7
(Fast Green FCF [Supplementary Concept] OR "fast green"[tiab] OR "food green 3"[tiab] OR "food green no 3"[tiab] OR "solid green fcf"[tiab] OR "fd & c green no 3"[tiab] OR "fd & c green 3"[tiab] OR "FD and C green no 3"[tiab] OR "FD and C green c"[tiab] OR "ci 42053"[tiab] OR "c.i. 42053"[tiab] OR E143[tiab] OR "e-143"[tiab] OR 2353-45-9[rn] OR 219-091-5[rn])
Fast Green terms
8
(indigo carmine[mh]OR "indigo carmine"[tiab] OR "D and C blue no 6"[tiab] OR "D and C blue 6"[tiab] OR "FD and C blue no 2"[tiab] OR "FD and C blue 2"[tiab] OR "FD & C blue no 2"[tiab] OR "FD & C blue 2"[tiab] OR "indigo blue"[tiab] OR "indigo disulfonate"[tiab] OR indigotin[tiab]
Indigo Carmine terms
Potential Neurobehavioral Effects of Synthetic CalEPA OEHHA Food Dyes in Children April 2021
32
ID Key Word Terms
OR indigotindisufonate[tiab] OR "acid blue 74"[tiab] OR indigocarmin*[tiab] OR "food blue no 2"[tiab] OR "food blue 2"[tiab] OR "amacid brilliant blue"[tiab] OR "food blue 1"[tiab] OR "food blue no 1"[tiab] OR "natural blue 2"[tiab] OR "natural blue o 2"[tiab] OR "grape blue a"[tiab] OR "airedale blue IN"[tiab] OR "acid blue w"[tiab] OR "cilefa blue r"[tiab] OR "intense blue"[tiab] OR "edicol supra blue x"[tiab] OR e132[tiab] OR e-132[tiab] OR 860-22-0[rn] OR 212-728-8[rn])
9
(brilliant blue [Supplementary Concept] OR "brilliant blue fcf"[tiab] OR "acid blue 9"[tiab] OR "acid blue no 9"[tiab] OR "blue 4"[tiab] OR "blue no 4"[tiab] OR "blue 1"[tiab] OR "blue no 1"[tiab] OR "c.i. 42090"[tiab] OR "ci 42090"[tiab] OR "caries check blue"[tiab] OR "d and c blue no 4"[tiab] OR "d and c blue 4"[tiab] OR "dc blue no 4"[tiab] OR "dc blue 4"[tiab] OR erioglaucine[tiab] OR "FD and C blue no 1"[tiab] OR "FD and C blue 1"[tiab] OR "FD & C blue no 1"[tiab] OR "FD & C blue 1"[tiab] OR e133[tiab] OR "e-133"[tiab] OR 3844-45-9[rn] OR 2650-18-2[rn])
Brilliant Blue FCF terms
10 ("orange b"[tiab] OR "c.i. acid orange 137"[tiab] OR "ci acid orange 137"[tiab] OR 53060-70-1[rn]) Orange B terms
11
("sulfanilic acid"[tiab] OR sulfanilic acids[mh] OR benzidines[mh] OR benzidine[tiab] OR aminopyrazalone[tiab] OR 1-amino-2-naphthol-6-sulfonic acid [Supplementary Concept] OR "5-sulfoanthranilic acid"[tiab] OR "p-acetamidobenzene-sulfonic acid"[tiab] OR "1-amino-2-naphthyl sulfate"[tiab] OR "Cresidine-4-sulfonic acid"[tiab] OR "Naphthionic acid"[Supplementary Concept]
Metabolite terms
12 (#2 OR #3 OR #4 OR #5 OR #6 OR #7 OR #8 OR #9 OR #10 OR #11) Combine Food Color Terms 13 #1 AND #12 Colors + Food Terms
14
(erythrosine[ti] OR tartrazine[ti] OR sunset yellow[ti] OR “allura red”[ti] OR "citrus red no 2"[ti] OR “fast green”[ti] OR “indigo carmine”[ti] OR "brilliant blue fcf"[ti] OR "orange b"[ti] OR "acid orange 137"[ti])
Food colors - title only

Potential Neurobehavioral Effects of Synthetic CalEPA OEHHA Food Dyes in Children April 2021
33
ID Key Word Terms
15
(neurobehav*[tiab] OR neurodevel*[tiab] OR neurocognit*[tiab] OR neurotoxic*[tiab] OR neurolog*[tiab] OR neurobiochemi*[tiab] OR neuropsych*[tiab] OR nerve[tiab] OR nervous[tiab] OR neural[tiab] OR brain[tiab] OR forebrain[tiab] OR midbrain[tiab] OR hindbrain[tiab] OR hippocampus[tiab] OR "prefrontal cortex"[tiab] OR “frontal cortex”[tiab] OR “frontal lobe”[tiab] OR “parietal lobe”[tiab] OR “temporal lobe”[tiab] OR “occipital lobe”[tiab] OR cerebellum[tiab] OR cogniti*[tiab] OR behavior*[tiab] OR memory[tiab] OR motor*[tiab] OR attention[tiab] OR adhd[tiab] OR hyperactiv*[tiab] OR activity[tiab] OR inattenti*[tiab] OR neurodevelopmental disorders[mh] OR hyperkine*[tiab] OR hyperkinesis[mh] OR nervous system diseases[mh] OR nervous system/drug effects[mh] OR "behavior and behavior mechanisms"[mh] OR mental disorders[mh] OR autism spectrum disorder[mh] OR autis*[tiab] OR 'conduct disorder'[tiab] OR substance-related disorders[mh] OR substance abuse*[tiab] OR drug abuse*[tiab] OR alcohol abuse*[tiab] OR alcoholi*[tiab] OR intoleran*[tiab] OR aggressi*[tiab] OR violen*[tiab])
Neuro Outcome terms
16
(risk[mh] OR risk assessment[mh] OR risk[tiab] OR risks[tiab] OR expos*[tiab] OR intake[tiab] OR consumption[tiab] OR consumed[tiab] OR consumes[tiab] OR ingest*[tiab] OR dose[tiab] OR doses[tiab] OR maternal exposure[mh] OR paternal exposure[mh] OR prenatal exposure delayed effects[mh] OR dietary exposure[mh] OR perinatal[tiab] OR in utero[tiab] OR pregnancy[tiab])
Exposure terms
17
(pharmacology[mh] OR pharmacology[sh] OR mechanism*[tiab] OR pathway*[tiab] OR 'signal transduction'[mh] OR signal*[tiab] OR epigenomics[mh] OR epigenesis, genetic[mh] OR epigenetic*[tiab] OR immunosupressive agents[mh] OR immun*[tiab] OR immunotoxins[mh] OR reactive oxygen species[mh] OR pharmacokinetics[mh] OR pharmacokinetic*[tiab] OR toxicokinetic*[tiab] OR oxidative stress[mh] OR inflammation[mh] OR immune evasion[mh] OR apoptosis[mh] OR apoptosis[tiab] OR 'programmed cell death'[tiab] OR 'cell proliferation[mh] OR 'receptors, cytoplasmic and nuclear'[mh] OR toxicity[mh] or 'receptor mediated'[tiab])
Mechanism terms
18 #14 AND (#15 OR #16 OR #17) Color in Title + Outcomes 19 #13 OR #18 Final set
Potential Neurobehavioral Effects of Synthetic CalEPA OEHHA Food Dyes in Children April 2021
34
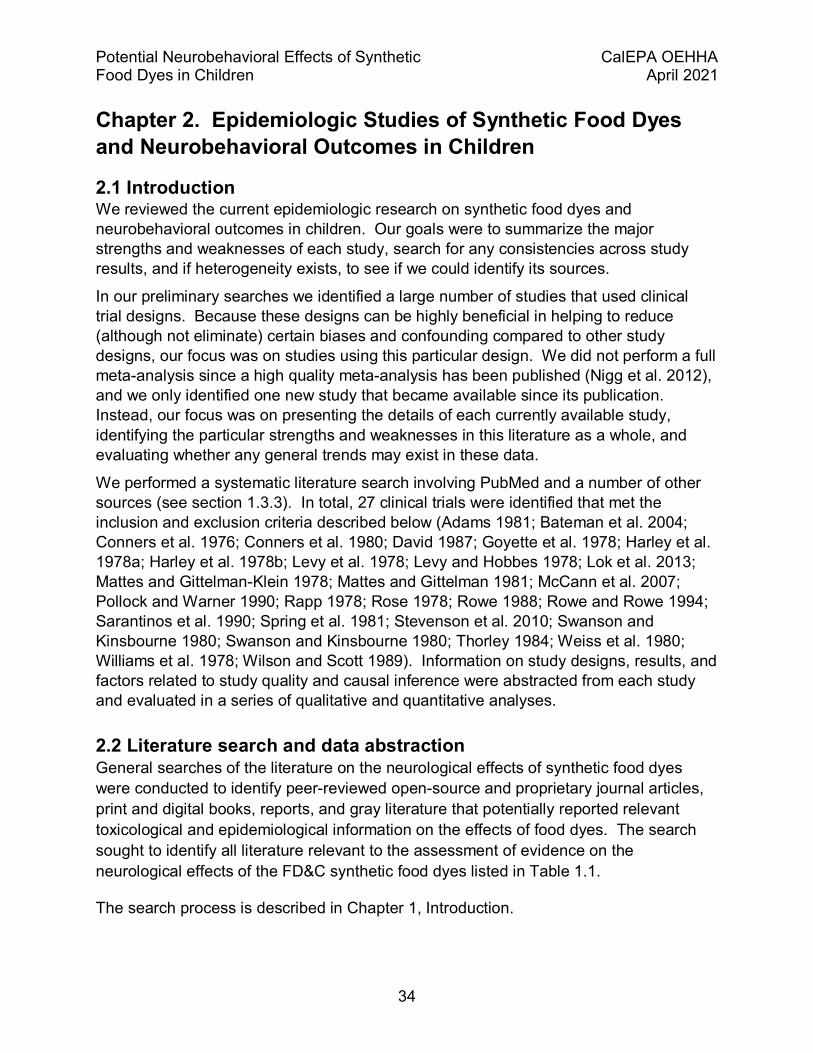
Chapter 2. Epidemiologic Studies of Synthetic Food Dyes and Neurobehavioral Outcomes in Children
2.1 Introduction We reviewed the current epidemiologic research on synthetic food dyes and neurobehavioral outcomes in children. Our goals were to summarize the major strengths and weaknesses of each study, search for any consistencies across study results, and if heterogeneity exists, to see if we could identify its sources.
In our preliminary searches we identified a large number of studies that used clinical trial designs. Because these designs can be highly beneficial in helping to reduce (although not eliminate) certain biases and confounding compared to other study designs, our focus was on studies using this particular design. We did not perform a full meta-analysis since a high quality meta-analysis has been published (Nigg et al. 2012), and we only identified one new study that became available since its publication. Instead, our focus was on presenting the details of each currently available study, identifying the particular strengths and weaknesses in this literature as a whole, and evaluating whether any general trends may exist in these data.
We performed a systematic literature search involving PubMed and a number of other sources (see section 1.3.3). In total, 27 clinical trials were identified that met the inclusion and exclusion criteria described below (Adams 1981; Bateman et al. 2004; Conners et al. 1976; Conners et al. 1980; David 1987; Goyette et al. 1978; Harley et al. 1978a; Harley et al. 1978b; Levy et al. 1978; Levy and Hobbes 1978; Lok et al. 2013; Mattes and Gittelman-Klein 1978; Mattes and Gittelman 1981; McCann et al. 2007; Pollock and Warner 1990; Rapp 1978; Rose 1978; Rowe 1988; Rowe and Rowe 1994; Sarantinos et al. 1990; Spring et al. 1981; Stevenson et al. 2010; Swanson and Kinsbourne 1980; Swanson and Kinsbourne 1980; Thorley 1984; Weiss et al. 1980; Williams et al. 1978; Wilson and Scott 1989). Information on study designs, results, and factors related to study quality and causal inference were abstracted from each study and evaluated in a series of qualitative and quantitative analyses.
2.2 Literature search and data abstraction General searches of the literature on the neurological effects of synthetic food dyes were conducted to identify peer-reviewed open-source and proprietary journal articles, print and digital books, reports, and gray literature that potentially reported relevant toxicological and epidemiological information on the effects of food dyes. The search sought to identify all literature relevant to the assessment of evidence on the neurological effects of the FD&C synthetic food dyes listed in Table 1.1.
The search process is described in Chapter 1, Introduction.
Potential Neurobehavioral Effects of Synthetic CalEPA OEHHA Food Dyes in Children April 2021
35
The bibliographies of all publications meeting our inclusion/exclusion criteria and relevant review articles and meta-analyses were also searched.
We abstracted information from all studies meeting the following criteria:
1. Epidemiologic studies 2. Clinical trial design 3. Participants were given a known quantity of synthetic food dyes or a diet low in or
eliminating synthetic food dyes 4. A neurobehavioral outcome related to hyperactivity or inattention was assessed 5. The majority of participants were children ≤19 years of age 6. The effects of an active ingredient or elimination diet were compared to those of
a placebo Studies meeting the following criteria were excluded:
1. Studies involving cohort, case-control, or cross-sectional designs 2. Studies that assessed the effects of a broad range of food groups and did not
specifically evaluate synthetic food dyes. This includes elimination studies involving broad categories of foods. This was done because the eliminated foods could contain a number of different chemicals besides artificial food dyes. As such, any effect identified in these studies would be difficult to ascribe specifically to artificial food dyes.
No exclusions were made based on the number of participants, participation rates, blinding, randomization, or source (e.g., government reports), although each of these factors was considered in our review of study quality and in our overall conclusions. Unpublished data were considered when available.
2.3 Assessment of individual studies We abstracted information on study design, participant selection and recruitment, methods for assessing exposure and outcomes, results, and other factors associated with causal inference and study quality. A full description of each variable for which we abstracted data and the reasons we included this information are provided in Section 2.4.3. Although all studies were clinical trials of synthetic food dyes and neurobehavioral outcomes, there was considerable variability within this design. For example, some studies assessed the effects of diets that eliminated synthetic food dyes (“elimination diet studies”) versus control diets, some assessed the effects of specific doses of synthetic food dyes (“challenge studies”) versus placebo, and some assessed both. Some studies provided only group means, some only results in individuals, and some both. Some studies assessed neurobehavioral outcomes using information from the children’s parents, some using information from the children’s teachers, some using neurological testing or observations by the researchers, and some using a combination of these. We abstracted information on all of these different methods. In most challenge studies, participants were placed on an elimination diet throughout the study. In several of these the researchers evaluated the behavior of the children before and

Potential Neurobehavioral Effects of Synthetic CalEPA OEHHA Food Dyes in Children April 2021
36
after they were placed on the elimination diet but before the challenge and placebo portion of the study was begun. We abstracted these particular results, although they did not play a major role in our conclusions since they were not compared to a control or placebo diet.
2.4 Study quality
2.4.1 Factors used in study quality assessments The following factors were used to evaluate study quality. These criteria were developed by first starting with the National Toxicology Program’s OHAT Risk of Bias Rating Tool (NTP Office of Health Assessment and Translation 2019). They were then modified to be specific to randomized clinical trials (RCT) on artificial food dyes and childhood neurobehavior. These modifications were based on basic epidemiologic principles (e.g., (Rothman and Greenland 1998)), principles of good RCT design (Hulley et al. 2013), issues raised in a public symposium sponsored by OEHHA, a preliminary review of the relevant studies, and issues and concerns raised in relevant review articles or reports. Detailed descriptions of these are provided in Section IV.C and in the coding dictionary for Table 2.3. Each factor was rated as “1” if the quality factor was present or “0” if it was not or was unclear.
• Random sample • Dropouts ≤ 30% • Cross-over design • Random cross-over • Double blinded • Exposure well defined • Food dyes only • Multiple doses tested • High dose (≥50 mg/day); This was approximately the median level in the clinical
dosing studies • Adequate placebo • Adequate washout period; a washout period >2 days was considered adequate • On elimination diet • Relevant outcome • Outcome method validated • Individual results given • Replication done • Infractions low • Order effect not seen • No potential conflicts (this includes funding and disclosures) • Full results given
This coding system was not meant to imply that each of these factors is equally important. As such, a study with twice the score of another does not necessarily mean it has twice the quality. Rather, this scoring method was kept simple in order to not

Potential Neurobehavioral Effects of Synthetic CalEPA OEHHA Food Dyes in Children April 2021
37
introduce unwarranted complexity. It was not used as the sole basis of our conclusions but as a guide to identify and evaluate any major weaknesses that may exist in the literature we reviewed.
2.4.2 Factors not used All of the studies we reviewed used a cross-over design in which participants were compared to themselves. That is, each subject received the placebo at one point in time and the active challenge at a different point in time, and their reactions to each were compared. This differs from studies in which one group receives the active challenge and a separate group receives the placebo. In this latter design, potential confounders that may differ between the two groups like age or socioeconomic status could cause false positive or false negative results. This confounding can be reduced in cross-over studies since subjects are compared to themselves, reducing the differences between the two sets of data being compared. Factors that change in the same people over time (i.e. the time between when the placebo is given and the time when the active challenge is given) could still cause some confounding. We evaluated the likelihood of confounding by identifying the major factors associated with neurobehavioral outcomes in children, assessing the likelihood that these could change over time or could be associated with synthetic food dye intakes, assessing the likely strength of these associations, and assessing the prevalence of these factors (Axelson 1978). Based on these evaluations we could not identify any obvious factor that would likely cause major confounding in the cross-over studies we reviewed.
It appears that the recruitment of participants in most of the studies we reviewed involved convenience sampling, and few studies provided enough information for us to calculate or estimate participation rates. Because of this, we could not use overall participation rates or other subject selection criteria as an indicator of study quality.
In preliminary analyses, we found that studies using information from parents to assess neurobehavioral outcomes were more likely to report associations than those using information from teachers. However, none of the studies that met our inclusion criteria relied solely on information from teachers. As such, we did not use outcome source (parent vs. teacher) as a quality criterion. Also, we could not find convincing evidence that factors such as differences in latency patterns, synthetic food dye dosages, study location (e.g., US vs. elsewhere), study size, or publication year were strongly related to study quality so these factors were also not used in our quality scoring. A number of researchers hypothesized that children who are hyperactive, or children who had previously been reported to positively respond to elimination diets (“prior responders”) might be more likely to show a reaction to synthetic food dyes than others. If so, studies involving these children might be more likely to report positive associations than those that did not. However, in our preliminary analyses we did not find this to be the case, so these factors were also not used in our quality scoring.
Finally, one of the key factors US FDA used in its review to assess the reliability was whether or not findings were consistent across multiple different outcome sources (FDA

Potential Neurobehavioral Effects of Synthetic CalEPA OEHHA Food Dyes in Children April 2021
38
2011). We did not use this criterion because of the generally low correlations seen between different methods of assessing children’s behavior (Achenbach et al. 1987).
2.4.3 Data abstraction Information on the following factors was abstracted from each study. The variable names used in our summary tables and data analyses are in parentheses. Since we used SAS for our statistical analyses, these names are in the SAS format.
2.4.3.1 General information and demographics Study (“Study” and “Publication_year”): The first author and year of publication.
Location (“Location”): The country where the study was performed.
Hyperactive (“Hyperactive”): This was recorded as “yes” if the study only included participants who were diagnosed with “hyperactivity” or some other related condition and “no” if they were not.
Responders (“Prior_responders”): This was recorded “yes” if the study only included participants who prior to the study had shown an improvement in behavior when placed on a diet that eliminated or reduced synthetic food dyes (an “elimination diet”). This was done in a number of studies because it was thought that these particular children might be particularly susceptible to challenges of synthetic food dyes.
Ages (“Ages”): The age range was recorded if provided. If not, the mean age was recorded.
N (“N”): The number of participants.
2.4.3.2 Recruitment and design Cohort: The population from which the study participants were recruited. This information was used to evaluate the generalizability of the study.
Selection (“Random_sample”): After reviewing the eligibility criteria for each study (if provided), we attempted to evaluate whether all eligible people, or a random selection of all eligible people, were invited to participate in the study. If this did not occur, the possibility of selection bias may be increased. Few studies provided sufficient information to evaluate this criterion.
Recruitment: We attempted to abstract information on the percentage of people who agreed to participate among those who were invited to participate. A low percentage could lead to selection bias or adversely affect the generalizability of the study.
Participation (“Dropouts_low”): This is the percentage of those for whom there were sufficient data to be included in the final study analyses among those who agreed to participate. If this percentage is low (e.g. below 70%) the possibility of selection bias may be increased.
Potential Neurobehavioral Effects of Synthetic CalEPA OEHHA Food Dyes in Children April 2021
39
All of the studies we reviewed were clinical trials in which the exposure to synthetic food dyes was controlled by the investigators. The following criteria were used to evaluate specific aspects of this design.
Cross-over (“Crossover”): The large majority of the studies we identified used cross-over designs. Here, participants are given the active challenge (i.e., a specific dose of synthetic food dyes) and a placebo at different times, and their responses to each are compared. This design can help reduce confounding since each participant is being compared to themselves.
Randomization (“Random_crossover”): In most studies, the cross-over was randomized. That is, some subjects were randomly selected to receive the placebo first and some were randomly selected to receive the active challenge first. The goal of this is to help reduce effects that might be related to the timing of exposure (e.g., “learning effects”).
Blinding (“Double_blinded”): In most studies the participants (or their parents) and the researchers assessing the outcome were both unaware of whether the participant was receiving placebo or the active challenge. Blinding can help reduce bias related to any expectations the researchers or the participants may have about the study outcome.
Placebo (“Placebo_used”): All studies used a placebo control. Again, this can help reduce bias related to expectations the researchers or the participants may have about the study outcome.
Adequate placebo (“Placebo_tested”): In studies using a placebo, we recorded information about any testing that was done to determine whether the placebo could be distinguished from the active challenge.
2.4.3.3 Exposure Exposure (“Elimination_tested”, “Challenge_tested”, “Exposure_defined”, “Other agent”, “Food_dyes_only”): Information on the active agent being tested was abstracted. This includes whether an elimination diet (“elimination diet studies”) was tested or a specific food dye or set of food dyes were tested (“challenge studies” or “active challenge studies”). We evaluated whether each study provided a clear and thorough description of the exposures given to each subject. This included the specific foods (if an elimination diet) or the specific synthetic food dyes (if a challenge study), and included whether any other agents were tested at the same time (e.g. preservatives). If another agent was given, we abstracted information on this agent. Combining synthetic food dyes with other agents can make it difficult to determine which was responsible for any effects identified.
Daily dose (“High_dose”): We extracted data on the daily dose of synthetic food dyes used in each study. This criterion was used to help identify possible sources of heterogeneity among studies and identify studies in which exposure levels may be too low to see true effects.
Potential Neurobehavioral Effects of Synthetic CalEPA OEHHA Food Dyes in Children April 2021
40
Multiple dose levels (“Multiple_doses”): For many toxic exposures, as the level of exposure increases the degree of toxicity or the number of people with the toxic endpoint also increases. Although not always monotonic and not an absolute criterion for causality, identifying strong evidence of a dose-response relationship can add confidence that a true association exists. Here, we provided information on whether each study looked for the presence of a dose-response relationship.
2.4.3.4 Exposure method Elimination diet (“On_elim_diet”): In studies involving an active challenge, we noted whether or not participants were on an elimination diet at the time of the study. If not, high levels of synthetic food dyes in the normal diets of some participants could potentially mask the effects of an active challenge.
Regimen: The frequency and timing of the dosing
Placebo and Vehicle: The type of placebo and vehicle used to deliver the active challenge and placebo
Washout (“Washout_method”, “Washout_period”, “Washout_adequate”): This is the period between the time when the active challenge was given and the time when the placebo was given. If the placebo is given after the active challenge and the washout period is short, then long lasting effects from the active challenge could potentially remain and wash over into the placebo period. This could mask any true differences in effects between the active challenge and the placebo.
Infractions (“Infractions_low”): In a few studies, participants were given the active challenge in a monitored hospital or clinic setting. In most others, participants were given materials (either an active challenge, placebo, or a specific diet) to take at home. In these later studies, we recorded whether or not the researchers provided information on compliance, that is, whether or not the child actually took the materials given. In general, we considered studies in which the compliance was high to be of higher quality. Importantly though, since most of the information on compliance was provided by the parent, this criterion may not be completely accurate and this was not used as our sole determinant of quality.
2.4.3.5 Outcomes assessed Outcome (“Outcome_hyperactivity”, “Outcome_other”, “Outcome_relevant”): This lists the major outcomes assessed in each study. Most studies assessed a wide variety of different outcomes or used a variety of different outcomes scales or metrics. The focus of the very large majority of studies we identified investigated outcomes related to hyperactivity. But we abstracted information on any other potentially relevant outcome. In order to be more inclusive than exclusive we included studies and abstracted data on a very broad array of outcomes (e.g., ADHD, aggressive behavior, classroom disturbances).

Potential Neurobehavioral Effects of Synthetic CalEPA OEHHA Food Dyes in Children April 2021
41
2.4.3.6 Outcome method Outcome method: This describes the metrics, scales, questionnaires, and tests used to assess the outcomes.
Validated (“Outcome_validated”): We examined whether the methods each study used to evaluate neurobehavioral outcomes were either validated, generally accepted, or otherwise reasonable methods for assessing exposure and outcome. Inaccurate or imprecise methods could lead to outcome misclassification. A variety of validation techniques were used, and most studies assessed multiple different outcomes, some of which used validated methods and some of which did not.
Timing (“Timing_outcome”): We evaluated the timing of the outcome assessment, that is, the number of hours or days the outcome was assessed after the exposure was given. Effects could potentially be missed if this period is too long or too short.
2.4.3.7 Main results Some studies only assessed the effect of a diet that eliminated synthetic food dyes (“elimination diet studies”), some only assessed effects after giving the child specific doses of synthetic food dyes (“challenge studies”), and some assessed both. Some studies provided only group means, some only results in individuals, and some both. Some studies assessed outcomes using information from the parents, some using information from the child’s teacher, some using neurological testing done by the researchers, some using observations done by the researchers, and some using a combination of each of these. In order to evaluate whether any particular method of assessing outcome might be more likely to be associated with positive findings, we abstracted results for each of these methods. We presented results separately for outcomes based on parent reports, teacher reports, and other methods. The “other” category involved some studies using researcher observations of behavior but mostly included studies using specific tests of activity, inattention, learning, or memory.
2.4.3.8 Other results Timing effect (“Timing_effect”): We abstracted information on whether studies evaluated latency of effects, that is, the time between when the participants received the active challenge and the time when any symptoms were first exhibited. Information on how long any observed effects lasted was also recorded, although few studies provided this.
Age effect (“Age_effect”): We recorded whether researchers examined differences in results in younger (e.g., ≤5 years old) vs. older participants.
Order effect (“No_order_effect”): We recorded whether researchers examined if active challenge-associated effects were greater in those receiving placebo first or in those receiving the active challenge first. If greater effects were seen in one of these groups than in the other, this might indicate a learning effect and limit the interpretability of the study findings.

Potential Neurobehavioral Effects of Synthetic CalEPA OEHHA Food Dyes in Children April 2021
42
Individual results (“Individ_results_given”): It has been suggested that some children may be more susceptible to the adverse effects of food dyes than others. If this is the case, studies that report only group means and not results in each individual child could potentially miss effects that only occur in a small fraction of particularly susceptible children. We evaluated whether each study looked for these types of individual effects.
Replication (“Replication_done”): We evaluated whether the main results were replicated. Replication reduces the possibility that the initial results may have occurred solely due to chance.
2.4.3.9 Other aspects of causal inference Magnitude of the association: If an association was identified, we evaluated whether the mean difference was greater than 20%, whether an effect >20% was seen in any individual, or whether the standardized effect size was >0.20. An effect size of 20% is close to the minimal effect size detectable with sufficient statistical power (β=0.80, α=0.05, paired sample test) for the parent portion of the Conners test in a study with 44 participants, the average size of the studies meeting our inclusion criteria (we used the average test-retest correlation of 0.70 reported by Nigg et al., 2012 and the mean score of 12.86 (standard deviation=6.39) from Harley et al., 1978b in these power calculations). A standardized effect size of 0.20 is also close to that reported for synthetic food dyes in the meta-analysis by Nigg et al. (Nigg et al. 2012). This criterion is similar to the “Large magnitude” criterion used by National Toxicology Program risk of bias tool (NTP Office of Health Assessment and Translation 2019) and the “Strength of the association” criterion used in the causal inference methods of Bradford Hill (Bradford Hill 1965). We acknowledge that the specific criteria we use here are somewhat arbitrary. However, effect size is an important component for evaluating causality since small effect sizes (mean differences close to 0) are more likely to be due to relatively small degrees of confounding or other bias than larger effect sizes (Axelson 1978). In addition, large effect sizes may be real, but not statistically significant because sample sizes were too small. Our evaluations of effect size are not meant to imply that all small effect sizes are due to confounding or bias or that all large effect sizes are real. Rather we used this criterion only to help identify results that might be especially prone to bias or confounding, and to identify effects that might be real but for which sample sizes were too small for statistical significance. We did not use this criterion as our sole indicator of causality.
Statistical significance: We evaluated whether each study found evidence for an association and whether the relevant result was statistically significant. Statistical significance was defined as a p-value <0.05 or 95% confidence intervals that excluded 1.0 for relative risk estimates or 0 for mean differences. We acknowledge that these definitions are somewhat arbitrary, that some results representing true effects may not meet these definitions, and that some results meeting these definitions may not represent true effects. As such, none of our conclusions were based solely on statistical significance.
Potential Neurobehavioral Effects of Synthetic CalEPA OEHHA Food Dyes in Children April 2021
43
Dose-response (“Dose_response”): If an association was identified and multiple doses were assessed, we evaluated the shape of the dose-response curve. We acknowledge that some true dose-response relationships may not be mono-tonic or linear. For this report, when statistically significant or large effects sizes were seen, we evaluated whether or not a dose-response relationship was seen and if so describe the pattern of this relationship. In general, dose-response patterns that are similar across different studies may be more likely to represent real effects. When dose-response patterns were not consistent from one study to the next, we tried to determine whether there might be a particular reason for this inconsistency.
Subgroup only (“Subgroup_only”): We recorded whether results were only identified in a specific subgroup of participants. Some studies presented results for all participants combined and separate results for certain subgroups (e.g., younger vs. older children). This criterion was considered because increasing the number of subgroups assessed could help to identify a particularly susceptible group. On the other hand, evaluating multiple different subgroups could also increase the risk of false positive results (i.e., the issue of “multiple comparisons”). This criterion was assessed to provide some insight into who may be most susceptible, into the generalizability of any associations identified, and into the possibility that results might be a result of large numbers of tests performed.
Funder (“No_conflicts”): We recorded the organization which funded the study and whether or not there might be any potential conflicts of interest. We were not able to judge actual conflicts of interest, so this assessment was based solely on potential conflicts.
Conflicts (“No_conflicts”): We recorded whether or not the authors declared that they had any conflicts of interest.
Full results (“Full_results”): We assessed whether the authors provided detailed results on all the relevant outcomes mentioned in the article’s methods section. This included actual effect sizes like group means, standard deviations, evaluations of chance (e.g. p-values), results in all subgroups studied, and results in individuals.
2.5 Statistical analyses All statistical analyses were conducted in SAS 9.4 (Cary, NC). A summary quality score for each study was calculated by summing the scores from each quality criterion listed above. Studies were divided into three main groups:
1. Those that reported statistically significant associations (“Statistically significant”)
2. Those that reported effect sizes or standardized effect sizes ≥20% that were not statistically significant (“Large effect size”), and
3. Those that did not report large effect sizes or statistically significant results (“No association”).
Potential Neurobehavioral Effects of Synthetic CalEPA OEHHA Food Dyes in Children April 2021
44
Statistical significance is not only related to the magnitude of the effect, if seen, but also to the number of participants in the study. As a result, all things being equal, smaller studies are less likely to report statistically significant results than larger studies. Because of this, and because we found no convincing evidence that smaller studies were of much less quality than larger studies, we created an addition category (labeled “Association identified”) that included studies that were in either the “Statistically significant” category or the “Large effect size” category. The proportion of studies in the “No association” vs. the “Association identified” categories were then compared across various factors such as study quality, sample size, or publication year using Chi-square tests. Only the challenge studies were included in these later analyses; we excluded elimination diet studies to help reduce heterogeneity. Since several of the continuous variables we examined were not normally distributed, we used the Wilcoxon rank sum test to compare means. All p-values are two sided unless otherwise noted.
2.6 Results A general description of the results of our literature search is provided in Figure 1. Overall we identified 27 studies meeting our inclusion and exclusion criteria. Of these, 25 involved challenge studies and two involved diet elimination studies. Detailed descriptions of each study are provided in Table 2.1. Excluded studies and the reason for their exclusion are provided in Table 2.2. The coding used in our statistical analyses and quality scoring is provided in Tables 2.3a and 2.3b.
The studies meeting our inclusion criteria were performed in a variety of different countries with the most common locations being the US (44%), followed by the UK (22%), and Australia and Canada (15% each) (Table 2.4). Almost all studies were done prior to the year 2000 (24 of 27 studies). Most studies included all or a mixture of hyperactive children (78% of studies) or all or a mixture of prior responders (59%). The average number of participants was 44, with a range of 1 to 297. All studies used cross-over designs. Most challenge studies were double blinded and the cross-over design was randomized, although in two studies blinding was unclear. In seven studies, the randomization was either not done or was unclear. Most studies assessed a number of synthetic food dyes combined, although six assessed tartrazine only. The average dose assessed was 55.8 mg/day with a range of 1.2 to 250 mg/day. In all but one challenge study, participants were placed on an elimination diet during the study. Most studies (70%) used a validated or otherwise commonly accepted metric to assess neurobehavioral outcomes, with the most common being the Conners Parent scale.
We identified two elimination diet studies that used a placebo or control diet. Both identified statistically significant associations between the elimination diet and improved neurobehavioral outcomes, although in one the strongest effect was seen for outcomes reported by the parents (Harley et al. 1978b), and in the other the strongest effect was seen for outcomes reported by teachers (Conners et al. 1976). As mentioned above, in many of the challenge studies the participants were placed on an elimination diet as
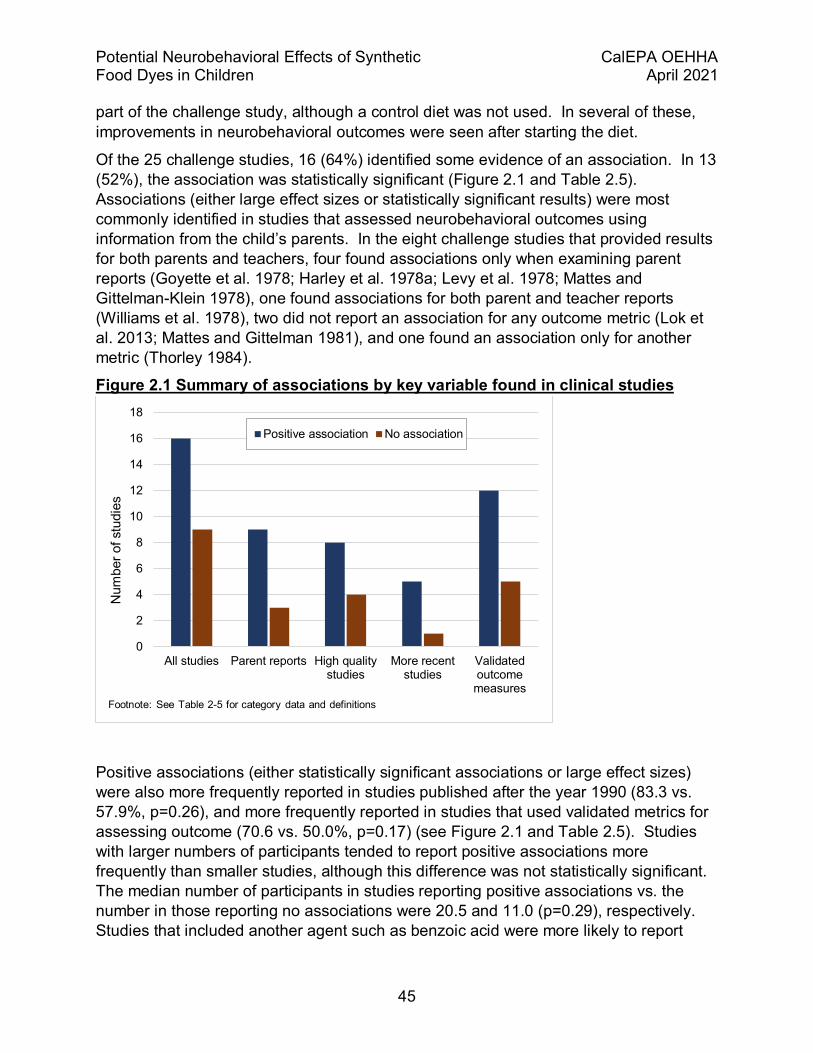
Potential Neurobehavioral Effects of Synthetic CalEPA OEHHA Food Dyes in Children April 2021
45
part of the challenge study, although a control diet was not used. In several of these, improvements in neurobehavioral outcomes were seen after starting the diet.
Of the 25 challenge studies, 16 (64%) identified some evidence of an association. In 13 (52%), the association was statistically significant (Figure 2.1 and Table 2.5). Associations (either large effect sizes or statistically significant results) were most commonly identified in studies that assessed neurobehavioral outcomes using information from the child’s parents. In the eight challenge studies that provided results for both parents and teachers, four found associations only when examining parent reports (Goyette et al. 1978; Harley et al. 1978a; Levy et al. 1978; Mattes and Gittelman-Klein 1978), one found associations for both parent and teacher reports (Williams et al. 1978), two did not report an association for any outcome metric (Lok et al. 2013; Mattes and Gittelman 1981), and one found an association only for another metric (Thorley 1984).
Figure 2.1 Summary of associations by key variable found in clinical studies
Positive associations (either statistically significant associations or large effect sizes) were also more frequently reported in studies published after the year 1990 (83.3 vs. 57.9%, p=0.26), and more frequently reported in studies that used validated metrics for assessing outcome (70.6 vs. 50.0%, p=0.17) (see Figure 2.1 and Table 2.5). Studies with larger numbers of participants tended to report positive associations more frequently than smaller studies, although this difference was not statistically significant. The median number of participants in studies reporting positive associations vs. the number in those reporting no associations were 20.5 and 11.0 (p=0.29), respectively. Studies that included another agent such as benzoic acid were more likely to report
0
2
4
6
8
10
12
14
16
18
All studies Parent reports High qualitystudies
More recentstudies
Validatedoutcomemeasures
Num
ber o
f stu
dies
Footnote: See Table 2-5 for category data and definitions
Positive association No association
Potential Neurobehavioral Effects of Synthetic CalEPA OEHHA Food Dyes in Children April 2021
46
positive associations (3 of 3 studies). However, a fairly large number of studies that tested synthetic food dyes without these other agents also found positive associations (59.1% overall), with 10 of them reporting associations that were statistically significant.
There appeared to be a trend between increasing doses of synthetic food dyes and whether or not a study reported a positive association but this trend was fairly weak and was not clearly linear. For example, the proportion of studies reporting positive results for highest dose levels of ≤10, 11-35, 36-99, and ≥100 mg/day were 50%, 42%, 75%, and 67%. The median dose was higher in those studies reporting positive vs. no associations (50 vs. 26 mg/day, p=0.50), but there was considerable overlap across these groups of studies. Only one study reported a dose-response relationship. Rowe and Rowe saw a dose-response pattern between increasing doses of 1, 2, 5, 10, 20, and 50 mg of multiple food dyes per day and worsening behavioral scores (Rowe and Rowe 1994). This study is discussed further in Section 7.5.3. Only two other studies reported information on dose-response, with neither finding a clear dose-response pattern (David 1987; J. M. Swanson and M. Kinsbourne 1980).
We found that factors such as our overall study quality scores, the use of a full randomized double-blinded design, study location, the use of multiple dyes vs. tartrazine only, and the presentation of full results were not strongly related to whether a study reported an association. Tartrazine was the only dye tested by itself, so the individual impact of the other dyes cannot be assessed based on the evidence we reviewed. Only two studies provided a full disclosure statement and the source of funding, with one reporting a statistically significant association and one finding no association. Positive associations were not reported more frequently in studies involving only hyperactive children or prior responders, in studies with longer washout periods, or in studies reporting low rates of infractions, each the opposite of expected, although none of these findings were statistically significant.
We did not find a consistent relationship between the time the dyes were ingested and timing of the outcome assessment (i.e., latency) (Table 2.5). Latency patterns were examined in several studies but the findings were somewhat inconsistent. For example, in Goyette et al., two challenge (26 mg/day total of multiple dyes) or placebo items were given per day in two week alternating sequences over a period of eight weeks. Here, a pattern of worsening behavior was seen in three “dye sensitive” children at 1 hour, but not at 2 or 3 hours after dosing (Goyette et al. 1978). In another study, adverse behavioral effects were seen within 30 minutes of dosing with up to 150 mg of multiple dyes, and continued to 3.5 hours later, the last time period assessed (Swanson and Kinsbourne 1980). In another study tartrazine or carmoisine were each given for 1 week on two separate occasions for a total of 4 weeks of dye administration. In the two children who “demonstrated significant responses” to the food dyes, effects began within two hours of ingestion but lasted at least 3-4 days and up to 3.5 weeks after the last dosing (Rowe 1988).
Potential Neurobehavioral Effects of Synthetic CalEPA OEHHA Food Dyes in Children April 2021
47
Most studies involved a fairly wide range of ages, and there was broad overlap in the ages across the studies we reviewed. For this reason, we could not divide studies based solely on age. However, several studies did perform sensitivity analyses examining age. In three of these, age did not impact the results (Adams 1981; Mattes and Gittelman 1981; Rowe and Rowe 1994). In three others, greater effects were seen in younger participants (Goyette et al. 1978; Harley et al. 1978b; McCann et al. 2007). For example, McCann et al. examined two separate age groups of children: 140 three-year olds, and 144 eight to nine year olds. In this study, larger standardized effect sizes were seen in the younger (0.17 to 0.20) compared to the older (0.08 to 0.12) children (McCann et al. 2007).
2.7 Discussion 2.7.1 Outcome assessment Overall, we found a wide disparity in results in the studies we identified, although the majority of studies reported at least some evidence of an association. In general, we found that studies that assessed neurobehavioral outcomes using reports from the children’s parents were more likely to report associations than studies assessing outcomes based on other methods, especially those using reports from teachers. Studies using validated questionnaires and studies published more recently were also more likely to report positive associations. Studies with larger numbers of participants and studies involving higher doses were more likely to report associations but these effects were fairly weak and inconsistent. Importantly, none of the factors we examined seem to explain the majority of the heterogeneity seen across the study results. For example, although a large fraction of the studies published since 1990 reported statistically significant results (5 of 6 challenge studies), many studies published before 1990 also reported statistically significant results (8 of 19). And, while studies using a validated outcome metric were more likely to report associations, several studies without validated outcome metrics reported similar associations.
The exact reason why associations were more likely to be reported based on parent than teacher reports is unknown. Previous studies have shown relatively low correlations (e.g., correlation coefficients of 0.2-0.5) between teacher and parent reports of children’s behavior (Achenbach et al. 1987). However, the American Academy of Pediatrics recommends that a diagnosis of attention-deficit/hyperactivity disorder should include information from both parents and teachers (as well as other school and mental health clinicians). Our results are similar to those of the relatively recent meta-analysis of child neurobehavioral outcomes and synthetic food additives (Nigg et al. 2012), where effect sizes were greater for parent reports than teacher reports (standardized effect sizes of 0.18 for parent reports (95% confidence interval (CI), 0.08-0.29; n=20 studies) vs. 0.07 for teacher reports (95% CI, -0.03-0.18; n=10 studies)). Interestingly in the Nigg et al. meta-analysis, the greatest summary effect size was seen for outcomes based on attention tests administered by the researchers (standardized effect size of
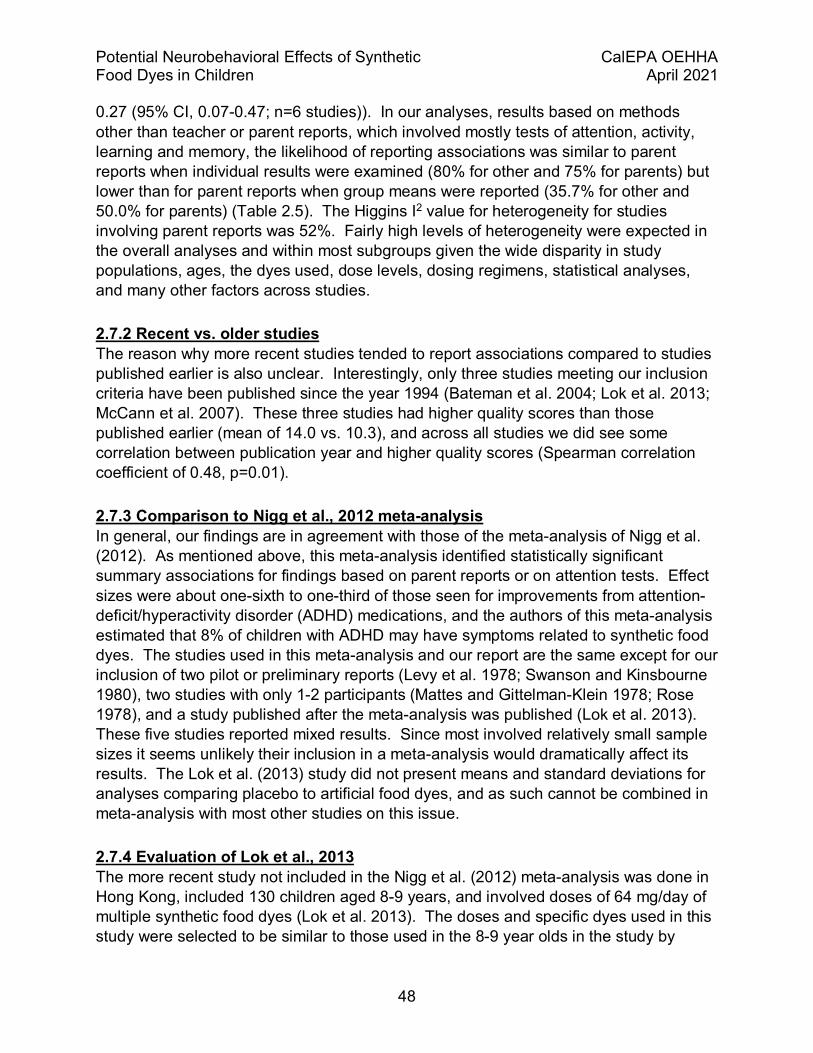
Potential Neurobehavioral Effects of Synthetic CalEPA OEHHA Food Dyes in Children April 2021
48
0.27 (95% CI, 0.07-0.47; n=6 studies)). In our analyses, results based on methods other than teacher or parent reports, which involved mostly tests of attention, activity, learning and memory, the likelihood of reporting associations was similar to parent reports when individual results were examined (80% for other and 75% for parents) but lower than for parent reports when group means were reported (35.7% for other and 50.0% for parents) (Table 2.5). The Higgins I2 value for heterogeneity for studies involving parent reports was 52%. Fairly high levels of heterogeneity were expected in the overall analyses and within most subgroups given the wide disparity in study populations, ages, the dyes used, dose levels, dosing regimens, statistical analyses, and many other factors across studies.
2.7.2 Recent vs. older studies The reason why more recent studies tended to report associations compared to studies published earlier is also unclear. Interestingly, only three studies meeting our inclusion criteria have been published since the year 1994 (Bateman et al. 2004; Lok et al. 2013; McCann et al. 2007). These three studies had higher quality scores than those published earlier (mean of 14.0 vs. 10.3), and across all studies we did see some correlation between publication year and higher quality scores (Spearman correlation coefficient of 0.48, p=0.01).
2.7.3 Comparison to Nigg et al., 2012 meta-analysis In general, our findings are in agreement with those of the meta-analysis of Nigg et al. (2012). As mentioned above, this meta-analysis identified statistically significant summary associations for findings based on parent reports or on attention tests. Effect sizes were about one-sixth to one-third of those seen for improvements from attention-deficit/hyperactivity disorder (ADHD) medications, and the authors of this meta-analysis estimated that 8% of children with ADHD may have symptoms related to synthetic food dyes. The studies used in this meta-analysis and our report are the same except for our inclusion of two pilot or preliminary reports (Levy et al. 1978; Swanson and Kinsbourne 1980), two studies with only 1-2 participants (Mattes and Gittelman-Klein 1978; Rose 1978), and a study published after the meta-analysis was published (Lok et al. 2013). These five studies reported mixed results. Since most involved relatively small sample sizes it seems unlikely their inclusion in a meta-analysis would dramatically affect its results. The Lok et al. (2013) study did not present means and standard deviations for analyses comparing placebo to artificial food dyes, and as such cannot be combined in meta-analysis with most other studies on this issue.
2.7.4 Evaluation of Lok et al., 2013 The more recent study not included in the Nigg et al. (2012) meta-analysis was done in Hong Kong, included 130 children aged 8-9 years, and involved doses of 64 mg/day of multiple synthetic food dyes (Lok et al. 2013). The doses and specific dyes used in this study were selected to be similar to those used in the 8-9 year olds in the study by
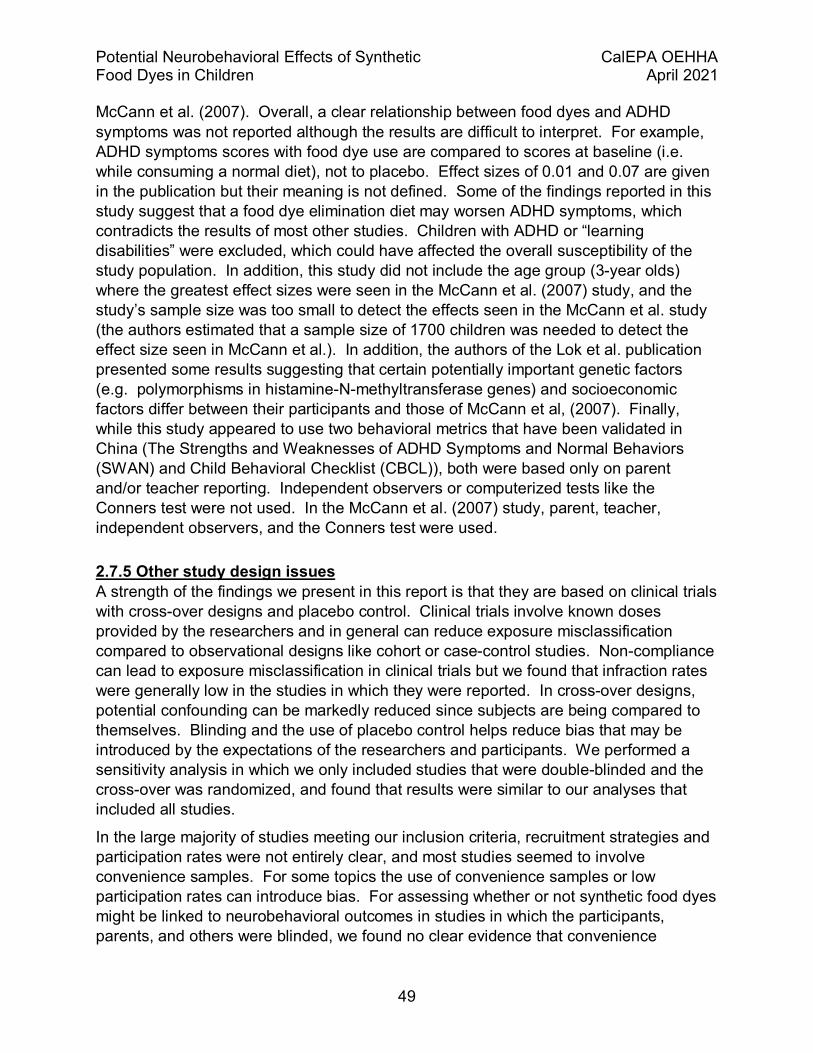
Potential Neurobehavioral Effects of Synthetic CalEPA OEHHA Food Dyes in Children April 2021
49
McCann et al. (2007). Overall, a clear relationship between food dyes and ADHD symptoms was not reported although the results are difficult to interpret. For example, ADHD symptoms scores with food dye use are compared to scores at baseline (i.e. while consuming a normal diet), not to placebo. Effect sizes of 0.01 and 0.07 are given in the publication but their meaning is not defined. Some of the findings reported in this study suggest that a food dye elimination diet may worsen ADHD symptoms, which contradicts the results of most other studies. Children with ADHD or “learning disabilities” were excluded, which could have affected the overall susceptibility of the study population. In addition, this study did not include the age group (3-year olds) where the greatest effect sizes were seen in the McCann et al. (2007) study, and the study’s sample size was too small to detect the effects seen in the McCann et al. study (the authors estimated that a sample size of 1700 children was needed to detect the effect size seen in McCann et al.). In addition, the authors of the Lok et al. publication presented some results suggesting that certain potentially important genetic factors (e.g. polymorphisms in histamine-N-methyltransferase genes) and socioeconomic factors differ between their participants and those of McCann et al, (2007). Finally, while this study appeared to use two behavioral metrics that have been validated in China (The Strengths and Weaknesses of ADHD Symptoms and Normal Behaviors (SWAN) and Child Behavioral Checklist (CBCL)), both were based only on parent and/or teacher reporting. Independent observers or computerized tests like the Conners test were not used. In the McCann et al. (2007) study, parent, teacher, independent observers, and the Conners test were used.
2.7.5 Other study design issues A strength of the findings we present in this report is that they are based on clinical trials with cross-over designs and placebo control. Clinical trials involve known doses provided by the researchers and in general can reduce exposure misclassification compared to observational designs like cohort or case-control studies. Non-compliance can lead to exposure misclassification in clinical trials but we found that infraction rates were generally low in the studies in which they were reported. In cross-over designs, potential confounding can be markedly reduced since subjects are being compared to themselves. Blinding and the use of placebo control helps reduce bias that may be introduced by the expectations of the researchers and participants. We performed a sensitivity analysis in which we only included studies that were double-blinded and the cross-over was randomized, and found that results were similar to our analyses that included all studies.
In the large majority of studies meeting our inclusion criteria, recruitment strategies and participation rates were not entirely clear, and most studies seemed to involve convenience samples. For some topics the use of convenience samples or low participation rates can introduce bias. For assessing whether or not synthetic food dyes might be linked to neurobehavioral outcomes in studies in which the participants, parents, and others were blinded, we found no clear evidence that convenience

Potential Neurobehavioral Effects of Synthetic CalEPA OEHHA Food Dyes in Children April 2021
50
sampling or low participation might cause false positive results. While convenience sampling and low participation rates might affect the generalizability of some studies, we see no reason why they would affect the ability of a study to examine whether at least some children, whether more sensitive or not, might be adversely affected by synthetic food dyes.
2.7.6 Susceptibility A number of studies presented evidence that certain children may be much more susceptible to the adverse impacts of synthetic food dyes than others. However, the reasons that may explain this sensitivity are not entirely clear. We did not find that studies that included only children who were previously diagnosed with hyperactivity were more likely to report associations. Several studies did report that younger children might be more susceptible than older children but this finding was not consistent across all studies. Stevenson et al. found that children (both 3 year olds and 8/9 year olds) with certain polymorphisms in histamine degradation genes had greater adverse responses to synthetic food dyes (Stevenson et al. 2010). In addition, gene polymorphisms in the dopamine transporter gene in 8/9 year old children moderated the effects of the food dyes. To our knowledge, these findings have not been replicated in another population. However, as discussed in Chapter 4, histamine plays a role as a neurotransmitter in the brain. Thus, polymorphisms in the histamine degradation genes are a plausible basis for varied sensitivity to dyes associated with histamine release. Overall, while it seems likely that sensitive populations exist, we did not find evidence that there is currently a simple and accurate way to identify these particularly sensitive children.
2.7.7 Publication bias Publication bias is the tendency of researchers not to publish findings in which no association or an association in the unexpected direction is found. Typically, it is thought to affect smaller studies to a greater extent than larger studies. While we attempted to be as inclusive as possible, and our search included multiple different literature sources, publication bias may still have occurred. In the meta-analysis by Nigg et al (2012), adjustments for publication bias attenuated summary effect sizes, although several remained statistically significant. For example, the standardized effect size in challenge studies using parent reports changed from 0.18 (95% CI, 0.08-0.29) to 0.12 (95% CI, 0.01-0.23) after adjustment for publication bias. Importantly though, the methods used to adjust for publication bias are based on assumptions that are not completely accurate and that have many exceptions (McShane et al. 2016). As such, the real impact of publication bias is unknown. Given the widespread interest on the potential health effects of synthetic food additives, it seems somewhat unlikely that a number of well-conducted clinical trials would remain unpublished.
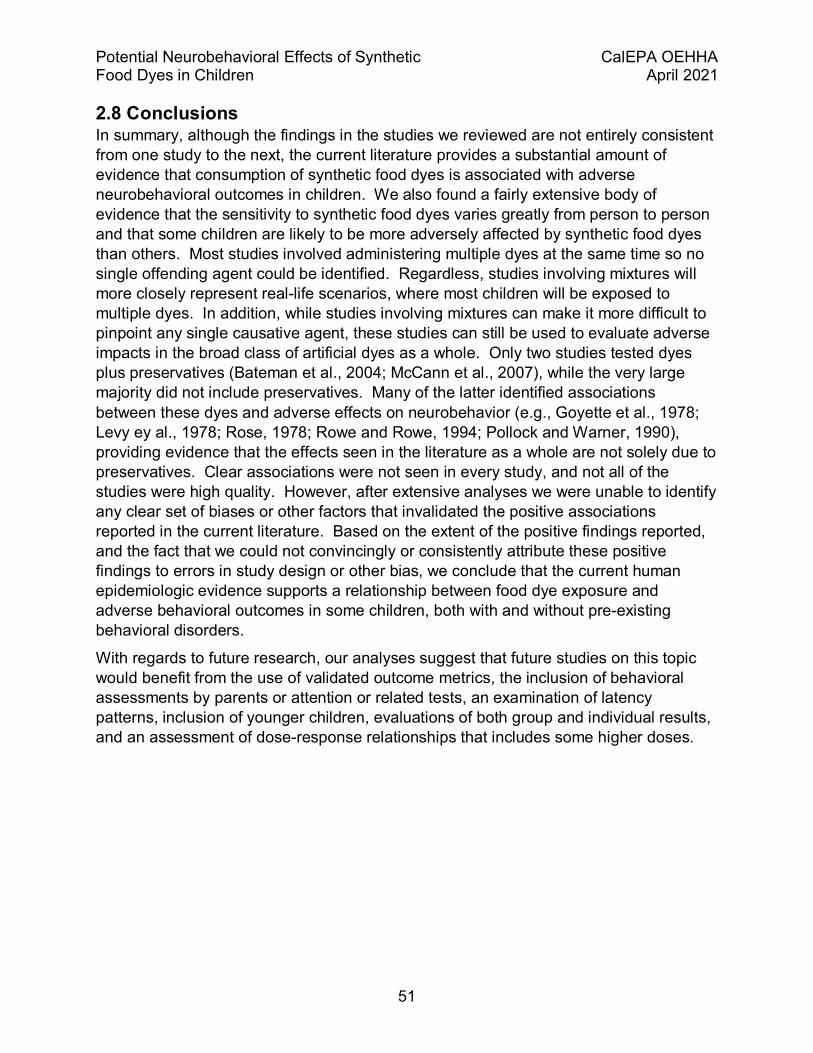
Potential Neurobehavioral Effects of Synthetic CalEPA OEHHA Food Dyes in Children April 2021
51
2.8 Conclusions In summary, although the findings in the studies we reviewed are not entirely consistent from one study to the next, the current literature provides a substantial amount of evidence that consumption of synthetic food dyes is associated with adverse neurobehavioral outcomes in children. We also found a fairly extensive body of evidence that the sensitivity to synthetic food dyes varies greatly from person to person and that some children are likely to be more adversely affected by synthetic food dyes than others. Most studies involved administering multiple dyes at the same time so no single offending agent could be identified. Regardless, studies involving mixtures will more closely represent real-life scenarios, where most children will be exposed to multiple dyes. In addition, while studies involving mixtures can make it more difficult to pinpoint any single causative agent, these studies can still be used to evaluate adverse impacts in the broad class of artificial dyes as a whole. Only two studies tested dyes plus preservatives (Bateman et al., 2004; McCann et al., 2007), while the very large majority did not include preservatives. Many of the latter identified associations between these dyes and adverse effects on neurobehavior (e.g., Goyette et al., 1978; Levy ey al., 1978; Rose, 1978; Rowe and Rowe, 1994; Pollock and Warner, 1990), providing evidence that the effects seen in the literature as a whole are not solely due to preservatives. Clear associations were not seen in every study, and not all of the studies were high quality. However, after extensive analyses we were unable to identify any clear set of biases or other factors that invalidated the positive associations reported in the current literature. Based on the extent of the positive findings reported, and the fact that we could not convincingly or consistently attribute these positive findings to errors in study design or other bias, we conclude that the current human epidemiologic evidence supports a relationship between food dye exposure and adverse behavioral outcomes in some children, both with and without pre-existing behavioral disorders.
With regards to future research, our analyses suggest that future studies on this topic would benefit from the use of validated outcome metrics, the inclusion of behavioral assessments by parents or attention or related tests, an examination of latency patterns, inclusion of younger children, evaluations of both group and individual results, and an assessment of dose-response relationships that includes some higher doses.
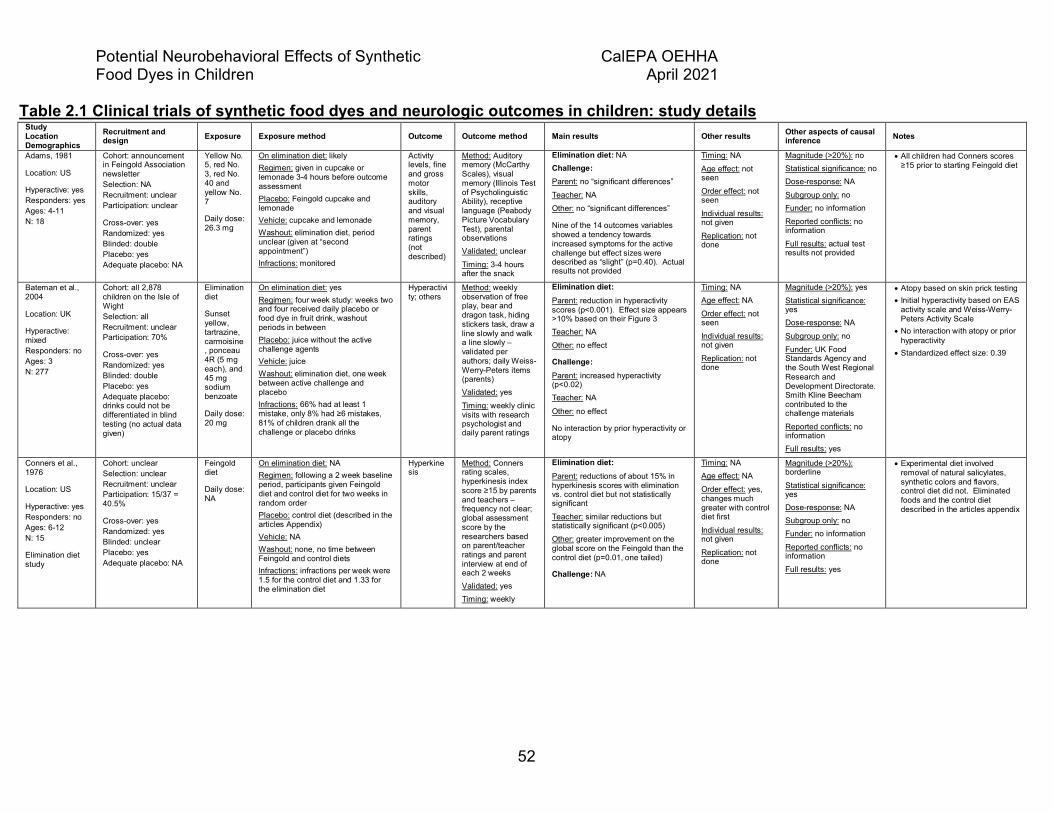
Potential Neurobehavioral Effects of Synthetic CalEPA OEHHA Food Dyes in Children April 2021
52
Table 2.1 Clinical trials of synthetic food dyes and neurologic outcomes in children: study details Study Location Demographics
Recruitment and design Exposure Exposure method Outcome Outcome method Main results Other results Other aspects of causal
inference Notes
Adams, 1981
Location: US
Hyperactive: yes Responders: yes Ages: 4-11 N: 18
Cohort: announcement in Feingold Association newsletter Selection: NA Recruitment: unclear Participation: unclear
Cross-over: yes Randomized: yes Blinded: double Placebo: yes Adequate placebo: NA
Yellow No. 5, red No. 3, red No. 40 and yellow No. 7
Daily dose: 26.3 mg
On elimination diet: likely Regimen: given in cupcake or lemonade 3-4 hours before outcome assessment Placebo: Feingold cupcake and lemonade Vehicle: cupcake and lemonade Washout: elimination diet, period unclear (given at “second appointment”) Infractions: monitored
Activity levels, fine and gross motor skills, auditory and visual memory, parent ratings (not described)
Method: Auditory memory (McCarthy Scales), visual memory (Illinois Test of Psycholinguistic Ability), receptive language (Peabody Picture Vocabulary Test), parental observations Validated: unclear Timing: 3-4 hours after the snack
Elimination diet: NA Challenge: Parent: no “significant differences” Teacher: NA Other: no “significant differences”
Nine of the 14 outcomes variables showed a tendency towards increased symptoms for the active challenge but effect sizes were described as “slight” (p=0.40). Actual results not provided
Timing: NA Age effect: not seen Order effect: not seen Individual results: not given Replication: not done
Magnitude (>20%): no Statistical significance: no Dose-response: NA Subgroup only: no Funder: no information Reported conflicts: no information Full results: actual test results not provided
• All children had Conners scores ≥15 prior to starting Feingold diet
Bateman et al., 2004
Location: UK
Hyperactive: mixed Responders: no Ages: 3 N: 277
Cohort: all 2,878 children on the Isle of Wight Selection: all Recruitment: unclear Participation: 70%
Cross-over: yes Randomized: yes Blinded: double Placebo: yes Adequate placebo: drinks could not be differentiated in blind testing (no actual data given)
Elimination diet
Sunset yellow, tartrazine, carmoisine, ponceau 4R (5 mg each), and 45 mg sodium benzoate
Daily dose: 20 mg
On elimination diet: yes Regimen: four week study: weeks two and four received daily placebo or food dye in fruit drink, washout periods in between Placebo: juice without the active challenge agents Vehicle: juice Washout: elimination diet, one week between active challenge and placebo Infractions: 66% had at least 1 mistake, only 8% had ≥6 mistakes, 81% of children drank all the challenge or placebo drinks
Hyperactivity; others
Method: weekly observation of free play, bear and dragon task, hiding stickers task, draw a line slowly and walk a line slowly – validated per authors; daily Weiss-Werry-Peters items (parents) Validated: yes Timing: weekly clinic visits with research psychologist and daily parent ratings
Elimination diet: Parent: reduction in hyperactivity scores (p<0.001). Effect size appears >10% based on their Figure 3 Teacher: NA Other: no effect
Challenge: Parent: increased hyperactivity (p<0.02) Teacher: NA
Other: no effect
No interaction by prior hyperactivity or atopy
Timing: NA Age effect: NA Order effect: not seen Individual results: not given Replication: not done
Magnitude (>20%): yes Statistical significance: yes Dose-response: NA Subgroup only: no Funder: UK Food Standards Agency and the South West Regional Research and Development Directorate. Smith Kline Beecham contributed to the challenge materials Reported conflicts: no information Full results: yes
• Atopy based on skin prick testing • Initial hyperactivity based on EAS
activity scale and Weiss-Werry-Peters Activity Scale
• No interaction with atopy or prior hyperactivity
• Standardized effect size: 0.39
Conners et al., 1976
Location: US
Hyperactive: yes Responders: no Ages: 6-12 N: 15
Elimination diet study
Cohort: unclear Selection: unclear Recruitment: unclear Participation: 15/37 = 40.5%
Cross-over: yes Randomized: yes Blinded: unclear Placebo: yes Adequate placebo: NA
Feingold diet
Daily dose: NA
On elimination diet: NA Regimen: following a 2 week baseline period, participants given Feingold diet and control diet for two weeks in random order Placebo: control diet (described in the articles Appendix) Vehicle: NA Washout: none, no time between Feingold and control diets Infractions: infractions per week were 1.5 for the control diet and 1.33 for the elimination diet
Hyperkinesis
Method: Conners rating scales, hyperkinesis index score ≥15 by parents and teachers – frequency not clear; global assessment score by the researchers based on parent/teacher ratings and parent interview at end of each 2 weeks Validated: yes Timing: weekly
Elimination diet: Parent: reductions of about 15% in hyperkinesis scores with elimination vs. control diet but not statistically significant Teacher: similar reductions but statistically significant (p<0.005) Other: greater improvement on the global score on the Feingold than the control diet (p=0.01, one tailed)
Challenge: NA
Timing: NA Age effect: NA Order effect: yes, changes much greater with control diet first Individual results: not given Replication: not done
Magnitude (>20%): borderline Statistical significance: yes Dose-response: NA Subgroup only: no Funder: no information Reported conflicts: no information Full results: yes
• Experimental diet involved removal of natural salicylates, synthetic colors and flavors, control diet did not. Eliminated foods and the control diet described in the articles appendix

Potential Neurobehavioral Effects of Synthetic CalEPA OEHHA Food Dyes in Children April 2021
53
Study Location Demographics
Recruitment and design Exposure Exposure method Outcome Outcome method Main results Other results Other aspects of causal
inference Notes
Conners et al., 1980
Location: US
Hyperactive: yes Responders: yes Ages: 5-10 N: 9
Cohort: responders to elimination diet and blind challenges in previous trials Selection: unclear Recruitment: unclear Participation: unclear
Cross-over: yes Randomized: yes Blinded: double Placebo: yes Adequate placebo: NA
Multiple Synthetic colors
Daily dose: 15 mg
On elimination diet: yes Regimen: two sessions at 1-2 week intervals, two chocolate cookies given at the beginning of each session Placebo: cookie without the active challenge Vehicle: chocolate cookie Washout: on elimination diet for 1-2 weeks between challenge and placebo Infractions: monitored intakes
Activity levels, behavior ratings, attention and learning
Method: actometer, chair motion detector, study specific behavioral ratings, attention and learning task designed by Swanson and Kinbourne Validated: unclear Timing: observations at baseline and 45, 90, 135, and 180 minutes after dosing
Elimination diet: NA
Challenge: Parent: NA Teacher: NA Other: activity testes and observer ratings don’t seem to differ between active challenge and placebo (shown in figure form). Learning errors appear worse with active challenge but not consistent across the two sessions
Timing: NA Age effect: NA Order effect: not seen Individual results: not given Replication: not done
Magnitude (>20%): no Statistical significance: no Dose-response: NA Subgroup only: no Funder: NIH Reported conflicts: no information Full results: yes
• Possible practice effect may have masked some findings
• synthetic colors not described in detail
David et al., 1987
Location: UK
Hyperactive: no Responders: yes Ages: 1-12 N: 24
Cohort: referred to allergy clinic, previous adverse behavioral reaction to food additives Selection: all children Recruitment: 24/30 = 80.0% Participation: 100%
Cross-over: yes Randomized: no Blinded: double (see notes) Placebo: yes Adequate placebo: NA
Tartrazine
Daily dose: 50 and 250 mg
On elimination diet: yes Regimen: given orange juice or Ribena throughout. Single dose of 50 mg, followed at least 2 hours later by a single dose of 250 mg. Both in either orange juice or Ribena (which contains sodium benzoate). Benzoic acid challenge given after tartrazine challenge on a separate day Placebo: Orange juice or Ribena Vehicle: Orange juice or Ribena Washout: all subjects were on elimination diets at the time of the study, it appears the time before the study was the comparison period Infractions: monitored
Any behavioral change following dye administration
Method: observation by parent and nursing staff for “any change in the child’s behavior” for an unclear period Validated: no Timing: unclear
Elimination diet: NA
Challenge: Parent: No behavioral change in any child for placebo or active. No change upon return to “normal diet” Teacher: NA Other: Same as parent
Timing: NA Age effect: NA Order effect: NA Individual results: yes, but no effects seen Replication: not done
Magnitude (>20%): no Statistical significance: no Dose-response: not seen Subgroup only: no Funder: no information Reported conflicts: no information Full results: yes
• 19 boys and 5 girls • Six children had attention deficit
disorder • Challenges were performed while
participants were in the hospital: 12 inpatients and 12 outpatients
• Benzoic acid also tested • Tartrazine challenge done first,
benzoic acid challenge done a few days later.
• Parents or observers did not know whether the child was receiving tartrazine or benzoic acid
Goyette et al., 1978
Location: US
Hyperactive: yes Responders: yes Ages: 4-12 N: 16
Cohort: unclear Selection: unclear Recruitment: unclear Participation: 16/27 = 59%
Cross-over: yes Randomized: unclear Blinded: double Placebo: yes Adequate placebo: NA
Elimination diet
“all synthetic colors currently approved by the FDA”
Daily dose: 26 mg (see notes)
On elimination diet: yes Regimen: two challenge or placebo items per day in 2 week alternating sequences over 8 weeks Placebo: cookie without the active challenge ingredient Vehicle: chocolate cookie Washout: none Infractions: NA
Hyperkinesis; visual motor tracking
Method: Conners Parent/Teacher Hyperkinesis Index; Zero Input Tracking Analyzer and Auxillary Distraction Task (ZITA/ADT) Validated: yes Timing: 3 times per week (Conners); 1-2 hours after ingestion (ZITA/ADT)
Elimination diet: Parent: 57% reduction in behavioral problems (no p-value) Teacher: 34% reduction in behavioral problems (no p-value) Other: no results given for ZITA/ADT
Challenge: Parent: Initially, no effects. Second study (N=13) with parent rating 1-3 hours after challenge showed challenge effect (p<0.025) (standardized effect size = 0.38) Teacher: no effects Other: performance deficits on ZITA/ADT but not statistically significant and effect size not given
Timing: effects seen within one hour of challenge but not 2-3 hours after Age effect: greater response in younger children Order effect: not seen Individual results: 3 children with large challenge effect on attention tests Replication: similar results when repeated in 3 responders
Magnitude (>20%): yes Statistical significance: yes Dose-response: NA Subgroup only: no Funder: no information Reported conflicts: no information Full results: no, some effect sizes not given
• Information on dose, participation, and some effect sizes given in C.K. Conners 1980, Food Additives and Hyperactive Children, Prenum Press, New York, pages 41-68
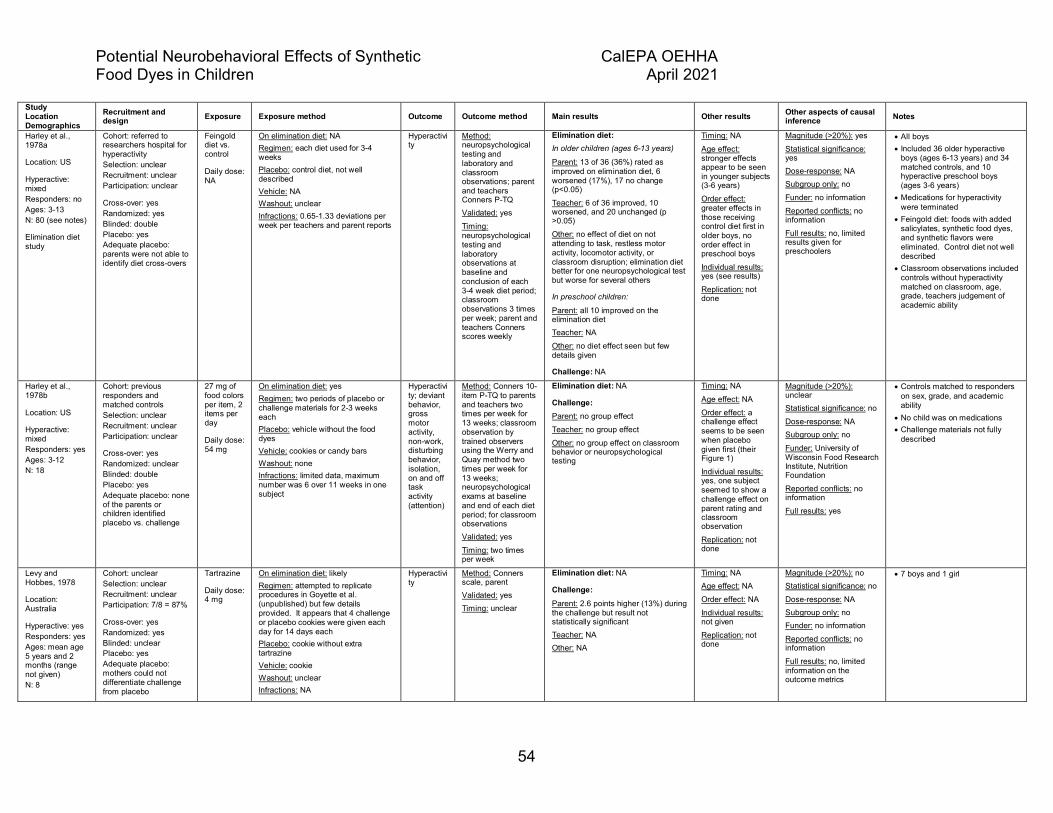
Potential Neurobehavioral Effects of Synthetic CalEPA OEHHA Food Dyes in Children April 2021
54
Study Location Demographics
Recruitment and design Exposure Exposure method Outcome Outcome method Main results Other results Other aspects of causal
inference Notes
Harley et al., 1978a
Location: US
Hyperactive: mixed Responders: no Ages: 3-13 N: 80 (see notes)
Elimination diet study
Cohort: referred to researchers hospital for hyperactivity Selection: unclear Recruitment: unclear Participation: unclear
Cross-over: yes Randomized: yes Blinded: double Placebo: yes Adequate placebo: parents were not able to identify diet cross-overs
Feingold diet vs. control
Daily dose: NA
On elimination diet: NA Regimen: each diet used for 3-4 weeks Placebo: control diet, not well described Vehicle: NA Washout: unclear Infractions: 0.65-1.33 deviations per week per teachers and parent reports
Hyperactivity
Method: neuropsychological testing and laboratory and classroom observations; parent and teachers Conners P-TQ Validated: yes Timing: neuropsychological testing and laboratory observations at baseline and conclusion of each 3-4 week diet period; classroom observations 3 times per week; parent and teachers Conners scores weekly
Elimination diet: In older children (ages 6-13 years)
Parent: 13 of 36 (36%) rated as improved on elimination diet, 6 worsened (17%), 17 no change (p<0.05) Teacher: 6 of 36 improved, 10 worsened, and 20 unchanged (p >0.05) Other: no effect of diet on not attending to task, restless motor activity, locomotor activity, or classroom disruption; elimination diet better for one neuropsychological test but worse for several others
In preschool children:
Parent: all 10 improved on the elimination diet Teacher: NA Other: no diet effect seen but few details given
Challenge: NA
Timing: NA Age effect: stronger effects appear to be seen in younger subjects (3-6 years) Order effect: greater effects in those receiving control diet first in older boys, no order effect in preschool boys Individual results: yes (see results) Replication: not done
Magnitude (>20%): yes Statistical significance: yes Dose-response: NA Subgroup only: no Funder: no information Reported conflicts: no information Full results: no, limited results given for preschoolers
• All boys • Included 36 older hyperactive
boys (ages 6-13 years) and 34 matched controls, and 10 hyperactive preschool boys (ages 3-6 years)
• Medications for hyperactivity were terminated
• Feingold diet: foods with added salicylates, synthetic food dyes, and synthetic flavors were eliminated. Control diet not well described
• Classroom observations included controls without hyperactivity matched on classroom, age, grade, teachers judgement of academic ability
Harley et al., 1978b
Location: US
Hyperactive: mixed Responders: yes Ages: 3-12 N: 18
Cohort: previous responders and matched controls Selection: unclear Recruitment: unclear Participation: unclear
Cross-over: yes Randomized: unclear Blinded: double Placebo: yes Adequate placebo: none of the parents or children identified placebo vs. challenge
27 mg of food colors per item, 2 items per day
Daily dose: 54 mg
On elimination diet: yes Regimen: two periods of placebo or challenge materials for 2-3 weeks each Placebo: vehicle without the food dyes Vehicle: cookies or candy bars Washout: none Infractions: limited data, maximum number was 6 over 11 weeks in one subject
Hyperactivity; deviant behavior, gross motor activity, non-work, disturbing behavior, isolation, on and off task activity (attention)
Method: Conners 10-item P-TQ to parents and teachers two times per week for 13 weeks; classroom observation by trained observers using the Werry and Quay method two times per week for 13 weeks; neuropsychological exams at baseline and end of each diet period; for classroom observations Validated: yes Timing: two times per week
Elimination diet: NA
Challenge: Parent: no group effect Teacher: no group effect Other: no group effect on classroom behavior or neuropsychological testing
Timing: NA Age effect: NA Order effect: a challenge effect seems to be seen when placebo given first (their Figure 1) Individual results: yes, one subject seemed to show a challenge effect on parent rating and classroom observation Replication: not done
Magnitude (>20%): unclear Statistical significance: no Dose-response: NA Subgroup only: no Funder: University of Wisconsin Food Research Institute, Nutrition Foundation Reported conflicts: no information Full results: yes
• Controls matched to responders on sex, grade, and academic ability
• No child was on medications • Challenge materials not fully
described
Levy and Hobbes, 1978
Location: Australia
Hyperactive: yes Responders: yes Ages: mean age 5 years and 2 months (range not given) N: 8
Cohort: unclear Selection: unclear Recruitment: unclear Participation: 7/8 = 87%
Cross-over: yes Randomized: yes Blinded: unclear Placebo: yes Adequate placebo: mothers could not differentiate challenge from placebo
Tartrazine
Daily dose: 4 mg
On elimination diet: likely Regimen: attempted to replicate procedures in Goyette et al. (unpublished) but few details provided. It appears that 4 challenge or placebo cookies were given each day for 14 days each Placebo: cookie without extra tartrazine Vehicle: cookie Washout: unclear Infractions: NA
Hyperactivity
Method: Conners scale, parent Validated: yes Timing: unclear
Elimination diet: NA
Challenge: Parent: 2.6 points higher (13%) during the challenge but result not statistically significant Teacher: NA Other: NA
Timing: NA Age effect: NA Order effect: NA Individual results: not given Replication: not done
Magnitude (>20%): no Statistical significance: no Dose-response: NA Subgroup only: no Funder: no information Reported conflicts: no information Full results: no, limited information on the outcome metrics
• 7 boys and 1 girl
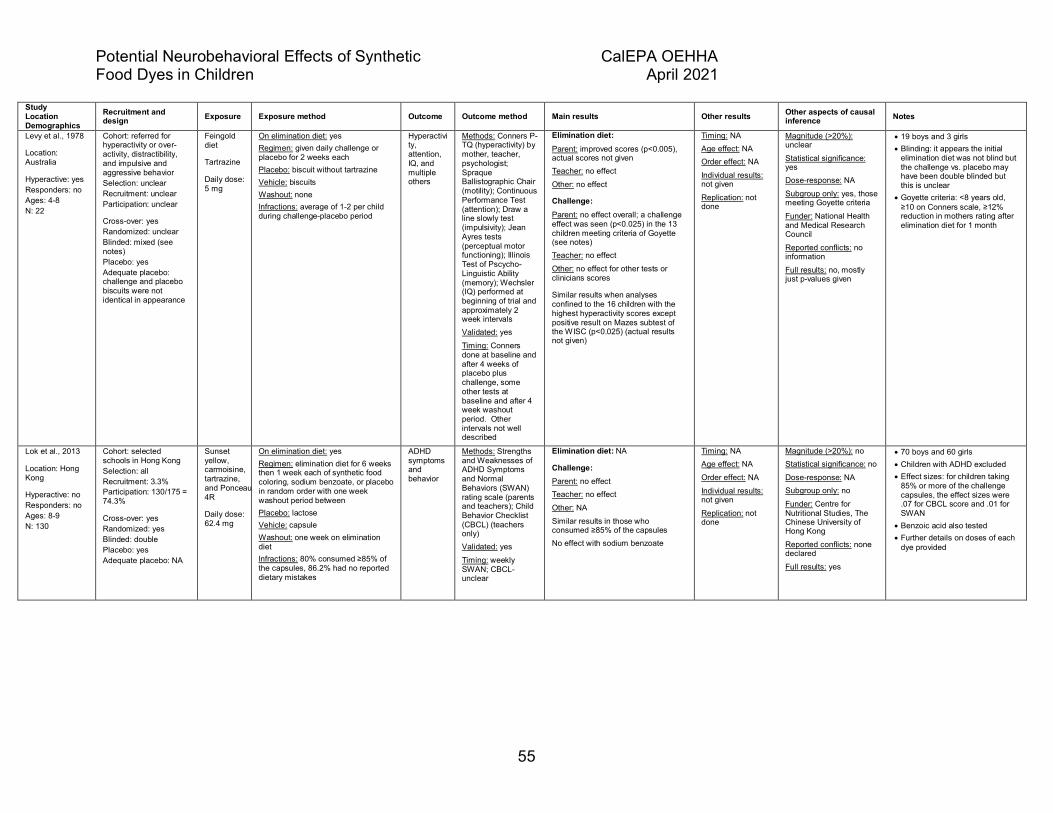
Potential Neurobehavioral Effects of Synthetic CalEPA OEHHA Food Dyes in Children April 2021
55
Study Location Demographics
Recruitment and design Exposure Exposure method Outcome Outcome method Main results Other results Other aspects of causal
inference Notes
Levy et al., 1978
Location: Australia
Hyperactive: yes Responders: no Ages: 4-8 N: 22
Cohort: referred for hyperactivity or over-activity, distractibility, and impulsive and aggressive behavior Selection: unclear Recruitment: unclear Participation: unclear
Cross-over: yes Randomized: unclear Blinded: mixed (see notes) Placebo: yes Adequate placebo: challenge and placebo biscuits were not identical in appearance
Feingold diet
Tartrazine
Daily dose: 5 mg
On elimination diet: yes Regimen: given daily challenge or placebo for 2 weeks each Placebo: biscuit without tartrazine Vehicle: biscuits Washout: none Infractions: average of 1-2 per child during challenge-placebo period
Hyperactivity, attention, IQ, and multiple others
Methods: Conners P-TQ (hyperactivity) by mother, teacher, psychologist; Spraque Ballistographic Chair (motility); Continuous Performance Test (attention); Draw a line slowly test (impulsivity); Jean Ayres tests (perceptual motor functioning); Illinois Test of Pscycho-Linguistic Ability (memory); Wechsler (IQ) performed at beginning of trial and approximately 2 week intervals Validated: yes Timing: Conners done at baseline and after 4 weeks of placebo plus challenge, some other tests at baseline and after 4 week washout period. Other intervals not well described
Elimination diet: Parent: improved scores (p<0.005), actual scores not given Teacher: no effect Other: no effect
Challenge: Parent: no effect overall; a challenge effect was seen (p<0.025) in the 13 children meeting criteria of Goyette (see notes) Teacher: no effect Other: no effect for other tests or clinicians scores
Similar results when analyses confined to the 16 children with the highest hyperactivity scores except positive result on Mazes subtest of the WISC (p<0.025) (actual results not given)
Timing: NA Age effect: NA Order effect: NA Individual results: not given Replication: not done
Magnitude (>20%): unclear Statistical significance: yes Dose-response: NA Subgroup only: yes, those meeting Goyette criteria Funder: National Health and Medical Research Council Reported conflicts: no information Full results: no, mostly just p-values given
• 19 boys and 3 girls • Blinding: it appears the initial
elimination diet was not blind but the challenge vs. placebo may have been double blinded but this is unclear
• Goyette criteria: <8 years old, ≥10 on Conners scale, ≥12% reduction in mothers rating after elimination diet for 1 month
Lok et al., 2013
Location: Hong Kong
Hyperactive: no Responders: no Ages: 8-9 N: 130
Cohort: selected schools in Hong Kong Selection: all Recruitment: 3.3% Participation: 130/175 = 74.3%
Cross-over: yes Randomized: yes Blinded: double Placebo: yes Adequate placebo: NA
Sunset yellow, carmoisine, tartrazine, and Ponceau 4R
Daily dose: 62.4 mg
On elimination diet: yes Regimen: elimination diet for 6 weeks then 1 week each of synthetic food coloring, sodium benzoate, or placebo in random order with one week washout period between Placebo: lactose Vehicle: capsule Washout: one week on elimination diet Infractions: 80% consumed ≥85% of the capsules, 86.2% had no reported dietary mistakes
ADHD symptoms and behavior
Methods: Strengths and Weaknesses of ADHD Symptoms and Normal Behaviors (SWAN) rating scale (parents and teachers); Child Behavior Checklist (CBCL) (teachers only) Validated: yes Timing: weekly SWAN; CBCL-unclear
Elimination diet: NA
Challenge: Parent: no effect Teacher: no effect Other: NA Similar results in those who consumed ≥85% of the capsules No effect with sodium benzoate
Timing: NA Age effect: NA Order effect: NA Individual results: not given Replication: not done
Magnitude (>20%): no Statistical significance: no Dose-response: NA Subgroup only: no Funder: Centre for Nutritional Studies, The Chinese University of Hong Kong Reported conflicts: none declared Full results: yes
• 70 boys and 60 girls • Children with ADHD excluded • Effect sizes: for children taking
85% or more of the challenge capsules, the effect sizes were .07 for CBCL score and .01 for SWAN
• Benzoic acid also tested • Further details on doses of each
dye provided
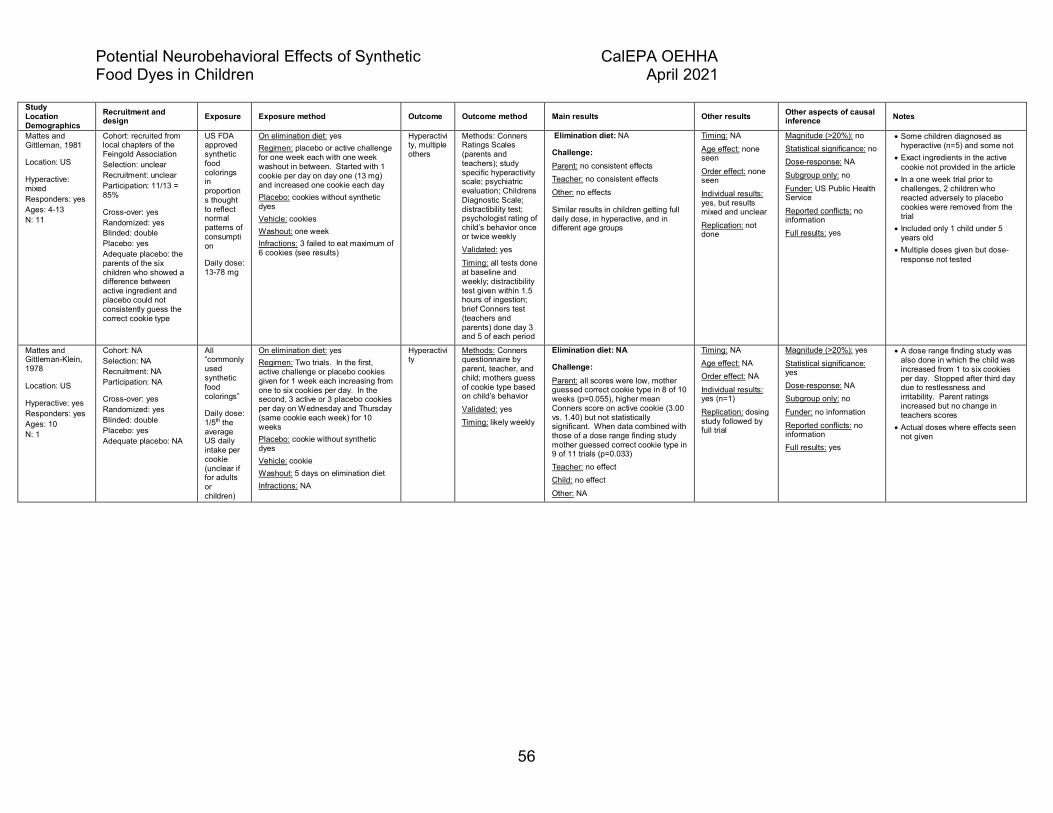
Potential Neurobehavioral Effects of Synthetic CalEPA OEHHA Food Dyes in Children April 2021
56
Study Location Demographics
Recruitment and design Exposure Exposure method Outcome Outcome method Main results Other results Other aspects of causal
inference Notes
Mattes and Gittleman, 1981
Location: US
Hyperactive: mixed Responders: yes Ages: 4-13 N: 11
Cohort: recruited from local chapters of the Feingold Association Selection: unclear Recruitment: unclear Participation: 11/13 = 85%
Cross-over: yes Randomized: yes Blinded: double Placebo: yes Adequate placebo: the parents of the six children who showed a difference between active ingredient and placebo could not consistently guess the correct cookie type
US FDA approved synthetic food colorings in proportions thought to reflect normal patterns of consumption
Daily dose: 13-78 mg
On elimination diet: yes Regimen: placebo or active challenge for one week each with one week washout in between. Started with 1 cookie per day on day one (13 mg) and increased one cookie each day Placebo: cookies without synthetic dyes Vehicle: cookies Washout: one week Infractions: 3 failed to eat maximum of 6 cookies (see results)
Hyperactivity, multiple others
Methods: Conners Ratings Scales (parents and teachers); study specific hyperactivity scale; psychiatric evaluation; Childrens Diagnostic Scale; distractibility test; psychologist rating of child’s behavior once or twice weekly Validated: yes Timing: all tests done at baseline and weekly; distractibility test given within 1.5 hours of ingestion; brief Conners test (teachers and parents) done day 3 and 5 of each period
Elimination diet: NA
Challenge: Parent: no consistent effects Teacher: no consistent effects Other: no effects
Similar results in children getting full daily dose, in hyperactive, and in different age groups
Timing: NA Age effect: none seen Order effect: none seen Individual results: yes, but results mixed and unclear Replication: not done
Magnitude (>20%): no Statistical significance: no Dose-response: NA Subgroup only: no Funder: US Public Health Service Reported conflicts: no information Full results: yes
• Some children diagnosed as hyperactive (n=5) and some not
• Exact ingredients in the active cookie not provided in the article
• In a one week trial prior to challenges, 2 children who reacted adversely to placebo cookies were removed from the trial
• Included only 1 child under 5 years old
• Multiple doses given but dose-response not tested
Mattes and Gittleman-Klein, 1978
Location: US
Hyperactive: yes Responders: yes Ages: 10 N: 1
Cohort: NA Selection: NA Recruitment: NA Participation: NA
Cross-over: yes Randomized: yes Blinded: double Placebo: yes Adequate placebo: NA
All “commonly used synthetic food colorings”
Daily dose: 1/5th the average US daily intake per cookie (unclear if for adults or children)
On elimination diet: yes Regimen: Two trials. In the first, active challenge or placebo cookies given for 1 week each increasing from one to six cookies per day. In the second, 3 active or 3 placebo cookies per day on Wednesday and Thursday (same cookie each week) for 10 weeks Placebo: cookie without synthetic dyes Vehicle: cookie Washout: 5 days on elimination diet Infractions: NA
Hyperactivity
Methods: Conners questionnaire by parent, teacher, and child; mothers guess of cookie type based on child’s behavior Validated: yes Timing: likely weekly
Elimination diet: NA
Challenge: Parent: all scores were low, mother guessed correct cookie type in 8 of 10 weeks (p=0.055), higher mean Conners score on active cookie (3.00 vs. 1.40) but not statistically significant. When data combined with those of a dose range finding study mother guessed correct cookie type in 9 of 11 trials (p=0.033) Teacher: no effect Child: no effect Other: NA
Timing: NA Age effect: NA Order effect: NA Individual results: yes (n=1) Replication: dosing study followed by full trial
Magnitude (>20%): yes Statistical significance: yes Dose-response: NA Subgroup only: no Funder: no information Reported conflicts: no information Full results: yes
• A dose range finding study was also done in which the child was increased from 1 to six cookies per day. Stopped after third day due to restlessness and irritability. Parent ratings increased but no change in teachers scores
• Actual doses where effects seen not given
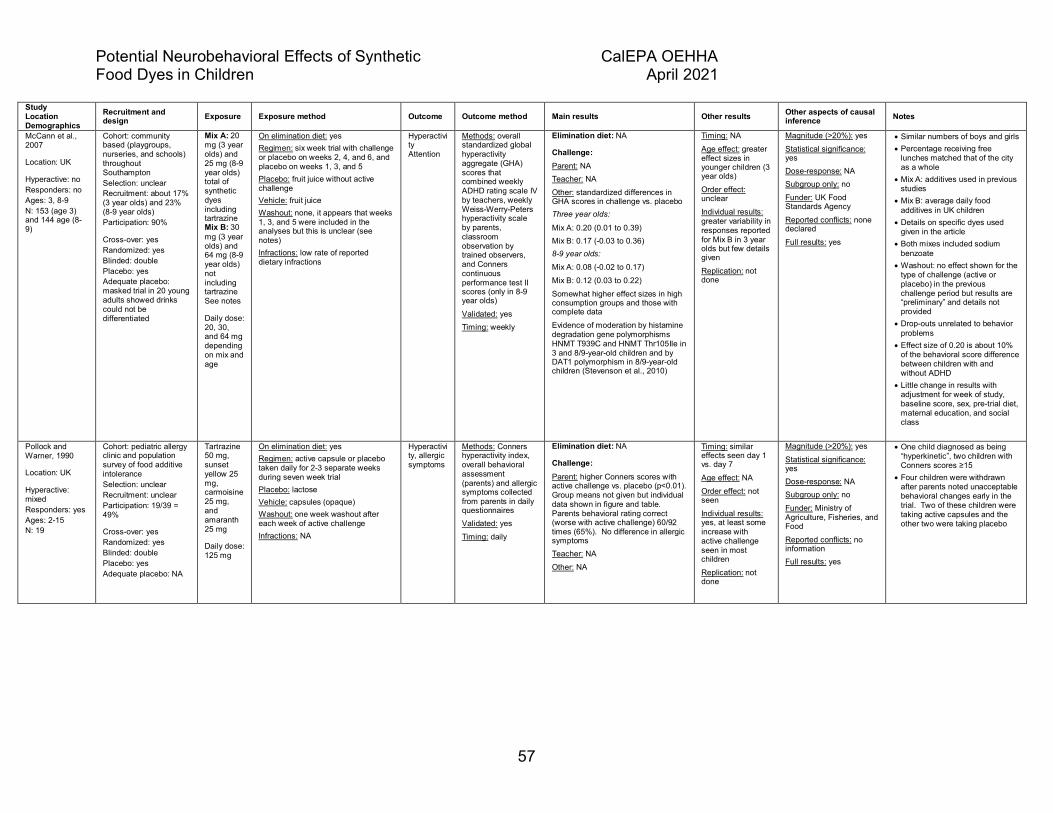
Potential Neurobehavioral Effects of Synthetic CalEPA OEHHA Food Dyes in Children April 2021
57
Study Location Demographics
Recruitment and design Exposure Exposure method Outcome Outcome method Main results Other results Other aspects of causal
inference Notes
McCann et al., 2007
Location: UK
Hyperactive: no Responders: no Ages: 3, 8-9 N: 153 (age 3) and 144 age (8-9)
Cohort: community based (playgroups, nurseries, and schools) throughout Southampton Selection: unclear Recruitment: about 17% (3 year olds) and 23% (8-9 year olds) Participation: 90%
Cross-over: yes Randomized: yes Blinded: double Placebo: yes Adequate placebo: masked trial in 20 young adults showed drinks could not be differentiated
Mix A: 20 mg (3 year olds) and 25 mg (8-9 year olds) total of synthetic dyes including tartrazine Mix B: 30 mg (3 year olds) and 64 mg (8-9 year olds) not including tartrazine See notes
Daily dose: 20, 30, and 64 mg depending on mix and age
On elimination diet: yes Regimen: six week trial with challenge or placebo on weeks 2, 4, and 6, and placebo on weeks 1, 3, and 5 Placebo: fruit juice without active challenge Vehicle: fruit juice Washout: none, it appears that weeks 1, 3, and 5 were included in the analyses but this is unclear (see notes) Infractions: low rate of reported dietary infractions
Hyperactivity Attention
Methods: overall standardized global hyperactivity aggregate (GHA) scores that combined weekly ADHD rating scale IV by teachers, weekly Weiss-Werry-Peters hyperactivity scale by parents, classroom observation by trained observers, and Conners continuous performance test II scores (only in 8-9 year olds) Validated: yes Timing: weekly
Elimination diet: NA
Challenge: Parent: NA Teacher: NA Other: standardized differences in GHA scores in challenge vs. placebo Three year olds:
Mix A: 0.20 (0.01 to 0.39) Mix B: 0.17 (-0.03 to 0.36) 8-9 year olds:
Mix A: 0.08 (-0.02 to 0.17) Mix B: 0.12 (0.03 to 0.22) Somewhat higher effect sizes in high consumption groups and those with complete data Evidence of moderation by histamine degradation gene polymorphisms HNMT T939C and HNMT Thr105Ile in 3 and 8/9-year-old children and by DAT1 polymorphism in 8/9-year-old children (Stevenson et al., 2010)
Timing: NA Age effect: greater effect sizes in younger children (3 year olds) Order effect: unclear Individual results: greater variability in responses reported for Mix B in 3 year olds but few details given Replication: not done
Magnitude (>20%): yes Statistical significance: yes Dose-response: NA Subgroup only: no Funder: UK Food Standards Agency Reported conflicts: none declared Full results: yes
• Similar numbers of boys and girls • Percentage receiving free
lunches matched that of the city as a whole
• Mix A: additives used in previous studies
• Mix B: average daily food additives in UK children
• Details on specific dyes used given in the article
• Both mixes included sodium benzoate
• Washout: no effect shown for the type of challenge (active or placebo) in the previous challenge period but results are “preliminary” and details not provided
• Drop-outs unrelated to behavior problems
• Effect size of 0.20 is about 10% of the behavioral score difference between children with and without ADHD
• Little change in results with adjustment for week of study, baseline score, sex, pre-trial diet, maternal education, and social class
Pollock and Warner, 1990
Location: UK
Hyperactive: mixed Responders: yes Ages: 2-15 N: 19
Cohort: pediatric allergy clinic and population survey of food additive intolerance Selection: unclear Recruitment: unclear Participation: 19/39 = 49%
Cross-over: yes Randomized: yes Blinded: double Placebo: yes Adequate placebo: NA
Tartrazine 50 mg, sunset yellow 25 mg, carmoisine 25 mg, and amaranth 25 mg
Daily dose: 125 mg
On elimination diet: yes Regimen: active capsule or placebo taken daily for 2-3 separate weeks during seven week trial Placebo: lactose Vehicle: capsules (opaque) Washout: one week washout after each week of active challenge Infractions: NA
Hyperactivity, allergic symptoms
Methods: Conners hyperactivity index, overall behavioral assessment (parents) and allergic symptoms collected from parents in daily questionnaires Validated: yes Timing: daily
Elimination diet: NA
Challenge: Parent: higher Conners scores with active challenge vs. placebo (p<0.01). Group means not given but individual data shown in figure and table. Parents behavioral rating correct (worse with active challenge) 60/92 times (65%). No difference in allergic symptoms Teacher: NA Other: NA
Timing: similar effects seen day 1 vs. day 7 Age effect: NA Order effect: not seen Individual results: yes, at least some increase with active challenge seen in most children Replication: not done
Magnitude (>20%): yes Statistical significance: yes Dose-response: NA Subgroup only: no Funder: Ministry of Agriculture, Fisheries, and Food Reported conflicts: no information Full results: yes
• One child diagnosed as being “hyperkinetic”, two children with Conners scores ≥15
• Four children were withdrawn after parents noted unacceptable behavioral changes early in the trial. Two of these children were taking active capsules and the other two were taking placebo

Potential Neurobehavioral Effects of Synthetic CalEPA OEHHA Food Dyes in Children April 2021
58
Study Location Demographics
Recruitment and design Exposure Exposure method Outcome Outcome method Main results Other results Other aspects of causal
inference Notes
Rapp, 1978
Location: US
Hyperactive: yes Responders: no Ages: 5-16 N: 24
Cohort: hyperactive and referred by physicians, psychologists, and members of the Association for Children with Learning Disabilities Selection: unclear Recruitment: unclear Participation: unclear
Cross-over: yes Randomized: yes Blinded: yes Placebo: yes Adequate placebo: NA
Red, yellow, green, and blue McCormick’s food coloring
Daily dose: “three drops” or 0.1 ml total
On elimination diet: no Regimen: dyes or control (grape juice) given once sublingually, each on the same day Placebo: similarly colored grape juice Vehicle: none Washout: none Infractions: monitored
Hyperactivity, other
Methods: direct observations of activity by trained “housewife” and study nurse; standard one-minute WISC Coding test and three-minute Ayres Southern California Motor Accuracy test, about 10-15 minutes before and after each challenge Validated: unclear Timing: within 10-15 minutes of dosing
Elimination diet: NA
Challenge: Parent: NA Teacher: NA Other: moderate or marked increase in activity was observed in 9 of 24 patients (37%), a slight increase in five of 24 (21%), and no change in 10 of 24 (42%). The grape juice control caused a marked change in one child (4%), a slight change in two, and no change in 20 of 24 children. No effects on WISC and Ayres tests
Timing: NA Age effect: NA Order effect: NA Individual results: yes, see results Replication: mentioned but no results given
Magnitude (>20%): yes Statistical significance: likely Dose-response: NA Subgroup only: no Funder: American Academy of Pediatrics Memorial and Endowment Fund for Children. Reported conflicts: no information Full results: no, actual scores and test details not given
• 6 girls and 18 boys • 15 currently on medications, 8
discontinued them during the study
• 14 of 19 had a family history of allergies
• Elimination diet also tested but involved milk, wheat, eggs, cocoa, corn, sugar in addition to food colorings (results not reported here)
Rose, 1978
Location: US
Hyperactive: yes Responders: yes Ages: 8 N: 2
Cohort: children with hyperactivity, not on medications, and using the KP diet for at least 4 months, “a search of the community” Selection: unclear Recruitment: unclear Participation: unclear
Cross-over: yes Randomized: no Blinded: double Placebo: yes Adequate placebo: cookies with food color could not be identified vs. those without in a separate study
Tartrazine
Daily dose: 1.2 mg (0.05 mg/kg)
On elimination diet: yes Regimen: one cookie was given each day for what appears to be 30 days, with tartrazine in the cookie on two of the days, placebo on two of the days, and elimination diet otherwise Placebo: cookie with no dyes or natural salicylates Vehicle: cookie Washout: unclear, it appears that placebo may have followed the active challenge without a washout in some instances (see their Figures 1 and 2) Infractions: 1-2 dietary infractions per subject
Hyperactivity, other
Methods: daily parent logs of “significant” changes in behavior and daily 30 minute observations by graduate students for the following variables: on task, out-of-seat, and physical aggression Validated: observer reliability vs. standard data ranged from 82.4 to 100% Timing: daily
Elimination diet: NA
Challenge: Parent: “correlated perfectly” with observer data, but actual results not given Teacher: NA Other: observer data given in figure form seem consistent with a challenge effect. Statistically significant changes seen in out-of-seat and percent time on task for both subjects (all p-values <0.01). Effect sizes appear >20% based on figures. No association with aggressive behavior but rates were very low
Timing: NA Age effect: NA Order effect: NA Individual results: yes, see results Replication: not done
Magnitude (>20%): yes Statistical significance: yes Dose-response: NA Subgroup only: no Funder: no information Reported conflicts: no information Full results: no, actual results from the parents logs not given
• Both girls
Rowe and Rowe, 1994
Location: Australia
Hyperactive: mixed Responders: mixed Ages: 2-14 N: 34 with and 20 without behavioral problems
Cohort: referred to the Royal Children‘s Hospital for suspected hyperactivity and parents reported behavior changes with diet Selection: unclear Recruitment: unclear Participation: unclear
Cross-over: yes Randomized: yes Blinded: double Placebo: yes Adequate placebo: NA
Tartrazine
Daily dose: 1, 2, 5, 10, 20, 50 mg
On elimination diet: yes Regimen: each dose given one day at random days over a 21 day period with placebo given at least 2-3 consecutive days in between Placebo: lactose Vehicle: colorless capsule Washout: none, on placebo for the days in between the challenge Infractions: NA
Irritability, sleep disturbance, restlessness, aggression, attention span
Methods: Behavioral Rating Inventory (BRI) (study specific, single score based on 30 item Likert scales for irritability, sleep disturbance, restlessness aggressiveness, and attention span) and Conners 10-item APTQ – both completed by the parents Validated: no (the BRI doesn’t seem to be validated) Timing: daily
Elimination diet: NA
Challenge: Parent: 24 “reactors” identified but this is not well defined (see notes). 2 of 20 controls were reactors. Greater behavioral scores following all doses (p<0.05) with apparent dose-response relationship in reactors but not consistently in non-reactors. Average effect sizes in reactors appear >20% in figures Teacher: NA Other: NA
Timing: NA Age effect: not seen Order effect: NA Individual results: yes, but few details given and results unclear Replication: not done
Magnitude (>20%): yes Statistical significance: yes Dose-response: yes Subgroup only: yes, reactors Funder: Royal Children’s Hospital Research Foundation Reported conflicts: no information Full results: full Conners results not given, and “consistent variations” not well defined
• 16 girls and 38 boys • Reactors: “consistent variations
in behavior for at least 5 of 6 dose challenges”

Potential Neurobehavioral Effects of Synthetic CalEPA OEHHA Food Dyes in Children April 2021
59
Study Location Demographics
Recruitment and design Exposure Exposure method Outcome Outcome method Main results Other results Other aspects of causal
inference Notes
Rowe, 1988
Location: Australia
Hyperactive: mixed Responders: yes Ages: 3-15 N: 8
Cohort: referral for suspected hyperactivity Selection: unclear Recruitment: 9/14 = 64% Participation: 8/9 = 89%
Cross-over: yes Randomized: unclear Blinded: double Placebo: yes Adequate placebo: NA
Tartrazine and carmoisine
Daily dose: 50 mg (1.25-2 mg/kg per day in the two reactors)
On elimination diet: yes Regimen: either placebo, carmoisine or tartrazine given once per day for 126 days. Placebo lead-in periods of 3, 4 or 5 weeks. Carmoisine and tartrazine were each tested for 1 week on two separate occasions (i.e. a total of 4 weeks of dye administration) Placebo: lactose Vehicle: capsules Washout: none, placebo given in between challenges Infractions: NA
Over-activity, restlessness, impulsiveness, distractibility, low frustration tolerance, overt aggression, short attention span and sleep disturbance
Methods: daily behavior checklists by parents Validated: no Timing: daily
Elimination diet: NA
Challenge: Parents: two of eight children demonstrated “significant responses” to both food colorings (e.g. irritability, short attention span) (p<0.05). Effect sizes in these individuals appear >20% based on figures Teacher: ratings were attempted but incomplete Other: NA
Timing: 2 hours to 3-4 days in one responder, start time of effects not given in the other (but based on figure seems within one day) but effect lasted 3.5 weeks after last coloring dose Age effect: responders were 7 and 9 years old Order effect: NA Individual results: yes, see results Replication: not done
Magnitude (>20%): yes Statistical significance: yes Dose-response: NA Subgroup only: no Funder: no information Reported conflicts: no information Full results: no, teacher responses incomplete, group means not given
• 6 boys and 2 girls • Only Phase II results reported
here (Phase 1 was used to identify responders)
• Both responders were atopic • One reactor did not have
“inattention” as a feature (which is the focus of the Conners questionnaire)
• All reactors to the dye challenge were atopic
Sarantinos et al., 1990
Location: Canada
Hyperactive: yes (ADHD) Responders: mixed Ages: 4-14 N: 13
Cohort: previously diagnosed with ADHD Selection: unclear Recruitment: unclear Participation: unclear
Cross-over: yes Randomized: yes Blinded: double Placebo: yes Adequate placebo: the mother of one responder correctly identified coloring vs. placebo in 25 of 28 occasions
Tartrazine and sunset yellow
Daily dose: 60 mg
On elimination diet: yes Regimen: one group received six challenges of tartrazine (10 mg per challenge), and one group received three daily challenges of tartrazine (10 mg per challenge) and three daily challenges of sunset yellow (10 mg per challenge) Placebo: orange juice with the challenge Vehicle: orange juice Washout: unclear, children may have received the placebo between active challenges Infractions: NA
Hyperactivity, others
Methods: Conners Abbreviated Parents Scale and Behavioral Rating Inventory, both by parents Validated: yes Timing: daily
Elimination diet: NA
Challenge: Parent: two children showed a significant change in behavior with both dyes on both scales (p<0.05). Few details provided, group means or effect sizes in individuals not given Teacher: NA Other: NA
Timing: NA Age effect: NA Order effect: NA Individual results: yes, see main results Replication: not done
Magnitude (>20%): unclear Statistical significance: yes Dose-response: NA Subgroup only: no Funder: no information Reported conflicts: no information Full results: no, group means or detailed individual results not given
• 1 girl and 12 boys • In 4 of the children, parents were
uncertain of improvement on synthetic color free diet
• Both responders were atopic
Spring et al., 1981
Location: US
Hyperactive: likely Responders: yes Ages: 8-13 N: 6
Cohort: previous responders Selection: unclear Recruitment: unclear Participation: 6/8 = 75%
Cross-over: yes Randomized: yes Blinded: double Placebo: yes Adequate placebo: active challenge could not be distinguished from placebo in pilot testing (few details given)
Feingold diet
Red 40, yellow 5, yellow 6, red 3, blue 1, blue 2, orange B, green 3
Daily dose: 26 mg
On elimination diet: yes Regimen: cookies with (active) or without (placebo) synthetic food colors eaten three consecutive days per week for two weeks each, with elimination diet in between Placebo: cookies without synthetic dyes Vehicle: cookies Washout: 4 days Infractions: low rate of infractions in the responding subject, greater infractions in 3 others
Hyperactivity, overall behavior
Methods: abbreviated study specific hyperactivity rating scale by parents, similar to the Conners abbreviated scale. Mothers and teachers asked to guess whether child had been given active challenge or placebo Validated: yes Timing: 3 days per week
Elimination diet: Parent: hyperactivity ratings all decreased while on the elimination diet (improvement of 49%, p-value not given) Teacher: NA Other: NA
Challenge: Parent: guesses were fairly accurate in one subject (“Subject E”) and moderately accurate in another subject. In Subject E, correlations seen between challenge and hyperactivity scores (p< 0.05). Inaccurate in all others Teacher: guesses were accurate in Subject E. Inaccurate in all others Other: NA
Timing: NA Age effect: NA Order effect: unclear Individual results: yes, positive results mostly confined to one individual Replication: results in Subject E could not be replicated
Magnitude (>20%): no Statistical significance: no (initial result not replicated) Dose-response: NA Subgroup only: no Funder: no information Reported conflicts: no information Full results: yes
• 6 Caucasian boys • Medications were discontinued

Potential Neurobehavioral Effects of Synthetic CalEPA OEHHA Food Dyes in Children April 2021
60
Study Location Demographics
Recruitment and design Exposure Exposure method Outcome Outcome method Main results Other results Other aspects of causal
inference Notes
Swanson and Kinsbourne, 1980a
Location: Canada
Hyperactive: mixed Responders: no Ages: 5-12 N: 40
Cohort: referrals with hyperactive symptoms Selection: unclear Recruitment: unclear Participation: unclear
Cross-over: yes Randomized: unclear Blinded: unclear Placebo: yes Adequate placebo: NA
A blend of nine food dyes, in proportion to use in the US
Daily dose: 100 (n=20) and 150 mg (n=20)
On elimination diet: yes Regimen: Feingold diet for 3 days then challenged with food coloring or placebo once per day on days 4 and 5 Placebo: capsule with sugar Vehicle: capsules Washout: none Infractions: monitored
Learning task; hyperactivity
Methods: paired associate learning test; Conners scale (unclear who filled this out) Validated: yes Timing: four times per day
Elimination diet: NA
Challenge: Parents: NA Teachers: NA Other: increase in errors associated with food dyes (p<0.05). Similar effects with 100 or 150 mg doses. Effects only seen in those who previously responded to methylphenidate. No associations seen on the Conners scale Large placebo effect seen in the non-hyperactive group
Timing: effects took ½ hour to become evident peaked at 1.5 hours after dosing, and lasted at least 3.5 hours. Age effect: NA Order effect: NA Individual results: not given Replication: not done
Magnitude (>20%): unclear Statistical significance: yes Dose-response: not seen Subgroup only: yes, previously responded to methylphenidate Funder: no information Reported conflicts: no information Full results: yes
• 36 boys and 4 girls • Children were hospitalized during
the study • Included 20 children who showed
a favorable response to stimulant medication (methylphenidate) (“hyperactive”) and 20 who did not
• Medications were stopped during the study
• Specific dyes and percentages given in the article
Swanson and Kinsbourne, 1980b
Location: Canada
Hyperactive: yes Responders: no Ages: unclear N: 8
Cohort: unclear Selection: unclear Recruitment: unclear Participation: unclear
Cross-over: yes Randomized: unclear Blinded: double Placebo: yes Adequate placebo: unclear
“color blend”, not described
Daily dose: 26 mg
On elimination diet: yes Regimen: Feingold diet for 2 days then challenged with placebo on day 3, and food colorings on days 4 and 5 Placebo: cookie without food dyes Vehicle: cookie Washout: none Infractions: monitored intakes
Learning task; hyperactivity
Methods: paired associate learning test; Conners scale (teacher and learning test administrator) Validated: yes Timing: six times per day
Elimination diet: NA
Challenge: Parents: NA Teachers: NA Other: increase in performance with active ingredient vs. placebo (opposite of expectation). Conners scores not given.
Timing: no effects Age effect: NA Order effect: NA Individual results: not given Replication: not done
Magnitude (>20%): no Statistical significance: no Dose-response: NA Subgroup only: NA Funder: no information Reported conflicts: no information Full results: no Conners scores
• Children were hospitalized during the study
• Medications were stopped • Specific dyes and percentages
not given • Higher doses assessed in
Swanson and Kinsbourne, 1980a and protocols somewhat different
Thorley, 1984
Location: UK
Hyperactive: unclear Responders: no Ages: 12 (mean) N: 10
Cohort: in residence boarders at a school for developmentally disabled Selection: all Recruitment: 100% Participation: 100%
Cross-over: yes Randomized: yes Blinded: double Placebo: yes Adequate placebo: may have been assessed but no details given
16 of the most commonly used dyes
Daily dose: 91.8 mg
On elimination diet: yes Regimen: 14 day trial with challenge once per day for 2 consecutive days, with placebo on other days Placebo: cocoa drink without challenge Vehicle: cocoa drink Washout: likely adequate, it appears that only tests done on the placebo days prior to challenge were used as the comparison, 14 days on elimination diet prior to study Infractions: none
Hyperactivity, others
Method: Conners scale reported by teachers and care staff; study specific scale of the “five most problematic behaviors; other tests (Porteus Mazes, paired associate learning test, actometers) Validated: yes Timing: testing -2 hours after ingestion, behavioral observations throughout the day
Elimination diet: NA
Challenge: Parent: scores improved on challenge days (opposite of expectation) Teacher: scores improved on challenge days (opposite of expectation) Other: Porteus mazes, paired-associate learning test and actometer readings and scores were worse with the challenge (5-30%) but results not statistically significant
Timing: NA Age effect: NA Order effect: NA Individual results: not given Replication: not done
Magnitude (>20%): yes Statistical significance: no Dose-response: NA Subgroup only: no Funder: no information Reported conflicts: no information Full results: yes
• 8 boys and 2 girls • Specific dyes and percentages
provided in the article
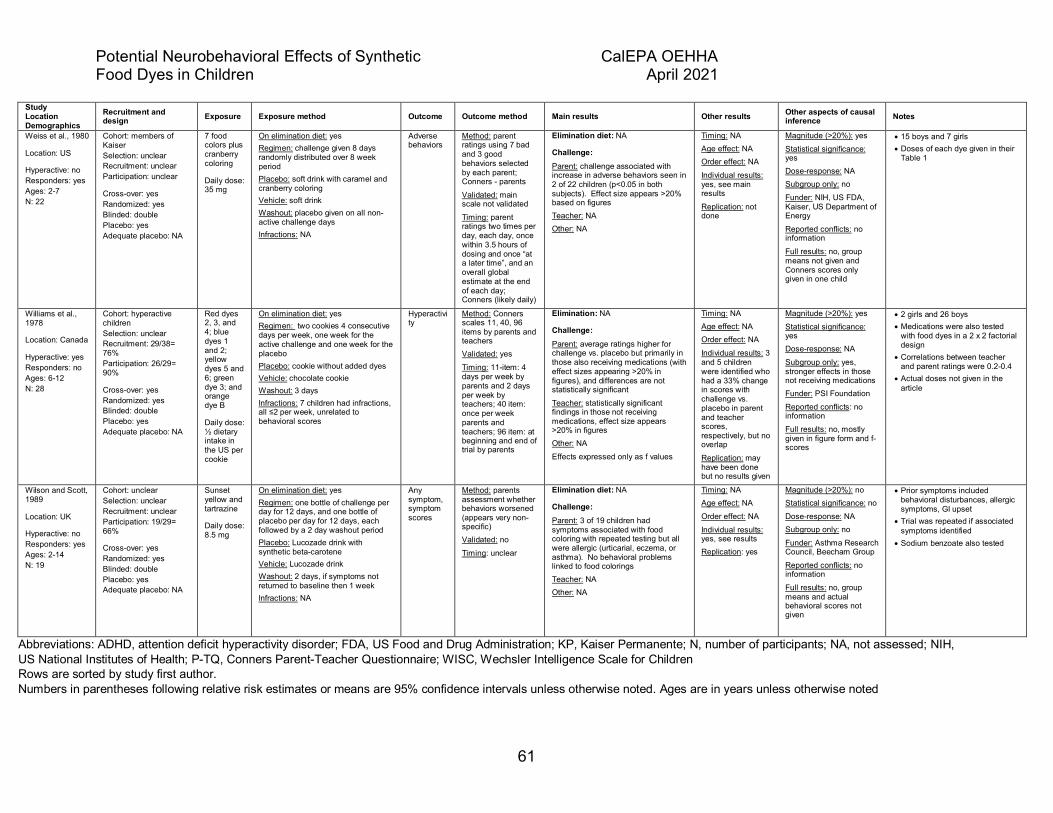
Potential Neurobehavioral Effects of Synthetic CalEPA OEHHA Food Dyes in Children April 2021
61
Study Location Demographics
Recruitment and design Exposure Exposure method Outcome Outcome method Main results Other results Other aspects of causal
inference Notes
Weiss et al., 1980
Location: US
Hyperactive: no Responders: yes Ages: 2-7 N: 22
Cohort: members of Kaiser Selection: unclear Recruitment: unclear Participation: unclear
Cross-over: yes Randomized: yes Blinded: double Placebo: yes Adequate placebo: NA
7 food colors plus cranberry coloring
Daily dose: 35 mg
On elimination diet: yes Regimen: challenge given 8 days randomly distributed over 8 week period Placebo: soft drink with caramel and cranberry coloring Vehicle: soft drink Washout: placebo given on all non-active challenge days Infractions: NA
Adverse behaviors
Method: parent ratings using 7 bad and 3 good behaviors selected by each parent; Conners - parents Validated: main scale not validated Timing: parent ratings two times per day, each day, once within 3.5 hours of dosing and once “at a later time”, and an overall global estimate at the end of each day; Conners (likely daily)
Elimination diet: NA
Challenge: Parent: challenge associated with increase in adverse behaviors seen in 2 of 22 children (p<0.05 in both subjects). Effect size appears >20% based on figures Teacher: NA Other: NA
Timing: NA Age effect: NA Order effect: NA Individual results: yes, see main results Replication: not done
Magnitude (>20%): yes Statistical significance: yes Dose-response: NA Subgroup only: no Funder: NIH, US FDA, Kaiser, US Department of Energy Reported conflicts: no information Full results: no, group means not given and Conners scores only given in one child
• 15 boys and 7 girls • Doses of each dye given in their
Table 1
Williams et al., 1978
Location: Canada
Hyperactive: yes Responders: no Ages: 6-12 N: 28
Cohort: hyperactive children Selection: unclear Recruitment: 29/38= 76% Participation: 26/29= 90%
Cross-over: yes Randomized: yes Blinded: double Placebo: yes Adequate placebo: NA
Red dyes 2, 3, and 4; blue dyes 1 and 2; yellow dyes 5 and 6; green dye 3; and orange dye B
Daily dose: ½ dietary intake in the US per cookie
On elimination diet: yes Regimen: two cookies 4 consecutive days per week, one week for the active challenge and one week for the placebo Placebo: cookie without added dyes Vehicle: chocolate cookie Washout: 3 days Infractions: 7 children had infractions, all ≤2 per week, unrelated to behavioral scores
Hyperactivity
Method: Conners scales 11, 40, 96 items by parents and teachers Validated: yes Timing: 11-item: 4 days per week by parents and 2 days per week by teachers; 40 item: once per week parents and teachers; 96 item: at beginning and end of trial by parents
Elimination: NA
Challenge: Parent: average ratings higher for challenge vs. placebo but primarily in those also receiving medications (with effect sizes appearing >20% in figures), and differences are not statistically significant Teacher: statistically significant findings in those not receiving medications, effect size appears >20% in figures Other: NA Effects expressed only as f values
Timing: NA Age effect: NA Order effect: NA Individual results: 3 and 5 children were identified who had a 33% change in scores with challenge vs. placebo in parent and teacher scores, respectively, but no overlap Replication: may have been done but no results given
Magnitude (>20%): yes Statistical significance: yes Dose-response: NA Subgroup only: yes, stronger effects in those not receiving medications Funder: PSI Foundation Reported conflicts: no information Full results: no, mostly given in figure form and f-scores
• 2 girls and 26 boys • Medications were also tested
with food dyes in a 2 x 2 factorial design
• Correlations between teacher and parent ratings were 0.2-0.4
• Actual doses not given in the article
Wilson and Scott, 1989
Location: UK
Hyperactive: no Responders: yes Ages: 2-14 N: 19
Cohort: unclear Selection: unclear Recruitment: unclear Participation: 19/29= 66%
Cross-over: yes Randomized: yes Blinded: double Placebo: yes Adequate placebo: NA
Sunset yellow and tartrazine
Daily dose: 8.5 mg
On elimination diet: yes Regimen: one bottle of challenge per day for 12 days, and one bottle of placebo per day for 12 days, each followed by a 2 day washout period Placebo: Lucozade drink with synthetic beta-carotene Vehicle: Lucozade drink Washout: 2 days, if symptoms not returned to baseline then 1 week Infractions: NA
Any symptom, symptom scores
Method: parents assessment whether behaviors worsened (appears very non-specific) Validated: no Timing: unclear
Elimination diet: NA
Challenge: Parent: 3 of 19 children had symptoms associated with food coloring with repeated testing but all were allergic (urticarial, eczema, or asthma). No behavioral problems linked to food colorings Teacher: NA Other: NA
Timing: NA Age effect: NA Order effect: NA Individual results: yes, see results Replication: yes
Magnitude (>20%): no Statistical significance: no Dose-response: NA Subgroup only: no Funder: Asthma Research Council, Beecham Group Reported conflicts: no information Full results: no, group means and actual behavioral scores not given
• Prior symptoms included behavioral disturbances, allergic symptoms, GI upset
• Trial was repeated if associated symptoms identified
• Sodium benzoate also tested
Abbreviations: ADHD, attention deficit hyperactivity disorder; FDA, US Food and Drug Administration; KP, Kaiser Permanente; N, number of participants; NA, not assessed; NIH, US National Institutes of Health; P-TQ, Conners Parent-Teacher Questionnaire; WISC, Wechsler Intelligence Scale for Children Rows are sorted by study first author. Numbers in parentheses following relative risk estimates or means are 95% confidence intervals unless otherwise noted. Ages are in years unless otherwise noted

Potential Neurobehavioral Effects of Synthetic CalEPA OEHHA Food Dyes in Children April 2021
62
Table 2.2 Excluded studies and reason for exclusion Study Reason for exclusion Summary of results Boris M and Mandel FS (1994). Foods and additives are common causes of the attention deficit hyperactive disorder in children. Ann Allergy 72(5): 462-468.
Only a small fraction of subjects were challenged with food dyes, and separate results were not provided for these subjects
Elimination diet involving multiple foods and colorings reduced, and challenge diet increased, hyperactivity in children with ADHD
Conners CK (1980). Food additives and hyperactive children. New York, Plenum Press.
Same as Conners et al., 1976; Conners et al., 1980a; and Goyette et al., 1978
NA
Conners CK, Goyette CH and Southwick DA (1976). Food additives and hyperkinesis: preliminary report of a double-blind crossover experiment. Psychopharmacol Bull 12(2): 10-11.
Same as Conners et al., 1976 NA
Conners, C. K. Food additives and hyperkinesis: A controlled double-blind experiment. Pittsburgh, Pennsylvania: University of Pittsburgh, 1975. (ERIC Document Reproduction Service No. ED 117 877).
Same as Conners et al., 1976 NA
Connolly A, Hearty A, Nugent A, McKevitt A, et al. (2010). Pattern of intake of food additives associated with hyperactivity in Irish children and teenagers. Food Addit Contam Part A Chem Anal Control Expo Risk Assess 27(4): 447-456.
Estimated exposure levels in Irish children, no outcome data
Mean intakes of the food additives were far below the doses used in McCann et al., 2007. Intakes at the 97.5th percentile were below those used in Mix B, while intakes for four of the six food colors were also below those used in Mix A.
Cook PS and Woodhill JM (1976). The Feingold dietary treatment of the hyperkinetic syndrome. Med J Aust 2(3): 85-88, 90.
No comparison or control diet used Parents in 10 of 15 children reported behavioral improvements on Feingold diet
Egger J, Carter CM, Graham PJ, Gumley D, et al. (1985). Controlled trial of oligoantigenic treatment in the hyperkinetic syndrome. Lancet 1(8428): 540-545.
Outcome (“reactions”) not well defined. Multiple items tested. Results comparing tartrazine to placebo not given.
27 of 34 children tested “reacted” to tartrazine or benzoic acid
Gajda-Wyrebek J, Kuzma K, Switka A, Jarecka J, et al. (2017). Exposure of Polish children to Southampton food colours. Food Addit Contam Part A Chem Anal Control Expo Risk Assess 34(1): 1-9.
Estimated exposure levels in Polish children, no outcome data
European Food Safety Authority Acceptable Daily Intakes for six food colors were exceeded in 4 of 149 children
Kaplan BJ, McNicol J, Conte RA and Moghadam HK (1989). Dietary replacement in preschool-aged hyperactive boys. Pediatrics 83(1): 7-17.
Multiple foods eliminated or reduced (e.g. chocolate, sugars, caffeine, dairy)
Improved behavior in more than half the children on the elimination diet
Kleinman RE, Brown RT, Cutter GR, Dupaul GJ, et al. (2011). A research model for investigating the effects of artificial food colorings on children with ADHD. Pediatrics 127(6): e1575-1584.
Proposed research methodology NA
Palmer S, Rapoport JL and Quinn PO (1975). Food additives and hyperactivity. Clin Pediatr (Phila) 14(10): 956-959.
Case-control study No difference seen in intake of “food additives” between hyperactive children and controls
Rowe KS and Briggs DR (1995). Behavioural change in children associated with synthetic food colourings. Appetite 24: 71.
Review of Rowe and Rowe, 1994 NA
Rowe KS, Hopkins IJ and Lynch BC (1979). Artificial food colorings and hyperkinesis. Australian Ped J 15: 202.
Abstract of Rowe 1988 study NA
Salzman LK (1976). Allergy testing, psychological assessment and dietary treatment of the hyperactive child syndrome. Med J Aust 2(7): 248-251.
No placebo 93% of children had improved behavior on a version of the Feingold diet
Schmidt MH, Mocks P, Lay B, Eisert HG, et al. (1997). Does oligoantigenic diet influence hyperactive/conduct-disordered children--a
Multiple foods tested Twelve children (24%) showed significant improvement in behavioral ratings on an
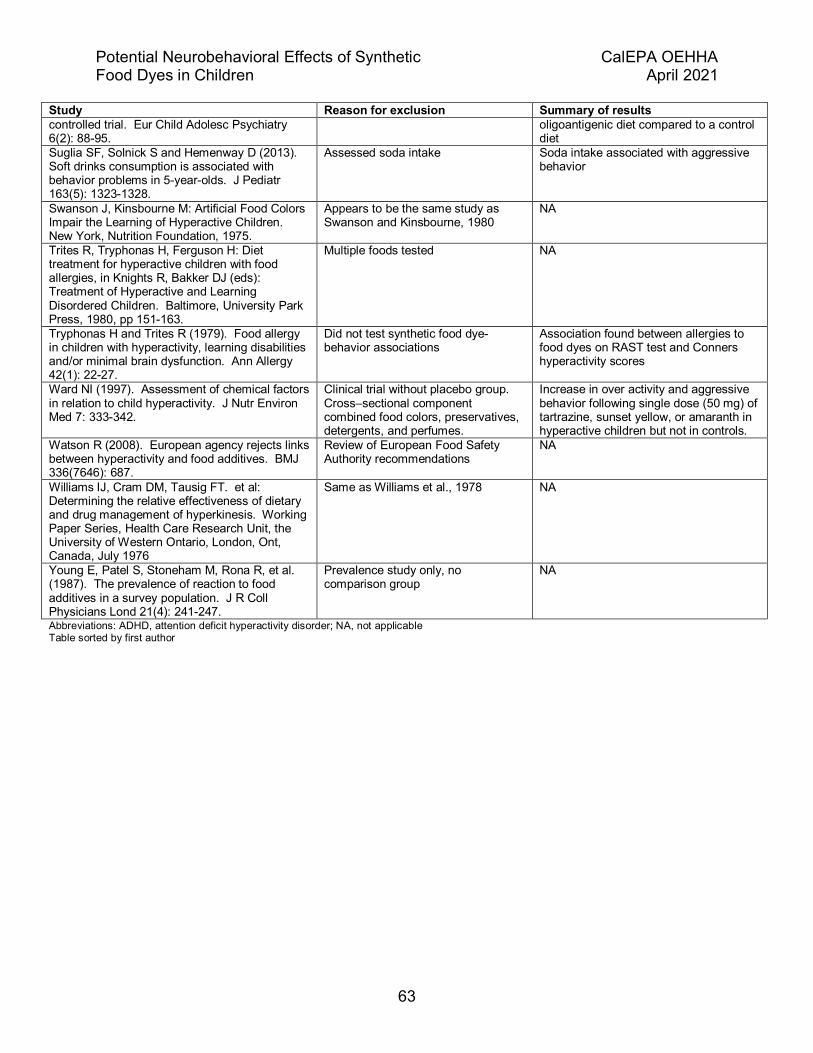
Potential Neurobehavioral Effects of Synthetic CalEPA OEHHA Food Dyes in Children April 2021
63
Study Reason for exclusion Summary of results controlled trial. Eur Child Adolesc Psychiatry 6(2): 88-95.
oligoantigenic diet compared to a control diet
Suglia SF, Solnick S and Hemenway D (2013). Soft drinks consumption is associated with behavior problems in 5-year-olds. J Pediatr 163(5): 1323-1328.
Assessed soda intake Soda intake associated with aggressive behavior
Swanson J, Kinsbourne M: Artificial Food Colors Impair the Learning of Hyperactive Children. New York, Nutrition Foundation, 1975.
Appears to be the same study as Swanson and Kinsbourne, 1980
NA
Trites R, Tryphonas H, Ferguson H: Diet treatment for hyperactive children with food allergies, in Knights R, Bakker DJ (eds): Treatment of Hyperactive and Learning Disordered Children. Baltimore, University Park Press, 1980, pp 151-163.
Multiple foods tested NA
Tryphonas H and Trites R (1979). Food allergy in children with hyperactivity, learning disabilities and/or minimal brain dysfunction. Ann Allergy 42(1): 22-27.
Did not test synthetic food dye-behavior associations
Association found between allergies to food dyes on RAST test and Conners hyperactivity scores
Ward NI (1997). Assessment of chemical factors in relation to child hyperactivity. J Nutr Environ Med 7: 333-342.
Clinical trial without placebo group. Cross–sectional component combined food colors, preservatives, detergents, and perfumes.
Increase in over activity and aggressive behavior following single dose (50 mg) of tartrazine, sunset yellow, or amaranth in hyperactive children but not in controls.
Watson R (2008). European agency rejects links between hyperactivity and food additives. BMJ 336(7646): 687.
Review of European Food Safety Authority recommendations
NA
Williams IJ, Cram DM, Tausig FT. et al: Determining the relative effectiveness of dietary and drug management of hyperkinesis. Working Paper Series, Health Care Research Unit, the University of Western Ontario, London, Ont, Canada, July 1976
Same as Williams et al., 1978 NA
Young E, Patel S, Stoneham M, Rona R, et al. (1987). The prevalence of reaction to food additives in a survey population. J R Coll Physicians Lond 21(4): 241-247.
Prevalence study only, no comparison group
NA
Abbreviations: ADHD, attention deficit hyperactivity disorder; NA, not applicable Table sorted by first author
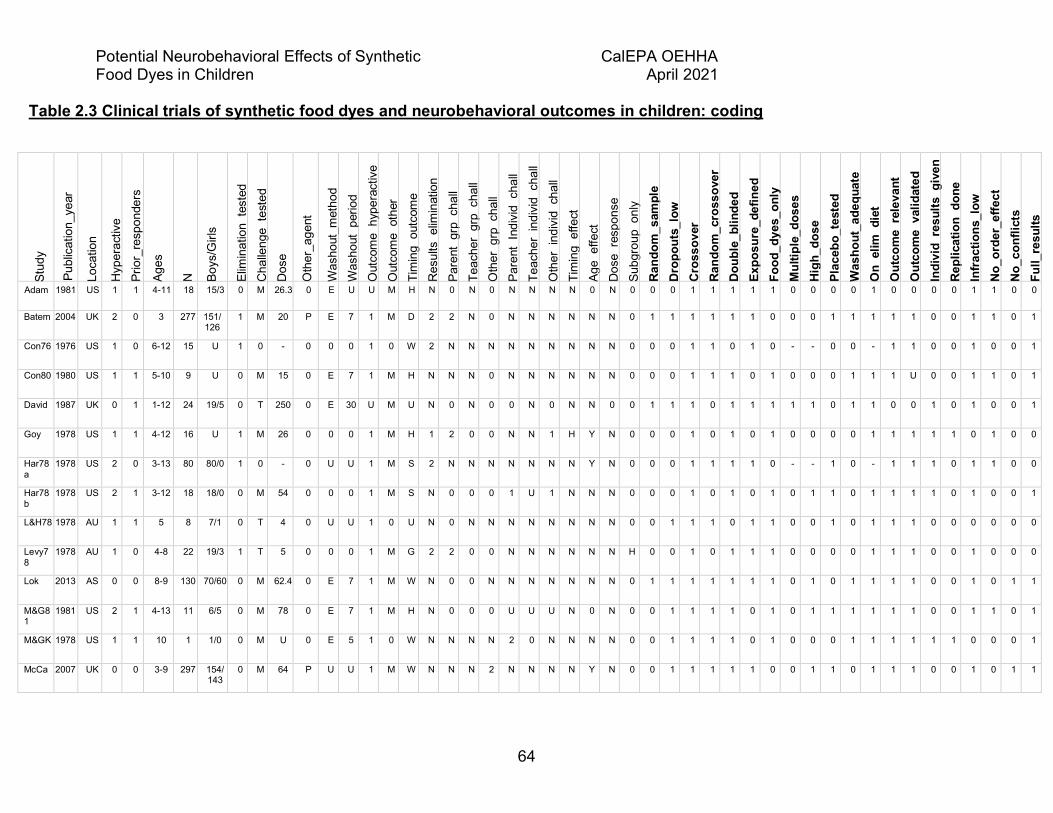
Potential Neurobehavioral Effects of Synthetic CalEPA OEHHA Food Dyes in Children April 2021
64
Table 2.3 Clinical trials of synthetic food dyes and neurobehavioral outcomes in children: coding
Stud
y
Publ
icat
ion_
year
Loca
tion
Hyp
erac
tive
Prio
r_re
spon
ders
Ages
N
Boys
/Girl
s
Elim
inat
ion
test
ed
Cha
lleng
ete
sted
D
ose
Oth
er_a
gent
Was
hout
_met
hod
Was
hout
perio
d O
utco
me
hype
ract
ive
Out
com
eot
her
Tim
ing
outc
ome
Res
ults
elim
inat
ion
Pare
ntgr
pch
all
Teac
her
grp
chal
l O
ther
grp
chal
l Pa
rent
Indi
vid
chal
l Te
ache
rin
divi
dch
all
Oth
erin
divi
dch
all
Tim
ing
effe
ct
Age
effe
ct
Dos
ere
spon
se
Subg
roup
only
Rand
om_s
ampl
e Dr
opou
ts_l
ow
Cros
sove
r Ra
ndom
_cro
ssov
er
Doub
le_b
linde
d Ex
posu
re_d
efin
ed
Food
_dye
s_on
ly
Mul
tiple
_dos
es
High
_dos
e Pl
aceb
o_te
sted
W
asho
ut_a
dequ
ate
On
elim
diet
O
utco
me
rele
vant
O
utco
me
valid
ated
In
divi
dre
sults
give
n Re
plic
atio
ndo
ne
Infra
ctio
ns_l
ow
No_o
rder
_effe
ct
No_c
onfli
cts
Full_
resu
lts
Adam 1981 US 1 1 4-11 18 15/3 0 M 26.3 0 E U U M H N 0 N 0 N N N N 0 N 0 0 0 1 1 1 1 1 0 0 0 0 1 0 0 0 0 1 1 0 0
Batem 2004 UK 2 0 3 277 151/ 126
1 M 20 P E 7 1 M D 2 2 N 0 N N N N N N 0 1 1 1 1 1 1 0 0 0 1 1 1 1 1 0 0 1 1 0 1
Con76 1976 US 1 0 6-12 15 U 1 0 - 0 0 0 1 0 W 2 N N N N N N N N N 0 0 0 1 1 0 1 0 - - 0 0 - 1 1 0 0 1 0 0 1
Con80 1980 US 1 1 5-10 9 U 0 M 15 0 E 7 1 M H N N N 0 N N N N N N 0 0 0 1 1 1 0 1 0 0 0 1 1 1 U 0 0 1 1 0 1
David 1987 UK 0 1 1-12 24 19/5 0 T 250 0 E 30 U M U N 0 N 0 0 N 0 N N 0 0 1 1 1 0 1 1 1 1 1 0 1 1 0 0 1 0 1 0 0 1
Goy 1978 US 1 1 4-12 16 U 1 M 26 0 0 0 1 M H 1 2 0 0 N N 1 H Y N 0 0 0 1 0 1 0 1 0 0 0 0 1 1 1 1 1 0 1 0 0
Har78a
1978 US 2 0 3-13 80 80/0 1 0 - 0 U U 1 M S 2 N N N N N N N Y N 0 0 0 1 1 1 1 0 - - 1 0 - 1 1 1 0 1 1 0 0
Har78b
1978 US 2 1 3-12 18 18/0 0 M 54 0 0 0 1 M S N 0 0 0 1 U 1 N N N 0 0 0 1 0 1 0 1 0 1 1 0 1 1 1 1 0 1 0 0 1
L&H78 1978 AU 1 1 5 8 7/1 0 T 4 0 U U 1 0 U N 0 N N N N N N N N 0 0 1 1 1 0 1 1 0 0 1 0 1 1 1 0 0 0 0 0 0
Levy78
1978 AU 1 0 4-8 22 19/3 1 T 5 0 0 0 1 M G 2 2 0 0 N N N N N N H 0 0 1 0 1 1 1 0 0 0 0 1 1 1 0 0 1 0 0 0
Lok 2013 AS 0 0 8-9 130 70/60 0 M 62.4 0 E 7 1 M W N 0 0 N N N N N N N 0 1 1 1 1 1 1 1 0 1 0 1 1 1 1 0 0 1 0 1 1
M&G81
1981 US 2 1 4-13 11 6/5 0 M 78 0 E 7 1 M H N 0 0 0 U U U N 0 N 0 0 1 1 1 1 0 1 0 1 1 1 1 1 1 0 0 1 1 0 1
M&GK 1978 US 1 1 10 1 1/0 0 M U 0 E 5 1 0 W N N N N 2 0 N N N N 0 0 1 1 1 1 0 1 0 0 0 1 1 1 1 1 1 0 0 0 1
McCa 2007 UK 0 0 3-9 297 154/ 143
0 M 64 P U U 1 M W N N N 2 N N N N Y N 0 0 1 1 1 1 1 0 0 1 1 0 1 1 1 0 0 1 0 1 1

Potential Neurobehavioral Effects of Synthetic CalEPA OEHHA Food Dyes in Children April 2021
65
Stud
y
Publ
icat
ion_
year
Loca
tion
Hyp
erac
tive
Prio
r_re
spon
ders
Ages
N
Boys
/Girl
s
Elim
inat
ion
test
ed
Cha
lleng
ete
sted
D
ose
Oth
er_a
gent
Was
hout
_met
hod
Was
hout
perio
d O
utco
me
hype
ract
ive
Out
com
eot
her
Tim
ing
outc
ome
Res
ults
elim
inat
ion
Pare
ntgr
pch
all
Teac
her
grp
chal
l O
ther
grp
chal
l Pa
rent
Indi
vid
chal
l Te
ache
rin
divi
dch
all
Oth
erin
divi
dch
all
Tim
ing
effe
ct
Age
effe
ct
Dos
ere
spon
se
Subg
roup
only
Rand
om_s
ampl
e Dr
opou
ts_l
ow
Cros
sove
r Ra
ndom
_cro
ssov
er
Doub
le_b
linde
d Ex
posu
re_d
efin
ed
Food
_dye
s_on
ly
Mul
tiple
_dos
es
High
_dos
e Pl
aceb
o_te
sted
W
asho
ut_a
dequ
ate
On
elim
diet
O
utco
me
rele
vant
O
utco
me
valid
ated
In
divi
dre
sults
give
n Re
plic
atio
ndo
ne
Infra
ctio
ns_l
ow
No_o
rder
_effe
ct
No_c
onfli
cts
Full_
resu
lts
Pollo 1990 UK 2 1 2-15 19 U 0 M 125 0 E 7 1 M D N 2 N N 1 N N 0 N N 0 0 0 1 1 1 1 1 0 1 0 1 1 1 1 1 0 0 1 0 1
Rapp 1978 US 1 0 5-16 24 18/6 0 M U 0 0 0 1 M H N N N 1 N N 1 N N N 0 0 0 1 1 1 0 1 0 0 0 0 0 1 0 1 0 1 0 0 0
Rose 1978 US 1 1 8 2 0/2 0 T 1.2 0 U U 1 M D N 2 N 2 2 N 2 N N N 0 0 0 1 0 1 1 1 0 0 1 0 1 1 1 1 0 1 0 0 0
Rowa94
1994 AU 2 2 2-14 54 38/16 0 T 50 0 0 0 1 M D N 2 N N 1 N N N 0 1 1 0 0 1 1 1 1 1 1 1 0 0 1 1 0 1 0 0 0 0 0
Rowb88
1988 AU 2 1 3-15 8 6/2 0 M 50 0 0 0 1 M D N N N N 2 N N H U N 0 0 1 1 0 1 1 1 0 1 0 0 1 1 0 1 0 0 0 0 0
Sara 1990 CA 1 2 4-14 13 12/1 0 T 60 0 0 0 1 M D N N N N 2 N N N N N 0 0 0 1 1 1 1 1 0 1 1 0 1 1 1 1 0 0 0 0 0
Spring 1981 US 1 1 8-13 6 6/0 1 M 26 0 E 4 1 M S 1 N N N 0 N N N N N 0 0 1 1 1 1 1 1 0 0 1 1 1 1 1 1 1 1 0 0 1
SKa 1980 CA 2 0 5-12 40 36/4 0 M 150 0 0 0 1 M H N N N 2 N N N H N 0 M 0 0 1 0 0 1 1 1 1 0 0 1 1 1 0 0 1 0 0 1
SKb 1980 CA 1 0 U 8 U 0 1 26 0 0 0 1 M H N N N 0 N N N 0 N N 0 0 0 1 0 1 0 1 0 0 0 0 1 1 1 0 0 1 0 0 0
Thorl 1984 UK U 0 12 10 8/2 0 M 91.8 0 E 14 1 M H N 0 0 1 N N N N N N 0 1 1 1 1 1 1 1 0 1 0 1 1 1 1 0 0 1 0 0 1
Weiss 1980 US 0 1 2-7 22 15/7 0 M 35 Y 0 0 1 M H N N N N 2 N N N N N 0 0 0 1 1 1 1 0 0 0 0 0 1 1 0 1 0 0 0 0 0
Willia 1978 CA 1 0 6-12 28 26/2 0 M U 0 E 3 1 M S N 1 2 N 1 1 N N N N M 0 1 1 1 1 0 1 0 0 0 1 1 1 1 1 0 1 0 0 0
Wils 1989 UK 0 1 2-14 19 11/8 0 M 8.5 0 E 7 U M U N N N N 0 N N N N N 0 0 0 1 1 1 1 1 0 0 0 1 1 0 0 1 1 0 0 0 0
Variable names are formatted for analysis in SAS Bolded variable names are those used for quality scoring Coding dictionary is provided in the following table Other coding notes: i. David et al., 1987: unclear if a placebo was used. The comparison appears to be the time before the challenge – a time which all children were on an elimination diet. As
such, placebo_used labeled as “0” ii. Mattes and Gittleman, 1981 and McCann et al., 2007: multiple dose levels used, but results not provided for each dose level. As such, multiple_doses labeled as “0”
Potential Neurobehavioral Effects of Synthetic CalEPA OEHHA Food Dyes in Children April 2021
66
iii. Rose, 1978: study only included two subjects but results were the same in each so “group” results were recorded the same as “individual” results iv. Sarantinos et al., 1990: one group received tartrazine only and one group received a combination of tartrazine and sunset yellow v. Spring et al., 1981: findings were recorded as negative since the initial findings were not confirmed in the replication study. Teacher ratings were not done in the replication
study so were recorded as “N” vi. Thorley, 1984: we estimated 6 days on average for the washout period (14 day trial, received challenge in randomly selected 2 consecutive days during this time)

Potential Neurobehavioral Effects of Synthetic CalEPA OEHHA Food Dyes in Children April 2021
67
Table 2.3b. Coding dictionary Variable name Category Definition Codes Notes Study Characteristic Abbreviated study name Publication_year Characteristic Publication year Year Few articles give the actual
dates the study was done Location Characteristic Where was the study
done? AS=Asia, AU=Australia, CA=Canada, O=other, U=US, UK=United Kingdom
If the location was not specifically provided then the institution of the first author used here
Hyperactive Characteristic Did the study only included participants who were diagnosed as hyperactive, had hyperactive symptoms, or a related condition?
1=yes, 0=no, 2=mixed, U=unclear
Includes any condition related to hyperactivity (e.g. ADHD)
Prior_responders Characteristic Did the study only include participants who had previously reported improvements on Feingold or similar diet?
1=yes, 0=no, 2=mixed, U=unclear
Ages Characteristic Age range of the participants
Range A single number is given if only the average age is provided in the article
N Characteristic Number of participants Number Boys/Girls Characteristic Number of boys/number
of girls Number; U=unclear or unknown
Elimination_tested Characteristic Was an elimination diet tested?
1=yes, 0=not tested, U=unclear If yes, this was almost always a version of the Feingold or KP diet
Challenge_tested Characteristic If there was a challenge with artificial food dyes, what were the dyes?
M=multiple dyes, 0=not tested, T=tartrazine
Dose Characteristic What was the total daily dose of all food dyes tested?
In mg, “-“ specific dyes not tested, U=unknown or unclear
If multiple doses, the highest dose is given
Other_agent Characteristic Was another agent tested in addition to food dyes and if so what?
0=none, P=preservative (e.g benzoic acid), Y=yes, other
Washout_method Characteristic What was given to the participant between the placebo and active challenges?
0=no washout, E=elimination diet, P=placebo only, U=unclear
Washout_period Characteristic If the placebo was given after the challenge, how many days after the challenge was it given?
In days, U=unclear, 30=if likely >30 days, 0=no washout
Outcome_hyperactive Characteristic Was hyperactivity or a related outcome tested?
1=yes, 0=no, U=unclear
Outcome_other Characteristic If an outcome other than hyperactivity was tested, what was it?
0= none, M=multiple
Timing_outcome Characteristic When was the outcome assessed relative to when the challenge was given?
H=about hourly or at least 2-3 times per day, D=daily, S=several times per week, W=weekly, G=greater than weekly, O=other, U=unclear
Results_elimination Results If an elimination diet was tested, what were the results?
0=no association, 1=≥20% effect size but not statistically significant (or statistical significance not given),
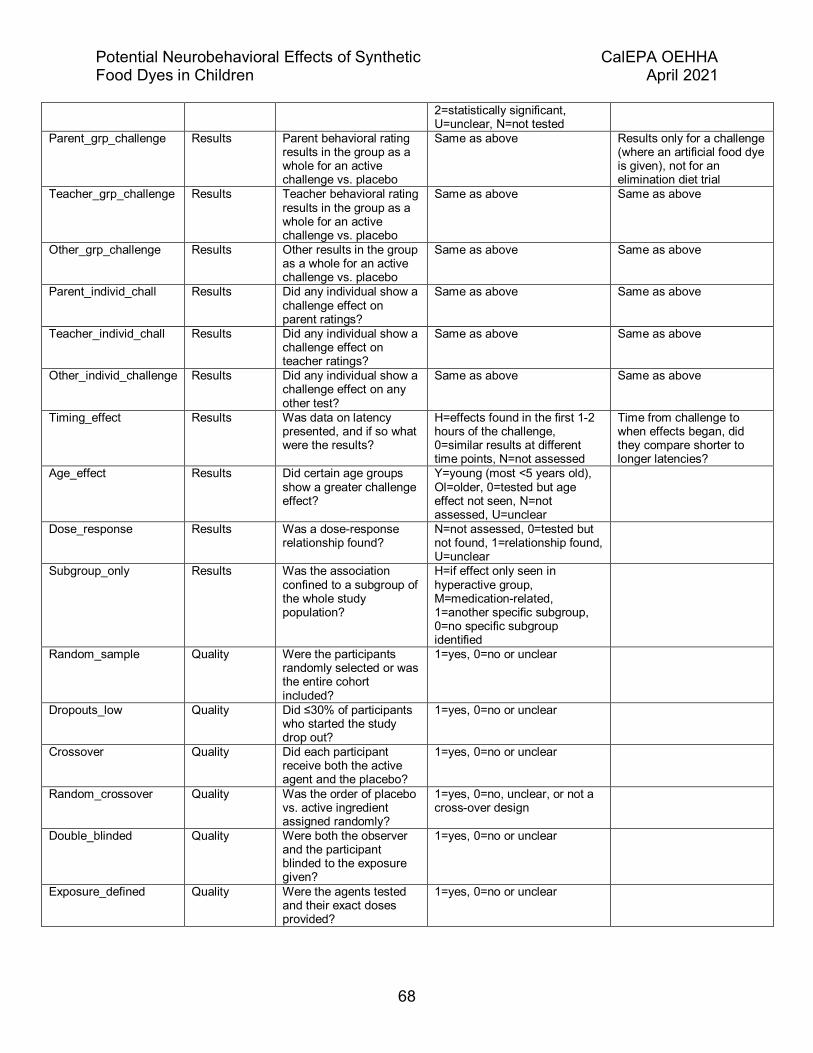
Potential Neurobehavioral Effects of Synthetic CalEPA OEHHA Food Dyes in Children April 2021
68
2=statistically significant, U=unclear, N=not tested
Parent_grp_challenge Results Parent behavioral rating results in the group as a whole for an active challenge vs. placebo
Same as above Results only for a challenge (where an artificial food dye is given), not for an elimination diet trial
Teacher_grp_challenge Results Teacher behavioral rating results in the group as a whole for an active challenge vs. placebo
Same as above Same as above
Other_grp_challenge Results Other results in the group as a whole for an active challenge vs. placebo
Same as above Same as above
Parent_individ_chall Results Did any individual show a challenge effect on parent ratings?
Same as above Same as above
Teacher_individ_chall Results Did any individual show a challenge effect on teacher ratings?
Same as above Same as above
Other_individ_challenge Results Did any individual show a challenge effect on any other test?
Same as above Same as above
Timing_effect Results Was data on latency presented, and if so what were the results?
H=effects found in the first 1-2 hours of the challenge, 0=similar results at different time points, N=not assessed
Time from challenge to when effects began, did they compare shorter to longer latencies?
Age_effect Results Did certain age groups show a greater challenge effect?
Y=young (most <5 years old), Ol=older, 0=tested but age effect not seen, N=not assessed, U=unclear
Dose_response Results Was a dose-response relationship found?
N=not assessed, 0=tested but not found, 1=relationship found, U=unclear
Subgroup_only Results Was the association confined to a subgroup of the whole study population?
H=if effect only seen in hyperactive group, M=medication-related, 1=another specific subgroup, 0=no specific subgroup identified
Random_sample Quality Were the participants randomly selected or was the entire cohort included?
1=yes, 0=no or unclear
Dropouts_low Quality Did ≤30% of participants who started the study drop out?
1=yes, 0=no or unclear
Crossover Quality Did each participant receive both the active agent and the placebo?
1=yes, 0=no or unclear
Random_crossover Quality Was the order of placebo vs. active ingredient assigned randomly?
1=yes, 0=no, unclear, or not a cross-over design
Double_blinded Quality Were both the observer and the participant blinded to the exposure given?
1=yes, 0=no or unclear
Exposure_defined Quality Were the agents tested and their exact doses provided?
1=yes, 0=no or unclear

Potential Neurobehavioral Effects of Synthetic CalEPA OEHHA Food Dyes in Children April 2021
69
Food_dyes_only
Quality Do results represent those of only artificial food dyes?
1=yes, 0=no or unclear “0” if food dyes were combined with another agent
Multiple_doses Quality Were multiple dose levels tested?
1=yes, 0=no or unclear Was dose-response assessed?
High_dose Quality Was a high dose tested? 1=dose ≥50 mg tested, 0=lower or unknown dose
Placebo_tested Quality Was it shown that the placebo and the active challenge could not be distinguished?
1=yes, 0=no or unclear
Washout_adequate Quality Was there a washout period of at least 2 days?
1=yes, 0=no, unclear, or not reported
On_elim_diet Quality If a challenge study, were the subjects on an elimination diet during the challenge
1=yes, 0=no, unclear, or not reported
Outcome_relevant Quality Was an outcome similar or relevant to hyperactivity assessed?
1=yes, 0=no or unclear
Outcome_validated Quality Was the method used to assess the outcome validated?
1=yes, 0=no, unclear, or not reported
Individ_results_given Quality Were the results in each child given (i.e. not just group means)?
1=yes, 0=no or unclear
Replication Quality Were positive findings replicated?
1=yes, 0=no, unclear, or no positive findings
Infractions Quality Were dietary infractions low (<2 per week)?
1=yes or monitored dosing, 0=no, unclear, or not reported
No_order_effect Quality Results were found not to be dependent on order the active challenge or placebo were given
1=yes, 0=no or unclear
No_conflicts Quality Were potential conflicts reported?
1=yes, 0=no, unknown, or unclear
Includes funding source and other potential conflicts
Full_results Quality Were full results reported?
1=yes, 0=no or unclear Includes group means, variance, individual results, and probability of chance

Potential Neurobehavioral Effects of Synthetic CalEPA OEHHA Food Dyes in Children April 2021
70
Table 2.4 Clinical trials of synthetic food dyes and neurobehavioral outcomes in children: summary of study characteristics Variable Category N %
Publication year Before 1980 10 37.0
1980-2000 14 51.9
After 2000 3 11.1
Location Asia 1 3.7
Australia 4 14.8
Canada 4 14.8
UK 6 22.2
US 12 44.4
Hyperactive participants Yes 13 48.1
No 5 18.5
Mixed 8 29.6
Unclear 1 3.7
Prior responders Yes 14 51.9
No 11 40.7
Mixed 2 7.4
Number of participants <20 16 59.3
20-99 8 29.6
≥100 3 11.1
Design RCDP 16 59.3
Diet trial 2 7.4
Blinding unclear 2 7.4
Randomization unclear 7 25.9
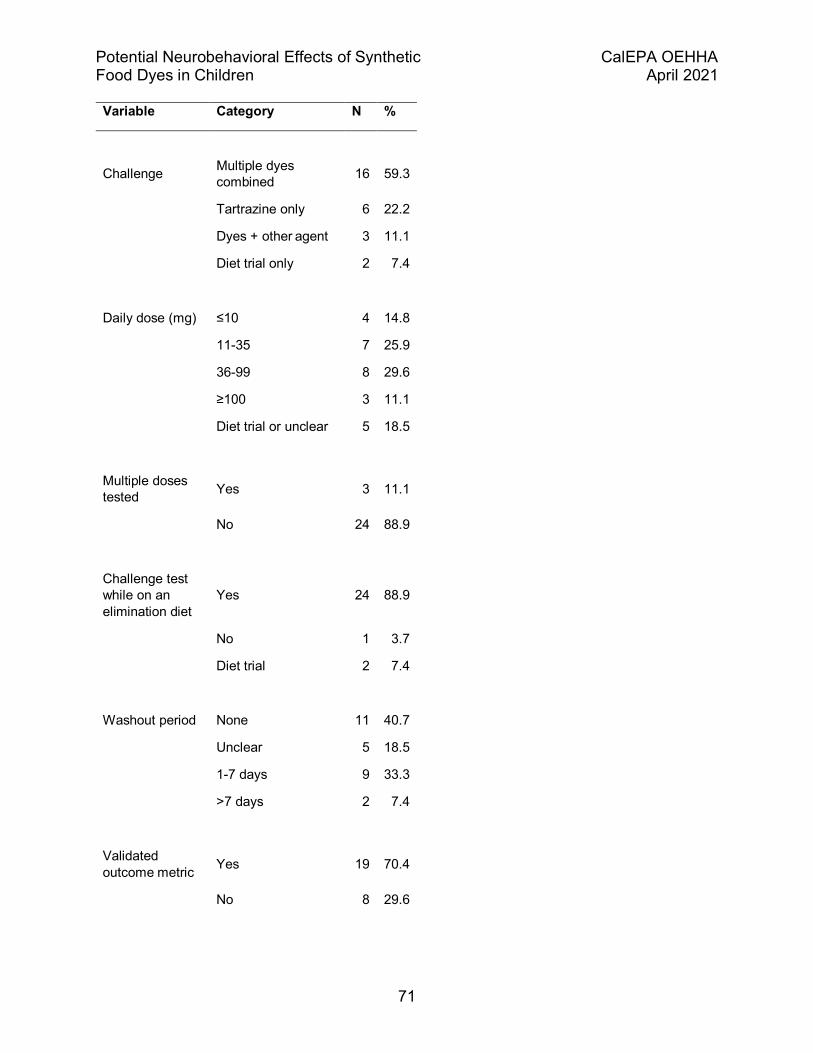
Potential Neurobehavioral Effects of Synthetic CalEPA OEHHA Food Dyes in Children April 2021
71
Variable Category N %
Challenge Multiple dyes combined 16 59.3
Tartrazine only 6 22.2
Dyes + other agent 3 11.1
Diet trial only 2 7.4
Daily dose (mg) ≤10 4 14.8
11-35 7 25.9
36-99 8 29.6
≥100 3 11.1
Diet trial or unclear 5 18.5
Multiple doses tested Yes 3 11.1
No 24 88.9
Challenge test while on an elimination diet
Yes 24 88.9
No 1 3.7
Diet trial 2 7.4
Washout period None 11 40.7
Unclear 5 18.5
1-7 days 9 33.3
>7 days 2 7.4
Validated outcome metric Yes 19 70.4
No 8 29.6

Potential Neurobehavioral Effects of Synthetic CalEPA OEHHA Food Dyes in Children April 2021
72
Variable Category N %
Outcome assessment: timing
Unclear 3 11.1
Hourly 9 33.3
Daily 6 22.2
Several times per week 4 14.8
Weekly 4 14.8
Greater than weekly 1 3.7
Outcome assessment: who1
Parent 20 76.9
Teacher 8 30.8
Other 14 53.8
Other characteristics2
Individual results given 15 55.6
Latency examined 5 18.5
Age examined 7 25.9
Replication done 4 14.8
Dose-response examined 3 11.1
No conflicts reported 2 7.4
Full results given 13 48.1
Low infractions reported 18 66.7
RCDP, randomized cross-over, double blinded, and placebo-controlled design 1. The sum of the percentages is greater than 100% since several studies used more than one outcome source 2. The denominator for percentages is all studies
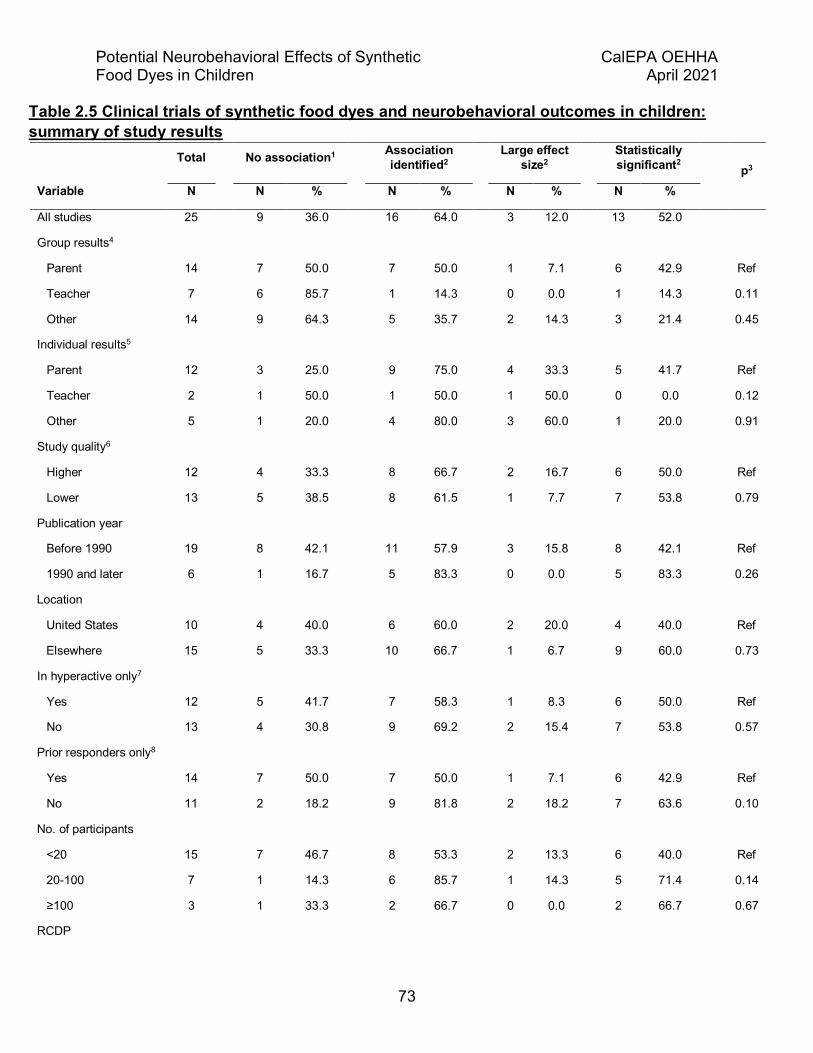
Potential Neurobehavioral Effects of Synthetic CalEPA OEHHA Food Dyes in Children April 2021
73
Table 2.5 Clinical trials of synthetic food dyes and neurobehavioral outcomes in children: summary of study results
Total No association1 Association identified2 Large effect
size2 Statistically significant2
p3
Variable N N % N % N % N %
All studies 25 9 36.0 16 64.0 3 12.0 13 52.0
Group results4
Parent 14 7 50.0 7 50.0 1 7.1 6 42.9 Ref
Teacher 7 6 85.7 1 14.3 0 0.0 1 14.3 0.11
Other 14 9 64.3 5 35.7 2 14.3 3 21.4 0.45
Individual results5
Parent 12 3 25.0 9 75.0 4 33.3 5 41.7 Ref
Teacher 2 1 50.0 1 50.0 1 50.0 0 0.0 0.12
Other 5 1 20.0 4 80.0 3 60.0 1 20.0 0.91
Study quality6
Higher 12 4 33.3 8 66.7 2 16.7 6 50.0 Ref
Lower 13 5 38.5 8 61.5 1 7.7 7 53.8 0.79
Publication year
Before 1990 19 8 42.1 11 57.9 3 15.8 8 42.1 Ref
1990 and later 6 1 16.7 5 83.3 0 0.0 5 83.3 0.26
Location
United States 10 4 40.0 6 60.0 2 20.0 4 40.0 Ref
Elsewhere 15 5 33.3 10 66.7 1 6.7 9 60.0 0.73
In hyperactive only7
Yes 12 5 41.7 7 58.3 1 8.3 6 50.0 Ref
No 13 4 30.8 9 69.2 2 15.4 7 53.8 0.57
Prior responders only8
Yes 14 7 50.0 7 50.0 1 7.1 6 42.9 Ref
No 11 2 18.2 9 81.8 2 18.2 7 63.6 0.10
No. of participants
<20 15 7 46.7 8 53.3 2 13.3 6 40.0 Ref
20-100 7 1 14.3 6 85.7 1 14.3 5 71.4 0.14
≥100 3 1 33.3 2 66.7 0 0.0 2 66.7 0.67
RCDP

Potential Neurobehavioral Effects of Synthetic CalEPA OEHHA Food Dyes in Children April 2021
74
Total No association1 Association identified2 Large effect
size2 Statistically significant2
p3
Variable N N % N % N % N %
Yes 16 6 37.5 10 62.5 2 12.5 8 50.0 Ref
No 9 3 33.3 6 66.7 1 11.1 5 55.6 0.83
Challenge agents
Multiple dyes 19 7 36.8 12 63.2 3 15.8 9 47.4 Ref
Tartrazine only 6 2 33.3 4 66.7 0 0.0 4 66.7 0.88
Daily dose (mg)
≤10 4 2 50.0 2 50.0 0 0.0 2 50.0 Ref
11-35 7 4 57.1 3 42.9 0 0.0 3 42.9 0.82
36-99 8 2 25.0 6 75.0 2 25.0 4 50.0 0.39
≥100+ 3 1 33.3 2 66.7 0 0.0 2 66.7 0.66
Unclear 3 0 0.0 3 100.0 1 33.3 2 66.7 0.15
Washout >2 days
Yes 11 6 54.5 5 45.5 1 9.1 4 36.4 Ref
No 14 3 21.4 11 78.6 2 14.3 9 64.3 0.09
Food dyes only
Yes 22 9 40.9 13 59.1 3 13.6 10 45.5 Ref
Additional agent9 3 0 0.0 3 100.0 0 0.0 3 100.0 0.17
Validated
Yes 17 5 29.4 12 70.6 2 11.8 10 58.8 Ref
No 8 4 50.0 4 50.0 1 12.5 3 37.5 0.32
Outcome timing
Hourly 9 4 44.4 5 55.6 2 22.2 3 33.3 Ref
Daily 6 0 0.0 6 100.0 0 0.0 6 100.0 0.06
Several per week 3 1 33.3 2 66.7 1 33.3 1 33.3 0.74
Weekly 3 1 33.3 2 66.7 0 0.0 2 66.7 0.74
Greater than weekly 1 0 0.0 1 100.0 0 0.0 1 100.0 0.39
Unclear 3 3 100.0 0 0.0 0 0.0 0 0.0 0.09
Full results
Yes 12 5 41.7 7 58.3 2 16.7 5 41.7 Ref
No 13 4 30.8 9 69.2 1 7.7 8 61.5 0.57
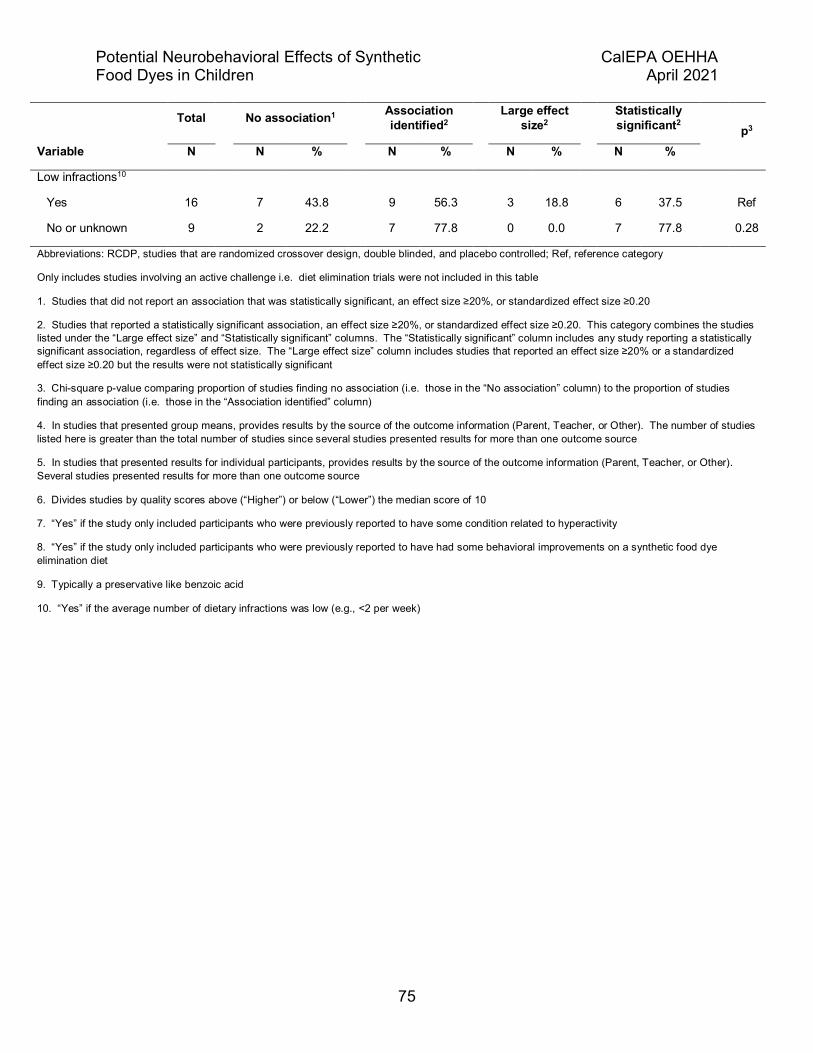
Potential Neurobehavioral Effects of Synthetic CalEPA OEHHA Food Dyes in Children April 2021
75
Total No association1 Association identified2 Large effect
size2 Statistically significant2
p3
Variable N N % N % N % N %
Low infractions10
Yes 16 7 43.8 9 56.3 3 18.8 6 37.5 Ref
No or unknown 9 2 22.2 7 77.8 0 0.0 7 77.8 0.28
Abbreviations: RCDP, studies that are randomized crossover design, double blinded, and placebo controlled; Ref, reference category
Only includes studies involving an active challenge i.e. diet elimination trials were not included in this table
1. Studies that did not report an association that was statistically significant, an effect size ≥20%, or standardized effect size ≥0.20
2. Studies that reported a statistically significant association, an effect size ≥20%, or standardized effect size ≥0.20. This category combines the studies listed under the “Large effect size” and “Statistically significant” columns. The “Statistically significant” column includes any study reporting a statistically significant association, regardless of effect size. The “Large effect size” column includes studies that reported an effect size ≥20% or a standardized effect size ≥0.20 but the results were not statistically significant
3. Chi-square p-value comparing proportion of studies finding no association (i.e. those in the “No association” column) to the proportion of studies finding an association (i.e. those in the “Association identified” column)
4. In studies that presented group means, provides results by the source of the outcome information (Parent, Teacher, or Other). The number of studies listed here is greater than the total number of studies since several studies presented results for more than one outcome source
5. In studies that presented results for individual participants, provides results by the source of the outcome information (Parent, Teacher, or Other). Several studies presented results for more than one outcome source
6. Divides studies by quality scores above (“Higher”) or below (“Lower”) the median score of 10
7. “Yes” if the study only included participants who were previously reported to have some condition related to hyperactivity
8. “Yes” if the study only included participants who were previously reported to have had some behavioral improvements on a synthetic food dye elimination diet
9. Typically a preservative like benzoic acid
10. “Yes” if the average number of dietary infractions was low (e.g., <2 per week)
Potential Neurobehavioral Effects of Synthetic CalEPA OEHHA Food Dyes in Children April 2021
76
Chapter 3. Animal Neurotoxicology 3.1 Introduction Animal toxicology studies have been central to assessing risk of chemical exposure in humans, and have been the basis of hazard identification and dose-response evaluations for regulatory risk assessments of food dyes. The literature search strategy is described in Chapter 1.
OEHHA reviewed published animal studies potentially relevant to the assessment of possible neurobehavioral effects of food dyes in children. This included studies of the food dyes that had neurobehavioral measures and exposure during prenatal, infant, and juvenile development, and in adulthood. We also reviewed information on the absorption, distribution, metabolism and excretion (ADME) of food dyes, as well as studies of biological mechanisms of action in Chapter 4.
Table 3.1a and 3.1b below provide information on the dosing used in studies we reviewed as well as the No-Observed-Adverse-Effect Level (NOAEL) in the study, or where there was no NOAEL, the Lowest-Observed-Adverse-Effect Level (LOAEL). Dosing is important for comparing animal toxicology findings with results of studies in children (Chapter 2) and data on children’s exposures (Chapter 6).
3.2 Developmental neurobehavioral toxicology studies 3.2.1 Introduction We reviewed primarily developmental studies with oral administration and neurobehavioral endpoints as most relevant to public health concerns about children’s behavioral response to food dyes. Studies were included if there was any dye exposure during development prior to puberty. If non-behavioral endpoints were included in the study, they were also reviewed. Studies of toxicokinetics and mechanisms are reviewed in Section 4 “Summary by Dye”, using.
Developmental neurotoxicity (DNT) studies of food dyes reviewed here are summarized by dye and publication date in Figure 3.1. Red No. 3 and Yellow No. 5 are the most studied. Notably there are no studies for Blue No. 2 or Green No. 3 as individual dyes. Both Blue No. 2 and Green No. 3 were included, however, in mixtures for several animal DNT studies (Doguc et al. 2013; Doguc et al. 2015; Doguc¸ et al. 2013; Goldenring et al. 1980; Kantor et al. 1984; Shaywitz et al. 1979) and mixture studies in children (Conners et al. 1980; Mattes and Gittelman 1981; Spring et al. 1981; J. M. Swanson and M. Kinsbourne 1980; Weiss et al. 1980). As regards publication dates, a group of studies appeared in the 1980s, and another group of studies had publication dates extending through 2019. The more recent studies used dye administration by gavage rather than in diet, and used current experimental methods and publication detail.

Potential Neurobehavioral Effects of Synthetic CalEPA OEHHA Food Dyes in Children April 2021
77
Table 3.1a NOAELs and LOAELs from developmental studies with individual dyes LOAELs are characterized by statistically significant differences between dose group and control group reported by authors. Endpoints are behavior or brain measures.
Vorhees et al.,
1983ac
Tanaka 2001d
Vorhees et al.,1983bc
Tanaka 1994d
Tanaka et al., 2012d
Sobotka et al., 1977
Tanaka et al., 2006d
Tanaka et al., 2008d
Tanaka 1996d
Dye Red No. 3
Red No. 3
Red No. 40
Red No. 40
Blue No. 1
Yellow No. 5
Yellow No. 5
Yellow No. 5
Yellow No. 6
Study Doses (as % diet)
NOAELa LOAELb
0, 0.25b,
0.5, 1.0
0, 0.005, 0.015a, 0.045b
0, 2.5b, 5.0, 10.0
0, 0.42, 0.84, 1.68a
0, 0.08b, 0.24, 0.72
0, 1.0, 2.0a
0, 0.05, 0.15, 0.45a
0, 0.05, 0.15, 0.45
0 0.15, 0.30, 0.60a
Study NOAEL
or LOAEL
in mg/kg/d
LOAEL 125c
NOAEL 24
LOAEL 1250c
NOAEL 3534
LOAEL 127
NOAEL 1000c
NOAEL 841
Significant trend tests
only
NOAEL 1146
aNOAEL for study. bLOAEL for study. cCalculated by OEHHA. dFor studies from the Tokyo Metropolitan Laboratory of Public Health, for NOAELS without LOAELS, the mean value for males and females were used. For LOAELs and NOAELs with LOAELs, the value for the sex affected at the LOAEL was used.

Potential Neurobehavioral Effects of Synthetic CalEPA OEHHA Food Dyes in Children April 2021
78
Table 3.1b NOAELs and LOAELs from adult studies with individual dyes LOAELs are characterized by statistically significant differences between dose group and control group reported by authors. Endpoints are behavior or brain measures.
Tanaka
2001e
Dalal and
Poddar 2009
Dalal and
Poddar 2010
Noorafshan et
al., 2018
Tanaka et al., 2012e
Tanaka et al., 2006e
Tanaka et al., 2008e
Gao et al., 2011 (mice)
Gao et al., 2011 (rats)
Rafati et al., 2017
Tanaka 1996e
Dye Red No. 3
Red No. 3
Red No. 3
Red No. 40
Blue No. 1
Yellow No. 5
Yellow No. 5
Yellow No. 5
Yellow No. 5
Yellow No. 5
Yellow No. 6
Study Doses
NOAELa LOAELb
0, 0.005, 0.015
a, 0.045
% dietf
0, 1a, 10,
100, 200
mg/kg/d
0, 1a, 10,
100,
mg/kg/d
0, 7b, 70
mg/kg/d
0, 0.08b, 0.24, 0.72
% dietf
0, 0.05a, 0.15cb 0.45
% dietf
0, 0.05, 0.15, 0.45b
% dietf
0, 175a
350b 700 mg/kg/d
0, 125a
250b 500
mg/kg/d
0, 5b, 50
mg/kg/d
0, 0.15, 0.30, 0.60a
% dietf
Study NOAEL
or LOAEL
in mg/kg/d
NOAEL
28
NOAEL 1.0
NOAEL 1
LOAEL 7.0
LOAEL 122
NOAEL 73
NOAEL 824
NOAEL 175c
NOAEL 125d
LOAEL 5
NOAEL 1052
aNOAEL for study. bLOAEL for study. eFor studies from the Tokyo Metropolitan Laboratory of Public Health, for NOAELS without LOAELS, the mean value for males and females were used. For LOAELs and NOAELs with LOAELs, the value for the sex affected at the LOAEL was used. fFor studies using % diet as dosing metric, doses were converted to mg/kg/d by OEHHA using information in the publication or standard assumptions.

Potential Neurobehavioral Effects of Synthetic CalEPA OEHHA Food Dyes in Children April 2021
79
Figure 3.1 Number of developmental neurobehavioral toxicity studies by dye and year Early studies are reviewed in section 2.2 and 2.3 and later studies are reviewed in section 2.4.
The exposure periods and assessment timepoints for the studies reviewed in this section are shown in Figure 3.2. There is great variety in these aspects of study design providing a depth of information, but precluding comparisons of findings. DNT studies typically focus on detecting long-term or permanent effects on brain and brain function that occur after developmental exposure. Consequently, the immediate effects of a short term exposure only during juvenile development, a design similar to the challenge studies in children, are not commonly studied. Three studies with juvenile exposure and testing are reviewed below (Erickson et al. 2014; Goldenring et al. 1980; Shaywitz et al. 1979).

Potential Neurobehavioral Effects of Synthetic CalEPA OEHHA Food Dyes in Children April 2021
80
Figure 3.2 Experimental designs of developmental neurotoxicity studies with food dyes First author and date of publications are shown. Details from all the studies reviewed in this section are shown in Table 3.9.
3.2.2 Studies of individual dyes from the 1970s and 1980s The FDA does not require that DNT studies be performed as part of the certification of food dyes. However, after publication of Feingold’s 1975 book entitled, “Why Your Child is Hyperactive” (Feingold 1975), which suggested food dye affects children’s behavior, FDA sponsored a series of animal developmental toxicology studies published in the late 1970s and early 1980s. These studies used higher doses of dyes than more recent studies. All studies used rats as the subjects.
In these studies, food dyes were provided at a fixed concentration (weight %) in the diet throughout in utero, infant, juvenile and adolescent development and extending into adulthood. They often reported a common finding in the dietary dosing studies, an increase in food consumption, which was attributed to the lower calorie content when dye was added.
The first study (Sobotka et al. 1977) was of Yellow No. 5 and used exposure from early pregnancy through 3 months of age in the offspring. The two doses (Table 3.9) were selected to be at or below the NOAEL (2% diet) from existing adult chronic toxicity studies. Offspring were tested for early development prior to weaning, and for activity and learning and memory after weaning. The authors reported no effect of Yellow No. 5 on the post-weaning behavioral tests and no data were shown. In the preweaning tests,
Potential Neurobehavioral Effects of Synthetic CalEPA OEHHA Food Dyes in Children April 2021
81
dye-treated female offspring (1% and 2% diet dose groups) were reported to show advanced clinging responses as infants. The lack of litter-based design or statistical analysis in the preweaning test limits confidence in the results.
Also included in this Yellow No. 5 study were growth data, and a hematology assay (CBC) and brain assays at weaning in the males. The brain assays did not find any effects on DNA, protein, or cholesterol content of three brain areas (brainstem, telencephalon, cerebellum). However, the 1% and 2% diets led to lower body weights in the offspring, and also lower thymus weights and higher red blood cell counts and hemoglobin concentration at the 2% dose. These effects on growth, organ weights and hematology are not directly related to neurotoxicity but could serve as appropriate endpoints for more general developmental toxicity risk assessment.
Strengths and weaknesses. Sobotka et al. (1977) was one of the first experiments to look systematically at food dye neurodevelopmental toxicity and doses were at or below doses known at the time to be toxic. General developmental toxicity was seen in terms of offspring growth, thymus weights and red blood cells. However, pregnancy outcome data were not presented. The power of the statistical tests was weakened by the use of individual t-tests without an initial analysis of variance (ANOVA). The statistical analysis was not litter-based. Without data on behavioral tests in controls it is not possible to judge their validity and statistical power.
The second study (Vorhees et al. 1983a) looked at Red No. 3 and was performed with FDA support at Cincinnati Children’s Hospital Research Center. It included two experiments with the same doses and similar, though not identical, designs and procedures. The doses were in the range known to be toxic. An extended test battery was used that had been constructed by the investigators and used in previous studies of potential neurodevelopmental toxicity of the food additives butylated hydroxyanisole and butylated hydroxytoluene (Vorhees et al. 1981). There were two tests of spontaneous motor activity, three tests of learning and memory, and an additional test of motor coordination. In terms of general toxicity, dye-treated offspring had increased mortality prior to weaning in the first experiment and after weaning in the second. For preweaning behavioral development, advanced maturation of swimming was reported in both experiments. In post-weaning behavioral testing, dye-treated groups showed increased activity in a Running Wheel test in both experiments and also in an Open Field test in the first experiment (females only) (see Table 3.9 for further description of behavioral results). No learning and memory effects were reported. Regional brain weights were obtained at the end of the study when offspring were adults. An increase in cerebellar weights was reported in the second experiment only.
Strengths and weaknesses: Vorhees (1983a) provided several different activity and learning and memory tests and used an ANOVA analysis across all dye groups. However, the sensitivity of the analysis is reduced by the use of p<0.01 as the threshold for statistical significance. The sensitivity of the learning and memory tests cannot be evaluated because no data were shown. The authors did two experiments to allow

Potential Neurobehavioral Effects of Synthetic CalEPA OEHHA Food Dyes in Children April 2021
82
replicability. However, the two experiments differed extensively, particularly in the general level of preweaning mortality, and the increased statistical power of the ANOVAs in the first experiment due to inclusion of two control groups. While the authors interpret an absence of toxicity due to lack of replicability and linear dose response trends, dye effects were demonstrated. The cerebellar weight effect is difficult to interpret without information on whole brain weights.
The third study (Vorhees et al. 1983b) looked at Red No. 40 using the same general design as the Red No. 3 study. The doses were in a range known to be toxic. The general toxicity in this experiment included reduced fertility in the dams, and increased mortality and restricted growth in the offspring. In preweaning testing, delayed swimming development was reported. In post-weaning testing, greater activity was seen in the Open Field test, while less activity was reported in the Running Wheel test. These two findings are not incompatible as the Open Field test is brief and activity is spontaneous, whereas the Running Wheel test continues over 24 h and activity is elicited by the apparatus. The learning and memory tests were reported to show no dye effects, with the exception of passive avoidance performance in the lowest dose group. The brain weight data obtained at the end of the study showed reduced cerebellar and brainstem weights. The telencephalon was apparently not affected and whole brain weights relative to body weights were not reported.
Strengths and weaknesses: The design and test protocols and statistical analysis in Vorhees et al. (1983b) were state-of-the-art for the period when the study was done. Interpretation of the data needs to take into account the fairly extensive general developmental toxicity seen at the doses used. Both the postnatal mortality, offspring growth restriction and delayed vaginal opening could be valid endpoints for general developmental toxicity risk assessment. The use of the p<0.01 statistical significance criterion is also relevant because it requires a larger effect size to reach statistical significance than the commonly used p<0.05 criterion. The sensitivity of the learning and memory tests is hard to determine without data from the control group.
3.2.3 Studies of mixtures from the 1970s and 1980s A series of studies that appeared in the late 1970s and early 1980s attempted to address the issue of dye effects on behavior in children with ADHD (Goldenring et al. 1980; Goldenring et al. 1982; Shaywitz et al. 1979). This work was supported by National Institutes of Health (NIH) grants. A feature of these studies was applying dye dosing to normal rats or to an animal model of ADHD, namely treatment with 6-hydroxydopamine (6-OHDA). Rat pups were treated and tested during the juvenile stage of development (postnatal day (PND)12-33) to parallel human childhood. A mixture of the eight certified FD&C food dyes, the Nutrition Foundation mixture, (see dye mixture comparison Table 3.2 and Table 3.10) was administered by gavage. Of note, the dye doses are much lower (less than 2 mg/kg/day) than in the developmental studies administering individual dyes in diet (Table 3.1a).
Potential Neurobehavioral Effects of Synthetic CalEPA OEHHA Food Dyes in Children April 2021
83
The individual dyes in the mixture were added in amounts estimated from then-current US exposure (Silbergeld and Anderson 1982). This same mixture was also used for children’s challenge studies in that era.
In the first study (Shaywitz et al. 1979), the behavior assessments included activity and learning and memory. A 60-minute Open Field test was given at three ages (PND 12,15,19, 26) to follow the developmental pattern of motor activity. Two learning and memory tests based on shock escape/avoidance were also conducted. As expected, 6-OHDA treatment led to greater activity in the rat pups as they matured. There was no significant interaction between 6-OHDA and the dye mixture. The dye mixture alone did influence activity with greater activity and decreased habituation over the session seen in the high-dose group. The treatment factor (dye mixture) was significant in the activity ANOVA, but the high dose group differed significantly only from the low dose group in pairwise comparisons. At the mid-dose and low-dose, activity was decreased at some ages. In the avoidance tests, 6-OHDA impaired performance of both tests, while food dye impaired performance only in the first test (shock escape) and at the lowest dose. After testing, brains were obtained and analyzed for neurotransmitter levels. 6-OHDA lowered dopamine, but food dye did not influence dopamine or norepinephrine levels.
Strengths and weaknesses: This study design, with juvenile exposure and testing, is a good parallel to human studies. The studies employed hypothesis-based designs. The behavioral data were presented in detail and analyzed appropriately. The exposures were direct, rather than through the milk of dye-treated dams. An expanded activity assessment included a longer test session, several test ages and a simple endpoint (% time active). Sex was not a factor in the statistical analysis, but sex differences may not emerge prior to puberty and sex was balanced in the treatment groups. Group size was not stated but could be inferred from the degrees of freedom in the ANOVA report. Growth and mortality were not reported. The hypothesized interaction with 6-OHDA did not appear. The authors suggest that the 6-OHDA treatment produced a maximum level of activity that could interfere with detection of an interaction.

Potential Neurobehavioral Effects of Synthetic CalEPA OEHHA Food Dyes in Children April 2021
84
Table 3.2 Comparison of dye doses in animal studies using the Nutrition Foundation mixture
Shaywitz et al., 1979
Goldenring et al. 1980 Kantor et al. 1984a
Reisen & Rothblatt 1986
Mix mg/kg/d by gavage
Mix in nutritional
fluid mg/kg/d % Mix in purified diet
Mix mg/kg/d by gavage
0.5 mg/kg/d 1 mg/kg/d 2 mg/kg/d 1 mg/kg/d 0.5 % 1.0% 2.0% 4.0% 2 mg/kg/d 5 mg/kg/d
Dye
Nutrition Foundation
mixture
Individual dye dose mg/kg/d
Individual dye dose mg/kg/d
Individual dye dose mg/kg/d
Individual dye dose mg/kg/d
Individual dye dose mg/kg/d
Individual dye dose mg/kg/d
Individual dye dose mg/kg/d
Individual dye dose mg/kg/d
Individual dye dose mg/kg/d
Individual dye dose mg/kg/d
Red No. 3 6% 0.03 0.06 0.12 0.06 1.3 2.6 5.7 11.5 0.12 0.30
Red No. 40 39% 0.19 0.39 0.78 0.39 8.5 16.9 37.2 74.5 0.774 1.935
Blue No. 1 3% 0.01 0.03 0.06 0.03 0.7 1.3 2.9 5.7 0.062 0.156
Blue No. 2 2% 0.01 0.02 0.04 0.02 0.4 0.9 1.9 3.8 0.034 0.085
Yellow No. 5 26% 0.13 0.27 0.54 0.27 5.9 11.7 25.8 51.6 0.538 1.34
Yellow No. 6 23% 0.11 0.23 0.46 0.23 5 10 22 43.9 0.454 1.135
Green No. 3 0.13% 0.00065 0.0013 0.0026 0.0052 n/a n/a n/a n/a 0.0026 0.0065
Orange B 0.54% 0.0027 0.0054 0.0108 0.0054 n/a n/a n/a n/a 0.0108 0.027
aDiscussed in Section 3.3.2 below.
Potential Neurobehavioral Effects of Synthetic CalEPA OEHHA Food Dyes in Children April 2021
85
Two more studies were published by this group. The first (Goldenring et al. 1980) used similar design in terms of dye mixture, 6-OHDA treatment ADHD model, activity testing, avoidance learning testing, and brain assays. Only one dose, the mid-dose in the previous study, was used. A unique feature of this study was use of a pup-rearing procedure common at that time, termed “pup in a cup”. In this procedure, a gastric cannula was implanted in pups shortly after birth for delivery of a liquid diet for the first 19 days of life. During this time pups were housed individually in small plastic cups. This ensured identical nutrition, dye dosing, and postnatal environment. At 19 days the cannulas were removed and pups continued to be fed liquid diet with or without the food dye mixture. The dye-treated pups had greater activity at all ages than the appropriate control. There was no interaction with 6-OHDA which did not increase activity under this rearing condition, though it did reduce habituation rate. In the shuttle box avoidance, dye-treated pups had impaired performance as did the 6-OHDA group, with no statistically significant interaction between the two treatments. (Shock escape was not tested in this study.) Brain dopamine was reduced by 6-OHDA as previously demonstrated but not affected by the dye mixture. These results generally support those of the previous experiment that found dye mixture at a dose of 1 mg/kg/day can affect juvenile behaviors assessed while the dye treatment is in progress. The attempt to identify unique effects of food dyes under conditions of ADHD, by use of the 6-OHDA model, were not successful.
The second follow up study (Goldenring et al. 1982) tested the hypothesis that sulfanilic acid, a common metabolite of the azo food dyes Yellow No. 5 and Yellow No. 6, was the effective agent in producing the dye mixture effects on activity. The design and testing schedule were similar to the previous studies (Goldenring et al. 1980; Shaywitz et al. 1979) using the Nutrition Foundation dye mixture. The sulfanilic acid was administered intraperitoneally to simulate absorption of this azo dye metabolite from the intestine. One dose was used. It was based on generation of sulfanilic acid from the two azo dyes used in the mixture in previous studies. The analysis found a significant effect of sulfanilic acid, which produced greater activity in treated pups than controls. There was also an interaction with age; the increase in activity was greatest at the oldest age tested (PND 28). The treated pups had impaired shock escape performance, but no effect on shock avoidance was seen. The developmental neurobehavioral effect of sulfanilic acid was shown in this study, and parallels to mixture studies suggest it could be the active agent.
In response to these studies, a replication was undertaken using the same dye mixture (Reisen and Rothblat 1986). Two doses were used, one equivalent to the highest dose in the Shaywitz study, the other 2.5 times higher (see Table 3.2 and Table 3.10). Dye was administered to individual pups by gavage from PND 2 through puberty using a split litter design, in parallel to the Shaywitz study. Activity was measured four times during development using a method based on the Shaywitz study. No effects of dye mixture on activity were found. A cognitive learning task also failed to identify dye mixture effects.
Potential Neurobehavioral Effects of Synthetic CalEPA OEHHA Food Dyes in Children April 2021
86
The different findings of the Reisen and Rothblat study may have been due to some major differences from Shaywitz et al. in experimental designs and procedures.
• Long Evans rather than Sprague Dawley rats were used. • While the commercial dye premix was used for some subjects, others
received a mixture with the same composition formulated by the investigators.
• Three additional behavioral tests were administered during the time activity was being assessed.
• The activity was scored by an observer present during the session, rather than by scoring of videotape taken during the session.
• Activity was scored once a minute for 60 minutes, rather than during alternate 5- minute periods during the session.
• Habituation was not studied. Decreased habituation was considered the basis of greater activity in the Shaywitz experiment.
• The data from all ages was combined for analysis, rather than including age as a factor in a multiple factor ANOVA.
• Also of possible relevance, the young rats in the Shaywitz et al. study were raised in litters that included 6-OHDA treated littermates.
3.2.4 Studies with development exposure to individual dyes from the Tokyo Metropolitan Research Laboratory of Public Health. Our review included studies of five FD&C synthetic food dyes done in the same lab, the Tokyo Metropolitan Research Laboratory of Public Health, using essentially the same design, and reported to the literature over a 28-year period (Table 3.3 and Table 3.9). This lab has published similar studies with pesticides and also methodological work in behavioral assessment relevant to interpretation of their data. The overall design is shown in Figure 3.2. The exposure period (premating of parent through adulthood of offspring) and route (dye in diet) was also used in the earlier publications from US labs (Sobotka et al. 1977; Vorhees et al. 1983a; Vorhees et al. 1983b). However, behavioral evaluations differed from the early studies. Activity was assessed with an automated test using a doughnut-shaped arena, unlike the Open Field test of the early studies which used a rectangular arena. Learning and memory were tested with a water maze, the Biel maze, unlike the shock-motivated tests used in the earlier US studies. These comparisons are important in attempting to compare findings of the earlier and later studies.

Potential Neurobehavioral Effects of Synthetic CalEPA OEHHA Food Dyes in Children April 2021
87
Table 3.3 Results of offspring activity testing by the Tokyo Metropolitan Institute of Public Health. Activity Endpoint is for an effect that is statistically significantly different from control, or for which there is a significant dose trend. For high dose NOAELs, the dose was based on the lowest mg/kg/day food intake in either sex or in the F0 or F1 generation.
Dye Study NOAEL (N) or LOAEL (L) dose and trend tests
Activity Endpoint Sex Statistics
Red No. 3 (Tanaka 2001)
(N) 0.015% diet, 24 mg/kg/d ↑ Average distance 3 wk Male Nonparametric, Shirley Williams Jonckheere Dose trend ↑ Average distance 3 wk
(N) 0.015% diet, 24 mg/kg/d ↓ Horizontal activity 3wk Dose trend ↓ Horizontal activity 3wk Dose trend ↑ Total distance 3 wk
Red No. 3 (Tanaka 2001) (N) 0.015 % diet, 28 mg/kg/d ↑ Move time 8wk Female Nonparametric, Shirley Williams Jonckheere Dose trend ↑ Move time 8wk
(N) 0.015 % diet, 28 mg/kg/d ↑ Speed 8wk Dose trend ↑ Speed 8wk (N) 0.015 % diet, 28 mg/kg/d ↑ Total distance 8wk Dose trend ↑ Total distance 8wk Dose trend ↑ Movements 8wk Dose trend ↑ Average distance 8wk
Red No. 40 (Tanaka 1994)
1146 mg/kg/d (high dose N) No effects reported Male/female Nonparametric, Mann-Whitney
Yellow No. 5 two-gen (Tanaka 2006)
Dose trend ↓ Movements 3 wk Male Nonparametric, Steel-Dwass Jonckheere
Yellow No. 5 three-gen (Tanaka et al. 2008)
Dose trend ↓ Move time 3 wk Male Nonparametric, Steel-Dwass Jonkheere Dose trend ↓ Total distance 3 wk
Dose trend ↓ Average distance 3 wk Dose trend ↓ Turns 3 wk
Yellow No. 6 (Tanaka 1996)
0.6% diet, 620 mg/kg/d (high dose N)
No effects reported Female Nonparametric, Mann-Whitney
Blue No. 1 (Tanaka et al. 2012)
(L) 0.015 % diet, 28 mg/kg/d ↓ Rears 8 wk Male Parametric, Jonckheere ANOVA
(L) 0.015 % diet, 28 mg/kg/d ↓ Horizontal activity 9-10 wk (L) 0.015 % diet, 28 mg/kg/d ↑ Rearing time
Blue No. 1 (Tanaka et al. 2012)
Dose trend ↓ Horizontal activity 8 wk Female Parametric, Jonckheere ANOVA

Potential Neurobehavioral Effects of Synthetic CalEPA OEHHA Food Dyes in Children April 2021
88
Dosing was continued throughout several generations and life stages in the Tanaka developmental toxicology studies. This is an important aspect of these studies because exposure periods covering all stages of development can be considered a worst case scenario if the effects of the agent are cumulative or could occur at multiple development time points. However, behavioral effects experienced day-to-day at a particular stage of development, such as the effects seen in children’s studies, would not be uncovered. The situation where the immature individual is removed from exposure and then re-exposed for a short period for evaluation, such as in the children’s challenge studies, is not modeled by these studies. In addition, a constant dose is not maintained as animals progress through different life stages, as illustrated by data from the Tokyo lab, making a single dose extrapolation to human exposure in childhood difficult. Further, it is not clear with this study design whether the behavioral effects are due to previous dosing or to concurrent dosing.
The doses for the Tokyo studies were selected with a low dose (as % diet) set to be equivalent to 100 X the current regulatory ADI (Red No. 3, Red No. 40, Yellow No. 6) or 10 X the current regulatory ADIs (Yellow No. 5, Blue No. 1). Note that this paradigm results in variable dosing on a mg/kg/day basis as the animals grow and go through pregnancy, and when the next generation grows from weaning through adulthood. The DNT data from the Tokyo studies need to be considered in the context of other toxicity data collected during the long exposure period, especially reproductive and developmental toxicity. One consideration is a reduced group size and statistical power if less than the 10 original dams assigned to the study survived to wean offspring, which was commonly the case. Offspring mortality can also influence behavioral assessments, allowing least-affected animals to survive to testing ages, or influencing preweaning behavior at ages when littermates are ill and dying. The general toxicity of the different dyes at the doses tested is described along with behavioral results.
3.2.4.1 FD&C Red No. 40. (Tanaka 1994). Red No. 40 was administered at a low dose of 0.42% diet, equivalent to a dose that is 100 times the European Food Safety Authority (EFSA) ADI. This dose was comparable to the NOAEL dose of the animal study used to establish the human ADI. While 10 dams were entered in each group, nine litters were delivered in the control, mid and high dose groups. Of these, one control litter and two low dose litters were lost during lactation. The author reported no effects on the preweaning behavior development tests, which were analyzed with litter-based statistics, or on the 5-minute preweaning or 10-minute young adult activity monitoring. In this study, and in the later studies from the Tokyo lab, the Water Maze performance was evaluated within groups with nonparametric statistics; learning was measured as a decrease in time-to-goal or errors-to-goal across the three trials. The maze performance endpoints were not compared across groups. Although time to goal decreased across trials in all groups, maze learning was not demonstrated statistically in any sex/dose group with the exception of the high-dose males and females.

Potential Neurobehavioral Effects of Synthetic CalEPA OEHHA Food Dyes in Children April 2021
89
3.2.4.2 FD&C Yellow No. 6 (Tanaka 1996). Yellow No. 6 was the second dye to be evaluated at 0.15% diet as the low dose, equivalent to a dose that is 100 times the EFSA ADI. In terms of general toxicity, three dams, one each in the low-, mid- and high- dose groups, failed to become pregnant during the mating period. Another low-dose dam aborted (lost her litter) prior to delivery, and a third low-dose dam killed her litter and died subsequently (thymoma). Two dams in the mid-dose group had underdeveloped mammary glands and one of the litters did not survive to weaning. Survival of pups during lactation was significantly lower in the low- and mid-dose groups. Against this background of developmental toxicity, the preweaning behavioral data indicated delayed development in terms of surface righting, negative geotaxis and swimming.
No effects on activity were reported in the 5-minute activity tests at three weeks of age or the 10-minute test at 8 weeks of age. For maze learning, the control males showed learning by reducing both time to goal and number of errors over trials. In the dye-treated groups, the males in the mid and low dose groups did not show learning, while the high dose males reduced their time to goal but not errors. The female controls did not show learning of the maze task, but each of the female dye-treated groups showed a decrease in time to goal across trials. These statistical results were obtained by within-group nonparametric comparisons across trials. Since the group sizes differed, it is not possible to compare statistical significance across groups. The authors also compared the treated groups and controls for the times and errors on each trial. All three female dye-treated groups had shorter times to goal than controls on at least one trial, and the low and high-dose groups also had fewer errors than controls on at least one trial. In general, the dye-treated females performed better than controls, but a dose-related statistical conclusion is difficult to obtain from the report and is difficult to interpret due to the varying group sizes.
3.2.4.3 FD&C Red No. 3 (Tanaka 2001). The low dose in the Tanaka (2001) Red No. 3 study was 0.005% diet, equivalent to a dose that is 100 times the Joint FAO/WHO Expert Committee on Food Additives (JECFA) ADI. Because the JECFA ADI is much lower than the FDA ADI (0.1 mg/kg/day vs. 2.5 mg/kg/day), the low dose was only about 3 times the FDA ADI. In the Red No. 3 study, failure to conceive and abortion resulted in eight litters in mid-dose and nine in the high-dose group. No effects of dye treatment on offspring survival, growth, early development or maze performance were reported.
When offspring were tested for activity at 3 weeks of age (young juvenile), the high-dose males performed fewer bouts of activity, but moved further during each bout than controls. A significant (p<0.01) dose trend was reported for both these measures, and, additionally for total distance (p<0.05). This effect was not seen when the males were older (8 weeks, young adult). For females at 3 weeks of age, more turning was reported in the high-dose group than in controls. At the older age (8 weeks) more
Potential Neurobehavioral Effects of Synthetic CalEPA OEHHA Food Dyes in Children April 2021
90
extensive indications of dye-induced increases in activity were seen in the females. Both the number of activity bouts and the distance traveled in each bout were increased in a dose-dependent manner with marginal statistical significance (p=0.05). Additionally, dose-dependent trends were reported for greater speed (p<0.05), total time moving (p<.05) and total distance (p<0.01). For each of these three measures, the high-dose group differed significantly from controls. This interesting sex, age and dose-dependent pattern of greater activity is particularly valuable in the absence of more severe developmental toxicity. The effects at 3 weeks of age are most relevant to children.
3.2.4.4 FD&C Yellow No. 5 (Tanaka 2006; Tanaka et al. 2008). The Tokyo lab conducted two studies of Yellow No. 5, a two-generation (Tanaka 2006) and a three-generation study (Tanaka et al. 2008). The second study was undertaken after the first study showed a dose trend for activity of male offspring at 3 weeks of age (early juvenile). In the first study, in the F0 (parental) generation litters were lost to abortion in one control, two low-dose dams, one mid-dose dam, and two high-dose dams. Additionally, one dam each in the control group and the high-dose group did not become pregnant, and one dam in the control group and one in the mid-dose group died during lactation. This left group sizes of seven to eight for behavioral assessment of offspring (F1 generation). In addition, pup survival was significantly reduced by PND 21 in the mid-dose group due to whole litter loss. Early development was accelerated in male offspring in the mid- and high dose groups as indexed by faster righting on PND 4 in the high dose group (with a significant dose trend), and greater cliff avoidance in the high dose group. On the other hand, negative geotaxis response was significantly delayed in the female offspring on PND 4. Since pups in all litters are pooled for these tests, disruptions due to dam and litter loss may influence these findings.
One early juvenile activity measure, number of movements in males, indicated treatment effects with a marginal trend test. No treatment effects were reported for activity data in adult offspring. For maze testing in adults, controls did not show learning by decrease in time or errors to the goal between trial 1 and trial 3. The low-dose males did show a decrease in time to goal, while female high-dose group decreased both time and errors to goal between the first and third trial. The time and error data of the treated groups were not compared to control in this study, but the significant decline in time and errors to goal in some dye-treated groups may be related to higher initial values of these measures.
In the second (3-generation) study, for the parental generation (F0), one dam in the control and low dose group, and two dams in the high dose group lost their litters to abortion, and two litters, control and high dose were lost during lactation. For this study, in order to form a second generation, 10 male and female pups per group continued on study at weaning although seven to nine litters were present at weaning across dose groups. For the F1 mating (F2 offspring), 10 males and females were mated. Two
Potential Neurobehavioral Effects of Synthetic CalEPA OEHHA Food Dyes in Children April 2021
91
dams in the control group and one each in the low-dose and mid-dose groups did not become pregnant, and one high dose dam lost her litter to abortion. This left group sizes of eight to nine male and female offspring for the behavioral testing of the F2 offspring. There were no survival differences unrelated to whole litter loss.
As in the first study, accelerated early postnatal development was reported in males and delayed development in females. For the F1 offspring, the mid-dose males had higher developmental scores than controls, with a dose-dependent trend for the swimming direction measure on PND 7. The mid-dose females had lower scores than controls for surface righting on PND 7, also with a dose trend. In the F2 offspring, swimming direction was accelerated in the high-dose males, as well as olfactory orientation at PND14 in the mid- and high-dose groups. Both effects showed dose-related trends. The females showed accelerated development in the female mid-dose group.
In the early juvenile activity test, a dose trend for reduced activity was reported for several endpoints in F1 male offspring (movement time, total distance, average distance, numbers of turns). Female offspring activity did not show treatment effects. There were no activity effects when the F1 offspring were tested as adults. Similarly, in F2 male offspring activity testing as juveniles, lower activity was seen with a dose-related trend test for total distance, average distance and average speed. In the F2 offspring, this dose-related trend for reduced activity was also seen at 8 weeks of age. No treatment effects were reported for female F2 offspring as juveniles or as adults.
This pattern of findings in both F1 and F2 generations (decreased activity in males as juveniles) is similar to that seen in the Yellow No. 5 F1 males in the 2-generation study (Tanaka 2006). Though some indication of improved maze performance was seen in the first (two-generation) Yellow No. 5 study, there were no treatment effects in the second (three-generation) study and lack of demonstration of learning in controls confounds interpretation of this test.
3.2.4.5 FD&C Blue No. 1 (Tanaka et al. 2012). The final Tokyo study reviewed here differed methodologically from previous studies in that a different automated activity system was used, the activity data were analyzed with parametric statistics, rather than nonparametric statistics as previously, and an additional, longer, activity test session was conducted at 9-10 weeks of age.
In terms of general toxicity, in the control group one dam was not pregnant and one had full litter resorption; in the low-dose group one dam died during lactation and one litter was killed by the dam; in the mid- and high-dose groups one dam each did not conceive resulting in eight to nine litters at weaning. In early development both males’ and females’ surface righting (PND 4) was delayed in the high dose group with a significant dose trend. The swimming direction variable showed accelerated development at PND 7 in the mid-dose females. No treatment effects on activity were reported at the young juvenile time point.
Potential Neurobehavioral Effects of Synthetic CalEPA OEHHA Food Dyes in Children April 2021
92
At the young adult time point for the offspring (8 weeks), some measures showed decreased activity. In females, there was a significant dose trend test for decreased horizontal activity. In the males, rearing was lower than controls in the low-dose group. The young adult tests used a 10-minute assessment, but additional tests were conducted 1-2 weeks later using a longer 120-minute assessment. In the later test, males in the low and mid dose groups had less mean rearing than controls but the differences were not statistically significant. The average time of rearing was significantly greater than controls early in the session. Also, males had a reduced number of activity periods in the low-dose group at 30 minutes. This group had generally fewer bouts of activity during the first 30 minutes of the session. However, the females in the high-dose group had higher mean values for three parameters across the session: total distance, average speed, and average time of movement. For the statistical analysis, one of the high dose group animals was removed as an outlier. With this correction, only average time of movement was marginally significantly different from control.
For the Blue No. 1 maze learning, using parametric statistics, the authors were able to examine main effects of trials, treatment group, and the interaction between them by ANOVA. The effect of trials, a decrease from the first to the last trial indicated learning and was significant for time-to-goal in both males and females with no treatment effect in either sex. However, there was a significant interaction between trials and treatment for the females. The females in the low-dose and the high-dose groups showed a decrease in time to goal from the first to the last trial that was not seen in controls. The same comparison (decrease over trials) was significant for the low-dose males. Examination of the data indicates that generation of this difference in females was due to both longer times the first day and shorter times on the third day, while for males, times were longer on the first day but similar to controls on the third day. The error data did not demonstrate trial or treatment effects or interactions in either sex.
The Blue No. 1 study deserves particular attention because it is the only DNT study for this dye. The early developmental endpoints were reported to show some group differences but the lack of litter-based statistics weakens the finding. The maze endpoints are not helpful for risk assessment because controls and dose groups were not compared statistically. The activity data generally indicated less activity as indexed by number of active periods and rears in the males. Greater activity as indexed by a number of parameters in females appeared to be due to an outlier.
3.2.4.6 Strengths and weaknesses of the Tokyo studies. The Tokyo studies are valuable for their dose-response designs and extensive data reporting. Reproductive and developmental toxicity data help provide a context for neurobehavioral toxicity data interpretation. However, there are obstacles to using data from the Tokyo studies for risk assessment:

Potential Neurobehavioral Effects of Synthetic CalEPA OEHHA Food Dyes in Children April 2021
93
1. The group size and power varied; from 7-10 mice per group were tested depending on reproductive effects. The power of these studies was not adequate given the sensitivity of many measures.
2. With the exception of the Red No. 40 study, the pups were pooled across litters for statistical analysis of the preweaning data, so that litter-based statistics were not performed.
3. The groups were not compared in the maze data analysis for most dyes; statistical analysis was within groups across trials only.
4. In most studies, nonparametric statistics were used because preliminary tests failed to support homogeneity of variance. A variety of approaches were used for the pairwise comparisons required in multiple dose studies (Hamada 2018).
5. Rank-based trend tests (Jonkheere) were used to evaluate dose-response in many studies but were often reported without pairwise comparisons of the individual dose groups with controls.
Data on general reproductive and developmental toxicity might be appropriate for risk assessment outside the more specific focus on neurodevelopmental toxicity.
It is tempting to compare across the food dyes for developmental neurotoxicity using the studies from the Tokyo lab. However, these data alone are not adequate to conclude that some dyes are more toxic than others by comparing across studies. While the design of the studies is similar there were changes in procedures, equipment and statistical analysis over time (1994-2012). An effort was made by the laboratory to test comparable dose ranges in this set of studies by using multiples of the JECFA ADIs for the low dose. However, different multiples (100X, 10X) were used and the JECFA Red No. 3 ADI is notable for being 25-fold lower than the FDA ADI. In addition, reproductive and developmental toxicity varied across studies and could influence the later behavioral assessments.
3.2.5 In utero exposure to mixtures In a series of publications from a single research group, a mixture of food dyes was given to rats only during pregnancy and offspring were evaluated for behavioral effects (Basak et al. 2014; Basak et al. 2017; Ceyhan et al. 2013; Doguc et al. 2019) as well as biological actions at the tissue level (Basak et al. 2014; Basak et al. 2017; Ceyhan et al. 2013; Doguc et al. 2013; Doguc et al. 2015). The components of the food dye mixture are shown in Table 3.7 and in Table 3.10. Six of the seven FD&C dyes were represented (no Green No. 3) along with three other dyes.
There were three studies using similar designs with some important differences (Table 3.10).

Potential Neurobehavioral Effects of Synthetic CalEPA OEHHA Food Dyes in Children April 2021
94
• Exposure period: The same exposure period, from 1 week prebreeding through delivery, was used in all three studies. No postnatal exposure occurred.
• Exposure route: Gavage administration to the dam was used in all studies. • Doses: The human mg/kg/day JECFA ADI dose was used in the first study
(Doguc et al. 2013) and a 100X JECFA ADI dose, equivalent to the animal NOAEL used to derive the human ADI, was used for the second and third studies (Doguc et al. 2015; Doguc et al. 2019).
• Behavior Endpoints: Three behavioral tests were used; Morris Water Maze for learning and memory, the Open Field for spontaneous behavior, and the Porsolt swim test for depression or behavioral despair. The tests were administered to adult offspring in the first and third study (Doguc et al. 2013; Doguc et al. 2019) and to juvenile offspring in the second study (Doguc et al. 2015).
• Tissue Assays: The first and third studies (Doguc et al. 2013; Doguc et al. 2019) conducted assays relevant to neurotransmitters in brain, while the second study (Doguc et al. 2015) conducted assays relevant to oxidative damage in brain and skin, and precancerous markers in laryngeal tissue (Basak et al. 2014). Because of the differences between studies, a comparison for purposes of replication or dose comparison cannot be made.
In the first study, dye effects were detected only in the Open Field test, whereas in the second and third study, at a dose equivalent to the NOAEL used by JECFA for their ADI, both Open Field and Porsolt swim test showed effects. Notably, the learning and memory test, the Morris Water Maze, was not affected in either study, although learning was demonstrated in controls and extensive data were taken and reported.
All three studies used a 5-minute Open Field duration. A smaller arena was used for the second and third studies than for the first study. Both males and females were tested. Data were scored by a blinded observer in the first study and automatically recorded by video software in the second and third studies. The researchers categorized the ten Open Field measures as reflecting locomotion, exploration and/or anxiety. The choice of nonparametric vs. parametric statistics was determined by result of the Levene test for homogeneity of variance.
In the first study (Doguc et al. 2013) (ADI dose, adult testing), the behavioral data were first analyzed separately with four treatment-sex groups using nonparametric statistics, then with sexes combined by ANOVA. In the four-group comparison, the dye-treated groups were more active (horizontal activity measure) than controls, but the comparison was significant only in the females. When male and female data were combined and analyzed by ANOVA, the dye effect was also significant. Another measure (walling, a vertical activity measure reflecting exploration) was also significantly greater in the dye-treated groups with males and females combined. A third Open Field measure, edge duration, was lower in the dye-treated males than in the male controls, indicating less anxiety or behavioral inhibition. No effects were reported in the Morris Maze or Forced Swim test.

Potential Neurobehavioral Effects of Synthetic CalEPA OEHHA Food Dyes in Children April 2021
95
In the second study (Doguc et al. 2015) (100 X ADI dose, juvenile testing), ANOVA was used for statistical analysis. Activity was consistently greater in the dye-treated group than controls, but a statistically significant dye effect was found only for the vertical activity measure (walling, rearing against the arena wall). There were no sex effects or sex – dye interactions. A nonlearning measure in the Morris maze showed a sex – dye interaction, with females taking more time to reach the visible platform than males in the experimental group, but there was no sex difference in controls. A dye effect was also found in the forced swim test. The measure of mobility time (how much time the subjects spent swimming) was greater in the dye-treated group (males and females combined) indicating less depression. Sex – dye interaction indicated that this was due primarily to higher activity in the dye-treated vs control males.
In the third study (Doguc et al. 2019) (100 x ADI, adult testing), two-way ANOVA showed a sex-dependent effect on the time spent in periphery vs center of the field, a measure interpreted as anxiety. Dye-treated males spent less time in the periphery than controls indicating lower anxiety. As in the second study, more time was seen in the dye-treated group in reaching the platform in the Morris Maze visible trial. Finally, mobility in the forced swim test was lower in the dye-treated group than controls. These results were similar to those of Doguc et al. (2013) using the ADI dose and juvenile testing, except that the Forced Swim test was not affected in juvenile testing.
While the results of these three studies cannot be directly compared, they demonstrate long term effects of in utero exposure on behavior at doses of the individual dyes found to have no effects in FDA regulatory reviews. Sensitive areas of brain function included regulation of activity, anxiety and exploration in a novel environment, and persistence in the forced swim test. Notably, no effects on learning and memory were seen.
These studies are notable for the post-study tissue assays. At the end of the studies, 90 days of age, the investigators collected tissues to test mechanism hypotheses.
One paper reported assays on neurotransmitters in brains from the first study (ADI dose) (Ceyhan et al. 2013). While early studies of neurotransmitter effects of dyes focused on levels of dopamine and norepinephrine, this paper used contemporary techniques (Western blots) to examine expression of glutamate and acetylcholine receptor proteins and looked at one specific cortical area (hippocampus). One of the two glutamate receptor proteins showed significant dye effects, but in different directions for the two sexes. Smaller deviations from control were seen for the three acetylcholine receptor proteins, but statistically significant effects were reported in males for two of them. In the Doguc 2019 study (Doguc et al. 2019), the glutamate receptor proteins were lower in the dye-treated vs. control females, with no dye effects on the acetylcholine receptor proteins. This pattern of changes did not provide enough information for interpretation except to say that these receptors are related to behavioral performance, and that long-term changes at the tissue level could be demonstrated after gestational dye exposure.
Potential Neurobehavioral Effects of Synthetic CalEPA OEHHA Food Dyes in Children April 2021
96
Two papers (Basak et al. 2014; Basak et al. 2017) and two abstracts (Aylak et al. 2012; Ilhan I. 2014) reported biochemical and histological measures using the ADI NOAEL dosing protocol. The offspring were 90 days old at the time of tissue acquisition. The tissues examined were brain (hippocampus), kidney, skin and larynx. While the larynx paper dealt with measures of mucosal defense and precancerous changes (Basak et al. 2014), another paper (Basak et al. 2017) and two abstracts (Aylak et al. 2012; Ilhan I. 2014) addressed oxidative damage. The Ilhan abstract has some relevance to neurotoxicology because brain tissue was studied. The Aylack assay also looked at oxidative damage, but in kidneys, while the Basak paper using skin samples. Both abstracts reported oxidative damage and increased antioxidant defense.
Strengths and weaknesses: The use of both parametric and nonparametric statistics and separate vs. pooled male and female behavioral data makes interpretation more difficult, but generally the identification of dye effects was supported. The state-of-the-art version of the Morris maze with extensive measures helps support the lack of effect on learning and memory. The finding of behavioral and tissue marker effects of in utero only exposure detected long after discontinuation of treatment speaks to an interference with developmental processes. More research would be needed to define a mechanism pathway from the tissue assays.
3.2.6 Juvenile exposure to mixtures A single study in rats used exposure during limited juvenile development, equivalent to childhood in humans (Erickson et al. 2014). This study was part of a multigeneration study of prenatal stress, so that some of the young rats exposed to food dyes were offspring of the fourth generation of stressed dams and some were offspring of unstressed controls.
A mixture of dyes (Red No. 40, Yellow No. 5, Yellow No. 6, Blue No. 1) was added to drinking water of offspring after they were weaned (PND 22) and continued through adolescence (PND 50). The individual dyes were consumed at between 0.51 and 1.61 times the FDA ADI, well below the 100 X ADI dose equivalent animal study NOAELs. The male offspring only were tested during and after the exposure for activity and anxiety. The effects of the dye mixture on the spontaneous activity (Open Field) were detected at 45 days of age, after 13 days of exposure. Increased movement time was seen. For the anxiety test (Affective Exploration), the dye-treated groups had a faster mean emergence times than controls and this difference was significant at 90 days of age, 40 days after the end of the exposure period. Notably, these same tests administered to older animal (7 and 13 months of age) did not show dye effects These results suggest greater activity and less anxiety emerge due to juvenile dye exposure at doses near the human ADIs but do not persist through adulthood. This provides a valuable parallel to human studies where behavioral problems resolve after discontinuation of dye-containing diets.
Potential Neurobehavioral Effects of Synthetic CalEPA OEHHA Food Dyes in Children April 2021
97
Strengths and weaknesses: Though the dye variable was added on to a larger study of developmental stress, statistical analysis did not detect dye-stress interactions that might limit generalization of the findings. All the dyes were given at the same dose in a mixture, but the actual doses of each were close to the FDA ADI. The experimental protocols and statistical analysis were state-of-the-art in this recent study. Only males were tested and there were 2/litter in a group size of eight that included offspring from the maternal stress and maternal no-stress line.
3.2.7 Summary 1. Effects were shown at doses below the FDA ADI NOAEL (ADI x 100) in some developmental studies (Table 3.1a).
2. The three brain function areas commonly investigated in the studies reviewed above were early postnatal motor development, spontaneous motor activity, and learning and memory. Activity tests appeared more sensitive to dye treatment than learning and memory tests.
3. Several studies used protocols that parallel to some degree the children’s diet restriction and challenge studies. Two studies reported behavioral effect during dye administration limited to juvenile ages. These studies would be similar to diet studies in children, except that those studies used an intra-subject design, while these animal studies used between-subjects designs. The Erickson study found increased movement time in males using a mixture of dyes in drinking water, each dye less than 2 times the FDA NOAEL. These mixture doses are in the range of human mixture studies. The Shaywitz study also used a mixture of dyes at doses near human ADIs and found greater activity at the higher dose of the mixture. Both studies used rats; both males and females were used by Shaywitz although no analysis by sex was presented. Erickson used only males. Notably, there was an additional independent variable in these studies, 6-OHDA for Shaywitz et al. and maternal stress for Erickson et al. Though statistical analysis did not find any interaction of dye with the additional variables, they may have influenced the developmental experiences of all the animals.
3.3 Adolescent/adult neurobehavioral toxicity studies 3.3.1 Introduction The studies reviewed in this section used exposures that began after puberty, which is generally at about 5 weeks of age in rodents. In some cases, the age of the subjects at the onset of exposure was not stated and was estimated from body weight data. The studies are reviewed in historical order. Details are provided in Table 3.10.
1. In the 1980s, two studies of food dye neurobehavioral toxicity were conducted with exposures beginning at puberty or later. The doses were typically in the range of general toxicity information available at that time.

Potential Neurobehavioral Effects of Synthetic CalEPA OEHHA Food Dyes in Children April 2021
98
2. In addition, adult neurobehavioral toxicity data is available in the DNT studies from the Tokyo Metropolitan Laboratory of Public Health described in section 2.4. These five studies were published between 1994 and 2012.
3. From 2008 to 2018, five research reports on dye neurobehavioral toxicity using Yellow No. 5, Red No. 3 and Red No. 40 were published. The reports included several experiments with behavioral testing (activity, learning and memory) as well as mechanism components and were often hypothesis based. Dye was given by gavage administration. Statistics typical of current toxicology standards were used. Also, due to more recent publication standards, they were more thoroughly documented than earlier research reports.
3.3.2 Nutrition Foundation mixture study The same dye mixture previously used by the Shaywitz lab for developmental studies (see Section 2.3) was also used in a short term study in adolescent/young adult rats (Kantor et al. 1984). All subjects were males. This was a hypothesis-based study, testing whether activity of an enzyme involved in monoamine neurotransmitter synthesis mediated the dye effects on behavior. The cofactor for this enzyme was the active form of vitamin B6, pyridoxal phosphate (PLP). Dyes were administered to male rats as % diet (0.5, 1.0, 2.0, 4.0%). The doses in mg/kg/day were much higher (~ 500 times) than those in the Shaywitz developmental studies (see Table 3.2). The behavior endpoint studied was activity. In this case, activity was automatically recorded 24 h/day for 4.5 weeks after a 9-day pretreatment baseline beginning at 24 days of age. Lower activity, as well as lower food intake and body weight, were reported for the high-dose group during the first 22 days of exposure with recovery by the end of the study. For the two lowest doses (0.5 and 1.0 % in diet), the data indicated greater initial activity than controls, but these differences were not statistically significant. There were no effects on body weight at these doses. These investigators also examined brains at the conclusion of the study and reported no dye effects on neurotransmitters or their metabolites. Also, there was no effect of the food dye mixture on PLP, the active form of vitamin B6 in brain. Thus, there was no support for the mechanistic hypothesis that dyes interfere with monoamine neurotransmitter via interaction with PLP. One other early study (Mailman et al. 1980) contained some activity measures but was not reported in enough detail to review.
Strengths and weaknesses: These were the first dye experiments with automated recording of activity. The decreases in 24-hour activity are difficult to compare to the early DNT studies with the same mixture at lower doses and shorter monitoring periods.
3.3.3 Studies with diet administration from the Tokyo Metropolitan Laboratory of Public Health The studies from Tokyo Metropolitan Laboratory of Public Health described in the DNT section (3.2.4) also contain data on neurobehavioral toxicity of dye in the adult parents
Potential Neurobehavioral Effects of Synthetic CalEPA OEHHA Food Dyes in Children April 2021
99
(Table 3.4). Prior to mating in these studies, after 28 days of diet exposure beginning at puberty, both male and female mice of the F0 generation were given a 10-minute activity assessment. Male and female data were analyzed separately. The Red No. 40 study did not include activity testing of adult parents and the Yellow No. 6 study reported no effects in the parents. For the other dyes (Red No. 3, Yellow No. 5, Blue No. 1), changes in activity were detected in either the male or female parent as shown in Table 3.4. Different measures of activity and different sexes were affected depending on the dye.
The results of the Blue No. 1 study (Tanaka et al. 2012) require special attention as this is the only study of postpubertal neurobehavioral toxicity for this dye. In the females, most of the activity measures showed an increase over doses, although only move time and average duration of rears had a significant linear dose trend (Jonckheere test, p=0.019 and p=0.027). A decreased duration of rears is compatible with greater move time. The authors do not report any significant pairwise comparisons with dose using Bonferroni post hoc tests. The male data showed a different pattern, with higher mean values than controls in the low-dose group for several movement endpoints (total distance, number of horizontal movements, movement time, number of rears), significant only for number of horizontal movements. At the two higher doses, the values for these parameters decreased from the low dose values. This pattern suggests a nonspecific interference with activity at the higher doses, but no effects on weight or mortality were reported in males.

Potential Neurobehavioral Effects of Synthetic CalEPA OEHHA Food Dyes in Children April 2021
100
Table 3.4 Results of the adult activity testing by the Tokyo Metropolitan Institute of Public Health. The Study NOAEL Endpoint is for an effect that is statistically significantly different from control, or for which there is a significant dose trend. For high dose NOAEL, the average daily intake of males and females at the highest dose is shown.
Dye Study NOAEL (N) or LOAEL (L) Dosea
Study NOAEL Endpoint
Sex Statistics
Red No. 3 (Tanaka 2001)
0.015% diet, (N) 28 mg/kg/d ↑ Turning Female Nonparametric, Shirley Williams Jonckheere Trend Test Linear dose trend ↑ Turning
Yellow No. 5 2- gen (Tanaka 2006)
0.05% diet, (N) 73 mg/kg/d ↑ Vertical activity Male Nonparametric, Steel-Dwass Jonckheere Trend Test
Yellow No. 5 3-gen(Tanaka et al. 2008)
0.45% diet, (N) 824 mg/kg/d No effects Female & Male
Nonparametric, Mann-Whitney
Yellow No. 6 (Tanaka 1996)
0.6% diet, (N) 1052 mg/kg/d No effects Female & Male
Nonparametric, Mann-Whitney
Blue No. 1 (Tanaka et al. 2012)
0.08% diet, (L)122 mg/kg/d
↑Horizontal movements
Male Parametric, ANOVA Jonckheere Trend Test
Linear dose trend
↑Move time
Male Parametric, ANOVA Jonckheere Trend Test
Linear dose trend ↓ Average duration of rears
Female
a Two dyes (Yellow No. 6, Yellow No. 5 3-gen) showed no activity effects (dose group vs. Control) and thus had a high dose NOAEL. Dose was administered as % diet across life stages; mg/kg/d doses were based on tables provided separately for sex and life stage by the authors.
Potential Neurobehavioral Effects of Synthetic CalEPA OEHHA Food Dyes in Children April 2021
101
Strengths and weaknesses: These adult data were based on 10/sex/group, unlike the offspring data which varied in group size. Both sexes were evaluated. Food intake and weights were also shown to assess general toxicity. Nonparametric statistics were used except for the Blue No. 1 study. The activity monitoring was automated with 10-minute sessions.
3.3.4 Studies with gavage administration: cognitive endpoints These studies featured short term exposures, usually around 1 month. Generally, the dosing began sometime during adolescence or early adulthood with behavior assessed during or at the end of the dosing period. These studies used gavage administration, a dosing procedure more comparable to the challenge studies in children. The top doses were at or below the FDA animal NOAEL (ADI x 100) (Table 3.1b). They speak to the ability of food dyes to affect behavior when the entire daily dose is administered at one time as is the case in children’s challenge studies.
Of particular interest are recent studies of two azo dyes, Yellow No. 5 and Red No. 40, performed in the same laboratory (Noorafshan et al. 2018; Rafati et al. 2017) (details provided in Table 3.9). These studies used a complex and thorough examination of cognitive function. They also recorded one of the lowest effective neurotoxicity doses in the literature we reviewed, the same dose that is designated by FDA as the ADI for these dyes. The dyes were administered daily by gavage to young adult male rats. The low dose was set at the FDA ADI, with a second, high dose at 10 times ADI.
Two cognitive tasks, novel object recognition and radial arm maze learning began after 4 weeks of treatment. Notably, the radial arm maze test is the only learning and memory test reviewed here with a positive reinforcer (food). The use of a food reinforcer requires food restriction during the experiment. After testing, brains were obtained to evaluate histomorphology and stereology of the medial prefrontal cortex, an area associated with performance of these cognitive tasks.
For Red No. 40 (Noorafshan et al. 2018), the high dose group spent less time exploring the novel object than controls, though this comparison was not statistically significant. In the radial arm maze, both Red No. 40 treated groups (the dose groups combined) performed more reference memory errors and working memory errors than controls, while learning the radial arm maze, and also in the retention test. When brains were examined at the end of the experiment, the volume of the medial prefrontal cortex was found to be smaller in high dose Red No. 40 group than controls. At the cellular level, there were fewer neurons and glial cells in this brain area in the high-dose group compared to controls. At greater magnification, the length of dendrites and the number of synaptic spines per unit length were also lower in the high-dose group than in controls. Thus, Red No. 40 influenced the learning and memory test, and the high dose resulted in adverse effects on the medial prefrontal cortex.
Potential Neurobehavioral Effects of Synthetic CalEPA OEHHA Food Dyes in Children April 2021
102
An aspect of this study seen frequently in recent literature was use of an antioxidant, in this case taurine, to test the hypothesis that the dye effects could be due to oxidative damage. Adding taurine to the gavage mixture mitigated most of the effects of Red No. 40 on brain and behavior. Of note, increasing the size of the experiment by including the taurine and taurine + Red No. 40 groups increased the statistical power of the ANOVAs used to analyze the data.
The other study (Rafati et al. 2017) evaluated Yellow No. 5 using the same design with low doses set at the JECFA ADI and the high-dose at 10 times ADI. The novel recognition task was affected only in the high-dose group in terms of exploration time. For the radial arm maze, more days were required for Yellow No. 5 treated rats (low- and high-dose groups combined) to reach the learning criterion. More errors were also seen in these dye-treated group on some of the learning days. A similar pattern of increased error in dye-treated groups was shown during the retention phase. The brain assays demonstrated smaller volume of the medial prefrontal cortex in the high-dose group. The number of cells was lower at the high dose and qualitative alterations in cell shape were described. Both the low and high dose resulted in shorter dendrites with lower spine density.
The study design for the Yellow No. 5 study, like the Red No. 40 study, also included an antioxidant, vitamin E, which mitigated most of the reported effects when it was administered with Yellow No. 5 in the gavage fluid.
Strengths and weaknesses: The behavioral tasks in these more recent studies are well-known for their sensitivity to neurotoxins. The gavage administration may result in higher internal doses and less binding to fiber in the intestines than the diet administration route used in most of the early dye toxicity studies. The detailed examination of brain histomorphology helps provide biological plausibility for the behavioral effects. In terms of weaknesses, the text and statistics presentation suggest that both dose groups were sometimes combined for comparison to controls in the Rafati et al. study. Thus conclusions about the individual dose groups cannot be reached.
3.3.5 Studies with gavage administration: activity endpoints A second set of two research reports from a different laboratory (Dalal and Poddar 2009, 2010) used gavage administration in adult male rats and looked in some detail at effects on spontaneous activity. Details of the study are provided in Table 3.9. These investigators also used brain assays to investigate a mechanism hypothesis.
Red No. 3 was administered at three or four dose levels with low dose set at the JECFA ADI (1 mg/kg/day). The activity measure was vertical rearing frequency detected automatically. Rearing is a form of spontaneous activity most closely associated with exploration. In their first study, the investigators looked at activity directly after single doses administered by gavage of 0, 1, 10, 100 or 200 mg/kg. The investigators measured activity for 5 minutes at 30-minute intervals for 3 hours, and then every hour
Potential Neurobehavioral Effects of Synthetic CalEPA OEHHA Food Dyes in Children April 2021
103
to 9 hours post-dosing. The resulting data are shown in Figure 3.3. No effect was seen at the lowest dose but the other three doses produced a dose-dependent pattern of diminished activity that reached a low at 2 hours after dye administration and then returned to baseline by 7 hours. Of note, the time of peak Red No. 3 effect on activity (2 h after administration) corresponds to the peak in Red No. 3 levels in circulation as described in a JECFA review (WHO JECFA 2019a).
Using this information, the investigators conducted a second experiment with the same dosing and obtained brains for analysis at the peak low activity timepoint (2 h post-dosing) and the recovery point (7 h post-dosing). Based on research suggesting a role for serotonin in modulating activity, the brain assays examined changes in the serotonin system that might correlate with the activity changes. Although dopamine and norepinephrine had previously received attention in dye neurotoxicity studies, serotonin had received less attention. The following measures were used:
• Serotonin concentration • Concentration of the serotonin metabolite 5-hydroxyindoleamine (5HIAA) • The activity of the serotonin metabolizing enzyme monoamine oxidase A (MAOA) • Administration of pargyline, an MAO inhibitor • Binding of serotonin to membranes
Four subcortical brain areas were studied: brainstem, hypothalamus, hippocampus, and striatum.
The data analysis demonstrated that serotonin was lowered in a dose dependent manner in all brain areas except striatum. In the hippocampus only, 5HIAA and MAO-A increased in a dose-dependent manner. This pattern suggested that that dye increased MAO-A activity and led to decreased levels of serotonin and increased levels of 5HIAA. By 7 hours after the Red No. 3 dose, all effects in brain had dissipated as was the case for behavioral effects. The LOAEL for the serotonin effect was 10 mg/kg; the LOAEL for the 5HIAA and MAO-A effects was 100 mg/kg. Binding of serotonin to membranes, studied with 3H-serotonin, followed a similar pattern of reduction in all brain areas except striatum at doses at or above 10 mg/kg.
To further explore the hypothesis that serotonin metabolism responded to the dye administration, an MAO inhibiting drug (MAOI, pargyline) was used. An MAOI drug would be expected to decrease the metabolism of serotonin, resulting in more serotonin and less 5HIAA metabolite. Dye would be expected to offset the effect of pargyline by increasing MAO-A. When brains were examined at 2 hour (peak dye effect) timepoint, dye antagonism of the pargyline effect on serotonin levels was seen in brainstem and hypothalamus at doses of 10 mg/kg/day or more. However, pargyline increases in serotonin were not affected by dye in the other two brain region. 5HIAA decrease was not affected in any brain region. An issue with this experiment is that MAO has two isoenzymes, MAO-A and MAO-B. Pargyline inhibits both MAO-A and MAO-B but MAO-B is somewhat more affected and MAO-A is the more selective for serotonin

Potential Neurobehavioral Effects of Synthetic CalEPA OEHHA Food Dyes in Children April 2021
104
metabolism. Further MAO-A is more prevalent in higher brain centers, while MAO-B predominates in lower centers.
Another experiment was done using activity as the endpoint with MAO inhibitors, one specific for MAO-A (clorgyline) and one for MAO-B (deprenyl). A combined treatment with both MAOIs was also used.
The MAOIs were injected 10 minute after the Red No. 3 gavage with 100 mg/kg and activity was measured at intervals after dosing as previously. At 1-1.5 h post dosing, the MAOIs alone led to increased activity, and at 3 h postdosing Red No. 3 led to decreased activity as in the previous experiment. When MAOIs were given after Red No. 3 they appeared to counteract the effect of Red No. 3 on activity, with the MAO-A specific drug somewhat more effective than the MAO-B specific drug. An additive effect of the two MAOIs was suggested; a combination of both MAOIs almost completely reversed the activity-lowering effect of Red No. 3.
Figure 3.3 Changes in activity after a single gavage dose of Red No. 3 in rats not previously exposed to Red No. 3. N=8-12 rats. Mean±sem are presented. aDifferent from control p<0.01 bDifferent from control p<0.05. From (Dalal and Poddar 2009).
The final experiment in this report also used activity as the endpoint, administered three doses of Red No. 3 with or without the two MAOIs, and measured activity only at 2 h post-dosing. This experiment again confirmed the dose dependent ability of Red No. 3 to decrease activity shortly after administration. It also demonstrated that in addition to

Potential Neurobehavioral Effects of Synthetic CalEPA OEHHA Food Dyes in Children April 2021
105
dye reversing the effect of MAO inhibitors on serotonin, the MAO inhibitors reversed the dye effect on activity as well.
This paper is relevant to situation where a child is not regularly exposed to large amounts of food dyes, but on a single occasion does experience this exposure, and this is linked to a subsequent change in behavior noted by the parents. It is also parallel to challenge studies in children where a single dose of dye or mixture is administered and behavior is measured shortly afterward. In both rats and children, the effect of dye peaks and then dissipates over a few hours after the exposure.
A second report (Dalal and Poddar 2010) is relevant to the situation where a child is exposed to food dye every day, and activity is evaluated in a time dependent manner after one daily exposures. This is a good reflection of typical exposures of children who regularly consume foods containing synthetic food dyes. After a period of daily dosing for 15 or 30 days, in sharp contrast to the decreased activity seen in the first report with a single dye administration, activity measured following the final administration of Red No. 3 was increased (Figure 3.4 below). This was true after either 15 or 30 days of pretreatment and the effect peaked at 2 h after the dye administration. Similarly, in contrast to the first report with a single dye administration, serotonin increased, rather than decreased, in the brain areas studied (brainstem, hypothalamus, hippocampus, striatum). In agreement with the increased serotonin, MAO-A activity was decreased in all brain regions, significant with the 100 mg/kg/day dose and 30-day exposure. The serotonin metabolite 5HIAA was not affected. The MAO inhibitor, pargyline, administered after Red No. 3 on 15th or 30th day of treatment exacerbated the elevation of serotonin in the brain regions studied. The investigators did not assess the effect of combined Red No. 3 and pargyline on activity.

Potential Neurobehavioral Effects of Synthetic CalEPA OEHHA Food Dyes in Children April 2021
106
Figure 3.4 Changes in activity after a single gavage dose of Red No. 3 in rats that were previously exposed to Red No 3 for either 15 or 30 days. N=8-12 rats. Mean ± sem are presented. aDifferent from control p<0.01 bDifferent from control p<0.05. From (Dalal and Poddar 2010).
In this second report, in addition to looking at brain serotonin synthesis, plasma corticosterone was evaluated at the same time points in both the Red No. 3 only and Red No. 3 + pargyline experiments. Plasma corticosterone was elevated 2 h postdosing after both 10 and 100 mg/kg Red No. 3. Pargyline alone also produced elevated corticosterone at the 2 h timepoint. These effects were additive as shown by exacerbation of the Red No. 3 effect when pargyline was also administered. The authors attribute the differing effects of Red No. 3 with and without prior daily exposure to elevated corticosterone status with repeated exposures which increases brain serotonin synthesis and synaptic levels causing increased activity.
Strengths and weaknesses: These studies have many strengths including a well-developed hypothesis concerning mechanism, replication of the main effect on behavior, and three to four doses with graphic illustration of dose response. The statistical analysis (ANOVA with post hocs) was appropriate. Although the effect is transient, which reduced its toxicological status, a transient effect mirrors the effects seen in children with followup after challenge. The statistical approach to the activity apparently uses an ANOVA with post hocs (Scheffe) at each test time point. While a repeated measure design would have been better for the behavioral measures, the analysis is convincing.

Potential Neurobehavioral Effects of Synthetic CalEPA OEHHA Food Dyes in Children April 2021
107
3.3.6 Study with gavage administration and cognitive and activity endpoints. Gao et al (2011) used 30 days of daily gavage dosing with Yellow No. 5 in both rats and mice and then assessed behavior and brain endpoints (Gao et al. 2011). Yellow No. 5 was studied in a 3-dose design with higher range of doses than in the previously described gavage experiments (Table 3.1b). Also the rats and mice appeared to be at a juvenile stage of development at the beginning of dosing judging from their weights (age was not given). Activity endpoints were studied in the rats, while learning and memory (water maze, passive avoidance) were studied in the mice. In the rat activity test (Open Field), greater activity in terms of both horizontal movement (squares crossed) and vertical activity (rearing) was seen in the mid- and high-dose groups (250, 500 mg/kg/day) compared to controls. The mid- and high-dose (350 and 700 mg/kg/day) interfered with the learning of mice in both the Morris Water Maze and the Step Through Avoidance task. The NOAEL was found at the low dose in both studies (125 mg/kg/day rats, 175 mg/kg/day mice).
These investigators added mechanism-based experiment to the rat study based on an oxidative stress hypothesis. In this hypothesis, aromatic amines, metabolites of azo dyes, generate ROS (reactive oxygen species). Malondialdehyde (MDA), a marker of oxidative damage, and the antioxidants glutathione peroxidase, catalase superoxide dismutase were assessed in whole brain homogenate. As with behavioral tests, the mid- and high-dose of Yellow No. 5 showed effects in increasing MDA levels and decreasing antioxidant levels. In the high-dose group, histological review described neuronal cell pathology indicative of apoptosis.
Strengths and weaknesses: The study used both male and female subjects, but did not include this factor in the statistical analysis. The sample as a whole was balanced for sex but the composition of the individual groups was not stated. The demonstration of changes relevant to an oxidative stress hypothesis was based on similar experiments with dyes in other tissues and is consistent with their findings.
3.3.7 Relevance of adult neurotoxicity studies to developmental neurotoxicity issues.
1. Lifestage specificity of neurotoxicants: The issue of food dye effects on children falls outside of the regulatory framework for developmental neurotoxicity, which focuses on long-term or lasting effects of an exposure limited to development. Some types of developmental neurobehavioral toxicity, however, can be seen to parallel adult neurotoxicity where dosing and testing are done at the same time. The same immediate effects of the agent are seen, but at different life stages. In fact, in constructing a database of developmental neurotoxicants, US EPA (Mundy et al. 2015) did not include studies where an effect was detected only during or shortly after treatment, which they termed “pharmacological”. Presumably, such effects would be considered neurotoxicity as expressed in immature lifestages. If the effect disappears with discontinuation of exposure, it

Potential Neurobehavioral Effects of Synthetic CalEPA OEHHA Food Dyes in Children April 2021
108
is presumably due to “immediate” effects of the dye rather than a consequence of previous exposures. Of course, both immediate and long term effects are possible after a developmental exposure.
2. Activity endpoints summary: Most of the studies reviewed above had activity endpoints. However, the activity tests differed broadly, including 24 h automated home cage activity for a month; one hour automated open field, five days; 10-minute automated activity in a circular arena; 5-minute automated vertical activity only, repeated assessment at 30 minute intervals for 9 h. These studies cannot directly be compared for the detection or the direction (increased/decreased) of the dye effect on activity.
3. Consistency across studies: These studies were designed to test hypotheses and not to replicate previous work. An exception is the work of Dalal and Poddar (Dalal and Poddar 2009, 2010) that contained a replication of the main dye effects within the first report. The differences in design, doses, and endpoints preclude an evaluation for consistency of effects across studies from different laboratories.
4. Dose-response linearity. Dose-response assessment was built into the design of most of the studies by including multiple doses. However, data were not modeled statistically to evaluate dose-response relationships. In several studies, effects found at lower doses were not statistically significant at higher doses.
3.4 Summary of mixture studies In reviewing the effects of individual dyes, we are acutely aware that, in real life, dye exposures never occur in isolation. Risk assessment has addressed this issue in various ways (Groten et al. 2004; USEPA 1986, 2000). One attempt to deal with this issue in animal toxicology experiments is to construct mixtures that correspond to anticipated real life exposures. This approach has been used to study common contaminants in drinking water and pesticides that are used together (Abou-Donia et al. 1996; Yang 1993) and also for food dyes.
3.4.1 Animal studies using the Nutrition Foundation mixture. Because many studies in children use dye mixtures, and the Nutrition Foundation mixture was frequently used in early studies, it is important to examine the effects of this mixture in animal studies. The animal studies using these mixture studies used gavage administration which is similar to children’s challenge studies.
In response to the Feingold controversies, the Nutrition Foundation (the predecessor of ILSI, the International Life Sciences Institute) developed a dye mix to be used in a produced “challenge cookie” for experiments in children. This mixture, produced by Nutrition Foundation, was also provided to researchers for animal studies. It was based on the average amount of dye manufactured per year (1973-75) divided by population (Silbergeld and Anderson 1982). The average total dye intake per person was 27.29 mg/d. The authors stated that 173 children were involved in studies using this mixture

Potential Neurobehavioral Effects of Synthetic CalEPA OEHHA Food Dyes in Children April 2021
109
in cookies or drinks. Indeed, most of the children’s challenge studies published from 1978 to 1984 used this mixture. The percent of each dye in the mixture is shown in Table 3.5.
Table 3.5 Comparison of Nutrition Foundation mixture composition to current estimates of dye exposure in children.
*From Exposure Assessment, Chapter 6.
The second column of Table 3.5 shows the percent of each dye a child 5-9 would consume if she ate the mean amount of dye for her age group based on our exposure assessment using National Health and Nutrition Examination Survey (NHANES) 2015-16 data (see Chapter 6). The profile is similar, except for the absence of Orange B in the estimates using the NHANES data sets, and a shift in the total of some dyes (e.g., less Red No. 3, more Red No. 40 currently consumed versus the Nutrition Foundation mix).
This same mixture was used in four rodent studies with different rat strains, doses of mixture, and protocols for measuring activity (see Section 2.3 and Table 3.10). In these studies, the doses were individually determined on a mg/kg/day basis (as opposed to the multi-life stage diet studies where doses were estimated using standard assumptions of weight and food intake in adults). The resulting mg/kg/day doses for individual dyes are shown in Table 2, Section 2.3. A major focus of the studies was assessment of activity during dosing. Cognitive tests were also performed.
Dye Nutrition Foundation mixture (%)
Dye exposure Child 5-9 years old (%)*
Red No. 3 6.08 2.53 Red No. 40 38.28 49.00
Yellow No. 5 25.91 17.14 Yellow No. 6 22.74 21.27 Blue No. 1 3.12 6.67 Blue No. 2 1.70 2.54
Green No. 3 0.13 0.63 Orange B 0.54 -
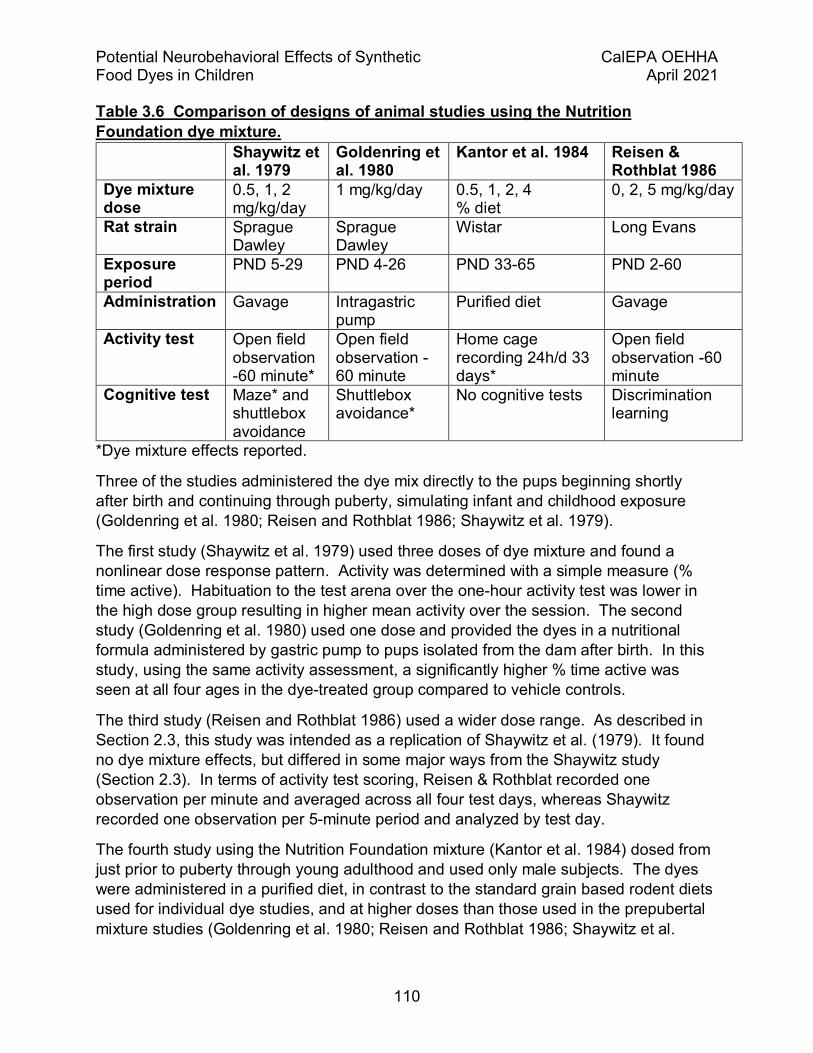
Potential Neurobehavioral Effects of Synthetic CalEPA OEHHA Food Dyes in Children April 2021
110
Table 3.6 Comparison of designs of animal studies using the Nutrition Foundation dye mixture. Shaywitz et
al. 1979 Goldenring et al. 1980
Kantor et al. 1984 Reisen & Rothblat 1986
Dye mixture dose
0.5, 1, 2 mg/kg/day
1 mg/kg/day 0.5, 1, 2, 4 % diet
0, 2, 5 mg/kg/day
Rat strain Sprague Dawley
Sprague Dawley
Wistar Long Evans
Exposure period
PND 5-29 PND 4-26 PND 33-65 PND 2-60
Administration Gavage Intragastric pump
Purified diet Gavage
Activity test Open field observation -60 minute*
Open field observation -60 minute
Home cage recording 24h/d 33 days*
Open field observation -60 minute
Cognitive test Maze* and shuttlebox avoidance
Shuttlebox avoidance*
No cognitive tests Discrimination learning
*Dye mixture effects reported.
Three of the studies administered the dye mix directly to the pups beginning shortly after birth and continuing through puberty, simulating infant and childhood exposure (Goldenring et al. 1980; Reisen and Rothblat 1986; Shaywitz et al. 1979).
The first study (Shaywitz et al. 1979) used three doses of dye mixture and found a nonlinear dose response pattern. Activity was determined with a simple measure (% time active). Habituation to the test arena over the one-hour activity test was lower in the high dose group resulting in higher mean activity over the session. The second study (Goldenring et al. 1980) used one dose and provided the dyes in a nutritional formula administered by gastric pump to pups isolated from the dam after birth. In this study, using the same activity assessment, a significantly higher % time active was seen at all four ages in the dye-treated group compared to vehicle controls.
The third study (Reisen and Rothblat 1986) used a wider dose range. As described in Section 2.3, this study was intended as a replication of Shaywitz et al. (1979). It found no dye mixture effects, but differed in some major ways from the Shaywitz study (Section 2.3). In terms of activity test scoring, Reisen & Rothblat recorded one observation per minute and averaged across all four test days, whereas Shaywitz recorded one observation per 5-minute period and analyzed by test day.
The fourth study using the Nutrition Foundation mixture (Kantor et al. 1984) dosed from just prior to puberty through young adulthood and used only male subjects. The dyes were administered in a purified diet, in contrast to the standard grain based rodent diets used for individual dye studies, and at higher doses than those used in the prepubertal mixture studies (Goldenring et al. 1980; Reisen and Rothblat 1986; Shaywitz et al.

Potential Neurobehavioral Effects of Synthetic CalEPA OEHHA Food Dyes in Children April 2021
111
1979) (see Table 3.2). At these doses, general developmental toxicity, in terms of growth retardation, was seen at the highest dose in the young rats. Activity was measured 24 h/day in the home cage. As was the case for the Shaywitz study, a linear dose response was not seen across doses; mean activity was higher at the two lowest doses, but was depressed in the high dose group. Only the high-dose group was significantly different from controls.
Like the human mixture studies, details in these mixture studies vary between experiments in both methodology and results. Taken together, the data from these mixture studies indicate that regulation of activity during developmental periods can be influenced by food dyes administered as a mixture, but the effect is variable depending on the amount of dye and details of experiments.
3.4.2 Recent mixture studies In addition to the early experiments using the Nutrition Foundation dye mixture, four later experiments used mixtures based on regulatory ADIs intended to be relevant to human use (see Section 2.5). Three of these studies (Doguc et al. 2013; Doguc et al. 2015; Doguc et al. 2019) used gavage administration during pregnancy (Table 3.7). Both the human JECFA ADI dose, and 100 times ADI dose (the animal NOAEL used to derive the ADI) were used. In the first study using the ADI dose, some effects on both brain and behavior were seen in adult offspring exposed only in utero. With respect to activity, the group treated at the ADI dose (Doguc et al. 2013) was more active in a 5- minute Open Field test in terms of horizontal and vertical activity. In the second study, at the 100 X ADI dose (Doguc et al. 2015) a smaller open field was used for 5 minute and greater vertical activity was recorded in the dye-treated group assessed in adolescence. No effects on a water maze learning and memory were seen at either dose, but longer duration of mobility was seen in the dye-treated group in the Porsolt forced swim test. The third study used the 100 times ADI dose and assessed the offspring as adults.
Although all three studies used the same period of exposure, the doses and age at evaluation were not the same (Table 3.7) and the studies cannot be considered replicates. They do show that residual effects of the in utero exposure emerge in the brain at 90 days of age, and that behavioral consequences can occur at two doses found to have “no adverse effect” in the toxicology studies used to develop ADIs.

Potential Neurobehavioral Effects of Synthetic CalEPA OEHHA Food Dyes in Children April 2021
112
Table 3.7 Mixture doses used in Doguc prenatal exposure studies. Food Dye Doguc et al.
2013 Doguc et al. 2015, 2019
JECFA ADI 100 X JECFA ADI mg/kg/day mg/kg/day Red No. 3 0.1 10 Red No. 40 7 700 Blue No. 1 12.5 600* Blue No. 2 5 500 Yellow No. 5 7.5 750 Yellow No. 6 2.5 250 Amaranth 0.5 15* Azorubine 4 400 Ponceau 4R 4 70*
*These values are not multiple of the 2013 values because the ADIs were revised between 2013 and 2015.
Table 3.8 Comparison of three studies with in utero exposure to dye mixture. Doguc et al.
2013/ Ceyhan 2013
Doguc et al. 2015
Doguc et al. 2019
Exposure period
1 week premating to delivery
1 week premating to delivery
1 week premating to delivery
Mixture dose ADI 100 x ADI 100 x ADI Behavioral testing age
Adult Adolescent Adult
Brain assay age 90 days of age No brain assays
90 days of age
These studies were important because they identified effects on both brain and behavior in offspring who were exposed only in utero. These effects could be relevant to children’s challenge studies if in utero exposure to dyes modifies an immediate behavioral response to dye dosing later in life. However, an experimental design testing this idea has not been used to date.
In another recent dye mixture study (Erickson et al. 2014), each individual dye contributed the same amount to the mixture which was provided in drinking water. The four most widely used dyes (the three azo dyes and Blue No. 1) were included at doses between 0.5 and 1.6 times the human FDA ADI. This study found increased activity in the treated group at PND 45, during the dye administration period, but not later at PND 90 after the dye treatment was discontinued. Notably, decreased anxiety was seen at PND 90. This study, along with the Shaywitz studies (Goldenring et al. 1980; Shaywitz et al. 1979) provide the closest approximation to children’s dye exposures studies in

Potential Neurobehavioral Effects of Synthetic CalEPA OEHHA Food Dyes in Children April 2021
113
that dye mixture was administered and behavior was measured during the juvenile lifestage.
In addition to activity, most of the mixture studies included a learning and memory test. For the Nutrition Foundation mixture studies, no effects on learning and memory were reported, with the exception of the Goldenring study (see Table 3.6). In the Doguc studies learning and memory in the water maze task was not affected. Erickson et al. did not include a learning and memory test.

Potential Neurobehavioral Effects of Synthetic CalEPA OEHHA Food Dyes in Children April 2021
114
Animal Toxicity Summary Table
Table 3.9 Individual dyes. Developmental and adolescent/adult studies. Results columns present statistically significant differences between a dose group and control group reported by authors. Statistically significant dose trend tests reported by the authors are also presented. Arrow (↑/↓) indicates direction of difference from control group. For additional variable measurements, statistically significant differences with dye-treatment exposures are presented. GD=gestational day; PND=postnatal day.
Study Information
Experimental Design Dye Information Exposure Outcome Assessed Behavioral Results
Brain Measurements
Results Reference: (Sobotka et al. 1977)
Institution: Division of Toxicology, US FDA
Funding Source: US FDA
Ethical Statement: Not provided
Conflict of Interest: Not provided
Species: Rats, Sprague-Dawley
Sex: Male and female
Group Size: Behavior: Dams: 4/group Offspring: Behavior: preweaning development 19-20 males & females/group; postweaning 8-10 males & females
Brain: Dams: 4-6 group Offspring: 10 males/group
Exposure Duration: GD 7 to end of PND 90
Dye Name: Yellow No. 5
Purity Level: 93%
Dye Source: H. Kohnstamm & Co.
Route of Administration: Diet
Doses: 0%, 1% and 2% diet
Control: 0% Diet
Dams: activity
Offspring: Preweaning development (right reflex, neuromotor clinging ability, auditory startle response, placing response and motor activity)
Avoidance learning
Brain assays: (telencephalon, brainstem, cerebellum; weight, protein, cholesterol, DNA)
Preweaning development: Females: ↑ clinging at 1% and 2% diet, PND 4, 6 and 8
No dye treatment effects

Potential Neurobehavioral Effects of Synthetic CalEPA OEHHA Food Dyes in Children April 2021
115
Study Information
Experimental Design Dye Information Exposure Outcome Assessed Behavioral Results
Brain Measurements
Results Age at test: PND 0-90
Reference: (Vorhees et al. 1983a)
Institution: Children’s Hospital Research Foundation
Funding Source: US FDA 223-75-2030 (partial)
Ethical Statement: Not provided
Conflict of Interest: Not provided
Species: Rats, Sprague Dawley
Sex: Male and female
Group Size: Dams: 10-18 /group Offspring behavior: 10-18 males, 10-18 females/group Offspring brain measures: not stated
Two separate experiments:
Exp. 1: Version 3 test battery + positive control, hydroxyurea
Exp. 2: Version 9 test battery doses without positive control
Exposure Duration: 2 weeks premating to PND 90-110
Age at test: Preweaning; PND 30-112
Dye Name: Red No. 3
Purity Level: 91%
Dye Source: H. Kohnstamm & Co.
Route of Administration: Diet
Doses: 0%, 0.25%, 0.5% and 1% diet
Control: 0% diet
Preweaning development (surface righting, pivoting, cliff avoidance (Exp. 1 only), negative geotaxis, auditory startle, swimming ontogeny, open field, olfactory orientation (Exp.2 only)
Swimming development
Preweaning open-field Postweaning open-field Operant discrimination (Exp. 1 only) Brightness discrimination (Exp. 2 only)
Rotorod
Active avoidance
Water maze (Exp. 2 only)
Passive avoidance
Swimming development: Exp. 1: ↑ swimming angle development at 1%, 0.25% diet, PND 10 Exp. 2: ↑ swimming angle development at 0.5% and 0.25% diet, PND 10 Exp. 2: ↓ swimming direction at 1% diet, PND 6 Postweaning open-field: Exp.1: ↑ activity at 0.25% and 1% diet, PND 15-17 Exp. 1: ↑ defecation at 0.5%, PND 15-17 Passive avoidance: Exp. 1 : ↑ entry latency at 0.25% diet, PND 110-112
Running wheel activity: Exp. 1: Females: ↑ activity at 0.25% diet, PND 30-50 Exp. 2: males and females: ↑ activity at 0.5% diet, PND 25-45
Brain measurements: Exp. 2: ↑ cerebellar weight at 0.25% and 0.5% diet

Potential Neurobehavioral Effects of Synthetic CalEPA OEHHA Food Dyes in Children April 2021
116
Study Information
Experimental Design Dye Information Exposure Outcome Assessed Behavioral Results
Brain Measurements
Results Running wheel activity
Brain measurements Brain region weights
Reference: (Vorhees et al. 1983b)
Institution: Cincinnati Children’s Hospital Research Foundation
Funding Source: US FDA Project 223-75-2030 (partial)
Ethical Statement: Not provided
Conflict of Interest: Not provided
Species: Rats, Sprague Dawley
Sex: Male and female
Group Size: Dams: 9-15/group Offspring behavior: 9-15 /group Offspring brain measures: not stated
Exposure Duration: 2 weeks premating to PND 90-110
Age at test: preweaning; PND 30-112
Dye Name: Red No. 40
Purity Level: Not provided
Dye Source: H. Kohnstamm & Co Additional Variable: Hydroyurea (positive control)
Route of Administration: Diet
Doses: 0%, 2.5%, 5% and 10% diet
Control: 0% diet
Preweaning development (surface righting, pivoting, cliff avoidance, negative geotaxis, auditory startle, swimming ontogeny, open field) M-Maze
Passive Avoidance
Running Wheel Rotorod
Active avoidance
Postweaning Open Field
Brain measurements: Brain region weights
Preweaning development: ↓ swimming direction: at 2.5% diet, PND 6 ↓ swimming paddling at 2.5% diet, PND 6
Passive Avoidance ↓ retention performance (re-entry latencies) at 2.5% diet, PND 110-112
Postweaning Open-field Males: ↑ ambulation central section at 5% diet ↑ rearing on day 3 at 5% and 10% diet, PND 41-43
Running wheel ↓ running wheel (nocturnal) activity at 2.5%, 5% and 10% diet, PND 30-50
Brain measurements: ↓ brainstem weight at 5% diet
↓ cerebellum weight at 2.5 %, 5% and 10% diet
Reference: (Tanaka 1994)
Species: Mice; CD-1
Dye Name: Red No. 40
Route of Administration: Diet
Preweaning development (surface righting, negative geotaxis, cliff avoidance, swimming
Maze learning: Males: ↓ time taken on 3rd trial compared to 1st trial at 1.68% diet
No brain assessments
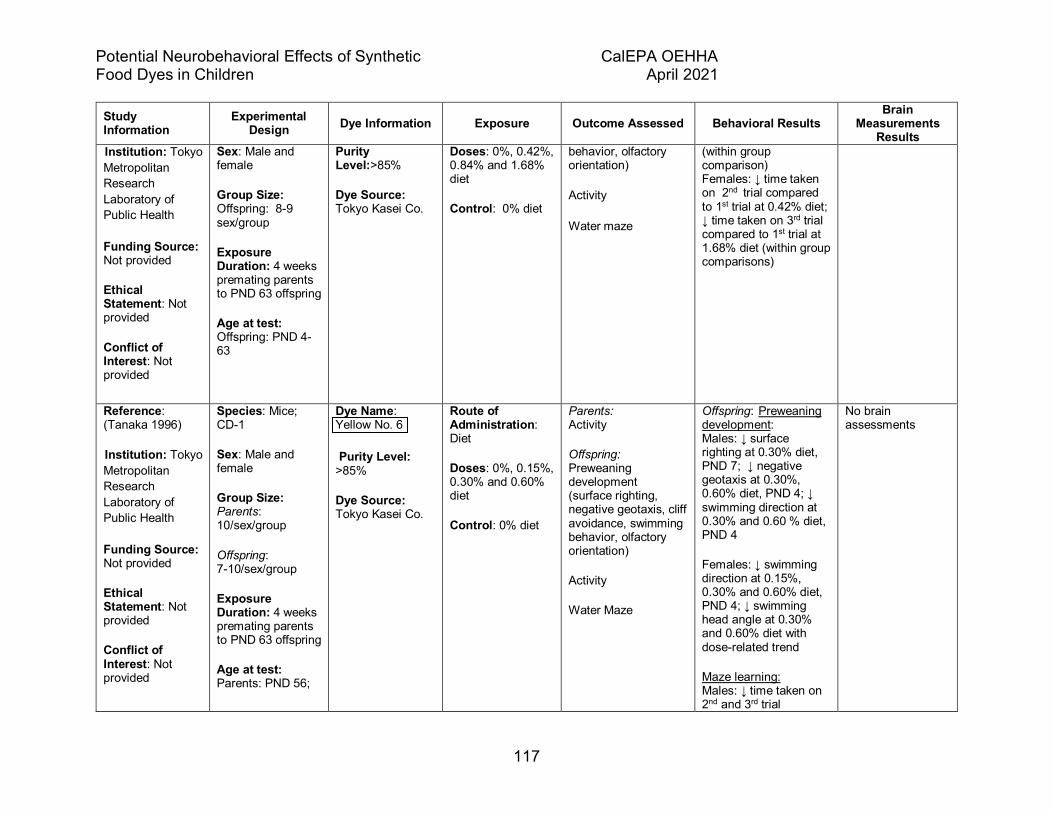
Potential Neurobehavioral Effects of Synthetic CalEPA OEHHA Food Dyes in Children April 2021
117
Study Information
Experimental Design Dye Information Exposure Outcome Assessed Behavioral Results
Brain Measurements
Results Institution: Tokyo Metropolitan Research Laboratory of Public Health
Funding Source: Not provided
Ethical Statement: Not provided
Conflict of Interest: Not provided
Sex: Male and female
Group Size: Offspring: 8-9 sex/group
Exposure Duration: 4 weeks premating parents to PND 63 offspring
Age at test: Offspring: PND 4-63
Purity Level:>85%
Dye Source: Tokyo Kasei Co.
Doses: 0%, 0.42%, 0.84% and 1.68% diet
Control: 0% diet
behavior, olfactory orientation)
Activity
Water maze
(within group comparison) Females: ↓ time taken on 2nd trial compared to 1st trial at 0.42% diet; ↓ time taken on 3rd trial compared to 1st trial at 1.68% diet (within group comparisons)
Reference: (Tanaka 1996)
Institution: Tokyo Metropolitan Research Laboratory of Public Health
Funding Source: Not provided
Ethical Statement: Not provided
Conflict of Interest: Not provided
Species: Mice; CD-1
Sex: Male and female
Group Size: Parents: 10/sex/group
Offspring: 7-10/sex/group
Exposure Duration: 4 weeks premating parents to PND 63 offspring
Age at test: Parents: PND 56;
Dye Name: Yellow No. 6 Purity Level: >85%
Dye Source: Tokyo Kasei Co.
Route of Administration: Diet
Doses: 0%, 0.15%, 0.30% and 0.60% diet
Control: 0% diet
Parents: Activity
Offspring: Preweaning development (surface righting, negative geotaxis, cliff avoidance, swimming behavior, olfactory orientation)
Activity
Water Maze
Offspring: Preweaning development: Males: ↓ surface righting at 0.30% diet, PND 7; ↓ negative geotaxis at 0.30%, 0.60% diet, PND 4; ↓ swimming direction at 0.30% and 0.60 % diet, PND 4
Females: ↓ swimming direction at 0.15%, 0.30% and 0.60% diet, PND 4; ↓ swimming head angle at 0.30% and 0.60% diet with dose-related trend
Maze learning: Males: ↓ time taken on 2nd and 3rd trial
No brain assessments

Potential Neurobehavioral Effects of Synthetic CalEPA OEHHA Food Dyes in Children April 2021
118
Study Information
Experimental Design Dye Information Exposure Outcome Assessed Behavioral Results
Brain Measurements
Results Offspring: PND 4-63
compared to 1st trial in control group and 0.60% diet group (within and group comparisons)
↓ number of errors on 3rd trial in the control group compared to the 1st trial (within group comparison) and ↓ number of errors on 3rd trial at 0.60% diet compared to controls (between group comparison)
Females: ↓ time taken on 2nd trial at 0.60% diet and on 3rd trial at 0.15% and 0.30% diet compared to 1st trial group (within group comparison)
↓ time taken on 2nd trial at 0.15%, 0.30% and 0.60% diet and on 3rd trial at 0.15% diet compared to control group (between group comparison)
↓ number of errors on 2nd trial at 0.15% and 0.60% diet compared to control group (between group comparison)

Potential Neurobehavioral Effects of Synthetic CalEPA OEHHA Food Dyes in Children April 2021
119
Study Information
Experimental Design Dye Information Exposure Outcome Assessed Behavioral Results
Brain Measurements
Results Reference: (Tanaka 2001)
Institution: Tokyo Metropolitan Research Laboratory of Public Health
Funding Source: Not provided
Ethical Statement: Not provided
Conflict of Interest: Not provided
Species: Mice; CD-1
Sex: Male and female
Group Size: Parents: 10/sex/group
Offspring: 8-10/sex/group
Exposure Duration: 4 weeks premating parents to PND 63 offspring
Age at test: Parents: PND 56
Offspring: PND 4- 63
Dye Name: Red No. 3
Purity Level: >85%
Dye Source: Tokyo Kasei Co.
Route of Administration: Diet
Doses: 0%, 0.005%, 0.015% and 0.045% diet
Control: 0% diet
Parents: Activity
Offspring: Preweaning development (surface righting, negative geotaxis, cliff avoidance, swimming behavior; olfactory orientation)
Activity
Water Maze
Activity: Parents: Females: ↑ number of turns at 0.045% diet (compared to controls; dose related trend)
Activity: Offspring: Males: ↓ horizontal activity at 0.045% diet, PND 21 (compared to controls; dose-related trend); ↑ total distance, PND 21 (dose related trend); ↑ in average distance, PND 21 (compared to controls; dose-related trend)
Females: ↑ movements and average distance at 0.045% diet, PND 56 (dose-related trend); ↑ movement time, average speed, total distance at 0.045% diet, PND 56 (compared to controls, dose-related trend)
No brain assessments
Reference: (Tanaka 2006)
Institution: Tokyo Metropolitan Research
Species: Mice; CD-1
Sex: Male and female
Dye Name: Yellow No. 5
Purity Level: >85%
Route of Administration: Diet
Doses: 0%, 0.05%, 0.15% and 0.45% diet
Parents Activity
Offspring: Preweaning development (surface righting, negative geotaxis, cliff
Parents: Males: ↑ vertical activity at 0.15% diet
Offspring Preweaning development: Males: ↑ surface
No brain assessments
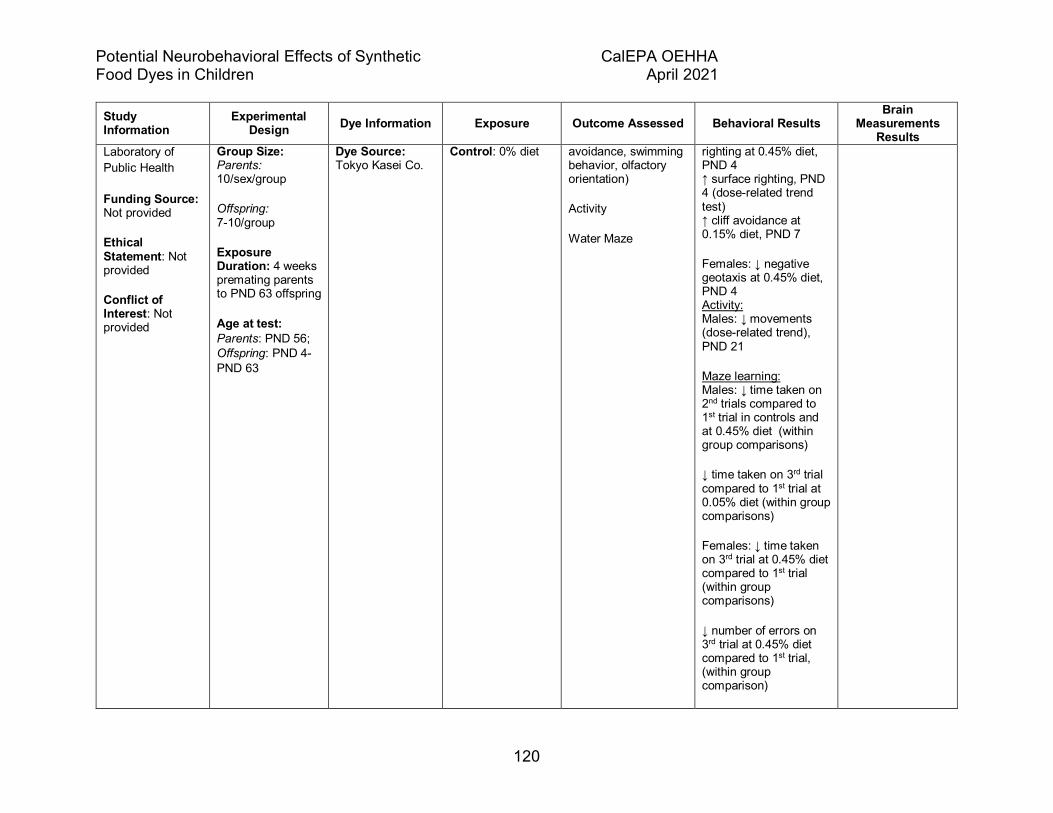
Potential Neurobehavioral Effects of Synthetic CalEPA OEHHA Food Dyes in Children April 2021
120
Study Information
Experimental Design Dye Information Exposure Outcome Assessed Behavioral Results
Brain Measurements
Results Laboratory of Public Health
Funding Source: Not provided
Ethical Statement: Not provided
Conflict of Interest: Not provided
Group Size: Parents: 10/sex/group
Offspring: 7-10/group
Exposure Duration: 4 weeks premating parents to PND 63 offspring
Age at test: Parents: PND 56; Offspring: PND 4-PND 63
Dye Source: Tokyo Kasei Co.
Control: 0% diet avoidance, swimming behavior, olfactory orientation)
Activity
Water Maze
righting at 0.45% diet, PND 4 ↑ surface righting, PND 4 (dose-related trend test) ↑ cliff avoidance at 0.15% diet, PND 7
Females: ↓ negative geotaxis at 0.45% diet, PND 4 Activity: Males: ↓ movements (dose-related trend), PND 21
Maze learning: Males: ↓ time taken on 2nd trials compared to 1st trial in controls and at 0.45% diet (within group comparisons)
↓ time taken on 3rd trial compared to 1st trial at 0.05% diet (within group comparisons)
Females: ↓ time taken on 3rd trial at 0.45% diet compared to 1st trial (within group comparisons)
↓ number of errors on 3rd trial at 0.45% diet compared to 1st trial, (within group comparison)

Potential Neurobehavioral Effects of Synthetic CalEPA OEHHA Food Dyes in Children April 2021
121
Study Information
Experimental Design Dye Information Exposure Outcome Assessed Behavioral Results
Brain Measurements
Results Reference: (Tanaka et al. 2008)
Institution: Tokyo Metropolitan Research Laboratory of Public Health
Funding Source: Not provided
Ethical Statement: Not provided
Conflict of Interest: None
Species: Mice; CD-1
Sex: Male and female
Group Size: Parents: F0, F1: 10/sex/group
Offspring: F1 7-8/sex/group F2 8-9/sex/group
Exposure Duration: 4 weeks premating F0 parents to PND 63; F2 offspring (3 generation study)
Age at test: Parents: PND 56 Offspring: PND 4-PND 63
Dye Name: Yellow No. 5
Purity Level: >85%
Dye Source: Tokyo Kasei Co.
Route of Administration: Diet
Doses: 0.05%, 0.15% and 0.45% diet
Control: 0% diet
Parents F0 Activity
Offspring: F1 Preweaning development: (surface righting, negative geotaxis, cliff avoidance, swimming behavior, olfactory orientation)
Activity
Water Maze
Parents F1 Activity
Offspring F2 Preweaning development: (surface righting, negative geotaxis, cliff avoidance, swimming behavior, olfactory orientation)
Activity
Water Maze
Offspring:F1 Preweaning development: Females: ↓ surface righting at 0.15% diet, PND 7 ↓ surface righting, PND 7 (dose-related trend) Males: ↑ swimming direction at 0.15% diet, PND 7 ↑ swimming direction, PND 7 (dose-related trend)
Activity: Males: ↓ move time, total distance, average distance, turns, PND 21 (dose-related trends) Offspring: F2 Preweaning development: Females: ↑ surface righting at 0.15% diet, PND 7 Males: ↑ swimming direction at 0.45% diet, PND 7 ↑ olfactory orientation at 0.15% and 0.45% diet, PND 14 ↑ olfactory orientation PND 14 (dose-related trend)
Activity: Males: ↓ total distance, average distance, average speed, number
No brain assessments
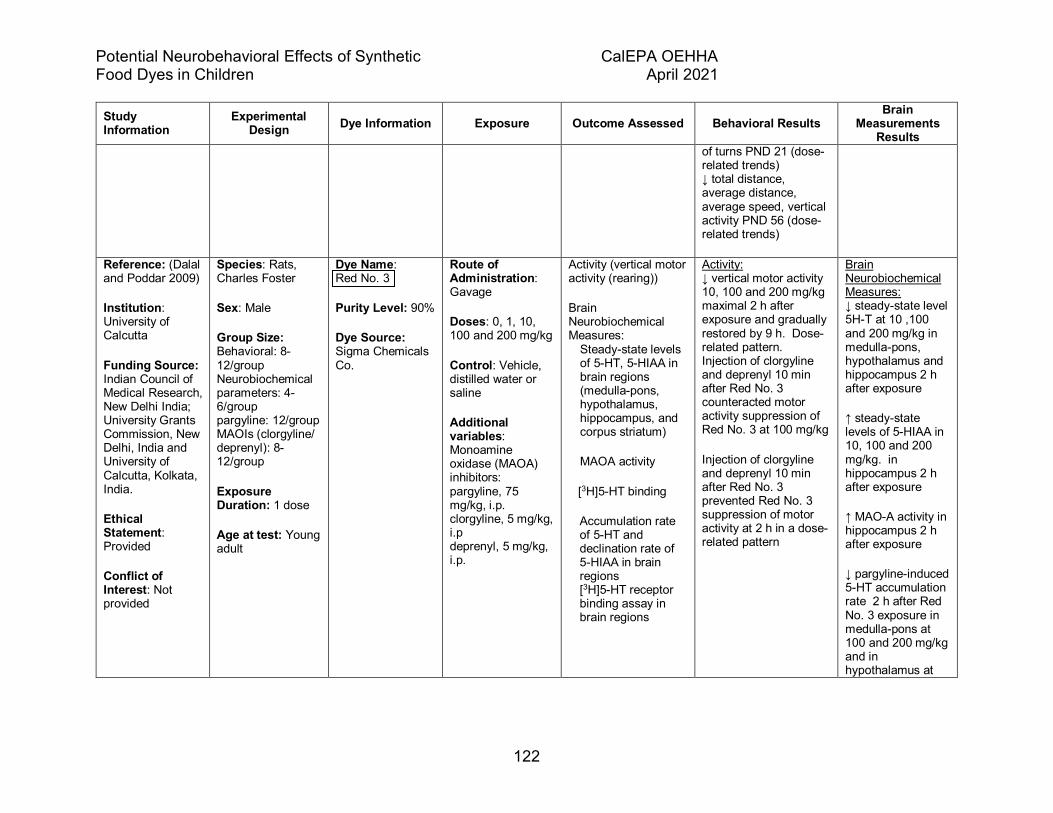
Potential Neurobehavioral Effects of Synthetic CalEPA OEHHA Food Dyes in Children April 2021
122
Study Information
Experimental Design Dye Information Exposure Outcome Assessed Behavioral Results
Brain Measurements
Results of turns PND 21 (dose-related trends) ↓ total distance, average distance, average speed, vertical activity PND 56 (dose-related trends)
Reference: (Dalal and Poddar 2009)
Institution: University of Calcutta
Funding Source: Indian Council of Medical Research, New Delhi India; University Grants Commission, New Delhi, India and University of Calcutta, Kolkata, India.
Ethical Statement: Provided
Conflict of Interest: Not provided
Species: Rats, Charles Foster
Sex: Male
Group Size: Behavioral: 8-12/group Neurobiochemical parameters: 4-6/group pargyline: 12/group MAOIs (clorgyline/ deprenyl): 8-12/group
Exposure Duration: 1 dose
Age at test: Young adult
Dye Name: Red No. 3
Purity Level: 90%
Dye Source: Sigma Chemicals Co.
Route of Administration: Gavage
Doses: 0, 1, 10, 100 and 200 mg/kg
Control: Vehicle, distilled water or saline
Additional variables: Monoamine oxidase (MAOA) inhibitors: pargyline, 75 mg/kg, i.p. clorgyline, 5 mg/kg, i.p deprenyl, 5 mg/kg, i.p.
Activity (vertical motor activity (rearing))
Brain Neurobiochemical Measures:
Steady-state levels of 5-HT, 5-HIAA in brain regions (medulla-pons, hypothalamus, hippocampus, and corpus striatum)
MAOA activity
[3H]5-HT binding
Accumulation rate of 5-HT and declination rate of 5-HIAA in brain regions [3H]5-HT receptor binding assay in brain regions
Activity: ↓ vertical motor activity 10, 100 and 200 mg/kg maximal 2 h after exposure and gradually restored by 9 h. Dose-related pattern. Injection of clorgyline and deprenyl 10 min after Red No. 3 counteracted motor activity suppression of Red No. 3 at 100 mg/kg
Injection of clorgyline and deprenyl 10 min after Red No. 3 prevented Red No. 3 suppression of motor activity at 2 h in a dose-related pattern
Brain Neurobiochemical Measures: ↓ steady-state level 5H-T at 10 ,100 and 200 mg/kg in medulla-pons, hypothalamus and hippocampus 2 h after exposure
↑ steady-state levels of 5-HIAA in 10, 100 and 200 mg/kg. in hippocampus 2 h after exposure
↑ MAO-A activity in hippocampus 2 h after exposure
↓ pargyline-induced 5-HT accumulation rate 2 h after Red No. 3 exposure in medulla-pons at 100 and 200 mg/kg and in hypothalamus at

Potential Neurobehavioral Effects of Synthetic CalEPA OEHHA Food Dyes in Children April 2021
123
Study Information
Experimental Design Dye Information Exposure Outcome Assessed Behavioral Results
Brain Measurements
Results 10, 100 and 200 mg/kg
↓ in specific [3H]5-HT receptor binding 2 h after Red No. 3 exposure in medulla-pons, and hippocampus at 100 and 200 mg/kg and in hypothalamus at 10, 100 and 200 mg/kg
Reference: (Dalal and Poddar 2010)
Institution: University of Calcutta
Funding Source: Indian Council of Medical Research, New Delhi India; University Grants Commission, New Delhi, India and University of Calcutta, Kolkata, India.
Ethical Statement: Provided
Species: Rats, Charles Foster
Sex: Male
Group Size: Behavioral: 8-12/group Neurobiochemical :4-6/group Pargyline interaction: 4-6/group
Exposure Duration: 15 or 30 consecutive days
Age at test: 12-14 weeks; adult
Dye Name: Red No. 3
Purity Level: 90%
Dye Source: Sigma Chemicals Co.
Route of Administration: Gavage
Doses: 0,1,10 and 100 mg/kg
Control: Vehicle: distilled water
Additional variable: Monoamine oxidase A (MAOA) inhibitor pargyline 75 mg/kg i.p.
Activity (vertical motor activity (rearing))
Brain Neurobiochemical Measures:
Steady-state levels of 5-HT, 5-HIAA in brain regions (medulla-pons, hypothalamus, hippocampus, and corpus striatum)
MAOA activity
Pargyline-induced accumulation rate of 5-HT and declination rate of 5-HIAA in brain regions
Plasma corticosterone
Activity: ↑ vertical motor activity at 10 and 100 mg/kg, 15 or 30 consecutive days, maximum 2 h after last Red No. 4 administration and gradually restored by 9 h.
Neurobiochemical Measure: ↑ brain regional (medulla-pons, hypothalamus, hippocampus, corpus striatum) steady-state levels of 5-HT at 10 and 100, mg/kg for 15 and 30 consecutive days 2 h after last administration
↓ MAOA activity at 100 mg/kg, 30 consecutive days in all brain regions 2 h after last administration
↑ pargyline-induced 5-HT accumulation
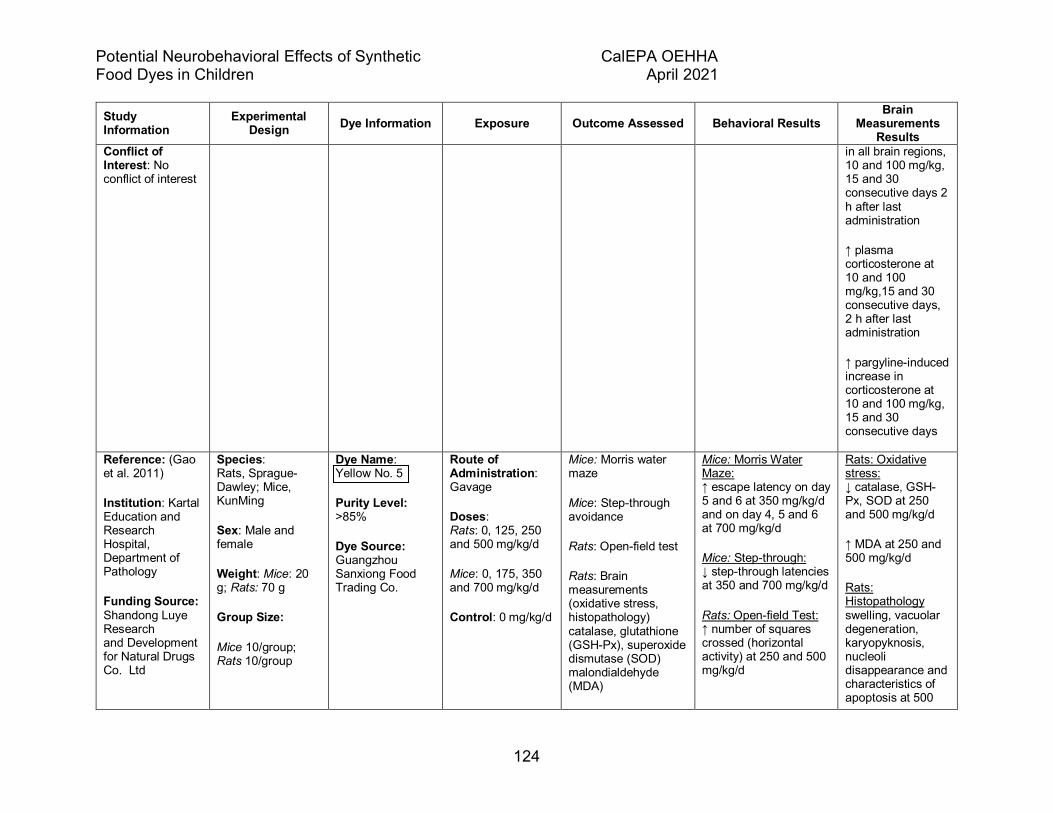
Potential Neurobehavioral Effects of Synthetic CalEPA OEHHA Food Dyes in Children April 2021
124
Study Information
Experimental Design Dye Information Exposure Outcome Assessed Behavioral Results
Brain Measurements
Results Conflict of Interest: No conflict of interest
in all brain regions, 10 and 100 mg/kg, 15 and 30 consecutive days 2 h after last administration
↑ plasma corticosterone at 10 and 100 mg/kg,15 and 30 consecutive days, 2 h after last administration
↑ pargyline-induced increase in corticosterone at 10 and 100 mg/kg, 15 and 30 consecutive days
Reference: (Gao et al. 2011)
Institution: Kartal Education and Research Hospital, Department of Pathology
Funding Source: Shandong Luye Research and Development for Natural Drugs Co. Ltd
Species: Rats, Sprague-Dawley; Mice, KunMing
Sex: Male and female
Weight: Mice: 20 g; Rats: 70 g
Group Size:
Mice 10/group; Rats 10/group
Dye Name: Yellow No. 5
Purity Level: >85%
Dye Source: Guangzhou Sanxiong Food Trading Co.
Route of Administration: Gavage
Doses: Rats: 0, 125, 250 and 500 mg/kg/d
Mice: 0, 175, 350 and 700 mg/kg/d
Control: 0 mg/kg/d
Mice: Morris water maze
Mice: Step-through avoidance
Rats: Open-field test
Rats: Brain measurements (oxidative stress, histopathology) catalase, glutathione (GSH-Px), superoxide dismutase (SOD) malondialdehyde (MDA)
Mice: Morris Water Maze: ↑ escape latency on day 5 and 6 at 350 mg/kg/d and on day 4, 5 and 6 at 700 mg/kg/d
Mice: Step-through: ↓ step-through latencies at 350 and 700 mg/kg/d
Rats: Open-field Test: ↑ number of squares crossed (horizontal activity) at 250 and 500 mg/kg/d
Rats: Oxidative stress: ↓ catalase, GSH-Px, SOD at 250 and 500 mg/kg/d
↑ MDA at 250 and 500 mg/kg/d
Rats: Histopathology swelling, vacuolar degeneration, karyopyknosis, nucleoli disappearance and characteristics of apoptosis at 500
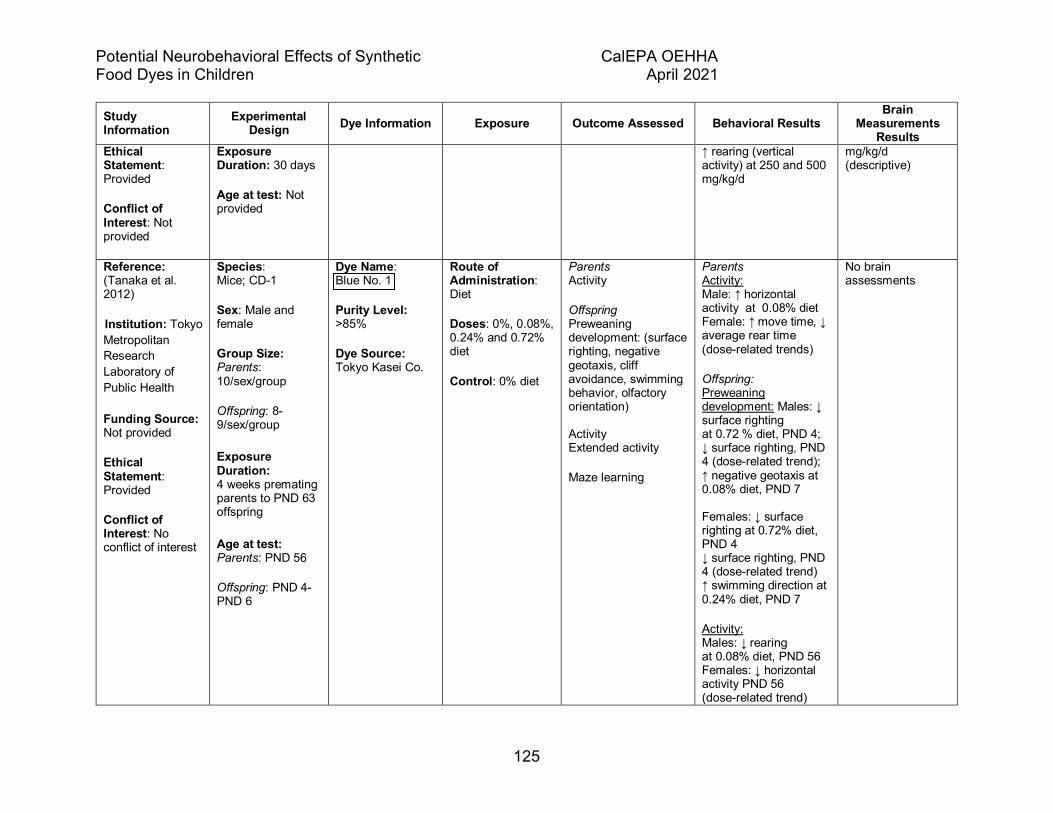
Potential Neurobehavioral Effects of Synthetic CalEPA OEHHA Food Dyes in Children April 2021
125
Study Information
Experimental Design Dye Information Exposure Outcome Assessed Behavioral Results
Brain Measurements
Results Ethical Statement: Provided
Conflict of Interest: Not provided
Exposure Duration: 30 days
Age at test: Not provided
↑ rearing (vertical activity) at 250 and 500 mg/kg/d
mg/kg/d (descriptive)
Reference: (Tanaka et al. 2012)
Institution: Tokyo Metropolitan Research Laboratory of Public Health
Funding Source: Not provided
Ethical Statement: Provided
Conflict of Interest: No conflict of interest
Species: Mice; CD-1
Sex: Male and female
Group Size: Parents: 10/sex/group
Offspring: 8-9/sex/group Exposure Duration: 4 weeks premating parents to PND 63 offspring Age at test: Parents: PND 56
Offspring: PND 4-PND 6
Dye Name: Blue No. 1
Purity Level: >85%
Dye Source: Tokyo Kasei Co.
Route of Administration: Diet
Doses: 0%, 0.08%, 0.24% and 0.72% diet
Control: 0% diet
Parents Activity
Offspring Preweaning development: (surface righting, negative geotaxis, cliff avoidance, swimming behavior, olfactory orientation) Activity Extended activity
Maze learning
Parents Activity: Male: ↑ horizontal activity at 0.08% diet Female: ↑ move time, ↓ average rear time (dose-related trends)
Offspring: Preweaning development: Males: ↓ surface righting at 0.72 % diet, PND 4; ↓ surface righting, PND 4 (dose-related trend); ↑ negative geotaxis at 0.08% diet, PND 7 Females: ↓ surface righting at 0.72% diet, PND 4 ↓ surface righting, PND 4 (dose-related trend) ↑ swimming direction at 0.24% diet, PND 7
Activity: Males: ↓ rearing at 0.08% diet, PND 56 Females: ↓ horizontal activity PND 56 (dose-related trend)
No brain assessments
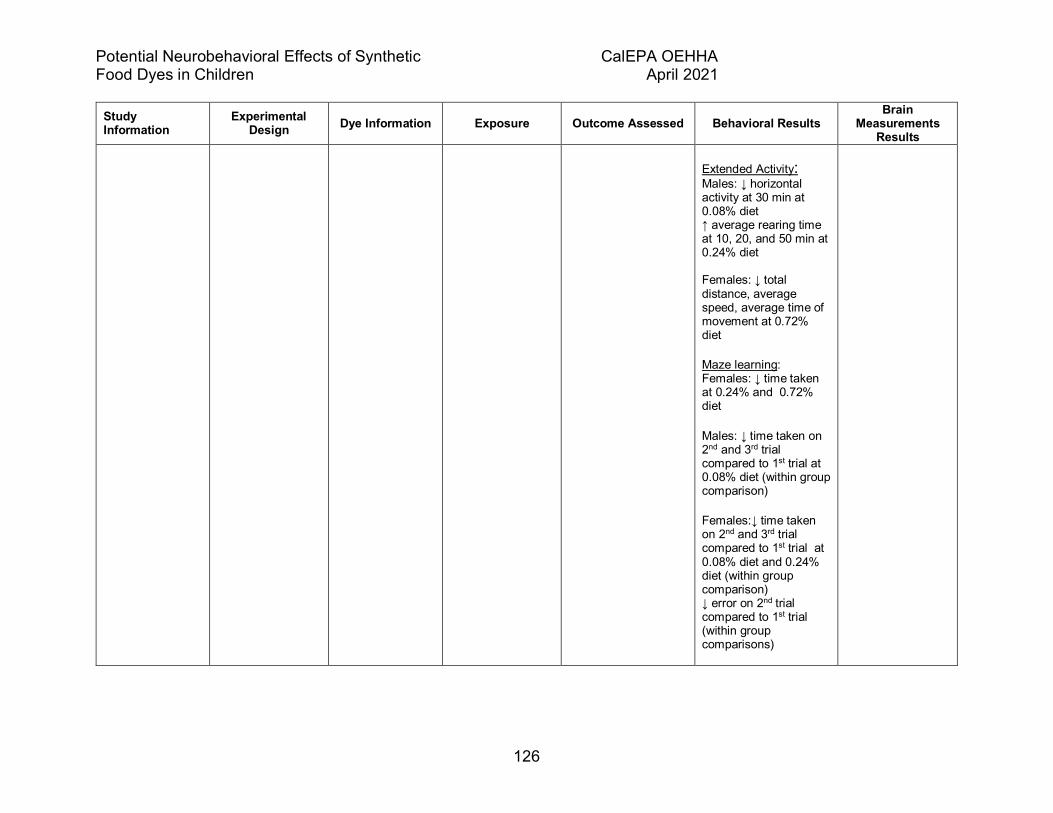
Potential Neurobehavioral Effects of Synthetic CalEPA OEHHA Food Dyes in Children April 2021
126
Study Information
Experimental Design Dye Information Exposure Outcome Assessed Behavioral Results
Brain Measurements
Results Extended Activity: Males: ↓ horizontal activity at 30 min at 0.08% diet ↑ average rearing time at 10, 20, and 50 min at 0.24% diet Females: ↓ total distance, average speed, average time of movement at 0.72% diet
Maze learning: Females: ↓ time taken at 0.24% and 0.72% diet
Males: ↓ time taken on 2nd and 3rd trial compared to 1st trial at 0.08% diet (within group comparison)
Females:↓ time taken on 2nd and 3rd trial compared to 1st trial at 0.08% diet and 0.24% diet (within group comparison) ↓ error on 2nd trial compared to 1st trial (within group comparisons)

Potential Neurobehavioral Effects of Synthetic CalEPA OEHHA Food Dyes in Children April 2021
127
Study Information
Experimental Design Dye Information Exposure Outcome Assessed Behavioral Results
Brain Measurements
Results Reference: (Rafati et al. 2017)
Institution: Shiraz University of Medical Sciences
Funding Source: Grant 94-7521 from Shiraz University of Medical Sciences
Ethical Statement: Provided
Conflict of Interest: No conflict of interest
Species: Rats, Sprague-Dawley
Sex: Male
Initial weight: 250-280 g
Group Size: Behavior: 10/ group Brain measurements: 6/group
Exposure Duration: 7 weeks
Age at test: Not stated; young adult
Dye Name: Yellow No. 5
Purity Level: Not provided
Dye Source: Sigma-Aldrich
Additional variable: Vitamin E; antioxidant; 100 mg/kg/d
Route of Administration: Gavage
Doses: 0, 5 and 50 mg/kg/d
Control: Vehicle distilled water
Novel Object Recognition
Eight-arm radial maze
Brain Measurements Medial Prefrontal Cortex (mPFC) and subregions: volume, number of neurons and glial cells, dendrite length, spine density and morphology)
Novel Object Recognition: ↓ exploration time at 50 mg/kg; addition of vitamin E increased exploration at 50 mg/kg/d
Eight-arm radial maze: ↑ days to criterion for combined 5 and 50 mg/kg/d groups. Vitamin E decreased days to criterion of 5 and 50 mg/kg/d combined groups
↑ working and reference memory errors during learning, combined 5 and 50 mg/kg/d groups. Vitamin E led to fewer errors at 5 and 50 mg/kg/d during acquisition phase
↑ working and reference memory errors at 5 and 50 mg/kg/d combined during retention test. Vitamin E led to fewer errors at 5 and 50 mg/kg/d during retention
mPFC volume: ↓ total volume at 50 mg/kg/d. Vitamin E prevented cell loss.
Number of neurons and glial cells: ↓ 50 mg/kg/d. Vitamin E prevented cell loss Dendrites length: ↓ at 5 and 50 mg/kg/d. Vitamin E prevented cell loss
Spine density and morphology: ↓ 5 and 50 mg/kg/d. Vitamin E prevented dendritic spine effects
Reference: (Noorafshan et al. 2018)
Institution: Shiraz University
Species: Rats, Sprague-Dawley
Sex: Female
Dye Name: Red No. 40
Purity Level: 99%
Route of Administration: Gavage
Novel object recognition
Eight-arm radial maze
Novel object recognition: ↓ object exploration and ↓ short– and long-term novelty preference at 70
mPFC volume: ↓ total volume and volume of subregions at 70
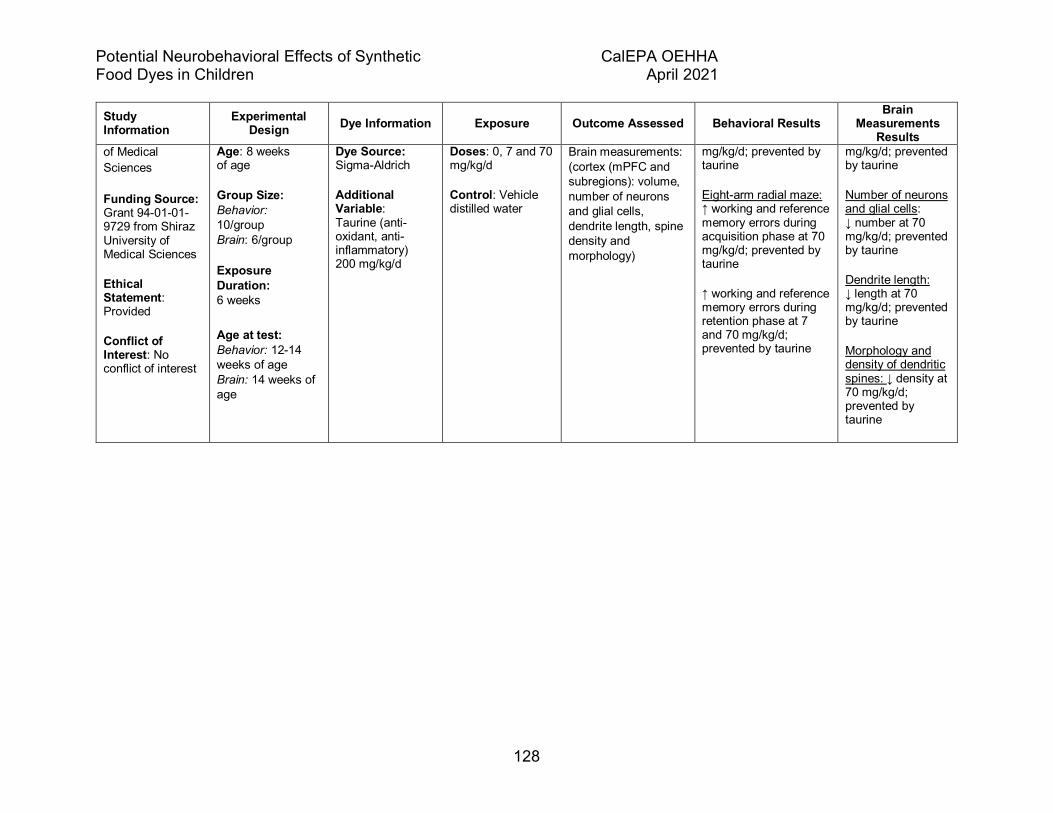
Potential Neurobehavioral Effects of Synthetic CalEPA OEHHA Food Dyes in Children April 2021
128
Study Information
Experimental Design Dye Information Exposure Outcome Assessed Behavioral Results
Brain Measurements
Results of Medical Sciences
Funding Source: Grant 94-01-01-9729 from Shiraz University of Medical Sciences
Ethical Statement: Provided
Conflict of Interest: No conflict of interest
Age: 8 weeks of age
Group Size: Behavior: 10/group Brain: 6/group
Exposure Duration: 6 weeks Age at test: Behavior: 12-14 weeks of age Brain: 14 weeks of age
Dye Source: Sigma-Aldrich
Additional Variable: Taurine (anti-oxidant, anti-inflammatory) 200 mg/kg/d
Doses: 0, 7 and 70 mg/kg/d
Control: Vehicle distilled water
Brain measurements: (cortex (mPFC and subregions): volume, number of neurons and glial cells, dendrite length, spine density and morphology)
mg/kg/d; prevented by taurine
Eight-arm radial maze: ↑ working and reference memory errors during acquisition phase at 70 mg/kg/d; prevented by taurine
↑ working and reference memory errors during retention phase at 7 and 70 mg/kg/d; prevented by taurine
mg/kg/d; prevented by taurine
Number of neurons and glial cells: ↓ number at 70 mg/kg/d; prevented by taurine
Dendrite length: ↓ length at 70 mg/kg/d; prevented by taurine
Morphology and density of dendritic spines: ↓ density at 70 mg/kg/d; prevented by taurine

Potential Neurobehavioral Effects of Synthetic CalEPA OEHHA Food Dyes in Children April 2021
129
Table 3.10 Dye mixture. Developmental and adolescent/adult studies. Results columns present statistically significant differences between a dose group and control group reported by authors. Statistically significant dose trend tests reported by the authors are also presented. Arrow (↑/↓) indicates direction of difference from control group. For additional variable measurements, statistically significant differences with dye-treatment exposures are presented. PND=postnatal day.
Study Information
Experimental Design
Dye Information Exposure Outcome Assessed Behavioral Results Brain Measurements Results
Reference: (Shaywitz et al. 1979)
Institution: Pediatric Neurology, Yale University School of Medicine
Funding Source: NIH grant: Nutrition Foundation
Ethical Statement: Not provided
Conflict of Interest: Not provided
Species: Rats, Sprague Dawley
Sex: Male and female (equal number in each group)
Group Size: 19-20/group (spit litter design)
Duration of Exposure: PND 5-33; pups dosed
Age at test: PND 12-30; PND 12, 15, 19, 26 (activity); PND 21 (T-maze avoidance); PND 28 (shuttlebox avoidance)
% of Dye in Nutrition Foundation Mixture: Red No. 3 6.0 Blue No. 1 3.12 Blue No. 2 1.70 Green No. 3 0.13 Yellow No. 5 26.91 Yellow No. 6 22.74 Orange B 0.54 (Note: Red No. 40 % was not stated in paper, but other papers using this mixture gave Red 40 as 40% of mixture)
Purity Level: Not provided
Dye Source: H. Kohnstamm, Nutrition Foundation Mixture
Additional variable: 6-hydroxydopamine (6-OHDA) (model of ADHD)
Route of Administration: Gavage
Doses: 0, 0.5, 1 and 2 mg/kg/d mix
Control: 0% dyes in gavage fluid
Open field
T-maze escape
Shuttle box avoidance
Brain catecholamines dopamine and norepinephrine
Open Field: ↑ activity (percent time active) at 2 mg/kg/d compared to 1 mg/kg/d, PND 12,15 and 26 T maze avoidance ↑ escape latency 0.5 mg/kg/d
No dye treatment effects

Potential Neurobehavioral Effects of Synthetic CalEPA OEHHA Food Dyes in Children April 2021
130
Study Information
Experimental Design
Dye Information Exposure Outcome Assessed Behavioral Results Brain Measurements Results
Reference: (Goldenring et al. 1980)
Institution: Pediatric Neurology, Yale University School of Medicine
Funding Source: The Thrasher Research Foundation and the Nutrition Foundation
Ethical Statement: Not provided
Conflict of Interest: Not provided
Species: Rats, Sprague Dawley
Sex: Male and female
Group Size: Group 1: treatment (7 pups) Group 2: control (12 pups) Duration of Exposure: PND 4-PND 30 “Pup in a cup:” Pups reared in synthetic environment separated from mother
Age at test: PND 12,15, 19 and 26 (activity) 28 (learning) and 30 (brain)
% of Dye in Nutrition Foundation Mixture: Red No. 3 6.0 Red No. 40 38.71 Blue No. 1 3.12 Blue No. 2 1.70 Green No. 3 0.13 Yellow No. 5 26.91 Yellow No. 6 22.74 Orange B 0.54
Purity Level: Not stated
Dye Source: Nutrition Foundation Mixture
Additional variable: 6-hydroxydopamine (6-OHDA) (model of ADHD)
Route of Administration: infusion via intragastic catheter
Doses: 0, and 1 mg/kg/d mix
Control: 0% dyes in gavage fluid
Open field activity
Shuttle box avoidance
Brain catecholamines Dopamine and norepinephrine
Activity: ↑ activity (percent time active) PND 12, 15, 19 and 26
Shuttle box avoidance ↓ number of avoidances, PND 28
Brain catecholamines: No dye treatment effects
Reference: (Goldenring et al. 1982)
Institution: Pediatric Neurology, Yale
Species: Rats, Sprague Dawley
Sex: Male and female (equal number in each group)
Metabolite of Dyes in Nutrition Foundation Mixture: Sulfanilic acid (p-amino-benzoic acid), metabolite of Yellow No. 5 and No. 6
Route of Administration: Gavage
Doses: 0 and 1 mg/kg/d
Open field activity
T Maze escape
Shuttle box avoidance
Activity: ↑ activity (percent time active) PND 15 26
T maze Escape Performance:
Brain catecholamines: No dye treatment effects
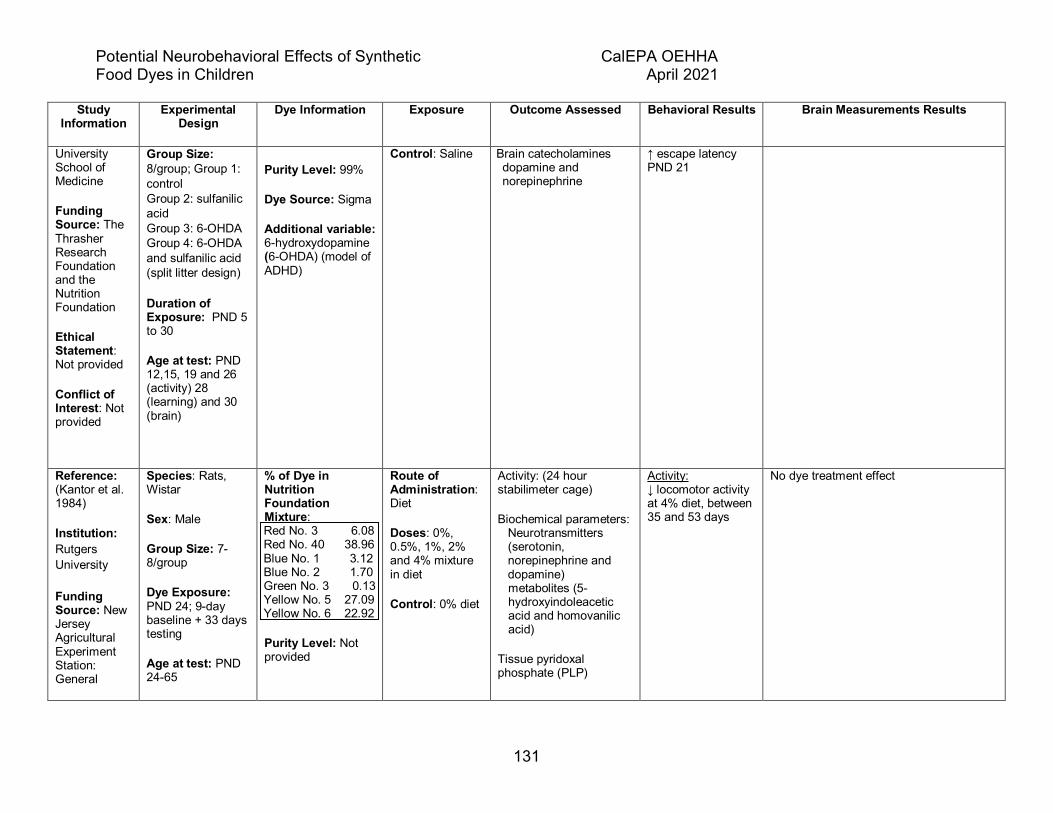
Potential Neurobehavioral Effects of Synthetic CalEPA OEHHA Food Dyes in Children April 2021
131
Study Information
Experimental Design
Dye Information Exposure Outcome Assessed Behavioral Results Brain Measurements Results
University School of Medicine
Funding Source: The Thrasher Research Foundation and the Nutrition Foundation
Ethical Statement: Not provided
Conflict of Interest: Not provided
Group Size: 8/group; Group 1: control Group 2: sulfanilic acid Group 3: 6-OHDA Group 4: 6-OHDA and sulfanilic acid (split litter design)
Duration of Exposure: PND 5 to 30
Age at test: PND 12,15, 19 and 26 (activity) 28 (learning) and 30 (brain)
Purity Level: 99%
Dye Source: Sigma
Additional variable: 6-hydroxydopamine (6-OHDA) (model of ADHD)
Control: Saline Brain catecholamines dopamine and norepinephrine
↑ escape latency PND 21
Reference: (Kantor et al. 1984)
Institution: Rutgers University
Funding Source: New Jersey Agricultural Experiment Station: General
Species: Rats, Wistar
Sex: Male
Group Size: 7-8/group
Dye Exposure: PND 24; 9-day baseline + 33 days testing
Age at test: PND 24-65
% of Dye in Nutrition Foundation Mixture: Red No. 3 6.08 Red No. 40 38.96 Blue No. 1 3.12 Blue No. 2 1.70 Green No. 3 0.13 Yellow No. 5 27.09 Yellow No. 6 22.92
Purity Level: Not provided
Route of Administration: Diet
Doses: 0%, 0.5%, 1%, 2% and 4% mixture in diet
Control: 0% diet
Activity: (24 hour stabilimeter cage)
Biochemical parameters: Neurotransmitters (serotonin, norepinephrine and dopamine) metabolites (5-hydroxyindoleacetic acid and homovanilic acid)
Tissue pyridoxal phosphate (PLP)
Activity: ↓ locomotor activity at 4% diet, between 35 and 53 days
No dye treatment effect

Potential Neurobehavioral Effects of Synthetic CalEPA OEHHA Food Dyes in Children April 2021
132
Study Information
Experimental Design
Dye Information Exposure Outcome Assessed Behavioral Results Brain Measurements Results
Foods Corporation
Ethical Statement: Not provided
Conflict of Interest: Not provided
Dye Source: Not stated
Reference: Reisen and Rothblat, 1986
(Reisen and Rothblat 1986)
Institution: Department of Psychology, The George Washington University
Funding Source: H. Kohnstamm and Co. (partial supplying food coloring)
Ethical Statement: Not provided
Species: Rats, Long-Evans
Sex: Male and females
Group Size: 10-12
Exposure Duration: PND 2 to 65
Age at test: PND 2 until PND 46
% of Dye in Nutrition Foundation Mixture: Red 3 6.0 Red 40 38.71* Blue 1 3.12 Blue 2 1.7 Green 3 0.13 Yellow 5 26.91 Yellow 6 22.7 Orange B 0.54* *Note: Two different dye mixtures administered per group. Second dye mixture identical to first except increased amount of Red No. 40 in lieu of Orange B.
Purity Level: Not provided
Dye Source: H. Kohnstamm, Nutrition Foundation Mixture
Route of Administration: Gavage
Doses: 0, 2 and 5 mg/kg/d mixture
Control: Not provided
Rope descent (PND 14 until criterion)
Position discrimination
Open-field
Observational activity measure
Visual discrimination
No dye treatment effects
No brain assessments
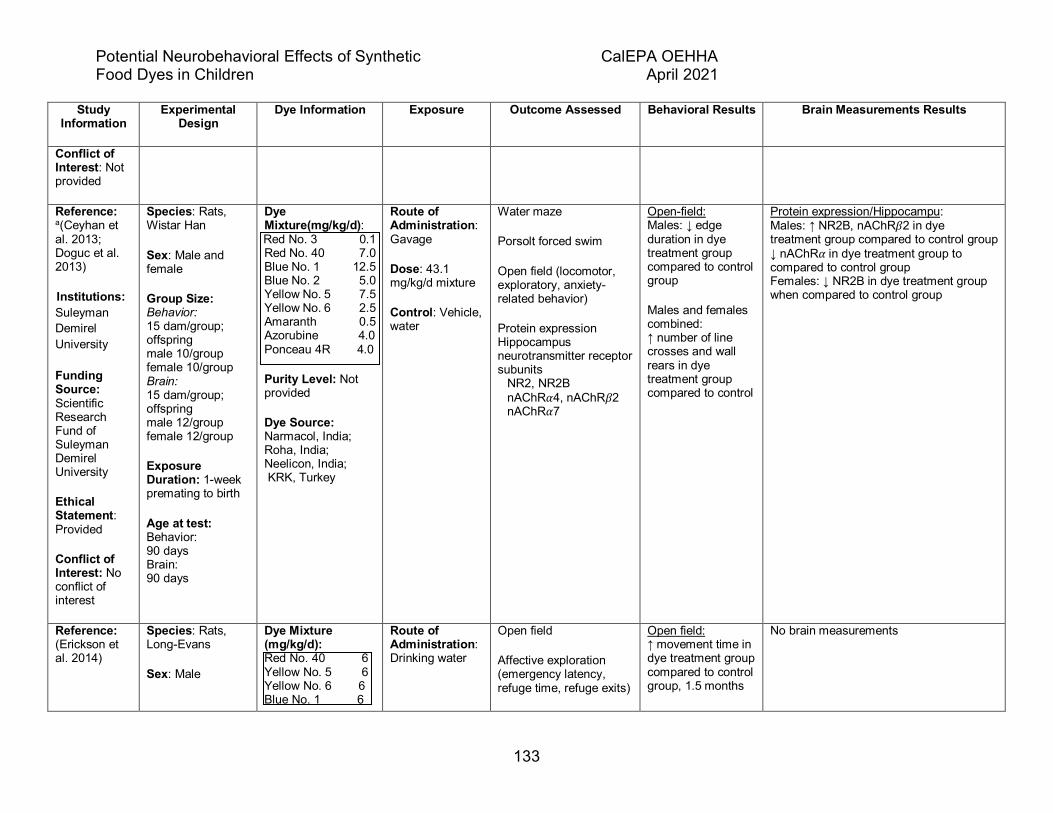
Potential Neurobehavioral Effects of Synthetic CalEPA OEHHA Food Dyes in Children April 2021
133
Study Information
Experimental Design
Dye Information Exposure Outcome Assessed Behavioral Results Brain Measurements Results
Conflict of Interest: Not provided
Reference: a(Ceyhan et al. 2013; Doguc et al. 2013)
Institutions: Suleyman Demirel University
Funding Source: Scientific Research Fund of Suleyman Demirel University
Ethical Statement: Provided
Conflict of Interest: No conflict of interest
Species: Rats, Wistar Han
Sex: Male and female
Group Size: Behavior: 15 dam/group; offspring male 10/group female 10/group Brain: 15 dam/group; offspring male 12/group female 12/group
Exposure Duration: 1-week premating to birth
Age at test: Behavior: 90 days Brain: 90 days
Dye Mixture(mg/kg/d): Red No. 3 0.1 Red No. 40 7.0 Blue No. 1 12.5 Blue No. 2 5.0 Yellow No. 5 7.5 Yellow No. 6 2.5 Amaranth 0.5 Azorubine 4.0 Ponceau 4R 4.0
Purity Level: Not provided
Dye Source: Narmacol, India; Roha, India; Neelicon, India; KRK, Turkey
Route of Administration: Gavage
Dose: 43.1 mg/kg/d mixture
Control: Vehicle, water
Water maze
Porsolt forced swim
Open field (locomotor, exploratory, anxiety-related behavior)
Protein expression Hippocampus neurotransmitter receptor subunits
NR2, NR2B nAChR𝛼𝛼4, nAChR𝛽𝛽2 nAChR𝛼𝛼7
Open-field: Males: ↓ edge duration in dye treatment group compared to control group
Males and females combined: ↑ number of line crosses and wall rears in dye treatment group compared to control
Protein expression/Hippocampu: Males: ↑ NR2B, nAChR𝛽𝛽2 in dye treatment group compared to control group ↓ nAChR𝛼𝛼 in dye treatment group to compared to control group Females: ↓ NR2B in dye treatment group when compared to control group
Reference: (Erickson et al. 2014)
Species: Rats, Long-Evans
Sex: Male
Dye Mixture (mg/kg/d): Red No. 40 6 Yellow No. 5 6 Yellow No. 6 6 Blue No. 1 6
Route of Administration: Drinking water
Open field
Affective exploration (emergency latency, refuge time, refuge exits)
Open field: ↑ movement time in dye treatment group compared to control group, 1.5 months
No brain measurements
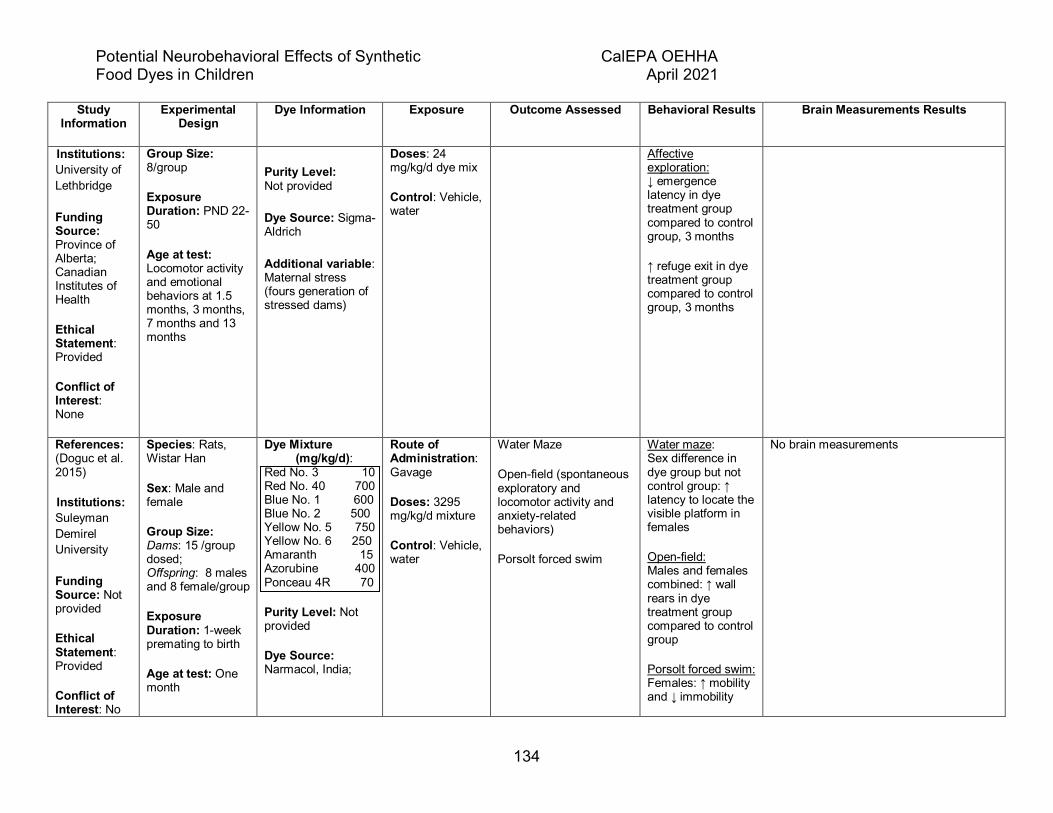
Potential Neurobehavioral Effects of Synthetic CalEPA OEHHA Food Dyes in Children April 2021
134
Study Information
Experimental Design
Dye Information Exposure Outcome Assessed Behavioral Results Brain Measurements Results
Institutions: University of Lethbridge
Funding Source: Province of Alberta; Canadian Institutes of Health
Ethical Statement: Provided
Conflict of Interest: None
Group Size: 8/group
Exposure Duration: PND 22-50
Age at test: Locomotor activity and emotional behaviors at 1.5 months, 3 months, 7 months and 13 months
Purity Level: Not provided Dye Source: Sigma-Aldrich Additional variable: Maternal stress (fours generation of stressed dams)
Doses: 24 mg/kg/d dye mix
Control: Vehicle, water
Affective exploration: ↓ emergence latency in dye treatment group compared to control group, 3 months
↑ refuge exit in dye treatment group compared to control group, 3 months
References: (Doguc et al. 2015)
Institutions: Suleyman Demirel University
Funding Source: Not provided
Ethical Statement: Provided
Conflict of Interest: No
Species: Rats, Wistar Han
Sex: Male and female
Group Size: Dams: 15 /group dosed; Offspring: 8 males and 8 female/group
Exposure Duration: 1-week premating to birth
Age at test: One month
Dye Mixture (mg/kg/d):
Red No. 3 10 Red No. 40 700 Blue No. 1 600 Blue No. 2 500 Yellow No. 5 750 Yellow No. 6 250 Amaranth 15 Azorubine 400 Ponceau 4R 70
Purity Level: Not provided
Dye Source: Narmacol, India;
Route of Administration: Gavage
Doses: 3295 mg/kg/d mixture
Control: Vehicle, water
Water Maze
Open-field (spontaneous exploratory and locomotor activity and anxiety-related behaviors)
Porsolt forced swim
Water maze: Sex difference in dye group but not control group: ↑ latency to locate the visible platform in females
Open-field: Males and females combined: ↑ wall rears in dye treatment group compared to control group
Porsolt forced swim: Females: ↑ mobility and ↓ immobility
No brain measurements

Potential Neurobehavioral Effects of Synthetic CalEPA OEHHA Food Dyes in Children April 2021
135
Study Information
Experimental Design
Dye Information Exposure Outcome Assessed Behavioral Results Brain Measurements Results
conflict of interest
Roha, India; KRK, Turkey
periods in dye treatment group compared to control group
Reference: (Doguc et al. 2019)
Institution: Suleyman Demirel University
Funding Source: Suleyman Demirel University (grant number 3110-TU-12)
Ethical Statement: Provided
Conflict of Interest: No conflict of interest
Species: Rats, Wistar albino
Sex: Male and female
Group Size: Dams: 15/group Offspring:12/group
Exposure Duration: 1-week premating to birth
Age at test: 3 months
Dye Mixture (mg/kg/d): Red No. 3 10 Red No. 40 700 Blue No. 1 600 Blue No. 2 500 Yellow No. 5 750 Yellow No. 6 250 Amaranth 15 Azorubine 400 Ponceau 4R 70
Purity Level: Not provided
Dye Source: Not provided
Route of Administration: Gavage
Doses: 3295 mg/kg/d mixture
Control: Vehicle, water
Water maze
Open-field (locomotor, exploratory, anxiety-related behavior)
Forced swim
Protein expression Hippocampus neurotransmitter receptor subunits NR2A, NR2B α7 nAChR
Water maze: ↓ swim speed, visible trial, in dye treatment group compared to control group
Open-field: Males: ↑ time in inner and central zones ↓ time in outer zone compared to control group
Forced swim ↓ mobility time and ↑ immobility time in the dye treatment group (males and females combined) compared to the control group
Protein expression Hippocampus Females: ↓ NR2A and NR2B in dye treatment group compared to the control group
aDoguc et al., 2013 and Ceyhan et al., 2013 are both from the same research unit and the same experimental design was used in both of the published papers.

Potential Neurobehavioral Effects of Synthetic CalEPA OEHHA Food Dyes in Children April 2021
136
Chapter 4. Toxicocokinetics and Mechanistic Data 4.1 Summary by dye: toxicokinetics and mechanisms In this section, literature on potential mechanisms of the FD&C synthetic food dyes and toxicokinetics, including absorption, distribution, metabolism and excretion (ADME), are reviewed.
The ADME information on the dyes is limited, and most was generated 30-50 years ago. The FDA Redbook (FDA 2007) requires metabolism and pharmacokinetic data for food additive certification and recommends an extensive series of ADME studies including pharmacokinetic modeling. However, these guidelines were promulgated in 1993 after all the current FD&C dyes had been certified and have not been implemented retroactively to our knowledge. Recent research on interactions of dyes with the gastrointestinal (GI) tract and the microbiome highlights the need for a more thorough understanding of dye ADME. To date, there is very little information available about differences in absorption of straight versus lake food dyes across the gut.
Further understanding of the processing of food dyes in the gut comes from studies of metabolism of dye-bound proteins (Umer Abdullah et al. 2008). When bound to protein preparations from foods (peanut, garlic, rice bran), the dye (Red No. 40) did not interfere with trypsin digestion. This suggests that dyes bound to protein may be taken up along with protein breakdown products from the gut. Unfortunately, we did not find any studies addressing the question of whether binding to protein inhibits metabolism of food dyes. Azo dyes bound to polymers for administration are metabolized by azoreductase in the gut (Brown and Parkinson 1985).
With advances in understanding of the microbiome in recent years, more light has been shed on our initial contact with food dyes in the gut. Early studies had concluded that azoreductase of gut microbiota were responsible for the initial metabolism of azo dyes (Parkinson and Brown 1981). Because azo dyes were known to produce mutagenic metabolites, work on azoreductase was continued in FDA laboratories in connection with cancer hazard determinations. The activity of azoreductase in the gut was found to be influenced by dietary components like fiber, protein, and glucose (Chung et al. 1992).
With the ability to identify and culture more of the resident gut microorganisms, more detailed studies of dye interaction with microbiota have been undertaken (Feng et al. 2012; Zou et al. 2020). Other studies examine the direct effects of the dyes on the gut, including inhibition of gut enzymes (Mehidi et al. 2017), inflammatory effects on gut mucosa (Moutinho et al. 2007; Schaubschläger et al. 1987), and interaction with gut transporters (Zou et al. 2020) and gut neurotransmitter receptors (Hutchinson et al. 1992). Because of advancing understanding of the gut-brain axis (Burokas et al. 2015; Dam et al. 2019; Diaz Heijtz et al. 2011), these dye interactions are potentially relevant to the behavioral effects of food dyes. New information on azo dyes in the GI tract is particularly important to childhood behavior because three of the seven FDA certified
Potential Neurobehavioral Effects of Synthetic CalEPA OEHHA Food Dyes in Children April 2021
137
dyes in the Nutrition Foundation mixture, and both of the FD&C certified dyes in the Southampton mixture, are azo dyes.
4.1.1 Red No. 3 mechanism and ADME Red No. 3 is one of the most widely studied dyes for mechanism of neurotoxicity. We identified 36 references, including 24 references published between 1979 and 1989. In the late 1970s, after the Feingold diet book was published (Feingold 1975), a series of in vitro studies appeared in the journal Science. Logan and Swanson (Logan and Swanson 1979) demonstrated decreased uptake of seven neurotransmitters from medium by rat brain homogenate during exposure to a mixture of food dyes. When the food dyes (Blue No. 1, Blue No. 2, Red No. 2, Red No. 3, Red No. 4, Yellow No. 5, YellowNo. 6) were tested individually using dopamine, only Red No. 3 produced this effect. Red No. 3 also inhibited uptake of other neurotransmitters including serotonin, gamma amino butyric acid (GABA), and glutamate. The authors suggested a general effect on membranes. A second study (Lafferman and Silbergeld 1979) found noncompetitive inhibition of dopamine uptake (increased dopamine at synapse) was produced by Red No. 3 in rat caudate synaptosomes thus affecting synaptic transmission. Dopamine was a focus because of the current theories of mechanism of hyperactivity in children. Effects on neurotransmitter transport across membranes were further investigated in some detail using in vitro brain preparations. Red No. 3 was found to inhibit Na+/K+-ATPase (Silbergeld 1980), which supplies energy for neurotransmitter transport across membranes. This effect was shared with Rose Bengal, another iodinated xanthene dye. Additionally, release of the neurotransmitter from synaptic vesicles was identified as part of the process (Wade et al. 1984). Outside the brain, effects of Red No. 3 on neurotransmitter release (Augustine Jr and Levitan 1980) and inhibition of ATPase (Morris et al. 1982) were confirmed.
In a more recent series of studies, Red No. 3 and Rose Bengal were studied for their ability to inhibit glutamate uptake into synaptic vesicles. These studies were searching for potential therapeutic agents targeting glutamate neurotransmission. After showing these dyes were potent inhibitors of vesicular glutamate uptake, the structural requirements for activity and the possible mechanisms were studied in some detail (Bole and Ueda 2005), concluding that inhibition involved binding to a protein site involved in transporter uptake. In another study exploring structural analogs of iodinated xanthenes, it was shown that Rose Bengal also inhibited vesicular serotonin uptake (Pietrancosta et al. 2010). In addition, inhibition of vesicular glutamate uptake has been studied in some azo dyes (Kehrl et al. 2017) but FD&C-certified azo dyes were not included. Together these studies of the mechanism of Red No. 3 interference with neurotransmitter uptake and release continue to help identify pathways for dye effects on brain function.
In addition to enzyme inhibition, Red No. 3, like other fluorescein compounds, can promote photooxidation of enzymes. Red No. 3 was found to bind to cholinesterase in

Potential Neurobehavioral Effects of Synthetic CalEPA OEHHA Food Dyes in Children April 2021
138
solution and to promote photooxidation of the enzyme (Tomlinson et al. 1986). In neuronal cell culture, Red No. 3 promoted photooxidation of nerve growth factor (NGF) (Morris and Chronwall 1982) Light also influenced Red No. 3 inhibition of tissue binding of ouabain, a Na+/K+-ATPase inhibitor and a calcium channel blocker (Hnatowich and LaBella 1982). This interest in enhanced photooxidation led to an experiment in which rats were injected intraperitoneally with Red No. 3 and tested for activity in light versus dark environmental conditions (Galloway et al. 1986). No Red No. 3 effects or interaction with light conditions were found.
The nonspecific effect of Red No. 3 on neural tissue was extended by studies showing that increasing the amount of tissue in the assays decreased the Red No. 3 effect on neurotransmitter uptake, presumably due to Red No. 3 binding at multiple sites in the tissues, thus reducing its availability to bind at uptake sites (Mailman et al. 1980). Together this in vitro work suggests that Red No. 3 can have many biological targets relevant to brain function and is consistent with contemporary work on Red No. 3 protein binding.
The issue of nonspecific binding of Red No. 3 was the topic of a more recent in vitro paper, “The food colorant erythrosine is a promiscuous protein-protein interaction inhibitor” (Ganesan et al. 2011). Lack of specificity was demonstrated by inhibition of 8 separate protein interactions related to immune function and cell viability. A further paper (Ganesan and Buchwald 2013) explored the structural properties of the dye that resulted in this nonspecific protein binding. Red No. 3 has also been studied for binding properties using albumin (Mathavan et al. 2009), and for inhibition of protein aggregation (Lee et al. 2016; Wong and Kwon 2011).
The topic of neurotransmitter mechanisms was taken up more recently in in vivo studies (Dalal and Poddar 2009, 2010) focusing on serotonin because of research showing its influence on dopamine systems that regulate activity in rodents. A major feature of the investigators’ approach was to measure serotonin repeatedly during a short period after administration of Red No. 3 (9 h). The time course of behavioral and neurotransmitter changes was documented and shown to coincide with peak effect 2 h after dosing. The investigators also pursued the pathway of the serotonergic mechanism in a series of studies, focusing on metabolism of the transmitter by the enzyme MAO-A. A role for corticosterone modulation of the serotonin response was also elucidated.
Red No. 3 been shown to affect thyroid hormones in both rodents and humans (Gardner et al. 1987; Kurebayashi et al. 1988). In fact, the effect of Red No. 3 on thyroid hormones in humans (Gardner et al. 1987) is the basis of the JECFA ADI. The mechanism of this effect has been considered inhibition of the enzyme iodothyronine deiodinase (Jennings et al. 1990), although iodotyrosine deiodinase has also recently been implicated (Shimizu et al. 2013). Red No. 3 effects on thyroid function have been studied in connection with carcinogenesis (thyroid tumors) (Capen 1998). While interference with thyroid systems is a major proposed mechanism for developmental neurotoxicity (Zoeller et al. 2002), it has not been discussed in connection with Red No.
Potential Neurobehavioral Effects of Synthetic CalEPA OEHHA Food Dyes in Children April 2021
139
3 neurobehavioral toxicity. We were not able to find any data on thyroid function in studies that demonstrated Red No. 3 neurobehavioral toxicity.
The argument is sometimes made that in vitro studies of Red No. 3 identify several neurotoxic mechanisms, but Red No. 3 does not enter the brain after oral administration, therefore these mechanisms would not be activated in neurobehavioral studies. As is the case for most FD&C-certified food dyes, pharmacokinetic data on Red No. 3 are limited. Studies conducted in the 1960s (reviewed by (Parkinson and Brown 1981) indicated that absorption via the oral route is “low”, metabolism occurs via deiodination, and excretion is via bile. In its most recent re-evaluation of Red No. 3, the JECFA panel (WHO JECFA 2019a) described an unpublished study using oral administration of radiotracer (Obrist et al. 1986) with some tissue distribution information. Circulating levels of Red No. 3 peaked 2 h after oral administration, while tissue levels peaked 4-12 h after administration, with no radioactivity detected in the brain. Of note, the time of peak Red No. 3 circulating levels corresponds to the time of peak Red No. 3 effects on behavior (activity) in the Dalal and Poddar papers (Dalal and Poddar 2009, 2010).
The study most cited to show lack of Red No. 3 transfer to the brain was conducted at NIH (Levitan et al. 1984) using Red No. 3 labelled with 14C. The finding of this study was that Red No. 3 readily crossed the blood-brain barrier and entered brain tissue when injected into the carotid artery in an electrolyte solution, but only in very low amounts if mixed into heparinized blood before carotid injection. The interpretation was that Red No. 3 entry into the brain is prevented by binding to plasma protein. This experiment was also done injecting labelled sucrose and labelled Red No. 3 at the same time (Levitan et al. 1985). Brain uptake of Red No. 3 was similar to that of sucrose, a standard for low BBB passage, under these conditions.
Several features of this sophisticated and complex series of experiments should be mentioned:
• Red No. 3 was not orally administered. There was no metabolism or protein binding of the dye in the GI tract, in circulation or in the liver as is the case with oral administration.
• Red No. 3 was found to penetrate the blood-brain barrier after injection of the dye in Ringers solution with a permeability value of 60-70 (ratio of 14C in tissue to 14C in infusion) in four brain regions studied (cerebral cortex, hippocampus, caudate, thalamus/hypothalamus).
• Red No. 3 dose was quantified in terms of radioactivity; the dose in terms of mg was not given. A comparison to doses administered in toxicology studies is not possible.
• Red No. 3 binding to plasma protein was assumed to occur based on dialysis of Red No. 3 in whole blood vs electrolyte solution (Ringers). Actual binding to various heparinized blood components was not determined.
• All studies were single injections. Consequences of repeated administrations are not known.
Potential Neurobehavioral Effects of Synthetic CalEPA OEHHA Food Dyes in Children April 2021
140
From what we now know about ubiquitous Red No. 3 protein binding and multiple central nervous system (CNS) and non-CNS biological targets, generalization from these studies to toxicology studies of oral administration is weak. Studies are needed with oral administration and toxicocokinetics, including distribution and elimination of Red No. 3 and its deiodinated metabolites, di-iodo-fluorescein, mono-iodo- fluorescein, and fluorescein.
The same investigators conducted other experiments where labelled Red No. 3 was injected in the femoral vein of conscious rats (Levitan et al. 1985) rather than in the carotid artery under anesthesia. Radioactivity was detected in 14 brain regions at levels greater than in the carotid studies with whole blood injection, but less than studies with saline injection. The authors were aware of the limitations of their methodology and comment that “significant uptake” could occur with an immature or damaged blood-brain barrier, and in some lower brain regions, including the hypothalamus, not included in the blood-brain barrier.
4.1.2 Yellow No. 5 mechanism and ADME. In contrast to Red No. 3, mechanism work on Yellow No. 5 neurotoxicity has been conducted recently and focused on the oxidative stress mechanism initially explored in the neurobehavioral studies of Gao et al. (2011). There are two papers studying oxidative stress in the brain after in vivo treatment of rats (Bhatt et al. 2018; Mohamed et al. 2015). In the Bhatt et al. study, the dose used in rats, 7.5 mg/kg/day, was equivalent to the EFSA ADI, in the range of the FDA ADI (5 mg/kg/day) and the JECFA ADI of 10 mg/kg/d (originally 7.5 mg/kg/day) (JECFA 2016). It was administered via gavage to weanling rats (male) for 40 days covering juvenile, adolescent and early adult development. The focus of the brain assays was possible oxidative damage to the brain by assessing five enzymes involved in oxidative defense, as well as oxidative tissue damage using the thiobarbituric acid reactive substances (TBARS) assay. Yellow No. 5 treatment led to significant developmental toxicity as seen by substantially lower weight gains beginning in the 3rd week of the study. Although brain weights were not affected, each of the regions studied (cortex, hippocampus, striatum, cerebellum) had lower protein content and higher TBARs levels. The activity of the anti-oxidative defense enzymes was lower than control, although not significantly in all brain regions. Glutathione peroxidase was increased, attributed by the investigators to compensatory response. The investigators attribute the brain effects to generation of reactive oxygen species (ROS) by Yellow No. 5 aromatic amine metabolites.
A 2015 study (Mohamed et al. 2015) used weanling male rats, gavage administration, 30 day exposure and a dose of 500 mg/kg/day. This design is similar to that of the Gao et al. (2011) study which included 500 mg/kg/day as the high dose. Lipid oxidative markers (TBARs) and anti-oxidant enzymes were assessed in cerebral cortex at the end of the exposure period. Compared to controls, Yellow No. 5 treatment led to lower anti-oxidant enzyme activity and increased lipid oxidation, supporting the results of the Gao et al. (2011) study. In addition to oxidative stress assays, the investigators

Potential Neurobehavioral Effects of Synthetic CalEPA OEHHA Food Dyes in Children April 2021
141
reported lower GABA, dopamine and serotonin concentrations in brain homogenates. In fixed tissues, increased incidence of histochemical markers of cell death were described in the treated group. Body weight gains during treatment were not reported in this study. As in the Gao et al. (2011) study, generation of ROS by Yellow No. 5 metabolites was suggested as the mechanism of the effects. This study essentially replicates the findings of Gao et al. in a similar dosing regimen (500 mg/kg/day, 30 days, young male rats). Gao et al. also reported neurobehavioral effects of Yellow No. 5 in rats whose brains were later examined.
Histamine release may also play a role in the neurobehavioral impacts of Yellow No. 5. As discussed in section 4.2 on mixtures, histamine is synthesized in neurons, stored in vesicles and released from the cell body or axonal varicosities to influence receptors in the post-synaptic membrane (Scammell et al. 2019). Histamine-N-methyltransferase has the primary role in histamine degradation in brain, and the study by Stevenson et al. (2010) demonstrated that polymorphisms in the HNMT gene influences response to synthetic food dyes in children. Histamine and serotonin systems are intertwined biologically (Best et al. 2017), providing a link between the Stevenson study in humans and serotonin mechanism studies in animals that we reviewed.
In the last three years, a number of studies demonstrating Yellow No. 5 oxidative stress effects in tissues other than the brain have been published (Abd-Elhakim et al. 2018; Abd-Elhakim et al. 2019; Al-Seeni et al. 2018; El-Desoky et al. 2017; El-Sakhawy et al. 2019; Elbanna et al. 2017; Erdemli et al. 2017; Khayyat et al. 2017; Velioglu et al. 2019). The lowest LOAEL from this group of studies was 7 mg/kg/day (Khayyat et al. 2017). For two other studies (El-Desoky et al. 2017; El-Sakhawy et al. 2019); the LOAEL was 7.5 mg/kg/day. Many of these studies, like the studies in the brain (Bhatt et al. 2018; Gao et al. 2011; Mohamed et al. 2015) had designs which included administration of a food with antioxidant properties along with Yellow No. 5. In each case the antioxidant treatment was able to prevent the oxidative stress induced by Yellow No. 5 alone on many endpoints. Taken together these studies provide considerable support for oxidative stress as a marker for Yellow No. 5 toxic effects on tissues including the brain.
Other toxicological effects have also been reported recently at low doses of Yellow No. 5. A 90-day toxicity study (Himri et al. 2011) conducted by gavage reported elevated plasma glucose, as well as cholesterol, and creatinine in rats. Doses were 5, 7.5 and 10 mg/kg/day. In follow up, two studies (Lahmass et al. 2017; Lahmass et al. 2018) replicated the glucose finding and showed antagonism by antidiabetic agents. The effects reported by Himri et al. (2011) occurred at doses at or below 10 mg/kg/day and were also produced by sulfanilic acid treatment. Little is known about the site of sulfanilic acid biological effects, but recently, production of ROS and effects on cultured pancreatic cells have been shown (Ameur et al. 2018) implicating sulfanilic acid as the active agent in the Yellow No. 5 studies of oxidative stress. Sulfanilic acid was also
Potential Neurobehavioral Effects of Synthetic CalEPA OEHHA Food Dyes in Children April 2021
142
found to reproduce the effects of Yellow No. 5 in a neurobehavioral study (Goldenring et al. 1982).
An in vitro study (Axon et al. 2012) potentially relevant to an endocrine disruption mechanism of developmental neurotoxicity (Rock and Patisaul 2018) identified Yellow No. 5 and Yellow No. 6 as “xenoestrogens”. The authors were looking for potential environmental causes of Primary Biliary Cirrhosis, an estrogen-dependent syndrome. Several food dyes (Yellow No. 5, Yellow No. 6, Red No. 40 and quinoline yellow) were screened for estrogenic gene activation along with seven other food additives and 14 pesticides. The study was conducted in a human cell line transfected with a reporter of human estrogen receptor alpha induced gene transcription (in this case thyroid transcription factor 1 (TTF1). Yellow No. 5 and Yellow No. 6 were identified as the most potent of the environmental chemicals studied. Of note, although both Yellow No. 5 and Yellow No. 6 were identified as estrogenic in this assay using the human estrogen receptor, other studies have found that the mouse estrogen receptor is not activated by Yellow No. 5 or sulfanilic acid (Yellow No. 6 was not evaluated) (Meyer et al. 2014).
In vitro studies of Yellow No. 5 have questionable relevance to in vivo toxicity based on ADME research. Early on it was recognized that azo dyes were excreted in the urine when administered intravenously but not when administered orally, indicating lack of absorption. Yellow No. 5 was adopted as a model azo dye in a series of studies from the same laboratory in the 1960s. They demonstrated in rats that Yellow No. 5 was metabolized by gut bacteria (Jones et al. 1964; Roxon et al. 1966, 1967; Ryan et al. 1969b) via cleavage of the azo bond (azoreduction). They also identified the two major metabolites, sulfanilic acid and aminopyrazolone, along with a number of further metabolites of aminopyrazolone (Ryan et al. 1969a) providing a detailed metabolic pathway of Yellow No. 5. Yellow No. 5 metabolites were excreted primarily in urine rather than feces indicating absorption from the gut; biliary excretion was not specifically studied. Similar metabolic pathways were also identified in rabbits (Daniel 1962; Jones et al. 1964). In humans, Yellow No. 5 was given to four men as a capsule at doses of 100, 100, 93 and 89 mg (Jones et al. 1964). No unchanged Yellow No. 5 was excreted in urine over 48 hours while 87-100% of the dose was excreted as sulfanilic acid, primarily from 24 to 48 h after dosing. Further work in rats showed that metabolism of Yellow No. 5 by azoreductase system in the gut can be affected by local conditions such as biliary salts and laxatives (Allan and Roxon 1974, 1977).
A more detailed study used radiotracers and urinary tract and bile duct cannulation. Dye and metabolites were administered by gavage to female rats (Honohan et al. 1977). During 72 h after administration of Yellow No. 5, no intact dye was detected in urine, and only trace amounts in bile. Further work found that 21% of sulfanilic acid and 45% of aminopyrazolone derived from Yellow No. 5 were excreted in urine.
These studies indicate that the toxicology of azo dyes was derived from their gut metabolites. Investigation of the biological activity and toxic potential of azo dye metabolites has been limited to concern about their mutagenicity and carcinogenicity

Potential Neurobehavioral Effects of Synthetic CalEPA OEHHA Food Dyes in Children April 2021
143
(Chung et al. 1992; Feng et al. 2012). Azo dyes with carcinogenic metabolites like benzidine, aniline and phenylenediamine have not been certified by FDA for use in food. However, other potential toxicities of metabolites of the Yellow No. 5 have been little studied. The finding of behavioral and brain effects of Yellow No. 5 and sulfanilic acid (Goldenring et al. 1982; Rafati et al. 2017) and on oxidative damage by sulfanilic acid (Ameur et al. 2018) suggest the value of further neurotoxicology research on Yellow No. 5 metabolites. We did not find any information on aminopyrazolone toxicity.
As is the case for other dyes, Yellow No. 5 has been found to bind with enzymes and affect their activity. Activity of several gut enzymes was depressed in mice with long term administration of Yellow No. 5 in drinking water (Mehidi et al. 2017). The doses in this study were 839 and 1626 mg/kg/day. In vitro, Yellow No. 5 inhibited carboxyl esterase from pig liver (Sondergaard et al. 1977).
Like most of the other FD&C-certified dyes, Yellow No. 5 has recently been studied in vitro to understand its protein binding properties (Al-Shabib et al. 2017; Al-Shabib et al. 2018; Basu and Kumar 2015a; Basu and Kumar 2015b; Basu and Suresh Kumar 2016a, 2017; Chen et al. 2019; Li et al. 2014). Both albumin and hemoglobin were model proteins in these studies.
4.1.3 Red No. 40 mechanisms and ADME. Like the other two azo dyes certified by FDA (Yellow No. 5 and Yellow No. 6), Red No. 40 is presumably broken down in the gut via azoreductase, but detailed studies of Red No. 40 are not available. FDA (Kokoski 1970) and JECFA (JECFA 2016) cited three unpublished studies from the 1970’s submitted for their review. They described 95% excretion of the dye in feces in rats and dogs, and cresidine sulfonic acid as the probable major metabolite released by reduction of the azo bond. Based on the structure of the dye, cresidine sulfonic acid and 1-amino-2-naphthol-6 sulfonic acid were suggested as the two metabolites released by reduction of the azo bond by sodium dithionate but this was not empirically confirmed (Esmaeili et al. 2016). Thus, unlike Yellow No. 5 and Yellow No. 6, sulfanilic acid is not a metabolite.
In vitro, Red No. 40 did not have estrogen receptor activating effects observed for Yellow No. 6 and Yellow No. 5 in cell culture (Axon et al. 2012), but instead showed some suppression. However, investigators have shown that probable metabolites of Red No. 40 are effective inhibitors of another enzyme with esterase properties, carbonic anhydrase, which is also inhibited by Red No. 40 at higher concentrations (Esmaeili et al. 2016; Khodarahmi et al. 2015). Carbonic anhydrase was chosen for study because Red No. 40 and its metabolites appeared to have structural similarities to drugs that inhibit the enzyme.
As is the case for other dyes, Red No. 40 is beginning to be studied with state-of-the-art computational methods for its protein binding characteristic using albumin as a representative protein (Lelis et al. 2017; Wang et al. 2014; Wu et al. 2015). Interference
Potential Neurobehavioral Effects of Synthetic CalEPA OEHHA Food Dyes in Children April 2021
144
with protein aggregation (Al-Shabib et al. 2019) is another protein binding property studied for Red No. 40.
Red No. 40 was found to be the most potent of the azo dyes in the only in vitro study specifically conducted for risk assessment of developmental neurotoxicity (Park et al. 2009). The study was conducted in neuronal progenitor cells and looked at four of the seven FDA certified dyes, the three azo dyes (Yellow No. 5, Yellow No. 6 and Red No. 40) and the trimethylamine dye Blue No. 1. As well, the investigators examined interactions between the dyes when administered together. The endpoints were viability and proliferation of the mouse neural progenitor cell line. Red No. 40 stood out from the other FDA certified dye by reducing cell viability at micromolar concentrations. None of the individual dyes influenced cell proliferation (MTT assay) at < 1 mM. Next the dyes were combined two at a time in the same assay. Red No. 40 was effective in reducing cell viability when combined with other dyes but no additive or antagonistic effects were seen. Given the lack of information on metabolism of Red No. 40, it is not clear that these in vitro studies are relevant to in vivo toxicity of the agent.
4.1.4 Yellow No. 6 mechanisms and ADME. Yellow No. 6 ADME has not been extensively studied but research on azo dye metabolism (reviewed by Chung and Cerniglia 1992; Feng et al. 2012; Parkinson and Brown 1981; Walker 1970) is relevant to this dye.
• Azo dyes are sulfonated for water solubility resulting in strong acids that are poorly absorbed from the gut.
• Azo dyes are metabolized in the gut by microorganism via an azoreductase system.
• The gut azo-reductase system is common to most mammalian species including humans.
• Cleavage of the azo dyes results in sulfonated metabolites that are readily absorbed from the gut.
• Intact azo dyes are excreted directly in the feces, while azo dye metabolites are excreted mainly in urine and some in bile.
• Azo dye metabolites are likely the biologically active agents in azo dye toxicity. • Toxicological studies using methods of administration other than oral do not
generalize to food dye exposure by ingestion. • In vitro studies of azo dyes without a metabolic component are not particularly
relevant to food dye exposure by ingestion.
There were three early studies of Yellow No. 6 metabolism. A study using spectrophotometry and paper chromatography, quantified Yellow No. 6 at 2% of the dose and sulfanilic acid at 53% of the metabolites in urine after administration by gavage to male rabbits (Daniel 1962). The appearance of intact Yellow No. 6 in urine was taken as an index of absorption. A second study using spectrophotometry in male rats (Radomski and Mellinger 1962) confirmed that little Yellow No. 6 is metabolized
Potential Neurobehavioral Effects of Synthetic CalEPA OEHHA Food Dyes in Children April 2021
145
after absorption and estimated absorption at 3.6%. A third study using radiotracers in female rats determined that 0.3% of administered Yellow No. 6 was excreted intact in urine and 1.5% in bile producing an absorption estimate of 1.8%. For sulfanilic acid, urinary excretion provided an absorption estimate of 37%. The authors indicated that urinary and biliary excretion occurred within 2-3 h of the gavage dosing (Honohan et al. 1977).
Azo dyes are most often studied for their immunological and carcinogenic effects, with little attention to neurotoxicity. However Osman et al. (Osman et al. 2002; Osman et al. 2004) conducted an interesting set of experiments on Yellow No. 6 cholinesterase inhibition. They first showed reversible inhibition of human cholinesterase and pseudocholinesterase in vitro (Osman et al. 2002). The potency (IC50) of Yellow No. 6 was about an order of magnitude lower than that of common organophosphate pesticides. In a second experiment (Osman et al. 2004), the IC50 for sulfanilic acid inhibition of cholinesterase and pseudocholinesterase was also demonstrated in vitro with a lower potency than Yellow No. 6. To determine whether these effects could occur in vivo, the investigators then fed rats diets with 4 mg/kg/day of either Yellow No. 6, sulfanilic acid, or another Yellow No. 6 metabolite, naphthionic acid (Osman et al. 2004). They then determined the activity of cholinesterase in blood samples. Yellow No. 6 led to the greatest decrease in cholinesterase (ChE) activity relative to controls (23% lower) while sulfanilic acid led to greatest reduction in pseudoChE activity (31%). Naphthionic acid had minimal effect on ChE and no effect on pseudoChE. This finding with sulfanilic acid suggests it is the active agent for Yellow No. 6 effects on cholinergic systems, as well as for effects on behavior (Goldenring et al. 1982) and identify this neurotransmitter system as a potential mechanistic pathway for Yellow No. 6 neurotoxicity.
As described, Yellow No. 5 and Yellow No. 6 were identified as potent xenoestrogens in an in vitro study of transcriptional activation of the human estrogen receptor (Axon et al. 2012). The EC50 of Yellow No. 6 was 220 nanomoles as compared to the estrogen EC50 of 5 nanomoles. In their discussion, the authors present a calculation that population dietary exposure to Yellow No. 6 at the 97.5th percentile, as estimated by EFSA (EU EFSA 2009a) and assuming 10% absorption, would result in plasma level of Yellow No. 6 above the EC50 for estrogen receptor transcriptional activation.
Yellow No. 6 is one of the food dyes recently tested for its ability to interfere with protein aggregation (Millan et al. 2019), and also one of the dyes being studied for structural binding properties using computational methods (Masone and Chanforan 2015; Mohseni-Shahri et al. 2018).
4.1.5 Blue No. 1, Green No. 3. trimethylamine dyes. mechanisms and ADME. We examined our literature database for recent toxicology studies of Green No. 3. A short- term (35 day) toxicology study (Ashour and Abdelaziz 2009) administered 125 mg/kg/day Green No. 3 by gavage. Standard assays conducted on blood samples

Potential Neurobehavioral Effects of Synthetic CalEPA OEHHA Food Dyes in Children April 2021
146
taken at the end of the dosing period included clinical chemistry panel and a complete blood count (CBC). Decreased serum glucose, cholesterol and triglycerides, among other differences, were identified by t-test between the Green No. 3 treated group and controls. Confidence in the study is limited by some design considerations. All six animals in a group were housed together and the controls did not appear to have been gavaged.
Blue No. 1 and Green No. 3 are trimethylamine dyes, very similar in structure, that are widely used in protein assays and diagnostic tissue staining. They are stable in biological systems and bind indiscriminately to proteins, providing color-based protein recognition. Concern about biological consequences of protein binding has led to investigation of protein binding properties of interest to neurotoxicity. A derivative of Blue No. 1, Brilliant Blue G, also a protein dye, is currently under investigation for its potential neurotherapeutic value in inhibiting purinergic receptors (Jiang et al. 2000). Blue No. 1 also has this biological action (Wang et al. 2013) as does Green No. 3 (Yang et al. 2019). Blue No. 1 protein binding has also has been shown to interfere with amyloid aggregation (Chen et al. 2016). Another study of neuroblastoma cells showed inhibition of neurite outgrowth when both Blue No. 1 and glutamic acid were added to the culture medium (Lau et al. 2006). For Green No. 3, little information is available. Van Hooft et al. (2002) investigated effects on hippocampal synaptic function and found interference with frequency, but not amplitude of “synaptic events” (van Hooft 2002). The authors undertook this study because they were using Green No. 3 for protein identification in their neuronal cell cultures.
Whether these biological effects detected in cell culture could mediate neurobehavioral effects depends on the dye reaching nervous system targets. Studies of Blue No. 1 in laboratory animals indicate low absorption from the GI tract and minimal metabolic breakdown based on ultimate recovery of 14C-labelled compound in feces, urine, and respiration (Brown et al. 1980; Phillips et al. 1980). A bile-duct ligated model (Brown et al. 1980) and i.v. injection model (Iga et al. 1970) indicate that absorbed dye is eliminated rapidly in bile in rats. Green No. 3 ADME studies are even more limited and were mainly conducted in the 1950’s (Hess and Fitzhugh 1955). In these early studies, labelled compound was not used. Dye was administered orally to rats, and feces and urine were collected over 36 hours for spectrophotometric analysis of Green No. 3. Feces contained 94% of the administered dose. Parallel studies in dogs with implanted bile duct cannulas indicated that 2.2% of the dose was excreted by that route. Minegishi later confirmed biliary excretion of Green No. 3 in rats using 3H-labeled compound (Minegishi et al. 1978). They also examined tissue levels in ear, plasma, abdominal muscle, and abdominal skin at intervals over 24 hours after dye administration. (These tissues were chosen as sites of tumor formation in other experiments). Distribution was similar across tissues with half-lives of 7-12 h.
Limitations of these studies include:
• Lack of information on GI absorption during developmental lifestages,
Potential Neurobehavioral Effects of Synthetic CalEPA OEHHA Food Dyes in Children April 2021
147
• Lack of internal dose information, • Lack of tissue distribution data, • Lack of toxicokinetic modeling, • Lack of information on metabolites.
Although animal studies demonstrate minimal Blue No. 1 GI absorption, absorption may be higher in some clinical conditions. The US FDA (FDA 2003) issued an advisory concerning the potential oral absorption of Blue No. 1 from enteral fluids associated with serious complications and death. Case studies have reported blue coloration of tissues in patients receiving enteral feedings containing Blue No. 1 (Lucarelli et al. 2004; Maloney et al. 2002). We found one experimental study of Blue No. 1 GI absorption in humans (Angarita et al. 2019). The investigators were examining the use of Blue No. 1 as an assay for intestinal permeability. The dye was measured by LC/MS in plasma after oral administration of 0.5 mg/kg Blue No. 1 to patients with a diagnosis of sepsis. They were compared to seven nonseptic patients including four healthy volunteers and three ICU patients. The dye was detected in only one of seven nonseptic patients but in five of the six septic patients. This study supports the low absorption of Blue No. 1 at low doses in healthy adults but points out a possible role of intestinal permeability disorder in susceptibility of children to trimethylamine dye effects.
4.1.6 Blue No. 2 mechanisms and ADME. Effects on neural tissues are among the mechanisms explored in connection with Blue No. 2 effects on blood pressure. Blue No. 2 is used for color-based visualization in clinical diagnostics, for example colonoscopy and brain tumor surgery. This extensive clinical use has generated a literature on cardiac “side effects” of the dye, including hypotension, hypertension and bradycardia and arrhythmia. In these clinical situations the dye was administered by intravenous, subcutaneous or intramuscular routes (not oral). A serotonin-based mechanism has been proposed. The hypertension was attributed to serotonin-mediated vasodilation based on an early study where Blue No. 2 was given to normal individuals and cardiovascular measures were made immediately afterward (Erickson and Lauron 1960). Authors also mention the structural similarity between Blue No. 2 and serotonin in suggesting this mechanism. Hypotension has been attributed to anaphylactic reactions (Jo et al. 2013) or histamine release (Lee et al. 2015). Free radical production (Choi et al. 2011) and batch impurities are also suggested causes. In addition to the peripheral vasculature, effects on cerebral vasculature have also been suggested by case studies (Kawaguchi et al. 2007).
A second indication of possible Blue No. 2 neurotoxic effects is the production of brain tumors in animal cancer studies (Hollingsworth 1982). The incidence of gliomas was significantly higher in male rats fed 2% Blue No. 2 in diet compared to controls, along with a significant dose trend. An increase in mammary tumors was also found in this experimental group (Kobylewski and Jacobson 2012). In deriving the ADI based on this
Potential Neurobehavioral Effects of Synthetic CalEPA OEHHA Food Dyes in Children April 2021
148
study, FDA mentioned carcinogenicity as an “unresolved issue” and based the NOAEL on developmental toxicity measures (Hollingsworth 1982).
Blue No. 2 degrades in water to two sulfonic acid metabolites. Gut microflora incubation studies found 73% metabolism with four metabolites (Singh et al. 1993). Studies of 35S-labeled Blue No. 2 identify a low amount of absorption of both the parent compound and sulfonated metabolites (3%) with excretion in urine and no bile excretion (Iga et al. 1970; Lethco and Webb 1966). Blue No. 2 was used for many years as a method for color-based histological visualization of kidney function. This led to a study of Blue No. 2 clearance in humans as part of a thesis (Oravisto 1957). Clearance depended on the plasma concentration of the dye (administered by intramuscular injection) and of albumin. In a study of drugs and chemicals used to assess kidney function, Blue No. 2 was found to inhibit human aldehyde reductase (Shinoda et al. 1999). One additional, more recent study of enzyme inhibition in vitro found Blue No. 2 inhibition of CYP2A6, a monooxygenase involved in drug metabolism (Kuno and Mizutani 2005).
Toxicology information on Blue No. 2 is limited to studies conducted between 1966 and 1985 primarily in connection with dye certification in the US and UK (Borzelleca and Hogan 1985; Borzelleca et al. 1985; Butterworth et al. 1975; Gaunt et al. 1969; Hansen et al. 1966a),). These studies administered Blue No. 2 in diet. We did not locate contemporary toxicology studies using gavage, in vitro mechanism studies, or investigation of dye protein binding for Blue No. 2.
4.2 Mechanistic studies with mixtures relevant to neurotoxicity In addition to constructing mixtures for toxicological evaluation, a second approach to potential dye interactions is to study effects of individual dyes compared to combinations of dyes. This approach is often used in vitro.
In one in vivo experiment (Park et al. 2009), dyes were administered orally for two weeks to mice and neuronal cell proliferation in the hippocampus was measured using Bromodeoxyuridine (BrdU) labelling. To determine the appropriate doses for these studies, the authors looked at an estimated daily intake(EDI) for the dye in their country (Korea). This value was then multiplied by 10, 100 and 1000 to provide doses for the study. The dyes were administered in combinations of two, and the three azo dyes were also administered together. With the highest dose of the Yellow No. 5-Blue No. 1 combination, the investigators reported significantly fewer BrdU labelled cells (new neurons) in the hippocampus and specifically in the subgranular zone of the hippocampus. BrdU was also used in an in vitro progenitor cell culture assay with five of the dye combinations. The dose for the individual dyes was 100 uM. Significantly, fewer BrdU labelled cells were found after incubations with the Yellow No. 5-Red No. 40 and Yellow No. 5-Blue No. 1 combinations.
A second in vitro study potentially relevant to dye mixture neurotoxicity looked at dye interactions in neuroblastoma cells (Lau et al. 2006). Blue No. 1 was the only FDA certified dye used; the other agents were quinoline yellow and the flavor additives aspartame and glutamic acid (MSG). The study was done with NBT, a neuroblastoma
Potential Neurobehavioral Effects of Synthetic CalEPA OEHHA Food Dyes in Children April 2021
149
cell culture, previously used to investigate neurotoxic interactions of pesticides. Individually Blue No. 1 and glutamic acid had similar potency in preventing neurite outgrowth, but together synergy was demonstrated as an effect greater than additive. An excitotoxic mechanism was demonstrated, as predicted, for glutamic acid but not for Blue No. 1. To generalize their findings, the investigators measured the amount of Blue No. 1 in a commercial candy product and estimated that two pieces ingested by a 10 kg child would produce plasma concentrations equivalent to the in vitro concentrations that produce 43% neurite inhibition.
As reviewed in Chapter 2, Stevenson et al. (2010) found that children with certain polymorphisms in the dopamine transporter gene and in the histamine degradation gene (histamine–N-methyltransferase) had greater adverse responses to synthetic food dyes. Our broad review of food dye literature indicates that Stevenson made a prescient decision in assessing HNMT polymorphisms in the population he studied (Stevenson 2010.) At that time, immunological studies indicated that dyes can result in histamine release and that certain HNMT polymorphisms can decrease histamine clearance. The apparent synergism of dye exposure and HNMT in his study serves as a bridge between immunological studies and current progress in understanding histamine as a neurotransmitter involved in regulation of behavior.
During our review, we found that interest in the relationship between histamine and food dyes began in the early 1980s when case reports and clinical studies reported allergic reactions and exacerbation of asthma by tartrazine (Yellow No. 5). Histamine is an important mediator of the allergic response, a bronchoconstrictor, and the target of antihistamines used to treat allergies. Yellow No. 5 effects on mast cells and basophils, immune cells known to release histamine during an immune response (Hedman and Andersson 1981, 1983; Safford and Goodwin 1984) were studied. In general histamine release was enhanced at low Yellow No. 5 concentrations, but inhibited at high concentrations when dose-response was studied in vitro. Capsules of Yellow No. 5 given orally to volunteers resulted in elevated blood and urine histamine (Murdoch et al. 1987). At that time, histamine’s role in brain function was just beginning to be understood (Haas et al. 2008). Consequently, the implication was that the behavioral effects of dyes in children might be immunologically mediated and limited to children with allergies.
Now we know that histamine is an important neurotransmitter. It is synthesized in neurons, stored in vesicles and released from the cell body or axonal varicosities to influence receptors in the post-synaptic membrane (Scammell et al. 2019). There are histaminergic neurons, as well as neurons that co-express other neurotransmitters (serotonin, dopamine, GABA). HNMT has the primary role in histamine degradation in brain, with MAO involved in further breakdown (Yoshikawa et al. 2019). Histamine and serotonin systems are intertwined biologically (Best et al. 2017), providing a link between the Stevenson study in humans and serotonin mechanism studies in animals that we reviewed.
Potential Neurobehavioral Effects of Synthetic CalEPA OEHHA Food Dyes in Children April 2021
150
Histamine effects on behavior are well known from the use of anti-histamine sleeping pills, but a broader range of effects have been revealed using transgenic mouse models. In the HNMT knock-out mouse, researchers used a behavioral test battery that included motor and sensory tests, activity, learning and memory, anxiety, depression and social interaction, and found that the most sensitive measures were activity and aggression (Naganuma et al. 2017). Using the histamine receptor (H3R) knock-out mouse, activity effects were also reported (Toyota et al. 2002). Histamine has been described as “wake-promoting” and, more generally, as a moderator of arousal.
Together Dr. Stevenson’s findings and the current science on histamine neurotransmission identify a path forward in understanding the mechanisms of food dye effects on behavior and the risk factors for these effects in children.
4.3 High-throughput screening assays OEHHA evaluated high-throughput screening (HTS) in vitro data to examine whether such data provide information relevant to mechanisms of action of the FD&C synthetic food dyes. One of the most robust HTS database is US EPA’s Toxicity Forecaster (ToxCast™) database (Judson et al. 2016; Sipes et al. 2013). As of 2018, ToxCast encompasses more than 9,000 tested chemicals, and more than 1,000 HTS assays across over 15 commercial or federal government–developed platforms. OEHHA utilized the publicly available ToxCast data to evaluate the seven US FDA-batch certified synthetic food dyes. We developed an approach to examining potential mechanisms of these synthetic food dyes and metabolites based on ToxCast results for specific molecular targets underlying neurological processes. The results were used to rank the food dyes by their bioactivity and potency for potential target markers using Toxicological Prioritization Index software.
4.3.1 Challenges in interpreting HTS data HTS data can lead to improved chemical screening, reduced data gaps, and prioritization for further research and risk assessment. However, when interpreting HTS data from databases such as ToxCast, it is important to note the challenges and limitations of such data. ToxCast assay results are generally evaluated based on bioactivity and potency (AC50S), efficacy (minimal data flags), and cytotoxicity limits; the latter two are components that should be considered in evaluating uncertainty of the results. Data flags are warnings for potential false positive and false negative findings based on methods. In ToxCast, flag assignment is automated and thus prone to some error. Currently, the cytotoxicity limit is defined as the lower bound of the prediction of the median cytotoxicity and therefore is predicted to be lower than many assay hits. Determining the appropriate cytotoxicity threshold is key to differentiating false positives. Although understanding data quality flags and cytotoxicity thresholds are pivotal to interpreting ToxCast data, filtering out AC50s because there are data flags or the AC50 is above cytotoxicity limits is not recommended because such an approach

Potential Neurobehavioral Effects of Synthetic CalEPA OEHHA Food Dyes in Children April 2021
151
would lead to a marked decrease in the number of candidate assays. Further, as data and methods are optimized, the output of assay AC50s may change, and thus the current flags and cytotoxicity limits would change. Instead, an integrated understanding of the flags and cytotoxicity limits for each assay can assist in identifying potential interference, and can be useful for considering an assay for greater scrutiny and interpreting the significance of the bioactivity and the uncertainty in the result, rather than as a cutoff for relevancy of the assay responses (Judson et al. 2016). Another factor to take into account in the interpretation of assays results is the potential interference of specific color emissions with assays that use autofluorescence and luminescence. A significant number of ToxCast assays utilized either fluorescence or luminescence detection-based technologies. Predictions of interference from InterPred indicate some of the dyes could interfere with assays using autofluorescence, although the extent of that interference is uncertain.
4.3.2 Methods: evaluating food dyes based on in vitro data Methods are described in more detail in Appendix A. Initially, OEHHA screened the food dyes in publicly available aggregate databases including the Comparative Toxicogenomics Database (CTD; (Davis et al. 2019)), Chemical Hazard Data Commons (CHDC), and the Chemistry Dashboard (Williams et al. 2017) to evaluate whether there were any known established associations between the food dye chemicals and neurological process targets linked to toxicity in vivo. In particular, OEHHA evaluated the food dyes in the Chemistry Dashboard in seven developmental neurotoxicity (DNT) lists to see if there were any hazards already associated with the food dyes. Presence on these lists would indicate that the dyes demonstrated some effects on neurodevelopment in humans or triggered DNT in vivo in animal toxicology studies based on the list sources. However, all the aggregate databases had limited information on the synthetic food dyes in relation to neurodevelopmental processes. For more detailed information on these other databases, refer to the last section of Appendix A.
Based on these initial screening methods, OEHHA developed an approach to map potential associations between the synthetic food dyes and neurological activity from existing in vitro data. OEHHA evaluated the seven dyes as well as the metabolites of the azo dyes (Red No. 40, Yellow No. 5, Yellow No. 6), which are known to be primarily metabolized in the gut (see Appendix A, Table A.1). Our approach is based on a proof-of-concept (Iyer et al. 2019) utilizing mechanistic data to identify chemicals potentially linked to known hazard traits (Iyer et al. 2019) (Chiu et al. 2018). This approach incorporates a strategy for linking the potential molecular targets examined in assays to neurological processes, and used chemicals with known DNT endpoints to profile potential neurological markers. The Toxicological Prioritization Index tool, ToxPi, was used to rank and examine the relevant chemical activity observed for these food dyes in the in vitro data.

Potential Neurobehavioral Effects of Synthetic CalEPA OEHHA Food Dyes in Children April 2021
152
We evaluated a total of 283 assays across a subset of the screening platforms (NovaScreen, Attagene, and Tox21) used in the ToxCast database at the time of our data collection on May 30, 2019 and April 20, 2020. There were 108 NVS assays, 50 ATG assays, and 24 Tox21 assays selected based on whether the assays: 1) had a neurological-related gene target; 2) were conducted in brain tissue (regardless of species); or 3) targeted the specific receptors of aryl hydrocarbon, androgen, estrogen, or the thyroid hormone. Appendix A provides more details regarding the criteria method for assay selection. The rationale to include the third criterion was based on literature reporting interactions between food dyes and these receptors (Axon et al. 2012; Dees et al. 1997; Jennings et al. 1990; Mathieu-Denoncourt et al. 2014). Such interactions may have downstream effects on targets underlying neurological processes, and therefore, these assays are pertinent to explore as well. There were 183 total assays from these three criteria.
To further expand the assay coverage, we also identified potential neurological process markers from known DNT candidates, such as pesticides, based on studies from the California Department of Pesticide Regulation’s (DPR) database. Identified pesticides were then screened to see which were tested in ToxCast. There are nine OP pesticides in the DPR database that are tested in ToxCast (see Appendix A, Table A.2). ToxCast assays were selected as potential markers if they were a hit for at least 3 pesticides (activity in a third of the total pesticides evaluated); as a result, 63 ToxCast assays were identified.
Lastly, oxidative stress and inflammation are proposed mechanisms linking the food dyes with potential downstream effects leading to toxicity. Based on the subsets of assays in Iyer et al. (2019) categorized under “induction of oxidative stress” and “induction of chronic inflammation”, we added 50 assays. Refer to Appendix A, Figure A.1 for the flow chart of methodology. Further details on the development of the full assay set can be found in Appendices A and C.
4.3.2.1 ToxPi visualization Using the Toxicological Prioritization Index (ToxPi) software (version 2.3), we assessed the NVS assay subset further. Only data from this subset was selected for input into the ToxPi software in order to make direct comparisons between the chemicals in enzymatic and receptor signaling assay activities. The ToxPi software calculates a unitless index score that represents a relative ranking of biological activity across multiple assays. This output can be used to rank order the FD&C synthetic food dyes to inform relative potency and activity. A ToxPi image is composed of “pie” slices that represent individual components being compared, or aggregations of multiple-related components. In this case, each ToxPi represented a food dye and was composed of slices representing assays that fell into one of six types of the NVS Intended Target Subtype or Intended Target Family categories (as categorized by the Chemistry Dashboard). For further details, see Appendix A.
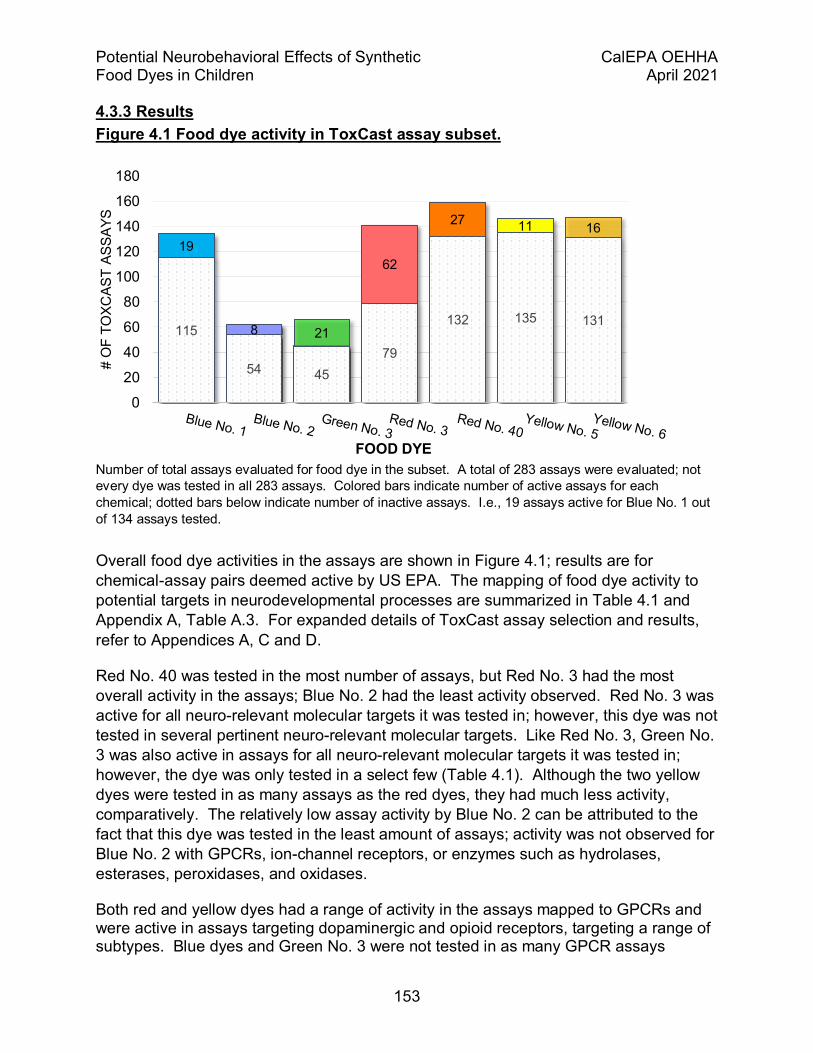
Potential Neurobehavioral Effects of Synthetic CalEPA OEHHA Food Dyes in Children April 2021
153
4.3.3 Results Figure 4.1 Food dye activity in ToxCast assay subset.
Number of total assays evaluated for food dye in the subset. A total of 283 assays were evaluated; not every dye was tested in all 283 assays. Colored bars indicate number of active assays for each chemical; dotted bars below indicate number of inactive assays. I.e., 19 assays active for Blue No. 1 out of 134 assays tested.
Overall food dye activities in the assays are shown in Figure 4.1; results are for chemical-assay pairs deemed active by US EPA. The mapping of food dye activity to potential targets in neurodevelopmental processes are summarized in Table 4.1 and Appendix A, Table A.3. For expanded details of ToxCast assay selection and results, refer to Appendices A, C and D.
Red No. 40 was tested in the most number of assays, but Red No. 3 had the most overall activity in the assays; Blue No. 2 had the least activity observed. Red No. 3 was active for all neuro-relevant molecular targets it was tested in; however, this dye was not tested in several pertinent neuro-relevant molecular targets. Like Red No. 3, Green No. 3 was also active in assays for all neuro-relevant molecular targets it was tested in; however, the dye was only tested in a select few (Table 4.1). Although the two yellow dyes were tested in as many assays as the red dyes, they had much less activity, comparatively. The relatively low assay activity by Blue No. 2 can be attributed to the fact that this dye was tested in the least amount of assays; activity was not observed for Blue No. 2 with GPCRs, ion-channel receptors, or enzymes such as hydrolases, esterases, peroxidases, and oxidases.
Both red and yellow dyes had a range of activity in the assays mapped to GPCRs and were active in assays targeting dopaminergic and opioid receptors, targeting a range of subtypes. Blue dyes and Green No. 3 were not tested in as many GPCR assays
115
54 4579
132 135 131
19
8 21
62
27 11 16
0
20
40
60
80
100
120
140
160
180
# O
F TO
XCAS
T AS
SAYS
FOOD DYE

Potential Neurobehavioral Effects of Synthetic CalEPA OEHHA Food Dyes in Children April 2021
154
therefore observations of their activity are inconclusive; only Blue No. 1 was tested in assays mapped to serotonergic receptors and had a hit for serotonin subtype 5HT7 (also a hit for Red No. 40 and both yellow dyes). The GPCR ion channels, glutamate and GABA, were not tested extensively across the food dye set. Pesticides were not tested in assays targeting the glutamatergic receptors, and although some were tested in assays for the GABA receptors, only chlorpyrifos had a hit for one assay.
Assays mapped to the nuclear receptors for androgen, estrogen, and thyroid hormone were tested across all the food dyes. Results are summarized in Appendix A, Table A.3. All the food dyes were active for the androgen receptor assays that they were tested in. A number of the synthetic food dyes were active for the receptor-based antagonist assays for the estrogen receptor, and/or antagonist assays for the thyroid hormone receptor. Red No. 3, Red No. 40, Blue No. 1, and Green No. 3 were also active for an assay mapped to thyroid peroxidase (TPO). This assay measures TPO activity as a loss of signal; TPO inhibition could lead to a decrease in thyroid hormone (TH) synthesis, which ultimately could lead to altered neurodevelopmental processes (AOP 4; http://www.aopwiki.org/). These same four dyes were also all active (and the only dyes tested) for an assay mapped to the glucocorticoid (GC) receptor NR3C1.
Red No. 3 was the only dye tested for activity for monoamine oxidase, and was active in that assay. The food dyes were not tested in assays mapped to the targets AChE and adenylyl cyclase.
4.3.3.1 Oxidative stress and inflammation pathways All the assays mapped to the induction of oxidative stress and inflammation (Iyer et al. 2019) were from the Bioseek platform (BSK). The molecular targets for these assays targeted a variety of cytokines, including chemokines, interleukins, and growth factors. Of the seven food dyes, only Red No. 3 had activity in these assays, all of which were associated with the downregulation of the signal.
4.3.3.2 Metabolites The activity for azo dye metabolites (Red No. 40, Yellow No. 5, Yellow No. 6) were explored in this current assessment. Of the six metabolites, four (cresidine-4-sulfonic acid, 1-amino-2-naphthol-7-sulfonic acid, sulfanilic acid, and 1-amino-2-naphthol-6-sulphonic acid) were found on the Chemistry Dashboard, but none were tested in ToxCast.
4.3.3.3 ToxPi results Refer to Appendix A for details on the analysis of results by ToxPi. The Tox Pi slices are described in Figure 4.2a, and the ToxPi pies are presented in Figure 4.2b. In order of activity observed, the most active to least were: Yellow No. 6, Yellow No. 5, Red No. 40, Red No. 3, Blue No. 1, Green No. 3, and Blue No. 2 (Figure 4.2b). Although the yellow dyes were not active in as many assays as some others, their biological activities in their active assays were greater than the other dyes. Based on the results, GPCR

Potential Neurobehavioral Effects of Synthetic CalEPA OEHHA Food Dyes in Children April 2021
155
assays had the most hits and the most number of assays (at least 50% of the assays evaluated in the ToxPis) which may influence how much overall activity was observed. The second most active group was the “ENZ” assays which included lyases, oxidases, and esterases. As expected, the slices representing the ion channels and ligand-gated ion channels had the least amount of activity, given that the food dyes were not tested extensively in these assays.

Potential Neurobehavioral Effects of Synthetic CalEPA OEHHA Food Dyes in Children April 2021
156
Table 4.1 Summary of food dye activities in in vitro assays. The “Molecular target” column addresses both protein and related receptors. “Pathways” represents suspected modes of action by the food dyes potentially linked to DNT. A “” represents a hit in at least one of the assays mapped to that target for that food dye (regardless of how many total assays were active or inactive for that target). Active hits do not differentiate between receptor subtypes or species. A “-“ represents a chemical that was tested but inactive in all assay(s) mapped to the molecular target. A “NT” means not tested and denotes that the food dye was not tested in assays related to the receptor. Active viability assays were not regarded as hits for the molecular targets. Comments under “Notes” indicate activity for different target subtypes. AOPs mentioned in this section do not imply a direct association to neurological outcomes, but instead are general AOPs linked to the molecular target. Supporting data for this table can be found in appendices C and D.
Molecular Target Blue No. 1
Blue No. 2
Green No. 3
Red No. 3
Red No. 40
Yellow No. 5
Yellow No. 6 Notes
GPCRs Adenosine: agonism linked to neurotoxicity; receptors predominantly expressed in the brain NT NT NT NT NT
Red No. 3 active for assay targeting A1; Yellow No. 6 active for assay targeting A2a
Adrenoreceptor: inhibits adenylate cyclase. Involved in release of NTs from nerves and adrenergic neurons in CNS
NT NT NT NT - Red No. 40 active for assay targeting α2c; Yellow No. 6 active for assay targeting α2a.
Dopaminergic: predominantly expressed in brain and CNS. Receptors regulate neuronal growth and development, and modulate behavioral responses
NT NT NT
Red No. 3, Red No. 40, Yellow No. 5, and Yellow No. 6 all active for assay targeting D1. Red No. 40 and Yellow No. 6 active for assays targeting D2 and D4; Yellow No. 5 active for assay targeting D4
Gamma-aminobutyric Acid: receptor for inhibitory NT in mammalian brain NT NT NT NT NT NT NT No dyes tested in subset assays mapped to this target.
Target linked to AOP 10.
Glutaminergic: dysregulation of receptor and associated NMDA receptors linked to abnormal neuronal development, abnormal synaptic plasticity, and neurodegeneration
NT NT NT NT - NT -
Red No. 40 and Yellow No. 6 were tested in an assay targeting Grik1 but both were inactive. Glutamate receptor binding is a key event in the two AOPs relevant to DNT and neurotoxicity. Target linked to AOP 48.
Muscarinic (cholinergic): binding of AChE leads to responses such as adenylate cyclase inhibition and potassium channel mediation
NT NT NT NT - Red No. 40 active for assays targeting m2, m3, and m5; Yellow No. 6 active for assay targeting m3
Nicotinic (cholinergic): ion channels serving as muscle and neuronal receptors in CNS NT NT NT NT NT NT Red No. 40 active for assay targeting α2
Opioid: expressed in the brain. Agonist-mediated activation leads to the modulation of many biological functions
NT NT NT Red No. 3 active for assay targeting μ1; Red No. 4 active for assay targeting δ1; Yellow No. 5 and 6 active for assays targeting κ1
Serotonergic: found in the central and peripheral nervous system; mediate both excitatory and inhibitory neurotransmission
NT NT NT
Blue No. 1, Red No. 40, Yellow No. 5, Yellow No. 6 active for assays targeting 5HT7. Red No. 40 active for assays targeting 5HT1, 5HT3, and 5HT4; Yellow No. 5 active for assay targeting 5HT4; Yellow No. 6 active for assays targeting 5HT1 and 5HT5A
Nuclear Receptors

Potential Neurobehavioral Effects of Synthetic CalEPA OEHHA Food Dyes in Children April 2021
157
Molecular Target Blue No. 1
Blue No. 2
Green No. 3
Red No. 3
Red No. 40
Yellow No. 5
Yellow No. 6 Notes
Androgen: receptor activated by binding of ligands and then is translocated into the nucleus
All dyes, except Blue No. 2, active for Tox21_AR_LUC_MDAKB2_Antagonist, suggesting antagonistic role. Blue No. 2 active for NVS_NR_cAR
Estrogen: steroid hormone receptor activated by binding of ligands and then is translocated into the nucleus
- - - Most dyes active for antagonism assays. Yellow dyes active for viability assays, but not receptor activity assays
Glucocorticoid: transcription factor binds to response elements in promoters of responsive genes, regulates other transcription factors
NT NT NT Activity of food dyes based on assay NVS_NR_hGR.
Thyroid Hormone: receptor for tyrosine-based hormones that are primarily responsible for regulation of metabolism.
- -
Activity based on TH and TSH. Green No. 3 active for NVS_NR_hTRa_Antagonist - looks at ability of chemical to bind and displace T3 from receptor α. Neither yellow dye was active for receptor assays. Associated with AOPs 8, 152, and 300.
Oxidases, esterases, transcription factors, and transporter proteins Acetylcholinesterase: In CNS, binding by acetylcholine (AChE) plays a role in the function of peripheral neuromuscular junctions.
NT NT NT NT NT NT NT No dyes tested in subset assays mapped to this target
Adenylyl Cyclase: catalyzes the formation of cyclic AMP and pyrophosphate from ATP. NT NT NT NT NT NT NT No dyes tested in subset assays mapped to this target
Aryl Hydrocarbon: protein involved in the regulation of biological responses to aromatic hydrocarbons
- - - Activity for target based on ATG_AhR_Cis (AOP 150).1 Only Yellow No. 5 associated with downregulation; others associated with upregulation
Monoamine Oxidase: regulates metabolic degradation of catecholamines and serotonin in neural/target tissues.
NT NT NT NT NT NT Red No. 3 was only dye tested. The dye was tested in 2 assays and active in 1
Soluble Carrier Protein 6: member of sodium NT symporter family, responsible for reuptake of norepinephrine into presynaptic nerve terminals.
NT NT NT - NT NT Activity observed in assays: NVS_TR_HNET, NVS_TR_HSERT, NVS_TR_RSERT. Red No. 3 active for assay targeting member 2.
Thyroid Peroxidase: oxidoreductase; inhibition leads to a decrease in thyroid hormone synthesis NT NT NT
Four dyes associated with downregulation; targeting the loss of signal of TPO activity. The assay is associated with AOP 42.1
Pathways Oxidative Stress: Targets include intercellular adhesion molecules, chemokines, and interleukins.
- - - - Green No. 3 and Yellow No. 6 were active in one assay each; Red No. 3 was active in three assays.
Inflammation: Targets include tumor necrosis factor and transforming growth factor - NT - - - - - No activity observed
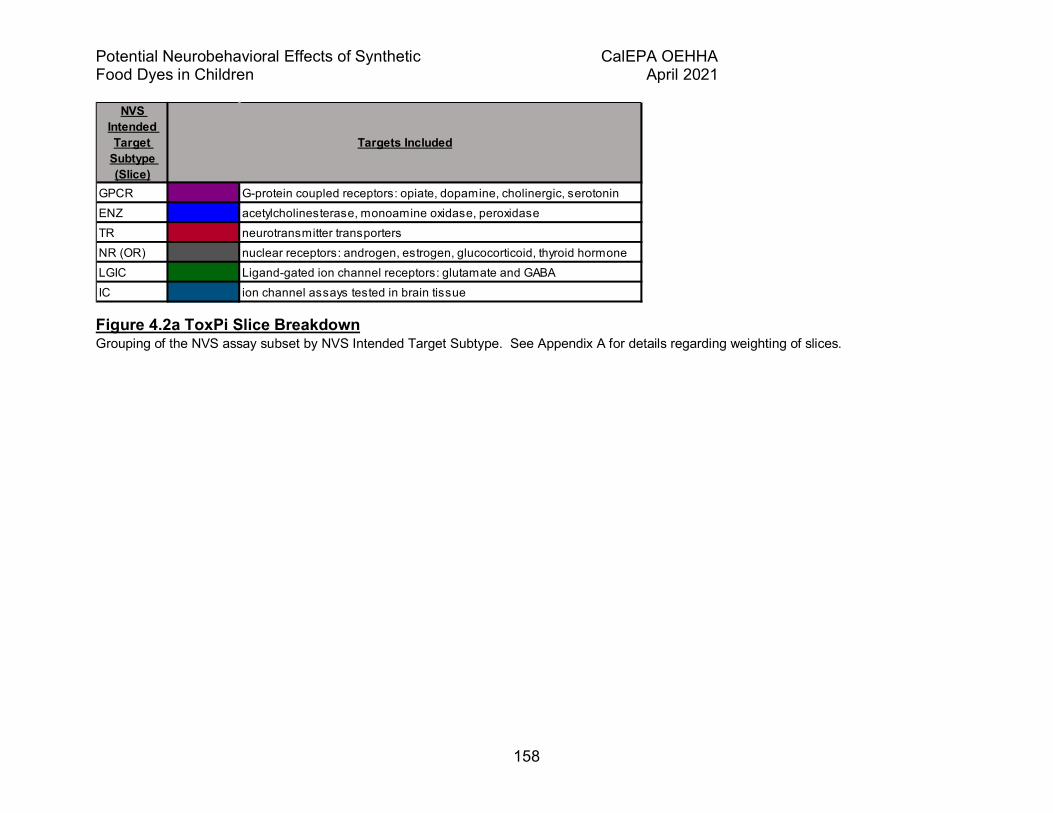
Potential Neurobehavioral Effects of Synthetic CalEPA OEHHA Food Dyes in Children April 2021
158
Figure 4.2a ToxPi Slice Breakdown Grouping of the NVS assay subset by NVS Intended Target Subtype. See Appendix A for details regarding weighting of slices.
NVS Intended Target
Subtype (Slice)
GPCR G-protein coupled receptors: opiate, dopamine, cholinergic, serotoninENZ acetylcholinesterase, monoamine oxidase, peroxidaseTR neurotransmitter transporters NR (OR) nuclear receptors: androgen, estrogen, glucocorticoid, thyroid hormoneLGIC Ligand-gated ion channel receptors: glutamate and GABAIC ion channel assays tested in brain tissue
Targets Included
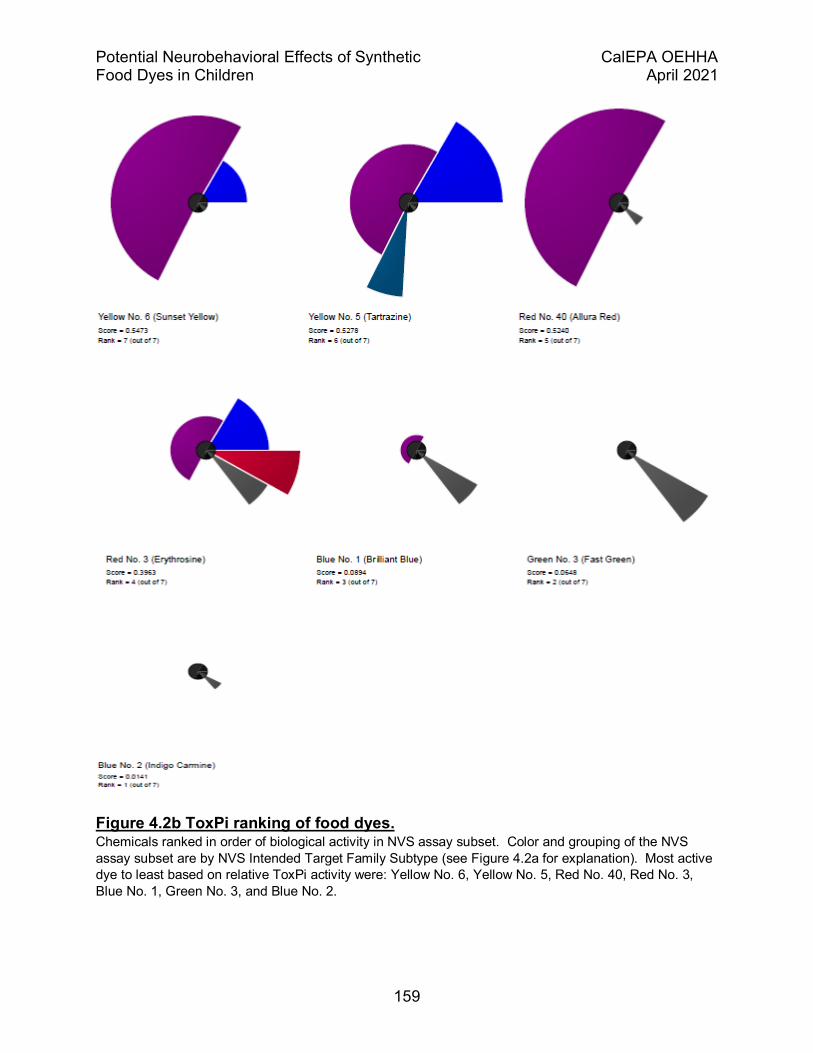
Potential Neurobehavioral Effects of Synthetic CalEPA OEHHA Food Dyes in Children April 2021
159
Figure 4.2b ToxPi ranking of food dyes. Chemicals ranked in order of biological activity in NVS assay subset. Color and grouping of the NVS assay subset are by NVS Intended Target Family Subtype (see Figure 4.2a for explanation). Most active dye to least based on relative ToxPi activity were: Yellow No. 6, Yellow No. 5, Red No. 40, Red No. 3, Blue No. 1, Green No. 3, and Blue No. 2.
Potential Neurobehavioral Effects of Synthetic CalEPA OEHHA Food Dyes in Children April 2021
160
4.3.4 Summary of HTS evaluation ToxCast activity for the food dyes ranged widely making it difficult to make strong correlations between what was observed, and adverse effects or potential mechanisms that have been reported in the literature. The lack of substantial correlations can be due to several factors. For one, the assays used in ToxCast do not represent the entire spectrum of biological processes that might be relevant to human health, including neurobehavioral effects. Therefore, there are gaps in biological coverage of the available assays. Biological coverage gaps persist even after expanding the assay selection to additional markers using the pesticide candidates and the pertinent pathways. Red No. 3 and Green No. 3 had hits for all the neuro-relevant molecular targets that they were tested in. It is unknown whether or not these dyes would show activity in the molecular targets in which they have yet to be tested. Because of this, no conclusion can be drawn with respect to dye activity in a number of the in vitro assays targeting several markers (including AChE, adenyl cyclase, and the ion channels GABA and glutamate). In our sub-analysis with ToxPi, we see that the number of active assays is just one component for evaluating the biological activity of a chemical. Another important factor to take into account is the potency of the chemical-assay pair – although a dye may be active in fewer assays, the potency in those active assays may be much higher, or vice-versa.
The current lack of metabolic activation and design limitations of the assays may also contribute to a higher number of inactives than expected. Proposed mechanisms linking food dye exposure to neurotoxicological effects include induction of oxidative stress and inflammation, which are thought to be primarily mediated through the active metabolites of the azo dyes. Typically, the azo dyes are substantially cleaved in the gut and the metabolites are absorbed. Thus, even in vivo, the synthetic azo dyes themselves would be less likely to reach the targets measured in the ToxCast assays. Therefore, a lack of observed activity in vitro does not necessarily translate to the absence of activity in vivo and may explain the lack of activity of several dyes (i.e., yellow dyes) across many of the molecular targets. Although Red No. 3 has activity in assays mapped to oxidative stress, which supports some literature findings (Floyd 1980) and indicates an area that may need to be explored further, none of the known metabolites have been tested in ToxCast (however, four were identified in the Chemistry Dashboard). Therefore, the role of metabolic activation in the toxic action of the food dyes could not be clearly assessed using ToxCast data.
Even with the limitations of the in vitro data, in contrast to a recent study published by (Chappell et al. 2020), our approach resulted in more assays being included in the assessment (283 for OEHHA compared to 99 for Chappell et al. (2020)) and more corresponding active “hit-calls” for OEHHA in comparison to Chappell et al. (2020). These differences could be explained by the fact that (i) we cast a much wider net to include indirect effects that may have potential associations with neurobehavioral outcomes and (ii) we did not integrate cytotoxicity and flags of efficacy as hard cutoffs when determining activity calls in contrast to the approach Chappell et al. (2020) took.
Potential Neurobehavioral Effects of Synthetic CalEPA OEHHA Food Dyes in Children April 2021
161
As mentioned previously, although data flags increase uncertainty, it is not recommended to use data flags and cytotoxicity limits as hard cutoffs to discount assay results, but rather they should be utilized as a set of cautions for users when considering the data (Judson et al. 2016). For instance, AC50s observed for chemical-assay pairs above the cytotoxicity threshold are more likely to be influenced by processes involved in cell death. However, certain quantitative uncertainties in AC50s (hit-calls are binary currently, but improvements are being done to integrate confidence intervals) still exist as well as our lack of true understanding of the dynamics between observed activity, cell stress, and cytotoxicity. Furthermore, there is not an established standardized way of incorporating cytotoxicity when interpreting ToxCast HTS data. ( Viability assays were given limited consideration in our evaluation due to a number of factors including 1) the variable number of cytotoxicity assays for each chemical; 2) appropriateness of utilizing Tox21 cytotoxicity assays in application to ToxCast assays outside the Tox21 platform (potentially important differences in the methods across platforms which would affect cell viability and non-concurrent measurements); 3) many cytotoxicity assays have flags of efficacy, which by the same rules, would render them less reliable. Due to their integration of cytotoxicity data in their analysis, the Chappell study had little or no hits for most of the seven food dyes. By comparison, our approach resulted in a significant number of assay hits for potentially relevant molecular targets underlying neurological processes (Figure 2).
Although our approach had certain limitations, much of our results showed concordance with the literature. The estrogen receptor is involved in brain development, and estrogens modulate many processes in the brain, including those influencing behavior (McCarthy 2008; McEwen et al. 2012). As noted by the McEwan et al. (2012) estrogen is involved in a number of processes in the brain that “include fine motor control, motor coordination, pain, mood regulation, cognitive function, cardiovascular regulation, neuroprotection and many others.” ToxCast data indicates an interaction with the estrogen receptor, although it is in the opposite direction (antagonistic), in contrast to the estrogenic activity observed in the literature for Red No. 3 (Dees et al. 1997). ToxCast data does not corroborate the estrogenic interactions of Yellow No. 5 and No. 6 as reported by Axon (2012). All the FD&C synthetic food dyes (except for yellow dyes) are active for antagonistic effects with the thyroid hormone receptor based on activity for assay TOX21_TR_LUC_GH3_Antagonist. Some have data flags and therefore the results should be viewed as less reliable. There are no data flags for Red No. 3, but because the assay is part of the Tox21 platform, viability assay results associated with this assay target should be given weight. Because of this, there is a likelihood that the AC50s observed for the Red No. 3 and Red No. 40 activities are influenced by cytotoxicity. However, the extent of cytotoxicity influence is unclear and therefore it should be noted that there may still be some concordance with effects on thyroid homeostasis reported in the literature. In particular, Red No. 3 is active for assays targeting the thyroid hormone supporting literature findings for the inhibitory effects of Red No. 3 on the conversion of T4 to T3 in rats and increased release of TRH
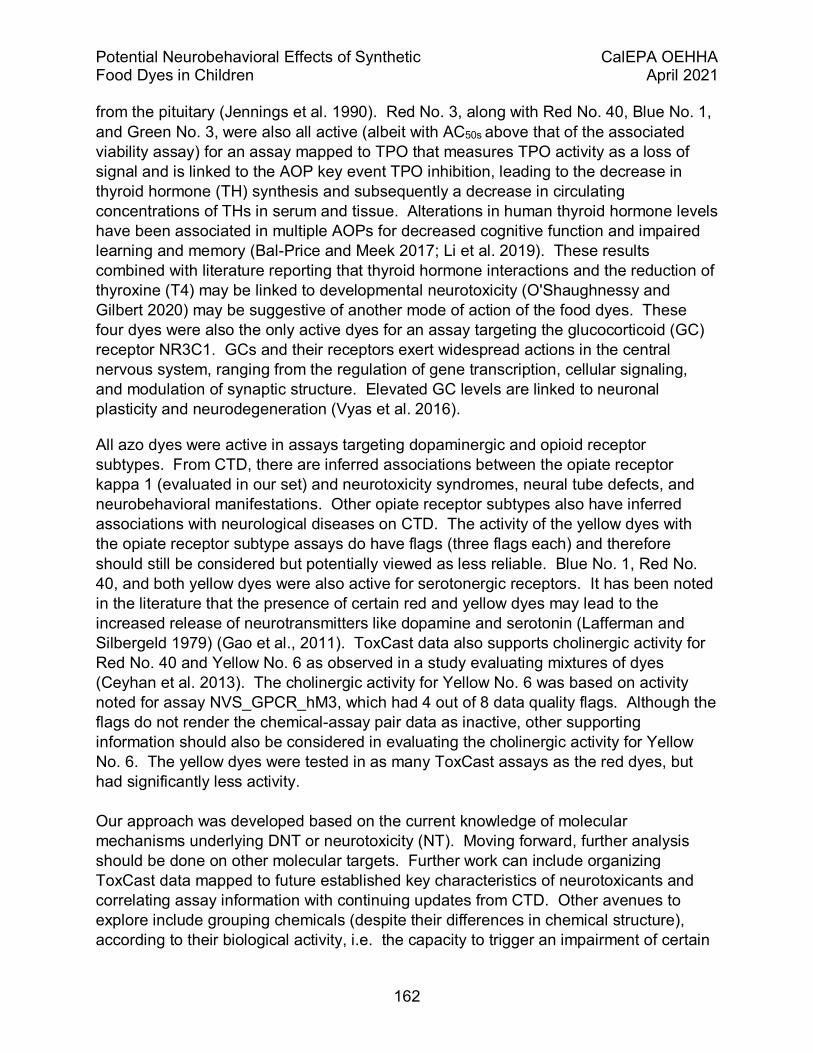
Potential Neurobehavioral Effects of Synthetic CalEPA OEHHA Food Dyes in Children April 2021
162
from the pituitary (Jennings et al. 1990). Red No. 3, along with Red No. 40, Blue No. 1, and Green No. 3, were also all active (albeit with AC50s above that of the associated viability assay) for an assay mapped to TPO that measures TPO activity as a loss of signal and is linked to the AOP key event TPO inhibition, leading to the decrease in thyroid hormone (TH) synthesis and subsequently a decrease in circulating concentrations of THs in serum and tissue. Alterations in human thyroid hormone levels have been associated in multiple AOPs for decreased cognitive function and impaired learning and memory (Bal-Price and Meek 2017; Li et al. 2019). These results combined with literature reporting that thyroid hormone interactions and the reduction of thyroxine (T4) may be linked to developmental neurotoxicity (O'Shaughnessy and Gilbert 2020) may be suggestive of another mode of action of the food dyes. These four dyes were also the only active dyes for an assay targeting the glucocorticoid (GC) receptor NR3C1. GCs and their receptors exert widespread actions in the central nervous system, ranging from the regulation of gene transcription, cellular signaling, and modulation of synaptic structure. Elevated GC levels are linked to neuronal plasticity and neurodegeneration (Vyas et al. 2016).
All azo dyes were active in assays targeting dopaminergic and opioid receptor subtypes. From CTD, there are inferred associations between the opiate receptor kappa 1 (evaluated in our set) and neurotoxicity syndromes, neural tube defects, and neurobehavioral manifestations. Other opiate receptor subtypes also have inferred associations with neurological diseases on CTD. The activity of the yellow dyes with the opiate receptor subtype assays do have flags (three flags each) and therefore should still be considered but potentially viewed as less reliable. Blue No. 1, Red No. 40, and both yellow dyes were also active for serotonergic receptors. It has been noted in the literature that the presence of certain red and yellow dyes may lead to the increased release of neurotransmitters like dopamine and serotonin (Lafferman and Silbergeld 1979) (Gao et al., 2011). ToxCast data also supports cholinergic activity for Red No. 40 and Yellow No. 6 as observed in a study evaluating mixtures of dyes (Ceyhan et al. 2013). The cholinergic activity for Yellow No. 6 was based on activity noted for assay NVS_GPCR_hM3, which had 4 out of 8 data quality flags. Although the flags do not render the chemical-assay pair data as inactive, other supporting information should also be considered in evaluating the cholinergic activity for Yellow No. 6. The yellow dyes were tested in as many ToxCast assays as the red dyes, but had significantly less activity. Our approach was developed based on the current knowledge of molecular mechanisms underlying DNT or neurotoxicity (NT). Moving forward, further analysis should be done on other molecular targets. Further work can include organizing ToxCast data mapped to future established key characteristics of neurotoxicants and correlating assay information with continuing updates from CTD. Other avenues to explore include grouping chemicals (despite their differences in chemical structure), according to their biological activity, i.e. the capacity to trigger an impairment of certain
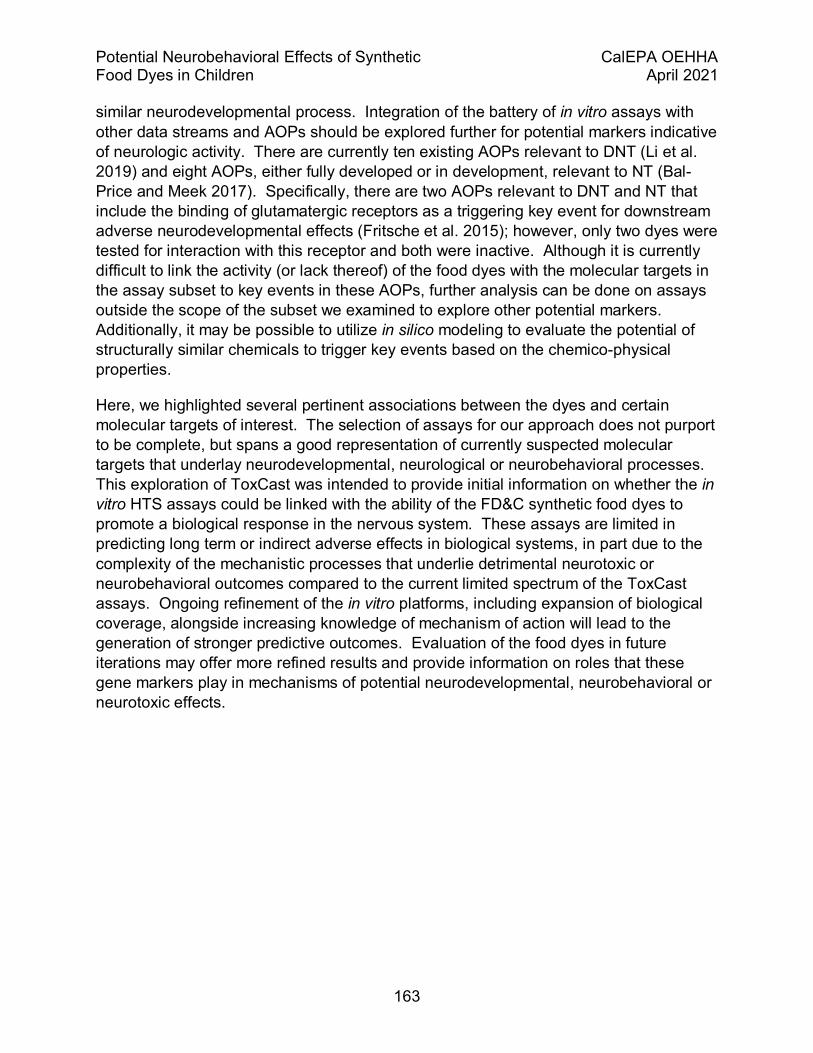
Potential Neurobehavioral Effects of Synthetic CalEPA OEHHA Food Dyes in Children April 2021
163
similar neurodevelopmental process. Integration of the battery of in vitro assays with other data streams and AOPs should be explored further for potential markers indicative of neurologic activity. There are currently ten existing AOPs relevant to DNT (Li et al. 2019) and eight AOPs, either fully developed or in development, relevant to NT (Bal-Price and Meek 2017). Specifically, there are two AOPs relevant to DNT and NT that include the binding of glutamatergic receptors as a triggering key event for downstream adverse neurodevelopmental effects (Fritsche et al. 2015); however, only two dyes were tested for interaction with this receptor and both were inactive. Although it is currently difficult to link the activity (or lack thereof) of the food dyes with the molecular targets in the assay subset to key events in these AOPs, further analysis can be done on assays outside the scope of the subset we examined to explore other potential markers. Additionally, it may be possible to utilize in silico modeling to evaluate the potential of structurally similar chemicals to trigger key events based on the chemico-physical properties.
Here, we highlighted several pertinent associations between the dyes and certain molecular targets of interest. The selection of assays for our approach does not purport to be complete, but spans a good representation of currently suspected molecular targets that underlay neurodevelopmental, neurological or neurobehavioral processes. This exploration of ToxCast was intended to provide initial information on whether the in vitro HTS assays could be linked with the ability of the FD&C synthetic food dyes to promote a biological response in the nervous system. These assays are limited in predicting long term or indirect adverse effects in biological systems, in part due to the complexity of the mechanistic processes that underlie detrimental neurotoxic or neurobehavioral outcomes compared to the current limited spectrum of the ToxCast assays. Ongoing refinement of the in vitro platforms, including expansion of biological coverage, alongside increasing knowledge of mechanism of action will lead to the generation of stronger predictive outcomes. Evaluation of the food dyes in future iterations may offer more refined results and provide information on roles that these gene markers play in mechanisms of potential neurodevelopmental, neurobehavioral or neurotoxic effects.

Potential Neurobehavioral Effects of Synthetic CalEPA OEHHA Food Dyes in Children April 2021
164
Chapter 5. Hazard Identification 5.1 Introduction In this chapter, we combine evidence streams, summarizing key points from previous sections, and integrate the information to describe the potential neurobehavioral hazards posed by consumption of synthetic food dyes. Note that we have not reviewed other toxicological endpoints including noncancer effects on other organs or systems or carcinogenicity. Thus, we do not make any statements regarding toxicity of the FD&C synthetic food dyes other than neurological or neurobehavioral hazards.
5.2 Human studies OEHHA reviewed the epidemiological literature on the FD&C batch-certified synthetic food dyes and neurobehavioral outcomes in children (Chapter 2). These neurobehavioral outcomes, many of which are components of the diagnosis of ADHD, were chosen since they are hazards in their own right. Further, these outcomes are generally continuous variables rather than dichotomous variables as with the clinical diagnosis of ADHD. Use of continuous variables results in a more statistically powerful examination of the potential impacts of exposure to certified synthetic food dyes on children’s behavior. The diagnostic criteria of ADHD have changed several times over the years making comparisons of data from studies conducted in different time periods difficult. In addition, ADHD is considered to exist on a spectrum of neurobehavioral symptoms and severity. Any induced alterations decreasing attention may shift the numbers of those who meet the criteria for the clinical diagnosis of ADHD resulting in large costs for society. Further, focusing solely on measuring attention metrics related to ADHD, as noted by Rowe and Rowe (1994), excludes symptoms observed to be exacerbated by food dyes such as sleeplessness, restlessness and irritability.
We identified 27 studies from five countries on four continents that used clinical trial designs and met other inclusion criteria (see Chapter 2). These criteria were designed to help identify the highest quality studies and reduce bias and confounding. Because clinical trials can be highly beneficial in helping to reduce certain biases and confounding compared to other study designs, our focus was on using these studies. Although designs, results, and quality varied from study to study, there is a fairly extensive body of evidence that the consumption of synthetic food dyes are associated with adverse neurobehavioral outcomes in children. In addition, the studies also showed that the sensitivity to synthetic food dyes varies greatly from person to person and that some children are likely to be more adversely affected by exposure to the dyes than others. The majority of studies reported at least some evidence of an association between synthetic food dye exposure and neurobehavioral outcomes, and these associations are consistent throughout a wide range of outcome assessment methods and metrics (e.g., parent report, teacher report, trained observers, or computer based assessment) and other study characteristics. For example, although clear associations were not seen in every study, those studies conducted after 1990 and studies utilizing
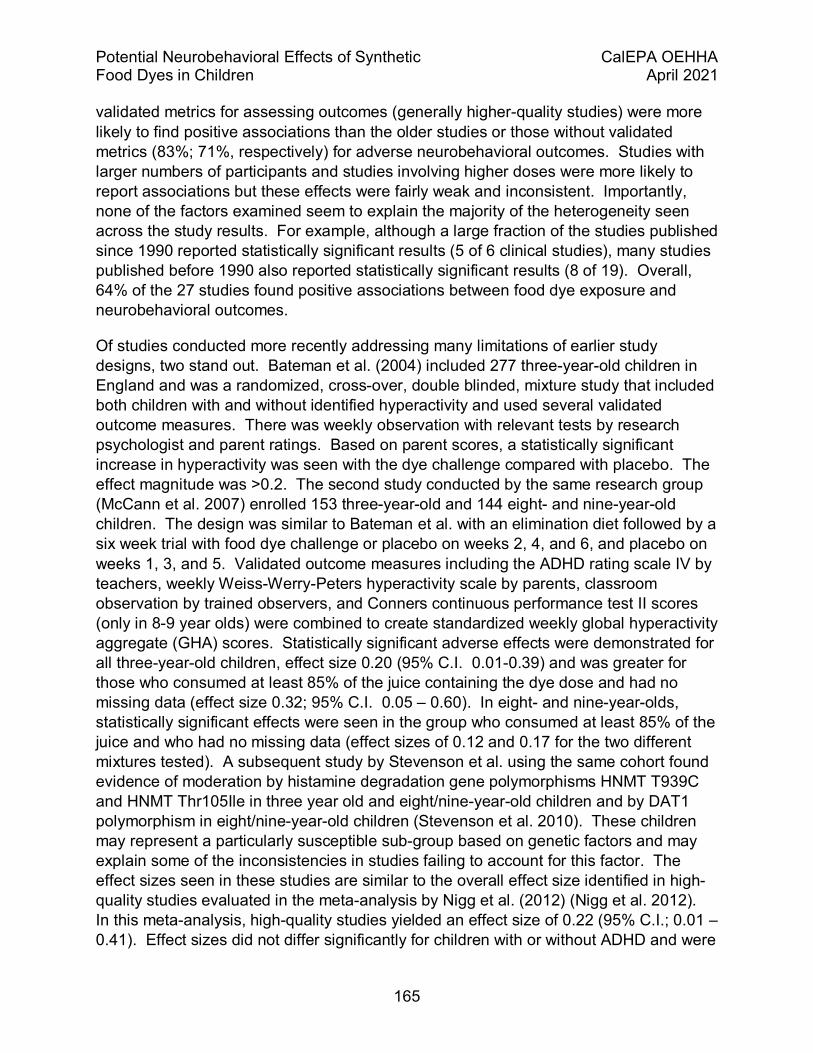
Potential Neurobehavioral Effects of Synthetic CalEPA OEHHA Food Dyes in Children April 2021
165
validated metrics for assessing outcomes (generally higher-quality studies) were more likely to find positive associations than the older studies or those without validated metrics (83%; 71%, respectively) for adverse neurobehavioral outcomes. Studies with larger numbers of participants and studies involving higher doses were more likely to report associations but these effects were fairly weak and inconsistent. Importantly, none of the factors examined seem to explain the majority of the heterogeneity seen across the study results. For example, although a large fraction of the studies published since 1990 reported statistically significant results (5 of 6 clinical studies), many studies published before 1990 also reported statistically significant results (8 of 19). Overall, 64% of the 27 studies found positive associations between food dye exposure and neurobehavioral outcomes.
Of studies conducted more recently addressing many limitations of earlier study designs, two stand out. Bateman et al. (2004) included 277 three-year-old children in England and was a randomized, cross-over, double blinded, mixture study that included both children with and without identified hyperactivity and used several validated outcome measures. There was weekly observation with relevant tests by research psychologist and parent ratings. Based on parent scores, a statistically significant increase in hyperactivity was seen with the dye challenge compared with placebo. The effect magnitude was >0.2. The second study conducted by the same research group (McCann et al. 2007) enrolled 153 three-year-old and 144 eight- and nine-year-old children. The design was similar to Bateman et al. with an elimination diet followed by a six week trial with food dye challenge or placebo on weeks 2, 4, and 6, and placebo on weeks 1, 3, and 5. Validated outcome measures including the ADHD rating scale IV by teachers, weekly Weiss-Werry-Peters hyperactivity scale by parents, classroom observation by trained observers, and Conners continuous performance test II scores (only in 8-9 year olds) were combined to create standardized weekly global hyperactivity aggregate (GHA) scores. Statistically significant adverse effects were demonstrated for all three-year-old children, effect size 0.20 (95% C.I. 0.01-0.39) and was greater for those who consumed at least 85% of the juice containing the dye dose and had no missing data (effect size 0.32; 95% C.I. 0.05 – 0.60). In eight- and nine-year-olds, statistically significant effects were seen in the group who consumed at least 85% of the juice and who had no missing data (effect sizes of 0.12 and 0.17 for the two different mixtures tested). A subsequent study by Stevenson et al. using the same cohort found evidence of moderation by histamine degradation gene polymorphisms HNMT T939C and HNMT Thr105Ile in three year old and eight/nine-year-old children and by DAT1 polymorphism in eight/nine-year-old children (Stevenson et al. 2010). These children may represent a particularly susceptible sub-group based on genetic factors and may explain some of the inconsistencies in studies failing to account for this factor. The effect sizes seen in these studies are similar to the overall effect size identified in high-quality studies evaluated in the meta-analysis by Nigg et al. (2012) (Nigg et al. 2012). In this meta-analysis, high-quality studies yielded an effect size of 0.22 (95% C.I.; 0.01 – 0.41). Effect sizes did not differ significantly for children with or without ADHD and were

Potential Neurobehavioral Effects of Synthetic CalEPA OEHHA Food Dyes in Children April 2021
166
about one-sixth to one-third of those seen for improvements from attention-deficit/hyperactivity disorder (ADHD) medications. The authors analysis suggested that as many as 8% of children with ADHD may have symptoms related to food dyes.
Nigg et al. (2012) (table 2) took a unique approach to analysis of study results. Three neuropsychologists sorted the tasks from all studies according to the cognitive abilities that they assessed and agreed 100% on those that measured attention. Examination of these psychometric tests of attention, in many ways the more relevant metrics, yielded a consistent higher effect size, 0.27 (p= 0.007). When limiting the analysis to studies that only included FDA dyes, the effect was 0.34 but with the caveat that this included only 5 studies with a total of 68 participants. This statistically significant higher effect size using measures of attention is important since this metric is an objective measurement from experimenter table-top administration of tests. These tests of attention avoid some limitations of other measurements obtained from parents or teachers, such as rater bias, cultural effects, or stratification of studies. The results remained significant after consideration of possible publication bias and were consistent in direction with those from parent and teacher report. Also noted was that the effect size was not different between studies that selected participants based on attention/ADHD status and those that used a general population indicating that the general childhood population, not just those with diagnosed ADHD, is at risk for the impacts of food dyes on behavior.
Most studies we reviewed involved concurrent administration of multiple dyes, and therefore no single offending agent could be identified. However, several studies evaluated the effect on behavioral scores for Yellow No. 5 (Levy et al. 1978; Levy and Hobbes 1978; Rose 1978; Rowe 1988; Rowe and Rowe 1994; Sarantinos et al. 1990) making this the only dye studied individually. In Rowe and Rowe (1994), Yellow No. 5 was studied alone and with a range of doses. Children were on a dye-free diet for at least 6 weeks before the trial. They were then given doses (randomly) of 0, 1, 2, 5, 10, or 20 mg/day Yellow No. 5 with two days in between each day of active dosing. A placebo was administered on the other days. This double blinded, placebo controlled study of the effects of Yellow No. 5 recruited 34 children (ages 2 – 14 years) being evaluated for hyperactivity and 20 children whose parents had no concern about behavior. The authors had noted in previous studies that parents often complained of symptoms of restlessness, irritability and sleeplessness following consumption of food dyes and included these symptoms in the assessment. To address these symptoms, which were not evaluated in previous studies, the investigators utilized a validated Behavioral Rating Inventory that included 11 items measuring irritability, 9 items that measured sleep disturbance, 4 items that measured restlessness, 3 items that measured aggression and 3 items that measured attention span. In addition, the investigators also used the Conners 10-item Abbreviated Parent-Teacher Questionnaire to assess behavior, which focuses on attention related problems. Parents rated the behavior daily using the two instruments.

Potential Neurobehavioral Effects of Synthetic CalEPA OEHHA Food Dyes in Children April 2021
167
The investigators ranked the behavioral scores for the six dye challenge days paired with a set of placebo days (the day before the dye challenge) and identified 24 children who had significant behavioral responses to dye challenge, whom they labelled as reactors. Notably two of these children were from the group whose parents did not report any previous behavioral problem. In the reactors, the mean behavioral scores on days the children were given the dye challenge were significantly different than the scores for the days they were given a placebo. Nonreactors showed random fluctuations in behavioral scores. For the reactor group, the mean score differences between behavioral ratings for placebo days and dye challenge days were statistically significant for all dose/placebo pairs (p<0.05). Using repeated measures ANOVA on the six dye-challenge scores with reactors and nonreactors as the between groups factor, the authors report a significant between-groups effect (p<0.001). The investigators also fit the dose-response relationship between behavioral score and the amount of dye administered and characterize the fit of the line as a third-order polynomial. The mean score difference between the reactor and the nonreactor groups were significant at doses of 2 mg and higher (p<0.05).
To put the dosing in perspective relative to a typical ingestion of dyes, one can divide the mg of total dye in the mixture studies by typical body weights (from USEPA Exposure Factors Handbook; available here: https://cfpub.epa.gov/ncea/risk/recordisplay.cfm?deid=236252). That can then be compared to total dye intake in our report, which is in Chapter 6, Table 6.13. The mean of total dye intake across age groups (5 to 12 years of age) was 0.41 mg/kg-day and the 95th percentile was 1.3 mg/kg-day; the maximum was 11 mg/kg-day. We did not calculate total dye intake by age groups. Doses in the clinical trials we reviewed ranged from 15 to a high of 78 mg and were given to children of varying ages and body weights. In the McCann et al. (2007) study, the dose of Mix A administered to three yr olds was 20 mg. Dividing by the average body weight for three yr olds of 14 kg yields a dose of 1.4 mg/kg-day. For the eight/nine year olds, the dose of Mix A was about 0.8 mg/kg-d. These doses are in the range of what we estimated for total dye ingestion for children ages 5 to 16 in the US. As another example, Rowe and Rowe (1994) in evaluating the effects of Yellow No. 5 used doses of 1, 2, 5, 10, 20 and 50 mg in 54 children ages 2 to 14 years. These investigators found a dose-dependent effect on measures of activity in children. Using body weight by age from USEPA’s Exposure Factors Handbook, those doses would then range from a low of about 0.02 mg/kg-d (lowest dose to oldest child) to a high of about 3.6 mg/kg-d (highest dose to youngest child). This can be compared to estimates of Yellow No. 5 exposure of about 0.056 up to about 0.3 mg/kg-day using the data in Appendix F, Table A6, on consumption of Yellow No. 5 by various age groupings of children, and dividing by reference body weights for those age ranges.
Despite the various study limitations, after extensive analysis, we were unable to identify strong evidence for any apparent biases or other factors that invalidated the
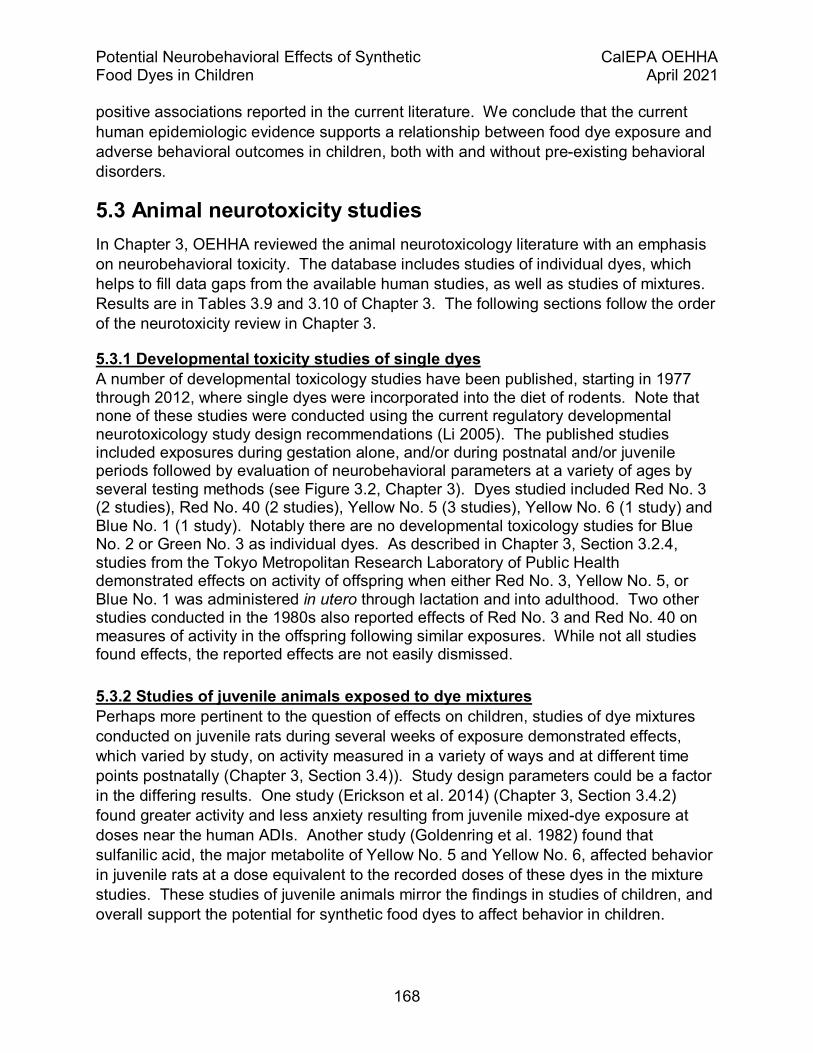
Potential Neurobehavioral Effects of Synthetic CalEPA OEHHA Food Dyes in Children April 2021
168
positive associations reported in the current literature. We conclude that the current human epidemiologic evidence supports a relationship between food dye exposure and adverse behavioral outcomes in children, both with and without pre-existing behavioral disorders.
5.3 Animal neurotoxicity studies In Chapter 3, OEHHA reviewed the animal neurotoxicology literature with an emphasis on neurobehavioral toxicity. The database includes studies of individual dyes, which helps to fill data gaps from the available human studies, as well as studies of mixtures. Results are in Tables 3.9 and 3.10 of Chapter 3. The following sections follow the order of the neurotoxicity review in Chapter 3.
5.3.1 Developmental toxicity studies of single dyes A number of developmental toxicology studies have been published, starting in 1977 through 2012, where single dyes were incorporated into the diet of rodents. Note that none of these studies were conducted using the current regulatory developmental neurotoxicology study design recommendations (Li 2005). The published studies included exposures during gestation alone, and/or during postnatal and/or juvenile periods followed by evaluation of neurobehavioral parameters at a variety of ages by several testing methods (see Figure 3.2, Chapter 3). Dyes studied included Red No. 3 (2 studies), Red No. 40 (2 studies), Yellow No. 5 (3 studies), Yellow No. 6 (1 study) and Blue No. 1 (1 study). Notably there are no developmental toxicology studies for Blue No. 2 or Green No. 3 as individual dyes. As described in Chapter 3, Section 3.2.4, studies from the Tokyo Metropolitan Research Laboratory of Public Health demonstrated effects on activity of offspring when either Red No. 3, Yellow No. 5, or Blue No. 1 was administered in utero through lactation and into adulthood. Two other studies conducted in the 1980s also reported effects of Red No. 3 and Red No. 40 on measures of activity in the offspring following similar exposures. While not all studies found effects, the reported effects are not easily dismissed.
5.3.2 Studies of juvenile animals exposed to dye mixtures Perhaps more pertinent to the question of effects on children, studies of dye mixtures conducted on juvenile rats during several weeks of exposure demonstrated effects, which varied by study, on activity measured in a variety of ways and at different time points postnatally (Chapter 3, Section 3.4)). Study design parameters could be a factor in the differing results. One study (Erickson et al. 2014) (Chapter 3, Section 3.4.2) found greater activity and less anxiety resulting from juvenile mixed-dye exposure at doses near the human ADIs. Another study (Goldenring et al. 1982) found that sulfanilic acid, the major metabolite of Yellow No. 5 and Yellow No. 6, affected behavior in juvenile rats at a dose equivalent to the recorded doses of these dyes in the mixture studies. These studies of juvenile animals mirror the findings in studies of children, and overall support the potential for synthetic food dyes to affect behavior in children.

Potential Neurobehavioral Effects of Synthetic CalEPA OEHHA Food Dyes in Children April 2021
169
5.3.3 Studies of adult animals with gestational exposure to dye mixtures Several more recent studies evaluated the effects of gestational exposure to dye mixtures on activity measured in adult animals (Chapter 3, Section 3.2.5). These studies demonstrate long-term effects of in utero exposure on behavior at doses of the individual dyes found to have no effects in FDA regulatory reviews. Sensitive areas of brain function affected in these studies included regulation of activity, anxiety and exploration in a novel environment, and persistence in the forced swim test. It should be noted that the studies used as the basis of the FDA ADIs were not designed to test for any type of neurobehavioral effects. Some of these newer studies also evaluated changes in neurotransmitter receptors for glutamate and acetylcholine in the hippocampus, and found statistically significant changes in receptor protein levels. The pattern of changes did not provide enough information for ready interpretation other than to state that these receptors are related to behavioral performance, and that long- term changes at the tissue level could be demonstrated after gestational dye exposure.
5.3.4 Studies of juvenile/adult animals Results from studies evaluating neurotoxicity in adult animals, some of which were part of reproductive and developmental dietary administration studies, have demonstrated changes in activity in animals administered Red No. 3, Red No. 40, Yellow No. 5, Yellow No. 6, and Blue No. 1 (Chapter 3, section 3.3).
A handful of the more recent studies also reported altered brain chemistry in adult rodents given Red No. 3, Red No. 40, Yellow No. 5 and Yellow No. 6 over a several week period (Chapter 3, section 3.3.4, 3.3.5). This is a new area of research and these are the first studies to evaluate brain chemistry after exposures to food dyes in vivo. In later studies with a gavage design (Chapter 3, Section 3.3.4), both cognitive effects and changes in brain cell count and morphology were reported. A study of Red No. 40 (Noorafshan et al. 2018) showed both more reference and working memory errors in dose groups than in controls while learning the radial arm maze and also in the retention test. When brains were examined at the end of the experiment, the volume of the medial prefrontal cortex was found to be smaller in the high dose group than in the control group. There were fewer neurons and glial cells in this brain area, and the length of dendrites and the number of synaptic spines per unit length were also lower in the high-dose group than in controls. Thus, Red No. 40 influenced the learning and memory test, and the high dose resulted in adverse effects on the medial prefrontal cortex. In one study of Yellow No. 5 (Rafati et al. 2017) more days were required for Yellow No. 5 treated rats (low- and high-dose groups combined) to reach the learning criterion in the radial arm maze. More errors during learning and during the retention phase were observed in the dye-treated groups. The brain assays demonstrated alterations in cell number, volume, and cell shape in the medial prefrontal cortex in dye-treated animals compared to controls.
Potential Neurobehavioral Effects of Synthetic CalEPA OEHHA Food Dyes in Children April 2021
170
A second set of two research reports from a different laboratory (Chapter 3, Section 3.3.5) used gavage administration, a dosing procedure more comparable to the “challenge” studies in children, in adult male rats and looked in some detail at effects on spontaneous activity. These investigators also conducted brain assays to investigate a mechanistic hypothesis that serotonin pathways were involved in activity changes seen after Red No. 3 administration. The first study (Dalal and Poddar 2009) reported that, after a single administration of Red No. 3, a dose-dependent pattern of diminished activity was observed in the rats that reached a low at 2 hours and returned to baseline by 7 hours (see Chapter 3, Figure 3.3). The study also demonstrated that levels of serotonin were lowered in a dose dependent manner in the brainstem, hypothalamus, and hippocampus. Binding of serotonin to membranes, studied with 3H-serotonin, followed a similar pattern of reduction in these brain areas at doses at 10mg/kg or above. Further data from this study showed that Red No. 3 inhibited the effect of the MAO inhibiting drug pargyline on serotonin levels in brainstem and hypothalamus at doses of 10 mg/kg or more, and a combination of two MAOIs almost completely reversed the activity-lowering effect of Red No. 3. This paper parallels the “challenge” studies in children where a single dose of dye or mixture is administered and behavior is measured shortly afterward. In both rats and children, the effect of dye peaks and then dissipates over a few hours after the exposure.
The second study (Dalal and Poddar 2010) is relevant to the situation where a child is exposed to food dye routinely, and activity is evaluated in a time dependent manner after one daily exposure. In that study, after a 15 or 30 day period of daily dosing, in sharp contrast to the decreased activity seen in the first report with a single administration, activity was increased (see chapter 3, Figure 3.4). This was true after either 15 or 30 days of pretreatment and the effect peaked at 2 h after the dye administration. Similarly, in contrast to the first report, serotonin increased, rather than decreased, in the brain areas studied (brainstem, hypothalamus, hippocampus, striatum). In this second report, in addition to looking at brain serotonin synthesis, plasma corticosterone was elevated 2 hours postdosing after both 10 and 100 mg/kg Red No. 3. Pargyline alone also produced elevated corticosterone and the effects were additive when Red No. 3 and pargyline was administered together. The authors attribute the differing effects of Red No. 3 with and without prior daily exposure to elevated corticosterone status with repeated exposures; elevated corticosterone centrally was associated with increased brain serotonin synthesis and synaptic levels. An explanation for these contrasting results is the role of two neuronal corticotrophin releasing factor (CRF) receptors that determine an active versus passive response to stress (Waselus et al. 2009). The authors suggest that repeated Red No. 3 dosing desensitizes the serotonin system and dysregulates its interaction with CRF receptors. This could result in recruitment of the active, versus the passive, response to the stress of being removed from the home cage and transferred to the test apparatus.

Potential Neurobehavioral Effects of Synthetic CalEPA OEHHA Food Dyes in Children April 2021
171
A study of Yellow No. 5 (Gao et al. 2011) conducted with relatively high doses that utilized a 30 day treatment regimen in mice and rats (Chapter 3, Section 3.3.6) found greater activity (both horizontal movement and vertical activity) in treated rats at the end of the treatment period compared to controls. This study also reported that Yellow No. 5 interfered with the learning of mice in both the Morris Water Maze and the Step Through Avoidance task.
Most notably, most studies of adult neurotoxicity conducted from 2001 to 2018 reported NOAELs much lower than those used as the basis of the FDA ADIs, which have been unchanged since they were developed in the 1960s through 1980s.
5.3.5 In vitro and in vivo mechanistic studies Mechanistic studies are reviewed in Chapter 4.
Some studies of Red No. 3 have reported changes in neurotransmitter uptake by brain tissues, inhibition of enzymes (acetylcholinesterase, Na+/K+ ATPase), and photooxidation of enzymes. Together this in vitro work suggests that Red No. 3 can have many biological targets relevant to brain function and is consistent with contemporary work on Red No. 3 protein binding. As well, Red No. 3 has been shown to affect thyroid hormones in both rodents and humans. The absorption of Red No. 3 appears to be low based on very limited pharmacokinetic data. However, there is some absorption and metabolism. Deiodinated metabolites have been measured in bile. The time of peak Red No. 3 circulating levels corresponds to the time of peak Red No. 3 effects on behavior (activity) and impacts on neurotransmitters measured in in vivo studies.
Studies of oxidative stress following Yellow No. 5 administration have attributed the brain effects to generation of reactive oxygen species (ROS) by Yellow No. 5 aromatic amine metabolites. Oxidative stress has been reported in other tissues by a number of investigators following Yellow No. 5 administration. As is the case for other dyes, Yellow No. 5 has been found to bind with enzymes and affect their activity.
Red No. 40 also binds proteins, like the other food dyes. Investigators have shown that metabolites of Red No. 40 are effective inhibitors of carbonic anhydrase, which is also inhibited by Red No. 40 at higher concentrations. Carbonic anhydrase was chosen for study because Red No. 40 and its metabolites appeared to have structural similarities to drugs that inhibit the enzyme. Red No. 40 was found to be the most potent of the azo dyes in the only in vitro study specifically conducted for risk assessment of developmental neurotoxicity, reducing cell viability at micromolar concentrations in neuronal progenitor cells. However, it is unclear that neuroprogenitor cells would have azoreductases, and thus it is hard to extrapolate these results to in vivo exposures where the azo dyes would be largely cleaved in the gut and the metabolites absorbed.

Potential Neurobehavioral Effects of Synthetic CalEPA OEHHA Food Dyes in Children April 2021
172
Yellow No. 6 has been shown to inhibit human cholinesterase and pseudocholinesterase in vitro and rat cholinesterase in vivo, with a potency lower than some organophosphate pesticides. Studies with sulfanilic acid, a metabolite of Yellow No. 6, suggests it is the active agent for Yellow No. 6 effects on cholinergic systems, as well as for effects on behavior. These studies identify this neurotransmitter system as a potential mechanistic pathway for Yellow No. 6 neurotoxicity. As with the other food dyes, Yellow No. 6 binds protein well.
Another possible mechanism of action involves endocrine disruption. An in vitro study (Axon et al. 2012), potentially relevant to an endrocrine disruption mechanism of development neurotoxicity (Rock and Patisaul 2018) identified Yellow No. 5 and Yellow No. 6 as “xenoestrogens”.
Blue No. 1 and Green No. 3 are trimethylamine dyes, very similar in structure, that are widely used in protein assays and diagnostic tissue staining. They are stable in biological systems and bind indiscriminately to proteins, providing color-based protein recognition. Both Blue No. 1 and Green No. 3 inhibit purinergic receptors. Blue No. 1 inhibited neurite outgrowth in cultured neuroblastoma cells.
Blue No. 2 is used for color-based visualization in clinical diagnostics, for example colonoscopy and brain tumor surgery. This extensive clinical use has generated a literature on cardiac “side effects” of the dye, including hypotension, hypertension and bradycardia and arrhythmia. Various hypotheses behind the cardiovascular side effects of the dye include serotonin-based mechanisms or histamine release into the peripheral circulation.
5.3.6 Effect of method of administration Our review revealed many NOAELs in more recent studies (Chapter 3, Table 3.1b) that are much lower than those used by the FDA to derive Acceptable Daily Intakes (ADIs) for regulatory purposes. The exceptions are the NOAELs from some of the Tanaka studies (Tanaka 1994, 1996, 2006) and the Sobotka study (Sobotka et al. 1977), which were closer or higher than the FDA ADI NOAELs. One difference between earlier studies, including those used as the basis of the ADI and the published DNT studies from the Tanaka lab, and later published studies was the method for oral administration. In the early studies used by FDA and in the Tanaka and Sobotka studies, all of which had relatively higher NOAELs, the investigators mixed dyes into the diet, whereas in the later published studies with lower NOAELs dyes were administered daily by gavage. With gavage administration, the entire daily dose is administered at one time and higher peak internal doses are achieved. A complicating factor in interpreting the differing results reported in dietary versus gavage studies is the difference in toxicity observed when dye was given in the typical rodent chow versus in a purified diet. A series of experiments done by a nutrition laboratory (Ershoff 1977) compared general toxicity of dyes administered in diets containing fiber to that administered in purified diets that do not contain fiber. Dyes were administered to immature male rats through either a

Potential Neurobehavioral Effects of Synthetic CalEPA OEHHA Food Dyes in Children April 2021
173
standard, grain-based rodent diet or a purified diet containing 66% sucrose, 24% casein, 5% salts, 5% cottonseed oil, and vitamins. There was a significant difference from controls in weight gain when dyes (Yellow No. 5, Yellow No. 6, Blue No. 1 and Red No. 40) were administered in the purified diets, but not in grain-based diets. Mortality was greatly increased in the dye treated animals on the purified diet compared to the control animals on the purified diet. These effects were seen at dye concentrations at or above 5% diet, and weight gain and mortality were the only endpoints studied.
This difference in toxicity was ameliorated when dietary fiber from natural sources was added to the purified diets. Further experiments (Ershoff 1977) showed that adding natural fiber (blond psyllium seed powder, carrot root powder, alfalfa leaf powder or wheat bran) to the purified diet containing Yellow No. 5 or Yellow No. 6 alleviated the dye toxicity, supporting the hypothesis that fiber in standard rodent diets played a role in mitigating dye toxicity. Notably, antagonism of toxicity did not occur in the Ershoff studies when pure cellulose, rather than a natural fiber like wheat bran that contains protein, was added to the purified diet containing Yellow No. 5. Another laboratory (Tsujita et al. 1979) also demonstrated that growth restriction and greater mortality in juvenile male rats fed Yellow No. 5, Yellow No. 6, Blue No. 1, or Red No. 3 at 5% in a purified diet was mitigated by addition of natural plant fiber to the diet. These data suggest that binding of dyes to the protein component of the natural fibers in grain-based diets may reduce their effects on growth restriction compared to gavage administration. Greater toxicity noted in the gavage studies might be partly due to higher availability of dissolved dye. It is not known whether neurobehavioral effects of dye are also dependent on fiber content associated with oral administration. A recent Yellow No. 5 study where the dye was given in solution by gavage to male weanling rats at a dose of 7.5 mg/kg/day presented a similar pattern of growth restriction (Bhatt et al. 2018). In addition, examination of brains at the end of 40-day treatment showed less protein, more oxidative damage and suppression of the antioxidant defense system in the dye-treated group.
Given that one of the main exposures of children to food dyes is through juice drinks or soft drinks, the significance of this difference in toxicity, possibly due to increased availability of dye in liquid form without natural fiber, is important to consider in the assessment of potential risks from food dyes.
5.3.7 Overall conclusion from animal studies When viewed across the in vivo animal toxicology database as a whole, effects of synthetic food dyes on activity, and learning and memory have been reported in young and adult animals with varied exposure regimens. In addition, effects on neurotransmitter pathways and on brain histomorphology and stereology have been reported following dye administration to adult animals. The use of varying study design makes cross-study comparisons difficult. The differences in doses used, method of administration, age of animals at dosing and age when effects were measured, and the

Potential Neurobehavioral Effects of Synthetic CalEPA OEHHA Food Dyes in Children April 2021
174
varied endpoints measured preclude an evaluation for consistency of effects across studies from different laboratories. Nonetheless, many animal studies conducted in a number of laboratories have found evidence of changes in behavior. Additionally, changes in brain chemistry and histomorphology have been reported following exposure to a number of food dyes. Thus, the animal studies provide evidence supporting findings that the synthetic food dyes can contribute to adverse behavioral effects in children. More evidence is available for Red No. 3, Red No. 40 and Yellow No. 5 as individual dyes because these dyes have been studied the most. Effects were also seen following administration of dye mixtures. These dye-mixture studies parallel more common children’s exposures and the challenge studies reviewed in Chapter 2. In the mixture studies, it is not possible to attribute the effects to a single dye.
Although it is not clear what the specific mechanism(s) for the effects on behavior from any of the dyes may be, mechanistic information is available from some studies. Food dyes bind proteins well, and there is evidence for some of the dyes that binding to a variety of proteins, such as enzymes involved in neurotransmitter pathways, inhibits their function. Some evidence is available that suggests a role for oxidative stress. Evidence from human studies supports a mechanism involving histamine release, including a study that demonstrated polymorphisms in the histamine degradation gene for histamine-N-methyltransferase influences response to a dye mixture. Yellow No. 5 is known to cause histamine release in sensitive individuals. Evidence for a serotonergic pathway for Red No. 3 is also both convincing and plausible.
Overall, the animal evidence is suggestive of effects of synthetic food dyes on behavior. Some would argue that the increased activity, restlessness, and so on are short term reversible effects and thus not a result of neurotoxicity per se. However, there are a number of adverse effects that are short term and reversible but nevertheless are important for public health. For the child who is affected and their family, their teachers, and the school system, a short term increase in inattentiveness or restlessness and anxiety that can be repeated routinely when food dye is consumed could reduce social and academic success, and is thus adverse.
5.4 In vitro high-throughput assays The approach to examining the ToxCast high throughput assays and the criteria for choosing assays are described in Chapter 4 and Appendices A through D.
We evaluated the activities of the seven dyes as well as associated azo dye metabolites in 283 unique assays. The assays evaluated both increased and decreased expression of the molecular targets. Red No. 40 was tested in the most number of assays in this set, but Red No. 3 was noted to have the most activity, while Blue No. 2 had the least activity (Figure 4.1). Both red and yellow dyes had a range of activity in the assays targeting the G-Protein Coupled Receptors (GPCRs), which include a variety of trans-membrane receptors involved in cell signaling including neurotransmission. The red and yellow dyes were all active in assays targeting dopaminergic and opioid receptor subtypes. Blue No. 1, Red No. 40, and the yellow dyes were also active for serotonergic receptors and had hits for serotonin 5HT7. It has been noted that the

Potential Neurobehavioral Effects of Synthetic CalEPA OEHHA Food Dyes in Children April 2021
175
presence of certain red and yellow dyes may lead to the increased release of neurotransmitters like dopamine and serotonin (Gao et al. 2011; Khiralla et al. 2015; Lafferman and Silbergeld 1979). Although the two yellow dyes were tested in as many assays as the red dyes, they had significantly less activity (Figure 4.1). Overall, the GPCR ion channels, glutamate and GABA, were not tested extensively in the food dye set.
Assays mapped to the nuclear receptors for androgen, estrogen, and thyroid hormone were tested across all the food dyes. All the food dyes were active for the androgen assays they were tested in. The dyes, except for Blue No. 2 and the yellow dyes, were active for the receptor-based antagonist assays for the estrogen receptor, potentially indicative of antagonism for this receptor. ToxCast data indicates an interaction with the estrogen receptor, although it is in the opposite direction (antagonistic), in contrast to the estrogenic activity observed in the literature for Red No. 3 (Dees et al. 1997). ToxCast data did not corroborate the estrogenic interactions in the literature for Yellow No. 5 and No. 6 (Chapter 3, Section 2.5). Except for the yellow dyes, all other dyes were active for antagonistic effects with the thyroid hormone receptor based on activity for assay TOX21_TR_LUC_GH3_Antagonist. Some have data flags and therefore the results should be viewed as less reliable. There is a likelihood that the AC50s observed for the Red No. 3 and Red No. 40 activities are influenced by cytotoxicity. However, the extent of cytotoxicity influence is unclear and therefore there may still be some concordance with effects on thyroid hormone homeostasis reported in the literature. In particular, Red No. 3 was active for assays targeting the thyroid hormone supporting literature findings for the inhibitory effects of Red No. 3 on the conversion of T4 to T3 in rats and increased release of TRH from the pituitary (Chapter 3). Red No. 3, along with Red No. 40, Blue No. 1, and Green No. 3, were also all active (albeit with AC50s above that of the associated viability assay) for an assay mapped to TPO that measures TPO activity as a loss of signal and is linked to the AOP key event TPO inhibition, leading to the decrease in thyroid hormone (TH) synthesis and subsequently a decrease in circulating concentrations of THs in serum and tissue. These results combined with literature reporting that interactions with the thyroid hormone and the reduction of thyroxine (T4) in serum and tissue may be linked to developmental neurotoxicity (O'Shaughnessy and Gilbert 2020) is suggestive of a mode of action of the food dyes related to the nervous system. These same four dyes were all active (and the only dyes tested) for an assay targeting the glucocorticoid (GC) receptor NR3C1. GC and their receptors exert widespread actions in the central nervous system, ranging from the regulation of gene transcription, cellular signaling, and modulation of synaptic structure. Elevated GC levels are linked to neuronal plasticity and neurodegeneration (Vyas et al. 2016).
All the dyes were tested and active for assays mapped to the aryl hydrocarbon receptor. Yellow No. 5 was the only dye associated with downregulation of the gene, while all other dyes were associated with upregulation. The aryl hydrocarbon interaction with

Potential Neurobehavioral Effects of Synthetic CalEPA OEHHA Food Dyes in Children April 2021
176
Blue No. 2 is noted in the literature (Chapter 3, Section 2.5, 4). Red No. 3 was the only dye tested for monoamine oxidase, and was active in that assay (Chapter 4, Table 4.1), a finding supportive of the observed effect in vivo (Chapter 3, Section 3.3.5). The food dyes were not tested in assays mapped to the targets AChE and adenylyl cyclase.
The lack of biological coverage may account for some gaps between the in vitro data and literature findings, and complicates comparisons to effects reported in the literature.
The lack of metabolic activation and limitations of assay design may have also contributed to a higher number of inactives than expected. Proposed mechanisms linking food dye exposure to neurological effects include induction of oxidative stress and inflammation, which are thought to be primarily mediated through the active metabolites of the azo dyes. Typically, the azo dyes are substantially cleaved in the gut and the metabolites are absorbed. Thus, in vivo, the dyes themselves would be less likely to reach the targets measured in the ToxCast assays. This may explain the lack of activity noted with the yellow dyes across many of the molecular targets; a lack of observed activity in vitro does not necessarily indicate the absence of activity in vivo. Although Red No. 3 had activity in assays associated with oxidative stress, which supported some literature findings (Floyd 1980) and indicated an area that may need to be explored further, none of the known metabolites were tested in ToxCast (four were identified in the Chemistry Dashboard).
Based on the subset of assays we evaluated here, the ToxCast assay results provide limited support for in vivo neurotoxicity observations for the food dyes. It should be noted that the assays explored here are intended to provide initial information about the capacity to associate in vitro work with the ability for a food dye to promote a biological response. However, these assays are limited for predicting long term or indirect adverse effects in complex biological systems, in part, due to the complexity of the in vivo pathway interactions leading to neurotoxicity (including neurobehavioral effects) and DNT compared to the current limited spectrum and range of the ToxCast assays.
5.5 Conclusion Clinical trial studies demonstrate changes in behavior associated with exposure to synthetic food dyes in children. Animal studies provide data indicating effects of exposure to synthetic food dyes on activity, memory and learning, changes in neurotransmitter systems in brain, and changes in brain histomorphology and stereology. Mechanistic studies provide evidence for potential roles of oxidative stress, and interaction with many neuronal targets such as neurotransmitter systems including receptors and key enzymes, and systems that exert influence on the brain including glucocorticoid pathways, thyroid and estrogen receptors. Data from multiple evidence streams, including epidemiology, animal neurotoxicology, in vitro and high throughput assays providing mechanistic insight, taken together, provide support that FD&C batch-certified synthetic food dyes can impact neurobehavior in some children. In terms of
Potential Neurobehavioral Effects of Synthetic CalEPA OEHHA Food Dyes in Children April 2021
177
which individual food dyes are responsible for adverse impacts on neurobehavior in children, most studies involved administering multiple dyes at the same time so no single offending agent could be identified. Yellow No. 5 was shown to affect children in several studies in which it was administered as the single dye. More evidence is currently available in animal studies for Red No. 3, Red No. 40, and Yellow No. 5 relative to the other FD&C batch-certified dyes we reviewed. These dyes have been the subject of more studies.
The studies that form the basis of the FDA ADIs are many decades old and as such were not capable of detecting the types of neurobehavioral outcomes measured in later studies, or for which there is concern in children consuming synthetic food dyes.
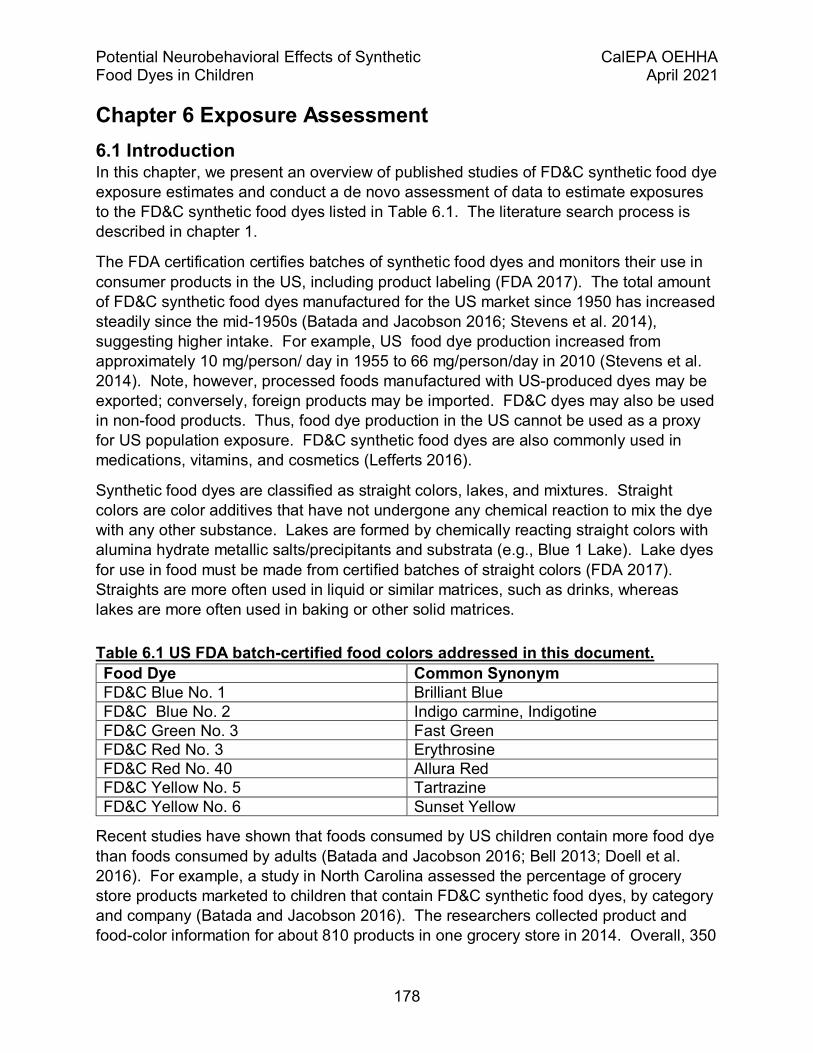
Potential Neurobehavioral Effects of Synthetic CalEPA OEHHA Food Dyes in Children April 2021
178
Chapter 6 Exposure Assessment 6.1 Introduction In this chapter, we present an overview of published studies of FD&C synthetic food dye exposure estimates and conduct a de novo assessment of data to estimate exposures to the FD&C synthetic food dyes listed in Table 6.1. The literature search process is described in chapter 1.
The FDA certification certifies batches of synthetic food dyes and monitors their use in consumer products in the US, including product labeling (FDA 2017). The total amount of FD&C synthetic food dyes manufactured for the US market since 1950 has increased steadily since the mid-1950s (Batada and Jacobson 2016; Stevens et al. 2014), suggesting higher intake. For example, US food dye production increased from approximately 10 mg/person/ day in 1955 to 66 mg/person/day in 2010 (Stevens et al. 2014). Note, however, processed foods manufactured with US-produced dyes may be exported; conversely, foreign products may be imported. FD&C dyes may also be used in non-food products. Thus, food dye production in the US cannot be used as a proxy for US population exposure. FD&C synthetic food dyes are also commonly used in medications, vitamins, and cosmetics (Lefferts 2016).
Synthetic food dyes are classified as straight colors, lakes, and mixtures. Straight colors are color additives that have not undergone any chemical reaction to mix the dye with any other substance. Lakes are formed by chemically reacting straight colors with alumina hydrate metallic salts/precipitants and substrata (e.g., Blue 1 Lake). Lake dyes for use in food must be made from certified batches of straight colors (FDA 2017). Straights are more often used in liquid or similar matrices, such as drinks, whereas lakes are more often used in baking or other solid matrices.
Table 6.1 US FDA batch-certified food colors addressed in this document. Food Dye Common Synonym FD&C Blue No. 1 Brilliant Blue FD&C Blue No. 2 Indigo carmine, Indigotine FD&C Green No. 3 Fast Green FD&C Red No. 3 Erythrosine FD&C Red No. 40 Allura Red FD&C Yellow No. 5 Tartrazine FD&C Yellow No. 6 Sunset Yellow
Recent studies have shown that foods consumed by US children contain more food dye than foods consumed by adults (Batada and Jacobson 2016; Bell 2013; Doell et al. 2016). For example, a study in North Carolina assessed the percentage of grocery store products marketed to children that contain FD&C synthetic food dyes, by category and company (Batada and Jacobson 2016). The researchers collected product and food-color information for about 810 products in one grocery store in 2014. Overall, 350
Potential Neurobehavioral Effects of Synthetic CalEPA OEHHA Food Dyes in Children April 2021
179
products (43.2%) contained FD&C synthetic food dyes. The most common dyes were FD&C Red No. 40 (29.8% of products), FD&C Blue No. 1 (24.2%), FD&C Yellow No. 5 (20.5%), and FD&C Yellow No. 6 (19.5%). Produce was the only category that did not have any FD&C synthetic food dyes. Candies (96.3%), fruit-flavored snacks (94%), and drink mixes/powders (89.7%) were the food categories with the highest percentage of products containing FD&C synthetic food dyes (Batada and Jacobson 2016).
Because fetuses and children are more vulnerable to chemical exposures than adults (Landrigan and Goldman 2011) this exposure assessment focuses on FD&C synthetic food dye exposure among pregnant women, women of childbearing age (18-49 years) and children (0-18 years) (Miller et al. 2014).
6.1.1 Relevant research In the past ten years, there have been six food dye exposure studies performed in the US and Canada focused on the consumption of some or all seven FDA batch-certified FD&C synthetic food dyes (Bastaki et al. 2017; Bell 2013; Doell et al. 2016; Polic 2018; Stevens et al. 2014; Stevens et al. 2015b).These studies are summarized in Table 6.2. They include a laboratory methods development effort to support food dye exposure assessments from beverages (Stevens et al. 2014) and confectionaries (Stevens et al. 2015b), a master’s thesis examining the relative frequency of FD&C synthetic food dye exposure between children and adults (Bell 2013), an FDA commissioned total consumption exposure assessment (Doell et al. 2016), a total consumption exposure assessment study supported by the International Association of Color Manufacturers (Bastaki et al. 2017), and a Master’s thesis that explores the impact of azo dyes on human gut metabolite production with an exposure assessment focusing on children 0-6 years old living in Canada (Polic 2018).

Potential Neurobehavioral Effects of Synthetic CalEPA OEHHA Food Dyes in Children April 2021
180
Table 6.2 Review of FD&C synthetic food dye exposure assessment studies performed in the US and Canada. Study Demographics Purpose Methods Results/Conclusions Notes Bell (2013) (Bell 2013)
21 US adults (18-60 years) and their 14 children (4-7 years)
Examine whether children have more frequent daily exposures to synthetic food dyes than adults.
- Participants kept detailed food records for five days. - Diets were analyzed for foods containing the 7 FD&C synthetic food dyes by comparing ingredient labels found in grocery stores and online.
- Daily food dye exposures was greater for children compared with adults. - Fruit and vegetable consumption was inversely correlated to the number of dye exposures per day in children.
Master’s thesis. Did not distinguish between straight-color dyes versus lake color additives.
Stevens et al. (2014) (Stevens et al. 2014)
US Population: Children 2-5 years Children 6-12 years And Adolescents 13-17 years
Developed laboratory methods to quantify the 7 FD&C food dyes in commonly consumed beverages.
- Analyzed 108 beverage samples containing lakes and standard dyes. - Measured 29 carbonated, 47 fruit-flavored, 16 sports drinks, 16 energy drinks.
- Reported that FD&C food dye concentrations ranged from 0.2 mg - 52.3 mg/240mL. - Red No. 40 was used most commonly. - children could consume anywhere from one milligram to over 90 milligrams of synthetic food dyes from beverages alone.
* Because Yellow No. 5 and Yellow No. 6 have overlapping wavelengths, the dye with the higher concentration was selected to calculate the total synthetic food dyes in solution.
Stevens, et al. (2015a) (Stevens et al. 2015a)
US Population
Report on the amount of synthetic food dyes present in commonly consumed food and sweets.
- Foods and candies with synthetic food dyes on the label were purchased from stores. Powdered colors were obtained from Sensient Colors LLC and were used as standards. The serving size was determined from the Nutrition Facts label. - Analyzed three samples of each food and results were averaged. - Some samples included natural dyes with similar wavelengths to synthetic food dyes; the concentration of synthetic dyes was likely overestimated.
- The most commonly used FD&C synthetic food dye was Red No. 40 followed by Yellow No. 5, and Yellow No. 6. - Many foods that contain synthetic food dyes also have a lot of added sugars. .
When two wavelengths overlapped only one dye (the one with the greater concentration) was chosen to calculate the total dyes.
Stevens, et al. (2015b) (Stevens et al. 2015b)
Response to criticisms of lab methods on Stevens 2014.
- In this update, researchers separated FD&C Yellow No. 5, FD&C Yellow No. 6, and FD&C Red No. 40 using isocratic chromatography. - Purity standards were applied as follows: FD&C Yellow No. 5, 85%; FD&C Yellow No. 6, 90%; FD&C Red No. 40, 80%; FD&C Blue No. 1, 88%.
- Generally, the values decreased by 10% to 36%, mostly due to a lack of correction for standard purity for the previous results. -"it would be easy for a child to consume a large amount of dyes from beverages alone. without
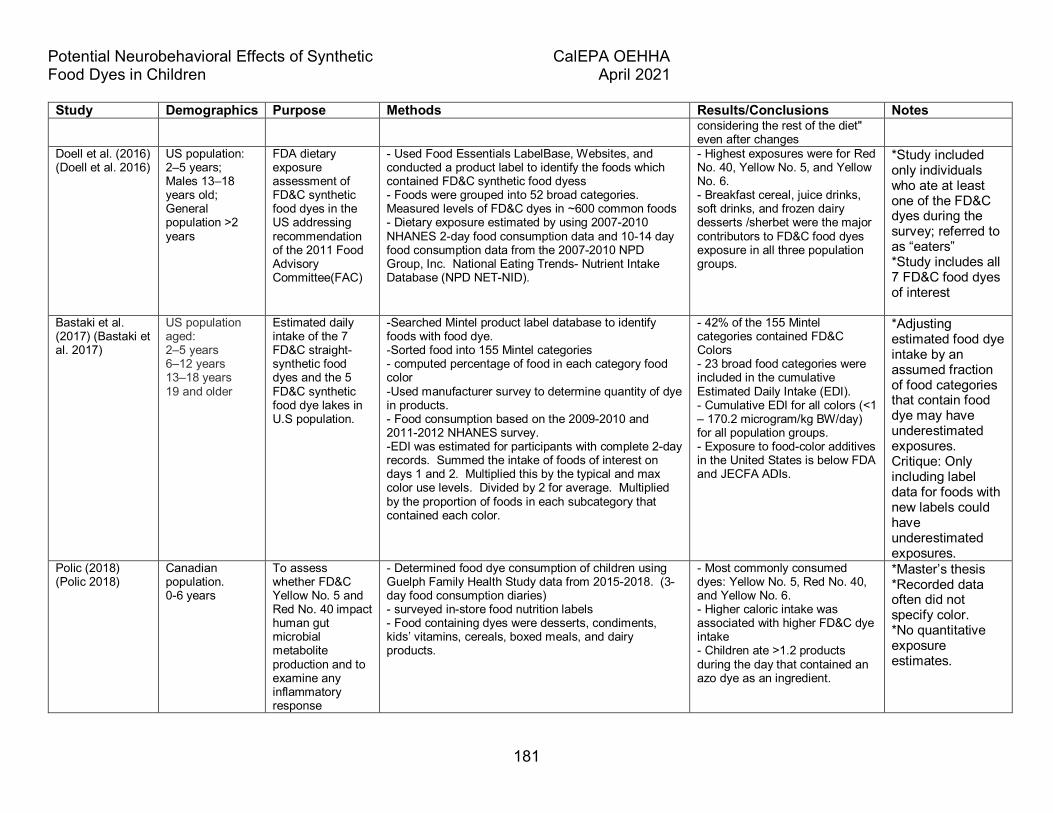
Potential Neurobehavioral Effects of Synthetic CalEPA OEHHA Food Dyes in Children April 2021
181
Study Demographics Purpose Methods Results/Conclusions Notes considering the rest of the diet" even after changes
Doell et al. (2016) (Doell et al. 2016)
US population: 2–5 years; Males 13–18 years old; General population >2 years
FDA dietary exposure assessment of FD&C synthetic food dyes in the US addressing recommendation of the 2011 Food Advisory Committee(FAC)
- Used Food Essentials LabelBase, Websites, and conducted a product label to identify the foods which contained FD&C synthetic food dyess - Foods were grouped into 52 broad categories. Measured levels of FD&C dyes in ~600 common foods - Dietary exposure estimated by using 2007-2010 NHANES 2-day food consumption data and 10-14 day food consumption data from the 2007-2010 NPD Group, Inc. National Eating Trends- Nutrient Intake Database (NPD NET-NID).
- Highest exposures were for Red No. 40, Yellow No. 5, and Yellow No. 6. - Breakfast cereal, juice drinks, soft drinks, and frozen dairy desserts /sherbet were the major contributors to FD&C food dyes exposure in all three population groups.
*Study included only individuals who ate at least one of the FD&C dyes during the survey; referred to as “eaters” *Study includes all 7 FD&C food dyes of interest
Bastaki et al. (2017) (Bastaki et al. 2017)
US population aged: 2–5 years 6–12 years 13–18 years 19 and older
Estimated daily intake of the 7 FD&C straight-synthetic food dyes and the 5 FD&C synthetic food dye lakes in U.S population.
-Searched Mintel product label database to identify foods with food dye. -Sorted food into 155 Mintel categories - computed percentage of food in each category food color -Used manufacturer survey to determine quantity of dye in products. - Food consumption based on the 2009-2010 and 2011-2012 NHANES survey. -EDI was estimated for participants with complete 2-day records. Summed the intake of foods of interest on days 1 and 2. Multiplied this by the typical and max color use levels. Divided by 2 for average. Multiplied by the proportion of foods in each subcategory that contained each color.
- 42% of the 155 Mintel categories contained FD&C Colors - 23 broad food categories were included in the cumulative Estimated Daily Intake (EDI). - Cumulative EDI for all colors (<1 – 170.2 microgram/kg BW/day) for all population groups. - Exposure to food-color additives in the United States is below FDA and JECFA ADIs.
*Adjusting estimated food dye intake by an assumed fraction of food categories that contain food dye may have underestimated exposures. Critique: Only including label data for foods with new labels could have underestimated exposures.
Polic (2018) (Polic 2018)
Canadian population. 0-6 years
To assess whether FD&C Yellow No. 5 and Red No. 40 impact human gut microbial metabolite production and to examine any inflammatory response
- Determined food dye consumption of children using Guelph Family Health Study data from 2015-2018. (3-day food consumption diaries) - surveyed in-store food nutrition labels - Food containing dyes were desserts, condiments, kids’ vitamins, cereals, boxed meals, and dairy products.
- Most commonly consumed dyes: Yellow No. 5, Red No. 40, and Yellow No. 6. - Higher caloric intake was associated with higher FD&C dye intake - Children ate >1.2 products during the day that contained an azo dye as an ingredient.
*Master’s thesis *Recorded data often did not specify color. *No quantitative exposure estimates.

Potential Neurobehavioral Effects of Synthetic CalEPA OEHHA Food Dyes in Children April 2021
182
6.1.2 Overview of food dye exposure assessments in the US and Canada For her masters’ thesis, Bell analyzed family food diaries cross-checked with product labels and concluded that children’s exposure to FD&C synthetic food dyes is likely greater than that of adults and inversely related to consumption of fruits and vegetables (Bell 2013). Similarly, Polic evaluated food consumption information from Canada and concluded that children had higher food dye consumption rates compared with adults (Polic 2018). Neither Bell (2013) nor Polic (2018) estimated synthetic food dye exposure on a mg/kg basis (Bell 2013; Polic 2018).
Stevens et al (2014) developed laboratory methods to measure synthetic food dyes in commonly consumed beverages (Stevens et al. 2014). The authors tested ~108 beverage samples and reported FD&C synthetic food dye amounts. In response to concerns about laboratory methods, Stevens et al. (2015b) updated the analysis and reported revised synthetic food dye measurements per 240 mL (≈ 8 Fluid ounces) for several beverages (Stevens et al. 2015a). Total synthetic food dye amounts in the 29 carbonated beverages analyzed ranged from 0.6 mg to 30.0 mg, amounts from the 47 tested fruit drinks ranged from 0.2 mg to 50.0 mg, and amounts from the 16 sports drinks ranged from 0.9 to 18.0 mg. Of the 16 tested energy drinks, the total synthetic food dye amounts ranged from 0.6 to 15.0 mg.
Stevens et al. (2015a) (Stevens et al. 2015a) extended this analysis to breakfast products, frozen foods, dairy products, baked goods, candies, and miscellaneous other foods. The authors reported the total amounts of synthetic food dyes ranging from 9.4 to 41.3 mg per serving of cereal, 0.3 to13.4 mg per popsicle, 1.6 to 22.4 mg per small slushy, 1.9 mg to 6.0 mg per serving of sherbet, 1.4 mg to 5.2 mg per serving of yogurt/pudding, 2.2 to 55.3 mg per serving of cake without icing and cupcakes, 1.2 to 34.7 mg per 2 tablespoons of icing, and 0.2 to 33.3 mg per serving of candies. The authors concluded that the most common food dyes in the foods tested were FD&C Red No. 40 followed by FD&C Yellow No. 5, and FD&C Yellow No. 6 (Stevens et al. 2015a).
In 2011, US FDA’s Food Advisory Committee recommended additional research to thoroughly examine FD&C batch-certified food dye consumption in the US (FDA 2011). In response, US FDA conducted the most comprehensive US synthetic food dyes exposure study to date that combined measurements of the seven FD&C food colors in approximately 600 private label and brand name foods with 2 day food-recall consumption data reported for the 2012 NHANES survey and 10-14 day consumption data provided for 2007-2010 by NPD Group, Inc. (National Eating Trends- Nutrient Intake Database (NPD NET-NID)) (Doell et al. 2016). Doell et al. estimated dietary exposures to the seven food dyes approved for general use in food in the United States for the US population (aged 2 years and older), children (aged 2–5 years) and teenage boys (aged 13–18 years) based on analytical levels of the FD&C color additives in foods (Doell et al. 2016).

Potential Neurobehavioral Effects of Synthetic CalEPA OEHHA Food Dyes in Children April 2021
183
As described in Doell et al., “The exposure estimate based on 2-day food consumption data was performed as follows. Foods that contained at least one of the FD&C color additives were identified and grouped into one of 52 broad food categories (e.g., Breakfast Cereal, Hard Candy, Juice Drinks, Soft Drinks, Sports Drinks). Next, the foods identified as containing at least one FD&C synthetic food dye were matched with food codes from the combined 2007–10 NHANES survey. Over 300 NHANES food codes were assigned to the identified foods”. Doell et al. then estimated exposures for “(1) a low-exposure scenario, where the lowest analytical value for a given FD&C synthetic food dye was assigned to each food code; (2) typical-exposure scenario, where the average of the analytical results were assigned to a given food code; and (3) a high-exposure scenario, where the highest analytical value for a given FD&C color additive was assigned to each food code.” The range of exposures reported by Doell et al., including the percentiles of the distribution, result from variability in foods consumed by individual participants in the NHANES surveys.
Limitations of this approach include assumptions about synthetic food dye levels in some foods based on measurements in related, but not identical, products. Additionally, the high exposure scenario would tend to overestimate exposure because an individual would be unlikely to consistently eat foods with the highest levels on a daily basis. For all populations and exposure scenarios, the highest cumulative exposures were estimated for Red No. 40, Yellow No. 5, and Yellow No. 6. Doell et al. (Doell et al. 2016) concluded that breakfast cereal, juice drinks, soft drinks, and frozen dairy desserts/sherbet were the major contributors to FD&C color additive exposure in the population groups studied: (1) the US population ≥2 years, (2) children 2-5 years, and (3) teenage boys 13-18 years. Table 6.3 presents estimated daily intakes for these groups (Doell et al. 2016).

Potential Neurobehavioral Effects of Synthetic CalEPA OEHHA Food Dyes in Children April 2021
184
Table 6.3 Estimated food dye intake in mg/kg bw/day (Doell et al. 2016). FD&C Blue No. 1 Low-exposure
scenario Average-exposure
scenario High-exposure
scenario NHANES 2-day data Population group Mean p90 Mean p90 Mean p90 Total population (≥2 years old) 0.01 0.03 0.02 0.05 0.04 0.09 Children (2-5 years old) 0.04 0.07 0.07 0.1 0.1 0.2 Males (13-18 years old) 0.02 0.03 0.02 0.05 0.04 0.1 NPD NET-NID 10-14 day data Population Group Total population (≥2 years old) 0.01 0.02 0.02 0.04 0.04 0.06 Children (2-5 years old) 0.02 0.04 0.04 0.07 0.1 0.1 Males (13-18 years old) 0.01 0.03 0.02 0.04 0.04 0.06 FD&C Blue No. 2 Low-exposure
scenario Average-exposure
scenario High-exposure
scenario NHANES 2-day data Population group Mean p90 Mean p90 Mean p90 Total population (≥2 years old) 0.01 0.02 0.01 0.03 0.02 0.05 Children (2-5 years old) 0.03 0.05 0.04 0.07 0.05 0.2 Males (13-18 years old) 0.01 0.02 0.01 0.03 0.03 0.07 NPD NET-NID 10-14 day data Population Group Total population (≥2 years old) 0.01 0.02 0.01 0.02 0.02 0.04 Children (2-5 years old) 0.02 0.05 0.03 0.06 0.05 0.1 Males (13-18 years old) 0.01 0.01 0.01 0.02 0.02 0.06 FD&C Green No. 3 Low-exposure
scenario Average-exposure
scenario High-exposure
scenario NHANES 2-day data Population group Mean p90 Mean p90 Mean p90 Total population (≥2 years old) 0.02 0.04 0.02 0.04 0.02 0.04 Children (2-5 years old) 0.04 0.09 0.04 0.09 0.04 0.09 Males (13-18 years old) 0.03 0.06 0.03 0.06 0.03 0.06 NPD NET-NID 10-14 day data Population Group Total population (≥2 years old) 0.01 0.02 0.01 0.02 0.01 0.02 Children (2-5 years old) 0.02 0.03 0.02 0.03 0.02 0.03 Males (13-18 years old) 0.01 0.02 0.01 0.02 0.01 0.02 FD&C Red No. 3 Low-exposure
scenario Average-exposure
scenario High-exposure
scenario NHANES 2-day data Population group Mean p90 Mean p90 Mean p90 Total population (≥2 years old) 0.02 0.05 0.04 0.06 0.07a 0.06 Children (2-5 years old) 0.04 0.07 0.1 0.1 0.2a 0.1 Males (13-18 years old) 0.01 0.04 0.03 0.04 0.04 0.05 NPD NET-NID 10-14 day data Population Group Total population (≥2 years old) 0.01 0.03 0.03 0.05 0.07a 0.05 Children (2-5 years old) 0.02 0.04 0.09 0.09 0.2a 0.1 Males (13-18 years old) 0.01 0.04 0.02 0.04 0.04 0.05

Potential Neurobehavioral Effects of Synthetic CalEPA OEHHA Food Dyes in Children April 2021
185
FD&C Red No. 40 Low-exposure scenario
Average-exposure scenario
High-exposure scenario
NHANES 2-day data Population group Mean p90 Mean p90 Mean p90 Total population (≥2 years old) 0.07 0.2 0.2 0.4 0.4 0.9 Children (2-5 years old) 0.2 0.4 0.4 1 0.9 2.2 Males (13-18 years old) 0.09 0.2 0.2 0.5 0.5 1.1 NPD NET-NID 10-14 day data Population Group Total population (≥2 years old) 0.05 0.1 0.1 0.2 0.3 0.7 Children (2-5 years old) 0.1 0.2 0.2 0.5 0.6 1.3 Males (13-18 years old) 0.06 0.1 0.1 0.3 0.4 0.8 FD&C Yellow No. 5 Low-exposure
scenario Average-exposure
scenario High-exposure
scenario NHANES 2-day data Population group Mean p90 Mean p90 Mean p90 Total population (≥2 years old) 0.05 0.1 0.08 0.2 0.1 0.3 Children (2-5 years old) 0.1 0.3 0.2 0.5 0.3 0.7 Males (13-18 years old) 0.05 0.1 0.09 0.2 0.2 0.4 NPD NET-NID 10-14 day data Population Group Total population (≥2 years old) 0.03 0.07 0.06 0.1 0.1 0.2 Children (2-5 years old) 0.08 0.2 0.1 0.2 0.2 0.4 Males (13-18 years old) 0.04 0.07 0.07 0.1 0.1 0.2 FD&C Yellow No. 6 Low-exposure
scenario Average-exposure
scenario High-exposure
scenario NHANES 2-day data Population group Mean p90 Mean p90 Mean p90 Total population (≥2 years old) 0.07 0.2 0.1 0.3 0.1 0.4 Children (2-5 years old) 0.1 0.4 0.2 0.6 0.4 0.8 Males (13-18 years old) 0.1 0.3 0.2 0.4 0.2 0.5 NPD NET-NID 10-14 day data Population Group Total population (≥2 years old) 0.04 0.1 0.07 0.2 0.1 0.2 Children (2-5 years old) 0.1 0.2 0.2 0.3 0.3 0.4 Males (13-18 years old) 0.06 0.1 0.09 0.2 0.1 0.2
Abbrev: NET-NID National Eating Trends- Nutrient Intake Database (NPD NET-NID) aFor Red No. 3 exposure estimates (high exposure scenario), there were several high values that resulted in a skewed distribution such that the mean is higher than the 90th percentile for some populations.
To estimate US exposures to synthetic food dyes, Bastaki et al (2017) evaluated food consumption patterns reported for 2009-2010 and 2011-2012 as part of the What We Eat in America (WWEIA) dietary component of the National Health and Nutrition Examination Survey (NHANES) (Bastaki et al. 2017). The goal of this study was “to estimate the realistic exposure among the US population using actual use data on FD&C colors… that were otherwise lacking in the public literature.” Use and consumption information were based on surveys lead by the International Association of
Potential Neurobehavioral Effects of Synthetic CalEPA OEHHA Food Dyes in Children April 2021
186
Color Manufacturers (IACM) “with additional input from color manufacturers.” Bastaki et al. focused (Bastaki et al. 2017) on children age 2-5 years, children 6-12 years, adolescents 13-18 years and adults ≥19 years. Exposure scenarios were adjusted to be more “realistic” based on product label information provided by Mintel International Ltd (Chicago, IL, USA). To compute the Estimated Daily Intake (EDI), the authors summed the individuals’ intake of the food of interest on days 1 and 2 of the survey, multiplied by the typical or maximum use dye level assigned to the food and averaged over the 2 days. They reported a cumulative EDI for all colors that ranged between <1 – 170.2 µg/kg body weight (bw)/day (0.001 – 0.1702 mg/kg bw/day) for all population groups. Table 6.4 is adapted from results reported in Bastaki et al. 2017. The table presents estimated typical and maximum exposure levels for the seven synthetic food dyes.
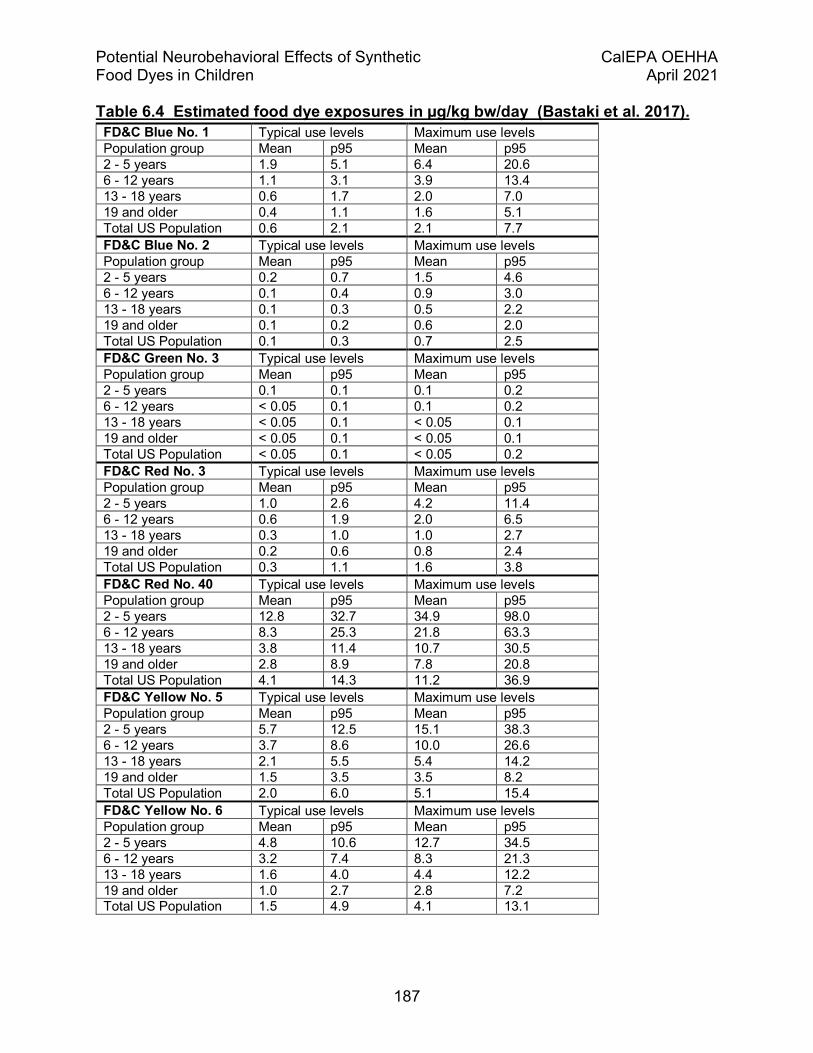
Potential Neurobehavioral Effects of Synthetic CalEPA OEHHA Food Dyes in Children April 2021
187
Table 6.4 Estimated food dye exposures in µg/kg bw/day (Bastaki et al. 2017). FD&C Blue No. 1 Typical use levels Maximum use levels Population group Mean p95 Mean p95 2 - 5 years 1.9 5.1 6.4 20.6 6 - 12 years 1.1 3.1 3.9 13.4 13 - 18 years 0.6 1.7 2.0 7.0 19 and older 0.4 1.1 1.6 5.1 Total US Population 0.6 2.1 2.1 7.7 FD&C Blue No. 2 Typical use levels Maximum use levels Population group Mean p95 Mean p95 2 - 5 years 0.2 0.7 1.5 4.6 6 - 12 years 0.1 0.4 0.9 3.0 13 - 18 years 0.1 0.3 0.5 2.2 19 and older 0.1 0.2 0.6 2.0 Total US Population 0.1 0.3 0.7 2.5 FD&C Green No. 3 Typical use levels Maximum use levels Population group Mean p95 Mean p95 2 - 5 years 0.1 0.1 0.1 0.2 6 - 12 years < 0.05 0.1 0.1 0.2 13 - 18 years < 0.05 0.1 < 0.05 0.1 19 and older < 0.05 0.1 < 0.05 0.1 Total US Population < 0.05 0.1 < 0.05 0.2 FD&C Red No. 3 Typical use levels Maximum use levels Population group Mean p95 Mean p95 2 - 5 years 1.0 2.6 4.2 11.4 6 - 12 years 0.6 1.9 2.0 6.5 13 - 18 years 0.3 1.0 1.0 2.7 19 and older 0.2 0.6 0.8 2.4 Total US Population 0.3 1.1 1.6 3.8 FD&C Red No. 40 Typical use levels Maximum use levels Population group Mean p95 Mean p95 2 - 5 years 12.8 32.7 34.9 98.0 6 - 12 years 8.3 25.3 21.8 63.3 13 - 18 years 3.8 11.4 10.7 30.5 19 and older 2.8 8.9 7.8 20.8 Total US Population 4.1 14.3 11.2 36.9 FD&C Yellow No. 5 Typical use levels Maximum use levels Population group Mean p95 Mean p95 2 - 5 years 5.7 12.5 15.1 38.3 6 - 12 years 3.7 8.6 10.0 26.6 13 - 18 years 2.1 5.5 5.4 14.2 19 and older 1.5 3.5 3.5 8.2 Total US Population 2.0 6.0 5.1 15.4 FD&C Yellow No. 6 Typical use levels Maximum use levels Population group Mean p95 Mean p95 2 - 5 years 4.8 10.6 12.7 34.5 6 - 12 years 3.2 7.4 8.3 21.3 13 - 18 years 1.6 4.0 4.4 12.2 19 and older 1.0 2.7 2.8 7.2 Total US Population 1.5 4.9 4.1 13.1
Potential Neurobehavioral Effects of Synthetic CalEPA OEHHA Food Dyes in Children April 2021
188
The exposure estimates in Bastaki et al. (2017) are lower than the estimates found in Doell et al. (2016) or in this review. There are a number of potential reasons for these differences including that Bastaki et al. used the Mintel database of finished product labels to estimate the amount of specific synthetic food dyes in foods by food categories. The Mintel dataset contained only products with newly published or changed labels between 2011 and 2015. In addition, the Mintel industry survey, which Bastaki et al. notes is based on information from members of the IACM, may have included products for sale outside the US, for example, in Europe where products may have been reformulated to exclude synthetic food dyes in response to EU labeling requirements and regional trends.
Differences in estimated synthetic food dye intake among the studies may reflect different methodologies. Doell used actual measurements of food dyes in a large number of sampled foods to calculate exposure estimates, whereas Bastaki used estimates based on labeling. Bastaki used the 2009-10 and 2011-12 NHANES food consumption survey data, whereas, we used the 2015-16 NHANES food consumption data along with Doell’s measurements of food dyes in foods. We also had food dye concentration measurements from UC Davis, which were new analyses of a number of foods that are major sources of food dye exposure and provide perspective to our and others’ estimates.
Differences between the Doell et al (2016) analysis and our report include estimates of exposure for different age groups. We estimated exposures for finer age groupings of children as well as pregnant women and women of childbearing age. We used the latest NHANES food consumption data (2015-16) where Doell et al. used the 2007-2010 NHANES food consumption survey data. Finally, Doell et al. (2016) had access to additional food consumption data that allowed them to look at 14 day averages, whereas we present single-day and two-day averages based on the NHANES data.
Overall, these studies indicate widespread consumption of synthetic food dyes in the US population and suggest that children and adolescents may have higher exposures compared with adults.
6.1.3 Objectives In general, children are more vulnerable to chemical exposures than adults because they eat, drink and breathe more per unit of body weight, resulting in higher exposures, and, along with fetuses, their rapidly developing body systems may be disrupted by biologically active xenobiotics during critical developmental windows. The goal of this chapter is to better understand exposures in potentially vulnerable populations to the seven approved food dyes subject to batch certification by US FDA. This exposure assessment focused on seven population groups: children, classified into five age categories (0-<2 years, 2-<5 years, 5-<9 years, 9-<16 years, 16-18 years), pregnant women, and women of childbearing age (18-49 years). These age groups were

Potential Neurobehavioral Effects of Synthetic CalEPA OEHHA Food Dyes in Children April 2021
189
selected to reflect important stages of fetal or child development. We included pregnant women and women of childbearing age to account for prenatal and perinatal exposure. Understanding exposures during windows of vulnerability can better inform risk assessments during different life stages.
Our primary objectives were to quantify single-day (acute) and two-day average exposures in these subpopulations to each of the seven FD&C synthetic food dyes currently approved for general use in foods (Table 6.1). In the Risk Characterization Chapter 7, we compare these exposure estimates to the acceptable daily intake (ADI) values established by US FDA and the WHO Joint Expert Committee on Food Additives (JECFA) (Table 6.5) (FDA 2011; WHO JECFA 2011, 2016, 2017, 2019b).
Table 6.5 Food dye ADI’s established by US FDA and JECFA. FD&C food dye US FDA
(mg/kg/day JECFA (mg/kg/day)
Blue No. 1 12.0 12.5 Blue No. 2 2.5 5.0 Green No. 3 2.5 25.0 Red No. 3 2.5 0.1 Red No. 40 7.0 7.0 Yellow No. 5 5.0 10.0 Yellow No. 6 3.75 4.0
Additionally, we summarized food dye measurements by Dr. Alyson Mitchell’s laboratory (UC Davis) in numerous brands of over-the-counter (OTC) medications and vitamins including children's cold and cough syrups, pain relievers, and gummy vitamins, as well as prenatal vitamins (See Appendix E). We estimated the range of potential exposures from OTC medications and vitamins to pregnant women and children of varying age groups. Finally, we also summarized new food dye measurements by Dr. Mitchell’s laboratory and estimated food dye intakes from 72 brands of food representing ten food categories known to contain synthetic food dyes. We estimated the range of exposures from these foods to pregnant women, women of childbearing age, and children of varying age groups and compared them to the exposures estimated above.
6.2 Materials and methods 6.2.1 Approach 6.2.1.1 FD&C color additive intake estimate calculations (mg/person/day) We used three data sources to estimate synthetic food dye intake (mg/person/day): 1) The 2015-2016 National Health and Nutrition Examination Survey (NHANES) Dietary Interview food consumption survey (CDC 2019); 2) NHANES demographic data, (CDC 2017) and 3) FD&C color additive concentration data (mg/kg) reported for approximately 600 specific foods by US FDA (Doell et al. 2016).
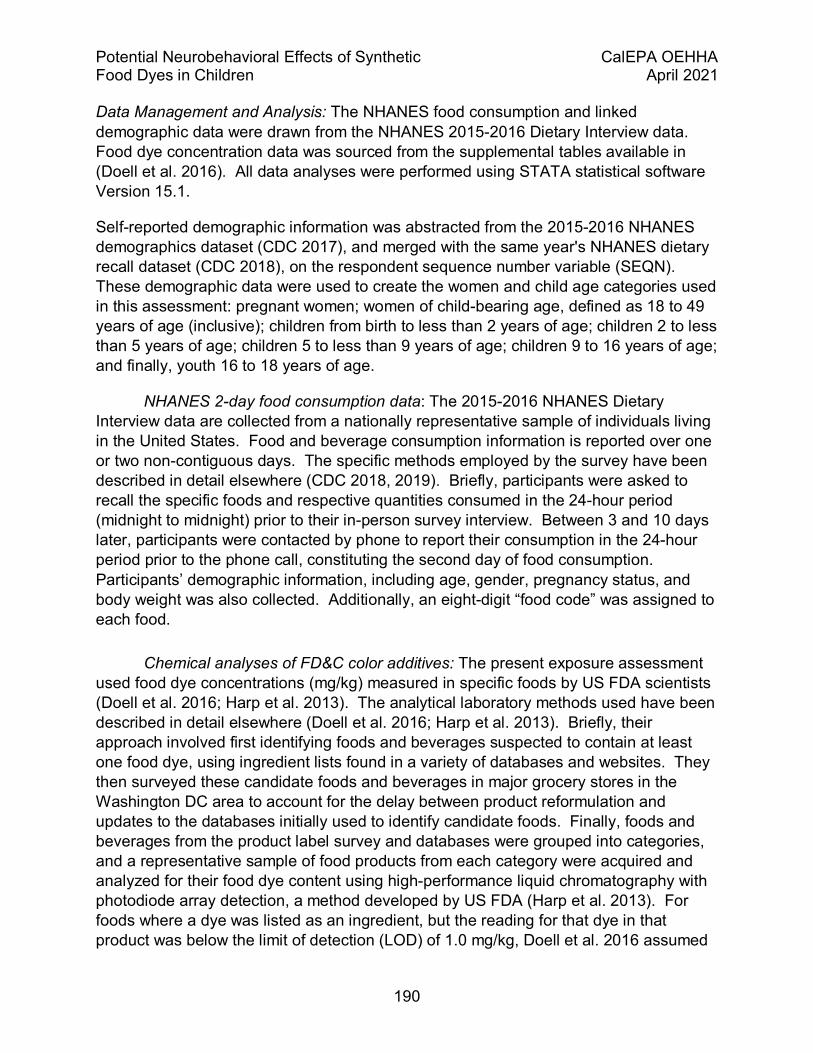
Potential Neurobehavioral Effects of Synthetic CalEPA OEHHA Food Dyes in Children April 2021
190
Data Management and Analysis: The NHANES food consumption and linked demographic data were drawn from the NHANES 2015-2016 Dietary Interview data. Food dye concentration data was sourced from the supplemental tables available in (Doell et al. 2016). All data analyses were performed using STATA statistical software Version 15.1.
Self-reported demographic information was abstracted from the 2015-2016 NHANES demographics dataset (CDC 2017), and merged with the same year's NHANES dietary recall dataset (CDC 2018), on the respondent sequence number variable (SEQN). These demographic data were used to create the women and child age categories used in this assessment: pregnant women; women of child-bearing age, defined as 18 to 49 years of age (inclusive); children from birth to less than 2 years of age; children 2 to less than 5 years of age; children 5 to less than 9 years of age; children 9 to 16 years of age; and finally, youth 16 to 18 years of age.
NHANES 2-day food consumption data: The 2015-2016 NHANES Dietary Interview data are collected from a nationally representative sample of individuals living in the United States. Food and beverage consumption information is reported over one or two non-contiguous days. The specific methods employed by the survey have been described in detail elsewhere (CDC 2018, 2019). Briefly, participants were asked to recall the specific foods and respective quantities consumed in the 24-hour period (midnight to midnight) prior to their in-person survey interview. Between 3 and 10 days later, participants were contacted by phone to report their consumption in the 24-hour period prior to the phone call, constituting the second day of food consumption. Participants’ demographic information, including age, gender, pregnancy status, and body weight was also collected. Additionally, an eight-digit “food code” was assigned to each food.
Chemical analyses of FD&C color additives: The present exposure assessment used food dye concentrations (mg/kg) measured in specific foods by US FDA scientists (Doell et al. 2016; Harp et al. 2013). The analytical laboratory methods used have been described in detail elsewhere (Doell et al. 2016; Harp et al. 2013). Briefly, their approach involved first identifying foods and beverages suspected to contain at least one food dye, using ingredient lists found in a variety of databases and websites. They then surveyed these candidate foods and beverages in major grocery stores in the Washington DC area to account for the delay between product reformulation and updates to the databases initially used to identify candidate foods. Finally, foods and beverages from the product label survey and databases were grouped into categories, and a representative sample of food products from each category were acquired and analyzed for their food dye content using high-performance liquid chromatography with photodiode array detection, a method developed by US FDA (Harp et al. 2013). For foods where a dye was listed as an ingredient, but the reading for that dye in that product was below the limit of detection (LOD) of 1.0 mg/kg, Doell et al. 2016 assumed
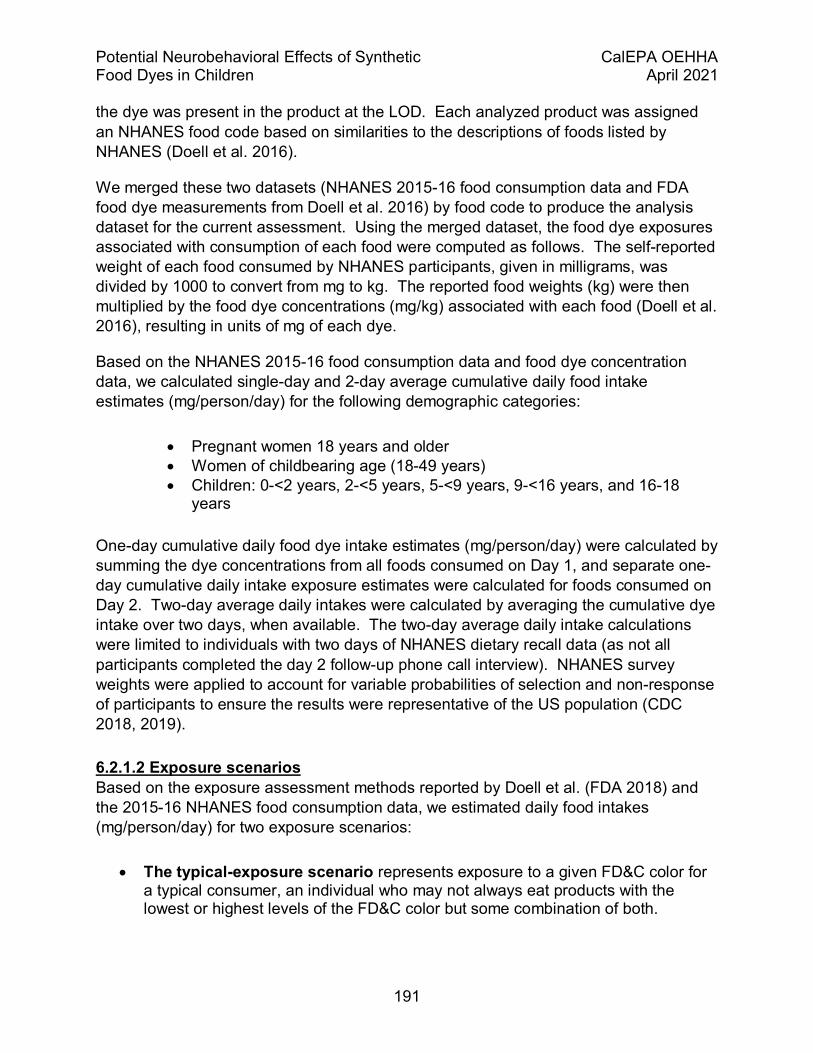
Potential Neurobehavioral Effects of Synthetic CalEPA OEHHA Food Dyes in Children April 2021
191
the dye was present in the product at the LOD. Each analyzed product was assigned an NHANES food code based on similarities to the descriptions of foods listed by NHANES (Doell et al. 2016).
We merged these two datasets (NHANES 2015-16 food consumption data and FDA food dye measurements from Doell et al. 2016) by food code to produce the analysis dataset for the current assessment. Using the merged dataset, the food dye exposures associated with consumption of each food were computed as follows. The self-reported weight of each food consumed by NHANES participants, given in milligrams, was divided by 1000 to convert from mg to kg. The reported food weights (kg) were then multiplied by the food dye concentrations (mg/kg) associated with each food (Doell et al. 2016), resulting in units of mg of each dye.
Based on the NHANES 2015-16 food consumption data and food dye concentration data, we calculated single-day and 2-day average cumulative daily food intake estimates (mg/person/day) for the following demographic categories:
• Pregnant women 18 years and older • Women of childbearing age (18-49 years) • Children: 0-<2 years, 2-<5 years, 5-<9 years, 9-<16 years, and 16-18
years
One-day cumulative daily food dye intake estimates (mg/person/day) were calculated by summing the dye concentrations from all foods consumed on Day 1, and separate one-day cumulative daily intake exposure estimates were calculated for foods consumed on Day 2. Two-day average daily intakes were calculated by averaging the cumulative dye intake over two days, when available. The two-day average daily intake calculations were limited to individuals with two days of NHANES dietary recall data (as not all participants completed the day 2 follow-up phone call interview). NHANES survey weights were applied to account for variable probabilities of selection and non-response of participants to ensure the results were representative of the US population (CDC 2018, 2019).
6.2.1.2 Exposure scenarios Based on the exposure assessment methods reported by Doell et al. (FDA 2018) and the 2015-16 NHANES food consumption data, we estimated daily food intakes (mg/person/day) for two exposure scenarios:
• The typical-exposure scenario represents exposure to a given FD&C color for a typical consumer, an individual who may not always eat products with the lowest or highest levels of the FD&C color but some combination of both.

Potential Neurobehavioral Effects of Synthetic CalEPA OEHHA Food Dyes in Children April 2021
192
• The high-exposure scenario represents the highest exposure where the individual is only consuming products with the highest levels of that food dye.
The typical-exposure scenario was calculated as follows: 1) for those foods measured by Doell et al. 2016 in triplicate, the average of the 3 measurements for each dye was used, and 2) in cases where a single NHANES food code represented multiple foods (with distinct dye profiles), the average of the dye concentration values across all foods with that code, for each dye, were assigned to that food code.
The high-exposure scenario was calculated as follows: 1) for those foods in the Doell et al. tables measured by Doell et al. 2016 in triplicate, the highest of the 3 measurements for each dye was used; and 2) in cases where a single food code represented multiple foods (with distinct dye profiles), the maximum dye concentration of each dye, across all those foods, was assigned to that food code.
The food dye intake estimates based on both exposure scenarios were produced for “eaters-only” of a given dye, meaning only those individuals consuming at least one food containing the dye were included in the exposure estimate generated for that dye.
We calculated FD&C color intake estimates (mg/person/day) for each combination of women and child demographic category, food dye, and time period (Day 1, Day 2, or Two-Day average). The range of FD&C color intake estimates, as well as the mean, median, 75th and 95th percentiles are presented in the Appendix F (Tables A1-A7).
6.2.1.3 FD&C synthetic food dye exposure estimate calculations (mg/kg/day) The mean, median, 75th and 95th percentiles, and maximum Day 1, Day 2 and Two-Day average cumulative daily food dye dose estimates (mg/kg/day) are presented in Appendix F (Tables A8-A14).
6.3 FD&C dye intake estimate (mg/person/day) We estimated seven FD&C color single and average two-day intake (mg/person/day) for U.S pregnant women, women of childbearing years, and children aged 0 to 18 years based on NHANES 2015-16 food consumption data (CDC 2018) and FDA food dye measurements (Doell et al. 2016). The estimated mean intake and distribution of Day 1, Day 2 and the average of the two days for these groups are presented in Appendix F (Tables A1-A7).
Overall, the highest median and 95th percentile intake estimates (mg/person/day) were found for FD&C Red No. 40 in children 9 to <16 years old, youth 16-18 years old and pregnant women (See Appendix F Table A5). FD&C Green No. 3 was by far the least frequently consumed dye with the lowest median and 95th percentile single and average 2-day intake estimates (See Appendix F Table A3).

Potential Neurobehavioral Effects of Synthetic CalEPA OEHHA Food Dyes in Children April 2021
193
In general, synthetic food dye intakes tended to be higher in children 5-18 years old compared with younger children and pregnant women or women of childbearing age (see Appendix F).
6.4 FD&C dye exposure estimate (mg/kg/day) As described above, using methods pioneered by Doell et al., we calculated food dye exposure on a mg/person/day basis for US pregnant women, women of childbearing age (18-49 years), and children (<=18 years). We then divided the women’s and children’s individual food dye intake estimates (mg/person/day) by their individual body weights available in the NHANES (CDC 2017) data to compute food dye exposure estimates in units of mg/kg/day. Children’s food dye exposure estimates are presented for five age categories (0-<2 years, 2-<5 years, 5-<9 years, 9-<16 years, 16-18 years). Complete distributions of the typical- and high-exposure scenario estimates (mean, median, 75th and 95th percentiles, and maximum) by food dye and demographic category are presented in the Appendix F (Tables A8-A14). Tables 6.6-6.12 and Figures 6.1-6.7, below, present median and 95th percentile single- and 2-day exposure estimates for each group and exposure scenario category for each dye.
Adjusted for body weight, exposure on a mg/kg/day basis also trended higher for children compared with pregnant women and women of child bearing age (Tables 6.6-6.12 and Figures 6.1-6.7). Exposure estimates were generally highest for FD&C Red No. 40 (Table 6.10).
We also provide tables presenting exposure estimate without application of NHANES survey weights are presented in Appendix F (Tables A15-A21)
.
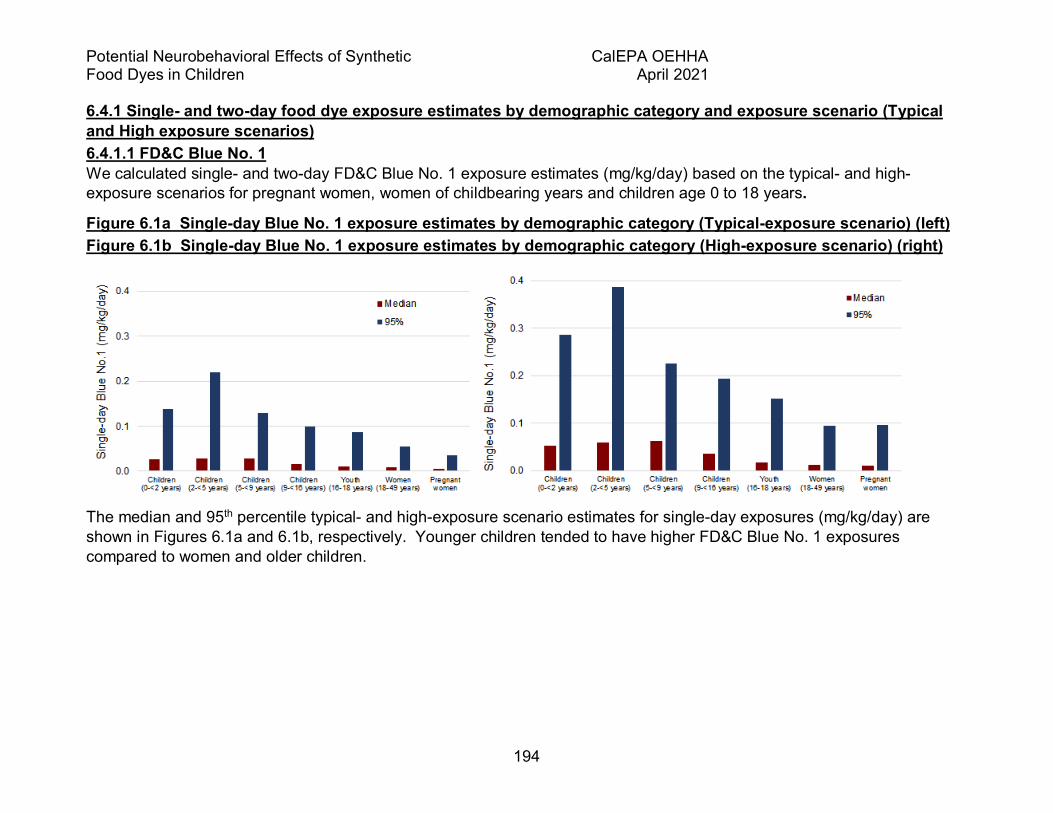
Potential Neurobehavioral Effects of Synthetic CalEPA OEHHA Food Dyes in Children April 2021
194
6.4.1 Single- and two-day food dye exposure estimates by demographic category and exposure scenario (Typical and High exposure scenarios) 6.4.1.1 FD&C Blue No. 1 We calculated single- and two-day FD&C Blue No. 1 exposure estimates (mg/kg/day) based on the typical- and high-exposure scenarios for pregnant women, women of childbearing years and children age 0 to 18 years.
Figure 6.1a Single-day Blue No. 1 exposure estimates by demographic category (Typical-exposure scenario) (left) Figure 6.1b Single-day Blue No. 1 exposure estimates by demographic category (High-exposure scenario) (right)
The median and 95th percentile typical- and high-exposure scenario estimates for single-day exposures (mg/kg/day) are shown in Figures 6.1a and 6.1b, respectively. Younger children tended to have higher FD&C Blue No. 1 exposures compared to women and older children.

Potential Neurobehavioral Effects of Synthetic CalEPA OEHHA Food Dyes in Children April 2021
195
Figure 6.1c Single-day Blue No. 1 exposure estimates by demographic category (Typical-exposure scenario) (left) Figure 6.1d Two-Day Blue No. 1 exposure estimates by demographic category (Typical-exposure scenario) (right)
The median and 95th percentile typical-exposure scenario estimates for single- and two-day exposures (mg/kg/day) are shown in Figures 6.1c and 6.1d, respectively. Younger children tended to have higher FD&C Blue No. 1 exposures compared to women and older children.

Potential Neurobehavioral Effects of Synthetic CalEPA OEHHA Food Dyes in Children April 2021
196
6.4.1.2 FD&C Blue 2 We calculated single- and two-day FD&C Blue No. 2 exposure estimates (mg/kg/day) based on the typical- and high-exposure scenarios for pregnant women, women of childbearing years and children age 0 to 18 years.
The median and 95th percentile typical- and high-exposure scenario estimates for single-day exposures (mg/kg/day) are shown in Figures 6.2a and 6.2b, respectively. Children 0 to <9 years old tended to have higher single-day FD&C Blue No. 2 exposures compared to women and older children. The single-day 95th percentile Blue No. 2 exposure estimates were highest for children 0 to <2 years old.
Figure 6.2a Single-day Blue No. 2 exposure estimates by demographic category y (Typical-exposure scenario) (left) Figure 6.2b Single-day Blue No. 2 exposure estimates by demographic category (High-exposure scenario) (right)
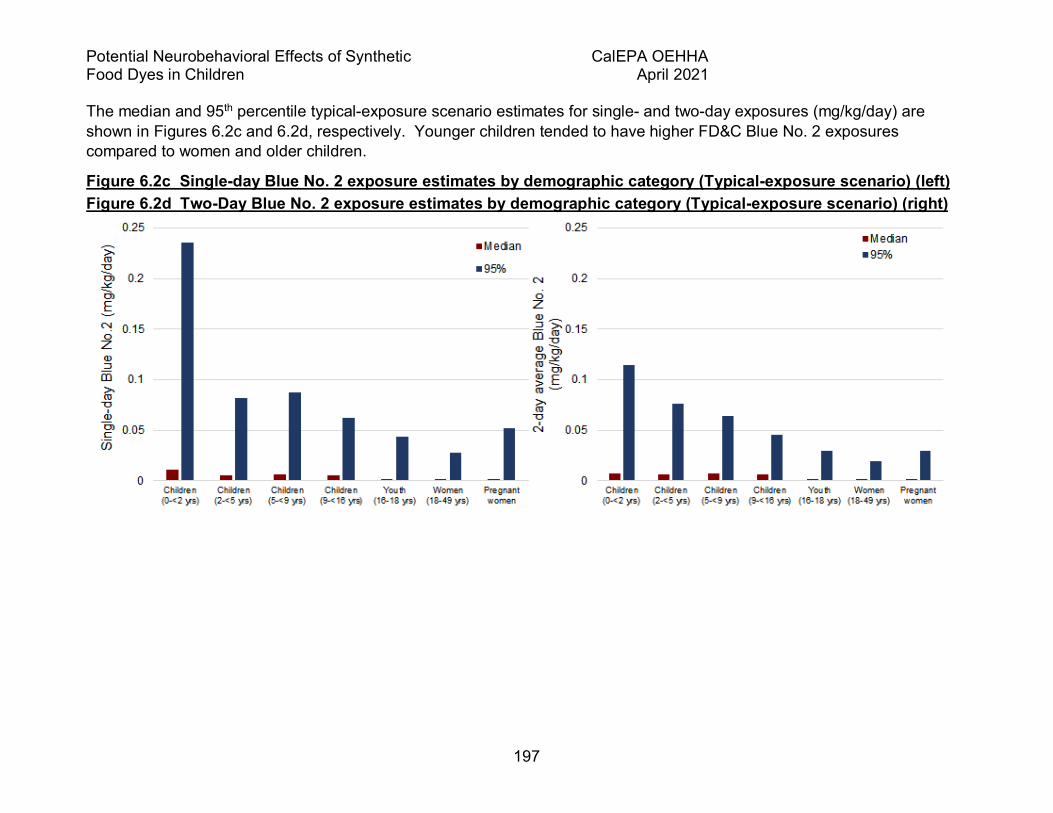
Potential Neurobehavioral Effects of Synthetic CalEPA OEHHA Food Dyes in Children April 2021
197
The median and 95th percentile typical-exposure scenario estimates for single- and two-day exposures (mg/kg/day) are shown in Figures 6.2c and 6.2d, respectively. Younger children tended to have higher FD&C Blue No. 2 exposures compared to women and older children.
Figure 6.2c Single-day Blue No. 2 exposure estimates by demographic category (Typical-exposure scenario) (left) Figure 6.2d Two-Day Blue No. 2 exposure estimates by demographic category (Typical-exposure scenario) (right)

Potential Neurobehavioral Effects of Synthetic CalEPA OEHHA Food Dyes in Children April 2021
198
6.4.1.3 FD&C Green No. 3 We calculated single- and two-day FD&C Green No. 3 exposure estimates (mg/kg/day) based on the typical- and high-exposure scenarios for pregnant women, women of childbearing years and children age 0 to 18 years.
The median and 95th percentile typical- and high-exposure scenario estimates for single-day exposures (mg/kg/day) are shown in Figures 6.3a and 6.3b, respectively. Children 0 to 18 years old tended to have higher single-day FD&C Green No. 3 exposures compared to women. FD&C Green No. 3 was infrequently consumed by women and children, and as a result, the typical- and high-exposure scenario median and 95th percentile estimates were the same.
Figure 6.3a Single-day Green No. 3 exposure estimates by demographic category (Typical-exposure scenario) (left) Figure 6.3b Single-day Green No. 3 exposure estimates by demographic category (High-exposure scenario) (right)

Potential Neurobehavioral Effects of Synthetic CalEPA OEHHA Food Dyes in Children April 2021
199
The median and 95th percentile typical-exposure scenario estimates for single- and two-day exposures (mg/kg/day) are shown in Figures 6.3c and 6.3d, respectively. Younger children tended to have higher FD&C Green No. 3 exposures compared to women and older children.
Figure 6.3c Single-day Green No. 3 exposure estimates by demographic category (Typical-exposure scenario) (left) Figure 6.3d Two-day Green No. 3 exposure estimates by demographic category (Typical-exposure scenario) (right)
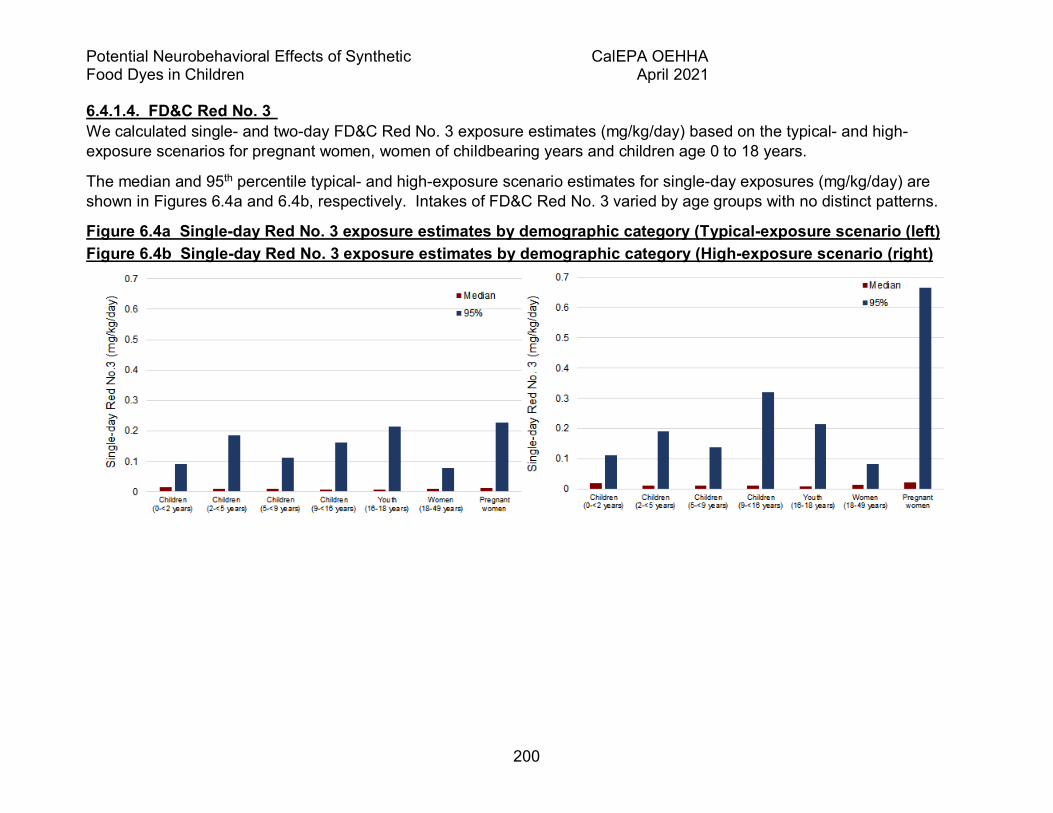
Potential Neurobehavioral Effects of Synthetic CalEPA OEHHA Food Dyes in Children April 2021
200
6.4.1.4. FD&C Red No. 3 We calculated single- and two-day FD&C Red No. 3 exposure estimates (mg/kg/day) based on the typical- and high-exposure scenarios for pregnant women, women of childbearing years and children age 0 to 18 years.
The median and 95th percentile typical- and high-exposure scenario estimates for single-day exposures (mg/kg/day) are shown in Figures 6.4a and 6.4b, respectively. Intakes of FD&C Red No. 3 varied by age groups with no distinct patterns.
Figure 6.4a Single-day Red No. 3 exposure estimates by demographic category (Typical-exposure scenario (left) Figure 6.4b Single-day Red No. 3 exposure estimates by demographic category (High-exposure scenario (right)
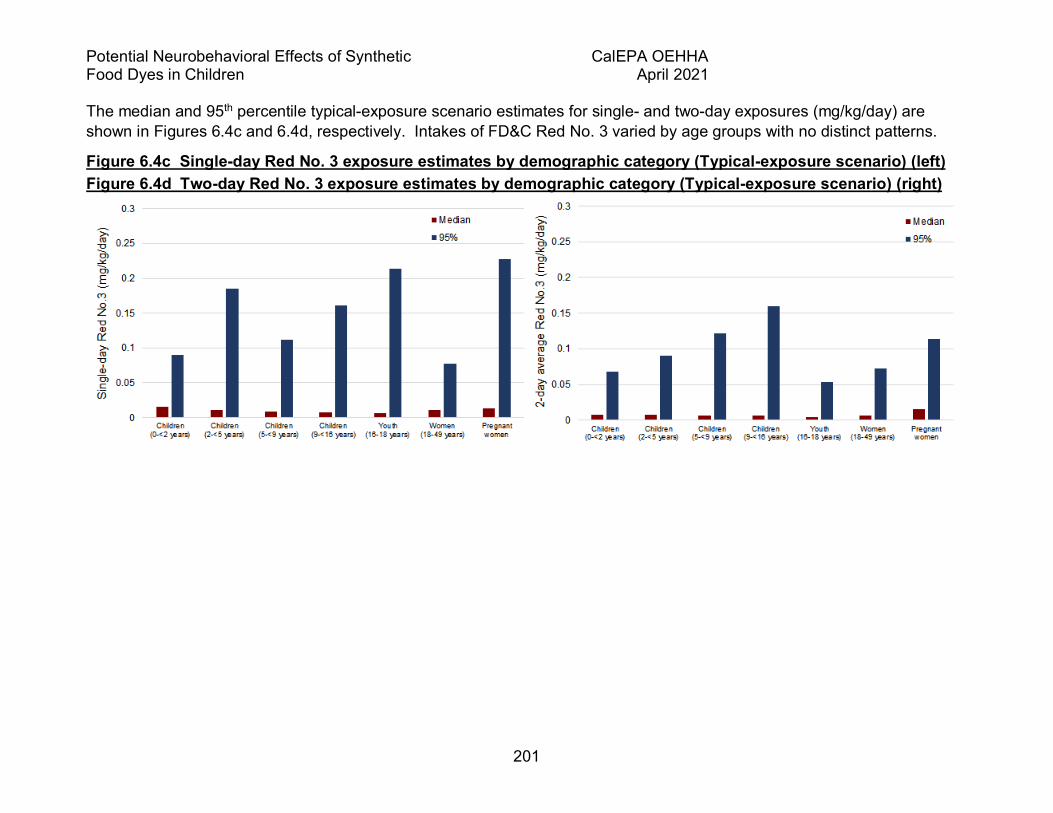
Potential Neurobehavioral Effects of Synthetic CalEPA OEHHA Food Dyes in Children April 2021
201
The median and 95th percentile typical-exposure scenario estimates for single- and two-day exposures (mg/kg/day) are shown in Figures 6.4c and 6.4d, respectively. Intakes of FD&C Red No. 3 varied by age groups with no distinct patterns.
Figure 6.4c Single-day Red No. 3 exposure estimates by demographic category (Typical-exposure scenario) (left) Figure 6.4d Two-day Red No. 3 exposure estimates by demographic category (Typical-exposure scenario) (right)

Potential Neurobehavioral Effects of Synthetic CalEPA OEHHA Food Dyes in Children April 2021
202
6.4.1.5. FD&C Red No. 40 We calculated single- and two-day FD&C Red No. 40 exposure estimates (mg/kg/day) based on the typical- and high-exposure scenarios for pregnant women, women of childbearing years and children age 0 to 18 years.
The median and 95th percentile typical- and high-exposure scenario estimates for single-day exposures (mg/kg/day) are shown in Figures 6.5a and 6.5b, respectively. Children 0 to <16 years old tended to have higher single-day FD&C Red No. 40 exposures compared to women and older children.
Figure 6.5a Single-day Red No. 40 exposure estimates demographic category (Typical-exposure scenario) (left) Figure 6.5b Single-day Red No. 40 exposure estimates demographic category (High-exposure scenario) (right)
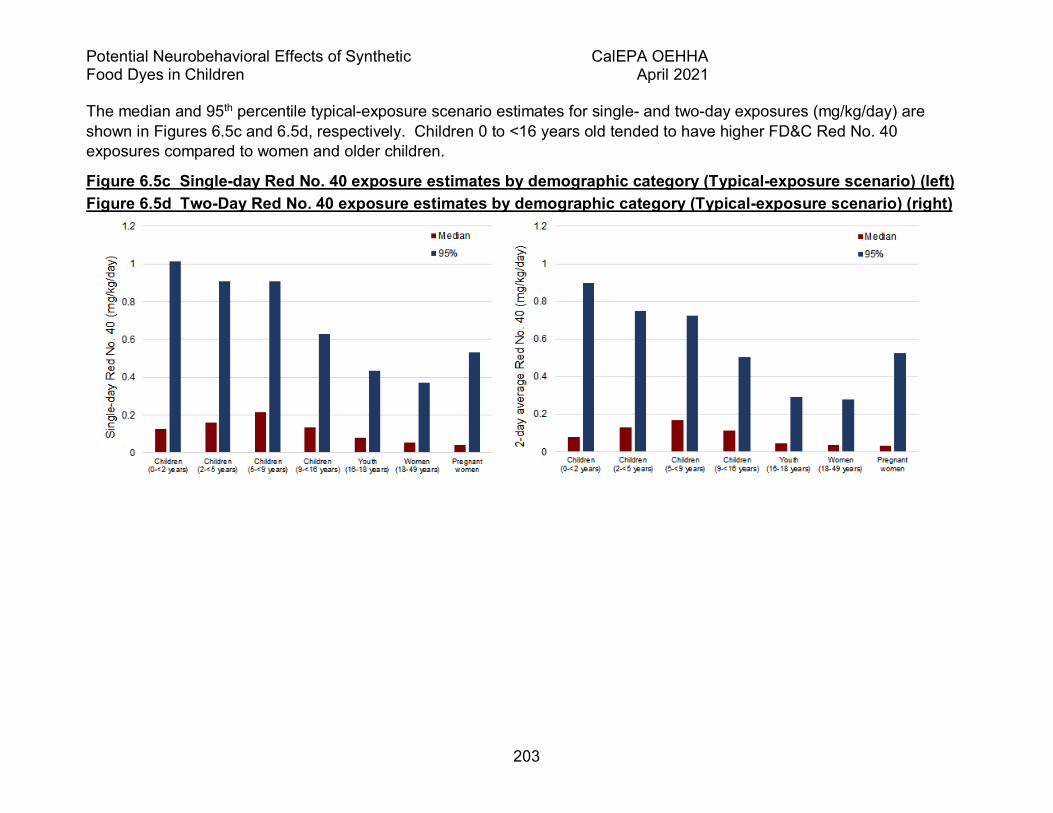
Potential Neurobehavioral Effects of Synthetic CalEPA OEHHA Food Dyes in Children April 2021
203
The median and 95th percentile typical-exposure scenario estimates for single- and two-day exposures (mg/kg/day) are shown in Figures 6.5c and 6.5d, respectively. Children 0 to <16 years old tended to have higher FD&C Red No. 40 exposures compared to women and older children.
Figure 6.5c Single-day Red No. 40 exposure estimates by demographic category (Typical-exposure scenario) (left) Figure 6.5d Two-Day Red No. 40 exposure estimates by demographic category (Typical-exposure scenario) (right)
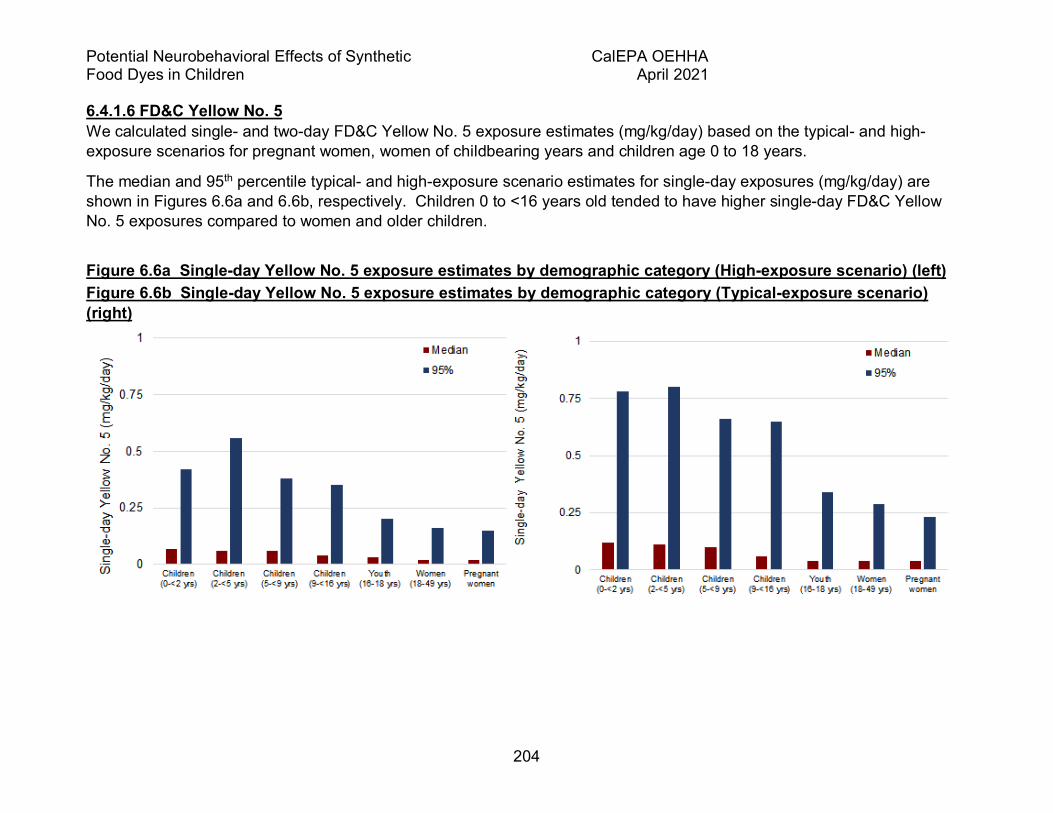
Potential Neurobehavioral Effects of Synthetic CalEPA OEHHA Food Dyes in Children April 2021
204
6.4.1.6 FD&C Yellow No. 5 We calculated single- and two-day FD&C Yellow No. 5 exposure estimates (mg/kg/day) based on the typical- and high-exposure scenarios for pregnant women, women of childbearing years and children age 0 to 18 years.
The median and 95th percentile typical- and high-exposure scenario estimates for single-day exposures (mg/kg/day) are shown in Figures 6.6a and 6.6b, respectively. Children 0 to <16 years old tended to have higher single-day FD&C Yellow No. 5 exposures compared to women and older children.
Figure 6.6a Single-day Yellow No. 5 exposure estimates by demographic category (High-exposure scenario) (left) Figure 6.6b Single-day Yellow No. 5 exposure estimates by demographic category (Typical-exposure scenario) (right)

Potential Neurobehavioral Effects of Synthetic CalEPA OEHHA Food Dyes in Children April 2021
205
The median and 95th percentile typical-exposure scenario estimates for single- and two-day FD&C Yellow No. 5 exposures (mg/kg/day) are shown in Figures 6.6c and 6.6d, respectively. Children 0 to <16 years old tended to have higher exposures compared to women and older children.
Figure 6.6c Single-day Yellow No. 5 exposure estimates by demographic category (Typical-exposure scenario) (left) Figure 6.6d Two-day Yellow No. 5 exposure estimates by demographic category (Typical-exposure scenario) (right)

Potential Neurobehavioral Effects of Synthetic CalEPA OEHHA Food Dyes in Children April 2021
206
6.4.1.7 FD&C Yellow No. 6 We calculated single- and two-day FD&C Yellow No. 6 exposure estimates (mg/kg/day) based on the typical- and high-exposure scenarios for pregnant women, women of childbearing years and children age 0 to 18 years.
The median and 95th percentile typical- and high-exposure scenario estimates for single-day exposures (mg/kg/day) are shown in Figures 6.7a and 6.7b, respectively. Children 0 to <9 years old tended to have higher single-day FD&C Yellow No. 6 exposures compared to women and older children.
Figure 6.7a Single-day Yellow No. 6 exposure estimates by demographic category (Typical-exposure scenario) (left) Figure 6.7b Single-day Yellow No. 6 exposure estimates by demographic category (High-exposure scenario) (right)
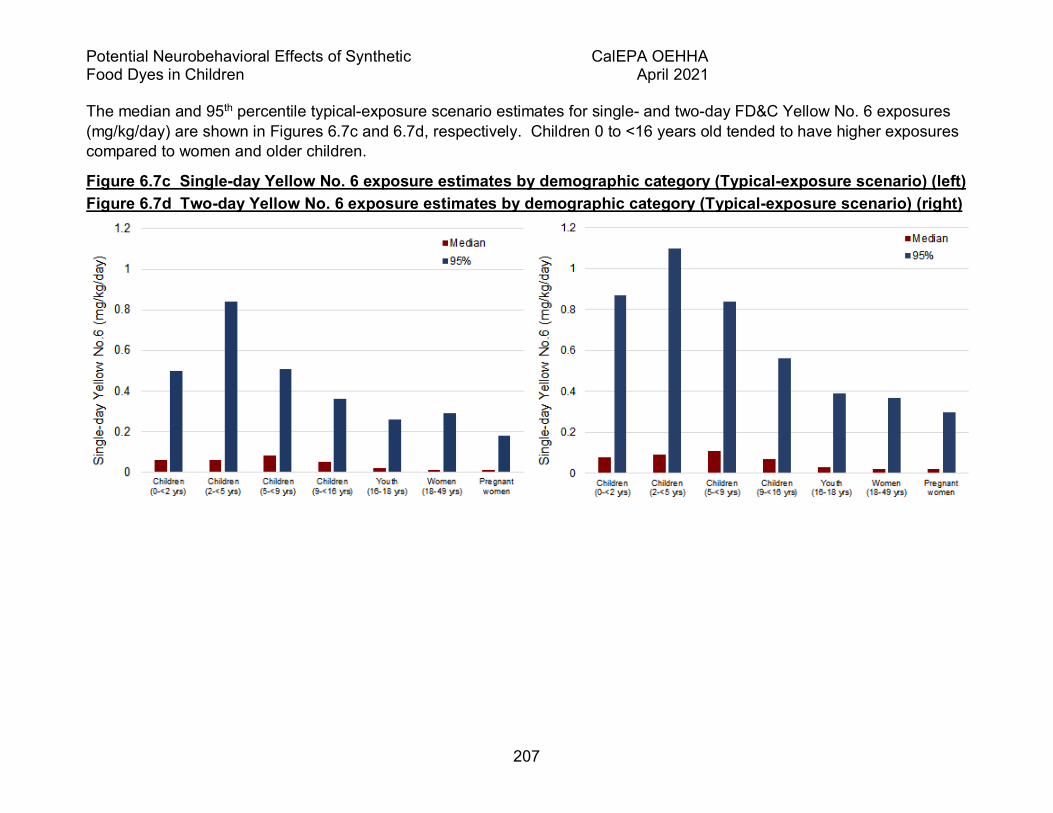
Potential Neurobehavioral Effects of Synthetic CalEPA OEHHA Food Dyes in Children April 2021
207
The median and 95th percentile typical-exposure scenario estimates for single- and two-day FD&C Yellow No. 6 exposures (mg/kg/day) are shown in Figures 6.7c and 6.7d, respectively. Children 0 to <16 years old tended to have higher exposures compared to women and older children.
Figure 6.7c Single-day Yellow No. 6 exposure estimates by demographic category (Typical-exposure scenario) (left) Figure 6.7d Two-day Yellow No. 6 exposure estimates by demographic category (Typical-exposure scenario) (right)

Potential Neurobehavioral Effects of Synthetic CalEPA OEHHA Food Dyes in Children April 2021
208
6.4.1.8 Food dye exposure summary Tables 6.6 – 6.12 provide the exposure estimates for each of the seven FD&C dyes that we assessed. Overall, children’s FD&C food color exposure estimates (mg/kg/day) tended to be higher compared to adult women. Among the food dyes, the highest exposures were to Red No. 40 followed by Yellow No. 5 and Yellow No. 6 (Tables 6.6-6.12). The lowest median and 95th percentile single and average 2-day exposure estimates were for Green No. 3.
For the typical-exposure scenario, the highest median Red No. 40 single-day and two-day average intake (mg/kg/day) was found for children 5 to <9 years old (0.21 and 0.17 mg/kg/day, respectively). The highest median FD&C Red No. 40 single-day and two-day average estimated intake for the high-exposure scenario was also found in children 5 to <9 years old (0.39 mg/kg/day and 0.32 mg/kg/day, respectively) (Table 6.10). Mean Red No. 40 exposure estimates were consistently higher than the median values, reflecting skewed distributions.
The highest 95th percentile single-day dose estimates based on the average- and high-exposure scenarios, were observed for FD&C Red No. 3 in children 0 to <2 years (4.83 and 7.90 mg/kg/day). These high values appear to be outliers compared to other values; however, we reviewed all source data and code and these results derive correctly from the underlying information.
In Chapter 7, Risk Characterization, we compare the estimated exposures to US FDA and JECFA ADIs, and present ratios of exposure to the ADI.
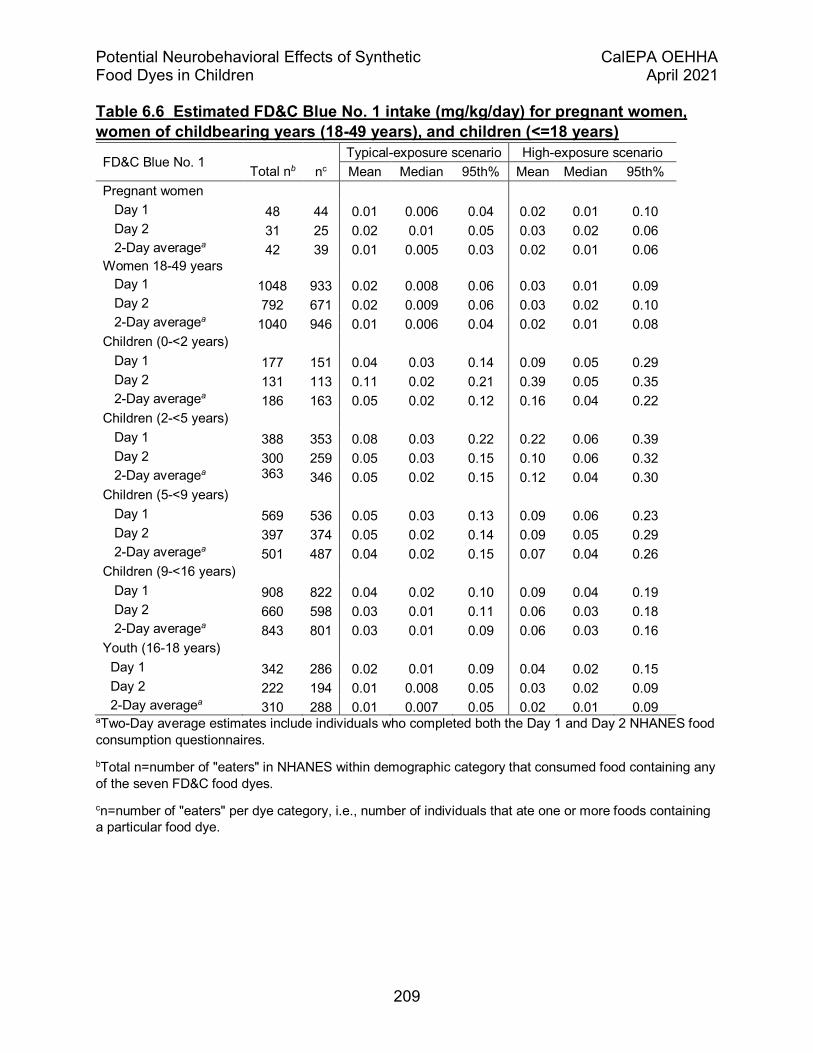
Potential Neurobehavioral Effects of Synthetic CalEPA OEHHA Food Dyes in Children April 2021
209
Table 6.6 Estimated FD&C Blue No. 1 intake (mg/kg/day) for pregnant women, women of childbearing years (18-49 years), and children (<=18 years)
aTwo-Day average estimates include individuals who completed both the Day 1 and Day 2 NHANES food consumption questionnaires. bTotal n=number of "eaters" in NHANES within demographic category that consumed food containing any of the seven FD&C food dyes. cn=number of "eaters" per dye category, i.e., number of individuals that ate one or more foods containing a particular food dye.
FD&C Blue No. 1 Typical-exposure scenario High-exposure scenario
Total nb nc Mean Median 95th% Mean Median 95th% Pregnant women
Day 1 48 44 0.01 0.006 0.04 0.02 0.01 0.10 Day 2 31 25 0.02 0.01 0.05 0.03 0.02 0.06 2-Day averagea 42 39 0.01 0.005 0.03 0.02 0.01 0.06 Women 18-49 years Day 1 1048 933 0.02 0.008 0.06 0.03 0.01 0.09 Day 2 792 671 0.02 0.009 0.06 0.03 0.02 0.10 2-Day averagea 1040 946 0.01 0.006 0.04 0.02 0.01 0.08 Children (0-<2 years) Day 1 177 151 0.04 0.03 0.14 0.09 0.05 0.29 Day 2 131 113 0.11 0.02 0.21 0.39 0.05 0.35 2-Day averagea 186 163 0.05 0.02 0.12 0.16 0.04 0.22 Children (2-<5 years) Day 1 388 353 0.08 0.03 0.22 0.22 0.06 0.39 Day 2 300 259 0.05 0.03 0.15 0.10 0.06 0.32 2-Day averagea 363
346 0.05 0.02 0.15 0.12 0.04 0.30 Children (5-<9 years) Day 1 569 536 0.05 0.03 0.13 0.09 0.06 0.23 Day 2 397 374 0.05 0.02 0.14 0.09 0.05 0.29 2-Day averagea 501 487 0.04 0.02 0.15 0.07 0.04 0.26 Children (9-<16 years) Day 1 908 822 0.04 0.02 0.10 0.09 0.04 0.19 Day 2 660 598 0.03 0.01 0.11 0.06 0.03 0.18 2-Day averagea 843 801 0.03 0.01 0.09 0.06 0.03 0.16 Youth (16-18 years) Day 1 342 286 0.02 0.01 0.09 0.04 0.02 0.15 Day 2 222 194 0.01 0.008 0.05 0.03 0.02 0.09 2-Day averagea 310 288 0.01 0.007 0.05 0.02 0.01 0.09

Potential Neurobehavioral Effects of Synthetic CalEPA OEHHA Food Dyes in Children April 2021
210
Table 6.7 Estimated FD&C Blue No. 2 intake (mg/kg/day) for pregnant women, women of childbearing years (18-49 years), and children (<=18 years).
aThe Two-Day average estimates include individuals who completed both the Day 1 and Day 2 NHANES food consumption questionnaires. bTotal n=number of "eaters" in NHANES within demographic category that consumed food containing any of the seven FD&C food dyes. cn=number of "eaters" per dye category, i.e., number of individuals that ate one or more foods containing a particular food dye.
FD&C Blue No. 2 Typical-exposure scenario High-exposure scenario
Total nb nc Mean Median 95th% Mean Median 95th% Pregnant women
Day 1 48 23 0.008 0.002 0.05 0.02 0.004 0.15 Day 2 31 18 0.008 0.003 0.03 0.02 0.005 0.07 2 -Day averagea 42 25 0.007 0.002 0.03 0.02 0.004 0.07 Women 18-49 years Day 1 1048 566 0.007 0.002 0.03 0.01 0.003 0.05 Day 2 792 426 0.009 0.003 0.03 0.02 0.005 0.07 2 -Day averagea 1040 645 0.005 0.002 0.02 0.009 0.003 0.04 Children (0-<2 years) Day 1 177 91 0.05 0.01 0.24 0.06 0.01 0.34 Day 2 131 68 0.04 0.009 0.20 0.09 0.01 0.24 2-Day averagea 186 108 0.03 0.007 0.11 0.05 0.009 0.24 Children (2-<5 years) Day 1 388 227 0.02 0.005 0.08 0.05 0.005 0.20 Day 2 300 155 0.03 0.009 0.14 0.06 0.01 0.21 2-Day averagea 363
235 0.02 0.006 0.08 0.04 0.007 0.13 Children (5-<9 years) Day 1 569 341 0.02 0.006 0.09 0.04 0.007 0.21 Day 2 397 232 0.03 0.007 0.08 0.05 0.009 0.24 2-Day averagea 501 360 0.02 0.007 0.06 0.03 0.01 0.13 Children (9-<16 years) Day 1 908 500 0.02 0.005 0.06 0.04 0.007 0.14 Day 2 660 348 0.02 0.009 0.08 0.04 0.01 0.14 2-Day averagea 843 570 0.02 0.006 0.05 0.03 0.008 0.09 Youth (16-18 years) Day 1 342 159 0.01 0.002 0.04 0.02 0.004 0.09 Day 2 222 110 0.01 0.004 0.04 0.02 0.005 0.09 2-Day averagea 310 187 0.007 0.002 0.03 0.01 0.003 0.06

Potential Neurobehavioral Effects of Synthetic CalEPA OEHHA Food Dyes in Children April 2021
211
Table 6.8 Estimated FD&C Green No. 3 intake (mg/kg/day) for pregnant women, women of childbearing years (18-49 years), and children (<=18 years).
aThe Two-Day average estimates include individuals who completed both the Day 1 and Day 2 NHANES food consumption questionnaires. bTotal n=number of "eaters" in NHANES within demographic category that consumed food containing any of the seven FD&C food dyes. cn=number of "eaters" per dye category, i.e., number of individuals that ate one or more foods containing a particular food dye.
FD&C Green No. 3 Typical-exposure scenario High-exposure scenario
Total nb nc Mean Median 95th% Mean Median 95th% Pregnant women
Day 1 48 3 0.002 0.002 0.002 0.002 0.002 0.002 Day 2 31 2 0.003 0.003 0.004 0.003 0.003 0.004 2 -Day averagea 42 4 0.001 0.001 0.003 0.001 0.001 0.003 Women 18-49 years Day 1 1048 102 0.002 0.001 0.004 0.002 0.001 0.004 Day 2 792 73 0.002 0.002 0.005 0.002 0.002 0.005 2 -Day averagea 1040 145 0.001 0.001 0.003 0.001 0.001 0.003 Children (0-<2 years) Day 1 177 13 0.003 0.004 0.007 0.003 0.004 0.007 Day 2 131 9 0.005 0.003 0.009 0.005 0.003 0.009 2-Day averagea 186 17 0.002 0.002 0.004 0.002 0.002 0.004 Children (2-<5 years) Day 1 388 32 0.005 0.005 0.01 0.005 0.005 0.010 Day 2 300 25 0.005 0.004 0.012 0.005 0.004 0.010 2-Day averagea 363
42 0.003 0.002 0.006 0.003 0.002 0.006 Children (5-<9 years) Day 1 569 69 0.004 0.003 0.01 0.004 0.003 0.010 Day 2 397 52 0.004 0.003 0.008 0.004 0.003 0.008 2-Day averagea 501 89 0.002 0.002 0.005 0.002 0.002 0.005 Children (9-<16 years) Day 1 908 103 0.003 0.002 0.008 0.003 0.002 0.008 Day 2 660 76 0.004 0.003 0.008 0.004 0.003 0.008 2-Day averagea 843 144 0.002 0.002 0.004 0.002 0.002 0.004 Youth (16-18 years) Day 1 342 20 0.002 0.002 0.004 0.002 0.002 0.004 Day 2 222 13 0.003 0.002 0.009 0.003 0.002 0.009 2-Day averagea 310 29 0.001 0.001 0.004 0.001 0.001 0.004

Potential Neurobehavioral Effects of Synthetic CalEPA OEHHA Food Dyes in Children April 2021
212
Table 6.9 Estimated FD&C Red No. 3 intake (mg/kg/day) for pregnant women, women of childbearing years (18-49 years), and children (<=18 years).
aThe Two-Day average estimates include individuals who completed both the Day 1 and Day 2 NHANES food consumption questionnaires. bTotal n=number of "eaters" in NHANES within demographic category that consumed food containing any of the seven FD&C food dyes. cn=number of "eaters" per dye category, i.e., number of individuals that ate one or more foods containing a particular food dye.
FD&C Red No. 3 Typical-exposure scenario High-exposure scenario
Total nb nc Mean Median 95th% Mean Median 95th% Pregnant women
Day 1 48 20 0.03 0.01 0.23 0.06 0.02 0.67 Day 2 31 18 0.02 0.02 0.04 0.02 0.02 0.05 2-Day averagea
c 42 25 0.02 0.02 0.11 0.04 0.02 0.33
Women 18-49 years Day 1 1048 520 0.03 0.01 0.08 0.04 0.01 0.08 Day 2 792 396 0.03 0.01 0.10 0.04 0.02 0.10 2-Day averagea 1040 592 0.02 0.007 0.07 0.02 0.009 0.08 Children(0-<2 years) Day 1 177 72 0.03 0.02 0.09 0.03 0.02 0.11 Day 2 131 53 0.54 0.01 4.83 1.50 0.01 7.90 2-Day averagea 186 84 0.17 0.008 0.07 0.47 0.008 0.07 Children (2-<5 years)
)
Day 1 388 200 0.19 0.01 0.19 0.49 0.01 0.19 Day 2 300 126 0.06 0.02 0.16 0.08 0.02 0.17 2-Day averagea 363 214 0.07 0.008 0.09 0.17 0.009 0.09 Children (5-<9 years)
)
Day 1 569 320 0.06 0.009 0.11 0.11 0.01 0.14 Day 2 397 209 0.11 0.01 0.20 0.17 0.01 0.21 2-Day averagea 501 349 0.06 0.007 0.12 0.10 0.009 0.23 Children (9-<16 yrs) Day 1 908 456 0.09 0.008 0.16 0.20 0.01 0.32 Day 2 660 303 0.09 0.01 0.14 0.15 0.01 0.14 Day averagea 843 536 0.06 0.007 0.16 0.11 0.009 0.42 Youth (16-18 years) Day 1 342 130 0.05 0.006 0.21 0.07 0.007 0.21 Day 2 222 99 0.02 0.007 0.06 0.02 0.01 0.08 2-Day averagea 310 162 0.02 0.004 0.05 0.02 0.006 0.06

Potential Neurobehavioral Effects of Synthetic CalEPA OEHHA Food Dyes in Children April 2021
213
Table 6.10 Estimated FD&C Red No. 40 intake (mg/kg/day) for pregnant women, women of childbearing years (18-49 years), and children (<=18 years).
aThe Two-Day average estimates include individuals who completed both the Day 1 and Day 2 NHANES food consumption questionnaires. bTotal n=number of "eaters" in NHANES within demographic category that consumed food containing any of the seven FD&C food dyes. cn=number of "eaters" per dye category, i.e., number of individuals that ate one or more foods containing a particular food dye.
FD&C Red No. 40 Typical-exposure scenario High-exposure scenario
Total nb nc Mean Median 95th% Mean Median 95th% Pregnant women
Day 1 48 44 0.14 0.04 0.53 0.26 0.07 1.38 Day 2 31 27 0.08 0.01 0.31 0.24 0.03 1.72 2 -Day averagea 42 39 0.09 0.03 0.52 0.21 0.06 0.69 Women 18-49 years Day 1 1048 982 0.11 0.05 0.37 0.23 0.08 0.91 Day 2 792 722 0.10 0.05 0.35 0.26 0.08 1.20 2 -Day averagea 1040 979 0.08 0.04 0.28 0.19 0.06 0.70 Children (0-<2 years) Day 1 177 166 0.29 0.13 1.01 0.57 0.22 2.65 Day 2 131 121 0.25 0.12 1.00 0.51 0.17 2.11 2-Day averagea 186 175 0.20 0.08 0.90 0.40 0.11 1.69 Children (2-<5 years) Day 1 388 366 0.30 0.16 0.91 0.66 0.23 3.28 Day 2 300 265 0.30 0.18 0.92 0.73 0.32 3.02 2-Day averagea 363 352 0.23 0.13 0.75 0.52 0.25 2.04 Children (5-<9 years) Day 1 569 550 0.30 0.21 0.91 0.71 0.39 2.51 Day 2 397 378 0.26 0.17 0.79 0.73 0.27 2.97 2-Day averagea 501 491 0.23 0.17 0.73 0.60 0.32 2.13 Children (9-<16 years) Day 1 908 860 0.20 0.14 0.63 0.52 0.25 2.05 Day 2 660 622 0.20 0.13 0.68 0.56 0.23 2.72 2-Day averagea 843 822 0.16 0.11 0.51 0.44 0.23 1.63 Youth (16-18 years) Day 1 342 315 0.13 0.08 0.43 0.30 0.12 1.18 Day 2 222 201 0.11 0.05 0.35 0.28 0.07 1.08 2-Day averagea 310 301 0.09 0.05 0.29 0.21 0.08 0.82

Potential Neurobehavioral Effects of Synthetic CalEPA OEHHA Food Dyes in Children April 2021
214
Table 6.11 Estimated FD&C Yellow No. 5 intake (mg/kg/day) for pregnant women, women of childbearing years (18-49 years), and children (<=18 years).
aThe Two-Day average estimates include individuals who completed both the Day 1 and Day 2 NHANES food consumption questionnaires. bTotal n=number of "eaters" in NHANES within demographic category that consumed food containing any of the seven FD&C food dyes. cn=number of "eaters" per dye category, i.e., number of individuals that ate one or more foods containing a particular food dye.
FD&C Yellow No. 5 Typical-exposure scenario High-exposure scenario
Total nb nc Mean Median 95th% Mean Median 95th% Pregnant women
Day 1 48 42 0.05 0.02 0.15 0.07 0.04 0.23 Day 2 31 29 0.03 0.02 0.05 0.05 0.02 0.21 2 -Day averagea 42 36 0.03 0.02 0.09 0.05 0.03 0.14 Women 18-49 years Day 1 1048 947 0.05 0.02 0.16 0.08 0.04 0.29 Day 2 792
715 0.05 0.02 0.18 0.08 0.03 0.28 2 -Day averagea 1040 973 0.03 0.02 0.13 0.06 0.03 0.20 Children (0-<2 years) Day 1 177
169 0.13 0.07 0.42 0.22 0.12 0.78 Day 2 131 121 0.19 0.08 0.76 0.27 0.14 1.02 2-Day averagea 186 176 0.12 0.06 0.45 0.19 0.10 0.76 Children (2-<5 years) Day 1 388 375 0.14 0.06 0.56 0.23 0.11 0.80 Day 2 300 286 0.16 0.09 0.58 0.25 0.13 0.85 2-Day averagea 363 353 0.12
0.07 0.39 0.19 0.11 0.51 Children (5-<9 years) Day 1 569 548 0.11 0.06 0.38 0.18 0.10 0.66 Day 2 397 381 0.11 0.05 0.46 0.18 0.08 0.60 2-Day averagea 501 495 0.09 0.05 0.31 0.15 0.09 0.48 Children (9-<16 years) Day 1 908 846 0.09 0.04 0.35 0.17 0.06 0.65 Day 2 660 627 0.08 0.04 0.33 0.14 0.06 0.56 2-Day averagea 843 816 0.07 0.04 0.26 0.12 0.06 0.40 Youth (16-18 years) Day 1 342 302 0.06 0.03 0.20 0.10 0.04 0.34 Day 2 222 206 0.03 0.03 0.17 0.08 0.04 0.26 2-Day averagea 310 294 0.02 0.02 0.12 0.07 0.04 0.27
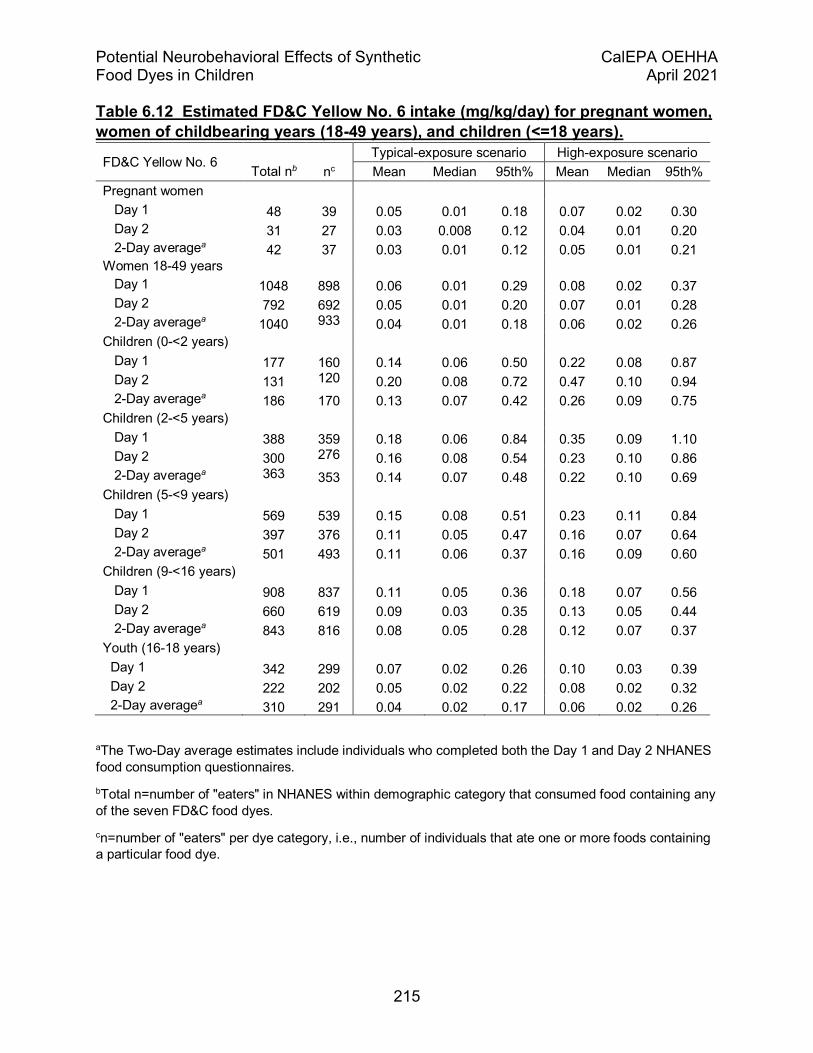
Potential Neurobehavioral Effects of Synthetic CalEPA OEHHA Food Dyes in Children April 2021
215
Table 6.12 Estimated FD&C Yellow No. 6 intake (mg/kg/day) for pregnant women, women of childbearing years (18-49 years), and children (<=18 years).
aThe Two-Day average estimates include individuals who completed both the Day 1 and Day 2 NHANES food consumption questionnaires. bTotal n=number of "eaters" in NHANES within demographic category that consumed food containing any of the seven FD&C food dyes. cn=number of "eaters" per dye category, i.e., number of individuals that ate one or more foods containing a particular food dye.
FD&C Yellow No. 6 Typical-exposure scenario High-exposure scenario
Total nb nc Mean Median 95th% Mean Median 95th% Pregnant women
Day 1 48 39 0.05 0.01 0.18 0.07 0.02 0.30 Day 2 31 27 0.03 0.008 0.12 0.04 0.01 0.20 2-Day averagea 42 37 0.03 0.01 0.12 0.05 0.01 0.21 Women 18-49 years Day 1 1048 898 0.06 0.01 0.29 0.08 0.02 0.37 Day 2 792 692 0.05 0.01 0.20 0.07 0.01 0.28 2-Day averagea 1040 933
0.04 0.01 0.18 0.06 0.02 0.26 Children (0-<2 years) Day 1 177 160 0.14 0.06 0.50 0.22 0.08 0.87 Day 2 131 120
0.20 0.08 0.72 0.47 0.10 0.94 2-Day averagea 186 170 0.13 0.07 0.42 0.26 0.09 0.75 Children (2-<5 years) Day 1 388 359 0.18 0.06 0.84 0.35 0.09 1.10 Day 2 300 276
0.16 0.08 0.54 0.23 0.10 0.86 2-Day averagea 363
353 0.14 0.07 0.48 0.22 0.10 0.69 Children (5-<9 years) Day 1 569 539 0.15 0.08 0.51 0.23 0.11 0.84 Day 2 397 376 0.11 0.05 0.47 0.16 0.07 0.64 2-Day averagea 501 493 0.11 0.06 0.37 0.16 0.09 0.60 Children (9-<16 years) Day 1 908 837 0.11 0.05 0.36 0.18 0.07 0.56 Day 2 660 619 0.09 0.03 0.35 0.13 0.05 0.44 2-Day averagea 843 816 0.08 0.05 0.28 0.12 0.07 0.37 Youth (16-18 years) Day 1 342 299 0.07 0.02 0.26 0.10 0.03 0.39 Day 2 222 202 0.05 0.02 0.22 0.08 0.02 0.32 2-Day averagea 310 291 0.04 0.02 0.17 0.06 0.02 0.26

Potential Neurobehavioral Effects of Synthetic CalEPA OEHHA Food Dyes in Children April 2021
216
6.5 Top food contributors to children’s food dye exposure estimates Below we identify the foods that were the largest contributors to estimated food dye exposures for children 0-<2 years, 2-<5 years, 5-<9 years and 9-<16 years of age. Figures 6.8–6.14 show the food categories that were the major contributors to two-day mean exposure (typical-exposure scenario) for each food dye by demographic category.
6.5.1 FD&C Blue No. 1 Figure 6.8 shows the food categories that are major contributors to FD&C Blue No. 1 exposure (two-day average; typical-exposure scenario) among children 0 to <16 years old. White icing contributed most to Blue No. 1 exposure estimates for children 0-<5 years old. Ice cream cones contributed most to Blue No. 1 exposure estimates among children 5-<16 years old.
Figure 6.8 Top foods contributing to FD&C Blue No. 1 exposure estimates in children ages 0-<16 years (Typical-exposure scenario)

Potential Neurobehavioral Effects of Synthetic CalEPA OEHHA Food Dyes in Children April 2021
217
6.5.2 FD&C Blue No. 2 Figure 6.9 shows the food categories that are major contributors to FD&C Blue No. 2 exposure (two-day average; typical-exposure scenario) among children 0 to <16 years old. Ice cream contributed most to Blue No. 2 exposure estimates among children 5-<16 years old. Breakfast cereal was the most important source for children 2-<5 years old. Chocolate pudding and fruit muffins were important sources of Blue No. 2 for children 0-<2 years old.
Figure 6.9 Top foods contributing to FD&C Blue No. 2 exposure estimates in children ages 0-<16 years (Typical-exposure scenario)
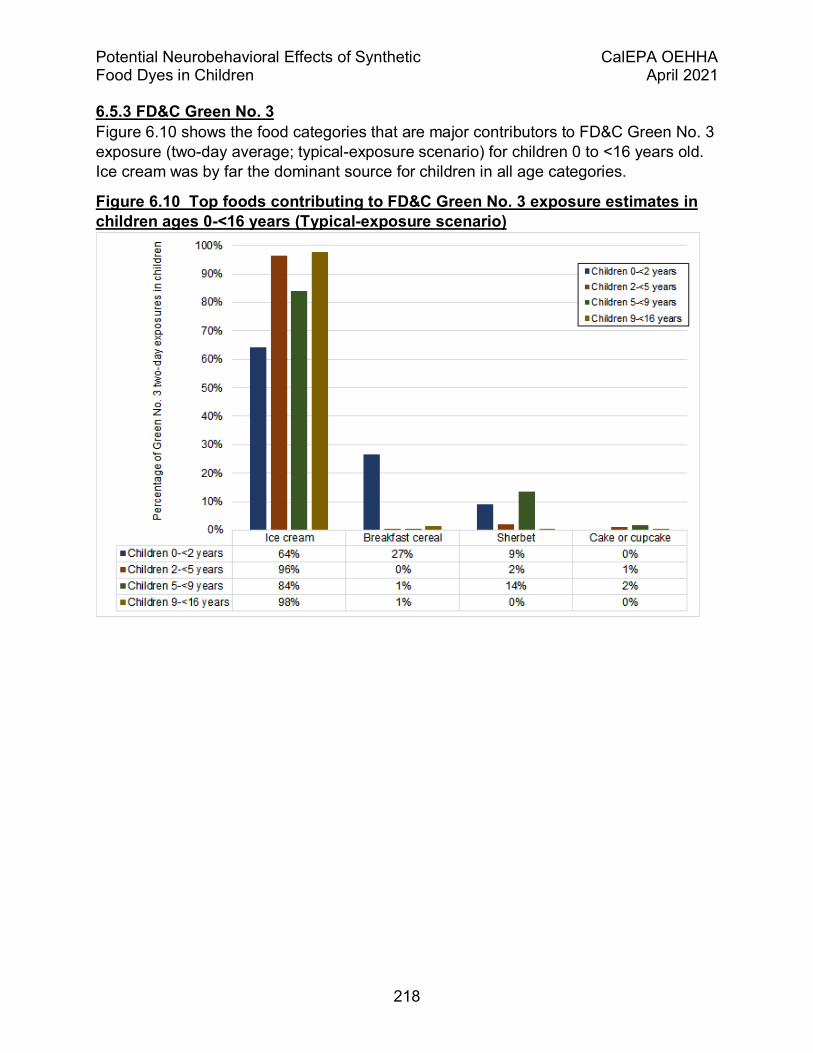
Potential Neurobehavioral Effects of Synthetic CalEPA OEHHA Food Dyes in Children April 2021
218
6.5.3 FD&C Green No. 3 Figure 6.10 shows the food categories that are major contributors to FD&C Green No. 3 exposure (two-day average; typical-exposure scenario) for children 0 to <16 years old. Ice cream was by far the dominant source for children in all age categories.
Figure 6.10 Top foods contributing to FD&C Green No. 3 exposure estimates in children ages 0-<16 years (Typical-exposure scenario)

Potential Neurobehavioral Effects of Synthetic CalEPA OEHHA Food Dyes in Children April 2021
219
6.5.4 FD&C Red No. 3 Figure 6.11 shows the food categories that are major contributors to FD&C Red No. 3 exposure (two-day average; typical-exposure scenario) among children 0 to <16 years old. Overall, ice cream cones and white icing were the primary sources of exposure to Red No. 3. Ice cream cones were especially important for children 5-<16 years old while white icing was the largest source of exposure for children 0-<5 years.
Figure 6.11 Top foods contributing to FD&C Red No. 3 exposure estimates in children ages 0-<16 years (Typical-exposure scenario)

Potential Neurobehavioral Effects of Synthetic CalEPA OEHHA Food Dyes in Children April 2021
220
6.5.5 FD&C Red No. 40 Figure 6.12 shows the food categories that are major contributors to FD&C Red No. 40 exposure (two-day average; typical-exposure scenario) among children 0 to <16 years old. Fruit juice drinks contributed most to Red No. 40 exposure estimates among children 0-<5 years old. Soft drinks were the most important source for older children 5-<16 years old.
Figure 6.12 Top foods contributing to FD&C Red No. 40 exposure estimates in children ages 0-<16 years (Typical-exposure scenario)

Potential Neurobehavioral Effects of Synthetic CalEPA OEHHA Food Dyes in Children April 2021
221
6.5.6 FD&C Yellow No. 5 Figure 6.13 shows the food categories that are major contributors to FD&C Yellow No. 5 exposure (two-day average; typical-exposure scenario) among children 0 to <16 years old. Overall, powdered fruit flavored drinks and fruit juice drinks were the most important sources of exposure to Yellow No. 5. Pasta-based meals from a mix were also an important contributor for children 0-<2 years old.
Figure 6.13 Top foods contributing to FD&C Yellow No. 5 exposure estimates in children ages 0-<16 years (Typical-exposure scenario)
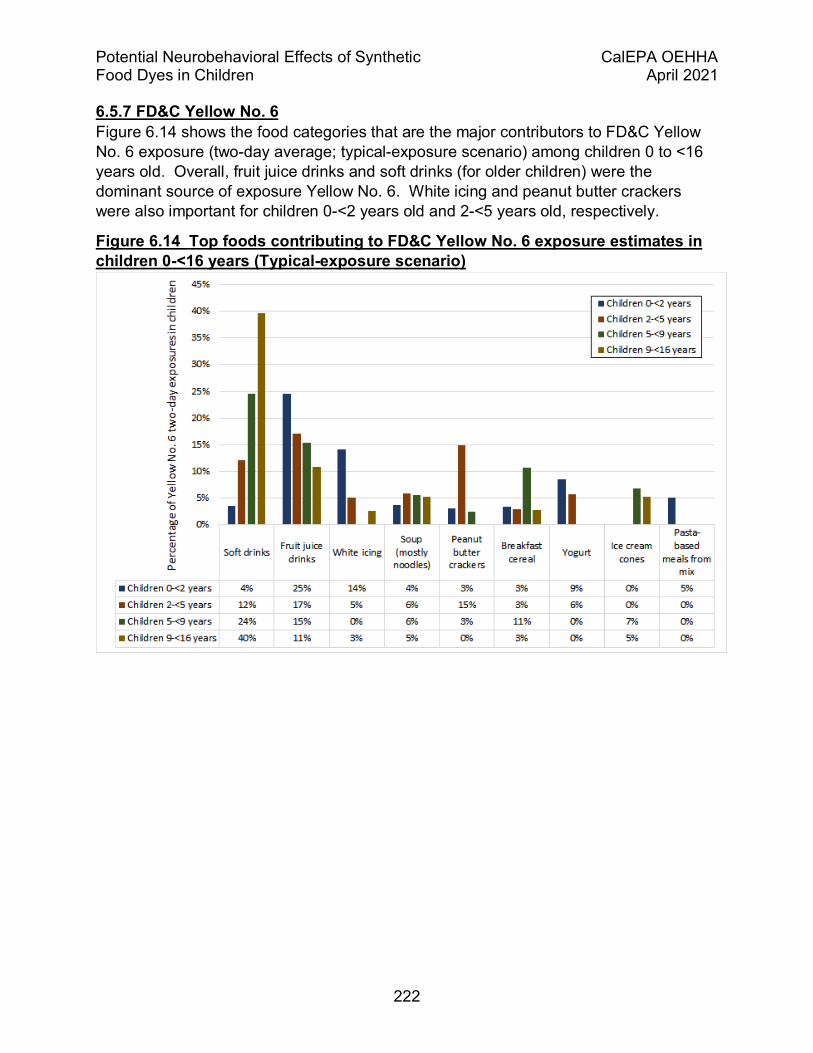
Potential Neurobehavioral Effects of Synthetic CalEPA OEHHA Food Dyes in Children April 2021
222
6.5.7 FD&C Yellow No. 6 Figure 6.14 shows the food categories that are the major contributors to FD&C Yellow No. 6 exposure (two-day average; typical-exposure scenario) among children 0 to <16 years old. Overall, fruit juice drinks and soft drinks (for older children) were the dominant source of exposure Yellow No. 6. White icing and peanut butter crackers were also important for children 0-<2 years old and 2-<5 years old, respectively.
Figure 6.14 Top foods contributing to FD&C Yellow No. 6 exposure estimates in children 0-<16 years (Typical-exposure scenario)
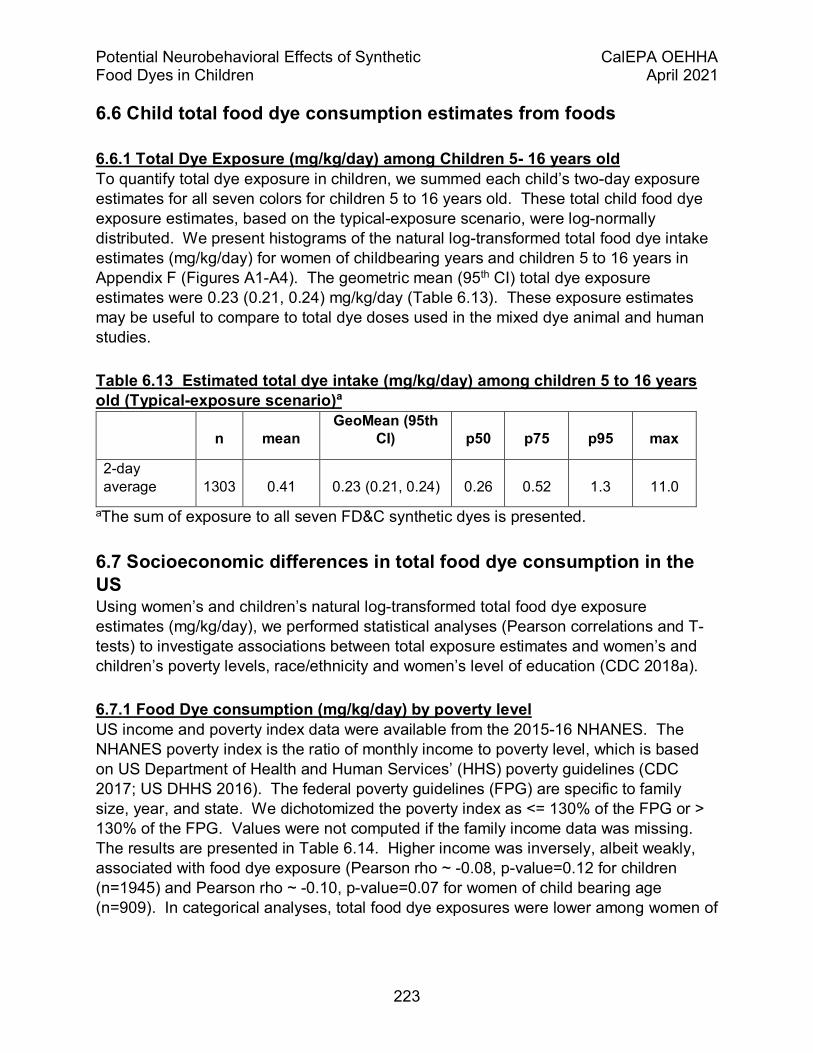
Potential Neurobehavioral Effects of Synthetic CalEPA OEHHA Food Dyes in Children April 2021
223
6.6 Child total food dye consumption estimates from foods
6.6.1 Total Dye Exposure (mg/kg/day) among Children 5- 16 years old To quantify total dye exposure in children, we summed each child’s two-day exposure estimates for all seven colors for children 5 to 16 years old. These total child food dye exposure estimates, based on the typical-exposure scenario, were log-normally distributed. We present histograms of the natural log-transformed total food dye intake estimates (mg/kg/day) for women of childbearing years and children 5 to 16 years in Appendix F (Figures A1-A4). The geometric mean (95th CI) total dye exposure estimates were 0.23 (0.21, 0.24) mg/kg/day (Table 6.13). These exposure estimates may be useful to compare to total dye doses used in the mixed dye animal and human studies.
Table 6.13 Estimated total dye intake (mg/kg/day) among children 5 to 16 years old (Typical-exposure scenario)a
n mean GeoMean (95th
CI) p50 p75 p95 max
2-day average 1303 0.41 0.23 (0.21, 0.24) 0.26 0.52 1.3 11.0
aThe sum of exposure to all seven FD&C synthetic dyes is presented.
6.7 Socioeconomic differences in total food dye consumption in the US Using women’s and children’s natural log-transformed total food dye exposure estimates (mg/kg/day), we performed statistical analyses (Pearson correlations and T-tests) to investigate associations between total exposure estimates and women’s and children’s poverty levels, race/ethnicity and women’s level of education (CDC 2018a).
6.7.1 Food Dye consumption (mg/kg/day) by poverty level US income and poverty index data were available from the 2015-16 NHANES. The NHANES poverty index is the ratio of monthly income to poverty level, which is based on US Department of Health and Human Services’ (HHS) poverty guidelines (CDC 2017; US DHHS 2016). The federal poverty guidelines (FPG) are specific to family size, year, and state. We dichotomized the poverty index as <= 130% of the FPG or > 130% of the FPG. Values were not computed if the family income data was missing. The results are presented in Table 6.14. Higher income was inversely, albeit weakly, associated with food dye exposure (Pearson rho ~ -0.08, p-value=0.12 for children (n=1945) and Pearson rho ~ -0.10, p-value=0.07 for women of child bearing age (n=909). In categorical analyses, total food dye exposures were lower among women of
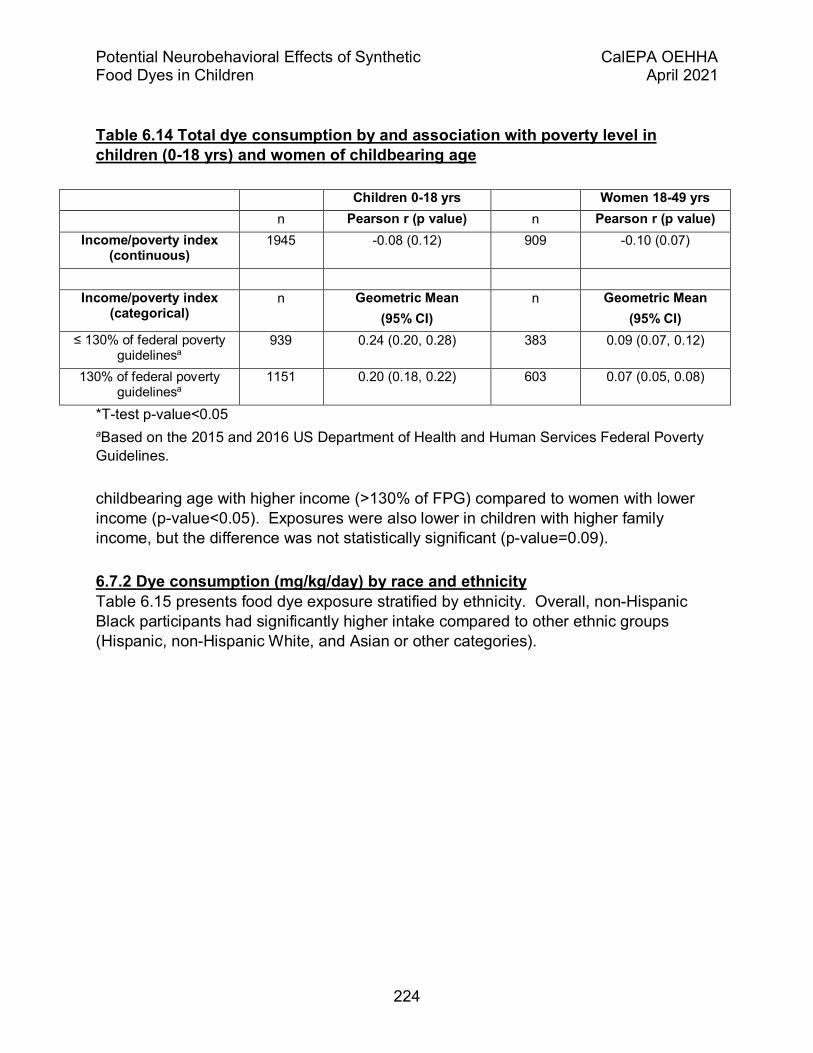
Potential Neurobehavioral Effects of Synthetic CalEPA OEHHA Food Dyes in Children April 2021
224
Table 6.14 Total dye consumption by and association with poverty level in children (0-18 yrs) and women of childbearing age
Children 0-18 yrs Women 18-49 yrs n Pearson r (p value) n Pearson r (p value)
Income/poverty index (continuous)
1945 -0.08 (0.12) 909 -0.10 (0.07)
Income/poverty index
(categorical) n Geometric Mean
(95% CI) n Geometric Mean
(95% CI) ≤ 130% of federal poverty
guidelinesa 939 0.24 (0.20, 0.28) 383 0.09 (0.07, 0.12)
130% of federal poverty guidelinesa
1151 0.20 (0.18, 0.22) 603 0.07 (0.05, 0.08)
*T-test p-value<0.05 aBased on the 2015 and 2016 US Department of Health and Human Services Federal Poverty Guidelines.
childbearing age with higher income (>130% of FPG) compared to women with lower income (p-value<0.05). Exposures were also lower in children with higher family income, but the difference was not statistically significant (p-value=0.09).
6.7.2 Dye consumption (mg/kg/day) by race and ethnicity Table 6.15 presents food dye exposure stratified by ethnicity. Overall, non-Hispanic Black participants had significantly higher intake compared to other ethnic groups (Hispanic, non-Hispanic White, and Asian or other categories).

Potential Neurobehavioral Effects of Synthetic CalEPA OEHHA Food Dyes in Children April 2021
225
Table 6.15 Dye consumption (mg/kg/day) by race and ethnicity, children (0-18) and women of childbearing age (18-49 years)
Children 0-18 years Women 18-49 years
Race/ethnicity
n
Geometric mean
(95% CI)
n
Geometric mean
(95% CI)
Non-Hispanic White 666 0.19 (0.17, 0.22) 305 0.07 (0.05, 0.09)
Non-Hispanic Black 521 0.33 (0.28, 0.39)** 251 0.11 (0.09, 0.14)**
Mexican American/Other Hispanic 722 0.20 (0.16, 0.24) 330 0.07 (0.05, 0.08)
Asian/othera 294 0.19 (0.14, 0.27) 154 0.06 (0.04, 0.09)
**T-test p-value<0.01; reference group for analysis: Non-Hispanic White. Abbreviations: Asian/other (Non-Hispanic Asian and other race/multi-racial) aCategory includes Non-Hispanic Asian and Other Race/Multi-Racial.
6.7.3 Dye consumption (mg/kg/day) by level of education, women of childbearing age (18-49 years) Table 6.16 presents women’s food dye exposure stratified by level of education. Food dye exposure was significantly lower in participants with more education.
Table 6.16 Dye consumption (mg/kg/day) by level of education, women of childbearing age (18-49 years)
Children 0-18 years Women 18-49 years
Education
n
Geometric mean
(95% CI)
n
Geometric mean
(95% CI)
High school/GED or less 260 0.10 (0.08, 0.13)*
More than high school/GED 620 0.06 (0.05, 0.08)
*T-test p-value<0.05
6.7.4 Summary Our analysis of socioeconomic determinants of food dye exposure demonstrate higher intake among non-Hispanic Black participants compared to non-Hispanic whites. The data suggest higher exposure in lower income families with less education, although the differences are not statistically significant. These results are based on univariate analyses and should be considered preliminary and hypothesis generating, rather than definitive.

Potential Neurobehavioral Effects of Synthetic CalEPA OEHHA Food Dyes in Children April 2021
226
Another limitation of this analysis is that the availability of food products in different neighborhoods in the US may vary, impacting exposure. For example, markets in “food deserts” or lower income communities might not carry the same range of products available in more affluent communities, limiting choices. Also, some US supermarket chains, often more expensive, have explicit policies prohibiting sales of foods with synthetic food coloring. Thus, consumers without access to these stores may have higher exposure because their neighborhood markets are more likely to sell foods containing synthetic food dyes even if they are purchasing the same general food categories as consumers in other neighborhoods. Thus, differences in exposure associated with socioeconomic variables may, in part, be due to food systems that unevenly distribute synthetic food dye-containing products into some communities.
6.8 Exposures to FD&C food dyes from over-the-counter medications, prenatal vitamins We estimated pregnant women and children’s FD&C batch-certified synthetic food dye exposure based on UC Davis laboratory measurements ((Lehmkuhler et al. 2020); see Appendix E for measurement methods and results) of 18 brands of over-the-counter (OTC) medications and vitamins, including children's cold and cough syrups, pain relievers/fever reducers, and gummie vitamins, as well as prenatal vitamins. To estimate exposure, we first averaged measurements from each brand (n = 3 measurements representing different lot numbers) and calculated food dye intakes based on the single and maximum recommended daily dosages of the OTC medications or vitamins using standard US EPA body weight reference values (Kleinman et al. 2011). Tables 6.17-6.18 present the estimated FD&C Red No. 40 and FD&C Blue No 2 intakes from OTC medications to children of varying age groups. Tables 6.19-6.20 presents the average estimated FD&C Red No. 40, FD&C Blue No. 1, FD&C Yellow No. 5 and FD&C Yellow No. 6 intakes to children from gummie vitamins, and pregnant women from prenatal vitamins (tablets and softgels).
6.8.1 Estimated FD&C Red No. 40 and Blue No. 1 exposures to children from pain relievers/fever reducers (2 to <11 years) Table 6.17 presents the FD&C Red No. 40 and FD&C Blue No. 1 exposure estimates (mg/kg/day) from five brands of children’s syrup pain relievers/fever reducer OTC medicines. The highest estimated exposures for children 2 to <11 years old were from the Brand 2, grape-flavored pain reliever/fever reducer. The estimated FD&C Red No. 40 exposures ranged from 0.029 to 0.032 mg/kg/day for 1 dose/day and 0.10 to 0.13 mg/kg/day for 4 doses/day. The estimated FD&C Blue No. 1 exposures ranged from 005 to 0.006 mg/kg/day for 1 dose/day and 0.018 to 0.023 mg/kg/day for 4 doses/day (Table 6.17).
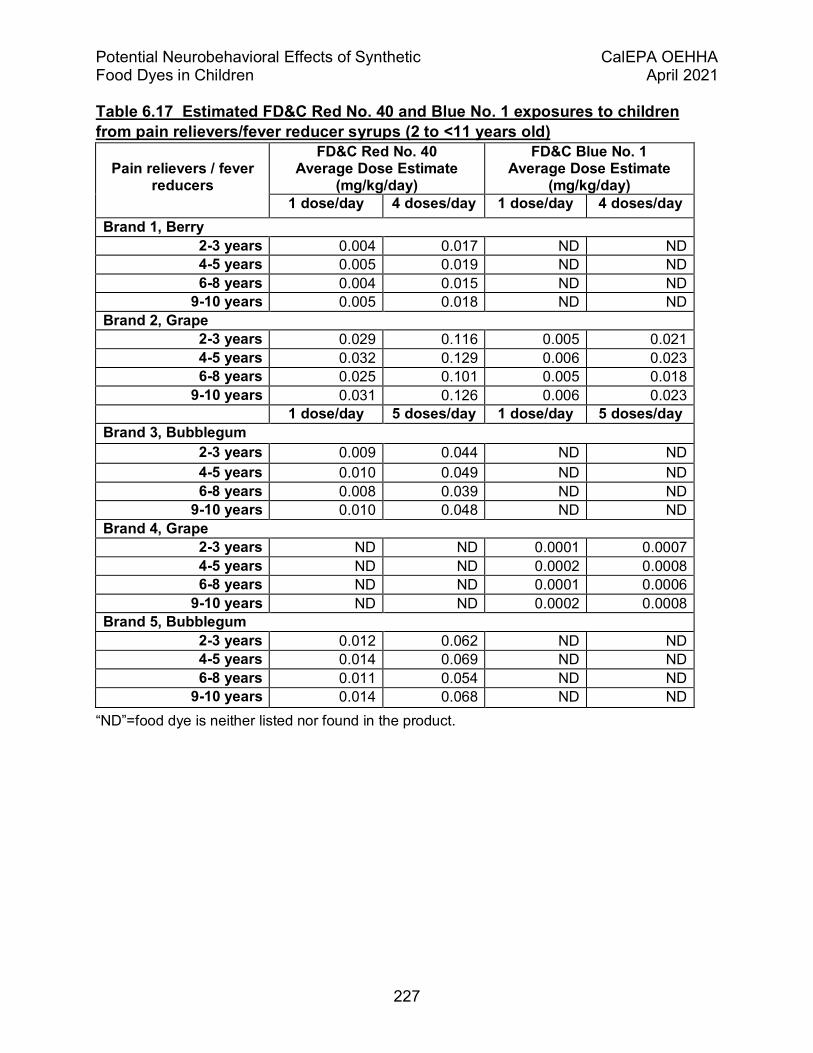
Potential Neurobehavioral Effects of Synthetic CalEPA OEHHA Food Dyes in Children April 2021
227
Table 6.17 Estimated FD&C Red No. 40 and Blue No. 1 exposures to children from pain relievers/fever reducer syrups (2 to <11 years old)
Pain relievers / fever
reducers
FD&C Red No. 40 Average Dose Estimate
(mg/kg/day)
FD&C Blue No. 1 Average Dose Estimate
(mg/kg/day) 1 dose/day 4 doses/day 1 dose/day 4 doses/day
Brand 1, Berry 2-3 years 0.004 0.017 ND ND 4-5 years 0.005 0.019 ND ND 6-8 years 0.004 0.015 ND ND
9-10 years 0.005 0.018 ND ND Brand 2, Grape
2-3 years 0.029 0.116 0.005 0.021 4-5 years 0.032 0.129 0.006 0.023 6-8 years 0.025 0.101 0.005 0.018
9-10 years 0.031 0.126 0.006 0.023 1 dose/day 5 doses/day 1 dose/day 5 doses/day
Brand 3, Bubblegum 2-3 years 0.009 0.044 ND ND 4-5 years 0.010 0.049 ND ND 6-8 years 0.008 0.039 ND ND
9-10 years 0.010 0.048 ND ND Brand 4, Grape
2-3 years ND ND 0.0001 0.0007 4-5 years ND ND 0.0002 0.0008 6-8 years ND ND 0.0001 0.0006
9-10 years ND ND 0.0002 0.0008 Brand 5, Bubblegum
2-3 years 0.012 0.062 ND ND 4-5 years 0.014 0.069 ND ND 6-8 years 0.011 0.054 ND ND
9-10 years 0.014 0.068 ND ND “ND”=food dye is neither listed nor found in the product.
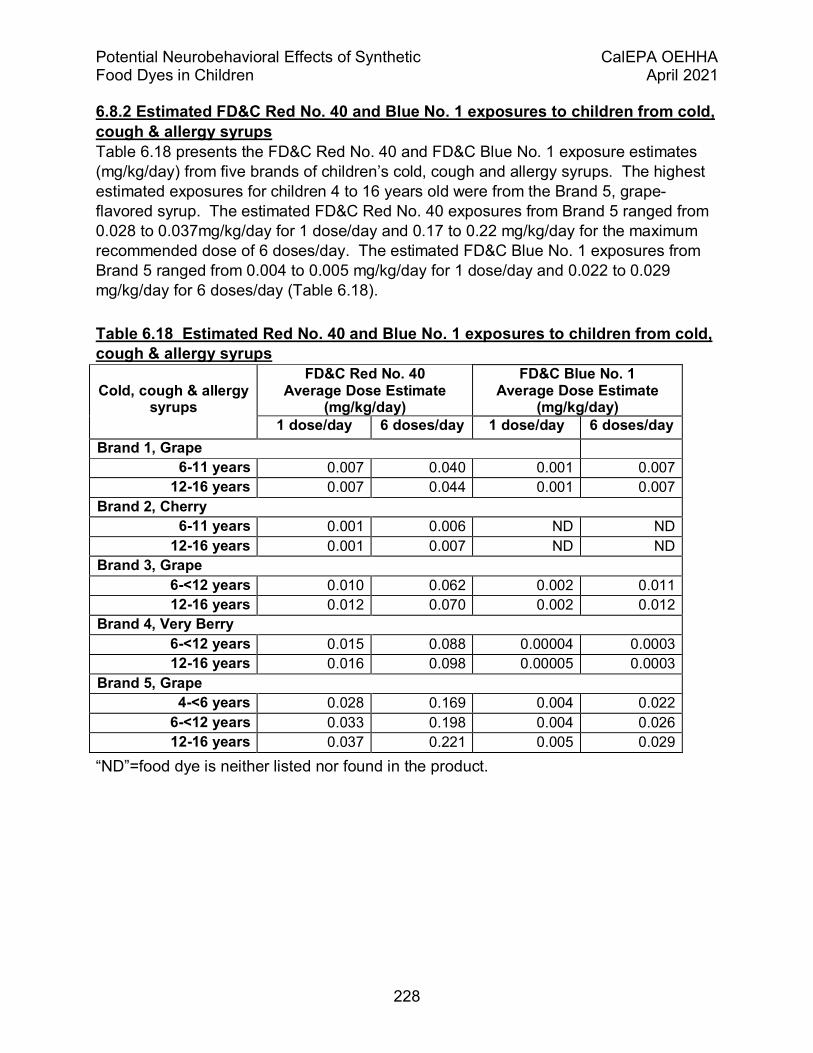
Potential Neurobehavioral Effects of Synthetic CalEPA OEHHA Food Dyes in Children April 2021
228
6.8.2 Estimated FD&C Red No. 40 and Blue No. 1 exposures to children from cold, cough & allergy syrups Table 6.18 presents the FD&C Red No. 40 and FD&C Blue No. 1 exposure estimates (mg/kg/day) from five brands of children’s cold, cough and allergy syrups. The highest estimated exposures for children 4 to 16 years old were from the Brand 5, grape-flavored syrup. The estimated FD&C Red No. 40 exposures from Brand 5 ranged from 0.028 to 0.037mg/kg/day for 1 dose/day and 0.17 to 0.22 mg/kg/day for the maximum recommended dose of 6 doses/day. The estimated FD&C Blue No. 1 exposures from Brand 5 ranged from 0.004 to 0.005 mg/kg/day for 1 dose/day and 0.022 to 0.029 mg/kg/day for 6 doses/day (Table 6.18).
Table 6.18 Estimated Red No. 40 and Blue No. 1 exposures to children from cold, cough & allergy syrups
Cold, cough & allergy
syrups
FD&C Red No. 40 Average Dose Estimate
(mg/kg/day)
FD&C Blue No. 1 Average Dose Estimate
(mg/kg/day) 1 dose/day 6 doses/day 1 dose/day 6 doses/day
Brand 1, Grape 6-11 years 0.007 0.040 0.001 0.007
12-16 years 0.007 0.044 0.001 0.007 Brand 2, Cherry
6-11 years 0.001 0.006 ND ND 12-16 years 0.001 0.007 ND ND
Brand 3, Grape 6-<12 years 0.010 0.062 0.002 0.011 12-16 years 0.012 0.070 0.002 0.012
Brand 4, Very Berry 6-<12 years 0.015 0.088 0.00004 0.0003 12-16 years 0.016 0.098 0.00005 0.0003
Brand 5, Grape 4-<6 years 0.028 0.169 0.004 0.022
6-<12 years 0.033 0.198 0.004 0.026 12-16 years 0.037 0.221 0.005 0.029
“ND”=food dye is neither listed nor found in the product.

Potential Neurobehavioral Effects of Synthetic CalEPA OEHHA Food Dyes in Children April 2021
229
6.8.3 Estimated FD&C Red No. 40, Blue No. 1, Yellow No. 5 and Yellow No. 6 exposures to children from vitamin gummies Overall, children’s average food dye exposure estimates from gummy vitamins were relatively low. The highest estimate was for Red No. 40 from Brand 3 vitamins (Red, Yellow & Green) (Table 6.19).
Table 6.19 Estimated children’s, Red No. 40, Blue No. 1, Yellow No. 5 and Yellow No. 6 exposures from children's gummie vitamins
Children's vitamins
(gummies of various colors)
FD&C Red No. 40 Average Dose Estimate
(mg/kg/day)
FD&C Blue No. 1 Average Dose Estimate
(mg/kg/day)
FD&C Yellow No. 5 Average Dose Estimate
(mg/kg/day)
FD&C Yellow No. 6 Average Dose Estimate
(mg/kg/day) 1 gummy
/day 2 gummies
/day 1 gummy
/day 2 gummies
/day 1 gummy
/day 2 gummies
/day 1 gummy
/day 2 gummies
/day Brand 1 (Red, Orange & Purple)
2-<3 years 0.04 NC 0.002 NC ND ND ND ND 3-<6 years 0.05 0.11 0.003 0.006 ND ND ND ND
6 -<11 years 0.03 0.06 0.002 0.004 ND ND ND ND 11-<16 years 0.02 0.03 0.001 0.002 ND ND ND ND
Brand 2 (Red, Orange & Purple) 2-<3 years 0.03 NC 0.002 NC ND ND 0.01 NC 3-<6 years 0.04 0.08 0.002 0.004 ND ND 0.01 0.03
6 -<11 years 0.02 0.05 0.001 0.002 ND ND 0.008 0.02 11-<16 years 0.01 0.03 0.001 0.002 ND ND 0.005 0.01
Brand 3 (Red, Yellow & Green) 2-<3 years 0.07 NC 0.004 NC 0.02 NC ND ND 3-<6 years 0.11 0.22 0.005 0.01 0.02 0.05 ND ND
6 -<11 years 0.06 0.13 0.003 0.006 0.01 0.03 ND ND 11-<16 years 0.04 0.07 0.002 0.004 0.008 0.02 ND ND
“ND”= Not detected: food dye is neither listed nor found in the product. “NC” = Not calculated because 2 gummy vitamins per day is not recommended for children under 3 years of age.
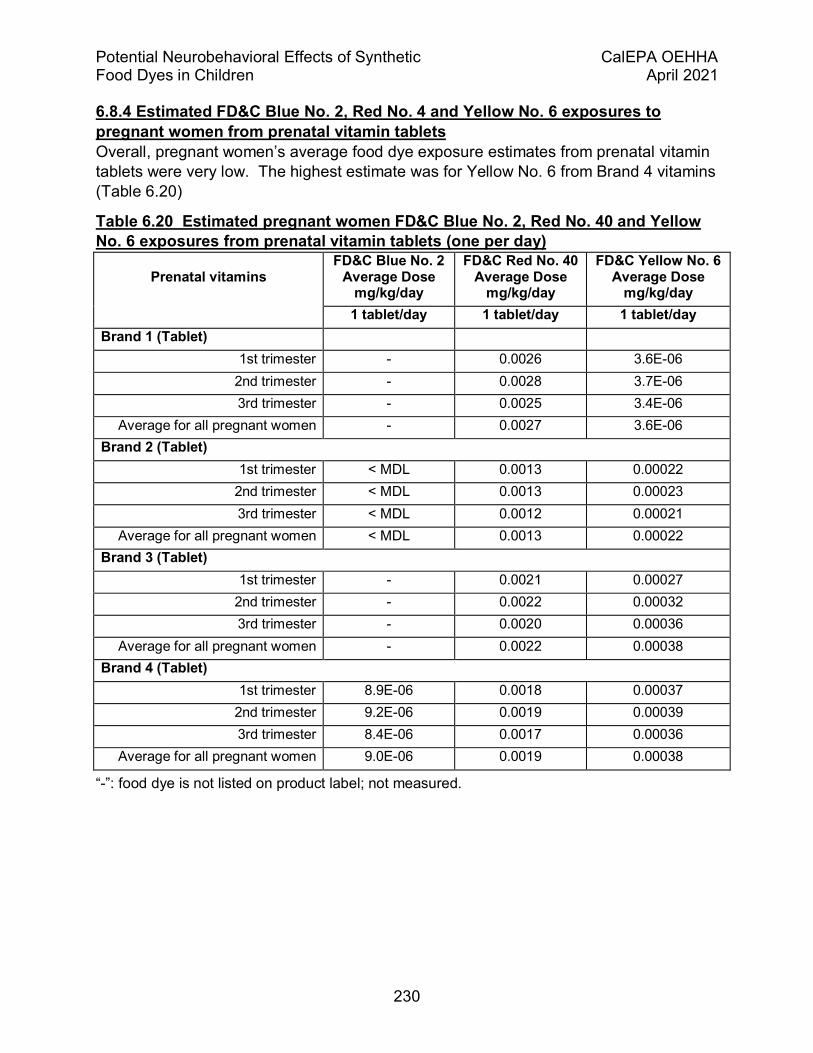
Potential Neurobehavioral Effects of Synthetic CalEPA OEHHA Food Dyes in Children April 2021
230
6.8.4 Estimated FD&C Blue No. 2, Red No. 4 and Yellow No. 6 exposures to pregnant women from prenatal vitamin tablets Overall, pregnant women’s average food dye exposure estimates from prenatal vitamin tablets were very low. The highest estimate was for Yellow No. 6 from Brand 4 vitamins (Table 6.20)
Table 6.20 Estimated pregnant women FD&C Blue No. 2, Red No. 40 and Yellow No. 6 exposures from prenatal vitamin tablets (one per day)
Prenatal vitamins
FD&C Blue No. 2 Average Dose
mg/kg/day
FD&C Red No. 40 Average Dose
mg/kg/day
FD&C Yellow No. 6 Average Dose
mg/kg/day 1 tablet/day 1 tablet/day 1 tablet/day
Brand 1 (Tablet) 1st trimester - 0.0026 3.6E-06
2nd trimester - 0.0028 3.7E-06 3rd trimester - 0.0025 3.4E-06
Average for all pregnant women - 0.0027 3.6E-06 Brand 2 (Tablet)
1st trimester < MDL 0.0013 0.00022 2nd trimester < MDL 0.0013 0.00023 3rd trimester < MDL 0.0012 0.00021
Average for all pregnant women < MDL 0.0013 0.00022 Brand 3 (Tablet)
1st trimester - 0.0021 0.00027 2nd trimester - 0.0022 0.00032 3rd trimester - 0.0020 0.00036
Average for all pregnant women - 0.0022 0.00038 Brand 4 (Tablet)
1st trimester 8.9E-06 0.0018 0.00037 2nd trimester 9.2E-06 0.0019 0.00039 3rd trimester 8.4E-06 0.0017 0.00036
Average for all pregnant women 9.0E-06 0.0019 0.00038
“-”: food dye is not listed on product label; not measured.

Potential Neurobehavioral Effects of Synthetic CalEPA OEHHA Food Dyes in Children April 2021
231
6.8.5 Estimated FD&C Blue No. 1 and Red No. 4 exposures to pregnant women from prenatal vitamin softgels Overall, pregnant women’s average food dye exposure estimates from prenatal vitamin softgels were very low. The highest estimate was for Red No. 40 (Table 6.21). None of the exposure estimates exceeded the US FDA and JECFA ADIs.
Table 6.21 Estimated pregnant women FD&C Blue No. 1 and Red No. 40 exposures from prenatal vitamin softgel (one per day)
Prenatal vitamins
FD&C Blue No. 1 Average Dose
mg/kg/day
FD&C Red No. 40 Average Dose
mg/kg/day 1 softgel/day 1 softgel/day
Brand 5 (Softgel) 1st trimester 0.0006 0.0046
2nd trimester 0.0006 0.0048 3rd trimester 0.0005 0.0043
Average for all pregnant women 0.0006 0.0046

Potential Neurobehavioral Effects of Synthetic CalEPA OEHHA Food Dyes in Children April 2021
232
6.8.6 Summary Overall, the highest exposure estimates from OTC medications and vitamins were for FD&C Red No. 40 from children’s pain reliever/fever reducer syrups and cold, cough and allergy syrups. If a child were to take several doses of some brands during a single day, their intake of Red No. 40 would not exceed the FDA and JECFA ADI of 7 mg/kg/day (Tables 6.17-6.18). It is likely that consumption of medications for acute illnesses would be of short duration (a few days or weeks). Consumption of some medications, such as allergy medications or NSAIDs for persistent conditions, however, would result in sub-chronic or chronic exposures.
Children’s FD&C Red No. 40 intake estimates based on the recommended maximum daily dosages of Brand 2, grape-flavored pain reliever/fever reducer syrup, which had the highest exposure estimates, did not exceed the US FDA and JECFA ADI (7 mg/kg/day) (Table 6.17; see Risk Characterization, Chapter 7). The estimated daily intake among children 2-10 years old taking the recommended maximum daily dosage of Brand 2 syrup ranged from 0.10 to 0.13 mg/kg/day. These estimated daily FD&C Red No. 40 child intakes from Brand 2 pain reliever/fever reducer syrup were 43% to 56% of the mean intake estimates (typical-exposure scenario) for children 2-10 years old based on the NHANES food consumption data (Table 6.10).
Children’s FD&C Red No. 40 intake estimates based on the recommended maximum daily doses of Brand 4, Very Berry and Brand 5, grape-flavored cold & cough syrups, also did not exceed the US FDA and JECFA ADI (7 mg/kg/day) (Table 7.18; see Risk Characterization, Chapter 7). The estimated daily intakes among children 6-<12 years and 12-16 years taking the recommended maximum daily dose of Brand 4 syrup were 0.088 mg/kg/day and 0.098 mg/kg/day, respectively. These estimated daily FD&C Red No. 40 intakes from Brand 4 cold & cough syrup were 61% of the mean intake estimates (typical-exposure scenario) for children 12-16 years based on the NHANES food consumption data (Table 6.10).
The estimated daily FD&C Red No. 40 intake among children 6-<12 years and 12-16 years taking the maximum daily recommended dose of Brand 5, Grape syrup, were 0.198 mg/kg/day and 0.221mg/kg/day, respectively (Table 6.18). These estimated daily FD&C Red No. 40 intakes from Brand 5 cold & cough syrup were 138% of the mean intake estimates (typical-exposure scenario) for children 12-16 years based on the NHANES food consumption data (Table 6.10).
6.9 Children’s estimated exposures to FD&C food dyes from sampled foods and beverages
We estimated children’s FD&C food dye exposures (mg/kg/day) based on laboratory measurements by UC Davis of breakfast cereals, frostings and icings, frozen desserts, ice cream cones, decorations/chips for baking, fruit snacks, juice drinks, fruit flavored

Potential Neurobehavioral Effects of Synthetic CalEPA OEHHA Food Dyes in Children April 2021
233
soft drinks, water enhancers, and reconstituted powdered fruit-flavored drinks (See Appendix E). Children’s mean and maximum food dye intakes (mg/kg/day) for each product were calculated using standard US EPA body weight reference values (USEPA 2011) and assuming consumption of one serving by children >2 years based on the serving size on the nutrition facts label. For children 0-<2 years old, we assumed consumption of one-half the labeled serving size. The mean intake was based on the average of measurements performed on three samples of each product with different lot numbers, thereby reflecting different production runs within each brand. The maximum intake was based on the highest of the three measurements.
Tables 6.22-6.27 present children’s estimated FD&C Blue No. 1, Red No. 3, Red No. 40, Yellow No. 5 and Yellow No. 6 intakes from breakfast cereals, fruit-flavored snacks, frozen desserts, and confections, i.e., ice cream cones, frostings and icings, and decoration chips for baking (ages 0 to <16 years). Tables 6.28-6.31 present the estimated FD&C Blue No. 1, Red No. 40, Yellow No. 5 and Yellow No. 6 intakes from four types of beverages: juice drinks; fruit-flavored soft drinks; water enhancers and reconstituted flavored fruit-powder drinks.
We also compared the UC Davis laboratory measurements of FD&C Blue No. 1, Red No. 3, Red No. 40, Yellow No. 5 and Yellow No. 6 in food with those reported by US FDA for the same food categories (Doell et al. 2016). In the present assessment, we measured two to three brands per food category (US FDA measured many more foods per food category). Overall, the range of food dye concentrations (mg/kg) UC Davis reported in breakfast cereals, decorations/chips for baking, frozen desserts, fruit snacks, ice cream cones, juice drinks and soft drinks were similar for the majority of dyes measured (see Appendix F, Tables A24 and A25). The maximum FD&C Red No. 3, Red No. 40, Yellow No. 5 and Yellow No 6 concentrations (mg/kg) UC Davis reported in frosting and icings, however, ranged between 1.7 to 168 times lower than those reported by Doell et al. 2016In contrast to the Doell et al. 2016 study, FD&C Blue No. 2 was not listed on the Nutrition Facts Labels or measured in any of the foods sampled for the current study. Doell et al. 2016 reported measurable levels of FD&C Blue No. 2 in breakfast cereal, decoration/chips for baking, frostings and icings, frozen desserts and snack foods. Food dye concentrations in powdered fruit-flavored drinks (reconstituted) were not reported by US FDA, so no comparison could be made.
6.9.1 Children’s estimated exposures to FD&C food dyes from sampled foods Overall, children’s mean food dye intakes (mg/kg/day) were highest from single servings of fruit drinks and fruit flavored soft drinks among 0 to <6 year olds (Tables 6.28 and 6.29). The mean intake of FD&C Red No. 40 from one serving of juice drink (Brand 1) and fruit flavored soft drink (Brand 1) ranged from 1.07 to 1.44 mg/kg/day and 0.90 to 1.21 mg/kg/day, respectively, for children 0 to <6 years old (Tables 6.28 and 6.29).
Potential Neurobehavioral Effects of Synthetic CalEPA OEHHA Food Dyes in Children April 2021
234
Children’s maximum food dye intakes (mg/kg/day) were also highest for FD&C Red No. 40 from servings of fruit drinks and fruit-flavored soft drinks (Tables 6.28 and 6.29). The maximum intake of FD&C Red No 40 from one serving of juice drink (Brand 1) and fruit flavored soft drink (Brand 1) ranged from 1.09 to 1.47 mg/kg/day and 0.91 to 1.21 mg/kg/day, respectively, for children 0 to <6 years old (Tables 6.28 and 6.29).
Children’s mean and maximum FD&C Red No. 3 intake estimates based on a daily serving of fruit flavored snacks (Brand 2), frozen desserts (Brand 1), and frosting and icings (Brand 1) exceeded the JECFA ADI (0.1 mg/kg/day) (Tables 6.23, 6.24 and 6.26). The mean estimated daily FD&C Red No. 3 intakes among children 0-<16 years old eating a single serving of frozen dessert (Brand 1) and frosting (Brand 1) ranged from 0.13 to 0.53 mg/kg/day and 0.05 to 0.20 mg/kg/day, respectively. The hazard indices (that is, the margins by which estimated exposures exceed an ADI) for FD&C Red No. 3 based on mean child intake estimates for these foods ranged from 1.3-5.3 and 0.5-2.0, respectively.
The maximum estimated daily FD&C Red No. 3 intakes among children 0-<16 years old eating a single serving of frozen dessert (Brand 1) and frosting (Brand 1) ranged from 0.29 to 1.19 mg/kg/day and 0.06 to 0.23 mg/kg/day, respectively (Tables 6.24, and 6.26). The hazard indices for FD&C Red No. 3 based on maximum child intake estimates for these foods ranged from 2.9 to 10.9 and 0.6 to 2.3, respectively.
We also compared mean food dye intake estimates for children 0 to <16 years old from single servings of sampled foods to children’s single-day food dye intake estimates that we computed using US FDA laboratory measurements and NHANES food consumption data (Doell et al. 2016) (Tables 6.6, 6.9-6.12). The ranges of children’s mean intake estimates of FD&C Blue No. 1 (0.001 to 0.33 mg/kg/day), Red No. 3 (0.008 to 0.53 mg/kg/day), Red No. 40 (0.0002 to 1.44 mg/kg/day), Yellow No. 5 (0.003 to 0.53 mg/kg/day) and Yellow No. 6 (0.0 to 0.70 mg/kg/day) from a single serving of food were similar to our single-day food dye intake estimates (typical-exposure scenario) (See Section 4.1.8). For example, the ranges of children’s mean single-day intake estimates (typical-exposure scenario) presented in Section 4.1.8 (Tables 6.6, 6.9-6.12) were: FD&C Blue No. 1 (0.03 to 0.11 mg/kg/day); Red No. 3 (0.03 to 0.51 mg/kg/day); Red No. 40 (0.20 to 0.99 mg/kg/day); Yellow No. 5 (0.09 to 0.36 mg/kg/day); and Yellow No. 6 (0.07 to 0.20 mg/kg/day). The upper range of mean child intake estimates based on a single serving of food were higher for some dyes (FD&C Blue No. 1, Red No. 40, Yellow No. 5 and Yellow No. 6) compared with the mean intake estimates based on the US FDA food measurements and NHANES food consumption data. However, these mean food dye intake estimates based on single-servings for children 0 to <16 years old were almost all lower than the 95th% food dye intake estimates based on the US FDA laboratory and NHANES food consumption data (Tables 6.6, 6.9-6.12).

Potential Neurobehavioral Effects of Synthetic CalEPA OEHHA Food Dyes in Children April 2021
235
Table 6.22 Estimated FD&C Blue No. 1, Red No. 3, Red No. 40, Yellow No. 5, and Yellow No. 6 exposure to children from single daily serving of breakfast cereals
“-”: food dye is not listed on product label; not measured. Mean estimates represent the mean of three food dye measurements for each food; each measurement was performed on a different lot number (See Appendix E, data from A. Mitchell)). Maximum estimates were calculated using the highest measurement.
Breakfast Cereals
FD&C Blue No. 1 Average Dose Estimate
(mg/kg/day)
FD&C Red No. 3 Average Dose Estimate
(mg/kg/day)
FD&C Red No. 40 Average Dose Estimate
(mg/kg/day)
FD&C Yellow No. 5 Average Dose Estimate
(mg/kg/day)
FD&C Yellow No. 6 Average Dose Estimate
(mg/kg/day)
1 serving/day 1 serving/day 1 serving/day 1 serving/day 1 serving/day
Mean Max Mean Max Mean Max Mean Max Mean Max
Brand 1 0-<2 years (0.5 serving size) 0.02 0.02 - - 0.02 0.03 - - 0.43 0.47 2-<3 years 0.02 0.03 - - 0.02 0.03 - - 0.48 0.52 3-<6 years 0.02 0.02 - - 0.02 0.02 - - 0.35 0.39 6-<11 years 0.009 0.01 - - 0.01 0.01 - - 0.21 0.23 11-<16 years 0.005 0.006 - - 0.006 0.01 - - 0.12 0.13 Brand 2 0-<2 years (0.5 serving size) 0.06 0.08 - - 0.21 0.22 0.43 0.61 0.35 0.45 2-<3 years 0.07 0.08 - - 0.23 0.24 0.48 0.68 0.39 0.50 3-<6 years 0.05 0.06 - - 0.17 0.18 0.36 0.51 0.29 0.37 6-<11 years 0.03 0.04 - - 0.10 0.11 0.21 0.30 0.17 0.22 11-<16 years 0.02 0.02 - - 0.06 0.06 0.12 0.17 0.09 0.12
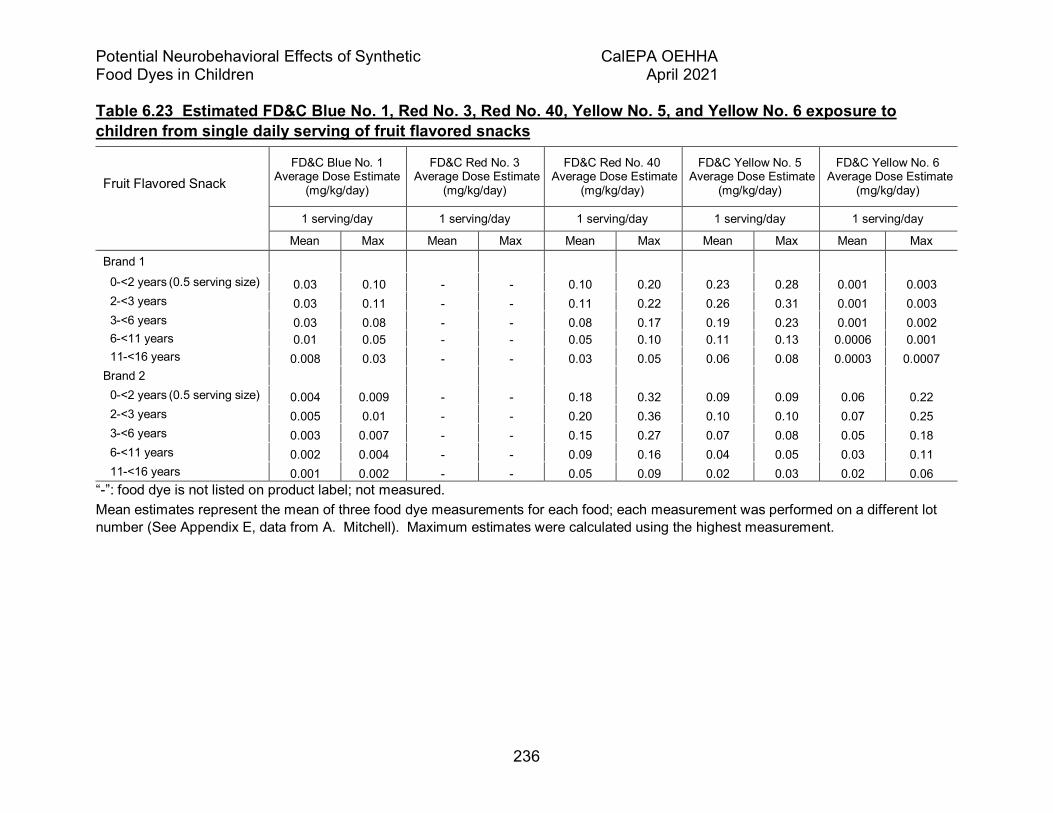
Potential Neurobehavioral Effects of Synthetic CalEPA OEHHA Food Dyes in Children April 2021
236
Table 6.23 Estimated FD&C Blue No. 1, Red No. 3, Red No. 40, Yellow No. 5, and Yellow No. 6 exposure to children from single daily serving of fruit flavored snacks
“-”: food dye is not listed on product label; not measured. Mean estimates represent the mean of three food dye measurements for each food; each measurement was performed on a different lot number (See Appendix E, data from A. Mitchell). Maximum estimates were calculated using the highest measurement.
Fruit Flavored Snack
FD&C Blue No. 1 Average Dose Estimate
(mg/kg/day)
FD&C Red No. 3 Average Dose Estimate
(mg/kg/day)
FD&C Red No. 40 Average Dose Estimate
(mg/kg/day)
FD&C Yellow No. 5 Average Dose Estimate
(mg/kg/day)
FD&C Yellow No. 6 Average Dose Estimate
(mg/kg/day)
1 serving/day 1 serving/day 1 serving/day 1 serving/day 1 serving/day
Mean Max Mean Max Mean Max Mean Max Mean Max
Brand 1 0-<2 years (0.5 serving size) 0.03 0.10 - - 0.10 0.20 0.23 0.28 0.001 0.003 2-<3 years 0.03 0.11 - - 0.11 0.22 0.26 0.31 0.001 0.003 3-<6 years 0.03 0.08 - - 0.08 0.17 0.19 0.23 0.001 0.002 6-<11 years 0.01 0.05 - - 0.05 0.10 0.11 0.13 0.0006 0.001 11-<16 years 0.008 0.03 - - 0.03 0.05 0.06 0.08 0.0003 0.0007 Brand 2 0-<2 years (0.5 serving size) 0.004 0.009 - - 0.18 0.32 0.09 0.09 0.06 0.22 2-<3 years 0.005 0.01 - - 0.20 0.36 0.10 0.10 0.07 0.25 3-<6 years 0.003 0.007 - - 0.15 0.27 0.07 0.08 0.05 0.18 6-<11 years 0.002 0.004 - - 0.09 0.16 0.04 0.05 0.03 0.11 11-<16 years 0.001 0.002 - - 0.05 0.09 0.02 0.03 0.02 0.06

Potential Neurobehavioral Effects of Synthetic CalEPA OEHHA Food Dyes in Children April 2021
237
Table 6.24 Estimated FD&C Blue No. 1, Red No. 3, Red No. 40, Yellow No. 5, and Yellow No. 6 exposure to children from single daily serving of frozen desserts
“-”: food dye is not listed on product label; not measured. Mean estimates represent the mean of three food dye measurements for each food; each measurement was performed on a different lot number (See Appendix E, data from A. Mitchell). Maximum estimates were calculated using the highest food dye measurement.
Frozen Dessert
FD&C Blue No. 1 Average Dose Estimate
(mg/kg/day)
FD&C Red No. 3 Average Dose Estimate
(mg/kg/day)
FD&C Red No. 40 Average Dose Estimate
(mg/kg/day)
FD&C Yellow No. 5 Average Dose Estimate
(mg/kg/day)
FD&C Yellow No. 6 Average Dose Estimate
(mg/kg/day)
1 serving/day 1 serving/day 1 serving/day 1 serving/day 1 serving/day
Mean Max Mean Max Mean Max Mean Max Mean Max
Brand 1 0-<2 years (0.5 serving size) - - 0.48 1.07 0.36 0.42 - - - - 2-<3 years - - 0.53 1.19 0.40 0.47 - - - - 3-<6 years - - 0.40 0.88 0.30 0.35 - - - - 6-<11 years - - 0.23 0.52 0.18 0.20 - - - - 11-<16 years - - 0.13 0.29 0.10 0.11 - - - - Brand 2 0-<2 years (0.5 serving size) 0.02 0,02 - - 0.05 0.07 0.04 0.06 0.07 0.09 2-<3 years 0.02 0.02 - - 0.06 0.07 0.05 0.06 0.08 0.10 3-<6 years 0.01 0.02 - - 0.04 0.06 0.04 0.05 0.06 0.07 6-<11 years 0.007 0.009 - - 0.03 0.03 0.02 0.03 0.03 0.04 11-<16 years 0.004 0.005 - - 0.01 0.02 0.01 0.02 0.08 0.02
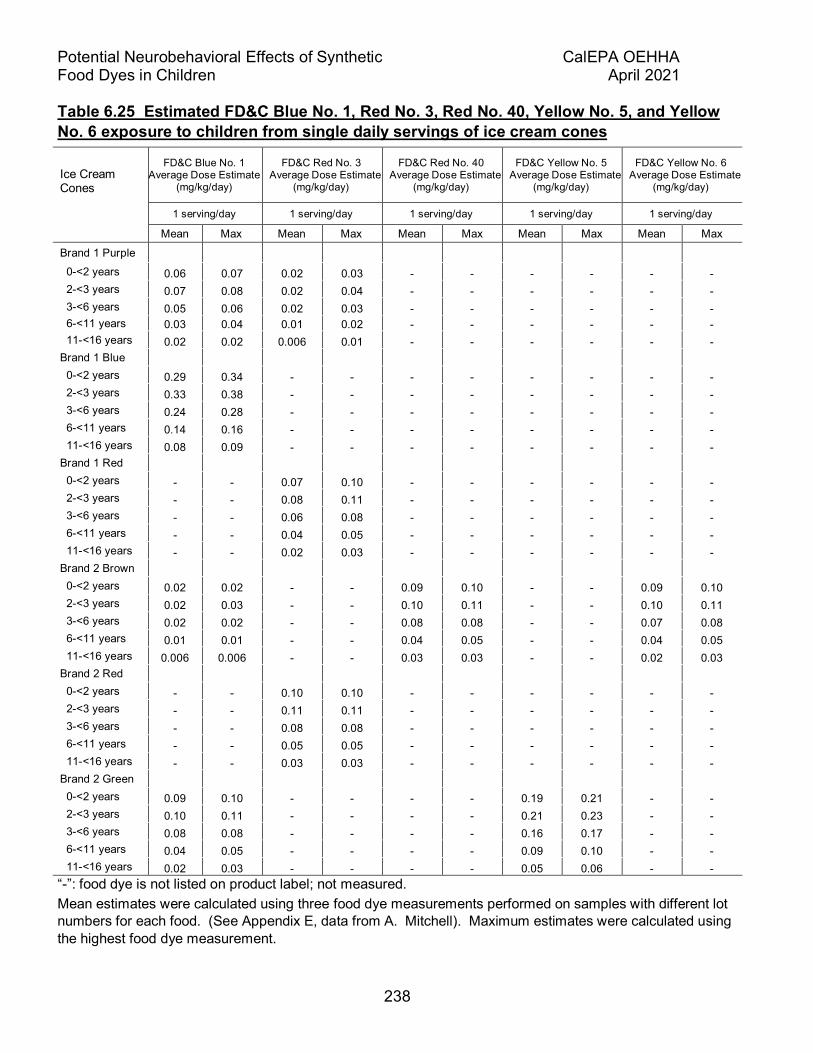
Potential Neurobehavioral Effects of Synthetic CalEPA OEHHA Food Dyes in Children April 2021
238
Table 6.25 Estimated FD&C Blue No. 1, Red No. 3, Red No. 40, Yellow No. 5, and Yellow No. 6 exposure to children from single daily servings of ice cream cones
“-”: food dye is not listed on product label; not measured. Mean estimates were calculated using three food dye measurements performed on samples with different lot numbers for each food. (See Appendix E, data from A. Mitchell). Maximum estimates were calculated using the highest food dye measurement.
Ice Cream Cones
FD&C Blue No. 1 Average Dose Estimate
(mg/kg/day)
FD&C Red No. 3 Average Dose Estimate
(mg/kg/day)
FD&C Red No. 40 Average Dose Estimate
(mg/kg/day)
FD&C Yellow No. 5 Average Dose Estimate
(mg/kg/day)
FD&C Yellow No. 6 Average Dose Estimate
(mg/kg/day)
1 serving/day 1 serving/day 1 serving/day 1 serving/day 1 serving/day
Mean Max Mean Max Mean Max Mean Max Mean Max
Brand 1 Purple 0-<2 years 0.06 0.07 0.02 0.03 - - - - - - 2-<3 years 0.07 0.08 0.02 0.04 - - - - - - 3-<6 years 0.05 0.06 0.02 0.03 - - - - - - 6-<11 years 0.03 0.04 0.01 0.02 - - - - - - 11-<16 years 0.02 0.02 0.006 0.01 - - - - - - Brand 1 Blue 0-<2 years 0.29 0.34 - - - - - - - - 2-<3 years 0.33 0.38 - - - - - - - - 3-<6 years 0.24 0.28 - - - - - - - - 6-<11 years 0.14 0.16 - - - - - - - - 11-<16 years 0.08 0.09 - - - - - - - - Brand 1 Red 0-<2 years - - 0.07 0.10 - - - - - - 2-<3 years - - 0.08 0.11 - - - - - - 3-<6 years - - 0.06 0.08 - - - - - - 6-<11 years - - 0.04 0.05 - - - - - - 11-<16 years - - 0.02 0.03 - - - - - - Brand 2 Brown 0-<2 years 0.02 0.02 - - 0.09 0.10 - - 0.09 0.10 2-<3 years 0.02 0.03 - - 0.10 0.11 - - 0.10 0.11 3-<6 years 0.02 0.02 - - 0.08 0.08 - - 0.07 0.08 6-<11 years 0.01 0.01 - - 0.04 0.05 - - 0.04 0.05 11-<16 years 0.006 0.006 - - 0.03 0.03 - - 0.02 0.03 Brand 2 Red 0-<2 years - - 0.10 0.10 - - - - - - 2-<3 years - - 0.11 0.11 - - - - - - 3-<6 years - - 0.08 0.08 - - - - - - 6-<11 years - - 0.05 0.05 - - - - - - 11-<16 years - - 0.03 0.03 - - - - - - Brand 2 Green 0-<2 years 0.09 0.10 - - - - 0.19 0.21 - - 2-<3 years 0.10 0.11 - - - - 0.21 0.23 - - 3-<6 years 0.08 0.08 - - - - 0.16 0.17 - - 6-<11 years 0.04 0.05 - - - - 0.09 0.10 - - 11-<16 years 0.02 0.03 - - - - 0.05 0.06 - -
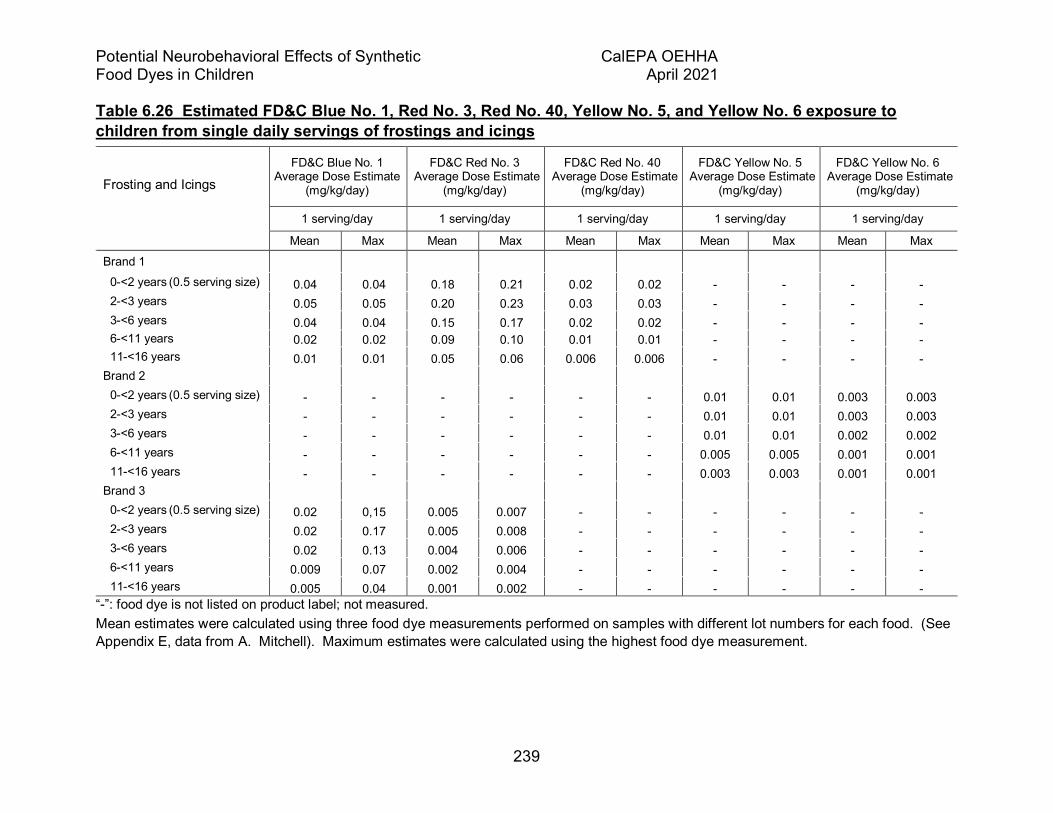
Potential Neurobehavioral Effects of Synthetic CalEPA OEHHA Food Dyes in Children April 2021
239
Table 6.26 Estimated FD&C Blue No. 1, Red No. 3, Red No. 40, Yellow No. 5, and Yellow No. 6 exposure to children from single daily servings of frostings and icings
“-”: food dye is not listed on product label; not measured. Mean estimates were calculated using three food dye measurements performed on samples with different lot numbers for each food. (See Appendix E, data from A. Mitchell). Maximum estimates were calculated using the highest food dye measurement.
Frosting and Icings
FD&C Blue No. 1 Average Dose Estimate
(mg/kg/day)
FD&C Red No. 3 Average Dose Estimate
(mg/kg/day)
FD&C Red No. 40 Average Dose Estimate
(mg/kg/day)
FD&C Yellow No. 5 Average Dose Estimate
(mg/kg/day)
FD&C Yellow No. 6 Average Dose Estimate
(mg/kg/day)
1 serving/day 1 serving/day 1 serving/day 1 serving/day 1 serving/day
Mean Max Mean Max Mean Max Mean Max Mean Max
Brand 1 0-<2 years (0.5 serving size) 0.04 0.04 0.18 0.21 0.02 0.02 - - - - 2-<3 years 0.05 0.05 0.20 0.23 0.03 0.03 - - - - 3-<6 years 0.04 0.04 0.15 0.17 0.02 0.02 - - - - 6-<11 years 0.02 0.02 0.09 0.10 0.01 0.01 - - - - 11-<16 years 0.01 0.01 0.05 0.06 0.006 0.006 - - - - Brand 2 0-<2 years (0.5 serving size) - - - - - - 0.01 0.01 0.003 0.003 2-<3 years - - - - - - 0.01 0.01 0.003 0.003 3-<6 years - - - - - - 0.01 0.01 0.002 0.002 6-<11 years - - - - - - 0.005 0.005 0.001 0.001 11-<16 years - - - - - - 0.003 0.003 0.001 0.001 Brand 3 0-<2 years (0.5 serving size) 0.02 0,15 0.005 0.007 - - - - - - 2-<3 years 0.02 0.17 0.005 0.008 - - - - - - 3-<6 years 0.02 0.13 0.004 0.006 - - - - - - 6-<11 years 0.009 0.07 0.002 0.004 - - - - - - 11-<16 years 0.005 0.04 0.001 0.002 - - - - - -

Potential Neurobehavioral Effects of Synthetic CalEPA OEHHA Food Dyes in Children April 2021
240
Table 6.27 Estimated FD&C Blue No. 1, Red No. 3, Red No. 40, Yellow No. 5, and Yellow No. 6 intakes to children from single daily servings of decoration/chips for baking
“-”: food dye is not listed on product label; not measured
Mean estimates were calculated using three food dye measurements performed on samples with different lot numbers for each food. (See Appendix E, data from A. Mitchell). Maximum estimates were calculated using the highest food dye measurement.
Decoration/Chips for Baking
FD&C Blue No. 1 Average Dose Estimate
(mg/kg/day)
FD&C Red No. 3 Average Dose Estimate
(mg/kg/day)
FD&C Red No. 40 Average Dose Estimate
(mg/kg/day)
FD&C Yellow No. 5 Average Dose Estimate
(mg/kg/day)
FD&C Yellow No. 6 Average Dose Estimate
(mg/kg/day)
1 serving/day 1 serving/day 1 serving/day 1 serving/day 1 serving/day
Mean Max Mean Max Mean Max Mean Max Mean Max
Brand 1 0-<2 years (0.5 serving size) 0.02 0.02 0.03 0.05 0.0008 0.0009 - - - - 2-<3 years 0.02 0.02 0.03 0.05 0.0009 0.001 - - - - 3-<6 years 0.02 0.02 0.02 0.04 0.0007 0.0008 - - - - 6-<11 years 0.009 0.01 0.01 0.02 0.0004 0.0004 - - - - 11-<16 years 0.005 0.006 0.008 0.01 0.0002 0.0002 - - - - Brand 2 0-<2 years (0.5 serving size) 0.02 0,03 0.04 0.05 0.02 0.02 0.03 0.03 0.02 0.02 2-<3 years 0.02 0.03 0.04 0.05 0.02 0.02 0.03 0.03 0.02 0.02 3-<6 years 0.01 0.03 0.03 0.04 0.02 0.02 0.02 0.02 0.01 0.01 6-<11 years 0.007 0.02 0.02 0.02 0.01 0.01 0.01 0.01 0.008 0.01 11-<16 years 0.004 0.008 0.01 0.01 0.005 0.006 0.01 0.01 0.005 0.005
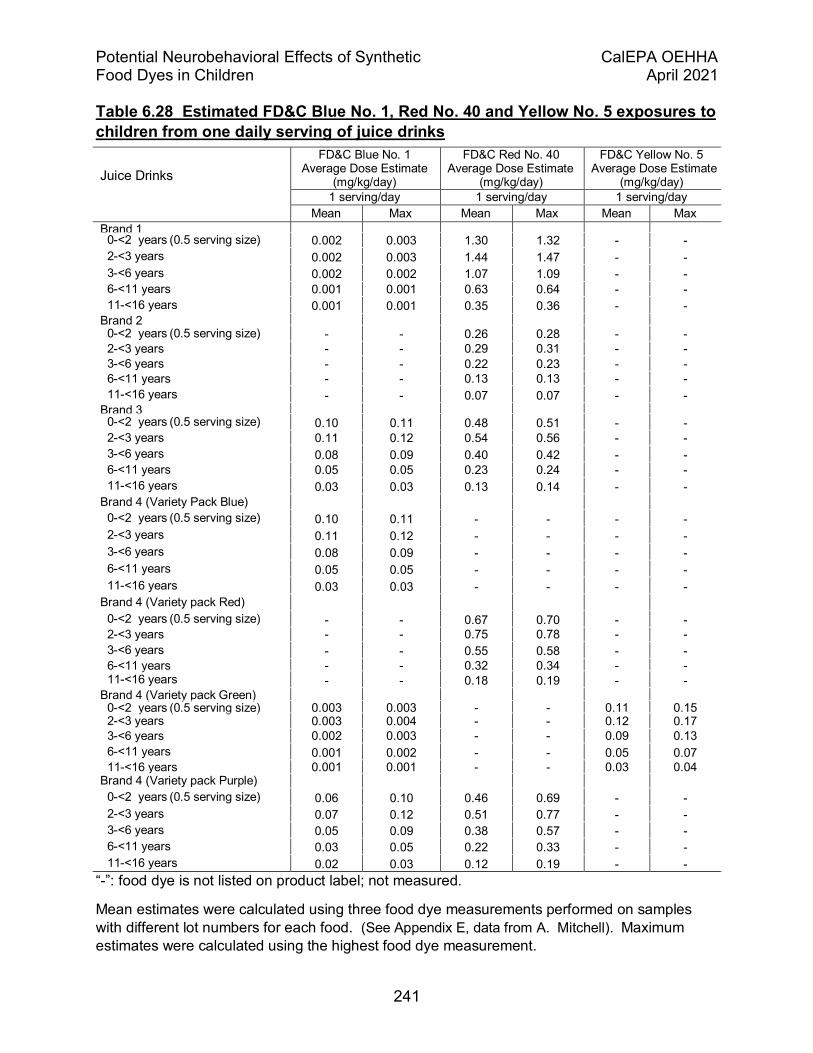
Potential Neurobehavioral Effects of Synthetic CalEPA OEHHA Food Dyes in Children April 2021
241
Table 6.28 Estimated FD&C Blue No. 1, Red No. 40 and Yellow No. 5 exposures to children from one daily serving of juice drinks
“-”: food dye is not listed on product label; not measured.
Mean estimates were calculated using three food dye measurements performed on samples with different lot numbers for each food. (See Appendix E, data from A. Mitchell). Maximum estimates were calculated using the highest food dye measurement.
Juice Drinks
FD&C Blue No. 1 Average Dose Estimate
(mg/kg/day)
FD&C Red No. 40 Average Dose Estimate
(mg/kg/day)
FD&C Yellow No. 5 Average Dose Estimate
(mg/kg/day)
1 serving/day 1 serving/day 1 serving/day
Mean Max Mean Max Mean Max Brand 1 0-<2 years (0.5 serving size) 0.002 0.003 1.30 1.32 - - 2-<3 years 0.002 0.003 1.44 1.47 - - 3-<6 years 0.002 0.002 1.07 1.09 - - 6-<11 years 0.001 0.001 0.63 0.64 - - 11-<16 years 0.001 0.001 0.35 0.36 - - Brand 2 0-<2 years (0.5 serving size) - - 0.26 0.28 - - 2-<3 years - - 0.29 0.31 - - 3-<6 years - - 0.22 0.23 - - 6-<11 years - - 0.13 0.13 - - 11-<16 years - - 0.07 0.07 - - Brand 3 0-<2 years (0.5 serving size) 0.10 0.11 0.48 0.51 - - 2-<3 years 0.11 0.12 0.54 0.56 - - 3-<6 years 0.08 0.09 0.40 0.42 - - 6-<11 years 0.05 0.05 0.23 0.24 - - 11-<16 years 0.03 0.03 0.13 0.14 - - Brand 4 (Variety Pack Blue) 0-<2 years (0.5 serving size) 0.10 0.11 - - - - 2-<3 years 0.11 0.12 - - - - 3-<6 years 0.08 0.09 - - - - 6-<11 years 0.05 0.05 - - - - 11-<16 years 0.03 0.03 - - - - Brand 4 (Variety pack Red) 0-<2 years (0.5 serving size) - - 0.67 0.70 - - 2-<3 years - - 0.75 0.78 - - 3-<6 years - - 0.55 0.58 - - 6-<11 years - - 0.32 0.34 - - 11-<16 years - - 0.18 0.19 - - Brand 4 (Variety pack Green) 0-<2 years (0.5 serving size) 0.003 0.003 - - 0.11 0.15 2-<3 years 0.003 0.004 - - 0.12 0.17 3-<6 years 0.002 0.003 - - 0.09 0.13 6-<11 years 0.001 0.002 - - 0.05 0.07 11-<16 years 0.001 0.001 - - 0.03 0.04 Brand 4 (Variety pack Purple) 0-<2 years (0.5 serving size) 0.06 0.10 0.46 0.69 - - 2-<3 years 0.07 0.12 0.51 0.77 - - 3-<6 years 0.05 0.09 0.38 0.57 - - 6-<11 years 0.03 0.05 0.22 0.33 - - 11-<16 years 0.02 0.03 0.12 0.19 - -
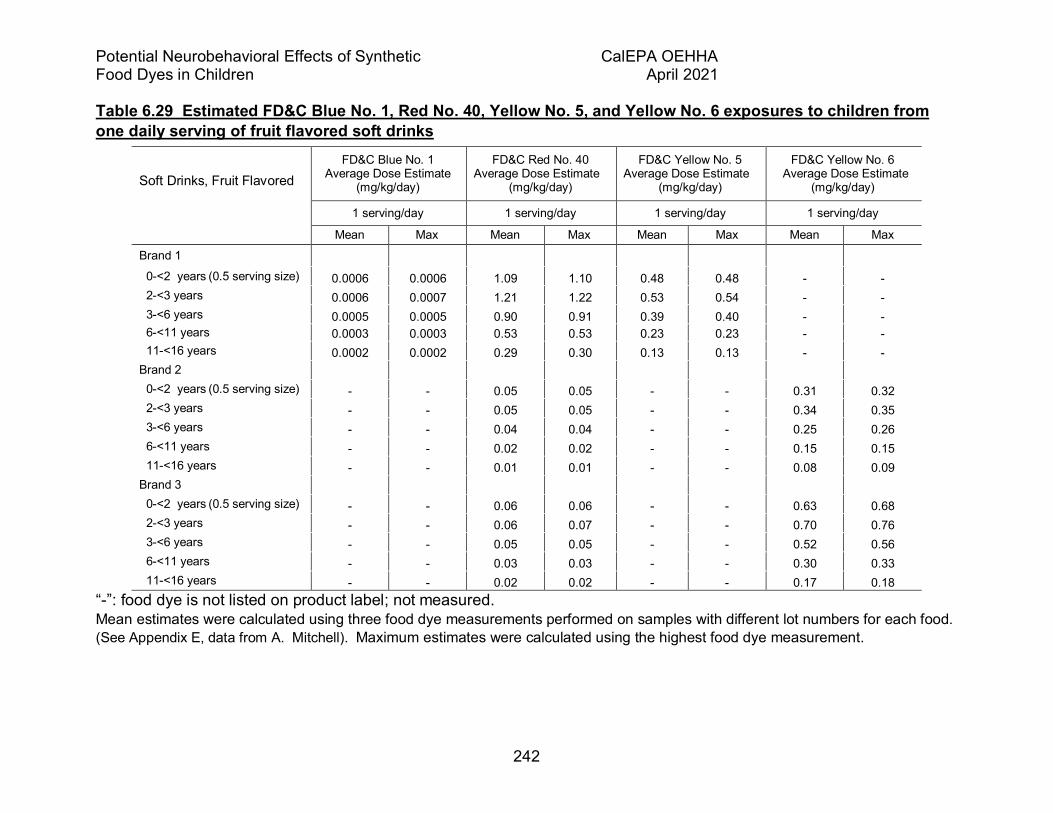
Potential Neurobehavioral Effects of Synthetic CalEPA OEHHA Food Dyes in Children April 2021
242
Table 6.29 Estimated FD&C Blue No. 1, Red No. 40, Yellow No. 5, and Yellow No. 6 exposures to children from one daily serving of fruit flavored soft drinks
“-”: food dye is not listed on product label; not measured. Mean estimates were calculated using three food dye measurements performed on samples with different lot numbers for each food. (See Appendix E, data from A. Mitchell). Maximum estimates were calculated using the highest food dye measurement.
Soft Drinks, Fruit Flavored
FD&C Blue No. 1 Average Dose Estimate
(mg/kg/day)
FD&C Red No. 40 Average Dose Estimate
(mg/kg/day)
FD&C Yellow No. 5 Average Dose Estimate
(mg/kg/day)
FD&C Yellow No. 6 Average Dose Estimate
(mg/kg/day)
1 serving/day 1 serving/day 1 serving/day 1 serving/day
Mean Max Mean Max Mean Max Mean Max
Brand 1
0-<2 years (0.5 serving size) 0.0006 0.0006 1.09 1.10 0.48 0.48 - - 2-<3 years 0.0006 0.0007 1.21 1.22 0.53 0.54 - - 3-<6 years 0.0005 0.0005 0.90 0.91 0.39 0.40 - - 6-<11 years 0.0003 0.0003 0.53 0.53 0.23 0.23 - - 11-<16 years 0.0002 0.0002 0.29 0.30 0.13 0.13 - - Brand 2 0-<2 years (0.5 serving size) - - 0.05 0.05 - - 0.31 0.32 2-<3 years - - 0.05 0.05 - - 0.34 0.35 3-<6 years - - 0.04 0.04 - - 0.25 0.26 6-<11 years - - 0.02 0.02 - - 0.15 0.15 11-<16 years - - 0.01 0.01 - - 0.08 0.09 Brand 3 0-<2 years (0.5 serving size) - - 0.06 0.06 - - 0.63 0.68 2-<3 years - - 0.06 0.07 - - 0.70 0.76 3-<6 years - - 0.05 0.05 - - 0.52 0.56 6-<11 years - - 0.03 0.03 - - 0.30 0.33 11-<16 years - - 0.02 0.02 - - 0.17 0.18

Potential Neurobehavioral Effects of Synthetic CalEPA OEHHA Food Dyes in Children April 2021
243
Table 6.30 Estimated Blue No. 1, Red No. 40, and Yellow No. 5 exposures to children from one daily serving of water enhancers
“-”: food dye is not listed on product label; not measured.
Mean estimates were calculated using three food dye measurements performed on samples with different lot numbers for each food. (See Appendix E, data from A. Mitchell). Maximum estimates were calculated using the highest food dye measurement.
Water Enhancers FD&C Blue No. 1
Average Dose Estimate (mg/kg/day)
FD&C Red No. 40 Average Dose Estimate
(mg/kg/day)
FD&C Yellow No. 5 Average Dose Estimate
(mg/kg/day)
1 serving/day 1 serving/day 1 serving/day
Mean Max Mean Max Mean Max Brand 1
0-<2 years (0.5 serving size) 0.02 0.02 0.10 0.10 - - 2-<3 years 0.03 0.03 0.11 0.11 - - 3-<6 years 0.02 0.02 0.08 0.08 - - 6-<11 years 0.01 0.01 0.05 0.05 - - 11-<16 years 0.006 0.007 0.03 0.03 - - Brand 2 0-<2 years (0.5 serving size) 0.006 0.006 0.10 0.11 0.10 0.10 2-<3 years 0.006 0.007 0.11 0.12 0.11 0.11 3-<6 years 0.005 0.005 0.08 0.09 0.08 0.08 6-<11 years 0.003 0.003 0.05 0.05 0.05 0.05 11-<16 years 0.002 0.002 0.03 0.03 0.03 0.03
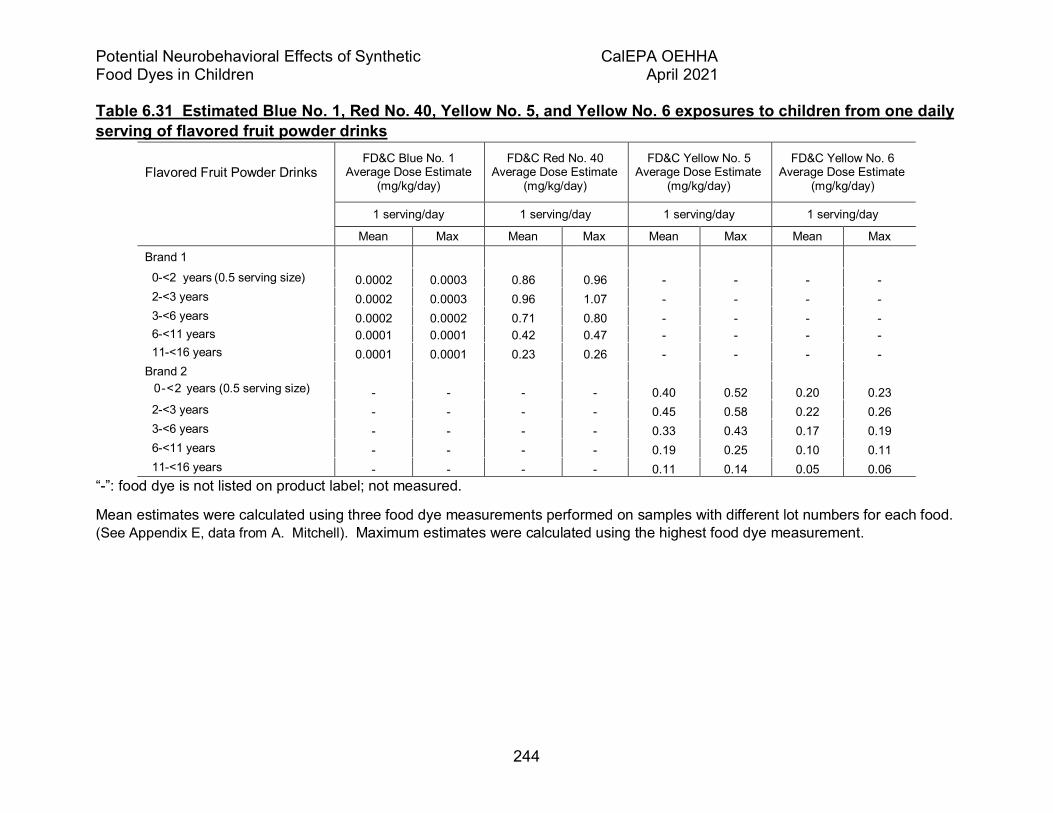
Potential Neurobehavioral Effects of Synthetic CalEPA OEHHA Food Dyes in Children April 2021
244
Table 6.31 Estimated Blue No. 1, Red No. 40, Yellow No. 5, and Yellow No. 6 exposures to children from one daily serving of flavored fruit powder drinks
Flavored Fruit Powder Drinks FD&C Blue No. 1
Average Dose Estimate (mg/kg/day)
FD&C Red No. 40 Average Dose Estimate
(mg/kg/day)
FD&C Yellow No. 5 Average Dose Estimate
(mg/kg/day)
FD&C Yellow No. 6 Average Dose Estimate
(mg/kg/day)
1 serving/day 1 serving/day 1 serving/day 1 serving/day
Mean Max Mean Max Mean Max Mean Max
Brand 1 0-<2 years (0.5 serving size) 0.0002 0.0003 0.86 0.96 - - - - 2-<3 years 0.0002 0.0003 0.96 1.07 - - - - 3-<6 years 0.0002 0.0002 0.71 0.80 - - - - 6-<11 years 0.0001 0.0001 0.42 0.47 - - - - 11-<16 years 0.0001 0.0001 0.23 0.26 - - - - Brand 2 0-<2 years (0.5 serving size) - - - - 0.40 0.52 0.20 0.23 2-<3 years - - - - 0.45 0.58 0.22 0.26 3-<6 years - - - - 0.33 0.43 0.17 0.19 6-<11 years - - - - 0.19 0.25 0.10 0.11 11-<16 years - - - - 0.11 0.14 0.05 0.06
“-”: food dye is not listed on product label; not measured.
Mean estimates were calculated using three food dye measurements performed on samples with different lot numbers for each food. (See Appendix E, data from A. Mitchell). Maximum estimates were calculated using the highest food dye measurement.
Potential Neurobehavioral Effects of Synthetic CalEPA OEHHA Food Dyes in Children April 2021
245
6.9.2 Summary Overall, the highest food-dye intakes in children based on the sampled food products and beverages were for FD&C Red No. 40 from single servings of fruit drinks and fruit- flavored soft drinks (Tables 28 and 29).
None of the child intake estimates based on a daily serving of sampled foods exceeded US FDA ADI’s for food dyes. Children’s mean FD&C Red No. 3 intake estimates based on a single serving of frozen desserts and frosting and icings exceeded the JECFA ADI (0.1 mg/kg/day) (Tables 23, 24 and 26). The hazard indices for FD&C Red No. 3 based on children’s mean intake estimates of these foods ranged from 0.5-5.3.
One limitation of this assessment is that the food-dye exposure estimates are based on a single serving of one food or beverage product, which may have resulted in an underestimate of children’s food dye exposure if a child consumed multiple foods and beverages containing dyes, e.g., breakfast cereals, fruit drinks, frozen desserts, etc., in a single day, or several days in a row.
Overall, the new measurements of FD&C food dye concentrations reported by UC Davis for this assessment were within range or somewhat lower than the upper range of concentrations reported by FDA (Doell et al. 2016). However, UC Davis tested much fewer samples (~70 versus ~600) and their sample was intended to provide an independent check on current food dye concentrations reported in the scientific literature but not necessarily represent the full range of concentrations currently on store shelves.
We also compared mean FD&C Blue No. 1, Red No. 3, Red No. 40, Yellow No. 5 and Yellow No. 6 intake estimates for children 0 to <16 years old from single servings of UC Davis sampled foods to children’s single-day intake estimates we computed using US FDA laboratory measurements and the NHANES food consumption data (Doell et al. 2016). With one exception, the upper range of children’s mean food dye intake estimates from a single serving of UC Davis sampled food fell within children’s mean and 95th% single-day food dye intake estimates (typical-exposure scenario) based on the US FDA laboratory and NHANES food consumption data (See Section 4.1).
More research is needed on the pharmacokinetics (absorption, distribution, metabolism, and excretion) of ingested food dyes (straights and lakes) in children and adult populations. Currently, there is very limited research in this area. Future studies using biomarkers of food dye exposure are also needed to more accurately assess exposure. Overall, on-going monitoring of food dye content in food is needed to determine exposure trends. Finally, future studies should evaluate differences in children’s food dye exposure by sex.

Potential Neurobehavioral Effects of Synthetic CalEPA OEHHA Food Dyes in Children April 2021
246
Chapter 7. Risk Characterization
7.1 Introduction Based on multiple streams of evidence, the FD&C synthetic food dyes cause or exacerbate neurobehavioral problems in children (see Chapter 5, Hazard Identification). To characterize the risk for neurobehavioral effects following food dye exposure, OEHHA first compared the US FDA ADIs and the NOAELs from which they were derived against NOAELs from the studies reviewed in Chapter 3, Animal Toxicology. Next we compared the estimated food dye exposures, described in Chapter 6, from food consumption and exposures from over-the-counter medicines and vitamins to available regulatory benchmarks in a traditional Hazard Index approach for noncancer health effects. The Hazard Index approach divides estimated exposures by a toxicity benchmark. If that ratio is greater than 1, then it is indicative of a possible risk of adverse noncancer effects. Finally, we compared the ADIs to NOAELs and LOAELs observed in the few key animal and human studies of sufficient quality to form the basis of a safe exposure level.
Since OEHHA is comparing estimates of exposure to the current US FDA ADIs and the JECFA ADIs, we provide a brief description of the ADIs for the FD&C batch-certified synthetic food dyes in the following section. Note the ADIs are not based on neurobehavioral toxicity but instead are based on a number of older studies of general toxicity with the exception of JECFA’s Red No. 3 ADI, which is based on perturbation of the thyroid hormone system in humans. Despite this limitation, the ADIs are currently the only available regulatory limits.
7.2 US FDA and JECFA Acceptable Daily Intakes Several organizations have derived acceptable daily intakes for food dyes, including the US FDA, the European Food Safety Administration (EFSA), and the Joint FAO/WHO Expert Committee on Food Additives (JECFA) (Table 7.1). We discuss in brief the basis of the ADIs from the US FDA and JECFA in this section. The EFSA ADIs are similar, and for the sake of brevity are not discussed here.
7.2.1 US FDA Acceptable Daily Intakes Animal studies have been the basis for the approval of food dyes by US FDA. The process is described in the US FDA “Redbook” (FDA 2007) and the 2011 US FDA review of safety in connection with Attention Deficit Hyperactivity Disorder (ADHD) (FDA 2011) (Figure 7.1). To determine whether there is “a reasonable certainty that a substance is not harmful under the intended conditions of use”, US FDA determines the NOAEL in animal studies. The NOAEL is then divided by a “safety factor” of 100 to produce an ADI for comparison to an estimate of daily human intake.
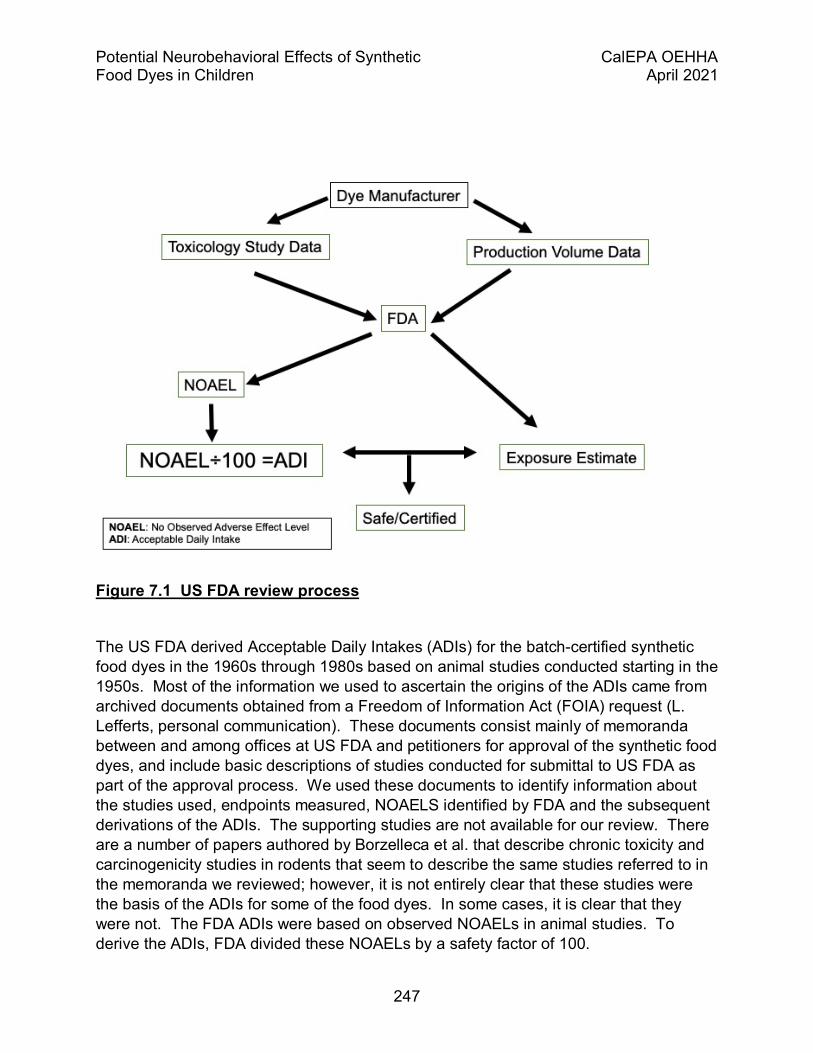
Potential Neurobehavioral Effects of Synthetic CalEPA OEHHA Food Dyes in Children April 2021
247
Figure 7.1 US FDA review process
The US FDA derived Acceptable Daily Intakes (ADIs) for the batch-certified synthetic food dyes in the 1960s through 1980s based on animal studies conducted starting in the 1950s. Most of the information we used to ascertain the origins of the ADIs came from archived documents obtained from a Freedom of Information Act (FOIA) request (L. Lefferts, personal communication). These documents consist mainly of memoranda between and among offices at US FDA and petitioners for approval of the synthetic food dyes, and include basic descriptions of studies conducted for submittal to US FDA as part of the approval process. We used these documents to identify information about the studies used, endpoints measured, NOAELS identified by FDA and the subsequent derivations of the ADIs. The supporting studies are not available for our review. There are a number of papers authored by Borzelleca et al. that describe chronic toxicity and carcinogenicity studies in rodents that seem to describe the same studies referred to in the memoranda we reviewed; however, it is not entirely clear that these studies were the basis of the ADIs for some of the food dyes. In some cases, it is clear that they were not. The FDA ADIs were based on observed NOAELs in animal studies. To derive the ADIs, FDA divided these NOAELs by a safety factor of 100.
Potential Neurobehavioral Effects of Synthetic CalEPA OEHHA Food Dyes in Children April 2021
248
The current US FDA ADI for Red No. 3 of 2.5 mg/kg bw/day was approved in 1969 and was based on a two-year study in rats and supported by a two-year study in dogs (FDA 2011) conducted at FDA by Hansen from 1952-1954. The study used doses of 0.5, 1.0, 2.0 and 5.0 % Red No. 3 in the diet fed to12 male and 12 female rats per dose group and 3 male and 3 female dogs per dose group (October 9, 1968 memorandum from Mr. D.J. Miller, Division of Color and Cosmetics to Dr. C.J. Kokoski, Division of Pharmacology and Toxicology). The NOAEL used for the ADI was 0.5% in the diet in rats, estimated as a dose of 250 mg/kg/day, based on observation of “distended cecum” at 1.0% in the diet. There was also decreased body weight at 2% in the diet in rats. There were some pathological findings in dogs that US FDA viewed as not treatment-related minor incidental abnormalities. FDA derived the ADI of 2.5 mg/kg/day by dividing the NOAEL in the rat study by 100.
The US FDA ADI for Red No. 40, approved in 1971, is based on a 21-month unpublished study in rats conducted by Hazelton labs and submitted to FDA in 1970 (December 4, 1970 memorandum to Mr. W.B. Link, Division of Colors and Cosmetics from Dr. C.J. Kokoski, Division of Toxicological Evaluation, Petitions Review Branch). Doses used were 0, 0.37% 1.39%, and 5.19% in the diet (30 males and 30 females per test group). The US FDA memorandum indicates that respiratory infections were severe and the investigators decided to sacrifice all animals by 21 months. The NOAEL was considered to be 1.39% in the diet based on growth suppression and kidney changes at higher doses. US FDA equated this dietary level to approximately 700 mg/kg/day using dose conversion assumptions regarding food consumed and body weight, and thus set the ADI to 7 mg/kg/day by dividing the NOAEL by 100.
US FDA approved an ADI for Yellow No. 5 in 1969, based on chronic studies in rats and dogs where dye was administered in the diet at 0, 1% and 2% to dogs (4/dose group) and 0, 0.5%, 1%, 2%, and 5% to rats (12 males and 12 females) for 104 weeks (rat study cited as Davis et al., Toxicol Appl Pharmacol 6(5):621-6261964 in November 1, 1965 memorandum from Mr. D.J. Miller, Division of Color Certification and Evaluation to Dr. C.J. Kokoski, Division of Toxicological Evaluation, Petitions Review Branch). Rats in the 5% exposure group exhibited diarrhea and gritty material in the renal pelvis. One female dog in the 2% diet group exhibited mild gastritis. US FDA determined that the NOAEL was 2% in the diet for both species. For rats, US FDA equated this NOAEL to 1000 mg/kg/day and for dogs, 500 mg/kg/day. US FDA based the ADI of 5.0 mg/kg/day on a NOAEL of 500 mg/kg/day (50 Fed Reg 35776, 1985) divided by an uncertainty factor of 100.
The US FDA ADI for Yellow No. 6, approved in 1986, is 3.75 mg/kg/day (51 Fed Reg 41773, 1986) based on depressed weight gain in a chronic feeding study in rats conducted by Biodynamics (March 17, 1986 memorandum from Additives Evaluation Branch to Blondell Anderson, Division of Food and Color Additives). This was a chronic toxicology/carcinogenicity study in Sprague-Dawley rats (N unknown), with a

Potential Neurobehavioral Effects of Synthetic CalEPA OEHHA Food Dyes in Children April 2021
249
component to assess reproductive performance, where F0 rats (and F1 pups following weaning) were given 0, 0.75%, 1.5%, 3%, and 5% dye in the diet. The NOAEL identified in the study was 0.75% in the diet, corresponding to a dose of 375 mg/kg/day, based on decreased mean body weight in F0 male rats at 1.5% diet and higher. Pup weights were lower as well at 1.5% diet and higher, and pup viability during lactation was less in the 3% and 5% Yellow No. 6 groups. The memorandum reports no treatment-related effects on numbers of pregnant animals per group. US FDA used the NOAEL of 375 mg/kg/day and divided by a safety factor of 100 to derive an ADI of 3.75 mg/kg/day.
According to documents obtained under FOIA (September 22, 1982 memorandum from Color and Cosmetics Evaluation Branch to Blondell Anderson, Petitions Control Branch) for Green No. 3, the US FDA ADI of 2.5 mg/kg/day is based on chronic feeding studies in dogs fed Green No. 3 at up to 2% in the diet. Green pigment was found in the tubular epithelium of the renal cortex in 1 male of 2 treated dogs that received 500 mg/kg/day of FD&C Green No. 3, but not in any dogs at the next lower dosage level (250 mg/kg/day). The ADI for humans of 2.5 mg/kg/day (47 Fed Reg 52142, 1982) was calculated by dividing the NOAEL by a safety factor of 100.
For Blue No. 1, the US FDA ADI of 12.0 mg/kg/day, approved in 1982, is based on experiments sponsored by the manufacturer and alluded to in the Federal Register described in (Fed Reg Vol 47 No 148 page 42564, September 28, 1982). The studies that formed the basis of the ADI were chronic two-year bioassays carried out in mice and rats. US FDA derived the ADI of 12 mg/kg/day by dividing a NOAEL of 1200 mg/kg/day by a safety factor of 100.
For Blue No. 2, the US FDA ADI of 2.5 mg/kg/day, approved in 1987, is based on a no-effect dietary level of 0.5% of Blue No. 2 in a long-term dietary feeding study in Charles River albino rats including gestational exposure (April 1, 1982 memorandum from Color and Cosmetics Evaluation Branch to Kenneth Falci, Petitions Control Branch). Blue No. 2 was fed at levels of 0, 0.5%, 1%, or 2% in the diet to 59-60 F0 males and females. Following weaning, the F1 generation were fed the same amount in diets for up to 900 days (70 males and 70 females per dose group). Change in body weight for the F0 females and for pups at weaning was lower in the 1% and 2% groups and pup survival was lower in the 1% and 2% groups relative to controls. US FDA chose the 0.5% level as representing a No Effect Level based on this study. FDA equates this level to a dose of approximately 250 mg/kg/day. US FDA derived an ADI for FD&C Blue No. 2 of 2.5 mg/kg/day by dividing the NOAEL by a 100-fold safety factor.
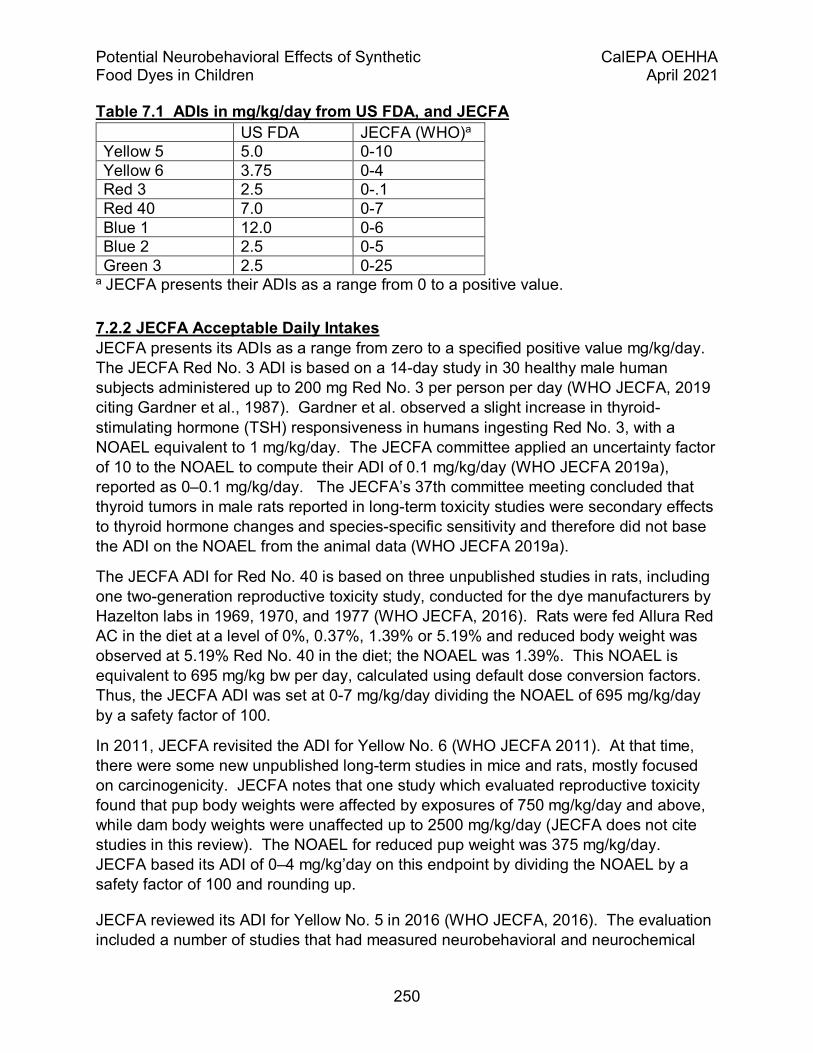
Potential Neurobehavioral Effects of Synthetic CalEPA OEHHA Food Dyes in Children April 2021
250
Table 7.1 ADIs in mg/kg/day from US FDA, and JECFA US FDA JECFA (WHO)a Yellow 5 5.0 0-10 Yellow 6 3.75 0-4 Red 3 2.5 0-.1 Red 40 7.0 0-7 Blue 1 12.0 0-6 Blue 2 2.5 0-5 Green 3 2.5 0-25
a JECFA presents their ADIs as a range from 0 to a positive value.
7.2.2 JECFA Acceptable Daily Intakes JECFA presents its ADIs as a range from zero to a specified positive value mg/kg/day. The JECFA Red No. 3 ADI is based on a 14-day study in 30 healthy male human subjects administered up to 200 mg Red No. 3 per person per day (WHO JECFA, 2019 citing Gardner et al., 1987). Gardner et al. observed a slight increase in thyroid-stimulating hormone (TSH) responsiveness in humans ingesting Red No. 3, with a NOAEL equivalent to 1 mg/kg/day. The JECFA committee applied an uncertainty factor of 10 to the NOAEL to compute their ADI of 0.1 mg/kg/day (WHO JECFA 2019a), reported as 0–0.1 mg/kg/day. The JECFA’s 37th committee meeting concluded that thyroid tumors in male rats reported in long-term toxicity studies were secondary effects to thyroid hormone changes and species-specific sensitivity and therefore did not base the ADI on the NOAEL from the animal data (WHO JECFA 2019a).
The JECFA ADI for Red No. 40 is based on three unpublished studies in rats, including one two-generation reproductive toxicity study, conducted for the dye manufacturers by Hazelton labs in 1969, 1970, and 1977 (WHO JECFA, 2016). Rats were fed Allura Red AC in the diet at a level of 0%, 0.37%, 1.39% or 5.19% and reduced body weight was observed at 5.19% Red No. 40 in the diet; the NOAEL was 1.39%. This NOAEL is equivalent to 695 mg/kg bw per day, calculated using default dose conversion factors. Thus, the JECFA ADI was set at 0-7 mg/kg/day dividing the NOAEL of 695 mg/kg/day by a safety factor of 100.
In 2011, JECFA revisited the ADI for Yellow No. 6 (WHO JECFA 2011). At that time, there were some new unpublished long-term studies in mice and rats, mostly focused on carcinogenicity. JECFA notes that one study which evaluated reproductive toxicity found that pup body weights were affected by exposures of 750 mg/kg/day and above, while dam body weights were unaffected up to 2500 mg/kg/day (JECFA does not cite studies in this review). The NOAEL for reduced pup weight was 375 mg/kg/day. JECFA based its ADI of 0–4 mg/kg’day on this endpoint by dividing the NOAEL by a safety factor of 100 and rounding up.
JECFA reviewed its ADI for Yellow No. 5 in 2016 (WHO JECFA, 2016). The evaluation included a number of studies that had measured neurobehavioral and neurochemical
Potential Neurobehavioral Effects of Synthetic CalEPA OEHHA Food Dyes in Children April 2021
251
parameters, but the committee dismissed the results of these studies either because they considered the results inconsistent across studies, or the sample sizes were small, or the studies used a dye mixture making it difficult to attribute an effect to any one dye. Note that OEHHA does not dismiss these studies for reasons described in Chapter 3. In the end, JECFA based its ADI on two chronic studies in rats given up to 5% in the diet that demonstrated decreased body weight in females at 1% in the diet and in males (12.2% decrease) and females (16.9% decrease) at 5% in the diet (citing Borzelleca et al., 1988). However, the Committee noted there were no effects on body weight at 2% in the diet, and thus disregarded the decreased body weight in female rats at 1% in the diet. The Committee concluded that 2% in the diet, which they equated to 984 mg/kg/day, was the NOAEL and established an ADI of 0–10 mg/kg/day, by dividing 984 mg/kg/day by a 100-fold uncertainty factor.
For Blue No. 2, the JECDFA ADI is based on a two-year dietary study in rats (JECFA, 2019) citing both Hansen et al, 1966 and Oettell et al, 1965). In the Oettell study, rats were fed a diet containing 1% Blue No. 2, which the authors equated to a dose of about 500 mg/kg/day. JECFA notes no treatment-related pathological signs were observed. In the Hansen study. Blue No. 2 was fed to groups of rats at dietary levels of 0, 0.5%, 1.0%, 2.0% or 5.0% for 2 years. JECFA notes the only effect seen was a reduced growth in males at 2.0% and 5.0%, and that the NOAEL in this study was 1% in the diet, equivalent to 500 mg/kg/day. JECFA derived its ADI by dividing 500 by a safety factor of 100 to give an ADI of 0–5 mg/kg/day.
JECFA re-evaluated their ADI for Blue No. 1 in 2017 (WHO JECFA, 2017), and based the latest ADI on a chronic toxicity study that focused on carcinogenicity, citing an unpublished study conducted by the International Research and Development Corporation for the International Association of Color Manufacturers and Borzelleca et al (1990). This study reported a 15% decreased mean terminal body weight with a NOAEL of 631 mg/kg/day. The ADI was established as 0–6 mg/kg/day by dividing the NOAEL by an uncertainty factor of 100.
In the same report (WHO JECFA 2017), JECFA confirmed its previous ADI of 25 mg/kg/day for Green No. 3, which is based on no adverse effects in a chronic toxicity study in rats (citing Hansen et al., 1966). In that study, rats were administered Green No. 3 in the diet at concentrations up to 5%. The authors report a NOAEL of 5% in the diet, which JECFA equated to 2500 mg/kg/day for rats. The ADI is thus the NOAEL divided by 100, or 0–25 mg/kg/day.
7.3 Comparison of US FDA ADI NOAELs to NOAELs in studies relevant to neurobehavior It is informative to compare the NOAELs from the older studies used by US FDA and JECFA to derive the ADIs with available NOAELs and LOAELs from published studies that evaluate neurobehavioral endpoints and other relevant data. This section
Potential Neurobehavioral Effects of Synthetic CalEPA OEHHA Food Dyes in Children April 2021
252
compares the NOAELs and endpoints from the neurobehavioral study review described in Chapter 3 with the US FDA NOAEL and endpoint. Note that results from preweaning behavioral development from the Tokyo studies are not used for LOAEL/NOAEL identification because statistics were not litter-based.
7.3.1 Comparison of NOAELs in the literature with the NOAELs used as the basis of the US FDA ADI US FDA uses NOAELs from the animal literature to derive the ADI (see section 7.2.1). While reviewing animal neurobehavioral toxicology studies, we compared the effective doses to animal NOAELs used by US FDA to derive human ADIs (hereinafter referred to as FDA ADI NOAELs). Table 7.2a and 7.2b makes these comparisons for both developmental and adult neurotoxicology studies where a single dye was administered. This comparison is somewhat difficult for the studies that administered dye mixtures. However, Erikson et al. (2014) reported increased activity in male rats administered synthetic food dye mixtures where each dye was given at less than twice the FDA ADI NOAEL. Notably, these mixture doses are in the range of doses in human mixture studies. Shaywitz et al. (1979) and Goldenring et al. (1980) also used a mixture of dyes at doses near the ADIs and found greater activity and decreased habituation in a rodent model (see Section 3.
As mentioned previously, US FDA divided animal study NOAELs by 100 (safety factor) to derive ADIs. To compare doses in animal neurotoxicology studies reviewed here with doses in animal studies used to derive US FDA NOAELs, a value of 100 X ADI is used.
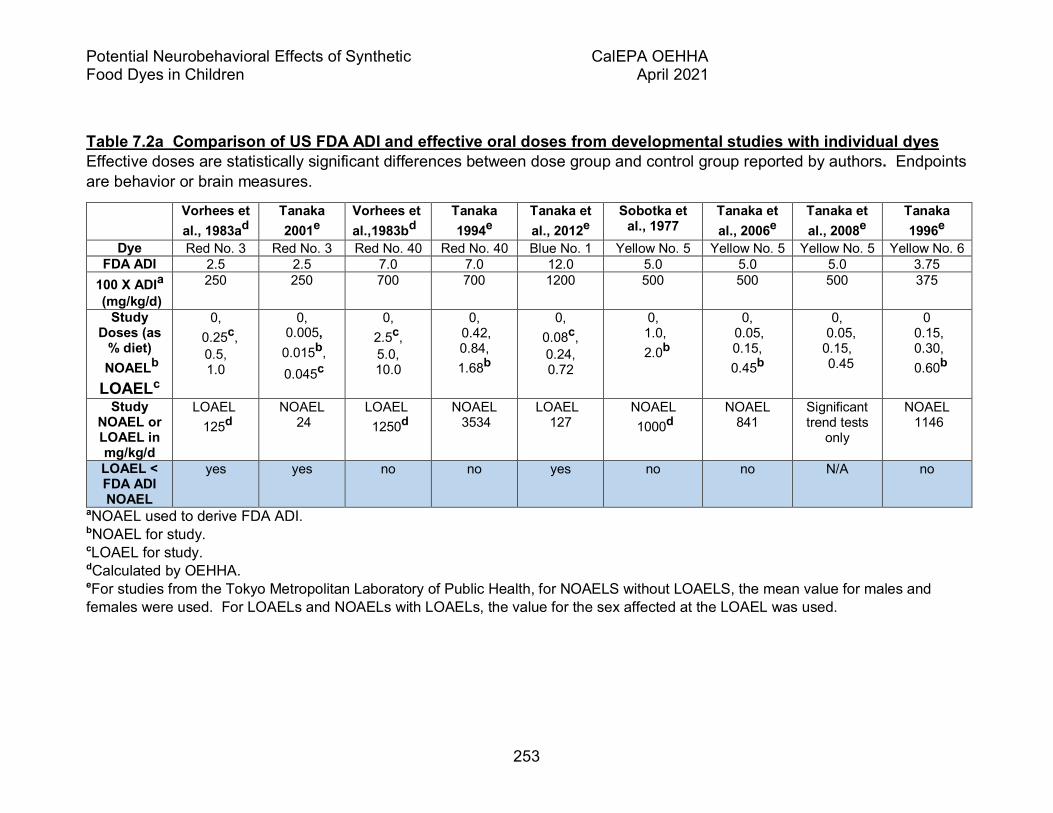
Potential Neurobehavioral Effects of Synthetic CalEPA OEHHA Food Dyes in Children April 2021
253
Table 7.2a Comparison of US FDA ADI and effective oral doses from developmental studies with individual dyes Effective doses are statistically significant differences between dose group and control group reported by authors. Endpoints are behavior or brain measures.
Vorhees et al., 1983ad
Tanaka 2001e
Vorhees et al.,1983bd
Tanaka 1994e
Tanaka et al., 2012e
Sobotka et al., 1977
Tanaka et al., 2006e
Tanaka et al., 2008e
Tanaka 1996e
Dye Red No. 3 Red No. 3 Red No. 40 Red No. 40 Blue No. 1 Yellow No. 5 Yellow No. 5 Yellow No. 5 Yellow No. 6 FDA ADI 2.5 2.5 7.0 7.0 12.0 5.0 5.0 5.0 3.75
100 X ADIa (mg/kg/d)
250 250 700 700 1200 500 500 500 375
Study Doses (as
% diet) NOAELb LOAELc
0, 0.25c,
0.5, 1.0
0, 0.005,
0.015b, 0.045c
0, 2.5c, 5.0, 10.0
0, 0.42, 0.84, 1.68b
0, 0.08c, 0.24, 0.72
0, 1.0,
2.0b
0, 0.05, 0.15, 0.45b
0, 0.05, 0.15, 0.45
0 0.15, 0.30,
0.60b
Study NOAEL or LOAEL in mg/kg/d
LOAEL 125d
NOAEL 24
LOAEL 1250d
NOAEL 3534
LOAEL 127
NOAEL 1000d
NOAEL 841
Significant trend tests
only
NOAEL 1146
LOAEL < FDA ADI NOAEL
yes yes no no yes no no N/A no
aNOAEL used to derive FDA ADI. bNOAEL for study. cLOAEL for study. dCalculated by OEHHA. eFor studies from the Tokyo Metropolitan Laboratory of Public Health, for NOAELS without LOAELS, the mean value for males and females were used. For LOAELs and NOAELs with LOAELs, the value for the sex affected at the LOAEL was used.
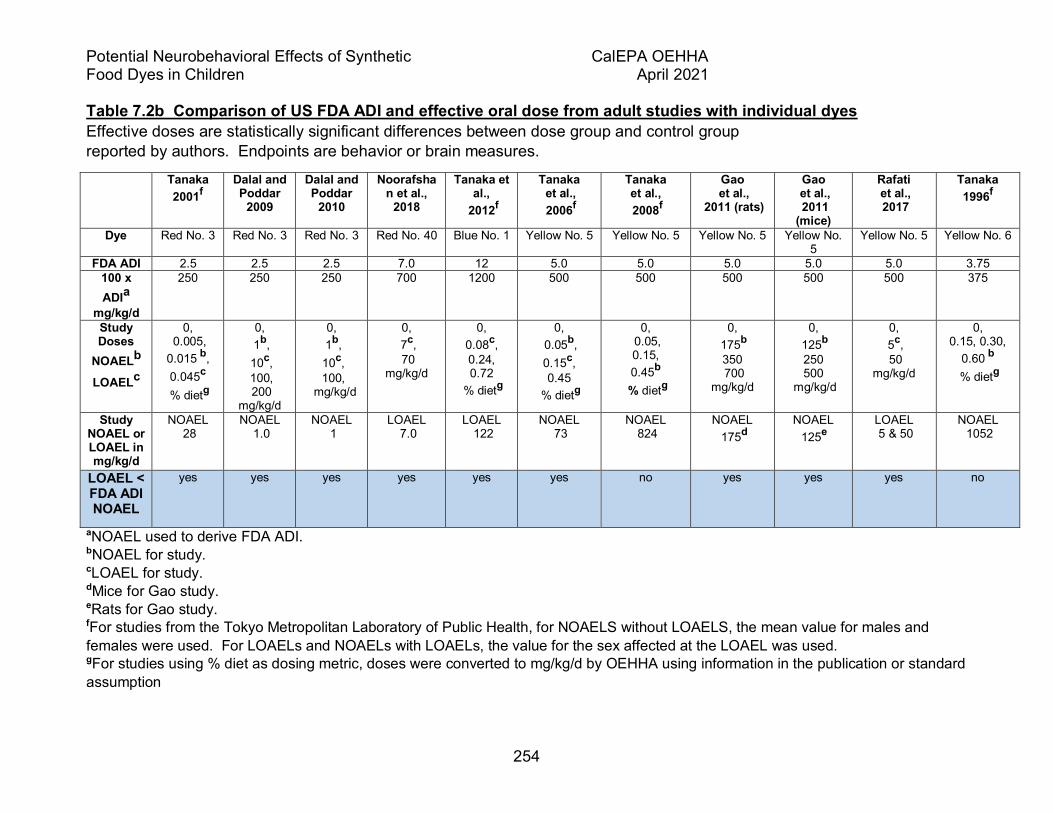
Potential Neurobehavioral Effects of Synthetic CalEPA OEHHA Food Dyes in Children April 2021
254
Table 7.2b Comparison of US FDA ADI and effective oral dose from adult studies with individual dyes Effective doses are statistically significant differences between dose group and control group reported by authors. Endpoints are behavior or brain measures. Tanaka
2001f Dalal and Poddar
2009
Dalal and Poddar
2010
Noorafshan et al.,
2018
Tanaka et al.,
2012f
Tanaka et al., 2006f
Tanaka et al., 2008f
Gao et al.,
2011 (rats)
Gao et al., 2011 (mice)
Rafati et al., 2017
Tanaka 1996f
Dye Red No. 3 Red No. 3 Red No. 3 Red No. 40 Blue No. 1 Yellow No. 5 Yellow No. 5 Yellow No. 5 Yellow No. 5
Yellow No. 5 Yellow No. 6
FDA ADI 2.5 2.5 2.5 7.0 12 5.0 5.0 5.0 5.0 5.0 3.75 100 x ADIa
mg/kg/d
250 250 250 700 1200 500 500 500 500 500 375
Study Doses
NOAELb LOAELc
0, 0.005, 0.015 b, 0.045c
% dietg
0, 1b, 10c, 100, 200
mg/kg/d
0, 1b, 10c, 100,
mg/kg/d
0, 7c, 70
mg/kg/d
0, 0.08c, 0.24, 0.72
% dietg
0, 0.05b, 0.15c, 0.45
% dietg
0, 0.05, 0.15, 0.45b
% dietg
0, 175b 350 700
mg/kg/d
0, 125b
250 500
mg/kg/d
0, 5c, 50
mg/kg/d
0, 0.15, 0.30,
0.60 b % dietg
Study NOAEL or LOAEL in mg/kg/d
NOAEL 28
NOAEL 1.0
NOAEL 1
LOAEL 7.0
LOAEL 122
NOAEL 73
NOAEL 824
NOAEL 175d
NOAEL 125e
LOAEL 5 & 50
NOAEL 1052
LOAEL < FDA ADI NOAEL
yes yes yes yes yes yes no yes yes yes no
aNOAEL used to derive FDA ADI. bNOAEL for study. cLOAEL for study. dMice for Gao study. eRats for Gao study. fFor studies from the Tokyo Metropolitan Laboratory of Public Health, for NOAELS without LOAELS, the mean value for males and females were used. For LOAELs and NOAELs with LOAELs, the value for the sex affected at the LOAEL was used. gFor studies using % diet as dosing metric, doses were converted to mg/kg/d by OEHHA using information in the publication or standard assumption
Potential Neurobehavioral Effects of Synthetic CalEPA OEHHA Food Dyes in Children April 2021
255
7.3.1.1 Red No. 3 There are two DNT studies (Tanaka 2001; Vorhees et al. 1983a) and three adult studies (Dalal and Poddar 2009, 2010; Tanaka 2001) of Red No. 3. The Vorhees DNT studies had a LOAEL at the low dose of 125 mg/kg/day, while the Tanaka study had a NOAEL at the mid-dose of 28 mg/kg/day. Both were based on activity, increased Open Field and Running Wheel activity in Vorhees and greater spontaneous activity in the Tanaka study. The Tanaka study reported age and sex dependent activity effects. In addition to dose-control comparisons, Tanaka reported significant dose trends on the activity measures (Jonckheere test), and additional dose trends for activity measures that did not show significant dose-control comparisons (see Chapter 3, Table 3.3). There were also adult activity effects with a NOAEL at the same dose in the Tanaka study.
The more recent Dalal and Poddar Red No. 3 studies using gavage administration (Dalal and Poddar 2009, 2010) had a broader dose range, from 1 to 200 mg/kg/day, with a NOAEL of 1 mg/kg/day. The activity endpoint affected was vertical activity. As well, this was the NOAEL for measures of serotonin levels and MAOA activity in various brain regions, and increased plasma corticosterone.
The US FDA ADI NOAEL was 0.5% in diet, estimated at 250 mg/kg-day, based on observation of “distended cecum” in a rat study conducted at FDA by Hansen from 1953 to 1954 (Kokoski 1968). The NOAEL in mg/kg/day was divided by a safety factor of 100 to give the ADI of 2.5 mg/kg/day.
7.3.1.2 Yellow No. 5 Three early studies (Sobotka et al. 1977; Tanaka 2006; Tanaka et al. 2008) administered Yellow No. 5 in diet from conception until the end of testing when offspring were adults. The Sobotka study reported no behavioral effects at either dose administered (500 and 1000 mg/kg/day,1% and 2% diets in rats). The Tanaka studies used 3 diet concentration below 1% in diet to mice (89, 262, 842 mg/kg/day in the offspring after weaning, 73, 239, 719 mg/kg/day in the male parents in the first study). Trend tests for a decrease in a number of activity measures with increasing dose were reported in the first generation offspring, and also in the second-generation offspring in the three-generation study. For comparison of dose and control groups, the authors selected the Steel-Dwass test, a nonparametric test of all pairwise comparisons in a multi-group study, and no pairwise comparisons between a dose group and controls were reported. Thus a NOAEL cannot be identified in offspring despite the significant trend tests for reduced activity with dose increases. In the adult parents, greater vertical activity was reported for males in the first study (NOAEL 73 mg/kg/day, no dose trend) with no effects reported in the second study (Tanaka et al. 2008). Taken together, these three studies did not identify a NOAEL dose supported by a higher lowest adverse effect level (LOAEL) dose.
The more recent studies conducted by gavage for shorter periods of time identified NOAELs of 175 mg/kg/day in mice and 125 mg/kg/day in rats (Gao et al. 2011) using

Potential Neurobehavioral Effects of Synthetic CalEPA OEHHA Food Dyes in Children April 2021
256
behavioral endpoints. Measures of oxidative stress in the brains of the rats had the same NOAEL. More recently, a LOAEL of 5 mg/kg/day was identified for brain histomorphometric endpoint (dendritic spine length) in a study that also included behavioral endpoints (Rafati et al. 2017). In the statistical analysis of the behavioral data, the two dose groups were combined, interfering with the ability to identify a LOAEL and NOAEL.
The FDA identified NOAELs from chronic toxicity studies of 2% in diet, estimated at 500 mg/kg/day in dogs and 1000 mg/kg/day in rats, and 1.5 % in diet estimated at 2250 mg/kg/day in mice (50 Fed Reg 35776, 1985). The dog study, conducted at FDA laboratories and published in the open literature in 1964 (Davis et al. 1964), was selected as having the lowest NOAEL. This NOAEL occurred at the highest dose used in the study. The 500 mg/kg/day dose from the dog study was used to derive the ADI of 5 mg/kg/day.
7.3.1.3 Red No. 40 Red No. 40 was studied in two developmental studies, one in rats (Vorhees et al. 1983b) and one in mice (Tanaka 1994). The doses in mg/kg/day overlapped, with the rat low dose higher than mouse low dose. No behavior findings were reported for the mouse study, while the rat study reported greater activity in an Open Field test, poorer performance in a learning test and less activity in a Running Wheel test, compared to controls. The LOAEL was at the lowest dose, estimated at 1250 mg/kg/day. The single adult neurotoxicity study in rats used lower mg/kg/day doses than either of the developmental studies but administered the dye by gavage. Poorer performance in a learning and memory test (Noorafshan et al. 2018) was reported. The LOAEL in that study was at the lowest dose (7 mg/kg/g) based on radial arm maze performance and lower numbers of glial cells in the medial prefrontal cortex. The investigators had selected this dose as “in the range” of the EFSA human ADI (EU EFSA 2009b). In fact, the US FDA, JECFA and EFSA ADIs are all 7 mg/kg/day.
The US FDA ADI NOAEL (Kokoski 1970) is 700 mg/kg/day based on growth suppression and kidney changes in an unpublished rat study (Olson and Voelker 1970) Thus, the Noorafsham et al. (2018) LOAEL is 100 times lower than the NOAEL used to establish the FDA ADI.
7.3.1.4 Yellow No. 6 There is only one study of Yellow No. 6 with neurobehavioral endpoints (Tanaka 1996). There were no dye effects on activity in either the parents or offspring. Although some neurobehavioral effects in offspring were reported for preweaning development and maze learning, it was not possible to draw firm conclusions due to the statistical approach and varying group sizes in the study. A NOAEL without a LOAEL in the same study is not suitable for risk assessment.
Potential Neurobehavioral Effects of Synthetic CalEPA OEHHA Food Dyes in Children April 2021
257
However, a relevant behavioral study looked at the azo dye metabolite sulfanilic acid, a common metabolite of Yellow No. 5 and Yellow No. 6. Effects of sulfanilic acid (1 mg/kg/day i.p.) included increased activity in pups assessed three times during a treatment extending throughout juvenile development (Goldenring et al. 1982). Of note, this sulfanilic acid study is particularly relevant to human studies because it used direct administration to the pups (rather than through the dam’s diet) and measured activity during the juvenile administration.
Assuming 37.4% gastrointestinal absorption of sulfanilic acid (Honohan et al. 1977), the 1 mg/kg intraperitoneal dose of sulfanilic acid used by Goldenring et al. would be equivalent to 2.7 mg/kg produced in the gastrointestinal tract, which in turn would result from metabolism of 7 mg/kg of orally administered Yellow No. 5. The authors describe unpublished data supporting distribution of sulfanilic acid to the brain, but no later publication containing these data was found.
The US FDA ADI for Yellow No. 6 is based on decreased body weight gain in offspring at 1.5% in diet in rat chronic feeding study (51 Fed Reg 41773, 1986). The NOAEL occurred at the lowest dose, 0.75% in diet, estimated at 375 mg/kg/day. It was divided by the hundredfold safety factor to derive the ADI. The current JECFA ADI (WHO JECFA 2011) is 4.0 mg/kg/day also based on the NOAEL of 375 mg/kg/day reduced pup body weight gain, apparently from the same study used by US FDA.
Yellow No. 6, certified in 1987, was the last of the US FDA-approved dyes to move from provisional to certified status after lengthy consideration of carcinogenicity issues (FDA 1986).
7.3.1.5 Blue No. 1 and Green No. 3 In the neurobehavioral toxicity literature reviewed in Chapter 3, there is only one study of Blue No. 1 (Tanaka et al. 2012) and there are no studies of Green No. 3. The Blue No. 1 study found activity effects in adult parents (Chapter 3, Table 3.4) and in offspring (Chapter 3, Table 3.3) at 122 mg/kg/day.
The US FDA ADI for Blue No. 1 (12 mg/kg/day) is the highest of the seven US FDA-registered food dyes reflecting a low toxicity profile in the limited information available. The US FDA ADI NOAEL was the highest dose tested in lifetime carcinogenicity/toxicity studies conducted in mice and rats, based on failure to find any dye effects (FDA 1982). In contrast, the current JECFA ADI (6 mg/kg/day) is based on decreased female weight and survival apparently in the same rat study used by US FDA for its ADI derivation (WHO JECFA 2017).
ADIs for Green No. 3 also varied by agency. The US FDA ADI for Green No. 3 is 2.5 mg/kg/day (47 Fed Reg 52142, 1982). It was apparently based on a 1966 study in dogs (Hansen et al. 1966b) with the endpoint of “occurrence of green pigment in the cytoplasm of cells of the renal cortical tubular epithelium” (Jackson 1982). Findings of

Potential Neurobehavioral Effects of Synthetic CalEPA OEHHA Food Dyes in Children April 2021
258
increased mortality and growth restriction in lactating/weanling rat pups were found in a later unpublished lifetime toxicity/carcinogenicity study (Borzelleca and Hallagan 1992) but were dismissed from consideration by US FDA based on the presumption that they were due to rapid growth and exaggerated food intake at this life stage (Jackson 1982). The US FDA ADI (2.5 mg/kg/day) differs from the current JECFA ADI (25 mg/kg/day)(WHO JECFA 2017) which is based on the same paper (Hansen et al. 1966b), but used the finding of no toxicity in the high dose of the rat study reported there for the NOAEL. JECFA did not review the unpublished lifetime toxicity/carcinogenicity study in their most recent monograph (2017).
7.3.1.6 Blue No. 2. No Blue No. 2 neurobehavioral studies were identified by our literature searches. Blue No. 2 is similar in structure to the dye indigo, differing only in addition of a sulfate group for solubility. We did not review the literature for indigo.
The US FDA ADI (2.5 mg/kg/day) is based on a NOAEL of 0.5% in diet (250 mg/kg/day), the lowest dose in a chronic rat study (48 Fed Reg 5259, 1983). Effects were seen at higher doses on developmental toxicity endpoints (dam and pup body weights at the end of lactation, post-weaning pup survival), in a lifetime toxicity/carcinogenicity study (Hollingsworth 1982). The JECFA ADI (5 mg/kg/day) was derived in 1974 based on a 1966 study (Hansen et al. 1966a) which found growth inhibition in male rats fed 1% Blue No. 2 in diet for two years (WHO JECFA 2019a).
7.4 Comparison of estimated exposures to Acceptable Daily Intakes The following sections show Hazard Index (HI) values for each of the FD&C synthetic food dyes, based on our exposure estimates described in Chapter 6 and the US FDA and JECFA ADIs. Note that none of the ADIs are based on neurobehavioral effects observed in animals or humans. Thus, the HI may not be applicable to nor adequate to describe risks for neurobehavioral changes.
7.4.1 Comparison of estimated dye intake from foods to the US FDA and JECFA ADIs As discussed in Chapter 6, the NHANES food consumption and linked demographic data were drawn from the NHANES 2015-2016 Dietary Interview data. Food dye concentration data was sourced from the supplemental tables available in (Doell et al. 2016). Based on the NHANES 2015-16 food consumption data and food-dye concentration data, we calculated single-day and two-day average cumulative daily food intake estimates (mg/person/day) for the following demographic categories:
• Pregnant women 18 years and older • Women of childbearing age (18-49 years) • Children: 0-<2 years, 2-<5 years, 5-<9 years, 9-<16 years, and 16-18
years
Potential Neurobehavioral Effects of Synthetic CalEPA OEHHA Food Dyes in Children April 2021
259
One-day cumulative daily food dye intake estimates (mg/person/day) were calculated by summing the dye concentrations from all foods consumed on Day 1, and separate one-day cumulative daily intake exposure estimates were calculated for foods consumed on Day 2. Two-day average daily intakes were calculated by averaging the cumulative dye intake over two days, when available.
Based on the exposure assessment methods reported by Doell et al. (2016) and the 2015-16 NHANES food consumption data, we estimated daily food dye intakes (mg/person/day) for two exposure scenarios:
• The typical-exposure scenario represents exposure to a given FD&C synthetic food dye for a typical consumer, an individual who may not always eat products with the lowest or highest levels of the FD&C color but some combination of both.
• The high-exposure scenario represents the highest exposure where the individual is only consuming products with the highest levels of that food dye.
We divided each individual’s FD&C synthetic food dye intake estimate (mg/person/day) by their body weight (kg) reported in NHANES 2015-16 (CDC 2017) to produce FD&C synthetic food dye dose estimates in units of mg/kg/day. We compared the FD&C food dye dose estimates to the US FDA and JECFA ADIs by calculating the ratio of the food dye dose estimates to the established ADIs (FDA 2011);(WHO JECFA 2011, 2016, 2017, 2019b). Table 7.1 presents the current US FDA and JECFA ADIs for each of the seven food dyes we assessed. Hazard index >1 signifies that the estimated food dye exposure estimates (mg/kg/day) exceeded the established ADI.
Tables 7.3-7.9 compare the mean and 95th percentile food dye exposure categories from foods to the ADIs established by US FDA and JECFA. Hazard indices >1 indicate that the estimated food dye exposure estimates (mg/kg/day) from foods for a particular demographic category exceeded the established ADI. Note that these exposure estimates do not include over the counter medicines or vitamins. These would constitute additional exposure categories.
With the exception of FD&C Red No. 3, all exposure estimates (mg/kg/day) from foods were below the US FDA or JECFA ADIs.
Typical-exposure scenario: For FD&C Red No. 3, the 95th percentile single-day typical-exposure scenario estimate (mg/kg/day) for children 0 to <2 years exceeded the FDA ADI (ADI=2.5 mg/kg/day). For this demographic group, the 95th percentile FD&C Red No. 3 FDA hazard index based on the single-day intake was 1.9. No other exposure estimates (typical-exposure scenario) exceeded the FDA ADI (Table 7.6).
Both mean and 95th percentile exposure estimates exceeded the JECFA ADI (ADI=0.1 mg/kg/day) for FD&C Red No. 3. The mean single-day (typical-exposure scenario) exposure estimate (mg/kg/day) for children 0 to <2 years, children 2 to <5 years, and

Potential Neurobehavioral Effects of Synthetic CalEPA OEHHA Food Dyes in Children April 2021
260
children 5 to <9 years exceeded the JECFA ADI (ADI=0.1 mg/kg/day) (Table 7.6), with hazard indices ranging from 1.1 to 5.
For FD&C Red No. 3, the 95th percentile single-day typical-exposure scenario (mg/kg/day) for pregnant women, women of childbearing age, children 0 to <2 years, children 2 to <5 years, children 5 to <9 years, children 9 to <16 years and youth 16 to18 years exceeded the JECFA ADI (ADI=0.1 mg/kg/day) (Table 7.6), with hazard indices ranging from 1.02 to 48.3. The highest hazard index was for children 0 to <2 years. For these same demographic groups, the 95th percentile FD&C Red No. 3 JECFA hazard indices based on the 2-day average intakes were 1.1 (pregnant women), 0.7 (women of childbearing age), 0.7 (children 0 to <2 years), 0.9 (children 2 to <5 years), 1.2 (children 5 to <9 years), 1.6 (children 9 to <16 years), and 0.5 (youth 16-18 years), respectively.
High-exposure scenario: For FD&C Red No. 3, the 95th percentile single-day high-exposure scenario estimate (mg/kg/day) for children 0 to <2 years exceeded the FDA ADI (ADI=2.5 mg/kg/day). For this demographic group, the 95th percentile FD&C Red No. 3 FDA hazard index based on the single-day intake was 3.2 (Table 7.6). No other exposure estimates (high-exposure scenario) exceeded the US FDA ADI.
Both mean and 95th percentile exposure estimates exceeded the JECFA ADI (ADI=0.1 mg/kg/day) for FD&C Red No. 3. The mean single-day (high-exposure scenario) exposure estimate (mg/kg/day) for children 0 to <2 years, children 2 to <5 years, children 5 to <9 years, and children 9 to <16 years exceeded the JECFA ADI (ADI=0.1 mg/kg/day), with hazard indices ranging from 1.1 to 15.0 (Table 7.6).
For FD&C Red No. 3, the 95th percentile single-day (high-exposure scenario) exposure estimates (mg/kg/day) for pregnant women, women of childbearing years, and all the child age categories exceeded the JECFA ADI (ADI=0.1 mg/kg/day), with ratios ranging from 1.02-79.0 (Table 7.6). The highest ratio was for children 0-<2 years. The 95th percentile FD&C Red No. 3 JECFA hazard indices based on the two-day average (high-exposure scenario) exposure estimates were 3.3 (pregnant women), 0.8 (women 18-49 years), 0.7 (children 0-<2 years), 0.9 (children 2-<5 years), 2.3 (children 5-<9 years), 4.2 (children 9-<16 years), and 0.6 (youth 16-18 years), respectively.

Potential Neurobehavioral Effects of Synthetic CalEPA OEHHA Food Dyes in Children April 2021
261
Table 7.3 Ratios of the FD&C Blue No. 1 intake compared with US FDA and JECFA ADIs for pregnant women, women of childbearing years (18-49 years), and children (<=18 years)
FD&C Blue No. 1
Typical-exposure scenario High-exposure scenario FDA Ratio Mean
FDA Ratio 95th%
JECFA Ratio Mean
JECFA Ratio 95th%
FDA Ratio Mean
FDA Ratio 95th%
JECFA Ratio Mean
JECFA Ratio 95th%
Pregnant women Day 1 0.001 0.003 0.001 0.003 0.002 0.008 0.002 0.008 Day 2 0.001 0.004 0.001 0.004 0.002 0.005 0.002 0.005 2-Day average 0.001 0.002 0.001 0.002 0.002 0.005 0.001 0.005 Women 18-49 years Day 1 0.001 0.005 0.001 0.004 0.002 0.008 0.002 0.008 Day 2 0.001 0.005 0.001 0.005 0.003 0.008 0.002 0.008 2-Day average 0.001 0.004 0.001 0.003 0.002 0.006 0.002 0.006 Children (0-<2 years) Day 1 0.004 0.01 0.004 0.01 0.01 0.02 0.01 0.023 Day 2 0.01 0.02 0.008 0.02 0.03 0.03 0.03 0.03 2-Day average 0.004 0.01 0.004 0.01 0.01 0.02 0.01 0.02 Children (2-<5 years) Day 1 0.006 0.02 0.006 0.02 0.02 0.03 0.02 0.03 Day 2 0.004 0.01 0.004 0.01 0.01 0.03 0.01 0.03 2-Day average 0.004 0.01 0.004 0.01 0.01 0.02 0.01 0.02 Children (5-<9 years) Day 1 0.004 0.01 0.004 0.01 0.01 0.02 0.01 0.02 Day 2 0.004 0.01 0.004 0.01 0.01 0.02 0.01 0.02 2-Day average 0.003 0.01 0.003 0.01 0.01 0.02 0.01 0.02 Children (9-<16 years) Day 1 0.003 0.01 0.003 0.01 0.01 0.02 0.007 0.02 Day 2 0.003 0.009 0.003 0.008 0.01 0.01 0.005 0.01 2-Day average 0.002 0.008 0.002 0.008 0.005 0.01 0.005 0.01 Youth (16-18 years) Day 1 0.002 0.007 0.002 0.007 0.003 0.01 0.003 0.01 Day 2 0.001 0.004 0.001 0.004 0.002 0.008 0.002 0.007 2-Day average 0.001 0.004 0.001 0.004 0.002 0.007 0.002 0.007
US Food and Drug Administration (US FDA ADI= 12.0 mg/kg/day). JECFA: Joint FAO/WHO Expert Committee on Food Additives (JECFA ADI= 12.5 mg/kg/day).

Potential Neurobehavioral Effects of Synthetic CalEPA OEHHA Food Dyes in Children April 2021
262
Table 7.4 Ratios of the FD&C Blue No. 2 intake compared with US FDA and JECFA ADIs for pregnant women, women of childbearing years (18-49 years), and children (<=18 years)
Blue No. 2
Typical-exposure scenario High-exposure scenario FDA Ratio Mean
FDA Ratio 95th%
JECFA Ratio Mean
JECFA Ratio 95th%
FDA Ratio Mean
FDA Ratio 95th%
JECFA Ratio Mean
JECFA Ratio 95th%
Pregnant women Day 1 0.003 0.02 0.002 0.01 0.008 0.06 0.004 0.03 Day 2 0.003 0.01 0.002 0.006 0.006 0.03 0.003 0.01 2 -Day average 0.003 0.01 0.001 0.006 0.006 0.03 0.003 0.01 Women 18-49 years Day 1 0.003 0.01 0.001 0.006 0.005 0.02 0.002 0.01 Day 2 0.004 0.01 0.002 0.007 0.006 0.03 0.003 0.01 2 -Day average 0.002 0.01 0.001 0.004 0.004 0.01 0.002 0.01 Children (0-<2 years) Day 1 0.02 0.09 0.01 0.05 0.03 0.13 0.01 0.07 Day 2 0.02 0.08 0.008 0.04 0.04 0.10 0.02 0.05 2-Day average 0.01 0.05 0.006 0.02 0.02 0.09 0.010 0.05 Children (2-<5 years) Day 1 0.01 0.03 0.005 0.02 0.02 0.08 0.01 0.04 Day 2 0.01 0.05 0.007 0.03 0.02 0.08 0.01 0.04 2-Day average 0.008 0.03 0.004 0.02 0.01 0.05 0.01 0.03 Children (5-<9 years) Day 1 0.009 0.03 0.004 0.02 0.02 0.08 0.01 0.04 Day 2 0.01 0.03 0.005 0.02 0.02 0.09 0.01 0.05 2-Day average 0.007 0.03 0.003 0.01 0.01 0.05 0.01 0.03 Children (9-<16 years) Day 1 0.009 0.02 0.005 0.01 0.02 0.06 0.008 0.03 Day 2 0.009 0.03 0.005 0.02 0.02 0.06 0.008 0.03 2-Day average 0.006 0.02 0.003 0.01 0.01 0.03 0.005 0.02 Youth (16-18 years) Day 1 0.005 0.02 0.002 0.01 0.01 0.04 0.004 0.02 Day 2 0.004 0.02 0.002 0.01 0.01 0.04 0.004 0.02 2-Day average 0.003 0.01 0.001 0.006 0.004 0.02 0.002 0.01
US Food and Drug Administration (US FDA ADI= 2.5 mg/kg/day). JECFA: Joint FAO/WHO Expert Committee on Food Additives (JECFA ADI= 5.0 mg/kg/day).
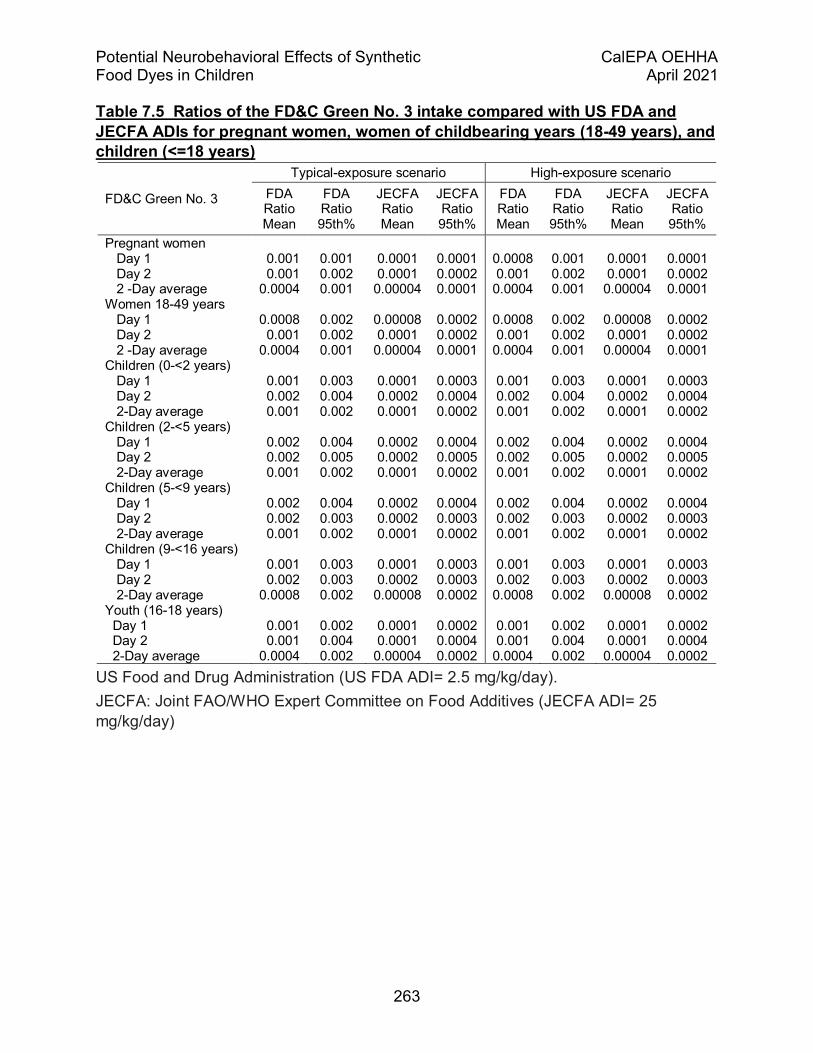
Potential Neurobehavioral Effects of Synthetic CalEPA OEHHA Food Dyes in Children April 2021
263
Table 7.5 Ratios of the FD&C Green No. 3 intake compared with US FDA and JECFA ADIs for pregnant women, women of childbearing years (18-49 years), and children (<=18 years)
FD&C Green No. 3
Typical-exposure scenario High-exposure scenario FDA Ratio Mean
FDA Ratio 95th%
JECFA Ratio Mean
JECFA Ratio 95th%
FDA Ratio Mean
FDA Ratio 95th%
JECFA Ratio Mean
JECFA Ratio 95th%
Pregnant women Day 1 0.001 0.001 0.0001 0.0001 0.0008 0.001 0.0001 0.0001 Day 2 0.001 0.002 0.0001 0.0002 0.001 0.002 0.0001 0.0002 2 -Day average 0.0004 0.001 0.00004 0.0001 0.0004 0.001 0.00004 0.0001 Women 18-49 years Day 1 0.0008 0.002 0.00008 0.0002 0.0008 0.002 0.00008 0.0002 Day 2 0.001 0.002 0.0001 0.0002 0.001 0.002 0.0001 0.0002 2 -Day average 0.0004 0.001 0.00004 0.0001 0.0004 0.001 0.00004 0.0001 Children (0-<2 years) Day 1 0.001 0.003 0.0001 0.0003 0.001 0.003 0.0001 0.0003 Day 2 0.002 0.004 0.0002 0.0004 0.002 0.004 0.0002 0.0004 2-Day average 0.001 0.002 0.0001 0.0002 0.001 0.002 0.0001 0.0002 Children (2-<5 years) Day 1 0.002 0.004 0.0002 0.0004 0.002 0.004 0.0002 0.0004 Day 2 0.002 0.005 0.0002 0.0005 0.002 0.005 0.0002 0.0005 2-Day average 0.001 0.002 0.0001 0.0002 0.001 0.002 0.0001 0.0002 Children (5-<9 years) Day 1 0.002 0.004 0.0002 0.0004 0.002 0.004 0.0002 0.0004 Day 2 0.002 0.003 0.0002 0.0003 0.002 0.003 0.0002 0.0003 2-Day average 0.001 0.002 0.0001 0.0002 0.001 0.002 0.0001 0.0002 Children (9-<16 years) Day 1 0.001 0.003 0.0001 0.0003 0.001 0.003 0.0001 0.0003 Day 2 0.002 0.003 0.0002 0.0003 0.002 0.003 0.0002 0.0003 2-Day average 0.0008 0.002 0.00008 0.0002 0.0008 0.002 0.00008 0.0002 Youth (16-18 years) Day 1 0.001 0.002 0.0001 0.0002 0.001 0.002 0.0001 0.0002 Day 2 0.001 0.004 0.0001 0.0004 0.001 0.004 0.0001 0.0004 2-Day average 0.0004 0.002 0.00004 0.0002 0.0004 0.002 0.00004 0.0002
US Food and Drug Administration (US FDA ADI= 2.5 mg/kg/day). JECFA: Joint FAO/WHO Expert Committee on Food Additives (JECFA ADI= 25 mg/kg/day)

Potential Neurobehavioral Effects of Synthetic CalEPA OEHHA Food Dyes in Children April 2021
264
Table 7.6 Ratios of the FD&C Red No. 3 intake compared with US FDA and JECFA ADIs for pregnant women, women of childbearing years (18-49 years), and children (<=18 years)
FD&C Red No. 3
Typical-exposure scenario High-exposure scenario FDA Ratio Mean
FDA Ratio 95th%
JECFA Ratio Mean
JECFA Ratio 95th%
FDA Ratio Mean
FDA Ratio 95th%
JECFA Ratio Mean
JECFA Ratio 95th%
Pregnant women Day 1 0.01 0.09 0.29 2.28 0.02 0.27 0.60 6.66 Day 2 0.008 0.02 0.20 0.41 0.01 0.02 0.23 0.54 2 -Day average 0.008 0.05 0.20 1.14 0.01 0.13 0.35 3.33 Women 18-49 years Day 1 0.01 0.03 0.27 0.78 0.02 0.03 0.38 0.81 Day 2 0.01 0.04 0.29 1.02 0.02 0.04 0.38 1.02 2 -Day average 0.01 0.03 0.18 0.72 0.01 0.03 0.24 0.80 Children (0-<2 years) Day 1 0.01 0.04 0.28 0.90 0.01 0.04 0.32 1.11 Day 2 0.21 1.93 5.35 48.3 0.60 3.16 15.0 79.0 2-Day average 0.07 0.03 1.73 0.68 0.19 0.03 4.72 0.68 Children (2-<5 years) Day 1 0.08 0.07 1.89 1.85 0.19 0.08 4.85 1.90 Day 2 0.02 0.06 0.56 1.56 0.03 0.07 0.84 1.68 2-Day average 0.03 0.04 0.70 0.90 0.07 0.04 1.66 0.90 Children (5-<9 years) Day 1 0.03 0.04 0.64 1.12 0.04 0.06 1.05 1.38 Day 2 0.04 0.08 1.09 1.98 0.07 0.09 1.72 2.14 2-Day average 0.02 0.05 0.62 1.22 0.04 0.09 0.98 2.28 Children (9-<16 years) Day 1 0.03 0.06 0.87 1.61 0.08 0.13 1.96 3.19 Day 2 0.03 0.06 0.87 1.38 0.06 0.06 1.52 1.44 2-Day average 0.02 0.06 0.55 1.60 0.04 0.17 1.05 4.21 Youth (16-18 years) Day 1 0.02 0.09 0.49 2.14 0.03 0.09 0.69 2.14 Day 2 0.007 0.02 0.17 0.57 0.01 0.03 0.21 0.80 2-Day average 0.007 0.02 0.18 0.54 0.01 0.02 0.24 0.62
US Food and Drug Administration (US FDA ADI= 2.5 mg/kg/day). JECFA: Joint FAO/WHO Expert Committee on Food Additives (JECFA ADI= 0.1 mg/kg/day).

Potential Neurobehavioral Effects of Synthetic CalEPA OEHHA Food Dyes in Children April 2021
265
Table 7.7 Ratios of the FD&C Red No. 40 intake compared with US FDA and JECFA ADIs for pregnant women, women of childbearing years (18-49 years), and children (<=18 years)
FD&C Red No. 40
Typical-exposure scenario High-exposure scenario FDA Ratio Mean
FDA Ratio 95th%
JECFA Ratio Mean
JECFA Ratio 95th%
FDA Ratio Mean
FDA Ratio 95th%
JECFA Ratio Mean
JECFA Ratio 95th%
Pregnant women Day 1 0.02 0.08 0.02 0.08 0.04 0.20 0.04 0.20 Day 2 0.01 0.04 0.01 0.04 0.03 0.25 0.03 0.25 2 -Day average 0.01 0.07 0.01 0.07 0.03 0.10 0.03 0.10 Women 18-49 years Day 1 0.02 0.05 0.02 0.05 0.03 0.13 0.03 0.13 Day 2 0.01 0.05 0.01 0.05 0.04 0.17 0.04 0.17 2 -Day average 0.01 0.04 0.01 0.04 0.03 0.10 0.03 0.10 Children (0-<2 years) Day 1 0.04 0.14 0.04 0.14 0.08 0.38 0.08 0.38 Day 2 0.04 0.14 0.04 0.14 0.07 0.30 0.07 0.30 2-Day average 0.03 0.13 0.03 0.13 0.06 0.24 0.06 0.24 Children (2-<5 years) Day 1 0.04 0.13 0.04 0.13 0.09 0.47 0.09 0.47 Day 2 0.04 0.13 0.04 0.13 0.10 0.43 0.10 0.43 2-Day average 0.03 0.11 0.03 0.11 0.07 0.29 0.07 0.29 Children (5-<9 years) Day 1 0.04 0.13 0.04 0.13 0.10 0.36 0.10 0.36 Day 2 0.04 0.11 0.04 0.11 0.10 0.42 0.10 0.42 2-Day average 0.03 0.10 0.03 0.10 0.09 0.30 0.09 0.30 Children (9-<16 years) Day 1 0.03 0.09 0.03 0.09 0.07 0.29 0.07 0.29 Day 2 0.03 0.10 0.03 0.10 0.08 0.39 0.08 0.39 2-Day average 0.02 0.07 0.02 0.07 0.06 0.23 0.06 0.23 Youth (16-18 years) Day 1 0.02 0.06 0.02 0.06 0.04 0.17 0.04 0.17 Day 2 0.02 0.05 0.02 0.05 0.04 0.15 0.04 0.15 2-Day average 0.01 0.04 0.01 0.04 0.03 0.12 0.03 0.12
US Food and Drug Administration (US FDA ADI= 7.0 mg/kg/day). JECFA: Joint FAO/WHO Expert Committee on Food Additives (JECFA ADI= 7.0 mg/kg/day).
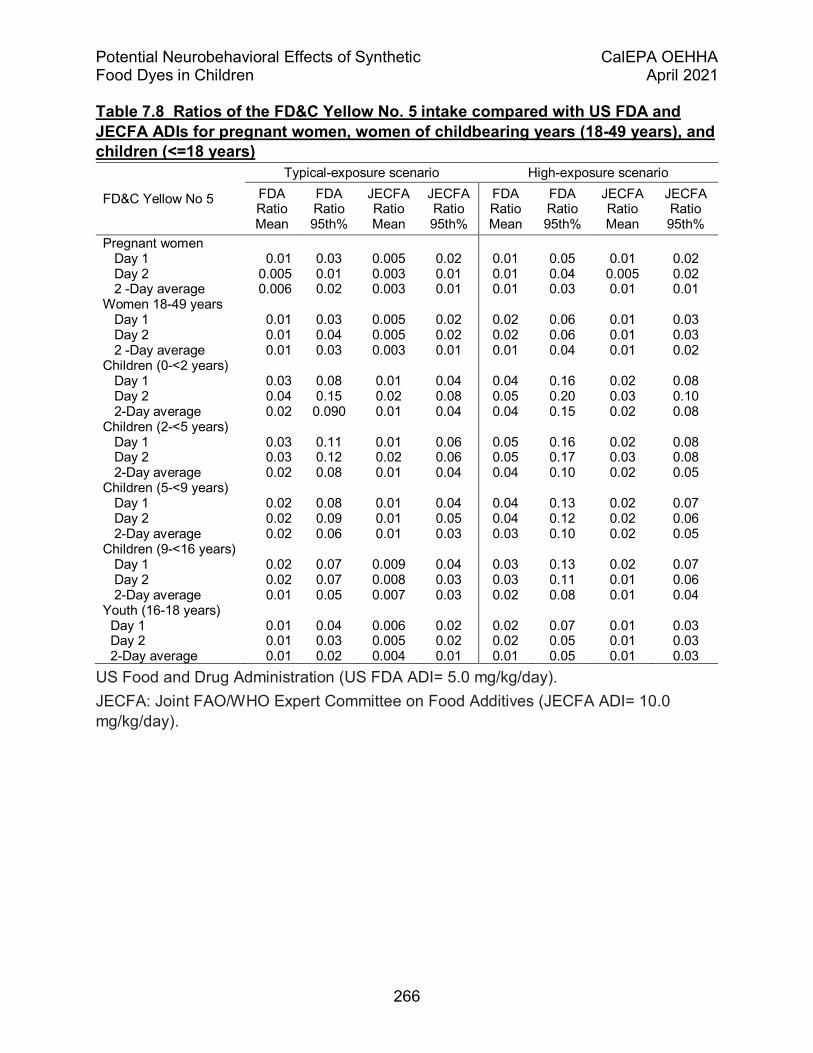
Potential Neurobehavioral Effects of Synthetic CalEPA OEHHA Food Dyes in Children April 2021
266
Table 7.8 Ratios of the FD&C Yellow No. 5 intake compared with US FDA and JECFA ADIs for pregnant women, women of childbearing years (18-49 years), and children (<=18 years)
FD&C Yellow No 5
Typical-exposure scenario High-exposure scenario FDA Ratio Mean
FDA Ratio 95th%
JECFA Ratio Mean
JECFA Ratio 95th%
FDA Ratio Mean
FDA Ratio 95th%
JECFA Ratio Mean
JECFA Ratio 95th%
Pregnant women Day 1 0.01 0.03 0.005 0.02 0.01 0.05 0.01 0.02 Day 2 0.005 0.01 0.003 0.01 0.01 0.04 0.005 0.02 2 -Day average 0.006 0.02 0.003 0.01 0.01 0.03 0.01 0.01 Women 18-49 years Day 1 0.01 0.03 0.005 0.02 0.02 0.06 0.01 0.03 Day 2 0.01 0.04 0.005 0.02 0.02 0.06 0.01 0.03 2 -Day average 0.01 0.03 0.003 0.01 0.01 0.04 0.01 0.02 Children (0-<2 years) Day 1 0.03 0.08 0.01 0.04 0.04 0.16 0.02 0.08 Day 2 0.04 0.15 0.02 0.08 0.05 0.20 0.03 0.10 2-Day average 0.02 0.090 0.01 0.04 0.04 0.15 0.02 0.08 Children (2-<5 years) Day 1 0.03 0.11 0.01 0.06 0.05 0.16 0.02 0.08 Day 2 0.03 0.12 0.02 0.06 0.05 0.17 0.03 0.08 2-Day average 0.02 0.08 0.01 0.04 0.04 0.10 0.02 0.05 Children (5-<9 years) Day 1 0.02 0.08 0.01 0.04 0.04 0.13 0.02 0.07 Day 2 0.02 0.09 0.01 0.05 0.04 0.12 0.02 0.06 2-Day average 0.02 0.06 0.01 0.03 0.03 0.10 0.02 0.05 Children (9-<16 years) Day 1 0.02 0.07 0.009 0.04 0.03 0.13 0.02 0.07 Day 2 0.02 0.07 0.008 0.03 0.03 0.11 0.01 0.06 2-Day average 0.01 0.05 0.007 0.03 0.02 0.08 0.01 0.04 Youth (16-18 years) Day 1 0.01 0.04 0.006 0.02 0.02 0.07 0.01 0.03 Day 2 0.01 0.03 0.005 0.02 0.02 0.05 0.01 0.03 2-Day average 0.01 0.02 0.004 0.01 0.01 0.05 0.01 0.03
US Food and Drug Administration (US FDA ADI= 5.0 mg/kg/day). JECFA: Joint FAO/WHO Expert Committee on Food Additives (JECFA ADI= 10.0 mg/kg/day).
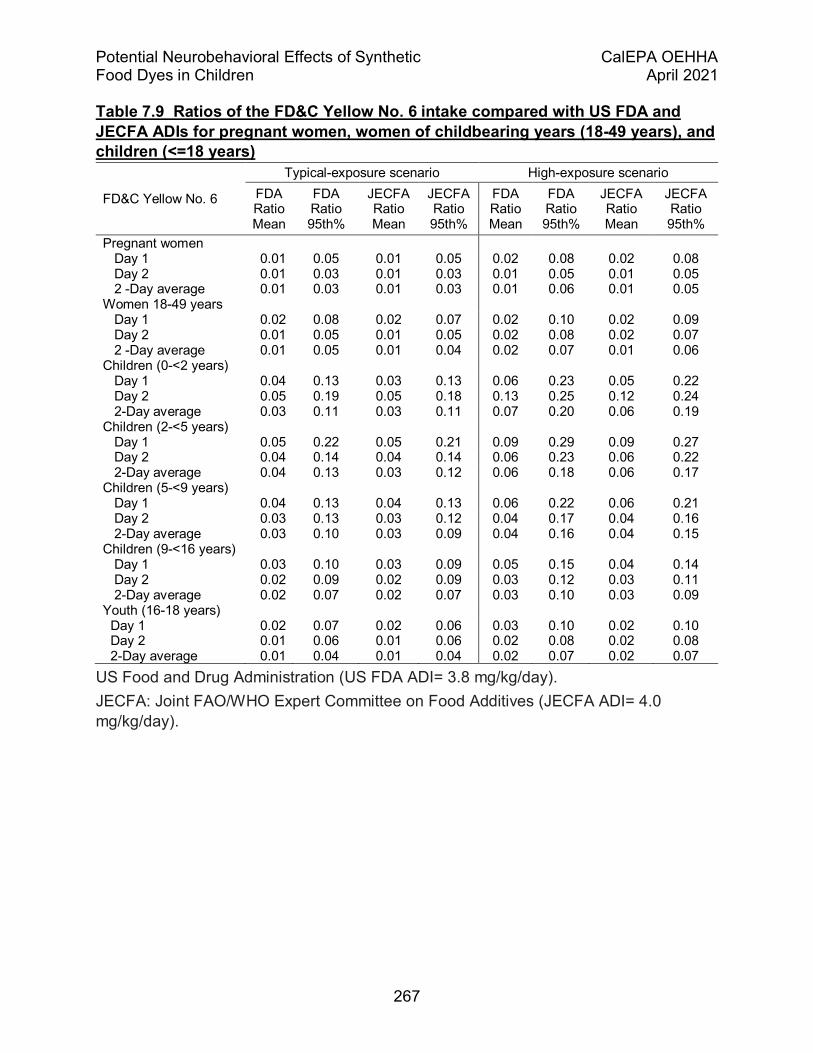
Potential Neurobehavioral Effects of Synthetic CalEPA OEHHA Food Dyes in Children April 2021
267
Table 7.9 Ratios of the FD&C Yellow No. 6 intake compared with US FDA and JECFA ADIs for pregnant women, women of childbearing years (18-49 years), and children (<=18 years)
FD&C Yellow No. 6
Typical-exposure scenario High-exposure scenario FDA Ratio Mean
FDA Ratio 95th%
JECFA Ratio Mean
JECFA Ratio 95th%
FDA Ratio Mean
FDA Ratio 95th%
JECFA Ratio Mean
JECFA Ratio 95th%
Pregnant women Day 1 0.01 0.05 0.01 0.05 0.02 0.08 0.02 0.08 Day 2 0.01 0.03 0.01 0.03 0.01 0.05 0.01 0.05 2 -Day average 0.01 0.03 0.01 0.03 0.01 0.06 0.01 0.05 Women 18-49 years Day 1 0.02 0.08 0.02 0.07 0.02 0.10 0.02 0.09 Day 2 0.01 0.05 0.01 0.05 0.02 0.08 0.02 0.07 2 -Day average 0.01 0.05 0.01 0.04 0.02 0.07 0.01 0.06 Children (0-<2 years) Day 1 0.04 0.13 0.03 0.13 0.06 0.23 0.05 0.22 Day 2 0.05 0.19 0.05 0.18 0.13 0.25 0.12 0.24 2-Day average 0.03 0.11 0.03 0.11 0.07 0.20 0.06 0.19 Children (2-<5 years) Day 1 0.05 0.22 0.05 0.21 0.09 0.29 0.09 0.27 Day 2 0.04 0.14 0.04 0.14 0.06 0.23 0.06 0.22 2-Day average 0.04 0.13 0.03 0.12 0.06 0.18 0.06 0.17 Children (5-<9 years) Day 1 0.04 0.13 0.04 0.13 0.06 0.22 0.06 0.21 Day 2 0.03 0.13 0.03 0.12 0.04 0.17 0.04 0.16 2-Day average 0.03 0.10 0.03 0.09 0.04 0.16 0.04 0.15 Children (9-<16 years) Day 1 0.03 0.10 0.03 0.09 0.05 0.15 0.04 0.14 Day 2 0.02 0.09 0.02 0.09 0.03 0.12 0.03 0.11 2-Day average 0.02 0.07 0.02 0.07 0.03 0.10 0.03 0.09 Youth (16-18 years) Day 1 0.02 0.07 0.02 0.06 0.03 0.10 0.02 0.10 Day 2 0.01 0.06 0.01 0.06 0.02 0.08 0.02 0.08 2-Day average 0.01 0.04 0.01 0.04 0.02 0.07 0.02 0.07
US Food and Drug Administration (US FDA ADI= 3.8 mg/kg/day). JECFA: Joint FAO/WHO Expert Committee on Food Additives (JECFA ADI= 4.0 mg/kg/day).
Potential Neurobehavioral Effects of Synthetic CalEPA OEHHA Food Dyes in Children April 2021
268
7.4.2 Comparison of estimates of food dye intake from over the counter medicines and vitamins to ADIs OEHHA contracted with UC Davis to analyze samples of over-the-counter medicines and vitamins for their US FDA batch-certified food-dye content (see Appendix E). These data were then used by exposure scientists at UC Berkeley to estimate children’s food dye intake by various ages, described in Chapter 6, Section 8, based on the recommended doses on the product label. If a child is treated with an over-the-counter fever reducer or pain reliever, the food dye exposures would not exceed the US FDA and JECFA ADIs. These exposures would be in addition to any food dye exposures that day from foods.
The FD&C Red No. 40 and Blue No. 1 exposure estimates from children’s pain reliever/fever reducer syrups are presented in Chapter 6, Section 6.8. None of the exposure estimates exceeded the US FDA and JECFA ADIs. The hazard indices for one brand of grape-flavored pain reliever/fever reducer, which had the highest exposure estimates for Red No. 40, were less than 0.02 for children 2 to 10 years old.
Chapter 6 also presents the FD&C Red No. 40 and Blue No. 1 exposure estimates (mg/kg/day) from five brands of children’s cold, cough and allergy syrups. None of the Red No. 40 exposure estimates based on the recommended maximum daily dose of cold, cough and allergy syrups exceeded the US FDA and JECFA ADI (7 mg/kg/day). The hazard indices for one brand of grape-flavored syrup, which had the highest exposure estimates in this category, were less than 0.03 for children 4 to <12 years old and less than 0.04 for children 12 to 16 years old. Thus, on a day where this medication is given, the child’s exposure to Red No. 40 would not exceed the dye’s ADI from the medication alone. Note that some children with allergies may receive this medication chronically.
We estimated children’s FD&C food dye exposures (mg/kg/day) based on laboratory measurements of FD&C Blue No. 1 and Blue No. 2 by UC Davis on three brands of pain reliever/fever reducer tablets and four brands of allergy tablets. Overall, child exposures to FD&C food dyes from tablet OTC medicines were well below US FDA and JECFA ADIs and lower than potential exposures from food or from syrup OTC medicines.
Overall, children’s average food-dye exposure estimates from vitamin gummies were relatively low. The highest estimate was for Red No. 40 from Brand 1 vitamins (Red, Orange and Purple) (Chapter 6, Section 6.8). None of the exposure estimates exceeded the US FDA and JECFA ADIs. As well, pregnant women’s average food dye exposure estimates from prenatal vitamin tablets were very low. The highest estimate was for Yellow No. 6 from Brand 4 vitamins (Chapter 6, Section 8). None of the exposure estimates exceeded the US FDA and JECFA ADIs.
Potential Neurobehavioral Effects of Synthetic CalEPA OEHHA Food Dyes in Children April 2021
269
7.4.3 Comparison of estimates of food dye intake from new analyses of specific food items and beverages to ADIs OEHHA contracted with UC Davis to analyze samples of specific food items recognized as major contributors to food-dye exposures in children for their US FDA batch-certified food-dye content (see Appendix E). The results were then used by UC Berkley exposure scientists to estimate food-dye exposures from these items. Our goal was to compare these results with samples of similar food items used by Doell et al. (2016) for their exposure estimate. Given that the market changes and the food-dye content also changes, this exercise was meant to see what differences there might be between the two time periods. The results of the exposure estimate are described in Chapter 6, Section 6.9.
As described in Chapter 6, Section 6.9, we estimated children’s FD&C food-dye exposures (mg/kg/day) based on laboratory measurements by UC Davis on breakfast cereals, frostings and icings, frozen desserts, ice cream cones, decorations/chips for baking, fruit snacks, juice drinks, fruit-flavored soft drinks, water enhancers, and reconstituted powdered fruit flavored drinks (See Appendix F). Children’s mean and maximum food dye intakes (mg/kg/day) for each product were calculated using standard US EPA body weight reference values (USEPA 2011) and assuming consumption of one serving by children >2 years based on the serving size on the nutrition facts label. For children 0-<2 years old, we assumed consumption of one-half the labeled serving size.
In the present assessment, we measured two to three brands per food category (US FDA measured many more foods per food category). Overall, the range of food dye concentrations (mg/kg) UC Davis reported in breakfast cereals, decorations/chips for baking, frozen desserts, fruit snacks, ice cream cones, juice drinks and soft drinks were similar for the majority of dyes measured.
Children’s mean and maximum FD&C Red No. 3 intake estimates based on a daily serving of fruit-flavored snacks (Brand 2), frozen desserts (Brand 1), and frosting and icings (Brand 1) exceeded the JECFA ADI (0.1 mg/kg/day) (Chapter 6, Section 9, Table 6.23, 6.24, and 6.26). The mean estimated daily FD&C Red No. 3 intakes among children 0-<16 years old eating a single serving of frozen dessert (Brand 1) and frosting (Brand 1) ranged from 0.13 to 0.53 mg/kg/day and 0.05 to 0.20 mg/kg/day, respectively. The hazard indices for FD&C Red No. 3 based on mean child intake estimates for these foods ranged from 1.3-5.3 and 0.5-2.0, respectively.
The maximum estimated daily FD&C Red No. 3 intakes among children 0-<16 years old eating a single serving of frozen dessert (Brand 1) and frosting (Brand 1) ranged from 0.29 to 1.19 mg/kg/day and 0.06 to 0.23 mg/kg/day, respectively (Chapter 6, Section 9, Table 6.24, and 6.26). The hazard indices for FD&C Red No. 3 based on maximum child-intake estimates for these foods ranged from 2.9 to 10.9 and 0.6 to 2.3, respectively.
Potential Neurobehavioral Effects of Synthetic CalEPA OEHHA Food Dyes in Children April 2021
270
7.5 Comparison of US FDA ADIs to NOAELs from studies useful for setting safe levels protective of neurobehavioral effects in children There are a number of studies that can be used as a basis for establishing a safe level of exposure for neurological endpoints, including neurobehavioral. OEHHA reviewed available literature from animal studies in Chapter 3, and human studies in Chapter 2. Here we compare NOAELs from several of the reviewed studies for neurobehavioral endpoints to the existing FDA ADIs. Details of the human studies are provided in Chapter 2, Table 2.1. Details of the animal studies are provided in Chapter 3, Table 3.9.
7.5.1 Red No. 3 A developmental toxicity study of Red No. 3 conducted by Tanaka et al (2001) reported a NOAEL of 24 mg/kg/day for the pups, based on increased activity measurements in female offspring. Study details are provided in Table 3.9 of Chapter 3. The study administered Red No. 3 to male and female rats from 4 weeks preconception through PND 63 at levels of 0%, 0.005%, 0.015% and 0.045% in the diet.
When offspring were tested for activity at 3 weeks of age (young juvenile), the high-dose males performed fewer bouts of activity, but moved further during each bout than controls. A significant (p<0.01) dose trend was reported for both these measures, and additionally for total distance (p<0.05). This effect was not seen when the males were older (8 weeks, young adult). For females at 3 weeks of age, more turning was reported in the high-dose group than in controls. At the older age (8 weeks) more extensive indications of dye-induced increases in activity were seen in the females. Both the number of activity bouts and the distance traveled in each bout were increased in a dose-dependent manner with marginal statistical significance (p=0.05). Additionally, dose-dependent trends were reported for greater speed (p<0.05), total time moving (p<.05) and total distance (p<0.01). For each of these three measures, the high-dose group differed significantly from controls. This interesting sex, age and dose-dependent pattern of greater activity is particularly valuable in the absence of more severe developmental toxicity. The effects at 3 weeks of age are most relevant to children.
Limitations of the Tanaka studies are described in Chapter 3, section 2.4.6. One weakness of Tanaka et al (2001) is a relatively small sample size which limits the power of the study. Nonetheless, statistically significant effects on both parent and offspring activity were observed.
This NOAEL is a factor of 10 higher than the FDA ADI of 2.5 mg/kg/day. If one were to apply the same methodology as US FDA to derive an ADI, the ADI would be a factor of 10 lower, 24 mg/kg/day/100 = 0.24 mg/kg/day.

Potential Neurobehavioral Effects of Synthetic CalEPA OEHHA Food Dyes in Children April 2021
271
The studies by Dalal and Poddar (2009, 2010) (see Chapter 3, Section 3.5) provide unique information on brain serotonin pathway changes in animals treated with Red No. 3. The same studies provide data on behavioral changes in adult animals either following single gavage administration or following 15 or 30 day exposures to Red No. 3. Changes in activity following administration of Red No. 3 were replicated in the first study in two different experiments. In both studies changes in behavior were reported, but the experimental paradigm of a single administration in the first study versus pretreatment with multiple administrations in the second study changed the direction of the effect. An explanation for these contrasting results is the role of two neuronal corticotrophin releasing factor (CRF) receptors that determine an active versus passive response to stress (Waselus et al. 2009). The authors suggest that repeated Red No. 3 dosing desensitizes serotonin system and dysregulates its interaction with CRF receptors. This could result in recruitment of the active, versus the passive, response to the stress of being removed from the home cage and transferred to the test apparatus.
In their first study, the investigators measured activity (vertical rearing frequency detected automatically) for 5 minutes at 30-minute intervals for 3 hours, and then every hour to 9 hours post-dosing after single doses administered by gavage of 0, 1, 10, 100 or 200 mg/kg. The resulting data are shown in Chapter 3, Figure 3.3 and Table 3.9. No effect was seen at the lowest dose but the other three doses produced a dose-dependent pattern of diminished activity that reached a low at 2 hours after dye administration and then returned to baseline by 7 hours. The effect of diminished activity was replicated in an experiment demonstrating reversal of this effect by MAO inhibitors. In the second report, the investigators administered the same doses daily for a period of 15 or 30 days and activity was measured following the last administration. Following the 15 or 30 day treatments, activity was increased rather than decreased in a dose-dependent fashion (Chapter 3, Figure 5). The NOAEL from these studies is 1 mg/kg/day based on changes in vertical activity in male rats, and on increased serotonin levels in specific brain regions, and increased plasma cortisone levels. These biochemical endpoints are relevant to the observed changes in activity levels. The animals in this case were juvenile rats and as such they are fairly representative developmentally of human children in the clinical trials.
There is, as always, uncertainty associated with any study. In this case, the researchers measured brain changes in serotonin pathway, which is relevant to neurobehavior. However, they only evaluated male rats. In this study, there is relatively large dose spacing (1, 10, 100) and thus the true NOAEL is between 1 and <10 mg/kg/day, the LOAEL in this study. However, multiple studies have observed effects on neurobehavioral measurements in animal models after dosing with Red No. 3.
The NOAEL of 1 mg/kg/day in these studies is lower than the FDA ADI of 2.5 mg/kg/day and tenfold higher than the JECFA ADI. If one were to use the same 100-fold safety factor with this NOAEL, the ADI would be 0.01 mg/kg/day.

Potential Neurobehavioral Effects of Synthetic CalEPA OEHHA Food Dyes in Children April 2021
272
7.5.2 Red No. 40 Noorafshan et al. (2018) administered Red No. 40 to adult female rats (N=10 per dose group) at doses of 0, 7, or 70 mg/kg/day (Chapter 3, Table 3.9) with and without 200 mg/kg/day taurine by gavage for 6 weeks. These investigators evaluated the effect of administered taurine, an anti-inflammatory and neuroprotective molecule, on mitigating the neurotoxicity of Red No. 40. Two cognitive tasks, novel object recognition and radial arm maze learning began after 4 weeks of treatment. The high-dose group spent less time exploring the novel object than controls, though this comparison was not statistically significant. In the radial arm maze, both Red No. 40 treated groups performed more reference memory errors and working memory errors than controls (p<0.01). Taurine administration mitigated this effect. Brains were obtained after 6 weeks of dosing to evaluate histomorphology and stereology of the medial prefrontal cortex, an area associated with performance of these cognitive tasks. The volume of the medial prefrontal cortex was found to be smaller in the high dose Red No. 40 group than controls, and there were fewer neurons and glial cells in this brain area in the high-dose group compared to controls. The length of dendrites and the number of synaptic spines per unit length were also lower in the high-dose group than in controls. Thus, Red No. 40 influenced the learning and memory test at both the low and high doses, and the high dose resulted in adverse effects on the medial prefrontal cortex. Thus, 7 mg/kg/day is a LOAEL for this study. This LOAEL is the same as the US FDA and JECFA ADI of 7 mg/kg/day, indicating that the ADI may not protect against neurobehavioral effects. If this study were to be used as the basis for setting an ADI for Red No. 40, the resulting ADI would be 100 to 1000 fold lower than the existing ADI, depending on the method used to derive the point of departure.
The evaluation of the changes in the brain in response to food dyes have not been well-studied. This area of research, using newly developed techniques, is just beginning to be applied to food dyes and other chemicals and no other studies of Red No. 40 are available at this time. The sample size was small, particularly for the histomorphology/stereology (6 animals per dose group). However, there is mechanistic support for oxidative damage from Red No. 40 from other studies (Khayyat et al. 2018) and the anti-oxidant taurine reportedly reversed the effects of Red No. 40. Additionally, the changes in the medial prefrontal cortex can be directly related to the cognitive performance of the animals, as this part of the rodent brain is involved in spatial memory, decision-making and attention (Noorafshan et al, 2018). The studies that form the basis of the US FDA and JECFA ADIs would not have been able to detect this type of adverse effect.
Potential Neurobehavioral Effects of Synthetic CalEPA OEHHA Food Dyes in Children April 2021
273
7.5.3 Yellow No. 5 The investigators who evaluated Red No. 40 (Noorafshan et al (2018) described above) used the same protocol to evaluate the effect of Yellow No. 5 on novel object recognition and the radial arm maze, and histomorphological and stereological parameters. Rafati et al. (2017) administered doses of 0, 5, or 50 mg/kg/day by gavage to adult male rats (N=10 per dose group) for 7 weeks with and without vitamin E. The novel recognition task was affected only in the high-dose group in terms of exploration time (p<0.01). For the radial arm maze, more days were required for Yellow No. 5 treated rats (low- and high-dose groups were combined) to reach the learning criterion. More errors were also seen in these dye-treated groups on some of the learning days. A similar pattern of increased error in dye-treated groups was shown during the retention phase. Vitamin E ameliorated these cognitive effects in the Yellow No. 5 treated animals. The NOAEL for the radial arm maze was ambiguous due to the apparent combining of the low and high dose groups. The brain assays demonstrated smaller volume of the medial prefrontal cortex in the high-dose group. The number of cells was lower at the high dose and qualitative alterations in cell shape were described. Both the low and high dose resulted in shorter dendrites with lower spine density. These effects were ameliorated by concomitant administration of vitamin E. For these morphometric parameters, the LOAEL was 5 mg/kg/day. The similarity in findings between Rafati et al. (2017) study on Yellow No. 5 and the Noorafshan et al. 2018 study of Red No. 40 is interesting in view of the fact that these are both azo dyes.
This LOAEL is the same as the US FDA ADI of 5 mg/kg/day and lower than the JECFA ADI of 10 mg/kg/day. If this study were to be used as the basis for setting an ADI, the resulting ADI would be 100 to 1000 fold lower than the existing ADI, depending on the method used to derive the point of departure.
The sample size in this study was small, particularly for the histomorphology and stereology (6 animals per dose group). However, there is mechanistic support for oxidative damage from Red No. 40 from other studies and the anti-oxidant Vitamin E reportedly reversed the effects of Yellow No. 5. Additionally, the changes in the medial prefrontal cortex can be directly related to the cognitive performance of the animals, as this part of the rodent brain is involved in spatial memory, decision-making and attention (Noorafshan et al. 2018); (Heidbreder and Groenewegen 2003). The studies that form the basis of the US FDA and JECFA ADIs would not have been able to detect this type of adverse effect.
Most of the clinical trials in children assessing whether food dyes affected behavior used a mixture of food dyes. A handful of studies evaluated the effects of a single dose of Yellow No. 5, and are thus not useful for dose-response assessment. One study in children used several doses and demonstrated a dose response effect on behavioral scores for Yellow No. 5 (Rowe and Rowe 1994). For this study, the investigators recruited 34 children whose parents had brought them to the Royal Children’s Hospital

Potential Neurobehavioral Effects of Synthetic CalEPA OEHHA Food Dyes in Children April 2021
274
in Melbourne to be evaluated for hyperactivity and 20 children whose parents had no concern about behavior. The children were enrolled in a double blind, placebo-controlled repeated measures study of the effects of Yellow No. 5 on behavioral score. The children ranged in age from 2 to 14 years. The authors had noted in previous studies that parents often complained of symptoms of restlessness, irritability and sleeplessness following consumption of food dyes. Previous reports in the literature had focused on attention disorders and had not emphasized these other symptoms. To address this, the investigators developed a Behavioral Rating Inventory applied for this study that included 11 items measuring irritability, 9 items that measured sleep disturbance, 4 items that measured restlessness, 3 items that measured aggression and 3 items that measured attention span. This Behavioral Rating Inventory successfully distinguished between placebo and dye administration in a blinded study of 8 children who were suspected reactors to food dye. In addition, the investigators also used the Conners 10-item Abbreviated Parent-Teacher Questionnaire to assess behavior, which focuses on attention related problems. Children were on a dye-free diet for at least 6 weeks before the trial. They were then given doses (randomly) of 0, 1, 2, 5, 10, or 20 mg Yellow No. 5 with two days in between each dosing, and parents rated the behavior daily using the two instruments.
The investigators ranked the behavioral scores for the six dye-challenge days paired with a set of placebo days (the day before the dye challenge) and found 24 children who had significant behavioral responses to dye challenge, whom they labelled as reactors. Notably two of these children were from the group whose parents did not consider to have a behavioral problem. The mean behavioral scores on dye-challenge days for the reactors were significantly different than the scores for the placebo (day before) challenge, while the nonreactors showed random fluctuations in behavioral scores. For the reactor group, the mean score differences between behavioral ratings for placebo days and dye challenge days were significant for all dose/placebo pairs (p<0.05). Using repeated measures ANOVA on the six dye-challenge scores with reactors and nonreactors as the between groups factor, the authors report a significant between-groups effect (p<0.001). The investigators also fit the dose-response relationship between behavioral score and the amount of dye administered and characterize the fit of the line as a third-order polynomial. The mean score difference between the reactor and the nonreactor groups were significant at doses of 2 mg and higher (p<0.05). There were no significant differences in mean behavioral rating between the groups on the placebo days. OEHHA identifies 1 mg tartrazine as a NOAEL. The children ranged from 2 to 16 years, with a mean of 7 years. To determine a NOAEL dosage, OEHHA divided the NOAEL of 1 mg by a reference body weight of 25.5 kg for the mean age of 7 years (US EPA, 2011, Table 8-10, based on NHANES 1988-1994); a NOAEL dosage of 0.04 mg/kg/day is obtained. This NOAEL is more than 100 fold lower than the US FDA ADI for Yellow No. 5 of 5 mg/kg/day. If this study were used as the basis of an acceptable exposure, the resulting ADI would be 250 times lower, assuming a small uncertainty factor of 2 were applied to the NOAEL in these sensitive children.
Potential Neurobehavioral Effects of Synthetic CalEPA OEHHA Food Dyes in Children April 2021
275
Not all of the human trials demonstrated effects of the food dyes or of Yellow No. 5 on neurobehavior. However, the findings of Rowe and Rowe (1994) are supported by some of the other clinical trials in children (Table 7.10). Note that in all these studies, effects were observed at estimated doses lower than the US FDA ADI for Yellow No. 5 of 5 mg/kg/day. In a previous study, (Rowe 1988) reports that in a six-week open trial of the Feingold diet in 55 subjects, ages 3 to 15 years, who had been suspected of reacting to food dyes, 40 children demonstrated improvement when on the Feingold diet (see Chapter 2 for study details). This was based on assessment of attention span, activity level, distractability, frustration tolerance, and social and manipulative skills by therapists, and teacher and parent questionnaire. Eight of these children were then in a double blind crossover study of the effects of a challenge dose of 50 mg Yellow No. 5 on behavior. Based on reference body weights for children ages 3 to 15 years, the dosages employed in Rowe (1988) would have been 0.9 – 2.7 mg/kg/day. Two children were obvious reactors who demonstrated increased activity, irritability, low frustration tolerance, short attention span and/or sleeplessness and aggression after exposure to Yellow No. 5. Levy et al. (1978) conducted a double-blind crossover study of 22 children, 4 to 8 years of age, using both objective tests for attention and parent and teacher ratings (Connors Parent Teacher Rating Scale for hyperactive behavior) administered before and after a 4 week dye-free diet, after a two week Yellow No. 5 (5 mg daily) challenge and after a 4 week washout dye-free diet. While the effects of a Yellow No. 5 challenge were not significant for the entire group, there were statistically significant effects of Yellow No. 5 based on parental ratings in a subgroup of children whose mothers had reported improved behavior while on the elimination diet. The dose for this range of ages and body weights to the children would be 0.2 to 0.3 mg/kg/day. Levy and Hobbs (1978) evaluated 8 children, averaging 5 years of age, in a 2 week crossover trial where subjects ingested either cookies containing a total of 4 mg Yellow No. 5 or placebo cookies, with daily ratings by parents for a 3 hour period after eating the cookies. While there were no statistically significant differences noted, the mothers’ ratings using the Connors scale were an average of 13% lower when the children ate placebo cookies compared to those containing Yellow No. 5. The authors reported that this effect “just failed to reach the .05 level of significance”. The dose of Yellow No. 5 in this study was about 0.1 to 0.2 mg/kg/day.

Potential Neurobehavioral Effects of Synthetic CalEPA OEHHA Food Dyes in Children April 2021
276
Table 7.10 Doses of Yellow No. 5 that elicited effects in children’s clinical trials Study Rowe and
Rowe (1994) Rowe (1988) Levy et al.
1978 Levy and Hobbs (1978)
Administered amount
0, 1, 2, 5, 10, or 20 mg
50 mg 5 mg 4 mg
Estimated effective dose (mg/kg/day)
0.04a 0.9 – 2.7b 0.2-0.3 b 0.1 – 0.2 b
a. LOAEL dose estimated for the mean age of 7 years. b. single dose studies, dose estimated for reported range of ages of children.
Taken together, these studies provide support for an effect of Yellow No. 5 on behavior and for use of a neurobehavioral endpoint to determine a safe level of exposure for Yellow No. 5 to protect children who respond to this food dye.
7.5.4 Yellow No. 6 There is only one study of Yellow No. 6 with neurobehavioral endpoints (Tanaka 1996). There were no dye effects on activity in either the parents or offspring. Although some neurobehavioral effects in offspring were reported for preweaning development and maze learning, it was not possible to draw firm conclusions due to the statistical approach and varying group sizes in the study. A NOAEL without a LOAEL in the same study is not suitable for risk assessment. However, like Yellow No. 5, the major metabolite of Yellow No. 6 is sulfanilic acid formed in the gut by the gut microflora and readily absorbed (Honohan et al. 1977). (Goldenring et al. 1982) tested the hypothesis that sulfanilic acid, a common metabolite of the azo food dyes Yellow No. 5 and Yellow No. 6, was the effective agent in producing the effects on activity seen in several dye mixture studies described in Chapter 3. Effects of sulfanilic acid (1 mg/kg/day I.p.) included increased activity in pups assessed three times during a treatment extending throughout juvenile development (Goldenring et al. 1982). Of note, this sulfanilic acid study is particularly relevant to human studies because it used direct administration to the pups (rather than through the dam’s diet) and measured activity during the juvenile administration.
Assuming 37.4% gastrointestinal absorption of sulfanilic acid (Honohan et al. 1977) the 1 mg/kg intraperitoneal dose of sulfanilic acid used by Goldenring et al. would be equivalent to 2.7 mg/kg produced in the gastrointestinal tract, which in turn would result from metabolism of 7 mg/kg of orally administered Yellow No. 5. Indirectly, one could view 7 mg/kg-/day of Yellow No. 6 to be a free-standing LOAEL. This LOAEL is about twice the FDA (3.75 mg/kg/day) and JECFA (4 mg/kg/day) ADIs. The study by Goldenring et al. (1982) indicates the ADIs for Yellow No. 6 may not be adequately protective of neurobehavioral effects.

Potential Neurobehavioral Effects of Synthetic CalEPA OEHHA Food Dyes in Children April 2021
277
7.6 Summary With the exception of FD&C Red No. 3, all exposure estimates (mg/kg/day) from foods based on the NHANES data were below the US FDA or JECFA ADIs. For the typical exposure scenario for FD&C Red No. 3, the 95th percentile single-day typical-exposure scenario estimate (mg/kg/day) for children 0 to <2 years exceeded the FDA ADI with a Hazard Index of 1.9. No other exposure estimates for the typical-exposure scenario exceeded the FDA ADI (Table 7.6). For the high exposure scenario for FD&C Red No. 3, the 95th percentile single-day estimate for children 0 to <2 years exceeded the FDA ADI with a Hazard Index of 3.2.
Some of the mean and 95th percentile exposure estimates for various age ranges for both the typical and high exposure scenarios exceeded the JECFA ADI (ADI=0.1 mg/kg/day) for FD&C Red No. 3, with Hazard Indices ranging from just above1 to 79.
None of the child intake estimates based on a daily serving of the U.C. Davis-sampled foods exceeded US FDA ADIs for food dyes. Children’s mean FD&C Red No. 3 intake estimates based on a single serving of frozen desserts and frosting and icings sometimes exceeded the JECFA ADI (0.1 mg/kg/day), with Hazard Indices for the mean intake estimates ranging from 0.5 to 5.3.
None of the exposures from over-the-counter medications exceed JECFA or FDA ADIs when following label instructions. Additional intake from food would increase children’s exposure beyond that of medications alone. Note that some children with allergies or other health conditions may receive such medication chronically.
A number of animal studies of single synthetic food dyes and a dosing regimen that included in utero, postnatal and juvenile exposures found evidence of effects on behavior in the offspring. A handful of these studies observed effects at doses lower than the NOAELs used by the FDA to derive their ADIs. Almost all the studies in mature animals that measured behavioral changes and/or changes in the brain found effects of the synthetic food dyes at doses lower than the NOAELs used by the US FDA for the derivation of the ADIs. A number of these studies observe effects on behavior in animals at doses close to or even lower than the existing FDA ADIs. The animal studies that form the basis of the FDA ADIs are many decades old and were not capable of detecting the types of neurobehavioral outcomes measured in later studies, or for which there is concern in children consuming synthetic food dyes. For several dyes, if ADIs were based on more modern studies that observed neurobehavioral effects, those ADIs would be considerably lower. We note this for Red No. 3 and Red No. 40 based on animal studies. Applying such ADIs explicitly for neurobehavioral effects would result in likely exceedances from food and some OTC medications.
A number of human challenge studies also found effects on behavior in children using a mixture of the dyes. These mixture studies render it impossible to attribute the effects to any particular dye. However, children are generally exposed to a mixture of dyes in food and OTC medications. Only one dye, Yellow No. 5, was assessed as a single dye

Potential Neurobehavioral Effects of Synthetic CalEPA OEHHA Food Dyes in Children April 2021
278
in human studies. If the ADI for Yellow No. 5 were based on the one study that evaluated a dose-response in children for behavioral effects, the ADI would be considerably lower.

Potential Neurobehavioral Effects of Synthetic CalEPA OEHHA Food Dyes in Children April 2021
279
Chapter 8. Overall Summary and Conclusions The scientific literature provides evidence in humans and animals, as well as mechanistic information, that synthetic food dyes can cause or exacerbate neuro-behavioral problems in some children. Data from multiple evidence streams, including epidemiology, animal neurotoxicology, in vitro and high throughput assays providing mechanistic insight, taken together, provide support that FD&C batch-certified synthetic food dyes can impact neurobehavior in some children. More evidence is currently available for Red No. 3, Red No. 40, and Yellow No. 5 than the other FD&C batch-certified dyes we reviewed.
8.1 Summary of human studies Overall, we identified 27 human studies meeting our inclusion and exclusion criteria. Of these, 25 involved challenge studies and two involved diet elimination studies. Detailed descriptions of each study are provided in Chapter 2, Table 2.1. Most studies included all or a mixture of hyperactive children or all or a mixture of prior responders. All studies used cross-over designs, and most challenge studies were double blinded and the cross-over design was randomized. Most studies assessed a number of synthetic food dyes combined, although six assessed tartrazine only.
Two elimination diet studies used a placebo or control diet, and identified statistically significant associations between the elimination diet and improved neurobehavioral outcomes. In line with this finding, many of the challenge studies reported improved behavior after the elimination diet was started.
Of the 25 challenge studies, 16 (64%) identified some evidence of an association. In 13 (52%), the association was statistically significant (Chapter 2, Table 2.5), and almost all over an effect size of 0.20. Positive associations (either statistically significant associations or large effect sizes) were also more frequently reported in studies published after the year 1990 and more frequently reported in studies that used validated metrics for assessing outcome.
Two more recent studies addressed many limitations of earlier study designs. Bateman et al. (2004) included 277 three-year-old children in England and was a randomized, cross-over, double blinded, mixture study that included both children with and without identified hyperactivity and used several validated outcome measures. Based on parent scores, a statistically significant increase in hyperactivity was seen with the dye challenge compared with placebo. The second study conducted by the same research group using a similar design (McCann et al. 2007) enrolled 153 three-year-olds and 144 eight- and nine-year-old children. Validated outcome measures were combined to create standardized weekly global hyperactivity aggregate (GHA) scores. Statistically significant adverse effects were demonstrated for all three-year-old children, effect size 0.20 (95% C.I. 0.01-0.39) and was greater for those who consumed at least 85% of the juice containing the dye dose and had no missing data (effect size 0.32; 95% C.I. 0.05 – 0.60). Statistically significant effects were also seen in eight and nine year olds who

Potential Neurobehavioral Effects of Synthetic CalEPA OEHHA Food Dyes in Children April 2021
280
consumed at least 85% of the juice. A subsequent study (Stevenson et al., 2010) using the same cohort found evidence of moderation by gene polymorphisms in histamine degradation and the dopamine transporter gene. The effect sizes seen in these studies are similar to the overall effect size identified in high-quality studies evaluated in the meta-analysis by Nigg et al. (2012), 0.22 (95% C.I.; 0.01 – 0.41). Examination of psychometric tests of attention specifically, an objective and relevant metric, yielded a higher effect size, 0.27 (p= 0.007). When limiting the analysis to studies that only included FDA dyes, the effect was 0.34 (p= 0.017). The effect size was not different between studies that selected participants based on attentional problems/ADHD status and those that used a general population indicating that the general childhood population, not just those with diagnosed ADHD, is at risk for the impacts of food dyes on behavior.
Most studies identified involved concurrent administration of multiple dyes, and therefore no single offending agent could be identified. However, several studies evaluated the effect on behavioral scores for Yellow No. 5 (Rose 1978; Rowe 1988; Rowe and Rowe 1994; Sarantinos et al. 1990; Levy et al. 1978; Levy and Hobbes 1978). Rowe and Rowe (1994), a double blinded, placebo controlled study of the effects of Yellow No. 5 in 54 children, assessed symptoms of restlessness, irritability, sleeplessness, aggression and attention following consumption of food dye or placebo. In the reactors, the mean behavioral scores on days the children were given the dye challenge were significantly different than the scores for the days they were given a placebo (p<0.05), and the reactors were significantly different than the non-reactor group on the dye-challenge days (p<0.001). The investigators also found a dose-response relationship between behavioral score and the amount of dye administered. The mean score difference between the reactor and the nonreactor groups were significant at doses of 2 mg and higher (p<0.05).
Despite the various study limitations, after extensive analysis, we were unable to identify strong evidence for any apparent biases or other factors that invalidated the positive associations reported in the current literature. Based on the extent of the positive findings reported, and the fact that we could not convincingly or consistently attribute these positive findings to errors in study design or other bias, we conclude that the current human epidemiologic evidence supports a relationship between food dye exposure and adverse behavioral outcomes in some children, both with and without pre-existing behavioral disorders.
8.2 Summary of animal toxicology Developmental toxicology studies where single synthetic food dyes were incorporated into the diet of rodents included exposures during gestation, and/or during postnatal and/or juvenile periods followed by evaluation of neurobehavioral parameters at a variety of ages by several testing methods (see Figure 3, Chapter 3). Developmental toxicology studies demonstrated effects on activity of offspring when either Red No. 3, Red No. 40, Yellow No. 5, or Blue No. 1 was administered in utero through lactation and

Potential Neurobehavioral Effects of Synthetic CalEPA OEHHA Food Dyes in Children April 2021
281
into adulthood. While not all studies found effects, the reported effects are not easily dismissed.
Studies of dye mixtures conducted on juvenile rats during several weeks of exposure demonstrated effects, which varied by study, on activity measured in a variety of ways and at different time points postnatally. One study found that sulfanilic acid, the major metabolite of Yellow No. 5 and Yellow No. 6, affected behavior in juvenile rats at a dose equivalent to the recorded doses of these dyes in the mixture studies. These studies of juvenile animals mirror the findings in studies of children, and overall support the potential for synthetic food dyes to affect behavior in children.
Several more recent studies demonstrate long-term effects in adult animals of in utero exposure on behavior, including effects involving regulation of activity, anxiety and exploration in a novel environment, and persistence in the forced swim test, at doses of the individual dyes found to have no effects in FDA regulatory reviews. It should be noted that the studies used as the basis of the FDA ADIs were not designed to test for any type of neurobehavioral effects. Some of these newer studies also evaluated changes in neurotransmitter receptors for glutamate and acetylcholine in the hippocampus, and found statistically significant changes in receptor protein levels. The pattern of changes did not allow for ready interpretation, but these receptors are related to behavioral performance, and long- term changes at the tissue level could be demonstrated after gestational dye exposure.
Results from studies evaluating neurotoxicity in adults have demonstrated changes in activity in animals administered Red No. 3, Red No. 40, Yellow No. 5, Yellow No. 6, and Blue No. 1. A handful of the more recent studies also reported altered brain chemistry in adult rodents given Red No. 3, Red No. 40, Yellow No. 5 and Yellow No. 6 over a several week period. In later studies with a gavage design, both cognitive effects and changes in brain cell count and morphology were reported. A study of Red No. 40 showed both more reference and working memory errors in dose groups than in controls in the radial arm maze. As well, changes in brain histomorphology and stereology were observed in the animals. In a similar study of Yellow No. 5, learning and memory was affected by exposure to the dye and changes in the brain were also observed.
In adult male rats after a single gavage administration of Red No. 3, a dose-dependent pattern of diminished activity was observed and levels of serotonin were lowered in a dose-dependent manner in the brainstem, hypothalamus, and hippocampus. This paper parallels the “challenge” studies in children where a single dose of dye or mixture is administered and behavior is measured shortly afterward. In both rats and children, the effect of dye peaks and then dissipates over a few hours after the exposure.
A second study by the same group exposed animals for a 15 or 30 day period of daily dosing, and in sharp contrast to the decreased activity seen with a single administration, activity was increased (Figure 5, Section 3.5), and serotonin increased, rather than

Potential Neurobehavioral Effects of Synthetic CalEPA OEHHA Food Dyes in Children April 2021
282
decreased, in the brain areas studied (brainstem, hypothalamus, hippocampus, striatum). A study of Yellow No. 5 that utilized a 30 day treatment regimen found greater activity in treated rats at the end of the treatment period compared to controls, and detrimental effects on learning. Most notably, most studies of adult neurotoxicity conducted from 2001 to 2018 reported NOAELs much lower than those used as the basis of the FDA ADIs, which have been unchanged since they were developed in the 1960s through 1980s.
When viewed across the in vivo animal toxicology database as a whole, effects of synthetic food dyes, both as mixtures and for single dyes on activity, and learning and memory, on neurotransmitter pathways and on brain histomorphology and stereology have been reported in young and adult animals with varied exposure regimens. The differences in doses used, method of administration, age of animals at dosing and age when effects were measured, and the varied endpoints measured preclude an evaluation for consistency of effects across studies from different laboratories. Nonetheless, many animal studies conducted in a number of laboratories have found evidence of changes in behavior. Thus, the animal studies provide evidence that the synthetic food dyes may contribute to adverse behavioral effects in children.
Mechanistic information is available from some studies. Food dyes bind proteins well, and there is evidence for some of the dyes that binding to a variety of proteins, such as enzymes involved in neurotransmitter pathways, inhibits their function. Some evidence is available that suggests a role for oxidative stress. Although it is not clear what the mechanism for the effects on behavior from any of the dyes may be, evidence for a serotonergic pathway for Red No. 3 is both convincing and plausible.
Overall, the animal evidence is suggestive of effects of synthetic food dyes on behavior. Although the effects are transient or short-term in nature, for the child who is affected and their family, their teachers, and the school system, a short term increase in inattentiveness or restlessness and anxiety that is repeated routinely when food dye is consumed is adverse.
8.3 Summary of hazard identification Clinical trial studies demonstrate changes in behavior associated with exposure to food dyes in children. Animal studies provide data indicating effects of exposure to food dyes on activity, memory and learning, changes in neurotransmitter systems in brain, and changes in brain histomorphology and stereology. Mechanistic studies provide evidence for potential roles of oxidative stress, and interaction with many neuronal targets such as neurotransmitter systems including receptors and key enzymes, and systems that exert influence on the brain including glucocorticoid pathways, thyroid and estrogen receptors.
Data from multiple evidence streams, including epidemiology, animal neurotoxicology, in vitro and high throughput assays providing mechanistic insight, taken together, provide support that FD&C batch-certified synthetic food dyes can impact
Potential Neurobehavioral Effects of Synthetic CalEPA OEHHA Food Dyes in Children April 2021
283
neurobehavior in some children. In terms of which individual food dyes are responsible for adverse impacts on neurobehavior in children, most human studies involved administering multiple dyes at the same time so no single offending agent could be identified. Yellow No. 5 was shown to affect children in several studies in which it was administered as the single dye. Animal toxicology studies of individual dyes provide support for behavioral impacts in children. More evidence is currently available from animal studies for Red No. 3, Red No. 40, and Yellow No. 5 relative to the other FD&C batch-certified dyes we reviewed. These dyes have been the subject of more studies.
Note that we have not reviewed other toxicological endpoints including noncancer effects on other organs or systems or carcinogenicity. Thus, we do not make any statements regarding toxicity of the FD&C synthetic food dyes other than neurological or neurobehavioral hazards.
8.4 Summary of exposure assessment We calculated FD&C synthetic food dye exposure from foods on a mg/person/day and a mg/kg/day basis for US pregnant women, women of childbearing age (18-49 years), and children for five age categories (0-<2 years, 2-<5 years, 5-<9 years, 9-<16 years, 16-18 years) for typical and high exposure scenarios (Chapter 6 and Appendix F). Adjusted for body weight, exposure on a mg/kg/day basis trended higher for children compared with pregnant women and women of child bearing age. The highest exposures were to Red No. 40 followed by Yellow No. 6 and Yellow No. 5.
For the typical-exposure scenario, the highest median Red No. 40 single-day and two-day average intake (mg/kg/day) was found for children 5 to <9 years old (0.21 and 0.17 mg/kg/day, respectively). The highest median FD&C Red No. 40 single-day and two-day average estimated intake for the high-exposure scenario was also found in children 5 to <9 years old (0.39 mg/kg/day and 0.32 mg/kg/day, respectively) (Table 6.10). Mean Red No. 40 exposure estimates were consistently higher than the median values.
The highest 95th percentile single-day dose estimates based on the typical- and high-exposure scenarios, however, were found for FD&C Red No. 3 in children 0 to <2 years (4.83 and 7.90 mg/kg/day).
Overall, white icing and ice cream cones contributed most to Blue No. 1 exposure estimates for children 0-<16 years old. For Blue No. 2, ice cream, breakfast cereals and fruit muffins were important sources for children 2-<16 years old. For Green No. 3, ice cream was the dominant source for children in all age categories. For children 0 < 16 years, overall, ice cream cones and white icing were the primary source of exposure to Red No. 3. Overall, fruit juice drinks and soft drinks were the dominant source of exposure to Red No. 40 among children 0 to <16 years old. Overall, powdered fruit flavored drinks and fruit juice drinks were primary sources of exposure to Yellow No. 5. Pasta-based meals from a mix were also an important contributor for children 0-<2
Potential Neurobehavioral Effects of Synthetic CalEPA OEHHA Food Dyes in Children April 2021
284
years old. Fruit juice drinks and soft drinks were the dominant source of exposure to Yellow No. 6.
Our analysis of socioeconomic determinants of food dye exposure suggest some weak trends with higher exposure in lower income families with less education, and significantly higher intake among non-Hispanic Black participants compared with other ethnic groups.
We also evaluated potential exposures to FD&C synthetic food dyes from several brands of over the counter (OTC) medications using laboratory measurements by UC Davis and dosing instructions from the label for children. The highest estimated exposures for children 4 to 16 years old from OTC medications were for FD&C Red No. 40 from one brand of, grape-flavored cough, cold and allergy syrup. The estimated FD&C Red No. 40 exposures from this brand ranged from 0.028 to 0.037 mg/kg/day for 1 dose/day to 0.17 to 0.22 mg/kg/day for the maximum recommended dose of 6 doses/day. Overall, children’s average food dye exposure estimates from gummie vitamins were relatively low as were exposures to pregnant women from prenatal vitamins.
8.5 Summary of risk characterization With the exception of FD&C Red No. 3, all exposure estimates (mg/kg/day) from foods were below the US FDA or JECFA ADIs. For the typical and high exposure scenarios, the 95th percentile estimates exceeded the US FDA ADI with Hazard Indices of 1.9 and 3.2, respectively. A number of the estimates for multiple age groupings in both the typical and high exposure scenarios exceeded the JECFA ADIs with Hazard Indices ranging from just above 1 to 79.
None of the child intake estimates based on a daily serving of foods sampled by U.C. Davis exceeded US FDA ADI’s for food dyes. Children’s mean FD&C Red No. 3 intake estimates based on a single serving of frozen desserts and frosting and icings sometimes exceeded the JECFA ADI (0.1 mg/kg/day), with Hazard Indices for the mean intake estimates ranging from 0.5 to 5.3.
Exposures from over-the-counter medications did not exceed JECFA or FDA ADIs when following label instructions. Any additional intake from food would increase the exposure. Note that some children with allergies or other health conditions may receive such medication chronically.
The animal studies that form the basis of the FDA ADIs are many decades old and were not capable of detecting the types of neurobehavioral outcomes measured in later studies, or for which there is concern in children consuming synthetic food dyes. A number of animal developmental toxicology studies of single synthetic food dyes found evidence of effects on behavior in the offspring. A handful of these studies observed effects at doses lower than the NOAELs used by the US FDA to derive their ADIs. Almost all the studies in mature animals that measured behavioral changes and/or
Potential Neurobehavioral Effects of Synthetic CalEPA OEHHA Food Dyes in Children April 2021
285
changes in the brain found effects of the synthetic food dyes at doses lower than the NOAELs used by US FDA for the derivation of the ADIs, and many of these studies observe effects on behavior in animals at doses close to or lower than the existing FDA ADIs. For several dyes, if ADIs were based on more modern studies that observed neurobehavioral effects, those ADIs would be considerably lower. We note this for Red No. 3 and Red No. 40 based on animal studies. Applying such ADIs explicitly for neurobehavioral effects would result in likely exceedances from both food and OTC medications.
Only one dye, Yellow No. 5, was assessed as a single dye in human studies. If the ADI for Yellow No. 5 were based on the one study that evaluated a dose-response in children for behavioral effects, the ADI would be considerably lower.
8.6 Research needs and future directions Our thorough review of the literature on neurobehavioral effects of the FD&C batch-certified synthetic food dyes has established a good basis for targeted research. A full contemporary set of regulatory studies would add valuable information for the development of safe exposure levels for children. Note, however, that a set of regulatory developmental neurotoxicology studies would not necessarily uncover the types of behavioral effects reported in the children’s studies. There are a number of data gaps that, if filled, will help in the understanding of the mechanistic underpinnings of response to the synthetic food dyes, and understanding which children would be most susceptible. These data gaps include very limited information on genetic susceptibility, on biomarkers of effect and exposure, and on potential long term effects of repeated brief exposures on brain development and function. Though some studies found a stronger response in younger children, this was not a consistent finding and we do not have adequate confidence in this finding to explore any etiologic reasoning further. Other than citing literature indicating long term behavioral implications of having attentional deficits during childhood there is no literature that we are aware of specifically examining this issue relevant to food dye exposure. There is also a lack of studies that evaluate a differential effect by gender, race, ethnicity, or socioeconomic status. More research is needed on the pharmacokinetics (absorption, distribution, metabolism, and excretion) of ingested food dyes (straights and lakes) in children and adult populations. Currently, there is very limited research in this area. Overall, on-going monitoring of food dye content in food is needed to determine exposure trends. Finally, future studies should evaluate differences in children’s food dye exposure by sex.
While more research will further elucidate a number of factors that modulate the response of children to synthetic food dyes, OEHHA concludes that the evidence to date indicates an association between exposure to food dyes and behavioral impacts in some children. The evidence from the clinical trials is clear in this regard and cannot be explained by bias or confounding. As well, as we have noted already, there are animal data supporting the finding of neurobehavioral impacts from the synthetic food dyes.

Potential Neurobehavioral Effects of Synthetic CalEPA OEHHA Food Dyes in Children April 2021
286
Finally, there is some, albeit limited, evidence of mechanistic possibilities by which the food dyes may exert neurobehavioral effects on children. As such, new research, while encouraged, should not be the reason to delay appropriate actions to reduce exposure.
Appropriate research that would help clarify the neurobehavioral hazards of FD&C synthetic food dyes to children would include the following:
• Animal testing in immature animals that includes a within-subjects design and measures of neurobehavior more similar to those in the human studies, and appropriate statistical analyses;
• Studies of the toxicokinetics of food dyes in humans, and studies of toxicokinetics of food dyes in animals using modern techniques and including exposures during in utero, preweaning, and juvenile stages;
• Mechanistic studies in humans, and studies of underlying genetic susceptibility both of which could help provide information on susceptible subgroups. These studies could be guided by the results of studies in laboratory animals.
• Studies examining absorption and bioavailability of straight versus lake food dye formulations are needed to inform the design and interpretation of exposure, toxicological, epidemiological, and clinical studies;
• Modern, high quality, adequately powered, ethically administered clinical trials in children of the FD&C batch-certified synthetic food dyes with a cross-over, double blinded design that includes placebo and dye exposure periods for each child, utilizing best practice methods including validated outcome measures, inclusion of behavioral assessments by parents, objective tests of attention and other behavioral measures, examination of time course of effects, and assessment of dose-response relationships for individual dyes, with calculation of dose based on the child’s body weight and amount administered. Such studies should attempt to evaluate whether the response differs by age, gender, ethnicity, race, or socioeconomic status through a design that evaluates dosing on a mg/kg-day basis.
• Studies that evaluate the potential long-term impacts of repeated exposures to food dyes in children.
• Studies of the perturbation of cellular targets particularly with respect to neurological outcomes.
Such research would provide a more targeted scientific database to assure appropriate safe exposure levels that explicitly protect children from neurobehavioral effects. Research is generally a long-term proposition. At a minimum, in the short-term, the neurobehavioral effects of synthetic food dyes in children should be acknowledged and steps taken to reduce exposure to these dyes in children.

Potential Neurobehavioral Effects of Synthetic CalEPA OEHHA Food Dyes in Children April 2021
287
8.7 Overall Conclusion The scientific literature indicates that synthetic food dyes can impact neurobehavior in some children. Data from multiple evidence streams, including epidemiology, animal neurotoxicology, in vitro and high throughput assays providing mechanistic insight, support this finding. Comparison of the recent animal studies and the single-dye human studies on neurotoxicological outcomes with the older studies that serve as the basis for FDA ADIs indicates that current ADIs may not provide adequate protection from neurobehavioral impacts in children
Potential Neurobehavioral Effects of Synthetic CalEPA OEHHA Food Dyes in Children April 2021
288
References
Abd-Elhakim YM, Hashem MM, El-Metwally AE, Anwar A, Abo-El-Sooud K, Moustafa GG, et al. 2018. Comparative haemato-immunotoxic impacts of long-term exposure to tartrazine and chlorophyll in rats. Int Immunopharmacol 63:145-154.
Abd-Elhakim YM, Moustafa GG, Hashem MM, Ali HA, Abo-El-Sooud K, El-Metwally AE. 2019. Influence of the long-term exposure to tartrazine and chlorophyll on the fibrogenic signalling pathway in liver and kidney of rats: the expression patterns of collagen 1-alpha, TGFbeta-1, fibronectin, and caspase-3 genes. Environ Sci Pollut Res Int 26:12368-12378.
Abou-Donia MB, Wilmarth KR, Jensen KF, Oehme FW, Kurt TL. 1996. Neurotoxicity resulting from coexposure to pyridostigmine bromide, deet, and permethrin: implications of Gulf War chemical exposures. J Toxicol Environ Health 48:35-56.
Achenbach TM, McConaughy SH, Howell CT. 1987. Child/adolescent behavioral and emotional problems: implications of cross-informant correlations for situational specificity. Psychol Bull 101:213-232.
Adams W. 1981. Lack of behavioral effects from Feingold diet violations. Percept Mot Skills 52:307-313.
Al-Seeni MN, El Rabey HA, Al-Hamed AM, Zamazami MA. 2018. Nigella sativa oil protects against tartrazine toxicity in male rats. Toxicol Rep 5:146-155.
Al-Shabib NA, Khan JM, Khan MS, Ali MS, Al-Senaidy AM, Alsenaidy MA, et al. 2017. Synthetic food additive dye “Tartrazine” triggers amorphous aggregation in cationic myoglobin. Int J Biol Macromol 98:277-286.
Al-Shabib NA, Khan JM, Alsenaidy MA, Alsenaidy AM, Khan MS, Husain FM, et al. 2018. Unveiling the stimulatory effects of tartrazine on human and bovine serum albumin fibrillogenesis: Spectroscopic and microscopic study. Spectrochim Acta A Mol Biomol Spectrosc 191:116-124.
Al-Shabib NA, Khan JM, Malik A, Sen P, Ramireddy S, Chinnappan S, et al. 2019. Allura red rapidly induces amyloid-like fibril formation in hen egg white lysozyme at physiological pH. Int J Biol Macromol 127:297-305.
Potential Neurobehavioral Effects of Synthetic CalEPA OEHHA Food Dyes in Children April 2021
289
Allan RJ, Roxon JJ. 1974. Metabolism by intestinal bacteria: the effect of bile salts on tartrazine azo reduction. Xenobiotica 4:637-643.
Allan RJ, Roxon JJ. 1977. The effect of dioctyl sodium sulphosuccinate on tartrazine azo reduction by intestinal bacteria. Xenobiotica 7:181-186.
Ameur FZ, Mehedi N, Kheroua O, Saidi D, Salido GM, Gonzalez A. 2018. Sulfanilic acid increases intracellular free-calcium concentration, induces reactive oxygen species production and impairs trypsin secretion in pancreatic AR42J cells. Food Chem Toxicol 120:71-80.
Angarita SAK, Duarte S, Russell TA, Ruchala P, Elliott IA, Whitelegge JP, et al. 2019. Quantitative Measure of Intestinal Permeability Using Blue Food Coloring. J Surg Res 233:20-25.
Ashour AA, Abdelaziz I. 2009. Role of fast green on the blood of rats and the therapeutic action of vitamins C or E. Int J Integr Biol 6:6-11.
Augustine Jr GJ, Levitan H. 1980. Neurotransmitter release from a vertebrate neuromuscular synapse affected by a food dye. Science 207:1489-1490.
Axelson O. 1978. Aspects on confounding in occupational health epidemiology. Scand J Work Environ Health 4:85-89.
Axon A, May FE, Gaughan LE, Williams FM, Blain PG, Wright MC. 2012. Tartrazine and sunset yellow are xenoestrogens in a new screening assay to identify modulators of human oestrogen receptor transcriptional activity. Toxicology 298:40-51.
Aylak F, Doguc¸ DK, Ceyhan BM, Kulac¸ E, Gultekin F. 2012. Effect of maternally exposed colouring food additives on renal oxidant and anti oxidant systems in rats. Cell Membr Free Radic Res 4:87-88.
Bal-Price A, Meek MEB. 2017. Adverse outcome pathways: Application to enhance mechanistic understanding of neurotoxicity. Pharmacol Ther 179:84-95.
Basak K, Doguc DK, Aylak F, Karadayi N, Gultekin F. 2014. Effects of maternally exposed food coloring additives on laryngeal histology in rats. J Environ Pathol Toxicol Oncol 33:123-130.
Basak K, Basak PY, Doguc DK, Aylak F, Oguztuzun S, Bozer BM, et al. 2017. Does maternal exposure to artificial food coloring additives increase oxidative stress in the skin of rats? Hum Exp Toxicol 36:1023-1030.
Potential Neurobehavioral Effects of Synthetic CalEPA OEHHA Food Dyes in Children April 2021
290
Bastaki M, Farrell T, Bhusari S, Bi X, Scrafford C. 2017. Estimated daily intake and safety of FD&C food-colour additives in the US population. Food Additives & Contaminants: Part A 34:891-904.
Basu A, Kumar GS. 2015a. Thermodynamics of the interaction of the food additive tartrazine with serum albumins: a microcalorimetric investigation. Food Chem 175:137-142.
Basu A, Kumar GS. 2015b. Interaction of human hemoglobin with food colorants: A multifaceted biophysical study. J Biomol Struct Dyn 33:131-132.
Basu A, Suresh Kumar G. 2016a. Multispectroscopic and calorimetric studies on the binding of the food colorant tartrazine with human hemoglobin. J Hazard Mater 318:468-476.
Basu A, Suresh Kumar G. 2017. Binding and Inhibitory Effect of the Dyes Amaranth and Tartrazine on Amyloid Fibrillation in Lysozyme. J Phys Chem B 121:1222-1239.
Batada A, Jacobson MF. 2016. Prevalence of Artificial Food Colors in Grocery Store Products Marketed to Children. Clin Pediatr (Phila) 55:1113-1119.
Bateman B, Warner JO, Hutchinson E, Dean T, Rowlandson P, Gant C, et al. 2004. The effects of a double blind, placebo controlled, artificial food colourings and benzoate preservative challenge on hyperactivity in a general population sample of preschool children. Arch Dis Child 89:506-511.
Bell C. 2013. A comparison of daily consumption of artificial dye-containing foods by american children and adults [Master's Thesis]:Eastern Michigan University.
Best J, Nijhout HF, Samaranayake S, Hashemi P, Reed M. 2017. A mathematical model for histamine synthesis, release, and control in varicosities. Theor Biol Med Model 14:24.
Bhatt D, Vyas K, Singh S, John PJ, Soni I. 2018. Tartrazine induced neurobiochemical alterations in rat brain sub-regions. Food Chem Toxicol 113:322-327.
Bole DG, Ueda T. 2005. Inhibition of vesicular glutamate uptake by Rose Bengal-related compounds: structure-activity relationship. Neurochem Res 30:363-369.
Borzelleca JF, Hogan GK. 1985. Chronic toxicity/carcinogenicity study of FD & C blue no. 2 in mice. Food Chem Toxicol 23:719-722.
Potential Neurobehavioral Effects of Synthetic CalEPA OEHHA Food Dyes in Children April 2021
291
Borzelleca JF, Hogan GK, Koestner A. 1985. Chronic toxicity/carcinogenicity study of FD & C Blue No. 2 in rats. Food Chem Toxicol 23:551-558.
Borzelleca JF, Hallagan JB. 1992. Safety and Regulatory Status of Food, Drug, and Cosmetic Color Additives. In: Food Safety Assessment, Vol. 484. Washington DC:American Chemical Society, 377-390.
Bradford Hill A. 1965. The environment and disease: association or causation? Proc R Soc Med 58:295-300.
Brown JP, Dorsky A, Enderlin FE, Hale RL, Wright VA, Parkinson TM. 1980. Synthesis of 14C-labelled FD & C Blue No. 1 (Brilliant Blue FCF) and its intestinal absorption and metabolic fate in rats. Food Cosmet Toxicol 18:1-5.
Brown JP, Parkinson TM. 1985. Nonabsorbable food additives through polymeric design. Drug Metab Rev 16:389-422.
Burokas A, Moloney RD, Dinan TG, Cryan JF. 2015. Microbiota regulation of the Mammalian gut-brain axis. Adv Appl Microbiol 91:1-62.
Butterworth KR, Hoosen J, Gaunt IF, Kiss IS, Grasso P. 1975. Long-term toxicity of indigo carmine in mice. Food Cosmet Toxicol 13:167-176.
Capen CC. 1998. Correlation of mechanistic data and histopathology in the evaluation of selected toxic endpoints of the endocrine system. Toxicol Lett 102-103:405-409.
CDC. 2017. NHANES 2015-2016 Demographics Data. Available: https://wwwn.cdc.gov/nchs/nhanes/search/datapage.aspx?Component=Demographics&CycleBeginYear=2015.
CDC. 2018. NHANES Dietary Data. Available: https://wwwn.cdc.gov/nchs/nhanes/Search/DataPage.aspx?Component=Dietary.
CDC. 2019. National Health and Nutrition Examination Survey. Available: https://www.cdc.gov/nchs/nhanes/index.htm.
Ceyhan BM, Gultekin F, Doguc DK, Kulac E. 2013. Effects of maternally exposed coloring food additives on receptor expressions related to learning and memory in rats. Food Chem Toxicol 56:145-148.
Potential Neurobehavioral Effects of Synthetic CalEPA OEHHA Food Dyes in Children April 2021
292
Chappell GA, Britt JK, Borghoff SJ. 2020. Systematic assessment of mechanistic data for FDA-certified food colors and neurodevelopmental processes. Food Chem Toxicol 140:111310.
Chen X, Qin P, Zheng X, Hu Z, Zong W, Zhang D, et al. 2019. Characterizing the noncovalent binding behavior of tartrazine to lysozyme: A combined spectroscopic and computational analysis. J Biochem Mol Toxicol 33:e22258.
Chen YH, Tseng CP, How SC, Lo CH, Chou WL, Wang SS. 2016. Amyloid fibrillogenesis of lysozyme is suppressed by a food additive brilliant blue FCF. Colloids Surf B Biointerfaces 142:351-359.
Chiu WA, Guyton KZ, Martin MT, Reif DM, Rusyn I. 2018. Use of high-throughput in vitro toxicity screening data in cancer hazard evaluations by IARC Monograph Working Groups. ALTEX 35:51-64.
Choi YS, Ok S-H, Lee SM, Park S-S, Ha YM, Chang KC, et al. 2011. Indigo carmine enhances phenylephrine-induced contractions in an isolated rat aorta. Korean J Anesthesiol 61:55-62.
Chung KT, Cerniglia CE. 1992. Mutagenicity of azo dyes: structure-activity relationships. Mutat Res 277:201-220.
Chung KT, Stevens SE, Jr., Cerniglia CE. 1992. The reduction of azo dyes by the intestinal microflora. Crit Rev Microbiol 18:175-190.
Conners CK, Goyette CH, Southwick DA, Lees JM, Andrulonis PA. 1976. Food additives and hyperkinesis: a controlled double-blind experiment. Pediatrics 58:154-166.
Conners CK, Goyette CH, Newman EB. 1980. Dose-time effect of artificial colors in hyperactive children. J Learn Disabil 13:512-516.
Dalal A, Poddar MK. 2009. Short-term erythrosine B-induced inhibition of the brain regional serotonergic activity suppresses motor activity (exploratory behavior) of young adult mammals. Pharmacol Biochem Behav 92:574-582.
Dalal A, Poddar MK. 2010. Involvement of high plasma corticosterone status and activation of brain regional serotonin metabolism in long-term erythrosine-induced rearing motor hyper activity in young adult male rats. Toxicol Mech Methods 20:287-297.
Potential Neurobehavioral Effects of Synthetic CalEPA OEHHA Food Dyes in Children April 2021
293
Dam SA, Mostert JC, Szopinska-Tokov JW, Bloemendaal M, Amato M, Arias-Vasquez A. 2019. The Role of the Gut-Brain Axis in Attention-Deficit/Hyperactivity Disorder. Gastroenterol Clin North Am 48:407-431.
Daniel JW. 1962. The excretion and metabolism of edible food colors. Toxicol Appl Pharmacol 4:572-594.
David TJ. 1987. Reactions to dietary tartrazine. Arch Dis Child 62:119-122.
Davis AP, Grondin CJ, Johnson RJ, Sciaky D, McMorran R, Wiegers J, et al. 2019. The Comparative Toxicogenomics Database: update 2019. Nucleic Acids Res 47:D948-D954.
Davis KJ, Fitzhugh OG, Nelson AA. 1964. Chronic rat and dog toxicity studies on tartrazine. Toxicol Appl Pharmacol 6:621-626.
Dees C, Askari M, Garrett S, Gehrs K, Henley D, Ardies CM. 1997. Estrogenic and DNA-damaging activity of Red No. 3 in human breast cancer cells. Environ Health Perspect 105 Suppl 3:625-632.
Diaz Heijtz R, Wang S, Anuar F, Qian Y, Björkholm B, Samuelsson A, et al. 2011. Normal gut microbiota modulates brain development and behavior. Proc Natl Acad Sci U S A 108:3047-3052.
Doell DL, Folmer DE, Lee HS, Butts KM, Carberry SE. 2016. Exposure estimate for FD&C colour additives for the US population. Food Addit Contam Part A Chem Anal Control Expo Risk Assess 33:782-797.
Doguc DK, Ceyhan BM, Ozturk M, Gultekin F. 2013. Effects of maternally exposed colouring food additives on cognitive performance in rats. Toxicol Ind Health 29:616-623.
Doguc DK, Aylak F, Ilhan I, Kulac E, Gultekin F. 2015. Are there any remarkable effects of prenatal exposure to food colourings on neurobehaviour and learning process in rat offspring? Nutr Neurosci 18:12-21.
Doguc DK, Deniz F, Ilhan I, Ergonul E, Gultekin F. 2019. Prenatal exposure to artificial food colorings alters NMDA receptor subunit concentrations in rat hippocampus. Nutr Neurosci:1-11.
Doguc¸ DK, Aylak F, Ilhan I, Kulac¸ E, Gultekin F. 2013. Effects of maternally exposed food colourings on neurobehaviour in offspring. J Neurol Sci 30:125.

Potential Neurobehavioral Effects of Synthetic CalEPA OEHHA Food Dyes in Children April 2021
294
El-Desoky GE, Abdel-Ghaffar A, Al-Othman ZA, Habila MA, Al-Sheikh YA, Ghneim HK, et al. 2017. Curcumin protects against tartrazine-mediated oxidative stress and hepatotoxicity in male rats. Eur Rev Med Pharmacol Sci 21:635-645.
El-Sakhawy MA, Mohamed DW, Ahmed YH. 2019. Histological and immunohistochemical evaluation of the effect of tartrazine on the cerebellum, submandibular glands, and kidneys of adult male albino rats. Environ Sci Pollut Res Int 26:9574-9584.
Elbanna K, Sarhan OM, Khider M, Elmogy M, Abulreesh HH, Shaaban MR. 2017. Microbiological, histological, and biochemical evidence for the adverse effects of food azo dyes on rats. J Food Drug Anal 25:667-680.
Erdemli ME, Gul M, Altinoz E, Zayman E, Aksungur Z, Bag HG. 2017. The protective role of crocin in tartrazine induced nephrotoxicity in Wistar rats. Biomed Pharmacother 96:930-935.
Erickson JC, 3rd, Lauron F. 1960. Vasopressor effect of indigo carmine. A preliminary report. Guthrie Clin Bull 30:30-35.
Erickson ZT, Falkenberg EA, Metz GA. 2014. Lifespan psychomotor behaviour profiles of multigenerational prenatal stress and artificial food dye effects in rats. PLoS One 9:e92132.
Ershoff BH. 1977. Effects of diet on growth and survival of rats fed toxic levels of tartrazine (FD & C Yellow No. 5) and sunset yellow FCF (FD & C Yellow No. 6). J Nutr 107:822-828.
Esmaeili S, Ashrafi-Kooshk MR, Khaledian K, Adibi H, Rouhani S, Khodarahmi R. 2016. Degradation products of the artificial azo dye, Allura red, inhibit esterase activity of carbonic anhydrase II: A basic in vitro study on the food safety of the colorant in terms of enzyme inhibition. Food Chem 213:494-504.
EU EFSA. 2009a. Scientific Opinion on the re-evaluation of Sunset Yellow FCF (E 110) as a food additive. EFSA Journal 7:1330.
EU EFSA. 2009b. Scientific Opinion on the re-evaluation of Allura Red AC (E 129) as a food additive. EFSA Journal 7:1327.
FDA. 1982. FD&C Blue No. 1. 47 Fed Reg:42563.
FDA. 1986. FD&C Yellow No. 6. 51 Fed Reg:41765.
Potential Neurobehavioral Effects of Synthetic CalEPA OEHHA Food Dyes in Children April 2021
295
FDA. 2003. FDA Public health advisory: Subject: reports of blue discoloration and death in patients receiving enteral feedings tinted with the dye, FD&C Blue No. 1.FDA.
FDA. 2007. Guidance for industry and other stakeholders. Toxicological principles for the safety assessment of food ingredients. Redbook 2000. Revised July 2007.
FDA. 2011. Background document for the food advisory committee: Certified color additives in food and possible association with attention deficit hyperactivity disorder in children. March 30-31, 2011.FDA.
FDA. 2017. Color Additives History. Available: fda.gov/industry/color-additives/color-additives-history [accessed 02/22/2021.
FDA. 2018. Color Additives Questions and Answers for Consumers. Available: fda.gov/food/food-additives-questions-and-answers-for consumers [accessed 02/22//2021.
Feingold B. 1975. Why Your Child Is Hyperactive:Random House.
Feng J, Cerniglia CE, Chen H. 2012. Toxicological significance of azo dye metabolism by human intestinal microbiota. Front Biosci (Elite Ed) 4:568-586.
Floyd RA. 1980. Erythrosine B (Red dye no. 3) mediated oxidation-reduction in brain membranes. Biochem Biophys Res Commun 96:1305-1311.
Fritsche E, Alm H, Baumann J, Geerts L, JHakansson H, Masjosthusman S, et al. 2015. Literature review on in vitro and alternative developmental neurotoxicity (DNT) testing methods. EFSA Supporting Publications EN-778.
Galloway WD, Olvey KM, Brown NT. 1986. Behavioral effects of erythrosine following light exposure. Neurobehav Toxicol Teratol 8:493-497.
Ganesan L, Margolles-Clark E, Song Y, Buchwald P. 2011. The food colorant erythrosine is a promiscuous protein-protein interaction inhibitor. Biochem Pharmacol 81:810-818.
Ganesan L, Buchwald P. 2013. The promiscuous protein binding ability of erythrosine B studied by metachromasy (metachromasia). J Mol Recognit 26:181-189.
Gao Y, Li C, Shen J, Yin H, An X, Jin H. 2011. Effect of Food Azo Dye Tartrazine on Learning and Memory Functions in Mice and Rats, and the Possible Mechanisms Involved. J Food Sci 76:T125-T129.

Potential Neurobehavioral Effects of Synthetic CalEPA OEHHA Food Dyes in Children April 2021
296
Gardner DF, Utiger RD, Schwartz SL, Witorsch P, Meyers B, Braverman LE, et al. 1987. Effects of oral erythrosine (2',4',5',7'-tetraiodofluorescein) on thyroid function in normal men. Toxicol Appl Pharmacol 91:299-304.
Gaunt IF, Kiss IS, Grasso P, Gangolli SD. 1969. Short-term toxicity study on indigo carmine in the pig. Food Cosmet Toxicol 7:17-24.
Goldenring JR, Wool RS, Shaywitz BA, Batter DK, Cohen DJ, Young JG, et al. 1980. Effects of continuous gastric infusion of food dyes on developing rat pups. Life Sci 27:1897-1904.
Goldenring JR, Batter DK, Shaywitz BA. 1982. Sulfanilic acid: Behavioral changes related to azo food dyes in developing rats. NEUROBEHAV TOXICOL TERATOL 4:43-49.
Goyette GH, Connors CK, Petti TA, Curtis LE. 1978. Effects of artificial colors on hyperkinetic children: a double-blind challenge study [proceedings]. Psychopharmacol Bull 14:39-40.
Groten JP, Heijne WHM, Stierum RH, Freidig AP, Feron VJ. 2004. Toxicology of chemical mixtures: a challenging quest along empirical sciences. Environ Toxicol Pharmacol 18:185-192.
Haas HL, Sergeeva OA, Selbach O. 2008. Histamine in the nervous system. Physiol Rev 88:1183-1241.
Hamada C. 2018. Statistical analysis for toxicity studies. J Toxicol Pathol 31:15-22.
Hansen WH, Fitzhugh OG, Nelson AA, Davis KJ. 1966a. Chronic toxicity of two food colors, brilliant blue FCF and indigotine. Toxicol Appl Pharmacol 8:29-36.
Hansen WH, Long EL, Davis KJ, Nelson AA, Fitzhugh OG. 1966b. Chronic toxicity of three food colourings: Guinea Green B, Light Green SF Yellowish and Fast Green FCF in rats, dogs and mice. Food Cosmet Toxicol 4:389-410.
Harley JP, Matthews CG, Eichman P. 1978a. Synthetic food colors and hyperactivity in children: a double-blind challenge experiment. Pediatrics 62:975-983.
Harley JP, Ray RS, Tomasi L, Eichman PL, Matthews CG, Chun R, et al. 1978b. Hyperkinesis and food additives: testing the Feingold hypothesis. Pediatrics 61:818-828.
Potential Neurobehavioral Effects of Synthetic CalEPA OEHHA Food Dyes in Children April 2021
297
Harp BP, Miranda-Bermudez E, Barrows JN. 2013. Determination of seven certified color additives in food products using liquid chromatography. J Agric Food Chem 61:3726-3736.
Hedman SE, Andersson RG. 1981. Effects of tartrazine of different contractile stimuli in guinea pig tracheal muscle. Acta Pharmacol Toxicol (Copenh) 48:101-107.
Hedman SE, Andersson RG. 1983. Release of biological mediators by tartrazine from human leukocytes and polyps. Acta Pharmacol Toxicol (Copenh) 52:153-154.
Heidbreder CA, Groenewegen HJ. 2003. The medial prefrontal cortex in the rat: evidence for a dorso-ventral distinction based upon functional and anatomical characteristics. Neurosci Biobehav Rev 27:555-579.
Hess SM, Fitzhugh OG. 1955. Absorption and excretion of certain triphenylmethane colours in rats and dogs. J Pharmacol Exp Ther 114:38-42.
Himri I, Bellahcen S, Souna F, Belmakki F, Aziz M, Bnouham M, et al. 2011. A 90-day oral toxicity study of Tartrazine, a synthetic food dye, in Wistar rats. Int J Pharmcy Pharm Sci 3:159-169.
Hnatowich M, LaBella FS. 1982. Light-enhanced inhibition of ouabain binding to digitalis receptor in rat brain and guinea pig heart by the food dye erythrosine. Mol Pharmacol 22:687-692.
Hollingsworth RL. 1982. Color Additive Petition No. 8C-0064. (FOIA archive: FD&C Blue2_Memos (96 pgs)_Redacted).
Honohan T, Enderlin FE, Ryerson BA, Parkinson TM. 1977. Intestinal absorption of polymeric derivatives of the food dyes sunset yellow and tartrazine in rats. Xenobiotica 7:765-774.
Hulley SB, Cummings SR, Browner WS, Grady DG, Newman TB. 2013. Designing Clinical Research. Philadelphia, PA:Lippincott, Williams & Wilkins.
Hutchinson AP, Carrick B, Miller K, Nickiin S. 1992. Adverse reactions to synthetic food colours: interactions between tartrazine and muscarinic acetylcholine receptors in isolated guinea-pig ileum. Toxicol Lett 60:165-173.
Iga T, Awazu S, Hanano M, Nogami H. 1970. Pharmacokinetic studies of biliary excretion. I. Comparison of the excretion behavior in azo dyes and indigo carmine. Chem Pharm Bull (Tokyo) 18:2431-2440.

Potential Neurobehavioral Effects of Synthetic CalEPA OEHHA Food Dyes in Children April 2021
298
Ilhan I. AF, Doguc¸ D.K., Buyukbayram H.I., Gultekin F. 2014. Effects of prenatal exposure to artificial food colourings on total antioxidant status (TAS), total oxidant status (TOS) levels and oxidative stress index (OSI) of hippocampus. Cell Membr Free Radic Res 6:405-406.
Iyer S, Pham N, Marty M, Sandy M, Solomon G, Zeise L. 2019. An Integrated Approach Using Publicly Available Resources for Identifying and Characterizing Chemicals of Potential Toxicity Concern: Proof-of-Concept With Chemicals That Affect Cancer Pathways. Toxicol Sci 169:14-24.
Jackson BA. 1982. FD&C Green No. 3. (FOIA archive:r_CAP 8C0065 Green 3).
Jennings AS, Schwartz SL, Balter NJ, Gardner D, Witorsch RJ. 1990. Effects of oral erythrosine (2',4',5',7'-tetraiodofluorescein) on the pituitary-thyroid axis in rats. Toxicol Appl Pharmacol 103:549-556.
Jiang LH, Mackenzie AB, North RA, Surprenant A. 2000. Brilliant blue G selectively blocks ATP-gated rat P2X(7) receptors. Mol Pharmacol 58:82-88.
Jo YY, Lee MG, Yun SY, Lee KC. 2013. Profound Hypotension after an Intradermal Injection of Indigo Carmine for Sentinel Node Mapping. J Breast Cancer 16:127-128.
Jones R, Ryan AJ, Wright SE. 1964. The metabolism and excretion of tartrazine in the rat, rabbit, and man Food Cosmet Toxicol 2:447-452.
Judson R, Houck K, Martin M, Richard AM, Knudsen TB, Shah I, et al. 2016. Analysis of the Effects of Cell Stress and Cytotoxicity on In Vitro Assay Activity Across a Diverse Chemical and Assay Space. Toxicol Sci 153:409.
Kantor MA, Trout JR, Lachance PA. 1984. Food Dyes Produce Minimal Effects on Locomotor Activity and Vitamin B-6 Levels in Postweanling Rats. J Nutr 114:1402-1412.
Kawaguchi Y, Hashimoto H, Kitayama M, Hirota K. 2007. Intravenous indigo carmine might cause cerebral ischemia. Acta Anaesth Scand 51:776-777.
Kehrl J, Althaus JC, Showalter HD, Rudzinski DM, Sutton MA, Ueda T. 2017. Vesicular Glutamate Transporter Inhibitors: Structurally Modified Brilliant Yellow Analogs. Neurochem Res 42:1823-1832.
Khayyat L, Essawy A, Sorour J, Soffar A. 2017. Tartrazine induces structural and functional aberrations and genotoxic effects in vivo. PeerJ 5:e3041.
Potential Neurobehavioral Effects of Synthetic CalEPA OEHHA Food Dyes in Children April 2021
299
Khayyat LI, Essawy AE, Sorour JM, Soffar A. 2018. Sunset Yellow and Allura Red modulate Bcl2 and COX2 expression levels and confer oxidative stress-mediated renal and hepatic toxicity in male rats. PeerJ 2018.
Khiralla A, Mohamed I, Thomas J, Mignard B, Spina R, Yagi S, et al. 2015. A pilot study of antioxidant potential of endophytic fungi from some Sudanese medicinal plants. Asian Pac J Trop Med 8:701-704.
Khodarahmi R, Ashrafi-Kooshk MR, Khaledian K. 2015. Allura red, the artificial azo dye, inhibits esterase activity of carbonic anhydrase II: A preliminary study on the food safety in term of enzyme inhibition. J Rep Pharm Sci 4:43-52.
Kleinman RE, Brown RT, Cutter GR, Dupaul GJ, Clydesdale FM. 2011. A research model for investigating the effects of artificial food colorings on children with ADHD. Pediatrics 127:e1575-1584.
Kobylewski S, Jacobson MF. 2012. Toxicology of food dyes. Int J Occup Environ Health 18:220-246.
Kokoski CJ. 1968. Color Additive Petition No. 67. (FOIA archive: r_CAP 8c0087, p 25).
Kokoski CJ. 1970. Color Additive Petition 97. (FOIA archive: r_CAP 97 Red 40_redacted).
Kuno N, Mizutani T. 2005. Influence of synthetic and natural food dyes on activities of CYP2A6, UGT1A6, and UGT2B7. J Toxicol Environ Health Part A 68:1431-1444.
Kurebayashi H, Fukuoka M, Nishimaki-Mogami T, Minegishi K, Tanaka A. 1988. Effects of rose bengal on serum levels of thyroid hormones and thyroid peroxidase activity in male mice. J Toxicol Sci 13:61-70.
Lafferman JA, Silbergeld EK. 1979. Erythrosin B inhibits dopamine transport in rat caudate synaptosomes. Science 205:410-412.
Lahmass I, Sabouni A, Elyoubi M, Benabbes R, Mokhtari S, Saalaoui E. 2017. Anti-diabetic effect of aqueous extract Crocus sativus L. in tartrazine induced diabetic male rats. Physiol Pharmacol 21:312-321.
Lahmass I, Sabouni A, Berraouan A, Zoheir K, Belakbir S, Elyoubi M, et al. 2018. Treatment with saffron extract of the diabetogenic rats induced by the food colorant Tartrazine. Indian J Physiol Pharmacol 62:249-258.

Potential Neurobehavioral Effects of Synthetic CalEPA OEHHA Food Dyes in Children April 2021
300
Landrigan PJ, Goldman LR. 2011. Children’s Vulnerability To Toxic Chemicals: A Challenge And Opportunity To Strengthen Health And Environmental Policy. Health Affairs 30:842-850.
Lau K, McLean WG, Williams DP, Howard CV. 2006. Synergistic interactions between commonly used food additives in a developmental neurotoxicity test. Toxicol Sci 90:178-187.
Lee J, Kwon I, Jang SS, Cho AE. 2016. Investigation of the effect of erythrosine B on amyloid beta peptide using molecular modeling. J Mol Model 22:92.
Lee KH, Baek DJ, Jeon SY. 2015. Repetitive severe hypotension induced by indigo carmine. J Anesth 29:156-156.
Lefferts L. 2016. Seeing Red: Time for Action on Food Dyes. Available: https://cspinet.org/resource/seeing-red-time-action-food-dyes.
Lehmkuhler AL, Miller MD, Bradman A, Castorina R, Mitchell AE. 2020. Dataset of certified food dye levels in over the counter medicines and vitamins intended for consumption by children and pregnant women. Data Brief 32:106073.
Lelis CA, Hudson EA, Ferreira GMD, Ferreira GMD, da Silva LHM, da Silva MdCH, et al. 2017. Binding thermodynamics of synthetic dye Allura Red with bovine serum albumin. Food Chem 217:52-58.
Lethco EJ, Webb JM. 1966. The fate of FD&C blue no. 2 in rats. J Pharmacol Exp Ther 154:384-389.
Levitan H, Ziylan Z, Smith QR, Takasato Y, Rapoport SI. 1984. Brain uptake of a food dye, erythrosin B, prevented by plasma protein binding. Brain Res 322:131-134.
Levitan H, Ziya Ziylan Y, Rapoport SI. 1985. Brain uptake of the food dye, erythrosin-B. IRCS Med Sci 13:64-65.
Levy F, Dumbrell S, Hobbes G, Ryan M, Wilton N, Woodhill JM. 1978. Hyperkinesis and diet: a double-blind crossover trial with a tartrazine challenge. Med J Aust 1:61-64.
Levy F, Hobbes G. 1978. Hyperkinesis and diet: a replication study. Am J Psychiatry 135:1559-1560.
Li AA. 2005. Regulatory developmental neurotoxicology testing: data evaluation for risk assessment purposes. Environ Toxicol Pharmacol 19:727-733.
Potential Neurobehavioral Effects of Synthetic CalEPA OEHHA Food Dyes in Children April 2021
301
Li Y, Wei H, Liu R. 2014. A probe to study the toxic interaction of tartrazine with bovine hemoglobin at the molecular level. Luminescence 29:195-200.
Li Y, Jia Y, Zeng Q, Jiang X, Cheng Z. 2019. A multifunctional sensor for selective and sensitive detection of vitamin B12 and tartrazine by Forster resonance energy transfer. Spectrochim Acta A Mol Biomol Spectrosc 211:178-188.
Logan WJ, Swanson JM. 1979. Erythrosin B inhibition of neurotransmitter accumulation by rat brain homogenate. Science (New York, NY) 206:363-364.
Lok KY, Chan RS, Lee VW, Leung PW, Leung C, Leung J, et al. 2013. Food additives and behavior in 8- to 9-year-old children in Hong Kong: a randomized, double-blind, placebo-controlled trial. J Dev Behav Pediatr 34:642-650.
Lucarelli MR, Shirk MB, Julian MW, Crouser ED. 2004. Toxicity of Food Drug and Cosmetic Blue No. 1 dye in critically ill patients. Chest 125:793-795.
Mailman RB, Ferris RM, Tang FL, Vogel RA, Kilts CD, Lipton MA, et al. 1980. Erythrosine (Red No. 3) and its nonspecific biochemical actions: what relation to behavioral changes? Science (New York, NY) 207:535-537.
Maloney JP, Ryan TA, Brasel KJ, Binion DG, Johnson DR, Halbower AC, et al. 2002. Food Dye Use in Enteral Feedings: A Review and a Call for a Moratorium. Nutr Clin Prac 17:169-181.
Masone D, Chanforan C. 2015. Study on the interaction of artificial and natural food colorants with human serum albumin: A computational point of view. Comput Biol Chem 56:152-158.
Mathavan VMK, Boh BK, Tayyab S. 2009. Characterization of erythrosine B binding to bovine serum albumin and bilirubin displacement. Indian J Biochem Biophys 46:325-331.
Mathieu-Denoncourt J, Martyniuk CJ, de Solla SR, Balakrishnan VK, Langlois VS. 2014. Sediment contaminated with the Azo Dye disperse yellow 7 alters cellular stress- and androgen-related transcription in Silurana tropicalis larvae. Environ Sci Technol 48:2952-2961.
Mattes J, Gittelman-Klein R. 1978. A crossover study of artificial food colorings in a hyperkinetic child. Am J Psychiatry 135:987-988.
Potential Neurobehavioral Effects of Synthetic CalEPA OEHHA Food Dyes in Children April 2021
302
Mattes JA, Gittelman R. 1981. Effects of artificial food colorings in children with hyperactive symptoms. A critical review and results of a controlled study. Arch Gen Psychiatry 38:714-718.
McCann D, Barrett A, Cooper A, Crumpler D, Dalen L, Grimshaw K, et al. 2007. Food additives and hyperactive behaviour in 3-year-old and 8/9-year-old children in the community: a randomised, double-blinded, placebo-controlled trial. Lancet 370:1560-1567.
McCarthy MM. 2008. Estradiol and the developing brain. Physiol Rev 88:91-124.
McEwen BS, Akama KT, Spencer-Segal JL, Milner TA, Waters EM. 2012. Estrogen effects on the brain: actions beyond the hypothalamus via novel mechanisms. Behav Neurosci 126:4-16.
McShane BB, Bockenholt U, Hansen KT. 2016. Adjusting for publication bias in meta-analysis: an evaluation of selection methods and some cautionary notes. Perspect Psychol Sci 11:730-749.
Mehidi A, Mehedi N, Kheroua O, Saidi D. 2017. Effects of tartrazine subchronic ingestion on brush border membrane enzymes of female Swiss albino mice intestine. Int J Toxicol Pharmacol Res 9:216-223.
Meyer S, Axon A, Jowsey P, Williams F, Blain P, Wright M. 2014. Tartrazine is not an activator of the mouse oestrogen ERα and ERμ receptors. Toxicol Lett 229:S180 (abstract).
Millan S, Satish L, Bera K, Sahoo H. 2019. Binding and inhibitory effect of the food colorants Sunset Yellow and Ponceau 4R on amyloid fibrillation of lysozyme. New J Chem 43:3956-3968.
Miller M, Marty M, Ekanayake R. 2014. Report to the Legislature Children’s Environmental Health Program. Available: https://oehha.ca.gov/media/downloads/risk-assessment/report/2014legreport.pdf.
Minegishi K, Morimoto K, Yamaha T. 1978. Metabolism of triphenylmethane colors (III). Comparison of tissue distribution and biliary excretion for 3H-benzyl violet 4B and 3H-fast green FCF (food green no. 3) in rats. J Food Hyg Soc Jpn 19:482-485.
Mohamed AA-R, Galal AAA, Elewa YHA. 2015. Comparative protective effects of royal jelly and cod liver oil against neurotoxic impact of tartrazine on male rat pups brain. Acta Histochem 117:649-658.
Potential Neurobehavioral Effects of Synthetic CalEPA OEHHA Food Dyes in Children April 2021
303
Mohseni-Shahri FS, Moeinpour F, Nosrati M. 2018. Spectroscopy and molecular dynamics simulation study on the interaction of sunset yellow food additive with pepsin. Int J Biol Macromol 115:273-280.
Morris SJ, Chronwall BM. 1982. Toxic effects of ouabain and food and cosmetic dyes on nerve growth factor-promoted differentiation of neurites in culture. J Neurosci Res 7:331-339.
Morris SJ, Silbergeld EK, Brown RR, Haynes DH. 1982. Erythrosin B (USFD&C RED 3) inhibits calcium transport and atpase activity of muscle sarcoplasmic reticulum. Biochem Biophys Res Commun 104:1306-1311.
Moutinho ILD, Bertges LC, Assis RVC. 2007. Prolonged use of the food dye tartrazine (FD&C yellow no 5) and its effects on the gastric mucosa of Wistar rats. Braz J Biol 67:141-145.
Mundy WR, Padilla S, Breier JM, Crofton KM, Gilbert ME, Herr DW, et al. 2015. Expanding the test set: Chemicals with potential to disrupt mammalian brain development. Neurotoxicol Teratol 52:25-35.
Murdoch RD, Pollock I, Naeem S. 1987. Tartrazine induced histamine release in vivo in normal subjects. J R Coll Physicians Lond 21:257-261.
Naganuma F, Nakamura T, Yoshikawa T, Iida T, Miura Y, Karpati A, et al. 2017. Histamine N-methyltransferase regulates aggression and the sleep-wake cycle. Sci Rep 7:15899.
Nigg JT, Lewis K, Edinger T, Falk M. 2012. Meta-analysis of attention-deficit/hyperactivity disorder or attention-deficit/hyperactivity disorder symptoms, restriction diet, and synthetic food color additives. J Am Acad Child Adolesc Psychiatry 51:86-97 e88.
Noorafshan A, Hashemi M, Karbalay-Doust S, Karimi F. 2018. High dose Allura Red, rather than the ADI dose, induces structural and behavioral changes in the medial prefrontal cortex of rats and taurine can protect it. Acta Histochem 120:586-594.
NTP Office of Health Assessment and Translation. 2019. OHAT Systematic Review. Available: https://ntp.niehs.nih.gov/pubhealth/hat/review/index-2.html.
O'Shaughnessy KL, Gilbert ME. 2020. Thyroid disrupting chemicals and developmental neurotoxicity - New tools and approaches to evaluate hormone action. Mol Cell Endocrinol 518:110663.
Potential Neurobehavioral Effects of Synthetic CalEPA OEHHA Food Dyes in Children April 2021
304
Obrist J, LeVan L, Puhl R, Duan R. 1986. Final report: Metabolism of FD&C Red No. 3 in rats, study no. 6145–100. Unpublished report by Hazleton Laboratories America, Inc.
Olson W, Voelker R. 1970. Twenty-one month dietary administration – albino rats, Red Z-4576. Unpublished report no. 165-121.
Oravisto KJ. 1957. Investigations into the excretion mechanism of indigo carmine in normal human kidney. Ann Chir Gynaecol Fenn Suppl 46:1-79.
Osman MY, Sharaf IA, el-Rehim WMA, el-Sharkawi AM. 2002. Synthetic organic hard capsule colouring agents: in vitro effect on human true and pseudo-cholinesterases. Br J Biomed Sci 59:212-217.
Osman MY, Sharaf IA, Osman HMY, El-Khouly ZA, Ahmed EI. 2004. Synthetic organic food colouring agents and their degraded products: effects on human and rat cholinesterases. Br J Biomed Sci 61:128-132.
Park M, Park HR, Kim SJ, Kim MS, Kong KH, Kim HS, et al. 2009. Risk assessment for the combinational effects of food color additives: Neural progenitor cells and hippocampal neurogenesis. J Toxicol Environ Health Part A Curr Iss 72:1412-1423.
Parkinson TM, Brown JP. 1981. Metabolic fate of food colorants. Annu Rev Nutr 1:175-205.
Phillips JC, Mendis D, Eason CT, Gangolli SD. 1980. The metabolic disposition of 14C-labelled green S and Brilliant Blue FCF in the rat, mouse and guinea-pig. Food Cosmet Toxicol 18:7-13.
Pietrancosta N, Kessler A, Favre-Besse FC, Triballeau N, Quentin T, Giros B, et al. 2010. Rose Bengal analogs and vesicular glutamate transporters (VGLUTs). Bioorg Med Chem 18:6922-6933.
Polic II. 2018. Thesis: Evaluation of the Impact of Azo Dyes on the Metabolism of Stabilized Fecal Communities and In Vitro Cell Culture. Guelph, Ontario, Canada:University of Guelph, Food Science.
Pollock I, Warner JO. 1990. Effect of artificial food colours on childhood behaviour. Arch Dis Child 65:74-77.
Radomski JL, Mellinger TJ. 1962. The absorption, fate and excretion in rats of the water-soluble azo dyes, FD&C Red No. 2, FD&C Red No. 4, and FD&C Yellow No. 6. J Pharmacol Exp Ther 136:259-266.

Potential Neurobehavioral Effects of Synthetic CalEPA OEHHA Food Dyes in Children April 2021
305
Rafati A, Nourzei N, Karbalay-Doust S, Noorafshan A. 2017. Using vitamin E to prevent the impairment in behavioral test, cell loss and dendrite changes in medial prefrontal cortex induced by tartrazine in rats. Acta Histochem 119:172-180.
Rapp DJ. 1978. Does diet affect hyperactivity? J Learn Disabil 11:383-389.
Reisen CA, Rothblat LA. 1986. Effect of certified artificial food coloring on learning and activity level in rats. Neurobehav Toxicol Teratol 8:317-320.
Rock KD, Patisaul HB. 2018. Environmental Mechanisms of Neurodevelopmental Toxicity. Curr Environ Health Rep 5:145-157.
Rose TL. 1978. The functional relationship between artificial food colors and hyperactivity. J Appl Behav Anal 11:439-446.
Rothman KJ, Greenland S. 1998. Modern Epidemiology:Lippincott-Raven.
Rowe KS. 1988. Synthetic food colourings and 'hyperactivity': a double-blind crossover study. Aust Paediatr J 24:143-147.
Rowe KS, Rowe KJ. 1994. Synthetic food coloring and behavior: a dose response effect in a double-blind, placebo-controlled, repeated-measures study. J Pediatr 125:691-698.
Roxon JJ, Ryan AJ, Wright SE. 1966. Reduction of tartrazine by a Proteus species isolated from rats. Food Cosmet Toxicol 4:419-426.
Roxon JJ, Ryan AJ, Wright SE. 1967. Enzymatic reduction of tartrazine by Proteus vulgaris from rats. Food Cosmet Toxicol 5:645-656.
Ryan AJ, Welling PG, Roxon JJ. 1969a. Metabolism of a tartrazine analogue by intestinal bacteria. Food Cosmet Toxicol 7:297-299.
Ryan AJ, Welling PG, Wright SE. 1969b. Further studies on the metabolism of tartrazine and related compounds in the intact rat. Food Cosmet Toxicol 7:287-295.
Safford RJ, Goodwin BFJ. 1984. The effect of tartrazine on histamine release from rat peritoneal mast cells. Int J Immunopharmacol 6:233-240.
Sarantinos J, Rowe KS, Briggs DR. 1990. Synthetic food colouring and behavioral change in children with attention deficit disorder: a double blinded, placebo controlled, repeated measures study. Proc Nutr Aust 15:233.
Potential Neurobehavioral Effects of Synthetic CalEPA OEHHA Food Dyes in Children April 2021
306
Scammell TE, Jackson AC, Franks NP, Wisden W, Dauvilliers Y. 2019. Histamine: neural circuits and new medications. Sleep 42:1-8.
Schaubschläger WW, Zabel P, Schlaak M. 1987. Tartrazine-induced histamine release from gastric mucosa. The Lancet 330:800-801.
Shaywitz BA, Goldenring JR, Wool RS. 1979. Effects of chronic administration of food colorings on activity levels and cognitive performance in developing rat pups treated with 6-hydroxydopamine. Neurobehav Toxicol 1:41-47.
Shimizu R, Yamaguchi M, Uramaru N, Kuroki H, Ohta S, Kitamura S, et al. 2013. Structure-activity relationships of 44 halogenated compounds for iodotyrosine deiodinase-inhibitory activity. Toxicology 314:22-29.
Shinoda M, Mori S, Shintani S, Ishikura S, Hara A. 1999. Inhibition of human aldehyde reductase by drugs for testing the function of liver and kidney. Biol Pharm Bull 22:741-744.
Silbergeld EK. 1980. Erythrosin B: Ouabain-like actions of an artificial food dye in rat brain tissue. PHARMACOLOGIST 22:215 (abstract).
Silbergeld EK, Anderson SM. 1982. Artificial food colors and childhood behavior disorders. Bull N Y Acad Med 58:275-295.
Singh S, Das M, Khanna SK. 1993. Bio-metabolism of green S and indigo carmine through caecal microflora of rats. Biochem Biophys Res Commun 195:490-496.
Sipes NS, Martin MT, Kothiya P, Reif DM, Judson RS, Richard AM, et al. 2013. Profiling 976 ToxCast chemicals across 331 enzymatic and receptor signaling assays. Chem Res Toxicol 26:878-895.
Sobotka TJ, Brodie RE, Spaid SL. 1977. Tartrazine and the developing nervous system of rats. J Toxicol Environ Health 2:1211-1220.
Sondergaard D, Hansen EV, Wurtzen G. 1977. A short-term study in the pig of the effects on the liver and on the blood of eight azo dyes. Toxicology 8:381-386.
Spring C, Vermeersch J, Blunden D, Sterling H. 1981. Case studies of effects of artificial food colors on hyperactivity. J Spec Educ 15:361-372.

Potential Neurobehavioral Effects of Synthetic CalEPA OEHHA Food Dyes in Children April 2021
307
Stevens LJ, Burgess JR, Stochelski MA, Kuczek T. 2014. Amounts of artificial food colors in commonly consumed beverages and potential behavioral implications for consumption in children. Clin Pediatr (Phila) 53:133-140.
Stevens LJ, Burgess JR, Stochelski MA, Kuczek T. 2015a. Amounts of artificial food dyes and added sugars in foods and sweets commonly consumed by children. Clin Pediatr (Phila) 54:309-321.
Stevens LJ, Burgess JR, Stochelski MA, Kuczek T. 2015b. Amounts of Artificial Food Colors in Commonly Consumed Beverages and Potential Behavioral Implications for Consumption in Children: Revisited. Clin Pediatr (Phila) 54:1228-1230.
Stevenson J, Sonuga-Barke E, McCann D, Grimshaw K, Parker KM, Rose-Zerilli MJ, et al. 2010. The role of histamine degradation gene polymorphisms in moderating the effects of food additives on children's ADHD symptoms. Am J Psychiatry 167:1108-1115.
Swanson JM, Kinsbourne M. 1980. Food dyes impair performance of hyperactive children on a laboratory learning test. Science 207:1485-1487.
Swanson JM, Kinsbourne M. 1980. Artificial color and hyperactive behavior. In: Treatment of Hyperactive and Learning Disordered Children. Baltimore:University Park Press, 131-149.
Swanson JM, Kinsbourne M, Nigg J, Lanphear B, Stefanatos GA, Volkow N, et al. 2007. Etiologic subtypes of attention-deficit/hyperactivity disorder: brain imaging, molecular genetic and environmental factors and the dopamine hypothesis. Neuropsychol Rev 17:39-59.
Tanaka T. 1994. Reproductive and neurobehavioral effects of Allura Red AC administered to mice in the diet. Toxicology 92:169-177.
Tanaka T. 1996. Reproductive and neurobehavioral effects of Sunset yellow FCF administered to mice in the diet. Toxicol Ind Health 12:69-79.
Tanaka T. 2001. Reproductive and neurobehavioural toxicity study of erythrosine administered to mice in the diet. Food Chem Toxicol 39:447-454.
Tanaka T. 2006. Reproductive and neurobehavioural toxicity study of tartrazine administered to mice in the diet. Food Chem Toxicol 44:179-187.
Tanaka T, Takahashi O, Oishi S, Ogata A. 2008. Effects of tartrazine on exploratory behavior in a three-generation toxicity study in mice. Reprod Toxicol 26:156-163.
Potential Neurobehavioral Effects of Synthetic CalEPA OEHHA Food Dyes in Children April 2021
308
Tanaka T, Takahashi O, Inomata A, Ogata A, Nakae D. 2012. Reproductive and neurobehavioral effects of brilliant blue FCF in mice. Birth Defects Res B Dev Reprod Toxicol 95:395-409.
Thorley G. 1984. Pilot study to assess behavioural and cognitive effects of artificial food colours in a group of retarded children. Dev Med Child Neurol 26:56-61.
Tomlinson G, Cummings MD, Hryshko L. 1986. Photoinactivation of acetylcholinesterase by erythrosin B and related compounds. Biochem Cell Biol 64:515-522.
Toyota H, Dugovic C, Koehl M, Laposky AD, Weber C, Ngo K, et al. 2002. Behavioral characterization of mice lacking histamine H(3) receptors. Mol Pharmacol 62:389-397.
Tsujita J, Takeda H, Ebihara K, Kiriyama S. 1979. Comparison of protective activity of dietary fiber against the toxicities of various food colors in rats. Nutr Rep Int 20:635-642.
Umer Abdullah S, Badaruddin M, Asad Sayeed S, Ali R, Riaz MN. 2008. Binding ability of Allura Red with food proteins and its impact on protein digestibility. Food Chem 110:605-610.
US DHHS. 2016. Poverty Guidelines, Research, and Measurement. Available: http://aspe.hhs.gov/POVERTY/index.shtml
USEPA. 1986. Guidelines for the Health Risk Assessment ofChemical Mixtures.
USEPA. 2000. Supplementary guidance for conducting health risk assessment of chemical mixtures.
USEPA. 2011. Exposure Factors Handbook (Chapter 8). (United States Environmental Protection Agency).
van Hooft JA. 2002. Fast Green FCF (Food Green 3) inhibits synaptic activity in rat hippocampal interneurons. Neurosci Lett 318:163-165.
Velioglu C, Erdemli ME, Gul M, Erdemli Z, Zayman E, Bag HG, et al. 2019. Protective effect of crocin on food azo dye tartrazine-induced hepatic damage by improving biochemical parameters and oxidative stress biomarkers in rats. Gen Physiol Biophys 38:73-82.
Potential Neurobehavioral Effects of Synthetic CalEPA OEHHA Food Dyes in Children April 2021
309
Vorhees C, Butcher R, Brunner R, Wootten V, Sobotka T. 1983a. A developmental toxicity and psychotoxicity evaluation of FD and C red dye #3 (erythrosine) in rats. Arch Toxicol 53:253-264.
Vorhees C, Butcher R, Brunner R, Wootten V, Sobotka T. 1983b. Developmental toxicity and psychotoxicity of FD and C red dye no. 40 (Allura red AC) in rats. Toxicology 28:207-217.
Vorhees CV, Butcher RE, Brunner RL, Wootten V, Sobotka TJ. 1981. Developmental neurobehavioral toxicity of butylated hydroxyanisole (BHA) in rats. Neurobehav Toxicol Teratol 3:321-329.
Vyas S, Rodrigues AJ, Silva JM, Tronche F, Almeida OF, Sousa N, et al. 2016. Chronic Stress and Glucocorticoids: From Neuronal Plasticity to Neurodegeneration. Neural Plast 2016:Article ID 6391686.
Wade PD, Marder E, Siekevitz P. 1984. Characterization of transmitter release as a response of vertebrate neural tissue to Erythrosin B. Brain Research 305:259-270.
Walker R. 1970. The metabolism of azo compounds: a review of the literature. Food Cosmet Toxicol 8:659-676.
Wang J, Jackson DG, Dahl G. 2013. The food dye FD&C Blue No. 1 is a selective inhibitor of the ATP release channel Panx1. J Gen Physiol 141:649-656.
Wang L, Zhang G, Wang Y. 2014. Binding properties of food colorant allura red with human serum albumin in vitro. Mol Biol Rep 41:3381-3391.
Waselus M, Nazzaro C, Valentino RJ, Van Bockstaele EJ. 2009. Stress-induced redistribution of corticotropin-releasing factor receptor subtypes in the dorsal raphe nucleus. Biol Psychiatry 66:76-83.
Weiss B, Williams JH, Margen S, Abrams B, Caan B, Citron LJ, et al. 1980. Behavioral responses to artificial food colors. Science 207:1487-1489.
WHO JECFA. 2011. Evaluation of certain food additives and contaminants: seventy-fourth report of the Joint FAO/WHO Expert Committee on Food Additives. (WHO technical report series). 978 92 4 120966 3.World Health Organization.
WHO JECFA. 2016. Evaluation of certain food additives: eighty-second report of the Joint FAO/WHO Expert Committee on Food Additives. (WHO technical report series). 978 92 4 121000 3.World Health Organization.
Potential Neurobehavioral Effects of Synthetic CalEPA OEHHA Food Dyes in Children April 2021
310
WHO JECFA. 2017. Evaluation of certain food additives: eighty-fourth report of the Joint FAO/WHO Expert Committee on Food Additives. (WHO Technical Report Series). 978-92-4-121016-4.World Health Organization.
WHO JECFA. 2019. Evaluation of certain food additives: eighty-sixth report of the Joint FAO/WHO Expert Committee on Food Additives. (WHO Technical Report Series).World Health Organization.
Williams AJ, Grulke CM, Edwards J, McEachran AD, Mansouri K, Baker NC, et al. 2017. The CompTox Chemistry Dashboard: a community data resource for environmental chemistry. J Cheminform 9:61.
Williams JI, Cram DM, Tausig FT, Webster E. 1978. Relative effects of drugs and diet on hyperactive behaviors: an experimental study. Pediatrics 61:811-817.
Wilson N, Scott A. 1989. A double-blind assessment of additive intolerance in children using a 12 day challenge period at home. Clin Exp Allergy 19:267-272.
Wong HE, Kwon I. 2011. Xanthene food dye, as a modulator of Alzheimer's disease amyloid-beta peptide aggregation and the associated impaired neuronal cell function. PLoS One 6.
Wu D, Yan J, Wang J, Wang Q, Li H. 2015. Characterisation of interaction between food colourant allura red AC and human serum albumin: multispectroscopic analyses and docking simulations. Food Chem 170:423-429.
Xu G, Strathearn L, Liu B, Yang B, Bao W. 2018. Twenty-Year Trends in Diagnosed Attention-Deficit/Hyperactivity Disorder Among US Children and Adolescents, 1997-2016. JAMA Netw Open 1:e181471.
Yang J, Liu R, Lu F, Xu F, Zheng J, Li Z, et al. 2019. Fast Green FCF Attenuates Lipopolysaccharide-Induced Depressive-Like Behavior and Downregulates TLR4/Myd88/NF-κB Signal Pathway in the Mouse Hippocampus. Front Pharmacol 10:Article 501.
Yang R. 1993. NTP technical report on the toxicity studies of a Chemical Mixture of 25 Groundwater Contaminants Administered in Drinking Water to F344/N Rats and B6C3F(1) Mice. Toxic Rep Ser 35:1-I12.
Yoshikawa T, Nakamura T, Yanai K. 2019. Histamine N-Methyltransferase in the Brain. Int J Mol Sci 20.

Potential Neurobehavioral Effects of Synthetic CalEPA OEHHA Food Dyes in Children April 2021
311
Zoeller TR, Dowling AL, Herzig CT, Iannacone EA, Gauger KJ, Bansal R. 2002. Thyroid hormone, brain development, and the environment. Environ Health Perspect 110 Suppl 3:355-361.
Zou L, Spanogiannopoulos P, Pieper LM, Chien HC, Cai W, Khuri N, et al. 2020. Bacterial metabolism rescues the inhibition of intestinal drug absorption by food and drug additives. Proc Natl Acad Sci U S A 117:16009-16018.