sweden's convergence programme 2013
TRANSCRIPT

Sweden’s convergence programme
2013

Introduction ...................................................................................................... 5
1 Economic policy framework and targets ....................................................... 7
1.1 The fiscal policy framework .............................................................................. 7
1.2 Monetary policy target .................................................................................... 13
1.3 The Government’s fiscal policy ...................................................................... 14
1.4 Monetary policy ............................................................................................... 23
2 Macroeconomic trend .............................................................................. 25
2.1 International and financial economy .............................................................. 25
2.2 Swedish economy............................................................................................. 25
2.3 Potential macroeconomic imbalances ............................................................. 27
3 General government finances ................................................................... 30
3.1 Accounting principles ...................................................................................... 30
3.2 The development of public finances ............................................................... 31
3.3 Net financial wealth and consolidated gross debt .......................................... 35
3.4 The follow up of the surplus target ................................................................ 36
3.5 Effects of fiscal policy on demand .................................................................. 39
3.6 Monitoring of the expenditure ceiling ............................................................ 41
3.7 Monitoring good financial management and the local government balanced budget requirement ......................................................................................... 42
3.8 Central government guarantees ...................................................................... 43
4 Alternative scenarios and comparison with Sweden’s convergence programme for 2012 ............................................................................... 46
4.1 Alternative scenarios ....................................................................................... 46
4.2 Comparison with the 2012 convergence programme .................................... 52
5 Long-term sustainability of fiscal policy .................................................... 53
5.1 Demographics and public finances ................................................................. 54
5.2 Calculations of fiscal sustainability................................................................. 57
5.3 Overall assessment of the long-term sustainability of fiscal policy .............. 66
6 Quality in general government finances ..................................................... 67
6.1 Expenditure ...................................................................................................... 67
6.2 Revenue ............................................................................................................ 69
Appendix A – Calculation assumptions ............................................................. 71
Appendix B – Comparison with the European Commission’s projections of demo-graphically dependent expenditure .............................................. 77
Appendix C – Tables ....................................................................................... 79

Introduction
In accordance with the Council’s regulation (EC) 1466/97, Sweden submitted its convergence programme in December 1998.1 The programme was evaluated and approved by the Council during the spring of 1999. In accordance with the Council’s regulation, an update of the convergence programme is to be submitted annually and this was consequently carried out 1999–2009.
Effective from 2010, reporting within the Stability and Growth Pact has been adjusted according to the European semester to strengthen the monitoring of fiscal policy. The convergence programme and the national reform programme are therefore submitted in the spring. This allows budgetary and structural policy to be assessed consistently and recommendations to be made to Member States while their budget processes are still at the preparatory stage.
Sweden’s 2013 convergence programme is based on the 2013 Spring Fiscal Policy Bill (Govt. Bill 2012/13:100) that the Government submitted to the Riksdag on 15 April 2013. The Riksdag’s Standing Committee on Finance was informed about the convergence programme on 18 April 2013. The Government approved the convergence programme on 19 April 2013.
The Riksdag’s EU Committee was informed of the European Commission’s proposals regarding country-specific recommendations for the 2012 convergence programme on 15 June 2012.
1 The Council’s regulation (EC) 1466/97 of 7 July 1997 regarding the reinforced monitoring of public finances and the monitoring of fiscal policy.

7
1 Economic policy framework and targets
1.1 The fiscal policy framework
The central elements of the fiscal policy framework can, in accordance with the Government Communication (skr. 2010/11:79, bet. 2010/11:FiU42, rskr. 2010/11:316) be summarised as follows.
The role of the fiscal policy framework in the political decision making process
The overarching objective of fiscal policy is to create as high level of welfare as possible by contributing to a high and sustainable level of economic growth and employment (through structural policy), welfare that benefits everyone (through redistribution policy), and stable resource utilisation (through stabilisation policy). Sustainable means economic growth that is achieved without unacceptable consequences for the environment, the climate, or people’s health. Public finances that are sustainable in the long term represent a basic precondition for the achievement of the overarching objectives of fiscal policy.
Fiscal policy covers several different objectives and means. The conflicts that arise between objectives must be addressed by the democratically elected members of the Riksdag. Fiscal policy design will vary over time depending on the composition of the Riksdag. For this reason, fiscal policy cannot be entirely mechanical. However, there are a number of basic principles that fiscal policy should adhere to for it to be sustainable and transparent in the long term. Combined, these principles form the fiscal policy framework.
The budget policy framework
A core component of the fiscal policy framework is the budget policy framework. The budget policy framework encompasses a surplus target for general government net lending, an expenditure ceiling for the central government’s expenditure, and the old-age pension system combined with a stringent central government budget process and a statutory balanced budget requirement for municipalities and county councils.
According to the Swedish Budget Act (2011:203), the Government is required to propose a target (surplus target) for general government net lending. The Riksdag has set a surplus target whereby net lending is to amount to 1 per cent of GDP on average over a business cycle. The surplus target’s current level is to be maintained over the present term of
8
office and as long as is necessary for the public finances to develop in a direction that is sustainable in the long term.
Surplus target evaluation is mainly forward-looking to assess whether there is budgetary scope or needs for budget reinforcement measures. Since the economic trend cannot be measured unequivocally, the surplus target is monitored using several different indicators. On the basis of this follow-up and of the overarching objectives of fiscal policy, long-term fiscal sustainability and the ever-present uncertainty of the future, the Government will make an assessment of whether there is scope for reforms that will weaken net lending or whether savings measures are necessary.
Divergences, if any, of the net lending to the surplus target, should be restored to the targeted level. However, this cannot be achieved mechanically. In the assessment of when and how a divergence should be corrected, it is necessary to make an overall assessment based on, among other factors, stabilisation policy, redistribution policy, and structural policy. Historical divergences from the surplus target need not to be accommodated in budgets further on.
According to the Budget Act, it is compulsory for the Government to propose, in its Budget Bill, an expenditure ceiling for the third additional year. The expenditure ceiling is then set by the Riksdag. An important function of the expenditure ceiling is to provide the conditions necessary for achieving the surplus target. The level of the expenditure ceiling should also promote a desirable long-term development of central government expenditure. Alongside the surplus target, the expenditure ceiling directs the overall level of the tax levy, helping to prevent a development whereby this must be gradually raised as a result of inadequate expenditure control or to prevent temporary revenue reinforcements being used for permanent expenditure increases.
The expenditure ceiling should not be circumvented by benefits normally financed through appropriations being budgeted and reported against revenue items. The main principle should also be that expenses should be recognised in the year in which they are expected to be incurred. Any divergences from these principles should be explained.
According to standard practices, there should be a budgeting margin of a certain scope beneath the expenditure ceiling. This should primarily act as a buffer in the event that expenditure develops in a direction not calculated on the basis of the economic trend.
A well-organised and stringent budget process is of key importance in achieving the budget policy targets. The expenditure ceiling is the overarching restriction that limits the budget process in terms of total expenditure. In the budget process, different expenses are compared against one another and expenditure increases are tested on the basis of a predetermined total financial range determined by the expenditure ceiling and the surplus target. The main approach is that expenditure increases in a particular area of expenditure should be covered through proposed expenditure reductions within the same area.
9
It is also of central importance that the central government budget is transparent and comprehensive. The Government’s budget proposal shall include all revenue and expenditure, as well as other payments that affect the central government’s borrowing needs (known as the principle of completeness). The main principle is also that central government revenues and expenditures should be budgeted and reported gross under revenue items and allocations (known as the gross accounting principle). This means that expenses shall be reported on the expenditure side of the budget, while revenues are to be reported on the revenue side.
The Ministry of Finance has a coordinating role and is responsible for the schedule, guidelines for budget work and the budget negotiation process. However, all ministries are responsible for there being sufficient data available for overarching priorities to be determined between sectors within the general government sector and between different areas of expenditure within the central government budget and for assessing the general government undertaking.
In order to strengthen the budget process at the local and regional levels, a statutory balanced budget requirement was introduced in 2000 for the local government sector. This stipulates that each individual municipality and county council should budget for a balanced outcome, unless specific conditions prevail. Municipalities and County Councils shall maintain good financial management in their operations.2
Stabilisation policy
The most important contribution made by fiscal policy in stabilising the economy is in upholding confidence in the long-term sustainability of the general government finances. If the financial market, households and companies lose confidence in the general government finances, this will help render less effective the automatic stabilisers and the active (discretionary) fiscal policy measures intended to have an effect in terms of stabilisation policy. Furthermore, if finances are not sustainable in the long term, the Riksbank’s efforts in maintaining price stability will be impeded. Experience shows that periods of high inflation are often preceded by periods of mismanaged general government finances.
When demand in the economy is disrupted, stabilising employment and inflation does not normally entail a contradiction. This means that the economy will normally be stimulated through monetary policy during an economic downturn and restrained during an upswing. In the event of such disruptions, fiscal policy aids economic stabilisation, mainly through the automatic and semi-automatic stabilisers.3
2 Effective from 2005, municipalities and county councils shall determine the financial targets that are of importance for good financial management. A common measure is that a result corresponding to 2 per cent of revenues from taxation and general government subsidies meets the requirement for good financial management. 3 The automatic stabilisers help mitigate economic fluctuations in that tax revenues automatically reduce (increase), expenditure on unemployment insurance and certain
10
Furthermore, unlike monetary policy, fiscal policy plays a role in managing specific problems that can arise in the economy in a downturn. This may, for example, involve strengthening labour market policy measures of various kinds and managing different consequences of redistribution policy. In major disruptions in demand and supply, fiscal policy may be required to provide support for monetary policy. Experiences from managing earlier crises show, however, that a strong economic downturn cannot be counteracted without jeopardising the general government finances. On the other hand, measures can help mitigate the rise in unemployment, decrease the risk of unemployment gaining a lasting hold and alleviating the consequences for particularly exposed groups.
It is important that the stabilisation measures be designed in such a way that they help net lending return to a level in line with the surplus target once resource utilisation normalises. Experience shows that certain temporary stabilisation measures undertaken can be politically difficult to retract. Consequently, such stabilisation measures should be avoided. To avoid stabilisation policy itself becoming a source of longer-term general government finance problems, it is necessary to ensure that any temporary measures implemented remain temporary.
If permanent measures are implemented to mitigate a downturn (on the condition that the scope exists for such measures), these should primarily involve measures that, in the long term, contribute to lasting increases in employment and GDP. It may also be a matter of permanently raising an allocation or transfer by means of redistribution policy. These examples show that it is neither meaningful nor desirable to take stabilisation policy decisions without, at the same time, weighing in structural and redistribution policy objectives.
Government interventions in the financial markets
Well-functioning financial markets are also decisive for stable macroeconomic development and effective stabilisation policy. For government interventions in the financial markets to be effective, a clear division of roles between authorities is important and clear rules must be in place regarding how the public finances are to be safeguarded in the event of such interventions.
In financial crises, the Government may need to implement special measures to aid financial stability and to thus prevent the crisis from having a severe impact throughout the economy. If the Government
income support automatically increases (decreases) in an economic upswing (downswing). The so-called semi-automatic stabilisers are a hybrid between active decisions and automatic stabilisers. It is primarily different types of labour market policy measures that are generally referred to as semi-automatic stabilisers; that is, active decisions are made regarding a large proportion of these although it is more the rule than the exception that such measures are adjusted to the prevailing economic conditions.
11
needs to undertake such measures, the point of departure lies in limiting the consequences for the public finances. It is important that it is the credit institutes themselves and, in particular, their shareholders and other contributors of risk capital, who should primarily bear any losses. If the state intervenes in a credit institute experiencing serious financial problems, the Government may, in accordance with the Government Support to Credit Institutions Act (2008:814), temporarily assume ownership of the institute if its financial position is very weak or if the institute fails to agree to terms for the support that are deemed to be reasonable. When the owners of the institute are aware that the Government has the opportunity to assume ownership and replace the institute’s leadership while, at the same time, it is the owners who must bear the losses, their willingness to accept exaggerated risks in the business of the institute decreases.
Openness and clarity
The Spring Fiscal Policy Bill normally details the focus of fiscal and budget policy for the coming years. In the Bill, the Government accounts for its view of the prevailing economic situation, reports the structural, stabilisation, and redistribution challenges facing policymakers, provides an assessment of a suitable level for the expenditure ceiling for at least a third additional year, follows up on budget policy targets, accounts for the calculated effects of measures, and gives an assessment of the current budgetary scope. The Spring Fiscal Policy Bill usually contains a special account of redistribution policy, an assessment of the long-term sustainability of the public finances and a report of general government investments and capital stock.
In the Budget Bill, the Government presents concrete policy proposals, particularly for the coming budget year, and presents proposals for the expenditure ceiling for at least a third additional year. In addition, an account of economic equality is presented.
The Government’s Annual Report follows up both the budget and the fiscal policy targets for the past budget year.
In both the Spring Fiscal Policy Bill and the Budget Bill, forecasts are made for four years into the future. Forecasts are to be prepared using the best methods available. The effects of measures considered to have a greater macro-economic impact are to be calculated in terms of GDP, employment and income distribution. Forecasts and calculations of effects are to be based on data of the highest possible quality and should be based on current research where possible.
Assessments of the sustainability of the general government finances are to be complemented with generation analyses at regular intervals. Long-term surveys shall also be carried out at regular intervals. These
12
represent an important foundation for the analysis of the future challenges facing fiscal policy.4
Swedish Fiscal Policy Council
In 2007, the Government established a Fiscal Policy Council with the task of assessing whether fiscal policy targets are achieved and submitting its observations in an annual report.
The overarching task of the Fiscal Policy Council is to support general government finances that are sustainable in the long term. The Council’s mandate is the following:
- The Council shall analyse how well the Government meets
budget policy targets and whether the public finances are sustainable in the long term.
- The Council shall also assess the effects on growth, employment, and the distribution of welfare, and how the focus of fiscal policy relates to the general economic trend. The Council shall also review the clarity of the Spring Fiscal Policy Bill, particularly in relation to the stated bases for fiscal policy and the reasoning behind proposed measures.
- The Council may also review and assess the quality of the forecasts submitted and the models on which those forecasts are based.
Sweden’s medium-term objective
As a member of the EU, Sweden must meet the regulations on net lending included in the EU’s Stability and Growth Pact. In addition to the deficit limit of 3 per cent of GDP, all EU members are required to set up a so-called Medium-Term Objective (MTO). According to earlier calculations by the European Commission, Sweden should have an MTO of at least minus 1 per cent of GDP.5
Sweden's MTO has been set at minus 1 per cent of GDP in accordance with the European Commission’s calculations. The MTO stated by Sweden in the convergence programme should be seen as a minimum requirement for net lending to which Sweden is subject as an EU member, while Sweden has set its own, more ambitious national net lending targets in the form of the surplus target of 1 per cent of GDP over a business cycle.
4 Work on long-term surveys is directed from the Ministry of Finance on the basis of extensive investigation data produced by agencies, organisations and individual experts. 5 See Public Finances in EMU, European Commission, 2007.
13
1.2 Monetary policy target
In Sweden, the Riksbank is responsible for monetary policy. In accordance with the Sveriges Riksbank Act (1988:1385), the objective of monetary policy is to maintain a stable monetary value. Changes to the Sveriges Riksbank Act adopted in 1999 gave the Riksbank greater autonomy. The constitution states that no other authority may determine the Riksbank’s decisions on matters of monetary policy. The independence of the decision-making Executive Board is also underscored by the Sveriges Riksbank Act which states that the members of the Board must not seek or receive instructions when performing their monetary policy tasks.
According to the Sveriges Riksbank Act, the objective of monetary policy is to maintain a fixed monetary value. The Riksbank has specified this as an inflation target entailing an annual change in the consumer price index (CPI) of 2 per cent.
At the same time as monetary policy is focused on achieving the inflation target, it shall support the objectives of general economic policy in achieving sustainable growth and a high level of employment. This is achieved by the Riksbank, in addition to stabilising inflation around the inflation target, also striving to stabilise production and employment around long-term sustainable development paths. Consequently, the Riksbank conducts what is termed a flexible inflation target policy. This does not mean that the Riksbank compromises on the priority of the inflation target.
It takes time for monetary policy to achieve full impact on inflation and the real economy. Monetary policy is therefore guided by economic trend forecasts. Among other things, the Riksbank publishes an assessment of how the repo rate will develop over the ensuing period. The interest rate path is a forecast, not a promise.
On the occasion of each monetary policy decision being made, the governors of the Riksbank assesses what repo rate path would be needed for monetary policy to be well balanced. This balancing normally entails finding a suitable equilibrium between stabilising inflation near the inflation target and stabilising the real economy.
There is no general answer as to how quickly the Riksbank aims to return inflation to 2 per cent if it deviates from the target. In certain situations, a rapid return may have undesired effects on production and employment, while a slow return can weaken the credibility of the inflation target. In general, the ambition has been to adjust interest and the interest path such that inflation is expected to be relatively close to the target in two years’ time.
In September 2003, Sweden held a referendum on the introduction of the euro. The result of the referendum, which was “no”, led to no changes in monetary and exchange rate policies. The government is responsible for overall exchange rate policy matters and decides on the exchange rate system, while the Riksbank is responsible for the

14
application of the exchange rate system. The current monetary and exchange rate policy regime stands firm. Sweden’s experience of an inflation target and a floating exchange rate is very favourable. Pegging the Swedish krona to ERM2 is not under consideration.
1.3 The Government’s fiscal policy
Government proposals in the Budget Bill for 2013
In the Budget Bill for 2013, the Government chose to prioritise initiatives to strengthen the potential for growth and to prevent unemployment from becoming entrenched. To strengthen conditions for growth and competitiveness, the Government proposed, among other measures, a sharp raise of the spending frame for infrastructure that provide scope for both extensive new investments and the largest ever increase in railway maintenance. The Government also proposed a major investment in research and innovation through increased funding to higher education and financers of research. To promote enterprise and entrepreneurship, the Government proposed a reduction of the corporate tax rate, which is expected to lead to increased productivity, higher real wages and higher employment.
The Government proposed a number of permanent and temporary measures to get more people into work, such as the strengthening of upper secondary vocational education and apprenticeship training by permanently extending the provider allowances for apprentices and raising the part of the allowance paid to employers. Furthermore, the Government proposed measures to facilitate the establishment in the Swedish labour market of persons who are born abroad, including increased opportunities for workplace-based initiatives. A change in the parental benefit system was proposed to counter delays in labour market establishment for foreign-born women. The Government also proposed education and training measures for people born abroad. In response to the continued weak economic situation, the Government proposed measures aimed to help people at high risk of long-term unemployment. The Budget Bill for 2013 also announced measures intended to clarify the requirements that apply to all recipients of labour market-related benefits or income support from the public authorities.
The Government also proposed measures intended to bring about a quality improvement and a more even distribution of welfare. The Government proposed stricter state supervision to promote better quality in health care and social services. The Government has also proposed a number of measures intended to strengthen the judicial system, including tougher sentences, early and clear intervention against young people who commit crimes, and measures to increase the efficiency and effectiveness of the judicial system. For the sake of social cohesion, and to ensure that economic growth benefits all, the Government proposed certain targeted measures for financially
15
vulnerable groups. Their incomes will be boosted by measures in the systems for financial aid for studies, parental insurance, and the housing supplement for pensioners.
Furthermore, the Government proposed a number of reforms in energy, climate and environmental policy, including more efficient permit processes, support for renewable energy sources and increased resources to protect valuable natural environments. In addition, a number of tax changes were proposed, aimed at improving the environment and making climate and energy policy more cost-effective.
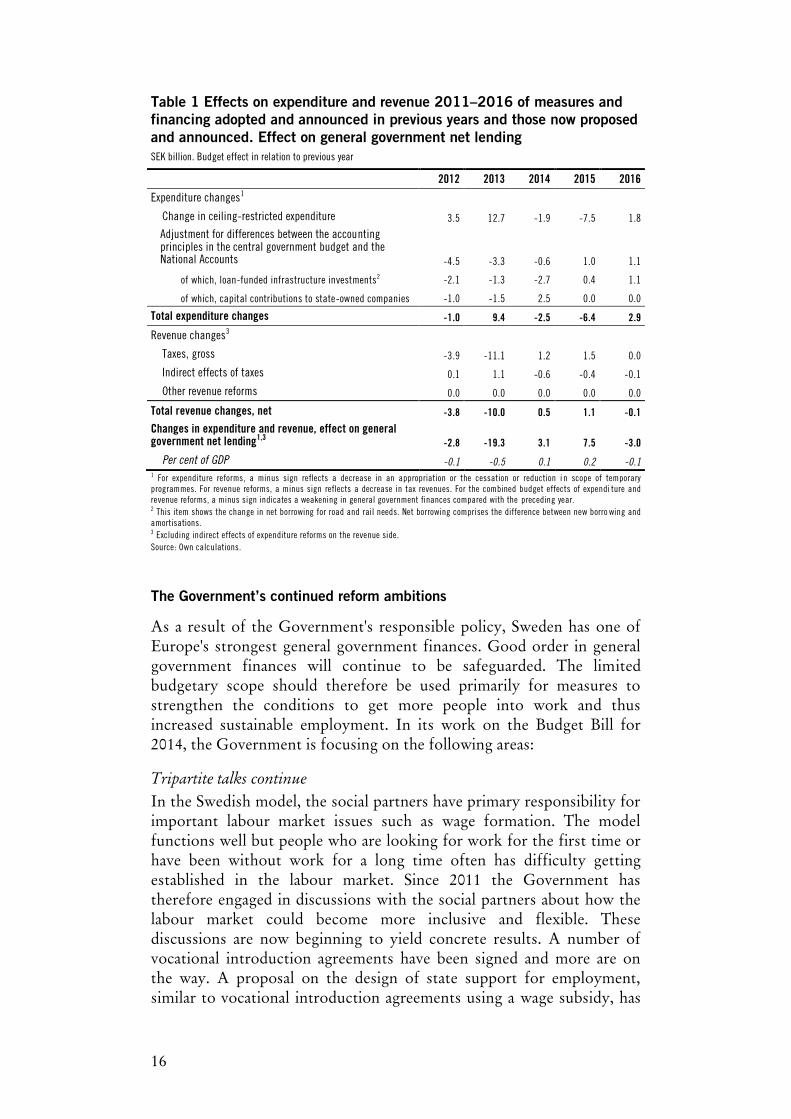
Table 1 shows the combined budgetary effects of all new policy reforms, both for 2013 and previously, that have been adopted or announced, including how these are financed, in relation to previous years.6 The table shows the Government’s priorities at an overarching level. The reforms included in table 1 involve both the expenditure and revenues sides of the central government budget. Indirect effects of expenditure reforms on the revenue side of the central government budget are not included.
In 2014 and 2015, the general government finances will be strengthened overall. This is primarily due to initiatives on the expenditure side, particularly in the labour market, being phased out. In 2016, the general government finances will be weakened, in part due to loan-funded infrastructure investments increasing in scope. Revenues will see relatively little change between these years as a result of decisions on reforms after 2013.
6 The proposals presented in the Spring Adjustment Budget for 2013 (Govt. Bill 2012/13:99) are also included.
16
Table 1 Effects on expenditure and revenue 2011–2016 of measures and financing adopted and announced in previous years and those now proposed and announced. Effect on general government net lending SEK billion. Budget effect in relation to previous year
2012 2013 2014 2015 2016
Expenditure changes1
Change in ceiling-restricted expenditure 3.5 12.7 -1.9 -7.5 1.8
Adjustment for differences between the accounting principles in the central government budget and the National Accounts -4.5 -3.3 -0.6 1.0 1.1
of which, loan-funded infrastructure investments2 -2.1 -1.3 -2.7 0.4 1.1
of which, capital contributions to state-owned companies -1.0 -1.5 2.5 0.0 0.0
Total expenditure changes -1.0 9.4 -2.5 -6.4 2.9
Revenue changes3
Taxes, gross -3.9 -11.1 1.2 1.5 0.0
Indirect effects of taxes 0.1 1.1 -0.6 -0.4 -0.1
Other revenue reforms 0.0 0.0 0.0 0.0 0.0
Total revenue changes, net -3.8 -10.0 0.5 1.1 -0.1
Changes in expenditure and revenue, effect on general government net lending1,3 -2.8 -19.3 3.1 7.5 -3.0
Per cent of GDP -0.1 -0.5 0.1 0.2 -0.1 1 For expenditure reforms, a minus sign reflects a decrease in an appropriation or the cessation or reduction i n scope of temporary programmes. For revenue reforms, a minus sign reflects a decrease in tax revenues. For the combined budget effects of expendi ture and revenue reforms, a minus sign indicates a weakening in general government finances compared with the preceding year. 2 This item shows the change in net borrowing for road and rail needs. Net borrowing comprises the difference between new borro wing and amortisations. 3 Excluding indirect effects of expenditure reforms on the revenue side. Source: Own calculations.
The Government’s continued reform ambitions
As a result of the Government's responsible policy, Sweden has one of Europe's strongest general government finances. Good order in general government finances will continue to be safeguarded. The limited budgetary scope should therefore be used primarily for measures to strengthen the conditions to get more people into work and thus increased sustainable employment. In its work on the Budget Bill for 2014, the Government is focusing on the following areas:
Tripartite talks continue
In the Swedish model, the social partners have primary responsibility for important labour market issues such as wage formation. The model functions well but people who are looking for work for the first time or have been without work for a long time often has difficulty getting established in the labour market. Since 2011 the Government has therefore engaged in discussions with the social partners about how the labour market could become more inclusive and flexible. These discussions are now beginning to yield concrete results. A number of vocational introduction agreements have been signed and more are on the way. A proposal on the design of state support for employment, similar to vocational introduction agreements using a wage subsidy, has
17
recently been referred for consideration. Further, the Government has presented a proposal for short-time working to the Council on Legislation.
Better conditions for getting more people into work
The protracted downturn means that people with a weak foothold in the labour market, particularly young people and those born abroad, have had much greater difficulties in establishing themselves in the labour market. It is therefore important to continue working to improve employment opportunities for these groups.
Stronger incentives to work and lower thresholds for entering the labour market are effective ways to increase employment. To reduce exclusion, increase sustainable employment and make it more attractive to get an education, to start and run a business, the Government wants to further strengthen the in-work tax credit and raise the lower state income tax threshold when the budgetary scope allows for this. When individuals and families get to keep more of their income, their independence and their opportunities to shape their own lives also increases.
The increasing long-term unemployment is a serious problem, especially in a period of weak economic conditions and rising unemployment. Regional disparities in employment ratio and unemployment are also considerable. To reduce long-term unemployment, there must be an increase in demand for people who are far from the labour market, at the same time as job-seeking activities are maintained and job-seekers are offered relevant initiatives. It is important to ensure the quality and level of activity in initiatives for people who have been out of work for a longer period and to increase in various ways employers' demand for people who currently have a weak attachment to the labour market.
Indicators suggest that matching in the labour market has worsened during the crisis. There is much to indicate that this is largely a temporary effect of the protracted downturn and of increased labour force participation. In order to improve matching, a broad approach is required. The continued work to improve matching focuses on the unemployed having clear incentives to seek work actively, on improving the skills of the labour force through education and placements, on improved employer contacts and on continued efficiency improvements in the activities of the Swedish Public Employment Service (Arbetsförmedlingen). It is important for the Public Employment Service to place clear demands on the unemployed to be at the disposal of the labour market through professional and geographical mobility. Regional differences in unemployment demonstrate the need for geographical mobility and a growth policy that will benefit the entire country. It is also important for the Public Employment Service to follow up job-seeking activities and become more efficient in mediating jobs.
18
Education initiatives
High-quality education is decisive for cohesion and the most important condition for social mobility. Education is also of vital importance for competitiveness, growth and employment. The education system is to provide the knowledge required for entering the labour market or for further studies. Sweden is to be one of the world's most prominent knowledge and research nations. There are many strengths in the Swedish education system upon which it is important to continue building. At the same time, there are major shortcomings, not least those indicated by declining learning outcomes. Since 2006, the Government has pursued an extensive work of reform to reverse this trend. Several key reforms have been implemented, but further efforts will be needed. The efforts needed include improving learning outcomes so that more pupils become qualified for upper secondary school programmes. Within upper secondary education, there is need to further strengthen the quality of vocational programmes, especially with regard to on-the-job training. The quality of the induction programme for vocational introduction needs to be developed.
Boosting competitiveness
Swedish companies compete in the world market through knowledge and quality. International comparisons show that the Swedish business climate is among the best in the world. However, increasingly tough competition higher up the value chain places increased demands on Swedish competitiveness. Conditions for business will be developed to improve competitiveness and strengthen the prerequisites for investment and employment. The tax system, conditions for research, innovation and technological development, simplifications for businesses and entrepreneurship and improved infrastructure are important factors in this regard.Strengthening competitiveness involves safeguarding and developing Sweden’s strengths and maintaining a dynamic business sector throughout the country
More housing
A policy for full employment and a cohesive society requires a well-functioning housing market. It should be possible for people to move to places where the demand for labour is high, where there are good opportunities to earn a living, and where the risk of exclusion and unemployment is low. The conditions for increasing housing construction, particularly of rental apartments, therefore need to be improved.
Stability in the financial markets
Financial stability is a prerequisite for a functioning economy. Since Sweden has a large banking sector relative to its GDP, a financial crisis risks becoming very costly. The Government's work on preventive measures for financial stability continues, such as through more

19
stringent capital adequacy requirements. In order for the financial system to function, it is important that consumers have confidence in the actors in the financial markets. Consumers and the sellers of financial services are rarely equal partners, and consumers can easily find themselves at a disadvantage. The Government is therefore continuing its work to promote strong consumer protection, both at the national and EU levels. The focus is on levelling the playing field through improved regulation and increased knowledge and information.
Environmental, climate and energy policy
The vision is for Sweden in 2050 to have a sustainable and resource-efficient energy supply and zero net emissions of greenhouse gases in the atmosphere. The ambition of environmental, climate and energy policy is to create cost-effective sustainability in the energy systems and to achieve the targets in this area. This will require an ambitious policy in Sweden, the EU and internationally.
One step in achieving the vision of zero net emissions by 2050 and the long-term priority of a vehicle fleet independent of fossil fuels by 2030 is the previously announced energy efficiency obligation scheme for low-admixture biofuels, planned to be introduced in 2014, as well as continued tax relief for high-admixture and pure biofuels. The intention is for the taxation difference between sustainable high-admixture biofuels and fossil free fuels and their fossil counterparts to continue to be just as great in future as today. This taxation may be altered in the event of overcompensation.
To further promote the conversion of the vehicle fleet, the Government intends to extend the temporary reduction in the benefit value of certain environmentally friendly cars by three years. This extension is made financially possible by the introduction of an energy efficiency obligation scheme for biofuels.
Social cohesion and welfare of high quality
Increased employment and reduced exclusion remain the core of the Government’s income distribution policy work. This work is also aimed at reducing financial vulnerability by improving the living standard of vulnerable households with weak finances. The Government has, for example, raised the housing allowance, the large-family supplement, the basic level of the parental benefit and the housing supplement and cut taxes for pensioners in several steps – most recently, on 1 January 2013. For 2014, the Government intends to return with further proposals to lower taxes for pensioners if the general government finances so allow.
The Government's goal for social services and health and medical care is for everyone, regardless of income and background, to be offered needs-adapted, accessible and effective health care and social services of good quality. From an international perspective, Swedish health care and social services function well. But an ageing population and increased demand for health care and social services involve challenges. It is
20
therefore important to continue improving the accessibility, quality and efficiency of health care and social services. Empowerment and freedom of choice, together with strengthened supervision and monitoring, are essential tools in this work.
An important part of a cohesive society in which welfare is for everyone is to work actively to improve the situation of economically and socially vulnerable children and young people.
A secure society
A basic precondition for a secure society is an effective justice system. Everyone should feel safe in their daily lives. There are still far too many people who are victims of crime, too few crimes that are solved and too many who feel unsafe. Crime prevention can be improved. The Government’s objective is that the justice system will become more effective and that more crimes will be prevented, solved and prosecuted.
The Government’s work to improve the legal system and make it more effective continues. One important part of this work is strengthening efforts to combat domestic violence, another important part is more severe punishment for the most violent crimes and a third is preventing crime by young people and reacting more rapidly when young people are victims or offenders.
Effects of the Government’s policies
The Government’s policies to improve the functioning of the labour market are a combination of measures to stimulate supply and demand for labour and to stimulate the matching of job-seekers and vacancies. In addition, the Government has implemented measures to increase employment among groups with a weak foothold in the labour market. The most important reform in strengthening the labour supply is the in-work tax credit, which has strengthened the motivation to work by making work more profitable. If it is more profitable to work, more people will seek participation in the labour market. In the long term, durable employment (that is average employment across an economic cycle) can thus increase. The Government has also implemented changes in unemployment insurance to increase the supply of labour and to shorten periods spent in unemployment.
To reduce the incapacity rate and to increase employment, the Government has also implemented extensive reforms in sickness insurance intended to strengthen the capacity for work among those on leave due to sickness, generate driving forces for work and to strengthen labour demand for those who have been unemployed for a long time, who have been on leave due to sickness for an extended period or who have received sickness or activity benefits.
In order that the measures designed to stimulate supply should quickly result in increased employment and reduced unemployment, the Government has also undertaken measures to strengthen the position of,
21
and demand for people with a loose foothold in the labour market. Labour market policy has been realigned. Among other things, the Swedish Public Employment Service has been given a clearer assignment to mediate jobs while labour market policy resources target, to a greater extent, those in greatest need. To make those who have been out of work for a certain amount of time more attractive in the labour market, new start jobs have been introduced.7 Other measures to increase demand for those with a weak foothold in the labour market include lowered employers’ contributions for young people and seniors. The Government has also introduced a tax credit for household services and RMI(repair, maintenance and improvement) to stimulate supply and demand in labour.
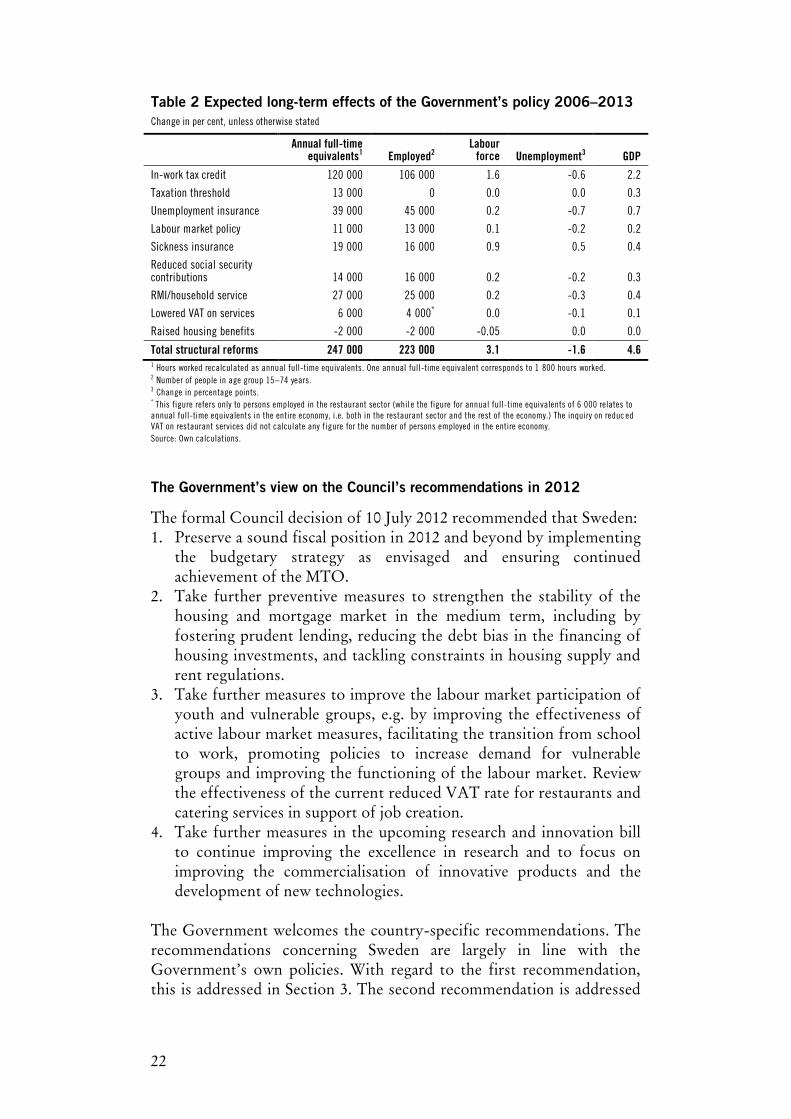
In the Government’s assessment, the structural reforms implemented in 2006-2013 have durably increased employment by approximately 223 000 people in the long term. Not only do the Government’s reforms effect employment – the number of people in work is also expected to rise because fewer people are absent due to sickness. In addition, the in-work tax credit encourages those already in work to work more by, for example, switching from part-time employment to full-time. On the whole, the structural reforms implemented to date are judged to durably increase the number of hours worked by approximately 6 per cent in the long term, corresponding to some 247 000 annual full-time equivalents. The in-work tax credit is judged to contribute about half of this increase (see table 2).
The Government’s assessment is based on the research available on the effects of different measures; for example, on how changes in the tax system, social insurance and labour market policy affect the labour supply and employment. However, knowledge about the scope of the effects and, in particular, the pace at which they achieve an impact is far from complete. Consequently, the assessments detailed in table 2 are uncertain.8
7 New start jobs serve to stimulate employees to hire an individual who has been outside the labour market for an extended period of time. An employer who hires an individual who has been outside the labour market for more than a year (six months for young people) can qualify for financial support for an amount corresponding to twice the employers’ contributions paid by the employer. 8 The methods and calculations on which the Government’s assessment of the effects of reforms are based are described in greater detail in the report How should the functioning of the labour market be assessed?, report 2011:1 from the Economics Affairs Department of the Ministry of Finance.
22
Table 2 Expected long-term effects of the Government’s policy 2006–2013 Change in per cent, unless otherwise stated
Annual full-time
equivalents1 Employed2 Labour
force Unemployment3 GDP
In-work tax credit 120 000 106 000 1.6 -0.6 2.2
Taxation threshold 13 000 0 0.0 0.0 0.3
Unemployment insurance 39 000 45 000 0.2 -0.7 0.7
Labour market policy 11 000 13 000 0.1 -0.2 0.2
Sickness insurance 19 000 16 000 0.9 0.5 0.4
Reduced social security contributions 14 000 16 000 0.2 -0.2 0.3
RMI/household service 27 000 25 000 0.2 -0.3 0.4
Lowered VAT on services 6 000 4 000* 0.0 -0.1 0.1
Raised housing benefits -2 000 -2 000 -0.05 0.0 0.0
Total structural reforms 247 000 223 000 3.1 -1.6 4.6 1 Hours worked recalculated as annual full-time equivalents. One annual full-time equivalent corresponds to 1 800 hours worked. 2 Number of people in age group 15–74 years. 3 Change in percentage points. * This figure refers only to persons employed in the restaurant sector (whil e the figure for annual full-time equivalents of 6 000 relates to annual full-time equivalents in the entire economy, i.e. both in the restaurant sector and the rest of the economy.) The inquiry on reduc ed VAT on restaurant services did not calculate any f igure for the number of persons employed in the entire economy. Source: Own calculations.
The Government’s view on the Council’s recommendations in 2012
The formal Council decision of 10 July 2012 recommended that Sweden: 1. Preserve a sound fiscal position in 2012 and beyond by implementing
the budgetary strategy as envisaged and ensuring continued achievement of the MTO.
2. Take further preventive measures to strengthen the stability of the housing and mortgage market in the medium term, including by fostering prudent lending, reducing the debt bias in the financing of housing investments, and tackling constraints in housing supply and rent regulations.
3. Take further measures to improve the labour market participation of youth and vulnerable groups, e.g. by improving the effectiveness of active labour market measures, facilitating the transition from school to work, promoting policies to increase demand for vulnerable groups and improving the functioning of the labour market. Review the effectiveness of the current reduced VAT rate for restaurants and catering services in support of job creation.
4. Take further measures in the upcoming research and innovation bill to continue improving the excellence in research and to focus on improving the commercialisation of innovative products and the development of new technologies.
The Government welcomes the country-specific recommendations. The recommendations concerning Sweden are largely in line with the Government’s own policies. With regard to the first recommendation, this is addressed in Section 3. The second recommendation is addressed
23
in Section 2.3. The response to the third and fourth recommendations comes in the national reform programme.
1.4 Monetary policy
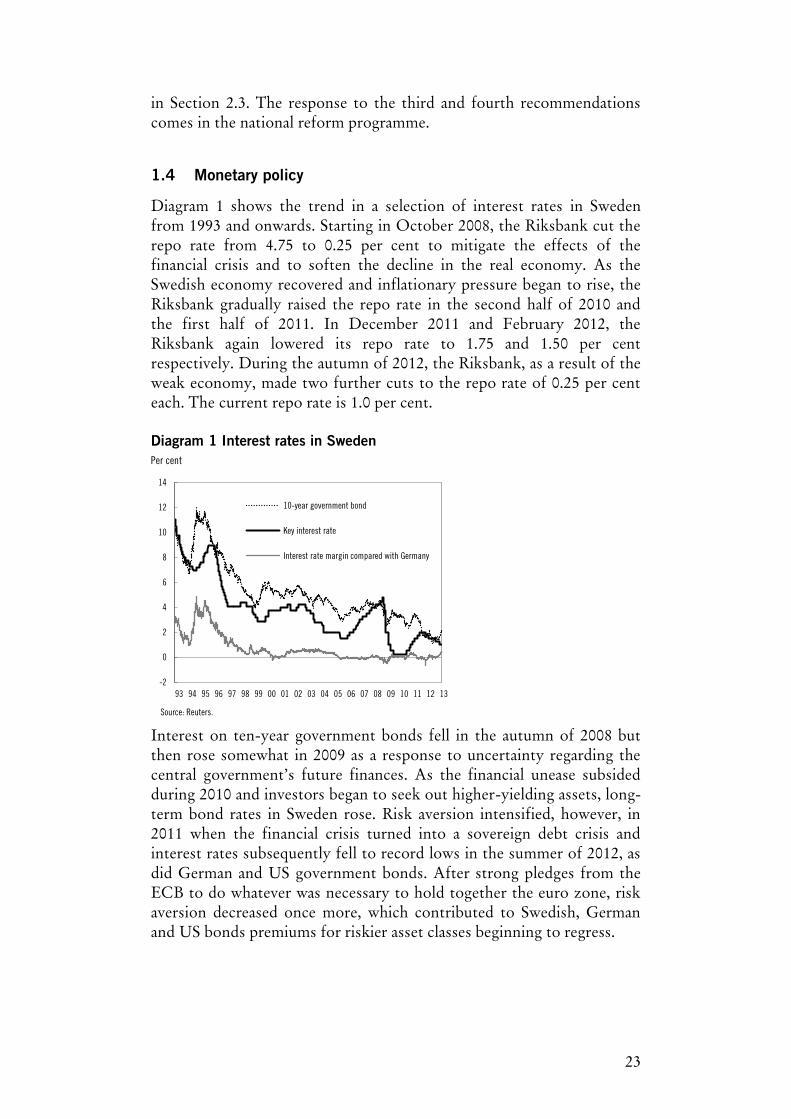
Diagram 1 shows the trend in a selection of interest rates in Sweden from 1993 and onwards. Starting in October 2008, the Riksbank cut the repo rate from 4.75 to 0.25 per cent to mitigate the effects of the financial crisis and to soften the decline in the real economy. As the Swedish economy recovered and inflationary pressure began to rise, the Riksbank gradually raised the repo rate in the second half of 2010 and the first half of 2011. In December 2011 and February 2012, the Riksbank again lowered its repo rate to 1.75 and 1.50 per cent respectively. During the autumn of 2012, the Riksbank, as a result of the weak economy, made two further cuts to the repo rate of 0.25 per cent each. The current repo rate is 1.0 per cent. Diagram 1 Interest rates in Sweden Per cent
Interest on ten-year government bonds fell in the autumn of 2008 but then rose somewhat in 2009 as a response to uncertainty regarding the central government’s future finances. As the financial unease subsided during 2010 and investors began to seek out higher-yielding assets, long-term bond rates in Sweden rose. Risk aversion intensified, however, in 2011 when the financial crisis turned into a sovereign debt crisis and interest rates subsequently fell to record lows in the summer of 2012, as did German and US government bonds. After strong pledges from the ECB to do whatever was necessary to hold together the euro zone, risk aversion decreased once more, which contributed to Swedish, German and US bonds premiums for riskier asset classes beginning to regress.
-2
0
2
4
6
8
10
12
14
10-year government bond
Key interest rate
Interest rate margin compared with Germany
Source: Reuters.
24
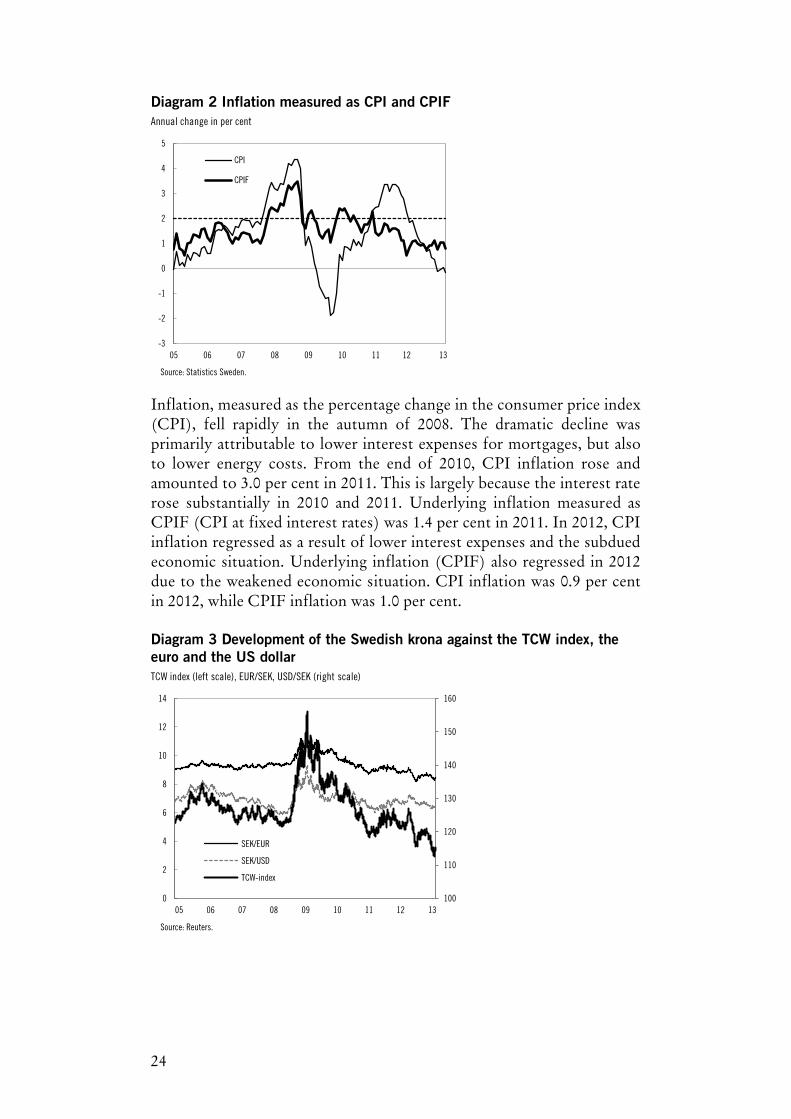
Diagram 2 Inflation measured as CPI and CPIF Annual change in per cent
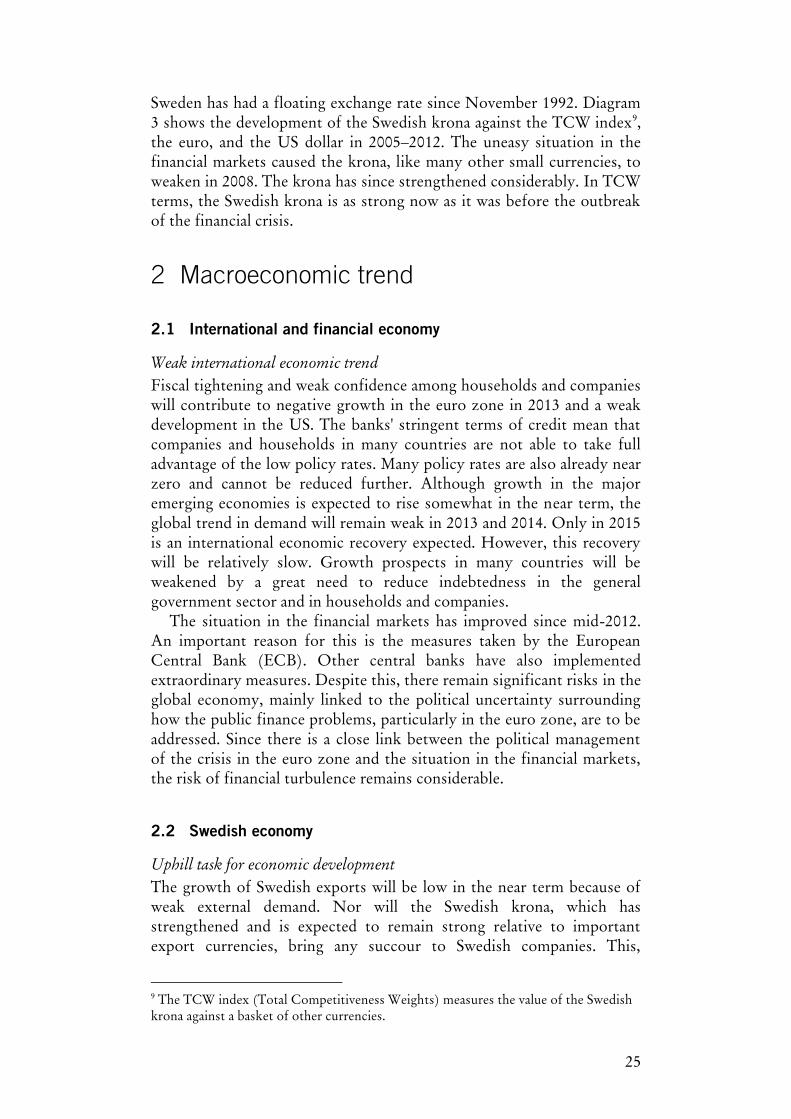
Inflation, measured as the percentage change in the consumer price index (CPI), fell rapidly in the autumn of 2008. The dramatic decline was primarily attributable to lower interest expenses for mortgages, but also to lower energy costs. From the end of 2010, CPI inflation rose and amounted to 3.0 per cent in 2011. This is largely because the interest rate rose substantially in 2010 and 2011. Underlying inflation measured as CPIF (CPI at fixed interest rates) was 1.4 per cent in 2011. In 2012, CPI inflation regressed as a result of lower interest expenses and the subdued economic situation. Underlying inflation (CPIF) also regressed in 2012 due to the weakened economic situation. CPI inflation was 0.9 per cent in 2012, while CPIF inflation was 1.0 per cent. Diagram 3 Development of the Swedish krona against the TCW index, the euro and the US dollar TCW index (left scale), EUR/SEK, USD/SEK (right scale)
-3
-2
-1
0
1
2
3
4
5
05 06 07 08 09 10 11 12 13
CPI
CPIF
Source: Statistics Sweden.
100
110
120
130
140
150
160
0
2
4
6
8
10
12
14
SEK/EUR
SEK/USD
TCW-index
Source: Reuters.
25
Sweden has had a floating exchange rate since November 1992. Diagram 3 shows the development of the Swedish krona against the TCW index9, the euro, and the US dollar in 2005–2012. The uneasy situation in the financial markets caused the krona, like many other small currencies, to weaken in 2008. The krona has since strengthened considerably. In TCW terms, the Swedish krona is as strong now as it was before the outbreak of the financial crisis.
2 Macroeconomic trend
2.1 International and financial economy
Weak international economic trend
Fiscal tightening and weak confidence among households and companies will contribute to negative growth in the euro zone in 2013 and a weak development in the US. The banks' stringent terms of credit mean that companies and households in many countries are not able to take full advantage of the low policy rates. Many policy rates are also already near zero and cannot be reduced further. Although growth in the major emerging economies is expected to rise somewhat in the near term, the global trend in demand will remain weak in 2013 and 2014. Only in 2015 is an international economic recovery expected. However, this recovery will be relatively slow. Growth prospects in many countries will be weakened by a great need to reduce indebtedness in the general government sector and in households and companies.
The situation in the financial markets has improved since mid-2012. An important reason for this is the measures taken by the European Central Bank (ECB). Other central banks have also implemented extraordinary measures. Despite this, there remain significant risks in the global economy, mainly linked to the political uncertainty surrounding how the public finance problems, particularly in the euro zone, are to be addressed. Since there is a close link between the political management of the crisis in the euro zone and the situation in the financial markets, the risk of financial turbulence remains considerable.
2.2 Swedish economy
Uphill task for economic development
The growth of Swedish exports will be low in the near term because of weak external demand. Nor will the Swedish krona, which has strengthened and is expected to remain strong relative to important export currencies, bring any succour to Swedish companies. This,
9 The TCW index (Total Competitiveness Weights) measures the value of the Swedish krona against a basket of other currencies.
26
together with the generally uncertain economic trend and the fact of unused capacity, means that companies will postpone investments. A deterioration in the labour market and rising unemployment mean that growth in consumer spending will also be restrained. Even though interest rates are low, saving will remain high in 2013.
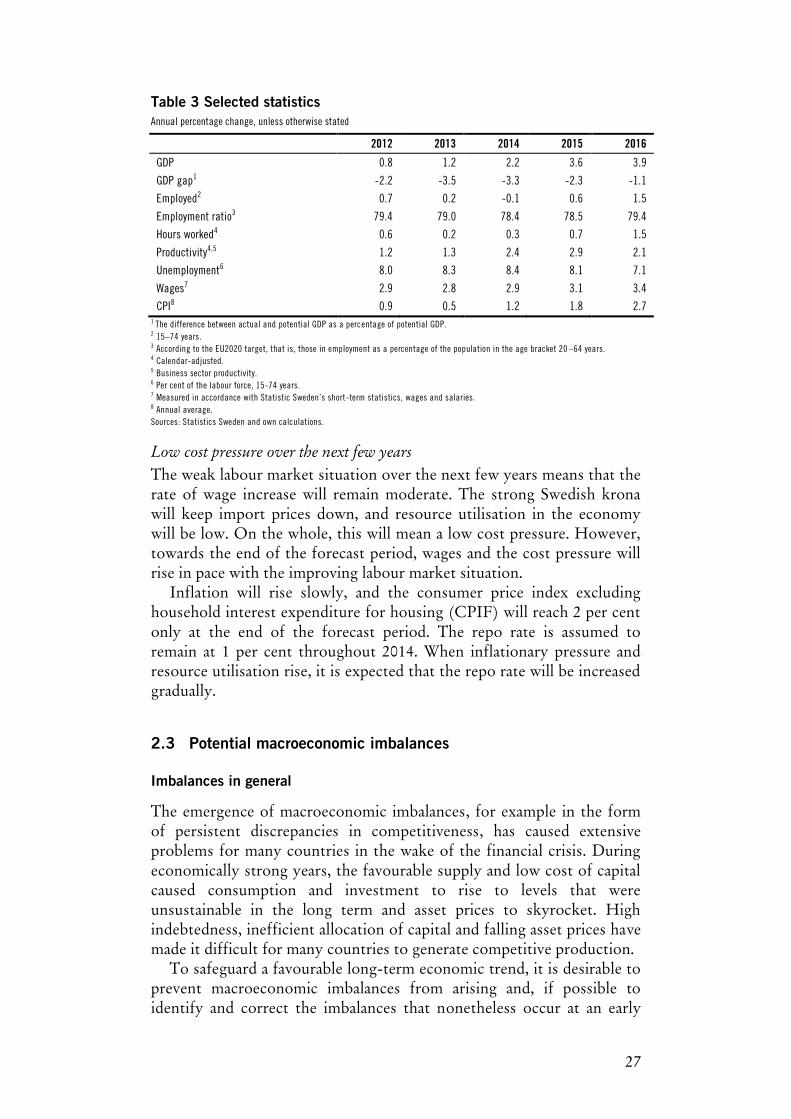
The weak growth in 2013 (see table 3) will lead to a lower resource utilisation in the Swedish economy and a continued low level in 2014. Dammed-up consumption needs, high initial levels of household saving and gradually falling unemployment will subsequently allow for a gradual normalisation. GDP is expected to grow at a good pace from 2015 onwards. Exports will develop relatively weakly, while household consumption will grow comparatively quickly in relation to previous economic recoveries. Resource utilisation will increase towards the end of the forecast period.
Weak international demand hits the Swedish labour market
Employment fell in connection with the financial crisis, but has increased since the autumn of 2009. Labour force participation has also increased in recent years. This increase in employment and the labour force can be explained by the improved economy after 2009, the growing population of employable age and by the Government's tax and labour market reforms.
Unemployment has increased since the crisis began and is currently high. Its increase since 2011 is partly explained by the weakened economy, but also by the increased labour force participation. The autumn of 2012 saw a sharp rise in the number of termination notices, indicating that unemployment will continue to rise in the near term. Other forward-looking indicators, such as new vacancies, also suggest a weak future trend in the labour market.
Employment is expected to remain largely unchanged in 2013 and 2014. At the same time, the labour force will continue to increase. This weak growth in employment, together with an increasing labour force, means unemployment is expected to rise to 8.4 per cent in 2014.
As the economy recovers, the situation in the labour market will gradually improve. Resource utilisation in the labour market is currently low, but companies should have a great need for taking on staff when economic recovery gathers pace.
27
Table 3 Selected statistics Annual percentage change, unless otherwise stated
2012 2013 2014 2015 2016
GDP 0.8 1.2 2.2 3.6 3.9
GDP gap1 -2.2 -3.5 -3.3 -2.3 -1.1
Employed2 0.7 0.2 -0.1 0.6 1.5
Employment ratio3 79.4 79.0 78.4 78.5 79.4
Hours worked4 0.6 0.2 0.3 0.7 1.5
Productivity4,5 1.2 1.3 2.4 2.9 2.1
Unemployment6 8.0 8.3 8.4 8.1 7.1
Wages7 2.9 2.8 2.9 3.1 3.4
CPI8 0.9 0.5 1.2 1.8 2.7 1 The difference between actual and potential GDP as a percentage of potential GDP. 2 15–74 years. 3 According to the EU2020 target, that is, those in employment as a percentage of the population in the age bracket 20 –64 years. 4 Calendar-adjusted. 5 Business sector productivity. 6 Per cent of the labour force, 15-74 years. 7 Measured in accordance with Statistic Sweden’s short-term statistics, wages and salaries. 8 Annual average. Sources: Statistics Sweden and own calculations.
Low cost pressure over the next few years
The weak labour market situation over the next few years means that the rate of wage increase will remain moderate. The strong Swedish krona will keep import prices down, and resource utilisation in the economy will be low. On the whole, this will mean a low cost pressure. However, towards the end of the forecast period, wages and the cost pressure will rise in pace with the improving labour market situation.
Inflation will rise slowly, and the consumer price index excluding household interest expenditure for housing (CPIF) will reach 2 per cent only at the end of the forecast period. The repo rate is assumed to remain at 1 per cent throughout 2014. When inflationary pressure and resource utilisation rise, it is expected that the repo rate will be increased gradually.
2.3 Potential macroeconomic imbalances
Imbalances in general
The emergence of macroeconomic imbalances, for example in the form of persistent discrepancies in competitiveness, has caused extensive problems for many countries in the wake of the financial crisis. During economically strong years, the favourable supply and low cost of capital caused consumption and investment to rise to levels that were unsustainable in the long term and asset prices to skyrocket. High indebtedness, inefficient allocation of capital and falling asset prices have made it difficult for many countries to generate competitive production.
To safeguard a favourable long-term economic trend, it is desirable to prevent macroeconomic imbalances from arising and, if possible to identify and correct the imbalances that nonetheless occur at an early

28
stage. It is difficult to formulate a precise definition of macroeconomic imbalances, but an imbalance reflects an underlying problem in a market with the potential to lead to a sizeable correction that in turn affects the overall economy. Examples of areas where imbalances can arise are international competitiveness and labour costs, asset prices, indebtedness in the private and general government sectors, consumption and investment, as well as current account and balances of payments.
The Macroeconomic Imbalance Procedure
As part of the EU economic governance, the EU Commission on 10 April 2013 published in-depth reviews of the macroeconomy of thirteen Member States. These countries had been identified on 28 November 2012 in the Alert Mechanism Report (AMR) as potentially having macroeconomic imbalances.10
As the EU Commission considered there to be macroeconomic imbalances in all the Member States assessed, of which very large in two of the countries, it will submit proposals for policy recommendations. These proposals will form part of the package of recommendations to be presented on 29 May 2013 within the framework of the European semester. The proposals will take into account the information presented in the countries' national reform programmes and stability or convergence programmes. However, for the two countries11 that the EU Commission assessed to have very large macroeconomic imbalances, the situation is more serious. If the EU Commission's assessment is that these countries' measures are not sufficiently vigorous, the Commission may recommend that the Council initiates an Excessive Imbalance Procedure (EIP), which represents the corrective part of the new procedure.
In the in-depth review, the EU Commission assesses Sweden to have macroeconomic imbalances that deserve monitoring and policy action. In particular, macroeconomic developments regarding private sector debt and deleveraging, coupled with remaining inefficiencies in the housing market deserve continued attention. Although the large current account surplus does not raise risks similar to large deficits, the Commission will continue to monitor the development of the current account in Sweden.
10 The four programme countries, Greece, Ireland, Portugal and Romania have not been covered by an in depth review. Cyprus, which was identified as a country with potential imbalances, has also not been subject to an in-depth review as a result of the political agreement on the key elements of an adjustment programme. 11 Slovenia and Spain.
29
Household borrowing
A high level of debt, whether it is private or public, could eventually lead to problems for both the financial and the macroeconomic stability. The Development in the euro area in recent years is a clear illustration of this interconnection.
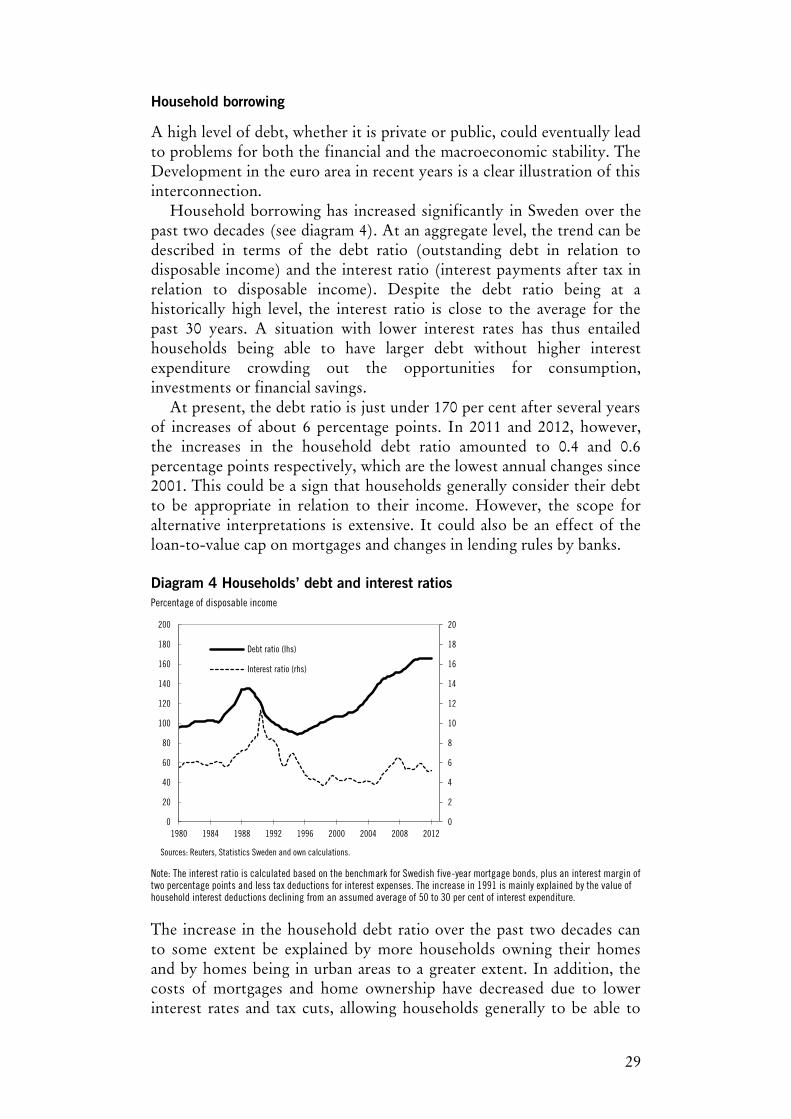
Household borrowing has increased significantly in Sweden over the past two decades (see diagram 4). At an aggregate level, the trend can be described in terms of the debt ratio (outstanding debt in relation to disposable income) and the interest ratio (interest payments after tax in relation to disposable income). Despite the debt ratio being at a historically high level, the interest ratio is close to the average for the past 30 years. A situation with lower interest rates has thus entailed households being able to have larger debt without higher interest expenditure crowding out the opportunities for consumption, investments or financial savings.
At present, the debt ratio is just under 170 per cent after several years of increases of about 6 percentage points. In 2011 and 2012, however, the increases in the household debt ratio amounted to 0.4 and 0.6 percentage points respectively, which are the lowest annual changes since 2001. This could be a sign that households generally consider their debt to be appropriate in relation to their income. However, the scope for alternative interpretations is extensive. It could also be an effect of the loan-to-value cap on mortgages and changes in lending rules by banks. Diagram 4 Households’ debt and interest ratios Percentage of disposable income
Note: The interest ratio is calculated based on the benchmark for Swedish five-year mortgage bonds, plus an interest margin of two percentage points and less tax deductions for interest expenses. The increase in 1991 is mainly explained by the value of household interest deductions declining from an assumed average of 50 to 30 per cent of interest expenditure.
The increase in the household debt ratio over the past two decades can to some extent be explained by more households owning their homes and by homes being in urban areas to a greater extent. In addition, the costs of mortgages and home ownership have decreased due to lower interest rates and tax cuts, allowing households generally to be able to
0
2
4
6
8
10
12
14
16
18
20
0
20
40
60
80
100
120
140
160
180
200
1980 1984 1988 1992 1996 2000 2004 2008 2012
Debt ratio (lhs)
Interest ratio (rhs)
Sources: Reuters, Statistics Sweden and own calculations.
30
handle a higher individual debt ratio. The increase in the aggregate debt ratio is thus both explained by more households having loans and by households having larger loans on average. This increase will in all likelihood be lasting in so far as the underlying changes are lasting. There may of course be other underlying factors that have influenced the level of the household debt ratio, something which contributes to the uncertainty of future developments.
To be able to assess whether household indebtedness represents an imbalance, it is suitable to analyse households’ abilities to durably carry the ongoing interest expenditure and deal with any amortisation demands. In the convergence programme for 2012, it was shown that very few households have high interest expenses and that these expenses remain moderate even when the interest level is more normal. Furthermore, in its analyses of the Swedish mortgage market, the Swedish Financial Supervisory Authority has conducted stress tests to observe households’ sensitivity to interest rate hikes, decreased income and falling housing prices. Based on these, it was concluded that most households having secured new mortgages have a good repayment capacity and are resilient to interest rate hikes. The results indicate that Swedish mortgages are not currently a threat to financial stability.
Thus, there are several explanations for the increase in the debt ratio. At the same time, there are risks for both the financial and the macroeconomic stability with a high household indebtedness. The Government and the Swedish Financial Supervisory Authority has implemented or announced a series of measures aimed at strengthening banks' resilience to financial crises and to attenuate the development of household indebtedness. Despite a somewhat more stable development, there is still reason for continued vigilance, and if the indebtedness of households will take off, the government is prepared to take further action. 12
3 General government finances
3.1 Accounting principles
This section details the forecast for the public finances given in the 2013 Spring Fiscal Policy Bill (Govt. Bill 2012/13:100). As in the Spring Fiscal Policy Bill, general government net lending is reported according to the EU’s regulations for the National Accounts (ESA 95). Revenue and expenditure are consequently reported in the established formats applied for some time by both the Ministry of Finance and the National Institute of Economic Research (NIER). This accounting principle is slightly different from the principle used by the EU for monitoring
12 The national reform programme reports measures already implemented.
31
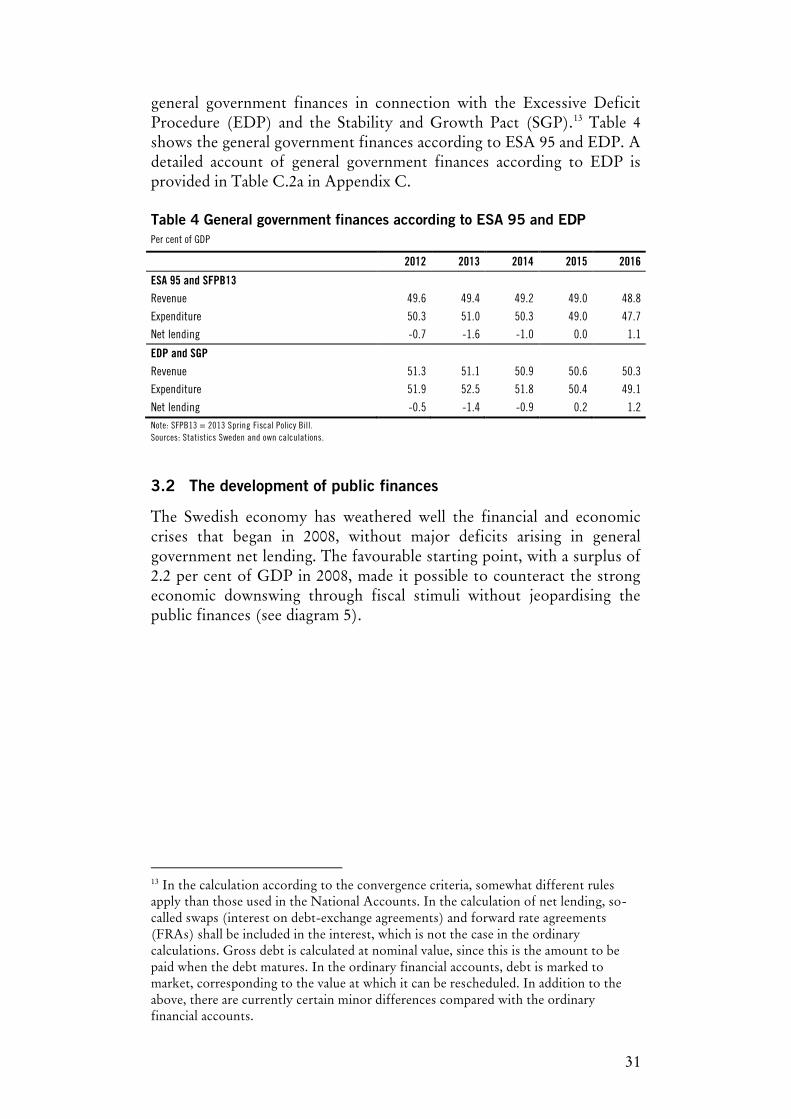
general government finances in connection with the Excessive Deficit Procedure (EDP) and the Stability and Growth Pact (SGP).13 Table 4 shows the general government finances according to ESA 95 and EDP. A detailed account of general government finances according to EDP is provided in Table C.2a in Appendix C. Table 4 General government finances according to ESA 95 and EDP Per cent of GDP
2012 2013 2014 2015 2016
ESA 95 and SFPB13 Revenue 49.6 49.4 49.2 49.0 48.8
Expenditure 50.3 51.0 50.3 49.0 47.7
Net lending -0.7 -1.6 -1.0 0.0 1.1
EDP and SGP
Revenue 51.3 51.1 50.9 50.6 50.3
Expenditure 51.9 52.5 51.8 50.4 49.1
Net lending -0.5 -1.4 -0.9 0.2 1.2 Note: SFPB13 = 2013 Spring Fiscal Policy Bill. Sources: Statistics Sweden and own calculations.
3.2 The development of public finances
The Swedish economy has weathered well the financial and economic crises that began in 2008, without major deficits arising in general government net lending. The favourable starting point, with a surplus of 2.2 per cent of GDP in 2008, made it possible to counteract the strong economic downswing through fiscal stimuli without jeopardising the public finances (see diagram 5).
13 In the calculation according to the convergence criteria, somewhat different rules apply than those used in the National Accounts. In the calculation of net lending, so-called swaps (interest on debt-exchange agreements) and forward rate agreements (FRAs) shall be included in the interest, which is not the case in the ordinary calculations. Gross debt is calculated at nominal value, since this is the amount to be paid when the debt matures. In the ordinary financial accounts, debt is marked to market, corresponding to the value at which it can be rescheduled. In addition to the above, there are currently certain minor differences compared with the ordinary financial accounts.
32
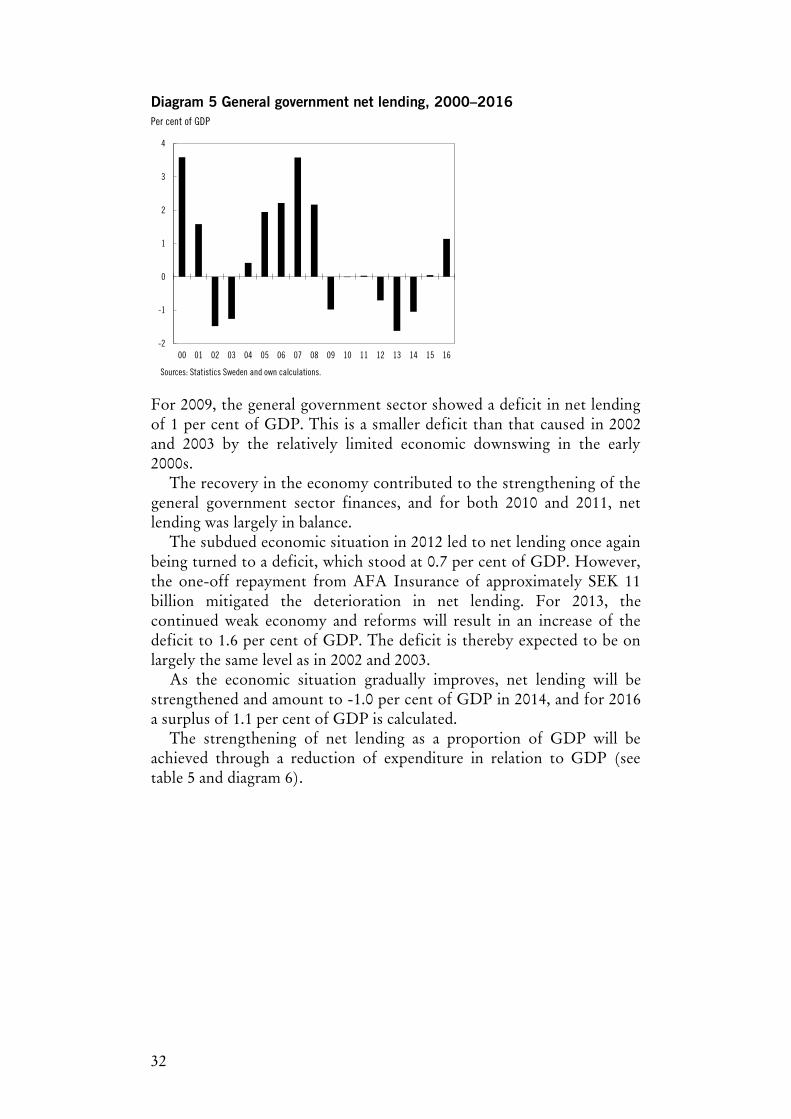
Diagram 5 General government net lending, 2000–2016 Per cent of GDP
For 2009, the general government sector showed a deficit in net lending of 1 per cent of GDP. This is a smaller deficit than that caused in 2002 and 2003 by the relatively limited economic downswing in the early 2000s.
The recovery in the economy contributed to the strengthening of the general government sector finances, and for both 2010 and 2011, net lending was largely in balance.
The subdued economic situation in 2012 led to net lending once again being turned to a deficit, which stood at 0.7 per cent of GDP. However, the one-off repayment from AFA Insurance of approximately SEK 11 billion mitigated the deterioration in net lending. For 2013, the continued weak economy and reforms will result in an increase of the deficit to 1.6 per cent of GDP. The deficit is thereby expected to be on largely the same level as in 2002 and 2003.
As the economic situation gradually improves, net lending will be strengthened and amount to -1.0 per cent of GDP in 2014, and for 2016 a surplus of 1.1 per cent of GDP is calculated.
The strengthening of net lending as a proportion of GDP will be achieved through a reduction of expenditure in relation to GDP (see table 5 and diagram 6).
-2
-1
0
1
2
3
4
00 01 02 03 04 05 06 07 08 09 10 11 12 13 14 15 16
Sources: Statistics Sweden and own calculations.
33
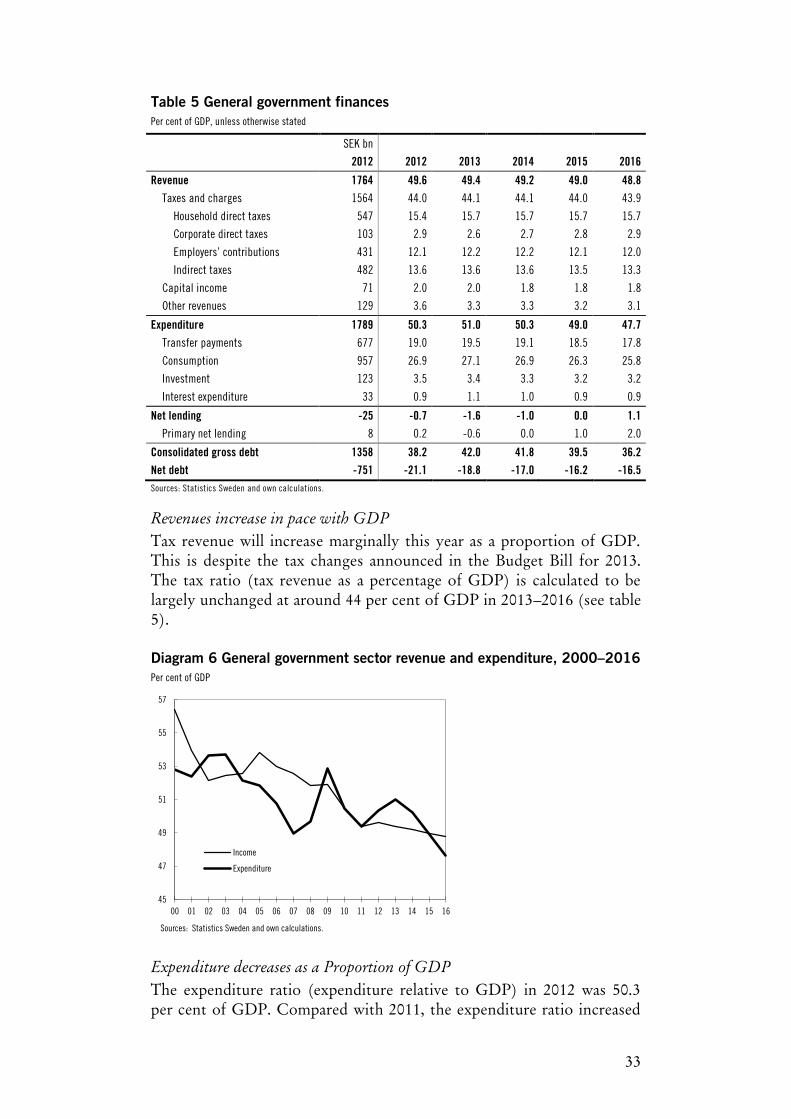
Table 5 General government finances Per cent of GDP, unless otherwise stated
SEK bn 2012 2012 2013 2014 2015 2016
Revenue 1764 49.6 49.4 49.2 49.0 48.8 Taxes and charges 1564 44.0 44.1 44.1 44.0 43.9
Household direct taxes 547 15.4 15.7 15.7 15.7 15.7
Corporate direct taxes 103 2.9 2.6 2.7 2.8 2.9
Employers’ contributions 431 12.1 12.2 12.2 12.1 12.0
Indirect taxes 482 13.6 13.6 13.6 13.5 13.3
Capital income 71 2.0 2.0 1.8 1.8 1.8
Other revenues 129 3.6 3.3 3.3 3.2 3.1
Expenditure 1789 50.3 51.0 50.3 49.0 47.7 Transfer payments 677 19.0 19.5 19.1 18.5 17.8
Consumption 957 26.9 27.1 26.9 26.3 25.8
Investment 123 3.5 3.4 3.3 3.2 3.2
Interest expenditure 33 0.9 1.1 1.0 0.9 0.9
Net lending -25 -0.7 -1.6 -1.0 0.0 1.1 Primary net lending 8 0.2 -0.6 0.0 1.0 2.0
Consolidated gross debt 1358 38.2 42.0 41.8 39.5 36.2 Net debt -751 -21.1 -18.8 -17.0 -16.2 -16.5 Sources: Statistics Sweden and own calculations.
Revenues increase in pace with GDP
Tax revenue will increase marginally this year as a proportion of GDP. This is despite the tax changes announced in the Budget Bill for 2013. The tax ratio (tax revenue as a percentage of GDP) is calculated to be largely unchanged at around 44 per cent of GDP in 2013–2016 (see table 5).
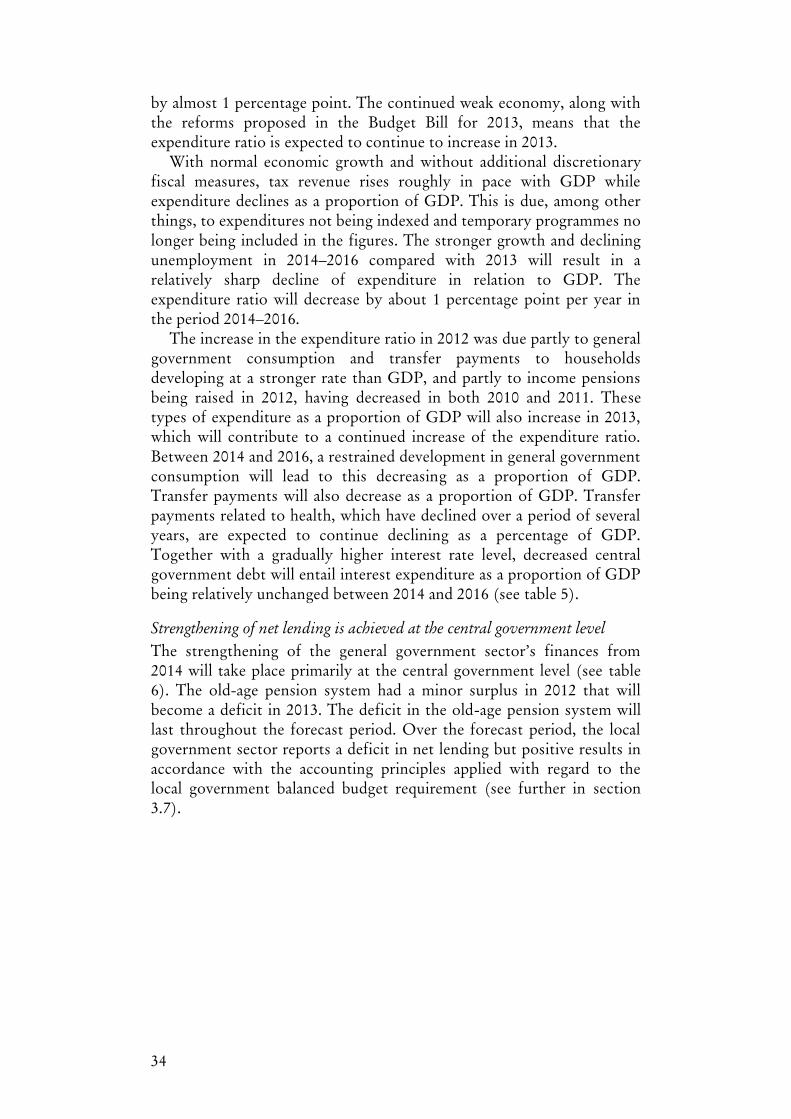
Diagram 6 General government sector revenue and expenditure, 2000–2016 Per cent of GDP
Expenditure decreases as a Proportion of GDP
The expenditure ratio (expenditure relative to GDP) in 2012 was 50.3 per cent of GDP. Compared with 2011, the expenditure ratio increased
45
47
49
51
53
55
57
00 01 02 03 04 05 06 07 08 09 10 11 12 13 14 15 16
Income
Expenditure
Sources: Statistics Sweden and own calculations.
34
by almost 1 percentage point. The continued weak economy, along with the reforms proposed in the Budget Bill for 2013, means that the expenditure ratio is expected to continue to increase in 2013.
With normal economic growth and without additional discretionary fiscal measures, tax revenue rises roughly in pace with GDP while expenditure declines as a proportion of GDP. This is due, among other things, to expenditures not being indexed and temporary programmes no longer being included in the figures. The stronger growth and declining unemployment in 2014–2016 compared with 2013 will result in a relatively sharp decline of expenditure in relation to GDP. The expenditure ratio will decrease by about 1 percentage point per year in the period 2014–2016.
The increase in the expenditure ratio in 2012 was due partly to general government consumption and transfer payments to households developing at a stronger rate than GDP, and partly to income pensions being raised in 2012, having decreased in both 2010 and 2011. These types of expenditure as a proportion of GDP will also increase in 2013, which will contribute to a continued increase of the expenditure ratio. Between 2014 and 2016, a restrained development in general government consumption will lead to this decreasing as a proportion of GDP. Transfer payments will also decrease as a proportion of GDP. Transfer payments related to health, which have declined over a period of several years, are expected to continue declining as a percentage of GDP. Together with a gradually higher interest rate level, decreased central government debt will entail interest expenditure as a proportion of GDP being relatively unchanged between 2014 and 2016 (see table 5).
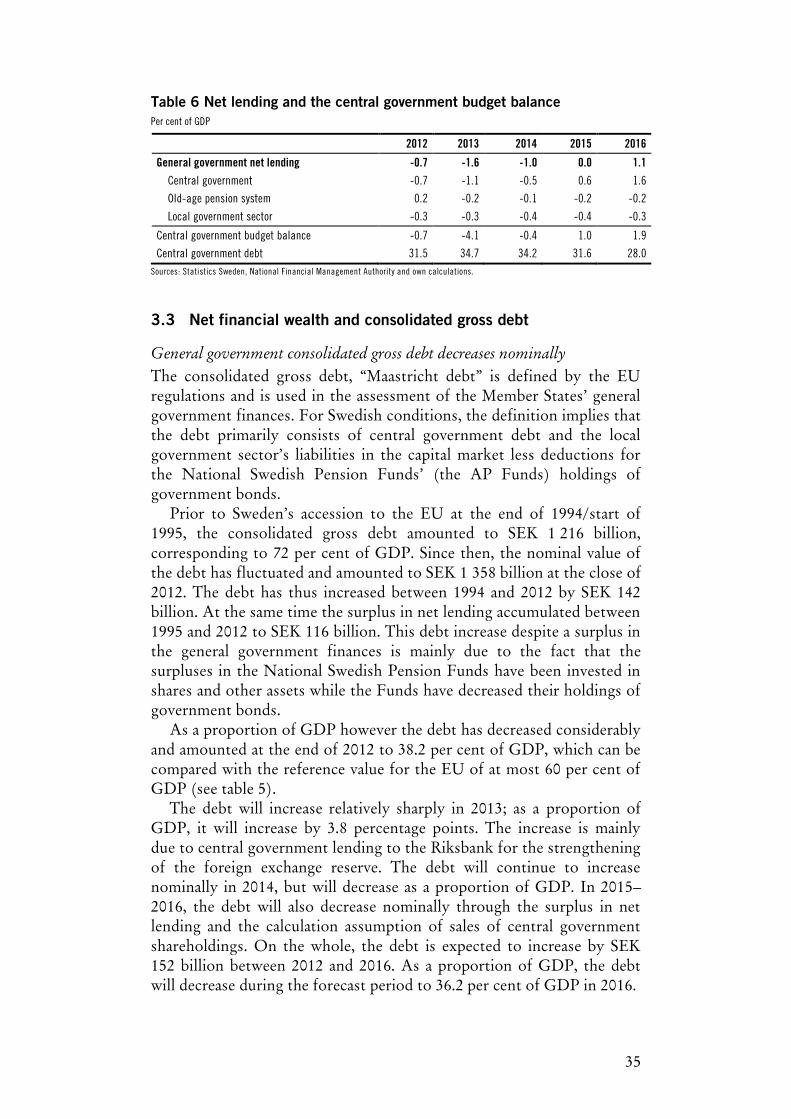
Strengthening of net lending is achieved at the central government level
The strengthening of the general government sector’s finances from 2014 will take place primarily at the central government level (see table 6). The old-age pension system had a minor surplus in 2012 that will become a deficit in 2013. The deficit in the old-age pension system will last throughout the forecast period. Over the forecast period, the local government sector reports a deficit in net lending but positive results in accordance with the accounting principles applied with regard to the local government balanced budget requirement (see further in section 3.7).
35
Table 6 Net lending and the central government budget balance Per cent of GDP
2012 2013 2014 2015 2016
General government net lending -0.7 -1.6 -1.0 0.0 1.1
Central government -0.7 -1.1 -0.5 0.6 1.6
Old-age pension system 0.2 -0.2 -0.1 -0.2 -0.2
Local government sector -0.3 -0.3 -0.4 -0.4 -0.3
Central government budget balance -0.7 -4.1 -0.4 1.0 1.9
Central government debt 31.5 34.7 34.2 31.6 28.0 Sources: Statistics Sweden, National Financial Management Authority and own calculations.
3.3 Net financial wealth and consolidated gross debt
General government consolidated gross debt decreases nominally
The consolidated gross debt, “Maastricht debt” is defined by the EU regulations and is used in the assessment of the Member States’ general government finances. For Swedish conditions, the definition implies that the debt primarily consists of central government debt and the local government sector’s liabilities in the capital market less deductions for the National Swedish Pension Funds’ (the AP Funds) holdings of government bonds.
Prior to Sweden’s accession to the EU at the end of 1994/start of 1995, the consolidated gross debt amounted to SEK 1 216 billion, corresponding to 72 per cent of GDP. Since then, the nominal value of the debt has fluctuated and amounted to SEK 1 358 billion at the close of 2012. The debt has thus increased between 1994 and 2012 by SEK 142 billion. At the same time the surplus in net lending accumulated between 1995 and 2012 to SEK 116 billion. This debt increase despite a surplus in the general government finances is mainly due to the fact that the surpluses in the National Swedish Pension Funds have been invested in shares and other assets while the Funds have decreased their holdings of government bonds.
As a proportion of GDP however the debt has decreased considerably and amounted at the end of 2012 to 38.2 per cent of GDP, which can be compared with the reference value for the EU of at most 60 per cent of GDP (see table 5).
The debt will increase relatively sharply in 2013; as a proportion of GDP, it will increase by 3.8 percentage points. The increase is mainly due to central government lending to the Riksbank for the strengthening of the foreign exchange reserve. The debt will continue to increase nominally in 2014, but will decrease as a proportion of GDP. In 2015–2016, the debt will also decrease nominally through the surplus in net lending and the calculation assumption of sales of central government shareholdings. On the whole, the debt is expected to increase by SEK 152 billion between 2012 and 2016. As a proportion of GDP, the debt will decrease during the forecast period to 36.2 per cent of GDP in 2016.
36
The general government sector’s net lending is strengthening
In 2012, the general government sector’s financial wealth amounted to SEK 751 billion, corresponding to 21.1 per cent of GDP. In the National Accounts, this measure is reported excluding the central government’s and most of the local government sector’s commitments regarding defined-benefit pensions. Nor are the liabilities for the consolidated defined-contribution service pensions, like the premium pension system, included in the general government sector, but are instead reported in the insurance sector.
Since 2005, net financial wealth has been positive, that is, the financial assets exceed the liabilities. The general government sector’s capital revenues, in the form of interest and dividends, also exceed its interest expenditure. Financial wealth increased by the equivalent of 3 per cent of GDP in 2012, despite the negative net lending. Value changes, etc. yielded a positive contribution of 4 percentage points to the change in wealth. The increase in GDP reduced wealth as a proportion of GDP by 0.3 percentage points.
Wealth is expected to decrease in relation to GDP in 2013–2015. In 2013 and 2014, wealth will also decrease nominally as a result of the deficit in net lending. In 2016, financial wealth is calculated to amount to SEK 687 billion, corresponding to 16.5 per cent of GDP.
Between 2012 and 2016, financial wealth is expected to decrease by SEK 64 billion, which largely follows the accumulated net lending. The forecast includes no other value changes beyond the effects of predicted currency exchange fluctuations on central government debt.
3.4 The follow up of the surplus target
The surplus target is a target for the net financial saving by the general government sector corresponding to 1 per cent of GDP over an economic cycle. The definition of the target in terms of an average over a business cycle instead of an annual requirement of 1 per cent is justified for stabilisation policy reasons. With an annual net lending target of 1 per cent of GDP, fiscal policy would need to be contractionary in a recession, and vice versa, to ensure fulfilment of the annual target. The policy would therefore be pro-cyclical, meaning that it would accentuate economic fluctuations and the automatic stabilisers would not be able to act freely. Consequently, there is good cause to formulate a net lending target as an average across an economic cycle.
However, the formulation of the target makes it more difficult to evaluate on an annual basis whether fiscal policy is in line with the target. The surplus target is evaluated in a retroactive perspective to ascertain whether it was achieved during the period in which it steered fiscal policy. But it is primarily analysed prospectively as a basis for the assessment of future budgetary scope or the need for savings.
The purpose of the retroactive analysis is to assess whether the surplus target has been achieved or if there are systematic error
37
tendencies in the relationship between fiscal policy and the surplus target which decrease the likelihood of the target being achieved in the future. For the retroactive review, a ten-year average is applied, calculated for the ten most recent years for which outcome data on net lending are available, currently 2002–2012. The assessment of this average also takes into account the average economic situation, expressed as a GDP gap, over the relevant historic period.
With this retrospective assessment as the point of departure, a forward-looking assessment is then made of the budgetary scope, that is the scope for new measures that weaken net lending, or the need for savings, based on the structural balance and the “Seven-year indicator”. The structural balance aims to show how large net lending should be in a balanced economic situation. In the Government’s calculation of the structural balance, net lending is adjusted to the current economic situation and for major one-off effects and extraordinary levels in households’ capital gains. The seven-year indicator is a seven-year moving average for net lending in the general government sector. The indicator for a given year includes the net lending (adjusted for major one-off effects) for that year, the three immediately preceding years and the three immediately following years. To a certain extent, the indicator takes the economic situation into account since it represents an average over several years. Nonetheless, there is a risk that the calculation will include more years with economic upturn than downturn, or the reverse, meaning that the indicator would give an inaccurate picture of the budgetary scope or of the need for savings. To correctly assess the seven-year indicator, the economic situation must therefore be taken into account.
There is a considerable degree of uncertainty surrounding the indicators used to follow up the surplus target. Since the target is formulated as an average over an economic cycle, the analysis must nonetheless take the economic situation into account, despite the difficulties this entails. For this reason no single indicator is used to determine the budgetary scope or the need for savings. Instead, an overall assessment is made of the two indicators (the seven-year indicator and the structural balance) also taking into account the current economic situation, whether it is appropriate to change net lending from a stabilisation policy perspective, and the risk that the actual development will differ from the forecast.
Calculation of the structural balance is associated with a high level of uncertainty besides the uncertainty associated with the net lending forecast. Firstly, the assessment of resource utilisation is uncertain. For GDP no potential outcome is ever reported – instead, each evaluator makes his/her own estimation of its historic and future values. The view of the GDP gap is frequently revised both retroactively and prospectively, due not only to a changed view on the economic situation but also to revisions of outcome statistics for actual GDP. Secondly, the assessment of the sensitivity of the general government net lending to
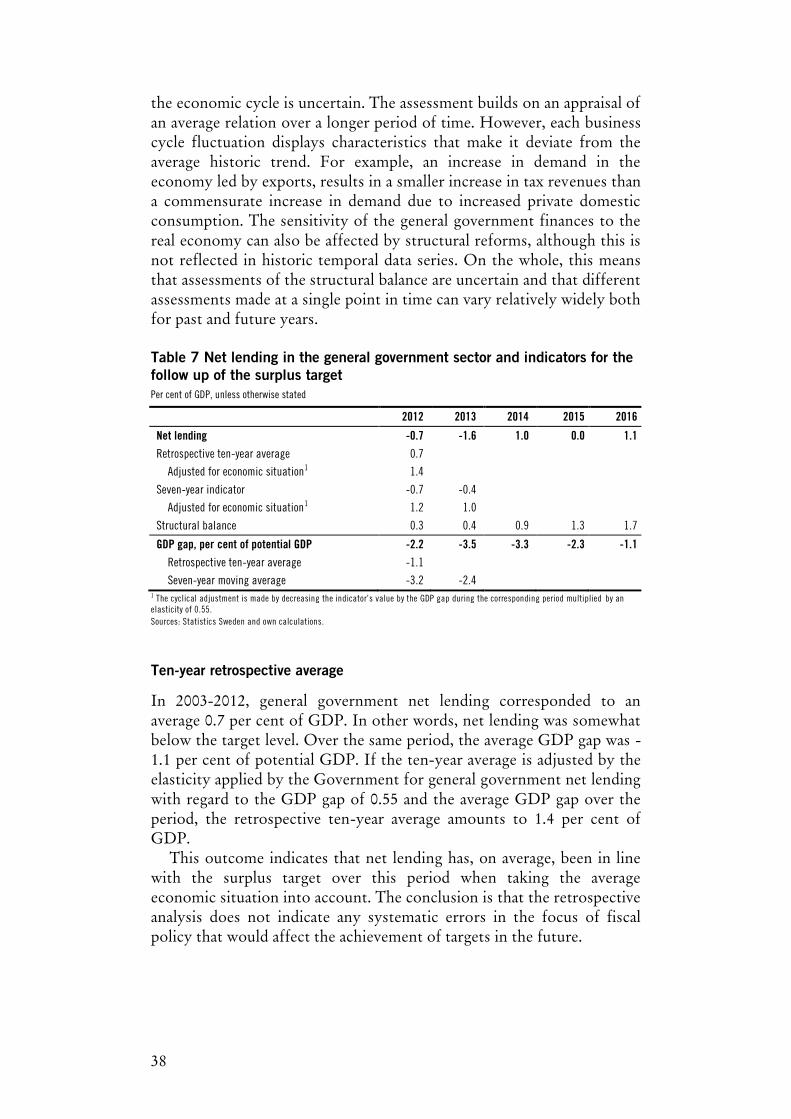
38
the economic cycle is uncertain. The assessment builds on an appraisal of an average relation over a longer period of time. However, each business cycle fluctuation displays characteristics that make it deviate from the average historic trend. For example, an increase in demand in the economy led by exports, results in a smaller increase in tax revenues than a commensurate increase in demand due to increased private domestic consumption. The sensitivity of the general government finances to the real economy can also be affected by structural reforms, although this is not reflected in historic temporal data series. On the whole, this means that assessments of the structural balance are uncertain and that different assessments made at a single point in time can vary relatively widely both for past and future years. Table 7 Net lending in the general government sector and indicators for the follow up of the surplus target Per cent of GDP, unless otherwise stated
2012 2013 2014 2015 2016
Net lending -0.7 -1.6 1.0 0.0 1.1
Retrospective ten-year average 0.7
Adjusted for economic situation1 1.4
Seven-year indicator -0.7 -0.4
Adjusted for economic situation1 1.2 1.0
Structural balance 0.3 0.4 0.9 1.3 1.7
GDP gap, per cent of potential GDP -2.2 -3.5 -3.3 -2.3 -1.1
Retrospective ten-year average -1.1
Seven-year moving average -3.2 -2.4 1 The cyclical adjustment is made by decreasing the indicator’s value by the GDP gap during the corresponding period multiplied by an elasticity of 0.55. Sources: Statistics Sweden and own calculations.
Ten-year retrospective average
In 2003-2012, general government net lending corresponded to an average 0.7 per cent of GDP. In other words, net lending was somewhat below the target level. Over the same period, the average GDP gap was -1.1 per cent of potential GDP. If the ten-year average is adjusted by the elasticity applied by the Government for general government net lending with regard to the GDP gap of 0.55 and the average GDP gap over the period, the retrospective ten-year average amounts to 1.4 per cent of GDP.
This outcome indicates that net lending has, on average, been in line with the surplus target over this period when taking the average economic situation into account. The conclusion is that the retrospective analysis does not indicate any systematic errors in the focus of fiscal policy that would affect the achievement of targets in the future.
39
Seven-year indicator
The seven-year indicator is -0.7 per cent of GDP in 2012 and then rises to -0.4 per cent of GDP in 2013. If resource utilisation in each seven-year period is taken into account, the indicator reflects net lending that is somewhat above the target. This is because the seven-year moving average for the GDP gap over the same period was strongly negative. However, when assessing the cycle-adjusted indicator, it must be borne in mind that the large negative GDP gap over the current recession will probably not be matched by equally large positive gaps in the years following the forecast period. table 7 shows, for example, that the negative GDP gaps on average during the seven-year period 2009–2015 were as great as 3.2 per cent of GDP in absolute terms. For this reason, the value of the cyclically adjusted seven-year indicator should not be taken fully into account. A combined assessment of the unadjusted and cyclically adjusted seven-year indicator suggests a net lending that is somewhat under 1 per cent of GDP in 2012 and 2013.
Structural balance
The structural balance is 0.3 per cent of GDP in 2012, 0.4 per cent of GDP in 2013 and then gradually rises to 1.7 per cent of GDP in 2016 if policy is unchanged (see table 7). Thus also this indicator suggests that net lending will be under 1 per cent of GDP up until 2014, and over in the subsequent years. One reason that the structural balance gradually strengthens over the years following 2013 is that no new fiscal policy decisions are taken into account in the calculation of the structural balance over that period. There is, however, considerable uncertainty in an assessment that stretches over such a long temporal horizon.
Overall assessment
The indicators used to follow up the surplus target suggest that net lending is currently under 1 per cent of GDP, but that net lending will increase to somewhat above the target level in the latter portion of the forecast period. The indicators also suggest that Sweden’s MTO of -1 per cent of GDP will be met during the entire reported period.
3.5 Effects of fiscal policy on demand
The change in actual net lending provides a measure of the general government sector’s effects on demand. The change can be divided into three underlying factors: automatic stabilisers, discretionary fiscal policy and other factors affecting the balance. The change in the structural balance is generally used as an indicator of fiscal policy stance. As can be seen in Table 8, this indicator encompasses not only discretionary fiscal policy in the central government budget but also other factors that affect
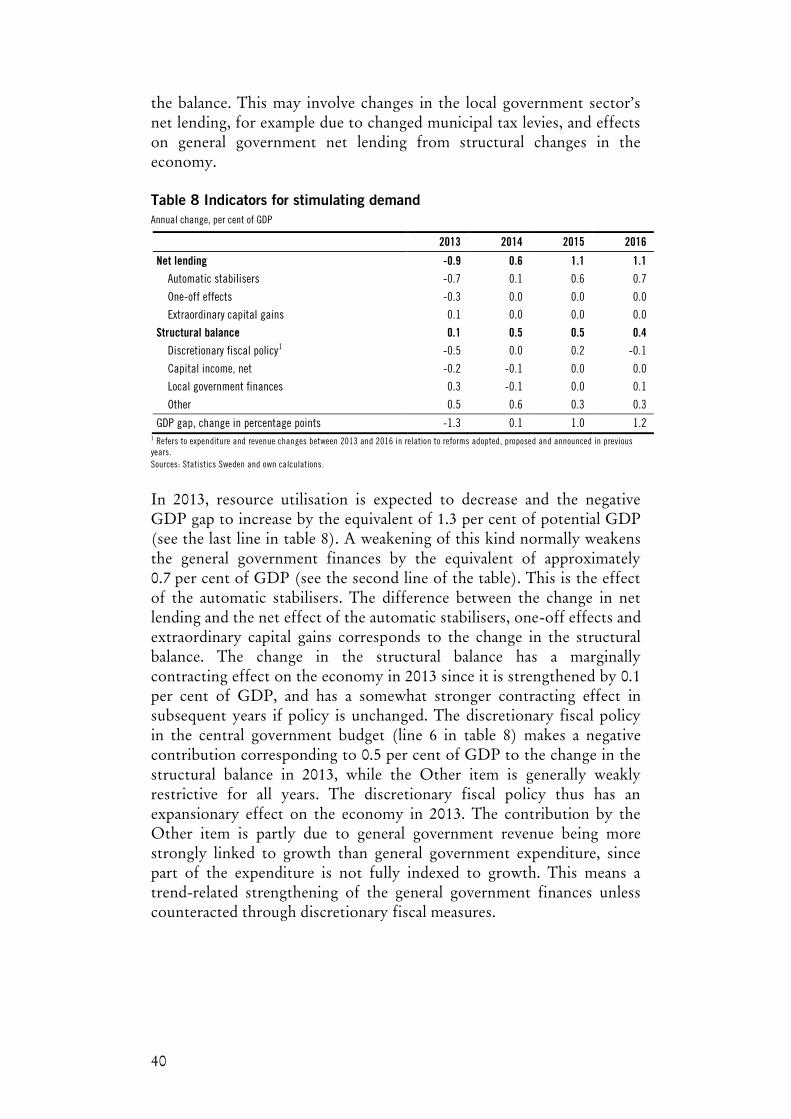
40
the balance. This may involve changes in the local government sector’s net lending, for example due to changed municipal tax levies, and effects on general government net lending from structural changes in the economy. Table 8 Indicators for stimulating demand Annual change, per cent of GDP
2013 2014 2015 2016
Net lending -0.9 0.6 1.1 1.1 Automatic stabilisers -0.7 0.1 0.6 0.7
One-off effects -0.3 0.0 0.0 0.0
Extraordinary capital gains 0.1 0.0 0.0 0.0
Structural balance 0.1 0.5 0.5 0.4 Discretionary fiscal policy1 -0.5 0.0 0.2 -0.1
Capital income, net -0.2 -0.1 0.0 0.0
Local government finances 0.3 -0.1 0.0 0.1
Other 0.5 0.6 0.3 0.3
GDP gap, change in percentage points -1.3 0.1 1.0 1.2 1 Refers to expenditure and revenue changes between 2013 and 2016 in relation to reforms adopted, proposed and announced in previous years. Sources: Statistics Sweden and own calculations.
In 2013, resource utilisation is expected to decrease and the negative GDP gap to increase by the equivalent of 1.3 per cent of potential GDP (see the last line in table 8). A weakening of this kind normally weakens the general government finances by the equivalent of approximately 0.7 per cent of GDP (see the second line of the table). This is the effect of the automatic stabilisers. The difference between the change in net lending and the net effect of the automatic stabilisers, one-off effects and extraordinary capital gains corresponds to the change in the structural balance. The change in the structural balance has a marginally contracting effect on the economy in 2013 since it is strengthened by 0.1 per cent of GDP, and has a somewhat stronger contracting effect in subsequent years if policy is unchanged. The discretionary fiscal policy in the central government budget (line 6 in table 8) makes a negative contribution corresponding to 0.5 per cent of GDP to the change in the structural balance in 2013, while the Other item is generally weakly restrictive for all years. The discretionary fiscal policy thus has an expansionary effect on the economy in 2013. The contribution by the Other item is partly due to general government revenue being more strongly linked to growth than general government expenditure, since part of the expenditure is not fully indexed to growth. This means a trend-related strengthening of the general government finances unless counteracted through discretionary fiscal measures.

41
3.6 Monitoring of the expenditure ceiling
The central government’s multi-year expenditure ceiling serves to foster the credibility of fiscal policy and is an important budget policy commitment for the Riksdag and the Government. In principle all expenditure in the central government budget is subject to the expenditure ceiling, with the exception of interest payments on central government debt. Furthermore, expenditure for the old-age pension system is encompassed alongside the central government budget by the expenditure ceiling. Ceiling-restricted expenditure consists of appropriations actually used, meaning that appropriation savings and appropriation credit actually used by central government agencies and authorities are included. The scope between the expenditure ceiling and the ceiling-restricted expenditure is termed the budgeting margin. As a rule, if the budgeting margin is utilised, the general government finances worsen.
In the 2013 Spring Fiscal Policy Bill, the Government makes an assessment of the expenditure ceiling for 2017 as an instrument to support the general government finances to develop in line with the surplus target. According to the Budget Act, it is compulsory for the Government to propose an expenditure ceiling for the third additional year. This proposed level forms the basis for the Riksdag's decision on expenditure ceiling. In the 2014 Budget Bill, the Government will, in accordance with the Budget Act, propose a level for the expenditure ceiling for 2016.
It is the Government’s assessment that the budgeting margin below the expenditure ceiling for 2013–2015 is sufficient to manage the uncertainty in the expenditure trend. For 2013, the budgeting margin is calculated to be SEK 27 million (see table 9). The margin falls somewhat in 2014 (to SEK 22 billion) but then rises to SEK 30 billion in 2015.
Ceiling-restricted expenditure rose relatively slowly in 2011. In 2012, the rise was faster. Despite the relatively fast rate of increase in ceiling-restricted expenditure in 2012, the budgeting margin remained comparatively great. Partly as a consequence of the large budgeting margins in 2011 and 2012, the Government has previously proposed levels for the expenditure ceiling for 2013 and 2014 for which the annual rate of increase is lower than the average annual increase since 1997 when the expenditure ceiling was introduced. For 2015 too, the Government proposed a level for the expenditure ceiling entailing a smaller annual increase than in previous years.
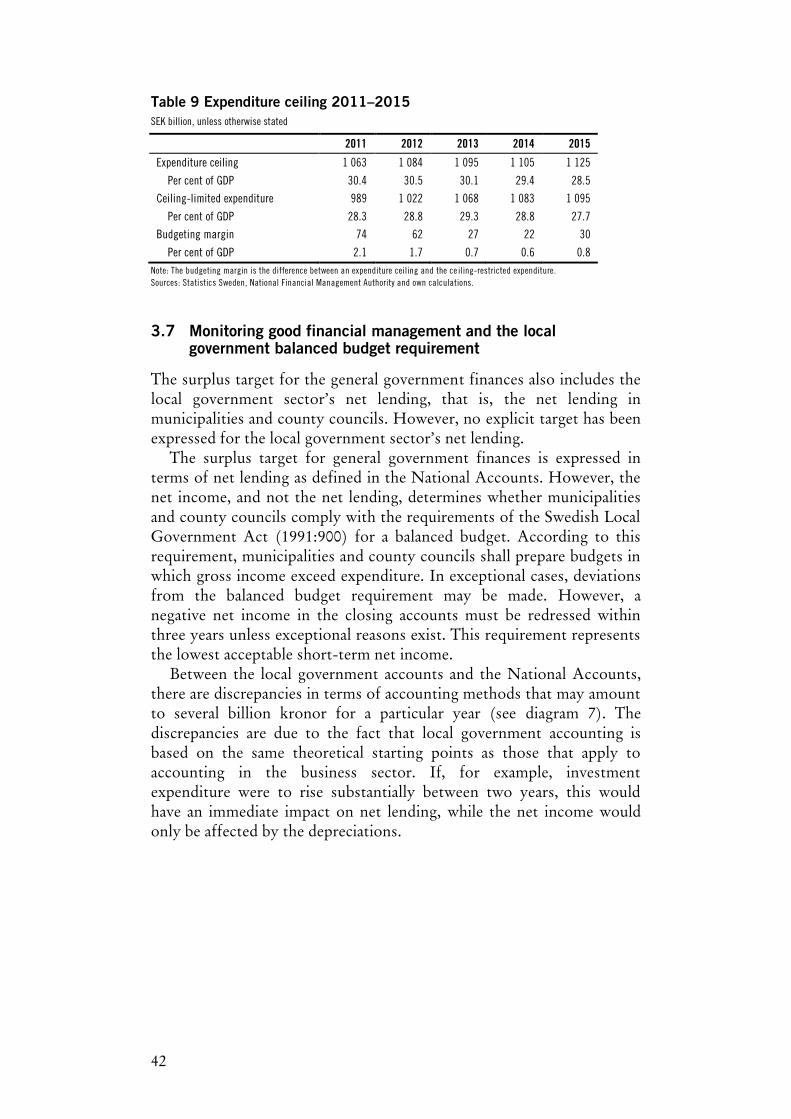
42
Table 9 Expenditure ceiling 2011–2015 SEK billion, unless otherwise stated
2011 2012 2013 2014 2015
Expenditure ceiling 1 063 1 084 1 095 1 105 1 125
Per cent of GDP 30.4 30.5 30.1 29.4 28.5
Ceiling-limited expenditure 989 1 022 1 068 1 083 1 095
Per cent of GDP 28.3 28.8 29.3 28.8 27.7
Budgeting margin 74 62 27 22 30
Per cent of GDP 2.1 1.7 0.7 0.6 0.8 Note: The budgeting margin is the difference between an expenditure ceiling and the ce iling-restricted expenditure. Sources: Statistics Sweden, National Financial Management Authority and own calculations.
3.7 Monitoring good financial management and the local government balanced budget requirement
The surplus target for the general government finances also includes the local government sector’s net lending, that is, the net lending in municipalities and county councils. However, no explicit target has been expressed for the local government sector’s net lending.
The surplus target for general government finances is expressed in terms of net lending as defined in the National Accounts. However, the net income, and not the net lending, determines whether municipalities and county councils comply with the requirements of the Swedish Local Government Act (1991:900) for a balanced budget. According to this requirement, municipalities and county councils shall prepare budgets in which gross income exceed expenditure. In exceptional cases, deviations from the balanced budget requirement may be made. However, a negative net income in the closing accounts must be redressed within three years unless exceptional reasons exist. This requirement represents the lowest acceptable short-term net income.
Between the local government accounts and the National Accounts, there are discrepancies in terms of accounting methods that may amount to several billion kronor for a particular year (see diagram 7). The discrepancies are due to the fact that local government accounting is based on the same theoretical starting points as those that apply to accounting in the business sector. If, for example, investment expenditure were to rise substantially between two years, this would have an immediate impact on net lending, while the net income would only be affected by the depreciations.
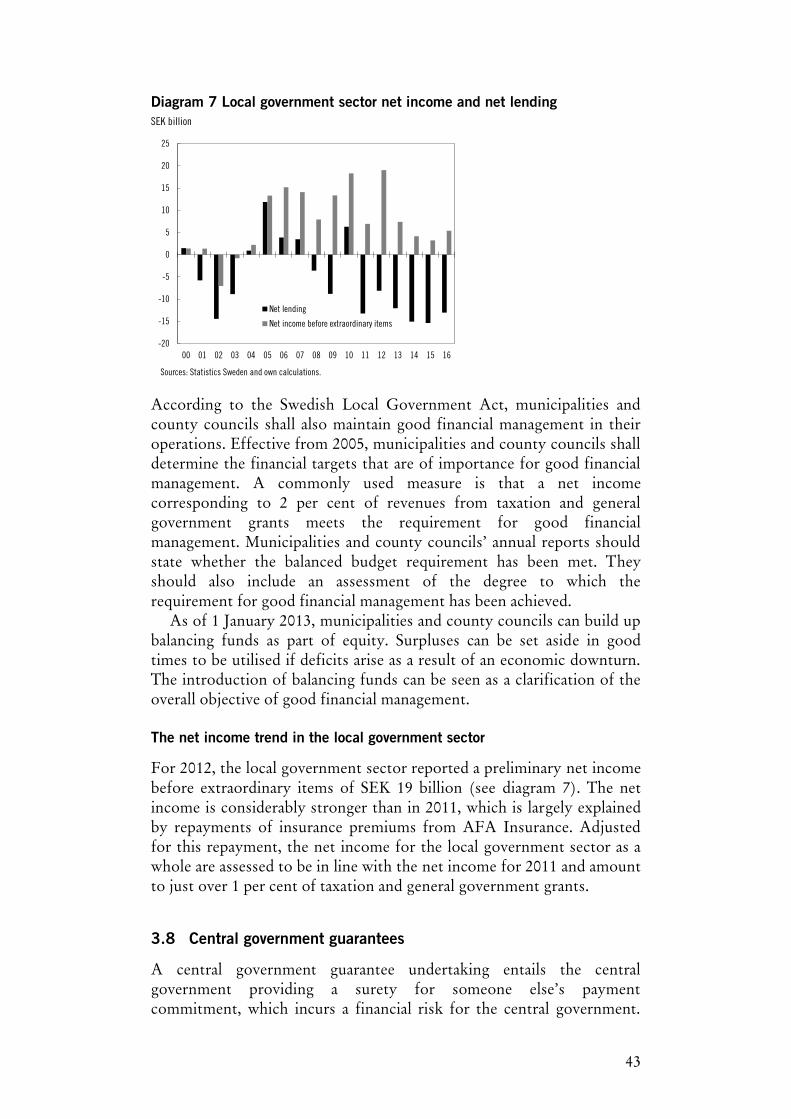
43
Diagram 7 Local government sector net income and net lending SEK billion
According to the Swedish Local Government Act, municipalities and county councils shall also maintain good financial management in their operations. Effective from 2005, municipalities and county councils shall determine the financial targets that are of importance for good financial management. A commonly used measure is that a net income corresponding to 2 per cent of revenues from taxation and general government grants meets the requirement for good financial management. Municipalities and county councils’ annual reports should state whether the balanced budget requirement has been met. They should also include an assessment of the degree to which the requirement for good financial management has been achieved.
As of 1 January 2013, municipalities and county councils can build up balancing funds as part of equity. Surpluses can be set aside in good times to be utilised if deficits arise as a result of an economic downturn. The introduction of balancing funds can be seen as a clarification of the overall objective of good financial management.
The net income trend in the local government sector
For 2012, the local government sector reported a preliminary net income before extraordinary items of SEK 19 billion (see diagram 7). The net income is considerably stronger than in 2011, which is largely explained by repayments of insurance premiums from AFA Insurance. Adjusted for this repayment, the net income for the local government sector as a whole are assessed to be in line with the net income for 2011 and amount to just over 1 per cent of taxation and general government grants.
3.8 Central government guarantees
A central government guarantee undertaking entails the central government providing a surety for someone else’s payment commitment, which incurs a financial risk for the central government.
-20
-15
-10
-5
0
5
10
15
20
25
00 01 02 03 04 05 06 07 08 09 10 11 12 13 14 15 16
Net lending
Net income before extraordinary items
Sources: Statistics Sweden and own calculations.
44
General rules for the management of central government guarantees are included in legislation and regulations.
According to the Budget Act, the Government may issue credit guarantees and enter other similar commitments for the purpose and not exceeding the amount determined by the Riksdag. A guarantee charge is to be imposed corresponding to the central government’s risk and other costs of the commitment, unless the Riksdag decides otherwise. The charge shall cover the expected costs associated with the guarantee, consisting of expected loss (or possible recovery) should the beneficiary of the guarantee be unable to meet his/her commitments, as well as administration costs. This government guarantee model was created to ensure that guarantee operations are self-financed in the long term. Examples of major guarantee commitments covered by the guarantee model are export credit guarantees and credit guarantees for infrastructure projects. Alongside the Budget Act, there are guarantees that are regulated by specific acts. The deposit guarantee14, investor compensation scheme and bank guarantee scheme are all examples of guarantees managed outside the guarantee model.
Composition of the guarantee portfolio
Table 10 provides a summary of the guarantees and pledges issued by the Government and various agencies. The central government’s guarantee portfolio amounted to SEK 1 609 billion at the close of 2012. The largest commitment was the deposit guarantee (SEK 1 226 billion as per 31 December 2011) followed by credit guarantees and guarantees for capital injections. Pension guarantees and other guarantees amounted to SEK 10 billion.
14 The institutes covered by the deposit guarantee scheme pay a fee to central government. The fee is regulated in the Deposit Guarantee Act (1995:1571) and is determined with reference to the institute's capital adequacy ratio.
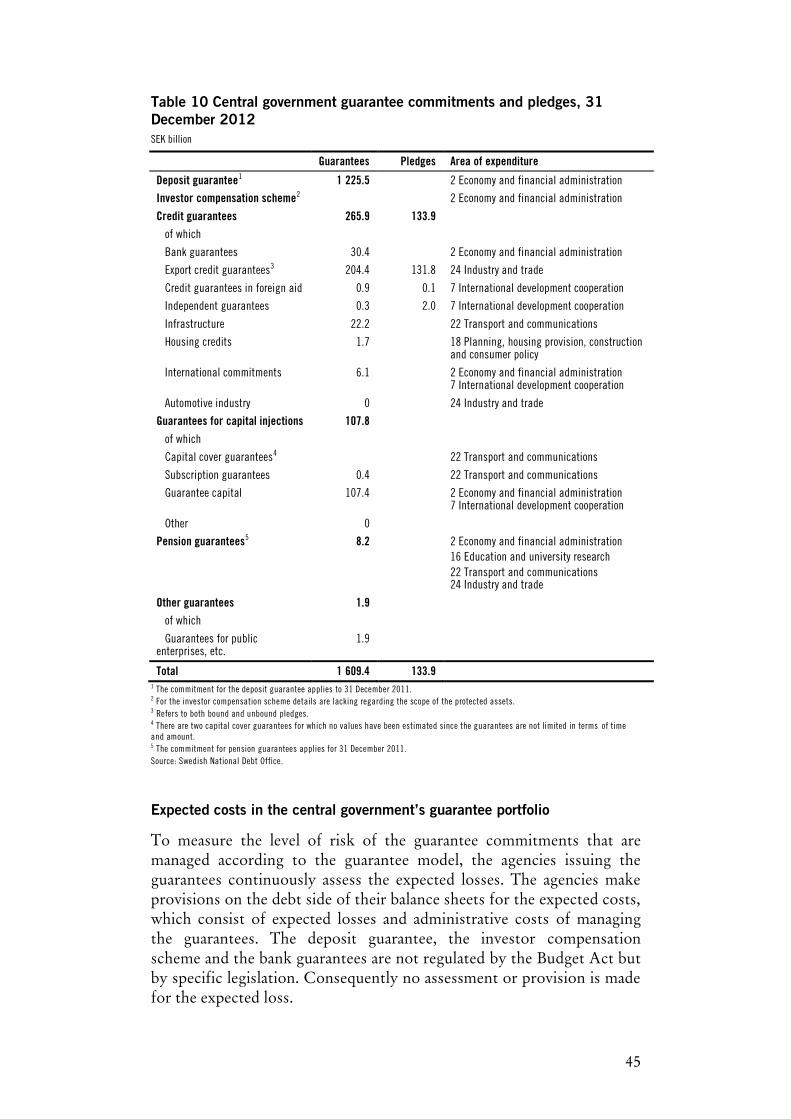
45
Table 10 Central government guarantee commitments and pledges, 31 December 2012 SEK billion
Guarantees Pledges Area of expenditure
Deposit guarantee1 1 225.5 2 Economy and financial administration
Investor compensation scheme2 2 Economy and financial administration
Credit guarantees 265.9 133.9
of which
Bank guarantees 30.4 2 Economy and financial administration
Export credit guarantees3 204.4 131.8 24 Industry and trade
Credit guarantees in foreign aid 0.9 0.1 7 International development cooperation
Independent guarantees 0.3 2.0 7 International development cooperation
Infrastructure 22.2 22 Transport and communications
Housing credits 1.7 18 Planning, housing provision, construction and consumer policy
International commitments 6.1 2 Economy and financial administration 7 International development cooperation
Automotive industry 0 24 Industry and trade
Guarantees for capital injections 107.8
of which
Capital cover guarantees4 22 Transport and communications
Subscription guarantees 0.4 22 Transport and communications
Guarantee capital 107.4 2 Economy and financial administration 7 International development cooperation
Other 0
Pension guarantees5 8.2 2 Economy and financial administration 16 Education and university research 22 Transport and communications 24 Industry and trade
Other guarantees 1.9
of which
Guarantees for public enterprises, etc.
1.9
Total 1 609.4 133.9 1 The commitment for the deposit guarantee applies to 31 December 2011. 2 For the investor compensation scheme details are lacking regarding the scope of the protected assets. 3 Refers to both bound and unbound pledges. 4 There are two capital cover guarantees for which no values have been estimated since the guarantees are not limited in terms of time and amount. 5 The commitment for pension guarantees applies for 31 December 2011. Source: Swedish National Debt Office.
Expected costs in the central government’s guarantee portfolio
To measure the level of risk of the guarantee commitments that are managed according to the guarantee model, the agencies issuing the guarantees continuously assess the expected losses. The agencies make provisions on the debt side of their balance sheets for the expected costs, which consist of expected losses and administrative costs of managing the guarantees. The deposit guarantee, the investor compensation scheme and the bank guarantees are not regulated by the Budget Act but by specific legislation. Consequently no assessment or provision is made for the expected loss.
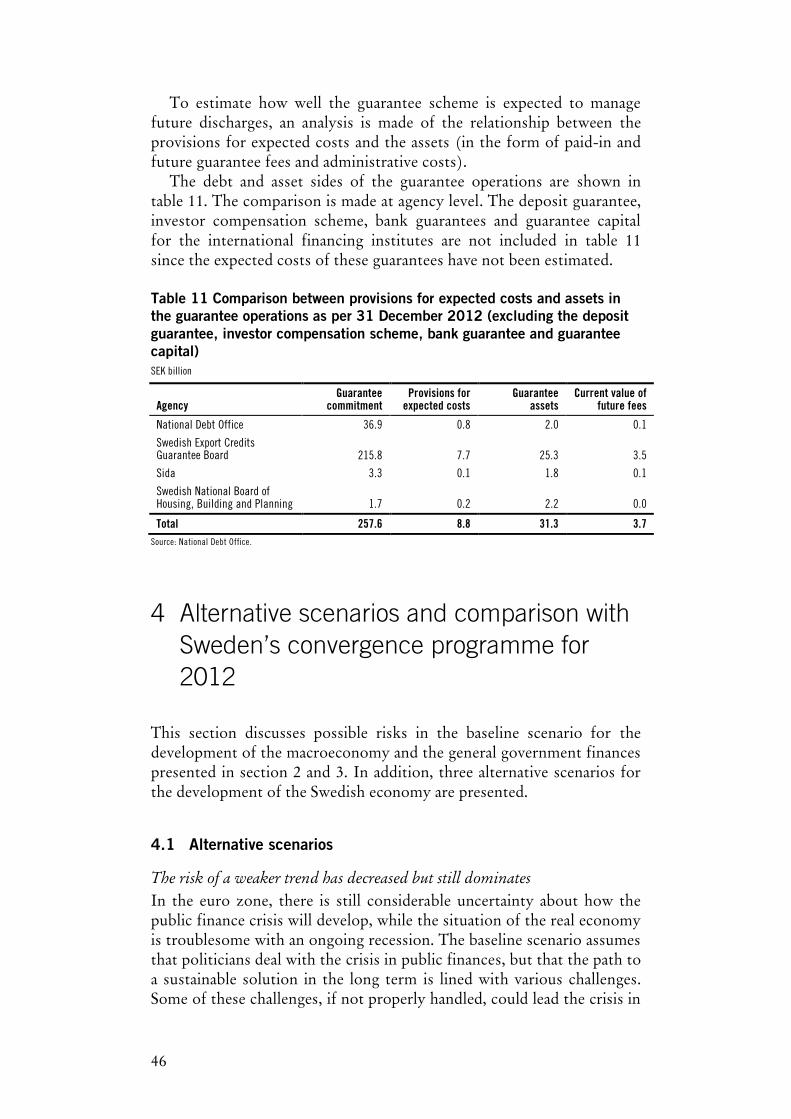
46
To estimate how well the guarantee scheme is expected to manage future discharges, an analysis is made of the relationship between the provisions for expected costs and the assets (in the form of paid-in and future guarantee fees and administrative costs).
The debt and asset sides of the guarantee operations are shown in table 11. The comparison is made at agency level. The deposit guarantee, investor compensation scheme, bank guarantees and guarantee capital for the international financing institutes are not included in table 11 since the expected costs of these guarantees have not been estimated.
Table 11 Comparison between provisions for expected costs and assets in the guarantee operations as per 31 December 2012 (excluding the deposit guarantee, investor compensation scheme, bank guarantee and guarantee capital) SEK billion
Agency Guarantee
commitment Provisions for
expected costs Guarantee
assets Current value of
future fees
National Debt Office 36.9 0.8 2.0 0.1
Swedish Export Credits Guarantee Board 215.8 7.7 25.3 3.5
Sida 3.3 0.1 1.8 0.1
Swedish National Board of Housing, Building and Planning 1.7 0.2 2.2 0.0
Total 257.6 8.8 31.3 3.7 Source: National Debt Office.
4 Alternative scenarios and comparison with Sweden’s convergence programme for 2012
This section discusses possible risks in the baseline scenario for the development of the macroeconomy and the general government finances presented in section 2 and 3. In addition, three alternative scenarios for the development of the Swedish economy are presented.
4.1 Alternative scenarios
The risk of a weaker trend has decreased but still dominates
In the euro zone, there is still considerable uncertainty about how the public finance crisis will develop, while the situation of the real economy is troublesome with an ongoing recession. The baseline scenario assumes that politicians deal with the crisis in public finances, but that the path to a sustainable solution in the long term is lined with various challenges. Some of these challenges, if not properly handled, could lead the crisis in
47
the euro zone to escalate once more. Political anxiety in several euro zone countries may lead to financial market turbulence. If voter support for crisis policy falters, it may restrict the tools available for managing the crisis and lead to a deepening of the sovereign debt crisis. The ambiguous results of the Italian elections at the end of February 2013 resulted in rising Italian government bond rates. The management of the crisis in the euro zone also involves many parties with different interests. Weighing up these interests has proved difficult, and crucial decisions have often been delayed. This has led to difficulty in predicting the development of the crisis in the euro zone, which at times has increased volatility of financial markets. As recently as March 2013, in connection with the Cyprus bailout negotiations, it was clear that management of the crisis continues to affect financial stability.
The US also faces challenges regarding the management of its general government finances. Failure to reach agreement on future federal government funding at set deadlines could have significant effects on the real economy. The risk is also great that the cuts in the federal budget in 2013 and 2014 will be greater than assumed in the forecast.
The international economy may experience a much stronger development than has been assumed in the forecast. Emerging economies such as China have the potential for strong future growth, partly as a result of expansionary fiscal and monetary policies. Furthermore, the problems facing public finance in the euro zone and the US may be resolved earlier than expected, and once confidence in the future economic development is restored, there are favourable conditions for a strong economic recovery.
The forecast sees household consumption as an important driving force of the recovery of the Swedish economy. This implies that the high level of household savings is expected to fall over the forecast period. But even if household savings are high, household debt is also high. There is a risk that households choose to continue saving a large part of their income as a buffer against rising interest rates or a potential fall in house prices. If households were to maintain their savings rate at a high level, consumption will be weaker than in the forecast, and the recovery of the Swedish economy will be more protracted, with higher unemployment as a result.
A decline in house prices could also lead to higher household savings than expected in the forecast. Lower house prices will weaken the financial position of households and will probably lead to increased amortisation of mortgages.
Alternative scenario 1: Significantly weaker growth internationally
The baseline scenario is based on the assumption that measures are taken to prevent the problems facing public finances from severely exacerbated in 2013 and that the global economic recovery gains momentum in 2015. This alternative scenario instead assumes a much weaker trend in the global economy, with a number of negative shocks that coincide and
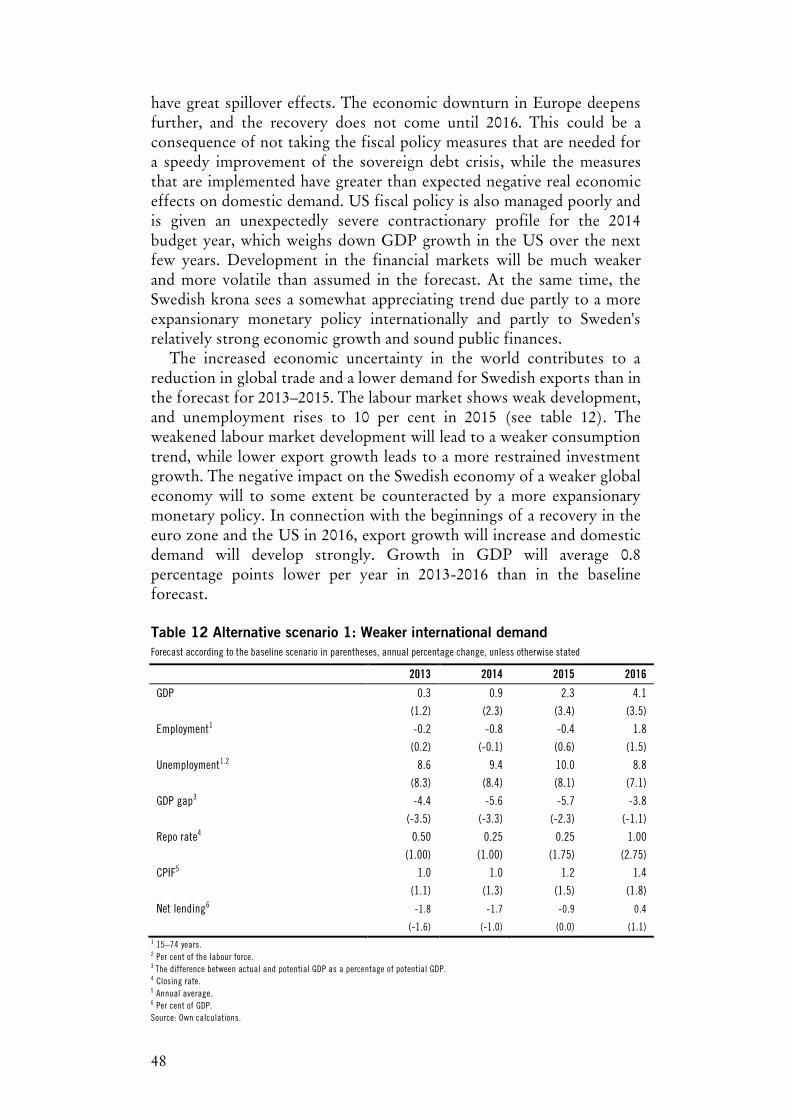
48
have great spillover effects. The economic downturn in Europe deepens further, and the recovery does not come until 2016. This could be a consequence of not taking the fiscal policy measures that are needed for a speedy improvement of the sovereign debt crisis, while the measures that are implemented have greater than expected negative real economic effects on domestic demand. US fiscal policy is also managed poorly and is given an unexpectedly severe contractionary profile for the 2014 budget year, which weighs down GDP growth in the US over the next few years. Development in the financial markets will be much weaker and more volatile than assumed in the forecast. At the same time, the Swedish krona sees a somewhat appreciating trend due partly to a more expansionary monetary policy internationally and partly to Sweden's relatively strong economic growth and sound public finances.
The increased economic uncertainty in the world contributes to a reduction in global trade and a lower demand for Swedish exports than in the forecast for 2013–2015. The labour market shows weak development, and unemployment rises to 10 per cent in 2015 (see table 12). The weakened labour market development will lead to a weaker consumption trend, while lower export growth leads to a more restrained investment growth. The negative impact on the Swedish economy of a weaker global economy will to some extent be counteracted by a more expansionary monetary policy. In connection with the beginnings of a recovery in the euro zone and the US in 2016, export growth will increase and domestic demand will develop strongly. Growth in GDP will average 0.8 percentage points lower per year in 2013-2016 than in the baseline forecast.
Table 12 Alternative scenario 1: Weaker international demand Forecast according to the baseline scenario in parentheses, annual percentage change, unless otherwise stated
2013 2014 2015 2016
GDP 0.3 0.9 2.3 4.1
(1.2) (2.3) (3.4) (3.5)
Employment1 -0.2 -0.8 -0.4 1.8
(0.2) (-0.1) (0.6) (1.5)
Unemployment1.2 8.6 9.4 10.0 8.8
(8.3) (8.4) (8.1) (7.1)
GDP gap3 -4.4 -5.6 -5.7 -3.8
(-3.5) (-3.3) (-2.3) (-1.1)
Repo rate4 0.50 0.25 0.25 1.00
(1.00) (1.00) (1.75) (2.75)
CPIF5 1.0 1.0 1.2 1.4
(1.1) (1.3) (1.5) (1.8)
Net lending6 -1.8 -1.7 -0.9 0.4
(-1.6) (-1.0) (0.0) (1.1) 1 15–74 years. 2 Per cent of the labour force. 3 The difference between actual and potential GDP as a percentage of potential GDP. 4 Closing rate. 5 Annual average. 6 Per cent of GDP. Source: Own calculations.
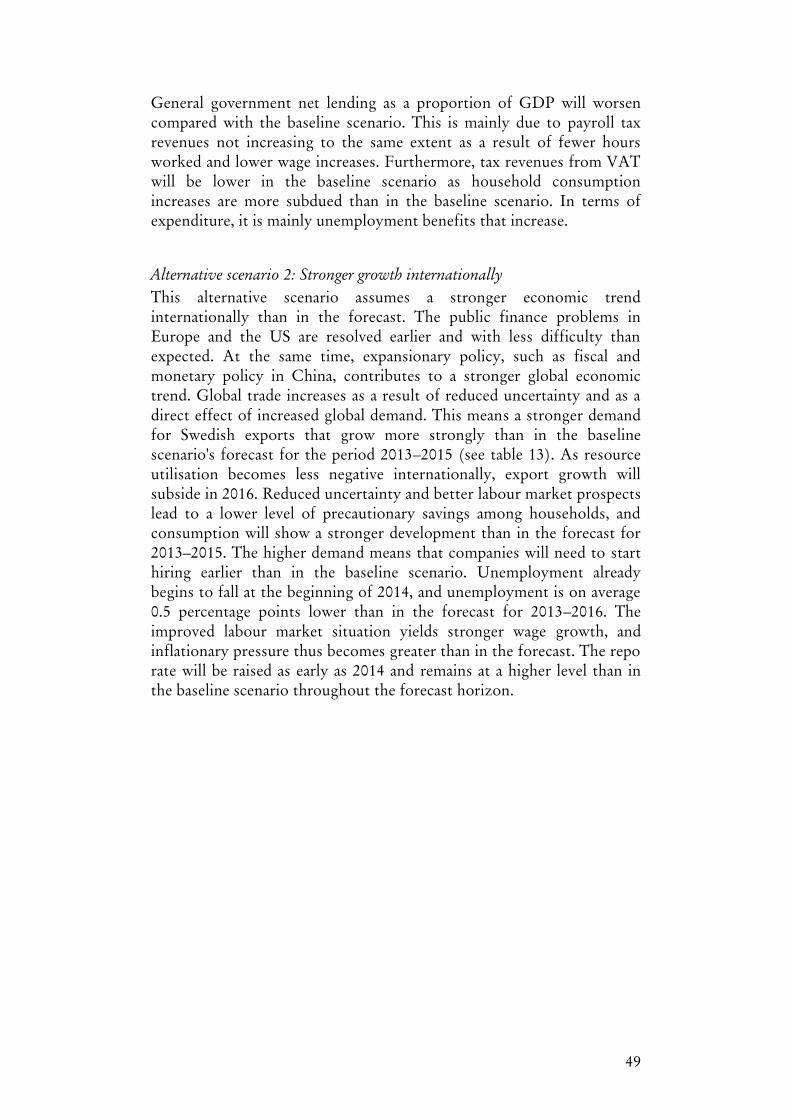
49
General government net lending as a proportion of GDP will worsen compared with the baseline scenario. This is mainly due to payroll tax revenues not increasing to the same extent as a result of fewer hours worked and lower wage increases. Furthermore, tax revenues from VAT will be lower in the baseline scenario as household consumption increases are more subdued than in the baseline scenario. In terms of expenditure, it is mainly unemployment benefits that increase.
Alternative scenario 2: Stronger growth internationally
This alternative scenario assumes a stronger economic trend internationally than in the forecast. The public finance problems in Europe and the US are resolved earlier and with less difficulty than expected. At the same time, expansionary policy, such as fiscal and monetary policy in China, contributes to a stronger global economic trend. Global trade increases as a result of reduced uncertainty and as a direct effect of increased global demand. This means a stronger demand for Swedish exports that grow more strongly than in the baseline scenario's forecast for the period 2013–2015 (see table 13). As resource utilisation becomes less negative internationally, export growth will subside in 2016. Reduced uncertainty and better labour market prospects lead to a lower level of precautionary savings among households, and consumption will show a stronger development than in the forecast for 2013–2015. The higher demand means that companies will need to start hiring earlier than in the baseline scenario. Unemployment already begins to fall at the beginning of 2014, and unemployment is on average 0.5 percentage points lower than in the forecast for 2013–2016. The improved labour market situation yields stronger wage growth, and inflationary pressure thus becomes greater than in the forecast. The repo rate will be raised as early as 2014 and remains at a higher level than in the baseline scenario throughout the forecast horizon.

50
Table 13 Alternative scenario 2: Stronger growth internationally Forecast according to the baseline scenario in parentheses, annual percentage change, unless otherwise stated
2013 2014 2015 2016
GDP 1.8 3.0 3.7 3.3
(1.2) (2.3) (3.4) (3.5)
Employment1 0.3 0.3 1.0 1.3
(0.2) (-0.1) (0.6) (1.5)
Unemployment1.2 8.2 7.9 7.2 6.4
(8.3) (8.4) (8.1) (7.1)
GDP gap3 -2.9 -2.0 -0.7 0.3
(-3.5) (-3.3) (-2.3) (-1.1)
Repo rate4 1.25 1.75 2.75 3.50
(1.00) (1.00) (1.75) (2.75)
CPIF5 1.3 1.6 1.9 2.0
(1.1) (1.3) (1.5) (1.8)
Net lending6 -1.5 -0.7 0.4 1.4
(-1.6) (-1.0) (0.0) (1.1) 1 15–74 years. 2 Per cent of the labour force. 3 The difference between actual and potential GDP as a percentage of potential GDP. 4 Closing rate. 5 Annual average. 6 Per cent of GDP. Source: Own calculations.
Net lending in the general government sector is strengthened compared with the baseline scenario. This is primarily an effect of higher payroll tax revenues, resulting from the number of hours worked being higher than in the baseline scenario. Tax revenues from VAT are also higher due to stronger consumption.
Alternative scenario 3: Higher levels of household savings
In the baseline scenario, household savings as a proportion of disposable income (savings ratio) falls during the period 2013–2016. However, there are several factors that could contribute to household saving being higher than it is in the baseline scenario. For example, household debt is currently at historically high levels, and if house prices were to fall, it might result in many households having larger loans exceeding the property value. It is therefore possible that households choose to consume less in order to reduce the level of debt and still have a safety buffer in case of an economic slowdown.
This alternative scenario assumes that households increase their consumption expenditure at a slower pace than in the baseline scenario. The savings ratio decreases slightly but stabilises at a positive level of about 3 per cent, compared with a fall to a negative level in the baseline scenario.
Since household consumption does not grow as fast, companies will be somewhat more cautious to increase their investments. GDP growth will be about 0.2 percentage points lower in 2013 and 2014 than in the baseline scenario (see table 14). The economic recovery will be
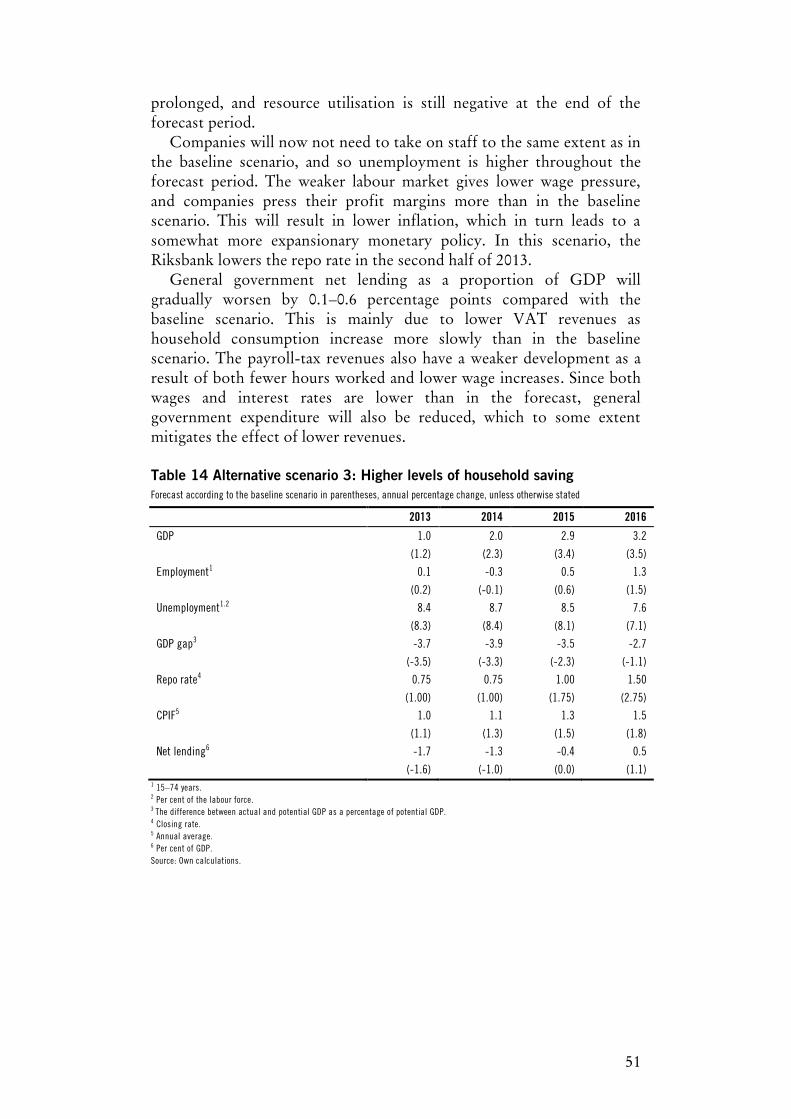
51
prolonged, and resource utilisation is still negative at the end of the forecast period.
Companies will now not need to take on staff to the same extent as in the baseline scenario, and so unemployment is higher throughout the forecast period. The weaker labour market gives lower wage pressure, and companies press their profit margins more than in the baseline scenario. This will result in lower inflation, which in turn leads to a somewhat more expansionary monetary policy. In this scenario, the Riksbank lowers the repo rate in the second half of 2013.
General government net lending as a proportion of GDP will gradually worsen by 0.1–0.6 percentage points compared with the baseline scenario. This is mainly due to lower VAT revenues as household consumption increase more slowly than in the baseline scenario. The payroll-tax revenues also have a weaker development as a result of both fewer hours worked and lower wage increases. Since both wages and interest rates are lower than in the forecast, general government expenditure will also be reduced, which to some extent mitigates the effect of lower revenues.
Table 14 Alternative scenario 3: Higher levels of household saving Forecast according to the baseline scenario in parentheses, annual percentage change, unless otherwise stated
2013 2014 2015 2016
GDP 1.0 2.0 2.9 3.2
(1.2) (2.3) (3.4) (3.5)
Employment1 0.1 -0.3 0.5 1.3
(0.2) (-0.1) (0.6) (1.5)
Unemployment1.2 8.4 8.7 8.5 7.6
(8.3) (8.4) (8.1) (7.1)
GDP gap3 -3.7 -3.9 -3.5 -2.7
(-3.5) (-3.3) (-2.3) (-1.1)
Repo rate4 0.75 0.75 1.00 1.50
(1.00) (1.00) (1.75) (2.75)
CPIF5 1.0 1.1 1.3 1.5
(1.1) (1.3) (1.5) (1.8)
Net lending6 -1.7 -1.3 -0.4 0.5
(-1.6) (-1.0) (0.0) (1.1) 1 15–74 years. 2 Per cent of the labour force. 3 The difference between actual and potential GDP as a percentage of potential GDP. 4 Closing rate. 5 Annual average. 6 Per cent of GDP. Source: Own calculations.
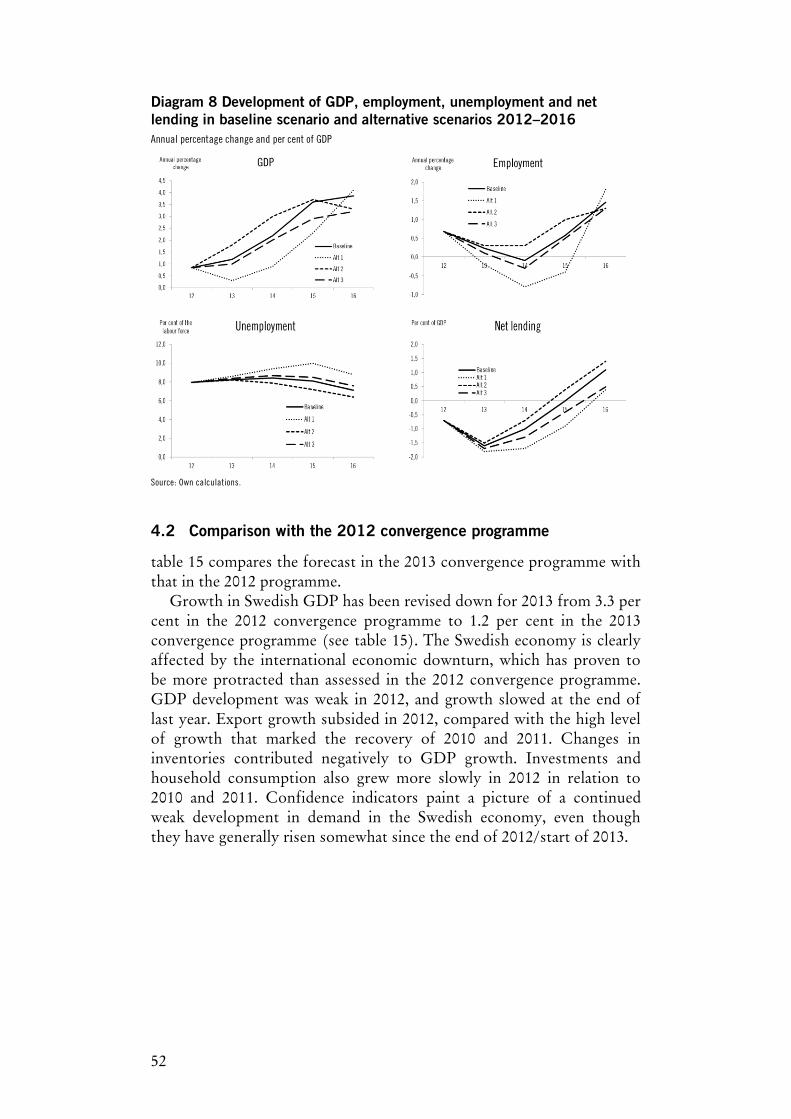
52
Diagram 8 Development of GDP, employment, unemployment and net lending in baseline scenario and alternative scenarios 2012–2016 Annual percentage change and per cent of GDP
Source: Own calculations.
4.2 Comparison with the 2012 convergence programme
table 15 compares the forecast in the 2013 convergence programme with that in the 2012 programme.
Growth in Swedish GDP has been revised down for 2013 from 3.3 per cent in the 2012 convergence programme to 1.2 per cent in the 2013 convergence programme (see table 15). The Swedish economy is clearly affected by the international economic downturn, which has proven to be more protracted than assessed in the 2012 convergence programme. GDP development was weak in 2012, and growth slowed at the end of last year. Export growth subsided in 2012, compared with the high level of growth that marked the recovery of 2010 and 2011. Changes in inventories contributed negatively to GDP growth. Investments and household consumption also grew more slowly in 2012 in relation to 2010 and 2011. Confidence indicators paint a picture of a continued weak development in demand in the Swedish economy, even though they have generally risen somewhat since the end of 2012/start of 2013.
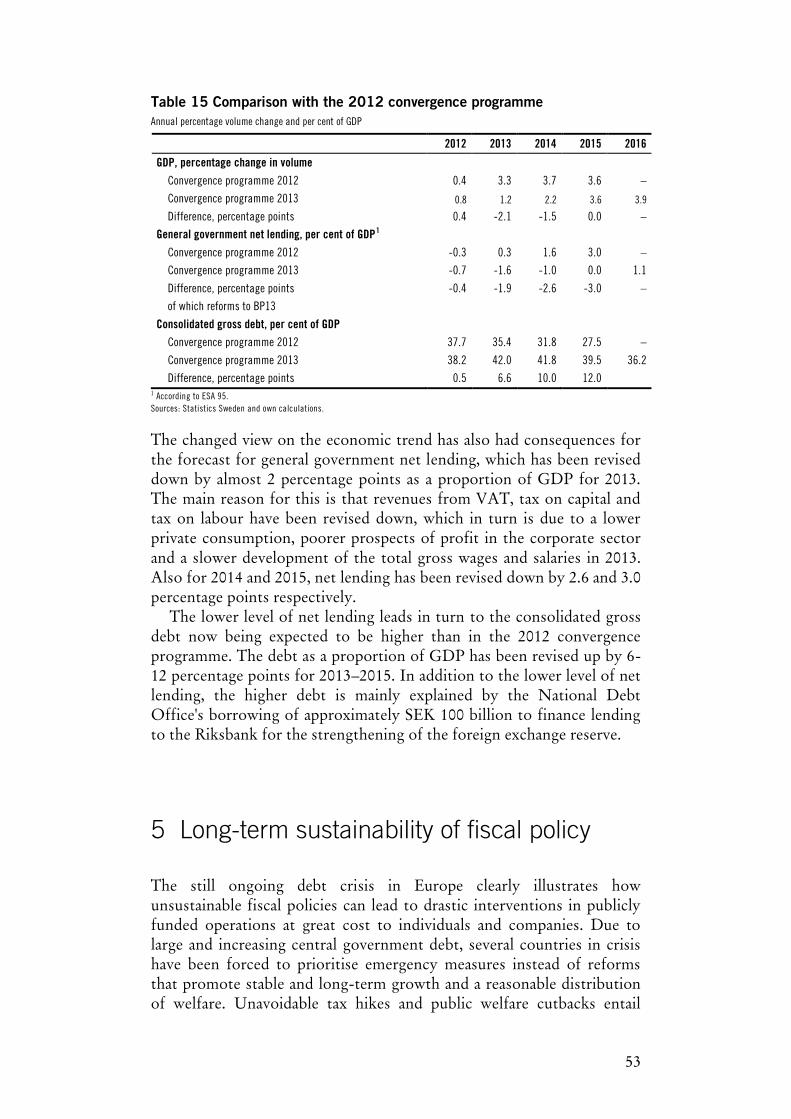
53
Table 15 Comparison with the 2012 convergence programme Annual percentage volume change and per cent of GDP
2012 2013 2014 2015 2016
GDP, percentage change in volume
Convergence programme 2012 0.4 3.3 3.7 3.6 –
Convergence programme 2013 0.8 1.2 2.2 3.6 3.9
Difference, percentage points 0.4 -2.1 -1.5 0.0 –
General government net lending, per cent of GDP1
Convergence programme 2012 -0.3 0.3 1.6 3.0 –
Convergence programme 2013 -0.7 -1.6 -1.0 0.0 1.1
Difference, percentage points -0.4 -1.9 -2.6 -3.0 –
of which reforms to BP13
Consolidated gross debt, per cent of GDP
Convergence programme 2012 37.7 35.4 31.8 27.5 –
Convergence programme 2013 38.2 42.0 41.8 39.5 36.2
Difference, percentage points 0.5 6.6 10.0 12.0 1 According to ESA 95. Sources: Statistics Sweden and own calculations.
The changed view on the economic trend has also had consequences for the forecast for general government net lending, which has been revised down by almost 2 percentage points as a proportion of GDP for 2013. The main reason for this is that revenues from VAT, tax on capital and tax on labour have been revised down, which in turn is due to a lower private consumption, poorer prospects of profit in the corporate sector and a slower development of the total gross wages and salaries in 2013. Also for 2014 and 2015, net lending has been revised down by 2.6 and 3.0 percentage points respectively.
The lower level of net lending leads in turn to the consolidated gross debt now being expected to be higher than in the 2012 convergence programme. The debt as a proportion of GDP has been revised up by 6-12 percentage points for 2013–2015. In addition to the lower level of net lending, the higher debt is mainly explained by the National Debt Office's borrowing of approximately SEK 100 billion to finance lending to the Riksbank for the strengthening of the foreign exchange reserve.
5 Long-term sustainability of fiscal policy
The still ongoing debt crisis in Europe clearly illustrates how unsustainable fiscal policies can lead to drastic interventions in publicly funded operations at great cost to individuals and companies. Due to large and increasing central government debt, several countries in crisis have been forced to prioritise emergency measures instead of reforms that promote stable and long-term growth and a reasonable distribution of welfare. Unavoidable tax hikes and public welfare cutbacks entail
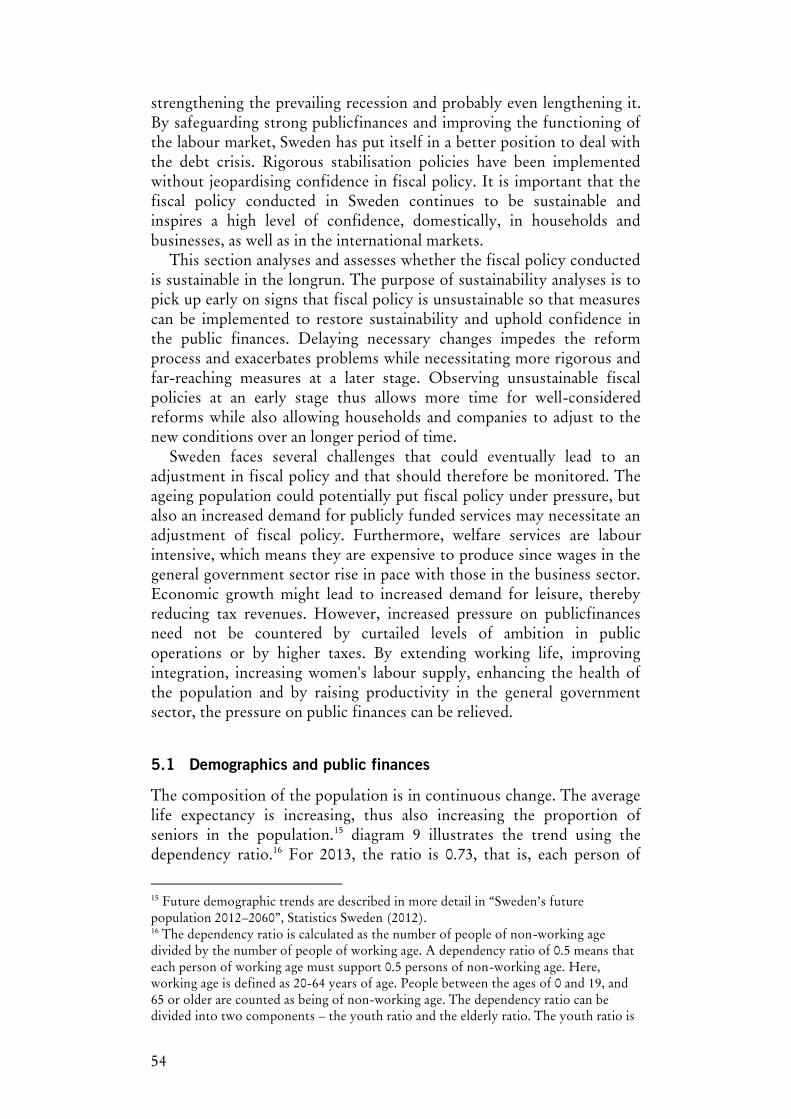
54
strengthening the prevailing recession and probably even lengthening it. By safeguarding strong publicfinances and improving the functioning of the labour market, Sweden has put itself in a better position to deal with the debt crisis. Rigorous stabilisation policies have been implemented without jeopardising confidence in fiscal policy. It is important that the fiscal policy conducted in Sweden continues to be sustainable and inspires a high level of confidence, domestically, in households and businesses, as well as in the international markets.
This section analyses and assesses whether the fiscal policy conducted is sustainable in the longrun. The purpose of sustainability analyses is to pick up early on signs that fiscal policy is unsustainable so that measures can be implemented to restore sustainability and uphold confidence in the public finances. Delaying necessary changes impedes the reform process and exacerbates problems while necessitating more rigorous and far-reaching measures at a later stage. Observing unsustainable fiscal policies at an early stage thus allows more time for well-considered reforms while also allowing households and companies to adjust to the new conditions over an longer period of time.
Sweden faces several challenges that could eventually lead to an adjustment in fiscal policy and that should therefore be monitored. The ageing population could potentially put fiscal policy under pressure, but also an increased demand for publicly funded services may necessitate an adjustment of fiscal policy. Furthermore, welfare services are labour intensive, which means they are expensive to produce since wages in the general government sector rise in pace with those in the business sector. Economic growth might lead to increased demand for leisure, thereby reducing tax revenues. However, increased pressure on publicfinances need not be countered by curtailed levels of ambition in public operations or by higher taxes. By extending working life, improving integration, increasing women's labour supply, enhancing the health of the population and by raising productivity in the general government sector, the pressure on public finances can be relieved.
5.1 Demographics and public finances
The composition of the population is in continuous change. The average life expectancy is increasing, thus also increasing the proportion of seniors in the population.15 diagram 9 illustrates the trend using the dependency ratio.16 For 2013, the ratio is 0.73, that is, each person of
15 Future demographic trends are described in more detail in “Sweden’s future population 2012–2060”, Statistics Sweden (2012). 16 The dependency ratio is calculated as the number of people of non-working age divided by the number of people of working age. A dependency ratio of 0.5 means that each person of working age must support 0.5 persons of non-working age. Here, working age is defined as 20-64 years of age. People between the ages of 0 and 19, and 65 or older are counted as being of non-working age. The dependency ratio can be divided into two components – the youth ratio and the elderly ratio. The youth ratio is
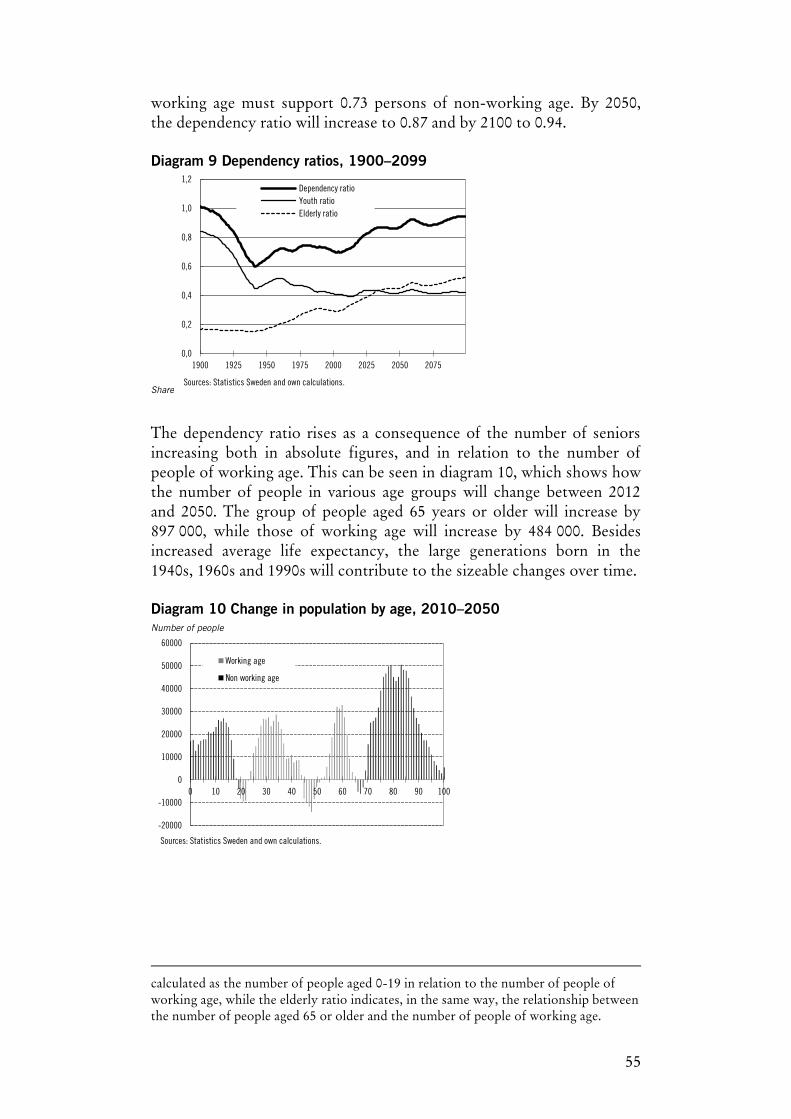
55
working age must support 0.73 persons of non-working age. By 2050, the dependency ratio will increase to 0.87 and by 2100 to 0.94. Diagram 9 Dependency ratios, 1900–2099
Share
The dependency ratio rises as a consequence of the number of seniors increasing both in absolute figures, and in relation to the number of people of working age. This can be seen in diagram 10, which shows how the number of people in various age groups will change between 2012 and 2050. The group of people aged 65 years or older will increase by 897 000, while those of working age will increase by 484 000. Besides increased average life expectancy, the large generations born in the 1940s, 1960s and 1990s will contribute to the sizeable changes over time.
Diagram 10 Change in population by age, 2010–2050 Number of people
calculated as the number of people aged 0-19 in relation to the number of people of working age, while the elderly ratio indicates, in the same way, the relationship between the number of people aged 65 or older and the number of people of working age.
0,0
0,2
0,4
0,6
0,8
1,0
1,2
1900 1925 1950 1975 2000 2025 2050 2075
Dependency ratioYouth ratioElderly ratio
Sources: Statistics Sweden and own calculations.
-20000
-10000
0
10000
20000
30000
40000
50000
60000
0 10 20 30 40 50 60 70 80 90 100
Working age
Non working age
Sources: Statistics Sweden and own calculations.
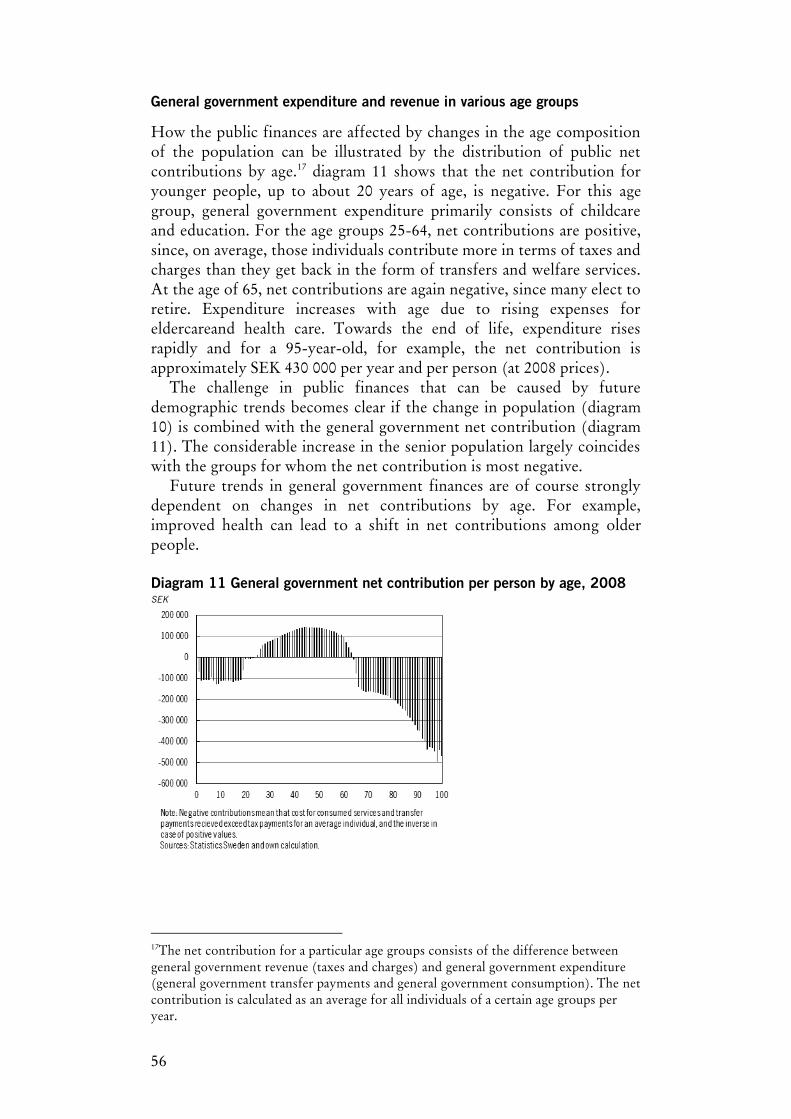
56
General government expenditure and revenue in various age groups
How the public finances are affected by changes in the age composition of the population can be illustrated by the distribution of public net contributions by age.17 diagram 11 shows that the net contribution for younger people, up to about 20 years of age, is negative. For this age group, general government expenditure primarily consists of childcare and education. For the age groups 25-64, net contributions are positive, since, on average, those individuals contribute more in terms of taxes and charges than they get back in the form of transfers and welfare services. At the age of 65, net contributions are again negative, since many elect to retire. Expenditure increases with age due to rising expenses for eldercareand health care. Towards the end of life, expenditure rises rapidly and for a 95-year-old, for example, the net contribution is approximately SEK 430 000 per year and per person (at 2008 prices).
The challenge in public finances that can be caused by future demographic trends becomes clear if the change in population (diagram 10) is combined with the general government net contribution (diagram 11). The considerable increase in the senior population largely coincides with the groups for whom the net contribution is most negative.
Future trends in general government finances are of course strongly dependent on changes in net contributions by age. For example, improved health can lead to a shift in net contributions among older people.
Diagram 11 General government net contribution per person by age, 2008 SEK
17The net contribution for a particular age groups consists of the difference between general government revenue (taxes and charges) and general government expenditure (general government transfer payments and general government consumption). The net contribution is calculated as an average for all individuals of a certain age groups per year.
57
5.2 Calculations of fiscal sustainability
Baseline scenario
The baseline scenario is based on the demographic changes. It should be emphasised that the baseline scenario does not necessarily illustrate the most probable development of the Swedish economy and public finances. The ambition behind the baseline scenario is rather that it should reflect developments in a state of unchanged policies and unchanged behaviour regarding such factors as labour force participation.
Calculation assumptions
The starting point for the long-term projection of the Swedish economy and the public finances is a forecast for the period up until and including 2017. The forecast for the period up until 2016 is presented in Section 2. In 2012, general government primary net lending corresponded to -1.8 per cent of GDP.18 Between 2014 and 2020, there will be a gradual adjustment towards a balanced resource utilisation in the economy, with higher employment and lower unemployment, which will improve the position of the public finances. In 2017, primary net lending and the total net lending in the general government sector is calculated to amount to 1.1 and 2.0 per cent of GDP respectively, which established a favourable starting point, from the perspective of public finances, for the long-term projection.
Productivity in the business sector is assumed to increase by 2.2 per cent in the long term. In the general government sector, however, it is assumed that labour productivity is constant. The difference in the productivity trend between the general government and private sectors, together with an assumption that the general government sector wage trend follows the business sector wage trend, causes the price of producing one unit to increase more rapidly in the general government sector than in the business sector (i.e. the Baumol Effect).
In the baseline scenario, the labour market behaviour of the population is assumed to remain unchanged as of 2018, so that the labour supply (that is, labour force participation, unemployment and average hours worked) in terms of age and gender remains constant. This means, for example, that in the future, a 50-year-old woman will work as much as a 50-year-old woman works today.
The scenario is also based on the assumption that fiscal policy remains unchanged. This means that taxes are kept at the same level as in 2017 so that their share of the tax base is constant. For general government consumption, it is assumed that the standard per user of a certain age
18 Primary net lending is the general government sector’s revenues less charges, excluding interest payments and income from capital. Net lending corresponds to the amount saved when interest payments and income from capital are included.
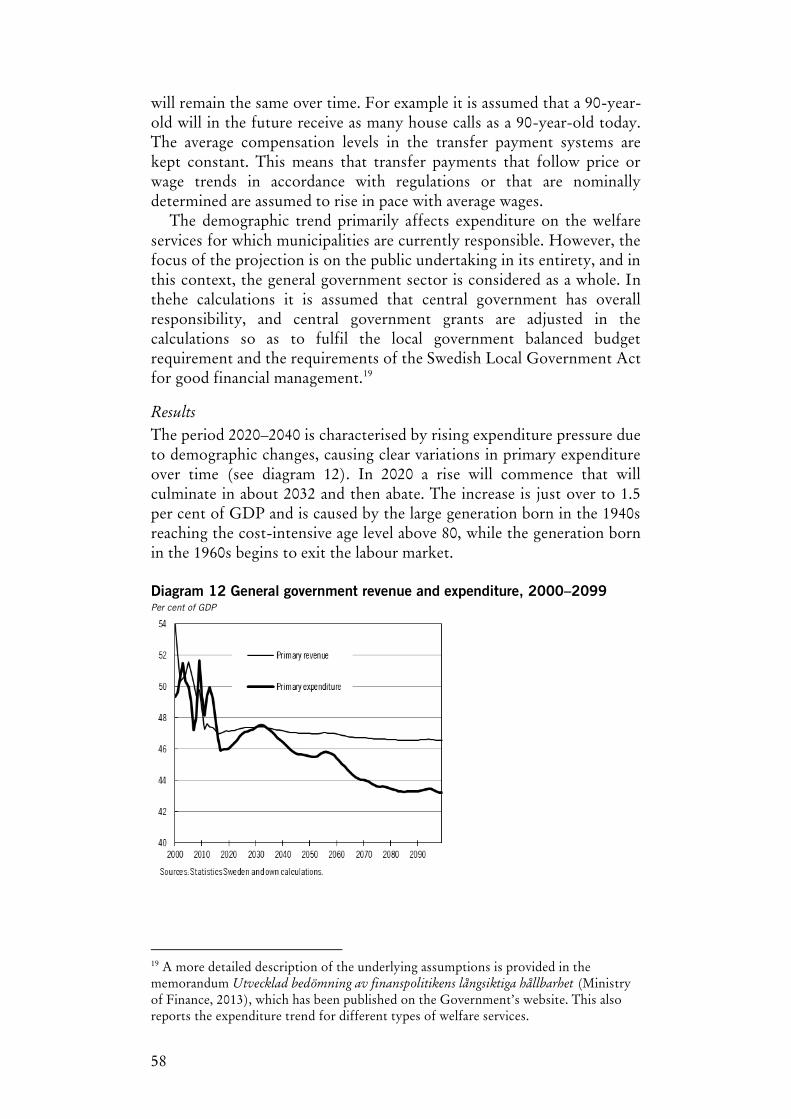
58
will remain the same over time. For example it is assumed that a 90-year-old will in the future receive as many house calls as a 90-year-old today. The average compensation levels in the transfer payment systems are kept constant. This means that transfer payments that follow price or wage trends in accordance with regulations or that are nominally determined are assumed to rise in pace with average wages.
The demographic trend primarily affects expenditure on the welfare services for which municipalities are currently responsible. However, the focus of the projection is on the public undertaking in its entirety, and in this context, the general government sector is considered as a whole. In thehe calculations it is assumed that central government has overall responsibility, and central government grants are adjusted in the calculations so as to fulfil the local government balanced budget requirement and the requirements of the Swedish Local Government Act for good financial management.19
Results
The period 2020–2040 is characterised by rising expenditure pressure due to demographic changes, causing clear variations in primary expenditure over time (see diagram 12). In 2020 a rise will commence that will culminate in about 2032 and then abate. The increase is just over to 1.5 per cent of GDP and is caused by the large generation born in the 1940s reaching the cost-intensive age level above 80, while the generation born in the 1960s begins to exit the labour market.
Diagram 12 General government revenue and expenditure, 2000–2099 Per cent of GDP
19 A more detailed description of the underlying assumptions is provided in the memorandum Utvecklad bedömning av finanspolitikens långsiktiga hållbarhet (Ministry of Finance, 2013), which has been published on the Government’s website. This also reports the expenditure trend for different types of welfare services.
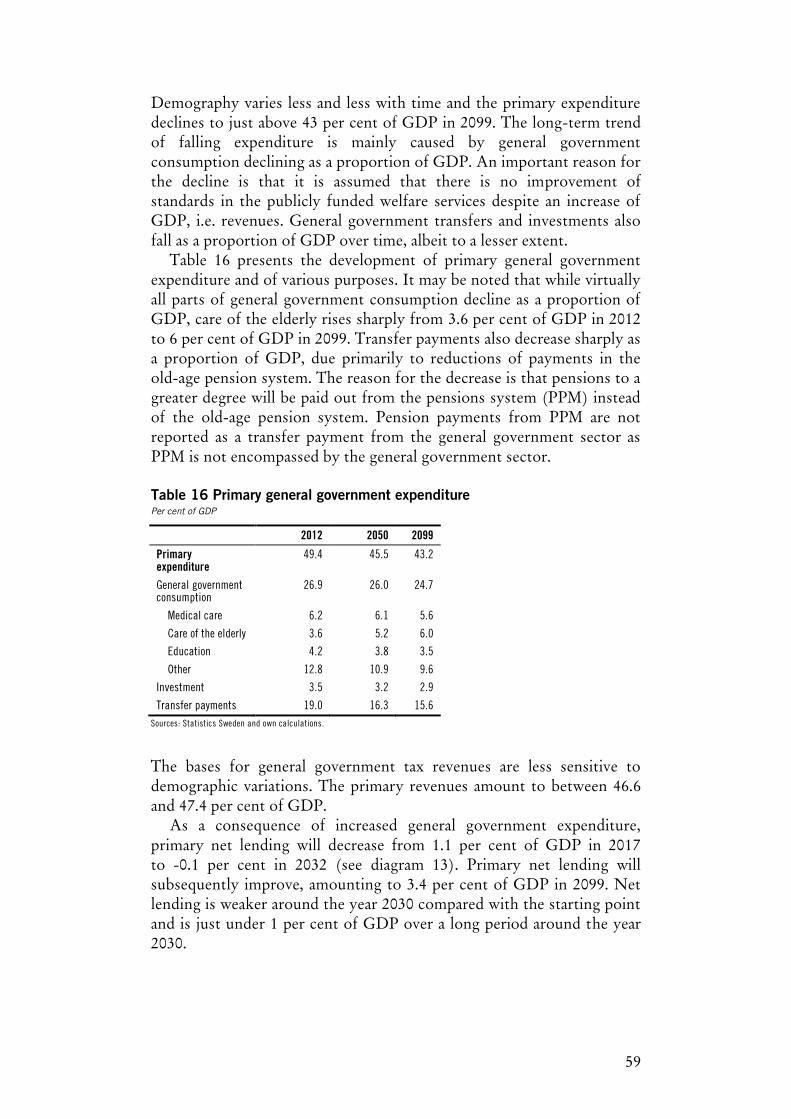
59
Demography varies less and less with time and the primary expenditure declines to just above 43 per cent of GDP in 2099. The long-term trend of falling expenditure is mainly caused by general government consumption declining as a proportion of GDP. An important reason for the decline is that it is assumed that there is no improvement of standards in the publicly funded welfare services despite an increase of GDP, i.e. revenues. General government transfers and investments also fall as a proportion of GDP over time, albeit to a lesser extent.
Table 16 presents the development of primary general government expenditure and of various purposes. It may be noted that while virtually all parts of general government consumption decline as a proportion of GDP, care of the elderly rises sharply from 3.6 per cent of GDP in 2012 to 6 per cent of GDP in 2099. Transfer payments also decrease sharply as a proportion of GDP, due primarily to reductions of payments in the old-age pension system. The reason for the decrease is that pensions to a greater degree will be paid out from the pensions system (PPM) instead of the old-age pension system. Pension payments from PPM are not reported as a transfer payment from the general government sector as PPM is not encompassed by the general government sector.
Table 16 Primary general government expenditure Per cent of GDP
2012 2050 2099
Primary expenditure
49.4 45.5 43.2
General government consumption
26.9 26.0 24.7
Medical care 6.2 6.1 5.6
Care of the elderly 3.6 5.2 6.0
Education 4.2 3.8 3.5
Other 12.8 10.9 9.6
Investment 3.5 3.2 2.9
Transfer payments 19.0 16.3 15.6 Sources: Statistics Sweden and own calculations.
The bases for general government tax revenues are less sensitive to demographic variations. The primary revenues amount to between 46.6 and 47.4 per cent of GDP.
As a consequence of increased general government expenditure, primary net lending will decrease from 1.1 per cent of GDP in 2017 to -0.1 per cent in 2032 (see diagram 13). Primary net lending will subsequently improve, amounting to 3.4 per cent of GDP in 2099. Net lending is weaker around the year 2030 compared with the starting point and is just under 1 per cent of GDP over a long period around the year 2030.
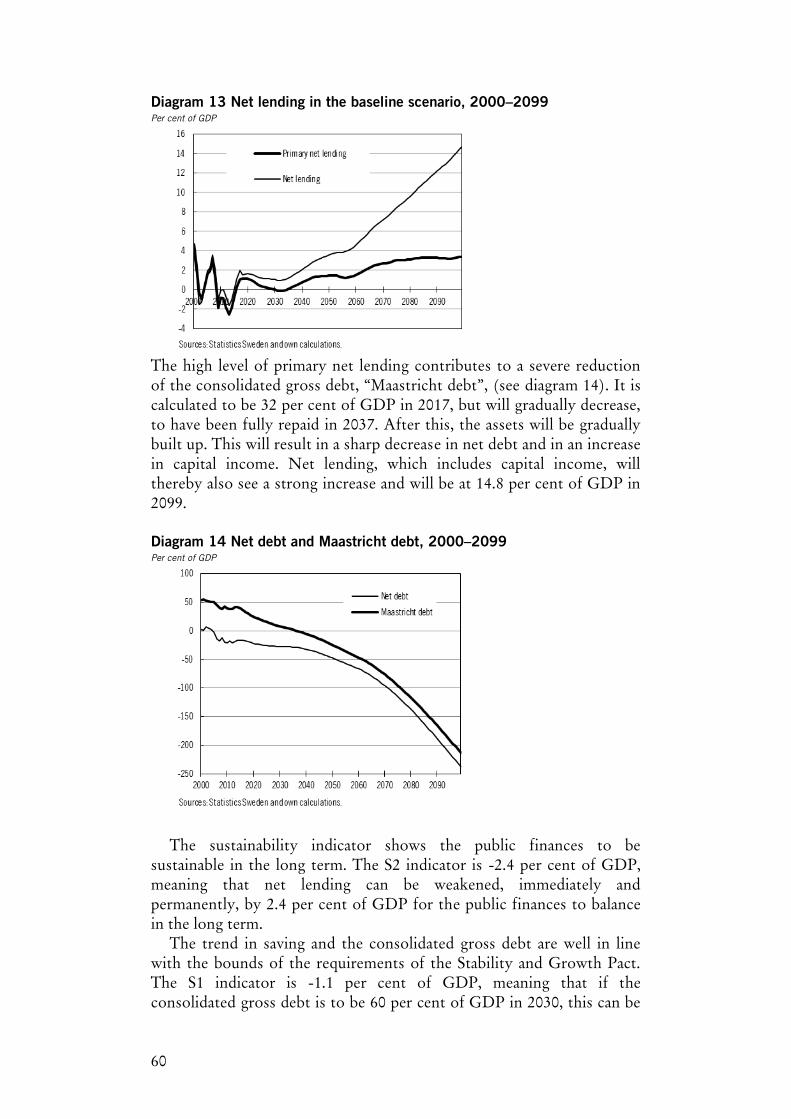
60
Diagram 13 Net lending in the baseline scenario, 2000–2099 Per cent of GDP
The high level of primary net lending contributes to a severe reduction of the consolidated gross debt, “Maastricht debt”, (see diagram 14). It is calculated to be 32 per cent of GDP in 2017, but will gradually decrease, to have been fully repaid in 2037. After this, the assets will be gradually built up. This will result in a sharp decrease in net debt and in an increase in capital income. Net lending, which includes capital income, will thereby also see a strong increase and will be at 14.8 per cent of GDP in 2099.
Diagram 14 Net debt and Maastricht debt, 2000–2099 Per cent of GDP
The sustainability indicator shows the public finances to be
sustainable in the long term. The S2 indicator is -2.4 per cent of GDP, meaning that net lending can be weakened, immediately and permanently, by 2.4 per cent of GDP for the public finances to balance in the long term.
The trend in saving and the consolidated gross debt are well in line with the bounds of the requirements of the Stability and Growth Pact. The S1 indicator is -1.1 per cent of GDP, meaning that if the consolidated gross debt is to be 60 per cent of GDP in 2030, this can be
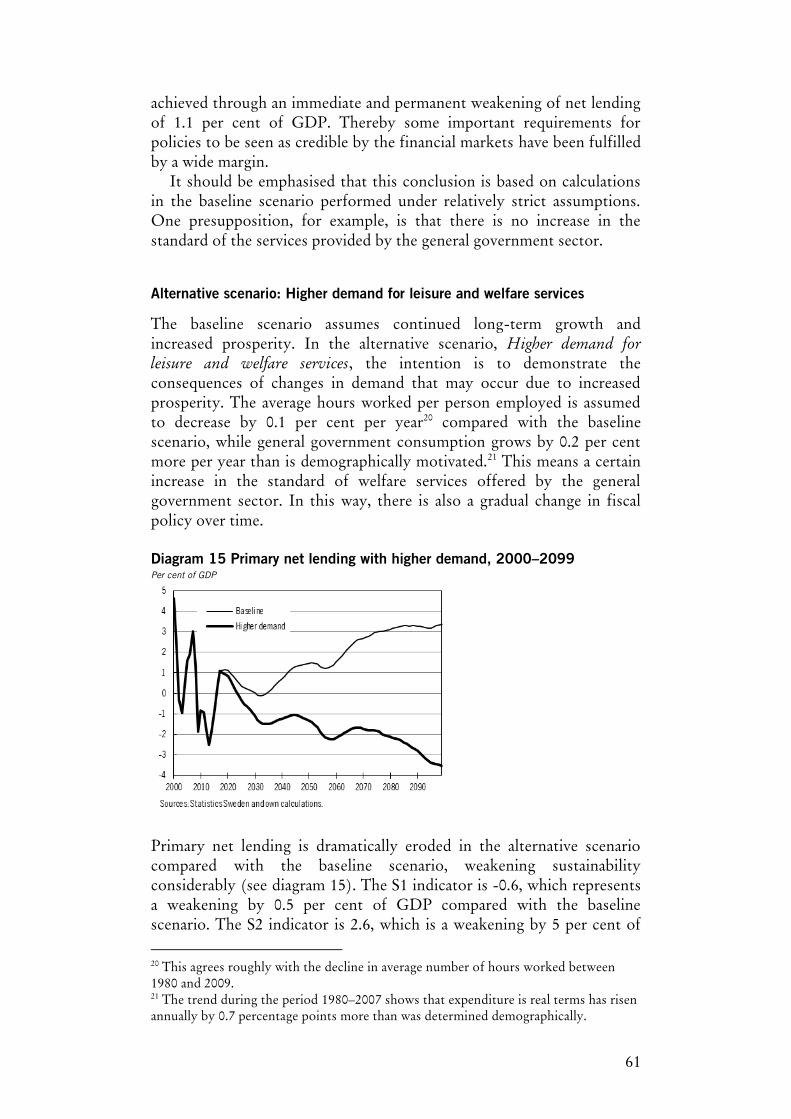
61
achieved through an immediate and permanent weakening of net lending of 1.1 per cent of GDP. Thereby some important requirements for policies to be seen as credible by the financial markets have been fulfilled by a wide margin.
It should be emphasised that this conclusion is based on calculations in the baseline scenario performed under relatively strict assumptions. One presupposition, for example, is that there is no increase in the standard of the services provided by the general government sector.
Alternative scenario: Higher demand for leisure and welfare services
The baseline scenario assumes continued long-term growth and increased prosperity. In the alternative scenario, Higher demand for leisure and welfare services, the intention is to demonstrate the consequences of changes in demand that may occur due to increased prosperity. The average hours worked per person employed is assumed to decrease by 0.1 per cent per year20 compared with the baseline scenario, while general government consumption grows by 0.2 per cent more per year than is demographically motivated.21 This means a certain increase in the standard of welfare services offered by the general government sector. In this way, there is also a gradual change in fiscal policy over time.
Diagram 15 Primary net lending with higher demand, 2000–2099 Per cent of GDP
Primary net lending is dramatically eroded in the alternative scenario compared with the baseline scenario, weakening sustainability considerably (see diagram 15). The S1 indicator is -0.6, which represents a weakening by 0.5 per cent of GDP compared with the baseline scenario. The S2 indicator is 2.6, which is a weakening by 5 per cent of
20 This agrees roughly with the decline in average number of hours worked between 1980 and 2009. 21 The trend during the period 1980–2007 shows that expenditure is real terms has risen annually by 0.7 percentage points more than was determined demographically.
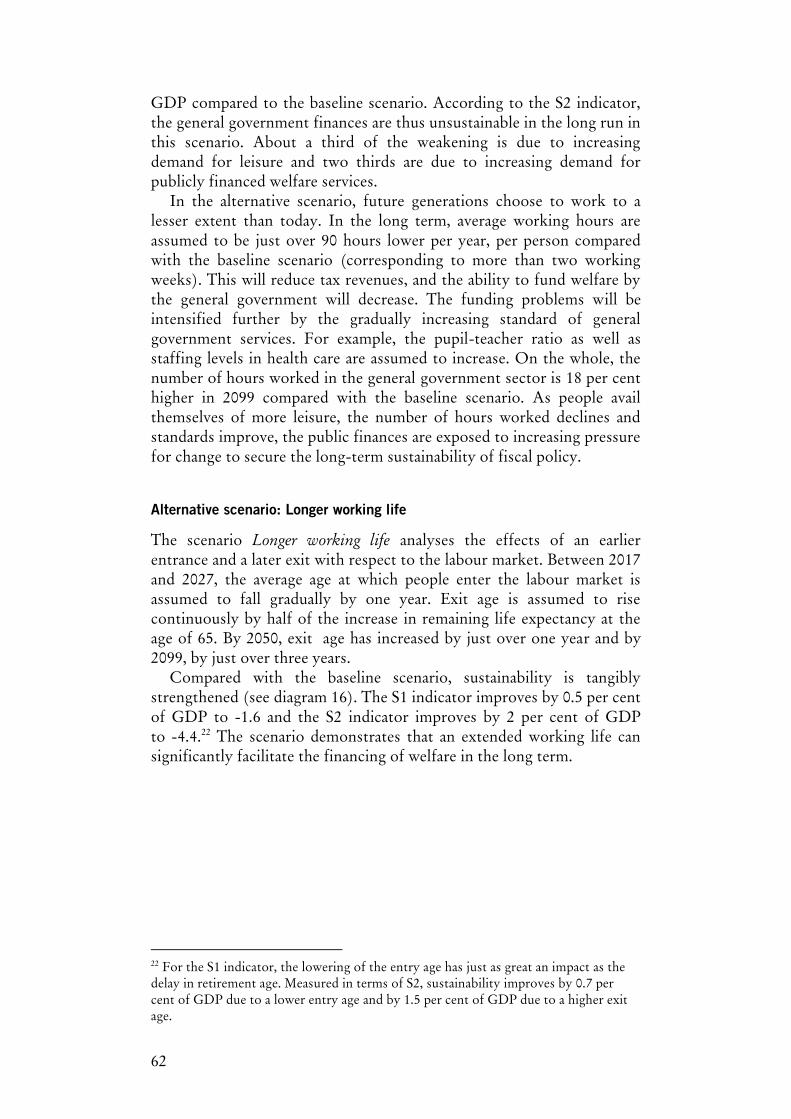
62
GDP compared to the baseline scenario. According to the S2 indicator, the general government finances are thus unsustainable in the long run in this scenario. About a third of the weakening is due to increasing demand for leisure and two thirds are due to increasing demand for publicly financed welfare services.
In the alternative scenario, future generations choose to work to a lesser extent than today. In the long term, average working hours are assumed to be just over 90 hours lower per year, per person compared with the baseline scenario (corresponding to more than two working weeks). This will reduce tax revenues, and the ability to fund welfare by the general government will decrease. The funding problems will be intensified further by the gradually increasing standard of general government services. For example, the pupil-teacher ratio as well as staffing levels in health care are assumed to increase. On the whole, the number of hours worked in the general government sector is 18 per cent higher in 2099 compared with the baseline scenario. As people avail themselves of more leisure, the number of hours worked declines and standards improve, the public finances are exposed to increasing pressure for change to secure the long-term sustainability of fiscal policy.
Alternative scenario: Longer working life
The scenario Longer working life analyses the effects of an earlier entrance and a later exit with respect to the labour market. Between 2017 and 2027, the average age at which people enter the labour market is assumed to fall gradually by one year. Exit age is assumed to rise continuously by half of the increase in remaining life expectancy at the age of 65. By 2050, exit age has increased by just over one year and by 2099, by just over three years.
Compared with the baseline scenario, sustainability is tangibly strengthened (see diagram 16). The S1 indicator improves by 0.5 per cent of GDP to -1.6 and the S2 indicator improves by 2 per cent of GDP to -4.4.22 The scenario demonstrates that an extended working life can significantly facilitate the financing of welfare in the long term.
22 For the S1 indicator, the lowering of the entry age has just as great an impact as the delay in retirement age. Measured in terms of S2, sustainability improves by 0.7 per cent of GDP due to a lower entry age and by 1.5 per cent of GDP due to a higher exit age.
63
Diagram 16 Primary net lending with a longer working life, 2000–2099 Per cent of GDP
Sensitivity in the calculations
The S1 and S2 sustainability indicators show the public finances to be sustainable in the long term in the baseline scenario. The results should, however, be interpreted with great caution for several reasons.
The fiscal challenges addressed in this section have an effect over a very long term and the calculations often extend far into the future for that reason. The long calculation horizon entails a sizeable element of uncertainty, which also affects the sustainability assessment. It should also be added that the calculations depend strongly on the assumptions made. To quantify and illustrate the uncertainty, table 17 reports how the alternative assumptions upon which the calculations are based affect S1 and S2. A number of sensitivity analyses are also reported.23
23 In the sensitivity analyses More leisure and Raised standards, the assumptions are the same as in the Increased demand for leisure and welfare services scenario. In the analyses Lower entry age and Higher exit age the assumptions are the same as in the A longer working life scenario.
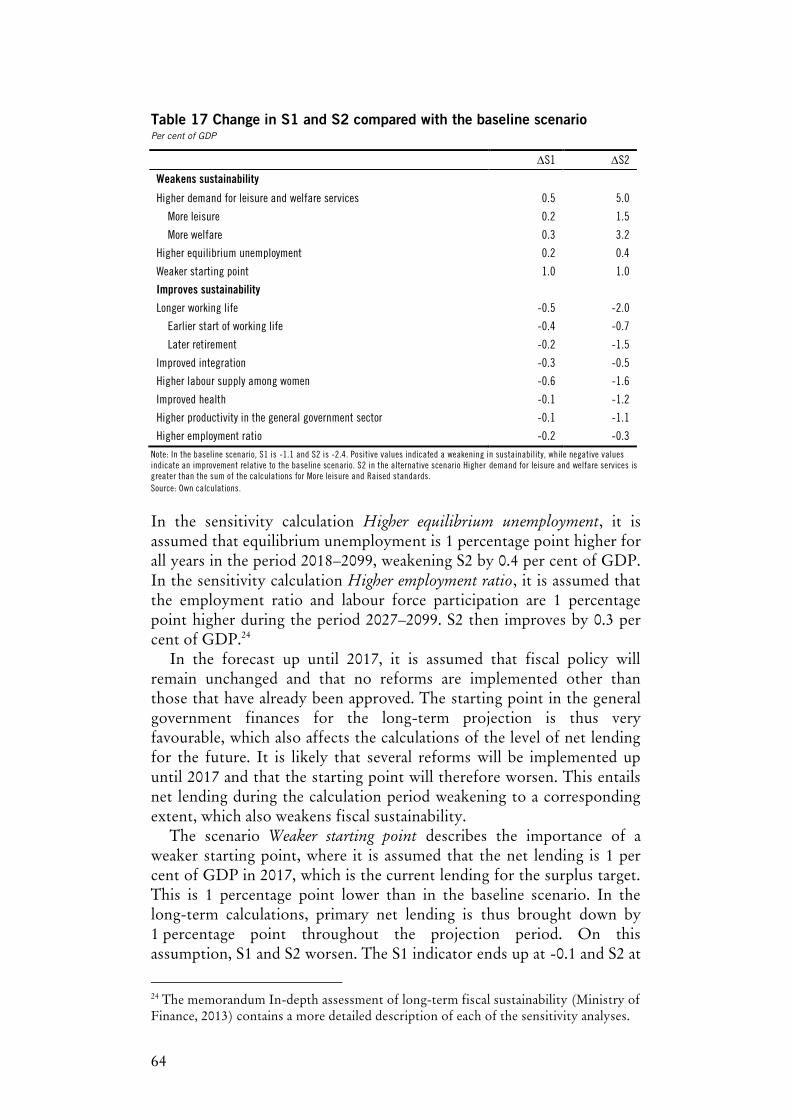
64
Table 17 Change in S1 and S2 compared with the baseline scenario Per cent of GDP
S1 S2
Weakens sustainability
Higher demand for leisure and welfare services 0.5 5.0
More leisure 0.2 1.5
More welfare 0.3 3.2
Higher equilibrium unemployment 0.2 0.4
Weaker starting point 1.0 1.0
Improves sustainability
Longer working life -0.5 -2.0
Earlier start of working life -0.4 -0.7
Later retirement -0.2 -1.5
Improved integration -0.3 -0.5
Higher labour supply among women -0.6 -1.6
Improved health -0.1 -1.2
Higher productivity in the general government sector -0.1 -1.1
Higher employment ratio -0.2 -0.3
Note: In the baseline scenario, S1 is -1.1 and S2 is -2.4. Positive values indicated a weakening in sustainability, while negative values indicate an improvement relative to the baseline scenario. S2 in the alternative scenario Higher demand for leisure and welfare services is greater than the sum of the calculations for More leisure and Raised standards. Source: Own calculations.
In the sensitivity calculation Higher equilibrium unemployment, it is assumed that equilibrium unemployment is 1 percentage point higher for all years in the period 2018–2099, weakening S2 by 0.4 per cent of GDP. In the sensitivity calculation Higher employment ratio, it is assumed that the employment ratio and labour force participation are 1 percentage point higher during the period 2027–2099. S2 then improves by 0.3 per cent of GDP.24
In the forecast up until 2017, it is assumed that fiscal policy will remain unchanged and that no reforms are implemented other than those that have already been approved. The starting point in the general government finances for the long-term projection is thus very favourable, which also affects the calculations of the level of net lending for the future. It is likely that several reforms will be implemented up until 2017 and that the starting point will therefore worsen. This entails net lending during the calculation period weakening to a corresponding extent, which also weakens fiscal sustainability.
The scenario Weaker starting point describes the importance of a weaker starting point, where it is assumed that the net lending is 1 per cent of GDP in 2017, which is the current lending for the surplus target. This is 1 percentage point lower than in the baseline scenario. In the long-term calculations, primary net lending is thus brought down by 1 percentage point throughout the projection period. On this assumption, S1 and S2 worsen. The S1 indicator ends up at -0.1 and S2 at
24 The memorandum In-depth assessment of long-term fiscal sustainability (Ministry of Finance, 2013) contains a more detailed description of each of the sensitivity analyses.
65
-1.4, thus showing fiscal policy to be fiscally sustainable still, even though net lending is lower at the starting point.
The period 2020-2040 is, however, also characterised by rising expenditure pressure due to demographic changes. Consequently, a weakening of the level of the starting point changes the picture vis-à-vis sustainability considerably, despite the public finances being considered sustainable according to S2. Primary net lending is weaker and a primary deficit of more than 1 per cent of GDP occurs over an extended period around 2030. This results in the debt during this period increasing by up to 20 per cent of GDP. Should such a development occur, the financial markets’ risk assessments may be affected, resulting in more stringent borrowing terms, despite demographic pressure being transitional in this case. Furthermore, the conflict between the objectives of stabilisation, redistribution and structural policy becomes more severe. The room for adjustment in stabilisation measures is considerably smaller and possible margins for countering recessions and crises may conflict with desires for reforms in terms of structural and redistribution policy.
The scenario Improved integration assesses the effect of improved integration on sustainability. There it is assumed that employment levels among people born abroad approach those born domestically by one third up until 2027. The number of hours worked in the economy thereby increases by 1.8 per cent up until 2027. This entails an increase in net lending and a strengthening of S1 and S2 by 0.3 and 0.5 per cent of GDP respectively. The calculations do not take into account any costs associated with bringing about the improved integration of those born outside Sweden.
Women's labour supply can increase in several different ways. In the scenario Higher labour supply among women, it is assumed that the working hours of women will increase and that the difference between men and women in the number of hours worked will be thereby halved by 2037. The number of women with sickness and activity compensation is also assumed to decrease. On the whole, this means that the number of hours worked in the economy in 2099 is 6.6 per cent higher compared with the baseline scenario. This entails an increase in net lending and a strengthening of S1 by 0.6 per cent of GDP, while S2 is strengthened by 1.6 per cent of GDP. The calculations do not take into account any costs associated with an increased labour supply among women, such as increasing costs for childcare.
In order to assess how improved health might affect sustainability, the scenario Improved health assumes that the age-specific costs for health care and care of the elderly for persons over 65 are gradually displaced upwards in terms of age in pace with the increase in expected remaining average life expectancy at 65. Thus, one year's increase in average life expectancy means a healthier year, relatively speaking. In 2099, age-specific costs have been displaced by five years of life. Requirements for health care and care services for an 80-year-old in 2099 will therefore be the same as for a 75-year-old today. This displacement entails an increase
66
in net lending and strengthens S1 by 0.1 per cent of GDP and S2 by 1.2 per cent of GDP.
In the scenario Higher productivity in the general government sector, it is assumed that labour productivity in the general government sector rises by 0.1 per cent per year. This improves S1 by 0.1 per cent of GDP and S2 by 1.1 per cent of GDP.
5.3 Overall assessment of the long-term sustainability of fiscal policy
In the baseline scenario fiscal policy is assumed to be unchanged and with no reforms being implemented other than those that have already been approved. Given these conditions, fiscal policy can be considered fiscally sustainable with S1 at -1.1 per cent of GDP and S2 at -2.4 per cent of GDP.
The trend in net lending and the consolidated gross debt also lie within the limits set by the Stability and Growth Pact. Consequently, two important requirements that form the basis for the markets’ assessment of sustainability are fulfilled and the risk of higher risk premiums and interest rates as a consequence of a lack of confidence in public finances can therefore be considered limited.
The trend in net lending in the baseline scenario also shows that the conflicting objectives between financial sustainability and consideration of stabilisation policy, on the one hand, and redistribution policy and structural policy, on the other, are limited.
The new pension system generates strong incentives to work until later in life as average life expectancy increases although if retirement age is not postponed, pensioners’ incomes decrease in relation to those of people in gainful employment. From the perspective of redistribution policy, there is then a risk of fiscal policy having to be realigned in the longer term to meet the needs and demands of future pensioners.
The period 2020–2040 is characterised by demographic expenditure pressure. Primary net lending is expected to decrease by about 1 per cent of GDP between 2020 and 2030. A weakened starting point in terms of the public finances as demographic pressure on expenditure starts to rise in 2020 could entail a lengthy period of weakened general government net lending, resulting in less scope for stabilisation measures and unfinanced reforms of redistribution and structural policy. Combined with possible needs and demands in terms of redistribution policy, for example because pensions are perceived as insufficient, fiscal policy could be forced to manage increasingly severe conflicts of objectives.
A severely weakened starting point in terms of general government finances could therefore confront fiscal policy with problems of sustainability, despite the policy being fiscally sustainable. Considering this background, the long-term fiscal room for manoeuvre generated by good fiscal sustainability according to the baseline scenario is very important.

67
The complex of problems discussed above also shows the importance of continued long-term policies aimed at strengthening the incentives for work and for an extended working life. A prerequisite for everyone to be able to enjoy a good economic standard, even in retirement, and to maintain publicly funded services of high quality, is a long and productive working life. With increased average life expectancy, it is possible to increase both leisure and the amount of time spent in work. As average life expectancy increases, it is therefore important to have a high labour force participation among both women and men, and to extend working life. This can take place both through an earlier entrance and a later exit.
6 Quality in general government finances
6.1 Expenditure
Principles have been developed at the EU level for the production of uniform statistics on the member countries’ distributions of general government finances. Uniform statistics facilitate comparisons of different Member States’ public expenditure and of their development over time. To be able to evaluate whether a change in the composition of general government expenditure has affected long-term growth, further information is required and at a greater degree of detail. The allocation of general government expenditure between different purposes and the change in allocation over time do, however, indicate how different types of expenditure and purposes have been prioritised and provide an indication of policy stance. Table 18 and table 19 provide details of expenditure by purpose in accordance with the COFOG classification25.
25 COFOG (Classification of the Functions of Government) is a tool for reporting and analysing the purposes of the goods and services provided by public entities. The classification is according to international standards.
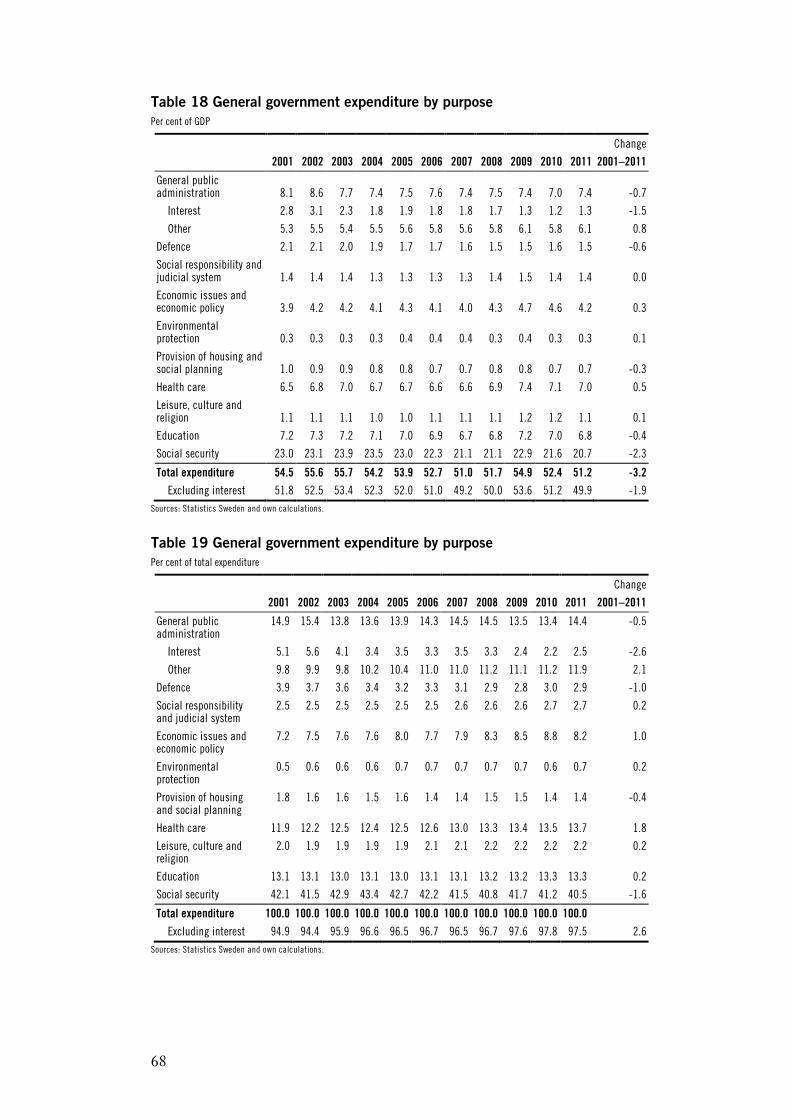
68
Table 18 General government expenditure by purpose Per cent of GDP
Change
2001 2002 2003 2004 2005 2006 2007 2008 2009 2010 2011 2001–2011
General public administration 8.1 8.6 7.7 7.4 7.5 7.6 7.4 7.5 7.4 7.0 7.4 -0.7
Interest 2.8 3.1 2.3 1.8 1.9 1.8 1.8 1.7 1.3 1.2 1.3 -1.5
Other 5.3 5.5 5.4 5.5 5.6 5.8 5.6 5.8 6.1 5.8 6.1 0.8
Defence 2.1 2.1 2.0 1.9 1.7 1.7 1.6 1.5 1.5 1.6 1.5 -0.6
Social responsibility and judicial system 1.4 1.4 1.4 1.3 1.3 1.3 1.3 1.4 1.5 1.4 1.4 0.0
Economic issues and economic policy 3.9 4.2 4.2 4.1 4.3 4.1 4.0 4.3 4.7 4.6 4.2 0.3
Environmental protection 0.3 0.3 0.3 0.3 0.4 0.4 0.4 0.3 0.4 0.3 0.3 0.1
Provision of housing and social planning 1.0 0.9 0.9 0.8 0.8 0.7 0.7 0.8 0.8 0.7 0.7 -0.3
Health care 6.5 6.8 7.0 6.7 6.7 6.6 6.6 6.9 7.4 7.1 7.0 0.5
Leisure, culture and religion 1.1 1.1 1.1 1.0 1.0 1.1 1.1 1.1 1.2 1.2 1.1 0.1
Education 7.2 7.3 7.2 7.1 7.0 6.9 6.7 6.8 7.2 7.0 6.8 -0.4
Social security 23.0 23.1 23.9 23.5 23.0 22.3 21.1 21.1 22.9 21.6 20.7 -2.3
Total expenditure 54.5 55.6 55.7 54.2 53.9 52.7 51.0 51.7 54.9 52.4 51.2 -3.2 Excluding interest 51.8 52.5 53.4 52.3 52.0 51.0 49.2 50.0 53.6 51.2 49.9 -1.9
Sources: Statistics Sweden and own calculations.
Table 19 General government expenditure by purpose Per cent of total expenditure
Change
2001 2002 2003 2004 2005 2006 2007 2008 2009 2010 2011 2001–2011
General public administration
14.9 15.4 13.8 13.6 13.9 14.3 14.5 14.5 13.5 13.4 14.4 -0.5
Interest 5.1 5.6 4.1 3.4 3.5 3.3 3.5 3.3 2.4 2.2 2.5 -2.6
Other 9.8 9.9 9.8 10.2 10.4 11.0 11.0 11.2 11.1 11.2 11.9 2.1
Defence 3.9 3.7 3.6 3.4 3.2 3.3 3.1 2.9 2.8 3.0 2.9 -1.0
Social responsibility and judicial system
2.5 2.5 2.5 2.5 2.5 2.5 2.6 2.6 2.6 2.7 2.7 0.2
Economic issues and economic policy
7.2 7.5 7.6 7.6 8.0 7.7 7.9 8.3 8.5 8.8 8.2 1.0
Environmental protection
0.5 0.6 0.6 0.6 0.7 0.7 0.7 0.7 0.7 0.6 0.7 0.2
Provision of housing and social planning
1.8 1.6 1.6 1.5 1.6 1.4 1.4 1.5 1.5 1.4 1.4 -0.4
Health care 11.9 12.2 12.5 12.4 12.5 12.6 13.0 13.3 13.4 13.5 13.7 1.8
Leisure, culture and religion
2.0 1.9 1.9 1.9 1.9 2.1 2.1 2.2 2.2 2.2 2.2 0.2
Education 13.1 13.1 13.0 13.1 13.0 13.1 13.1 13.2 13.2 13.3 13.3 0.2
Social security 42.1 41.5 42.9 43.4 42.7 42.2 41.5 40.8 41.7 41.2 40.5 -1.6
Total expenditure 100.0 100.0 100.0 100.0 100.0 100.0 100.0 100.0 100.0 100.0 100.0
Excluding interest 94.9 94.4 95.9 96.6 96.5 96.7 96.5 96.7 97.6 97.8 97.5 2.6 Sources: Statistics Sweden and own calculations.

69
Related to GDP, overall expenditure declined over the period 2000-2011, even though it rose notably in 2009 in the wake of the financial crisis. The decline is explained by, among other things, falling interest expenses and the fact that GDP growth was relatively high across that period. A high level of GDP growth means that expenditure following the general price trend gradually falls as a percentage of GDP.
Expenditure on social security in Sweden accounts for more than 20 per cent of GDP and more than 40 per cent of total general government expenditure. These expenditures as a proportion of total expenditure fell from the middle of the first decade of the new millennium, although it rose again in 2009 in connection with the financial crisis. Expenditure on health care also accounts for a major share of general government expenditure. Having amounted to 11 per cent of total expenditure in 2000, the proportion rose over a period of several years and in 2011 amounted to almost 14 per cent. Interest expenditure has fallen considerably, which is mainly the result of the sharp fall in general government consolidated gross debt as a percentage of GDP, at the same time as the interest rate level was relatively low.
6.2 Revenue
Between 2005 and 2012, the tax ratio, i.e. total tax revenue as a percentage of GDP, declined by 3.5 percentage points (see table 20). In 2016, the tax ratio is expected to be 44.1 per cent of GDP.
Tax on labour in particular has declined over the period 2005–2012. The in-work tax credit and lowered social security fees account for most of these tax cuts. Major changes in capital taxation in recent years include the lowering of corporation tax, the abolition of wealth tax and the reduction in tax on property. The contribution by consumption and investment to the balance of resources has increased, contributing to VAT revenues also increasing as a percentage of GDP. Revenue from excise duties, including tax on energy and carbon dioxide, declines despite increased taxes. This decline is explained by more efficient residential heating, the switch from electricity and oil to geothermal heat and district heating, as well as a newer vehicle stock with more energy-efficient engines.
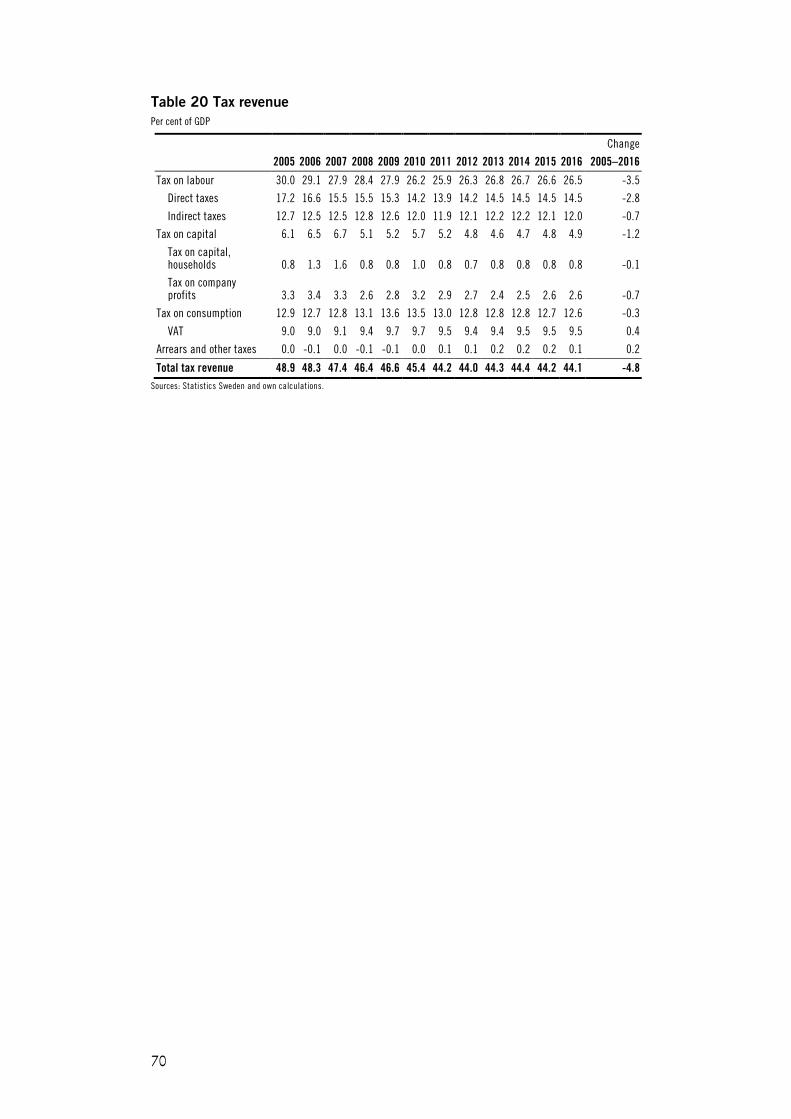
70
Table 20 Tax revenue Per cent of GDP
Change
2005 2006 2007 2008 2009 2010 2011 2012 2013 2014 2015 2016 2005–2016
Tax on labour 30.0 29.1 27.9 28.4 27.9 26.2 25.9 26.3 26.8 26.7 26.6 26.5 -3.5
Direct taxes 17.2 16.6 15.5 15.5 15.3 14.2 13.9 14.2 14.5 14.5 14.5 14.5 -2.8
Indirect taxes 12.7 12.5 12.5 12.8 12.6 12.0 11.9 12.1 12.2 12.2 12.1 12.0 -0.7
Tax on capital 6.1 6.5 6.7 5.1 5.2 5.7 5.2 4.8 4.6 4.7 4.8 4.9 -1.2
Tax on capital, households 0.8 1.3 1.6 0.8 0.8 1.0 0.8 0.7 0.8 0.8 0.8 0.8 -0.1
Tax on company profits 3.3 3.4 3.3 2.6 2.8 3.2 2.9 2.7 2.4 2.5 2.6 2.6 -0.7
Tax on consumption 12.9 12.7 12.8 13.1 13.6 13.5 13.0 12.8 12.8 12.8 12.7 12.6 -0.3
VAT 9.0 9.0 9.1 9.4 9.7 9.7 9.5 9.4 9.4 9.5 9.5 9.5 0.4
Arrears and other taxes 0.0 -0.1 0.0 -0.1 -0.1 0.0 0.1 0.1 0.2 0.2 0.2 0.1 0.2
Total tax revenue 48.9 48.3 47.4 46.4 46.6 45.4 44.2 44.0 44.3 44.4 44.2 44.1 -4.8 Sources: Statistics Sweden and own calculations.
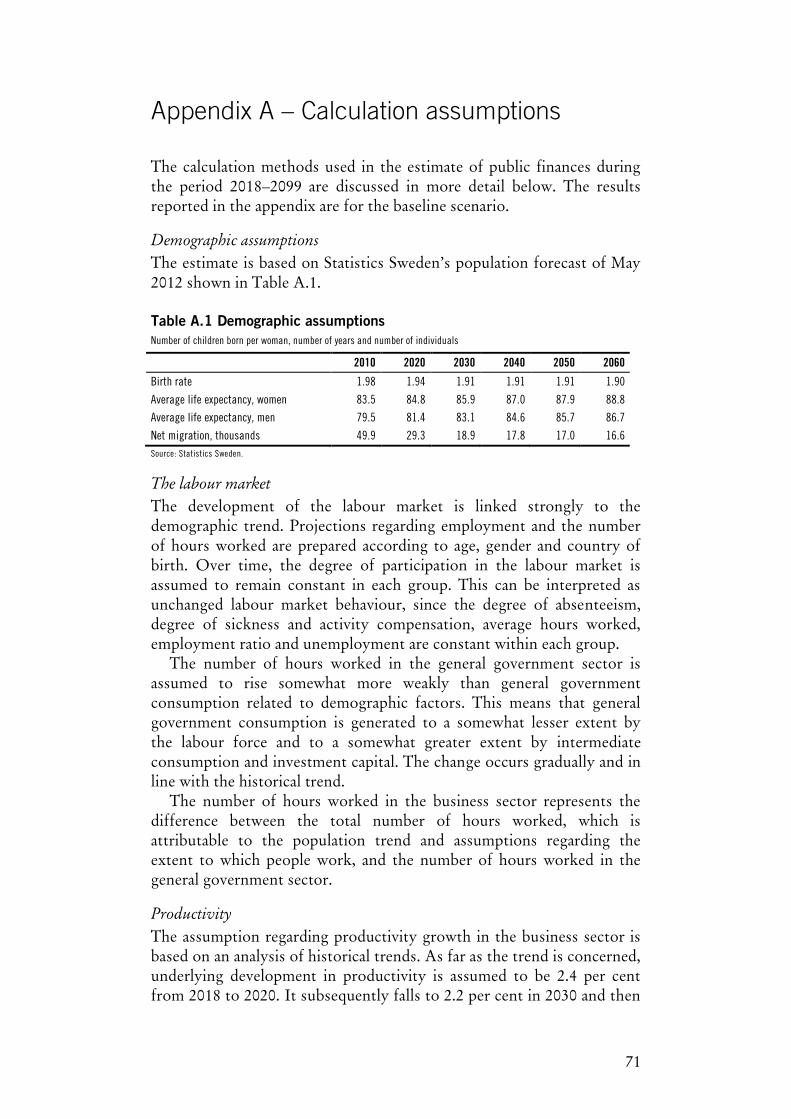
71
Appendix A – Calculation assumptions
The calculation methods used in the estimate of public finances during the period 2018–2099 are discussed in more detail below. The results reported in the appendix are for the baseline scenario.
Demographic assumptions
The estimate is based on Statistics Sweden’s population forecast of May 2012 shown in Table A.1. Table A.1 Demographic assumptions Number of children born per woman, number of years and number of individuals
2010 2020 2030 2040 2050 2060
Birth rate 1.98 1.94 1.91 1.91 1.91 1.90
Average life expectancy, women 83.5 84.8 85.9 87.0 87.9 88.8
Average life expectancy, men 79.5 81.4 83.1 84.6 85.7 86.7
Net migration, thousands 49.9 29.3 18.9 17.8 17.0 16.6 Source: Statistics Sweden.
The labour market
The development of the labour market is linked strongly to the demographic trend. Projections regarding employment and the number of hours worked are prepared according to age, gender and country of birth. Over time, the degree of participation in the labour market is assumed to remain constant in each group. This can be interpreted as unchanged labour market behaviour, since the degree of absenteeism, degree of sickness and activity compensation, average hours worked, employment ratio and unemployment are constant within each group.
The number of hours worked in the general government sector is assumed to rise somewhat more weakly than general government consumption related to demographic factors. This means that general government consumption is generated to a somewhat lesser extent by the labour force and to a somewhat greater extent by intermediate consumption and investment capital. The change occurs gradually and in line with the historical trend.
The number of hours worked in the business sector represents the difference between the total number of hours worked, which is attributable to the population trend and assumptions regarding the extent to which people work, and the number of hours worked in the general government sector.
Productivity
The assumption regarding productivity growth in the business sector is based on an analysis of historical trends. As far as the trend is concerned, underlying development in productivity is assumed to be 2.4 per cent from 2018 to 2020. It subsequently falls to 2.2 per cent in 2030 and then
72
remains at that level of growth. In an international comparison, except for the period 2007–2009, the productivity trend in Sweden has been strong over a period of just less than two decades. It is reasonable to assume that, in the long term, it will adjust to international growth rates. The weak trend in 2007–2009 has not affected the view regarding the long-term productivity trend.
The labour productivity trend in the general government sector is assumed to be zero from 2018. This means that productivity at base prices increases somewhat since the capital deterioration increases somewhat more than the hours.
Balance of resources and production
GDP growth is the sum of the productivity trend in the economy as a whole and the trend in the number of hours worked. GDP is composed such that household expenditure on consumption accounts for 50 per cent of GDP in nominal terms. The level is adjusted to allow for reasonable development in household saving and net assets. Investments account for 20 per cent and inventories for 2 per cent. Imports will increase somewhat in the future, reaching 50 per cent in 2050. General government consumption is not set at any fixed percentage but is projected in line with the demographic trend and the price trend on general government consumption. The remaining component in the balance of resources consists of exports, which, in the calculations are residual. This means that there are several scenarios with unbalanced growth, i.e. the various components of GDP are not in balance. A possible high level of net lending in the general government sector is balanced by high net lending in another sector. In these calculations, that sector is the foreign sector. In the calculations, imbalances in general government net lending will therefore generate corresponding imbalances in foreign trade and thus in the current account balance, since exports are calculated residually.
Production in the general government sector is derived from general government consumption and an assumption of an unchanged degree of privatisation. Production in the business sector is determined as the sum of productivity and hours worked in that sector.
Inflation and wages
The Riksbank is assumed to pursue a monetary policy whereby inflation maintains a rate of 2 per cent. The proportion of wage costs and gross profits in the business sector is assumed to be constant in the long term. Wages are thus determined by the price level and productivity. Higher productivity and a higher GDP deflator generate scope for increased wages.
Wages in the general government sector rise in pace with those in the private sector.
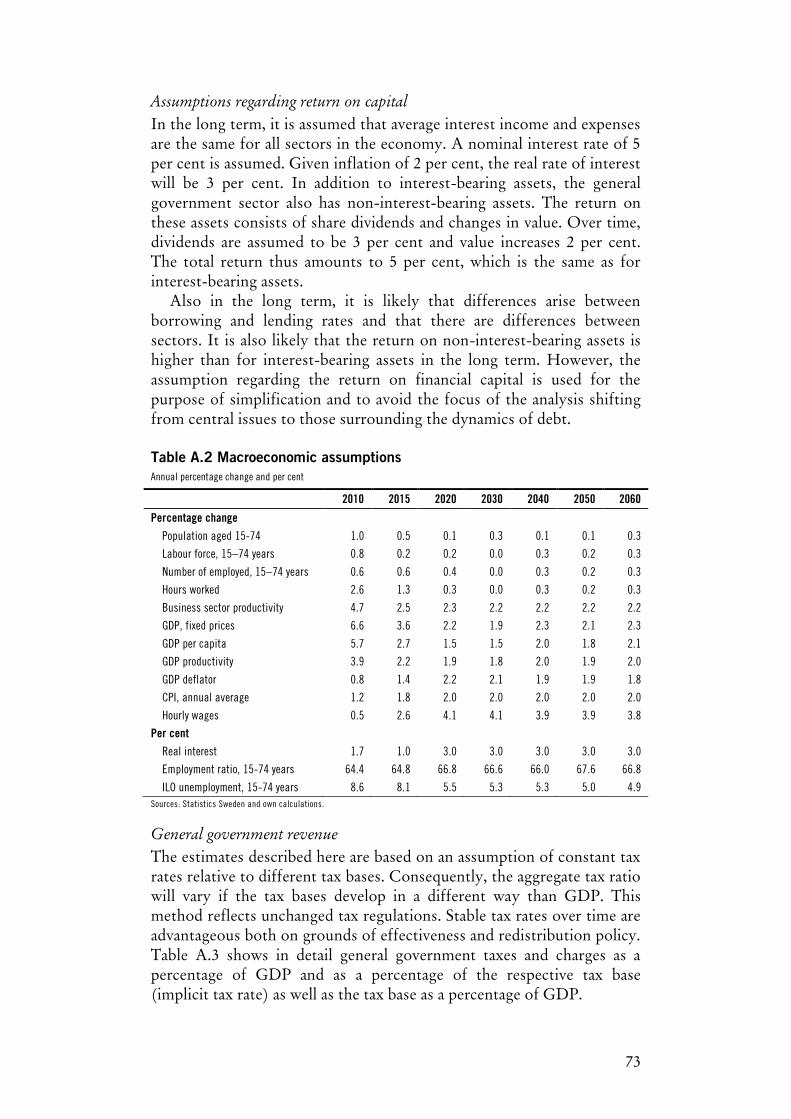
73
Assumptions regarding return on capital
In the long term, it is assumed that average interest income and expenses are the same for all sectors in the economy. A nominal interest rate of 5 per cent is assumed. Given inflation of 2 per cent, the real rate of interest will be 3 per cent. In addition to interest-bearing assets, the general government sector also has non-interest-bearing assets. The return on these assets consists of share dividends and changes in value. Over time, dividends are assumed to be 3 per cent and value increases 2 per cent. The total return thus amounts to 5 per cent, which is the same as for interest-bearing assets.
Also in the long term, it is likely that differences arise between borrowing and lending rates and that there are differences between sectors. It is also likely that the return on non-interest-bearing assets is higher than for interest-bearing assets in the long term. However, the assumption regarding the return on financial capital is used for the purpose of simplification and to avoid the focus of the analysis shifting from central issues to those surrounding the dynamics of debt. Table A.2 Macroeconomic assumptions Annual percentage change and per cent
2010 2015 2020 2030 2040 2050 2060
Percentage change
Population aged 15-74 1.0 0.5 0.1 0.3 0.1 0.1 0.3
Labour force, 15–74 years 0.8 0.2 0.2 0.0 0.3 0.2 0.3
Number of employed, 15–74 years 0.6 0.6 0.4 0.0 0.3 0.2 0.3
Hours worked 2.6 1.3 0.3 0.0 0.3 0.2 0.3
Business sector productivity 4.7 2.5 2.3 2.2 2.2 2.2 2.2
GDP, fixed prices 6.6 3.6 2.2 1.9 2.3 2.1 2.3
GDP per capita 5.7 2.7 1.5 1.5 2.0 1.8 2.1
GDP productivity 3.9 2.2 1.9 1.8 2.0 1.9 2.0
GDP deflator 0.8 1.4 2.2 2.1 1.9 1.9 1.8
CPI, annual average 1.2 1.8 2.0 2.0 2.0 2.0 2.0
Hourly wages 0.5 2.6 4.1 4.1 3.9 3.9 3.8
Per cent
Real interest 1.7 1.0 3.0 3.0 3.0 3.0 3.0
Employment ratio, 15-74 years 64.4 64.8 66.8 66.6 66.0 67.6 66.8
ILO unemployment, 15-74 years 8.6 8.1 5.5 5.3 5.3 5.0 4.9 Sources: Statistics Sweden and own calculations.
General government revenue
The estimates described here are based on an assumption of constant tax rates relative to different tax bases. Consequently, the aggregate tax ratio will vary if the tax bases develop in a different way than GDP. This method reflects unchanged tax regulations. Stable tax rates over time are advantageous both on grounds of effectiveness and redistribution policy. Table A.3 shows in detail general government taxes and charges as a percentage of GDP and as a percentage of the respective tax base (implicit tax rate) as well as the tax base as a percentage of GDP.
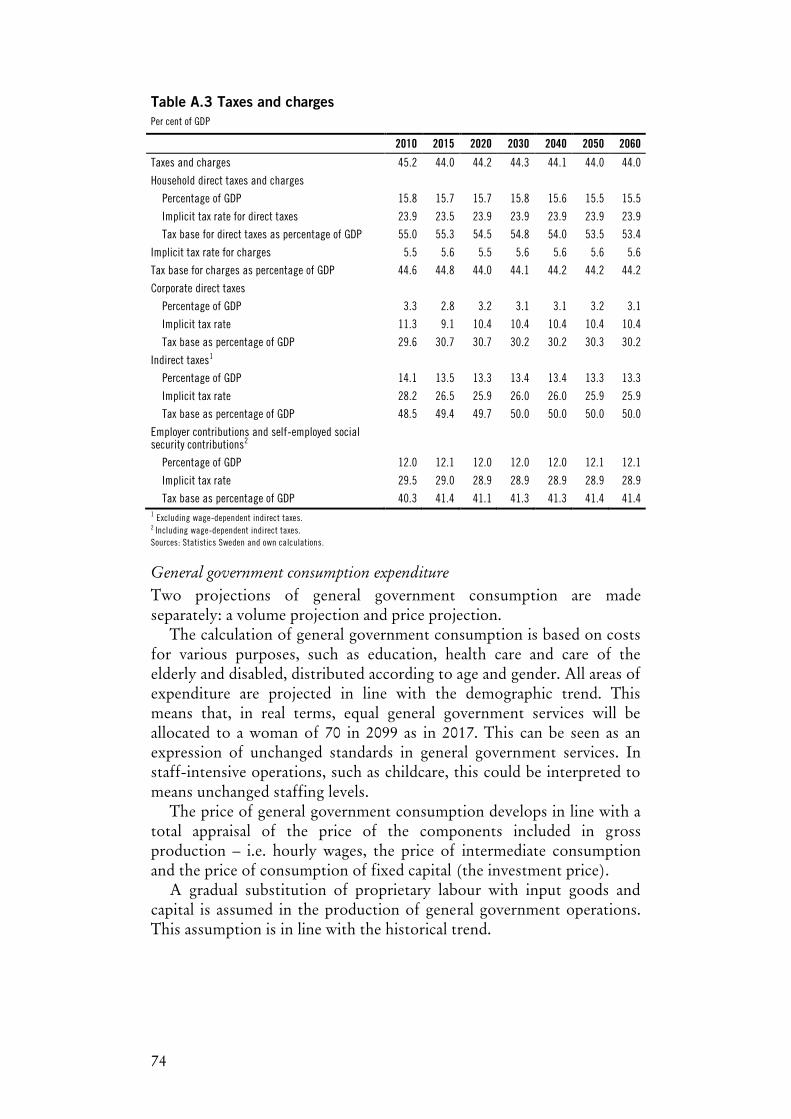
74
Table A.3 Taxes and charges Per cent of GDP
2010 2015 2020 2030 2040 2050 2060
Taxes and charges 45.2 44.0 44.2 44.3 44.1 44.0 44.0
Household direct taxes and charges
Percentage of GDP 15.8 15.7 15.7 15.8 15.6 15.5 15.5
Implicit tax rate for direct taxes 23.9 23.5 23.9 23.9 23.9 23.9 23.9
Tax base for direct taxes as percentage of GDP 55.0 55.3 54.5 54.8 54.0 53.5 53.4
Implicit tax rate for charges 5.5 5.6 5.5 5.6 5.6 5.6 5.6
Tax base for charges as percentage of GDP 44.6 44.8 44.0 44.1 44.2 44.2 44.2
Corporate direct taxes
Percentage of GDP 3.3 2.8 3.2 3.1 3.1 3.2 3.1
Implicit tax rate 11.3 9.1 10.4 10.4 10.4 10.4 10.4
Tax base as percentage of GDP 29.6 30.7 30.7 30.2 30.2 30.3 30.2
Indirect taxes1
Percentage of GDP 14.1 13.5 13.3 13.4 13.4 13.3 13.3
Implicit tax rate 28.2 26.5 25.9 26.0 26.0 25.9 25.9
Tax base as percentage of GDP 48.5 49.4 49.7 50.0 50.0 50.0 50.0
Employer contributions and self-employed social security contributions2
Percentage of GDP 12.0 12.1 12.0 12.0 12.0 12.1 12.1
Implicit tax rate 29.5 29.0 28.9 28.9 28.9 28.9 28.9
Tax base as percentage of GDP 40.3 41.4 41.1 41.3 41.3 41.4 41.4 1 Excluding wage-dependent indirect taxes. 2 Including wage-dependent indirect taxes. Sources: Statistics Sweden and own calculations.
General government consumption expenditure
Two projections of general government consumption are made separately: a volume projection and price projection.
The calculation of general government consumption is based on costs for various purposes, such as education, health care and care of the elderly and disabled, distributed according to age and gender. All areas of expenditure are projected in line with the demographic trend. This means that, in real terms, equal general government services will be allocated to a woman of 70 in 2099 as in 2017. This can be seen as an expression of unchanged standards in general government services. In staff-intensive operations, such as childcare, this could be interpreted to means unchanged staffing levels.
The price of general government consumption develops in line with a total appraisal of the price of the components included in gross production – i.e. hourly wages, the price of intermediate consumption and the price of consumption of fixed capital (the investment price).
A gradual substitution of proprietary labour with input goods and capital is assumed in the production of general government operations. This assumption is in line with the historical trend.
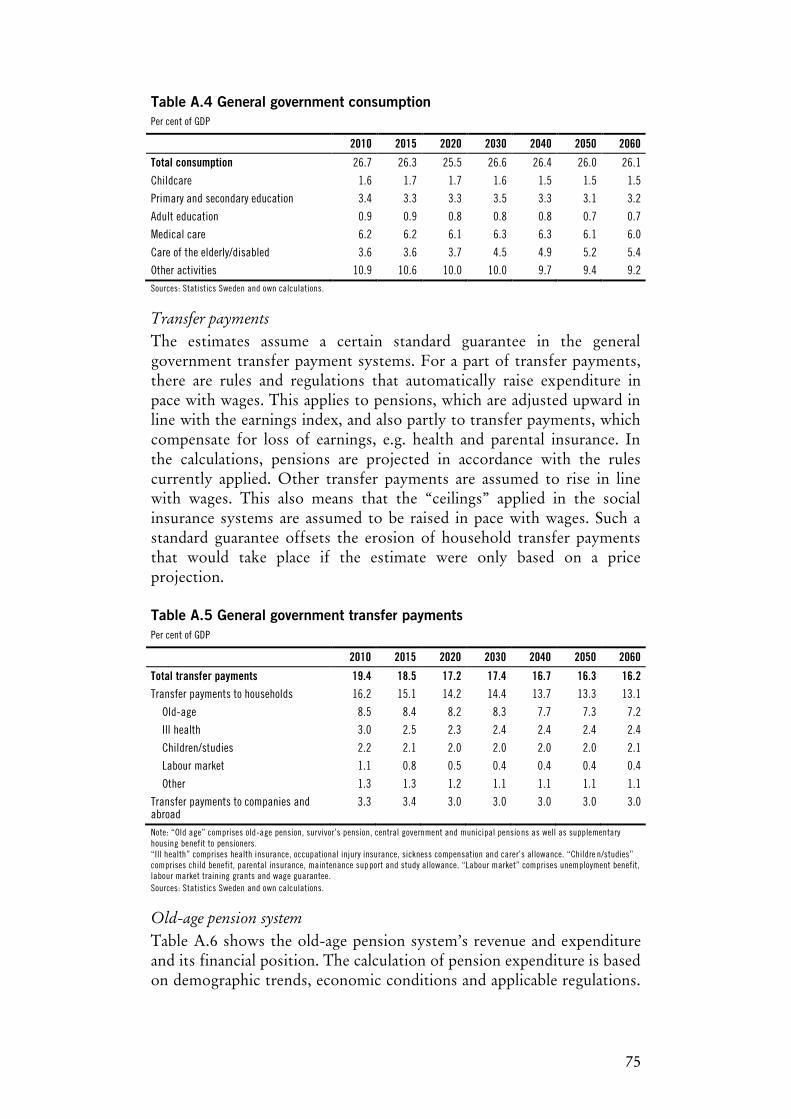
75
Table A.4 General government consumption Per cent of GDP
2010 2015 2020 2030 2040 2050 2060
Total consumption 26.7 26.3 25.5 26.6 26.4 26.0 26.1
Childcare 1.6 1.7 1.7 1.6 1.5 1.5 1.5
Primary and secondary education 3.4 3.3 3.3 3.5 3.3 3.1 3.2
Adult education 0.9 0.9 0.8 0.8 0.8 0.7 0.7
Medical care 6.2 6.2 6.1 6.3 6.3 6.1 6.0
Care of the elderly/disabled 3.6 3.6 3.7 4.5 4.9 5.2 5.4
Other activities 10.9 10.6 10.0 10.0 9.7 9.4 9.2 Sources: Statistics Sweden and own calculations.
Transfer payments
The estimates assume a certain standard guarantee in the general government transfer payment systems. For a part of transfer payments, there are rules and regulations that automatically raise expenditure in pace with wages. This applies to pensions, which are adjusted upward in line with the earnings index, and also partly to transfer payments, which compensate for loss of earnings, e.g. health and parental insurance. In the calculations, pensions are projected in accordance with the rules currently applied. Other transfer payments are assumed to rise in line with wages. This also means that the “ceilings” applied in the social insurance systems are assumed to be raised in pace with wages. Such a standard guarantee offsets the erosion of household transfer payments that would take place if the estimate were only based on a price projection. Table A.5 General government transfer payments Per cent of GDP
2010 2015 2020 2030 2040 2050 2060
Total transfer payments 19.4 18.5 17.2 17.4 16.7 16.3 16.2 Transfer payments to households 16.2 15.1 14.2 14.4 13.7 13.3 13.1
Old-age 8.5 8.4 8.2 8.3 7.7 7.3 7.2
Ill health 3.0 2.5 2.3 2.4 2.4 2.4 2.4
Children/studies 2.2 2.1 2.0 2.0 2.0 2.0 2.1
Labour market 1.1 0.8 0.5 0.4 0.4 0.4 0.4
Other 1.3 1.3 1.2 1.1 1.1 1.1 1.1
Transfer payments to companies and abroad
3.3 3.4 3.0 3.0 3.0 3.0 3.0
Note: “Old age” comprises old-age pension, survivor’s pension, central government and municipal pensions as well as supplementary housing benefit to pensioners. “Ill health” comprises health insurance, occupational injury insurance, sickness compensation and carer’s allowance. “Childre n/studies” comprises child benefit, parental insurance, maintenance support and study allowance. “Labour market” comprises unemployment benefit, labour market training grants and wage guarantee. Sources: Statistics Sweden and own calculations.
Old-age pension system
Table A.6 shows the old-age pension system’s revenue and expenditure and its financial position. The calculation of pension expenditure is based on demographic trends, economic conditions and applicable regulations.
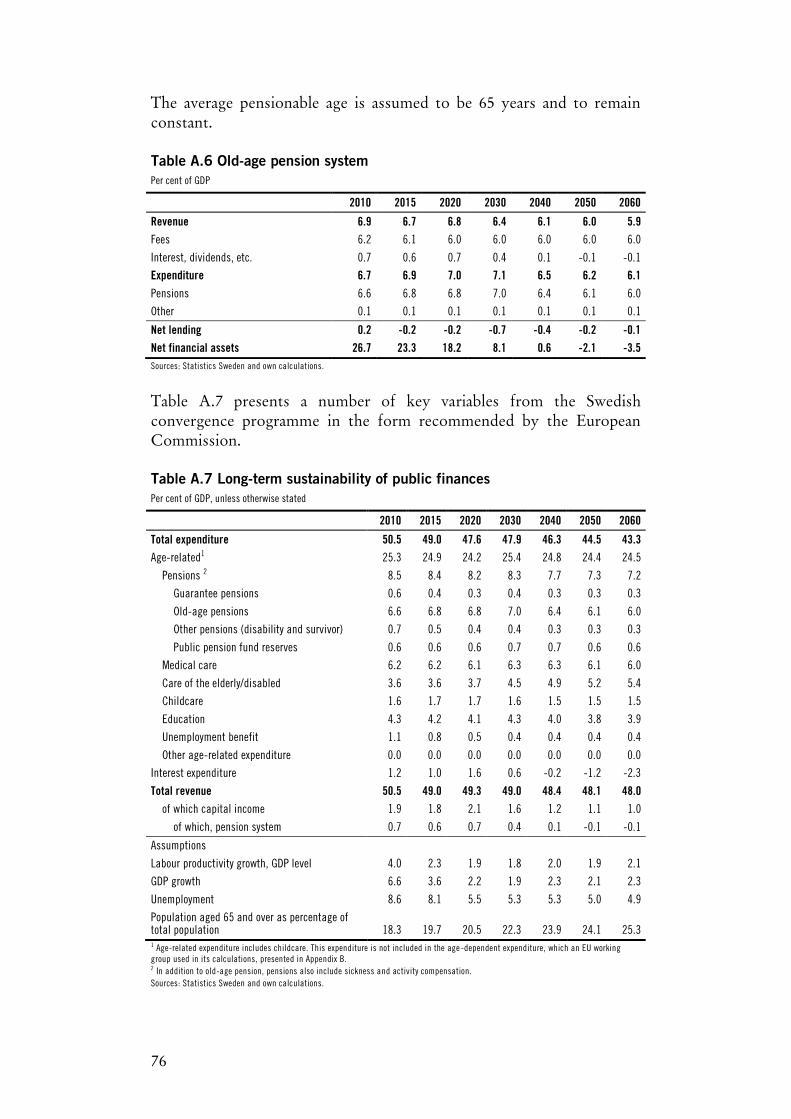
76
The average pensionable age is assumed to be 65 years and to remain constant. Table A.6 Old-age pension system Per cent of GDP
2010 2015 2020 2030 2040 2050 2060
Revenue 6.9 6.7 6.8 6.4 6.1 6.0 5.9 Fees 6.2 6.1 6.0 6.0 6.0 6.0 6.0
Interest, dividends, etc. 0.7 0.6 0.7 0.4 0.1 -0.1 -0.1
Expenditure 6.7 6.9 7.0 7.1 6.5 6.2 6.1
Pensions 6.6 6.8 6.8 7.0 6.4 6.1 6.0
Other 0.1 0.1 0.1 0.1 0.1 0.1 0.1
Net lending 0.2 -0.2 -0.2 -0.7 -0.4 -0.2 -0.1 Net financial assets 26.7 23.3 18.2 8.1 0.6 -2.1 -3.5 Sources: Statistics Sweden and own calculations.
Table A.7 presents a number of key variables from the Swedish convergence programme in the form recommended by the European Commission. Table A.7 Long-term sustainability of public finances Per cent of GDP, unless otherwise stated
2010 2015 2020 2030 2040 2050 2060
Total expenditure 50.5 49.0 47.6 47.9 46.3 44.5 43.3 Age-related1 25.3 24.9 24.2 25.4 24.8 24.4 24.5
Pensions 2 8.5 8.4 8.2 8.3 7.7 7.3 7.2
Guarantee pensions 0.6 0.4 0.3 0.4 0.3 0.3 0.3
Old-age pensions 6.6 6.8 6.8 7.0 6.4 6.1 6.0
Other pensions (disability and survivor) 0.7 0.5 0.4 0.4 0.3 0.3 0.3
Public pension fund reserves 0.6 0.6 0.6 0.7 0.7 0.6 0.6
Medical care 6.2 6.2 6.1 6.3 6.3 6.1 6.0
Care of the elderly/disabled 3.6 3.6 3.7 4.5 4.9 5.2 5.4
Childcare 1.6 1.7 1.7 1.6 1.5 1.5 1.5
Education 4.3 4.2 4.1 4.3 4.0 3.8 3.9
Unemployment benefit 1.1 0.8 0.5 0.4 0.4 0.4 0.4
Other age-related expenditure 0.0 0.0 0.0 0.0 0.0 0.0 0.0
Interest expenditure 1.2 1.0 1.6 0.6 -0.2 -1.2 -2.3
Total revenue 50.5 49.0 49.3 49.0 48.4 48.1 48.0 of which capital income 1.9 1.8 2.1 1.6 1.2 1.1 1.0
of which, pension system 0.7 0.6 0.7 0.4 0.1 -0.1 -0.1
Assumptions
Labour productivity growth, GDP level 4.0 2.3 1.9 1.8 2.0 1.9 2.1
GDP growth 6.6 3.6 2.2 1.9 2.3 2.1 2.3
Unemployment 8.6 8.1 5.5 5.3 5.3 5.0 4.9
Population aged 65 and over as percentage of total population 18.3 19.7 20.5 22.3 23.9 24.1 25.3 1 Age-related expenditure includes childcare. This expenditure is not included in the age -dependent expenditure, which an EU working group used in its calculations, presented in Appendix B. 2 In addition to old-age pension, pensions also include sickness and activity compensation. Sources: Statistics Sweden and own calculations.
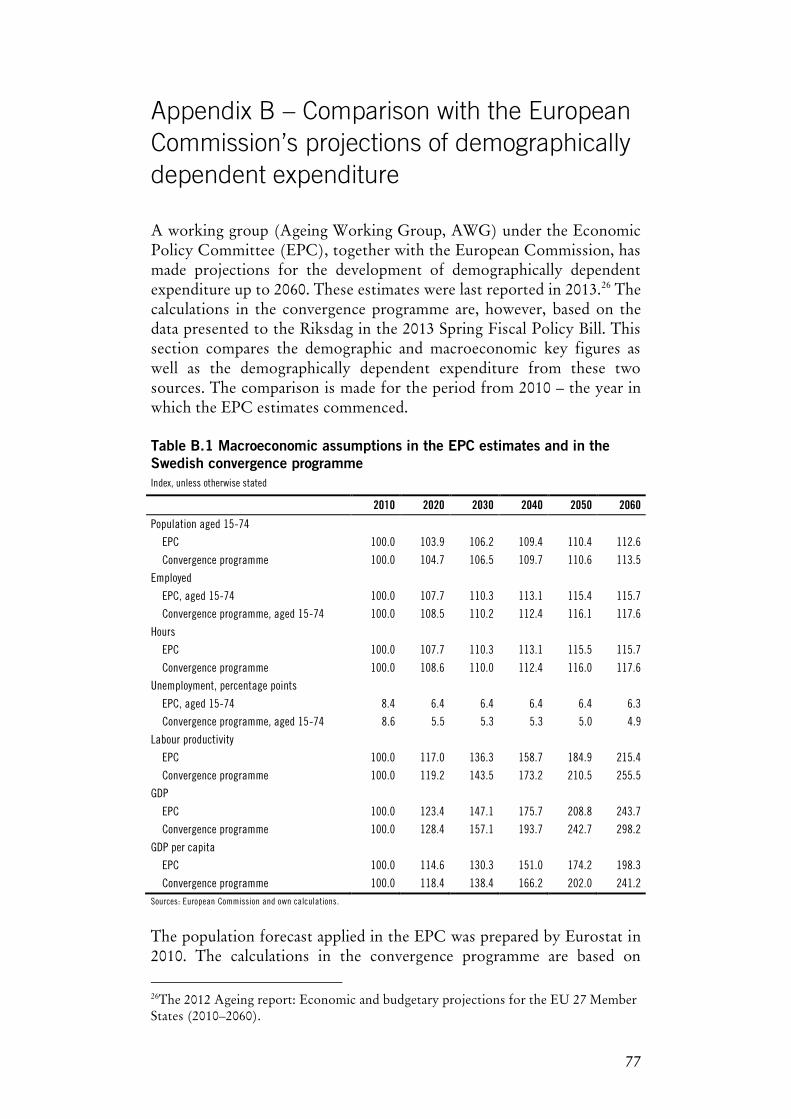
77
Appendix B – Comparison with the European Commission’s projections of demographically dependent expenditure
A working group (Ageing Working Group, AWG) under the Economic Policy Committee (EPC), together with the European Commission, has made projections for the development of demographically dependent expenditure up to 2060. These estimates were last reported in 2013.26 The calculations in the convergence programme are, however, based on the data presented to the Riksdag in the 2013 Spring Fiscal Policy Bill. This section compares the demographic and macroeconomic key figures as well as the demographically dependent expenditure from these two sources. The comparison is made for the period from 2010 – the year in which the EPC estimates commenced. Table B.1 Macroeconomic assumptions in the EPC estimates and in the Swedish convergence programme Index, unless otherwise stated
2010 2020 2030 2040 2050 2060
Population aged 15-74
EPC 100.0 103.9 106.2 109.4 110.4 112.6
Convergence programme 100.0 104.7 106.5 109.7 110.6 113.5
Employed
EPC, aged 15-74 100.0 107.7 110.3 113.1 115.4 115.7
Convergence programme, aged 15-74 100.0 108.5 110.2 112.4 116.1 117.6
Hours
EPC 100.0 107.7 110.3 113.1 115.5 115.7
Convergence programme 100.0 108.6 110.0 112.4 116.0 117.6
Unemployment, percentage points
EPC, aged 15-74 8.4 6.4 6.4 6.4 6.4 6.3
Convergence programme, aged 15-74 8.6 5.5 5.3 5.3 5.0 4.9
Labour productivity
EPC 100.0 117.0 136.3 158.7 184.9 215.4
Convergence programme 100.0 119.2 143.5 173.2 210.5 255.5
GDP
EPC 100.0 123.4 147.1 175.7 208.8 243.7
Convergence programme 100.0 128.4 157.1 193.7 242.7 298.2
GDP per capita
EPC 100.0 114.6 130.3 151.0 174.2 198.3
Convergence programme 100.0 118.4 138.4 166.2 202.0 241.2 Sources: European Commission and own calculations.
The population forecast applied in the EPC was prepared by Eurostat in 2010. The calculations in the convergence programme are based on
26The 2012 Ageing report: Economic and budgetary projections for the EU 27 Member States (2010–2060).
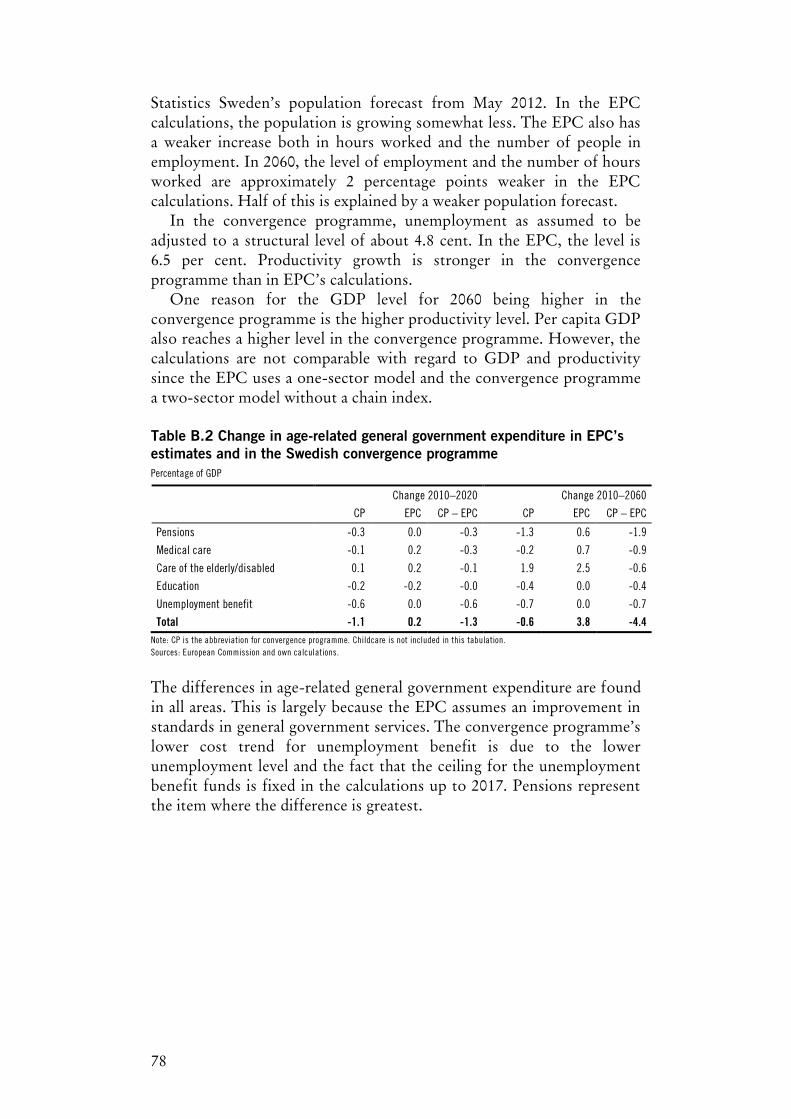
78
Statistics Sweden’s population forecast from May 2012. In the EPC calculations, the population is growing somewhat less. The EPC also has a weaker increase both in hours worked and the number of people in employment. In 2060, the level of employment and the number of hours worked are approximately 2 percentage points weaker in the EPC calculations. Half of this is explained by a weaker population forecast.
In the convergence programme, unemployment as assumed to be adjusted to a structural level of about 4.8 cent. In the EPC, the level is 6.5 per cent. Productivity growth is stronger in the convergence programme than in EPC’s calculations.
One reason for the GDP level for 2060 being higher in the convergence programme is the higher productivity level. Per capita GDP also reaches a higher level in the convergence programme. However, the calculations are not comparable with regard to GDP and productivity since the EPC uses a one-sector model and the convergence programme a two-sector model without a chain index. Table B.2 Change in age-related general government expenditure in EPC’s estimates and in the Swedish convergence programme Percentage of GDP
Change 2010–2020 Change 2010–2060
CP EPC CP – EPC CP EPC CP – EPC
Pensions -0.3 0.0 -0.3 -1.3 0.6 -1.9
Medical care -0.1 0.2 -0.3 -0.2 0.7 -0.9
Care of the elderly/disabled 0.1 0.2 -0.1 1.9 2.5 -0.6
Education -0.2 -0.2 -0.0 -0.4 0.0 -0.4
Unemployment benefit -0.6 0.0 -0.6 -0.7 0.0 -0.7
Total -1.1 0.2 -1.3 -0.6 3.8 -4.4 Note: CP is the abbreviation for convergence programme. Childcare is not included in this tabulation. Sources: European Commission and own calculations.
The differences in age-related general government expenditure are found in all areas. This is largely because the EPC assumes an improvement in standards in general government services. The convergence programme’s lower cost trend for unemployment benefit is due to the lower unemployment level and the fact that the ceiling for the unemployment benefit funds is fixed in the calculations up to 2017. Pensions represent the item where the difference is greatest.
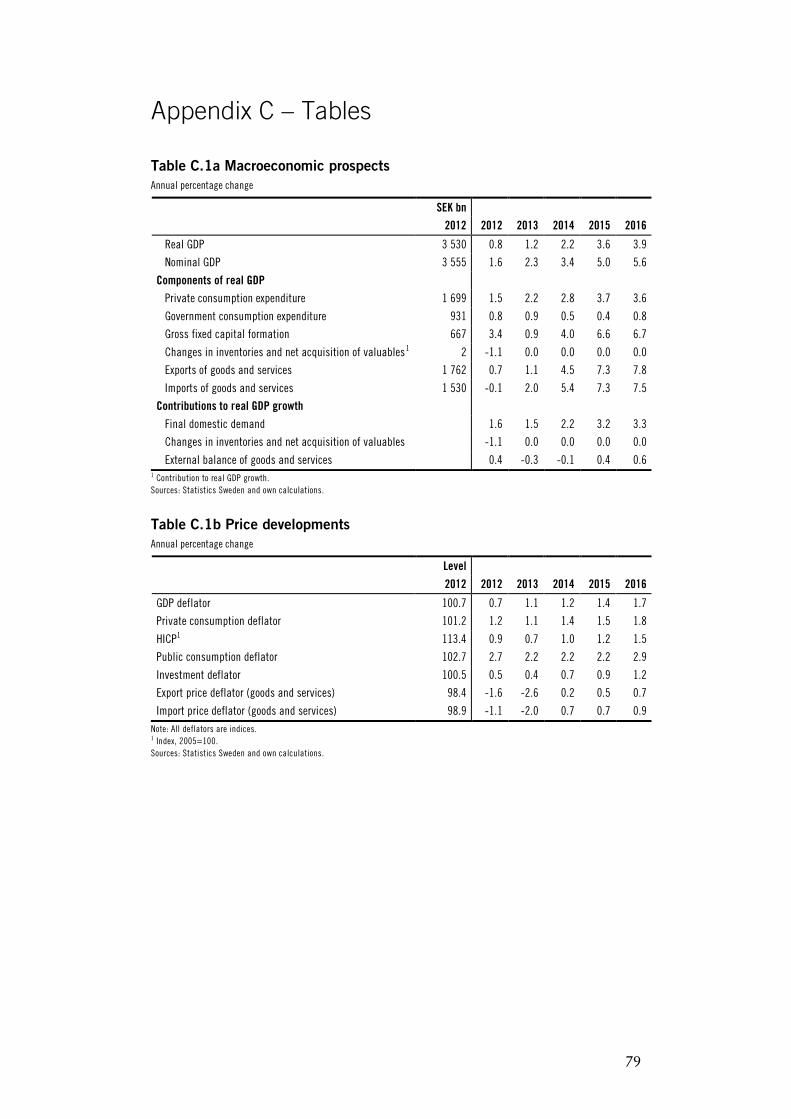
79
Appendix C – Tables
Table C.1a Macroeconomic prospects Annual percentage change
SEK bn 2012 2012 2013 2014 2015 2016
Real GDP 3 530 0.8 1.2 2.2 3.6 3.9
Nominal GDP 3 555 1.6 2.3 3.4 5.0 5.6
Components of real GDP Private consumption expenditure 1 699 1.5 2.2 2.8 3.7 3.6
Government consumption expenditure 931 0.8 0.9 0.5 0.4 0.8
Gross fixed capital formation 667 3.4 0.9 4.0 6.6 6.7
Changes in inventories and net acquisition of valuables1 2 -1.1 0.0 0.0 0.0 0.0
Exports of goods and services 1 762 0.7 1.1 4.5 7.3 7.8
Imports of goods and services 1 530 -0.1 2.0 5.4 7.3 7.5
Contributions to real GDP growth
Final domestic demand 1.6 1.5 2.2 3.2 3.3
Changes in inventories and net acquisition of valuables -1.1 0.0 0.0 0.0 0.0
External balance of goods and services 0.4 -0.3 -0.1 0.4 0.6 1 Contribution to real GDP growth. Sources: Statistics Sweden and own calculations.
Table C.1b Price developments Annual percentage change
Level
2012 2012 2013 2014 2015 2016
GDP deflator 100.7 0.7 1.1 1.2 1.4 1.7
Private consumption deflator 101.2 1.2 1.1 1.4 1.5 1.8
HICP1 113.4 0.9 0.7 1.0 1.2 1.5
Public consumption deflator 102.7 2.7 2.2 2.2 2.2 2.9
Investment deflator 100.5 0.5 0.4 0.7 0.9 1.2
Export price deflator (goods and services) 98.4 -1.6 -2.6 0.2 0.5 0.7
Import price deflator (goods and services) 98.9 -1.1 -2.0 0.7 0.7 0.9 Note: All deflators are indices. 1 Index, 2005=100. Sources: Statistics Sweden and own calculations.
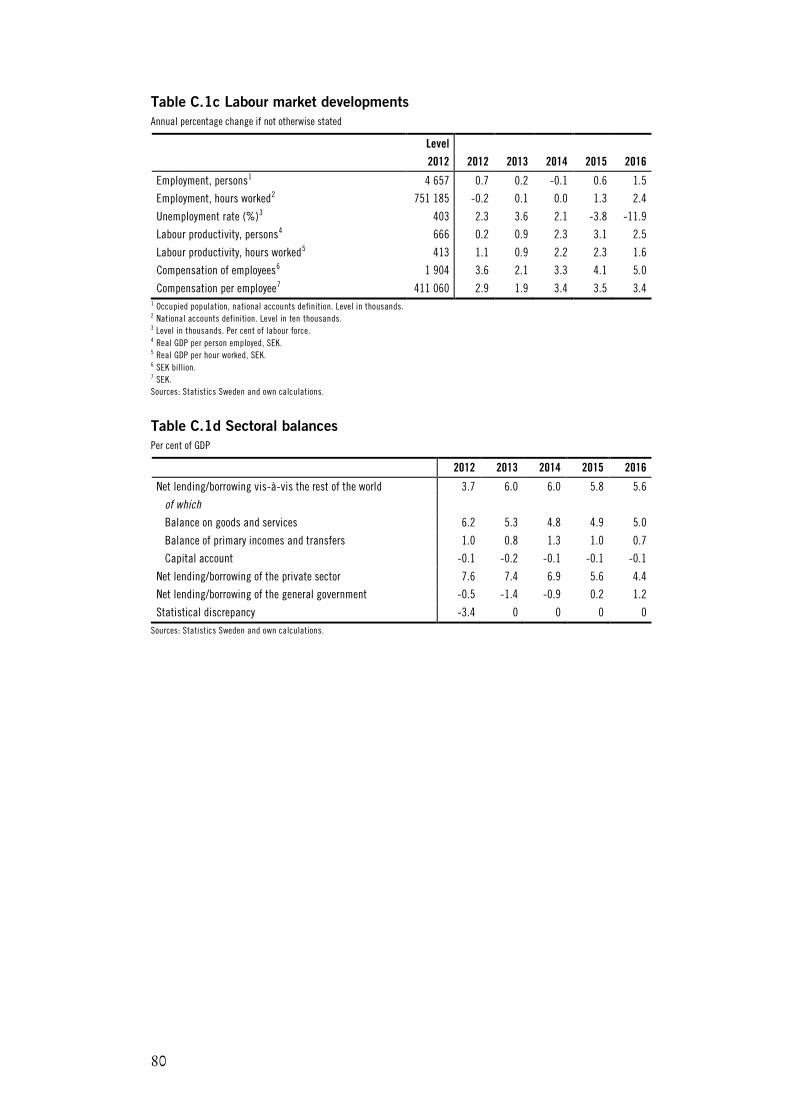
80
Table C.1c Labour market developments Annual percentage change if not otherwise stated
Level 2012 2012 2013 2014 2015 2016
Employment, persons1 4 657 0.7 0.2 -0.1 0.6 1.5
Employment, hours worked2 751 185 -0.2 0.1 0.0 1.3 2.4
Unemployment rate (%)3 403 2.3 3.6 2.1 -3.8 -11.9
Labour productivity, persons4 666 0.2 0.9 2.3 3.1 2.5
Labour productivity, hours worked5 413 1.1 0.9 2.2 2.3 1.6
Compensation of employees6 1 904 3.6 2.1 3.3 4.1 5.0
Compensation per employee7 411 060 2.9 1.9 3.4 3.5 3.4 1 Occupied population, national accounts definition. Level in thousands. 2 National accounts definition. Level in ten thousands. 3 Level in thousands. Per cent of labour force. 4 Real GDP per person employed, SEK. 5 Real GDP per hour worked, SEK. 6 SEK billion. 7 SEK. Sources: Statistics Sweden and own calculations.
Table C.1d Sectoral balances Per cent of GDP
2012 2013 2014 2015 2016
Net lending/borrowing vis-à-vis the rest of the world 3.7 6.0 6.0 5.8 5.6
of which
Balance on goods and services 6.2 5.3 4.8 4.9 5.0
Balance of primary incomes and transfers 1.0 0.8 1.3 1.0 0.7
Capital account -0.1 -0.2 -0.1 -0.1 -0.1
Net lending/borrowing of the private sector 7.6 7.4 6.9 5.6 4.4
Net lending/borrowing of the general government -0.5 -1.4 -0.9 0.2 1.2
Statistical discrepancy -3.4 0 0 0 0 Sources: Statistics Sweden and own calculations.
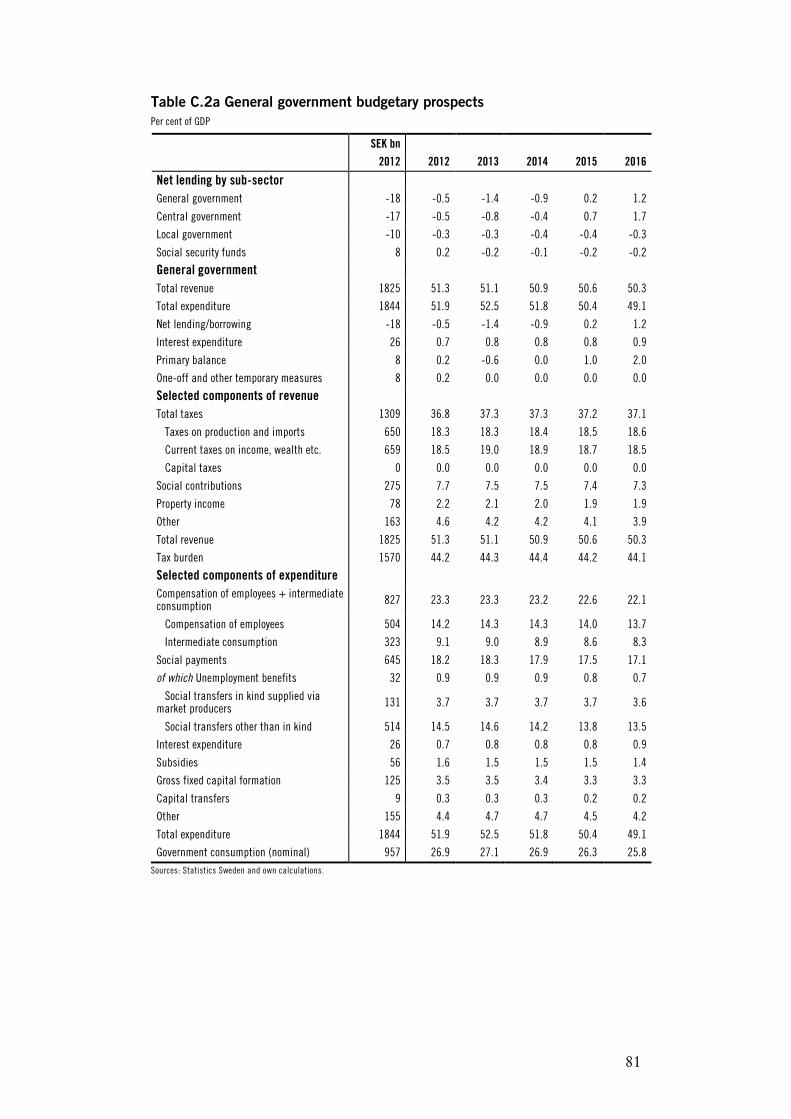
81
Table C.2a General government budgetary prospects Per cent of GDP
SEK bn 2012 2012 2013 2014 2015 2016
Net lending by sub-sector General government -18 -0.5 -1.4 -0.9 0.2 1.2
Central government -17 -0.5 -0.8 -0.4 0.7 1.7
Local government -10 -0.3 -0.3 -0.4 -0.4 -0.3
Social security funds 8 0.2 -0.2 -0.1 -0.2 -0.2
General government Total revenue 1825 51.3 51.1 50.9 50.6 50.3
Total expenditure 1844 51.9 52.5 51.8 50.4 49.1
Net lending/borrowing -18 -0.5 -1.4 -0.9 0.2 1.2
Interest expenditure 26 0.7 0.8 0.8 0.8 0.9
Primary balance 8 0.2 -0.6 0.0 1.0 2.0
One-off and other temporary measures 8 0.2 0.0 0.0 0.0 0.0
Selected components of revenue Total taxes 1309 36.8 37.3 37.3 37.2 37.1
Taxes on production and imports 650 18.3 18.3 18.4 18.5 18.6
Current taxes on income, wealth etc. 659 18.5 19.0 18.9 18.7 18.5
Capital taxes 0 0.0 0.0 0.0 0.0 0.0
Social contributions 275 7.7 7.5 7.5 7.4 7.3
Property income 78 2.2 2.1 2.0 1.9 1.9
Other 163 4.6 4.2 4.2 4.1 3.9
Total revenue 1825 51.3 51.1 50.9 50.6 50.3
Tax burden 1570 44.2 44.3 44.4 44.2 44.1
Selected components of expenditure Compensation of employees + intermediate consumption 827 23.3 23.3 23.2 22.6 22.1
Compensation of employees 504 14.2 14.3 14.3 14.0 13.7
Intermediate consumption 323 9.1 9.0 8.9 8.6 8.3
Social payments 645 18.2 18.3 17.9 17.5 17.1
of which Unemployment benefits 32 0.9 0.9 0.9 0.8 0.7
Social transfers in kind supplied via market producers 131 3.7 3.7 3.7 3.7 3.6
Social transfers other than in kind 514 14.5 14.6 14.2 13.8 13.5
Interest expenditure 26 0.7 0.8 0.8 0.8 0.9
Subsidies 56 1.6 1.5 1.5 1.5 1.4
Gross fixed capital formation 125 3.5 3.5 3.4 3.3 3.3
Capital transfers 9 0.3 0.3 0.3 0.2 0.2
Other 155 4.4 4.7 4.7 4.5 4.2
Total expenditure 1844 51.9 52.5 51.8 50.4 49.1
Government consumption (nominal) 957 26.9 27.1 26.9 26.3 25.8 Sources: Statistics Sweden and own calculations.
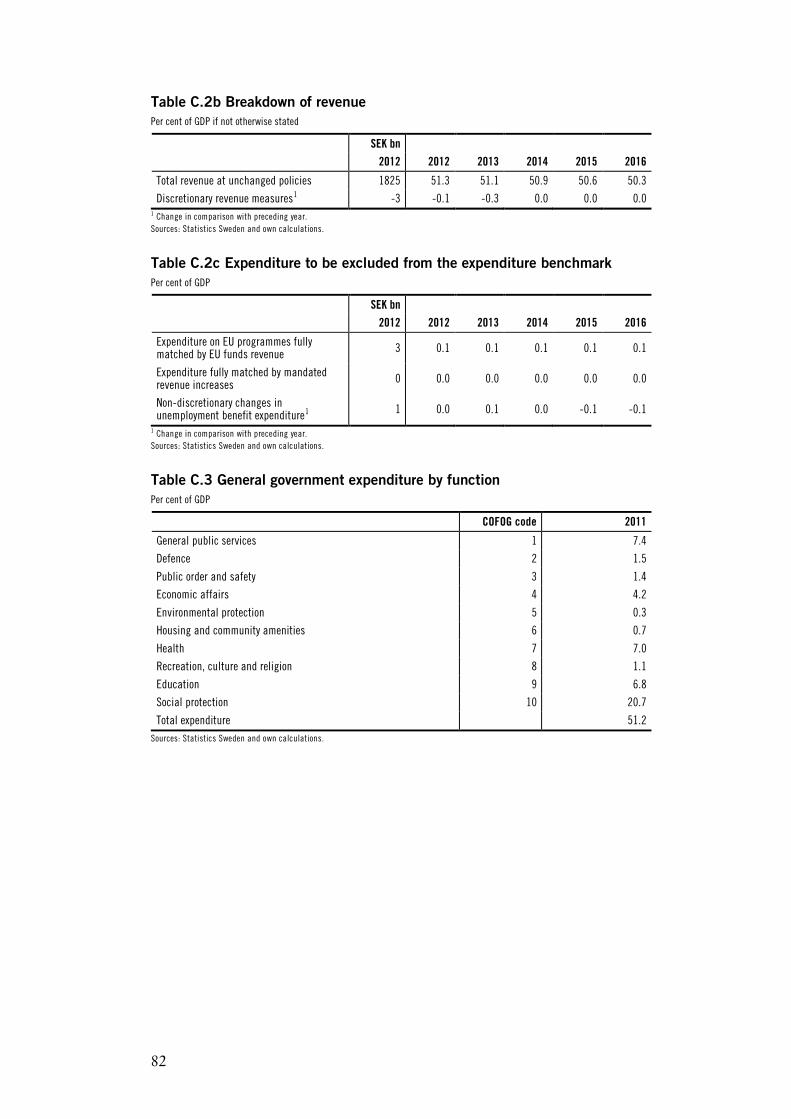
82
Table C.2b Breakdown of revenue Per cent of GDP if not otherwise stated
SEK bn 2012 2012 2013 2014 2015 2016
Total revenue at unchanged policies 1825 51.3 51.1 50.9 50.6 50.3
Discretionary revenue measures1 -3 -0.1 -0.3 0.0 0.0 0.0 1 Change in comparison with preceding year. Sources: Statistics Sweden and own calculations.
Table C.2c Expenditure to be excluded from the expenditure benchmark Per cent of GDP
SEK bn 2012 2012 2013 2014 2015 2016
Expenditure on EU programmes fully matched by EU funds revenue 3 0.1 0.1 0.1 0.1 0.1
Expenditure fully matched by mandated revenue increases 0 0.0 0.0 0.0 0.0 0.0
Non-discretionary changes in unemployment benefit expenditure1 1 0.0 0.1 0.0 -0.1 -0.1
1 Change in comparison with preceding year. Sources: Statistics Sweden and own calculations.
Table C.3 General government expenditure by function Per cent of GDP
COFOG code 2011
General public services 1 7.4
Defence 2 1.5
Public order and safety 3 1.4
Economic affairs 4 4.2
Environmental protection 5 0.3
Housing and community amenities 6 0.7
Health 7 7.0
Recreation, culture and religion 8 1.1
Education 9 6.8
Social protection 10 20.7
Total expenditure 51.2 Sources: Statistics Sweden and own calculations.
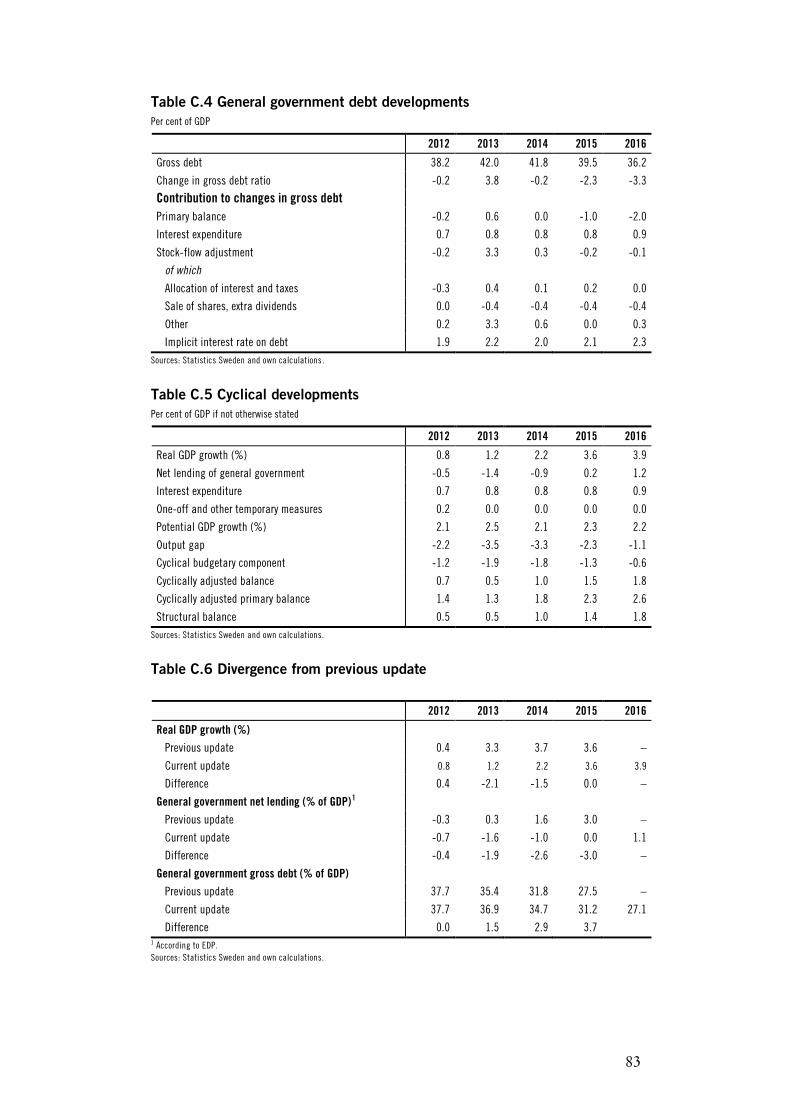
83
Table C.4 General government debt developments Per cent of GDP
2012 2013 2014 2015 2016
Gross debt 38.2 42.0 41.8 39.5 36.2
Change in gross debt ratio -0.2 3.8 -0.2 -2.3 -3.3
Contribution to changes in gross debt
Primary balance -0.2 0.6 0.0 -1.0 -2.0
Interest expenditure 0.7 0.8 0.8 0.8 0.9
Stock-flow adjustment -0.2 3.3 0.3 -0.2 -0.1
of which
Allocation of interest and taxes -0.3 0.4 0.1 0.2 0.0
Sale of shares, extra dividends 0.0 -0.4 -0.4 -0.4 -0.4
Other 0.2 3.3 0.6 0.0 0.3
Implicit interest rate on debt 1.9 2.2 2.0 2.1 2.3 Sources: Statistics Sweden and own calculations.
Table C.5 Cyclical developments Per cent of GDP if not otherwise stated
2012 2013 2014 2015 2016
Real GDP growth (%) 0.8 1.2 2.2 3.6 3.9
Net lending of general government -0.5 -1.4 -0.9 0.2 1.2
Interest expenditure 0.7 0.8 0.8 0.8 0.9
One-off and other temporary measures 0.2 0.0 0.0 0.0 0.0
Potential GDP growth (%) 2.1 2.5 2.1 2.3 2.2
Output gap -2.2 -3.5 -3.3 -2.3 -1.1
Cyclical budgetary component -1.2 -1.9 -1.8 -1.3 -0.6
Cyclically adjusted balance 0.7 0.5 1.0 1.5 1.8
Cyclically adjusted primary balance 1.4 1.3 1.8 2.3 2.6
Structural balance 0.5 0.5 1.0 1.4 1.8 Sources: Statistics Sweden and own calculations.
Table C.6 Divergence from previous update
2012 2013 2014 2015 2016
Real GDP growth (%)
Previous update 0.4 3.3 3.7 3.6 –
Current update 0.8 1.2 2.2 3.6 3.9
Difference 0.4 -2.1 -1.5 0.0 –
General government net lending (% of GDP)1
Previous update -0.3 0.3 1.6 3.0 –
Current update -0.7 -1.6 -1.0 0.0 1.1
Difference -0.4 -1.9 -2.6 -3.0 –
General government gross debt (% of GDP)
Previous update 37.7 35.4 31.8 27.5 –
Current update 37.7 36.9 34.7 31.2 27.1
Difference 0.0 1.5 2.9 3.7 1 According to EDP. Sources: Statistics Sweden and own calculations.
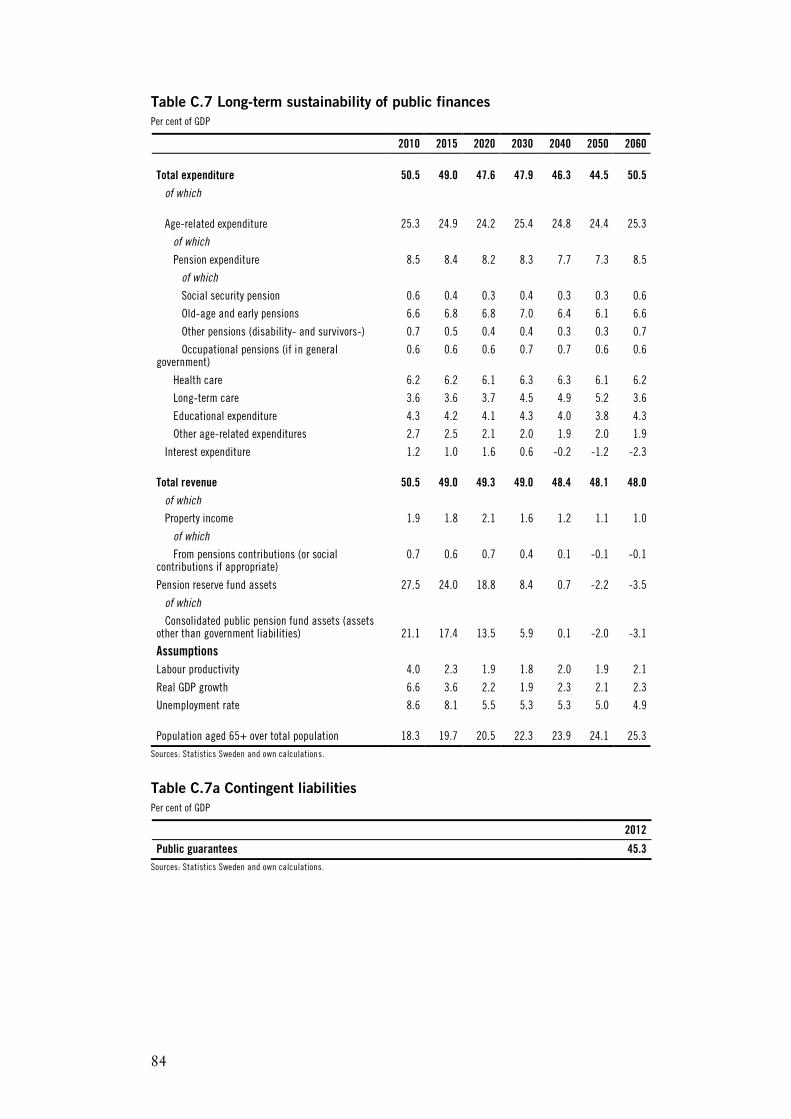
84
Table C.7 Long-term sustainability of public finances Per cent of GDP
2010 2015 2020 2030 2040 2050 2060
Total expenditure
50.5
49.0
47.6
47.9
46.3
44.5
50.5
of which
Age-related expenditure
25.3
24.9
24.2
25.4
24.8
24.4
25.3
of which
Pension expenditure 8.5 8.4 8.2 8.3 7.7 7.3 8.5
of which
Social security pension 0.6 0.4 0.3 0.4 0.3 0.3 0.6
Old-age and early pensions 6.6 6.8 6.8 7.0 6.4 6.1 6.6
Other pensions (disability- and survivors-) 0.7 0.5 0.4 0.4 0.3 0.3 0.7
Occupational pensions (if in general government)
0.6 0.6 0.6 0.7 0.7 0.6 0.6
Health care 6.2 6.2 6.1 6.3 6.3 6.1 6.2
Long-term care 3.6 3.6 3.7 4.5 4.9 5.2 3.6
Educational expenditure 4.3 4.2 4.1 4.3 4.0 3.8 4.3
Other age-related expenditures 2.7 2.5 2.1 2.0 1.9 2.0 1.9
Interest expenditure 1.2 1.0 1.6 0.6 -0.2 -1.2 -2.3
Total revenue
50.5
49.0
49.3
49.0
48.4
48.1
48.0
of which
Property income 1.9 1.8 2.1 1.6 1.2 1.1 1.0
of which
From pensions contributions (or social contributions if appropriate)
0.7 0.6 0.7 0.4 0.1 -0.1 -0.1
Pension reserve fund assets 27.5 24.0 18.8 8.4 0.7 -2.2 -3.5
of which
Consolidated public pension fund assets (assets other than government liabilities) 21.1 17.4 13.5 5.9 0.1 -2.0 -3.1
Assumptions Labour productivity 4.0 2.3 1.9 1.8 2.0 1.9 2.1
Real GDP growth 6.6 3.6 2.2 1.9 2.3 2.1 2.3
Unemployment rate 8.6 8.1 5.5 5.3 5.3 5.0 4.9
Population aged 65+ over total population
18.3
19.7
20.5
22.3
23.9
24.1
25.3 Sources: Statistics Sweden and own calculations.
Table C.7a Contingent liabilities Per cent of GDP
2012
Public guarantees 45.3 Sources: Statistics Sweden and own calculations.
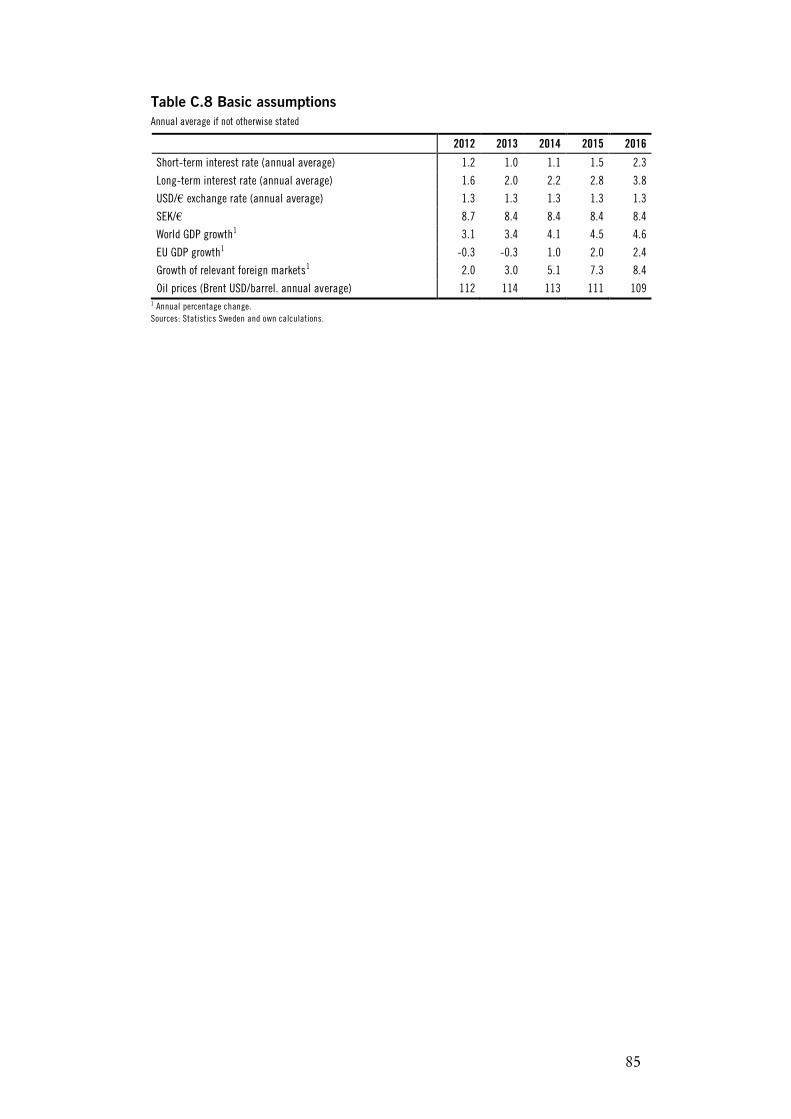
85
Table C.8 Basic assumptions Annual average if not otherwise stated
2012 2013 2014 2015 2016
Short-term interest rate (annual average) 1.2 1.0 1.1 1.5 2.3
Long-term interest rate (annual average) 1.6 2.0 2.2 2.8 3.8
USD/€ exchange rate (annual average) 1.3 1.3 1.3 1.3 1.3
SEK/€ 8.7 8.4 8.4 8.4 8.4
World GDP growth1 3.1 3.4 4.1 4.5 4.6
EU GDP growth1 -0.3 -0.3 1.0 2.0 2.4
Growth of relevant foreign markets1 2.0 3.0 5.1 7.3 8.4
Oil prices (Brent USD/barrel. annual average) 112 114 113 111 109 1 Annual percentage change. Sources: Statistics Sweden and own calculations.