swath bathymetry processing of glori-b and seabeam 2000
TRANSCRIPT

Swath Bathymetry Processing of GLORI-B and SeaBeam 2000
ZHENGRONG J. LIU and DAVID F. NAAR
Department of Marine Science, University of South Florida, 140 Seventh Avenue South, St. Petersburg, FL 33701-5016, USA
(Received 23 February 1996; accepted in revised form 1 October 1997)
Key words: GLORIA, GLORI-B, SeaBeam, bathymetry processing, metric swath widths which are closer to the side-scanEaster Island, seamounts, hotspot widths, but the data resolution is less and there are
system artifacts in the data, including across-trackbias, along-track bias, impossible edge geometries, and
Abstract. A new bathymetry processing software package has beengeneral system noise. A software package, which wedeveloped to postprocess new GLORI-B swath bathymetry datacall BP (Bathymetry Processing), was developed tousing preexisting techniques. GLORI-B bathymetry is calculated
using an interferometry (phase delay) method using the modified postprocess these new data (Liu et al., 1994; Liu, 1996)GLORIA towfish which has parallel rows of transducers on both in order to minimize the system artifacts and mergesides. We describe four types of artifacts observed during the first different bathymetry data types into one grid file. Al-use of this new system during Legs 5 and 6 of the Gloria Expedition
though the majority of techniques have been previouslywhich surveyed the fastest spreading segment of the global seafloordeveloped, this software package is new, is designedspreading system and the broad chain of volcanoes near Easter
Island. These artifacts include cross-track bias, along-track bias, a to be compatible with UNIX and GMT (Generic Map-‘dropped edge’ effect, and random noise. We describe and illustrate ping Tools; Wessel and Smith, 1991) and is of potentialhow we minimize these artifacts. We merge the SeaBeam 2000 ba- use for others who will want to postprocess GLORI-Bthymetry data with the GLORI-B bathymetry data to produce a
or similar bathymetric data sets. The final processedfinal bathymetric mosaic which covers about 243,400 km2 and showsdata presented here are used in several manuscriptsa different style of diffuse widely spread volcanism not previously
observed along hotspot chains. The data are used in several studies (Liu, 1996; Rappaport, 1996; Kruse et al., 1997;describing seamount morphology, elastic thickness of the litho- Rappaport et al., 1997; Liu and Naar, 1997; Naarsphere, tectonic and geochemical evolution of the area, and mantle et al., 1997; Pan and Batiza, 1997; Kingsley andflow from a hotspot to a superfast seafloor spreading center.
Schilling, 1997).
1. Introduction 2. GLORI-B and SeaBeam 2000 System Descriptions
The GLORIA (Geological LOng Range InclinedWe describe the techniques and methods used for theprocessing of swath bathymetry data collected with ASDIC) system was originally designed to collect
acoustic side-scan image data of the seafloor in deepboth GLORI-B and SeaBeam 2000 systems, duringLegs 5, 6 and 7 of the Gloria Expedition (Hey et al., oceans (Caress and Chayes, 1996; Goff and Kleinrock,
1991; Kleinrock, 1992; Kleinrock et al., 1992; Mitchell,1995; Naar et al., 1993ab; Somers and Huggett, 1993)along the Easter seamount chain during 1993 1991; Mitchell and Somers, 1989; Rusby, 1970; Searle,
1992; Searle et al., 1990; Searle et al., 1989; Somers(Figure 1). Previously, the GLORIA system only pro-vided side-scan data. Earlier attempts to collect swath et al., 1978; Somers and Huggett, 1993; Tyce, 1986;
Vogt and Tucholke, 1986). The new capability ofbathymetry data during a GLORIA survey involvedusing a ship-mounted multibeam bathymetry system acquiring swath bathymetry was recently added to the
system based on the interferometry (phase delay)(e.g., Larson et al., 1992; Searle et al., 1992; Bird et al.,1997), but the width of the multibeam swaths were method used by the SeaMARC II 12-kHz system
(Blackinton et al., 1983; Hussong and Fryer, 1983;much less than the GLORIA side-scan swaths. TheGLORIA towfish was modified to collect bathymetry Sender et al., 1989). The modified fish was towed
D300 m behind the R/V Melville at a depth of D50 m.data, which Somers and Huggett (1993) have namedGLORI-B. The GLORI-B system collects wide bathy- The towfish, consisting of two parallel rows of long
Marine Geophysical Researches 19: 407–419, 1997.Ó 1997 Kluwer Academic Publishers. Printed in the Netherlands.

408 z. j. liu and d. f. naar
Fig. 1. A: Map of Southeast Pacific, showing the Pacific Plate, Nazca Plate, and Easter Microplate. Bathymetry (ETOPO5) data are shownwith darker tones representing deeper areas. Large box represents the location of Figure 1B. The small box represents the test area used toillustrate the data processing in Figures 2 and 4. B: The shiptracks of Legs 5, 6 and 7 of the Gloria expedition in the survey area; small boxrepresents the test area. GLORI-B and SeaBeam 2000 data were collected on Legs 5 and 6 with track orientation of about 070º. Leg 7 was
a dredging and SeaBeam 2000 leg with variable track orientations.
transducer arrays on each side, transmits a 2-second- have an along-track sampling of D125 m, a cross-track sampling of D45 m, and a vertical sampling oflong 6.5-kHz FM pulse every 20–40 seconds (30 sec-
onds during the Gloria Expedition) within a 2.7º D50 m.SeaBeam 2000 is a hull-mounted system developednarrow beam. The returning signal is correlated (to
compress the pulse) and is recorded in digital form for out of previous work on narrow-beam echo sounders,and, as such, is designed toward production of ba-subsequent processing. The phase differences of the
return signals to the two transducer arrays are used thymetry maps rather than seafloor acoustic imagescommon to traditional side-looking sonars (Caressto compute beam angles, which are used together with
travel time to calculate the depth to the seafloor that and Chayes, 1996; Goff and Kleinrock, 1991; Klein-rock, 1992; Kleinrock et al., 1992; Tyce, 1986; Vogtreflects the signals. The full swath of bathymetry data
is D24-km wide. At 8 knots towing speed, the data and Tucholke, 1986; Farr, 1980; de Moustier, 1988;

409swath bathymetry processing of glori-b and seabeam 2000
de Moustier and Kleinrock, 1986; General Instrument depth because Leg 5 surveyed near the shallow EastPacific Rise. Therefore, different correction profilesCorporation, 1981; Renard and Allenou, 1979). The
system also collects acoustic intensity data similar to are used to minimize the biases for the data collectedfrom the different regions. For further discussion seeside-scan data (e.g., de Moustier and Pavlicek, 1987;
Hagen et al., 1996; Liu et al., 1997). SeaBeam 2000 Liu (1996).The along-track bias is a major artifact in theuses a 7 msec long transmit pulse. The 2º beams are
overlapped to give a 1º spacing across-track. The beam GLORI-B bathymetry data and is quite visible inFigure 2B. A line filter, developed to deal with thiswidth along-track is 2º. The SeaBeam 2000 bathymetry
has 1 m vertical resolution. The roll and pitch of the problem, is applied to the data twice. First, the linefilter is applied to the individual swaths of data. Sec-ship are precisely removed using gyro sensors. A roll
error of 0.1º is detectable in the outerbeam depths ond, the line filter is applied to the mosaicked data inan orientation of 070º to match the primary shiptrackbecause they extend 60º from vertical. At a water depth
of 3 km, the system produces a bathymetric swath orientation. The second treatment is very effective ofremoving biases formed at the swath edges. The linewidth of about 10 km.filter is fully described in Liu (1996).
At shallow depths, the bathymetry data acquired atthe edges of the GLORI-B swaths deflect downwards3. Data Collected and Artifacts Observeddrastically with a very steep slope. We call this artifactthe ‘dropped edge’ effect (see the swath edges nearThe location of the collected data is shown in Figure 1.
The swath of GLORI-B bathymetry data extends the seamount at 26.9º S and 106.9º W in Figure 2B).The slope of the ‘dropped edge’ is so steep that itD12 km to each side of the shiptrack, and is partially
overlapped by a higher resolution SeaBeam swath that should be in the ‘shadow zone’ of the towfish. Inother words, the system could not possibly detectextends only D5 km to each side of the shiptrack
(Figures 2A and 2B). The SeaBeam 2000 data are used direct acoustic reflections from such a steeply outwarddipping portion of seafloor along the outer swathnot only to calibrate the GLORI-B data but also to
replace the lower resolution GLORI-B data in over- edges. These portions of erroneous data are removedfollowing the procedure described in the next sec-lapped areas. GLORI-B data can be processed without
the SeaBeam 2000 data. However, the overall accuracy tion. The cause of this ‘dropped edge’ effect is un-certain.of the processed data is improved by incorporating
the SeaBeam 2000 data. The small data gaps present Random noise becomes more detectable near theouter edges of the swath (Figure 2B). The noise isbetween adjacent GLORI-B bathymetry swaths
(Figure 2B) are filled by interpolation after various reduced with a median filter with a boxcar size of 5¶5cells. Larger random noise, or speckles, are reduceddata artifacts are removed or minimized (Figure 2C).
Although the GLORI-B system produces less accurate with a clipping technique (Paul Johnson, personalcommunication, 1994; Hey et al., 1995).data than the SeaBeam 2000 system, it is able to survey
large regions because of the 24-km wide bathymetryswaths it produces. The artifacts in the GLORI-B datainclude: cross-track bias, along-track bias, a ‘dropped 4. Bathymetry Processing Packageedge’ effect, and random noise.
The cross-track bias in GLORI-B bathymetry data The BP software package is composed of 37 programswritten in ANSI C (Liu, 1996). The modular open(Figure 3) is much greater than observed in other
swath bathymetry systems (Bird et al., 1996; Caress package has been installed and operated on SUN/UNIX and SGI/IRIX platforms. Each of the programsand Chayes, 1996; Chavez, 1986; Goff and Kleinrock,
1991; Liu et al., 1994; Liu, 1996; Miller et al., 1991; can be run separately as a regular UNIX commandor executed sequentially in a UNIX shell script toMitchell, 1991; Somers et al., 1978; Somers and Hug-
gett, 1993; Kleinrock, 1992; Kleinrock et al., 1992; produce the desired result. Many of the programs pro-vide multiple functions to handle a set of similar tasks,Tyce, 1986; Vogt and Tucholke, 1986; de Moustier,
1988; de Moustier and Kleinrock, 1986; General In- depending on the settings used in the command line.Most of the programs in the BP package use the GMT-strument Corporation, 1981; Renard and Allenou,
1979; Blackinton and Matsumoto, 1988; Blackinton, style syntax for setting command line parameters.Because of design similarities, GMT routines can be1986; Blackinton et al., 1983). There are significant
differences between the two profiles from Leg 5 and used with the BP routines during processing. In addi-tion, the BP package is compatible with the IP (Image6, suggesting that the bias is associated with water

410 z. j. liu and d. f. naar
Fig. 2. A: The SeaBeam 2000 data before processing. B: The GLORI-B data before processing. C: The processed data including bothGLORI-B and SeaBeam 2000 data, and the interpolated data in the gaps between the swaths.

411swath bathymetry processing of glori-b and seabeam 2000
Fig. 3. The GLORI-B average cross-track residual profiles. The dashed and solid lines are the profiles calculated from GLORI-B dataobtained during Legs 5 and 6, respectively.
Processing) package (Liu and Naar, 1997), WHIPS verted and merged with the GLORI-B data for furtherprocessing in the next step.(Woods Hole Image Processing Software — Paskevich,
1992), and MB (MultiBeam — Caress and Chayes,1996). Online help is provided in each of the programs. Converting the data into RAS format
To remove cross-track and along-track biases, the dataAlthough the package is designed for processing swathbathymetry data from GLORI-B and SeaBeam 2000, need to be in a raster format that maintains the lateral
geometry of the data points in a swath. The data aresome programs may be useful for other types of dataprocessing. The software package (including docu- converted into raster format and merged with naviga-
tion data using glormras. The GLORI-B vehicle ismentation and example scripts) is fully described (in-cluding processing flow charts and example scripts) in towed D300 m behind the ship at a speed of about
13 km/hr (D7 knots). Therefore, a time lag of 90 sec-Liu (1996).onds is applied to the data.
Reducing random noise and filling small data gaps5. Brief Illustration of Processing StepsSome high frequency noise is removed or reduced usingrasfilter. GLORI-B data have more high-frequencyThe following discussion italicizes names which refer
to programs used. noise than SeaBeam 2000 (Figures 2A and 2B). A 5¶5boxcar median filter is used to reduce the noise. Somesmall data gaps on the swaths are filled at this time asPreparing the towfish navigation
GLORI-B bathymetry data do not include the naviga- well. Figure 4B compared to Figure 4A shows thereduction of noise after the application of rasfilter.tion information. The ship’s navigational data are con-

412 z. j. liu and d. f. naar
Removing cross-track biases Trimming the dataSome small isolated spots or peninsulas of data existGLORI-B data contain cross-track biases. Figure 3
shows an average residual cross-track profile calculated near the swath edges after removing the ‘droppededges’. The program grdtrim is used to remove thesefrom data collected during Legs 5 and 6. This ‘correc-
tion’ profile is based on a statistical approach of very data when one of their dimensions is less than a givennumber of cells (5 in our case). Although the majoritylarge numbers. Although this practice is used in marine
geophysics, a more deterministic approach of swath of these small data patches are erroneous ‘droppededges’ that still remain, some of them are not. Thus,error analysis should be considered for future surveys.
Unfortunately, we are unable to follow this approach the threshold of the trimming dimension should bechosen to cut primarily the erroneous data. Largerwith our existing SeaBeam 2000 data coverage. In addi-
tion, instead of using a single correction profile for an thresholds will cause normal data to be removed,whereas smaller thresholds will not remove all the erro-entire leg, we calculate correction profiles from similar
areas to correct the cross-track biases related to each neous data near the swath edges. Figure 4F shows thedata after applying grdtrim (compare with Figure 4E).area or depth (Liu, 1996). The program rasprof calcu-
lates the profile and makes the correction (compare A few cells attached to the edges of all the swaths arecut further with grdshrink. This program is used twiceFigure 4D with 4A).to remove a band of two cells from the swath edges(Figure 4G). Finally, any remaining data determinedReducing along-track biases
A line filter is used to reduce along-track bias. Two to be erroneous after visual inspection, are removedsemiautomatically using grdholing (Liu, 1996).multifunctional programs, rasfilter and rasmath, are
combined to produce the line filter. The boxcar of thefirst (median) filter is 0.05¶20 km (or 1¶200 cells) Clipping speckles and funnels
Speckles and funnels (larger narrow peaks and valleyswith the long axis parallel to shiptrack. The boxcardimension of the second (mean) filter is 10¶20 km of random noise) are reduced using a clipping tech-
nique. An averaged grid is calculated using a moving(or 200¶200 cells) with long (distance) axis parallelto the shiptrack. Figure 4D shows the data after the boxcar of 5¶5 cells. The magnitude of the noise is
derived from the difference between the data and theremoval of both the cross-track and along-trackartifacts. Further discussion of the line filter design smoothed grid. The cells with a difference greater than
200 m are removed (Figure 4H). Most of the holes,can be found in Liu (1996).formed after the cut, are near the edges of the swathsbecause the noise is usually greater near the edges.Cutting the ‘dropped edges’
We detect these erroneous ‘dropped edges’ (see thedark areas at the swath edges in Figure 4C) using Calibrating GLORI-B data using the SeaBeam grid
The GLORI-B data are calibrated to match the Sea-raslope and cut them using rascull. Figure 4E showsthe swaths after cutting the ‘dropped edges’. Beam 2000 data so that they can be merged smoothly
on the borders. Because the GLORI-B vehicle is towedabout 50 meters below the sea surface, there should beRemoving duplicated pings
When the GLORI-B data are converted to the raster a constant offset between GLORI-B and SeaBeam 2000data. During the data processing, we found that the off-format, about 200 extra pings are duplicated at the
beginning and end of each file to enable the boxcar set is not constant. Therefore, GLORI-B data arematched to the SeaBeam 2000 data by using a varyingfilters to work properly. The program rascut removes
these pings after the boxcar filtering. offset correction. To calculate the correction, a smoothand interpolated surface is created from the SeaBeamgrid (Figure 4I). A difference grid between the GLORI-Converting the data from raster to grid format
The geographical coordinates (longitude and latitude) B and the smoothed SeaBeam grids is calculated by sub-tracting the two grids. The difference grid is smoothedare computed for each data point in the raster files
using rasmllz in a similar way as was done for the using grdmean with a boxcar size of 50¶50 cells to ob-tain the varying offset correction (Figure 4J), which isSeaBeam 2000 data using sb2llz (Scheirer and Mac-
donald, 1993; Scheirer et al., 1996). The output of then used to adjust the GLORI-B grid (Figure 4K).rasmllz (longitude, latitude and depth) is gridded usingxyzmgrd. The data shown in Figure 1B represents the Merging GLORI-B and SeaBeam grids
The 10-km-wide SeaBeam 2000 swaths overlap D40%boundaries of the grid file, which has a cell size of0.003¶0.003 degrees. of the GLORI-B swaths along the center tracks. These

413swath bathymetry processing of glori-b and seabeam 2000
Fig. 4A-H

414 z. j. liu and d. f. naar
Fig. 4I-P

415swath bathymetry processing of glori-b and seabeam 2000
SeaBeam 2000 data replace the GLORI-B data in the Reducing the along-track bias furtherA line filter is applied again to further reduce theoverlapped areas. The two data sets may not match
perfectly on their borders, e.g., a small ‘cliff’ may be along-track biases in the gridded bathymetry data. It ispossible to use the line filter on the gridded bathymetryobserved on the borders. To smooth the data along
the ‘cliff’, a boxcar filter of 5¶3 cells is used with its data because most of the shiptracks (and thus thealong-track biases) are oriented in the same directionlong axis in the N–S direction, which is approximately
perpendicular to the shiptrack orientation (070º). To (070º). The line filter is applied to the data through acombination of grdmedian, grdmean, and grdmath. Theretain the best data, the SeaBeam grid is again restored
to the smoothed grid (Figure 4L). first filter, grdmedian, uses a boxcar of 1.5¶30 km(or 5¶100 cells) with its long axis in the 070º direction.The second filter uses grdmean with a boxcar ofInterpolating the merged data to fill the data gaps
The data gaps between the swaths are filled by interpo- 30¶30 km. The two filtered grids are subtractedto produce a difference grid (Figure 4N). By sub-lating the merged grid using grdsurface (Figure 4M).
The program grdsurface, modified form a GMT pro- tracting the difference grid from the data grid, weacquire a new grid with fewer along-track biasesgram surface, fits a surface to the grid (Smith and
Wessel, 1990; Wessel and Smith, 1991). The gaps are (Figure 4O).interpolated by solving
Restoring the SeaBeam 2000 data(1ÖT) • L(L(z))+T • L(z)>0
The original SeaBeam 2000 data are slightly modifiedfrom the previous processing, so they are restored towhere T is a tension factor between 0 and 1, and L indi-
cates the Laplacian operator. T>0 gives the ‘minimum the processed grid. The GLORI-B data are adjustedagain to match the original SeaBeam data in the man-curvature’ solution and T>1 gives a harmonic surface
(Smith and Wessel, 1990). A tension factor of 0.25 was ner described previously. This final touch reduces theborders between the GLORI-B and SeaBeam 2000used for our data. There are about 20-km-wide data
gaps between the SeaBeam swaths in the western por- data further, while restoring the SeaBeam 2000 dataat the same time (Figure 4P).tion of the mosaicked area because the GLORI-B sys-
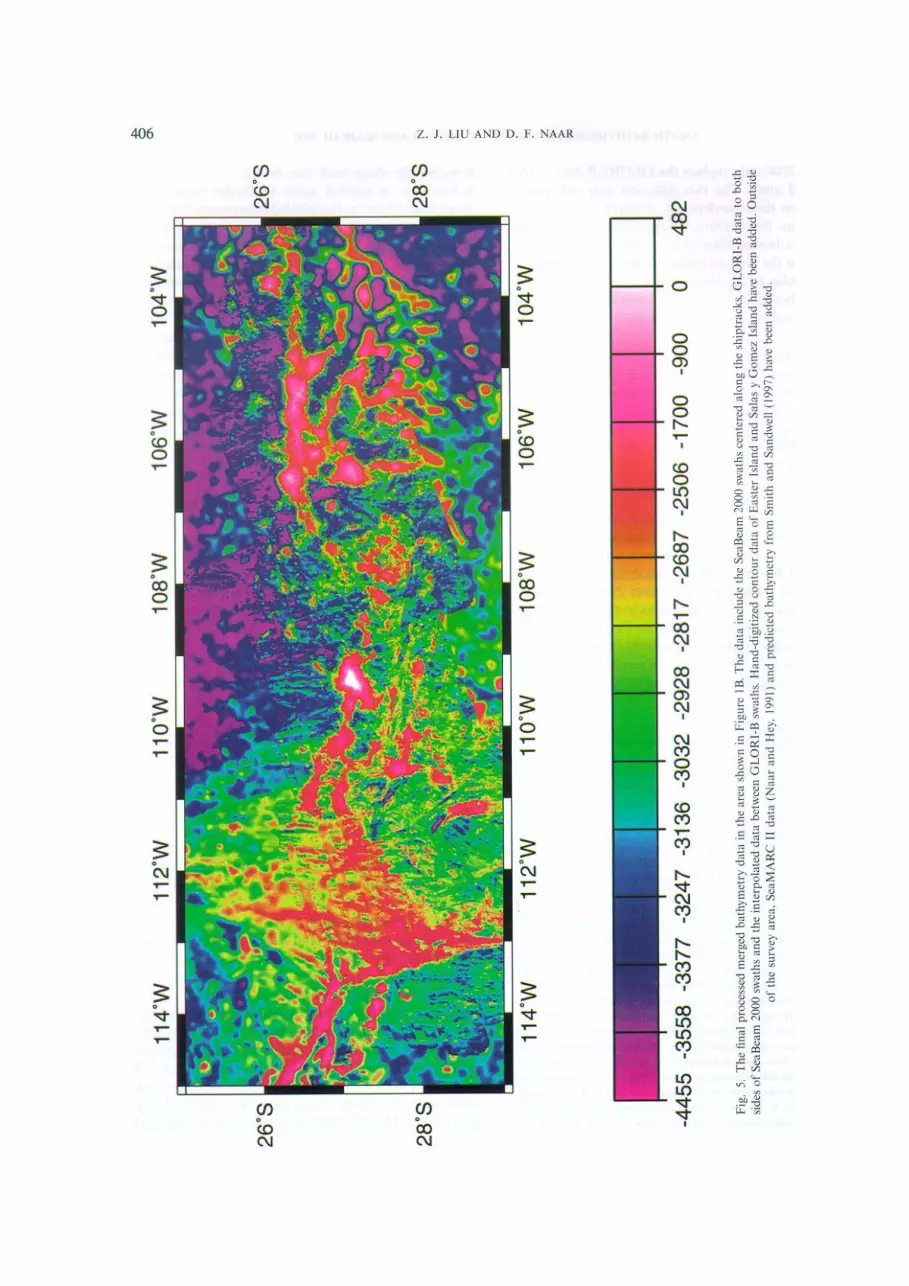
tem was not operating properly during the early part ofLeg 5 (Figure 5). These gaps are not interpolated be- Filling in island topography
There are two large data holes left in the bathymetrycause of the large distance between the SeaBeam swaths.grid near Easter Island and Salas y Gomez Island.The topographic data for the islands were acquiredk Fig. 4. Test region showing some of the data artifacts and theseparately and patched onto the final grid. The topo-results of the bathymetry processing steps described in the text. The
bathymetry gray scale matches that of Figure 2. The insets A through graphic data of Easter Island were previously digitizedE illustrate the processing while the data is in raster format. The from contour maps (Hagen et al., 1990). We digitizedinsets F through P illustrate the processing while the data are in a the topographic data of Salas y Gomez Island (Fishergridded format. A: The GLORI-B bathymetry data without any
and Norris, 1960). However, their center of Salas ypostprocessing corrections. B: The bathymetry data after filteringGomez Island (26º27.8� S, 105º27.8� W) does not agreewith a 5¶5 cells median filter. C: Example of the ‘dropped edge’
effect; the dark areas at the swath edges represent very steep outward- with our observed position during Leg 6 of the Gloriafacing slopes that should be undetectable because they lie within Expedition (26º28.5� S, 105º21.7� W). The digitizedthe towfish ‘shadow’ zone. D: The bathymetry data after removing data of Salas y Gomez Island are shifted accordingly.cross-track biases and reducing along-track biases. E: The bathyme-try data after ‘dropped edges’ are cut. F: The bathymetry data after
Filling in surrounding bathymetrytrimming isolated data along the swath edges. G: The bathymetrydata after uniform trimming of the swath edges. H: The bathymetry There are no GLORI-B and SeaBeam 2000 data be-data after clipping data outliers. I: Smooth bathymetry calculated yond the densely surveyed region. These areas are filledfrom SeaBeam 2000 data. J: The difference offset between the with SeaMARC II (provided by R. Hey) and the pre-GLORI-B and the SeaBeam 2000 smoothed bathymetry. K: The
dicted bathymetry data of Smith and Sandwell (1997).GLORI-B bathymetry data after applying the difference offset inThese data are patched in the unsurveyed regions with-order to match up the two data sets. L: The merged bathymetry
with the original high-resolution SeaBeam 2000 data replacing the out any adjustments made to match up the data sets.GLORI-B data where overlap exists. M: The merged bathymetry Both of the SeaMARC II and predicted bathymetrydata after the data gaps are interpolated. N: The along-track biases grids are resampled to the same grid size (0.003¶0.003calculated from the interpolated merged data. O: The merged data
degrees). The SeaMARC II data exists only in a fewafter the along-track biases are removed from data in Panel M usingareas west of 109º W (Naar and Hey, 1991; Hagenbiases in Panel N. P: The final processed merged bathymetry data
after the high-resolution SeaBeam 2000 data are restored. et al., 1990). Thus, the final grid (Figure 5) is composed
417swath bathymetry processing of glori-b and seabeam 2000
of five data sets, GLORI-B, SeaBeam 2000, SeaMARC floor spreading which has not previously been ob-served along other hotspot chains. Several geophysicalII, digitized island topography, and bathymetry pre-
dicted from altimetry data. Although there was no and geochemical studies make use of these data toinvestigate seamount morphology, elastic thickness ofattempt to match the predicted bathymetry with the
other four data sets, there is relatively good agreement the lithosphere, tectonic and geochemical evolution ofthe area, and mantle flow from a hotspot to a superfastalong the borders.seafloor spreading center.
6. Major FindingsAcknowledgments
Although we focus on the data processing of a newbathymetric sonar system, some fundamental first- We thank R. Hey for providing us GLORI-B ba-
thymetry data collected during Leg 5 of the Gloriaorder observations of this new data set can be made,and other data analyses (Kruse et al., 1997; Rappaport Expedition, R. Hagen for providing the digitized
topography data of Easter Island, and D. Scheireret al., 1997) have led to new findings regarding thisarea of superfast seafloor spreading and active hotspot for providing us the sb2llz program. Some GMT
programs are used for processing the data and gener-volcanism (Naar and Hey, 1989; DeMets et al., 1990,1994; Hagen et al., 1990; Klaus et al., 1991; Hey et al., ating maps (Smith and Wessel, 1990; Wessel and
Smith, 1991). We thank R. Beale for his dedicated1995; Liu, 1996). The total coverage of the GLORI-Bmosaic is about 243,400 km2 and shows a different effort in software development at sea to provide near
real-time GLORI-B bathymetry. C. Jacobs, D. Bishop,style of diffuse widely spread young volcanism notpreviously observed along other hotspot chains. The A. Harris and R. Rusby provided support on many
aspects of the GLORI-B data collection, processing,distribution of the volcanoes are not linear, nor are allthe volcanic ridges subparallel (Liu, 1996; Rappaport, and interpretation. M. Somers and Q. Huggett also
provided assistance at several stages of this project.1997). There are over 3000 volcanoes or small circularvolcanic structures and 553 volcanoes with heights We thank R. Hagen, R. Hey, F. Martinez, P. Johnson,
C. de Moustier, K. Stewart, S. Miller, D. Caress andgreater than 200 m and less than 3300 m in the mosa-icked area, although only 383 of these seamounts have D. Scheirer for discussions regarding this work. We
also thank Y. Rappaport, M. Kuykendall andbasal–length to basal–width aspect ratios less than2 (Rappaport , 1996; Rappaport et al., 1997). The S. Kruse for reviewing various drafts of this paper.
Reviews by S. Miller and an anonymous reviewerseamounts cover about 27% of the seafloor (excludinglava flows and volcanoes smaller than 200 m (Rappa- improved the manuscript. To obtain the software
by anonymous ftp, email [email protected] orport et al., 1997). Modeling of shipboard gravity, al-timetry gravity, and the bathymetry data (Kruse et al., [email protected]. The work was partially sup-
ported by NSF Grants OCE9116012, OCE9302802,1997) indicates that the effective elastic thickness ofthe lithosphere along most of the Easter seamount and American Chemical Society/Petroleum Research
Fund 24362-G2.chain is very thin (D3 km). Geochemical manuscriptsrelated to these data have been submitted or are inpreparation (Pan and Batiza, 1997; Kingsley and Schil-ling, 1997). References
Bird, R. T., Searle, R. C., Paskevich, V., and Twichell, D. C., 1996,Merged GLORIA Sidescan and Hydrosweep Pseudo-Sidescan:7. SummaryProcessing and Creation of Digital Mosaics, Mar. Geophys. Res.18, 651–661.A new bathymetry processing software package (BP)
Bird, R. T., Naar, D. F., Larson, R. L., Searle, R. C., and Scotese,has been developed and used to postprocess GLORI-B C. R., 1997, Plate Tectonic Reconstructions of the Juan Fernandezand to merge several bathymetry data sets including Microplate: Transformation from Internal Shear to Rigid Rota-
tion, J. Geophys. Res., in press.SeaBeam 2000 data. Four types of data artifacts areBlackinton, J. G. and Matsumoto, H., 1988, SeaMARC Systems:observed: cross-track bias, along-track bias, ‘dropped
Today and Tomorrow, in Proc. 3rd Pacific Congr. Marine Sci.edge’ effect, and random noise, all of which were mini-Technol., PACON88, OST8, 29.
mized using BP. The resulting grid for the Easter–Salas Blackinton, J. G., 1986, Bathymetric Mapping with SeaMARC II:y Gomez region indicates a different style of diffuse An Elevation-Angle Measuring SideScan Sonar System, Ph.D.
Dissertation, University of Hawaii, Honolulu, 1986.widely spread volcanism in this area of superfast sea-

418 z. j. liu and d. f. naar
Blackinton, J. G., Hussong, D. M., and Kosalos, J. G., 1983, First Liu, Z. J., 1996, The Origin and Evolution of the Easter SeamountChain, Ph.D. Dissertation, University of South Florida,Results from a Combination Side-Scan Sonar and Sea-Floor
Mapping system (SeaMARC II), Offshore Technology Conference St. Petersburg, 1996.Liu, Z. J. and Naar, D. F., 1997, Side-Scan Processing of GLORI-B4478, 307–311.
Caress, D. W. and Chayes, D. N., 1996, Improved Processing of and SeaBeam 2000, Mar. Geophys. Res. 19, 397–405 (thisissue).Hydrosweep DS Multibeam Data on the R/V Maurice Ewing,
Mar. Geophys. Res. 18, 631–650. Liu, Z. J., Naar, D. F., Beale, R., Somers, M., and Demoustier,C., 1994, GLORI-B Data Processing, EOS Trans. AGU 75,Chavez, P. S. Jr., 1986, Processing Techniques for Digital Sonar
Images from GLORIA, Photogrammetric Engineering and Remote 341.Miller, R. L., Dwan, F. S., and Cheng, C.-F., 1991, Digital Prepro-Sensing 52, 1133–1145.
DeMets, C., Gordon, R. G., Argus, D. F., and Stein, S., 1990, cessing Techniques for GLORIA II Sonar Images, Geo-MarineLett. 11, 23–31.Current Plate Motions, Geophys. J. Int. 101, 425–478.
DeMets, C., Gordon, R. G., Argus, D. F., and Stein, S., 1994, Mitchell, N. C., 1991, Improving GLORIA Images Using Sea BeamData, J. Geophys. Res. 96, 337–351.Effect of recent revisions to the geomagnetic reversal time scale
on estimates of current plate motions, Geophys. Res. Lett. 21, Mitchell, N. C. and Somers, M. L., 1989, Quantitative BackscatterMeasurements with a Long Range Side-Scan Sonar, IEEE J.2191–2194.
de Moustier, C. and Pavlicek, F. V., 1987, On-line SeaBeam acoustic Oceanic Eng. 14, 368–374.Naar, D. F., Batiza, R., Poreda, R., and Schilling, J.-G., 1993a, Finalimaging, Proc. MTS-IEEE, Oceans 87, 1197.
de Moustier, C. and Kleinrock, M.C., 1986, Bathymetric Artifacts Cruise Report for the R/V Melville Gloria Expedition Legs 6and 7.in SeaBeam Data: How to Recognize Them and What Causes
Them, J. Geophys. Res. 91, 3407. Naar, D. F., Liu, Z. J., Rappaport, Y., Batiza, R., Hagen, R., Hey,R., Nelson, R., Plake, T., Stefani, R., Schilling, J.-G., Kincaid,de Moustier, C., 1988, State of the Art in Swath Bathymetry Survey
Systems, Int. Hydrog. Rev. 65, 25. C., Xu, G., Poreda, R., Joseph, L., Jacobs, C., Beale, R., Bishop,D., Harris, A., Rusby, R., Fontignie, D., Woods, A., Kruse, S.,Farr, H. K., 1980, Multibeam Bathymetric Sonar, Sea Beam and
Hydrochart, Mar. Geodesy 4, 77. Korenaga, J., Seama, N., Vergara, H., and Guarda, R., 1993b,GLORI-B and Geochemical Investigation of the Easter SeamountFisher, R. L. and Norris, R. M., 1960, Bathymetry and Geology of
Sala y Gomez, Southeast Pacific, Bull. Geol. Soc. of America 71, Chain: EPR to San Ambrosio Island, EOS Trans. AGU 74,672.497–502.
General Instrument Corporation, 1981, Sea Beam Bathymetric Sur- Naar, D. F. and Hey, R. N., 1989, Recent Pacific–Easter–NazcaPlate Motions, in Evolution of Mid Ocean Ridges, edited by J. M.vey System, Technical Manual, Vol. 2, Westwood, MA.
Goff, J. A. and Kleinrock, M. C., 1991, Quantitative Comparison Sinton, Geophysical Monograph Series 57, 9–30, AGU, Wash-ington D.C.of Bathymetric Survey Systems, Geophys. Res. Lett. 18, 1253–
1256. Naar, D. F. and Hey, R. N., 1991, Tectonic Evolution of the EasterMicroplate, J. Geophys. Res. 96, 7961–7993.Hagen, R. A., Baker, N. A., Naar, D. F., and Hey, R. N., 1990, A
SeaMARC II Survey of Recent Submarine Volcanism near Easter Paskevich, V., 1992, Woods Hole Image Processing System SoftwareImplementation: Using NetCDF as a Software Interface for Im-Island, Mar. Geophys. Res. 12, 297–315.
Hagen, R. A., Vergara, H., and Naar, D. F., 1996, Morphology of age Processing, U.S. Geological Survey, Open-file Report 92–25,72pp.San Antonio Submarine Canyon on the Central Chile Forearc,
Mar. Geol. 129, 197–205. Rappaport, Y., 1996, Seamount Shape and Size Distribution nearEaster Island, M.S. Thesis, University of South Florida,Hey, R. N., Johnson, P. D., Martinez, F., Korenaga, J., Somers, M.
L., Huggett, Q. J., Lebas, T. P., Rusby, R. I., and Naar, D. F., St. Petersburg, 265 pp., 1996.Rappaport, Y., Naar, D. F., Barton, C., Liu, Z. J., and Hey, R. N.,1995, Plate Boundary Reorganization along the Fastest Seafloor
Spreading Center, Nature 378, 167–170. 1997, Morphology and Distribution of Seamounts SurroundingEaster Island, J. Geophys. Res. in press.Hussong, D. M. and Fryer, P., 1983, Back-Arc Seamounts and the
SeaMARC II Seafloor Mapping System, Eos Trans. AGU 64, Renard, V. and Allenou, J. P., 1979, SEABEAM Multi-Beam Echo-Sounding in "Jean Charcot". Description, Evaluation, and First627–632.
Klaus, A., Icay, W., Naar, D. F., and Hey, R. N., 1991, SeaMARC Results, Int. Hydrogr. Rev. 56, 35.Rusby, S., 1970, A Long Range Sidescan Sonar for Use in the Deep-II Survey of a Propagating Limb of a Large Non-Transform Offset
along the Fastest Spreading East Pacific Rise Segment, J. Geophys. sea, Int. Hydrogr. Rev. 47, 25–39.Scheirer, D. S. and Macdonald, K. C., 1993, Variation in Cross-Res. 96, 9985–9998.
Kleinrock, M. C., 1992, Capabilities of Some Systems Used to sectional Area of the Axial Ridge along the East Pacific Rise:Evidence for the Magmatic Budget of a Fast Spreading Center,Survey the Deep-Sea Floor, CRC Handbook of Geophysical Ex-
ploration at Sea. Boca Raton, CRC Press. J. Geophys. Res. 98, 7871–7885.Scheirer, D. S., Macdonald, K. C., Forsyth, D. W., and Shen, Y.,Kleinrock, M. C., Hey, R. N., and Theberge, A. E., 1992, Practical
Geological Comparison of Some Seafloor Survey Instruments, 1996, Abundant Seamounts of the Rano Rahi Seamount FieldNear the Southern East Pacific Rise, 15º S to 19º S, Mar. Geophys.Geophys. Res. Lett. 19, 1407–1410.
Kruse, S. K., Liu, Z. J., Naar, D. F., and Duncan, R., 1997, Effective Res. 18, 13–52.Searle, R. C., 1992, Near Real-Time Merging of GLORIA andElastic Thickness of the Lithosphere Along the Easter Seamount
Chain, J. Geophys. Res. in press. Hydrosweep Pseudo-Sidescan Image, Geophys. Res. Lett. 19,1137–1140.Larson, R. L., Searle, R. C., Kleinrock, M. C., Schouten, H., Bird,
R. T., Naar, D. F., Rusby, R.I., Hooft, E. E., and Lasthiotakis, H., Searle, R. C., Lebas, T. P., Mitchell, N. C., Somers, M. L., Parson,L. M., and Patriat, P., 1990, GLORIA Image Processing: The1992, Roller-Bearing Tectonic Evolution of the Juan Fernandez
Microplate, Nature 356, 571–576. State of the Art, Mar. Geophys. Res. 12, 21–39.

419swath bathymetry processing of glori-b and seabeam 2000
Searle, R. C., Rusby, R. I., Engeln, J., Hey, R. N., Zukin, J., Hunter, Range Sidescan Sonar., in Proc. IEEE/IERE Sub-conference onOffshore Instrumentation, Oceanology International ’78, Tech-P. M., LeBas, T. P., Hoffman, H.-J., and Livermore, R., 1989,
Comprehensive Sonar Imaging of the Easter Microplate, Nature nical Session J., London, BPS Publications, Ltd., London, v. 16–24.341, 701–705.
Sender, K. L., Shor, A., and Hagen, R., 1989, SeaMARC II Side- Somers,M.L.andHuggett,Q.J., 1993,FromGLORIAtoGLORI-B:New Upgrades Add Swath Bathymetry to 20-Year-Old GLORIAScan Processing Techniques, Eos Trans. AGU 70, 11304.
Smith, W. H. F. and Sandwell, D., 1997, Measured and Estimated Reconnaissance Sonar Images, Sea Technol. 34, 64–68.Tyce, R. C., 1986, Deep Seafloor Mapping Systems — A Review,Seafloor Topography, Version 4.2, World Data Center A for
Marine Geology and Geophysics Research Publication RP-1, MTS Journal 20, 4–16.Vogt, P. R. and Tucholke, B. E., 1986, Imaging the Ocean Floor:Poster 34¶53 inches, Boulder, Colorado.
Smith, W. H. F. and Wessel, P., 1990, Gridding with Continuous History and State of the Art, The Western North Atlantic Region.Boulder, Geological Society of America, Inc.Curvature Splines in Tension, Geophysics 55, 293–305.
Somers, M. L., Carson, R. M., Revie, J. A., Edge, R. H., Barrow, Wessel, P. and Smith, W. H., 1991, Free Software Helps Map andDisplay Data, EOS Trans. AGU 72, 5–446.B. J., and Andrews, A. G., 1978, Gloria II – An Improved Long