sustainable dala - myanmar water portal
TRANSCRIPT

Sustainable DalaShowcase of a sustainable water infrastructure
by
Giacomo Bandinu 4620372Lot Barendsen 4152271Jeroen Delfos 4144147Arnout Janse 4155785Irene Overtoom 4240235
at the Delft University of Technology,
Project duration: April 2017 – October 2017Supervisors: Dr. Ir. M. M. Rutten
Dr. Ir. A. J. Pel
This report is part of the studies at the Faculty of Civil Engineering and Geosciences and has beenprepared with great care under the guidance of staff of Delft University of Technology. However, thereader should acknowledge that this report has been prepared for educational purposes and will beprimarily judged on educational criteria. Delft University of Technology cannot accept liability for allcontents of this report. All photographs and figures without external referencing have been createdby members of this group. The photographs and figures may be used, however proper referencing is
expected.
An electronic version of this thesis is available at http://repository.tudelft.nl/.
In collaboration with:

Preface
Dear reader,
Before you lies the report of our multidisciplinary project in Myanmar: Sustainable Dala . This projectwas carried out as part of our masters program at the Delft University of Technology and in preparationfor the Amsterdam International Water Week 2017, where the result will be presented. From 28 Augustuntil 20 October 2017 we worked in Yangon, where we could visit the area of study, Dala, and where wewere in contact with local experts. We were very impressed by the things we saw in the Dala Township.The problems regarding drinking water were visible, and the stories we heard from inhabitants weredaunting.
This led us to work towards an innovative design that could be solve the problems and be feasibleto implement in the area of Dala. We hope that, although the scope of the design is limited, somevaluable ideas and information can be found in this document by local stakeholders.
We would like to give a special thanks to Daw Tin Tin Kyi, Daw Nyein Aye, Daw Saw Sandar Oo andDaw Khaing Moe Nyunt from the Yangon City Development Committee for showing us around in Dala,giving us feedback on our findings and joining our workshop. We also want to thank UNESCO-IHEalumni U Cho Cho, U Khin Lat and U Aye Myint from the National Engineering and Planning Servicesfor their thorough knowledge and elaborated feedback on our report and workshops. Furthermore wewant to thank the Dutch and Burmese experts from the Young Expert Programme and the students,both from Maritime Myanmar University and Yangon Technological University, for their input duringour workshops. We want to especially thank Ir. Tanya Huizer and Ir. Alwin Commandeur from theYoung Expert Programme for guiding us in Yangon and introducing us to the right people. Likewiseour supervisors in the Netherlands, Dr. Ir. Martine Rutten and Dr. Ir. Adam Pel, who gave answersto our questions and advise us via e-mail and Skype while being in Yangon, and helped us setting upthe project. Thank you for your time, involvement and expertise during the project. Furthermore, wewould like to thank our sponsors for making this project possible and our followers on social media fortheir interest. You really motivated us to work on this project even harder to achieve better results. Wewould also like to thank our families for their love and support. Your phone calls, motivating messagesand kind words kept us going.
We hope you enjoy reading our report.
G.L. BandinuL. Barendsen
J. DelfosA.M. Janse
I.A.E. OvertoomYangon, October 2017
”Don’t spend money as water, spend water like money” - U Cho Cho
iii

Abstract
The goal of this project is to develop a design for Dala s water system that deals with challenges of thetownship in a sustainable way. Dala is a township of Yangon, Myanmar s economic centre. It is locateddirectly South of the central business district (CBD), across the Yangon river. The area is now largelyunderdeveloped, but in 2021 it will be directly connected to Yangon s CBD by a bridge, after which rapidurbanization and growth is expected. Current water infrastructure is already lacking heavily, makingthe need for a full new system even more imminent for the future.
In an 8 week field research period, a full design cycle was conducted with input from severallocal experts and stakeholders. The final advice is to implement a new system focused on rainwaterharvesting, large-scale storage in reservoirs and a dual reticulation system for water supply to theconsumer. Other water infrastructure, such as drainage, sewage and treatment is designed to fit thesefocal points.
This system is more sustainable than commonly used methods, as the resource is not impactedand energy is saved on treatment and transport. Furthermore, it caters for all expected water needsin 2040, making Dala fully self sufficient in closing the water circle.
v

Contents
1 Introduction 1
2 Context 32.1 Introduction to Dala . . . . . . . . . . . . . . . . . . . . . . . . . . . . . . . . . . . . . 32.2 Scope and assumptions . . . . . . . . . . . . . . . . . . . . . . . . . . . . . . . . . . . 62.3 Stakeholder analysis. . . . . . . . . . . . . . . . . . . . . . . . . . . . . . . . . . . . . 72.4 Scenarios . . . . . . . . . . . . . . . . . . . . . . . . . . . . . . . . . . . . . . . . . . . 9
2.4.1 Influencing factors . . . . . . . . . . . . . . . . . . . . . . . . . . . . . . . . . . 102.4.2 Scenario description . . . . . . . . . . . . . . . . . . . . . . . . . . . . . . . . . 12
3 Requirement analysis 153.1 Requirements of the system . . . . . . . . . . . . . . . . . . . . . . . . . . . . . . . . 15
3.1.1 Constraints . . . . . . . . . . . . . . . . . . . . . . . . . . . . . . . . . . . . . . 153.1.2 Functional requirements . . . . . . . . . . . . . . . . . . . . . . . . . . . . . . 163.1.3 Non-functional requirements . . . . . . . . . . . . . . . . . . . . . . . . . . . . 16
3.2 Land-use model. . . . . . . . . . . . . . . . . . . . . . . . . . . . . . . . . . . . . . . . 163.2.1 Conceptual model . . . . . . . . . . . . . . . . . . . . . . . . . . . . . . . . . . 163.2.2 Zonal map of Dala . . . . . . . . . . . . . . . . . . . . . . . . . . . . . . . . . . 18
4 Functional analysis 234.1 Definition of functions . . . . . . . . . . . . . . . . . . . . . . . . . . . . . . . . . . . . 234.2 Morphological design . . . . . . . . . . . . . . . . . . . . . . . . . . . . . . . . . . . . 23
4.2.1 Harvesting of water/resource. . . . . . . . . . . . . . . . . . . . . . . . . . . . 244.2.2 Storage of harvested water . . . . . . . . . . . . . . . . . . . . . . . . . . . . . 244.2.3 Treatment of household- and drinking water . . . . . . . . . . . . . . . . . . 244.2.4 Quality control of drinking water . . . . . . . . . . . . . . . . . . . . . . . . . 244.2.5 Supply of drinking water . . . . . . . . . . . . . . . . . . . . . . . . . . . . . . 254.2.6 Collection of wastewater. . . . . . . . . . . . . . . . . . . . . . . . . . . . . . . 254.2.7 Limiting pollution of wastewater . . . . . . . . . . . . . . . . . . . . . . . . . . 264.2.8 Monitoring water consumption. . . . . . . . . . . . . . . . . . . . . . . . . . . 264.2.9 Treatment of wastewater . . . . . . . . . . . . . . . . . . . . . . . . . . . . . . 264.2.10Protection against pluvial flooding. . . . . . . . . . . . . . . . . . . . . . . . . 264.2.11Collection of run-off water . . . . . . . . . . . . . . . . . . . . . . . . . . . . . 26
4.3 Alternative designs . . . . . . . . . . . . . . . . . . . . . . . . . . . . . . . . . . . . . . 264.3.1 Economic sustainability . . . . . . . . . . . . . . . . . . . . . . . . . . . . . . . 274.3.2 Environmental sustainability. . . . . . . . . . . . . . . . . . . . . . . . . . . . 274.3.3 Social sustainability . . . . . . . . . . . . . . . . . . . . . . . . . . . . . . . . . 28
5 Evaluation 315.1 Evaluation of the alternatives . . . . . . . . . . . . . . . . . . . . . . . . . . . . . . . 31
5.1.1 Economic sustainability . . . . . . . . . . . . . . . . . . . . . . . . . . . . . . . 325.1.2 Environmental sustainability. . . . . . . . . . . . . . . . . . . . . . . . . . . . 335.1.3 Social sustainability . . . . . . . . . . . . . . . . . . . . . . . . . . . . . . . . . 335.1.4 Focal points . . . . . . . . . . . . . . . . . . . . . . . . . . . . . . . . . . . . . . 34
5.2 Expert evaluation. . . . . . . . . . . . . . . . . . . . . . . . . . . . . . . . . . . . . . . 345.3 Synthesis . . . . . . . . . . . . . . . . . . . . . . . . . . . . . . . . . . . . . . . . . . . 35
6 Final design 376.1 Focal functions . . . . . . . . . . . . . . . . . . . . . . . . . . . . . . . . . . . . . . . . 37
6.1.1 Water harvesting and source . . . . . . . . . . . . . . . . . . . . . . . . . . . . 376.1.2 Storage . . . . . . . . . . . . . . . . . . . . . . . . . . . . . . . . . . . . . . . . . 406.1.3 Water supply . . . . . . . . . . . . . . . . . . . . . . . . . . . . . . . . . . . . . 41
vii
viii Contents
6.2 Additional functions design. . . . . . . . . . . . . . . . . . . . . . . . . . . . . . . . . 436.2.1 Drinking water treatment . . . . . . . . . . . . . . . . . . . . . . . . . . . . . . 446.2.2 Quality control of drinking water . . . . . . . . . . . . . . . . . . . . . . . . . 446.2.3 Collection of wastewater. . . . . . . . . . . . . . . . . . . . . . . . . . . . . . . 456.2.4 Limiting pollution of wastewater . . . . . . . . . . . . . . . . . . . . . . . . . . 456.2.5 Monitoring water consumption. . . . . . . . . . . . . . . . . . . . . . . . . . . 466.2.6 Treatment of wastewater . . . . . . . . . . . . . . . . . . . . . . . . . . . . . . 476.2.7 Discharge of wastewater. . . . . . . . . . . . . . . . . . . . . . . . . . . . . . . 486.2.8 Protection against pluvial flooding. . . . . . . . . . . . . . . . . . . . . . . . . 486.2.9 Drainage system . . . . . . . . . . . . . . . . . . . . . . . . . . . . . . . . . . . 496.2.10Protection against fluvial flooding . . . . . . . . . . . . . . . . . . . . . . . . . 516.2.11Institutional, financial, legal and social framework. . . . . . . . . . . . . . . 51
6.3 Design overview. . . . . . . . . . . . . . . . . . . . . . . . . . . . . . . . . . . . . . . . 536.4 Implementation phases . . . . . . . . . . . . . . . . . . . . . . . . . . . . . . . . . . . 54
6.4.1 Bridging the gap . . . . . . . . . . . . . . . . . . . . . . . . . . . . . . . . . . . 546.4.2 Short-term: now-2020. . . . . . . . . . . . . . . . . . . . . . . . . . . . . . . . 546.4.3 Medium-term: 2020-2025 . . . . . . . . . . . . . . . . . . . . . . . . . . . . . 546.4.4 Long-term: 2025-2035 . . . . . . . . . . . . . . . . . . . . . . . . . . . . . . . 55
7 Verification and validation 577.1 Verification . . . . . . . . . . . . . . . . . . . . . . . . . . . . . . . . . . . . . . . . . . 57
7.1.1 Requirement verification . . . . . . . . . . . . . . . . . . . . . . . . . . . . . . 577.1.2 Scenario verification . . . . . . . . . . . . . . . . . . . . . . . . . . . . . . . . . 607.1.3 Stakeholder verification . . . . . . . . . . . . . . . . . . . . . . . . . . . . . . . 63
7.2 Validation . . . . . . . . . . . . . . . . . . . . . . . . . . . . . . . . . . . . . . . . . . . 647.2.1 Interview water management experts . . . . . . . . . . . . . . . . . . . . . . . 64
8 Conclusion 678.1 Design cycle . . . . . . . . . . . . . . . . . . . . . . . . . . . . . . . . . . . . . . . . . . 678.2 Limitations . . . . . . . . . . . . . . . . . . . . . . . . . . . . . . . . . . . . . . . . . . 688.3 Further research . . . . . . . . . . . . . . . . . . . . . . . . . . . . . . . . . . . . . . . 69
A Appendix: Stakeholder analysis 71A.1 Stakeholder list . . . . . . . . . . . . . . . . . . . . . . . . . . . . . . . . . . . . . . . . 71A.2 Stakeholder evaluation . . . . . . . . . . . . . . . . . . . . . . . . . . . . . . . . . . . 74A.3 Power-interest grid . . . . . . . . . . . . . . . . . . . . . . . . . . . . . . . . . . . . . . 74
B Appendix: Scenario analysis 77B.1 Exploring driving forces . . . . . . . . . . . . . . . . . . . . . . . . . . . . . . . . . . . 77B.2 Ranking driving forces. . . . . . . . . . . . . . . . . . . . . . . . . . . . . . . . . . . . 78B.3 Alternative projections. . . . . . . . . . . . . . . . . . . . . . . . . . . . . . . . . . . . 78
B.3.1 Population growth . . . . . . . . . . . . . . . . . . . . . . . . . . . . . . . . . . 78B.3.2 Industrial growth . . . . . . . . . . . . . . . . . . . . . . . . . . . . . . . . . . . 79B.3.3 Climate change . . . . . . . . . . . . . . . . . . . . . . . . . . . . . . . . . . . . 81
B.4 Scenario development . . . . . . . . . . . . . . . . . . . . . . . . . . . . . . . . . . . . 82B.4.1 Relieving Yangon . . . . . . . . . . . . . . . . . . . . . . . . . . . . . . . . . . . 82B.4.2 Residential township. . . . . . . . . . . . . . . . . . . . . . . . . . . . . . . . . 82B.4.3 Industrial potential. . . . . . . . . . . . . . . . . . . . . . . . . . . . . . . . . . 83B.4.4 Economic corridor . . . . . . . . . . . . . . . . . . . . . . . . . . . . . . . . . . 83
C Appendix: Land use model 85C.1 Method . . . . . . . . . . . . . . . . . . . . . . . . . . . . . . . . . . . . . . . . . . . . . 85
D Appendix: Morphological chart 89
E Appendix: Meetings local stakeholders 93E.1 Dala tea shop interview - 29 August 2017 . . . . . . . . . . . . . . . . . . . . . . . . 93E.2 Dala squatters interview - 29 August 2017 . . . . . . . . . . . . . . . . . . . . . . . 94E.3 YCDC - 19 September 2017 . . . . . . . . . . . . . . . . . . . . . . . . . . . . . . . . 95E.4 Dala Community Committee - 29 September 2017 . . . . . . . . . . . . . . . . . . . 95
Contents ix
E.5 YCDC - 02 October 2017 . . . . . . . . . . . . . . . . . . . . . . . . . . . . . . . . . . 97E.6 AG Resources Myanmar - 02 October 2017 . . . . . . . . . . . . . . . . . . . . . . . 97
E.6.1 Current situation . . . . . . . . . . . . . . . . . . . . . . . . . . . . . . . . . . . 97E.6.2 Aim of AG Resources Myanmar . . . . . . . . . . . . . . . . . . . . . . . . . . 98
E.7 Impact Terra - 06 October 2017 . . . . . . . . . . . . . . . . . . . . . . . . . . . . . . 98
F Appendix: Workshops 101F.1 First workshop - 16 September 2017 . . . . . . . . . . . . . . . . . . . . . . . . . . .101F.2 Second workshop - 28 September 2017 . . . . . . . . . . . . . . . . . . . . . . . . .102
G Appendix: Calculations final design 105G.1 Water harvesting and source . . . . . . . . . . . . . . . . . . . . . . . . . . . . . . . .105G.2 Storage . . . . . . . . . . . . . . . . . . . . . . . . . . . . . . . . . . . . . . . . . . . . .107G.3 Dual reticulation system . . . . . . . . . . . . . . . . . . . . . . . . . . . . . . . . . .109G.4 Drinking water treatment . . . . . . . . . . . . . . . . . . . . . . . . . . . . . . . . . .112
H Appendix: Validation interviews 115H.1 Interview set-up . . . . . . . . . . . . . . . . . . . . . . . . . . . . . . . . . . . . . . .115
H.1.1 Introduction to interviews. . . . . . . . . . . . . . . . . . . . . . . . . . . . . .115H.1.2 Background questions. . . . . . . . . . . . . . . . . . . . . . . . . . . . . . . .115H.1.3 General impression/face validation . . . . . . . . . . . . . . . . . . . . . . . .115H.1.4 Harvesting and resource . . . . . . . . . . . . . . . . . . . . . . . . . . . . . .116H.1.5 Storage . . . . . . . . . . . . . . . . . . . . . . . . . . . . . . . . . . . . . . . . .116H.1.6 Supply . . . . . . . . . . . . . . . . . . . . . . . . . . . . . . . . . . . . . . . . .117H.1.7 Finalizing . . . . . . . . . . . . . . . . . . . . . . . . . . . . . . . . . . . . . . .117
H.2 Interview NEPS . . . . . . . . . . . . . . . . . . . . . . . . . . . . . . . . . . . . . . . .117H.2.1 Background questions. . . . . . . . . . . . . . . . . . . . . . . . . . . . . . . .117H.2.2 General impression/face validation . . . . . . . . . . . . . . . . . . . . . . . .118H.2.3 Harvesting and resource . . . . . . . . . . . . . . . . . . . . . . . . . . . . . .118H.2.4 Storage . . . . . . . . . . . . . . . . . . . . . . . . . . . . . . . . . . . . . . . . .119H.2.5 Supply . . . . . . . . . . . . . . . . . . . . . . . . . . . . . . . . . . . . . . . . .120H.2.6 Finalizing . . . . . . . . . . . . . . . . . . . . . . . . . . . . . . . . . . . . . . .120
Bibliography 121

1Introduction
Water supply and sanitation are some of the most serious impediments in developing countries [106].Even in areas where large, sometimes overflowing rivers and a monsoon season brings in more thanenough water, people are facing shortage of drinking water. Yangon is one such regions. Situatedin the Ayeyarwady delta and subject to a monsoon season of almost four months, the region has anabundance of water. However, not all of Yangon s inhabitants can benefit from this. They lack adequatewater infrastructure and become dependent on donations.
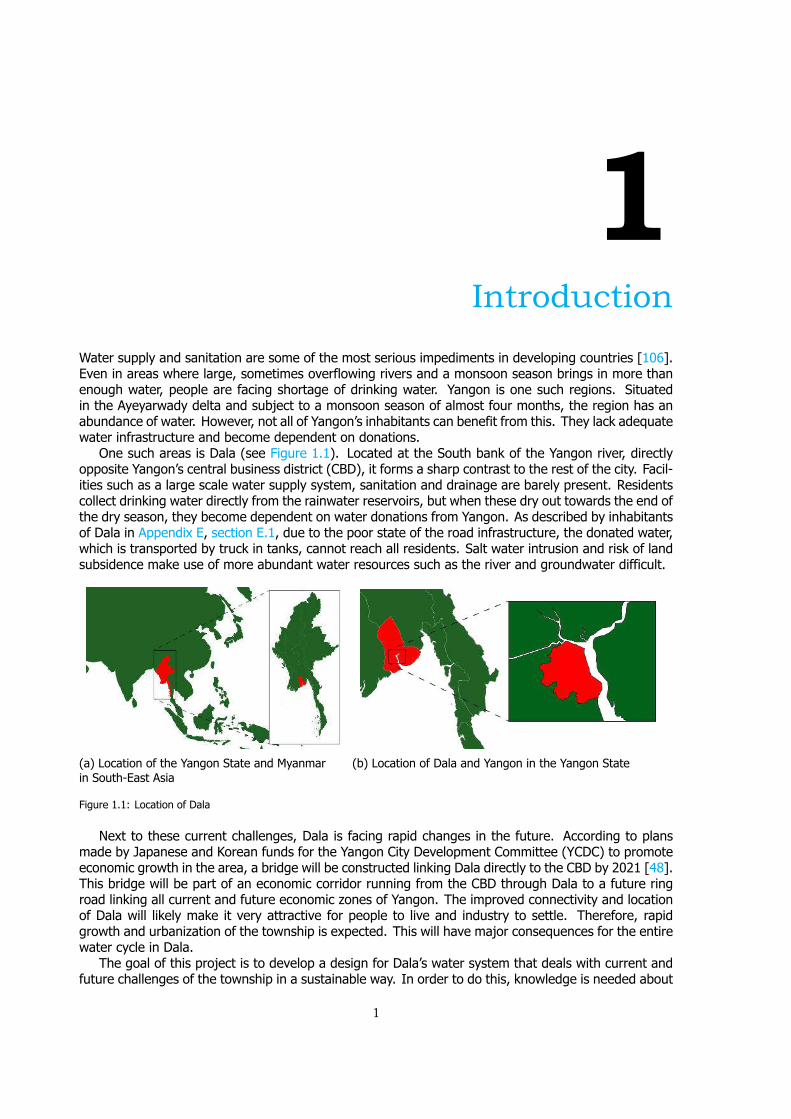
One such areas is Dala (see Figure 1.1). Located at the South bank of the Yangon river, directlyopposite Yangon s central business district (CBD), it forms a sharp contrast to the rest of the city. Facil-ities such as a large scale water supply system, sanitation and drainage are barely present. Residentscollect drinking water directly from the rainwater reservoirs, but when these dry out towards the end ofthe dry season, they become dependent on water donations from Yangon. As described by inhabitantsof Dala in Appendix E, section E.1, due to the poor state of the road infrastructure, the donated water,which is transported by truck in tanks, cannot reach all residents. Salt water intrusion and risk of landsubsidence make use of more abundant water resources such as the river and groundwater difficult.
(a) Location of the Yangon State and Myanmarin South-East Asia
(b) Location of Dala and Yangon in the Yangon State
Figure 1.1: Location of Dala
Next to these current challenges, Dala is facing rapid changes in the future. According to plansmade by Japanese and Korean funds for the Yangon City Development Committee (YCDC) to promoteeconomic growth in the area, a bridge will be constructed linking Dala directly to the CBD by 2021 [48].This bridge will be part of an economic corridor running from the CBD through Dala to a future ringroad linking all current and future economic zones of Yangon. The improved connectivity and locationof Dala will likely make it very attractive for people to live and industry to settle. Therefore, rapidgrowth and urbanization of the township is expected. This will have major consequences for the entirewater cycle in Dala.
The goal of this project is to develop a design for Dala s water system that deals with current andfuture challenges of the township in a sustainable way. In order to do this, knowledge is needed about
1
2 1. Introduction
the parties involved in governing Dala s water system, the spatial development of the township, thewater needs and possible sustainable and innovative measures. Therefore the main research questionis:
Which steps need to be undertaken to develop a sustainable, future-proof water infrastructure forthe Township of Dala?
This research question can be answered by addressing the following sub-questions:
How can the actor framework governing Dala’s water system be characterized?
How can the expected spatial development of Dala be characterized?
How can the resulting water needs in Dala be characterized?
How can these water needs be tended to in a sustainable and innovative way?
A two month field research period was conducted during which three visits were made to theresearch area, Dala. The research period was also used to conduct interviews with stakeholders such asDala inhabitants, Dala local government and the YCDC. Besides this, workshop sessions and interviewswere arranged to gain insights from students from the Yangon Technological University (YTU) andMyanmar Maritime University (MMU), local experts from the Young Expert Programmes (YEP) andexperts from other relevant organizations such as the National Engineering and Planning Services(NEPS) and the National Water Resources Committee (NWRC).
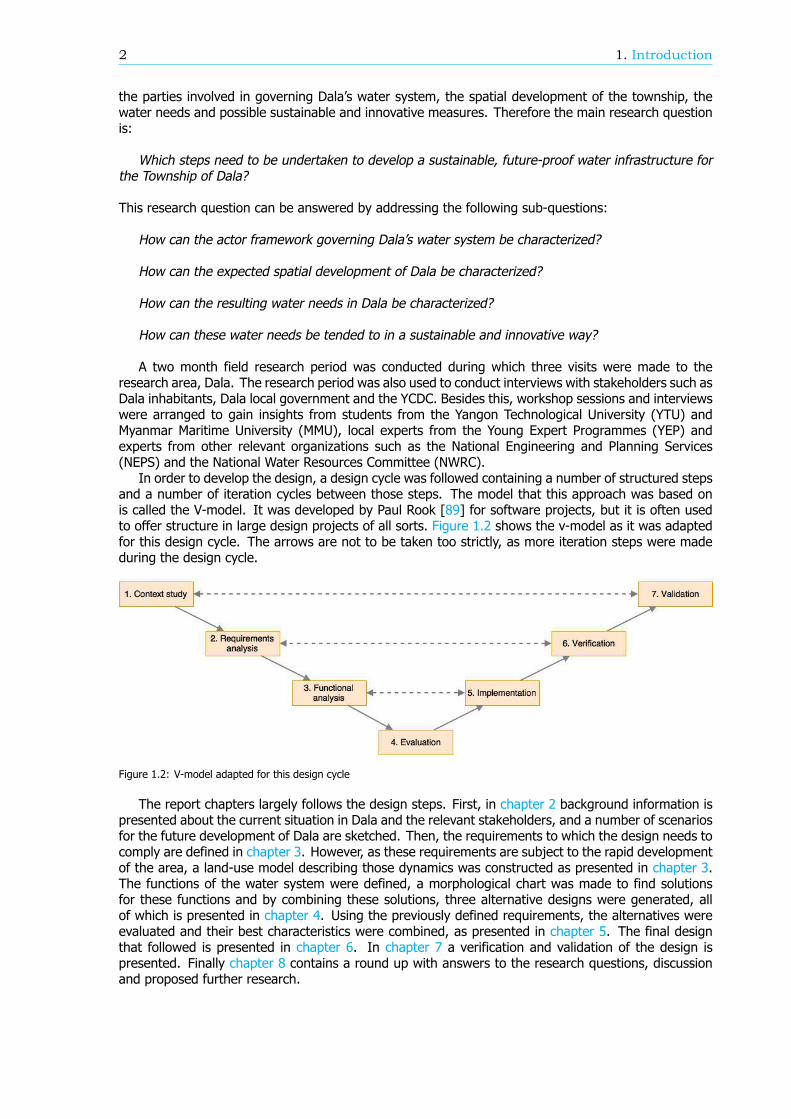
In order to develop the design, a design cycle was followed containing a number of structured stepsand a number of iteration cycles between those steps. The model that this approach was based onis called the V-model. It was developed by Paul Rook [89] for software projects, but it is often usedto offer structure in large design projects of all sorts. Figure 1.2 shows the v-model as it was adaptedfor this design cycle. The arrows are not to be taken too strictly, as more iteration steps were madeduring the design cycle.
Figure 1.2: V-model adapted for this design cycle
The report chapters largely follows the design steps. First, in chapter 2 background information ispresented about the current situation in Dala and the relevant stakeholders, and a number of scenariosfor the future development of Dala are sketched. Then, the requirements to which the design needs tocomply are defined in chapter 3. However, as these requirements are subject to the rapid developmentof the area, a land-use model describing those dynamics was constructed as presented in chapter 3.The functions of the water system were defined, a morphological chart was made to find solutionsfor these functions and by combining these solutions, three alternative designs were generated, allof which is presented in chapter 4. Using the previously defined requirements, the alternatives wereevaluated and their best characteristics were combined, as presented in chapter 5. The final designthat followed is presented in chapter 6. In chapter 7 a verification and validation of the design ispresented. Finally chapter 8 contains a round up with answers to the research questions, discussionand proposed further research.
2Context
When designing a system, it is important to have a clear picture of the context in which the system willbe implemented and operative. In this chapter that context is presented. First a short introduction isgiven of Dala in its current state, then the scope and assumptions bounding this project are presented,after this an analysis of the relevant stakeholders is given, and finally the scenarios for the futuredevelopment of Dala are presented.
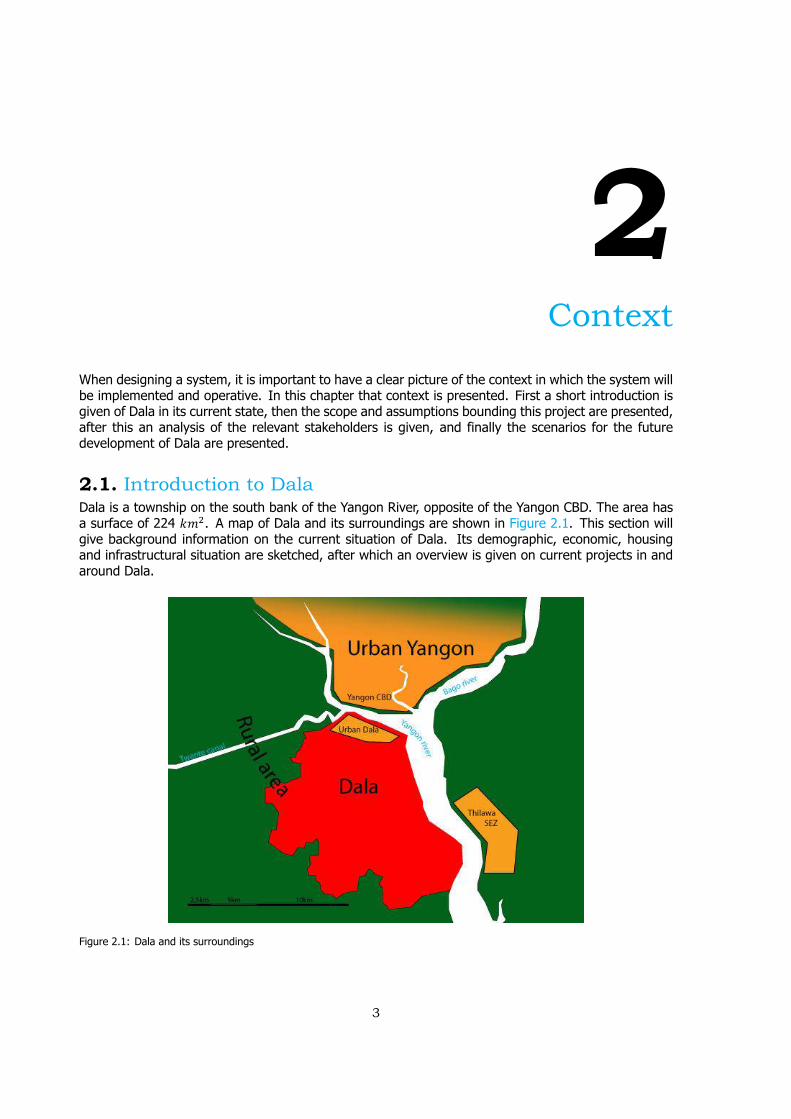
2.1. Introduction to DalaDala is a township on the south bank of the Yangon River, opposite of the Yangon CBD. The area hasa surface of 224 . A map of Dala and its surroundings are shown in Figure 2.1. This section willgive background information on the current situation of Dala. Its demographic, economic, housingand infrastructural situation are sketched, after which an overview is given on current projects in andaround Dala.
Figure 2.1: Dala and its surroundings
3
4 2. Context
DemographyDala is home to around 173.000 inhabitants, of which most live in the urban area, in the north ofDala [20]. Table 2.1 depicts the basis demographic information of Dala.
Table 2.1: Demographic data Dala in 2014 [20]
Total inhabitants Male Female In urban area In rural area172,860 84,670 88,190 119,370 53,490
EconomyIn comparison to Yangon, Dala stayed behind with respect to economical growth [9]. From observa-tions, made during field work in the urban area of Dala, it can be stated that commercial activitieswithin Dala are limited to the retail of products used in the area itself. A large portion of the total areaof Dala is used for agricultural purposes [48, p.13]. Lastly, a large amount of the inhabitants of Dalaare dependent on work in Yangon, and rely on the ferry service to commute to Yangon each day, asstated in Appendix E, section E.4. This is supported by the fact that about 30.000 people make use ofthe ferry between Dala and Yangon each day [48, p.77].
HousingDuring field work in Dala, it was observed that most of the houses are built with waste materials onland which is not owned by the residents themselves, as seen in Figure 2.2a. Although this form ofsquatting is officially illegal in Myanmar, the government does not take any action against it. As statedin Appendix E, section E.4, interventions are not undertaken by governmental institutions. This isbecause any actions will lead to squatters reallocating themselves. Instead of solving the problem ofillegal settlements, this would replace the problem. Therefore Dala is currently attractive for squatters.
(a) Houses of squatters in Dala (b) Crowds at the Dala ferry
Figure 2.2: Photos of housing and the ferry in Dala
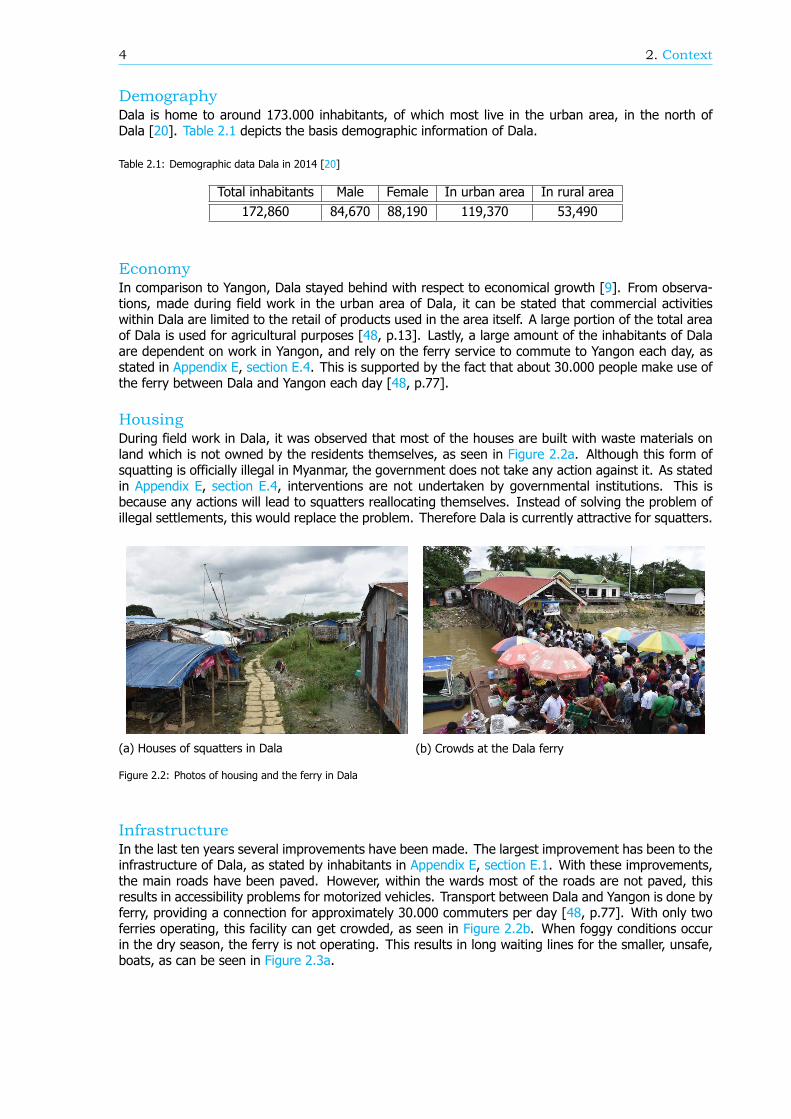
InfrastructureIn the last ten years several improvements have been made. The largest improvement has been to theinfrastructure of Dala, as stated by inhabitants in Appendix E, section E.1. With these improvements,the main roads have been paved. However, within the wards most of the roads are not paved, thisresults in accessibility problems for motorized vehicles. Transport between Dala and Yangon is done byferry, providing a connection for approximately 30.000 commuters per day [48, p.77]. With only twoferries operating, this facility can get crowded, as seen in Figure 2.2b. When foggy conditions occurin the dry season, the ferry is not operating. This results in long waiting lines for the smaller, unsafe,boats, as can be seen in Figure 2.3a.
2.1. Introduction to Dala 5
(a) Dala inhabitants waiting forsmall boats to cross the river
(b) Officials inspecting a dried out pond in Dala
Figure 2.3: Photos of Dala, made by U Tin Hla
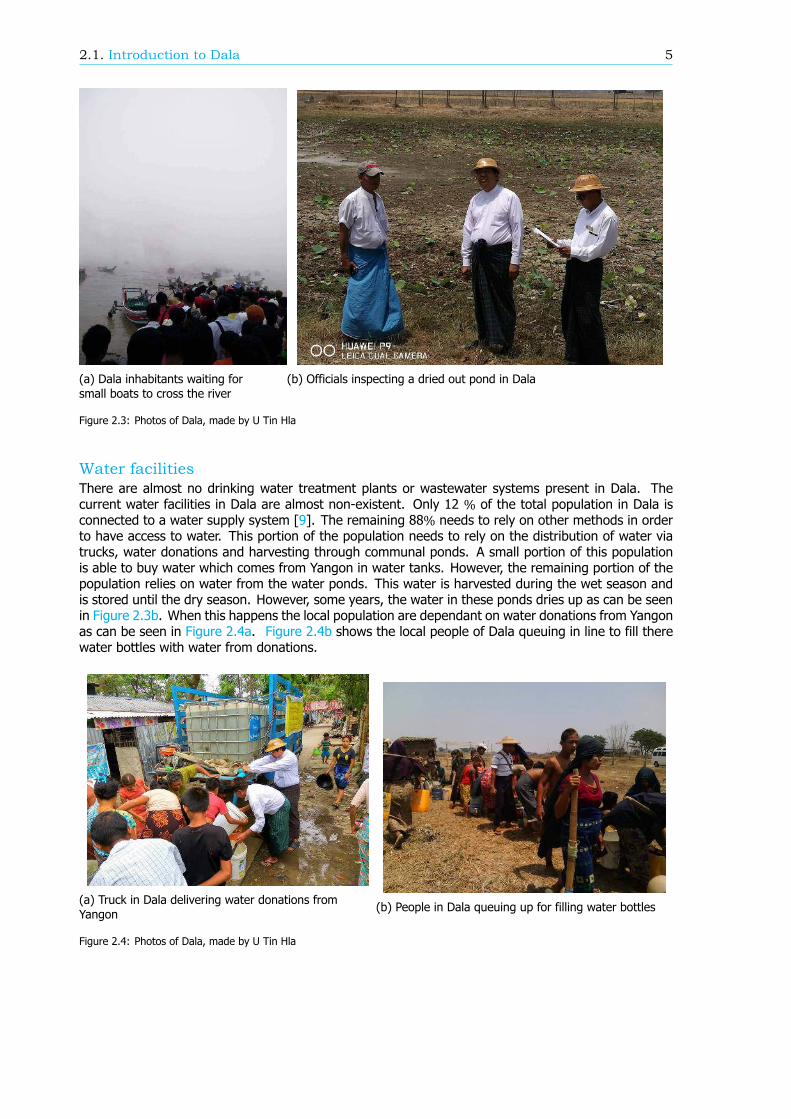
Water facilitiesThere are almost no drinking water treatment plants or wastewater systems present in Dala. Thecurrent water facilities in Dala are almost non-existent. Only 12 % of the total population in Dala isconnected to a water supply system [9]. The remaining 88% needs to rely on other methods in orderto have access to water. This portion of the population needs to rely on the distribution of water viatrucks, water donations and harvesting through communal ponds. A small portion of this populationis able to buy water which comes from Yangon in water tanks. However, the remaining portion of thepopulation relies on water from the water ponds. This water is harvested during the wet season andis stored until the dry season. However, some years, the water in these ponds dries up as can be seenin Figure 2.3b. When this happens the local population are dependant on water donations from Yangonas can be seen in Figure 2.4a. Figure 2.4b shows the local people of Dala queuing in line to fill therewater bottles with water from donations.
(a) Truck in Dala delivering water donations fromYangon (b) People in Dala queuing up for filling water bottles
Figure 2.4: Photos of Dala, made by U Tin Hla
6 2. Context
Current and future projectsAs already described in chapter 1, foreign funds are involved in the development of Greater Yangon.Next to the plans of the Koreans and Japanese, other companies are setting up projects to treat waterto produce drinking water, as described in Appendix E. From the plans described in JICA and YCDC[48, p. 80] namely infrastructure projects are already implemented. Water treatments projects in Dalawill be executed, starting from November 2017, described in Appendix E, section E.3.
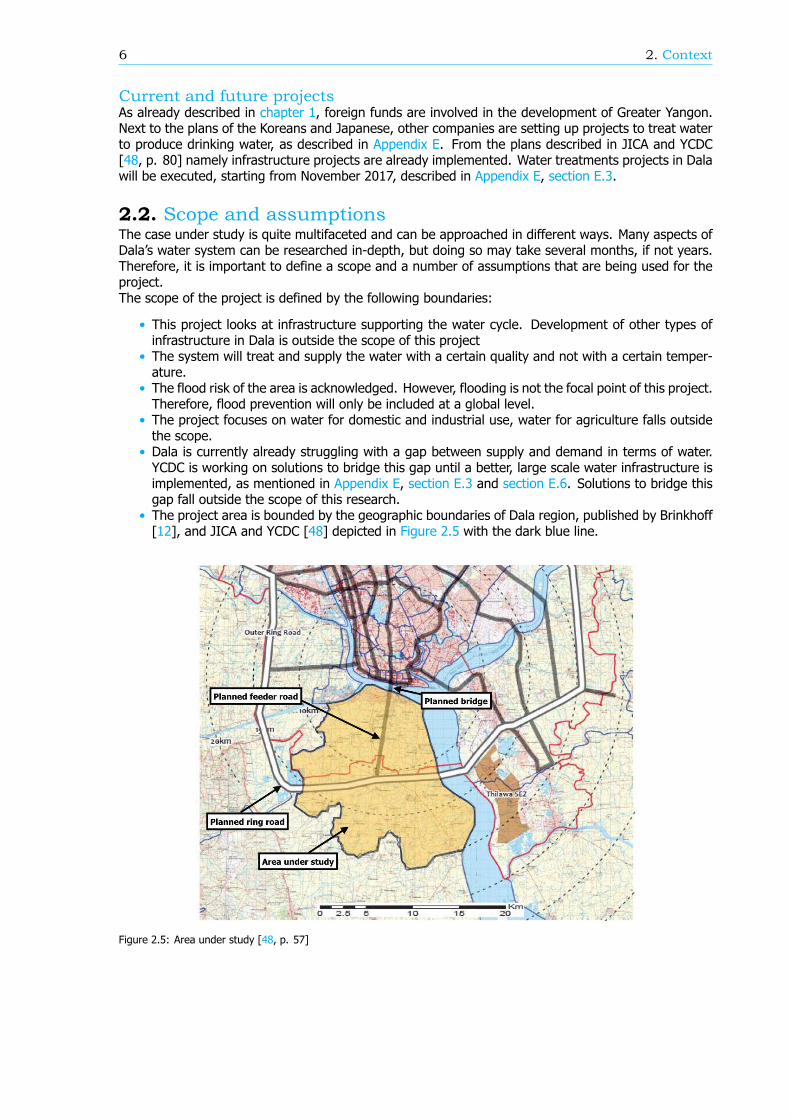
2.2. Scope and assumptionsThe case under study is quite multifaceted and can be approached in different ways. Many aspects ofDala s water system can be researched in-depth, but doing so may take several months, if not years.Therefore, it is important to define a scope and a number of assumptions that are being used for theproject.The scope of the project is defined by the following boundaries:
• This project looks at infrastructure supporting the water cycle. Development of other types ofinfrastructure in Dala is outside the scope of this project
• The system will treat and supply the water with a certain quality and not with a certain temper-ature.
• The flood risk of the area is acknowledged. However, flooding is not the focal point of this project.Therefore, flood prevention will only be included at a global level.
• The project focuses on water for domestic and industrial use, water for agriculture falls outsidethe scope.
• Dala is currently already struggling with a gap between supply and demand in terms of water.YCDC is working on solutions to bridge this gap until a better, large scale water infrastructure isimplemented, as mentioned in Appendix E, section E.3 and section E.6. Solutions to bridge thisgap fall outside the scope of this research.
• The project area is bounded by the geographic boundaries of Dala region, published by Brinkhoff[12], and JICA and YCDC [48] depicted in Figure 2.5 with the dark blue line.
Figure 2.5: Area under study [48, p. 57]
2.3. Stakeholder analysis 7
The assumptions that are made are as follows:
• By the year of 2021 there will be a connection (bridge or tunnel) between Yangon s CBD andDala [107].
• By the year of 2035 there will be an outer ring road connecting the southern part of Dala withThilawa [48, p.86].
• The landing of the connection will be roughly 1 inward from the river bank. The Dala landingwill be at the intersection of Bo Min Yaung rd. and Dala-Twante rd.
• By the year of 2030 there will be a connection (bridge or tunnel) [48, p. 87] between Dala andThilawa
• The population of the Yangon region will increase with 2,6% each year [48, p.44].• Although sources can be found on the negative influence of climate change on the investmentsfor industrial activities [68, p. 24], the assumption is that Dala is still considered as a potentiallocation for these activities. This is supported by multiple news articles that speculate on foreigninvestments on activities in Dala and testimonies from representatives of YCDC and NWRC, ascan be seen in Appendix E, section E.5 and in Win [121] and Mon and Nyein Aye [67].
• No heavy industry will settle in the Dala region, as explained in section E.5.• A large share of the riverbank of Dala will be developed for recreational use, as explained in sec-tion E.5.
• A public transport connection will arise between Dala and Yangon.• Other infrastructure, such as electricity supply, will increase proportionally with the populationand industry.
• Businesses servicing the population (eg. banks, convenience stores) will increase proportionallyto the population.
2.3. Stakeholder analysisTo form a complete picture of the environment in which the problem plays and the design should beimplemented, a stakeholder analysis was conducted. The aim of a stakeholder analysis is to map anyand all parties that are affected by or can affect the problem or the solution. Dala, as it is beinganalyzed and designed for in this research, should be seen as a socio-technical system: people interactwith technology and infrastructure. Technology determines the success of human endeavours andhuman behaviour determines the success of technological solutions. Therefore, it is important toanalyze stakeholders interests, opinions and resources. This helps to see under which conditions thesolution will be successful and which stakeholders need to be actively or passively involved.
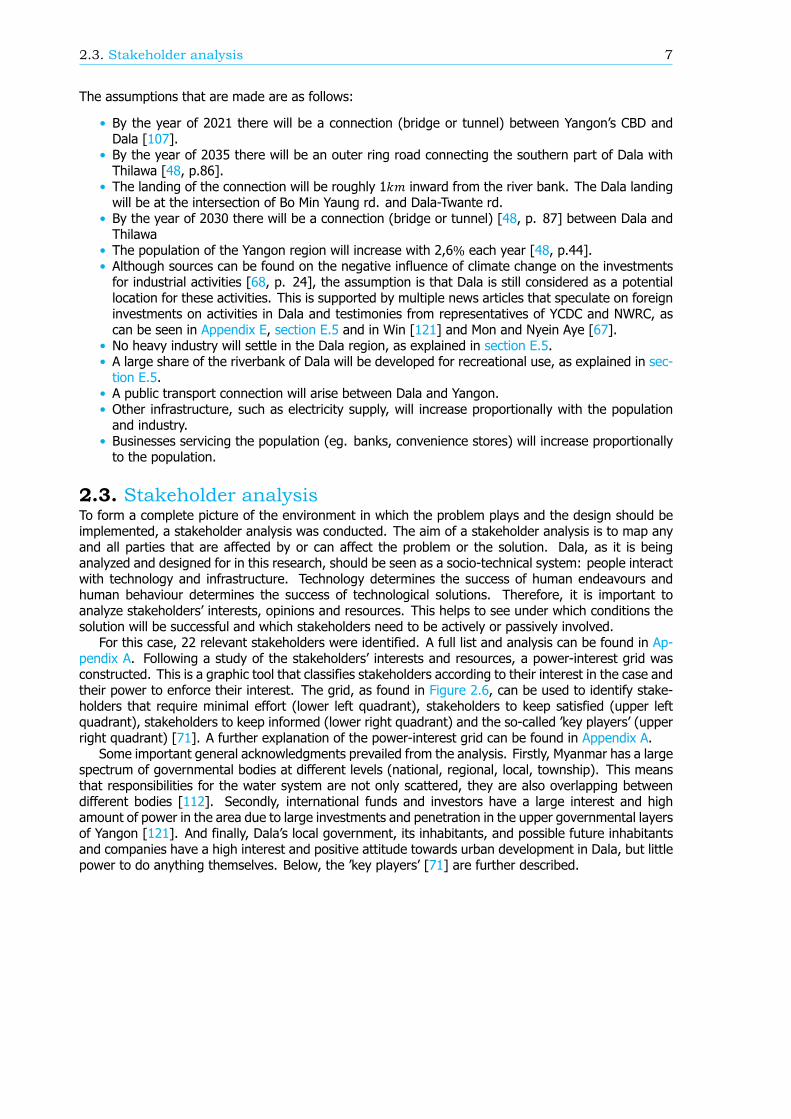
For this case, 22 relevant stakeholders were identified. A full list and analysis can be found in Ap-pendix A. Following a study of the stakeholders interests and resources, a power-interest grid wasconstructed. This is a graphic tool that classifies stakeholders according to their interest in the case andtheir power to enforce their interest. The grid, as found in Figure 2.6, can be used to identify stake-holders that require minimal effort (lower left quadrant), stakeholders to keep satisfied (upper leftquadrant), stakeholders to keep informed (lower right quadrant) and the so-called key players (upperright quadrant) [71]. A further explanation of the power-interest grid can be found in Appendix A.
Some important general acknowledgments prevailed from the analysis. Firstly, Myanmar has a largespectrum of governmental bodies at different levels (national, regional, local, township). This meansthat responsibilities for the water system are not only scattered, they are also overlapping betweendifferent bodies [112]. Secondly, international funds and investors have a large interest and highamount of power in the area due to large investments and penetration in the upper governmental layersof Yangon [121]. And finally, Dala s local government, its inhabitants, and possible future inhabitantsand companies have a high interest and positive attitude towards urban development in Dala, but littlepower to do anything themselves. Below, the key players [71] are further described.
8 2. Context
Figure 2.6: Power-interest grid of stakeholders
YCDCThe YCDC is the municipal government and the problem owner for this research. Their main goal isthe welfare of the city of Yangon for which they have drawn up a plan in cooperation with JICA: TheStrategic Urban Development Plan of the Greater Yangon [48]. From this plan, the intention to build thebridge in order to connect (new) economic centres and the intention to improve water infrastructurewere derived. In terms of water management the YCDC is responsible for the quality of drinking waterand sanitation in Yangon [112].
Chief Minister Yangon regionMyanmar has 14 regional governments with each a Chief Minister as their chief executive [69]. Theregional government s main task is to implement projects that fall within the union government s poli-cies. Yangon region s Chief Minister, Phyo Min Thein, has grand plans for the Yangon region for hisperiod in office. His goal is to improve living conditions and connectivity to ensure economic growth.Roads and bridges of regional significance fall under the regional government s jurisdiction [112].
National Water Resources Council (NWRC)As Myanmar has many governmental bodies who have (overlapping) water topics in their jurisdiction,the NWRC was established in 2013 and formulated a National Water Policy (NWP) in 2014 [113]. Thispolicy acknowledges that an integrated water resources management approach is needed to exploitMyanmar s abundant water resources to its fullest while mitigating problems with water, such as waterquality, water supply and flooding. The NWRC receives advice from an advisory group of water man-agement professionals chaired by U Cho Cho [112], one of the water management experts who wereinvolved in this project.
2.4. Scenarios 9
Ministry of ConstructionThis ministry is, among other things, responsible for building and maintaining the transport infrastruc-ture. Next to this, they are also responsible for ensuring proper drainage of the system, and planningand developing sanitation systems in new settlement areas [5, 48].
International funds and loansA number of international funds have invested money and knowledge in the development of the GreaterYangon region. Together, these funds have invested more than $1,2 billion in Myanmar, mainly aimedat improving the infrastructure [1, 49, 53]. First and foremost, there is the Japanese InternationalCooperation Agency (JICA), who have not only administered a significant loan to the governmentof Myanmar to invest in water and transport infrastructure projects, but have also cooperated withYCDC in a long and intensive research to create The Strategic Urban Development Plan of the GreaterYangon [48]. Second, the Korean International Cooperation Agency (KOICA) who have attributed theirresources to write a master plan for several areas of economic interest in Yangon, of which Dala isone [38]. The South Korean Economic Development Cooperation Fund (EDCF) have administered aloan for the construction of the bridge between Yangon and Dala [53]. Lastly, the Asian DevelopmentBank (ADB), helps YCDC with investments in creating labour and infrastructure investments [1]. Theyare also involved in the construction of water management solutions to bridge the current gap in Dala.These funds have similar interests, namely economic development of the region. By doing this, theycan also improve the competitive position of companies from their country. Japanese and Koreancompanies already have a large share in the new Special Economic Zone (SEZ) in Thilawa [41] and forthe bridge construction tender only Korean companies were invited to participate [53].
UN HabitatUN Habitat is a UN programme working on better living conditions in urban areas [105]. In Myanmarthey advised the government on urban planning and consequences of climate change [104]. Thesetwo topics are very relevant for Dala as it is now included in the urban plans for greater Yangon andbecause its location makes it sensitive to the effects of climate change.
2.4. ScenariosOne difficulty for this design is that it is not being made for the current context or for a future contextthat can easily be extrapolated from the current context. In fact, the future development of Dala isvery uncertain and probably very different from the current situation.
In order to enable decision making and to clarify present actions and consequences, scenariosregarding the future development of Dala area are built. The primary purpose of scenario buildingis to create an integrated picture of how the future might evolve according to the interaction amongdifferent factors and actors that can influence the development of the area [78]. The resulting figureswill become the context for planning, developing, and testing new ideas.
For this context, the year of 2040 is chosen as a target year. This year is taken as the targetyear for the plans presented in JICA and YCDC [48]. The design for Dala, as presented in this report,will have to provide the water infrastructure for the situation of 2040. It is assumed that urban andeconomic growth, which will be given an impulse with the construction of the CBD-Dala connection,have stabilized by this year.
The scenarios were developed following the Ratcliffe method [86]. This method follows five steps:
1. Task identification and analysis2. Exploring driving forces and key decision factors3. Ranking driving forces4. Alternative projections5. Scenario development
After the first three steps, which are described more in detail in Appendix B, three external factors withhigh impact and high uncertainty were identified: population growth, industrial activity and climatechange. Below, a summary of the alternative projections for these factors will be given, after whichthe conclusion about the resulting scenarios will be presented. Further elaboration on each step of theRatcliffe method can be found in Appendix B.
10 2. Context
2.4.1. Influencing factorsAbove, three external factors with high impact and high uncertainty were identified for the basis ofthe future scenarios for Dala. In this section, a summary is given of the various trajectories that wereidentified for these factors. As mentioned, an elaboration and calculations can be found in Appendix B.
Population growthPopulation growth is of main importance, since the number of inhabitants will have a relevant influenceon the demand of water and on the design of the infrastructure in Dala. It is thus crucial to estimatethe coming growth rate of Dala population in order to provide a design able to satisfy the needs of theTownship in 2040.
To make an assumption about the population growth, a distinction is made between the periodbefore the connection with the CBD is constructed, until 2021, and the period after the connectionis constructed. The growth after 2021 is calculated based on the yearly growth of Yangon area andthe percentage that will move from Yangon to Dala due to the increased attractiveness caused by theconnection.
An estimation is made of 6% population growth in the period before 2021. For the period after2021 a comparison is made with Bangkok and Ho Chi Minh City [18]. This resulted in a 7,8% growannually.
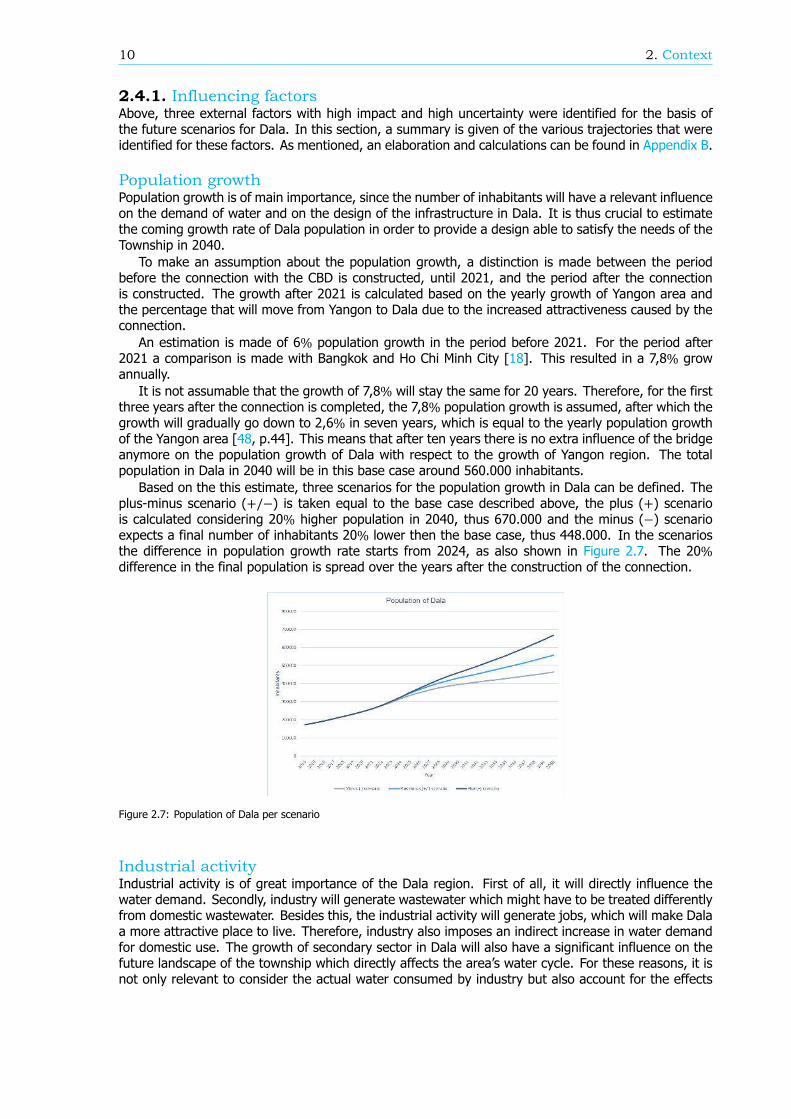
It is not assumable that the growth of 7,8% will stay the same for 20 years. Therefore, for the firstthree years after the connection is completed, the 7,8% population growth is assumed, after which thegrowth will gradually go down to 2,6% in seven years, which is equal to the yearly population growthof the Yangon area [48, p.44]. This means that after ten years there is no extra influence of the bridgeanymore on the population growth of Dala with respect to the growth of Yangon region. The totalpopulation in Dala in 2040 will be in this base case around 560.000 inhabitants.
Based on the this estimate, three scenarios for the population growth in Dala can be defined. Theplus-minus scenario (+/−) is taken equal to the base case described above, the plus (+) scenariois calculated considering 20% higher population in 2040, thus 670.000 and the minus (−) scenarioexpects a final number of inhabitants 20% lower then the base case, thus 448.000. In the scenariosthe difference in population growth rate starts from 2024, as also shown in Figure 2.7. The 20%difference in the final population is spread over the years after the construction of the connection.
Figure 2.7: Population of Dala per scenario
Industrial activityIndustrial activity is of great importance of the Dala region. First of all, it will directly influence thewater demand. Secondly, industry will generate wastewater which might have to be treated differentlyfrom domestic wastewater. Besides this, the industrial activity will generate jobs, which will make Dalaa more attractive place to live. Therefore, industry also imposes an indirect increase in water demandfor domestic use. The growth of secondary sector in Dala will also have a significant influence on thefuture landscape of the township which directly affects the area s water cycle. For these reasons, it isnot only relevant to consider the actual water consumed by industry but also account for the effects
2.4. Scenarios 11
that these activities have. Besides this, infrastructural improvements in the region, needed for thelogistics bound to the industrial activity, will further increase the attractiveness of Dala as a residentialarea [125, p.7-2], again increasing water demand.
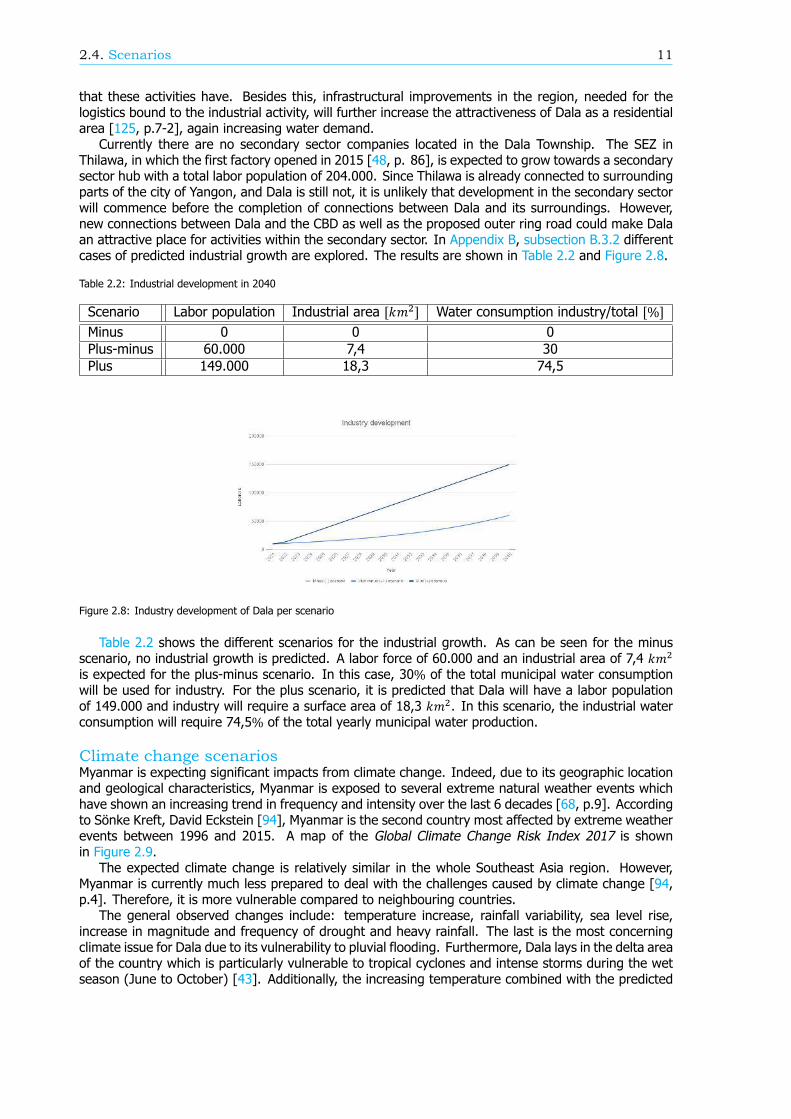
Currently there are no secondary sector companies located in the Dala Township. The SEZ inThilawa, in which the first factory opened in 2015 [48, p. 86], is expected to grow towards a secondarysector hub with a total labor population of 204.000. Since Thilawa is already connected to surroundingparts of the city of Yangon, and Dala is still not, it is unlikely that development in the secondary sectorwill commence before the completion of connections between Dala and its surroundings. However,new connections between Dala and the CBD as well as the proposed outer ring road could make Dalaan attractive place for activities within the secondary sector. In Appendix B, subsection B.3.2 differentcases of predicted industrial growth are explored. The results are shown in Table 2.2 and Figure 2.8.
Table 2.2: Industrial development in 2040
Scenario Labor population Industrial area [ ] Water consumption industry/total [%]Minus 0 0 0Plus-minus 60.000 7,4 30Plus 149.000 18,3 74,5
Figure 2.8: Industry development of Dala per scenario
Table 2.2 shows the different scenarios for the industrial growth. As can be seen for the minusscenario, no industrial growth is predicted. A labor force of 60.000 and an industrial area of 7,4is expected for the plus-minus scenario. In this case, 30% of the total municipal water consumptionwill be used for industry. For the plus scenario, it is predicted that Dala will have a labor populationof 149.000 and industry will require a surface area of 18,3 . In this scenario, the industrial waterconsumption will require 74,5% of the total yearly municipal water production.
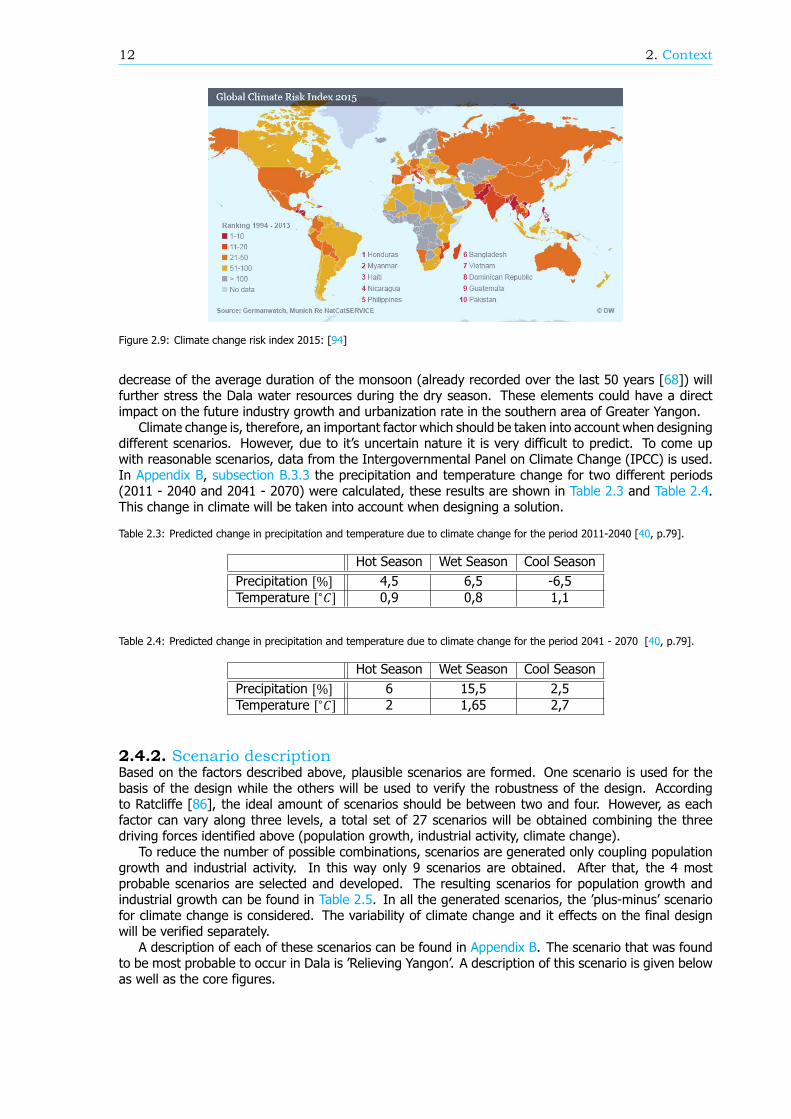
Climate change scenariosMyanmar is expecting significant impacts from climate change. Indeed, due to its geographic locationand geological characteristics, Myanmar is exposed to several extreme natural weather events whichhave shown an increasing trend in frequency and intensity over the last 6 decades [68, p.9]. Accordingto Sönke Kreft, David Eckstein [94], Myanmar is the second country most affected by extreme weatherevents between 1996 and 2015. A map of the Global Climate Change Risk Index 2017 is shownin Figure 2.9.
The expected climate change is relatively similar in the whole Southeast Asia region. However,Myanmar is currently much less prepared to deal with the challenges caused by climate change [94,p.4]. Therefore, it is more vulnerable compared to neighbouring countries.
The general observed changes include: temperature increase, rainfall variability, sea level rise,increase in magnitude and frequency of drought and heavy rainfall. The last is the most concerningclimate issue for Dala due to its vulnerability to pluvial flooding. Furthermore, Dala lays in the delta areaof the country which is particularly vulnerable to tropical cyclones and intense storms during the wetseason (June to October) [43]. Additionally, the increasing temperature combined with the predicted
12 2. Context
Figure 2.9: Climate change risk index 2015: [94]
decrease of the average duration of the monsoon (already recorded over the last 50 years [68]) willfurther stress the Dala water resources during the dry season. These elements could have a directimpact on the future industry growth and urbanization rate in the southern area of Greater Yangon.
Climate change is, therefore, an important factor which should be taken into account when designingdifferent scenarios. However, due to it s uncertain nature it is very difficult to predict. To come upwith reasonable scenarios, data from the Intergovernmental Panel on Climate Change (IPCC) is used.In Appendix B, subsection B.3.3 the precipitation and temperature change for two different periods(2011 - 2040 and 2041 - 2070) were calculated, these results are shown in Table 2.3 and Table 2.4.This change in climate will be taken into account when designing a solution.
Table 2.3: Predicted change in precipitation and temperature due to climate change for the period 2011-2040 [40, p.79].
Hot Season Wet Season Cool SeasonPrecipitation [%] 4,5 6,5 -6,5Temperature [ ] 0,9 0,8 1,1
Table 2.4: Predicted change in precipitation and temperature due to climate change for the period 2041 - 2070 [40, p.79].
Hot Season Wet Season Cool SeasonPrecipitation [%] 6 15,5 2,5Temperature [ ] 2 1,65 2,7
2.4.2. Scenario descriptionBased on the factors described above, plausible scenarios are formed. One scenario is used for thebasis of the design while the others will be used to verify the robustness of the design. Accordingto Ratcliffe [86], the ideal amount of scenarios should be between two and four. However, as eachfactor can vary along three levels, a total set of 27 scenarios will be obtained combining the threedriving forces identified above (population growth, industrial activity, climate change).
To reduce the number of possible combinations, scenarios are generated only coupling populationgrowth and industrial activity. In this way only 9 scenarios are obtained. After that, the 4 mostprobable scenarios are selected and developed. The resulting scenarios for population growth andindustrial growth can be found in Table 2.5. In all the generated scenarios, the plus-minus scenariofor climate change is considered. The variability of climate change and it effects on the final designwill be verified separately.
A description of each of these scenarios can be found in Appendix B. The scenario that was foundto be most probable to occur in Dala is Relieving Yangon. A description of this scenario is given belowas well as the core figures.
2.4. Scenarios 13
Table 2.5: Scenarios
Scenario Population growth Industrial activityRelieving Yangon + +/-Residential township + -Industrial potential +/- +/-Economic corridor +/- -
Relieving YangonThe connection with the Yangon CBD makes Dala a very convenient place to live for people working inand around the CBD. Commuters can easily access the connection that crosses the Yangon river. Theouter ring road on the South as designed in JICA and YCDC [48] connects Yangon to Thilawa, makingDala a popular place to live when working in Thilawa. Dala will also develop some industrial activities,across the river from Thilawa. Since Thilawa is the appointed SEZ, the industry in Dala will be smaller,and for example more focused on textile. This industry will generate labour, attracting new residentsto Dala. All the new residents of Dala that work either in CBD, Thilawa or Dala s new industry alsogenerate service jobs in Dala. This newly generated labour will in turn attract more new residents toDala. As land prices have already gone up significantly in anticipation of the bridge project [66], it isassumed that average welfare will rise in Dala as new residents move in. This will increase the needfor high quality facilities.
To evaluate whether the potential sources can provide enough water to the future urban area,the water demand in 2040 has to be estimated. In this section, the distinction between drinking anddomestic water need is not considered.
The water consumption of the township is in agreement with the rest of Yangon and is estimated tobe 150 litres per inhabitant per day [123, p.4-2]. This results in a total water demand of 100.300 / .This number, however, does not take into account the industrial water consumption. This is estimatedto be equal to the 30% of the total private water demand in Dala according to the assumptions madein subsection 2.4.1 and results in a demand of 30.100 / . Finally, to estimate the real daily demandthat the water sources have to satisfy a value of 10% of non-revenue water (NRW) was consideredtruthful and consistent with the YCDC objective set for the NRW reduction [123, p.4-2], which leadsto a final estimate of around 144.000 / for the average daily water demand. The resulting corefigures for this scenario are presented in Table 2.6.
Table 2.6: Core figures Relieving Yangon in 2040
Parameter ValuePopulation [#] 670.000Municipal water consumption [ / ] 100.300Laborers in Dala industry [#] 60.000Industrial area [ ] 7,36Industrial water consumption [ / ] 30.100Total daily water demand [ / ] 144.000Total annual water demand [ / ] 52.333.00

3Requirement analysis
After the stage in which the system will operate has been sketched, the next step of the design processis to define requirements to which the system needs to conform. By defining these requirements earlyon, the functions for the design can be derived from them. Furthermore, it is possible to return tothem later for evaluation and verification purposes. By doing a requirement analysis, performanceof the system is ensured. Usually a requirement analysis consists just of a list of constraints andrequirements. However, it should be acknowledged that the environment in which the system willoperate is dynamic, making the requirements dynamic as well. To capture this dynamic behaviour, aland use model was made.
3.1. Requirements of the systemIn this section, the requirements that were defined for the system are listed. Three types of re-quirements are distinguished: constraints, functional requirements and non-functional requirements.Constraints are conditions that the system absolutely has to comply to, otherwise it has no use. Thesecan be checked with a simple yes or no. Functional requirements are things the system has to do.They determine the degree to which the system serves its purpose. Non-functional requirements areattributes that the system must have. They are performance measures that do not directly relate tothe purpose of the system, such as price, sustainability or reliability. The requirements were first gen-erated by means of a brainstorm, involving local experts, as shown in Appendix F, section F.1. Thenthey were supplemented and adjusted during a number of iteration steps in the design cycle.
3.1.1. Constraints• The system shall provide water for all water demanding activities in Dala.• The system shall collect wastewater of wastewater creating activities.• The system shall protect the area against pluvial flooding.• The system shall protect the area against fluvial flooding.• The system s capacity shall match the projected population growth.• The system s capacity shall match the projected industrial growth.• The system shall provide drinking water according to World Health Organization(WHO) qualitystandard reported in [35].
• The system should treat the wastewater which is collected.
It should be mentioned that Dala is a flood prone area [48, p.13]. Cyclones can cause severedamage to Dala, and its water infrastructure. The water infrastructure as presented in this reportshould be protected from these forces. Therefore the protection from fluvial flooding should be aconstraint for the design of the water infrastructure. However, the design of flood protection is not partof this design. The work presented in Nientker et al. [72] is used as a reference for the requirementson making Dala protected against fluvial flooding. Any consequence induced by the measures to makeDala flood proof should be taken into account in the design for Dala s water infrastructure.
15
16 3. Requirement analysis
3.1.2. Functional requirements• The system should ensure a maximum of 10% non-revenue water.• The system should provide each Dala inhabitant with clean drinking water at no more than 500meters distance from their home [101].
• The system should preserve the quality of the water sources.• The system should preserve the capacity of the water sources.• The system should allow for the harvesting of resources from wastewater.• The system should limit the pollution of industry wastewater.• The system should ensure as little waste of water as possible during consumption.
3.1.3. Non-functional requirements• The system should consume less energy compared to traditional methods.• The system shall be as safe as possible.• The system shall reduce the environmental impact of the Dala urbanization.• The system shall be climate change-resilient.• The system shall have as little greenhouse gas (GHG) emissions as possible.• The system should have an as high mean time to failure (MTTF) as possible.• The system should have an as low mean time to repair (MTTR) as possible.• The system should provide affordable water for every inhabitant of Dala.• The system shall be implementable by local laborers.• The system shall be maintainable by local laborers• The system shall allow for flexible, step wise implementation.• The system shall allow for investments to be spread over time and parties.
3.2. Land-use modelIn order to design a system that tenders to the water needs as defined in the requirements, it isimportant to know how Dala will develop spatially after 2021. In other words, it is important to knowhow the land is used, what the densities will be and what the patterns behind these developments are.If Dala is divided into a number of zones, land-use tendency, density and therefore water needs can bedefined per zone. This provides valuable insights for the design of the water infrastructure. The zonalland-use is not only a given that needs to be taken into account when designing the water infrastructure,it can also be influenced by the design. Therefore, the land-use itself can not be given as a scenario.It is only important to understand the relationships between relevant factors that influence the designand that can in turn be influenced by the design. Therefore, in this chapter a conceptual model isproposed outlining relationships between factors that are relevant for this case. This conceptual modelis then visualized for the zones as defined for Dala.
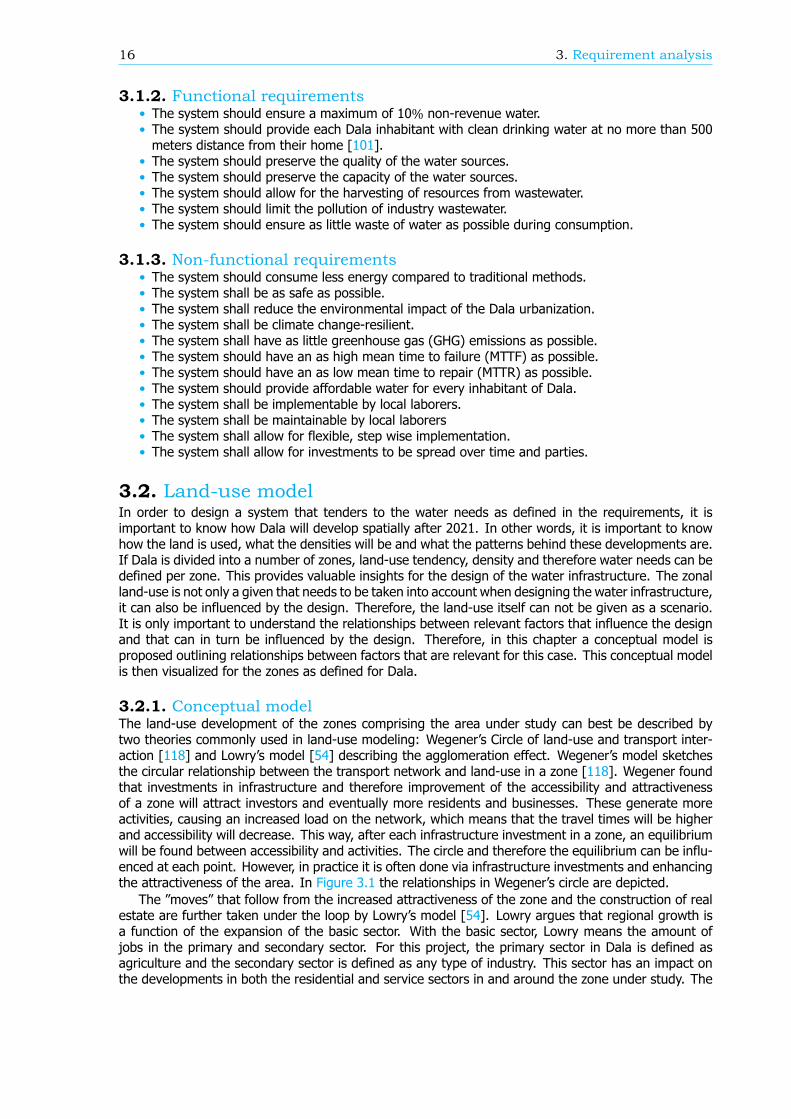
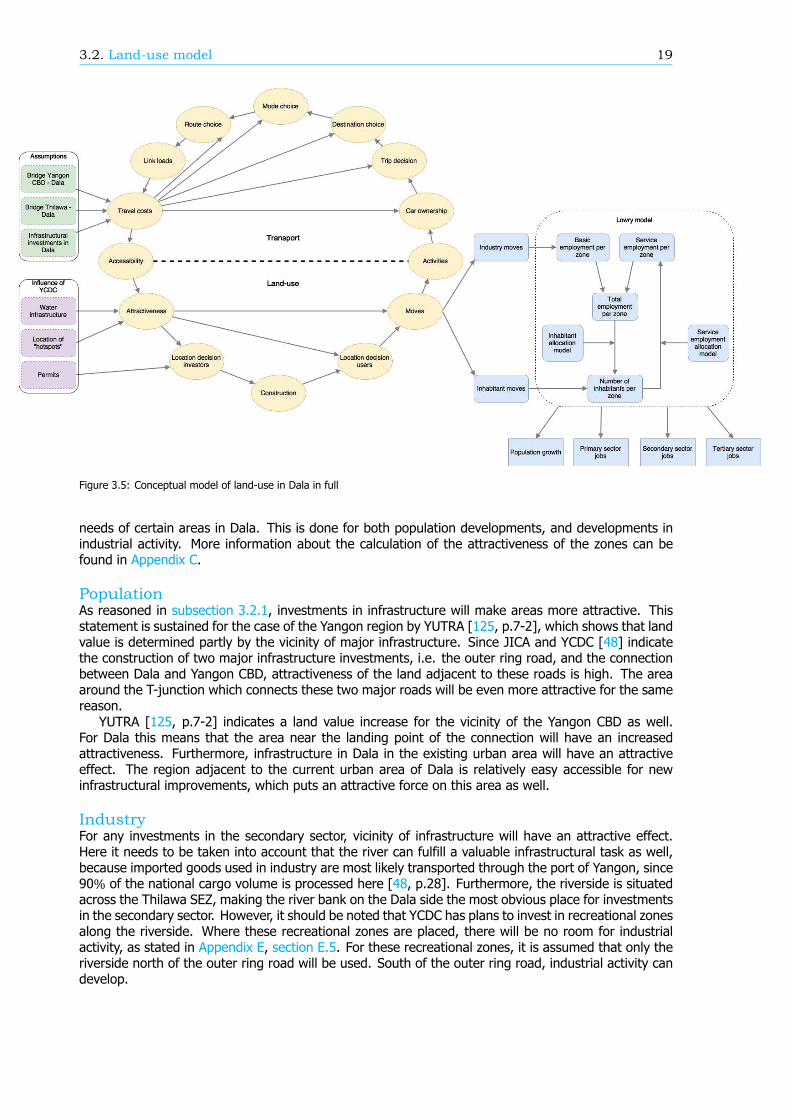
3.2.1. Conceptual modelThe land-use development of the zones comprising the area under study can best be described bytwo theories commonly used in land-use modeling: Wegener s Circle of land-use and transport inter-action [118] and Lowry s model [54] describing the agglomeration effect. Wegener s model sketchesthe circular relationship between the transport network and land-use in a zone [118]. Wegener foundthat investments in infrastructure and therefore improvement of the accessibility and attractivenessof a zone will attract investors and eventually more residents and businesses. These generate moreactivities, causing an increased load on the network, which means that the travel times will be higherand accessibility will decrease. This way, after each infrastructure investment in a zone, an equilibriumwill be found between accessibility and activities. The circle and therefore the equilibrium can be influ-enced at each point. However, in practice it is often done via infrastructure investments and enhancingthe attractiveness of the area. In Figure 3.1 the relationships in Wegener s circle are depicted.
The moves that follow from the increased attractiveness of the zone and the construction of realestate are further taken under the loop by Lowry s model [54]. Lowry argues that regional growth isa function of the expansion of the basic sector. With the basic sector, Lowry means the amount ofjobs in the primary and secondary sector. For this project, the primary sector in Dala is defined asagriculture and the secondary sector is defined as any type of industry. This sector has an impact onthe developments in both the residential and service sectors in and around the zone under study. The
3.2. Land-use model 17
Figure 3.1: Wegener s Circle of land-use and transport [118]
residential sector is here defined as the amount of people living in the area and the service sector isdefined as the amount of tertiary sector jobs, or service jobs, in the area. A certain amount of basicsector jobs will attract residents to the zone itself and the zones around it depending on the accessibilityand attractiveness of each zone. This in turn generates service jobs in the respective zones which willin turn attract residents. In Figure 3.2 Lowry s model is depicted.
Figure 3.2: Lowry s model of basic jobs, residents and service sector jobs [54]
As was said, when something changes in the land-use and transport circle, this is usually the resultof infrastructure investments and enhancing the attractiveness of the zone. In the case of Dala, theroad infrastructure investments are seen as a given. That is, the bridges between Yangon and Dala,
18 3. Requirement analysis
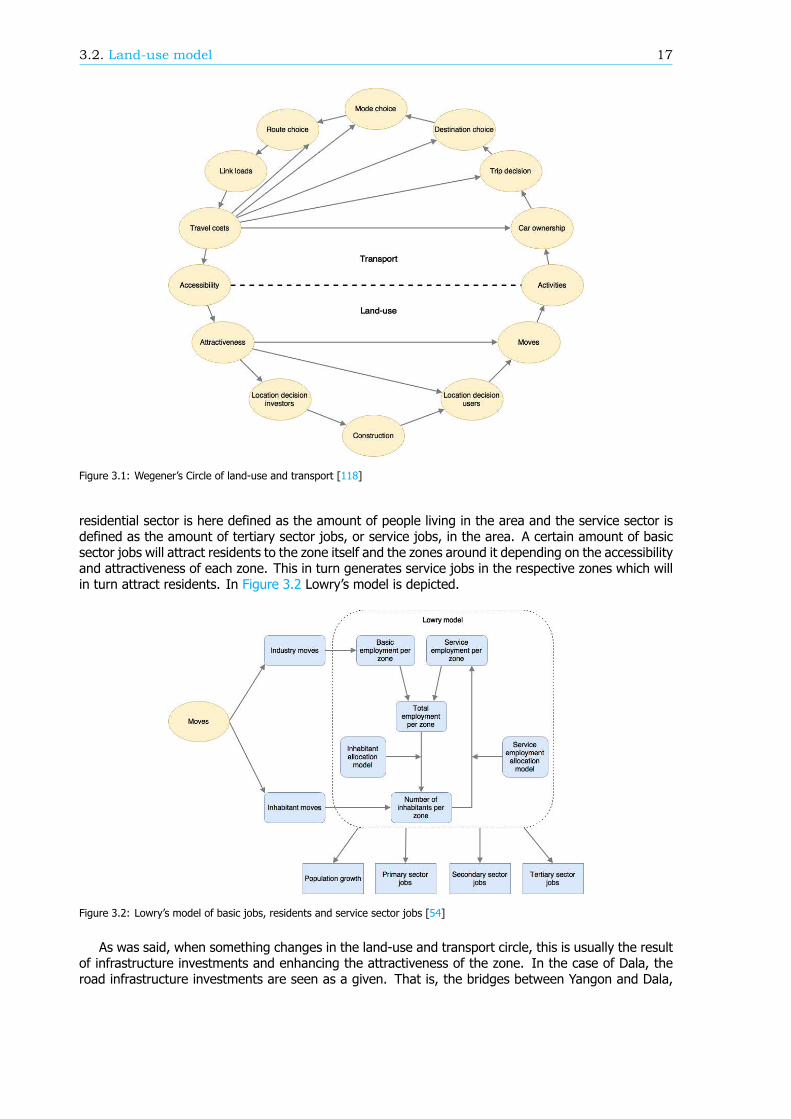
and Dala and Thilawa are assumed to be built. Furthermore, as stated in the Master Plan for GreaterYangon [48], further infrastructure investments in Dala are expected, such as the outer ring road, thefeeder road from the Dala - Yangon CBD connection to the outer ring road, improved public transportand an improved road network, reducing travel costs. In Figure 3.3 the influence of these assumedinvestments on the conceptual model is shown.
Figure 3.3: Assumptions on infrastructure investments influencing Wegener s Circle for Dala
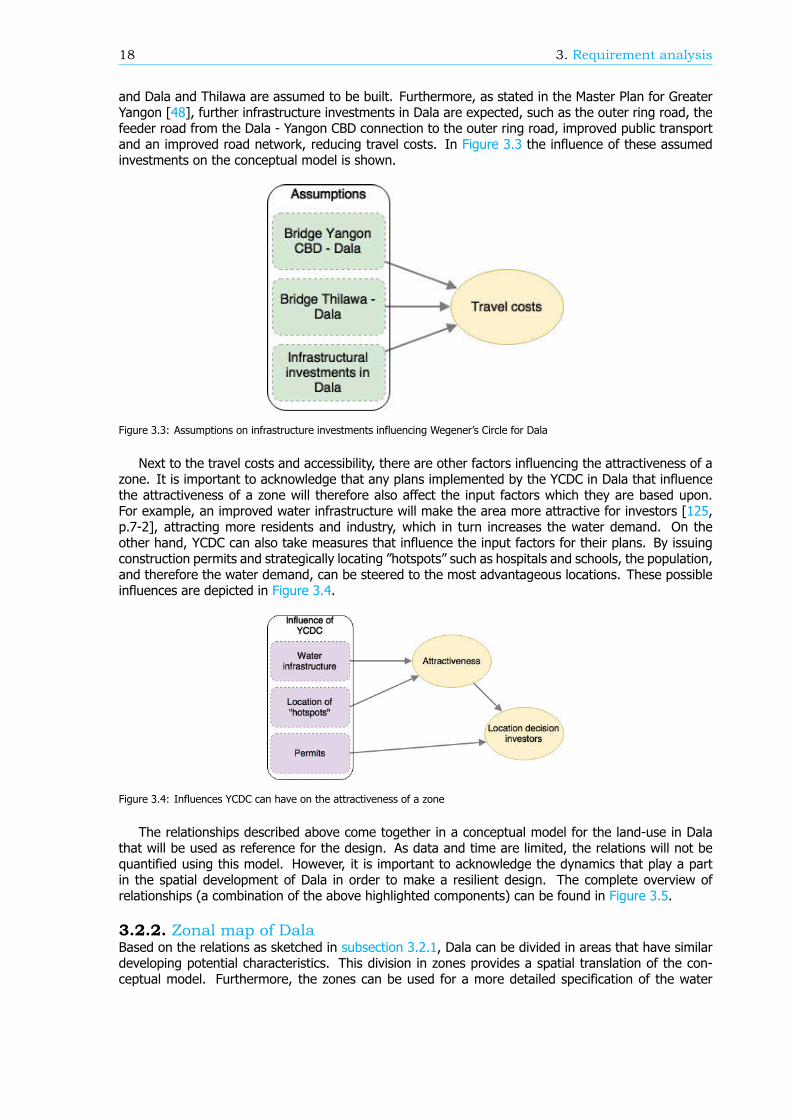
Next to the travel costs and accessibility, there are other factors influencing the attractiveness of azone. It is important to acknowledge that any plans implemented by the YCDC in Dala that influencethe attractiveness of a zone will therefore also affect the input factors which they are based upon.For example, an improved water infrastructure will make the area more attractive for investors [125,p.7-2], attracting more residents and industry, which in turn increases the water demand. On theother hand, YCDC can also take measures that influence the input factors for their plans. By issuingconstruction permits and strategically locating hotspots such as hospitals and schools, the population,and therefore the water demand, can be steered to the most advantageous locations. These possibleinfluences are depicted in Figure 3.4.
Figure 3.4: Influences YCDC can have on the attractiveness of a zone
The relationships described above come together in a conceptual model for the land-use in Dalathat will be used as reference for the design. As data and time are limited, the relations will not bequantified using this model. However, it is important to acknowledge the dynamics that play a partin the spatial development of Dala in order to make a resilient design. The complete overview ofrelationships (a combination of the above highlighted components) can be found in Figure 3.5.
3.2.2. Zonal map of DalaBased on the relations as sketched in subsection 3.2.1, Dala can be divided in areas that have similardeveloping potential characteristics. This division in zones provides a spatial translation of the con-ceptual model. Furthermore, the zones can be used for a more detailed specification of the water
3.2. Land-use model 19
Figure 3.5: Conceptual model of land-use in Dala in full
needs of certain areas in Dala. This is done for both population developments, and developments inindustrial activity. More information about the calculation of the attractiveness of the zones can befound in Appendix C.
PopulationAs reasoned in subsection 3.2.1, investments in infrastructure will make areas more attractive. Thisstatement is sustained for the case of the Yangon region by YUTRA [125, p.7-2], which shows that landvalue is determined partly by the vicinity of major infrastructure. Since JICA and YCDC [48] indicatethe construction of two major infrastructure investments, i.e. the outer ring road, and the connectionbetween Dala and Yangon CBD, attractiveness of the land adjacent to these roads is high. The areaaround the T-junction which connects these two major roads will be even more attractive for the samereason.
YUTRA [125, p.7-2] indicates a land value increase for the vicinity of the Yangon CBD as well.For Dala this means that the area near the landing point of the connection will have an increasedattractiveness. Furthermore, infrastructure in Dala in the existing urban area will have an attractiveeffect. The region adjacent to the current urban area of Dala is relatively easy accessible for newinfrastructural improvements, which puts an attractive force on this area as well.
IndustryFor any investments in the secondary sector, vicinity of infrastructure will have an attractive effect.Here it needs to be taken into account that the river can fulfill a valuable infrastructural task as well,because imported goods used in industry are most likely transported through the port of Yangon, since90% of the national cargo volume is processed here [48, p.28]. Furthermore, the riverside is situatedacross the Thilawa SEZ, making the river bank on the Dala side the most obvious place for investmentsin the secondary sector. However, it should be noted that YCDC has plans to invest in recreational zonesalong the riverside. Where these recreational zones are placed, there will be no room for industrialactivity, as stated in Appendix E, section E.5. For these recreational zones, it is assumed that only theriverside north of the outer ring road will be used. South of the outer ring road, industrial activity candevelop.
20 3. Requirement analysis
Furthermore, the outer ring road will have an impact on the attractiveness of zones. One of themain purposes of the ring road is to create an outer ring where industry can settle, while keeping areascloser to the city of Yangon free for residential and tertiary sector purposes [48, p.19]. For this reasonthe road connecting Dala with Yangon CBD is assumed to be less of an attraction factor on secondarysector activity, in comparison with the outer ring road.
As described in subsection 3.2.1, the agglomeration effect of Lowry [54] will lead to more inhabitantsand service jobs in areas that are connected to areas with secondary sector jobs (i.e. basic jobs).Therefore, the attractiveness as a residential area or a commercial area of connected zones will increasedue to the industrial activity that is expected.
In Appendix C, Table C.1, the influence of all factors that are described in this Section are coupledto the zones of Dala. The factors taken into account are:
• Connection road Dala - Yangon CBD;• Outer ring road;• Yangon CBD, being the landing point of the connection between Dala and Yangon CBD;• Existing urban area;• River south of the ring road;• River north of the ring road;• Adjacency to the zone that is directly influenced by the factors mentioned.
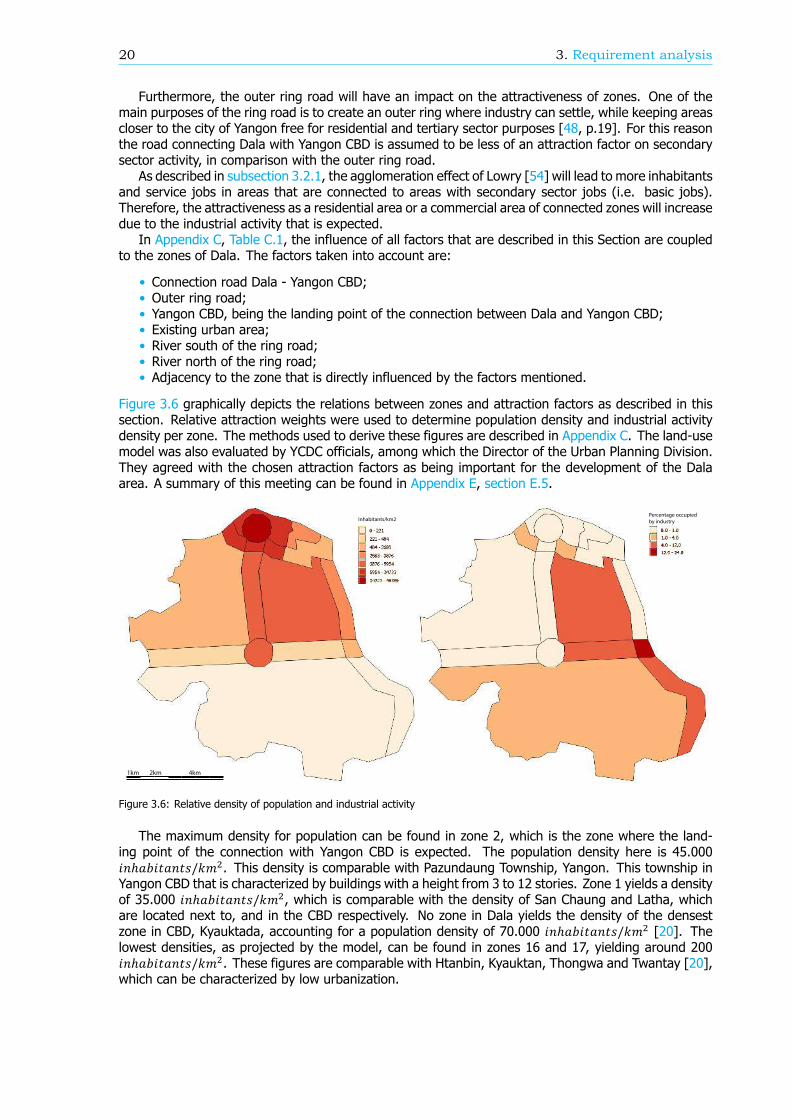
Figure 3.6 graphically depicts the relations between zones and attraction factors as described in thissection. Relative attraction weights were used to determine population density and industrial activitydensity per zone. The methods used to derive these figures are described in Appendix C. The land-usemodel was also evaluated by YCDC officials, among which the Director of the Urban Planning Division.They agreed with the chosen attraction factors as being important for the development of the Dalaarea. A summary of this meeting can be found in Appendix E, section E.5.
Inhabitants/km2Percentage occupied
by industry
1km 2km 4km
Figure 3.6: Relative density of population and industrial activity
The maximum density for population can be found in zone 2, which is the zone where the land-ing point of the connection with Yangon CBD is expected. The population density here is 45.000 ℎ / . This density is comparable with Pazundaung Township, Yangon. This township inYangon CBD that is characterized by buildings with a height from 3 to 12 stories. Zone 1 yields a densityof 35.000 ℎ / , which is comparable with the density of San Chaung and Latha, whichare located next to, and in the CBD respectively. No zone in Dala yields the density of the densestzone in CBD, Kyauktada, accounting for a population density of 70.000 ℎ / [20]. Thelowest densities, as projected by the model, can be found in zones 16 and 17, yielding around 200 ℎ / . These figures are comparable with Htanbin, Kyauktan, Thongwa and Twantay [20],which can be characterized by low urbanization.
3.2. Land-use model 21
The maximum density for industry can be found in zone 15, yielding a surface occupation of 24%.Furthermore, zone 11 attracts industry up till a surface occupation of 12%. The rest of the zones area lot less attractive and all yield surface occupation rates between 0% and 6%. Although it is hard togive a reference case for this occupation rate, it can be concluded that the water demand for industryin zones 15 and 11 will be the highest
Urban areaFor calculations on the drainage system, a figure for the urban area should be derived. Where thisfigure is not directly derived from the land-use model, some assumptions have to be made. Deuskar[21] states the most common threshold used for identifying an area as urban, lies at 2000 ℎ/ .When this figure is used for the zones of Dala, 63 is identified as urban. Industrial area should alsobe taken into account. As stated in subsection 2.4.1, the surface for industrial area is projected to be7,36 . Besides these areas, the area of Dala will be provided with two major infrastructure projects,connecting the industrial areas and the residential areas. Furthermore, the water infrastructure that ispresented in this report also needs to be drained. To be on the safe side for the calculations of the tobe drained area, it is assumed that 50% of the total area of Dala needs to be drained, and is identifiedas urban area. This results in 112,5 .

4Functional analysis
After having defined the requirements of the system, a functional analysis can be conducted. Based onthe requirements, a number of functions of the system can be defined. Using morphological design,as many potential solutions as possible are then identified for these functions. The first step that wastaken to narrow down these solutions to a design, is generating three alternative designs with one or aset of solutions per row of the morphological chart. The themes that were chosen for these alternativedesigns are economic sustainability, environmental sustainability and social sustainability.
4.1. Definition of functionsFrom the constraints and functional requirements as defined in the previous chapter, a number offunctions were derived which were used to generate a design. The goal of dividing the system upinto a number of functions is to enable the design of bite-sized subsystems. These will afterwards beunified in an integrated design. The functions were defined as follows:
• Harvesting of water/resource• Storage of harvested water• Treatment of household- and drinking water• Quality control of drinking water• Supply (bringing to consumer) of drinking water• Collection of wastewater• Limiting pollution of wastewater• Monitoring water consumption• Treatment of wastewater• Protection against pluvial flooding• Collection of run-off water
4.2. Morphological designWhen the functions have been defined, they can be used to generate a number of designs. This isdone using a morphological chart. A morphological chart is a tool that can be used for functionaldesign brainstorms. The functions are listed below each other and methods to fulfill these functionscan be filled in for each of them. In the end, alternative designs can be generated by combiningsolutions for all the functions. The full morphological chart, which can be found in Appendix D, wasgenerated by means of multiple internal brainstorm sessions and an external brainstorm session withexperts from the YEP network and students from MMU and YTU. A detailed account of the externalbrainstorm can be found in Appendix F, section F.1. The goal of these sessions was to generate as manyideas as possible. These ideas were then filtered down to a number of feasible ideas based on somepreconditions inherent to the area. After further research regarding the feasible solutions, combinationsof solutions were selected to generate three alternatives, which are described in section 4.3.
This section gives an overview of the current situation for all the functions as listed in section 4.1.After explaining the current situation, the alternative designs are sketched, giving insight in the changes
23
24 4. Functional analysis
that will occur when implementing an alternative design in Dala.
4.2.1. Harvesting of water/resourceDala is located in the lower part of the Ayeyarwady Delta. This area is particularly rich in surface water.However, due to the proximity of the sea, the majority of the streams that flow in the lower delta arecharacterized by a high level of salinity [124, p.2-18]. For this reason, river water is not currently usedin Dala for drinking purposes. According to Aung [7], the Toe river, located 46 Southeast of Dala,is potentially suitable to produce drinking water for the growing Yangon region. Compared to otherrivers in the area, the Toe combines a high basic discharge during the dry season with a relatively lowsalt content, as stated in Appendix E, section E.3, and YCDC and JICA [124].
Groundwater (GW) is a source that has been used in Dala area over the last decades. The pipesystem currently present in Dala uses GW extracted in the Pauk Yangon village [7, p.34]. Furthermore,YCDC is planning the construction of 3 small GW treatment plants to provide water to the most remotewards in Dala, as described in Appendix E, section E.3. This can be seen as a controversial solution dueto the link between groundwater extraction and land subsidence in the surrounding areas [111]. Thisphenomenon can be mitigated by increasing the natural infiltration of the rainwater or through artificialinfiltration [83]. The groundwater in Dala is also characterized by a relatively high salt concentration,as reported in section E.3, section E.6. The production of freshwater from it implies the employmentof high energy consuming treatment (e.g. reverse osmosis filtration) and the production of a wastebrine which is usually hard to dispose of.
The average yearly rainfall in the Yangon Region is around 2.700 [7, p.24], most of which isconcentrated during the wet season (June to September). This currently represents the main watersource for Dala during most of the year. At the moment, there are 323 rainwater ponds located inDala [9]. This system is inadequate as it cannot provide the population of Dala with enough water tolast the dry season [9]. However, the extraordinary amount of rainfall makes it interesting to look intothe potential use of rain as main water source also for the future urban expansion of Dala. Furthermore,The YCDC plans to forbid air-polluting industries to settle in Dala, as stated in Appendix E, section E.5,can prevent the contamination of the rainwater.
4.2.2. Storage of harvested waterCurrently Dala makes use of 323 rainwater reservoirs for water storage [8]. However, this does notprovide the residents with enough water to last the entire dry season. Not only do the reservoirs haveinsufficient capacity, a large part of the stored water also evaporates. Using data from Aung [7], it wascalculated that only in the dry season the potential evaporation is roughly 1 meter in the Great Yangonregion.
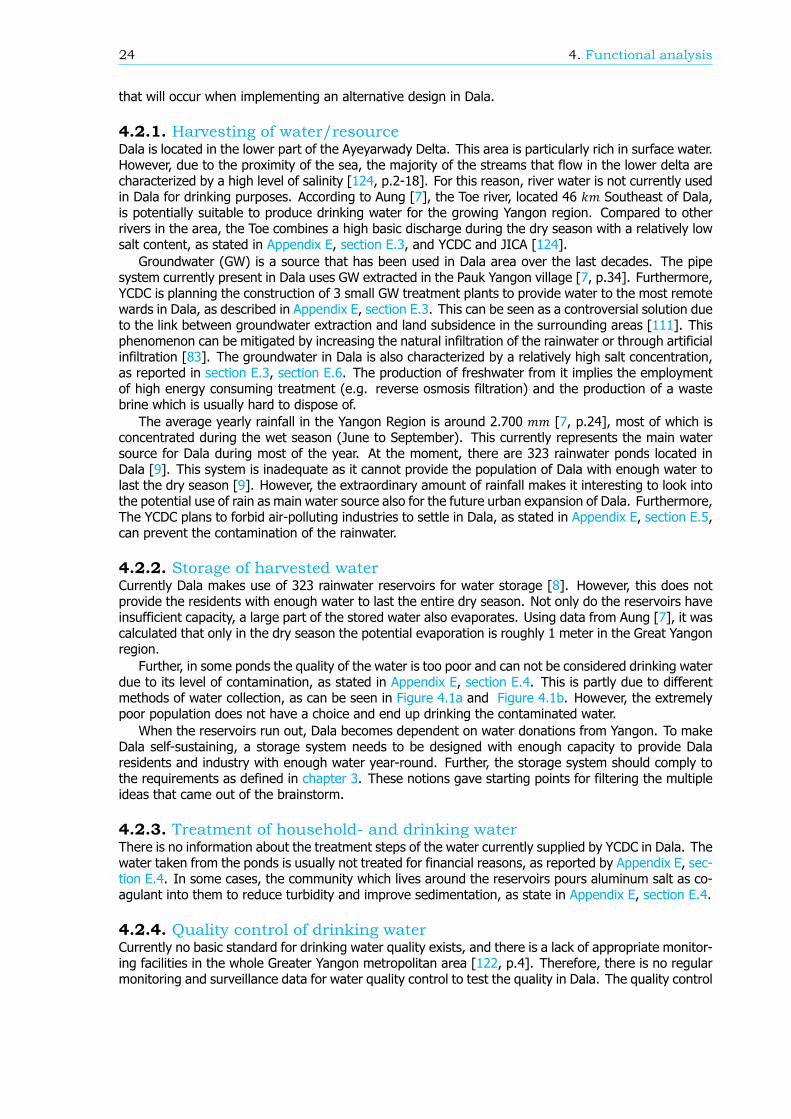
Further, in some ponds the quality of the water is too poor and can not be considered drinking waterdue to its level of contamination, as stated in Appendix E, section E.4. This is partly due to differentmethods of water collection, as can be seen in Figure 4.1a and Figure 4.1b. However, the extremelypoor population does not have a choice and end up drinking the contaminated water.
When the reservoirs run out, Dala becomes dependent on water donations from Yangon. To makeDala self-sustaining, a storage system needs to be designed with enough capacity to provide Dalaresidents and industry with enough water year-round. Further, the storage system should comply tothe requirements as defined in chapter 3. These notions gave starting points for filtering the multipleideas that came out of the brainstorm.
4.2.3. Treatment of household- and drinking waterThere is no information about the treatment steps of the water currently supplied by YCDC in Dala. Thewater taken from the ponds is usually not treated for financial reasons, as reported by Appendix E, sec-tion E.4. In some cases, the community which lives around the reservoirs pours aluminum salt as co-agulant into them to reduce turbidity and improve sedimentation, as state in Appendix E, section E.4.
4.2.4. Quality control of drinking waterCurrently no basic standard for drinking water quality exists, and there is a lack of appropriate monitor-ing facilities in the whole Greater Yangon metropolitan area [122, p.4]. Therefore, there is no regularmonitoring and surveillance data for water quality control to test the quality in Dala. The quality control
4.2. Morphological design 25
(a) Reservoir with electric pump (b) Reservoir with bucket collection
Figure 4.1: Rainwater reservoirs with different types of water extraction
per source is operated by different organizations: the reservoirs are under observation of the irrigationdepartment, while the YCDC tests the quality of the groundwater and the river is under custody ofdepartment of meteorology and hydrology [99].
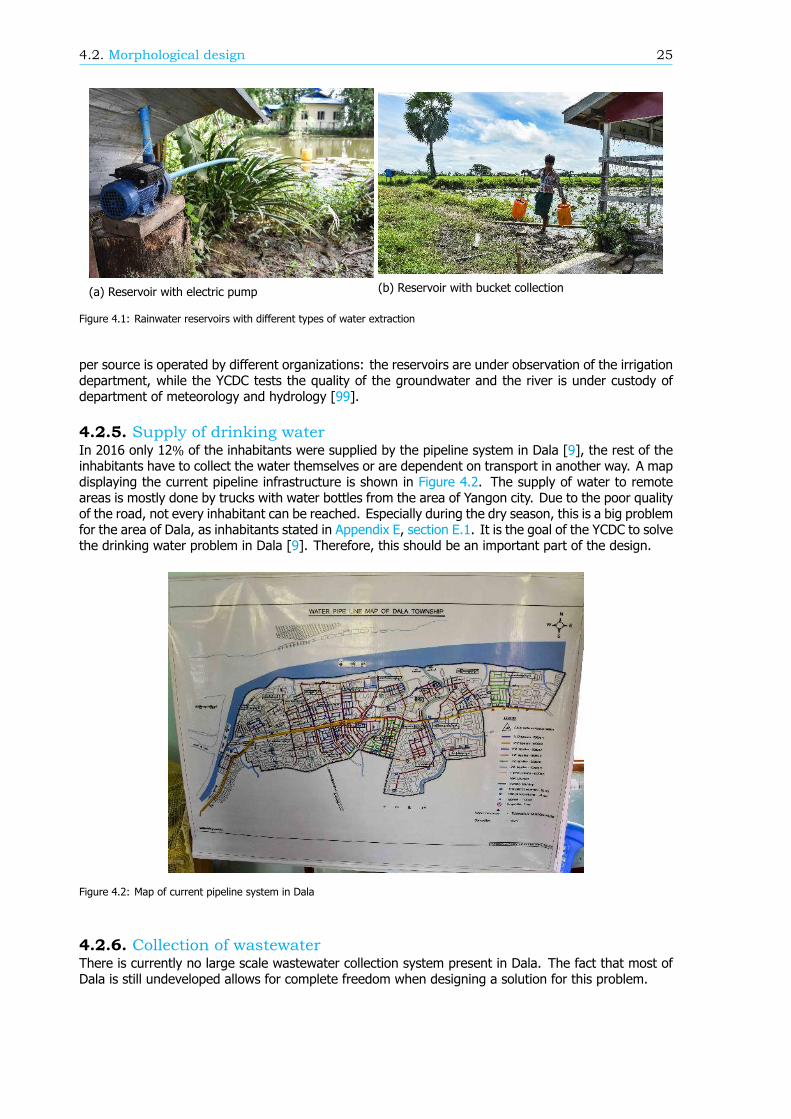
4.2.5. Supply of drinking waterIn 2016 only 12% of the inhabitants were supplied by the pipeline system in Dala [9], the rest of theinhabitants have to collect the water themselves or are dependent on transport in another way. A mapdisplaying the current pipeline infrastructure is shown in Figure 4.2. The supply of water to remoteareas is mostly done by trucks with water bottles from the area of Yangon city. Due to the poor qualityof the road, not every inhabitant can be reached. Especially during the dry season, this is a big problemfor the area of Dala, as inhabitants stated in Appendix E, section E.1. It is the goal of the YCDC to solvethe drinking water problem in Dala [9]. Therefore, this should be an important part of the design.
Figure 4.2: Map of current pipeline system in Dala
4.2.6. Collection of wastewaterThere is currently no large scale wastewater collection system present in Dala. The fact that most ofDala is still undeveloped allows for complete freedom when designing a solution for this problem.
26 4. Functional analysis
4.2.7. Limiting pollution of wastewaterNo information can be found on any measures taken in Dala to limit the pollution of wastewater. Limitingthe pollution of wastewater can make the wastewater treatment process easier and cheaper, and istherefore a valuable function to take into account.
4.2.8. Monitoring water consumptionCurrently there is no system to monitor the water consumption per household in Dala, a system onlyexists in Yangon [58, p. 26]. It is important to include this function in the general design to make thesystem more efficient. Indeed, the development of a monitoring system for Dala is also part of thefuture goals of YCDC for the Greater Yangon [48, p.123]. Compared with other countries, the drinkingwater tariff of YCDC is much cheaper. Therefore, user awareness on water savings is low. This watertariff has to be reconsidered, since it cannot cover the investment cost for the construction of newwater facilities [48, p.30]
4.2.9. Treatment of wastewaterCurrently in Dala most of the residents discharge grey and black water into a hole in the ground.Waste, heavier than water, will sediment to the bottom of this hole, while water will float on top ofthis waste. When the hole overflows only water and light particles will leave the hole. In this way,a share of pollutants in the wastewater is not discharged. The effluent will either infiltrate into theground around the hole, or flow into nearby water bodies. Although the wastewater loses a part of thesolid fraction, the effluent can still contain a large amount of pathogens, causing health risks. Besidesthis, pathogens in the effluent can affect the flora and fauna of the area. The ground in which thewastewater infiltrates, or the water body in which the wastewater ends up, might be a water sourceused by the inhabitants, which again causes health risks.
4.2.10. Protection against pluvial floodingThere are currently no specific protection measures in place to protect Dala against pluvial flooding.The only measures which have been observed are the creation of natural retention area in which theexcess rainwater is collected and stored, and the heightening of buildings and roads. The entrance ofthe building is about half a meter higher than the surrounding area, a similar height difference is alsoobserved with the roads. As assumed by Nientker et al. [72], these houses and roads where specificallyconstructed at a higher level to prevent the occurrence of flooding.
4.2.11. Collection of run-off waterThere is currently no actual drainage system implemented in Dala. The runoff generated during stormis collected in trenches located beside the streets or in natural water retention areas.
4.3. Alternative designsAs mentioned before, the morphological chart can be used to generate multiple alternative designsby combining solutions for the functions. These solutions can be chosen using certain pillars. In thiscase three pillars for sustainable development as defined by UNESCO [80] were chosen: economicsustainability, environmental sustainability and social sustainability. A compressed morphological chartwith only the solutions that were chosen for these alternatives can be found in Table 4.1. The resultingthree alternatives were generated by combining the solutions which for their own function were eitherthe most economically, environmentally or socially sustainable. In that respect, these designs areextremes and their functional solutions do not necessarily fit well together. Therefore, in chapter 5 asynthesis will be formed.
4.3. Alternative designs 27
4.3.1. Economic sustainabilityThis alternative focuses on creating an economically sustainable solution for the Dala region. Thismeans that this alternative should allow for industrial growth of Dala, generation of jobs, the engage-ment of local companies and allow for the agricultural sector in Dala to become more efficient.
The economic alternative consists of the collection of water from two main sources, the groundwaterand the river water from the Toe river. In order to survive the dry period, the water needs to be stored.On a large scale the water will be injected into aquifers or allowed to infiltrate naturally, while on asmaller scale the water will be stored in small tanks for personal use. The use of these tanks will benefitthe economy because they can be manufactured and supplied by means of a large project engaginglocal businesses to come up with the best and cheapest design. The water will be treated using reverseosmosis and later re-mineralized. This technique has already been implemented in industrial areas inthe Yangon region [45] and is therefore easier to operate by locals. Private groundwater withdrawallows industries to directly extract the needed amount of water. This results in more flexibility andautonomy for the industrial activity, making the area more attractive for investors.
The supply of water to the local population will be done using a separate pipeline system for house-hold water and drinking water. The collection of wastewater will also be done with the use of pipes,which will consist of a separate, gravity-based system for black water and runoff water. The use ofpipes to supply and collect water can indirectly benefit the economic growth of the Dala region byprotecting the natural environment as well as increasing the quality of life, resulting in an increased at-tractiveness for the Dala region. Since the drinking water is supplied in a different system, the amountof water that has to be treated is reduced. The quality of the water should be checked on a regularbasis to ensure safe drinking water. This will be done by implementing a Citizen Science Project whichconsists in promoting the use of smartphones to collect and analyze water quality data. This systemallows the local government to collect enough information to keep track of the water quality. Theimprovement of the water quality will also result in the increase of the attractiveness of Dala. Theconsumption of water will be monitored by a pay for usage system where water is supplied only tocostumers who have paid beforehand. This can be implemented by using a prepaid card system. Inthis way, money is only deducted when water is consumed. This system ensures that all the waterconsumed is charged, supporting the economic sustainability of the design.
To prevent the occurrence and consequences of severe pluvial flooding in the Dala region, a drainagesystem will be used to collect run-off water. The drainage system implemented will be similar to theone operating in Yangon. This system consists of elevated sidewalks covered with concrete slabs underwhich the rainwater can be collected and drained. This drainage system will be easy to construct, butit will require regular maintenance to prevent clogging, which in turn will provide the local populationwith jobs.
Lastly, the treatment of wastewater needs to be discussed. In order to reduce the amount ofwastewater to be treated, the amount of pollution present in the wastewater should be limited. Thiscan be done by putting sanctions on exceeding pollution standards such as fees or criminal prosecution.This option is opted for because the other option, reuse of wastewater for own usage, will bring extracosts to companies. This will reduce the attractiveness of the area for investments. Before discharged,wastewater is treated by means of phytodepuration. The wastewater treatment will be implementedand maintained by local laborers. This will be possible thanks to the simplicity of the employed method.
4.3.2. Environmental sustainabilityThis alternative has the following focus points for Dala: protecting the fauna and flora; minimizingemission of greenhouse gasses as well as the impact on natural resources, and keeping the interruptionof natural cycles, mainly water, as small as possible.
This alternative includes the use of rainwater harvesting as main water source. The rainwater willbe directly harvested on the reservoirs or collected from the surface runoffs. This solution requires lesstransport and therefore has a smaller emission during operation than using the Toe river or groundwater.Further, by using rainwater harvesting as resource, the harvesting itself does not affect the resource.Big reservoirs are needed on a large scale to store enough water for the dry season. To cope with theproblem of the evaporation of the water, solutions on two scales will be implemented. On a large scale,the currently used reservoirs will be deepened and new deeper reservoirs will be built. On a local scaleunderground cisterns are going to be constructed. In order to prevent seepage loss and contaminationby the salty groundwater in the reservoirs, an impermeable layer has to be included in the reservoir
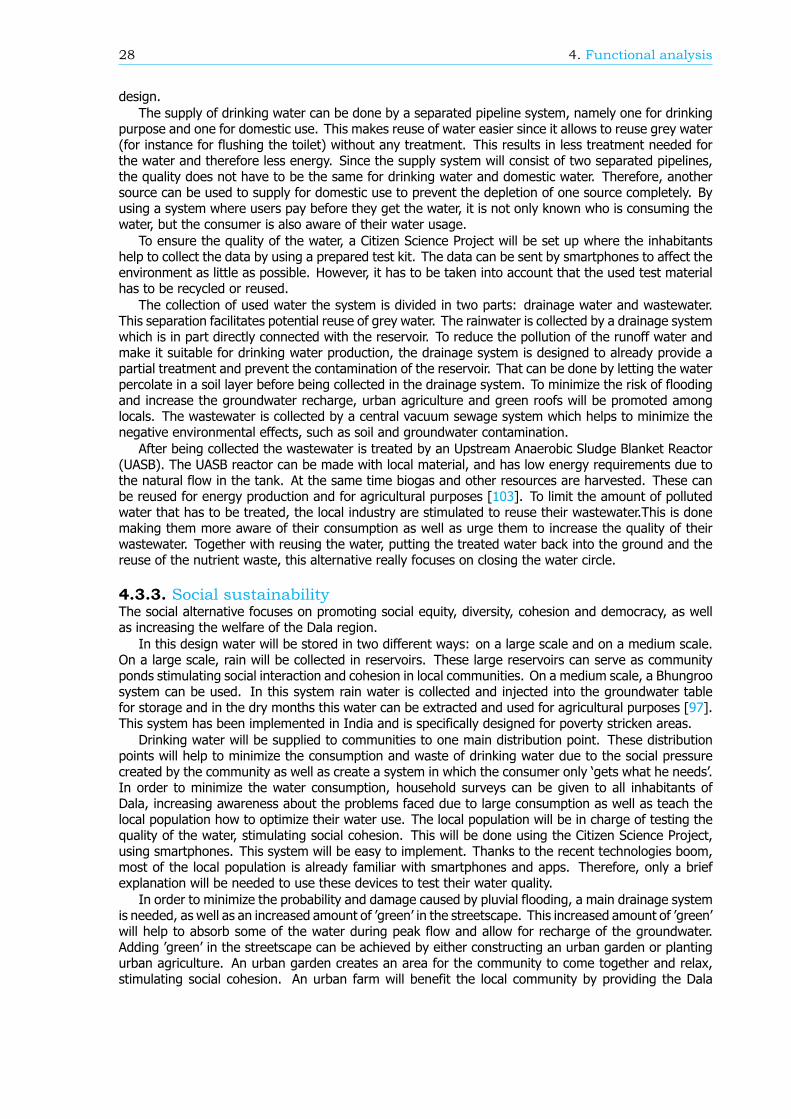
28 4. Functional analysis
design.The supply of drinking water can be done by a separated pipeline system, namely one for drinking
purpose and one for domestic use. This makes reuse of water easier since it allows to reuse grey water(for instance for flushing the toilet) without any treatment. This results in less treatment needed forthe water and therefore less energy. Since the supply system will consist of two separated pipelines,the quality does not have to be the same for drinking water and domestic water. Therefore, anothersource can be used to supply for domestic use to prevent the depletion of one source completely. Byusing a system where users pay before they get the water, it is not only known who is consuming thewater, but the consumer is also aware of their water usage.
To ensure the quality of the water, a Citizen Science Project will be set up where the inhabitantshelp to collect the data by using a prepared test kit. The data can be sent by smartphones to affect theenvironment as little as possible. However, it has to be taken into account that the used test materialhas to be recycled or reused.
The collection of used water the system is divided in two parts: drainage water and wastewater.This separation facilitates potential reuse of grey water. The rainwater is collected by a drainage systemwhich is in part directly connected with the reservoir. To reduce the pollution of the runoff water andmake it suitable for drinking water production, the drainage system is designed to already provide apartial treatment and prevent the contamination of the reservoir. That can be done by letting the waterpercolate in a soil layer before being collected in the drainage system. To minimize the risk of floodingand increase the groundwater recharge, urban agriculture and green roofs will be promoted amonglocals. The wastewater is collected by a central vacuum sewage system which helps to minimize thenegative environmental effects, such as soil and groundwater contamination.
After being collected the wastewater is treated by an Upstream Anaerobic Sludge Blanket Reactor(UASB). The UASB reactor can be made with local material, and has low energy requirements due tothe natural flow in the tank. At the same time biogas and other resources are harvested. These canbe reused for energy production and for agricultural purposes [103]. To limit the amount of pollutedwater that has to be treated, the local industry are stimulated to reuse their wastewater.This is donemaking them more aware of their consumption as well as urge them to increase the quality of theirwastewater. Together with reusing the water, putting the treated water back into the ground and thereuse of the nutrient waste, this alternative really focuses on closing the water circle.
4.3.3. Social sustainabilityThe social alternative focuses on promoting social equity, diversity, cohesion and democracy, as wellas increasing the welfare of the Dala region.
In this design water will be stored in two different ways: on a large scale and on a medium scale.On a large scale, rain will be collected in reservoirs. These large reservoirs can serve as communityponds stimulating social interaction and cohesion in local communities. On a medium scale, a Bhungroosystem can be used. In this system rain water is collected and injected into the groundwater tablefor storage and in the dry months this water can be extracted and used for agricultural purposes [97].This system has been implemented in India and is specifically designed for poverty stricken areas.
Drinking water will be supplied to communities to one main distribution point. These distributionpoints will help to minimize the consumption and waste of drinking water due to the social pressurecreated by the community as well as create a system in which the consumer only gets what he needs.In order to minimize the water consumption, household surveys can be given to all inhabitants ofDala, increasing awareness about the problems faced due to large consumption as well as teach thelocal population how to optimize their water use. The local population will be in charge of testing thequality of the water, stimulating social cohesion. This will be done using the Citizen Science Project,using smartphones. This system will be easy to implement. Thanks to the recent technologies boom,most of the local population is already familiar with smartphones and apps. Therefore, only a briefexplanation will be needed to use these devices to test their water quality.
In order to minimize the probability and damage caused by pluvial flooding, a main drainage systemis needed, as well as an increased amount of green in the streetscape. This increased amount of greenwill help to absorb some of the water during peak flow and allow for recharge of the groundwater.Adding green in the streetscape can be achieved by either constructing an urban garden or plantingurban agriculture. An urban garden creates an area for the community to come together and relax,stimulating social cohesion. An urban farm will benefit the local community by providing the Dala

4.3. Alternative designs 29
population with an increased income as well as provide the possibility for every inhabitant to haveaccess to food, because it is locally produced.
For the collection of run-off water, a main drainage system will be needed. The drainage of this waterwill minimize the damage to the infrastructure as well as protect the public from outbreaks of diseasesdue to the development of stagnant ponds with mosquitoes. The use of pipes to collect wastewater willmake living conditions of the poorer population safer, instead of living in contact with their own bodilywaste. This promotes equality among the inhabitants of Dala. In order to limit the pollution of thewastewater, the company or individual should be forced to reuse their own wastewater. This providesthe company and individual incentive to produce less wastewater as well as improve the quality of thewastewater produced. Finally, the wastewater will be treated using a septic tank system in combinationwith Phytodepuration. The phytodepuration can take place decentralized, bringing the water treatmentcloser to inhabitants. This creates more awareness about water usage. Furthermore, implementationof the phytodepuration infrastructure combined with other green in the city can promote social healthand community cohesion [116].
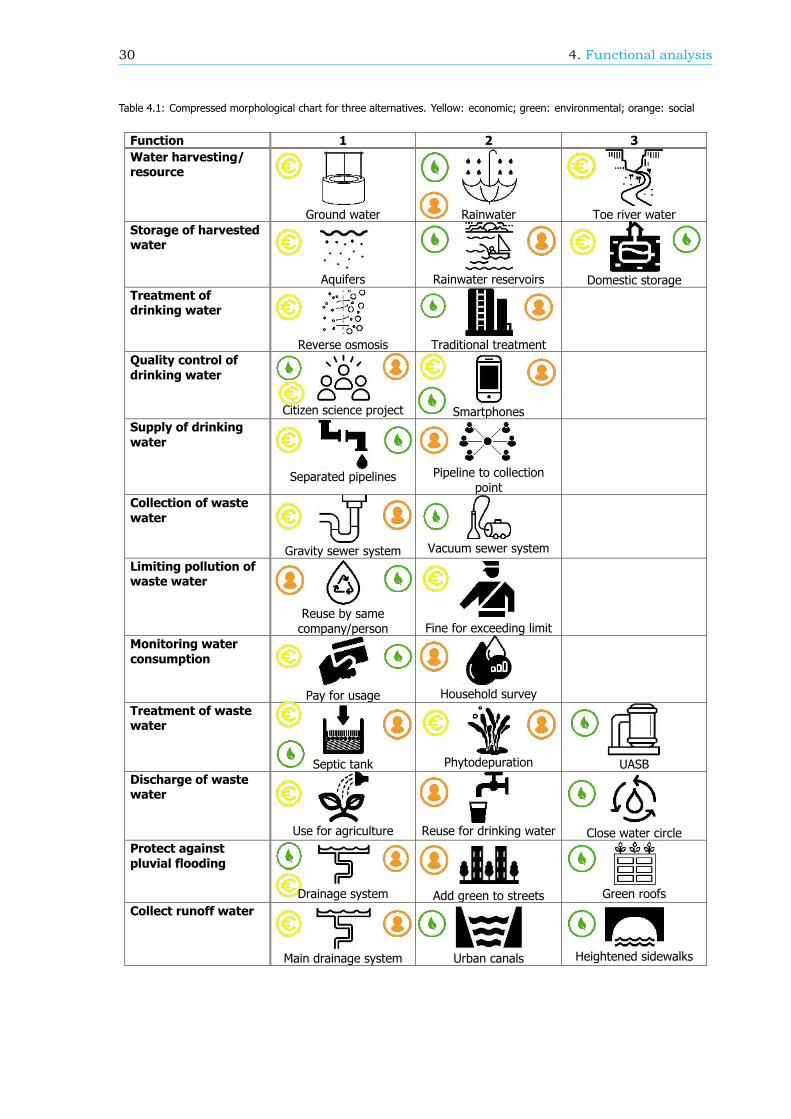
30 4. Functional analysis
Table 4.1: Compressed morphological chart for three alternatives. Yellow: economic; green: environmental; orange: social
Function 1 2 3
Water harvesting/ resource
Ground water
Rainwater
Toe river water
Storage of harvested water
Aquifers
Rainwater reservoirs
Domestic storage
Treatment of drinking water
Reverse osmosis
Traditional treatment
Quality control of
drinking water
Citizen science project
Smartphones
Supply of drinking
water
Separated pipelines
Pipeline to collection
point
Collection of waste
water
Gravity sewer system
Vacuum sewer system
Limiting pollution of waste water
Reuse by same
company/person
Fine for exceeding limit
Monitoring water
consumption
Pay for usage
Household survey
Treatment of waste water
Septic tank
Phytodepuration
UASB
Discharge of waste water
Use for agriculture
Reuse for drinking water
Close water circle
Protect against
pluvial flooding
Drainage system
Add green to streets
Green roofs
Collect runoff water
Main drainage system
Urban canals
Heightened sidewalks
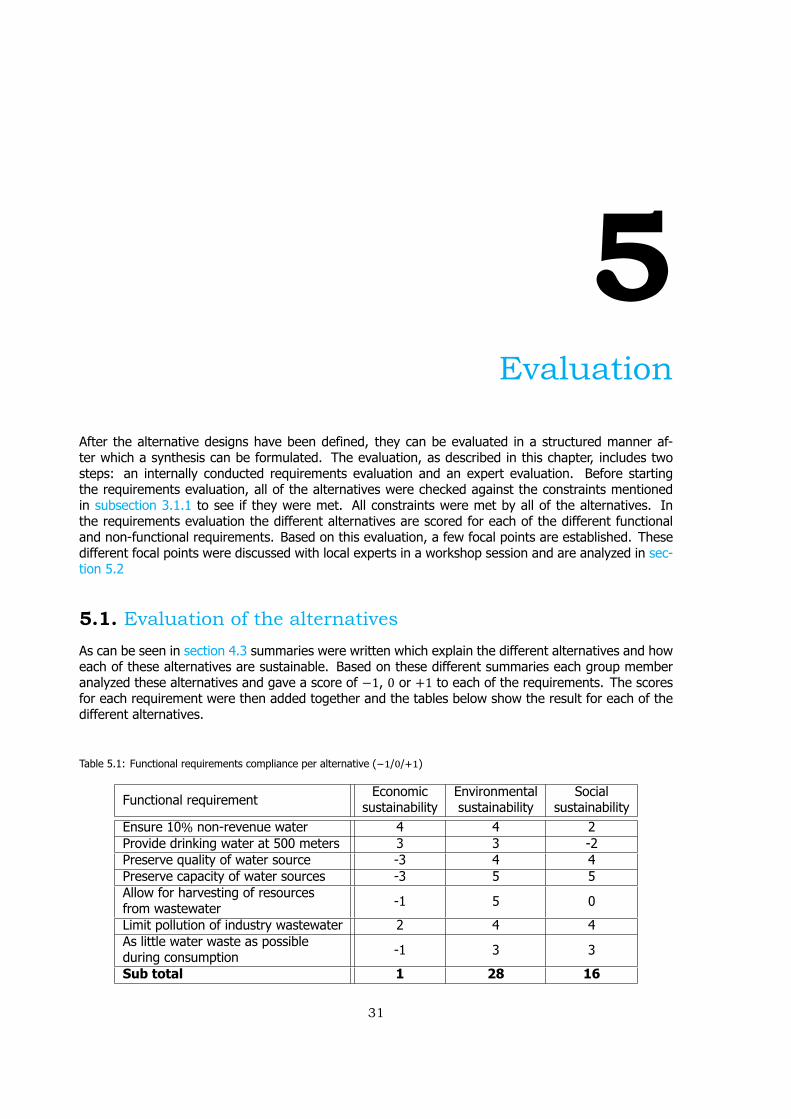
5Evaluation
After the alternative designs have been defined, they can be evaluated in a structured manner af-ter which a synthesis can be formulated. The evaluation, as described in this chapter, includes twosteps: an internally conducted requirements evaluation and an expert evaluation. Before startingthe requirements evaluation, all of the alternatives were checked against the constraints mentionedin subsection 3.1.1 to see if they were met. All constraints were met by all of the alternatives. Inthe requirements evaluation the different alternatives are scored for each of the different functionaland non-functional requirements. Based on this evaluation, a few focal points are established. Thesedifferent focal points were discussed with local experts in a workshop session and are analyzed in sec-tion 5.2
5.1. Evaluation of the alternativesAs can be seen in section 4.3 summaries were written which explain the different alternatives and howeach of these alternatives are sustainable. Based on these different summaries each group memberanalyzed these alternatives and gave a score of −1, 0 or +1 to each of the requirements. The scoresfor each requirement were then added together and the tables below show the result for each of thedifferent alternatives.
Table 5.1: Functional requirements compliance per alternative ( / / )
Functional requirementEconomic
sustainabilityEnvironmentalsustainability
Socialsustainability
Ensure 10% non-revenue water 4 4 2Provide drinking water at 500 meters 3 3 -2Preserve quality of water source -3 4 4Preserve capacity of water sources -3 5 5Allow for harvesting of resourcesfrom wastewater -1 5 0
Limit pollution of industry wastewater 2 4 4As little water waste as possibleduring consumption -1 3 3
Sub total 1 28 16
31
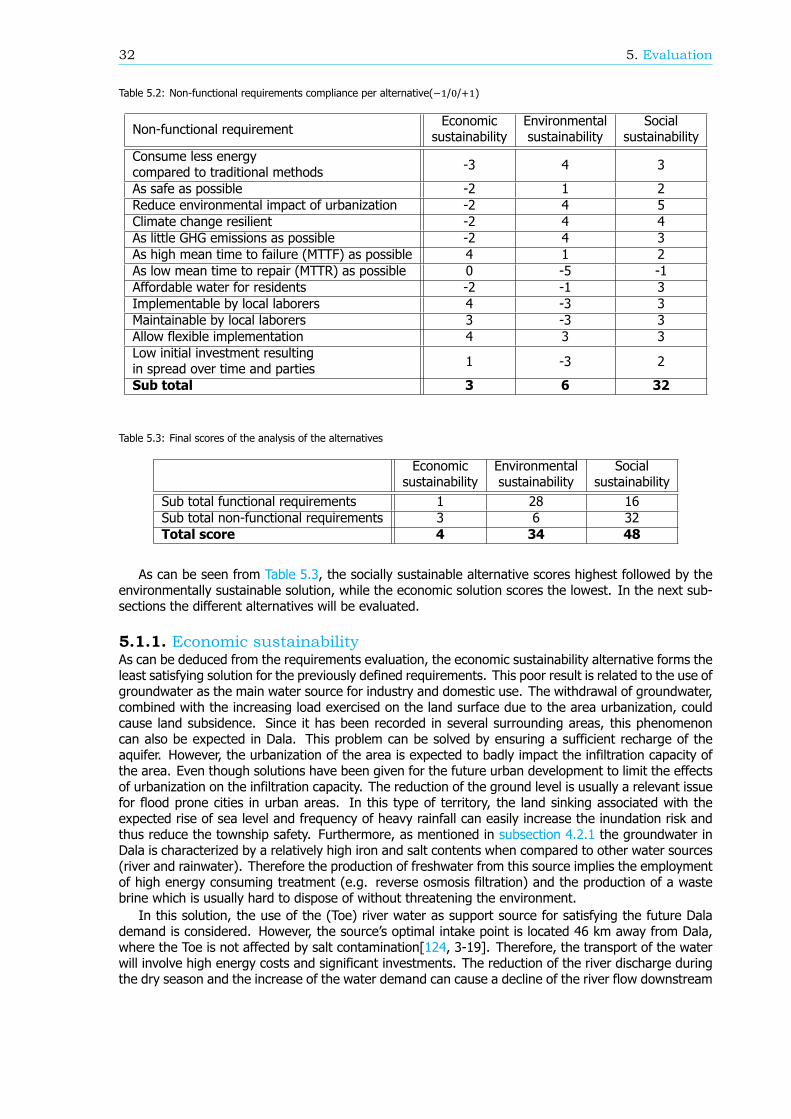
32 5. Evaluation
Table 5.2: Non-functional requirements compliance per alternative( / / )
Non-functional requirementEconomic
sustainabilityEnvironmentalsustainability
Socialsustainability
Consume less energycompared to traditional methods -3 4 3
As safe as possible -2 1 2Reduce environmental impact of urbanization -2 4 5Climate change resilient -2 4 4As little GHG emissions as possible -2 4 3As high mean time to failure (MTTF) as possible 4 1 2As low mean time to repair (MTTR) as possible 0 -5 -1Affordable water for residents -2 -1 3Implementable by local laborers 4 -3 3Maintainable by local laborers 3 -3 3Allow flexible implementation 4 3 3Low initial investment resultingin spread over time and parties 1 -3 2
Sub total 3 6 32
Table 5.3: Final scores of the analysis of the alternatives
Economicsustainability
Environmentalsustainability
Socialsustainability
Sub total functional requirements 1 28 16Sub total non-functional requirements 3 6 32Total score 4 34 48
As can be seen from Table 5.3, the socially sustainable alternative scores highest followed by theenvironmentally sustainable solution, while the economic solution scores the lowest. In the next sub-sections the different alternatives will be evaluated.
5.1.1. Economic sustainabilityAs can be deduced from the requirements evaluation, the economic sustainability alternative forms theleast satisfying solution for the previously defined requirements. This poor result is related to the use ofgroundwater as the main water source for industry and domestic use. The withdrawal of groundwater,combined with the increasing load exercised on the land surface due to the area urbanization, couldcause land subsidence. Since it has been recorded in several surrounding areas, this phenomenoncan also be expected in Dala. This problem can be solved by ensuring a sufficient recharge of theaquifer. However, the urbanization of the area is expected to badly impact the infiltration capacity ofthe area. Even though solutions have been given for the future urban development to limit the effectsof urbanization on the infiltration capacity. The reduction of the ground level is usually a relevant issuefor flood prone cities in urban areas. In this type of territory, the land sinking associated with theexpected rise of sea level and frequency of heavy rainfall can easily increase the inundation risk andthus reduce the township safety. Furthermore, as mentioned in subsection 4.2.1 the groundwater inDala is characterized by a relatively high iron and salt contents when compared to other water sources(river and rainwater). Therefore the production of freshwater from this source implies the employmentof high energy consuming treatment (e.g. reverse osmosis filtration) and the production of a wastebrine which is usually hard to dispose of without threatening the environment.
In this solution, the use of the (Toe) river water as support source for satisfying the future Dalademand is considered. However, the source s optimal intake point is located 46 km away from Dala,where the Toe is not affected by salt contamination[124, 3-19]. Therefore, the transport of the waterwill involve high energy costs and significant investments. The reduction of the river discharge duringthe dry season and the increase of the water demand can cause a decline of the river flow downstream
5.1. Evaluation of the alternatives 33
in the dry season. This could lead to potential problems for the ecosystem and the sediment transport.This last issue, however, occurs only if a significant amount of water intake from the river is needed.
The economic sustainability design scores higher in the requirements related to the feasibility andflexibility of the system. This is due to the implementation of solutions already employed in the country(e.g. reverse osmosis treatment and gravity sewage system). For this design less training is needed forsystem operators. Since the laborers are already partially familiar with the implemented technology, ahigher MTTF is also expected.
5.1.2. Environmental sustainabilityAccording to the requirements evaluation, the environmental sustainable solution is able to successfullymeet most of the requirements. The harvesting of rain as main water source will not only minimizethe impact of the water supply on the environment but it will also decrease the pluvial flooding riskin the area. In this solution, the water needs to be collected and stored in big reservoirs and privatetanks placed within the urban area. These facilities play an important role in increasing the total buffercapacity of the township, improving its resilience to climate change threats.
Furthermore, this alternative, compared to the design where river- or groundwater is employed,can potentially reduce the stress on the sewage and treatment system. That follows from the fact thatthis alternative is not dependent on any external water streams in the natural cycle of the study area.The maximization of green area and the institutional promotion of urban agriculture create favorableconditions for water to infiltrate, making the area more flood resistant.
Nevertheless, this design also has some important drawbacks. The majority of these are relatedto the feasibility and deploy-ability of the solutions involved. Most of the concepts present in thisdesign require an expert and well-trained labour force, or are ideas that involve technologies andknowledge which are hardly applied on a large scale in more developed countries (eg. vacuum sewagesystem). This weakness of the system is reflected in the poor result scored by this alternative in thenon-functional requirements where the feasibility and the reliability of the system are assessed in thespecific Dala context.
5.1.3. Social sustainabilityThe evaluation shows that the social sustainable design has the highest score. This alternative focuseson making a design which will benefit all of the inhabitants. This solution uses rainwater as the mainsource. Rainwater harvesting makes it possible to preserve both the capacity and the quality of thewater source as well as limit the probability and impact of pluvial flooding on the area. By harvestingwater which is already part of the natural system of Dala, further pressure on the water system causedby additional water input in the water cycle is prevented. This protects the system from having to copewith the additional stress of water being added to the system.
The social sustainable alternative also scores high on reducing the environmental impact of urban-ization. This will be done by adding green to the streetscape, constructing urban gardens and creatingurban agriculture. Normally urbanization changes the whole water cycle of the area. However, withthe implementation of these systems water will be allowed to follow its original path, therefore mini-mizing the impact of urbanization on the environment. Introducing plants and gardens will also helpto minimize the concentrations of GHG in the atmosphere.
The alternative scores relatively high on climate change resilience. This is because the systemalready incorporates a sustainable water source, as well as allowing the natural water cycle to continueduring the urbanization of Dala. This solution scores highest for the requirement of producing affordablewater, because the system will provide drinking water to communities at one main location. The useof one distribution point will also minimize the loss of non-revenue water, because having one maindistribution system will allow for more accurate measurements. This is because less meters need tobe checked and the probability of one meter breaking without the water company knowing is reduced.This central system will also help to limit the unneeded waste of water, because residents need tocollect drinking water themselves and will be less likely to waste it.
The main source of water will be located within the Dala region, minimizing the cost of the transportof water from the source to the location where it will be needed. The social sustainable system willconsist of dual pipeline systems, supplying separately potable and domestic water. The drainage systemwill collect surface run-off of as well was wastewater from households. It will be easy to construct,maintain and repair for the local population since these systems are already present in Yangon. The
34 5. Evaluation
gravity sewage system is much easier to implement than the vacuum system of the environmentalalternative and can therefore be installed by local laborers, promoting more equality.
5.1.4. Focal pointsAfter evaluating the requirements, three main focal points were identified. They are, the harvesting ofrainwater, storage in reservoirs, and the dual pipeline system for the water supply and collection. Boththe environmental and social sustainable alternative score very high in the requirement evaluation andthis is in part due to the fact that rainwater will be used as a main source to produce drinking water. Itshould be noted, however, that this source should be paired with a high capacity storage system. Theseparation of pipes came out as the best solution from the morphological design for all of the differentalternatives and therefore this should also be a focal point. It is expected that these focal points willallow for the most innovative solutions to be designed and will therefore be discussed in a workshopwith local experts.
5.2. Expert evaluationA workshop was organized on 28 September 2017 to get valuable input about, among others, the focalpoints that were chosen and described in the previous section. The participants of the workshop weredistinguished guests from YCDC, alumni from NEPS, NWRC and the TU Delft, students from YTU andMMU, and local experts from YEP. The full attendance list and the setup of the workshop are presentedin Appendix F,section F.2. In this section, a summary of the most relevant outcomes of the workshopis provided.
The participants agreed that rainwater harvesting is one of the solutions which has the smallesteffect on the water cycle. However, the harvesting of rainwater will affect the amount of water whichcan infiltrate into the ground, which in turn can lead to subsidence. Calculations have to be madeto give an educated opinion about this topic. Furthermore, multiple experts indicated that the use ofrainwater as the only source for water supply is probably not enough for all water consumption in Dala.Participants also named the Toe river as a good water source with potentially more capacity.
The separation of the supply system into domestic and drinking water, to reduce the energy con-sumed for treatment, was not directly accepted by everybody. A critical influencing factor was identifiedin the water source quality. Looking to drinking water, it was mentioned that the Toe river is almostpotable and therefore almost no treatment is needed. This means that separating the pipelines wouldnot be convenient anymore. The use of rainwater results in more treatment needed, which could makea separate pipe system effective in reducing energy usage. Regarding the energy costs and reductionsof energy consumption, the participants advised to come up with rough calculations of the energy con-sumption within the total water system. Drinking water treatment might not be the part of the watercycle that consumes most energy. Supply might be a more energy intense part of the system. In thiscase it would not be efficient to split the system since this would increase the energy demand for thesupply. Moreover, the cost of the pipelines have to be accounted. The investment costs are higherfor a separated pipe system with respect to a single system. Therefore, the payback time is expectedto be longer. A more practical issue of separated system is the implementation, since locals are notfamiliar with this concept.
An important issue is the awareness of consumption of water. The proposed idea coming fromthe evaluation of the alternative designs is that this can be improved by making people responsiblefor their own water by storing water on local scale. Inhabitants of Dala can be encouraged withpersonal incentives. YCDC has found that assigning responsibility at community level does not work,because of a lack of water conservation awareness. For example, community ponds are often notwell maintained, meaning drinking water quality will drop. Therefore, assigning personal responsibilityworks better. However, the economic feasibility of local storage is questioned. Besides this, the feelingof responsibility for storing the water might not always be present among inhabitants. To solve this andto create more awareness, education has to be improved on the storage of water as well as on howto save water and efficiently harvest water. Lastly, the laws and regulations about water consumption,water quality and wastewater production were mentioned. These laws are at least 50 years old, fromback when Dala only had a few inhabitants. They are outdated and need to be adapted to the currentconsumers and standards.
To improve the water system an economic option was proposed, namely: make the drinking water
5.3. Synthesis 35
free of charges and set this margin on domestic water to cover the expenses for the total waterconsumption of Dala. In this way, all inhabitants will have access to drinking water. Completely freedrinking water was not the best option according to the experts, since people will use drinking waterfor other purposes to save money. Alternatives were proposed from which the community can earnmoney, for example with tourism, so the water for the poor people can be paid.
5.3. SynthesisAs argued in the previous paragraphs, each of the three alternative designs combines beneficial solu-tions with significant drawbacks. The main objective of the synthesis is to find a suitable combinationof the measures discussed for each alternative in order to come up with an integrated design able tosynthesize the main positive findings and minimize the weaknesses addressed in the three differentdesigns. The focal points presented in subsection 5.1.4 will be used to pivot the rest of the designaround.
As mentioned in subsection 5.1.4, rainwater harvesting will be used as the main source for water. Aspointed out in section 5.2 the amount of rainwater harvested should consider the needed recharge of theGW table in order to minimize the land subsidence. Based on the output of the requirements evaluationand the expert evaluation, the storage of rain will be one of the main challenges. This is because, thevariability of rain throughout the year is large. The main storage system will consist of either a fewlarge reservoirs in which the rain water will be collected or the combination of reservoirs and smallscale storage points. The current reservoirs in Dala are shallow and highly vulnerable to evaporationlosses. It is therefore recommended to make the reservoirs deeper. A rough feasibility study will bedone in subsection 6.1.2 to determine which storage system is the most suitable. An impermeable layerwill be applied to the base of the reservoirs to prevent seepage losses and groundwater salt intrusion.
Since the needed treatment processes are influenced by the quality of the source and the storagemethod (and time), a customized treatment process will be defined once information on the watersource quality characteristics are better defined.
Initially the quality control of the water will be performed by specialized operators using smartphonesand a small quality control device. In the long term, the objective is to make the users perform qualitytests on their own tap water. The local consumers can connect their smartphones to a quality testingdevice to regularly assess the quality of the drinking water in Dala.
The water will be supplied to households by using a dual pipeline system. There will be one pipesystem which supplies only water for domestic purpose and another pipeline which will provide drinkingwater to the different users in Dala. The consumption of the two water types will be monitored andcharged through a pay for usage system.
The collection of wastewater and run-off water will be performed by separate sewage systems.Grey and black wastewater will be collected and treated together. This stream will be independentfrom the run-off drainage system. The run-off stream consists of all the water that is considered toopolluted to be efficiently used to produce drinking water (e.g. street water run-off). This water will betreated and then discharged in the environment.
The roof runoff will be collected, stored and treated together with the water collected in the reser-voirs and uncontaminated green area to produce drinking and domestic water. The implementation ofa complete drainage system as well as the increase of green to the urban landscape will aid in pro-tecting the Dala from pluvial flooding. Adding trees, urban agriculture, urban farming and other greenarea will smoothen the peak flows on the drainage system during heavy rainstorms.
In order to limit the pollution of the water, standards on quality of the discharge will be set andreuse of wastewater will be mandated to any company that exceeds this limit. The wastewater will betreated using combination of an Upstream Anaerobic Sludge Blanked Reactor (UASB) and phytodepura-tion/wetlands. This combination positively impacts the sustainability of the system and provides a goodquality effluent [103]. The UASB reactor has relatively low energy demands, and produces valuable by-products like biogas and sludge. Biogas can be used to reduce the energy cost of the treatment whilethe sludge is suitable for agricultural purposes [103]. The relatively high and constant temperaturesin the Greater Yangon Region allows for the UASB reactor to achieve high efficiency rates. However,UASB technology needs to be operated and implemented by skilled and trained laborers, which arenot readily available in Dala. The wetlands that are proposed in subsection 4.3.3 are able to get ridof excess pathogens and nutrients, that the UASB reactor did not filter out of the wastewater [103].

36 5. Evaluation
Furthermore these wetlands will bring more green area to Dala, giving an aesthetic bonus. They areeasy to construct and maintain. The high temperatures in Dala go well with the wetlands.
Lastly, the treated wastewater and runoff water will be made available for reuse in agriculture. Hereit can be used for irrigation of the crops, making Dala s paddy fields more productive while it can alsoevaporate into the atmosphere and return to the system as rainwater. Here it should be noticed thatwater taken directly from the UASB reactor suits the agricultural use better, due to the nutrients thatare not yet filtered out by the wetlands.
6Final design
From the previous design steps a synthesis of all the functions of the water infrastructure was done.The synthesis was based on three focal points to which the rest of the functions were adjusted. Thisis however not yet a design. Extensive measurements and calculations will be needed to design thefull water infrastructure of Dala and give dimensions of the major parts of the design. However,conducting all these measurements and calculations is not realistic within the time available for thisproject. Therefore, choices had to be made about the level of detail. It was decided that the focalfunctions (resource and harvesting, storage, and supply, as presented in subsection 5.1.4) will beelaborated on in more detail. For the rest of the functions, their chosen methods and how they fit inwith the system will be described more generally.
Feasibility and details of the chosen methods for the focal functions will be assessed and presentedin section 6.1. The design for the additional functions will be presented in section 6.2. A graphicaloverview of the total design will be presented in section 6.3.
6.1. Focal functionsAs was explained before, the chosen solutions for the focal functions as presented in subsection 5.1.4will be designed in more detail. This section presents the considerations that were made while assessingthe feasibility and the considerations which should be made when deciding the design parameters.In Appendix G the calculations that support the assessment and decisions are presented.
6.1.1. Water harvesting and sourceIn this section, solutions that originate from urban planning regulations and harvesting techniques areanalyzed to assess if this source can autonomously provide enough water for the future Dala area.In Appendix G calculations on the potential harvested water in Dala shows that this source would beenough to satisfy the predicted water demand for Dala in 2040.Three major forms of rainwater harvesting (RWH) can be identified [39]:
• In situ RWH: collecting the rainfall on the surface where it falls and storing it in the soil. In thispoint the in situ RWH in reservoirs can be included as well.
• External water harvesting: collecting runoff originating from rainfall over a surface elsewhere andstoring it off site.
• Domestic rainwater harvesting (DRHW): collecting runoff water from roofs, streets and courtyardareas by residents.
Storage of in situ rainwater in the soil is hard to implement in the Dala territory due to the saltintrusion in the aquifers, as stated in Appendix E, section E.6. In situ RWH in reservoirs is possible. Sincethis method overlaps with the chosen storage method, this form of RWH is described in subsection 6.1.2.The external and domestic water harvesting can be seen as important potential methods to increasethe water source of the Township. In the following sub-paragraphs calculations to quantify the wateractual harvested by the system are carried out.
37
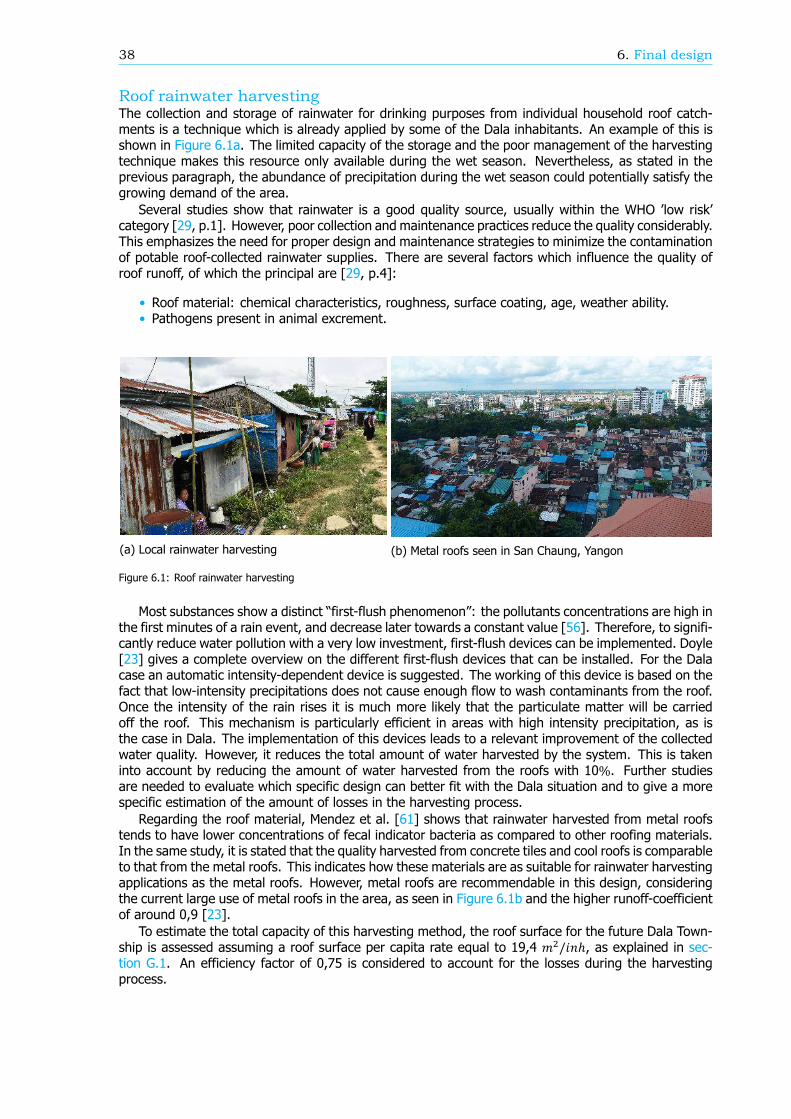
38 6. Final design
Roof rainwater harvestingThe collection and storage of rainwater for drinking purposes from individual household roof catch-ments is a technique which is already applied by some of the Dala inhabitants. An example of this isshown in Figure 6.1a. The limited capacity of the storage and the poor management of the harvestingtechnique makes this resource only available during the wet season. Nevertheless, as stated in theprevious paragraph, the abundance of precipitation during the wet season could potentially satisfy thegrowing demand of the area.
Several studies show that rainwater is a good quality source, usually within the WHO low riskcategory [29, p.1]. However, poor collection and maintenance practices reduce the quality considerably.This emphasizes the need for proper design and maintenance strategies to minimize the contaminationof potable roof-collected rainwater supplies. There are several factors which influence the quality ofroof runoff, of which the principal are [29, p.4]:
• Roof material: chemical characteristics, roughness, surface coating, age, weather ability.• Pathogens present in animal excrement.
(a) Local rainwater harvesting (b) Metal roofs seen in San Chaung, Yangon
Figure 6.1: Roof rainwater harvesting
Most substances show a distinct first-flush phenomenon : the pollutants concentrations are high inthe first minutes of a rain event, and decrease later towards a constant value [56]. Therefore, to signifi-cantly reduce water pollution with a very low investment, first-flush devices can be implemented. Doyle[23] gives a complete overview on the different first-flush devices that can be installed. For the Dalacase an automatic intensity-dependent device is suggested. The working of this device is based on thefact that low-intensity precipitations does not cause enough flow to wash contaminants from the roof.Once the intensity of the rain rises it is much more likely that the particulate matter will be carriedoff the roof. This mechanism is particularly efficient in areas with high intensity precipitation, as isthe case in Dala. The implementation of this devices leads to a relevant improvement of the collectedwater quality. However, it reduces the total amount of water harvested by the system. This is takeninto account by reducing the amount of water harvested from the roofs with 10%. Further studiesare needed to evaluate which specific design can better fit with the Dala situation and to give a morespecific estimation of the amount of losses in the harvesting process.
Regarding the roof material, Mendez et al. [61] shows that rainwater harvested from metal roofstends to have lower concentrations of fecal indicator bacteria as compared to other roofing materials.In the same study, it is stated that the quality harvested from concrete tiles and cool roofs is comparableto that from the metal roofs. This indicates how these materials are as suitable for rainwater harvestingapplications as the metal roofs. However, metal roofs are recommendable in this design, consideringthe current large use of metal roofs in the area, as seen in Figure 6.1b and the higher runoff-coefficientof around 0,9 [23].
To estimate the total capacity of this harvesting method, the roof surface for the future Dala Town-ship is assessed assuming a roof surface per capita rate equal to 19,4 / ℎ, as explained in sec-tion G.1. An efficiency factor of 0,75 is considered to account for the losses during the harvestingprocess.
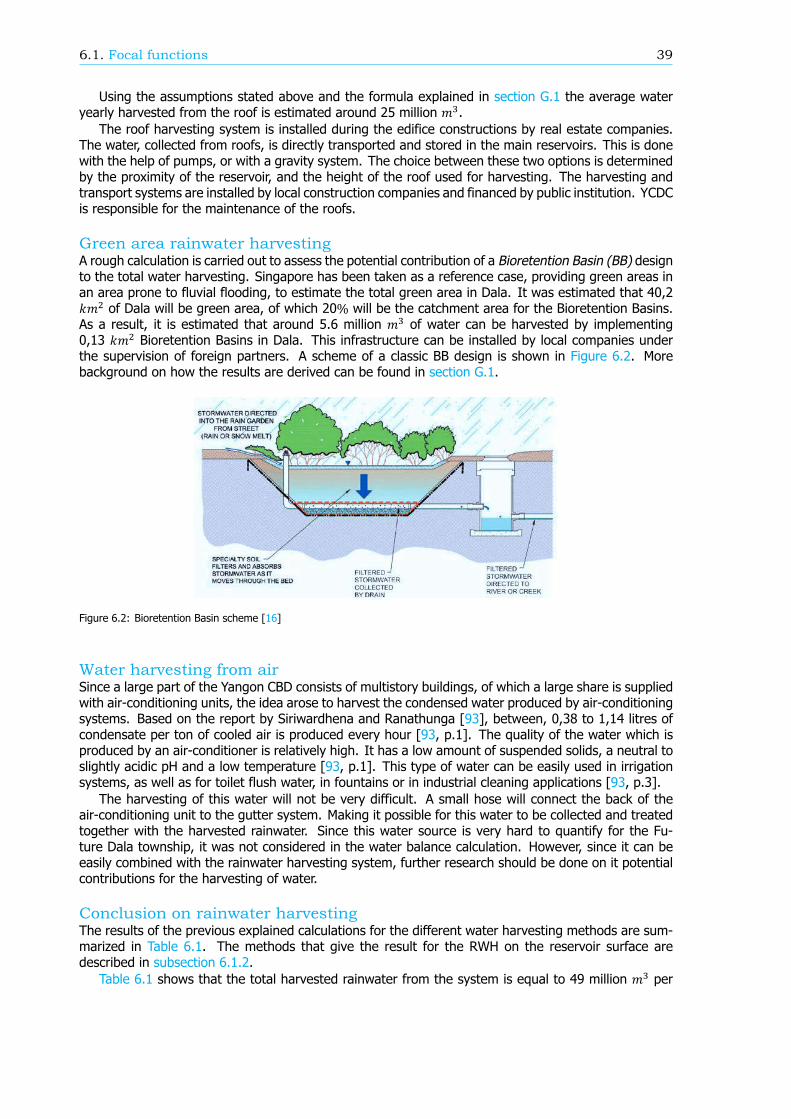
6.1. Focal functions 39
Using the assumptions stated above and the formula explained in section G.1 the average wateryearly harvested from the roof is estimated around 25 million .
The roof harvesting system is installed during the edifice constructions by real estate companies.The water, collected from roofs, is directly transported and stored in the main reservoirs. This is donewith the help of pumps, or with a gravity system. The choice between these two options is determinedby the proximity of the reservoir, and the height of the roof used for harvesting. The harvesting andtransport systems are installed by local construction companies and financed by public institution. YCDCis responsible for the maintenance of the roofs.
Green area rainwater harvestingA rough calculation is carried out to assess the potential contribution of a Bioretention Basin (BB) designto the total water harvesting. Singapore has been taken as a reference case, providing green areas inan area prone to fluvial flooding, to estimate the total green area in Dala. It was estimated that 40,2
of Dala will be green area, of which 20% will be the catchment area for the Bioretention Basins.As a result, it is estimated that around 5.6 million of water can be harvested by implementing0,13 Bioretention Basins in Dala. This infrastructure can be installed by local companies underthe supervision of foreign partners. A scheme of a classic BB design is shown in Figure 6.2. Morebackground on how the results are derived can be found in section G.1.
Figure 6.2: Bioretention Basin scheme [16]
Water harvesting from airSince a large part of the Yangon CBD consists of multistory buildings, of which a large share is suppliedwith air-conditioning units, the idea arose to harvest the condensed water produced by air-conditioningsystems. Based on the report by Siriwardhena and Ranathunga [93], between, 0,38 to 1,14 litres ofcondensate per ton of cooled air is produced every hour [93, p.1]. The quality of the water which isproduced by an air-conditioner is relatively high. It has a low amount of suspended solids, a neutral toslightly acidic pH and a low temperature [93, p.1]. This type of water can be easily used in irrigationsystems, as well as for toilet flush water, in fountains or in industrial cleaning applications [93, p.3].
The harvesting of this water will not be very difficult. A small hose will connect the back of theair-conditioning unit to the gutter system. Making it possible for this water to be collected and treatedtogether with the harvested rainwater. Since this water source is very hard to quantify for the Fu-ture Dala township, it was not considered in the water balance calculation. However, since it can beeasily combined with the rainwater harvesting system, further research should be done on it potentialcontributions for the harvesting of water.
Conclusion on rainwater harvestingThe results of the previous explained calculations for the different water harvesting methods are sum-marized in Table 6.1. The methods that give the result for the RWH on the reservoir surface aredescribed in subsection 6.1.2.
Table 6.1 shows that the total harvested rainwater from the system is equal to 49 million per
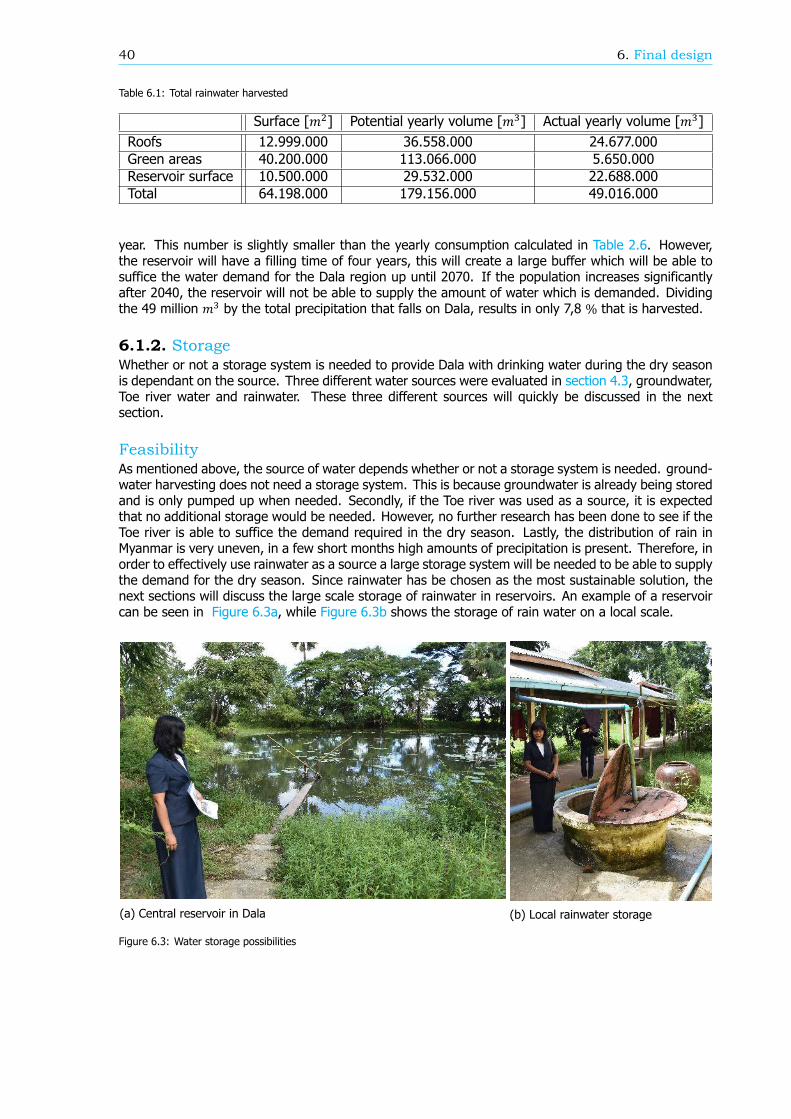
40 6. Final design
Table 6.1: Total rainwater harvested
Surface [ ] Potential yearly volume [ ] Actual yearly volume [ ]Roofs 12.999.000 36.558.000 24.677.000Green areas 40.200.000 113.066.000 5.650.000Reservoir surface 10.500.000 29.532.000 22.688.000Total 64.198.000 179.156.000 49.016.000
year. This number is slightly smaller than the yearly consumption calculated in Table 2.6. However,the reservoir will have a filling time of four years, this will create a large buffer which will be able tosuffice the water demand for the Dala region up until 2070. If the population increases significantlyafter 2040, the reservoir will not be able to supply the amount of water which is demanded. Dividingthe 49 million by the total precipitation that falls on Dala, results in only 7,8 % that is harvested.
6.1.2. StorageWhether or not a storage system is needed to provide Dala with drinking water during the dry seasonis dependant on the source. Three different water sources were evaluated in section 4.3, groundwater,Toe river water and rainwater. These three different sources will quickly be discussed in the nextsection.
FeasibilityAs mentioned above, the source of water depends whether or not a storage system is needed. ground-water harvesting does not need a storage system. This is because groundwater is already being storedand is only pumped up when needed. Secondly, if the Toe river was used as a source, it is expectedthat no additional storage would be needed. However, no further research has been done to see if theToe river is able to suffice the demand required in the dry season. Lastly, the distribution of rain inMyanmar is very uneven, in a few short months high amounts of precipitation is present. Therefore, inorder to effectively use rainwater as a source a large storage system will be needed to be able to supplythe demand for the dry season. Since rainwater has be chosen as the most sustainable solution, thenext sections will discuss the large scale storage of rainwater in reservoirs. An example of a reservoircan be seen in Figure 6.3a, while Figure 6.3b shows the storage of rain water on a local scale.
(a) Central reservoir in Dala (b) Local rainwater storage
Figure 6.3: Water storage possibilities
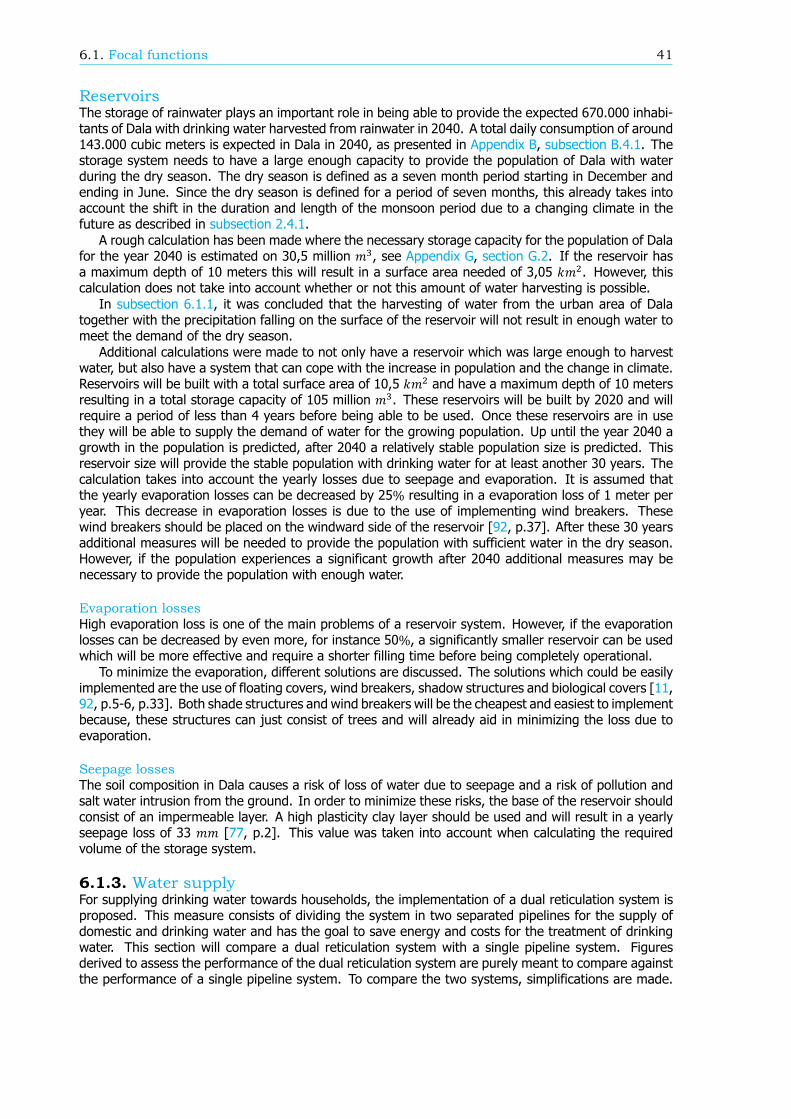
6.1. Focal functions 41
ReservoirsThe storage of rainwater plays an important role in being able to provide the expected 670.000 inhabi-tants of Dala with drinking water harvested from rainwater in 2040. A total daily consumption of around143.000 cubic meters is expected in Dala in 2040, as presented in Appendix B, subsection B.4.1. Thestorage system needs to have a large enough capacity to provide the population of Dala with waterduring the dry season. The dry season is defined as a seven month period starting in December andending in June. Since the dry season is defined for a period of seven months, this already takes intoaccount the shift in the duration and length of the monsoon period due to a changing climate in thefuture as described in subsection 2.4.1.
A rough calculation has been made where the necessary storage capacity for the population of Dalafor the year 2040 is estimated on 30,5 million , see Appendix G, section G.2. If the reservoir hasa maximum depth of 10 meters this will result in a surface area needed of 3,05 . However, thiscalculation does not take into account whether or not this amount of water harvesting is possible.
In subsection 6.1.1, it was concluded that the harvesting of water from the urban area of Dalatogether with the precipitation falling on the surface of the reservoir will not result in enough water tomeet the demand of the dry season.
Additional calculations were made to not only have a reservoir which was large enough to harvestwater, but also have a system that can cope with the increase in population and the change in climate.Reservoirs will be built with a total surface area of 10,5 and have a maximum depth of 10 metersresulting in a total storage capacity of 105 million . These reservoirs will be built by 2020 and willrequire a period of less than 4 years before being able to be used. Once these reservoirs are in usethey will be able to supply the demand of water for the growing population. Up until the year 2040 agrowth in the population is predicted, after 2040 a relatively stable population size is predicted. Thisreservoir size will provide the stable population with drinking water for at least another 30 years. Thecalculation takes into account the yearly losses due to seepage and evaporation. It is assumed thatthe yearly evaporation losses can be decreased by 25% resulting in a evaporation loss of 1 meter peryear. This decrease in evaporation losses is due to the use of implementing wind breakers. Thesewind breakers should be placed on the windward side of the reservoir [92, p.37]. After these 30 yearsadditional measures will be needed to provide the population with sufficient water in the dry season.However, if the population experiences a significant growth after 2040 additional measures may benecessary to provide the population with enough water.
Evaporation lossesHigh evaporation loss is one of the main problems of a reservoir system. However, if the evaporationlosses can be decreased by even more, for instance 50%, a significantly smaller reservoir can be usedwhich will be more effective and require a shorter filling time before being completely operational.
To minimize the evaporation, different solutions are discussed. The solutions which could be easilyimplemented are the use of floating covers, wind breakers, shadow structures and biological covers [11,92, p.5-6, p.33]. Both shade structures and wind breakers will be the cheapest and easiest to implementbecause, these structures can just consist of trees and will already aid in minimizing the loss due toevaporation.
Seepage lossesThe soil composition in Dala causes a risk of loss of water due to seepage and a risk of pollution andsalt water intrusion from the ground. In order to minimize these risks, the base of the reservoir shouldconsist of an impermeable layer. A high plasticity clay layer should be used and will result in a yearlyseepage loss of 33 [77, p.2]. This value was taken into account when calculating the requiredvolume of the storage system.
6.1.3. Water supplyFor supplying drinking water towards households, the implementation of a dual reticulation system isproposed. This measure consists of dividing the system in two separated pipelines for the supply ofdomestic and drinking water and has the goal to save energy and costs for the treatment of drinkingwater. This section will compare a dual reticulation system with a single pipeline system. Figuresderived to assess the performance of the dual reticulation system are purely meant to compare againstthe performance of a single pipeline system. To compare the two systems, simplifications are made.
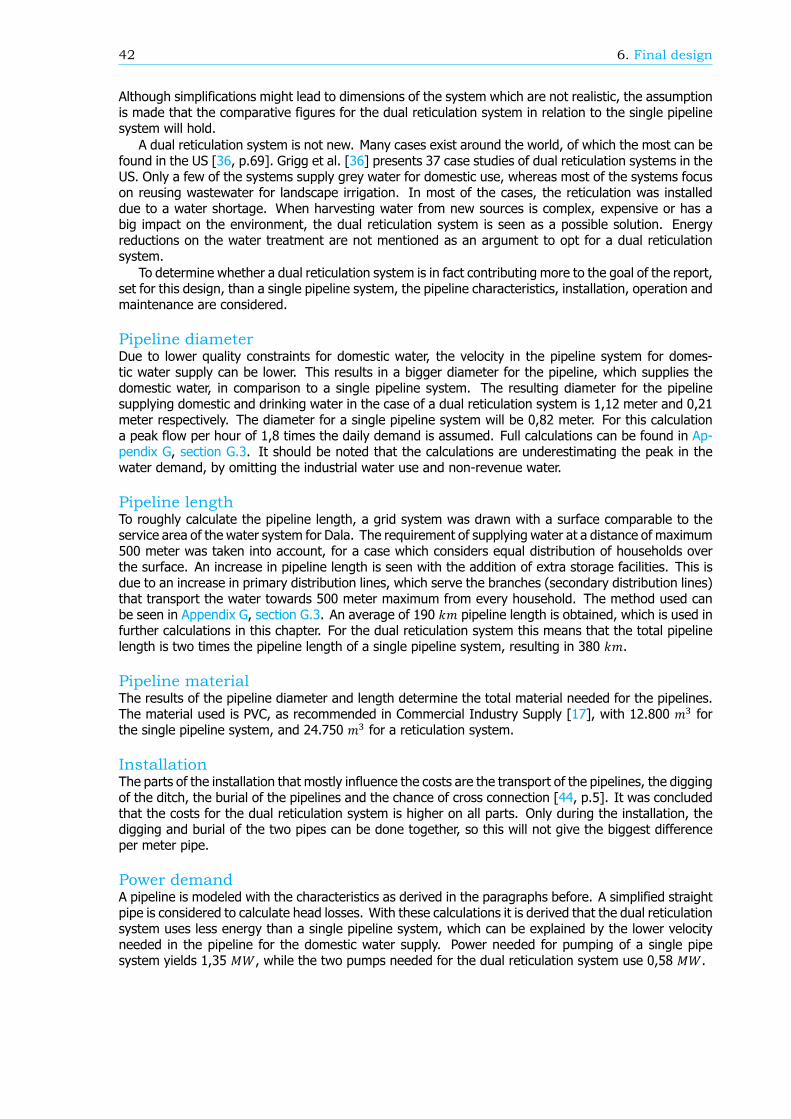
42 6. Final design
Although simplifications might lead to dimensions of the system which are not realistic, the assumptionis made that the comparative figures for the dual reticulation system in relation to the single pipelinesystem will hold.
A dual reticulation system is not new. Many cases exist around the world, of which the most can befound in the US [36, p.69]. Grigg et al. [36] presents 37 case studies of dual reticulation systems in theUS. Only a few of the systems supply grey water for domestic use, whereas most of the systems focuson reusing wastewater for landscape irrigation. In most of the cases, the reticulation was installeddue to a water shortage. When harvesting water from new sources is complex, expensive or has abig impact on the environment, the dual reticulation system is seen as a possible solution. Energyreductions on the water treatment are not mentioned as an argument to opt for a dual reticulationsystem.
To determine whether a dual reticulation system is in fact contributing more to the goal of the report,set for this design, than a single pipeline system, the pipeline characteristics, installation, operation andmaintenance are considered.
Pipeline diameterDue to lower quality constraints for domestic water, the velocity in the pipeline system for domes-tic water supply can be lower. This results in a bigger diameter for the pipeline, which supplies thedomestic water, in comparison to a single pipeline system. The resulting diameter for the pipelinesupplying domestic and drinking water in the case of a dual reticulation system is 1,12 meter and 0,21meter respectively. The diameter for a single pipeline system will be 0,82 meter. For this calculationa peak flow per hour of 1,8 times the daily demand is assumed. Full calculations can be found in Ap-pendix G, section G.3. It should be noted that the calculations are underestimating the peak in thewater demand, by omitting the industrial water use and non-revenue water.
Pipeline lengthTo roughly calculate the pipeline length, a grid system was drawn with a surface comparable to theservice area of the water system for Dala. The requirement of supplying water at a distance of maximum500 meter was taken into account, for a case which considers equal distribution of households overthe surface. An increase in pipeline length is seen with the addition of extra storage facilities. This isdue to an increase in primary distribution lines, which serve the branches (secondary distribution lines)that transport the water towards 500 meter maximum from every household. The method used canbe seen in Appendix G, section G.3. An average of 190 pipeline length is obtained, which is used infurther calculations in this chapter. For the dual reticulation system this means that the total pipelinelength is two times the pipeline length of a single pipeline system, resulting in 380 .
Pipeline materialThe results of the pipeline diameter and length determine the total material needed for the pipelines.The material used is PVC, as recommended in Commercial Industry Supply [17], with 12.800 forthe single pipeline system, and 24.750 for a reticulation system.
InstallationThe parts of the installation that mostly influence the costs are the transport of the pipelines, the diggingof the ditch, the burial of the pipelines and the chance of cross connection [44, p.5]. It was concludedthat the costs for the dual reticulation system is higher on all parts. Only during the installation, thedigging and burial of the two pipes can be done together, so this will not give the biggest differenceper meter pipe.
Power demandA pipeline is modeled with the characteristics as derived in the paragraphs before. A simplified straightpipe is considered to calculate head losses. With these calculations it is derived that the dual reticulationsystem uses less energy than a single pipeline system, which can be explained by the lower velocityneeded in the pipeline for the domestic water supply. Power needed for pumping of a single pipesystem yields 1,35 , while the two pumps needed for the dual reticulation system use 0,58 .
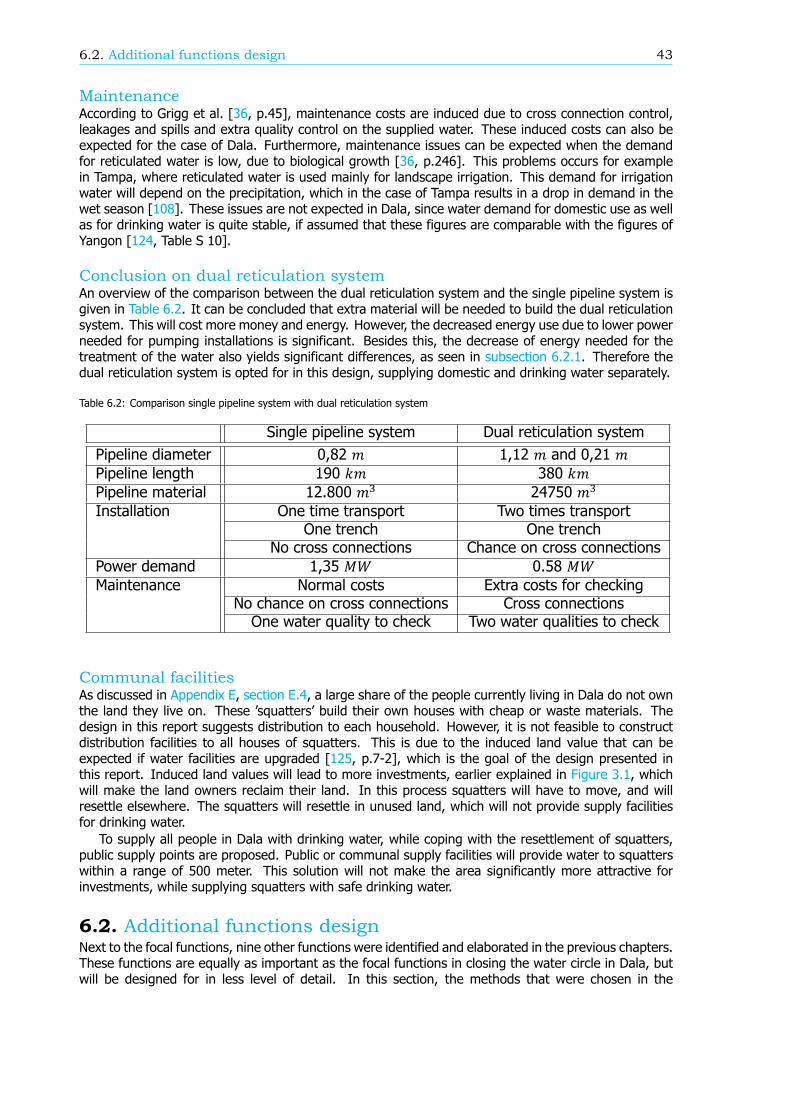
6.2. Additional functions design 43
MaintenanceAccording to Grigg et al. [36, p.45], maintenance costs are induced due to cross connection control,leakages and spills and extra quality control on the supplied water. These induced costs can also beexpected for the case of Dala. Furthermore, maintenance issues can be expected when the demandfor reticulated water is low, due to biological growth [36, p.246]. This problems occurs for examplein Tampa, where reticulated water is used mainly for landscape irrigation. This demand for irrigationwater will depend on the precipitation, which in the case of Tampa results in a drop in demand in thewet season [108]. These issues are not expected in Dala, since water demand for domestic use as wellas for drinking water is quite stable, if assumed that these figures are comparable with the figures ofYangon [124, Table S 10].
Conclusion on dual reticulation systemAn overview of the comparison between the dual reticulation system and the single pipeline system isgiven in Table 6.2. It can be concluded that extra material will be needed to build the dual reticulationsystem. This will cost more money and energy. However, the decreased energy use due to lower powerneeded for pumping installations is significant. Besides this, the decrease of energy needed for thetreatment of the water also yields significant differences, as seen in subsection 6.2.1. Therefore thedual reticulation system is opted for in this design, supplying domestic and drinking water separately.
Table 6.2: Comparison single pipeline system with dual reticulation system
Single pipeline system Dual reticulation systemPipeline diameter 0,82 1,12 and 0,21Pipeline length 190 380Pipeline material 12.800 24750Installation One time transport Two times transport
One trench One trenchNo cross connections Chance on cross connections
Power demand 1,35 0.58 Maintenance Normal costs Extra costs for checking
No chance on cross connections Cross connectionsOne water quality to check Two water qualities to check
Communal facilitiesAs discussed in Appendix E, section E.4, a large share of the people currently living in Dala do not ownthe land they live on. These squatters build their own houses with cheap or waste materials. Thedesign in this report suggests distribution to each household. However, it is not feasible to constructdistribution facilities to all houses of squatters. This is due to the induced land value that can beexpected if water facilities are upgraded [125, p.7-2], which is the goal of the design presented inthis report. Induced land values will lead to more investments, earlier explained in Figure 3.1, whichwill make the land owners reclaim their land. In this process squatters will have to move, and willresettle elsewhere. The squatters will resettle in unused land, which will not provide supply facilitiesfor drinking water.
To supply all people in Dala with drinking water, while coping with the resettlement of squatters,public supply points are proposed. Public or communal supply facilities will provide water to squatterswithin a range of 500 meter. This solution will not make the area significantly more attractive forinvestments, while supplying squatters with safe drinking water.
6.2. Additional functions designNext to the focal functions, nine other functions were identified and elaborated in the previous chapters.These functions are equally as important as the focal functions in closing the water circle in Dala, butwill be designed for in less level of detail. In this section, the methods that were chosen in the
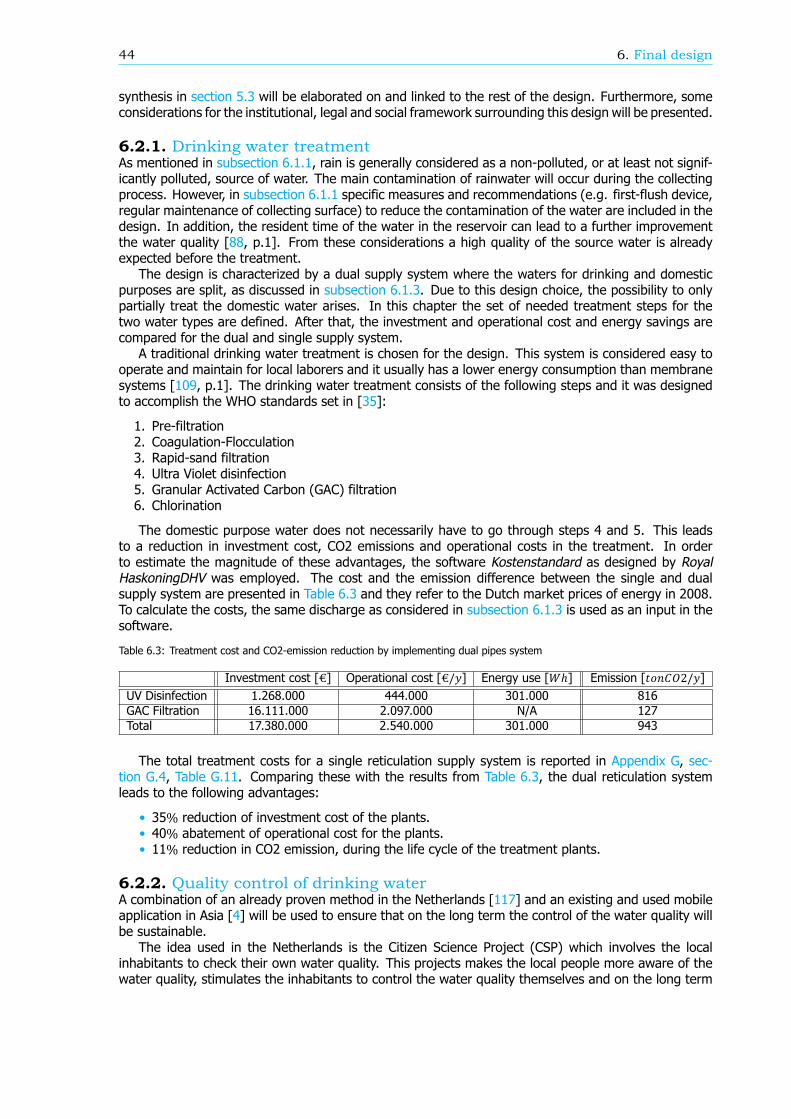
44 6. Final design
synthesis in section 5.3 will be elaborated on and linked to the rest of the design. Furthermore, someconsiderations for the institutional, legal and social framework surrounding this design will be presented.
6.2.1. Drinking water treatmentAs mentioned in subsection 6.1.1, rain is generally considered as a non-polluted, or at least not signif-icantly polluted, source of water. The main contamination of rainwater will occur during the collectingprocess. However, in subsection 6.1.1 specific measures and recommendations (e.g. first-flush device,regular maintenance of collecting surface) to reduce the contamination of the water are included in thedesign. In addition, the resident time of the water in the reservoir can lead to a further improvementthe water quality [88, p.1]. From these considerations a high quality of the source water is alreadyexpected before the treatment.
The design is characterized by a dual supply system where the waters for drinking and domesticpurposes are split, as discussed in subsection 6.1.3. Due to this design choice, the possibility to onlypartially treat the domestic water arises. In this chapter the set of needed treatment steps for thetwo water types are defined. After that, the investment and operational cost and energy savings arecompared for the dual and single supply system.
A traditional drinking water treatment is chosen for the design. This system is considered easy tooperate and maintain for local laborers and it usually has a lower energy consumption than membranesystems [109, p.1]. The drinking water treatment consists of the following steps and it was designedto accomplish the WHO standards set in [35]:
1. Pre-filtration2. Coagulation-Flocculation3. Rapid-sand filtration4. Ultra Violet disinfection5. Granular Activated Carbon (GAC) filtration6. Chlorination
The domestic purpose water does not necessarily have to go through steps 4 and 5. This leadsto a reduction in investment cost, CO2 emissions and operational costs in the treatment. In orderto estimate the magnitude of these advantages, the software Kostenstandard as designed by RoyalHaskoningDHV was employed. The cost and the emission difference between the single and dualsupply system are presented in Table 6.3 and they refer to the Dutch market prices of energy in 2008.To calculate the costs, the same discharge as considered in subsection 6.1.3 is used as an input in thesoftware.
Table 6.3: Treatment cost and CO2-emission reduction by implementing dual pipes system
Investment cost [€] Operational cost [€/] Energy use [ℎ] Emission [ 2/]UV Disinfection 1.268.000 444.000 301.000 816GAC Filtration 16.111.000 2.097.000 N/A 127Total 17.380.000 2.540.000 301.000 943
The total treatment costs for a single reticulation supply system is reported in Appendix G, sec-tion G.4, Table G.11. Comparing these with the results from Table 6.3, the dual reticulation systemleads to the following advantages:
• 35% reduction of investment cost of the plants.• 40% abatement of operational cost for the plants.• 11% reduction in CO2 emission, during the life cycle of the treatment plants.
6.2.2. Quality control of drinking waterA combination of an already proven method in the Netherlands [117] and an existing and used mobileapplication in Asia [4] will be used to ensure that on the long term the control of the water quality willbe sustainable.
The idea used in the Netherlands is the Citizen Science Project (CSP) which involves the localinhabitants to check their own water quality. This projects makes the local people more aware of thewater quality, stimulates the inhabitants to control the water quality themselves and on the long term
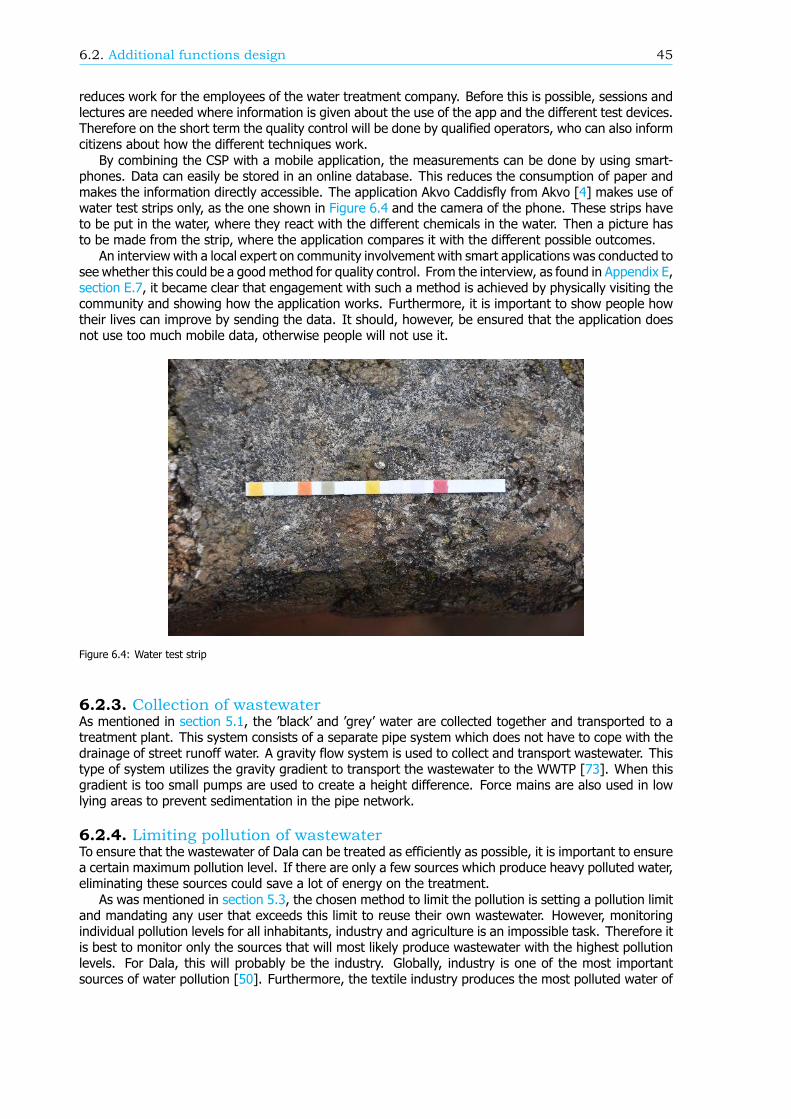
6.2. Additional functions design 45
reduces work for the employees of the water treatment company. Before this is possible, sessions andlectures are needed where information is given about the use of the app and the different test devices.Therefore on the short term the quality control will be done by qualified operators, who can also informcitizens about how the different techniques work.
By combining the CSP with a mobile application, the measurements can be done by using smart-phones. Data can easily be stored in an online database. This reduces the consumption of paper andmakes the information directly accessible. The application Akvo Caddisfly from Akvo [4] makes use ofwater test strips only, as the one shown in Figure 6.4 and the camera of the phone. These strips haveto be put in the water, where they react with the different chemicals in the water. Then a picture hasto be made from the strip, where the application compares it with the different possible outcomes.
An interview with a local expert on community involvement with smart applications was conducted tosee whether this could be a good method for quality control. From the interview, as found in Appendix E,section E.7, it became clear that engagement with such a method is achieved by physically visiting thecommunity and showing how the application works. Furthermore, it is important to show people howtheir lives can improve by sending the data. It should, however, be ensured that the application doesnot use too much mobile data, otherwise people will not use it.
Figure 6.4: Water test strip
6.2.3. Collection of wastewaterAs mentioned in section 5.1, the black and grey water are collected together and transported to atreatment plant. This system consists of a separate pipe system which does not have to cope with thedrainage of street runoff water. A gravity flow system is used to collect and transport wastewater. Thistype of system utilizes the gravity gradient to transport the wastewater to the WWTP [73]. When thisgradient is too small pumps are used to create a height difference. Force mains are also used in lowlying areas to prevent sedimentation in the pipe network.
6.2.4. Limiting pollution of wastewaterTo ensure that the wastewater of Dala can be treated as efficiently as possible, it is important to ensurea certain maximum pollution level. If there are only a few sources which produce heavy polluted water,eliminating these sources could save a lot of energy on the treatment.
As was mentioned in section 5.3, the chosen method to limit the pollution is setting a pollution limitand mandating any user that exceeds this limit to reuse their own wastewater. However, monitoringindividual pollution levels for all inhabitants, industry and agriculture is an impossible task. Therefore itis best to monitor only the sources that will most likely produce wastewater with the highest pollutionlevels. For Dala, this will probably be the industry. Globally, industry is one of the most importantsources of water pollution [50]. Furthermore, the textile industry produces the most polluted water of
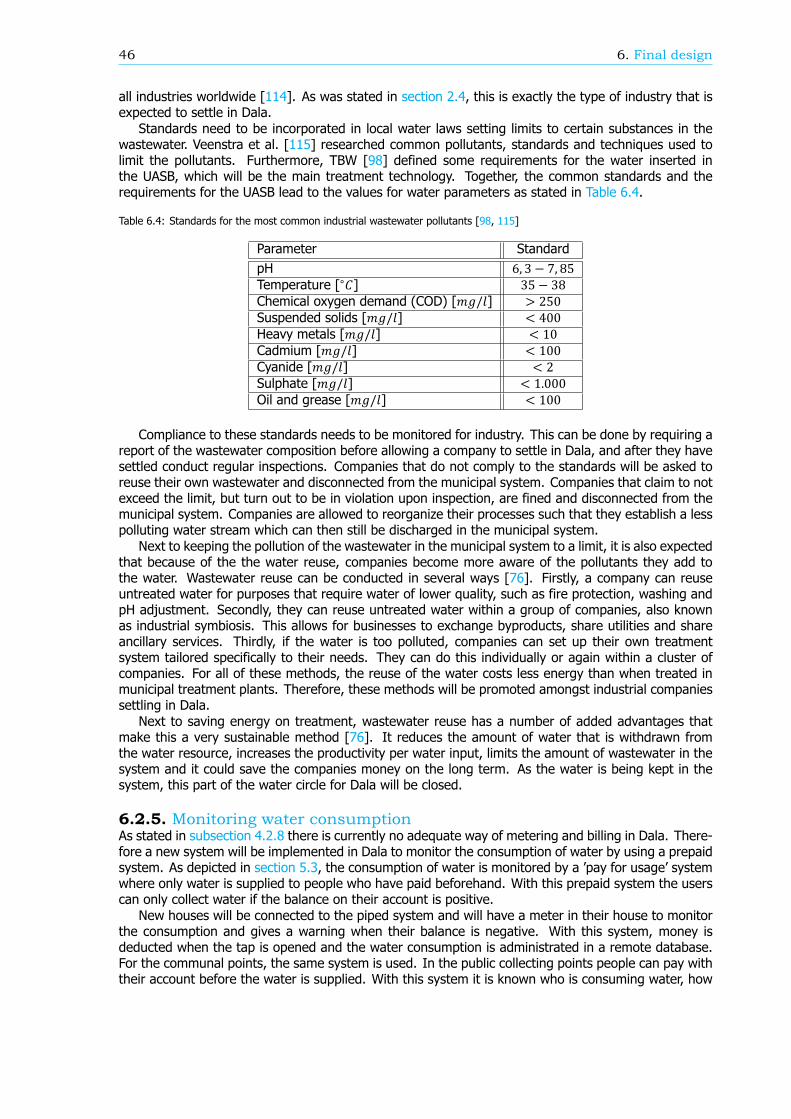
46 6. Final design
all industries worldwide [114]. As was stated in section 2.4, this is exactly the type of industry that isexpected to settle in Dala.
Standards need to be incorporated in local water laws setting limits to certain substances in thewastewater. Veenstra et al. [115] researched common pollutants, standards and techniques used tolimit the pollutants. Furthermore, TBW [98] defined some requirements for the water inserted inthe UASB, which will be the main treatment technology. Together, the common standards and therequirements for the UASB lead to the values for water parameters as stated in Table 6.4.
Table 6.4: Standards for the most common industrial wastewater pollutants [98, 115]
Parameter StandardpH 6, 3 − 7, 85Temperature [ ] 35 − 38Chemical oxygen demand (COD) [ / ] > 250Suspended solids [ / ] < 400Heavy metals [ / ] < 10Cadmium [ / ] < 100Cyanide [ / ] < 2Sulphate [ / ] < 1.000Oil and grease [ / ] < 100
Compliance to these standards needs to be monitored for industry. This can be done by requiring areport of the wastewater composition before allowing a company to settle in Dala, and after they havesettled conduct regular inspections. Companies that do not comply to the standards will be asked toreuse their own wastewater and disconnected from the municipal system. Companies that claim to notexceed the limit, but turn out to be in violation upon inspection, are fined and disconnected from themunicipal system. Companies are allowed to reorganize their processes such that they establish a lesspolluting water stream which can then still be discharged in the municipal system.
Next to keeping the pollution of the wastewater in the municipal system to a limit, it is also expectedthat because of the the water reuse, companies become more aware of the pollutants they add tothe water. Wastewater reuse can be conducted in several ways [76]. Firstly, a company can reuseuntreated water for purposes that require water of lower quality, such as fire protection, washing andpH adjustment. Secondly, they can reuse untreated water within a group of companies, also knownas industrial symbiosis. This allows for businesses to exchange byproducts, share utilities and shareancillary services. Thirdly, if the water is too polluted, companies can set up their own treatmentsystem tailored specifically to their needs. They can do this individually or again within a cluster ofcompanies. For all of these methods, the reuse of the water costs less energy than when treated inmunicipal treatment plants. Therefore, these methods will be promoted amongst industrial companiessettling in Dala.
Next to saving energy on treatment, wastewater reuse has a number of added advantages thatmake this a very sustainable method [76]. It reduces the amount of water that is withdrawn fromthe water resource, increases the productivity per water input, limits the amount of wastewater in thesystem and it could save the companies money on the long term. As the water is being kept in thesystem, this part of the water circle for Dala will be closed.
6.2.5. Monitoring water consumptionAs stated in subsection 4.2.8 there is currently no adequate way of metering and billing in Dala. There-fore a new system will be implemented in Dala to monitor the consumption of water by using a prepaidsystem. As depicted in section 5.3, the consumption of water is monitored by a pay for usage systemwhere only water is supplied to people who have paid beforehand. With this prepaid system the userscan only collect water if the balance on their account is positive.
New houses will be connected to the piped system and will have a meter in their house to monitorthe consumption and gives a warning when their balance is negative. With this system, money isdeducted when the tap is opened and the water consumption is administrated in a remote database.For the communal points, the same system is used. In the public collecting points people can pay withtheir account before the water is supplied. With this system it is known who is consuming water, how
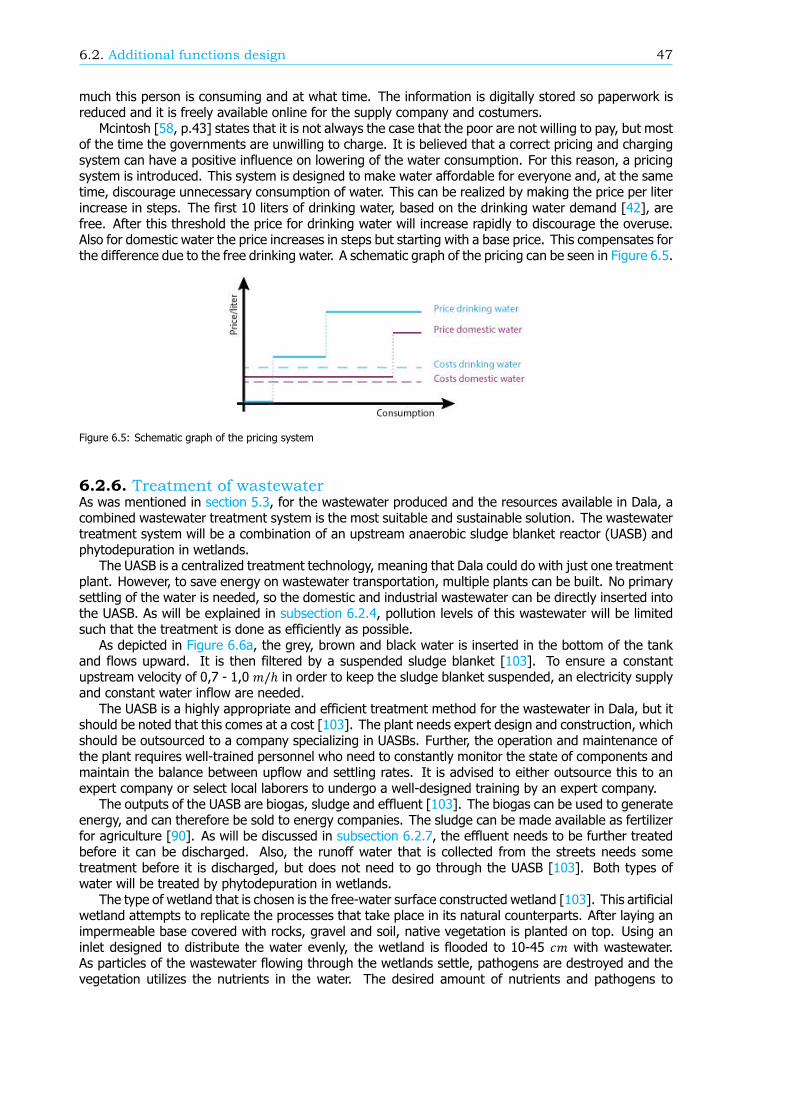
6.2. Additional functions design 47
much this person is consuming and at what time. The information is digitally stored so paperwork isreduced and it is freely available online for the supply company and costumers.
Mcintosh [58, p.43] states that it is not always the case that the poor are not willing to pay, but mostof the time the governments are unwilling to charge. It is believed that a correct pricing and chargingsystem can have a positive influence on lowering of the water consumption. For this reason, a pricingsystem is introduced. This system is designed to make water affordable for everyone and, at the sametime, discourage unnecessary consumption of water. This can be realized by making the price per literincrease in steps. The first 10 liters of drinking water, based on the drinking water demand [42], arefree. After this threshold the price for drinking water will increase rapidly to discourage the overuse.Also for domestic water the price increases in steps but starting with a base price. This compensates forthe difference due to the free drinking water. A schematic graph of the pricing can be seen in Figure 6.5.
Figure 6.5: Schematic graph of the pricing system
6.2.6. Treatment of wastewaterAs was mentioned in section 5.3, for the wastewater produced and the resources available in Dala, acombined wastewater treatment system is the most suitable and sustainable solution. The wastewatertreatment system will be a combination of an upstream anaerobic sludge blanket reactor (UASB) andphytodepuration in wetlands.
The UASB is a centralized treatment technology, meaning that Dala could do with just one treatmentplant. However, to save energy on wastewater transportation, multiple plants can be built. No primarysettling of the water is needed, so the domestic and industrial wastewater can be directly inserted intothe UASB. As will be explained in subsection 6.2.4, pollution levels of this wastewater will be limitedsuch that the treatment is done as efficiently as possible.
As depicted in Figure 6.6a, the grey, brown and black water is inserted in the bottom of the tankand flows upward. It is then filtered by a suspended sludge blanket [103]. To ensure a constantupstream velocity of 0,7 - 1,0 /ℎ in order to keep the sludge blanket suspended, an electricity supplyand constant water inflow are needed.
The UASB is a highly appropriate and efficient treatment method for the wastewater in Dala, but itshould be noted that this comes at a cost [103]. The plant needs expert design and construction, whichshould be outsourced to a company specializing in UASBs. Further, the operation and maintenance ofthe plant requires well-trained personnel who need to constantly monitor the state of components andmaintain the balance between upflow and settling rates. It is advised to either outsource this to anexpert company or select local laborers to undergo a well-designed training by an expert company.
The outputs of the UASB are biogas, sludge and effluent [103]. The biogas can be used to generateenergy, and can therefore be sold to energy companies. The sludge can be made available as fertilizerfor agriculture [90]. As will be discussed in subsection 6.2.7, the effluent needs to be further treatedbefore it can be discharged. Also, the runoff water that is collected from the streets needs sometreatment before it is discharged, but does not need to go through the UASB [103]. Both types ofwater will be treated by phytodepuration in wetlands.
The type of wetland that is chosen is the free-water surface constructed wetland [103]. This artificialwetland attempts to replicate the processes that take place in its natural counterparts. After laying animpermeable base covered with rocks, gravel and soil, native vegetation is planted on top. Using aninlet designed to distribute the water evenly, the wetland is flooded to 10-45 with wastewater.As particles of the wastewater flowing through the wetlands settle, pathogens are destroyed and thevegetation utilizes the nutrients in the water. The desired amount of nutrients and pathogens to
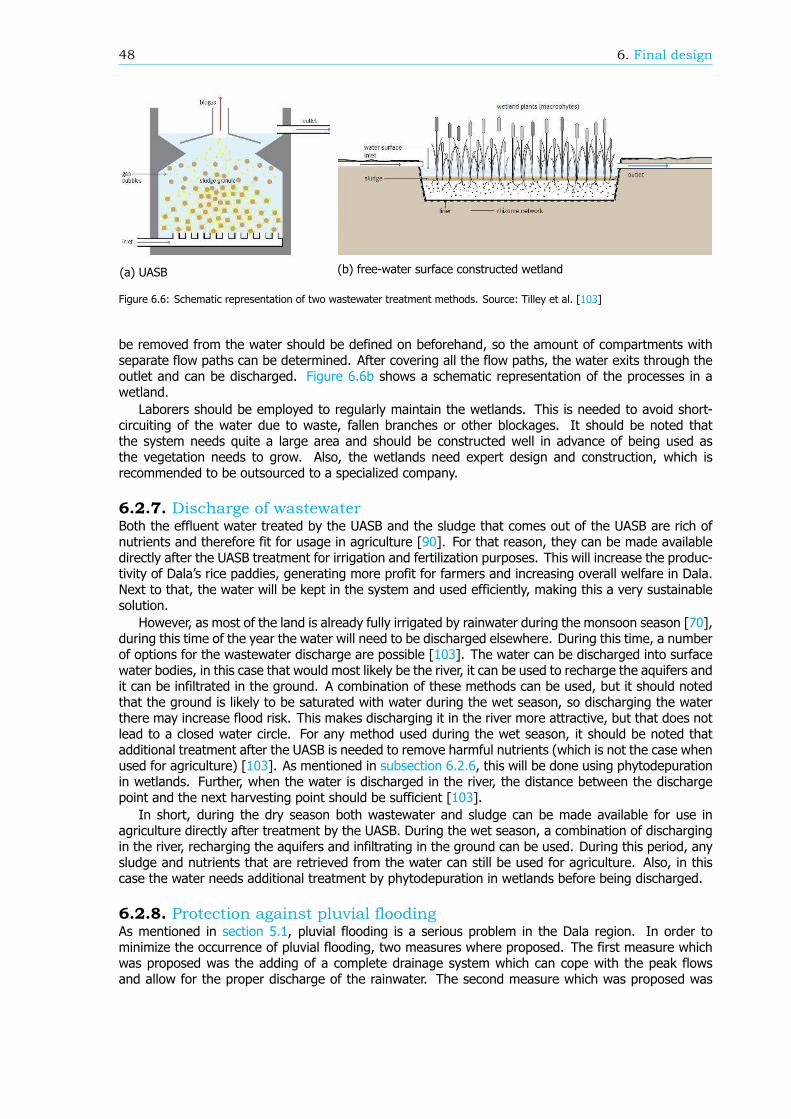
48 6. Final design
(a) UASB (b) free-water surface constructed wetland
Figure 6.6: Schematic representation of two wastewater treatment methods. Source: Tilley et al. [103]
be removed from the water should be defined on beforehand, so the amount of compartments withseparate flow paths can be determined. After covering all the flow paths, the water exits through theoutlet and can be discharged. Figure 6.6b shows a schematic representation of the processes in awetland.
Laborers should be employed to regularly maintain the wetlands. This is needed to avoid short-circuiting of the water due to waste, fallen branches or other blockages. It should be noted thatthe system needs quite a large area and should be constructed well in advance of being used asthe vegetation needs to grow. Also, the wetlands need expert design and construction, which isrecommended to be outsourced to a specialized company.
6.2.7. Discharge of wastewaterBoth the effluent water treated by the UASB and the sludge that comes out of the UASB are rich ofnutrients and therefore fit for usage in agriculture [90]. For that reason, they can be made availabledirectly after the UASB treatment for irrigation and fertilization purposes. This will increase the produc-tivity of Dala s rice paddies, generating more profit for farmers and increasing overall welfare in Dala.Next to that, the water will be kept in the system and used efficiently, making this a very sustainablesolution.
However, as most of the land is already fully irrigated by rainwater during the monsoon season [70],during this time of the year the water will need to be discharged elsewhere. During this time, a numberof options for the wastewater discharge are possible [103]. The water can be discharged into surfacewater bodies, in this case that would most likely be the river, it can be used to recharge the aquifers andit can be infiltrated in the ground. A combination of these methods can be used, but it should notedthat the ground is likely to be saturated with water during the wet season, so discharging the waterthere may increase flood risk. This makes discharging it in the river more attractive, but that does notlead to a closed water circle. For any method used during the wet season, it should be noted thatadditional treatment after the UASB is needed to remove harmful nutrients (which is not the case whenused for agriculture) [103]. As mentioned in subsection 6.2.6, this will be done using phytodepurationin wetlands. Further, when the water is discharged in the river, the distance between the dischargepoint and the next harvesting point should be sufficient [103].
In short, during the dry season both wastewater and sludge can be made available for use inagriculture directly after treatment by the UASB. During the wet season, a combination of dischargingin the river, recharging the aquifers and infiltrating in the ground can be used. During this period, anysludge and nutrients that are retrieved from the water can still be used for agriculture. Also, in thiscase the water needs additional treatment by phytodepuration in wetlands before being discharged.
6.2.8. Protection against pluvial floodingAs mentioned in section 5.1, pluvial flooding is a serious problem in the Dala region. In order tominimize the occurrence of pluvial flooding, two measures where proposed. The first measure whichwas proposed was the adding of a complete drainage system which can cope with the peak flowsand allow for the proper discharge of the rainwater. The second measure which was proposed was
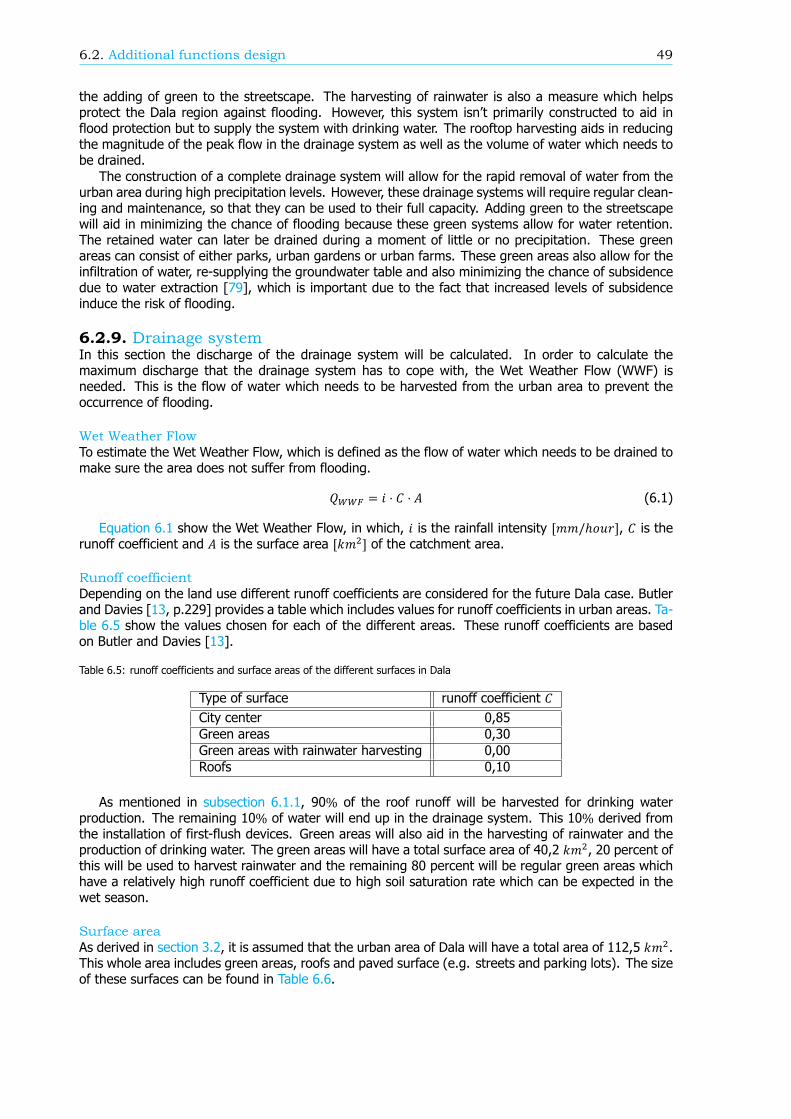
6.2. Additional functions design 49
the adding of green to the streetscape. The harvesting of rainwater is also a measure which helpsprotect the Dala region against flooding. However, this system isn t primarily constructed to aid inflood protection but to supply the system with drinking water. The rooftop harvesting aids in reducingthe magnitude of the peak flow in the drainage system as well as the volume of water which needs tobe drained.
The construction of a complete drainage system will allow for the rapid removal of water from theurban area during high precipitation levels. However, these drainage systems will require regular clean-ing and maintenance, so that they can be used to their full capacity. Adding green to the streetscapewill aid in minimizing the chance of flooding because these green systems allow for water retention.The retained water can later be drained during a moment of little or no precipitation. These greenareas can consist of either parks, urban gardens or urban farms. These green areas also allow for theinfiltration of water, re-supplying the groundwater table and also minimizing the chance of subsidencedue to water extraction [79], which is important due to the fact that increased levels of subsidenceinduce the risk of flooding.
6.2.9. Drainage systemIn this section the discharge of the drainage system will be calculated. In order to calculate themaximum discharge that the drainage system has to cope with, the Wet Weather Flow (WWF) isneeded. This is the flow of water which needs to be harvested from the urban area to prevent theoccurrence of flooding.
Wet Weather FlowTo estimate the Wet Weather Flow, which is defined as the flow of water which needs to be drained tomake sure the area does not suffer from flooding.= ⋅ ⋅ (6.1)
Equation 6.1 show the Wet Weather Flow, in which, is the rainfall intensity [ /ℎ ], is therunoff coefficient and is the surface area [ ] of the catchment area.Runoff coefficientDepending on the land use different runoff coefficients are considered for the future Dala case. Butlerand Davies [13, p.229] provides a table which includes values for runoff coefficients in urban areas. Ta-ble 6.5 show the values chosen for each of the different areas. These runoff coefficients are basedon Butler and Davies [13].
Table 6.5: runoff coefficients and surface areas of the different surfaces in Dala
Type of surface runoff coefficientCity center 0,85Green areas 0,30Green areas with rainwater harvesting 0,00Roofs 0,10
As mentioned in subsection 6.1.1, 90% of the roof runoff will be harvested for drinking waterproduction. The remaining 10% of water will end up in the drainage system. This 10% derived fromthe installation of first-flush devices. Green areas will also aid in the harvesting of rainwater and theproduction of drinking water. The green areas will have a total surface area of 40,2 , 20 percent ofthis will be used to harvest rainwater and the remaining 80 percent will be regular green areas whichhave a relatively high runoff coefficient due to high soil saturation rate which can be expected in thewet season.
Surface areaAs derived in section 3.2, it is assumed that the urban area of Dala will have a total area of 112,5 .This whole area includes green areas, roofs and paved surface (e.g. streets and parking lots). The sizeof these surfaces can be found in Table 6.6.
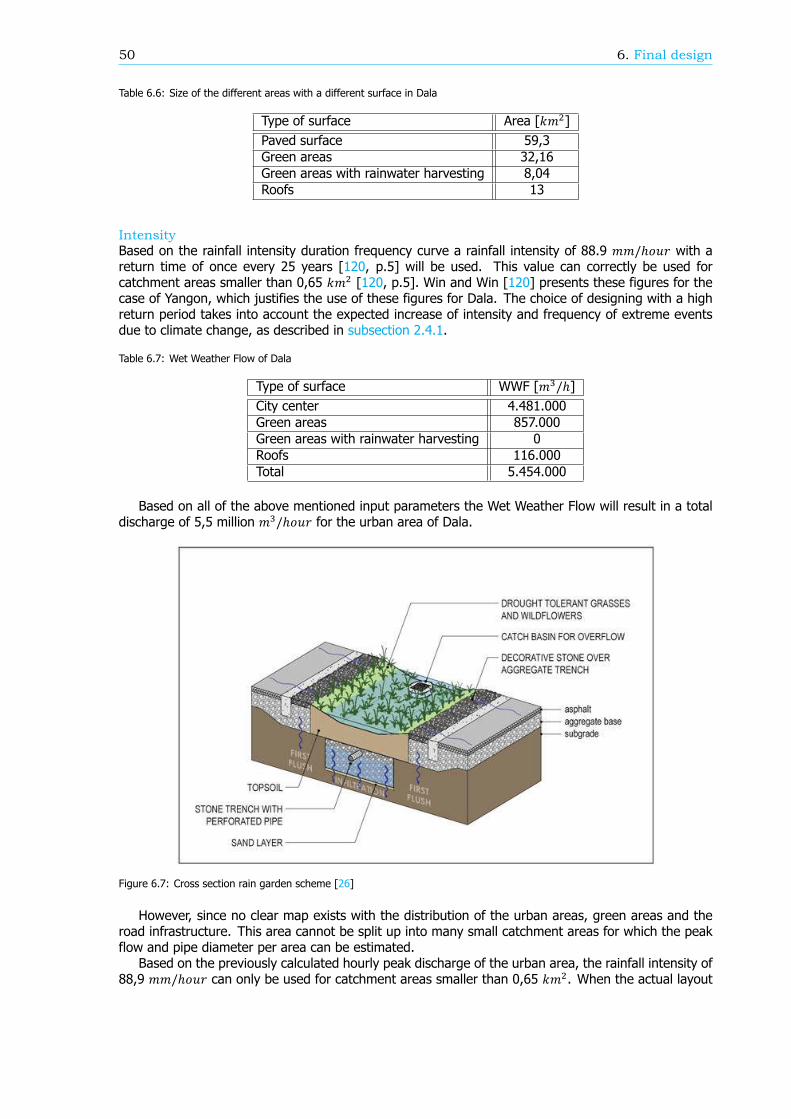
50 6. Final design
Table 6.6: Size of the different areas with a different surface in Dala
Type of surface Area [ ]Paved surface 59,3Green areas 32,16Green areas with rainwater harvesting 8,04Roofs 13
IntensityBased on the rainfall intensity duration frequency curve a rainfall intensity of 88.9 /ℎ with areturn time of once every 25 years [120, p.5] will be used. This value can correctly be used forcatchment areas smaller than 0,65 [120, p.5]. Win and Win [120] presents these figures for thecase of Yangon, which justifies the use of these figures for Dala. The choice of designing with a highreturn period takes into account the expected increase of intensity and frequency of extreme eventsdue to climate change, as described in subsection 2.4.1.
Table 6.7: Wet Weather Flow of Dala
Type of surface WWF [ /ℎ]City center 4.481.000Green areas 857.000Green areas with rainwater harvesting 0Roofs 116.000Total 5.454.000
Based on all of the above mentioned input parameters the Wet Weather Flow will result in a totaldischarge of 5,5 million /ℎ for the urban area of Dala.
Figure 6.7: Cross section rain garden scheme [26]
However, since no clear map exists with the distribution of the urban areas, green areas and theroad infrastructure. This area cannot be split up into many small catchment areas for which the peakflow and pipe diameter per area can be estimated.
Based on the previously calculated hourly peak discharge of the urban area, the rainfall intensity of88,9 /ℎ can only be used for catchment areas smaller than 0,65 . When the actual layout
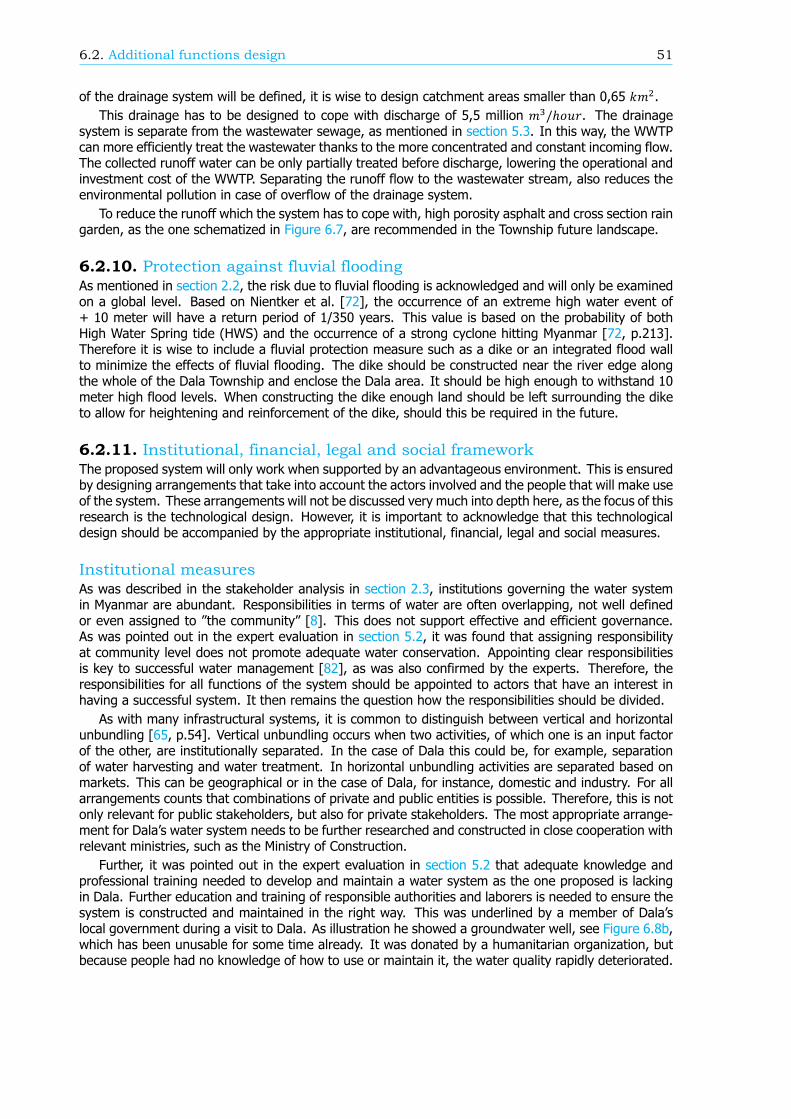
6.2. Additional functions design 51
of the drainage system will be defined, it is wise to design catchment areas smaller than 0,65 .This drainage has to be designed to cope with discharge of 5,5 million /ℎ . The drainage
system is separate from the wastewater sewage, as mentioned in section 5.3. In this way, the WWTPcan more efficiently treat the wastewater thanks to the more concentrated and constant incoming flow.The collected runoff water can be only partially treated before discharge, lowering the operational andinvestment cost of the WWTP. Separating the runoff flow to the wastewater stream, also reduces theenvironmental pollution in case of overflow of the drainage system.
To reduce the runoff which the system has to cope with, high porosity asphalt and cross section raingarden, as the one schematized in Figure 6.7, are recommended in the Township future landscape.
6.2.10. Protection against fluvial floodingAs mentioned in section 2.2, the risk due to fluvial flooding is acknowledged and will only be examinedon a global level. Based on Nientker et al. [72], the occurrence of an extreme high water event of+ 10 meter will have a return period of 1/350 years. This value is based on the probability of bothHigh Water Spring tide (HWS) and the occurrence of a strong cyclone hitting Myanmar [72, p.213].Therefore it is wise to include a fluvial protection measure such as a dike or an integrated flood wallto minimize the effects of fluvial flooding. The dike should be constructed near the river edge alongthe whole of the Dala Township and enclose the Dala area. It should be high enough to withstand 10meter high flood levels. When constructing the dike enough land should be left surrounding the diketo allow for heightening and reinforcement of the dike, should this be required in the future.
6.2.11. Institutional, financial, legal and social frameworkThe proposed system will only work when supported by an advantageous environment. This is ensuredby designing arrangements that take into account the actors involved and the people that will make useof the system. These arrangements will not be discussed very much into depth here, as the focus of thisresearch is the technological design. However, it is important to acknowledge that this technologicaldesign should be accompanied by the appropriate institutional, financial, legal and social measures.
Institutional measuresAs was described in the stakeholder analysis in section 2.3, institutions governing the water systemin Myanmar are abundant. Responsibilities in terms of water are often overlapping, not well definedor even assigned to the community [8]. This does not support effective and efficient governance.As was pointed out in the expert evaluation in section 5.2, it was found that assigning responsibilityat community level does not promote adequate water conservation. Appointing clear responsibilitiesis key to successful water management [82], as was also confirmed by the experts. Therefore, theresponsibilities for all functions of the system should be appointed to actors that have an interest inhaving a successful system. It then remains the question how the responsibilities should be divided.
As with many infrastructural systems, it is common to distinguish between vertical and horizontalunbundling [65, p.54]. Vertical unbundling occurs when two activities, of which one is an input factorof the other, are institutionally separated. In the case of Dala this could be, for example, separationof water harvesting and water treatment. In horizontal unbundling activities are separated based onmarkets. This can be geographical or in the case of Dala, for instance, domestic and industry. For allarrangements counts that combinations of private and public entities is possible. Therefore, this is notonly relevant for public stakeholders, but also for private stakeholders. The most appropriate arrange-ment for Dala s water system needs to be further researched and constructed in close cooperation withrelevant ministries, such as the Ministry of Construction.
Further, it was pointed out in the expert evaluation in section 5.2 that adequate knowledge andprofessional training needed to develop and maintain a water system as the one proposed is lackingin Dala. Further education and training of responsible authorities and laborers is needed to ensure thesystem is constructed and maintained in the right way. This was underlined by a member of Dala slocal government during a visit to Dala. As illustration he showed a groundwater well, see Figure 6.8b,which has been unusable for some time already. It was donated by a humanitarian organization, butbecause people had no knowledge of how to use or maintain it, the water quality rapidly deteriorated.
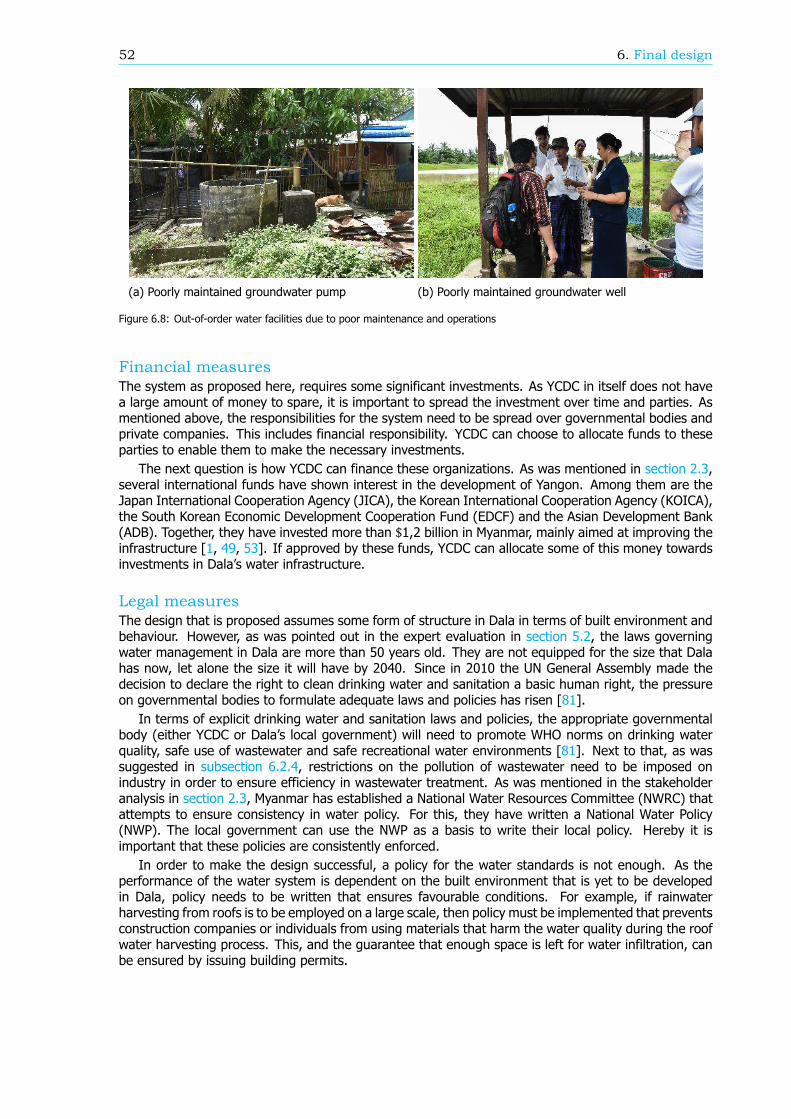
52 6. Final design
(a) Poorly maintained groundwater pump (b) Poorly maintained groundwater well
Figure 6.8: Out-of-order water facilities due to poor maintenance and operations
Financial measuresThe system as proposed here, requires some significant investments. As YCDC in itself does not havea large amount of money to spare, it is important to spread the investment over time and parties. Asmentioned above, the responsibilities for the system need to be spread over governmental bodies andprivate companies. This includes financial responsibility. YCDC can choose to allocate funds to theseparties to enable them to make the necessary investments.
The next question is how YCDC can finance these organizations. As was mentioned in section 2.3,several international funds have shown interest in the development of Yangon. Among them are theJapan International Cooperation Agency (JICA), the Korean International Cooperation Agency (KOICA),the South Korean Economic Development Cooperation Fund (EDCF) and the Asian Development Bank(ADB). Together, they have invested more than $1,2 billion in Myanmar, mainly aimed at improving theinfrastructure [1, 49, 53]. If approved by these funds, YCDC can allocate some of this money towardsinvestments in Dala s water infrastructure.
Legal measuresThe design that is proposed assumes some form of structure in Dala in terms of built environment andbehaviour. However, as was pointed out in the expert evaluation in section 5.2, the laws governingwater management in Dala are more than 50 years old. They are not equipped for the size that Dalahas now, let alone the size it will have by 2040. Since in 2010 the UN General Assembly made thedecision to declare the right to clean drinking water and sanitation a basic human right, the pressureon governmental bodies to formulate adequate laws and policies has risen [81].
In terms of explicit drinking water and sanitation laws and policies, the appropriate governmentalbody (either YCDC or Dala s local government) will need to promote WHO norms on drinking waterquality, safe use of wastewater and safe recreational water environments [81]. Next to that, as wassuggested in subsection 6.2.4, restrictions on the pollution of wastewater need to be imposed onindustry in order to ensure efficiency in wastewater treatment. As was mentioned in the stakeholderanalysis in section 2.3, Myanmar has established a National Water Resources Committee (NWRC) thatattempts to ensure consistency in water policy. For this, they have written a National Water Policy(NWP). The local government can use the NWP as a basis to write their local policy. Hereby it isimportant that these policies are consistently enforced.
In order to make the design successful, a policy for the water standards is not enough. As theperformance of the water system is dependent on the built environment that is yet to be developedin Dala, policy needs to be written that ensures favourable conditions. For example, if rainwaterharvesting from roofs is to be employed on a large scale, then policy must be implemented that preventsconstruction companies or individuals from using materials that harm the water quality during the roofwater harvesting process. This, and the guarantee that enough space is left for water infiltration, canbe ensured by issuing building permits.
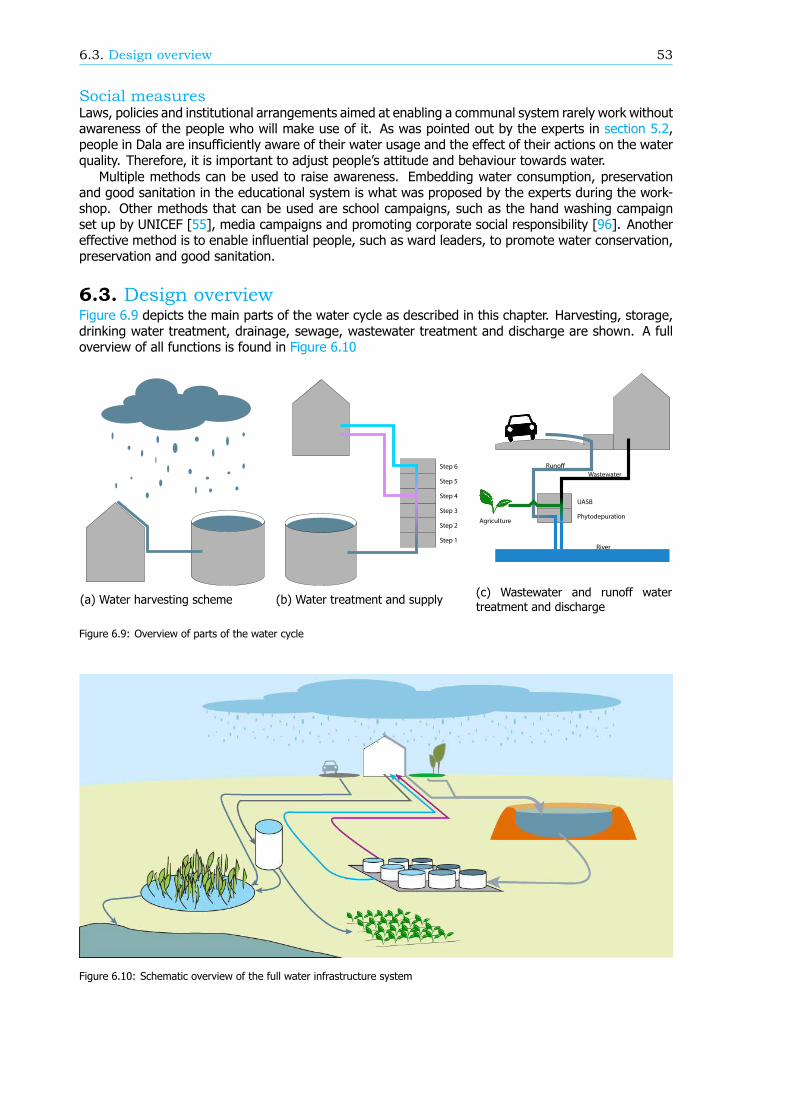
6.3. Design overview 53
Social measuresLaws, policies and institutional arrangements aimed at enabling a communal system rarely work withoutawareness of the people who will make use of it. As was pointed out by the experts in section 5.2,people in Dala are insufficiently aware of their water usage and the effect of their actions on the waterquality. Therefore, it is important to adjust people s attitude and behaviour towards water.
Multiple methods can be used to raise awareness. Embedding water consumption, preservationand good sanitation in the educational system is what was proposed by the experts during the work-shop. Other methods that can be used are school campaigns, such as the hand washing campaignset up by UNICEF [55], media campaigns and promoting corporate social responsibility [96]. Anothereffective method is to enable influential people, such as ward leaders, to promote water conservation,preservation and good sanitation.
6.3. Design overviewFigure 6.9 depicts the main parts of the water cycle as described in this chapter. Harvesting, storage,drinking water treatment, drainage, sewage, wastewater treatment and discharge are shown. A fulloverview of all functions is found in Figure 6.10
(a) Water harvesting scheme
Step 6
Step 5
Step 4
Step 3
Step 2
Step 1
(b) Water treatment and supply
UASB
Phytodepuration
Runo
Wastewater
River
Agriculture
(c) Wastewater and runoff watertreatment and discharge
Figure 6.9: Overview of parts of the water cycle
Figure 6.10: Schematic overview of the full water infrastructure system
54 6. Final design
6.4. Implementation phasesThe above described design is very extensive and above all formulated for a water demand that isexpected in 2040. It is necessary to distinguish a number of comprehensive implementation phasesthat are meant to make the design practicable and gradually build up the system proportionally tothe population and industrial growth. For the design implementation phases, a distinction is madebetween short-term, medium-term and long-term. Short-term is now until 2020, medium-term is 2020until 2025 and long-term is 2025 until 2035. Next to the phases determined for the implementation ofthis design, solutions that are suggested to bridge the gap between supply and demand in the meantime are described. These are however not part of the design that was developed here.
6.4.1. Bridging the gapBefore the designed system is operational, temporary solutions have to be implemented to battle thedrinking water shortage currently faced in Dala. These solutions are not part of this design, and aretherefore not elaborated in this report. The main characteristic of these systems is that they haveto be implementable in a short period to bridge the gap before the completion of the design. Theseshort term solutions are designed as quick fix solutions and should not be implemented as a long termsolution. This is because these solutions are not considered to be sustainable and for this reason thedesigned system should prevent these solutions to become definitive. To supply water for the Dalainhabitants during the dry season small mobile RO plants are implemented. These systems are fedwith the water from the Twante canal (West of Dala s downtown) and groundwater wells and will notbe combined with a pipe supply system, as stated in Appendix E, section E.3 and section E.6. Thismeans that the drinking water is supplied only through collecting points close to each treatment plant.
6.4.2. Short-term: now-2020The first order of business is to get the institutional and legal framework set up. As mentioned in sub-section 6.2.11, setting up the institutional framework is all about assigning responsibilities and providingthe necessary education. This needs to be done on the short term so parties involved can start makingtheir own tactical and operational plans, assessing resources and training personnel. As stated in sub-section 6.2.11, the legal framework deals with water management standards and guidelines. Thisneeds to be established on the short term since industrial and water management companies need tobe aware of the restrictions before they start operating in Dala. Further, on the short term, legal mea-sures should also be written that govern the development of the built environment. Before developersstart buying land and building on the area, it is important that they are aware of the requirements forthe rainwater harvesting and the required green area. These institutional and legal measures can thenbe supplemented with social measures to raise awareness about water consumption among the inhab-itants and industrial companies. This is easy to implement on the short term and is already relevantnow, because there is a large gap to bridge between supply and demand.
As described in subsection 6.2.2 the inhabitants have to be involved in the quality control as soonas possible. This involvement will also result in raised awareness which can be beneficial in reducingwater consumption and waste of water in the future.
As mentioned in subsection 6.1.2 the construction and the completion of the total reservoir playsan important part in allowing the water supply for Dala to be sustainable. This is because, in order forthe rainwater harvesting to be sufficient the reservoir requires a buffer volume. This buffer volume willbe acquired and explained in the next subsection. In this period, rooftop harvesting systems shouldbe implemented as well as the pipe system which is required to transport the harvested water to thereservoir should be constructed.
6.4.3. Medium-term: 2020-2025The volume of water which is needed as a buffer, will require a little less than 4 years to be harvested.This takes into account the yearly increase in volume of water which can be harvested. This yearlyincrease in volume is dependant on the relative growth of the urban area. After four years, the reservoircan be used as a source to provide drinking water. Therefore, the needed infrastructure to allow forthis should also be constructed. This means that the pipe system which supplies the water to thedifferent households should be laid as well as the construction and completion of the drinking waterand wastewater treatment plant.
6.4. Implementation phases 55
A number of parts of the system need trained personnel for operation and maintenance: the drink-ing water treatment facilities, the drainage system, the dual reticulation system, the UASB and thewetlands. For these systems it is best to hire a foreign specialized company to work together withlocal laborers to construct the systems. By working alongside with foreign experts on the constructionand initial operations of the systems, the local laborers become familiar with it and will soon be able tooperate and maintain the systems themselves. The drinking water treatment plant and the wastewatertreatment facilities will need to be constructed between 2020 and 2024 to be fully operative by thetime that the water supply is ready. This means that personnel can also be trained during this periodand be ready to independently run the facilities by 2024. The drainage system and the dual reticulationsystem will be built gradually with the development of real estate. For this system, laborers can alsobe trained between 2020 and 2024 to make them fully able to continue construction, operation andmaintenance by 2024. For all of the above systems, it should be taken into account that it can takesome time from the start of construction until the system is operative. Especially creating the rightconditions in the UASB and growing the vegetation in the wetlands can be time-consuming.
Lastly, in this term public facilities should be constructed such as toilets and water taps. Thesefacilities should be constructed before the drinking water and wastewater systems are implemented.This is because these systems should be connected to these networks and provide the extremely poorpopulation access to these services. For example, if the extremely poor population of Dala is not able toaccess a toilet which is connected to the wastewater network, this waste will be disposed of in anothermanner such as dumping at a specific site. This can result in contamination of the groundwater andsurrounding area.
6.4.4. Long-term: 2025-2035Since rainwater harvesting is partly done in the urban area, the catchment area of rainwater harvestingwill increase with increased urbanization. The expected growth of the urban area of Dala will lead tomore rainwater harvesting from roofs and green space. With this the water harvesting scales with theurban growth.
Treatment facilities for drinking water as well as for wastewater will have to be scaled up as wellwith the growth of population in the area. The location chosen for these facilities should take intoaccount that additional facilities will be placed.
Supply and collection pipelines to newly urbanized areas will be built where necessary. These newbranches will be coupled to the primary supply and collection infrastructure, so digging new trenchesis minimized.

7Verification and validation
The final design described in the previous chapter, has to be verified and validated on several aspects.First of all, the design has to comply with the initial goals of the project. Therefore, it is compared withthe requirements described in section 3.1. Furthermore, the design has to be resilient for differentscenarios, as set up in section 2.4. Another verification is done by looking into the interests andresources of various stakeholders stated in section 2.3. Verification of the requirements, scenarios andstakeholders will be done in section 7.1. In addition, to see if the project is implementable, section 7.2describes the validation with local experts of the final design and its implementation.
7.1. VerificationThe verification is an important step in the design of the total solution. It reflects back on what is saidearlier in chapter 2 and chapter 3 to see whether the design complies to these statements.
7.1.1. Requirement verificationIn section 5.1 a MCA was conducted on the different alternatives with respect to the constraints, thefunctional and the non-functional requirements. In this section, a critical assessment is conducted onthe different requirements.
Functional requirementsEnsure 10% non-revenue waterThe use of a system in which water consumption is closely monitored allows for any discrepanciesbetween production and actual supply to quickly be discovered. This minimizes the amount of revenuelost due to water which has not been accounted for, and it allows for quick discoveries of leaks inthe system. The implementation of a dual reticulation system allows to reduce the minimum flowvelocity, and thus pressure losses, in the domestic water pipeline, as described in subsection 4.2.5. Forthis reason, the average pressure in the pipes will be lower. As a result, less leakages are expectedduring the transport and distribution of water for domestic use when the dual reticulation system isemployed [51, p.9].
Provide drinking water at 500 metersThe pipeline supply system makes it possible to serve water to every Dala inhabitant within 500 meters.However, since a detailed design of the urban area is not yet defined, this requirement can be fullyverified only during the actual construction of the system. This is particularly relevant when communaldistribution points are allocated.
Preserve quality of water sourceThe system does not affect the quality of the water source. Rainwater contamination is prevented bythe YCDC policy which avoids the settle of air polluting industries in the south of Yangon, as explainedin Appendix E, section E.5. The choice of rainwater as principal source prevents the use of other sourceswhich have a bigger impact on the Dala water resources, as explained in subsection 4.2.1. For example,
57
58 7. Verification and validation
excessive extraction of groundwater can eventually lead to salt water intrusion and deterioration ofgroundwater quality.
Preserve capacity of water sourcesOnly 7.8% of the yearly amount of rain falling on Dala is harvested for drinking water purposes, as de-scribed in subsection 6.1.1. This ensures the annual recharge of the groundwater table. Furthermore,the system is designed to reintroduce the used water in the natural water cycle. Wastewater treatmentis included in the design to not impact the quality of the water body that receives the effluent, asmentioned in subsection 6.2.6.
Allow harvesting of resources from wastewaterDuring the treatment of wastewater, by-products are produced. The UASB reactor produces biogas,sludge and water. Biogas can be used as an energy source. The sludge which is produced in the settlingtank can be used as a fertilizer by the local farming population, as mentioned in subsection 6.2.7. Inthe dry season the water which comes out of the UASB reactor can be directly be used for irrigation,because it contains nutrients.
It cannot be said that the harvesting of resources is maximized, since other ways of wastewatertreatment will harvest other resources more efficiently. However, the combination of harvesting sludge,effluent and biogas is quite unique for the UASB facility [103].
Limit pollution of industry wastewaterIndustrial companies are encouraged to reuse their own wastewater. The standards companies haveto comply with the standards that are given in subsection 6.2.4. These standards are based on therequirements to have an efficient UASB treatment system.
The strictness with which the standards are preserved will influence the limit of pollution highly. Ifwastewater is regularly checked on pollution levels, the design as proposed in this report will limit thepollution of industry wastewater.
As little waste of water as possible during consumptionIncreasing the awareness of the local population, with respect to water consumption, helps to mini-mize the waste of water. The use of a pay for usage system reduces the waste of valuable wateras well as makes each person more aware of the amount of water they are consuming/collecting.Furthermore, the reuse of wastewater as promoted for industry in subsection 6.2.4 not only directlyreduces the consumption of resource water, it also generates awareness among companies about theirconsumption.
Non-functional requirementsConsume less energy compared to traditional methodsThe main reason for splitting the pipeline systems for supply and waste-/runoff water was based onthe assumption that it would consume less energy. After rough calculations, it was indeed shown thatduring the supply and treatment, less energy is consumed with respect to a single pipeline system.Implementing separate sewer systems for the collection of wastewater and the collection of runoffwater reduces the energy consumption of wastewater treatment as stated in subsection 6.2.6. Thisalso increases the treatment efficiency and bio-gas production of the UASB reactors.
As safe as possibleImplementing underground pipelines, a closed treatment area and a secured storage area are all de-cisions that reduce the risk of infection of the water. Not choosing for open systems like canals andlimiting pollution reduces the risk of accidents. The promotion of green areas, bioretention basins andrainwater harvesting reduces the risk of pluvial flooding in the urban area as mentioned in section 5.3.
Reduce environmental impact of urbanizationThe use of rainwater as a water source reduces the impact of the water demand rise on the Dalawater resources. Using roof surface for harvesting is even an example of making positive use ofthe urbanization. The treatment of wastewater before reintroducing it into the local environmentminimizes the impact of the water use on the river ecosystem and the groundwater level. Introducingmeasures which reduce the pollution of wastewater, supports the development of environmentallyfriendly activities in the area.
7.1. Verification 59
Climate change resilientIn this report, change in precipitation and temperature, depicted in subsection 2.4.1, are taken intoaccount with respect to climate change. Regarding precipitation, the variability of the monsoon andthe increase in precipitation intensity are considered in the design of the volume of the storage system.The first aspect is covered by designing for a dry season which lasts for 7 months instead of the current6 months. The second aspect is taken into account by designing a drainage system for rainfall data witha higher return period. However, the increase in rates of evaporation due to higher mean temperaturesis not taken into account in the design of the storage.
As little GHG emissions as possibleComponents of the designed system produce GHG emission during fabrication and operation. Choosingfor a dual reticulation system results in more material used for the pipelines. On the other hand, thissolution is expected to have a lower energy consumption, and thus less emission, during operation.It is not certain whether in the long term the lower energy consumption overcomes the GHG emittedfor the material production. Institutional measures promoting the efficient use and reuse of water,leads to a reduction of GHG emissions. Finally, the employment of natural and low energy demandingtreatments, for domestic-, drinking- and wastewater, reduces the overall emissions of the system.
As high mean time to failure as possibleBy making use of proven technologies and providing extensive training, the system can be easily de-ployed and maintained by local laborers. It is expected to reduce the frequency of failure. However,variations in precipitation and unexpected increase of the water demand could threaten the systemcapacity and reliability. Also, the double reticulation system doubles the length of the pipelines, height-ening the probability of failure.
As low mean time to repair as possibleAs mentioned in subsection 6.1.3 the dual reticulation system brings several benefits. However, prob-lems can arise during maintenance and repair due to its complexity. The implementation of thesesystems is done under guidance of foreign expert partners. These companies are also responsible foreducating the local laborers on the new implementation. This measure is included in the design inorder to overcome the lack of knowledge minimizing the time required to repair the system.
Affordable water for residentsThe system makes a distinction between drinking water and domestic water, listed in subsection 6.2.5.The first 10 liters of drinking water are made free for everyone, sufficing in the basic needs for drinkingwater. These free liters are economically compensated by an increased price for using drinking waterover this threshold. With this, drinking water is made affordable for everybody in Dala.
Implementable by local laborersNot all parts of the design can be implemented solely by local laborers, because knowledge in theDala is lacking. However, the entire new system is planned to be implementable by local work-force incooperation with, and under supervision of foreign specialists.
Maintainable by local laborersThe new system will be implemented by local workers. When new techniques are used, the local laborforce will be working under guidance of foreign specialists. The same foreign partners are responsiblefor educating local laborers to operate, maintain and repair the system independently.
Allow flexible implementationParts of the solution allow for flexible implementation while others do not. When implementing thedesign, the first step is to setup an institutional and legal framework. This needs to be done in thebeginning of the implementation so that throughout the development this framework is followed. Thispart of the solution is not flexible. Secondly, the whole storage capacity need to be constructed before2020, which is not flexible. This is because then a buffer can be created so that the reservoirs will beable to satisfy the growing water demand of Dala for a much longer period of time. On the other hand,all of the infrastructure needed to supply the different systems with water, will expand in correlationwith the growth of the population. Therefore, this allows for flexible implementation.
60 7. Verification and validation
Investment spread over time and partiesSince the total surface area of the reservoir needs to be constructed at once, the capital expenditurecan not be spread over time by building the reservoirs in steps. The supply, the collection and thetreatment systems will require lower initial investments because these systems are dependent on thepopulation growth. Therefore the total capacity is not needed in the beginning and the system willexpand over time. As mentioned in section 2.1, foreign funds have been granted to water projectsin and around Dala. Similar funds will aid in minimizing the initial investment costs of the responsibleparties.
7.1.2. Scenario verificationThe final design is based on a scenario with high population growth and moderate industrial activity,described in subsection 2.4.2. This part of the verification tests the design on its resilience againstchanges in the driving forces which affect the development of the Dala area.
First, the resilience of the design is tested for changes in the three main driving forces. After that,the resilience to other forces, as listed in Appendix B, section B.1, are assessed.
Population growthThe scenario for which the water infrastructure in this report is designed takes into account the plusscenario for population growth, with a total population of 670.000 people in 2040. When testing thedesign against lower rates of population growth, the design will still cater to the water needs of thesepeople. Some overcapacity can be expected, which is undesirable due to the investments that are notused to their full potential.
The choice to harvest rainwater from roofs results in less harvesting for the minus scenario on pop-ulation growth. The same counts for harvesting water from green area within urban areas. However,the choice made to store drinking water in open reservoirs provides a catchment area for rainwaterharvesting that is not dependent on the amount of inhabitants. Since the catchment of water on thereservoir surface accounts for a significant share of the total water harvested, the decrease of harvestedrainwater is smaller than the decrease in water demand.
The choice to store drinking water in open reservoirs, which are designed to store water for 670.000people, will generate a surplus of storage capacity for lower population growth scenarios. The choiceto build all reservoir capacity in 2020, in order to create enough buffer capacity, implies that this designfor the storage is not scale-able. Since this is not violating the constraints given in subsection 3.1.1, thisdoes not result in a non-functioning design. However, investment costs needed for the construction ofthe reservoirs, are not used to their full potential, which is undesirable.
Drinking water and domestic water supply facilities will be constructed towards areas that are aboutto host residential functions. Considering the conceptual land use model as presented in subsec-tion 3.2.1, a lower amount of moves towards Dala can be related back to a lower attractiveness ofan area. This lower attractiveness will cause investors to construct less residential functions in Dala.Water supply facilities directed at areas which are not attractive will not be constructed, and thereforelower investments will be made for the supply system. The primary pipelines, however, will have adimension that takes into account the population growth towards 670.000 inhabitants. These pipelinesare therefore overdimensioned, and therefore lack cost-effectiveness.
The treatment of drinking-, domestic- and wastewater will be scaled up according to the populationand industrial growth. Only sudden drops in these growth rates will result in the construction ofovercapacity on these facilities.
Although deemed unlikely, in Appendix B it is also stated that a higher population growth thanexpected could occur in Dala. In this case, the storage lacks capacity to suffice the water needs of thetotal population. In this case the design as presented in this report does not comply with the constraintsof subsection 3.1.1. However, rainwater harvesting is a practice that can be easily extended or coupledwith other water sources. Therefore, the capacity of the system could be easily enlarged including acomplementary sources and/or increasing the storage capacity.
Industrial activityThe design as presented in this report is aimed to facilitate the plus-minus scenario of industrial activity.The scenarios in section 2.4 describe second option to be a case in which Dala does not attract any
7.1. Verification 61
industrial activity. In this case, the total water demand drops with 30%. As seen in subsection 7.1.2this reduced demand causes overcapacity.
The roof surface per capita is taken as input value to calculate the roof rainwater harvesting. In thisfigure not only roofs of residential buildings are taken into account, but the roofs of other functions, likeindustry, as well. Lower industrial activity will lead to less roof surface for industry, and therefore lessroof surface per capita. Lower industrial activity therefore leads to less rainwater harvesting. However,it is expected that industry uses more water than can be harvested on the roofs of buildings withindustrial functions. Therefore, no shortage in water harvesting is expected.
As described in subsection 7.1.2, the lower water demand causes the storage to be overdimen-sioned. This does not violate any constraints, but causes undesirable overcapacity.
Industrial activity will mainly settle in different zones than the population, as seen in Figure 3.6.This will mean that industrial areas will be served with a primary supply pipeline that is not the same asthe one leading to residential areas. If no industrial development will take place in Dala, this primarysupply will not be constructed. In this way, the supply can cope with any absence of industry, withoutspilling investments.
Any case of lower industrial activity will require less facilities to treat drinking-, domestic- andwastewater. The design takes into account that these treatment facilities will scale up according to thegrowth of population and industry. In this way the treatment facilities as designed are able to copewith growth rates lower than the growth rate as taken into account in the chosen scenario.
The plus scenario for industrial activity was assessed to be less likely than the plus-minus or minusscenario. However, if this situation does occur, the system will be affected. The high case for industryprojects a water demand of 74,5% of that of the demand of the population. This will impose an increasein the total water demand on the system of 34%. The system as designed is not able to cope with thisinduced demand. Storage and harvesting facilities will not be able to supply the water for this intensityof activity.
Climate changeThe water infrastructures of this report are designed for a climate change scenario which takes intoaccount climate variation according to a RCP scenario calculated between the 4,5 and the 8,5. Thisresulted in an average precipitation increase of 4.5% and temperature increase of 0,93 between2011 and 2040. Since rainwater harvesting is the main source, a changing climate can significantlyimpact the volume of water which can potentially be harvested. In the design, the effect of evaporationwas taken into account. However, the change in evaporation rates due to an increase in temperaturewas not accounted for. A constant evaporation rate was assumed for the 2011-2040 period.
Minus scenario (RCP 4,5)If a lower RCP value is chosen, the precipitation will decrease by 12% while the temperature willincrease with 0,63 between 2011 and 2040. The increase in temperature is slightly lower than inthe plus-minus scenario. It can be assumed that the average evaporation will not be higher than theevaporation experienced in the chosen scenario. The precipitation is significantly lower than in theplus-minus scenario. This can potentially create a serious problem in the dry season, because notenough water can be harvested. Upscaling of the solution can be done to solve this problem
The drainage system will not be impacted by lower levels of precipitation. Lower levels of precipi-tation will only result in a longer return time of the predicted intensity of rainfall, which may cause thedrainage system to be overdimensioned.
Plus scenario (RCP 8,5)Both the temperature and precipitation levels would increase for a higher RCP value. The precipitationwould increase on average by about 14,7% and the temperature by around 1 between 2011 and2040. This increase in precipitation will greatly influence the amount of water which can be harvestedeach year. The temperature increase is not much more than in the chosen scenario, so it can beassumed that the evaporation will not increase significantly. The combination of more precipitationand a slightly higher rate of evaporation will allow the storage system to be just as effective with asmaller surface area as well as allow for a shorter filling time to create the buffer.
Higher precipitation levels will also have an impact on the drainage system and the occurrence ofpluvial flooding. It is expected that the intensity of the individual rainfall event will increase. This
62 7. Verification and validation
is because the onset of the monsoon season is increasingly later and finishes at the same time [40,p.49]. The designed drainage also takes into account the expected increase of intensity and frequencyof extreme events due to climate change, depicted in subsection 2.4.1. However, this system is able tocope with a 1/25 year occurring rainfall intensity of 88,9 /ℎ which is higher than the commonoccurrence of 1/2 year [120, p.5].
Other driving forcesPopulation densityThe design does not include any regulations on the maximum density of an area. Therefore, some partsof Dala potentially yield high density figures in the future. This high density will result in a lower roofsurface per capita, leading to lower harvesting of rainwater. When not compensated in other areas,this leads to a shortage of water.
Industrial densityTo limit pollution of wastewater, the design in this report stimulates reuse of wastewater for industrialcompanies. However, high densities of industrial activities might not allow for the space required toinstall wastewater treatment facilities. In this case, wastewater treatment might take place outwardsfrom this industrial center.
Agricultural growthIf agricultural growth is high, less land is available for urban development. The opposite can be said ifthe agricultural sector will decrease, more land will be available for urban development. An optimumcan be reached, where the agricultural sector can benefit from population growth. The wastewaterfrom urban areas will be treated using an UASB system. This system produces sludge which can beused as a fertilizer for the agriculture. Effluent water can directly be used to irrigate the crops duringthe dry season and contains high values of nutrients.
Economic welfareChang et al. [15] notes that income is a factor influencing water consumption. For the case of Dala,it is assumed that 150 liters of water per day is consumed per person. This might increase if welfareincreases in above average rates. On the other hand, lower income might lead to less consumptionthan 150 liter.
Labour in rest of YangonThe attractiveness of other areas can have a negative influence on the amount of industry that settlesin Dala and on the amount of people working and living in Dala. If more people will work in otherareas, less people will go to Dala. However, it has to be noted that people working somewhere elsecan still live in Dala, this is for example also influenced by the connection between Dala and the restof Yangon, which is out of the scope of this project.
SquattingThe design takes into account that squatters will also live in Dala. Public toilets will be constructed sothat these squatters will also have access to proper sanitation and that their bodily waste is properlyremoved from the area and treated. Communal systems will help subsidizing the cost of drinking waterfor squatters, making it possible for them to have access to drinking water.
However, if the percentage of squatters inhabiting Dala is to drastically increase, this would have alarge effect on the public sanitation systems and on the drinking water. A larger population of squattersresults in a larger demand of subsidized drinking water. This can in turn result in an increase in pricefor the regular population of Dala to be able to support these squatters.
If the number of squatters is to significantly decrease, the only effect this would have is that thecommunity spends less money on subsidizing the water for the squatters, since less water is needed.
Technology reducing water usage in agricultureIf new technologies in reducing water usage in agriculture occur, a higher share of the water, neededfor irrigation, can be supplied by the effluent of the UASB treatment, as proposed in the design. Thetechnologies will not impose any effects on the system designed in this report. However, economicwelfare might increase due to new technologies, which in turn might induce water usage of domesticand drinking water [15].
7.1. Verification 63
7.1.3. Stakeholder verificationIn this section, a short evaluation will be conducted to see whether the interests of the key players , aspresented in section 2.3, are served and whether all the stakeholders with the resources to ensure thesuccess of the system are included. Further, the inclusion of other stakeholders who were not identifiedas key players is evaluated.
YCDCYCDC s main interest is to ensure welfare for the citizens of Yangon and a healthy economy of Yangon. Itis therefore also in the interest of YCDC to serve the interest of the people in Dala and local companies,who are both less powerful stakeholders themselves. The proposed design is an adequate tool to doso while still answering to the wishes of the national and regional government to connect and improveMyanmar s economic centres, using Dala as a corridor.
Chief Minister of the Yangon RegionThe Chief Minister of the Yangon Region acts as a middle man to implement national policy in the regionof Yangon [69]. His main goal is to improve living conditions and connectivity to ensure economicgrowth. It is therefore in his interest to exploit Dala s position for economic purposes, while alsoimproving the conditions there. Although the design succeeds at doing both, resources might havebeen allocated more efficiently when a less sustainable design was chosen. The Chief Minister has thepower to reject the plans, and therefore he should be convinced of the necessity to have a sustainablewater infrastructure instead of a cheap one.
National Water Resources Council (NWRC)The interest of the NWRC is to ensure consistency in water policies in Myanmar through the NationalWater Policy (NWP) [113]. As mentioned in subsection 6.2.11, the laws governing the water system inDala are over 50 years old and should therefore be rewritten before the new system is implemented.The role and expertise of the NWRC is acknowledged to the extent that the NWP can be very helpfulin formulating policy and should serve as a basis to ensure consistency across Myanmar.
Ministry of ConstructionAs the Ministry of Construction is responsible for constructing and maintaining roads while ensuringproper drainage and sanitation in new settlement areas [5, 48], this is an important party to workclosely together with. As mentioned in subsection 6.2.11, responsibilities for the water system shouldbe allocated clearly and in close cooperation with the Ministry of Construction.
International funds and loansAs mentioned in section 2.3, the international funds of JICA, KOICA, EDCF and ADB have invested morethan $1,2 billion in Myanmar, mainly to use towards infrastructure improvements. It was acknowledgedin subsection 6.2.11 that when YCDC wants to use some of this money towards improving the waterinfrastructure in Dala, it should be done in communication with these funds. As their overarching goal isto ensure welfare and economic growth through infrastructural improvements in developing countries,using the money toward this cause should not be a problem. However, sustainability is not necessarilythe funds main goal, while making the system sustainable might increase the investment. Just like theChief Minister, these funds should be convinced of the necessity to implement a sustainable system inDala.
UN HabitatIt was mentioned that UN Habitat plays a big role in advising the Myanmar government on urbanplanning and climate change. These are design aspects that have been taken into account in thisresearch. However, the specific expertise of UN Habitat on the area could have been employed moreexplicitly.
Other stakeholdersAs mentioned in Appendix A, 22 stakeholders were identified. Only a part of them were categorized askey players and taken into account in the design. However, during the design and multiple interviews,some of the other stakeholders often surfaced as important players to take into account. These are
64 7. Verification and validation
mainly less powerful stakeholders whose interests are defended by key players, but they are also worthmentioning separately.
Firstly, the local laborers. The new systems that are being proposed will generate a lot of labour forconstruction, maintenance and operations. This will therefore positively influence the labour marketin Dala and potentially even attract people from outside Dala. Some technologies that are beingproposed are quite advanced, which may cause difficulties for the laborers in their work. However,intensive supervision from expert companies is planned to be implemented in the starting phase.
Secondly, Dala s local government. In interviews with Dala s local government, as seen in Ap-pendix E, section E.4, they expressed their concern with the current state of the water supply in Dalaand their inability to cope with more people, meaning more demand. Their expectation is that thebridge will be supplied with a water pipeline from Yangon, supplying Dala with all the water they needin the future. This design does not incorporate that idea, but offers a more sustainable solution fortending to Dala s future water demand. Although this design would need a lot more planning in Dalaitself than a pipeline from Yangon would, the expectation is that Dala s local government would graspany opportunity to increase the water supply.
Finally, Dala s inhabitants and industry, both current and future. It is in their interest that the waterinfrastructure improves in Dala. This would raise the overall standard of living, attract more labour tothe area and improve people s health. However, the proposed design does require some cooperationof the local people and companies. It must be ensured that they are willing to cooperate in order toimprove the situation in Dala.
7.2. ValidationOnce the internal check, the verification, is performed, it is important to perform an external check: thevalidation. To be able to make a design in 8 weeks time, reductions and assumptions had to be made.The validation is meant to check whether our design still fits with the actual real-world system thatit was created for. Normally, this can be done by comparing output with real-world measurements.However, this real-world system is a future situation, which is still very uncertain. Therefore, themethod chosen to validate the design, is conducting expert interviews. The local experts, that werechosen to interview, know a lot about the situation in Dala, possible water infrastructure systems inMyanmar, and urban development.
Two expert interviews were planned for the validation of the design. For the first interview, twowater management experts from the National Engineering and Planning Services (NEPS), who are alsopart of the advisory group for the National Water Resources Council (NWRC), were invited. For thesecond interview, four officials from the urban planning department of YCDC (of which one is thedirector of the department) were invited. However, this last interview was cancelled from their partdue to a visit from the Minister of Construction and attempts to reschedule it failed.
7.2.1. Interview water management expertsFor the validation of the design, an expert interview was organized on 13 October 2017. Before theinterview, the experts had the opportunity to read the final design, check the crucial assumptions andlook at the interview questions. Two local water management specialists were consulted, namely: UCho Cho, member of the advisory board at NEPS and chairman of the advisory group for the NWRC;and U Khin Lat, senior consultant at NEPS and member of the advisory group for the NWRC. Bothof them received a Master in Hydraulic Engineering at UNESCO-IHE (Delft, The Netherlands) and areconsidered among the most experienced consultants in the Burmese water sector. A summary of thecentral aspects which emerged during the interview is presented below. The integral version of theinterview can be found in Appendix H. The outcome of this validation does not change the design butwill be taken into account with the recommendations.
General impression/face validationThe first set of questions was aimed at getting a general face validation of the entire design. Thequestions concern the general impacts of the design on the principal stakeholders and the systemresults in terms of environmental, social and economic sustainability. Overall the two experts expresseda positive judgment on the implement-ability of the system by the local workforce. U Khin Lat pointedout the importance of a detailed urban plan to support the design. This was addressed as crucial to
7.2. Validation 65
coping with the potential discrepancies between the actual total future water demand and the picturepainted in the chosen scenario.
The main stakeholders affected by and influencing the design were identified as; YCDC, the in-vestors, the contractors and local laborers. YCDC s role in the feasibility of the design was appointedas the most relevant. This authority can exercise a veto on companies and investors involved in thedesign deployment. In regard to the sustainability of the system, the only concern which emergedwas related to the design effects on the rest of the southern Yangon region. Only improving the in-frastructure in the Dala urban area will create an unbalanced situation in the southern Yangon zone.The development of Dala will attract people from the rural area that are looking for a better lifestyle(e.g. access to drinking water during dry season). These people will be subtracted from the laborersworking in the agricultural sector. According to the experts, Yangon region is already facing a shortageof farmers and this will result in an increase in the food prices in the future. If the living conditions inrural areas are not improved at the same rate as the development of the city, the whole economic andsocial system of the area might collapse. This point was further highlighted later by U Cho Cho whoemphasized that the design for Dala should fit in a general masterplan for the whole region, otherwiseit will not work.
Harvesting and resourceAfter the general questions, the interview focused more in detail on the chosen source and harvestingmethods. In this part, the assumptions regarding the scenarios taken in section 2.4 where discussedas well. Globally, U Khin Lat and U Cho Cho agreed on the choice of rainwater harvesting as the mainsource. They emphasized that this solution is consistent with the government s plan to maximize therain source in the country. The 75% of possible water harvested from rooftops was considered as a goodestimate. In contrast, for the green area harvesting, the efficiency of 25% was evaluated as being toohigh, due to the significant infiltration capacity of the existing soil in Dala. With regard to future waterdemand, they gave positive feedback on the values used for water demand calculations. However, thetwo specialists expressed some doubts about the low industrial development scenario chosen for Dala,in contrast to most other experts in this project. Finally, U Cho Cho remarked that educating peopleabout rain harvesting techniques and water-use is a fundamental aspect for the success of the entiredesign.
StorageThe third part of the interview was a more in-depth analysis of the design choices taken with regardto the water storage. During this part, the two experts provided their ideas on the storage designand gave important suggestions on how to improve the reservoirs efficiency. Both experts agreed onthe values used for the calculation of the seepage and evaporation losses. For reducing the latter, itwas suggested to not use only trees. This is because the leafs could cause deterioration of the waterquality once fallen into the reservoir. U Cho Cho recommends applying a green-net on the water-bodysurfaces during the dry season in order to minimize the evaporation and the contamination, a smallscale example is shown in Figure 7.1. Through this improvement, they thought that a value below 1meter of evaporation per year can be achieved.
SupplyFinally, questions regarding the dual reticulation water supply system were asked. U Cho Cho wasnot convinced about the feasibility of this system. He stated that the drinking water flow is too lowto justify the installation of a separate additional pipe system. He suggested how this issue can bepartially overcome by implementing drinking water collecting points instead of serving drinking waterfrom domestic taps. He also questioned the possibility to extend the system in the whole southernYangon area. U Khin Lat did not fully share U Cho Cho s idea. He was convinced that the energy savedby splitting the pipeline can make the implementation of a second parallel supply system for drinkingwater more affordable. According to him, the presence of the domestic system will also allow thepossible reuse of wastewater within the Township. However, U Khin Lat did not agree on the choiceto centralize the storage system. He remarked that by making local water tanks accessible to privateusers, the energy demand for transport and treatment will drop.
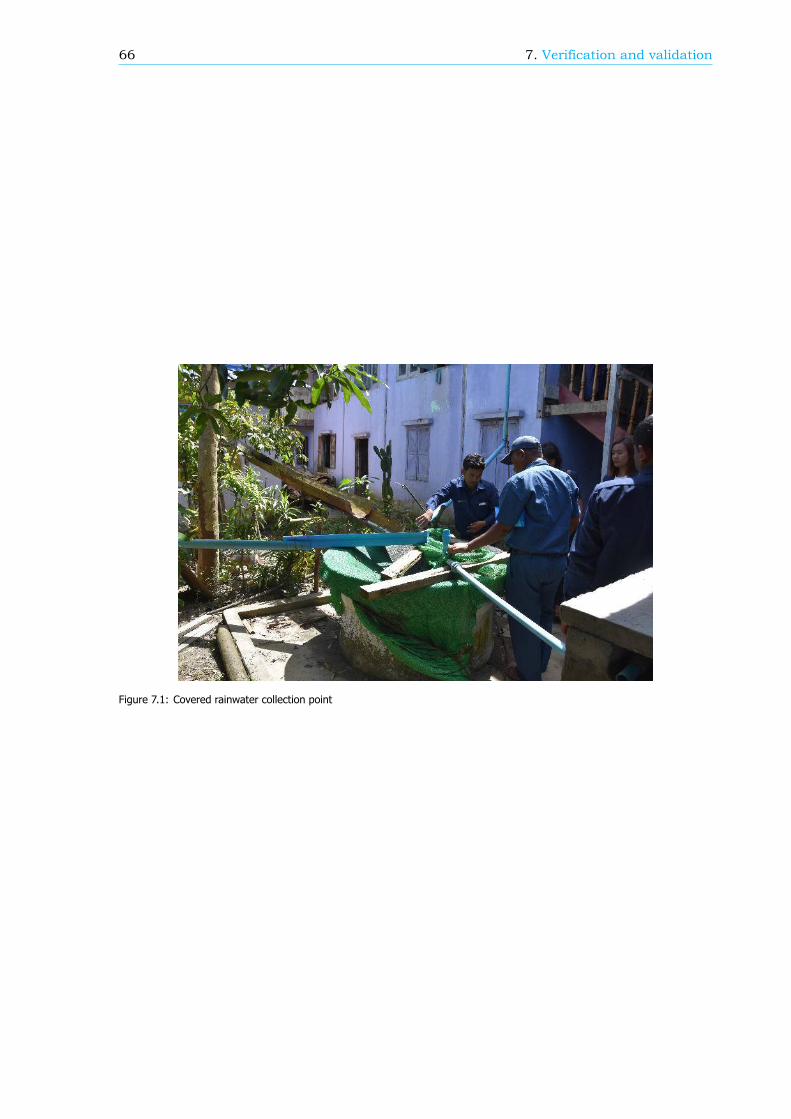
66 7. Verification and validation
Figure 7.1: Covered rainwater collection point
8Conclusion
The goal of this project was to develop a design for Dala s water system that deals with challenges ofthe township in a sustainable way. This chapter is meant to reflect on whether this goal was achieved.First, the research questions will be answered while revisiting the methodology that was applied. Then,any limitations to this research will be presented. Finally, some suggestions will be made for furtherresearch.
8.1. Design cycleAs Dala, with regards to its water infrastructure, is a socio-technical environment, it is necessaryto first identify the most important stakeholders before designing a new system. It was found thatboth municipal and local government are pushing to infrastructural developments, such as the bridgebetween Yangon CBD and Dala, that help improve Yangon s economy. While Dala s location makesthe area in this regard more of a tool than a goal in itself, the governmental parties also acknowledgethe need for an improved water infrastructure to enhance quality of living there. In this, they aresupported by multiple international funds that have invested large sums in infrastructural and waterprojects, for which they expect advantages for companies from their country in return. Responsibilitiesfor different aspects of the water infrastructure are scattered over a multitude of governmental bodies,with many overlaps. Therefore, the NWRC has formulated a National Water Policy (NWP) aimed atreaching consistency across water policies in Myanmar and exploiting its abundant water resourceswhile mitigating problems with water such as quality, supply and flooding.
The region is expected to undergo rapid changes in the coming decades after construction of theCBD - Dala bridge in 2021, and a bridge connecting Dala to the Thilawa SEZ in 2035. As the extent ofthese changes is quite uncertain, but the success of the water infrastructure depends on the future stateof the area, a scenario analysis was conducted. It was concluded that next to a significant populationgrowth due to increased connectivity with Yangon and Thilawa, some industry can also be expected tosettle in Dala. Through the amount of labour, the industry generates more population growth, whilethis population in turn generates labour in the service sector, and therefore more population growth.Furthermore, it should be noted that improved facilities, such as a water infrastructure, may also attractmore population. At the point where the existing infrastructure reaches its limit, population growth isexpected to come to a halt. The resulting expected 670.000 inhabitants and industry in 2040 havea significant impact on the entire water circle in Dala. This means that the township should rapidlytransform from an area where almost no water infrastructure is available to an area where all needsare met by a single system in a sustainable way.
The land-use models also shows the spread of the developments in both population growth andindustrial activity. This gives information on the locations where water should be supplied towards.A conceptual model led to a zonal map, which, in combination with attraction factors per zone, gaveinsight into the relative densities for population and industry of the zones in Dala. A super-lineardistribution of the total amount of inhabitants, expected in Dala for the year of 2040, provided insightin the absolute densities expected per zone. This yields relatively high densities of population forthe zones near the landing point of the connection between Dala and Yangon CBD, with a maximum
67
68 8. Conclusion
of 45.000 ℎ / . For industrial activity, the highest density can be expected near theconnection with Thilawa, at the outer ring road, yielding a surface occupation of 24%.
To meet the needs of Dala in 2040, solutions were generated for water harvesting, water stor-age, drinking/domestic water treatment, water supply, quality control, monitoring the consumption,wastewater collection, wastewater treatment and disposal, limiting the pollution of wastewater, runoffwater collection and protection against pluvial flooding. From these solutions, three alternative designswere generated: an economically sustainable, an environmentally sustainable and a socially sustain-able alternative. From an internal evaluation, it was concluded that the final design should pivot aroundthree focal points in order to attain adequate sustainability while working as a well-integrated system.These focal points are rainwater harvesting, storage in reservoirs and a dual reticulation system for thesupply. These focal points were checked by means of an external evaluation with local experts, whichled to valuable considerations towards the final design.
The result is a design for the full water circle which can provide enough water to cater to the futuremunicipal and industrial demand using only rainwater. This is more environmentally sustainable thanthe use of any other water resource because harvesting it does not affect the resource itself, and limitedtransport and treatment is needed. Furthermore, it also increases the storage capacity of the urbanarea reducing the risk of pluvial flooding. High capacity reservoirs will ensure that Dala has enoughwater to supply the dry season demand. The water supply will be more efficient as domestic usewater and drinking water are delivered through separate pipelines. This does not only save energy ontreatment of domestic water, it also saves energy on transportation of water. The system is completedwith methods for other functions of the water circle that do not only complement the focal points, butalso perform well on sustainability measures. All in all, this system will make Dala fully self sustainingin terms of water while allowing for rapid growth of the township. Besides this, the solutions chosenin Dala will not affect the fresh water source availability in the rest of Great Yangon area.
8.2. LimitationsOne of the main limitations is the short time frame in which the whole project needed to be realized.Therefore, it was decided that the focus of this research would be on three focal points, as mentionedin the previous section. Further research should be done on the remaining functions to accuratelydecide whether or not these solutions are actually feasible in Dala.
The lack of a detailed and official urban development plan on Dala limits the accuracy of thisproject. This is because certain assumptions were made (based on the available information) whichcan influence the magnitude of some of the different design variables. When a complete spatial planfor the development of Dala exists, more detailed calculations can be performed which will result in amore complete design.
The land-use model as presented in this report uses relative attractiveness for each zone to estimatepopulation densities and density of industrial activity. A super-linear relationship is assumed betweenthe attractiveness of a zone, and its density. Although the distribution of densities over zones gives anidea on where to expect relatively high densities, the model lacks underlying data which can providereliable absolute numbers with respect to these densities.
This research focuses on developing Dala as a system which is independent of the rest of southernYangon region. However, as mentioned in the expert interview in subsection 7.2.1, in order for thisdesign to work, it should fit into the masterplan for the whole region South of Yangon. As this regionwas not included in the scope of this research, it was not assessed how the described design for Dalacan be integrated in this masterplan.
The scarce amount of available data on water quality and soil composition made it difficult to createan accurately worked-out design. Most of the assumptions which were made during the design phases,were based on hearsay of local experts. The difficulty with hearsay is that it is hard to verify whetheror not the information given is correct.
One of the assumptions which was made was that there will be a connection between Dala andYangon and Dala and Thilawa. However, this research has shown that, here in Myanmar, large infras-tructure projects take quite a long time before being approved and then finally constructed. Therefore,the assumptions made about the completion dates of these connections can limit the implement-abilityof this research.
During the design was assumed that the population will have reached a peak in 2040 and after
8.3. Further research 69
this the population will no longer grow anymore. This assumption limits the adaptability of the designwith respect to a storage system. The use of reservoirs will be able to suffice the demand for drinkingwater for a relatively long period of time (30 - 40 years). However, it must be realized that this storagesystem of the source is exhaustible for a constant population of 670.000. This means that the reservoirwill eventually empty over time, if no additional measures are taken to increase the storage capacity.
8.3. Further researchThis section is based on the conclusion and limitations explained in the previous two sections. Duringthis project the main struggle was the short time frame in which this project was realized. This resultedin making many assumptions throughout the project, which limited the amount of detail of certaindesign aspects. In the next few paragraphs, some recommendations will be given for further research.
One of the possibilities for further research is the coupling of the designed system with a differentsources. This new system could, for instance, combine the water from the Toe river with the waterfrom rainwater harvesting. This will create a system with two independent sources. This solution couldbecome especially interesting if the demand is higher that the one used in the final design. Furtherresearch on this combination would be suggested also because plans are already in place to constructa complete water supply system to provide water to Yangon from the Toe river. This was mentioned inthe interview with AG Resources Myanmar, found in Appendix E, section E.6.
Rainwater harvesting was chosen above groundwater extraction, partly because of the risk of landsubsidence. However, in the evaluation in section 5.2 it was pointed out that harvesting the rainwatermay have an effect on the amount of water that will infiltrate in the ground, which might cause landsubsidence. As data about the soil composition was missing, this effect was not further researched.It was only argued that there will probably be little effect on the groundwater table, as only 7,8%of rainwater is harvested. However, when rainwater harvesting is to be implemented, this should beresearch more in detail.
Further, a more detailed plan of the implementation phases of the system can be explored. Thisplan should focus on prioritizing which parts of the solution should be implemented first.
In this project, the only effect of climate change which was taken into account was the changinglength of the monsoon period and the intensity of the precipitation in this period. Additional researchcan be done on the other effects of a changing climate. For example the effects of the temperaturechange on the evaporation rates and the consequences of the sea level rise.
The possibility to implement the concepts described in the designed (e.g. rainwater harvesting anddual reticulation system) system to the whole Yangon should be further research. It should be done insuch a way that the water scarcity in the Yangon region can be eradicated as a whole. By doing this,a solution can be made which fits into the master plan of Yangon on the short and long term.
More research can be done in the field of storing the water during dry season, where the focus can beon reducing evaporation of the stored water in reservoirs. Other ways of storage can be researched,for example injecting water in the ground. This requires more information about the soil, which isinadequate right now, as mentioned before.
Rough calculations are made to address the different options and the feasibility of the chosensolutions for the focal points. When more data is available, the validity of the calculations needs to bechecked, the demand for treatment of drinking water and wastewater have to be sharpened, and thefeasibility for other solutions, for example the bio-retention basins, has to be calculated.
In this report, a land-use model is used to determine the water demand in the defined zones of Dala.Attraction factors found in literature and articles are used to compare the attractiveness of differentzones. On the base of this relative attractiveness, population is distributed (super-)linearly over thezones. However, combining data on population densities in relation to land value figures, as currentlyobserved in Yangon, might give more insight into the relationship between the attractiveness of a zone,and its population density.
Unfortunately, the planned validation interview with officials from YCDC s urban planning depart-ment could not take place. Therefore, the design had to be validated only using the input from otherexperts. However, before any of the plans in this design are further worked out, it is important to haveapproval of YCDC. Not only can they make a good estimation of what will work and what not, they alsohave the power to decide whether or not something will be executed in Yangon.

AAppendix: Stakeholder analysis
To form a complete picture of the environment in which the problem plays and the design should beimplemented, a stakeholder analysis was conducted. The aim of a stakeholder analysis is to map anyand all parties that are affected by or can affect the problem or the solution. Dala, as it is beinganalyzed and designed for in this research, should be seen as a socio-technical system: people interactwith technology and infrastructure. Technology determines the success of human endeavours andhuman behaviour determines the success of technological solutions. Therefore, it is important toanalyze stakeholders interests, opinions and resources. This helps to see under which conditions thesolution will be successful and which stakeholders need to be actively or passively involved.
In this appendix, the identified stakeholders are first briefly described. Based on the stakeholderdescription and the general impression of the stakeholder, they are evaluated in the stakeholder eval-uation table. This table is then used as input for the power-interest grid which is used to identify themost important stakeholders, or key players .
A.1. Stakeholder listA full list with all the 22 stakeholders are presented.
Yangon City Development Committee (YCDC)The Yangon City Development Committee is the problem owner for this research. Their main goal isthe welfare of the city of Yangon for which they have drawn up a plan in cooperation with JICA: TheStrategic Urban Development Plan of the Greater Yangon [48]. From this plan, the intention to build thebridge in order to connect (new) economic centres and the intention to improve water infrastructurewere derived. In terms of water management is the YCDC responsible for the quality of drinking waterand sanitation in Yangon [112].
Chief Minister Yangon regionMyanmar has 14 regional governments with each a Chief Minister as their chief executive [69]. Theregional government s main task is to implement projects that fall within the union government s poli-cies. Yangon region s Chief Minister, Phyo Min Thein, has grand plans for the Yangon region for hisperiod in office. His goal is to improve living conditions and connectivity to ensure economic growth.Roads and bridges of regional significance fall under the regional government s jurisdiction [112].
National Water Resources Committee (NWRC)As Myanmar has many governmental bodies who have (overlapping) water topics in their jurisdiction,the NWRC was established in 2013 and formulated a National Water Policy (NWP) in 2014 [113]. Thispolicy acknowledges that an integrated water resources management approach is needed to exploitMyanmar s abundant water resources to its fullest while mitigating problems with water, such as waterquality, water supply and flooding. The NWRC receives advice from an advisory group of water man-agement professionals chaired by U Cho Cho [112], one of the water management experts who wereinvolved in this project.
71
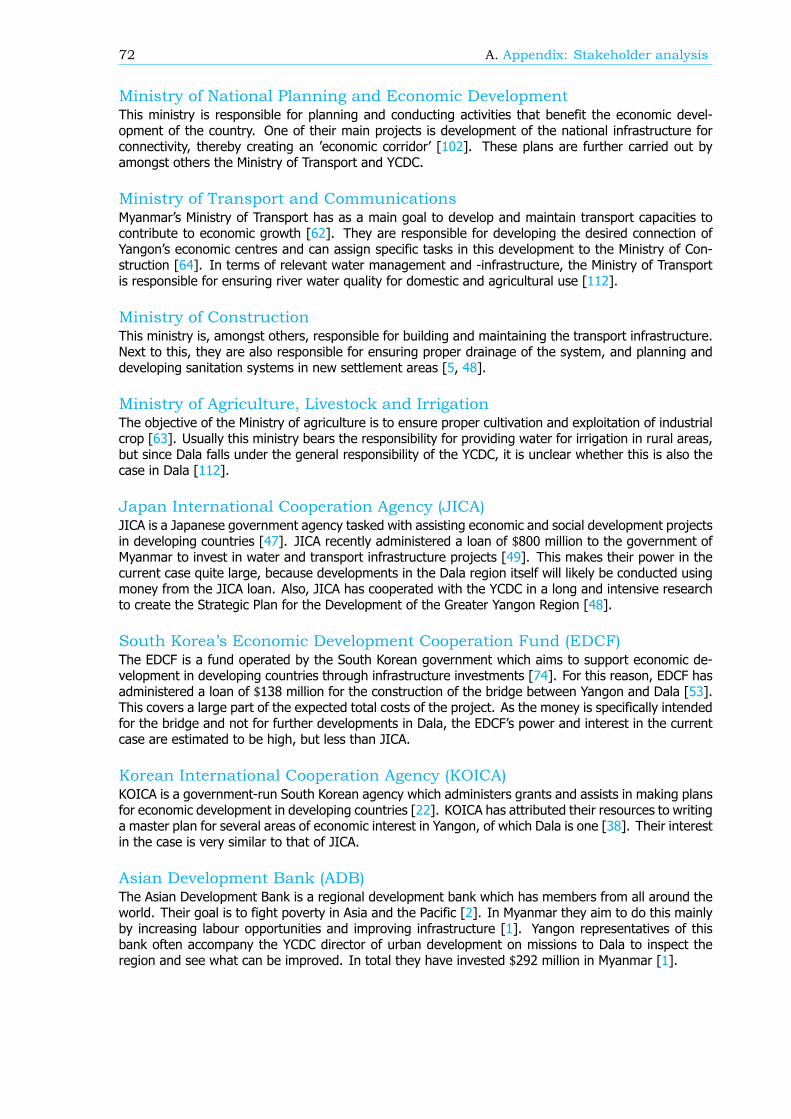
72 A. Appendix: Stakeholder analysis
Ministry of National Planning and Economic DevelopmentThis ministry is responsible for planning and conducting activities that benefit the economic devel-opment of the country. One of their main projects is development of the national infrastructure forconnectivity, thereby creating an economic corridor [102]. These plans are further carried out byamongst others the Ministry of Transport and YCDC.
Ministry of Transport and CommunicationsMyanmar s Ministry of Transport has as a main goal to develop and maintain transport capacities tocontribute to economic growth [62]. They are responsible for developing the desired connection ofYangon s economic centres and can assign specific tasks in this development to the Ministry of Con-struction [64]. In terms of relevant water management and -infrastructure, the Ministry of Transportis responsible for ensuring river water quality for domestic and agricultural use [112].
Ministry of ConstructionThis ministry is, amongst others, responsible for building and maintaining the transport infrastructure.Next to this, they are also responsible for ensuring proper drainage of the system, and planning anddeveloping sanitation systems in new settlement areas [5, 48].
Ministry of Agriculture, Livestock and IrrigationThe objective of the Ministry of agriculture is to ensure proper cultivation and exploitation of industrialcrop [63]. Usually this ministry bears the responsibility for providing water for irrigation in rural areas,but since Dala falls under the general responsibility of the YCDC, it is unclear whether this is also thecase in Dala [112].
Japan International Cooperation Agency (JICA)JICA is a Japanese government agency tasked with assisting economic and social development projectsin developing countries [47]. JICA recently administered a loan of $800 million to the government ofMyanmar to invest in water and transport infrastructure projects [49]. This makes their power in thecurrent case quite large, because developments in the Dala region itself will likely be conducted usingmoney from the JICA loan. Also, JICA has cooperated with the YCDC in a long and intensive researchto create the Strategic Plan for the Development of the Greater Yangon Region [48].
South Korea’s Economic Development Cooperation Fund (EDCF)The EDCF is a fund operated by the South Korean government which aims to support economic de-velopment in developing countries through infrastructure investments [74]. For this reason, EDCF hasadministered a loan of $138 million for the construction of the bridge between Yangon and Dala [53].This covers a large part of the expected total costs of the project. As the money is specifically intendedfor the bridge and not for further developments in Dala, the EDCF s power and interest in the currentcase are estimated to be high, but less than JICA.
Korean International Cooperation Agency (KOICA)KOICA is a government-run South Korean agency which administers grants and assists in making plansfor economic development in developing countries [22]. KOICA has attributed their resources to writinga master plan for several areas of economic interest in Yangon, of which Dala is one [38]. Their interestin the case is very similar to that of JICA.
Asian Development Bank (ADB)The Asian Development Bank is a regional development bank which has members from all around theworld. Their goal is to fight poverty in Asia and the Pacific [2]. In Myanmar they aim to do this mainlyby increasing labour opportunities and improving infrastructure [1]. Yangon representatives of thisbank often accompany the YCDC director of urban development on missions to Dala to inspect theregion and see what can be improved. In total they have invested $292 million in Myanmar [1].
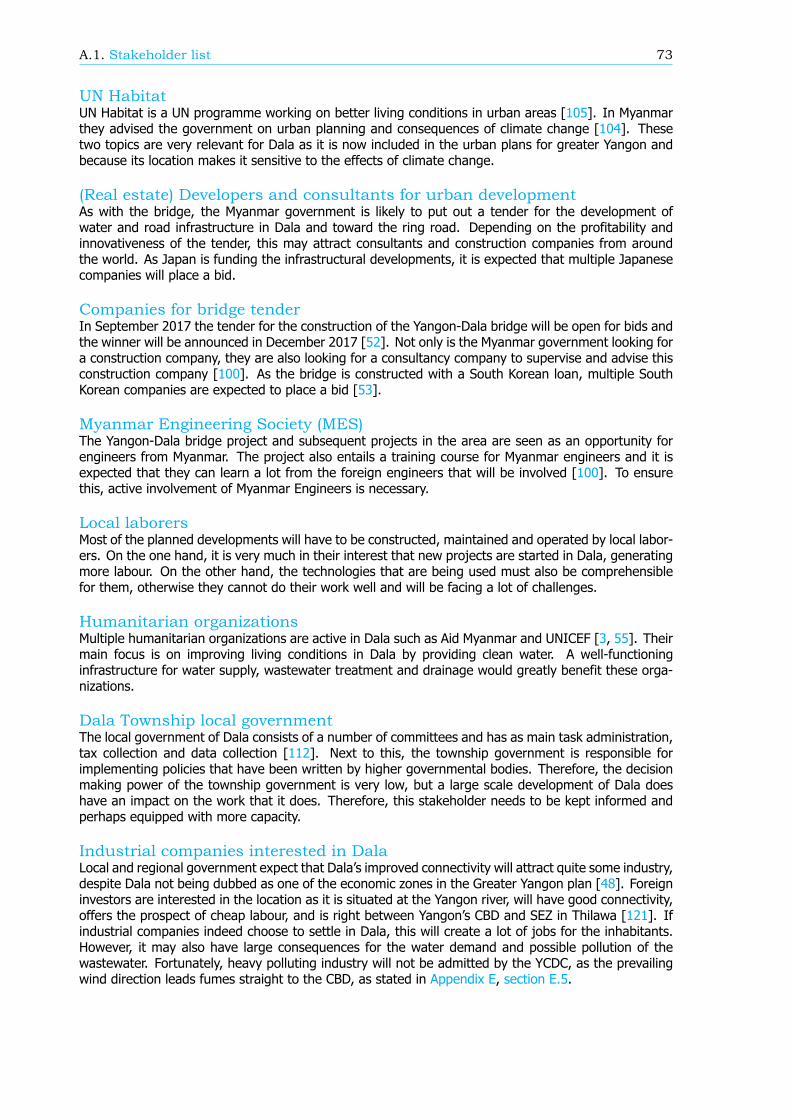
A.1. Stakeholder list 73
UN HabitatUN Habitat is a UN programme working on better living conditions in urban areas [105]. In Myanmarthey advised the government on urban planning and consequences of climate change [104]. Thesetwo topics are very relevant for Dala as it is now included in the urban plans for greater Yangon andbecause its location makes it sensitive to the effects of climate change.
(Real estate) Developers and consultants for urban developmentAs with the bridge, the Myanmar government is likely to put out a tender for the development ofwater and road infrastructure in Dala and toward the ring road. Depending on the profitability andinnovativeness of the tender, this may attract consultants and construction companies from aroundthe world. As Japan is funding the infrastructural developments, it is expected that multiple Japanesecompanies will place a bid.
Companies for bridge tenderIn September 2017 the tender for the construction of the Yangon-Dala bridge will be open for bids andthe winner will be announced in December 2017 [52]. Not only is the Myanmar government looking fora construction company, they are also looking for a consultancy company to supervise and advise thisconstruction company [100]. As the bridge is constructed with a South Korean loan, multiple SouthKorean companies are expected to place a bid [53].
Myanmar Engineering Society (MES)The Yangon-Dala bridge project and subsequent projects in the area are seen as an opportunity forengineers from Myanmar. The project also entails a training course for Myanmar engineers and it isexpected that they can learn a lot from the foreign engineers that will be involved [100]. To ensurethis, active involvement of Myanmar Engineers is necessary.
Local laborersMost of the planned developments will have to be constructed, maintained and operated by local labor-ers. On the one hand, it is very much in their interest that new projects are started in Dala, generatingmore labour. On the other hand, the technologies that are being used must also be comprehensiblefor them, otherwise they cannot do their work well and will be facing a lot of challenges.
Humanitarian organizationsMultiple humanitarian organizations are active in Dala such as Aid Myanmar and UNICEF [3, 55]. Theirmain focus is on improving living conditions in Dala by providing clean water. A well-functioninginfrastructure for water supply, wastewater treatment and drainage would greatly benefit these orga-nizations.
Dala Township local governmentThe local government of Dala consists of a number of committees and has as main task administration,tax collection and data collection [112]. Next to this, the township government is responsible forimplementing policies that have been written by higher governmental bodies. Therefore, the decisionmaking power of the township government is very low, but a large scale development of Dala doeshave an impact on the work that it does. Therefore, this stakeholder needs to be kept informed andperhaps equipped with more capacity.
Industrial companies interested in DalaLocal and regional government expect that Dala s improved connectivity will attract quite some industry,despite Dala not being dubbed as one of the economic zones in the Greater Yangon plan [48]. Foreigninvestors are interested in the location as it is situated at the Yangon river, will have good connectivity,offers the prospect of cheap labour, and is right between Yangon s CBD and SEZ in Thilawa [121]. Ifindustrial companies indeed choose to settle in Dala, this will create a lot of jobs for the inhabitants.However, it may also have large consequences for the water demand and possible pollution of thewastewater. Fortunately, heavy polluting industry will not be admitted by the YCDC, as the prevailingwind direction leads fumes straight to the CBD, as stated in Appendix E, section E.5.
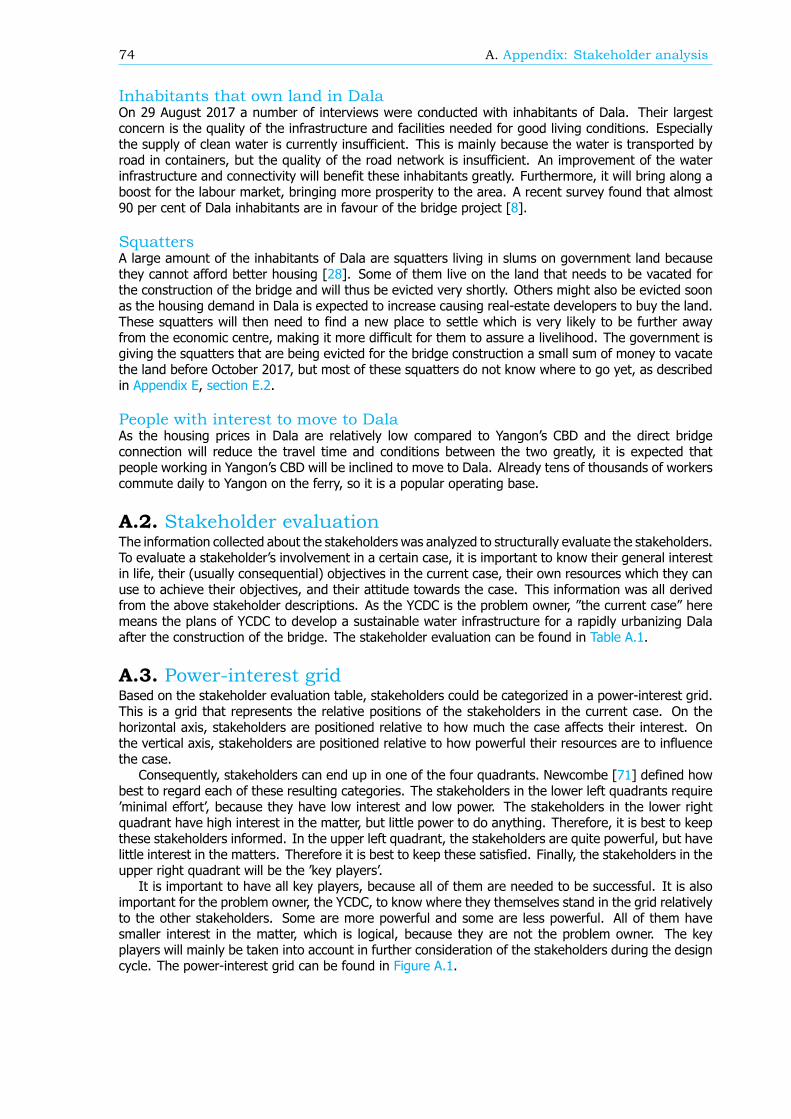
74 A. Appendix: Stakeholder analysis
Inhabitants that own land in DalaOn 29 August 2017 a number of interviews were conducted with inhabitants of Dala. Their largestconcern is the quality of the infrastructure and facilities needed for good living conditions. Especiallythe supply of clean water is currently insufficient. This is mainly because the water is transported byroad in containers, but the quality of the road network is insufficient. An improvement of the waterinfrastructure and connectivity will benefit these inhabitants greatly. Furthermore, it will bring along aboost for the labour market, bringing more prosperity to the area. A recent survey found that almost90 per cent of Dala inhabitants are in favour of the bridge project [8].
SquattersA large amount of the inhabitants of Dala are squatters living in slums on government land becausethey cannot afford better housing [28]. Some of them live on the land that needs to be vacated forthe construction of the bridge and will thus be evicted very shortly. Others might also be evicted soonas the housing demand in Dala is expected to increase causing real-estate developers to buy the land.These squatters will then need to find a new place to settle which is very likely to be further awayfrom the economic centre, making it more difficult for them to assure a livelihood. The government isgiving the squatters that are being evicted for the bridge construction a small sum of money to vacatethe land before October 2017, but most of these squatters do not know where to go yet, as describedin Appendix E, section E.2.
People with interest to move to DalaAs the housing prices in Dala are relatively low compared to Yangon s CBD and the direct bridgeconnection will reduce the travel time and conditions between the two greatly, it is expected thatpeople working in Yangon s CBD will be inclined to move to Dala. Already tens of thousands of workerscommute daily to Yangon on the ferry, so it is a popular operating base.
A.2. Stakeholder evaluationThe information collected about the stakeholders was analyzed to structurally evaluate the stakeholders.To evaluate a stakeholder s involvement in a certain case, it is important to know their general interestin life, their (usually consequential) objectives in the current case, their own resources which they canuse to achieve their objectives, and their attitude towards the case. This information was all derivedfrom the above stakeholder descriptions. As the YCDC is the problem owner, the current case heremeans the plans of YCDC to develop a sustainable water infrastructure for a rapidly urbanizing Dalaafter the construction of the bridge. The stakeholder evaluation can be found in Table A.1.
A.3. Power-interest gridBased on the stakeholder evaluation table, stakeholders could be categorized in a power-interest grid.This is a grid that represents the relative positions of the stakeholders in the current case. On thehorizontal axis, stakeholders are positioned relative to how much the case affects their interest. Onthe vertical axis, stakeholders are positioned relative to how powerful their resources are to influencethe case.
Consequently, stakeholders can end up in one of the four quadrants. Newcombe [71] defined howbest to regard each of these resulting categories. The stakeholders in the lower left quadrants requireminimal effort , because they have low interest and low power. The stakeholders in the lower rightquadrant have high interest in the matter, but little power to do anything. Therefore, it is best to keepthese stakeholders informed. In the upper left quadrant, the stakeholders are quite powerful, but havelittle interest in the matters. Therefore it is best to keep these satisfied. Finally, the stakeholders in theupper right quadrant will be the key players .
It is important to have all key players, because all of them are needed to be successful. It is alsoimportant for the problem owner, the YCDC, to know where they themselves stand in the grid relativelyto the other stakeholders. Some are more powerful and some are less powerful. All of them havesmaller interest in the matter, which is logical, because they are not the problem owner. The keyplayers will mainly be taken into account in further consideration of the stakeholders during the designcycle. The power-interest grid can be found in Figure A.1.
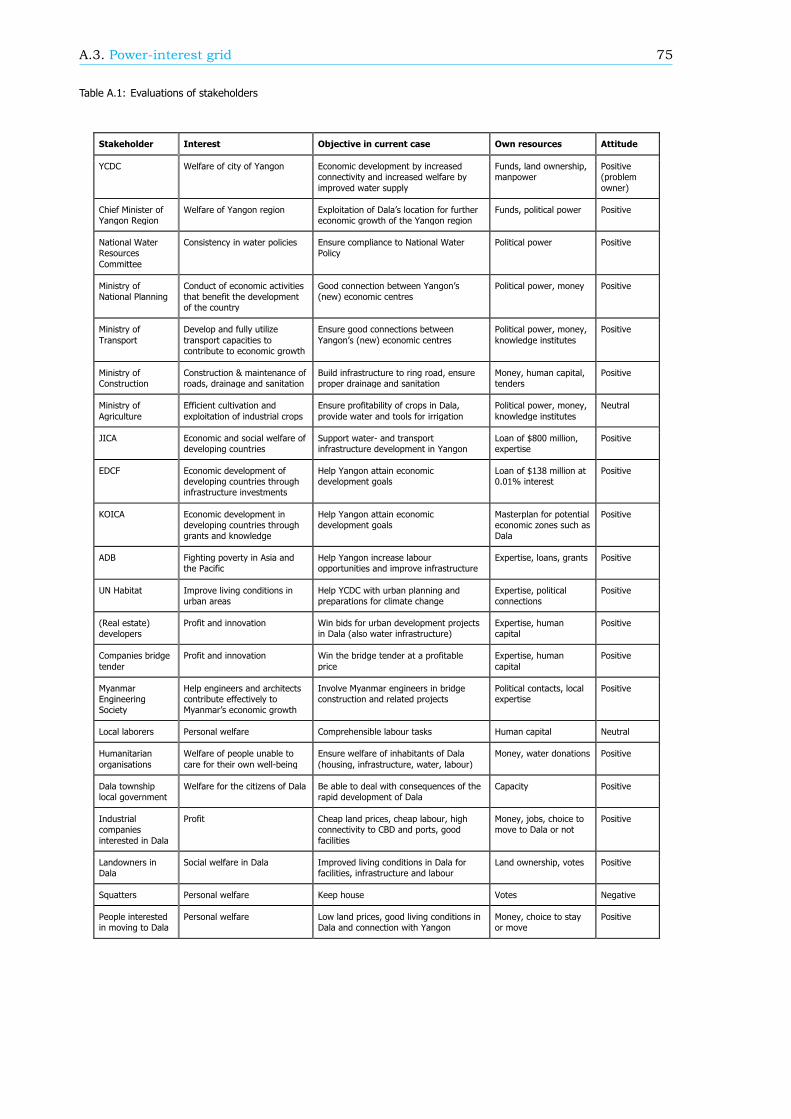
A.3. Power-interest grid 75
Table A.1: Evaluations of stakeholders
Stakeholder Interest Objective in current case Own resources Attitude
YCDC Welfare of city of Yangon Economic development by increased connectivity and increased welfare by
improved water supply
Funds, land ownership, manpower
Positive (problem
owner)
Chief Minister of Yangon Region
Welfare of Yangon region Exploitation of Dala’s location for further economic growth of the Yangon region
Funds, political power Positive
National Water Resources
Committee
Consistency in water policies Ensure compliance to National Water Policy
Political power Positive
Ministry of National Planning
Conduct of economic activities that benefit the development of the country
Good connection between Yangon’s (new) economic centres
Political power, money Positive
Ministry of
Transport
Develop and fully utilize
transport capacities to contribute to economic growth
Ensure good connections between
Yangon’s (new) economic centres
Political power, money,
knowledge institutes
Positive
Ministry of Construction
Construction & maintenance of roads, drainage and sanitation
Build infrastructure to ring road, ensure proper drainage and sanitation
Money, human capital, tenders
Positive
Ministry of
Agriculture
Efficient cultivation and
exploitation of industrial crops
Ensure profitability of crops in Dala,
provide water and tools for irrigation
Political power, money,
knowledge institutes
Neutral
JICA Economic and social welfare of developing countries
Support water- and transport infrastructure development in Yangon
Loan of $800 million, expertise
Positive
EDCF Economic development of developing countries through infrastructure investments
Help Yangon attain economic development goals
Loan of $138 million at 0.01% interest
Positive
KOICA Economic development in developing countries through grants and knowledge
Help Yangon attain economic development goals
Masterplan for potential economic zones such as Dala
Positive
ADB Fighting poverty in Asia and the Pacific
Help Yangon increase labour opportunities and improve infrastructure
Expertise, loans, grants Positive
UN Habitat Improve living conditions in urban areas
Help YCDC with urban planning and preparations for climate change
Expertise, political connections
Positive
(Real estate) developers
Profit and innovation Win bids for urban development projects in Dala (also water infrastructure)
Expertise, human capital
Positive
Companies bridge
tender
Profit and innovation Win the bridge tender at a profitable
price
Expertise, human
capital
Positive
Myanmar Engineering Society
Help engineers and architects contribute effectively to Myanmar’s economic growth
Involve Myanmar engineers in bridge construction and related projects
Political contacts, local expertise
Positive
Local laborers Personal welfare Comprehensible labour tasks Human capital Neutral
Humanitarian
organisations
Welfare of people unable to
care for their own well-being
Ensure welfare of inhabitants of Dala
(housing, infrastructure, water, labour)
Money, water donations Positive
Dala township local government
Welfare for the citizens of Dala Be able to deal with consequences of the rapid development of Dala
Capacity Positive
Industrial companies
interested in Dala
Profit Cheap land prices, cheap labour, high connectivity to CBD and ports, good
facilities
Money, jobs, choice to move to Dala or not
Positive
Landowners in Dala
Social welfare in Dala Improved living conditions in Dala for facilities, infrastructure and labour
Land ownership, votes Positive
Squatters Personal welfare Keep house Votes Negative
People interested in moving to Dala
Personal welfare Low land prices, good living conditions in Dala and connection with Yangon
Money, choice to stay or move
Positive
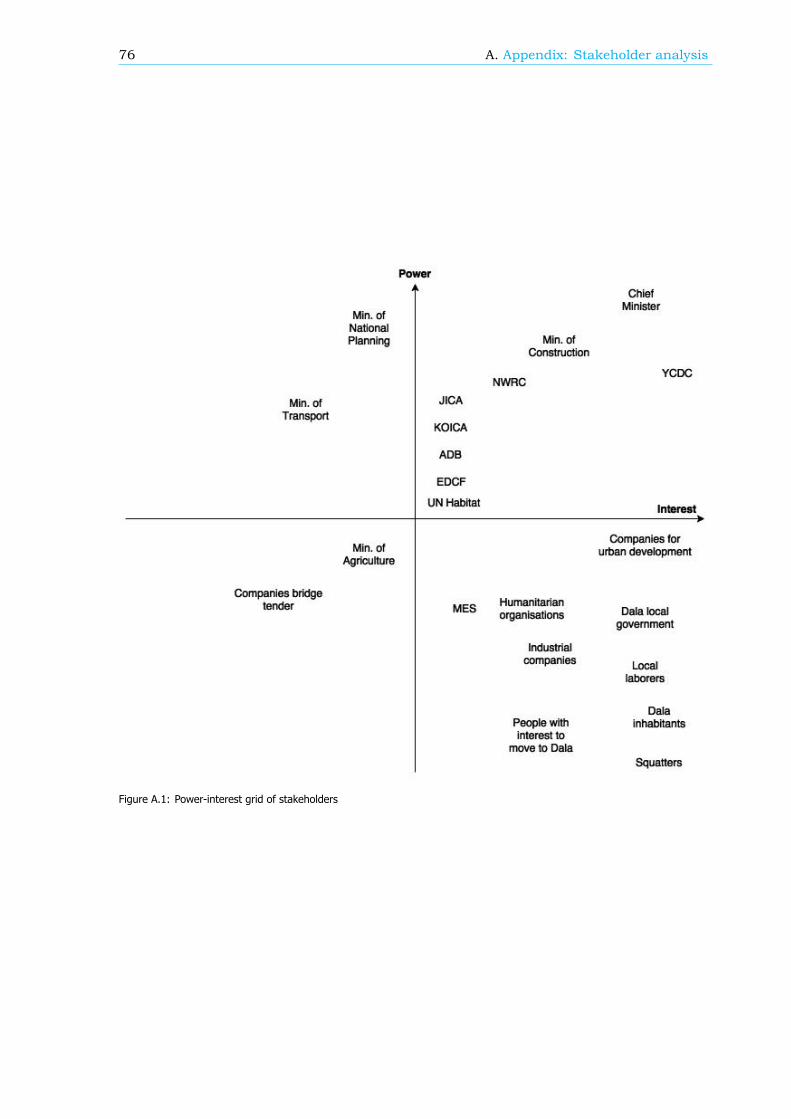
76 A. Appendix: Stakeholder analysis
Figure A.1: Power-interest grid of stakeholders
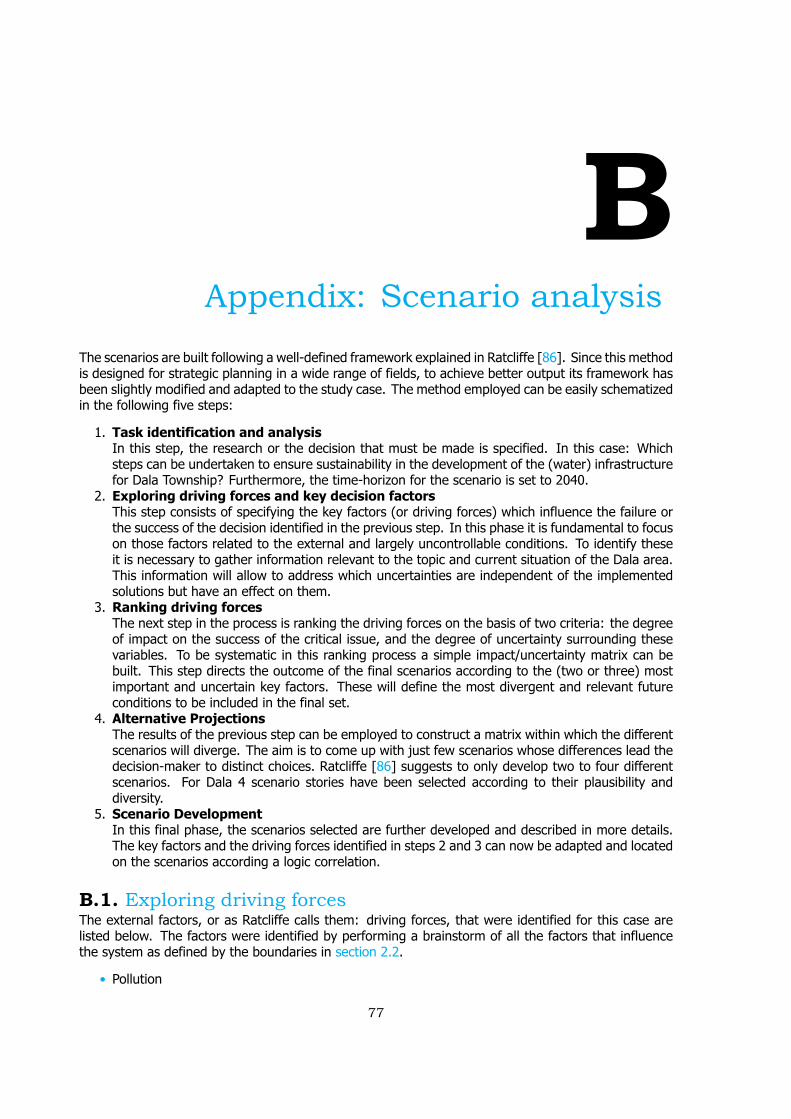
BAppendix: Scenario analysis
The scenarios are built following a well-defined framework explained in Ratcliffe [86]. Since this methodis designed for strategic planning in a wide range of fields, to achieve better output its framework hasbeen slightly modified and adapted to the study case. The method employed can be easily schematizedin the following five steps:
1. Task identification and analysisIn this step, the research or the decision that must be made is specified. In this case: Whichsteps can be undertaken to ensure sustainability in the development of the (water) infrastructurefor Dala Township? Furthermore, the time-horizon for the scenario is set to 2040.
2. Exploring driving forces and key decision factorsThis step consists of specifying the key factors (or driving forces) which influence the failure orthe success of the decision identified in the previous step. In this phase it is fundamental to focuson those factors related to the external and largely uncontrollable conditions. To identify theseit is necessary to gather information relevant to the topic and current situation of the Dala area.This information will allow to address which uncertainties are independent of the implementedsolutions but have an effect on them.
3. Ranking driving forcesThe next step in the process is ranking the driving forces on the basis of two criteria: the degreeof impact on the success of the critical issue, and the degree of uncertainty surrounding thesevariables. To be systematic in this ranking process a simple impact/uncertainty matrix can bebuilt. This step directs the outcome of the final scenarios according to the (two or three) mostimportant and uncertain key factors. These will define the most divergent and relevant futureconditions to be included in the final set.
4. Alternative ProjectionsThe results of the previous step can be employed to construct a matrix within which the differentscenarios will diverge. The aim is to come up with just few scenarios whose differences lead thedecision-maker to distinct choices. Ratcliffe [86] suggests to only develop two to four differentscenarios. For Dala 4 scenario stories have been selected according to their plausibility anddiversity.
5. Scenario DevelopmentIn this final phase, the scenarios selected are further developed and described in more details.The key factors and the driving forces identified in steps 2 and 3 can now be adapted and locatedon the scenarios according a logic correlation.
B.1. Exploring driving forcesThe external factors, or as Ratcliffe calls them: driving forces, that were identified for this case arelisted below. The factors were identified by performing a brainstorm of all the factors that influencethe system as defined by the boundaries in section 2.2.
• Pollution
77
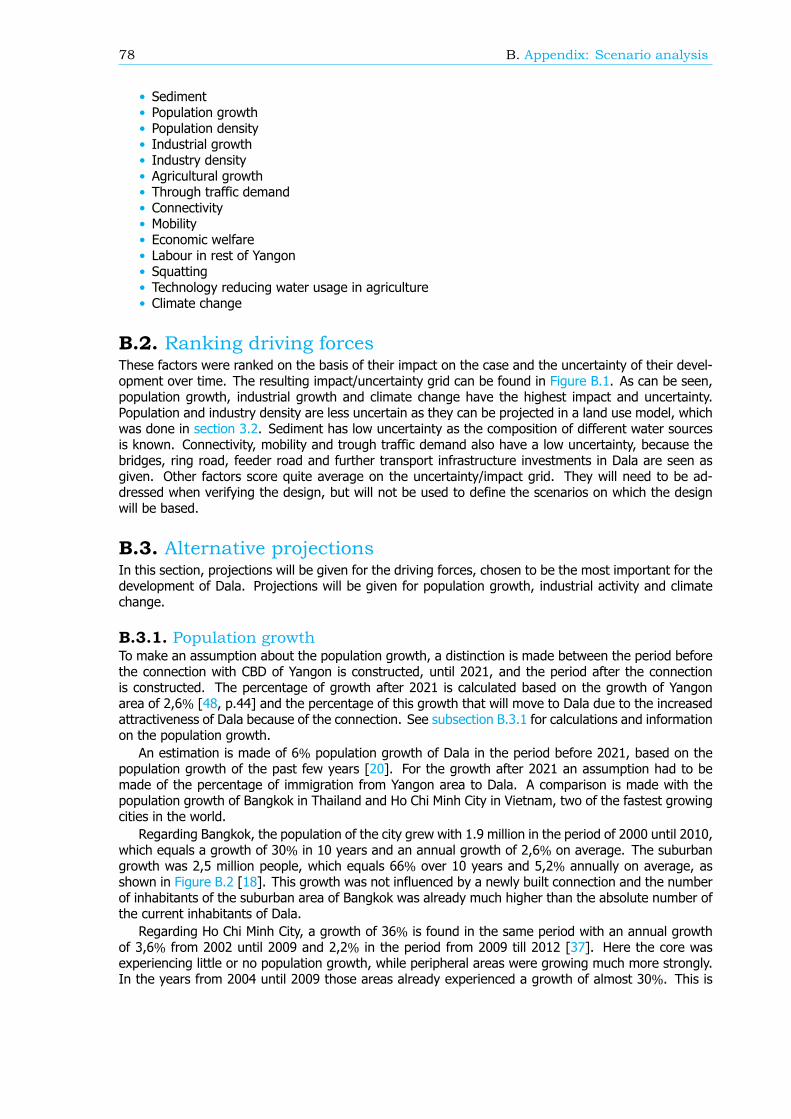
78 B. Appendix: Scenario analysis
• Sediment• Population growth• Population density• Industrial growth• Industry density• Agricultural growth• Through traffic demand• Connectivity• Mobility• Economic welfare• Labour in rest of Yangon• Squatting• Technology reducing water usage in agriculture• Climate change
B.2. Ranking driving forcesThese factors were ranked on the basis of their impact on the case and the uncertainty of their devel-opment over time. The resulting impact/uncertainty grid can be found in Figure B.1. As can be seen,population growth, industrial growth and climate change have the highest impact and uncertainty.Population and industry density are less uncertain as they can be projected in a land use model, whichwas done in section 3.2. Sediment has low uncertainty as the composition of different water sourcesis known. Connectivity, mobility and trough traffic demand also have a low uncertainty, because thebridges, ring road, feeder road and further transport infrastructure investments in Dala are seen asgiven. Other factors score quite average on the uncertainty/impact grid. They will need to be ad-dressed when verifying the design, but will not be used to define the scenarios on which the designwill be based.
B.3. Alternative projectionsIn this section, projections will be given for the driving forces, chosen to be the most important for thedevelopment of Dala. Projections will be given for population growth, industrial activity and climatechange.
B.3.1. Population growthTo make an assumption about the population growth, a distinction is made between the period beforethe connection with CBD of Yangon is constructed, until 2021, and the period after the connectionis constructed. The percentage of growth after 2021 is calculated based on the growth of Yangonarea of 2,6% [48, p.44] and the percentage of this growth that will move to Dala due to the increasedattractiveness of Dala because of the connection. See subsection B.3.1 for calculations and informationon the population growth.
An estimation is made of 6% population growth of Dala in the period before 2021, based on thepopulation growth of the past few years [20]. For the growth after 2021 an assumption had to bemade of the percentage of immigration from Yangon area to Dala. A comparison is made with thepopulation growth of Bangkok in Thailand and Ho Chi Minh City in Vietnam, two of the fastest growingcities in the world.
Regarding Bangkok, the population of the city grew with 1.9 million in the period of 2000 until 2010,which equals a growth of 30% in 10 years and an annual growth of 2,6% on average. The suburbangrowth was 2,5 million people, which equals 66% over 10 years and 5,2% annually on average, asshown in Figure B.2 [18]. This growth was not influenced by a newly built connection and the numberof inhabitants of the suburban area of Bangkok was already much higher than the absolute number ofthe current inhabitants of Dala.
Regarding Ho Chi Minh City, a growth of 36% is found in the same period with an annual growthof 3,6% from 2002 until 2009 and 2,2% in the period from 2009 till 2012 [37]. Here the core wasexperiencing little or no population growth, while peripheral areas were growing much more strongly.In the years from 2004 until 2009 those areas already experienced a growth of almost 30%. This is
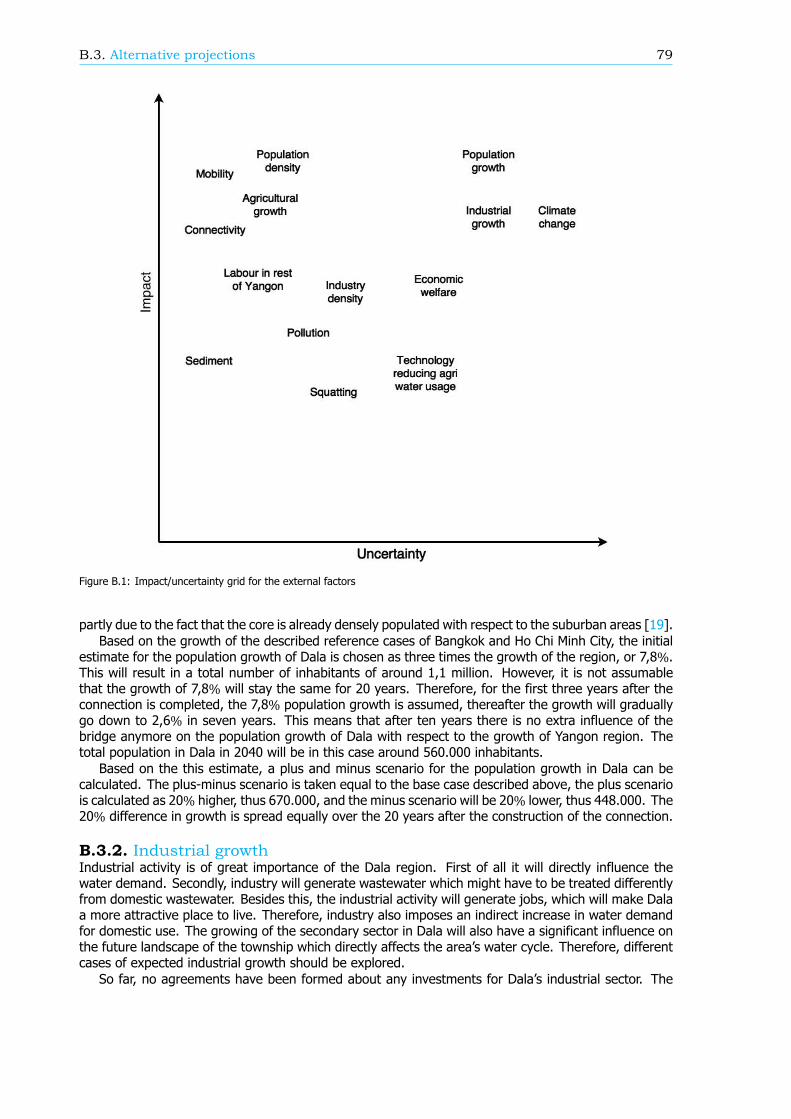
B.3. Alternative projections 79
Figure B.1: Impact/uncertainty grid for the external factors
partly due to the fact that the core is already densely populated with respect to the suburban areas [19].Based on the growth of the described reference cases of Bangkok and Ho Chi Minh City, the initial
estimate for the population growth of Dala is chosen as three times the growth of the region, or 7,8%.This will result in a total number of inhabitants of around 1,1 million. However, it is not assumablethat the growth of 7,8% will stay the same for 20 years. Therefore, for the first three years after theconnection is completed, the 7,8% population growth is assumed, thereafter the growth will graduallygo down to 2,6% in seven years. This means that after ten years there is no extra influence of thebridge anymore on the population growth of Dala with respect to the growth of Yangon region. Thetotal population in Dala in 2040 will be in this case around 560.000 inhabitants.
Based on the this estimate, a plus and minus scenario for the population growth in Dala can becalculated. The plus-minus scenario is taken equal to the base case described above, the plus scenariois calculated as 20% higher, thus 670.000, and the minus scenario will be 20% lower, thus 448.000. The20% difference in growth is spread equally over the 20 years after the construction of the connection.
B.3.2. Industrial growthIndustrial activity is of great importance of the Dala region. First of all it will directly influence thewater demand. Secondly, industry will generate wastewater which might have to be treated differentlyfrom domestic wastewater. Besides this, the industrial activity will generate jobs, which will make Dalaa more attractive place to live. Therefore, industry also imposes an indirect increase in water demandfor domestic use. The growing of the secondary sector in Dala will also have a significant influence onthe future landscape of the township which directly affects the area s water cycle. Therefore, differentcases of expected industrial growth should be explored.
So far, no agreements have been formed about any investments for Dala s industrial sector. The
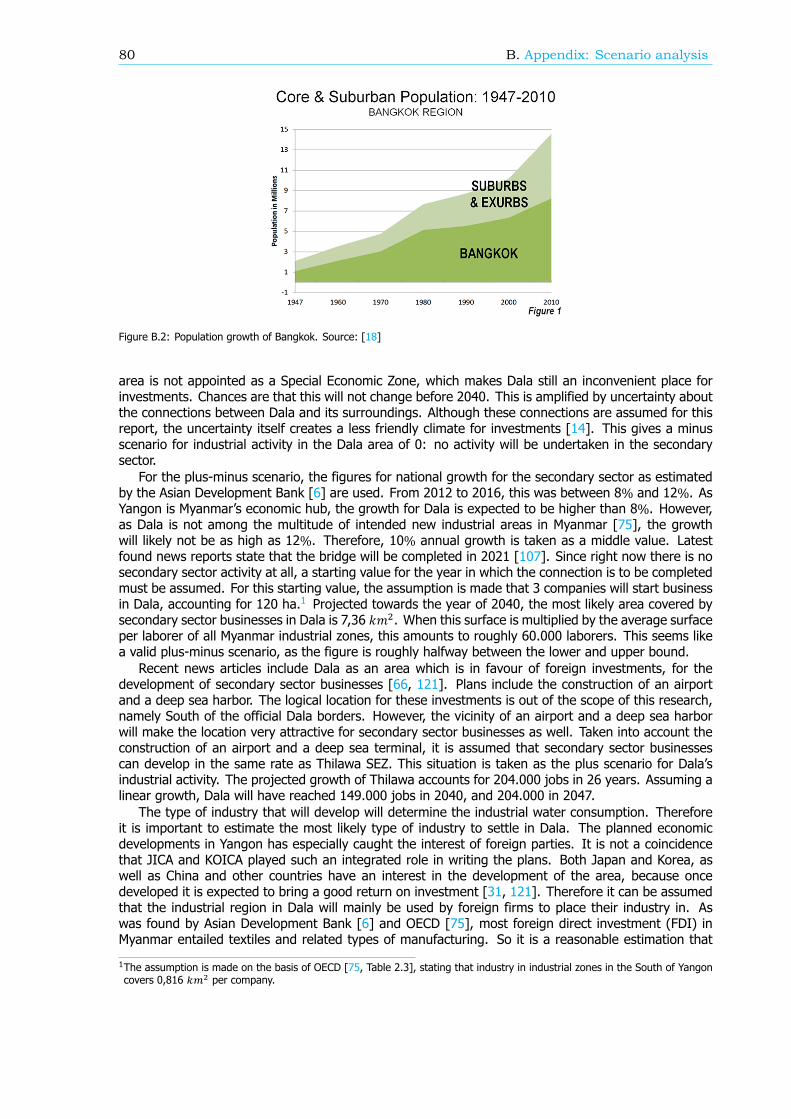
80 B. Appendix: Scenario analysis
Figure B.2: Population growth of Bangkok. Source: [18]
area is not appointed as a Special Economic Zone, which makes Dala still an inconvenient place forinvestments. Chances are that this will not change before 2040. This is amplified by uncertainty aboutthe connections between Dala and its surroundings. Although these connections are assumed for thisreport, the uncertainty itself creates a less friendly climate for investments [14]. This gives a minusscenario for industrial activity in the Dala area of 0: no activity will be undertaken in the secondarysector.
For the plus-minus scenario, the figures for national growth for the secondary sector as estimatedby the Asian Development Bank [6] are used. From 2012 to 2016, this was between 8% and 12%. AsYangon is Myanmar s economic hub, the growth for Dala is expected to be higher than 8%. However,as Dala is not among the multitude of intended new industrial areas in Myanmar [75], the growthwill likely not be as high as 12%. Therefore, 10% annual growth is taken as a middle value. Latestfound news reports state that the bridge will be completed in 2021 [107]. Since right now there is nosecondary sector activity at all, a starting value for the year in which the connection is to be completedmust be assumed. For this starting value, the assumption is made that 3 companies will start businessin Dala, accounting for 120 ha.1 Projected towards the year of 2040, the most likely area covered bysecondary sector businesses in Dala is 7,36 . When this surface is multiplied by the average surfaceper laborer of all Myanmar industrial zones, this amounts to roughly 60.000 laborers. This seems likea valid plus-minus scenario, as the figure is roughly halfway between the lower and upper bound.
Recent news articles include Dala as an area which is in favour of foreign investments, for thedevelopment of secondary sector businesses [66, 121]. Plans include the construction of an airportand a deep sea harbor. The logical location for these investments is out of the scope of this research,namely South of the official Dala borders. However, the vicinity of an airport and a deep sea harborwill make the location very attractive for secondary sector businesses as well. Taken into account theconstruction of an airport and a deep sea terminal, it is assumed that secondary sector businessescan develop in the same rate as Thilawa SEZ. This situation is taken as the plus scenario for Dala sindustrial activity. The projected growth of Thilawa accounts for 204.000 jobs in 26 years. Assuming alinear growth, Dala will have reached 149.000 jobs in 2040, and 204.000 in 2047.
The type of industry that will develop will determine the industrial water consumption. Thereforeit is important to estimate the most likely type of industry to settle in Dala. The planned economicdevelopments in Yangon has especially caught the interest of foreign parties. It is not a coincidencethat JICA and KOICA played such an integrated role in writing the plans. Both Japan and Korea, aswell as China and other countries have an interest in the development of the area, because oncedeveloped it is expected to bring a good return on investment [31, 121]. Therefore it can be assumedthat the industrial region in Dala will mainly be used by foreign firms to place their industry in. Aswas found by Asian Development Bank [6] and OECD [75], most foreign direct investment (FDI) inMyanmar entailed textiles and related types of manufacturing. So it is a reasonable estimation that
1The assumption is made on the basis of OECD [75, Table 2.3], stating that industry in industrial zones in the South of Yangoncovers 0,816 per company.
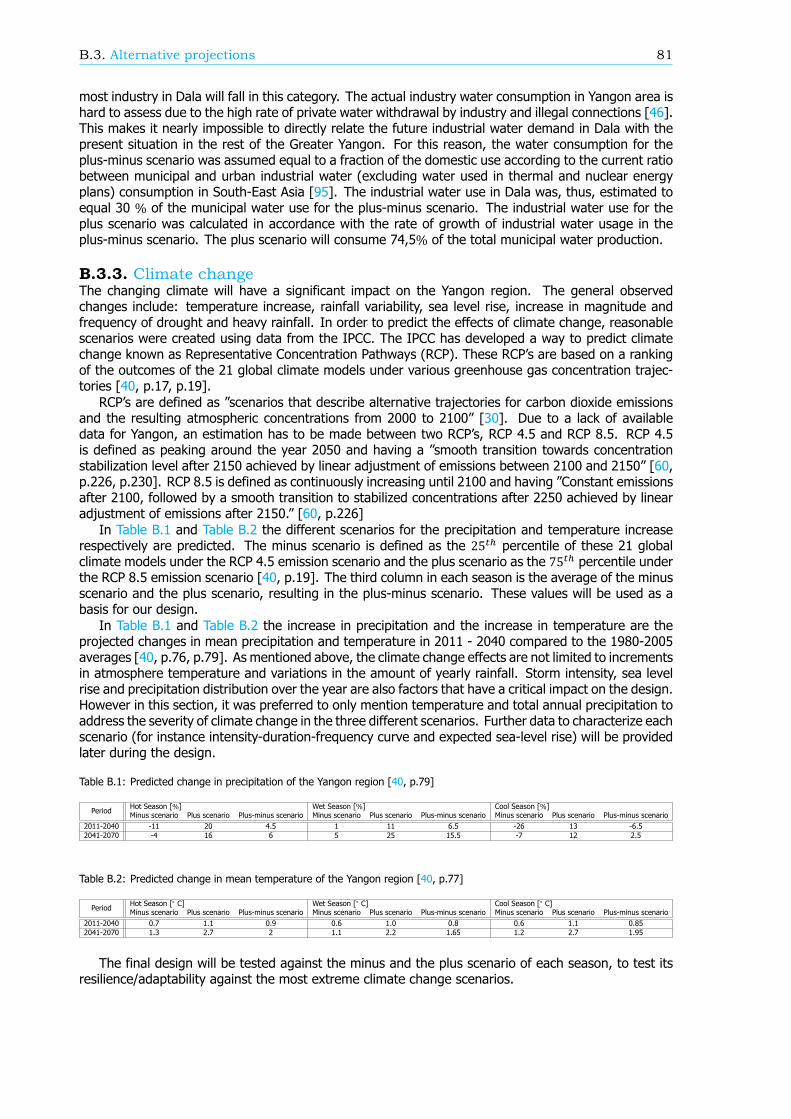
B.3. Alternative projections 81
most industry in Dala will fall in this category. The actual industry water consumption in Yangon area ishard to assess due to the high rate of private water withdrawal by industry and illegal connections [46].This makes it nearly impossible to directly relate the future industrial water demand in Dala with thepresent situation in the rest of the Greater Yangon. For this reason, the water consumption for theplus-minus scenario was assumed equal to a fraction of the domestic use according to the current ratiobetween municipal and urban industrial water (excluding water used in thermal and nuclear energyplans) consumption in South-East Asia [95]. The industrial water use in Dala was, thus, estimated toequal 30 % of the municipal water use for the plus-minus scenario. The industrial water use for theplus scenario was calculated in accordance with the rate of growth of industrial water usage in theplus-minus scenario. The plus scenario will consume 74,5% of the total municipal water production.
B.3.3. Climate changeThe changing climate will have a significant impact on the Yangon region. The general observedchanges include: temperature increase, rainfall variability, sea level rise, increase in magnitude andfrequency of drought and heavy rainfall. In order to predict the effects of climate change, reasonablescenarios were created using data from the IPCC. The IPCC has developed a way to predict climatechange known as Representative Concentration Pathways (RCP). These RCP s are based on a rankingof the outcomes of the 21 global climate models under various greenhouse gas concentration trajec-tories [40, p.17, p.19].
RCP s are defined as scenarios that describe alternative trajectories for carbon dioxide emissionsand the resulting atmospheric concentrations from 2000 to 2100 [30]. Due to a lack of availabledata for Yangon, an estimation has to be made between two RCP s, RCP 4.5 and RCP 8.5. RCP 4.5is defined as peaking around the year 2050 and having a smooth transition towards concentrationstabilization level after 2150 achieved by linear adjustment of emissions between 2100 and 2150 [60,p.226, p.230]. RCP 8.5 is defined as continuously increasing until 2100 and having Constant emissionsafter 2100, followed by a smooth transition to stabilized concentrations after 2250 achieved by linearadjustment of emissions after 2150. [60, p.226]
In Table B.1 and Table B.2 the different scenarios for the precipitation and temperature increaserespectively are predicted. The minus scenario is defined as the 25 percentile of these 21 globalclimate models under the RCP 4.5 emission scenario and the plus scenario as the 75 percentile underthe RCP 8.5 emission scenario [40, p.19]. The third column in each season is the average of the minusscenario and the plus scenario, resulting in the plus-minus scenario. These values will be used as abasis for our design.
In Table B.1 and Table B.2 the increase in precipitation and the increase in temperature are theprojected changes in mean precipitation and temperature in 2011 - 2040 compared to the 1980-2005averages [40, p.76, p.79]. As mentioned above, the climate change effects are not limited to incrementsin atmosphere temperature and variations in the amount of yearly rainfall. Storm intensity, sea levelrise and precipitation distribution over the year are also factors that have a critical impact on the design.However in this section, it was preferred to only mention temperature and total annual precipitation toaddress the severity of climate change in the three different scenarios. Further data to characterize eachscenario (for instance intensity-duration-frequency curve and expected sea-level rise) will be providedlater during the design.
Table B.1: Predicted change in precipitation of the Yangon region [40, p.79]
Period Hot Season [%] Wet Season [%] Cool Season [%]Minus scenario Plus scenario Plus-minus scenario Minus scenario Plus scenario Plus-minus scenario Minus scenario Plus scenario Plus-minus scenario
2011-2040 -11 20 4.5 1 11 6.5 -26 13 -6.52041-2070 -4 16 6 5 25 15.5 -7 12 2.5
Table B.2: Predicted change in mean temperature of the Yangon region [40, p.77]
Period Hot Season [ C] Wet Season [ C] Cool Season [ C]Minus scenario Plus scenario Plus-minus scenario Minus scenario Plus scenario Plus-minus scenario Minus scenario Plus scenario Plus-minus scenario
2011-2040 0.7 1.1 0.9 0.6 1.0 0.8 0.6 1.1 0.852041-2070 1.3 2.7 2 1.1 2.2 1.65 1.2 2.7 1.95
The final design will be tested against the minus and the plus scenario of each season, to test itsresilience/adaptability against the most extreme climate change scenarios.
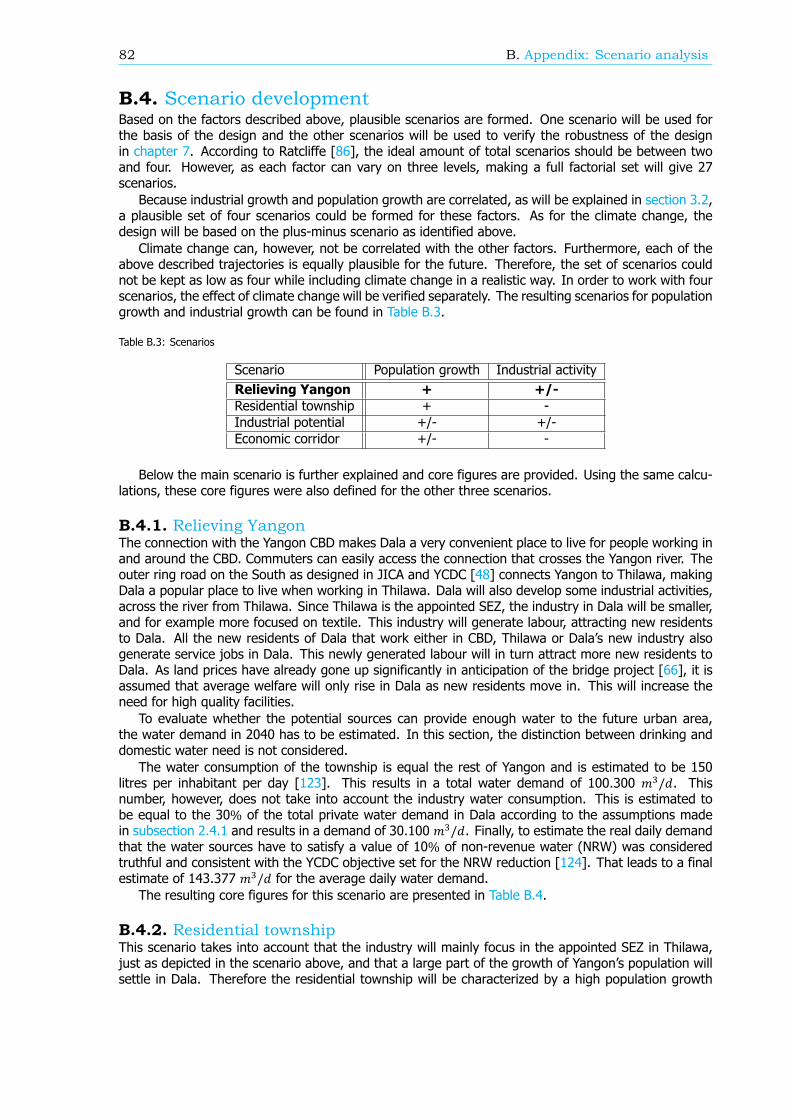
82 B. Appendix: Scenario analysis
B.4. Scenario developmentBased on the factors described above, plausible scenarios are formed. One scenario will be used forthe basis of the design and the other scenarios will be used to verify the robustness of the designin chapter 7. According to Ratcliffe [86], the ideal amount of total scenarios should be between twoand four. However, as each factor can vary on three levels, making a full factorial set will give 27scenarios.
Because industrial growth and population growth are correlated, as will be explained in section 3.2,a plausible set of four scenarios could be formed for these factors. As for the climate change, thedesign will be based on the plus-minus scenario as identified above.
Climate change can, however, not be correlated with the other factors. Furthermore, each of theabove described trajectories is equally plausible for the future. Therefore, the set of scenarios couldnot be kept as low as four while including climate change in a realistic way. In order to work with fourscenarios, the effect of climate change will be verified separately. The resulting scenarios for populationgrowth and industrial growth can be found in Table B.3.
Table B.3: Scenarios
Scenario Population growth Industrial activityRelieving Yangon + +/-Residential township + -Industrial potential +/- +/-Economic corridor +/- -
Below the main scenario is further explained and core figures are provided. Using the same calcu-lations, these core figures were also defined for the other three scenarios.
B.4.1. Relieving YangonThe connection with the Yangon CBD makes Dala a very convenient place to live for people working inand around the CBD. Commuters can easily access the connection that crosses the Yangon river. Theouter ring road on the South as designed in JICA and YCDC [48] connects Yangon to Thilawa, makingDala a popular place to live when working in Thilawa. Dala will also develop some industrial activities,across the river from Thilawa. Since Thilawa is the appointed SEZ, the industry in Dala will be smaller,and for example more focused on textile. This industry will generate labour, attracting new residentsto Dala. All the new residents of Dala that work either in CBD, Thilawa or Dala s new industry alsogenerate service jobs in Dala. This newly generated labour will in turn attract more new residents toDala. As land prices have already gone up significantly in anticipation of the bridge project [66], it isassumed that average welfare will only rise in Dala as new residents move in. This will increase theneed for high quality facilities.
To evaluate whether the potential sources can provide enough water to the future urban area,the water demand in 2040 has to be estimated. In this section, the distinction between drinking anddomestic water need is not considered.
The water consumption of the township is equal the rest of Yangon and is estimated to be 150litres per inhabitant per day [123]. This results in a total water demand of 100.300 / . Thisnumber, however, does not take into account the industry water consumption. This is estimated tobe equal to the 30% of the total private water demand in Dala according to the assumptions madein subsection 2.4.1 and results in a demand of 30.100 / . Finally, to estimate the real daily demandthat the water sources have to satisfy a value of 10% of non-revenue water (NRW) was consideredtruthful and consistent with the YCDC objective set for the NRW reduction [124]. That leads to a finalestimate of 143.377 / for the average daily water demand.
The resulting core figures for this scenario are presented in Table B.4.
B.4.2. Residential townshipThis scenario takes into account that the industry will mainly focus in the appointed SEZ in Thilawa,just as depicted in the scenario above, and that a large part of the growth of Yangon s population willsettle in Dala. Therefore the residential township will be characterized by a high population growth
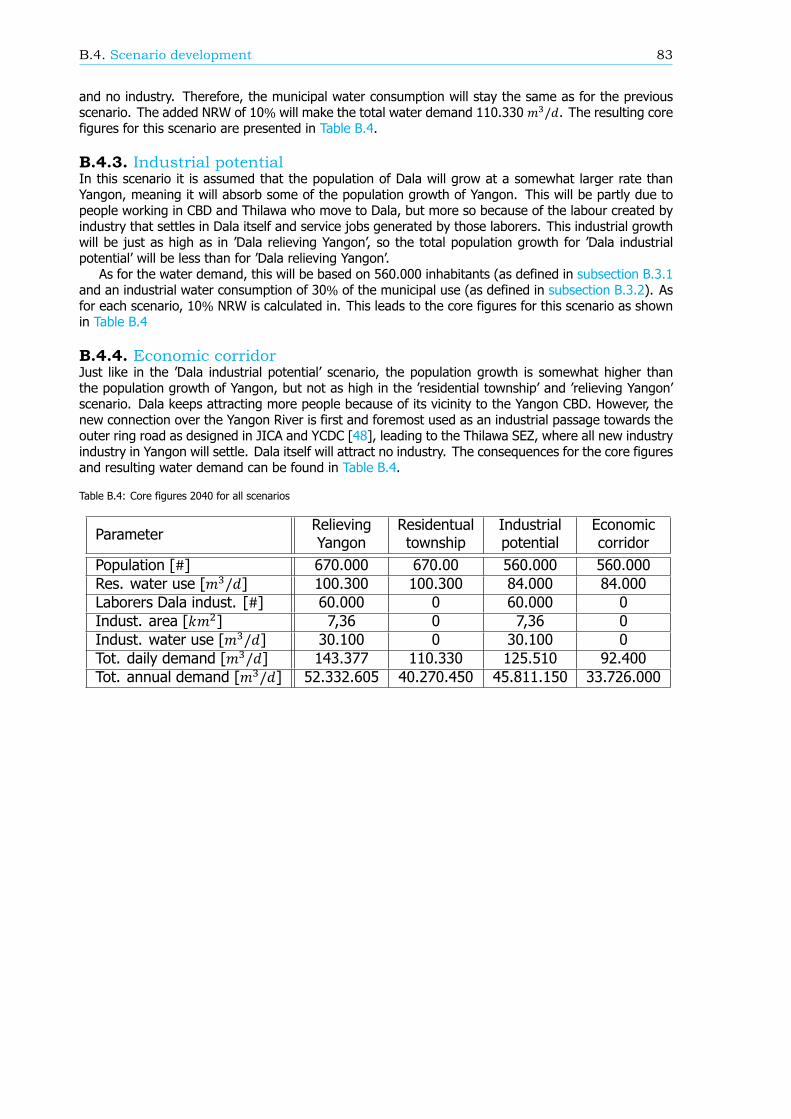
B.4. Scenario development 83
and no industry. Therefore, the municipal water consumption will stay the same as for the previousscenario. The added NRW of 10% will make the total water demand 110.330 / . The resulting corefigures for this scenario are presented in Table B.4.
B.4.3. Industrial potentialIn this scenario it is assumed that the population of Dala will grow at a somewhat larger rate thanYangon, meaning it will absorb some of the population growth of Yangon. This will be partly due topeople working in CBD and Thilawa who move to Dala, but more so because of the labour created byindustry that settles in Dala itself and service jobs generated by those laborers. This industrial growthwill be just as high as in Dala relieving Yangon, so the total population growth for Dala industrialpotential will be less than for Dala relieving Yangon.
As for the water demand, this will be based on 560.000 inhabitants (as defined in subsection B.3.1and an industrial water consumption of 30% of the municipal use (as defined in subsection B.3.2). Asfor each scenario, 10% NRW is calculated in. This leads to the core figures for this scenario as shownin Table B.4
B.4.4. Economic corridorJust like in the Dala industrial potential scenario, the population growth is somewhat higher thanthe population growth of Yangon, but not as high in the residential township and relieving Yangonscenario. Dala keeps attracting more people because of its vicinity to the Yangon CBD. However, thenew connection over the Yangon River is first and foremost used as an industrial passage towards theouter ring road as designed in JICA and YCDC [48], leading to the Thilawa SEZ, where all new industryindustry in Yangon will settle. Dala itself will attract no industry. The consequences for the core figuresand resulting water demand can be found in Table B.4.
Table B.4: Core figures 2040 for all scenarios
ParameterRelievingYangon
Residentualtownship
Industrialpotential
Economiccorridor
Population [#] 670.000 670.00 560.000 560.000Res. water use [ / ] 100.300 100.300 84.000 84.000Laborers Dala indust. [#] 60.000 0 60.000 0Indust. area [ ] 7,36 0 7,36 0Indust. water use [ / ] 30.100 0 30.100 0Tot. daily demand [ / ] 143.377 110.330 125.510 92.400Tot. annual demand [ / ] 52.332.605 40.270.450 45.811.150 33.726.000

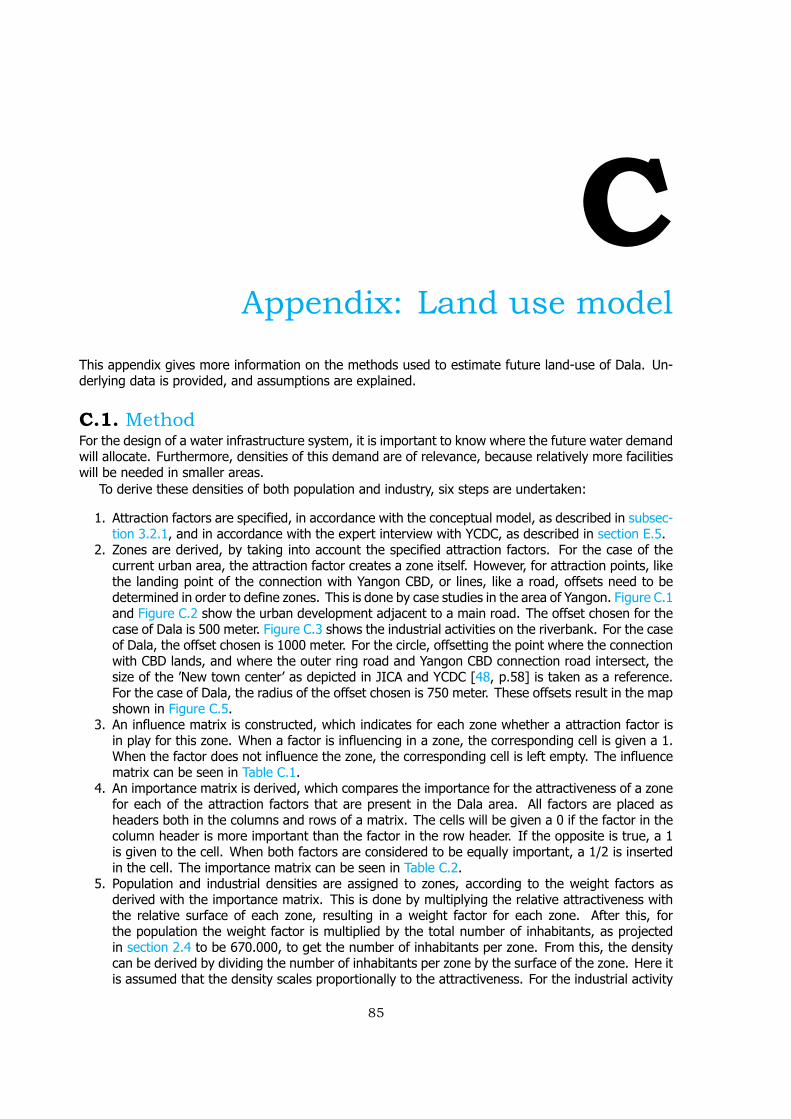
CAppendix: Land use model
This appendix gives more information on the methods used to estimate future land-use of Dala. Un-derlying data is provided, and assumptions are explained.
C.1. MethodFor the design of a water infrastructure system, it is important to know where the future water demandwill allocate. Furthermore, densities of this demand are of relevance, because relatively more facilitieswill be needed in smaller areas.
To derive these densities of both population and industry, six steps are undertaken:
1. Attraction factors are specified, in accordance with the conceptual model, as described in subsec-tion 3.2.1, and in accordance with the expert interview with YCDC, as described in section E.5.
2. Zones are derived, by taking into account the specified attraction factors. For the case of thecurrent urban area, the attraction factor creates a zone itself. However, for attraction points, likethe landing point of the connection with Yangon CBD, or lines, like a road, offsets need to bedetermined in order to define zones. This is done by case studies in the area of Yangon. Figure C.1and Figure C.2 show the urban development adjacent to a main road. The offset chosen for thecase of Dala is 500 meter. Figure C.3 shows the industrial activities on the riverbank. For the caseof Dala, the offset chosen is 1000 meter. For the circle, offsetting the point where the connectionwith CBD lands, and where the outer ring road and Yangon CBD connection road intersect, thesize of the New town center as depicted in JICA and YCDC [48, p.58] is taken as a reference.For the case of Dala, the radius of the offset chosen is 750 meter. These offsets result in the mapshown in Figure C.5.
3. An influence matrix is constructed, which indicates for each zone whether a attraction factor isin play for this zone. When a factor is influencing in a zone, the corresponding cell is given a 1.When the factor does not influence the zone, the corresponding cell is left empty. The influencematrix can be seen in Table C.1.
4. An importance matrix is derived, which compares the importance for the attractiveness of a zonefor each of the attraction factors that are present in the Dala area. All factors are placed asheaders both in the columns and rows of a matrix. The cells will be given a 0 if the factor in thecolumn header is more important than the factor in the row header. If the opposite is true, a 1is given to the cell. When both factors are considered to be equally important, a 1/2 is insertedin the cell. The importance matrix can be seen in Table C.2.
5. Population and industrial densities are assigned to zones, according to the weight factors asderived with the importance matrix. This is done by multiplying the relative attractiveness withthe relative surface of each zone, resulting in a weight factor for each zone. After this, forthe population the weight factor is multiplied by the total number of inhabitants, as projectedin section 2.4 to be 670.000, to get the number of inhabitants per zone. From this, the densitycan be derived by dividing the number of inhabitants per zone by the surface of the zone. Here itis assumed that the density scales proportionally to the attractiveness. For the industrial activity
85
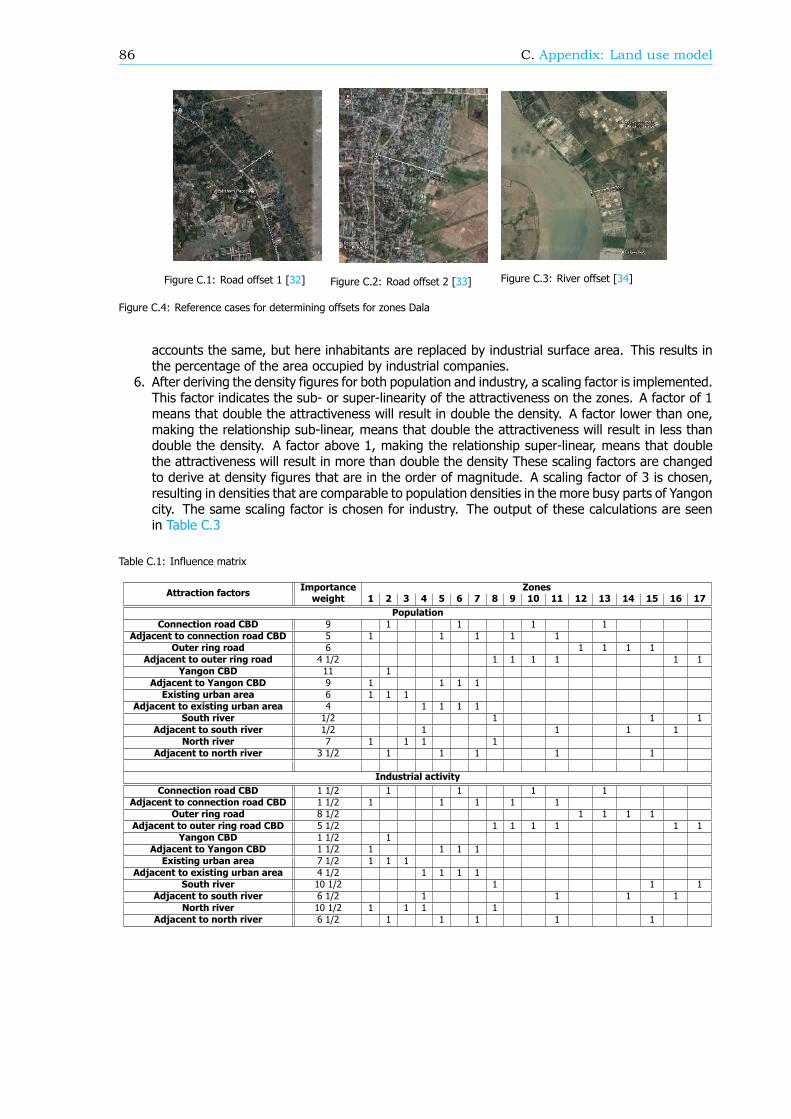
86 C. Appendix: Land use model
Figure C.1: Road offset 1 [32] Figure C.2: Road offset 2 [33] Figure C.3: River offset [34]
Figure C.4: Reference cases for determining offsets for zones Dala
accounts the same, but here inhabitants are replaced by industrial surface area. This results inthe percentage of the area occupied by industrial companies.
6. After deriving the density figures for both population and industry, a scaling factor is implemented.This factor indicates the sub- or super-linearity of the attractiveness on the zones. A factor of 1means that double the attractiveness will result in double the density. A factor lower than one,making the relationship sub-linear, means that double the attractiveness will result in less thandouble the density. A factor above 1, making the relationship super-linear, means that doublethe attractiveness will result in more than double the density These scaling factors are changedto derive at density figures that are in the order of magnitude. A scaling factor of 3 is chosen,resulting in densities that are comparable to population densities in the more busy parts of Yangoncity. The same scaling factor is chosen for industry. The output of these calculations are seenin Table C.3
Table C.1: Influence matrix
Attraction factors Importanceweight
Zones1 2 3 4 5 6 7 8 9 10 11 12 13 14 15 16 17
PopulationConnection road CBD 9 1 1 1 1
Adjacent to connection road CBD 5 1 1 1 1 1Outer ring road 6 1 1 1 1
Adjacent to outer ring road 4 1/2 1 1 1 1 1 1Yangon CBD 11 1
Adjacent to Yangon CBD 9 1 1 1 1Existing urban area 6 1 1 1
Adjacent to existing urban area 4 1 1 1 1South river 1/2 1 1 1
Adjacent to south river 1/2 1 1 1 1North river 7 1 1 1 1
Adjacent to north river 3 1/2 1 1 1 1 1
Industrial activityConnection road CBD 1 1/2 1 1 1 1
Adjacent to connection road CBD 1 1/2 1 1 1 1 1Outer ring road 8 1/2 1 1 1 1
Adjacent to outer ring road CBD 5 1/2 1 1 1 1 1 1Yangon CBD 1 1/2 1
Adjacent to Yangon CBD 1 1/2 1 1 1 1Existing urban area 7 1/2 1 1 1
Adjacent to existing urban area 4 1/2 1 1 1 1South river 10 1/2 1 1 1
Adjacent to south river 6 1/2 1 1 1 1North river 10 1/2 1 1 1 1
Adjacent to north river 6 1/2 1 1 1 1 1
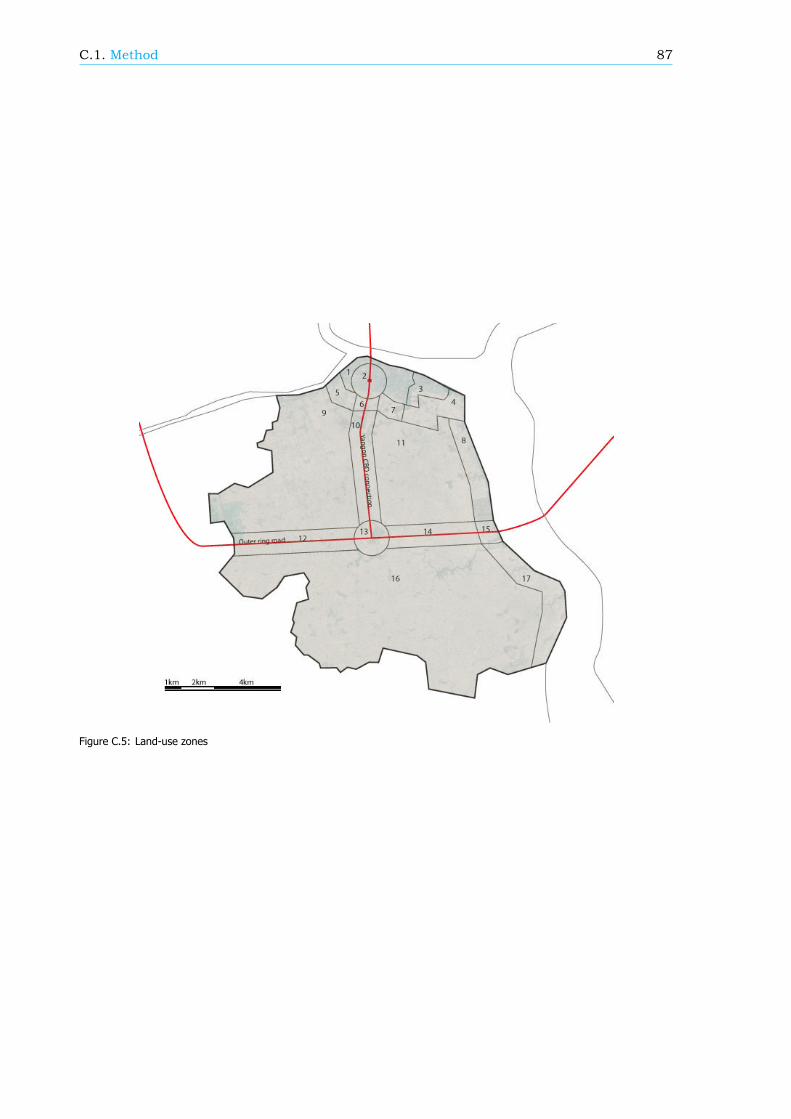
C.1. Method 87
Figure C.5: Land-use zones
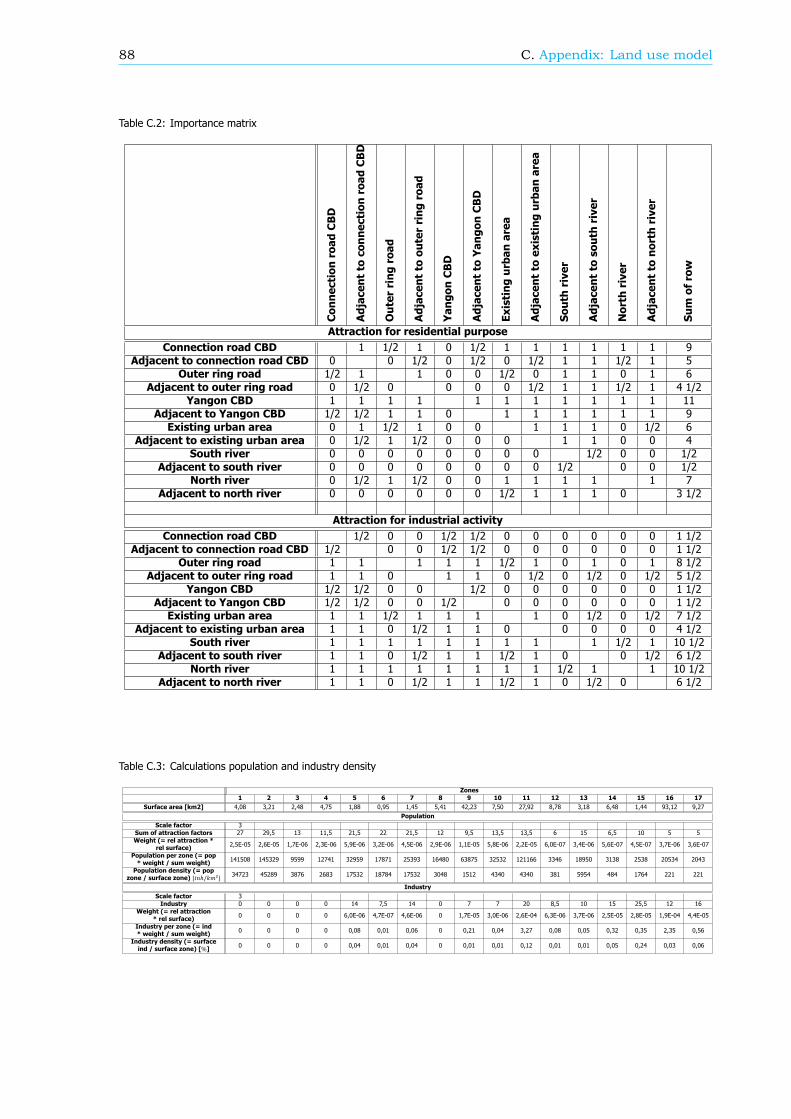
88 C. Appendix: Land use model
Table C.2: Importance matrix
ConnectionroadCBD
AdjacenttoconnectionroadCBD
Outerringroad
Adjacenttoouterringroad
YangonCBD
AdjacenttoYangonCBD
Existingurbanarea
Adjacenttoexistingurbanarea
Southriver
Adjacenttosouthriver
Northriver
Adjacenttonorthriver
Sumofrow
Attraction for residential purposeConnection road CBD 1 1/2 1 0 1/2 1 1 1 1 1 1 9
Adjacent to connection road CBD 0 0 1/2 0 1/2 0 1/2 1 1 1/2 1 5Outer ring road 1/2 1 1 0 0 1/2 0 1 1 0 1 6
Adjacent to outer ring road 0 1/2 0 0 0 0 1/2 1 1 1/2 1 4 1/2Yangon CBD 1 1 1 1 1 1 1 1 1 1 1 11
Adjacent to Yangon CBD 1/2 1/2 1 1 0 1 1 1 1 1 1 9Existing urban area 0 1 1/2 1 0 0 1 1 1 0 1/2 6
Adjacent to existing urban area 0 1/2 1 1/2 0 0 0 1 1 0 0 4South river 0 0 0 0 0 0 0 0 1/2 0 0 1/2
Adjacent to south river 0 0 0 0 0 0 0 0 1/2 0 0 1/2North river 0 1/2 1 1/2 0 0 1 1 1 1 1 7
Adjacent to north river 0 0 0 0 0 0 1/2 1 1 1 0 3 1/2
Attraction for industrial activityConnection road CBD 1/2 0 0 1/2 1/2 0 0 0 0 0 0 1 1/2
Adjacent to connection road CBD 1/2 0 0 1/2 1/2 0 0 0 0 0 0 1 1/2Outer ring road 1 1 1 1 1 1/2 1 0 1 0 1 8 1/2
Adjacent to outer ring road 1 1 0 1 1 0 1/2 0 1/2 0 1/2 5 1/2Yangon CBD 1/2 1/2 0 0 1/2 0 0 0 0 0 0 1 1/2
Adjacent to Yangon CBD 1/2 1/2 0 0 1/2 0 0 0 0 0 0 1 1/2Existing urban area 1 1 1/2 1 1 1 1 0 1/2 0 1/2 7 1/2
Adjacent to existing urban area 1 1 0 1/2 1 1 0 0 0 0 0 4 1/2South river 1 1 1 1 1 1 1 1 1 1/2 1 10 1/2
Adjacent to south river 1 1 0 1/2 1 1 1/2 1 0 0 1/2 6 1/2North river 1 1 1 1 1 1 1 1 1/2 1 1 10 1/2
Adjacent to north river 1 1 0 1/2 1 1 1/2 1 0 1/2 0 6 1/2
Table C.3: Calculations population and industry density
Zones1 2 3 4 5 6 7 8 9 10 11 12 13 14 15 16 17
Surface area [km2] 4,08 3,21 2,48 4,75 1,88 0,95 1,45 5,41 42,23 7,50 27,92 8,78 3,18 6,48 1,44 93,12 9,27Population
Scale factor 3Sum of attraction factors 27 29,5 13 11,5 21,5 22 21,5 12 9,5 13,5 13,5 6 15 6,5 10 5 5Weight (= rel attraction *
rel surface) 2,5E-05 2,6E-05 1,7E-06 2,3E-06 5,9E-06 3,2E-06 4,5E-06 2,9E-06 1,1E-05 5,8E-06 2,2E-05 6,0E-07 3,4E-06 5,6E-07 4,5E-07 3,7E-06 3,6E-07
Population per zone (= pop* weight / sum weight) 141508 145329 9599 12741 32959 17871 25393 16480 63875 32532 121166 3346 18950 3138 2538 20534 2043
Population density (= popzone / surface zone) [ ℎ/ ] 34723 45289 3876 2683 17532 18784 17532 3048 1512 4340 4340 381 5954 484 1764 221 221
IndustryScale factor 3Industry 0 0 0 0 14 7,5 14 0 7 7 20 8,5 10 15 25,5 12 16
Weight (= rel attraction* rel surface) 0 0 0 0 6,0E-06 4,7E-07 4,6E-06 0 1,7E-05 3,0E-06 2,6E-04 6,3E-06 3,7E-06 2,5E-05 2,8E-05 1,9E-04 4,4E-05
Industry per zone (= ind* weight / sum weight) 0 0 0 0 0,08 0,01 0,06 0 0,21 0,04 3,27 0,08 0,05 0,32 0,35 2,35 0,56
Industry density (= surfaceind / surface zone) [%] 0 0 0 0 0,04 0,01 0,04 0 0,01 0,01 0,12 0,01 0,01 0,05 0,24 0,03 0,06

DAppendix: Morphological chart
An important part of the functional design phase is constructing a morphological chart. A morphologicalchart is a tool that can be used to generate solutions for each function of the system and by combiningthem, constructing alternative designs. For this project, the chart was constructed on several occasions:during two internal brainstorm sessions and during one external brainstorm session, which are fullyelaborated in Appendix F, to which experts from the YEP network and students from YTU and MMU wereinvited to participate. The goal of these brainstorms was to generate as many solutions as possibleand to think out of the box. As a result, the combined chart was very large and contained some ideasthat could immediately be classified as too unfeasible or ineffective for further research. Therefore,the chart was trimmed slightly. The remaining solutions were further researched and evaluated on thebasis of how well they would fit in either of the three alternative designs. The ideas that were furtherresearched can be found in Table D.1.
89
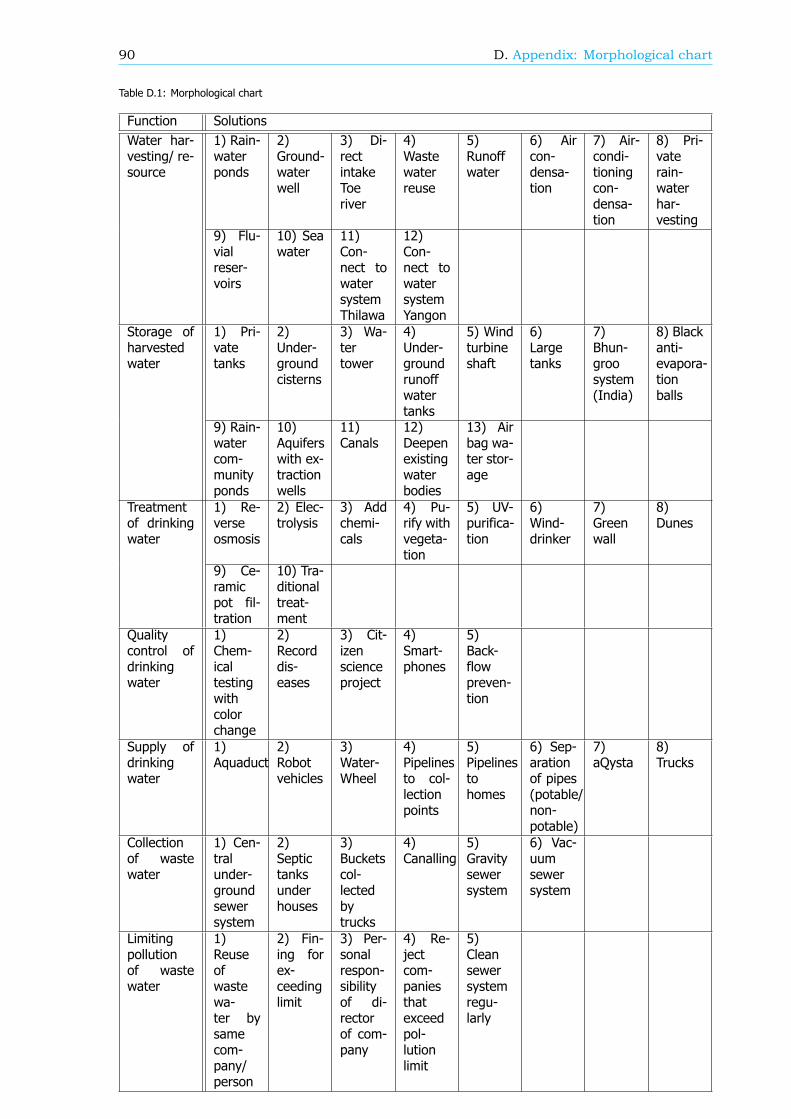
90 D. Appendix: Morphological chart
Table D.1: Morphological chart
Function SolutionsWater har-vesting/ re-source
1) Rain-waterponds
2)Ground-waterwell
3) Di-rectintakeToeriver
4)Wastewaterreuse
5)Runoffwater
6) Aircon-densa-tion
7) Air-condi-tioningcon-densa-tion
8) Pri-vaterain-waterhar-vesting
9) Flu-vialreser-voirs
10) Seawater
11)Con-nect towatersystemThilawa
12)Con-nect towatersystemYangon
Storage ofharvestedwater
1) Pri-vatetanks
2)Under-groundcisterns
3) Wa-tertower
4)Under-groundrunoffwatertanks
5) Windturbineshaft
6)Largetanks
7)Bhun-groosystem(India)
8) Blackanti-evapora-tionballs
9) Rain-watercom-munityponds
10)Aquiferswith ex-tractionwells
11)Canals
12)Deepenexistingwaterbodies
13) Airbag wa-ter stor-age
Treatmentof drinkingwater
1) Re-verseosmosis
2) Elec-trolysis
3) Addchemi-cals
4) Pu-rify withvegeta-tion
5) UV-purifica-tion
6)Wind-drinker
7)Greenwall
8)Dunes
9) Ce-ramicpot fil-tration
10) Tra-ditionaltreat-ment
Qualitycontrol ofdrinkingwater
1)Chem-icaltestingwithcolorchange
2)Recorddis-eases
3) Cit-izenscienceproject
4)Smart-phones
5)Back-flowpreven-tion
Supply ofdrinkingwater
1)Aquaduct
2)Robotvehicles
3)Water-Wheel
4)Pipelinesto col-lectionpoints
5)Pipelinestohomes
6) Sep-arationof pipes(potable/non-potable)
7)aQysta
8)Trucks
Collectionof wastewater
1) Cen-tralunder-groundsewersystem
2)Septictanksunderhouses
3)Bucketscol-lectedbytrucks
4)Canalling
5)Gravitysewersystem
6) Vac-uumsewersystem
Limitingpollutionof wastewater
1)Reuseofwastewa-ter bysamecom-pany/person
2) Fin-ing forex-ceedinglimit
3) Per-sonalrespon-sibilityof di-rectorof com-pany
4) Re-jectcom-paniesthatexceedpol-lutionlimit
5)Cleansewersystemregu-larly
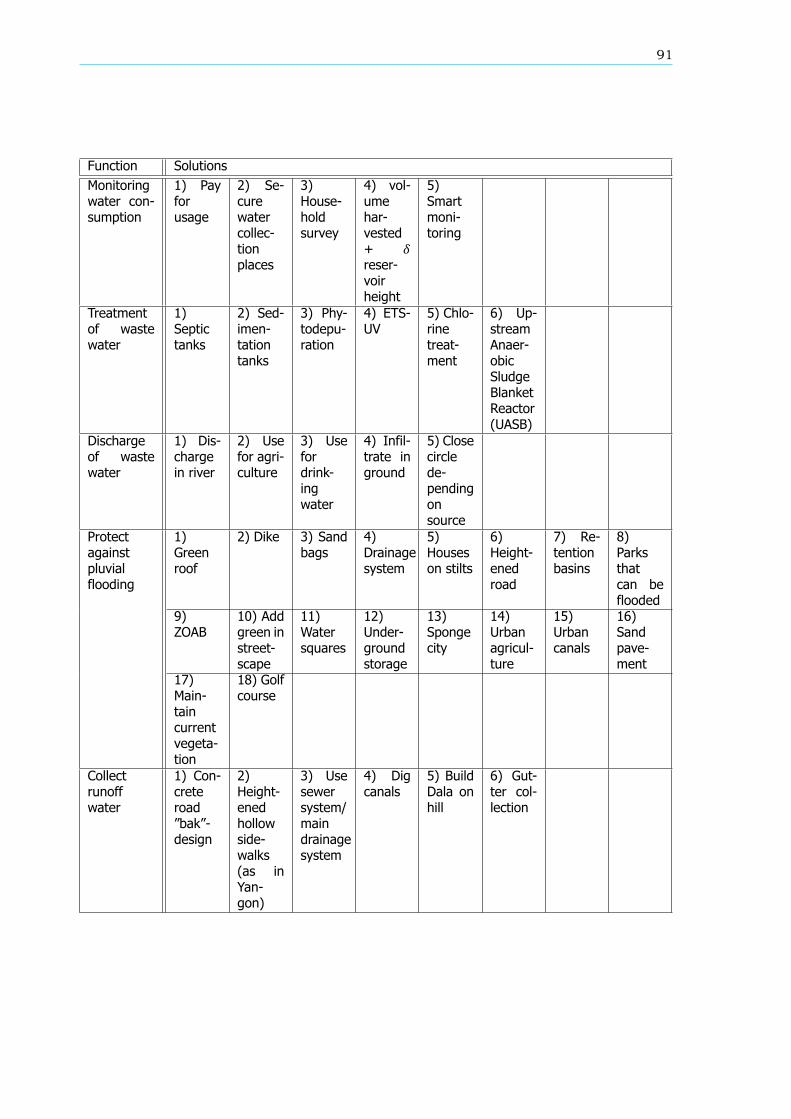
91
Function SolutionsMonitoringwater con-sumption
1) Payforusage
2) Se-curewatercollec-tionplaces
3)House-holdsurvey
4) vol-umehar-vested+ reser-voirheight
5)Smartmoni-toring
Treatmentof wastewater
1)Septictanks
2) Sed-imen-tationtanks
3) Phy-todepu-ration
4) ETS-UV
5) Chlo-rinetreat-ment
6) Up-streamAnaer-obicSludgeBlanketReactor(UASB)
Dischargeof wastewater
1) Dis-chargein river
2) Usefor agri-culture
3) Usefordrink-ingwater
4) Infil-trate inground
5) Closecirclede-pendingonsource
Protectagainstpluvialflooding
1)Greenroof
2) Dike 3) Sandbags
4)Drainagesystem
5)Houseson stilts
6)Height-enedroad
7) Re-tentionbasins
8)Parksthatcan beflooded
9)ZOAB
10) Addgreen instreet-scape
11)Watersquares
12)Under-groundstorage
13)Spongecity
14)Urbanagricul-ture
15)Urbancanals
16)Sandpave-ment
17)Main-taincurrentvegeta-tion
18) Golfcourse
Collectrunoffwater
1) Con-creteroadbak -design
2)Height-enedhollowside-walks(as inYan-gon)
3) Usesewersystem/maindrainagesystem
4) Digcanals
5) BuildDala onhill
6) Gut-ter col-lection

EAppendix: Meetings local
stakeholders
During the 8 week period, a number of visits, interviews, meetings and workshops were conducted.Some of them with a specific goal, such as the workshops and the validation interviews, but someof them were used as general input for this project. A number of these general input meetings aresummarized in this appendix.
E.1. Dala tea shop interview - 29 August 2017Attendants:
• Inhabitants of Dala (3)• Pann Ei Ei Phyoe - Interpreter• Giacomo Bandinu• Jeroen Delfos
This interview was conducted in a local tea shop, with three inhabitants of the Dala township. Thethree inhabitants were working in an office in Dala itself. Questions were asked about the problemsthat Dala faces, and about the expected influences of the planned bridge connection between Dala andYangon CBD.
• Is there a lot of flooding in Dala?
– Not a lot. There is some flooding in June, July and august, but it is not destructive. Thereare different parts of Dala and in some areas the water will flood, like at the riverside it cancome up to 4 feet in the rainy season. The area where the interview is taken, is not floodedby tide, but only by rain.
• Are you bothered by the flooding in those areas?
– It does not matter that much, because if the tide goes down the water also flows away. Itonly lasts for one hour.
• Do you use the flooded water? For example for agriculture or drinking water?
– No. Most of the people of this township have office jobs and therefore do not use it foragriculture. For the people in the villages around, they also do not use it because it is verysalty. They have the water ponds which they use for drinking water.
• How do people get access to drinking water?
– Annually there is a problem with a lack of water. In the end of the dry season, in March,April and May, the ponds dry out, and there is not enough water, although there are a lot ofponds. When the ponds dry out, there are people from Yangon that donate water for Dala.All the donations are collected at a central point in Dala, after which the water is distributedin tanks of 20 liters and some bigger.
93
94 E. Appendix: Meetings local stakeholders
– During the time that the ponds can provide water, every household has to get the watermanually with buckets.
• How do they transport the water?
– Nowadays there are wider roads where water can be transported on. Donations are oftennot transported by boat because it s more expensive. Instead, the transportation is done byroad, through Hlaing Township1. There are 23 quarters in Dala Township, some are reallydifficult to reach. There the water is really needed, because the car cannot go to the village.The roads are really a problem for transportation of the water right now.
• Is the bridge a good idea for Dala?
– It will be good for the transportation, however more people will go to live in Dala becauseit is cheaper, increasing the drinking water problem already present. There is no bus rightnow, so transportation is done by motorbikes. It is expected that the bridge connection willresult in bus lines connecting Dala.
• How is the water quality?
– Quite okay. The water from the ponds is used for domestic purposes. However, salt wateris intruded in the ground, so a lot of the pond sources are not good for drinking water.
• What changed in Dala within the last 10 years?
– Everything is developed, electricity, the roads. Drinking water scarcity has changed for theworse, because there are more people living in Dala right now so the demand has gone up,but the harvested water has stayed the same.
E.2. Dala squatters interview - 29 August 2017Attendants:
• Squatters (2)• Pann Ei Ei Phyoe - Interpreter• Giacomo Bandinu• Lot Barendsen• Arnout Janse• Irene Overtoom
On the 29th of August, a field trip to Dala was conducted. A family that was currently living on thelocation where the bridge to connect Dala with Yangon will be built was interviewed. Most of the citizensthat live in that area, including the family which was interviewed, are not the land owners, but squaton this public land. The first part of the interview is about the relocation method and compensationfor the people that are living in the future bridge area. The second part of the interview investigatesthe occurrence of flooding in the area close to the river bank and how floods affect the local life.
Relocation due to bridge construction• How much does the government pay you to move from this location?
– Since we are not land owners the government only pays 300.000 MMK per family/house toremove all their goods from the public land. The government pays 10 million MMK (8.000$) toeach house owner that must sell their land. The people who own the land do not necessarilyhave to move, they only have to sell their land to government. These are only a few houses,since most of the people in that area don t own the land on which they have built theirhouses.
• When do you have to remove your house?
– They must remove their house before October 2017. This is one month after the day of theinterview.
• Is the government providing a specific place for the people of Dala that have to relocate?
1A trip by road of about 35 is needed to reach the Hlaing Township
E.3. YCDC - 19 September 2017 95
– No, we must find that by our-self.
• Are people complaining about the relocation method and payment?
– The people who get the money seem to be OK with the compensation. There are only 1 or2 families who do not agree with the compensation, but, since they are illegally occupyingpublic land they do not have any right to disagree.
• When did you receive the notification that you must vacate the area?
– Last year some authority (they do not which one exactly) told us that we must move. How-ever, we did not have any official communication from the government. Also the notificationthat they have to move in October is apparently not official.
• Which organization is operating the relocation and the compensation payment?
– We do not know, but most likely the YCDC or Dala Community Committee.
Floodings in Dala• Are you bothered by the flooding? Is your house high enough?
– We do not have real problems with the high water since our houses are constructed highenough to not be bothered by the flooding, even when high water occurs.
• How often does the riverbank area flood? Do you know when it is going to happen? Can youforecast the high water?
– The high water occurs every year during the rainy season (May to September). It occurs 1or 2 days per month during the rainy season.
E.3. YCDC - 19 September 2017Attendants:
• Daw Nyein Aye - Assistant Director Urban Planning Division YCDC• Giacomo Bandinu• Arnout Janse
This meeting was intended to introduce the Sustainable Dala group and YCDC to each other. Aftera quick introduction about the Sustainable Dala project by the present group members, Nyein Aye gavean update of the planned and ongoing projects in Dala under the supervision of YCDC. It was agreedafterward that more appointments will follow to discuss the outcome of the project and to visit Dala.
The current drinking water for Dala is taken from a groundwater source located in Puak Yangon,26 south of Dala. The capacity of this source is not big enough to cover all the households. Topartially overcome this problem, a Korean donor constructed a small water treatment plant which useslocal groundwater to provide wards No. 6 with drinking water.
The Japanese Fund for Poverty Reduction (JFPR) and the ADB have financed $2 million for devel-oping projects for Dala. This will finance the construction of in total seven small treatment plants toprovide drinking water in rural area of the Greater Yangon region. Three of them will be placed in Dalatownship in ward No. 11/14 and in Auntgui west ward. All of them will treat groundwater with reverseosmosis units. Furthermore, a public toilet project and solid waste management project in Dala will befinanced by the same fund.
For the future, YCDC is looking into using the Toe River, in the south-west of Dala, as water aresource which will supply drinking water to Dala as well as to Yangon City.
E.4. Dala Community Committee - 29 September 2017Attendants:
• Daw Nyein Aye - Assistant Director Urban Planning Division YCDC• U Tin Hla - Member Dala Community Committee• Dala Community Committee members• Kyaw Nyunt Linn - Interpreter• Kyi Kyi Thar - Interpreter
96 E. Appendix: Meetings local stakeholders
• Giacomo Bandinu• Jeroen Delfos
During this visit to Dala, Nyein Aye (YCDC) accompanied and introduced the Sustainable Dala groupto the Dala Community Committee. Different points were discussed, concerning the water use andcurrent infrastructure. The impact of the bridge was also discussed. Lastly more in depth questionsabout possible design decisions were discussed.
Current water systemCurrently there are three sources for water:
• Groundwater, harvested south of Dala and transported through pipelines.
– Water is salty, and is therefore only used for domestic use;– it can only serve a very small part of the Township.
• Rainwater, harvested directly in ponds. Sometimes rainwater is harvested on roofs of publicbuildings (like schools), adjacent to ponds, and stored in the ponds.
– The water is used for drinking water for the poor people;– Water is not clean. Health problems are occurring due to the quality of the water;– Water is not cleaned at household level. Boiling the water requires energy, which is tooexpensive;
– Ponds dry up in the dry season. Depending on the storage characteristics of the pond theycan empty out between February and May.
• Water from Yangon, transported by road or boat.
– In the rainy season this is the water source for the less poor people;– In the dry season, when ponds are dried out, the poor people rely on water donations.People sometimes wait a whole day for this water, receiving only one or two bottles (litres)of water.
Impact of the Dala BridgeThe Dala Committee are very positive and are looking forward to the construction of the bridge. Thesooner the better. Reasons for this are:
• The committee thinks the designed water pipeline will bring a more certain supply of drinkingwater;
• The water shortage also induces the danger of fires, since there is no water to extinguish them;• During foggy conditions, which occur during dry season, getting across the Yangon river is prob-lematic, obstructing commuters to work in Yangon;
• Transport for emergency situations requiring a proper hospital in Yangon need to be done byboat, which is not always available, or is brings his own safety risks.
Negative impacts of the bridge (induced water demand due to population growth, more urbaniza-tion, induced industrial activity) are not playing a role in the discussion on the bridge. When specificallyasking about these negative impacts, they are largely denied, possibly to not give any reason to post-pone the construction of the bridge. The Dala Community Committee wants only non-smoking industryin Dala.
Possible design solutionsAs said before, one of the current water sources is rainwater. Dala residents have experience withrainwater harvesting, and are used to the idea of drinking rainwater. Alternatives were also discussedwith the committee:
• Groundwater is not trusted as a source for drinking water, due to the salinity of the water fromthe source.
• Water from the river Toe is not seen as a feasible solution, since the committee members thinkthat the price of this water will be too high, due to the transportation costs.
E.5. YCDC - 02 October 2017 97
Pond visitAfter the meeting with the Dala Community Committee, some of the members of the Committee showedthe SD group a drinking water pond in the western part of Dala. During the conversations here, somestatements were made by Nyein Aye, and committee members, that give more insight in the situationof Dala.
• Some inhabitants don t have enough money even to buy a bucket, with which water can betransported to their houses.
• One pond, which is used for drinking purposes, lies adjacent to a graveyard. During heavy rainfall,runoff from this graveyard flows into the pond.
• A large share of the Dala inhabitants is housed in illegal buildings.• The owners of the land on which illegal settlements have been formed allow this situation for now,because the land has a very low value. Any actions to remove settlements are not undertaken,because squatters will just move to a new illegal spot.
E.5. YCDC - 02 October 2017Attendants:
• Daw Tin Tin Kyi - Director Urban Planning Division YCDC• Daw Saw Sandar Oo - Division Head City Planning and Land Administration Department YCDC• Daw Nyein Aye - Assistant Director Urban Planning Division YCDC• Daw Khaing Moe Nyunt - Deputy Director Urban Planning Division• Jeroen Delfos• Irene Overtoom
In this meeting the land-use model as found in Appendix C was discussed. The methods used, andthe resulting maps for population density and industrial activity density were presented.
Feedback on the assumptions used, and resulting figures were given by Daw Tin Tin Kyi, Daw SawSandar Oo, Daw Nyaing Aye and Daw Khaing Moe Nyunt:
• The listed attraction factors, used to determine the attractiveness for population growth arecorrect.
• A large part of the riverbank will be used for recreational space. Hence, industry can not settlehere.
• Heavy, polluting industry is not welcome in Dala, due to the prevailing wind direction towardsYangon CBD.
• Non-polluting industry, like garment industry is welcome in Dala.
E.6. AG Resources Myanmar - 02 October 2017This meeting took place so that more information could be gathered on the current progress of theplans in Dala. Attendants:
• Captain Zaw Min Win - Managing Director• Pyaet Phyoe Aung - Operation Manager• Lot Barendsen• Giacomo Bandinu
E.6.1. Current situation• Industrial wastewater is not treated.• Yangon has 60 percent non-revenue water.• The pipe network was constructed during the British colonization.• YCDC has 10 tube wells in the Dala region, of which 6 can be used for drinking water. Theremaining four have high iron concentration.
• These tube wells are not able to supply water 24/7 and the supply can be at any hour of the day,including the night.
98 E. Appendix: Meetings local stakeholders
E.6.2. Aim of AG Resources MyanmarThe aim of AG Resources is to supply the Dala region with drinking water. This will be done using twotreatment plants. In order to bridge the time between the construction and completion of the pilotproject AG has mobile RO treatment facilities which can be connected within 3 days. This system willprovide the surrounding inhabitants with free drinking water until the pilot project has started. Thissystem is able to create 20.000 liters of drinking water per day.
Pilot project - 3 million liters per day• Reverse osmosis treatment• Will require 4 months to build• located 2 miles from Dala• Water which will be treated is very dirty and polluted• The raw water is very low in pH
50 million liters per day• TECHKEM water from Malaysia will be responsible for drinking water treatment• Together with partners from USA and Germany• WHO requires 220 liters pppd.• YCDC assumes 90 liters pppd• This system will be able to supply 555.555 people according to YCDC standards.• Only membrane filtration will be needed (UF)• The source is located 19 miles downstream from the Yangon river, where the water is muchcleaner.
• The test on the salinity of this potential source were carried out only during the wet season.• Distribution system will follow the road to Dala and also provide the population of Twan Taytownship (200.000) with water. The pipe network will have a length of 40 km.
• Will supply drinking water with the use of a prepaid system.• 1000 liters of drinking water will cost approximately 855 kyat.• The system will be completed by 2020 and will cost approximately $ 100 million.• If its expansion is necessary an additional 3 months will be required to upgrade the system to150 million liters pppd.
• Money will be loaned and after approximately 35 - 55 years the entire system will be donated tothe local government.
E.7. Impact Terra - 06 October 2017Attendants (phone conversation):
• Gerdien Velink - Head of External Communications• Arnout Janse
For the quality control of water, an application has to be used by the local inhabitants. To see if thisis implementable in Dala a local expert, Gerdien Velink from Impact Terra was consulted. Impact Terrahas developed the application Golden Paddy for farmers to improve agriculture by providing themwith information about the markets. Although their application focuses more on giving information tofarmers instead of asking for input, they have conducted surveys as well within their app. Therefore,she was able to give advice on how to implement a new technology with local people and share theirexperiences until now.
Overall, people wanted to be involved and they are curious to use new technologies to improve theirlife. Some points were stressed and have to be taken into account by setting up and implementing thisapplication for water quality control:
• The application has to be easy to understand. Therefore, the application will be made in bothEnglish and Myanmar language and the use of images for the interface instead of words will theattempted.
• For the inhabitants it is important that the application does not use all of their data while uploadinginformation. Therefore it is important to also make it available offline and to not let it consumea lot of data.

E.7. Impact Terra - 06 October 2017 99
• Show the relevance for the inhabitants. If they see what can be improved for themselves theyare willing to help. Therefore it is important to show that the water quality will improve if theyfill it in correctly.
• To increase the usage of the application, information will be given by going to Dala in person.At Impact Terra, they saw rapid increase in usage if someone went to the area and explained tothe people how to use the application. Social media can be used to stay in contact afterwards.Another option to increase the response is by rewarding people personally for their feedback.
• It is important to know what the stakes of the company are that collects the data. An example wasgiven by Gerdien about the collection of data. If a company only wants data, they are probablynot open to invest in an application that stores everything directly in a database. If they want towork more efficiently, it is a good argument to use an application.

FAppendix: Workshops
During the project, two workshops were organized where inputs were asked from experts living andworking in and around Yangon. The first workshop focused on generating ideas for the differentsolutions where the second workshop was for evaluating the chosen solutions for the design.
F.1. First workshop - 16 September 2017The first workshop was set up as an open brainstorm for input on the different functions and washosted at the office of ICCO Cooperation. The people that were attending this workshop are listedin Table F.1.
Table F.1: Attendance list first workshop
Name OccupationAlwin Commandeur YEPper and river engineer at RoyalhaskoningDHVKyaw Hyunt Linn Project Assistant at The Water AgencyKyi Kyi Thar Intern at The Water AgencyPan Ei Phyu Student at Myanmar Maritime UniversityPyae Phyo Sein One Student at Myanmar Maritime UniversityRobbert Groenen YEPper and founder of Rockstar ImpactTanya Huizer YEPper and Project manager Water & Environment at ArcadisThet Oo Mon Intern at RoyalhaskoningDHVWeiyan Moe Aye Student at MMUMarielle Chartier Intern urban development at Arcadis
After a short introduction and update on the Sustainable Dala project, three heterogeneous groupswere formed to brainstorm about potential solutions for the several water-related issues that Dala willface in the future. In the first part of the workshop, the three teams generated many innovative ideas.The most promising ideas were chosen and worked out. Finally, each group pitched its solutions. Itwas interesting to observe how each team approached the problem differently and focused on differentaspects. The first group presented the idea to involve the local people to let the project succeed andto create more awareness on the possible implementable solutions. The second group combined thefuture urban design of Dala with the water harvesting capacity of the township, really coming up witha design for a living city. The third group focused more on the total water cycle and particularly on thedifferent possibilities to store water for the dry season.
101
102 F. Appendix: Workshops
F.2. Second workshop - 28 September 2017The second workshop organized by Sustainable Dala took place at the embassy of the Netherlands. Theattendance list can be found in Table F.2. After an introduction and sn update on the Sustainable Dala
Table F.2: Attendance list second workshop
Name OccupationAlwin Commandeur YEPper and employee of RoyalhaskoningDHVAung Myint Oo Employee of the embassy of the NetherlandsDaw Khaing Moe Nyunt Deputy Director of Urban Planning Division, YCDCDaw Nyein Aye Assistant Director of Urban Planning Division, YCDCDaw Saw Sandar Oo Division Head City Planning and Land Administration Department, YCDCHuub Buise Deputy ambassador of the embassy of the NetherlandsJan Jaap Pape Researcher at Irrigation Technology Centre BagoKhin Muyar Kyaw Student at Yangon Technological UniversityKhin Myatthu YEPper and civil engineer at ArcadisKyaw Hyunt Linn Project Assistant at The Water AgencyKyi Kyi Thar Intern at The Water AgencyLauren Huisman Intern at the embassy of the NetherlandsLindsey Schwidder Project manager water innovations at TU DelftMarcel Stive Professor emeritus of hydraulic engineering at TU DelftMarielle Chartier Intern at ArcadisMarjan Kreijns Head of Project Management Department at Valorisation Centre TU DelftMarleen Brouwer YEPper and country coordinator Myanmar at ICCO CooperationPan Ei Phyu Student at Myanmar Maritime UniversityPyae Phyo Sein One Student at Myanmar Maritime UniversityTanya Huizer YEPper and employee of Arcadis
U Aye MintSenior water resources engineer at NEPS,chairman of the advisory board for NWRC and IHE-NUFFIC alumnus
U Cho ChoMember of the advisory board at NEPS,chairman of the advisory board for NWRC and IHE-NUFFIC alumnus
U Khin LatSenior consultant at NEPS,member of the advisory board for NWRC and IHE-NUFFIC alumnus
Weiyan Moe Aye Student at Myanmar Maritime University
project, four heterogeneous groups were formed all containing a discussion leader from the SustainableDala group. The goal of this workshop was to evaluate some of the chosen solutions by asking theattendants the following questions:
• Is rainwater the source that interrupts the water cycle the least?• Can the responsibility for storage of water be given to the inhabitants of Dala?• Will the separation of drinkable water and domestic water in Dala contribute to less energyconsumption?
• How do we ensure economic feasibility for the water system, while making drinking water freeof charge?
The questions were formulated in such a way that it would bring up a discussion about the fo-cal points of the design. The discussion leaders wrote down the reactions after which the followingsummary was written.
The participants agreed that rainwater harvesting is one of the solutions which has the smallesteffect on the water cycle. However, the harvesting of rainwater will affect the amount of water whichcan infiltrate into the ground, which in turn can lead to subsidence. A calculation has to be made togive an educated opinion about this topic. Furthermore, multiple experts indicated that the use ofrainwater as the only source for water supply is probably not enough for all water consumption in Dala.Participants also named the Toe river as a good water source that possibly has more capacity.
F.2. Second workshop - 28 September 2017 103
The idea of the separation of pipeline system into domestic and drinking water, to consume lessenergy for the treatment, was not accepted directly by everybody. A big influence factor is the wayof harvesting water. Looking to drinking water, it was mentioned that the river Toe is almost potableand therefore almost no treatment is needed. This means that separating the pipelines would notbe necessary. Using rainwater as a source results in more treatment needed, which could make aseparate pipe system effective in reducing energy usage. Regarding the energy costs and reductionsof energy consumption, the participants advice was to come up with rough calculations of the energyconsumption within the total water cycle. Drinking water treatment might not be the part of the watercycle that consumes most of the energy. Supply might be a more energy intense part of the cycle.In this case it would not be efficient to split the system since this increases the energy demand forsupply. Moreover, the cost of the pipelines have to be calculated. The investment costs are higherfor a separated pipe system with respect to a single system and the payback time can therefore takelonger. A more practical point of separating the system is the implementation, since the inhabitants donot know the idea of a separated system.
An important issue is the awareness of consumption of water. The proposed idea coming fromthe evaluation of the alternative designs is that this can be improved by making people responsiblefor their own water by storing water on local scale. Inhabitants of Dala can be encouraged withpersonal incentives. YCDC has found that assigning responsibility at community level does not work,because of a lack of water conservation awareness. For example, community ponds are often notwell maintained, meaning drinking water quality will drop. Therefore, assigning personal responsibilityworks better. However, the economic feasibility of local storage is questioned. Besides this, the feelingof responsibility for storing the water might not always be present among inhabitants. To solve this andto create more awareness, education has to be improved on the storage of water as well as on howto save water and efficiently harvest water. Lastly the laws and regulations about water consumption,water quality and wastewater production were mentioned. These laws are at least 50 years old, fromback when Dala only had a few inhabitants. They are outdated and need to be adapted to the currentconsumers and standards.
To improve the water system an economic option was proposed, namely: make the drinking waterfree of charges and set this margin on domestic water to cover the expenses for the total waterconsumption of Dala. In this way, all inhabitants will have access to drinking water. Completely freedrinking water was not the best option according to the experts, since people will use drinking waterfor other purposes to save money. Some options were proposed from which the community can earnmoney, for example with tourism, so the water for the poor people can be paid.

GAppendix: Calculations final design
To work out the core functions of the design in more detail, some calculations had to be made. Thecalculations that were made to support the statements in chapter 6 are presented in this appendix.
G.1. Water harvesting and sourceAung [7] calculated the annual amount of rainfall in the Yangon region based on data collected between1993 and 2013 in the three stations of Kaba-Aye, Mingalardon, and Hmawbi. The averaged yearlyprecipitation recorded by these stations are 2.884 , 2.607 and 2.562 respectively. Fromthis, it is possible to extrapolate that, on average, the Yangon region is showered by more than 2.680
every year. This large amount of precipitation makes it interesting to look into the possibility toimplement a rain water harvesting (RHW) system to partially solve the drinking water problem in Dala.It is important to address that every millimetre of water harvested on a surface of one square meter isequivalent to 1 litre of potential drinkable water.
Even if this solution is extremely attractive in terms of sustainability and environmental impact, italso faces several challenges. First of all, around 80% [7, p.24] of the total annual precipitation isconcentrated in a four month period, therefore the water once collected has to be stored to satisfythe demand throughout the rest of the year. Rainwater is characterized by having a very high quality.However, it can be heavily contaminated during the collection process [59]. For these reasons anelaborate design is needed to maximize the rain harvesting capacity and storage for the future Dalatownship. In order to do that, the first step consists of calculating the total potential water that can becollected during an entire year. This capacity can be easily estimated with Equation G.1
Potential Rainwater harvesting =Dala total surface Yearly precipitation in 2040 (G.1)
The result of Equation G.1 is more than 0,36 . To give a comparison, this is equal to the totalamount of water needed to satisfy the yearly water demand of half the population of London (UK).However, it is too ambitious to collect all the water that falls within the Dala area. This calculationgives an estimate of the potential that the rainwater source has in wet tropical regions such as theAyeyarwady Delta.
Roof rainwater harvestingIn the following calculations, some reduction factors are employed to take into account the uncer-tainty related to the future landscape of the township. In this section, the land use model describedin section 3.2 serves as an important tool to support the assumptions on the expected outline of thearea. Wiginton et al. [119] states that there is a linear relationship between the population of an urbanarea and the roof surface with a correlation factor ( ) equal to 0,993. The relation found by Wigintonet al. [119] is shown below:
Roof surface =Population 70+ 23700 (G.2)
105
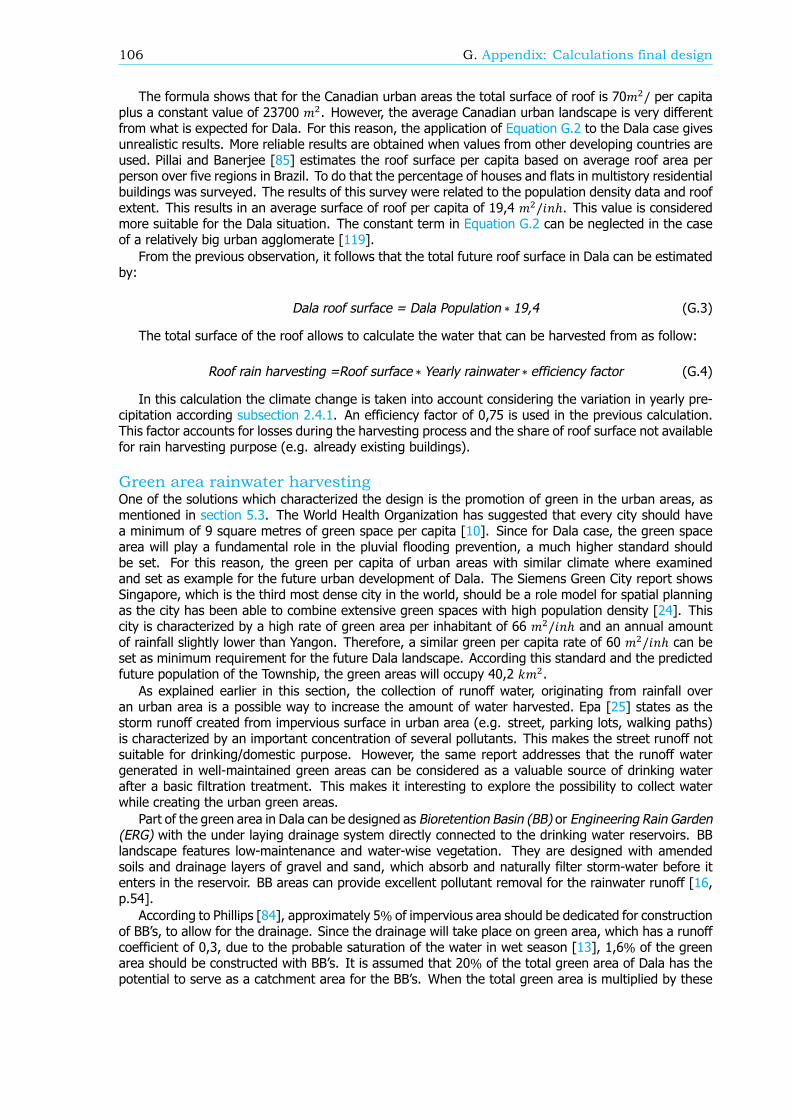
106 G. Appendix: Calculations final design
The formula shows that for the Canadian urban areas the total surface of roof is 70 / per capitaplus a constant value of 23700 . However, the average Canadian urban landscape is very differentfrom what is expected for Dala. For this reason, the application of Equation G.2 to the Dala case givesunrealistic results. More reliable results are obtained when values from other developing countries areused. Pillai and Banerjee [85] estimates the roof surface per capita based on average roof area perperson over five regions in Brazil. To do that the percentage of houses and flats in multistory residentialbuildings was surveyed. The results of this survey were related to the population density data and roofextent. This results in an average surface of roof per capita of 19,4 / ℎ. This value is consideredmore suitable for the Dala situation. The constant term in Equation G.2 can be neglected in the caseof a relatively big urban agglomerate [119].
From the previous observation, it follows that the total future roof surface in Dala can be estimatedby:
Dala roof surface = Dala Population 19,4 (G.3)
The total surface of the roof allows to calculate the water that can be harvested from as follow:
Roof rain harvesting =Roof surface Yearly rainwater efficiency factor (G.4)
In this calculation the climate change is taken into account considering the variation in yearly pre-cipitation according subsection 2.4.1. An efficiency factor of 0,75 is used in the previous calculation.This factor accounts for losses during the harvesting process and the share of roof surface not availablefor rain harvesting purpose (e.g. already existing buildings).
Green area rainwater harvestingOne of the solutions which characterized the design is the promotion of green in the urban areas, asmentioned in section 5.3. The World Health Organization has suggested that every city should havea minimum of 9 square metres of green space per capita [10]. Since for Dala case, the green spacearea will play a fundamental role in the pluvial flooding prevention, a much higher standard shouldbe set. For this reason, the green per capita of urban areas with similar climate where examinedand set as example for the future urban development of Dala. The Siemens Green City report showsSingapore, which is the third most dense city in the world, should be a role model for spatial planningas the city has been able to combine extensive green spaces with high population density [24]. Thiscity is characterized by a high rate of green area per inhabitant of 66 / ℎ and an annual amountof rainfall slightly lower than Yangon. Therefore, a similar green per capita rate of 60 / ℎ can beset as minimum requirement for the future Dala landscape. According this standard and the predictedfuture population of the Township, the green areas will occupy 40,2 .
As explained earlier in this section, the collection of runoff water, originating from rainfall overan urban area is a possible way to increase the amount of water harvested. Epa [25] states as thestorm runoff created from impervious surface in urban area (e.g. street, parking lots, walking paths)is characterized by an important concentration of several pollutants. This makes the street runoff notsuitable for drinking/domestic purpose. However, the same report addresses that the runoff watergenerated in well-maintained green areas can be considered as a valuable source of drinking waterafter a basic filtration treatment. This makes it interesting to explore the possibility to collect waterwhile creating the urban green areas.
Part of the green area in Dala can be designed as Bioretention Basin (BB) or Engineering Rain Garden(ERG) with the under laying drainage system directly connected to the drinking water reservoirs. BBlandscape features low-maintenance and water-wise vegetation. They are designed with amendedsoils and drainage layers of gravel and sand, which absorb and naturally filter storm-water before itenters in the reservoir. BB areas can provide excellent pollutant removal for the rainwater runoff [16,p.54].
According to Phillips [84], approximately 5% of impervious area should be dedicated for constructionof BB s, to allow for the drainage. Since the drainage will take place on green area, which has a runoffcoefficient of 0,3, due to the probable saturation of the water in wet season [13], 1,6% of the greenarea should be constructed with BB s. It is assumed that 20% of the total green area of Dala has thepotential to serve as a catchment area for the BB s. When the total green area is multiplied by these
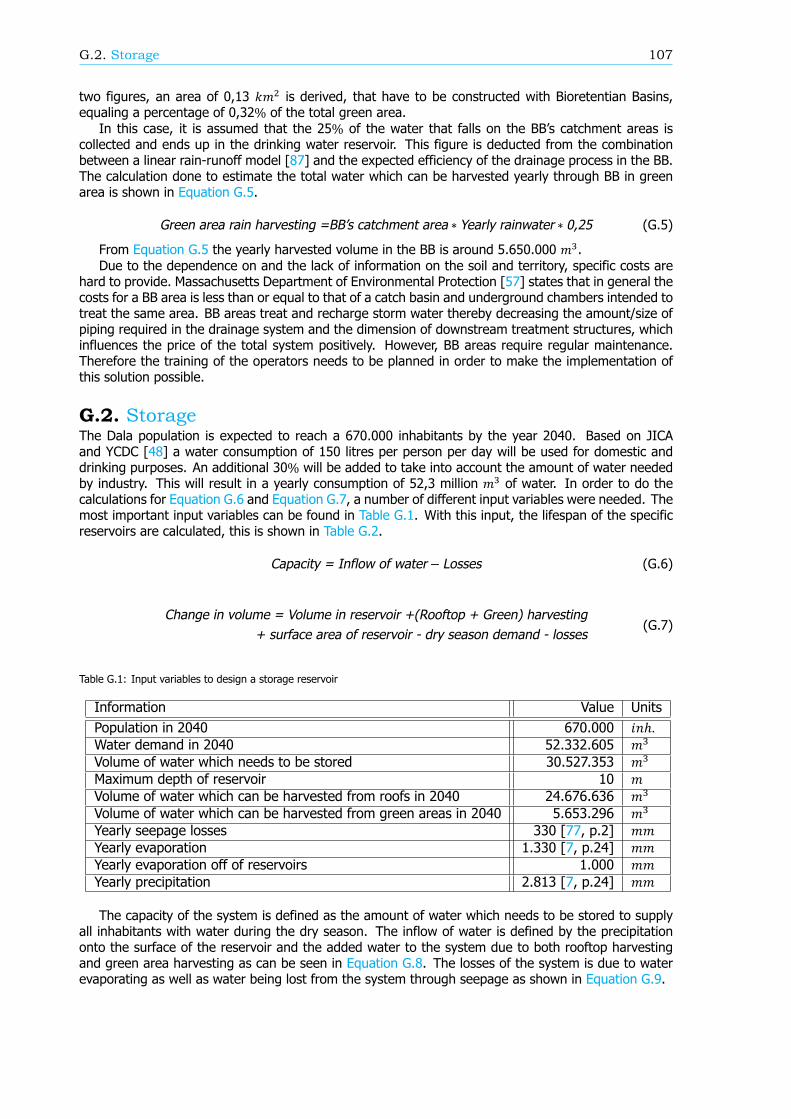
G.2. Storage 107
two figures, an area of 0,13 is derived, that have to be constructed with Bioretentian Basins,equaling a percentage of 0,32% of the total green area.
In this case, it is assumed that the 25% of the water that falls on the BB s catchment areas iscollected and ends up in the drinking water reservoir. This figure is deducted from the combinationbetween a linear rain-runoff model [87] and the expected efficiency of the drainage process in the BB.The calculation done to estimate the total water which can be harvested yearly through BB in greenarea is shown in Equation G.5.
Green area rain harvesting =BB’s catchment area Yearly rainwater 0,25 (G.5)
From Equation G.5 the yearly harvested volume in the BB is around 5.650.000 .Due to the dependence on and the lack of information on the soil and territory, specific costs are
hard to provide. Massachusetts Department of Environmental Protection [57] states that in general thecosts for a BB area is less than or equal to that of a catch basin and underground chambers intended totreat the same area. BB areas treat and recharge storm water thereby decreasing the amount/size ofpiping required in the drainage system and the dimension of downstream treatment structures, whichinfluences the price of the total system positively. However, BB areas require regular maintenance.Therefore the training of the operators needs to be planned in order to make the implementation ofthis solution possible.
G.2. StorageThe Dala population is expected to reach a 670.000 inhabitants by the year 2040. Based on JICAand YCDC [48] a water consumption of 150 litres per person per day will be used for domestic anddrinking purposes. An additional 30% will be added to take into account the amount of water neededby industry. This will result in a yearly consumption of 52,3 million of water. In order to do thecalculations for Equation G.6 and Equation G.7, a number of different input variables were needed. Themost important input variables can be found in Table G.1. With this input, the lifespan of the specificreservoirs are calculated, this is shown in Table G.2.
Capacity = Inflow of water− Losses (G.6)
Change in volume = Volume in reservoir +(Rooftop + Green) harvesting+ surface area of reservoir - dry season demand - losses
(G.7)
Table G.1: Input variables to design a storage reservoir
Information Value UnitsPopulation in 2040 670.000 ℎ.Water demand in 2040 52.332.605Volume of water which needs to be stored 30.527.353Maximum depth of reservoir 10Volume of water which can be harvested from roofs in 2040 24.676.636Volume of water which can be harvested from green areas in 2040 5.653.296Yearly seepage losses 330 [77, p.2]Yearly evaporation 1.330 [7, p.24]Yearly evaporation off of reservoirs 1.000Yearly precipitation 2.813 [7, p.24]
The capacity of the system is defined as the amount of water which needs to be stored to supplyall inhabitants with water during the dry season. The inflow of water is defined by the precipitationonto the surface of the reservoir and the added water to the system due to both rooftop harvestingand green area harvesting as can be seen in Equation G.8. The losses of the system is due to waterevaporating as well as water being lost from the system through seepage as shown in Equation G.9.
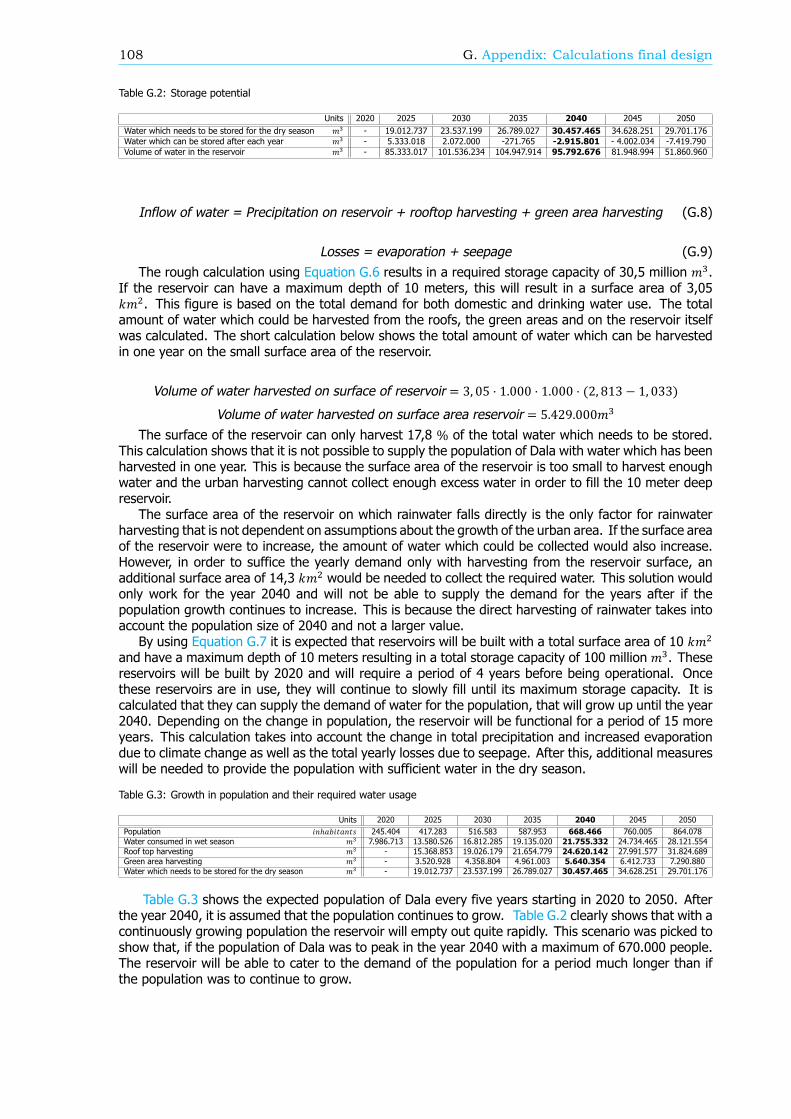
108 G. Appendix: Calculations final design
Table G.2: Storage potential
Units 2020 2025 2030 2035 2040 2045 2050Water which needs to be stored for the dry season - 19.012.737 23.537.199 26.789.027 30.457.465 34.628.251 29.701.176Water which can be stored after each year - 5.333.018 2.072.000 -271.765 -2.915.801 - 4.002.034 -7.419.790Volume of water in the reservoir - 85.333.017 101.536.234 104.947.914 95.792.676 81.948.994 51.860.960
Inflow of water = Precipitation on reservoir + rooftop harvesting + green area harvesting (G.8)
Losses = evaporation + seepage (G.9)The rough calculation using Equation G.6 results in a required storage capacity of 30,5 million .
If the reservoir can have a maximum depth of 10 meters, this will result in a surface area of 3,05. This figure is based on the total demand for both domestic and drinking water use. The total
amount of water which could be harvested from the roofs, the green areas and on the reservoir itselfwas calculated. The short calculation below shows the total amount of water which can be harvestedin one year on the small surface area of the reservoir.
Volume of water harvested on surface of reservoir = 3, 05 ⋅ 1.000 ⋅ 1.000 ⋅ (2, 813 − 1, 033)Volume of water harvested on surface area reservoir = 5.429.000
The surface of the reservoir can only harvest 17,8 % of the total water which needs to be stored.This calculation shows that it is not possible to supply the population of Dala with water which has beenharvested in one year. This is because the surface area of the reservoir is too small to harvest enoughwater and the urban harvesting cannot collect enough excess water in order to fill the 10 meter deepreservoir.
The surface area of the reservoir on which rainwater falls directly is the only factor for rainwaterharvesting that is not dependent on assumptions about the growth of the urban area. If the surface areaof the reservoir were to increase, the amount of water which could be collected would also increase.However, in order to suffice the yearly demand only with harvesting from the reservoir surface, anadditional surface area of 14,3 would be needed to collect the required water. This solution wouldonly work for the year 2040 and will not be able to supply the demand for the years after if thepopulation growth continues to increase. This is because the direct harvesting of rainwater takes intoaccount the population size of 2040 and not a larger value.
By using Equation G.7 it is expected that reservoirs will be built with a total surface area of 10and have a maximum depth of 10 meters resulting in a total storage capacity of 100 million . Thesereservoirs will be built by 2020 and will require a period of 4 years before being operational. Oncethese reservoirs are in use, they will continue to slowly fill until its maximum storage capacity. It iscalculated that they can supply the demand of water for the population, that will grow up until the year2040. Depending on the change in population, the reservoir will be functional for a period of 15 moreyears. This calculation takes into account the change in total precipitation and increased evaporationdue to climate change as well as the total yearly losses due to seepage. After this, additional measureswill be needed to provide the population with sufficient water in the dry season.
Table G.3: Growth in population and their required water usage
Units 2020 2025 2030 2035 2040 2045 2050Population ℎ 245.404 417.283 516.583 587.953 668.466 760.005 864.078Water consumed in wet season 7.986.713 13.580.526 16.812.285 19.135.020 21.755.332 24.734.465 28.121.554Roof top harvesting - 15.368.853 19.026.179 21.654.779 24.620.142 27.991.577 31.824.689Green area harvesting - 3.520.928 4.358.804 4.961.003 5.640.354 6.412.733 7.290.880Water which needs to be stored for the dry season - 19.012.737 23.537.199 26.789.027 30.457.465 34.628.251 29.701.176
Table G.3 shows the expected population of Dala every five years starting in 2020 to 2050. Afterthe year 2040, it is assumed that the population continues to grow. Table G.2 clearly shows that with acontinuously growing population the reservoir will empty out quite rapidly. This scenario was picked toshow that, if the population of Dala was to peak in the year 2040 with a maximum of 670.000 people.The reservoir will be able to cater to the demand of the population for a period much longer than ifthe population was to continue to grow.
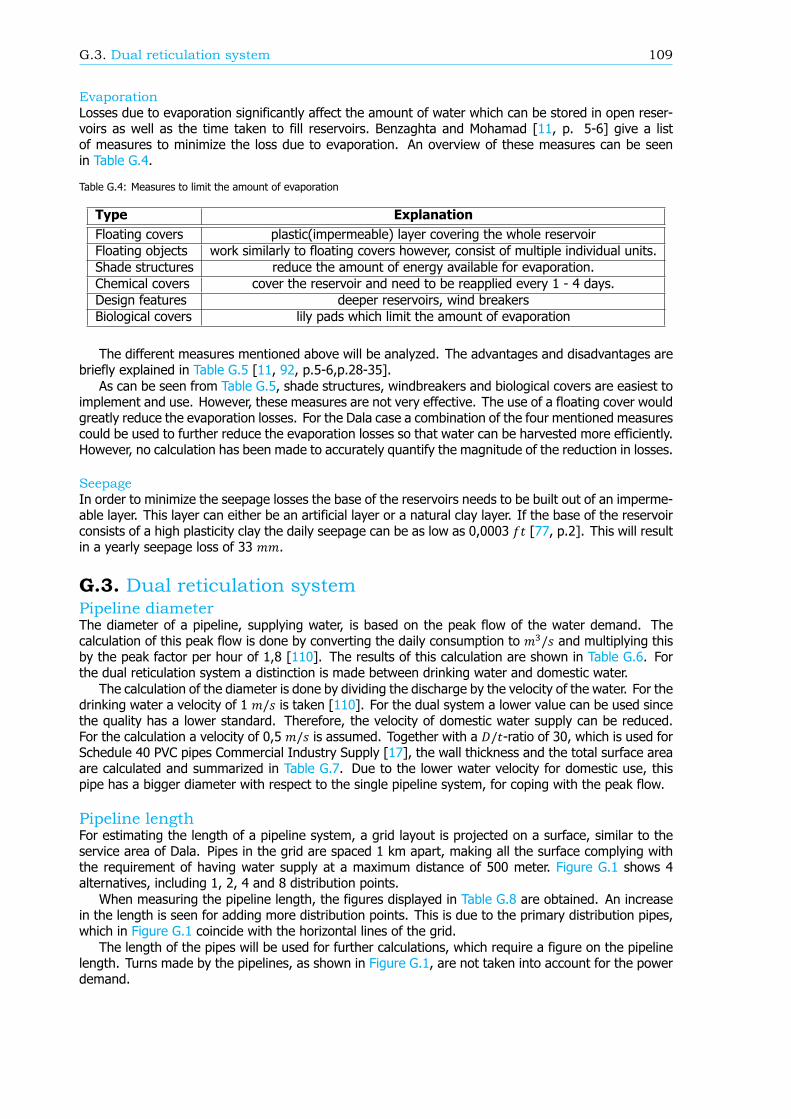
G.3. Dual reticulation system 109
EvaporationLosses due to evaporation significantly affect the amount of water which can be stored in open reser-voirs as well as the time taken to fill reservoirs. Benzaghta and Mohamad [11, p. 5-6] give a listof measures to minimize the loss due to evaporation. An overview of these measures can be seenin Table G.4.
Table G.4: Measures to limit the amount of evaporation
Type ExplanationFloating covers plastic(impermeable) layer covering the whole reservoirFloating objects work similarly to floating covers however, consist of multiple individual units.Shade structures reduce the amount of energy available for evaporation.Chemical covers cover the reservoir and need to be reapplied every 1 - 4 days.Design features deeper reservoirs, wind breakersBiological covers lily pads which limit the amount of evaporation
The different measures mentioned above will be analyzed. The advantages and disadvantages arebriefly explained in Table G.5 [11, 92, p.5-6,p.28-35].
As can be seen from Table G.5, shade structures, windbreakers and biological covers are easiest toimplement and use. However, these measures are not very effective. The use of a floating cover wouldgreatly reduce the evaporation losses. For the Dala case a combination of the four mentioned measurescould be used to further reduce the evaporation losses so that water can be harvested more efficiently.However, no calculation has been made to accurately quantify the magnitude of the reduction in losses.
SeepageIn order to minimize the seepage losses the base of the reservoirs needs to be built out of an imperme-able layer. This layer can either be an artificial layer or a natural clay layer. If the base of the reservoirconsists of a high plasticity clay the daily seepage can be as low as 0,0003 [77, p.2]. This will resultin a yearly seepage loss of 33 .
G.3. Dual reticulation systemPipeline diameterThe diameter of a pipeline, supplying water, is based on the peak flow of the water demand. Thecalculation of this peak flow is done by converting the daily consumption to / and multiplying thisby the peak factor per hour of 1,8 [110]. The results of this calculation are shown in Table G.6. Forthe dual reticulation system a distinction is made between drinking water and domestic water.
The calculation of the diameter is done by dividing the discharge by the velocity of the water. For thedrinking water a velocity of 1 / is taken [110]. For the dual system a lower value can be used sincethe quality has a lower standard. Therefore, the velocity of domestic water supply can be reduced.For the calculation a velocity of 0,5 / is assumed. Together with a / -ratio of 30, which is used forSchedule 40 PVC pipes Commercial Industry Supply [17], the wall thickness and the total surface areaare calculated and summarized in Table G.7. Due to the lower water velocity for domestic use, thispipe has a bigger diameter with respect to the single pipeline system, for coping with the peak flow.
Pipeline lengthFor estimating the length of a pipeline system, a grid layout is projected on a surface, similar to theservice area of Dala. Pipes in the grid are spaced 1 km apart, making all the surface complying withthe requirement of having water supply at a maximum distance of 500 meter. Figure G.1 shows 4alternatives, including 1, 2, 4 and 8 distribution points.
When measuring the pipeline length, the figures displayed in Table G.8 are obtained. An increasein the length is seen for adding more distribution points. This is due to the primary distribution pipes,which in Figure G.1 coincide with the horizontal lines of the grid.
The length of the pipes will be used for further calculations, which require a figure on the pipelinelength. Turns made by the pipelines, as shown in Figure G.1, are not taken into account for the powerdemand.
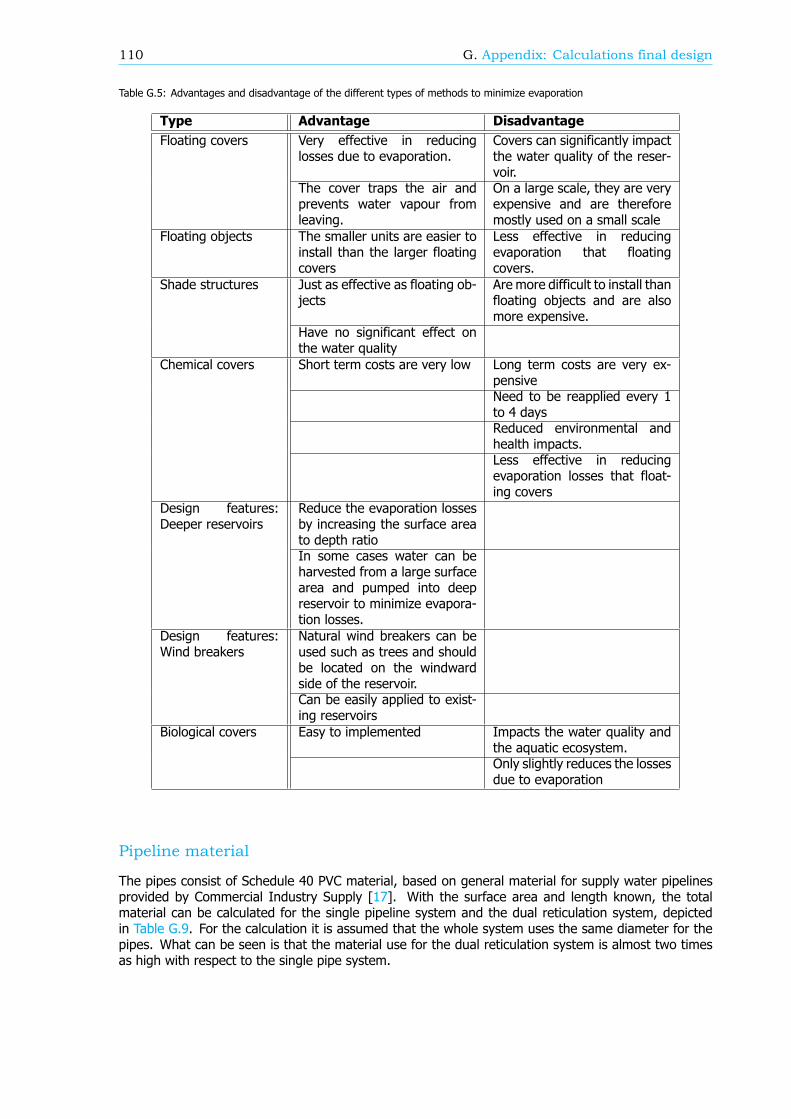
110 G. Appendix: Calculations final design
Table G.5: Advantages and disadvantage of the different types of methods to minimize evaporation
Type Advantage DisadvantageFloating covers Very effective in reducing
losses due to evaporation.Covers can significantly impactthe water quality of the reser-voir.
The cover traps the air andprevents water vapour fromleaving.
On a large scale, they are veryexpensive and are thereforemostly used on a small scale
Floating objects The smaller units are easier toinstall than the larger floatingcovers
Less effective in reducingevaporation that floatingcovers.
Shade structures Just as effective as floating ob-jects
Are more difficult to install thanfloating objects and are alsomore expensive.
Have no significant effect onthe water quality
Chemical covers Short term costs are very low Long term costs are very ex-pensiveNeed to be reapplied every 1to 4 daysReduced environmental andhealth impacts.Less effective in reducingevaporation losses that float-ing covers
Design features:Deeper reservoirs
Reduce the evaporation lossesby increasing the surface areato depth ratioIn some cases water can beharvested from a large surfacearea and pumped into deepreservoir to minimize evapora-tion losses.
Design features:Wind breakers
Natural wind breakers can beused such as trees and shouldbe located on the windwardside of the reservoir.Can be easily applied to exist-ing reservoirs
Biological covers Easy to implemented Impacts the water quality andthe aquatic ecosystem.Only slightly reduces the lossesdue to evaporation
Pipeline material
The pipes consist of Schedule 40 PVC material, based on general material for supply water pipelinesprovided by Commercial Industry Supply [17]. With the surface area and length known, the totalmaterial can be calculated for the single pipeline system and the dual reticulation system, depictedin Table G.9. For the calculation it is assumed that the whole system uses the same diameter for thepipes. What can be seen is that the material use for the dual reticulation system is almost two timesas high with respect to the single pipe system.
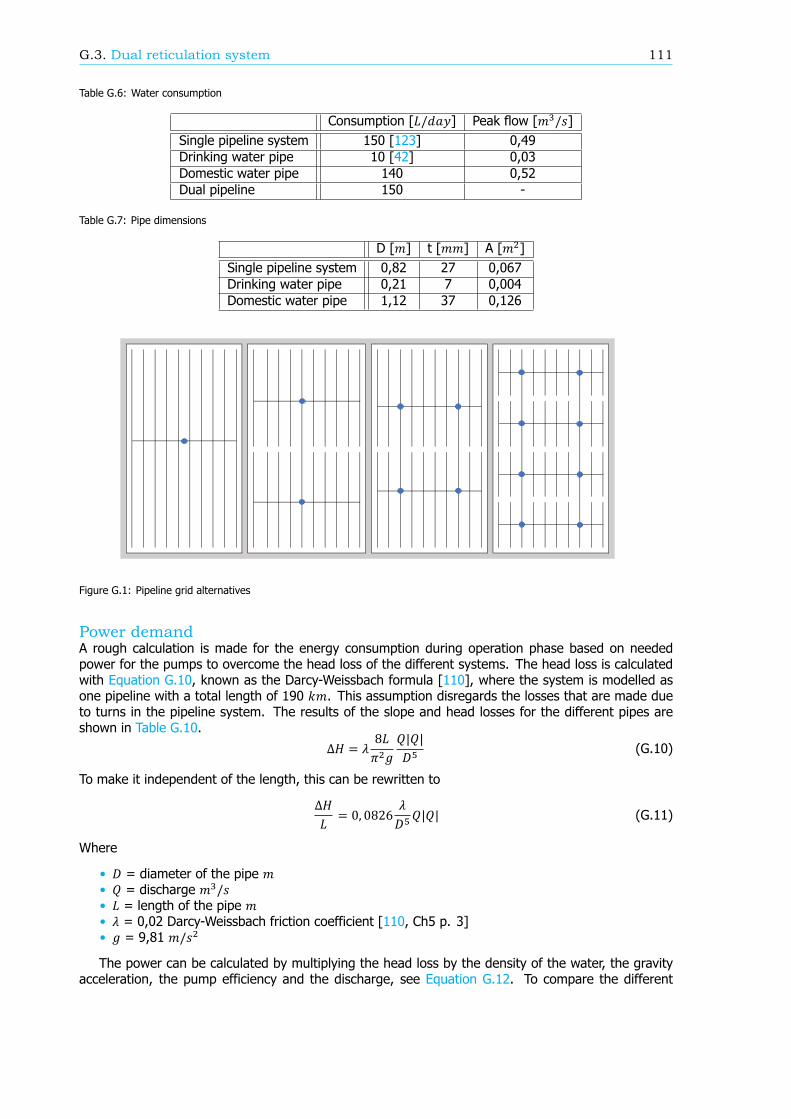
G.3. Dual reticulation system 111
Table G.6: Water consumption
Consumption [ / ] Peak flow [ / ]Single pipeline system 150 [123] 0,49Drinking water pipe 10 [42] 0,03Domestic water pipe 140 0,52Dual pipeline 150 -
Table G.7: Pipe dimensions
D [ ] t [ ] A [ ]Single pipeline system 0,82 27 0,067Drinking water pipe 0,21 7 0,004Domestic water pipe 1,12 37 0,126
Figure G.1: Pipeline grid alternatives
Power demandA rough calculation is made for the energy consumption during operation phase based on neededpower for the pumps to overcome the head loss of the different systems. The head loss is calculatedwith Equation G.10, known as the Darcy-Weissbach formula [110], where the system is modelled asone pipeline with a total length of 190 . This assumption disregards the losses that are made dueto turns in the pipeline system. The results of the slope and head losses for the different pipes areshown in Table G.10. Δ = 8 | |
(G.10)
To make it independent of the length, this can be rewritten toΔ = 0, 0826 | | (G.11)
Where
• = diameter of the pipe• = discharge /• = length of the pipe• = 0,02 Darcy-Weissbach friction coefficient [110, Ch5 p. 3]• = 9,81 /The power can be calculated by multiplying the head loss by the density of the water, the gravity
acceleration, the pump efficiency and the discharge, see Equation G.12. To compare the different
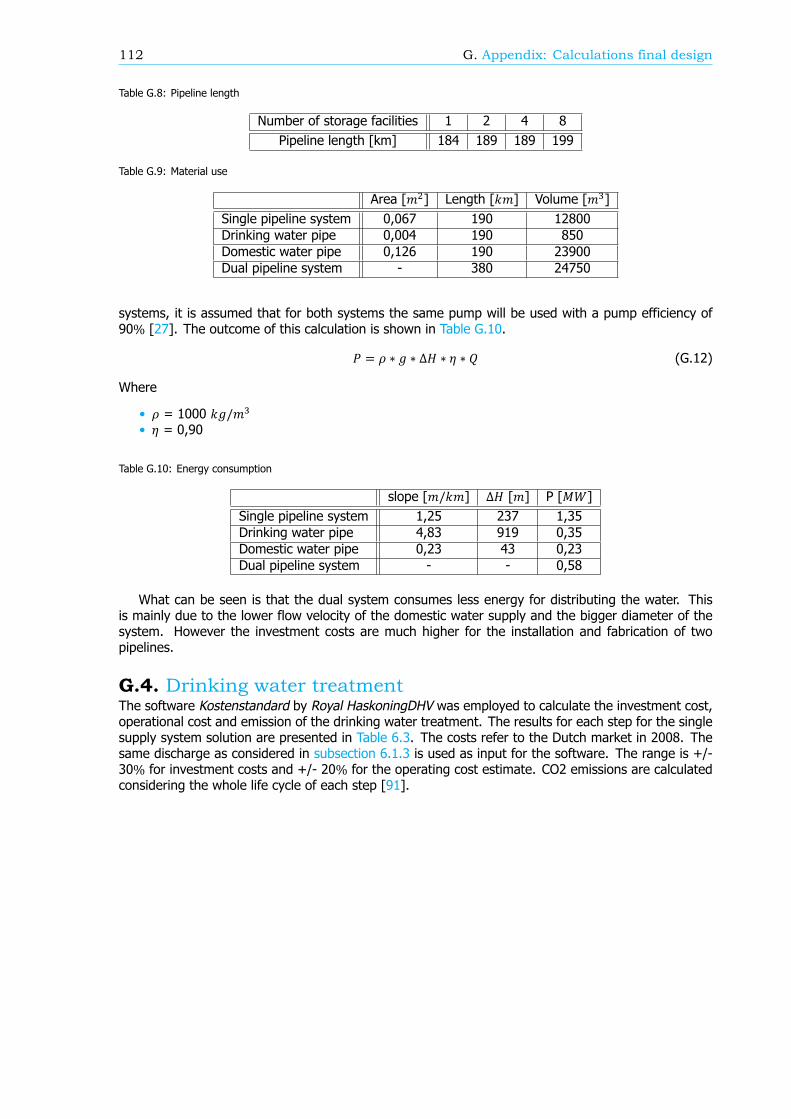
112 G. Appendix: Calculations final design
Table G.8: Pipeline length
Number of storage facilities 1 2 4 8Pipeline length [km] 184 189 189 199
Table G.9: Material use
Area [ ] Length [ ] Volume [ ]Single pipeline system 0,067 190 12800Drinking water pipe 0,004 190 850Domestic water pipe 0,126 190 23900Dual pipeline system - 380 24750
systems, it is assumed that for both systems the same pump will be used with a pump efficiency of90% [27]. The outcome of this calculation is shown in Table G.10.= Δ (G.12)
Where
• = 1000 /• = 0,90
Table G.10: Energy consumption
slope [ / ] Δ [ ] P [ ]Single pipeline system 1,25 237 1,35Drinking water pipe 4,83 919 0,35Domestic water pipe 0,23 43 0,23Dual pipeline system - - 0,58
What can be seen is that the dual system consumes less energy for distributing the water. Thisis mainly due to the lower flow velocity of the domestic water supply and the bigger diameter of thesystem. However the investment costs are much higher for the installation and fabrication of twopipelines.
G.4. Drinking water treatmentThe software Kostenstandard by Royal HaskoningDHV was employed to calculate the investment cost,operational cost and emission of the drinking water treatment. The results for each step for the singlesupply system solution are presented in Table 6.3. The costs refer to the Dutch market in 2008. Thesame discharge as considered in subsection 6.1.3 is used as input for the software. The range is +/-30% for investment costs and +/- 20% for the operating cost estimate. CO2 emissions are calculatedconsidering the whole life cycle of each step [91].
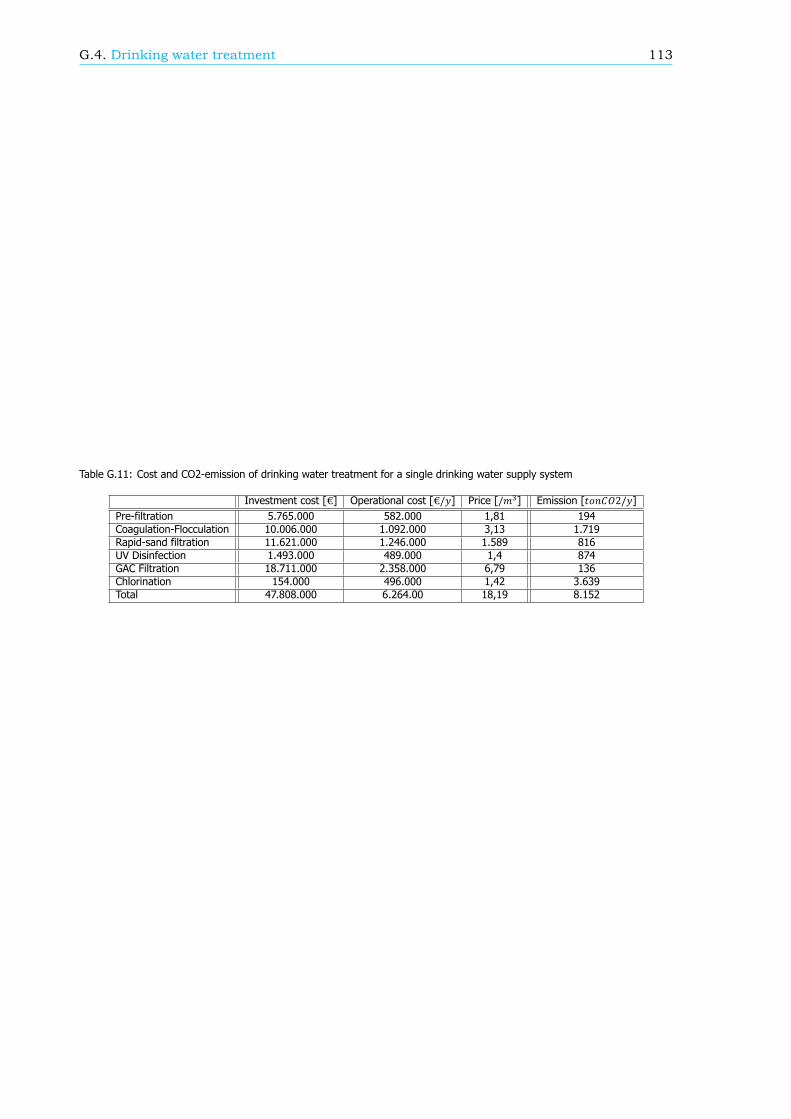
G.4. Drinking water treatment 113
Table G.11: Cost and CO2-emission of drinking water treatment for a single drinking water supply system
Investment cost [€] Operational cost [€/] Price [/ ] Emission [ 2/]Pre-filtration 5.765.000 582.000 1,81 194Coagulation-Flocculation 10.006.000 1.092.000 3,13 1.719Rapid-sand filtration 11.621.000 1.246.000 1.589 816UV Disinfection 1.493.000 489.000 1,4 874GAC Filtration 18.711.000 2.358.000 6,79 136Chlorination 154.000 496.000 1,42 3.639Total 47.808.000 6.264.00 18,19 8.152

HAppendix: Validation interviews
Two expert interviews were planned for the validation of the design. For the first interview, two watermanagement experts from the National Engineering and Planning Services, who are also part of theadvisory committee for the National Water Resources Council (NWRC), were invited. For the secondinterview, four officials from the urban planning department of YCDC (of which one is the director ofthe department) were invited. However, this last interview was cancelled from their part due to a visitfrom the Minister of Construction and attempts to reschedule it failed. In this appendix, the interviewset-up is first described after which the summary of the conducted interviews is presented.
H.1. Interview set-upIn this section, the interview questions are listed and the short introduction that was given duringthe interviews is presented. To tailor to the functions of the interviewees, some questions were onlyasked to the urban development officials at YCDC and some were only asked to the water managementexperts at NEPS. The background questions and face validation questions were asked to all experts.
H.1.1. Introduction to interviewsTo enable us to make a design in 8 weeks time, reductions and assumptions had to be made. Thisinterview is meant to check whether our design still fits with the actual real-world system that it wascreated for. However, this real-world system is a future situation which is still very uncertain. Thereforewe would like to ask you to critically look at our design and the underlying reductions and assumptions,and assess whether it is realistic and implementable in future Dala.
We will start with some general questions about the design as a whole. Some focal points werechosen which we worked out more in detail than others. For these focal points, we would like to knowwhat you think about some of the quantitative assumptions and calculations. We tried to tailor theselast questions to the function that you have at YCDC/NEPS.
H.1.2. Background questions1. What is your name?2. What is the name of your organization?3. What is your function within the organization?4. How long have you been working in this function?5. What is your (academic) background?
H.1.3. General impression/face validation1. To what extent do you think the system as presented in the design will cater to all the waterneeds in future Dala?
2. To what extent do you think the system as presented in the design can be constructed, operatedand maintained in future Dala?
3. To what extent do you think the system is robust and flexible to cope with different ways in whichthe township of Dala may develop?
115
116 H. Appendix: Validation interviews
4. On which actors do the solutions proposed have an impact?5. Which actors can influence the proposed system?6. To what extent do you think the solutions proposed are environmentally sustainable?7. To what extent do you think the solutions proposed promote a healthy economy in Dala?8. To what extent do you think the solutions proposed promote equality amongst inhabitants ofDala?
9. To what extent do you think the system is a complete water infrastructure design?
H.1.4. Harvesting and resourceYCDCThese questions will only be asked to the officials from the urban development department of YCDC.
1. To calculate the total roof surface of Dala in 2040, a study was used that determined the averageroof surface per capita in five regions in Brazil. This resulted in an average roof surface per capitaof 19,4 / ℎ. To what extent do you think this is realistic?
2. For decrease the impact of urbanization on flood risk, it is established that by 2040 a minimumof 36% of the Dala s urban area will be green area. The rest can be built area. To what extentdo you think this is realistic?
3. Do you think the harvesting system as sketched in the design can be installed in Dala?4. Do you think the harvesting system as sketched in the design can be operated and maintainedby local people and laborers?
NEPSThese questions will only be asked to the water management experts from the National Engineeringand Planning Services.
1. For rainwater harvesting it is assumed that of all the rainwater that falls on Dala roofs, 75% canbe harvested. To what extent do you agree that this is a valid assumption?
2. Using bioretention basins for runoff water, it was calculated that 25% of the water that falls onthe catchment area, which is 20% of the green area, can be harvested. To what extent do youthink this is a realistic estimate?
3. For harvesting from green areas an efficiency factor of 25% has been chosen. While for the roofsurface a factor of 75% is considered. To what extent do you think these are realistic figures?
4. For water that is harvested directly on the rainwater reservoir, a loss factor due to seepage andevaporation is used. This amounts to a total annual loss of 23%. To what extent do you thinkthis is realistic?
5. The final annually harvested volume is compared to an estimated demand in 2040 which is basedon a population of 670.000 inhabitants that use 150 litres per person per day and an industrywater demand of 30% the amount of residents water demand. To what extent do you think thisis realistic?
6. Do you think the harvesting system as sketched in the design can be installed in Dala?7. Do you think the harvesting system as sketched in the design can be operated and maintainedby local people and laborers?
H.1.5. StorageYCDCThese questions will only be asked to the officials from the urban development department of YCDC.
1. It is assumed that all the rainwater reservoirs can be completed by 2020 to allow them to fill overthe course of 4 years. In these four years the reservoirs are not to be used. Do you think this isimplementable in Dala?
2. For the reservoirs, a maximum depth of 10 meter is taken. Is this a realistic depth consideringthe soil in Dala?
3. Do you think the storage system as sketched in the design can be operated and maintained bylocal people and laborers?
H.2. Interview NEPS 117
NEPSThese questions will only be asked to the water management experts from the National Engineeringand Planning Services.
1. An annual water demand of 52 million liter is assumed. The reservoirs have a buffer of 88 millionliter. Do you think this is a realistic amount?
2. For the reservoirs, a maximum depth of 10 meter is taken. Is this a realistic depth consideringthe soil in Dala?
3. Do you think the storage system as sketched in the design can be operated and maintained bylocal people and laborers?
H.1.6. SupplyYCDCThese questions will only be asked to the officials from the urban development department of YCDC.
1. To what extent do you think having two water supplies in the house is user-friendly? (keeping inmind that currently people also don t drink the water that they use for showering)
2. Do you think the supply system as sketched in the design can be operated and maintained bylocal people and laborers?
NEPSThese questions will only be asked to the water management experts from the National Engineeringand Planning Services.
1. It is assumed that pumping the water through the pipeline system and treatment of the waterare the governing factors, determining the energy consumption. Is this a realistic assumption?
2. For the calculations, corners in the pipelines were omitted because there was no way to realisti-cally estimate the amount of corners in the pipes. Is this a realistic assumption?
3. To what extent do you think having two water supplies in the house is user-friendly? (keeping inmind that currently people also don t drink the water that they use for showering)
4. Do you think the supply system as sketched in the design can be operated and maintained bylocal people and laborers?
H.1.7. Finalizing1. Is there anything we missed that you would like to remark upon?
H.2. Interview NEPSBelow the answers from the water management experts at NEPS are presented. This interview wasconducted at the NEPS office in Yangon on 13 October 2017. The interviewees had the opportunityto read the design and core assumptions on beforehand. The interview questions were also sent onbeforehand.
H.2.1. Background questions1. What is your name?U Cho Cho and U Khin Lat
2. What is the name of your organization?Both: NEPS and NWRC
3. What is your function within the organization?U Cho Cho: Member of the advisory board at NEPS and chairman of the advisory board for NWRC.U Khin Lat: Senior consultant at NEPS and member of the advisory board for NWRC.
4. How long have you been working in this function?U Cho Cho: Advisor at NEPS for 11 years, before that managing director at NEPS for 20 yearsU Khin Lat: Around 20 years.
5. What is your (academic) background?U Cho Cho: BSc Civil Engineering in Yangon, MSc Experimental and Computational Hydraulics atUNESCO-IHE (Delft)
118 H. Appendix: Validation interviews
U Khin Lat: BSc Civil Engineering in Yangon, MSc Hydraulic Engineering of Delta Areas at UNESCO-IHE (Delft)
H.2.2. General impression/face validation1. To what extent do you think the system as presented in the design will cater to all the waterneeds in future Dala?U Cho Cho: I think that in the present situation it is doable but I am not sure that our system cancope with the rapid growth of Dala without a detailed urban planning. I share the idea to stressthe need for treatment plants in Dala.U Khin Lat: I agree with Cho Cho about his statements.
2. To what extent do you think the system as presented in the design can be constructed, operatedand maintained in future Dala?U Cho Cho: A bridge connecting Yangon and Dala across Yangon River is going to be constructedsoon. So the demand of water for Dala will be drastically raised in the near future. For theimplementation, I think that local people can do it easily.U Khin Lat: I agree with Cho Cho. I think you have to assume that the company has to beauthorized by YCDC. It is a very important assumption to make, because in Myanmar it is hardto get the authorization of the government for these kind of things.
3. To what extent do you think the system is robust and flexible to cope with different ways in whichthe township of Dala may develop?U Cho Cho: I think that industry could be a problem. If Dala develops as an extension of theYangon business area, a much higher water demand should be assumed.U Khin Lat: I think that the system is flexible as long as it is combined with a well-defined spatialurban plan for the future Dala township.
4. On which actors do the solutions proposed have an impact?U Cho Cho: Local communities and Yangon Regional authorities.U Khin Lat: Investors and contractors. Laborers that are attracted by the Dala development (Iexpect that these people will come from the south rural area). Also YCDC, and agriculture andirrigation people because the development of the area can reduce agriculture production.
5. Which actors can influence the proposed system?U Cho Cho: YCDC and Yangon Regional Government.U Khin Lat: YCDC can prevent companies to work on the Dala area (very important to have theapproval from them)
6. To what extent do you think the solutions proposed are environmentally sustainable?U Cho Cho: 90% environmentally sustainable.U Khin Lat: Yes
7. To what extent do you think the solutions proposed promote a healthy economy in Dala?U Cho Cho: 80% assurance is expected for the promotion of a healthy economy.U Khin Lat: I think (this concept was stressed also by Cho Cho) that the development of a waterinfrastructure only for the Dala urban area will create an unbalanced situation in the south ofYangon area. The development of Dala will beckon in the people from the rural area that areaiming for a better lifestyle (access to drinking water). These people will be subtracted from thelaborers in the agriculture sector. Myanmar already has a shortage of farmers because of theattraction of the city. If the rural areas are not developed, this will result in an increase in thefood prices. I think that some reflection about how to promote a healthy economy is necessaryfor the design otherwise the system will collapse.
8. To what extent do you think the solutions proposed promote equality amongst inhabitants ofDala?U Cho Cho: 95% assures for equality among inhabitants of Dala.
9. To what extent do you think the system is a complete water infrastructure design?U Cho Cho: A comprehensive water infrastructure design.
H.2.3. Harvesting and resource1. For rainwater harvesting it is assumed that of all the rainwater that falls on Dala roofs, 75% canbe harvested. To what extent do you agree that this is a valid assumption?U Cho Cho: I fully agree. I agree with the use of rainwater as the first source. This coincides
H.2. Interview NEPS 119
with the plan of the Ministry and YCDC to increase the use of harvesting techniques.2. Using bioretention basins for runoff water, it was calculated that 25% of the water that falls onthe catchment area, which is 20% of the green area, can be harvested. To what extent do youthink this is a realistic estimateU Cho Cho: It would depend on the infiltration character of the existing soil. To harvest morewater in the reservoirs it is possible to use plastic sheets to reduce the infiltration in the soil ofthe catchment areas. This will also help to reduce the buffering period to fill the reservoirs up.U Khin Lat: I agree that the future urban plan for Dala should include green areas and that theycan be used for the water harvesting.
3. For harvesting from green areas an efficiency factor of 25% has been chosen. While for the roofsurface a factor of 75% is considered. To what extent do you think these are realistic figures?U Cho Cho: Roof surface 75% is agreeable. 25% efficiency for green area depends on the natureof existing soil of the green area. this two surfaces can be used for harvesting and the estimationon the amount of water that can be harvested are good as long as local people are educatedabout the different harvesting technique. For the roof, you can actually aim to reach an efficiencywhich is even higher than 75%. I think that the 25% for the green water is too much. This isbecause the infiltration in the soil will be high.U Khin Lat: I agree with Cho Cho about the efficiency of the harvesting methods. I also thinkthat you should have designed the rainwater tanks in such a way that people can directly use thewater.
4. The final annually harvested volume is compared to an estimated demand in 2040 which is basedon a population of 670.000 inhabitants that use 150 litres per person per day and an industrywater demand of 30% the amount of residents water demand. To what extent do you think thisis realistic?U Cho Cho: Industry water demand will be more than 30% The construction of the bridge willhave a very big impact on the population growth of Dala. The World Bank considered Dala as anagricultural area. But now the situation has changed so Dala will be an urbanized area. I thinkthat more industry will be there. Maybe some textile industry or medium company. You shouldtake into account more for the industry. (After explaining to him that our assumption was derivedfrom the YCDC plan for development and on newspaper articles): If YCDC does not want to havean industry area in Dala probably your assumption is correct.U Khin Lat: I agree with Cho Cho, and I think that the assumption of 150 litre per day is a goodassumption for the future water consumption.
5. Do you think the harvesting system as sketched in the design can be installed in Dala?U Cho Cho: Yes, I do.
6. Do you think the harvesting system as sketched in the design can be operated and maintainedby local people and laborers?U Cho Cho: Yes, I do.
H.2.4. Storage1. An annual water demand of 52 million liters is assumed. The reservoirs have a buffer of 88 millionliter. Do you think this is a realistic amount?U Cho Cho: If Dala area is boomed up, there will be much more demand. We have to designthem in a remote zone to avoid contamination from runoff. We have to consider that if we havetrees the leaves can deflate the water quality. So I suggest applying a sort of green net on thewater body surface to reduce evaporation.U Khin Lat: The ponds have to be connected and only one pond has to be used as intake for thedrinking water. The connection has to be by gravity. This allows energy to be saved during thetransportation of the water. We can build the ponds all together. I agree on using the green netagainst evaporation. The pond has to be designed in such a way that people have water duringthe buffering period. I also suggest improving the catchment areas of the reservoirs by applyingplastics layer on the surrounding surfaces.
2. For the reservoirs, a maximum depth of 10 meter is taken. Is this a realistic depth consideringthe soil in Dala?U Cho Cho: It is possible to go in reach 10 meter depth, but different slope angles have to beused for the stability of the structure. Intermediate berms would be needed for stability of slope
120 H. Appendix: Validation interviews
depending on the soil properties.U Khin Lat: I agree with Cho Cho.
3. Do you think the storage system as sketched in the design can be operated and maintained bylocal people and laborers?U Cho Cho: Yes
H.2.5. Supply1. It is assumed that pumping the water through the pipeline system and treatment of the waterare the governing factors, determining the energy consumption. Is this a realistic assumption?U Cho Cho: A water source would also be considered. I think that the two pipeline system isnot practical because the flow of the drinking water demand is not big enough to justify theimplementation of a complete pipe system. Since the amount of water is very small, drinkingwater can be distributed to a collection point. I agree that it is better to use this method (pipesystem) than plastic bottles. Maybe dual reticulation can work for Dala but is difficult to spreadto the rest of the south of Yangon area.U Khin Lat: I think that it is the best way. You can save energy on treatment of the domesticwater. The presence of the domestic system will also allow the possible reuse of wastewater.
2. For the calculations, corners in the pipelines were omitted because there was no way to realisti-cally estimate the amount of corners in the pipes. Is this a realistic assumption?U Cho Cho: A certain percentage could be added.
3. To what extent do you think having two water supplies in the house is user-friendly? (keeping inmind that currently people also don t drink the water that they use for showering)U Cho Cho: It is not practicable. I agree on the fact that splitting the two water purposes inthe system can save energy (less treatment and less pressure needed). I think that a pipe fordrinking water is not needed, because people in Yangon are not used to receiving drinking waterfrom the tap. I suggest to explore the idea of the collection points further.U Khin Lat: I suggest to further analyze the two possibilities: using local (community) tanks orusing a central tank. I think that in the present system it is not possible, but if we are able tointroduce regulation on the future building design, it will become possible.
4. Do you think the supply system as sketched in the design can be operated and maintained bylocal people and laborers?U Cho Cho: Yes. I suggest to increase the water price during the rainy season to increase theharvesting capacity and to make people more aware of the fact that their use of water duringrainy season will impact the availability of water during the dry season.U Khin Lat: The implementation of the policy about roofs and construction will take too muchtime.
H.2.6. Finalizing1. Is there anything we missed that you would like to remark upon?U Cho Cho: It should be noted that your plan must fit in the masterplan for the whole regionSouth of Yangon, otherwise it will not work.
Bibliography
[1] ADB (2016). Asian Development Bank Member Factsheet: Myanmar. Technical report.
[2] ADB (n.d.). Who we are. https://www.adb.org/about/main.[3] Aid Myanmar (n.d.). The Aid Myanmar Society. http://www.aidmyanmar.com/.[4] Akvo (2017). Caddisfly. https://akvo.org/akvo-caddisfly/.[5] Asian Development Bank (2013). Myanmar: Urban Development and Water Sector Assessment,Strategy, and Road Map. Asian Development Bank, Philippines, 1 edition.
[6] Asian Development Bank (2017). Asian Development Outlook 2017 - Transcending the Middle-Income Challenge. Technical report, Mandaluyong City, Philippines.
[7] Aung, Z. W. (2014). Water supply options for the growing megacity of Yangon - scenarios with theWEAP model. PhD thesis, University of Hannover.
[8] Aye, M. N. (2016). Some fears but most in favour of downtown-to-Dala bridge. https://www.mmtimes.com/national-news/yangon/23362-some-fears-but-most-in-favour-of-downtown-to-dala-bridge.html.
[9] Aye, N., Lwin, S. P., and Mu, A. A. (2016). Township Action Plan of Dala Township.
[10] Bagherian, B. (2017). Liveable Cities: Howmuch green space does your city have? http://www.baharash.com/liveable-cities-how-much-green-space-does-your-city-have/.
[11] Benzaghta, M. A. and Mohamad, T. A. (2009). Evaporation from reservoir and reduction methods:An overview and assessment study. International Engineering Convention. Domascus, Syria andMedinah, Kingdom of Saudi Arabia, (May 11-18):9p.
[12] Brinkhoff, T. C. P. (2015). Dala (Township, Myanmar). https://www.citypopulation.de/php/myanmar-admin.php?adm2id=120308.
[13] Butler, D. and Davies, J. W. (2004). Urban Drainage. London, second edition.
[14] Carruth, A., Dickerson, A., and Henley, A. (2000). What do We Know About Investment UnderUncertainty? Journal of Economic Surveys, 14(2):119–154.
[15] Chang, Bonnette, Stoker, Crow-Miller, and Wentz (2017). Determinants of single family residentialwater use across scales in four western US cities. Science of The Total Environment, 596-597:451–464.
[16] City of Calgary (2007). Stormwater Source Control Practices Handbook. (May).
[17] Commercial Industry Supply (2014). PVC Pipe and PVC Fittings Dimen-sions. https://www.commercial-industrial-supply.com/resource-center/pvc-pipe-and-fittings-dimensions/.
[18] Cox, W. (2012a). The evolving urban form: Bangkok. http://www.newgeography.com/content/003367-the-evolving-urban-form-bangkok.
[19] Cox, W. (2012b). The evolving urban form: Ho Chi Minh City. http://www.newgeography.com/content/002738-the-evolving-urban-form-ho-chi-minh-city-saigon.
[20] Department of Population (2015). The 2014 Myanmar Population and Housing Census, The UnionReport, Census Report Volume 2. Technical report, Ministry of Immigration and Population.
121
122 Bibliography
[21] Deuskar, C. (2015). What does urban mean? http://blogs.worldbank.org/sustainablecities/what-does-urban-mean.
[22] Development Finance International (2015). South Korea Profile Republic of South Korea. Technicalreport.
[23] Doyle, K. C. (2008). Sizing the First Flush and its Effect on the Storage-Reliability- Yield Behaviorof Rainwater Harvesting in Rwanda By Sizing the First Flush and its Effects on the Storage-Reliability-Yield Behavior of Rainwater Harvesting in Rwanda. pages 1–151.
[24] EIU (2012). The Green City Index. The Economist Intelligence Unit (EIU).
[25] Epa (2001). Source Water Protection Practices Bulletin Managing Septic Systems to PreventContamination of Drinking Water. United States Environmental Protection Agency, i(4606):July.
[26] FANDO (2011). Cross section rain garden.
[27] Foray, J. (2014). Energy efficiency considerations in pumps an pump stations.
[28] Forbes, E. (2016). On the Frontier of Urbanization: Informal Settlements in Yangon, Myanmar.Independent Journal of Burmese Scholarship, 1(1):197–238.
[29] Förster, J. (1996). Patterns of roof runoff contamination and their potential implications on practiceand regulation of treatment and local infiltration. Water science and technology, 33(6):39–48.
[30] Furphy, D. (2013). What on earth is a RCP? https://medium.com/@davidfurphy/what-on-earth-is-an-rcp-bbb206ddee26.
[31] Gelb, S., Calabrese, L., and Tang, X. (2017). Foreign Direct Investment and Economic Transfor-mation in Myanmar. Technical report, Supporting Economic Transformation.
[32] GoogleMaps (2017a). Map location. https://www.google.nl/maps/place/16°41’56.9%22N+96°18’15.7%22E/@16.6991431,96.3021763,1084m/data=!3m2!1e3!4b1!4m5!3m4!1s0x0:0x0!8m2!3d16.699138!4d96.304365.
[33] GoogleMaps (2017b). Map location. https://www.google.nl/maps/place/16°39’07.4%22N+96°15’47.3%22E/@16.6520571,96.2609493,1085m/data=!3m2!1e3!4b1!4m5!3m4!1s0x0:0x0!8m2!3d16.652052!4d96.263138.
[34] GoogleMaps (2017c). Map location. https://www.google.nl/maps/place/16°57’26.0%22N+96°07’55.5%22E/@16.9572251,96.1298913,1083m/data=!3m2!1e3!4b1!4m5!3m4!1s0x0:0x0!8m2!3d16.95722!4d96.13208.
[35] Gordon, B., Callan, P., and Vickers, C. (2008). WHO guidelines for drinking-water quality. WHOchronicle, 38(3):564.
[36] Grigg, N. S., Rogers, P. D., and Edmiston, S. (2013). Dual Water Systems: Characterization andPerformance for Distribution of Reclaimed Water. Technical report, Water Research Foundation.
[37] GSOV (2017). General Statistics Office Of Vietnam.
[38] Hammond, C. (2015). KOICA signs for Dala and Bago master plans.
[39] Helmreich, B. and Horn, H. (2009). Opportunities in rainwater harvesting. Desalination.
[40] Horton, R., Mel, D. M., Peters, D., Lesk, C., Bartlett, R., Helsingen, H., Bader, D., Capizzi, P., Martin,S., and Rosenzweig, C. (2017). Assessing Climate Risk in Myanmar: Technical Report. Technicalreport.
[41] Htin Lynn Aung (2016). Thilawa factories open doors. https://www.mmtimes.com/business/23635-thilawa-factories-open-doors.html.
[42] Huyzer, T. (2017). Rain water harvesting 2 pager.
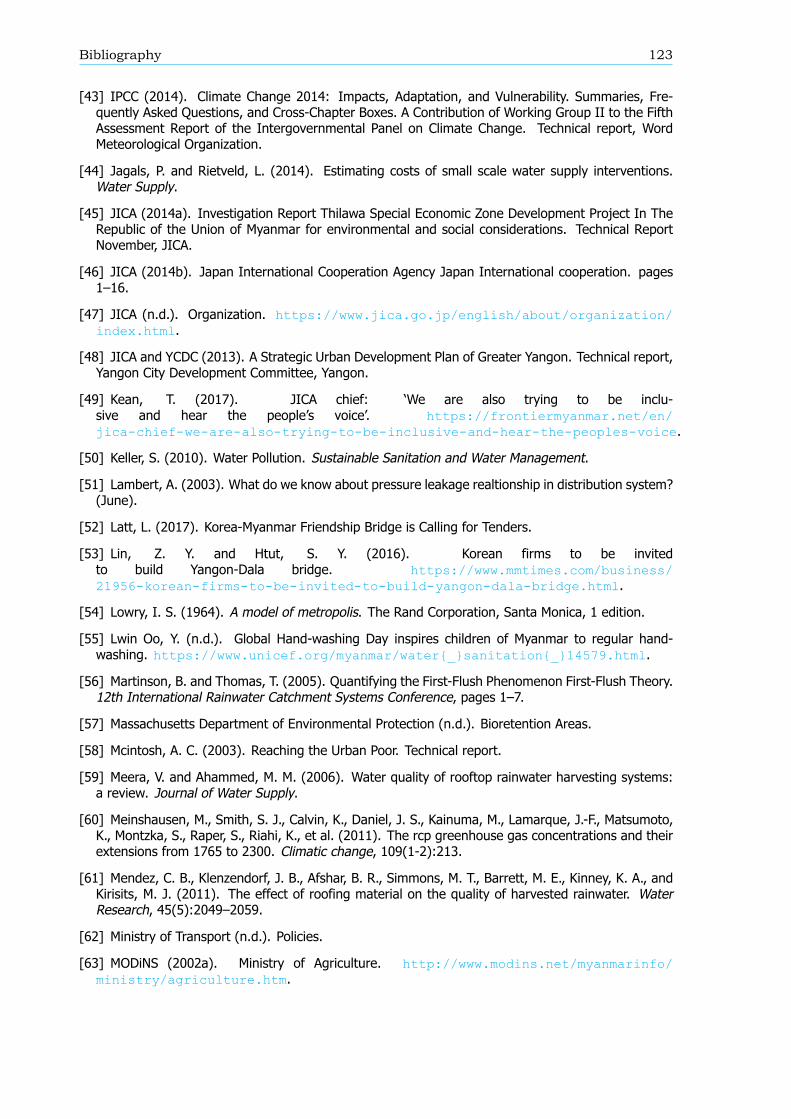
Bibliography 123
[43] IPCC (2014). Climate Change 2014: Impacts, Adaptation, and Vulnerability. Summaries, Fre-quently Asked Questions, and Cross-Chapter Boxes. A Contribution of Working Group II to the FifthAssessment Report of the Intergovernmental Panel on Climate Change. Technical report, WordMeteorological Organization.
[44] Jagals, P. and Rietveld, L. (2014). Estimating costs of small scale water supply interventions.Water Supply.
[45] JICA (2014a). Investigation Report Thilawa Special Economic Zone Development Project In TheRepublic of the Union of Myanmar for environmental and social considerations. Technical ReportNovember, JICA.
[46] JICA (2014b). Japan International Cooperation Agency Japan International cooperation. pages1–16.
[47] JICA (n.d.). Organization. https://www.jica.go.jp/english/about/organization/index.html.
[48] JICA and YCDC (2013). A Strategic Urban Development Plan of Greater Yangon. Technical report,Yangon City Development Committee, Yangon.
[49] Kean, T. (2017). JICA chief: We are also trying to be inclu-sive and hear the people s voice. https://frontiermyanmar.net/en/jica-chief-we-are-also-trying-to-be-inclusive-and-hear-the-peoples-voice.
[50] Keller, S. (2010). Water Pollution. Sustainable Sanitation and Water Management.
[51] Lambert, A. (2003). What do we know about pressure leakage realtionship in distribution system?(June).
[52] Latt, L. (2017). Korea-Myanmar Friendship Bridge is Calling for Tenders.
[53] Lin, Z. Y. and Htut, S. Y. (2016). Korean firms to be invitedto build Yangon-Dala bridge. https://www.mmtimes.com/business/21956-korean-firms-to-be-invited-to-build-yangon-dala-bridge.html.
[54] Lowry, I. S. (1964). A model of metropolis. The Rand Corporation, Santa Monica, 1 edition.
[55] Lwin Oo, Y. (n.d.). Global Hand-washing Day inspires children of Myanmar to regular hand-washing. https://www.unicef.org/myanmar/water_sanitation_14579.html.
[56] Martinson, B. and Thomas, T. (2005). Quantifying the First-Flush Phenomenon First-Flush Theory.12th International Rainwater Catchment Systems Conference, pages 1–7.
[57] Massachusetts Department of Environmental Protection (n.d.). Bioretention Areas.
[58] Mcintosh, A. C. (2003). Reaching the Urban Poor. Technical report.
[59] Meera, V. and Ahammed, M. M. (2006). Water quality of rooftop rainwater harvesting systems:a review. Journal of Water Supply.
[60] Meinshausen, M., Smith, S. J., Calvin, K., Daniel, J. S., Kainuma, M., Lamarque, J.-F., Matsumoto,K., Montzka, S., Raper, S., Riahi, K., et al. (2011). The rcp greenhouse gas concentrations and theirextensions from 1765 to 2300. Climatic change, 109(1-2):213.
[61] Mendez, C. B., Klenzendorf, J. B., Afshar, B. R., Simmons, M. T., Barrett, M. E., Kinney, K. A., andKirisits, M. J. (2011). The effect of roofing material on the quality of harvested rainwater. WaterResearch, 45(5):2049–2059.
[62] Ministry of Transport (n.d.). Policies.
[63] MODiNS (2002a). Ministry of Agriculture. http://www.modins.net/myanmarinfo/ministry/agriculture.htm.
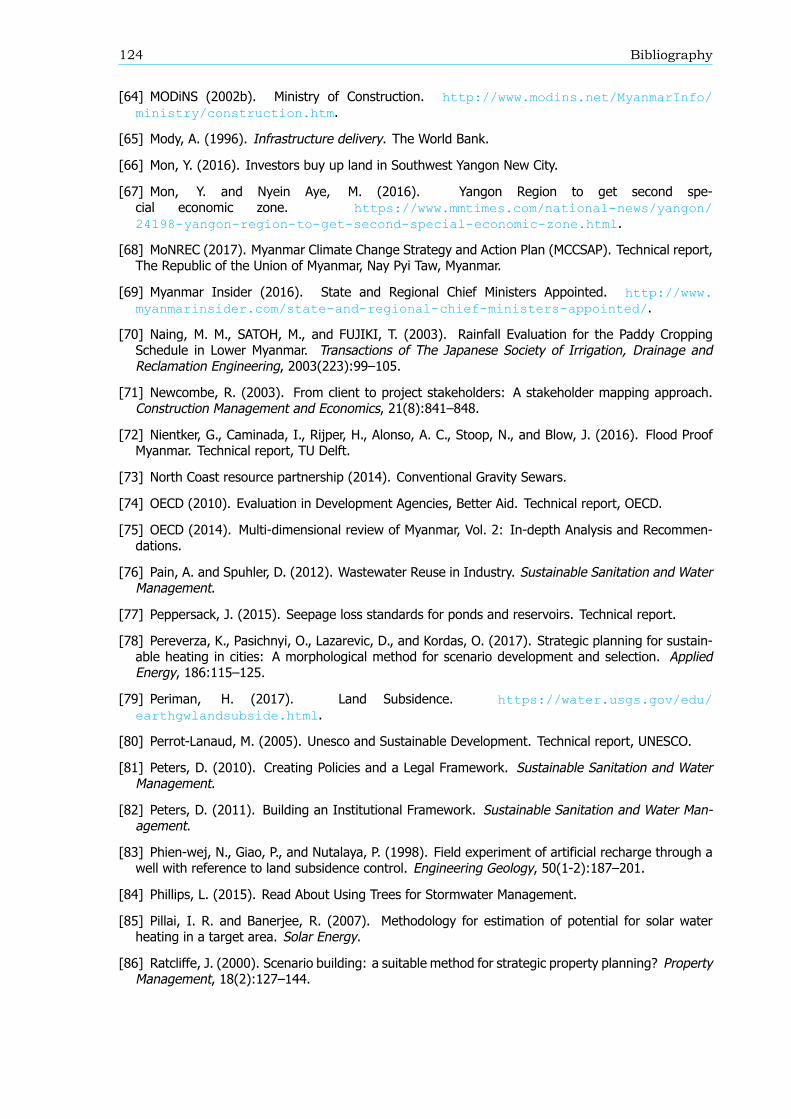
124 Bibliography
[64] MODiNS (2002b). Ministry of Construction. http://www.modins.net/MyanmarInfo/ministry/construction.htm.
[65] Mody, A. (1996). Infrastructure delivery. The World Bank.
[66] Mon, Y. (2016). Investors buy up land in Southwest Yangon New City.
[67] Mon, Y. and Nyein Aye, M. (2016). Yangon Region to get second spe-cial economic zone. https://www.mmtimes.com/national-news/yangon/24198-yangon-region-to-get-second-special-economic-zone.html.
[68] MoNREC (2017). Myanmar Climate Change Strategy and Action Plan (MCCSAP). Technical report,The Republic of the Union of Myanmar, Nay Pyi Taw, Myanmar.
[69] Myanmar Insider (2016). State and Regional Chief Ministers Appointed. http://www.myanmarinsider.com/state-and-regional-chief-ministers-appointed/.
[70] Naing, M. M., SATOH, M., and FUJIKI, T. (2003). Rainfall Evaluation for the Paddy CroppingSchedule in Lower Myanmar. Transactions of The Japanese Society of Irrigation, Drainage andReclamation Engineering, 2003(223):99–105.
[71] Newcombe, R. (2003). From client to project stakeholders: A stakeholder mapping approach.Construction Management and Economics, 21(8):841–848.
[72] Nientker, G., Caminada, I., Rijper, H., Alonso, A. C., Stoop, N., and Blow, J. (2016). Flood ProofMyanmar. Technical report, TU Delft.
[73] North Coast resource partnership (2014). Conventional Gravity Sewars.
[74] OECD (2010). Evaluation in Development Agencies, Better Aid. Technical report, OECD.
[75] OECD (2014). Multi-dimensional review of Myanmar, Vol. 2: In-depth Analysis and Recommen-dations.
[76] Pain, A. and Spuhler, D. (2012). Wastewater Reuse in Industry. Sustainable Sanitation and WaterManagement.
[77] Peppersack, J. (2015). Seepage loss standards for ponds and reservoirs. Technical report.
[78] Pereverza, K., Pasichnyi, O., Lazarevic, D., and Kordas, O. (2017). Strategic planning for sustain-able heating in cities: A morphological method for scenario development and selection. AppliedEnergy, 186:115–125.
[79] Periman, H. (2017). Land Subsidence. https://water.usgs.gov/edu/earthgwlandsubside.html.
[80] Perrot-Lanaud, M. (2005). Unesco and Sustainable Development. Technical report, UNESCO.
[81] Peters, D. (2010). Creating Policies and a Legal Framework. Sustainable Sanitation and WaterManagement.
[82] Peters, D. (2011). Building an Institutional Framework. Sustainable Sanitation and Water Man-agement.
[83] Phien-wej, N., Giao, P., and Nutalaya, P. (1998). Field experiment of artificial recharge through awell with reference to land subsidence control. Engineering Geology, 50(1-2):187–201.
[84] Phillips, L. (2015). Read About Using Trees for Stormwater Management.
[85] Pillai, I. R. and Banerjee, R. (2007). Methodology for estimation of potential for solar waterheating in a target area. Solar Energy.
[86] Ratcliffe, J. (2000). Scenario building: a suitable method for strategic property planning? PropertyManagement, 18(2):127–144.
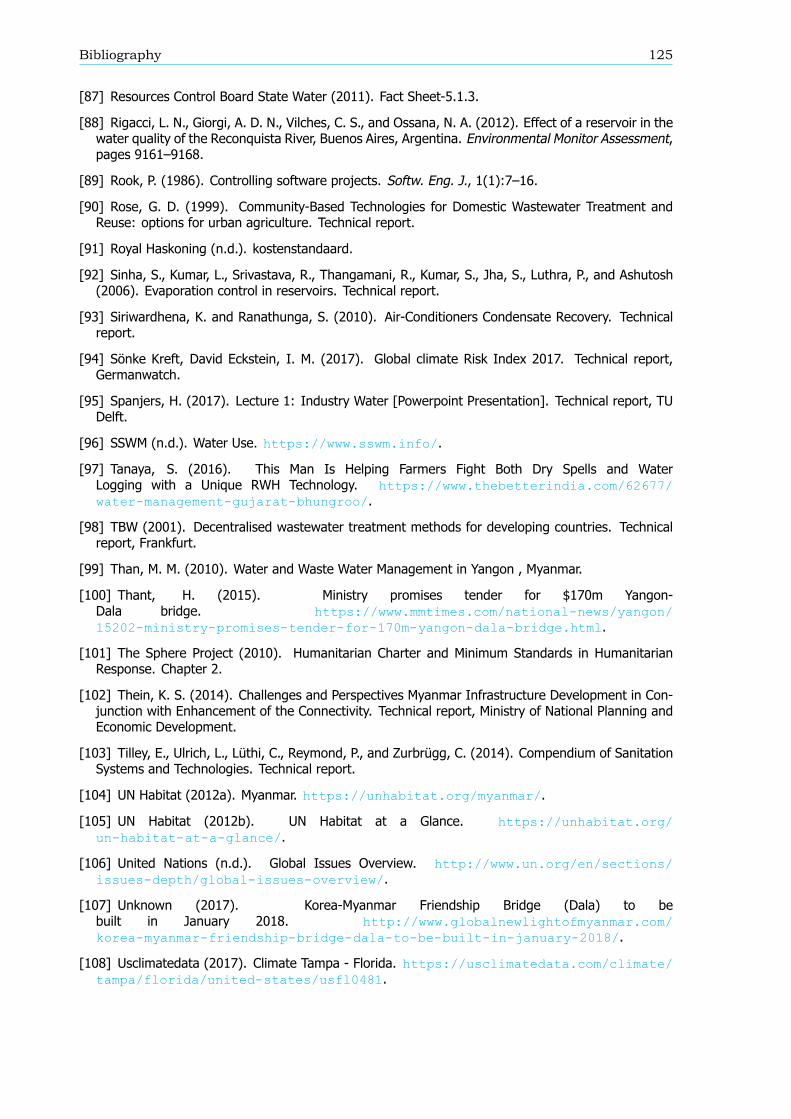
Bibliography 125
[87] Resources Control Board State Water (2011). Fact Sheet-5.1.3.
[88] Rigacci, L. N., Giorgi, A. D. N., Vilches, C. S., and Ossana, N. A. (2012). Effect of a reservoir in thewater quality of the Reconquista River, Buenos Aires, Argentina. Environmental Monitor Assessment,pages 9161–9168.
[89] Rook, P. (1986). Controlling software projects. Softw. Eng. J., 1(1):7–16.
[90] Rose, G. D. (1999). Community-Based Technologies for Domestic Wastewater Treatment andReuse: options for urban agriculture. Technical report.
[91] Royal Haskoning (n.d.). kostenstandaard.
[92] Sinha, S., Kumar, L., Srivastava, R., Thangamani, R., Kumar, S., Jha, S., Luthra, P., and Ashutosh(2006). Evaporation control in reservoirs. Technical report.
[93] Siriwardhena, K. and Ranathunga, S. (2010). Air-Conditioners Condensate Recovery. Technicalreport.
[94] Sönke Kreft, David Eckstein, I. M. (2017). Global climate Risk Index 2017. Technical report,Germanwatch.
[95] Spanjers, H. (2017). Lecture 1: Industry Water [Powerpoint Presentation]. Technical report, TUDelft.
[96] SSWM (n.d.). Water Use. https://www.sswm.info/.[97] Tanaya, S. (2016). This Man Is Helping Farmers Fight Both Dry Spells and WaterLogging with a Unique RWH Technology. https://www.thebetterindia.com/62677/water-management-gujarat-bhungroo/.
[98] TBW (2001). Decentralised wastewater treatment methods for developing countries. Technicalreport, Frankfurt.
[99] Than, M. M. (2010). Water and Waste Water Management in Yangon , Myanmar.
[100] Thant, H. (2015). Ministry promises tender for $170m Yangon-Dala bridge. https://www.mmtimes.com/national-news/yangon/15202-ministry-promises-tender-for-170m-yangon-dala-bridge.html.
[101] The Sphere Project (2010). Humanitarian Charter and Minimum Standards in HumanitarianResponse. Chapter 2.
[102] Thein, K. S. (2014). Challenges and Perspectives Myanmar Infrastructure Development in Con-junction with Enhancement of the Connectivity. Technical report, Ministry of National Planning andEconomic Development.
[103] Tilley, E., Ulrich, L., Lüthi, C., Reymond, P., and Zurbrügg, C. (2014). Compendium of SanitationSystems and Technologies. Technical report.
[104] UN Habitat (2012a). Myanmar. https://unhabitat.org/myanmar/.[105] UN Habitat (2012b). UN Habitat at a Glance. https://unhabitat.org/
un-habitat-at-a-glance/.[106] United Nations (n.d.). Global Issues Overview. http://www.un.org/en/sections/
issues-depth/global-issues-overview/.[107] Unknown (2017). Korea-Myanmar Friendship Bridge (Dala) to bebuilt in January 2018. http://www.globalnewlightofmyanmar.com/korea-myanmar-friendship-bridge-dala-to-be-built-in-january-2018/.
[108] Usclimatedata (2017). Climate Tampa - Florida. https://usclimatedata.com/climate/tampa/florida/united-states/usfl0481.
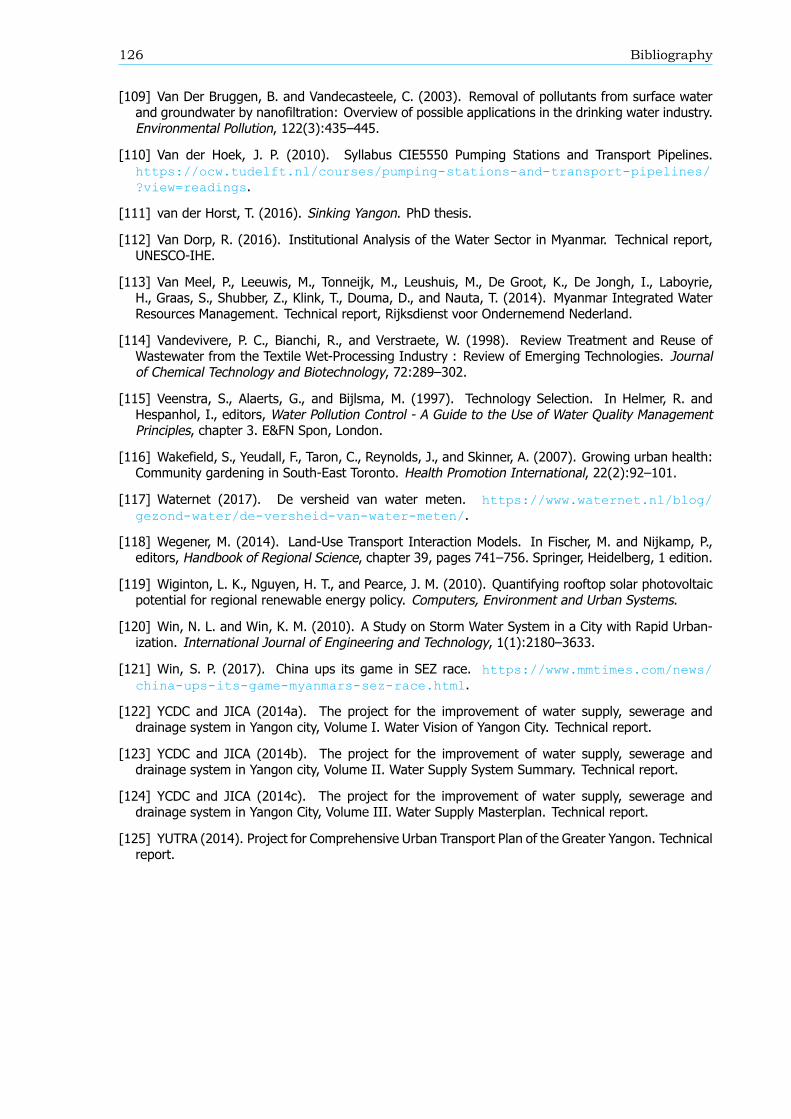
126 Bibliography
[109] Van Der Bruggen, B. and Vandecasteele, C. (2003). Removal of pollutants from surface waterand groundwater by nanofiltration: Overview of possible applications in the drinking water industry.Environmental Pollution, 122(3):435–445.
[110] Van der Hoek, J. P. (2010). Syllabus CIE5550 Pumping Stations and Transport Pipelines.https://ocw.tudelft.nl/courses/pumping-stations-and-transport-pipelines/?view=readings.
[111] van der Horst, T. (2016). Sinking Yangon. PhD thesis.
[112] Van Dorp, R. (2016). Institutional Analysis of the Water Sector in Myanmar. Technical report,UNESCO-IHE.
[113] Van Meel, P., Leeuwis, M., Tonneijk, M., Leushuis, M., De Groot, K., De Jongh, I., Laboyrie,H., Graas, S., Shubber, Z., Klink, T., Douma, D., and Nauta, T. (2014). Myanmar Integrated WaterResources Management. Technical report, Rijksdienst voor Ondernemend Nederland.
[114] Vandevivere, P. C., Bianchi, R., and Verstraete, W. (1998). Review Treatment and Reuse ofWastewater from the Textile Wet-Processing Industry : Review of Emerging Technologies. Journalof Chemical Technology and Biotechnology, 72:289–302.
[115] Veenstra, S., Alaerts, G., and Bijlsma, M. (1997). Technology Selection. In Helmer, R. andHespanhol, I., editors, Water Pollution Control - A Guide to the Use of Water Quality ManagementPrinciples, chapter 3. E&FN Spon, London.
[116] Wakefield, S., Yeudall, F., Taron, C., Reynolds, J., and Skinner, A. (2007). Growing urban health:Community gardening in South-East Toronto. Health Promotion International, 22(2):92–101.
[117] Waternet (2017). De versheid van water meten. https://www.waternet.nl/blog/gezond-water/de-versheid-van-water-meten/.
[118] Wegener, M. (2014). Land-Use Transport Interaction Models. In Fischer, M. and Nijkamp, P.,editors, Handbook of Regional Science, chapter 39, pages 741–756. Springer, Heidelberg, 1 edition.
[119] Wiginton, L. K., Nguyen, H. T., and Pearce, J. M. (2010). Quantifying rooftop solar photovoltaicpotential for regional renewable energy policy. Computers, Environment and Urban Systems.
[120] Win, N. L. and Win, K. M. (2010). A Study on Storm Water System in a City with Rapid Urban-ization. International Journal of Engineering and Technology, 1(1):2180–3633.
[121] Win, S. P. (2017). China ups its game in SEZ race. https://www.mmtimes.com/news/china-ups-its-game-myanmars-sez-race.html.
[122] YCDC and JICA (2014a). The project for the improvement of water supply, sewerage anddrainage system in Yangon city, Volume I. Water Vision of Yangon City. Technical report.
[123] YCDC and JICA (2014b). The project for the improvement of water supply, sewerage anddrainage system in Yangon city, Volume II. Water Supply System Summary. Technical report.
[124] YCDC and JICA (2014c). The project for the improvement of water supply, sewerage anddrainage system in Yangon City, Volume III. Water Supply Masterplan. Technical report.
[125] YUTRA (2014). Project for Comprehensive Urban Transport Plan of the Greater Yangon. Technicalreport.