surgical robots - icon group international
TRANSCRIPT
The 2021-2026 World Outlook for
Surgical Robots
Professor Philip M. Parker, Ph.D.Chaired Professor of Management Science
INSEAD (Singapore and Fontainebleau, France)
i
www.icongrouponline.com © 2020 ICON Group International, Inc.
COPYRIGHT NOTICE
BC3-L-L0-1ANA9R-2
All of ICON Group International, Inc. publications are copyrighted. Copying ourpublications in whole or in part, for whatever reason, is a violation of copyright laws andcan lead to penalties and fines.
Should you want to copy tables, graphs, or other materials from our publications, pleasecontact us to request permission. ICON Group International, Inc. often grants permissionfor very limited reproduction of our publications for internal use, press releases, andacademic research. Such reproduction requires, however, confirmed permission fromICON Group International, Inc. Please read the full copyright notice, disclaimer, anduser agreement provisions at the end of this report.
IMPORTANT DISCLAIMER
Neither ICON Group International, Inc. nor its employees or the author of this report canbe held accountable for the use and subsequent actions of the user of the informationprovided in this publication. Great efforts have been made to ensure the accuracy of thedata, but we can not guarantee, given the volume of information, accuracy. Since theinformation given in this report is forward-looking, the reader should read thedisclaimer statement and user agreement provisions at the end of this report.
ii
www.icongrouponline.com © 2020 ICON Group International, Inc.
About the Author
Dr. Philip M. Parker is the INSEAD Chair Professor of Management Science at INSEAD wherehe has taught courses on global competitive strategy since 1988. He has also taught courses atMIT, Stanford University, Harvard University, UCLA, UCSD, and the Hong Kong University ofScience and Technology. Professor Parker is the author of six books on the economicconvergence of nations. These books introduce the notion of "physioeconomics" which foreseesa lack of global convergence in economic behaviors due to physiological and physiographicforces. His latest book is Physioeconomics: The Basis for Long-Run Economic Growth (MITPress). He has also published numerous articles in academic journals, including, the RandJournal of Economics, Marketing Science, the Journal of International Business Studies,Technological Forecasting and Social Change, the International Journal of Forecasting, theEuropean Management Journal, the European Journal of Operational Research, the Journal ofMarketing, the International Journal of Research in Marketing, and the Journal of MarketingResearch. He is also on the editorial boards of several academic journals.
Dr. Parker received his Ph.D. in Business Economics from the Wharton School of the Universityof Pennsylvania and has Master's degrees in Finance and Banking (University of Aix-Marseille)and Managerial Economics (Wharton). His undergraduate degrees are in mathematics, biology,and economics (minor in aeronautical engineering). He has consulted and/or taught courses inAfrica, the Middle East, Asia, Latin America, North America, and Europe.
About this Series
This series was created for international firms who rely on foreign markets for a substantialportion of their business or who might be threatened by international competition. The estimatesgiven in this report were created using a methodology developed by and implemented under thedirect supervision of Professor Philip M. Parker, the Eli Lilly Chaired Professor of Innovation,Business and Society, at INSEAD. The methodology relies on historical figures across countries.Reported figures should be seen as estimates of past and future levels of latent demand.
Acknowledgements
Some of the methodologies and research approaches used in this report have benefited from theR&D Committee at INSEAD, whose research support is gratefully acknowledged.
iii
www.icongrouponline.com © 2020 ICON Group International, Inc.
About ICON Group International, Inc.
ICON Group International, Inc.'s primary mission is to assist managers with their internationalinformation needs. U.S.-owned and operated, ICON Group has published hundreds of multi-client databases and global/regional market data, industry, and country publications.
Global/Regional Management Studies: Summarizing over 190 countries, management studiesare generally organized into regional volumes and cover key management functions. The humanresource series covers minimum wages, child labor, unionization, and collective bargaining. Theinternational law series covers media control and censorship, search and seizure, and trial justiceand punishment. The diversity management series covers a variety of environmental contextdrivers that effect global operations. These include women's rights, children's rights,discrimination/racism, and religious forces and risks. Global strategic planning studies covereconomic risk assessments, political risk assessments, foreign direct investment strategy,intellectual property strategy, and export strategies. Financial management studies cover taxesand tariffs. Global marketing studies focus on target segments (e.g. seniors, children, women)and strategic marketing planning.
Country Studies: Often managers need an in-depth, yet broad and up-to-date understanding of acountry's strategic market potential and situation before the first field trip or investment proposal.There are over 190 country studies available. Each study consists of analysis, statistics, forecasts,and information of relevance to managers. The studies are continually updated to ensure that thereports have the most relevant information available. In addition to raw information, the reportsprovide relevant analyses which put a more general perspective on a country (seen in the contextof relative performance vis-à-vis benchmarks).
Industry Studies: Companies are racing to become more international, if not global in theirstrategies. For over 15,000 product/industry categories, these reports give the reader a concisesummary of latent market forecasts, pro-forma financials, import competition profiles, contacts,key references, and trends across 190 countries of the world. Some reports focus on a particularproduct and region (up to four regions per product), while others focus on a product within aparticular country.
ICON Group Customer ServicePO BOX 27740Las Vegas, NV 89126-7440USAE-mail: [email protected]: www.icongrouponline.com
iv
www.icongrouponline.com © 2020 ICON Group International, Inc.
Table of Contents
1 INTRODUCTION............................................................................................................ 1
1.1 OVERVIEW.............................................................................................................. 1
1.2 WHAT IS LATENT DEMAND AND THE P.I.E.?...........................................................1
1.3 THE METHODOLOGY...............................................................................................2
1.4 FREQUENTLY ASKED QUESTIONS (FAQ)..................................................................7
2 SUMMARY OF FINDINGS............................................................................................ 11
2.1 THE WORLDWIDE MARKET POTENTIAL................................................................ 11
3 AFRICA........................................................................................................................ 13
3.1 EXECUTIVE SUMMARY.......................................................................................... 13
3.2 ALGERIA................................................................................................................ 16
3.3 ANGOLA................................................................................................................ 17
3.4 BENIN.................................................................................................................... 18
3.5 BOTSWANA........................................................................................................... 19
3.6 BURKINA FASO......................................................................................................20
3.7 BURUNDI...............................................................................................................21
3.8 CAMEROON.......................................................................................................... 22
3.9 CAPE VERDE.......................................................................................................... 23
3.10 CENTRAL AFRICAN REPUBLIC................................................................................24
3.11 CHAD.....................................................................................................................25
3.12 COMOROS.............................................................................................................26
3.13 CONGO (FORMERLY ZAIRE).................................................................................. 27
3.14 COTE D'IVOIRE...................................................................................................... 28
3.15 DJIBOUTI............................................................................................................... 29
3.16 EGYPT....................................................................................................................30
3.17 EQUATORIAL GUINEA........................................................................................... 31
3.18 ERITREA.................................................................................................................32
3.19 ETHIOPIA...............................................................................................................33
3.20 GABON.................................................................................................................. 34
v
www.icongrouponline.com © 2020 ICON Group International, Inc.
3.21 GHANA.................................................................................................................. 35
3.22 GUINEA................................................................................................................. 36
3.23 GUINEA-BISSAU.................................................................................................... 37
3.24 KENYA................................................................................................................... 38
3.25 LESOTHO............................................................................................................... 39
3.26 LIBERIA.................................................................................................................. 40
3.27 LIBYA..................................................................................................................... 41
3.28 MADAGASCAR...................................................................................................... 42
3.29 MALAWI................................................................................................................ 43
3.30 MALI......................................................................................................................44
3.31 MAURITANIA.........................................................................................................45
3.32 MAURITIUS........................................................................................................... 46
3.34 MOROCCO............................................................................................................ 46
3.35 MOZAMBIQUE...................................................................................................... 48
3.36 NAMIBIA............................................................................................................... 49
3.37 NIGER.................................................................................................................... 50
3.38 NIGERIA.................................................................................................................51
3.39 REPUBLIC OF CONGO............................................................................................53
3.40 RWANDA...............................................................................................................54
3.41 SAO TOME E PRINCIPE.......................................................................................... 55
3.42 SENEGAL............................................................................................................... 56
3.43 SIERRA LEONE....................................................................................................... 57
3.44 SOMALIA............................................................................................................... 58
3.45 SOUTH AFRICA...................................................................................................... 58
3.46 SOUTH SUDAN...................................................................................................... 60
3.47 ST. HELENA........................................................................................................... 60
3.48 SUDAN.................................................................................................................. 61
3.49 SWAZILAND...........................................................................................................62
3.50 TANZANIA............................................................................................................. 63
3.51 THE GAMBIA......................................................................................................... 64
vi
www.icongrouponline.com © 2020 ICON Group International, Inc.
3.52 TOGO.................................................................................................................... 65
3.53 TUNISIA................................................................................................................. 66
3.54 UGANDA............................................................................................................... 67
3.55 WESTERN SAHARA................................................................................................ 68
3.56 ZAMBIA................................................................................................................. 69
3.57 ZIMBABWE............................................................................................................69
4 ASIA.............................................................................................................................71
4.1 EXECUTIVE SUMMARY.......................................................................................... 71
4.2 BANGLADESH........................................................................................................ 73
4.3 BHUTAN................................................................................................................ 75
4.4 BRUNEI..................................................................................................................75
4.5 BURMA................................................................................................................. 76
4.6 CAMBODIA............................................................................................................77
4.7 CHINA....................................................................................................................78
4.8 HONG KONG......................................................................................................... 80
4.9 INDIA.....................................................................................................................81
4.10 INDONESIA............................................................................................................82
4.11 JAPAN....................................................................................................................84
4.12 LAOS......................................................................................................................88
4.13 MACAU................................................................................................................. 89
4.14 MALAYSIA............................................................................................................. 89
4.15 MALDIVES............................................................................................................. 91
4.16 MONGOLIA........................................................................................................... 91
4.17 NEPAL................................................................................................................... 93
4.18 NORTH KOREA...................................................................................................... 93
4.19 PAPUA NEW GUINEA............................................................................................ 95
4.20 PHILIPPINES.......................................................................................................... 96
4.21 SEYCHELLES.........................................................................................................101
4.22 SINGAPORE......................................................................................................... 101
4.23 SOUTH KOREA.....................................................................................................104
vii
www.icongrouponline.com © 2020 ICON Group International, Inc.
4.24 SRI LANKA........................................................................................................... 106
4.25 TAIWAN.............................................................................................................. 106
4.26 THAILAND........................................................................................................... 108
4.27 TIMOR - LESTE, DEMOCRATIC REPUBLIC OF....................................................... 108
4.28 VIETNAM.............................................................................................................109
5 EUROPE.....................................................................................................................111
5.1 EXECUTIVE SUMMARY........................................................................................ 111
5.2 ALBANIA..............................................................................................................114
5.3 ANDORRA........................................................................................................... 115
5.4 AUSTRIA.............................................................................................................. 116
5.5 BELARUS............................................................................................................. 117
5.6 BELGIUM............................................................................................................. 118
5.7 BOSNIA AND HERZEGOVINA............................................................................... 119
5.8 BULGARIA........................................................................................................... 119
5.9 CROATIA..............................................................................................................121
5.10 CYPRUS............................................................................................................... 122
5.11 CZECH REPUBLIC................................................................................................. 123
5.12 DENMARK........................................................................................................... 124
5.13 ESTONIA.............................................................................................................. 125
5.14 FINLAND..............................................................................................................126
5.15 FRANCE............................................................................................................... 127
5.16 GEORGIA............................................................................................................. 129
5.17 GERMANY........................................................................................................... 129
5.18 GIBRALTAR.......................................................................................................... 131
5.19 GREECE............................................................................................................... 131
5.20 GUERNSEY...........................................................................................................133
5.21 HUNGARY............................................................................................................133
5.22 ICELAND.............................................................................................................. 134
5.23 IRELAND.............................................................................................................. 135
5.24 ISLE OF MAN....................................................................................................... 136
viii
www.icongrouponline.com © 2020 ICON Group International, Inc.
5.25 ITALY................................................................................................................... 137
5.26 JERSEY................................................................................................................. 139
5.27 KAZAKHSTAN...................................................................................................... 139
5.28 KOSOVO.............................................................................................................. 141
5.29 LATVIA.................................................................................................................141
5.30 LIECHTENSTEIN................................................................................................... 142
5.31 LITHUANIA.......................................................................................................... 143
5.32 LUXEMBOURG.................................................................................................... 144
5.33 MACEDONIA....................................................................................................... 145
5.34 MALTA................................................................................................................ 145
5.35 MOLDOVA...........................................................................................................146
5.36 MONACO............................................................................................................ 147
5.37 MONTENEGRO....................................................................................................148
5.38 NORWAY............................................................................................................. 149
5.39 POLAND.............................................................................................................. 150
5.40 PORTUGAL.......................................................................................................... 151
5.41 ROMANIA............................................................................................................152
5.42 RUSSIA................................................................................................................ 154
5.43 SAN MARINO...................................................................................................... 157
5.44 SERBIA.................................................................................................................157
5.45 SLOVAKIA............................................................................................................ 158
5.46 SLOVENIA............................................................................................................ 159
5.47 SPAIN.................................................................................................................. 160
5.48 SWEDEN.............................................................................................................. 163
5.49 SWITZERLAND..................................................................................................... 164
5.50 THE FAROE ISLANDS........................................................................................... 165
5.51 THE NETHERLANDS............................................................................................. 165
5.52 THE UNITED KINGDOM....................................................................................... 167
5.53 UKRAINE............................................................................................................. 169
6 LATIN AMERICA........................................................................................................ 172
ix
www.icongrouponline.com © 2020 ICON Group International, Inc.
6.1 EXECUTIVE SUMMARY........................................................................................ 172
6.2 ARGENTINA.........................................................................................................174
6.3 BELIZE................................................................................................................. 178
6.4 BOLIVIA............................................................................................................... 179
6.5 BRAZIL................................................................................................................. 180
6.6 CHILE................................................................................................................... 184
6.7 COLOMBIA.......................................................................................................... 185
6.8 COSTA RICA.........................................................................................................187
6.9 ECUADOR............................................................................................................ 188
6.10 EL SALVADOR...................................................................................................... 189
6.12 GUATEMALA....................................................................................................... 190
6.13 GUYANA.............................................................................................................. 191
6.14 HONDURAS......................................................................................................... 192
6.15 MEXICO............................................................................................................... 193
6.16 NICARAGUA........................................................................................................ 195
6.17 PANAMA............................................................................................................. 196
6.18 PARAGUAY.......................................................................................................... 197
6.19 PERU................................................................................................................... 198
6.20 SURINAME.......................................................................................................... 200
6.21 THE FALKLAND ISLANDS..................................................................................... 200
6.22 URUGUAY........................................................................................................... 201
6.23 VENEZUELA......................................................................................................... 202
7 NORTH AMERICA & THE CARIBBEAN........................................................................205
7.1 EXECUTIVE SUMMARY........................................................................................ 205
7.2 ANGUILLA........................................................................................................... 208
7.3 ANTIGUA AND BARBUDA....................................................................................208
7.4 ARUBA.................................................................................................................209
7.5 BARBADOS.......................................................................................................... 210
7.6 BERMUDA........................................................................................................... 210
7.7 CANADA.............................................................................................................. 211
x
www.icongrouponline.com © 2020 ICON Group International, Inc.
7.8 CUBA................................................................................................................... 213
7.9 CURACAO............................................................................................................ 214
7.10 DOMINICA...........................................................................................................215
7.11 DOMINICAN REPUBLIC........................................................................................215
7.12 GREENLAND........................................................................................................ 217
7.13 GRENADA............................................................................................................ 218
7.15 HAITI................................................................................................................... 218
7.16 JAMAICA............................................................................................................. 219
7.18 MONTSERRAT..................................................................................................... 220
7.19 PUERTO RICO...................................................................................................... 221
7.20 SINT MAARTEN................................................................................................... 222
7.21 ST PIERRE AND MIQUELON.................................................................................222
7.22 ST. KITTS AND NEVIS........................................................................................... 222
7.23 ST. LUCIA.............................................................................................................223
7.24 ST. VINCENT AND THE GRENADINES.................................................................. 224
7.25 THE BAHAMAS.................................................................................................... 225
7.26 THE BRITISH VIRGIN ISLANDS............................................................................. 225
7.27 THE CAYMAN ISLANDS........................................................................................226
7.28 THE U.S. VIRGIN ISLANDS....................................................................................227
7.29 THE UNITED STATES............................................................................................228
7.30 TRINIDAD AND TOBAGO..................................................................................... 229
7.31 TURKS AND CAICOS ISLANDS.............................................................................. 230
8 OCEANIA................................................................................................................... 231
8.1 EXECUTIVE SUMMARY........................................................................................ 231
8.2 AMERICAN SAMOA............................................................................................. 233
8.3 AUSTRALIA.......................................................................................................... 234
8.4 CHRISTMAS ISLAND............................................................................................ 235
8.6 COOK ISLANDS.................................................................................................... 236
8.7 FIJI....................................................................................................................... 237
8.8 FRENCH POLYNESIA............................................................................................ 237
xi
www.icongrouponline.com © 2020 ICON Group International, Inc.
8.9 GUAM................................................................................................................. 238
8.10 KIRIBATI.............................................................................................................. 239
8.11 MARSHALL ISLANDS............................................................................................240
8.12 MICRONESIA FEDERATION..................................................................................240
8.13 NAURU................................................................................................................ 241
8.14 NEW CALEDONIA................................................................................................ 242
8.15 NEW ZEALAND.................................................................................................... 243
8.16 NIUE.................................................................................................................... 244
8.17 NORFOLK ISLAND................................................................................................ 244
8.18 PALAU................................................................................................................. 245
8.19 SOLOMON ISLANDS............................................................................................ 246
8.20 THE NORTHERN MARIANA ISLAND..................................................................... 246
8.22 TOKELAU............................................................................................................. 247
8.23 TONGA................................................................................................................ 247
8.24 TUVALU...............................................................................................................248
8.25 VANUATU............................................................................................................249
8.26 WALLIS AND FUTUNA......................................................................................... 249
8.27 WESTERN SAMOA............................................................................................... 250
9 THE MIDDLE EAST..................................................................................................... 252
9.1 EXECUTIVE SUMMARY........................................................................................ 252
9.2 AFGHANISTAN.................................................................................................... 254
9.3 ARMENIA............................................................................................................ 255
9.4 AZERBAIJAN........................................................................................................ 256
9.5 BAHRAIN............................................................................................................. 257
9.6 IRAN.................................................................................................................... 258
9.7 IRAQ.................................................................................................................... 261
9.8 ISRAEL................................................................................................................. 262
9.9 JORDAN...............................................................................................................263
9.10 KUWAIT...............................................................................................................264
9.11 KYRGYZSTAN....................................................................................................... 266
xii
www.icongrouponline.com © 2020 ICON Group International, Inc.
9.12 LEBANON............................................................................................................ 267
9.13 OMAN................................................................................................................. 268
9.14 PAKISTAN............................................................................................................ 268
9.15 PALESTINE........................................................................................................... 271
9.16 QATAR.................................................................................................................272
9.17 SAUDI ARABIA..................................................................................................... 273
9.18 SYRIAN ARAB REPUBLIC...................................................................................... 274
9.19 TAJIKISTAN.......................................................................................................... 275
9.20 THE UNITED ARAB EMIRATES............................................................................. 276
9.21 TURKEY............................................................................................................... 277
9.22 TURKMENISTAN.................................................................................................. 280
9.23 UZBEKISTAN........................................................................................................ 281
9.24 YEMEN................................................................................................................ 282
10 DISCLAIMERS, WARRANTEES, AND USER AGREEMENT PROVISIONS....................... 284
10.1 DISCLAIMERS & SAFE HARBOR........................................................................... 284
10.2 ICON GROUP INTERNATIONAL, INC. USER AGREEMENT PROVISIONS............... 285
1 INTRODUCTION 1
www.icongrouponline.com © 2020 ICON Group International, Inc.
1 INTRODUCTION
1.1 OVERVIEW
This study covers the world outlook for surgical robots across more than 190 countries. For eachyear reported, estimates are given for the latent demand, or potential industry earnings (P.I.E.),for the country in question (in millions of U.S. dollars), the percent share the country is of theregion, and of the globe. These comparative benchmarks allow the reader to quickly gauge acountry vis-à-vis others. Using econometric models which project fundamental economicdynamics within each country and across countries, latent demand estimates are created. Thisreport does not discuss the specific players in the market serving the latent demand, nor specificdetails at the product level. The study also does not consider short-term cyclicalities that mightaffect realized sales. The study, therefore, is strategic in nature, taking an aggregate and long-runview, irrespective of the players or products involved.
This study does not report actual sales data (which are simply unavailable, in a comparable orconsistent manner in virtually all of the countries of the world). This study gives, however, myestimates for the worldwide latent demand, or the P.I.E., for surgical robots. It also shows howthe P.I.E. is divided across the world's regional and national markets. For each country, I alsoshow my estimates of how the P.I.E. grows over time (positive or negative growth). In order tomake these estimates, a multi-stage methodology was employed that is often taught in courses oninternational strategic planning at graduate schools of business.
Another reason why sales do not equate to latent demand is exchange rates. In this report, allfigures assume the long-run efficiency of currency markets. Figures, therefore, equate valuesbased on purchasing power parities across countries. Short-run distortions in the value of thedollar, therefore, do not figure into the estimates. Purchasing power parity estimates of countryincome were collected from official sources, and extrapolated using standard econometricmodels. The report uses the dollar as the currency of comparison, but not as a measure oftransaction volume. The units used in this report are: US $ mln.
1.2 WHAT IS LATENT DEMAND AND THE P.I.E.?
The concept of latent demand is rather subtle. The term latent typically refers to something thatis dormant, not observable, or not yet realized. Demand is the notion of an economic quantitythat a target population or market requires under different assumptions of price, quality, anddistribution, among other factors. Latent demand, therefore, is commonly defined by economistsas the industry earnings of a market when that market becomes accessible and attractive to serveby competing firms. It is a measure, therefore, of potential industry earnings (P.I.E.) or totalrevenues (not profit) if a market is served in an efficient manner. It is typically expressed as thetotal revenues potentially extracted by firms. The "market" is defined at a given level in the valuechain. There can be latent demand at the retail level, at the wholesale level, the manufacturinglevel, and the raw materials level (the P.I.E. of higher levels of the value chain being alwayssmaller than the P.I.E. of levels at lower levels of the same value chain, assuming all levelsmaintain minimum profitability).
1 INTRODUCTION 2
www.icongrouponline.com © 2020 ICON Group International, Inc.
The latent demand for surgical robots is not actual or historic sales. Nor is latent demand futuresales. In fact, latent demand can be either lower or higher than actual sales if a market isinefficient (i.e., not representative of relatively competitive levels). Inefficiencies arise from anumber of factors, including the lack of international openness, cultural barriers to consumption,regulations, and cartel-like behavior on the part of firms. In general, however, latent demand istypically larger than actual sales in a country market.
For reasons discussed later, this report does not consider the notion of "unit quantities", onlytotal latent revenues (i.e., a calculation of price times quantity is never made, though one isimplied). The units used in this report are U.S. dollars not adjusted for inflation (i.e., the figuresincorporate inflationary trends) and not adjusted for future dynamics in exchange rates. Ifinflation rates or exchange rates vary in a substantial way compared to recent experience, actualsales can also exceed latent demand (when expressed in U.S. dollars, not adjusted for inflation).On the other hand, latent demand can be typically higher than actual sales as there are oftendistribution inefficiencies that reduce actual sales below the level of latent demand.
As mentioned in the introduction, this study is strategic in nature, taking an aggregate and long-run view, irrespective of the players or products and/or services involved. In fact, all the currentproducts and/or services on the market can cease to exist in their present form (i.e., at a brand-,R&D specification, or corporate-image level) and all the players can be replaced by other firms(i.e., via exits, entries, mergers, bankruptcies, etc.), and there will still be an international latentdemand for surgical robots at the aggregate level. Product and/or service offering details, and theactual identity of the players involved, while important for certain issues, are relativelyunimportant for estimates of latent demand.
1.3 THE METHODOLOGY
In order to estimate the latent demand for surgical robots on a worldwide basis, I used a multi-stage approach. Before applying the approach, one needs a basic theory from which suchestimates are created. In this case, I heavily rely on the use of certain basic economicassumptions. In particular, there is an assumption governing the shape and type of aggregatelatent demand functions. Latent demand functions relate the income of a country, city, state,household, or individual to realized consumption. Latent demand (often realized as consumptionwhen an industry is efficient), at any level of the value chain, takes place if an equilibrium isrealized. For firms to serve a market, they must perceive a latent demand and be able to servethat demand at a minimal return. The single most important variable determining consumption,assuming latent demand exists, is income (or other financial resources at higher levels of thevalue chain). Other factors that can pivot or shape demand curves include external or exogenousshocks (i.e., business cycles), and or changes in utility for the product in question.
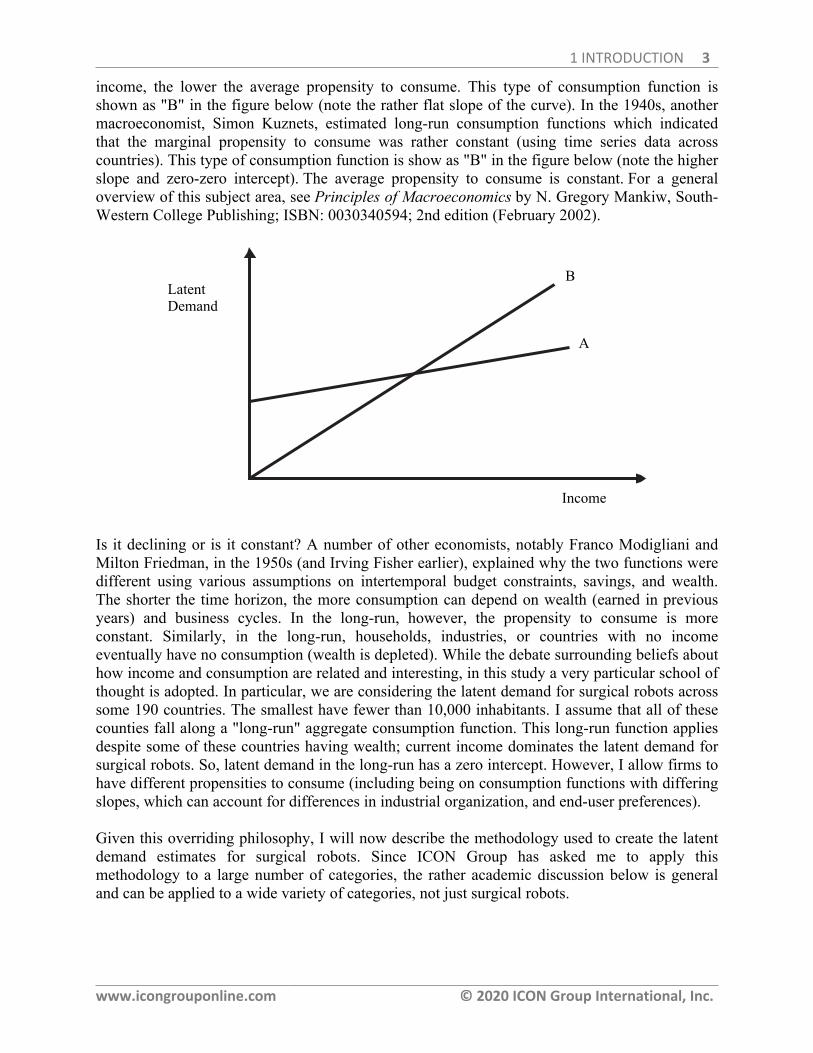
Ignoring, for the moment, exogenous shocks and variations in utility across countries, theaggregate relation between income and consumption has been a central theme in economics. Thefigure below concisely summarizes one aspect of problem. In the 1930s, John Meynard Keynesconjectured that as incomes rise, the average propensity to consume would fall. The averagepropensity to consume is the level of consumption divided by the level of income, or the slope ofthe line from the origin to the consumption function. He estimated this relationship empiricallyand found it to be true in the short-run (mostly based on cross-sectional data). The higher the
1 INTRODUCTION 3
www.icongrouponline.com © 2020 ICON Group International, Inc.
income, the lower the average propensity to consume. This type of consumption function isshown as "B" in the figure below (note the rather flat slope of the curve). In the 1940s, anothermacroeconomist, Simon Kuznets, estimated long-run consumption functions which indicatedthat the marginal propensity to consume was rather constant (using time series data acrosscountries). This type of consumption function is show as "B" in the figure below (note the higherslope and zero-zero intercept). The average propensity to consume is constant. For a generaloverview of this subject area, see Principles of Macroeconomics by N. Gregory Mankiw, South-Western College Publishing; ISBN: 0030340594; 2nd edition (February 2002).
Is it declining or is it constant? A number of other economists, notably Franco Modigliani andMilton Friedman, in the 1950s (and Irving Fisher earlier), explained why the two functions weredifferent using various assumptions on intertemporal budget constraints, savings, and wealth.The shorter the time horizon, the more consumption can depend on wealth (earned in previousyears) and business cycles. In the long-run, however, the propensity to consume is moreconstant. Similarly, in the long-run, households, industries, or countries with no incomeeventually have no consumption (wealth is depleted). While the debate surrounding beliefs abouthow income and consumption are related and interesting, in this study a very particular school ofthought is adopted. In particular, we are considering the latent demand for surgical robots acrosssome 190 countries. The smallest have fewer than 10,000 inhabitants. I assume that all of thesecounties fall along a "long-run" aggregate consumption function. This long-run function appliesdespite some of these countries having wealth; current income dominates the latent demand forsurgical robots. So, latent demand in the long-run has a zero intercept. However, I allow firms tohave different propensities to consume (including being on consumption functions with differingslopes, which can account for differences in industrial organization, and end-user preferences).
Given this overriding philosophy, I will now describe the methodology used to create the latentdemand estimates for surgical robots. Since ICON Group has asked me to apply thismethodology to a large number of categories, the rather academic discussion below is generaland can be applied to a wide variety of categories, not just surgical robots.
LatentDemand
B
A
Income
1 INTRODUCTION 4
www.icongrouponline.com © 2020 ICON Group International, Inc.
1.3.1 STEP 1. PRODUCT DEFINITION AND DATA COLLECTION
Any study of latent demand across countries requires that some standard be established to define"efficiently served". Having implemented various alternatives and matched these with marketoutcomes, I have found that the optimal approach is to assume that certain key countries aremore likely to be at or near efficiency than others. These countries are given greater weight thanothers in the estimation of latent demand compared to other countries for which no known dataare available. Of the many alternatives, I have found the assumption that the world's highestaggregate income and highest income-per-capita markets reflect the best standards for"efficiency". High aggregate income alone is not sufficient (i.e., China has high aggregateincome, but low income per capita and cannot be assumed to be efficient). Aggregate income canbe operationalized in a number of ways, including gross domestic product (for industrialcategories), or total disposable income (for household categories; population times averageincome per capita, or number of households times average household income per capita). Brunei,Nauru, Kuwait, and Lichtenstein are examples of countries with high income per capita, but notassumed to be efficient, given low aggregate level of income (or gross domestic product); thesecountries have, however, high incomes per capita but may not benefit from the efficienciesderived from economies of scale associated with large economies. Only countries with highincome per capita and large aggregate income are assumed efficient. This greatly restricts thepool of countries to those in the OECD (Organization for Economic Cooperation andDevelopment), like the United States, or the United Kingdom (which were earlier than otherlarge OECD economies to liberalize their markets).
The selection of countries is further reduced by the fact that not all countries in the OECD reporthave industry revenues at the category level. Countries that typically have ample data at theaggregate level that meet the efficiency criteria include the United States, the United Kingdom,and in some cases France and Germany.
Latent demand is therefore estimated using data collected for relatively efficient markets fromindependent data sources (e.g. Euromonitor, Mintel, Thomson Financial Services, the U.S.Industrial Outlook, the World Resources Institute, the Organization for Economic Cooperationand Development, various agencies from the United Nations, industry trade associations, theInternational Monetary Fund, and the World Bank). Depending on original data sources used, thedefinition of surgical robots is established. In the case of this report, the data were reported at theaggregate level, with no further breakdown or definition. In other words, any potential productsand/or services that might be incorporated within surgical robots fall under this category. Publicsources rarely report data at the disaggregated level in order to protect private information fromindividual firms that might dominate a specific product-market. These sources will thereforeaggregate across components of a category and report only the aggregate to the public. Whileprivate data are certainly available, this report only relies on public data at the aggregate levelwithout reliance on the summation of various category components. In other words, this reportdoes not aggregate a number of components to arrive at the "whole". Rather, it starts with the"whole", and estimates the whole for all countries and the world at large (without needing toknow the specific parts that went into the whole in the first place).
Given this caveat, in this report we define the sales of surgical robots as including all commonlyunderstood products and/or services falling within this broad category, such as surgical robot
1 INTRODUCTION 5
www.icongrouponline.com © 2020 ICON Group International, Inc.
systems, instruments, accessories, and services and robots used in the general surgery, urology,orthopedic, neurosurgery, cardiovascular, gynecology, radiology, transplant, and gastrointestinaldepartments, irrespective of product packaging, formulation, size, or form. In addition to thesources indicated below, additional information available to the public via news and/or pressreleases published by players in the industry was considered in defining and calibrating thiscategory. All figures are in a common currency (U.S. dollars, millions) and are not adjusted forinflation (i.e., they are current values). Exchange rates used to convert to U.S. dollars areaverages for the year in question. Future exchange rates are assumed to be constant in the futureat the current level (the average of the year of this publication's release in 2020).
This report was prepared from a variety of sources including excerpts from documents andofficial reports or databases published by the World Bank, the U.S. Department of Commerce,the U.S. State Department, various national agencies, the International Monetary Fund, theCentral Intelligence Agency, various agencies from the United Nations (e.g. ILO, ITU, UNDP,etc.), and non-governmental sources, including ICON Group Ltd., Euromonitor, the WorldResources Institute, Mintel, the U.S. Industrial Outlook, and various public sources cited in thetrade press.
1.3.2 STEP 2. FILTERING AND SMOOTHING
Based on the aggregate view of surgical robots as defined above, data were then collected for asmany similar countries as possible for that same definition, at the same level of the value chain.This generates a convenience sample of countries from which comparable figures are available.If the series in question do not reflect the same accounting period, then adjustments are made. Inorder to eliminate short-term effects of business cycles, the series are smoothed using a 2-yearmoving average weighting scheme (longer weighting schemes do not substantially change theresults). If data are available for a country, but these reflect short-run aberrations due toexogenous shocks (such as would be the case of beef sales in a country stricken with foot andmouth disease), these observations were dropped or "filtered" from the analysis.
1.3.3 STEP 3. FILLING IN MISSING VALUES
In some cases, data are available for countries on a sporadic basis. In other cases, data from acountry may be available for only one year. From a Bayesian perspective, these observationsshould be given the greatest weight in estimating missing years. Assuming that other factors areheld constant, the missing years are extrapolated using changes and growth in aggregate nationalincome. Based on the overriding philosophy of a long-run consumption function (definedearlier), countries which have missing data for any given year are estimated based on historicaldynamics of aggregate income for that country.
1.3.4 STEP 4. VARYING PARAMETER, NON-LINEAR ESTIMATION
Given the data available from the first three steps, the latent demand in additional countries isestimated using a "varying-parameter cross-sectionally pooled time series model". The interestedreader can find longer discussions of this type of modeling in Studies in Global Econometrics (Advanced Studies in Theoretical and Applied Econometrics V. 30), by Henri Theil, et al., KluwerAcademic Publishers; ISBN: 0792336607; (June 1996), and in Principles of Econometrics, by
1 INTRODUCTION 6
www.icongrouponline.com © 2020 ICON Group International, Inc.
Henri Theil John Wiley & Sons; ISBN: 0471858455; (December 1971), and in EconometricModels and Economic Forecasts by Robert S. Pindyck, Daniel L. Rubinfeld McGraw Hill Text;ISBN: 0070500983; 3rd edition (December 1991). Simply stated, the effect of income on latentdemand is assumed to be constant across countries unless there is empirical evidence to suggestthat this effect varies (i.e., the slope of the income effect is not necessarily the same for allcountries). This assumption applies across countries along the aggregate consumption function,but also over time (i.e., not all countries are perceived to have the same income growth prospectsover time and this effect can vary from country to country as well). Another way of looking atthis is to say that latent demand for surgical robots is more likely to be similar across countriesthat have similar characteristics in terms of economic development (i.e., African countries willhave similar latent demand structures controlling for the income variation across the pool ofAfrican countries).
This approach is useful across countries for which some notion of non-linearity exists in theaggregate cross-country consumption function. For some categories, however, the reader mustrealize that the numbers will reflect a country's contribution to global latent demand and maynever be realized in the form of local sales. For certain country-category combinations this willresult in what at first glance will be odd results. For example, the latent demand for the category"space vehicles" will exist for Togo even though they have no space program. The assumption isthat if the economies in these countries did not exist, the world aggregate for these categorieswould be lower. The share attributed to these countries is based on a proportion of their income(however small) being used to consume the category in question (i.e., perhaps via resellers).
1.3.5 STEP 5. FIXED-PARAMETER LINEAR ESTIMATION
Nonlinearities are assumed in cases where filtered data exist along the aggregate consumptionfunction. Because the world consists of more than 200 countries, there will always be thosecountries, especially toward the bottom of the consumption function, where non-linearestimation is simply not possible. For these countries, equilibrium latent demand is assumed tobe perfectly parametric and not a function of wealth (i.e., a country's stock of income), but afunction of current income (a country's flow of income). In the long run, if a country has nocurrent income, the latent demand for surgical robots is assumed to approach zero. Theassumption is that wealth stocks fall rapidly to zero if flow income falls to zero (i.e., countrieswhich earn low levels of income will not use their savings, in the long run, to demand surgicalrobots). In a graphical sense, for low-income countries, latent demand approaches zero in aparametric linear fashion with a zero-zero intercept. In this stage of the estimation procedure,low-income countries are assumed to have a latent demand proportional to their income, basedon the country closest to it on the aggregate consumption function.
1.3.6 STEP 6. AGGREGATION AND BENCHMARKING
Based on the models described in Chapter 1, latent demand figures are estimated for all countriesof the world, including for the smallest economies. These are then aggregated to get world totalsand regional totals. To make the numbers more meaningful, regional and global demandaverages are presented. Figures are rounded, so minor inconsistencies may exist across tables.
1 INTRODUCTION 7
www.icongrouponline.com © 2020 ICON Group International, Inc.
1.3.7 STEP 7. LATENT DEMAND DENSITY: ALLOCATING ACROSS CITIES
With the advent of a "borderless world", cities become a more important criteria in prioritizingmarkets, as opposed to regions, continents, or countries. This report also covers the world's top2,000 cities. The purpose is to understand the density of demand within a country and the extentto which a city might be used as a point of distribution within its region. From an economicperspective, however, a city does not represent a population within rigid geographicalboundaries. To an economist or strategic planner, a city represents an area of dominant influenceover markets in adjacent areas. This influence varies from one industry to another, but also fromone period of time to another.
Similar to country-level data, the reader needs to realize that latent demand allocated to a citymay or may not represent real sales. For many items, latent demand is clearly observable insales, as in the case for food or housing items. Consider, again, the category "satellite launchvehicles." Clearly, there are no launch pads in most cities of the world. However, the core benefitof the vehicles (e.g. telecommunications, etc.) is "consumed" by residents or industries withinthe world's cities. Without certain cities, in other words, the world market for satellite launchvehicles would be lower for the world in general. One needs to allocate, therefore, a portion ofthe worldwide economic demand for launch vehicles to regions, countries, and cities. This reporttakes the broader definition and considers, therefore, a city as a part of the global market. Iallocate latent demand across areas of dominant influence based on the relative economicimportance of cities within its home country, within its region, and across the world total. Not allcities are estimated within each country as demand may be allocated to adjacent areas ofinfluence. Since some cities have higher economic wealth than others within the same country, acity's population is not generally used to allocate latent demand. Rather, the level of economicactivity of the city is used vis-à-vis others.
1.4 FREQUENTLY ASKED QUESTIONS (FAQ)
1.4.1 CATEGORY DEFINITION
Q: What is the definition of surgical robots?
A: Please refer to section 1.3.1 for the complete category definition.
Q: Can I get a breakdown and more detailed definition of surgical robots?
A: This report does not cover the individual items, but rather the aggregate level ofdemand across all items within the category surgical robots. The category cannot befurther defined or broken down to a finer level.
1 INTRODUCTION 8
www.icongrouponline.com © 2020 ICON Group International, Inc.
1.4.2 UNITS
Q: Are the data in this report real or forecasts?
A: This report covers "latent demand", not actual sales, historic sales, or future sales.Latent demand can be either lower or higher than actual sales if a market is inefficient(i.e., not representative of relatively competitive levels). Inefficiencies arise from anumber of factors. In general, latent demand is typically larger than actual sales in acountry market.
Q: Is latent demand a commonly adopted indicator to reflect the market size of anindustry?
A: No, latent demand is an econometric estimate of the market when it is efficientlyserved. No market is served to its level of efficiency, so it is not a common indicatorof actual market size. However, it can be used by strategic planners to prioritizemarkets.
Q: What are the "units" used in this report?
A: This report does not consider the notion of "unit quantities", only total latentrevenues (i.e., a calculation of price times quantity is never made, though one isimplied), in millions of U.S. dollars. Units from one market to another may not becomparable, whereas the revenues are a common accounting unit that can be easilycompared and used as strategic variables for relative comparisons. To derive unitsales, one must assume an average price per unit; however, the units (in volume) mayvary in quality, size, etc.
Q: Can this report provide estimates based in tons?
A: This report does not provide estimates based in tons because units of accountingvary from one source to another.
Q: What about exchange rates and inflation?
A: The units used in this report are U.S. dollars not adjusted for inflation (i.e., thefigures incorporate inflationary trends) and not adjusted for future dynamics inexchange rates (i.e., the figures reflect average exchange rates over recent history). Ifinflation rates or exchange rates vary in a substantial way compared to recentexperience, actual sales can also exceed latent demand.
Q: How is latent demand interpreted in local currency?
A: This report does not provide local currency PIE figures. The best approach forinterpreting latent demand in local currency is to choose, over the length of the series,an exchange rate that reflects a long-run average over the period. One may observe

1 INTRODUCTION 9
www.icongrouponline.com © 2020 ICON Group International, Inc.
market declines and increases due to short-run changes in exchange rates vis-à-vis theU.S. dollar.
Q: If the value of U.S. dollars declines, how does this relate to the number of items sold?
A: This report provides latent demand, not units sold. The dollar amounts do notincorporate exchange rate volatility; one would need to consider this independently.
Q: Does latent demand include captive demand? How is total demand derived from actualdemand?
A: The latent demand numbers are not sales-related, but rather economic constructs.Furthermore, these measures do not cover "captive" demand, but only products andservices that are traded on the market. One can collect primary data from the marketfor sales and use these in conjunction with the report estimates.
Q: Does this report contain the relevant size as well as installed capacity?
A: This report only provides estimates of latent demand, not estimates of relevant sizeor installed capacity.
1.4.3 METHODOLOGY
Q: What are the underlying factors in the model for latent demand?
A: Average long-run growth rates are created for each country using historical datawhere a country is in its industrial maturity vis-à-vis its potential. These are createdbased on economic models and expert judgment.
Q: How is international demand handled in this report?
A: International demand is extrapolated using econometrics (not from sales withineach market) using a consumption function.
Q: How are forecasts performed in this report?
A: The forecasted values combine the economic macroeconomic growth rates of eachcountry economy with the aggregate growth in the category. Therefore, fastergrowing economies have faster growth than others, etc. The baseline growth acrosscountries is based on aggregate dynamics of the category.
Q: Do these values reflect the location of the purchaser rather than the location of productor service use?
A: The numbers reflect where the purchase is located, not where the product orservice is used.
1 INTRODUCTION 10
www.icongrouponline.com © 2020 ICON Group International, Inc.
Q: How does the global market break down by individual purchaser?
A: This report is purely econometric and does not provide data on individualpurchases. One must conduct primary research to go beyond the report.
Q: What are the main drivers of product use?
A: This report does not consider drivers of product use.
Q: Are there barriers (other than price) to the use of specific branded products?
A: This report does not consider branded products.
Q: What is the impact of the WHO guidelines? How closely are they followed?
A: This report does not consider WHO guidelines.
Q: Another source suggests a flat to negative growth rate over the same timeframe. Howcan this be reconciled with the growth rate indicated in this report?
A: This study uses long-run averages and cannot be used to gauge growth rates inindustry sales that might be affected by exogenous business cycles.
Q: Why is the latent demand of one category greater than another when it appears thelesser category represents the entire market, contains the other category, and thereforeshould have a greater latent demand?
A: The first category may not in fact represent the entire market and therefore wouldnot include the other category as presumed. In this case, the categories are likelyseparately defined and have no relative relationship.
2 SUMMARY OF FINDINGS 11
www.icongrouponline.com © 2020 ICON Group International, Inc.
2 SUMMARY OF FINDINGS
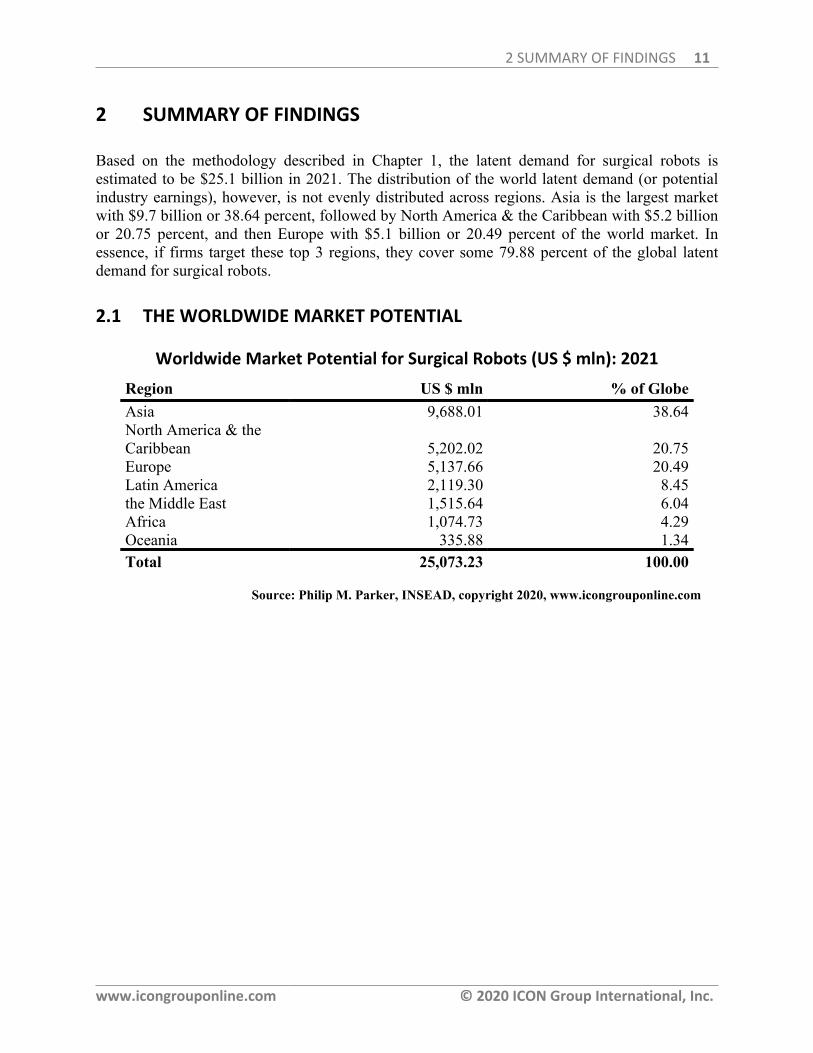
Based on the methodology described in Chapter 1, the latent demand for surgical robots isestimated to be $25.1 billion in 2021. The distribution of the world latent demand (or potentialindustry earnings), however, is not evenly distributed across regions. Asia is the largest marketwith $9.7 billion or 38.64 percent, followed by North America & the Caribbean with $5.2 billionor 20.75 percent, and then Europe with $5.1 billion or 20.49 percent of the world market. Inessence, if firms target these top 3 regions, they cover some 79.88 percent of the global latentdemand for surgical robots.
2.1 THE WORLDWIDE MARKET POTENTIAL
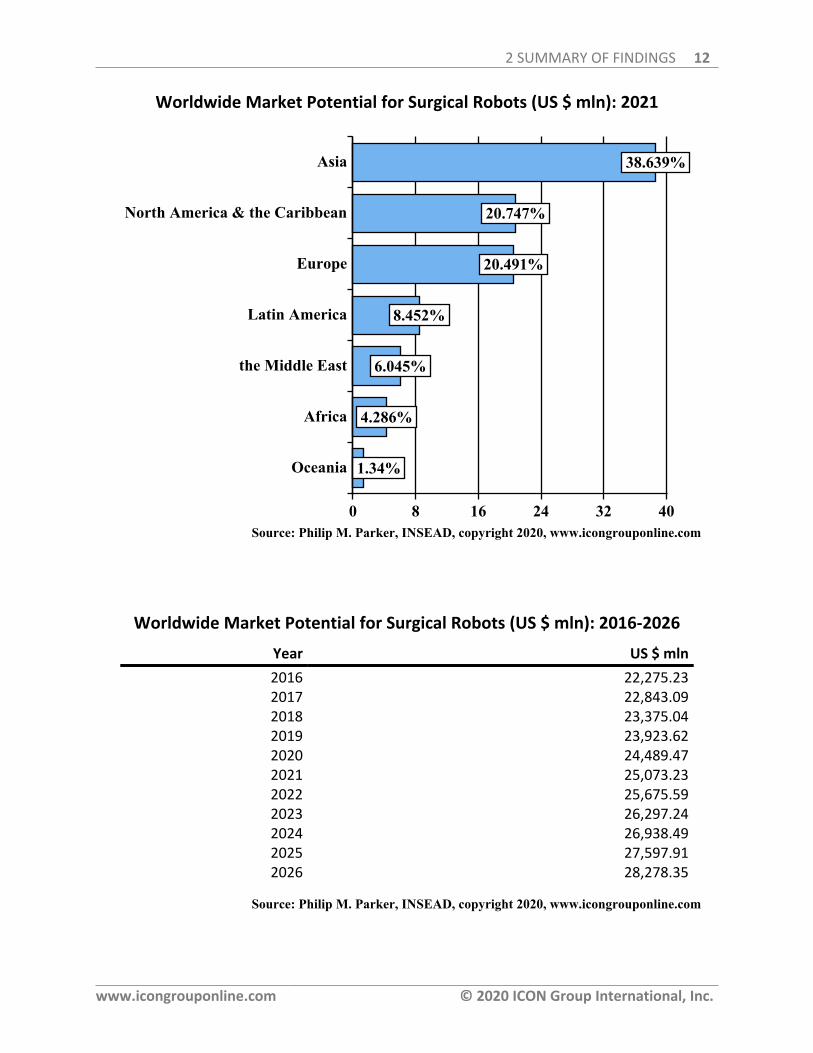
Worldwide Market Potential for Surgical Robots (US $ mln): 2021
Region US $ mln % of GlobeAsia 9,688.01 38.64North America & theCaribbean 5,202.02 20.75Europe 5,137.66 20.49Latin America 2,119.30 8.45the Middle East 1,515.64 6.04Africa 1,074.73 4.29Oceania 335.88 1.34Total 25,073.23 100.00
Source: Philip M. Parker, INSEAD, copyright 2020, www.icongrouponline.com
2 SUMMARY OF FINDINGS 12
www.icongrouponline.com © 2020 ICON Group International, Inc.
Worldwide Market Potential for Surgical Robots (US $ mln): 2021
1.34%
4.286%
6.045%
8.452%
20.491%
20.747%
38.639%Asia
North America & the Caribbean
Europe
Latin America
the Middle East
Africa
Oceania
0 8 16 24 32 40Source: Philip M. Parker, INSEAD, copyright 2020, www.icongrouponline.com
Worldwide Market Potential for Surgical Robots (US $ mln): 2016-2026
Year US $ mln2016 22,275.232017 22,843.092018 23,375.042019 23,923.622020 24,489.472021 25,073.232022 25,675.592023 26,297.242024 26,938.492025 27,597.912026 28,278.35
Source: Philip M. Parker, INSEAD, copyright 2020, www.icongrouponline.com

3 AFRICA 13
www.icongrouponline.com © 2020 ICON Group International, Inc.
3 AFRICA
3.1 EXECUTIVE SUMMARY
Market Potential for Surgical Robots in Africa (US $ mln): 2021
Country US $ mln % of AfricaSouth Africa 168.6510 15.6920Nigeria 156.3050 14.5440Egypt 155.0390 14.4260Algeria 83.7030 7.7880Morocco 56.6510 5.2710Angola 42.1900 3.9260Ethiopia 39.6650 3.6910Tunisia 31.5440 2.9350Ghana 31.2690 2.9090Sudan 27.1840 2.5290Tanzania 26.6080 2.4760Kenya 25.1470 2.3400Uganda 17.4040 1.6190Cameroon 16.4490 1.5310Libya 16.2530 1.5120Cote d'Ivoire 15.1540 1.4100Botswana 10.2730 0.9560Gabon 9.9530 0.9260Congo, DemocraticRepublic of the 9.6000 0.8930Mozambique 9.4460 0.8790Burkina Faso 8.7480 0.8140South Sudan 8.7440 0.8140Chad 8.4600 0.7870Senegal 8.4040 0.7820Zambia 8.2640 0.7690Congo, Republic of the 6.5290 0.6080Madagascar 6.3670 0.5920Mauritius 6.2230 0.5790Mali 5.8880 0.5480Rwanda 5.5860 0.5200Namibia 5.4680 0.5090Benin 5.2230 0.4860Equatorial Guinea 4.9350 0.4590Malawi 4.7110 0.4380Niger 4.5670 0.4250Sierra Leone 3.7850 0.3520Guinea 3.6670 0.3410Mauritania 2.6980 0.2510
3 AFRICA 14
www.icongrouponline.com © 2020 ICON Group International, Inc.
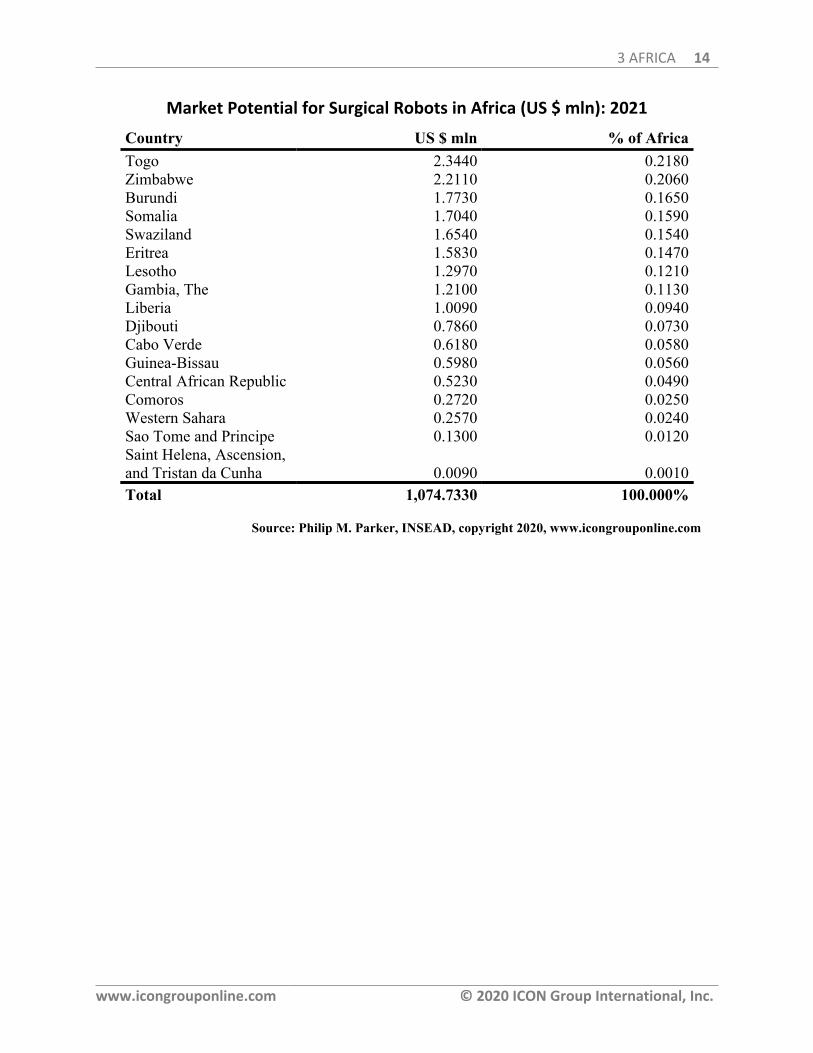
Market Potential for Surgical Robots in Africa (US $ mln): 2021
Country US $ mln % of AfricaTogo 2.3440 0.2180Zimbabwe 2.2110 0.2060Burundi 1.7730 0.1650Somalia 1.7040 0.1590Swaziland 1.6540 0.1540Eritrea 1.5830 0.1470Lesotho 1.2970 0.1210Gambia, The 1.2100 0.1130Liberia 1.0090 0.0940Djibouti 0.7860 0.0730Cabo Verde 0.6180 0.0580Guinea-Bissau 0.5980 0.0560Central African Republic 0.5230 0.0490Comoros 0.2720 0.0250Western Sahara 0.2570 0.0240Sao Tome and Principe 0.1300 0.0120Saint Helena, Ascension,and Tristan da Cunha 0.0090 0.0010Total 1,074.7330 100.000%
Source: Philip M. Parker, INSEAD, copyright 2020, www.icongrouponline.com
3 AFRICA 15
www.icongrouponline.com © 2020 ICON Group International, Inc.
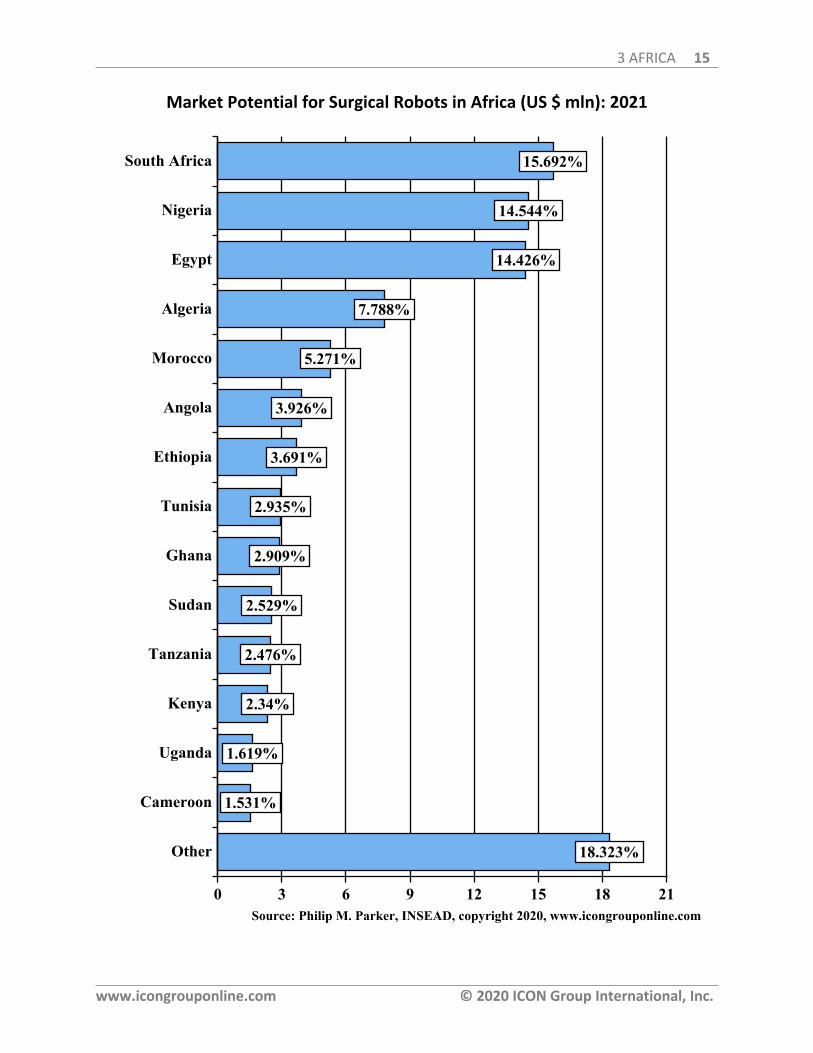
Market Potential for Surgical Robots in Africa (US $ mln): 2021
18.323%
1.531%
1.619%
2.34%
2.476%
2.529%
2.909%
2.935%
3.691%
3.926%
5.271%
7.788%
14.426%
14.544%
15.692%South Africa
Nigeria
Egypt
Algeria
Morocco
Angola
Ethiopia
Tunisia
Ghana
Sudan
Tanzania
Kenya
Uganda
Cameroon
Other
0 3 6 9 12 15 18 21Source: Philip M. Parker, INSEAD, copyright 2020, www.icongrouponline.com
3 AFRICA 16
www.icongrouponline.com © 2020 ICON Group International, Inc.
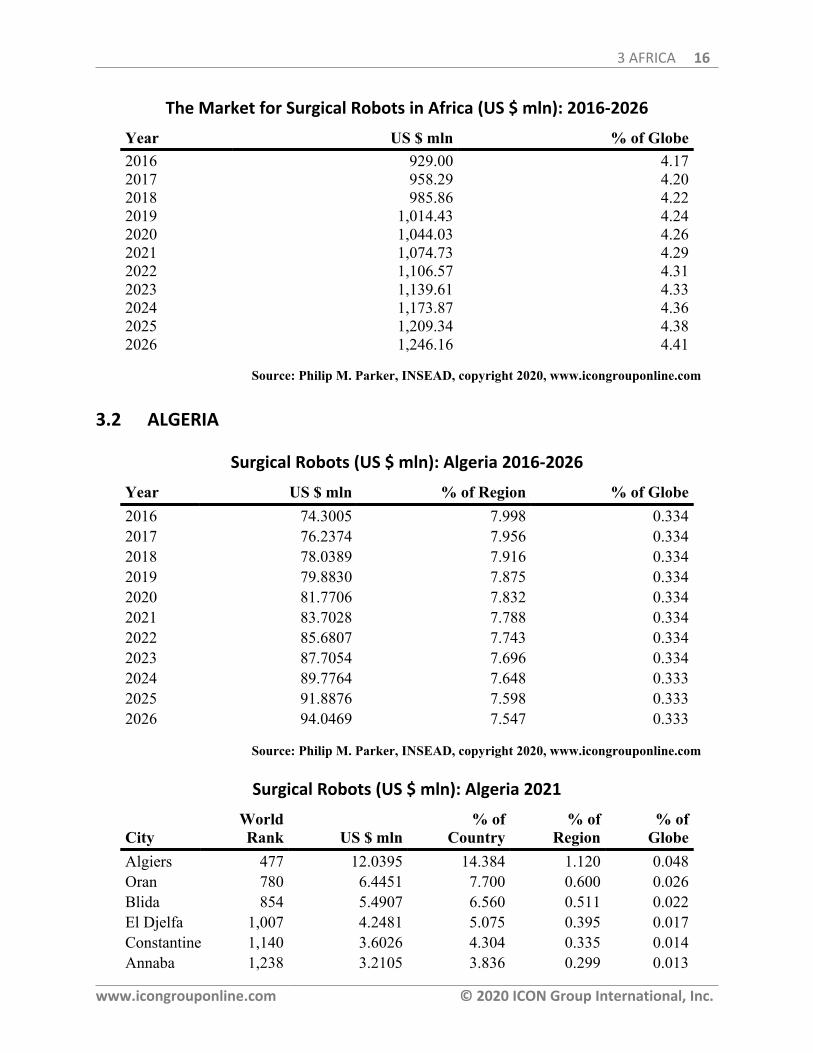
The Market for Surgical Robots in Africa (US $ mln): 2016-2026
Year US $ mln % of Globe2016 929.00 4.172017 958.29 4.202018 985.86 4.222019 1,014.43 4.242020 1,044.03 4.262021 1,074.73 4.292022 1,106.57 4.312023 1,139.61 4.332024 1,173.87 4.362025 1,209.34 4.382026 1,246.16 4.41
Source: Philip M. Parker, INSEAD, copyright 2020, www.icongrouponline.com
3.2 ALGERIA
Surgical Robots (US $ mln): Algeria 2016-2026
Year US $ mln % of Region % of Globe2016 74.3005 7.998 0.3342017 76.2374 7.956 0.3342018 78.0389 7.916 0.3342019 79.8830 7.875 0.3342020 81.7706 7.832 0.3342021 83.7028 7.788 0.3342022 85.6807 7.743 0.3342023 87.7054 7.696 0.3342024 89.7764 7.648 0.3332025 91.8876 7.598 0.3332026 94.0469 7.547 0.333
Source: Philip M. Parker, INSEAD, copyright 2020, www.icongrouponline.com
Surgical Robots (US $ mln): Algeria 2021
CityWorldRank US $ mln
% ofCountry
% ofRegion
% ofGlobe
Algiers 477 12.0395 14.384 1.120 0.048Oran 780 6.4451 7.700 0.600 0.026Blida 854 5.4907 6.560 0.511 0.022El Djelfa 1,007 4.2481 5.075 0.395 0.017Constantine 1,140 3.6026 4.304 0.335 0.014Annaba 1,238 3.2105 3.836 0.299 0.013
3 AFRICA 17
www.icongrouponline.com © 2020 ICON Group International, Inc.
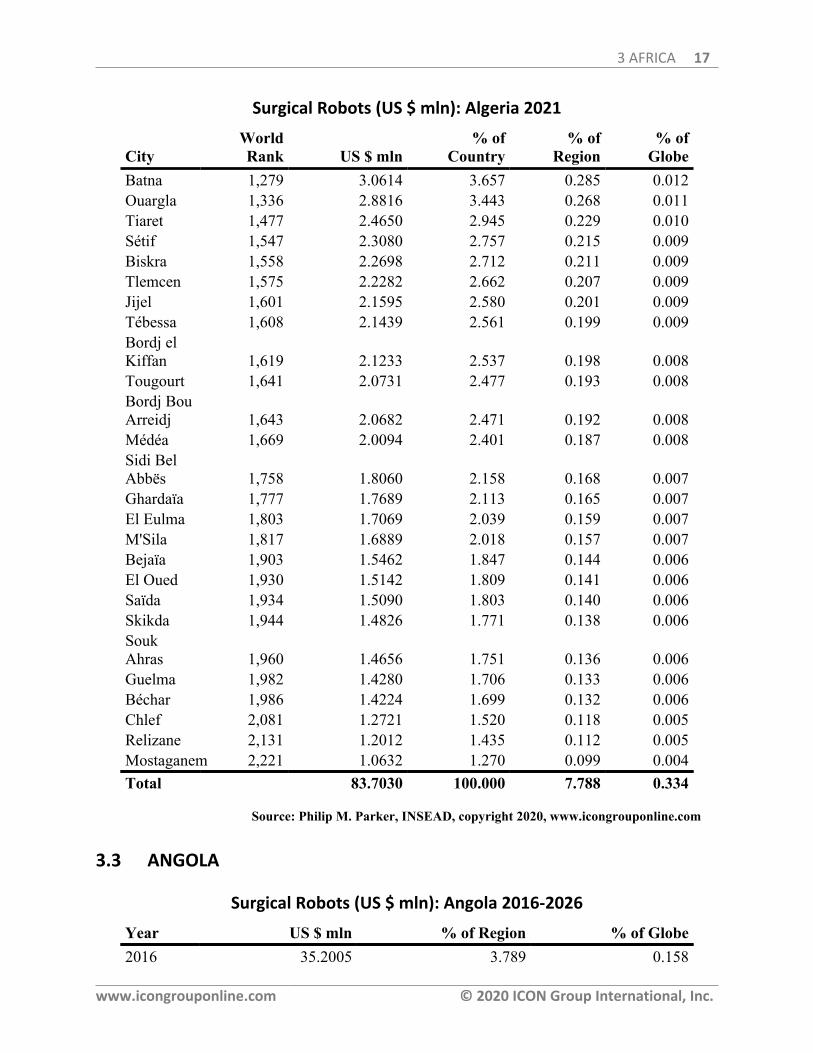
Surgical Robots (US $ mln): Algeria 2021
CityWorldRank US $ mln
% ofCountry
% ofRegion
% ofGlobe
Batna 1,279 3.0614 3.657 0.285 0.012Ouargla 1,336 2.8816 3.443 0.268 0.011Tiaret 1,477 2.4650 2.945 0.229 0.010Sétif 1,547 2.3080 2.757 0.215 0.009Biskra 1,558 2.2698 2.712 0.211 0.009Tlemcen 1,575 2.2282 2.662 0.207 0.009Jijel 1,601 2.1595 2.580 0.201 0.009Tébessa 1,608 2.1439 2.561 0.199 0.009Bordj elKiffan 1,619 2.1233 2.537 0.198 0.008Tougourt 1,641 2.0731 2.477 0.193 0.008Bordj BouArreidj 1,643 2.0682 2.471 0.192 0.008Médéa 1,669 2.0094 2.401 0.187 0.008Sidi BelAbbës 1,758 1.8060 2.158 0.168 0.007Ghardaïa 1,777 1.7689 2.113 0.165 0.007El Eulma 1,803 1.7069 2.039 0.159 0.007M'Sila 1,817 1.6889 2.018 0.157 0.007Bejaïa 1,903 1.5462 1.847 0.144 0.006El Oued 1,930 1.5142 1.809 0.141 0.006Saïda 1,934 1.5090 1.803 0.140 0.006Skikda 1,944 1.4826 1.771 0.138 0.006SoukAhras 1,960 1.4656 1.751 0.136 0.006Guelma 1,982 1.4280 1.706 0.133 0.006Béchar 1,986 1.4224 1.699 0.132 0.006Chlef 2,081 1.2721 1.520 0.118 0.005Relizane 2,131 1.2012 1.435 0.112 0.005Mostaganem 2,221 1.0632 1.270 0.099 0.004Total 83.7030 100.000 7.788 0.334
Source: Philip M. Parker, INSEAD, copyright 2020, www.icongrouponline.com
3.3 ANGOLA
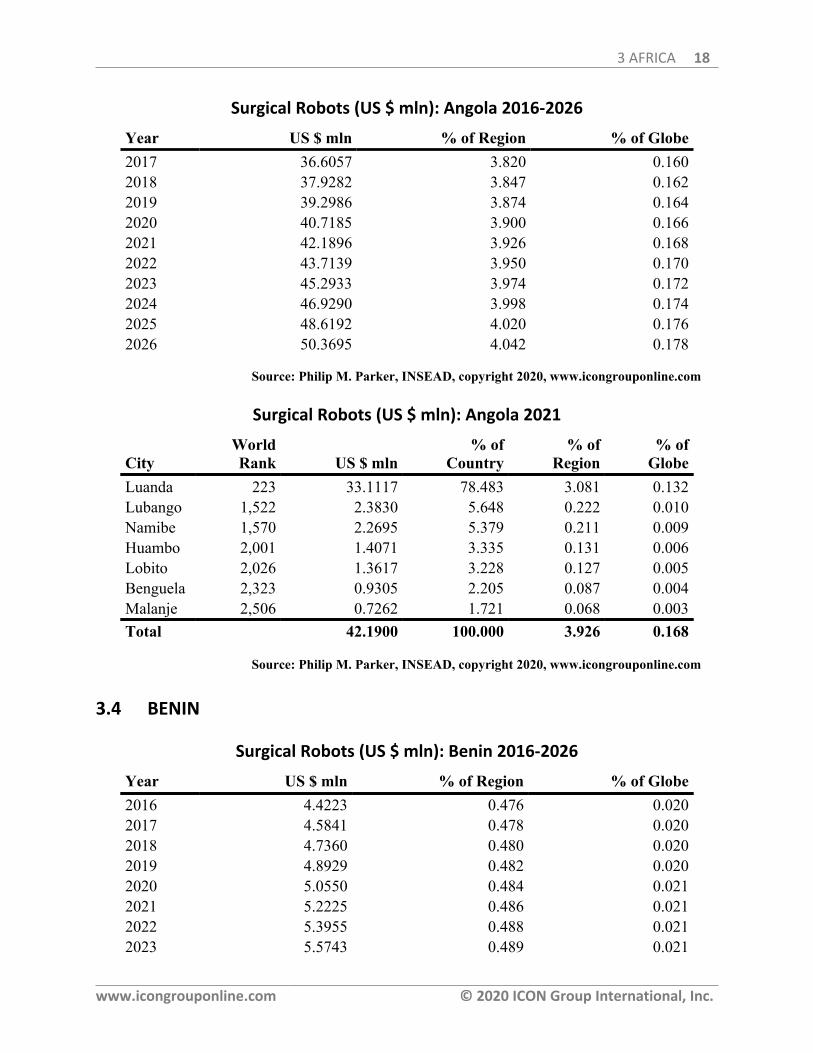
Surgical Robots (US $ mln): Angola 2016-2026
Year US $ mln % of Region % of Globe2016 35.2005 3.789 0.158
3 AFRICA 18
www.icongrouponline.com © 2020 ICON Group International, Inc.
Surgical Robots (US $ mln): Angola 2016-2026
Year US $ mln % of Region % of Globe2017 36.6057 3.820 0.1602018 37.9282 3.847 0.1622019 39.2986 3.874 0.1642020 40.7185 3.900 0.1662021 42.1896 3.926 0.1682022 43.7139 3.950 0.1702023 45.2933 3.974 0.1722024 46.9290 3.998 0.1742025 48.6192 4.020 0.1762026 50.3695 4.042 0.178
Source: Philip M. Parker, INSEAD, copyright 2020, www.icongrouponline.com
Surgical Robots (US $ mln): Angola 2021
CityWorldRank US $ mln
% ofCountry
% ofRegion
% ofGlobe
Luanda 223 33.1117 78.483 3.081 0.132Lubango 1,522 2.3830 5.648 0.222 0.010Namibe 1,570 2.2695 5.379 0.211 0.009Huambo 2,001 1.4071 3.335 0.131 0.006Lobito 2,026 1.3617 3.228 0.127 0.005Benguela 2,323 0.9305 2.205 0.087 0.004Malanje 2,506 0.7262 1.721 0.068 0.003Total 42.1900 100.000 3.926 0.168
Source: Philip M. Parker, INSEAD, copyright 2020, www.icongrouponline.com
3.4 BENIN
Surgical Robots (US $ mln): Benin 2016-2026
Year US $ mln % of Region % of Globe2016 4.4223 0.476 0.0202017 4.5841 0.478 0.0202018 4.7360 0.480 0.0202019 4.8929 0.482 0.0202020 5.0550 0.484 0.0212021 5.2225 0.486 0.0212022 5.3955 0.488 0.0212023 5.5743 0.489 0.021

3 AFRICA 19
www.icongrouponline.com © 2020 ICON Group International, Inc.
Surgical Robots (US $ mln): Benin 2016-2026
Year US $ mln % of Region % of Globe2024 5.7589 0.491 0.0212025 5.9490 0.492 0.0222026 6.1453 0.493 0.022
Source: Philip M. Parker, INSEAD, copyright 2020, www.icongrouponline.com
Surgical Robots (US $ mln): Benin 2021
CityWorldRank US $ mln
% ofCountry
% ofRegion
% ofGlobe
Abomey-Calavi 1,845 1.6566 31.720 0.154 0.007Cotonou 2,377 0.8534 16.341 0.079 0.003Porto-Novo 3,221 0.2901 5.556 0.027 0.001Sèmè-Kpodji 3,227 0.2860 5.476 0.027 0.001Djougou 3,253 0.2706 5.181 0.025 0.001Banikoara 3,268 0.2578 4.937 0.024 0.001Parakou 3,288 0.2494 4.775 0.023 0.001Tchaourou 3,338 0.2178 4.170 0.020 0.001Aplahoué 3,350 0.2108 4.037 0.020 0.001Ketou 3,374 0.2006 3.841 0.019 0.001Kalalé 3,375 0.1997 3.823 0.019 0.001Malanville 3,397 0.1827 3.498 0.017 0.001Bohicon 3,411 0.1736 3.323 0.016 0.001Savalou 3,412 0.1735 3.322 0.016 0.001Total 5.2230 100.000 0.486 0.021
Source: Philip M. Parker, INSEAD, copyright 2020, www.icongrouponline.com
3.5 BOTSWANA
Surgical Robots (US $ mln): Botswana 2016-2026
Year US $ mln % of Region % of Globe2016 8.9393 0.962 0.0402017 9.2119 0.961 0.0402018 9.4665 0.960 0.0402019 9.7280 0.959 0.0412020 9.9968 0.958 0.0412021 10.2730 0.956 0.0412022 10.5569 0.954 0.041
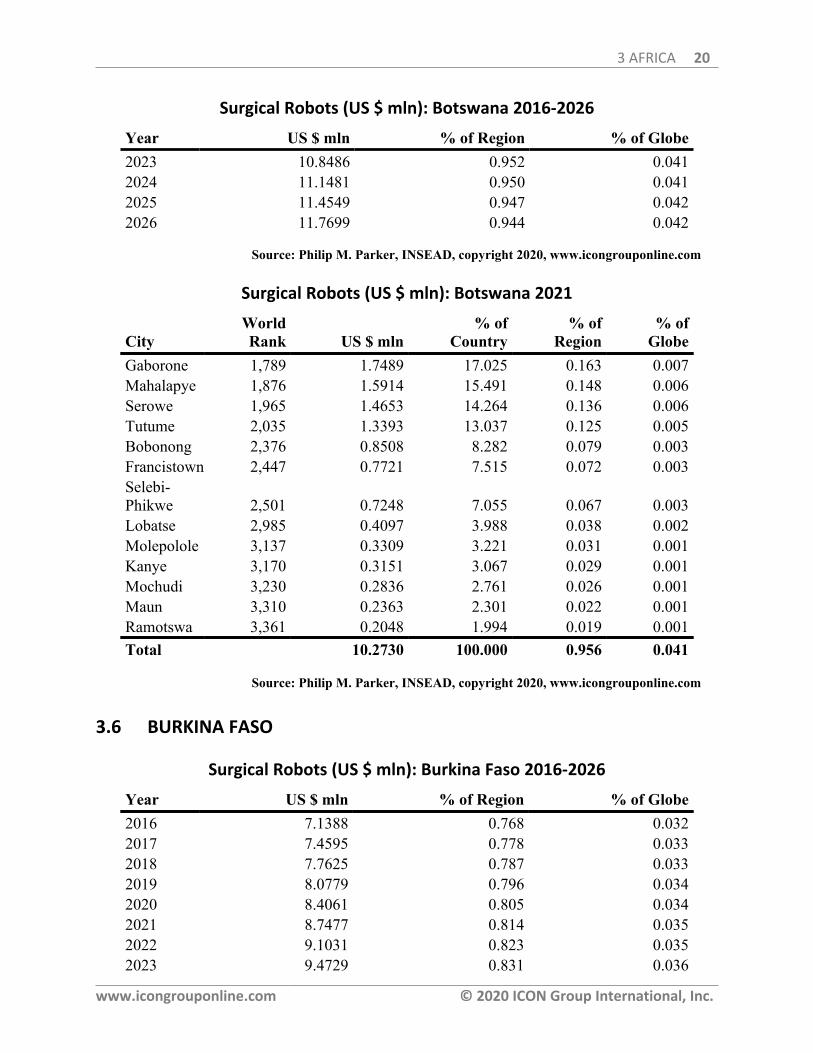
3 AFRICA 20
www.icongrouponline.com © 2020 ICON Group International, Inc.
Surgical Robots (US $ mln): Botswana 2016-2026
Year US $ mln % of Region % of Globe2023 10.8486 0.952 0.0412024 11.1481 0.950 0.0412025 11.4549 0.947 0.0422026 11.7699 0.944 0.042
Source: Philip M. Parker, INSEAD, copyright 2020, www.icongrouponline.com
Surgical Robots (US $ mln): Botswana 2021
CityWorldRank US $ mln
% ofCountry
% ofRegion
% ofGlobe
Gaborone 1,789 1.7489 17.025 0.163 0.007Mahalapye 1,876 1.5914 15.491 0.148 0.006Serowe 1,965 1.4653 14.264 0.136 0.006Tutume 2,035 1.3393 13.037 0.125 0.005Bobonong 2,376 0.8508 8.282 0.079 0.003Francistown 2,447 0.7721 7.515 0.072 0.003Selebi-Phikwe 2,501 0.7248 7.055 0.067 0.003Lobatse 2,985 0.4097 3.988 0.038 0.002Molepolole 3,137 0.3309 3.221 0.031 0.001Kanye 3,170 0.3151 3.067 0.029 0.001Mochudi 3,230 0.2836 2.761 0.026 0.001Maun 3,310 0.2363 2.301 0.022 0.001Ramotswa 3,361 0.2048 1.994 0.019 0.001Total 10.2730 100.000 0.956 0.041
Source: Philip M. Parker, INSEAD, copyright 2020, www.icongrouponline.com
3.6 BURKINA FASO
Surgical Robots (US $ mln): Burkina Faso 2016-2026
Year US $ mln % of Region % of Globe2016 7.1388 0.768 0.0322017 7.4595 0.778 0.0332018 7.7625 0.787 0.0332019 8.0779 0.796 0.0342020 8.4061 0.805 0.0342021 8.7477 0.814 0.0352022 9.1031 0.823 0.0352023 9.4729 0.831 0.036
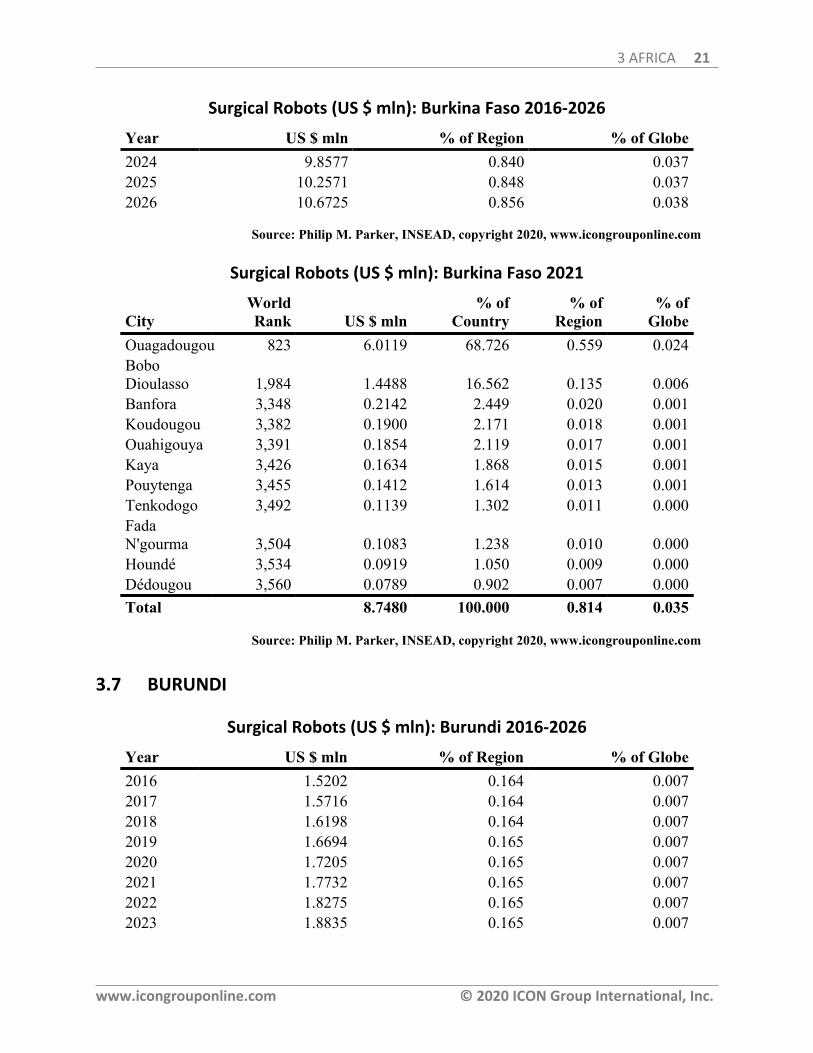
3 AFRICA 21
www.icongrouponline.com © 2020 ICON Group International, Inc.
Surgical Robots (US $ mln): Burkina Faso 2016-2026
Year US $ mln % of Region % of Globe2024 9.8577 0.840 0.0372025 10.2571 0.848 0.0372026 10.6725 0.856 0.038
Source: Philip M. Parker, INSEAD, copyright 2020, www.icongrouponline.com
Surgical Robots (US $ mln): Burkina Faso 2021
CityWorldRank US $ mln
% ofCountry
% ofRegion
% ofGlobe
Ouagadougou 823 6.0119 68.726 0.559 0.024BoboDioulasso 1,984 1.4488 16.562 0.135 0.006Banfora 3,348 0.2142 2.449 0.020 0.001Koudougou 3,382 0.1900 2.171 0.018 0.001Ouahigouya 3,391 0.1854 2.119 0.017 0.001Kaya 3,426 0.1634 1.868 0.015 0.001Pouytenga 3,455 0.1412 1.614 0.013 0.001Tenkodogo 3,492 0.1139 1.302 0.011 0.000FadaN'gourma 3,504 0.1083 1.238 0.010 0.000Houndé 3,534 0.0919 1.050 0.009 0.000Dédougou 3,560 0.0789 0.902 0.007 0.000Total 8.7480 100.000 0.814 0.035
Source: Philip M. Parker, INSEAD, copyright 2020, www.icongrouponline.com
3.7 BURUNDI
Surgical Robots (US $ mln): Burundi 2016-2026
Year US $ mln % of Region % of Globe2016 1.5202 0.164 0.0072017 1.5716 0.164 0.0072018 1.6198 0.164 0.0072019 1.6694 0.165 0.0072020 1.7205 0.165 0.0072021 1.7732 0.165 0.0072022 1.8275 0.165 0.0072023 1.8835 0.165 0.007

3 AFRICA 22
www.icongrouponline.com © 2020 ICON Group International, Inc.
Surgical Robots (US $ mln): Burundi 2016-2026
Year US $ mln % of Region % of Globe2024 1.9412 0.165 0.0072025 2.0004 0.165 0.0072026 2.0614 0.165 0.007
Source: Philip M. Parker, INSEAD, copyright 2020, www.icongrouponline.com
Surgical Robots (US $ mln): Burundi 2021
CityWorldRank US $ mln
% ofCountry
% ofRegion
% ofGlobe
Bujumbura 2,098 1.2574 70.909 0.117 0.005Gitega 2,940 0.4375 24.675 0.041 0.002Bururi 3,644 0.0368 2.078 0.003 0.000Rumonge 3,669 0.0230 1.299 0.002 0.000Ngozi 3,678 0.0184 1.039 0.002 0.000Total 1.7730 100.000 0.165 0.007
Source: Philip M. Parker, INSEAD, copyright 2020, www.icongrouponline.com
3.8 CAMEROON
Surgical Robots (US $ mln): Cameroon 2016-2026
Year US $ mln % of Region % of Globe2016 14.0676 1.514 0.0632017 14.5512 1.518 0.0642018 15.0042 1.522 0.0642019 15.4712 1.525 0.0652020 15.9529 1.528 0.0652021 16.4495 1.531 0.0662022 16.9615 1.533 0.0662023 17.4896 1.535 0.0672024 18.0337 1.536 0.0672025 18.5931 1.537 0.0672026 19.1694 1.538 0.068
Source: Philip M. Parker, INSEAD, copyright 2020, www.icongrouponline.com
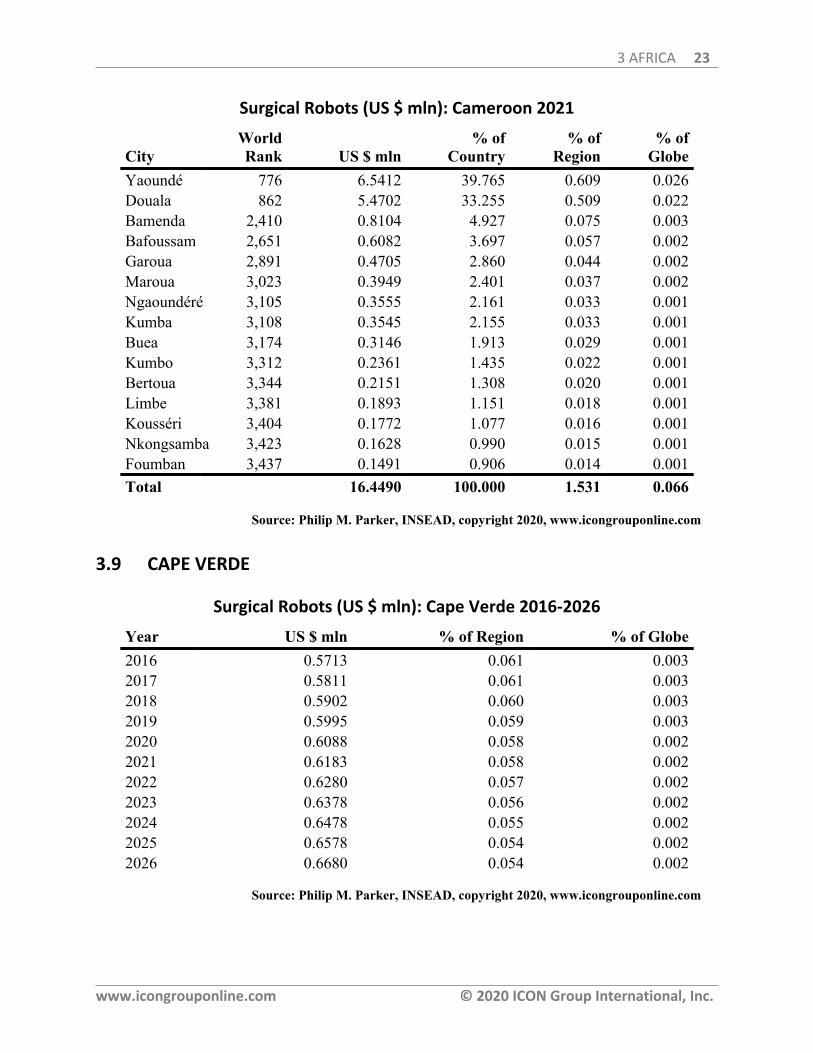
3 AFRICA 23
www.icongrouponline.com © 2020 ICON Group International, Inc.
Surgical Robots (US $ mln): Cameroon 2021
CityWorldRank US $ mln
% ofCountry
% ofRegion
% ofGlobe
Yaoundé 776 6.5412 39.765 0.609 0.026Douala 862 5.4702 33.255 0.509 0.022Bamenda 2,410 0.8104 4.927 0.075 0.003Bafoussam 2,651 0.6082 3.697 0.057 0.002Garoua 2,891 0.4705 2.860 0.044 0.002Maroua 3,023 0.3949 2.401 0.037 0.002Ngaoundéré 3,105 0.3555 2.161 0.033 0.001Kumba 3,108 0.3545 2.155 0.033 0.001Buea 3,174 0.3146 1.913 0.029 0.001Kumbo 3,312 0.2361 1.435 0.022 0.001Bertoua 3,344 0.2151 1.308 0.020 0.001Limbe 3,381 0.1893 1.151 0.018 0.001Kousséri 3,404 0.1772 1.077 0.016 0.001Nkongsamba 3,423 0.1628 0.990 0.015 0.001Foumban 3,437 0.1491 0.906 0.014 0.001Total 16.4490 100.000 1.531 0.066
Source: Philip M. Parker, INSEAD, copyright 2020, www.icongrouponline.com
3.9 CAPE VERDE
Surgical Robots (US $ mln): Cape Verde 2016-2026
Year US $ mln % of Region % of Globe2016 0.5713 0.061 0.0032017 0.5811 0.061 0.0032018 0.5902 0.060 0.0032019 0.5995 0.059 0.0032020 0.6088 0.058 0.0022021 0.6183 0.058 0.0022022 0.6280 0.057 0.0022023 0.6378 0.056 0.0022024 0.6478 0.055 0.0022025 0.6578 0.054 0.0022026 0.6680 0.054 0.002
Source: Philip M. Parker, INSEAD, copyright 2020, www.icongrouponline.com
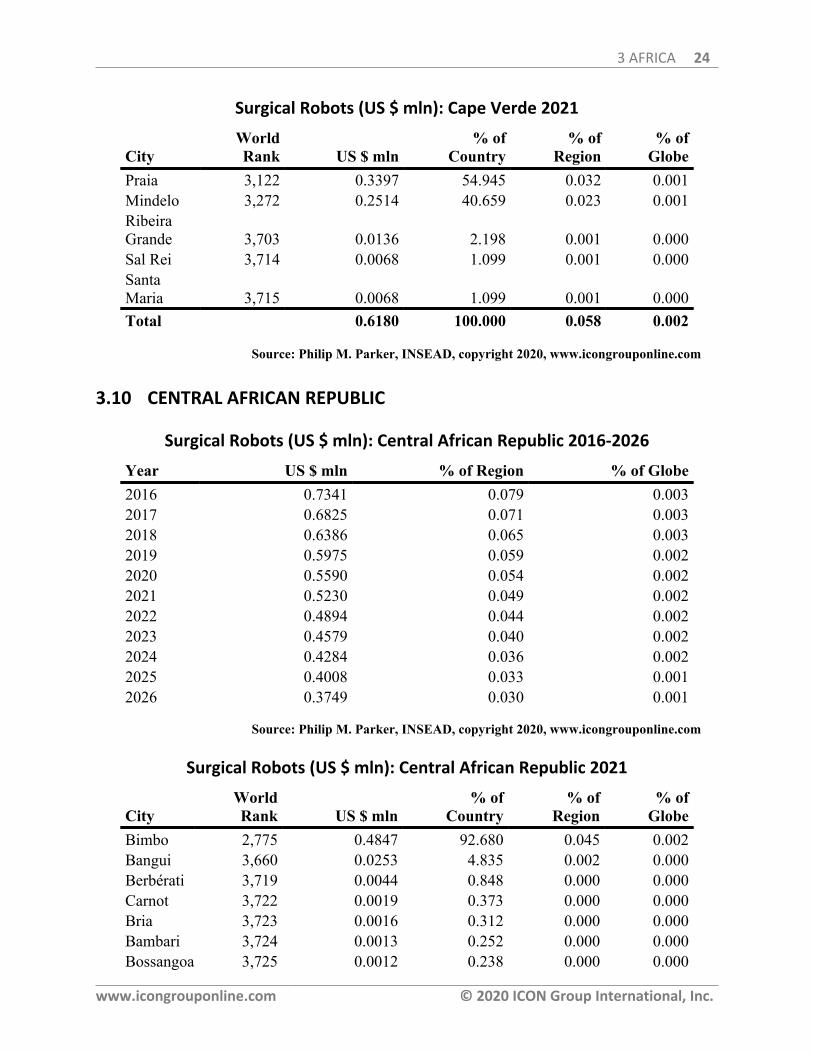
3 AFRICA 24
www.icongrouponline.com © 2020 ICON Group International, Inc.
Surgical Robots (US $ mln): Cape Verde 2021
CityWorldRank US $ mln
% ofCountry
% ofRegion
% ofGlobe
Praia 3,122 0.3397 54.945 0.032 0.001Mindelo 3,272 0.2514 40.659 0.023 0.001RibeiraGrande 3,703 0.0136 2.198 0.001 0.000Sal Rei 3,714 0.0068 1.099 0.001 0.000SantaMaria 3,715 0.0068 1.099 0.001 0.000Total 0.6180 100.000 0.058 0.002
Source: Philip M. Parker, INSEAD, copyright 2020, www.icongrouponline.com
3.10 CENTRAL AFRICAN REPUBLIC
Surgical Robots (US $ mln): Central African Republic 2016-2026
Year US $ mln % of Region % of Globe2016 0.7341 0.079 0.0032017 0.6825 0.071 0.0032018 0.6386 0.065 0.0032019 0.5975 0.059 0.0022020 0.5590 0.054 0.0022021 0.5230 0.049 0.0022022 0.4894 0.044 0.0022023 0.4579 0.040 0.0022024 0.4284 0.036 0.0022025 0.4008 0.033 0.0012026 0.3749 0.030 0.001
Source: Philip M. Parker, INSEAD, copyright 2020, www.icongrouponline.com
Surgical Robots (US $ mln): Central African Republic 2021
CityWorldRank US $ mln
% ofCountry
% ofRegion
% ofGlobe
Bimbo 2,775 0.4847 92.680 0.045 0.002Bangui 3,660 0.0253 4.835 0.002 0.000Berbérati 3,719 0.0044 0.848 0.000 0.000Carnot 3,722 0.0019 0.373 0.000 0.000Bria 3,723 0.0016 0.312 0.000 0.000Bambari 3,724 0.0013 0.252 0.000 0.000Bossangoa 3,725 0.0012 0.238 0.000 0.000
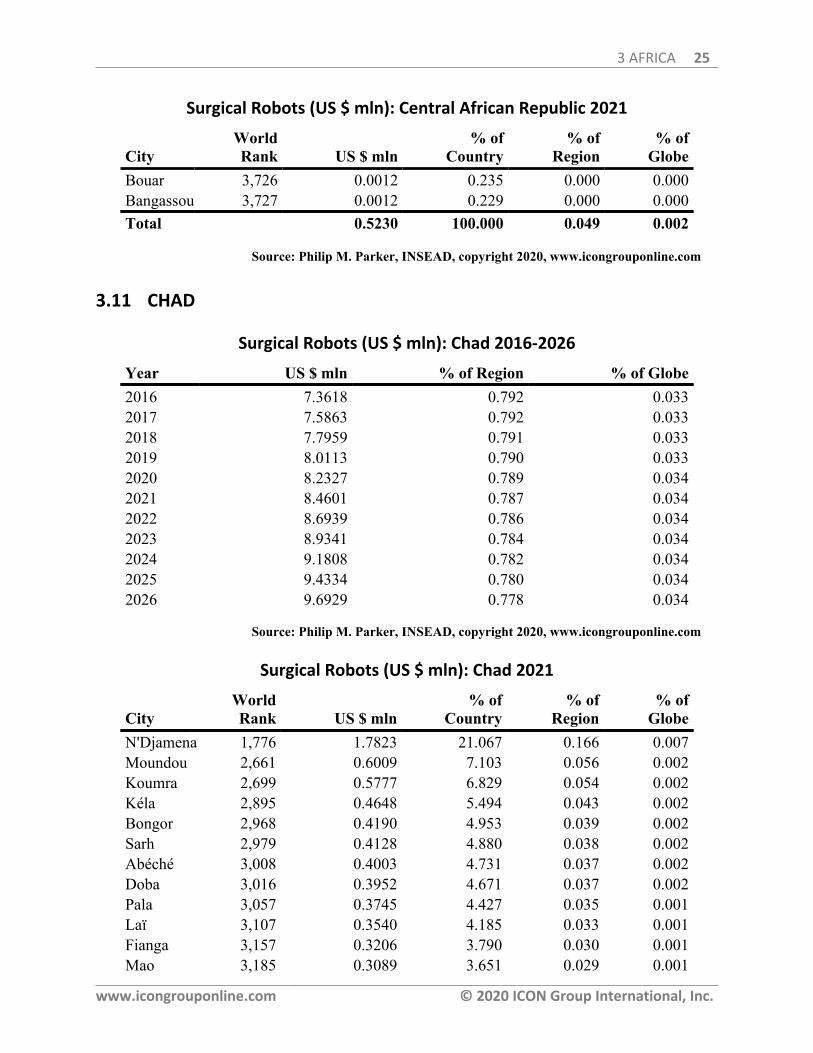
3 AFRICA 25
www.icongrouponline.com © 2020 ICON Group International, Inc.
Surgical Robots (US $ mln): Central African Republic 2021
CityWorldRank US $ mln
% ofCountry
% ofRegion
% ofGlobe
Bouar 3,726 0.0012 0.235 0.000 0.000Bangassou 3,727 0.0012 0.229 0.000 0.000Total 0.5230 100.000 0.049 0.002
Source: Philip M. Parker, INSEAD, copyright 2020, www.icongrouponline.com
3.11 CHAD
Surgical Robots (US $ mln): Chad 2016-2026
Year US $ mln % of Region % of Globe2016 7.3618 0.792 0.0332017 7.5863 0.792 0.0332018 7.7959 0.791 0.0332019 8.0113 0.790 0.0332020 8.2327 0.789 0.0342021 8.4601 0.787 0.0342022 8.6939 0.786 0.0342023 8.9341 0.784 0.0342024 9.1808 0.782 0.0342025 9.4334 0.780 0.0342026 9.6929 0.778 0.034
Source: Philip M. Parker, INSEAD, copyright 2020, www.icongrouponline.com
Surgical Robots (US $ mln): Chad 2021
CityWorldRank US $ mln
% ofCountry
% ofRegion
% ofGlobe
N'Djamena 1,776 1.7823 21.067 0.166 0.007Moundou 2,661 0.6009 7.103 0.056 0.002Koumra 2,699 0.5777 6.829 0.054 0.002Kéla 2,895 0.4648 5.494 0.043 0.002Bongor 2,968 0.4190 4.953 0.039 0.002Sarh 2,979 0.4128 4.880 0.038 0.002Abéché 3,008 0.4003 4.731 0.037 0.002Doba 3,016 0.3952 4.671 0.037 0.002Pala 3,057 0.3745 4.427 0.035 0.001Laï 3,107 0.3540 4.185 0.033 0.001Fianga 3,157 0.3206 3.790 0.030 0.001Mao 3,185 0.3089 3.651 0.029 0.001

3 AFRICA 26
www.icongrouponline.com © 2020 ICON Group International, Inc.
Surgical Robots (US $ mln): Chad 2021
CityWorldRank US $ mln
% ofCountry
% ofRegion
% ofGlobe
Léré 3,205 0.2987 3.530 0.028 0.001Ati 3,220 0.2904 3.432 0.027 0.001Bokoro 3,269 0.2552 3.016 0.024 0.001Moïssala 3,277 0.2533 2.994 0.024 0.001Bol 3,293 0.2426 2.868 0.023 0.001AmTiman 3,301 0.2414 2.853 0.022 0.001Bousso 3,316 0.2341 2.767 0.022 0.001Massakory 3,318 0.2335 2.760 0.022 0.001Total 8.4600 100.000 0.787 0.034
Source: Philip M. Parker, INSEAD, copyright 2020, www.icongrouponline.com
3.12 COMOROS
Surgical Robots (US $ mln): Comoros 2016-2026
Year US $ mln % of Region % of Globe2016 0.2386 0.026 0.0012017 0.2454 0.026 0.0012018 0.2517 0.026 0.0012019 0.2581 0.025 0.0012020 0.2647 0.025 0.0012021 0.2715 0.025 0.0012022 0.2785 0.025 0.0012023 0.2856 0.025 0.0012024 0.2929 0.025 0.0012025 0.3004 0.025 0.0012026 0.3081 0.025 0.001
Source: Philip M. Parker, INSEAD, copyright 2020, www.icongrouponline.com
Surgical Robots (US $ mln): Comoros 2021
CityWorldRank US $ mln
% ofCountry
% ofRegion
% ofGlobe
Moroni 3,429 0.1588 58.484 0.015 0.001
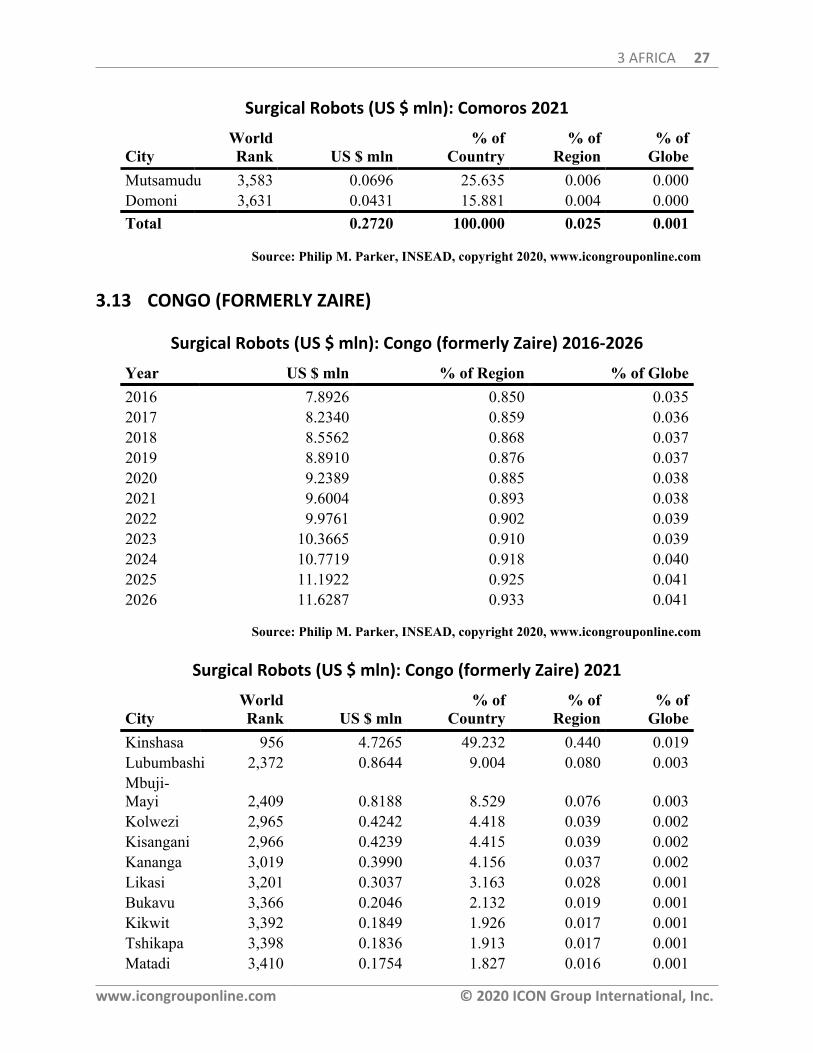
3 AFRICA 27
www.icongrouponline.com © 2020 ICON Group International, Inc.
Surgical Robots (US $ mln): Comoros 2021
CityWorldRank US $ mln
% ofCountry
% ofRegion
% ofGlobe
Mutsamudu 3,583 0.0696 25.635 0.006 0.000Domoni 3,631 0.0431 15.881 0.004 0.000Total 0.2720 100.000 0.025 0.001
Source: Philip M. Parker, INSEAD, copyright 2020, www.icongrouponline.com
3.13 CONGO (FORMERLY ZAIRE)
Surgical Robots (US $ mln): Congo (formerly Zaire) 2016-2026
Year US $ mln % of Region % of Globe2016 7.8926 0.850 0.0352017 8.2340 0.859 0.0362018 8.5562 0.868 0.0372019 8.8910 0.876 0.0372020 9.2389 0.885 0.0382021 9.6004 0.893 0.0382022 9.9761 0.902 0.0392023 10.3665 0.910 0.0392024 10.7719 0.918 0.0402025 11.1922 0.925 0.0412026 11.6287 0.933 0.041
Source: Philip M. Parker, INSEAD, copyright 2020, www.icongrouponline.com
Surgical Robots (US $ mln): Congo (formerly Zaire) 2021
CityWorldRank US $ mln
% ofCountry
% ofRegion
% ofGlobe
Kinshasa 956 4.7265 49.232 0.440 0.019Lubumbashi 2,372 0.8644 9.004 0.080 0.003Mbuji-Mayi 2,409 0.8188 8.529 0.076 0.003Kolwezi 2,965 0.4242 4.418 0.039 0.002Kisangani 2,966 0.4239 4.415 0.039 0.002Kananga 3,019 0.3990 4.156 0.037 0.002Likasi 3,201 0.3037 3.163 0.028 0.001Bukavu 3,366 0.2046 2.132 0.019 0.001Kikwit 3,392 0.1849 1.926 0.017 0.001Tshikapa 3,398 0.1836 1.913 0.017 0.001Matadi 3,410 0.1754 1.827 0.016 0.001
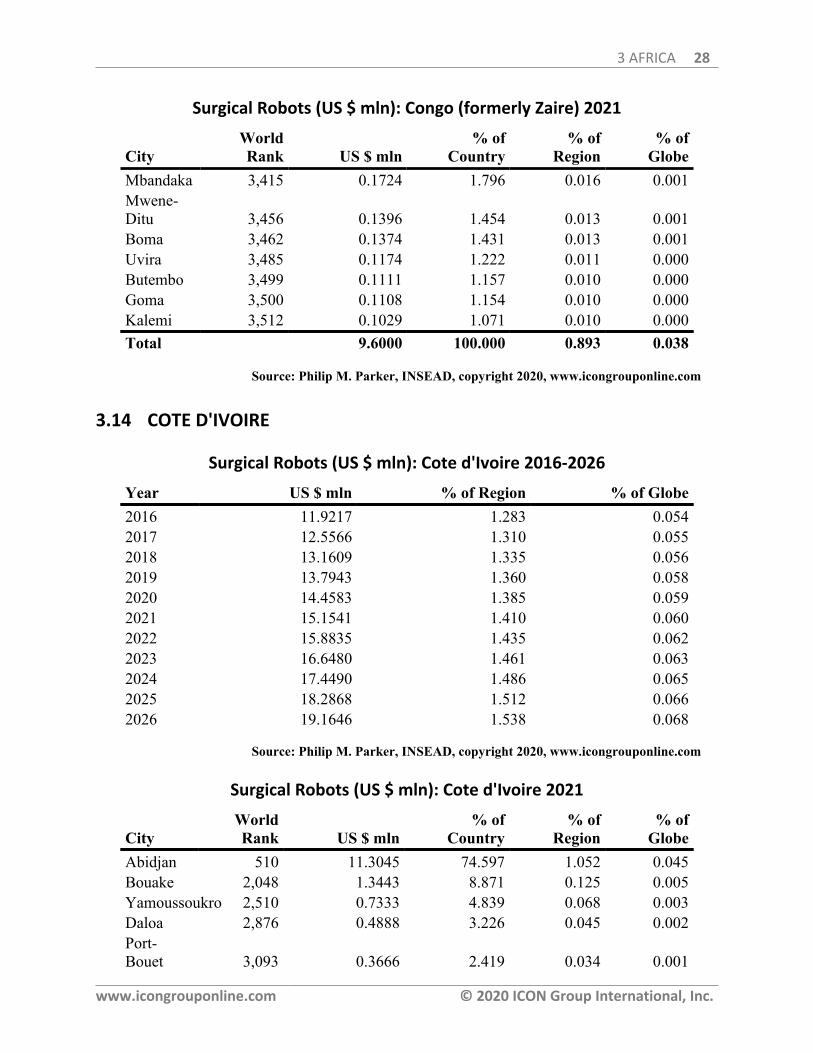
3 AFRICA 28
www.icongrouponline.com © 2020 ICON Group International, Inc.
Surgical Robots (US $ mln): Congo (formerly Zaire) 2021
CityWorldRank US $ mln
% ofCountry
% ofRegion
% ofGlobe
Mbandaka 3,415 0.1724 1.796 0.016 0.001Mwene-Ditu 3,456 0.1396 1.454 0.013 0.001Boma 3,462 0.1374 1.431 0.013 0.001Uvira 3,485 0.1174 1.222 0.011 0.000Butembo 3,499 0.1111 1.157 0.010 0.000Goma 3,500 0.1108 1.154 0.010 0.000Kalemi 3,512 0.1029 1.071 0.010 0.000Total 9.6000 100.000 0.893 0.038
Source: Philip M. Parker, INSEAD, copyright 2020, www.icongrouponline.com
3.14 COTE D'IVOIRE
Surgical Robots (US $ mln): Cote d'Ivoire 2016-2026
Year US $ mln % of Region % of Globe2016 11.9217 1.283 0.0542017 12.5566 1.310 0.0552018 13.1609 1.335 0.0562019 13.7943 1.360 0.0582020 14.4583 1.385 0.0592021 15.1541 1.410 0.0602022 15.8835 1.435 0.0622023 16.6480 1.461 0.0632024 17.4490 1.486 0.0652025 18.2868 1.512 0.0662026 19.1646 1.538 0.068
Source: Philip M. Parker, INSEAD, copyright 2020, www.icongrouponline.com
Surgical Robots (US $ mln): Cote d'Ivoire 2021
CityWorldRank US $ mln
% ofCountry
% ofRegion
% ofGlobe
Abidjan 510 11.3045 74.597 1.052 0.045Bouake 2,048 1.3443 8.871 0.125 0.005Yamoussoukro 2,510 0.7333 4.839 0.068 0.003Daloa 2,876 0.4888 3.226 0.045 0.002Port-Bouet 3,093 0.3666 2.419 0.034 0.001
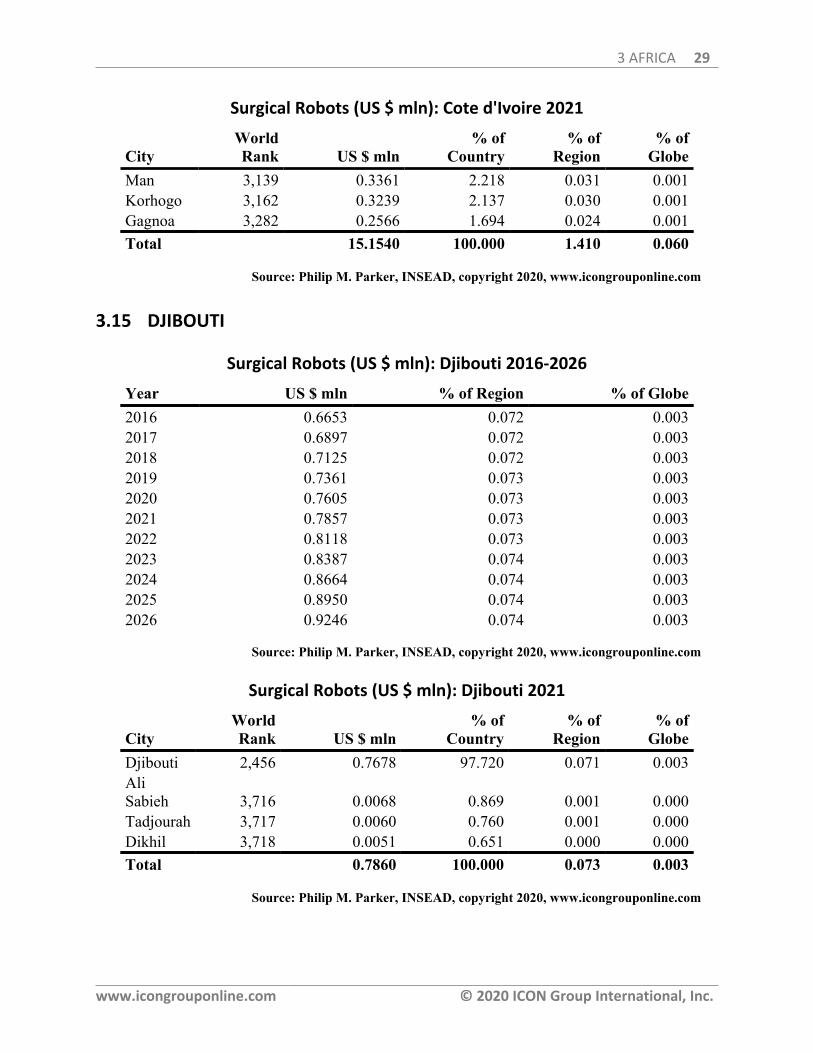
3 AFRICA 29
www.icongrouponline.com © 2020 ICON Group International, Inc.
Surgical Robots (US $ mln): Cote d'Ivoire 2021
CityWorldRank US $ mln
% ofCountry
% ofRegion
% ofGlobe
Man 3,139 0.3361 2.218 0.031 0.001Korhogo 3,162 0.3239 2.137 0.030 0.001Gagnoa 3,282 0.2566 1.694 0.024 0.001Total 15.1540 100.000 1.410 0.060
Source: Philip M. Parker, INSEAD, copyright 2020, www.icongrouponline.com
3.15 DJIBOUTI
Surgical Robots (US $ mln): Djibouti 2016-2026
Year US $ mln % of Region % of Globe2016 0.6653 0.072 0.0032017 0.6897 0.072 0.0032018 0.7125 0.072 0.0032019 0.7361 0.073 0.0032020 0.7605 0.073 0.0032021 0.7857 0.073 0.0032022 0.8118 0.073 0.0032023 0.8387 0.074 0.0032024 0.8664 0.074 0.0032025 0.8950 0.074 0.0032026 0.9246 0.074 0.003
Source: Philip M. Parker, INSEAD, copyright 2020, www.icongrouponline.com
Surgical Robots (US $ mln): Djibouti 2021
CityWorldRank US $ mln
% ofCountry
% ofRegion
% ofGlobe
Djibouti 2,456 0.7678 97.720 0.071 0.003AliSabieh 3,716 0.0068 0.869 0.001 0.000Tadjourah 3,717 0.0060 0.760 0.001 0.000Dikhil 3,718 0.0051 0.651 0.000 0.000Total 0.7860 100.000 0.073 0.003
Source: Philip M. Parker, INSEAD, copyright 2020, www.icongrouponline.com
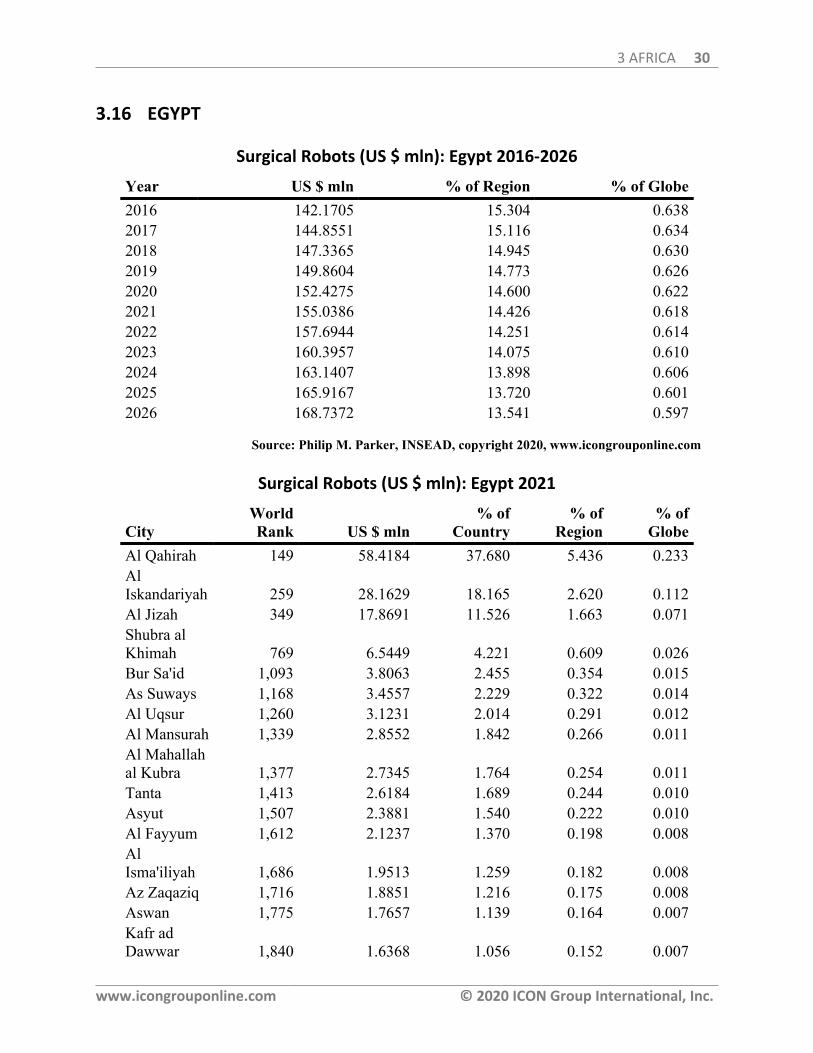
3 AFRICA 30
www.icongrouponline.com © 2020 ICON Group International, Inc.
3.16 EGYPT
Surgical Robots (US $ mln): Egypt 2016-2026
Year US $ mln % of Region % of Globe2016 142.1705 15.304 0.6382017 144.8551 15.116 0.6342018 147.3365 14.945 0.6302019 149.8604 14.773 0.6262020 152.4275 14.600 0.6222021 155.0386 14.426 0.6182022 157.6944 14.251 0.6142023 160.3957 14.075 0.6102024 163.1407 13.898 0.6062025 165.9167 13.720 0.6012026 168.7372 13.541 0.597
Source: Philip M. Parker, INSEAD, copyright 2020, www.icongrouponline.com
Surgical Robots (US $ mln): Egypt 2021
CityWorldRank US $ mln
% ofCountry
% ofRegion
% ofGlobe
Al Qahirah 149 58.4184 37.680 5.436 0.233AlIskandariyah 259 28.1629 18.165 2.620 0.112Al Jizah 349 17.8691 11.526 1.663 0.071Shubra alKhimah 769 6.5449 4.221 0.609 0.026Bur Sa'id 1,093 3.8063 2.455 0.354 0.015As Suways 1,168 3.4557 2.229 0.322 0.014Al Uqsur 1,260 3.1231 2.014 0.291 0.012Al Mansurah 1,339 2.8552 1.842 0.266 0.011Al Mahallahal Kubra 1,377 2.7345 1.764 0.254 0.011Tanta 1,413 2.6184 1.689 0.244 0.010Asyut 1,507 2.3881 1.540 0.222 0.010Al Fayyum 1,612 2.1237 1.370 0.198 0.008AlIsma'iliyah 1,686 1.9513 1.259 0.182 0.008Az Zaqaziq 1,716 1.8851 1.216 0.175 0.008Aswan 1,775 1.7657 1.139 0.164 0.007Kafr adDawwar 1,840 1.6368 1.056 0.152 0.007
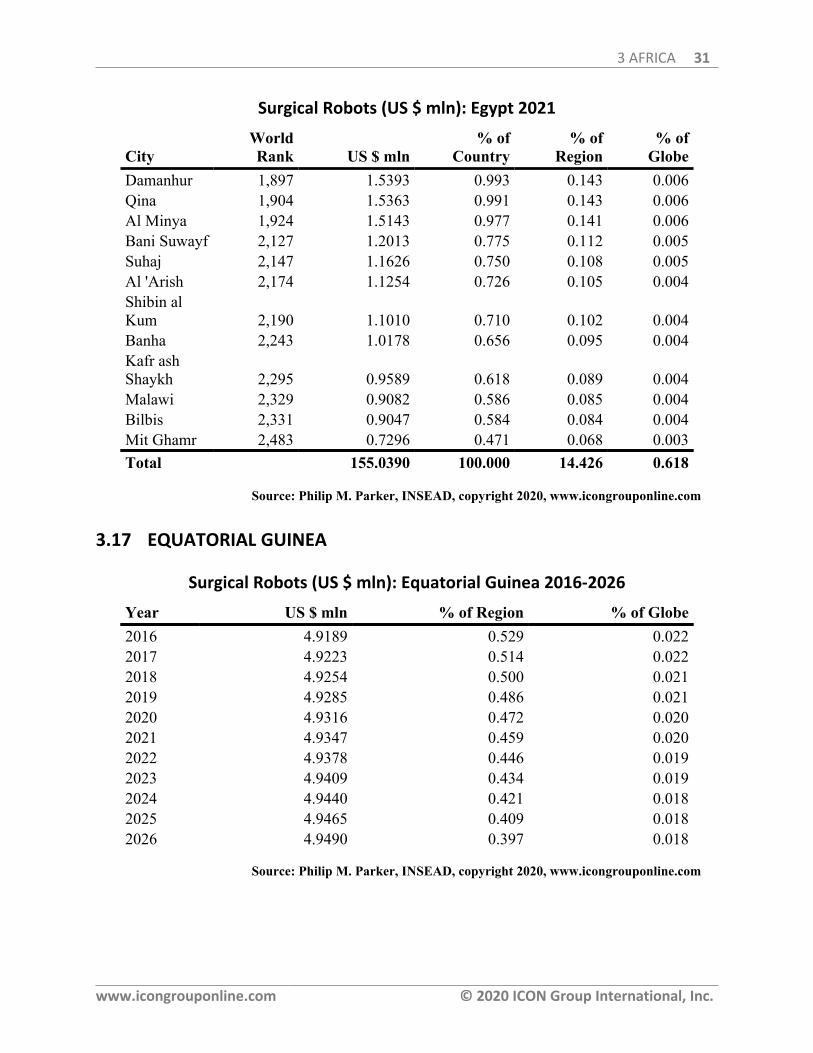
3 AFRICA 31
www.icongrouponline.com © 2020 ICON Group International, Inc.
Surgical Robots (US $ mln): Egypt 2021
CityWorldRank US $ mln
% ofCountry
% ofRegion
% ofGlobe
Damanhur 1,897 1.5393 0.993 0.143 0.006Qina 1,904 1.5363 0.991 0.143 0.006Al Minya 1,924 1.5143 0.977 0.141 0.006Bani Suwayf 2,127 1.2013 0.775 0.112 0.005Suhaj 2,147 1.1626 0.750 0.108 0.005Al 'Arish 2,174 1.1254 0.726 0.105 0.004Shibin alKum 2,190 1.1010 0.710 0.102 0.004Banha 2,243 1.0178 0.656 0.095 0.004Kafr ashShaykh 2,295 0.9589 0.618 0.089 0.004Malawi 2,329 0.9082 0.586 0.085 0.004Bilbis 2,331 0.9047 0.584 0.084 0.004Mit Ghamr 2,483 0.7296 0.471 0.068 0.003Total 155.0390 100.000 14.426 0.618
Source: Philip M. Parker, INSEAD, copyright 2020, www.icongrouponline.com
3.17 EQUATORIAL GUINEA
Surgical Robots (US $ mln): Equatorial Guinea 2016-2026
Year US $ mln % of Region % of Globe2016 4.9189 0.529 0.0222017 4.9223 0.514 0.0222018 4.9254 0.500 0.0212019 4.9285 0.486 0.0212020 4.9316 0.472 0.0202021 4.9347 0.459 0.0202022 4.9378 0.446 0.0192023 4.9409 0.434 0.0192024 4.9440 0.421 0.0182025 4.9465 0.409 0.0182026 4.9490 0.397 0.018
Source: Philip M. Parker, INSEAD, copyright 2020, www.icongrouponline.com
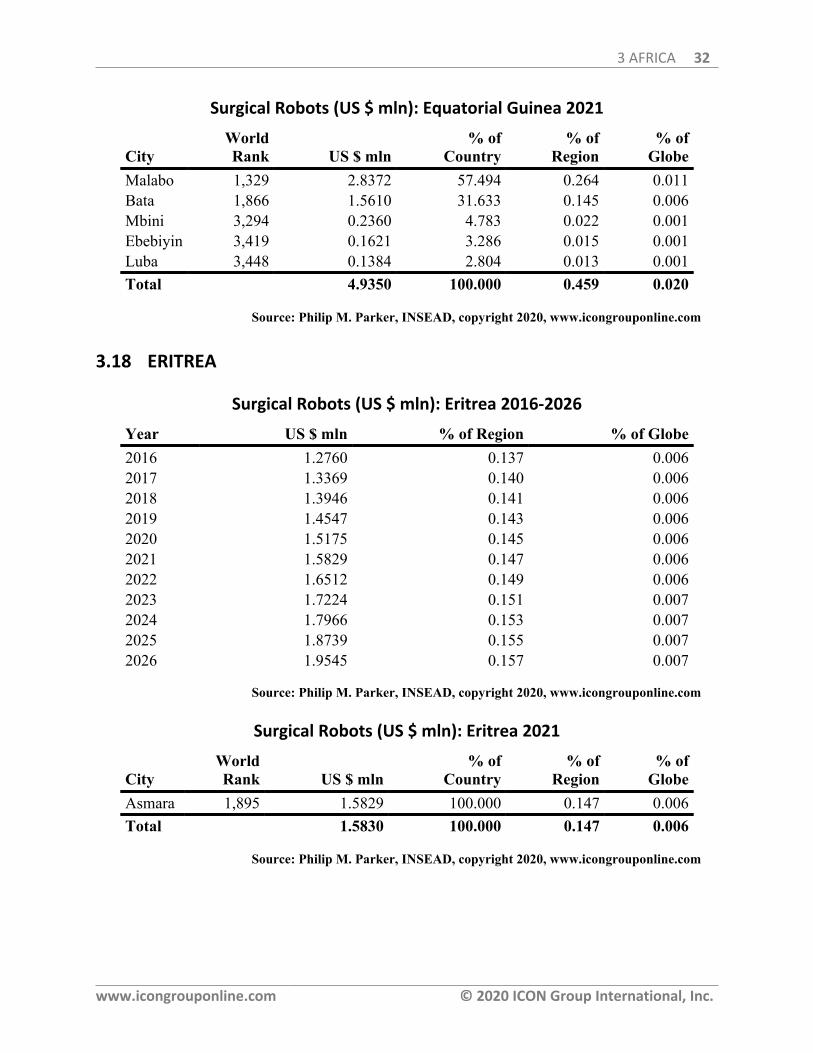
3 AFRICA 32
www.icongrouponline.com © 2020 ICON Group International, Inc.
Surgical Robots (US $ mln): Equatorial Guinea 2021
CityWorldRank US $ mln
% ofCountry
% ofRegion
% ofGlobe
Malabo 1,329 2.8372 57.494 0.264 0.011Bata 1,866 1.5610 31.633 0.145 0.006Mbini 3,294 0.2360 4.783 0.022 0.001Ebebiyin 3,419 0.1621 3.286 0.015 0.001Luba 3,448 0.1384 2.804 0.013 0.001Total 4.9350 100.000 0.459 0.020
Source: Philip M. Parker, INSEAD, copyright 2020, www.icongrouponline.com
3.18 ERITREA
Surgical Robots (US $ mln): Eritrea 2016-2026
Year US $ mln % of Region % of Globe2016 1.2760 0.137 0.0062017 1.3369 0.140 0.0062018 1.3946 0.141 0.0062019 1.4547 0.143 0.0062020 1.5175 0.145 0.0062021 1.5829 0.147 0.0062022 1.6512 0.149 0.0062023 1.7224 0.151 0.0072024 1.7966 0.153 0.0072025 1.8739 0.155 0.0072026 1.9545 0.157 0.007
Source: Philip M. Parker, INSEAD, copyright 2020, www.icongrouponline.com
Surgical Robots (US $ mln): Eritrea 2021
CityWorldRank US $ mln
% ofCountry
% ofRegion
% ofGlobe
Asmara 1,895 1.5829 100.000 0.147 0.006Total 1.5830 100.000 0.147 0.006
Source: Philip M. Parker, INSEAD, copyright 2020, www.icongrouponline.com
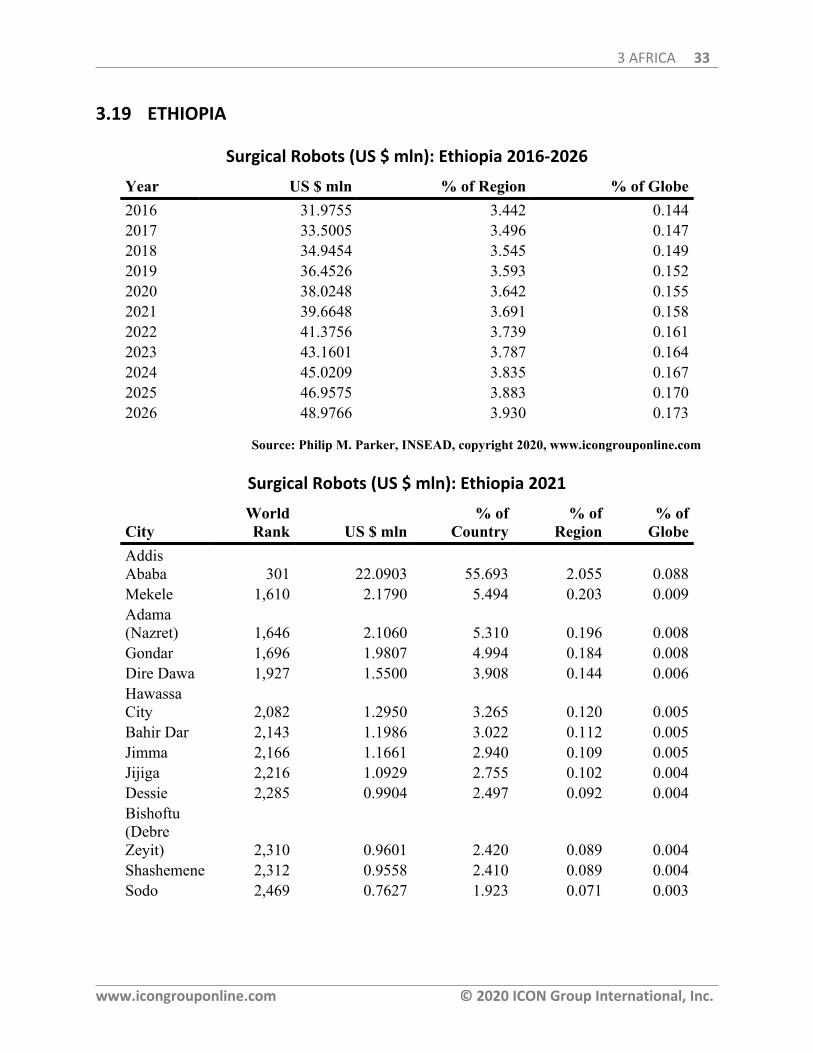
3 AFRICA 33
www.icongrouponline.com © 2020 ICON Group International, Inc.
3.19 ETHIOPIA
Surgical Robots (US $ mln): Ethiopia 2016-2026
Year US $ mln % of Region % of Globe2016 31.9755 3.442 0.1442017 33.5005 3.496 0.1472018 34.9454 3.545 0.1492019 36.4526 3.593 0.1522020 38.0248 3.642 0.1552021 39.6648 3.691 0.1582022 41.3756 3.739 0.1612023 43.1601 3.787 0.1642024 45.0209 3.835 0.1672025 46.9575 3.883 0.1702026 48.9766 3.930 0.173
Source: Philip M. Parker, INSEAD, copyright 2020, www.icongrouponline.com
Surgical Robots (US $ mln): Ethiopia 2021
CityWorldRank US $ mln
% ofCountry
% ofRegion
% ofGlobe
AddisAbaba 301 22.0903 55.693 2.055 0.088Mekele 1,610 2.1790 5.494 0.203 0.009Adama(Nazret) 1,646 2.1060 5.310 0.196 0.008Gondar 1,696 1.9807 4.994 0.184 0.008Dire Dawa 1,927 1.5500 3.908 0.144 0.006HawassaCity 2,082 1.2950 3.265 0.120 0.005Bahir Dar 2,143 1.1986 3.022 0.112 0.005Jimma 2,166 1.1661 2.940 0.109 0.005Jijiga 2,216 1.0929 2.755 0.102 0.004Dessie 2,285 0.9904 2.497 0.092 0.004Bishoftu(DebreZeyit) 2,310 0.9601 2.420 0.089 0.004Shashemene 2,312 0.9558 2.410 0.089 0.004Sodo 2,469 0.7627 1.923 0.071 0.003
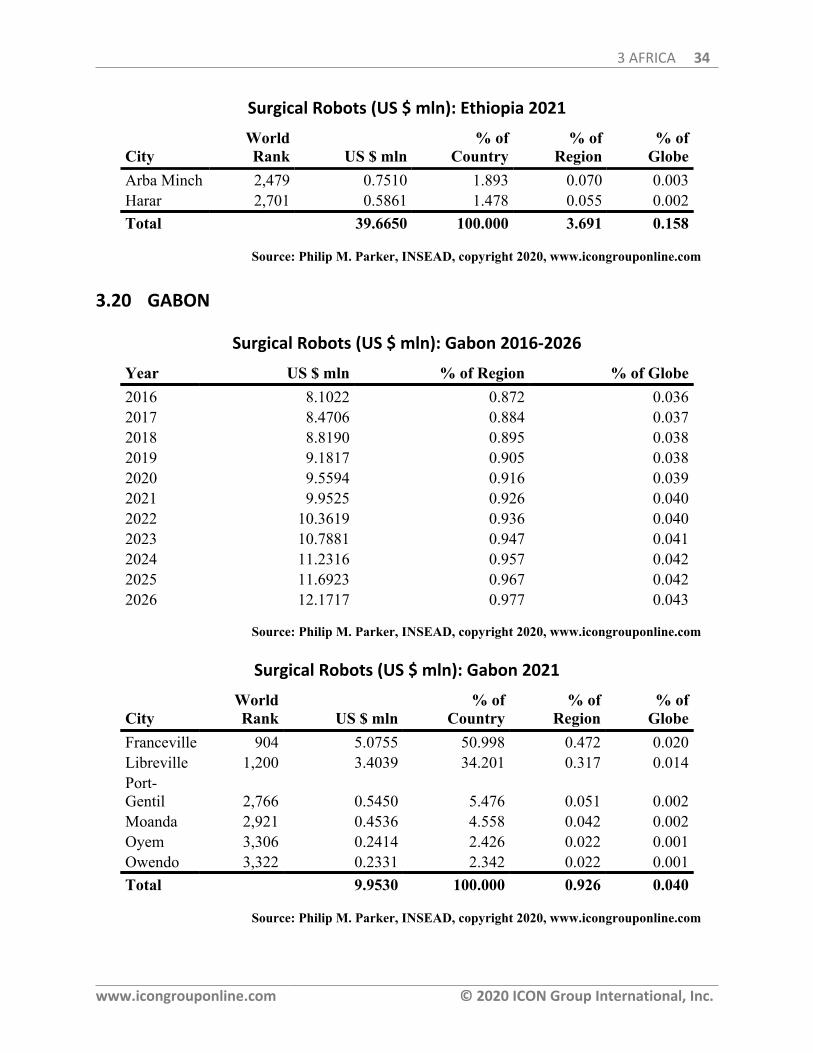
3 AFRICA 34
www.icongrouponline.com © 2020 ICON Group International, Inc.
Surgical Robots (US $ mln): Ethiopia 2021
CityWorldRank US $ mln
% ofCountry
% ofRegion
% ofGlobe
Arba Minch 2,479 0.7510 1.893 0.070 0.003Harar 2,701 0.5861 1.478 0.055 0.002Total 39.6650 100.000 3.691 0.158
Source: Philip M. Parker, INSEAD, copyright 2020, www.icongrouponline.com
3.20 GABON
Surgical Robots (US $ mln): Gabon 2016-2026
Year US $ mln % of Region % of Globe2016 8.1022 0.872 0.0362017 8.4706 0.884 0.0372018 8.8190 0.895 0.0382019 9.1817 0.905 0.0382020 9.5594 0.916 0.0392021 9.9525 0.926 0.0402022 10.3619 0.936 0.0402023 10.7881 0.947 0.0412024 11.2316 0.957 0.0422025 11.6923 0.967 0.0422026 12.1717 0.977 0.043
Source: Philip M. Parker, INSEAD, copyright 2020, www.icongrouponline.com
Surgical Robots (US $ mln): Gabon 2021
CityWorldRank US $ mln
% ofCountry
% ofRegion
% ofGlobe
Franceville 904 5.0755 50.998 0.472 0.020Libreville 1,200 3.4039 34.201 0.317 0.014Port-Gentil 2,766 0.5450 5.476 0.051 0.002Moanda 2,921 0.4536 4.558 0.042 0.002Oyem 3,306 0.2414 2.426 0.022 0.001Owendo 3,322 0.2331 2.342 0.022 0.001Total 9.9530 100.000 0.926 0.040
Source: Philip M. Parker, INSEAD, copyright 2020, www.icongrouponline.com
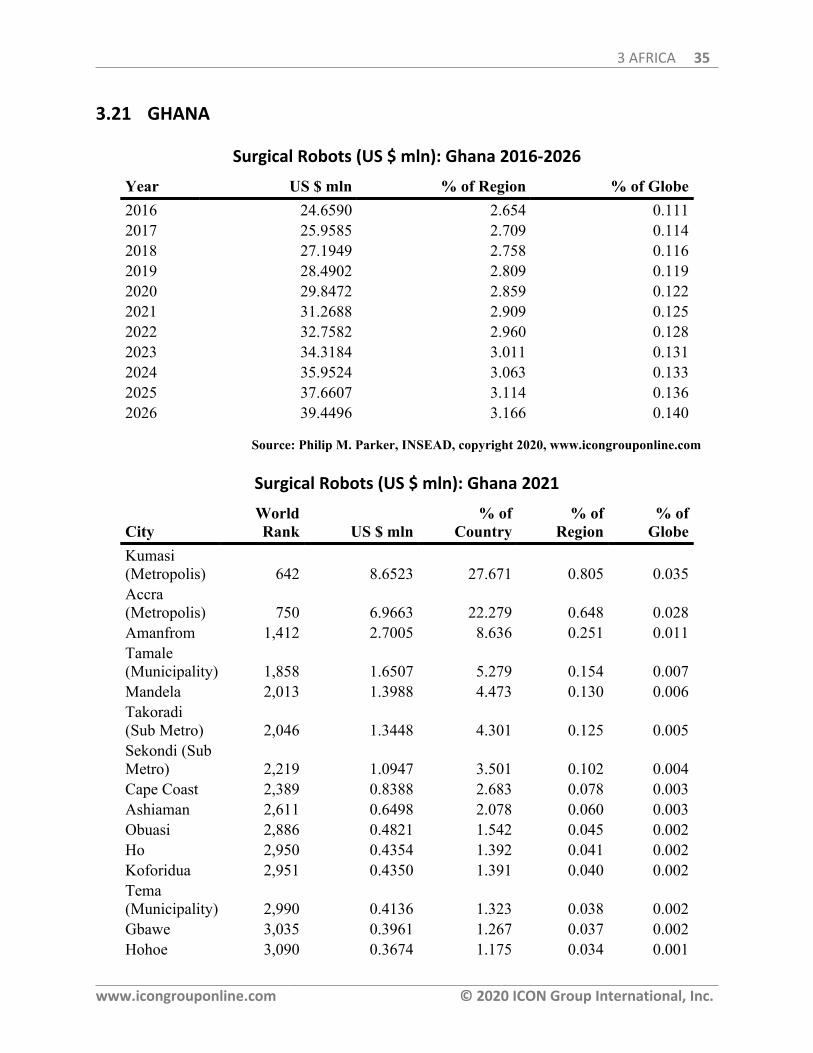
3 AFRICA 35
www.icongrouponline.com © 2020 ICON Group International, Inc.
3.21 GHANA
Surgical Robots (US $ mln): Ghana 2016-2026
Year US $ mln % of Region % of Globe2016 24.6590 2.654 0.1112017 25.9585 2.709 0.1142018 27.1949 2.758 0.1162019 28.4902 2.809 0.1192020 29.8472 2.859 0.1222021 31.2688 2.909 0.1252022 32.7582 2.960 0.1282023 34.3184 3.011 0.1312024 35.9524 3.063 0.1332025 37.6607 3.114 0.1362026 39.4496 3.166 0.140
Source: Philip M. Parker, INSEAD, copyright 2020, www.icongrouponline.com
Surgical Robots (US $ mln): Ghana 2021
CityWorldRank US $ mln
% ofCountry
% ofRegion
% ofGlobe
Kumasi(Metropolis) 642 8.6523 27.671 0.805 0.035Accra(Metropolis) 750 6.9663 22.279 0.648 0.028Amanfrom 1,412 2.7005 8.636 0.251 0.011Tamale(Municipality) 1,858 1.6507 5.279 0.154 0.007Mandela 2,013 1.3988 4.473 0.130 0.006Takoradi(Sub Metro) 2,046 1.3448 4.301 0.125 0.005Sekondi (SubMetro) 2,219 1.0947 3.501 0.102 0.004Cape Coast 2,389 0.8388 2.683 0.078 0.003Ashiaman 2,611 0.6498 2.078 0.060 0.003Obuasi 2,886 0.4821 1.542 0.045 0.002Ho 2,950 0.4354 1.392 0.041 0.002Koforidua 2,951 0.4350 1.391 0.040 0.002Tema(Municipality) 2,990 0.4136 1.323 0.038 0.002Gbawe 3,035 0.3961 1.267 0.037 0.002Hohoe 3,090 0.3674 1.175 0.034 0.001
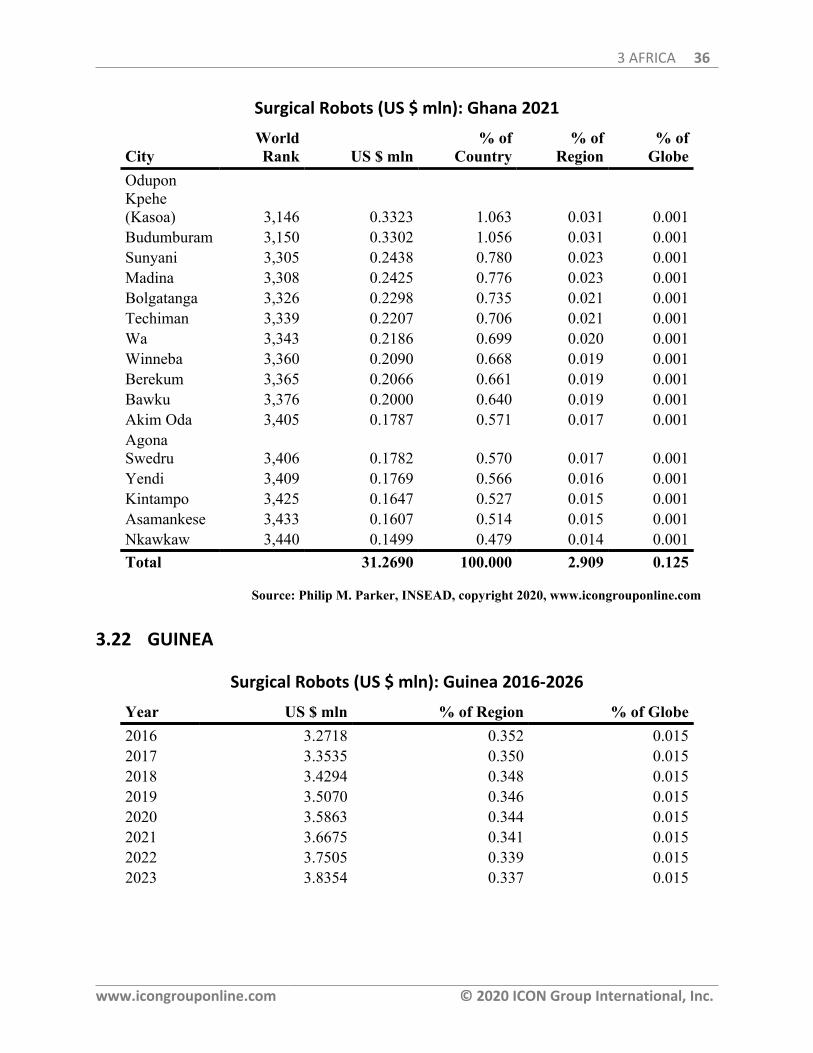
3 AFRICA 36
www.icongrouponline.com © 2020 ICON Group International, Inc.
Surgical Robots (US $ mln): Ghana 2021
CityWorldRank US $ mln
% ofCountry
% ofRegion
% ofGlobe
OduponKpehe(Kasoa) 3,146 0.3323 1.063 0.031 0.001Budumburam 3,150 0.3302 1.056 0.031 0.001Sunyani 3,305 0.2438 0.780 0.023 0.001Madina 3,308 0.2425 0.776 0.023 0.001Bolgatanga 3,326 0.2298 0.735 0.021 0.001Techiman 3,339 0.2207 0.706 0.021 0.001Wa 3,343 0.2186 0.699 0.020 0.001Winneba 3,360 0.2090 0.668 0.019 0.001Berekum 3,365 0.2066 0.661 0.019 0.001Bawku 3,376 0.2000 0.640 0.019 0.001Akim Oda 3,405 0.1787 0.571 0.017 0.001AgonaSwedru 3,406 0.1782 0.570 0.017 0.001Yendi 3,409 0.1769 0.566 0.016 0.001Kintampo 3,425 0.1647 0.527 0.015 0.001Asamankese 3,433 0.1607 0.514 0.015 0.001Nkawkaw 3,440 0.1499 0.479 0.014 0.001Total 31.2690 100.000 2.909 0.125
Source: Philip M. Parker, INSEAD, copyright 2020, www.icongrouponline.com
3.22 GUINEA
Surgical Robots (US $ mln): Guinea 2016-2026
Year US $ mln % of Region % of Globe2016 3.2718 0.352 0.0152017 3.3535 0.350 0.0152018 3.4294 0.348 0.0152019 3.5070 0.346 0.0152020 3.5863 0.344 0.0152021 3.6675 0.341 0.0152022 3.7505 0.339 0.0152023 3.8354 0.337 0.015
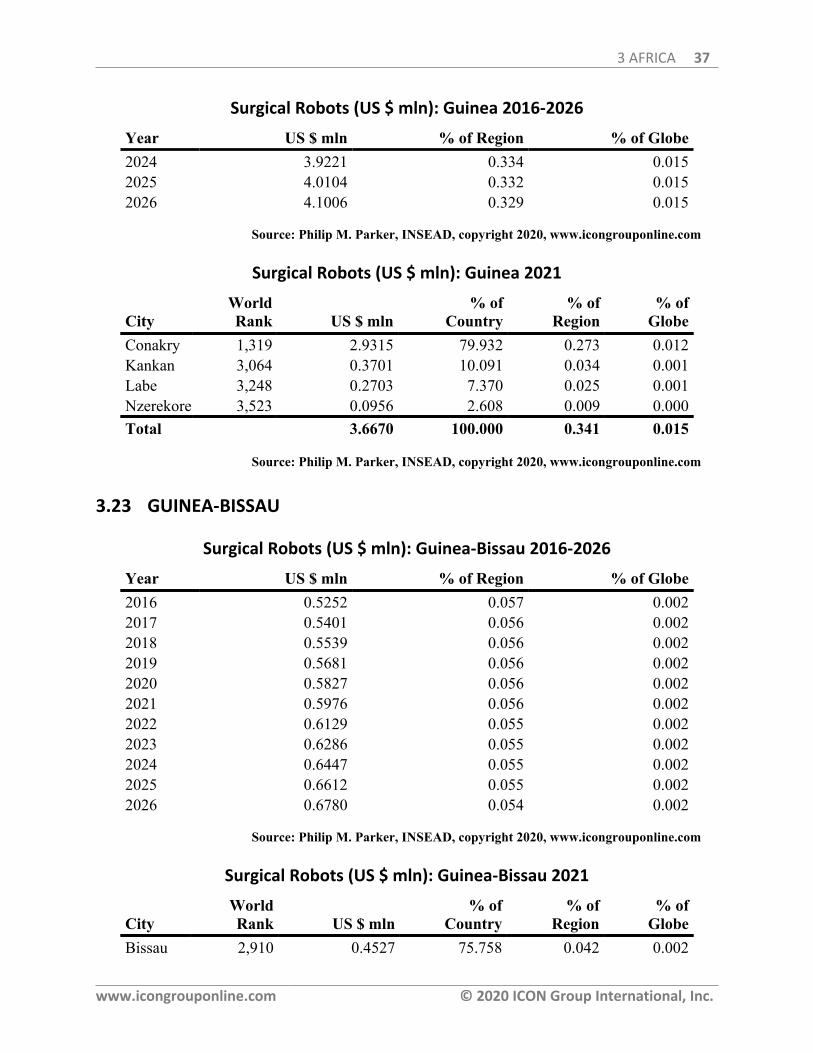
3 AFRICA 37
www.icongrouponline.com © 2020 ICON Group International, Inc.
Surgical Robots (US $ mln): Guinea 2016-2026
Year US $ mln % of Region % of Globe2024 3.9221 0.334 0.0152025 4.0104 0.332 0.0152026 4.1006 0.329 0.015
Source: Philip M. Parker, INSEAD, copyright 2020, www.icongrouponline.com
Surgical Robots (US $ mln): Guinea 2021
CityWorldRank US $ mln
% ofCountry
% ofRegion
% ofGlobe
Conakry 1,319 2.9315 79.932 0.273 0.012Kankan 3,064 0.3701 10.091 0.034 0.001Labe 3,248 0.2703 7.370 0.025 0.001Nzerekore 3,523 0.0956 2.608 0.009 0.000Total 3.6670 100.000 0.341 0.015
Source: Philip M. Parker, INSEAD, copyright 2020, www.icongrouponline.com
3.23 GUINEA-BISSAU
Surgical Robots (US $ mln): Guinea-Bissau 2016-2026
Year US $ mln % of Region % of Globe2016 0.5252 0.057 0.0022017 0.5401 0.056 0.0022018 0.5539 0.056 0.0022019 0.5681 0.056 0.0022020 0.5827 0.056 0.0022021 0.5976 0.056 0.0022022 0.6129 0.055 0.0022023 0.6286 0.055 0.0022024 0.6447 0.055 0.0022025 0.6612 0.055 0.0022026 0.6780 0.054 0.002
Source: Philip M. Parker, INSEAD, copyright 2020, www.icongrouponline.com
Surgical Robots (US $ mln): Guinea-Bissau 2021
CityWorldRank US $ mln
% ofCountry
% ofRegion
% ofGlobe
Bissau 2,910 0.4527 75.758 0.042 0.002
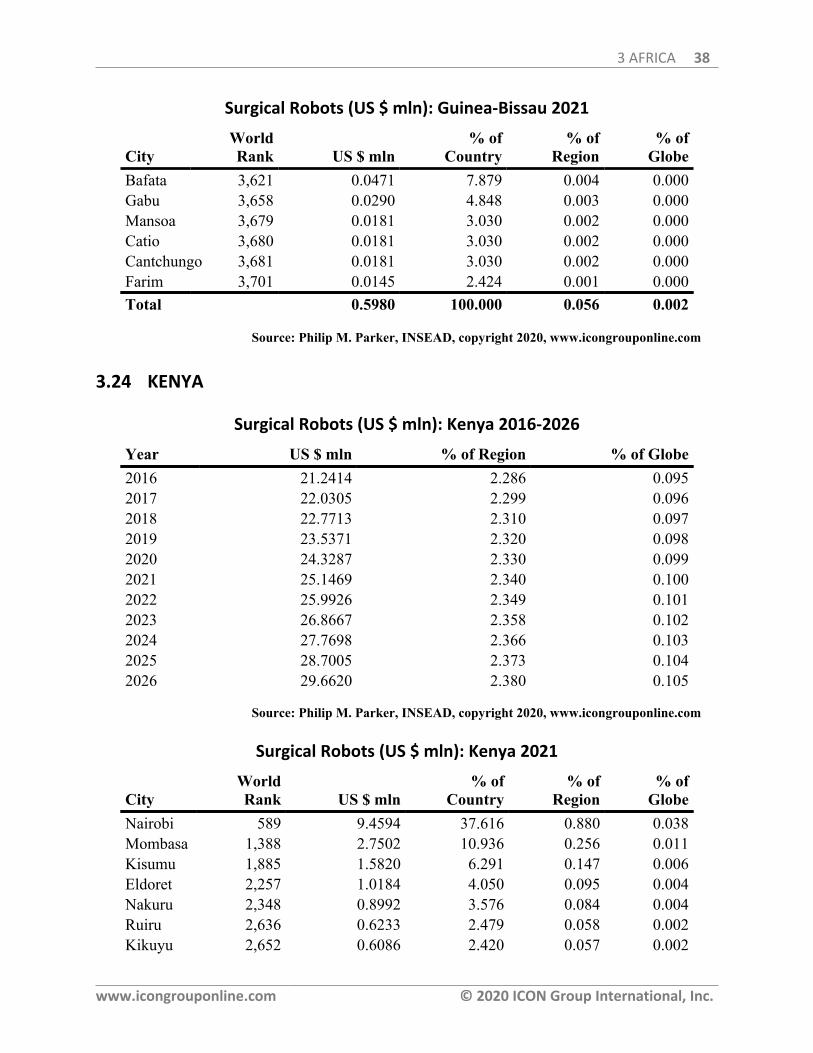
3 AFRICA 38
www.icongrouponline.com © 2020 ICON Group International, Inc.
Surgical Robots (US $ mln): Guinea-Bissau 2021
CityWorldRank US $ mln
% ofCountry
% ofRegion
% ofGlobe
Bafata 3,621 0.0471 7.879 0.004 0.000Gabu 3,658 0.0290 4.848 0.003 0.000Mansoa 3,679 0.0181 3.030 0.002 0.000Catio 3,680 0.0181 3.030 0.002 0.000Cantchungo 3,681 0.0181 3.030 0.002 0.000Farim 3,701 0.0145 2.424 0.001 0.000Total 0.5980 100.000 0.056 0.002
Source: Philip M. Parker, INSEAD, copyright 2020, www.icongrouponline.com
3.24 KENYA
Surgical Robots (US $ mln): Kenya 2016-2026
Year US $ mln % of Region % of Globe2016 21.2414 2.286 0.0952017 22.0305 2.299 0.0962018 22.7713 2.310 0.0972019 23.5371 2.320 0.0982020 24.3287 2.330 0.0992021 25.1469 2.340 0.1002022 25.9926 2.349 0.1012023 26.8667 2.358 0.1022024 27.7698 2.366 0.1032025 28.7005 2.373 0.1042026 29.6620 2.380 0.105
Source: Philip M. Parker, INSEAD, copyright 2020, www.icongrouponline.com
Surgical Robots (US $ mln): Kenya 2021
CityWorldRank US $ mln
% ofCountry
% ofRegion
% ofGlobe
Nairobi 589 9.4594 37.616 0.880 0.038Mombasa 1,388 2.7502 10.936 0.256 0.011Kisumu 1,885 1.5820 6.291 0.147 0.006Eldoret 2,257 1.0184 4.050 0.095 0.004Nakuru 2,348 0.8992 3.576 0.084 0.004Ruiru 2,636 0.6233 2.479 0.058 0.002Kikuyu 2,652 0.6086 2.420 0.057 0.002
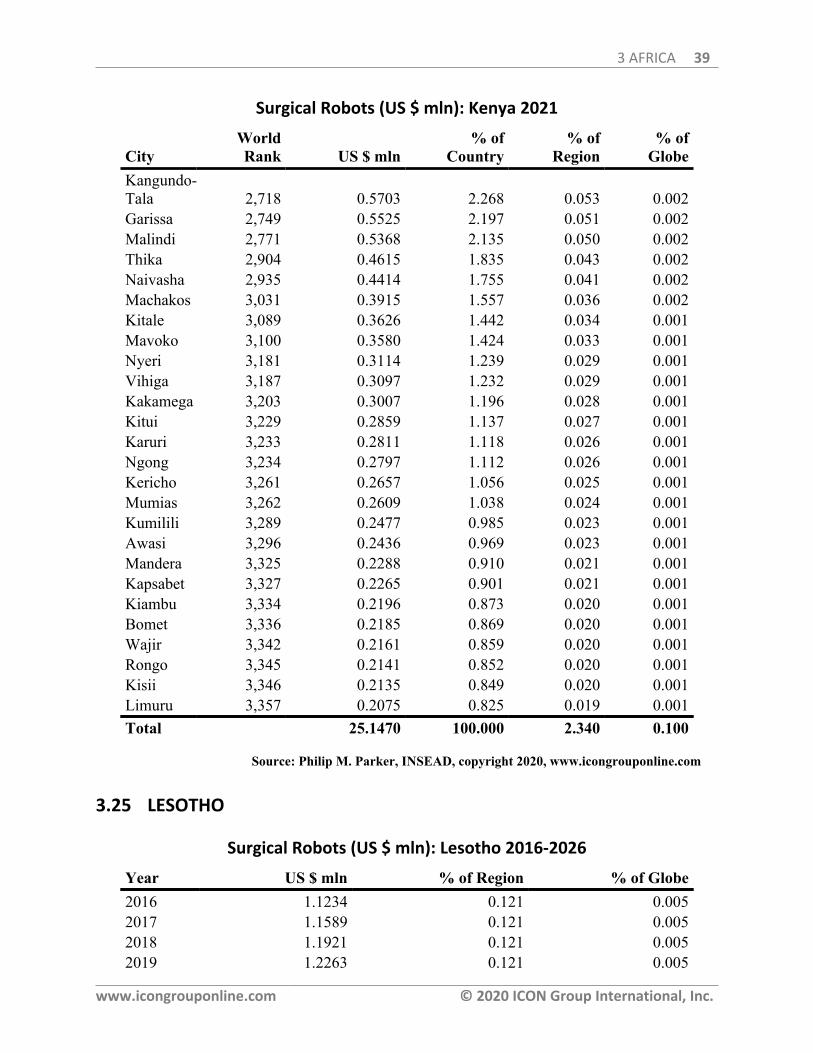
3 AFRICA 39
www.icongrouponline.com © 2020 ICON Group International, Inc.
Surgical Robots (US $ mln): Kenya 2021
CityWorldRank US $ mln
% ofCountry
% ofRegion
% ofGlobe
Kangundo-Tala 2,718 0.5703 2.268 0.053 0.002Garissa 2,749 0.5525 2.197 0.051 0.002Malindi 2,771 0.5368 2.135 0.050 0.002Thika 2,904 0.4615 1.835 0.043 0.002Naivasha 2,935 0.4414 1.755 0.041 0.002Machakos 3,031 0.3915 1.557 0.036 0.002Kitale 3,089 0.3626 1.442 0.034 0.001Mavoko 3,100 0.3580 1.424 0.033 0.001Nyeri 3,181 0.3114 1.239 0.029 0.001Vihiga 3,187 0.3097 1.232 0.029 0.001Kakamega 3,203 0.3007 1.196 0.028 0.001Kitui 3,229 0.2859 1.137 0.027 0.001Karuri 3,233 0.2811 1.118 0.026 0.001Ngong 3,234 0.2797 1.112 0.026 0.001Kericho 3,261 0.2657 1.056 0.025 0.001Mumias 3,262 0.2609 1.038 0.024 0.001Kumilili 3,289 0.2477 0.985 0.023 0.001Awasi 3,296 0.2436 0.969 0.023 0.001Mandera 3,325 0.2288 0.910 0.021 0.001Kapsabet 3,327 0.2265 0.901 0.021 0.001Kiambu 3,334 0.2196 0.873 0.020 0.001Bomet 3,336 0.2185 0.869 0.020 0.001Wajir 3,342 0.2161 0.859 0.020 0.001Rongo 3,345 0.2141 0.852 0.020 0.001Kisii 3,346 0.2135 0.849 0.020 0.001Limuru 3,357 0.2075 0.825 0.019 0.001Total 25.1470 100.000 2.340 0.100
Source: Philip M. Parker, INSEAD, copyright 2020, www.icongrouponline.com
3.25 LESOTHO
Surgical Robots (US $ mln): Lesotho 2016-2026
Year US $ mln % of Region % of Globe2016 1.1234 0.121 0.0052017 1.1589 0.121 0.0052018 1.1921 0.121 0.0052019 1.2263 0.121 0.005
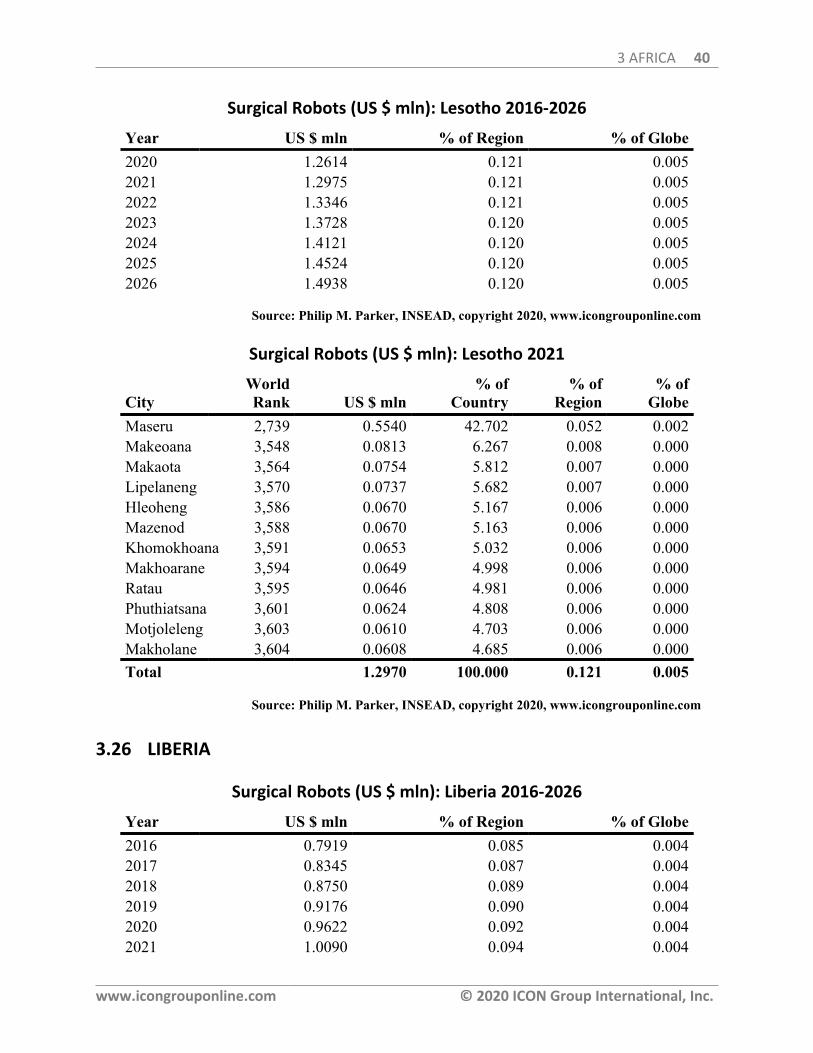
3 AFRICA 40
www.icongrouponline.com © 2020 ICON Group International, Inc.
Surgical Robots (US $ mln): Lesotho 2016-2026
Year US $ mln % of Region % of Globe2020 1.2614 0.121 0.0052021 1.2975 0.121 0.0052022 1.3346 0.121 0.0052023 1.3728 0.120 0.0052024 1.4121 0.120 0.0052025 1.4524 0.120 0.0052026 1.4938 0.120 0.005
Source: Philip M. Parker, INSEAD, copyright 2020, www.icongrouponline.com
Surgical Robots (US $ mln): Lesotho 2021
CityWorldRank US $ mln
% ofCountry
% ofRegion
% ofGlobe
Maseru 2,739 0.5540 42.702 0.052 0.002Makeoana 3,548 0.0813 6.267 0.008 0.000Makaota 3,564 0.0754 5.812 0.007 0.000Lipelaneng 3,570 0.0737 5.682 0.007 0.000Hleoheng 3,586 0.0670 5.167 0.006 0.000Mazenod 3,588 0.0670 5.163 0.006 0.000Khomokhoana 3,591 0.0653 5.032 0.006 0.000Makhoarane 3,594 0.0649 4.998 0.006 0.000Ratau 3,595 0.0646 4.981 0.006 0.000Phuthiatsana 3,601 0.0624 4.808 0.006 0.000Motjoleleng 3,603 0.0610 4.703 0.006 0.000Makholane 3,604 0.0608 4.685 0.006 0.000Total 1.2970 100.000 0.121 0.005
Source: Philip M. Parker, INSEAD, copyright 2020, www.icongrouponline.com
3.26 LIBERIA
Surgical Robots (US $ mln): Liberia 2016-2026
Year US $ mln % of Region % of Globe2016 0.7919 0.085 0.0042017 0.8345 0.087 0.0042018 0.8750 0.089 0.0042019 0.9176 0.090 0.0042020 0.9622 0.092 0.0042021 1.0090 0.094 0.004
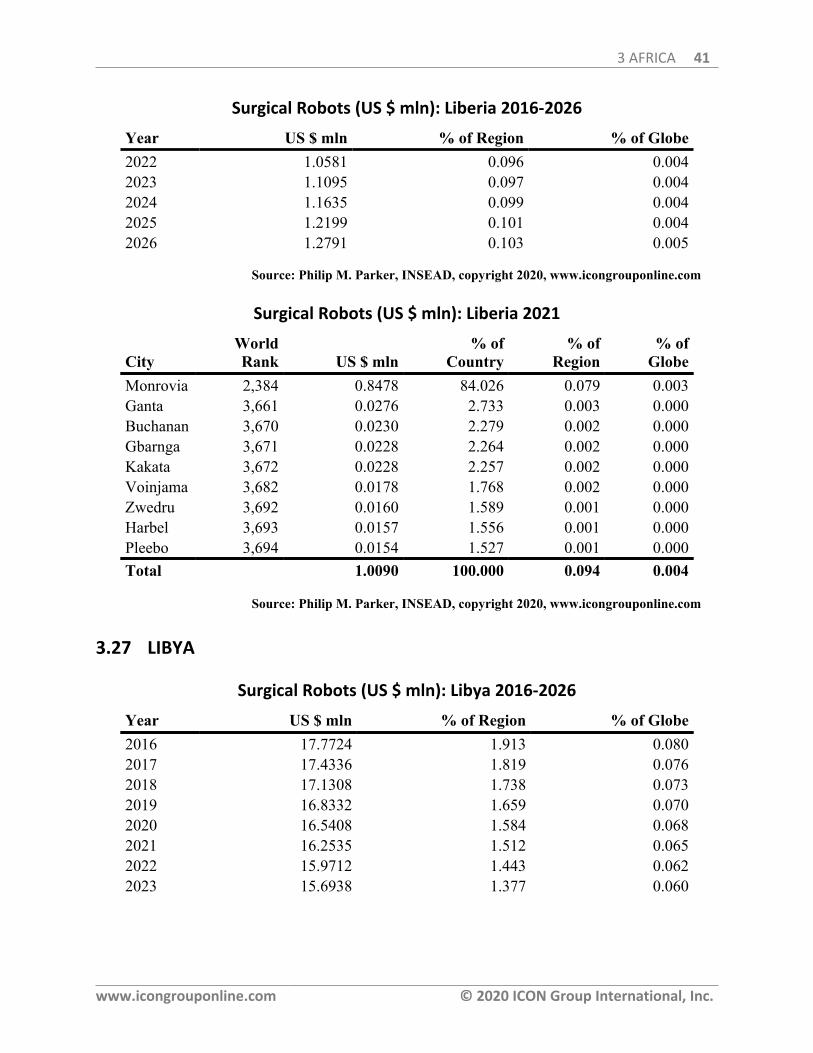
3 AFRICA 41
www.icongrouponline.com © 2020 ICON Group International, Inc.
Surgical Robots (US $ mln): Liberia 2016-2026
Year US $ mln % of Region % of Globe2022 1.0581 0.096 0.0042023 1.1095 0.097 0.0042024 1.1635 0.099 0.0042025 1.2199 0.101 0.0042026 1.2791 0.103 0.005
Source: Philip M. Parker, INSEAD, copyright 2020, www.icongrouponline.com
Surgical Robots (US $ mln): Liberia 2021
CityWorldRank US $ mln
% ofCountry
% ofRegion
% ofGlobe
Monrovia 2,384 0.8478 84.026 0.079 0.003Ganta 3,661 0.0276 2.733 0.003 0.000Buchanan 3,670 0.0230 2.279 0.002 0.000Gbarnga 3,671 0.0228 2.264 0.002 0.000Kakata 3,672 0.0228 2.257 0.002 0.000Voinjama 3,682 0.0178 1.768 0.002 0.000Zwedru 3,692 0.0160 1.589 0.001 0.000Harbel 3,693 0.0157 1.556 0.001 0.000Pleebo 3,694 0.0154 1.527 0.001 0.000Total 1.0090 100.000 0.094 0.004
Source: Philip M. Parker, INSEAD, copyright 2020, www.icongrouponline.com
3.27 LIBYA
Surgical Robots (US $ mln): Libya 2016-2026
Year US $ mln % of Region % of Globe2016 17.7724 1.913 0.0802017 17.4336 1.819 0.0762018 17.1308 1.738 0.0732019 16.8332 1.659 0.0702020 16.5408 1.584 0.0682021 16.2535 1.512 0.0652022 15.9712 1.443 0.0622023 15.6938 1.377 0.060
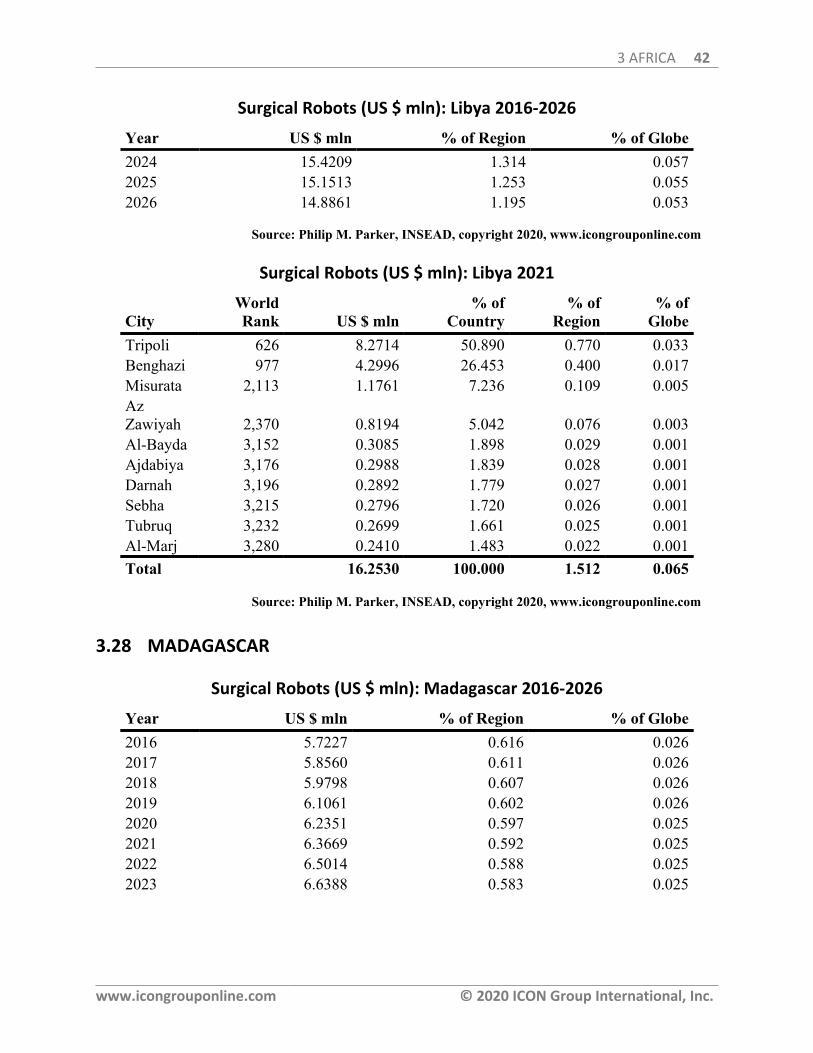
3 AFRICA 42
www.icongrouponline.com © 2020 ICON Group International, Inc.
Surgical Robots (US $ mln): Libya 2016-2026
Year US $ mln % of Region % of Globe2024 15.4209 1.314 0.0572025 15.1513 1.253 0.0552026 14.8861 1.195 0.053
Source: Philip M. Parker, INSEAD, copyright 2020, www.icongrouponline.com
Surgical Robots (US $ mln): Libya 2021
CityWorldRank US $ mln
% ofCountry
% ofRegion
% ofGlobe
Tripoli 626 8.2714 50.890 0.770 0.033Benghazi 977 4.2996 26.453 0.400 0.017Misurata 2,113 1.1761 7.236 0.109 0.005AzZawiyah 2,370 0.8194 5.042 0.076 0.003Al-Bayda 3,152 0.3085 1.898 0.029 0.001Ajdabiya 3,176 0.2988 1.839 0.028 0.001Darnah 3,196 0.2892 1.779 0.027 0.001Sebha 3,215 0.2796 1.720 0.026 0.001Tubruq 3,232 0.2699 1.661 0.025 0.001Al-Marj 3,280 0.2410 1.483 0.022 0.001Total 16.2530 100.000 1.512 0.065
Source: Philip M. Parker, INSEAD, copyright 2020, www.icongrouponline.com
3.28 MADAGASCAR
Surgical Robots (US $ mln): Madagascar 2016-2026
Year US $ mln % of Region % of Globe2016 5.7227 0.616 0.0262017 5.8560 0.611 0.0262018 5.9798 0.607 0.0262019 6.1061 0.602 0.0262020 6.2351 0.597 0.0252021 6.3669 0.592 0.0252022 6.5014 0.588 0.0252023 6.6388 0.583 0.025

3 AFRICA 43
www.icongrouponline.com © 2020 ICON Group International, Inc.
Surgical Robots (US $ mln): Madagascar 2016-2026
Year US $ mln % of Region % of Globe2024 6.7790 0.577 0.0252025 6.9214 0.572 0.0252026 7.0668 0.567 0.025
Source: Philip M. Parker, INSEAD, copyright 2020, www.icongrouponline.com
Surgical Robots (US $ mln): Madagascar 2021
CityWorldRank US $ mln
% ofCountry
% ofRegion
% ofGlobe
Antananarivo 1,146 3.5665 56.016 0.332 0.014Toamasina 2,521 0.7052 11.076 0.066 0.003Mahajanga 2,720 0.5631 8.845 0.052 0.002Fianarantsoa 2,721 0.5631 8.845 0.052 0.002Antsirabe 2,993 0.4008 6.295 0.037 0.002Toliara 3,199 0.2993 4.701 0.028 0.001Antsiranana 3,252 0.2689 4.223 0.025 0.001Total 6.3670 100.000 0.592 0.025
Source: Philip M. Parker, INSEAD, copyright 2020, www.icongrouponline.com
3.29 MALAWI
Surgical Robots (US $ mln): Malawi 2016-2026
Year US $ mln % of Region % of Globe2016 3.9894 0.429 0.0182017 4.1354 0.432 0.0182018 4.2724 0.433 0.0182019 4.4139 0.435 0.0182020 4.5602 0.437 0.0192021 4.7112 0.438 0.0192022 4.8673 0.440 0.0192023 5.0286 0.441 0.0192024 5.1951 0.443 0.0192025 5.3666 0.444 0.0192026 5.5437 0.445 0.020
Source: Philip M. Parker, INSEAD, copyright 2020, www.icongrouponline.com
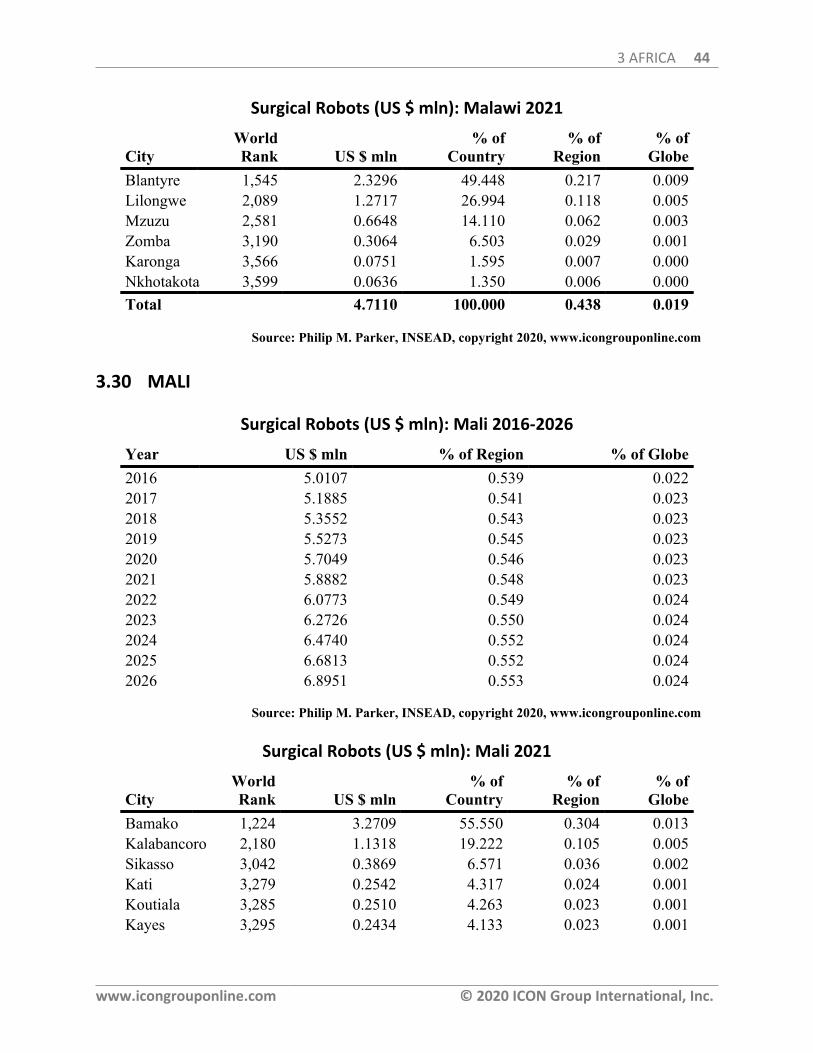
3 AFRICA 44
www.icongrouponline.com © 2020 ICON Group International, Inc.
Surgical Robots (US $ mln): Malawi 2021
CityWorldRank US $ mln
% ofCountry
% ofRegion
% ofGlobe
Blantyre 1,545 2.3296 49.448 0.217 0.009Lilongwe 2,089 1.2717 26.994 0.118 0.005Mzuzu 2,581 0.6648 14.110 0.062 0.003Zomba 3,190 0.3064 6.503 0.029 0.001Karonga 3,566 0.0751 1.595 0.007 0.000Nkhotakota 3,599 0.0636 1.350 0.006 0.000Total 4.7110 100.000 0.438 0.019
Source: Philip M. Parker, INSEAD, copyright 2020, www.icongrouponline.com
3.30 MALI
Surgical Robots (US $ mln): Mali 2016-2026
Year US $ mln % of Region % of Globe2016 5.0107 0.539 0.0222017 5.1885 0.541 0.0232018 5.3552 0.543 0.0232019 5.5273 0.545 0.0232020 5.7049 0.546 0.0232021 5.8882 0.548 0.0232022 6.0773 0.549 0.0242023 6.2726 0.550 0.0242024 6.4740 0.552 0.0242025 6.6813 0.552 0.0242026 6.8951 0.553 0.024
Source: Philip M. Parker, INSEAD, copyright 2020, www.icongrouponline.com
Surgical Robots (US $ mln): Mali 2021
CityWorldRank US $ mln
% ofCountry
% ofRegion
% ofGlobe
Bamako 1,224 3.2709 55.550 0.304 0.013Kalabancoro 2,180 1.1318 19.222 0.105 0.005Sikasso 3,042 0.3869 6.571 0.036 0.002Kati 3,279 0.2542 4.317 0.024 0.001Koutiala 3,285 0.2510 4.263 0.023 0.001Kayes 3,295 0.2434 4.133 0.023 0.001
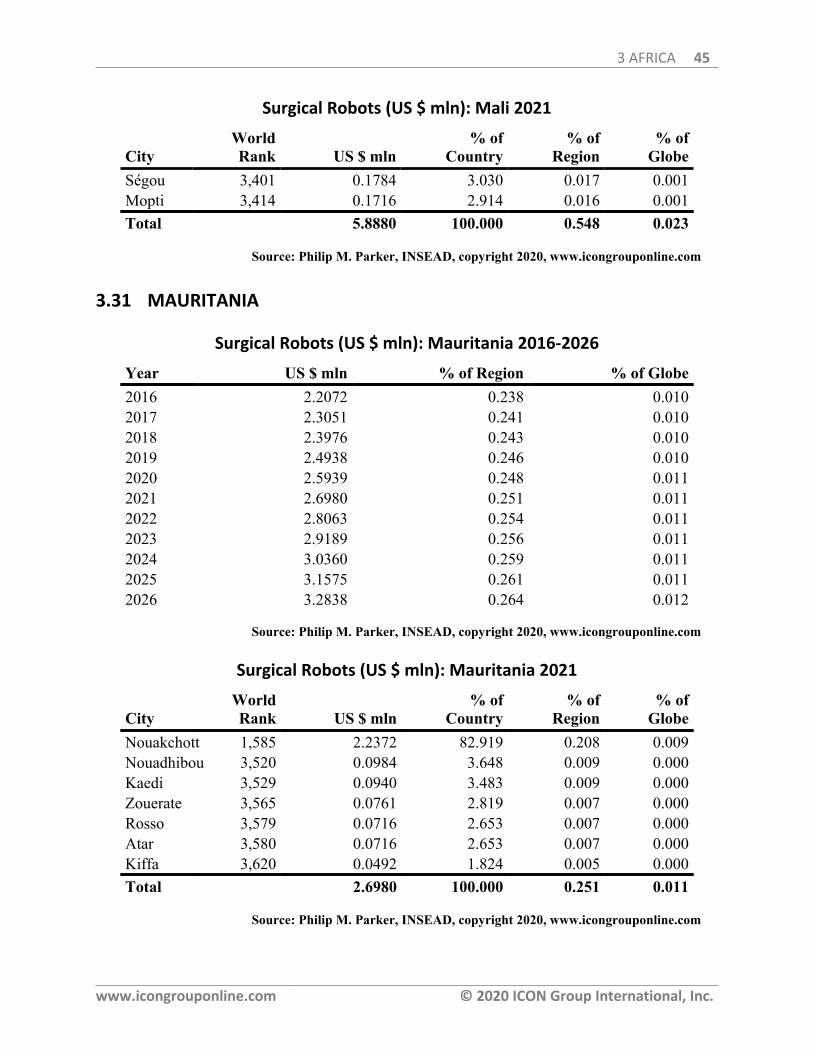
3 AFRICA 45
www.icongrouponline.com © 2020 ICON Group International, Inc.
Surgical Robots (US $ mln): Mali 2021
CityWorldRank US $ mln
% ofCountry
% ofRegion
% ofGlobe
Ségou 3,401 0.1784 3.030 0.017 0.001Mopti 3,414 0.1716 2.914 0.016 0.001Total 5.8880 100.000 0.548 0.023
Source: Philip M. Parker, INSEAD, copyright 2020, www.icongrouponline.com
3.31 MAURITANIA
Surgical Robots (US $ mln): Mauritania 2016-2026
Year US $ mln % of Region % of Globe2016 2.2072 0.238 0.0102017 2.3051 0.241 0.0102018 2.3976 0.243 0.0102019 2.4938 0.246 0.0102020 2.5939 0.248 0.0112021 2.6980 0.251 0.0112022 2.8063 0.254 0.0112023 2.9189 0.256 0.0112024 3.0360 0.259 0.0112025 3.1575 0.261 0.0112026 3.2838 0.264 0.012
Source: Philip M. Parker, INSEAD, copyright 2020, www.icongrouponline.com
Surgical Robots (US $ mln): Mauritania 2021
CityWorldRank US $ mln
% ofCountry
% ofRegion
% ofGlobe
Nouakchott 1,585 2.2372 82.919 0.208 0.009Nouadhibou 3,520 0.0984 3.648 0.009 0.000Kaedi 3,529 0.0940 3.483 0.009 0.000Zouerate 3,565 0.0761 2.819 0.007 0.000Rosso 3,579 0.0716 2.653 0.007 0.000Atar 3,580 0.0716 2.653 0.007 0.000Kiffa 3,620 0.0492 1.824 0.005 0.000Total 2.6980 100.000 0.251 0.011
Source: Philip M. Parker, INSEAD, copyright 2020, www.icongrouponline.com
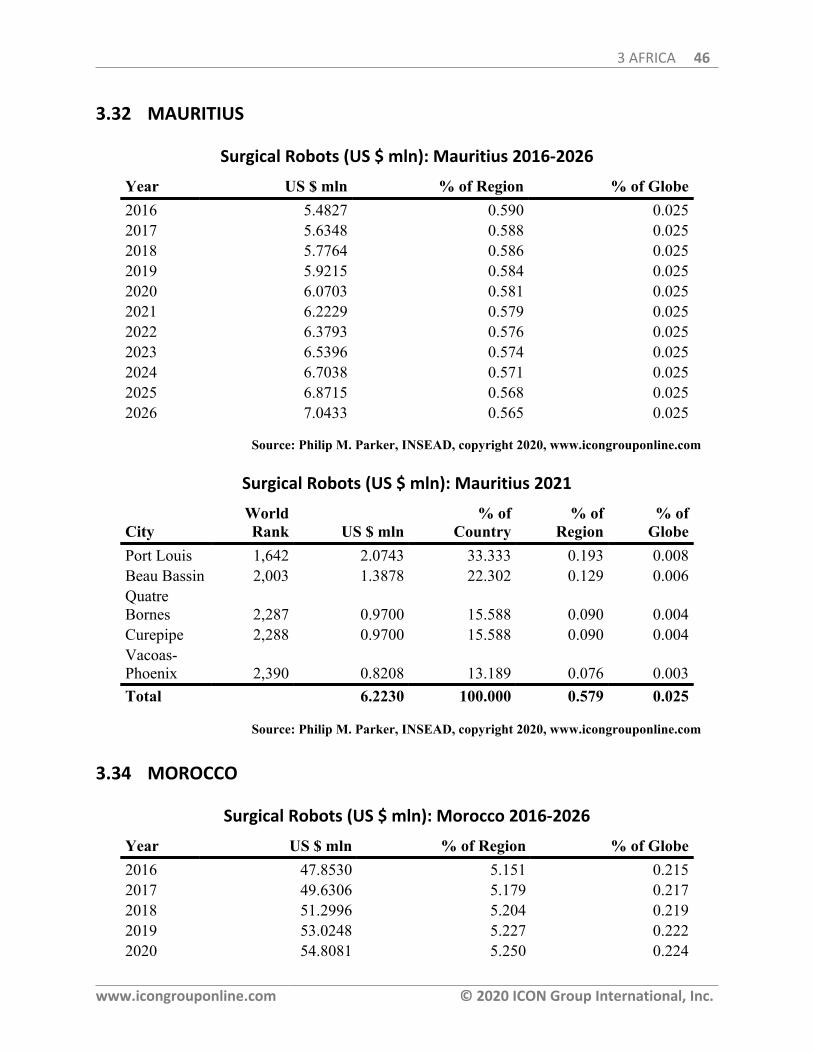
3 AFRICA 46
www.icongrouponline.com © 2020 ICON Group International, Inc.
3.32 MAURITIUS
Surgical Robots (US $ mln): Mauritius 2016-2026
Year US $ mln % of Region % of Globe2016 5.4827 0.590 0.0252017 5.6348 0.588 0.0252018 5.7764 0.586 0.0252019 5.9215 0.584 0.0252020 6.0703 0.581 0.0252021 6.2229 0.579 0.0252022 6.3793 0.576 0.0252023 6.5396 0.574 0.0252024 6.7038 0.571 0.0252025 6.8715 0.568 0.0252026 7.0433 0.565 0.025
Source: Philip M. Parker, INSEAD, copyright 2020, www.icongrouponline.com
Surgical Robots (US $ mln): Mauritius 2021
CityWorldRank US $ mln
% ofCountry
% ofRegion
% ofGlobe
Port Louis 1,642 2.0743 33.333 0.193 0.008Beau Bassin 2,003 1.3878 22.302 0.129 0.006QuatreBornes 2,287 0.9700 15.588 0.090 0.004Curepipe 2,288 0.9700 15.588 0.090 0.004Vacoas-Phoenix 2,390 0.8208 13.189 0.076 0.003Total 6.2230 100.000 0.579 0.025
Source: Philip M. Parker, INSEAD, copyright 2020, www.icongrouponline.com
3.34 MOROCCO
Surgical Robots (US $ mln): Morocco 2016-2026
Year US $ mln % of Region % of Globe2016 47.8530 5.151 0.2152017 49.6306 5.179 0.2172018 51.2996 5.204 0.2192019 53.0248 5.227 0.2222020 54.8081 5.250 0.224
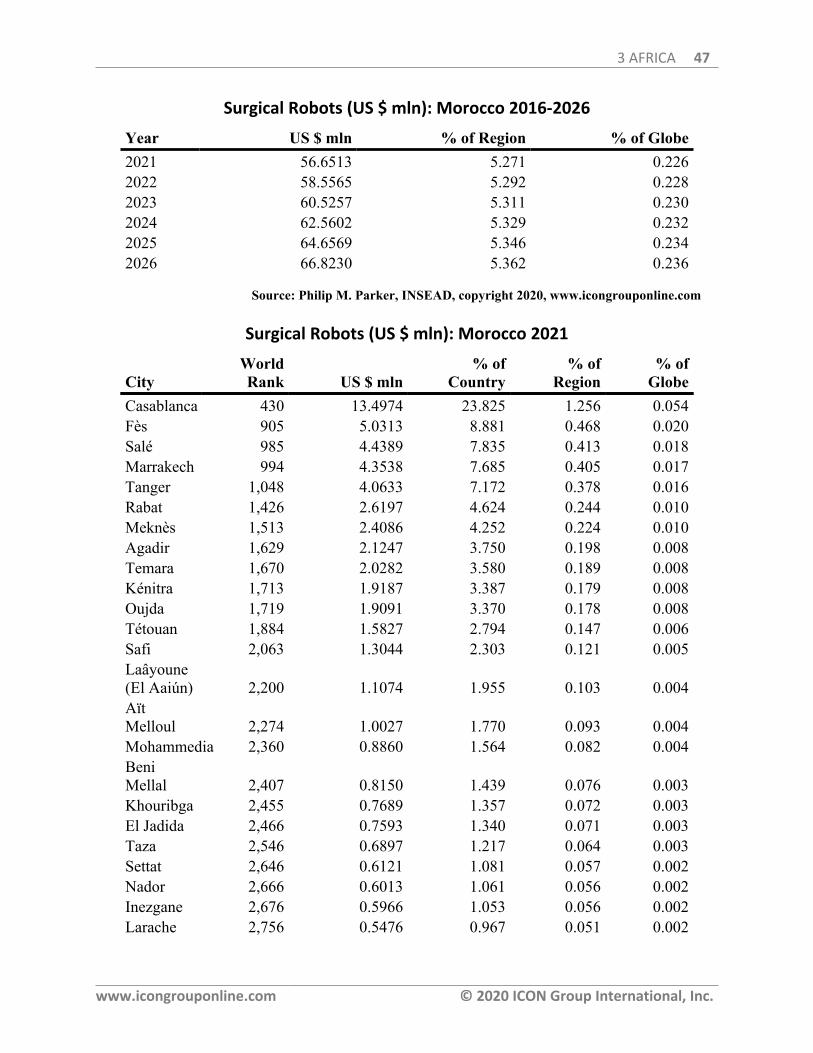
3 AFRICA 47
www.icongrouponline.com © 2020 ICON Group International, Inc.
Surgical Robots (US $ mln): Morocco 2016-2026
Year US $ mln % of Region % of Globe2021 56.6513 5.271 0.2262022 58.5565 5.292 0.2282023 60.5257 5.311 0.2302024 62.5602 5.329 0.2322025 64.6569 5.346 0.2342026 66.8230 5.362 0.236
Source: Philip M. Parker, INSEAD, copyright 2020, www.icongrouponline.com
Surgical Robots (US $ mln): Morocco 2021
CityWorldRank US $ mln
% ofCountry
% ofRegion
% ofGlobe
Casablanca 430 13.4974 23.825 1.256 0.054Fès 905 5.0313 8.881 0.468 0.020Salé 985 4.4389 7.835 0.413 0.018Marrakech 994 4.3538 7.685 0.405 0.017Tanger 1,048 4.0633 7.172 0.378 0.016Rabat 1,426 2.6197 4.624 0.244 0.010Meknès 1,513 2.4086 4.252 0.224 0.010Agadir 1,629 2.1247 3.750 0.198 0.008Temara 1,670 2.0282 3.580 0.189 0.008Kénitra 1,713 1.9187 3.387 0.179 0.008Oujda 1,719 1.9091 3.370 0.178 0.008Tétouan 1,884 1.5827 2.794 0.147 0.006Safi 2,063 1.3044 2.303 0.121 0.005Laâyoune(El Aaiún) 2,200 1.1074 1.955 0.103 0.004AïtMelloul 2,274 1.0027 1.770 0.093 0.004Mohammedia 2,360 0.8860 1.564 0.082 0.004BeniMellal 2,407 0.8150 1.439 0.076 0.003Khouribga 2,455 0.7689 1.357 0.072 0.003El Jadida 2,466 0.7593 1.340 0.071 0.003Taza 2,546 0.6897 1.217 0.064 0.003Settat 2,646 0.6121 1.081 0.057 0.002Nador 2,666 0.6013 1.061 0.056 0.002Inezgane 2,676 0.5966 1.053 0.056 0.002Larache 2,756 0.5476 0.967 0.051 0.002
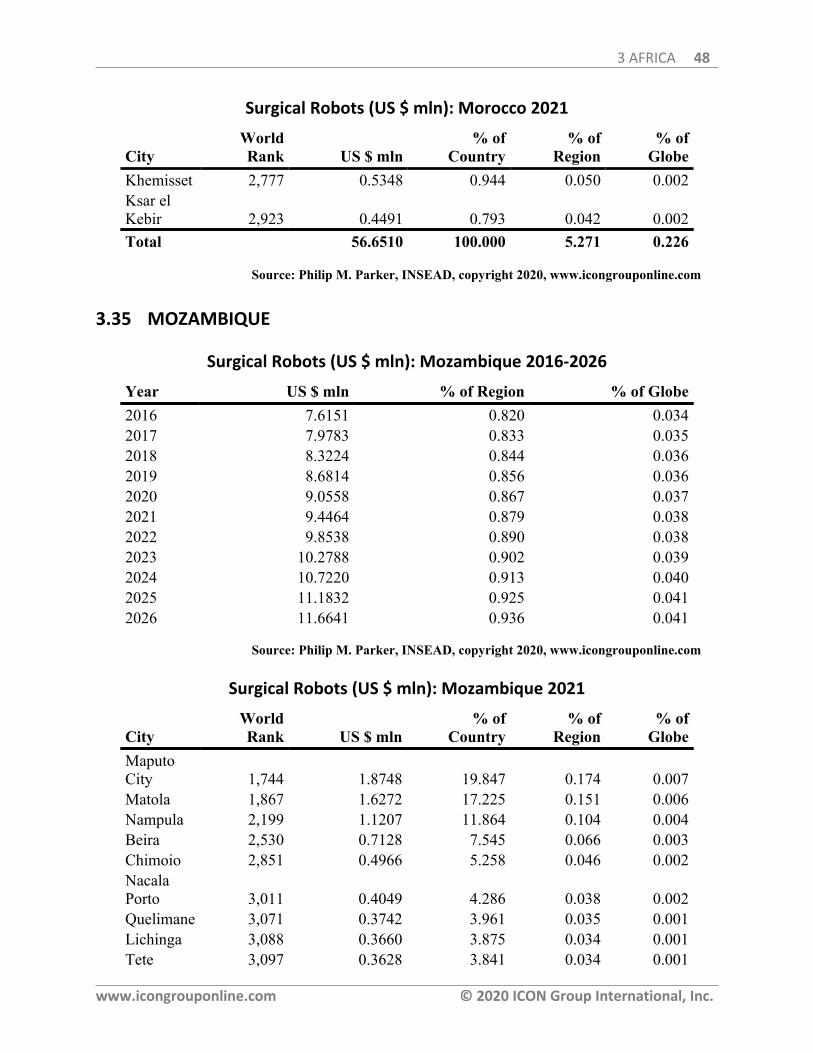
3 AFRICA 48
www.icongrouponline.com © 2020 ICON Group International, Inc.
Surgical Robots (US $ mln): Morocco 2021
CityWorldRank US $ mln
% ofCountry
% ofRegion
% ofGlobe
Khemisset 2,777 0.5348 0.944 0.050 0.002Ksar elKebir 2,923 0.4491 0.793 0.042 0.002Total 56.6510 100.000 5.271 0.226
Source: Philip M. Parker, INSEAD, copyright 2020, www.icongrouponline.com
3.35 MOZAMBIQUE
Surgical Robots (US $ mln): Mozambique 2016-2026
Year US $ mln % of Region % of Globe2016 7.6151 0.820 0.0342017 7.9783 0.833 0.0352018 8.3224 0.844 0.0362019 8.6814 0.856 0.0362020 9.0558 0.867 0.0372021 9.4464 0.879 0.0382022 9.8538 0.890 0.0382023 10.2788 0.902 0.0392024 10.7220 0.913 0.0402025 11.1832 0.925 0.0412026 11.6641 0.936 0.041
Source: Philip M. Parker, INSEAD, copyright 2020, www.icongrouponline.com
Surgical Robots (US $ mln): Mozambique 2021
CityWorldRank US $ mln
% ofCountry
% ofRegion
% ofGlobe
MaputoCity 1,744 1.8748 19.847 0.174 0.007Matola 1,867 1.6272 17.225 0.151 0.006Nampula 2,199 1.1207 11.864 0.104 0.004Beira 2,530 0.7128 7.545 0.066 0.003Chimoio 2,851 0.4966 5.258 0.046 0.002NacalaPorto 3,011 0.4049 4.286 0.038 0.002Quelimane 3,071 0.3742 3.961 0.035 0.001Lichinga 3,088 0.3660 3.875 0.034 0.001Tete 3,097 0.3628 3.841 0.034 0.001
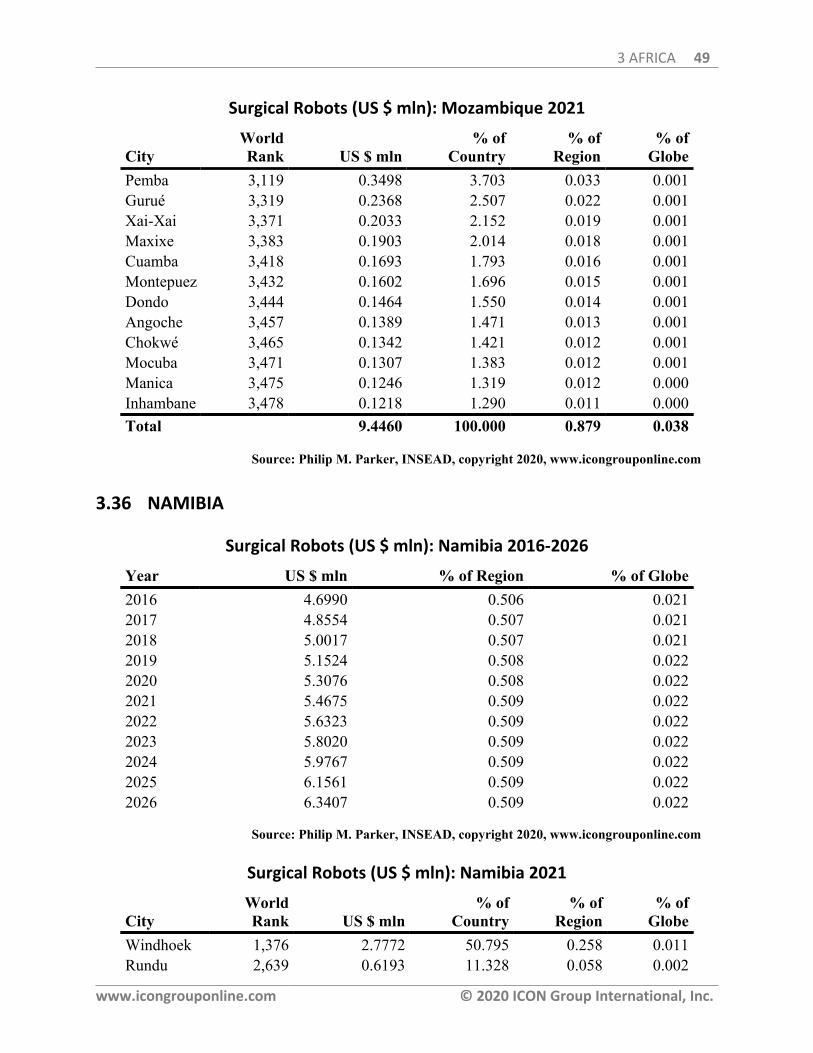
3 AFRICA 49
www.icongrouponline.com © 2020 ICON Group International, Inc.
Surgical Robots (US $ mln): Mozambique 2021
CityWorldRank US $ mln
% ofCountry
% ofRegion
% ofGlobe
Pemba 3,119 0.3498 3.703 0.033 0.001Gurué 3,319 0.2368 2.507 0.022 0.001Xai-Xai 3,371 0.2033 2.152 0.019 0.001Maxixe 3,383 0.1903 2.014 0.018 0.001Cuamba 3,418 0.1693 1.793 0.016 0.001Montepuez 3,432 0.1602 1.696 0.015 0.001Dondo 3,444 0.1464 1.550 0.014 0.001Angoche 3,457 0.1389 1.471 0.013 0.001Chokwé 3,465 0.1342 1.421 0.012 0.001Mocuba 3,471 0.1307 1.383 0.012 0.001Manica 3,475 0.1246 1.319 0.012 0.000Inhambane 3,478 0.1218 1.290 0.011 0.000Total 9.4460 100.000 0.879 0.038
Source: Philip M. Parker, INSEAD, copyright 2020, www.icongrouponline.com
3.36 NAMIBIA
Surgical Robots (US $ mln): Namibia 2016-2026
Year US $ mln % of Region % of Globe2016 4.6990 0.506 0.0212017 4.8554 0.507 0.0212018 5.0017 0.507 0.0212019 5.1524 0.508 0.0222020 5.3076 0.508 0.0222021 5.4675 0.509 0.0222022 5.6323 0.509 0.0222023 5.8020 0.509 0.0222024 5.9767 0.509 0.0222025 6.1561 0.509 0.0222026 6.3407 0.509 0.022
Source: Philip M. Parker, INSEAD, copyright 2020, www.icongrouponline.com
Surgical Robots (US $ mln): Namibia 2021
CityWorldRank US $ mln
% ofCountry
% ofRegion
% ofGlobe
Windhoek 1,376 2.7772 50.795 0.258 0.011Rundu 2,639 0.6193 11.328 0.058 0.002
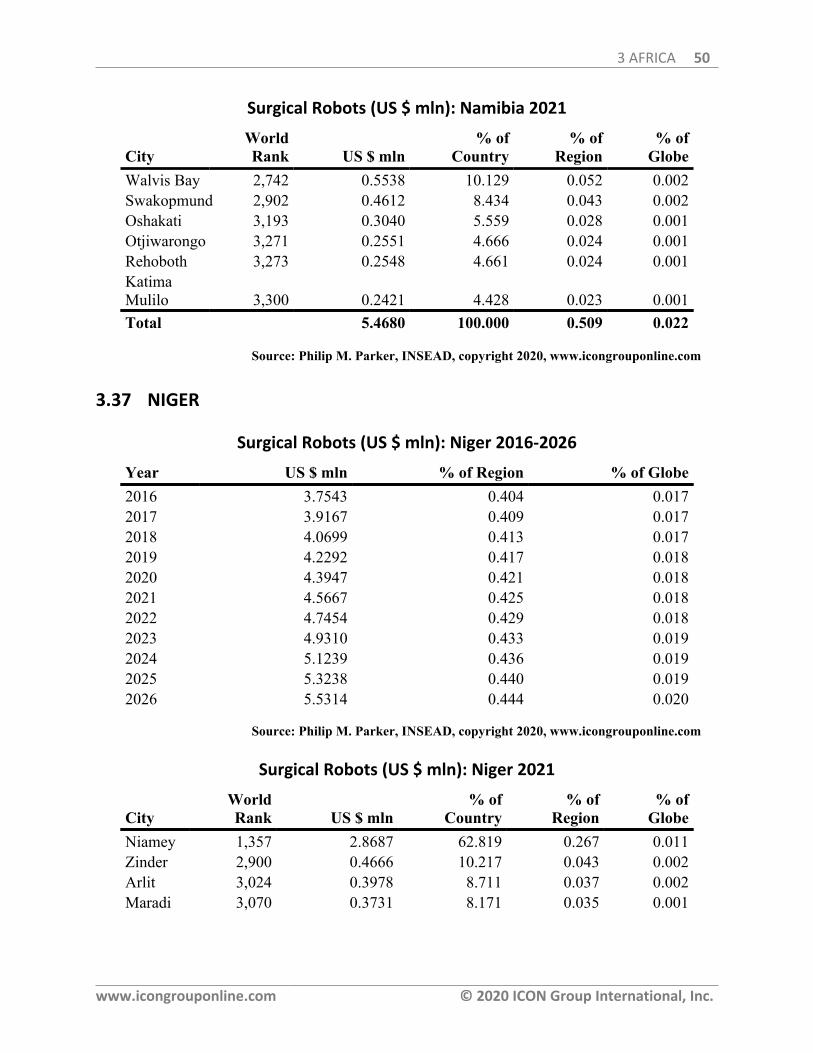
3 AFRICA 50
www.icongrouponline.com © 2020 ICON Group International, Inc.
Surgical Robots (US $ mln): Namibia 2021
CityWorldRank US $ mln
% ofCountry
% ofRegion
% ofGlobe
Walvis Bay 2,742 0.5538 10.129 0.052 0.002Swakopmund 2,902 0.4612 8.434 0.043 0.002Oshakati 3,193 0.3040 5.559 0.028 0.001Otjiwarongo 3,271 0.2551 4.666 0.024 0.001Rehoboth 3,273 0.2548 4.661 0.024 0.001KatimaMulilo 3,300 0.2421 4.428 0.023 0.001Total 5.4680 100.000 0.509 0.022
Source: Philip M. Parker, INSEAD, copyright 2020, www.icongrouponline.com
3.37 NIGER
Surgical Robots (US $ mln): Niger 2016-2026
Year US $ mln % of Region % of Globe2016 3.7543 0.404 0.0172017 3.9167 0.409 0.0172018 4.0699 0.413 0.0172019 4.2292 0.417 0.0182020 4.3947 0.421 0.0182021 4.5667 0.425 0.0182022 4.7454 0.429 0.0182023 4.9310 0.433 0.0192024 5.1239 0.436 0.0192025 5.3238 0.440 0.0192026 5.5314 0.444 0.020
Source: Philip M. Parker, INSEAD, copyright 2020, www.icongrouponline.com
Surgical Robots (US $ mln): Niger 2021
CityWorldRank US $ mln
% ofCountry
% ofRegion
% ofGlobe
Niamey 1,357 2.8687 62.819 0.267 0.011Zinder 2,900 0.4666 10.217 0.043 0.002Arlit 3,024 0.3978 8.711 0.037 0.002Maradi 3,070 0.3731 8.171 0.035 0.001
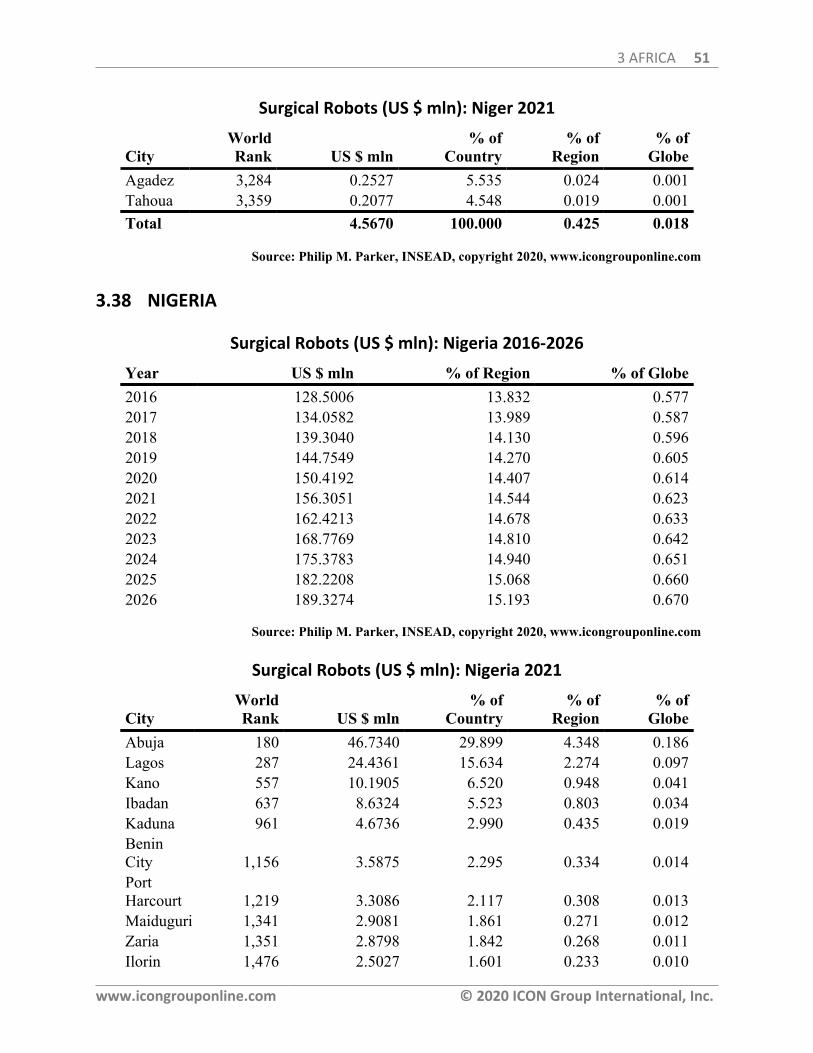
3 AFRICA 51
www.icongrouponline.com © 2020 ICON Group International, Inc.
Surgical Robots (US $ mln): Niger 2021
CityWorldRank US $ mln
% ofCountry
% ofRegion
% ofGlobe
Agadez 3,284 0.2527 5.535 0.024 0.001Tahoua 3,359 0.2077 4.548 0.019 0.001Total 4.5670 100.000 0.425 0.018
Source: Philip M. Parker, INSEAD, copyright 2020, www.icongrouponline.com
3.38 NIGERIA
Surgical Robots (US $ mln): Nigeria 2016-2026
Year US $ mln % of Region % of Globe2016 128.5006 13.832 0.5772017 134.0582 13.989 0.5872018 139.3040 14.130 0.5962019 144.7549 14.270 0.6052020 150.4192 14.407 0.6142021 156.3051 14.544 0.6232022 162.4213 14.678 0.6332023 168.7769 14.810 0.6422024 175.3783 14.940 0.6512025 182.2208 15.068 0.6602026 189.3274 15.193 0.670
Source: Philip M. Parker, INSEAD, copyright 2020, www.icongrouponline.com
Surgical Robots (US $ mln): Nigeria 2021
CityWorldRank US $ mln
% ofCountry
% ofRegion
% ofGlobe
Abuja 180 46.7340 29.899 4.348 0.186Lagos 287 24.4361 15.634 2.274 0.097Kano 557 10.1905 6.520 0.948 0.041Ibadan 637 8.6324 5.523 0.803 0.034Kaduna 961 4.6736 2.990 0.435 0.019BeninCity 1,156 3.5875 2.295 0.334 0.014PortHarcourt 1,219 3.3086 2.117 0.308 0.013Maiduguri 1,341 2.9081 1.861 0.271 0.012Zaria 1,351 2.8798 1.842 0.268 0.011Ilorin 1,476 2.5027 1.601 0.233 0.010
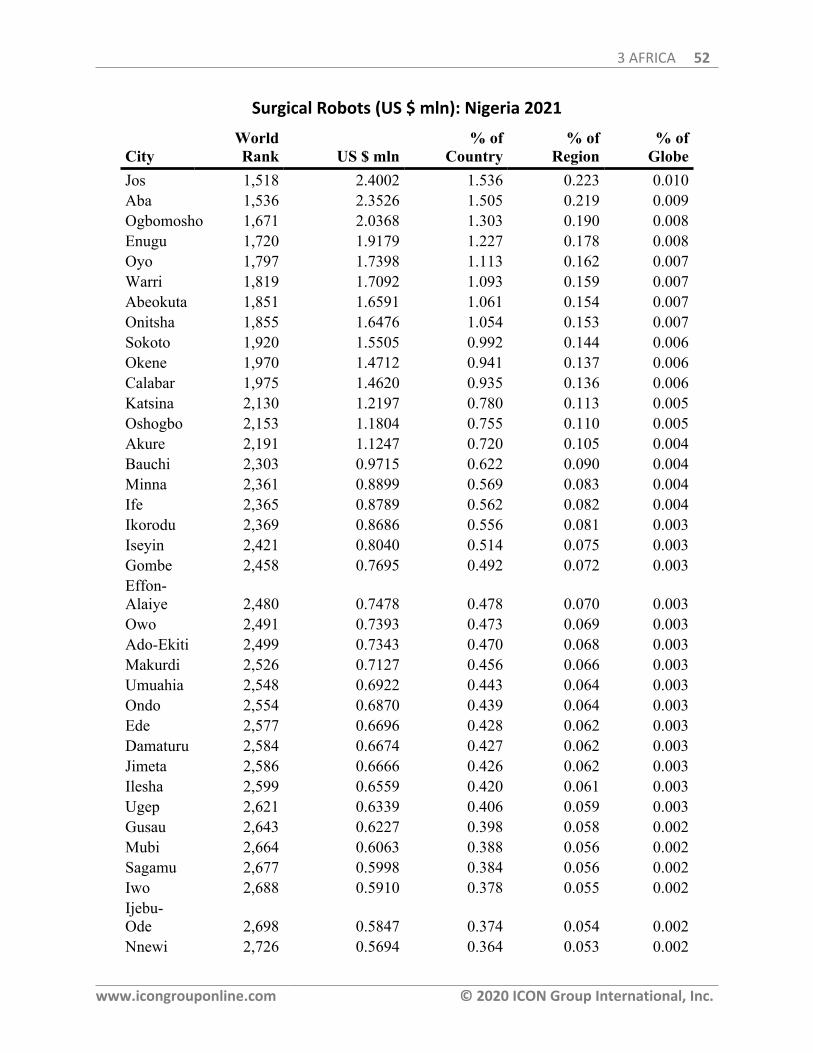
3 AFRICA 52
www.icongrouponline.com © 2020 ICON Group International, Inc.
Surgical Robots (US $ mln): Nigeria 2021
CityWorldRank US $ mln
% ofCountry
% ofRegion
% ofGlobe
Jos 1,518 2.4002 1.536 0.223 0.010Aba 1,536 2.3526 1.505 0.219 0.009Ogbomosho 1,671 2.0368 1.303 0.190 0.008Enugu 1,720 1.9179 1.227 0.178 0.008Oyo 1,797 1.7398 1.113 0.162 0.007Warri 1,819 1.7092 1.093 0.159 0.007Abeokuta 1,851 1.6591 1.061 0.154 0.007Onitsha 1,855 1.6476 1.054 0.153 0.007Sokoto 1,920 1.5505 0.992 0.144 0.006Okene 1,970 1.4712 0.941 0.137 0.006Calabar 1,975 1.4620 0.935 0.136 0.006Katsina 2,130 1.2197 0.780 0.113 0.005Oshogbo 2,153 1.1804 0.755 0.110 0.005Akure 2,191 1.1247 0.720 0.105 0.004Bauchi 2,303 0.9715 0.622 0.090 0.004Minna 2,361 0.8899 0.569 0.083 0.004Ife 2,365 0.8789 0.562 0.082 0.004Ikorodu 2,369 0.8686 0.556 0.081 0.003Iseyin 2,421 0.8040 0.514 0.075 0.003Gombe 2,458 0.7695 0.492 0.072 0.003Effon-Alaiye 2,480 0.7478 0.478 0.070 0.003Owo 2,491 0.7393 0.473 0.069 0.003Ado-Ekiti 2,499 0.7343 0.470 0.068 0.003Makurdi 2,526 0.7127 0.456 0.066 0.003Umuahia 2,548 0.6922 0.443 0.064 0.003Ondo 2,554 0.6870 0.439 0.064 0.003Ede 2,577 0.6696 0.428 0.062 0.003Damaturu 2,584 0.6674 0.427 0.062 0.003Jimeta 2,586 0.6666 0.426 0.062 0.003Ilesha 2,599 0.6559 0.420 0.061 0.003Ugep 2,621 0.6339 0.406 0.059 0.003Gusau 2,643 0.6227 0.398 0.058 0.002Mubi 2,664 0.6063 0.388 0.056 0.002Sagamu 2,677 0.5998 0.384 0.056 0.002Iwo 2,688 0.5910 0.378 0.055 0.002Ijebu-Ode 2,698 0.5847 0.374 0.054 0.002Nnewi 2,726 0.5694 0.364 0.053 0.002
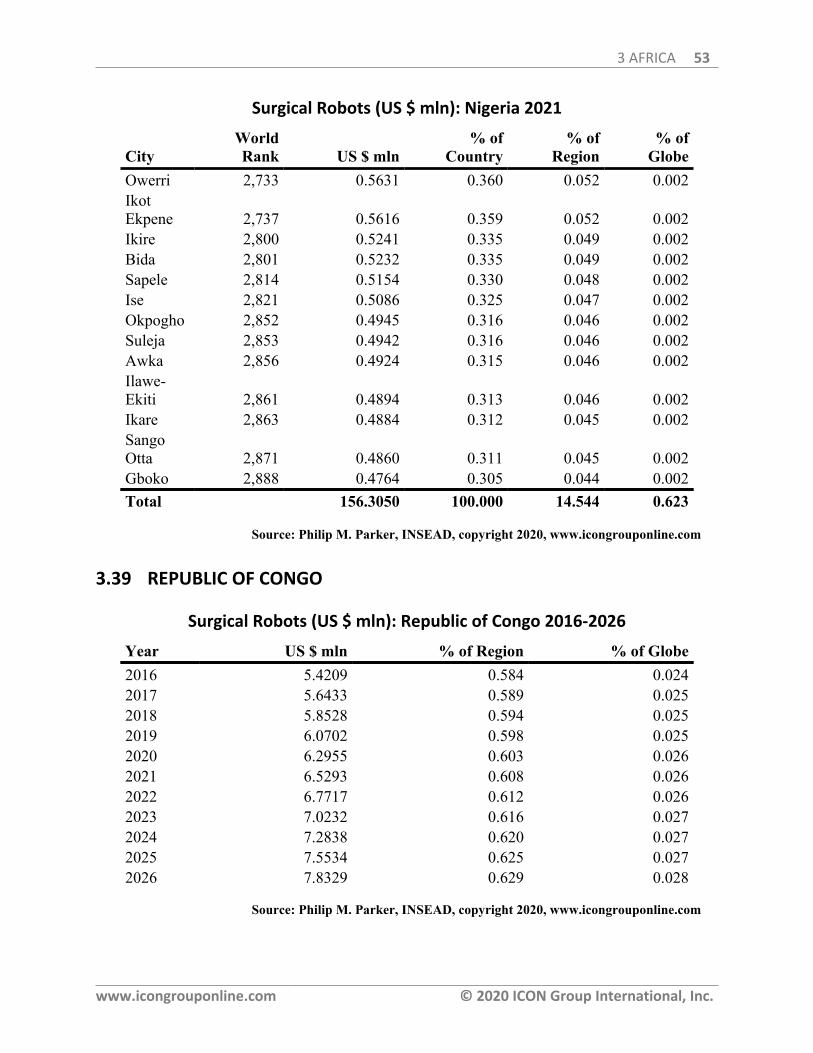
3 AFRICA 53
www.icongrouponline.com © 2020 ICON Group International, Inc.
Surgical Robots (US $ mln): Nigeria 2021
CityWorldRank US $ mln
% ofCountry
% ofRegion
% ofGlobe
Owerri 2,733 0.5631 0.360 0.052 0.002IkotEkpene 2,737 0.5616 0.359 0.052 0.002Ikire 2,800 0.5241 0.335 0.049 0.002Bida 2,801 0.5232 0.335 0.049 0.002Sapele 2,814 0.5154 0.330 0.048 0.002Ise 2,821 0.5086 0.325 0.047 0.002Okpogho 2,852 0.4945 0.316 0.046 0.002Suleja 2,853 0.4942 0.316 0.046 0.002Awka 2,856 0.4924 0.315 0.046 0.002Ilawe-Ekiti 2,861 0.4894 0.313 0.046 0.002Ikare 2,863 0.4884 0.312 0.045 0.002SangoOtta 2,871 0.4860 0.311 0.045 0.002Gboko 2,888 0.4764 0.305 0.044 0.002Total 156.3050 100.000 14.544 0.623
Source: Philip M. Parker, INSEAD, copyright 2020, www.icongrouponline.com
3.39 REPUBLIC OF CONGO
Surgical Robots (US $ mln): Republic of Congo 2016-2026
Year US $ mln % of Region % of Globe2016 5.4209 0.584 0.0242017 5.6433 0.589 0.0252018 5.8528 0.594 0.0252019 6.0702 0.598 0.0252020 6.2955 0.603 0.0262021 6.5293 0.608 0.0262022 6.7717 0.612 0.0262023 7.0232 0.616 0.0272024 7.2838 0.620 0.0272025 7.5534 0.625 0.0272026 7.8329 0.629 0.028
Source: Philip M. Parker, INSEAD, copyright 2020, www.icongrouponline.com
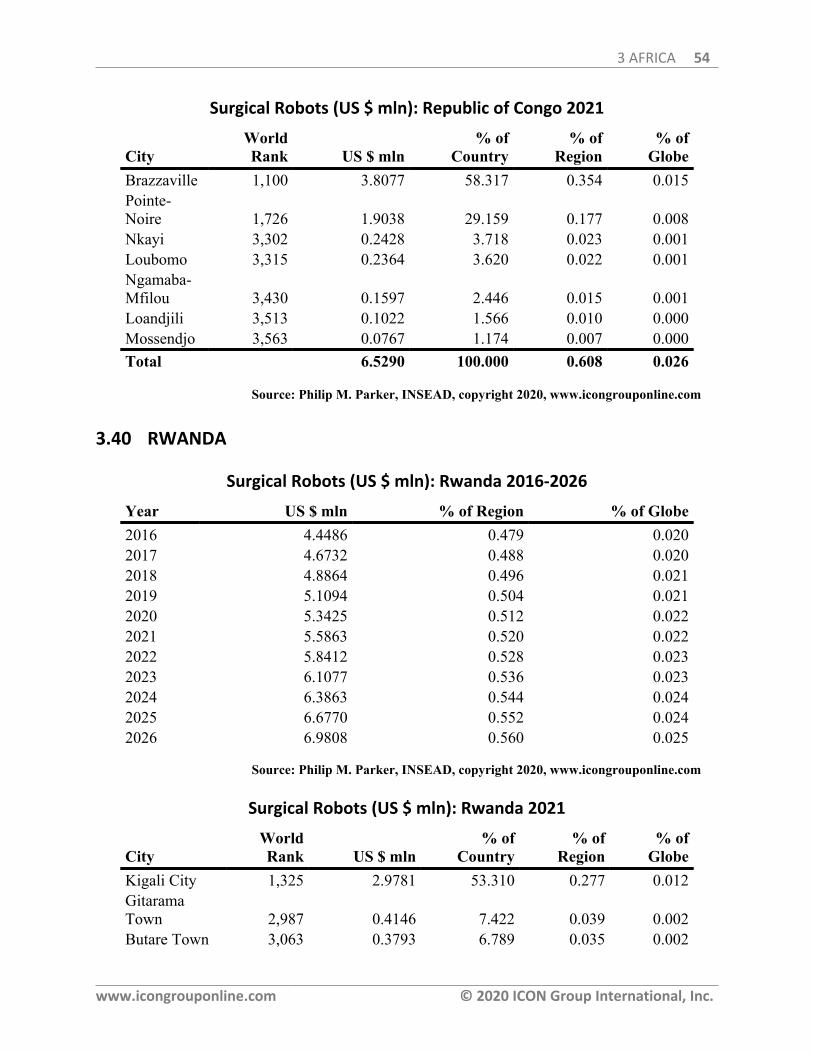
3 AFRICA 54
www.icongrouponline.com © 2020 ICON Group International, Inc.
Surgical Robots (US $ mln): Republic of Congo 2021
CityWorldRank US $ mln
% ofCountry
% ofRegion
% ofGlobe
Brazzaville 1,100 3.8077 58.317 0.354 0.015Pointe-Noire 1,726 1.9038 29.159 0.177 0.008Nkayi 3,302 0.2428 3.718 0.023 0.001Loubomo 3,315 0.2364 3.620 0.022 0.001Ngamaba-Mfilou 3,430 0.1597 2.446 0.015 0.001Loandjili 3,513 0.1022 1.566 0.010 0.000Mossendjo 3,563 0.0767 1.174 0.007 0.000Total 6.5290 100.000 0.608 0.026
Source: Philip M. Parker, INSEAD, copyright 2020, www.icongrouponline.com
3.40 RWANDA
Surgical Robots (US $ mln): Rwanda 2016-2026
Year US $ mln % of Region % of Globe2016 4.4486 0.479 0.0202017 4.6732 0.488 0.0202018 4.8864 0.496 0.0212019 5.1094 0.504 0.0212020 5.3425 0.512 0.0222021 5.5863 0.520 0.0222022 5.8412 0.528 0.0232023 6.1077 0.536 0.0232024 6.3863 0.544 0.0242025 6.6770 0.552 0.0242026 6.9808 0.560 0.025
Source: Philip M. Parker, INSEAD, copyright 2020, www.icongrouponline.com
Surgical Robots (US $ mln): Rwanda 2021
CityWorldRank US $ mln
% ofCountry
% ofRegion
% ofGlobe
Kigali City 1,325 2.9781 53.310 0.277 0.012GitaramaTown 2,987 0.4146 7.422 0.039 0.002Butare Town 3,063 0.3793 6.789 0.035 0.002
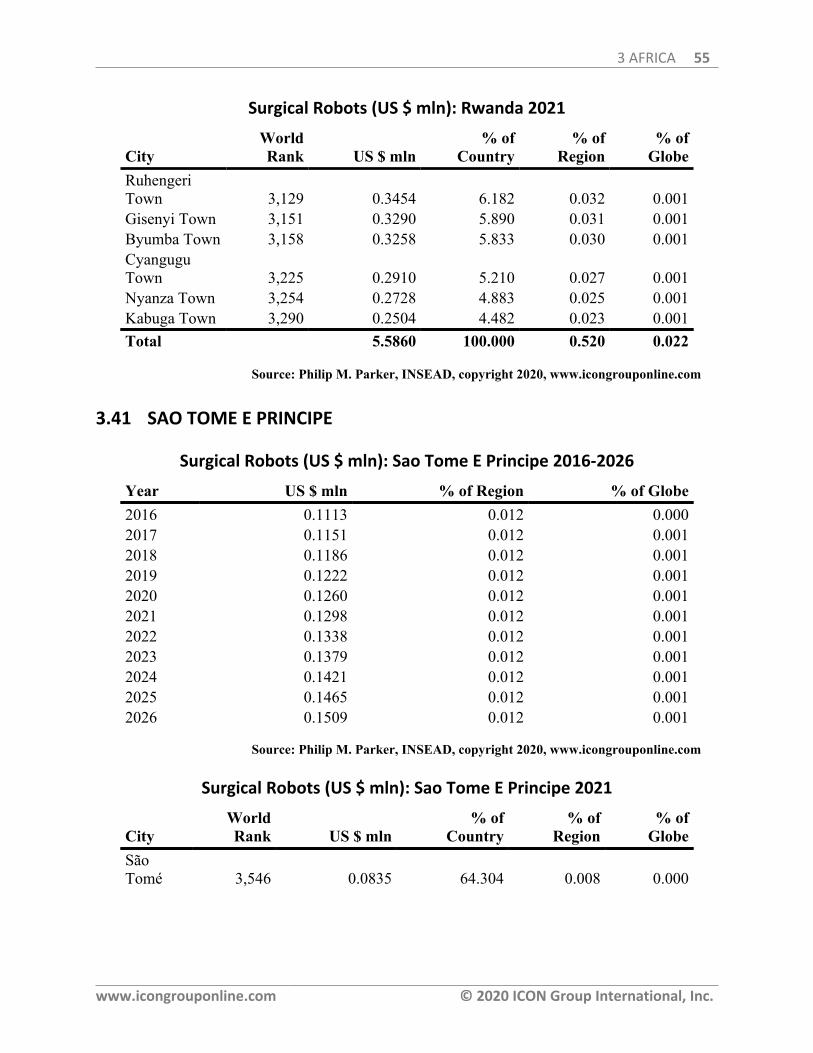
3 AFRICA 55
www.icongrouponline.com © 2020 ICON Group International, Inc.
Surgical Robots (US $ mln): Rwanda 2021
CityWorldRank US $ mln
% ofCountry
% ofRegion
% ofGlobe
RuhengeriTown 3,129 0.3454 6.182 0.032 0.001Gisenyi Town 3,151 0.3290 5.890 0.031 0.001Byumba Town 3,158 0.3258 5.833 0.030 0.001CyanguguTown 3,225 0.2910 5.210 0.027 0.001Nyanza Town 3,254 0.2728 4.883 0.025 0.001Kabuga Town 3,290 0.2504 4.482 0.023 0.001Total 5.5860 100.000 0.520 0.022
Source: Philip M. Parker, INSEAD, copyright 2020, www.icongrouponline.com
3.41 SAO TOME E PRINCIPE
Surgical Robots (US $ mln): Sao Tome E Principe 2016-2026
Year US $ mln % of Region % of Globe2016 0.1113 0.012 0.0002017 0.1151 0.012 0.0012018 0.1186 0.012 0.0012019 0.1222 0.012 0.0012020 0.1260 0.012 0.0012021 0.1298 0.012 0.0012022 0.1338 0.012 0.0012023 0.1379 0.012 0.0012024 0.1421 0.012 0.0012025 0.1465 0.012 0.0012026 0.1509 0.012 0.001
Source: Philip M. Parker, INSEAD, copyright 2020, www.icongrouponline.com
Surgical Robots (US $ mln): Sao Tome E Principe 2021
CityWorldRank US $ mln
% ofCountry
% ofRegion
% ofGlobe
SãoTomé 3,546 0.0835 64.304 0.008 0.000

3 AFRICA 56
www.icongrouponline.com © 2020 ICON Group International, Inc.
Surgical Robots (US $ mln): Sao Tome E Principe 2021
CityWorldRank US $ mln
% ofCountry
% ofRegion
% ofGlobe
Trindade 3,651 0.0321 24.757 0.003 0.000Neves 3,702 0.0142 10.939 0.001 0.000Total 0.1300 100.000 0.012 0.001
Source: Philip M. Parker, INSEAD, copyright 2020, www.icongrouponline.com
3.42 SENEGAL
Surgical Robots (US $ mln): Senegal 2016-2026
Year US $ mln % of Region % of Globe2016 7.2949 0.785 0.0332017 7.5214 0.785 0.0332018 7.7330 0.784 0.0332019 7.9506 0.784 0.0332020 8.1742 0.783 0.0332021 8.4041 0.782 0.0342022 8.6405 0.781 0.0342023 8.8836 0.780 0.0342024 9.1334 0.778 0.0342025 9.3892 0.776 0.0342026 9.6521 0.775 0.034
Source: Philip M. Parker, INSEAD, copyright 2020, www.icongrouponline.com
Surgical Robots (US $ mln): Senegal 2021
CityWorldRank US $ mln
% ofCountry
% ofRegion
% ofGlobe
Dakar 1,422 2.6163 31.131 0.243 0.010Pikine 1,604 2.1646 25.756 0.201 0.009Guediawaye 2,497 0.7274 8.656 0.068 0.003Thiès 2,628 0.6238 7.423 0.058 0.002M'Bour 2,860 0.4844 5.764 0.045 0.002Kaolack 2,960 0.4213 5.013 0.039 0.002Saint-Louis 2,989 0.4061 4.832 0.038 0.002Rufisque 3,014 0.3977 4.733 0.037 0.002

3 AFRICA 57
www.icongrouponline.com © 2020 ICON Group International, Inc.
Surgical Robots (US $ mln): Senegal 2021
CityWorldRank US $ mln
% ofCountry
% ofRegion
% ofGlobe
Ziguinchor 3,114 0.3460 4.117 0.032 0.001Diourbel 3,340 0.2165 2.576 0.020 0.001Total 8.4040 100.000 0.782 0.034
Source: Philip M. Parker, INSEAD, copyright 2020, www.icongrouponline.com
3.43 SIERRA LEONE
Surgical Robots (US $ mln): Sierra Leone 2016-2026
Year US $ mln % of Region % of Globe2016 2.6213 0.282 0.0122017 2.8385 0.296 0.0122018 3.0503 0.309 0.0132019 3.2780 0.323 0.0142020 3.5226 0.337 0.0142021 3.7855 0.352 0.0152022 4.0680 0.368 0.0162023 4.3716 0.384 0.0172024 4.6978 0.400 0.0172025 5.0478 0.417 0.0182026 5.4239 0.435 0.019
Source: Philip M. Parker, INSEAD, copyright 2020, www.icongrouponline.com
Surgical Robots (US $ mln): Sierra Leone 2021
CityWorldRank US $ mln
% ofCountry
% ofRegion
% ofGlobe
Freetown 1,659 2.1324 56.332 0.198 0.009Bo 2,612 0.6638 17.534 0.062 0.003Kenema 2,790 0.5501 14.532 0.051 0.002Makeni 3,236 0.2890 7.635 0.027 0.001Koidu 3,447 0.1502 3.967 0.014 0.001Total 3.7850 100.000 0.352 0.015
Source: Philip M. Parker, INSEAD, copyright 2020, www.icongrouponline.com
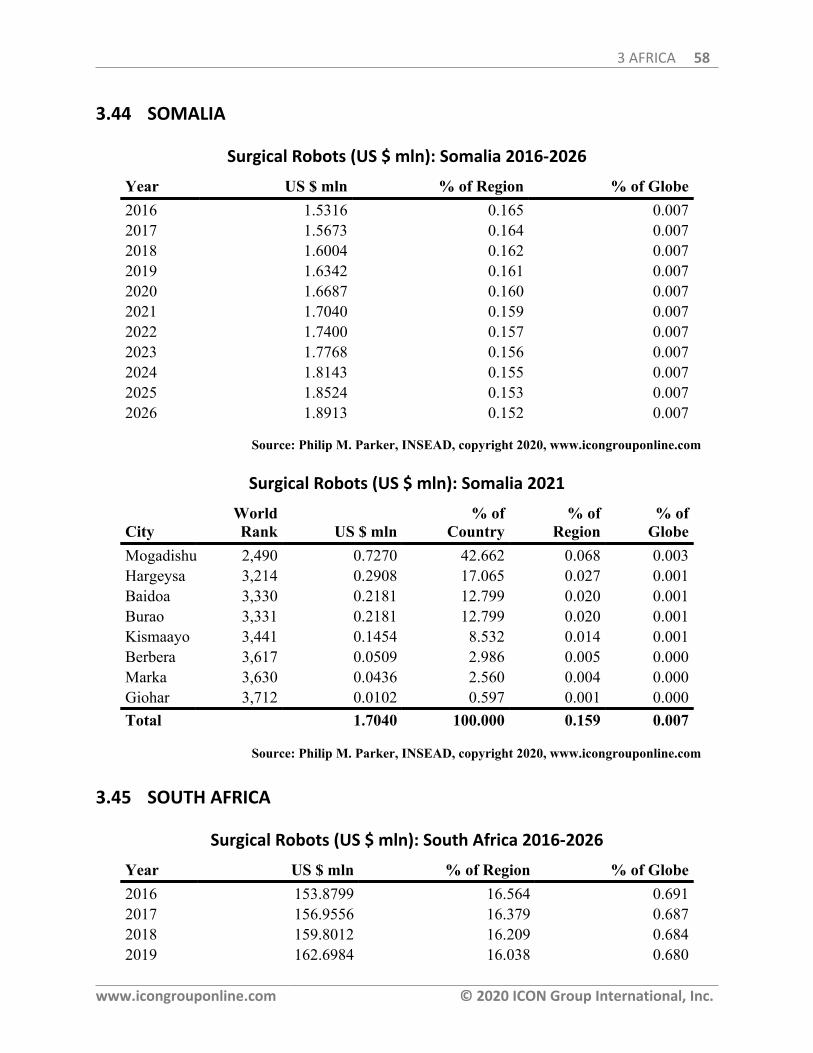
3 AFRICA 58
www.icongrouponline.com © 2020 ICON Group International, Inc.
3.44 SOMALIA
Surgical Robots (US $ mln): Somalia 2016-2026
Year US $ mln % of Region % of Globe2016 1.5316 0.165 0.0072017 1.5673 0.164 0.0072018 1.6004 0.162 0.0072019 1.6342 0.161 0.0072020 1.6687 0.160 0.0072021 1.7040 0.159 0.0072022 1.7400 0.157 0.0072023 1.7768 0.156 0.0072024 1.8143 0.155 0.0072025 1.8524 0.153 0.0072026 1.8913 0.152 0.007
Source: Philip M. Parker, INSEAD, copyright 2020, www.icongrouponline.com
Surgical Robots (US $ mln): Somalia 2021
CityWorldRank US $ mln
% ofCountry
% ofRegion
% ofGlobe
Mogadishu 2,490 0.7270 42.662 0.068 0.003Hargeysa 3,214 0.2908 17.065 0.027 0.001Baidoa 3,330 0.2181 12.799 0.020 0.001Burao 3,331 0.2181 12.799 0.020 0.001Kismaayo 3,441 0.1454 8.532 0.014 0.001Berbera 3,617 0.0509 2.986 0.005 0.000Marka 3,630 0.0436 2.560 0.004 0.000Giohar 3,712 0.0102 0.597 0.001 0.000Total 1.7040 100.000 0.159 0.007
Source: Philip M. Parker, INSEAD, copyright 2020, www.icongrouponline.com
3.45 SOUTH AFRICA
Surgical Robots (US $ mln): South Africa 2016-2026
Year US $ mln % of Region % of Globe2016 153.8799 16.564 0.6912017 156.9556 16.379 0.6872018 159.8012 16.209 0.6842019 162.6984 16.038 0.680
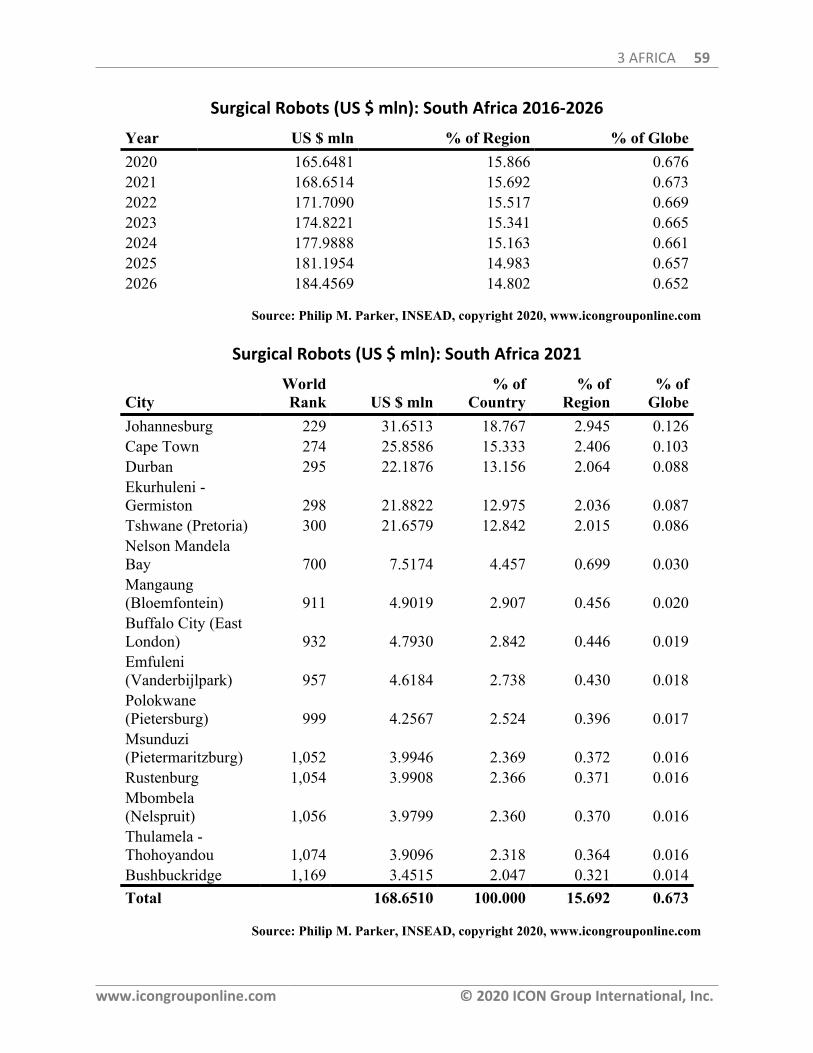
3 AFRICA 59
www.icongrouponline.com © 2020 ICON Group International, Inc.
Surgical Robots (US $ mln): South Africa 2016-2026
Year US $ mln % of Region % of Globe2020 165.6481 15.866 0.6762021 168.6514 15.692 0.6732022 171.7090 15.517 0.6692023 174.8221 15.341 0.6652024 177.9888 15.163 0.6612025 181.1954 14.983 0.6572026 184.4569 14.802 0.652
Source: Philip M. Parker, INSEAD, copyright 2020, www.icongrouponline.com
Surgical Robots (US $ mln): South Africa 2021
CityWorldRank US $ mln
% ofCountry
% ofRegion
% ofGlobe
Johannesburg 229 31.6513 18.767 2.945 0.126Cape Town 274 25.8586 15.333 2.406 0.103Durban 295 22.1876 13.156 2.064 0.088Ekurhuleni -Germiston 298 21.8822 12.975 2.036 0.087Tshwane (Pretoria) 300 21.6579 12.842 2.015 0.086Nelson MandelaBay 700 7.5174 4.457 0.699 0.030Mangaung(Bloemfontein) 911 4.9019 2.907 0.456 0.020Buffalo City (EastLondon) 932 4.7930 2.842 0.446 0.019Emfuleni(Vanderbijlpark) 957 4.6184 2.738 0.430 0.018Polokwane(Pietersburg) 999 4.2567 2.524 0.396 0.017Msunduzi(Pietermaritzburg) 1,052 3.9946 2.369 0.372 0.016Rustenburg 1,054 3.9908 2.366 0.371 0.016Mbombela(Nelspruit) 1,056 3.9799 2.360 0.370 0.016Thulamela -Thohoyandou 1,074 3.9096 2.318 0.364 0.016Bushbuckridge 1,169 3.4515 2.047 0.321 0.014Total 168.6510 100.000 15.692 0.673
Source: Philip M. Parker, INSEAD, copyright 2020, www.icongrouponline.com
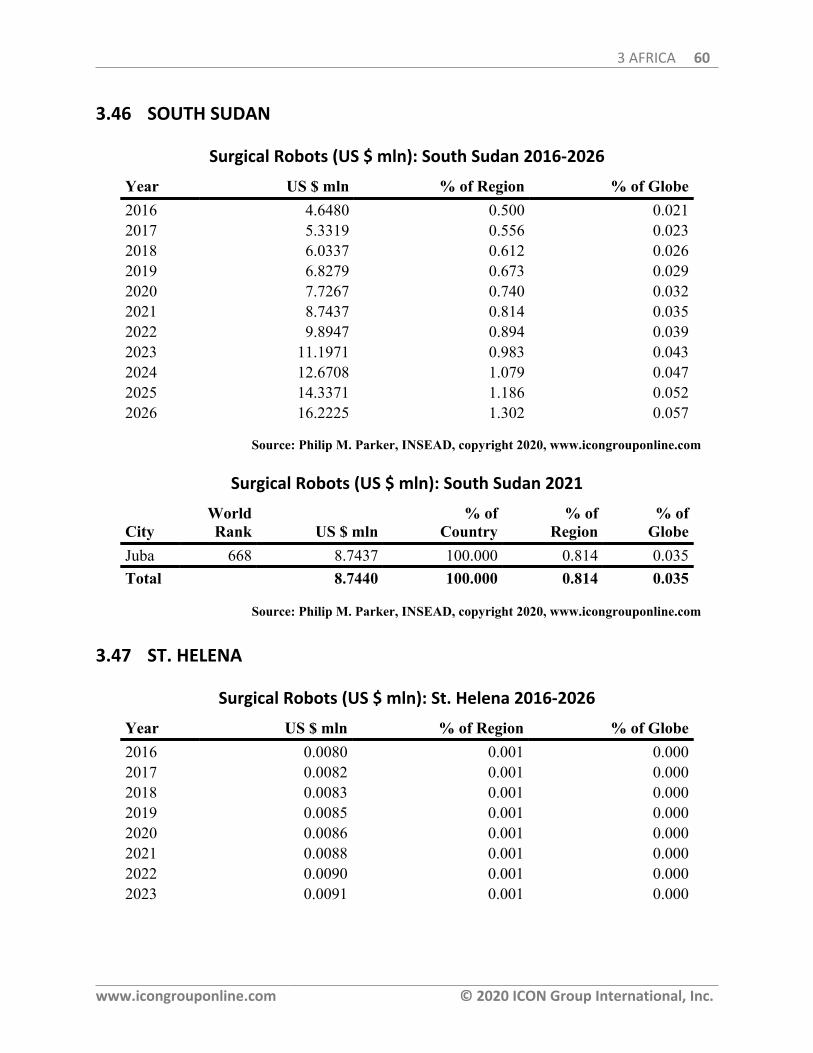
3 AFRICA 60
www.icongrouponline.com © 2020 ICON Group International, Inc.
3.46 SOUTH SUDAN
Surgical Robots (US $ mln): South Sudan 2016-2026
Year US $ mln % of Region % of Globe2016 4.6480 0.500 0.0212017 5.3319 0.556 0.0232018 6.0337 0.612 0.0262019 6.8279 0.673 0.0292020 7.7267 0.740 0.0322021 8.7437 0.814 0.0352022 9.8947 0.894 0.0392023 11.1971 0.983 0.0432024 12.6708 1.079 0.0472025 14.3371 1.186 0.0522026 16.2225 1.302 0.057
Source: Philip M. Parker, INSEAD, copyright 2020, www.icongrouponline.com
Surgical Robots (US $ mln): South Sudan 2021
CityWorldRank US $ mln
% ofCountry
% ofRegion
% ofGlobe
Juba 668 8.7437 100.000 0.814 0.035Total 8.7440 100.000 0.814 0.035
Source: Philip M. Parker, INSEAD, copyright 2020, www.icongrouponline.com
3.47 ST. HELENA
Surgical Robots (US $ mln): St. Helena 2016-2026
Year US $ mln % of Region % of Globe2016 0.0080 0.001 0.0002017 0.0082 0.001 0.0002018 0.0083 0.001 0.0002019 0.0085 0.001 0.0002020 0.0086 0.001 0.0002021 0.0088 0.001 0.0002022 0.0090 0.001 0.0002023 0.0091 0.001 0.000
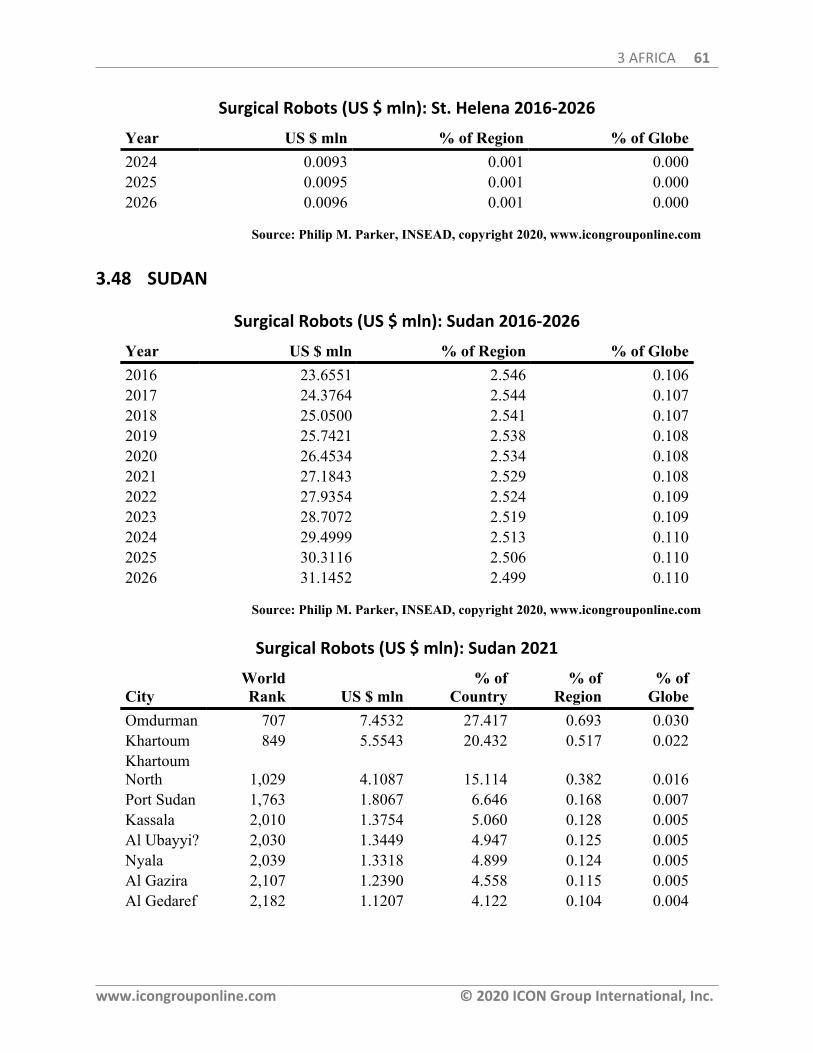
3 AFRICA 61
www.icongrouponline.com © 2020 ICON Group International, Inc.
Surgical Robots (US $ mln): St. Helena 2016-2026
Year US $ mln % of Region % of Globe2024 0.0093 0.001 0.0002025 0.0095 0.001 0.0002026 0.0096 0.001 0.000
Source: Philip M. Parker, INSEAD, copyright 2020, www.icongrouponline.com
3.48 SUDAN
Surgical Robots (US $ mln): Sudan 2016-2026
Year US $ mln % of Region % of Globe2016 23.6551 2.546 0.1062017 24.3764 2.544 0.1072018 25.0500 2.541 0.1072019 25.7421 2.538 0.1082020 26.4534 2.534 0.1082021 27.1843 2.529 0.1082022 27.9354 2.524 0.1092023 28.7072 2.519 0.1092024 29.4999 2.513 0.1102025 30.3116 2.506 0.1102026 31.1452 2.499 0.110
Source: Philip M. Parker, INSEAD, copyright 2020, www.icongrouponline.com
Surgical Robots (US $ mln): Sudan 2021
CityWorldRank US $ mln
% ofCountry
% ofRegion
% ofGlobe
Omdurman 707 7.4532 27.417 0.693 0.030Khartoum 849 5.5543 20.432 0.517 0.022KhartoumNorth 1,029 4.1087 15.114 0.382 0.016Port Sudan 1,763 1.8067 6.646 0.168 0.007Kassala 2,010 1.3754 5.060 0.128 0.005Al Ubayyi? 2,030 1.3449 4.947 0.125 0.005Nyala 2,039 1.3318 4.899 0.124 0.005Al Gazira 2,107 1.2390 4.558 0.115 0.005Al Gedaref 2,182 1.1207 4.122 0.104 0.004
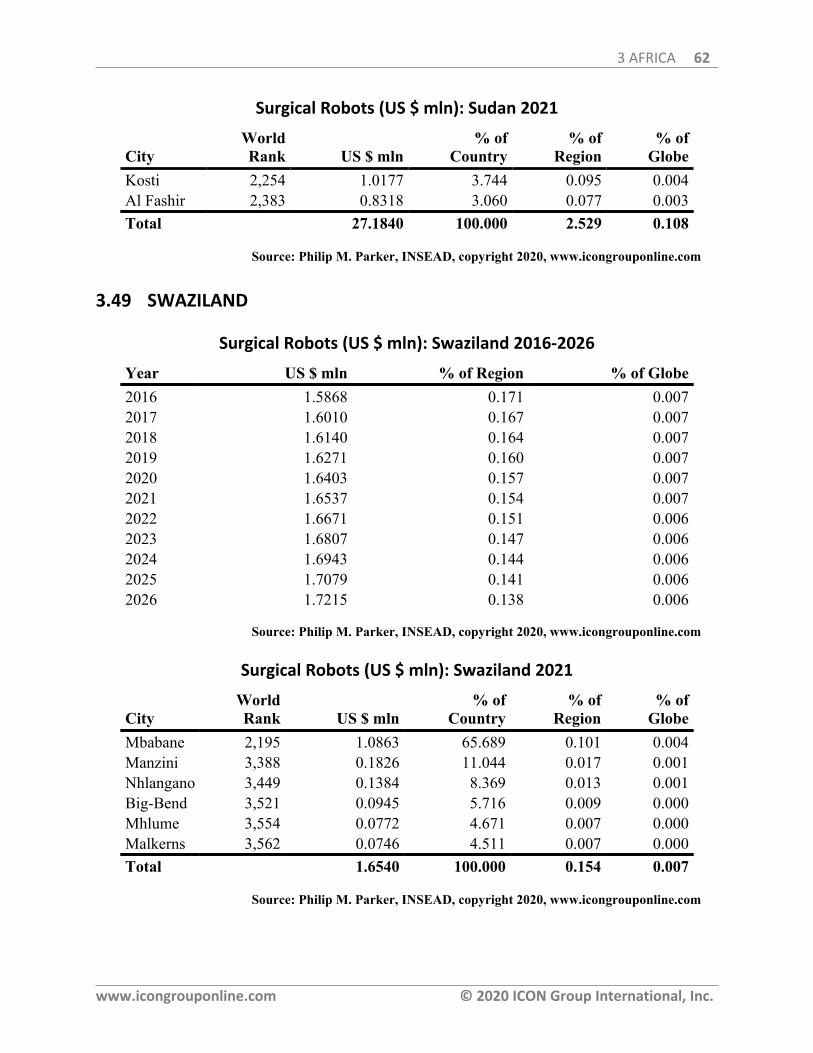
3 AFRICA 62
www.icongrouponline.com © 2020 ICON Group International, Inc.
Surgical Robots (US $ mln): Sudan 2021
CityWorldRank US $ mln
% ofCountry
% ofRegion
% ofGlobe
Kosti 2,254 1.0177 3.744 0.095 0.004Al Fashir 2,383 0.8318 3.060 0.077 0.003Total 27.1840 100.000 2.529 0.108
Source: Philip M. Parker, INSEAD, copyright 2020, www.icongrouponline.com
3.49 SWAZILAND
Surgical Robots (US $ mln): Swaziland 2016-2026
Year US $ mln % of Region % of Globe2016 1.5868 0.171 0.0072017 1.6010 0.167 0.0072018 1.6140 0.164 0.0072019 1.6271 0.160 0.0072020 1.6403 0.157 0.0072021 1.6537 0.154 0.0072022 1.6671 0.151 0.0062023 1.6807 0.147 0.0062024 1.6943 0.144 0.0062025 1.7079 0.141 0.0062026 1.7215 0.138 0.006
Source: Philip M. Parker, INSEAD, copyright 2020, www.icongrouponline.com
Surgical Robots (US $ mln): Swaziland 2021
CityWorldRank US $ mln
% ofCountry
% ofRegion
% ofGlobe
Mbabane 2,195 1.0863 65.689 0.101 0.004Manzini 3,388 0.1826 11.044 0.017 0.001Nhlangano 3,449 0.1384 8.369 0.013 0.001Big-Bend 3,521 0.0945 5.716 0.009 0.000Mhlume 3,554 0.0772 4.671 0.007 0.000Malkerns 3,562 0.0746 4.511 0.007 0.000Total 1.6540 100.000 0.154 0.007
Source: Philip M. Parker, INSEAD, copyright 2020, www.icongrouponline.com
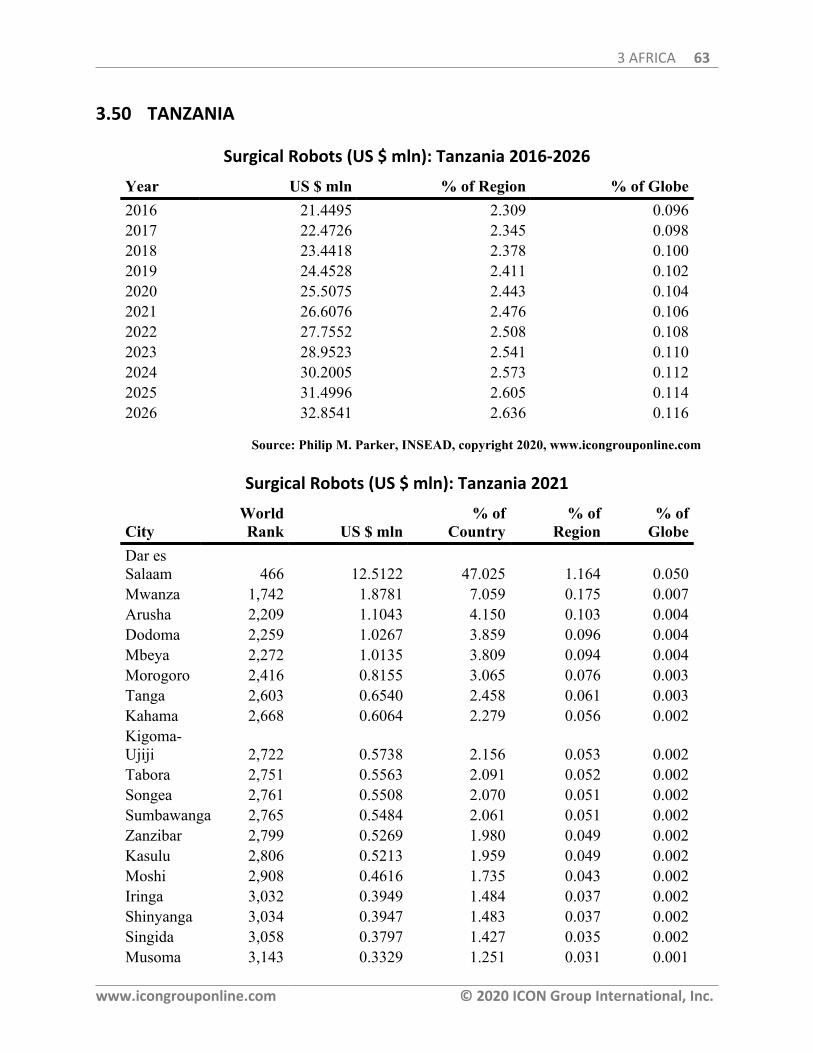
3 AFRICA 63
www.icongrouponline.com © 2020 ICON Group International, Inc.
3.50 TANZANIA
Surgical Robots (US $ mln): Tanzania 2016-2026
Year US $ mln % of Region % of Globe2016 21.4495 2.309 0.0962017 22.4726 2.345 0.0982018 23.4418 2.378 0.1002019 24.4528 2.411 0.1022020 25.5075 2.443 0.1042021 26.6076 2.476 0.1062022 27.7552 2.508 0.1082023 28.9523 2.541 0.1102024 30.2005 2.573 0.1122025 31.4996 2.605 0.1142026 32.8541 2.636 0.116
Source: Philip M. Parker, INSEAD, copyright 2020, www.icongrouponline.com
Surgical Robots (US $ mln): Tanzania 2021
CityWorldRank US $ mln
% ofCountry
% ofRegion
% ofGlobe
Dar esSalaam 466 12.5122 47.025 1.164 0.050Mwanza 1,742 1.8781 7.059 0.175 0.007Arusha 2,209 1.1043 4.150 0.103 0.004Dodoma 2,259 1.0267 3.859 0.096 0.004Mbeya 2,272 1.0135 3.809 0.094 0.004Morogoro 2,416 0.8155 3.065 0.076 0.003Tanga 2,603 0.6540 2.458 0.061 0.003Kahama 2,668 0.6064 2.279 0.056 0.002Kigoma-Ujiji 2,722 0.5738 2.156 0.053 0.002Tabora 2,751 0.5563 2.091 0.052 0.002Songea 2,761 0.5508 2.070 0.051 0.002Sumbawanga 2,765 0.5484 2.061 0.051 0.002Zanzibar 2,799 0.5269 1.980 0.049 0.002Kasulu 2,806 0.5213 1.959 0.049 0.002Moshi 2,908 0.4616 1.735 0.043 0.002Iringa 3,032 0.3949 1.484 0.037 0.002Shinyanga 3,034 0.3947 1.483 0.037 0.002Singida 3,058 0.3797 1.427 0.035 0.002Musoma 3,143 0.3329 1.251 0.031 0.001
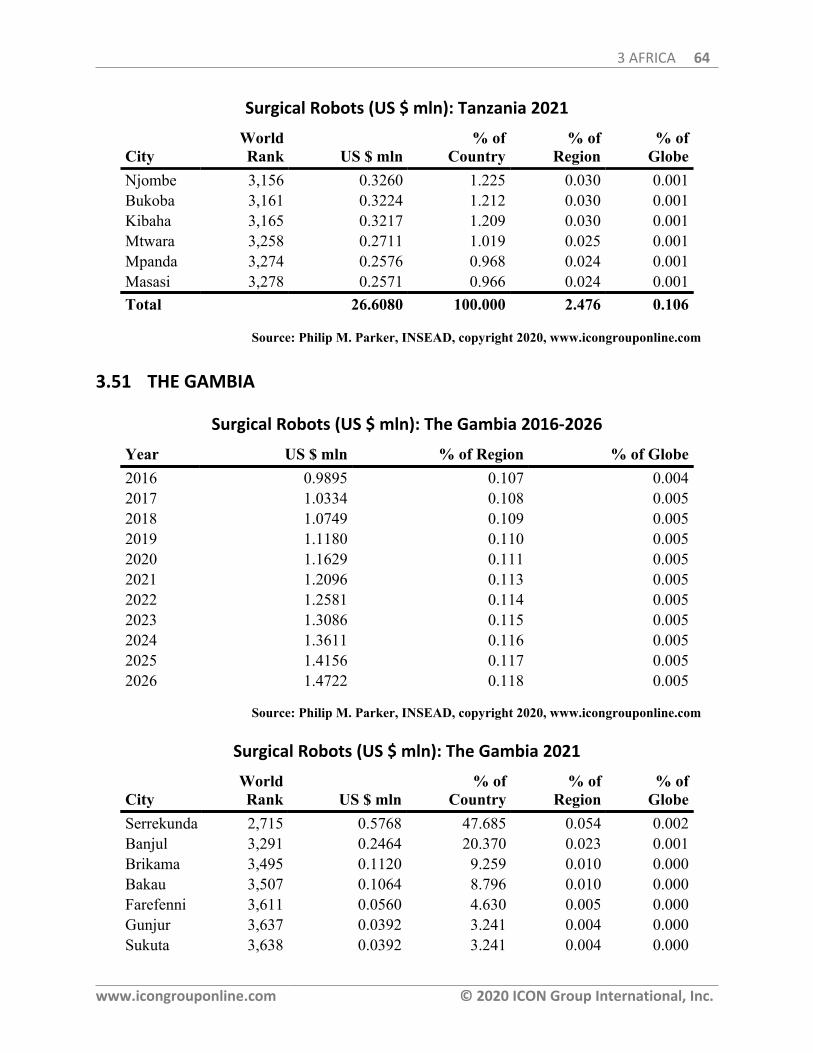
3 AFRICA 64
www.icongrouponline.com © 2020 ICON Group International, Inc.
Surgical Robots (US $ mln): Tanzania 2021
CityWorldRank US $ mln
% ofCountry
% ofRegion
% ofGlobe
Njombe 3,156 0.3260 1.225 0.030 0.001Bukoba 3,161 0.3224 1.212 0.030 0.001Kibaha 3,165 0.3217 1.209 0.030 0.001Mtwara 3,258 0.2711 1.019 0.025 0.001Mpanda 3,274 0.2576 0.968 0.024 0.001Masasi 3,278 0.2571 0.966 0.024 0.001Total 26.6080 100.000 2.476 0.106
Source: Philip M. Parker, INSEAD, copyright 2020, www.icongrouponline.com
3.51 THE GAMBIA
Surgical Robots (US $ mln): The Gambia 2016-2026
Year US $ mln % of Region % of Globe2016 0.9895 0.107 0.0042017 1.0334 0.108 0.0052018 1.0749 0.109 0.0052019 1.1180 0.110 0.0052020 1.1629 0.111 0.0052021 1.2096 0.113 0.0052022 1.2581 0.114 0.0052023 1.3086 0.115 0.0052024 1.3611 0.116 0.0052025 1.4156 0.117 0.0052026 1.4722 0.118 0.005
Source: Philip M. Parker, INSEAD, copyright 2020, www.icongrouponline.com
Surgical Robots (US $ mln): The Gambia 2021
CityWorldRank US $ mln
% ofCountry
% ofRegion
% ofGlobe
Serrekunda 2,715 0.5768 47.685 0.054 0.002Banjul 3,291 0.2464 20.370 0.023 0.001Brikama 3,495 0.1120 9.259 0.010 0.000Bakau 3,507 0.1064 8.796 0.010 0.000Farefenni 3,611 0.0560 4.630 0.005 0.000Gunjur 3,637 0.0392 3.241 0.004 0.000Sukuta 3,638 0.0392 3.241 0.004 0.000
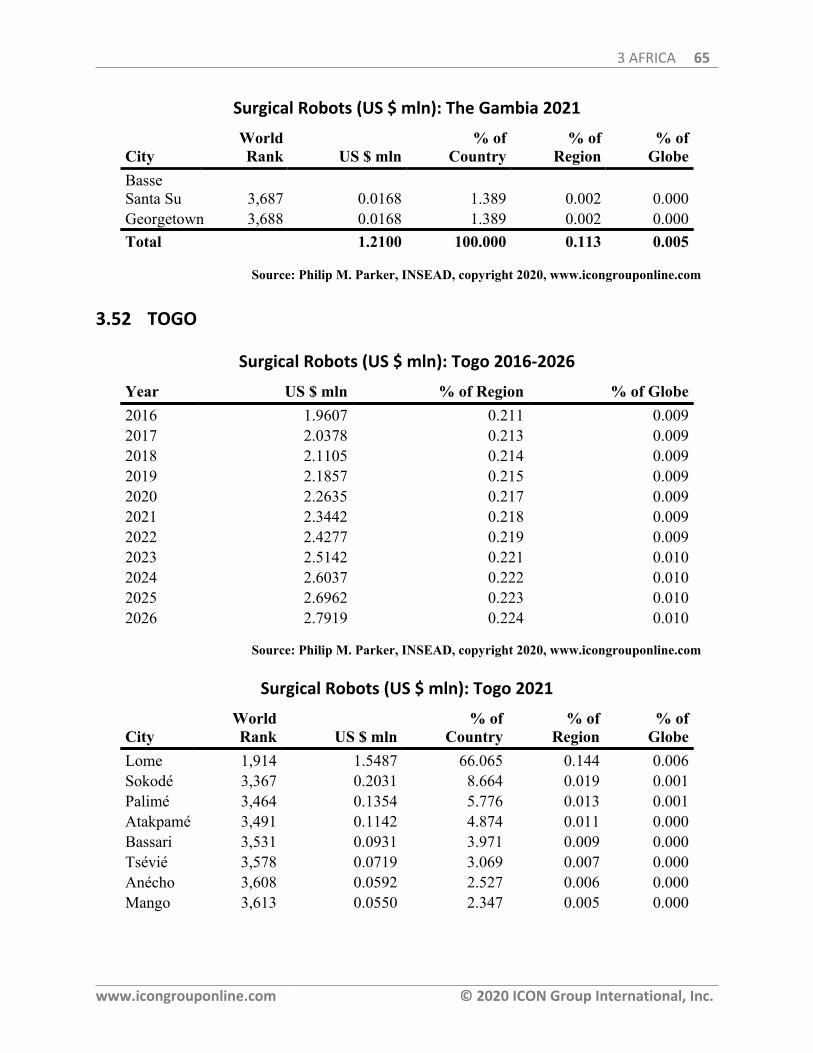
3 AFRICA 65
www.icongrouponline.com © 2020 ICON Group International, Inc.
Surgical Robots (US $ mln): The Gambia 2021
CityWorldRank US $ mln
% ofCountry
% ofRegion
% ofGlobe
BasseSanta Su 3,687 0.0168 1.389 0.002 0.000Georgetown 3,688 0.0168 1.389 0.002 0.000Total 1.2100 100.000 0.113 0.005
Source: Philip M. Parker, INSEAD, copyright 2020, www.icongrouponline.com
3.52 TOGO
Surgical Robots (US $ mln): Togo 2016-2026
Year US $ mln % of Region % of Globe2016 1.9607 0.211 0.0092017 2.0378 0.213 0.0092018 2.1105 0.214 0.0092019 2.1857 0.215 0.0092020 2.2635 0.217 0.0092021 2.3442 0.218 0.0092022 2.4277 0.219 0.0092023 2.5142 0.221 0.0102024 2.6037 0.222 0.0102025 2.6962 0.223 0.0102026 2.7919 0.224 0.010
Source: Philip M. Parker, INSEAD, copyright 2020, www.icongrouponline.com
Surgical Robots (US $ mln): Togo 2021
CityWorldRank US $ mln
% ofCountry
% ofRegion
% ofGlobe
Lome 1,914 1.5487 66.065 0.144 0.006Sokodé 3,367 0.2031 8.664 0.019 0.001Palimé 3,464 0.1354 5.776 0.013 0.001Atakpamé 3,491 0.1142 4.874 0.011 0.000Bassari 3,531 0.0931 3.971 0.009 0.000Tsévié 3,578 0.0719 3.069 0.007 0.000Anécho 3,608 0.0592 2.527 0.006 0.000Mango 3,613 0.0550 2.347 0.005 0.000
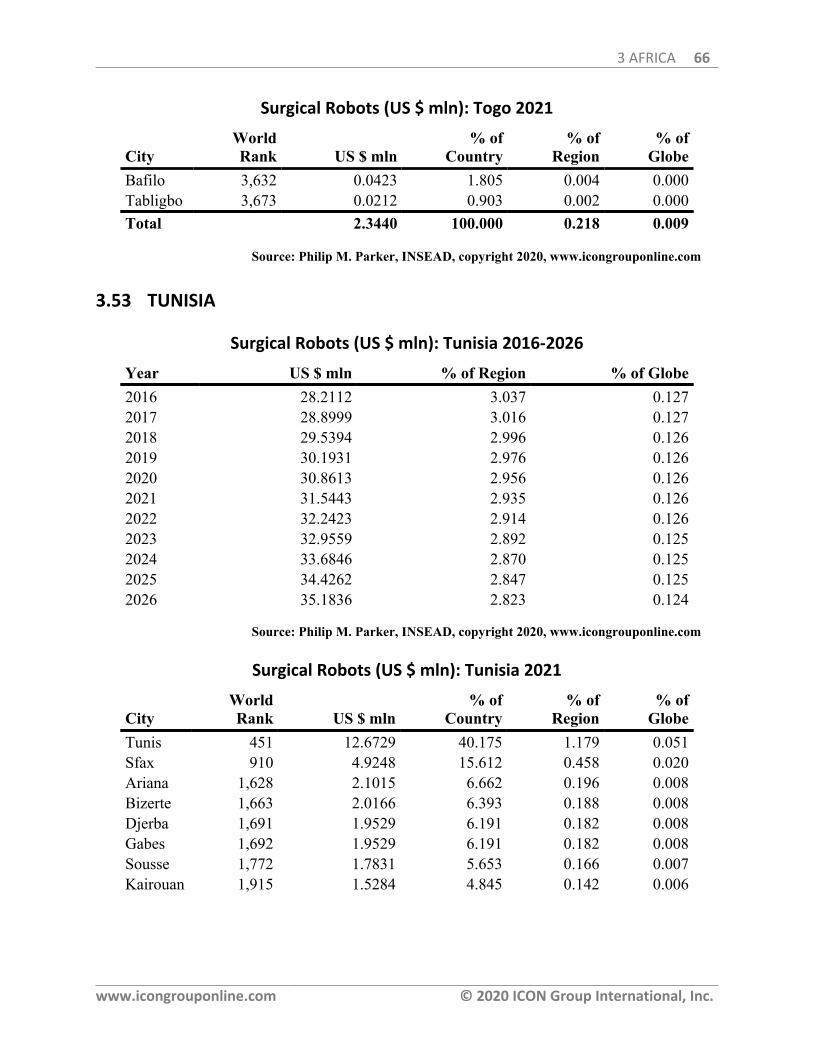
3 AFRICA 66
www.icongrouponline.com © 2020 ICON Group International, Inc.
Surgical Robots (US $ mln): Togo 2021
CityWorldRank US $ mln
% ofCountry
% ofRegion
% ofGlobe
Bafilo 3,632 0.0423 1.805 0.004 0.000Tabligbo 3,673 0.0212 0.903 0.002 0.000Total 2.3440 100.000 0.218 0.009
Source: Philip M. Parker, INSEAD, copyright 2020, www.icongrouponline.com
3.53 TUNISIA
Surgical Robots (US $ mln): Tunisia 2016-2026
Year US $ mln % of Region % of Globe2016 28.2112 3.037 0.1272017 28.8999 3.016 0.1272018 29.5394 2.996 0.1262019 30.1931 2.976 0.1262020 30.8613 2.956 0.1262021 31.5443 2.935 0.1262022 32.2423 2.914 0.1262023 32.9559 2.892 0.1252024 33.6846 2.870 0.1252025 34.4262 2.847 0.1252026 35.1836 2.823 0.124
Source: Philip M. Parker, INSEAD, copyright 2020, www.icongrouponline.com
Surgical Robots (US $ mln): Tunisia 2021
CityWorldRank US $ mln
% ofCountry
% ofRegion
% ofGlobe
Tunis 451 12.6729 40.175 1.179 0.051Sfax 910 4.9248 15.612 0.458 0.020Ariana 1,628 2.1015 6.662 0.196 0.008Bizerte 1,663 2.0166 6.393 0.188 0.008Djerba 1,691 1.9529 6.191 0.182 0.008Gabes 1,692 1.9529 6.191 0.182 0.008Sousse 1,772 1.7831 5.653 0.166 0.007Kairouan 1,915 1.5284 4.845 0.142 0.006
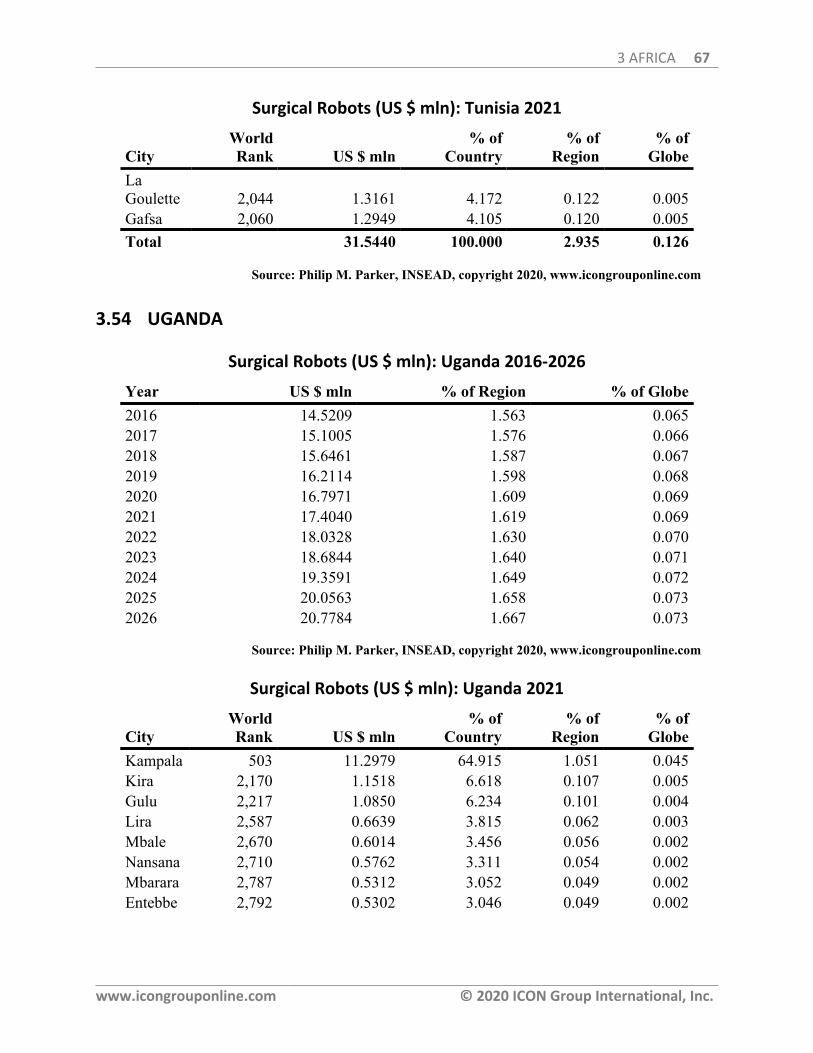
3 AFRICA 67
www.icongrouponline.com © 2020 ICON Group International, Inc.
Surgical Robots (US $ mln): Tunisia 2021
CityWorldRank US $ mln
% ofCountry
% ofRegion
% ofGlobe
LaGoulette 2,044 1.3161 4.172 0.122 0.005Gafsa 2,060 1.2949 4.105 0.120 0.005Total 31.5440 100.000 2.935 0.126
Source: Philip M. Parker, INSEAD, copyright 2020, www.icongrouponline.com
3.54 UGANDA
Surgical Robots (US $ mln): Uganda 2016-2026
Year US $ mln % of Region % of Globe2016 14.5209 1.563 0.0652017 15.1005 1.576 0.0662018 15.6461 1.587 0.0672019 16.2114 1.598 0.0682020 16.7971 1.609 0.0692021 17.4040 1.619 0.0692022 18.0328 1.630 0.0702023 18.6844 1.640 0.0712024 19.3591 1.649 0.0722025 20.0563 1.658 0.0732026 20.7784 1.667 0.073
Source: Philip M. Parker, INSEAD, copyright 2020, www.icongrouponline.com
Surgical Robots (US $ mln): Uganda 2021
CityWorldRank US $ mln
% ofCountry
% ofRegion
% ofGlobe
Kampala 503 11.2979 64.915 1.051 0.045Kira 2,170 1.1518 6.618 0.107 0.005Gulu 2,217 1.0850 6.234 0.101 0.004Lira 2,587 0.6639 3.815 0.062 0.003Mbale 2,670 0.6014 3.456 0.056 0.002Nansana 2,710 0.5762 3.311 0.054 0.002Mbarara 2,787 0.5312 3.052 0.049 0.002Entebbe 2,792 0.5302 3.046 0.049 0.002
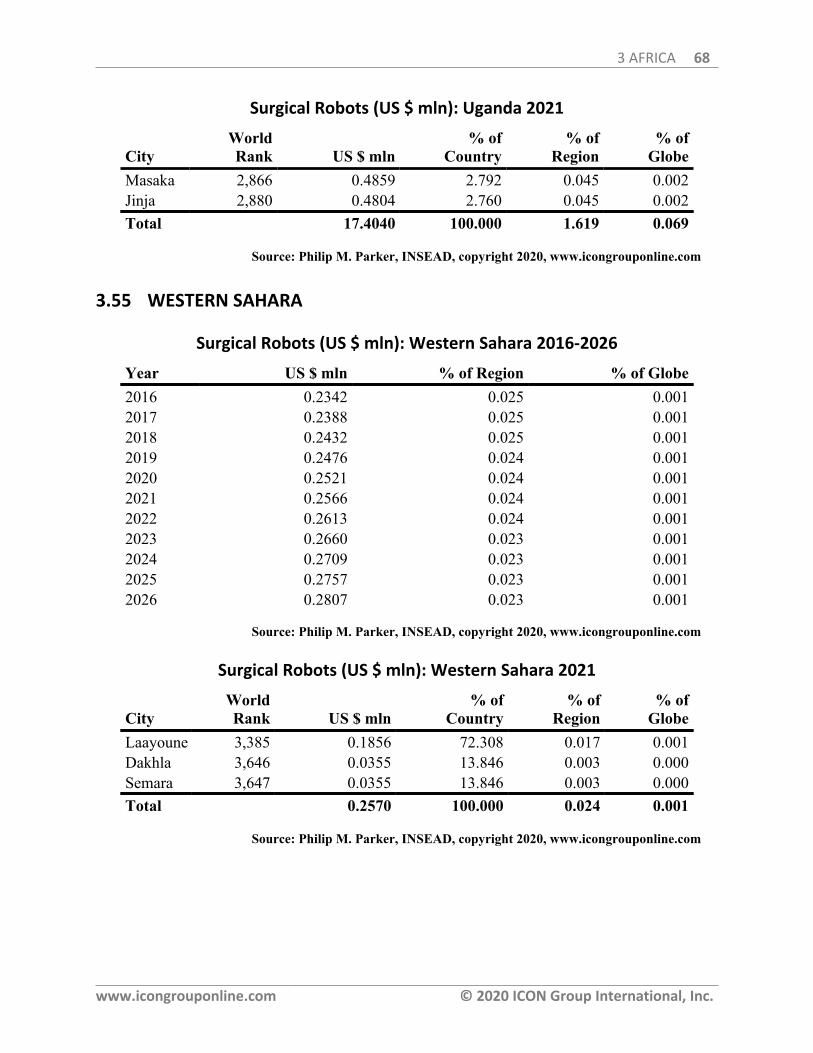
3 AFRICA 68
www.icongrouponline.com © 2020 ICON Group International, Inc.
Surgical Robots (US $ mln): Uganda 2021
CityWorldRank US $ mln
% ofCountry
% ofRegion
% ofGlobe
Masaka 2,866 0.4859 2.792 0.045 0.002Jinja 2,880 0.4804 2.760 0.045 0.002Total 17.4040 100.000 1.619 0.069
Source: Philip M. Parker, INSEAD, copyright 2020, www.icongrouponline.com
3.55 WESTERN SAHARA
Surgical Robots (US $ mln): Western Sahara 2016-2026
Year US $ mln % of Region % of Globe2016 0.2342 0.025 0.0012017 0.2388 0.025 0.0012018 0.2432 0.025 0.0012019 0.2476 0.024 0.0012020 0.2521 0.024 0.0012021 0.2566 0.024 0.0012022 0.2613 0.024 0.0012023 0.2660 0.023 0.0012024 0.2709 0.023 0.0012025 0.2757 0.023 0.0012026 0.2807 0.023 0.001
Source: Philip M. Parker, INSEAD, copyright 2020, www.icongrouponline.com
Surgical Robots (US $ mln): Western Sahara 2021
CityWorldRank US $ mln
% ofCountry
% ofRegion
% ofGlobe
Laayoune 3,385 0.1856 72.308 0.017 0.001Dakhla 3,646 0.0355 13.846 0.003 0.000Semara 3,647 0.0355 13.846 0.003 0.000Total 0.2570 100.000 0.024 0.001
Source: Philip M. Parker, INSEAD, copyright 2020, www.icongrouponline.com
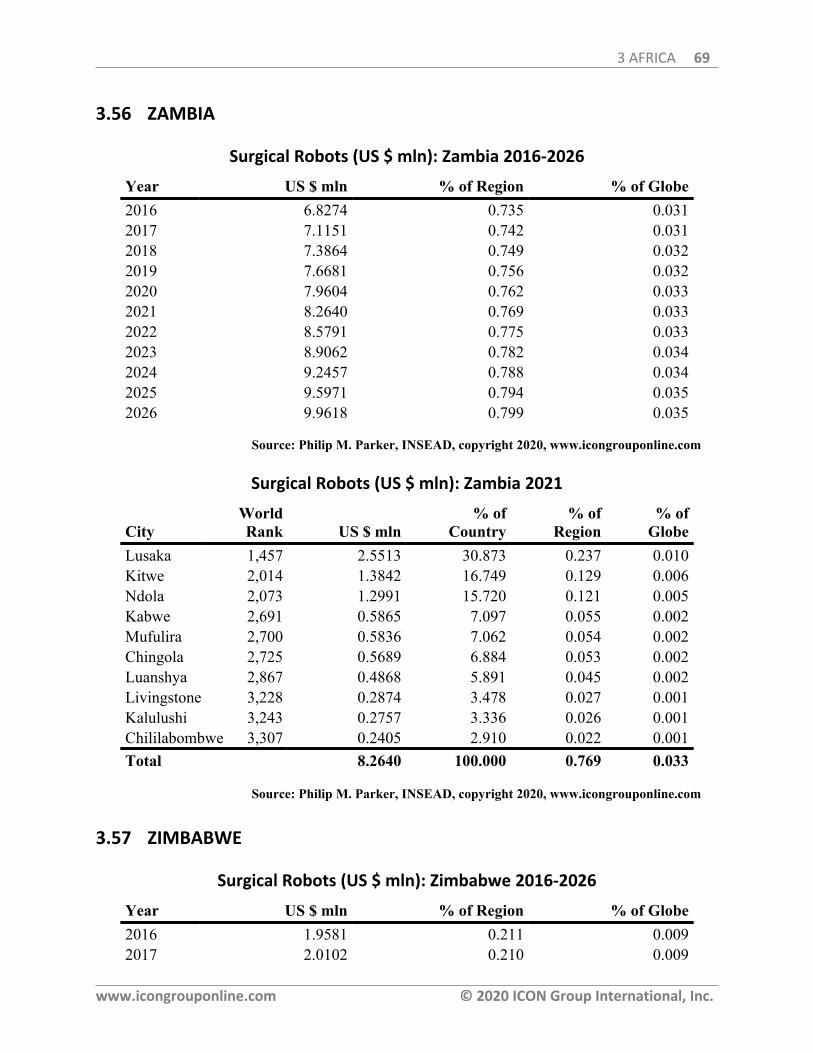
3 AFRICA 69
www.icongrouponline.com © 2020 ICON Group International, Inc.
3.56 ZAMBIA
Surgical Robots (US $ mln): Zambia 2016-2026
Year US $ mln % of Region % of Globe2016 6.8274 0.735 0.0312017 7.1151 0.742 0.0312018 7.3864 0.749 0.0322019 7.6681 0.756 0.0322020 7.9604 0.762 0.0332021 8.2640 0.769 0.0332022 8.5791 0.775 0.0332023 8.9062 0.782 0.0342024 9.2457 0.788 0.0342025 9.5971 0.794 0.0352026 9.9618 0.799 0.035
Source: Philip M. Parker, INSEAD, copyright 2020, www.icongrouponline.com
Surgical Robots (US $ mln): Zambia 2021
CityWorldRank US $ mln
% ofCountry
% ofRegion
% ofGlobe
Lusaka 1,457 2.5513 30.873 0.237 0.010Kitwe 2,014 1.3842 16.749 0.129 0.006Ndola 2,073 1.2991 15.720 0.121 0.005Kabwe 2,691 0.5865 7.097 0.055 0.002Mufulira 2,700 0.5836 7.062 0.054 0.002Chingola 2,725 0.5689 6.884 0.053 0.002Luanshya 2,867 0.4868 5.891 0.045 0.002Livingstone 3,228 0.2874 3.478 0.027 0.001Kalulushi 3,243 0.2757 3.336 0.026 0.001Chililabombwe 3,307 0.2405 2.910 0.022 0.001Total 8.2640 100.000 0.769 0.033
Source: Philip M. Parker, INSEAD, copyright 2020, www.icongrouponline.com
3.57 ZIMBABWE
Surgical Robots (US $ mln): Zimbabwe 2016-2026
Year US $ mln % of Region % of Globe2016 1.9581 0.211 0.0092017 2.0102 0.210 0.009

3 AFRICA 70
www.icongrouponline.com © 2020 ICON Group International, Inc.
Surgical Robots (US $ mln): Zimbabwe 2016-2026
Year US $ mln % of Region % of Globe2018 2.0587 0.209 0.0092019 2.1084 0.208 0.0092020 2.1593 0.207 0.0092021 2.2114 0.206 0.0092022 2.2648 0.205 0.0092023 2.3194 0.204 0.0092024 2.3753 0.202 0.0092025 2.4324 0.201 0.0092026 2.4908 0.200 0.009
Source: Philip M. Parker, INSEAD, copyright 2020, www.icongrouponline.com
Surgical Robots (US $ mln): Zimbabwe 2021
CityWorldRank US $ mln
% ofCountry
% ofRegion
% ofGlobe
Harare 2,334 0.9094 41.123 0.085 0.004Bulawayo 3,025 0.3920 17.724 0.036 0.002Chitungwiza 3,328 0.2231 10.088 0.021 0.001Mutare 3,481 0.1172 5.300 0.011 0.000Epworth 3,483 0.1164 5.265 0.011 0.000Gweru 3,517 0.0992 4.486 0.009 0.000Kwekwe 3,600 0.0626 2.831 0.006 0.000Kadoma 3,605 0.0597 2.698 0.006 0.000Masvingo 3,609 0.0576 2.605 0.005 0.000Chinhoyi 3,615 0.0530 2.397 0.005 0.000Norton 3,624 0.0466 2.106 0.004 0.000Marondera 3,634 0.0398 1.801 0.004 0.000Chegutu 3,649 0.0349 1.576 0.003 0.000Total 2.2110 100.000 0.206 0.009
Source: Philip M. Parker, INSEAD, copyright 2020, www.icongrouponline.com
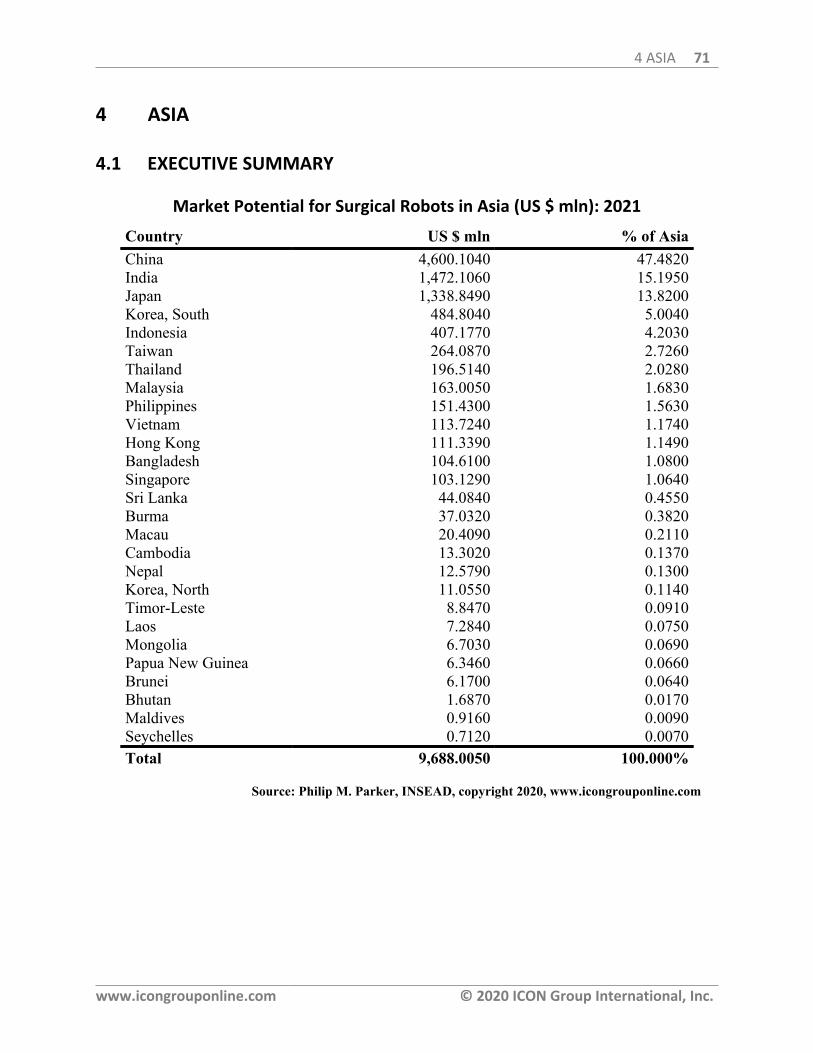
4 ASIA 71
www.icongrouponline.com © 2020 ICON Group International, Inc.
4 ASIA
4.1 EXECUTIVE SUMMARY
Market Potential for Surgical Robots in Asia (US $ mln): 2021
Country US $ mln % of AsiaChina 4,600.1040 47.4820India 1,472.1060 15.1950Japan 1,338.8490 13.8200Korea, South 484.8040 5.0040Indonesia 407.1770 4.2030Taiwan 264.0870 2.7260Thailand 196.5140 2.0280Malaysia 163.0050 1.6830Philippines 151.4300 1.5630Vietnam 113.7240 1.1740Hong Kong 111.3390 1.1490Bangladesh 104.6100 1.0800Singapore 103.1290 1.0640Sri Lanka 44.0840 0.4550Burma 37.0320 0.3820Macau 20.4090 0.2110Cambodia 13.3020 0.1370Nepal 12.5790 0.1300Korea, North 11.0550 0.1140Timor-Leste 8.8470 0.0910Laos 7.2840 0.0750Mongolia 6.7030 0.0690Papua New Guinea 6.3460 0.0660Brunei 6.1700 0.0640Bhutan 1.6870 0.0170Maldives 0.9160 0.0090Seychelles 0.7120 0.0070Total 9,688.0050 100.000%
Source: Philip M. Parker, INSEAD, copyright 2020, www.icongrouponline.com

4 ASIA 72
www.icongrouponline.com © 2020 ICON Group International, Inc.
Market Potential for Surgical Robots in Asia (US $ mln): 2021
1.373%
0.455%
1.064%
1.08%
1.149%
1.174%
1.563%
1.683%
2.028%
2.726%
4.203%
5.004%
13.82%
15.195%
47.482%China
India
Japan
Korea, South
Indonesia
Taiwan
Thailand
Malaysia
Philippines
Vietnam
Hong Kong
Bangladesh
Singapore
Sri Lanka
Other
0 7 14 21 28 35 42 49Source: Philip M. Parker, INSEAD, copyright 2020, www.icongrouponline.com
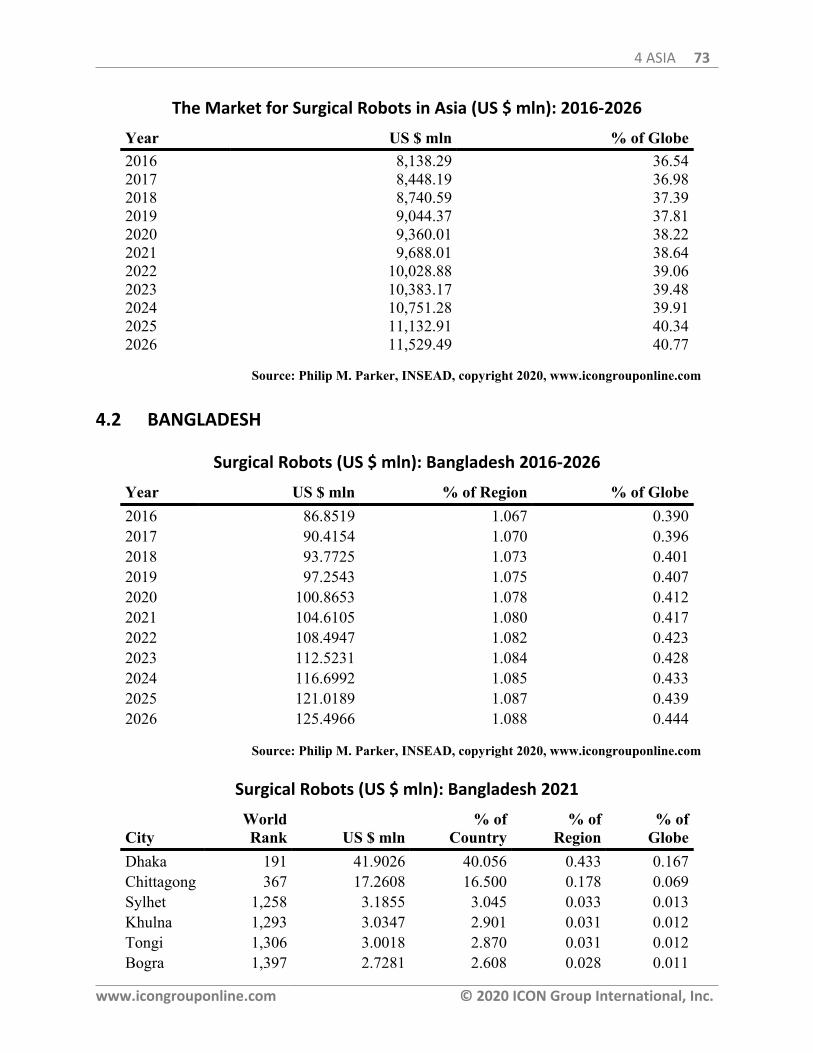
4 ASIA 73
www.icongrouponline.com © 2020 ICON Group International, Inc.
The Market for Surgical Robots in Asia (US $ mln): 2016-2026
Year US $ mln % of Globe2016 8,138.29 36.542017 8,448.19 36.982018 8,740.59 37.392019 9,044.37 37.812020 9,360.01 38.222021 9,688.01 38.642022 10,028.88 39.062023 10,383.17 39.482024 10,751.28 39.912025 11,132.91 40.342026 11,529.49 40.77
Source: Philip M. Parker, INSEAD, copyright 2020, www.icongrouponline.com
4.2 BANGLADESH
Surgical Robots (US $ mln): Bangladesh 2016-2026
Year US $ mln % of Region % of Globe2016 86.8519 1.067 0.3902017 90.4154 1.070 0.3962018 93.7725 1.073 0.4012019 97.2543 1.075 0.4072020 100.8653 1.078 0.4122021 104.6105 1.080 0.4172022 108.4947 1.082 0.4232023 112.5231 1.084 0.4282024 116.6992 1.085 0.4332025 121.0189 1.087 0.4392026 125.4966 1.088 0.444
Source: Philip M. Parker, INSEAD, copyright 2020, www.icongrouponline.com
Surgical Robots (US $ mln): Bangladesh 2021
CityWorldRank US $ mln
% ofCountry
% ofRegion
% ofGlobe
Dhaka 191 41.9026 40.056 0.433 0.167Chittagong 367 17.2608 16.500 0.178 0.069Sylhet 1,258 3.1855 3.045 0.033 0.013Khulna 1,293 3.0347 2.901 0.031 0.012Tongi 1,306 3.0018 2.870 0.031 0.012Bogra 1,397 2.7281 2.608 0.028 0.011
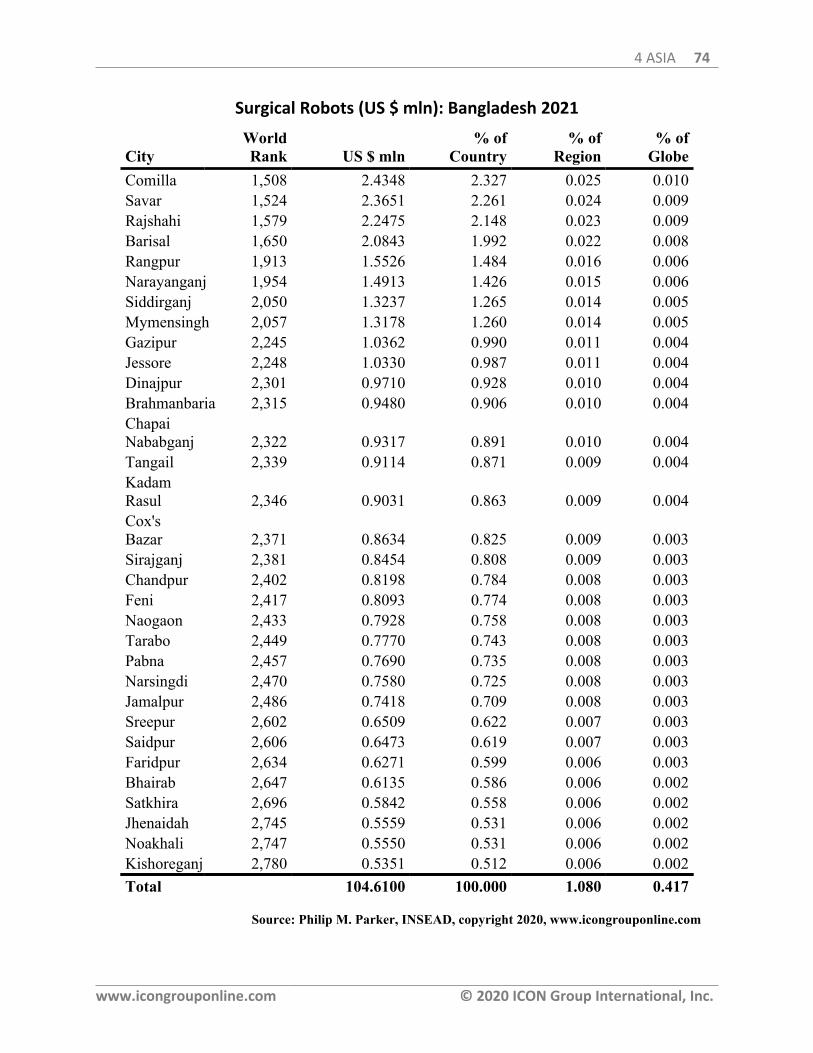
4 ASIA 74
www.icongrouponline.com © 2020 ICON Group International, Inc.
Surgical Robots (US $ mln): Bangladesh 2021
CityWorldRank US $ mln
% ofCountry
% ofRegion
% ofGlobe
Comilla 1,508 2.4348 2.327 0.025 0.010Savar 1,524 2.3651 2.261 0.024 0.009Rajshahi 1,579 2.2475 2.148 0.023 0.009Barisal 1,650 2.0843 1.992 0.022 0.008Rangpur 1,913 1.5526 1.484 0.016 0.006Narayanganj 1,954 1.4913 1.426 0.015 0.006Siddirganj 2,050 1.3237 1.265 0.014 0.005Mymensingh 2,057 1.3178 1.260 0.014 0.005Gazipur 2,245 1.0362 0.990 0.011 0.004Jessore 2,248 1.0330 0.987 0.011 0.004Dinajpur 2,301 0.9710 0.928 0.010 0.004Brahmanbaria 2,315 0.9480 0.906 0.010 0.004ChapaiNababganj 2,322 0.9317 0.891 0.010 0.004Tangail 2,339 0.9114 0.871 0.009 0.004KadamRasul 2,346 0.9031 0.863 0.009 0.004Cox'sBazar 2,371 0.8634 0.825 0.009 0.003Sirajganj 2,381 0.8454 0.808 0.009 0.003Chandpur 2,402 0.8198 0.784 0.008 0.003Feni 2,417 0.8093 0.774 0.008 0.003Naogaon 2,433 0.7928 0.758 0.008 0.003Tarabo 2,449 0.7770 0.743 0.008 0.003Pabna 2,457 0.7690 0.735 0.008 0.003Narsingdi 2,470 0.7580 0.725 0.008 0.003Jamalpur 2,486 0.7418 0.709 0.008 0.003Sreepur 2,602 0.6509 0.622 0.007 0.003Saidpur 2,606 0.6473 0.619 0.007 0.003Faridpur 2,634 0.6271 0.599 0.006 0.003Bhairab 2,647 0.6135 0.586 0.006 0.002Satkhira 2,696 0.5842 0.558 0.006 0.002Jhenaidah 2,745 0.5559 0.531 0.006 0.002Noakhali 2,747 0.5550 0.531 0.006 0.002Kishoreganj 2,780 0.5351 0.512 0.006 0.002Total 104.6100 100.000 1.080 0.417
Source: Philip M. Parker, INSEAD, copyright 2020, www.icongrouponline.com
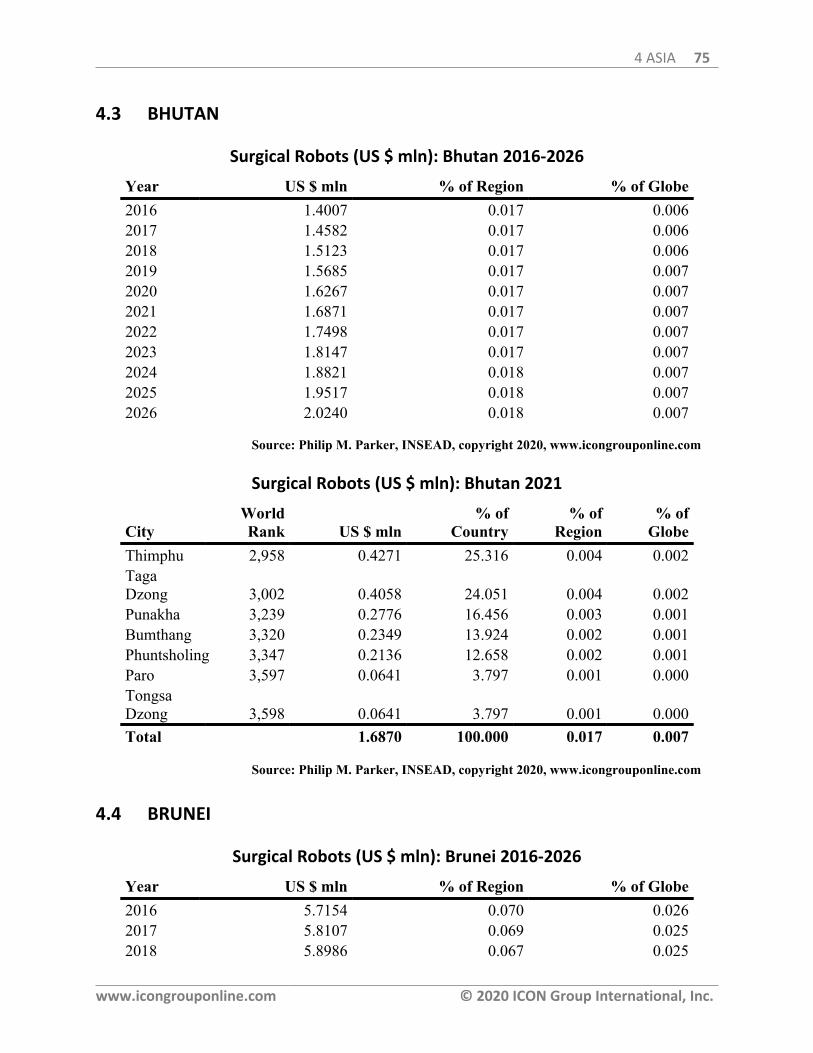
4 ASIA 75
www.icongrouponline.com © 2020 ICON Group International, Inc.
4.3 BHUTAN
Surgical Robots (US $ mln): Bhutan 2016-2026
Year US $ mln % of Region % of Globe2016 1.4007 0.017 0.0062017 1.4582 0.017 0.0062018 1.5123 0.017 0.0062019 1.5685 0.017 0.0072020 1.6267 0.017 0.0072021 1.6871 0.017 0.0072022 1.7498 0.017 0.0072023 1.8147 0.017 0.0072024 1.8821 0.018 0.0072025 1.9517 0.018 0.0072026 2.0240 0.018 0.007
Source: Philip M. Parker, INSEAD, copyright 2020, www.icongrouponline.com
Surgical Robots (US $ mln): Bhutan 2021
CityWorldRank US $ mln
% ofCountry
% ofRegion
% ofGlobe
Thimphu 2,958 0.4271 25.316 0.004 0.002TagaDzong 3,002 0.4058 24.051 0.004 0.002Punakha 3,239 0.2776 16.456 0.003 0.001Bumthang 3,320 0.2349 13.924 0.002 0.001Phuntsholing 3,347 0.2136 12.658 0.002 0.001Paro 3,597 0.0641 3.797 0.001 0.000TongsaDzong 3,598 0.0641 3.797 0.001 0.000Total 1.6870 100.000 0.017 0.007
Source: Philip M. Parker, INSEAD, copyright 2020, www.icongrouponline.com
4.4 BRUNEI
Surgical Robots (US $ mln): Brunei 2016-2026
Year US $ mln % of Region % of Globe2016 5.7154 0.070 0.0262017 5.8107 0.069 0.0252018 5.8986 0.067 0.025
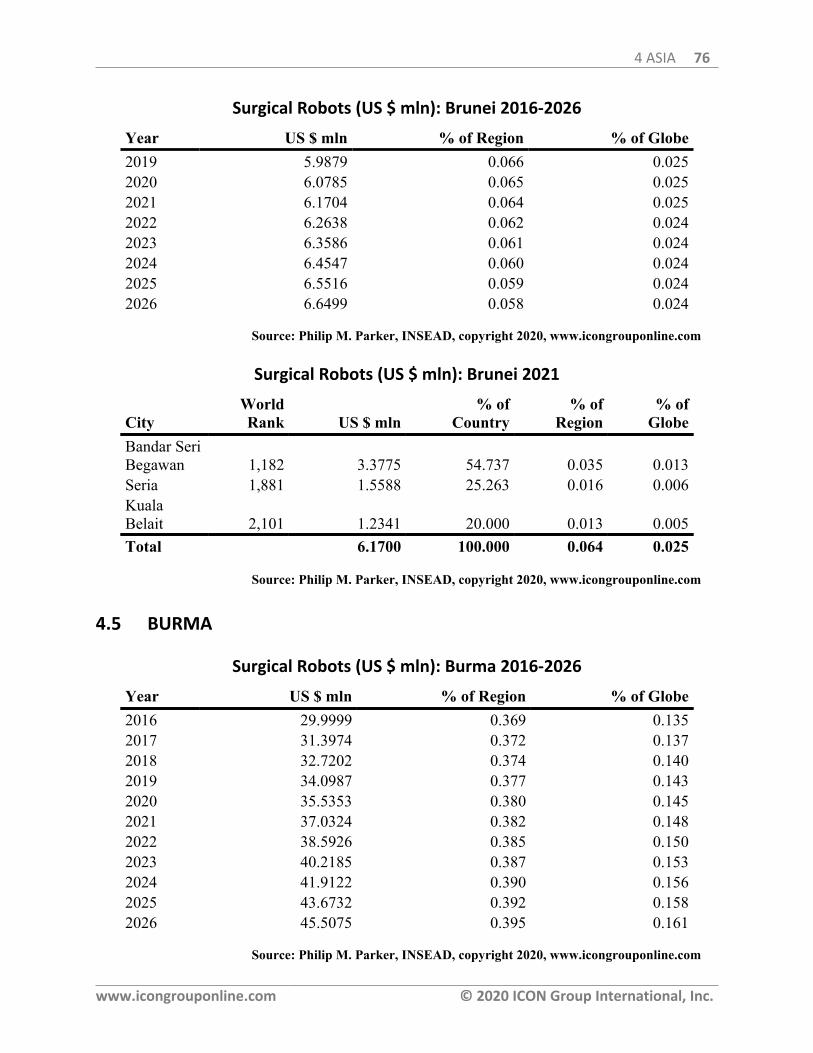
4 ASIA 76
www.icongrouponline.com © 2020 ICON Group International, Inc.
Surgical Robots (US $ mln): Brunei 2016-2026
Year US $ mln % of Region % of Globe2019 5.9879 0.066 0.0252020 6.0785 0.065 0.0252021 6.1704 0.064 0.0252022 6.2638 0.062 0.0242023 6.3586 0.061 0.0242024 6.4547 0.060 0.0242025 6.5516 0.059 0.0242026 6.6499 0.058 0.024
Source: Philip M. Parker, INSEAD, copyright 2020, www.icongrouponline.com
Surgical Robots (US $ mln): Brunei 2021
CityWorldRank US $ mln
% ofCountry
% ofRegion
% ofGlobe
Bandar SeriBegawan 1,182 3.3775 54.737 0.035 0.013Seria 1,881 1.5588 25.263 0.016 0.006KualaBelait 2,101 1.2341 20.000 0.013 0.005Total 6.1700 100.000 0.064 0.025
Source: Philip M. Parker, INSEAD, copyright 2020, www.icongrouponline.com
4.5 BURMA
Surgical Robots (US $ mln): Burma 2016-2026
Year US $ mln % of Region % of Globe2016 29.9999 0.369 0.1352017 31.3974 0.372 0.1372018 32.7202 0.374 0.1402019 34.0987 0.377 0.1432020 35.5353 0.380 0.1452021 37.0324 0.382 0.1482022 38.5926 0.385 0.1502023 40.2185 0.387 0.1532024 41.9122 0.390 0.1562025 43.6732 0.392 0.1582026 45.5075 0.395 0.161
Source: Philip M. Parker, INSEAD, copyright 2020, www.icongrouponline.com
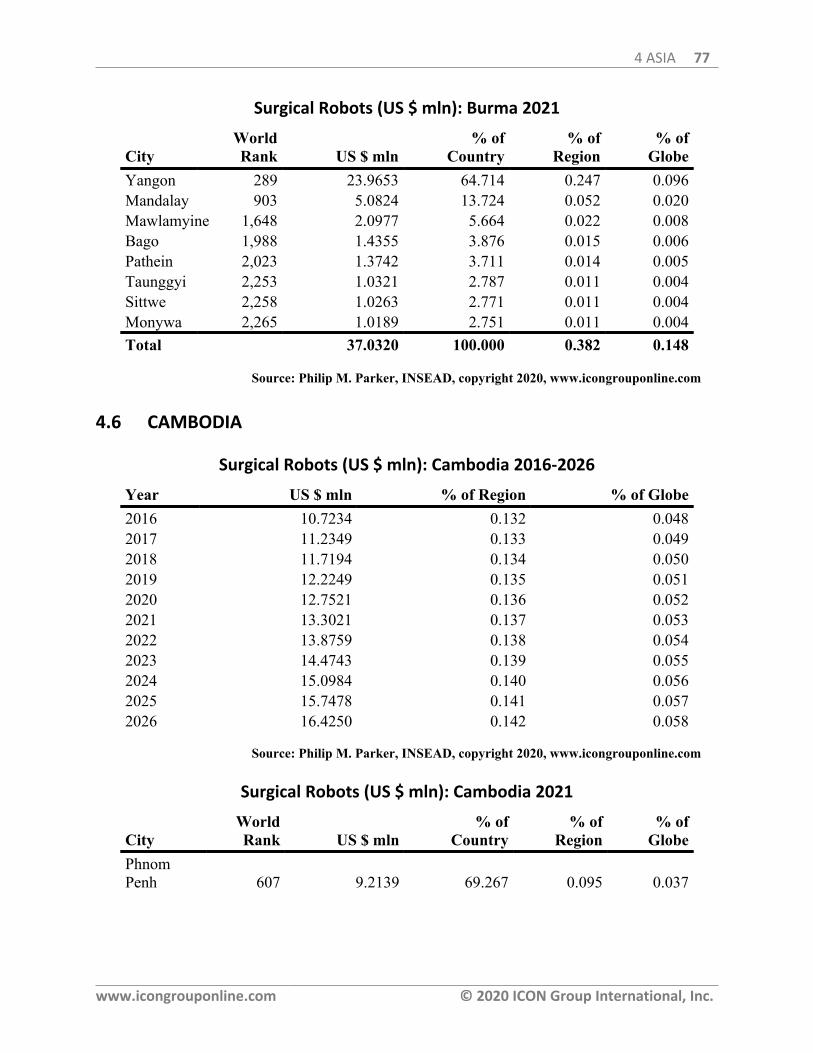
4 ASIA 77
www.icongrouponline.com © 2020 ICON Group International, Inc.
Surgical Robots (US $ mln): Burma 2021
CityWorldRank US $ mln
% ofCountry
% ofRegion
% ofGlobe
Yangon 289 23.9653 64.714 0.247 0.096Mandalay 903 5.0824 13.724 0.052 0.020Mawlamyine 1,648 2.0977 5.664 0.022 0.008Bago 1,988 1.4355 3.876 0.015 0.006Pathein 2,023 1.3742 3.711 0.014 0.005Taunggyi 2,253 1.0321 2.787 0.011 0.004Sittwe 2,258 1.0263 2.771 0.011 0.004Monywa 2,265 1.0189 2.751 0.011 0.004Total 37.0320 100.000 0.382 0.148
Source: Philip M. Parker, INSEAD, copyright 2020, www.icongrouponline.com
4.6 CAMBODIA
Surgical Robots (US $ mln): Cambodia 2016-2026
Year US $ mln % of Region % of Globe2016 10.7234 0.132 0.0482017 11.2349 0.133 0.0492018 11.7194 0.134 0.0502019 12.2249 0.135 0.0512020 12.7521 0.136 0.0522021 13.3021 0.137 0.0532022 13.8759 0.138 0.0542023 14.4743 0.139 0.0552024 15.0984 0.140 0.0562025 15.7478 0.141 0.0572026 16.4250 0.142 0.058
Source: Philip M. Parker, INSEAD, copyright 2020, www.icongrouponline.com
Surgical Robots (US $ mln): Cambodia 2021
CityWorldRank US $ mln
% ofCountry
% ofRegion
% ofGlobe
PhnomPenh 607 9.2139 69.267 0.095 0.037
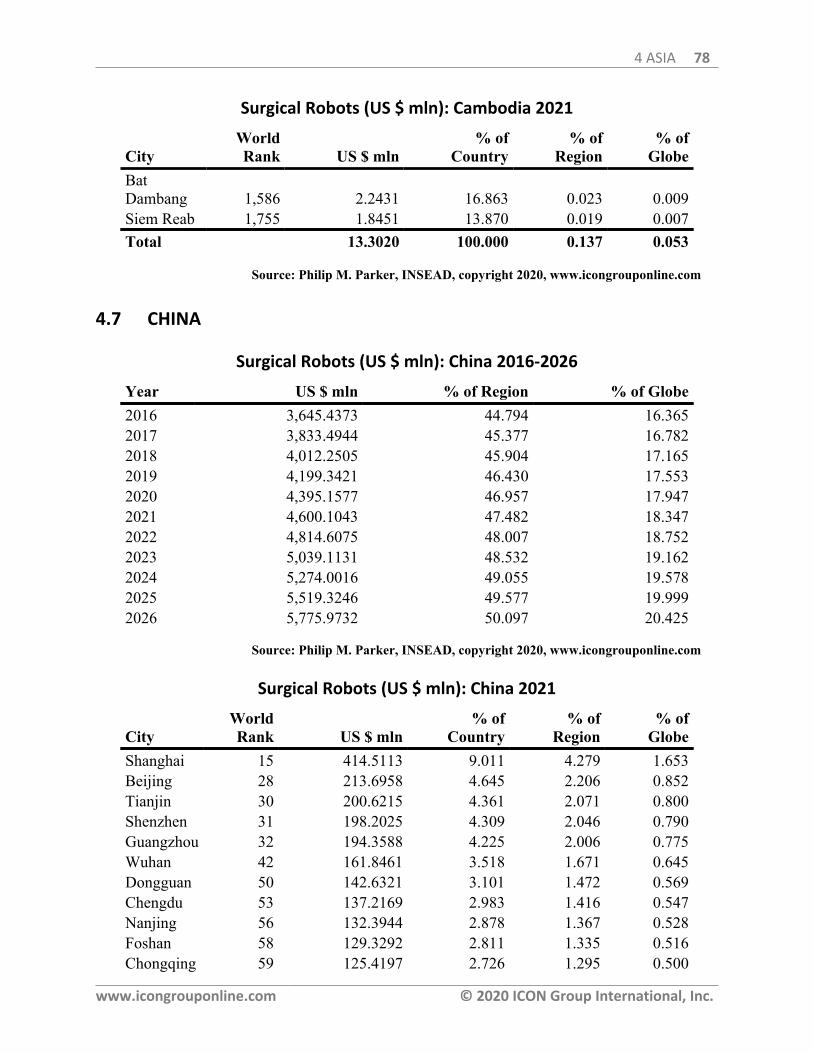
4 ASIA 78
www.icongrouponline.com © 2020 ICON Group International, Inc.
Surgical Robots (US $ mln): Cambodia 2021
CityWorldRank US $ mln
% ofCountry
% ofRegion
% ofGlobe
BatDambang 1,586 2.2431 16.863 0.023 0.009Siem Reab 1,755 1.8451 13.870 0.019 0.007Total 13.3020 100.000 0.137 0.053
Source: Philip M. Parker, INSEAD, copyright 2020, www.icongrouponline.com
4.7 CHINA
Surgical Robots (US $ mln): China 2016-2026
Year US $ mln % of Region % of Globe2016 3,645.4373 44.794 16.3652017 3,833.4944 45.377 16.7822018 4,012.2505 45.904 17.1652019 4,199.3421 46.430 17.5532020 4,395.1577 46.957 17.9472021 4,600.1043 47.482 18.3472022 4,814.6075 48.007 18.7522023 5,039.1131 48.532 19.1622024 5,274.0016 49.055 19.5782025 5,519.3246 49.577 19.9992026 5,775.9732 50.097 20.425
Source: Philip M. Parker, INSEAD, copyright 2020, www.icongrouponline.com
Surgical Robots (US $ mln): China 2021
CityWorldRank US $ mln
% ofCountry
% ofRegion
% ofGlobe
Shanghai 15 414.5113 9.011 4.279 1.653Beijing 28 213.6958 4.645 2.206 0.852Tianjin 30 200.6215 4.361 2.071 0.800Shenzhen 31 198.2025 4.309 2.046 0.790Guangzhou 32 194.3588 4.225 2.006 0.775Wuhan 42 161.8461 3.518 1.671 0.645Dongguan 50 142.6321 3.101 1.472 0.569Chengdu 53 137.2169 2.983 1.416 0.547Nanjing 56 132.3944 2.878 1.367 0.528Foshan 58 129.3292 2.811 1.335 0.516Chongqing 59 125.4197 2.726 1.295 0.500
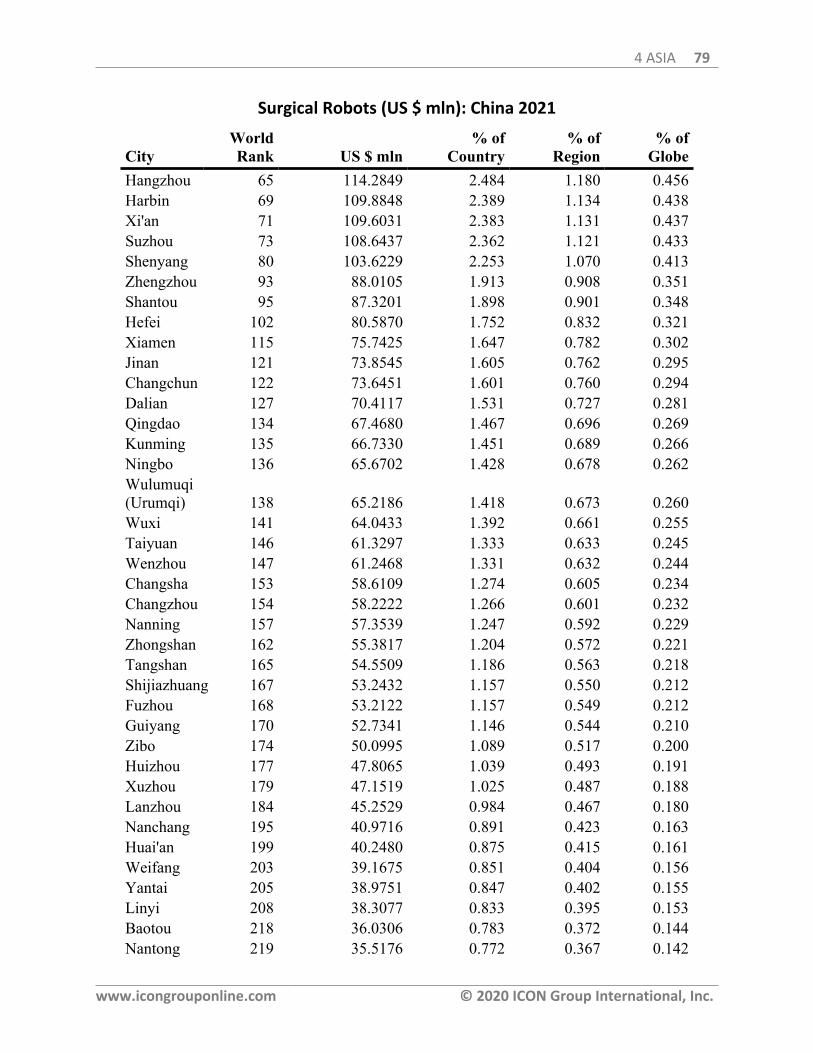
4 ASIA 79
www.icongrouponline.com © 2020 ICON Group International, Inc.
Surgical Robots (US $ mln): China 2021
CityWorldRank US $ mln
% ofCountry
% ofRegion
% ofGlobe
Hangzhou 65 114.2849 2.484 1.180 0.456Harbin 69 109.8848 2.389 1.134 0.438Xi'an 71 109.6031 2.383 1.131 0.437Suzhou 73 108.6437 2.362 1.121 0.433Shenyang 80 103.6229 2.253 1.070 0.413Zhengzhou 93 88.0105 1.913 0.908 0.351Shantou 95 87.3201 1.898 0.901 0.348Hefei 102 80.5870 1.752 0.832 0.321Xiamen 115 75.7425 1.647 0.782 0.302Jinan 121 73.8545 1.605 0.762 0.295Changchun 122 73.6451 1.601 0.760 0.294Dalian 127 70.4117 1.531 0.727 0.281Qingdao 134 67.4680 1.467 0.696 0.269Kunming 135 66.7330 1.451 0.689 0.266Ningbo 136 65.6702 1.428 0.678 0.262Wulumuqi(Urumqi) 138 65.2186 1.418 0.673 0.260Wuxi 141 64.0433 1.392 0.661 0.255Taiyuan 146 61.3297 1.333 0.633 0.245Wenzhou 147 61.2468 1.331 0.632 0.244Changsha 153 58.6109 1.274 0.605 0.234Changzhou 154 58.2222 1.266 0.601 0.232Nanning 157 57.3539 1.247 0.592 0.229Zhongshan 162 55.3817 1.204 0.572 0.221Tangshan 165 54.5509 1.186 0.563 0.218Shijiazhuang 167 53.2432 1.157 0.550 0.212Fuzhou 168 53.2122 1.157 0.549 0.212Guiyang 170 52.7341 1.146 0.544 0.210Zibo 174 50.0995 1.089 0.517 0.200Huizhou 177 47.8065 1.039 0.493 0.191Xuzhou 179 47.1519 1.025 0.487 0.188Lanzhou 184 45.2529 0.984 0.467 0.180Nanchang 195 40.9716 0.891 0.423 0.163Huai'an 199 40.2480 0.875 0.415 0.161Weifang 203 39.1675 0.851 0.404 0.156Yantai 205 38.9751 0.847 0.402 0.155Linyi 208 38.3077 0.833 0.395 0.153Baotou 218 36.0306 0.783 0.372 0.144Nantong 219 35.5176 0.772 0.367 0.142
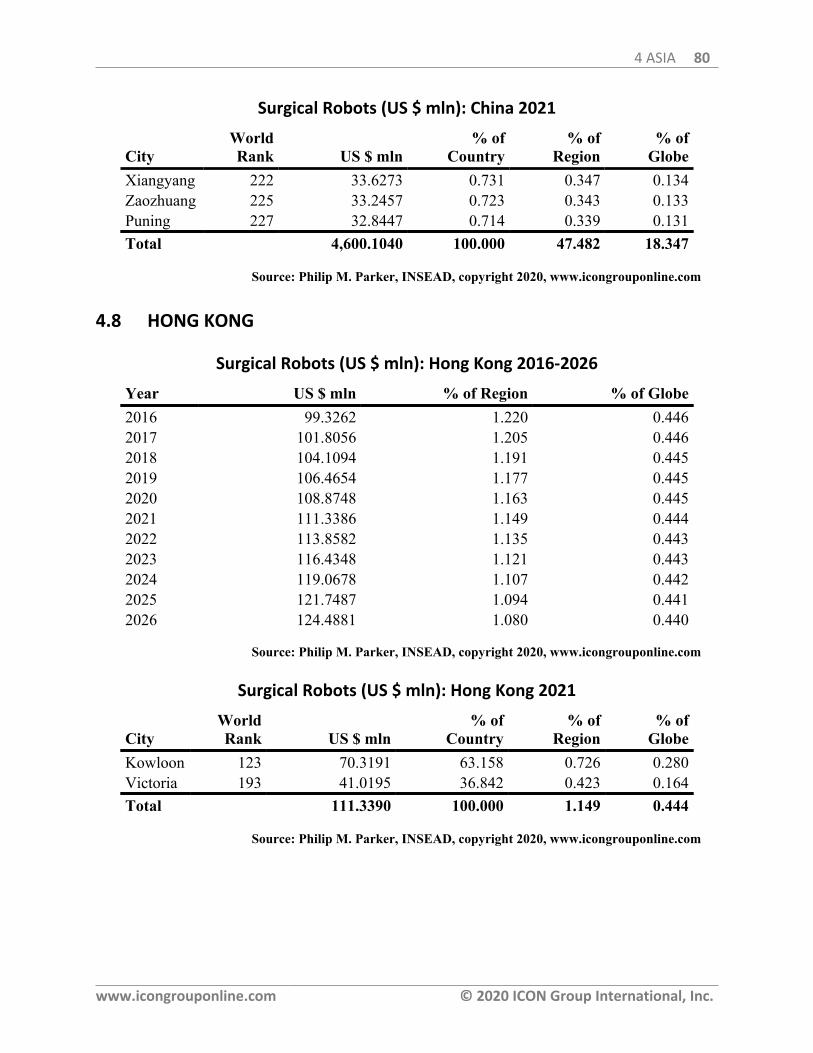
4 ASIA 80
www.icongrouponline.com © 2020 ICON Group International, Inc.
Surgical Robots (US $ mln): China 2021
CityWorldRank US $ mln
% ofCountry
% ofRegion
% ofGlobe
Xiangyang 222 33.6273 0.731 0.347 0.134Zaozhuang 225 33.2457 0.723 0.343 0.133Puning 227 32.8447 0.714 0.339 0.131Total 4,600.1040 100.000 47.482 18.347
Source: Philip M. Parker, INSEAD, copyright 2020, www.icongrouponline.com
4.8 HONG KONG
Surgical Robots (US $ mln): Hong Kong 2016-2026
Year US $ mln % of Region % of Globe2016 99.3262 1.220 0.4462017 101.8056 1.205 0.4462018 104.1094 1.191 0.4452019 106.4654 1.177 0.4452020 108.8748 1.163 0.4452021 111.3386 1.149 0.4442022 113.8582 1.135 0.4432023 116.4348 1.121 0.4432024 119.0678 1.107 0.4422025 121.7487 1.094 0.4412026 124.4881 1.080 0.440
Source: Philip M. Parker, INSEAD, copyright 2020, www.icongrouponline.com
Surgical Robots (US $ mln): Hong Kong 2021
CityWorldRank US $ mln
% ofCountry
% ofRegion
% ofGlobe
Kowloon 123 70.3191 63.158 0.726 0.280Victoria 193 41.0195 36.842 0.423 0.164Total 111.3390 100.000 1.149 0.444
Source: Philip M. Parker, INSEAD, copyright 2020, www.icongrouponline.com
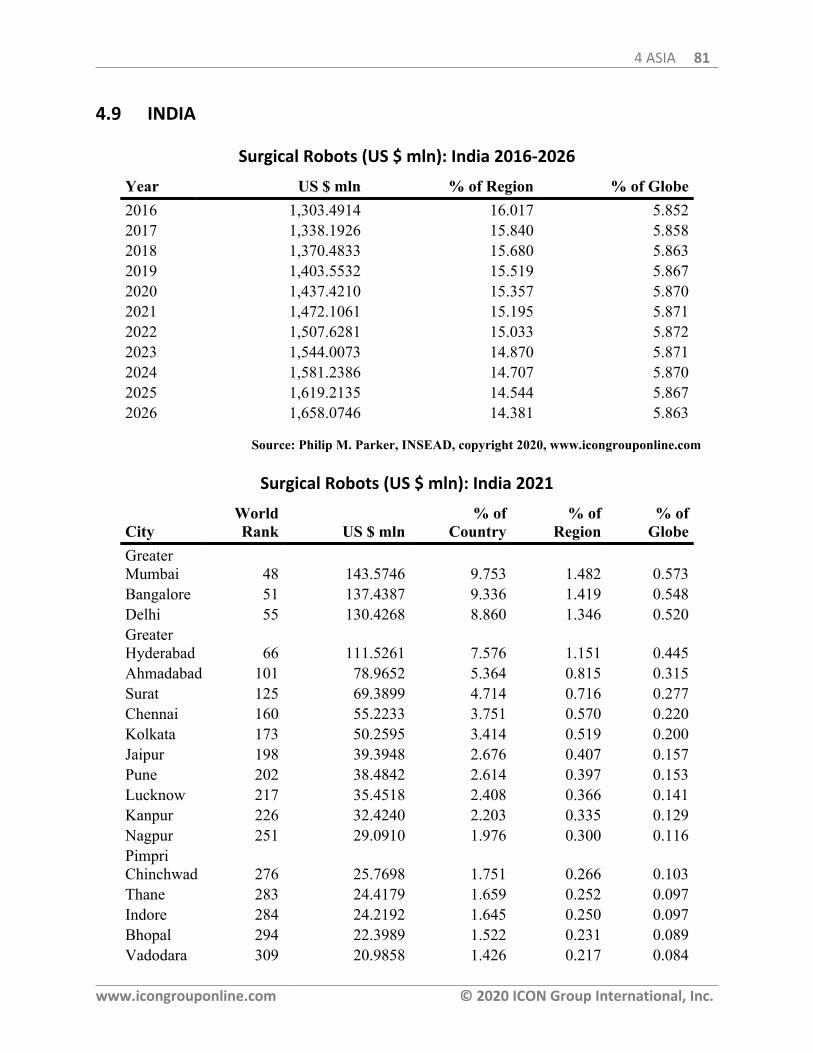
4 ASIA 81
www.icongrouponline.com © 2020 ICON Group International, Inc.
4.9 INDIA
Surgical Robots (US $ mln): India 2016-2026
Year US $ mln % of Region % of Globe2016 1,303.4914 16.017 5.8522017 1,338.1926 15.840 5.8582018 1,370.4833 15.680 5.8632019 1,403.5532 15.519 5.8672020 1,437.4210 15.357 5.8702021 1,472.1061 15.195 5.8712022 1,507.6281 15.033 5.8722023 1,544.0073 14.870 5.8712024 1,581.2386 14.707 5.8702025 1,619.2135 14.544 5.8672026 1,658.0746 14.381 5.863
Source: Philip M. Parker, INSEAD, copyright 2020, www.icongrouponline.com
Surgical Robots (US $ mln): India 2021
CityWorldRank US $ mln
% ofCountry
% ofRegion
% ofGlobe
GreaterMumbai 48 143.5746 9.753 1.482 0.573Bangalore 51 137.4387 9.336 1.419 0.548Delhi 55 130.4268 8.860 1.346 0.520GreaterHyderabad 66 111.5261 7.576 1.151 0.445Ahmadabad 101 78.9652 5.364 0.815 0.315Surat 125 69.3899 4.714 0.716 0.277Chennai 160 55.2233 3.751 0.570 0.220Kolkata 173 50.2595 3.414 0.519 0.200Jaipur 198 39.3948 2.676 0.407 0.157Pune 202 38.4842 2.614 0.397 0.153Lucknow 217 35.4518 2.408 0.366 0.141Kanpur 226 32.4240 2.203 0.335 0.129Nagpur 251 29.0910 1.976 0.300 0.116PimpriChinchwad 276 25.7698 1.751 0.266 0.103Thane 283 24.4179 1.659 0.252 0.097Indore 284 24.2192 1.645 0.250 0.097Bhopal 294 22.3989 1.522 0.231 0.089Vadodara 309 20.9858 1.426 0.217 0.084
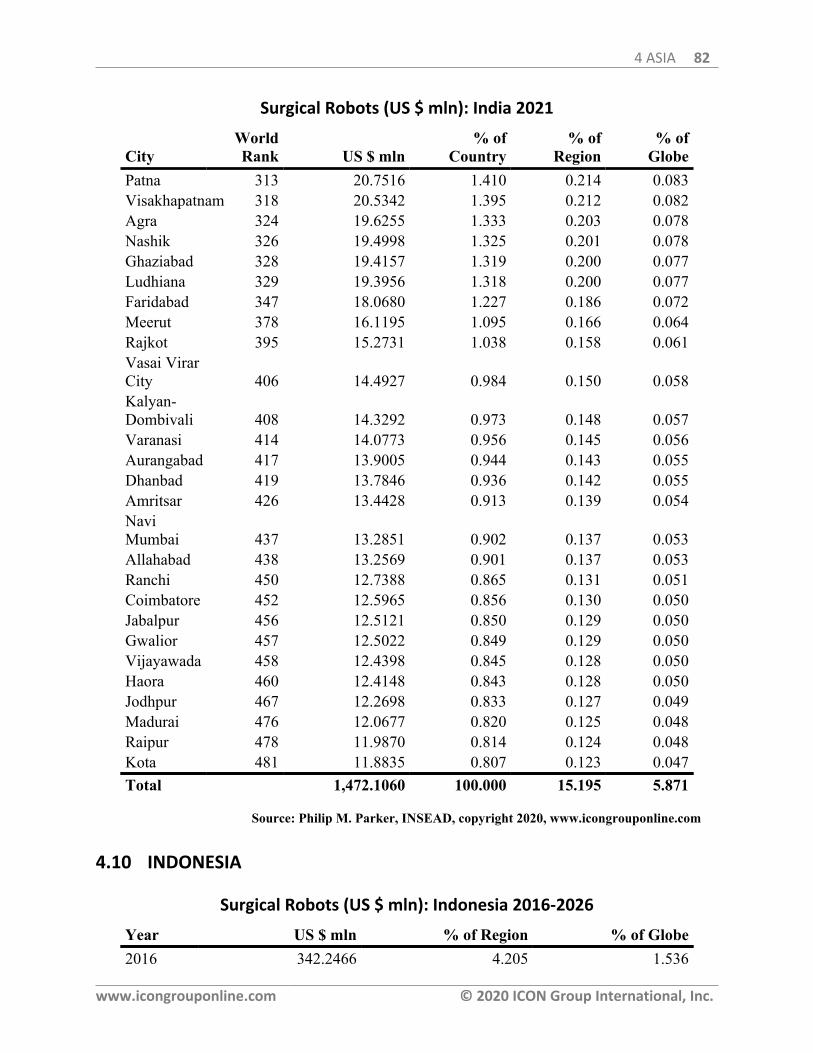
4 ASIA 82
www.icongrouponline.com © 2020 ICON Group International, Inc.
Surgical Robots (US $ mln): India 2021
CityWorldRank US $ mln
% ofCountry
% ofRegion
% ofGlobe
Patna 313 20.7516 1.410 0.214 0.083Visakhapatnam 318 20.5342 1.395 0.212 0.082Agra 324 19.6255 1.333 0.203 0.078Nashik 326 19.4998 1.325 0.201 0.078Ghaziabad 328 19.4157 1.319 0.200 0.077Ludhiana 329 19.3956 1.318 0.200 0.077Faridabad 347 18.0680 1.227 0.186 0.072Meerut 378 16.1195 1.095 0.166 0.064Rajkot 395 15.2731 1.038 0.158 0.061Vasai VirarCity 406 14.4927 0.984 0.150 0.058Kalyan-Dombivali 408 14.3292 0.973 0.148 0.057Varanasi 414 14.0773 0.956 0.145 0.056Aurangabad 417 13.9005 0.944 0.143 0.055Dhanbad 419 13.7846 0.936 0.142 0.055Amritsar 426 13.4428 0.913 0.139 0.054NaviMumbai 437 13.2851 0.902 0.137 0.053Allahabad 438 13.2569 0.901 0.137 0.053Ranchi 450 12.7388 0.865 0.131 0.051Coimbatore 452 12.5965 0.856 0.130 0.050Jabalpur 456 12.5121 0.850 0.129 0.050Gwalior 457 12.5022 0.849 0.129 0.050Vijayawada 458 12.4398 0.845 0.128 0.050Haora 460 12.4148 0.843 0.128 0.050Jodhpur 467 12.2698 0.833 0.127 0.049Madurai 476 12.0677 0.820 0.125 0.048Raipur 478 11.9870 0.814 0.124 0.048Kota 481 11.8835 0.807 0.123 0.047Total 1,472.1060 100.000 15.195 5.871
Source: Philip M. Parker, INSEAD, copyright 2020, www.icongrouponline.com
4.10 INDONESIA
Surgical Robots (US $ mln): Indonesia 2016-2026
Year US $ mln % of Region % of Globe2016 342.2466 4.205 1.536
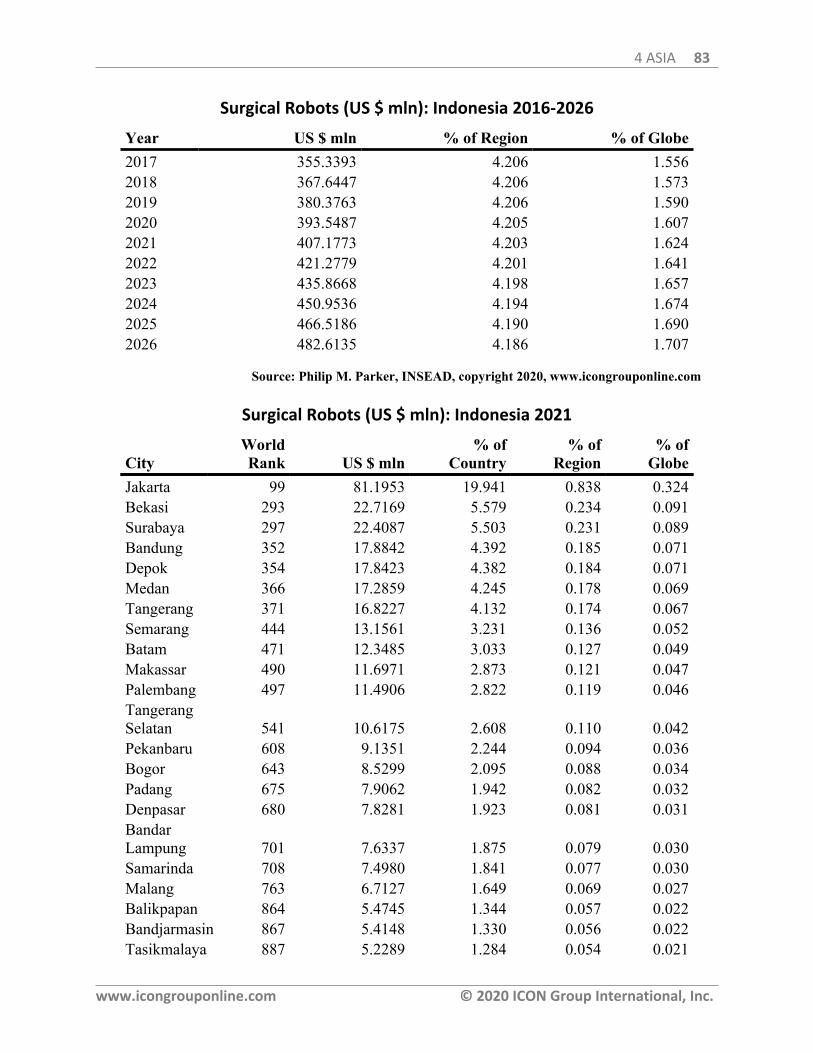
4 ASIA 83
www.icongrouponline.com © 2020 ICON Group International, Inc.
Surgical Robots (US $ mln): Indonesia 2016-2026
Year US $ mln % of Region % of Globe2017 355.3393 4.206 1.5562018 367.6447 4.206 1.5732019 380.3763 4.206 1.5902020 393.5487 4.205 1.6072021 407.1773 4.203 1.6242022 421.2779 4.201 1.6412023 435.8668 4.198 1.6572024 450.9536 4.194 1.6742025 466.5186 4.190 1.6902026 482.6135 4.186 1.707
Source: Philip M. Parker, INSEAD, copyright 2020, www.icongrouponline.com
Surgical Robots (US $ mln): Indonesia 2021
CityWorldRank US $ mln
% ofCountry
% ofRegion
% ofGlobe
Jakarta 99 81.1953 19.941 0.838 0.324Bekasi 293 22.7169 5.579 0.234 0.091Surabaya 297 22.4087 5.503 0.231 0.089Bandung 352 17.8842 4.392 0.185 0.071Depok 354 17.8423 4.382 0.184 0.071Medan 366 17.2859 4.245 0.178 0.069Tangerang 371 16.8227 4.132 0.174 0.067Semarang 444 13.1561 3.231 0.136 0.052Batam 471 12.3485 3.033 0.127 0.049Makassar 490 11.6971 2.873 0.121 0.047Palembang 497 11.4906 2.822 0.119 0.046TangerangSelatan 541 10.6175 2.608 0.110 0.042Pekanbaru 608 9.1351 2.244 0.094 0.036Bogor 643 8.5299 2.095 0.088 0.034Padang 675 7.9062 1.942 0.082 0.032Denpasar 680 7.8281 1.923 0.081 0.031BandarLampung 701 7.6337 1.875 0.079 0.030Samarinda 708 7.4980 1.841 0.077 0.030Malang 763 6.7127 1.649 0.069 0.027Balikpapan 864 5.4745 1.344 0.057 0.022Bandjarmasin 867 5.4148 1.330 0.056 0.022Tasikmalaya 887 5.2289 1.284 0.054 0.021
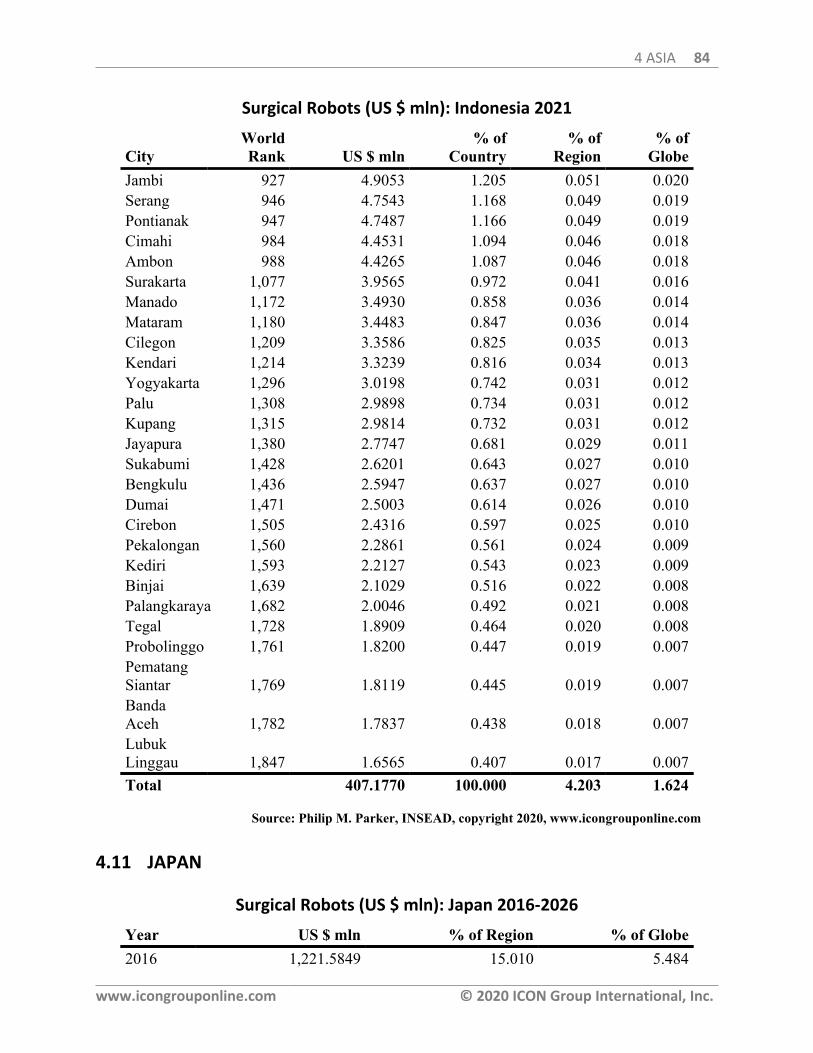
4 ASIA 84
www.icongrouponline.com © 2020 ICON Group International, Inc.
Surgical Robots (US $ mln): Indonesia 2021
CityWorldRank US $ mln
% ofCountry
% ofRegion
% ofGlobe
Jambi 927 4.9053 1.205 0.051 0.020Serang 946 4.7543 1.168 0.049 0.019Pontianak 947 4.7487 1.166 0.049 0.019Cimahi 984 4.4531 1.094 0.046 0.018Ambon 988 4.4265 1.087 0.046 0.018Surakarta 1,077 3.9565 0.972 0.041 0.016Manado 1,172 3.4930 0.858 0.036 0.014Mataram 1,180 3.4483 0.847 0.036 0.014Cilegon 1,209 3.3586 0.825 0.035 0.013Kendari 1,214 3.3239 0.816 0.034 0.013Yogyakarta 1,296 3.0198 0.742 0.031 0.012Palu 1,308 2.9898 0.734 0.031 0.012Kupang 1,315 2.9814 0.732 0.031 0.012Jayapura 1,380 2.7747 0.681 0.029 0.011Sukabumi 1,428 2.6201 0.643 0.027 0.010Bengkulu 1,436 2.5947 0.637 0.027 0.010Dumai 1,471 2.5003 0.614 0.026 0.010Cirebon 1,505 2.4316 0.597 0.025 0.010Pekalongan 1,560 2.2861 0.561 0.024 0.009Kediri 1,593 2.2127 0.543 0.023 0.009Binjai 1,639 2.1029 0.516 0.022 0.008Palangkaraya 1,682 2.0046 0.492 0.021 0.008Tegal 1,728 1.8909 0.464 0.020 0.008Probolinggo 1,761 1.8200 0.447 0.019 0.007PematangSiantar 1,769 1.8119 0.445 0.019 0.007BandaAceh 1,782 1.7837 0.438 0.018 0.007LubukLinggau 1,847 1.6565 0.407 0.017 0.007Total 407.1770 100.000 4.203 1.624
Source: Philip M. Parker, INSEAD, copyright 2020, www.icongrouponline.com
4.11 JAPAN
Surgical Robots (US $ mln): Japan 2016-2026
Year US $ mln % of Region % of Globe2016 1,221.5849 15.010 5.484
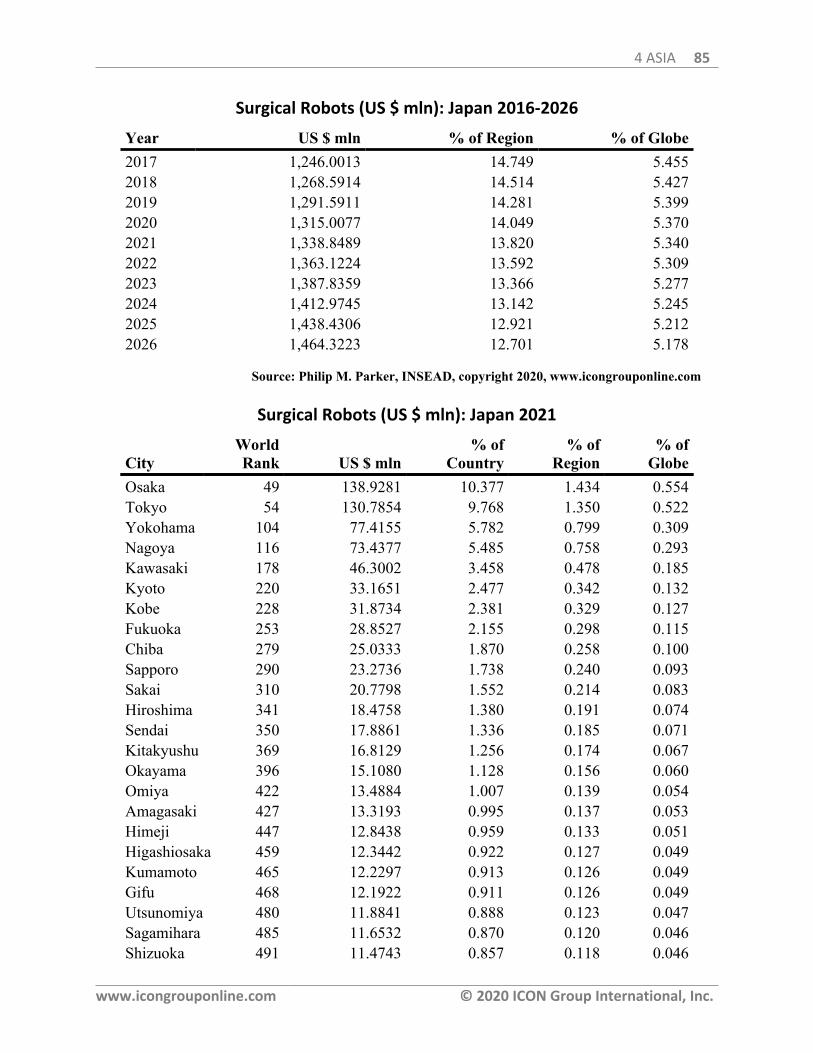
4 ASIA 85
www.icongrouponline.com © 2020 ICON Group International, Inc.
Surgical Robots (US $ mln): Japan 2016-2026
Year US $ mln % of Region % of Globe2017 1,246.0013 14.749 5.4552018 1,268.5914 14.514 5.4272019 1,291.5911 14.281 5.3992020 1,315.0077 14.049 5.3702021 1,338.8489 13.820 5.3402022 1,363.1224 13.592 5.3092023 1,387.8359 13.366 5.2772024 1,412.9745 13.142 5.2452025 1,438.4306 12.921 5.2122026 1,464.3223 12.701 5.178
Source: Philip M. Parker, INSEAD, copyright 2020, www.icongrouponline.com
Surgical Robots (US $ mln): Japan 2021
CityWorldRank US $ mln
% ofCountry
% ofRegion
% ofGlobe
Osaka 49 138.9281 10.377 1.434 0.554Tokyo 54 130.7854 9.768 1.350 0.522Yokohama 104 77.4155 5.782 0.799 0.309Nagoya 116 73.4377 5.485 0.758 0.293Kawasaki 178 46.3002 3.458 0.478 0.185Kyoto 220 33.1651 2.477 0.342 0.132Kobe 228 31.8734 2.381 0.329 0.127Fukuoka 253 28.8527 2.155 0.298 0.115Chiba 279 25.0333 1.870 0.258 0.100Sapporo 290 23.2736 1.738 0.240 0.093Sakai 310 20.7798 1.552 0.214 0.083Hiroshima 341 18.4758 1.380 0.191 0.074Sendai 350 17.8861 1.336 0.185 0.071Kitakyushu 369 16.8129 1.256 0.174 0.067Okayama 396 15.1080 1.128 0.156 0.060Omiya 422 13.4884 1.007 0.139 0.054Amagasaki 427 13.3193 0.995 0.137 0.053Himeji 447 12.8438 0.959 0.133 0.051Higashiosaka 459 12.3442 0.922 0.127 0.049Kumamoto 465 12.2297 0.913 0.126 0.049Gifu 468 12.1922 0.911 0.126 0.049Utsunomiya 480 11.8841 0.888 0.123 0.047Sagamihara 485 11.6532 0.870 0.120 0.046Shizuoka 491 11.4743 0.857 0.118 0.046
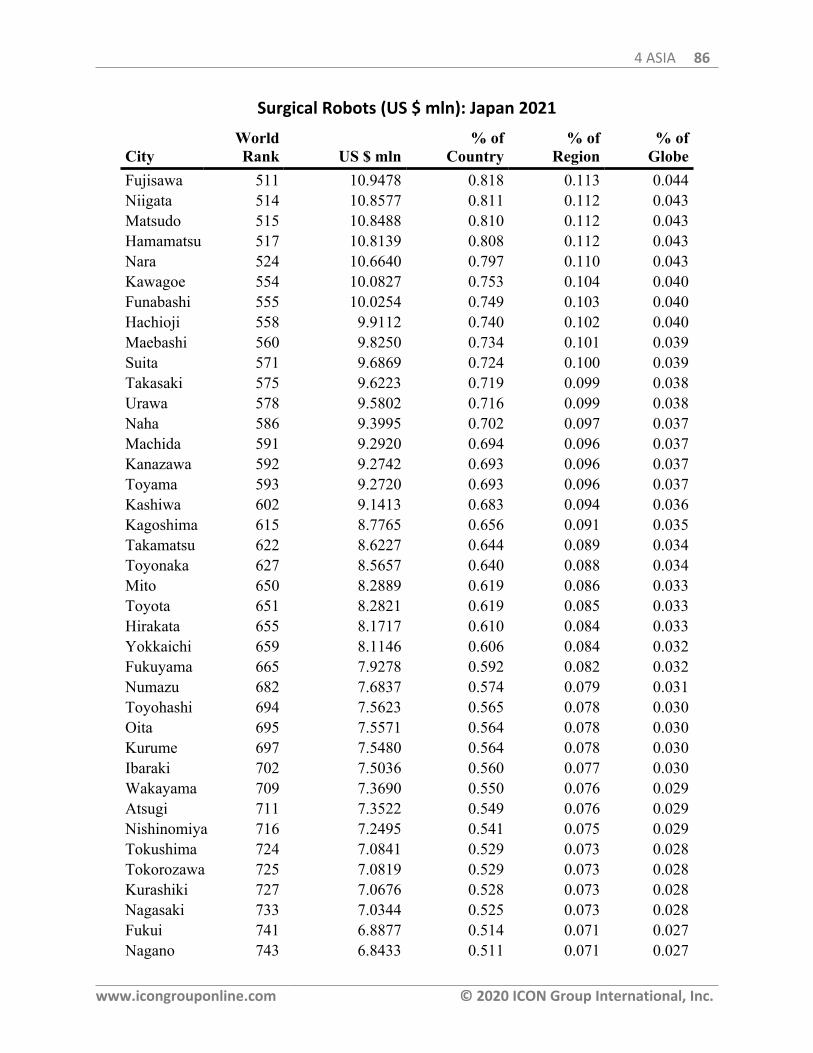
4 ASIA 86
www.icongrouponline.com © 2020 ICON Group International, Inc.
Surgical Robots (US $ mln): Japan 2021
CityWorldRank US $ mln
% ofCountry
% ofRegion
% ofGlobe
Fujisawa 511 10.9478 0.818 0.113 0.044Niigata 514 10.8577 0.811 0.112 0.043Matsudo 515 10.8488 0.810 0.112 0.043Hamamatsu 517 10.8139 0.808 0.112 0.043Nara 524 10.6640 0.797 0.110 0.043Kawagoe 554 10.0827 0.753 0.104 0.040Funabashi 555 10.0254 0.749 0.103 0.040Hachioji 558 9.9112 0.740 0.102 0.040Maebashi 560 9.8250 0.734 0.101 0.039Suita 571 9.6869 0.724 0.100 0.039Takasaki 575 9.6223 0.719 0.099 0.038Urawa 578 9.5802 0.716 0.099 0.038Naha 586 9.3995 0.702 0.097 0.037Machida 591 9.2920 0.694 0.096 0.037Kanazawa 592 9.2742 0.693 0.096 0.037Toyama 593 9.2720 0.693 0.096 0.037Kashiwa 602 9.1413 0.683 0.094 0.036Kagoshima 615 8.7765 0.656 0.091 0.035Takamatsu 622 8.6227 0.644 0.089 0.034Toyonaka 627 8.5657 0.640 0.088 0.034Mito 650 8.2889 0.619 0.086 0.033Toyota 651 8.2821 0.619 0.085 0.033Hirakata 655 8.1717 0.610 0.084 0.033Yokkaichi 659 8.1146 0.606 0.084 0.032Fukuyama 665 7.9278 0.592 0.082 0.032Numazu 682 7.6837 0.574 0.079 0.031Toyohashi 694 7.5623 0.565 0.078 0.030Oita 695 7.5571 0.564 0.078 0.030Kurume 697 7.5480 0.564 0.078 0.030Ibaraki 702 7.5036 0.560 0.077 0.030Wakayama 709 7.3690 0.550 0.076 0.029Atsugi 711 7.3522 0.549 0.076 0.029Nishinomiya 716 7.2495 0.541 0.075 0.029Tokushima 724 7.0841 0.529 0.073 0.028Tokorozawa 725 7.0819 0.529 0.073 0.028Kurashiki 727 7.0676 0.528 0.073 0.028Nagasaki 733 7.0344 0.525 0.073 0.028Fukui 741 6.8877 0.514 0.071 0.027Nagano 743 6.8433 0.511 0.071 0.027
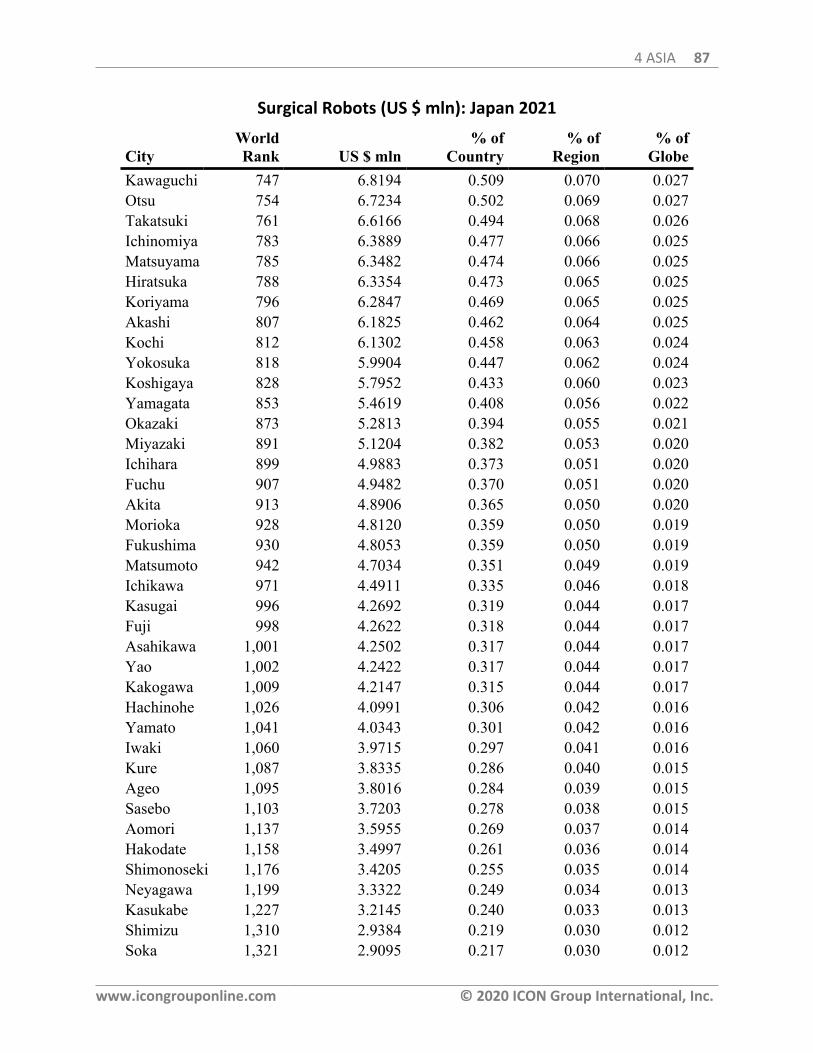
4 ASIA 87
www.icongrouponline.com © 2020 ICON Group International, Inc.
Surgical Robots (US $ mln): Japan 2021
CityWorldRank US $ mln
% ofCountry
% ofRegion
% ofGlobe
Kawaguchi 747 6.8194 0.509 0.070 0.027Otsu 754 6.7234 0.502 0.069 0.027Takatsuki 761 6.6166 0.494 0.068 0.026Ichinomiya 783 6.3889 0.477 0.066 0.025Matsuyama 785 6.3482 0.474 0.066 0.025Hiratsuka 788 6.3354 0.473 0.065 0.025Koriyama 796 6.2847 0.469 0.065 0.025Akashi 807 6.1825 0.462 0.064 0.025Kochi 812 6.1302 0.458 0.063 0.024Yokosuka 818 5.9904 0.447 0.062 0.024Koshigaya 828 5.7952 0.433 0.060 0.023Yamagata 853 5.4619 0.408 0.056 0.022Okazaki 873 5.2813 0.394 0.055 0.021Miyazaki 891 5.1204 0.382 0.053 0.020Ichihara 899 4.9883 0.373 0.051 0.020Fuchu 907 4.9482 0.370 0.051 0.020Akita 913 4.8906 0.365 0.050 0.020Morioka 928 4.8120 0.359 0.050 0.019Fukushima 930 4.8053 0.359 0.050 0.019Matsumoto 942 4.7034 0.351 0.049 0.019Ichikawa 971 4.4911 0.335 0.046 0.018Kasugai 996 4.2692 0.319 0.044 0.017Fuji 998 4.2622 0.318 0.044 0.017Asahikawa 1,001 4.2502 0.317 0.044 0.017Yao 1,002 4.2422 0.317 0.044 0.017Kakogawa 1,009 4.2147 0.315 0.044 0.017Hachinohe 1,026 4.0991 0.306 0.042 0.016Yamato 1,041 4.0343 0.301 0.042 0.016Iwaki 1,060 3.9715 0.297 0.041 0.016Kure 1,087 3.8335 0.286 0.040 0.015Ageo 1,095 3.8016 0.284 0.039 0.015Sasebo 1,103 3.7203 0.278 0.038 0.015Aomori 1,137 3.5955 0.269 0.037 0.014Hakodate 1,158 3.4997 0.261 0.036 0.014Shimonoseki 1,176 3.4205 0.255 0.035 0.014Neyagawa 1,199 3.3322 0.249 0.034 0.013Kasukabe 1,227 3.2145 0.240 0.033 0.013Shimizu 1,310 2.9384 0.219 0.030 0.012Soka 1,321 2.9095 0.217 0.030 0.012
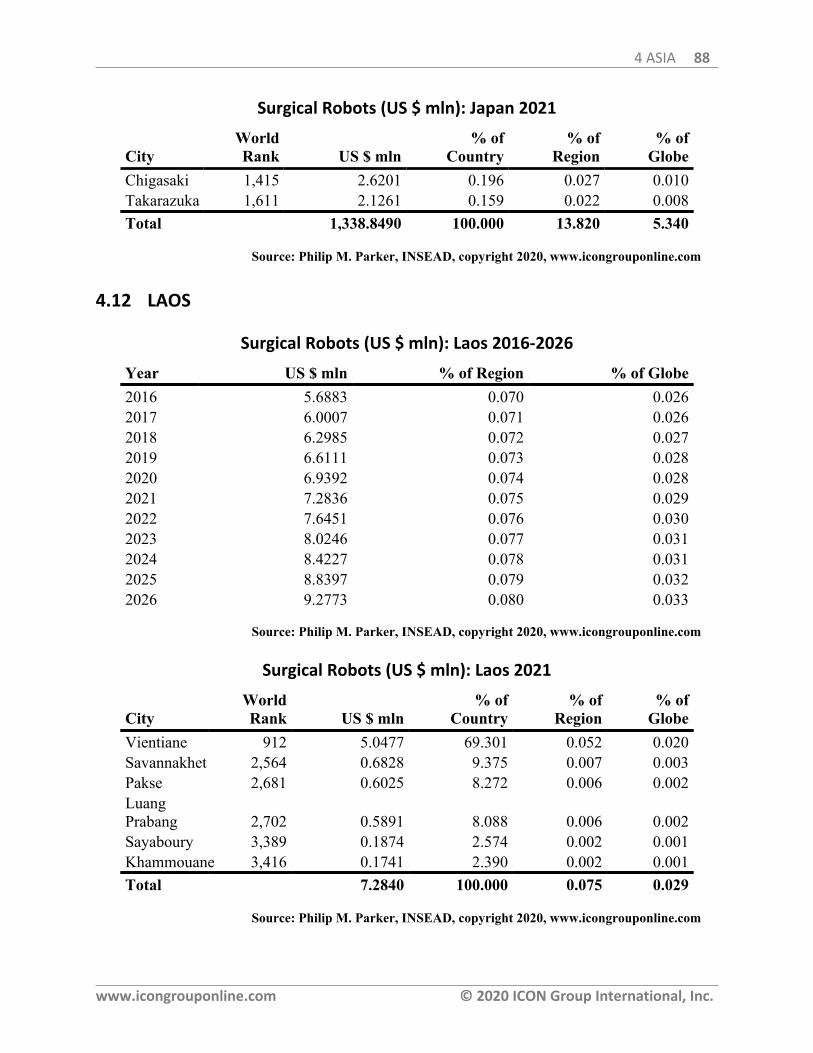
4 ASIA 88
www.icongrouponline.com © 2020 ICON Group International, Inc.
Surgical Robots (US $ mln): Japan 2021
CityWorldRank US $ mln
% ofCountry
% ofRegion
% ofGlobe
Chigasaki 1,415 2.6201 0.196 0.027 0.010Takarazuka 1,611 2.1261 0.159 0.022 0.008Total 1,338.8490 100.000 13.820 5.340
Source: Philip M. Parker, INSEAD, copyright 2020, www.icongrouponline.com
4.12 LAOS
Surgical Robots (US $ mln): Laos 2016-2026
Year US $ mln % of Region % of Globe2016 5.6883 0.070 0.0262017 6.0007 0.071 0.0262018 6.2985 0.072 0.0272019 6.6111 0.073 0.0282020 6.9392 0.074 0.0282021 7.2836 0.075 0.0292022 7.6451 0.076 0.0302023 8.0246 0.077 0.0312024 8.4227 0.078 0.0312025 8.8397 0.079 0.0322026 9.2773 0.080 0.033
Source: Philip M. Parker, INSEAD, copyright 2020, www.icongrouponline.com
Surgical Robots (US $ mln): Laos 2021
CityWorldRank US $ mln
% ofCountry
% ofRegion
% ofGlobe
Vientiane 912 5.0477 69.301 0.052 0.020Savannakhet 2,564 0.6828 9.375 0.007 0.003Pakse 2,681 0.6025 8.272 0.006 0.002LuangPrabang 2,702 0.5891 8.088 0.006 0.002Sayaboury 3,389 0.1874 2.574 0.002 0.001Khammouane 3,416 0.1741 2.390 0.002 0.001Total 7.2840 100.000 0.075 0.029
Source: Philip M. Parker, INSEAD, copyright 2020, www.icongrouponline.com
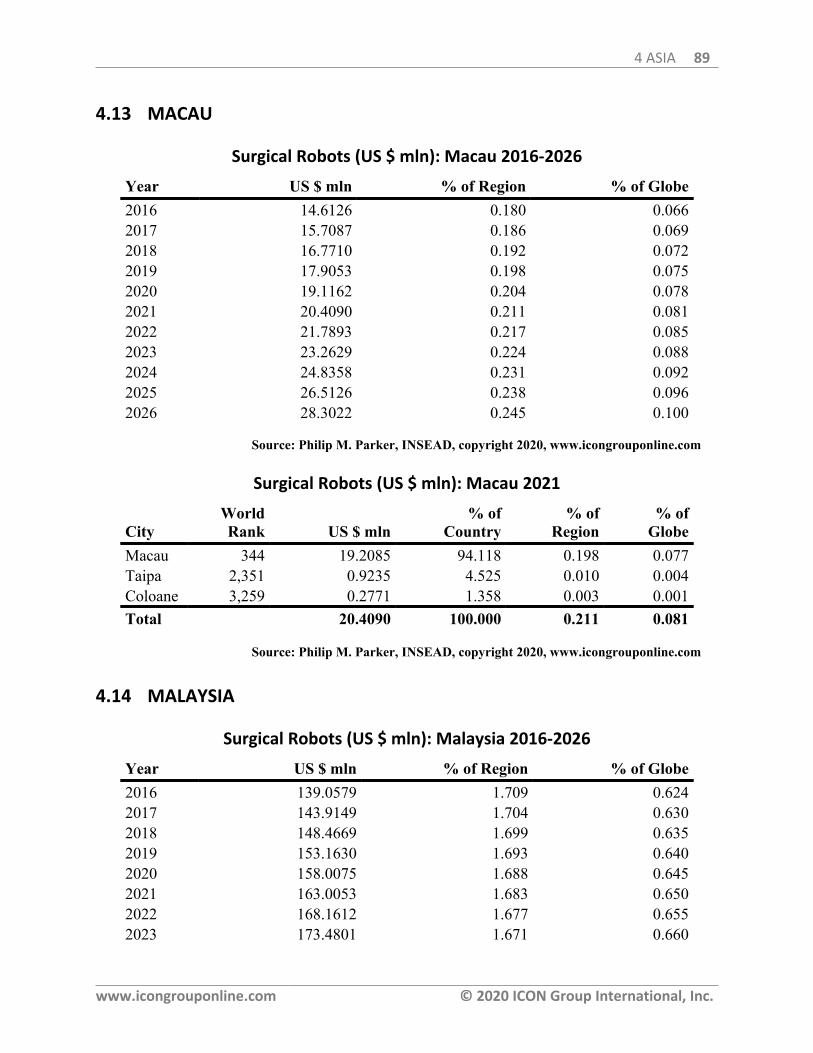
4 ASIA 89
www.icongrouponline.com © 2020 ICON Group International, Inc.
4.13 MACAU
Surgical Robots (US $ mln): Macau 2016-2026
Year US $ mln % of Region % of Globe2016 14.6126 0.180 0.0662017 15.7087 0.186 0.0692018 16.7710 0.192 0.0722019 17.9053 0.198 0.0752020 19.1162 0.204 0.0782021 20.4090 0.211 0.0812022 21.7893 0.217 0.0852023 23.2629 0.224 0.0882024 24.8358 0.231 0.0922025 26.5126 0.238 0.0962026 28.3022 0.245 0.100
Source: Philip M. Parker, INSEAD, copyright 2020, www.icongrouponline.com
Surgical Robots (US $ mln): Macau 2021
CityWorldRank US $ mln
% ofCountry
% ofRegion
% ofGlobe
Macau 344 19.2085 94.118 0.198 0.077Taipa 2,351 0.9235 4.525 0.010 0.004Coloane 3,259 0.2771 1.358 0.003 0.001Total 20.4090 100.000 0.211 0.081
Source: Philip M. Parker, INSEAD, copyright 2020, www.icongrouponline.com
4.14 MALAYSIA
Surgical Robots (US $ mln): Malaysia 2016-2026
Year US $ mln % of Region % of Globe2016 139.0579 1.709 0.6242017 143.9149 1.704 0.6302018 148.4669 1.699 0.6352019 153.1630 1.693 0.6402020 158.0075 1.688 0.6452021 163.0053 1.683 0.6502022 168.1612 1.677 0.6552023 173.4801 1.671 0.660
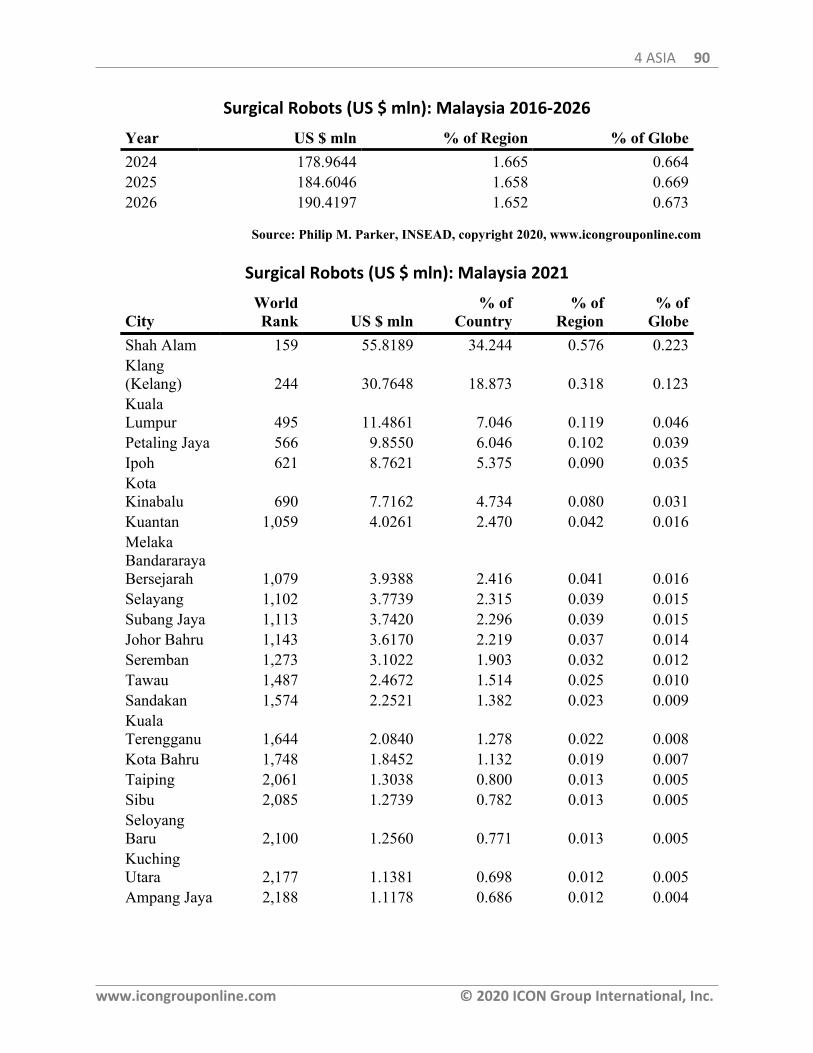
4 ASIA 90
www.icongrouponline.com © 2020 ICON Group International, Inc.
Surgical Robots (US $ mln): Malaysia 2016-2026
Year US $ mln % of Region % of Globe2024 178.9644 1.665 0.6642025 184.6046 1.658 0.6692026 190.4197 1.652 0.673
Source: Philip M. Parker, INSEAD, copyright 2020, www.icongrouponline.com
Surgical Robots (US $ mln): Malaysia 2021
CityWorldRank US $ mln
% ofCountry
% ofRegion
% ofGlobe
Shah Alam 159 55.8189 34.244 0.576 0.223Klang(Kelang) 244 30.7648 18.873 0.318 0.123KualaLumpur 495 11.4861 7.046 0.119 0.046Petaling Jaya 566 9.8550 6.046 0.102 0.039Ipoh 621 8.7621 5.375 0.090 0.035KotaKinabalu 690 7.7162 4.734 0.080 0.031Kuantan 1,059 4.0261 2.470 0.042 0.016MelakaBandararayaBersejarah 1,079 3.9388 2.416 0.041 0.016Selayang 1,102 3.7739 2.315 0.039 0.015Subang Jaya 1,113 3.7420 2.296 0.039 0.015Johor Bahru 1,143 3.6170 2.219 0.037 0.014Seremban 1,273 3.1022 1.903 0.032 0.012Tawau 1,487 2.4672 1.514 0.025 0.010Sandakan 1,574 2.2521 1.382 0.023 0.009KualaTerengganu 1,644 2.0840 1.278 0.022 0.008Kota Bahru 1,748 1.8452 1.132 0.019 0.007Taiping 2,061 1.3038 0.800 0.013 0.005Sibu 2,085 1.2739 0.782 0.013 0.005SeloyangBaru 2,100 1.2560 0.771 0.013 0.005KuchingUtara 2,177 1.1381 0.698 0.012 0.005Ampang Jaya 2,188 1.1178 0.686 0.012 0.004

4 ASIA 91
www.icongrouponline.com © 2020 ICON Group International, Inc.
Surgical Robots (US $ mln): Malaysia 2021
CityWorldRank US $ mln
% ofCountry
% ofRegion
% ofGlobe
Georgetown 2,308 0.9515 0.584 0.010 0.004Alor Setar 2,520 0.7128 0.437 0.007 0.003Total 163.0050 100.000 1.683 0.650
Source: Philip M. Parker, INSEAD, copyright 2020, www.icongrouponline.com
4.15 MALDIVES
Surgical Robots (US $ mln): Maldives 2016-2026
Year US $ mln % of Region % of Globe2016 0.8050 0.010 0.0042017 0.8277 0.010 0.0042018 0.8490 0.010 0.0042019 0.8707 0.010 0.0042020 0.8930 0.010 0.0042021 0.9159 0.009 0.0042022 0.9394 0.009 0.0042023 0.9635 0.009 0.0042024 0.9881 0.009 0.0042025 1.0134 0.009 0.0042026 1.0392 0.009 0.004
Source: Philip M. Parker, INSEAD, copyright 2020, www.icongrouponline.com
Surgical Robots (US $ mln): Maldives 2021
CityWorldRank US $ mln
% ofCountry
% ofRegion
% ofGlobe
Male 2,328 0.9159 100.000 0.009 0.004Total 0.9160 100.000 0.009 0.004
Source: Philip M. Parker, INSEAD, copyright 2020, www.icongrouponline.com
4.16 MONGOLIA
Surgical Robots (US $ mln): Mongolia 2016-2026
Year US $ mln % of Region % of Globe2016 4.8109 0.059 0.0222017 5.1691 0.061 0.023
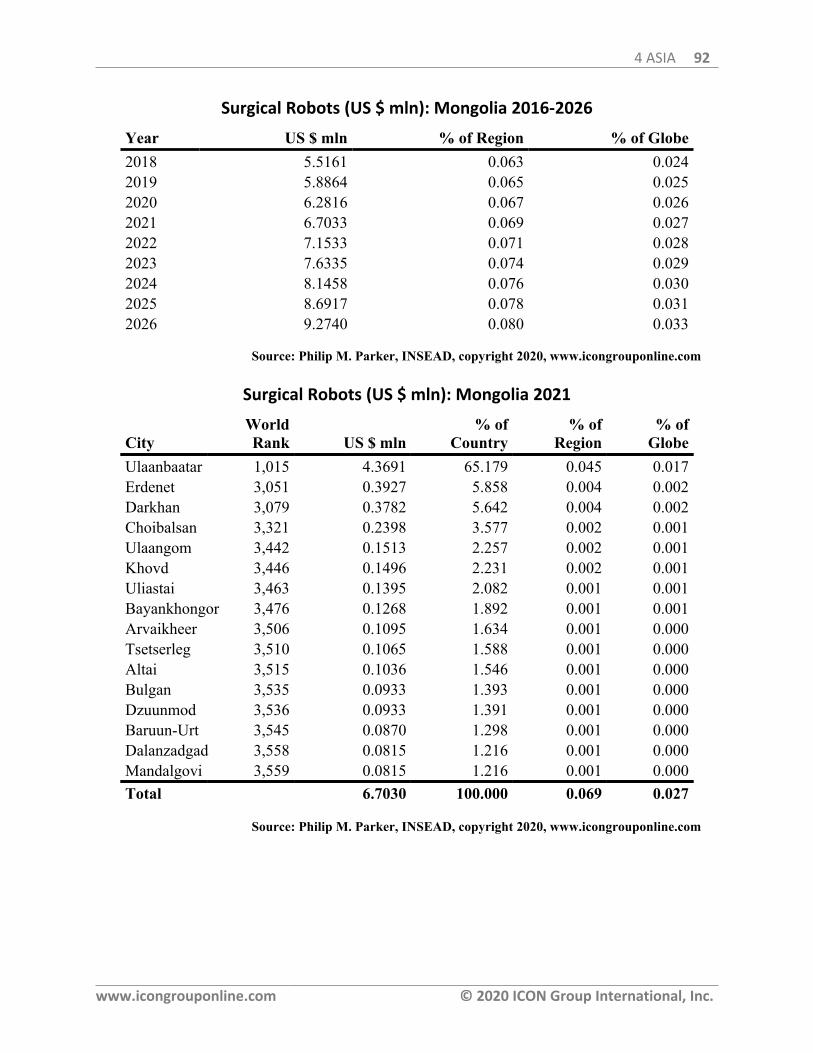
4 ASIA 92
www.icongrouponline.com © 2020 ICON Group International, Inc.
Surgical Robots (US $ mln): Mongolia 2016-2026
Year US $ mln % of Region % of Globe2018 5.5161 0.063 0.0242019 5.8864 0.065 0.0252020 6.2816 0.067 0.0262021 6.7033 0.069 0.0272022 7.1533 0.071 0.0282023 7.6335 0.074 0.0292024 8.1458 0.076 0.0302025 8.6917 0.078 0.0312026 9.2740 0.080 0.033
Source: Philip M. Parker, INSEAD, copyright 2020, www.icongrouponline.com
Surgical Robots (US $ mln): Mongolia 2021
CityWorldRank US $ mln
% ofCountry
% ofRegion
% ofGlobe
Ulaanbaatar 1,015 4.3691 65.179 0.045 0.017Erdenet 3,051 0.3927 5.858 0.004 0.002Darkhan 3,079 0.3782 5.642 0.004 0.002Choibalsan 3,321 0.2398 3.577 0.002 0.001Ulaangom 3,442 0.1513 2.257 0.002 0.001Khovd 3,446 0.1496 2.231 0.002 0.001Uliastai 3,463 0.1395 2.082 0.001 0.001Bayankhongor 3,476 0.1268 1.892 0.001 0.001Arvaikheer 3,506 0.1095 1.634 0.001 0.000Tsetserleg 3,510 0.1065 1.588 0.001 0.000Altai 3,515 0.1036 1.546 0.001 0.000Bulgan 3,535 0.0933 1.393 0.001 0.000Dzuunmod 3,536 0.0933 1.391 0.001 0.000Baruun-Urt 3,545 0.0870 1.298 0.001 0.000Dalanzadgad 3,558 0.0815 1.216 0.001 0.000Mandalgovi 3,559 0.0815 1.216 0.001 0.000Total 6.7030 100.000 0.069 0.027
Source: Philip M. Parker, INSEAD, copyright 2020, www.icongrouponline.com
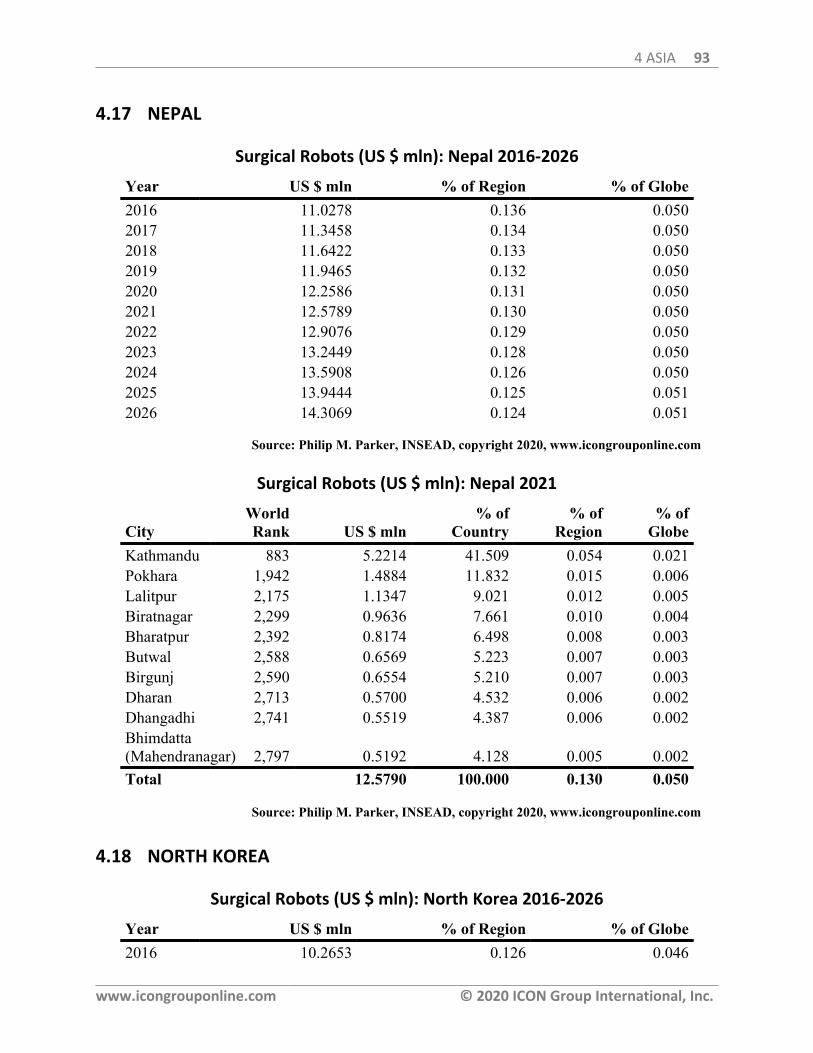
4 ASIA 93
www.icongrouponline.com © 2020 ICON Group International, Inc.
4.17 NEPAL
Surgical Robots (US $ mln): Nepal 2016-2026
Year US $ mln % of Region % of Globe2016 11.0278 0.136 0.0502017 11.3458 0.134 0.0502018 11.6422 0.133 0.0502019 11.9465 0.132 0.0502020 12.2586 0.131 0.0502021 12.5789 0.130 0.0502022 12.9076 0.129 0.0502023 13.2449 0.128 0.0502024 13.5908 0.126 0.0502025 13.9444 0.125 0.0512026 14.3069 0.124 0.051
Source: Philip M. Parker, INSEAD, copyright 2020, www.icongrouponline.com
Surgical Robots (US $ mln): Nepal 2021
CityWorldRank US $ mln
% ofCountry
% ofRegion
% ofGlobe
Kathmandu 883 5.2214 41.509 0.054 0.021Pokhara 1,942 1.4884 11.832 0.015 0.006Lalitpur 2,175 1.1347 9.021 0.012 0.005Biratnagar 2,299 0.9636 7.661 0.010 0.004Bharatpur 2,392 0.8174 6.498 0.008 0.003Butwal 2,588 0.6569 5.223 0.007 0.003Birgunj 2,590 0.6554 5.210 0.007 0.003Dharan 2,713 0.5700 4.532 0.006 0.002Dhangadhi 2,741 0.5519 4.387 0.006 0.002Bhimdatta(Mahendranagar) 2,797 0.5192 4.128 0.005 0.002Total 12.5790 100.000 0.130 0.050
Source: Philip M. Parker, INSEAD, copyright 2020, www.icongrouponline.com
4.18 NORTH KOREA
Surgical Robots (US $ mln): North Korea 2016-2026
Year US $ mln % of Region % of Globe2016 10.2653 0.126 0.046
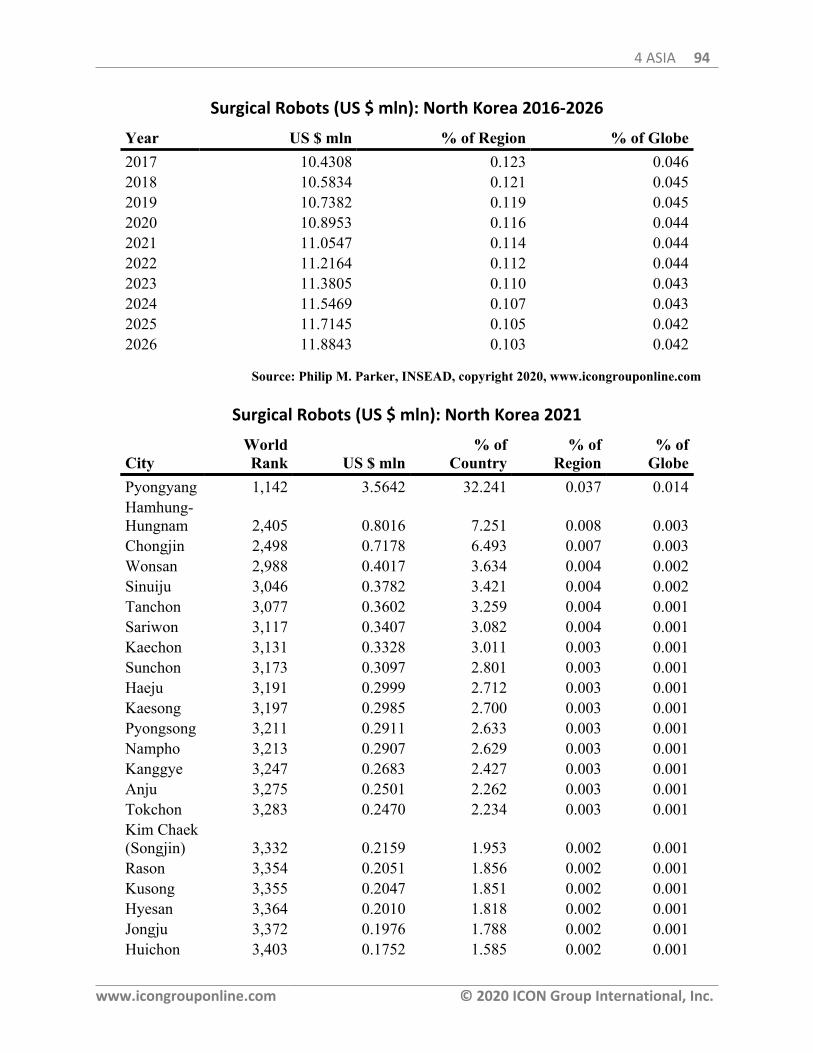
4 ASIA 94
www.icongrouponline.com © 2020 ICON Group International, Inc.
Surgical Robots (US $ mln): North Korea 2016-2026
Year US $ mln % of Region % of Globe2017 10.4308 0.123 0.0462018 10.5834 0.121 0.0452019 10.7382 0.119 0.0452020 10.8953 0.116 0.0442021 11.0547 0.114 0.0442022 11.2164 0.112 0.0442023 11.3805 0.110 0.0432024 11.5469 0.107 0.0432025 11.7145 0.105 0.0422026 11.8843 0.103 0.042
Source: Philip M. Parker, INSEAD, copyright 2020, www.icongrouponline.com
Surgical Robots (US $ mln): North Korea 2021
CityWorldRank US $ mln
% ofCountry
% ofRegion
% ofGlobe
Pyongyang 1,142 3.5642 32.241 0.037 0.014Hamhung-Hungnam 2,405 0.8016 7.251 0.008 0.003Chongjin 2,498 0.7178 6.493 0.007 0.003Wonsan 2,988 0.4017 3.634 0.004 0.002Sinuiju 3,046 0.3782 3.421 0.004 0.002Tanchon 3,077 0.3602 3.259 0.004 0.001Sariwon 3,117 0.3407 3.082 0.004 0.001Kaechon 3,131 0.3328 3.011 0.003 0.001Sunchon 3,173 0.3097 2.801 0.003 0.001Haeju 3,191 0.2999 2.712 0.003 0.001Kaesong 3,197 0.2985 2.700 0.003 0.001Pyongsong 3,211 0.2911 2.633 0.003 0.001Nampho 3,213 0.2907 2.629 0.003 0.001Kanggye 3,247 0.2683 2.427 0.003 0.001Anju 3,275 0.2501 2.262 0.003 0.001Tokchon 3,283 0.2470 2.234 0.003 0.001Kim Chaek(Songjin) 3,332 0.2159 1.953 0.002 0.001Rason 3,354 0.2051 1.856 0.002 0.001Kusong 3,355 0.2047 1.851 0.002 0.001Hyesan 3,364 0.2010 1.818 0.002 0.001Jongju 3,372 0.1976 1.788 0.002 0.001Huichon 3,403 0.1752 1.585 0.002 0.001
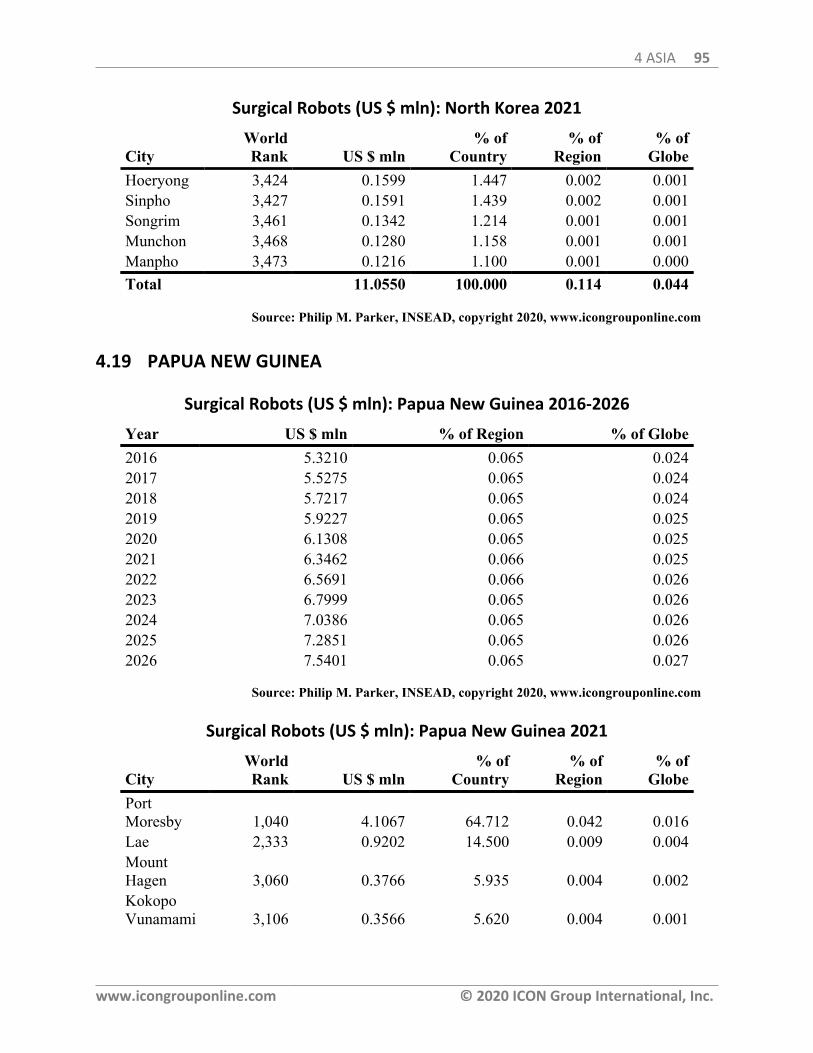
4 ASIA 95
www.icongrouponline.com © 2020 ICON Group International, Inc.
Surgical Robots (US $ mln): North Korea 2021
CityWorldRank US $ mln
% ofCountry
% ofRegion
% ofGlobe
Hoeryong 3,424 0.1599 1.447 0.002 0.001Sinpho 3,427 0.1591 1.439 0.002 0.001Songrim 3,461 0.1342 1.214 0.001 0.001Munchon 3,468 0.1280 1.158 0.001 0.001Manpho 3,473 0.1216 1.100 0.001 0.000Total 11.0550 100.000 0.114 0.044
Source: Philip M. Parker, INSEAD, copyright 2020, www.icongrouponline.com
4.19 PAPUA NEW GUINEA
Surgical Robots (US $ mln): Papua New Guinea 2016-2026
Year US $ mln % of Region % of Globe2016 5.3210 0.065 0.0242017 5.5275 0.065 0.0242018 5.7217 0.065 0.0242019 5.9227 0.065 0.0252020 6.1308 0.065 0.0252021 6.3462 0.066 0.0252022 6.5691 0.066 0.0262023 6.7999 0.065 0.0262024 7.0386 0.065 0.0262025 7.2851 0.065 0.0262026 7.5401 0.065 0.027
Source: Philip M. Parker, INSEAD, copyright 2020, www.icongrouponline.com
Surgical Robots (US $ mln): Papua New Guinea 2021
CityWorldRank US $ mln
% ofCountry
% ofRegion
% ofGlobe
PortMoresby 1,040 4.1067 64.712 0.042 0.016Lae 2,333 0.9202 14.500 0.009 0.004MountHagen 3,060 0.3766 5.935 0.004 0.002KokopoVunamami 3,106 0.3566 5.620 0.004 0.001
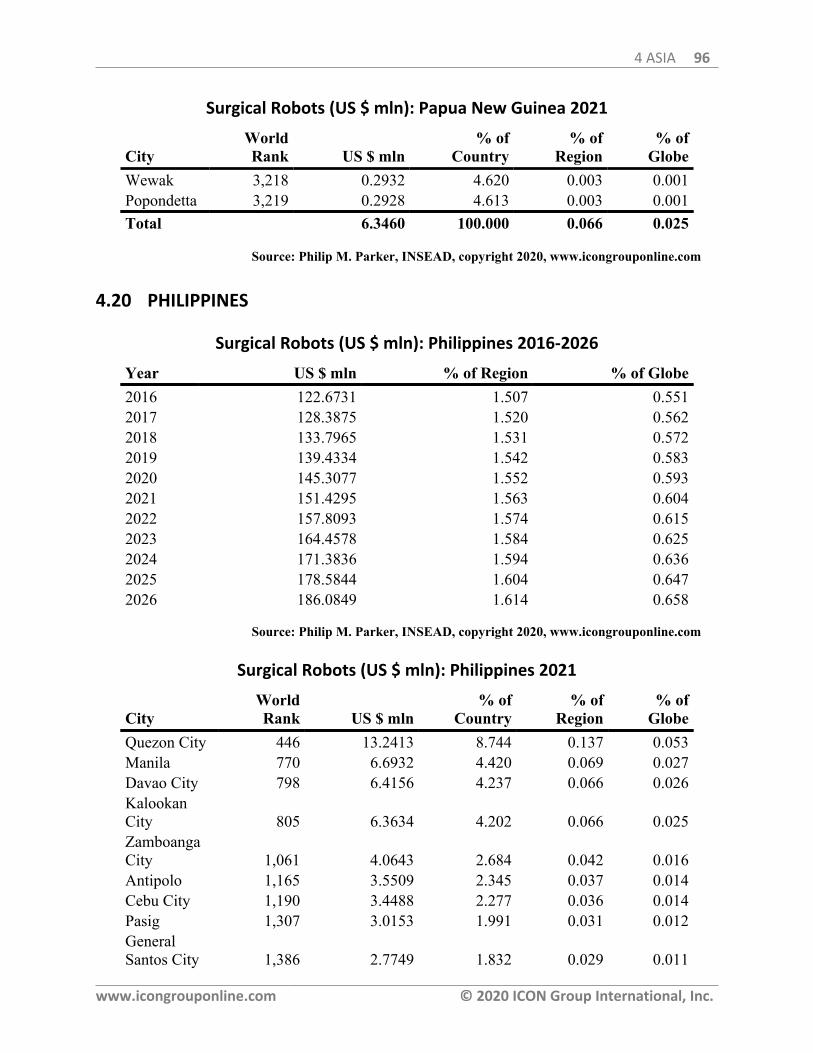
4 ASIA 96
www.icongrouponline.com © 2020 ICON Group International, Inc.
Surgical Robots (US $ mln): Papua New Guinea 2021
CityWorldRank US $ mln
% ofCountry
% ofRegion
% ofGlobe
Wewak 3,218 0.2932 4.620 0.003 0.001Popondetta 3,219 0.2928 4.613 0.003 0.001Total 6.3460 100.000 0.066 0.025
Source: Philip M. Parker, INSEAD, copyright 2020, www.icongrouponline.com
4.20 PHILIPPINES
Surgical Robots (US $ mln): Philippines 2016-2026
Year US $ mln % of Region % of Globe2016 122.6731 1.507 0.5512017 128.3875 1.520 0.5622018 133.7965 1.531 0.5722019 139.4334 1.542 0.5832020 145.3077 1.552 0.5932021 151.4295 1.563 0.6042022 157.8093 1.574 0.6152023 164.4578 1.584 0.6252024 171.3836 1.594 0.6362025 178.5844 1.604 0.6472026 186.0849 1.614 0.658
Source: Philip M. Parker, INSEAD, copyright 2020, www.icongrouponline.com
Surgical Robots (US $ mln): Philippines 2021
CityWorldRank US $ mln
% ofCountry
% ofRegion
% ofGlobe
Quezon City 446 13.2413 8.744 0.137 0.053Manila 770 6.6932 4.420 0.069 0.027Davao City 798 6.4156 4.237 0.066 0.026KalookanCity 805 6.3634 4.202 0.066 0.025ZamboangaCity 1,061 4.0643 2.684 0.042 0.016Antipolo 1,165 3.5509 2.345 0.037 0.014Cebu City 1,190 3.4488 2.277 0.036 0.014Pasig 1,307 3.0153 1.991 0.031 0.012GeneralSantos City 1,386 2.7749 1.832 0.029 0.011
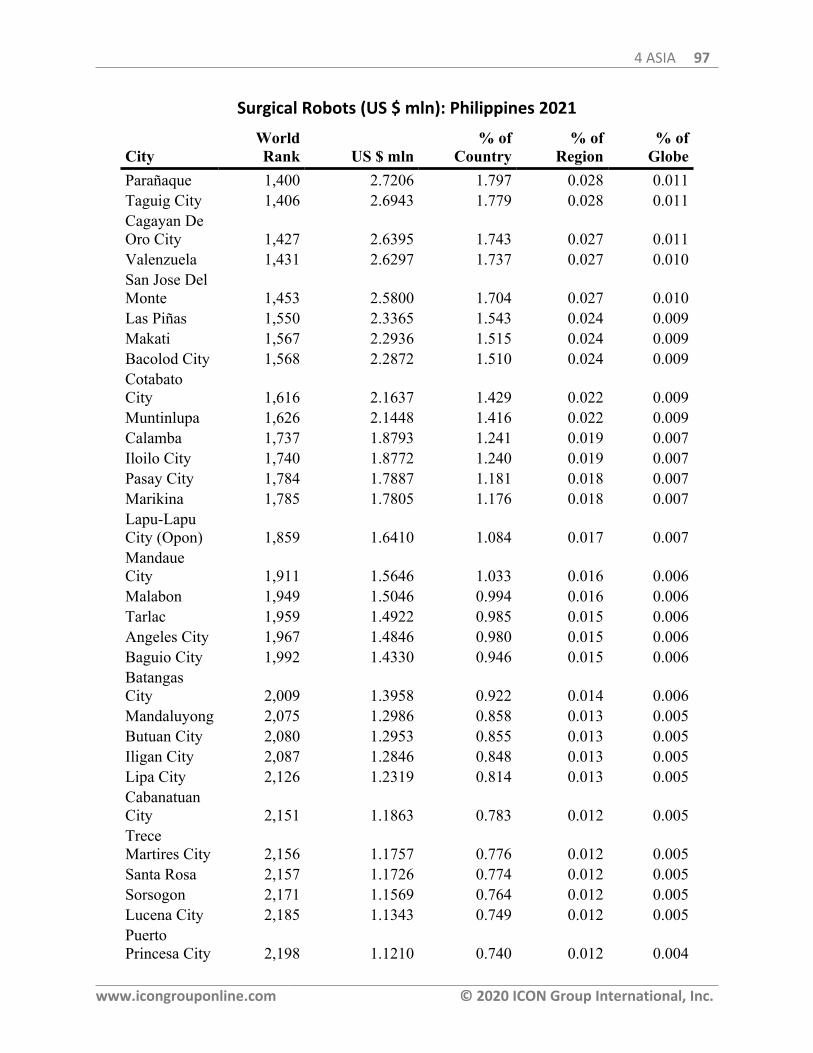
4 ASIA 97
www.icongrouponline.com © 2020 ICON Group International, Inc.
Surgical Robots (US $ mln): Philippines 2021
CityWorldRank US $ mln
% ofCountry
% ofRegion
% ofGlobe
Parañaque 1,400 2.7206 1.797 0.028 0.011Taguig City 1,406 2.6943 1.779 0.028 0.011Cagayan DeOro City 1,427 2.6395 1.743 0.027 0.011Valenzuela 1,431 2.6297 1.737 0.027 0.010San Jose DelMonte 1,453 2.5800 1.704 0.027 0.010Las Piñas 1,550 2.3365 1.543 0.024 0.009Makati 1,567 2.2936 1.515 0.024 0.009Bacolod City 1,568 2.2872 1.510 0.024 0.009CotabatoCity 1,616 2.1637 1.429 0.022 0.009Muntinlupa 1,626 2.1448 1.416 0.022 0.009Calamba 1,737 1.8793 1.241 0.019 0.007Iloilo City 1,740 1.8772 1.240 0.019 0.007Pasay City 1,784 1.7887 1.181 0.018 0.007Marikina 1,785 1.7805 1.176 0.018 0.007Lapu-LapuCity (Opon) 1,859 1.6410 1.084 0.017 0.007MandaueCity 1,911 1.5646 1.033 0.016 0.006Malabon 1,949 1.5046 0.994 0.016 0.006Tarlac 1,959 1.4922 0.985 0.015 0.006Angeles City 1,967 1.4846 0.980 0.015 0.006Baguio City 1,992 1.4330 0.946 0.015 0.006BatangasCity 2,009 1.3958 0.922 0.014 0.006Mandaluyong 2,075 1.2986 0.858 0.013 0.005Butuan City 2,080 1.2953 0.855 0.013 0.005Iligan City 2,087 1.2846 0.848 0.013 0.005Lipa City 2,126 1.2319 0.814 0.013 0.005CabanatuanCity 2,151 1.1863 0.783 0.012 0.005TreceMartires City 2,156 1.1757 0.776 0.012 0.005Santa Rosa 2,157 1.1726 0.774 0.012 0.005Sorsogon 2,171 1.1569 0.764 0.012 0.005Lucena City 2,185 1.1343 0.749 0.012 0.005PuertoPrincesa City 2,198 1.1210 0.740 0.012 0.004
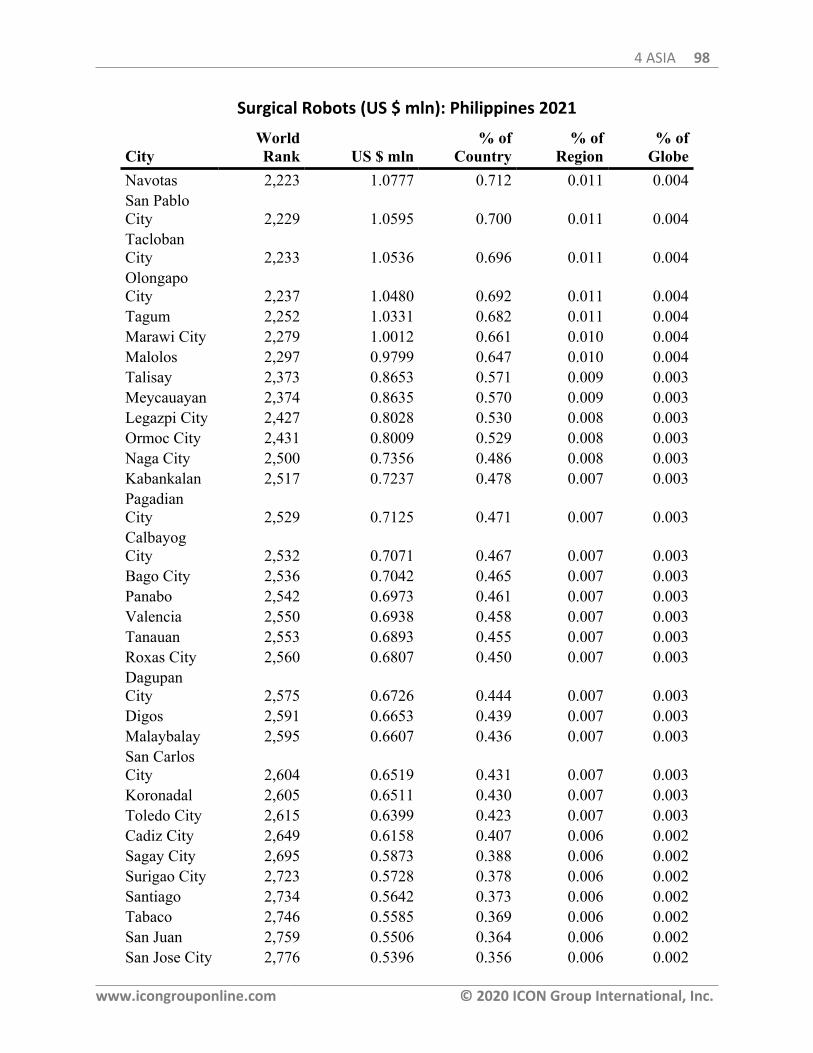
4 ASIA 98
www.icongrouponline.com © 2020 ICON Group International, Inc.
Surgical Robots (US $ mln): Philippines 2021
CityWorldRank US $ mln
% ofCountry
% ofRegion
% ofGlobe
Navotas 2,223 1.0777 0.712 0.011 0.004San PabloCity 2,229 1.0595 0.700 0.011 0.004TaclobanCity 2,233 1.0536 0.696 0.011 0.004OlongapoCity 2,237 1.0480 0.692 0.011 0.004Tagum 2,252 1.0331 0.682 0.011 0.004Marawi City 2,279 1.0012 0.661 0.010 0.004Malolos 2,297 0.9799 0.647 0.010 0.004Talisay 2,373 0.8653 0.571 0.009 0.003Meycauayan 2,374 0.8635 0.570 0.009 0.003Legazpi City 2,427 0.8028 0.530 0.008 0.003Ormoc City 2,431 0.8009 0.529 0.008 0.003Naga City 2,500 0.7356 0.486 0.008 0.003Kabankalan 2,517 0.7237 0.478 0.007 0.003PagadianCity 2,529 0.7125 0.471 0.007 0.003CalbayogCity 2,532 0.7071 0.467 0.007 0.003Bago City 2,536 0.7042 0.465 0.007 0.003Panabo 2,542 0.6973 0.461 0.007 0.003Valencia 2,550 0.6938 0.458 0.007 0.003Tanauan 2,553 0.6893 0.455 0.007 0.003Roxas City 2,560 0.6807 0.450 0.007 0.003DagupanCity 2,575 0.6726 0.444 0.007 0.003Digos 2,591 0.6653 0.439 0.007 0.003Malaybalay 2,595 0.6607 0.436 0.007 0.003San CarlosCity 2,604 0.6519 0.431 0.007 0.003Koronadal 2,605 0.6511 0.430 0.007 0.003Toledo City 2,615 0.6399 0.423 0.007 0.003Cadiz City 2,649 0.6158 0.407 0.006 0.002Sagay City 2,695 0.5873 0.388 0.006 0.002Surigao City 2,723 0.5728 0.378 0.006 0.002Santiago 2,734 0.5642 0.373 0.006 0.002Tabaco 2,746 0.5585 0.369 0.006 0.002San Juan 2,759 0.5506 0.364 0.006 0.002San Jose City 2,776 0.5396 0.356 0.006 0.002
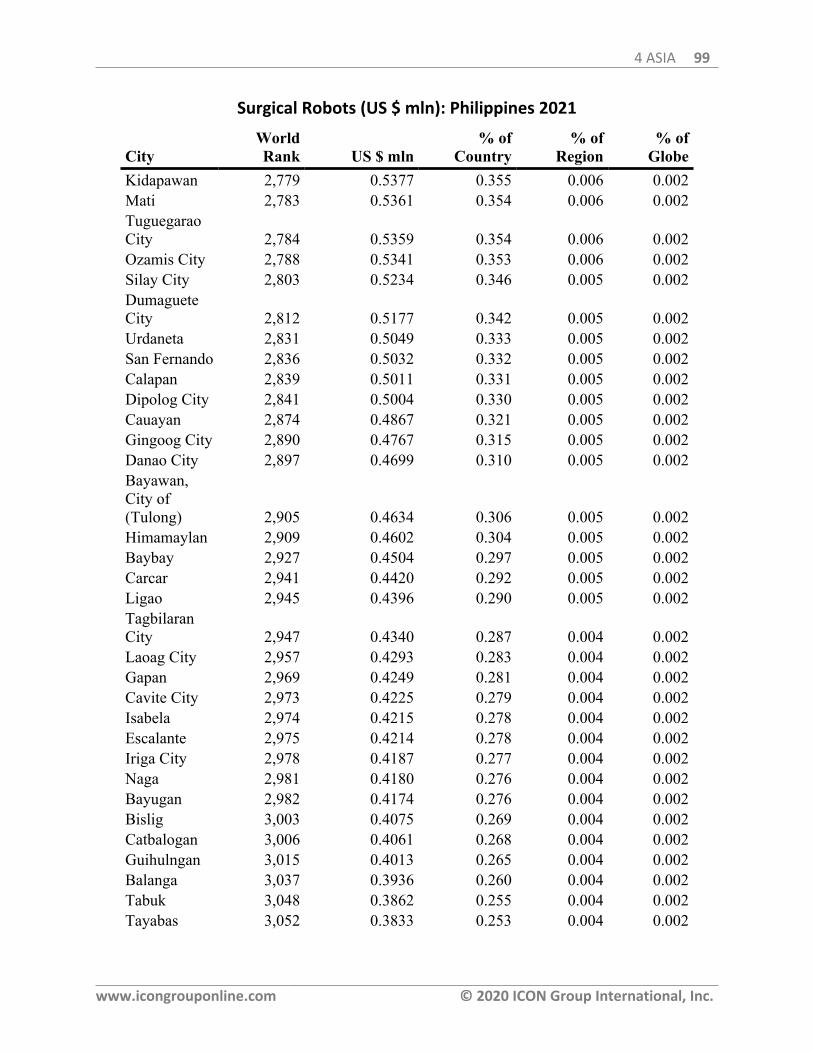
4 ASIA 99
www.icongrouponline.com © 2020 ICON Group International, Inc.
Surgical Robots (US $ mln): Philippines 2021
CityWorldRank US $ mln
% ofCountry
% ofRegion
% ofGlobe
Kidapawan 2,779 0.5377 0.355 0.006 0.002Mati 2,783 0.5361 0.354 0.006 0.002TuguegaraoCity 2,784 0.5359 0.354 0.006 0.002Ozamis City 2,788 0.5341 0.353 0.006 0.002Silay City 2,803 0.5234 0.346 0.005 0.002DumagueteCity 2,812 0.5177 0.342 0.005 0.002Urdaneta 2,831 0.5049 0.333 0.005 0.002San Fernando 2,836 0.5032 0.332 0.005 0.002Calapan 2,839 0.5011 0.331 0.005 0.002Dipolog City 2,841 0.5004 0.330 0.005 0.002Cauayan 2,874 0.4867 0.321 0.005 0.002Gingoog City 2,890 0.4767 0.315 0.005 0.002Danao City 2,897 0.4699 0.310 0.005 0.002Bayawan,City of(Tulong) 2,905 0.4634 0.306 0.005 0.002Himamaylan 2,909 0.4602 0.304 0.005 0.002Baybay 2,927 0.4504 0.297 0.005 0.002Carcar 2,941 0.4420 0.292 0.005 0.002Ligao 2,945 0.4396 0.290 0.005 0.002TagbilaranCity 2,947 0.4340 0.287 0.004 0.002Laoag City 2,957 0.4293 0.283 0.004 0.002Gapan 2,969 0.4249 0.281 0.004 0.002Cavite City 2,973 0.4225 0.279 0.004 0.002Isabela 2,974 0.4215 0.278 0.004 0.002Escalante 2,975 0.4214 0.278 0.004 0.002Iriga City 2,978 0.4187 0.277 0.004 0.002Naga 2,981 0.4180 0.276 0.004 0.002Bayugan 2,982 0.4174 0.276 0.004 0.002Bislig 3,003 0.4075 0.269 0.004 0.002Catbalogan 3,006 0.4061 0.268 0.004 0.002Guihulngan 3,015 0.4013 0.265 0.004 0.002Balanga 3,037 0.3936 0.260 0.004 0.002Tabuk 3,048 0.3862 0.255 0.004 0.002Tayabas 3,052 0.3833 0.253 0.004 0.002
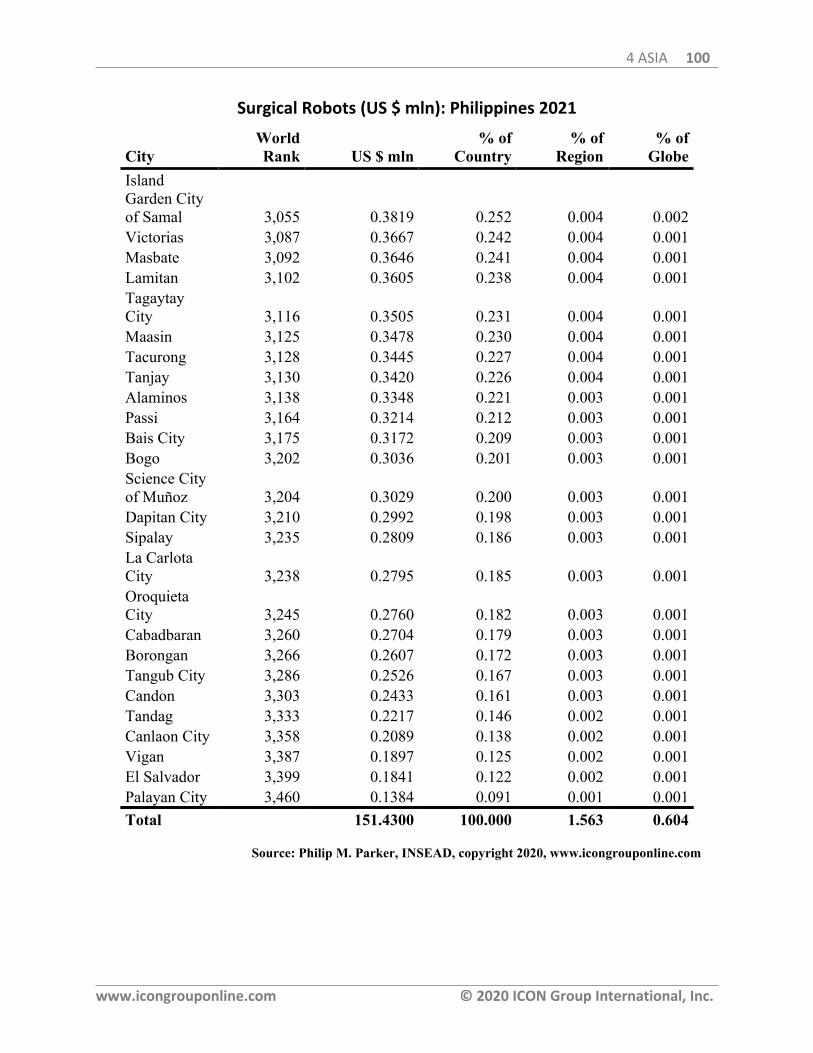
4 ASIA 100
www.icongrouponline.com © 2020 ICON Group International, Inc.
Surgical Robots (US $ mln): Philippines 2021
CityWorldRank US $ mln
% ofCountry
% ofRegion
% ofGlobe
IslandGarden Cityof Samal 3,055 0.3819 0.252 0.004 0.002Victorias 3,087 0.3667 0.242 0.004 0.001Masbate 3,092 0.3646 0.241 0.004 0.001Lamitan 3,102 0.3605 0.238 0.004 0.001TagaytayCity 3,116 0.3505 0.231 0.004 0.001Maasin 3,125 0.3478 0.230 0.004 0.001Tacurong 3,128 0.3445 0.227 0.004 0.001Tanjay 3,130 0.3420 0.226 0.004 0.001Alaminos 3,138 0.3348 0.221 0.003 0.001Passi 3,164 0.3214 0.212 0.003 0.001Bais City 3,175 0.3172 0.209 0.003 0.001Bogo 3,202 0.3036 0.201 0.003 0.001Science Cityof Muñoz 3,204 0.3029 0.200 0.003 0.001Dapitan City 3,210 0.2992 0.198 0.003 0.001Sipalay 3,235 0.2809 0.186 0.003 0.001La CarlotaCity 3,238 0.2795 0.185 0.003 0.001OroquietaCity 3,245 0.2760 0.182 0.003 0.001Cabadbaran 3,260 0.2704 0.179 0.003 0.001Borongan 3,266 0.2607 0.172 0.003 0.001Tangub City 3,286 0.2526 0.167 0.003 0.001Candon 3,303 0.2433 0.161 0.003 0.001Tandag 3,333 0.2217 0.146 0.002 0.001Canlaon City 3,358 0.2089 0.138 0.002 0.001Vigan 3,387 0.1897 0.125 0.002 0.001El Salvador 3,399 0.1841 0.122 0.002 0.001Palayan City 3,460 0.1384 0.091 0.001 0.001Total 151.4300 100.000 1.563 0.604
Source: Philip M. Parker, INSEAD, copyright 2020, www.icongrouponline.com
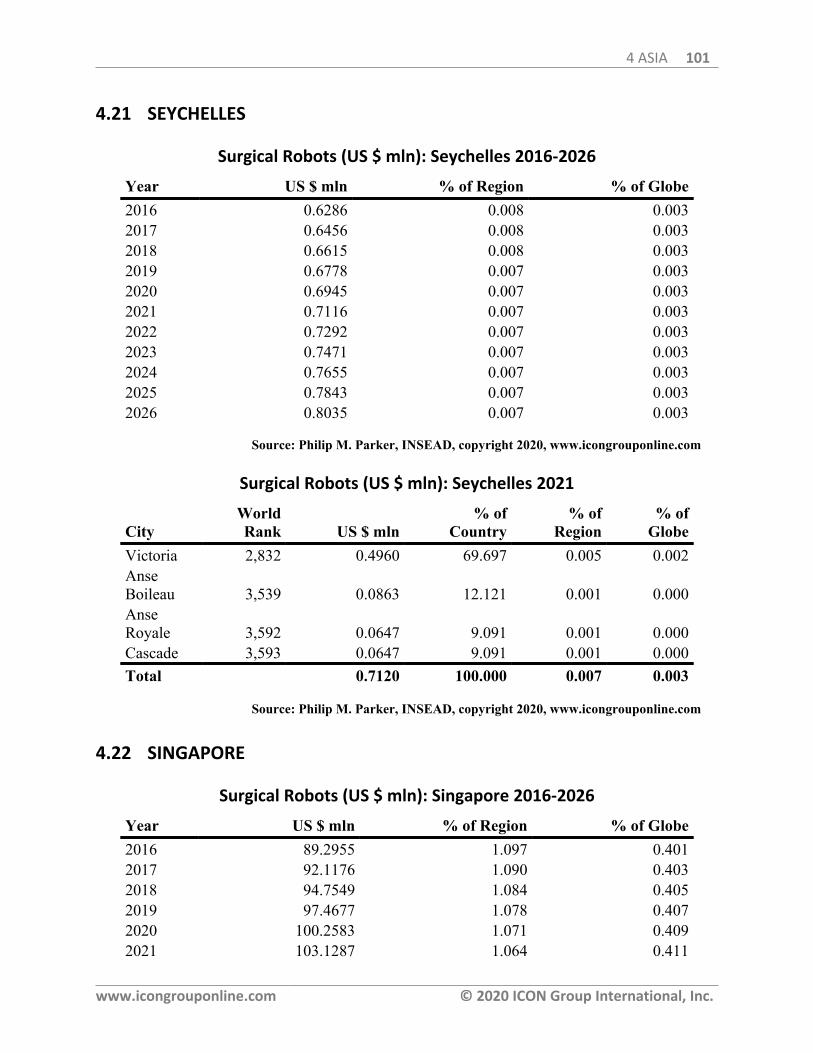
4 ASIA 101
www.icongrouponline.com © 2020 ICON Group International, Inc.
4.21 SEYCHELLES
Surgical Robots (US $ mln): Seychelles 2016-2026
Year US $ mln % of Region % of Globe2016 0.6286 0.008 0.0032017 0.6456 0.008 0.0032018 0.6615 0.008 0.0032019 0.6778 0.007 0.0032020 0.6945 0.007 0.0032021 0.7116 0.007 0.0032022 0.7292 0.007 0.0032023 0.7471 0.007 0.0032024 0.7655 0.007 0.0032025 0.7843 0.007 0.0032026 0.8035 0.007 0.003
Source: Philip M. Parker, INSEAD, copyright 2020, www.icongrouponline.com
Surgical Robots (US $ mln): Seychelles 2021
CityWorldRank US $ mln
% ofCountry
% ofRegion
% ofGlobe
Victoria 2,832 0.4960 69.697 0.005 0.002AnseBoileau 3,539 0.0863 12.121 0.001 0.000AnseRoyale 3,592 0.0647 9.091 0.001 0.000Cascade 3,593 0.0647 9.091 0.001 0.000Total 0.7120 100.000 0.007 0.003
Source: Philip M. Parker, INSEAD, copyright 2020, www.icongrouponline.com
4.22 SINGAPORE
Surgical Robots (US $ mln): Singapore 2016-2026
Year US $ mln % of Region % of Globe2016 89.2955 1.097 0.4012017 92.1176 1.090 0.4032018 94.7549 1.084 0.4052019 97.4677 1.078 0.4072020 100.2583 1.071 0.4092021 103.1287 1.064 0.411
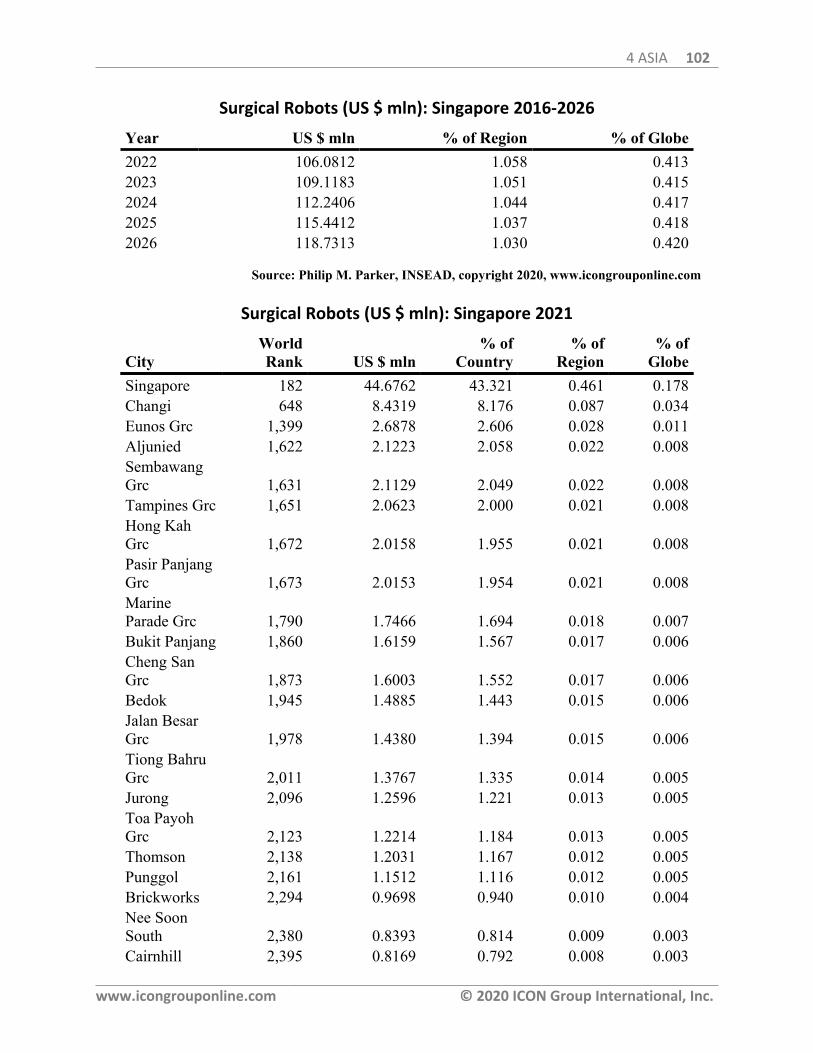
4 ASIA 102
www.icongrouponline.com © 2020 ICON Group International, Inc.
Surgical Robots (US $ mln): Singapore 2016-2026
Year US $ mln % of Region % of Globe2022 106.0812 1.058 0.4132023 109.1183 1.051 0.4152024 112.2406 1.044 0.4172025 115.4412 1.037 0.4182026 118.7313 1.030 0.420
Source: Philip M. Parker, INSEAD, copyright 2020, www.icongrouponline.com
Surgical Robots (US $ mln): Singapore 2021
CityWorldRank US $ mln
% ofCountry
% ofRegion
% ofGlobe
Singapore 182 44.6762 43.321 0.461 0.178Changi 648 8.4319 8.176 0.087 0.034Eunos Grc 1,399 2.6878 2.606 0.028 0.011Aljunied 1,622 2.1223 2.058 0.022 0.008SembawangGrc 1,631 2.1129 2.049 0.022 0.008Tampines Grc 1,651 2.0623 2.000 0.021 0.008Hong KahGrc 1,672 2.0158 1.955 0.021 0.008Pasir PanjangGrc 1,673 2.0153 1.954 0.021 0.008MarineParade Grc 1,790 1.7466 1.694 0.018 0.007Bukit Panjang 1,860 1.6159 1.567 0.017 0.006Cheng SanGrc 1,873 1.6003 1.552 0.017 0.006Bedok 1,945 1.4885 1.443 0.015 0.006Jalan BesarGrc 1,978 1.4380 1.394 0.015 0.006Tiong BahruGrc 2,011 1.3767 1.335 0.014 0.005Jurong 2,096 1.2596 1.221 0.013 0.005Toa PayohGrc 2,123 1.2214 1.184 0.013 0.005Thomson 2,138 1.2031 1.167 0.012 0.005Punggol 2,161 1.1512 1.116 0.012 0.005Brickworks 2,294 0.9698 0.940 0.010 0.004Nee SoonSouth 2,380 0.8393 0.814 0.009 0.003Cairnhill 2,395 0.8169 0.792 0.008 0.003
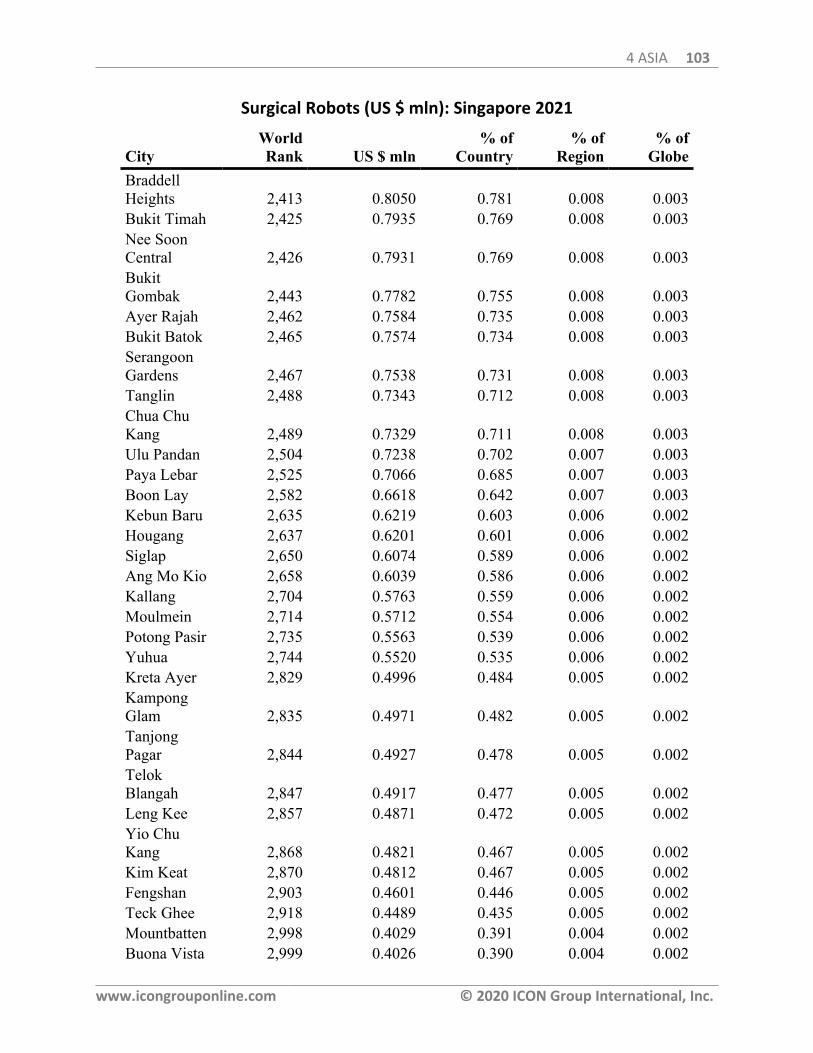
4 ASIA 103
www.icongrouponline.com © 2020 ICON Group International, Inc.
Surgical Robots (US $ mln): Singapore 2021
CityWorldRank US $ mln
% ofCountry
% ofRegion
% ofGlobe
BraddellHeights 2,413 0.8050 0.781 0.008 0.003Bukit Timah 2,425 0.7935 0.769 0.008 0.003Nee SoonCentral 2,426 0.7931 0.769 0.008 0.003BukitGombak 2,443 0.7782 0.755 0.008 0.003Ayer Rajah 2,462 0.7584 0.735 0.008 0.003Bukit Batok 2,465 0.7574 0.734 0.008 0.003SerangoonGardens 2,467 0.7538 0.731 0.008 0.003Tanglin 2,488 0.7343 0.712 0.008 0.003Chua ChuKang 2,489 0.7329 0.711 0.008 0.003Ulu Pandan 2,504 0.7238 0.702 0.007 0.003Paya Lebar 2,525 0.7066 0.685 0.007 0.003Boon Lay 2,582 0.6618 0.642 0.007 0.003Kebun Baru 2,635 0.6219 0.603 0.006 0.002Hougang 2,637 0.6201 0.601 0.006 0.002Siglap 2,650 0.6074 0.589 0.006 0.002Ang Mo Kio 2,658 0.6039 0.586 0.006 0.002Kallang 2,704 0.5763 0.559 0.006 0.002Moulmein 2,714 0.5712 0.554 0.006 0.002Potong Pasir 2,735 0.5563 0.539 0.006 0.002Yuhua 2,744 0.5520 0.535 0.006 0.002Kreta Ayer 2,829 0.4996 0.484 0.005 0.002KampongGlam 2,835 0.4971 0.482 0.005 0.002TanjongPagar 2,844 0.4927 0.478 0.005 0.002TelokBlangah 2,847 0.4917 0.477 0.005 0.002Leng Kee 2,857 0.4871 0.472 0.005 0.002Yio ChuKang 2,868 0.4821 0.467 0.005 0.002Kim Keat 2,870 0.4812 0.467 0.005 0.002Fengshan 2,903 0.4601 0.446 0.005 0.002Teck Ghee 2,918 0.4489 0.435 0.005 0.002Mountbatten 2,998 0.4029 0.391 0.004 0.002Buona Vista 2,999 0.4026 0.390 0.004 0.002

4 ASIA 104
www.icongrouponline.com © 2020 ICON Group International, Inc.
Surgical Robots (US $ mln): Singapore 2021
CityWorldRank US $ mln
% ofCountry
% ofRegion
% ofGlobe
Macpherson 3,007 0.4007 0.389 0.004 0.002Kim Seng 3,010 0.3993 0.387 0.004 0.002Bukit Merah 3,172 0.3148 0.305 0.003 0.001Whampoa 3,186 0.3083 0.299 0.003 0.001Total 103.1290 100.000 1.064 0.411
Source: Philip M. Parker, INSEAD, copyright 2020, www.icongrouponline.com
4.23 SOUTH KOREA
Surgical Robots (US $ mln): South Korea 2016-2026
Year US $ mln % of Region % of Globe2016 433.5786 5.328 1.9462017 444.1620 5.257 1.9442018 453.9913 5.194 1.9422019 464.0382 5.131 1.9402020 474.3074 5.067 1.9372021 484.8038 5.004 1.9342022 495.5326 4.941 1.9302023 506.4988 4.878 1.9262024 517.6992 4.815 1.9222025 529.0968 4.753 1.9172026 540.7369 4.690 1.912
Source: Philip M. Parker, INSEAD, copyright 2020, www.icongrouponline.com
Surgical Robots (US $ mln): South Korea 2021
CityWorldRank US $ mln
% ofCountry
% ofRegion
% ofGlobe
Seoul 60 114.7928 23.678 1.185 0.458Busan(Pusan) 197 39.3393 8.114 0.406 0.157Incheon 221 32.8961 6.785 0.340 0.131Daegu(Taegu) 252 28.9858 5.979 0.299 0.116Daejeon(Taejon) 340 18.5494 3.826 0.191 0.074Gwangju(Kwangju) 346 18.2249 3.759 0.188 0.073
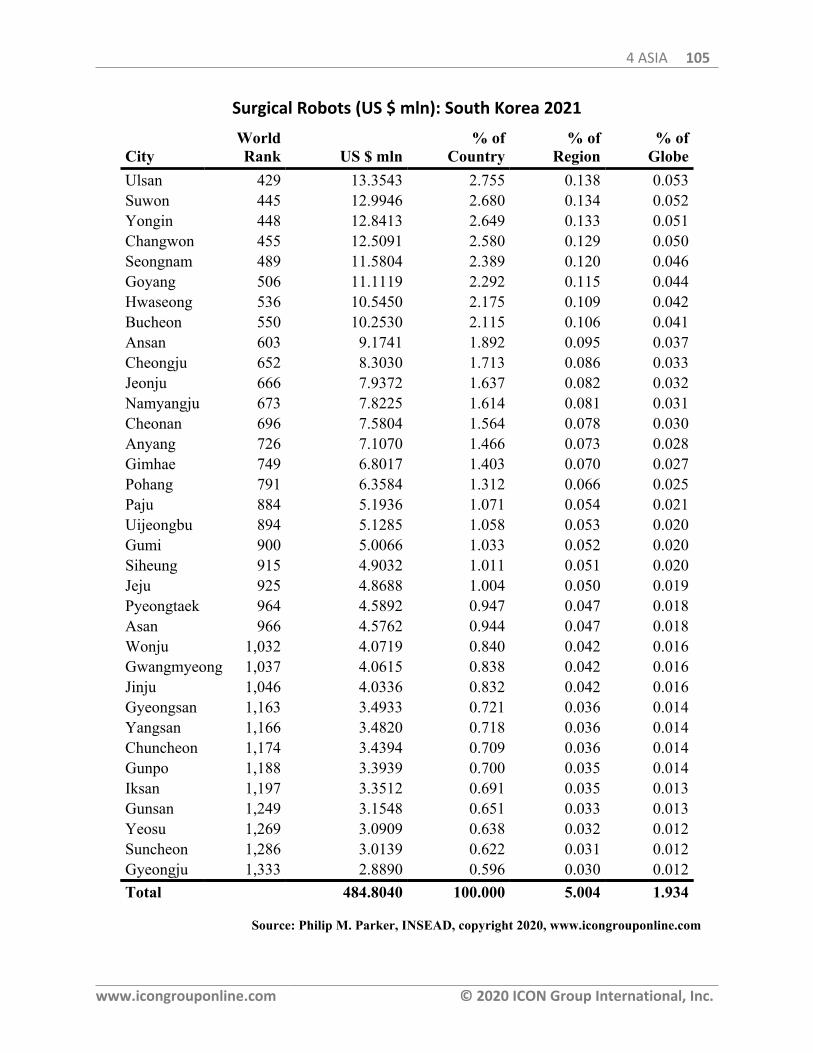
4 ASIA 105
www.icongrouponline.com © 2020 ICON Group International, Inc.
Surgical Robots (US $ mln): South Korea 2021
CityWorldRank US $ mln
% ofCountry
% ofRegion
% ofGlobe
Ulsan 429 13.3543 2.755 0.138 0.053Suwon 445 12.9946 2.680 0.134 0.052Yongin 448 12.8413 2.649 0.133 0.051Changwon 455 12.5091 2.580 0.129 0.050Seongnam 489 11.5804 2.389 0.120 0.046Goyang 506 11.1119 2.292 0.115 0.044Hwaseong 536 10.5450 2.175 0.109 0.042Bucheon 550 10.2530 2.115 0.106 0.041Ansan 603 9.1741 1.892 0.095 0.037Cheongju 652 8.3030 1.713 0.086 0.033Jeonju 666 7.9372 1.637 0.082 0.032Namyangju 673 7.8225 1.614 0.081 0.031Cheonan 696 7.5804 1.564 0.078 0.030Anyang 726 7.1070 1.466 0.073 0.028Gimhae 749 6.8017 1.403 0.070 0.027Pohang 791 6.3584 1.312 0.066 0.025Paju 884 5.1936 1.071 0.054 0.021Uijeongbu 894 5.1285 1.058 0.053 0.020Gumi 900 5.0066 1.033 0.052 0.020Siheung 915 4.9032 1.011 0.051 0.020Jeju 925 4.8688 1.004 0.050 0.019Pyeongtaek 964 4.5892 0.947 0.047 0.018Asan 966 4.5762 0.944 0.047 0.018Wonju 1,032 4.0719 0.840 0.042 0.016Gwangmyeong 1,037 4.0615 0.838 0.042 0.016Jinju 1,046 4.0336 0.832 0.042 0.016Gyeongsan 1,163 3.4933 0.721 0.036 0.014Yangsan 1,166 3.4820 0.718 0.036 0.014Chuncheon 1,174 3.4394 0.709 0.036 0.014Gunpo 1,188 3.3939 0.700 0.035 0.014Iksan 1,197 3.3512 0.691 0.035 0.013Gunsan 1,249 3.1548 0.651 0.033 0.013Yeosu 1,269 3.0909 0.638 0.032 0.012Suncheon 1,286 3.0139 0.622 0.031 0.012Gyeongju 1,333 2.8890 0.596 0.030 0.012Total 484.8040 100.000 5.004 1.934
Source: Philip M. Parker, INSEAD, copyright 2020, www.icongrouponline.com
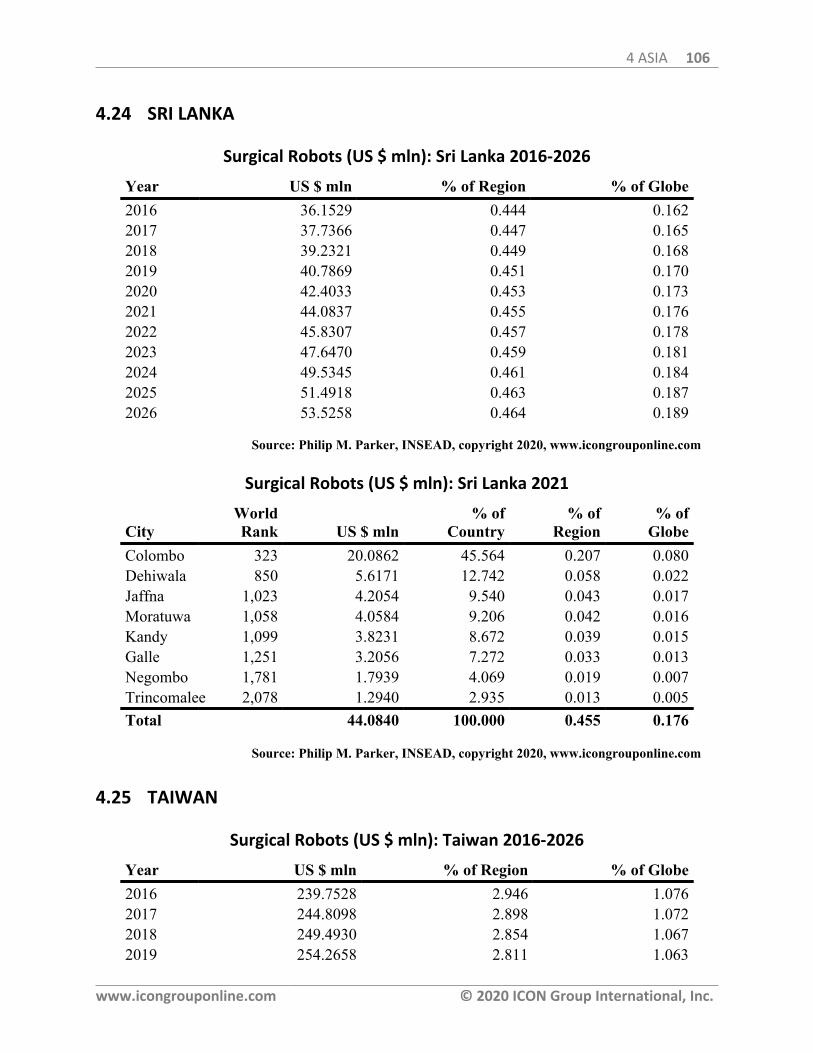
4 ASIA 106
www.icongrouponline.com © 2020 ICON Group International, Inc.
4.24 SRI LANKA
Surgical Robots (US $ mln): Sri Lanka 2016-2026
Year US $ mln % of Region % of Globe2016 36.1529 0.444 0.1622017 37.7366 0.447 0.1652018 39.2321 0.449 0.1682019 40.7869 0.451 0.1702020 42.4033 0.453 0.1732021 44.0837 0.455 0.1762022 45.8307 0.457 0.1782023 47.6470 0.459 0.1812024 49.5345 0.461 0.1842025 51.4918 0.463 0.1872026 53.5258 0.464 0.189
Source: Philip M. Parker, INSEAD, copyright 2020, www.icongrouponline.com
Surgical Robots (US $ mln): Sri Lanka 2021
CityWorldRank US $ mln
% ofCountry
% ofRegion
% ofGlobe
Colombo 323 20.0862 45.564 0.207 0.080Dehiwala 850 5.6171 12.742 0.058 0.022Jaffna 1,023 4.2054 9.540 0.043 0.017Moratuwa 1,058 4.0584 9.206 0.042 0.016Kandy 1,099 3.8231 8.672 0.039 0.015Galle 1,251 3.2056 7.272 0.033 0.013Negombo 1,781 1.7939 4.069 0.019 0.007Trincomalee 2,078 1.2940 2.935 0.013 0.005Total 44.0840 100.000 0.455 0.176
Source: Philip M. Parker, INSEAD, copyright 2020, www.icongrouponline.com
4.25 TAIWAN
Surgical Robots (US $ mln): Taiwan 2016-2026
Year US $ mln % of Region % of Globe2016 239.7528 2.946 1.0762017 244.8098 2.898 1.0722018 249.4930 2.854 1.0672019 254.2658 2.811 1.063
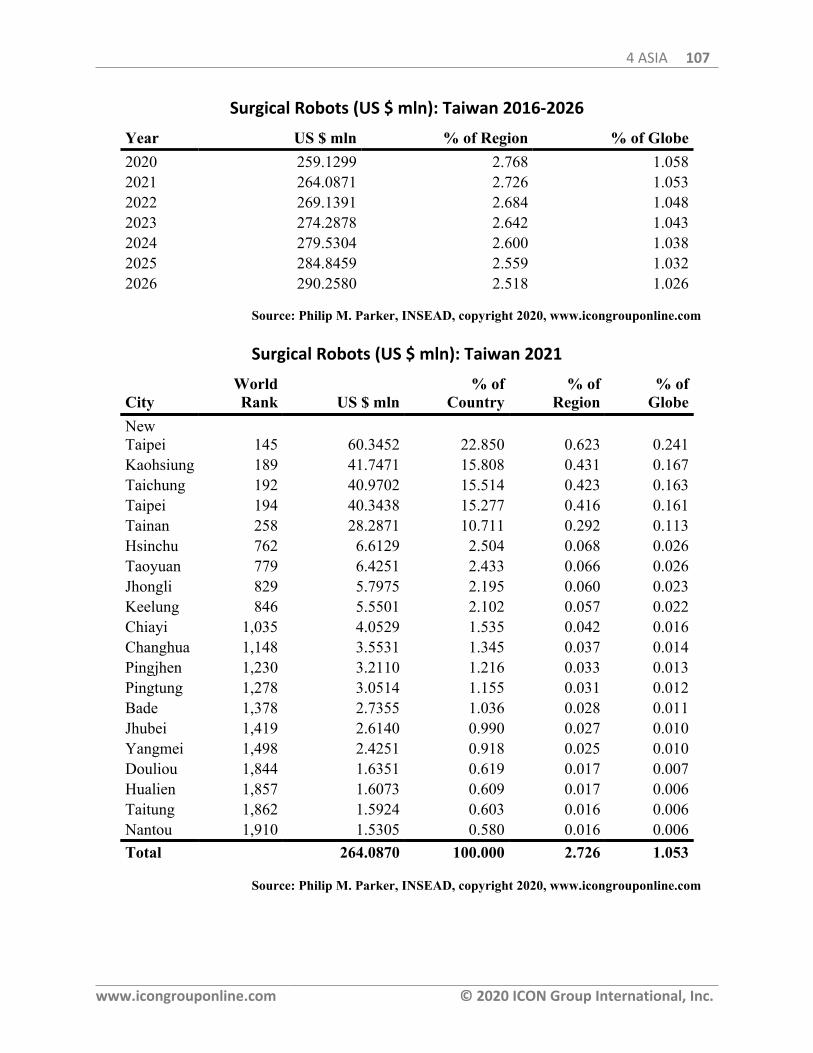
4 ASIA 107
www.icongrouponline.com © 2020 ICON Group International, Inc.
Surgical Robots (US $ mln): Taiwan 2016-2026
Year US $ mln % of Region % of Globe2020 259.1299 2.768 1.0582021 264.0871 2.726 1.0532022 269.1391 2.684 1.0482023 274.2878 2.642 1.0432024 279.5304 2.600 1.0382025 284.8459 2.559 1.0322026 290.2580 2.518 1.026
Source: Philip M. Parker, INSEAD, copyright 2020, www.icongrouponline.com
Surgical Robots (US $ mln): Taiwan 2021
CityWorldRank US $ mln
% ofCountry
% ofRegion
% ofGlobe
NewTaipei 145 60.3452 22.850 0.623 0.241Kaohsiung 189 41.7471 15.808 0.431 0.167Taichung 192 40.9702 15.514 0.423 0.163Taipei 194 40.3438 15.277 0.416 0.161Tainan 258 28.2871 10.711 0.292 0.113Hsinchu 762 6.6129 2.504 0.068 0.026Taoyuan 779 6.4251 2.433 0.066 0.026Jhongli 829 5.7975 2.195 0.060 0.023Keelung 846 5.5501 2.102 0.057 0.022Chiayi 1,035 4.0529 1.535 0.042 0.016Changhua 1,148 3.5531 1.345 0.037 0.014Pingjhen 1,230 3.2110 1.216 0.033 0.013Pingtung 1,278 3.0514 1.155 0.031 0.012Bade 1,378 2.7355 1.036 0.028 0.011Jhubei 1,419 2.6140 0.990 0.027 0.010Yangmei 1,498 2.4251 0.918 0.025 0.010Douliou 1,844 1.6351 0.619 0.017 0.007Hualien 1,857 1.6073 0.609 0.017 0.006Taitung 1,862 1.5924 0.603 0.016 0.006Nantou 1,910 1.5305 0.580 0.016 0.006Total 264.0870 100.000 2.726 1.053
Source: Philip M. Parker, INSEAD, copyright 2020, www.icongrouponline.com
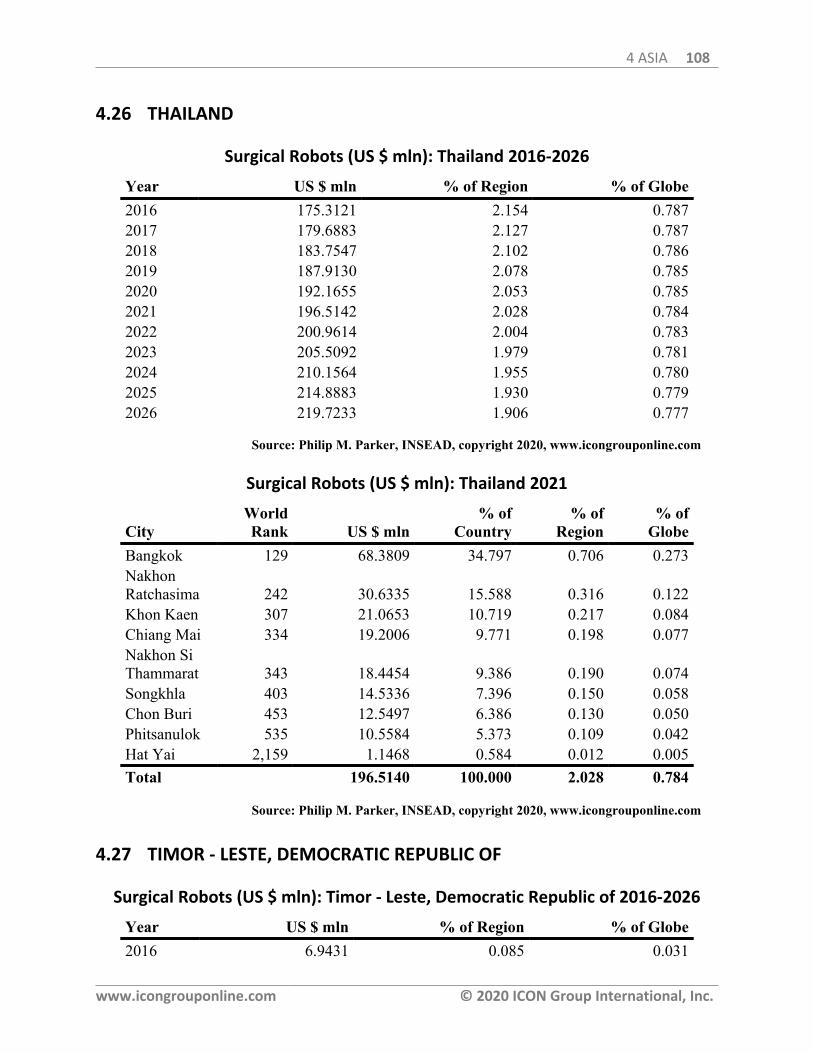
4 ASIA 108
www.icongrouponline.com © 2020 ICON Group International, Inc.
4.26 THAILAND
Surgical Robots (US $ mln): Thailand 2016-2026
Year US $ mln % of Region % of Globe2016 175.3121 2.154 0.7872017 179.6883 2.127 0.7872018 183.7547 2.102 0.7862019 187.9130 2.078 0.7852020 192.1655 2.053 0.7852021 196.5142 2.028 0.7842022 200.9614 2.004 0.7832023 205.5092 1.979 0.7812024 210.1564 1.955 0.7802025 214.8883 1.930 0.7792026 219.7233 1.906 0.777
Source: Philip M. Parker, INSEAD, copyright 2020, www.icongrouponline.com
Surgical Robots (US $ mln): Thailand 2021
CityWorldRank US $ mln
% ofCountry
% ofRegion
% ofGlobe
Bangkok 129 68.3809 34.797 0.706 0.273NakhonRatchasima 242 30.6335 15.588 0.316 0.122Khon Kaen 307 21.0653 10.719 0.217 0.084Chiang Mai 334 19.2006 9.771 0.198 0.077Nakhon SiThammarat 343 18.4454 9.386 0.190 0.074Songkhla 403 14.5336 7.396 0.150 0.058Chon Buri 453 12.5497 6.386 0.130 0.050Phitsanulok 535 10.5584 5.373 0.109 0.042Hat Yai 2,159 1.1468 0.584 0.012 0.005Total 196.5140 100.000 2.028 0.784
Source: Philip M. Parker, INSEAD, copyright 2020, www.icongrouponline.com
4.27 TIMOR - LESTE, DEMOCRATIC REPUBLIC OF
Surgical Robots (US $ mln): Timor - Leste, Democratic Republic of 2016-2026
Year US $ mln % of Region % of Globe2016 6.9431 0.085 0.031
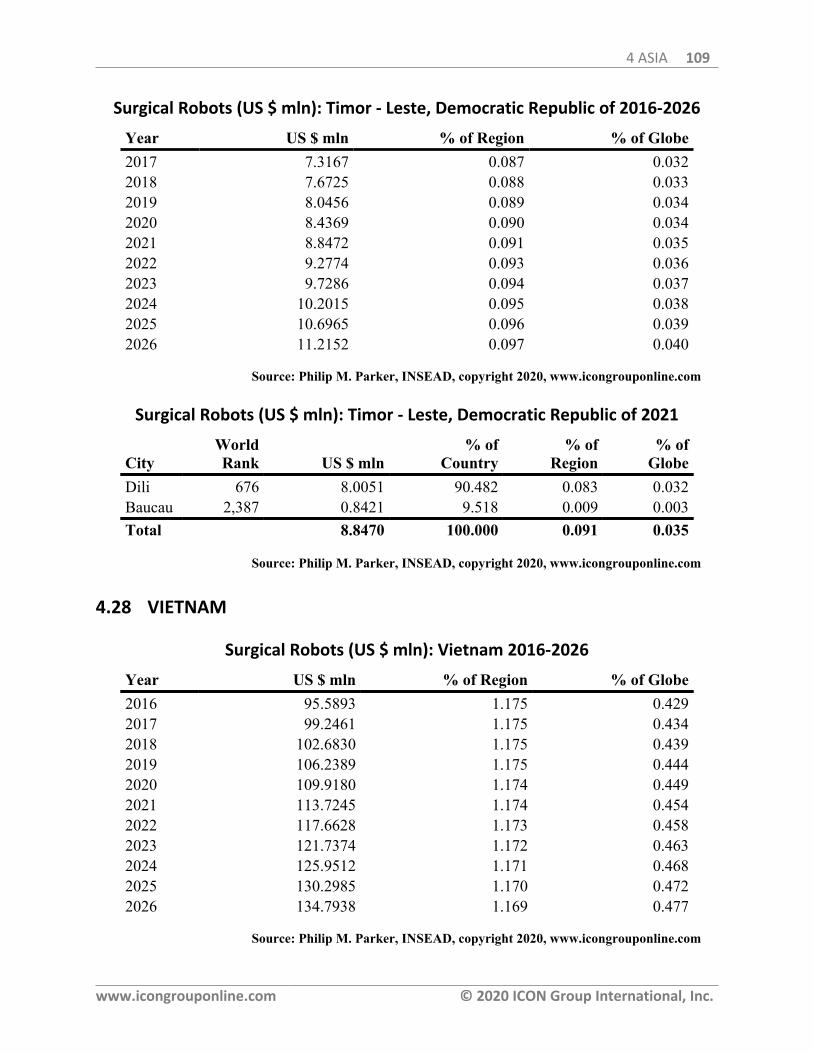
4 ASIA 109
www.icongrouponline.com © 2020 ICON Group International, Inc.
Surgical Robots (US $ mln): Timor - Leste, Democratic Republic of 2016-2026
Year US $ mln % of Region % of Globe2017 7.3167 0.087 0.0322018 7.6725 0.088 0.0332019 8.0456 0.089 0.0342020 8.4369 0.090 0.0342021 8.8472 0.091 0.0352022 9.2774 0.093 0.0362023 9.7286 0.094 0.0372024 10.2015 0.095 0.0382025 10.6965 0.096 0.0392026 11.2152 0.097 0.040
Source: Philip M. Parker, INSEAD, copyright 2020, www.icongrouponline.com
Surgical Robots (US $ mln): Timor - Leste, Democratic Republic of 2021
CityWorldRank US $ mln
% ofCountry
% ofRegion
% ofGlobe
Dili 676 8.0051 90.482 0.083 0.032Baucau 2,387 0.8421 9.518 0.009 0.003Total 8.8470 100.000 0.091 0.035
Source: Philip M. Parker, INSEAD, copyright 2020, www.icongrouponline.com
4.28 VIETNAM
Surgical Robots (US $ mln): Vietnam 2016-2026
Year US $ mln % of Region % of Globe2016 95.5893 1.175 0.4292017 99.2461 1.175 0.4342018 102.6830 1.175 0.4392019 106.2389 1.175 0.4442020 109.9180 1.174 0.4492021 113.7245 1.174 0.4542022 117.6628 1.173 0.4582023 121.7374 1.172 0.4632024 125.9512 1.171 0.4682025 130.2985 1.170 0.4722026 134.7938 1.169 0.477
Source: Philip M. Parker, INSEAD, copyright 2020, www.icongrouponline.com
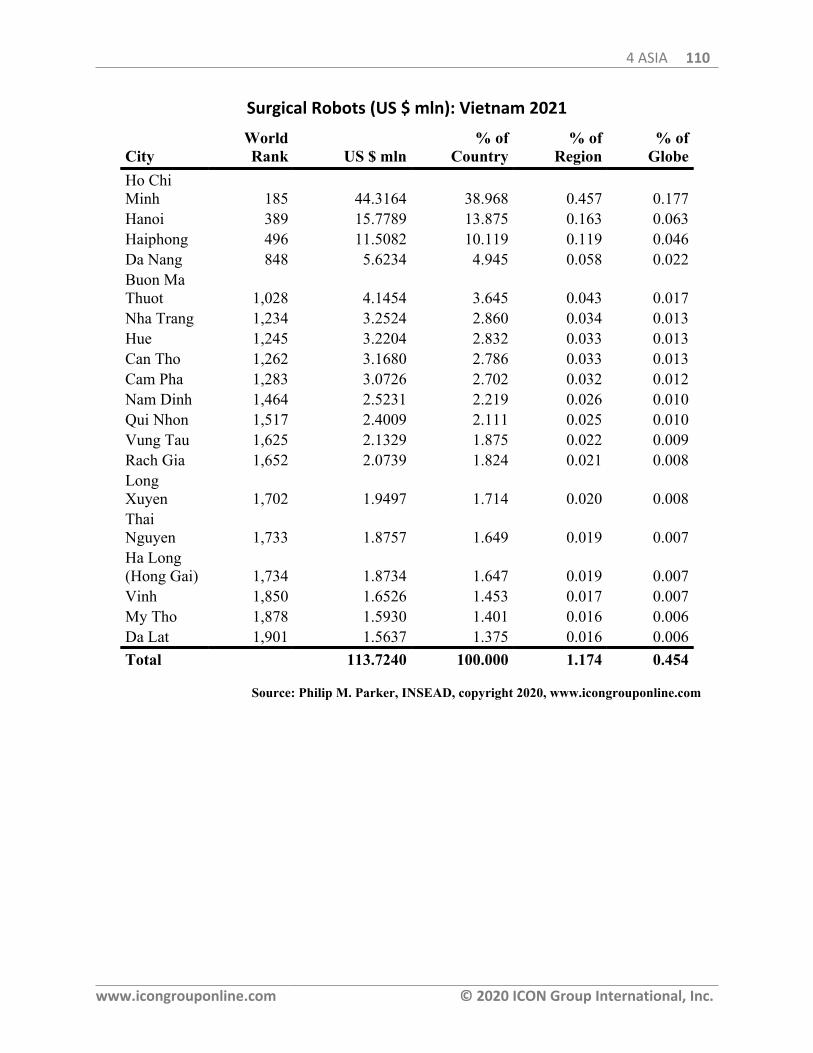
4 ASIA 110
www.icongrouponline.com © 2020 ICON Group International, Inc.
Surgical Robots (US $ mln): Vietnam 2021
CityWorldRank US $ mln
% ofCountry
% ofRegion
% ofGlobe
Ho ChiMinh 185 44.3164 38.968 0.457 0.177Hanoi 389 15.7789 13.875 0.163 0.063Haiphong 496 11.5082 10.119 0.119 0.046Da Nang 848 5.6234 4.945 0.058 0.022Buon MaThuot 1,028 4.1454 3.645 0.043 0.017Nha Trang 1,234 3.2524 2.860 0.034 0.013Hue 1,245 3.2204 2.832 0.033 0.013Can Tho 1,262 3.1680 2.786 0.033 0.013Cam Pha 1,283 3.0726 2.702 0.032 0.012Nam Dinh 1,464 2.5231 2.219 0.026 0.010Qui Nhon 1,517 2.4009 2.111 0.025 0.010Vung Tau 1,625 2.1329 1.875 0.022 0.009Rach Gia 1,652 2.0739 1.824 0.021 0.008LongXuyen 1,702 1.9497 1.714 0.020 0.008ThaiNguyen 1,733 1.8757 1.649 0.019 0.007Ha Long(Hong Gai) 1,734 1.8734 1.647 0.019 0.007Vinh 1,850 1.6526 1.453 0.017 0.007My Tho 1,878 1.5930 1.401 0.016 0.006Da Lat 1,901 1.5637 1.375 0.016 0.006Total 113.7240 100.000 1.174 0.454
Source: Philip M. Parker, INSEAD, copyright 2020, www.icongrouponline.com
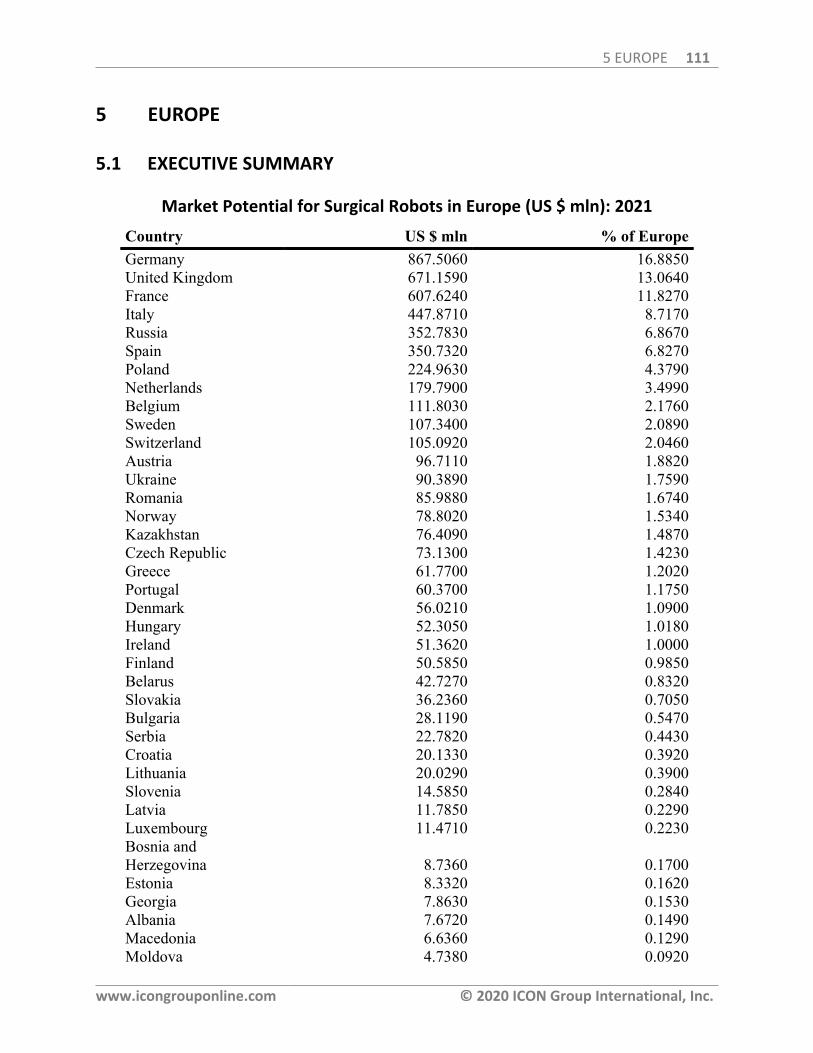
5 EUROPE 111
www.icongrouponline.com © 2020 ICON Group International, Inc.
5 EUROPE
5.1 EXECUTIVE SUMMARY
Market Potential for Surgical Robots in Europe (US $ mln): 2021
Country US $ mln % of EuropeGermany 867.5060 16.8850United Kingdom 671.1590 13.0640France 607.6240 11.8270Italy 447.8710 8.7170Russia 352.7830 6.8670Spain 350.7320 6.8270Poland 224.9630 4.3790Netherlands 179.7900 3.4990Belgium 111.8030 2.1760Sweden 107.3400 2.0890Switzerland 105.0920 2.0460Austria 96.7110 1.8820Ukraine 90.3890 1.7590Romania 85.9880 1.6740Norway 78.8020 1.5340Kazakhstan 76.4090 1.4870Czech Republic 73.1300 1.4230Greece 61.7700 1.2020Portugal 60.3700 1.1750Denmark 56.0210 1.0900Hungary 52.3050 1.0180Ireland 51.3620 1.0000Finland 50.5850 0.9850Belarus 42.7270 0.8320Slovakia 36.2360 0.7050Bulgaria 28.1190 0.5470Serbia 22.7820 0.4430Croatia 20.1330 0.3920Lithuania 20.0290 0.3900Slovenia 14.5850 0.2840Latvia 11.7850 0.2290Luxembourg 11.4710 0.2230Bosnia andHerzegovina 8.7360 0.1700Estonia 8.3320 0.1620Georgia 7.8630 0.1530Albania 7.6720 0.1490Macedonia 6.6360 0.1290Moldova 4.7380 0.0920
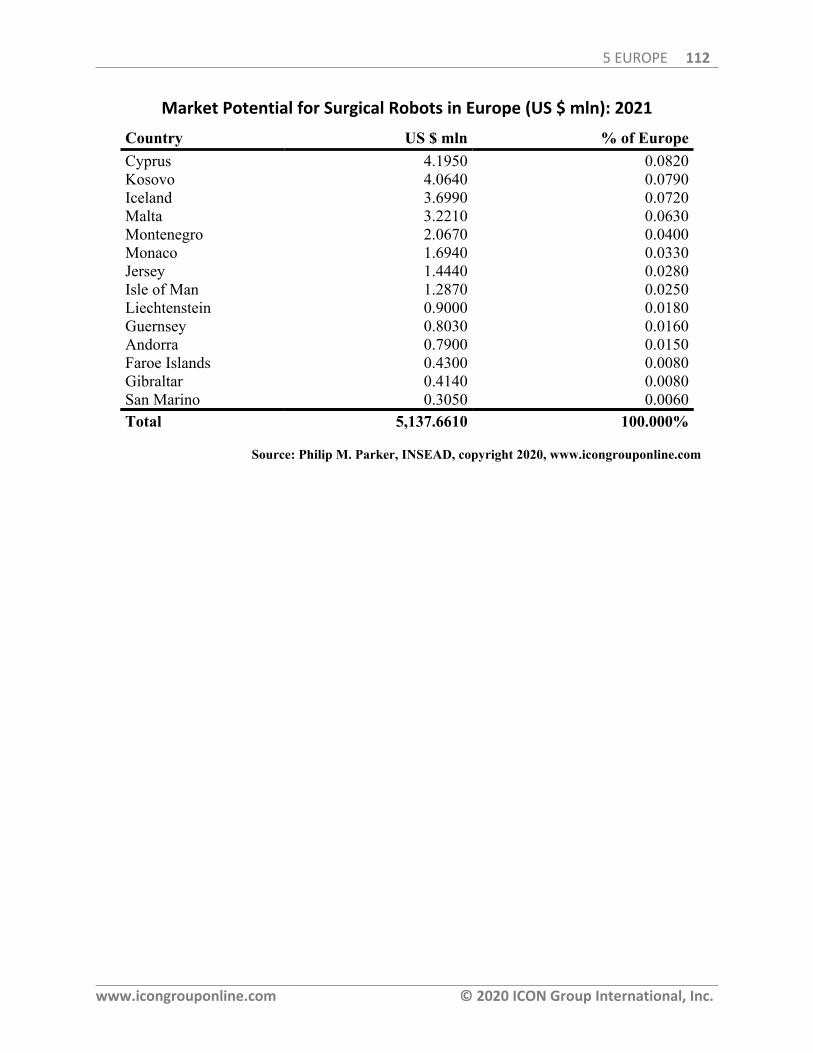
5 EUROPE 112
www.icongrouponline.com © 2020 ICON Group International, Inc.
Market Potential for Surgical Robots in Europe (US $ mln): 2021
Country US $ mln % of EuropeCyprus 4.1950 0.0820Kosovo 4.0640 0.0790Iceland 3.6990 0.0720Malta 3.2210 0.0630Montenegro 2.0670 0.0400Monaco 1.6940 0.0330Jersey 1.4440 0.0280Isle of Man 1.2870 0.0250Liechtenstein 0.9000 0.0180Guernsey 0.8030 0.0160Andorra 0.7900 0.0150Faroe Islands 0.4300 0.0080Gibraltar 0.4140 0.0080San Marino 0.3050 0.0060Total 5,137.6610 100.000%
Source: Philip M. Parker, INSEAD, copyright 2020, www.icongrouponline.com
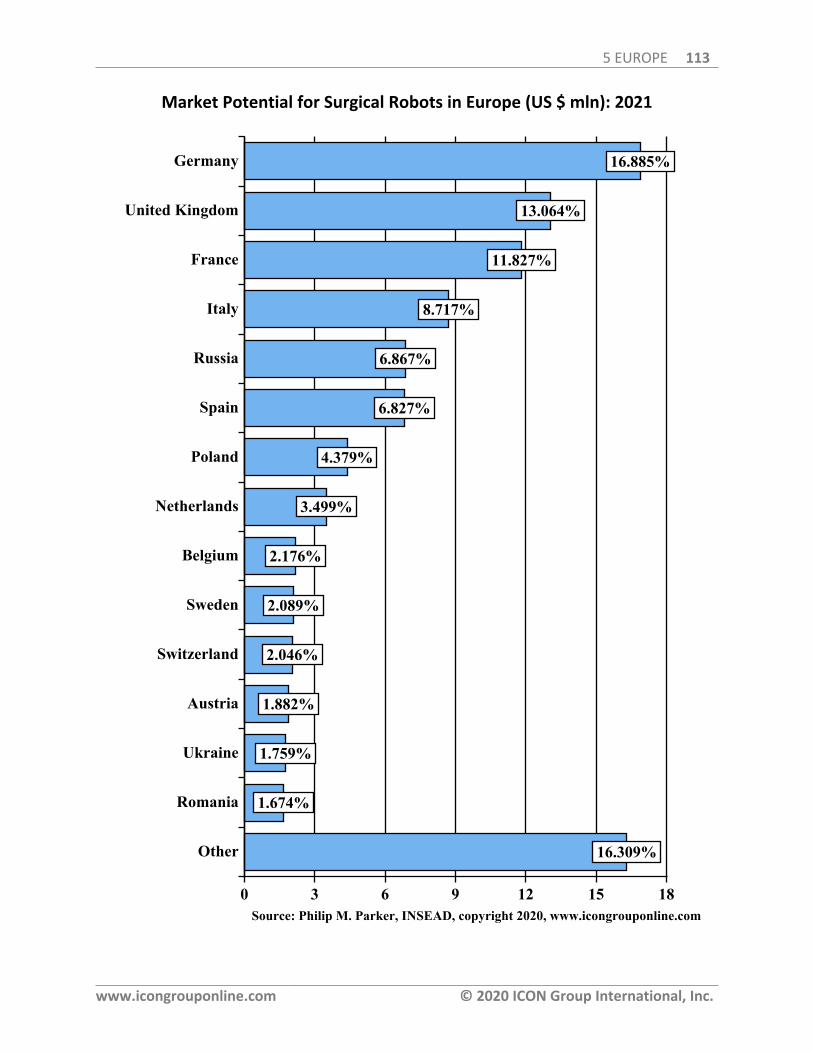
5 EUROPE 113
www.icongrouponline.com © 2020 ICON Group International, Inc.
Market Potential for Surgical Robots in Europe (US $ mln): 2021
16.309%
1.674%
1.759%
1.882%
2.046%
2.089%
2.176%
3.499%
4.379%
6.827%
6.867%
8.717%
11.827%
13.064%
16.885%Germany
United Kingdom
France
Italy
Russia
Spain
Poland
Netherlands
Belgium
Sweden
Switzerland
Austria
Ukraine
Romania
Other
0 3 6 9 12 15 18Source: Philip M. Parker, INSEAD, copyright 2020, www.icongrouponline.com
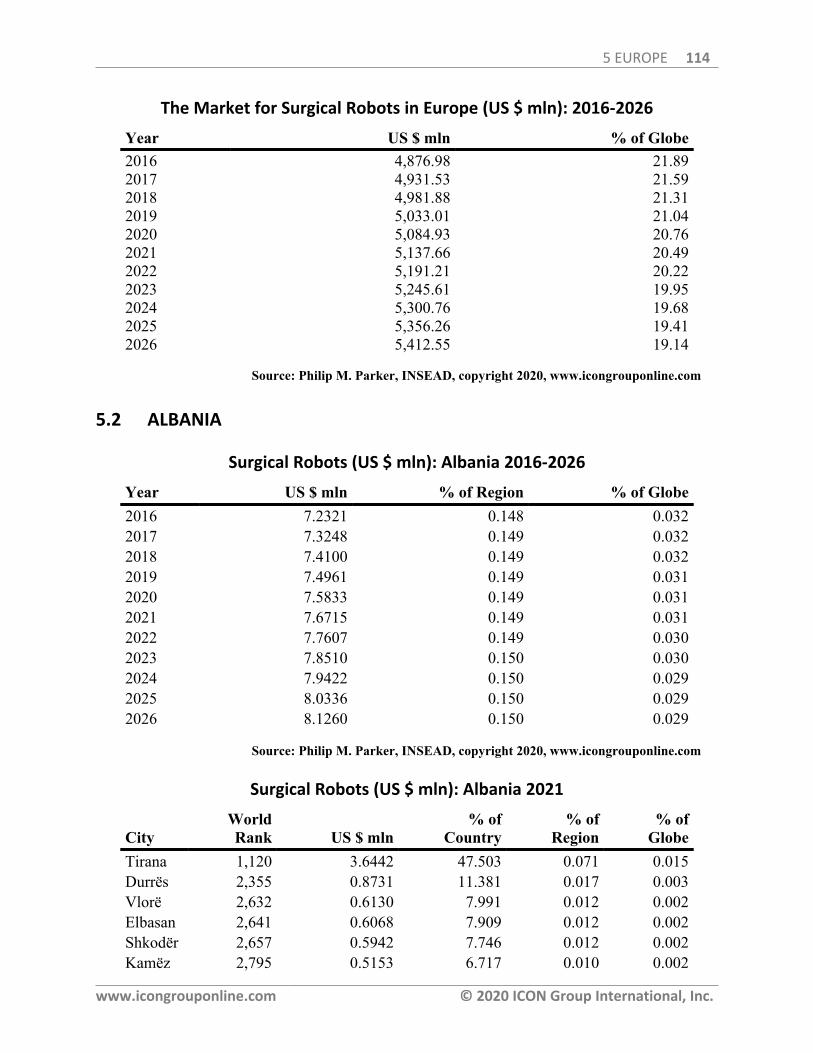
5 EUROPE 114
www.icongrouponline.com © 2020 ICON Group International, Inc.
The Market for Surgical Robots in Europe (US $ mln): 2016-2026
Year US $ mln % of Globe2016 4,876.98 21.892017 4,931.53 21.592018 4,981.88 21.312019 5,033.01 21.042020 5,084.93 20.762021 5,137.66 20.492022 5,191.21 20.222023 5,245.61 19.952024 5,300.76 19.682025 5,356.26 19.412026 5,412.55 19.14
Source: Philip M. Parker, INSEAD, copyright 2020, www.icongrouponline.com
5.2 ALBANIA
Surgical Robots (US $ mln): Albania 2016-2026
Year US $ mln % of Region % of Globe2016 7.2321 0.148 0.0322017 7.3248 0.149 0.0322018 7.4100 0.149 0.0322019 7.4961 0.149 0.0312020 7.5833 0.149 0.0312021 7.6715 0.149 0.0312022 7.7607 0.149 0.0302023 7.8510 0.150 0.0302024 7.9422 0.150 0.0292025 8.0336 0.150 0.0292026 8.1260 0.150 0.029
Source: Philip M. Parker, INSEAD, copyright 2020, www.icongrouponline.com
Surgical Robots (US $ mln): Albania 2021
CityWorldRank US $ mln
% ofCountry
% ofRegion
% ofGlobe
Tirana 1,120 3.6442 47.503 0.071 0.015Durrës 2,355 0.8731 11.381 0.017 0.003Vlorë 2,632 0.6130 7.991 0.012 0.002Elbasan 2,641 0.6068 7.909 0.012 0.002Shkodër 2,657 0.5942 7.746 0.012 0.002Kamëz 2,795 0.5153 6.717 0.010 0.002
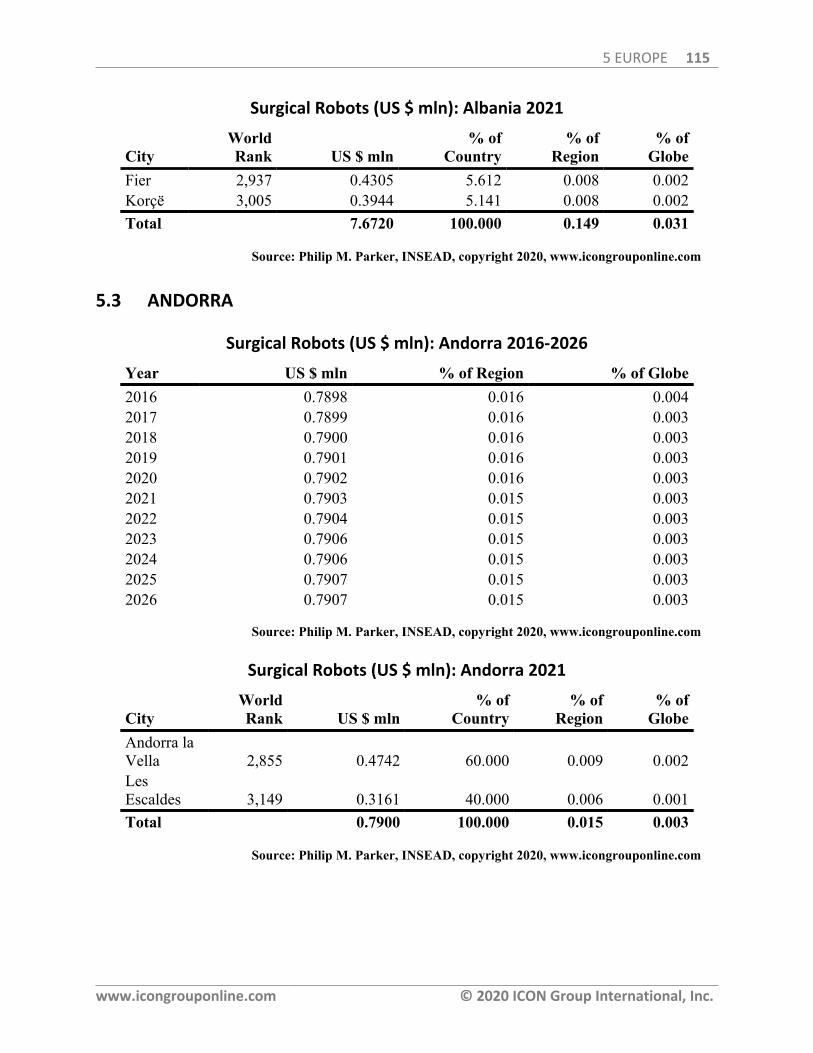
5 EUROPE 115
www.icongrouponline.com © 2020 ICON Group International, Inc.
Surgical Robots (US $ mln): Albania 2021
CityWorldRank US $ mln
% ofCountry
% ofRegion
% ofGlobe
Fier 2,937 0.4305 5.612 0.008 0.002Korçë 3,005 0.3944 5.141 0.008 0.002Total 7.6720 100.000 0.149 0.031
Source: Philip M. Parker, INSEAD, copyright 2020, www.icongrouponline.com
5.3 ANDORRA
Surgical Robots (US $ mln): Andorra 2016-2026
Year US $ mln % of Region % of Globe2016 0.7898 0.016 0.0042017 0.7899 0.016 0.0032018 0.7900 0.016 0.0032019 0.7901 0.016 0.0032020 0.7902 0.016 0.0032021 0.7903 0.015 0.0032022 0.7904 0.015 0.0032023 0.7906 0.015 0.0032024 0.7906 0.015 0.0032025 0.7907 0.015 0.0032026 0.7907 0.015 0.003
Source: Philip M. Parker, INSEAD, copyright 2020, www.icongrouponline.com
Surgical Robots (US $ mln): Andorra 2021
CityWorldRank US $ mln
% ofCountry
% ofRegion
% ofGlobe
Andorra laVella 2,855 0.4742 60.000 0.009 0.002LesEscaldes 3,149 0.3161 40.000 0.006 0.001Total 0.7900 100.000 0.015 0.003
Source: Philip M. Parker, INSEAD, copyright 2020, www.icongrouponline.com
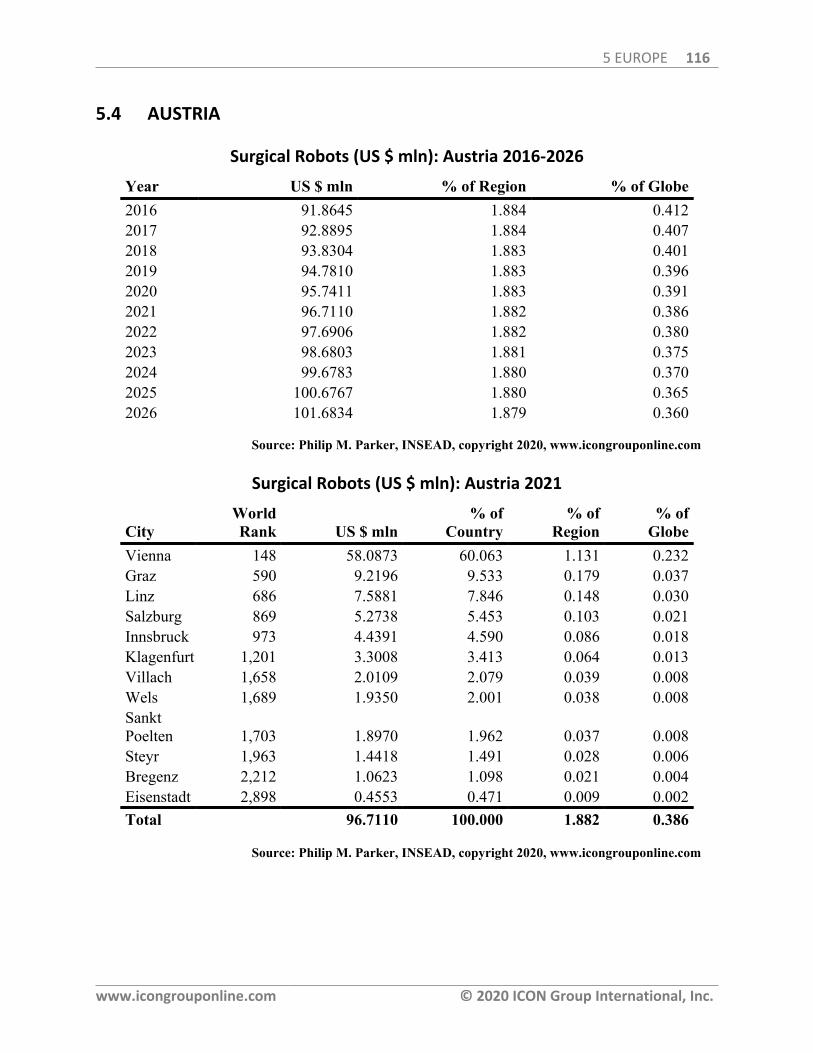
5 EUROPE 116
www.icongrouponline.com © 2020 ICON Group International, Inc.
5.4 AUSTRIA
Surgical Robots (US $ mln): Austria 2016-2026
Year US $ mln % of Region % of Globe2016 91.8645 1.884 0.4122017 92.8895 1.884 0.4072018 93.8304 1.883 0.4012019 94.7810 1.883 0.3962020 95.7411 1.883 0.3912021 96.7110 1.882 0.3862022 97.6906 1.882 0.3802023 98.6803 1.881 0.3752024 99.6783 1.880 0.3702025 100.6767 1.880 0.3652026 101.6834 1.879 0.360
Source: Philip M. Parker, INSEAD, copyright 2020, www.icongrouponline.com
Surgical Robots (US $ mln): Austria 2021
CityWorldRank US $ mln
% ofCountry
% ofRegion
% ofGlobe
Vienna 148 58.0873 60.063 1.131 0.232Graz 590 9.2196 9.533 0.179 0.037Linz 686 7.5881 7.846 0.148 0.030Salzburg 869 5.2738 5.453 0.103 0.021Innsbruck 973 4.4391 4.590 0.086 0.018Klagenfurt 1,201 3.3008 3.413 0.064 0.013Villach 1,658 2.0109 2.079 0.039 0.008Wels 1,689 1.9350 2.001 0.038 0.008SanktPoelten 1,703 1.8970 1.962 0.037 0.008Steyr 1,963 1.4418 1.491 0.028 0.006Bregenz 2,212 1.0623 1.098 0.021 0.004Eisenstadt 2,898 0.4553 0.471 0.009 0.002Total 96.7110 100.000 1.882 0.386
Source: Philip M. Parker, INSEAD, copyright 2020, www.icongrouponline.com
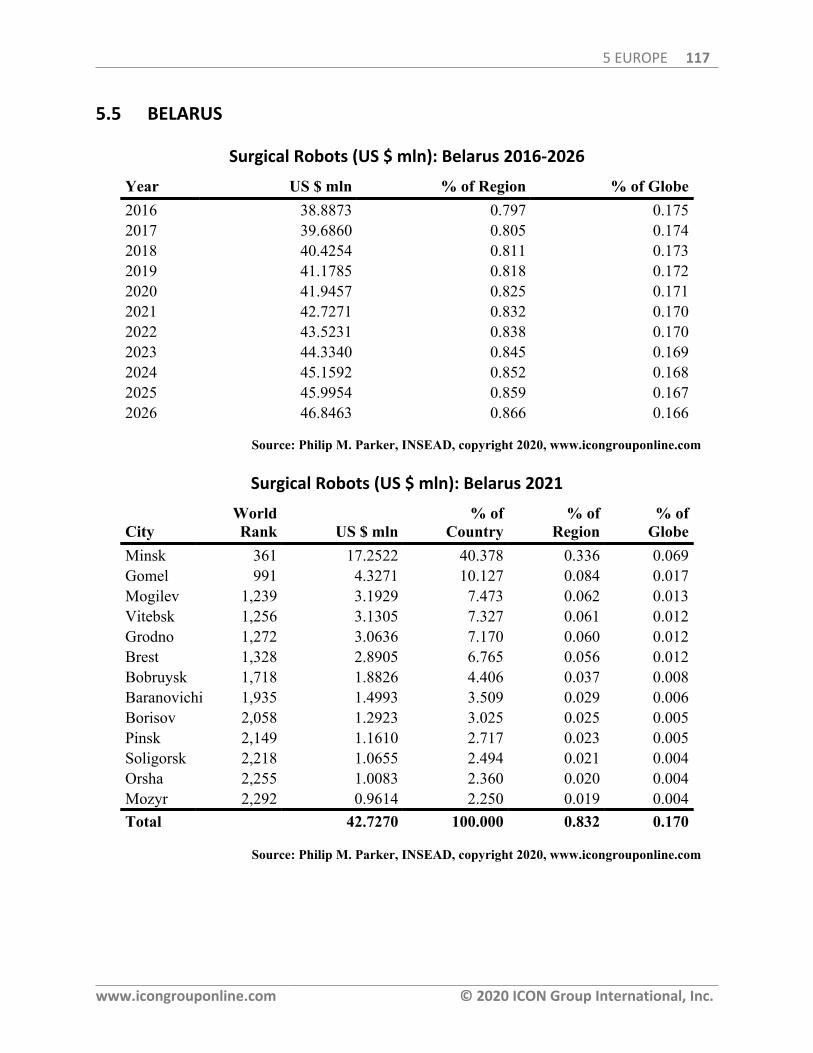
5 EUROPE 117
www.icongrouponline.com © 2020 ICON Group International, Inc.
5.5 BELARUS
Surgical Robots (US $ mln): Belarus 2016-2026
Year US $ mln % of Region % of Globe2016 38.8873 0.797 0.1752017 39.6860 0.805 0.1742018 40.4254 0.811 0.1732019 41.1785 0.818 0.1722020 41.9457 0.825 0.1712021 42.7271 0.832 0.1702022 43.5231 0.838 0.1702023 44.3340 0.845 0.1692024 45.1592 0.852 0.1682025 45.9954 0.859 0.1672026 46.8463 0.866 0.166
Source: Philip M. Parker, INSEAD, copyright 2020, www.icongrouponline.com
Surgical Robots (US $ mln): Belarus 2021
CityWorldRank US $ mln
% ofCountry
% ofRegion
% ofGlobe
Minsk 361 17.2522 40.378 0.336 0.069Gomel 991 4.3271 10.127 0.084 0.017Mogilev 1,239 3.1929 7.473 0.062 0.013Vitebsk 1,256 3.1305 7.327 0.061 0.012Grodno 1,272 3.0636 7.170 0.060 0.012Brest 1,328 2.8905 6.765 0.056 0.012Bobruysk 1,718 1.8826 4.406 0.037 0.008Baranovichi 1,935 1.4993 3.509 0.029 0.006Borisov 2,058 1.2923 3.025 0.025 0.005Pinsk 2,149 1.1610 2.717 0.023 0.005Soligorsk 2,218 1.0655 2.494 0.021 0.004Orsha 2,255 1.0083 2.360 0.020 0.004Mozyr 2,292 0.9614 2.250 0.019 0.004Total 42.7270 100.000 0.832 0.170
Source: Philip M. Parker, INSEAD, copyright 2020, www.icongrouponline.com
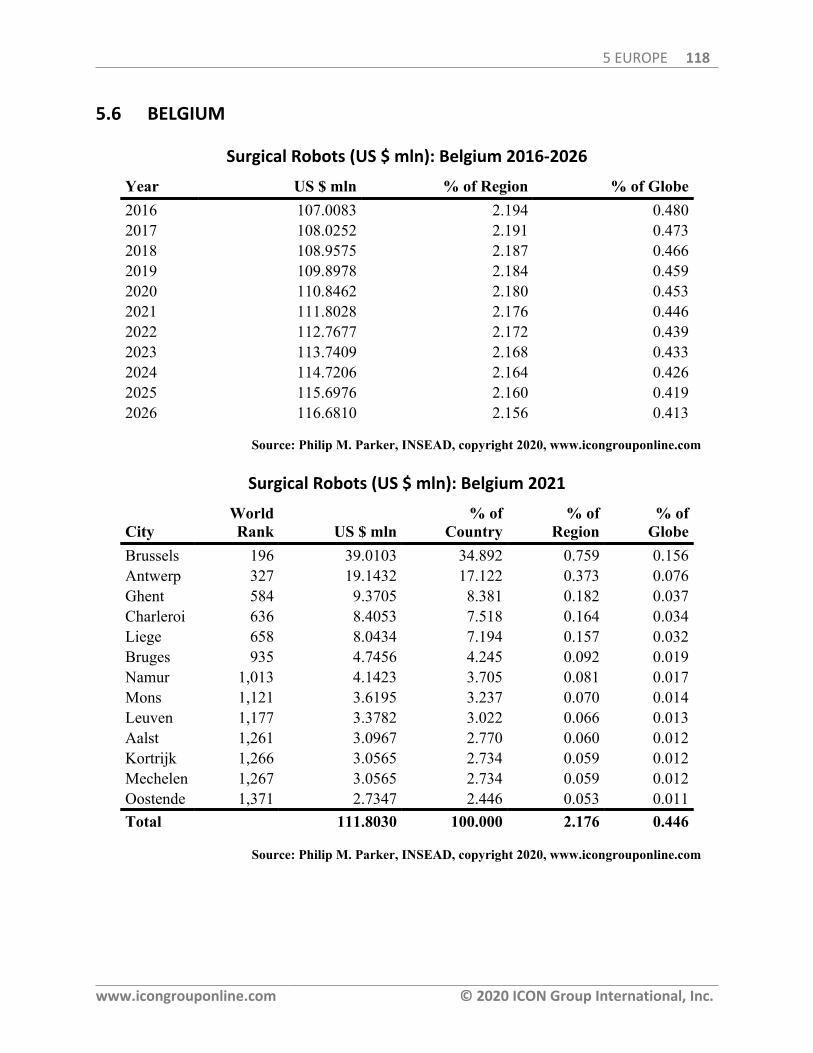
5 EUROPE 118
www.icongrouponline.com © 2020 ICON Group International, Inc.
5.6 BELGIUM
Surgical Robots (US $ mln): Belgium 2016-2026
Year US $ mln % of Region % of Globe2016 107.0083 2.194 0.4802017 108.0252 2.191 0.4732018 108.9575 2.187 0.4662019 109.8978 2.184 0.4592020 110.8462 2.180 0.4532021 111.8028 2.176 0.4462022 112.7677 2.172 0.4392023 113.7409 2.168 0.4332024 114.7206 2.164 0.4262025 115.6976 2.160 0.4192026 116.6810 2.156 0.413
Source: Philip M. Parker, INSEAD, copyright 2020, www.icongrouponline.com
Surgical Robots (US $ mln): Belgium 2021
CityWorldRank US $ mln
% ofCountry
% ofRegion
% ofGlobe
Brussels 196 39.0103 34.892 0.759 0.156Antwerp 327 19.1432 17.122 0.373 0.076Ghent 584 9.3705 8.381 0.182 0.037Charleroi 636 8.4053 7.518 0.164 0.034Liege 658 8.0434 7.194 0.157 0.032Bruges 935 4.7456 4.245 0.092 0.019Namur 1,013 4.1423 3.705 0.081 0.017Mons 1,121 3.6195 3.237 0.070 0.014Leuven 1,177 3.3782 3.022 0.066 0.013Aalst 1,261 3.0967 2.770 0.060 0.012Kortrijk 1,266 3.0565 2.734 0.059 0.012Mechelen 1,267 3.0565 2.734 0.059 0.012Oostende 1,371 2.7347 2.446 0.053 0.011Total 111.8030 100.000 2.176 0.446
Source: Philip M. Parker, INSEAD, copyright 2020, www.icongrouponline.com
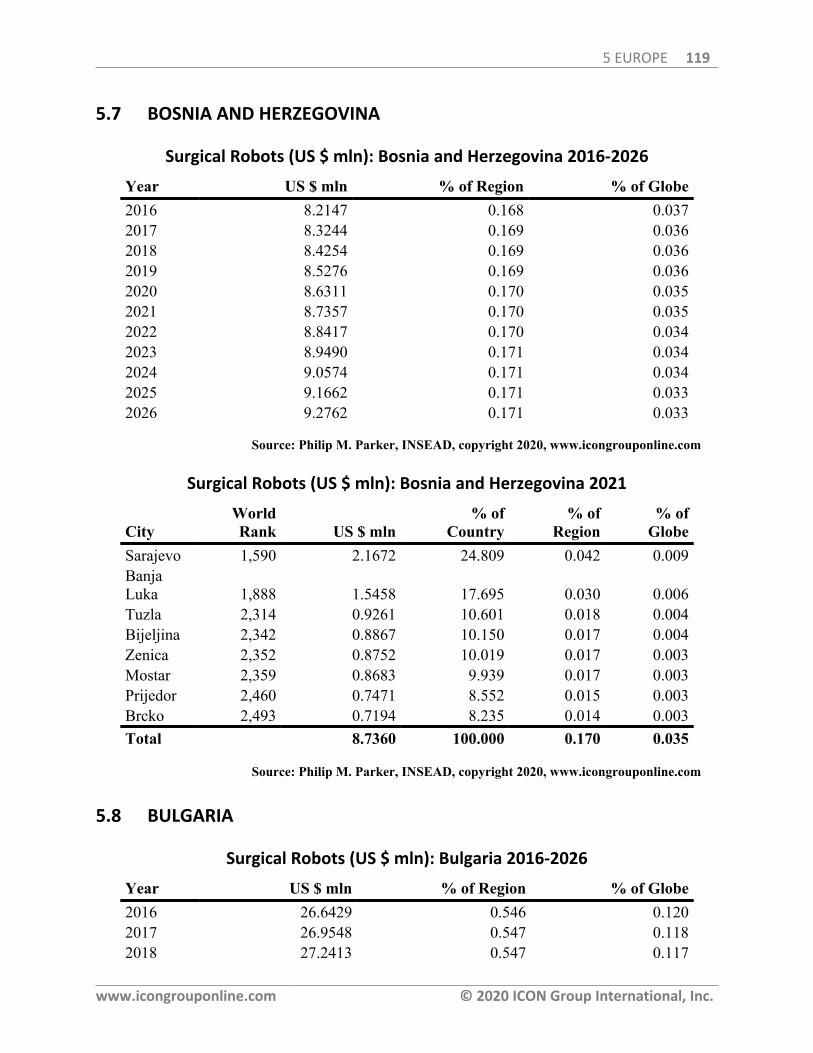
5 EUROPE 119
www.icongrouponline.com © 2020 ICON Group International, Inc.
5.7 BOSNIA AND HERZEGOVINA
Surgical Robots (US $ mln): Bosnia and Herzegovina 2016-2026
Year US $ mln % of Region % of Globe2016 8.2147 0.168 0.0372017 8.3244 0.169 0.0362018 8.4254 0.169 0.0362019 8.5276 0.169 0.0362020 8.6311 0.170 0.0352021 8.7357 0.170 0.0352022 8.8417 0.170 0.0342023 8.9490 0.171 0.0342024 9.0574 0.171 0.0342025 9.1662 0.171 0.0332026 9.2762 0.171 0.033
Source: Philip M. Parker, INSEAD, copyright 2020, www.icongrouponline.com
Surgical Robots (US $ mln): Bosnia and Herzegovina 2021
CityWorldRank US $ mln
% ofCountry
% ofRegion
% ofGlobe
Sarajevo 1,590 2.1672 24.809 0.042 0.009BanjaLuka 1,888 1.5458 17.695 0.030 0.006Tuzla 2,314 0.9261 10.601 0.018 0.004Bijeljina 2,342 0.8867 10.150 0.017 0.004Zenica 2,352 0.8752 10.019 0.017 0.003Mostar 2,359 0.8683 9.939 0.017 0.003Prijedor 2,460 0.7471 8.552 0.015 0.003Brcko 2,493 0.7194 8.235 0.014 0.003Total 8.7360 100.000 0.170 0.035
Source: Philip M. Parker, INSEAD, copyright 2020, www.icongrouponline.com
5.8 BULGARIA
Surgical Robots (US $ mln): Bulgaria 2016-2026
Year US $ mln % of Region % of Globe2016 26.6429 0.546 0.1202017 26.9548 0.547 0.1182018 27.2413 0.547 0.117
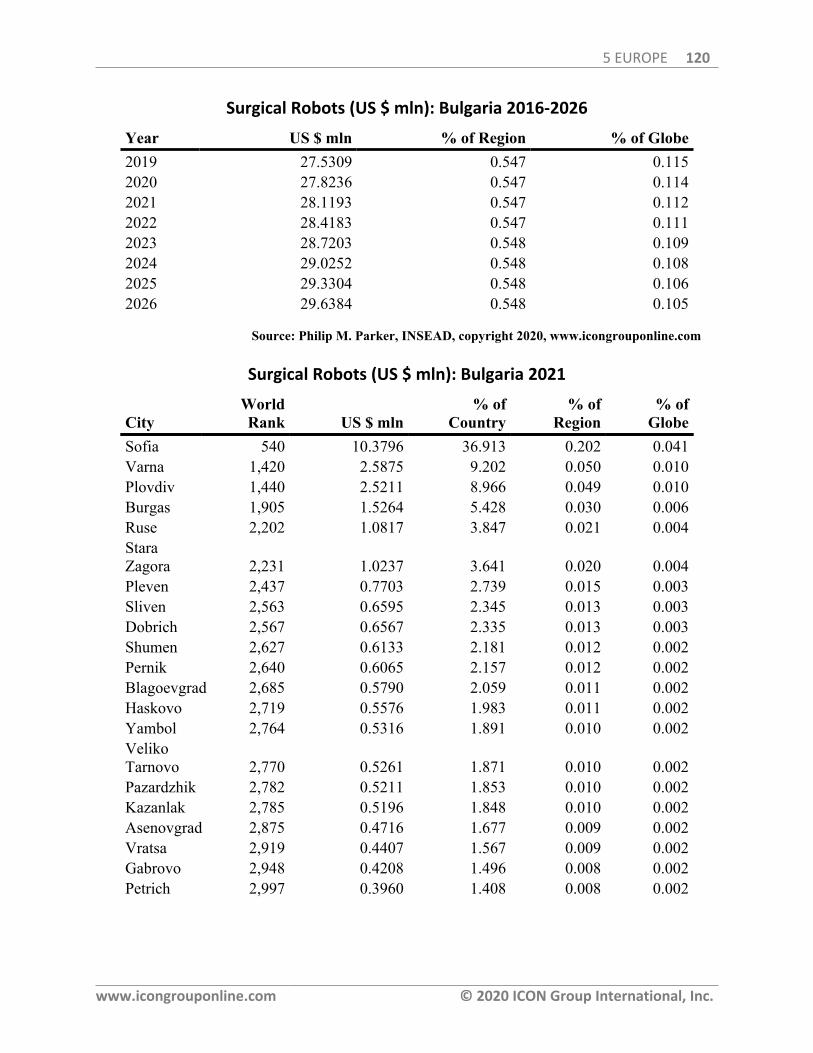
5 EUROPE 120
www.icongrouponline.com © 2020 ICON Group International, Inc.
Surgical Robots (US $ mln): Bulgaria 2016-2026
Year US $ mln % of Region % of Globe2019 27.5309 0.547 0.1152020 27.8236 0.547 0.1142021 28.1193 0.547 0.1122022 28.4183 0.547 0.1112023 28.7203 0.548 0.1092024 29.0252 0.548 0.1082025 29.3304 0.548 0.1062026 29.6384 0.548 0.105
Source: Philip M. Parker, INSEAD, copyright 2020, www.icongrouponline.com
Surgical Robots (US $ mln): Bulgaria 2021
CityWorldRank US $ mln
% ofCountry
% ofRegion
% ofGlobe
Sofia 540 10.3796 36.913 0.202 0.041Varna 1,420 2.5875 9.202 0.050 0.010Plovdiv 1,440 2.5211 8.966 0.049 0.010Burgas 1,905 1.5264 5.428 0.030 0.006Ruse 2,202 1.0817 3.847 0.021 0.004StaraZagora 2,231 1.0237 3.641 0.020 0.004Pleven 2,437 0.7703 2.739 0.015 0.003Sliven 2,563 0.6595 2.345 0.013 0.003Dobrich 2,567 0.6567 2.335 0.013 0.003Shumen 2,627 0.6133 2.181 0.012 0.002Pernik 2,640 0.6065 2.157 0.012 0.002Blagoevgrad 2,685 0.5790 2.059 0.011 0.002Haskovo 2,719 0.5576 1.983 0.011 0.002Yambol 2,764 0.5316 1.891 0.010 0.002VelikoTarnovo 2,770 0.5261 1.871 0.010 0.002Pazardzhik 2,782 0.5211 1.853 0.010 0.002Kazanlak 2,785 0.5196 1.848 0.010 0.002Asenovgrad 2,875 0.4716 1.677 0.009 0.002Vratsa 2,919 0.4407 1.567 0.009 0.002Gabrovo 2,948 0.4208 1.496 0.008 0.002Petrich 2,997 0.3960 1.408 0.008 0.002
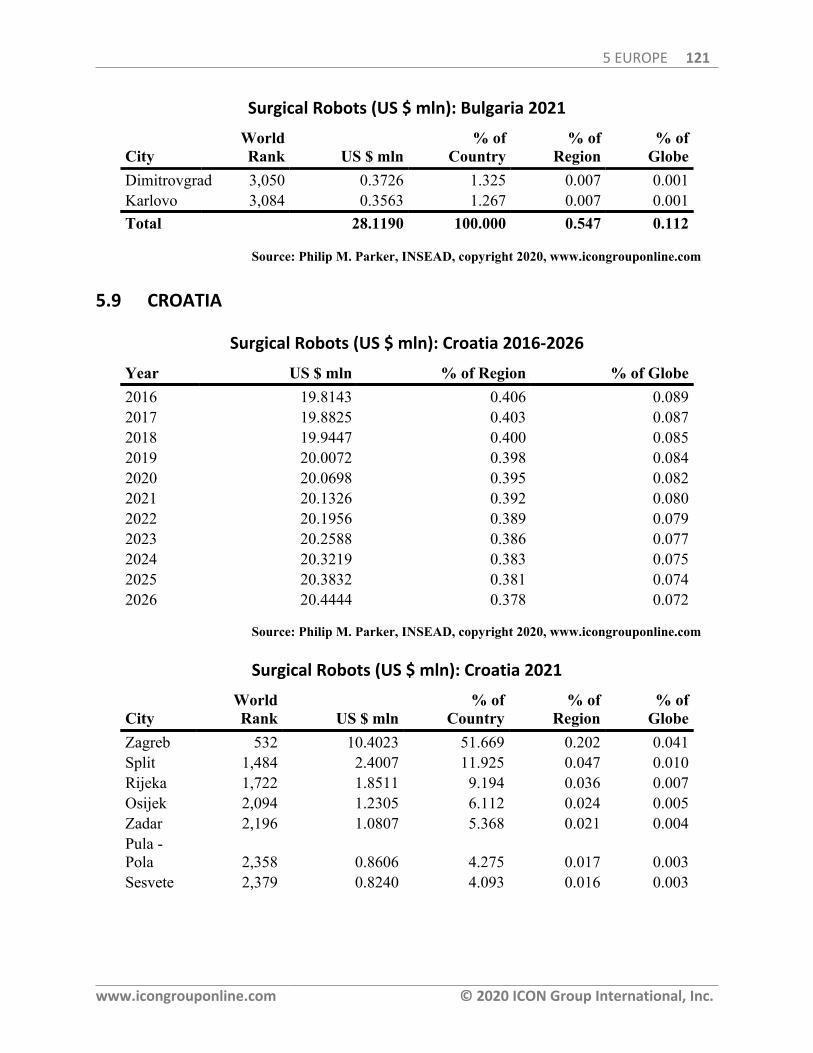
5 EUROPE 121
www.icongrouponline.com © 2020 ICON Group International, Inc.
Surgical Robots (US $ mln): Bulgaria 2021
CityWorldRank US $ mln
% ofCountry
% ofRegion
% ofGlobe
Dimitrovgrad 3,050 0.3726 1.325 0.007 0.001Karlovo 3,084 0.3563 1.267 0.007 0.001Total 28.1190 100.000 0.547 0.112
Source: Philip M. Parker, INSEAD, copyright 2020, www.icongrouponline.com
5.9 CROATIA
Surgical Robots (US $ mln): Croatia 2016-2026
Year US $ mln % of Region % of Globe2016 19.8143 0.406 0.0892017 19.8825 0.403 0.0872018 19.9447 0.400 0.0852019 20.0072 0.398 0.0842020 20.0698 0.395 0.0822021 20.1326 0.392 0.0802022 20.1956 0.389 0.0792023 20.2588 0.386 0.0772024 20.3219 0.383 0.0752025 20.3832 0.381 0.0742026 20.4444 0.378 0.072
Source: Philip M. Parker, INSEAD, copyright 2020, www.icongrouponline.com
Surgical Robots (US $ mln): Croatia 2021
CityWorldRank US $ mln
% ofCountry
% ofRegion
% ofGlobe
Zagreb 532 10.4023 51.669 0.202 0.041Split 1,484 2.4007 11.925 0.047 0.010Rijeka 1,722 1.8511 9.194 0.036 0.007Osijek 2,094 1.2305 6.112 0.024 0.005Zadar 2,196 1.0807 5.368 0.021 0.004Pula -Pola 2,358 0.8606 4.275 0.017 0.003Sesvete 2,379 0.8240 4.093 0.016 0.003

5 EUROPE 122
www.icongrouponline.com © 2020 ICON Group International, Inc.
Surgical Robots (US $ mln): Croatia 2021
CityWorldRank US $ mln
% ofCountry
% ofRegion
% ofGlobe
SlavonskiBrod 2,415 0.7842 3.895 0.015 0.003Karlovac 2,514 0.6985 3.469 0.014 0.003Total 20.1330 100.000 0.392 0.080
Source: Philip M. Parker, INSEAD, copyright 2020, www.icongrouponline.com
5.10 CYPRUS
Surgical Robots (US $ mln): Cyprus 2016-2026
Year US $ mln % of Region % of Globe2016 5.0407 0.103 0.0232017 4.8454 0.098 0.0212018 4.6740 0.094 0.0202019 4.5087 0.090 0.0192020 4.3492 0.086 0.0182021 4.1954 0.082 0.0172022 4.0470 0.078 0.0162023 3.9039 0.074 0.0152024 3.7657 0.071 0.0142025 3.6321 0.068 0.0132026 3.5032 0.065 0.012
Source: Philip M. Parker, INSEAD, copyright 2020, www.icongrouponline.com
Surgical Robots (US $ mln): Cyprus 2021
CityWorldRank US $ mln
% ofCountry
% ofRegion
% ofGlobe
Lemesos 2,093 1.1836 28.212 0.023 0.005Strovolos 2,362 0.8239 19.639 0.016 0.003Lefkosia(Nicosia) 2,523 0.6649 15.849 0.013 0.003Larnaka 2,598 0.6106 14.554 0.012 0.002Lakatameia 2,772 0.5005 11.930 0.010 0.002Pafos 2,936 0.4118 9.816 0.008 0.002Total 4.1950 100.000 0.082 0.017
Source: Philip M. Parker, INSEAD, copyright 2020, www.icongrouponline.com

5 EUROPE 123
www.icongrouponline.com © 2020 ICON Group International, Inc.
5.11 CZECH REPUBLIC
Surgical Robots (US $ mln): Czech Republic 2016-2026
Year US $ mln % of Region % of Globe2016 71.7910 1.472 0.3222017 72.0778 1.462 0.3162018 72.3395 1.452 0.3092019 72.6021 1.443 0.3032020 72.8656 1.433 0.2982021 73.1301 1.423 0.2922022 73.3956 1.414 0.2862023 73.6620 1.404 0.2802024 73.9282 1.395 0.2742025 74.1882 1.385 0.2692026 74.4479 1.375 0.263
Source: Philip M. Parker, INSEAD, copyright 2020, www.icongrouponline.com
Surgical Robots (US $ mln): Czech Republic 2021
CityWorldRank US $ mln
% ofCountry
% ofRegion
% ofGlobe
Praha 260 27.5204 37.632 0.536 0.110Brno 619 8.5473 11.688 0.166 0.034Ostrava 777 6.3376 8.666 0.123 0.025Plzen 1,136 3.5535 4.859 0.069 0.014Liberec 1,569 2.2014 3.010 0.043 0.009Olomouc 1,617 2.0834 2.849 0.041 0.008Ústí nadLabem 1,636 2.0464 2.798 0.040 0.008HradecKrálové 1,681 1.9456 2.661 0.038 0.008CeskéBudejovice 1,683 1.9440 2.658 0.038 0.008Pardubice 1,715 1.8608 2.545 0.036 0.007Havírov 1,814 1.6587 2.268 0.032 0.007Zlín 1,863 1.5662 2.142 0.030 0.006Kladno 1,951 1.4471 1.979 0.028 0.006Most 1,973 1.4182 1.939 0.028 0.006Karviná 2,083 1.2403 1.696 0.024 0.005Opava 2,108 1.2079 1.652 0.024 0.005Frýdek-Místek 2,114 1.2000 1.641 0.023 0.005
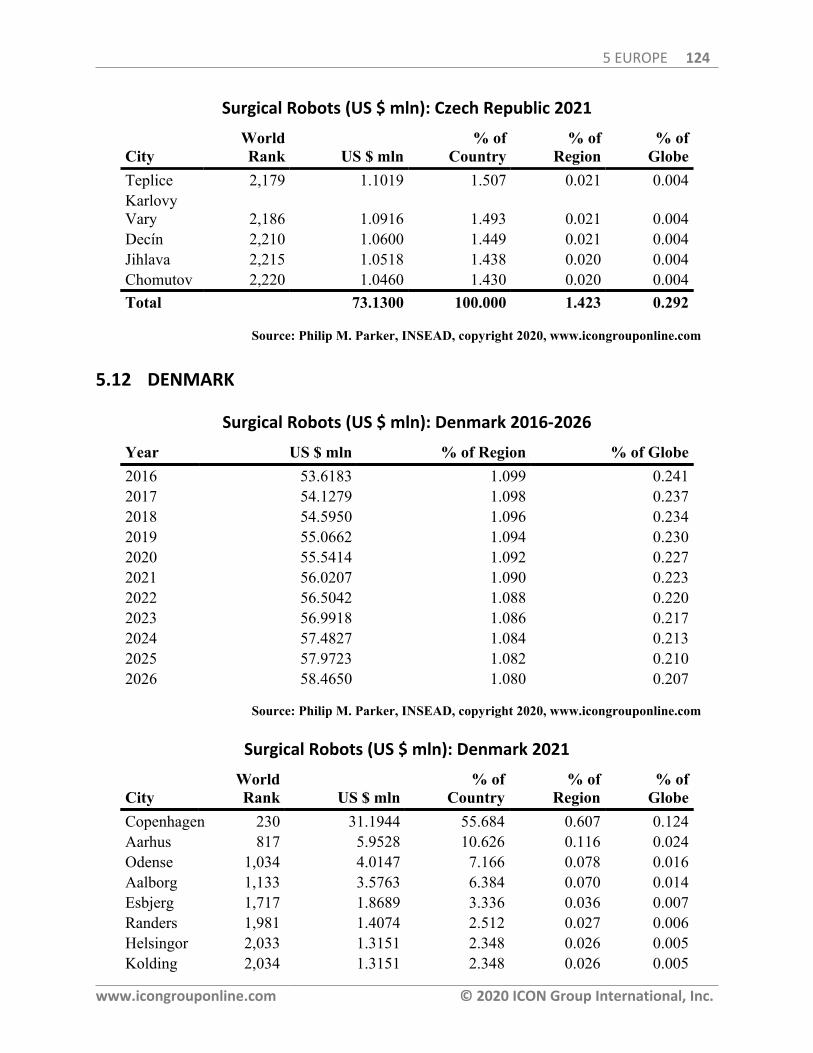
5 EUROPE 124
www.icongrouponline.com © 2020 ICON Group International, Inc.
Surgical Robots (US $ mln): Czech Republic 2021
CityWorldRank US $ mln
% ofCountry
% ofRegion
% ofGlobe
Teplice 2,179 1.1019 1.507 0.021 0.004KarlovyVary 2,186 1.0916 1.493 0.021 0.004Decín 2,210 1.0600 1.449 0.021 0.004Jihlava 2,215 1.0518 1.438 0.020 0.004Chomutov 2,220 1.0460 1.430 0.020 0.004Total 73.1300 100.000 1.423 0.292
Source: Philip M. Parker, INSEAD, copyright 2020, www.icongrouponline.com
5.12 DENMARK
Surgical Robots (US $ mln): Denmark 2016-2026
Year US $ mln % of Region % of Globe2016 53.6183 1.099 0.2412017 54.1279 1.098 0.2372018 54.5950 1.096 0.2342019 55.0662 1.094 0.2302020 55.5414 1.092 0.2272021 56.0207 1.090 0.2232022 56.5042 1.088 0.2202023 56.9918 1.086 0.2172024 57.4827 1.084 0.2132025 57.9723 1.082 0.2102026 58.4650 1.080 0.207
Source: Philip M. Parker, INSEAD, copyright 2020, www.icongrouponline.com
Surgical Robots (US $ mln): Denmark 2021
CityWorldRank US $ mln
% ofCountry
% ofRegion
% ofGlobe
Copenhagen 230 31.1944 55.684 0.607 0.124Aarhus 817 5.9528 10.626 0.116 0.024Odense 1,034 4.0147 7.166 0.078 0.016Aalborg 1,133 3.5763 6.384 0.070 0.014Esbjerg 1,717 1.8689 3.336 0.036 0.007Randers 1,981 1.4074 2.512 0.027 0.006Helsingor 2,033 1.3151 2.348 0.026 0.005Kolding 2,034 1.3151 2.348 0.026 0.005
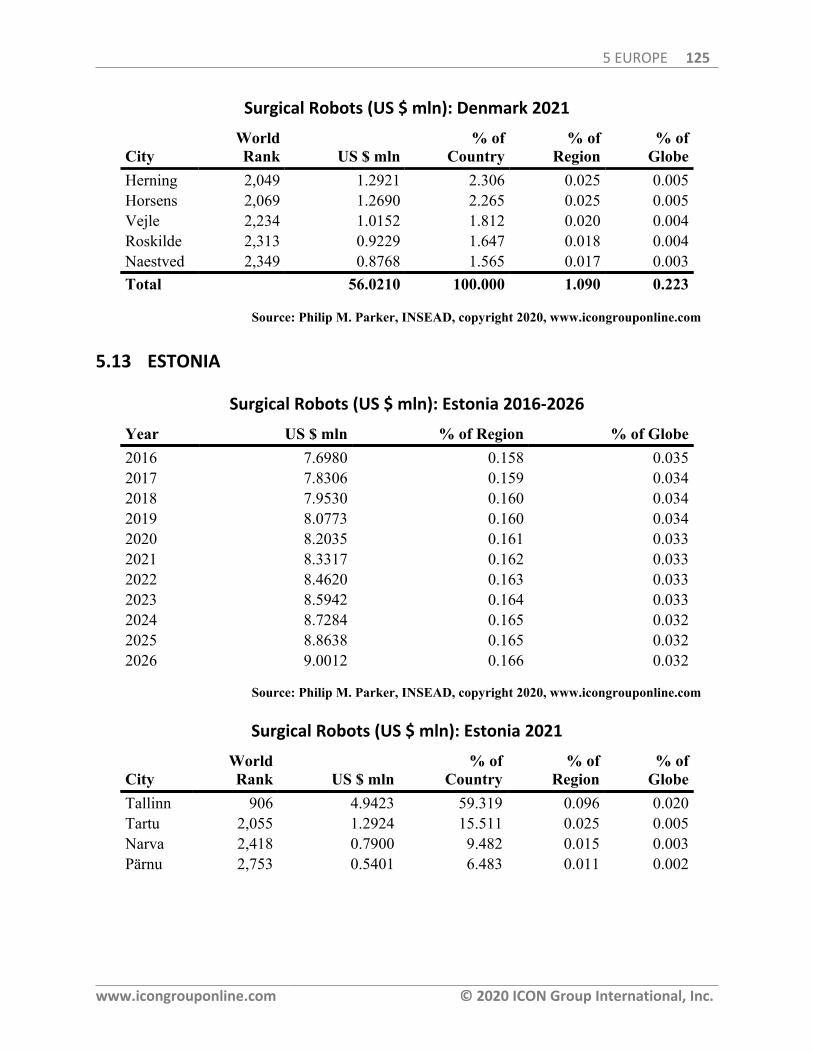
5 EUROPE 125
www.icongrouponline.com © 2020 ICON Group International, Inc.
Surgical Robots (US $ mln): Denmark 2021
CityWorldRank US $ mln
% ofCountry
% ofRegion
% ofGlobe
Herning 2,049 1.2921 2.306 0.025 0.005Horsens 2,069 1.2690 2.265 0.025 0.005Vejle 2,234 1.0152 1.812 0.020 0.004Roskilde 2,313 0.9229 1.647 0.018 0.004Naestved 2,349 0.8768 1.565 0.017 0.003Total 56.0210 100.000 1.090 0.223
Source: Philip M. Parker, INSEAD, copyright 2020, www.icongrouponline.com
5.13 ESTONIA
Surgical Robots (US $ mln): Estonia 2016-2026
Year US $ mln % of Region % of Globe2016 7.6980 0.158 0.0352017 7.8306 0.159 0.0342018 7.9530 0.160 0.0342019 8.0773 0.160 0.0342020 8.2035 0.161 0.0332021 8.3317 0.162 0.0332022 8.4620 0.163 0.0332023 8.5942 0.164 0.0332024 8.7284 0.165 0.0322025 8.8638 0.165 0.0322026 9.0012 0.166 0.032
Source: Philip M. Parker, INSEAD, copyright 2020, www.icongrouponline.com
Surgical Robots (US $ mln): Estonia 2021
CityWorldRank US $ mln
% ofCountry
% ofRegion
% ofGlobe
Tallinn 906 4.9423 59.319 0.096 0.020Tartu 2,055 1.2924 15.511 0.025 0.005Narva 2,418 0.7900 9.482 0.015 0.003Pärnu 2,753 0.5401 6.483 0.011 0.002

5 EUROPE 126
www.icongrouponline.com © 2020 ICON Group International, Inc.
Surgical Robots (US $ mln): Estonia 2021
CityWorldRank US $ mln
% ofCountry
% ofRegion
% ofGlobe
Kohtla-Järve 2,773 0.5269 6.324 0.010 0.002Viljandi 3,292 0.2400 2.880 0.005 0.001Total 8.3320 100.000 0.162 0.033
Source: Philip M. Parker, INSEAD, copyright 2020, www.icongrouponline.com
5.14 FINLAND
Surgical Robots (US $ mln): Finland 2016-2026
Year US $ mln % of Region % of Globe2016 49.2824 1.011 0.2212017 49.5606 1.005 0.2172018 49.8149 1.000 0.2132019 50.0704 0.995 0.2092020 50.3273 0.990 0.2062021 50.5855 0.985 0.2022022 50.8450 0.979 0.1982023 51.1058 0.974 0.1942024 51.3672 0.969 0.1912025 51.6248 0.964 0.1872026 51.8830 0.959 0.183
Source: Philip M. Parker, INSEAD, copyright 2020, www.icongrouponline.com
Surgical Robots (US $ mln): Finland 2021
CityWorldRank US $ mln
% ofCountry
% ofRegion
% ofGlobe
Helsinki 388 15.3441 30.333 0.299 0.061Tampere 861 5.3330 10.543 0.104 0.021Espoo 870 5.2394 10.358 0.102 0.021Turku 892 5.0523 9.988 0.098 0.020Vantaa 937 4.7093 9.310 0.092 0.019Oulu 1,257 3.0875 6.104 0.060 0.012Lahti 1,298 2.9316 5.795 0.057 0.012Pori 1,447 2.4950 4.932 0.049 0.010Kuopio 1,460 2.4638 4.871 0.048 0.010
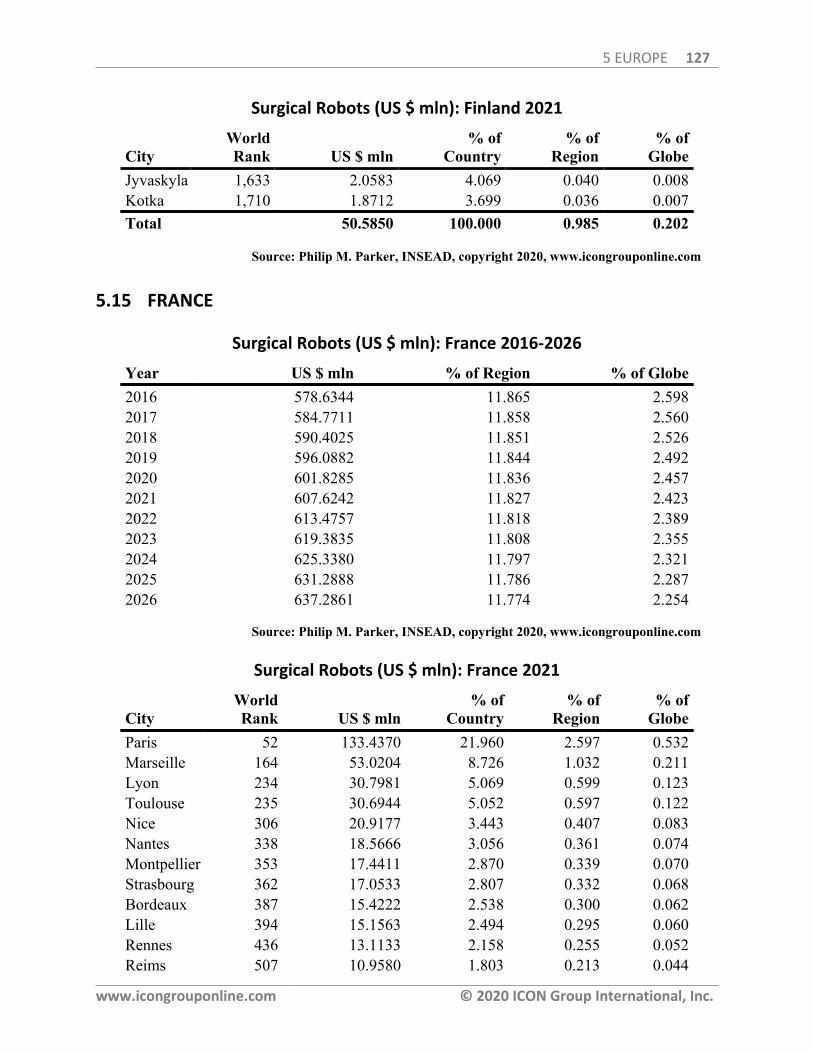
5 EUROPE 127
www.icongrouponline.com © 2020 ICON Group International, Inc.
Surgical Robots (US $ mln): Finland 2021
CityWorldRank US $ mln
% ofCountry
% ofRegion
% ofGlobe
Jyvaskyla 1,633 2.0583 4.069 0.040 0.008Kotka 1,710 1.8712 3.699 0.036 0.007Total 50.5850 100.000 0.985 0.202
Source: Philip M. Parker, INSEAD, copyright 2020, www.icongrouponline.com
5.15 FRANCE
Surgical Robots (US $ mln): France 2016-2026
Year US $ mln % of Region % of Globe2016 578.6344 11.865 2.5982017 584.7711 11.858 2.5602018 590.4025 11.851 2.5262019 596.0882 11.844 2.4922020 601.8285 11.836 2.4572021 607.6242 11.827 2.4232022 613.4757 11.818 2.3892023 619.3835 11.808 2.3552024 625.3380 11.797 2.3212025 631.2888 11.786 2.2872026 637.2861 11.774 2.254
Source: Philip M. Parker, INSEAD, copyright 2020, www.icongrouponline.com
Surgical Robots (US $ mln): France 2021
CityWorldRank US $ mln
% ofCountry
% ofRegion
% ofGlobe
Paris 52 133.4370 21.960 2.597 0.532Marseille 164 53.0204 8.726 1.032 0.211Lyon 234 30.7981 5.069 0.599 0.123Toulouse 235 30.6944 5.052 0.597 0.122Nice 306 20.9177 3.443 0.407 0.083Nantes 338 18.5666 3.056 0.361 0.074Montpellier 353 17.4411 2.870 0.339 0.070Strasbourg 362 17.0533 2.807 0.332 0.068Bordeaux 387 15.4222 2.538 0.300 0.062Lille 394 15.1563 2.494 0.295 0.060Rennes 436 13.1133 2.158 0.255 0.052Reims 507 10.9580 1.803 0.213 0.044
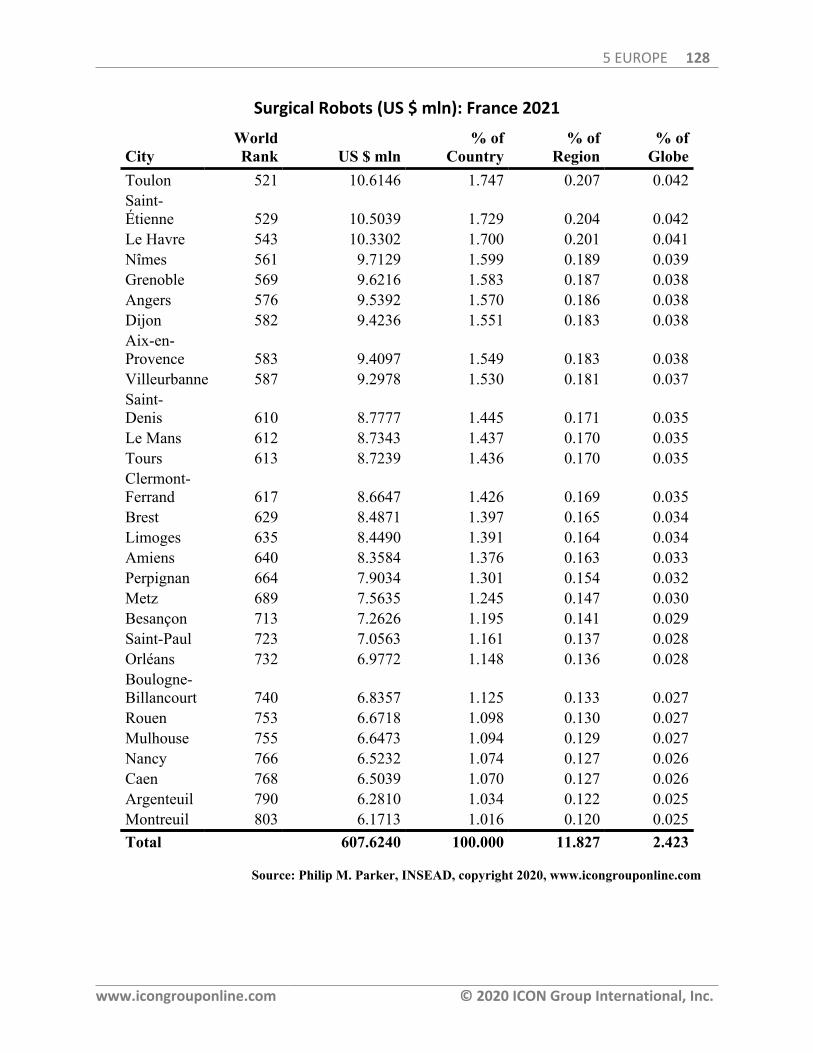
5 EUROPE 128
www.icongrouponline.com © 2020 ICON Group International, Inc.
Surgical Robots (US $ mln): France 2021
CityWorldRank US $ mln
% ofCountry
% ofRegion
% ofGlobe
Toulon 521 10.6146 1.747 0.207 0.042Saint-Étienne 529 10.5039 1.729 0.204 0.042Le Havre 543 10.3302 1.700 0.201 0.041Nîmes 561 9.7129 1.599 0.189 0.039Grenoble 569 9.6216 1.583 0.187 0.038Angers 576 9.5392 1.570 0.186 0.038Dijon 582 9.4236 1.551 0.183 0.038Aix-en-Provence 583 9.4097 1.549 0.183 0.038Villeurbanne 587 9.2978 1.530 0.181 0.037Saint-Denis 610 8.7777 1.445 0.171 0.035Le Mans 612 8.7343 1.437 0.170 0.035Tours 613 8.7239 1.436 0.170 0.035Clermont-Ferrand 617 8.6647 1.426 0.169 0.035Brest 629 8.4871 1.397 0.165 0.034Limoges 635 8.4490 1.391 0.164 0.034Amiens 640 8.3584 1.376 0.163 0.033Perpignan 664 7.9034 1.301 0.154 0.032Metz 689 7.5635 1.245 0.147 0.030Besançon 713 7.2626 1.195 0.141 0.029Saint-Paul 723 7.0563 1.161 0.137 0.028Orléans 732 6.9772 1.148 0.136 0.028Boulogne-Billancourt 740 6.8357 1.125 0.133 0.027Rouen 753 6.6718 1.098 0.130 0.027Mulhouse 755 6.6473 1.094 0.129 0.027Nancy 766 6.5232 1.074 0.127 0.026Caen 768 6.5039 1.070 0.127 0.026Argenteuil 790 6.2810 1.034 0.122 0.025Montreuil 803 6.1713 1.016 0.120 0.025Total 607.6240 100.000 11.827 2.423
Source: Philip M. Parker, INSEAD, copyright 2020, www.icongrouponline.com
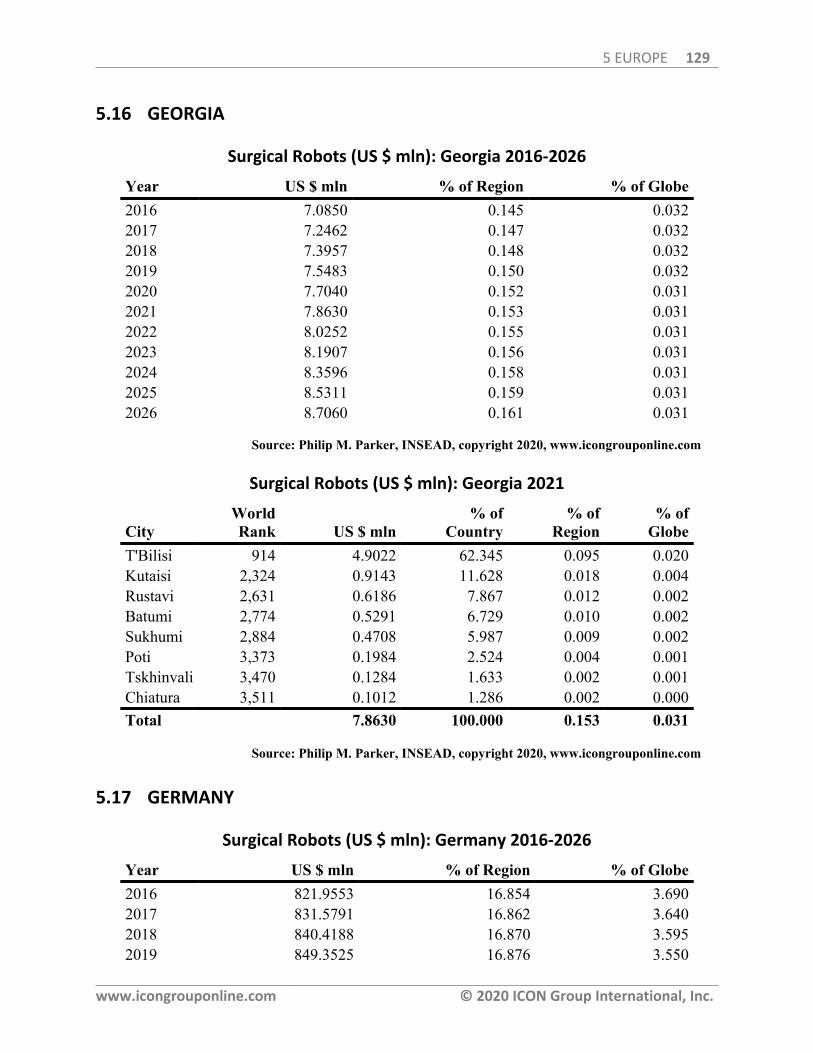
5 EUROPE 129
www.icongrouponline.com © 2020 ICON Group International, Inc.
5.16 GEORGIA
Surgical Robots (US $ mln): Georgia 2016-2026
Year US $ mln % of Region % of Globe2016 7.0850 0.145 0.0322017 7.2462 0.147 0.0322018 7.3957 0.148 0.0322019 7.5483 0.150 0.0322020 7.7040 0.152 0.0312021 7.8630 0.153 0.0312022 8.0252 0.155 0.0312023 8.1907 0.156 0.0312024 8.3596 0.158 0.0312025 8.5311 0.159 0.0312026 8.7060 0.161 0.031
Source: Philip M. Parker, INSEAD, copyright 2020, www.icongrouponline.com
Surgical Robots (US $ mln): Georgia 2021
CityWorldRank US $ mln
% ofCountry
% ofRegion
% ofGlobe
T'Bilisi 914 4.9022 62.345 0.095 0.020Kutaisi 2,324 0.9143 11.628 0.018 0.004Rustavi 2,631 0.6186 7.867 0.012 0.002Batumi 2,774 0.5291 6.729 0.010 0.002Sukhumi 2,884 0.4708 5.987 0.009 0.002Poti 3,373 0.1984 2.524 0.004 0.001Tskhinvali 3,470 0.1284 1.633 0.002 0.001Chiatura 3,511 0.1012 1.286 0.002 0.000Total 7.8630 100.000 0.153 0.031
Source: Philip M. Parker, INSEAD, copyright 2020, www.icongrouponline.com
5.17 GERMANY
Surgical Robots (US $ mln): Germany 2016-2026
Year US $ mln % of Region % of Globe2016 821.9553 16.854 3.6902017 831.5791 16.862 3.6402018 840.4188 16.870 3.5952019 849.3525 16.876 3.550
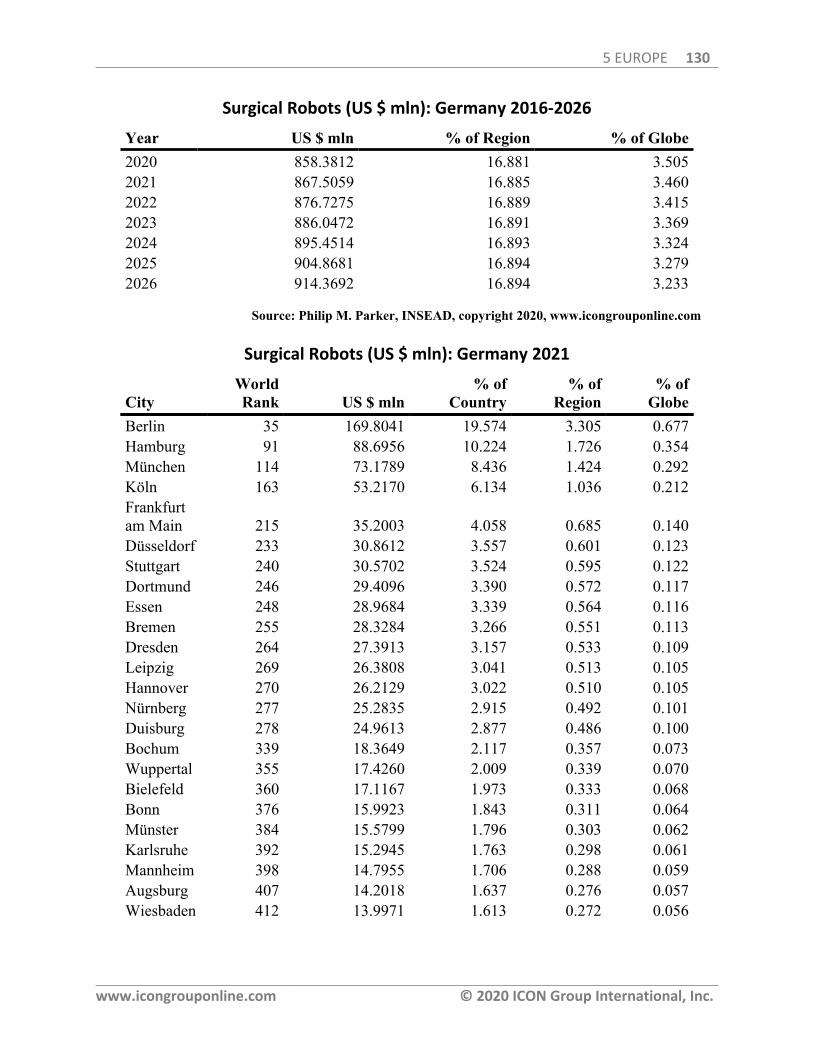
5 EUROPE 130
www.icongrouponline.com © 2020 ICON Group International, Inc.
Surgical Robots (US $ mln): Germany 2016-2026
Year US $ mln % of Region % of Globe2020 858.3812 16.881 3.5052021 867.5059 16.885 3.4602022 876.7275 16.889 3.4152023 886.0472 16.891 3.3692024 895.4514 16.893 3.3242025 904.8681 16.894 3.2792026 914.3692 16.894 3.233
Source: Philip M. Parker, INSEAD, copyright 2020, www.icongrouponline.com
Surgical Robots (US $ mln): Germany 2021
CityWorldRank US $ mln
% ofCountry
% ofRegion
% ofGlobe
Berlin 35 169.8041 19.574 3.305 0.677Hamburg 91 88.6956 10.224 1.726 0.354München 114 73.1789 8.436 1.424 0.292Köln 163 53.2170 6.134 1.036 0.212Frankfurtam Main 215 35.2003 4.058 0.685 0.140Düsseldorf 233 30.8612 3.557 0.601 0.123Stuttgart 240 30.5702 3.524 0.595 0.122Dortmund 246 29.4096 3.390 0.572 0.117Essen 248 28.9684 3.339 0.564 0.116Bremen 255 28.3284 3.266 0.551 0.113Dresden 264 27.3913 3.157 0.533 0.109Leipzig 269 26.3808 3.041 0.513 0.105Hannover 270 26.2129 3.022 0.510 0.105Nürnberg 277 25.2835 2.915 0.492 0.101Duisburg 278 24.9613 2.877 0.486 0.100Bochum 339 18.3649 2.117 0.357 0.073Wuppertal 355 17.4260 2.009 0.339 0.070Bielefeld 360 17.1167 1.973 0.333 0.068Bonn 376 15.9923 1.843 0.311 0.064Münster 384 15.5799 1.796 0.303 0.062Karlsruhe 392 15.2945 1.763 0.298 0.061Mannheim 398 14.7955 1.706 0.288 0.059Augsburg 407 14.2018 1.637 0.276 0.057Wiesbaden 412 13.9971 1.613 0.272 0.056
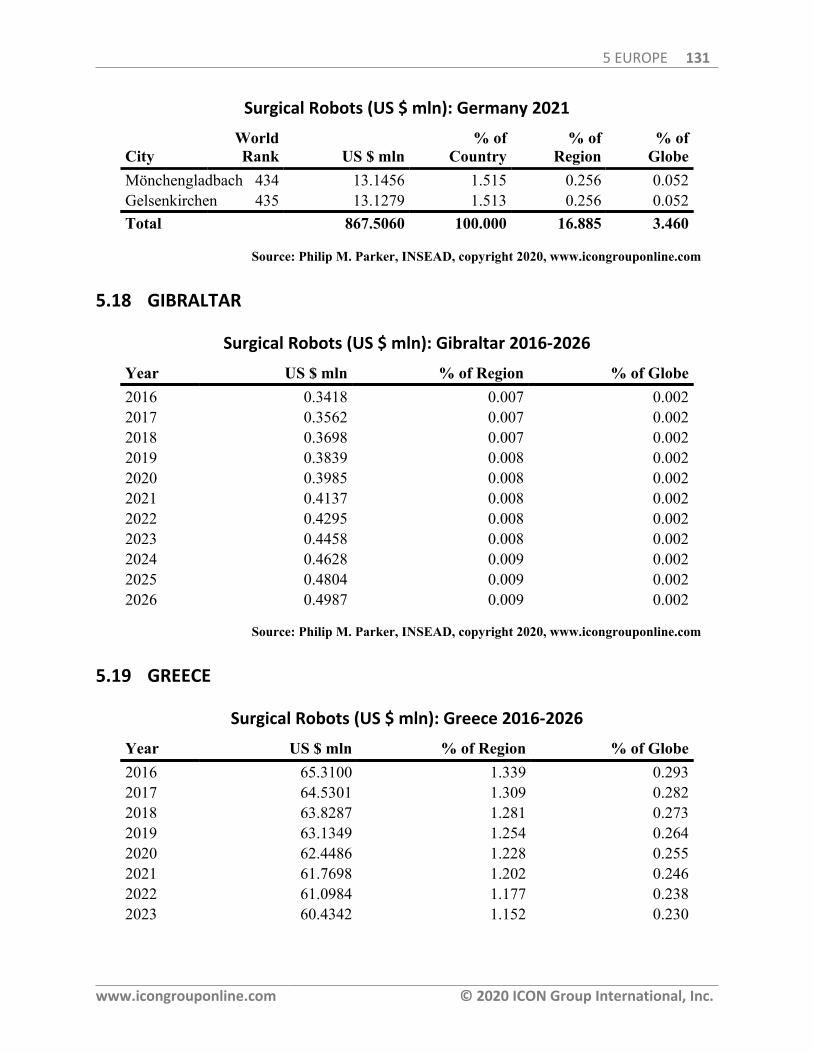
5 EUROPE 131
www.icongrouponline.com © 2020 ICON Group International, Inc.
Surgical Robots (US $ mln): Germany 2021
CityWorldRank US $ mln
% ofCountry
% ofRegion
% ofGlobe
Mönchengladbach 434 13.1456 1.515 0.256 0.052Gelsenkirchen 435 13.1279 1.513 0.256 0.052Total 867.5060 100.000 16.885 3.460
Source: Philip M. Parker, INSEAD, copyright 2020, www.icongrouponline.com
5.18 GIBRALTAR
Surgical Robots (US $ mln): Gibraltar 2016-2026
Year US $ mln % of Region % of Globe2016 0.3418 0.007 0.0022017 0.3562 0.007 0.0022018 0.3698 0.007 0.0022019 0.3839 0.008 0.0022020 0.3985 0.008 0.0022021 0.4137 0.008 0.0022022 0.4295 0.008 0.0022023 0.4458 0.008 0.0022024 0.4628 0.009 0.0022025 0.4804 0.009 0.0022026 0.4987 0.009 0.002
Source: Philip M. Parker, INSEAD, copyright 2020, www.icongrouponline.com
5.19 GREECE
Surgical Robots (US $ mln): Greece 2016-2026
Year US $ mln % of Region % of Globe2016 65.3100 1.339 0.2932017 64.5301 1.309 0.2822018 63.8287 1.281 0.2732019 63.1349 1.254 0.2642020 62.4486 1.228 0.2552021 61.7698 1.202 0.2462022 61.0984 1.177 0.2382023 60.4342 1.152 0.230
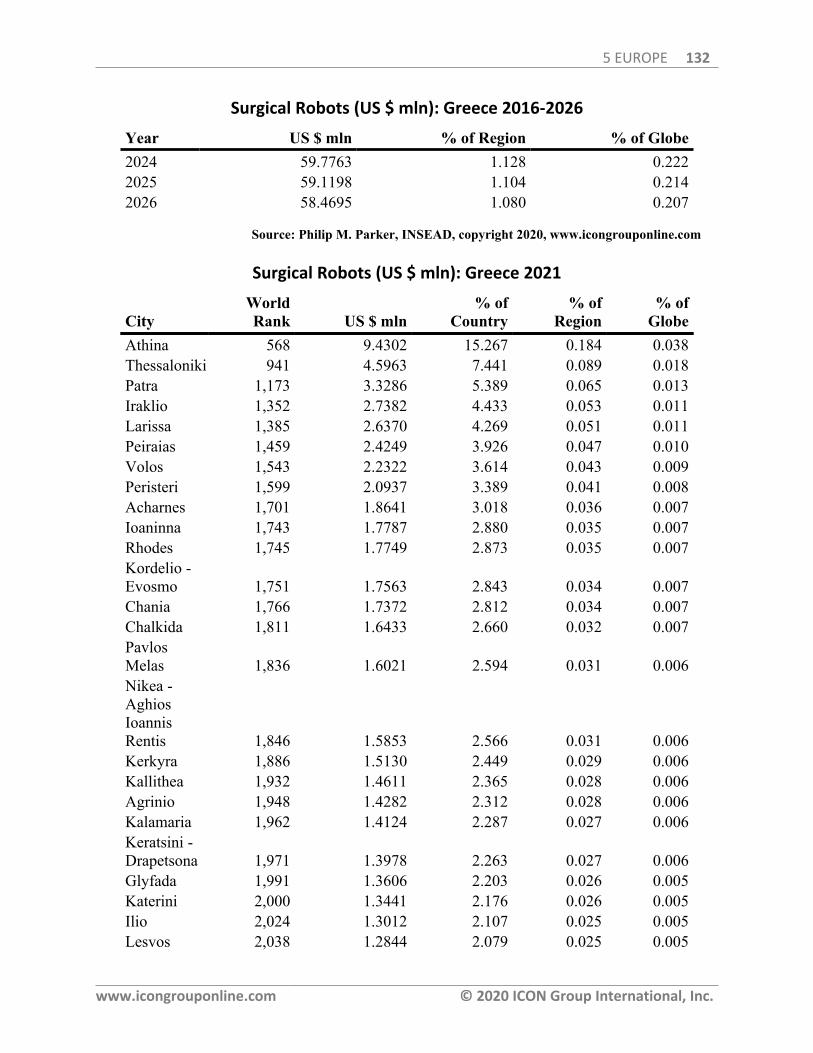
5 EUROPE 132
www.icongrouponline.com © 2020 ICON Group International, Inc.
Surgical Robots (US $ mln): Greece 2016-2026
Year US $ mln % of Region % of Globe2024 59.7763 1.128 0.2222025 59.1198 1.104 0.2142026 58.4695 1.080 0.207
Source: Philip M. Parker, INSEAD, copyright 2020, www.icongrouponline.com
Surgical Robots (US $ mln): Greece 2021
CityWorldRank US $ mln
% ofCountry
% ofRegion
% ofGlobe
Athina 568 9.4302 15.267 0.184 0.038Thessaloniki 941 4.5963 7.441 0.089 0.018Patra 1,173 3.3286 5.389 0.065 0.013Iraklio 1,352 2.7382 4.433 0.053 0.011Larissa 1,385 2.6370 4.269 0.051 0.011Peiraias 1,459 2.4249 3.926 0.047 0.010Volos 1,543 2.2322 3.614 0.043 0.009Peristeri 1,599 2.0937 3.389 0.041 0.008Acharnes 1,701 1.8641 3.018 0.036 0.007Ioaninna 1,743 1.7787 2.880 0.035 0.007Rhodes 1,745 1.7749 2.873 0.035 0.007Kordelio -Evosmo 1,751 1.7563 2.843 0.034 0.007Chania 1,766 1.7372 2.812 0.034 0.007Chalkida 1,811 1.6433 2.660 0.032 0.007PavlosMelas 1,836 1.6021 2.594 0.031 0.006Nikea -AghiosIoannisRentis 1,846 1.5853 2.566 0.031 0.006Kerkyra 1,886 1.5130 2.449 0.029 0.006Kallithea 1,932 1.4611 2.365 0.028 0.006Agrinio 1,948 1.4282 2.312 0.028 0.006Kalamaria 1,962 1.4124 2.287 0.027 0.006Keratsini -Drapetsona 1,971 1.3978 2.263 0.027 0.006Glyfada 1,991 1.3606 2.203 0.026 0.005Katerini 2,000 1.3441 2.176 0.026 0.005Ilio 2,024 1.3012 2.107 0.025 0.005Lesvos 2,038 1.2844 2.079 0.025 0.005
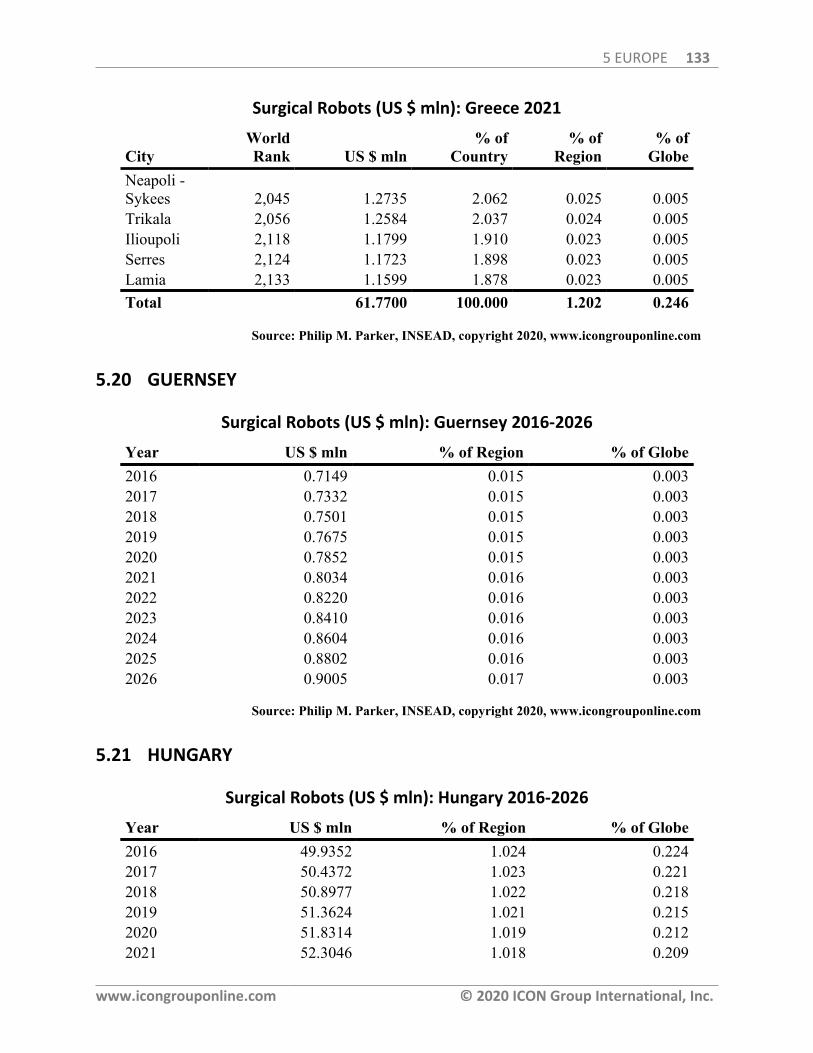
5 EUROPE 133
www.icongrouponline.com © 2020 ICON Group International, Inc.
Surgical Robots (US $ mln): Greece 2021
CityWorldRank US $ mln
% ofCountry
% ofRegion
% ofGlobe
Neapoli -Sykees 2,045 1.2735 2.062 0.025 0.005Trikala 2,056 1.2584 2.037 0.024 0.005Ilioupoli 2,118 1.1799 1.910 0.023 0.005Serres 2,124 1.1723 1.898 0.023 0.005Lamia 2,133 1.1599 1.878 0.023 0.005Total 61.7700 100.000 1.202 0.246
Source: Philip M. Parker, INSEAD, copyright 2020, www.icongrouponline.com
5.20 GUERNSEY
Surgical Robots (US $ mln): Guernsey 2016-2026
Year US $ mln % of Region % of Globe2016 0.7149 0.015 0.0032017 0.7332 0.015 0.0032018 0.7501 0.015 0.0032019 0.7675 0.015 0.0032020 0.7852 0.015 0.0032021 0.8034 0.016 0.0032022 0.8220 0.016 0.0032023 0.8410 0.016 0.0032024 0.8604 0.016 0.0032025 0.8802 0.016 0.0032026 0.9005 0.017 0.003
Source: Philip M. Parker, INSEAD, copyright 2020, www.icongrouponline.com
5.21 HUNGARY
Surgical Robots (US $ mln): Hungary 2016-2026
Year US $ mln % of Region % of Globe2016 49.9352 1.024 0.2242017 50.4372 1.023 0.2212018 50.8977 1.022 0.2182019 51.3624 1.021 0.2152020 51.8314 1.019 0.2122021 52.3046 1.018 0.209
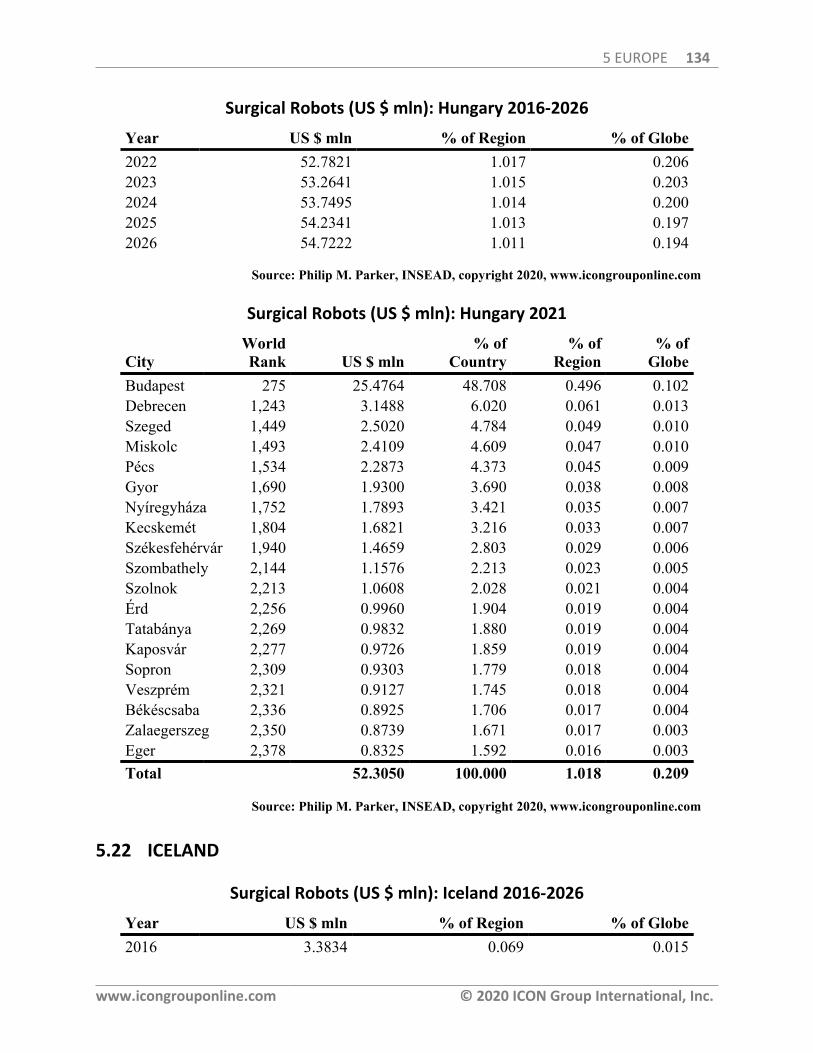
5 EUROPE 134
www.icongrouponline.com © 2020 ICON Group International, Inc.
Surgical Robots (US $ mln): Hungary 2016-2026
Year US $ mln % of Region % of Globe2022 52.7821 1.017 0.2062023 53.2641 1.015 0.2032024 53.7495 1.014 0.2002025 54.2341 1.013 0.1972026 54.7222 1.011 0.194
Source: Philip M. Parker, INSEAD, copyright 2020, www.icongrouponline.com
Surgical Robots (US $ mln): Hungary 2021
CityWorldRank US $ mln
% ofCountry
% ofRegion
% ofGlobe
Budapest 275 25.4764 48.708 0.496 0.102Debrecen 1,243 3.1488 6.020 0.061 0.013Szeged 1,449 2.5020 4.784 0.049 0.010Miskolc 1,493 2.4109 4.609 0.047 0.010Pécs 1,534 2.2873 4.373 0.045 0.009Gyor 1,690 1.9300 3.690 0.038 0.008Nyíregyháza 1,752 1.7893 3.421 0.035 0.007Kecskemét 1,804 1.6821 3.216 0.033 0.007Székesfehérvár 1,940 1.4659 2.803 0.029 0.006Szombathely 2,144 1.1576 2.213 0.023 0.005Szolnok 2,213 1.0608 2.028 0.021 0.004Érd 2,256 0.9960 1.904 0.019 0.004Tatabánya 2,269 0.9832 1.880 0.019 0.004Kaposvár 2,277 0.9726 1.859 0.019 0.004Sopron 2,309 0.9303 1.779 0.018 0.004Veszprém 2,321 0.9127 1.745 0.018 0.004Békéscsaba 2,336 0.8925 1.706 0.017 0.004Zalaegerszeg 2,350 0.8739 1.671 0.017 0.003Eger 2,378 0.8325 1.592 0.016 0.003Total 52.3050 100.000 1.018 0.209
Source: Philip M. Parker, INSEAD, copyright 2020, www.icongrouponline.com
5.22 ICELAND
Surgical Robots (US $ mln): Iceland 2016-2026
Year US $ mln % of Region % of Globe2016 3.3834 0.069 0.015

5 EUROPE 135
www.icongrouponline.com © 2020 ICON Group International, Inc.
Surgical Robots (US $ mln): Iceland 2016-2026
Year US $ mln % of Region % of Globe2017 3.4491 0.070 0.0152018 3.5099 0.070 0.0152019 3.5718 0.071 0.0152020 3.6348 0.071 0.0152021 3.6989 0.072 0.0152022 3.7641 0.073 0.0152023 3.8305 0.073 0.0152024 3.8979 0.074 0.0142025 3.9662 0.074 0.0142026 4.0356 0.075 0.014
Source: Philip M. Parker, INSEAD, copyright 2020, www.icongrouponline.com
Surgical Robots (US $ mln): Iceland 2021
CityWorldRank US $ mln
% ofCountry
% ofRegion
% ofGlobe
Reykjavik 1,597 2.1652 58.537 0.042 0.009Kopavogur 3,126 0.3383 9.146 0.007 0.001Hafnarfjordhur 3,159 0.3158 8.537 0.006 0.001Akureyri 3,160 0.3158 8.537 0.006 0.001Keflavik 3,428 0.1579 4.268 0.003 0.001Vestmannaeyjar 3,488 0.1128 3.049 0.002 0.000Akranes 3,489 0.1128 3.049 0.002 0.000Isafjorour 3,584 0.0677 1.829 0.001 0.000Husavik 3,585 0.0677 1.829 0.001 0.000Neskaupstaour 3,626 0.0451 1.219 0.001 0.000Total 3.6990 100.000 0.072 0.015
Source: Philip M. Parker, INSEAD, copyright 2020, www.icongrouponline.com
5.23 IRELAND
Surgical Robots (US $ mln): Ireland 2016-2026
Year US $ mln % of Region % of Globe2016 48.5428 0.995 0.2182017 49.1379 0.996 0.2152018 49.6848 0.997 0.2132019 50.2378 0.998 0.2102020 50.7969 0.999 0.207
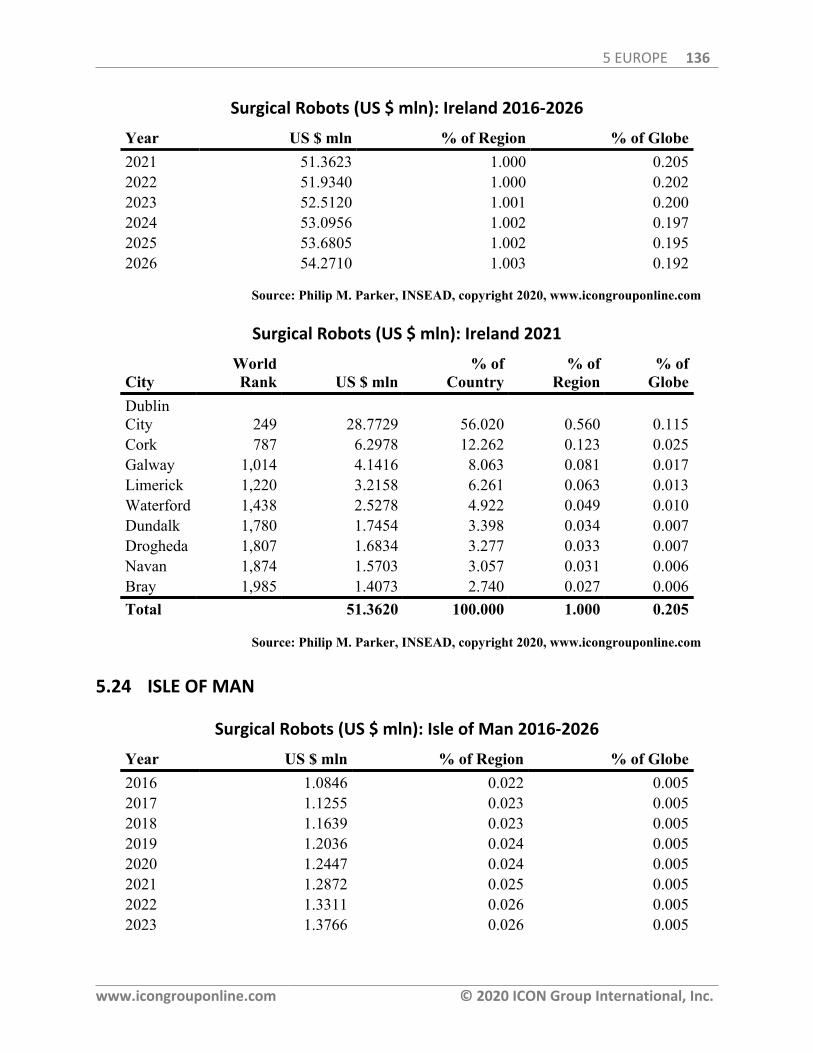
5 EUROPE 136
www.icongrouponline.com © 2020 ICON Group International, Inc.
Surgical Robots (US $ mln): Ireland 2016-2026
Year US $ mln % of Region % of Globe2021 51.3623 1.000 0.2052022 51.9340 1.000 0.2022023 52.5120 1.001 0.2002024 53.0956 1.002 0.1972025 53.6805 1.002 0.1952026 54.2710 1.003 0.192
Source: Philip M. Parker, INSEAD, copyright 2020, www.icongrouponline.com
Surgical Robots (US $ mln): Ireland 2021
CityWorldRank US $ mln
% ofCountry
% ofRegion
% ofGlobe
DublinCity 249 28.7729 56.020 0.560 0.115Cork 787 6.2978 12.262 0.123 0.025Galway 1,014 4.1416 8.063 0.081 0.017Limerick 1,220 3.2158 6.261 0.063 0.013Waterford 1,438 2.5278 4.922 0.049 0.010Dundalk 1,780 1.7454 3.398 0.034 0.007Drogheda 1,807 1.6834 3.277 0.033 0.007Navan 1,874 1.5703 3.057 0.031 0.006Bray 1,985 1.4073 2.740 0.027 0.006Total 51.3620 100.000 1.000 0.205
Source: Philip M. Parker, INSEAD, copyright 2020, www.icongrouponline.com
5.24 ISLE OF MAN
Surgical Robots (US $ mln): Isle of Man 2016-2026
Year US $ mln % of Region % of Globe2016 1.0846 0.022 0.0052017 1.1255 0.023 0.0052018 1.1639 0.023 0.0052019 1.2036 0.024 0.0052020 1.2447 0.024 0.0052021 1.2872 0.025 0.0052022 1.3311 0.026 0.0052023 1.3766 0.026 0.005
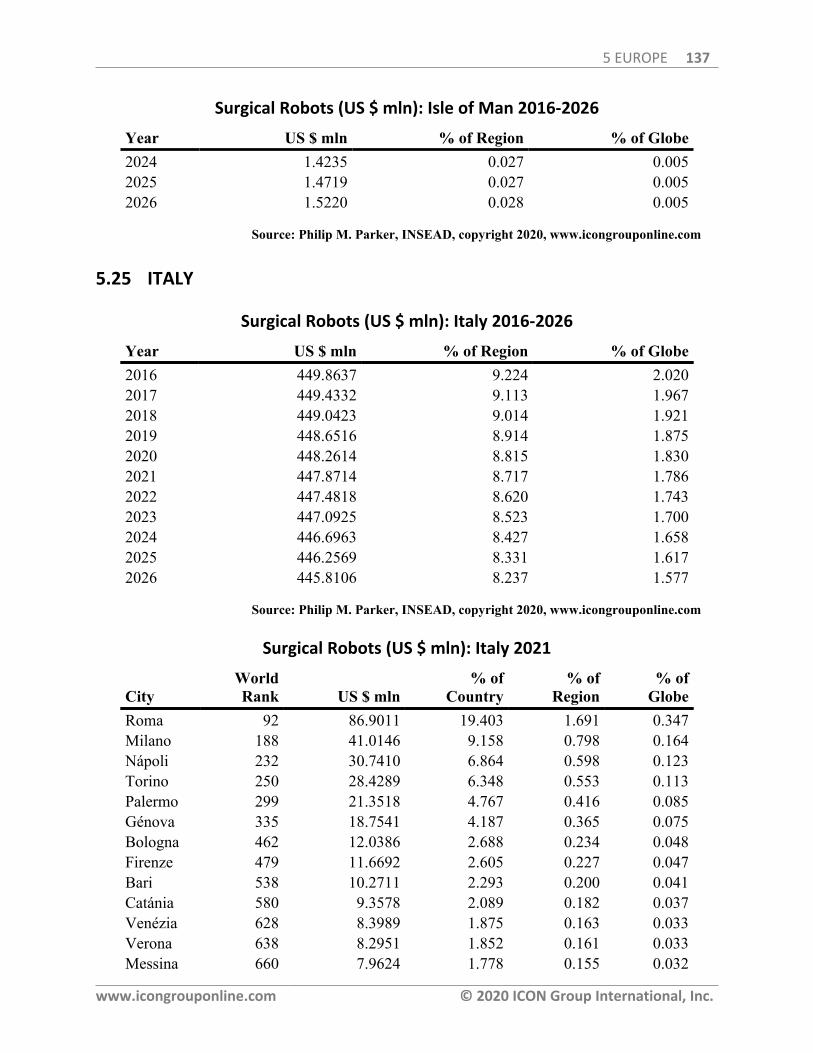
5 EUROPE 137
www.icongrouponline.com © 2020 ICON Group International, Inc.
Surgical Robots (US $ mln): Isle of Man 2016-2026
Year US $ mln % of Region % of Globe2024 1.4235 0.027 0.0052025 1.4719 0.027 0.0052026 1.5220 0.028 0.005
Source: Philip M. Parker, INSEAD, copyright 2020, www.icongrouponline.com
5.25 ITALY
Surgical Robots (US $ mln): Italy 2016-2026
Year US $ mln % of Region % of Globe2016 449.8637 9.224 2.0202017 449.4332 9.113 1.9672018 449.0423 9.014 1.9212019 448.6516 8.914 1.8752020 448.2614 8.815 1.8302021 447.8714 8.717 1.7862022 447.4818 8.620 1.7432023 447.0925 8.523 1.7002024 446.6963 8.427 1.6582025 446.2569 8.331 1.6172026 445.8106 8.237 1.577
Source: Philip M. Parker, INSEAD, copyright 2020, www.icongrouponline.com
Surgical Robots (US $ mln): Italy 2021
CityWorldRank US $ mln
% ofCountry
% ofRegion
% ofGlobe
Roma 92 86.9011 19.403 1.691 0.347Milano 188 41.0146 9.158 0.798 0.164Nápoli 232 30.7410 6.864 0.598 0.123Torino 250 28.4289 6.348 0.553 0.113Palermo 299 21.3518 4.767 0.416 0.085Génova 335 18.7541 4.187 0.365 0.075Bologna 462 12.0386 2.688 0.234 0.048Firenze 479 11.6692 2.605 0.227 0.047Bari 538 10.2711 2.293 0.200 0.041Catánia 580 9.3578 2.089 0.182 0.037Venézia 628 8.3989 1.875 0.163 0.033Verona 638 8.2951 1.852 0.161 0.033Messina 660 7.9624 1.778 0.155 0.032
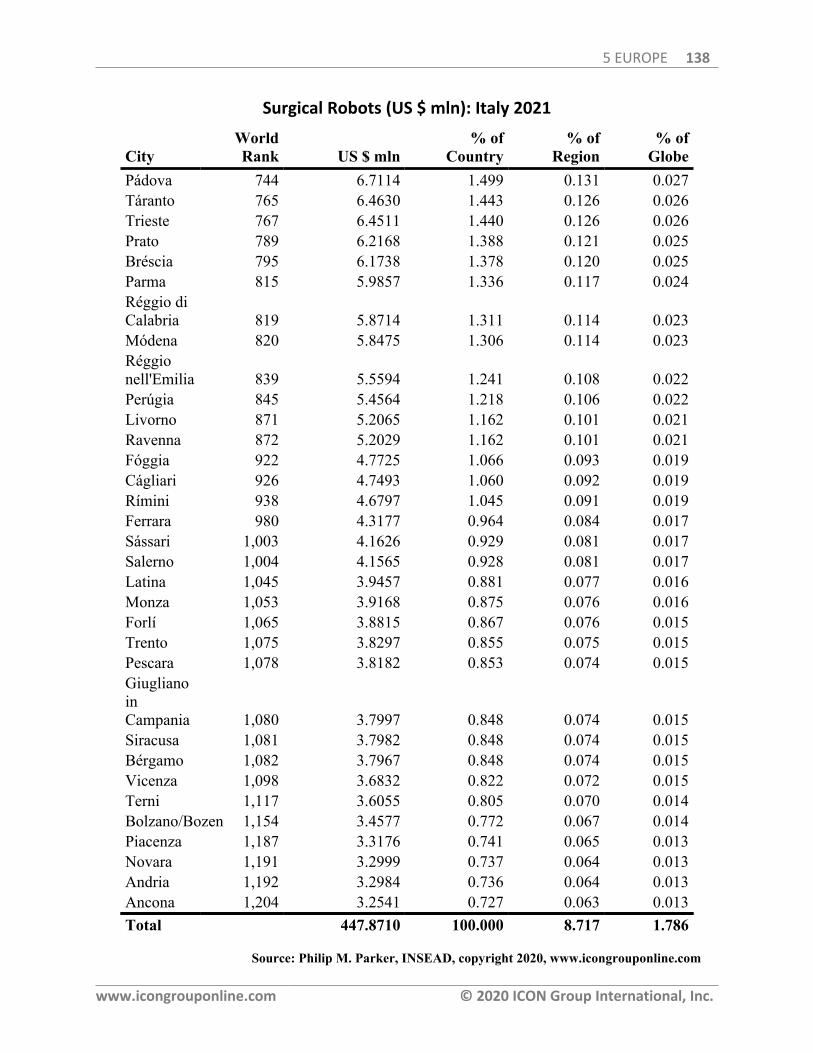
5 EUROPE 138
www.icongrouponline.com © 2020 ICON Group International, Inc.
Surgical Robots (US $ mln): Italy 2021
CityWorldRank US $ mln
% ofCountry
% ofRegion
% ofGlobe
Pádova 744 6.7114 1.499 0.131 0.027Táranto 765 6.4630 1.443 0.126 0.026Trieste 767 6.4511 1.440 0.126 0.026Prato 789 6.2168 1.388 0.121 0.025Bréscia 795 6.1738 1.378 0.120 0.025Parma 815 5.9857 1.336 0.117 0.024Réggio diCalabria 819 5.8714 1.311 0.114 0.023Módena 820 5.8475 1.306 0.114 0.023Réggionell'Emilia 839 5.5594 1.241 0.108 0.022Perúgia 845 5.4564 1.218 0.106 0.022Livorno 871 5.2065 1.162 0.101 0.021Ravenna 872 5.2029 1.162 0.101 0.021Fóggia 922 4.7725 1.066 0.093 0.019Cágliari 926 4.7493 1.060 0.092 0.019Rímini 938 4.6797 1.045 0.091 0.019Ferrara 980 4.3177 0.964 0.084 0.017Sássari 1,003 4.1626 0.929 0.081 0.017Salerno 1,004 4.1565 0.928 0.081 0.017Latina 1,045 3.9457 0.881 0.077 0.016Monza 1,053 3.9168 0.875 0.076 0.016Forlí 1,065 3.8815 0.867 0.076 0.015Trento 1,075 3.8297 0.855 0.075 0.015Pescara 1,078 3.8182 0.853 0.074 0.015GiuglianoinCampania 1,080 3.7997 0.848 0.074 0.015Siracusa 1,081 3.7982 0.848 0.074 0.015Bérgamo 1,082 3.7967 0.848 0.074 0.015Vicenza 1,098 3.6832 0.822 0.072 0.015Terni 1,117 3.6055 0.805 0.070 0.014Bolzano/Bozen 1,154 3.4577 0.772 0.067 0.014Piacenza 1,187 3.3176 0.741 0.065 0.013Novara 1,191 3.2999 0.737 0.064 0.013Andria 1,192 3.2984 0.736 0.064 0.013Ancona 1,204 3.2541 0.727 0.063 0.013Total 447.8710 100.000 8.717 1.786
Source: Philip M. Parker, INSEAD, copyright 2020, www.icongrouponline.com
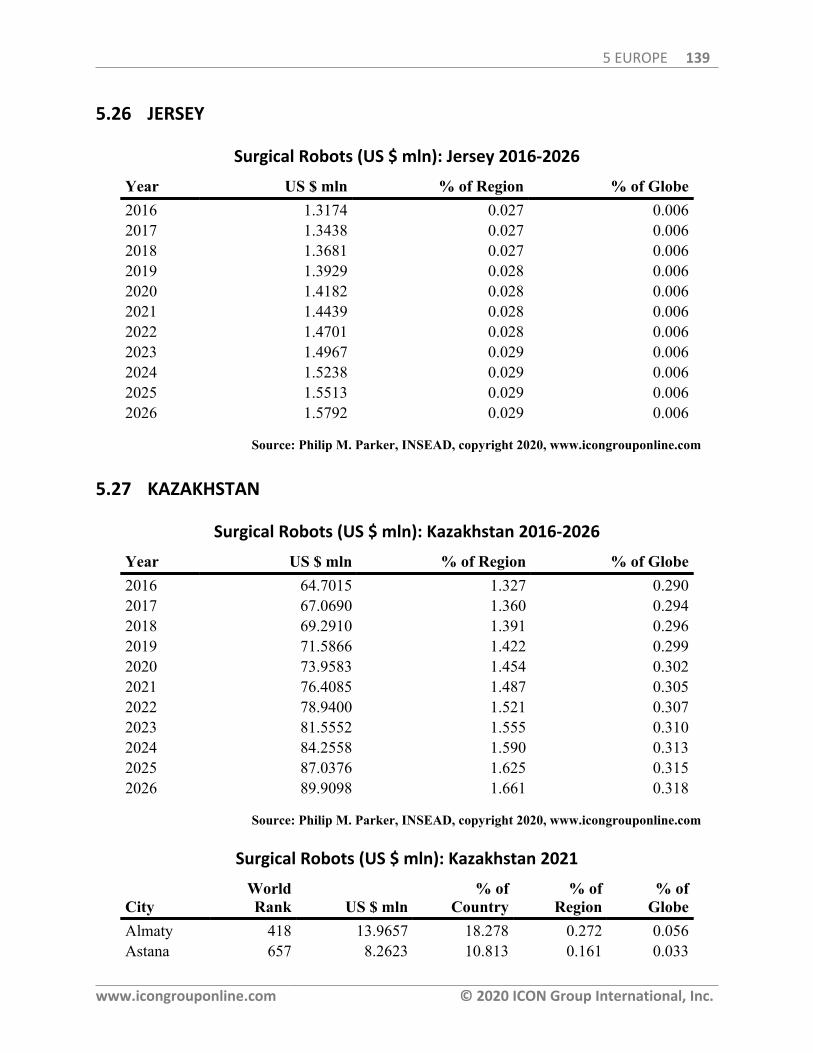
5 EUROPE 139
www.icongrouponline.com © 2020 ICON Group International, Inc.
5.26 JERSEY
Surgical Robots (US $ mln): Jersey 2016-2026
Year US $ mln % of Region % of Globe2016 1.3174 0.027 0.0062017 1.3438 0.027 0.0062018 1.3681 0.027 0.0062019 1.3929 0.028 0.0062020 1.4182 0.028 0.0062021 1.4439 0.028 0.0062022 1.4701 0.028 0.0062023 1.4967 0.029 0.0062024 1.5238 0.029 0.0062025 1.5513 0.029 0.0062026 1.5792 0.029 0.006
Source: Philip M. Parker, INSEAD, copyright 2020, www.icongrouponline.com
5.27 KAZAKHSTAN
Surgical Robots (US $ mln): Kazakhstan 2016-2026
Year US $ mln % of Region % of Globe2016 64.7015 1.327 0.2902017 67.0690 1.360 0.2942018 69.2910 1.391 0.2962019 71.5866 1.422 0.2992020 73.9583 1.454 0.3022021 76.4085 1.487 0.3052022 78.9400 1.521 0.3072023 81.5552 1.555 0.3102024 84.2558 1.590 0.3132025 87.0376 1.625 0.3152026 89.9098 1.661 0.318
Source: Philip M. Parker, INSEAD, copyright 2020, www.icongrouponline.com
Surgical Robots (US $ mln): Kazakhstan 2021
CityWorldRank US $ mln
% ofCountry
% ofRegion
% ofGlobe
Almaty 418 13.9657 18.278 0.272 0.056Astana 657 8.2623 10.813 0.161 0.033
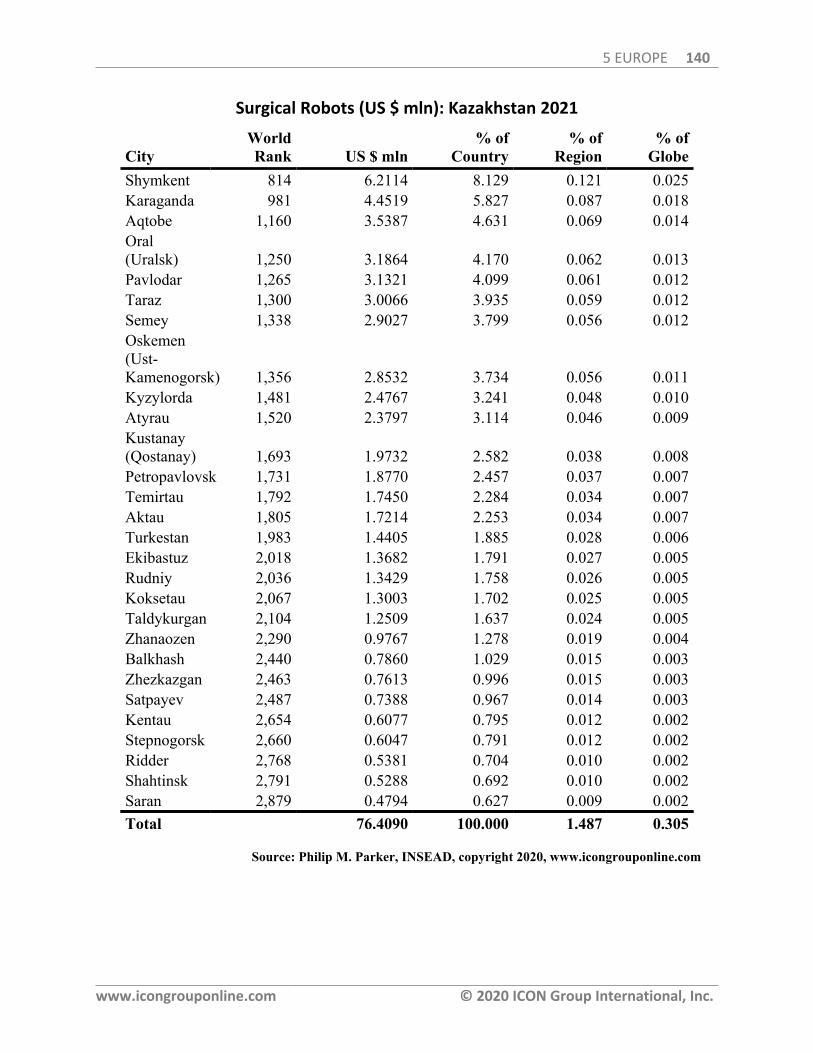
5 EUROPE 140
www.icongrouponline.com © 2020 ICON Group International, Inc.
Surgical Robots (US $ mln): Kazakhstan 2021
CityWorldRank US $ mln
% ofCountry
% ofRegion
% ofGlobe
Shymkent 814 6.2114 8.129 0.121 0.025Karaganda 981 4.4519 5.827 0.087 0.018Aqtobe 1,160 3.5387 4.631 0.069 0.014Oral(Uralsk) 1,250 3.1864 4.170 0.062 0.013Pavlodar 1,265 3.1321 4.099 0.061 0.012Taraz 1,300 3.0066 3.935 0.059 0.012Semey 1,338 2.9027 3.799 0.056 0.012Oskemen(Ust-Kamenogorsk) 1,356 2.8532 3.734 0.056 0.011Kyzylorda 1,481 2.4767 3.241 0.048 0.010Atyrau 1,520 2.3797 3.114 0.046 0.009Kustanay(Qostanay) 1,693 1.9732 2.582 0.038 0.008Petropavlovsk 1,731 1.8770 2.457 0.037 0.007Temirtau 1,792 1.7450 2.284 0.034 0.007Aktau 1,805 1.7214 2.253 0.034 0.007Turkestan 1,983 1.4405 1.885 0.028 0.006Ekibastuz 2,018 1.3682 1.791 0.027 0.005Rudniy 2,036 1.3429 1.758 0.026 0.005Koksetau 2,067 1.3003 1.702 0.025 0.005Taldykurgan 2,104 1.2509 1.637 0.024 0.005Zhanaozen 2,290 0.9767 1.278 0.019 0.004Balkhash 2,440 0.7860 1.029 0.015 0.003Zhezkazgan 2,463 0.7613 0.996 0.015 0.003Satpayev 2,487 0.7388 0.967 0.014 0.003Kentau 2,654 0.6077 0.795 0.012 0.002Stepnogorsk 2,660 0.6047 0.791 0.012 0.002Ridder 2,768 0.5381 0.704 0.010 0.002Shahtinsk 2,791 0.5288 0.692 0.010 0.002Saran 2,879 0.4794 0.627 0.009 0.002Total 76.4090 100.000 1.487 0.305
Source: Philip M. Parker, INSEAD, copyright 2020, www.icongrouponline.com
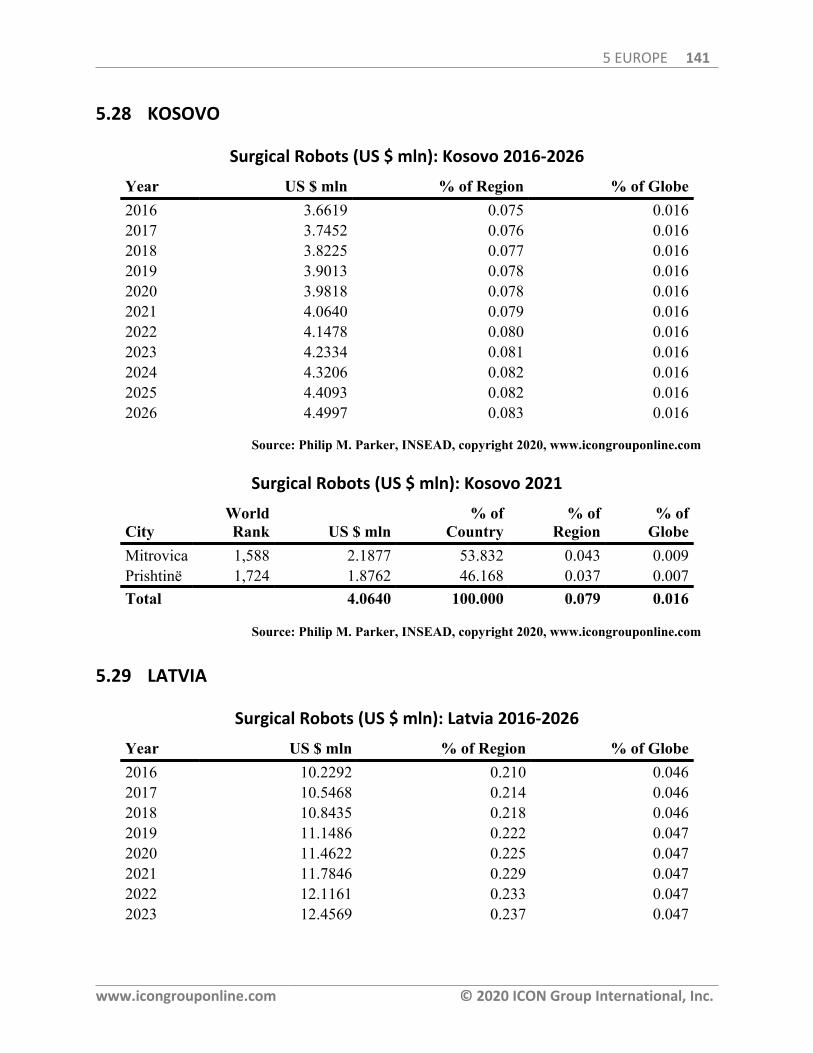
5 EUROPE 141
www.icongrouponline.com © 2020 ICON Group International, Inc.
5.28 KOSOVO
Surgical Robots (US $ mln): Kosovo 2016-2026
Year US $ mln % of Region % of Globe2016 3.6619 0.075 0.0162017 3.7452 0.076 0.0162018 3.8225 0.077 0.0162019 3.9013 0.078 0.0162020 3.9818 0.078 0.0162021 4.0640 0.079 0.0162022 4.1478 0.080 0.0162023 4.2334 0.081 0.0162024 4.3206 0.082 0.0162025 4.4093 0.082 0.0162026 4.4997 0.083 0.016
Source: Philip M. Parker, INSEAD, copyright 2020, www.icongrouponline.com
Surgical Robots (US $ mln): Kosovo 2021
CityWorldRank US $ mln
% ofCountry
% ofRegion
% ofGlobe
Mitrovica 1,588 2.1877 53.832 0.043 0.009Prishtinë 1,724 1.8762 46.168 0.037 0.007Total 4.0640 100.000 0.079 0.016
Source: Philip M. Parker, INSEAD, copyright 2020, www.icongrouponline.com
5.29 LATVIA
Surgical Robots (US $ mln): Latvia 2016-2026
Year US $ mln % of Region % of Globe2016 10.2292 0.210 0.0462017 10.5468 0.214 0.0462018 10.8435 0.218 0.0462019 11.1486 0.222 0.0472020 11.4622 0.225 0.0472021 11.7846 0.229 0.0472022 12.1161 0.233 0.0472023 12.4569 0.237 0.047
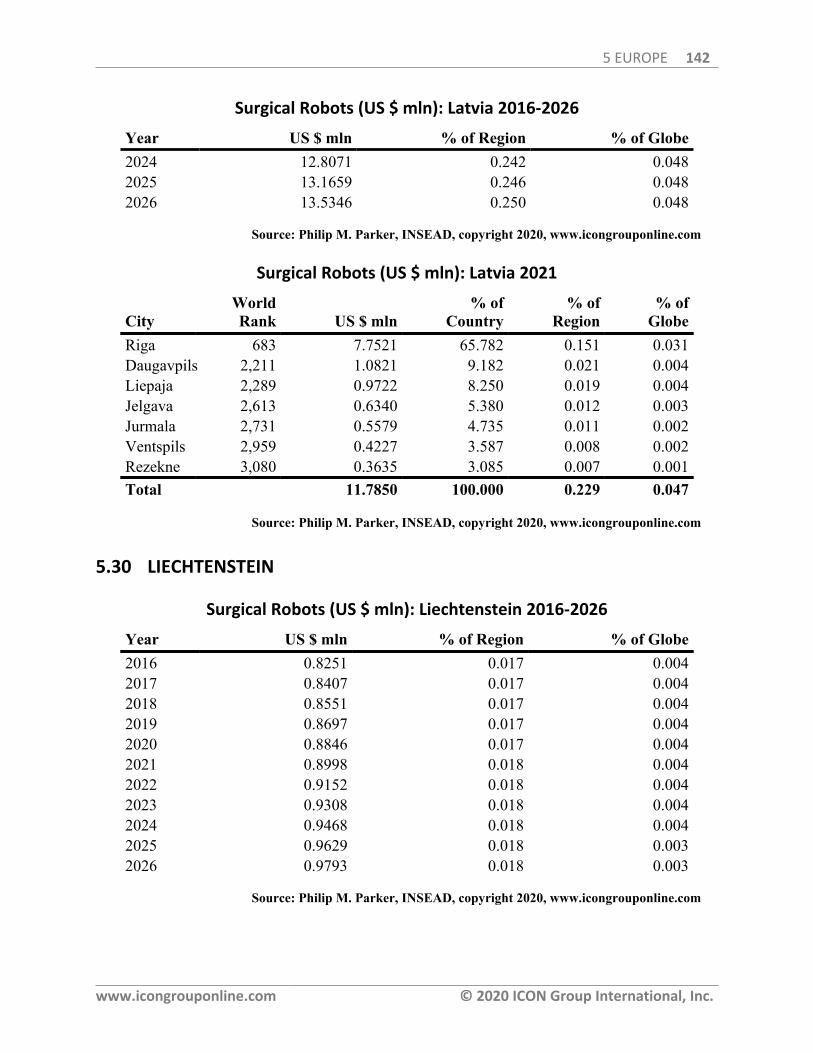
5 EUROPE 142
www.icongrouponline.com © 2020 ICON Group International, Inc.
Surgical Robots (US $ mln): Latvia 2016-2026
Year US $ mln % of Region % of Globe2024 12.8071 0.242 0.0482025 13.1659 0.246 0.0482026 13.5346 0.250 0.048
Source: Philip M. Parker, INSEAD, copyright 2020, www.icongrouponline.com
Surgical Robots (US $ mln): Latvia 2021
CityWorldRank US $ mln
% ofCountry
% ofRegion
% ofGlobe
Riga 683 7.7521 65.782 0.151 0.031Daugavpils 2,211 1.0821 9.182 0.021 0.004Liepaja 2,289 0.9722 8.250 0.019 0.004Jelgava 2,613 0.6340 5.380 0.012 0.003Jurmala 2,731 0.5579 4.735 0.011 0.002Ventspils 2,959 0.4227 3.587 0.008 0.002Rezekne 3,080 0.3635 3.085 0.007 0.001Total 11.7850 100.000 0.229 0.047
Source: Philip M. Parker, INSEAD, copyright 2020, www.icongrouponline.com
5.30 LIECHTENSTEIN
Surgical Robots (US $ mln): Liechtenstein 2016-2026
Year US $ mln % of Region % of Globe2016 0.8251 0.017 0.0042017 0.8407 0.017 0.0042018 0.8551 0.017 0.0042019 0.8697 0.017 0.0042020 0.8846 0.017 0.0042021 0.8998 0.018 0.0042022 0.9152 0.018 0.0042023 0.9308 0.018 0.0042024 0.9468 0.018 0.0042025 0.9629 0.018 0.0032026 0.9793 0.018 0.003
Source: Philip M. Parker, INSEAD, copyright 2020, www.icongrouponline.com
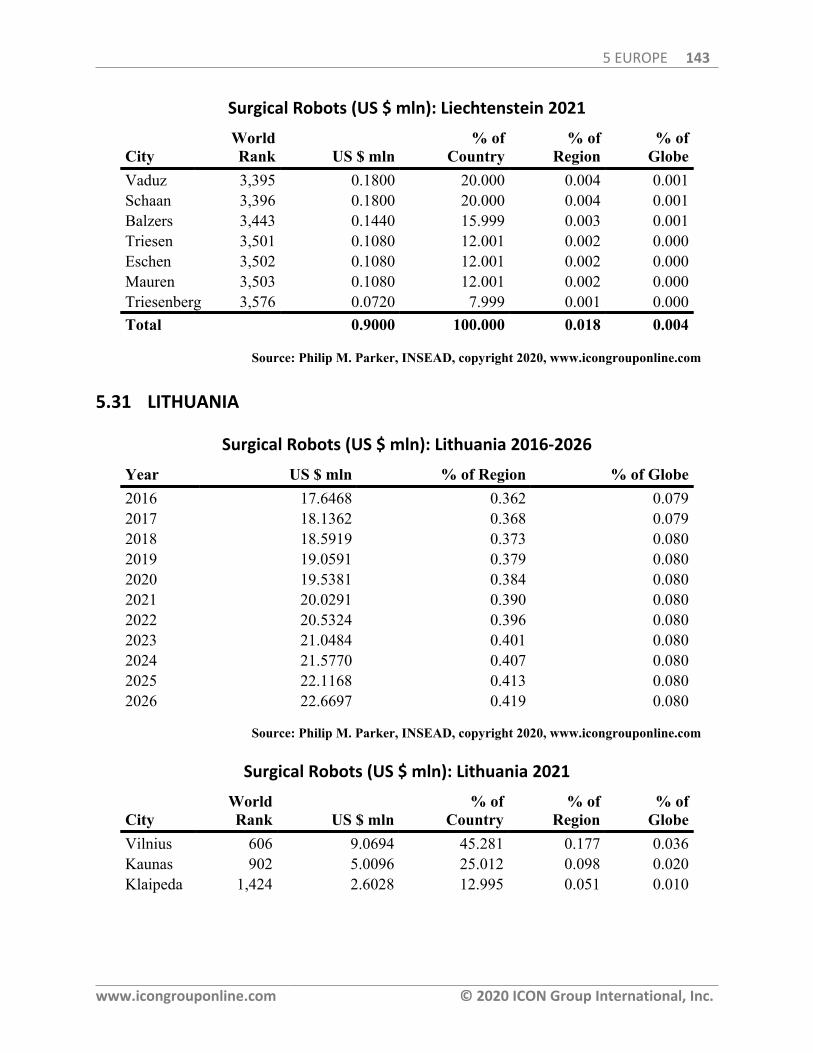
5 EUROPE 143
www.icongrouponline.com © 2020 ICON Group International, Inc.
Surgical Robots (US $ mln): Liechtenstein 2021
CityWorldRank US $ mln
% ofCountry
% ofRegion
% ofGlobe
Vaduz 3,395 0.1800 20.000 0.004 0.001Schaan 3,396 0.1800 20.000 0.004 0.001Balzers 3,443 0.1440 15.999 0.003 0.001Triesen 3,501 0.1080 12.001 0.002 0.000Eschen 3,502 0.1080 12.001 0.002 0.000Mauren 3,503 0.1080 12.001 0.002 0.000Triesenberg 3,576 0.0720 7.999 0.001 0.000Total 0.9000 100.000 0.018 0.004
Source: Philip M. Parker, INSEAD, copyright 2020, www.icongrouponline.com
5.31 LITHUANIA
Surgical Robots (US $ mln): Lithuania 2016-2026
Year US $ mln % of Region % of Globe2016 17.6468 0.362 0.0792017 18.1362 0.368 0.0792018 18.5919 0.373 0.0802019 19.0591 0.379 0.0802020 19.5381 0.384 0.0802021 20.0291 0.390 0.0802022 20.5324 0.396 0.0802023 21.0484 0.401 0.0802024 21.5770 0.407 0.0802025 22.1168 0.413 0.0802026 22.6697 0.419 0.080
Source: Philip M. Parker, INSEAD, copyright 2020, www.icongrouponline.com
Surgical Robots (US $ mln): Lithuania 2021
CityWorldRank US $ mln
% ofCountry
% ofRegion
% ofGlobe
Vilnius 606 9.0694 45.281 0.177 0.036Kaunas 902 5.0096 25.012 0.098 0.020Klaipeda 1,424 2.6028 12.995 0.051 0.010
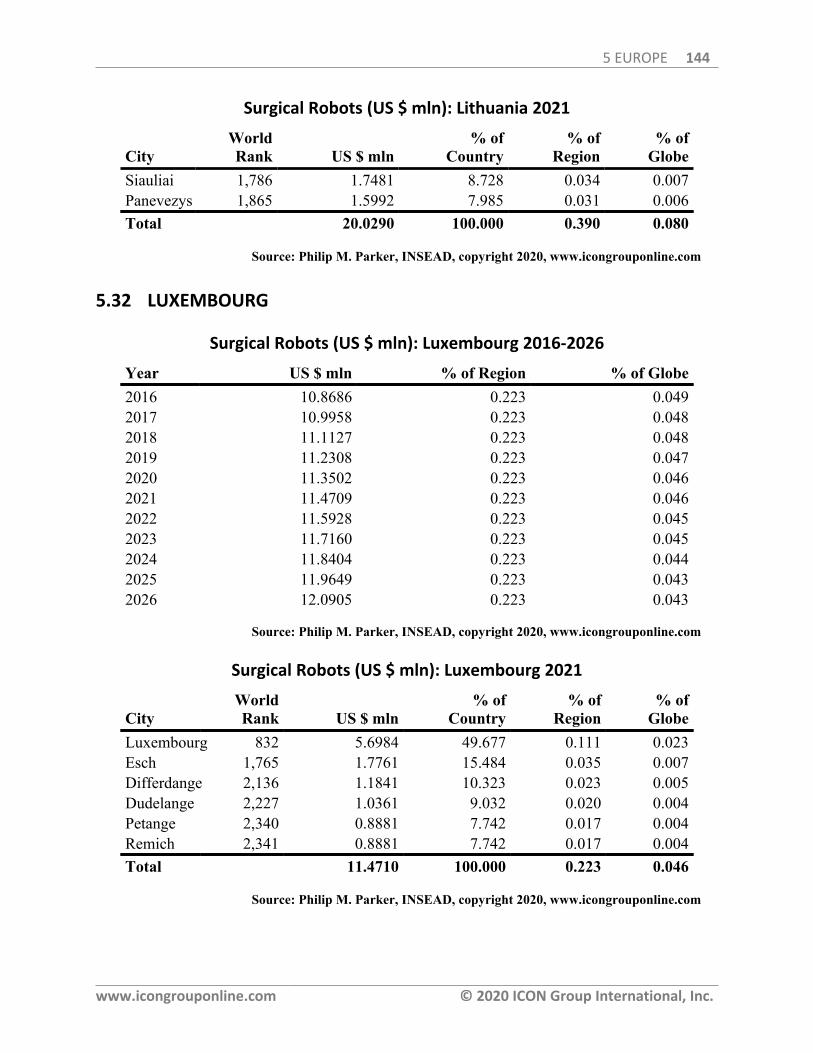
5 EUROPE 144
www.icongrouponline.com © 2020 ICON Group International, Inc.
Surgical Robots (US $ mln): Lithuania 2021
CityWorldRank US $ mln
% ofCountry
% ofRegion
% ofGlobe
Siauliai 1,786 1.7481 8.728 0.034 0.007Panevezys 1,865 1.5992 7.985 0.031 0.006Total 20.0290 100.000 0.390 0.080
Source: Philip M. Parker, INSEAD, copyright 2020, www.icongrouponline.com
5.32 LUXEMBOURG
Surgical Robots (US $ mln): Luxembourg 2016-2026
Year US $ mln % of Region % of Globe2016 10.8686 0.223 0.0492017 10.9958 0.223 0.0482018 11.1127 0.223 0.0482019 11.2308 0.223 0.0472020 11.3502 0.223 0.0462021 11.4709 0.223 0.0462022 11.5928 0.223 0.0452023 11.7160 0.223 0.0452024 11.8404 0.223 0.0442025 11.9649 0.223 0.0432026 12.0905 0.223 0.043
Source: Philip M. Parker, INSEAD, copyright 2020, www.icongrouponline.com
Surgical Robots (US $ mln): Luxembourg 2021
CityWorldRank US $ mln
% ofCountry
% ofRegion
% ofGlobe
Luxembourg 832 5.6984 49.677 0.111 0.023Esch 1,765 1.7761 15.484 0.035 0.007Differdange 2,136 1.1841 10.323 0.023 0.005Dudelange 2,227 1.0361 9.032 0.020 0.004Petange 2,340 0.8881 7.742 0.017 0.004Remich 2,341 0.8881 7.742 0.017 0.004Total 11.4710 100.000 0.223 0.046
Source: Philip M. Parker, INSEAD, copyright 2020, www.icongrouponline.com
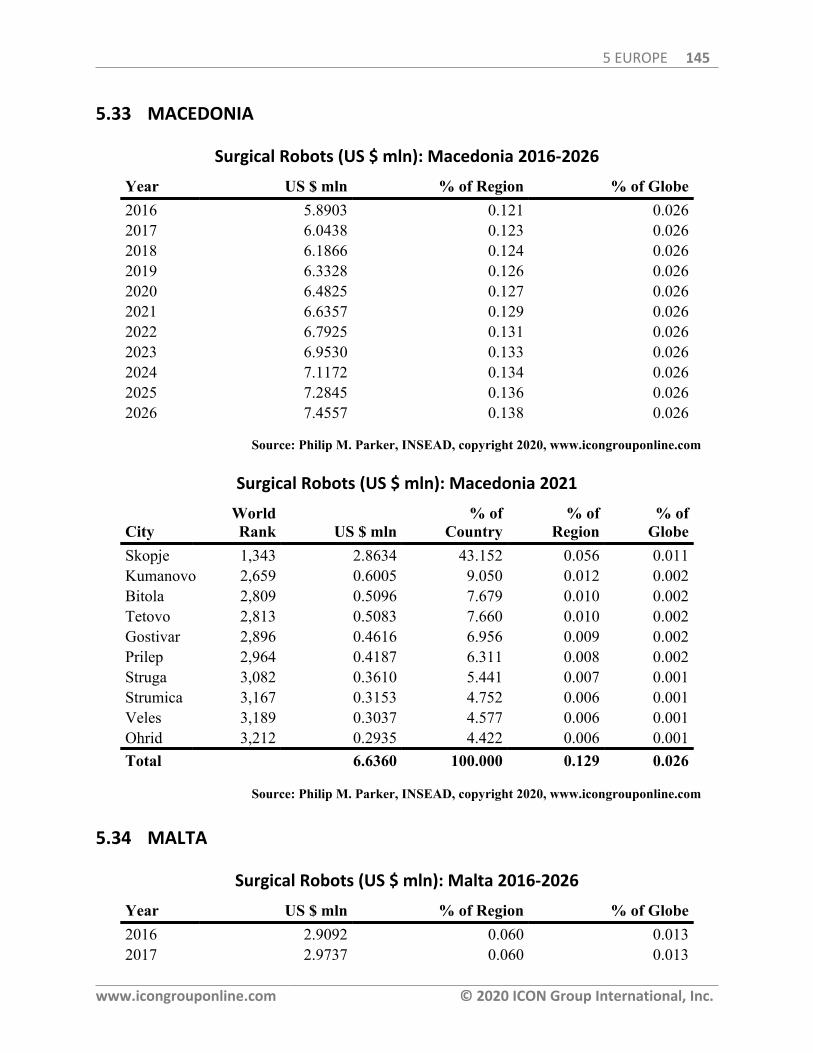
5 EUROPE 145
www.icongrouponline.com © 2020 ICON Group International, Inc.
5.33 MACEDONIA
Surgical Robots (US $ mln): Macedonia 2016-2026
Year US $ mln % of Region % of Globe2016 5.8903 0.121 0.0262017 6.0438 0.123 0.0262018 6.1866 0.124 0.0262019 6.3328 0.126 0.0262020 6.4825 0.127 0.0262021 6.6357 0.129 0.0262022 6.7925 0.131 0.0262023 6.9530 0.133 0.0262024 7.1172 0.134 0.0262025 7.2845 0.136 0.0262026 7.4557 0.138 0.026
Source: Philip M. Parker, INSEAD, copyright 2020, www.icongrouponline.com
Surgical Robots (US $ mln): Macedonia 2021
CityWorldRank US $ mln
% ofCountry
% ofRegion
% ofGlobe
Skopje 1,343 2.8634 43.152 0.056 0.011Kumanovo 2,659 0.6005 9.050 0.012 0.002Bitola 2,809 0.5096 7.679 0.010 0.002Tetovo 2,813 0.5083 7.660 0.010 0.002Gostivar 2,896 0.4616 6.956 0.009 0.002Prilep 2,964 0.4187 6.311 0.008 0.002Struga 3,082 0.3610 5.441 0.007 0.001Strumica 3,167 0.3153 4.752 0.006 0.001Veles 3,189 0.3037 4.577 0.006 0.001Ohrid 3,212 0.2935 4.422 0.006 0.001Total 6.6360 100.000 0.129 0.026
Source: Philip M. Parker, INSEAD, copyright 2020, www.icongrouponline.com
5.34 MALTA
Surgical Robots (US $ mln): Malta 2016-2026
Year US $ mln % of Region % of Globe2016 2.9092 0.060 0.0132017 2.9737 0.060 0.013

5 EUROPE 146
www.icongrouponline.com © 2020 ICON Group International, Inc.
Surgical Robots (US $ mln): Malta 2016-2026
Year US $ mln % of Region % of Globe2018 3.0336 0.061 0.0132019 3.0947 0.061 0.0132020 3.1570 0.062 0.0132021 3.2205 0.063 0.0132022 3.2853 0.063 0.0132023 3.3515 0.064 0.0132024 3.4189 0.064 0.0132025 3.4873 0.065 0.0132026 3.5571 0.066 0.013
Source: Philip M. Parker, INSEAD, copyright 2020, www.icongrouponline.com
Surgical Robots (US $ mln): Malta 2021
CityWorldRank US $ mln
% ofCountry
% ofRegion
% ofGlobe
Birkirkara 2,296 0.9614 29.851 0.019 0.004Qormi 2,325 0.9133 28.358 0.018 0.004Sliema 2,555 0.6729 20.895 0.013 0.003Valletta 2,942 0.4326 13.433 0.008 0.002Victoria 3,297 0.2403 7.463 0.005 0.001Total 3.2210 100.000 0.063 0.013
Source: Philip M. Parker, INSEAD, copyright 2020, www.icongrouponline.com
5.35 MOLDOVA
Surgical Robots (US $ mln): Moldova 2016-2026
Year US $ mln % of Region % of Globe2016 3.6468 0.075 0.0162017 3.8593 0.078 0.0172018 4.0624 0.082 0.0172019 4.2762 0.085 0.0182020 4.5013 0.089 0.0182021 4.7382 0.092 0.0192022 4.9875 0.096 0.0192023 5.2500 0.100 0.020
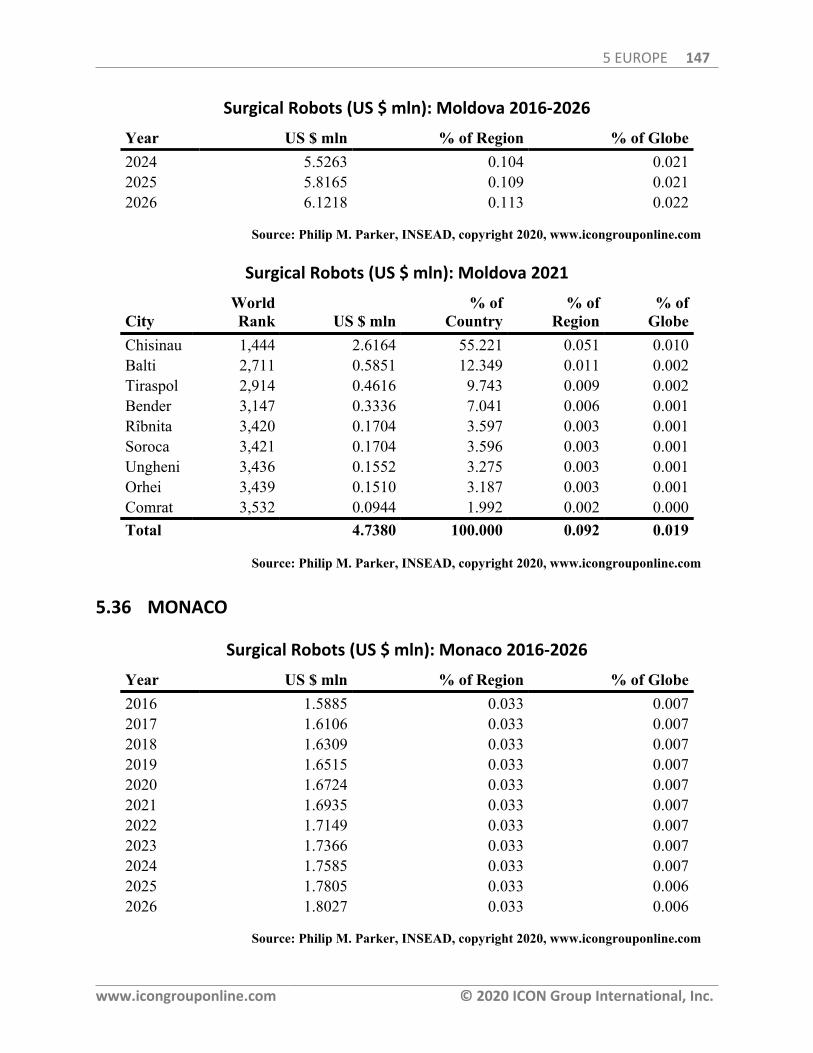
5 EUROPE 147
www.icongrouponline.com © 2020 ICON Group International, Inc.
Surgical Robots (US $ mln): Moldova 2016-2026
Year US $ mln % of Region % of Globe2024 5.5263 0.104 0.0212025 5.8165 0.109 0.0212026 6.1218 0.113 0.022
Source: Philip M. Parker, INSEAD, copyright 2020, www.icongrouponline.com
Surgical Robots (US $ mln): Moldova 2021
CityWorldRank US $ mln
% ofCountry
% ofRegion
% ofGlobe
Chisinau 1,444 2.6164 55.221 0.051 0.010Balti 2,711 0.5851 12.349 0.011 0.002Tiraspol 2,914 0.4616 9.743 0.009 0.002Bender 3,147 0.3336 7.041 0.006 0.001Rîbnita 3,420 0.1704 3.597 0.003 0.001Soroca 3,421 0.1704 3.596 0.003 0.001Ungheni 3,436 0.1552 3.275 0.003 0.001Orhei 3,439 0.1510 3.187 0.003 0.001Comrat 3,532 0.0944 1.992 0.002 0.000Total 4.7380 100.000 0.092 0.019
Source: Philip M. Parker, INSEAD, copyright 2020, www.icongrouponline.com
5.36 MONACO
Surgical Robots (US $ mln): Monaco 2016-2026
Year US $ mln % of Region % of Globe2016 1.5885 0.033 0.0072017 1.6106 0.033 0.0072018 1.6309 0.033 0.0072019 1.6515 0.033 0.0072020 1.6724 0.033 0.0072021 1.6935 0.033 0.0072022 1.7149 0.033 0.0072023 1.7366 0.033 0.0072024 1.7585 0.033 0.0072025 1.7805 0.033 0.0062026 1.8027 0.033 0.006
Source: Philip M. Parker, INSEAD, copyright 2020, www.icongrouponline.com
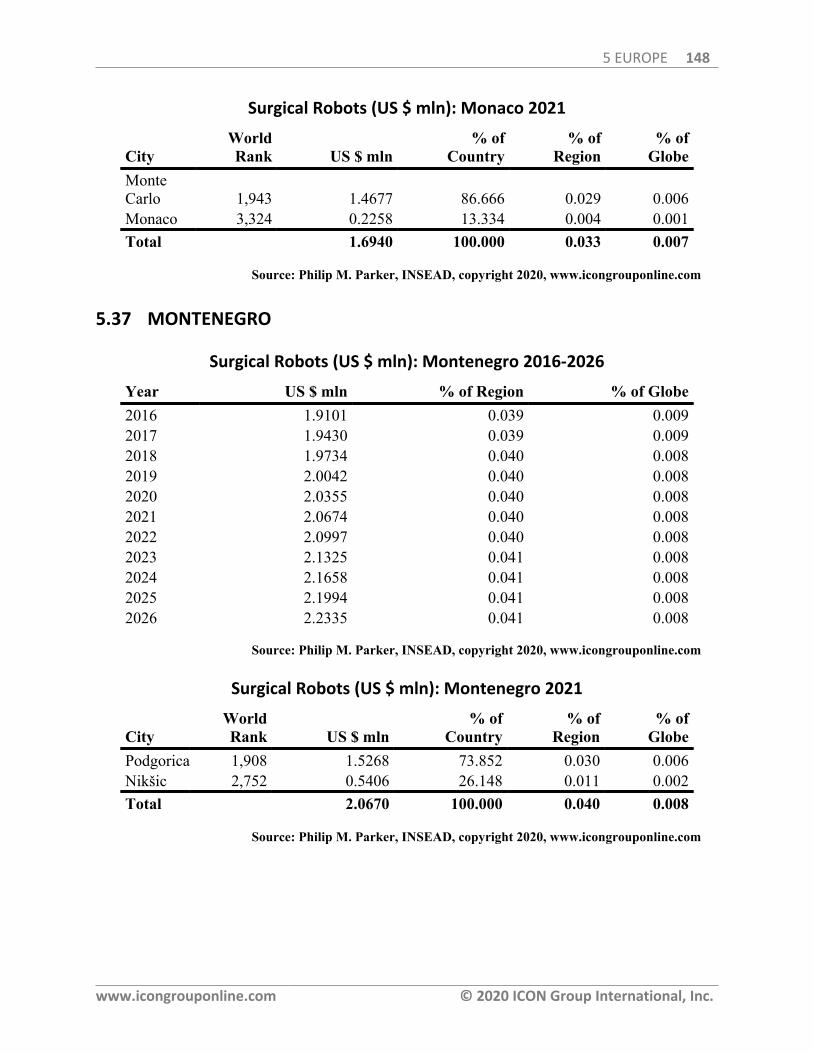
5 EUROPE 148
www.icongrouponline.com © 2020 ICON Group International, Inc.
Surgical Robots (US $ mln): Monaco 2021
CityWorldRank US $ mln
% ofCountry
% ofRegion
% ofGlobe
MonteCarlo 1,943 1.4677 86.666 0.029 0.006Monaco 3,324 0.2258 13.334 0.004 0.001Total 1.6940 100.000 0.033 0.007
Source: Philip M. Parker, INSEAD, copyright 2020, www.icongrouponline.com
5.37 MONTENEGRO
Surgical Robots (US $ mln): Montenegro 2016-2026
Year US $ mln % of Region % of Globe2016 1.9101 0.039 0.0092017 1.9430 0.039 0.0092018 1.9734 0.040 0.0082019 2.0042 0.040 0.0082020 2.0355 0.040 0.0082021 2.0674 0.040 0.0082022 2.0997 0.040 0.0082023 2.1325 0.041 0.0082024 2.1658 0.041 0.0082025 2.1994 0.041 0.0082026 2.2335 0.041 0.008
Source: Philip M. Parker, INSEAD, copyright 2020, www.icongrouponline.com
Surgical Robots (US $ mln): Montenegro 2021
CityWorldRank US $ mln
% ofCountry
% ofRegion
% ofGlobe
Podgorica 1,908 1.5268 73.852 0.030 0.006Nikšic 2,752 0.5406 26.148 0.011 0.002Total 2.0670 100.000 0.040 0.008
Source: Philip M. Parker, INSEAD, copyright 2020, www.icongrouponline.com
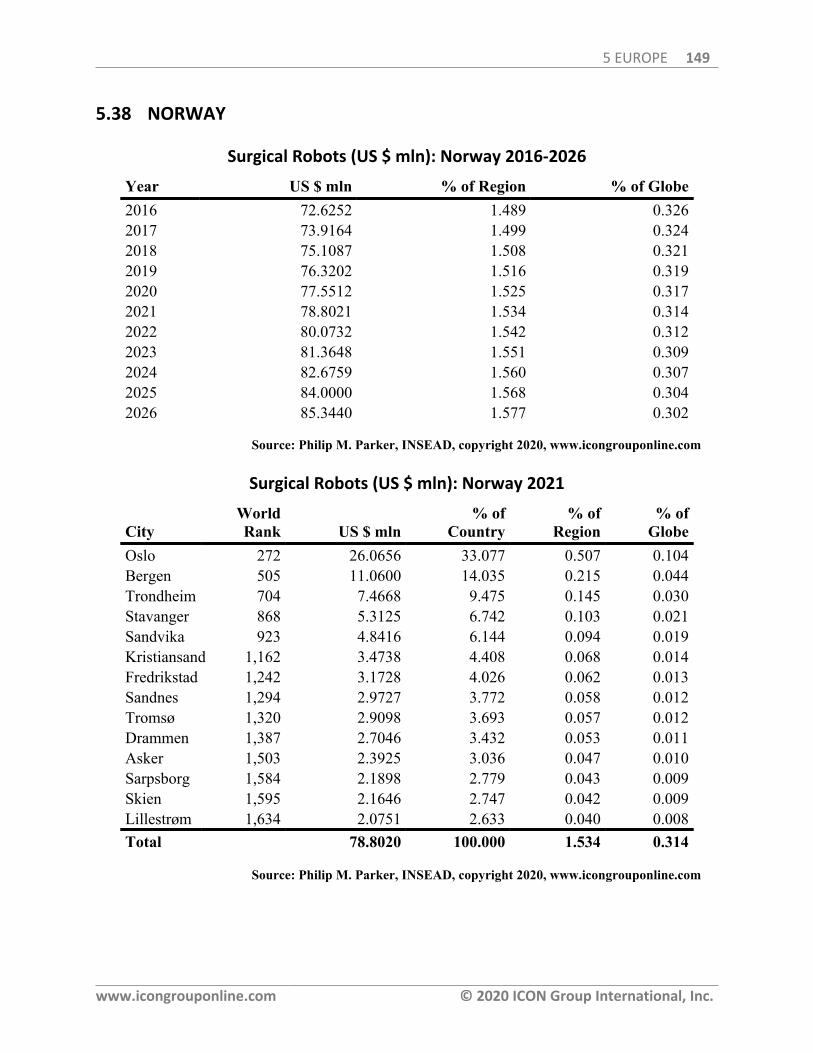
5 EUROPE 149
www.icongrouponline.com © 2020 ICON Group International, Inc.
5.38 NORWAY
Surgical Robots (US $ mln): Norway 2016-2026
Year US $ mln % of Region % of Globe2016 72.6252 1.489 0.3262017 73.9164 1.499 0.3242018 75.1087 1.508 0.3212019 76.3202 1.516 0.3192020 77.5512 1.525 0.3172021 78.8021 1.534 0.3142022 80.0732 1.542 0.3122023 81.3648 1.551 0.3092024 82.6759 1.560 0.3072025 84.0000 1.568 0.3042026 85.3440 1.577 0.302
Source: Philip M. Parker, INSEAD, copyright 2020, www.icongrouponline.com
Surgical Robots (US $ mln): Norway 2021
CityWorldRank US $ mln
% ofCountry
% ofRegion
% ofGlobe
Oslo 272 26.0656 33.077 0.507 0.104Bergen 505 11.0600 14.035 0.215 0.044Trondheim 704 7.4668 9.475 0.145 0.030Stavanger 868 5.3125 6.742 0.103 0.021Sandvika 923 4.8416 6.144 0.094 0.019Kristiansand 1,162 3.4738 4.408 0.068 0.014Fredrikstad 1,242 3.1728 4.026 0.062 0.013Sandnes 1,294 2.9727 3.772 0.058 0.012Tromsø 1,320 2.9098 3.693 0.057 0.012Drammen 1,387 2.7046 3.432 0.053 0.011Asker 1,503 2.3925 3.036 0.047 0.010Sarpsborg 1,584 2.1898 2.779 0.043 0.009Skien 1,595 2.1646 2.747 0.042 0.009Lillestrøm 1,634 2.0751 2.633 0.040 0.008Total 78.8020 100.000 1.534 0.314
Source: Philip M. Parker, INSEAD, copyright 2020, www.icongrouponline.com
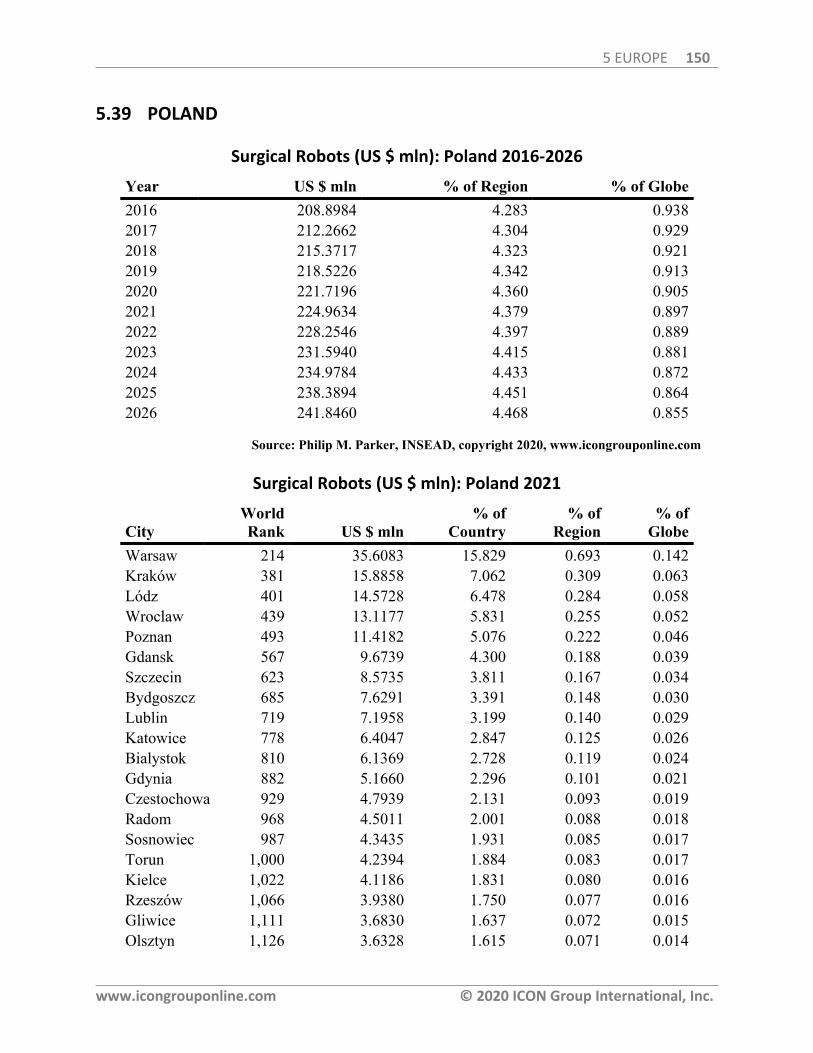
5 EUROPE 150
www.icongrouponline.com © 2020 ICON Group International, Inc.
5.39 POLAND
Surgical Robots (US $ mln): Poland 2016-2026
Year US $ mln % of Region % of Globe2016 208.8984 4.283 0.9382017 212.2662 4.304 0.9292018 215.3717 4.323 0.9212019 218.5226 4.342 0.9132020 221.7196 4.360 0.9052021 224.9634 4.379 0.8972022 228.2546 4.397 0.8892023 231.5940 4.415 0.8812024 234.9784 4.433 0.8722025 238.3894 4.451 0.8642026 241.8460 4.468 0.855
Source: Philip M. Parker, INSEAD, copyright 2020, www.icongrouponline.com
Surgical Robots (US $ mln): Poland 2021
CityWorldRank US $ mln
% ofCountry
% ofRegion
% ofGlobe
Warsaw 214 35.6083 15.829 0.693 0.142Kraków 381 15.8858 7.062 0.309 0.063Lódz 401 14.5728 6.478 0.284 0.058Wroclaw 439 13.1177 5.831 0.255 0.052Poznan 493 11.4182 5.076 0.222 0.046Gdansk 567 9.6739 4.300 0.188 0.039Szczecin 623 8.5735 3.811 0.167 0.034Bydgoszcz 685 7.6291 3.391 0.148 0.030Lublin 719 7.1958 3.199 0.140 0.029Katowice 778 6.4047 2.847 0.125 0.026Bialystok 810 6.1369 2.728 0.119 0.024Gdynia 882 5.1660 2.296 0.101 0.021Czestochowa 929 4.7939 2.131 0.093 0.019Radom 968 4.5011 2.001 0.088 0.018Sosnowiec 987 4.3435 1.931 0.085 0.017Torun 1,000 4.2394 1.884 0.083 0.017Kielce 1,022 4.1186 1.831 0.080 0.016Rzeszów 1,066 3.9380 1.750 0.077 0.016Gliwice 1,111 3.6830 1.637 0.072 0.015Olsztyn 1,126 3.6328 1.615 0.071 0.014
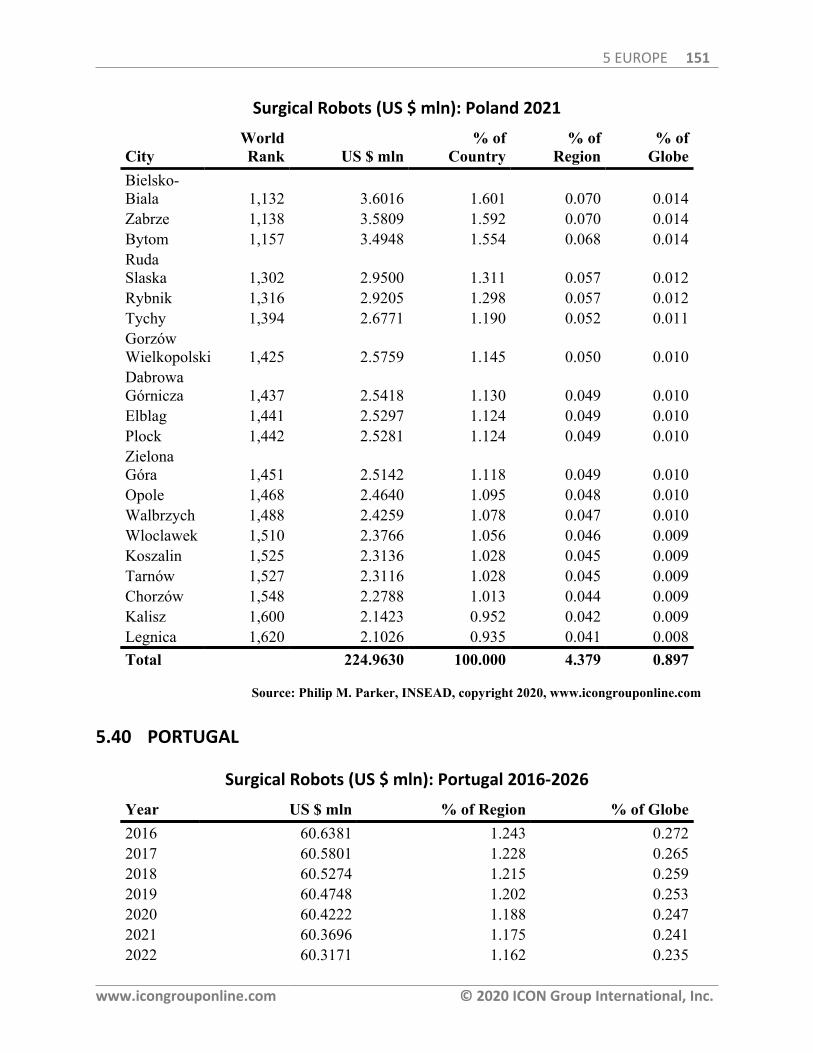
5 EUROPE 151
www.icongrouponline.com © 2020 ICON Group International, Inc.
Surgical Robots (US $ mln): Poland 2021
CityWorldRank US $ mln
% ofCountry
% ofRegion
% ofGlobe
Bielsko-Biala 1,132 3.6016 1.601 0.070 0.014Zabrze 1,138 3.5809 1.592 0.070 0.014Bytom 1,157 3.4948 1.554 0.068 0.014RudaSlaska 1,302 2.9500 1.311 0.057 0.012Rybnik 1,316 2.9205 1.298 0.057 0.012Tychy 1,394 2.6771 1.190 0.052 0.011GorzówWielkopolski 1,425 2.5759 1.145 0.050 0.010DabrowaGórnicza 1,437 2.5418 1.130 0.049 0.010Elblag 1,441 2.5297 1.124 0.049 0.010Plock 1,442 2.5281 1.124 0.049 0.010ZielonaGóra 1,451 2.5142 1.118 0.049 0.010Opole 1,468 2.4640 1.095 0.048 0.010Walbrzych 1,488 2.4259 1.078 0.047 0.010Wloclawek 1,510 2.3766 1.056 0.046 0.009Koszalin 1,525 2.3136 1.028 0.045 0.009Tarnów 1,527 2.3116 1.028 0.045 0.009Chorzów 1,548 2.2788 1.013 0.044 0.009Kalisz 1,600 2.1423 0.952 0.042 0.009Legnica 1,620 2.1026 0.935 0.041 0.008Total 224.9630 100.000 4.379 0.897
Source: Philip M. Parker, INSEAD, copyright 2020, www.icongrouponline.com
5.40 PORTUGAL
Surgical Robots (US $ mln): Portugal 2016-2026
Year US $ mln % of Region % of Globe2016 60.6381 1.243 0.2722017 60.5801 1.228 0.2652018 60.5274 1.215 0.2592019 60.4748 1.202 0.2532020 60.4222 1.188 0.2472021 60.3696 1.175 0.2412022 60.3171 1.162 0.235
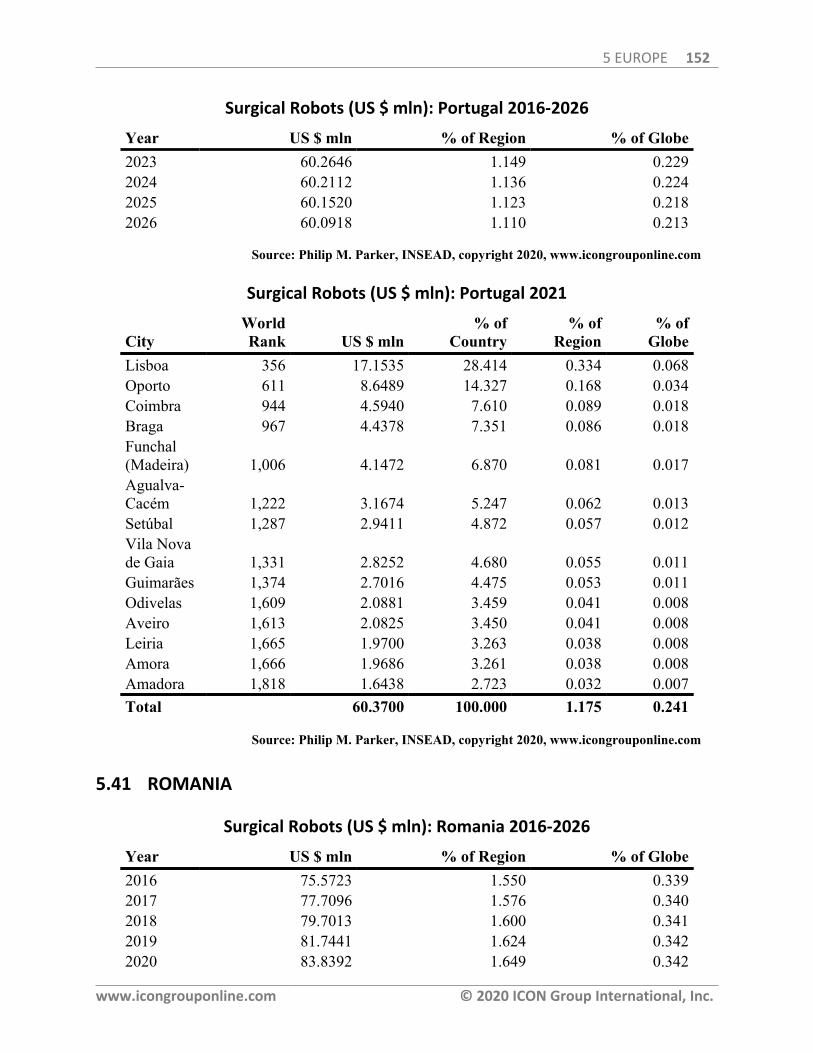
5 EUROPE 152
www.icongrouponline.com © 2020 ICON Group International, Inc.
Surgical Robots (US $ mln): Portugal 2016-2026
Year US $ mln % of Region % of Globe2023 60.2646 1.149 0.2292024 60.2112 1.136 0.2242025 60.1520 1.123 0.2182026 60.0918 1.110 0.213
Source: Philip M. Parker, INSEAD, copyright 2020, www.icongrouponline.com
Surgical Robots (US $ mln): Portugal 2021
CityWorldRank US $ mln
% ofCountry
% ofRegion
% ofGlobe
Lisboa 356 17.1535 28.414 0.334 0.068Oporto 611 8.6489 14.327 0.168 0.034Coimbra 944 4.5940 7.610 0.089 0.018Braga 967 4.4378 7.351 0.086 0.018Funchal(Madeira) 1,006 4.1472 6.870 0.081 0.017Agualva-Cacém 1,222 3.1674 5.247 0.062 0.013Setúbal 1,287 2.9411 4.872 0.057 0.012Vila Novade Gaia 1,331 2.8252 4.680 0.055 0.011Guimarães 1,374 2.7016 4.475 0.053 0.011Odivelas 1,609 2.0881 3.459 0.041 0.008Aveiro 1,613 2.0825 3.450 0.041 0.008Leiria 1,665 1.9700 3.263 0.038 0.008Amora 1,666 1.9686 3.261 0.038 0.008Amadora 1,818 1.6438 2.723 0.032 0.007Total 60.3700 100.000 1.175 0.241
Source: Philip M. Parker, INSEAD, copyright 2020, www.icongrouponline.com
5.41 ROMANIA
Surgical Robots (US $ mln): Romania 2016-2026
Year US $ mln % of Region % of Globe2016 75.5723 1.550 0.3392017 77.7096 1.576 0.3402018 79.7013 1.600 0.3412019 81.7441 1.624 0.3422020 83.8392 1.649 0.342
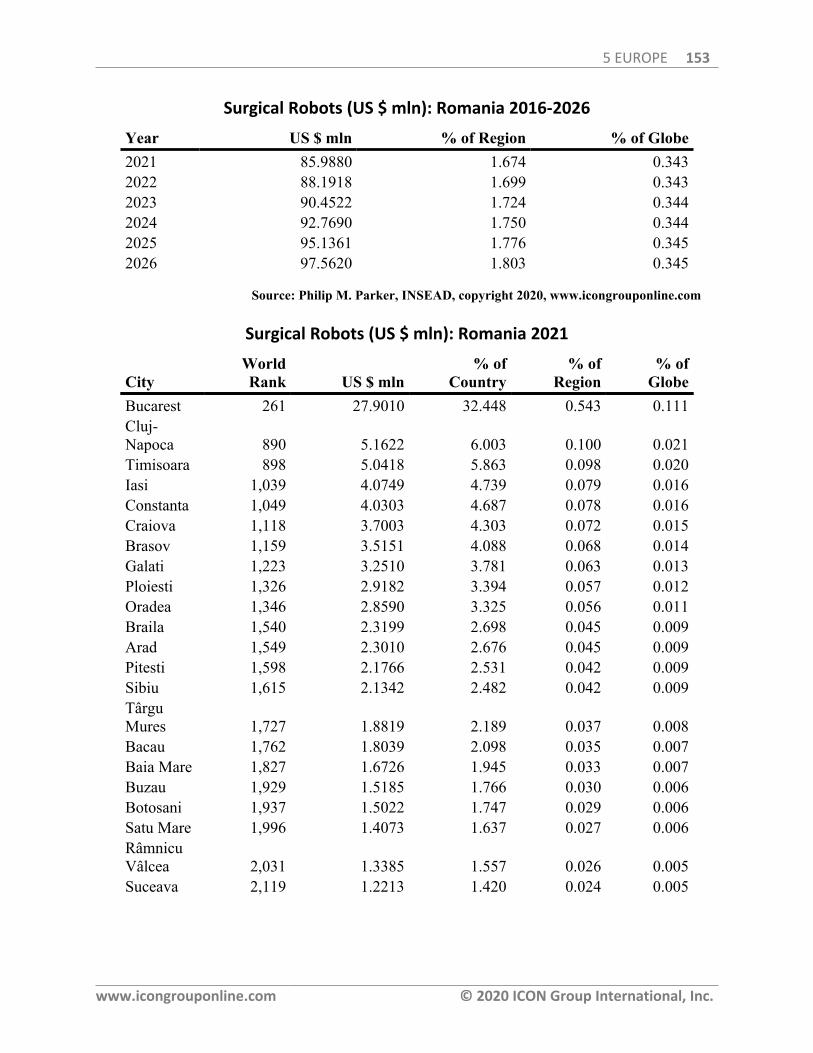
5 EUROPE 153
www.icongrouponline.com © 2020 ICON Group International, Inc.
Surgical Robots (US $ mln): Romania 2016-2026
Year US $ mln % of Region % of Globe2021 85.9880 1.674 0.3432022 88.1918 1.699 0.3432023 90.4522 1.724 0.3442024 92.7690 1.750 0.3442025 95.1361 1.776 0.3452026 97.5620 1.803 0.345
Source: Philip M. Parker, INSEAD, copyright 2020, www.icongrouponline.com
Surgical Robots (US $ mln): Romania 2021
CityWorldRank US $ mln
% ofCountry
% ofRegion
% ofGlobe
Bucarest 261 27.9010 32.448 0.543 0.111Cluj-Napoca 890 5.1622 6.003 0.100 0.021Timisoara 898 5.0418 5.863 0.098 0.020Iasi 1,039 4.0749 4.739 0.079 0.016Constanta 1,049 4.0303 4.687 0.078 0.016Craiova 1,118 3.7003 4.303 0.072 0.015Brasov 1,159 3.5151 4.088 0.068 0.014Galati 1,223 3.2510 3.781 0.063 0.013Ploiesti 1,326 2.9182 3.394 0.057 0.012Oradea 1,346 2.8590 3.325 0.056 0.011Braila 1,540 2.3199 2.698 0.045 0.009Arad 1,549 2.3010 2.676 0.045 0.009Pitesti 1,598 2.1766 2.531 0.042 0.009Sibiu 1,615 2.1342 2.482 0.042 0.009TârguMures 1,727 1.8819 2.189 0.037 0.008Bacau 1,762 1.8039 2.098 0.035 0.007Baia Mare 1,827 1.6726 1.945 0.033 0.007Buzau 1,929 1.5185 1.766 0.030 0.006Botosani 1,937 1.5022 1.747 0.029 0.006Satu Mare 1,996 1.4073 1.637 0.027 0.006RâmnicuVâlcea 2,031 1.3385 1.557 0.026 0.005Suceava 2,119 1.2213 1.420 0.024 0.005
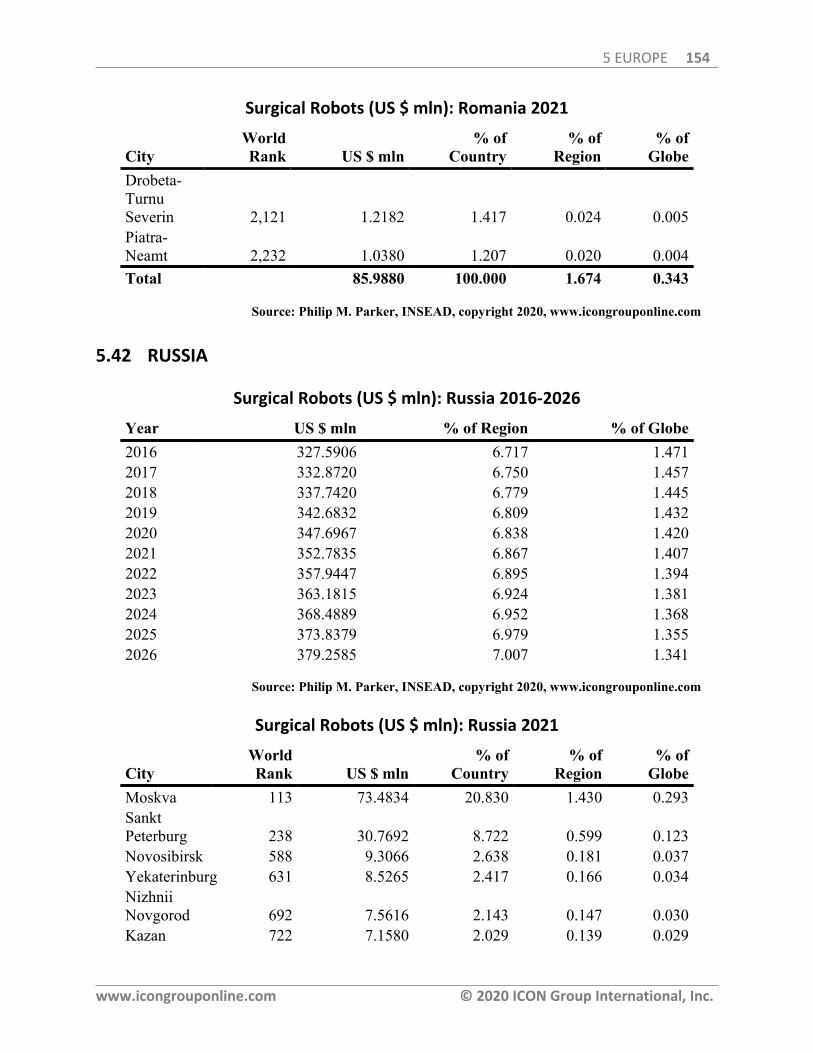
5 EUROPE 154
www.icongrouponline.com © 2020 ICON Group International, Inc.
Surgical Robots (US $ mln): Romania 2021
CityWorldRank US $ mln
% ofCountry
% ofRegion
% ofGlobe
Drobeta-TurnuSeverin 2,121 1.2182 1.417 0.024 0.005Piatra-Neamt 2,232 1.0380 1.207 0.020 0.004Total 85.9880 100.000 1.674 0.343
Source: Philip M. Parker, INSEAD, copyright 2020, www.icongrouponline.com
5.42 RUSSIA
Surgical Robots (US $ mln): Russia 2016-2026
Year US $ mln % of Region % of Globe2016 327.5906 6.717 1.4712017 332.8720 6.750 1.4572018 337.7420 6.779 1.4452019 342.6832 6.809 1.4322020 347.6967 6.838 1.4202021 352.7835 6.867 1.4072022 357.9447 6.895 1.3942023 363.1815 6.924 1.3812024 368.4889 6.952 1.3682025 373.8379 6.979 1.3552026 379.2585 7.007 1.341
Source: Philip M. Parker, INSEAD, copyright 2020, www.icongrouponline.com
Surgical Robots (US $ mln): Russia 2021
CityWorldRank US $ mln
% ofCountry
% ofRegion
% ofGlobe
Moskva 113 73.4834 20.830 1.430 0.293SanktPeterburg 238 30.7692 8.722 0.599 0.123Novosibirsk 588 9.3066 2.638 0.181 0.037Yekaterinburg 631 8.5265 2.417 0.166 0.034NizhniiNovgorod 692 7.5616 2.143 0.147 0.030Kazan 722 7.1580 2.029 0.139 0.029
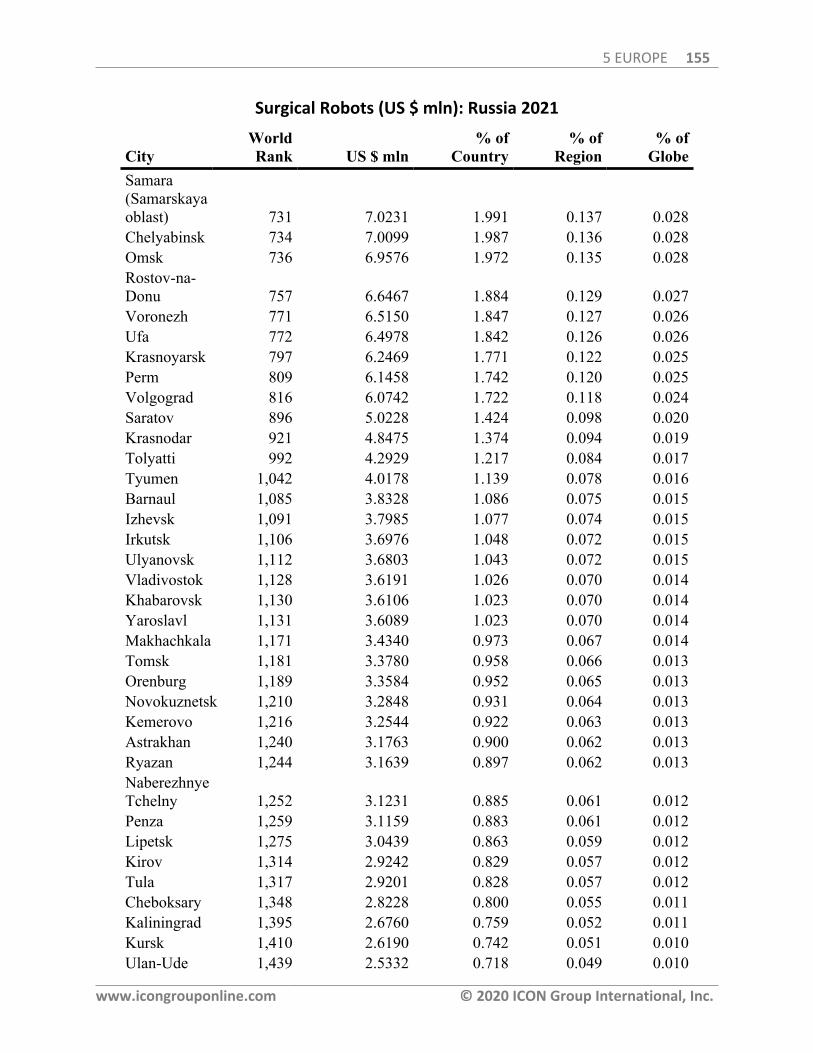
5 EUROPE 155
www.icongrouponline.com © 2020 ICON Group International, Inc.
Surgical Robots (US $ mln): Russia 2021
CityWorldRank US $ mln
% ofCountry
% ofRegion
% ofGlobe
Samara(Samarskayaoblast) 731 7.0231 1.991 0.137 0.028Chelyabinsk 734 7.0099 1.987 0.136 0.028Omsk 736 6.9576 1.972 0.135 0.028Rostov-na-Donu 757 6.6467 1.884 0.129 0.027Voronezh 771 6.5150 1.847 0.127 0.026Ufa 772 6.4978 1.842 0.126 0.026Krasnoyarsk 797 6.2469 1.771 0.122 0.025Perm 809 6.1458 1.742 0.120 0.025Volgograd 816 6.0742 1.722 0.118 0.024Saratov 896 5.0228 1.424 0.098 0.020Krasnodar 921 4.8475 1.374 0.094 0.019Tolyatti 992 4.2929 1.217 0.084 0.017Tyumen 1,042 4.0178 1.139 0.078 0.016Barnaul 1,085 3.8328 1.086 0.075 0.015Izhevsk 1,091 3.7985 1.077 0.074 0.015Irkutsk 1,106 3.6976 1.048 0.072 0.015Ulyanovsk 1,112 3.6803 1.043 0.072 0.015Vladivostok 1,128 3.6191 1.026 0.070 0.014Khabarovsk 1,130 3.6106 1.023 0.070 0.014Yaroslavl 1,131 3.6089 1.023 0.070 0.014Makhachkala 1,171 3.4340 0.973 0.067 0.014Tomsk 1,181 3.3780 0.958 0.066 0.013Orenburg 1,189 3.3584 0.952 0.065 0.013Novokuznetsk 1,210 3.2848 0.931 0.064 0.013Kemerovo 1,216 3.2544 0.922 0.063 0.013Astrakhan 1,240 3.1763 0.900 0.062 0.013Ryazan 1,244 3.1639 0.897 0.062 0.013NaberezhnyeTchelny 1,252 3.1231 0.885 0.061 0.012Penza 1,259 3.1159 0.883 0.061 0.012Lipetsk 1,275 3.0439 0.863 0.059 0.012Kirov 1,314 2.9242 0.829 0.057 0.012Tula 1,317 2.9201 0.828 0.057 0.012Cheboksary 1,348 2.8228 0.800 0.055 0.011Kaliningrad 1,395 2.6760 0.759 0.052 0.011Kursk 1,410 2.6190 0.742 0.051 0.010Ulan-Ude 1,439 2.5332 0.718 0.049 0.010
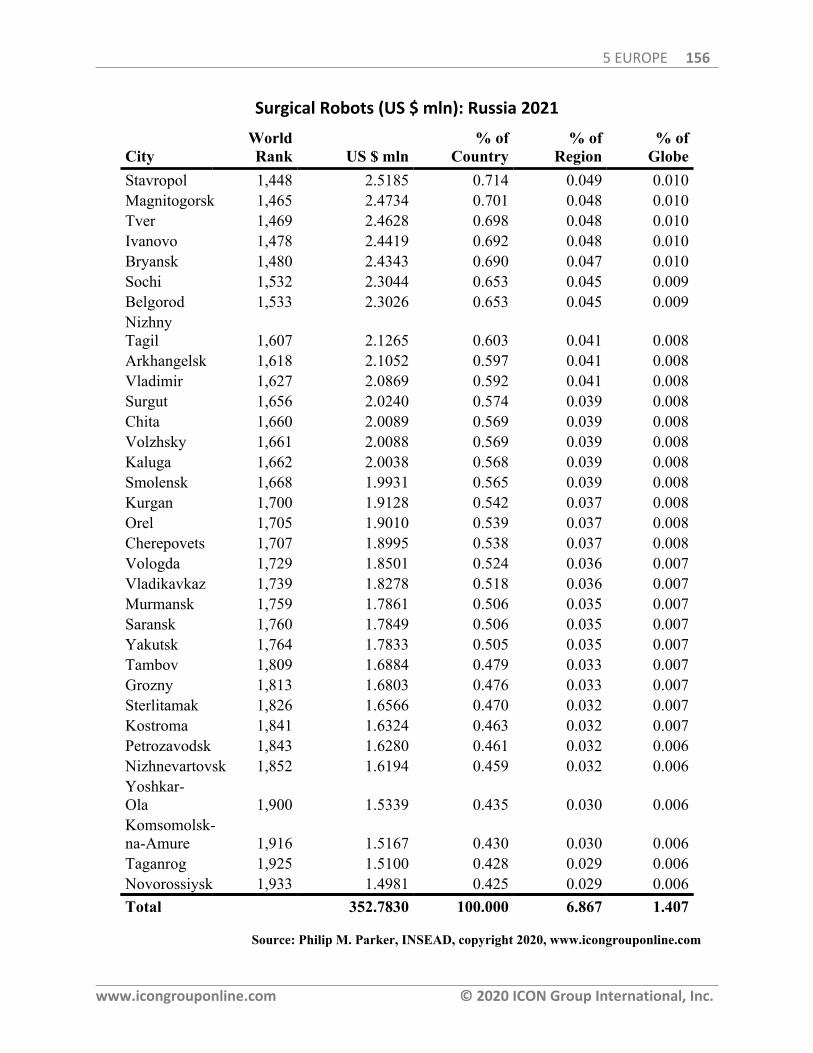
5 EUROPE 156
www.icongrouponline.com © 2020 ICON Group International, Inc.
Surgical Robots (US $ mln): Russia 2021
CityWorldRank US $ mln
% ofCountry
% ofRegion
% ofGlobe
Stavropol 1,448 2.5185 0.714 0.049 0.010Magnitogorsk 1,465 2.4734 0.701 0.048 0.010Tver 1,469 2.4628 0.698 0.048 0.010Ivanovo 1,478 2.4419 0.692 0.048 0.010Bryansk 1,480 2.4343 0.690 0.047 0.010Sochi 1,532 2.3044 0.653 0.045 0.009Belgorod 1,533 2.3026 0.653 0.045 0.009NizhnyTagil 1,607 2.1265 0.603 0.041 0.008Arkhangelsk 1,618 2.1052 0.597 0.041 0.008Vladimir 1,627 2.0869 0.592 0.041 0.008Surgut 1,656 2.0240 0.574 0.039 0.008Chita 1,660 2.0089 0.569 0.039 0.008Volzhsky 1,661 2.0088 0.569 0.039 0.008Kaluga 1,662 2.0038 0.568 0.039 0.008Smolensk 1,668 1.9931 0.565 0.039 0.008Kurgan 1,700 1.9128 0.542 0.037 0.008Orel 1,705 1.9010 0.539 0.037 0.008Cherepovets 1,707 1.8995 0.538 0.037 0.008Vologda 1,729 1.8501 0.524 0.036 0.007Vladikavkaz 1,739 1.8278 0.518 0.036 0.007Murmansk 1,759 1.7861 0.506 0.035 0.007Saransk 1,760 1.7849 0.506 0.035 0.007Yakutsk 1,764 1.7833 0.505 0.035 0.007Tambov 1,809 1.6884 0.479 0.033 0.007Grozny 1,813 1.6803 0.476 0.033 0.007Sterlitamak 1,826 1.6566 0.470 0.032 0.007Kostroma 1,841 1.6324 0.463 0.032 0.007Petrozavodsk 1,843 1.6280 0.461 0.032 0.006Nizhnevartovsk 1,852 1.6194 0.459 0.032 0.006Yoshkar-Ola 1,900 1.5339 0.435 0.030 0.006Komsomolsk-na-Amure 1,916 1.5167 0.430 0.030 0.006Taganrog 1,925 1.5100 0.428 0.029 0.006Novorossiysk 1,933 1.4981 0.425 0.029 0.006Total 352.7830 100.000 6.867 1.407
Source: Philip M. Parker, INSEAD, copyright 2020, www.icongrouponline.com
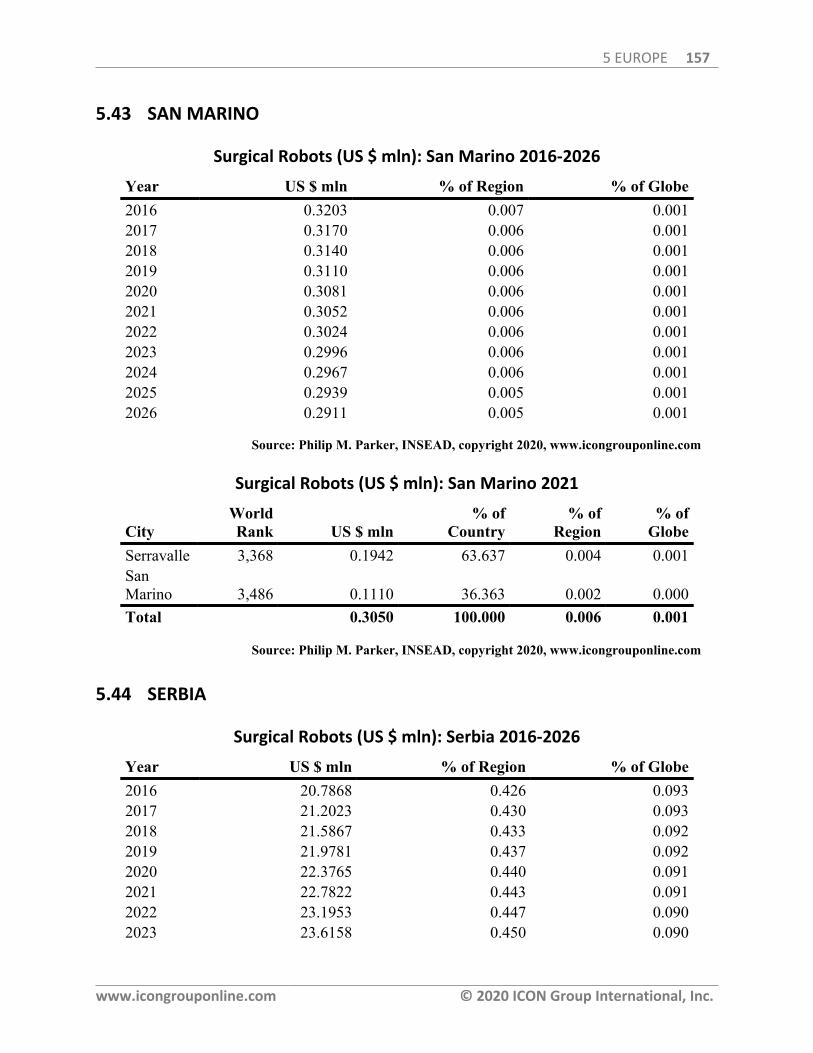
5 EUROPE 157
www.icongrouponline.com © 2020 ICON Group International, Inc.
5.43 SAN MARINO
Surgical Robots (US $ mln): San Marino 2016-2026
Year US $ mln % of Region % of Globe2016 0.3203 0.007 0.0012017 0.3170 0.006 0.0012018 0.3140 0.006 0.0012019 0.3110 0.006 0.0012020 0.3081 0.006 0.0012021 0.3052 0.006 0.0012022 0.3024 0.006 0.0012023 0.2996 0.006 0.0012024 0.2967 0.006 0.0012025 0.2939 0.005 0.0012026 0.2911 0.005 0.001
Source: Philip M. Parker, INSEAD, copyright 2020, www.icongrouponline.com
Surgical Robots (US $ mln): San Marino 2021
CityWorldRank US $ mln
% ofCountry
% ofRegion
% ofGlobe
Serravalle 3,368 0.1942 63.637 0.004 0.001SanMarino 3,486 0.1110 36.363 0.002 0.000Total 0.3050 100.000 0.006 0.001
Source: Philip M. Parker, INSEAD, copyright 2020, www.icongrouponline.com
5.44 SERBIA
Surgical Robots (US $ mln): Serbia 2016-2026
Year US $ mln % of Region % of Globe2016 20.7868 0.426 0.0932017 21.2023 0.430 0.0932018 21.5867 0.433 0.0922019 21.9781 0.437 0.0922020 22.3765 0.440 0.0912021 22.7822 0.443 0.0912022 23.1953 0.447 0.0902023 23.6158 0.450 0.090
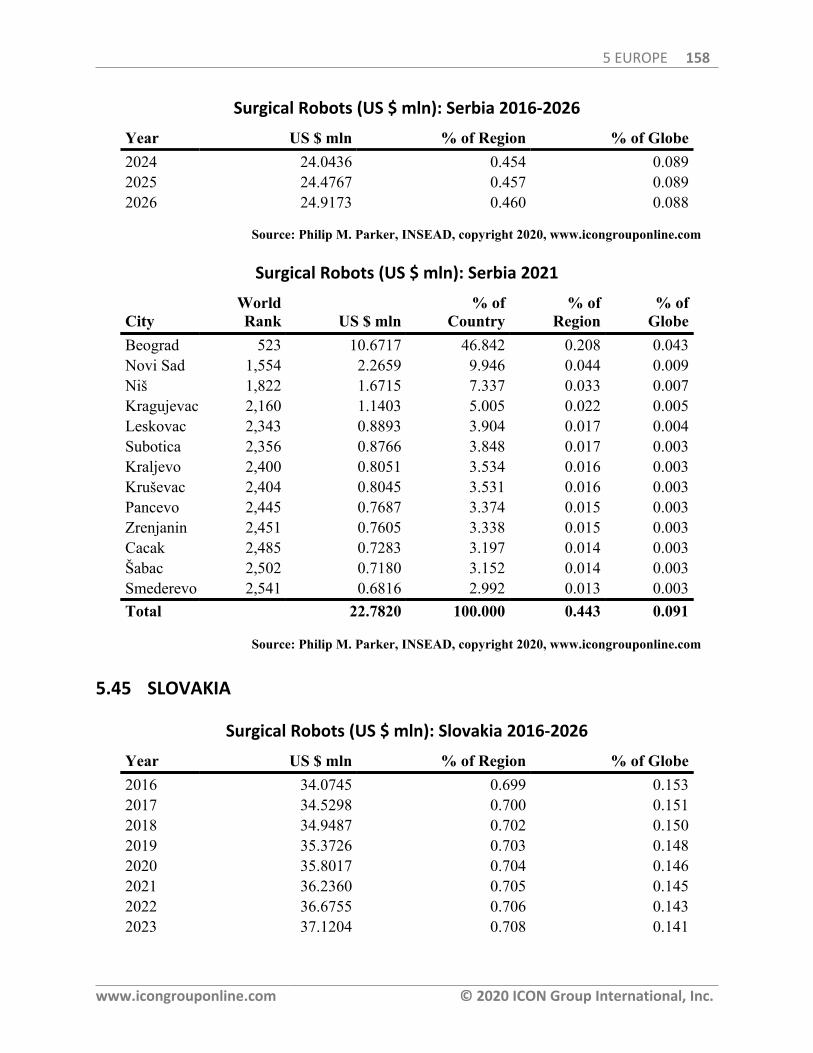
5 EUROPE 158
www.icongrouponline.com © 2020 ICON Group International, Inc.
Surgical Robots (US $ mln): Serbia 2016-2026
Year US $ mln % of Region % of Globe2024 24.0436 0.454 0.0892025 24.4767 0.457 0.0892026 24.9173 0.460 0.088
Source: Philip M. Parker, INSEAD, copyright 2020, www.icongrouponline.com
Surgical Robots (US $ mln): Serbia 2021
CityWorldRank US $ mln
% ofCountry
% ofRegion
% ofGlobe
Beograd 523 10.6717 46.842 0.208 0.043Novi Sad 1,554 2.2659 9.946 0.044 0.009Niš 1,822 1.6715 7.337 0.033 0.007Kragujevac 2,160 1.1403 5.005 0.022 0.005Leskovac 2,343 0.8893 3.904 0.017 0.004Subotica 2,356 0.8766 3.848 0.017 0.003Kraljevo 2,400 0.8051 3.534 0.016 0.003Kruševac 2,404 0.8045 3.531 0.016 0.003Pancevo 2,445 0.7687 3.374 0.015 0.003Zrenjanin 2,451 0.7605 3.338 0.015 0.003Cacak 2,485 0.7283 3.197 0.014 0.003Šabac 2,502 0.7180 3.152 0.014 0.003Smederevo 2,541 0.6816 2.992 0.013 0.003Total 22.7820 100.000 0.443 0.091
Source: Philip M. Parker, INSEAD, copyright 2020, www.icongrouponline.com
5.45 SLOVAKIA
Surgical Robots (US $ mln): Slovakia 2016-2026
Year US $ mln % of Region % of Globe2016 34.0745 0.699 0.1532017 34.5298 0.700 0.1512018 34.9487 0.702 0.1502019 35.3726 0.703 0.1482020 35.8017 0.704 0.1462021 36.2360 0.705 0.1452022 36.6755 0.706 0.1432023 37.1204 0.708 0.141
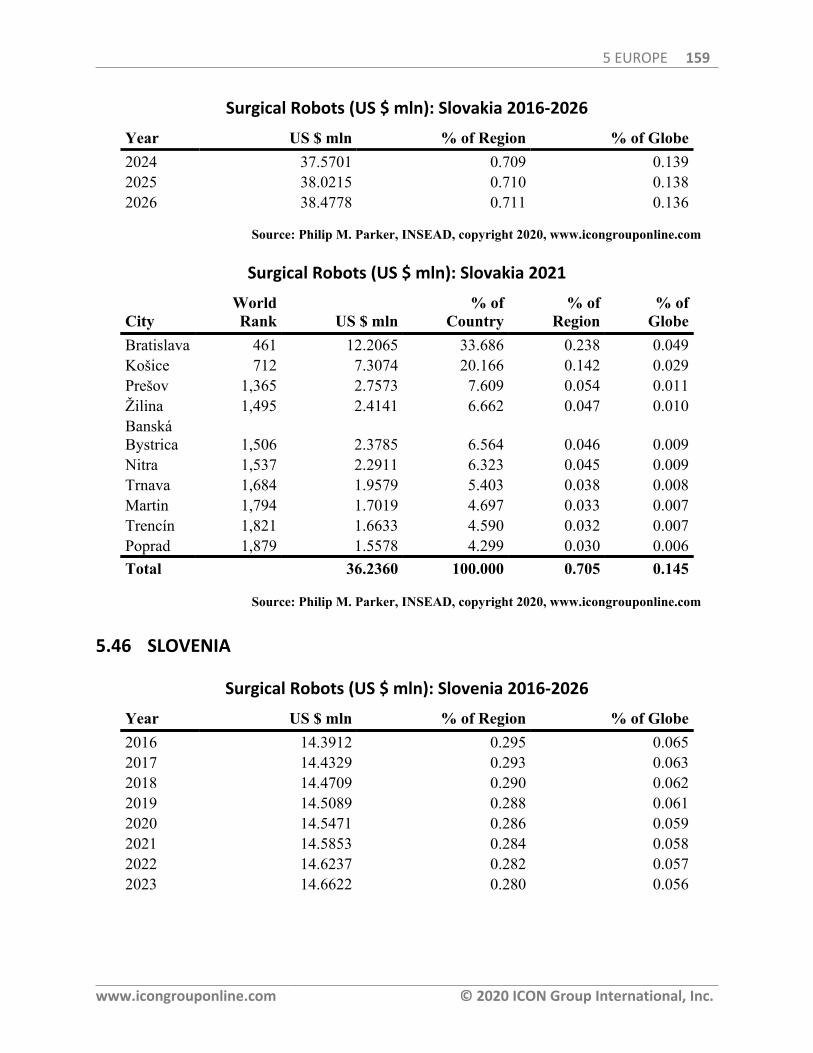
5 EUROPE 159
www.icongrouponline.com © 2020 ICON Group International, Inc.
Surgical Robots (US $ mln): Slovakia 2016-2026
Year US $ mln % of Region % of Globe2024 37.5701 0.709 0.1392025 38.0215 0.710 0.1382026 38.4778 0.711 0.136
Source: Philip M. Parker, INSEAD, copyright 2020, www.icongrouponline.com
Surgical Robots (US $ mln): Slovakia 2021
CityWorldRank US $ mln
% ofCountry
% ofRegion
% ofGlobe
Bratislava 461 12.2065 33.686 0.238 0.049Košice 712 7.3074 20.166 0.142 0.029Prešov 1,365 2.7573 7.609 0.054 0.011Žilina 1,495 2.4141 6.662 0.047 0.010BanskáBystrica 1,506 2.3785 6.564 0.046 0.009Nitra 1,537 2.2911 6.323 0.045 0.009Trnava 1,684 1.9579 5.403 0.038 0.008Martin 1,794 1.7019 4.697 0.033 0.007Trencín 1,821 1.6633 4.590 0.032 0.007Poprad 1,879 1.5578 4.299 0.030 0.006Total 36.2360 100.000 0.705 0.145
Source: Philip M. Parker, INSEAD, copyright 2020, www.icongrouponline.com
5.46 SLOVENIA
Surgical Robots (US $ mln): Slovenia 2016-2026
Year US $ mln % of Region % of Globe2016 14.3912 0.295 0.0652017 14.4329 0.293 0.0632018 14.4709 0.290 0.0622019 14.5089 0.288 0.0612020 14.5471 0.286 0.0592021 14.5853 0.284 0.0582022 14.6237 0.282 0.0572023 14.6622 0.280 0.056

5 EUROPE 160
www.icongrouponline.com © 2020 ICON Group International, Inc.
Surgical Robots (US $ mln): Slovenia 2016-2026
Year US $ mln % of Region % of Globe2024 14.7005 0.277 0.0552025 14.7375 0.275 0.0532026 14.7743 0.273 0.052
Source: Philip M. Parker, INSEAD, copyright 2020, www.icongrouponline.com
Surgical Robots (US $ mln): Slovenia 2021
CityWorldRank US $ mln
% ofCountry
% ofRegion
% ofGlobe
Ljubljana 729 6.9508 47.656 0.135 0.028Maribor 993 4.2389 29.062 0.083 0.017Koper 2,282 0.9572 6.563 0.019 0.004Kranj 2,422 0.7748 5.313 0.015 0.003Celje 2,448 0.7521 5.156 0.015 0.003Trbovlje 2,892 0.4558 3.125 0.009 0.002Jesenice 2,893 0.4558 3.125 0.009 0.002Total 14.5850 100.000 0.284 0.058
Source: Philip M. Parker, INSEAD, copyright 2020, www.icongrouponline.com
5.47 SPAIN
Surgical Robots (US $ mln): Spain 2016-2026
Year US $ mln % of Region % of Globe2016 347.8309 7.132 1.5622017 348.4547 7.066 1.5252018 349.0227 7.006 1.4932019 349.5916 6.946 1.4612020 350.1615 6.886 1.4302021 350.7323 6.827 1.3992022 351.3040 6.767 1.3682023 351.8767 6.708 1.3382024 352.4445 6.649 1.3082025 352.9789 6.590 1.2792026 353.5084 6.531 1.250
Source: Philip M. Parker, INSEAD, copyright 2020, www.icongrouponline.com
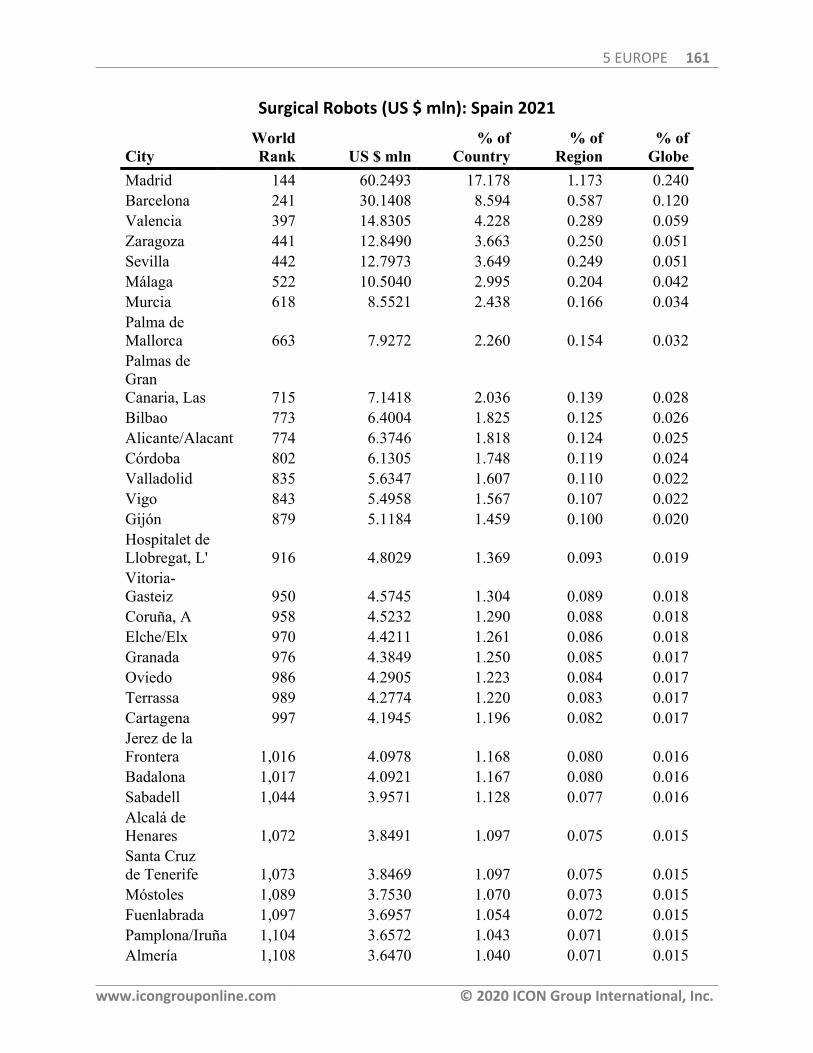
5 EUROPE 161
www.icongrouponline.com © 2020 ICON Group International, Inc.
Surgical Robots (US $ mln): Spain 2021
CityWorldRank US $ mln
% ofCountry
% ofRegion
% ofGlobe
Madrid 144 60.2493 17.178 1.173 0.240Barcelona 241 30.1408 8.594 0.587 0.120Valencia 397 14.8305 4.228 0.289 0.059Zaragoza 441 12.8490 3.663 0.250 0.051Sevilla 442 12.7973 3.649 0.249 0.051Málaga 522 10.5040 2.995 0.204 0.042Murcia 618 8.5521 2.438 0.166 0.034Palma deMallorca 663 7.9272 2.260 0.154 0.032Palmas deGranCanaria, Las 715 7.1418 2.036 0.139 0.028Bilbao 773 6.4004 1.825 0.125 0.026Alicante/Alacant 774 6.3746 1.818 0.124 0.025Córdoba 802 6.1305 1.748 0.119 0.024Valladolid 835 5.6347 1.607 0.110 0.022Vigo 843 5.4958 1.567 0.107 0.022Gijón 879 5.1184 1.459 0.100 0.020Hospitalet deLlobregat, L' 916 4.8029 1.369 0.093 0.019Vitoria-Gasteiz 950 4.5745 1.304 0.089 0.018Coruña, A 958 4.5232 1.290 0.088 0.018Elche/Elx 970 4.4211 1.261 0.086 0.018Granada 976 4.3849 1.250 0.085 0.017Oviedo 986 4.2905 1.223 0.084 0.017Terrassa 989 4.2774 1.220 0.083 0.017Cartagena 997 4.1945 1.196 0.082 0.017Jerez de laFrontera 1,016 4.0978 1.168 0.080 0.016Badalona 1,017 4.0921 1.167 0.080 0.016Sabadell 1,044 3.9571 1.128 0.077 0.016Alcalá deHenares 1,072 3.8491 1.097 0.075 0.015Santa Cruzde Tenerife 1,073 3.8469 1.097 0.075 0.015Móstoles 1,089 3.7530 1.070 0.073 0.015Fuenlabrada 1,097 3.6957 1.054 0.072 0.015Pamplona/Iruña 1,104 3.6572 1.043 0.071 0.015Almería 1,108 3.6470 1.040 0.071 0.015
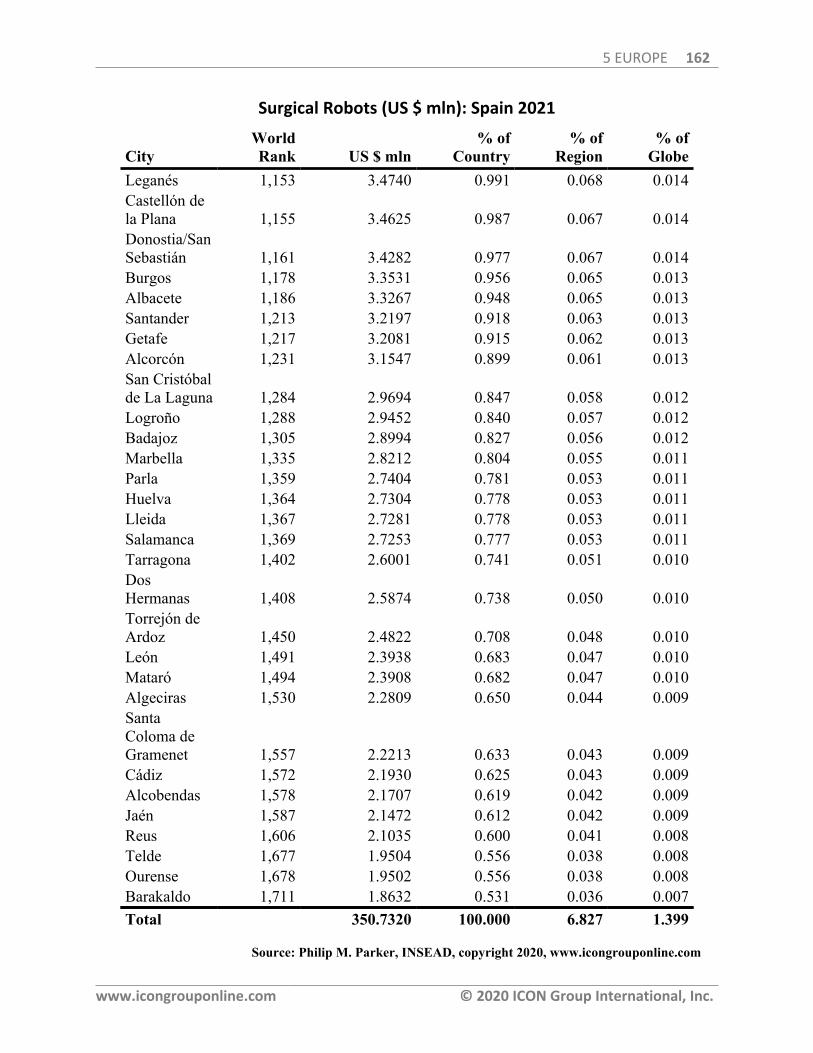
5 EUROPE 162
www.icongrouponline.com © 2020 ICON Group International, Inc.
Surgical Robots (US $ mln): Spain 2021
CityWorldRank US $ mln
% ofCountry
% ofRegion
% ofGlobe
Leganés 1,153 3.4740 0.991 0.068 0.014Castellón dela Plana 1,155 3.4625 0.987 0.067 0.014Donostia/SanSebastián 1,161 3.4282 0.977 0.067 0.014Burgos 1,178 3.3531 0.956 0.065 0.013Albacete 1,186 3.3267 0.948 0.065 0.013Santander 1,213 3.2197 0.918 0.063 0.013Getafe 1,217 3.2081 0.915 0.062 0.013Alcorcón 1,231 3.1547 0.899 0.061 0.013San Cristóbalde La Laguna 1,284 2.9694 0.847 0.058 0.012Logroño 1,288 2.9452 0.840 0.057 0.012Badajoz 1,305 2.8994 0.827 0.056 0.012Marbella 1,335 2.8212 0.804 0.055 0.011Parla 1,359 2.7404 0.781 0.053 0.011Huelva 1,364 2.7304 0.778 0.053 0.011Lleida 1,367 2.7281 0.778 0.053 0.011Salamanca 1,369 2.7253 0.777 0.053 0.011Tarragona 1,402 2.6001 0.741 0.051 0.010DosHermanas 1,408 2.5874 0.738 0.050 0.010Torrejón deArdoz 1,450 2.4822 0.708 0.048 0.010León 1,491 2.3938 0.683 0.047 0.010Mataró 1,494 2.3908 0.682 0.047 0.010Algeciras 1,530 2.2809 0.650 0.044 0.009SantaColoma deGramenet 1,557 2.2213 0.633 0.043 0.009Cádiz 1,572 2.1930 0.625 0.043 0.009Alcobendas 1,578 2.1707 0.619 0.042 0.009Jaén 1,587 2.1472 0.612 0.042 0.009Reus 1,606 2.1035 0.600 0.041 0.008Telde 1,677 1.9504 0.556 0.038 0.008Ourense 1,678 1.9502 0.556 0.038 0.008Barakaldo 1,711 1.8632 0.531 0.036 0.007Total 350.7320 100.000 6.827 1.399
Source: Philip M. Parker, INSEAD, copyright 2020, www.icongrouponline.com
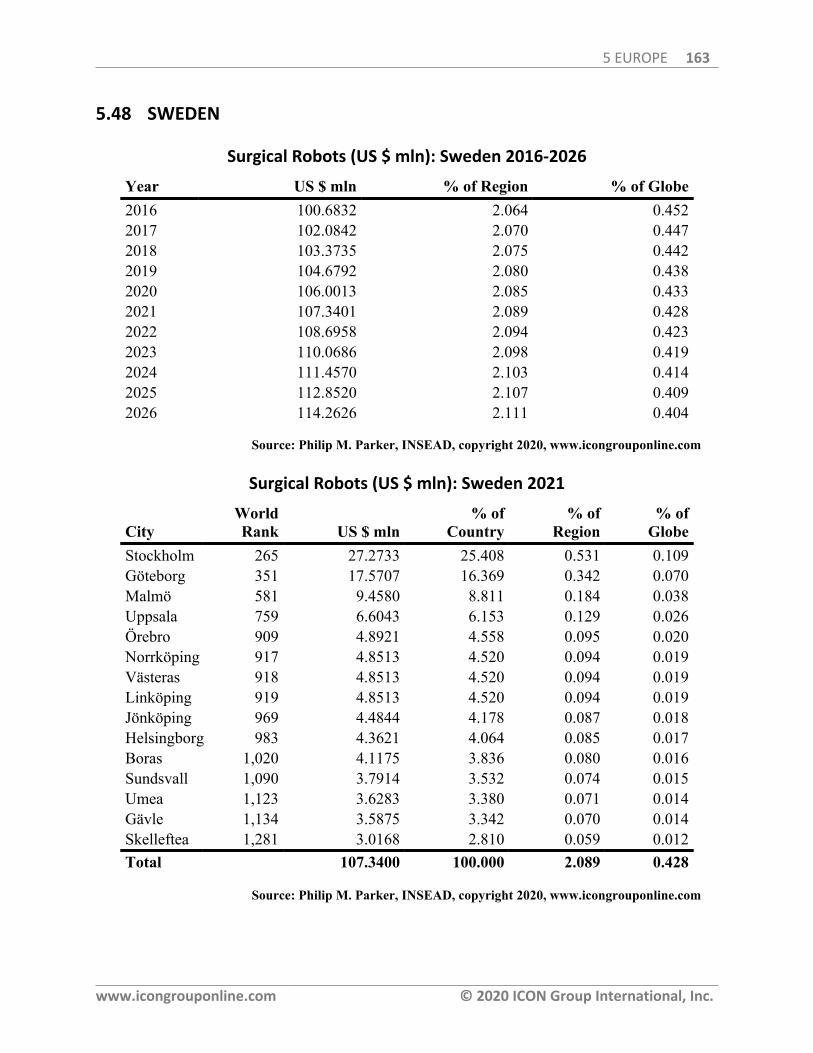
5 EUROPE 163
www.icongrouponline.com © 2020 ICON Group International, Inc.
5.48 SWEDEN
Surgical Robots (US $ mln): Sweden 2016-2026
Year US $ mln % of Region % of Globe2016 100.6832 2.064 0.4522017 102.0842 2.070 0.4472018 103.3735 2.075 0.4422019 104.6792 2.080 0.4382020 106.0013 2.085 0.4332021 107.3401 2.089 0.4282022 108.6958 2.094 0.4232023 110.0686 2.098 0.4192024 111.4570 2.103 0.4142025 112.8520 2.107 0.4092026 114.2626 2.111 0.404
Source: Philip M. Parker, INSEAD, copyright 2020, www.icongrouponline.com
Surgical Robots (US $ mln): Sweden 2021
CityWorldRank US $ mln
% ofCountry
% ofRegion
% ofGlobe
Stockholm 265 27.2733 25.408 0.531 0.109Göteborg 351 17.5707 16.369 0.342 0.070Malmö 581 9.4580 8.811 0.184 0.038Uppsala 759 6.6043 6.153 0.129 0.026Örebro 909 4.8921 4.558 0.095 0.020Norrköping 917 4.8513 4.520 0.094 0.019Västeras 918 4.8513 4.520 0.094 0.019Linköping 919 4.8513 4.520 0.094 0.019Jönköping 969 4.4844 4.178 0.087 0.018Helsingborg 983 4.3621 4.064 0.085 0.017Boras 1,020 4.1175 3.836 0.080 0.016Sundsvall 1,090 3.7914 3.532 0.074 0.015Umea 1,123 3.6283 3.380 0.071 0.014Gävle 1,134 3.5875 3.342 0.070 0.014Skelleftea 1,281 3.0168 2.810 0.059 0.012Total 107.3400 100.000 2.089 0.428
Source: Philip M. Parker, INSEAD, copyright 2020, www.icongrouponline.com
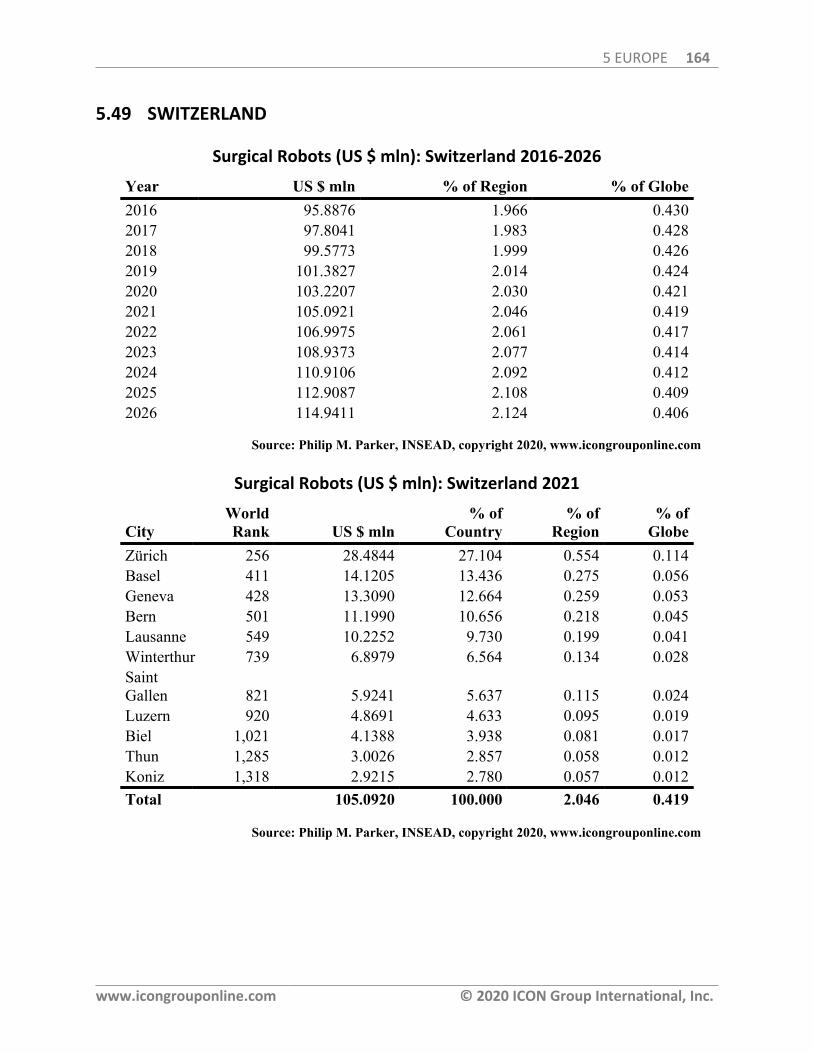
5 EUROPE 164
www.icongrouponline.com © 2020 ICON Group International, Inc.
5.49 SWITZERLAND
Surgical Robots (US $ mln): Switzerland 2016-2026
Year US $ mln % of Region % of Globe2016 95.8876 1.966 0.4302017 97.8041 1.983 0.4282018 99.5773 1.999 0.4262019 101.3827 2.014 0.4242020 103.2207 2.030 0.4212021 105.0921 2.046 0.4192022 106.9975 2.061 0.4172023 108.9373 2.077 0.4142024 110.9106 2.092 0.4122025 112.9087 2.108 0.4092026 114.9411 2.124 0.406
Source: Philip M. Parker, INSEAD, copyright 2020, www.icongrouponline.com
Surgical Robots (US $ mln): Switzerland 2021
CityWorldRank US $ mln
% ofCountry
% ofRegion
% ofGlobe
Zürich 256 28.4844 27.104 0.554 0.114Basel 411 14.1205 13.436 0.275 0.056Geneva 428 13.3090 12.664 0.259 0.053Bern 501 11.1990 10.656 0.218 0.045Lausanne 549 10.2252 9.730 0.199 0.041Winterthur 739 6.8979 6.564 0.134 0.028SaintGallen 821 5.9241 5.637 0.115 0.024Luzern 920 4.8691 4.633 0.095 0.019Biel 1,021 4.1388 3.938 0.081 0.017Thun 1,285 3.0026 2.857 0.058 0.012Koniz 1,318 2.9215 2.780 0.057 0.012Total 105.0920 100.000 2.046 0.419
Source: Philip M. Parker, INSEAD, copyright 2020, www.icongrouponline.com
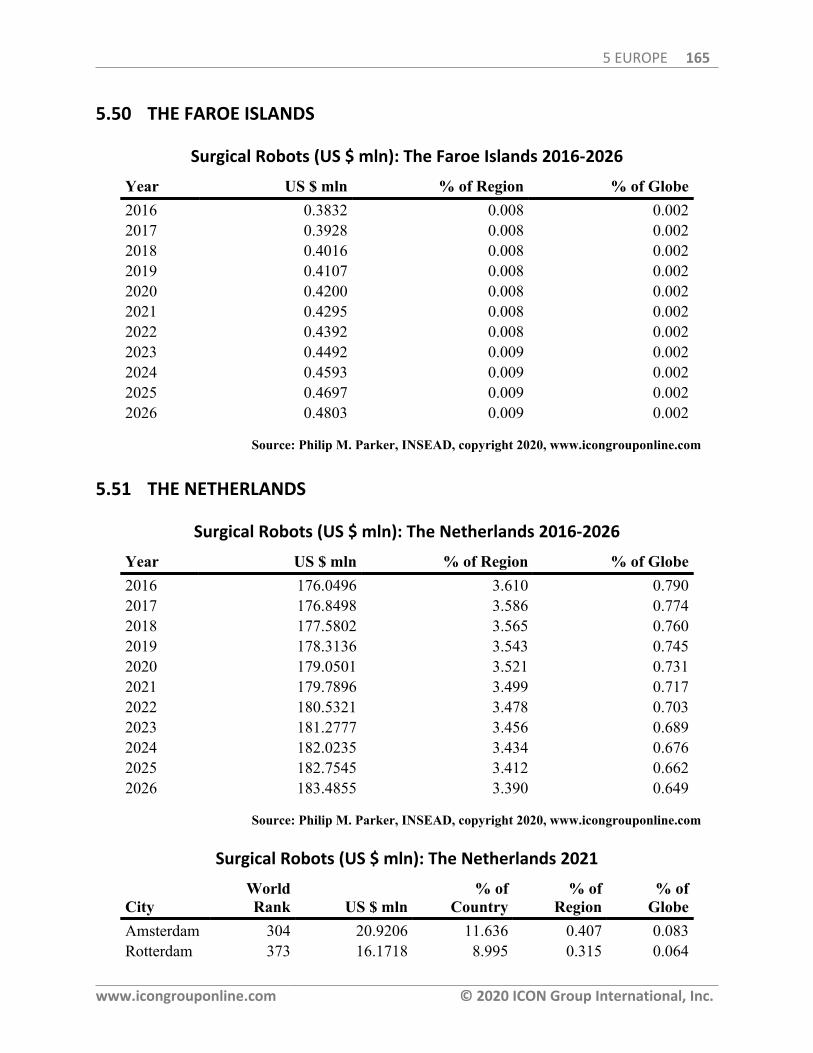
5 EUROPE 165
www.icongrouponline.com © 2020 ICON Group International, Inc.
5.50 THE FAROE ISLANDS
Surgical Robots (US $ mln): The Faroe Islands 2016-2026
Year US $ mln % of Region % of Globe2016 0.3832 0.008 0.0022017 0.3928 0.008 0.0022018 0.4016 0.008 0.0022019 0.4107 0.008 0.0022020 0.4200 0.008 0.0022021 0.4295 0.008 0.0022022 0.4392 0.008 0.0022023 0.4492 0.009 0.0022024 0.4593 0.009 0.0022025 0.4697 0.009 0.0022026 0.4803 0.009 0.002
Source: Philip M. Parker, INSEAD, copyright 2020, www.icongrouponline.com
5.51 THE NETHERLANDS
Surgical Robots (US $ mln): The Netherlands 2016-2026
Year US $ mln % of Region % of Globe2016 176.0496 3.610 0.7902017 176.8498 3.586 0.7742018 177.5802 3.565 0.7602019 178.3136 3.543 0.7452020 179.0501 3.521 0.7312021 179.7896 3.499 0.7172022 180.5321 3.478 0.7032023 181.2777 3.456 0.6892024 182.0235 3.434 0.6762025 182.7545 3.412 0.6622026 183.4855 3.390 0.649
Source: Philip M. Parker, INSEAD, copyright 2020, www.icongrouponline.com
Surgical Robots (US $ mln): The Netherlands 2021
CityWorldRank US $ mln
% ofCountry
% ofRegion
% ofGlobe
Amsterdam 304 20.9206 11.636 0.407 0.083Rotterdam 373 16.1718 8.995 0.315 0.064
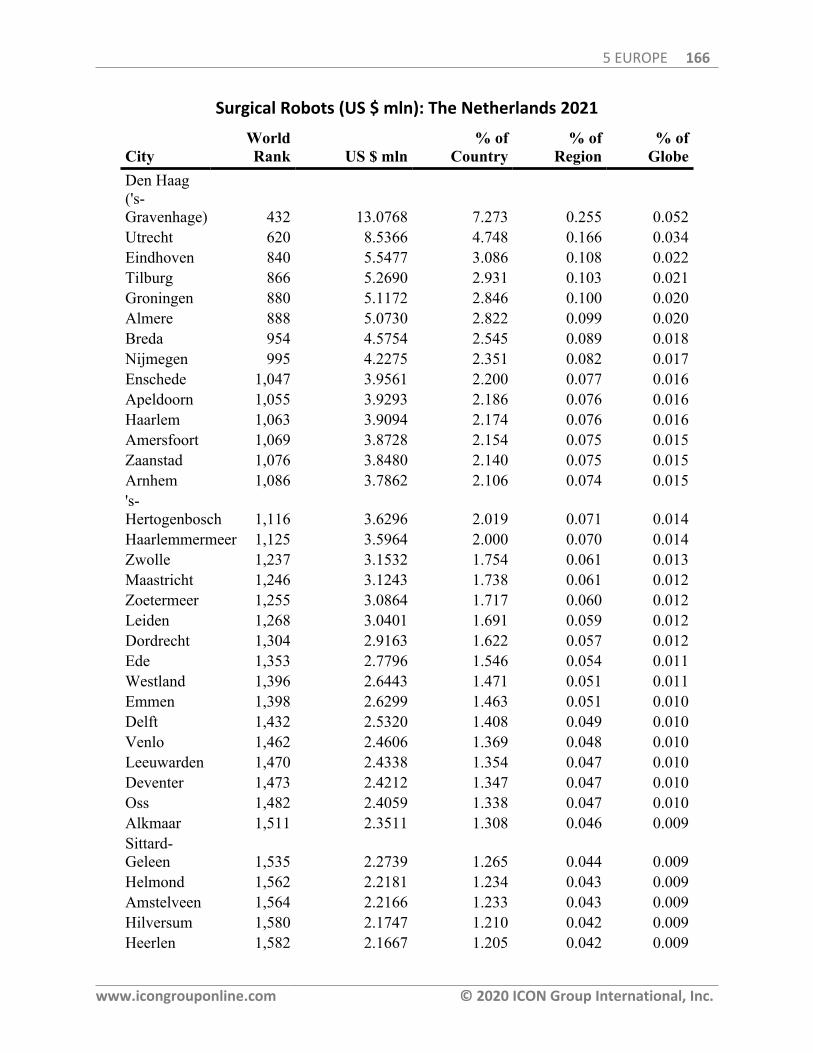
5 EUROPE 166
www.icongrouponline.com © 2020 ICON Group International, Inc.
Surgical Robots (US $ mln): The Netherlands 2021
CityWorldRank US $ mln
% ofCountry
% ofRegion
% ofGlobe
Den Haag('s-Gravenhage) 432 13.0768 7.273 0.255 0.052Utrecht 620 8.5366 4.748 0.166 0.034Eindhoven 840 5.5477 3.086 0.108 0.022Tilburg 866 5.2690 2.931 0.103 0.021Groningen 880 5.1172 2.846 0.100 0.020Almere 888 5.0730 2.822 0.099 0.020Breda 954 4.5754 2.545 0.089 0.018Nijmegen 995 4.2275 2.351 0.082 0.017Enschede 1,047 3.9561 2.200 0.077 0.016Apeldoorn 1,055 3.9293 2.186 0.076 0.016Haarlem 1,063 3.9094 2.174 0.076 0.016Amersfoort 1,069 3.8728 2.154 0.075 0.015Zaanstad 1,076 3.8480 2.140 0.075 0.015Arnhem 1,086 3.7862 2.106 0.074 0.015's-Hertogenbosch 1,116 3.6296 2.019 0.071 0.014Haarlemmermeer 1,125 3.5964 2.000 0.070 0.014Zwolle 1,237 3.1532 1.754 0.061 0.013Maastricht 1,246 3.1243 1.738 0.061 0.012Zoetermeer 1,255 3.0864 1.717 0.060 0.012Leiden 1,268 3.0401 1.691 0.059 0.012Dordrecht 1,304 2.9163 1.622 0.057 0.012Ede 1,353 2.7796 1.546 0.054 0.011Westland 1,396 2.6443 1.471 0.051 0.011Emmen 1,398 2.6299 1.463 0.051 0.010Delft 1,432 2.5320 1.408 0.049 0.010Venlo 1,462 2.4606 1.369 0.048 0.010Leeuwarden 1,470 2.4338 1.354 0.047 0.010Deventer 1,473 2.4212 1.347 0.047 0.010Oss 1,482 2.4059 1.338 0.047 0.010Alkmaar 1,511 2.3511 1.308 0.046 0.009Sittard-Geleen 1,535 2.2739 1.265 0.044 0.009Helmond 1,562 2.2181 1.234 0.043 0.009Amstelveen 1,564 2.2166 1.233 0.043 0.009Hilversum 1,580 2.1747 1.210 0.042 0.009Heerlen 1,582 2.1667 1.205 0.042 0.009
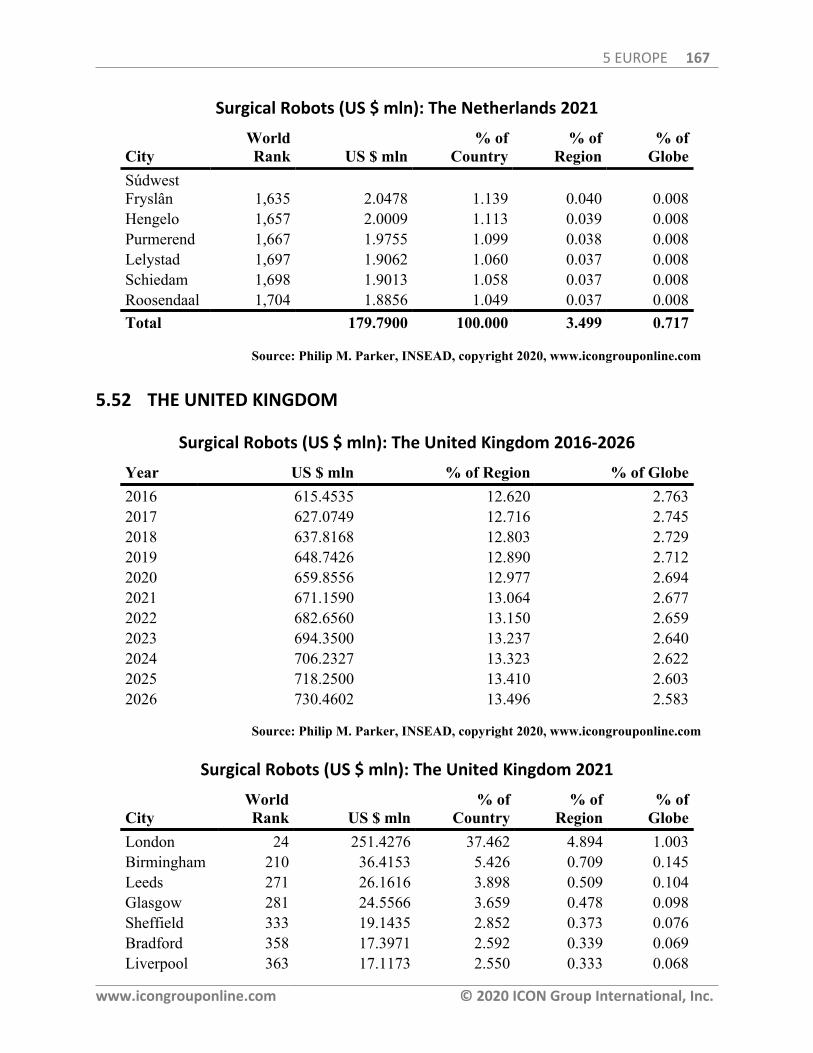
5 EUROPE 167
www.icongrouponline.com © 2020 ICON Group International, Inc.
Surgical Robots (US $ mln): The Netherlands 2021
CityWorldRank US $ mln
% ofCountry
% ofRegion
% ofGlobe
SúdwestFryslân 1,635 2.0478 1.139 0.040 0.008Hengelo 1,657 2.0009 1.113 0.039 0.008Purmerend 1,667 1.9755 1.099 0.038 0.008Lelystad 1,697 1.9062 1.060 0.037 0.008Schiedam 1,698 1.9013 1.058 0.037 0.008Roosendaal 1,704 1.8856 1.049 0.037 0.008Total 179.7900 100.000 3.499 0.717
Source: Philip M. Parker, INSEAD, copyright 2020, www.icongrouponline.com
5.52 THE UNITED KINGDOM
Surgical Robots (US $ mln): The United Kingdom 2016-2026
Year US $ mln % of Region % of Globe2016 615.4535 12.620 2.7632017 627.0749 12.716 2.7452018 637.8168 12.803 2.7292019 648.7426 12.890 2.7122020 659.8556 12.977 2.6942021 671.1590 13.064 2.6772022 682.6560 13.150 2.6592023 694.3500 13.237 2.6402024 706.2327 13.323 2.6222025 718.2500 13.410 2.6032026 730.4602 13.496 2.583
Source: Philip M. Parker, INSEAD, copyright 2020, www.icongrouponline.com
Surgical Robots (US $ mln): The United Kingdom 2021
CityWorldRank US $ mln
% ofCountry
% ofRegion
% ofGlobe
London 24 251.4276 37.462 4.894 1.003Birmingham 210 36.4153 5.426 0.709 0.145Leeds 271 26.1616 3.898 0.509 0.104Glasgow 281 24.5566 3.659 0.478 0.098Sheffield 333 19.1435 2.852 0.373 0.076Bradford 358 17.3971 2.592 0.339 0.069Liverpool 363 17.1173 2.550 0.333 0.068
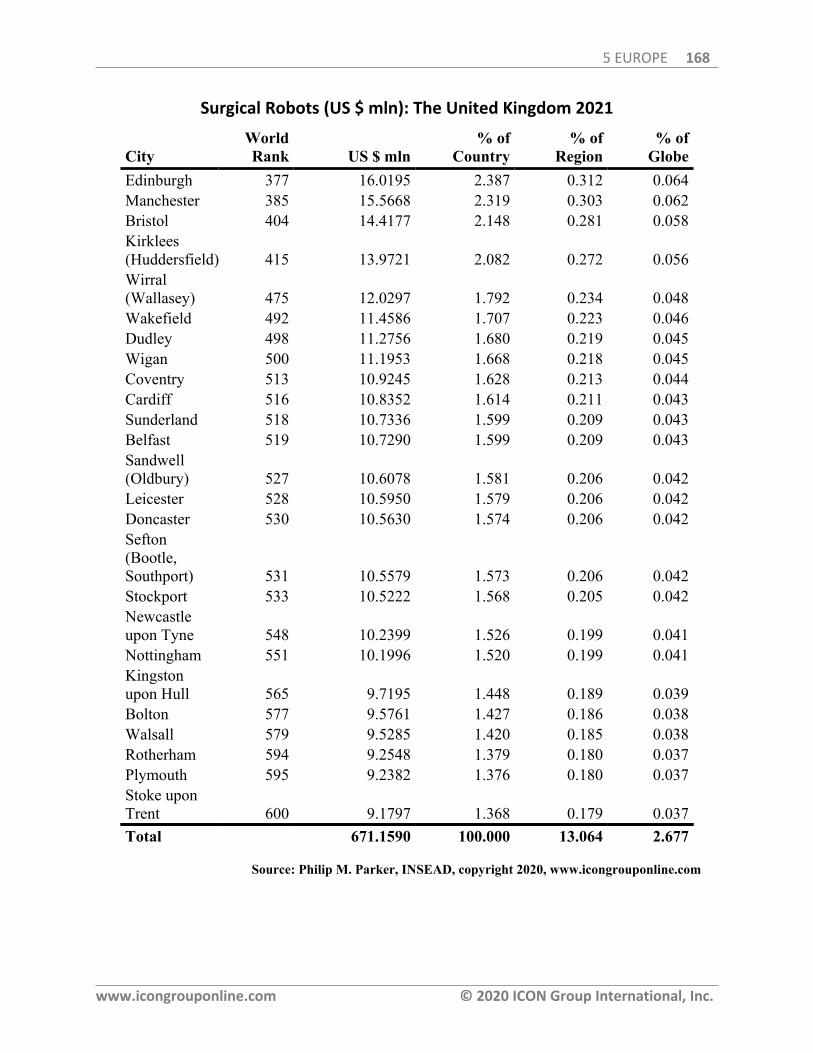
5 EUROPE 168
www.icongrouponline.com © 2020 ICON Group International, Inc.
Surgical Robots (US $ mln): The United Kingdom 2021
CityWorldRank US $ mln
% ofCountry
% ofRegion
% ofGlobe
Edinburgh 377 16.0195 2.387 0.312 0.064Manchester 385 15.5668 2.319 0.303 0.062Bristol 404 14.4177 2.148 0.281 0.058Kirklees(Huddersfield) 415 13.9721 2.082 0.272 0.056Wirral(Wallasey) 475 12.0297 1.792 0.234 0.048Wakefield 492 11.4586 1.707 0.223 0.046Dudley 498 11.2756 1.680 0.219 0.045Wigan 500 11.1953 1.668 0.218 0.045Coventry 513 10.9245 1.628 0.213 0.044Cardiff 516 10.8352 1.614 0.211 0.043Sunderland 518 10.7336 1.599 0.209 0.043Belfast 519 10.7290 1.599 0.209 0.043Sandwell(Oldbury) 527 10.6078 1.581 0.206 0.042Leicester 528 10.5950 1.579 0.206 0.042Doncaster 530 10.5630 1.574 0.206 0.042Sefton(Bootle,Southport) 531 10.5579 1.573 0.206 0.042Stockport 533 10.5222 1.568 0.205 0.042Newcastleupon Tyne 548 10.2399 1.526 0.199 0.041Nottingham 551 10.1996 1.520 0.199 0.041Kingstonupon Hull 565 9.7195 1.448 0.189 0.039Bolton 577 9.5761 1.427 0.186 0.038Walsall 579 9.5285 1.420 0.185 0.038Rotherham 594 9.2548 1.379 0.180 0.037Plymouth 595 9.2382 1.376 0.180 0.037Stoke uponTrent 600 9.1797 1.368 0.179 0.037Total 671.1590 100.000 13.064 2.677
Source: Philip M. Parker, INSEAD, copyright 2020, www.icongrouponline.com
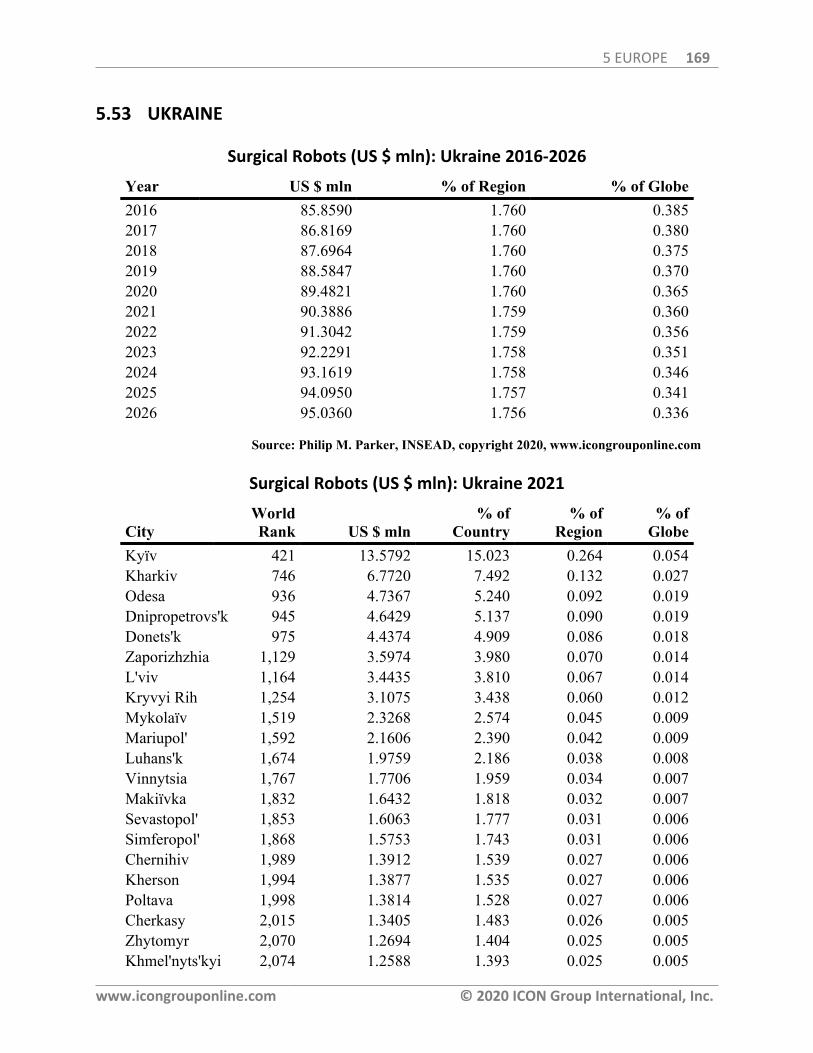
5 EUROPE 169
www.icongrouponline.com © 2020 ICON Group International, Inc.
5.53 UKRAINE
Surgical Robots (US $ mln): Ukraine 2016-2026
Year US $ mln % of Region % of Globe2016 85.8590 1.760 0.3852017 86.8169 1.760 0.3802018 87.6964 1.760 0.3752019 88.5847 1.760 0.3702020 89.4821 1.760 0.3652021 90.3886 1.759 0.3602022 91.3042 1.759 0.3562023 92.2291 1.758 0.3512024 93.1619 1.758 0.3462025 94.0950 1.757 0.3412026 95.0360 1.756 0.336
Source: Philip M. Parker, INSEAD, copyright 2020, www.icongrouponline.com
Surgical Robots (US $ mln): Ukraine 2021
CityWorldRank US $ mln
% ofCountry
% ofRegion
% ofGlobe
Kyïv 421 13.5792 15.023 0.264 0.054Kharkiv 746 6.7720 7.492 0.132 0.027Odesa 936 4.7367 5.240 0.092 0.019Dnipropetrovs'k 945 4.6429 5.137 0.090 0.019Donets'k 975 4.4374 4.909 0.086 0.018Zaporizhzhia 1,129 3.5974 3.980 0.070 0.014L'viv 1,164 3.4435 3.810 0.067 0.014Kryvyi Rih 1,254 3.1075 3.438 0.060 0.012Mykolaïv 1,519 2.3268 2.574 0.045 0.009Mariupol' 1,592 2.1606 2.390 0.042 0.009Luhans'k 1,674 1.9759 2.186 0.038 0.008Vinnytsia 1,767 1.7706 1.959 0.034 0.007Makiïvka 1,832 1.6432 1.818 0.032 0.007Sevastopol' 1,853 1.6063 1.777 0.031 0.006Simferopol' 1,868 1.5753 1.743 0.031 0.006Chernihiv 1,989 1.3912 1.539 0.027 0.006Kherson 1,994 1.3877 1.535 0.027 0.006Poltava 1,998 1.3814 1.528 0.027 0.006Cherkasy 2,015 1.3405 1.483 0.026 0.005Zhytomyr 2,070 1.2694 1.404 0.025 0.005Khmel'nyts'kyi 2,074 1.2588 1.393 0.025 0.005
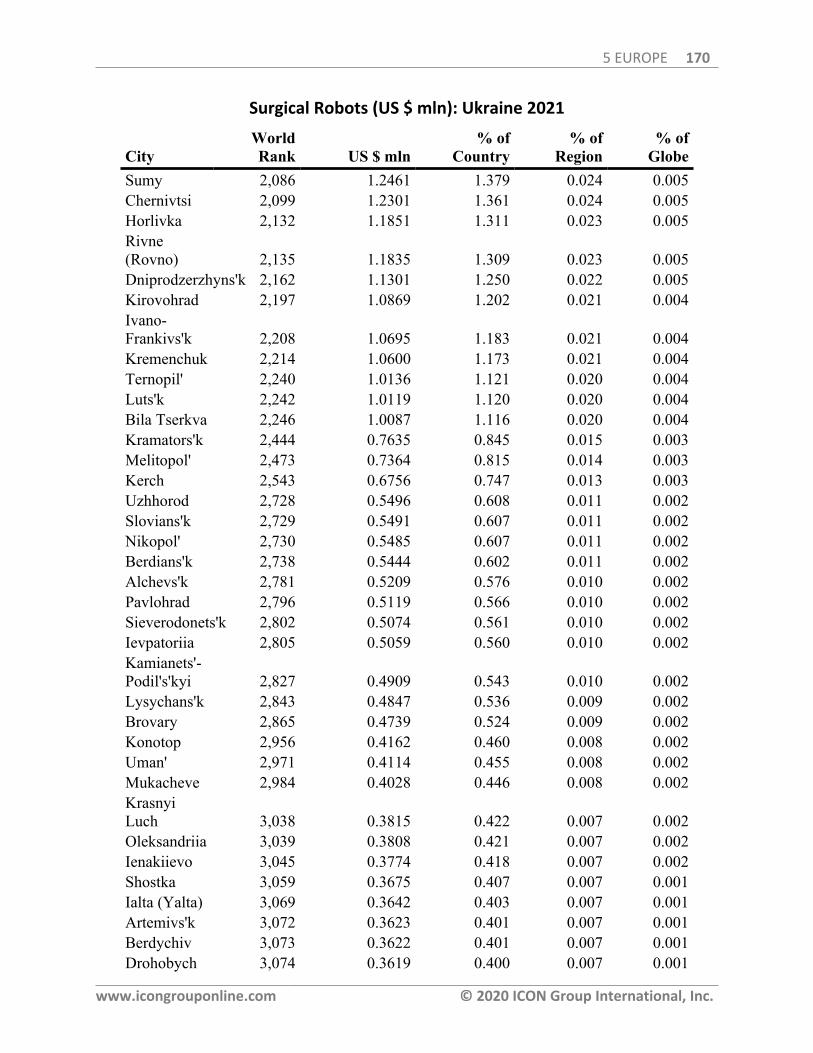
5 EUROPE 170
www.icongrouponline.com © 2020 ICON Group International, Inc.
Surgical Robots (US $ mln): Ukraine 2021
CityWorldRank US $ mln
% ofCountry
% ofRegion
% ofGlobe
Sumy 2,086 1.2461 1.379 0.024 0.005Chernivtsi 2,099 1.2301 1.361 0.024 0.005Horlivka 2,132 1.1851 1.311 0.023 0.005Rivne(Rovno) 2,135 1.1835 1.309 0.023 0.005Dniprodzerzhyns'k 2,162 1.1301 1.250 0.022 0.005Kirovohrad 2,197 1.0869 1.202 0.021 0.004Ivano-Frankivs'k 2,208 1.0695 1.183 0.021 0.004Kremenchuk 2,214 1.0600 1.173 0.021 0.004Ternopil' 2,240 1.0136 1.121 0.020 0.004Luts'k 2,242 1.0119 1.120 0.020 0.004Bila Tserkva 2,246 1.0087 1.116 0.020 0.004Kramators'k 2,444 0.7635 0.845 0.015 0.003Melitopol' 2,473 0.7364 0.815 0.014 0.003Kerch 2,543 0.6756 0.747 0.013 0.003Uzhhorod 2,728 0.5496 0.608 0.011 0.002Slovians'k 2,729 0.5491 0.607 0.011 0.002Nikopol' 2,730 0.5485 0.607 0.011 0.002Berdians'k 2,738 0.5444 0.602 0.011 0.002Alchevs'k 2,781 0.5209 0.576 0.010 0.002Pavlohrad 2,796 0.5119 0.566 0.010 0.002Sieverodonets'k 2,802 0.5074 0.561 0.010 0.002Ievpatoriia 2,805 0.5059 0.560 0.010 0.002Kamianets'-Podil's'kyi 2,827 0.4909 0.543 0.010 0.002Lysychans'k 2,843 0.4847 0.536 0.009 0.002Brovary 2,865 0.4739 0.524 0.009 0.002Konotop 2,956 0.4162 0.460 0.008 0.002Uman' 2,971 0.4114 0.455 0.008 0.002Mukacheve 2,984 0.4028 0.446 0.008 0.002KrasnyiLuch 3,038 0.3815 0.422 0.007 0.002Oleksandriia 3,039 0.3808 0.421 0.007 0.002Ienakiievo 3,045 0.3774 0.418 0.007 0.002Shostka 3,059 0.3675 0.407 0.007 0.001Ialta (Yalta) 3,069 0.3642 0.403 0.007 0.001Artemivs'k 3,072 0.3623 0.401 0.007 0.001Berdychiv 3,073 0.3622 0.401 0.007 0.001Drohobych 3,074 0.3619 0.400 0.007 0.001
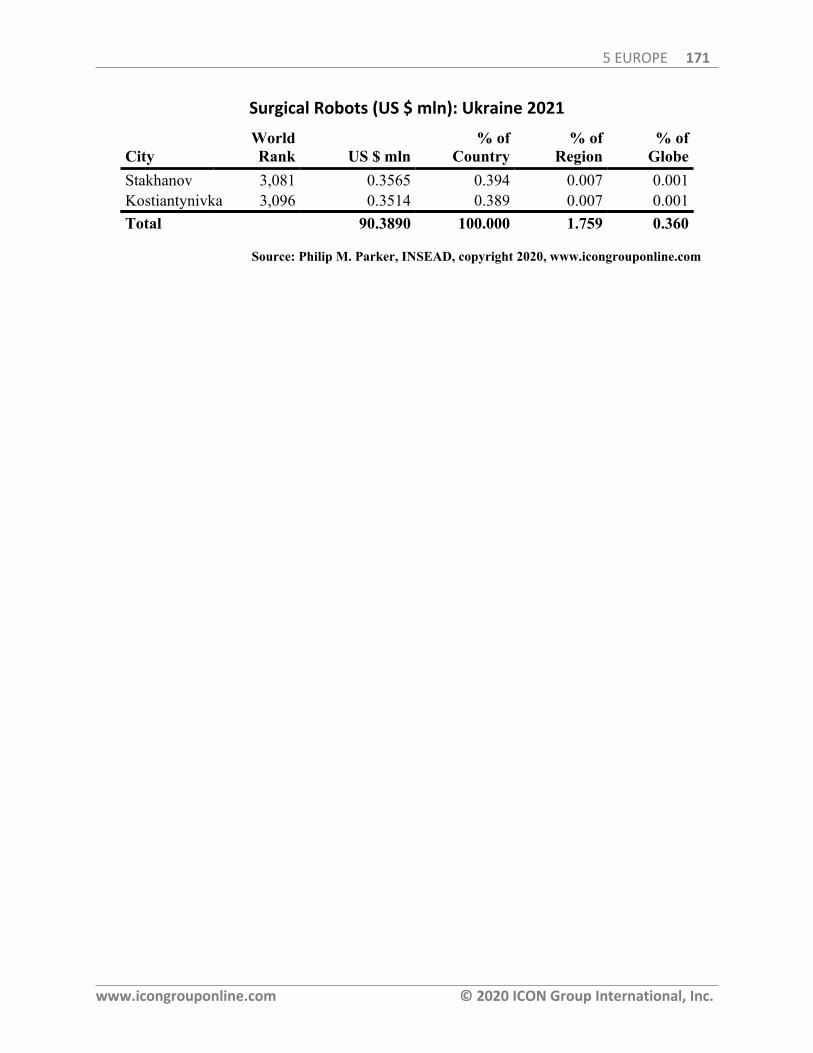
5 EUROPE 171
www.icongrouponline.com © 2020 ICON Group International, Inc.
Surgical Robots (US $ mln): Ukraine 2021
CityWorldRank US $ mln
% ofCountry
% ofRegion
% ofGlobe
Stakhanov 3,081 0.3565 0.394 0.007 0.001Kostiantynivka 3,096 0.3514 0.389 0.007 0.001Total 90.3890 100.000 1.759 0.360
Source: Philip M. Parker, INSEAD, copyright 2020, www.icongrouponline.com
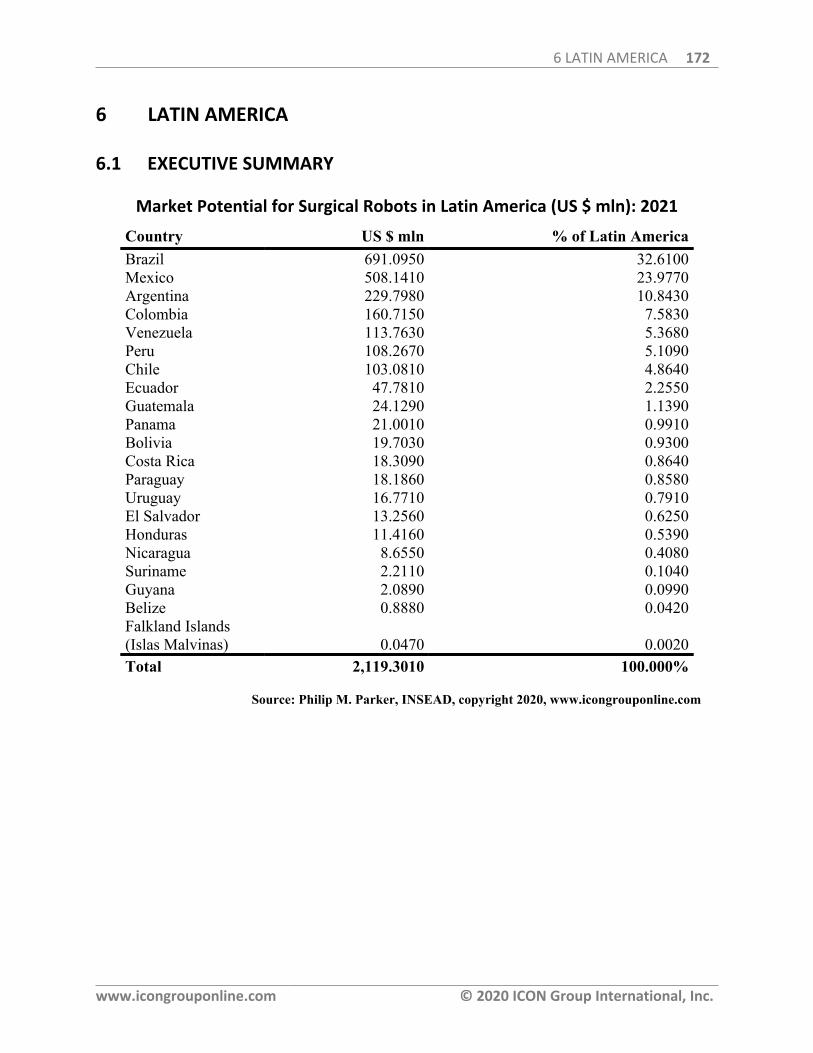
6 LATIN AMERICA 172
www.icongrouponline.com © 2020 ICON Group International, Inc.
6 LATIN AMERICA
6.1 EXECUTIVE SUMMARY
Market Potential for Surgical Robots in Latin America (US $ mln): 2021
Country US $ mln % of Latin AmericaBrazil 691.0950 32.6100Mexico 508.1410 23.9770Argentina 229.7980 10.8430Colombia 160.7150 7.5830Venezuela 113.7630 5.3680Peru 108.2670 5.1090Chile 103.0810 4.8640Ecuador 47.7810 2.2550Guatemala 24.1290 1.1390Panama 21.0010 0.9910Bolivia 19.7030 0.9300Costa Rica 18.3090 0.8640Paraguay 18.1860 0.8580Uruguay 16.7710 0.7910El Salvador 13.2560 0.6250Honduras 11.4160 0.5390Nicaragua 8.6550 0.4080Suriname 2.2110 0.1040Guyana 2.0890 0.0990Belize 0.8880 0.0420Falkland Islands(Islas Malvinas) 0.0470 0.0020Total 2,119.3010 100.000%
Source: Philip M. Parker, INSEAD, copyright 2020, www.icongrouponline.com
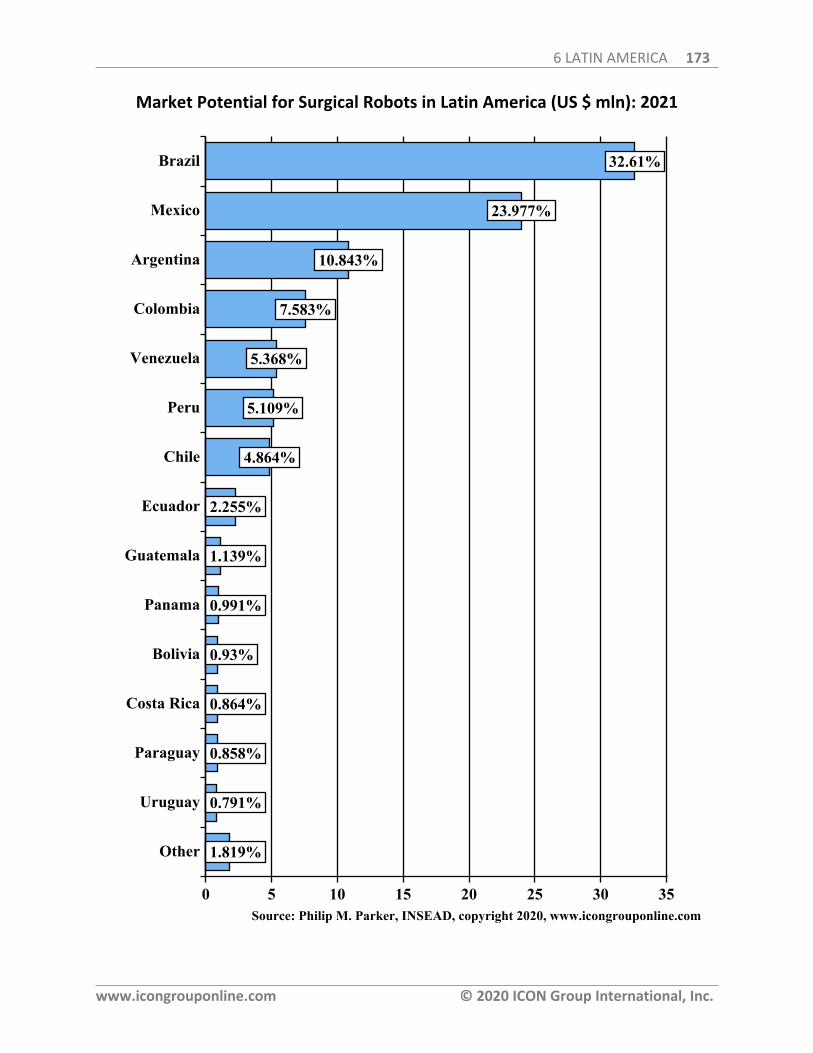
6 LATIN AMERICA 173
www.icongrouponline.com © 2020 ICON Group International, Inc.
Market Potential for Surgical Robots in Latin America (US $ mln): 2021
1.819%
0.791%
0.858%
0.864%
0.93%
0.991%
1.139%
2.255%
4.864%
5.109%
5.368%
7.583%
10.843%
23.977%
32.61%Brazil
Mexico
Argentina
Colombia
Venezuela
Peru
Chile
Ecuador
Guatemala
Panama
Bolivia
Costa Rica
Paraguay
Uruguay
Other
0 5 10 15 20 25 30 35Source: Philip M. Parker, INSEAD, copyright 2020, www.icongrouponline.com
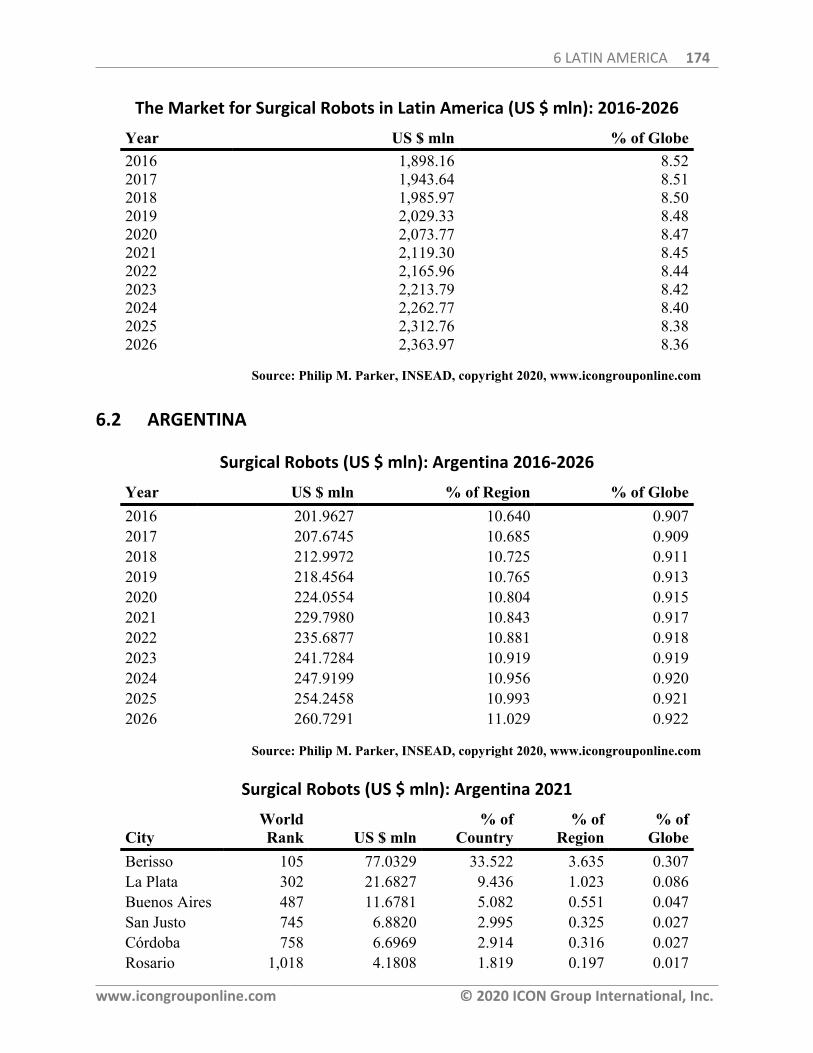
6 LATIN AMERICA 174
www.icongrouponline.com © 2020 ICON Group International, Inc.
The Market for Surgical Robots in Latin America (US $ mln): 2016-2026
Year US $ mln % of Globe2016 1,898.16 8.522017 1,943.64 8.512018 1,985.97 8.502019 2,029.33 8.482020 2,073.77 8.472021 2,119.30 8.452022 2,165.96 8.442023 2,213.79 8.422024 2,262.77 8.402025 2,312.76 8.382026 2,363.97 8.36
Source: Philip M. Parker, INSEAD, copyright 2020, www.icongrouponline.com
6.2 ARGENTINA
Surgical Robots (US $ mln): Argentina 2016-2026
Year US $ mln % of Region % of Globe2016 201.9627 10.640 0.9072017 207.6745 10.685 0.9092018 212.9972 10.725 0.9112019 218.4564 10.765 0.9132020 224.0554 10.804 0.9152021 229.7980 10.843 0.9172022 235.6877 10.881 0.9182023 241.7284 10.919 0.9192024 247.9199 10.956 0.9202025 254.2458 10.993 0.9212026 260.7291 11.029 0.922
Source: Philip M. Parker, INSEAD, copyright 2020, www.icongrouponline.com
Surgical Robots (US $ mln): Argentina 2021
CityWorldRank US $ mln
% ofCountry
% ofRegion
% ofGlobe
Berisso 105 77.0329 33.522 3.635 0.307La Plata 302 21.6827 9.436 1.023 0.086Buenos Aires 487 11.6781 5.082 0.551 0.047San Justo 745 6.8820 2.995 0.325 0.027Córdoba 758 6.6969 2.914 0.316 0.027Rosario 1,018 4.1808 1.819 0.197 0.017
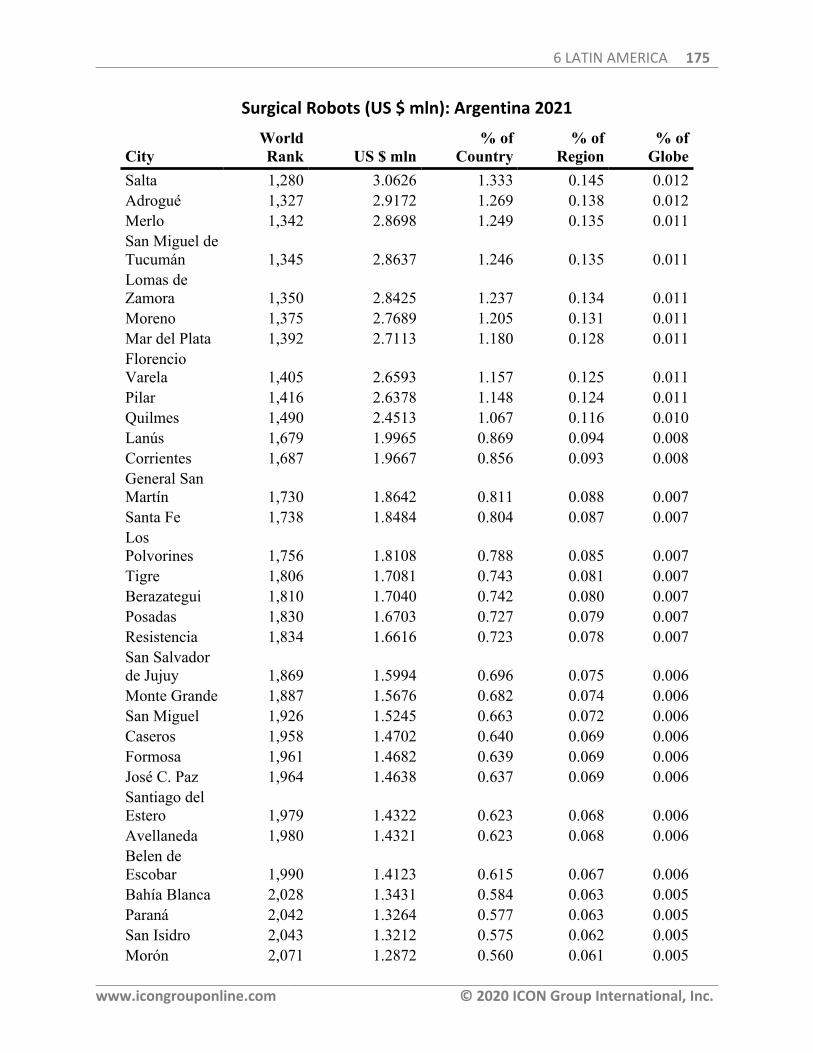
6 LATIN AMERICA 175
www.icongrouponline.com © 2020 ICON Group International, Inc.
Surgical Robots (US $ mln): Argentina 2021
CityWorldRank US $ mln
% ofCountry
% ofRegion
% ofGlobe
Salta 1,280 3.0626 1.333 0.145 0.012Adrogué 1,327 2.9172 1.269 0.138 0.012Merlo 1,342 2.8698 1.249 0.135 0.011San Miguel deTucumán 1,345 2.8637 1.246 0.135 0.011Lomas deZamora 1,350 2.8425 1.237 0.134 0.011Moreno 1,375 2.7689 1.205 0.131 0.011Mar del Plata 1,392 2.7113 1.180 0.128 0.011FlorencioVarela 1,405 2.6593 1.157 0.125 0.011Pilar 1,416 2.6378 1.148 0.124 0.011Quilmes 1,490 2.4513 1.067 0.116 0.010Lanús 1,679 1.9965 0.869 0.094 0.008Corrientes 1,687 1.9667 0.856 0.093 0.008General SanMartín 1,730 1.8642 0.811 0.088 0.007Santa Fe 1,738 1.8484 0.804 0.087 0.007LosPolvorines 1,756 1.8108 0.788 0.085 0.007Tigre 1,806 1.7081 0.743 0.081 0.007Berazategui 1,810 1.7040 0.742 0.080 0.007Posadas 1,830 1.6703 0.727 0.079 0.007Resistencia 1,834 1.6616 0.723 0.078 0.007San Salvadorde Jujuy 1,869 1.5994 0.696 0.075 0.006Monte Grande 1,887 1.5676 0.682 0.074 0.006San Miguel 1,926 1.5245 0.663 0.072 0.006Caseros 1,958 1.4702 0.640 0.069 0.006Formosa 1,961 1.4682 0.639 0.069 0.006José C. Paz 1,964 1.4638 0.637 0.069 0.006Santiago delEstero 1,979 1.4322 0.623 0.068 0.006Avellaneda 1,980 1.4321 0.623 0.068 0.006Belen deEscobar 1,990 1.4123 0.615 0.067 0.006Bahía Blanca 2,028 1.3431 0.584 0.063 0.005Paraná 2,042 1.3264 0.577 0.063 0.005San Isidro 2,043 1.3212 0.575 0.062 0.005Morón 2,071 1.2872 0.560 0.061 0.005
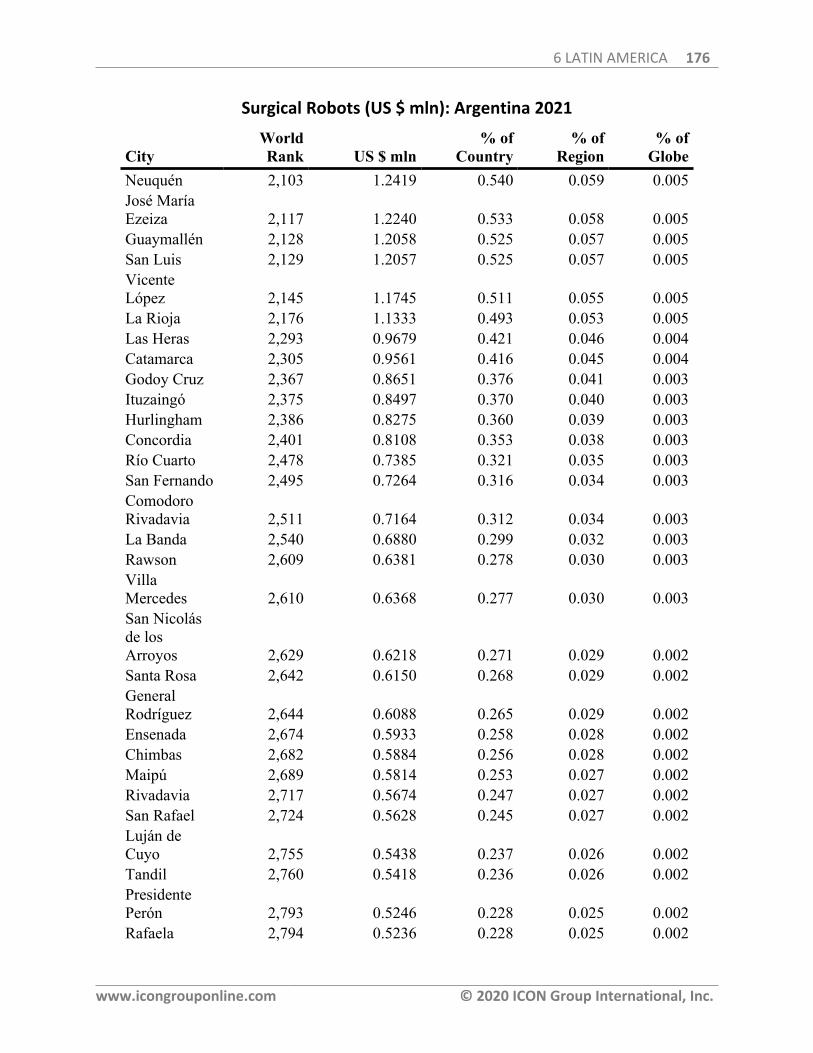
6 LATIN AMERICA 176
www.icongrouponline.com © 2020 ICON Group International, Inc.
Surgical Robots (US $ mln): Argentina 2021
CityWorldRank US $ mln
% ofCountry
% ofRegion
% ofGlobe
Neuquén 2,103 1.2419 0.540 0.059 0.005José MaríaEzeiza 2,117 1.2240 0.533 0.058 0.005Guaymallén 2,128 1.2058 0.525 0.057 0.005San Luis 2,129 1.2057 0.525 0.057 0.005VicenteLópez 2,145 1.1745 0.511 0.055 0.005La Rioja 2,176 1.1333 0.493 0.053 0.005Las Heras 2,293 0.9679 0.421 0.046 0.004Catamarca 2,305 0.9561 0.416 0.045 0.004Godoy Cruz 2,367 0.8651 0.376 0.041 0.003Ituzaingó 2,375 0.8497 0.370 0.040 0.003Hurlingham 2,386 0.8275 0.360 0.039 0.003Concordia 2,401 0.8108 0.353 0.038 0.003Río Cuarto 2,478 0.7385 0.321 0.035 0.003San Fernando 2,495 0.7264 0.316 0.034 0.003ComodoroRivadavia 2,511 0.7164 0.312 0.034 0.003La Banda 2,540 0.6880 0.299 0.032 0.003Rawson 2,609 0.6381 0.278 0.030 0.003VillaMercedes 2,610 0.6368 0.277 0.030 0.003San Nicolásde losArroyos 2,629 0.6218 0.271 0.029 0.002Santa Rosa 2,642 0.6150 0.268 0.029 0.002GeneralRodríguez 2,644 0.6088 0.265 0.029 0.002Ensenada 2,674 0.5933 0.258 0.028 0.002Chimbas 2,682 0.5884 0.256 0.028 0.002Maipú 2,689 0.5814 0.253 0.027 0.002Rivadavia 2,717 0.5674 0.247 0.027 0.002San Rafael 2,724 0.5628 0.245 0.027 0.002Luján deCuyo 2,755 0.5438 0.237 0.026 0.002Tandil 2,760 0.5418 0.236 0.026 0.002PresidentePerón 2,793 0.5246 0.228 0.025 0.002Rafaela 2,794 0.5236 0.228 0.025 0.002
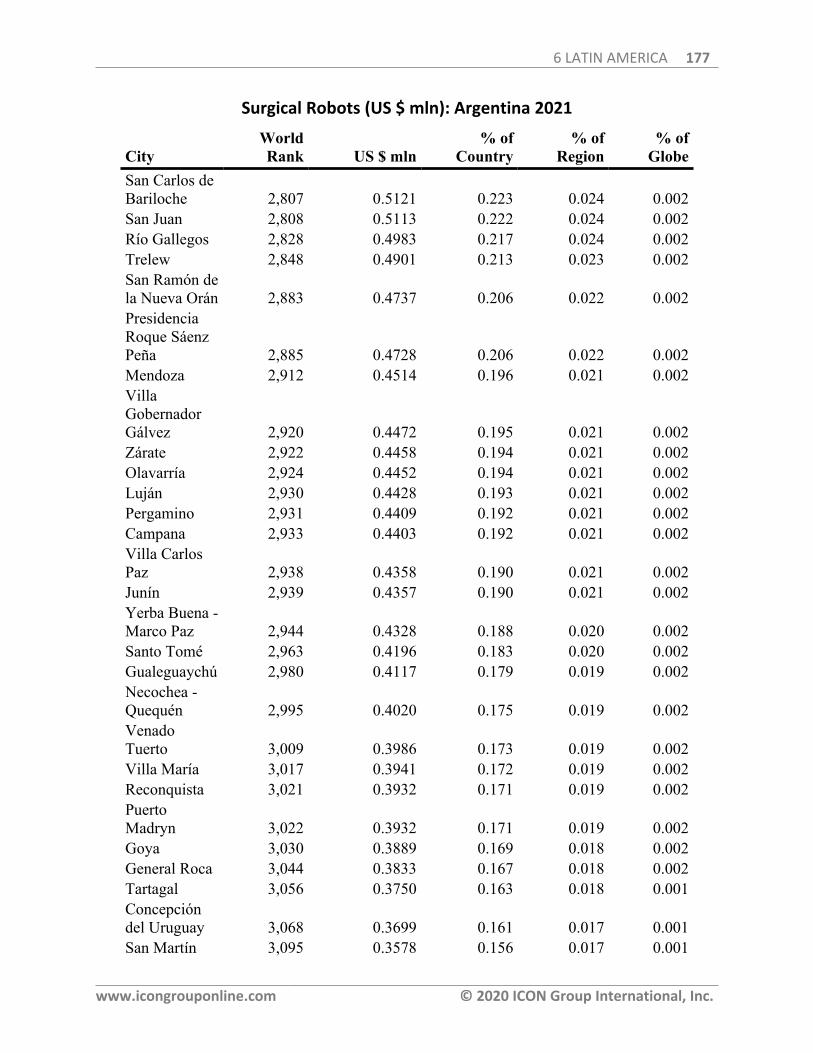
6 LATIN AMERICA 177
www.icongrouponline.com © 2020 ICON Group International, Inc.
Surgical Robots (US $ mln): Argentina 2021
CityWorldRank US $ mln
% ofCountry
% ofRegion
% ofGlobe
San Carlos deBariloche 2,807 0.5121 0.223 0.024 0.002San Juan 2,808 0.5113 0.222 0.024 0.002Río Gallegos 2,828 0.4983 0.217 0.024 0.002Trelew 2,848 0.4901 0.213 0.023 0.002San Ramón dela Nueva Orán 2,883 0.4737 0.206 0.022 0.002PresidenciaRoque SáenzPeña 2,885 0.4728 0.206 0.022 0.002Mendoza 2,912 0.4514 0.196 0.021 0.002VillaGobernadorGálvez 2,920 0.4472 0.195 0.021 0.002Zárate 2,922 0.4458 0.194 0.021 0.002Olavarría 2,924 0.4452 0.194 0.021 0.002Luján 2,930 0.4428 0.193 0.021 0.002Pergamino 2,931 0.4409 0.192 0.021 0.002Campana 2,933 0.4403 0.192 0.021 0.002Villa CarlosPaz 2,938 0.4358 0.190 0.021 0.002Junín 2,939 0.4357 0.190 0.021 0.002Yerba Buena -Marco Paz 2,944 0.4328 0.188 0.020 0.002Santo Tomé 2,963 0.4196 0.183 0.020 0.002Gualeguaychú 2,980 0.4117 0.179 0.019 0.002Necochea -Quequén 2,995 0.4020 0.175 0.019 0.002VenadoTuerto 3,009 0.3986 0.173 0.019 0.002Villa María 3,017 0.3941 0.172 0.019 0.002Reconquista 3,021 0.3932 0.171 0.019 0.002PuertoMadryn 3,022 0.3932 0.171 0.019 0.002Goya 3,030 0.3889 0.169 0.018 0.002General Roca 3,044 0.3833 0.167 0.018 0.002Tartagal 3,056 0.3750 0.163 0.018 0.001Concepcióndel Uruguay 3,068 0.3699 0.161 0.017 0.001San Martín 3,095 0.3578 0.156 0.017 0.001
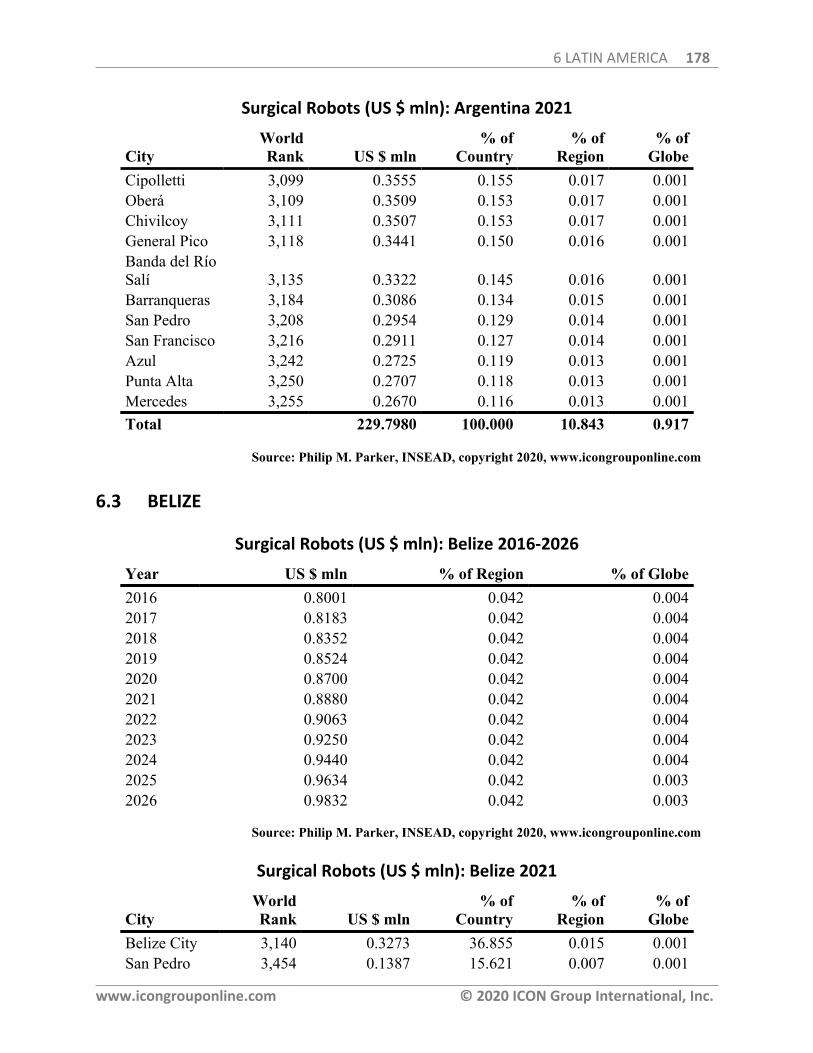
6 LATIN AMERICA 178
www.icongrouponline.com © 2020 ICON Group International, Inc.
Surgical Robots (US $ mln): Argentina 2021
CityWorldRank US $ mln
% ofCountry
% ofRegion
% ofGlobe
Cipolletti 3,099 0.3555 0.155 0.017 0.001Oberá 3,109 0.3509 0.153 0.017 0.001Chivilcoy 3,111 0.3507 0.153 0.017 0.001General Pico 3,118 0.3441 0.150 0.016 0.001Banda del RíoSalí 3,135 0.3322 0.145 0.016 0.001Barranqueras 3,184 0.3086 0.134 0.015 0.001San Pedro 3,208 0.2954 0.129 0.014 0.001San Francisco 3,216 0.2911 0.127 0.014 0.001Azul 3,242 0.2725 0.119 0.013 0.001Punta Alta 3,250 0.2707 0.118 0.013 0.001Mercedes 3,255 0.2670 0.116 0.013 0.001Total 229.7980 100.000 10.843 0.917
Source: Philip M. Parker, INSEAD, copyright 2020, www.icongrouponline.com
6.3 BELIZE
Surgical Robots (US $ mln): Belize 2016-2026
Year US $ mln % of Region % of Globe2016 0.8001 0.042 0.0042017 0.8183 0.042 0.0042018 0.8352 0.042 0.0042019 0.8524 0.042 0.0042020 0.8700 0.042 0.0042021 0.8880 0.042 0.0042022 0.9063 0.042 0.0042023 0.9250 0.042 0.0042024 0.9440 0.042 0.0042025 0.9634 0.042 0.0032026 0.9832 0.042 0.003
Source: Philip M. Parker, INSEAD, copyright 2020, www.icongrouponline.com
Surgical Robots (US $ mln): Belize 2021
CityWorldRank US $ mln
% ofCountry
% ofRegion
% ofGlobe
Belize City 3,140 0.3273 36.855 0.015 0.001San Pedro 3,454 0.1387 15.621 0.007 0.001
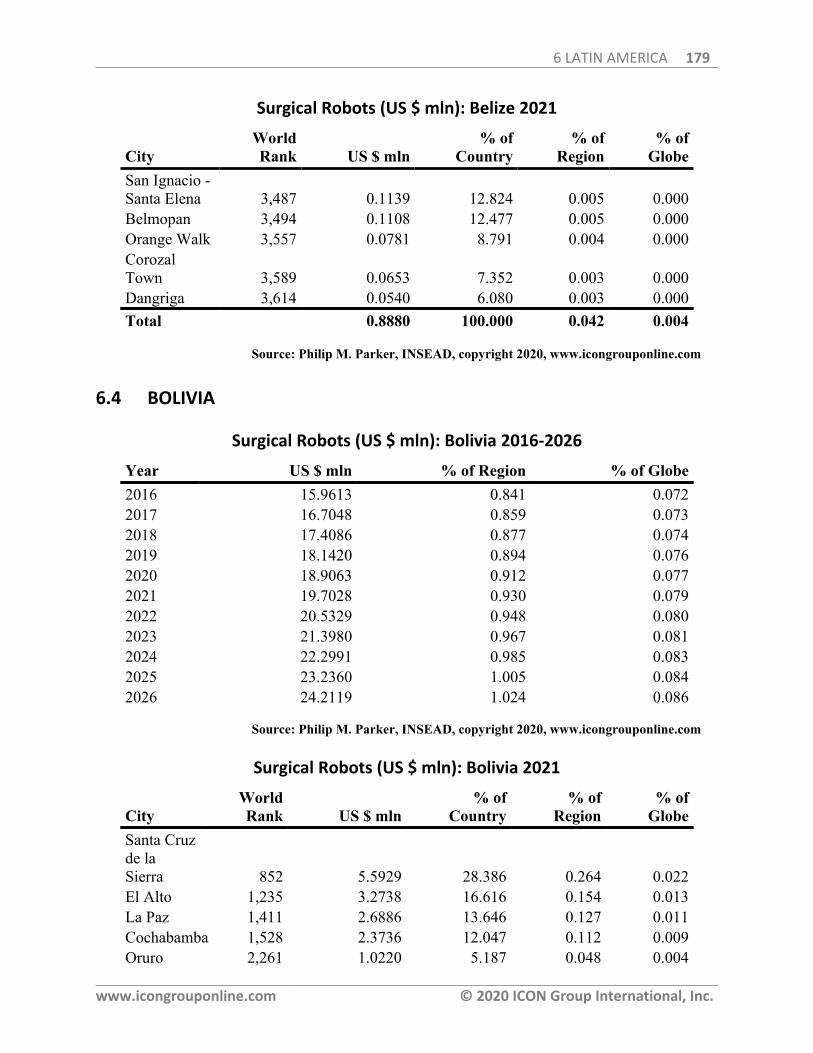
6 LATIN AMERICA 179
www.icongrouponline.com © 2020 ICON Group International, Inc.
Surgical Robots (US $ mln): Belize 2021
CityWorldRank US $ mln
% ofCountry
% ofRegion
% ofGlobe
San Ignacio -Santa Elena 3,487 0.1139 12.824 0.005 0.000Belmopan 3,494 0.1108 12.477 0.005 0.000Orange Walk 3,557 0.0781 8.791 0.004 0.000CorozalTown 3,589 0.0653 7.352 0.003 0.000Dangriga 3,614 0.0540 6.080 0.003 0.000Total 0.8880 100.000 0.042 0.004
Source: Philip M. Parker, INSEAD, copyright 2020, www.icongrouponline.com
6.4 BOLIVIA
Surgical Robots (US $ mln): Bolivia 2016-2026
Year US $ mln % of Region % of Globe2016 15.9613 0.841 0.0722017 16.7048 0.859 0.0732018 17.4086 0.877 0.0742019 18.1420 0.894 0.0762020 18.9063 0.912 0.0772021 19.7028 0.930 0.0792022 20.5329 0.948 0.0802023 21.3980 0.967 0.0812024 22.2991 0.985 0.0832025 23.2360 1.005 0.0842026 24.2119 1.024 0.086
Source: Philip M. Parker, INSEAD, copyright 2020, www.icongrouponline.com
Surgical Robots (US $ mln): Bolivia 2021
CityWorldRank US $ mln
% ofCountry
% ofRegion
% ofGlobe
Santa Cruzde laSierra 852 5.5929 28.386 0.264 0.022El Alto 1,235 3.2738 16.616 0.154 0.013La Paz 1,411 2.6886 13.646 0.127 0.011Cochabamba 1,528 2.3736 12.047 0.112 0.009Oruro 2,261 1.0220 5.187 0.048 0.004
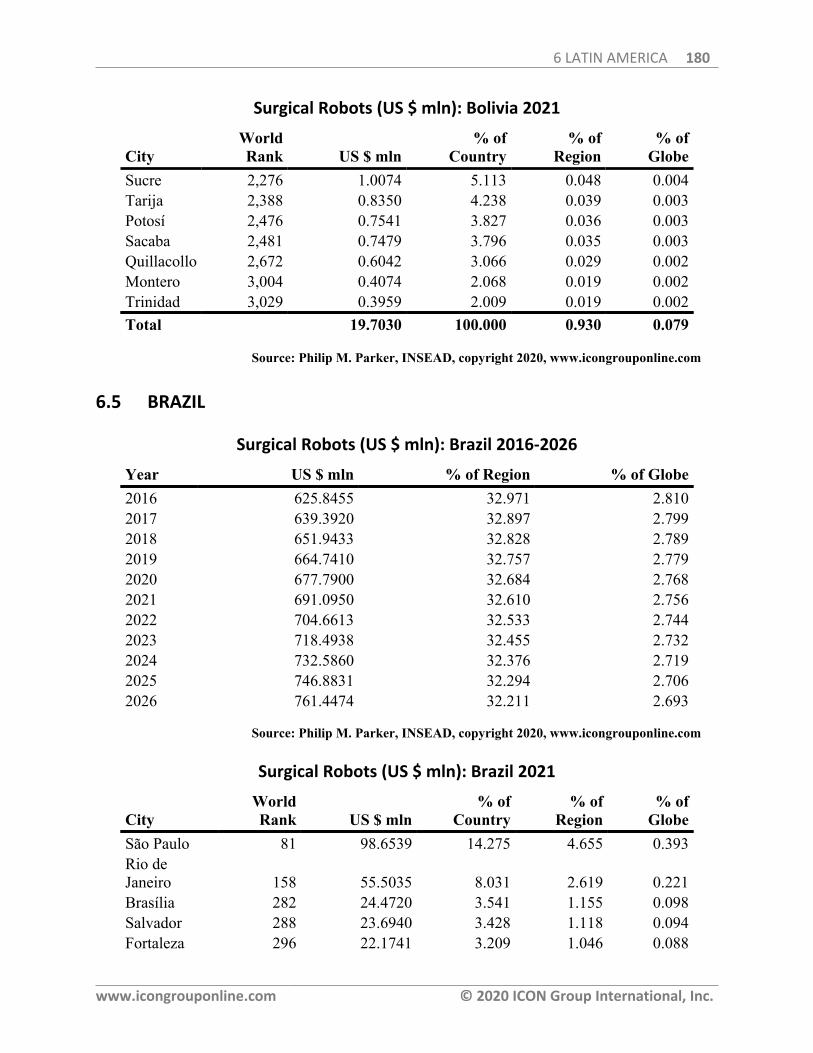
6 LATIN AMERICA 180
www.icongrouponline.com © 2020 ICON Group International, Inc.
Surgical Robots (US $ mln): Bolivia 2021
CityWorldRank US $ mln
% ofCountry
% ofRegion
% ofGlobe
Sucre 2,276 1.0074 5.113 0.048 0.004Tarija 2,388 0.8350 4.238 0.039 0.003Potosí 2,476 0.7541 3.827 0.036 0.003Sacaba 2,481 0.7479 3.796 0.035 0.003Quillacollo 2,672 0.6042 3.066 0.029 0.002Montero 3,004 0.4074 2.068 0.019 0.002Trinidad 3,029 0.3959 2.009 0.019 0.002Total 19.7030 100.000 0.930 0.079
Source: Philip M. Parker, INSEAD, copyright 2020, www.icongrouponline.com
6.5 BRAZIL
Surgical Robots (US $ mln): Brazil 2016-2026
Year US $ mln % of Region % of Globe2016 625.8455 32.971 2.8102017 639.3920 32.897 2.7992018 651.9433 32.828 2.7892019 664.7410 32.757 2.7792020 677.7900 32.684 2.7682021 691.0950 32.610 2.7562022 704.6613 32.533 2.7442023 718.4938 32.455 2.7322024 732.5860 32.376 2.7192025 746.8831 32.294 2.7062026 761.4474 32.211 2.693
Source: Philip M. Parker, INSEAD, copyright 2020, www.icongrouponline.com
Surgical Robots (US $ mln): Brazil 2021
CityWorldRank US $ mln
% ofCountry
% ofRegion
% ofGlobe
São Paulo 81 98.6539 14.275 4.655 0.393Rio deJaneiro 158 55.5035 8.031 2.619 0.221Brasília 282 24.4720 3.541 1.155 0.098Salvador 288 23.6940 3.428 1.118 0.094Fortaleza 296 22.1741 3.209 1.046 0.088
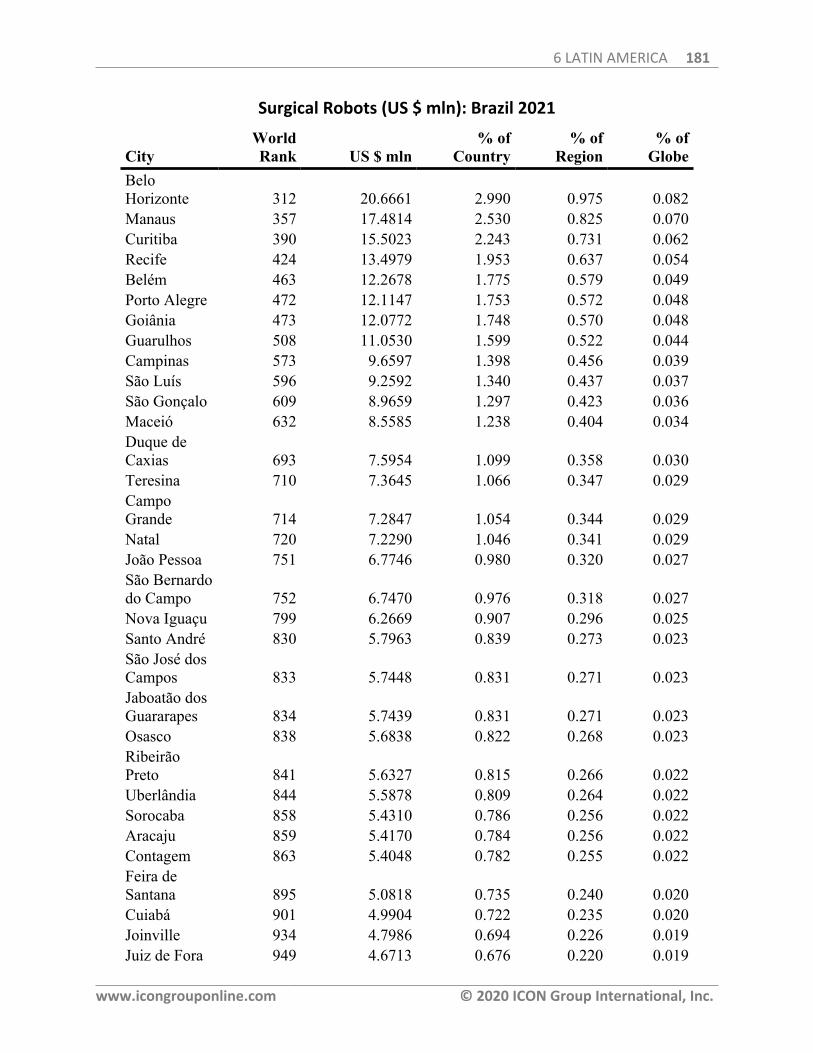
6 LATIN AMERICA 181
www.icongrouponline.com © 2020 ICON Group International, Inc.
Surgical Robots (US $ mln): Brazil 2021
CityWorldRank US $ mln
% ofCountry
% ofRegion
% ofGlobe
BeloHorizonte 312 20.6661 2.990 0.975 0.082Manaus 357 17.4814 2.530 0.825 0.070Curitiba 390 15.5023 2.243 0.731 0.062Recife 424 13.4979 1.953 0.637 0.054Belém 463 12.2678 1.775 0.579 0.049Porto Alegre 472 12.1147 1.753 0.572 0.048Goiânia 473 12.0772 1.748 0.570 0.048Guarulhos 508 11.0530 1.599 0.522 0.044Campinas 573 9.6597 1.398 0.456 0.039São Luís 596 9.2592 1.340 0.437 0.037São Gonçalo 609 8.9659 1.297 0.423 0.036Maceió 632 8.5585 1.238 0.404 0.034Duque deCaxias 693 7.5954 1.099 0.358 0.030Teresina 710 7.3645 1.066 0.347 0.029CampoGrande 714 7.2847 1.054 0.344 0.029Natal 720 7.2290 1.046 0.341 0.029João Pessoa 751 6.7746 0.980 0.320 0.027São Bernardodo Campo 752 6.7470 0.976 0.318 0.027Nova Iguaçu 799 6.2669 0.907 0.296 0.025Santo André 830 5.7963 0.839 0.273 0.023São José dosCampos 833 5.7448 0.831 0.271 0.023Jaboatão dosGuararapes 834 5.7439 0.831 0.271 0.023Osasco 838 5.6838 0.822 0.268 0.023RibeirãoPreto 841 5.6327 0.815 0.266 0.022Uberlândia 844 5.5878 0.809 0.264 0.022Sorocaba 858 5.4310 0.786 0.256 0.022Aracaju 859 5.4170 0.784 0.256 0.022Contagem 863 5.4048 0.782 0.255 0.022Feira deSantana 895 5.0818 0.735 0.240 0.020Cuiabá 901 4.9904 0.722 0.235 0.020Joinville 934 4.7986 0.694 0.226 0.019Juiz de Fora 949 4.6713 0.676 0.220 0.019
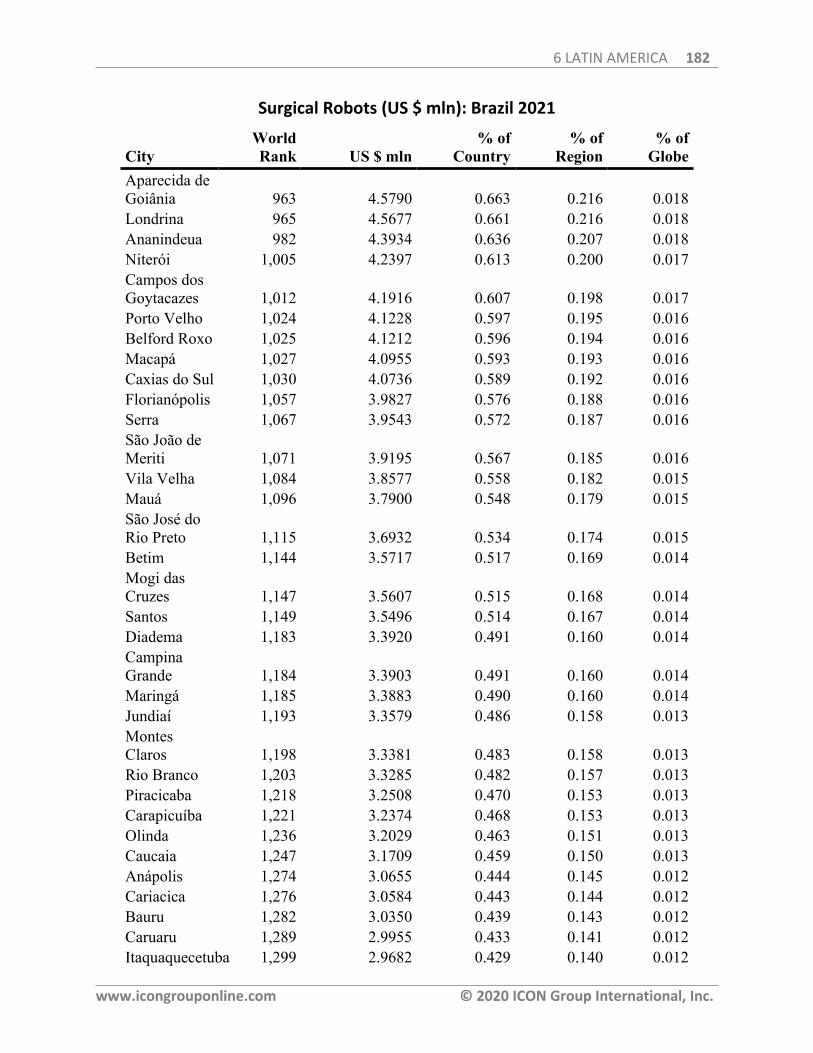
6 LATIN AMERICA 182
www.icongrouponline.com © 2020 ICON Group International, Inc.
Surgical Robots (US $ mln): Brazil 2021
CityWorldRank US $ mln
% ofCountry
% ofRegion
% ofGlobe
Aparecida deGoiânia 963 4.5790 0.663 0.216 0.018Londrina 965 4.5677 0.661 0.216 0.018Ananindeua 982 4.3934 0.636 0.207 0.018Niterói 1,005 4.2397 0.613 0.200 0.017Campos dosGoytacazes 1,012 4.1916 0.607 0.198 0.017Porto Velho 1,024 4.1228 0.597 0.195 0.016Belford Roxo 1,025 4.1212 0.596 0.194 0.016Macapá 1,027 4.0955 0.593 0.193 0.016Caxias do Sul 1,030 4.0736 0.589 0.192 0.016Florianópolis 1,057 3.9827 0.576 0.188 0.016Serra 1,067 3.9543 0.572 0.187 0.016São João deMeriti 1,071 3.9195 0.567 0.185 0.016Vila Velha 1,084 3.8577 0.558 0.182 0.015Mauá 1,096 3.7900 0.548 0.179 0.015São José doRio Preto 1,115 3.6932 0.534 0.174 0.015Betim 1,144 3.5717 0.517 0.169 0.014Mogi dasCruzes 1,147 3.5607 0.515 0.168 0.014Santos 1,149 3.5496 0.514 0.167 0.014Diadema 1,183 3.3920 0.491 0.160 0.014CampinaGrande 1,184 3.3903 0.491 0.160 0.014Maringá 1,185 3.3883 0.490 0.160 0.014Jundiaí 1,193 3.3579 0.486 0.158 0.013MontesClaros 1,198 3.3381 0.483 0.158 0.013Rio Branco 1,203 3.3285 0.482 0.157 0.013Piracicaba 1,218 3.2508 0.470 0.153 0.013Carapicuíba 1,221 3.2374 0.468 0.153 0.013Olinda 1,236 3.2029 0.463 0.151 0.013Caucaia 1,247 3.1709 0.459 0.150 0.013Anápolis 1,274 3.0655 0.444 0.145 0.012Cariacica 1,276 3.0584 0.443 0.144 0.012Bauru 1,282 3.0350 0.439 0.143 0.012Caruaru 1,289 2.9955 0.433 0.141 0.012Itaquaquecetuba 1,299 2.9682 0.429 0.140 0.012
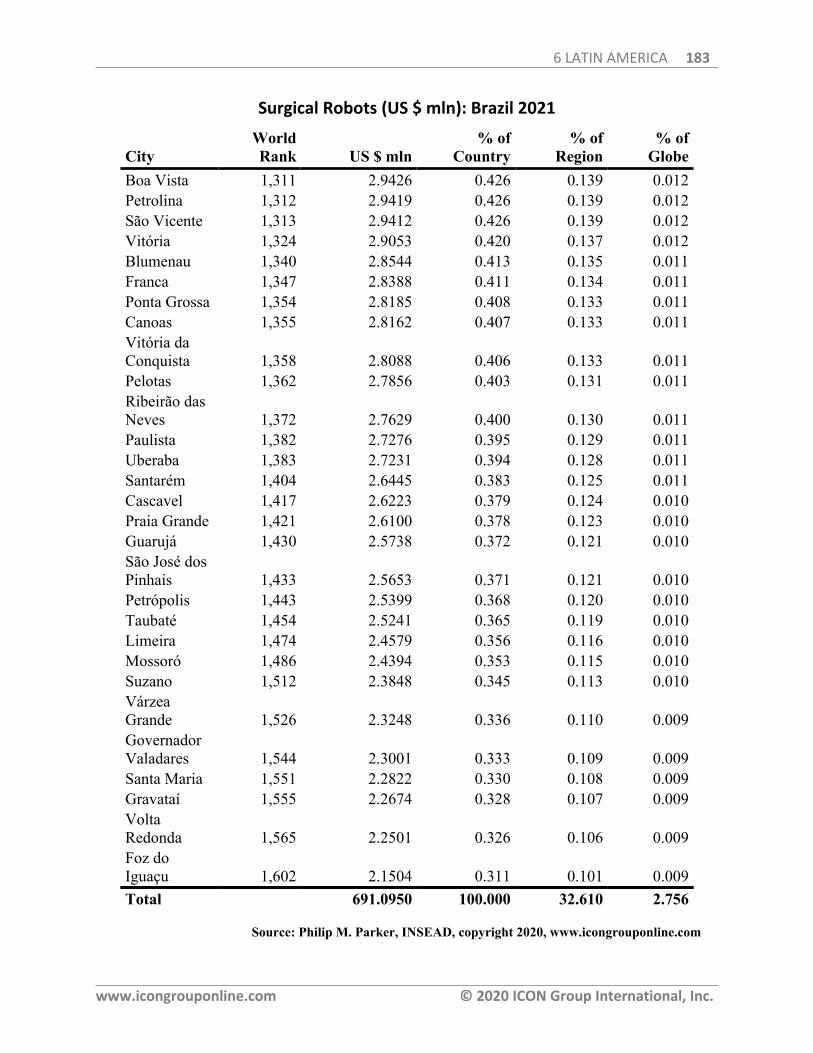
6 LATIN AMERICA 183
www.icongrouponline.com © 2020 ICON Group International, Inc.
Surgical Robots (US $ mln): Brazil 2021
CityWorldRank US $ mln
% ofCountry
% ofRegion
% ofGlobe
Boa Vista 1,311 2.9426 0.426 0.139 0.012Petrolina 1,312 2.9419 0.426 0.139 0.012São Vicente 1,313 2.9412 0.426 0.139 0.012Vitória 1,324 2.9053 0.420 0.137 0.012Blumenau 1,340 2.8544 0.413 0.135 0.011Franca 1,347 2.8388 0.411 0.134 0.011Ponta Grossa 1,354 2.8185 0.408 0.133 0.011Canoas 1,355 2.8162 0.407 0.133 0.011Vitória daConquista 1,358 2.8088 0.406 0.133 0.011Pelotas 1,362 2.7856 0.403 0.131 0.011Ribeirão dasNeves 1,372 2.7629 0.400 0.130 0.011Paulista 1,382 2.7276 0.395 0.129 0.011Uberaba 1,383 2.7231 0.394 0.128 0.011Santarém 1,404 2.6445 0.383 0.125 0.011Cascavel 1,417 2.6223 0.379 0.124 0.010Praia Grande 1,421 2.6100 0.378 0.123 0.010Guarujá 1,430 2.5738 0.372 0.121 0.010São José dosPinhais 1,433 2.5653 0.371 0.121 0.010Petrópolis 1,443 2.5399 0.368 0.120 0.010Taubaté 1,454 2.5241 0.365 0.119 0.010Limeira 1,474 2.4579 0.356 0.116 0.010Mossoró 1,486 2.4394 0.353 0.115 0.010Suzano 1,512 2.3848 0.345 0.113 0.010VárzeaGrande 1,526 2.3248 0.336 0.110 0.009GovernadorValadares 1,544 2.3001 0.333 0.109 0.009Santa Maria 1,551 2.2822 0.330 0.108 0.009Gravataí 1,555 2.2674 0.328 0.107 0.009VoltaRedonda 1,565 2.2501 0.326 0.106 0.009Foz doIguaçu 1,602 2.1504 0.311 0.101 0.009Total 691.0950 100.000 32.610 2.756
Source: Philip M. Parker, INSEAD, copyright 2020, www.icongrouponline.com
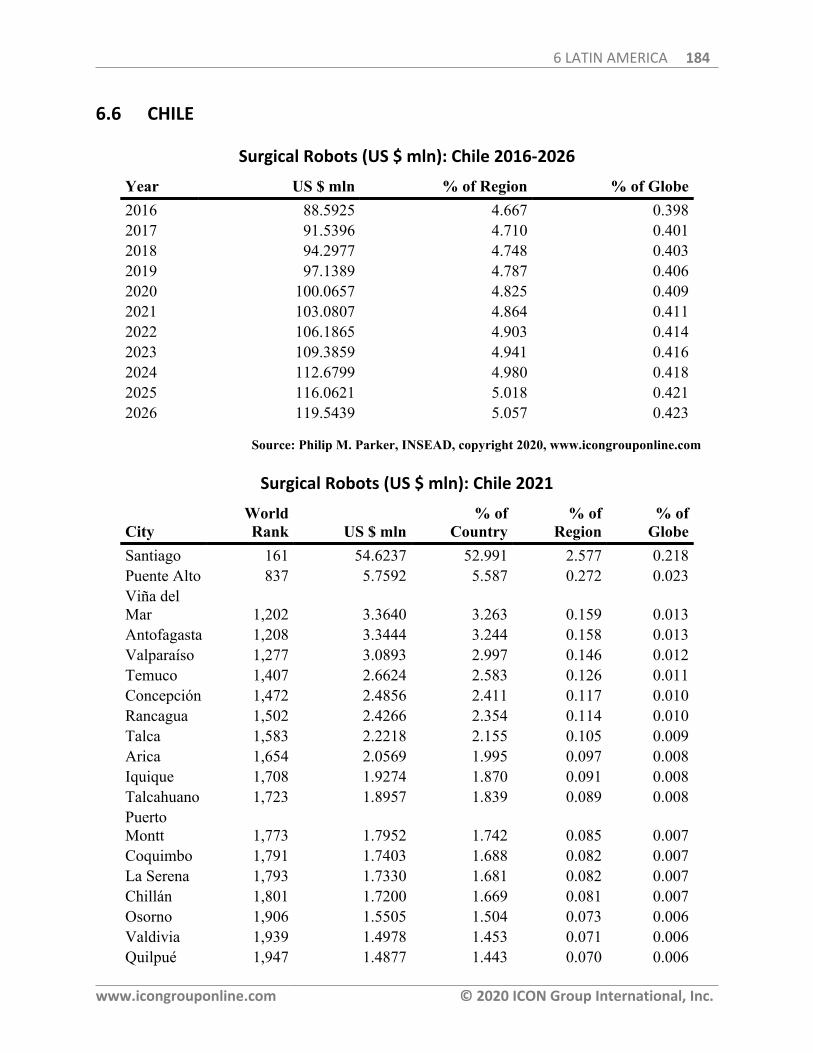
6 LATIN AMERICA 184
www.icongrouponline.com © 2020 ICON Group International, Inc.
6.6 CHILE
Surgical Robots (US $ mln): Chile 2016-2026
Year US $ mln % of Region % of Globe2016 88.5925 4.667 0.3982017 91.5396 4.710 0.4012018 94.2977 4.748 0.4032019 97.1389 4.787 0.4062020 100.0657 4.825 0.4092021 103.0807 4.864 0.4112022 106.1865 4.903 0.4142023 109.3859 4.941 0.4162024 112.6799 4.980 0.4182025 116.0621 5.018 0.4212026 119.5439 5.057 0.423
Source: Philip M. Parker, INSEAD, copyright 2020, www.icongrouponline.com
Surgical Robots (US $ mln): Chile 2021
CityWorldRank US $ mln
% ofCountry
% ofRegion
% ofGlobe
Santiago 161 54.6237 52.991 2.577 0.218Puente Alto 837 5.7592 5.587 0.272 0.023Viña delMar 1,202 3.3640 3.263 0.159 0.013Antofagasta 1,208 3.3444 3.244 0.158 0.013Valparaíso 1,277 3.0893 2.997 0.146 0.012Temuco 1,407 2.6624 2.583 0.126 0.011Concepción 1,472 2.4856 2.411 0.117 0.010Rancagua 1,502 2.4266 2.354 0.114 0.010Talca 1,583 2.2218 2.155 0.105 0.009Arica 1,654 2.0569 1.995 0.097 0.008Iquique 1,708 1.9274 1.870 0.091 0.008Talcahuano 1,723 1.8957 1.839 0.089 0.008PuertoMontt 1,773 1.7952 1.742 0.085 0.007Coquimbo 1,791 1.7403 1.688 0.082 0.007La Serena 1,793 1.7330 1.681 0.082 0.007Chillán 1,801 1.7200 1.669 0.081 0.007Osorno 1,906 1.5505 1.504 0.073 0.006Valdivia 1,939 1.4978 1.453 0.071 0.006Quilpué 1,947 1.4877 1.443 0.070 0.006
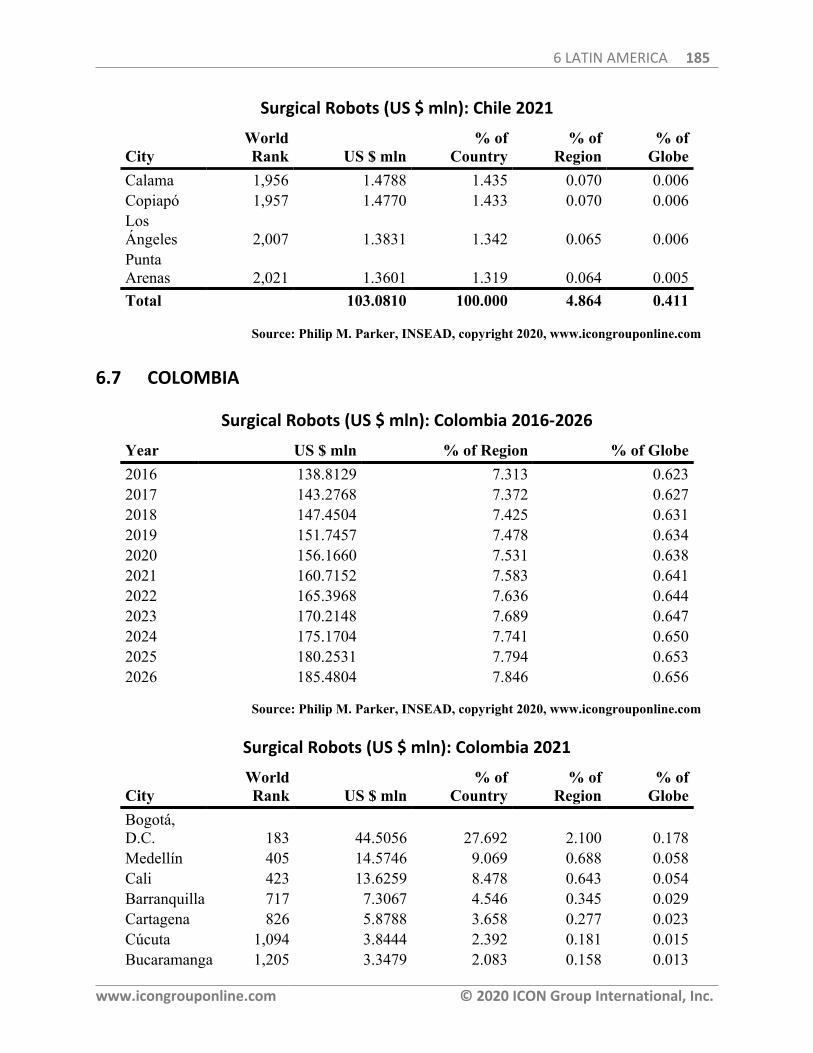
6 LATIN AMERICA 185
www.icongrouponline.com © 2020 ICON Group International, Inc.
Surgical Robots (US $ mln): Chile 2021
CityWorldRank US $ mln
% ofCountry
% ofRegion
% ofGlobe
Calama 1,956 1.4788 1.435 0.070 0.006Copiapó 1,957 1.4770 1.433 0.070 0.006LosÁngeles 2,007 1.3831 1.342 0.065 0.006PuntaArenas 2,021 1.3601 1.319 0.064 0.005Total 103.0810 100.000 4.864 0.411
Source: Philip M. Parker, INSEAD, copyright 2020, www.icongrouponline.com
6.7 COLOMBIA
Surgical Robots (US $ mln): Colombia 2016-2026
Year US $ mln % of Region % of Globe2016 138.8129 7.313 0.6232017 143.2768 7.372 0.6272018 147.4504 7.425 0.6312019 151.7457 7.478 0.6342020 156.1660 7.531 0.6382021 160.7152 7.583 0.6412022 165.3968 7.636 0.6442023 170.2148 7.689 0.6472024 175.1704 7.741 0.6502025 180.2531 7.794 0.6532026 185.4804 7.846 0.656
Source: Philip M. Parker, INSEAD, copyright 2020, www.icongrouponline.com
Surgical Robots (US $ mln): Colombia 2021
CityWorldRank US $ mln
% ofCountry
% ofRegion
% ofGlobe
Bogotá,D.C. 183 44.5056 27.692 2.100 0.178Medellín 405 14.5746 9.069 0.688 0.058Cali 423 13.6259 8.478 0.643 0.054Barranquilla 717 7.3067 4.546 0.345 0.029Cartagena 826 5.8788 3.658 0.277 0.023Cúcuta 1,094 3.8444 2.392 0.181 0.015Bucaramanga 1,205 3.3479 2.083 0.158 0.013
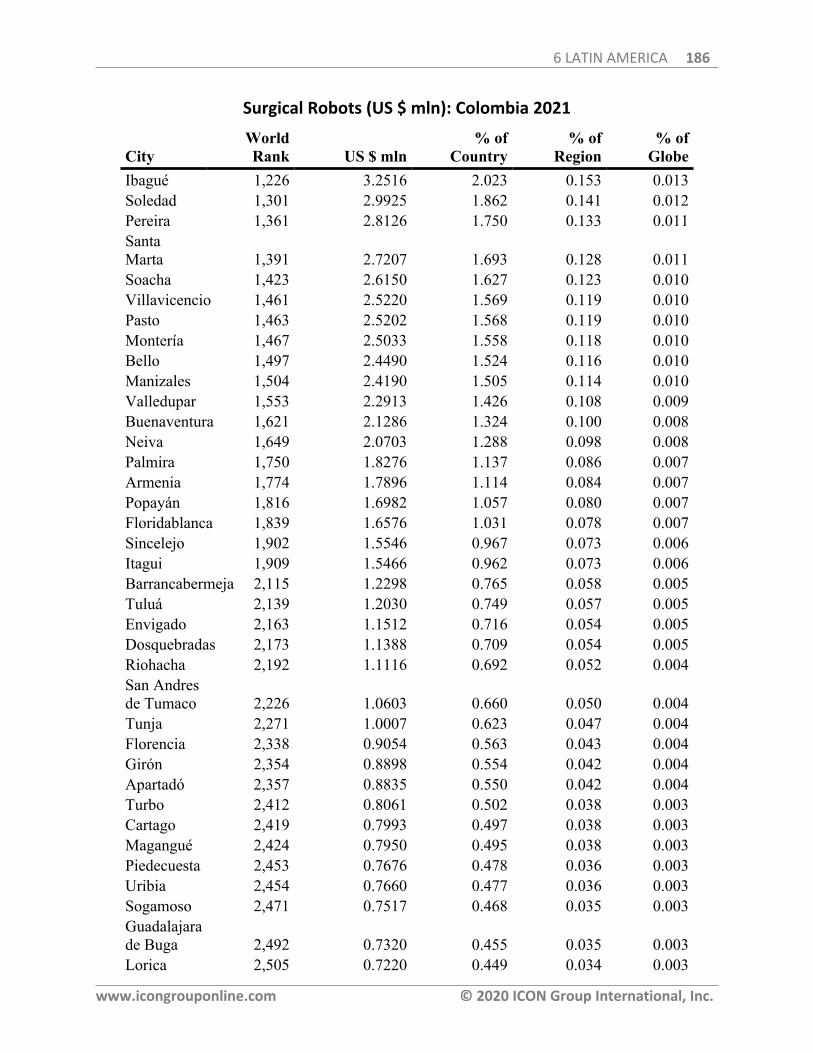
6 LATIN AMERICA 186
www.icongrouponline.com © 2020 ICON Group International, Inc.
Surgical Robots (US $ mln): Colombia 2021
CityWorldRank US $ mln
% ofCountry
% ofRegion
% ofGlobe
Ibagué 1,226 3.2516 2.023 0.153 0.013Soledad 1,301 2.9925 1.862 0.141 0.012Pereira 1,361 2.8126 1.750 0.133 0.011SantaMarta 1,391 2.7207 1.693 0.128 0.011Soacha 1,423 2.6150 1.627 0.123 0.010Villavicencio 1,461 2.5220 1.569 0.119 0.010Pasto 1,463 2.5202 1.568 0.119 0.010Montería 1,467 2.5033 1.558 0.118 0.010Bello 1,497 2.4490 1.524 0.116 0.010Manizales 1,504 2.4190 1.505 0.114 0.010Valledupar 1,553 2.2913 1.426 0.108 0.009Buenaventura 1,621 2.1286 1.324 0.100 0.008Neiva 1,649 2.0703 1.288 0.098 0.008Palmira 1,750 1.8276 1.137 0.086 0.007Armenia 1,774 1.7896 1.114 0.084 0.007Popayán 1,816 1.6982 1.057 0.080 0.007Floridablanca 1,839 1.6576 1.031 0.078 0.007Sincelejo 1,902 1.5546 0.967 0.073 0.006Itagui 1,909 1.5466 0.962 0.073 0.006Barrancabermeja 2,115 1.2298 0.765 0.058 0.005Tuluá 2,139 1.2030 0.749 0.057 0.005Envigado 2,163 1.1512 0.716 0.054 0.005Dosquebradas 2,173 1.1388 0.709 0.054 0.005Riohacha 2,192 1.1116 0.692 0.052 0.004San Andresde Tumaco 2,226 1.0603 0.660 0.050 0.004Tunja 2,271 1.0007 0.623 0.047 0.004Florencia 2,338 0.9054 0.563 0.043 0.004Girón 2,354 0.8898 0.554 0.042 0.004Apartadó 2,357 0.8835 0.550 0.042 0.004Turbo 2,412 0.8061 0.502 0.038 0.003Cartago 2,419 0.7993 0.497 0.038 0.003Magangué 2,424 0.7950 0.495 0.038 0.003Piedecuesta 2,453 0.7676 0.478 0.036 0.003Uribia 2,454 0.7660 0.477 0.036 0.003Sogamoso 2,471 0.7517 0.468 0.035 0.003Guadalajarade Buga 2,492 0.7320 0.455 0.035 0.003Lorica 2,505 0.7220 0.449 0.034 0.003
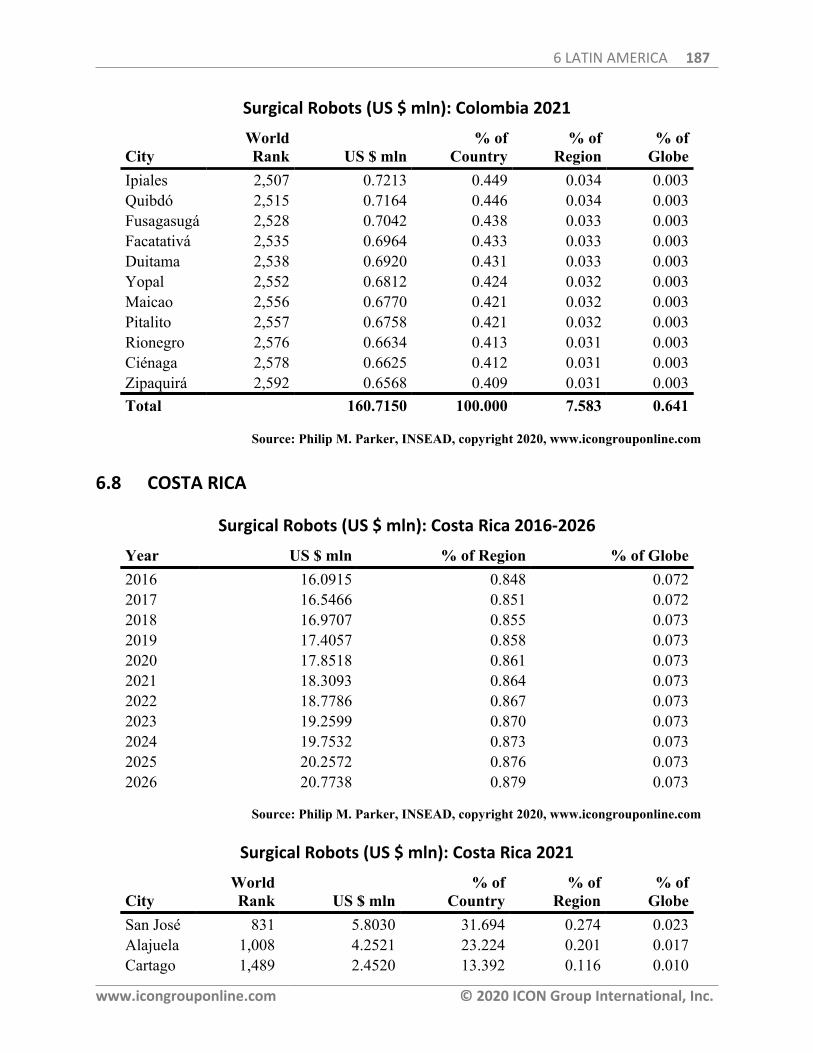
6 LATIN AMERICA 187
www.icongrouponline.com © 2020 ICON Group International, Inc.
Surgical Robots (US $ mln): Colombia 2021
CityWorldRank US $ mln
% ofCountry
% ofRegion
% ofGlobe
Ipiales 2,507 0.7213 0.449 0.034 0.003Quibdó 2,515 0.7164 0.446 0.034 0.003Fusagasugá 2,528 0.7042 0.438 0.033 0.003Facatativá 2,535 0.6964 0.433 0.033 0.003Duitama 2,538 0.6920 0.431 0.033 0.003Yopal 2,552 0.6812 0.424 0.032 0.003Maicao 2,556 0.6770 0.421 0.032 0.003Pitalito 2,557 0.6758 0.421 0.032 0.003Rionegro 2,576 0.6634 0.413 0.031 0.003Ciénaga 2,578 0.6625 0.412 0.031 0.003Zipaquirá 2,592 0.6568 0.409 0.031 0.003Total 160.7150 100.000 7.583 0.641
Source: Philip M. Parker, INSEAD, copyright 2020, www.icongrouponline.com
6.8 COSTA RICA
Surgical Robots (US $ mln): Costa Rica 2016-2026
Year US $ mln % of Region % of Globe2016 16.0915 0.848 0.0722017 16.5466 0.851 0.0722018 16.9707 0.855 0.0732019 17.4057 0.858 0.0732020 17.8518 0.861 0.0732021 18.3093 0.864 0.0732022 18.7786 0.867 0.0732023 19.2599 0.870 0.0732024 19.7532 0.873 0.0732025 20.2572 0.876 0.0732026 20.7738 0.879 0.073
Source: Philip M. Parker, INSEAD, copyright 2020, www.icongrouponline.com
Surgical Robots (US $ mln): Costa Rica 2021
CityWorldRank US $ mln
% ofCountry
% ofRegion
% ofGlobe
San José 831 5.8030 31.694 0.274 0.023Alajuela 1,008 4.2521 23.224 0.201 0.017Cartago 1,489 2.4520 13.392 0.116 0.010
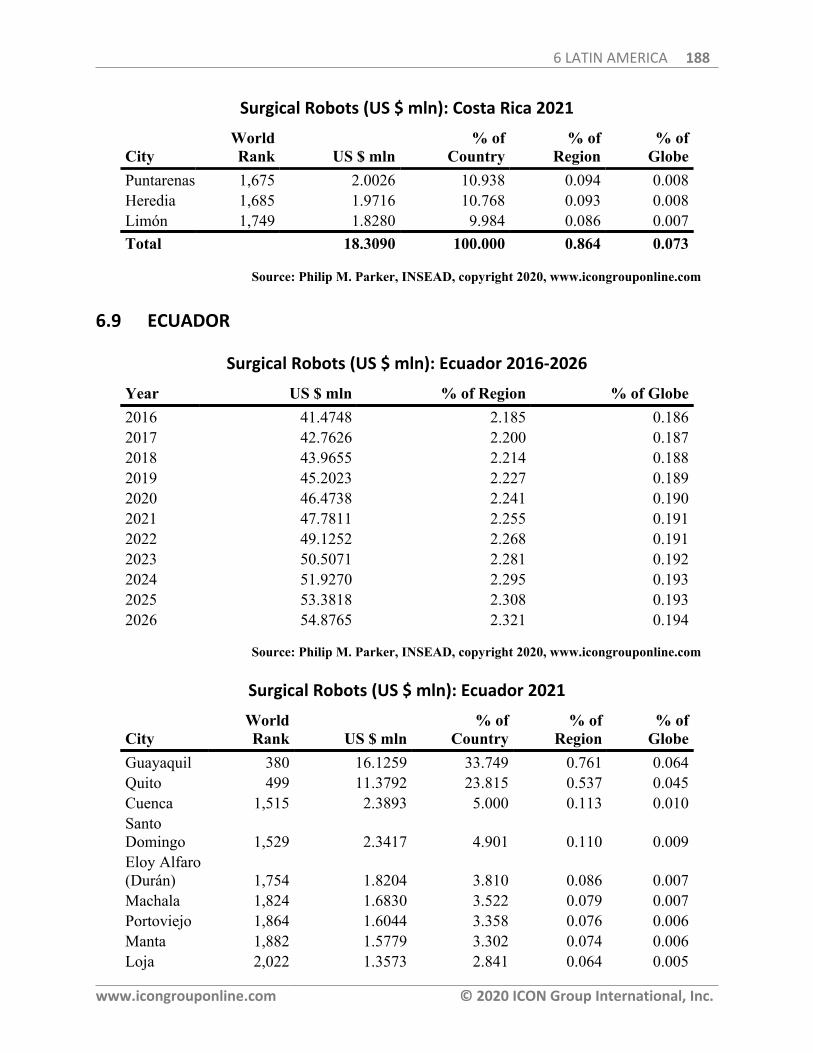
6 LATIN AMERICA 188
www.icongrouponline.com © 2020 ICON Group International, Inc.
Surgical Robots (US $ mln): Costa Rica 2021
CityWorldRank US $ mln
% ofCountry
% ofRegion
% ofGlobe
Puntarenas 1,675 2.0026 10.938 0.094 0.008Heredia 1,685 1.9716 10.768 0.093 0.008Limón 1,749 1.8280 9.984 0.086 0.007Total 18.3090 100.000 0.864 0.073
Source: Philip M. Parker, INSEAD, copyright 2020, www.icongrouponline.com
6.9 ECUADOR
Surgical Robots (US $ mln): Ecuador 2016-2026
Year US $ mln % of Region % of Globe2016 41.4748 2.185 0.1862017 42.7626 2.200 0.1872018 43.9655 2.214 0.1882019 45.2023 2.227 0.1892020 46.4738 2.241 0.1902021 47.7811 2.255 0.1912022 49.1252 2.268 0.1912023 50.5071 2.281 0.1922024 51.9270 2.295 0.1932025 53.3818 2.308 0.1932026 54.8765 2.321 0.194
Source: Philip M. Parker, INSEAD, copyright 2020, www.icongrouponline.com
Surgical Robots (US $ mln): Ecuador 2021
CityWorldRank US $ mln
% ofCountry
% ofRegion
% ofGlobe
Guayaquil 380 16.1259 33.749 0.761 0.064Quito 499 11.3792 23.815 0.537 0.045Cuenca 1,515 2.3893 5.000 0.113 0.010SantoDomingo 1,529 2.3417 4.901 0.110 0.009Eloy Alfaro(Durán) 1,754 1.8204 3.810 0.086 0.007Machala 1,824 1.6830 3.522 0.079 0.007Portoviejo 1,864 1.6044 3.358 0.076 0.006Manta 1,882 1.5779 3.302 0.074 0.006Loja 2,022 1.3573 2.841 0.064 0.005
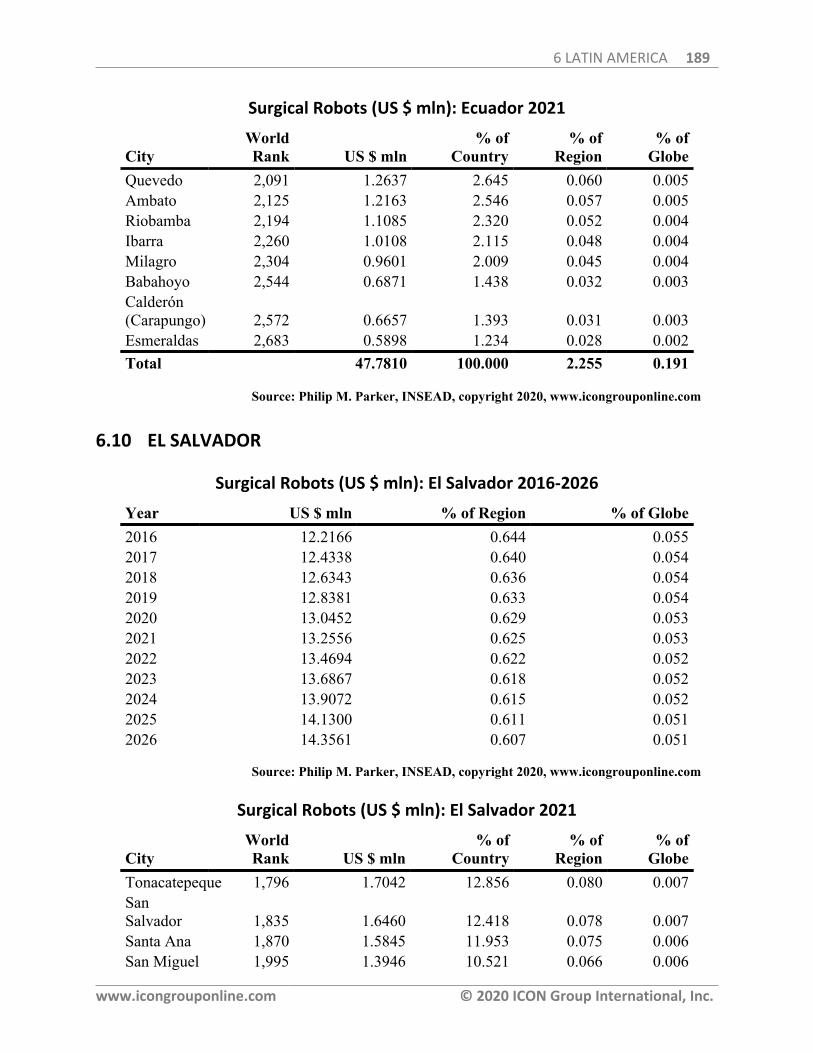
6 LATIN AMERICA 189
www.icongrouponline.com © 2020 ICON Group International, Inc.
Surgical Robots (US $ mln): Ecuador 2021
CityWorldRank US $ mln
% ofCountry
% ofRegion
% ofGlobe
Quevedo 2,091 1.2637 2.645 0.060 0.005Ambato 2,125 1.2163 2.546 0.057 0.005Riobamba 2,194 1.1085 2.320 0.052 0.004Ibarra 2,260 1.0108 2.115 0.048 0.004Milagro 2,304 0.9601 2.009 0.045 0.004Babahoyo 2,544 0.6871 1.438 0.032 0.003Calderón(Carapungo) 2,572 0.6657 1.393 0.031 0.003Esmeraldas 2,683 0.5898 1.234 0.028 0.002Total 47.7810 100.000 2.255 0.191
Source: Philip M. Parker, INSEAD, copyright 2020, www.icongrouponline.com
6.10 EL SALVADOR
Surgical Robots (US $ mln): El Salvador 2016-2026
Year US $ mln % of Region % of Globe2016 12.2166 0.644 0.0552017 12.4338 0.640 0.0542018 12.6343 0.636 0.0542019 12.8381 0.633 0.0542020 13.0452 0.629 0.0532021 13.2556 0.625 0.0532022 13.4694 0.622 0.0522023 13.6867 0.618 0.0522024 13.9072 0.615 0.0522025 14.1300 0.611 0.0512026 14.3561 0.607 0.051
Source: Philip M. Parker, INSEAD, copyright 2020, www.icongrouponline.com
Surgical Robots (US $ mln): El Salvador 2021
CityWorldRank US $ mln
% ofCountry
% ofRegion
% ofGlobe
Tonacatepeque 1,796 1.7042 12.856 0.080 0.007SanSalvador 1,835 1.6460 12.418 0.078 0.007Santa Ana 1,870 1.5845 11.953 0.075 0.006San Miguel 1,995 1.3946 10.521 0.066 0.006
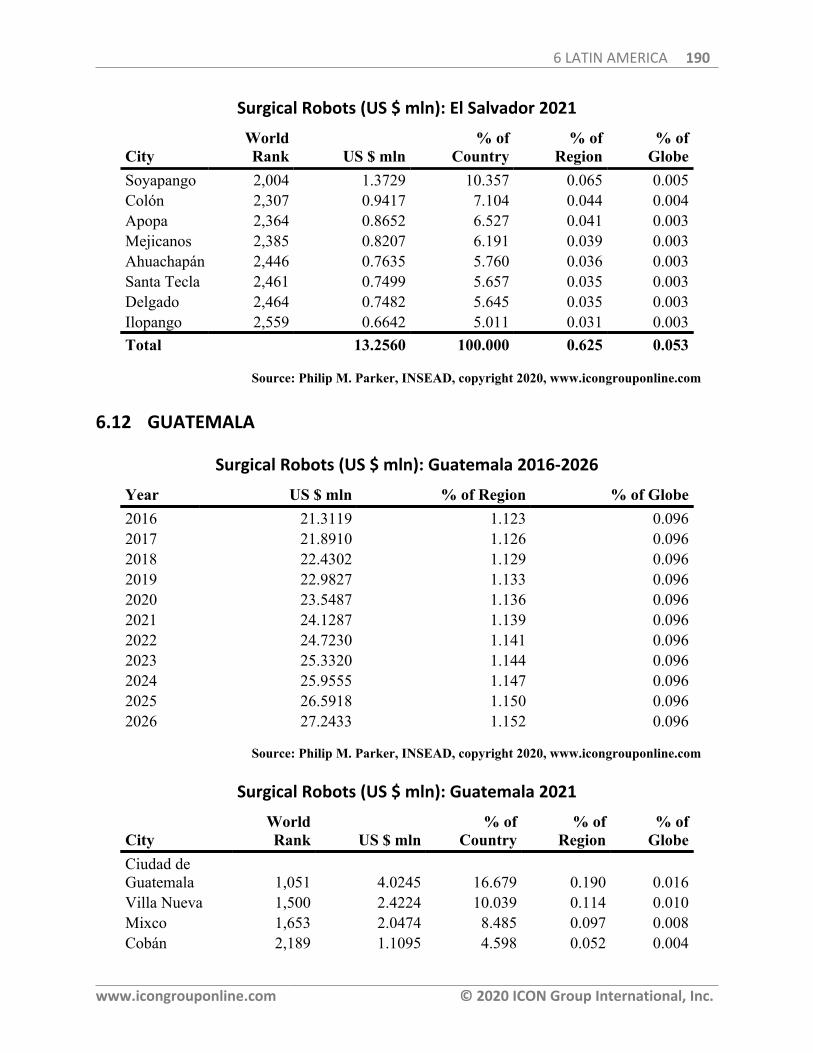
6 LATIN AMERICA 190
www.icongrouponline.com © 2020 ICON Group International, Inc.
Surgical Robots (US $ mln): El Salvador 2021
CityWorldRank US $ mln
% ofCountry
% ofRegion
% ofGlobe
Soyapango 2,004 1.3729 10.357 0.065 0.005Colón 2,307 0.9417 7.104 0.044 0.004Apopa 2,364 0.8652 6.527 0.041 0.003Mejicanos 2,385 0.8207 6.191 0.039 0.003Ahuachapán 2,446 0.7635 5.760 0.036 0.003Santa Tecla 2,461 0.7499 5.657 0.035 0.003Delgado 2,464 0.7482 5.645 0.035 0.003Ilopango 2,559 0.6642 5.011 0.031 0.003Total 13.2560 100.000 0.625 0.053
Source: Philip M. Parker, INSEAD, copyright 2020, www.icongrouponline.com
6.12 GUATEMALA
Surgical Robots (US $ mln): Guatemala 2016-2026
Year US $ mln % of Region % of Globe2016 21.3119 1.123 0.0962017 21.8910 1.126 0.0962018 22.4302 1.129 0.0962019 22.9827 1.133 0.0962020 23.5487 1.136 0.0962021 24.1287 1.139 0.0962022 24.7230 1.141 0.0962023 25.3320 1.144 0.0962024 25.9555 1.147 0.0962025 26.5918 1.150 0.0962026 27.2433 1.152 0.096
Source: Philip M. Parker, INSEAD, copyright 2020, www.icongrouponline.com
Surgical Robots (US $ mln): Guatemala 2021
CityWorldRank US $ mln
% ofCountry
% ofRegion
% ofGlobe
Ciudad deGuatemala 1,051 4.0245 16.679 0.190 0.016Villa Nueva 1,500 2.4224 10.039 0.114 0.010Mixco 1,653 2.0474 8.485 0.097 0.008Cobán 2,189 1.1095 4.598 0.052 0.004
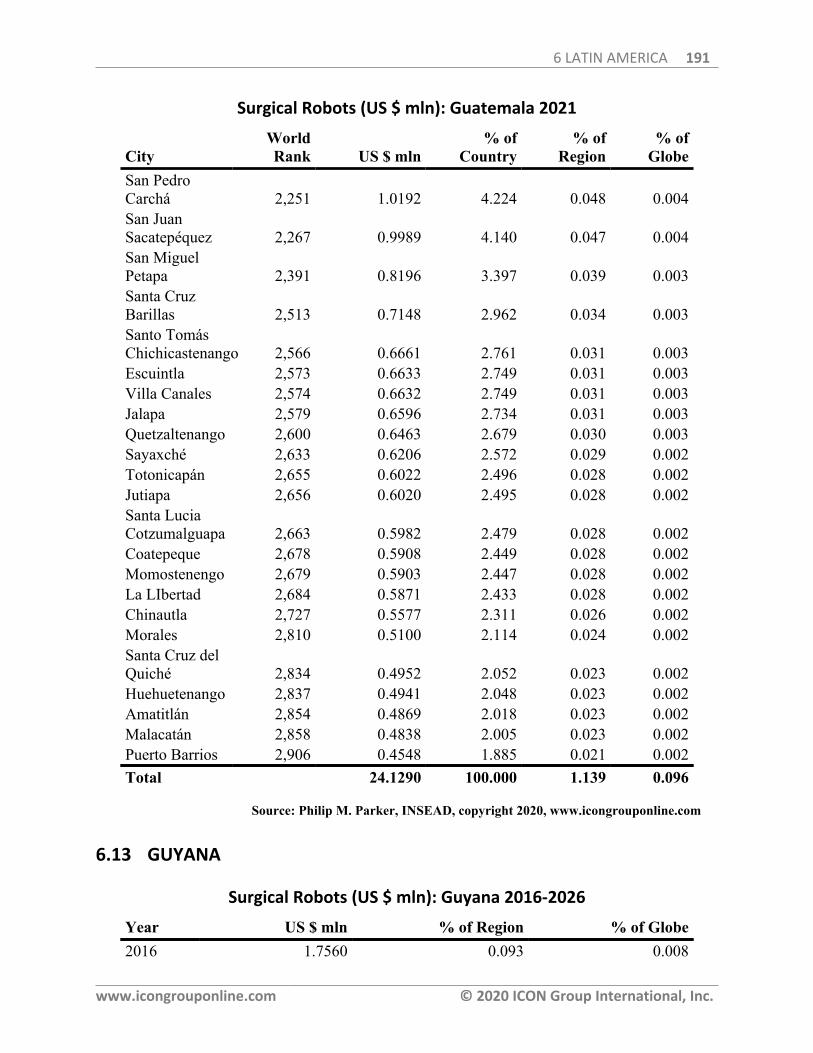
6 LATIN AMERICA 191
www.icongrouponline.com © 2020 ICON Group International, Inc.
Surgical Robots (US $ mln): Guatemala 2021
CityWorldRank US $ mln
% ofCountry
% ofRegion
% ofGlobe
San PedroCarchá 2,251 1.0192 4.224 0.048 0.004San JuanSacatepéquez 2,267 0.9989 4.140 0.047 0.004San MiguelPetapa 2,391 0.8196 3.397 0.039 0.003Santa CruzBarillas 2,513 0.7148 2.962 0.034 0.003Santo TomásChichicastenango 2,566 0.6661 2.761 0.031 0.003Escuintla 2,573 0.6633 2.749 0.031 0.003Villa Canales 2,574 0.6632 2.749 0.031 0.003Jalapa 2,579 0.6596 2.734 0.031 0.003Quetzaltenango 2,600 0.6463 2.679 0.030 0.003Sayaxché 2,633 0.6206 2.572 0.029 0.002Totonicapán 2,655 0.6022 2.496 0.028 0.002Jutiapa 2,656 0.6020 2.495 0.028 0.002Santa LuciaCotzumalguapa 2,663 0.5982 2.479 0.028 0.002Coatepeque 2,678 0.5908 2.449 0.028 0.002Momostenengo 2,679 0.5903 2.447 0.028 0.002La LIbertad 2,684 0.5871 2.433 0.028 0.002Chinautla 2,727 0.5577 2.311 0.026 0.002Morales 2,810 0.5100 2.114 0.024 0.002Santa Cruz delQuiché 2,834 0.4952 2.052 0.023 0.002Huehuetenango 2,837 0.4941 2.048 0.023 0.002Amatitlán 2,854 0.4869 2.018 0.023 0.002Malacatán 2,858 0.4838 2.005 0.023 0.002Puerto Barrios 2,906 0.4548 1.885 0.021 0.002Total 24.1290 100.000 1.139 0.096
Source: Philip M. Parker, INSEAD, copyright 2020, www.icongrouponline.com
6.13 GUYANA
Surgical Robots (US $ mln): Guyana 2016-2026
Year US $ mln % of Region % of Globe2016 1.7560 0.093 0.008

6 LATIN AMERICA 192
www.icongrouponline.com © 2020 ICON Group International, Inc.
Surgical Robots (US $ mln): Guyana 2016-2026
Year US $ mln % of Region % of Globe2017 1.8232 0.094 0.0082018 1.8863 0.095 0.0082019 1.9516 0.096 0.0082020 2.0192 0.097 0.0082021 2.0891 0.099 0.0082022 2.1615 0.100 0.0082023 2.2363 0.101 0.0092024 2.3137 0.102 0.0092025 2.3936 0.103 0.0092026 2.4762 0.105 0.009
Source: Philip M. Parker, INSEAD, copyright 2020, www.icongrouponline.com
Surgical Robots (US $ mln): Guyana 2021
CityWorldRank US $ mln
% ofCountry
% ofRegion
% ofGlobe
Georgetown 1,893 1.5708 75.188 0.074 0.006Linden 3,317 0.2356 11.278 0.011 0.001NewAmsterdam 3,434 0.1571 7.519 0.007 0.001Corriverton 3,541 0.0864 4.135 0.004 0.000Mahaicony 3,635 0.0393 1.880 0.002 0.000Total 2.0890 100.000 0.099 0.008
Source: Philip M. Parker, INSEAD, copyright 2020, www.icongrouponline.com
6.14 HONDURAS
Surgical Robots (US $ mln): Honduras 2016-2026
Year US $ mln % of Region % of Globe2016 10.2097 0.538 0.0462017 10.4589 0.538 0.0462018 10.6903 0.538 0.0462019 10.9269 0.538 0.0462020 11.1687 0.539 0.0462021 11.4159 0.539 0.0462022 11.6685 0.539 0.0452023 11.9267 0.539 0.045
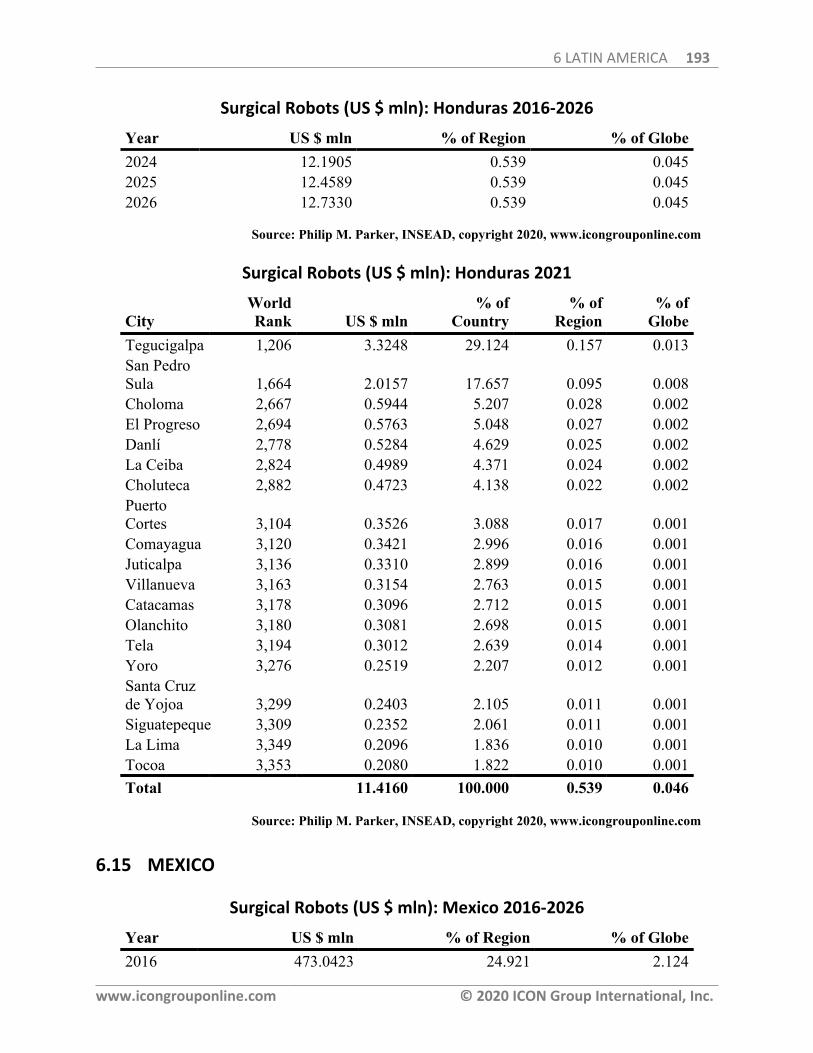
6 LATIN AMERICA 193
www.icongrouponline.com © 2020 ICON Group International, Inc.
Surgical Robots (US $ mln): Honduras 2016-2026
Year US $ mln % of Region % of Globe2024 12.1905 0.539 0.0452025 12.4589 0.539 0.0452026 12.7330 0.539 0.045
Source: Philip M. Parker, INSEAD, copyright 2020, www.icongrouponline.com
Surgical Robots (US $ mln): Honduras 2021
CityWorldRank US $ mln
% ofCountry
% ofRegion
% ofGlobe
Tegucigalpa 1,206 3.3248 29.124 0.157 0.013San PedroSula 1,664 2.0157 17.657 0.095 0.008Choloma 2,667 0.5944 5.207 0.028 0.002El Progreso 2,694 0.5763 5.048 0.027 0.002Danlí 2,778 0.5284 4.629 0.025 0.002La Ceiba 2,824 0.4989 4.371 0.024 0.002Choluteca 2,882 0.4723 4.138 0.022 0.002PuertoCortes 3,104 0.3526 3.088 0.017 0.001Comayagua 3,120 0.3421 2.996 0.016 0.001Juticalpa 3,136 0.3310 2.899 0.016 0.001Villanueva 3,163 0.3154 2.763 0.015 0.001Catacamas 3,178 0.3096 2.712 0.015 0.001Olanchito 3,180 0.3081 2.698 0.015 0.001Tela 3,194 0.3012 2.639 0.014 0.001Yoro 3,276 0.2519 2.207 0.012 0.001Santa Cruzde Yojoa 3,299 0.2403 2.105 0.011 0.001Siguatepeque 3,309 0.2352 2.061 0.011 0.001La Lima 3,349 0.2096 1.836 0.010 0.001Tocoa 3,353 0.2080 1.822 0.010 0.001Total 11.4160 100.000 0.539 0.046
Source: Philip M. Parker, INSEAD, copyright 2020, www.icongrouponline.com
6.15 MEXICO
Surgical Robots (US $ mln): Mexico 2016-2026
Year US $ mln % of Region % of Globe2016 473.0423 24.921 2.124

6 LATIN AMERICA 194
www.icongrouponline.com © 2020 ICON Group International, Inc.
Surgical Robots (US $ mln): Mexico 2016-2026
Year US $ mln % of Region % of Globe2017 480.4076 24.717 2.1032018 487.1958 24.532 2.0842019 494.0799 24.347 2.0652020 501.0613 24.162 2.0462021 508.1414 23.977 2.0272022 515.3215 23.792 2.0072023 522.6030 23.607 1.9872024 529.9788 23.422 1.9672025 537.4070 23.237 1.9472026 544.9307 23.052 1.927
Source: Philip M. Parker, INSEAD, copyright 2020, www.icongrouponline.com
Surgical Robots (US $ mln): Mexico 2021
CityWorldRank US $ mln
% ofCountry
% ofRegion
% ofGlobe
Mexico City 72 105.8230 20.826 4.993 0.422Tijuana 315 20.3919 4.013 0.962 0.081Ecatepec deMorelos 331 19.1382 3.766 0.903 0.076León 332 19.1238 3.763 0.902 0.076Puebla (deZaragoza) 337 18.8080 3.701 0.887 0.075Guadalajara 372 16.4786 3.243 0.778 0.066Juárez 379 15.9189 3.133 0.751 0.063Zapopan 382 15.7969 3.109 0.745 0.063Monterrey 425 13.3948 2.636 0.632 0.053Nezahualcóyotl 449 12.7375 2.507 0.601 0.051Mexicali 470 12.1170 2.385 0.572 0.048Culiacán 509 10.9701 2.159 0.518 0.044Toluca 525 10.6211 2.090 0.501 0.042Chihuahua 537 10.4501 2.057 0.493 0.042Mérida 539 10.4218 2.051 0.492 0.042Aguascalientes 542 10.3898 2.045 0.490 0.041Hermosillo 544 10.3759 2.042 0.490 0.041Querétaro 545 10.3521 2.037 0.488 0.041Acapulco deJuárez 547 10.2779 2.023 0.485 0.041Naucalpan deJuárez 556 9.9686 1.962 0.470 0.040
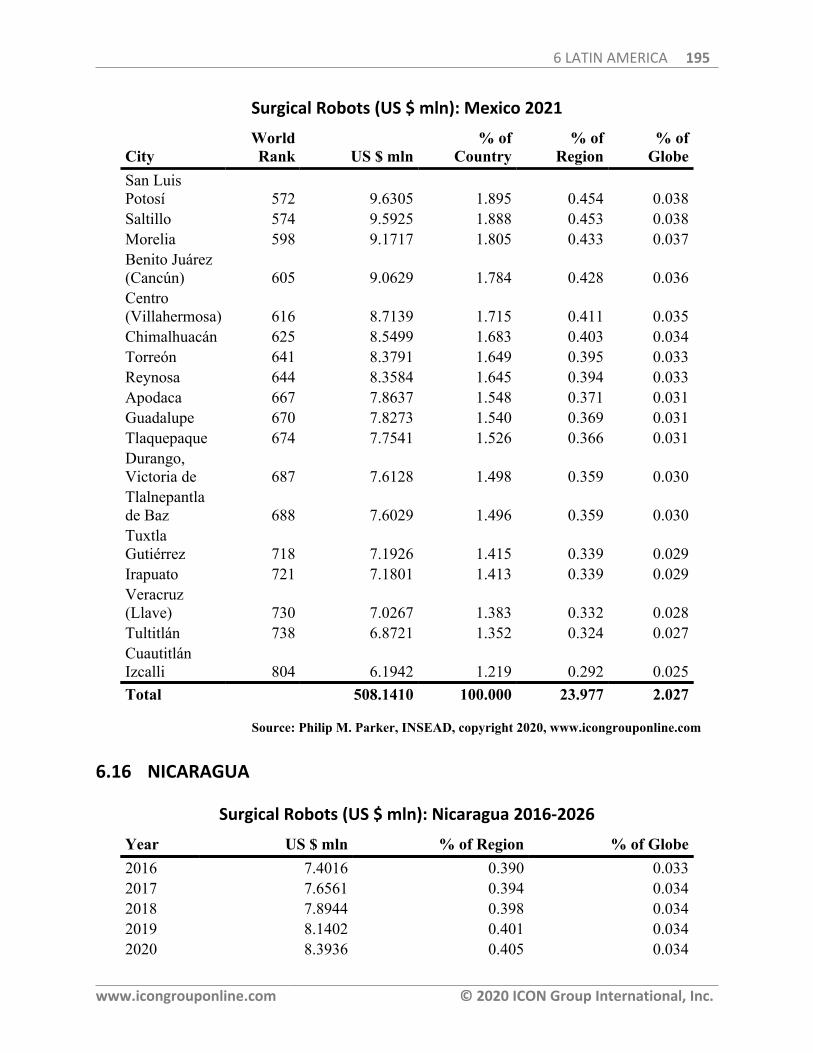
6 LATIN AMERICA 195
www.icongrouponline.com © 2020 ICON Group International, Inc.
Surgical Robots (US $ mln): Mexico 2021
CityWorldRank US $ mln
% ofCountry
% ofRegion
% ofGlobe
San LuisPotosí 572 9.6305 1.895 0.454 0.038Saltillo 574 9.5925 1.888 0.453 0.038Morelia 598 9.1717 1.805 0.433 0.037Benito Juárez(Cancún) 605 9.0629 1.784 0.428 0.036Centro(Villahermosa) 616 8.7139 1.715 0.411 0.035Chimalhuacán 625 8.5499 1.683 0.403 0.034Torreón 641 8.3791 1.649 0.395 0.033Reynosa 644 8.3584 1.645 0.394 0.033Apodaca 667 7.8637 1.548 0.371 0.031Guadalupe 670 7.8273 1.540 0.369 0.031Tlaquepaque 674 7.7541 1.526 0.366 0.031Durango,Victoria de 687 7.6128 1.498 0.359 0.030Tlalnepantlade Baz 688 7.6029 1.496 0.359 0.030TuxtlaGutiérrez 718 7.1926 1.415 0.339 0.029Irapuato 721 7.1801 1.413 0.339 0.029Veracruz(Llave) 730 7.0267 1.383 0.332 0.028Tultitlán 738 6.8721 1.352 0.324 0.027CuautitlánIzcalli 804 6.1942 1.219 0.292 0.025Total 508.1410 100.000 23.977 2.027
Source: Philip M. Parker, INSEAD, copyright 2020, www.icongrouponline.com
6.16 NICARAGUA
Surgical Robots (US $ mln): Nicaragua 2016-2026
Year US $ mln % of Region % of Globe2016 7.4016 0.390 0.0332017 7.6561 0.394 0.0342018 7.8944 0.398 0.0342019 8.1402 0.401 0.0342020 8.3936 0.405 0.034
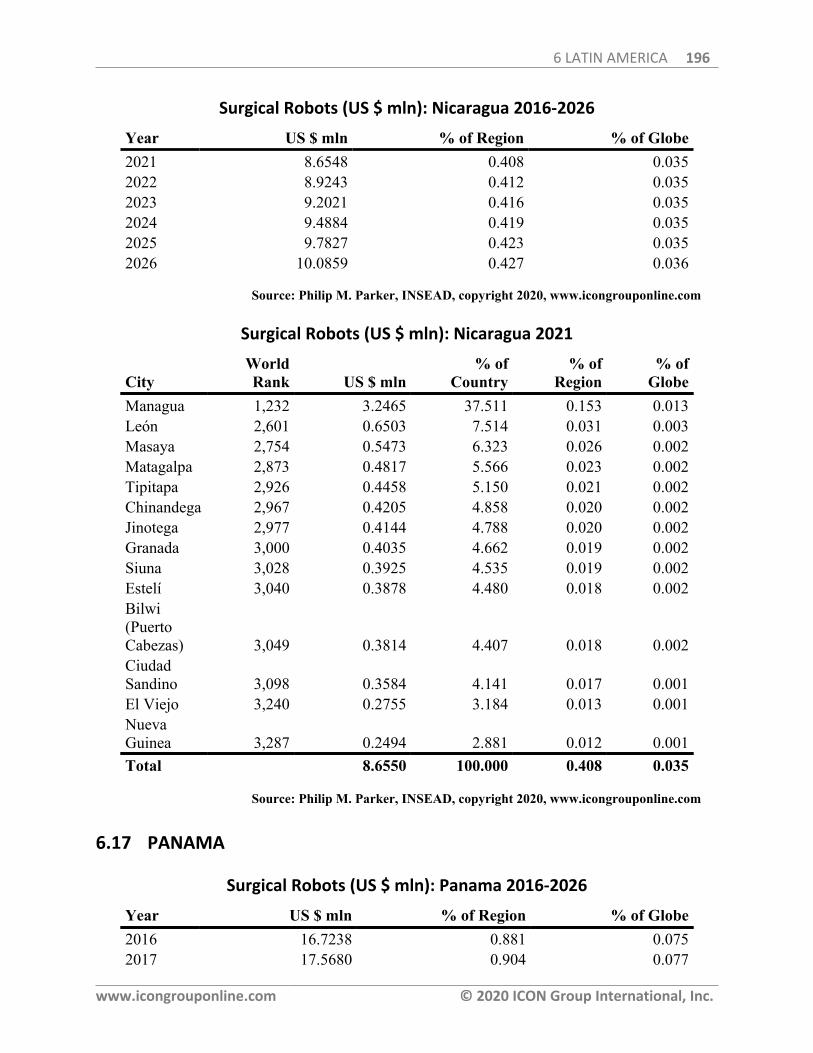
6 LATIN AMERICA 196
www.icongrouponline.com © 2020 ICON Group International, Inc.
Surgical Robots (US $ mln): Nicaragua 2016-2026
Year US $ mln % of Region % of Globe2021 8.6548 0.408 0.0352022 8.9243 0.412 0.0352023 9.2021 0.416 0.0352024 9.4884 0.419 0.0352025 9.7827 0.423 0.0352026 10.0859 0.427 0.036
Source: Philip M. Parker, INSEAD, copyright 2020, www.icongrouponline.com
Surgical Robots (US $ mln): Nicaragua 2021
CityWorldRank US $ mln
% ofCountry
% ofRegion
% ofGlobe
Managua 1,232 3.2465 37.511 0.153 0.013León 2,601 0.6503 7.514 0.031 0.003Masaya 2,754 0.5473 6.323 0.026 0.002Matagalpa 2,873 0.4817 5.566 0.023 0.002Tipitapa 2,926 0.4458 5.150 0.021 0.002Chinandega 2,967 0.4205 4.858 0.020 0.002Jinotega 2,977 0.4144 4.788 0.020 0.002Granada 3,000 0.4035 4.662 0.019 0.002Siuna 3,028 0.3925 4.535 0.019 0.002Estelí 3,040 0.3878 4.480 0.018 0.002Bilwi(PuertoCabezas) 3,049 0.3814 4.407 0.018 0.002CiudadSandino 3,098 0.3584 4.141 0.017 0.001El Viejo 3,240 0.2755 3.184 0.013 0.001NuevaGuinea 3,287 0.2494 2.881 0.012 0.001Total 8.6550 100.000 0.408 0.035
Source: Philip M. Parker, INSEAD, copyright 2020, www.icongrouponline.com
6.17 PANAMA
Surgical Robots (US $ mln): Panama 2016-2026
Year US $ mln % of Region % of Globe2016 16.7238 0.881 0.0752017 17.5680 0.904 0.077
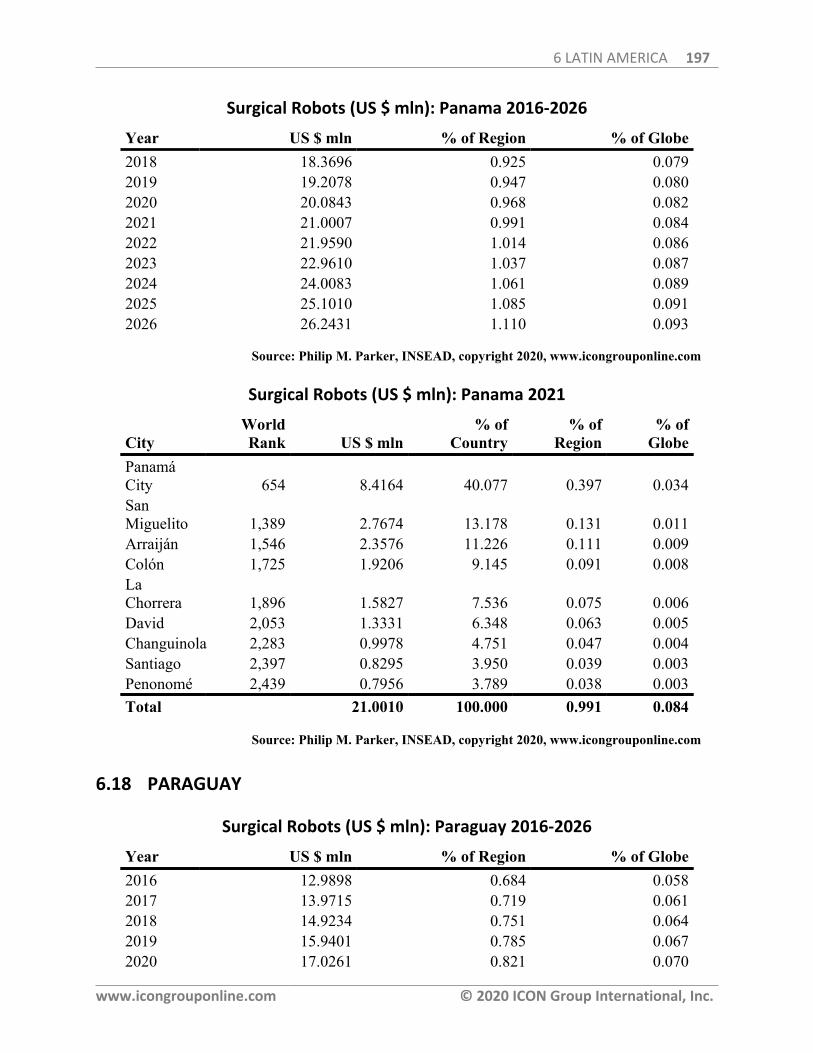
6 LATIN AMERICA 197
www.icongrouponline.com © 2020 ICON Group International, Inc.
Surgical Robots (US $ mln): Panama 2016-2026
Year US $ mln % of Region % of Globe2018 18.3696 0.925 0.0792019 19.2078 0.947 0.0802020 20.0843 0.968 0.0822021 21.0007 0.991 0.0842022 21.9590 1.014 0.0862023 22.9610 1.037 0.0872024 24.0083 1.061 0.0892025 25.1010 1.085 0.0912026 26.2431 1.110 0.093
Source: Philip M. Parker, INSEAD, copyright 2020, www.icongrouponline.com
Surgical Robots (US $ mln): Panama 2021
CityWorldRank US $ mln
% ofCountry
% ofRegion
% ofGlobe
PanamáCity 654 8.4164 40.077 0.397 0.034SanMiguelito 1,389 2.7674 13.178 0.131 0.011Arraiján 1,546 2.3576 11.226 0.111 0.009Colón 1,725 1.9206 9.145 0.091 0.008LaChorrera 1,896 1.5827 7.536 0.075 0.006David 2,053 1.3331 6.348 0.063 0.005Changuinola 2,283 0.9978 4.751 0.047 0.004Santiago 2,397 0.8295 3.950 0.039 0.003Penonomé 2,439 0.7956 3.789 0.038 0.003Total 21.0010 100.000 0.991 0.084
Source: Philip M. Parker, INSEAD, copyright 2020, www.icongrouponline.com
6.18 PARAGUAY
Surgical Robots (US $ mln): Paraguay 2016-2026
Year US $ mln % of Region % of Globe2016 12.9898 0.684 0.0582017 13.9715 0.719 0.0612018 14.9234 0.751 0.0642019 15.9401 0.785 0.0672020 17.0261 0.821 0.070
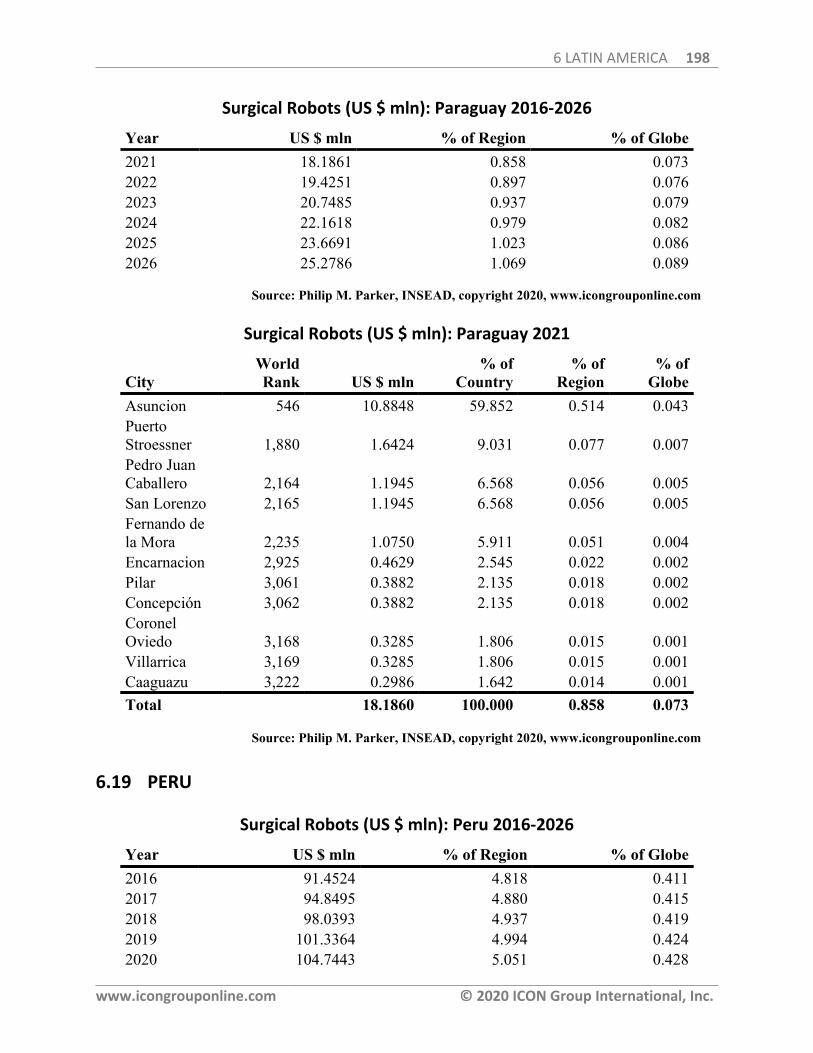
6 LATIN AMERICA 198
www.icongrouponline.com © 2020 ICON Group International, Inc.
Surgical Robots (US $ mln): Paraguay 2016-2026
Year US $ mln % of Region % of Globe2021 18.1861 0.858 0.0732022 19.4251 0.897 0.0762023 20.7485 0.937 0.0792024 22.1618 0.979 0.0822025 23.6691 1.023 0.0862026 25.2786 1.069 0.089
Source: Philip M. Parker, INSEAD, copyright 2020, www.icongrouponline.com
Surgical Robots (US $ mln): Paraguay 2021
CityWorldRank US $ mln
% ofCountry
% ofRegion
% ofGlobe
Asuncion 546 10.8848 59.852 0.514 0.043PuertoStroessner 1,880 1.6424 9.031 0.077 0.007Pedro JuanCaballero 2,164 1.1945 6.568 0.056 0.005San Lorenzo 2,165 1.1945 6.568 0.056 0.005Fernando dela Mora 2,235 1.0750 5.911 0.051 0.004Encarnacion 2,925 0.4629 2.545 0.022 0.002Pilar 3,061 0.3882 2.135 0.018 0.002Concepción 3,062 0.3882 2.135 0.018 0.002CoronelOviedo 3,168 0.3285 1.806 0.015 0.001Villarrica 3,169 0.3285 1.806 0.015 0.001Caaguazu 3,222 0.2986 1.642 0.014 0.001Total 18.1860 100.000 0.858 0.073
Source: Philip M. Parker, INSEAD, copyright 2020, www.icongrouponline.com
6.19 PERU
Surgical Robots (US $ mln): Peru 2016-2026
Year US $ mln % of Region % of Globe2016 91.4524 4.818 0.4112017 94.8495 4.880 0.4152018 98.0393 4.937 0.4192019 101.3364 4.994 0.4242020 104.7443 5.051 0.428
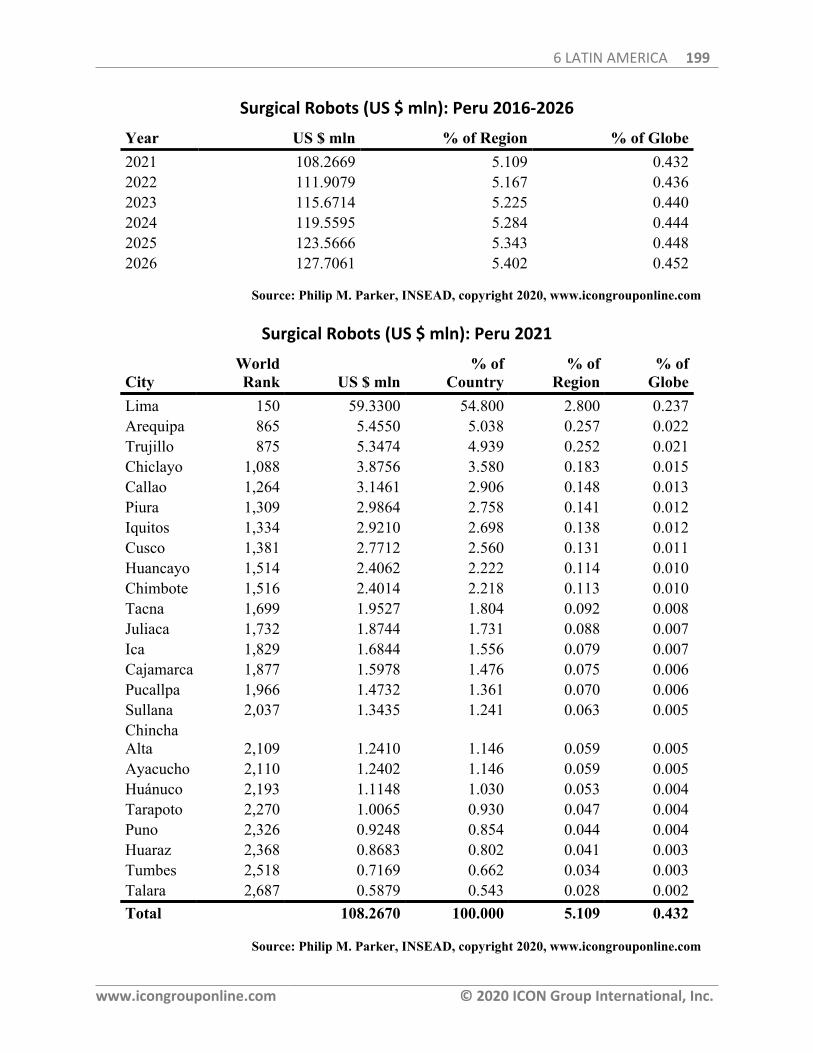
6 LATIN AMERICA 199
www.icongrouponline.com © 2020 ICON Group International, Inc.
Surgical Robots (US $ mln): Peru 2016-2026
Year US $ mln % of Region % of Globe2021 108.2669 5.109 0.4322022 111.9079 5.167 0.4362023 115.6714 5.225 0.4402024 119.5595 5.284 0.4442025 123.5666 5.343 0.4482026 127.7061 5.402 0.452
Source: Philip M. Parker, INSEAD, copyright 2020, www.icongrouponline.com
Surgical Robots (US $ mln): Peru 2021
CityWorldRank US $ mln
% ofCountry
% ofRegion
% ofGlobe
Lima 150 59.3300 54.800 2.800 0.237Arequipa 865 5.4550 5.038 0.257 0.022Trujillo 875 5.3474 4.939 0.252 0.021Chiclayo 1,088 3.8756 3.580 0.183 0.015Callao 1,264 3.1461 2.906 0.148 0.013Piura 1,309 2.9864 2.758 0.141 0.012Iquitos 1,334 2.9210 2.698 0.138 0.012Cusco 1,381 2.7712 2.560 0.131 0.011Huancayo 1,514 2.4062 2.222 0.114 0.010Chimbote 1,516 2.4014 2.218 0.113 0.010Tacna 1,699 1.9527 1.804 0.092 0.008Juliaca 1,732 1.8744 1.731 0.088 0.007Ica 1,829 1.6844 1.556 0.079 0.007Cajamarca 1,877 1.5978 1.476 0.075 0.006Pucallpa 1,966 1.4732 1.361 0.070 0.006Sullana 2,037 1.3435 1.241 0.063 0.005ChinchaAlta 2,109 1.2410 1.146 0.059 0.005Ayacucho 2,110 1.2402 1.146 0.059 0.005Huánuco 2,193 1.1148 1.030 0.053 0.004Tarapoto 2,270 1.0065 0.930 0.047 0.004Puno 2,326 0.9248 0.854 0.044 0.004Huaraz 2,368 0.8683 0.802 0.041 0.003Tumbes 2,518 0.7169 0.662 0.034 0.003Talara 2,687 0.5879 0.543 0.028 0.002Total 108.2670 100.000 5.109 0.432
Source: Philip M. Parker, INSEAD, copyright 2020, www.icongrouponline.com
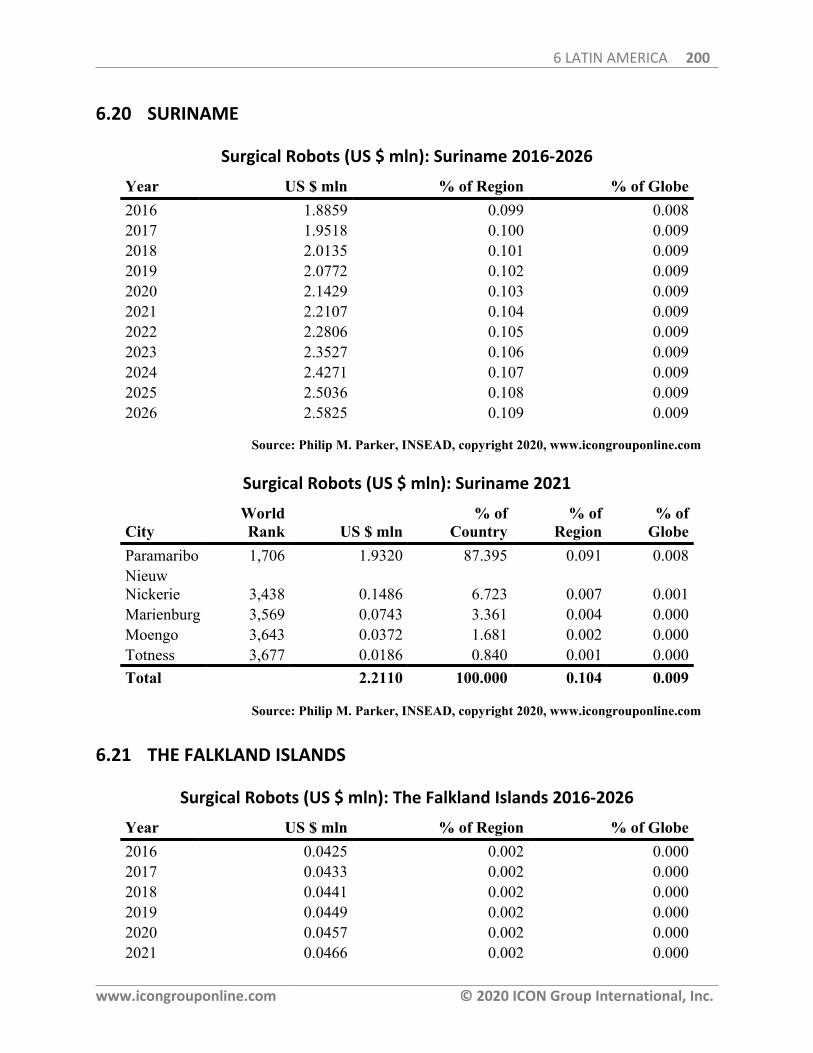
6 LATIN AMERICA 200
www.icongrouponline.com © 2020 ICON Group International, Inc.
6.20 SURINAME
Surgical Robots (US $ mln): Suriname 2016-2026
Year US $ mln % of Region % of Globe2016 1.8859 0.099 0.0082017 1.9518 0.100 0.0092018 2.0135 0.101 0.0092019 2.0772 0.102 0.0092020 2.1429 0.103 0.0092021 2.2107 0.104 0.0092022 2.2806 0.105 0.0092023 2.3527 0.106 0.0092024 2.4271 0.107 0.0092025 2.5036 0.108 0.0092026 2.5825 0.109 0.009
Source: Philip M. Parker, INSEAD, copyright 2020, www.icongrouponline.com
Surgical Robots (US $ mln): Suriname 2021
CityWorldRank US $ mln
% ofCountry
% ofRegion
% ofGlobe
Paramaribo 1,706 1.9320 87.395 0.091 0.008NieuwNickerie 3,438 0.1486 6.723 0.007 0.001Marienburg 3,569 0.0743 3.361 0.004 0.000Moengo 3,643 0.0372 1.681 0.002 0.000Totness 3,677 0.0186 0.840 0.001 0.000Total 2.2110 100.000 0.104 0.009
Source: Philip M. Parker, INSEAD, copyright 2020, www.icongrouponline.com
6.21 THE FALKLAND ISLANDS
Surgical Robots (US $ mln): The Falkland Islands 2016-2026
Year US $ mln % of Region % of Globe2016 0.0425 0.002 0.0002017 0.0433 0.002 0.0002018 0.0441 0.002 0.0002019 0.0449 0.002 0.0002020 0.0457 0.002 0.0002021 0.0466 0.002 0.000
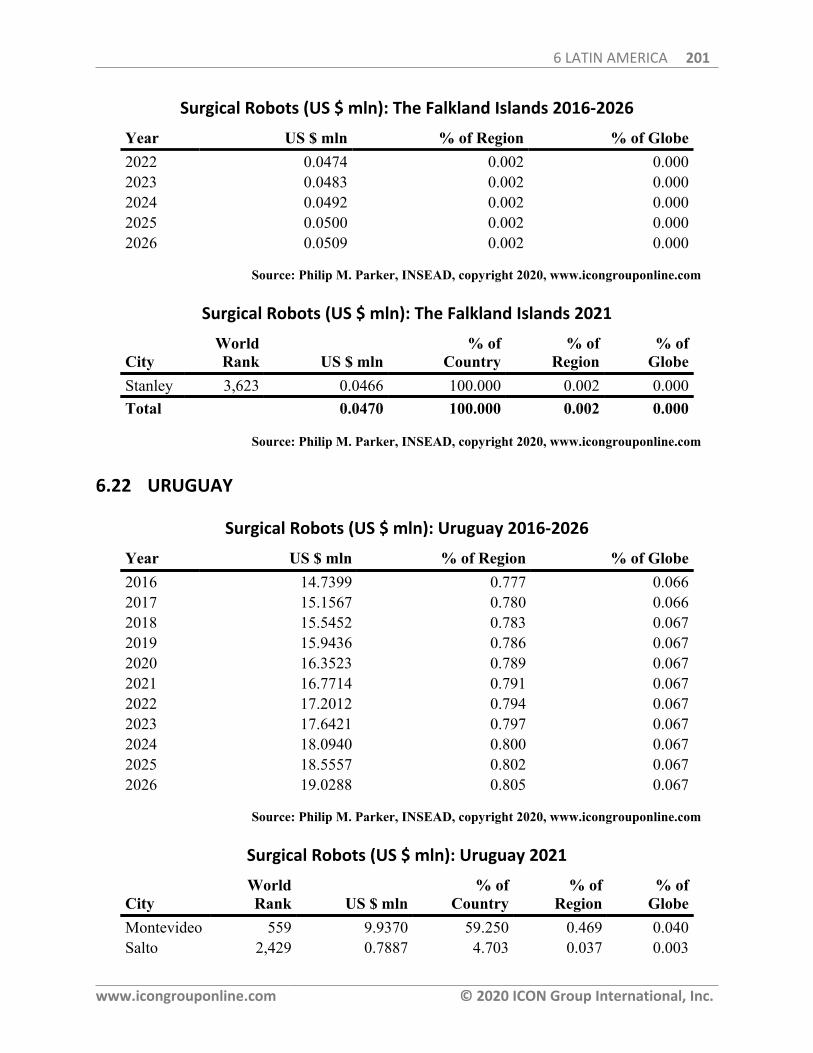
6 LATIN AMERICA 201
www.icongrouponline.com © 2020 ICON Group International, Inc.
Surgical Robots (US $ mln): The Falkland Islands 2016-2026
Year US $ mln % of Region % of Globe2022 0.0474 0.002 0.0002023 0.0483 0.002 0.0002024 0.0492 0.002 0.0002025 0.0500 0.002 0.0002026 0.0509 0.002 0.000
Source: Philip M. Parker, INSEAD, copyright 2020, www.icongrouponline.com
Surgical Robots (US $ mln): The Falkland Islands 2021
CityWorldRank US $ mln
% ofCountry
% ofRegion
% ofGlobe
Stanley 3,623 0.0466 100.000 0.002 0.000Total 0.0470 100.000 0.002 0.000
Source: Philip M. Parker, INSEAD, copyright 2020, www.icongrouponline.com
6.22 URUGUAY
Surgical Robots (US $ mln): Uruguay 2016-2026
Year US $ mln % of Region % of Globe2016 14.7399 0.777 0.0662017 15.1567 0.780 0.0662018 15.5452 0.783 0.0672019 15.9436 0.786 0.0672020 16.3523 0.789 0.0672021 16.7714 0.791 0.0672022 17.2012 0.794 0.0672023 17.6421 0.797 0.0672024 18.0940 0.800 0.0672025 18.5557 0.802 0.0672026 19.0288 0.805 0.067
Source: Philip M. Parker, INSEAD, copyright 2020, www.icongrouponline.com
Surgical Robots (US $ mln): Uruguay 2021
CityWorldRank US $ mln
% ofCountry
% ofRegion
% ofGlobe
Montevideo 559 9.9370 59.250 0.469 0.040Salto 2,429 0.7887 4.703 0.037 0.003
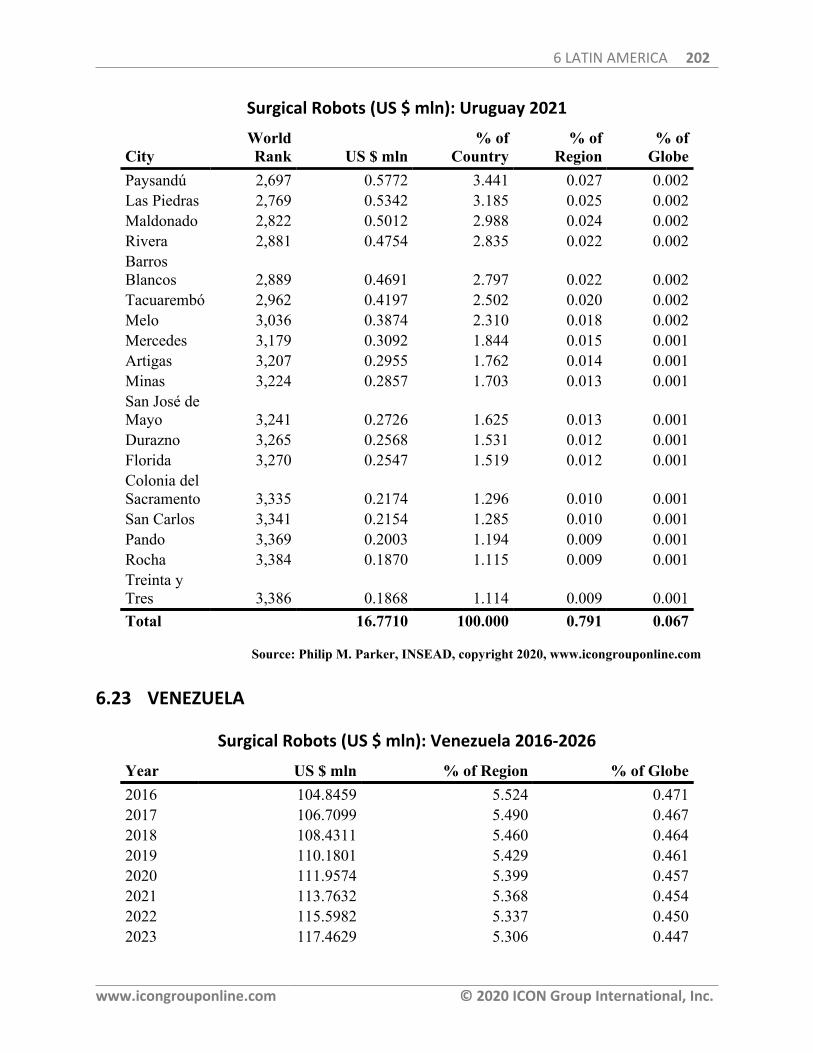
6 LATIN AMERICA 202
www.icongrouponline.com © 2020 ICON Group International, Inc.
Surgical Robots (US $ mln): Uruguay 2021
CityWorldRank US $ mln
% ofCountry
% ofRegion
% ofGlobe
Paysandú 2,697 0.5772 3.441 0.027 0.002Las Piedras 2,769 0.5342 3.185 0.025 0.002Maldonado 2,822 0.5012 2.988 0.024 0.002Rivera 2,881 0.4754 2.835 0.022 0.002BarrosBlancos 2,889 0.4691 2.797 0.022 0.002Tacuarembó 2,962 0.4197 2.502 0.020 0.002Melo 3,036 0.3874 2.310 0.018 0.002Mercedes 3,179 0.3092 1.844 0.015 0.001Artigas 3,207 0.2955 1.762 0.014 0.001Minas 3,224 0.2857 1.703 0.013 0.001San José deMayo 3,241 0.2726 1.625 0.013 0.001Durazno 3,265 0.2568 1.531 0.012 0.001Florida 3,270 0.2547 1.519 0.012 0.001Colonia delSacramento 3,335 0.2174 1.296 0.010 0.001San Carlos 3,341 0.2154 1.285 0.010 0.001Pando 3,369 0.2003 1.194 0.009 0.001Rocha 3,384 0.1870 1.115 0.009 0.001Treinta yTres 3,386 0.1868 1.114 0.009 0.001Total 16.7710 100.000 0.791 0.067
Source: Philip M. Parker, INSEAD, copyright 2020, www.icongrouponline.com
6.23 VENEZUELA
Surgical Robots (US $ mln): Venezuela 2016-2026
Year US $ mln % of Region % of Globe2016 104.8459 5.524 0.4712017 106.7099 5.490 0.4672018 108.4311 5.460 0.4642019 110.1801 5.429 0.4612020 111.9574 5.399 0.4572021 113.7632 5.368 0.4542022 115.5982 5.337 0.4502023 117.4629 5.306 0.447
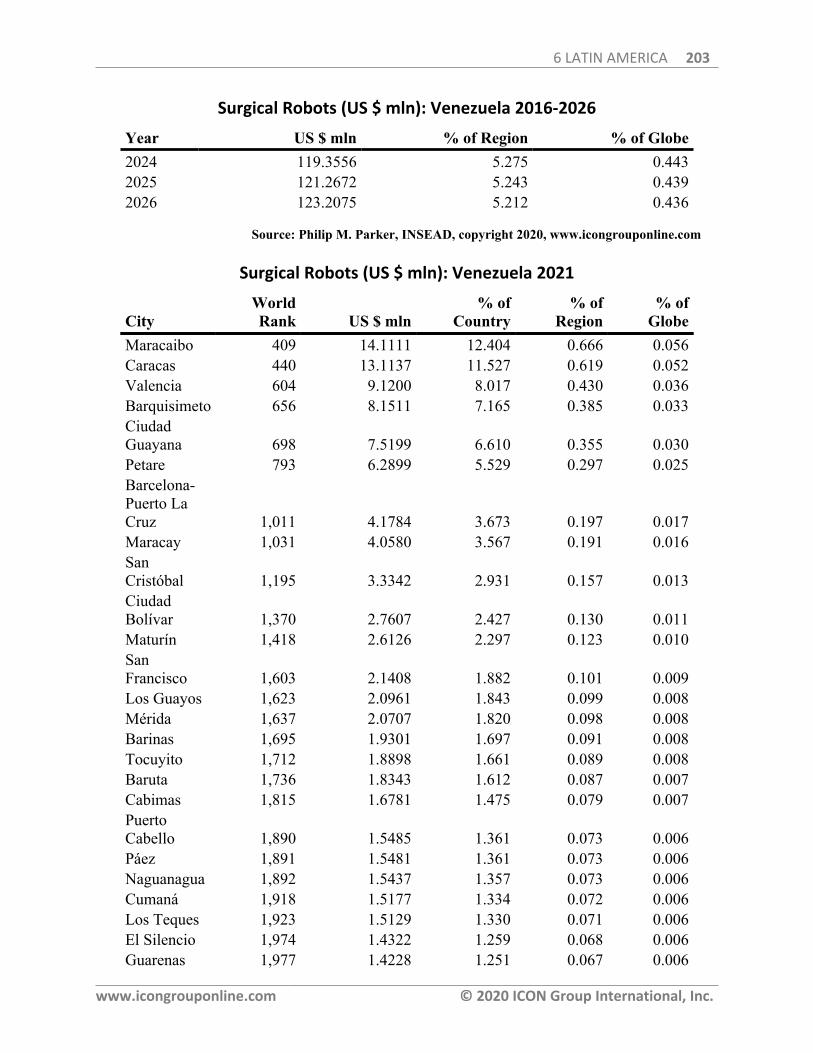
6 LATIN AMERICA 203
www.icongrouponline.com © 2020 ICON Group International, Inc.
Surgical Robots (US $ mln): Venezuela 2016-2026
Year US $ mln % of Region % of Globe2024 119.3556 5.275 0.4432025 121.2672 5.243 0.4392026 123.2075 5.212 0.436
Source: Philip M. Parker, INSEAD, copyright 2020, www.icongrouponline.com
Surgical Robots (US $ mln): Venezuela 2021
CityWorldRank US $ mln
% ofCountry
% ofRegion
% ofGlobe
Maracaibo 409 14.1111 12.404 0.666 0.056Caracas 440 13.1137 11.527 0.619 0.052Valencia 604 9.1200 8.017 0.430 0.036Barquisimeto 656 8.1511 7.165 0.385 0.033CiudadGuayana 698 7.5199 6.610 0.355 0.030Petare 793 6.2899 5.529 0.297 0.025Barcelona-Puerto LaCruz 1,011 4.1784 3.673 0.197 0.017Maracay 1,031 4.0580 3.567 0.191 0.016SanCristóbal 1,195 3.3342 2.931 0.157 0.013CiudadBolívar 1,370 2.7607 2.427 0.130 0.011Maturín 1,418 2.6126 2.297 0.123 0.010SanFrancisco 1,603 2.1408 1.882 0.101 0.009Los Guayos 1,623 2.0961 1.843 0.099 0.008Mérida 1,637 2.0707 1.820 0.098 0.008Barinas 1,695 1.9301 1.697 0.091 0.008Tocuyito 1,712 1.8898 1.661 0.089 0.008Baruta 1,736 1.8343 1.612 0.087 0.007Cabimas 1,815 1.6781 1.475 0.079 0.007PuertoCabello 1,890 1.5485 1.361 0.073 0.006Páez 1,891 1.5481 1.361 0.073 0.006Naguanagua 1,892 1.5437 1.357 0.073 0.006Cumaná 1,918 1.5177 1.334 0.072 0.006Los Teques 1,923 1.5129 1.330 0.071 0.006El Silencio 1,974 1.4322 1.259 0.068 0.006Guarenas 1,977 1.4228 1.251 0.067 0.006
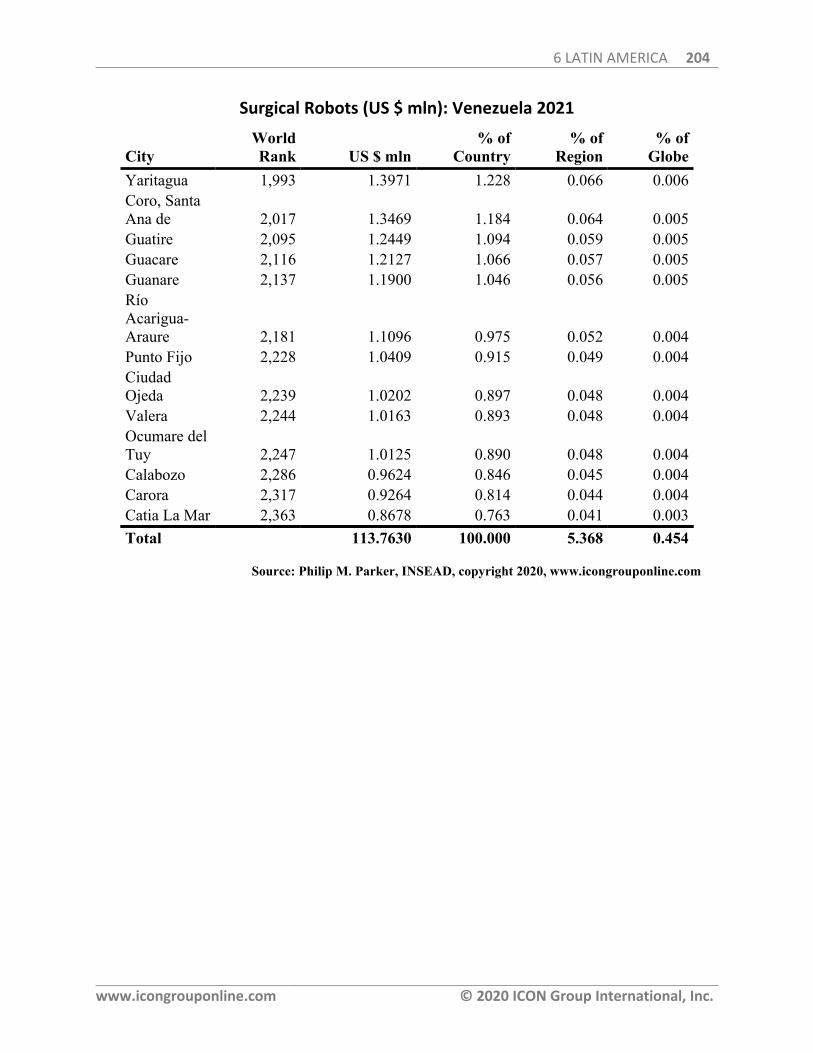
6 LATIN AMERICA 204
www.icongrouponline.com © 2020 ICON Group International, Inc.
Surgical Robots (US $ mln): Venezuela 2021
CityWorldRank US $ mln
% ofCountry
% ofRegion
% ofGlobe
Yaritagua 1,993 1.3971 1.228 0.066 0.006Coro, SantaAna de 2,017 1.3469 1.184 0.064 0.005Guatire 2,095 1.2449 1.094 0.059 0.005Guacare 2,116 1.2127 1.066 0.057 0.005Guanare 2,137 1.1900 1.046 0.056 0.005RíoAcarigua-Araure 2,181 1.1096 0.975 0.052 0.004Punto Fijo 2,228 1.0409 0.915 0.049 0.004CiudadOjeda 2,239 1.0202 0.897 0.048 0.004Valera 2,244 1.0163 0.893 0.048 0.004Ocumare delTuy 2,247 1.0125 0.890 0.048 0.004Calabozo 2,286 0.9624 0.846 0.045 0.004Carora 2,317 0.9264 0.814 0.044 0.004Catia La Mar 2,363 0.8678 0.763 0.041 0.003Total 113.7630 100.000 5.368 0.454
Source: Philip M. Parker, INSEAD, copyright 2020, www.icongrouponline.com
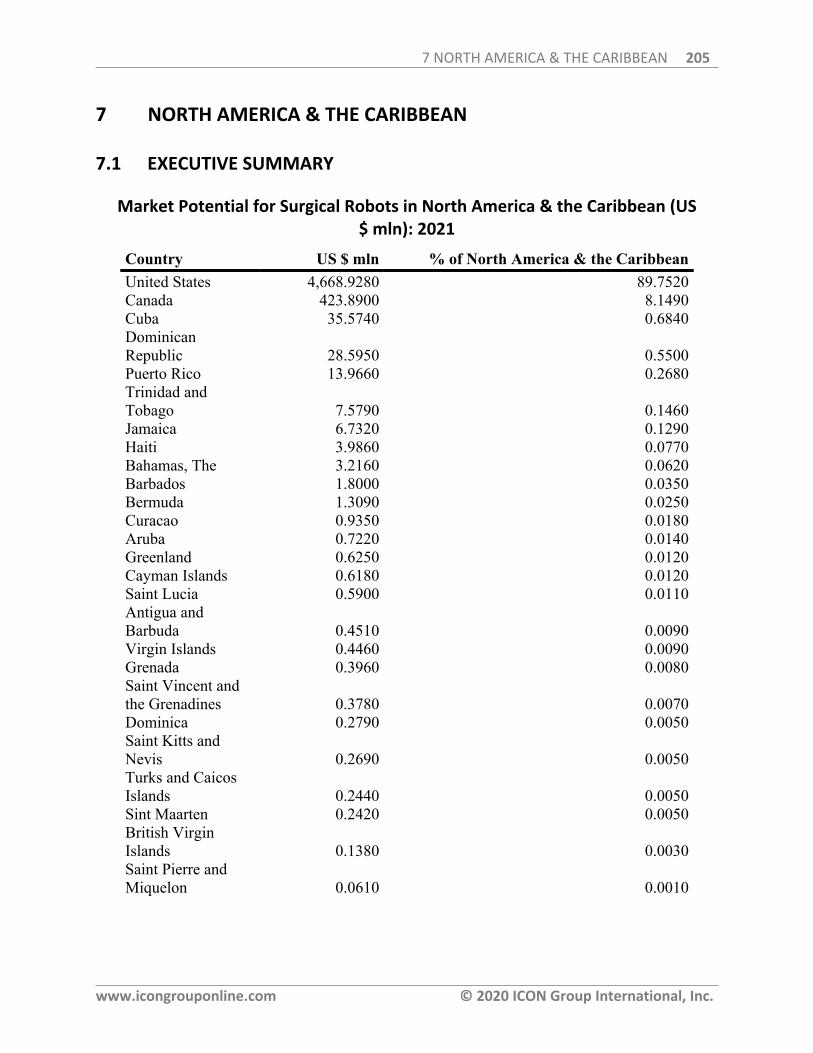
7 NORTH AMERICA & THE CARIBBEAN 205
www.icongrouponline.com © 2020 ICON Group International, Inc.
7 NORTH AMERICA & THE CARIBBEAN
7.1 EXECUTIVE SUMMARY
Market Potential for Surgical Robots in North America & the Caribbean (US$ mln): 2021
Country US $ mln % of North America & the CaribbeanUnited States 4,668.9280 89.7520Canada 423.8900 8.1490Cuba 35.5740 0.6840DominicanRepublic 28.5950 0.5500Puerto Rico 13.9660 0.2680Trinidad andTobago 7.5790 0.1460Jamaica 6.7320 0.1290Haiti 3.9860 0.0770Bahamas, The 3.2160 0.0620Barbados 1.8000 0.0350Bermuda 1.3090 0.0250Curacao 0.9350 0.0180Aruba 0.7220 0.0140Greenland 0.6250 0.0120Cayman Islands 0.6180 0.0120Saint Lucia 0.5900 0.0110Antigua andBarbuda 0.4510 0.0090Virgin Islands 0.4460 0.0090Grenada 0.3960 0.0080Saint Vincent andthe Grenadines 0.3780 0.0070Dominica 0.2790 0.0050Saint Kitts andNevis 0.2690 0.0050Turks and CaicosIslands 0.2440 0.0050Sint Maarten 0.2420 0.0050British VirginIslands 0.1380 0.0030Saint Pierre andMiquelon 0.0610 0.0010
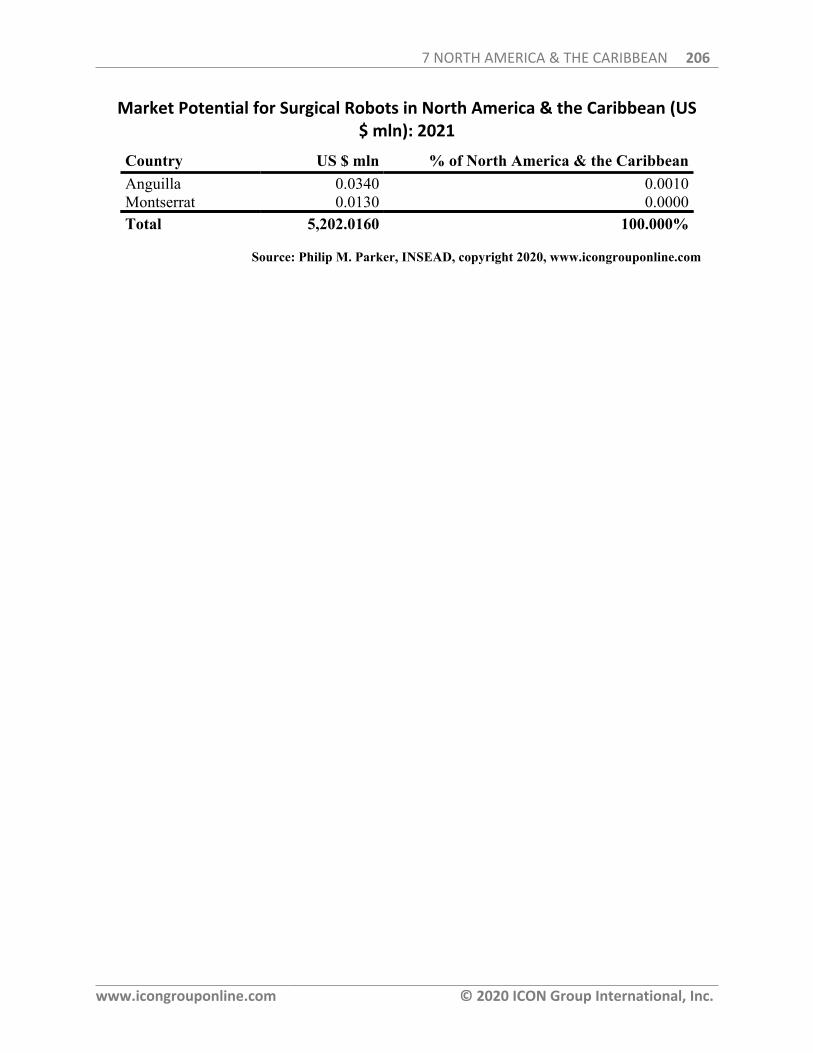
7 NORTH AMERICA & THE CARIBBEAN 206
www.icongrouponline.com © 2020 ICON Group International, Inc.
Market Potential for Surgical Robots in North America & the Caribbean (US$ mln): 2021
Country US $ mln % of North America & the CaribbeanAnguilla 0.0340 0.0010Montserrat 0.0130 0.0000Total 5,202.0160 100.000%
Source: Philip M. Parker, INSEAD, copyright 2020, www.icongrouponline.com
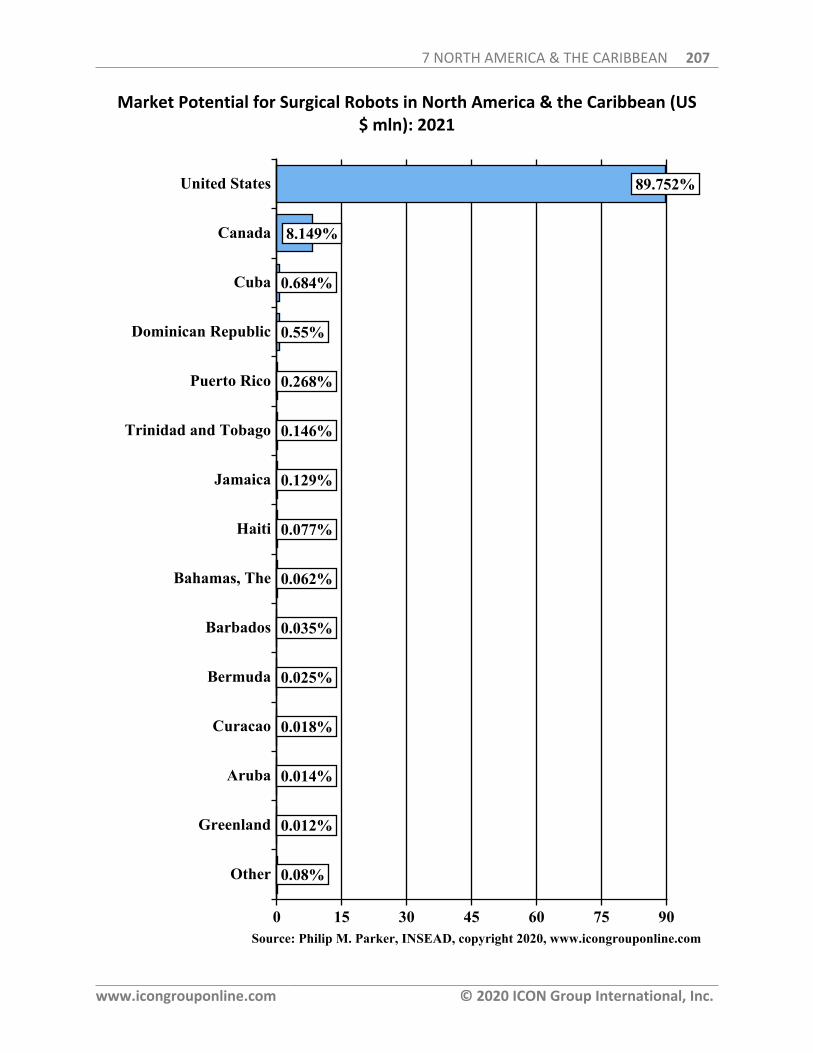
7 NORTH AMERICA & THE CARIBBEAN 207
www.icongrouponline.com © 2020 ICON Group International, Inc.
Market Potential for Surgical Robots in North America & the Caribbean (US$ mln): 2021
0.08%
0.012%
0.014%
0.018%
0.025%
0.035%
0.062%
0.077%
0.129%
0.146%
0.268%
0.55%
0.684%
8.149%
89.752%United States
Canada
Cuba
Dominican Republic
Puerto Rico
Trinidad and Tobago
Jamaica
Haiti
Bahamas, The
Barbados
Bermuda
Curacao
Aruba
Greenland
Other
0 15 30 45 60 75 90Source: Philip M. Parker, INSEAD, copyright 2020, www.icongrouponline.com
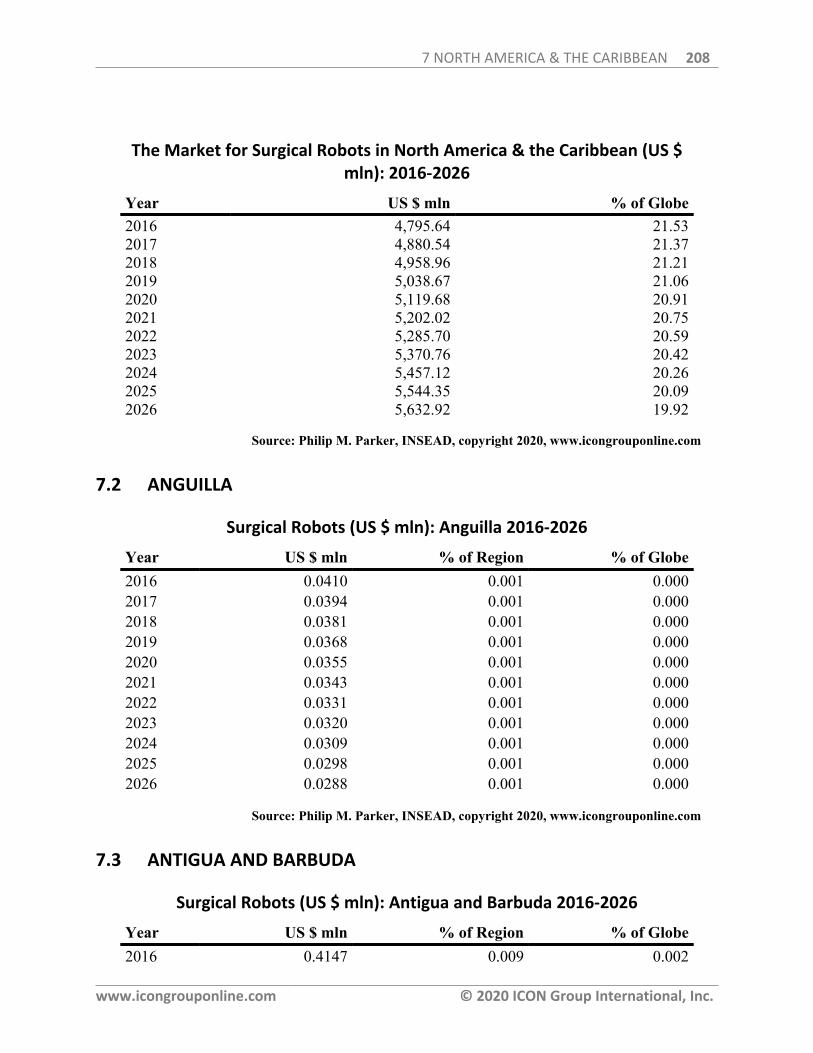
7 NORTH AMERICA & THE CARIBBEAN 208
www.icongrouponline.com © 2020 ICON Group International, Inc.
The Market for Surgical Robots in North America & the Caribbean (US $mln): 2016-2026
Year US $ mln % of Globe2016 4,795.64 21.532017 4,880.54 21.372018 4,958.96 21.212019 5,038.67 21.062020 5,119.68 20.912021 5,202.02 20.752022 5,285.70 20.592023 5,370.76 20.422024 5,457.12 20.262025 5,544.35 20.092026 5,632.92 19.92
Source: Philip M. Parker, INSEAD, copyright 2020, www.icongrouponline.com
7.2 ANGUILLA
Surgical Robots (US $ mln): Anguilla 2016-2026
Year US $ mln % of Region % of Globe2016 0.0410 0.001 0.0002017 0.0394 0.001 0.0002018 0.0381 0.001 0.0002019 0.0368 0.001 0.0002020 0.0355 0.001 0.0002021 0.0343 0.001 0.0002022 0.0331 0.001 0.0002023 0.0320 0.001 0.0002024 0.0309 0.001 0.0002025 0.0298 0.001 0.0002026 0.0288 0.001 0.000
Source: Philip M. Parker, INSEAD, copyright 2020, www.icongrouponline.com
7.3 ANTIGUA AND BARBUDA
Surgical Robots (US $ mln): Antigua and Barbuda 2016-2026
Year US $ mln % of Region % of Globe2016 0.4147 0.009 0.002
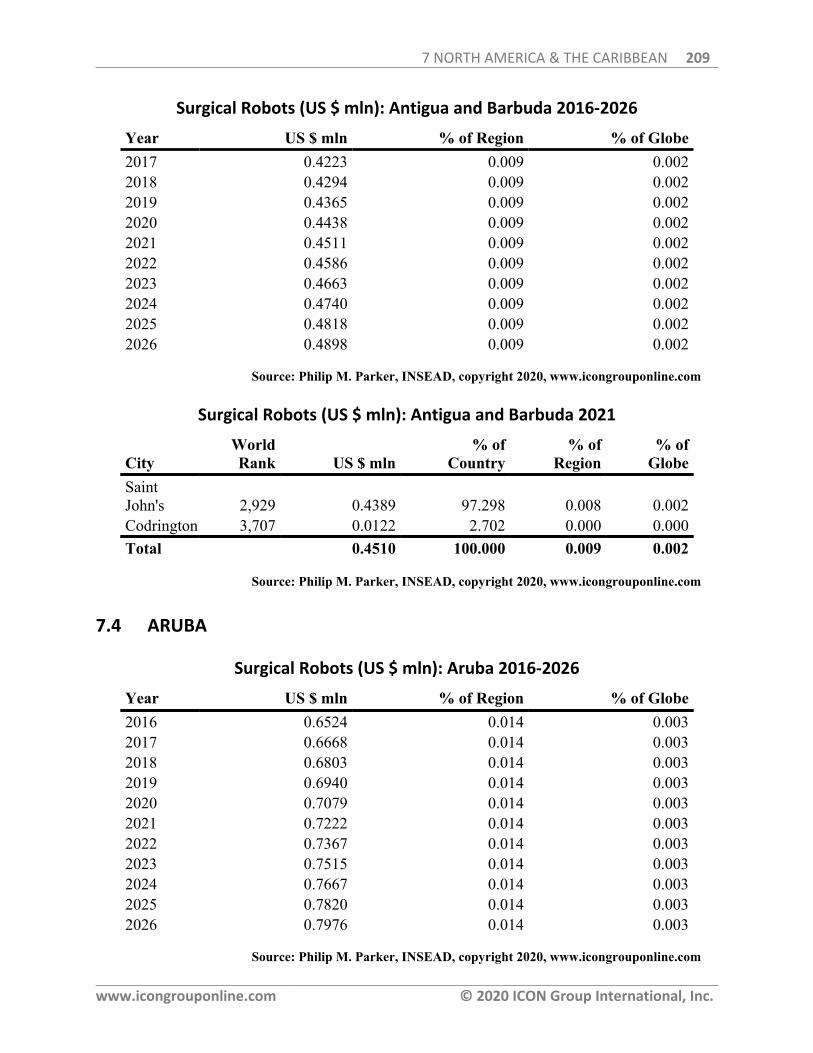
7 NORTH AMERICA & THE CARIBBEAN 209
www.icongrouponline.com © 2020 ICON Group International, Inc.
Surgical Robots (US $ mln): Antigua and Barbuda 2016-2026
Year US $ mln % of Region % of Globe2017 0.4223 0.009 0.0022018 0.4294 0.009 0.0022019 0.4365 0.009 0.0022020 0.4438 0.009 0.0022021 0.4511 0.009 0.0022022 0.4586 0.009 0.0022023 0.4663 0.009 0.0022024 0.4740 0.009 0.0022025 0.4818 0.009 0.0022026 0.4898 0.009 0.002
Source: Philip M. Parker, INSEAD, copyright 2020, www.icongrouponline.com
Surgical Robots (US $ mln): Antigua and Barbuda 2021
CityWorldRank US $ mln
% ofCountry
% ofRegion
% ofGlobe
SaintJohn's 2,929 0.4389 97.298 0.008 0.002Codrington 3,707 0.0122 2.702 0.000 0.000Total 0.4510 100.000 0.009 0.002
Source: Philip M. Parker, INSEAD, copyright 2020, www.icongrouponline.com
7.4 ARUBA
Surgical Robots (US $ mln): Aruba 2016-2026
Year US $ mln % of Region % of Globe2016 0.6524 0.014 0.0032017 0.6668 0.014 0.0032018 0.6803 0.014 0.0032019 0.6940 0.014 0.0032020 0.7079 0.014 0.0032021 0.7222 0.014 0.0032022 0.7367 0.014 0.0032023 0.7515 0.014 0.0032024 0.7667 0.014 0.0032025 0.7820 0.014 0.0032026 0.7976 0.014 0.003
Source: Philip M. Parker, INSEAD, copyright 2020, www.icongrouponline.com
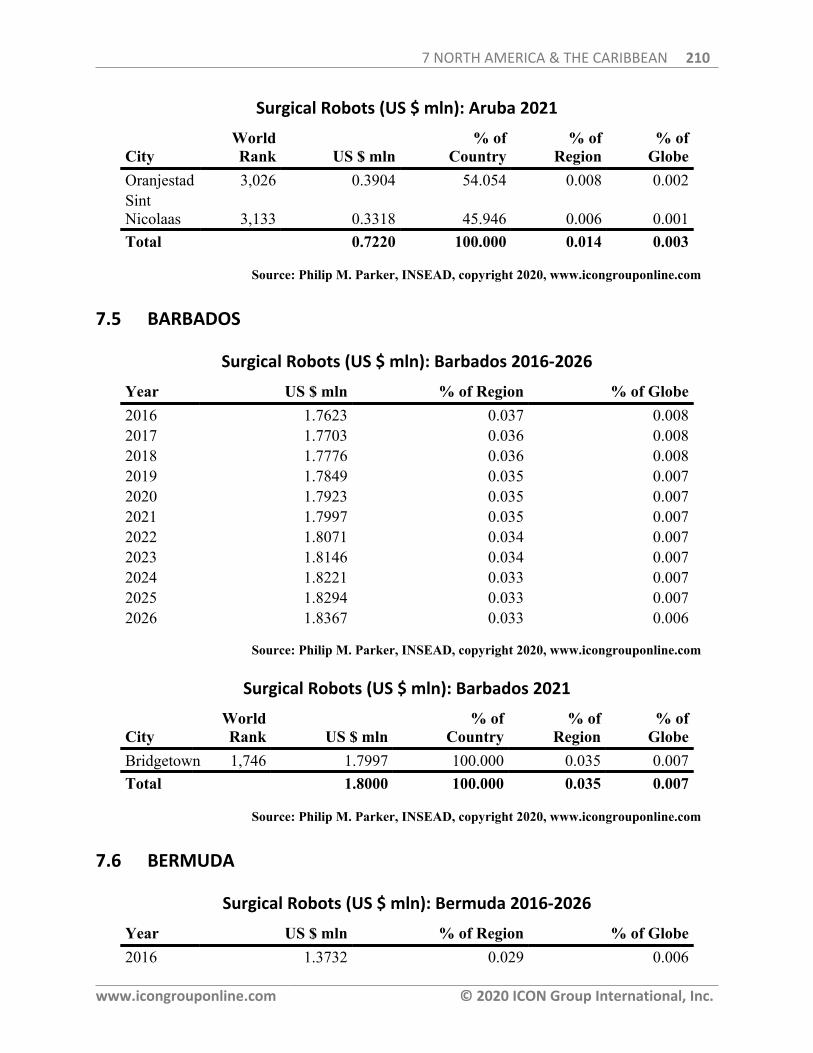
7 NORTH AMERICA & THE CARIBBEAN 210
www.icongrouponline.com © 2020 ICON Group International, Inc.
Surgical Robots (US $ mln): Aruba 2021
CityWorldRank US $ mln
% ofCountry
% ofRegion
% ofGlobe
Oranjestad 3,026 0.3904 54.054 0.008 0.002SintNicolaas 3,133 0.3318 45.946 0.006 0.001Total 0.7220 100.000 0.014 0.003
Source: Philip M. Parker, INSEAD, copyright 2020, www.icongrouponline.com
7.5 BARBADOS
Surgical Robots (US $ mln): Barbados 2016-2026
Year US $ mln % of Region % of Globe2016 1.7623 0.037 0.0082017 1.7703 0.036 0.0082018 1.7776 0.036 0.0082019 1.7849 0.035 0.0072020 1.7923 0.035 0.0072021 1.7997 0.035 0.0072022 1.8071 0.034 0.0072023 1.8146 0.034 0.0072024 1.8221 0.033 0.0072025 1.8294 0.033 0.0072026 1.8367 0.033 0.006
Source: Philip M. Parker, INSEAD, copyright 2020, www.icongrouponline.com
Surgical Robots (US $ mln): Barbados 2021
CityWorldRank US $ mln
% ofCountry
% ofRegion
% ofGlobe
Bridgetown 1,746 1.7997 100.000 0.035 0.007Total 1.8000 100.000 0.035 0.007
Source: Philip M. Parker, INSEAD, copyright 2020, www.icongrouponline.com
7.6 BERMUDA
Surgical Robots (US $ mln): Bermuda 2016-2026
Year US $ mln % of Region % of Globe2016 1.3732 0.029 0.006
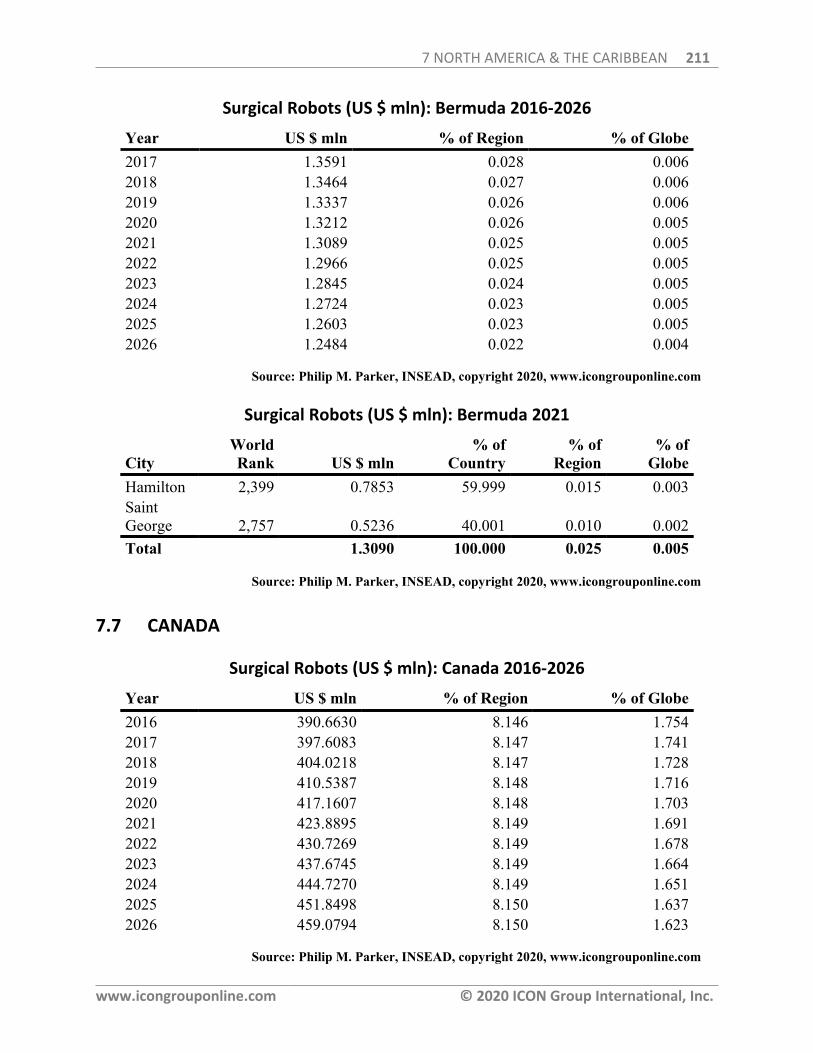
7 NORTH AMERICA & THE CARIBBEAN 211
www.icongrouponline.com © 2020 ICON Group International, Inc.
Surgical Robots (US $ mln): Bermuda 2016-2026
Year US $ mln % of Region % of Globe2017 1.3591 0.028 0.0062018 1.3464 0.027 0.0062019 1.3337 0.026 0.0062020 1.3212 0.026 0.0052021 1.3089 0.025 0.0052022 1.2966 0.025 0.0052023 1.2845 0.024 0.0052024 1.2724 0.023 0.0052025 1.2603 0.023 0.0052026 1.2484 0.022 0.004
Source: Philip M. Parker, INSEAD, copyright 2020, www.icongrouponline.com
Surgical Robots (US $ mln): Bermuda 2021
CityWorldRank US $ mln
% ofCountry
% ofRegion
% ofGlobe
Hamilton 2,399 0.7853 59.999 0.015 0.003SaintGeorge 2,757 0.5236 40.001 0.010 0.002Total 1.3090 100.000 0.025 0.005
Source: Philip M. Parker, INSEAD, copyright 2020, www.icongrouponline.com
7.7 CANADA
Surgical Robots (US $ mln): Canada 2016-2026
Year US $ mln % of Region % of Globe2016 390.6630 8.146 1.7542017 397.6083 8.147 1.7412018 404.0218 8.147 1.7282019 410.5387 8.148 1.7162020 417.1607 8.148 1.7032021 423.8895 8.149 1.6912022 430.7269 8.149 1.6782023 437.6745 8.149 1.6642024 444.7270 8.149 1.6512025 451.8498 8.150 1.6372026 459.0794 8.150 1.623
Source: Philip M. Parker, INSEAD, copyright 2020, www.icongrouponline.com

7 NORTH AMERICA & THE CARIBBEAN 212
www.icongrouponline.com © 2020 ICON Group International, Inc.
Surgical Robots (US $ mln): Canada 2021
CityWorldRank US $ mln
% ofCountry
% ofRegion
% ofGlobe
Toronto 143 61.1337 14.422 1.175 0.244Montréal 206 37.7578 8.907 0.726 0.151Calgary 266 26.9992 6.369 0.519 0.108Ottawa 303 21.3647 5.040 0.411 0.085Edmonton 319 20.0241 4.724 0.385 0.080Mississauga 365 16.9781 4.005 0.326 0.068Winnipeg 386 15.5507 3.669 0.299 0.062Vancouver 410 14.1028 3.327 0.271 0.056Brampton 416 13.9092 3.281 0.267 0.055Surrey 464 12.2227 2.883 0.235 0.049QuebecCity 469 12.1493 2.866 0.234 0.048Hamilton 474 12.0208 2.836 0.231 0.048Laval 563 9.7230 2.294 0.187 0.039Halifax 601 9.1340 2.155 0.176 0.036London 634 8.5224 2.011 0.164 0.034Markham 681 7.6829 1.812 0.148 0.031Vaughan 684 7.6511 1.805 0.147 0.031Gatineau 775 6.4605 1.524 0.124 0.026Burnaby 851 5.4539 1.287 0.105 0.022Saskatoon 856 5.4181 1.278 0.104 0.022Longueuil 874 5.2591 1.241 0.101 0.021Kitchener 877 5.2318 1.234 0.101 0.021RichmondHill 943 4.6772 1.103 0.090 0.019Windsor 948 4.6602 1.099 0.090 0.019Regina 952 4.6335 1.093 0.089 0.018Richmond 955 4.6229 1.091 0.089 0.018Oakville 974 4.4648 1.053 0.086 0.018Burlington 1,010 4.1897 0.988 0.081 0.017GreaterSudbury 1,119 3.6614 0.864 0.070 0.015Sherbrooke 1,127 3.6257 0.855 0.070 0.014Oshawa 1,151 3.5309 0.833 0.068 0.014Lévis 1,207 3.3036 0.779 0.064 0.013Saguenay 1,211 3.2856 0.775 0.063 0.013Barrie 1,229 3.2029 0.756 0.062 0.013Abbotsford 1,233 3.1957 0.754 0.061 0.013Coquitlam 1,263 3.0982 0.731 0.060 0.012
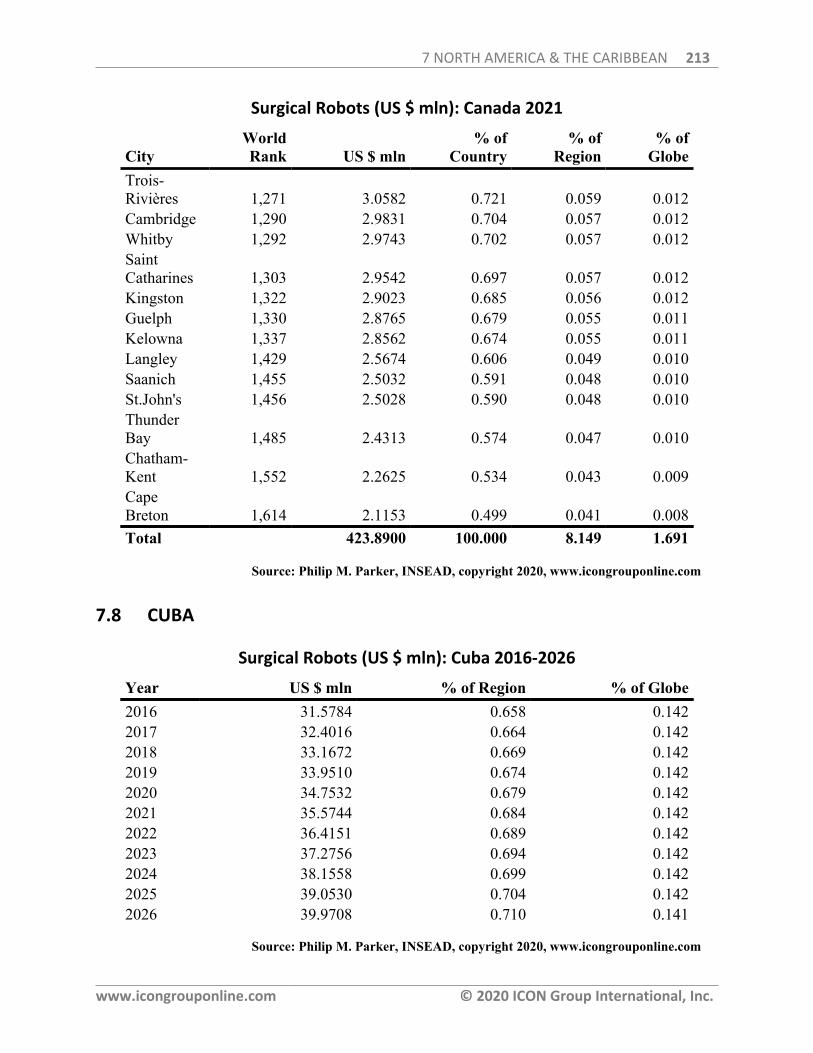
7 NORTH AMERICA & THE CARIBBEAN 213
www.icongrouponline.com © 2020 ICON Group International, Inc.
Surgical Robots (US $ mln): Canada 2021
CityWorldRank US $ mln
% ofCountry
% ofRegion
% ofGlobe
Trois-Rivières 1,271 3.0582 0.721 0.059 0.012Cambridge 1,290 2.9831 0.704 0.057 0.012Whitby 1,292 2.9743 0.702 0.057 0.012SaintCatharines 1,303 2.9542 0.697 0.057 0.012Kingston 1,322 2.9023 0.685 0.056 0.012Guelph 1,330 2.8765 0.679 0.055 0.011Kelowna 1,337 2.8562 0.674 0.055 0.011Langley 1,429 2.5674 0.606 0.049 0.010Saanich 1,455 2.5032 0.591 0.048 0.010St.John's 1,456 2.5028 0.590 0.048 0.010ThunderBay 1,485 2.4313 0.574 0.047 0.010Chatham-Kent 1,552 2.2625 0.534 0.043 0.009CapeBreton 1,614 2.1153 0.499 0.041 0.008Total 423.8900 100.000 8.149 1.691
Source: Philip M. Parker, INSEAD, copyright 2020, www.icongrouponline.com
7.8 CUBA
Surgical Robots (US $ mln): Cuba 2016-2026
Year US $ mln % of Region % of Globe2016 31.5784 0.658 0.1422017 32.4016 0.664 0.1422018 33.1672 0.669 0.1422019 33.9510 0.674 0.1422020 34.7532 0.679 0.1422021 35.5744 0.684 0.1422022 36.4151 0.689 0.1422023 37.2756 0.694 0.1422024 38.1558 0.699 0.1422025 39.0530 0.704 0.1422026 39.9708 0.710 0.141
Source: Philip M. Parker, INSEAD, copyright 2020, www.icongrouponline.com
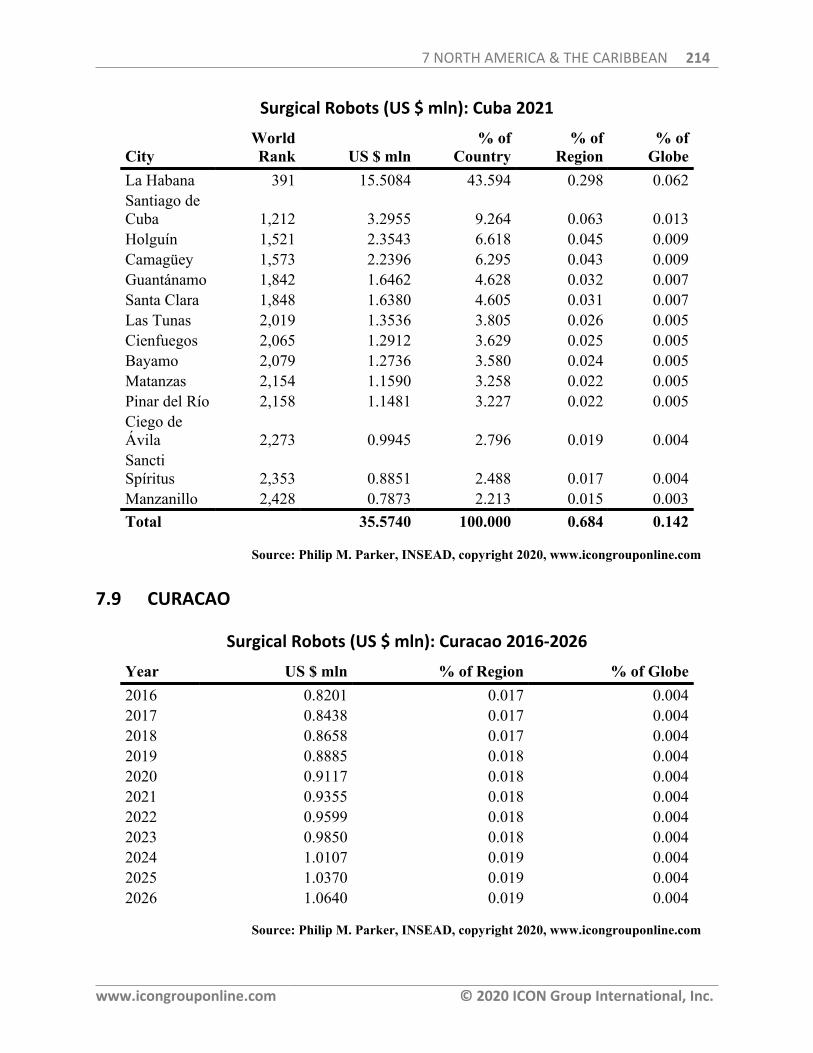
7 NORTH AMERICA & THE CARIBBEAN 214
www.icongrouponline.com © 2020 ICON Group International, Inc.
Surgical Robots (US $ mln): Cuba 2021
CityWorldRank US $ mln
% ofCountry
% ofRegion
% ofGlobe
La Habana 391 15.5084 43.594 0.298 0.062Santiago deCuba 1,212 3.2955 9.264 0.063 0.013Holguín 1,521 2.3543 6.618 0.045 0.009Camagüey 1,573 2.2396 6.295 0.043 0.009Guantánamo 1,842 1.6462 4.628 0.032 0.007Santa Clara 1,848 1.6380 4.605 0.031 0.007Las Tunas 2,019 1.3536 3.805 0.026 0.005Cienfuegos 2,065 1.2912 3.629 0.025 0.005Bayamo 2,079 1.2736 3.580 0.024 0.005Matanzas 2,154 1.1590 3.258 0.022 0.005Pinar del Río 2,158 1.1481 3.227 0.022 0.005Ciego deÁvila 2,273 0.9945 2.796 0.019 0.004SanctiSpíritus 2,353 0.8851 2.488 0.017 0.004Manzanillo 2,428 0.7873 2.213 0.015 0.003Total 35.5740 100.000 0.684 0.142
Source: Philip M. Parker, INSEAD, copyright 2020, www.icongrouponline.com
7.9 CURACAO
Surgical Robots (US $ mln): Curacao 2016-2026
Year US $ mln % of Region % of Globe2016 0.8201 0.017 0.0042017 0.8438 0.017 0.0042018 0.8658 0.017 0.0042019 0.8885 0.018 0.0042020 0.9117 0.018 0.0042021 0.9355 0.018 0.0042022 0.9599 0.018 0.0042023 0.9850 0.018 0.0042024 1.0107 0.019 0.0042025 1.0370 0.019 0.0042026 1.0640 0.019 0.004
Source: Philip M. Parker, INSEAD, copyright 2020, www.icongrouponline.com
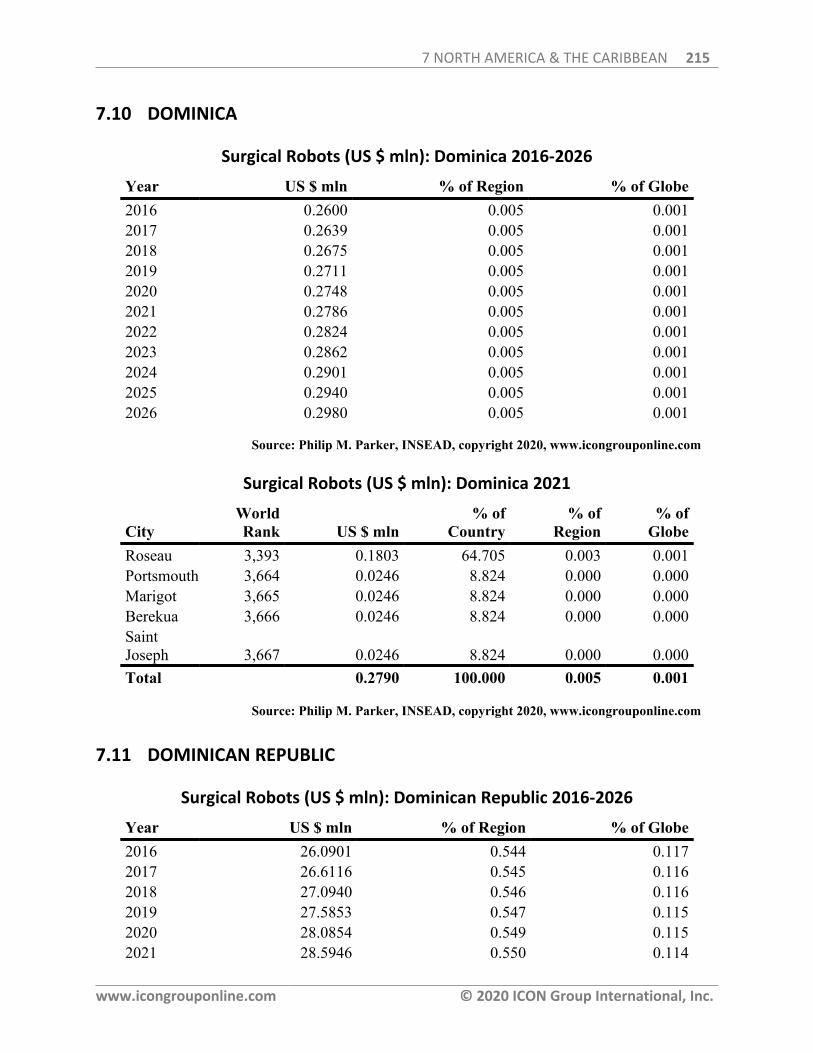
7 NORTH AMERICA & THE CARIBBEAN 215
www.icongrouponline.com © 2020 ICON Group International, Inc.
7.10 DOMINICA
Surgical Robots (US $ mln): Dominica 2016-2026
Year US $ mln % of Region % of Globe2016 0.2600 0.005 0.0012017 0.2639 0.005 0.0012018 0.2675 0.005 0.0012019 0.2711 0.005 0.0012020 0.2748 0.005 0.0012021 0.2786 0.005 0.0012022 0.2824 0.005 0.0012023 0.2862 0.005 0.0012024 0.2901 0.005 0.0012025 0.2940 0.005 0.0012026 0.2980 0.005 0.001
Source: Philip M. Parker, INSEAD, copyright 2020, www.icongrouponline.com
Surgical Robots (US $ mln): Dominica 2021
CityWorldRank US $ mln
% ofCountry
% ofRegion
% ofGlobe
Roseau 3,393 0.1803 64.705 0.003 0.001Portsmouth 3,664 0.0246 8.824 0.000 0.000Marigot 3,665 0.0246 8.824 0.000 0.000Berekua 3,666 0.0246 8.824 0.000 0.000SaintJoseph 3,667 0.0246 8.824 0.000 0.000Total 0.2790 100.000 0.005 0.001
Source: Philip M. Parker, INSEAD, copyright 2020, www.icongrouponline.com
7.11 DOMINICAN REPUBLIC
Surgical Robots (US $ mln): Dominican Republic 2016-2026
Year US $ mln % of Region % of Globe2016 26.0901 0.544 0.1172017 26.6116 0.545 0.1162018 27.0940 0.546 0.1162019 27.5853 0.547 0.1152020 28.0854 0.549 0.1152021 28.5946 0.550 0.114
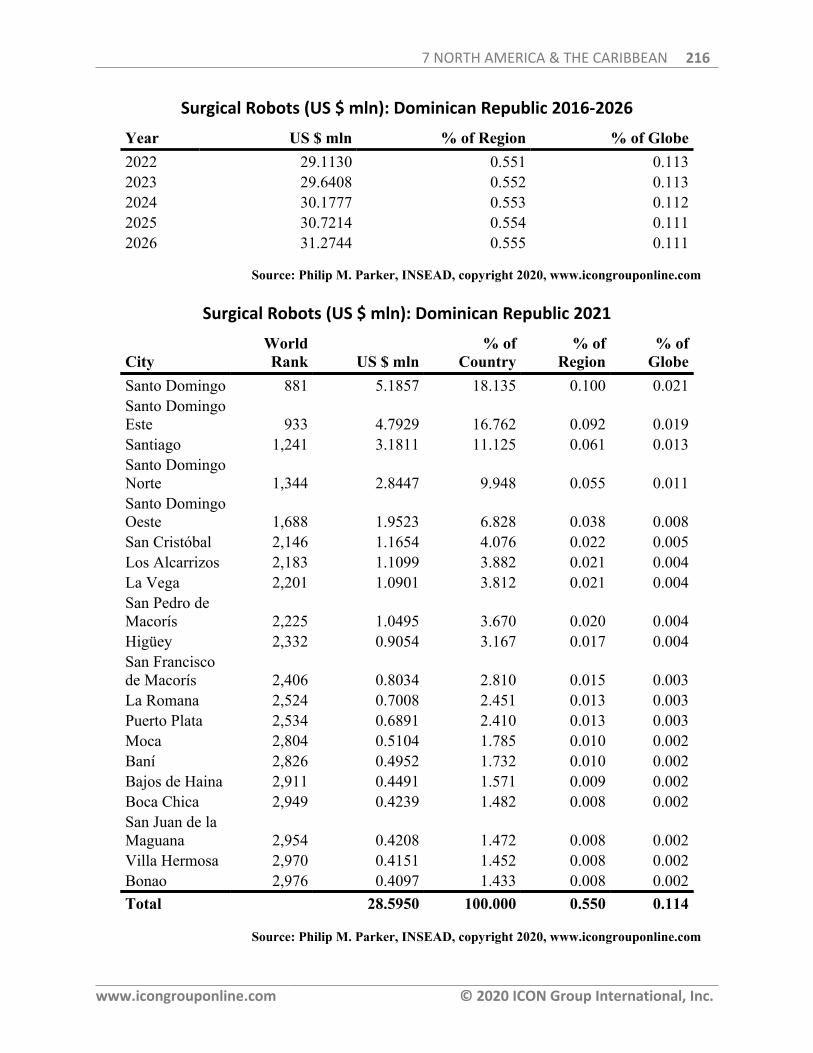
7 NORTH AMERICA & THE CARIBBEAN 216
www.icongrouponline.com © 2020 ICON Group International, Inc.
Surgical Robots (US $ mln): Dominican Republic 2016-2026
Year US $ mln % of Region % of Globe2022 29.1130 0.551 0.1132023 29.6408 0.552 0.1132024 30.1777 0.553 0.1122025 30.7214 0.554 0.1112026 31.2744 0.555 0.111
Source: Philip M. Parker, INSEAD, copyright 2020, www.icongrouponline.com
Surgical Robots (US $ mln): Dominican Republic 2021
CityWorldRank US $ mln
% ofCountry
% ofRegion
% ofGlobe
Santo Domingo 881 5.1857 18.135 0.100 0.021Santo DomingoEste 933 4.7929 16.762 0.092 0.019Santiago 1,241 3.1811 11.125 0.061 0.013Santo DomingoNorte 1,344 2.8447 9.948 0.055 0.011Santo DomingoOeste 1,688 1.9523 6.828 0.038 0.008San Cristóbal 2,146 1.1654 4.076 0.022 0.005Los Alcarrizos 2,183 1.1099 3.882 0.021 0.004La Vega 2,201 1.0901 3.812 0.021 0.004San Pedro deMacorís 2,225 1.0495 3.670 0.020 0.004Higüey 2,332 0.9054 3.167 0.017 0.004San Franciscode Macorís 2,406 0.8034 2.810 0.015 0.003La Romana 2,524 0.7008 2.451 0.013 0.003Puerto Plata 2,534 0.6891 2.410 0.013 0.003Moca 2,804 0.5104 1.785 0.010 0.002Baní 2,826 0.4952 1.732 0.010 0.002Bajos de Haina 2,911 0.4491 1.571 0.009 0.002Boca Chica 2,949 0.4239 1.482 0.008 0.002San Juan de laMaguana 2,954 0.4208 1.472 0.008 0.002Villa Hermosa 2,970 0.4151 1.452 0.008 0.002Bonao 2,976 0.4097 1.433 0.008 0.002Total 28.5950 100.000 0.550 0.114
Source: Philip M. Parker, INSEAD, copyright 2020, www.icongrouponline.com
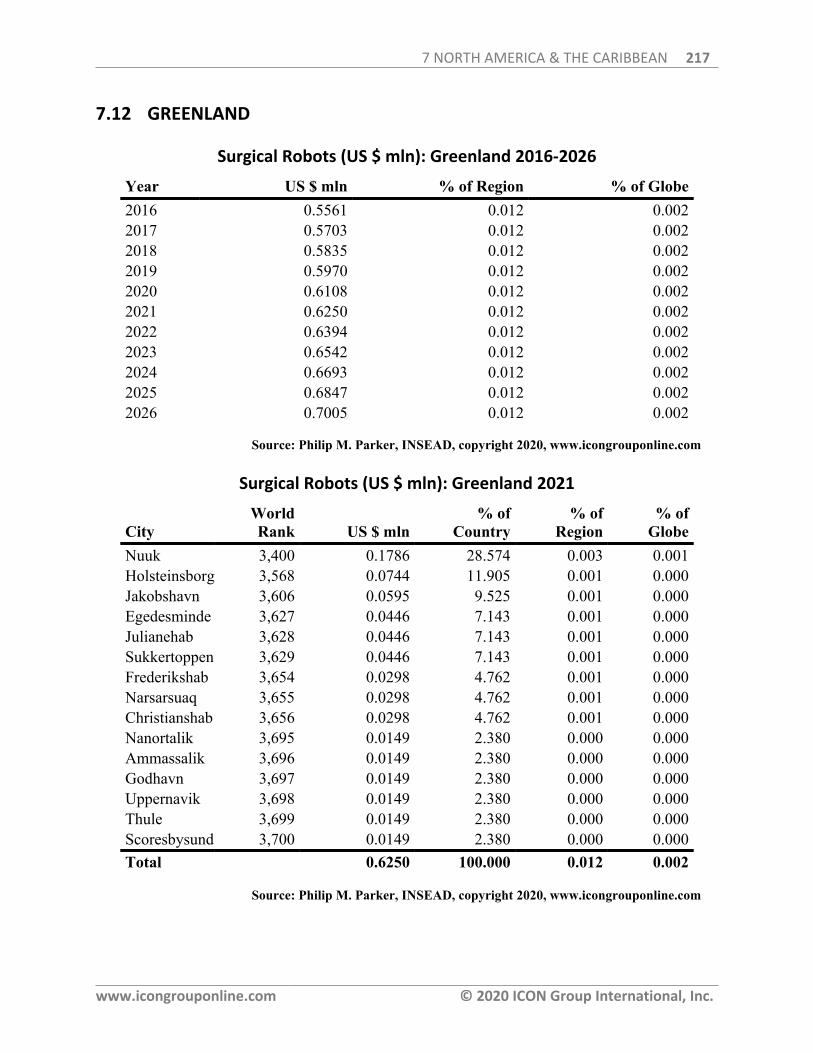
7 NORTH AMERICA & THE CARIBBEAN 217
www.icongrouponline.com © 2020 ICON Group International, Inc.
7.12 GREENLAND
Surgical Robots (US $ mln): Greenland 2016-2026
Year US $ mln % of Region % of Globe2016 0.5561 0.012 0.0022017 0.5703 0.012 0.0022018 0.5835 0.012 0.0022019 0.5970 0.012 0.0022020 0.6108 0.012 0.0022021 0.6250 0.012 0.0022022 0.6394 0.012 0.0022023 0.6542 0.012 0.0022024 0.6693 0.012 0.0022025 0.6847 0.012 0.0022026 0.7005 0.012 0.002
Source: Philip M. Parker, INSEAD, copyright 2020, www.icongrouponline.com
Surgical Robots (US $ mln): Greenland 2021
CityWorldRank US $ mln
% ofCountry
% ofRegion
% ofGlobe
Nuuk 3,400 0.1786 28.574 0.003 0.001Holsteinsborg 3,568 0.0744 11.905 0.001 0.000Jakobshavn 3,606 0.0595 9.525 0.001 0.000Egedesminde 3,627 0.0446 7.143 0.001 0.000Julianehab 3,628 0.0446 7.143 0.001 0.000Sukkertoppen 3,629 0.0446 7.143 0.001 0.000Frederikshab 3,654 0.0298 4.762 0.001 0.000Narsarsuaq 3,655 0.0298 4.762 0.001 0.000Christianshab 3,656 0.0298 4.762 0.001 0.000Nanortalik 3,695 0.0149 2.380 0.000 0.000Ammassalik 3,696 0.0149 2.380 0.000 0.000Godhavn 3,697 0.0149 2.380 0.000 0.000Uppernavik 3,698 0.0149 2.380 0.000 0.000Thule 3,699 0.0149 2.380 0.000 0.000Scoresbysund 3,700 0.0149 2.380 0.000 0.000Total 0.6250 100.000 0.012 0.002
Source: Philip M. Parker, INSEAD, copyright 2020, www.icongrouponline.com

7 NORTH AMERICA & THE CARIBBEAN 218
www.icongrouponline.com © 2020 ICON Group International, Inc.
7.13 GRENADA
Surgical Robots (US $ mln): Grenada 2016-2026
Year US $ mln % of Region % of Globe2016 0.3724 0.008 0.0022017 0.3774 0.008 0.0022018 0.3820 0.008 0.0022019 0.3866 0.008 0.0022020 0.3913 0.008 0.0022021 0.3960 0.008 0.0022022 0.4008 0.008 0.0022023 0.4057 0.008 0.0022024 0.4106 0.008 0.0022025 0.4156 0.007 0.0022026 0.4205 0.007 0.001
Source: Philip M. Parker, INSEAD, copyright 2020, www.icongrouponline.com
Surgical Robots (US $ mln): Grenada 2021
CityWorldRank US $ mln
% ofCountry
% ofRegion
% ofGlobe
SaintGeorge's 3,155 0.3168 80.000 0.006 0.001Gouyave 3,552 0.0792 20.000 0.002 0.000Total 0.3960 100.000 0.008 0.002
Source: Philip M. Parker, INSEAD, copyright 2020, www.icongrouponline.com
7.15 HAITI
Surgical Robots (US $ mln): Haiti 2016-2026
Year US $ mln % of Region % of Globe2016 3.5121 0.073 0.0162017 3.6095 0.074 0.0162018 3.7002 0.075 0.0162019 3.7932 0.075 0.0162020 3.8885 0.076 0.0162021 3.9862 0.077 0.0162022 4.0864 0.077 0.0162023 4.1891 0.078 0.016
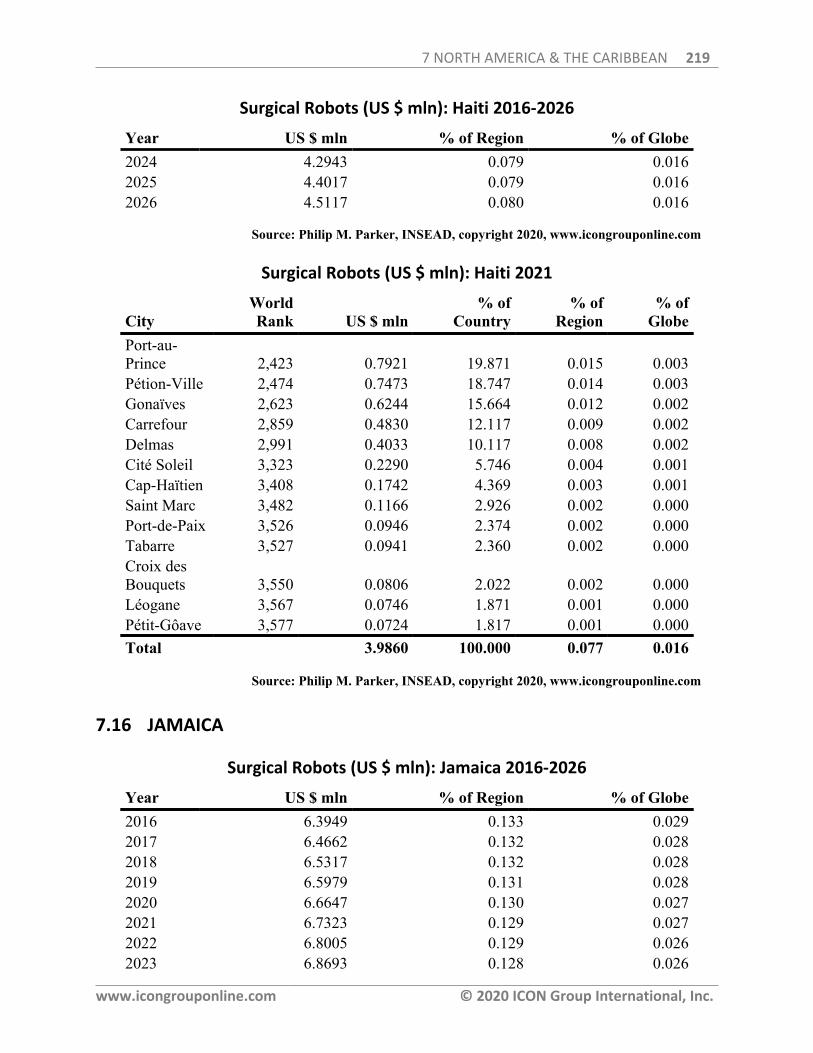
7 NORTH AMERICA & THE CARIBBEAN 219
www.icongrouponline.com © 2020 ICON Group International, Inc.
Surgical Robots (US $ mln): Haiti 2016-2026
Year US $ mln % of Region % of Globe2024 4.2943 0.079 0.0162025 4.4017 0.079 0.0162026 4.5117 0.080 0.016
Source: Philip M. Parker, INSEAD, copyright 2020, www.icongrouponline.com
Surgical Robots (US $ mln): Haiti 2021
CityWorldRank US $ mln
% ofCountry
% ofRegion
% ofGlobe
Port-au-Prince 2,423 0.7921 19.871 0.015 0.003Pétion-Ville 2,474 0.7473 18.747 0.014 0.003Gonaïves 2,623 0.6244 15.664 0.012 0.002Carrefour 2,859 0.4830 12.117 0.009 0.002Delmas 2,991 0.4033 10.117 0.008 0.002Cité Soleil 3,323 0.2290 5.746 0.004 0.001Cap-Haïtien 3,408 0.1742 4.369 0.003 0.001Saint Marc 3,482 0.1166 2.926 0.002 0.000Port-de-Paix 3,526 0.0946 2.374 0.002 0.000Tabarre 3,527 0.0941 2.360 0.002 0.000Croix desBouquets 3,550 0.0806 2.022 0.002 0.000Léogane 3,567 0.0746 1.871 0.001 0.000Pétit-Gôave 3,577 0.0724 1.817 0.001 0.000Total 3.9860 100.000 0.077 0.016
Source: Philip M. Parker, INSEAD, copyright 2020, www.icongrouponline.com
7.16 JAMAICA
Surgical Robots (US $ mln): Jamaica 2016-2026
Year US $ mln % of Region % of Globe2016 6.3949 0.133 0.0292017 6.4662 0.132 0.0282018 6.5317 0.132 0.0282019 6.5979 0.131 0.0282020 6.6647 0.130 0.0272021 6.7323 0.129 0.0272022 6.8005 0.129 0.0262023 6.8693 0.128 0.026
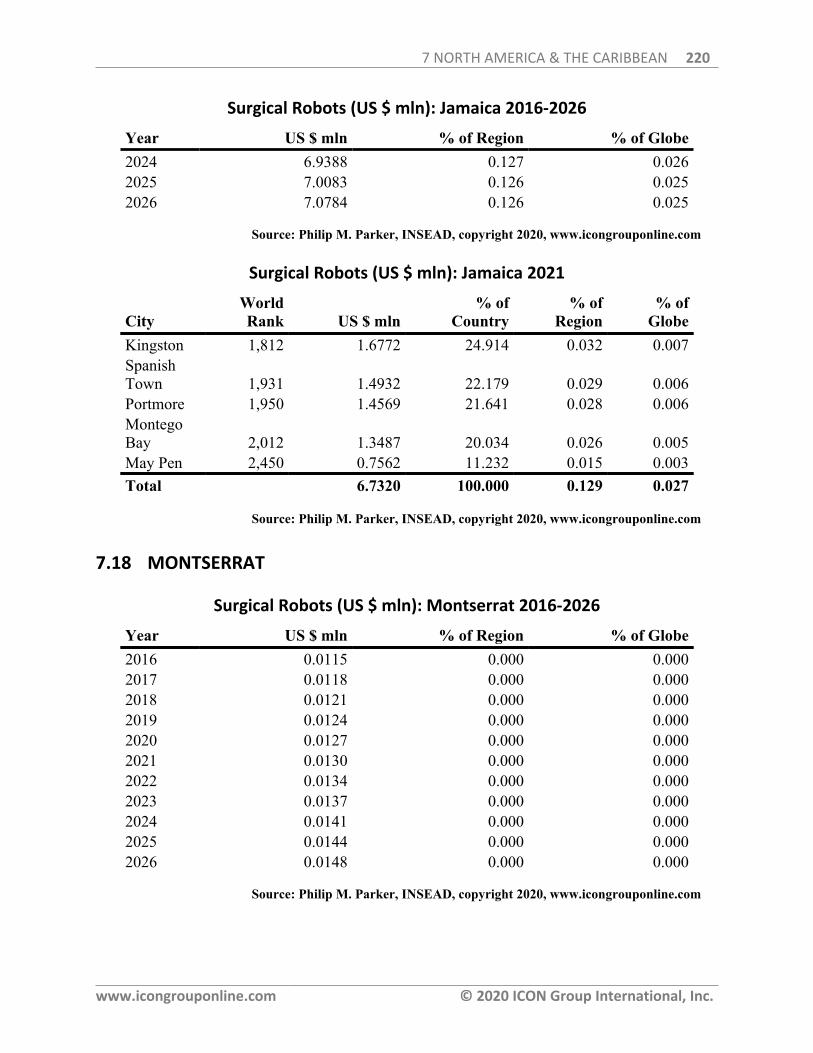
7 NORTH AMERICA & THE CARIBBEAN 220
www.icongrouponline.com © 2020 ICON Group International, Inc.
Surgical Robots (US $ mln): Jamaica 2016-2026
Year US $ mln % of Region % of Globe2024 6.9388 0.127 0.0262025 7.0083 0.126 0.0252026 7.0784 0.126 0.025
Source: Philip M. Parker, INSEAD, copyright 2020, www.icongrouponline.com
Surgical Robots (US $ mln): Jamaica 2021
CityWorldRank US $ mln
% ofCountry
% ofRegion
% ofGlobe
Kingston 1,812 1.6772 24.914 0.032 0.007SpanishTown 1,931 1.4932 22.179 0.029 0.006Portmore 1,950 1.4569 21.641 0.028 0.006MontegoBay 2,012 1.3487 20.034 0.026 0.005May Pen 2,450 0.7562 11.232 0.015 0.003Total 6.7320 100.000 0.129 0.027
Source: Philip M. Parker, INSEAD, copyright 2020, www.icongrouponline.com
7.18 MONTSERRAT
Surgical Robots (US $ mln): Montserrat 2016-2026
Year US $ mln % of Region % of Globe2016 0.0115 0.000 0.0002017 0.0118 0.000 0.0002018 0.0121 0.000 0.0002019 0.0124 0.000 0.0002020 0.0127 0.000 0.0002021 0.0130 0.000 0.0002022 0.0134 0.000 0.0002023 0.0137 0.000 0.0002024 0.0141 0.000 0.0002025 0.0144 0.000 0.0002026 0.0148 0.000 0.000
Source: Philip M. Parker, INSEAD, copyright 2020, www.icongrouponline.com
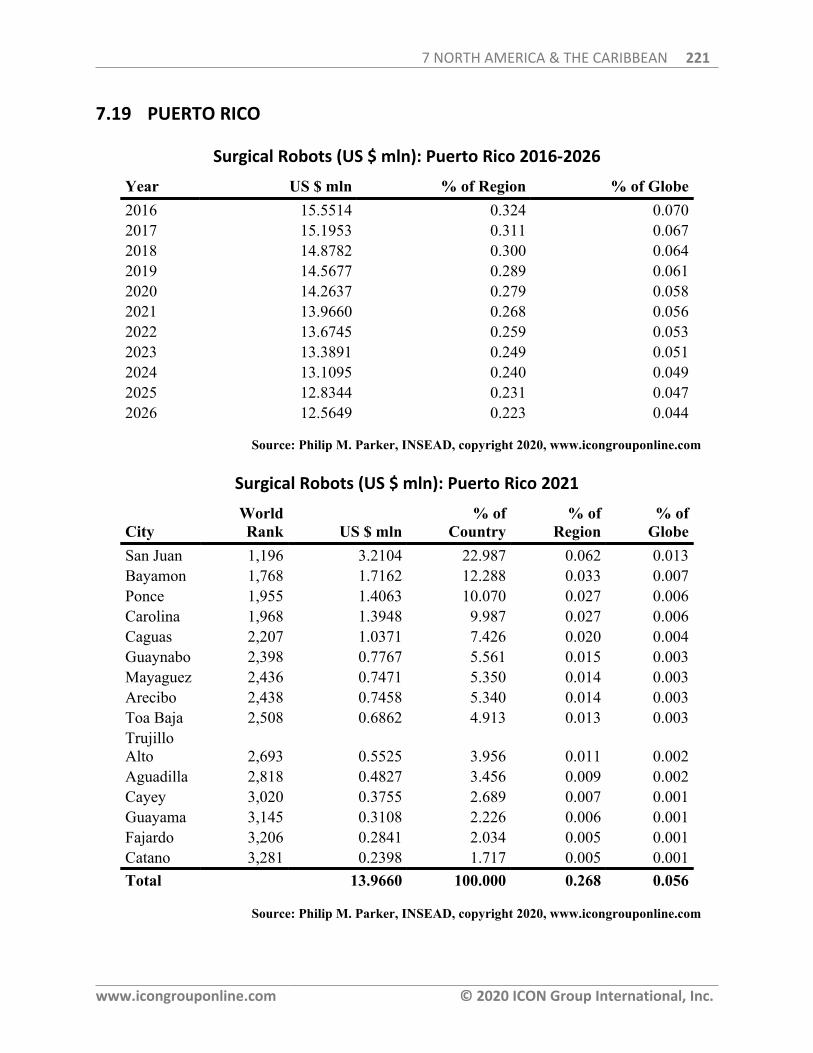
7 NORTH AMERICA & THE CARIBBEAN 221
www.icongrouponline.com © 2020 ICON Group International, Inc.
7.19 PUERTO RICO
Surgical Robots (US $ mln): Puerto Rico 2016-2026
Year US $ mln % of Region % of Globe2016 15.5514 0.324 0.0702017 15.1953 0.311 0.0672018 14.8782 0.300 0.0642019 14.5677 0.289 0.0612020 14.2637 0.279 0.0582021 13.9660 0.268 0.0562022 13.6745 0.259 0.0532023 13.3891 0.249 0.0512024 13.1095 0.240 0.0492025 12.8344 0.231 0.0472026 12.5649 0.223 0.044
Source: Philip M. Parker, INSEAD, copyright 2020, www.icongrouponline.com
Surgical Robots (US $ mln): Puerto Rico 2021
CityWorldRank US $ mln
% ofCountry
% ofRegion
% ofGlobe
San Juan 1,196 3.2104 22.987 0.062 0.013Bayamon 1,768 1.7162 12.288 0.033 0.007Ponce 1,955 1.4063 10.070 0.027 0.006Carolina 1,968 1.3948 9.987 0.027 0.006Caguas 2,207 1.0371 7.426 0.020 0.004Guaynabo 2,398 0.7767 5.561 0.015 0.003Mayaguez 2,436 0.7471 5.350 0.014 0.003Arecibo 2,438 0.7458 5.340 0.014 0.003Toa Baja 2,508 0.6862 4.913 0.013 0.003TrujilloAlto 2,693 0.5525 3.956 0.011 0.002Aguadilla 2,818 0.4827 3.456 0.009 0.002Cayey 3,020 0.3755 2.689 0.007 0.001Guayama 3,145 0.3108 2.226 0.006 0.001Fajardo 3,206 0.2841 2.034 0.005 0.001Catano 3,281 0.2398 1.717 0.005 0.001Total 13.9660 100.000 0.268 0.056
Source: Philip M. Parker, INSEAD, copyright 2020, www.icongrouponline.com
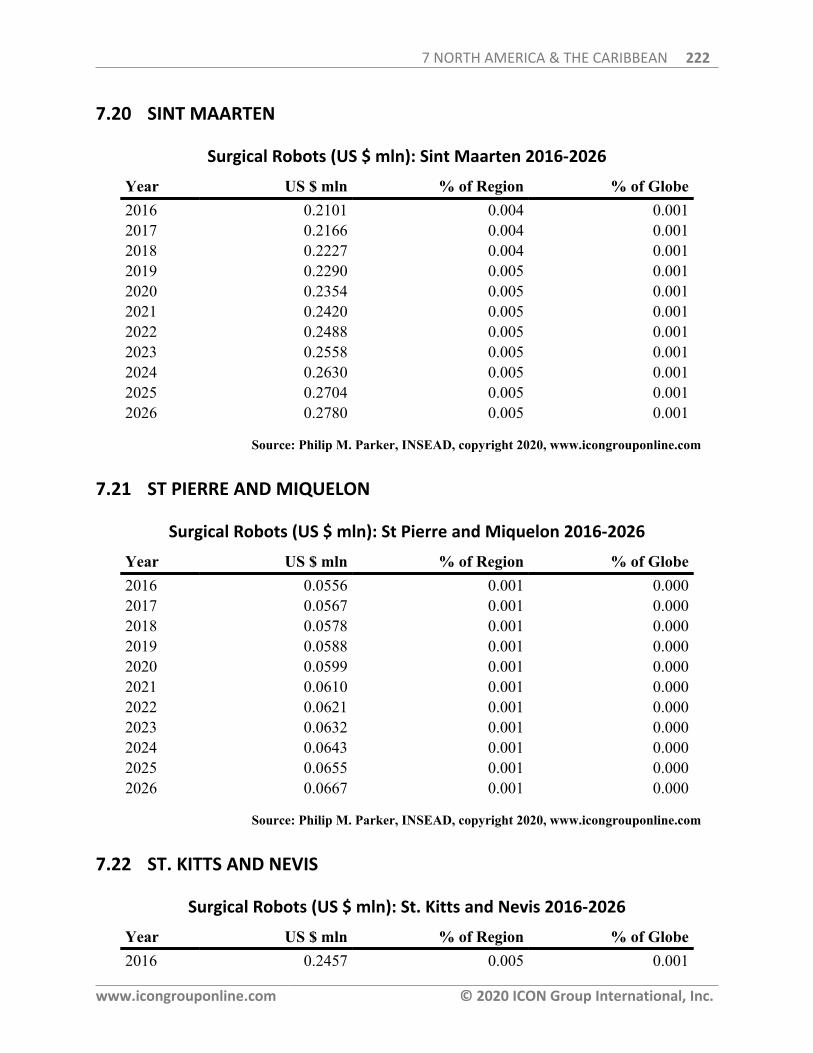
7 NORTH AMERICA & THE CARIBBEAN 222
www.icongrouponline.com © 2020 ICON Group International, Inc.
7.20 SINT MAARTEN
Surgical Robots (US $ mln): Sint Maarten 2016-2026
Year US $ mln % of Region % of Globe2016 0.2101 0.004 0.0012017 0.2166 0.004 0.0012018 0.2227 0.004 0.0012019 0.2290 0.005 0.0012020 0.2354 0.005 0.0012021 0.2420 0.005 0.0012022 0.2488 0.005 0.0012023 0.2558 0.005 0.0012024 0.2630 0.005 0.0012025 0.2704 0.005 0.0012026 0.2780 0.005 0.001
Source: Philip M. Parker, INSEAD, copyright 2020, www.icongrouponline.com
7.21 ST PIERRE AND MIQUELON
Surgical Robots (US $ mln): St Pierre and Miquelon 2016-2026
Year US $ mln % of Region % of Globe2016 0.0556 0.001 0.0002017 0.0567 0.001 0.0002018 0.0578 0.001 0.0002019 0.0588 0.001 0.0002020 0.0599 0.001 0.0002021 0.0610 0.001 0.0002022 0.0621 0.001 0.0002023 0.0632 0.001 0.0002024 0.0643 0.001 0.0002025 0.0655 0.001 0.0002026 0.0667 0.001 0.000
Source: Philip M. Parker, INSEAD, copyright 2020, www.icongrouponline.com
7.22 ST. KITTS AND NEVIS
Surgical Robots (US $ mln): St. Kitts and Nevis 2016-2026
Year US $ mln % of Region % of Globe2016 0.2457 0.005 0.001
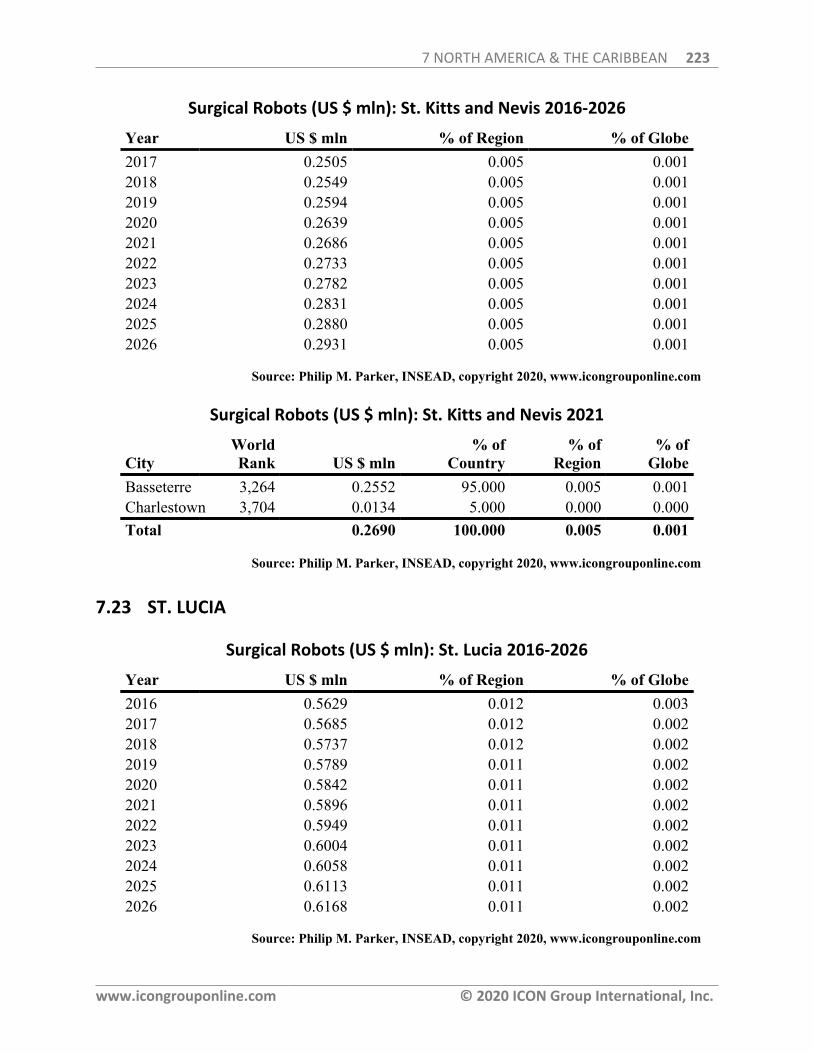
7 NORTH AMERICA & THE CARIBBEAN 223
www.icongrouponline.com © 2020 ICON Group International, Inc.
Surgical Robots (US $ mln): St. Kitts and Nevis 2016-2026
Year US $ mln % of Region % of Globe2017 0.2505 0.005 0.0012018 0.2549 0.005 0.0012019 0.2594 0.005 0.0012020 0.2639 0.005 0.0012021 0.2686 0.005 0.0012022 0.2733 0.005 0.0012023 0.2782 0.005 0.0012024 0.2831 0.005 0.0012025 0.2880 0.005 0.0012026 0.2931 0.005 0.001
Source: Philip M. Parker, INSEAD, copyright 2020, www.icongrouponline.com
Surgical Robots (US $ mln): St. Kitts and Nevis 2021
CityWorldRank US $ mln
% ofCountry
% ofRegion
% ofGlobe
Basseterre 3,264 0.2552 95.000 0.005 0.001Charlestown 3,704 0.0134 5.000 0.000 0.000Total 0.2690 100.000 0.005 0.001
Source: Philip M. Parker, INSEAD, copyright 2020, www.icongrouponline.com
7.23 ST. LUCIA
Surgical Robots (US $ mln): St. Lucia 2016-2026
Year US $ mln % of Region % of Globe2016 0.5629 0.012 0.0032017 0.5685 0.012 0.0022018 0.5737 0.012 0.0022019 0.5789 0.011 0.0022020 0.5842 0.011 0.0022021 0.5896 0.011 0.0022022 0.5949 0.011 0.0022023 0.6004 0.011 0.0022024 0.6058 0.011 0.0022025 0.6113 0.011 0.0022026 0.6168 0.011 0.002
Source: Philip M. Parker, INSEAD, copyright 2020, www.icongrouponline.com
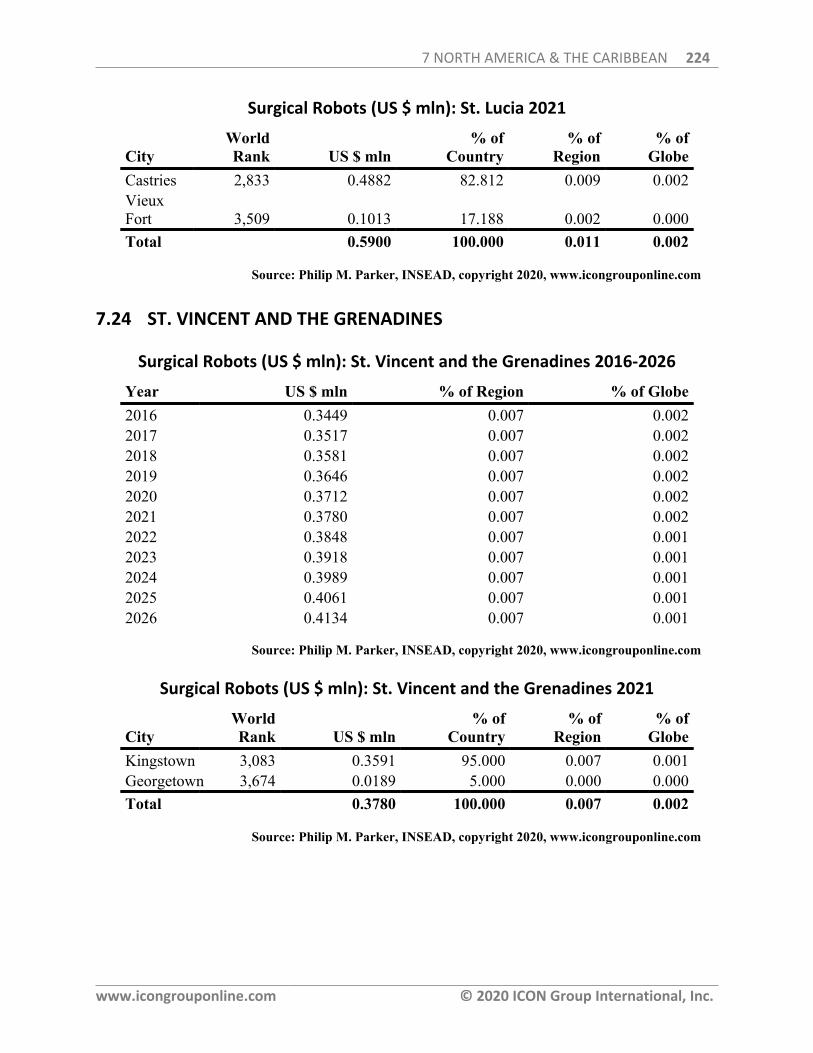
7 NORTH AMERICA & THE CARIBBEAN 224
www.icongrouponline.com © 2020 ICON Group International, Inc.
Surgical Robots (US $ mln): St. Lucia 2021
CityWorldRank US $ mln
% ofCountry
% ofRegion
% ofGlobe
Castries 2,833 0.4882 82.812 0.009 0.002VieuxFort 3,509 0.1013 17.188 0.002 0.000Total 0.5900 100.000 0.011 0.002
Source: Philip M. Parker, INSEAD, copyright 2020, www.icongrouponline.com
7.24 ST. VINCENT AND THE GRENADINES
Surgical Robots (US $ mln): St. Vincent and the Grenadines 2016-2026
Year US $ mln % of Region % of Globe2016 0.3449 0.007 0.0022017 0.3517 0.007 0.0022018 0.3581 0.007 0.0022019 0.3646 0.007 0.0022020 0.3712 0.007 0.0022021 0.3780 0.007 0.0022022 0.3848 0.007 0.0012023 0.3918 0.007 0.0012024 0.3989 0.007 0.0012025 0.4061 0.007 0.0012026 0.4134 0.007 0.001
Source: Philip M. Parker, INSEAD, copyright 2020, www.icongrouponline.com
Surgical Robots (US $ mln): St. Vincent and the Grenadines 2021
CityWorldRank US $ mln
% ofCountry
% ofRegion
% ofGlobe
Kingstown 3,083 0.3591 95.000 0.007 0.001Georgetown 3,674 0.0189 5.000 0.000 0.000Total 0.3780 100.000 0.007 0.002
Source: Philip M. Parker, INSEAD, copyright 2020, www.icongrouponline.com
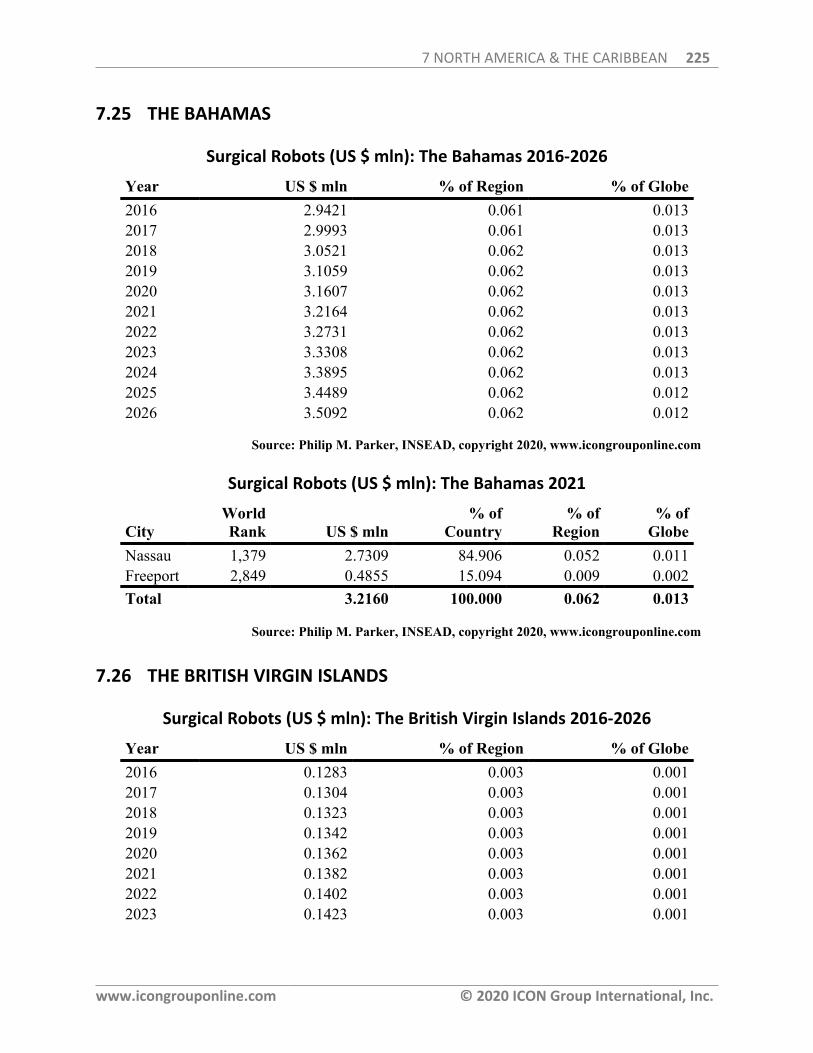
7 NORTH AMERICA & THE CARIBBEAN 225
www.icongrouponline.com © 2020 ICON Group International, Inc.
7.25 THE BAHAMAS
Surgical Robots (US $ mln): The Bahamas 2016-2026
Year US $ mln % of Region % of Globe2016 2.9421 0.061 0.0132017 2.9993 0.061 0.0132018 3.0521 0.062 0.0132019 3.1059 0.062 0.0132020 3.1607 0.062 0.0132021 3.2164 0.062 0.0132022 3.2731 0.062 0.0132023 3.3308 0.062 0.0132024 3.3895 0.062 0.0132025 3.4489 0.062 0.0122026 3.5092 0.062 0.012
Source: Philip M. Parker, INSEAD, copyright 2020, www.icongrouponline.com
Surgical Robots (US $ mln): The Bahamas 2021
CityWorldRank US $ mln
% ofCountry
% ofRegion
% ofGlobe
Nassau 1,379 2.7309 84.906 0.052 0.011Freeport 2,849 0.4855 15.094 0.009 0.002Total 3.2160 100.000 0.062 0.013
Source: Philip M. Parker, INSEAD, copyright 2020, www.icongrouponline.com
7.26 THE BRITISH VIRGIN ISLANDS
Surgical Robots (US $ mln): The British Virgin Islands 2016-2026
Year US $ mln % of Region % of Globe2016 0.1283 0.003 0.0012017 0.1304 0.003 0.0012018 0.1323 0.003 0.0012019 0.1342 0.003 0.0012020 0.1362 0.003 0.0012021 0.1382 0.003 0.0012022 0.1402 0.003 0.0012023 0.1423 0.003 0.001
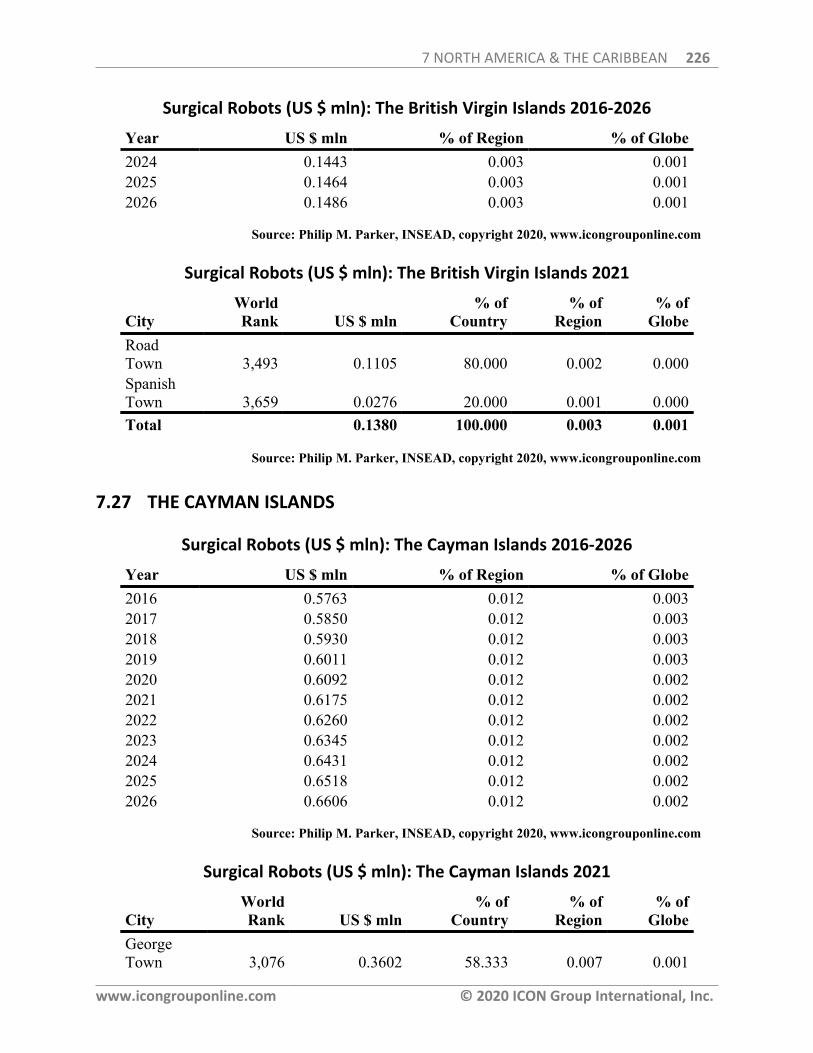
7 NORTH AMERICA & THE CARIBBEAN 226
www.icongrouponline.com © 2020 ICON Group International, Inc.
Surgical Robots (US $ mln): The British Virgin Islands 2016-2026
Year US $ mln % of Region % of Globe2024 0.1443 0.003 0.0012025 0.1464 0.003 0.0012026 0.1486 0.003 0.001
Source: Philip M. Parker, INSEAD, copyright 2020, www.icongrouponline.com
Surgical Robots (US $ mln): The British Virgin Islands 2021
CityWorldRank US $ mln
% ofCountry
% ofRegion
% ofGlobe
RoadTown 3,493 0.1105 80.000 0.002 0.000SpanishTown 3,659 0.0276 20.000 0.001 0.000Total 0.1380 100.000 0.003 0.001
Source: Philip M. Parker, INSEAD, copyright 2020, www.icongrouponline.com
7.27 THE CAYMAN ISLANDS
Surgical Robots (US $ mln): The Cayman Islands 2016-2026
Year US $ mln % of Region % of Globe2016 0.5763 0.012 0.0032017 0.5850 0.012 0.0032018 0.5930 0.012 0.0032019 0.6011 0.012 0.0032020 0.6092 0.012 0.0022021 0.6175 0.012 0.0022022 0.6260 0.012 0.0022023 0.6345 0.012 0.0022024 0.6431 0.012 0.0022025 0.6518 0.012 0.0022026 0.6606 0.012 0.002
Source: Philip M. Parker, INSEAD, copyright 2020, www.icongrouponline.com
Surgical Robots (US $ mln): The Cayman Islands 2021
CityWorldRank US $ mln
% ofCountry
% ofRegion
% ofGlobe
GeorgeTown 3,076 0.3602 58.333 0.007 0.001
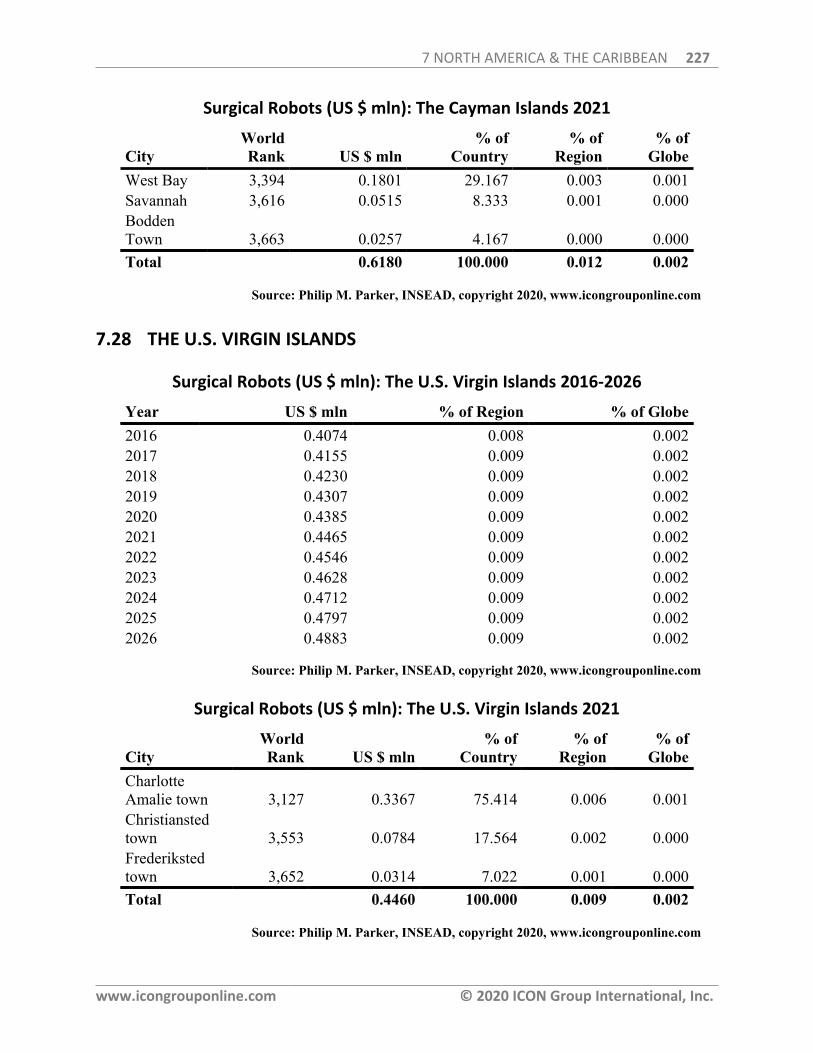
7 NORTH AMERICA & THE CARIBBEAN 227
www.icongrouponline.com © 2020 ICON Group International, Inc.
Surgical Robots (US $ mln): The Cayman Islands 2021
CityWorldRank US $ mln
% ofCountry
% ofRegion
% ofGlobe
West Bay 3,394 0.1801 29.167 0.003 0.001Savannah 3,616 0.0515 8.333 0.001 0.000BoddenTown 3,663 0.0257 4.167 0.000 0.000Total 0.6180 100.000 0.012 0.002
Source: Philip M. Parker, INSEAD, copyright 2020, www.icongrouponline.com
7.28 THE U.S. VIRGIN ISLANDS
Surgical Robots (US $ mln): The U.S. Virgin Islands 2016-2026
Year US $ mln % of Region % of Globe2016 0.4074 0.008 0.0022017 0.4155 0.009 0.0022018 0.4230 0.009 0.0022019 0.4307 0.009 0.0022020 0.4385 0.009 0.0022021 0.4465 0.009 0.0022022 0.4546 0.009 0.0022023 0.4628 0.009 0.0022024 0.4712 0.009 0.0022025 0.4797 0.009 0.0022026 0.4883 0.009 0.002
Source: Philip M. Parker, INSEAD, copyright 2020, www.icongrouponline.com
Surgical Robots (US $ mln): The U.S. Virgin Islands 2021
CityWorldRank US $ mln
% ofCountry
% ofRegion
% ofGlobe
CharlotteAmalie town 3,127 0.3367 75.414 0.006 0.001Christianstedtown 3,553 0.0784 17.564 0.002 0.000Frederikstedtown 3,652 0.0314 7.022 0.001 0.000Total 0.4460 100.000 0.009 0.002
Source: Philip M. Parker, INSEAD, copyright 2020, www.icongrouponline.com
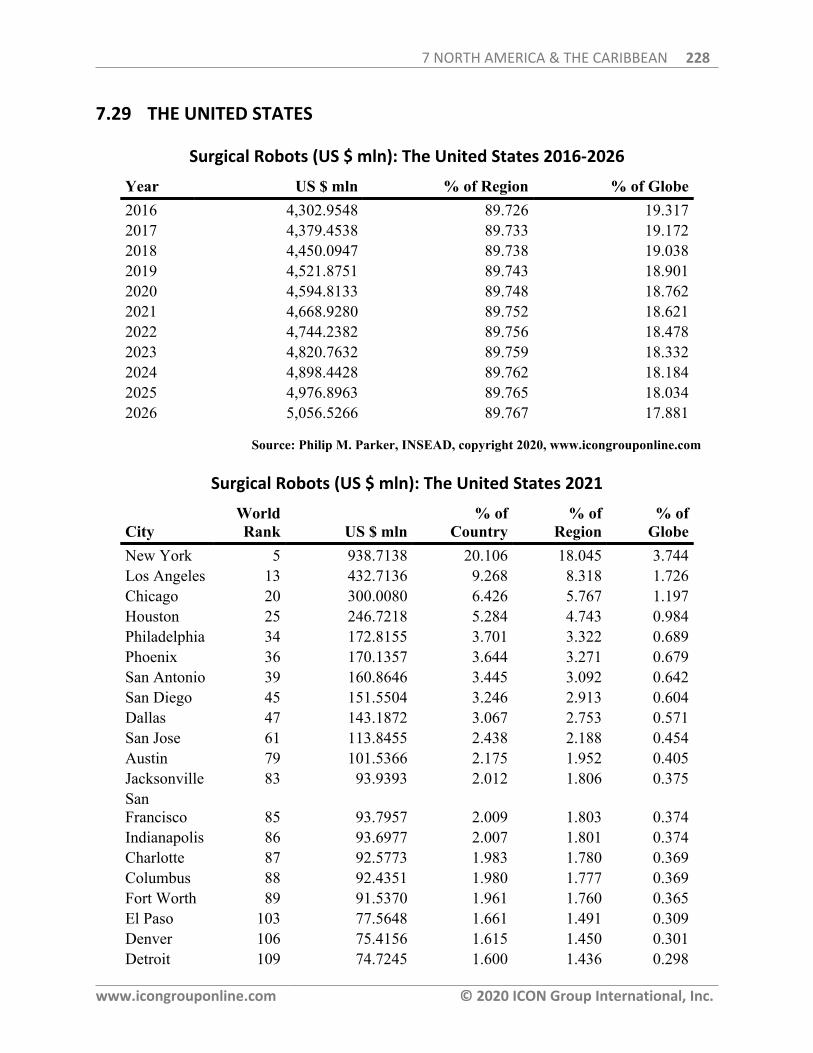
7 NORTH AMERICA & THE CARIBBEAN 228
www.icongrouponline.com © 2020 ICON Group International, Inc.
7.29 THE UNITED STATES
Surgical Robots (US $ mln): The United States 2016-2026
Year US $ mln % of Region % of Globe2016 4,302.9548 89.726 19.3172017 4,379.4538 89.733 19.1722018 4,450.0947 89.738 19.0382019 4,521.8751 89.743 18.9012020 4,594.8133 89.748 18.7622021 4,668.9280 89.752 18.6212022 4,744.2382 89.756 18.4782023 4,820.7632 89.759 18.3322024 4,898.4428 89.762 18.1842025 4,976.8963 89.765 18.0342026 5,056.5266 89.767 17.881
Source: Philip M. Parker, INSEAD, copyright 2020, www.icongrouponline.com
Surgical Robots (US $ mln): The United States 2021
CityWorldRank US $ mln
% ofCountry
% ofRegion
% ofGlobe
New York 5 938.7138 20.106 18.045 3.744Los Angeles 13 432.7136 9.268 8.318 1.726Chicago 20 300.0080 6.426 5.767 1.197Houston 25 246.7218 5.284 4.743 0.984Philadelphia 34 172.8155 3.701 3.322 0.689Phoenix 36 170.1357 3.644 3.271 0.679San Antonio 39 160.8646 3.445 3.092 0.642San Diego 45 151.5504 3.246 2.913 0.604Dallas 47 143.1872 3.067 2.753 0.571San Jose 61 113.8455 2.438 2.188 0.454Austin 79 101.5366 2.175 1.952 0.405Jacksonville 83 93.9393 2.012 1.806 0.375SanFrancisco 85 93.7957 2.009 1.803 0.374Indianapolis 86 93.6977 2.007 1.801 0.374Charlotte 87 92.5773 1.983 1.780 0.369Columbus 88 92.4351 1.980 1.777 0.369Fort Worth 89 91.5370 1.961 1.760 0.365El Paso 103 77.5648 1.661 1.491 0.309Denver 106 75.4156 1.615 1.450 0.301Detroit 109 74.7245 1.600 1.436 0.298
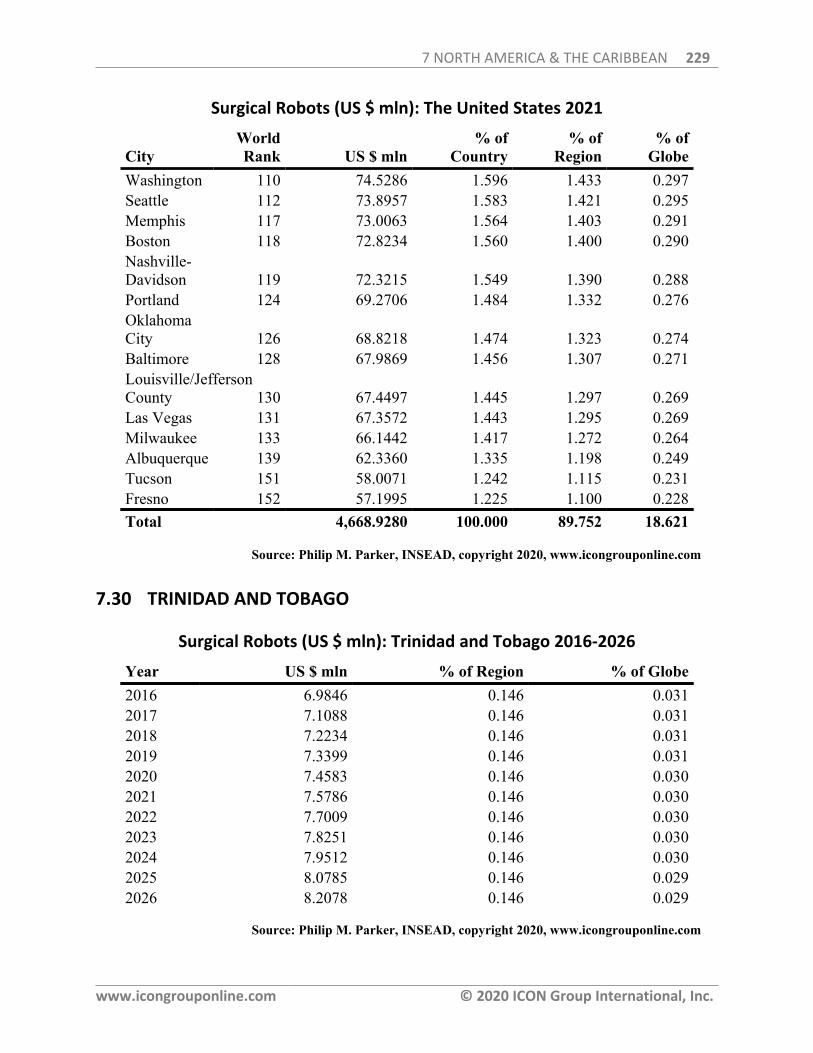
7 NORTH AMERICA & THE CARIBBEAN 229
www.icongrouponline.com © 2020 ICON Group International, Inc.
Surgical Robots (US $ mln): The United States 2021
CityWorldRank US $ mln
% ofCountry
% ofRegion
% ofGlobe
Washington 110 74.5286 1.596 1.433 0.297Seattle 112 73.8957 1.583 1.421 0.295Memphis 117 73.0063 1.564 1.403 0.291Boston 118 72.8234 1.560 1.400 0.290Nashville-Davidson 119 72.3215 1.549 1.390 0.288Portland 124 69.2706 1.484 1.332 0.276OklahomaCity 126 68.8218 1.474 1.323 0.274Baltimore 128 67.9869 1.456 1.307 0.271Louisville/JeffersonCounty 130 67.4497 1.445 1.297 0.269Las Vegas 131 67.3572 1.443 1.295 0.269Milwaukee 133 66.1442 1.417 1.272 0.264Albuquerque 139 62.3360 1.335 1.198 0.249Tucson 151 58.0071 1.242 1.115 0.231Fresno 152 57.1995 1.225 1.100 0.228Total 4,668.9280 100.000 89.752 18.621
Source: Philip M. Parker, INSEAD, copyright 2020, www.icongrouponline.com
7.30 TRINIDAD AND TOBAGO
Surgical Robots (US $ mln): Trinidad and Tobago 2016-2026
Year US $ mln % of Region % of Globe2016 6.9846 0.146 0.0312017 7.1088 0.146 0.0312018 7.2234 0.146 0.0312019 7.3399 0.146 0.0312020 7.4583 0.146 0.0302021 7.5786 0.146 0.0302022 7.7009 0.146 0.0302023 7.8251 0.146 0.0302024 7.9512 0.146 0.0302025 8.0785 0.146 0.0292026 8.2078 0.146 0.029
Source: Philip M. Parker, INSEAD, copyright 2020, www.icongrouponline.com
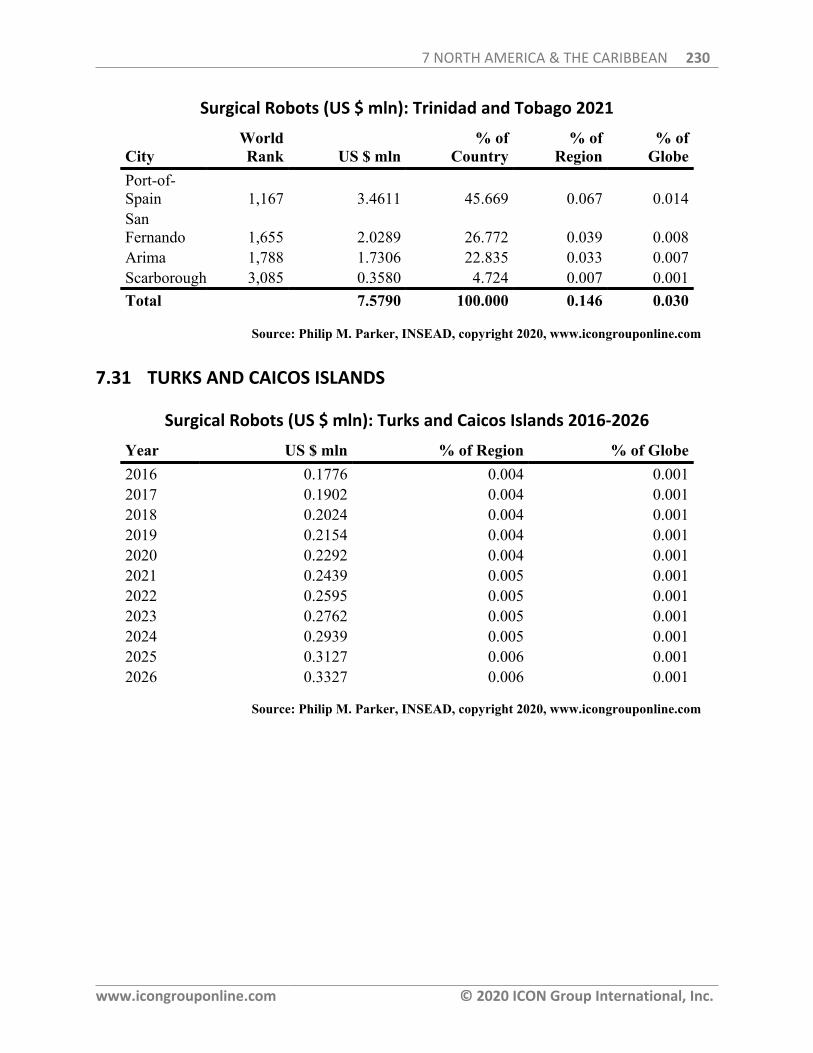
7 NORTH AMERICA & THE CARIBBEAN 230
www.icongrouponline.com © 2020 ICON Group International, Inc.
Surgical Robots (US $ mln): Trinidad and Tobago 2021
CityWorldRank US $ mln
% ofCountry
% ofRegion
% ofGlobe
Port-of-Spain 1,167 3.4611 45.669 0.067 0.014SanFernando 1,655 2.0289 26.772 0.039 0.008Arima 1,788 1.7306 22.835 0.033 0.007Scarborough 3,085 0.3580 4.724 0.007 0.001Total 7.5790 100.000 0.146 0.030
Source: Philip M. Parker, INSEAD, copyright 2020, www.icongrouponline.com
7.31 TURKS AND CAICOS ISLANDS
Surgical Robots (US $ mln): Turks and Caicos Islands 2016-2026
Year US $ mln % of Region % of Globe2016 0.1776 0.004 0.0012017 0.1902 0.004 0.0012018 0.2024 0.004 0.0012019 0.2154 0.004 0.0012020 0.2292 0.004 0.0012021 0.2439 0.005 0.0012022 0.2595 0.005 0.0012023 0.2762 0.005 0.0012024 0.2939 0.005 0.0012025 0.3127 0.006 0.0012026 0.3327 0.006 0.001
Source: Philip M. Parker, INSEAD, copyright 2020, www.icongrouponline.com
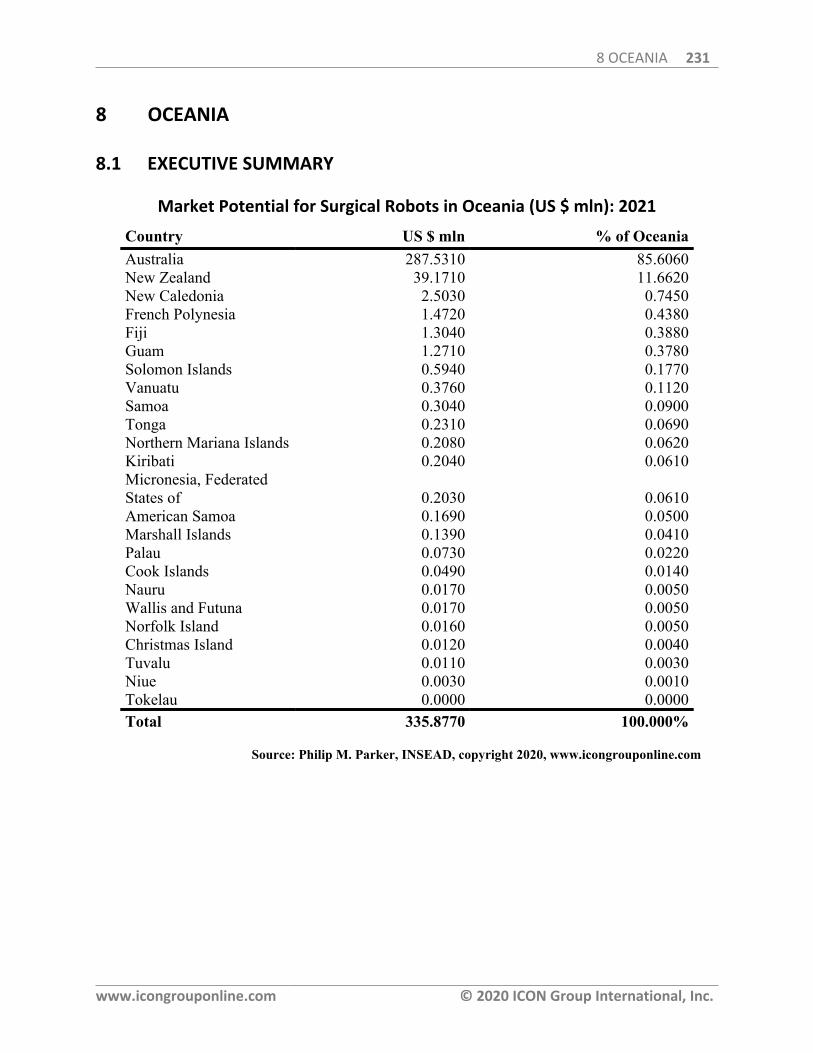
8 OCEANIA 231
www.icongrouponline.com © 2020 ICON Group International, Inc.
8 OCEANIA
8.1 EXECUTIVE SUMMARY
Market Potential for Surgical Robots in Oceania (US $ mln): 2021
Country US $ mln % of OceaniaAustralia 287.5310 85.6060New Zealand 39.1710 11.6620New Caledonia 2.5030 0.7450French Polynesia 1.4720 0.4380Fiji 1.3040 0.3880Guam 1.2710 0.3780Solomon Islands 0.5940 0.1770Vanuatu 0.3760 0.1120Samoa 0.3040 0.0900Tonga 0.2310 0.0690Northern Mariana Islands 0.2080 0.0620Kiribati 0.2040 0.0610Micronesia, FederatedStates of 0.2030 0.0610American Samoa 0.1690 0.0500Marshall Islands 0.1390 0.0410Palau 0.0730 0.0220Cook Islands 0.0490 0.0140Nauru 0.0170 0.0050Wallis and Futuna 0.0170 0.0050Norfolk Island 0.0160 0.0050Christmas Island 0.0120 0.0040Tuvalu 0.0110 0.0030Niue 0.0030 0.0010Tokelau 0.0000 0.0000Total 335.8770 100.000%
Source: Philip M. Parker, INSEAD, copyright 2020, www.icongrouponline.com
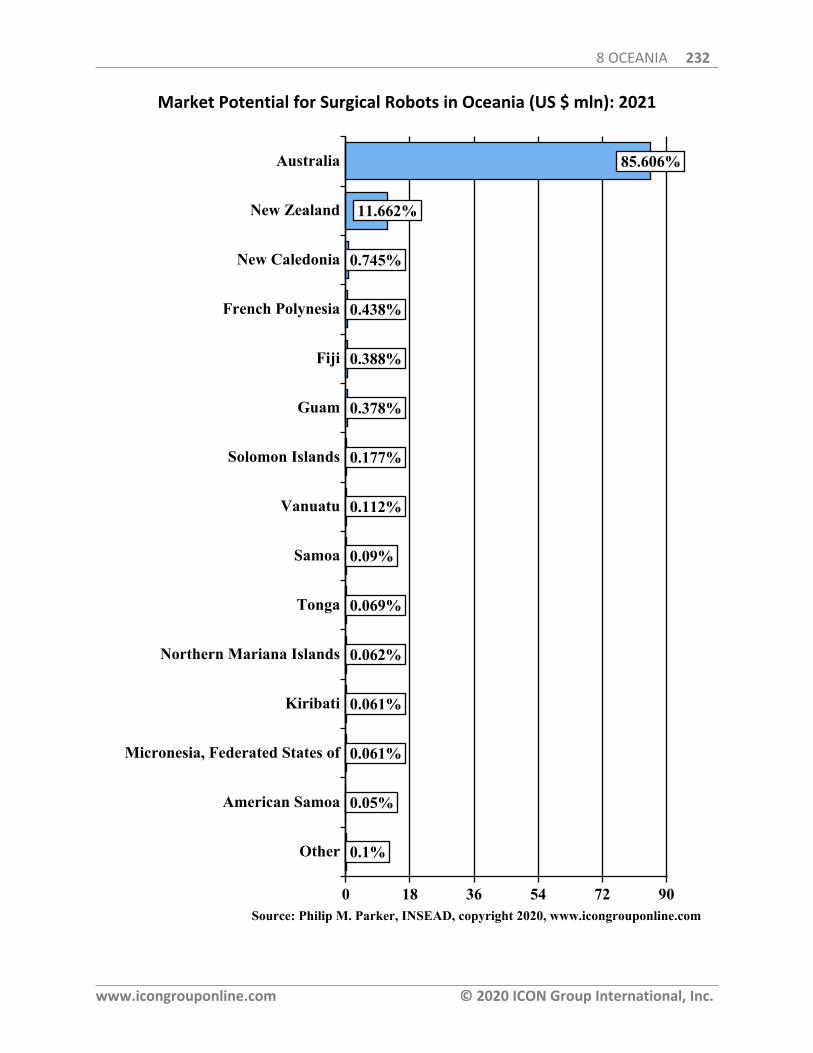
8 OCEANIA 232
www.icongrouponline.com © 2020 ICON Group International, Inc.
Market Potential for Surgical Robots in Oceania (US $ mln): 2021
0.1%
0.05%
0.061%
0.061%
0.062%
0.069%
0.09%
0.112%
0.177%
0.378%
0.388%
0.438%
0.745%
11.662%
85.606%Australia
New Zealand
New Caledonia
French Polynesia
Fiji
Guam
Solomon Islands
Vanuatu
Samoa
Tonga
Northern Mariana Islands
Kiribati
Micronesia, Federated States of
American Samoa
Other
0 18 36 54 72 90Source: Philip M. Parker, INSEAD, copyright 2020, www.icongrouponline.com
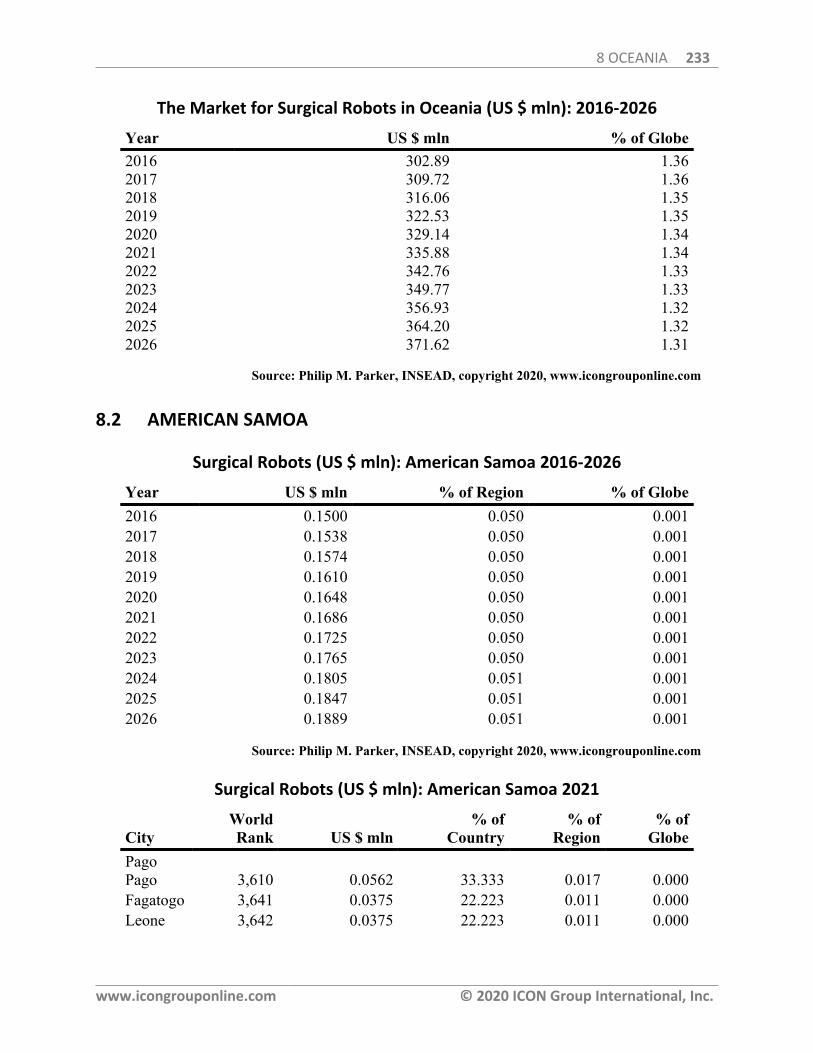
8 OCEANIA 233
www.icongrouponline.com © 2020 ICON Group International, Inc.
The Market for Surgical Robots in Oceania (US $ mln): 2016-2026
Year US $ mln % of Globe2016 302.89 1.362017 309.72 1.362018 316.06 1.352019 322.53 1.352020 329.14 1.342021 335.88 1.342022 342.76 1.332023 349.77 1.332024 356.93 1.322025 364.20 1.322026 371.62 1.31
Source: Philip M. Parker, INSEAD, copyright 2020, www.icongrouponline.com
8.2 AMERICAN SAMOA
Surgical Robots (US $ mln): American Samoa 2016-2026
Year US $ mln % of Region % of Globe2016 0.1500 0.050 0.0012017 0.1538 0.050 0.0012018 0.1574 0.050 0.0012019 0.1610 0.050 0.0012020 0.1648 0.050 0.0012021 0.1686 0.050 0.0012022 0.1725 0.050 0.0012023 0.1765 0.050 0.0012024 0.1805 0.051 0.0012025 0.1847 0.051 0.0012026 0.1889 0.051 0.001
Source: Philip M. Parker, INSEAD, copyright 2020, www.icongrouponline.com
Surgical Robots (US $ mln): American Samoa 2021
CityWorldRank US $ mln
% ofCountry
% ofRegion
% ofGlobe
PagoPago 3,610 0.0562 33.333 0.017 0.000Fagatogo 3,641 0.0375 22.223 0.011 0.000Leone 3,642 0.0375 22.223 0.011 0.000
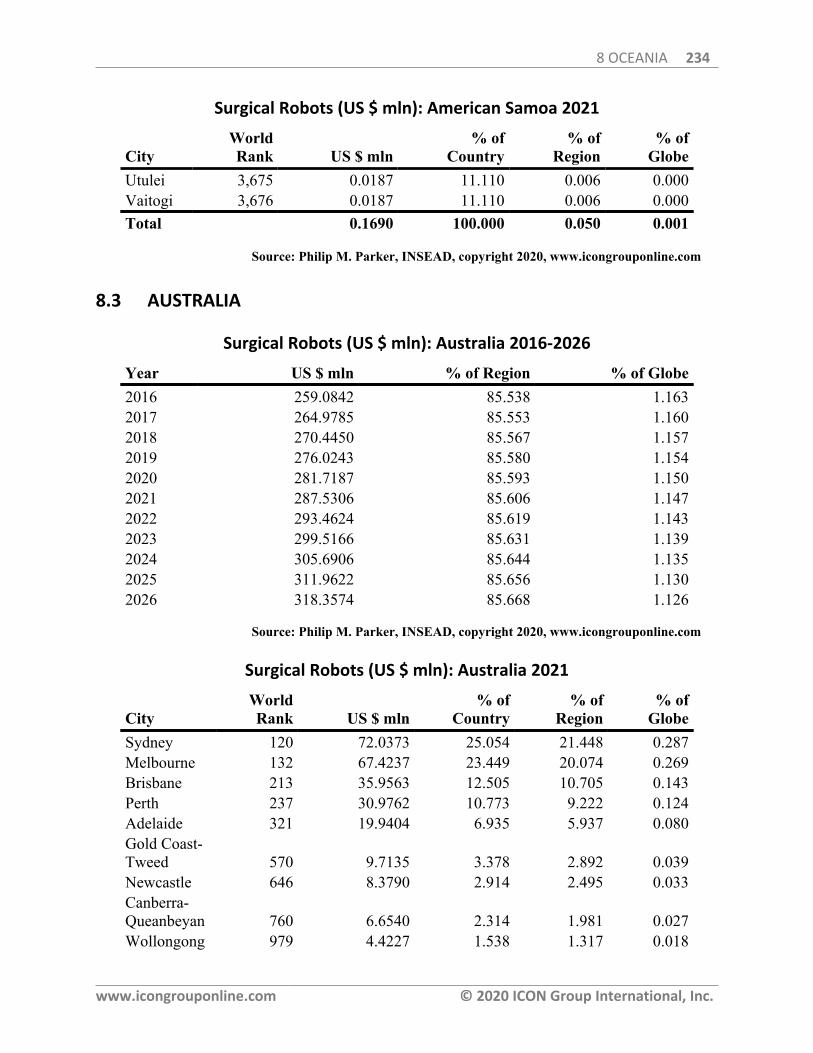
8 OCEANIA 234
www.icongrouponline.com © 2020 ICON Group International, Inc.
Surgical Robots (US $ mln): American Samoa 2021
CityWorldRank US $ mln
% ofCountry
% ofRegion
% ofGlobe
Utulei 3,675 0.0187 11.110 0.006 0.000Vaitogi 3,676 0.0187 11.110 0.006 0.000Total 0.1690 100.000 0.050 0.001
Source: Philip M. Parker, INSEAD, copyright 2020, www.icongrouponline.com
8.3 AUSTRALIA
Surgical Robots (US $ mln): Australia 2016-2026
Year US $ mln % of Region % of Globe2016 259.0842 85.538 1.1632017 264.9785 85.553 1.1602018 270.4450 85.567 1.1572019 276.0243 85.580 1.1542020 281.7187 85.593 1.1502021 287.5306 85.606 1.1472022 293.4624 85.619 1.1432023 299.5166 85.631 1.1392024 305.6906 85.644 1.1352025 311.9622 85.656 1.1302026 318.3574 85.668 1.126
Source: Philip M. Parker, INSEAD, copyright 2020, www.icongrouponline.com
Surgical Robots (US $ mln): Australia 2021
CityWorldRank US $ mln
% ofCountry
% ofRegion
% ofGlobe
Sydney 120 72.0373 25.054 21.448 0.287Melbourne 132 67.4237 23.449 20.074 0.269Brisbane 213 35.9563 12.505 10.705 0.143Perth 237 30.9762 10.773 9.222 0.124Adelaide 321 19.9404 6.935 5.937 0.080Gold Coast-Tweed 570 9.7135 3.378 2.892 0.039Newcastle 646 8.3790 2.914 2.495 0.033Canberra-Queanbeyan 760 6.6540 2.314 1.981 0.027Wollongong 979 4.4227 1.538 1.317 0.018
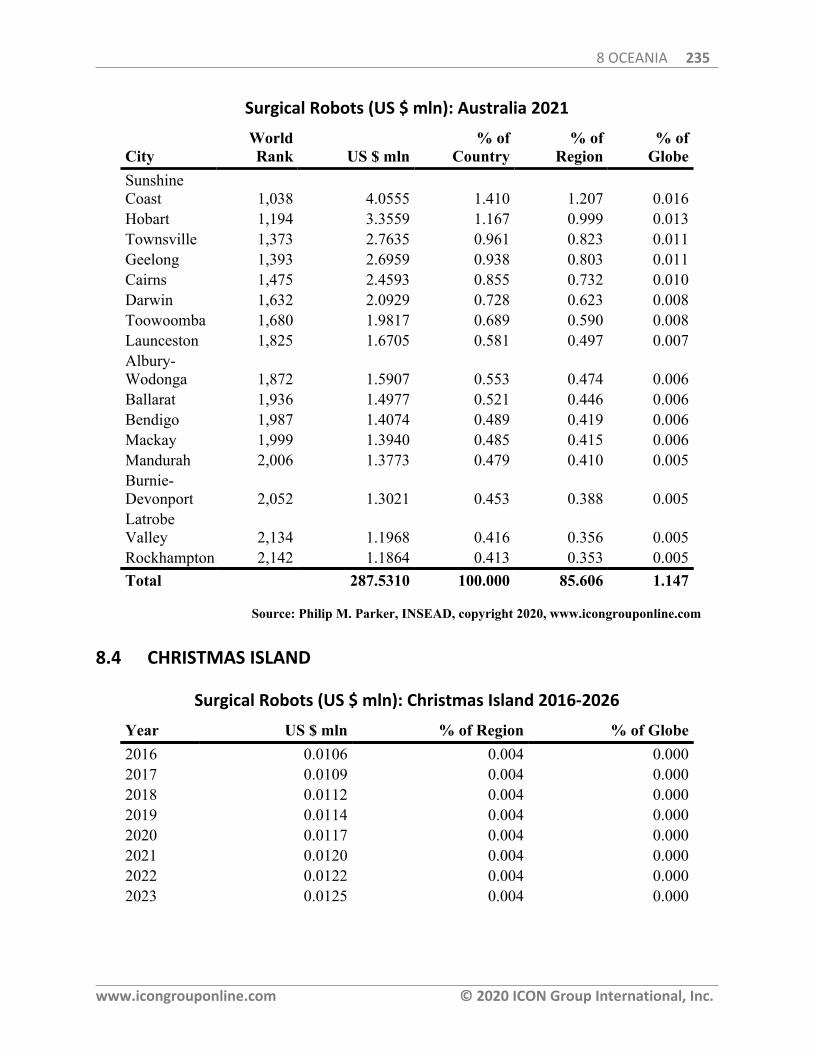
8 OCEANIA 235
www.icongrouponline.com © 2020 ICON Group International, Inc.
Surgical Robots (US $ mln): Australia 2021
CityWorldRank US $ mln
% ofCountry
% ofRegion
% ofGlobe
SunshineCoast 1,038 4.0555 1.410 1.207 0.016Hobart 1,194 3.3559 1.167 0.999 0.013Townsville 1,373 2.7635 0.961 0.823 0.011Geelong 1,393 2.6959 0.938 0.803 0.011Cairns 1,475 2.4593 0.855 0.732 0.010Darwin 1,632 2.0929 0.728 0.623 0.008Toowoomba 1,680 1.9817 0.689 0.590 0.008Launceston 1,825 1.6705 0.581 0.497 0.007Albury-Wodonga 1,872 1.5907 0.553 0.474 0.006Ballarat 1,936 1.4977 0.521 0.446 0.006Bendigo 1,987 1.4074 0.489 0.419 0.006Mackay 1,999 1.3940 0.485 0.415 0.006Mandurah 2,006 1.3773 0.479 0.410 0.005Burnie-Devonport 2,052 1.3021 0.453 0.388 0.005LatrobeValley 2,134 1.1968 0.416 0.356 0.005Rockhampton 2,142 1.1864 0.413 0.353 0.005Total 287.5310 100.000 85.606 1.147
Source: Philip M. Parker, INSEAD, copyright 2020, www.icongrouponline.com
8.4 CHRISTMAS ISLAND
Surgical Robots (US $ mln): Christmas Island 2016-2026
Year US $ mln % of Region % of Globe2016 0.0106 0.004 0.0002017 0.0109 0.004 0.0002018 0.0112 0.004 0.0002019 0.0114 0.004 0.0002020 0.0117 0.004 0.0002021 0.0120 0.004 0.0002022 0.0122 0.004 0.0002023 0.0125 0.004 0.000
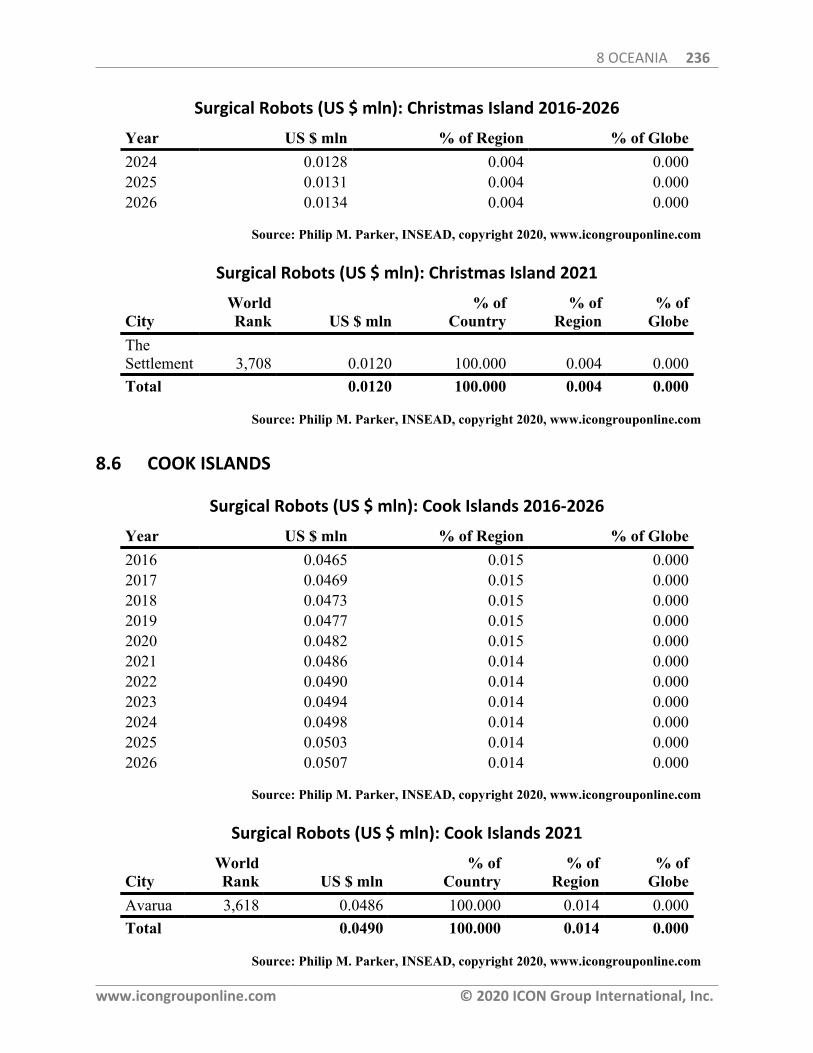
8 OCEANIA 236
www.icongrouponline.com © 2020 ICON Group International, Inc.
Surgical Robots (US $ mln): Christmas Island 2016-2026
Year US $ mln % of Region % of Globe2024 0.0128 0.004 0.0002025 0.0131 0.004 0.0002026 0.0134 0.004 0.000
Source: Philip M. Parker, INSEAD, copyright 2020, www.icongrouponline.com
Surgical Robots (US $ mln): Christmas Island 2021
CityWorldRank US $ mln
% ofCountry
% ofRegion
% ofGlobe
TheSettlement 3,708 0.0120 100.000 0.004 0.000Total 0.0120 100.000 0.004 0.000
Source: Philip M. Parker, INSEAD, copyright 2020, www.icongrouponline.com
8.6 COOK ISLANDS
Surgical Robots (US $ mln): Cook Islands 2016-2026
Year US $ mln % of Region % of Globe2016 0.0465 0.015 0.0002017 0.0469 0.015 0.0002018 0.0473 0.015 0.0002019 0.0477 0.015 0.0002020 0.0482 0.015 0.0002021 0.0486 0.014 0.0002022 0.0490 0.014 0.0002023 0.0494 0.014 0.0002024 0.0498 0.014 0.0002025 0.0503 0.014 0.0002026 0.0507 0.014 0.000
Source: Philip M. Parker, INSEAD, copyright 2020, www.icongrouponline.com
Surgical Robots (US $ mln): Cook Islands 2021
CityWorldRank US $ mln
% ofCountry
% ofRegion
% ofGlobe
Avarua 3,618 0.0486 100.000 0.014 0.000Total 0.0490 100.000 0.014 0.000
Source: Philip M. Parker, INSEAD, copyright 2020, www.icongrouponline.com
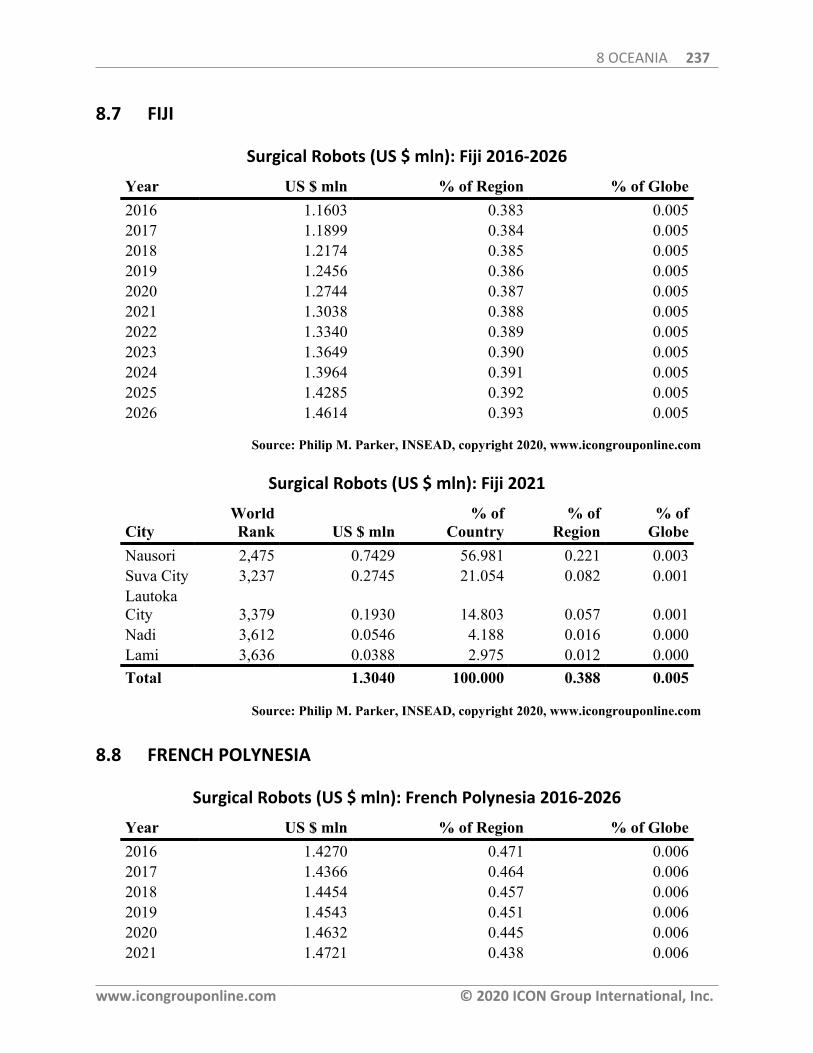
8 OCEANIA 237
www.icongrouponline.com © 2020 ICON Group International, Inc.
8.7 FIJI
Surgical Robots (US $ mln): Fiji 2016-2026
Year US $ mln % of Region % of Globe2016 1.1603 0.383 0.0052017 1.1899 0.384 0.0052018 1.2174 0.385 0.0052019 1.2456 0.386 0.0052020 1.2744 0.387 0.0052021 1.3038 0.388 0.0052022 1.3340 0.389 0.0052023 1.3649 0.390 0.0052024 1.3964 0.391 0.0052025 1.4285 0.392 0.0052026 1.4614 0.393 0.005
Source: Philip M. Parker, INSEAD, copyright 2020, www.icongrouponline.com
Surgical Robots (US $ mln): Fiji 2021
CityWorldRank US $ mln
% ofCountry
% ofRegion
% ofGlobe
Nausori 2,475 0.7429 56.981 0.221 0.003Suva City 3,237 0.2745 21.054 0.082 0.001LautokaCity 3,379 0.1930 14.803 0.057 0.001Nadi 3,612 0.0546 4.188 0.016 0.000Lami 3,636 0.0388 2.975 0.012 0.000Total 1.3040 100.000 0.388 0.005
Source: Philip M. Parker, INSEAD, copyright 2020, www.icongrouponline.com
8.8 FRENCH POLYNESIA
Surgical Robots (US $ mln): French Polynesia 2016-2026
Year US $ mln % of Region % of Globe2016 1.4270 0.471 0.0062017 1.4366 0.464 0.0062018 1.4454 0.457 0.0062019 1.4543 0.451 0.0062020 1.4632 0.445 0.0062021 1.4721 0.438 0.006

8 OCEANIA 238
www.icongrouponline.com © 2020 ICON Group International, Inc.
Surgical Robots (US $ mln): French Polynesia 2016-2026
Year US $ mln % of Region % of Globe2022 1.4812 0.432 0.0062023 1.4903 0.426 0.0062024 1.4994 0.420 0.0062025 1.5084 0.414 0.0052026 1.5174 0.408 0.005
Source: Philip M. Parker, INSEAD, copyright 2020, www.icongrouponline.com
Surgical Robots (US $ mln): French Polynesia 2021
CityWorldRank US $ mln
% ofCountry
% ofRegion
% ofGlobe
Papeete 2,435 0.7681 52.174 0.229 0.003Mahina 3,144 0.3200 21.739 0.095 0.001Papara 3,377 0.1920 13.043 0.057 0.001Mataiea 3,519 0.0960 6.522 0.029 0.000Afareaitu 3,590 0.0640 4.348 0.019 0.000Teahupoo 3,650 0.0320 2.174 0.010 0.000Total 1.4720 100.000 0.438 0.006
Source: Philip M. Parker, INSEAD, copyright 2020, www.icongrouponline.com
8.9 GUAM
Surgical Robots (US $ mln): Guam 2016-2026
Year US $ mln % of Region % of Globe2016 1.1805 0.390 0.0052017 1.1995 0.387 0.0052018 1.2171 0.385 0.0052019 1.2349 0.383 0.0052020 1.2530 0.381 0.0052021 1.2713 0.378 0.0052022 1.2899 0.376 0.0052023 1.3088 0.374 0.0052024 1.3279 0.372 0.0052025 1.3472 0.370 0.0052026 1.3667 0.368 0.005
Source: Philip M. Parker, INSEAD, copyright 2020, www.icongrouponline.com
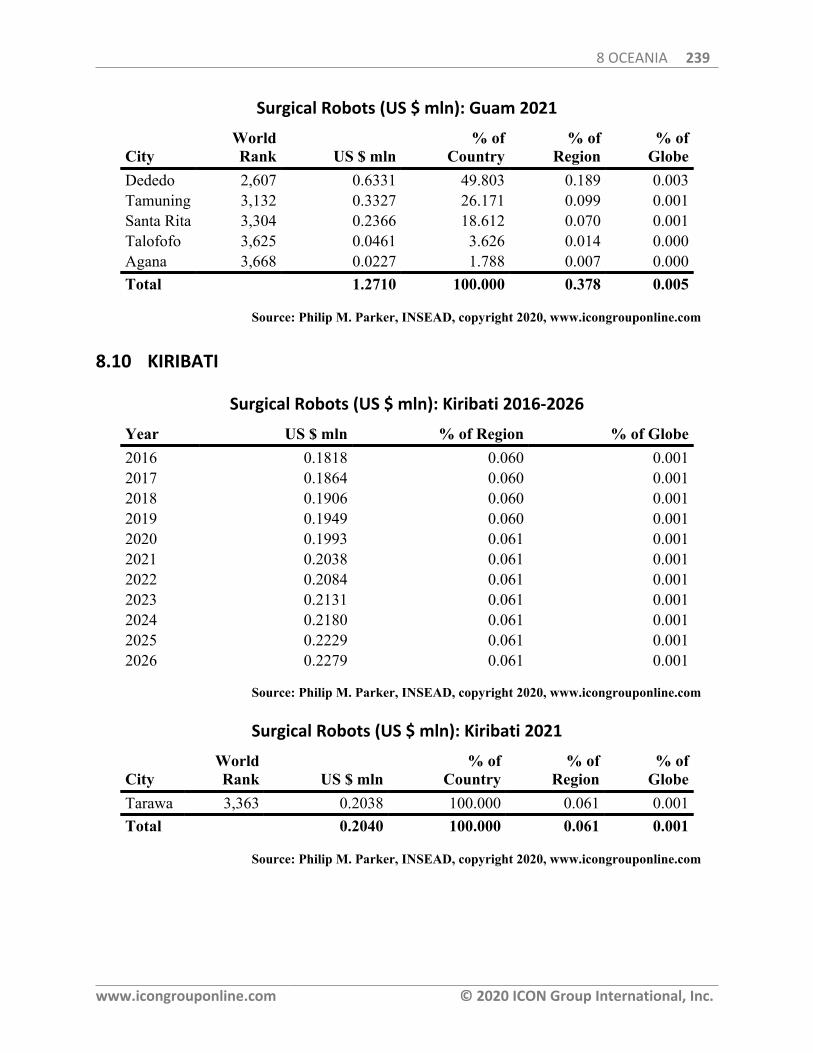
8 OCEANIA 239
www.icongrouponline.com © 2020 ICON Group International, Inc.
Surgical Robots (US $ mln): Guam 2021
CityWorldRank US $ mln
% ofCountry
% ofRegion
% ofGlobe
Dededo 2,607 0.6331 49.803 0.189 0.003Tamuning 3,132 0.3327 26.171 0.099 0.001Santa Rita 3,304 0.2366 18.612 0.070 0.001Talofofo 3,625 0.0461 3.626 0.014 0.000Agana 3,668 0.0227 1.788 0.007 0.000Total 1.2710 100.000 0.378 0.005
Source: Philip M. Parker, INSEAD, copyright 2020, www.icongrouponline.com
8.10 KIRIBATI
Surgical Robots (US $ mln): Kiribati 2016-2026
Year US $ mln % of Region % of Globe2016 0.1818 0.060 0.0012017 0.1864 0.060 0.0012018 0.1906 0.060 0.0012019 0.1949 0.060 0.0012020 0.1993 0.061 0.0012021 0.2038 0.061 0.0012022 0.2084 0.061 0.0012023 0.2131 0.061 0.0012024 0.2180 0.061 0.0012025 0.2229 0.061 0.0012026 0.2279 0.061 0.001
Source: Philip M. Parker, INSEAD, copyright 2020, www.icongrouponline.com
Surgical Robots (US $ mln): Kiribati 2021
CityWorldRank US $ mln
% ofCountry
% ofRegion
% ofGlobe
Tarawa 3,363 0.2038 100.000 0.061 0.001Total 0.2040 100.000 0.061 0.001
Source: Philip M. Parker, INSEAD, copyright 2020, www.icongrouponline.com
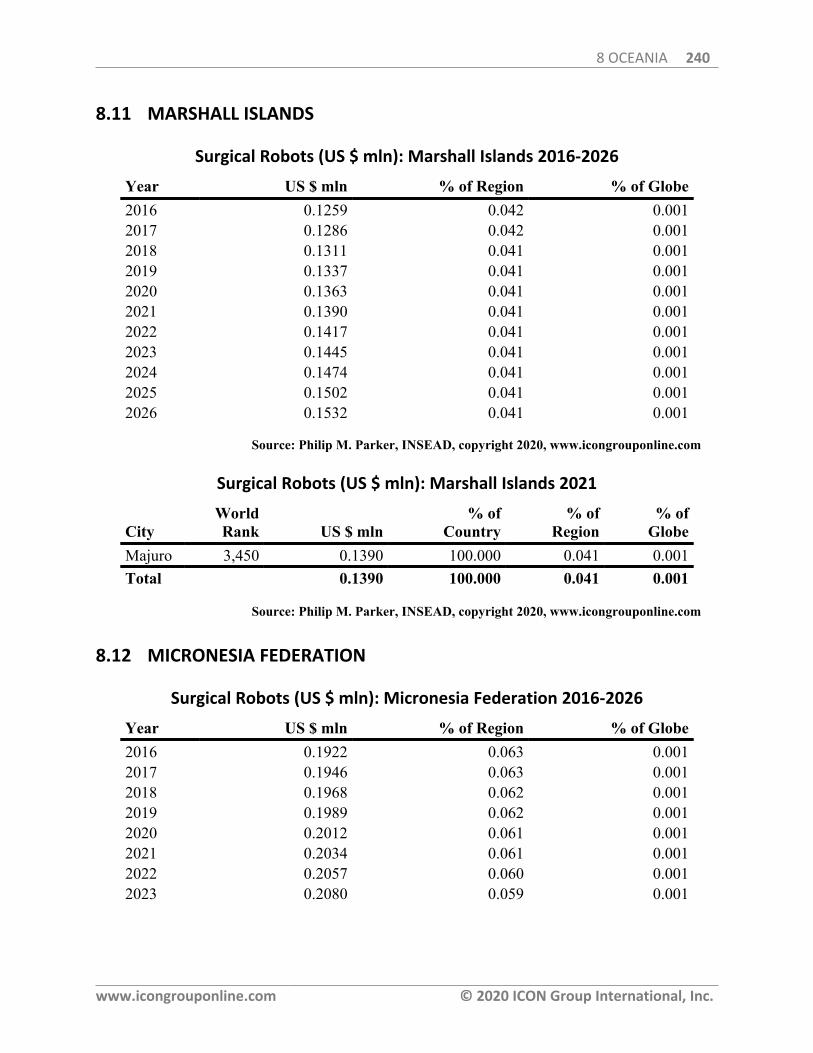
8 OCEANIA 240
www.icongrouponline.com © 2020 ICON Group International, Inc.
8.11 MARSHALL ISLANDS
Surgical Robots (US $ mln): Marshall Islands 2016-2026
Year US $ mln % of Region % of Globe2016 0.1259 0.042 0.0012017 0.1286 0.042 0.0012018 0.1311 0.041 0.0012019 0.1337 0.041 0.0012020 0.1363 0.041 0.0012021 0.1390 0.041 0.0012022 0.1417 0.041 0.0012023 0.1445 0.041 0.0012024 0.1474 0.041 0.0012025 0.1502 0.041 0.0012026 0.1532 0.041 0.001
Source: Philip M. Parker, INSEAD, copyright 2020, www.icongrouponline.com
Surgical Robots (US $ mln): Marshall Islands 2021
CityWorldRank US $ mln
% ofCountry
% ofRegion
% ofGlobe
Majuro 3,450 0.1390 100.000 0.041 0.001Total 0.1390 100.000 0.041 0.001
Source: Philip M. Parker, INSEAD, copyright 2020, www.icongrouponline.com
8.12 MICRONESIA FEDERATION
Surgical Robots (US $ mln): Micronesia Federation 2016-2026
Year US $ mln % of Region % of Globe2016 0.1922 0.063 0.0012017 0.1946 0.063 0.0012018 0.1968 0.062 0.0012019 0.1989 0.062 0.0012020 0.2012 0.061 0.0012021 0.2034 0.061 0.0012022 0.2057 0.060 0.0012023 0.2080 0.059 0.001
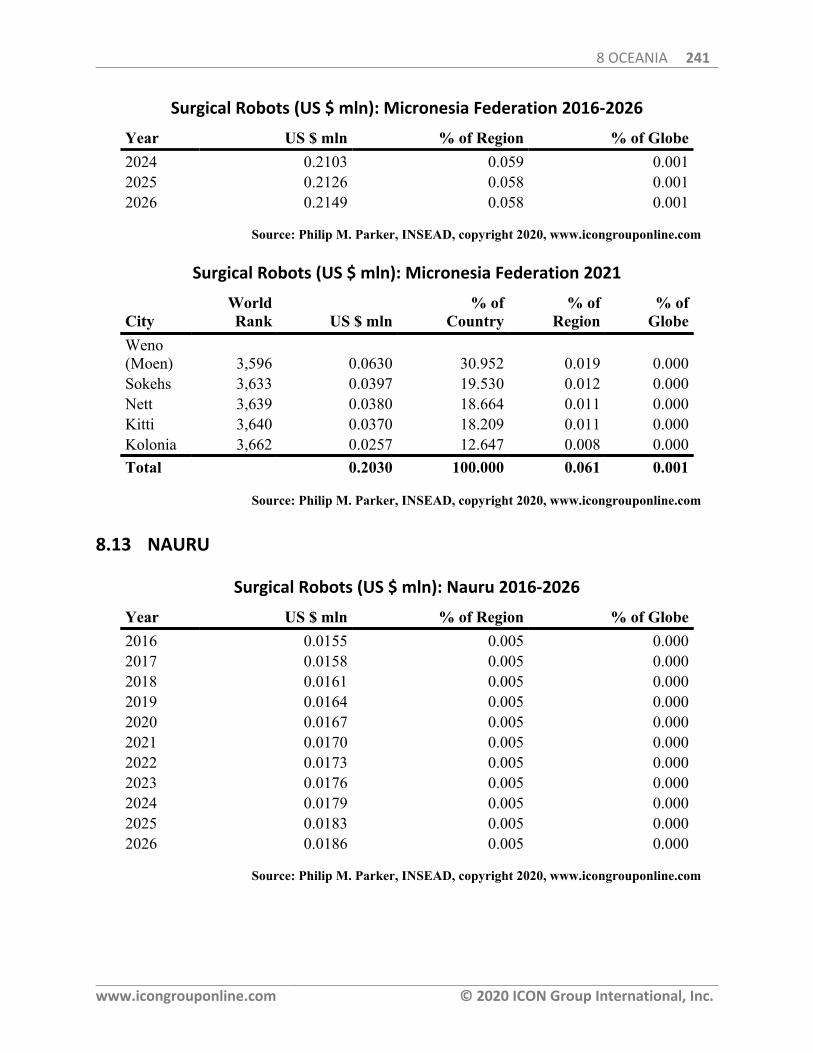
8 OCEANIA 241
www.icongrouponline.com © 2020 ICON Group International, Inc.
Surgical Robots (US $ mln): Micronesia Federation 2016-2026
Year US $ mln % of Region % of Globe2024 0.2103 0.059 0.0012025 0.2126 0.058 0.0012026 0.2149 0.058 0.001
Source: Philip M. Parker, INSEAD, copyright 2020, www.icongrouponline.com
Surgical Robots (US $ mln): Micronesia Federation 2021
CityWorldRank US $ mln
% ofCountry
% ofRegion
% ofGlobe
Weno(Moen) 3,596 0.0630 30.952 0.019 0.000Sokehs 3,633 0.0397 19.530 0.012 0.000Nett 3,639 0.0380 18.664 0.011 0.000Kitti 3,640 0.0370 18.209 0.011 0.000Kolonia 3,662 0.0257 12.647 0.008 0.000Total 0.2030 100.000 0.061 0.001
Source: Philip M. Parker, INSEAD, copyright 2020, www.icongrouponline.com
8.13 NAURU
Surgical Robots (US $ mln): Nauru 2016-2026
Year US $ mln % of Region % of Globe2016 0.0155 0.005 0.0002017 0.0158 0.005 0.0002018 0.0161 0.005 0.0002019 0.0164 0.005 0.0002020 0.0167 0.005 0.0002021 0.0170 0.005 0.0002022 0.0173 0.005 0.0002023 0.0176 0.005 0.0002024 0.0179 0.005 0.0002025 0.0183 0.005 0.0002026 0.0186 0.005 0.000
Source: Philip M. Parker, INSEAD, copyright 2020, www.icongrouponline.com
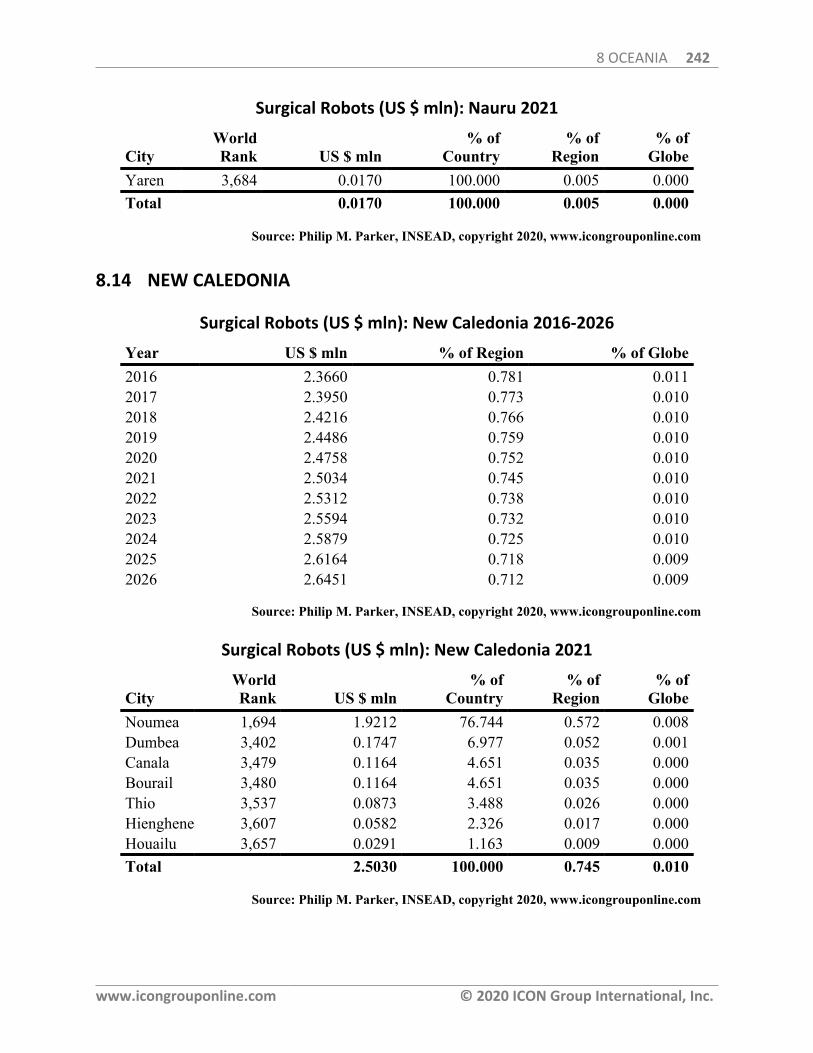
8 OCEANIA 242
www.icongrouponline.com © 2020 ICON Group International, Inc.
Surgical Robots (US $ mln): Nauru 2021
CityWorldRank US $ mln
% ofCountry
% ofRegion
% ofGlobe
Yaren 3,684 0.0170 100.000 0.005 0.000Total 0.0170 100.000 0.005 0.000
Source: Philip M. Parker, INSEAD, copyright 2020, www.icongrouponline.com
8.14 NEW CALEDONIA
Surgical Robots (US $ mln): New Caledonia 2016-2026
Year US $ mln % of Region % of Globe2016 2.3660 0.781 0.0112017 2.3950 0.773 0.0102018 2.4216 0.766 0.0102019 2.4486 0.759 0.0102020 2.4758 0.752 0.0102021 2.5034 0.745 0.0102022 2.5312 0.738 0.0102023 2.5594 0.732 0.0102024 2.5879 0.725 0.0102025 2.6164 0.718 0.0092026 2.6451 0.712 0.009
Source: Philip M. Parker, INSEAD, copyright 2020, www.icongrouponline.com
Surgical Robots (US $ mln): New Caledonia 2021
CityWorldRank US $ mln
% ofCountry
% ofRegion
% ofGlobe
Noumea 1,694 1.9212 76.744 0.572 0.008Dumbea 3,402 0.1747 6.977 0.052 0.001Canala 3,479 0.1164 4.651 0.035 0.000Bourail 3,480 0.1164 4.651 0.035 0.000Thio 3,537 0.0873 3.488 0.026 0.000Hienghene 3,607 0.0582 2.326 0.017 0.000Houailu 3,657 0.0291 1.163 0.009 0.000Total 2.5030 100.000 0.745 0.010
Source: Philip M. Parker, INSEAD, copyright 2020, www.icongrouponline.com
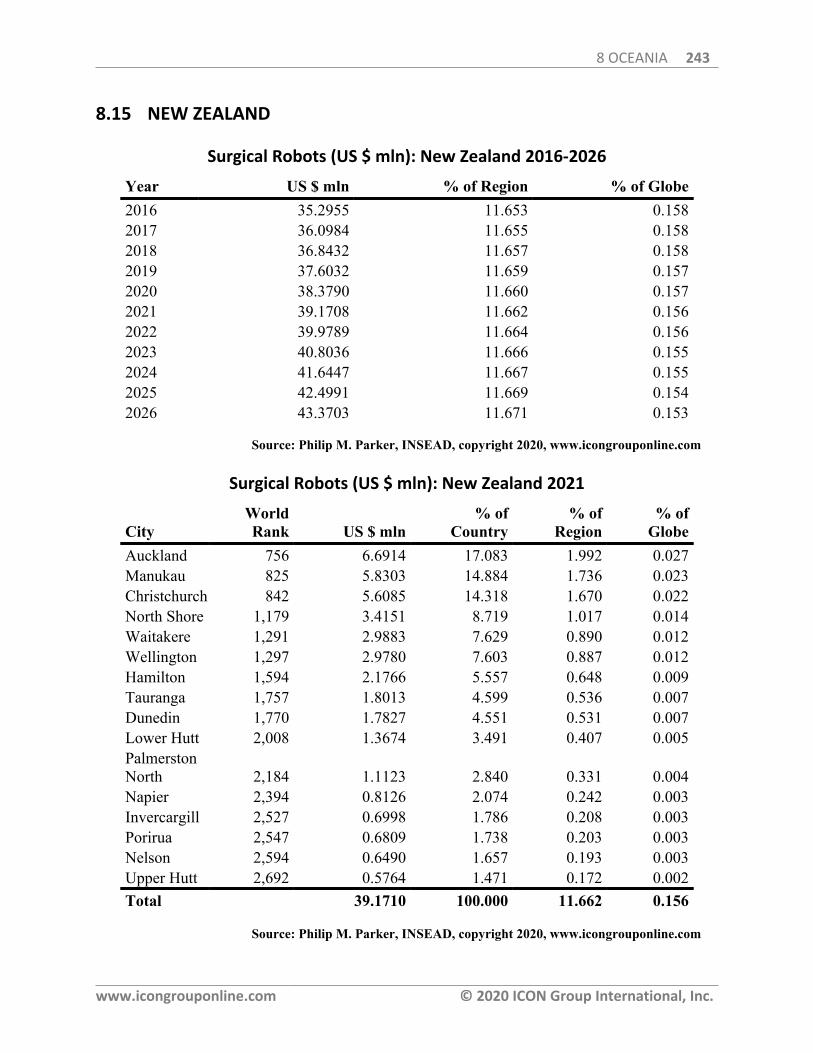
8 OCEANIA 243
www.icongrouponline.com © 2020 ICON Group International, Inc.
8.15 NEW ZEALAND
Surgical Robots (US $ mln): New Zealand 2016-2026
Year US $ mln % of Region % of Globe2016 35.2955 11.653 0.1582017 36.0984 11.655 0.1582018 36.8432 11.657 0.1582019 37.6032 11.659 0.1572020 38.3790 11.660 0.1572021 39.1708 11.662 0.1562022 39.9789 11.664 0.1562023 40.8036 11.666 0.1552024 41.6447 11.667 0.1552025 42.4991 11.669 0.1542026 43.3703 11.671 0.153
Source: Philip M. Parker, INSEAD, copyright 2020, www.icongrouponline.com
Surgical Robots (US $ mln): New Zealand 2021
CityWorldRank US $ mln
% ofCountry
% ofRegion
% ofGlobe
Auckland 756 6.6914 17.083 1.992 0.027Manukau 825 5.8303 14.884 1.736 0.023Christchurch 842 5.6085 14.318 1.670 0.022North Shore 1,179 3.4151 8.719 1.017 0.014Waitakere 1,291 2.9883 7.629 0.890 0.012Wellington 1,297 2.9780 7.603 0.887 0.012Hamilton 1,594 2.1766 5.557 0.648 0.009Tauranga 1,757 1.8013 4.599 0.536 0.007Dunedin 1,770 1.7827 4.551 0.531 0.007Lower Hutt 2,008 1.3674 3.491 0.407 0.005PalmerstonNorth 2,184 1.1123 2.840 0.331 0.004Napier 2,394 0.8126 2.074 0.242 0.003Invercargill 2,527 0.6998 1.786 0.208 0.003Porirua 2,547 0.6809 1.738 0.203 0.003Nelson 2,594 0.6490 1.657 0.193 0.003Upper Hutt 2,692 0.5764 1.471 0.172 0.002Total 39.1710 100.000 11.662 0.156
Source: Philip M. Parker, INSEAD, copyright 2020, www.icongrouponline.com
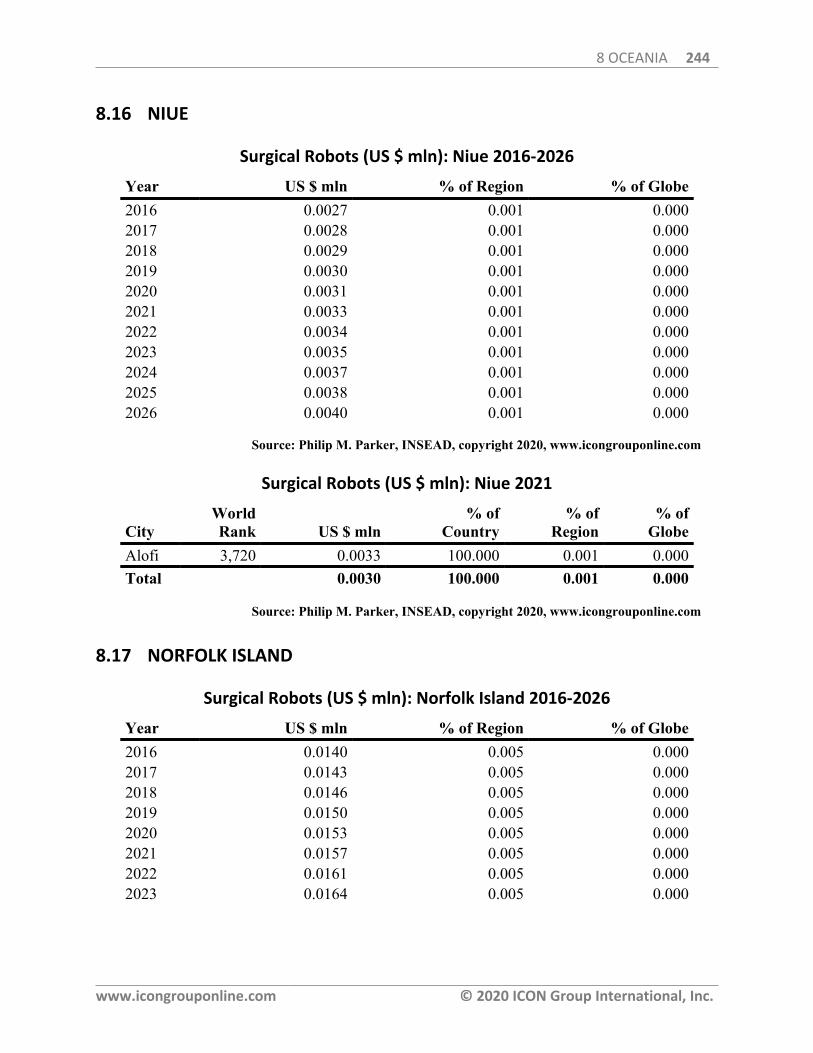
8 OCEANIA 244
www.icongrouponline.com © 2020 ICON Group International, Inc.
8.16 NIUE
Surgical Robots (US $ mln): Niue 2016-2026
Year US $ mln % of Region % of Globe2016 0.0027 0.001 0.0002017 0.0028 0.001 0.0002018 0.0029 0.001 0.0002019 0.0030 0.001 0.0002020 0.0031 0.001 0.0002021 0.0033 0.001 0.0002022 0.0034 0.001 0.0002023 0.0035 0.001 0.0002024 0.0037 0.001 0.0002025 0.0038 0.001 0.0002026 0.0040 0.001 0.000
Source: Philip M. Parker, INSEAD, copyright 2020, www.icongrouponline.com
Surgical Robots (US $ mln): Niue 2021
CityWorldRank US $ mln
% ofCountry
% ofRegion
% ofGlobe
Alofi 3,720 0.0033 100.000 0.001 0.000Total 0.0030 100.000 0.001 0.000
Source: Philip M. Parker, INSEAD, copyright 2020, www.icongrouponline.com
8.17 NORFOLK ISLAND
Surgical Robots (US $ mln): Norfolk Island 2016-2026
Year US $ mln % of Region % of Globe2016 0.0140 0.005 0.0002017 0.0143 0.005 0.0002018 0.0146 0.005 0.0002019 0.0150 0.005 0.0002020 0.0153 0.005 0.0002021 0.0157 0.005 0.0002022 0.0161 0.005 0.0002023 0.0164 0.005 0.000
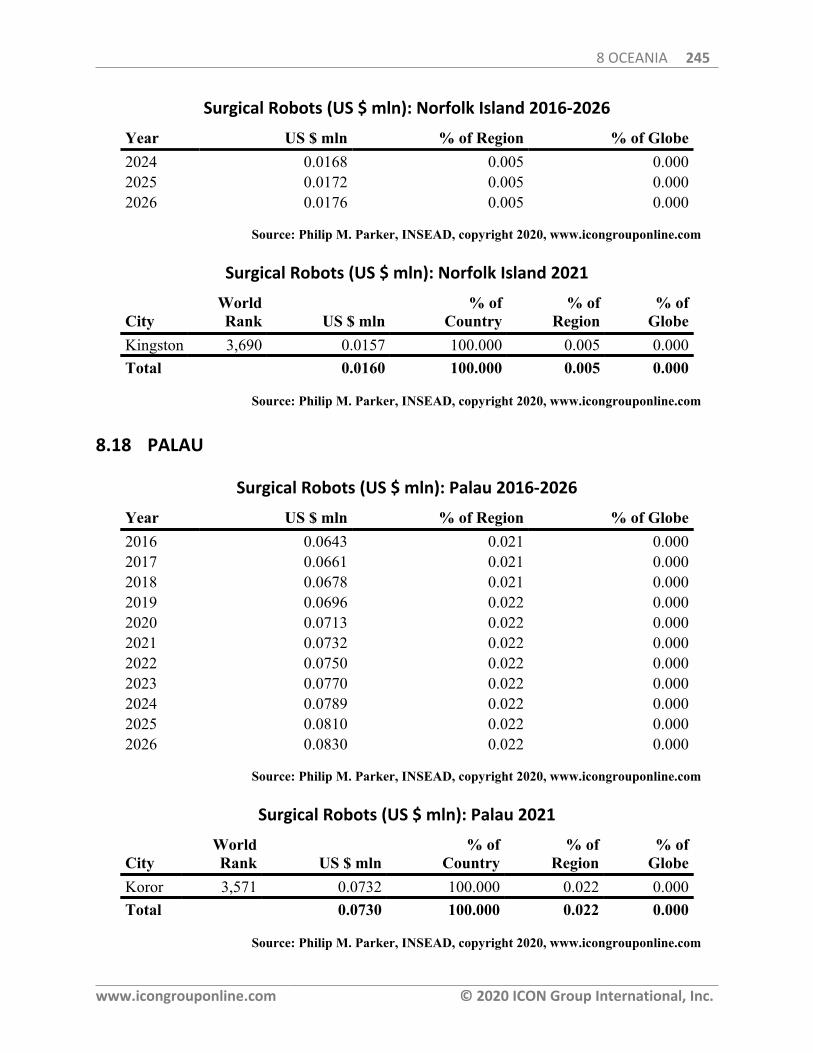
8 OCEANIA 245
www.icongrouponline.com © 2020 ICON Group International, Inc.
Surgical Robots (US $ mln): Norfolk Island 2016-2026
Year US $ mln % of Region % of Globe2024 0.0168 0.005 0.0002025 0.0172 0.005 0.0002026 0.0176 0.005 0.000
Source: Philip M. Parker, INSEAD, copyright 2020, www.icongrouponline.com
Surgical Robots (US $ mln): Norfolk Island 2021
CityWorldRank US $ mln
% ofCountry
% ofRegion
% ofGlobe
Kingston 3,690 0.0157 100.000 0.005 0.000Total 0.0160 100.000 0.005 0.000
Source: Philip M. Parker, INSEAD, copyright 2020, www.icongrouponline.com
8.18 PALAU
Surgical Robots (US $ mln): Palau 2016-2026
Year US $ mln % of Region % of Globe2016 0.0643 0.021 0.0002017 0.0661 0.021 0.0002018 0.0678 0.021 0.0002019 0.0696 0.022 0.0002020 0.0713 0.022 0.0002021 0.0732 0.022 0.0002022 0.0750 0.022 0.0002023 0.0770 0.022 0.0002024 0.0789 0.022 0.0002025 0.0810 0.022 0.0002026 0.0830 0.022 0.000
Source: Philip M. Parker, INSEAD, copyright 2020, www.icongrouponline.com
Surgical Robots (US $ mln): Palau 2021
CityWorldRank US $ mln
% ofCountry
% ofRegion
% ofGlobe
Koror 3,571 0.0732 100.000 0.022 0.000Total 0.0730 100.000 0.022 0.000
Source: Philip M. Parker, INSEAD, copyright 2020, www.icongrouponline.com
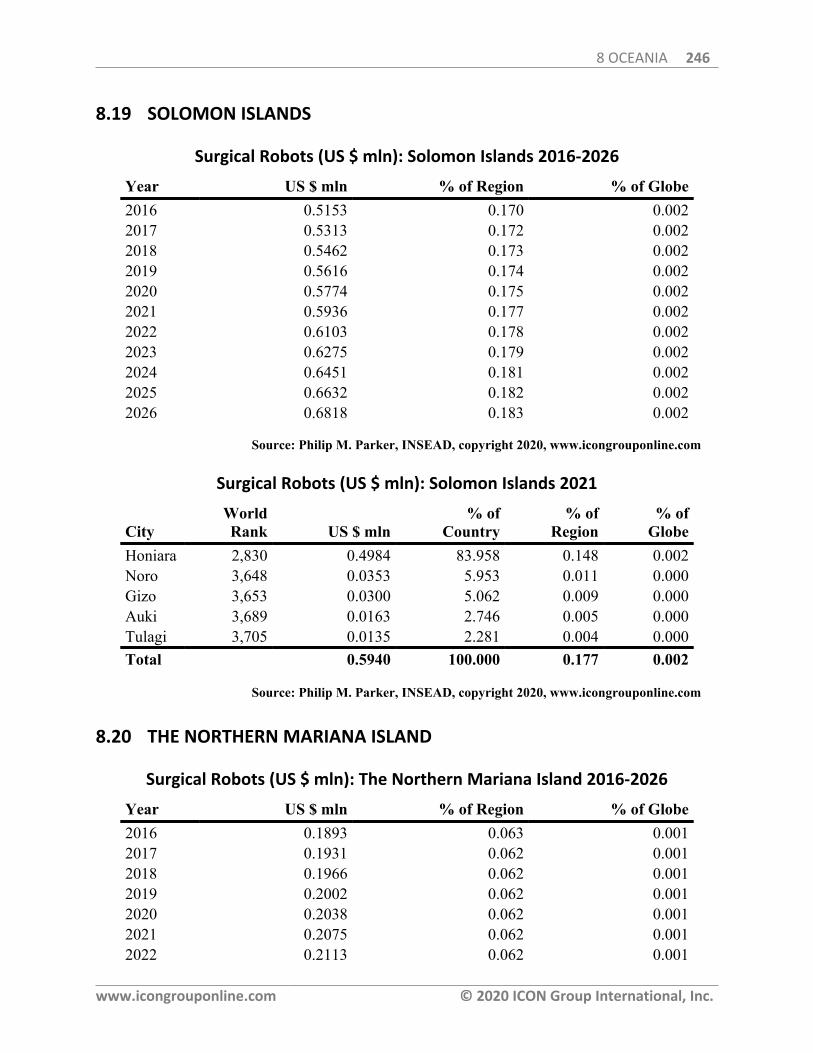
8 OCEANIA 246
www.icongrouponline.com © 2020 ICON Group International, Inc.
8.19 SOLOMON ISLANDS
Surgical Robots (US $ mln): Solomon Islands 2016-2026
Year US $ mln % of Region % of Globe2016 0.5153 0.170 0.0022017 0.5313 0.172 0.0022018 0.5462 0.173 0.0022019 0.5616 0.174 0.0022020 0.5774 0.175 0.0022021 0.5936 0.177 0.0022022 0.6103 0.178 0.0022023 0.6275 0.179 0.0022024 0.6451 0.181 0.0022025 0.6632 0.182 0.0022026 0.6818 0.183 0.002
Source: Philip M. Parker, INSEAD, copyright 2020, www.icongrouponline.com
Surgical Robots (US $ mln): Solomon Islands 2021
CityWorldRank US $ mln
% ofCountry
% ofRegion
% ofGlobe
Honiara 2,830 0.4984 83.958 0.148 0.002Noro 3,648 0.0353 5.953 0.011 0.000Gizo 3,653 0.0300 5.062 0.009 0.000Auki 3,689 0.0163 2.746 0.005 0.000Tulagi 3,705 0.0135 2.281 0.004 0.000Total 0.5940 100.000 0.177 0.002
Source: Philip M. Parker, INSEAD, copyright 2020, www.icongrouponline.com
8.20 THE NORTHERN MARIANA ISLAND
Surgical Robots (US $ mln): The Northern Mariana Island 2016-2026
Year US $ mln % of Region % of Globe2016 0.1893 0.063 0.0012017 0.1931 0.062 0.0012018 0.1966 0.062 0.0012019 0.2002 0.062 0.0012020 0.2038 0.062 0.0012021 0.2075 0.062 0.0012022 0.2113 0.062 0.001
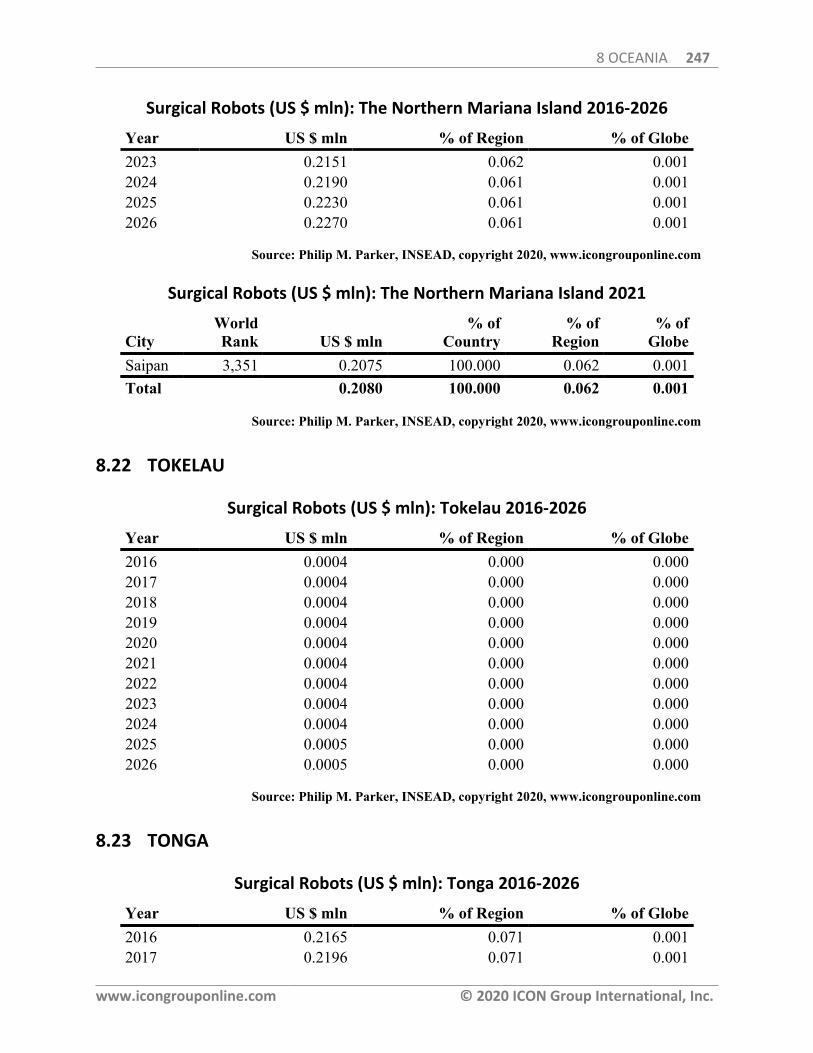
8 OCEANIA 247
www.icongrouponline.com © 2020 ICON Group International, Inc.
Surgical Robots (US $ mln): The Northern Mariana Island 2016-2026
Year US $ mln % of Region % of Globe2023 0.2151 0.062 0.0012024 0.2190 0.061 0.0012025 0.2230 0.061 0.0012026 0.2270 0.061 0.001
Source: Philip M. Parker, INSEAD, copyright 2020, www.icongrouponline.com
Surgical Robots (US $ mln): The Northern Mariana Island 2021
CityWorldRank US $ mln
% ofCountry
% ofRegion
% ofGlobe
Saipan 3,351 0.2075 100.000 0.062 0.001Total 0.2080 100.000 0.062 0.001
Source: Philip M. Parker, INSEAD, copyright 2020, www.icongrouponline.com
8.22 TOKELAU
Surgical Robots (US $ mln): Tokelau 2016-2026
Year US $ mln % of Region % of Globe2016 0.0004 0.000 0.0002017 0.0004 0.000 0.0002018 0.0004 0.000 0.0002019 0.0004 0.000 0.0002020 0.0004 0.000 0.0002021 0.0004 0.000 0.0002022 0.0004 0.000 0.0002023 0.0004 0.000 0.0002024 0.0004 0.000 0.0002025 0.0005 0.000 0.0002026 0.0005 0.000 0.000
Source: Philip M. Parker, INSEAD, copyright 2020, www.icongrouponline.com
8.23 TONGA
Surgical Robots (US $ mln): Tonga 2016-2026
Year US $ mln % of Region % of Globe2016 0.2165 0.071 0.0012017 0.2196 0.071 0.001

8 OCEANIA 248
www.icongrouponline.com © 2020 ICON Group International, Inc.
Surgical Robots (US $ mln): Tonga 2016-2026
Year US $ mln % of Region % of Globe2018 0.2225 0.070 0.0012019 0.2254 0.070 0.0012020 0.2284 0.069 0.0012021 0.2314 0.069 0.0012022 0.2344 0.068 0.0012023 0.2375 0.068 0.0012024 0.2406 0.067 0.0012025 0.2438 0.067 0.0012026 0.2469 0.066 0.001
Source: Philip M. Parker, INSEAD, copyright 2020, www.icongrouponline.com
Surgical Robots (US $ mln): Tonga 2021
CityWorldRank US $ mln
% ofCountry
% ofRegion
% ofGlobe
Nuku'alofa 3,313 0.2314 100.000 0.069 0.001Total 0.2310 100.000 0.069 0.001
Source: Philip M. Parker, INSEAD, copyright 2020, www.icongrouponline.com
8.24 TUVALU
Surgical Robots (US $ mln): Tuvalu 2016-2026
Year US $ mln % of Region % of Globe2016 0.0102 0.003 0.0002017 0.0104 0.003 0.0002018 0.0105 0.003 0.0002019 0.0107 0.003 0.0002020 0.0108 0.003 0.0002021 0.0110 0.003 0.0002022 0.0111 0.003 0.0002023 0.0113 0.003 0.0002024 0.0114 0.003 0.0002025 0.0116 0.003 0.0002026 0.0117 0.003 0.000
Source: Philip M. Parker, INSEAD, copyright 2020, www.icongrouponline.com
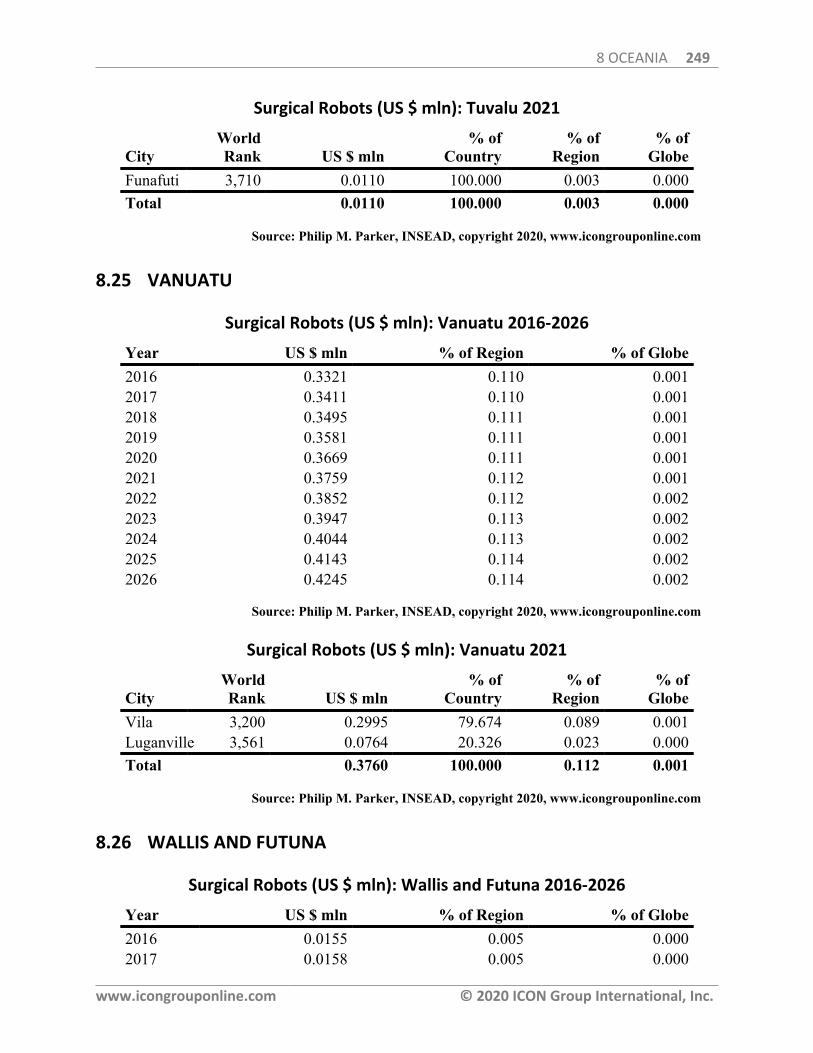
8 OCEANIA 249
www.icongrouponline.com © 2020 ICON Group International, Inc.
Surgical Robots (US $ mln): Tuvalu 2021
CityWorldRank US $ mln
% ofCountry
% ofRegion
% ofGlobe
Funafuti 3,710 0.0110 100.000 0.003 0.000Total 0.0110 100.000 0.003 0.000
Source: Philip M. Parker, INSEAD, copyright 2020, www.icongrouponline.com
8.25 VANUATU
Surgical Robots (US $ mln): Vanuatu 2016-2026
Year US $ mln % of Region % of Globe2016 0.3321 0.110 0.0012017 0.3411 0.110 0.0012018 0.3495 0.111 0.0012019 0.3581 0.111 0.0012020 0.3669 0.111 0.0012021 0.3759 0.112 0.0012022 0.3852 0.112 0.0022023 0.3947 0.113 0.0022024 0.4044 0.113 0.0022025 0.4143 0.114 0.0022026 0.4245 0.114 0.002
Source: Philip M. Parker, INSEAD, copyright 2020, www.icongrouponline.com
Surgical Robots (US $ mln): Vanuatu 2021
CityWorldRank US $ mln
% ofCountry
% ofRegion
% ofGlobe
Vila 3,200 0.2995 79.674 0.089 0.001Luganville 3,561 0.0764 20.326 0.023 0.000Total 0.3760 100.000 0.112 0.001
Source: Philip M. Parker, INSEAD, copyright 2020, www.icongrouponline.com
8.26 WALLIS AND FUTUNA
Surgical Robots (US $ mln): Wallis and Futuna 2016-2026
Year US $ mln % of Region % of Globe2016 0.0155 0.005 0.0002017 0.0158 0.005 0.000
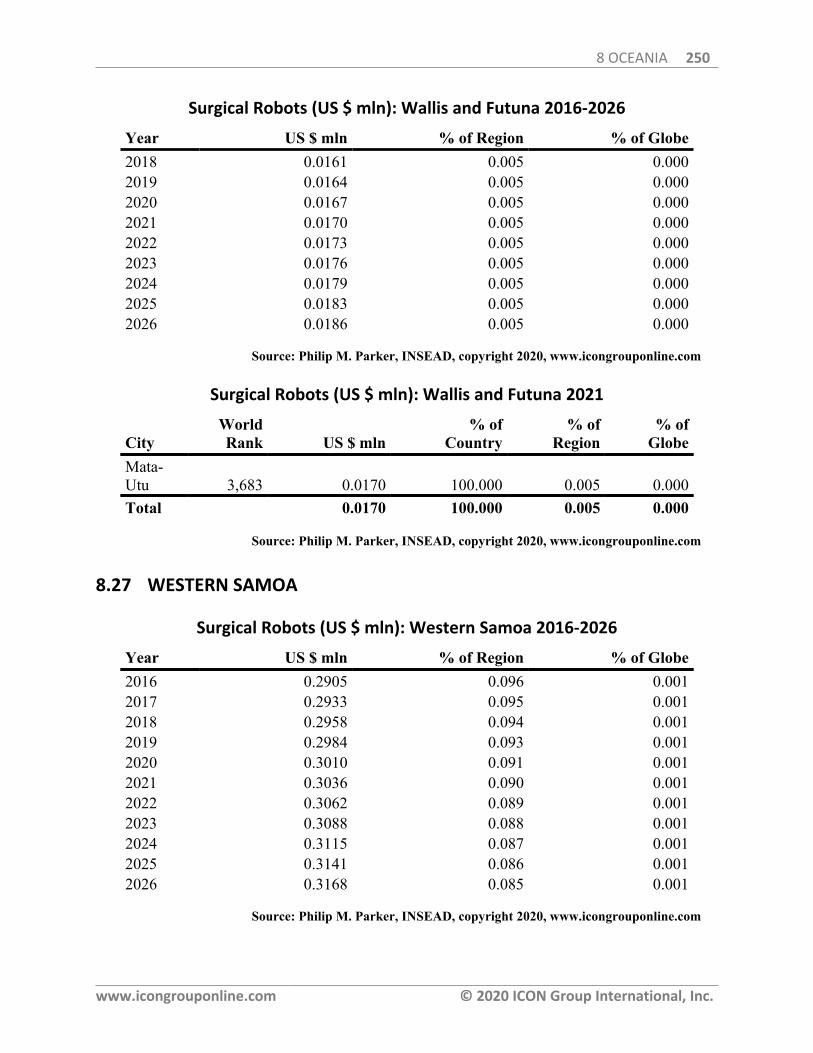
8 OCEANIA 250
www.icongrouponline.com © 2020 ICON Group International, Inc.
Surgical Robots (US $ mln): Wallis and Futuna 2016-2026
Year US $ mln % of Region % of Globe2018 0.0161 0.005 0.0002019 0.0164 0.005 0.0002020 0.0167 0.005 0.0002021 0.0170 0.005 0.0002022 0.0173 0.005 0.0002023 0.0176 0.005 0.0002024 0.0179 0.005 0.0002025 0.0183 0.005 0.0002026 0.0186 0.005 0.000
Source: Philip M. Parker, INSEAD, copyright 2020, www.icongrouponline.com
Surgical Robots (US $ mln): Wallis and Futuna 2021
CityWorldRank US $ mln
% ofCountry
% ofRegion
% ofGlobe
Mata-Utu 3,683 0.0170 100.000 0.005 0.000Total 0.0170 100.000 0.005 0.000
Source: Philip M. Parker, INSEAD, copyright 2020, www.icongrouponline.com
8.27 WESTERN SAMOA
Surgical Robots (US $ mln): Western Samoa 2016-2026
Year US $ mln % of Region % of Globe2016 0.2905 0.096 0.0012017 0.2933 0.095 0.0012018 0.2958 0.094 0.0012019 0.2984 0.093 0.0012020 0.3010 0.091 0.0012021 0.3036 0.090 0.0012022 0.3062 0.089 0.0012023 0.3088 0.088 0.0012024 0.3115 0.087 0.0012025 0.3141 0.086 0.0012026 0.3168 0.085 0.001
Source: Philip M. Parker, INSEAD, copyright 2020, www.icongrouponline.com
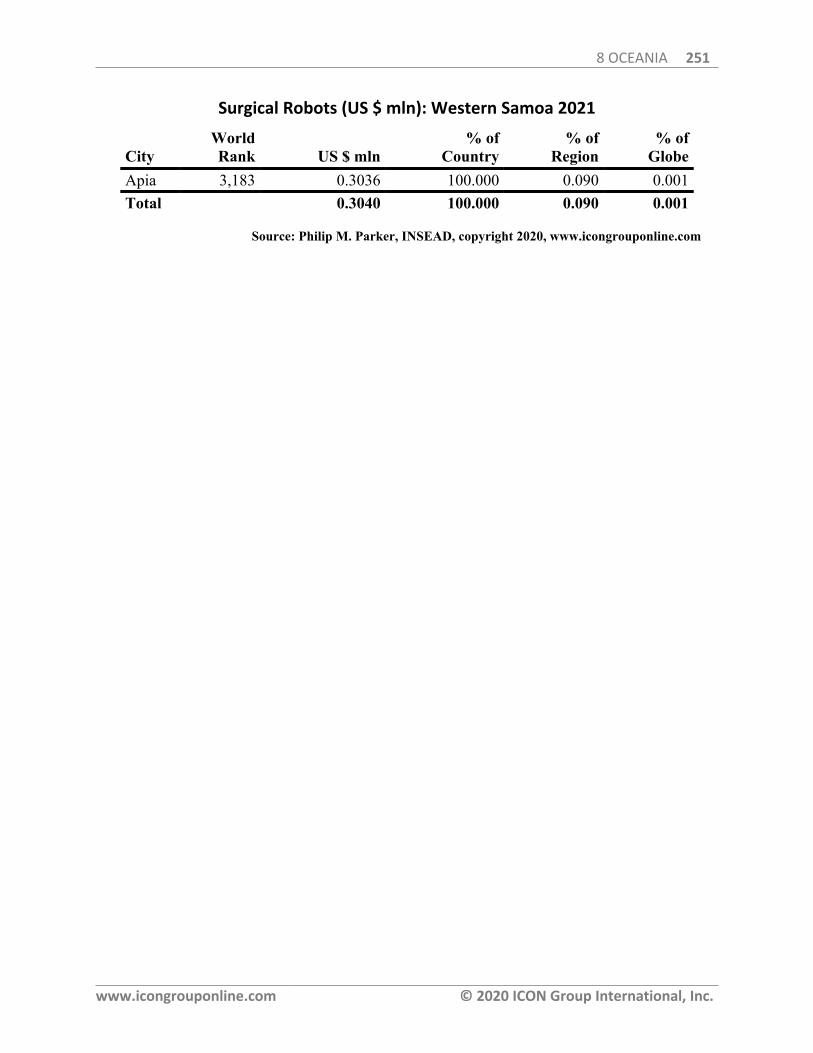
8 OCEANIA 251
www.icongrouponline.com © 2020 ICON Group International, Inc.
Surgical Robots (US $ mln): Western Samoa 2021
CityWorldRank US $ mln
% ofCountry
% ofRegion
% ofGlobe
Apia 3,183 0.3036 100.000 0.090 0.001Total 0.3040 100.000 0.090 0.001
Source: Philip M. Parker, INSEAD, copyright 2020, www.icongrouponline.com
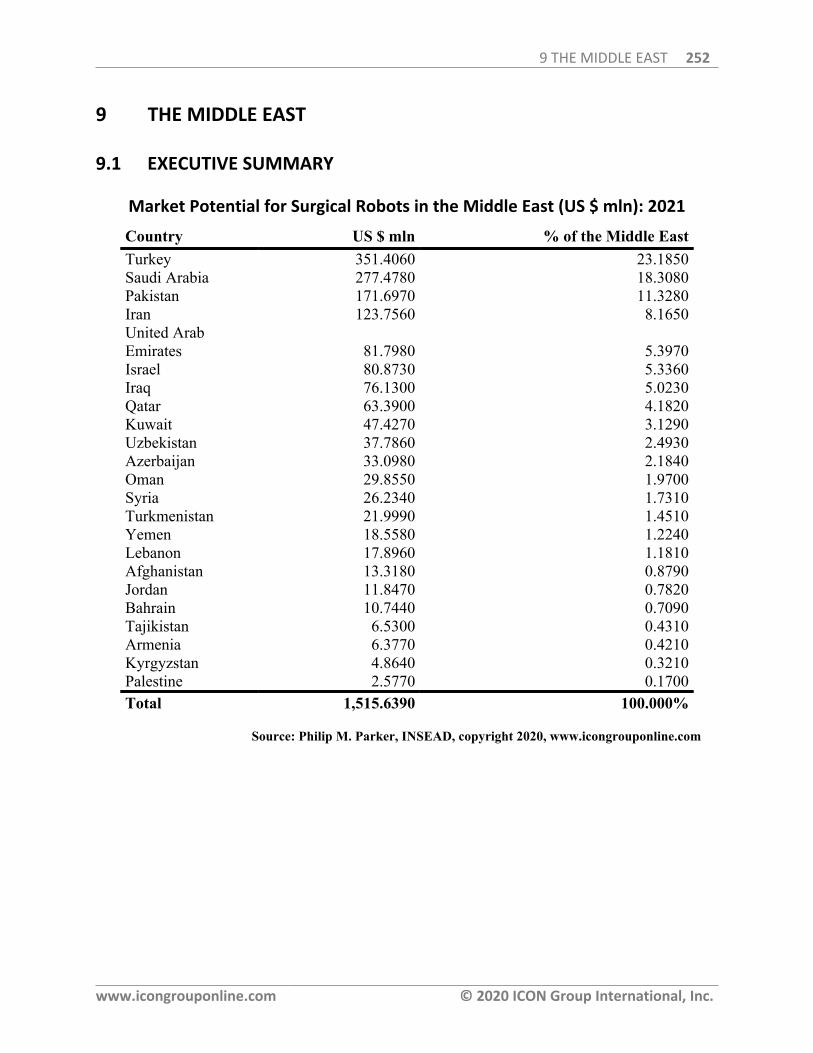
9 THE MIDDLE EAST 252
www.icongrouponline.com © 2020 ICON Group International, Inc.
9 THE MIDDLE EAST
9.1 EXECUTIVE SUMMARY
Market Potential for Surgical Robots in the Middle East (US $ mln): 2021
Country US $ mln % of the Middle EastTurkey 351.4060 23.1850Saudi Arabia 277.4780 18.3080Pakistan 171.6970 11.3280Iran 123.7560 8.1650United ArabEmirates 81.7980 5.3970Israel 80.8730 5.3360Iraq 76.1300 5.0230Qatar 63.3900 4.1820Kuwait 47.4270 3.1290Uzbekistan 37.7860 2.4930Azerbaijan 33.0980 2.1840Oman 29.8550 1.9700Syria 26.2340 1.7310Turkmenistan 21.9990 1.4510Yemen 18.5580 1.2240Lebanon 17.8960 1.1810Afghanistan 13.3180 0.8790Jordan 11.8470 0.7820Bahrain 10.7440 0.7090Tajikistan 6.5300 0.4310Armenia 6.3770 0.4210Kyrgyzstan 4.8640 0.3210Palestine 2.5770 0.1700Total 1,515.6390 100.000%
Source: Philip M. Parker, INSEAD, copyright 2020, www.icongrouponline.com
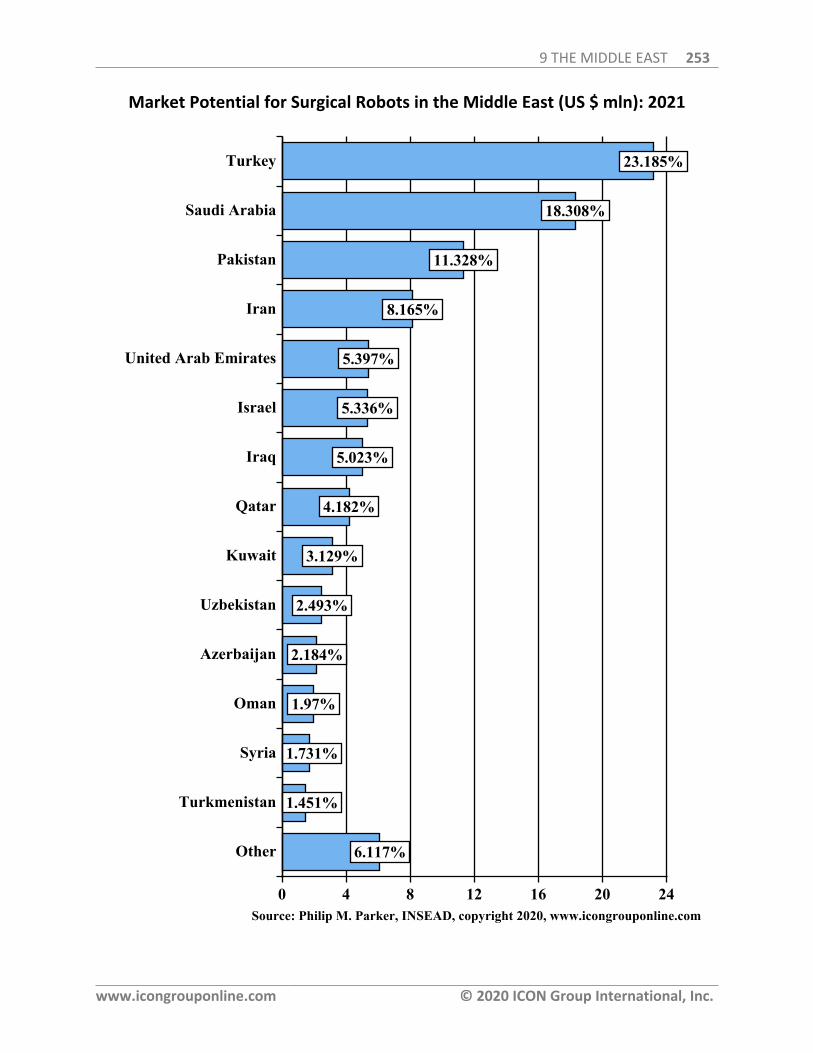
9 THE MIDDLE EAST 253
www.icongrouponline.com © 2020 ICON Group International, Inc.
Market Potential for Surgical Robots in the Middle East (US $ mln): 2021
6.117%
1.451%
1.731%
1.97%
2.184%
2.493%
3.129%
4.182%
5.023%
5.336%
5.397%
8.165%
11.328%
18.308%
23.185%Turkey
Saudi Arabia
Pakistan
Iran
United Arab Emirates
Israel
Iraq
Qatar
Kuwait
Uzbekistan
Azerbaijan
Oman
Syria
Turkmenistan
Other
0 4 8 12 16 20 24Source: Philip M. Parker, INSEAD, copyright 2020, www.icongrouponline.com
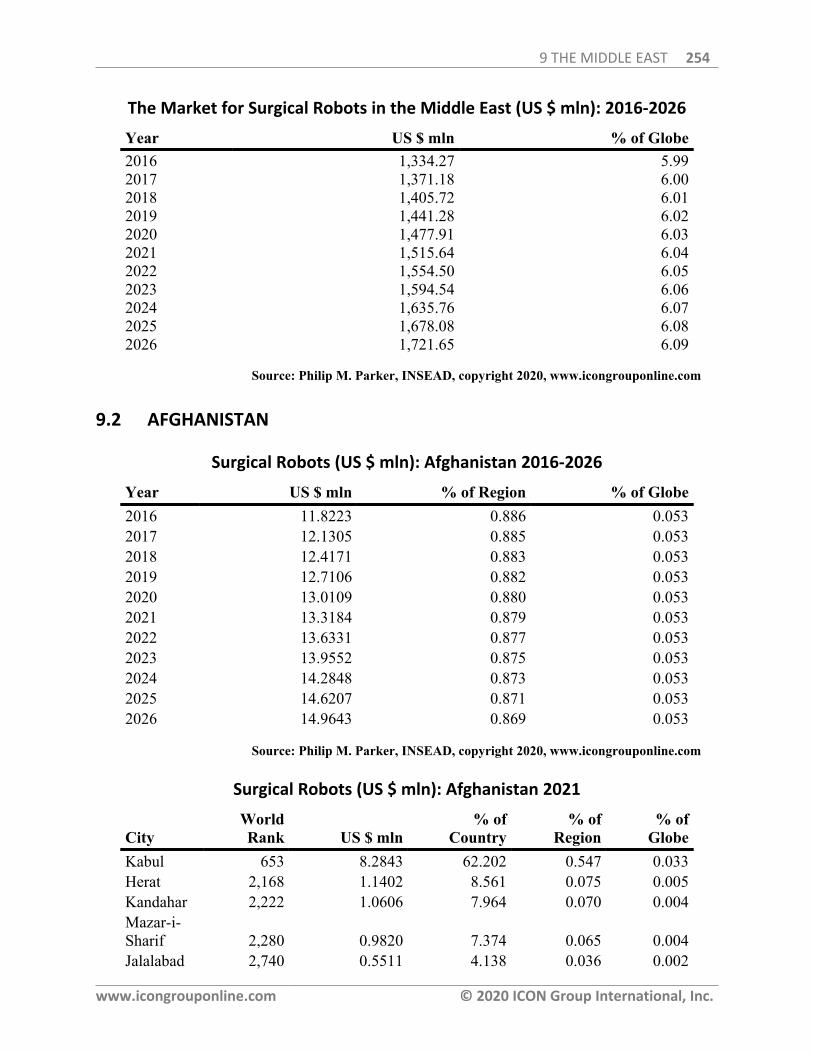
9 THE MIDDLE EAST 254
www.icongrouponline.com © 2020 ICON Group International, Inc.
The Market for Surgical Robots in the Middle East (US $ mln): 2016-2026
Year US $ mln % of Globe2016 1,334.27 5.992017 1,371.18 6.002018 1,405.72 6.012019 1,441.28 6.022020 1,477.91 6.032021 1,515.64 6.042022 1,554.50 6.052023 1,594.54 6.062024 1,635.76 6.072025 1,678.08 6.082026 1,721.65 6.09
Source: Philip M. Parker, INSEAD, copyright 2020, www.icongrouponline.com
9.2 AFGHANISTAN
Surgical Robots (US $ mln): Afghanistan 2016-2026
Year US $ mln % of Region % of Globe2016 11.8223 0.886 0.0532017 12.1305 0.885 0.0532018 12.4171 0.883 0.0532019 12.7106 0.882 0.0532020 13.0109 0.880 0.0532021 13.3184 0.879 0.0532022 13.6331 0.877 0.0532023 13.9552 0.875 0.0532024 14.2848 0.873 0.0532025 14.6207 0.871 0.0532026 14.9643 0.869 0.053
Source: Philip M. Parker, INSEAD, copyright 2020, www.icongrouponline.com
Surgical Robots (US $ mln): Afghanistan 2021
CityWorldRank US $ mln
% ofCountry
% ofRegion
% ofGlobe
Kabul 653 8.2843 62.202 0.547 0.033Herat 2,168 1.1402 8.561 0.075 0.005Kandahar 2,222 1.0606 7.964 0.070 0.004Mazar-i-Sharif 2,280 0.9820 7.374 0.065 0.004Jalalabad 2,740 0.5511 4.138 0.036 0.002
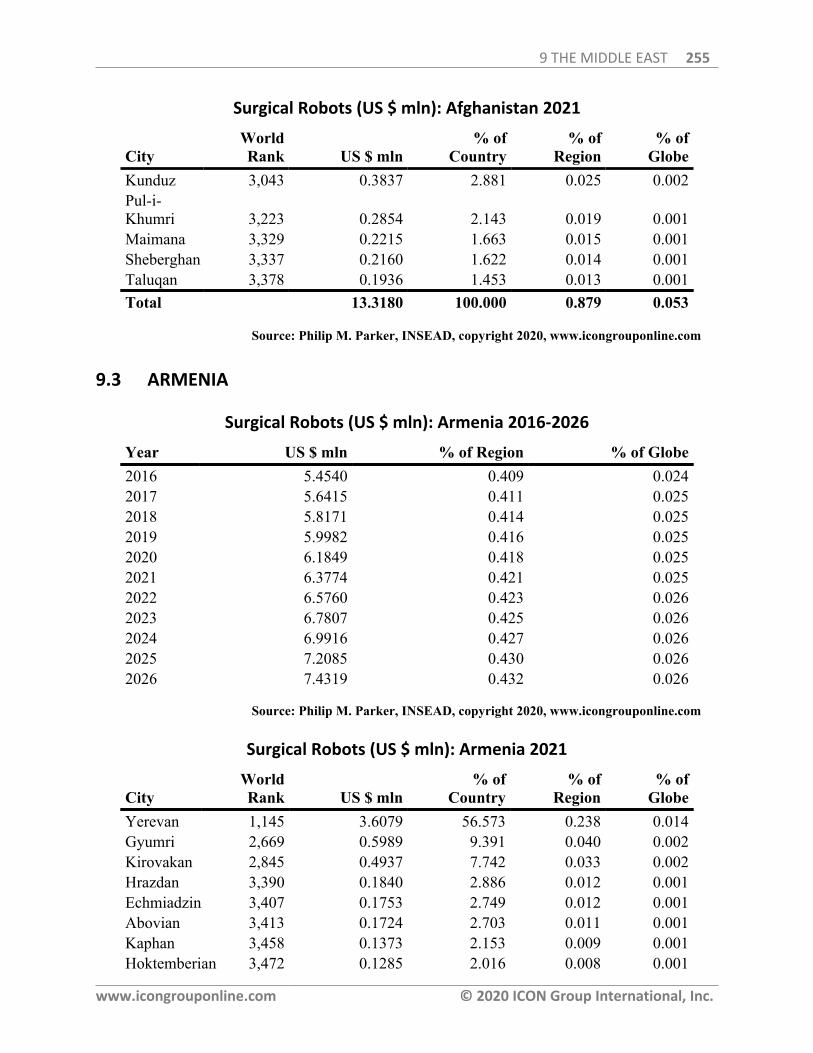
9 THE MIDDLE EAST 255
www.icongrouponline.com © 2020 ICON Group International, Inc.
Surgical Robots (US $ mln): Afghanistan 2021
CityWorldRank US $ mln
% ofCountry
% ofRegion
% ofGlobe
Kunduz 3,043 0.3837 2.881 0.025 0.002Pul-i-Khumri 3,223 0.2854 2.143 0.019 0.001Maimana 3,329 0.2215 1.663 0.015 0.001Sheberghan 3,337 0.2160 1.622 0.014 0.001Taluqan 3,378 0.1936 1.453 0.013 0.001Total 13.3180 100.000 0.879 0.053
Source: Philip M. Parker, INSEAD, copyright 2020, www.icongrouponline.com
9.3 ARMENIA
Surgical Robots (US $ mln): Armenia 2016-2026
Year US $ mln % of Region % of Globe2016 5.4540 0.409 0.0242017 5.6415 0.411 0.0252018 5.8171 0.414 0.0252019 5.9982 0.416 0.0252020 6.1849 0.418 0.0252021 6.3774 0.421 0.0252022 6.5760 0.423 0.0262023 6.7807 0.425 0.0262024 6.9916 0.427 0.0262025 7.2085 0.430 0.0262026 7.4319 0.432 0.026
Source: Philip M. Parker, INSEAD, copyright 2020, www.icongrouponline.com
Surgical Robots (US $ mln): Armenia 2021
CityWorldRank US $ mln
% ofCountry
% ofRegion
% ofGlobe
Yerevan 1,145 3.6079 56.573 0.238 0.014Gyumri 2,669 0.5989 9.391 0.040 0.002Kirovakan 2,845 0.4937 7.742 0.033 0.002Hrazdan 3,390 0.1840 2.886 0.012 0.001Echmiadzin 3,407 0.1753 2.749 0.012 0.001Abovian 3,413 0.1724 2.703 0.011 0.001Kaphan 3,458 0.1373 2.153 0.009 0.001Hoktemberian 3,472 0.1285 2.016 0.008 0.001
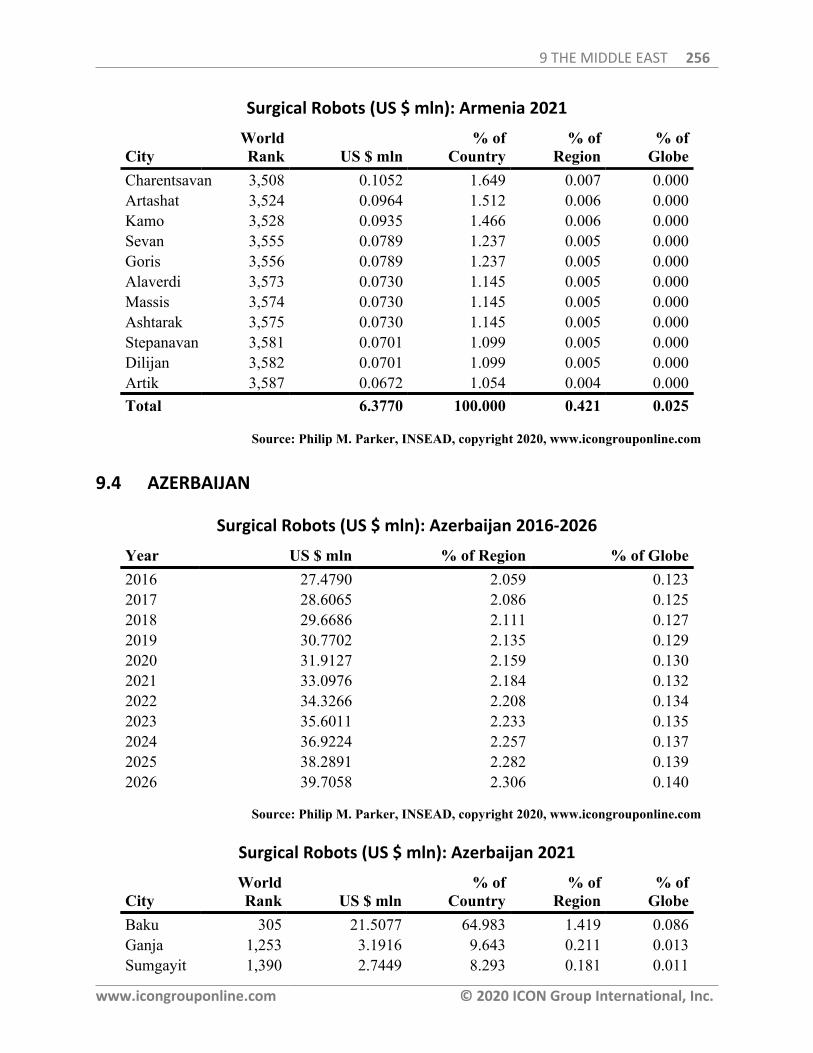
9 THE MIDDLE EAST 256
www.icongrouponline.com © 2020 ICON Group International, Inc.
Surgical Robots (US $ mln): Armenia 2021
CityWorldRank US $ mln
% ofCountry
% ofRegion
% ofGlobe
Charentsavan 3,508 0.1052 1.649 0.007 0.000Artashat 3,524 0.0964 1.512 0.006 0.000Kamo 3,528 0.0935 1.466 0.006 0.000Sevan 3,555 0.0789 1.237 0.005 0.000Goris 3,556 0.0789 1.237 0.005 0.000Alaverdi 3,573 0.0730 1.145 0.005 0.000Massis 3,574 0.0730 1.145 0.005 0.000Ashtarak 3,575 0.0730 1.145 0.005 0.000Stepanavan 3,581 0.0701 1.099 0.005 0.000Dilijan 3,582 0.0701 1.099 0.005 0.000Artik 3,587 0.0672 1.054 0.004 0.000Total 6.3770 100.000 0.421 0.025
Source: Philip M. Parker, INSEAD, copyright 2020, www.icongrouponline.com
9.4 AZERBAIJAN
Surgical Robots (US $ mln): Azerbaijan 2016-2026
Year US $ mln % of Region % of Globe2016 27.4790 2.059 0.1232017 28.6065 2.086 0.1252018 29.6686 2.111 0.1272019 30.7702 2.135 0.1292020 31.9127 2.159 0.1302021 33.0976 2.184 0.1322022 34.3266 2.208 0.1342023 35.6011 2.233 0.1352024 36.9224 2.257 0.1372025 38.2891 2.282 0.1392026 39.7058 2.306 0.140
Source: Philip M. Parker, INSEAD, copyright 2020, www.icongrouponline.com
Surgical Robots (US $ mln): Azerbaijan 2021
CityWorldRank US $ mln
% ofCountry
% ofRegion
% ofGlobe
Baku 305 21.5077 64.983 1.419 0.086Ganja 1,253 3.1916 9.643 0.211 0.013Sumgayit 1,390 2.7449 8.293 0.181 0.011
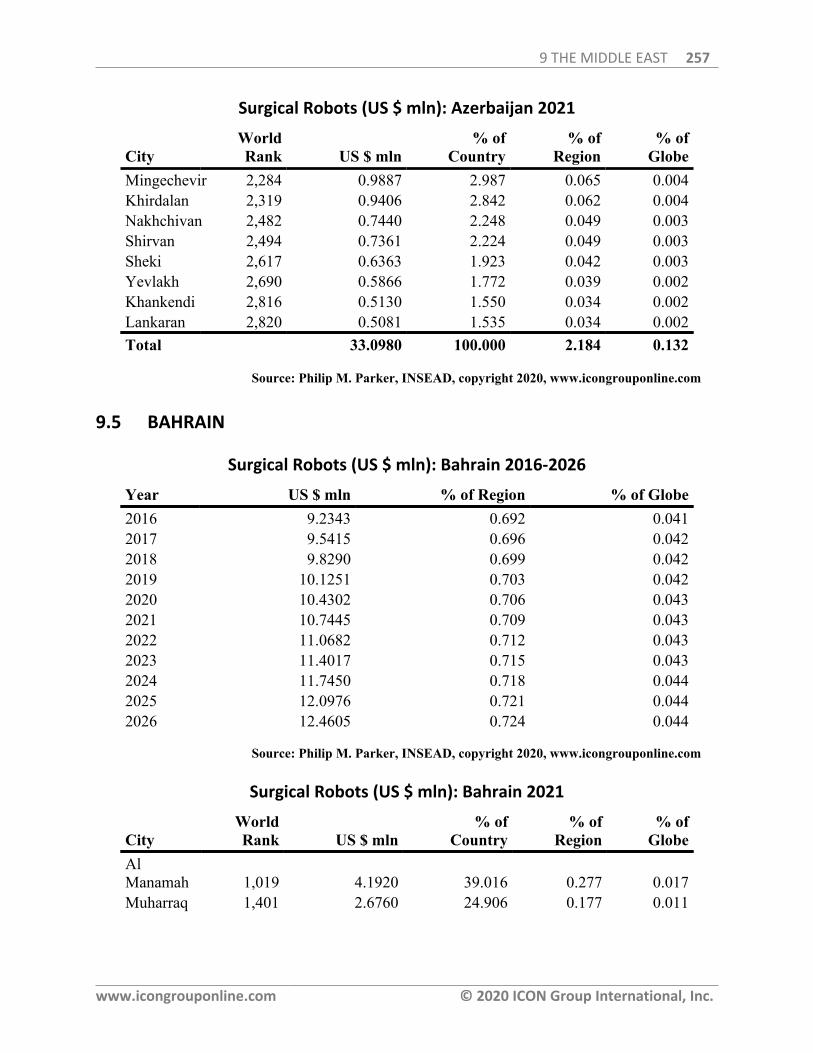
9 THE MIDDLE EAST 257
www.icongrouponline.com © 2020 ICON Group International, Inc.
Surgical Robots (US $ mln): Azerbaijan 2021
CityWorldRank US $ mln
% ofCountry
% ofRegion
% ofGlobe
Mingechevir 2,284 0.9887 2.987 0.065 0.004Khirdalan 2,319 0.9406 2.842 0.062 0.004Nakhchivan 2,482 0.7440 2.248 0.049 0.003Shirvan 2,494 0.7361 2.224 0.049 0.003Sheki 2,617 0.6363 1.923 0.042 0.003Yevlakh 2,690 0.5866 1.772 0.039 0.002Khankendi 2,816 0.5130 1.550 0.034 0.002Lankaran 2,820 0.5081 1.535 0.034 0.002Total 33.0980 100.000 2.184 0.132
Source: Philip M. Parker, INSEAD, copyright 2020, www.icongrouponline.com
9.5 BAHRAIN
Surgical Robots (US $ mln): Bahrain 2016-2026
Year US $ mln % of Region % of Globe2016 9.2343 0.692 0.0412017 9.5415 0.696 0.0422018 9.8290 0.699 0.0422019 10.1251 0.703 0.0422020 10.4302 0.706 0.0432021 10.7445 0.709 0.0432022 11.0682 0.712 0.0432023 11.4017 0.715 0.0432024 11.7450 0.718 0.0442025 12.0976 0.721 0.0442026 12.4605 0.724 0.044
Source: Philip M. Parker, INSEAD, copyright 2020, www.icongrouponline.com
Surgical Robots (US $ mln): Bahrain 2021
CityWorldRank US $ mln
% ofCountry
% ofRegion
% ofGlobe
AlManamah 1,019 4.1920 39.016 0.277 0.017Muharraq 1,401 2.6760 24.906 0.177 0.011
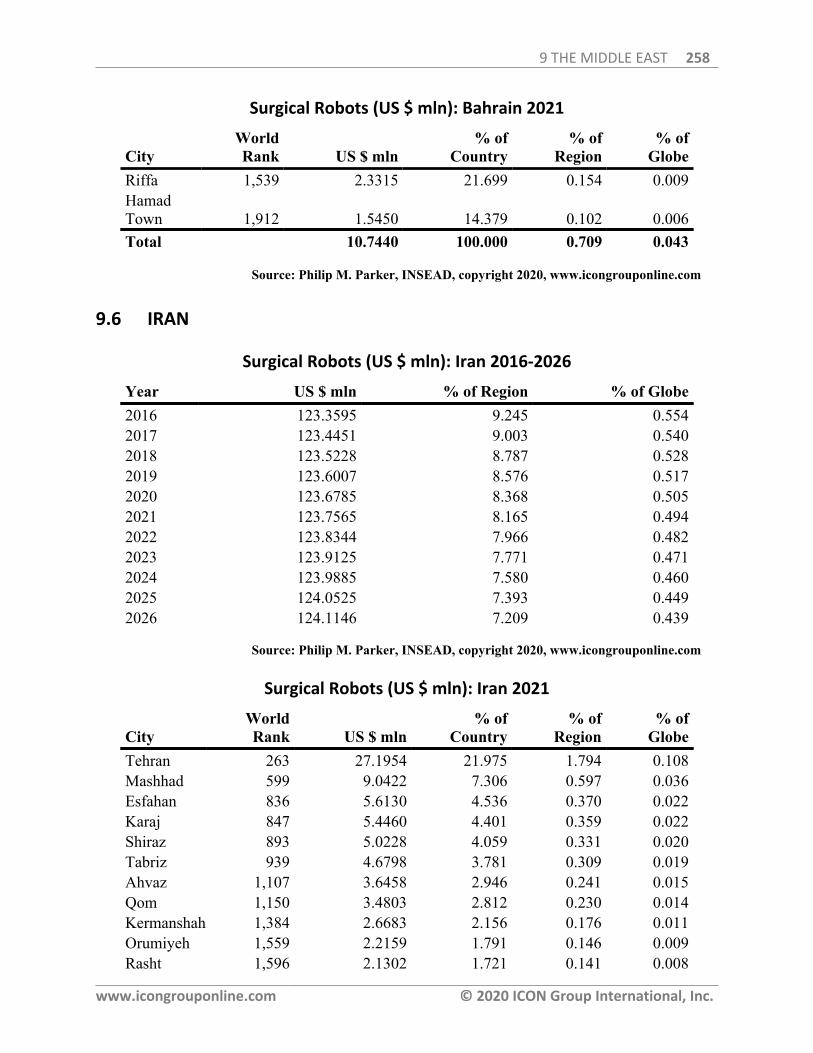
9 THE MIDDLE EAST 258
www.icongrouponline.com © 2020 ICON Group International, Inc.
Surgical Robots (US $ mln): Bahrain 2021
CityWorldRank US $ mln
% ofCountry
% ofRegion
% ofGlobe
Riffa 1,539 2.3315 21.699 0.154 0.009HamadTown 1,912 1.5450 14.379 0.102 0.006Total 10.7440 100.000 0.709 0.043
Source: Philip M. Parker, INSEAD, copyright 2020, www.icongrouponline.com
9.6 IRAN
Surgical Robots (US $ mln): Iran 2016-2026
Year US $ mln % of Region % of Globe2016 123.3595 9.245 0.5542017 123.4451 9.003 0.5402018 123.5228 8.787 0.5282019 123.6007 8.576 0.5172020 123.6785 8.368 0.5052021 123.7565 8.165 0.4942022 123.8344 7.966 0.4822023 123.9125 7.771 0.4712024 123.9885 7.580 0.4602025 124.0525 7.393 0.4492026 124.1146 7.209 0.439
Source: Philip M. Parker, INSEAD, copyright 2020, www.icongrouponline.com
Surgical Robots (US $ mln): Iran 2021
CityWorldRank US $ mln
% ofCountry
% ofRegion
% ofGlobe
Tehran 263 27.1954 21.975 1.794 0.108Mashhad 599 9.0422 7.306 0.597 0.036Esfahan 836 5.6130 4.536 0.370 0.022Karaj 847 5.4460 4.401 0.359 0.022Shiraz 893 5.0228 4.059 0.331 0.020Tabriz 939 4.6798 3.781 0.309 0.019Ahvaz 1,107 3.6458 2.946 0.241 0.015Qom 1,150 3.4803 2.812 0.230 0.014Kermanshah 1,384 2.6683 2.156 0.176 0.011Orumiyeh 1,559 2.2159 1.791 0.146 0.009Rasht 1,596 2.1302 1.721 0.141 0.008
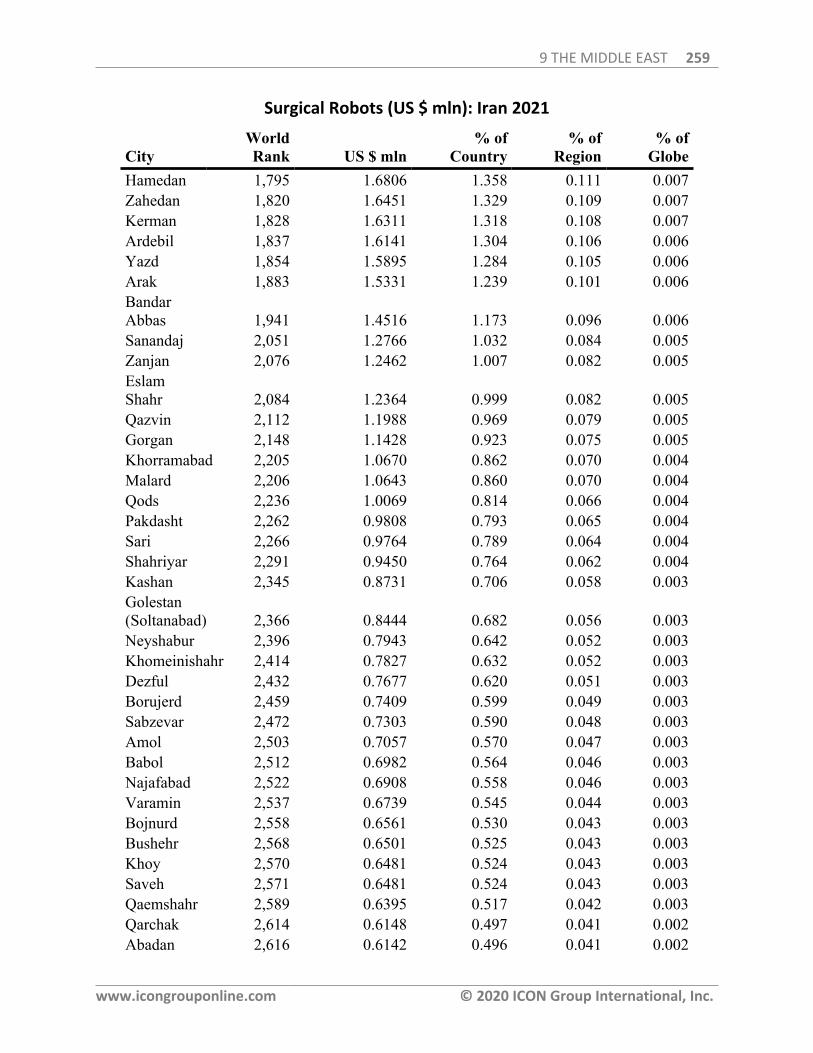
9 THE MIDDLE EAST 259
www.icongrouponline.com © 2020 ICON Group International, Inc.
Surgical Robots (US $ mln): Iran 2021
CityWorldRank US $ mln
% ofCountry
% ofRegion
% ofGlobe
Hamedan 1,795 1.6806 1.358 0.111 0.007Zahedan 1,820 1.6451 1.329 0.109 0.007Kerman 1,828 1.6311 1.318 0.108 0.007Ardebil 1,837 1.6141 1.304 0.106 0.006Yazd 1,854 1.5895 1.284 0.105 0.006Arak 1,883 1.5331 1.239 0.101 0.006BandarAbbas 1,941 1.4516 1.173 0.096 0.006Sanandaj 2,051 1.2766 1.032 0.084 0.005Zanjan 2,076 1.2462 1.007 0.082 0.005EslamShahr 2,084 1.2364 0.999 0.082 0.005Qazvin 2,112 1.1988 0.969 0.079 0.005Gorgan 2,148 1.1428 0.923 0.075 0.005Khorramabad 2,205 1.0670 0.862 0.070 0.004Malard 2,206 1.0643 0.860 0.070 0.004Qods 2,236 1.0069 0.814 0.066 0.004Pakdasht 2,262 0.9808 0.793 0.065 0.004Sari 2,266 0.9764 0.789 0.064 0.004Shahriyar 2,291 0.9450 0.764 0.062 0.004Kashan 2,345 0.8731 0.706 0.058 0.003Golestan(Soltanabad) 2,366 0.8444 0.682 0.056 0.003Neyshabur 2,396 0.7943 0.642 0.052 0.003Khomeinishahr 2,414 0.7827 0.632 0.052 0.003Dezful 2,432 0.7677 0.620 0.051 0.003Borujerd 2,459 0.7409 0.599 0.049 0.003Sabzevar 2,472 0.7303 0.590 0.048 0.003Amol 2,503 0.7057 0.570 0.047 0.003Babol 2,512 0.6982 0.564 0.046 0.003Najafabad 2,522 0.6908 0.558 0.046 0.003Varamin 2,537 0.6739 0.545 0.044 0.003Bojnurd 2,558 0.6561 0.530 0.043 0.003Bushehr 2,568 0.6501 0.525 0.043 0.003Khoy 2,570 0.6481 0.524 0.043 0.003Saveh 2,571 0.6481 0.524 0.043 0.003Qaemshahr 2,589 0.6395 0.517 0.042 0.003Qarchak 2,614 0.6148 0.497 0.041 0.002Abadan 2,616 0.6142 0.496 0.041 0.002

9 THE MIDDLE EAST 260
www.icongrouponline.com © 2020 ICON Group International, Inc.
Surgical Robots (US $ mln): Iran 2021
CityWorldRank US $ mln
% ofCountry
% ofRegion
% ofGlobe
Bandar-e-Mahshahr 2,620 0.6106 0.493 0.040 0.002Sirjan 2,653 0.5887 0.476 0.039 0.002Bukan 2,703 0.5609 0.453 0.037 0.002Shahr-e-Kord 2,705 0.5597 0.452 0.037 0.002Birjand 2,707 0.5581 0.451 0.037 0.002Ilam 2,736 0.5410 0.437 0.036 0.002Semnan 2,743 0.5375 0.434 0.035 0.002Nasimshahr
(Akbarabad) 2,758 0.5287 0.427 0.035 0.002Maragheh 2,786 0.5132 0.415 0.034 0.002Malayer 2,838 0.4823 0.390 0.032 0.002Rafsanjan 2,840 0.4808 0.388 0.032 0.002Gonbad-e-kavus 2,862 0.4704 0.380 0.031 0.002Shahinshahr 2,869 0.4686 0.379 0.031 0.002Mahabad 2,877 0.4665 0.377 0.031 0.002Marvdasht 2,899 0.4498 0.363 0.030 0.002Bam 2,901 0.4483 0.362 0.030 0.002Shahrud 2,917 0.4368 0.353 0.029 0.002KamalShahr 2,928 0.4323 0.349 0.029 0.002Saqqez 2,932 0.4300 0.347 0.028 0.002Torbat-e-heydariyeh 2,953 0.4143 0.335 0.027 0.002Zabol 2,961 0.4097 0.331 0.027 0.002Shahreza 2,972 0.4061 0.328 0.027 0.002Marand 2,992 0.3932 0.318 0.026 0.002Andimeshk 2,994 0.3924 0.317 0.026 0.002Khorramshahr 2,996 0.3922 0.317 0.026 0.002Miyandoap 3,013 0.3879 0.313 0.026 0.002Marivan 3,018 0.3843 0.310 0.025 0.002Izeh 3,027 0.3820 0.309 0.025 0.002Jiroft 3,041 0.3755 0.303 0.025 0.001Jahrom 3,065 0.3613 0.292 0.024 0.001BandarAnzali 3,067 0.3609 0.292 0.024 0.001Fasa 3,086 0.3526 0.285 0.023 0.001
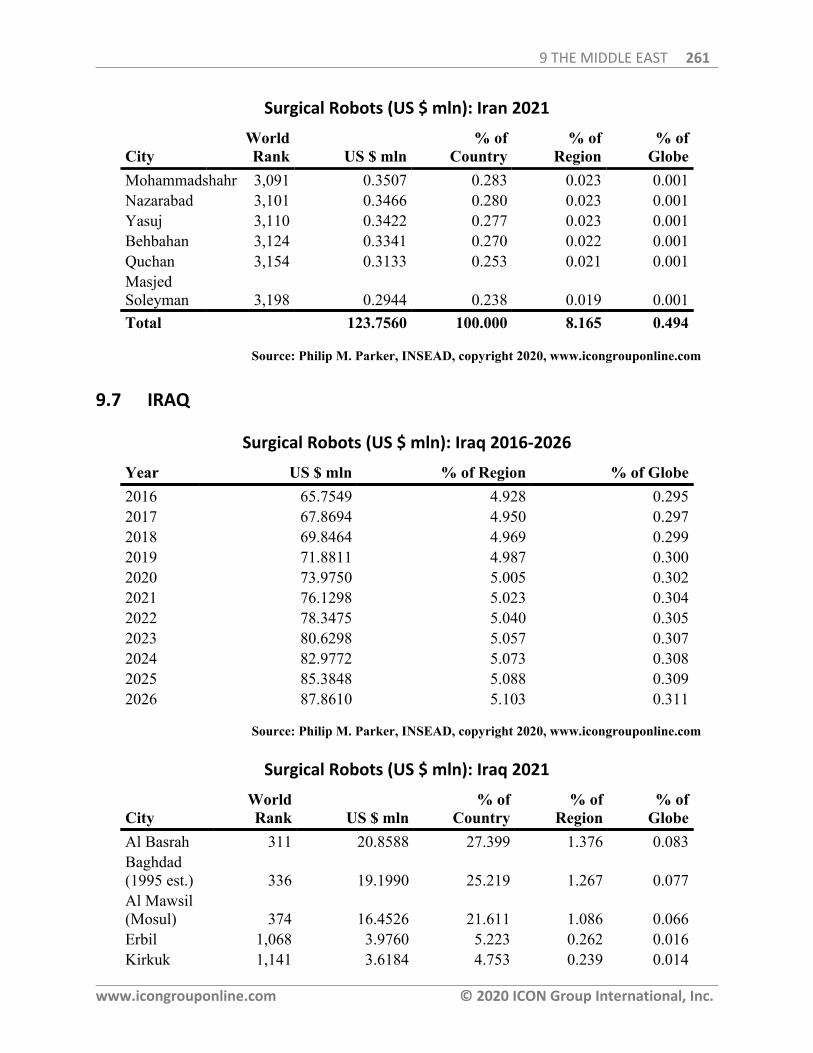
9 THE MIDDLE EAST 261
www.icongrouponline.com © 2020 ICON Group International, Inc.
Surgical Robots (US $ mln): Iran 2021
CityWorldRank US $ mln
% ofCountry
% ofRegion
% ofGlobe
Mohammadshahr 3,091 0.3507 0.283 0.023 0.001Nazarabad 3,101 0.3466 0.280 0.023 0.001Yasuj 3,110 0.3422 0.277 0.023 0.001Behbahan 3,124 0.3341 0.270 0.022 0.001Quchan 3,154 0.3133 0.253 0.021 0.001MasjedSoleyman 3,198 0.2944 0.238 0.019 0.001Total 123.7560 100.000 8.165 0.494
Source: Philip M. Parker, INSEAD, copyright 2020, www.icongrouponline.com
9.7 IRAQ
Surgical Robots (US $ mln): Iraq 2016-2026
Year US $ mln % of Region % of Globe2016 65.7549 4.928 0.2952017 67.8694 4.950 0.2972018 69.8464 4.969 0.2992019 71.8811 4.987 0.3002020 73.9750 5.005 0.3022021 76.1298 5.023 0.3042022 78.3475 5.040 0.3052023 80.6298 5.057 0.3072024 82.9772 5.073 0.3082025 85.3848 5.088 0.3092026 87.8610 5.103 0.311
Source: Philip M. Parker, INSEAD, copyright 2020, www.icongrouponline.com
Surgical Robots (US $ mln): Iraq 2021
CityWorldRank US $ mln
% ofCountry
% ofRegion
% ofGlobe
Al Basrah 311 20.8588 27.399 1.376 0.083Baghdad(1995 est.) 336 19.1990 25.219 1.267 0.077Al Mawsil(Mosul) 374 16.4526 21.611 1.086 0.066Erbil 1,068 3.9760 5.223 0.262 0.016Kirkuk 1,141 3.6184 4.753 0.239 0.014
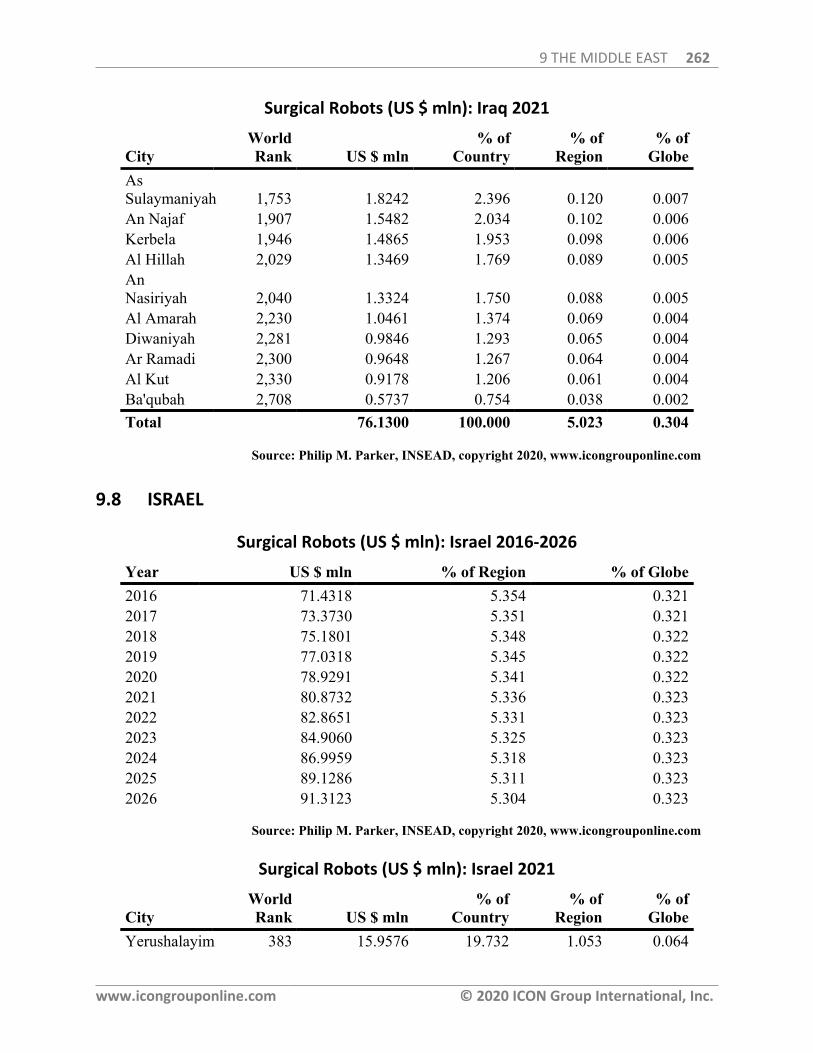
9 THE MIDDLE EAST 262
www.icongrouponline.com © 2020 ICON Group International, Inc.
Surgical Robots (US $ mln): Iraq 2021
CityWorldRank US $ mln
% ofCountry
% ofRegion
% ofGlobe
AsSulaymaniyah 1,753 1.8242 2.396 0.120 0.007An Najaf 1,907 1.5482 2.034 0.102 0.006Kerbela 1,946 1.4865 1.953 0.098 0.006Al Hillah 2,029 1.3469 1.769 0.089 0.005AnNasiriyah 2,040 1.3324 1.750 0.088 0.005Al Amarah 2,230 1.0461 1.374 0.069 0.004Diwaniyah 2,281 0.9846 1.293 0.065 0.004Ar Ramadi 2,300 0.9648 1.267 0.064 0.004Al Kut 2,330 0.9178 1.206 0.061 0.004Ba'qubah 2,708 0.5737 0.754 0.038 0.002Total 76.1300 100.000 5.023 0.304
Source: Philip M. Parker, INSEAD, copyright 2020, www.icongrouponline.com
9.8 ISRAEL
Surgical Robots (US $ mln): Israel 2016-2026
Year US $ mln % of Region % of Globe2016 71.4318 5.354 0.3212017 73.3730 5.351 0.3212018 75.1801 5.348 0.3222019 77.0318 5.345 0.3222020 78.9291 5.341 0.3222021 80.8732 5.336 0.3232022 82.8651 5.331 0.3232023 84.9060 5.325 0.3232024 86.9959 5.318 0.3232025 89.1286 5.311 0.3232026 91.3123 5.304 0.323
Source: Philip M. Parker, INSEAD, copyright 2020, www.icongrouponline.com
Surgical Robots (US $ mln): Israel 2021
CityWorldRank US $ mln
% ofCountry
% ofRegion
% ofGlobe
Yerushalayim 383 15.9576 19.732 1.053 0.064
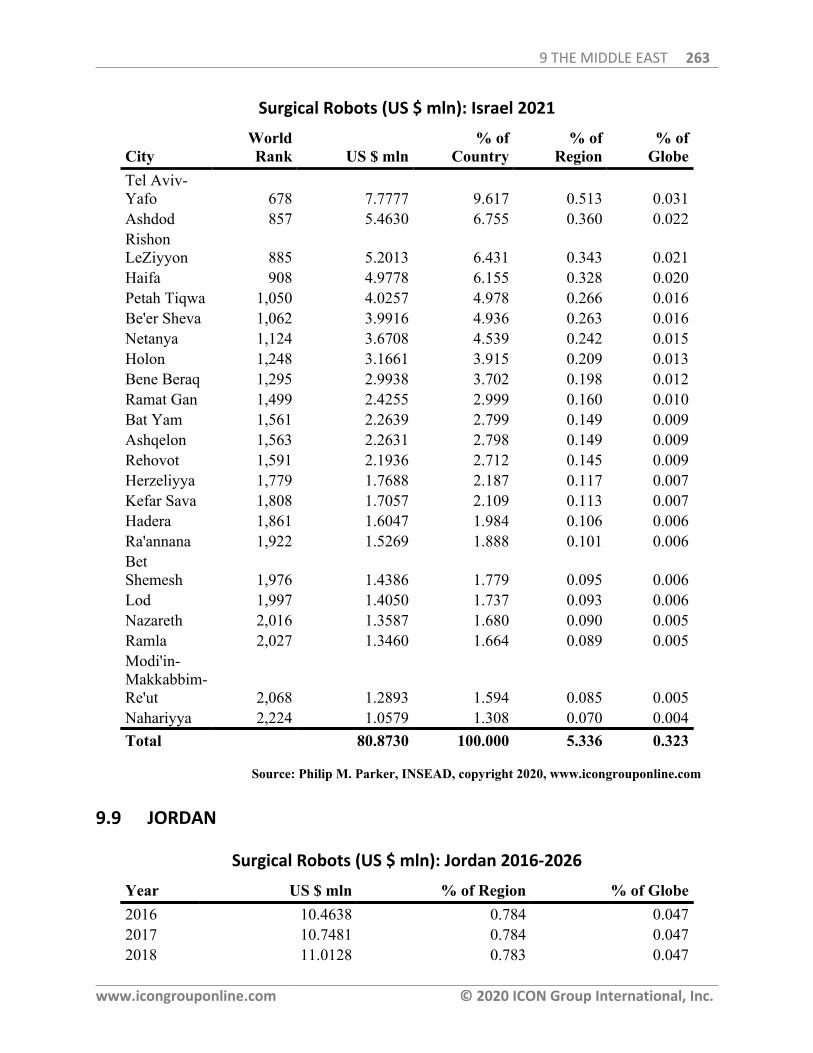
9 THE MIDDLE EAST 263
www.icongrouponline.com © 2020 ICON Group International, Inc.
Surgical Robots (US $ mln): Israel 2021
CityWorldRank US $ mln
% ofCountry
% ofRegion
% ofGlobe
Tel Aviv-Yafo 678 7.7777 9.617 0.513 0.031Ashdod 857 5.4630 6.755 0.360 0.022RishonLeZiyyon 885 5.2013 6.431 0.343 0.021Haifa 908 4.9778 6.155 0.328 0.020Petah Tiqwa 1,050 4.0257 4.978 0.266 0.016Be'er Sheva 1,062 3.9916 4.936 0.263 0.016Netanya 1,124 3.6708 4.539 0.242 0.015Holon 1,248 3.1661 3.915 0.209 0.013Bene Beraq 1,295 2.9938 3.702 0.198 0.012Ramat Gan 1,499 2.4255 2.999 0.160 0.010Bat Yam 1,561 2.2639 2.799 0.149 0.009Ashqelon 1,563 2.2631 2.798 0.149 0.009Rehovot 1,591 2.1936 2.712 0.145 0.009Herzeliyya 1,779 1.7688 2.187 0.117 0.007Kefar Sava 1,808 1.7057 2.109 0.113 0.007Hadera 1,861 1.6047 1.984 0.106 0.006Ra'annana 1,922 1.5269 1.888 0.101 0.006BetShemesh 1,976 1.4386 1.779 0.095 0.006Lod 1,997 1.4050 1.737 0.093 0.006Nazareth 2,016 1.3587 1.680 0.090 0.005Ramla 2,027 1.3460 1.664 0.089 0.005Modi'in-Makkabbim-Re'ut 2,068 1.2893 1.594 0.085 0.005Nahariyya 2,224 1.0579 1.308 0.070 0.004Total 80.8730 100.000 5.336 0.323
Source: Philip M. Parker, INSEAD, copyright 2020, www.icongrouponline.com
9.9 JORDAN
Surgical Robots (US $ mln): Jordan 2016-2026
Year US $ mln % of Region % of Globe2016 10.4638 0.784 0.0472017 10.7481 0.784 0.0472018 11.0128 0.783 0.047
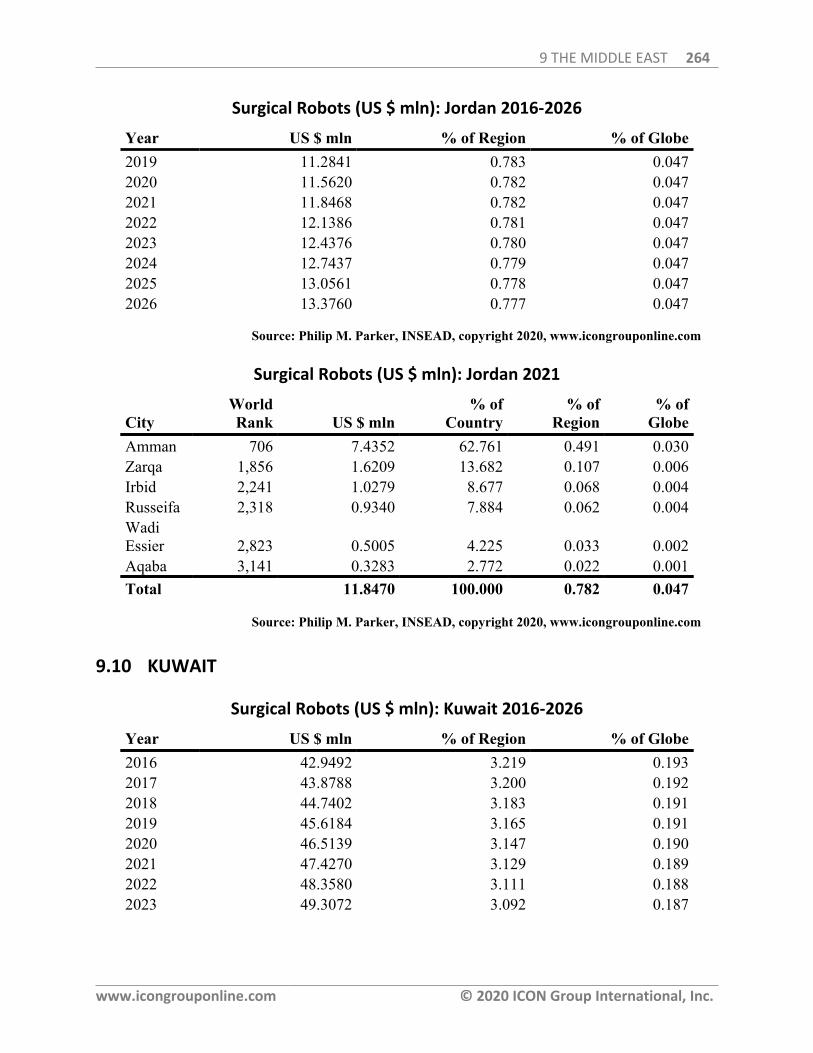
9 THE MIDDLE EAST 264
www.icongrouponline.com © 2020 ICON Group International, Inc.
Surgical Robots (US $ mln): Jordan 2016-2026
Year US $ mln % of Region % of Globe2019 11.2841 0.783 0.0472020 11.5620 0.782 0.0472021 11.8468 0.782 0.0472022 12.1386 0.781 0.0472023 12.4376 0.780 0.0472024 12.7437 0.779 0.0472025 13.0561 0.778 0.0472026 13.3760 0.777 0.047
Source: Philip M. Parker, INSEAD, copyright 2020, www.icongrouponline.com
Surgical Robots (US $ mln): Jordan 2021
CityWorldRank US $ mln
% ofCountry
% ofRegion
% ofGlobe
Amman 706 7.4352 62.761 0.491 0.030Zarqa 1,856 1.6209 13.682 0.107 0.006Irbid 2,241 1.0279 8.677 0.068 0.004Russeifa 2,318 0.9340 7.884 0.062 0.004WadiEssier 2,823 0.5005 4.225 0.033 0.002Aqaba 3,141 0.3283 2.772 0.022 0.001Total 11.8470 100.000 0.782 0.047
Source: Philip M. Parker, INSEAD, copyright 2020, www.icongrouponline.com
9.10 KUWAIT
Surgical Robots (US $ mln): Kuwait 2016-2026
Year US $ mln % of Region % of Globe2016 42.9492 3.219 0.1932017 43.8788 3.200 0.1922018 44.7402 3.183 0.1912019 45.6184 3.165 0.1912020 46.5139 3.147 0.1902021 47.4270 3.129 0.1892022 48.3580 3.111 0.1882023 49.3072 3.092 0.187
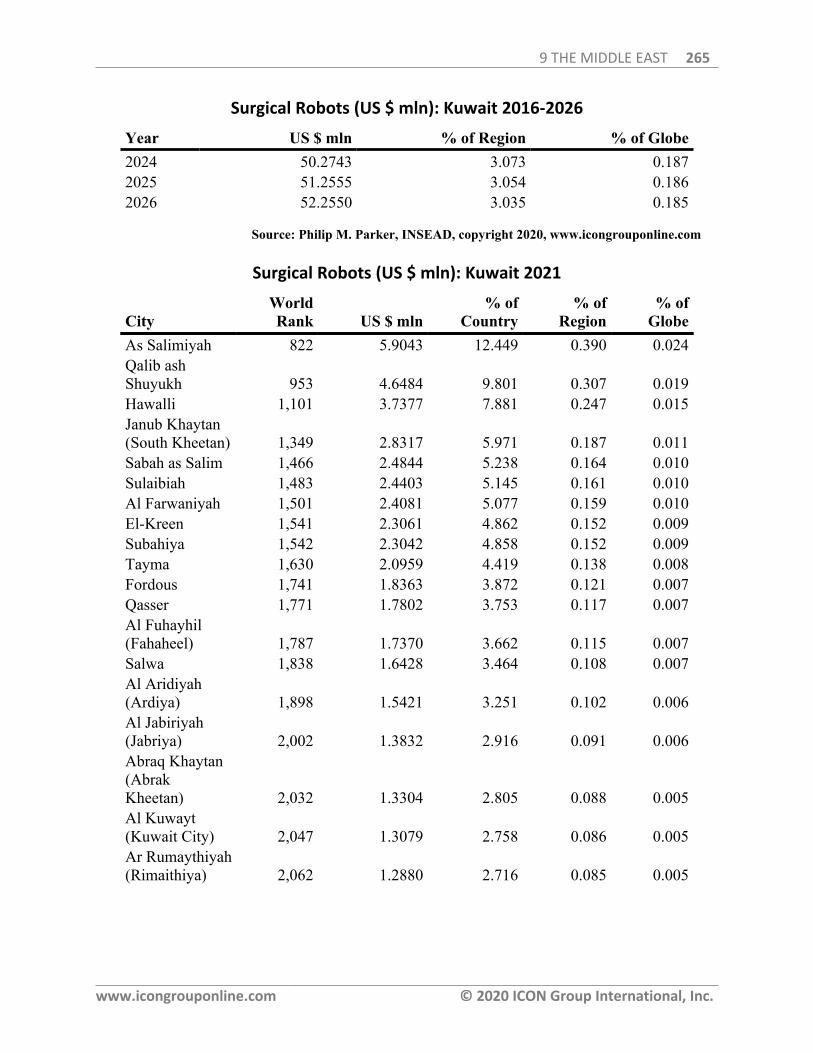
9 THE MIDDLE EAST 265
www.icongrouponline.com © 2020 ICON Group International, Inc.
Surgical Robots (US $ mln): Kuwait 2016-2026
Year US $ mln % of Region % of Globe2024 50.2743 3.073 0.1872025 51.2555 3.054 0.1862026 52.2550 3.035 0.185
Source: Philip M. Parker, INSEAD, copyright 2020, www.icongrouponline.com
Surgical Robots (US $ mln): Kuwait 2021
CityWorldRank US $ mln
% ofCountry
% ofRegion
% ofGlobe
As Salimiyah 822 5.9043 12.449 0.390 0.024Qalib ashShuyukh 953 4.6484 9.801 0.307 0.019Hawalli 1,101 3.7377 7.881 0.247 0.015Janub Khaytan(South Kheetan) 1,349 2.8317 5.971 0.187 0.011Sabah as Salim 1,466 2.4844 5.238 0.164 0.010Sulaibiah 1,483 2.4403 5.145 0.161 0.010Al Farwaniyah 1,501 2.4081 5.077 0.159 0.010El-Kreen 1,541 2.3061 4.862 0.152 0.009Subahiya 1,542 2.3042 4.858 0.152 0.009Tayma 1,630 2.0959 4.419 0.138 0.008Fordous 1,741 1.8363 3.872 0.121 0.007Qasser 1,771 1.7802 3.753 0.117 0.007Al Fuhayhil(Fahaheel) 1,787 1.7370 3.662 0.115 0.007Salwa 1,838 1.6428 3.464 0.108 0.007Al Aridiyah(Ardiya) 1,898 1.5421 3.251 0.102 0.006Al Jabiriyah(Jabriya) 2,002 1.3832 2.916 0.091 0.006Abraq Khaytan(AbrakKheetan) 2,032 1.3304 2.805 0.088 0.005Al Kuwayt(Kuwait City) 2,047 1.3079 2.758 0.086 0.005Ar Rumaythiyah(Rimaithiya) 2,062 1.2880 2.716 0.085 0.005
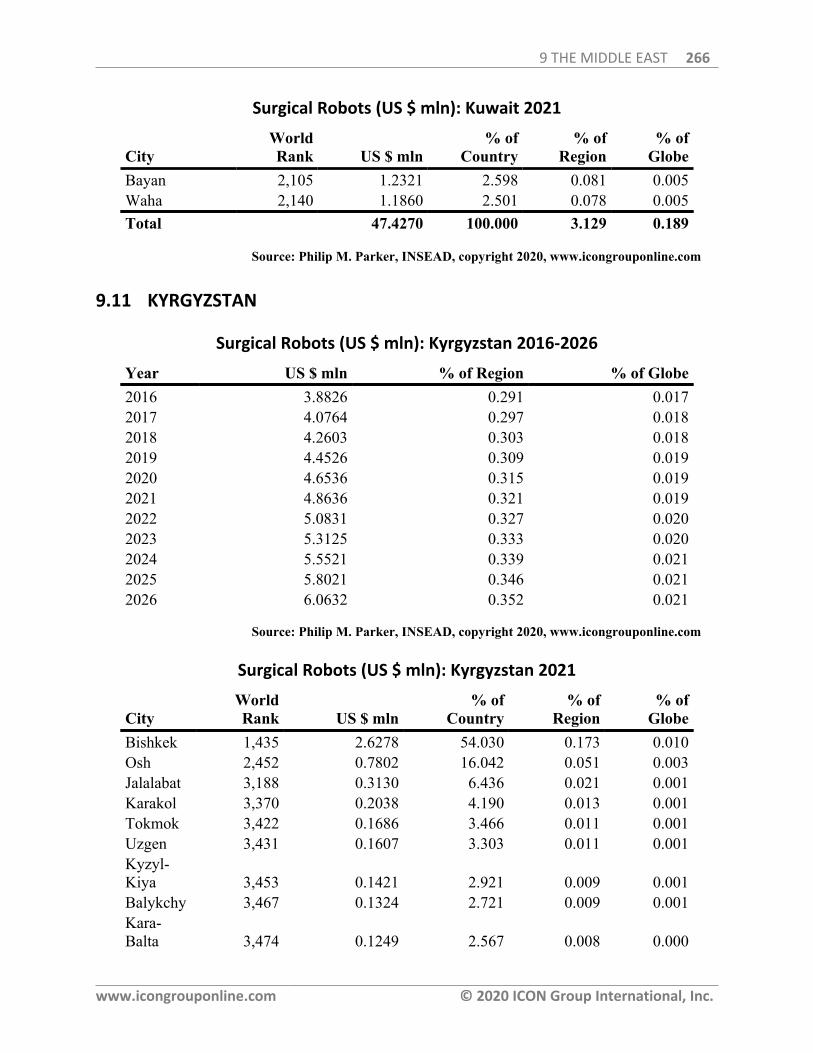
9 THE MIDDLE EAST 266
www.icongrouponline.com © 2020 ICON Group International, Inc.
Surgical Robots (US $ mln): Kuwait 2021
CityWorldRank US $ mln
% ofCountry
% ofRegion
% ofGlobe
Bayan 2,105 1.2321 2.598 0.081 0.005Waha 2,140 1.1860 2.501 0.078 0.005Total 47.4270 100.000 3.129 0.189
Source: Philip M. Parker, INSEAD, copyright 2020, www.icongrouponline.com
9.11 KYRGYZSTAN
Surgical Robots (US $ mln): Kyrgyzstan 2016-2026
Year US $ mln % of Region % of Globe2016 3.8826 0.291 0.0172017 4.0764 0.297 0.0182018 4.2603 0.303 0.0182019 4.4526 0.309 0.0192020 4.6536 0.315 0.0192021 4.8636 0.321 0.0192022 5.0831 0.327 0.0202023 5.3125 0.333 0.0202024 5.5521 0.339 0.0212025 5.8021 0.346 0.0212026 6.0632 0.352 0.021
Source: Philip M. Parker, INSEAD, copyright 2020, www.icongrouponline.com
Surgical Robots (US $ mln): Kyrgyzstan 2021
CityWorldRank US $ mln
% ofCountry
% ofRegion
% ofGlobe
Bishkek 1,435 2.6278 54.030 0.173 0.010Osh 2,452 0.7802 16.042 0.051 0.003Jalalabat 3,188 0.3130 6.436 0.021 0.001Karakol 3,370 0.2038 4.190 0.013 0.001Tokmok 3,422 0.1686 3.466 0.011 0.001Uzgen 3,431 0.1607 3.303 0.011 0.001Kyzyl-Kiya 3,453 0.1421 2.921 0.009 0.001Balykchy 3,467 0.1324 2.721 0.009 0.001Kara-Balta 3,474 0.1249 2.567 0.008 0.000
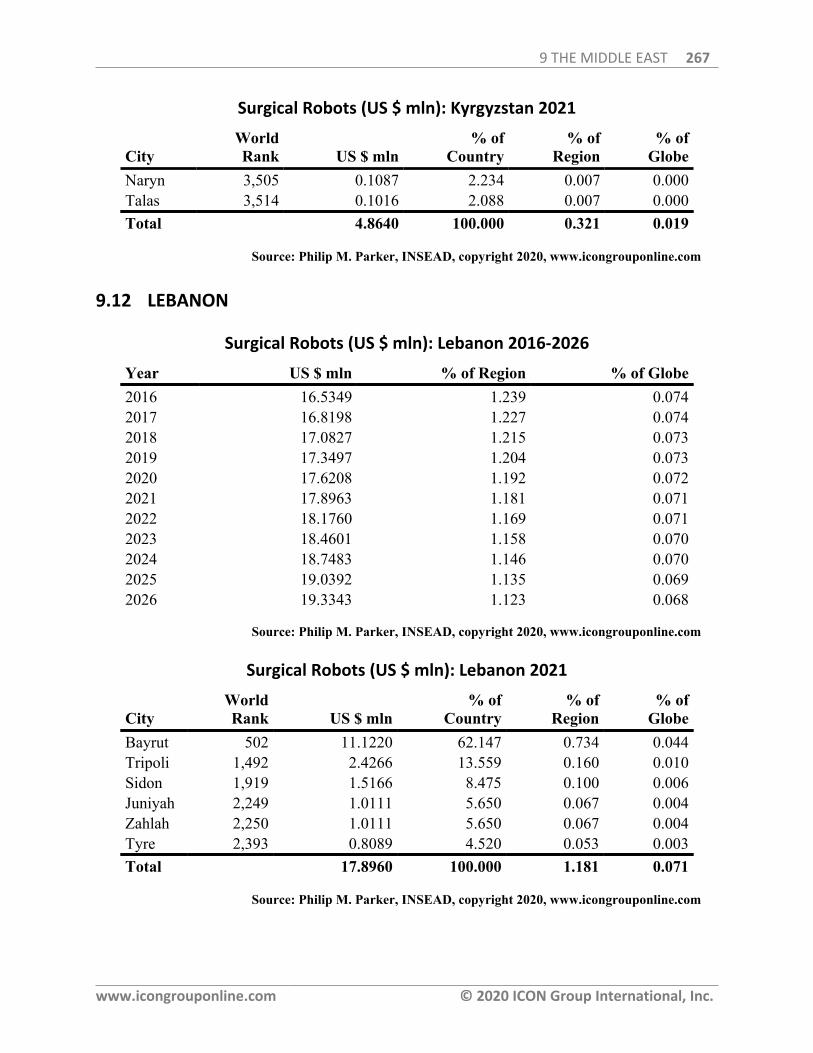
9 THE MIDDLE EAST 267
www.icongrouponline.com © 2020 ICON Group International, Inc.
Surgical Robots (US $ mln): Kyrgyzstan 2021
CityWorldRank US $ mln
% ofCountry
% ofRegion
% ofGlobe
Naryn 3,505 0.1087 2.234 0.007 0.000Talas 3,514 0.1016 2.088 0.007 0.000Total 4.8640 100.000 0.321 0.019
Source: Philip M. Parker, INSEAD, copyright 2020, www.icongrouponline.com
9.12 LEBANON
Surgical Robots (US $ mln): Lebanon 2016-2026
Year US $ mln % of Region % of Globe2016 16.5349 1.239 0.0742017 16.8198 1.227 0.0742018 17.0827 1.215 0.0732019 17.3497 1.204 0.0732020 17.6208 1.192 0.0722021 17.8963 1.181 0.0712022 18.1760 1.169 0.0712023 18.4601 1.158 0.0702024 18.7483 1.146 0.0702025 19.0392 1.135 0.0692026 19.3343 1.123 0.068
Source: Philip M. Parker, INSEAD, copyright 2020, www.icongrouponline.com
Surgical Robots (US $ mln): Lebanon 2021
CityWorldRank US $ mln
% ofCountry
% ofRegion
% ofGlobe
Bayrut 502 11.1220 62.147 0.734 0.044Tripoli 1,492 2.4266 13.559 0.160 0.010Sidon 1,919 1.5166 8.475 0.100 0.006Juniyah 2,249 1.0111 5.650 0.067 0.004Zahlah 2,250 1.0111 5.650 0.067 0.004Tyre 2,393 0.8089 4.520 0.053 0.003Total 17.8960 100.000 1.181 0.071
Source: Philip M. Parker, INSEAD, copyright 2020, www.icongrouponline.com

9 THE MIDDLE EAST 268
www.icongrouponline.com © 2020 ICON Group International, Inc.
9.13 OMAN
Surgical Robots (US $ mln): Oman 2016-2026
Year US $ mln % of Region % of Globe2016 25.2185 1.890 0.1132017 26.1553 1.907 0.1142018 27.0349 1.923 0.1162019 27.9441 1.939 0.1172020 28.8839 1.954 0.1182021 29.8552 1.970 0.1192022 30.8593 1.985 0.1202023 31.8971 2.000 0.1212024 32.9692 2.016 0.1222025 34.0742 2.031 0.1232026 35.2157 2.045 0.125
Source: Philip M. Parker, INSEAD, copyright 2020, www.icongrouponline.com
Surgical Robots (US $ mln): Oman 2021
CityWorldRank US $ mln
% ofCountry
% ofRegion
% ofGlobe
As Seeb 662 8.1890 27.429 0.540 0.033Bawshahr 924 4.9246 16.495 0.325 0.020Salalah 1,083 3.9123 13.104 0.258 0.016Sohar 1,114 3.7481 12.554 0.247 0.015Mutrah 1,270 3.1152 10.434 0.206 0.012Ibri 1,366 2.8155 9.430 0.186 0.011AsSuwayq 1,458 2.5376 8.500 0.167 0.010Muscat 2,645 0.6131 2.054 0.040 0.002Total 29.8550 100.000 1.970 0.119
Source: Philip M. Parker, INSEAD, copyright 2020, www.icongrouponline.com
9.14 PAKISTAN
Surgical Robots (US $ mln): Pakistan 2016-2026
Year US $ mln % of Region % of Globe2016 150.5244 11.281 0.6762017 154.8648 11.294 0.6782018 158.9115 11.305 0.680
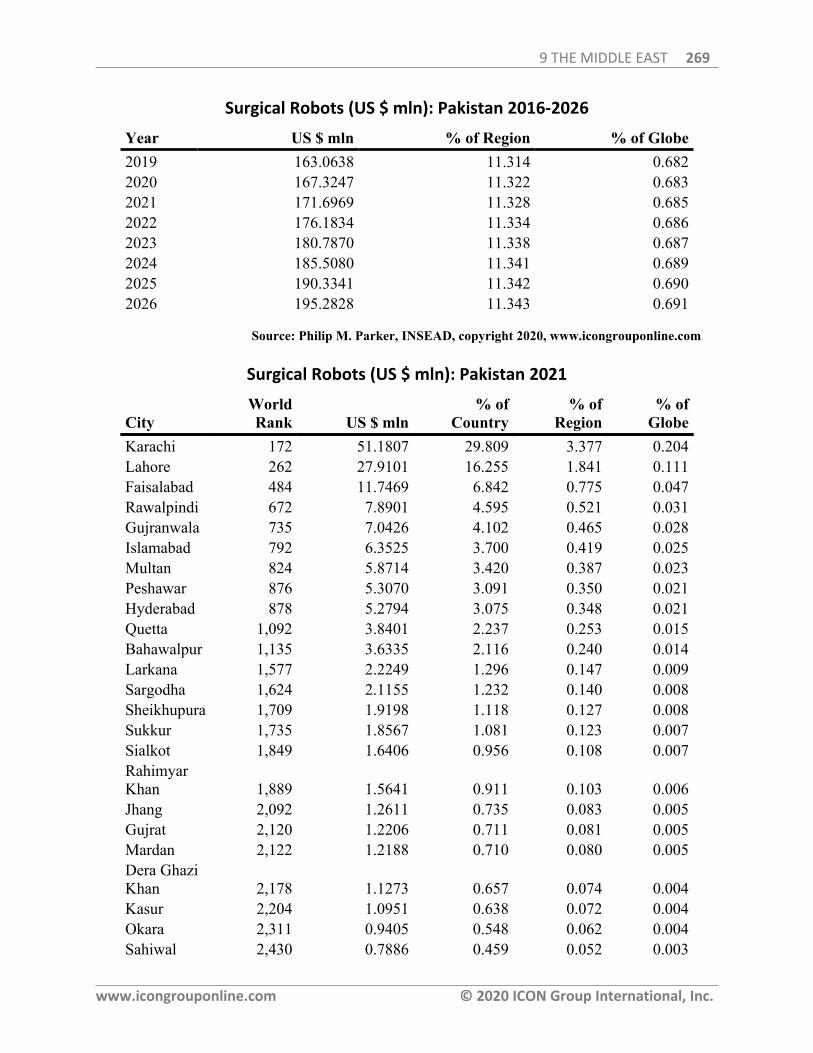
9 THE MIDDLE EAST 269
www.icongrouponline.com © 2020 ICON Group International, Inc.
Surgical Robots (US $ mln): Pakistan 2016-2026
Year US $ mln % of Region % of Globe2019 163.0638 11.314 0.6822020 167.3247 11.322 0.6832021 171.6969 11.328 0.6852022 176.1834 11.334 0.6862023 180.7870 11.338 0.6872024 185.5080 11.341 0.6892025 190.3341 11.342 0.6902026 195.2828 11.343 0.691
Source: Philip M. Parker, INSEAD, copyright 2020, www.icongrouponline.com
Surgical Robots (US $ mln): Pakistan 2021
CityWorldRank US $ mln
% ofCountry
% ofRegion
% ofGlobe
Karachi 172 51.1807 29.809 3.377 0.204Lahore 262 27.9101 16.255 1.841 0.111Faisalabad 484 11.7469 6.842 0.775 0.047Rawalpindi 672 7.8901 4.595 0.521 0.031Gujranwala 735 7.0426 4.102 0.465 0.028Islamabad 792 6.3525 3.700 0.419 0.025Multan 824 5.8714 3.420 0.387 0.023Peshawar 876 5.3070 3.091 0.350 0.021Hyderabad 878 5.2794 3.075 0.348 0.021Quetta 1,092 3.8401 2.237 0.253 0.015Bahawalpur 1,135 3.6335 2.116 0.240 0.014Larkana 1,577 2.2249 1.296 0.147 0.009Sargodha 1,624 2.1155 1.232 0.140 0.008Sheikhupura 1,709 1.9198 1.118 0.127 0.008Sukkur 1,735 1.8567 1.081 0.123 0.007Sialkot 1,849 1.6406 0.956 0.108 0.007RahimyarKhan 1,889 1.5641 0.911 0.103 0.006Jhang 2,092 1.2611 0.735 0.083 0.005Gujrat 2,120 1.2206 0.711 0.081 0.005Mardan 2,122 1.2188 0.710 0.080 0.005Dera GhaziKhan 2,178 1.1273 0.657 0.074 0.004Kasur 2,204 1.0951 0.638 0.072 0.004Okara 2,311 0.9405 0.548 0.062 0.004Sahiwal 2,430 0.7886 0.459 0.052 0.003
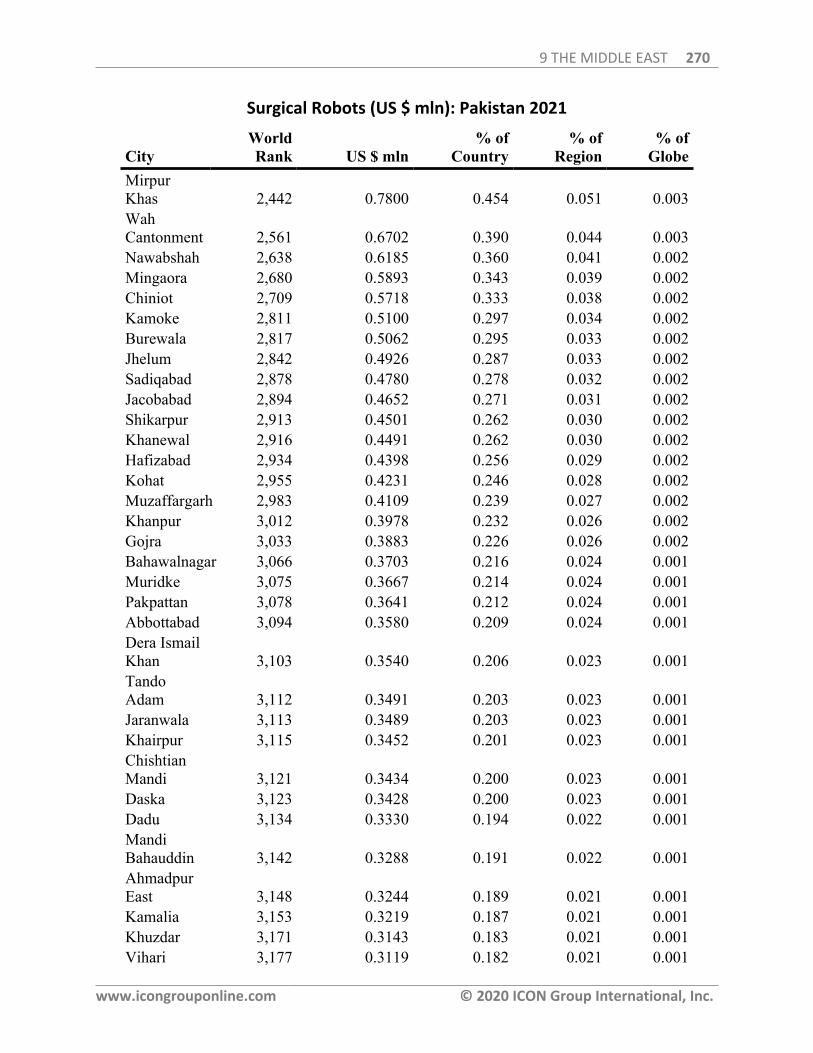
9 THE MIDDLE EAST 270
www.icongrouponline.com © 2020 ICON Group International, Inc.
Surgical Robots (US $ mln): Pakistan 2021
CityWorldRank US $ mln
% ofCountry
% ofRegion
% ofGlobe
MirpurKhas 2,442 0.7800 0.454 0.051 0.003WahCantonment 2,561 0.6702 0.390 0.044 0.003Nawabshah 2,638 0.6185 0.360 0.041 0.002Mingaora 2,680 0.5893 0.343 0.039 0.002Chiniot 2,709 0.5718 0.333 0.038 0.002Kamoke 2,811 0.5100 0.297 0.034 0.002Burewala 2,817 0.5062 0.295 0.033 0.002Jhelum 2,842 0.4926 0.287 0.033 0.002Sadiqabad 2,878 0.4780 0.278 0.032 0.002Jacobabad 2,894 0.4652 0.271 0.031 0.002Shikarpur 2,913 0.4501 0.262 0.030 0.002Khanewal 2,916 0.4491 0.262 0.030 0.002Hafizabad 2,934 0.4398 0.256 0.029 0.002Kohat 2,955 0.4231 0.246 0.028 0.002Muzaffargarh 2,983 0.4109 0.239 0.027 0.002Khanpur 3,012 0.3978 0.232 0.026 0.002Gojra 3,033 0.3883 0.226 0.026 0.002Bahawalnagar 3,066 0.3703 0.216 0.024 0.001Muridke 3,075 0.3667 0.214 0.024 0.001Pakpattan 3,078 0.3641 0.212 0.024 0.001Abbottabad 3,094 0.3580 0.209 0.024 0.001Dera IsmailKhan 3,103 0.3540 0.206 0.023 0.001TandoAdam 3,112 0.3491 0.203 0.023 0.001Jaranwala 3,113 0.3489 0.203 0.023 0.001Khairpur 3,115 0.3452 0.201 0.023 0.001ChishtianMandi 3,121 0.3434 0.200 0.023 0.001Daska 3,123 0.3428 0.200 0.023 0.001Dadu 3,134 0.3330 0.194 0.022 0.001MandiBahauddin 3,142 0.3288 0.191 0.022 0.001AhmadpurEast 3,148 0.3244 0.189 0.021 0.001Kamalia 3,153 0.3219 0.187 0.021 0.001Khuzdar 3,171 0.3143 0.183 0.021 0.001Vihari 3,177 0.3119 0.182 0.021 0.001
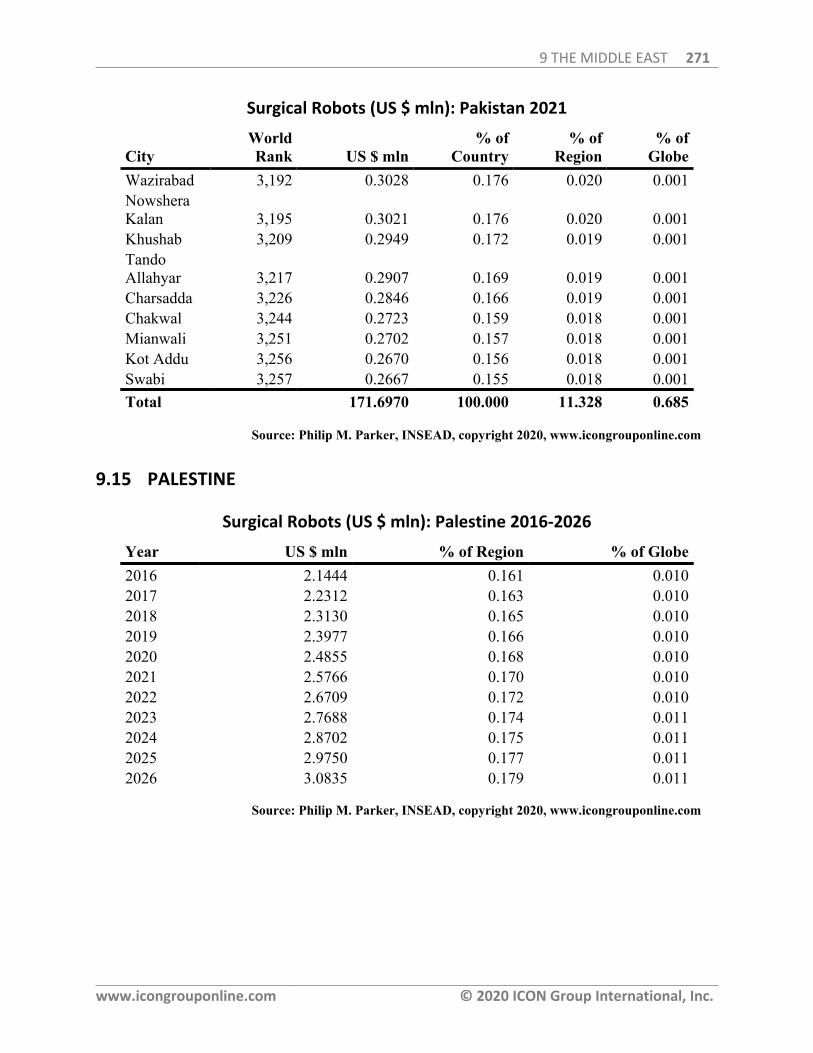
9 THE MIDDLE EAST 271
www.icongrouponline.com © 2020 ICON Group International, Inc.
Surgical Robots (US $ mln): Pakistan 2021
CityWorldRank US $ mln
% ofCountry
% ofRegion
% ofGlobe
Wazirabad 3,192 0.3028 0.176 0.020 0.001NowsheraKalan 3,195 0.3021 0.176 0.020 0.001Khushab 3,209 0.2949 0.172 0.019 0.001TandoAllahyar 3,217 0.2907 0.169 0.019 0.001Charsadda 3,226 0.2846 0.166 0.019 0.001Chakwal 3,244 0.2723 0.159 0.018 0.001Mianwali 3,251 0.2702 0.157 0.018 0.001Kot Addu 3,256 0.2670 0.156 0.018 0.001Swabi 3,257 0.2667 0.155 0.018 0.001Total 171.6970 100.000 11.328 0.685
Source: Philip M. Parker, INSEAD, copyright 2020, www.icongrouponline.com
9.15 PALESTINE
Surgical Robots (US $ mln): Palestine 2016-2026
Year US $ mln % of Region % of Globe2016 2.1444 0.161 0.0102017 2.2312 0.163 0.0102018 2.3130 0.165 0.0102019 2.3977 0.166 0.0102020 2.4855 0.168 0.0102021 2.5766 0.170 0.0102022 2.6709 0.172 0.0102023 2.7688 0.174 0.0112024 2.8702 0.175 0.0112025 2.9750 0.177 0.0112026 3.0835 0.179 0.011
Source: Philip M. Parker, INSEAD, copyright 2020, www.icongrouponline.com
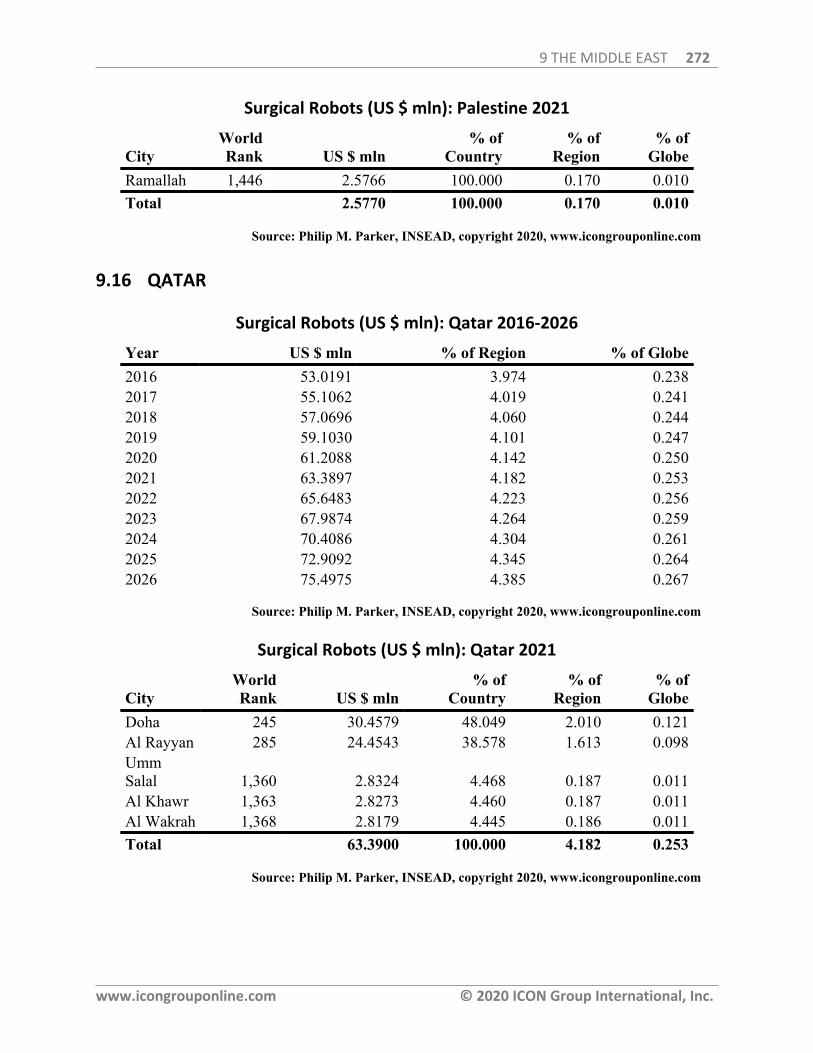
9 THE MIDDLE EAST 272
www.icongrouponline.com © 2020 ICON Group International, Inc.
Surgical Robots (US $ mln): Palestine 2021
CityWorldRank US $ mln
% ofCountry
% ofRegion
% ofGlobe
Ramallah 1,446 2.5766 100.000 0.170 0.010Total 2.5770 100.000 0.170 0.010
Source: Philip M. Parker, INSEAD, copyright 2020, www.icongrouponline.com
9.16 QATAR
Surgical Robots (US $ mln): Qatar 2016-2026
Year US $ mln % of Region % of Globe2016 53.0191 3.974 0.2382017 55.1062 4.019 0.2412018 57.0696 4.060 0.2442019 59.1030 4.101 0.2472020 61.2088 4.142 0.2502021 63.3897 4.182 0.2532022 65.6483 4.223 0.2562023 67.9874 4.264 0.2592024 70.4086 4.304 0.2612025 72.9092 4.345 0.2642026 75.4975 4.385 0.267
Source: Philip M. Parker, INSEAD, copyright 2020, www.icongrouponline.com
Surgical Robots (US $ mln): Qatar 2021
CityWorldRank US $ mln
% ofCountry
% ofRegion
% ofGlobe
Doha 245 30.4579 48.049 2.010 0.121Al Rayyan 285 24.4543 38.578 1.613 0.098UmmSalal 1,360 2.8324 4.468 0.187 0.011Al Khawr 1,363 2.8273 4.460 0.187 0.011Al Wakrah 1,368 2.8179 4.445 0.186 0.011Total 63.3900 100.000 4.182 0.253
Source: Philip M. Parker, INSEAD, copyright 2020, www.icongrouponline.com
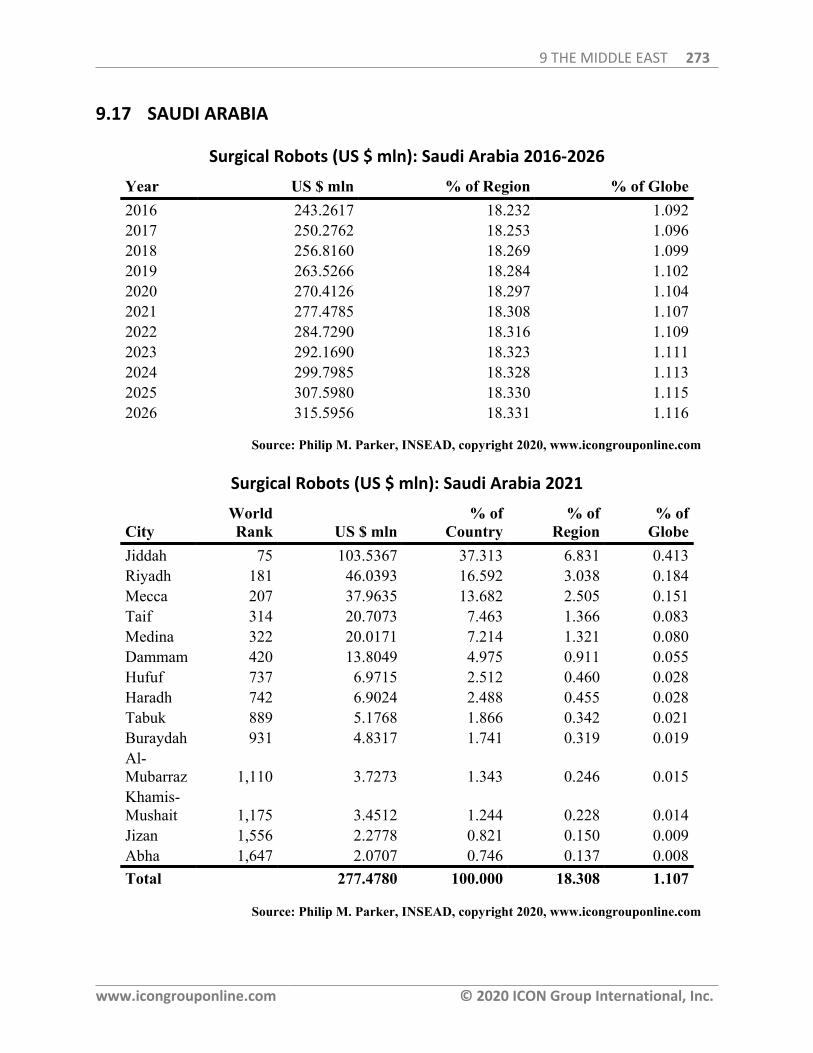
9 THE MIDDLE EAST 273
www.icongrouponline.com © 2020 ICON Group International, Inc.
9.17 SAUDI ARABIA
Surgical Robots (US $ mln): Saudi Arabia 2016-2026
Year US $ mln % of Region % of Globe2016 243.2617 18.232 1.0922017 250.2762 18.253 1.0962018 256.8160 18.269 1.0992019 263.5266 18.284 1.1022020 270.4126 18.297 1.1042021 277.4785 18.308 1.1072022 284.7290 18.316 1.1092023 292.1690 18.323 1.1112024 299.7985 18.328 1.1132025 307.5980 18.330 1.1152026 315.5956 18.331 1.116
Source: Philip M. Parker, INSEAD, copyright 2020, www.icongrouponline.com
Surgical Robots (US $ mln): Saudi Arabia 2021
CityWorldRank US $ mln
% ofCountry
% ofRegion
% ofGlobe
Jiddah 75 103.5367 37.313 6.831 0.413Riyadh 181 46.0393 16.592 3.038 0.184Mecca 207 37.9635 13.682 2.505 0.151Taif 314 20.7073 7.463 1.366 0.083Medina 322 20.0171 7.214 1.321 0.080Dammam 420 13.8049 4.975 0.911 0.055Hufuf 737 6.9715 2.512 0.460 0.028Haradh 742 6.9024 2.488 0.455 0.028Tabuk 889 5.1768 1.866 0.342 0.021Buraydah 931 4.8317 1.741 0.319 0.019Al-Mubarraz 1,110 3.7273 1.343 0.246 0.015Khamis-Mushait 1,175 3.4512 1.244 0.228 0.014Jizan 1,556 2.2778 0.821 0.150 0.009Abha 1,647 2.0707 0.746 0.137 0.008Total 277.4780 100.000 18.308 1.107
Source: Philip M. Parker, INSEAD, copyright 2020, www.icongrouponline.com
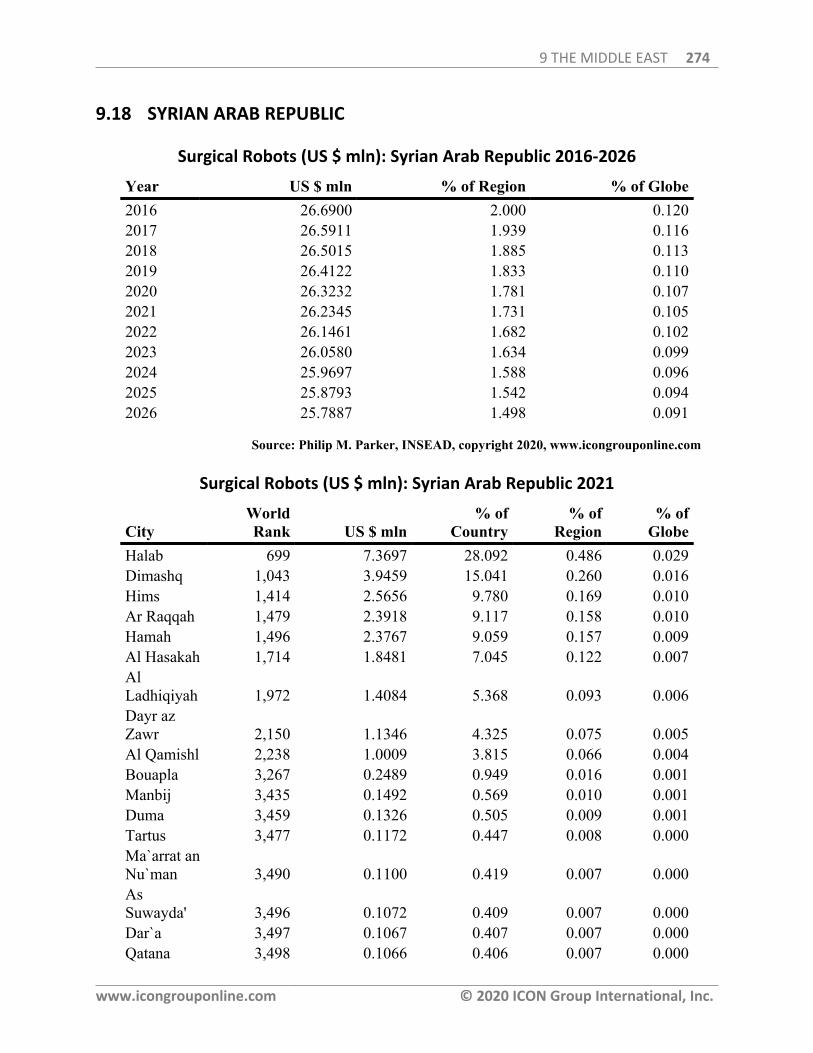
9 THE MIDDLE EAST 274
www.icongrouponline.com © 2020 ICON Group International, Inc.
9.18 SYRIAN ARAB REPUBLIC
Surgical Robots (US $ mln): Syrian Arab Republic 2016-2026
Year US $ mln % of Region % of Globe2016 26.6900 2.000 0.1202017 26.5911 1.939 0.1162018 26.5015 1.885 0.1132019 26.4122 1.833 0.1102020 26.3232 1.781 0.1072021 26.2345 1.731 0.1052022 26.1461 1.682 0.1022023 26.0580 1.634 0.0992024 25.9697 1.588 0.0962025 25.8793 1.542 0.0942026 25.7887 1.498 0.091
Source: Philip M. Parker, INSEAD, copyright 2020, www.icongrouponline.com
Surgical Robots (US $ mln): Syrian Arab Republic 2021
CityWorldRank US $ mln
% ofCountry
% ofRegion
% ofGlobe
Halab 699 7.3697 28.092 0.486 0.029Dimashq 1,043 3.9459 15.041 0.260 0.016Hims 1,414 2.5656 9.780 0.169 0.010Ar Raqqah 1,479 2.3918 9.117 0.158 0.010Hamah 1,496 2.3767 9.059 0.157 0.009Al Hasakah 1,714 1.8481 7.045 0.122 0.007AlLadhiqiyah 1,972 1.4084 5.368 0.093 0.006Dayr azZawr 2,150 1.1346 4.325 0.075 0.005Al Qamishl 2,238 1.0009 3.815 0.066 0.004Bouapla 3,267 0.2489 0.949 0.016 0.001Manbij 3,435 0.1492 0.569 0.010 0.001Duma 3,459 0.1326 0.505 0.009 0.001Tartus 3,477 0.1172 0.447 0.008 0.000Ma`arrat anNu`man 3,490 0.1100 0.419 0.007 0.000AsSuwayda' 3,496 0.1072 0.409 0.007 0.000Dar`a 3,497 0.1067 0.407 0.007 0.000Qatana 3,498 0.1066 0.406 0.007 0.000
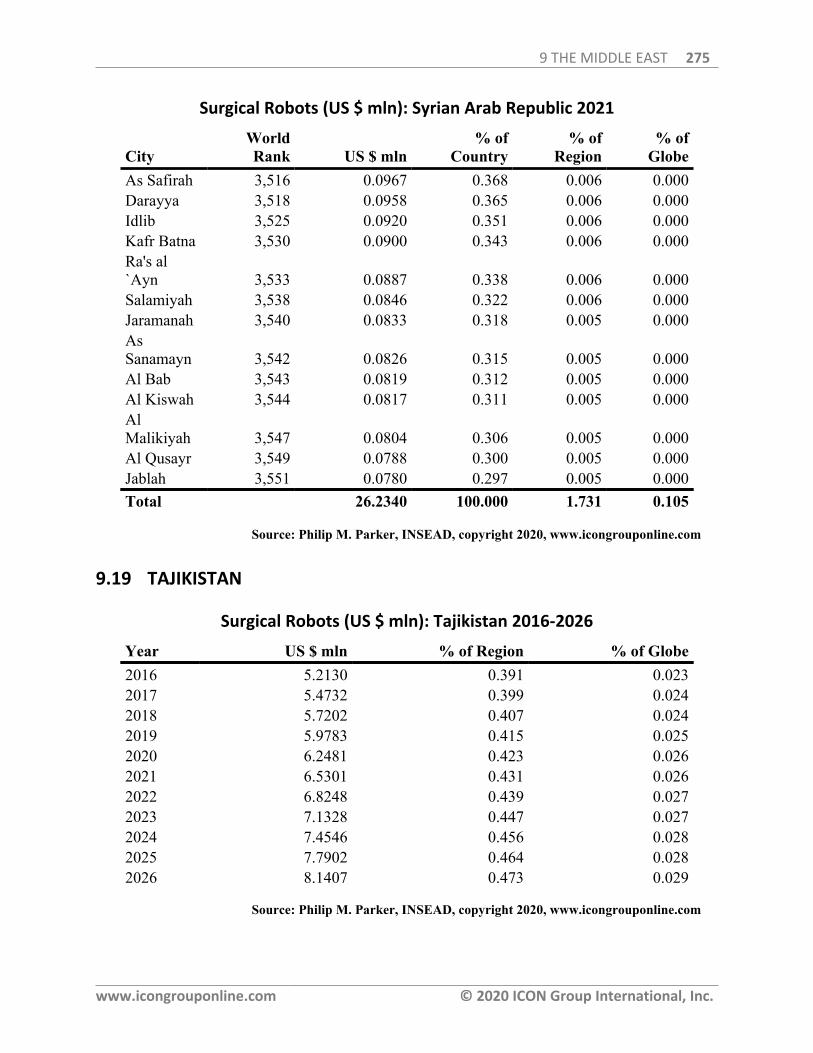
9 THE MIDDLE EAST 275
www.icongrouponline.com © 2020 ICON Group International, Inc.
Surgical Robots (US $ mln): Syrian Arab Republic 2021
CityWorldRank US $ mln
% ofCountry
% ofRegion
% ofGlobe
As Safirah 3,516 0.0967 0.368 0.006 0.000Darayya 3,518 0.0958 0.365 0.006 0.000Idlib 3,525 0.0920 0.351 0.006 0.000Kafr Batna 3,530 0.0900 0.343 0.006 0.000Ra's al`Ayn 3,533 0.0887 0.338 0.006 0.000Salamiyah 3,538 0.0846 0.322 0.006 0.000Jaramanah 3,540 0.0833 0.318 0.005 0.000AsSanamayn 3,542 0.0826 0.315 0.005 0.000Al Bab 3,543 0.0819 0.312 0.005 0.000Al Kiswah 3,544 0.0817 0.311 0.005 0.000AlMalikiyah 3,547 0.0804 0.306 0.005 0.000Al Qusayr 3,549 0.0788 0.300 0.005 0.000Jablah 3,551 0.0780 0.297 0.005 0.000Total 26.2340 100.000 1.731 0.105
Source: Philip M. Parker, INSEAD, copyright 2020, www.icongrouponline.com
9.19 TAJIKISTAN
Surgical Robots (US $ mln): Tajikistan 2016-2026
Year US $ mln % of Region % of Globe2016 5.2130 0.391 0.0232017 5.4732 0.399 0.0242018 5.7202 0.407 0.0242019 5.9783 0.415 0.0252020 6.2481 0.423 0.0262021 6.5301 0.431 0.0262022 6.8248 0.439 0.0272023 7.1328 0.447 0.0272024 7.4546 0.456 0.0282025 7.7902 0.464 0.0282026 8.1407 0.473 0.029
Source: Philip M. Parker, INSEAD, copyright 2020, www.icongrouponline.com
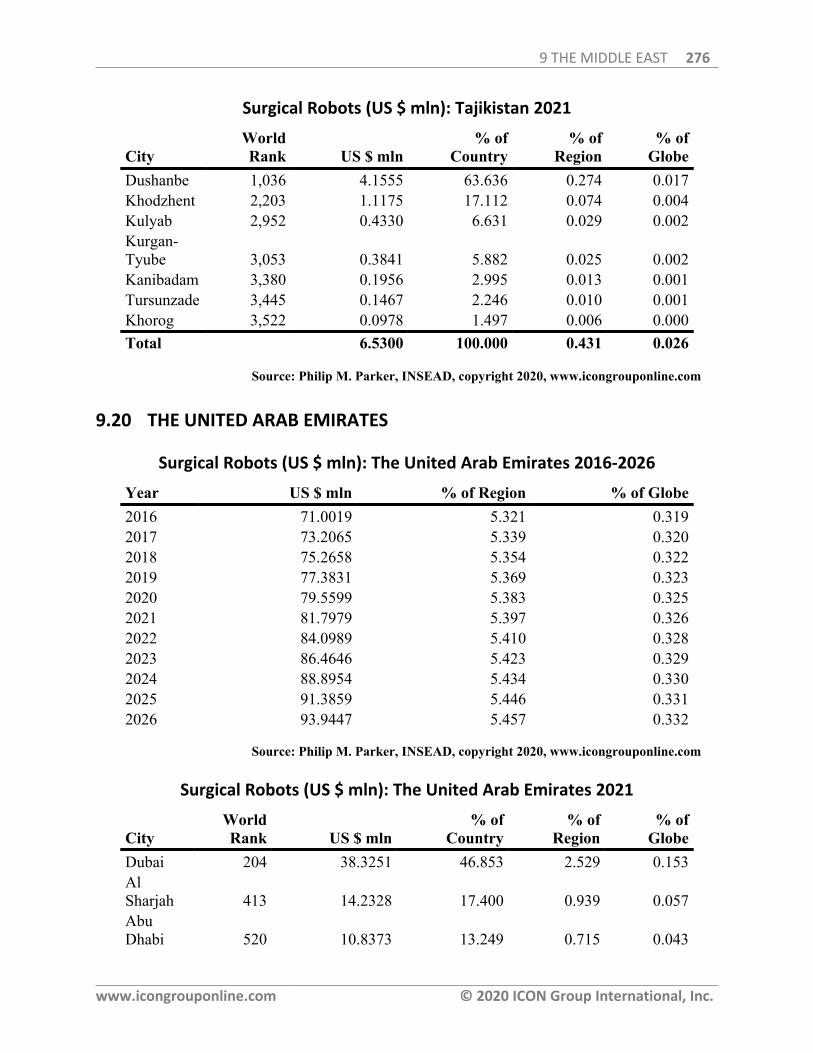
9 THE MIDDLE EAST 276
www.icongrouponline.com © 2020 ICON Group International, Inc.
Surgical Robots (US $ mln): Tajikistan 2021
CityWorldRank US $ mln
% ofCountry
% ofRegion
% ofGlobe
Dushanbe 1,036 4.1555 63.636 0.274 0.017Khodzhent 2,203 1.1175 17.112 0.074 0.004Kulyab 2,952 0.4330 6.631 0.029 0.002Kurgan-Tyube 3,053 0.3841 5.882 0.025 0.002Kanibadam 3,380 0.1956 2.995 0.013 0.001Tursunzade 3,445 0.1467 2.246 0.010 0.001Khorog 3,522 0.0978 1.497 0.006 0.000Total 6.5300 100.000 0.431 0.026
Source: Philip M. Parker, INSEAD, copyright 2020, www.icongrouponline.com
9.20 THE UNITED ARAB EMIRATES
Surgical Robots (US $ mln): The United Arab Emirates 2016-2026
Year US $ mln % of Region % of Globe2016 71.0019 5.321 0.3192017 73.2065 5.339 0.3202018 75.2658 5.354 0.3222019 77.3831 5.369 0.3232020 79.5599 5.383 0.3252021 81.7979 5.397 0.3262022 84.0989 5.410 0.3282023 86.4646 5.423 0.3292024 88.8954 5.434 0.3302025 91.3859 5.446 0.3312026 93.9447 5.457 0.332
Source: Philip M. Parker, INSEAD, copyright 2020, www.icongrouponline.com
Surgical Robots (US $ mln): The United Arab Emirates 2021
CityWorldRank US $ mln
% ofCountry
% ofRegion
% ofGlobe
Dubai 204 38.3251 46.853 2.529 0.153AlSharjah 413 14.2328 17.400 0.939 0.057AbuDhabi 520 10.8373 13.249 0.715 0.043
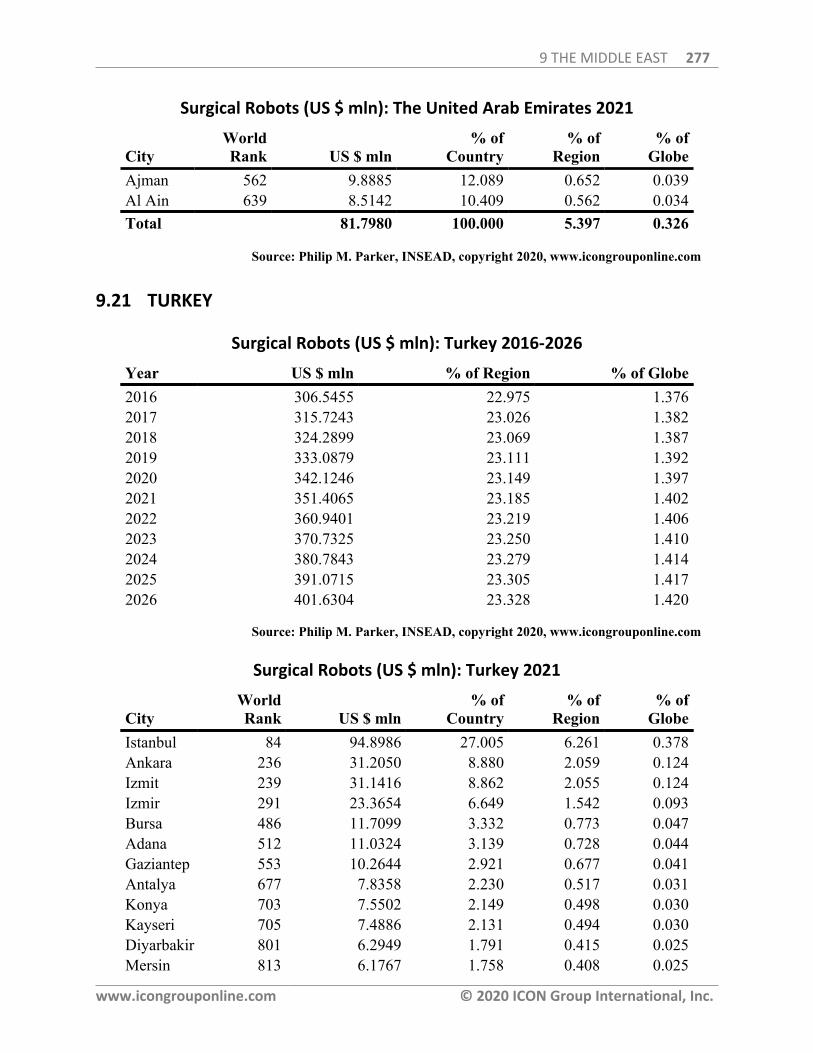
9 THE MIDDLE EAST 277
www.icongrouponline.com © 2020 ICON Group International, Inc.
Surgical Robots (US $ mln): The United Arab Emirates 2021
CityWorldRank US $ mln
% ofCountry
% ofRegion
% ofGlobe
Ajman 562 9.8885 12.089 0.652 0.039Al Ain 639 8.5142 10.409 0.562 0.034Total 81.7980 100.000 5.397 0.326
Source: Philip M. Parker, INSEAD, copyright 2020, www.icongrouponline.com
9.21 TURKEY
Surgical Robots (US $ mln): Turkey 2016-2026
Year US $ mln % of Region % of Globe2016 306.5455 22.975 1.3762017 315.7243 23.026 1.3822018 324.2899 23.069 1.3872019 333.0879 23.111 1.3922020 342.1246 23.149 1.3972021 351.4065 23.185 1.4022022 360.9401 23.219 1.4062023 370.7325 23.250 1.4102024 380.7843 23.279 1.4142025 391.0715 23.305 1.4172026 401.6304 23.328 1.420
Source: Philip M. Parker, INSEAD, copyright 2020, www.icongrouponline.com
Surgical Robots (US $ mln): Turkey 2021
CityWorldRank US $ mln
% ofCountry
% ofRegion
% ofGlobe
Istanbul 84 94.8986 27.005 6.261 0.378Ankara 236 31.2050 8.880 2.059 0.124Izmit 239 31.1416 8.862 2.055 0.124Izmir 291 23.3654 6.649 1.542 0.093Bursa 486 11.7099 3.332 0.773 0.047Adana 512 11.0324 3.139 0.728 0.044Gaziantep 553 10.2644 2.921 0.677 0.041Antalya 677 7.8358 2.230 0.517 0.031Konya 703 7.5502 2.149 0.498 0.030Kayseri 705 7.4886 2.131 0.494 0.030Diyarbakir 801 6.2949 1.791 0.415 0.025Mersin 813 6.1767 1.758 0.408 0.025
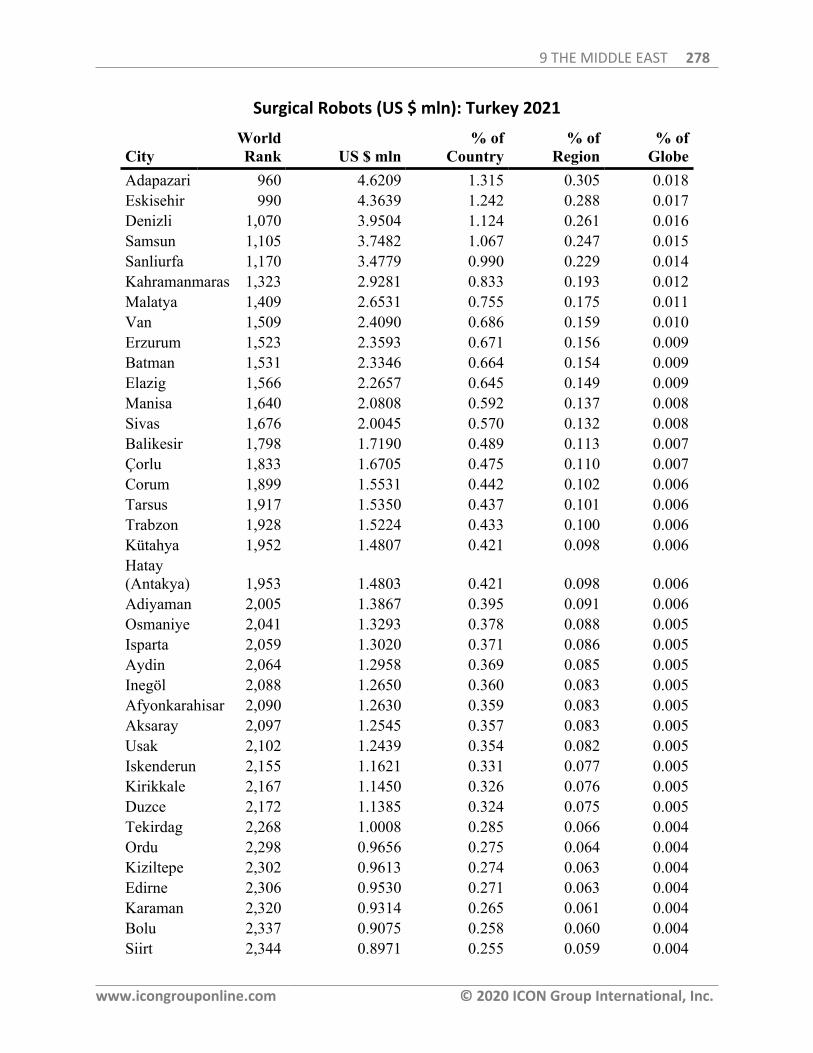
9 THE MIDDLE EAST 278
www.icongrouponline.com © 2020 ICON Group International, Inc.
Surgical Robots (US $ mln): Turkey 2021
CityWorldRank US $ mln
% ofCountry
% ofRegion
% ofGlobe
Adapazari 960 4.6209 1.315 0.305 0.018Eskisehir 990 4.3639 1.242 0.288 0.017Denizli 1,070 3.9504 1.124 0.261 0.016Samsun 1,105 3.7482 1.067 0.247 0.015Sanliurfa 1,170 3.4779 0.990 0.229 0.014Kahramanmaras 1,323 2.9281 0.833 0.193 0.012Malatya 1,409 2.6531 0.755 0.175 0.011Van 1,509 2.4090 0.686 0.159 0.010Erzurum 1,523 2.3593 0.671 0.156 0.009Batman 1,531 2.3346 0.664 0.154 0.009Elazig 1,566 2.2657 0.645 0.149 0.009Manisa 1,640 2.0808 0.592 0.137 0.008Sivas 1,676 2.0045 0.570 0.132 0.008Balikesir 1,798 1.7190 0.489 0.113 0.007Çorlu 1,833 1.6705 0.475 0.110 0.007Corum 1,899 1.5531 0.442 0.102 0.006Tarsus 1,917 1.5350 0.437 0.101 0.006Trabzon 1,928 1.5224 0.433 0.100 0.006Kütahya 1,952 1.4807 0.421 0.098 0.006Hatay(Antakya) 1,953 1.4803 0.421 0.098 0.006Adiyaman 2,005 1.3867 0.395 0.091 0.006Osmaniye 2,041 1.3293 0.378 0.088 0.005Isparta 2,059 1.3020 0.371 0.086 0.005Aydin 2,064 1.2958 0.369 0.085 0.005Inegöl 2,088 1.2650 0.360 0.083 0.005Afyonkarahisar 2,090 1.2630 0.359 0.083 0.005Aksaray 2,097 1.2545 0.357 0.083 0.005Usak 2,102 1.2439 0.354 0.082 0.005Iskenderun 2,155 1.1621 0.331 0.077 0.005Kirikkale 2,167 1.1450 0.326 0.076 0.005Duzce 2,172 1.1385 0.324 0.075 0.005Tekirdag 2,268 1.0008 0.285 0.066 0.004Ordu 2,298 0.9656 0.275 0.064 0.004Kiziltepe 2,302 0.9613 0.274 0.063 0.004Edirne 2,306 0.9530 0.271 0.063 0.004Karaman 2,320 0.9314 0.265 0.061 0.004Bolu 2,337 0.9075 0.258 0.060 0.004Siirt 2,344 0.8971 0.255 0.059 0.004
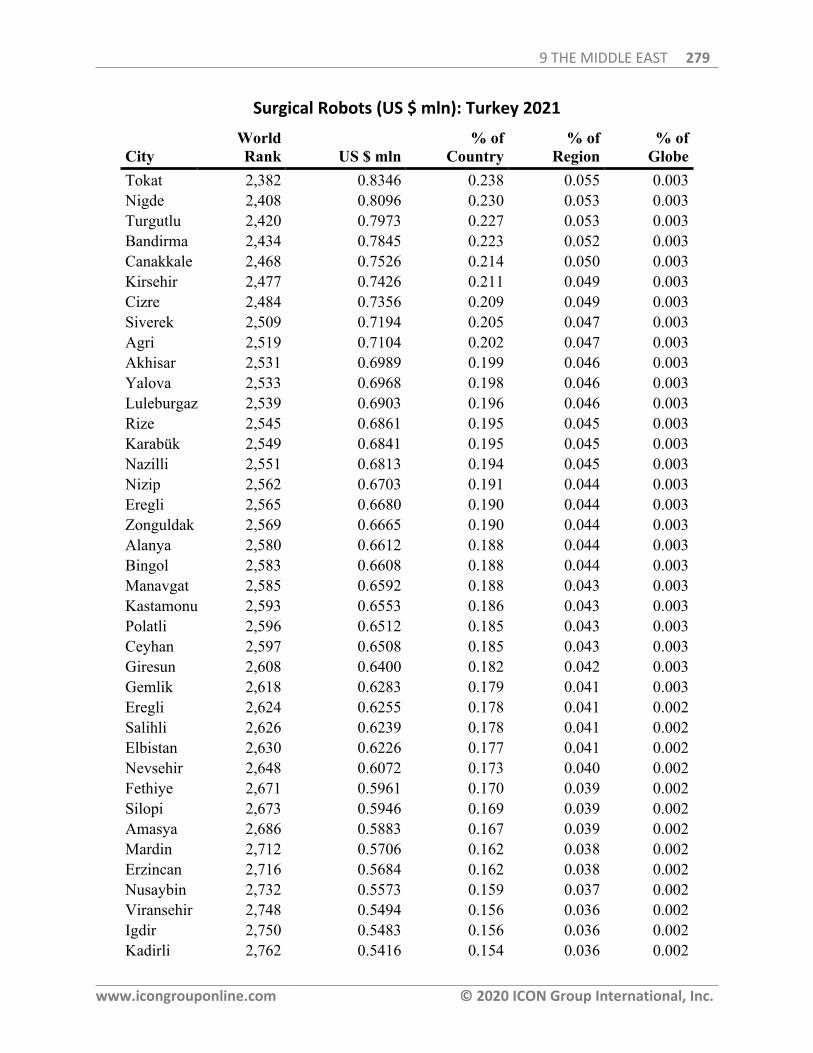
9 THE MIDDLE EAST 279
www.icongrouponline.com © 2020 ICON Group International, Inc.
Surgical Robots (US $ mln): Turkey 2021
CityWorldRank US $ mln
% ofCountry
% ofRegion
% ofGlobe
Tokat 2,382 0.8346 0.238 0.055 0.003Nigde 2,408 0.8096 0.230 0.053 0.003Turgutlu 2,420 0.7973 0.227 0.053 0.003Bandirma 2,434 0.7845 0.223 0.052 0.003Canakkale 2,468 0.7526 0.214 0.050 0.003Kirsehir 2,477 0.7426 0.211 0.049 0.003Cizre 2,484 0.7356 0.209 0.049 0.003Siverek 2,509 0.7194 0.205 0.047 0.003Agri 2,519 0.7104 0.202 0.047 0.003Akhisar 2,531 0.6989 0.199 0.046 0.003Yalova 2,533 0.6968 0.198 0.046 0.003Luleburgaz 2,539 0.6903 0.196 0.046 0.003Rize 2,545 0.6861 0.195 0.045 0.003Karabük 2,549 0.6841 0.195 0.045 0.003Nazilli 2,551 0.6813 0.194 0.045 0.003Nizip 2,562 0.6703 0.191 0.044 0.003Eregli 2,565 0.6680 0.190 0.044 0.003Zonguldak 2,569 0.6665 0.190 0.044 0.003Alanya 2,580 0.6612 0.188 0.044 0.003Bingol 2,583 0.6608 0.188 0.044 0.003Manavgat 2,585 0.6592 0.188 0.043 0.003Kastamonu 2,593 0.6553 0.186 0.043 0.003Polatli 2,596 0.6512 0.185 0.043 0.003Ceyhan 2,597 0.6508 0.185 0.043 0.003Giresun 2,608 0.6400 0.182 0.042 0.003Gemlik 2,618 0.6283 0.179 0.041 0.003Eregli 2,624 0.6255 0.178 0.041 0.002Salihli 2,626 0.6239 0.178 0.041 0.002Elbistan 2,630 0.6226 0.177 0.041 0.002Nevsehir 2,648 0.6072 0.173 0.040 0.002Fethiye 2,671 0.5961 0.170 0.039 0.002Silopi 2,673 0.5946 0.169 0.039 0.002Amasya 2,686 0.5883 0.167 0.039 0.002Mardin 2,712 0.5706 0.162 0.038 0.002Erzincan 2,716 0.5684 0.162 0.038 0.002Nusaybin 2,732 0.5573 0.159 0.037 0.002Viransehir 2,748 0.5494 0.156 0.036 0.002Igdir 2,750 0.5483 0.156 0.036 0.002Kadirli 2,762 0.5416 0.154 0.036 0.002
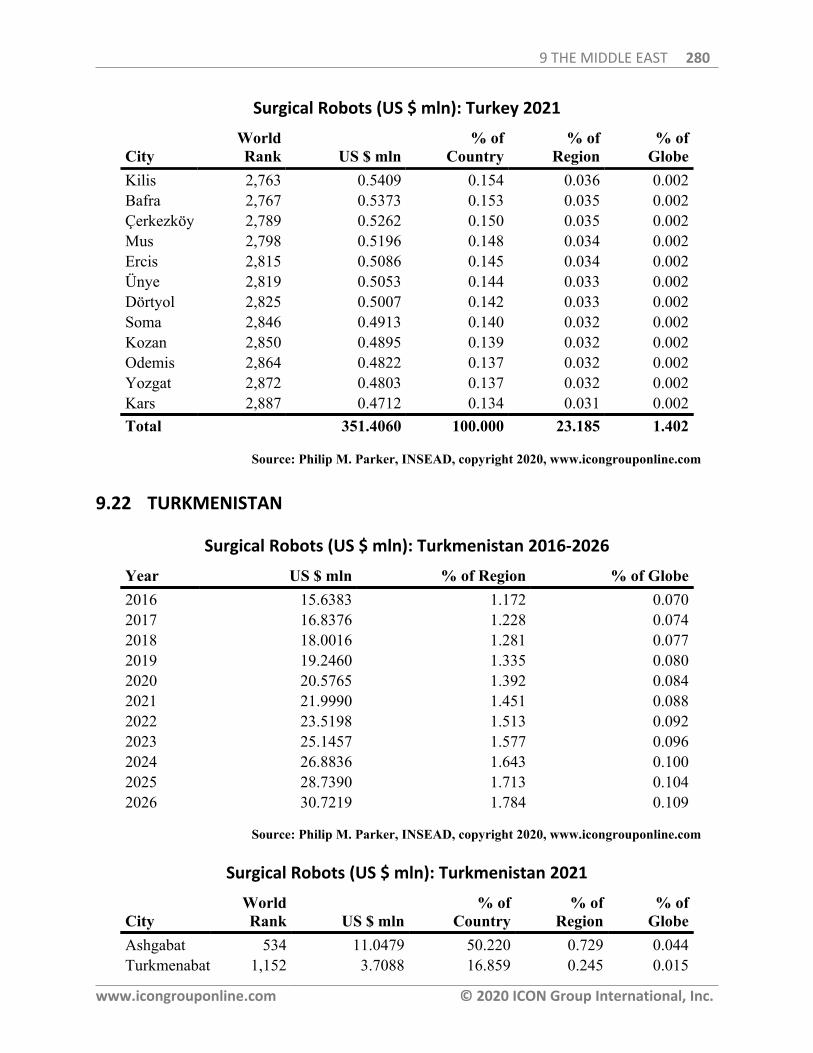
9 THE MIDDLE EAST 280
www.icongrouponline.com © 2020 ICON Group International, Inc.
Surgical Robots (US $ mln): Turkey 2021
CityWorldRank US $ mln
% ofCountry
% ofRegion
% ofGlobe
Kilis 2,763 0.5409 0.154 0.036 0.002Bafra 2,767 0.5373 0.153 0.035 0.002Çerkezköy 2,789 0.5262 0.150 0.035 0.002Mus 2,798 0.5196 0.148 0.034 0.002Ercis 2,815 0.5086 0.145 0.034 0.002Ünye 2,819 0.5053 0.144 0.033 0.002Dörtyol 2,825 0.5007 0.142 0.033 0.002Soma 2,846 0.4913 0.140 0.032 0.002Kozan 2,850 0.4895 0.139 0.032 0.002Odemis 2,864 0.4822 0.137 0.032 0.002Yozgat 2,872 0.4803 0.137 0.032 0.002Kars 2,887 0.4712 0.134 0.031 0.002Total 351.4060 100.000 23.185 1.402
Source: Philip M. Parker, INSEAD, copyright 2020, www.icongrouponline.com
9.22 TURKMENISTAN
Surgical Robots (US $ mln): Turkmenistan 2016-2026
Year US $ mln % of Region % of Globe2016 15.6383 1.172 0.0702017 16.8376 1.228 0.0742018 18.0016 1.281 0.0772019 19.2460 1.335 0.0802020 20.5765 1.392 0.0842021 21.9990 1.451 0.0882022 23.5198 1.513 0.0922023 25.1457 1.577 0.0962024 26.8836 1.643 0.1002025 28.7390 1.713 0.1042026 30.7219 1.784 0.109
Source: Philip M. Parker, INSEAD, copyright 2020, www.icongrouponline.com
Surgical Robots (US $ mln): Turkmenistan 2021
CityWorldRank US $ mln
% ofCountry
% ofRegion
% ofGlobe
Ashgabat 534 11.0479 50.220 0.729 0.044Turkmenabat 1,152 3.7088 16.859 0.245 0.015
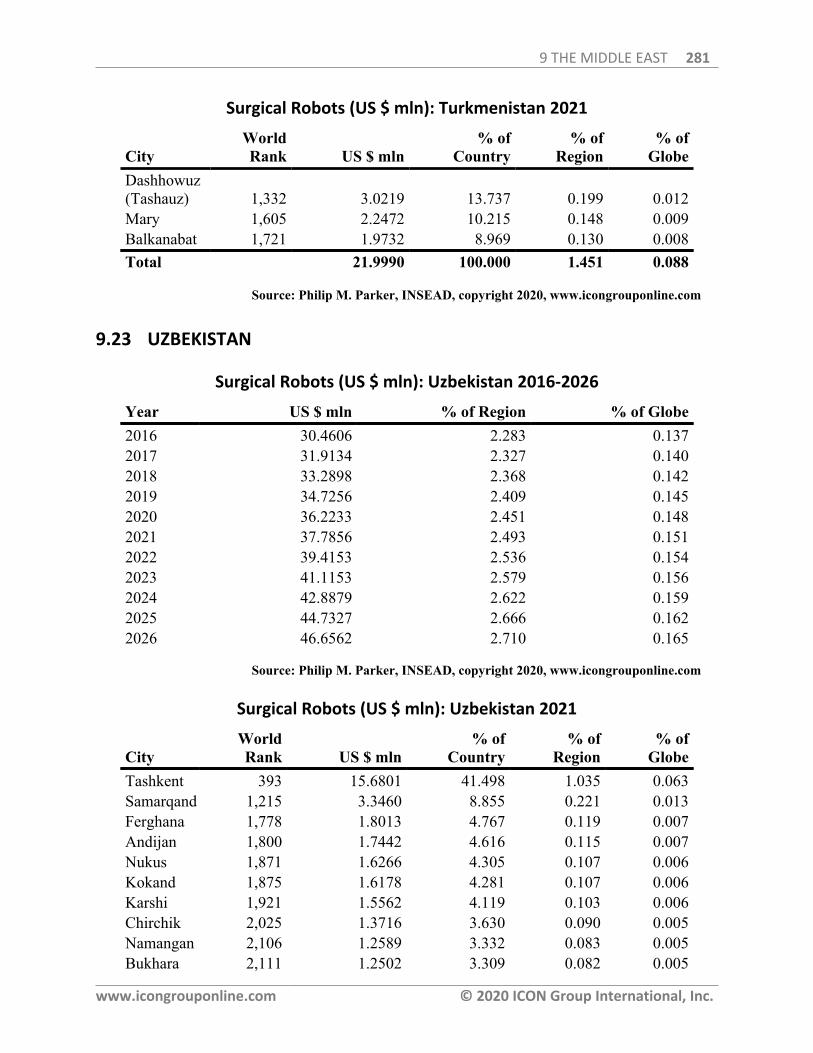
9 THE MIDDLE EAST 281
www.icongrouponline.com © 2020 ICON Group International, Inc.
Surgical Robots (US $ mln): Turkmenistan 2021
CityWorldRank US $ mln
% ofCountry
% ofRegion
% ofGlobe
Dashhowuz(Tashauz) 1,332 3.0219 13.737 0.199 0.012Mary 1,605 2.2472 10.215 0.148 0.009Balkanabat 1,721 1.9732 8.969 0.130 0.008Total 21.9990 100.000 1.451 0.088
Source: Philip M. Parker, INSEAD, copyright 2020, www.icongrouponline.com
9.23 UZBEKISTAN
Surgical Robots (US $ mln): Uzbekistan 2016-2026
Year US $ mln % of Region % of Globe2016 30.4606 2.283 0.1372017 31.9134 2.327 0.1402018 33.2898 2.368 0.1422019 34.7256 2.409 0.1452020 36.2233 2.451 0.1482021 37.7856 2.493 0.1512022 39.4153 2.536 0.1542023 41.1153 2.579 0.1562024 42.8879 2.622 0.1592025 44.7327 2.666 0.1622026 46.6562 2.710 0.165
Source: Philip M. Parker, INSEAD, copyright 2020, www.icongrouponline.com
Surgical Robots (US $ mln): Uzbekistan 2021
CityWorldRank US $ mln
% ofCountry
% ofRegion
% ofGlobe
Tashkent 393 15.6801 41.498 1.035 0.063Samarqand 1,215 3.3460 8.855 0.221 0.013Ferghana 1,778 1.8013 4.767 0.119 0.007Andijan 1,800 1.7442 4.616 0.115 0.007Nukus 1,871 1.6266 4.305 0.107 0.006Kokand 1,875 1.6178 4.281 0.107 0.006Karshi 1,921 1.5562 4.119 0.103 0.006Chirchik 2,025 1.3716 3.630 0.090 0.005Namangan 2,106 1.2589 3.332 0.083 0.005Bukhara 2,111 1.2502 3.309 0.082 0.005
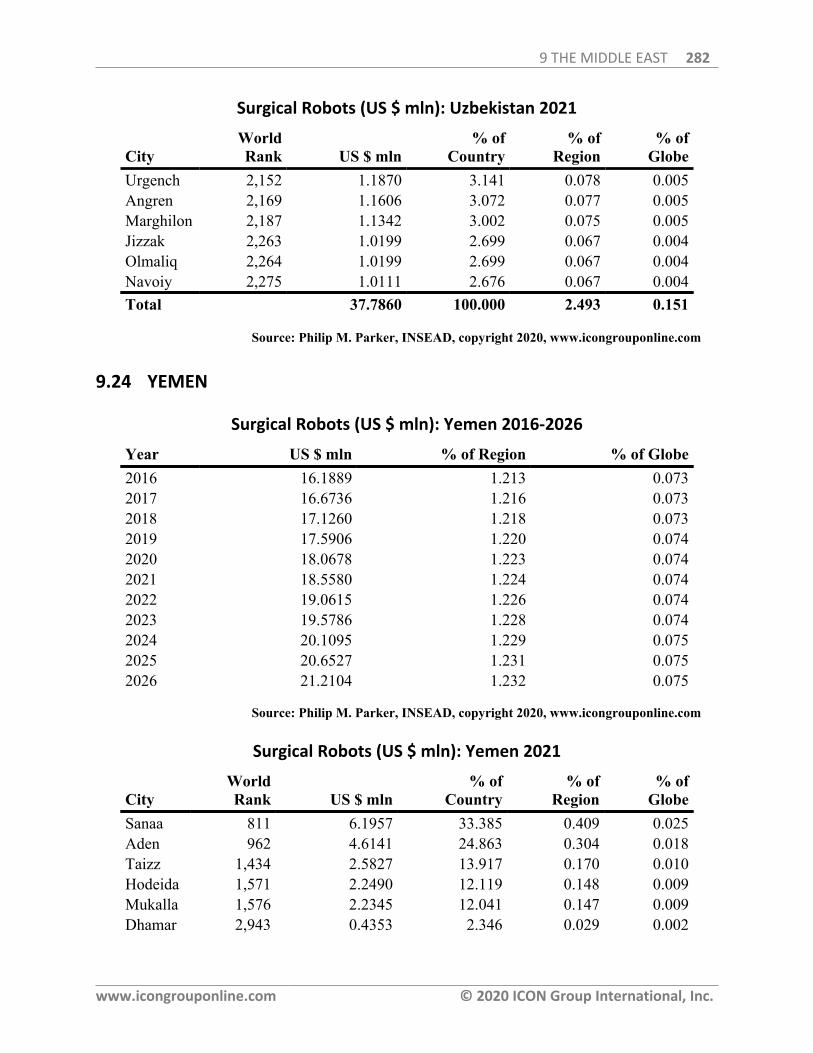
9 THE MIDDLE EAST 282
www.icongrouponline.com © 2020 ICON Group International, Inc.
Surgical Robots (US $ mln): Uzbekistan 2021
CityWorldRank US $ mln
% ofCountry
% ofRegion
% ofGlobe
Urgench 2,152 1.1870 3.141 0.078 0.005Angren 2,169 1.1606 3.072 0.077 0.005Marghilon 2,187 1.1342 3.002 0.075 0.005Jizzak 2,263 1.0199 2.699 0.067 0.004Olmaliq 2,264 1.0199 2.699 0.067 0.004Navoiy 2,275 1.0111 2.676 0.067 0.004Total 37.7860 100.000 2.493 0.151
Source: Philip M. Parker, INSEAD, copyright 2020, www.icongrouponline.com
9.24 YEMEN
Surgical Robots (US $ mln): Yemen 2016-2026
Year US $ mln % of Region % of Globe2016 16.1889 1.213 0.0732017 16.6736 1.216 0.0732018 17.1260 1.218 0.0732019 17.5906 1.220 0.0742020 18.0678 1.223 0.0742021 18.5580 1.224 0.0742022 19.0615 1.226 0.0742023 19.5786 1.228 0.0742024 20.1095 1.229 0.0752025 20.6527 1.231 0.0752026 21.2104 1.232 0.075
Source: Philip M. Parker, INSEAD, copyright 2020, www.icongrouponline.com
Surgical Robots (US $ mln): Yemen 2021
CityWorldRank US $ mln
% ofCountry
% ofRegion
% ofGlobe
Sanaa 811 6.1957 33.385 0.409 0.025Aden 962 4.6141 24.863 0.304 0.018Taizz 1,434 2.5827 13.917 0.170 0.010Hodeida 1,571 2.2490 12.119 0.148 0.009Mukalla 1,576 2.2345 12.041 0.147 0.009Dhamar 2,943 0.4353 2.346 0.029 0.002

9 THE MIDDLE EAST 283
www.icongrouponline.com © 2020 ICON Group International, Inc.
Surgical Robots (US $ mln): Yemen 2021
CityWorldRank US $ mln
% ofCountry
% ofRegion
% ofGlobe
El Beida 3,466 0.1306 0.704 0.009 0.001Hajja 3,484 0.1161 0.625 0.008 0.000Total 18.5580 100.000 1.224 0.074
Source: Philip M. Parker, INSEAD, copyright 2020, www.icongrouponline.com
10 DISCLAIMERS, WARRANTEES, AND USER AGREEMENT PROVISIONS 284
www.icongrouponline.com © 2020 ICON Group International, Inc.
10 DISCLAIMERS, WARRANTEES, AND USER AGREEMENTPROVISIONS
10.1 DISCLAIMERS & SAFE HARBOR
Summary disclaimer. This publication ("Report") does not constitute legal, valuation, tax, orfinancial consulting advice. Nor is it a statement on the performance, management capability orfuture potential (good or bad) of the company(ies), industry(ies), product(s), region(s), city(ies)or country(ies) discussed. It is offered as an information service to clients, associates, andacademicians. Those interested in specific guidance for legal, strategic, and/or financial oraccounting matters should seek competent professional assistance from their own advisors.
Information was furnished to ICON Group International, Inc. ("ICON Group"), and itssubsidiaries, by its internal researchers and/or extracted from public filings, or sources availablewithin the public domain, including other information providers (e.g. EDGAR filings, nationalorganizations and international organizations). ICON Group does not promise or warrant that wewill obtain information from any particular independent source. Published regularly by ICONGroup, this and similar reports provide analysis on cities, countries, industries, and/or foreignand domestic companies which may or may not be publicly traded. ICON Group reports are usedby various companies and persons including consulting firms, investment officers, pension fundmanagers, registered representatives, and other financial service professionals. Any commentary,observations or discussion by ICON Group about a country, city, region, industry or companydoes not constitute a recommendation to buy or sell company shares or make investmentdecisions. Further, the financial condition or outlook for each industry, city, country, or companymay change after the date of the publication, and ICON Group does not warrant, promise orrepresent that it will provide report users with notice of that change, nor will ICON Grouppromise updates on the information presented.
Safe Harbor for Forward-Looking Statements. ICON Group reports, including the presentreport, make numerous forward-looking statements which should be treated as such. Forward-looking statements are made pursuant to the safe harbor provisions of the Private SecuritiesReform Act of 1995, and similar local laws. Forward-looking statements involve known andunknown risks and uncertainties, which may cause a company's, city's, country's or industry'sactual results or outlook in future periods to differ materially from those forecasted. These risksand uncertainties include, among other things, product price volatility, exchange rate volatility,regulation volatility, product demand volatility, data inaccuracies, computer or software-generated calculation inaccuracies, market competition, changes in management style, changesin corporate strategy, and risks inherent in international and corporate operations. Forward-looking statements can be identified in statements by the fact that they do not relate strictly tohistorical or current facts. They use words such as "anticipate," "estimate," "expect," "project,""intend," "plan," "feel", "think", "hear," "guess," "forecast," "believe," and other words and termsof similar meaning in connection with any discussion of future operating, economic or financialperformance. This equally applies to all statements relating to an industry, city, country, region,economic variable or company financial situation. ICON Group recommends that the readerfollow the advice of Nancy M. Smith, Director of SEC's Office of Investor Education andAssistance, who has been quoted to say, "Never, ever, make an investment based solely on what
10 DISCLAIMERS, WARRANTEES, AND USER AGREEMENT PROVISIONS 285
www.icongrouponline.com © 2020 ICON Group International, Inc.
you read in an online newsletter or Internet bulletin board, especially if the investment involves asmall, thinly-traded company that isn't well known … Assume that the information about thesecompanies is not trustworthy unless you can prove otherwise through your own independentresearch." Similar recommendations apply to decisions relating to industry studies, productcategory studies, corporate strategies discussions and country evaluations. In the case of ICONGroup reports, many factors can affect the actual outcome of the period discussed, includingexchange rate volatility, changes in accounting standards, the lack of oversight or comparabilityin accounting standards, changes in economic conditions, changes in competition, changes in theglobal economy, changes in source data quality, changes in reported data quality, changes inmethodology and similar factors.
Information Accuracy. Although the statements in this report are derived from or based uponvarious information sources and/or econometric models that ICON Group believes to be reliable,we do not guarantee their accuracy, reliability, quality, and any such information, or resultinganalyses, may be incomplete, rounded, inaccurate or condensed. All estimates included in thisreport are subject to change without notice. This report is for informational purposes only and isnot intended as a recommendation to invest in a city, country, industry or product area, or anoffer or solicitation with respect to the purchase or sale of a security, stock, or financialinstrument. This report does not take into account the investment objectives, financial situationor particular needs of any particular person or legal entity. With respect to any specific company,city, country, region, or industry that might be discussed in this report, investors should obtainindividual financial advice based on their own particular circumstances before making aninvestment decision on the basis of the information in this report. Investing in either U.S. or non-U.S. securities or markets entails inherent risks. In addition, exchange rate movements may havean effect on the reliability of the estimates provided in this report. ICON Group is not aregistered Investment Adviser or a Broker/Dealer.
10.2 ICON GROUP INTERNATIONAL, INC. USER AGREEMENT PROVISIONS
Ownership. User agrees that ICON Group International, Inc. ("ICON Group") and itssubsidiaries retain all rights, title and interests, including copyright and other proprietary rights,in this report and all material, including but not limited to text, images, and other multimediadata, provided or made available as part of this report ("Report").
Restrictions on Use. User agrees that it will not copy nor license, sell, transfer, make availableor otherwise distribute the Report to any entity or person, except that User may (a) makeavailable to its employees electronic copies of Report, (b) allow its employees to store,manipulate, and reformat Report, and (c) allow its employees to make paper copies of Report,provided that such electronic and paper copies are used solely internally and are not distributedto any third parties. In all cases the User agrees to fully inform and distribute to other internalusers all discussions covering the methodology of this Report and the disclaimers and caveatsassociated with this Report. User shall use its best efforts to stop any unauthorized copying ordistribution immediately after such unauthorized use becomes known. The provisions of thisparagraph are for the benefit of ICON Group and its information resellers, each of which shallhave the right to enforce its rights hereunder directly and on its own behalf.
No Warranty. The Report is provided on an "AS IS" basis. ICON GROUP DISCLAIMS ANYAND ALL WARRANTIES, INCLUDING BUT NOT LIMITED TO THE IMPLIED
10 DISCLAIMERS, WARRANTEES, AND USER AGREEMENT PROVISIONS 286
www.icongrouponline.com © 2020 ICON Group International, Inc.
WARRANTIES OF MERCHANTABILITY AND FITNESS FOR A PARTICULARPURPOSE, RELATING TO THIS AGREEMENT, PERFORMANCE UNDER THISAGREEMENT, THE REPORT. ICON Group makes no warranties regarding the completeness,accuracy or availability of the Report.
Limitation of Liability. In no event shall ICON Group, its employees or its agent, resellers anddistributors be liable to User or any other person or entity for any direct, indirect, special,exemplary, punitive, or consequential damages, including lost profits, based on breach ofwarranty, contract, negligence, strict liability or otherwise, arising from the use of the report orunder this Agreement or any performance under this Agreement, whether or not they or it hadany knowledge, actual or constructive, that such damages might be incurred.
Indemnification. User shall indemnify and hold harmless ICON Group and its resellers,distributors and information providers against any claim, damages, loss, liability or expensearising out of User's use of the Report in any way contrary to this Agreement.
© ICON Group International, Inc., 2020. All rights reserved. Any unauthorized use, duplicationor disclosure is prohibited by law and will result in prosecution. Text, graphics, and HTML orother computer code are protected by US and International Copyright Laws, and may not becopied, reprinted, published, translated, hosted, or otherwise distributed by any means withoutexplicit permission. Permission is granted to quote small portions of this report with properattribution. Media quotations with source attributions are encouraged. Reporters requestingadditional information or editorial comments should contact ICON Group via email [email protected].
Sources: This report was prepared from a variety of sources including excerpts from documentsand official reports or databases published by the World Bank, the U.S. Department ofCommerce, the U.S. State Department, various national agencies, the International MonetaryFund, the Central Intelligence Agency, the United Nations, and Icon Group International, Inc.
END